Steadfast Group Annual Report 2021
135
-
Upload
khangminh22 -
Category
Documents
-
view
3 -
download
0
Transcript of Steadfast Group Annual Report 2021


Vision: Continually growing shareholder value through our leading general insurance distribution model and related businesses domestically and internationally.
Mission: Continue to deliver value to our broker network and stakeholders by being a market leader and an innovator in insurance.
Values: Our corporate values resonate across all facets of our business.
Co
nte
nts
Annual General Meeting
The Steadfast Group FY21 Annual General Meeting will be a virtual meeting held on Friday, 22 October 2021. Steadfast will provide further details with the notice of the 2021 Annual General Meeting to be released in September 2021.
Co
nte
nts
Co
nte
ntsContents
02 Message from the Chairman
04 Message from the Managing Director & CEO
07 2021 financial highlights
08 Message from the Chief Financial Officer
10 How we create value model
12 Our business
20 Board of Directors
22 Senior Management Team
25 CSR and ESG
41 Financial Report
131 Glossary of Terms
132 Corporate Directory
Steadfast Group Annual Report 2021 01

Message from the Chairman
On behalf of the Directors, I am pleased to report
excellent Steadfast Group earnings for FY21, with
our underlying net profit after tax at the top end of
our upgraded guidance range advised to the ASX on
28 April 2021.
The Group produced a 17.6% increase in underlying
earnings before interest, tax and amortisation (EBITA) to
$262.7 million and a 20.2% increase in underlying net
profit after tax (NPAT) to $130.7 million. Pleasingly, we
reported underlying earnings per share of 15.1 cents, an
uplift of 18.8%. The Group has delivered this outstanding
result against the backdrop of a global pandemic.
Statutory net profit after tax, including non-recurring
items, was $143.0 million compared with a loss of
$55.2 million for FY20. Last year's statutory loss arose from
the accounting treatment of the IBNA acquisition and PSF
Rebate Offer.
Dividend
The Board has declared a fully-franked final dividend of 7.0
cents per share, up 16.7% from last year. This takes the total
dividend to 11.4 cps (fully-franked).
The Group's strong performance has continued since
listing in 2013. Our total shareholder return was 34.3% for
the year and since listing has been 334%.
Accumulated Total Shareholder Return (TSR) (%)
IPO
FY14
FY15
FY16
FY17
FY18
FY19
FY20
FY21
0
100
200
300
400
Capital management
We continue to be prudent with our capital as we assess
potential acquisition opportunities against disciplined
criteria. We made a number of earnings accretive
acquisitions during FY21 for a total investment of $172m.
02 Steadfast Group Annual Report 2021
Steadfast has already completed some small acquisitions
for FY22, and on 16 August 2021 announced the
acquisition of Coverforce for $411.5m to be funded by
the issue of new shares. We expect further acquisitions
from current negotiations with a number of the Steadfast
Network Brokers with these acquisitions being funded
from the unutilised debt facilities.
As at 30 June 2021 our total Group gearing ratio was
22.0% (excluding premium funding) and is within the
Board-mandated Group maximum of 30%. At the date of
this report, Steadfast has unutilised facilities of $163 million
for future expansion.
Governance
Your Board acknowledges its responsibility to lead and
support Environmental, Social, and Governance (ESG)
initiatives within Steadfast Group as being integral to
the sustainability and continuing financial growth of
our business.
Steadfast Group continues to contribute to the
communities in which we operate, mitigate the
environmental impact of our business activities and
ensure the fair treatment of our customers, employees
and suppliers.
This year, we established our People, Culture &
Governance board committee and Steadfast Group has
increased its focus on ESG reporting, disclosure of our
key ESG objectives, and progress on these objectives,
particularly on culture, diversity and inclusion. We set out
our plan for increased ESG commitments in more detail on
page 40 of this report.
During the year Steadfast completed an ESG assessment
of its network brokers, which resulted in Steadfast
implementing Nine Positions that requires further
commitments from our broker network to ensure that
the network is meeting and exceeding the expectations of
its customers, and the broader community. More detail is
provided on page 39 of this report.
Steadfast Group continues to adhere to the corporate
governance principles as set out by the ASX Corporate
Governance Council. Our governance framework and
robust risk management strategies are set out in more
detail on page 39. I note another year in which there were
no material departures from these principles.
Thank you
On behalf of the Board, I would like to thank our
people, including our hard working CEO & Managing
Director, Robert Kelly, and our executive team, for their
significant contribution in the difficult environment to
deliver excellent results for our shareholders and ongoing
support to our Network Brokers and other stakeholders.
Our strong performance would not have been
possible without the outstanding contribution from
Steadfast brokers, Steadfast Underwriting Agencies and
complementary businesses, and the loyalty of our clients.
I would like to welcome Vicki Allen, Non-Executive
Director to the Steadfast Group Board. Vicki has significant
executive experience, particularly in distribution
businesses, and as a non-executive director.
Finally, I would also like to extend my gratitude
to my fellow Board Directors who continue to
be focused on driving increased shareholder value,
supporting the Steadfast team, and improving our already
strong governance.
Frank O’Halloran, AM Chairman
Steadfast Group continues to contribute to the communities in which we operate, mitigate the environmental impact of our business activities and ensure the fair treatment of our customers, employees and suppliers.
Steadfast Group Annual Report 2021 03
Message from the Managing Director & CEO
Once again, I am pleased to report that FY21 continues
our year on year record growth since our August 2013
IPO. Our underlying EBITA of $262.7 million and NPAT
of $130.7 million are a result of our enduring business
model, the skills and stability of our executive team and
the strong performance of the substantial majority of
our equity owned businesses.
Our Group's Broking and Underwriting Agency
businesses experienced strong organic growth over
the year.
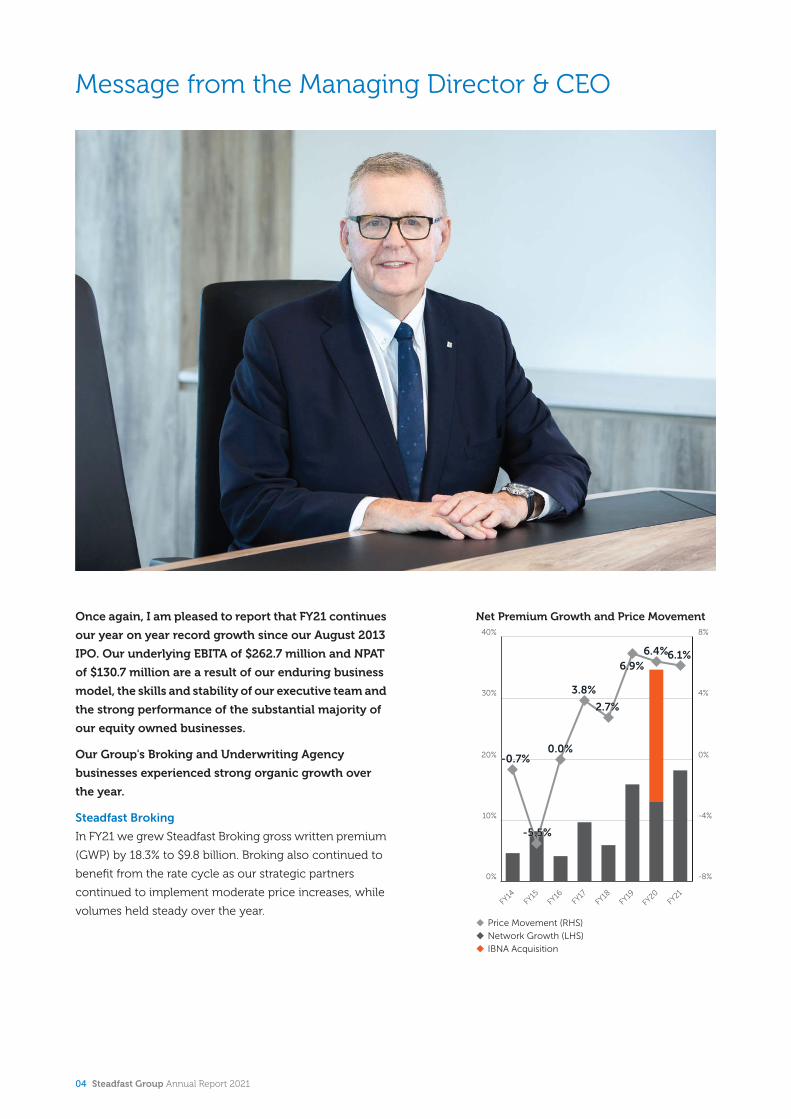
Steadfast Broking
In FY21 we grew Steadfast Broking gross written premium
(GWP) by 18.3% to $9.8 billion. Broking also continued to
benefit from the rate cycle as our strategic partners
continued to implement moderate price increases, while
volumes held steady over the year.
Net Premium Growth and Price Movement
-0.7%-0.7%
-5.5%-5.5%
0.0%0.0%
3.8%3.8%
2.7%2.7%
6.9%6.9%6.4%6.4%6.1%6.1%
u Price Movement (RHS)
u Network Growth (LHS)
u IBNA Acquisition
FY14
FY15
FY16
FY17
FY18
FY19
FY20
FY21
0%
10%
20%
30%
40%
-8%
-4%
0%
4%
8%
04 Steadfast Group Annual Report 2021
Expense savings and increased revenue have driven our
excellent underlying EBITA growth of 21.5%. Acquisitions
during the year made a solid contribution of 8.5% of the
underlying EBITA growth.
We now have 457 brokerages in the network, with 386
in Australia and, internationally, 52 in New Zealand and
19 in Singapore. Steadfast Group has equity holdings
in 59 of the 457 brokerages in the Steadfast Network.
Strategically, we increased our holding in unisonSteadfast
to a majority interest of 60%. Further, the unisonSteadfast
network encompasses another 264 brokerages across 140
countries with billings in excess of USD$35 billion.
Steadfast Underwriting Agencies
Steadfast Underwriting Agencies continue to outperform
with sustained organic growth, generating $1.48 billion of
GWP, a 11.5% uplift over FY20. This strong performance
was due to the diligent underwriting expertise of our team
and their ability to provide sustainable profit margins from
our network of agencies.
Market share continues to grow due to our expertise
in the various niche products of our agencies. This
combined with further moderate premium price increases
by insurers, led to underlying EBITA growth of 13.0%.
We currently have 24 specialist agencies offering over 100
niche products.
Our insurTech
This year, $793 million of GWP was transacted on our
market-leading Steadfast Client Trading Platform (SCTP)
as brokers take advantage of the full efficiency and wide
market access the platform delivers.
Steadfast continued to refine and improve our technology
to drive growth and improved customer experience.
Auto-rating capability for insurers for Liability and
Professional Indemnity product lines and the launch
of our Commercial Motor line auto-rating will see the
addition of another four insurers to the platform in the first
half of FY22.
Steadfast Technology remains focused on continued
improvement of the SCTP with more product lines, new
insurers and the expansion of auto-rating capabilities to
drive increased SCTP usage.
There are 181 brokers live on our INSIGHT platform. The
Steadfast team will continue to support the migration
of brokers on INSIGHT with an additional 30 brokers
committed to migrate and ongoing discussions with
another 95 brokers.
New Strategic initiatives
Project Trapped Capital
In February we announced the implementation of our
Trapped Capital Project, where the Group is seeking to
increase our equity positions in the Network Brokers, by
providing the opportunity to unlock trapped capital by
partial sale to Steadfast.
Enhanced client offering:
Mutuals
Steadfast launched Xenia Mutual Limited, to establish and
manage Discretionary Mutual Funds, designed to provide
property protection for members of the Hospitality
Industry. Importantly, Xenia will be adopting a risk
based methodology to acceptance requiring members
to subscribe to an approach whereby their property risks
are expected to be of superior quality.
Enhanced claims solutions
Steadfast Claims Solutions was launched on 1 July 2021
to deliver a comprehensive claims service to Steadfast
Underwriting Agencies and Steadfast Brokers. Services
offered will include claims advocacy, claims preparation
and catastrophe claims advocacy.
Risk Management tools
Steadfast Risk Group Pty Ltd has been formed to
provide enhanced risk management solutions including
alternative risk transfer businesses. Steadfast Risk Group
continues to gain momentum within the broker network
in providing property risk surveys and engineering
services as well as related consulting services.
Gold Seal compliance rollout
Steadfast acquired Gold Seal Practice Management
(GSPM) and Gold Seal Intellectual Property (GSIP) to
strengthen our capabilities in Compliance, Training,
Customer Experience and HR Management within our
Compliance and Customer Experience division for the
Steadfast broker network.
Steadfast Group Annual Report 2021 05
Message from the Managing Director & CEO continued
unisonSteadfast
Steadfast increased our shareholding in unisonSteadfast
to a majority stake of 60% from 40%. This strategic
step signals the next evolution in the successful
partnership of both networks, with plans to realise
the potential opportunities that exist for both parties.
It solidifies the mutual commitment to growing the
global distribution platform for both unisonSteadfast and
Steadfast network brokers.
Howden Partnership
Steadfast formed a partnership with London-based
Howden Group, building on our 20-year relationship. The
partnership was established to support Steadfast’s London
market broking requirements while Howden launched a
new Australian broking operation that has become part of
the Steadfast broker network.
The partnership is the start of an exciting period for the
network with a focus on broadening local risk coverage
and product availability.
Steadfast Accelerate
Steadfast has established Steadfast Accelerate, offering
access for our broker network and underwriting agencies
to Robotic Process Automation to provide enormous
efficiency gains. Increased administrative and compliance
burdens on brokers and underwriting agencies continue
to distract from their core client focus and automation
provides an opportunity to relieve some of this burden and
allow them to prioritise their primary function.
$9.8bnSteadfast Network GWP
$130.7munderlying NPAT
Outlook
We saw moderate price increases by strategic partners
across the market continue in FY21. We expect this trend
to remain throughout FY22 as insurers seek to improve
their profitability. At the time of print, Steadfast has
executed the acquisition of Coverforce, funded via scrip
issued to the vendors and an equity capital raising.
Steadfast Group provides FY22 guidance of:
Underlying EBITA of between $320 million and
$330 million
Underlying NPAT of between $159 million and
$166 million
Underlying diluted eps (NPAT) growth of 10% to 15%
Key assumptions included in this guidance have been
detailed within the Directors' Report, on page 50 of
this report.
Thank you
I would like to thank our amazing employees,
Board members, Steadfast Network brokers, Steadfast
Underwriting Agencies, complementary businesses, our
clients and strategic partners for contributing to our
record performance particularly given the significant
disruption caused by Covid.
I would also like to thank all our shareholders for their
ongoing support. I look forward to working with our
stakeholders for years to come.
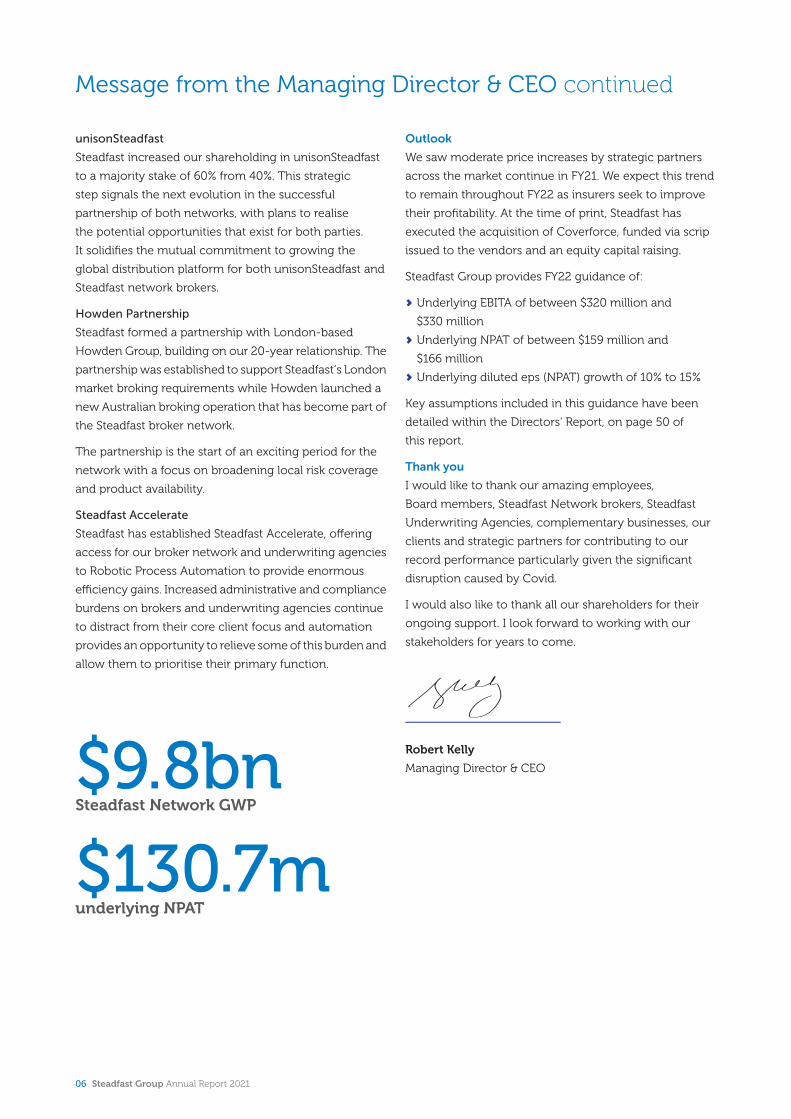
Robert Kelly
Managing Director & CEO
06 Steadfast Group Annual Report 2021
2021 financial highlights
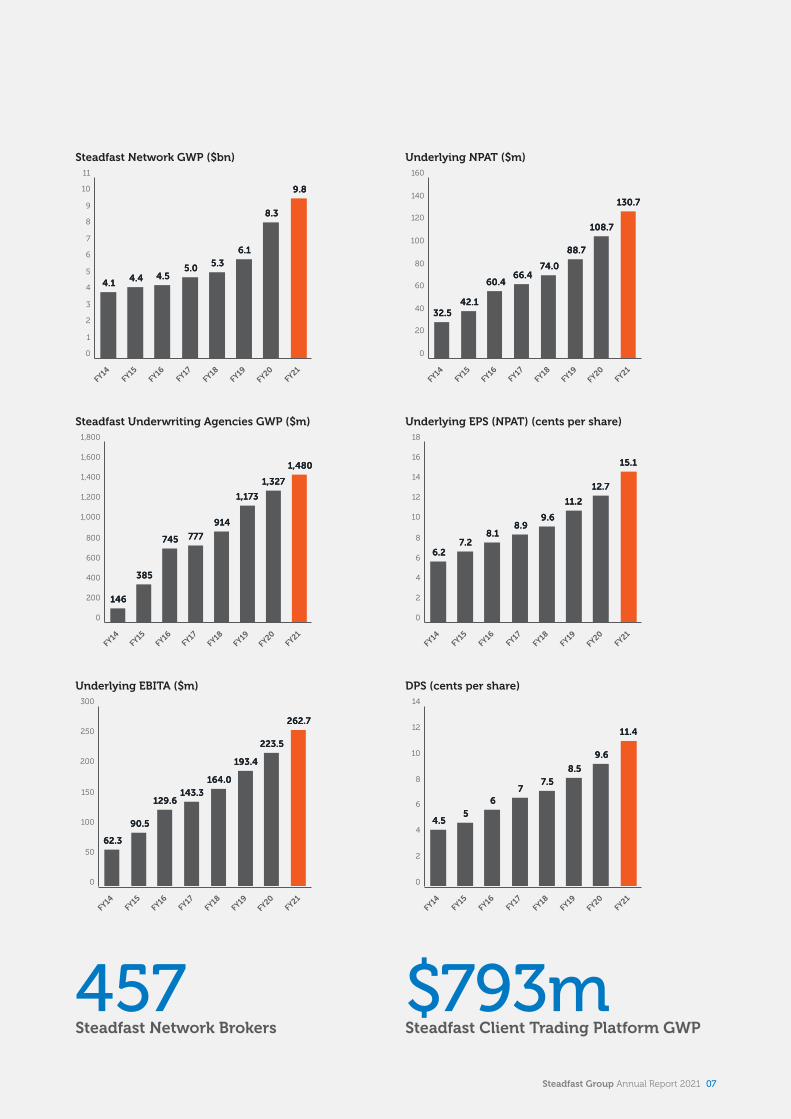
Steadfast Network GWP ($bn)
4.14.1 4.44.4 4.54.55.05.0 5.35.3
6.16.1
8.38.3
9.89.8
FY14FY15
FY16FY17
FY18FY19
FY20FY21
0
1
2
3
4
5
6
7
8
9
10
11
Steadfast Underwriting Agencies GWP ($m)
146146
385385
745745 777777
914914
1,1731,173
1,3271,327
1,4801,480
FY14FY15
FY16FY17
FY18FY19
FY20FY21
0
200
400
600
800
1,000
1,200
1,400
1,600
1,800
Underlying EBITA ($m)
62.362.3
90.590.5
129.6129.6143.3143.3
164.0164.0
193.4193.4
223.5223.5
262.7262.7
FY14FY15
FY16FY17
FY18FY19
FY20FY21
0
50
100
150
200
250
300
457Steadfast Network Brokers
Underlying NPAT ($m)
32.532.542.142.1
60.460.466.466.4
74.074.0
88.788.7
108.7108.7
130.7130.7
FY14FY15
FY16FY17
FY18FY19
FY20FY21
0
20
40
60
80
100
120
140
160
Underlying EPS (NPAT) (cents per share)
6.26.27.27.2
8.18.18.98.9
9.69.6
11.211.2
12.712.7
15.115.1
FY14FY15
FY16FY17
FY18FY19
FY20FY21
0
2
4
6
8
10
12
14
16
18
DPS (cents per share)
4.54.555
6677
7.57.5
8.58.5
9.69.6
11.411.4
FY14FY15
FY16FY17
FY18FY19
FY20FY21
0
2
4
6
8
10
12
14
$793mSteadfast Client Trading Platform GWP
Steadfast Group Annual Report 2021 07
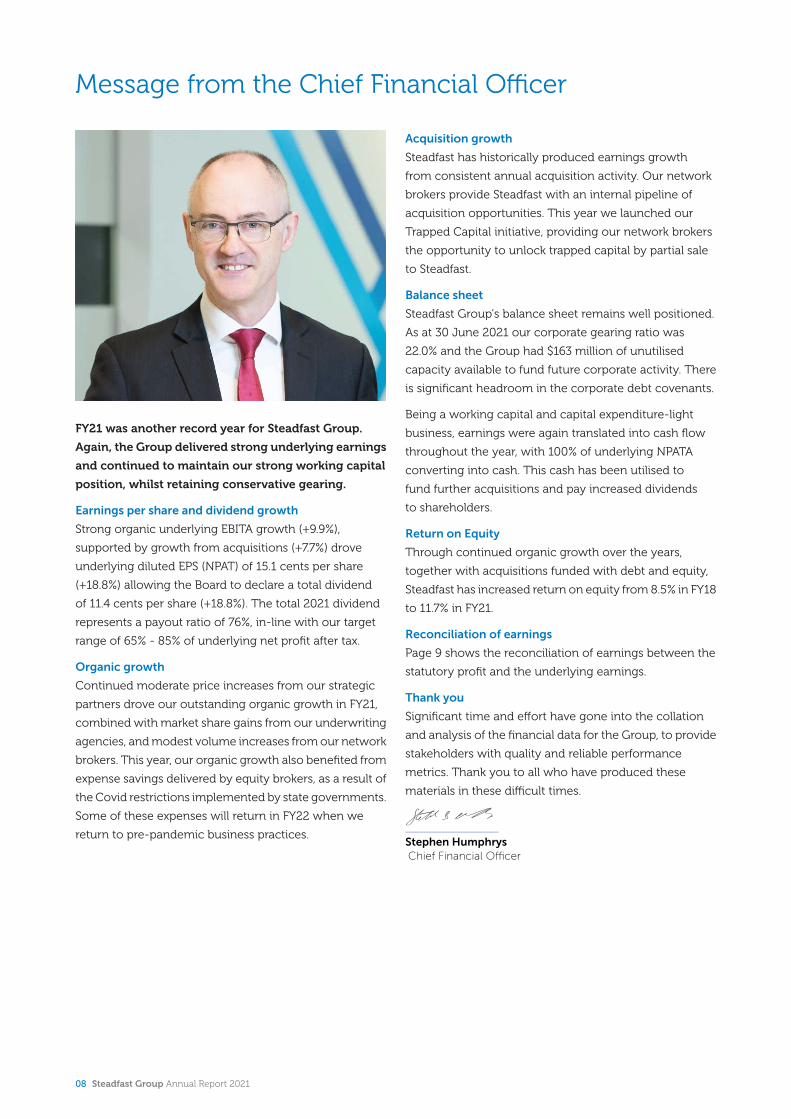
Message from the Chief Financial Officer
FY21 was another record year for Steadfast Group.
Again, the Group delivered strong underlying earnings
and continued to maintain our strong working capital
position, whilst retaining conservative gearing.
Earnings per share and dividend growth
Strong organic underlying EBITA growth (+9.9%),
supported by growth from acquisitions (+7.7%) drove
underlying diluted EPS (NPAT) of 15.1 cents per share
(+18.8%) allowing the Board to declare a total dividend
of 11.4 cents per share (+18.8%). The total 2021 dividend
represents a payout ratio of 76%, in-line with our target
range of 65% - 85% of underlying net profit after tax.
Organic growth
Continued moderate price increases from our strategic
partners drove our outstanding organic growth in FY21,
combined with market share gains from our underwriting
agencies, and modest volume increases from our network
brokers. This year, our organic growth also benefited from
expense savings delivered by equity brokers, as a result of
the Covid restrictions implemented by state governments.
Some of these expenses will return in FY22 when we
return to pre-pandemic business practices.
Acquisition growth
Steadfast has historically produced earnings growth
from consistent annual acquisition activity. Our network
brokers provide Steadfast with an internal pipeline of
acquisition opportunities. This year we launched our
Trapped Capital initiative, providing our network brokers
the opportunity to unlock trapped capital by partial sale
to Steadfast.
Balance sheet
Steadfast Group’s balance sheet remains well positioned.
As at 30 June 2021 our corporate gearing ratio was
22.0% and the Group had $163 million of unutilised
capacity available to fund future corporate activity. There
is significant headroom in the corporate debt covenants.
Being a working capital and capital expenditure-light
business, earnings were again translated into cash flow
throughout the year, with 100% of underlying NPATA
converting into cash. This cash has been utilised to
fund further acquisitions and pay increased dividends
to shareholders.
Return on Equity
Through continued organic growth over the years,
together with acquisitions funded with debt and equity,
Steadfast has increased return on equity from 8.5% in FY18
to 11.7% in FY21.
Reconciliation of earnings
Page 9 shows the reconciliation of earnings between the
statutory profit and the underlying earnings.
Thank you
Significant time and effort have gone into the collation
and analysis of the financial data for the Group, to provide
stakeholders with quality and reliable performance
metrics. Thank you to all who have produced these
materials in these difficult times.
Stephen Humphrys Chief Financial Officer
08 Steadfast Group Annual Report 2021
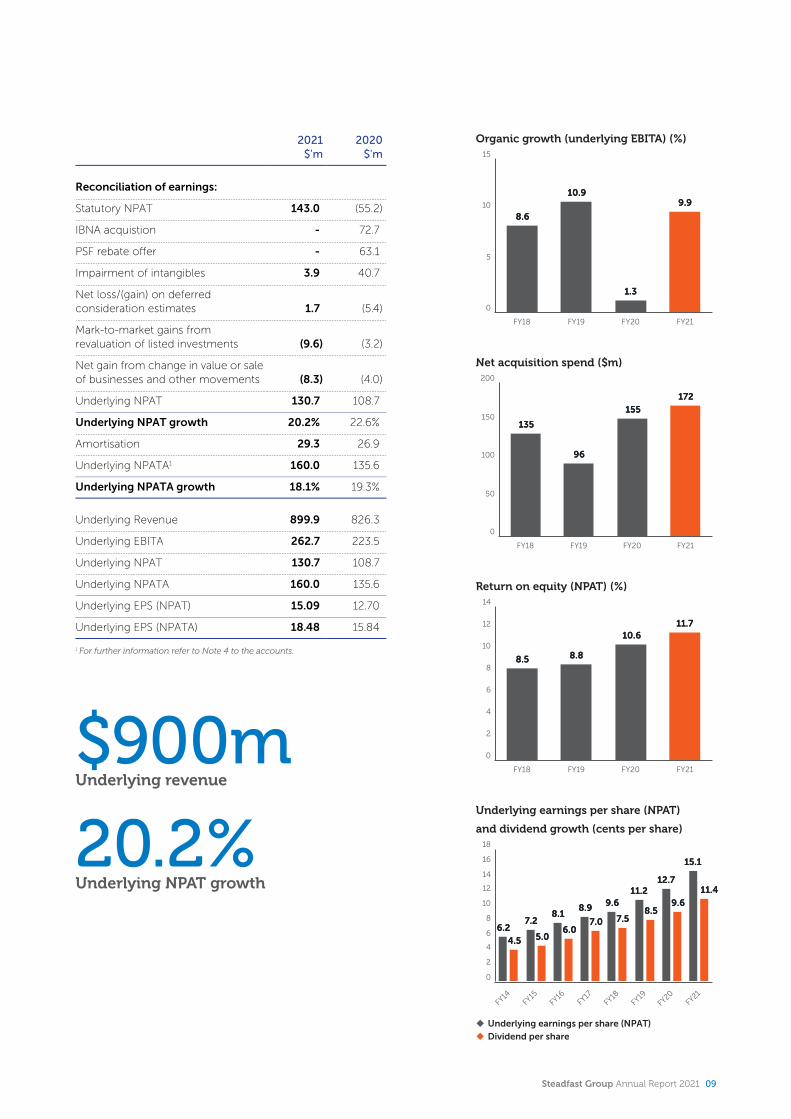
$900mUnderlying revenue
20.2%Underlying NPAT growth
2021$'m
2020$'m
Reconciliation of earnings:
Statutory NPAT 143.0 (55.2)
IBNA acquistion - 72.7
PSF rebate offer - 63.1
Impairment of intangibles 3.9 40.7
Net loss/(gain) on deferred consideration estimates 1.7 (5.4)
Mark-to-market gains from revaluation of listed investments (9.6) (3.2)
Net gain from change in value or sale of businesses and other movements (8.3) (4.0)
Underlying NPAT 130.7 108.7
Underlying NPAT growth 20.2% 22.6%
Amortisation 29.3 26.9
Underlying NPATA1 160.0 135.6
Underlying NPATA growth 18.1% 19.3%
Underlying Revenue 899.9 826.3
Underlying EBITA 262.7 223.5
Underlying NPAT 130.7 108.7
Underlying NPATA 160.0 135.6
Underlying EPS (NPAT) 15.09 12.70
Underlying EPS (NPATA) 18.48 15.84
1 For further information refer to Note 4 to the accounts.
Organic growth (underlying EBITA) (%)
8.68.6
10.910.9
1.31.3
9.99.9
FY18 FY19 FY20 FY21
0
5
10
15
Net acquisition spend ($m)
135135
9696
155155
172172
FY18 FY19 FY20 FY21
0
50
100
150
200
Return on equity (NPAT) (%)
8.58.5 8.88.8
10.610.611.711.7
FY18 FY19 FY20 FY21
0
2
4
6
8
10
12
14
Underlying earnings per share (NPAT)
and dividend growth (cents per share)
6.26.27.27.2
8.18.18.98.9 9.69.6
11.211.212.712.7
15.115.1
4.54.5 5.05.06.06.0
7.07.0 7.57.58.58.5
9.69.6
11.411.4
u Underlying earnings per share (NPAT)
u Dividend per share
FY14
FY15
FY16
FY17
FY18
FY19
FY20
FY21
0
2
4
6
8
10
12
14
16
18
Steadfast Group Annual Report 2021 09

How we create value model
Our Operating Environment
Our Business Activities
Our Business Value Drivers
Value Creation Outcome
Our business value drivers ensure our business activities maximise value created for stakeholders.
The risks and opportunities in our operating environment impact our ability to create value. We ensure we understand these factors and how they a�ect our business ensuring we are best placed to manage risks whilst capitalising on opportunities to deliver long term value to our stakeholders.
Market disruption:Changing technology & increasing data collection
Sector consolidation:SME brokers increasingly needing support of an aligned network & equity investment
Regulatory change and increasing stakeholder scrutiny
Capacity risk:Strategic partners seeking enhanced returns via selective risk appetite and increasing premiums, with increasing natural disasters
Highly competitive landscape for human capital:Attracting and retaining customer centric talent whilst o�ering increasingly flexible work arrangements
Increasing cybersecurity risk
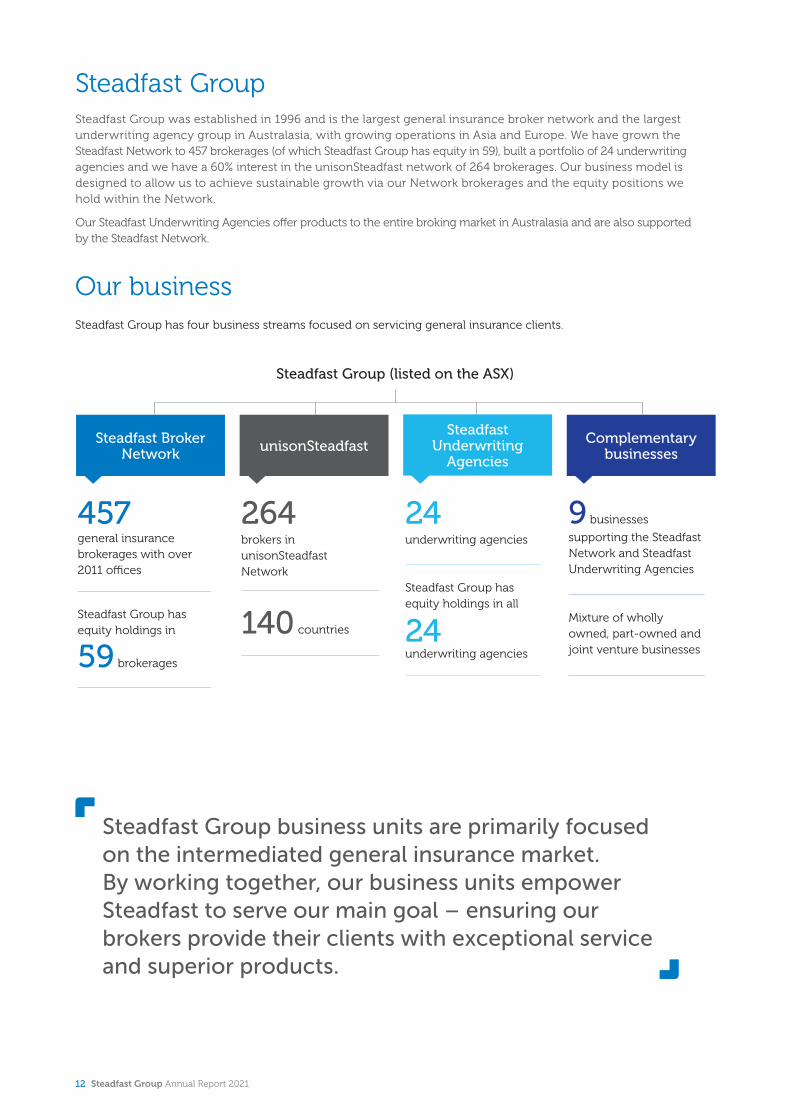
Steadfast is the largest general insurance broker network and the largest group of underwriting agencies in Australasia. We have three business units focused on the intermediated general insurance market, being Steadfast Broker Network (in which we have an equity interest in 59 brokers), Steadfast Underwriting agencies and the complementary businesses division.
Policies & Customers: Protect businesses & consumers as a key component of risk mitigation against numerous perils and disasters
Broker Services: Provides brokers market-leading policy wordings for customers, global leading technology that continues to be refined and rolled out, providing e cient processes to administer risk management data transfer, training, service o�ering
457 Network Insurance Brokerages: Advising clients on risk management solutions, especially SME solutions and personal lines
24 Specialty Underwriting Agencies: Providing risk management products to the market
9 Complementary businesses: Leading technology, premium funding solutions, other specialty advisory lines supporting the broker network and underwriting agencies
We use a range of resources and relationships to create sustainable value.
People:Employees with high calibre key competen-cies and ethical behaviours in order to drive business performance
Product & Advice:Steadfast suite of support services
Technology & data capabilities:Our leading technology provides clarity around alternative insurance solutions
Operational scale:The size and scale of our broker network and underwriting agencies and their underlying customers
Finance: Access to debt & equity to execute our strategy and invest for sustainable earnings growth
Community & relationships:Localised relationships with local communities
Corporate Governance:Proactively managing risk within strongcorporate governance framework to create sustainable longer-term growth
Shareholder Value:Continued focus on long term value creation through astute use of funds to deliver growth in profits, dividends and capital value. Have achieved total shareholder return of 334% since listing.
Customer Value:Better outcomes for clients
• SCTP is a contestable digital marketplace generating improved pricing competition and coverage
• Market leading policy wordings
• Instant policy issue, maintenance & renewal, all on a market contestable basis
• E ciency of delivery for clients
• Achieved net promoter score of 62 in our most recent survey
Employee Value:Investment in our people to increase employee engagement through cultural, behavioural and skills based developmental initiatives to drive business growth. In FY21:
• 73% employee engagement score
• 1,741 hours of training
Community Value:Connecting and investing in our community to support our business and industry
• $502,958 donated to charitable causes
• $63.4m income tax paid to the Australian Government
We aim to create long term value for all of our stakeholders.
Our business activities and business value drivers and resulting value
creation, enable us to meet our strategic objectives.
10 Steadfast Group Annual Report 2021

Our Operating Environment
Our Business Activities
Our Business Value Drivers
Value Creation Outcome
Our business value drivers ensure our business activities maximise value created for stakeholders.
The risks and opportunities in our operating environment impact our ability to create value. We ensure we understand these factors and how they a�ect our business ensuring we are best placed to manage risks whilst capitalising on opportunities to deliver long term value to our stakeholders.
Market disruption:Changing technology & increasing data collection
Sector consolidation:SME brokers increasingly needing support of an aligned network & equity investment
Regulatory change and increasing stakeholder scrutiny
Capacity risk:Strategic partners seeking enhanced returns via selective risk appetite and increasing premiums, with increasing natural disasters
Highly competitive landscape for human capital:Attracting and retaining customer centric talent whilst o�ering increasingly flexible work arrangements
Increasing cybersecurity risk
Steadfast is the largest general insurance broker network and the largest group of underwriting agencies in Australasia. We have three business units focused on the intermediated general insurance market, being Steadfast Broker Network (in which we have an equity interest in 59 brokers), Steadfast Underwriting agencies and the complementary businesses division.
Policies & Customers: Protect businesses & consumers as a key component of risk mitigation against numerous perils and disasters
Broker Services: Provides brokers market-leading policy wordings for customers, global leading technology that continues to be refined and rolled out, providing e cient processes to administer risk management data transfer, training, service o�ering
457 Network Insurance Brokerages: Advising clients on risk management solutions, especially SME solutions and personal lines
24 Specialty Underwriting Agencies: Providing risk management products to the market
9 Complementary businesses: Leading technology, premium funding solutions, other specialty advisory lines supporting the broker network and underwriting agencies
We use a range of resources and relationships to create sustainable value.
People:Employees with high calibre key competen-cies and ethical behaviours in order to drive business performance
Product & Advice:Steadfast suite of support services
Technology & data capabilities:Our leading technology provides clarity around alternative insurance solutions
Operational scale:The size and scale of our broker network and underwriting agencies and their underlying customers
Finance: Access to debt & equity to execute our strategy and invest for sustainable earnings growth
Community & relationships:Localised relationships with local communities
Corporate Governance:Proactively managing risk within strongcorporate governance framework to create sustainable longer-term growth
Shareholder Value:Continued focus on long term value creation through astute use of funds to deliver growth in profits, dividends and capital value. Have achieved total shareholder return of 334% since listing.
Customer Value:Better outcomes for clients
• SCTP is a contestable digital marketplace generating improved pricing competition and coverage
• Market leading policy wordings
• Instant policy issue, maintenance & renewal, all on a market contestable basis
• E ciency of delivery for clients
• Achieved net promoter score of 62 in our most recent survey
Employee Value:Investment in our people to increase employee engagement through cultural, behavioural and skills based developmental initiatives to drive business growth. In FY21:
• 73% employee engagement score
• 1,741 hours of training
Community Value:Connecting and investing in our community to support our business and industry
• $1m one-o� donation made to Steadfast Foundation
• $502,958 donated to charitable causes
• $63.4m income tax paid to the Australian Government
Steadfast Group Annual Report 2021 11
Steadfast Group business units are primarily focused on the intermediated general insurance market. By working together, our business units empower Steadfast to serve our main goal – ensuring our brokers provide their clients with exceptional service and superior products.
underwriting agencies
Steadfast Underwriting
Agencies
9 businesses
supporting the Steadfast Network and Steadfast Underwriting Agencies
Mixture of wholly owned, part-owned and joint venture businesses
unisonSteadfast
24
24 underwriting agencies
Steadfast GroupSteadfast Group was established in 1996 and is the largest general insurance broker network and the largest underwriting agency group in Australasia, with growing operations in Asia and Europe. We have grown the Steadfast Network to 457 brokerages (of which Steadfast Group has equity in 59), built a portfolio of 24 underwriting agencies and we have a 60% interest in the unisonSteadfast network of 264 brokerages. Our business model is designed to allow us to achieve sustainable growth via our Network brokerages and the equity positions we hold within the Network.
Our Steadfast Underwriting Agencies offer products to the entire broking market in Australasia and are also supported by the Steadfast Network.
Our businessSteadfast Group has four business streams focused on servicing general insurance clients.
Steadfast Group (listed on the ASX)
Steadfast Broker Network
general insurance brokerages with over 2011 offices
457
Steadfast Group has equity holdings in
59 brokerages
Steadfast Group has equity holdings in all
Complementary businesses
264
140 countries
brokers in unisonSteadfast Network
12 Steadfast Group Annual Report 2021
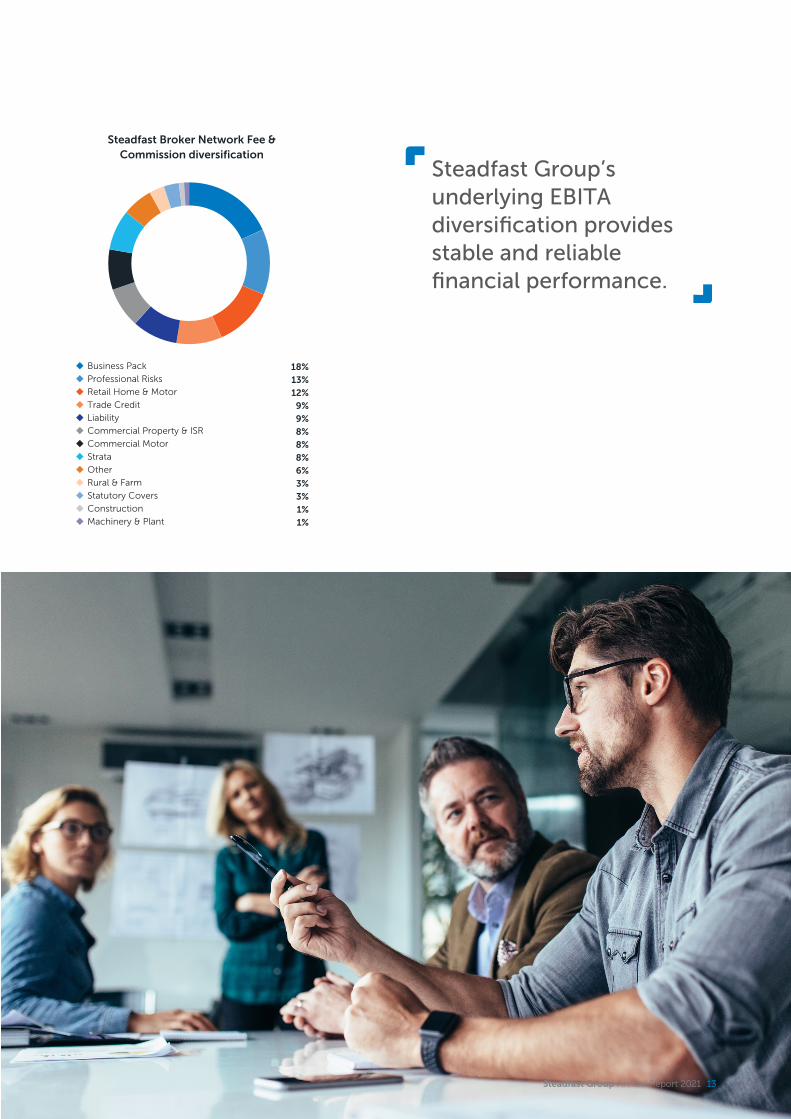
Steadfast Broker Network Fee & Commission diversification
18%u Business Pack
13%u Professional Risks
12%u Retail Home & Motor
9%u Trade Credit
9%u Liability
8%u Commercial Property & ISR
8%u Commercial Motor
8%u Strata
6%u Other
3%u Rural & Farm
3%u Statutory Covers
1%u Construction
1%u Machinery & Plant
Steadfast Group’s underlying EBITA diversification provides stable and reliable financial performance.
Steadfast Group Annual Report 2021 13
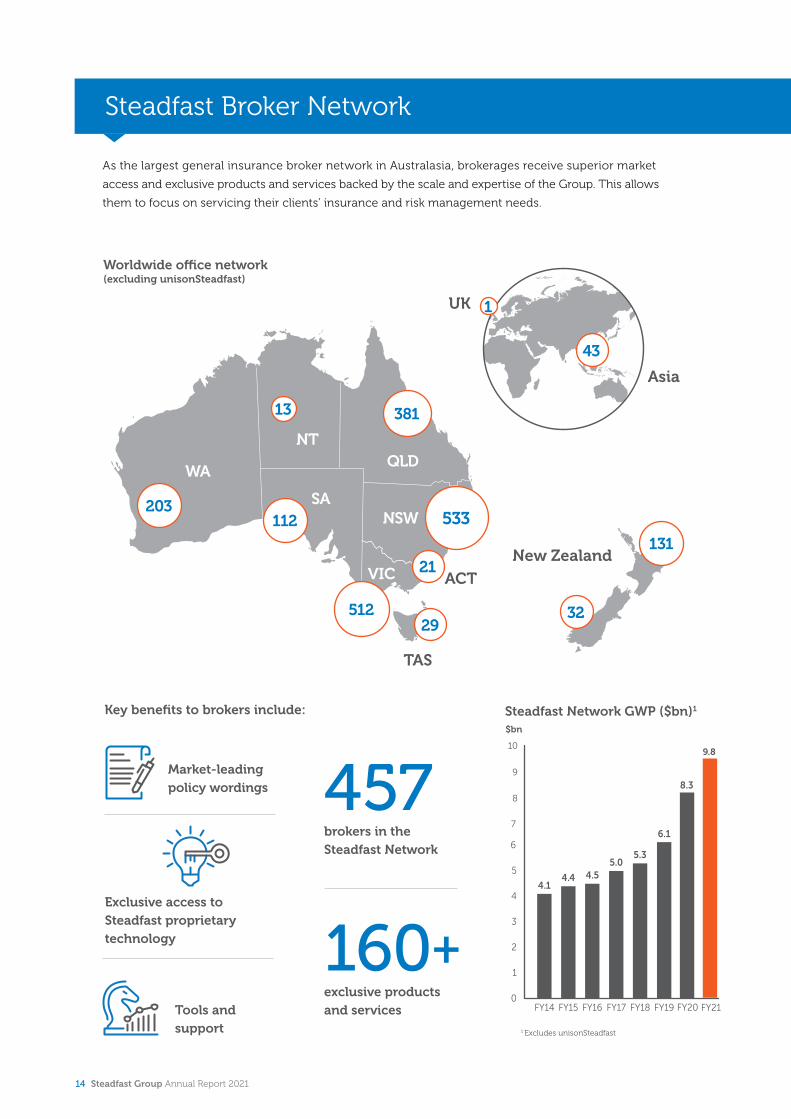
Steadfast Broker Network
Worldwide office network (excluding unisonSteadfast)
Asia
UK
New Zealand
WA
NT
SA
QLD
NSW
VIC ACT
TAS
As the largest general insurance broker network in Australasia, brokerages receive superior market
access and exclusive products and services backed by the scale and expertise of the Group. This allows
them to focus on servicing their clients’ insurance and risk management needs.
203
13 381
112
512
21
533
2932
131
43
1
0
1
2
3
4
5
6
FY19FY18FY17FY16FY15FY14
4.14.4 4.5
5.05.3
6.1
1 Excludes unisonSteadfast
$bn
FY20
8.3
FY21
14 Steadfast Group Annual Report 2021
Our clientsSteadfast Group is primarily focused on the small-to-
medium enterprise (SME) market. The SME market is
advice-driven, which means that client relationships are
key to Steadfast Network brokers, and the Underwriting
Agencies who provide niche advice and products
for brokers.
These relationships ensure that the SME market is more
stable than the sometimes fickle corporate market.
Diversified product offering and client base
Steadfast Network brokers and Underwriting Agencies
offer a diverse range of general insurance products to their
clients across Australasia. This diversity of product and
client base supports sustainable sales growth.
Diversified by client base
3%u Micro (Policy size <$650)
32%u Small Enterprise (Policy size $650 -
$5,000)u Small Enterprise (Policy size $5,000 - 36%
$50,000)u Medium Enterprise (Policy size $50,000 - 13%
$250,000)
4%u Corporate (Policy size >$250,000)
12%u Retail
Diversified by product line
18%u Business pack
14%u Commerical motor
12%u Retail
9%u Commercial property & ISR
9%u Liability
9%u Professional risks
7%u Statutory covers
8%u Strata
5%u Rural & Farm
5%u Construction & engineering
4%u Other
Diversified by geography
38%u VIC
24%u NSW
13%u QLD
11%u WA
6%u NZ
4%u SA
3%u TAS
1%u ACT
Steadfast Group Annual Report 2021 15
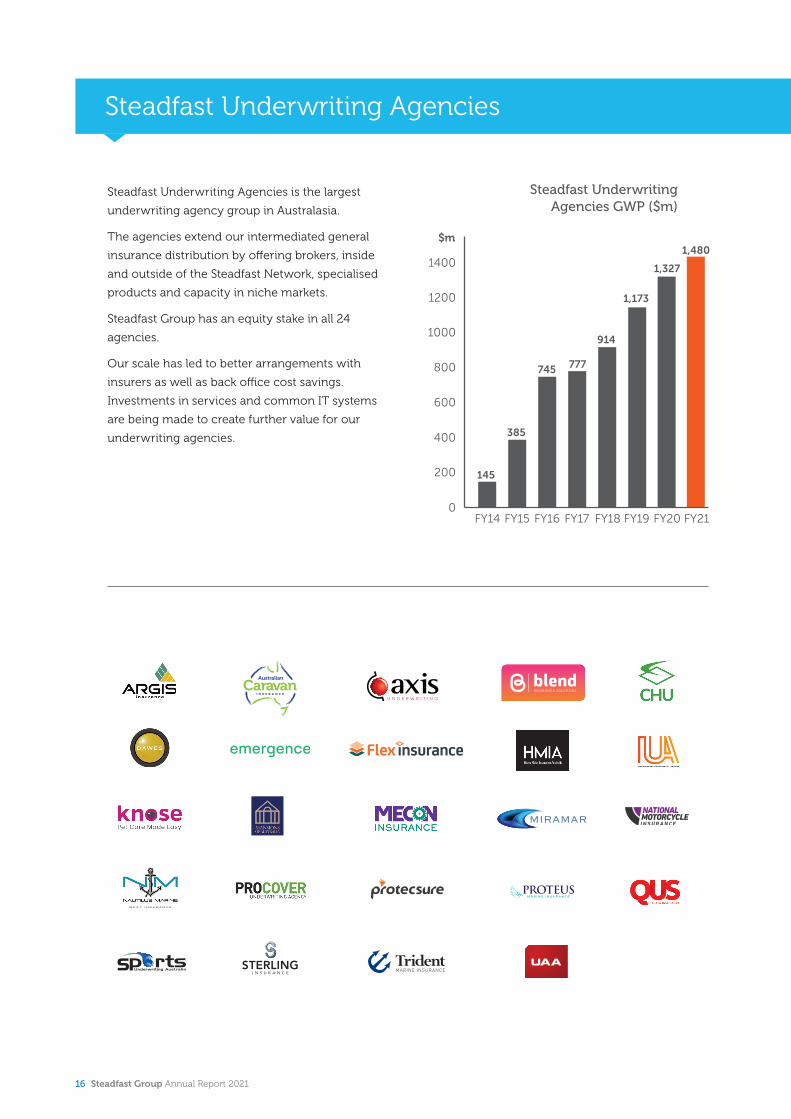
Steadfast Underwriting Agencies
Steadfast Underwriting Agencies GWP ($m)
$m
Steadfast Underwriting Agencies is the largest
underwriting agency group in Australasia.
The agencies extend our intermediated general
insurance distribution by offering brokers, inside
and outside of the Steadfast Network, specialised
products and capacity in niche markets.
Steadfast Group has an equity stake in all 24
agencies.
Our scale has led to better arrangements with
insurers as well as back office cost savings.
Investments in services and common IT systems
are being made to create further value for our
underwriting agencies.
1,327
1,480
1,173
914
777745
385
145
16 Steadfast Group Annual Report 2021
Complementary businesses
ReReinsurance Brokers
Life
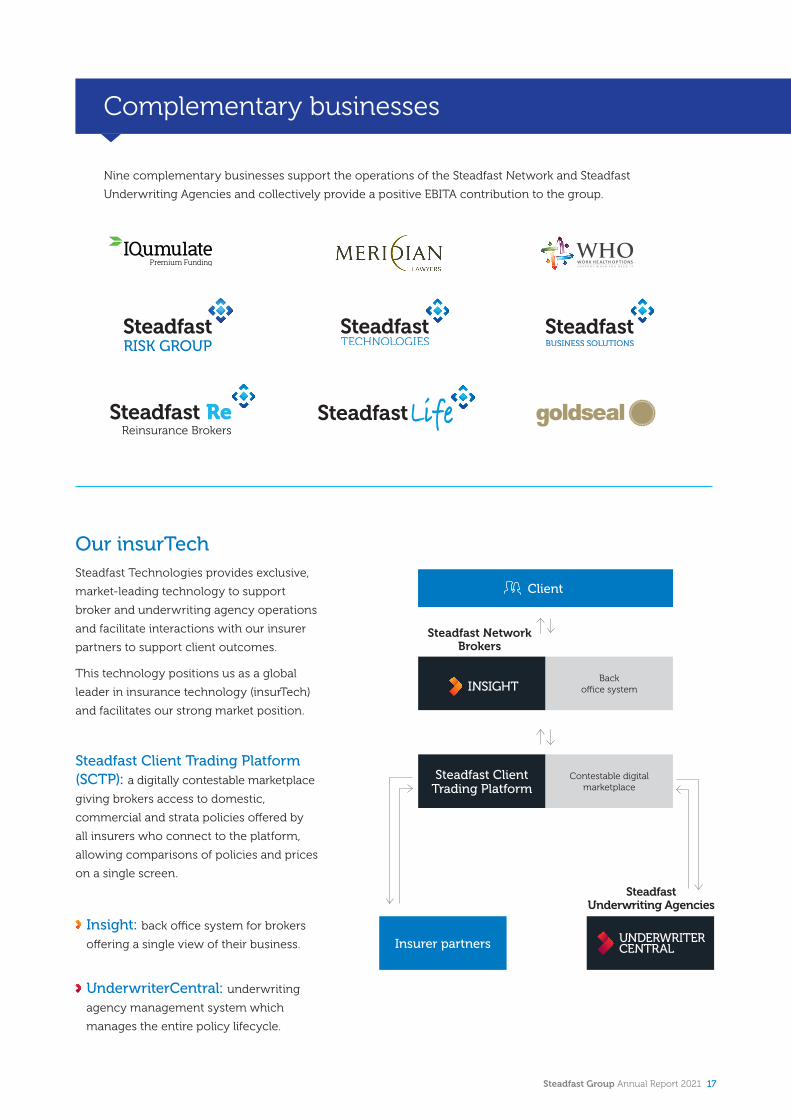
Our insurTechSteadfast Technologies provides exclusive,
market-leading technology to support
broker and underwriting agency operations
and facilitate interactions with our insurer
partners to support client outcomes.
This technology positions us as a global
leader in insurance technology (insurTech)
and facilitates our strong market position.
Steadfast Client Trading Platform (SCTP): a digitally contestable marketplace
giving brokers access to domestic,
commercial and strata policies offered by
all insurers who connect to the platform,
allowing comparisons of policies and prices
on a single screen.
Insight: back office system for brokers
offering a single view of their business.
UnderwriterCentral: underwriting
agency management system which
manages the entire policy lifecycle.
Nine complementary businesses support the operations of the Steadfast Network and Steadfast
Underwriting Agencies and collectively provide a positive EBITA contribution to the group.
Client
Back office system
Steadfast Client Trading Platform
Contestable digital marketplace
Insurer partners
Steadfast Network Brokers
Steadfast Underwriting Agencies
Steadfast Group Annual Report 2021 17
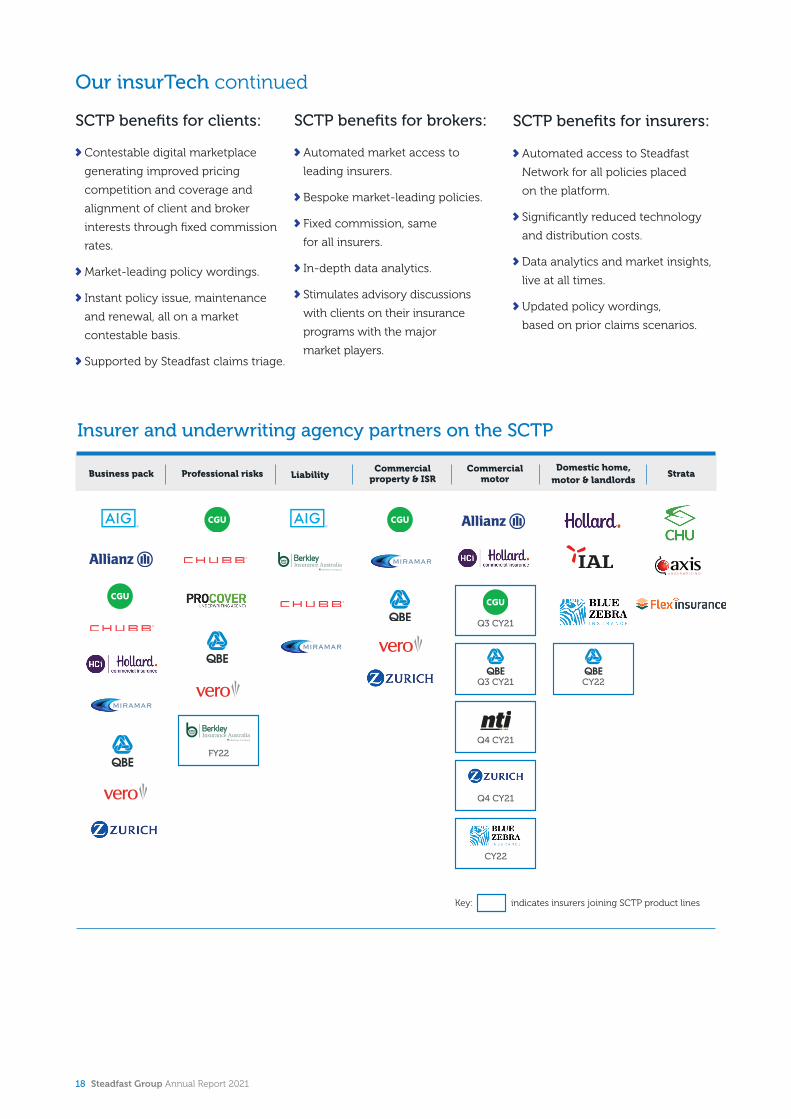
Contestable digital marketplace
generating improved pricing
competition and coverage and
alignment of client and broker
interests through fixed commission
rates.
Market-leading policy wordings.
Instant policy issue, maintenance
and renewal, all on a market
contestable basis.
Supported by Steadfast claims triage.
SCTP benefits for clients: SCTP benefits for brokers:
Automated access to Steadfast
Network for all policies placed
on the platform.
Significantly reduced technology
and distribution costs.
Data analytics and market insights,
live at all times.
Updated policy wordings,
based on prior claims scenarios.
SCTP benefits for insurers:
Automated market access to
leading insurers.
Bespoke market-leading policies.
Fixed commission, same
for all insurers.
In-depth data analytics.
Stimulates advisory discussions
with clients on their insurance
programs with the major
market players.
Our insurTech continued
Insurer and underwriting agency partners on the SCTP
FY22
Business pack Professional risks LiabilityCommercial
property & ISRCommercial
motorDomestic home,
motor & landlordsStrata
Q4 CY21
Q3 CY21
Q3 CY21
Key: indicates insurers joining SCTP product lines
CY22
CY22
Q4 CY21
18 Steadfast Group Annual Report 2021

Life $24bn
Priv
ate
healt
h $25bn
No
n-i
nte
rmed
iate
d
Intermediated ($27bn)
Non-interm
edia
ted
(dir
ect)
($2
7bn
)$103bnAustralianinsurance
market
Steadfast Network brokers CY20 GWP $8.9bn
$27bnintermediated
market
Gen
eral $54b
n
Australian intermediated general insurance market1
Key market The intermediated general insurance market consists of insurance brokers and underwriting agencies. Australia is Steadfast Group’s largest market, with intermediated gross written premium of $27 billion generated in calendar year 2020, of which our insurance broker network have a 32% share.
We are a key distribution channel for our insurer partners as the Steadfast Network has a large and diverse client base across Australia.
Over our 25 year history,
Steadfast Group has developed
strong relationships with
carefully selected insurers,
underwriting agencies,
premium funding and strategic
partners that support the
Steadfast Network.
Major insurer partners Our partners
Premium funding partnersStrategic partner
1 APRA Quarterly General Insurance Performance Statistics (March 2021), Steadfast Group and APRA Intermediated General Insurance Performance Statistics (December 2020)
Steadfast Group Annual Report 2021 19

Board of Directors
Frank O'Halloran, AMNon-Executive Chairman (independent)
Frank had over 35 years’ experience at QBE where he was Group CEO from 1998 until 2012. He also worked with Coopers & Lybrand for 13 years where he started his career as a Chartered Accountant. Frank was President of the Insurance Council of Australia from 1999 to 2000 and was inducted into the International Insurance Hall of Fame in 2010. Frank received his AM for services to the insurance industry and philanthropy.
Robert KellyManaging Director & CEO
Robert co-founded Steadfast and has over 52 years’ experience in the insurance industry. He was voted the second most influential person in insurance by Insurance News, and was awarded the ACORD Rainmaker Award in 2014. Robert is a Qualified Practising Insurance Broker, a Fellow of NIBA, a Senior Associate of ANZIIF, a Certified Insurance Professional and a Graduate member of the Australian Institute of Company Directors. Robert is the Chairman of the ACORD Board and is also a Director of ASX-listed Johns Lyng Group Limited and not-for-profit organisation KidsXpress.
Vicki AllenNon-Executive Director (independent)
Vicki has over thirty years of business experience across the financial services and property sectors. She held senior executive roles at a number of organisations including Trust Company, MLC Limited and Lend Lease Corporation. Vicki is currently the Chairman of the BT Funds board, and a non-executive director of Bennelong Funds Management. She is a fellow of the Australian Institute of Company Directors.
David Liddy, AMDeputy Chairman & Non-Executive Director (independent)
David has over 45 years’ experience in banking, including postings in London and Hong Kong. He was Managing Director of Bank of Queensland from 2001 to 2011. David is a Director of Emerchants Limited. He is a a Fellow of the Australian Institute of Company Directors. David received his AM for services to the banking and finance sectors and the community of Queensland.
20 Steadfast Group Annual Report 2021

Gai McGrathNon-Executive Director (independent)
Gai has over 35 years’ experience in the financial services and legal industries, including 12 years with Westpac Group as General Manager of Westpac’s retail banking businesses in Australia and New Zealand. Gai is a Director of Genworth Mortgage Insurance Australia Limited (and also chairs the Risk Committee), BT Superannuation Trustees (Chair of BT Funds Management Ltd, BT Funds Management No 2 Ltd & Westpac Securities Administration Ltd), Toyota Finance Australia Limited, HBF Health Limited and Humanitix Limited (Chair). Gai holds a BA, LLB (Hons), LLM (Distinction) and is a Graduate of the Australian Institute of Company Directors.
Anne O’DriscollNon-Executive Director (independent)
Anne has over 35 years’ of business experience. A Chartered Accountant since 1984, she was CFO of Genworth Australia from 2009 to 2012 following more than 13 years with IAG. Anne is chairman of FINEOS Corporation Holdings Plc and a Director of Infomedia Limited, Commonwealth Insurance Limited and MDA National Insurance Pty Ltd. She is also a Fellow of ANZIIF and a Graduate of the Australian Institute of Company Directors.
Philip PurcellNon-Executive Director (independent)
Philip has over 45 years’ experience in the insurance and legal industries. He has been a partner at Dunhill Madden Butler, PricewaterhouseCoopers Legal and Ebsworth & Ebsworth, and has held two Board positions with GE in Australia. Philip consults to clients who are engaged in commercial transactions or mediation of commercial disputes. Philip holds an LLB and BA.
Greg RynenbergNon-Executive Director (independent)
Greg has over 40 years’ of experience in the insurance broking industry, with 36 years spent running his own business, East West Group. East West Group is a Steadfast Network Broker not owned by Steadfast. Greg is a Qualified Practising Insurance Broker, a Fellow of NIBA and an Associate of ANZIIF. He holds an Advanced Diploma in Financial Services (General Insurance Broking) and was named NIBA Queensland Broker for 2014.
Steadfast Group Annual Report 2021 21

Senior Management Team
Robert KellyManaging Director & CEO
Robert co-founded Steadfast and has over 52 years’ experience in the insurance industry. He was voted the second most influential person in insurance by Insurance News, and was awarded the ACORD Rainmaker Award in 2014. Robert is a Qualified Practising Insurance Broker, a Fellow of NIBA, a Senior Associate of ANZIIF, a Certified Insurance Professional, Graduate member of the Australian Institute of Company Directors and is the Chairman of the ACORD Board in New York. Robert is also a Director of ASX-listed Johns Lyng Group Limited and not-for-profit organisation KidsXpress.
Stephen HumphrysChief Financial Officer
Stephen joined Steadfast in 2013 and has over 30 years’ experience as a Chartered Accountant and extensive experience in acquisitions, integration of networks and developing businesses. As Managing Director of Moore Stephens Sydney for 10 years and Chairman of Moore Stephens Australasia for three, Stephen played a key role in placing Moore Stephens into the top 10 accounting firms in Australia. Stephen is a Fellow of Australia and New Zealand Chartered Accountants.
Samantha HollmanChief Operating Officer
Samantha has over 25 years' experience in the insurance industry including 21 years at Steadfast. She was promoted to COO in September 2016 to direct and manage operational activities of the organisation and to ensure the implementation of the overall strategy. Samantha works closely with the Managing Director & CEO and the Board to implement strategic initiatives for the Group on a national and international level. Samantha sits on the unisonSteadfast Supervisory Board.
Simon LightbodyChief Executive Officer Steadfast Underwriting Agencies
Simon has worked in the insurance industry for over 25 years in both the UK (at Lloyd’s of London) and Australia, including nine years within his own business, Miramar Underwriting Agency (Miramar). Steadfast entered into the underwriting agency market in 2005 as a 50% joint venture partner of Miramar and acquired the remaining balance in August 2013. Simon is a member of the Underwriting Agencies Council.
Allan ReynoldsExecutive General ManagerAsia, New Zealand & Domestic
Allan joined Steadfast in 2002, and in April 2015 took on the Domestic, New Zealand & Singapore portfolios. With a background in product development and distribution, corporate strategy and portfolio management, Allan has more than 45 years' experience in general insurance. He holds a Diploma of Business Studies (Insurance), is a Certified Insurance Professional and is a Fellow, honorary member and former Chairman of ANZIIF.
Nick CookExecutive General ManagerPartner & Broker Services
Nick, who joined Steadfast in February 2015, had over 15 years’ experience at Zurich Financial Services, including three as the Head of Customer & Proposition Development and nine years as a distribution manager. He is a member of the NIBA Board and an Associate ANZIIF member. He has graduated from both the AGSM Leadership Program and the Prosci Organizational Change Management Program.
Peter RobertsExecutive General ManagerBusiness Solutions
Peter joined Steadfast in 2013 and focuses on back office outsourcing opportunities for the Group. He was also Managing Director of White Outsourcing until stepping down on 30 June 2016 to concentrate on his role at Steadfast Business Solutions. Peter has over 25 years’ experience in accounting and back office services to the financial services sector, is a member of Australia and New Zealand Chartered Accountants, and commenced his career in accounting with KPMG. Peter is a company secretary of Steadfast.
John O'HerlihyExecutive General Manager – Operations & Acquisitions
John joined Steadfast in 2012 and is joint lead of the Operations and Acquisitions team. Having completed his professional accounting training with KPMG in 1996, John has spent over 15 years working within the insurance industry. During this time he has held a number of senior finance and operational roles in both North America and Australia specialising in corporate transactions. John is now a Fellow of the Institute of Chartered Accountants Ireland.
22 Steadfast Group Annual Report 2021

Jeff PappsExecutive General Manager – Operations & Acquisitions
Jeff joined Steadfast in 2012 and is joint lead of the Operations and Acquisitions team. Prior to joining Steadfast, Jeff worked for PwC specialising in financial services. After transferring from London to Sydney in 1998, he focused on mergers and acquisitions, leading domestic and cross border transactions and listings across Australia, Asia, Europe and North America. Jeff is a Member of the Institute of Chartered Accountants in England and Wales.
Duncan RamseyGeneral Counsel
Duncan began with Steadfast in June 2014 after 20 years at QBE. He was Group General Counsel and Company Secretary. Duncan's career commenced in 1986 with Freehills in Sydney. He holds degrees in commerce and law, and a graduate certificate in applied risk management. Duncan is a Fellow of ANZIIF and the Governance Institute of Australia, as well as a graduate of the Australian Institute of Company Directors.
Linda EllisGroup Company Secretary & Corporate Counsel
Linda is Group Company Secretary & Corporate Counsel at Steadfast Group Limited and has been part of the Executive team since 2013. Before joining Steadfast, she specialised in mergers and acquisitions and worked in Sydney and London at global law firms. Linda is a Graduate member of the Australian Institute of Company Directors, holds a BEc and LLB (Hons I) from The University of Sydney and is on the boards of Abbotsleigh School for Girls, Mosman Preparatory School and the advisory board of Heads Over Heels.
Martyn ThompsonExecutive General Manager – Corporate Development
Martyn joined Steadfast with over 35 years’ experience as an Insurance Broker, the previous 29 years working in senior roles for the global Broker, Willis Towers Watson. During this tenure he was National Client Service Director responsible for implementing service platforms and standards across the network including providing risk and insurance solutions to many ASX companies, government and Multi-National organisations. He is a Senior Associate ANZIIF, holds a Diploma of Financial Services and a Graduate Certificate in Business Administration.
Nathan HilleryChief Information Officer
Nathan Hillery joined Steadfast in late 2019 as the Chief Information Officer and has 20 years’ experience within IT management roles spanning advertising, media, and legal industries. With a strong background in big data and cybersecurity and a passion for innovation, his role is working closely across the entire group aligning technology and cybersecurity strategies.
Sheila BakerExecutive General Manager, Compliance and Customer Experience
Sheila Baker joined Steadfast in October 2020, following our purchase of Gold Seal, which specialised in the provision of Compliance, HR and Training and Education Services. Gold Seal had a long standing reputation industry-wide for quality advice and integrity which Sheila brought to Steadfast with a highly skilled team with a broad range of capabilities in compliance. Sheila was involved in Gold Seal since their establishment and has in excess of 20 years of experience in the capacity of service provision to the broking sector.
Steadfast Group Annual Report 2021 23
Steadfast’s long term sustainability is enhanced by our CSR program and by our focus on ESG considerations.
24 Steadfast Group Annual Report 2021
CSR and ESG
Co
nte
nts
CSR
an
d E
SG
Our approach to Corporate and Social Responsibility (CSR), Environmental, Social and Governance (ESG)Steadfast’s long term sustainability is enhanced by our
CSR program and by our focus on ESG considerations.
Our Board considers that CSR and ESG are important
elements of acting in the best interests of our shareholders
as we continue to develop our long-term sustainability as
a business.
In 2021, the Board established a People, Culture
& Governance committee, broadening our focus on
identifying and mitigating environmental, social and
governance risks and disclosing our practices and policies
in these areas.
Steadfast, being a services based business with operations
in local communities, has a relatively small environmental
footprint and a limited exposure to supply chain risks. We
consider ESG from the perspectives of the environment,
customer advocacy, taking care of our people and
stakeholders, and contributing to our communities.
As part of our culture, a commitment to doing the
right thing and acting responsibly are key planks of our
commitment to CSR and ESG standards. In the process we
strive to:
Engage our people by demonstrating that we care
about them and the issues that are important to them.
Make our businesses feel proud of being part of the
Steadfast Group.
Maintain a culture that is ethical and responsible.
Make a positive impact in our communities.
Have better long-term sustainability and performance
in the best interests of our stakeholders.
Steadfast Group Annual Report 2021 25

CSR and ESG continued
Our CSR Framework
We have considered how we can help make a difference to some of the world's most pressing environmental and social
challenges. Through our CSR program to our business and sphere of influence, we are committed to five of the United
Nations Sustainable Development Goals (UN SDG) which align with our business and culture and where we can have
the most impact.
26 Steadfast Group Annual Report 2021
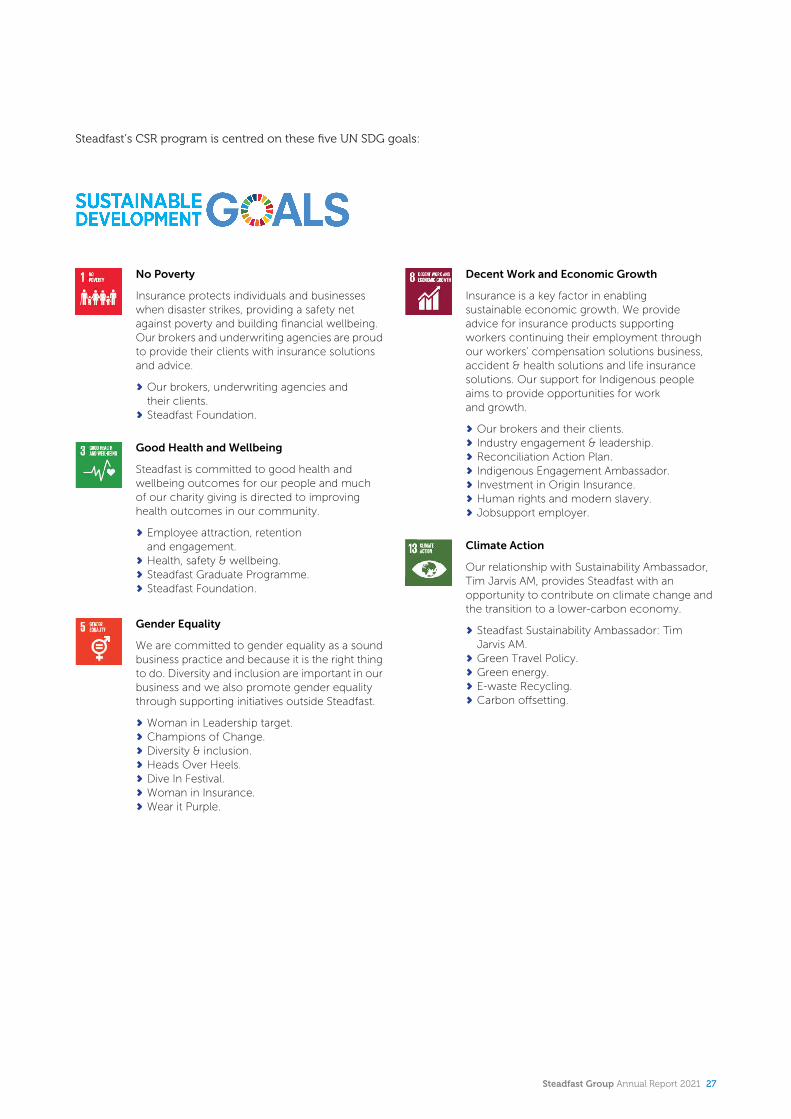
Steadfast’s CSR program is centred on these five UN SDG goals:
No Poverty
Insurance protects individuals and businesses when disaster strikes, providing a safety net against poverty and building financial wellbeing. Our brokers and underwriting agencies are proud to provide their clients with insurance solutions and advice.
Our brokers, underwriting agencies and their clients.Steadfast Foundation.
Good Health and Wellbeing
Steadfast is committed to good health and wellbeing outcomes for our people and much of our charity giving is directed to improving health outcomes in our community.
Employee attraction, retention and engagement.Health, safety & wellbeing.Steadfast Graduate Programme.Steadfast Foundation.
Gender Equality
We are committed to gender equality as a sound business practice and because it is the right thing to do. Diversity and inclusion are important in our business and we also promote gender equality through supporting initiatives outside Steadfast.
Woman in Leadership target.Champions of Change.Diversity & inclusion.Heads Over Heels.Dive In Festival.Woman in Insurance.Wear it Purple.
Decent Work and Economic Growth
Insurance is a key factor in enabling sustainable economic growth. We provide advice for insurance products supporting workers continuing their employment through our workers’ compensation solutions business, accident & health solutions and life insurance solutions. Our support for Indigenous people aims to provide opportunities for work and growth.
Our brokers and their clients.Industry engagement & leadership.Reconciliation Action Plan.Indigenous Engagement Ambassador.Investment in Origin Insurance.Human rights and modern slavery.Jobsupport employer.
Climate Action
Our relationship with Sustainability Ambassador, Tim Jarvis AM, provides Steadfast with an opportunity to contribute on climate change and the transition to a lower-carbon economy.
Steadfast Sustainability Ambassador: Tim Jarvis AM.Green Travel Policy.Green energy.E-waste Recycling.Carbon offsetting.
Steadfast Group Annual Report 2021 27
CSR and ESG continued
Environmental
In continuing our commitment to enhance the longterm sustainability of our company and our environment, Steadfast is undertaking a review of our carbon emissions footprint as part of our pledge to mitigate our environmental impact.
Carbon emissions review
As a services based business, Steadfast has a relatively
small environmental footprint. In continuing our
commitment to enhance the long-term sustainability
of our company and our environment, Steadfast is
undertaking a review of our carbon emissions footprint as
part of our pledge to mitigate our environmental impact.
In doing so, we have elected to use FY19 as a base case
due to the operating abnormalities created by the Covid
pandemic for FY20 and FY21.
Our initial investigation of carbon emissions covers the
entities of Steadfast Group, Steadfast Business Solutions
and Steadfast Technologies. Our other carbon emitting
sources include transport energy consumption from air
travel, and the heating and lighting of our office spaces.
In considering our carbon emissions, Steadfast has
implemented the following initiatives during the year:
Green Travel Policy
Steadfast recognises that travel, especially air travel, has a
direct impact on the environment, and transport energy
consumption from air travel represents our largest source
of carbon emissions in our pre-pandemic base year
of FY19. We are committed to reducing the need for
unnecessary business travel and encouraging the use of
more sustainable forms of transport across our operations.
The impact of Covid on our operations, particularly on
air travel, has led to a significant decrease in carbon
emissions in FY20 and FY21. However, we are conscious
that once air travel is again available, our need for business
travel will increase.
This year we launched our Green Travel Policy, in
preparation for when international travel bans are lifted,
and overseas travel is permitted, to seek to embed
some of the Covid adjustments we have made to the
way we do business that drives a reduction in our
environmental impact. This policy has been implemented
to help reduce our environmental impact associated with
work-related travel.
Energy efficiency
Steadfast looks for opportunities to reduce our
environmental impact and improve energy efficiency.
This year our head office in Bathurst St, Sydney and our
Melbourne office both used 100% green energy after we
transitioned both offices last year to use green energy.
28 Steadfast Group Annual Report 2021
Electronic waste recycling
Further demonstrating our commitment to reducing our
impact on the environment, Steadfast is now using a
recycling company for electronic waste in our Bathurst
Street Office. The e-waste recycling service accepts
a wide variety of e-waste such as: desktops, laptops,
servers, pads, mobile phones, monitors, printers, handheld
devices, PSU, switches, TVs, modems, speakers, batteries,
USB devices, and all IT accessories. This year Steadfast
recycled 759kg of e-waste.
Carbon offsetting
Steadfast demonstrates our commitment to minimising
the impact we have on the environment by offsetting the
carbon emissions for our corporate travel. With the Covid
lockdown management has spent less time travelling and
has been making use of video conferencing technology,
tools we will continue to utilise as part of our Green
Travel Policy. This will see a permanent reduction in our
travel impact.
This year Steadfast purchased 108 carbon offsets, for
the corporate travel undertaken across the Group.
We direct our carbon offsetting to support local
communities in Africa with a focus on empowering
women and addressing the effects of climate change on
communities there.
Landcare Australia sponsorship
As a leader in the environmental sector and in recognition
of the success Landcare Australia has achieved in
their efforts to improve biodiversity, build resilience in
Australia’s food and farming systems, and create stronger
communities, Steadfast made a commitment during
the year to sponsor Landcare Australia’s 2021 State
and Territory Landcare Awards and the 2022 National
Landcare Awards.
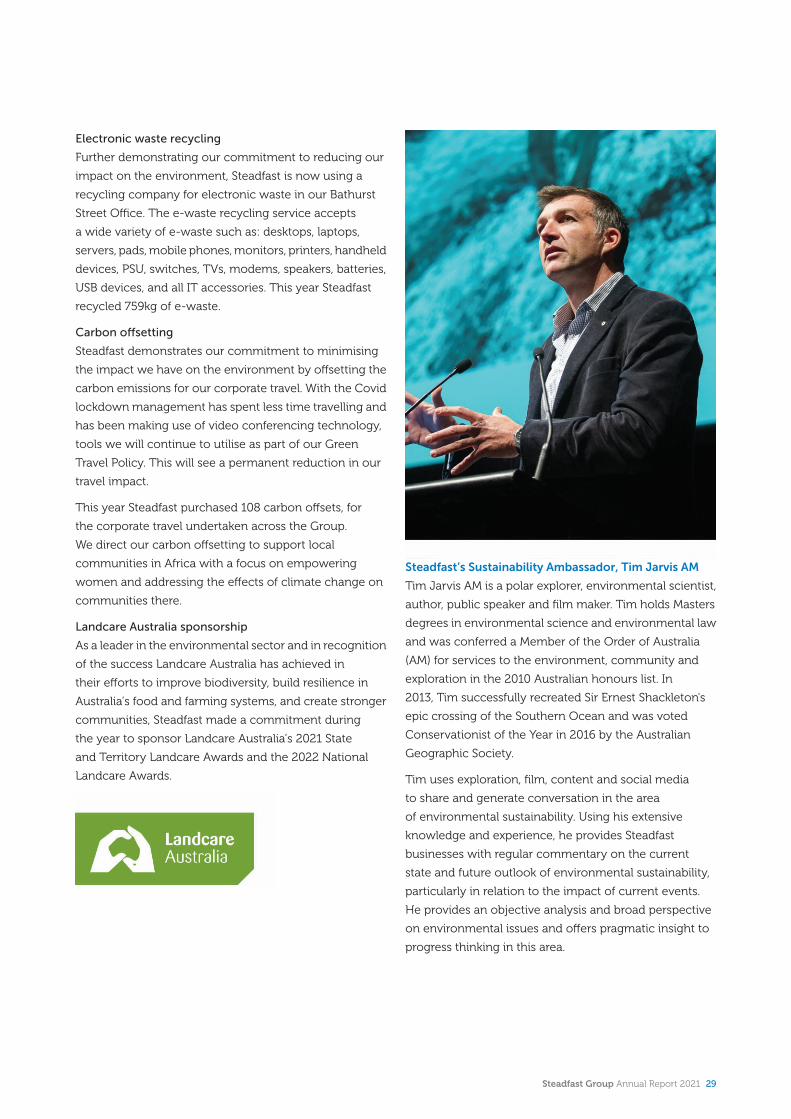
Steadfast’s Sustainability Ambassador, Tim Jarvis AM
Tim Jarvis AM is a polar explorer, environmental scientist,
author, public speaker and film maker. Tim holds Masters
degrees in environmental science and environmental law
and was conferred a Member of the Order of Australia
(AM) for services to the environment, community and
exploration in the 2010 Australian honours list. In
2013, Tim successfully recreated Sir Ernest Shackleton's
epic crossing of the Southern Ocean and was voted
Conservationist of the Year in 2016 by the Australian
Geographic Society.
Tim uses exploration, film, content and social media
to share and generate conversation in the area
of environmental sustainability. Using his extensive
knowledge and experience, he provides Steadfast
businesses with regular commentary on the current
state and future outlook of environmental sustainability,
particularly in relation to the impact of current events.
He provides an objective analysis and broad perspective
on environmental issues and offers pragmatic insight to
progress thinking in this area.
Steadfast Group Annual Report 2021 29

CSR and ESG continued
We consider social sustainability from the perspectives of customer advocacy, taking care of our people and stakeholders, and contributing to our communities.
30 Steadfast Group Annual Report 2021

SocialOur culture and values
It is a strategic priority for Steadfast to have a culture that
supports and enables us to achieve our purpose, vision
and strategy in an ethical and responsible manner. This is
a strategic priority for Steadfast. Culture is key to ensuring
that how we go about doing our work is just as important
as what gets achieved. All our people undertake training
on the standards of behaviour that are expected and these
are also encapsulated in our corporate governance
policies such as our code of conduct. All our people have
culture and values KPIs and the Board has charged the
senior management team with the responsibility of
setting the tone from the top in all aspects of their
interactions and work.
Our brokers and their clients
We prioritise what matters to our brokers and strive to
deliver an outstanding broker service to enable Steadfast
Network brokers to thrive.
Our SCTP provides Steadfast brokers and their clients with
choice across leading insurers and ‘best in class’ product
wordings. The SCTP provides real time, full policy life cycle
capability. This ensures our brokers can provide clients
with insurance solutions from a range of insurers quickly
and efficiently.
Steadfast performs an annual ‘Your Shout’ survey of its
brokers. In our most recent survey, our brokers rated
Steadfast with a net promoter score (NPS) of 62, up from
57 in the previous ‘Your Shout’ survey completed in 2019
and indicated that they continue to be very pleased with
the products and service offerings Steadfast provides. Our
continual interaction with our broker community ensures
continual improvement in levels of broker satisfaction as
represented by the NPS.
62Net Promoter score
Our culture supports and enables us to achieve our purpose, vision and strategy in an ethical and responsible manner.
Steadfast Group Annual Report 2021 31

CSR and ESG continued
Diversity and Inclusion
Diversity and inclusion (D&I) are integral to the success of
Steadfast Group. Steadfast believes that we perform better
as a business with diverse people and an inclusive culture.
It helps us attract, retain and motivate the best people.
We strive to continually foster a workplace where
individual’s feel safe, valued and encouraged to be
their true selves every day. We aim to create a diverse
work environment in which everyone is treated fairly
and with respect and where everyone feels responsible
for the reputation and performance of Steadfast.
The Board and management believe that Steadfast’s
commitment to diversity and inclusion contributes to
achieving Steadfast’s corporate objectives and embeds
the importance and value of diversity within the culture
of Steadfast.
We do not tolerate discrimination, harassment or
vilification and employees undertake annual training
supporting our commitment to inclusion. Additionally,
during the year our managers undertook domestic
and family violence training - to help them recognise
warning signs, respond, and refer staff to counselling and
support services.
During the year, Steadfast continued our commitment
to increasing and supporting diversity with the
establishment of Steadfast’s D&I committee, the
commencement of our D&I Strategy and the introduction
of our Diversity Policy, that sets out Steadfast’s
commitment to diversity and inclusion in the workplace
and provides a framework to achieve Steadfast’s
diversity goals.
In setting our D&I framework, we asked our people
to complete a D&I survey to find out what they are
passionate about and what their experiences are in
the workplace to help shape the framework of D&I at
Steadfast. We recorded a 60% participation rate with
responses showing a true representation of the diverse
community in which we operate, and the feedback
identified some key areas for improvement.
As part of our ongoing commitment to the enhancement
of our gender diversity, Steadfast has set an aspirational
target for Women in Leadership of 45% by 2024, which we
believe will provide our business an improved alignment
with the diversity within our society. We currently have
40% females in leadership roles.
Steadfast also launched Aspire Women in Leadership
Program, a year-long development program specifically
tailored to Steadfast female insurance brokers who are
looking to become future business leaders.
Steadfast continued to support Heads over Heels - an
organisation that creates opportunities for women in
leadership positions through business connections. For
the 2020 Dive In Festival - Steadfast engaged Rosie Batty,
AO, to discuss the topic “Domestic and Family Violence –
we all have a role to play for an equal future”.
Furthermore, Steadfast continued our support of
the employment service for people with moderate
intellectual disability through the government
organisation, Jobsupport. We currently have two
Jobsupport employees.
Steadfast offers flexible work practices to assist our
people to live balanced lives. We have training programs
to prepare our people, particularly those we have
identified as high potential, for senior positions and
we actively create opportunities, such as appointing
them to boards within the Steadfast Group, to assist
professional development.
We are proud of our increasing gender, ethnic and age
diversity and are committed to inclusion at all levels
regardless of sexual orientation, gender identity, age,
disability, ethnicity, religious beliefs, cultural background
or socio-economic background.
32 Steadfast Group Annual Report 2021

GenderWe are committed to gender diversity at all levels
Non-executive directors
57%u Male
43%u Female
Senior executives
60%u Male
40%u Female
Group wide leadership
60%u Male
40%u Female
Group wide employees
48%u Male
52%u Female
Promotions and transfers
37%u Male
63%u Female
Participant in our managerdevelopment program
50%u Male
50%u Female
Ethnic & AgeSteadfast has considerable ethnic and age diversity
Head office employeesplace of birth
42%u Born outside Australia
58%u Born in Australia
Workforce language diversity
31%u Non-english speaking background
69%u English speaking background
Age Diversity
34%u Under 35 years old
32%u Between 35 and 44 years old
34%u Over 44 years old
Steadfast Group Annual Report 2021 33

CSR and ESG continued
Support for Aboriginal & Torres Strait Islander peoples
Reconciliation Action Plan
Steadfast launched our first Reconciliation Action Plan
(RAP), ‘Reflect’ in March 2020 as part of our broader
commitment to CSR and diversity and inclusion. Our RAP
committee was formed to establish meaningful and long-
term relationships with Australia’s First Nations peoples
and contribute to reconciliation in a structured, relevant
and respectful way. The three pillars of reconciliation,
respect, relationships and opportunities are our guiding
principles on this journey.
As part of our Reflect RAP, we have begun to raise
awareness and encourage a deeper understanding of
Aboriginal and Torres Strait Islander peoples - including
their culture, history, achievements and aspirations –
through content, workshops and events.
During the year, through the Steadfast Foundation, we
supported The Earbus Foundation, an organisation
focused on improving the ear health of Aboriginal children
in WA. Earbus mobile ear health clinics offer a model of
continuous care to Aboriginal children and young people.
With four custom-designed buses in the Earbus fleet, the
Earbus clinicians visit locations across regional and
remote WA - the South West, Kimberley, Pilbara and
Goldfields regions. Each location is visited up to 11 times
a year so the team can ensure continuous surveillance
and follow-up.
Steadfast has partnered with Career Trackers and
committed to support first nation students with the
inclusion of two undergraduates on the Steadfast
Internship program. In addition, Steadfast has also
committed to two students to participate in the Career
Trackers Launchpad program which provides valuable
work experience between finishing the HSC and
commencing university.
Steadfast has an entrepreneurial culture and we intend to
continue to explore opportunities to act within our sphere
of influence, and through our relationships, to support
reconciliation.
Indigenous Engagement Ambassador
Steadfast has appointed David Liddiard OAM as our
Indigenous Engagement Ambassador. For the past three
decades, David has been committed to closing the
education, health and wellbeing and employment gaps
between Indigenous and non-Indigenous Australians.
David is a Ngarabal from Northern NSW and a well-known
passionate advocate of Indigenous Australians.
David’s role includes representing Steadfast’s RAP
commitments and programs, providing advice and
facilitating Aboriginal and Torres Strait Islander
engagement and supporting the business interests of
Steadfast.
Indigenous Talent Program sponsorship
Underwriting Agencies of Australia (UAA), a Steadfast
business, is in its seventh year of sponsoring the
annual Indigenous Talent Program to ‘unearth’ local
Indigenous talent from the Central Coast region and
provide scholarships to CCAS sports programs, as a
platinum partner of Central Coast Academy of Sport.
The scholarships provide a localised training environment
for eligible aspiring Aboriginal and Torres Strait Islander
youth to access quality development opportunities and
support for a number of sports. In 2021, UAA provided
50 scholarships. UAA are very proud of all the scholarship
participants and happy to see that what they are doing is
making a difference in the local community.
David Liddiard OAM
34 Steadfast Group Annual Report 2021
Human Rights and Modern Slavery
Steadfast rejects any form of modern slavery such as
slavery, servitude, human trafficking and forced labour. We
respect the human rights of our employees, customers
and those of our suppliers and business partners. We
aim to identify and manage risks related to human rights
across our business and supply chain. Our Modern Slavery
Statement 2021 sets out our position on this matter and is
available from our investor website.
As part of our commitment to human rights, Steadfast
joined The Freedom Hub, an organisation that helps
people who have experienced human trafficking and
slavery. The Freedom Hub Survivor School provides
survivors with long-term support by running free,
personalised classes to assist them in recovering from
trauma and become ready to work.
Steadfast is committed to complying with relevant laws,
community expectations and ethical standards related
to human rights and modern slavery in respect of our
employees and business. Employees are encouraged
to report any genuine concerns about modern slavery
relating to our people, business or supply chain.
Our People
Workplace Culture
We are very proud of our culture and our approach to
CSR. Our people are the cornerstone of Steadfast’s success
and providing an engaging and rewarding culture are
important aspects of our employee attraction, retention
and engagement strategy.
As part of our CSR commitment, in March this year
Steadfast conducted its annual employee engagement
survey which measures the emotional connection people
have to the Group. This year with a participation rate of
92% the group-wide engagement score was 73%, up from
71% in 2020. This result continues to place Steadfast in the
‘performing’ or ‘highly engaged’ zone of the engagement
spectrum and is 11% above the Australian industry norm.
Our voluntary staff turnover rate was 8.4%, which was well
below the industry average turnover rate of 13.0%. Our
average current employee tenure is three years and nine
months with Steadfast.
We continue to implement initiatives designed to engage
employees and build relationships, such as our intranet,
regular staff meetings and briefings, a formal performance
review process, participation in a number of community
events, social activities and quarterly off-site workshops.
Steadfast’s volunteer day program encourages our people
to donate their time by way of volunteering at a registered
charity of their choice, on a day of paid employment.
Due to the Covid pandemic, volunteer opportunities
have been limited so Steadfast encouraged employees
to partake in fundraising events for a charity of their choice
to count towards their volunteer day. If the event of choice
that raises funds was held on a weekend, employees could
opt to take an additional annual leave day to count for
their volunteer time.
This year Steadfast donated an additional one-off
$1 million to the Steadfast Foundation, in recognition of
the support some members of the Group received from
the Jobkeeper Scheme implemented as Covid support by
the Australian Federal Government.
Steadfast offers an Additional Leave Purchase Scheme
enabling our people to salary sacrifice to acquire
additional annual leave to facilitate a better balance
between professional and personal lives.
Steadfast has a Short-Term Employee Incentive Scheme
to increase market competitiveness and attract, retain and
motivate our people. The scheme has been designed to
ensure goal alignment throughout the business and also
provides our people with the opportunity to receive shares
in Steadfast. As well as salary and incentive arrangements,
Steadfast offers a wide-ranging benefits program for our
people including travel insurance and discounts on a wide
range of consumer goods and cars.
73%Employee engagement survey result
8.4%Voluntary employee turnover rate
3.75Average years of employee tenure
Steadfast Group Annual Report 2021 35
CSR and ESG continued
Career Growth
We actively invest in developing our people and Steadfast
has a formal talent development strategy. We have a
dedicated training and development manager who
delivers a substantial number of training programs
throughout the year at all levels. Steadfast’s College of
Leadership offers our current and future leaders the
opportunity to develop while exposing them to forward-
thinking, relevant and practical leadership methodology
and application. In addition to leadership and
management training, our people participate in annual
development planning to ensure their continued
technical and non-technical development.
In August last year, Steadfast launched a new Learning and
Development Leadership program for employees who are
in new-to-leadership roles. Delivered over a six month
period, the aim of the training was to provide dedicated
support for new leaders. This involves the individuals
developing a greater understanding of how they lead
themselves and those around them.
During the year, 11 Steadfast employees received an
internal promotion, eight of whom were female
employees.
Developing female talent
During the year 92 of our leaders from across the business
participated in our various leadership training
programmes, and 46 of the participants were female
employees.
Broker Training
In collaboration with Hollard Commercial Insurance, and
as part of our continuing support of our brokers, Steadfast
established the Aspire Women in Leadership Program.
Although improving, there are still steps to be taken to
ensure that women are at least equally represented and
valued in management and executive positions in our
industry. We have demonstrated our commitment to our
female brokers and offer a dedicated leadership program.
The Aspire Women Leaders Program offers a curated
program of relevant and topical courses that are designed
to provide leadership skills and advance participants
careers within the insurance broking industry.
Developing Young Talent
At Steadfast, we recognise the importance of developing
young talent and have an established Graduate
Development Program and a School Leavers’ Summer
Intern Program.
Steadfast is thrilled to be recognised by the Australian HR
Awards 2021 as a finalist for ‘Best Graduate Development
program’ of the year. The annual Australian HR Awards
have been recognised as the leading independent awards
event in the HR profession. The awards run across 20
categories for outstanding HR achievements, programs,
and transformative work that make a profound difference
to their employees and workplaces,
Steadfast’s Summer Intern Program offers six roles to
school leavers each year, and of the six roles, two
are reserved for First Nations peoples as part of the
Steadfast RAP.
We are delighted in the quality of people who have joined
us, and stayed, through these programs.
We actively invest in developing our people and Steadfast has a formal talent development strategy.
36 Steadfast Group Annual Report 2021

Health, safety and wellbeing
We actively promote the health, safety and wellbeing of
our people. We have had one work, health and safety
incident during the year and it has been resolved.
Our Board receives regular work, health and safety
(WHS) reports and has overseen improvements, including
improved reporting and analysis resulting from the
recommendations of a comprehensive WHS external
audit. We have a work, health and safety committee to
provide a forum for our people to suggest initiatives and
raise any concerns.
Steadfast has implemented a comprehensive health and
wellbeing program. Some of our initiatives include:
Annual health assessments and flu shot.
A range of education and awareness of key health and
wellbeing issues including physical fitness, nutrition,
mental health and stress management.
Annual financial wellbeing health check.
Access to confidential external Employee Assistance.
Programs (EAPs) for counselling to support
mental health.
Workplace health and safety training - 5% of staff have
been trained as mental health first aid officers.
Steadfast supports flexible workplace initiatives to
recognise and respond to people’s different needs at
different stages of their lives and to help our people
balance personal obligations with their careers. Currently
100% of our workforce (should they wish to) work to the
Hybrid working model.
We offer paid parental leave at 12 weeks’ full pay. We
engage with our people when they are on parental leave, if
they wish, to maintain a sense of connectedness and ease
the transition back to work. Steadfast provides a parents’
room in our head office as a practical support for the
increasing number of new parents in our team and to ease
their transition back to work.
Steadfast has implemented a comprehensive health and wellbeing program for our people.
Steadfast Group Annual Report 2021 37
CSR and ESG continued
Steadfast Foundation
The Steadfast Foundation is in its tenth year and the New
Zealand Steadfast Foundation is in its fourth year.
Steadfast created the Steadfast Foundation to facilitate
grants and charitable contributions that support charities
helping people to overcome adversity, with $502,958
donated during FY21 to charities. Steadfast Group made
an additional one-off donation to the foundation of
$1 million, in recognition of the support some members
of the Group received from the Jobkeeper Scheme
implemented as Covid support by the Australian Federal
Government.
Charities are often chosen based on the
recommendations of Steadfast brokers, and include
cancer research and support, mental health, children’s
causes and charities supporting domestic violence, the
homeless and disadvantaged. Some of the charities the
Steadfast Foundation supported this year include:
Assistance Dogs Australia, Children’s cancer institute,
Earbus Foundation WA, The Helmsmann Project, McGrath
Foundation, Mirabel Foundation and the Prostate Cancer
Foundation of Australia. Steadfast sponsored assistance dog Ziggy.
38 Steadfast Group Annual Report 2021
GovernanceSound compliance
The Steadfast Board of Directors is committed to sound
corporate governance and following the ASX Corporate
Governance Principles and Recommendations. FY21
was another year in which there were no material
departures from our governance framework and risk
management strategies.
Whistleblower policy
Steadfast Group’s whistleblower policy encourages
people to report or disclose corruption, fraud, tax evasion
or avoidance, misconduct and improper states of affairs
within the corporate sector and provides appropriate
protections to whistleblowers to facilitate the uncovering
of corporate crime and to combat poor compliance.
There were no material whistleblower incidents reporting
during the year.
Consumer protection
Responsible selling practices
In response to the final report of the Hayne Royal
Commission, we continue to make adjustments to our
practices, and lead the way, on our journey of continual
improvement and make appropriate adjustments as best
practice in insurance broking continues to evolve.
During the year Steadfast completed a cultural assessment
of its network brokers. This resulted in Steadfast
implementing Steadfast’s Nine Positions that includes
the following drivers and behaviours, to ensure brokers
conduct is meeting and exceeding the expectations of its
customers, and the broader community. Overarching this
is the thrust of the Hayne Royal Commission and spotlight
on remuneration to financial service providers.
1. Steadfast will expand its internal audit and risk resources
with the acquisition of Gold Seal.
2. Steadfast will educate, inform and encourage its
network brokers to no longer engage in the practice
of accepting volume-based incentives and/or soft
dollar benefits.
3. Steadfast will require transparency of
remuneration from all network brokers in all dealings
with their customers. This will require an undertaking
from network brokers that all remuneration will be
transparently documented in their transactions with their
customer base.
4. Steadfast will facilitate elevated levels of excellence in
the services provided by its network brokers through:
Driving higher quality standards of training
and education
Meeting clients and legislative expectations in a
reasoned and compliant approach to advice, conduct
and ultimate outcome
Maintain an appropriate trail of the documentation and
fact gathering that support the placement of any client
insurance policies / programmes or claims handling
We will review and bolster our licence agreements with
our network brokers to ensure compliance with:
Best practice standards
Regulations
Laws and
Relevant codes (including the Steadfast Code
of Conduct)
which will be incorporated into conduct standards,
included in the licence agreements and integrated into
network brokers’ operations.
5. Steadfast’s Code of Conduct will clearly and
emphatically focus on the best interests of network
brokers’ clients and as such, we will review existing
policies, procedures and resources provided to ensure
brokers receive all encouragement and assistance they
may need to meet the same expectation.
6. Steadfast Gold Seal will be the public face for the
Network’s Customer Advocacy function, providing the
consumer with an advocate to present any issues where
the network has not complied with the customer’s
expectation for the services provided.
7. Steadfast will establish a reference checking and
information sharing service to record details of network
employees or ARs who have acted in contravention of
accepted industry ethical standards, allowing the network
to identify individuals during the recruitment process who
do not uphold Steadfast’s high standards.
8. Steadfast will play a leadership role with National
Insurance Brokers Association (NIBA) to enhance the
industry’s training and qualification requirements and
work with regulators to increase the recognition of the
Qualified Practising Insurance Broker (QPIB) designation.
9. Steadfast will complete a compliance and best practice
audit of network brokers.
Our network brokers are guided by regulation and comply
with the financial services laws to deliver responsible
selling practices to meet their clients' requirements.
Steadfast Group Annual Report 2021 39
CSR and ESG continued
Acquisition of Gold Seal
We acquired Gold Seal to enhance and expand Steadfast’s
internal audit and risk resources within the Steadfast
broker network for the benefit of their clients.
Customer Advocacy Program
During the year Steadfast Gold Seal established our
Customer Advocacy Program. The objective of this
program is “Make every client of a Steadfast business the
sole focus of every broking transaction, the broker will act
in the client’s best interest – whether that coincides with
their own best interest or not”.
Data privacy and cyber security
Information is vital in our knowledge-driven organisation.
Security of data and information is an integral part
of Steadfast’s integrity and is critical to building
and maintaining trust with our brokers and strategic
partners and for our brokers to build relationships with
their customers.
We are committed to protecting data privacy
and remaining cyber secure through implementing
appropriate policies and procedures throughout our
business. We manage and mitigate emerging threats, by
seeking to adhere to all legislation and appropriate risk
management standards and maintaining contact with
relevant industry bodies and government agencies. We
have had no notifiable breaches in the past 12 months.
During FY21 we enhanced our data privacy and
cyber security capabilities with appointment of a Chief
Information Security Officer (CISO), and the expansion of
our technology team to include a dedicated data team.
We further strengthened our capabilities with the
implementation of the following initiatives:
Commenced implementation of privacy enhancing
technologies and initiatives.
Completed a data discovery audit, including data
classification and consolidation exercises, such as
defined data retention periods to meet industry
obligations and legal retention requirements.
Established a data classification policy.
Extended data protection and privacy programs to cover
suppliers and business partners with the introduction
of programmes examining both vendors during tender
process and equity owned businesses.
Access control and protection of personal and sensitive
data was improved with the introduction of real time
monitoring of data access.
Industry engagement and leadership
A number of our senior executives hold leadership roles
within the industry such as serving on the board of
industry bodies. Our executives contribute by speaking
and industry events and judging industry awards. Our
executives are recognised throughout the industry and
receive accolades for their leadership and contribution.
Working with the industry body, NIBA, Steadfast continues
to play a leading role in seeking to ensure that the
insurance broker industry stays strong, delivers excellent
outcomes for customers and meets its legal and ethical
obligations from a regulatory perspective.
Future commitment
Steadfast will continue to enhance our contribution to our
communities and minimise our environmental impact,
while remaining focused on the fair treatment of our
customers, employees and suppliers.
Steadfast has committed to:
Achieve carbon neutrality by FY24 (within Group
head office, Steadfast Business Solutions and
Steadfast Technologies).
Women in leadership aspirational target of 45% by 2024.
Implementation of Steadfast’s Nine Positions
embedding cultural behaviours to ensure brokers
conduct is meeting and exceeding the expectations of
its customers, and the broader community.
40 Steadfast Group Annual Report 2021
Co
nte
nts
202
1 Fi
nan
cial
Rep
ort
Directors’ Report
44 Operating and financial review
52 2021 Remuneration Report
75 Lead Auditor's Independence Declaration
Financial Statements
76 Consolidated Statement of Profit or Loss and Other Comprehensive Income
78 Consolidated Statement of Financial Position
80 Consolidated Statement of Changes in Equity
82 Consolidated Statement of Cash Flows
Notes to the Financial Statements
84 1. General Information
84 2. Significant accounting policies
88 3. Critical accounting judgements, estimates and assumptions
90 4. Operating segments
92 5. Earnings per share
93 6. Dividends
94 7. Intangible assets and goodwill
97 8. Borrowings
100 9. Notes to the Statement of Changes in Equity and Reserves
102 10. Business combinations
105 11. Subsidiaries
108 12. Investments in associates & joint ventures
110 13. Trade and other receivables
111 14. Financial instruments
114 15. Contingencies
114 16. Events after the reporting period
114 17. Share-based remuneration
116 18. Taxation
119 19. Notes to the Statement of Cash Flows
120 20. Related party transactions
121 21. Parent entity information
122 22. Remuneration of auditors
123 Director's declaration
124 Independent Auditor's Report
129 Shareholders' information
Steadfast Group Annual Report 2021 41
Directors’ Report
The Directors present their report together with the consolidated financial statements of Steadfast Group Limited (Steadfast or the Company), its subsidiaries and interests in associates and joint ventures (collectively Steadfast Group or the Group) for the financial year ended 30 June 2021 (FY21) and the auditor’s report thereon.
Directors
The Directors of the Company at any time during or since the end of the financial year are as follows. Directors were in office for the entire period unless otherwise stated.
Name Date of appointment
Chairman
Frank O’Halloran, AM 21 October 2012
Managing Director & CEO
Robert Kelly 18 April 1996
Other Directors
David Liddy, AM (Deputy Chairman) 1 January 2013
Vicki Allen 18 March 2021
Gai McGrath 1 June 2018
Anne O’Driscoll 1 July 2013
Philip Purcell 1 February 2013
Greg Rynenberg 10 August 1998
Directorships of other listed companies
Directorships of other listed companies held by the Directors in the three years preceding the end of the financial year are as follows:
Name Company Period of directorship
Frank O’Halloran, AM None
Robert Kelly Johns Lyng Group Limited Since 16 November 2017
David Liddy, AM EML Payments Limited Since April 2012
Vicki Allen Mortgage Choice Limited Since June 2017
Gai McGrath Genworth Mortgage Insurance Australia Limited Since August 2016
Investa Office Fund October 2017 to December 2018
Anne O’Driscoll Infomedia Limited Since December 2014
FINEOS Corporation Holdings Plc Since July 2019
Philip Purcell None
Greg Rynenberg None
Particulars of the Directors’ qualifications and experience are set out under Board of Directors on page 20.
42 Steadfast Group Annual Report 2021
Directors Meetings
The number of Directors’ meetings (including meetings of committees of Directors) and number of meetings attended by each of the Directors of the Company during the financial year were as follows:
BoardAudit & RiskCommittee
NominationCommittee
Remuneration &Performance Committee1
People, Culture & Governance Committee
Total number of meetings held 10 4 5 4 1
1 The Remuneration & Succession Planning Committee changed its name to the Remuneration & Performance Committee on 30 March 2021.
Director
Eligible to attend
as a member
Attend-ed as a
member
Eligible to attend
as a member
Attend-ed as a
member
Eligible to attend
as a member
Attend-ed as a
member
Eligible to attend
as a member
Attend-ed as a
member
Eligible to attend
as a member
Attend-ed as a
member
Frank O’Halloran, AM 10 10 3 3 5 5 3 3 - -
Robert Kelly 10 10 - - 5 5 - - 1 1
David Liddy, AM 10 10 3 3 5 5 4 4 - -
Vicki Allen 2 2 1 1 1 1 1 1 - -
Gai McGrath 10 10 3 3 5 5 3 3 1 1
Anne O’Driscoll 10 9 4 4 5 5 3 3 - -
Philip Purcell 10 10 3 3 5 5 4 4 1 1
Greg Rynenberg 10 10 4 4 5 5 3 3 1 1
Particular details of the responsibilities of the members of the Board and the various committees are set out in the Corporate Governance Statement in this report, and are also available in the corporate governance section of the Steadfast Investor website (http://investor.steadfast.com.au/).
Prinicpal Activities
The principal activities of the Group during the financial year were the provision of services to Steadfast Network brokers, the distribution of insurance policies via insurance brokerages and underwriting agencies, and related services.
Significant changes in the state of affairs
There were no significant changes in the state of affairs of the Group. The Group continued to acquire businesses during the year. Refer Note 10.
Steadfast Group Annual Report 2021 43

Directors’ Report continued
Operating and financial review
A. Operating results for the year
The trading results for the year are summarised as follows (refer Note 5):
2021$'m
2020$'m
Statutory net profit/(loss) after income tax attributable to owners of Steadfast Group Limited (statutory NPAT)1 143.0 (55.2)
Adjusted for (net of tax and non-controlling interest):
IBNA acquisition - 72.7
PSF rebate offer - 63.1
Impairment of intangibles 3.9 40.7
Net loss/(gain) on deferred consideration estimates 1.7 (5.4)
Mark-to-market gains from revaluation of listed investments (9.6) (3.2)
Net gain from change in value or sale of businesses and other movements (8.3) (4.0)
Underlying net profit after income tax attributable to owners of Steadfast Group Limited (underlying NPAT) 130.7 108.7
Underlying diluted earnings per share (cents per share) 15.09 12.70
Statutory diluted earnings per share (cents per share) 16.51 (6.47)
1 The Group reported a statutory loss for the prior financial year as a result of expensing the consideration paid for both the acquisition of IBNA and the PSF rebate expense.
The underlying profit attributable to the Group after income tax, before non-trading items was $130.7 million compared to $108.7 million in 30 June 2020. The increase was mainly due to:
revenue growth from continuing hardening insurance market;increased net professional services fees derived from PSF rebate offer in FY20 and growth in revenue;acquisitions of interests in further businesses; andexpense savings as our businesses adapted to Covid impacts.
The Group benefited from continued price rises by insurers on insurance premiums. Whilst there has been significant impact to the economy resulting from the Covid pandemic, the essential nature of insurance to provide financial protection for businesses and consumers meant that volumes of policies sold remained stable.
The underlying net profit after tax (underlying NPAT) reflects an assessment of the result for the business of the Group as determined by the Board and management. Underlying NPAT has been calculated in accordance with ASIC’s Regulatory Guide RG230. Underlying NPAT has not been audited by the Group’s external auditors; however the adjustments to statutory profit/(loss) after tax have been extracted from the books and records that have been audited. Underlying NPAT is disclosed as it is useful for investors to gain a better understanding of the Group’s financial results from normal operating activities.
44 Steadfast Group Annual Report 2021
B. Review of financial condition
I. Financial position
The increase in the total assets and total liabilities of the Group during the financial year was mainly attributable to the acquisitions of new businesses funded through the corporate debt facility as detailed in Note 10 to the financial statements, together with net profit after tax, net of dividends paid.
II. Cash from operations
The net inflows of $249.7 million include net inflows from operating activities of $225.1 million and a net inflow of $24.6 million to broking trust accounts.
Included in the net $225.1 million cash inflows from operating activities was $38.7 million of premium funding instalments in late June 2021 that were applied to borrowings in July 2021. When taking this into account, together with $14.0 million of lease liability payments, the adjusted cash inflows from operating activities was $172.4 million. Consistent with prior years, Steadfast Group converted all its underlying net profit after tax and before amortisation of $160.0 million into cash. This was used to fund dividend payments and other corporate activities.
III. Capital management
As at 30 June 2021, the Company had a total of 871.5 million ordinary shares on issue, which increased from the 863.2 million ordinary shares on issue at 30 June 2020, with the increase due to shares issued through the Dividend Reinvestment Plan. The Company continues to acquire shares on market to provide for potential share issues to employees including Key Management Personnel (KMP) under equity based incentive programmes.
The Group leverages its equity, adopting a maximum 30.0% total gearing ratio excluding premium funding borrowings. As at 30 June 2021, the Group’s total gearing ratio was 22.0% (2020: 21.5%). Refer Note 9C. The increased gearing resulted from financing acquisitions predominantly through the corporate debt facility.
The Group's premium funding subsidiary, IQumulate Premium Funding Pty Ltd, established a new borrowing facility in July 2020 to refinance the majority of its existing borrowing facilities. The facility limit is $470.0 million (inclusive of $16.5 million Steadfast Group funds). The facility will continue to provide a source of funding for the Australian premium funding operations. The facility has a maturity date of July 2022. Consistent with previous funding arrangements, IQumulate continues to hold trade credit insurance, with recourse to assets limited to IQumulate only. The facility is not cross-collateralised with other borrowings in the Group.
Steadfast Group Annual Report 2021 45
Directors’ Report continued
Strategy and prospects
The Group's business strategy is to maintain its position as the largest intermediated insurance distribution network in Australasia by continuing to grow shareholder value through continued expansion of the Steadfast insurance distribution model and related businesses.
Steadfast Group is a stable and resilient business. The Group aims to increase value for all shareholders by providing quality support to all stakeholders including shareholders, customers, strategic partners, employees and our community. The Group's strategic plan is a framework for decision making and planning for the Group's development of the strategic objectives which include:
Drive growth organically and through acquisitionsMaintain and enhance the premier service offering to Steadfast Network brokersMaintain and strengthen our strategic relationshipsContinue to develop and rollout our market leading technology platformsContinue to enhance organisational capability and sustainability
A. Steadfast Group
FY21 Highlights
Underlying earnings per share growth of 18.8%Dividend per share growth of 18.8%Acquisitions costing $172 million were executed during the year
Steadfast Group grew underlying FY21 EBITA by 17.6% to $262.7 million. This result was driven by both organic growth +9.9% and acquisition growth +7.7%.
As an industry leader, Steadfast continued to actively review the implications of the Hayne Royal Commission to our sector. This included engagement with industry peers and industry bodies on the conflicted remuneration issue. During FY21, Steadfast purchased Gold Seal Practice Management Pty Ltd and Gold Seal I.P. Pty Ltd (Gold Seal), to support the Steadfast broker network and to improve our client advocacy offering.
Steadfast also increased its shareholding in the global unisonSteadfast network to a majority stake of 60%. It solidifies the mutual commitment to growing the global distribution platform for both unisonSteadfast and Steadfast Network brokers.
Medium-term
Steadfast has a strong corporate governance foundation, including risk management and culture, to enable sustainable growth over the long term. This positions the business well to continue to improve operational efficiency through a culture of excellence and talent, seeking opportunities to promote entrepreneurship and reduce operating costs and improving underlying margins.
Steadfast Risk Group Pty Ltd has been formed to provide enhanced risk management solutions including alternative risk transfer businesses. Steadfast Risk Group continues to gain momentum within the broker network in providing property risk surveys and engineering services as well as related consulting services.
B. Steadfast Broking
FY21 Highlights
$9.8 billion Network GWP, up 18.3% on FY20457 broker members in the NetworkSteadfast has an equity stake in 59 brokersUnderlying EBITA up 21.5%
During FY21, growth in the Steadfast Broker Network was driven by organic growth and investing into the Steadfast Network brokers. Organic growth of 13.0% in Underlying EBITA was primarily a result of price increases in insurance premiums and cost savings as our businesses adapted to Covid impacts. Acquisitions provided a further 8.5% increase in Underlying EBITA.
As part of Steadfast’s objective to maintain and build our premium services to the broker network, and in response to the unfolding Covid pandemic, Steadfast put in place a number of measures to assist the broker network in supporting their clients through the challenges created by Covid experienced in Australia over the year including:
resourcing a dedicated page on the Broker Website for Covid detailing measures put in place by Government, Industry and Insurers;providing assistance to National Insurance Brokers Association (NIBA) in developing a coordinated approach as to how insurers can support brokers through Covid;launching an alternative premium funding option to support distressed clients; andcommissioning a guide to assist brokers and clients in assessing business interruption insurance.
46 Steadfast Group Annual Report 2021
Medium-term
Being a nimble and service focused business means Steadfast is continuously developing improvements and expanding its products and services to attract more brokers to the network and provide better solutions for the benefit of the network broker's clients. By investing in these improvements, Steadfast can maintain, build and enhance relationships with its stakeholders.
Steadfast is well positioned to respond to the current market conditions and will proceed with caution to implement management buy-ins, hubbing and co-owner opportunities when its strict cultural, risk and financial acquisition guidelines are met. Steadfast Group has an equity holding in 32% of the GWP and 13% of the number of brokers within the Steadfast Network, which provides potential future acquisition growth for the Group. The “trapped capital” initiative has been launched to execute on this strategy. The trapped capital initiative provides Steadfast Network brokers the opportunity to unlock trapped capital by partial sale to Steadfast.
C. Steadfast Underwriting Agencies
FY21 Highlights
$1.5 billion GWP, up 11.5% on FY20Steadfast has equity stakes in 24 agenciesUnderlying EBITA up 13.0%
The FY21 growth in Steadfast Underwriting Agencies is predominately organic growth and primarily driven by price and volume uplift. Most agencies experienced strong growth during FY21, particularly in property lines. The division’s excellent performance was also due to the long-term strategy of closely aligning capacity providers, technology and a strong service ethic to the agencies' niche product offerings.
By enhancing the partnerships between underwriting agencies and strategic partners and working effectively together, Steadfast Underwriting Agencies expanded its product range for the benefit of the brokers and their clients.
Medium-term
Steadfast Underwriting Agencies is well positioned to maintain organic growth through strong renewals and new business, as it aims to improve customer service, and the expectation of moderate price increases coming from strategic partners.
Steadfast Underwriting Agencies' focus remains on seeking new opportunities with strategic partners to expand its product range, as a number of insurers reposition their approach to distribution.
D. Steadfast Complementary Businesses
FY21 Highlights
$793 million GWP written through Steadfast Client Trading Platform (SCTP), up 24%181 brokers live on INSIGHT, up from 142 in FY20
The technology team continued the migration of Network brokers onto the Group's proprietary broking management system (INSIGHT) and continued enhancing the offering by SCTP – increasing the number of strategic partners and product lines offered. Steadfast continues to invest in further enhancements to the platform.
The Group continued to expand its complementary businesses with the purchase of Gold Seal and the establisment of risk management and claims management offerrings.
Medium-term
As an industry leader in innovation, Steadfast is well positioned to continue modernising its technology platforms to improve broker and client experience and support growth. Steadfast remains focused on improving SCTP by adding more product lines, new insurers and the expansion of auto-rating capabilities, driving increased SCTP usage and more transparent alternative pricing and coverage for clients.
The Steadfast team will continue to support the migration of brokers on to the INSIGHT platform with an additional 30 brokers committed to migrate and ongoing discussions with another 95 brokers. Focus will also remain on the development of enhancements to the security and efficiency of INSIGHT, seeking to continue to provide Steadfast brokers and their clients with a market leading secure and efficient platform.
Principal risks and uncertainties
The principal risks and uncertainties outlined in this section reflect the risks that could materially affect Steadfast Group, or its ability to meet its strategic objectives, either directly or by triggering a succession of events that in aggregate become material to the Group.
This section describes what Steadfast Group considers to be some of the key risks associated with Steadfast’s business and the industry in which it operates. The risks listed in this section should not be considered to be an exhaustive list of every possible risk associated with Steadfast Group Limited.
With respect to Covid, the Group is monitoring the potential short and medium-term impacts, including on the operating environment, workforce, products and services, as well as the resilience of the Australian and global economies to support recovery. Any longer-term impacts will also be considered and addressed, as appropriate.
Steadfast Group Annual Report 2021 47
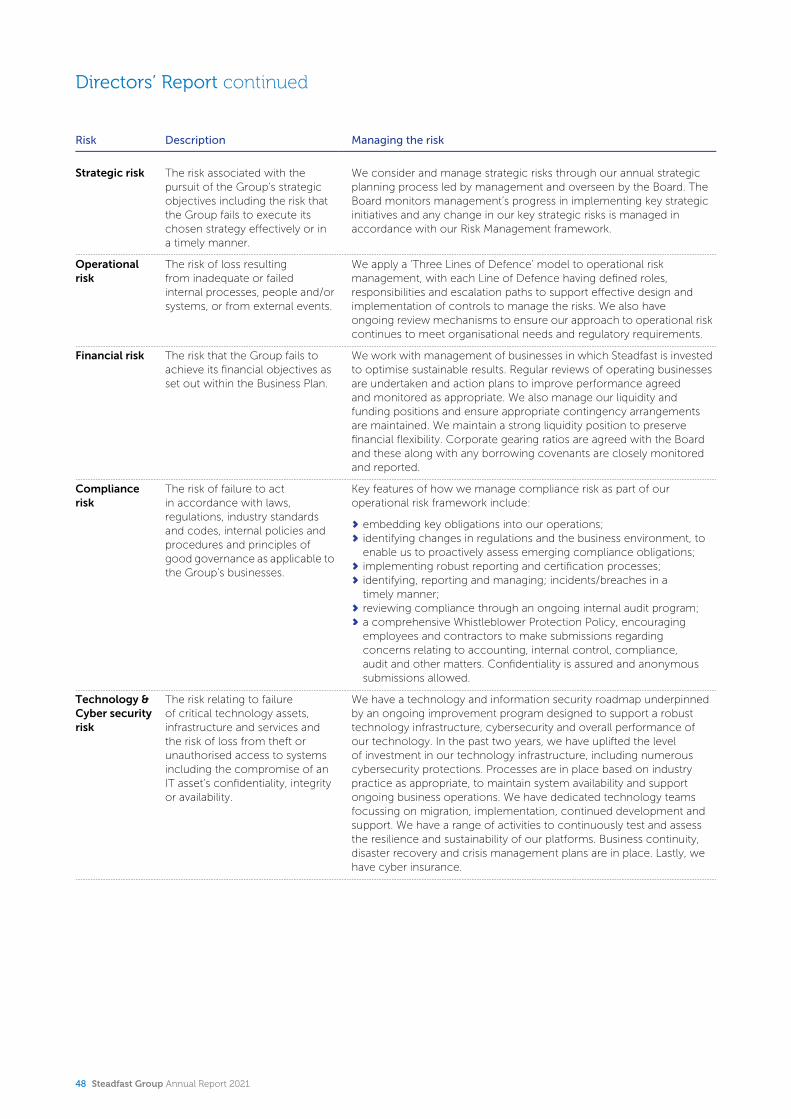
Directors’ Report continued
Risk Description Managing the risk
Strategic risk The risk associated with the pursuit of the Group’s strategic objectives including the risk that the Group fails to execute its chosen strategy effectively or in a timely manner.
We consider and manage strategic risks through our annual strategic planning process led by management and overseen by the Board. The Board monitors management’s progress in implementing key strategic initiatives and any change in our key strategic risks is managed in accordance with our Risk Management framework.
Operational risk
The risk of loss resulting from inadequate or failed internal processes, people and/or systems, or from external events.
We apply a ‘Three Lines of Defence’ model to operational risk management, with each Line of Defence having defined roles, responsibilities and escalation paths to support effective design and implementation of controls to manage the risks. We also have ongoing review mechanisms to ensure our approach to operational risk continues to meet organisational needs and regulatory requirements.
Financial risk The risk that the Group fails to achieve its financial objectives as set out within the Business Plan.
We work with management of businesses in which Steadfast is invested to optimise sustainable results. Regular reviews of operating businesses are undertaken and action plans to improve performance agreed and monitored as appropriate. We also manage our liquidity and funding positions and ensure appropriate contingency arrangements are maintained. We maintain a strong liquidity position to preserve financial flexibility. Corporate gearing ratios are agreed with the Board and these along with any borrowing covenants are closely monitored and reported.
Compliance risk
The risk of failure to act in accordance with laws, regulations, industry standards and codes, internal policies and procedures and principles of good governance as applicable to the Group’s businesses.
Key features of how we manage compliance risk as part of our operational risk framework include:
embedding key obligations into our operations;identifying changes in regulations and the business environment, to enable us to proactively assess emerging compliance obligations;implementing robust reporting and certification processes;identifying, reporting and managing; incidents/breaches in a timely manner;reviewing compliance through an ongoing internal audit program;a comprehensive Whistleblower Protection Policy, encouraging employees and contractors to make submissions regarding concerns relating to accounting, internal control, compliance, audit and other matters. Confidentiality is assured and anonymous submissions allowed.
Technology & Cyber security risk
The risk relating to failure of critical technology assets, infrastructure and services and the risk of loss from theft or unauthorised access to systems including the compromise of an IT asset’s confidentiality, integrity or availability.
We have a technology and information security roadmap underpinned by an ongoing improvement program designed to support a robust technology infrastructure, cybersecurity and overall performance of our technology. In the past two years, we have uplifted the level of investment in our technology infrastructure, including numerous cybersecurity protections. Processes are in place based on industry practice as appropriate, to maintain system availability and support ongoing business operations. We have dedicated technology teams focussing on migration, implementation, continued development and support. We have a range of activities to continuously test and assess the resilience and sustainability of our platforms. Business continuity, disaster recovery and crisis management plans are in place. Lastly, we have cyber insurance.
48 Steadfast Group Annual Report 2021
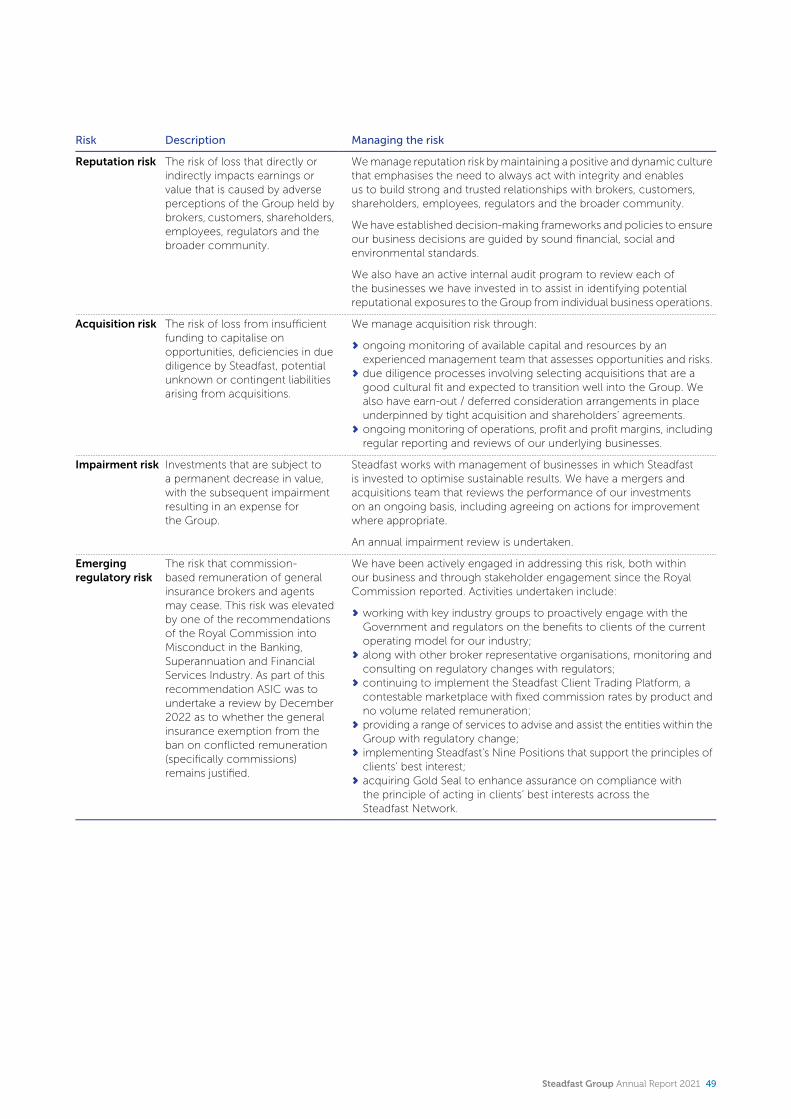
Risk Description Managing the risk
Reputation risk The risk of loss that directly or indirectly impacts earnings or value that is caused by adverse perceptions of the Group held by brokers, customers, shareholders, employees, regulators and the broader community.
We manage reputation risk by maintaining a positive and dynamic culture that emphasises the need to always act with integrity and enables us to build strong and trusted relationships with brokers, customers, shareholders, employees, regulators and the broader community.
We have established decision-making frameworks and policies to ensure our business decisions are guided by sound financial, social and environmental standards.
We also have an active internal audit program to review each of the businesses we have invested in to assist in identifying potential reputational exposures to the Group from individual business operations.
Acquisition risk The risk of loss from insufficient funding to capitalise on opportunities, deficiencies in due diligence by Steadfast, potential unknown or contingent liabilities arising from acquisitions.
We manage acquisition risk through:
ongoing monitoring of available capital and resources by an experienced management team that assesses opportunities and risks.due diligence processes involving selecting acquisitions that are a good cultural fit and expected to transition well into the Group. We also have earn-out / deferred consideration arrangements in place underpinned by tight acquisition and shareholders’ agreements.ongoing monitoring of operations, profit and profit margins, including regular reporting and reviews of our underlying businesses.
Impairment risk Investments that are subject to a permanent decrease in value, with the subsequent impairment resulting in an expense for the Group.
Steadfast works with management of businesses in which Steadfast is invested to optimise sustainable results. We have a mergers and acquisitions team that reviews the performance of our investments on an ongoing basis, including agreeing on actions for improvement where appropriate.
An annual impairment review is undertaken.
Emerging regulatory risk
The risk that commissionbased remuneration of general insurance brokers and agents may cease. This risk was elevated by one of the recommendations of the Royal Commission into Misconduct in the Banking, Superannuation and Financial Services Industry. As part of this recommendation ASIC was to undertake a review by December 2022 as to whether the general insurance exemption from the ban on conflicted remuneration (specifically commissions) remains justified.
We have been actively engaged in addressing this risk, both within our business and through stakeholder engagement since the Royal Commission reported. Activities undertaken include:
working with key industry groups to proactively engage with the Government and regulators on the benefits to clients of the current operating model for our industry;along with other broker representative organisations, monitoring and consulting on regulatory changes with regulators;continuing to implement the Steadfast Client Trading Platform, a contestable marketplace with fixed commission rates by product and no volume related remuneration;providing a range of services to advise and assist the entities within the Group with regulatory change;implementing Steadfast's Nine Positions that support the principles of clients’ best interest;acquiring Gold Seal to enhance assurance on compliance with the principle of acting in clients’ best interests across the Steadfast Network.
Steadfast Group Annual Report 2021 49
Directors’ Report continued
Dividends
Details of dividends paid or declared by the Company are set out in Note 6 to the financial statements.
During the financial year ended 30 June 2021, a final dividend for FY20 of 6.0 cents per share and an interim dividend for FY21 of 4.4 cents per share were declared and paid, both fully franked.
Events after the reporting period
Final dividend
On 16 August 2021, the Board declared a final dividend for FY21 of 7.0 cents per share, fully franked. The dividend will be paid on 10 September 2021.
Acquisition of Coverforce
In August 2021 the Group announced the acquisition of Coverforce for a purchase price of $411.5 million. The acquisition will be fully funded by equity, with $217.8 million of Steadfast scrip to be issued to the Coverforce vendors, and a fully underwritten placement of $200.0 million.
Capital raising
The Group is undertaking a fully underwritten placement to raise approximately $200.0 million together with an accompanying non-underwritten Share Purchase Plan.
Likely developments
The Group’s ongoing business strategy is to grow shareholder value through maintaining and growing its market position in the provision of insurance and related services, with a core focus on general insurance intermediation. Please refer to the Strategy and Prospects section of the Directors’ report.
The Group continues to work closely with the management team of each acquired business, and allow each business to operate in a manner consistent with the Group’s co-ownership model. In most cases, this model involves ongoing equity participation of key management personnel in the business acquired.
The Board has provided the following FY22 guidance.
Underlying EBITA of $320.0 million to $330.0 millionUnderlying NPAT of $159.0 million to $166.0 millionUnderlying diluted EPS (NPAT) growth of 10% to 15%
This is subject to:
strategic partners continuing to require moderate premium price increases;$39 million of EBITA in FY22 from the acquisitions of Coverforce and interests in Network brokers including the Trapped Capital Project;equity raising of $418 million;further technology investment; andno negative consequences from Covid.
Environmental Regulation
The Group’s operations are not subject to any particular significant environmental regulations under a law of the Commonwealth or under State or Territory legislation.
Indemnification and insurance of officers
In accordance with its Constitution, and where permitted under relevant legislation or regulation, the Company indemnifies the Directors and Officers against all liabilities to another person that may arise from their position as Directors or Officers of the Company and its subsidiaries, except if, in the Board’s reasonable opinion, the liability arises out of conduct which is fraudulent, criminal, dishonest or a wilful default of the Directors’ or Officers’ duties.
In accordance with the provisions of the Corporations Act 2001, the Company has insured the Directors and Officers against liabilities incurred in their role as Directors and Officers of the Company. The terms of the insurance policy, including the premium, are subject to confidentiality clauses and therefore the Company is prohibited from disclosing the nature of the liabilities covered and the premium paid.
50 Steadfast Group Annual Report 2021

Non-audit services
During the financial year, KPMG, the Group’s auditor, performed certain other services in addition to their statutory duties.
The Board has considered the non-audit services provided by the auditor and is satisfied that the provision of those non-audit services is compatible with, and did not compromise, the auditor independence requirements of the Corporations Act 2001 for the following reasons:
all non-audit services engagements were subject to the corporate governance procedures adopted by the Group, and have been reviewed by the Audit & Risk Committee to ensure they do not affect the integrity and objectivity of the auditor; andthe non-audit services provided do not undermine the general principles relating to auditor independence as set out in APES 110 Code of Ethics for Professional Accountants, as they did not involve reviewing or auditing the auditor’s own work, acting in a management or decision-making capacity for the Group, acting as an advocate for the Group or jointly sharing risks and rewards.
Details of the amounts paid to the auditor of the Group, KPMG, and its network firms, for audit and non-audit services provided during the financial year are provided in Note 22 to the financial statements.
Lead Auditor's Independence Declaration
The lead auditor’s independence declaration is set out on page 75 and forms part of the Directors’ Report for the year ended 30 June 2021.
Steadfast Group Annual Report 2021 51
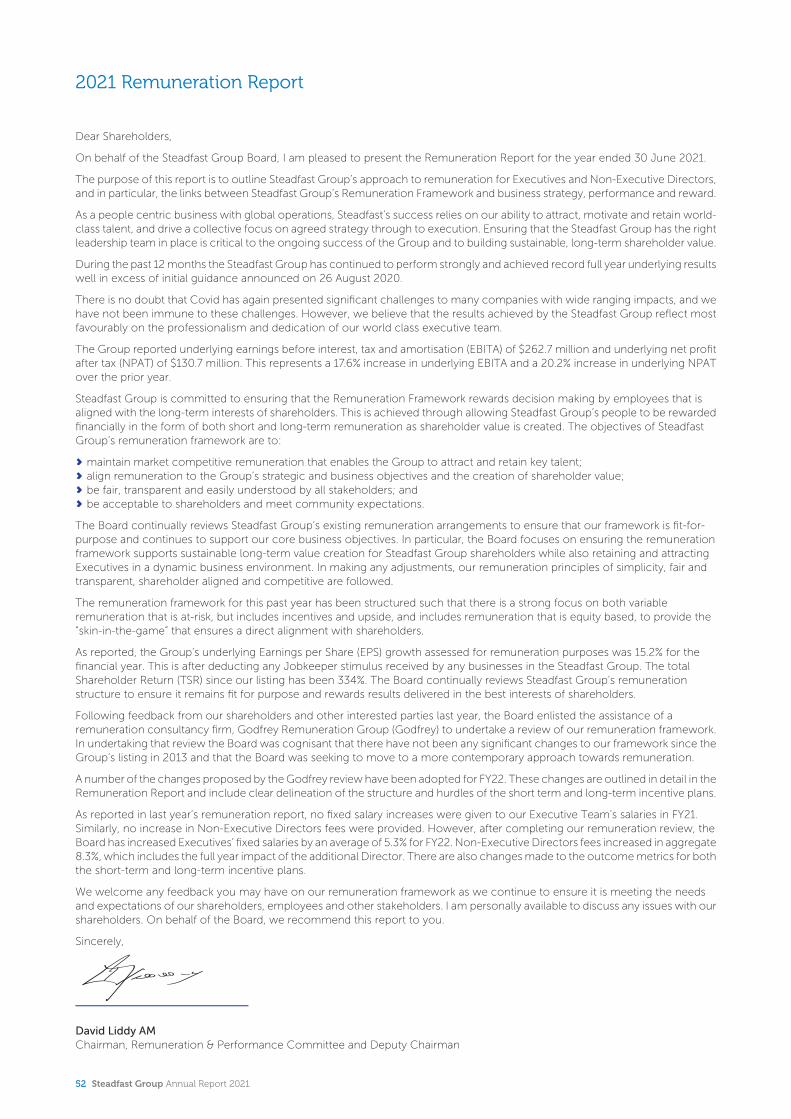
2021 Remuneration Report
Dear Shareholders,
On behalf of the Steadfast Group Board, I am pleased to present the Remuneration Report for the year ended 30 June 2021.
The purpose of this report is to outline Steadfast Group’s approach to remuneration for Executives and Non-Executive Directors, and in particular, the links between Steadfast Group’s Remuneration Framework and business strategy, performance and reward.
As a people centric business with global operations, Steadfast’s success relies on our ability to attract, motivate and retain world- class talent, and drive a collective focus on agreed strategy through to execution. Ensuring that the Steadfast Group has the right leadership team in place is critical to the ongoing success of the Group and to building sustainable, long-term shareholder value.
During the past 12 months the Steadfast Group has continued to perform strongly and achieved record full year underlying results well in excess of initial guidance announced on 26 August 2020.
There is no doubt that Covid has again presented significant challenges to many companies with wide ranging impacts, and we have not been immune to these challenges. However, we believe that the results achieved by the Steadfast Group reflect most favourably on the professionalism and dedication of our world class executive team.
The Group reported underlying earnings before interest, tax and amortisation (EBITA) of $262.7 million and underlying net profit after tax (NPAT) of $130.7 million. This represents a 17.6% increase in underlying EBITA and a 20.2% increase in underlying NPAT over the prior year.
Steadfast Group is committed to ensuring that the Remuneration Framework rewards decision making by employees that is aligned with the long-term interests of shareholders. This is achieved through allowing Steadfast Group’s people to be rewarded financially in the form of both short and long-term remuneration as shareholder value is created. The objectives of Steadfast Group’s remuneration framework are to:
maintain market competitive remuneration that enables the Group to attract and retain key talent;align remuneration to the Group’s strategic and business objectives and the creation of shareholder value;be fair, transparent and easily understood by all stakeholders; andbe acceptable to shareholders and meet community expectations.
The Board continually reviews Steadfast Group’s existing remuneration arrangements to ensure that our framework is fit-for-purpose and continues to support our core business objectives. In particular, the Board focuses on ensuring the remuneration framework supports sustainable long-term value creation for Steadfast Group shareholders while also retaining and attracting Executives in a dynamic business environment. In making any adjustments, our remuneration principles of simplicity, fair and transparent, shareholder aligned and competitive are followed.
The remuneration framework for this past year has been structured such that there is a strong focus on both variable remuneration that is at-risk, but includes incentives and upside, and includes remuneration that is equity based, to provide the “skin-in-the-game” that ensures a direct alignment with shareholders.
As reported, the Group’s underlying Earnings per Share (EPS) growth assessed for remuneration purposes was 15.2% for the financial year. This is after deducting any Jobkeeper stimulus received by any businesses in the Steadfast Group. The total Shareholder Return (TSR) since our listing has been 334%. The Board continually reviews Steadfast Group’s remuneration structure to ensure it remains fit for purpose and rewards results delivered in the best interests of shareholders.
Following feedback from our shareholders and other interested parties last year, the Board enlisted the assistance of a remuneration consultancy firm, Godfrey Remuneration Group (Godfrey) to undertake a review of our remuneration framework. In undertaking that review the Board was cognisant that there have not been any significant changes to our framework since the Group’s listing in 2013 and that the Board was seeking to move to a more contemporary approach towards remuneration.
A number of the changes proposed by the Godfrey review have been adopted for FY22. These changes are outlined in detail in the Remuneration Report and include clear delineation of the structure and hurdles of the short term and long-term incentive plans.
As reported in last year’s remuneration report, no fixed salary increases were given to our Executive Team's salaries in FY21. Similarly, no increase in Non-Executive Directors fees were provided. However, after completing our remuneration review, the Board has increased Executives’ fixed salaries by an average of 5.3% for FY22. Non-Executive Directors fees increased in aggregate 8.3%, which includes the full year impact of the additional Director. There are also changes made to the outcome metrics for both the short-term and long-term incentive plans.
We welcome any feedback you may have on our remuneration framework as we continue to ensure it is meeting the needs and expectations of our shareholders, employees and other stakeholders. I am personally available to discuss any issues with our shareholders. On behalf of the Board, we recommend this report to you.
Sincerely,
David Liddy AMChairman, Remuneration & Performance Committee and Deputy Chairman
52 Steadfast Group Annual Report 2021
Co
nte
nts
202
1 R
emu
ner
atio
n R
epo
rt
54 1. Introduction
54 1.1. Key management personnel
54 2. Remuneration outcomes for 2021
54 2.1. Link between Steadfast’s performance and remuneration
58 2.2. Maximum potential and actual STI and LTI outcomes
59 2.3. Targeted maximum potential and actual remuneration mix for FY21
59 2.4. STI and LTI vesting information
60 3. Remuneration explained
61 3.1. Remuneration framework
63 3.2. Fixed remuneration for FY21
63 3.3. Short-term incentives for FY21
64 3.4. Long-term incentives for FY21
66 3.5. Keeping Executives’ and shareholders’ interest aligned
67 4. Remuneration in detail
67 4.1. Statutory remuneration disclosure
68 4.2. Conditional rights
68 4.3. Executive service agreements
69 5. Non-Executive director remuneration
69 5.1. Fee structure and policy
70 5.2. Minimum shareholding requirement
71 5.3. Remuneration details for Non-Executive Directors
71 6. Additional information
71 6.1. Remuneration governance
72 6.2. Valuation of conditional rights
73 6.3. Shareholdings
73 6.4. Related party transactions
Steadfast Group Annual Report 2021 53
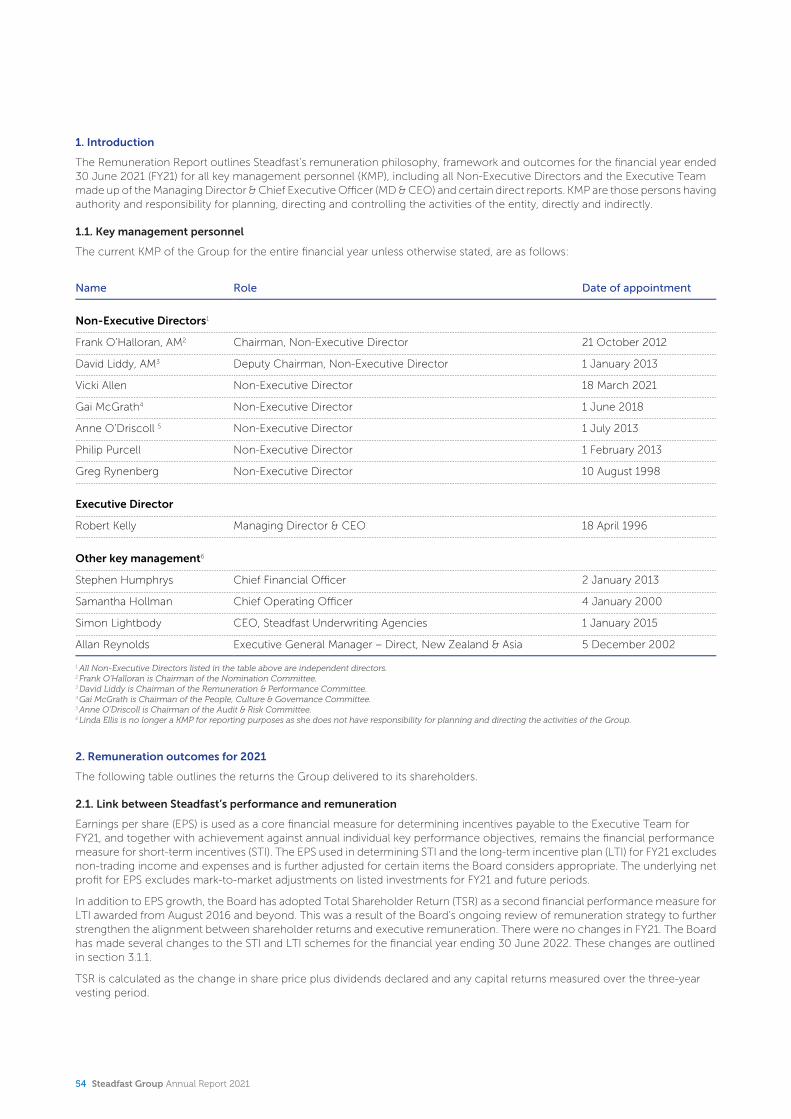
1. Introduction
The Remuneration Report outlines Steadfast’s remuneration philosophy, framework and outcomes for the financial year ended 30 June 2021 (FY21) for all key management personnel (KMP), including all Non-Executive Directors and the Executive Team made up of the Managing Director & Chief Executive Officer (MD & CEO) and certain direct reports. KMP are those persons having authority and responsibility for planning, directing and controlling the activities of the entity, directly and indirectly.
1.1. Key management personnel
The current KMP of the Group for the entire financial year unless otherwise stated, are as follows:
Name Role Date of appointment
Non-Executive Directors1
Frank O’Halloran, AM2 Chairman, Non-Executive Director 21 October 2012
David Liddy, AM3 Deputy Chairman, Non-Executive Director 1 January 2013
Vicki Allen Non-Executive Director 18 March 2021
Gai McGrath4 Non-Executive Director 1 June 2018
Anne O’Driscoll 5 Non-Executive Director 1 July 2013
Philip Purcell Non-Executive Director 1 February 2013
Greg Rynenberg Non-Executive Director 10 August 1998
Executive Director
Robert Kelly Managing Director & CEO 18 April 1996
Other key management6
Stephen Humphrys Chief Financial Officer 2 January 2013
Samantha Hollman Chief Operating Officer 4 January 2000
Simon Lightbody CEO, Steadfast Underwriting Agencies 1 January 2015
Allan Reynolds Executive General Manager – Direct, New Zealand & Asia 5 December 2002
1 All Non-Executive Directors listed in the table above are independent directors.2Frank O’Halloran is Chairman of the Nomination Committee.3David Liddy is Chairman of the Remuneration & Performance Committee.4Gai McGrath is Chairman of the People, Culture & Governance Committee.5 Anne O’Driscoll is Chairman of the Audit & Risk Committee.6Linda Ellis is no longer a KMP for reporting purposes as she does not have responsibility for planning and directing the activities of the Group.
2. Remuneration outcomes for 2021
The following table outlines the returns the Group delivered to its shareholders.
2.1. Link between Steadfast’s performance and remuneration
Earnings per share (EPS) is used as a core financial measure for determining incentives payable to the Executive Team for FY21, and together with achievement against annual individual key performance objectives, remains the financial performance measure for short-term incentives (STI). The EPS used in determining STI and the long-term incentive plan (LTI) for FY21 excludes non-trading income and expenses and is further adjusted for certain items the Board considers appropriate. The underlying net profit for EPS excludes mark-to-market adjustments on listed investments for FY21 and future periods.
In addition to EPS growth, the Board has adopted Total Shareholder Return (TSR) as a second financial performance measure for LTI awarded from August 2016 and beyond. This was a result of the Board’s ongoing review of remuneration strategy to further strengthen the alignment between shareholder returns and executive remuneration. There were no changes in FY21. The Board has made several changes to the STI and LTI schemes for the financial year ending 30 June 2022. These changes are outlined in section 3.1.1.
TSR is calculated as the change in share price plus dividends declared and any capital returns measured over the three-year vesting period.
54 Steadfast Group Annual Report 2021
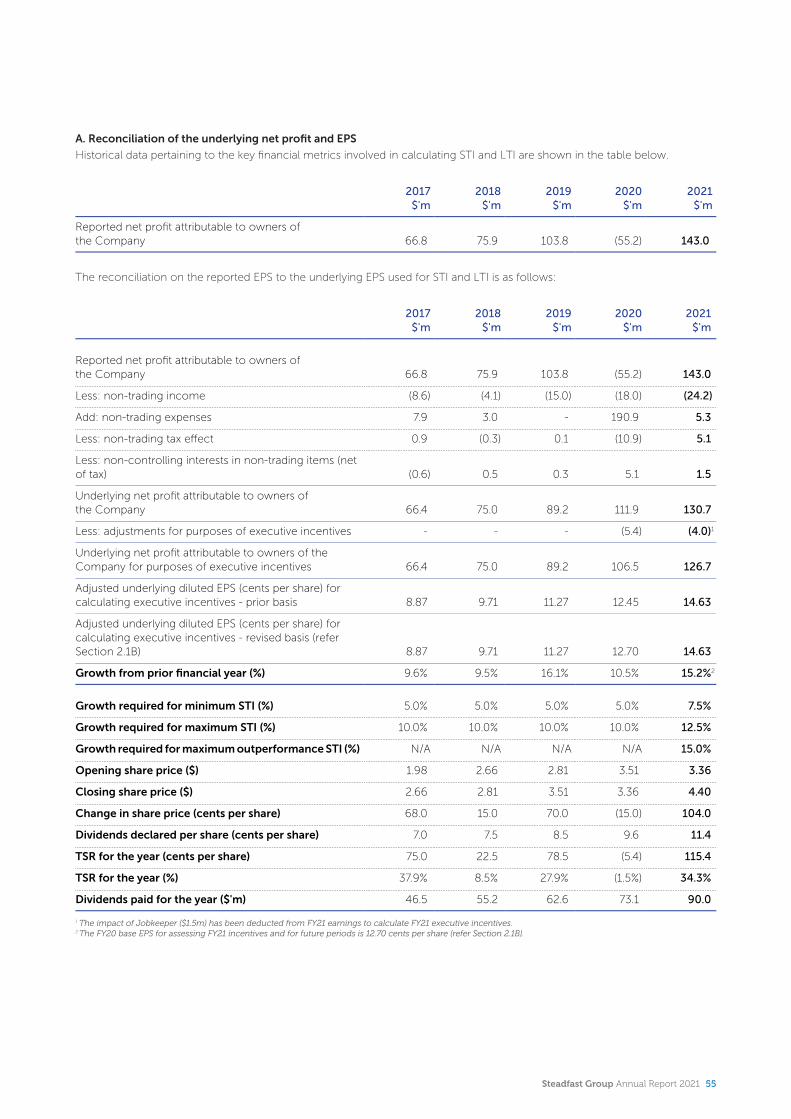
A. Reconciliation of the underlying net profit and EPS
Historical data pertaining to the key financial metrics involved in calculating STI and LTI are shown in the table below.
2017$'m
2018$'m
2019$'m
2020$'m
2021$'m
Reported net profit attributable to owners of the Company 66.8 75.9 103.8 (55.2) 143.0
The reconciliation on the reported EPS to the underlying EPS used for STI and LTI is as follows:
2017$'m
2018$'m
2019$'m
2020$'m
2021$'m
Reported net profit attributable to owners of the Company 66.8 75.9 103.8 (55.2) 143.0
Less: non-trading income (8.6) (4.1) (15.0) (18.0) (24.2)
Add: non-trading expenses 7.9 3.0 - 190.9 5.3
Less: non-trading tax effect 0.9 (0.3) 0.1 (10.9) 5.1
Less: non-controlling interests in non-trading items (net of tax) (0.6) 0.5 0.3 5.1 1.5
Underlying net profit attributable to owners of the Company 66.4 75.0 89.2 111.9 130.7
Less: adjustments for purposes of executive incentives - - - (5.4) (4.0)1
Underlying net profit attributable to owners of the Company for purposes of executive incentives 66.4 75.0 89.2 106.5 126.7
Adjusted underlying diluted EPS (cents per share) for calculating executive incentives - prior basis 8.87 9.71 11.27 12.45 14.63
Adjusted underlying diluted EPS (cents per share) for calculating executive incentives - revised basis (refer Section 2.1B) 8.87 9.71 11.27 12.70 14.63
Growth from prior financial year (%) 9.6% 9.5% 16.1% 10.5% 15.2%2
Growth required for minimum STI (%) 5.0% 5.0% 5.0% 5.0% 7.5%
Growth required for maximum STI (%) 10.0% 10.0% 10.0% 10.0% 12.5%
Growth required for maximum outperformance STI (%) N/A N/A N/A N/A 15.0%
Opening share price ($) 1.98 2.66 2.81 3.51 3.36
Closing share price ($) 2.66 2.81 3.51 3.36 4.40
Change in share price (cents per share) 68.0 15.0 70.0 (15.0) 104.0
Dividends declared per share (cents per share) 7.0 7.5 8.5 9.6 11.4
TSR for the year (cents per share) 75.0 22.5 78.5 (5.4) 115.4
TSR for the year (%) 37.9% 8.5% 27.9% (1.5%) 34.3%
Dividends paid for the year ($'m) 46.5 55.2 62.6 73.1 90.0
1 The impact of Jobkeeper ($1.5m) has been deducted from FY21 earnings to calculate FY21 executive incentives.2The FY20 base EPS for assessing FY21 incentives and for future periods is 12.70 cents per share (refer Section 2.1B).
Steadfast Group Annual Report 2021 55
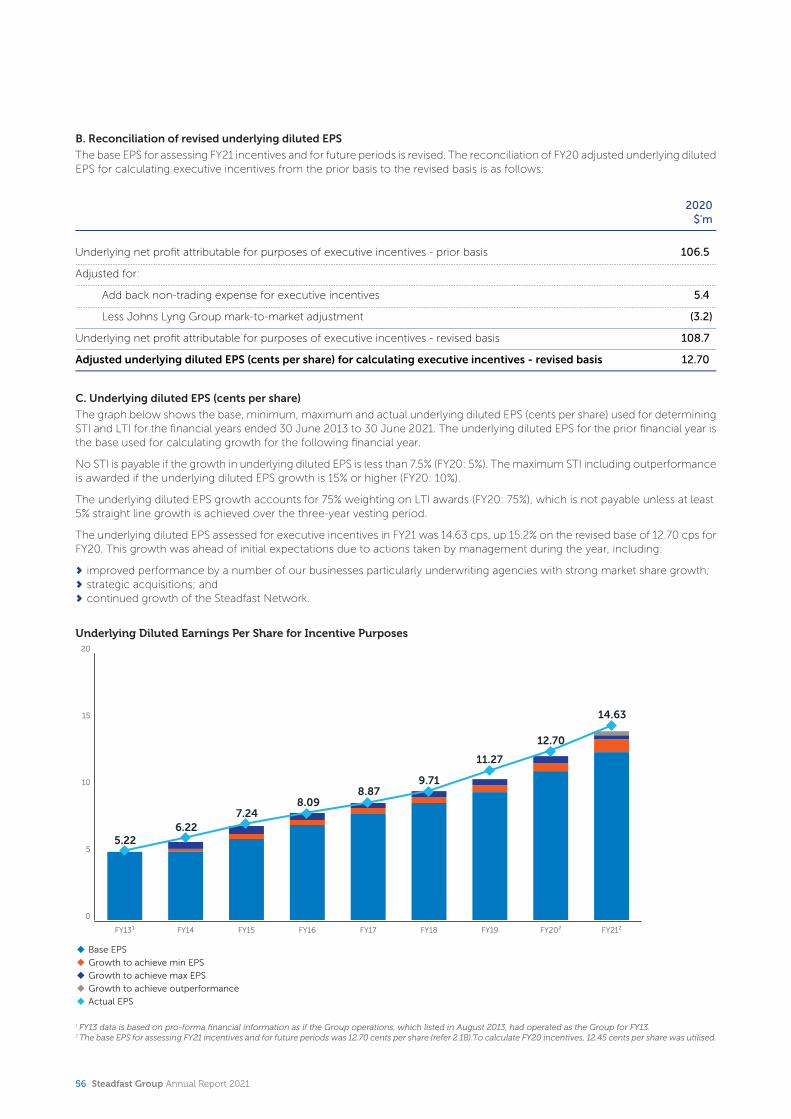
B. Reconciliation of revised underlying diluted EPS
The base EPS for assessing FY21 incentives and for future periods is revised. The reconciliation of FY20 adjusted underlying diluted EPS for calculating executive incentives from the prior basis to the revised basis is as follows:
2020$'m
Underlying net profit attributable for purposes of executive incentives - prior basis 106.5
Adjusted for:
Add back non-trading expense for executive incentives 5.4
Less Johns Lyng Group mark-to-market adjustment (3.2)
Underlying net profit attributable for purposes of executive incentives - revised basis 108.7
Adjusted underlying diluted EPS (cents per share) for calculating executive incentives - revised basis 12.70
C. Underlying diluted EPS (cents per share)
The graph below shows the base, minimum, maximum and actual underlying diluted EPS (cents per share) used for determining STI and LTI for the financial years ended 30 June 2013 to 30 June 2021. The underlying diluted EPS for the prior financial year is the base used for calculating growth for the following financial year.
No STI is payable if the growth in underlying diluted EPS is less than 7.5% (FY20: 5%). The maximum STI including outperformance is awarded if the underlying diluted EPS growth is 15% or higher (FY20: 10%).
The underlying diluted EPS growth accounts for 75% weighting on LTI awards (FY20: 75%), which is not payable unless at least 5% straight line growth is achieved over the three-year vesting period.
The underlying diluted EPS assessed for executive incentives in FY21 was 14.63 cps, up 15.2% on the revised base of 12.70 cps for FY20. This growth was ahead of initial expectations due to actions taken by management during the year, including:
improved performance by a number of our businesses particularly underwriting agencies with strong market share growth;strategic acquisitions; andcontinued growth of the Steadfast Network.
Underlying Diluted Earnings Per Share for Incentive Purposes
5.225.226.226.22
7.247.248.098.09
8.878.879.719.71
11.2711.27
12.7012.70
14.6314.63
u Base EPS
u Growth to achieve min EPS
u Growth to achieve max EPS
u Growth to achieve outperformance
u Actual EPS
FY13¹ FY14 FY15 FY16 FY17 FY18 FY19 FY20² FY21²
0
5
10
15
20
1 FY13 data is based on pro-forma financial information as if the Group operations, which listed in August 2013, had operated as the Group for FY13.2The base EPS for assessing FY21 incentives and for future periods was 12.70 cents per share (refer 2.1B).To calculate FY20 incentives, 12.45 cents per share was utilised.
56 Steadfast Group Annual Report 2021
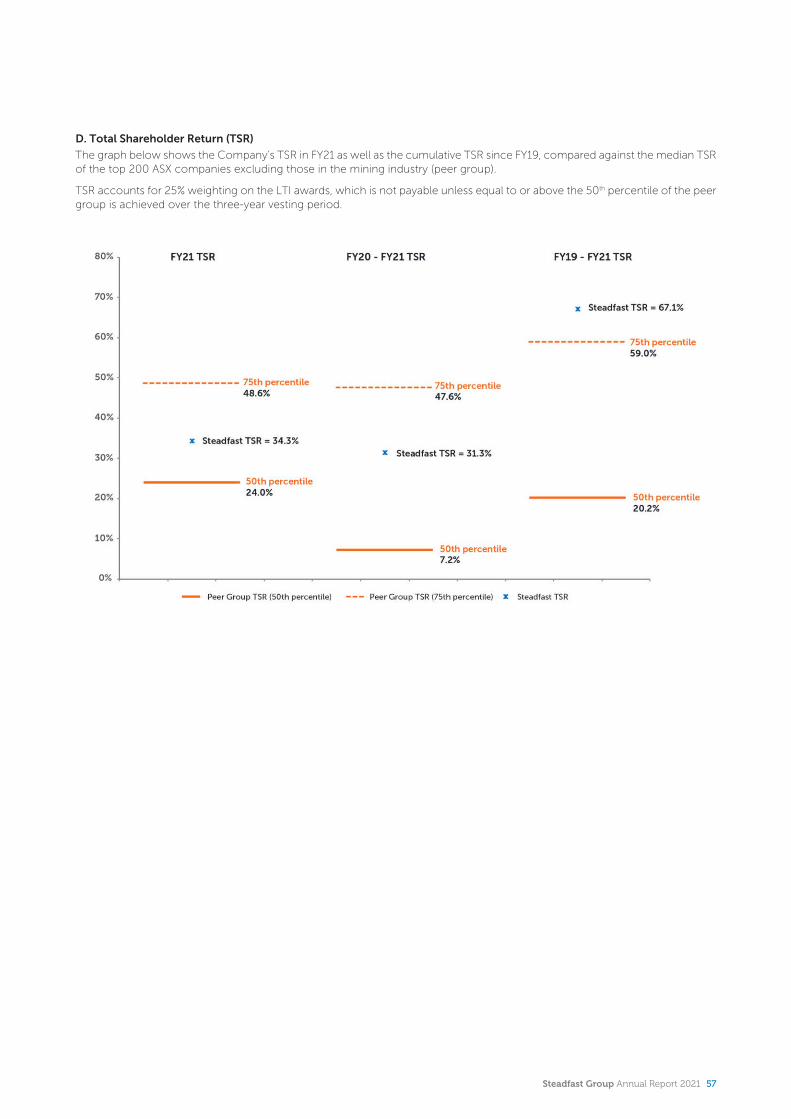
D. Total Shareholder Return (TSR)
The graph below shows the Company’s TSR in FY21 as well as the cumulative TSR since FY19, compared against the median TSR of the top 200 ASX companies excluding those in the mining industry (peer group).
TSR accounts for 25% weighting on the LTI awards, which is not payable unless equal to or above the 50th percentile of the peer group is achieved over the three-year vesting period.
Steadfast Group Annual Report 2021 57

2.2. Maximum potential and actual STI and LTI outcomes
All participants of the STI and LTI schemes have to achieve at least 60% of their annual key performance objectives to be eligible for any incentive payments.
The MD & CEO’s performance against his annual key performance indicators (KPIs) set at the beginning of FY21 is set out below:
FY21 performance measures Weighting % Achieved % Comments
Continue to drive improvements to the business and deliver FY21 NPAT target of $120m 15 15 Achieved $130.7m.
Successfully implement new financial services model for the benefit of our customers. 15 15 Implemented.
Drive improvement of 25% in the profitability of the bottom 20 underperforming businesses 10 8 16% uplift achieved.
Continue successful formula for delivering sustainable future growth 10 10
A number of acquisitions achieved and a number of new initiatives implemented during the year (refer pages 4 to 6).
Continue our focus on working with our key stakeholders on sustainability 10 8
Maintained focus on long term relationships with key stakeholders whilst delivering FY21 results.
Drive values (called TOGETHER) that define our culture, maintain high 360-degree assessment and focus on diversity and inclusiveness 10 8
Continued to enhance culture through TOGETHER and diversity.
Enhance executive development and succession planning 10 6
New enhanced process commenced during the year.
Maintain high customer retention though quality service and alternatives and grow network 10 10 Network brokers' GWP increased 18%.
Maintain high standards of risk management throughout the business 10 10 No material breaches during the year.
100 90
The above scorecard shows more than 60% of KPIs were achieved.
The table below provides details of maximum potential STI and LTI, and actual STI and LTI awarded to KMP.
Fixed pay$
Maximum STI
(including outperformance)
potential(% of fixed
pay)
Actual STI outcome(a)
(% of fixed pay)
STI – cash out-
come(60% of
outcome)$
STI – deferred
equity award
outcome(b)
(40% of outcome)
$
Maximum LTI
potential(% of fixed
pay)
Actual LTI outcome(a)
(% of fixed pay)
LTI – deferred
equity award
outcome(b)
$
Robert Kelly 1,100,000 200.00% 200.00% 1,320,000 880,000 100.00% 100.00% 1,100,000
Stephen Humphrys 600,000 125.00% 125.00% 450,000 300,000 100.00% 100.00% 600,000
Samantha Hollman 500,000 125.00% 125.00% 375,000 250,000 75.00% 75.00% 375,000
Simon Lightbody 500,000 125.00% 125.00% 375,000 250,000 75.00% 75.00% 375,000
Allan Reynolds 460,000 100.00% 100.00% 276,000 184,000 75.00% 75.00% 345,000
Tables notes
a. All participants of the FY21 STI and LTI schemes have exceeded the 60% non-financial performance hurdle and therefore are eligible.
58 Steadfast Group Annual Report 2021
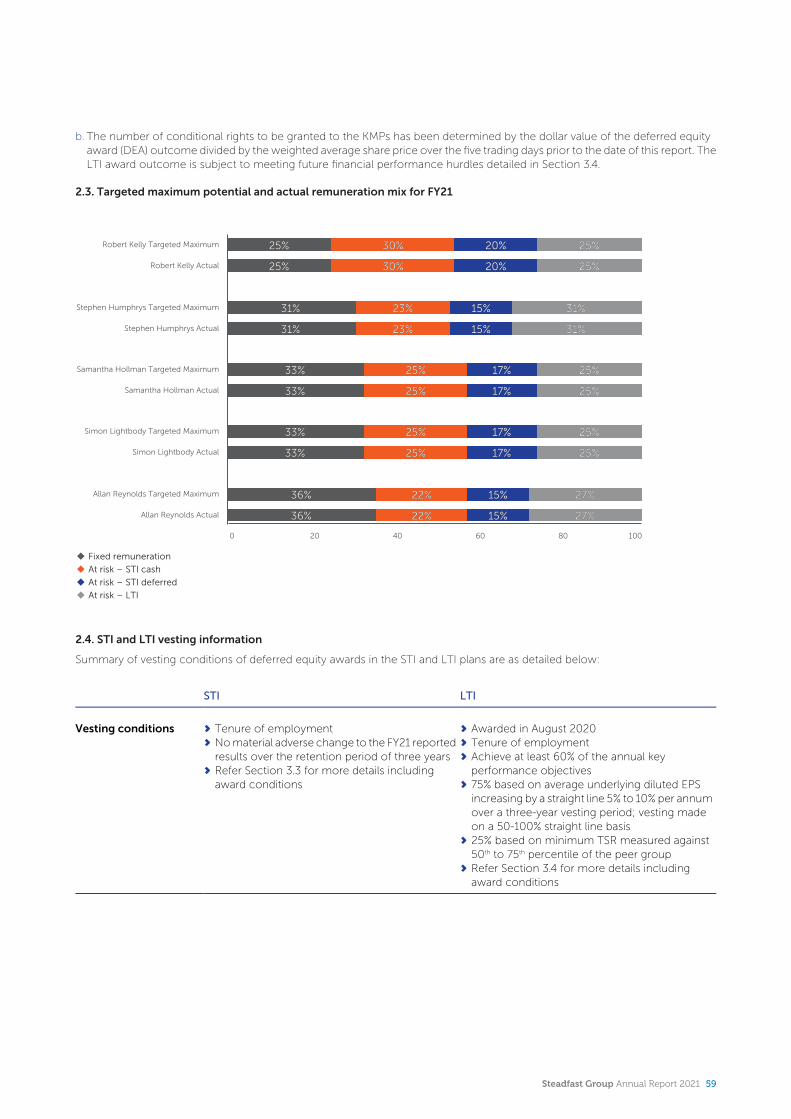
b. The number of conditional rights to be granted to the KMPs has been determined by the dollar value of the deferred equity award (DEA) outcome divided by the weighted average share price over the five trading days prior to the date of this report. The LTI award outcome is subject to meeting future financial performance hurdles detailed in Section 3.4.
2.3. Targeted maximum potential and actual remuneration mix for FY21
36%36%
36%36%
33%33%
33%33%
33%33%
33%33%
31%31%
31%31%
25%25%
25%25%
22%22%
22%22%
25%25%
25%25%
25%25%
25%25%
23%23%
23%23%
30%30%
30%30%
15%15%
15%15%
17%17%
17%17%
17%17%
17%17%
15%15%
15%15%
20%20%
20%20%
27%27%
27%27%
25%25%
25%25%
25%25%
25%25%
31%31%
31%31%
25%25%
25%25%
u Fixed remuneration
u At risk – STI cash
u At risk – STI deferred
u At risk – LTI
Allan Reynolds Actual
Allan Reynolds Targeted Maximum
Simon Lightbody Actual
Simon Lightbody Targeted Maximum
Samantha Hollman Actual
Samantha Hollman Targeted Maximum
Stephen Humphrys Actual
Stephen Humphrys Targeted Maximum
Robert Kelly Actual
Robert Kelly Targeted Maximum
0 20 40 60 80 100
2.4. STI and LTI vesting information
Summary of vesting conditions of deferred equity awards in the STI and LTI plans are as detailed below:
STI LTI
Vesting conditions Tenure of employmentNo material adverse change to the FY21 reported results over the retention period of three yearsRefer Section 3.3 for more details including award conditions
Awarded in August 2020Tenure of employmentAchieve at least 60% of the annual key performance objectives75% based on average underlying diluted EPS increasing by a straight line 5% to 10% per annum over a three-year vesting period; vesting made on a 50-100% straight line basis25% based on minimum TSR measured against 50th to 75th percentile of the peer groupRefer Section 3.4 for more details including award conditions
Steadfast Group Annual Report 2021 59
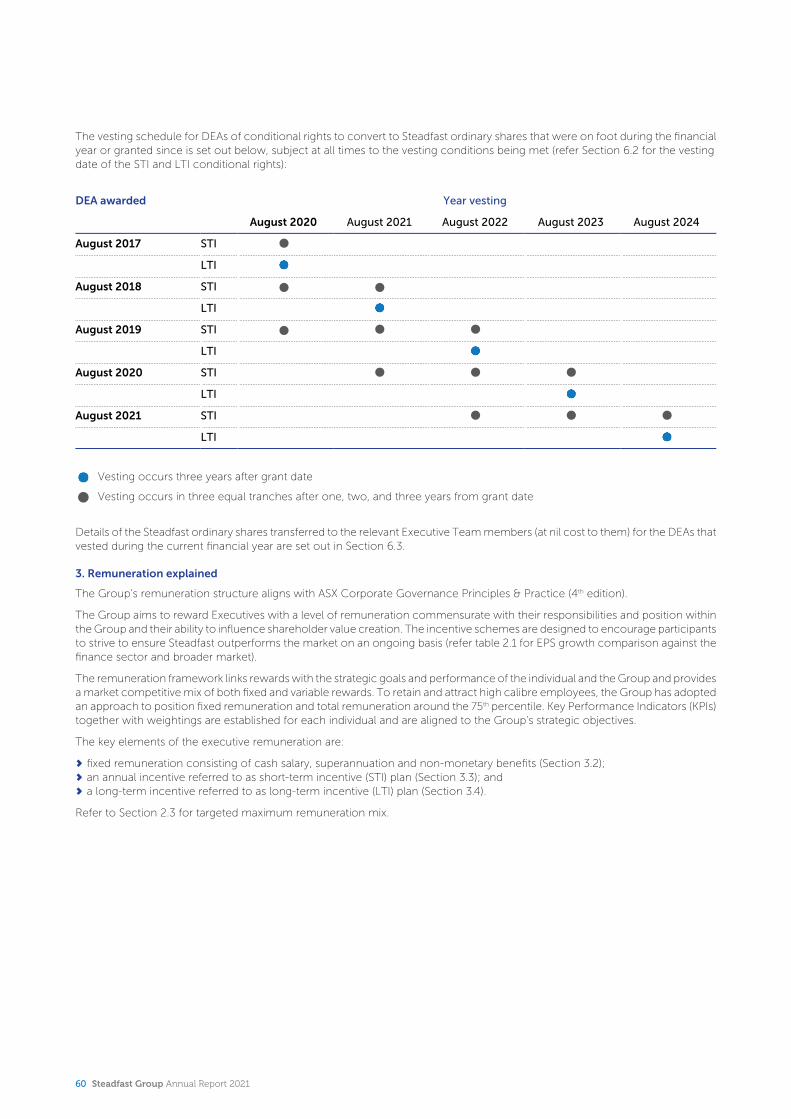
The vesting schedule for DEAs of conditional rights to convert to Steadfast ordinary shares that were on foot during the financial year or granted since is set out below, subject at all times to the vesting conditions being met (refer Section 6.2 for the vesting date of the STI and LTI conditional rights):
DEA awarded Year vesting
August 2020 August 2021 August 2022 August 2023 August 2024
August 2017 STI
LTI
August 2018 STI
LTI
August 2019 STI
LTI
August 2020 STI
LTI
August 2021 STI
LTI
Vesting occurs three years after grant date
Vesting occurs in three equal tranches after one, two, and three years from grant date
Details of the Steadfast ordinary shares transferred to the relevant Executive Team members (at nil cost to them) for the DEAs that vested during the current financial year are set out in Section 6.3.
3. Remuneration explained
The Group’s remuneration structure aligns with ASX Corporate Governance Principles & Practice (4th edition).
The Group aims to reward Executives with a level of remuneration commensurate with their responsibilities and position within the Group and their ability to influence shareholder value creation. The incentive schemes are designed to encourage participants to strive to ensure Steadfast outperforms the market on an ongoing basis (refer table 2.1 for EPS growth comparison against the finance sector and broader market).
The remuneration framework links rewards with the strategic goals and performance of the individual and the Group and provides a market competitive mix of both fixed and variable rewards. To retain and attract high calibre employees, the Group has adopted an approach to position fixed remuneration and total remuneration around the 75th percentile. Key Performance Indicators (KPIs) together with weightings are established for each individual and are aligned to the Group’s strategic objectives.
The key elements of the executive remuneration are:
fixed remuneration consisting of cash salary, superannuation and non-monetary benefits (Section 3.2);an annual incentive referred to as short-term incentive (STI) plan (Section 3.3); anda long-term incentive referred to as long-term incentive (LTI) plan (Section 3.4).
Refer to Section 2.3 for targeted maximum remuneration mix.
60 Steadfast Group Annual Report 2021
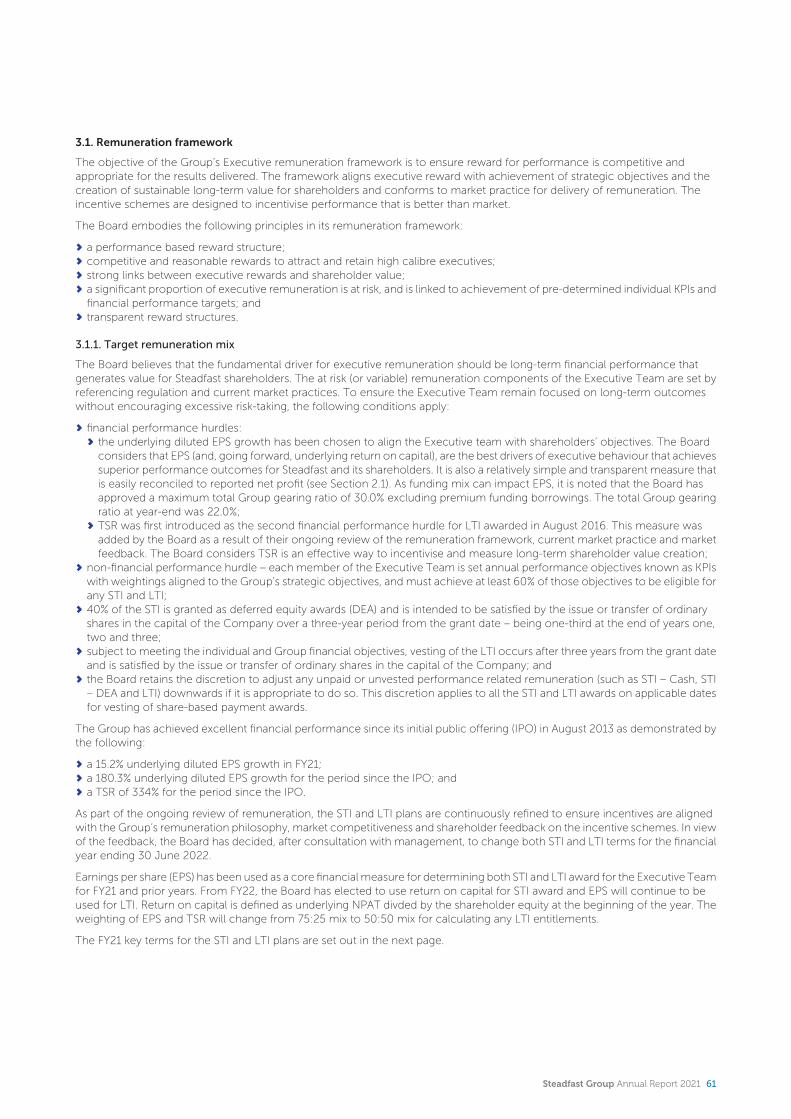
3.1. Remuneration framework
The objective of the Group’s Executive remuneration framework is to ensure reward for performance is competitive and appropriate for the results delivered. The framework aligns executive reward with achievement of strategic objectives and the creation of sustainable long-term value for shareholders and conforms to market practice for delivery of remuneration. The incentive schemes are designed to incentivise performance that is better than market.
The Board embodies the following principles in its remuneration framework:
a performance based reward structure;competitive and reasonable rewards to attract and retain high calibre executives;strong links between executive rewards and shareholder value;a significant proportion of executive remuneration is at risk, and is linked to achievement of pre-determined individual KPIs and financial performance targets; andtransparent reward structures.
3.1.1. Target remuneration mix
The Board believes that the fundamental driver for executive remuneration should be long-term financial performance that generates value for Steadfast shareholders. The at risk (or variable) remuneration components of the Executive Team are set by referencing regulation and current market practices. To ensure the Executive Team remain focused on long-term outcomes without encouraging excessive risk-taking, the following conditions apply:
financial performance hurdles:the underlying diluted EPS growth has been chosen to align the Executive team with shareholders’ objectives. The Board considers that EPS (and, going forward, underlying return on capital), are the best drivers of executive behaviour that achieves superior performance outcomes for Steadfast and its shareholders. It is also a relatively simple and transparent measure that is easily reconciled to reported net profit (see Section 2.1). As funding mix can impact EPS, it is noted that the Board has approved a maximum total Group gearing ratio of 30.0% excluding premium funding borrowings. The total Group gearing ratio at year-end was 22.0%;TSR was first introduced as the second financial performance hurdle for LTI awarded in August 2016. This measure was added by the Board as a result of their ongoing review of the remuneration framework, current market practice and market feedback. The Board considers TSR is an effective way to incentivise and measure long-term shareholder value creation;
non-financial performance hurdle – each member of the Executive Team is set annual performance objectives known as KPIs with weightings aligned to the Group’s strategic objectives, and must achieve at least 60% of those objectives to be eligible for any STI and LTI;40% of the STI is granted as deferred equity awards (DEA) and is intended to be satisfied by the issue or transfer of ordinary shares in the capital of the Company over a three-year period from the grant date – being one-third at the end of years one, two and three;subject to meeting the individual and Group financial objectives, vesting of the LTI occurs after three years from the grant date and is satisfied by the issue or transfer of ordinary shares in the capital of the Company; andthe Board retains the discretion to adjust any unpaid or unvested performance related remuneration (such as STI – Cash, STI – DEA and LTI) downwards if it is appropriate to do so. This discretion applies to all the STI and LTI awards on applicable dates for vesting of share-based payment awards.
The Group has achieved excellent financial performance since its initial public offering (IPO) in August 2013 as demonstrated by the following:
a 15.2% underlying diluted EPS growth in FY21;a 180.3% underlying diluted EPS growth for the period since the IPO; anda TSR of 334% for the period since the IPO.
As part of the ongoing review of remuneration, the STI and LTI plans are continuously refined to ensure incentives are aligned with the Group’s remuneration philosophy, market competitiveness and shareholder feedback on the incentive schemes. In view of the feedback, the Board has decided, after consultation with management, to change both STI and LTI terms for the financial year ending 30 June 2022.
Earnings per share (EPS) has been used as a core financial measure for determining both STI and LTI award for the Executive Team for FY21 and prior years. From FY22, the Board has elected to use return on capital for STI award and EPS will continue to be used for LTI. Return on capital is defined as underlying NPAT divded by the shareholder equity at the beginning of the year. The weighting of EPS and TSR will change from 75:25 mix to 50:50 mix for calculating any LTI entitlements.
The FY21 key terms for the STI and LTI plans are set out in the next page.
Steadfast Group Annual Report 2021 61
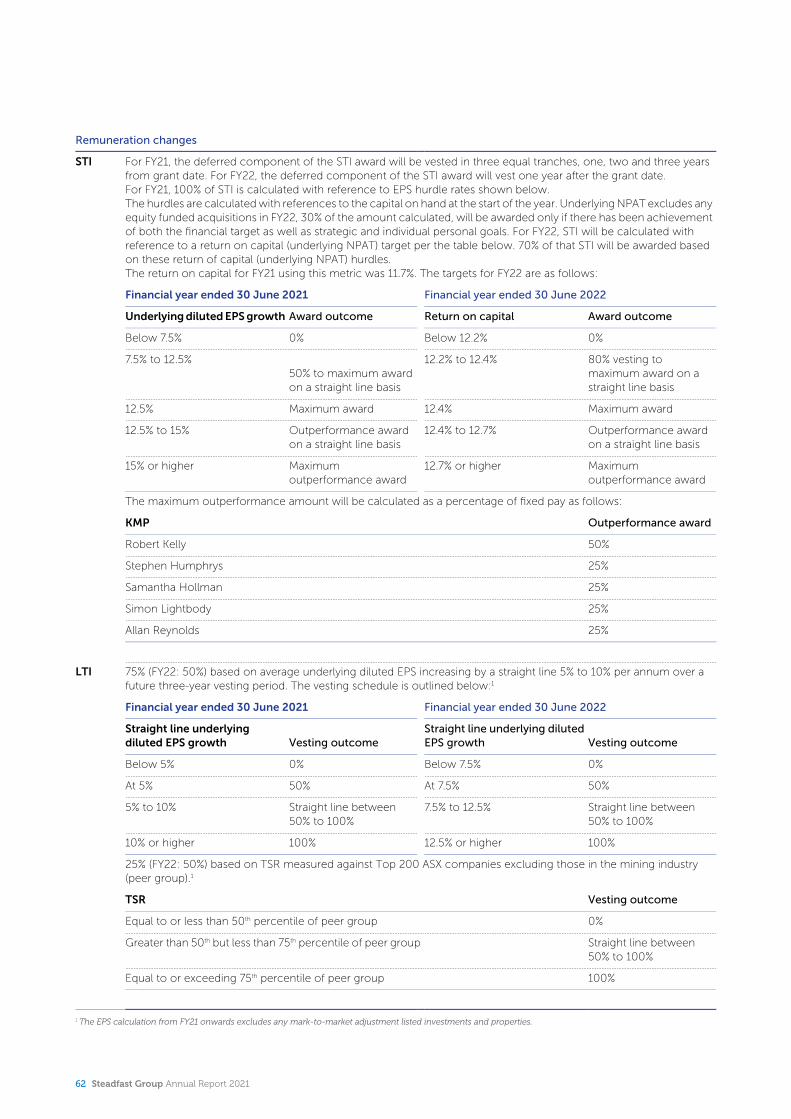
Remuneration changes
STI For FY21, the deferred component of the STI award will be vested in three equal tranches, one, two and three years from grant date. For FY22, the deferred component of the STI award will vest one year after the grant date.For FY21, 100% of STI is calculated with reference to EPS hurdle rates shown below.The hurdles are calculated with references to the capital on hand at the start of the year. Underlying NPAT excludes any equity funded acquisitions in FY22, 30% of the amount calculated, will be awarded only if there has been achievement of both the financial target as well as strategic and individual personal goals. For FY22, STI will be calculated with reference to a return on capital (underlying NPAT) target per the table below. 70% of that STI will be awarded based on these return of capital (underlying NPAT) hurdles.The return on capital for FY21 using this metric was 11.7%. The targets for FY22 are as follows:
Financial year ended 30 June 2021 Financial year ended 30 June 2022
Underlying diluted EPS growth Award outcome Return on capital Award outcome
Below 7.5% 0% Below 12.2% 0%
7.5% to 12.5%50% to maximum award on a straight line basis
12.2% to 12.4% 80% vesting to maximum award on a straight line basis
12.5% Maximum award 12.4% Maximum award
12.5% to 15% Outperformance award on a straight line basis
12.4% to 12.7% Outperformance award on a straight line basis
15% or higher Maximum outperformance award
12.7% or higher Maximum outperformance award
The maximum outperformance amount will be calculated as a percentage of fixed pay as follows:
KMP Outperformance award
Robert Kelly 50%
Stephen Humphrys 25%
Samantha Hollman 25%
Simon Lightbody 25%
Allan Reynolds 25%
LTI 75% (FY22: 50%) based on average underlying diluted EPS increasing by a straight line 5% to 10% per annum over a future three-year vesting period. The vesting schedule is outlined below:1
Financial year ended 30 June 2021 Financial year ended 30 June 2022
Straight line underlying diluted EPS growth Vesting outcome
Straight line underlying diluted EPS growth Vesting outcome
Below 5% 0% Below 7.5% 0%
At 5% 50% At 7.5% 50%
5% to 10% Straight line between 50% to 100%
7.5% to 12.5% Straight line between 50% to 100%
10% or higher 100% 12.5% or higher 100%
25% (FY22: 50%) based on TSR measured against Top 200 ASX companies excluding those in the mining industry (peer group).1
TSR Vesting outcome
Equal to or less than 50th percentile of peer group 0%
Greater than 50th but less than 75th percentile of peer group Straight line between 50% to 100%
Equal to or exceeding 75th percentile of peer group 100%
1 The EPS calculation from FY21 onwards excludes any mark-to-market adjustment listed investments and properties.
62 Steadfast Group Annual Report 2021
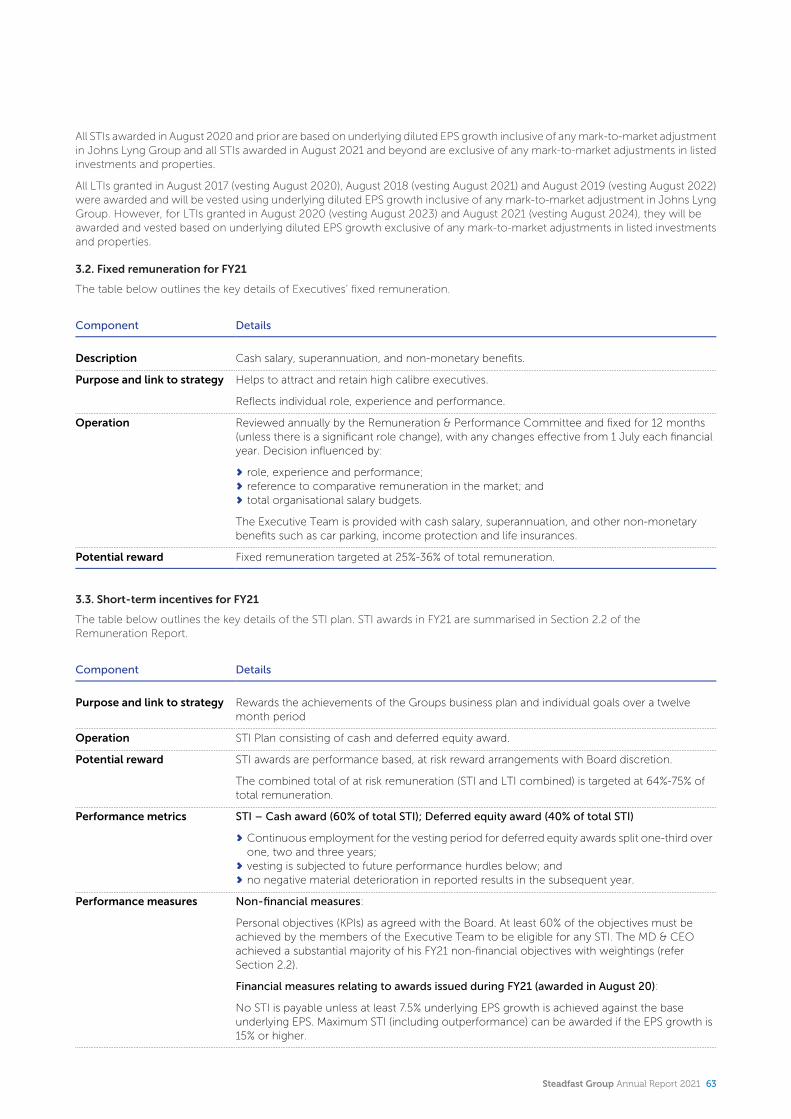
All STIs awarded in August 2020 and prior are based on underlying diluted EPS growth inclusive of any mark-to-market adjustment in Johns Lyng Group and all STIs awarded in August 2021 and beyond are exclusive of any mark-to-market adjustments in listed investments and properties.
All LTIs granted in August 2017 (vesting August 2020), August 2018 (vesting August 2021) and August 2019 (vesting August 2022) were awarded and will be vested using underlying diluted EPS growth inclusive of any mark-to-market adjustment in Johns Lyng Group. However, for LTIs granted in August 2020 (vesting August 2023) and August 2021 (vesting August 2024), they will be awarded and vested based on underlying diluted EPS growth exclusive of any mark-to-market adjustments in listed investments and properties.
3.2. Fixed remuneration for FY21
The table below outlines the key details of Executives’ fixed remuneration.
Component Details
Description Cash salary, superannuation, and non-monetary benefits.
Purpose and link to strategy Helps to attract and retain high calibre executives.
Reflects individual role, experience and performance.
Operation Reviewed annually by the Remuneration & Performance Committee and fixed for 12 months (unless there is a significant role change), with any changes effective from 1 July each financial year. Decision influenced by:
role, experience and performance;reference to comparative remuneration in the market; andtotal organisational salary budgets.
The Executive Team is provided with cash salary, superannuation, and other non-monetary benefits such as car parking, income protection and life insurances.
Potential reward Fixed remuneration targeted at 25%-36% of total remuneration.
3.3. Short-term incentives for FY21
The table below outlines the key details of the STI plan. STI awards in FY21 are summarised in Section 2.2 of the Remuneration Report.
Component Details
Purpose and link to strategy Rewards the achievements of the Groups business plan and individual goals over a twelve month period
Operation STI Plan consisting of cash and deferred equity award.
Potential reward STI awards are performance based, at risk reward arrangements with Board discretion.
The combined total of at risk remuneration (STI and LTI combined) is targeted at 64%-75% of total remuneration.
Performance metrics STI – Cash award (60% of total STI); Deferred equity award (40% of total STI)
Continuous employment for the vesting period for deferred equity awards split one-third over one, two and three years;vesting is subjected to future performance hurdles below; andno negative material deterioration in reported results in the subsequent year.
Performance measures Non-financial measures:
Personal objectives (KPIs) as agreed with the Board. At least 60% of the objectives must be achieved by the members of the Executive Team to be eligible for any STI. The MD & CEO achieved a substantial majority of his FY21 non-financial objectives with weightings (refer Section 2.2).
Financial measures relating to awards issued during FY21 (awarded in August 20):
No STI is payable unless at least 7.5% underlying EPS growth is achieved against the base underlying EPS. Maximum STI (including outperformance) can be awarded if the EPS growth is 15% or higher.
Steadfast Group Annual Report 2021 63
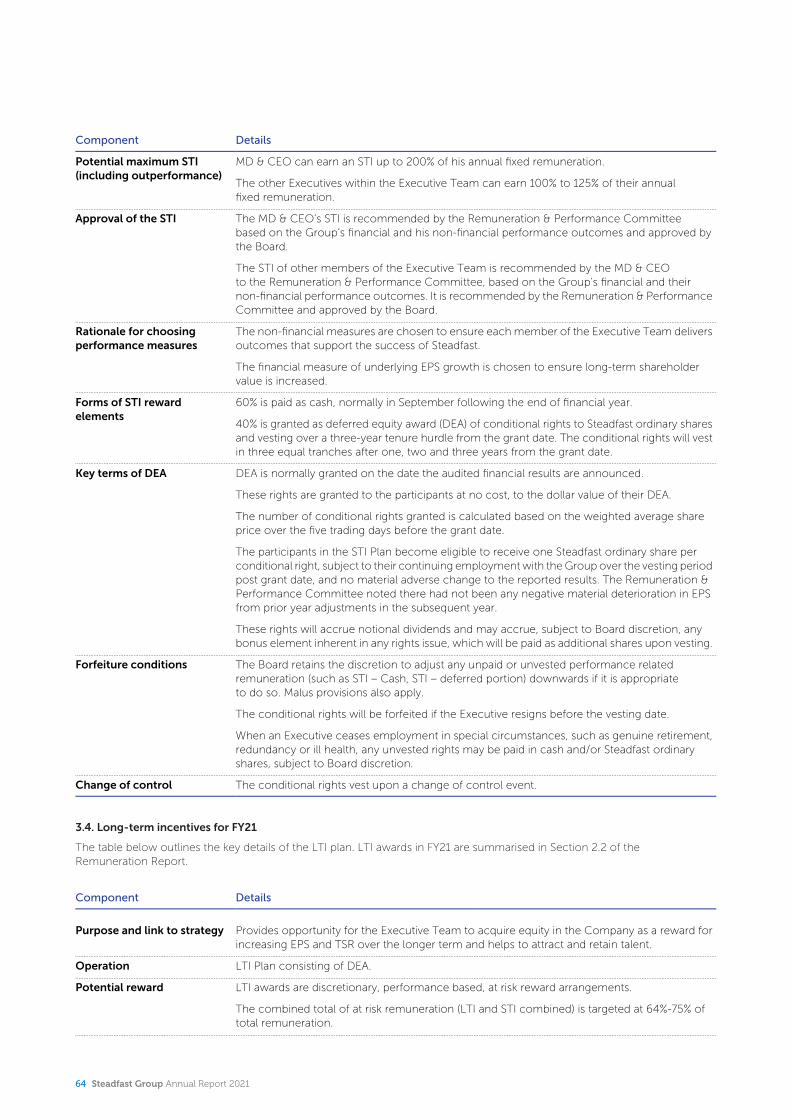
Component Details
Potential maximum STI (including outperformance)
MD & CEO can earn an STI up to 200% of his annual fixed remuneration.
The other Executives within the Executive Team can earn 100% to 125% of their annual fixed remuneration.
Approval of the STI The MD & CEO’s STI is recommended by the Remuneration & Performance Committee based on the Group’s financial and his non-financial performance outcomes and approved by the Board.
The STI of other members of the Executive Team is recommended by the MD & CEO to the Remuneration & Performance Committee, based on the Group’s financial and their non-financial performance outcomes. It is recommended by the Remuneration & Performance Committee and approved by the Board.
Rationale for choosing performance measures
The non-financial measures are chosen to ensure each member of the Executive Team delivers outcomes that support the success of Steadfast.
The financial measure of underlying EPS growth is chosen to ensure long-term shareholder value is increased.
Forms of STI rewardelements
60% is paid as cash, normally in September following the end of financial year.
40% is granted as deferred equity award (DEA) of conditional rights to Steadfast ordinary shares and vesting over a three-year tenure hurdle from the grant date. The conditional rights will vest in three equal tranches after one, two and three years from the grant date.
Key terms of DEA DEA is normally granted on the date the audited financial results are announced.
These rights are granted to the participants at no cost, to the dollar value of their DEA.
The number of conditional rights granted is calculated based on the weighted average share price over the five trading days before the grant date.
The participants in the STI Plan become eligible to receive one Steadfast ordinary share per conditional right, subject to their continuing employment with the Group over the vesting period post grant date, and no material adverse change to the reported results. The Remuneration & Performance Committee noted there had not been any negative material deterioration in EPS from prior year adjustments in the subsequent year.
These rights will accrue notional dividends and may accrue, subject to Board discretion, any bonus element inherent in any rights issue, which will be paid as additional shares upon vesting.
Forfeiture conditions The Board retains the discretion to adjust any unpaid or unvested performance related remuneration (such as STI – Cash, STI – deferred portion) downwards if it is appropriate to do so. Malus provisions also apply.
The conditional rights will be forfeited if the Executive resigns before the vesting date.
When an Executive ceases employment in special circumstances, such as genuine retirement, redundancy or ill health, any unvested rights may be paid in cash and/or Steadfast ordinary shares, subject to Board discretion.
Change of control The conditional rights vest upon a change of control event.
3.4. Long-term incentives for FY21
The table below outlines the key details of the LTI plan. LTI awards in FY21 are summarised in Section 2.2 of the Remuneration Report.
Component Details
Purpose and link to strategy Provides opportunity for the Executive Team to acquire equity in the Company as a reward for increasing EPS and TSR over the longer term and helps to attract and retain talent.
Operation LTI Plan consisting of DEA.
Potential reward LTI awards are discretionary, performance based, at risk reward arrangements.
The combined total of at risk remuneration (LTI and STI combined) is targeted at 64%-75% of total remuneration.
64 Steadfast Group Annual Report 2021
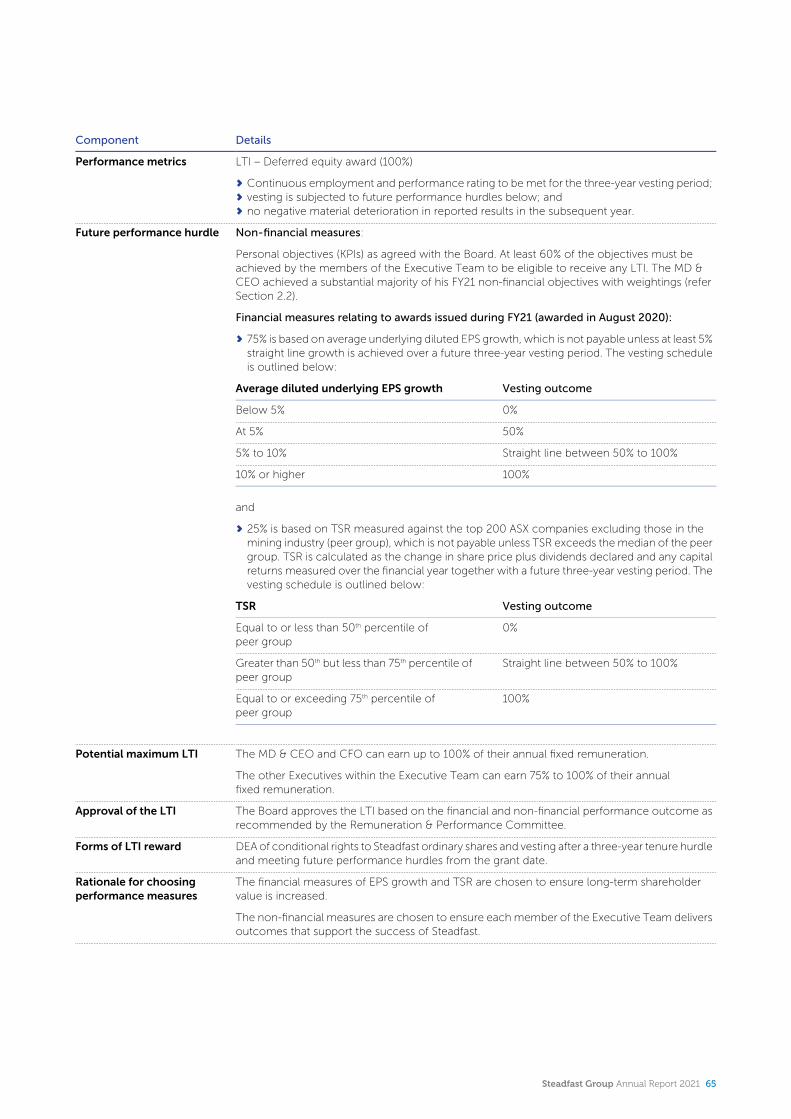
Component Details
Performance metrics LTI – Deferred equity award (100%)
Continuous employment and performance rating to be met for the three-year vesting period;vesting is subjected to future performance hurdles below; andno negative material deterioration in reported results in the subsequent year.
Future performance hurdle Non-financial measures:
Personal objectives (KPIs) as agreed with the Board. At least 60% of the objectives must be achieved by the members of the Executive Team to be eligible to receive any LTI. The MD & CEO achieved a substantial majority of his FY21 non-financial objectives with weightings (refer Section 2.2).
Financial measures relating to awards issued during FY21 (awarded in August 2020):
75% is based on average underlying diluted EPS growth, which is not payable unless at least 5% straight line growth is achieved over a future three-year vesting period. The vesting schedule is outlined below:
Average diluted underlying EPS growth Vesting outcome
Below 5% 0%
At 5% 50%
5% to 10% Straight line between 50% to 100%
10% or higher 100%
and
25% is based on TSR measured against the top 200 ASX companies excluding those in the mining industry (peer group), which is not payable unless TSR exceeds the median of the peer group. TSR is calculated as the change in share price plus dividends declared and any capital returns measured over the financial year together with a future three-year vesting period. The vesting schedule is outlined below:
TSR Vesting outcome
Equal to or less than 50th percentile of peer group
0%
Greater than 50th but less than 75th percentile of peer group
Straight line between 50% to 100%
Equal to or exceeding 75th percentile of peer group
100%
Potential maximum LTI The MD & CEO and CFO can earn up to 100% of their annual fixed remuneration.
The other Executives within the Executive Team can earn 75% to 100% of their annual fixed remuneration.
Approval of the LTI The Board approves the LTI based on the financial and non-financial performance outcome as recommended by the Remuneration & Performance Committee.
Forms of LTI reward DEA of conditional rights to Steadfast ordinary shares and vesting after a three-year tenure hurdle and meeting future performance hurdles from the grant date.
Rationale for choosing performance measures
The financial measures of EPS growth and TSR are chosen to ensure long-term shareholder value is increased.
The non-financial measures are chosen to ensure each member of the Executive Team delivers outcomes that support the success of Steadfast.
Steadfast Group Annual Report 2021 65
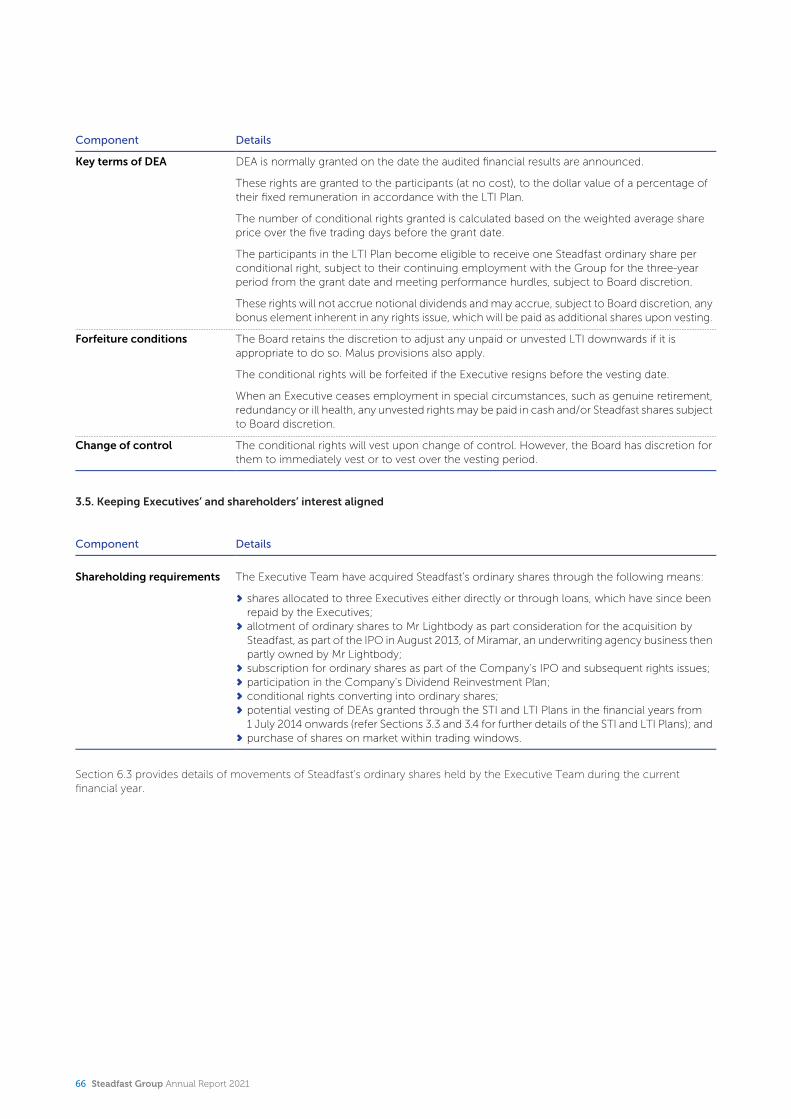
Component Details
Key terms of DEA DEA is normally granted on the date the audited financial results are announced.
These rights are granted to the participants (at no cost), to the dollar value of a percentage of their fixed remuneration in accordance with the LTI Plan.
The number of conditional rights granted is calculated based on the weighted average share price over the five trading days before the grant date.
The participants in the LTI Plan become eligible to receive one Steadfast ordinary share per conditional right, subject to their continuing employment with the Group for the three-year period from the grant date and meeting performance hurdles, subject to Board discretion.
These rights will not accrue notional dividends and may accrue, subject to Board discretion, any bonus element inherent in any rights issue, which will be paid as additional shares upon vesting.
Forfeiture conditions The Board retains the discretion to adjust any unpaid or unvested LTI downwards if it is appropriate to do so. Malus provisions also apply.
The conditional rights will be forfeited if the Executive resigns before the vesting date.
When an Executive ceases employment in special circumstances, such as genuine retirement, redundancy or ill health, any unvested rights may be paid in cash and/or Steadfast shares subject to Board discretion.
Change of control The conditional rights will vest upon change of control. However, the Board has discretion for them to immediately vest or to vest over the vesting period.
3.5. Keeping Executives’ and shareholders’ interest aligned
Component Details
Shareholding requirements The Executive Team have acquired Steadfast’s ordinary shares through the following means:
shares allocated to three Executives either directly or through loans, which have since been repaid by the Executives;allotment of ordinary shares to Mr Lightbody as part consideration for the acquisition by Steadfast, as part of the IPO in August 2013, of Miramar, an underwriting agency business then partly owned by Mr Lightbody;subscription for ordinary shares as part of the Company’s IPO and subsequent rights issues;participation in the Company’s Dividend Reinvestment Plan;conditional rights converting into ordinary shares;potential vesting of DEAs granted through the STI and LTI Plans in the financial years from 1 July 2014 onwards (refer Sections 3.3 and 3.4 for further details of the STI and LTI Plans); andpurchase of shares on market within trading windows.
Section 6.3 provides details of movements of Steadfast’s ordinary shares held by the Executive Team during the current financial year.
66 Steadfast Group Annual Report 2021
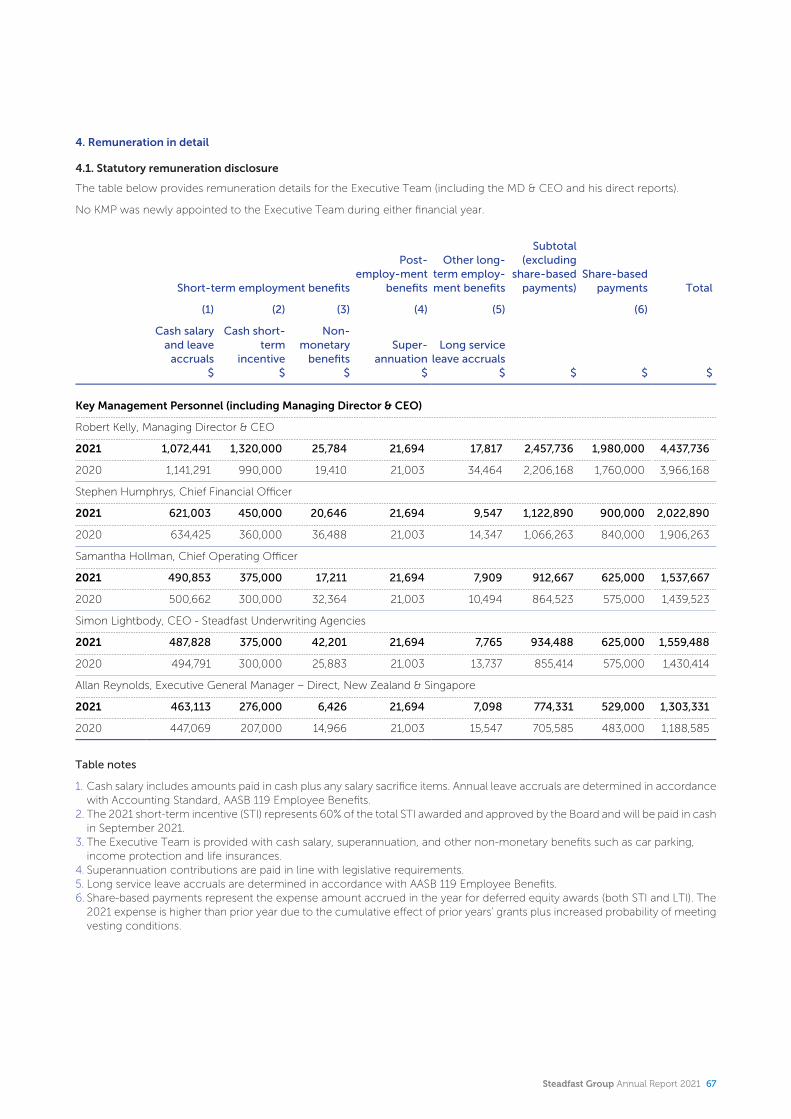
4. Remuneration in detail
4.1. Statutory remuneration disclosure
The table below provides remuneration details for the Executive Team (including the MD & CEO and his direct reports).
No KMP was newly appointed to the Executive Team during either financial year.
Short-term employment benefits
Post- employ-ment
benefits
Other long-term employ-ment benefits
Subtotal (excluding
share-based payments)
Share-based payments Total
(1) (2) (3) (4) (5) (6)
Cash salary and leave
accruals$
Cash short- term
incentive$
Non-monetary
benefits$
Super-annuation
$
Long service leave accruals
$ $ $ $
Key Management Personnel (including Managing Director & CEO)
Robert Kelly, Managing Director & CEO
2021 1,072,441 1,320,000 25,784 21,694 17,817 2,457,736 1,980,000 4,437,736
2020 1,141,291 990,000 19,410 21,003 34,464 2,206,168 1,760,000 3,966,168
Stephen Humphrys, Chief Financial Officer
2021 621,003 450,000 20,646 21,694 9,547 1,122,890 900,000 2,022,890
2020 634,425 360,000 36,488 21,003 14,347 1,066,263 840,000 1,906,263
Samantha Hollman, Chief Operating Officer
2021 490,853 375,000 17,211 21,694 7,909 912,667 625,000 1,537,667
2020 500,662 300,000 32,364 21,003 10,494 864,523 575,000 1,439,523
Simon Lightbody, CEO - Steadfast Underwriting Agencies
2021 487,828 375,000 42,201 21,694 7,765 934,488 625,000 1,559,488
2020 494,791 300,000 25,883 21,003 13,737 855,414 575,000 1,430,414
Allan Reynolds, Executive General Manager – Direct, New Zealand & Singapore
2021 463,113 276,000 6,426 21,694 7,098 774,331 529,000 1,303,331
2020 447,069 207,000 14,966 21,003 15,547 705,585 483,000 1,188,585
Table notes
1. Cash salary includes amounts paid in cash plus any salary sacrifice items. Annual leave accruals are determined in accordance with Accounting Standard, AASB 119 Employee Benefits.
2. The 2021 short-term incentive (STI) represents 60% of the total STI awarded and approved by the Board and will be paid in cash in September 2021.
3. The Executive Team is provided with cash salary, superannuation, and other non-monetary benefits such as car parking, income protection and life insurances.
4. Superannuation contributions are paid in line with legislative requirements.5. Long service leave accruals are determined in accordance with AASB 119 Employee Benefits.6. Share-based payments represent the expense amount accrued in the year for deferred equity awards (both STI and LTI). The
2021 expense is higher than prior year due to the cumulative effect of prior years’ grants plus increased probability of meeting vesting conditions.
Steadfast Group Annual Report 2021 67
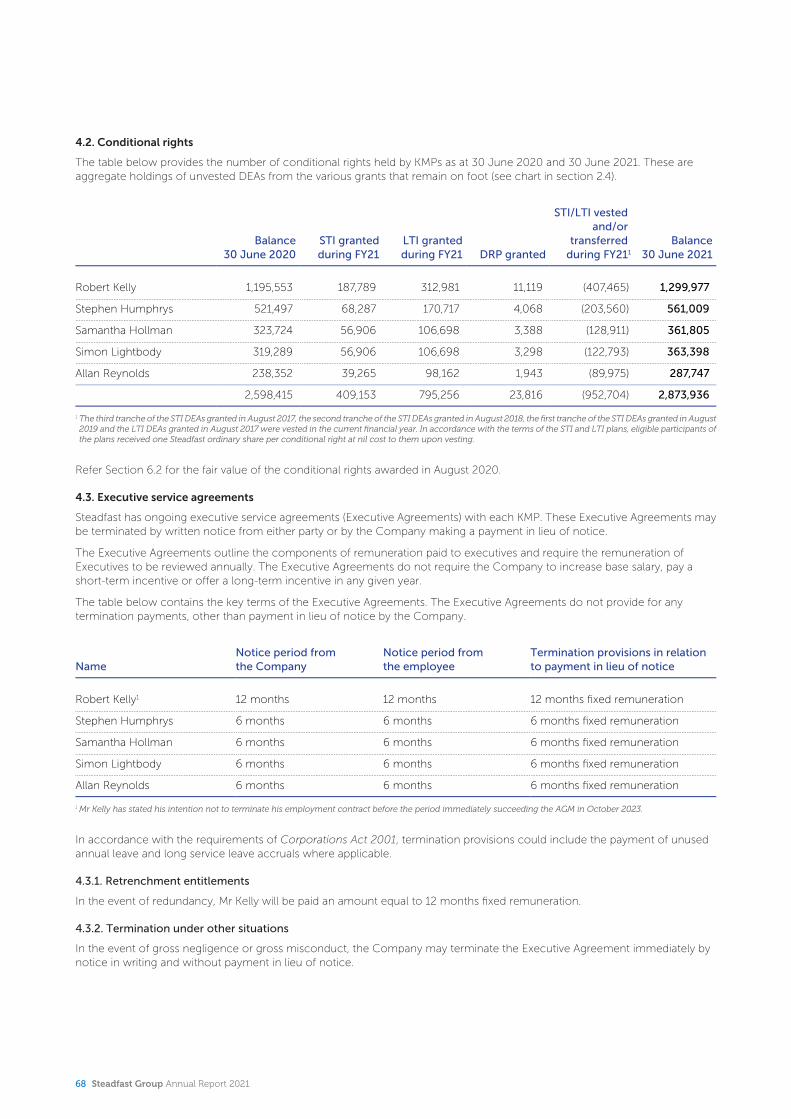
4.2. Conditional rights
The table below provides the number of conditional rights held by KMPs as at 30 June 2020 and 30 June 2021. These are aggregate holdings of unvested DEAs from the various grants that remain on foot (see chart in section 2.4).
Balance30 June 2020
STI granted during FY21
LTI granted during FY21 DRP granted
STI/LTI vested and/or
transferred during FY211
Balance30 June 2021
Robert Kelly 1,195,553 187,789 312,981 11,119 (407,465) 1,299,977
Stephen Humphrys 521,497 68,287 170,717 4,068 (203,560) 561,009
Samantha Hollman 323,724 56,906 106,698 3,388 (128,911) 361,805
Simon Lightbody 319,289 56,906 106,698 3,298 (122,793) 363,398
Allan Reynolds 238,352 39,265 98,162 1,943 (89,975) 287,747
2,598,415 409,153 795,256 23,816 (952,704) 2,873,936
1 The third tranche of the STI DEAs granted in August 2017, the second tranche of the STI DEAs granted in August 2018, the first tranche of the STI DEAs granted in August 2019 and the LTI DEAs granted in August 2017 were vested in the current financial year. In accordance with the terms of the STI and LTI plans, eligible participants of the plans received one Steadfast ordinary share per conditional right at nil cost to them upon vesting.
Refer Section 6.2 for the fair value of the conditional rights awarded in August 2020.
4.3. Executive service agreements
Steadfast has ongoing executive service agreements (Executive Agreements) with each KMP. These Executive Agreements may be terminated by written notice from either party or by the Company making a payment in lieu of notice.
The Executive Agreements outline the components of remuneration paid to executives and require the remuneration of Executives to be reviewed annually. The Executive Agreements do not require the Company to increase base salary, pay a short-term incentive or offer a long-term incentive in any given year.
The table below contains the key terms of the Executive Agreements. The Executive Agreements do not provide for any termination payments, other than payment in lieu of notice by the Company.
NameNotice period from the Company
Notice period from the employee
Termination provisions in relation to payment in lieu of notice
Robert Kelly1 12 months 12 months 12 months fixed remuneration
Stephen Humphrys 6 months 6 months 6 months fixed remuneration
Samantha Hollman 6 months 6 months 6 months fixed remuneration
Simon Lightbody 6 months 6 months 6 months fixed remuneration
Allan Reynolds 6 months 6 months 6 months fixed remuneration
1 Mr Kelly has stated his intention not to terminate his employment contract before the period immediately succeeding the AGM in October 2023.
In accordance with the requirements of Corporations Act 2001, termination provisions could include the payment of unused annual leave and long service leave accruals where applicable.
4.3.1. Retrenchment entitlements
In the event of redundancy, Mr Kelly will be paid an amount equal to 12 months fixed remuneration.
4.3.2. Termination under other situations
In the event of gross negligence or gross misconduct, the Company may terminate the Executive Agreement immediately by notice in writing and without payment in lieu of notice.
68 Steadfast Group Annual Report 2021

5. Non-Executive director remuneration
5.1. Fee structure and policy
Non-Executive Directors’ fees are determined within an aggregate Directors’ fee pool limit, which is reviewed periodically and recommended for approval by shareholders.
The fee structure is designed to provide the Group with the ability to attract and retain directors of the highest calibre.
The aggregate amount of remuneration sought to be approved by shareholders and the manner in which it is paid to Directors is reviewed annually. The Board considers advice from external consultants as well as fees paid to Non-Executive Directors of comparable companies when undertaking the review process.
Independent and non-independent Non-Executive Director remuneration consists of three elements:
Board fees;committee fees; andsuperannuation, which is paid in line with legislative requirements.
Directors do not receive retirement benefits beyond superannuation contributions and do not participate in any incentive programs.
Directors may also be reimbursed for travel and other expenses incurred in attending to the Company’s affairs.
At the Annual General Meeting held on 17 October 2019, the shareholders approved the maximum aggregate Directors’ fee pool of $1,500,000 per annum for each financial year effective from and including the financial year commenced on 1 July 2019.
The table below contains the annual fee structure for the Steadfast Board and committees (inclusive of superannuation).
Board$
Audit & Risk Committee
$
Nomination Committee
$
Remuneration & Performance
Committee$
People, Culture & Governance Committee
$
Chairman 2021 275,000 30,000 - 27,500 20,000
2020 275,000 30,000 - 27,500 -
Deputy Chairman 2021 160,000 - - - -
2020 - - - - -
Members 2021 135,000 7,500 - 7,500 -
2020 135,000 7,500 - 7,500 -
No additional remuneration will be paid for the Chairman and members of the Nomination Committee nor any directorships of subsidiaries. Consistent with the Executive Team, the Directors did not increase their fees for FY21. Following a review by external consultants, the Directors have determined the fees will increase by 8.3% in FY22, which includes the full year impact of the additional Director.
Board members are allocated to different Committees based on the requirements of the Committee, hence Board members do not sit on all the Committees. The Chairman and Deputy Chairman have a standing invitation to attend all committee meetings.
Steadfast Group Annual Report 2021 69
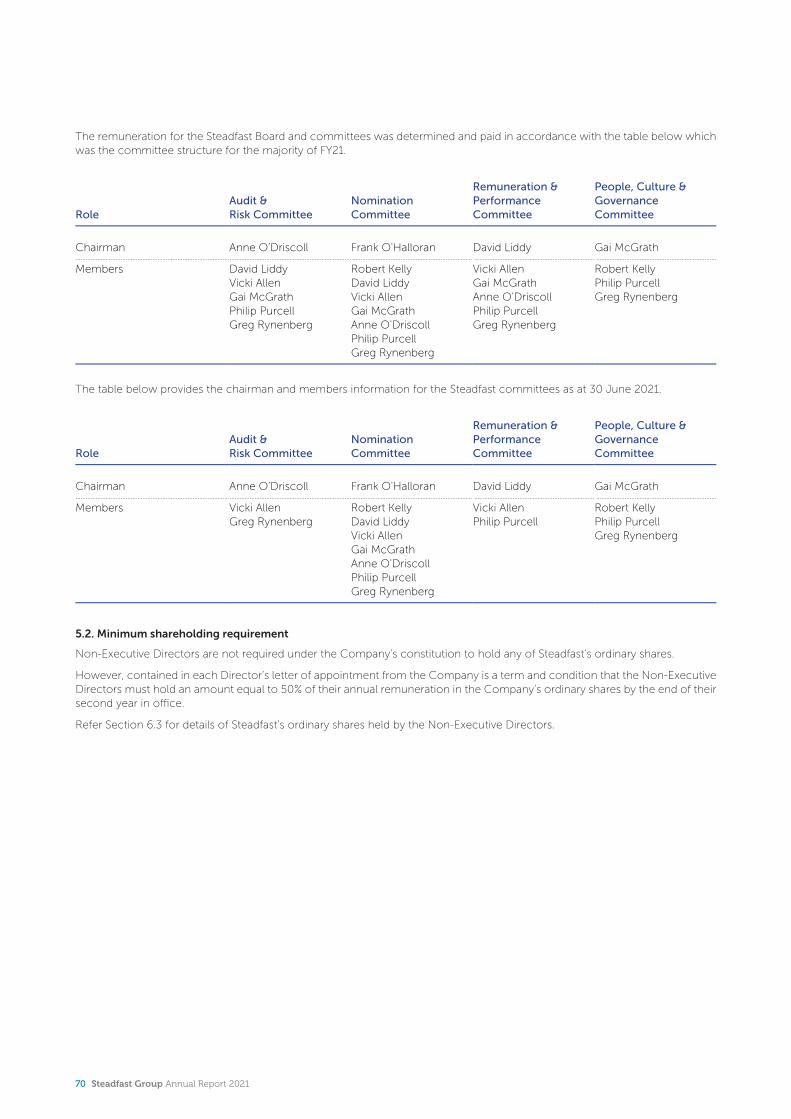
The remuneration for the Steadfast Board and committees was determined and paid in accordance with the table below which was the committee structure for the majority of FY21.
RoleAudit & Risk Committee
Nomination Committee
Remuneration & Performance Committee
People, Culture & Governance Committee
Chairman Anne O’Driscoll Frank O'Halloran David Liddy Gai McGrath
Members David LiddyVicki AllenGai McGrathPhilip PurcellGreg Rynenberg
Robert KellyDavid LiddyVicki AllenGai McGrathAnne O'DriscollPhilip PurcellGreg Rynenberg
Vicki AllenGai McGrathAnne O’DriscollPhilip PurcellGreg Rynenberg
Robert KellyPhilip PurcellGreg Rynenberg
The table below provides the chairman and members information for the Steadfast committees as at 30 June 2021.
RoleAudit & Risk Committee
Nomination Committee
Remuneration & Performance Committee
People, Culture & Governance Committee
Chairman Anne O’Driscoll Frank O'Halloran David Liddy Gai McGrath
Members Vicki AllenGreg Rynenberg
Robert KellyDavid LiddyVicki AllenGai McGrathAnne O'DriscollPhilip PurcellGreg Rynenberg
Vicki AllenPhilip Purcell
Robert KellyPhilip PurcellGreg Rynenberg
5.2. Minimum shareholding requirement
Non-Executive Directors are not required under the Company’s constitution to hold any of Steadfast’s ordinary shares.
However, contained in each Director’s letter of appointment from the Company is a term and condition that the Non-Executive Directors must hold an amount equal to 50% of their annual remuneration in the Company’s ordinary shares by the end of their second year in office.
Refer Section 6.3 for details of Steadfast’s ordinary shares held by the Non-Executive Directors.
70 Steadfast Group Annual Report 2021
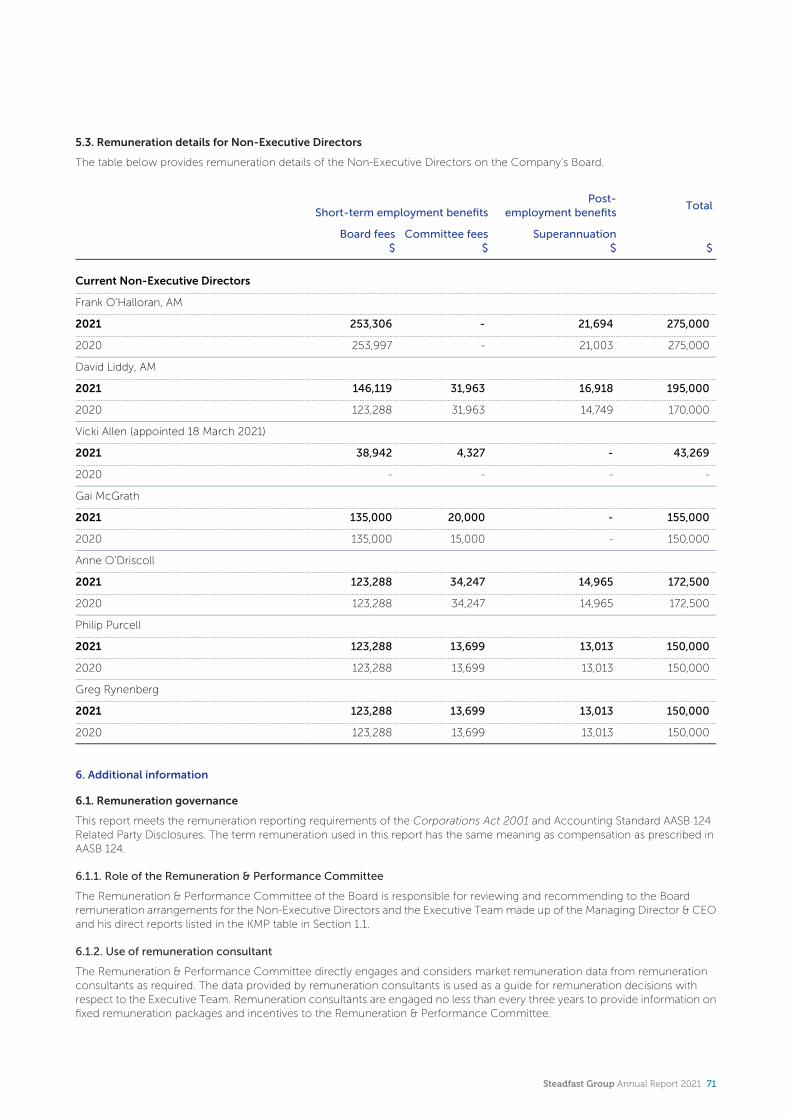
5.3. Remuneration details for Non-Executive Directors
The table below provides remuneration details of the Non-Executive Directors on the Company’s Board.
Short-term employment benefitsPost-
employment benefitsTotal
Board fees$
Committee fees$
Superannuation$ $
Current Non-Executive Directors
Frank O’Halloran, AM
2021 253,306 - 21,694 275,000
2020 253,997 - 21,003 275,000
David Liddy, AM
2021 146,119 31,963 16,918 195,000
2020 123,288 31,963 14,749 170,000
Vicki Allen (appointed 18 March 2021)
2021 38,942 4,327 - 43,269
2020 - - - -
Gai McGrath
2021 135,000 20,000 - 155,000
2020 135,000 15,000 - 150,000
Anne O’Driscoll
2021 123,288 34,247 14,965 172,500
2020 123,288 34,247 14,965 172,500
Philip Purcell
2021 123,288 13,699 13,013 150,000
2020 123,288 13,699 13,013 150,000
Greg Rynenberg
2021 123,288 13,699 13,013 150,000
2020 123,288 13,699 13,013 150,000
6. Additional information
6.1. Remuneration governance
This report meets the remuneration reporting requirements of the Corporations Act 2001 and Accounting Standard AASB 124 Related Party Disclosures. The term remuneration used in this report has the same meaning as compensation as prescribed in AASB 124.
6.1.1. Role of the Remuneration & Performance Committee
The Remuneration & Performance Committee of the Board is responsible for reviewing and recommending to the Board remuneration arrangements for the Non-Executive Directors and the Executive Team made up of the Managing Director & CEO and his direct reports listed in the KMP table in Section 1.1.
6.1.2. Use of remuneration consultant
The Remuneration & Performance Committee directly engages and considers market remuneration data from remuneration consultants as required. The data provided by remuneration consultants is used as a guide for remuneration decisions with respect to the Executive Team. Remuneration consultants are engaged no less than every three years to provide information on fixed remuneration packages and incentives to the Remuneration & Performance Committee.
Steadfast Group Annual Report 2021 71

An external remuneration consultant, Godfrey Remuneration Group, was engaged during the financial year to conduct remuneration benchmarking of base salaries for Executive Team and fees for the Board, as well as a reveiw of STI and LTI schemes for the Executive Team.
6.2. Valuation of conditional rights
The table below details the fair value of conditional rights issued affecting remuneration of KMP in the previous, current or future reporting periods:
Description Recipient Grant date Vesting date
Fair value at grant date
$1
Volume weighted
average share price (VWAP)
$2
October 2020 STI conditional rights3 MD & CEO 28-Oct-20 25-Aug-21 3.5586 3.5146
October 2020 STI conditional rights3 MD & CEO 28-Oct-20 25-Aug-22 3.5496 3.5146
October 2020 STI conditional rights3 MD & CEO 28-Oct-20 25-Aug-23 3.5338 3.5146
August 2020 STI conditional rights3 Other executives 25-Aug-20 25-Aug-21 3.5142 3.5146
August 2020 STI conditional rights3 Other executives 25-Aug-20 25-Aug-22 3.5018 3.5146
August 2020 STI conditional rights3 Other executives 25-Aug-20 25-Aug-23 3.4830 3.5146
October 2019 STI conditional rights3 MD & CEO 17-Oct-19 21-Aug-20 3.5985 3.5057
October 2019 STI conditional rights3 MD & CEO 17-Oct-19 21-Aug-21 3.5891 3.5057
October 2019 STI conditional rights3 MD & CEO 17-Oct-19 21-Aug-22 3.5723 3.5057
August 2019 STI conditional rights3 Other executives 21-Aug-19 21-Aug-20 3.5539 3.5057
August 2019 STI conditional rights3 Other executives 21-Aug-19 21-Aug-21 3.5401 3.5057
August 2019 STI conditional rights3 Other executives 21-Aug-19 21-Aug-22 3.5194 3.5057
October 2018 STI conditional rights3 MD & CEO 18-Oct-18 24-Aug-20 2.9403 3.0648
October 2018 STI conditional rights3 MD & CEO 18-Oct-18 24-Aug-21 2.9252 3.0648
August 2018 STI conditional rights3 Other executives 24-Aug-18 24-Aug-20 2.9922 3.0648
August 2018 STI conditional rights3 Other executives 24-Aug-18 24-Aug-21 2.9737 3.0648
October 2017 STI conditional rights3 MD & CEO 26-Oct-17 23-Aug-20 2.7175 2.8170
August 2017 STI conditional rights3 Other executives 23-Aug-17 23-Aug-20 2.5771 2.8170
October 2020 LTI conditional rights MD & CEO 28-Oct-20 25-Aug-23 3.3398 3.5146
August 2020 LTI conditional rights Other executives 25-Aug-20 25-Aug-23 3.2525 3.5146
October 2019 LTI conditional rights MD & CEO 17-Oct-19 21-Aug-22 3.3868 3.5057
August 2019 LTI conditional rights Other executives 21-Aug-19 21-Aug-22 3.2975 3.5057
October 2018 LTI conditional rights MD & CEO 18-Oct-18 24-Aug-21 2.7609 3.0648
August 2018 LTI conditional rights Other executives 24-Aug-18 24-Aug-21 2.7771 3.0648
October 2017 LTI conditional rights MD & CEO 26-Oct-17 23-Aug-20 2.5581 2.8170
August 2017 LTI conditional rights Other executives 23-Aug-17 23-Aug-20 2.3879 2.8170
1 The fair value at grant date is determined in accordance with Accounting Standard, AASB 2 Share-based Payment.2To calculate the number of conditional rights to be granted, the award value is divided by the volume weighted average share price of Steadfast shares over the five trading days on the Australian Securities Exchange prior to Steadfast announcing its full year results.
3The STI conditional rights granted all vest in three equal tranches after one, two and three years from the grant date.
72 Steadfast Group Annual Report 2021
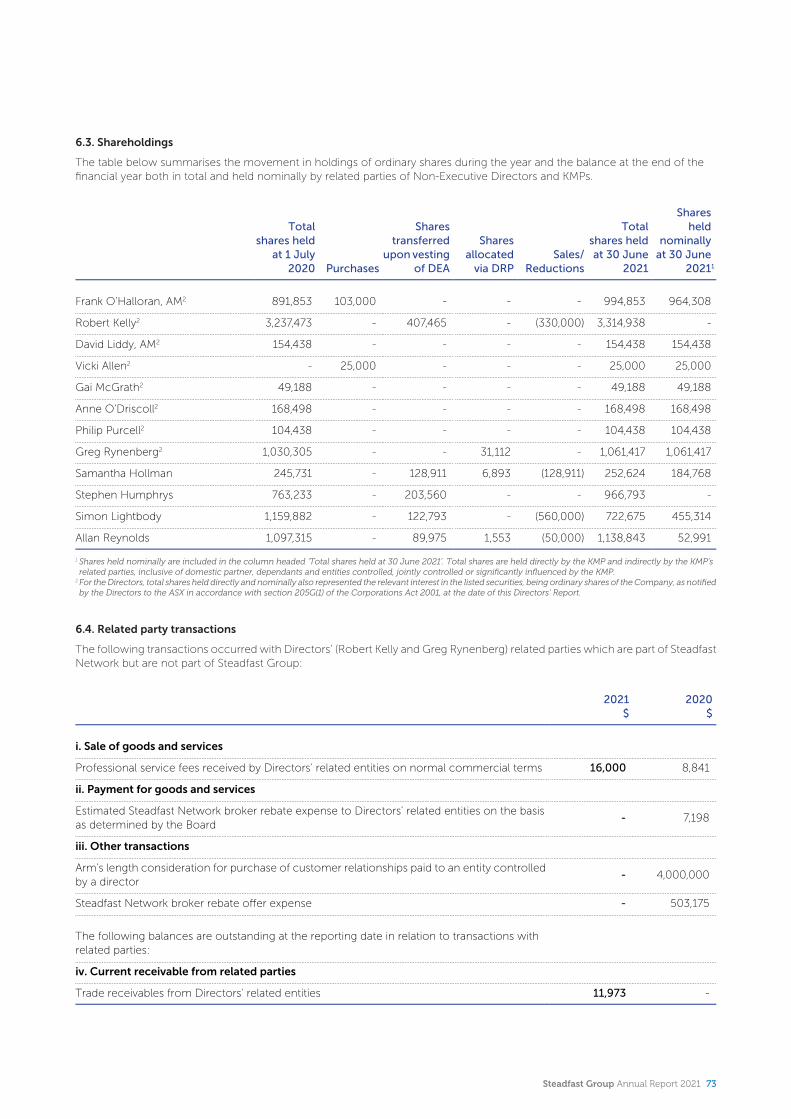
6.3. Shareholdings
The table below summarises the movement in holdings of ordinary shares during the year and the balance at the end of the financial year both in total and held nominally by related parties of Non-Executive Directors and KMPs.
Total shares held
at 1 July 2020 Purchases
Shares transferred
upon vesting of DEA
Shares allocated
via DRPSales/
Reductions
Total shares held at 30 June
2021
Shares held
nominally at 30 June
20211
Frank O’Halloran, AM2 891,853 103,000 - - - 994,853 964,308
Robert Kelly2 3,237,473 - 407,465 - (330,000) 3,314,938 -
David Liddy, AM2 154,438 - - - - 154,438 154,438
Vicki Allen2 - 25,000 - - - 25,000 25,000
Gai McGrath2 49,188 - - - - 49,188 49,188
Anne O’Driscoll2 168,498 - - - - 168,498 168,498
Philip Purcell2 104,438 - - - - 104,438 104,438
Greg Rynenberg2 1,030,305 - - 31,112 - 1,061,417 1,061,417
Samantha Hollman 245,731 - 128,911 6,893 (128,911) 252,624 184,768
Stephen Humphrys 763,233 - 203,560 - - 966,793 -
Simon Lightbody 1,159,882 - 122,793 - (560,000) 722,675 455,314
Allan Reynolds 1,097,315 - 89,975 1,553 (50,000) 1,138,843 52,991
1 Shares held nominally are included in the column headed ‘Total shares held at 30 June 2021’. Total shares are held directly by the KMP and indirectly by the KMP’s related parties, inclusive of domestic partner, dependants and entities controlled, jointly controlled or significantly influenced by the KMP.
2For the Directors, total shares held directly and nominally also represented the relevant interest in the listed securities, being ordinary shares of the Company, as notified by the Directors to the ASX in accordance with section 205G(1) of the Corporations Act 2001, at the date of this Directors’ Report.
6.4. Related party transactions
The following transactions occurred with Directors’ (Robert Kelly and Greg Rynenberg) related parties which are part of Steadfast Network but are not part of Steadfast Group:
2021$
2020$
i. Sale of goods and services
Professional service fees received by Directors' related entities on normal commercial terms 16,000 8,841
ii. Payment for goods and services
Estimated Steadfast Network broker rebate expense to Directors' related entities on the basis as determined by the Board
- 7,198
iii. Other transactions
Arm's length consideration for purchase of customer relationships paid to an entity controlled by a director
- 4,000,000
Steadfast Network broker rebate offer expense - 503,175
The following balances are outstanding at the reporting date in relation to transactions with related parties:
iv. Current receivable from related parties
Trade receivables from Directors' related entities 11,973 -
Steadfast Group Annual Report 2021 73

Rounding
The Group is of the kind referred to in the ASIC Corporations (Rounding in Financial/Directors’ Reports) Instrument 2016/191 issued by the Australian Securities & Investments Commission. In accordance with that Instrument, amounts in the Directors’ Report and financial report have been rounded to the nearest hundred thousand dollars, unless otherwise stated.
Signed at Sydney on 16 August 2021 in accordance with a resolution of the Directors.
Frank O’Halloran, AMChairman
Robert KellyManaging Director & CEO
74 Steadfast Group Annual Report 2021
KPMG, an Australian partnership and a member firm of the KPMG global organisation of independent member firms affiliated with KPMG International Limited, a private English company limited by guarantee. All rights reserved. The KPMG name and logo are trademarks used under license by the independent member firms of the KPMG global organisation. Liability limited by a scheme approved under Professional Standards Legislation.
Lead Auditor’s Independence Declaration under
Section 307C of the Corporations Act 2001
To the Directors of Steadfast Group Limited
I declare that, to the best of my knowledge and belief, in relation to the audit of Steadfast Group Limited for the financial year ended 30 June 2021 there have been:
i. no contraventions of the auditor independence requirements as set out in theCorporations Act 2001 in relation to the audit; and
ii. no contraventions of any applicable code of professional conduct in relation to the audit.
KPMG Scott Guse Partner
Sydney
16 August 2021
Steadfast Group Annual Report 2021 75
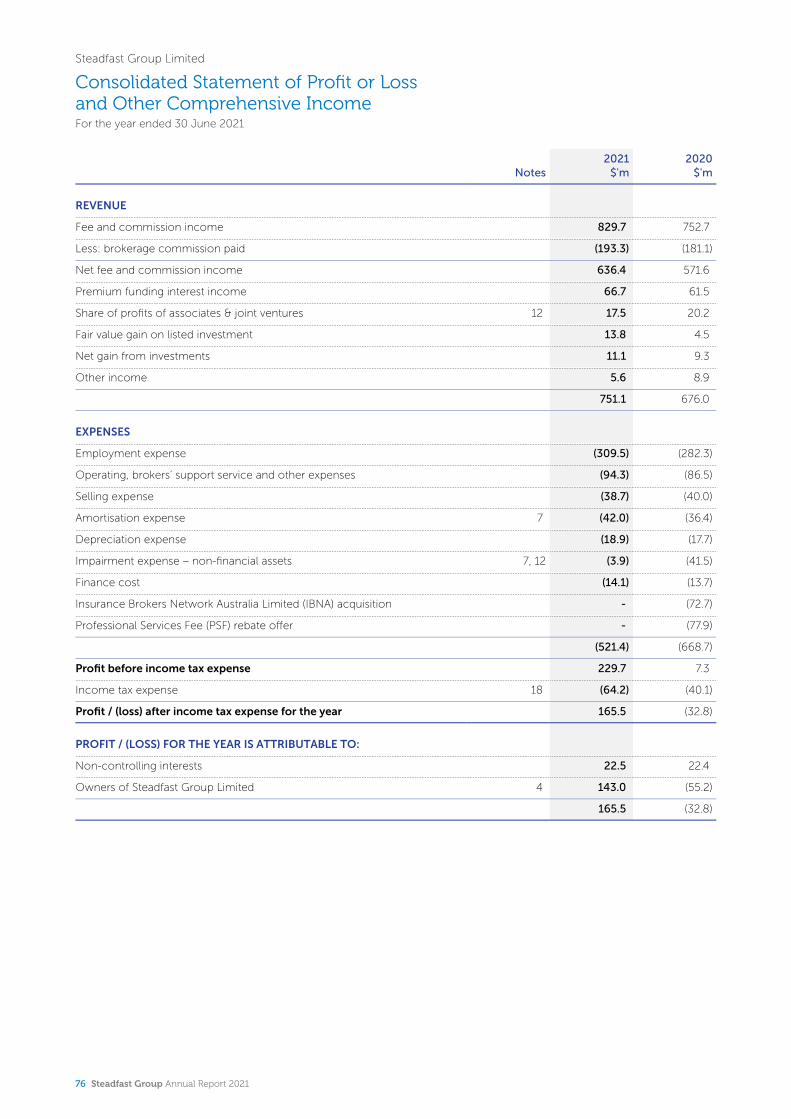
Notes2021
$'m2020
$'m
REVENUE
Fee and commission income 829.7 752.7
Less: brokerage commission paid (193.3) (181.1)
Net fee and commission income 636.4 571.6
Premium funding interest income 66.7 61.5
Share of profits of associates & joint ventures 12 17.5 20.2
Fair value gain on listed investment 13.8 4.5
Net gain from investments 11.1 9.3
Other income 5.6 8.9
751.1 676.0
EXPENSES
Employment expense (309.5) (282.3)
Operating, brokers’ support service and other expenses (94.3) (86.5)
Selling expense (38.7) (40.0)
Amortisation expense 7 (42.0) (36.4)
Depreciation expense (18.9) (17.7)
Impairment expense – non-financial assets 7, 12 (3.9) (41.5)
Finance cost (14.1) (13.7)
Insurance Brokers Network Australia Limited (IBNA) acquisition - (72.7)
Professional Services Fee (PSF) rebate offer - (77.9)
(521.4) (668.7)
Profit before income tax expense 229.7 7.3
Income tax expense 18 (64.2) (40.1)
Profit / (loss) after income tax expense for the year 165.5 (32.8)
PROFIT / (LOSS) FOR THE YEAR IS ATTRIBUTABLE TO:
Non-controlling interests 22.5 22.4
Owners of Steadfast Group Limited 4 143.0 (55.2)
165.5 (32.8)
76 Steadfast Group Annual Report 2021
Steadfast Group Limited
Consolidated Statement of Profit or Loss and Other Comprehensive IncomeFor the year ended 30 June 2021

Notes2021
$'m2020
$'m
OTHER COMPREHENSIVE INCOME
Items that may be reclassified subsequently to profit or loss
Net movement in foreign currency translation reserve - (1.2)
Cash flow hedge effective portion of change in fair value 0.1 (0.1)
Income tax benefit on other comprehensive income - 0.4
Total other comprehensive income / (loss) for the year, net of tax 0.1 (0.9)
Total comprehensive income / (loss) for the year, net of tax 165.6 (33.7)
TOTAL COMPREHENSIVE INCOME FOR THE YEAR IS ATTRIBUTABLE TO:
Non-controlling interests 22.5 22.4
Owners of Steadfast Group Limited 143.1 (56.1)
165.6 (33.7)
EARNINGS PER SHARE
Basic earnings per share (cents per share) 5 16.55 (6.47)
Diluted earnings per share (cents per share) 5 16.51 (6.47)
The above Consolidated Statement of Profit or Loss and Other Comprehensive Income should be read in conjunction with the notes to the financial statements.
Steadfast Group Annual Report 2021 77
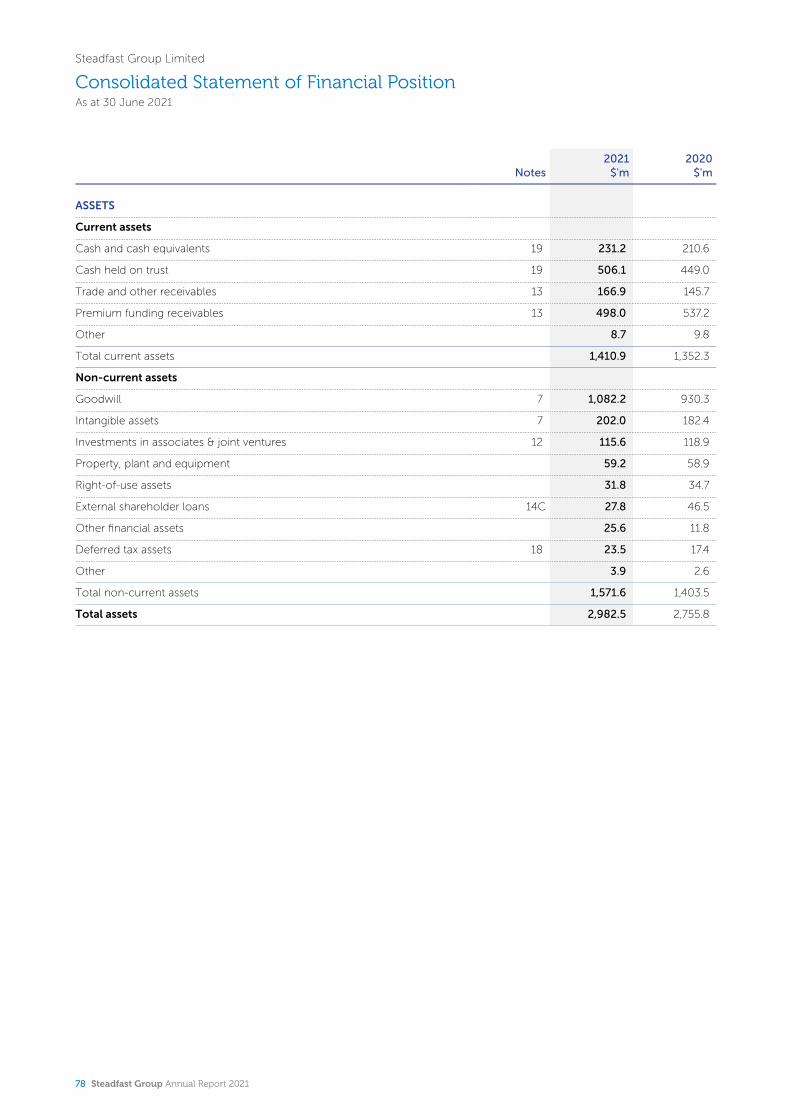
Steadfast Group Limited
Consolidated Statement of Financial PositionAs at 30 June 2021
Notes2021
$'m2020
$'m
ASSETS
Current assets
Cash and cash equivalents 19 231.2 210.6
Cash held on trust 19 506.1 449.0
Trade and other receivables 13 166.9 145.7
Premium funding receivables 13 498.0 537.2
Other 8.7 9.8
Total current assets 1,410.9 1,352.3
Non-current assets
Goodwill 7 1,082.2 930.3
Intangible assets 7 202.0 182.4
Investments in associates & joint ventures 12 115.6 118.9
Property, plant and equipment 59.2 58.9
Right-of-use assets 31.8 34.7
External shareholder loans 14C 27.8 46.5
Other financial assets 25.6 11.8
Deferred tax assets 18 23.5 17.4
Other 3.9 2.6
Total non-current assets 1,571.6 1,403.5
Total assets 2,982.5 2,755.8
78 Steadfast Group Annual Report 2021
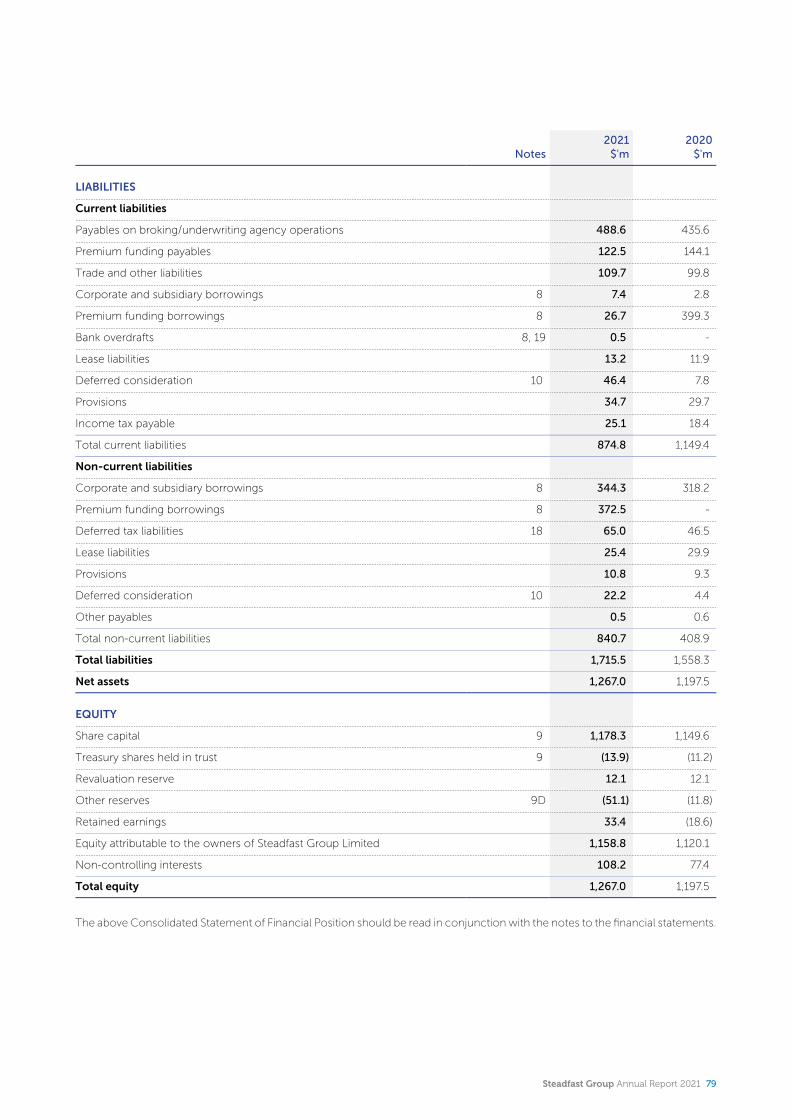
Notes2021
$'m2020
$'m
LIABILITIES
Current liabilities
Payables on broking/underwriting agency operations 488.6 435.6
Premium funding payables 122.5 144.1
Trade and other liabilities 109.7 99.8
Corporate and subsidiary borrowings 8 7.4 2.8
Premium funding borrowings 8 26.7 399.3
Bank overdrafts 8, 19 0.5 -
Lease liabilities 13.2 11.9
Deferred consideration 10 46.4 7.8
Provisions 34.7 29.7
Income tax payable 25.1 18.4
Total current liabilities 874.8 1,149.4
Non-current liabilities
Corporate and subsidiary borrowings 8 344.3 318.2
Premium funding borrowings 8 372.5 -
Deferred tax liabilities 18 65.0 46.5
Lease liabilities 25.4 29.9
Provisions 10.8 9.3
Deferred consideration 10 22.2 4.4
Other payables 0.5 0.6
Total non-current liabilities 840.7 408.9
Total liabilities 1,715.5 1,558.3
Net assets 1,267.0 1,197.5
EQUITY
Share capital 9 1,178.3 1,149.6
Treasury shares held in trust 9 (13.9) (11.2)
Revaluation reserve 12.1 12.1
Other reserves 9D (51.1) (11.8)
Retained earnings 33.4 (18.6)
Equity attributable to the owners of Steadfast Group Limited 1,158.8 1,120.1
Non-controlling interests 108.2 77.4
Total equity 1,267.0 1,197.5
The above Consolidated Statement of Financial Position should be read in conjunction with the notes to the financial statements.
Steadfast Group Annual Report 2021 79
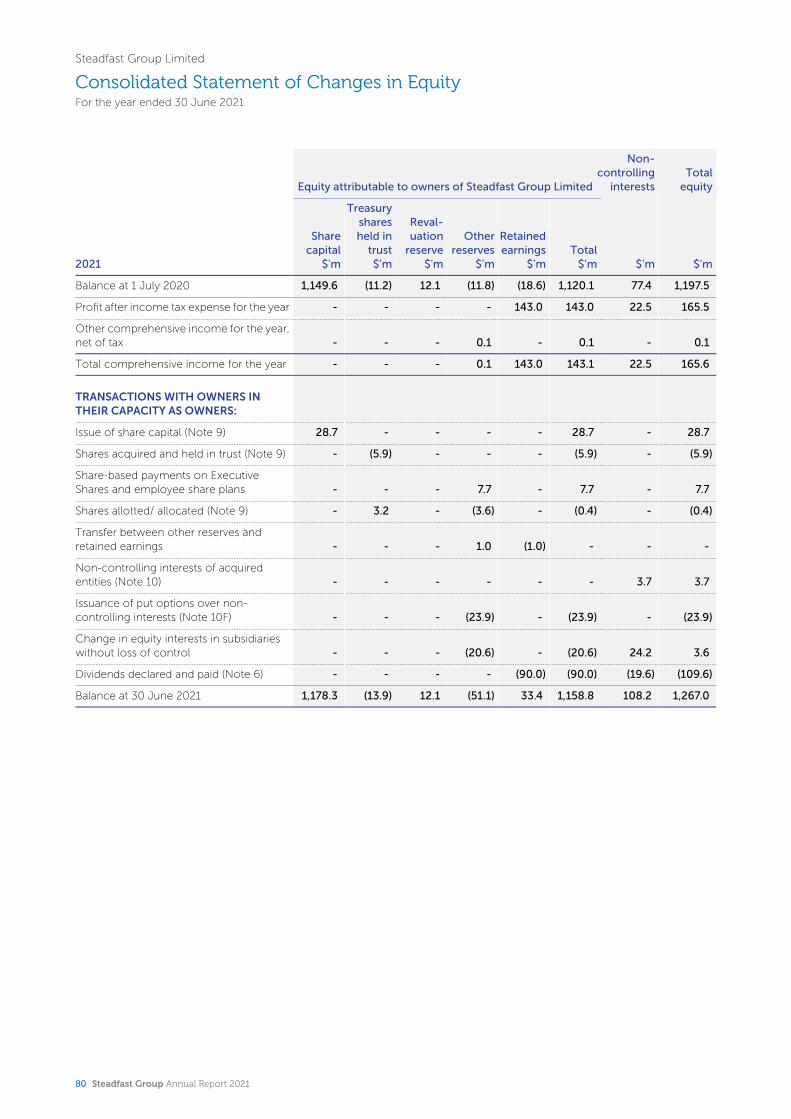
Steadfast Group Limited
Consolidated Statement of Changes in EquityFor the year ended 30 June 2021
Equity attributable to owners of Steadfast Group Limited
Non-controlling
interestsTotal
equity
2021
Share capital
$'m
Treasury shares held in
trust$’m
Reval-uation
reserve$'m
Other reserves
$’m
Retained earnings
$’mTotal
$’m $’m $’m
Balance at 1 July 2020 1,149.6 (11.2) 12.1 (11.8) (18.6) 1,120.1 77.4 1,197.5
Profit after income tax expense for the year - - - - 143.0 143.0 22.5 165.5
Other comprehensive income for the year, net of tax - - - 0.1 - 0.1 - 0.1
Total comprehensive income for the year - - - 0.1 143.0 143.1 22.5 165.6
TRANSACTIONS WITH OWNERS IN THEIR CAPACITY AS OWNERS:
Issue of share capital (Note 9) 28.7 - - - - 28.7 - 28.7
Shares acquired and held in trust (Note 9) - (5.9) - - - (5.9) - (5.9)
Share-based payments on Executive Shares and employee share plans - - - 7.7 - 7.7 - 7.7
Shares allotted/ allocated (Note 9) - 3.2 - (3.6) - (0.4) - (0.4)
Transfer between other reserves and retained earnings - - - 1.0 (1.0) - - -
Non-controlling interests of acquired entities (Note 10) - - - - - - 3.7 3.7
Issuance of put options over noncontrolling interests (Note 10F) - - - (23.9) - (23.9) - (23.9)
Change in equity interests in subsidiaries without loss of control - - - (20.6) - (20.6) 24.2 3.6
Dividends declared and paid (Note 6) - - - - (90.0) (90.0) (19.6) (109.6)
Balance at 30 June 2021 1,178.3 (13.9) 12.1 (51.1) 33.4 1,158.8 108.2 1,267.0
80 Steadfast Group Annual Report 2021
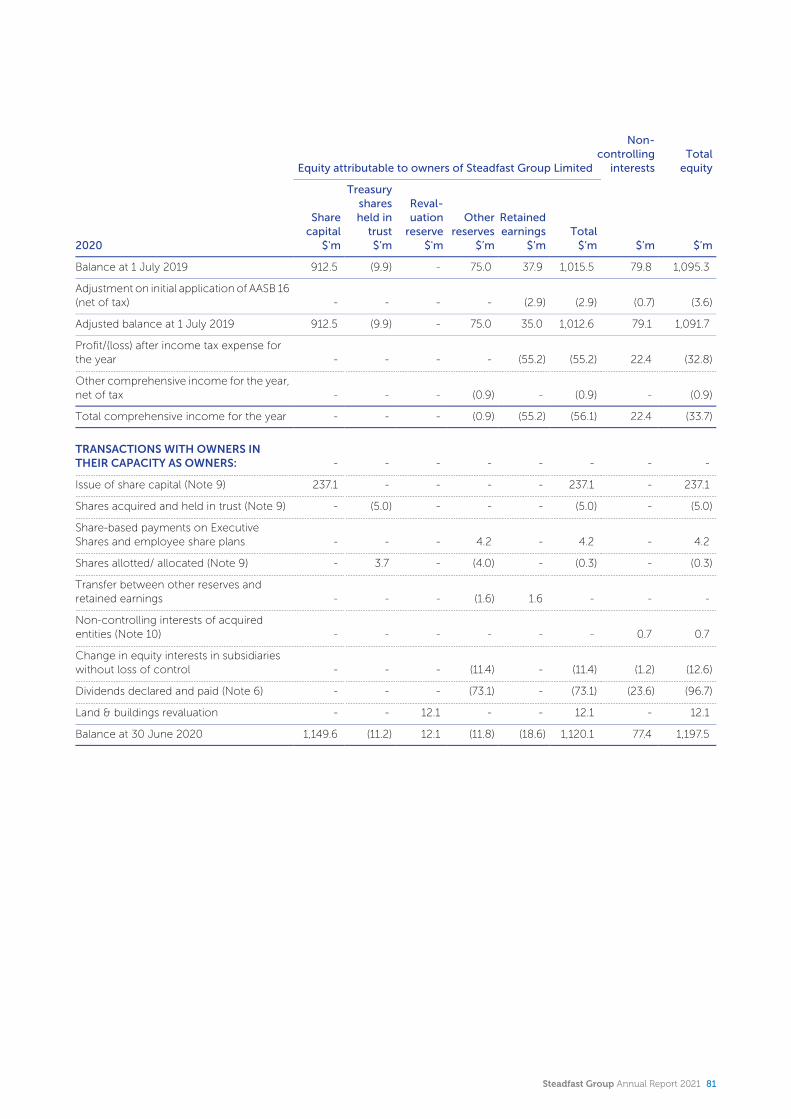
Equity attributable to owners of Steadfast Group Limited
Non-controlling
interestsTotal
equity
2020
Share capital
$'m
Treasury shares held in
trust$’m
Reval-uation
reserve$'m
Other reserves
$’m
Retained earnings
$’mTotal
$’m $’m $’m
Balance at 1 July 2019 912.5 (9.9) - 75.0 37.9 1,015.5 79.8 1,095.3
Adjustment on initial application of AASB 16 (net of tax) - - - - (2.9) (2.9) (0.7) (3.6)
Adjusted balance at 1 July 2019 912.5 (9.9) - 75.0 35.0 1,012.6 79.1 1,091.7
Profit/(loss) after income tax expense for the year - - - - (55.2) (55.2) 22.4 (32.8)
Other comprehensive income for the year, net of tax - - - (0.9) - (0.9) - (0.9)
Total comprehensive income for the year - - - (0.9) (55.2) (56.1) 22.4 (33.7)
TRANSACTIONS WITH OWNERS IN THEIR CAPACITY AS OWNERS: - - - - - - - -
Issue of share capital (Note 9) 237.1 - - - - 237.1 - 237.1
Shares acquired and held in trust (Note 9) - (5.0) - - - (5.0) - (5.0)
Share-based payments on Executive Shares and employee share plans - - - 4.2 - 4.2 - 4.2
Shares allotted/ allocated (Note 9) - 3.7 - (4.0) - (0.3) - (0.3)
Transfer between other reserves and retained earnings - - - (1.6) 1.6 - - -
Non-controlling interests of acquired entities (Note 10) - - - - - - 0.7 0.7
Change in equity interests in subsidiaries without loss of control - - - (11.4) - (11.4) (1.2) (12.6)
Dividends declared and paid (Note 6) - - - (73.1) - (73.1) (23.6) (96.7)
Land & buildings revaluation - - 12.1 - - 12.1 - 12.1
Balance at 30 June 2020 1,149.6 (11.2) 12.1 (11.8) (18.6) 1,120.1 77.4 1,197.5
Steadfast Group Annual Report 2021 81
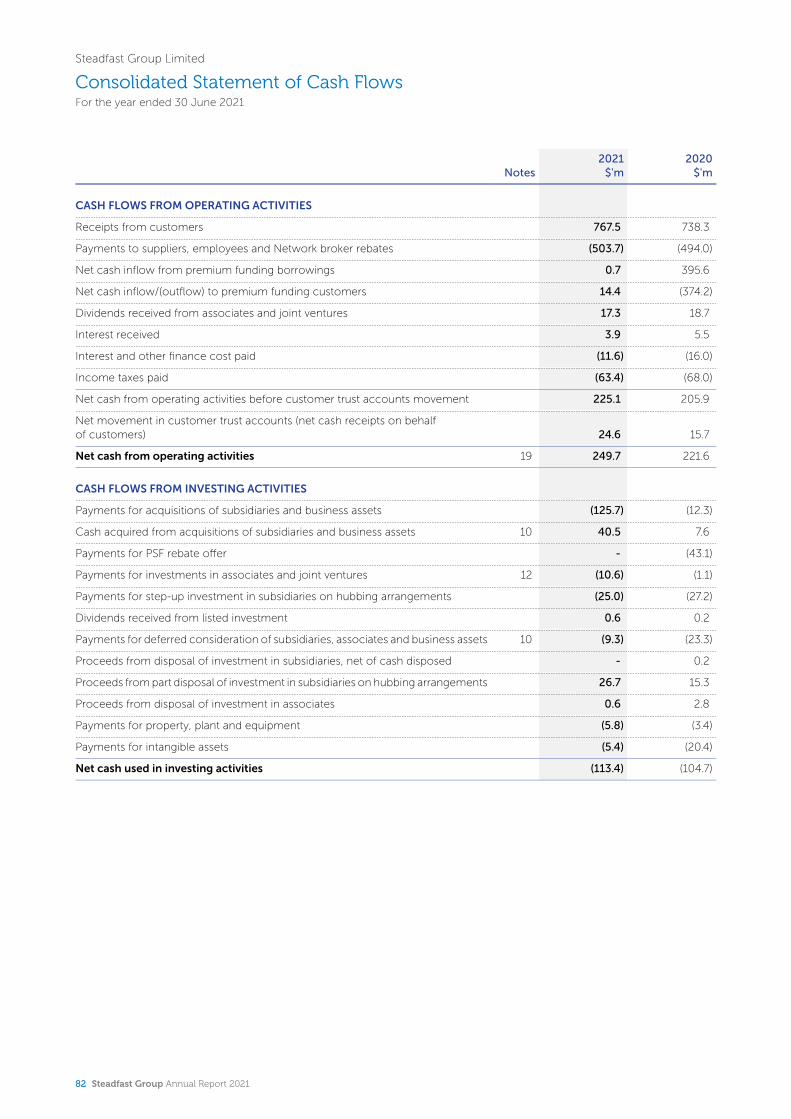
Steadfast Group Limited
Consolidated Statement of Cash FlowsFor the year ended 30 June 2021
Notes2021
$'m2020
$'m
CASH FLOWS FROM OPERATING ACTIVITIES
Receipts from customers 767.5 738.3
Payments to suppliers, employees and Network broker rebates (503.7) (494.0)
Net cash inflow from premium funding borrowings 0.7 395.6
Net cash inflow/(outflow) to premium funding customers 14.4 (374.2)
Dividends received from associates and joint ventures 17.3 18.7
Interest received 3.9 5.5
Interest and other finance cost paid (11.6) (16.0)
Income taxes paid (63.4) (68.0)
Net cash from operating activities before customer trust accounts movement 225.1 205.9
Net movement in customer trust accounts (net cash receipts on behalf of customers) 24.6 15.7
Net cash from operating activities 19 249.7 221.6
CASH FLOWS FROM INVESTING ACTIVITIES
Payments for acquisitions of subsidiaries and business assets (125.7) (12.3)
Cash acquired from acquisitions of subsidiaries and business assets 10 40.5 7.6
Payments for PSF rebate offer - (43.1)
Payments for investments in associates and joint ventures 12 (10.6) (1.1)
Payments for step-up investment in subsidiaries on hubbing arrangements (25.0) (27.2)
Dividends received from listed investment 0.6 0.2
Payments for deferred consideration of subsidiaries, associates and business assets 10 (9.3) (23.3)
Proceeds from disposal of investment in subsidiaries, net of cash disposed - 0.2
Proceeds from part disposal of investment in subsidiaries on hubbing arrangements 26.7 15.3
Proceeds from disposal of investment in associates 0.6 2.8
Payments for property, plant and equipment (5.8) (3.4)
Payments for intangible assets (5.4) (20.4)
Net cash used in investing activities (113.4) (104.7)
82 Steadfast Group Annual Report 2021
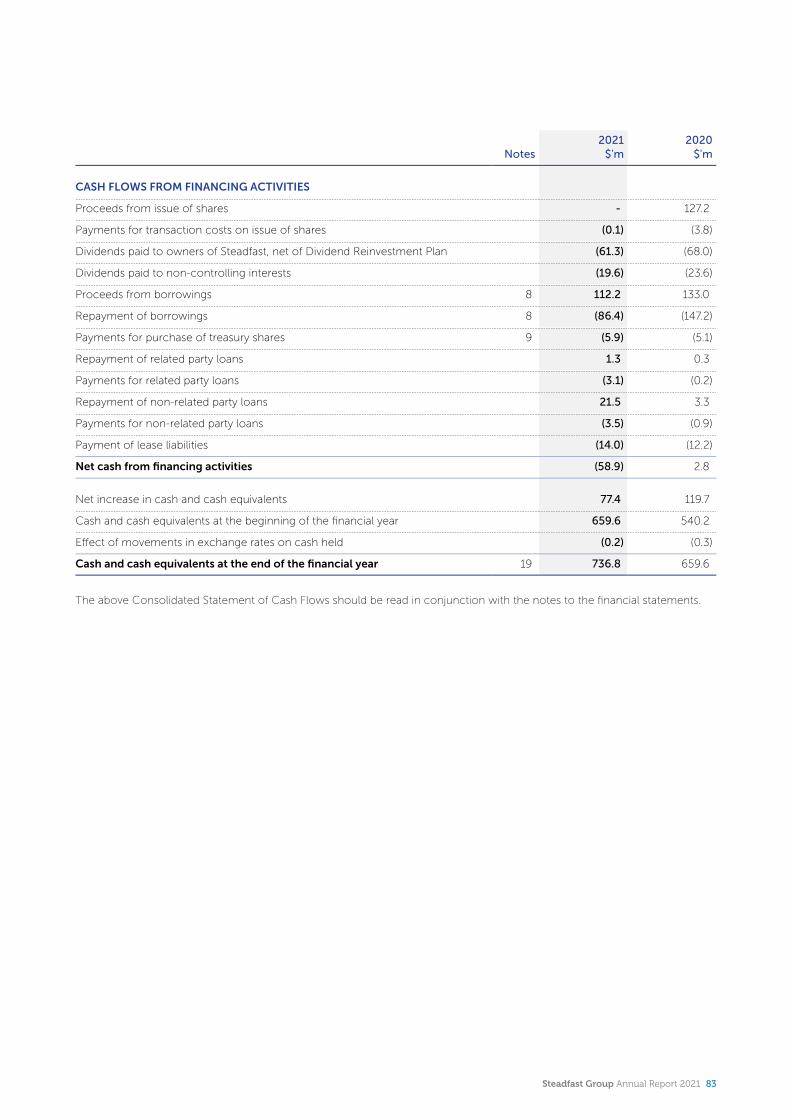
Notes2021
$'m2020
$'m
CASH FLOWS FROM FINANCING ACTIVITIES
Proceeds from issue of shares - 127.2
Payments for transaction costs on issue of shares (0.1) (3.8)
Dividends paid to owners of Steadfast, net of Dividend Reinvestment Plan (61.3) (68.0)
Dividends paid to non-controlling interests (19.6) (23.6)
Proceeds from borrowings 8 112.2 133.0
Repayment of borrowings 8 (86.4) (147.2)
Payments for purchase of treasury shares 9 (5.9) (5.1)
Repayment of related party loans 1.3 0.3
Payments for related party loans (3.1) (0.2)
Repayment of non-related party loans 21.5 3.3
Payments for non-related party loans (3.5) (0.9)
Payment of lease liabilities (14.0) (12.2)
Net cash from financing activities (58.9) 2.8
Net increase in cash and cash equivalents 77.4 119.7
Cash and cash equivalents at the beginning of the financial year 659.6 540.2
Effect of movements in exchange rates on cash held (0.2) (0.3)
Cash and cash equivalents at the end of the financial year 19 736.8 659.6
The above Consolidated Statement of Cash Flows should be read in conjunction with the notes to the financial statements.
Steadfast Group Annual Report 2021 83
Steadfast Group Limited
Notes to the Financial StatementsFor the year ended 30 June 2021
Note 1. General Information
This general purpose financial report is for the year ended 30 June 2021 and comprises the consolidated financial statements for Steadfast Group Limited (Steadfast or the Company) and its subsidiaries and the Group’s interests in associates and joint ventures (Steadfast Group or the Group). These financial statements are presented in Australian dollars, which is Steadfast’s functional and presentation currency.
The Company is a for-profit listed public company limited by shares, incorporated and domiciled in Australia. Its registered office and principal place of business is Level 4, 99 Bathurst Street, Sydney NSW 2000.
A description of the nature of the Group's operations and its principal activities is included in the Directors' Report, which is not part of this financial report.
This general purpose financial report was authorised for issue by the Board on 16 August 2021.
Note 2. Significant accounting policies
A. Statement of Compliance
This financial report has been prepared in accordance with the Corporations Act 2001, Australian Accounting Standards and other authoritative pronouncements of the Australian Accounting Standards Board, as appropriate for for-profit oriented entities and the Australian Securities Exchange (ASX) Listing Rules.
International Financial Reporting Standards (IFRS) refer to the overall framework of standards and pronouncements approved by the International Accounting Standards Board. IFRS forms the basis of the Australian Accounting Standards. This financial report of the Group complies with IFRS.
B. Basis of preparation of the financial report
The significant accounting policies adopted in the preparation of this financial report have been applied consistently by all entities in the Group and are the same as those applied for the previous reporting period unless otherwise noted. These financial statements have been prepared under the historical cost convention, modified, where applicable, by the measurement at fair value of certain non-current assets, financial assets and financial liabilities.
I. New and amended standards adopted by the Group
The Group has adopted the following revised or amending Australian Accounting Standards and Interpretations issued by the Australian Accounting Standards Board that are mandatory for the year ended 30 June 2021. Adoption of these standards has not had any material effect on the financial position or performance of the Group.
Title Description Note
AASB 2019-1 Amendments to Australian Accounting Standards – References to the Conceptual Framework (i)
AASB 2019-3 Amendments to Australian Accounting Standards – Interest Rate Benchmark Reform (ii)
Table notes
i. The revised Conceptual Framework has been introduced so that for-profit publicly accountable entities that comply with Australian Accounting Standards can assert compliance with IFRS Standards. As the Group has been preparing Tier 1 general- purpose financial statements, there is no material impact to the Group from the adoption of the amendments.
ii. At the date of reporting, there is no material impact to the Group from the implementation of the amendments.
II. Comparative balances
The Group recognises commission and fee income from underwriting agencies net of commissions paid to insurance brokers. Conversely, brokerage commission payments to authorised representatives and other referrers has historically been recognised under selling expense. To align presentation, all fee and commission income will be recognised as net of brokerage commission paid in the statement of profit or loss and other comprehensive income. As a result, $21.1 million has been reclassified to ensure comparability between reporting periods.
There was no impact on the consolidated statement of profit or loss and other comprehensive income.
III. Rounding
The Group is of the kind referred to in the ASIC Corporations (Rounding in Financial/Directors’ Reports) Instrument 2016/191 issued by the Australian Securities and Investments Commission. In accordance with that Instrument, amounts in this financial report have been rounded to the nearest hundred thousand dollars, unless otherwise stated.
84 Steadfast Group Annual Report 2021
C. Principles of Consolidation
I. Business combinations
The Group accounts for business combinations using the acquisition method when control is transferred to the Group. The consideration transferred in the acquisition is measured at fair value, as are the identifiable net assets acquired. The excess of the consideration transferred over the fair value of identifiable net assets acquired and non-controlling interests is recorded as goodwill. If the consideration transferred is less than the fair value of identifiable net assets acquired and non-controlling interests, the difference is recognised directly in the consolidated statement of profit or loss and other comprehensive income. Costs of acquisition are expensed as incurred, except if they relate to the issue of debt or equity securities.
II. Subsidiaries
Subsidiaries are entities controlled by the Group. The Group controls an entity when it is exposed to, or has rights to, variable returns from its involvement with the entity and has the ability to affect those returns through its power over the entity. The financial statements of subsidiaries are included in the consolidated financial statements of the Group from the date on which control commences until the date on which control ceases.
III. Non-controlling interests
Non-controlling interests (NCI) are measured at their proportionate share of the acquired subsidiaries’ identifiable net assets at the date of acquisition. For operations and businesses being put into a business hub, NCI represent the fair value at the hubbing date. Changes in the Group’s interest in a subsidiary that do not result in a loss of control are accounted for as equity transactions.
IV. Loss of control
When the Group ceases control over a subsidiary, it derecognises the assets and liabilities of the subsidiary, and any related NCI and other components of equity. Any resulting gain or loss is recognised in the consolidated statement of profit or loss and other comprehensive income. Any interest retained in the former subsidiary is measured at fair value when control is lost.
V. Interests in equity-accounted investees
The Group’s interests in equity-accounted investees comprise interests in associates and joint ventures. Associates are those entities in which the Group has significant influence, but not control or joint control, over the financial and operating policies. Joint ventures are arrangements in which the Group has joint control, whereby the Group has rights to the net assets of the arrangement, rather than rights to its assets and obligations for its liabilities.
Interests in associates and joint ventures are accounted for using the equity method. They are initially recognised at cost, which includes transaction costs. Subsequent to initial recognition, the Group’s share of the profit or loss of associates and the joint ventures is included in the Group’s consolidated statement of profit or loss and other comprehensive income.
VI. Transactions eliminated on consolidation
Intra-group balances and transactions, and any unrealised income and expenses arising from intra-group transactions, are eliminated in full.
D. Revenue recognition
Revenue is recognised as the Group provides services. Revenue is recognised to the extent that there is no future performance obligation. Where there is a future performance obligation, a portion is deferred over the expected service period.
Revenue is measured based on the consideration to which the Group expects to be entitled in a contract. The Group's revenue does not have a significant financing component so the transaction (invoice) price is considered to have no difference between the promised consideration and the cash selling price.
The Group’s revenue is disaggregated by major products and services which is consistent with the revenue information by reportable segment as disclosed in note 4.
The Group recognises revenue on contract assets when the service is provided, which is generally at the point in time when the invoice is raised resulting in a recognition of a receivable. It is possible that there is a short time lag between invoice date and policy inception date. Following a detailed review, it has been determined that revenue is generally recognised in the same month that work is undertaken, and any revenue earned but not invoiced would be immaterial.
I. Fee and commission income
The Group retains a portion of policy premiums as fee and commission income. Premiums are typically collected on an annual basis, at or near invoice date (which could be up to 90 days from contract inception). In some cases, customers are offered to pay in instalments or are directed to a premium credit provider.
Commission, brokerage and fees are recognised when the related service has been provided and it is probable that the Group will be compensated for services rendered, and the amount of consideration for such services can be reliably measured. This is deemed to be the invoice date. An allowance is made for anticipated lapses and cancellations. Where there is a future obligation to provide claims handling services, a portion of the commission income is deferred over the expected service period.
The company receives professional services fees, for services provided, from strategic partners such as insurers, premium funders and underwriting agencies.
Steadfast Group Annual Report 2021 85
Notes to the Financial Statements continued
The Group utilises the practical expedient in AASB 15 to recognise the incremental costs of obtaining a contract as an expense when incurred if the amortisation period of the asset that the entity would have recognised is one year or less.
II. Premium funding income
Premium funding interest income is brought to account at amortised cost using the effective interest method. The effective interest method calculates the amortised cost of a financial instrument and allocates the interest income or expense and any application fee income that is considered an integral part of the effective interest rate over the relevant period. The effective interest rate is that rate that exactly discounts estimated future cash payments or receipts through the expected life of the financial instrument, or, when appropriate, a shorter period, to the net carrying amount of the financial asset or liability.
III. Claims experience benefit
The Group may receive a claims experience benefit payment or payments in respect of certain types of insurance purchased for the benefit of Steadfast Network brokers. Revenue is recognised for a claims experience benefit for a particular policy year when it is likely that a claims experience benefit is receivable and the amount can be reliably measured.
Factors taken into account in recognising a claims experience benefit include the number of years that have passed since the end of a policy year and whether various claims have been closed or can be reliably measured.
IV. Other revenue
Other revenue is recognised when the right to receive payment is established.
E. Taxation
The Company (the head entity) and its wholly-owned Australian subsidiaries have formed an income tax consolidated group under the tax consolidation regime. Consequently, these entities are taxed as a single entity and the deferred tax assets and liabilities of these entities are offset in the consolidated financial statements.
In addition, certain controlled subsidiaries and their wholly-owned Australian subsidiaries have formed income tax consolidated groups under the tax consolidation regime. These entities are also taxed as a single entity and the deferred tax assets and liabilities of these tax consolidated groups are offset in the consolidated financial statements.
F. Cash and cash equivalents
Cash and cash equivalents includes cash at bank, deposits held at call with financial institutions, and other short-term, highly liquid investments with original maturities of three months or less that are readily convertible to known amounts of cash. This includes cash held by the subsidiaries for business operations/operating expenses purposes.
Cash held on trust relates to cash held for insurance premiums received from policyholders, which will ultimately be paid to underwriters. Cash held on trust cannot be used to meet business operations/operating expenses other than payments to underwriters and/or refunds to policyholders.
G. Trade and other receivables
Trade and other receivables includes fee and commission receivables recognised at amoritised cost, net of the associated expected credit loss (ECL) provision, as well as other receivables. Refer to Note 3(F) for additional information on the calculation of the ECL provision.
H. Premium funding receivables
Premium funding receivables represent the amounts due from clients in the Group’s premium funding businesses and is recognised at amortised cost, net of the associated expected credit loss (ECL) provision. Funds are collected on a monthly instalment basis and generally within twelve months of the loan issuance date. Refer to Note 3(F) for additional information on the calculation of the ECL provision.
I. Property, plant and equipment
Items of plant and equipment are measured at cost, less accumulated depreciation and any accumulated impairment losses. The carrying value of plant and equipment is periodically reviewed for impairment when events or changes in circumstances indicate that the carrying value may not be recoverable.
Any gain or loss on disposal of an item of plant and equipment is recognised in the consolidated statement of profit or loss and other comprehensive income.
J. Intangible assets
Identifiable intangible assets acquired separately or in a business combination (mainly customer relationships and capitalised software) are initially measured at cost. The cost of an intangible asset acquired in a business combination is its fair value as at the date of acquisition. The useful lives of these intangible assets are assessed on acquisition.
Internally developed software costs are capitalised once the project is assessed to be feasible. The costs capitalised include licensing and direct labour costs. The useful lives of capitalised software assets are assessed when the projects are completed and available for use.
86 Steadfast Group Annual Report 2021
Following initial recognition, intangible assets are carried at cost less any accumulated amortisation and provision for impairment.
Intangible assets with finite lives are amortised over their useful lives, currently estimated to be up to 10 years, and their useful lives are reviewed annually.
Software-as-a-Service (SaaS) arrangements are service contracts that provide the Group with the right to access the cloud provider's application software over the contract period. As the Group does not receive a software intangible asset at the contract commencement date, the costs incurred in relation to SaaS arrangements are treated as follows:
Fee for use of application software and customisation costs - recognise as an expense over the term of the service contact.Configuration, migration, testing and training costs - recognise as an expense as the service is received.
K. Premium funding borrowings
The Group’s premium funding borrowings are loans from third party financial institutions to finance the premium funding businesses. These loans have recourse to the assets of the premium funding businesses only and are not cross-collateralised with the other borrowings in the Group.
L. Payables on broking/underwriting agency operations
These amounts represent insurance premiums payable to insurance companies for broking/underwriting agency operations on amounts received from customers (policyholders) prior to the end of the financial period.
M. Hedge Accounting
Hedge accounting is applied when the Group designates certain derivatives to be part of a hedging relationship, and they meet the criteria for hedge accounting.
The Group uses cash flow hedges to mitigate the risk of variability of future cash flows attributable to interest rate fluctuations associated with the corporate debt facility. For cash flow hedges, the portion of the gain or loss on the hedge instrument that is effective is recognised directly in equity, while the ineffective portion is recognised in profit or loss. Amounts deferred in equity are transferred to profit or loss in the same period the hedged item is recognised in the profit or loss.
N. Land and buildings
The Group recognises land & buildings at fair value, being Board valuation based on an independent appraisal. The Group obtains regular independent appraisals to ensure that the carrying amount of land & buildings reported does not differ materially from its fair value.
Any surplus arising on the revaluation of land & buildings will be accumulated in equity under ‘revaluation reserve’. Any deficit on revaluation will be recognised in the statement of profit or loss and other comprehensive income except to the extent that it reverses a previous revaluation surplus on the same asset, in which case the deficit is recognised as a reduction in the revaluation reserve within equity.
O. Australian Accounting Standards issued and not yet effective
The Group has not early adopted and applied any new, revised or amending Australian Accounting Standards and Interpretations that are not yet mandatory for the year ended 30 June 2021.
The Group intends to adopt new, revised or amending Australian Accounting Standards and Interpretations in the operating year commencing 1 July after the effective date of these standards and interpretations as set out in the table below. Additional disclosures as a result of adopting these new accounting standards will be provided in accordance with the disclosure requirements. The Group does not expect any adverse impact to financial covenants as a result of applying the new accounting standards.
Title Description Effective date Operating year Note
AASB 17 Insurance Contracts 1 January 2023 30 June 2024 (i)
Table notes
i. AASB 17 Insurance Contracts was issued in July 2017 as a replacement for AASB 4 Insurance Contracts and will be applicable to general, life and health insurance businesses. As the Group does not assume underwriting risk on insurance contracts or reinsurance contracts issued on behalf of licensed insurers as an intermediary, there will be no financial impact from AASB 17 on the Group.
Steadfast Group Annual Report 2021 87

Notes to the Financial Statements continued
Note 3. Critical accounting judgements, estimates and assumptions
The preparation of the financial statements requires management to make judgements, estimates and assumptions that affect the reported amounts in the financial statements. Management continually evaluates its judgements and estimates in relation to assets, liabilities, contingent liabilities, revenue and expenses. Management bases its judgements, estimates and assumptions on historical experience and on various other factors, including expectations of future events management believes to be reasonable under the circumstances. The resulting accounting judgements and estimates may differ from the related actual results. The judgements, estimates and assumptions that have a significant risk of causing a material adjustment to the carrying amounts of assets and liabilities (refer to the respective notes) during the year ended 30 June 2021 are discussed below.
The Group has considered the impact of Covid when preparing the consolidated financial statements and related note disclosures, including the impact on the Group's forecast cash flows and liquidity. While the effects of Covid do not change the significant estimates, judgements and assumptions considered by management in the preparation of the consolidated financial statements, they have increased the level of estimation uncertainty and the application of further judgement within these identified areas.
A. Goodwill
Goodwill is not amortised but assessed for impairment annually or more frequently when there is evidence of impairment.
The recoverable amount of goodwill is estimated using the higher of fair value or the value in use of the relevant Cash Generating Unit (CGU) deducting the carrying amount of the identifiable net assets of the CGU. Key assumptions used in the calculation of recoverable amounts are the discount rates, terminal value growth rates and inputs to revenue and expense growth assumptions.
B. Intangible assets
The carrying amounts of intangible assets with finite lives are reviewed at each reporting date to determine whether there is any indication of impairment. If any such indication exists, then the asset’s recoverable amount is estimated on the same basis as goodwill above.
An impairment loss is recognised if the carrying amount of the intangible asset exceeds its recoverable amount.
C. Equity-accounted investments
Equity-accounted investments are carried at the lower of the equity-accounted amount and the recoverable amount.
The carrying amounts of equity-accounted investments are reviewed at each reporting date to determine whether there is any indication of impairment. If any such indication exists, then the asset’s recoverable amount is estimated on the same basis as goodwill above.
An impairment loss is recognised if the carrying amount of the equity-accounted investment exceeds its recoverable amount.
D. Fair value of assets acquired
The Group measures the net assets acquired in a business combination at their fair value at the date of acquisition. If new information obtained within one year from the acquisition date about facts and circumstances that existed at the acquisition date identifies adjustments to the fair value, then the amounts recognised as at the acquisition date will be retrospectively revised.
Fair value is estimated with reference to the market transactions for similar assets or discounted cash flow analysis.
88 Steadfast Group Annual Report 2021

E. Fair value of financial assets and liabilities
The Group’s financial assets and liabilities are measured at fair value at the end of each reporting period. The following table gives information about how the fair value of financial assets and liabilities is determined, including the valuation technique and inputs used. For the Group’s financial assets and liabilities not measured at fair value, their carrying amount provides a reasonable approximation of their fair values.
Fair values are categorised into different levels in a fair value hierarchy, based on the inputs used in the valuation techniques, as follows:
Level 1: quoted prices (unadjusted) in active markets for identical assets or liabilities.Level 2: inputs other than quoted prices included in Level 1 that are observable for the asset or liability, either directly (i.e. as prices) or indirectly (i.e. derived from prices).Level 3: inputs for the asset or liability that are not based on observable market data.
Financialinstrument
Fair value hierarchy Valuation technique
Significant unobservable inputs
Relationship of unobservable inputs to fair value
Deferred consideration
Level 3 The fair value is calculated based on a contracted multiple, typically of forecast EBITA or fees and commissions
Forecast EBITA or fees and commissions
The estimated fair value would increase/decrease if the forecast EBITA or fees and commissions were higher/lower
Interest rate swaps (trade and other liabilities)
Level 2 The fair value is calculated using the present value of the estimated future cash flow based on observable yield curves
Not applicable Not applicable
Investment in listed shares (other financial assets)
Level 1 The fair value is calculated based on number of shares multiplied by quoted price on ASX at balance date
Not applicable Not applicable
F. Expected credit loss provision
The expected credit loss provision is estimated based on the analysis of aged receivables, as the Group assumes that the credit risk on fee and commission receivable increases significantly if it is more than 90 days past due, as well as based on assumptions made on forward-looking information. For the premium funding businesses, the expected credit loss provision is based on historical analysis of credit losses for loans in arrears, having considered whether this remains appropriate.
G. Climate Change
Climate change, together with increased urbanisation, is a global risk that is a material risk for the insurance industry including insurers’ operations, customers and the whole economy. Climate change may increase the frequency and severity of acute weather-related events such as floods, bushfires and storms, as well as changes such as rising sea levels, increased heat waves and droughts.
The principal activities of the Group are the provision of services to Steadfast Network brokers, the distribution of insurance policies via insurance brokerages and underwriting agencies, and related services. As such the Group is not exposed to climate change risk in the same manner as insurers that underwrite the risk of an insurance policy. Whilst the potential risks and related opportunities from climate change are considered as part of the Group's asset impairment review methodology and processes, based on what is currently known, it is not expected that climate risks will have a significant impact on the Group's principal activities, particularly from an asset impairment standpoint.
Steadfast Group Annual Report 2021 89
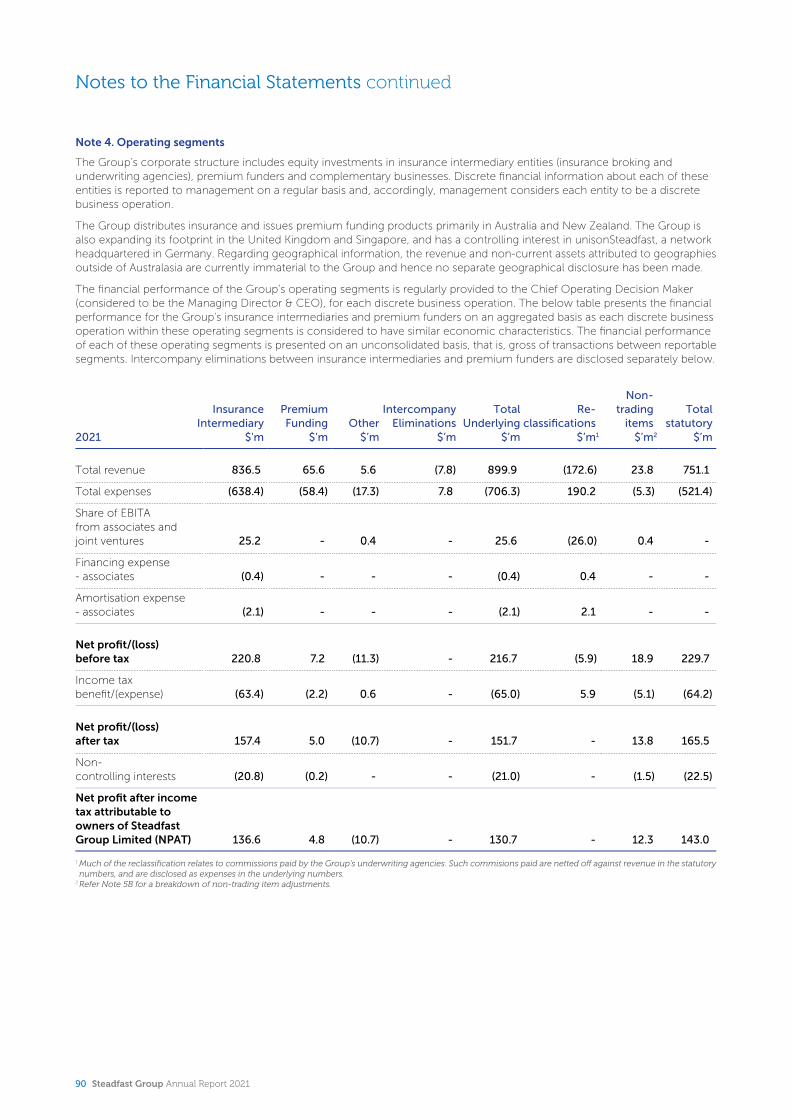
Notes to the Financial Statements continued
Note 4. Operating segments
The Group’s corporate structure includes equity investments in insurance intermediary entities (insurance broking and underwriting agencies), premium funders and complementary businesses. Discrete financial information about each of these entities is reported to management on a regular basis and, accordingly, management considers each entity to be a discrete business operation.
The Group distributes insurance and issues premium funding products primarily in Australia and New Zealand. The Group is also expanding its footprint in the United Kingdom and Singapore, and has a controlling interest in unisonSteadfast, a network headquartered in Germany. Regarding geographical information, the revenue and non-current assets attributed to geographies outside of Australasia are currently immaterial to the Group and hence no separate geographical disclosure has been made.
The financial performance of the Group’s operating segments is regularly provided to the Chief Operating Decision Maker (considered to be the Managing Director & CEO), for each discrete business operation. The below table presents the financial performance for the Group's insurance intermediaries and premium funders on an aggregated basis as each discrete business operation within these operating segments is considered to have similar economic characteristics. The financial performance of each of these operating segments is presented on an unconsolidated basis, that is, gross of transactions between reportable segments. Intercompany eliminations between insurance intermediaries and premium funders are disclosed separately below.
2021
Insurance Intermediary
$'m
Premium Funding
$’mOther
$’m
Intercompany Eliminations
$’m
Total Underlying
$’m
Re-classifications
$’m1
Non-trading
items$’m2
Total statutory
$’m
Total revenue 836.5 65.6 5.6 (7.8) 899.9 (172.6) 23.8 751.1
Total expenses (638.4) (58.4) (17.3) 7.8 (706.3) 190.2 (5.3) (521.4)
Share of EBITA from associates and joint ventures 25.2 - 0.4 - 25.6 (26.0) 0.4 -
Financing expense - associates (0.4) - - - (0.4) 0.4 - -
Amortisation expense - associates (2.1) - - - (2.1) 2.1 - -
Net profit/(loss) before tax 220.8 7.2 (11.3) - 216.7 (5.9) 18.9 229.7
Income tax benefit/(expense) (63.4) (2.2) 0.6 - (65.0) 5.9 (5.1) (64.2)
Net profit/(loss) after tax 157.4 5.0 (10.7) - 151.7 - 13.8 165.5
Noncontrolling interests (20.8) (0.2) - - (21.0) - (1.5) (22.5)
Net profit after income tax attributable to owners of Steadfast Group Limited (NPAT) 136.6 4.8 (10.7) - 130.7 - 12.3 143.0
1 Much of the reclassification relates to commissions paid by the Group's underwriting agencies. Such commisions paid are netted off against revenue in the statutory numbers, and are disclosed as expenses in the underlying numbers.
2Refer Note 5B for a breakdown of non-trading item adjustments.
90 Steadfast Group Annual Report 2021

2020
Insurance Intermediary
$’m
Premium Funding
$’mOther
$’m
Intercompany Eliminations
$'m
Total Underlying
$’m
Re-classifications
$’m
Non-trading
items$’m
Total statutory
$’m
Total revenue 756.1 73.1 4.4 (7.2) 826.4 (166.3) 15.9 676.0
Total expenses (595.3) (62.5) (13.5) 7.2 (664.1) 186.3 (190.9) (668.7)
Share of EBITA from associates and joint ventures 21.5 - 0.1 - 21.6 (29.2) 7.6 -
Financing expense - associates (0.4) - (0.1) - (0.5) 0.5 - -
Amortisation expense - associates (2.2) - (0.1) - (2.3) 2.3 - -
Net profit/(loss) before tax 179.7 10.6 (9.2) - 181.1 (6.4) (167.4) 7.3
Income tax benefit/(expense) (54.8) (2.9) 2.7 - (55.0) 6.4 8.5 (40.1)
Net profit/(loss) after tax 124.9 7.7 (6.5) - 126.1 - (158.9) (32.8)
Noncontrolling interests (16.8) (0.6) - - (17.4) - (5.0) (22.4)
Net profit after income tax attributable to owners of Steadfast Group Limited (NPAT) 108.1 7.1 (6.5) - 108.7 - (163.9) (55.2)
Steadfast Group Annual Report 2021 91

Notes to the Financial Statements continued
Note 5. Earnings per share
A. Reporting period value
2021Cents
2020Cents
Basic earnings per share 16.55 (6.47)
Diluted earnings per share 16.51 (6.47)
If non-trading items were removed, the underlying earnings per share would be as follows:
Basic earnings per share 15.12 12.73
Diluted earnings per share 15.09 12.70
B. Reconciliation of earnings used in calculating earnings per share
2021$'m
2020$'m
Profit/(loss) after income tax 165.5 (32.8)
Non-controlling interests (22.5) (22.4)
Profit/(loss) after income tax attributable to the owners of Steadfast Group Limited for calculation of statutory basic and diluted earnings per share 143.0 (55.2)
Removing non-trading items (net of tax and non-controlling interest):
IBNA acquisition - 72.7
PSF rebate offer - 63.1
Impairment of intangibles 3.9 40.7
Net loss/(gain) on deferred consideration estimates 1.7 (5.4)
Mark-to-market gains from revaluation of listed investments (9.6) (3.2)
Net gain from change in value or sale of businesses and other movements (8.3) (4.0)
Underlying profit after income tax attributable to the owners of Steadfast Group Limited (underlying NPAT) for calculation of underlying basic and diluted earnings per share 130.7 108.7
C. Reconciliation of weighted average number of shares used in calculating earnings per share
2021Number in
'm
2020Number in
'm
I. Weighted average number of ordinary shares issued
Weighted average number of ordinary shares issued 868.0 857.0
Weighted average number of treasury shares held in trust (3.7) (3.4)
Weighted average number of ordinary shares used in calculating basic earnings per share 864.3 853.6
II. Weighted average number of dilutive potential ordinary shares related to
Weighted average number of ordinary shares 864.3 853.6
Effect of share-based payments arrangements 1.8 2.1
Weighted average number of ordinary shares used in calculating diluted earnings per share 866.1 855.7
92 Steadfast Group Annual Report 2021
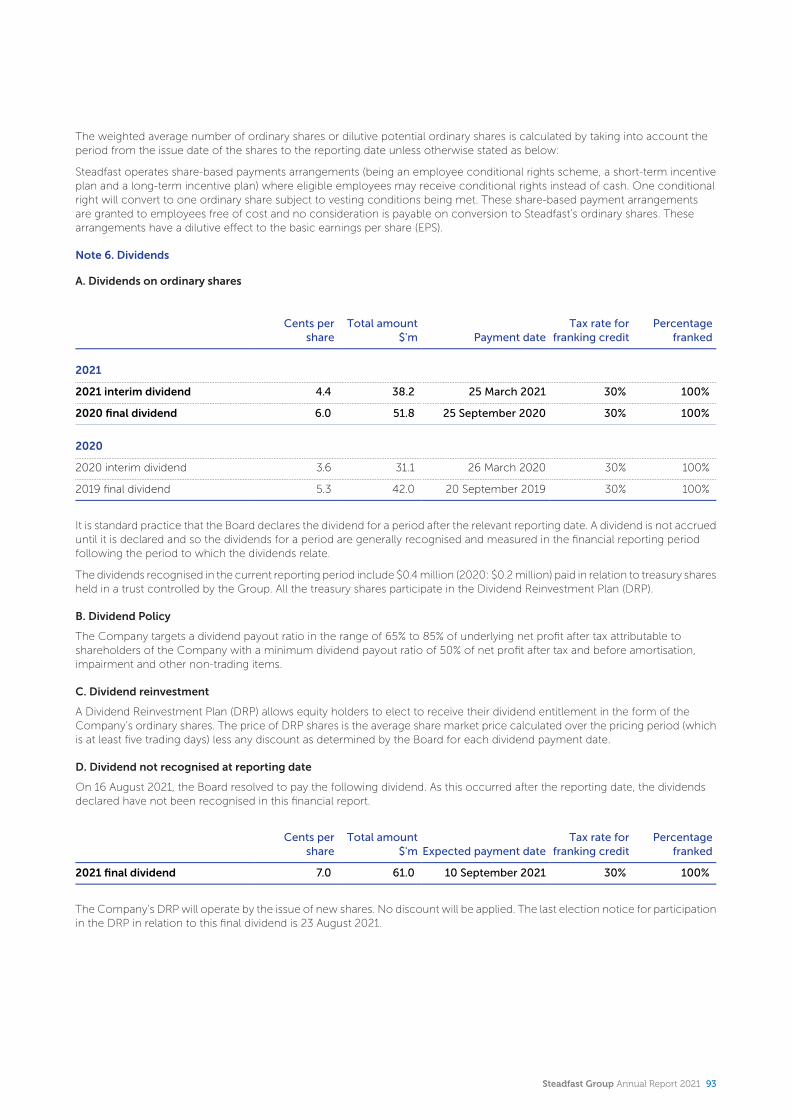
The weighted average number of ordinary shares or dilutive potential ordinary shares is calculated by taking into account the period from the issue date of the shares to the reporting date unless otherwise stated as below:
Steadfast operates share-based payments arrangements (being an employee conditional rights scheme, a short-term incentive plan and a long-term incentive plan) where eligible employees may receive conditional rights instead of cash. One conditional right will convert to one ordinary share subject to vesting conditions being met. These share-based payment arrangements are granted to employees free of cost and no consideration is payable on conversion to Steadfast’s ordinary shares. These arrangements have a dilutive effect to the basic earnings per share (EPS).
Note 6. Dividends
A. Dividends on ordinary shares
Cents per share
Total amount $'m Payment date
Tax rate for franking credit
Percentage franked
2021
2021 interim dividend 4.4 38.2 25 March 2021 30% 100%
2020 final dividend 6.0 51.8 25 September 2020 30% 100%
2020
2020 interim dividend 3.6 31.1 26 March 2020 30% 100%
2019 final dividend 5.3 42.0 20 September 2019 30% 100%
It is standard practice that the Board declares the dividend for a period after the relevant reporting date. A dividend is not accrued until it is declared and so the dividends for a period are generally recognised and measured in the financial reporting period following the period to which the dividends relate.
The dividends recognised in the current reporting period include $0.4 million (2020: $0.2 million) paid in relation to treasury shares held in a trust controlled by the Group. All the treasury shares participate in the Dividend Reinvestment Plan (DRP).
B. Dividend Policy
The Company targets a dividend payout ratio in the range of 65% to 85% of underlying net profit after tax attributable to shareholders of the Company with a minimum dividend payout ratio of 50% of net profit after tax and before amortisation, impairment and other non-trading items.
C. Dividend reinvestment
A Dividend Reinvestment Plan (DRP) allows equity holders to elect to receive their dividend entitlement in the form of the Company’s ordinary shares. The price of DRP shares is the average share market price calculated over the pricing period (which is at least five trading days) less any discount as determined by the Board for each dividend payment date.
D. Dividend not recognised at reporting date
On 16 August 2021, the Board resolved to pay the following dividend. As this occurred after the reporting date, the dividends declared have not been recognised in this financial report.
Cents per share
Total amount $'m Expected payment date
Tax rate for franking credit
Percentage franked
2021 final dividend 7.0 61.0 10 September 2021 30% 100%
The Company’s DRP will operate by the issue of new shares. No discount will be applied. The last election notice for participation in the DRP in relation to this final dividend is 23 August 2021.
Steadfast Group Annual Report 2021 93

Notes to the Financial Statements continued
E. Franking credits
2021$'m
2020$'m
Franking account balance at reporting date at 30% 63.7 61.6
Franking credits to arise from payment of income tax payable 12.7 4.3
Franking credits available for future reporting periods 76.4 65.9
Franking account impact of dividends declared before issuance of financial report but not recognised at reporting date (26.1) (22.2)
Franking credits available for subsequent financial periods based on a tax rate of 30% 50.3 43.7
Note 7. Intangible assets and goodwill
A. Composition
2021
Customer relationships
$'m
Capitalised software
$'m
Other intangible
assets$'m
Total intangible
assets$'m
Goodwill$'m
At cost 342.4 62.8 8.0 413.2 1,129.2
Accumulated amortisation and impairment (174.6) (29.3) (7.3) (211.2) (47.0)
167.8 33.5 0.7 202.0 1,082.2
B. Movements
2021
Customer relationships
$'m
Capitalised software
$'m
Other intangible
assets$'m
Total intangible
assets$'m
Goodwill$'m
Balance at the beginning of the financial year 148.4 32.8 1.2 182.4 930.3
Additions 5.4 11.4 - 16.8 -
Additions through business combinations 45.1 - - 45.1 156.0
Reduction upon loss of control - (0.2) - (0.2) -
Amortisation expense – acquired intangibles (31.0) (0.2) (0.5) (31.7) -
Amortisation expense – developed intangibles - (10.3) - (10.3) -
Impairment expense - - - - (3.9)
Net foreign currency exchange difference (0.1) - - (0.1) (0.2)
Balance at the end of the financial year 167.8 33.5 0.7 202.0 1,082.2
94 Steadfast Group Annual Report 2021
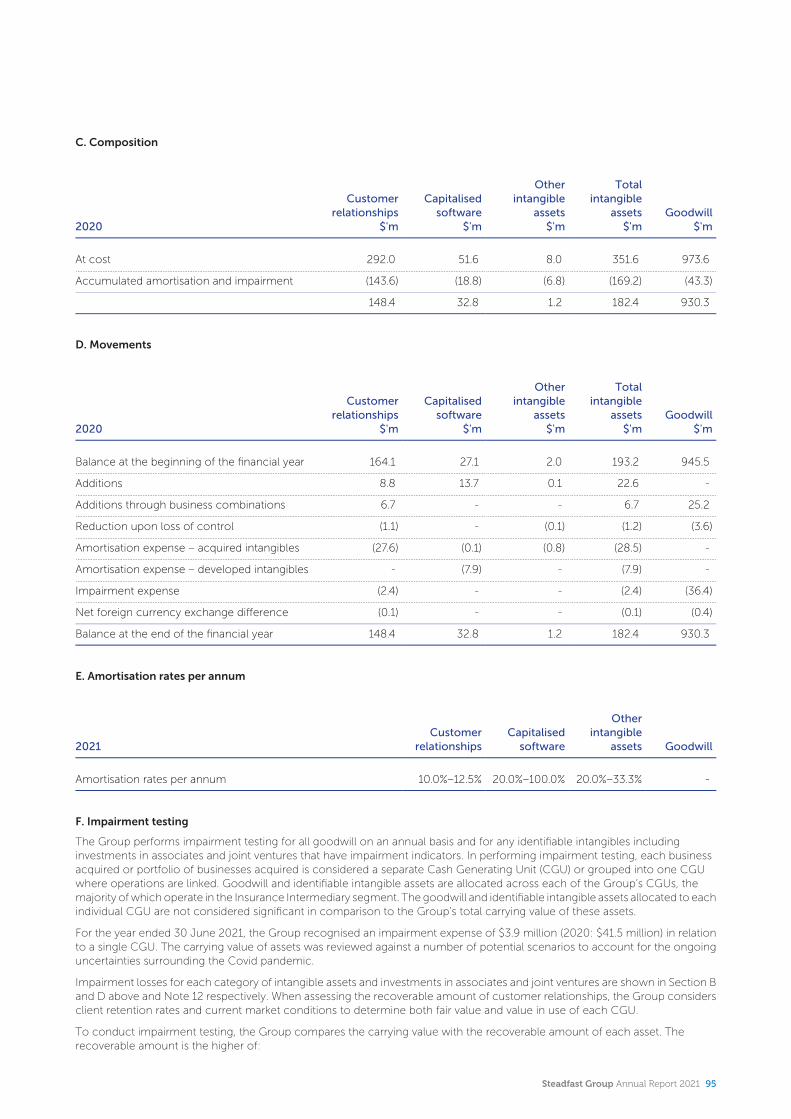
C. Composition
2020
Customer relationships
$'m
Capitalised software
$'m
Other intangible
assets$'m
Total intangible
assets$'m
Goodwill$'m
At cost 292.0 51.6 8.0 351.6 973.6
Accumulated amortisation and impairment (143.6) (18.8) (6.8) (169.2) (43.3)
148.4 32.8 1.2 182.4 930.3
D. Movements
2020
Customer relationships
$'m
Capitalised software
$'m
Other intangible
assets$'m
Total intangible
assets$'m
Goodwill$'m
Balance at the beginning of the financial year 164.1 27.1 2.0 193.2 945.5
Additions 8.8 13.7 0.1 22.6 -
Additions through business combinations 6.7 - - 6.7 25.2
Reduction upon loss of control (1.1) - (0.1) (1.2) (3.6)
Amortisation expense – acquired intangibles (27.6) (0.1) (0.8) (28.5) -
Amortisation expense – developed intangibles - (7.9) - (7.9) -
Impairment expense (2.4) - - (2.4) (36.4)
Net foreign currency exchange difference (0.1) - - (0.1) (0.4)
Balance at the end of the financial year 148.4 32.8 1.2 182.4 930.3
E. Amortisation rates per annum
2021Customer
relationshipsCapitalised
software
Other intangible
assets Goodwill
Amortisation rates per annum 10.0%–12.5% 20.0%–100.0% 20.0%–33.3% -
F. Impairment testing
The Group performs impairment testing for all goodwill on an annual basis and for any identifiable intangibles including investments in associates and joint ventures that have impairment indicators. In performing impairment testing, each business acquired or portfolio of businesses acquired is considered a separate Cash Generating Unit (CGU) or grouped into one CGU where operations are linked. Goodwill and identifiable intangible assets are allocated across each of the Group’s CGUs, the majority of which operate in the Insurance Intermediary segment. The goodwill and identifiable intangible assets allocated to each individual CGU are not considered significant in comparison to the Group’s total carrying value of these assets.
For the year ended 30 June 2021, the Group recognised an impairment expense of $3.9 million (2020: $41.5 million) in relation to a single CGU. The carrying value of assets was reviewed against a number of potential scenarios to account for the ongoing uncertainties surrounding the Covid pandemic.
Impairment losses for each category of intangible assets and investments in associates and joint ventures are shown in Section B and D above and Note 12 respectively. When assessing the recoverable amount of customer relationships, the Group considers client retention rates and current market conditions to determine both fair value and value in use of each CGU.
To conduct impairment testing, the Group compares the carrying value with the recoverable amount of each asset. The recoverable amount is the higher of:
Steadfast Group Annual Report 2021 95
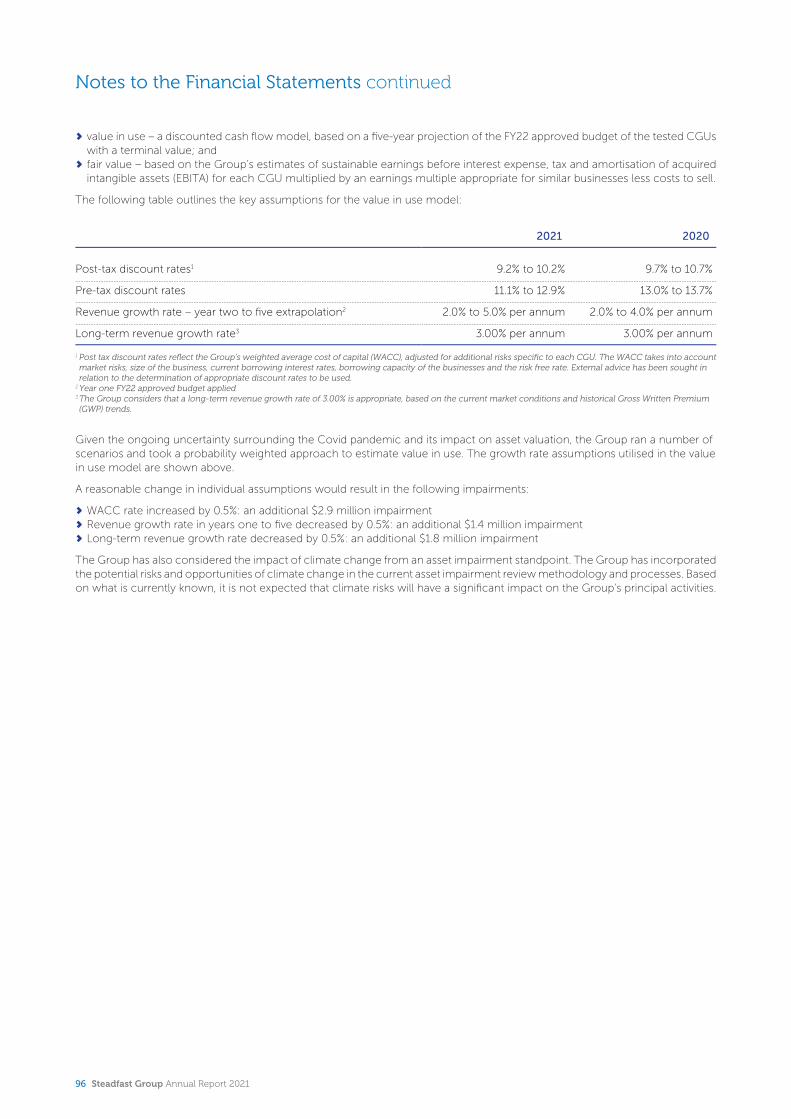
Notes to the Financial Statements continued
value in use – a discounted cash flow model, based on a five-year projection of the FY22 approved budget of the tested CGUs with a terminal value; andfair value – based on the Group’s estimates of sustainable earnings before interest expense, tax and amortisation of acquired intangible assets (EBITA) for each CGU multiplied by an earnings multiple appropriate for similar businesses less costs to sell.
The following table outlines the key assumptions for the value in use model:
2021 2020
Post-tax discount rates1 9.2% to 10.2% 9.7% to 10.7%
Pre-tax discount rates 11.1% to 12.9% 13.0% to 13.7%
Revenue growth rate – year two to five extrapolation2 2.0% to 5.0% per annum 2.0% to 4.0% per annum
Long-term revenue growth rate3 3.00% per annum 3.00% per annum
1 Post tax discount rates reflect the Group’s weighted average cost of capital (WACC), adjusted for additional risks specific to each CGU. The WACC takes into account market risks, size of the business, current borrowing interest rates, borrowing capacity of the businesses and the risk free rate. External advice has been sought in relation to the determination of appropriate discount rates to be used.
2Year one FY22 approved budget applied3The Group considers that a long-term revenue growth rate of 3.00% is appropriate, based on the current market conditions and historical Gross Written Premium (GWP) trends.
Given the ongoing uncertainty surrounding the Covid pandemic and its impact on asset valuation, the Group ran a number of scenarios and took a probability weighted approach to estimate value in use. The growth rate assumptions utilised in the value in use model are shown above.
A reasonable change in individual assumptions would result in the following impairments:
WACC rate increased by 0.5%: an additional $2.9 million impairmentRevenue growth rate in years one to five decreased by 0.5%: an additional $1.4 million impairmentLong-term revenue growth rate decreased by 0.5%: an additional $1.8 million impairment
The Group has also considered the impact of climate change from an asset impairment standpoint. The Group has incorporated the potential risks and opportunities of climate change in the current asset impairment review methodology and processes. Based on what is currently known, it is not expected that climate risks will have a significant impact on the Group's principal activities.
96 Steadfast Group Annual Report 2021
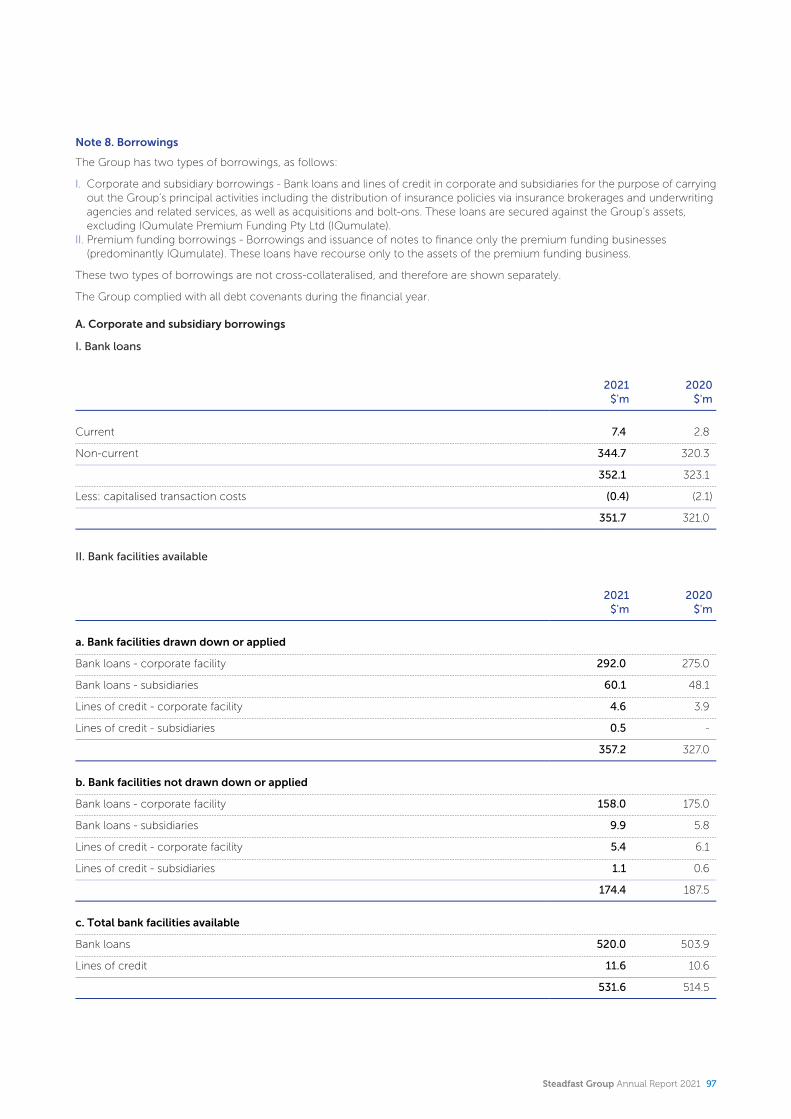
Note 8. Borrowings
The Group has two types of borrowings, as follows:
I. Corporate and subsidiary borrowings - Bank loans and lines of credit in corporate and subsidiaries for the purpose of carrying out the Group’s principal activities including the distribution of insurance policies via insurance brokerages and underwriting agencies and related services, as well as acquisitions and bolt-ons. These loans are secured against the Group’s assets, excluding IQumulate Premium Funding Pty Ltd (IQumulate).
II. Premium funding borrowings - Borrowings and issuance of notes to finance only the premium funding businesses (predominantly IQumulate). These loans have recourse only to the assets of the premium funding business.
These two types of borrowings are not cross-collateralised, and therefore are shown separately.
The Group complied with all debt covenants during the financial year.
A. Corporate and subsidiary borrowings
I. Bank loans
2021$'m
2020$'m
Current 7.4 2.8
Non-current 344.7 320.3
352.1 323.1
Less: capitalised transaction costs (0.4) (2.1)
351.7 321.0
II. Bank facilities available
2021$'m
2020$'m
a. Bank facilities drawn down or applied
Bank loans - corporate facility 292.0 275.0
Bank loans - subsidiaries 60.1 48.1
Lines of credit - corporate facility 4.6 3.9
Lines of credit - subsidiaries 0.5 -
357.2 327.0
b. Bank facilities not drawn down or applied
Bank loans - corporate facility 158.0 175.0
Bank loans - subsidiaries 9.9 5.8
Lines of credit - corporate facility 5.4 6.1
Lines of credit - subsidiaries 1.1 0.6
174.4 187.5
c. Total bank facilities available
Bank loans 520.0 503.9
Lines of credit 11.6 10.6
531.6 514.5
Steadfast Group Annual Report 2021 97
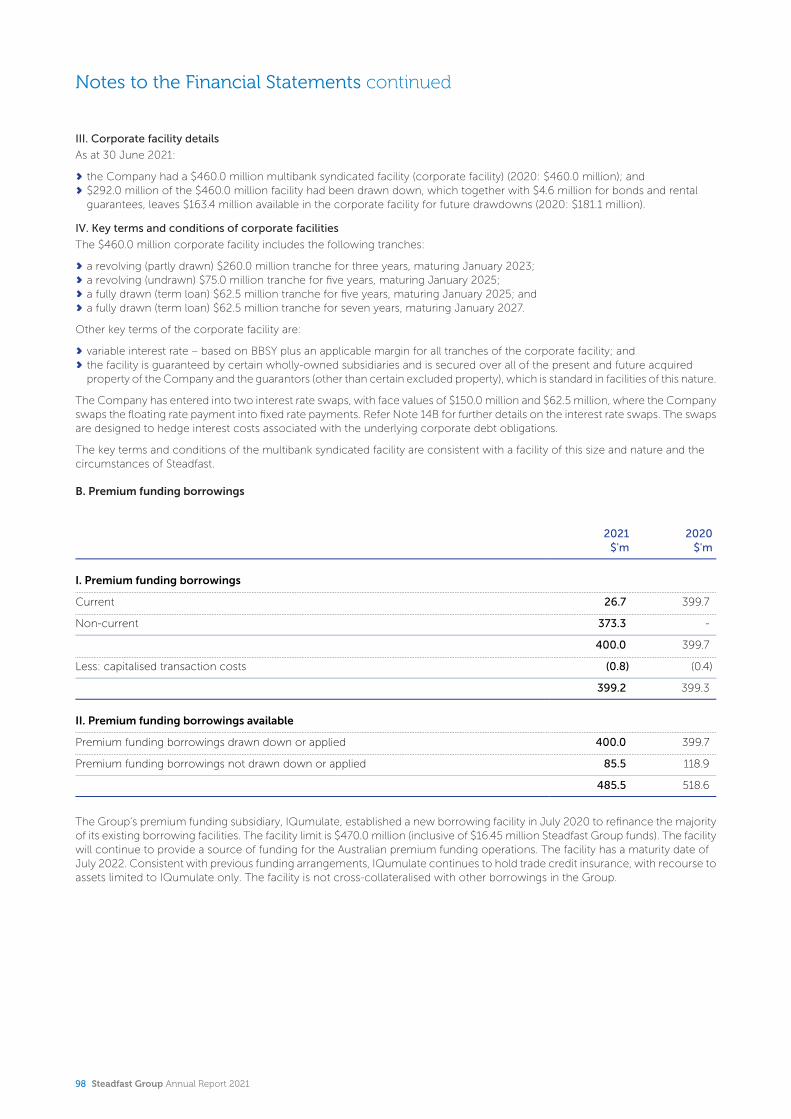
Notes to the Financial Statements continued
III. Corporate facility details
As at 30 June 2021:
the Company had a $460.0 million multibank syndicated facility (corporate facility) (2020: $460.0 million); and$292.0 million of the $460.0 million facility had been drawn down, which together with $4.6 million for bonds and rental guarantees, leaves $163.4 million available in the corporate facility for future drawdowns (2020: $181.1 million).
IV. Key terms and conditions of corporate facilities
The $460.0 million corporate facility includes the following tranches:
a revolving (partly drawn) $260.0 million tranche for three years, maturing January 2023;a revolving (undrawn) $75.0 million tranche for five years, maturing January 2025;a fully drawn (term loan) $62.5 million tranche for five years, maturing January 2025; anda fully drawn (term loan) $62.5 million tranche for seven years, maturing January 2027.
Other key terms of the corporate facility are:
variable interest rate – based on BBSY plus an applicable margin for all tranches of the corporate facility; andthe facility is guaranteed by certain wholly-owned subsidiaries and is secured over all of the present and future acquired property of the Company and the guarantors (other than certain excluded property), which is standard in facilities of this nature.
The Company has entered into two interest rate swaps, with face values of $150.0 million and $62.5 million, where the Company swaps the floating rate payment into fixed rate payments. Refer Note 14B for further details on the interest rate swaps. The swaps are designed to hedge interest costs associated with the underlying corporate debt obligations.
The key terms and conditions of the multibank syndicated facility are consistent with a facility of this size and nature and the circumstances of Steadfast.
B. Premium funding borrowings
2021$'m
2020$'m
I. Premium funding borrowings
Current 26.7 399.7
Non-current 373.3 -
400.0 399.7
Less: capitalised transaction costs (0.8) (0.4)
399.2 399.3
II. Premium funding borrowings available
Premium funding borrowings drawn down or applied 400.0 399.7
Premium funding borrowings not drawn down or applied 85.5 118.9
485.5 518.6
The Group's premium funding subsidiary, IQumulate, established a new borrowing facility in July 2020 to refinance the majority of its existing borrowing facilities. The facility limit is $470.0 million (inclusive of $16.45 million Steadfast Group funds). The facility will continue to provide a source of funding for the Australian premium funding operations. The facility has a maturity date of July 2022. Consistent with previous funding arrangements, IQumulate continues to hold trade credit insurance, with recourse to assets limited to IQumulate only. The facility is not cross-collateralised with other borrowings in the Group.
98 Steadfast Group Annual Report 2021
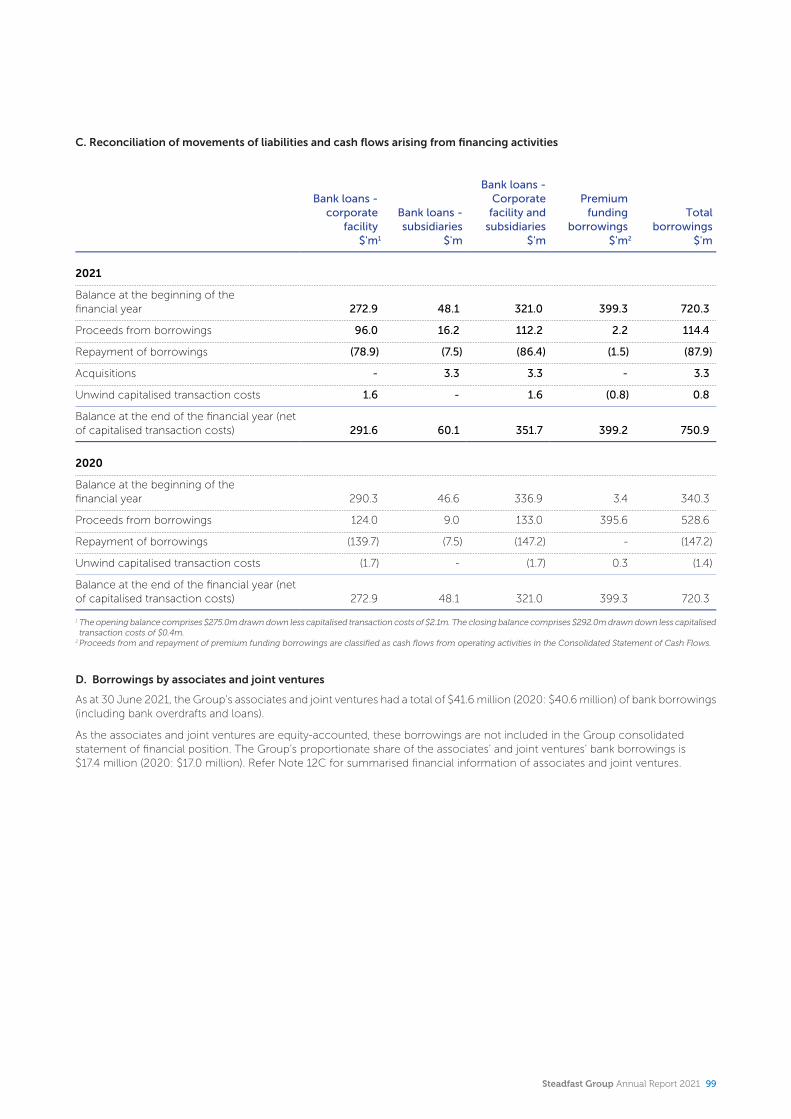
C. Reconciliation of movements of liabilities and cash flows arising from financing activities
Bank loans - corporate
facility$'m1
Bank loans - subsidiaries
$'m
Bank loans - Corporate
facility and subsidiaries
$'m
Premium funding
borrowings$'m2
Total borrowings
$'m
2021
Balance at the beginning of the financial year 272.9 48.1 321.0 399.3 720.3
Proceeds from borrowings 96.0 16.2 112.2 2.2 114.4
Repayment of borrowings (78.9) (7.5) (86.4) (1.5) (87.9)
Acquisitions - 3.3 3.3 - 3.3
Unwind capitalised transaction costs 1.6 - 1.6 (0.8) 0.8
Balance at the end of the financial year (net of capitalised transaction costs) 291.6 60.1 351.7 399.2 750.9
2020
Balance at the beginning of the financial year 290.3 46.6 336.9 3.4 340.3
Proceeds from borrowings 124.0 9.0 133.0 395.6 528.6
Repayment of borrowings (139.7) (7.5) (147.2) - (147.2)
Unwind capitalised transaction costs (1.7) - (1.7) 0.3 (1.4)
Balance at the end of the financial year (net of capitalised transaction costs) 272.9 48.1 321.0 399.3 720.3
1 The opening balance comprises $275.0m drawn down less capitalised transaction costs of $2.1m. The closing balance comprises $292.0m drawn down less capitalised transaction costs of $0.4m.
2Proceeds from and repayment of premium funding borrowings are classified as cash flows from operating activities in the Consolidated Statement of Cash Flows.
D. Borrowings by associates and joint ventures
As at 30 June 2021, the Group’s associates and joint ventures had a total of $41.6 million (2020: $40.6 million) of bank borrowings (including bank overdrafts and loans).
As the associates and joint ventures are equity-accounted, these borrowings are not included in the Group consolidated statement of financial position. The Group’s proportionate share of the associates’ and joint ventures’ bank borrowings is $17.4 million (2020: $17.0 million). Refer Note 12C for summarised financial information of associates and joint ventures.
Steadfast Group Annual Report 2021 99
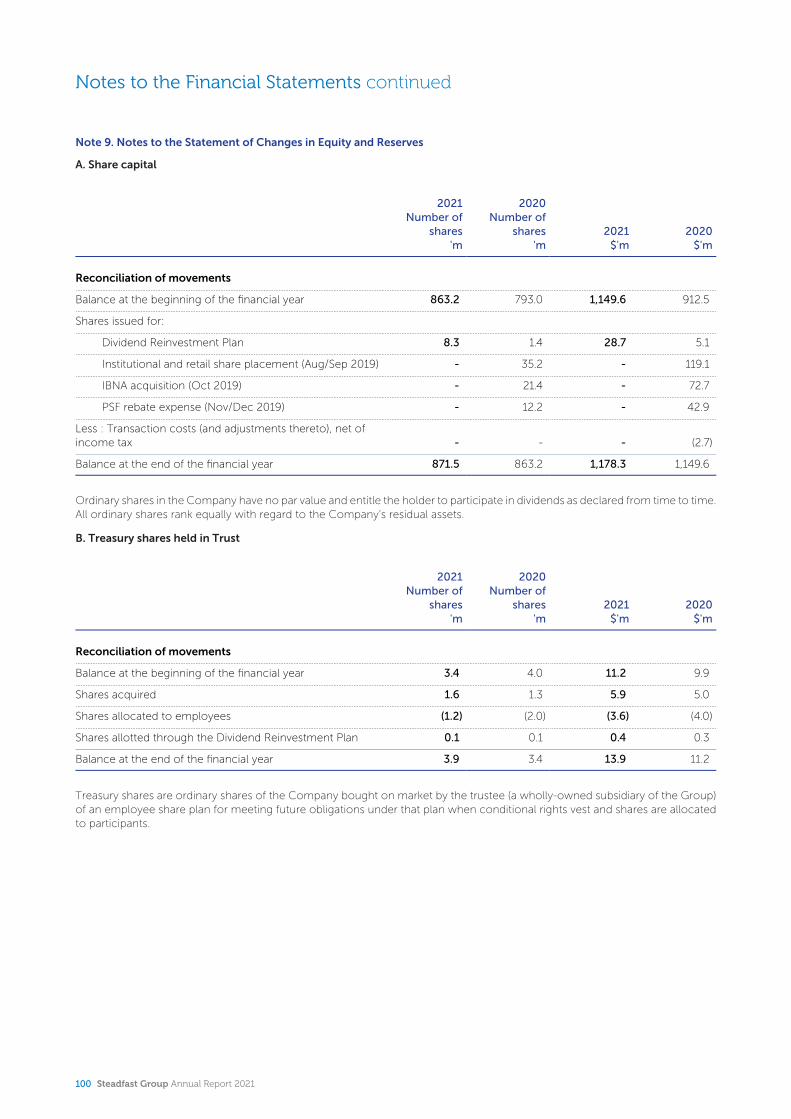
Notes to the Financial Statements continued
Note 9. Notes to the Statement of Changes in Equity and Reserves
A. Share capital
2021Number of
shares'm
2020Number of
shares'm
2021$'m
2020$'m
Reconciliation of movements
Balance at the beginning of the financial year 863.2 793.0 1,149.6 912.5
Shares issued for:
Dividend Reinvestment Plan 8.3 1.4 28.7 5.1
Institutional and retail share placement (Aug/Sep 2019) - 35.2 - 119.1
IBNA acquisition (Oct 2019) - 21.4 - 72.7
PSF rebate expense (Nov/Dec 2019) - 12.2 - 42.9
Less : Transaction costs (and adjustments thereto), net of income tax - - - (2.7)
Balance at the end of the financial year 871.5 863.2 1,178.3 1,149.6
Ordinary shares in the Company have no par value and entitle the holder to participate in dividends as declared from time to time. All ordinary shares rank equally with regard to the Company’s residual assets.
B. Treasury shares held in Trust
2021Number of
shares'm
2020Number of
shares'm
2021$'m
2020$'m
Reconciliation of movements
Balance at the beginning of the financial year 3.4 4.0 11.2 9.9
Shares acquired 1.6 1.3 5.9 5.0
Shares allocated to employees (1.2) (2.0) (3.6) (4.0)
Shares allotted through the Dividend Reinvestment Plan 0.1 0.1 0.4 0.3
Balance at the end of the financial year 3.9 3.4 13.9 11.2
Treasury shares are ordinary shares of the Company bought on market by the trustee (a wholly-owned subsidiary of the Group) of an employee share plan for meeting future obligations under that plan when conditional rights vest and shares are allocated to participants.
100 Steadfast Group Annual Report 2021
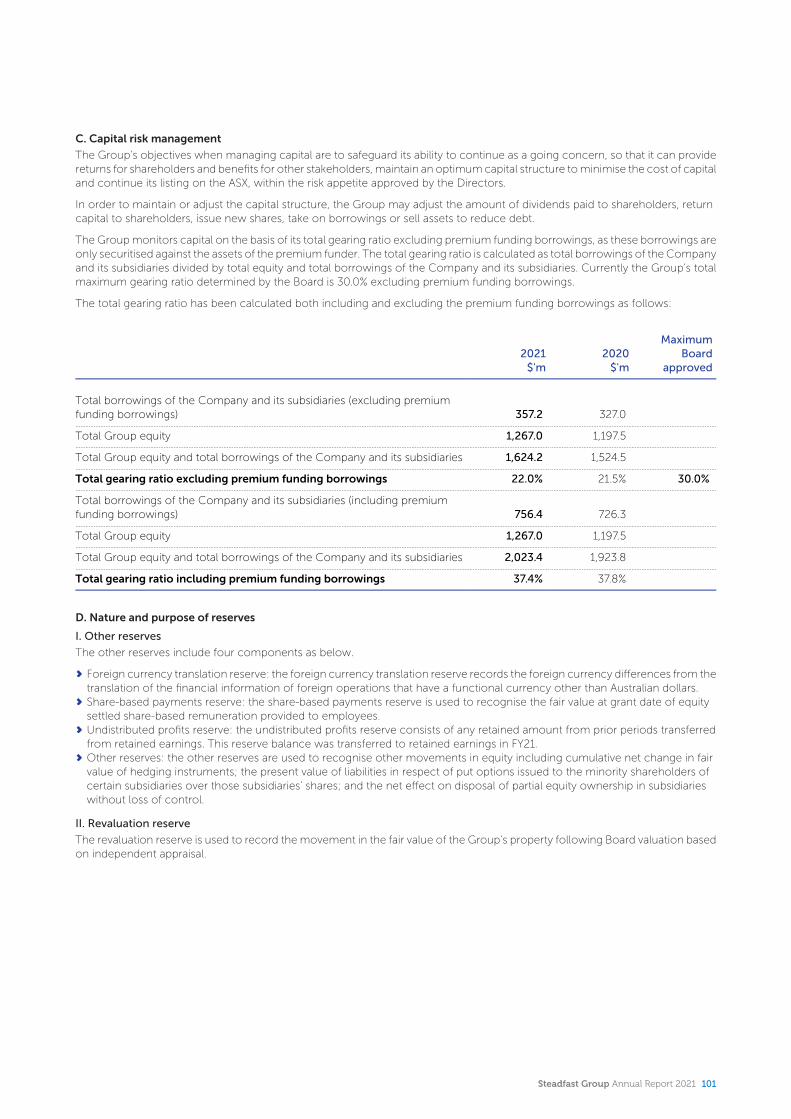
C. Capital risk management
The Group’s objectives when managing capital are to safeguard its ability to continue as a going concern, so that it can provide returns for shareholders and benefits for other stakeholders, maintain an optimum capital structure to minimise the cost of capital and continue its listing on the ASX, within the risk appetite approved by the Directors.
In order to maintain or adjust the capital structure, the Group may adjust the amount of dividends paid to shareholders, return capital to shareholders, issue new shares, take on borrowings or sell assets to reduce debt.
The Group monitors capital on the basis of its total gearing ratio excluding premium funding borrowings, as these borrowings are only securitised against the assets of the premium funder. The total gearing ratio is calculated as total borrowings of the Company and its subsidiaries divided by total equity and total borrowings of the Company and its subsidiaries. Currently the Group’s total maximum gearing ratio determined by the Board is 30.0% excluding premium funding borrowings.
The total gearing ratio has been calculated both including and excluding the premium funding borrowings as follows:
2021$'m
2020$'m
Maximum Board
approved
Total borrowings of the Company and its subsidiaries (excluding premium funding borrowings) 357.2 327.0
Total Group equity 1,267.0 1,197.5
Total Group equity and total borrowings of the Company and its subsidiaries 1,624.2 1,524.5
Total gearing ratio excluding premium funding borrowings 22.0% 21.5% 30.0%
Total borrowings of the Company and its subsidiaries (including premium funding borrowings) 756.4 726.3
Total Group equity 1,267.0 1,197.5
Total Group equity and total borrowings of the Company and its subsidiaries 2,023.4 1,923.8
Total gearing ratio including premium funding borrowings 37.4% 37.8%
D. Nature and purpose of reserves
I. Other reserves
The other reserves include four components as below.
Foreign currency translation reserve: the foreign currency translation reserve records the foreign currency differences from the translation of the financial information of foreign operations that have a functional currency other than Australian dollars.Share-based payments reserve: the share-based payments reserve is used to recognise the fair value at grant date of equity settled share-based remuneration provided to employees.Undistributed profits reserve: the undistributed profits reserve consists of any retained amount from prior periods transferred from retained earnings. This reserve balance was transferred to retained earnings in FY21.Other reserves: the other reserves are used to recognise other movements in equity including cumulative net change in fair value of hedging instruments; the present value of liabilities in respect of put options issued to the minority shareholders of certain subsidiaries over those subsidiaries' shares; and the net effect on disposal of partial equity ownership in subsidiaries without loss of control.
II. Revaluation reserve
The revaluation reserve is used to record the movement in the fair value of the Group’s property following Board valuation based on independent appraisal.
Steadfast Group Annual Report 2021 101

Notes to the Financial Statements continued
Note 10. Business combinations
Acquisitions for the year ended 30 June 2021
During the year ended 30 June 2021, the Group completed a number of acquisitions in accordance with its strategy. No individual acquisition was material to the Group and hence the information is shown in aggregate. Note 10E includes the ownership interest in the businesses acquired which became subsidiaries of the Group.
A. Consideration paid/payable
2021$'m
2020$'m
Cash 130.3 12.3
Consideration shares 0.7 -
Deemed consideration(i) 21.8 10.1
Deferred consideration(ii) 39.6 4.3
192.4 26.7
Table notesi. This amount represents the fair value of the original investments at the date the Group gained control of the entity which was
previously an associate of the Group.ii. Pursuant to the Share Purchase Agreements, some of the consideration will be settled based on future years’ actual financial
performance and thus was recognised as deferred consideration by the Group. The deferred consideration is estimated based on a multiple of forecast revenue and/or earnings. Any variations at the time of settlement will be recognised as an expense or income in the consolidated statement of profit or loss and other comprehensive income. The deferred consideration shown above represents: - $36.2 million of deferred consideration for which the maximum amount of payment is variable and not capped;- $2.2 million of deferred consideration which is capped; and- $1.2 million of deferred consideration which is fixed.The deferred consideration excludes the present value of liabilities ($23.9 million) in respect of put options issued to the minority shareholders of certain subsidiaries over those subsidiaries' shares (refer Note 10F).
B. Identifiable assets and liabilities acquired
2021$'m
2020$'m
Cash and cash equivalents1 40.5 7.6
Trade and other receivables2 9.4 0.7
Property, plant and equipment 0.8 0.6
Right-of-use assets 2.7 0.9
Deferred tax assets 2.8 0.3
Identifiable intangibles 45.1 6.7
Other assets 13.7 0.1
Trade and other payables (43.1) (8.0)
Income tax payable (4.6) (0.1)
Lease liabilities (2.8) (1.3)
Provisions (2.6) (0.4)
Deferred tax liabilities (15.5) (2.2)
Other liabilities (6.3) (2.6)
Total net identifiable assets acquired 40.1 2.3
1 Includes cash held on trust2The trade receivables comprise contractual amounts and are expected to be fully recoverable.
102 Steadfast Group Annual Report 2021
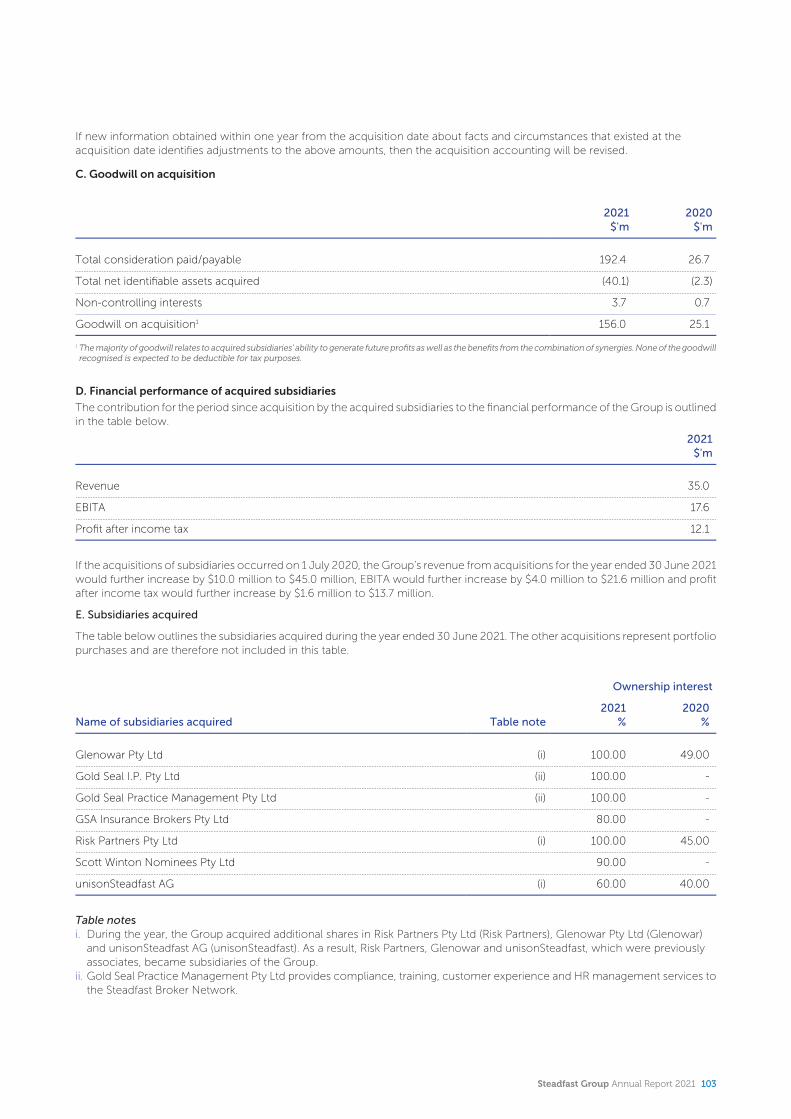
If new information obtained within one year from the acquisition date about facts and circumstances that existed at the acquisition date identifies adjustments to the above amounts, then the acquisition accounting will be revised.
C. Goodwill on acquisition
2021$'m
2020$'m
Total consideration paid/payable 192.4 26.7
Total net identifiable assets acquired (40.1) (2.3)
Non-controlling interests 3.7 0.7
Goodwill on acquisition1 156.0 25.1
1 The majority of goodwill relates to acquired subsidiaries' ability to generate future profits as well as the benefits from the combination of synergies. None of the goodwill recognised is expected to be deductible for tax purposes.
D. Financial performance of acquired subsidiaries
The contribution for the period since acquisition by the acquired subsidiaries to the financial performance of the Group is outlined in the table below.
2021$'m
Revenue 35.0
EBITA 17.6
Profit after income tax 12.1
If the acquisitions of subsidiaries occurred on 1 July 2020, the Group’s revenue from acquisitions for the year ended 30 June 2021 would further increase by $10.0 million to $45.0 million, EBITA would further increase by $4.0 million to $21.6 million and profit after income tax would further increase by $1.6 million to $13.7 million.
E. Subsidiaries acquired
The table below outlines the subsidiaries acquired during the year ended 30 June 2021. The other acquisitions represent portfolio purchases and are therefore not included in this table.
Ownership interest
Name of subsidiaries acquired Table note2021
%2020
%
Glenowar Pty Ltd (i) 100.00 49.00
Gold Seal I.P. Pty Ltd (ii) 100.00 -
Gold Seal Practice Management Pty Ltd (ii) 100.00 -
GSA Insurance Brokers Pty Ltd 80.00 -
Risk Partners Pty Ltd (i) 100.00 45.00
Scott Winton Nominees Pty Ltd 90.00 -
unisonSteadfast AG (i) 60.00 40.00
Table notesi. During the year, the Group acquired additional shares in Risk Partners Pty Ltd (Risk Partners), Glenowar Pty Ltd (Glenowar)
and unisonSteadfast AG (unisonSteadfast). As a result, Risk Partners, Glenowar and unisonSteadfast, which were previously associates, became subsidiaries of the Group.
ii. Gold Seal Practice Management Pty Ltd provides compliance, training, customer experience and HR management services to the Steadfast Broker Network.
Steadfast Group Annual Report 2021 103
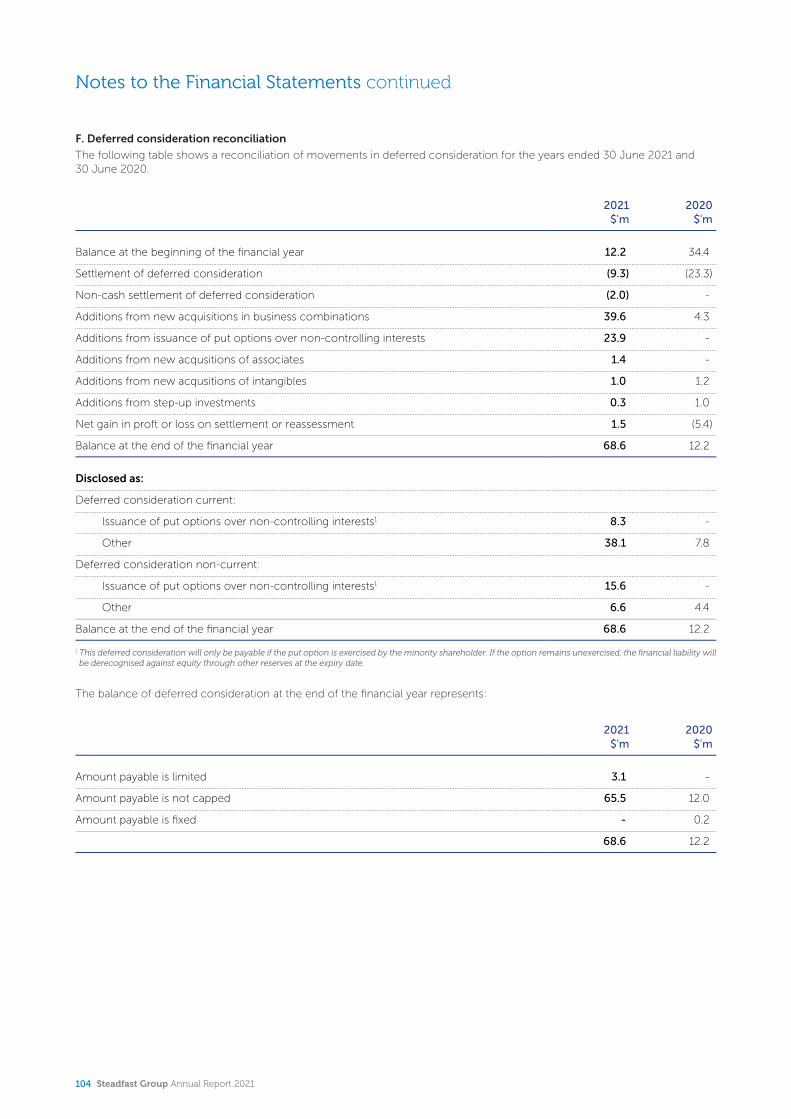
Notes to the Financial Statements continued
F. Deferred consideration reconciliation
The following table shows a reconciliation of movements in deferred consideration for the years ended 30 June 2021 and 30 June 2020.
2021$'m
2020$'m
Balance at the beginning of the financial year 12.2 34.4
Settlement of deferred consideration (9.3) (23.3)
Non-cash settlement of deferred consideration (2.0) -
Additions from new acquisitions in business combinations 39.6 4.3
Additions from issuance of put options over non-controlling interests 23.9 -
Additions from new acqusitions of associates 1.4 -
Additions from new acqusitions of intangibles 1.0 1.2
Additions from step-up investments 0.3 1.0
Net gain in proft or loss on settlement or reassessment 1.5 (5.4)
Balance at the end of the financial year 68.6 12.2
Disclosed as:
Deferred consideration current:
Issuance of put options over non-controlling interests1 8.3 -
Other 38.1 7.8
Deferred consideration non-current:
Issuance of put options over non-controlling interests1 15.6 -
Other 6.6 4.4
Balance at the end of the financial year 68.6 12.2
1 This deferred consideration will only be payable if the put option is exercised by the minority shareholder. If the option remains unexercised, the financial liability will be derecognised against equity through other reserves at the expiry date.
The balance of deferred consideration at the end of the financial year represents:
2021$'m
2020$'m
Amount payable is limited 3.1 -
Amount payable is not capped 65.5 12.0
Amount payable is fixed - 0.2
68.6 12.2
104 Steadfast Group Annual Report 2021
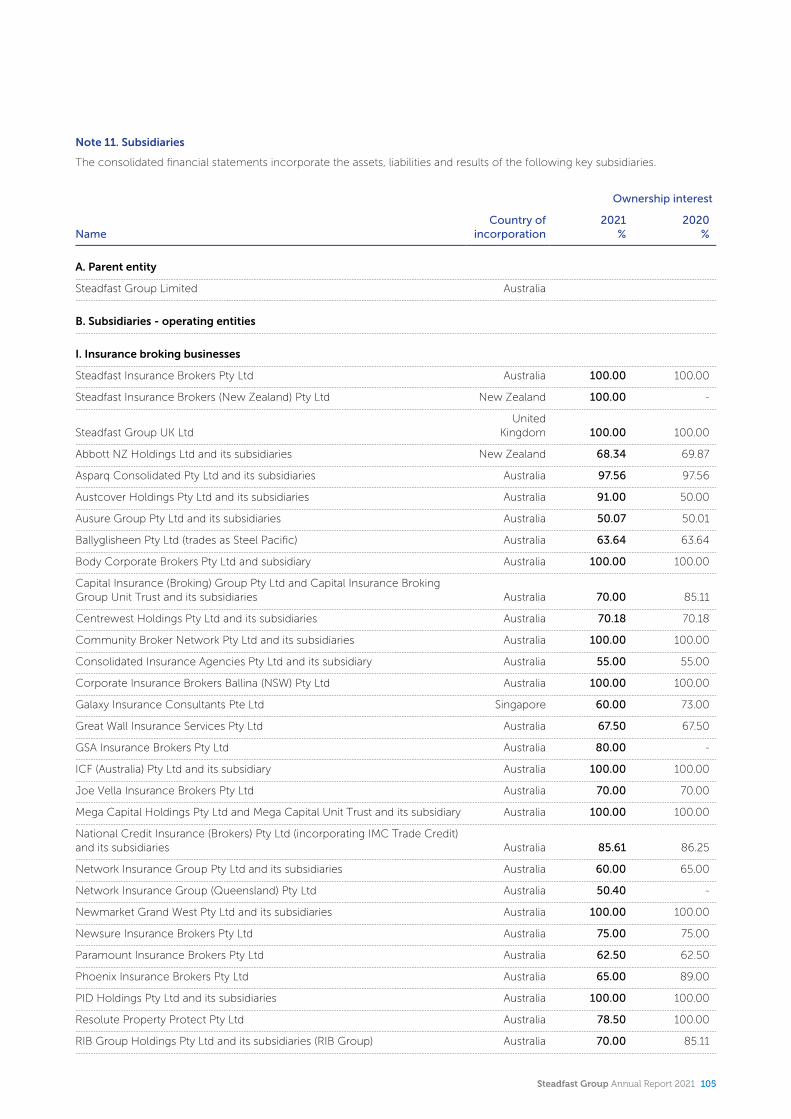
Note 11. Subsidiaries
The consolidated financial statements incorporate the assets, liabilities and results of the following key subsidiaries.
Ownership interest
NameCountry of
incorporation2021
%2020
%
A. Parent entity
Steadfast Group Limited Australia
B. Subsidiaries - operating entities
I. Insurance broking businesses
Steadfast Insurance Brokers Pty Ltd Australia 100.00 100.00
Steadfast Insurance Brokers (New Zealand) Pty Ltd New Zealand 100.00 -
Steadfast Group UK LtdUnited
Kingdom 100.00 100.00
Abbott NZ Holdings Ltd and its subsidiaries New Zealand 68.34 69.87
Asparq Consolidated Pty Ltd and its subsidiaries Australia 97.56 97.56
Austcover Holdings Pty Ltd and its subsidiaries Australia 91.00 50.00
Ausure Group Pty Ltd and its subsidiaries Australia 50.07 50.01
Ballyglisheen Pty Ltd (trades as Steel Pacific) Australia 63.64 63.64
Body Corporate Brokers Pty Ltd and subsidiary Australia 100.00 100.00
Capital Insurance (Broking) Group Pty Ltd and Capital Insurance Broking Group Unit Trust and its subsidiaries Australia 70.00 85.11
Centrewest Holdings Pty Ltd and its subsidiaries Australia 70.18 70.18
Community Broker Network Pty Ltd and its subsidiaries Australia 100.00 100.00
Consolidated Insurance Agencies Pty Ltd and its subsidiary Australia 55.00 55.00
Corporate Insurance Brokers Ballina (NSW) Pty Ltd Australia 100.00 100.00
Galaxy Insurance Consultants Pte Ltd Singapore 60.00 73.00
Great Wall Insurance Services Pty Ltd Australia 67.50 67.50
GSA Insurance Brokers Pty Ltd Australia 80.00 -
ICF (Australia) Pty Ltd and its subsidiary Australia 100.00 100.00
Joe Vella Insurance Brokers Pty Ltd Australia 70.00 70.00
Mega Capital Holdings Pty Ltd and Mega Capital Unit Trust and its subsidiary Australia 100.00 100.00
National Credit Insurance (Brokers) Pty Ltd (incorporating IMC Trade Credit) and its subsidiaries Australia 85.61 86.25
Network Insurance Group Pty Ltd and its subsidiaries Australia 60.00 65.00
Network Insurance Group (Queensland) Pty Ltd Australia 50.40 -
Newmarket Grand West Pty Ltd and its subsidiaries Australia 100.00 100.00
Newsure Insurance Brokers Pty Ltd Australia 75.00 75.00
Paramount Insurance Brokers Pty Ltd Australia 62.50 62.50
Phoenix Insurance Brokers Pty Ltd Australia 65.00 89.00
PID Holdings Pty Ltd and its subsidiaries Australia 100.00 100.00
Resolute Property Protect Pty Ltd Australia 78.50 100.00
RIB Group Holdings Pty Ltd and its subsidiaries (RIB Group) Australia 70.00 85.11
Steadfast Group Annual Report 2021 105

Notes to the Financial Statements continued
Ownership interest
NameCountry of
incorporation2021
%2020
%
Risk Partners Pty Ltd Australia 100.00 45.00
Scott & Broad Pty Ltd and its subsidiary Australia 65.00 65.00
Scott Winton Nominees Pty Ltd Australia 90.00 -
SRB Management Pty Ltd and its subsidiaries Australia 50.00 50.00
Steadfast Distribution Services Pte Ltd Singapore 100.00 100.00
Steadfast IFS Pty Ltd Australia 50.40 50.98
Steadfast IRS Pty Ltd and its subsidiaries Australia 60.00 65.00
Steadfast NZ Holdings Ltd New Zealand 100.00 100.00
Steadfast NZ Ltd New Zealand 100.00 100.00
Steadfast Shared Services Pty Ltd Philippines 100.00 100.00
Steadfast Taswide Insurance Brokers Pty Ltd and its subsidiaries Australia 66.12 66.12
T&G Insurance Brokers Pty Ltd and its subsidiary Australia 80.00 80.00
Trident Insurance Group Pty Ltd and its subsidiary Australia 80.00 80.00
VBIH Pty Ltd and its subsidiary Australia 100.00 80.00
Webmere Pty Ltd and its subsidiaries Australia 76.00 76.00
Whitbread Life Pty Ltd Australia 100.00 100.00
Whitbread Holdings Pty Ltd and its subsidiary Australia 100.00 100.00
Work Health Alternatives Pty Ltd Australia 59.00 57.00
II. Underwriting agency businesses
Steadfast Underwriting Agencies Holdings Pty Ltd Australia 100.00 100.00
SUA Services Pty Ltd Australia 100.00 100.00
Axis Underwriting Services Pty Ltd Australia 100.00 100.00
Calliden Group Pty Ltd and its subsidiaries Australia 100.00 100.00
CHU Underwriting Agencies Pty Ltd and its subsidiaries Australia 100.00 97.00
Emergence Insurance Group Pty Ltd and its subsidiary Australia 50.00 50.00
Grange Underwriting Pty Ltd Australia 76.00 76.00
HMIA Pty Ltd Australia 80.00 80.00
Hostsure Underwriting Agency Pty Ltd Australia 100.00 100.00
JMT Insurance Holdings Pty Ltd and its subsidiaries Australia 89.19 89.19
Miramar Underwriting Agency Pty Ltd Australia 100.00 100.00
NM Insurance Pty Ltd and its subsidiary Australia 80.00 80.00
Platinum Placement Solutions Pty Ltd Australia 100.00 100.00
Procover Underwriting Agency Pty Ltd Australia 100.00 100.00
Proteus Marine Insurance Pty Ltd Australia 87.50 87.50
Residential Builders Underwriting Agency Pty Ltd Australia 100.00 100.00
Sports Underwriting Australia Pty Ltd Australia 90.00 90.00
Steadfast Placement Solutions Pty Ltd Australia 100.00 100.00
Steadfast Placement Solutions UK LtdUnited
Kingdom 100.00 100.00
Underwriting Agencies of Australia Pty Ltd Australia 88.33 88.33
106 Steadfast Group Annual Report 2021
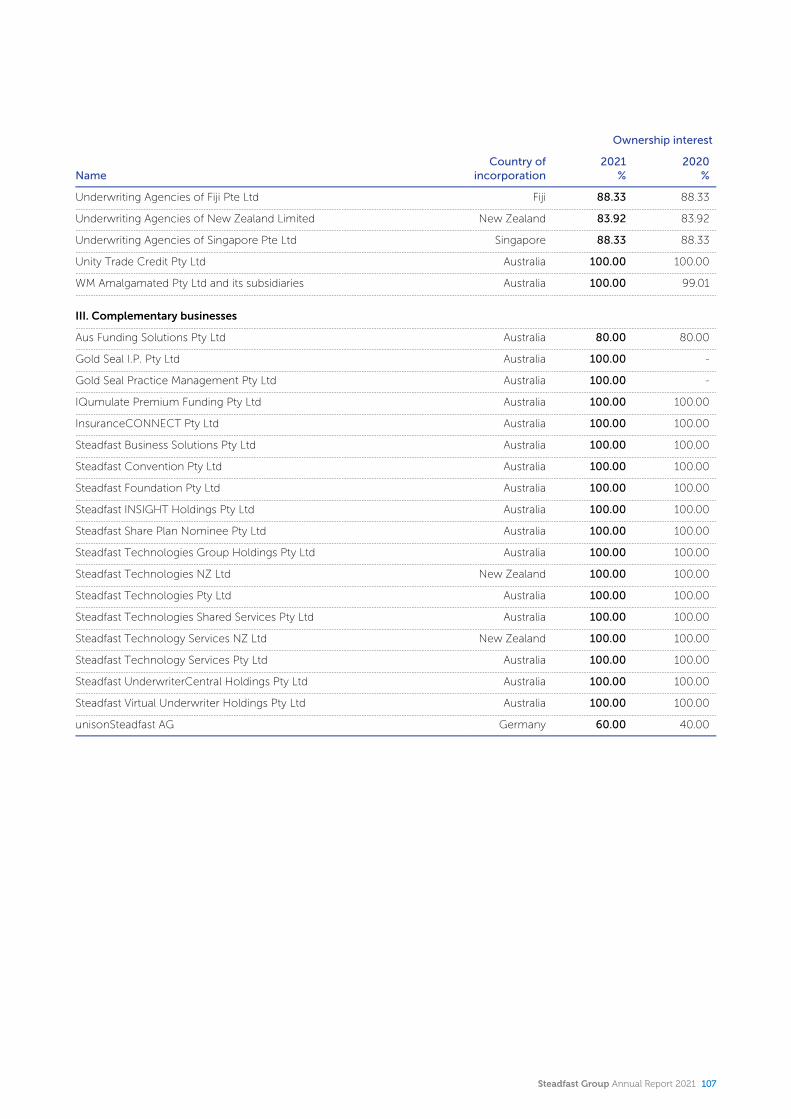
Ownership interest
NameCountry of
incorporation2021
%2020
%
Underwriting Agencies of Fiji Pte Ltd Fiji 88.33 88.33
Underwriting Agencies of New Zealand Limited New Zealand 83.92 83.92
Underwriting Agencies of Singapore Pte Ltd Singapore 88.33 88.33
Unity Trade Credit Pty Ltd Australia 100.00 100.00
WM Amalgamated Pty Ltd and its subsidiaries Australia 100.00 99.01
III. Complementary businesses
Aus Funding Solutions Pty Ltd Australia 80.00 80.00
Gold Seal I.P. Pty Ltd Australia 100.00 -
Gold Seal Practice Management Pty Ltd Australia 100.00 -
IQumulate Premium Funding Pty Ltd Australia 100.00 100.00
InsuranceCONNECT Pty Ltd Australia 100.00 100.00
Steadfast Business Solutions Pty Ltd Australia 100.00 100.00
Steadfast Convention Pty Ltd Australia 100.00 100.00
Steadfast Foundation Pty Ltd Australia 100.00 100.00
Steadfast INSIGHT Holdings Pty Ltd Australia 100.00 100.00
Steadfast Share Plan Nominee Pty Ltd Australia 100.00 100.00
Steadfast Technologies Group Holdings Pty Ltd Australia 100.00 100.00
Steadfast Technologies NZ Ltd New Zealand 100.00 100.00
Steadfast Technologies Pty Ltd Australia 100.00 100.00
Steadfast Technologies Shared Services Pty Ltd Australia 100.00 100.00
Steadfast Technology Services NZ Ltd New Zealand 100.00 100.00
Steadfast Technology Services Pty Ltd Australia 100.00 100.00
Steadfast UnderwriterCentral Holdings Pty Ltd Australia 100.00 100.00
Steadfast Virtual Underwriter Holdings Pty Ltd Australia 100.00 100.00
unisonSteadfast AG Germany 60.00 40.00
Steadfast Group Annual Report 2021 107

Notes to the Financial Statements continued
Note 12. Investments in associates & joint ventures
A. Details of associates & joint ventures
Interests in associates and joint ventures are accounted for using the equity method of accounting. Information relating to key associates is set out below.
Ownership interest Equity-accounted
Name2021
%2020
%2021
$'m2020
$'m
I. Insurance broking businesses
Armstrong's Insurance Brokers Pty Ltd and Armstrong's Insurance Brokers Unit Trust 25.00 25.00 1.0 1.0
Ausure Group Pty Ltd – associates thereof 16.52 19.65 5.5 5.7
Blackburn (Insurance Brokers) Pty Ltd and Liability Brokers Pty Ltd 40.00 40.00 2.7 2.8
Collective Insurance Brokers Pty Ltd 49.00 49.00 0.3 -
Covercorp Pty Ltd 49.00 49.00 1.1 1.1
Edgewise Insurance Brokers Pty Ltd and The Bradstock GIS Unit Trust 49.23 35.31 9.1 5.0
Empire Insurance Services Pty Ltd and McLardy McShane & Associates Pty Ltd 37.00 37.00 2.9 2.9
Fenchurch Insurance Brokers Pty Ltd 22.50 - 2.0 -
Finpac Insurance Advisors Pty Ltd 49.00 49.00 1.0 1.0
Glenowar Pty Ltd - 49.00 - 4.0
J.D.I. (Young) Pty Ltd 25.00 25.00 1.0 0.9
Johansen Insurance Brokers Pty Ltd 48.35 48.35 4.1 4.3
Listsure Pty Ltd 29.80 - 1.5 -
McKillops Insurance Brokers Pty Ltd 49.00 49.00 4.3 4.6
Melbourne Insurance Brokers Pty Ltd 49.00 49.00 1.6 1.6
Origin Insurance Brokers Pty Ltd 49.00 49.00 - -
Pollard Advisory Services Pty Ltd 46.50 46.50 3.9 3.9
Quattro Risk Services Pty Ltd - associates thereof 12.00 13.00 0.2 0.2
Risk Partners Pty Ltd - 45.00 - 9.2
Rose Stanton Insurance Brokers Pty Ltd 49.00 49.00 0.7 0.7
Rothbury Group Ltd and its subsidiaries 42.80 42.80 28.7 27.4
RSM Group Pty Ltd 49.00 49.00 5.0 5.0
Sapphire Star Pty Ltd 30.00 30.00 0.7 0.7
Southside Insurance Brokers Pty Ltd 49.00 49.00 0.5 0.5
Steadfast Eastern Insurance Brokers Pty Ltd 25.00 25.00 0.6 0.5
Steadfast IRS Pty Ltd - associates thereof 21.00 - 3.0 -
Steadfast Life Pty Ltd and its subsidiary 50.00 50.00 3.2 3.2
Tudor Insurance Australia (Insurance Brokers) Pty Ltd and Tudor Insurance Agency Unit Trust 48.00 48.00 2.1 2.0
unisonSteadfast AG - 40.00 - 3.0
unisonSteadfast AG - associates thereof 30.00 - - -
108 Steadfast Group Annual Report 2021
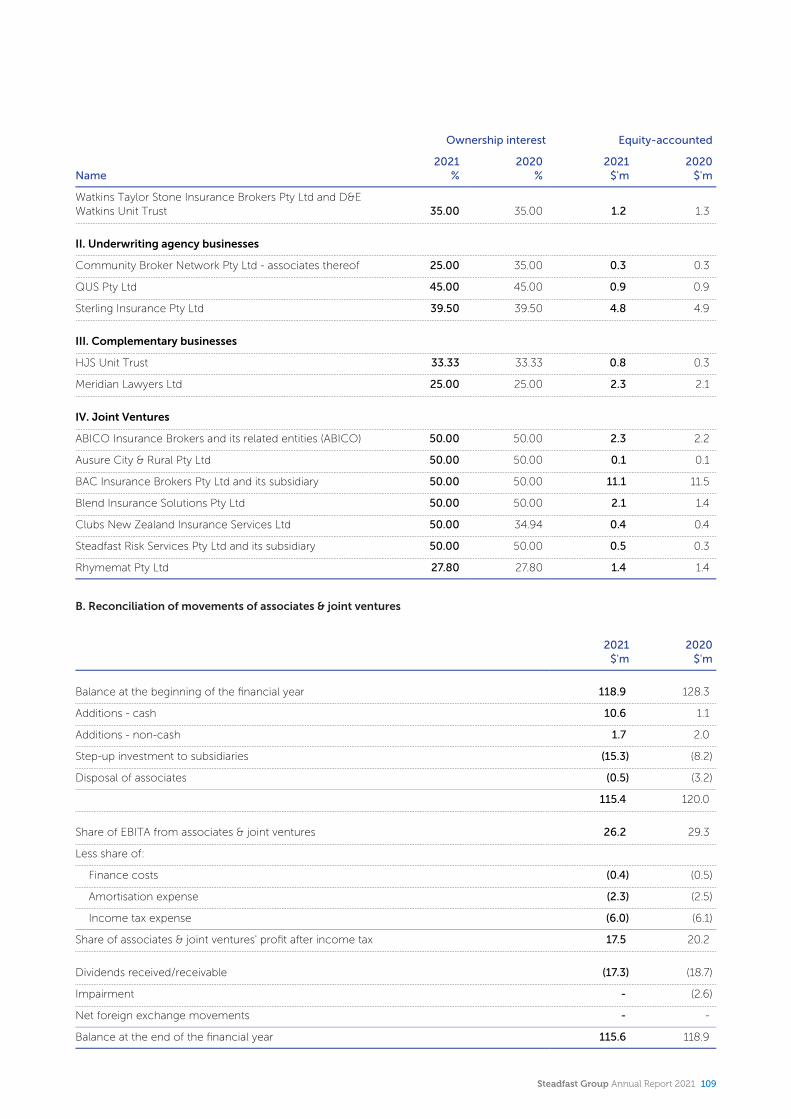
Ownership interest Equity-accounted
Name2021
%2020
%2021
$'m2020
$'m
Watkins Taylor Stone Insurance Brokers Pty Ltd and D&E Watkins Unit Trust 35.00 35.00 1.2 1.3
II. Underwriting agency businesses
Community Broker Network Pty Ltd - associates thereof 25.00 35.00 0.3 0.3
QUS Pty Ltd 45.00 45.00 0.9 0.9
Sterling Insurance Pty Ltd 39.50 39.50 4.8 4.9
III. Complementary businesses
HJS Unit Trust 33.33 33.33 0.8 0.3
Meridian Lawyers Ltd 25.00 25.00 2.3 2.1
IV. Joint Ventures
ABICO Insurance Brokers and its related entities (ABICO) 50.00 50.00 2.3 2.2
Ausure City & Rural Pty Ltd 50.00 50.00 0.1 0.1
BAC Insurance Brokers Pty Ltd and its subsidiary 50.00 50.00 11.1 11.5
Blend Insurance Solutions Pty Ltd 50.00 50.00 2.1 1.4
Clubs New Zealand Insurance Services Ltd 50.00 34.94 0.4 0.4
Steadfast Risk Services Pty Ltd and its subsidiary 50.00 50.00 0.5 0.3
Rhymemat Pty Ltd 27.80 27.80 1.4 1.4
B. Reconciliation of movements of associates & joint ventures
2021$'m
2020$'m
Balance at the beginning of the financial year 118.9 128.3
Additions - cash 10.6 1.1
Additions - non-cash 1.7 2.0
Step-up investment to subsidiaries (15.3) (8.2)
Disposal of associates (0.5) (3.2)
115.4 120.0
Share of EBITA from associates & joint ventures 26.2 29.3
Less share of:
Finance costs (0.4) (0.5)
Amortisation expense (2.3) (2.5)
Income tax expense (6.0) (6.1)
Share of associates & joint ventures' profit after income tax 17.5 20.2
Dividends received/receivable (17.3) (18.7)
Impairment - (2.6)
Net foreign exchange movements - -
Balance at the end of the financial year 115.6 118.9
Steadfast Group Annual Report 2021 109
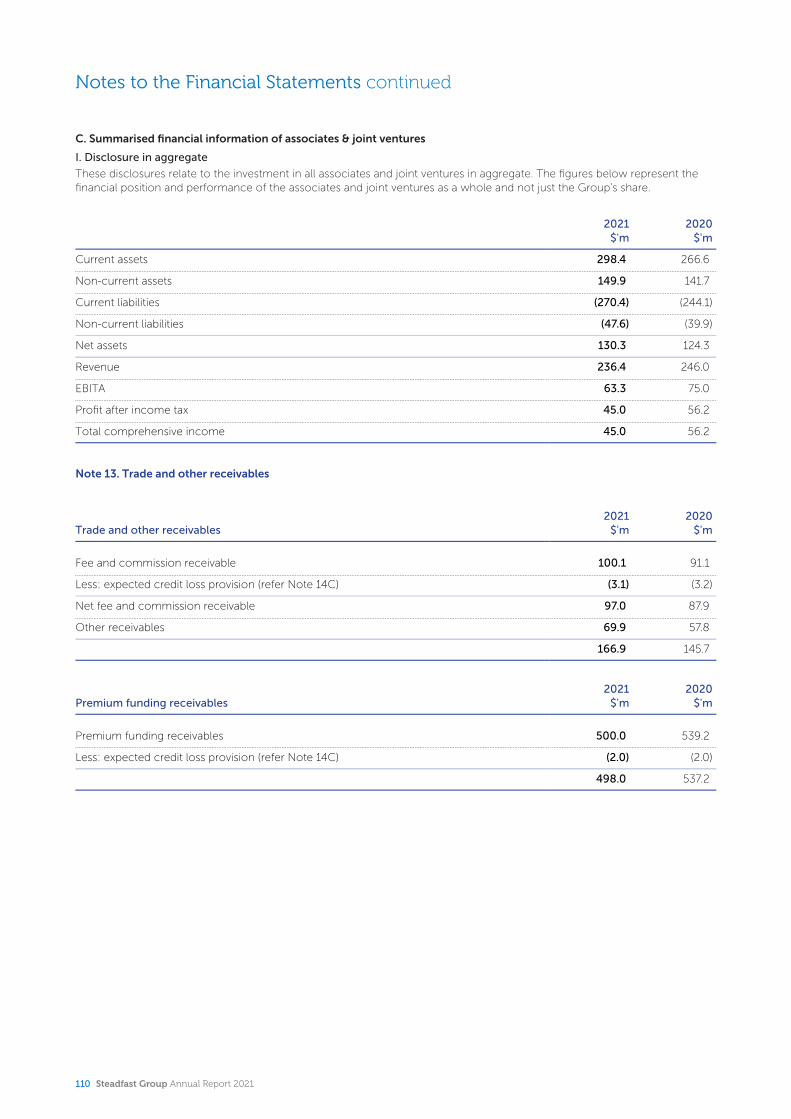
Notes to the Financial Statements continued
C. Summarised financial information of associates & joint ventures
I. Disclosure in aggregate
These disclosures relate to the investment in all associates and joint ventures in aggregate. The figures below represent the financial position and performance of the associates and joint ventures as a whole and not just the Group’s share.
2021$'m
2020$'m
Current assets 298.4 266.6
Non-current assets 149.9 141.7
Current liabilities (270.4) (244.1)
Non-current liabilities (47.6) (39.9)
Net assets 130.3 124.3
Revenue 236.4 246.0
EBITA 63.3 75.0
Profit after income tax 45.0 56.2
Total comprehensive income 45.0 56.2
Note 13. Trade and other receivables
Trade and other receivables2021
$'m2020
$'m
Fee and commission receivable 100.1 91.1
Less: expected credit loss provision (refer Note 14C) (3.1) (3.2)
Net fee and commission receivable 97.0 87.9
Other receivables 69.9 57.8
166.9 145.7
Premium funding receivables2021
$'m2020
$'m
Premium funding receivables 500.0 539.2
Less: expected credit loss provision (refer Note 14C) (2.0) (2.0)
498.0 537.2
110 Steadfast Group Annual Report 2021
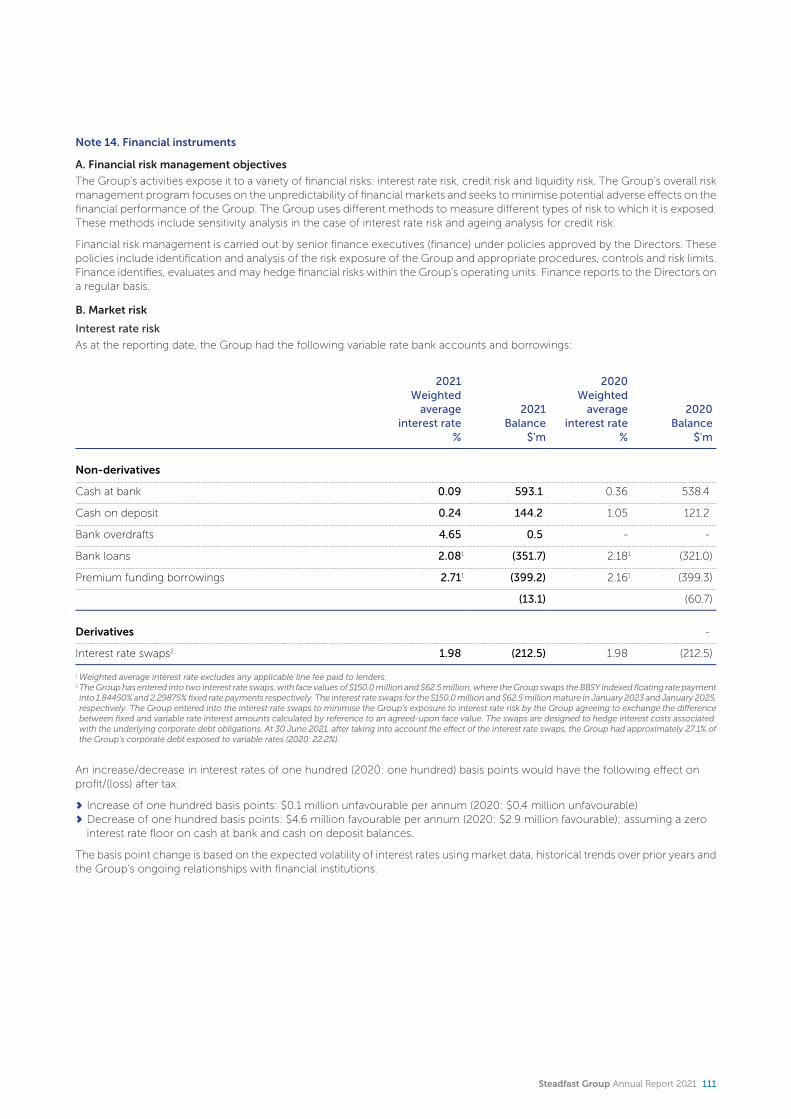
Note 14. Financial instruments
A. Financial risk management objectives
The Group's activities expose it to a variety of financial risks: interest rate risk, credit risk and liquidity risk. The Group's overall risk management program focuses on the unpredictability of financial markets and seeks to minimise potential adverse effects on the financial performance of the Group. The Group uses different methods to measure different types of risk to which it is exposed. These methods include sensitivity analysis in the case of interest rate risk and ageing analysis for credit risk.
Financial risk management is carried out by senior finance executives (finance) under policies approved by the Directors. These policies include identification and analysis of the risk exposure of the Group and appropriate procedures, controls and risk limits. Finance identifies, evaluates and may hedge financial risks within the Group's operating units. Finance reports to the Directors on a regular basis.
B. Market risk
Interest rate risk
As at the reporting date, the Group had the following variable rate bank accounts and borrowings:
2021Weighted
average interest rate
%
2021Balance
$'m
2020Weighted
average interest rate
%
2020Balance
$'m
Non-derivatives
Cash at bank 0.09 593.1 0.36 538.4
Cash on deposit 0.24 144.2 1.05 121.2
Bank overdrafts 4.65 0.5 - -
Bank loans 2.081 (351.7) 2.181 (321.0)
Premium funding borrowings 2.711 (399.2) 2.161 (399.3)
(13.1) (60.7)
Derivatives -
Interest rate swaps2 1.98 (212.5) 1.98 (212.5)
1 Weighted average interest rate excludes any applicable line fee paid to lenders.2The Group has entered into two interest rate swaps, with face values of $150.0 million and $62.5 million, where the Group swaps the BBSY indexed floating rate payment into 1.84450% and 2.29875% fixed rate payments respectively. The interest rate swaps for the $150.0 million and $62.5 million mature in January 2023 and January 2025, respectively. The Group entered into the interest rate swaps to minimise the Group’s exposure to interest rate risk by the Group agreeing to exchange the difference between fixed and variable rate interest amounts calculated by reference to an agreed-upon face value. The swaps are designed to hedge interest costs associated with the underlying corporate debt obligations. At 30 June 2021, after taking into account the effect of the interest rate swaps, the Group had approximately 27.1% of the Group’s corporate debt exposed to variable rates (2020: 22.2%).
An increase/decrease in interest rates of one hundred (2020: one hundred) basis points would have the following effect on profit/(loss) after tax:
Increase of one hundred basis points: $0.1 million unfavourable per annum (2020: $0.4 million unfavourable)Decrease of one hundred basis points: $4.6 million favourable per annum (2020: $2.9 million favourable); assuming a zero interest rate floor on cash at bank and cash on deposit balances.
The basis point change is based on the expected volatility of interest rates using market data, historical trends over prior years and the Group's ongoing relationships with financial institutions.
Steadfast Group Annual Report 2021 111
Notes to the Financial Statements continued
C. Credit risk
Credit risk refers to the risk that a counterparty will default on its contractual obligations resulting in financial loss to the Group. The Group obtains guarantees where appropriate to mitigate credit risk. The maximum exposure to credit risk at the reporting date to recognised financial assets is the carrying amount (net of any provisions for impairment of those assets) as disclosed in the statement of financial position and notes to the financial statements. The Group does not hold any collateral, except for the collateral specified in relation to loans to facilitate management buy-ins as described below.
Credit risk of the Group mainly arises from cash and cash equivalents, and trade and other receivables.
The Group has funded $27.8 million (2020: $46.5 million) of loans to facilitate management buy-ins to certain businesses under the Group’s owner-driven business model. These loans are disclosed as other non-current assets in the Consolidated Statement of Financial Position. These loans attract commercial interest rates, with dividends from these businesses used to fund interest and loan repayments. The shares held by management in those businesses are provided as loan collateral.
The Group’s exposure to credit risk is concentrated in the financial services industry with parties that are considered to be of sufficiently high credit quality (including cash held with major Australian banks) to minimise credit risk losses. Receivables include amounts due from policyholders in respect of insurances arranged by controlled entities. The Group assumes that the credit risk on fee and commission receivable increases significantly if outstanding past credit due terms. An expected credit loss provision is recognised in respect of fee and commission receivable.
The Group also has exposure to credit risk from premium funding loans. The expected credit loss provision for premium funding loans is based on historical data as a percentage of total loans written, after expected recoveries from trade credit policies.
The following table shows the movement in expected credit loss that has been recognised for fee and commission receivable and premium funding receivables in accordance with the simplified approach set out in AASB 9:
Fee & commission receivables2021
$'m2020
$'m
Balance at the beginning of the financial year 3.2 2.8
(Decrease)/increase in expected credit loss (0.3) 0.4
Additions through business combinations 0.2 -
Balance at the end of the financial year 3.1 3.2
Premium funding receivables2021
$'m2020
$'m
Balance at the beginning of the financial year 2.0 0.2
Increase in expected credit loss - 1.8
Balance at the end of the financial year 2.0 2.0
D. Liquidity risk
Vigilant liquidity risk management requires that the Group maintains sufficient liquid assets to be able to pay debts as and when they become due and payable. For both the Group’s insurance intermediaries and premium funders, this is largely achieved by maintaining sufficient cash reserves in the forms of cash and cash equivalents and available borrowing facilities.
The Group manages liquidity risk by maintaining adequate cash reserves and available borrowing facilities, continuously monitoring actual and forecast cash flows, and by matching the maturity profiles of financial assets and liabilities.
For the Group’s premium funders, liquidity risk is mitigated by allocating premium funding to a diverse range of corporate and SME businesses, limiting the majority of premium funding loans to 10 monthly instalments, minimising the life cycle of funds in use, retaining adequate levels of available funds to safeguard against exceeding facility limits, and by matching the maturity profile of current and prospective financial assets against available funding limits.
The following tables detail the Group's remaining contractual maturity for its financial liabilities. The tables have been drawn up based on the undiscounted cash flows of financial liabilities based on the earliest date on which the financial liabilities are required to be paid.
112 Steadfast Group Annual Report 2021
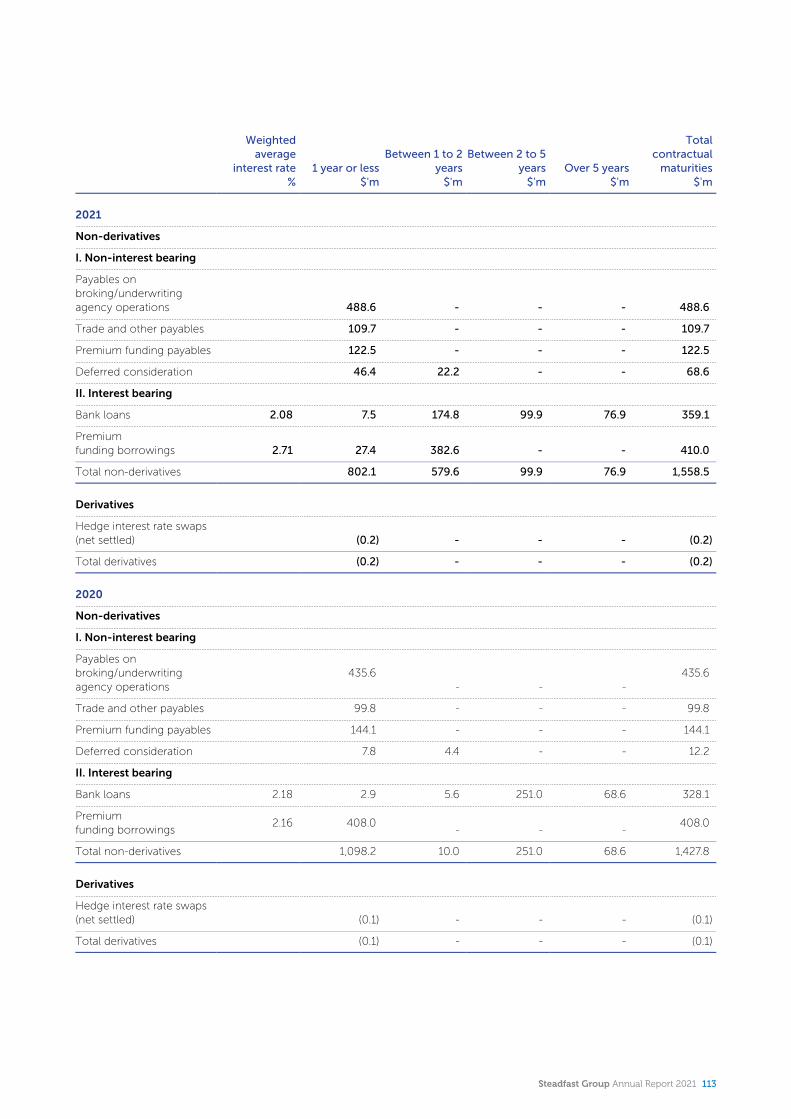
Weighted average
interest rate%
1 year or less$'m
Between 1 to 2 years
$'m
Between 2 to 5 years
$'mOver 5 years
$'m
Total contractual
maturities$'m
2021
Non-derivatives
I. Non-interest bearing
Payables on broking/underwriting agency operations 488.6 - - - 488.6
Trade and other payables 109.7 - - - 109.7
Premium funding payables 122.5 - - - 122.5
Deferred consideration 46.4 22.2 - - 68.6
II. Interest bearing
Bank loans 2.08 7.5 174.8 99.9 76.9 359.1
Premium funding borrowings 2.71 27.4 382.6 - - 410.0
Total non-derivatives 802.1 579.6 99.9 76.9 1,558.5
Derivatives
Hedge interest rate swaps (net settled) (0.2) - - - (0.2)
Total derivatives (0.2) - - - (0.2)
2020
Non-derivatives
I. Non-interest bearing
Payables on broking/underwriting agency operations
435.6- - -
435.6
Trade and other payables 99.8 - - - 99.8
Premium funding payables 144.1 - - - 144.1
Deferred consideration 7.8 4.4 - - 12.2
II. Interest bearing
Bank loans 2.18 2.9 5.6 251.0 68.6 328.1
Premium funding borrowings
2.16 408.0- - -
408.0
Total non-derivatives 1,098.2 10.0 251.0 68.6 1,427.8
Derivatives
Hedge interest rate swaps (net settled) (0.1) - - - (0.1)
Total derivatives (0.1) - - - (0.1)
Steadfast Group Annual Report 2021 113
Notes to the Financial Statements continued
Note 15. Contingencies
Contingent liabilities
Macquarie Bank put options
The Group has granted options to Macquarie Bank Limited (Macquarie) to enable Macquarie to put shares held by other shareholders in associates to the Group at fair value if Macquarie enforces its security over those shares. These have been granted in relation to shares held by other shareholders in associates over which Macquarie holds a security interest to secure indebtedness by those shareholders. The Group expects no material net exposure from this arrangement as the contingent liabilities have contingent assets (being rights to shares held by the relevant shareholders) approximating similar values.
Bank guarantee
In the normal course of business, certain controlled entities in the Group have provided security for bank guarantees principally in respect of their contractual obligations on commercial leases.
Note 16. Events after the reporting period
Final dividend
On 16 August 2021, the Board declared a final dividend for FY21 of 7.0 cents per share, fully franked. The dividend will be paid on 10 September 2021.
Acquisition of Coverforce
In August 2021 the Group announced the acquisition of Coverforce for a purchase price of $411.5 million. The acquisition will be fully funded by equity, with $217.8 million of Steadfast scrip to be issued to the Coverforce vendors, and a fully underwritten placement of $200.0 million.
Capital raising
The Group is undertaking a fully underwritten placement to raise approximately $200.0 million together with an accompanying non-underwritten Share Purchase Plan.
Note 17. Share-based remuneration
Share-based payments – employee related
Share-based remuneration encourages employee share ownership, links employee reward to the performance of the Group and assists with attracting, retaining and motivating highly qualified and key personnel.
The Company intends to settle its obligations under share-based payment arrangements by the on-market purchase of the Company’s ordinary shares which will be held in trust pending exercise of vested rights by employees. The Group has established a practice of purchasing a tranche of shares on or near grant date at the prevailing market price to facilitate building up a portfolio sufficient to meet the obligations when rights vest.
Trading in the Company’s ordinary shares awarded under the share-based remuneration arrangements is covered by the same restrictions that apply to all forms of share ownership by employees. These restrictions prohibit an employee trading in the Company’s ordinary shares when they are aware of price sensitive information and limit their trading at other times.
The Group has the following types of share-based remuneration arrangements provided to employees; each arrangement has different purposes and different rules:
short-term incentive plan; andlong-term incentive plan.
The share-based payments are included in the employment expense line in the statement of profit or loss and other comprehensive income.
Senior management and executive share plans
The senior management and executive share plan arrangements are awarded based on the terms and conditions as set out in the short-term and long-term incentive plans. When granted, the awards in these two plans may be in the form of cash and/or conditional rights. The Board has approved the participation of each individual in these arrangements as well as the actual awards based on the performance conditions in these two plans being met.
A. The short-term incentive plan (STI)
The STI plan is a discretionary, performance-based, at risk reward arrangement. STI is awarded based on each participant’s performance hurdles and whether the financial performance hurdle of a minimum 7.5% (FY20: 5%) of diluted earnings per share growth of the Group are met.
The key terms of the STI plan for the 2021 financial year are:
total STI will be awarded and settled in the form of cash and conditional rights as approved by the Board if diluted EPS growth targets and individual participant’s performance criteria for the performance period (i.e. 1 July to 30 June) are met. If met:
60% of STI will be settled in the form of cash and will be paid annually in August after the performance period; and
114 Steadfast Group Annual Report 2021
40% of STI awarded will be deferred and granted in the form of conditional rights;conditional rights (rights) are granted for nil consideration;the vesting condition of rights is not market related and requires the participant to continue in relevant employment from the grant date of the rights (retention period), split one-third over one, two and three years;the rights will accrue notional dividends during the retention period;when vesting (after completion of the retention period), each right will be converted into one Steadfast ordinary share per right for nil consideration upon exercise by the participant. The notional dividends will be converted into an equivalent number of Steadfast ordinary shares based on the Dividend Reinvestment Plan issue price applicable to each dividend;the Board has discretion to settle the rights in cash instead of Steadfast ordinary shares;the vesting is conditional on there being no material adverse deterioration in the 2021 reported results during the performance period before the exercise of the rights; andif the vesting condition is not met then the rights lapse.
Further details of the 2021 STI in relation to the Group’s key management personnel are disclosed in the Remuneration Report.
B. The long-term incentive plan (LTI)
The LTI plan is a discretionary, performance-based, at risk reward arrangement. LTI is awarded based on each participant’s performance hurdles and whether the minimum financial performance hurdles in diluted earnings per share growth and Total Shareholder Return (TSR) are met.
The key terms of the LTI plan for the 2021 financial year are:
LTI will be awarded in the form of conditional rights as approved by the Board and will be granted in August following the end of each financial year;conditional rights (rights) are granted for nil consideration;the vesting condition of rights is not market related and is conditional on meeting the following performance hurdles:
the participants meeting their individual performance hurdles during the three-year employment tenure from the grant date of the rights (retention period);75% based on the Group achieving a minimum 5% (maximum at 10%) average straight line per annum diluted EPS growth during the retention period; and25% based on the Group achieving a minimum TSR above the 50th percentile (maximum at 75th percentile) of the peer group during the retention period;
the rights will not accrue notional dividends during the retention period;before vesting, the Board will determine the number of rights to vest based on the combined outcome of the performance hurdles;when vesting (after completion of the retention period), each right will be converted into one Steadfast ordinary share for nil consideration upon exercise by the participant;the Board has discretion to settle the rights in cash instead of Steadfast ordinary shares; andif the vesting conditions are not met then the rights lapse.
Further details of the 2021 LTI in relation to the Group’s key management personnel are disclosed in the Remuneration Report.
Employee share plan
The Short-Term Employee Incentive Plan (STEIP) is a discretionary, performance based at-risk reward arrangement for employees other than senior management and Executives that aims to recognise the contributions of the eligible employees of Steadfast Group Limited when outstanding financial results and individual performance objectives are achieved.
The 2021 STEIP consists of two potential reward components:
cash component – a cash award which may be delivered if diluted EPS growth targets are met; anddeferred equity component – a deferred equity award (DEA) of conditional rights to Steadfast shares if diluted EPS growth targets are met and subject to a tenure hurdle and no negative material deterioration in EPS from prior year adjustments in the subsequent year. Participation in the DEA component of the STEIP is by invitation only and is limited to participants approved by the Group Managing Director & CEO.
The diluted underlying EPS growth targets for the STEIP are aligned with those in the senior management and executive STI plan.
Notional dividends on the conditional rights will accrue during the tenure hurdle period from the first interim dividend after the grant date. The notional dividends will be calculated in accordance with the Dividend Reinvestment Plan (DRP) as varied from time to time. The accrued value of notional dividends will be provided to a participant on the vesting date of a conditional right in the form of additional Steadfast shares (or cash in lieu).
Steadfast Group Annual Report 2021 115
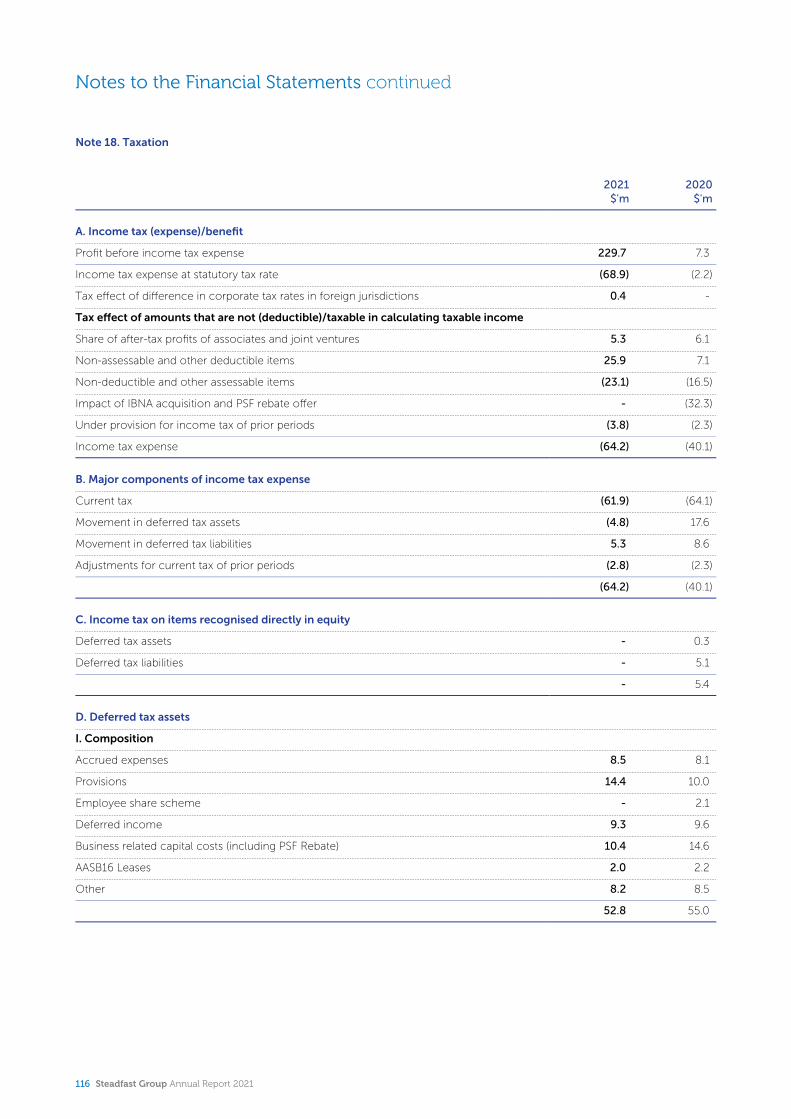
Notes to the Financial Statements continued
Note 18. Taxation
2021$'m
2020$'m
A. Income tax (expense)/benefit
Profit before income tax expense 229.7 7.3
Income tax expense at statutory tax rate (68.9) (2.2)
Tax effect of difference in corporate tax rates in foreign jurisdictions 0.4 -
Tax effect of amounts that are not (deductible)/taxable in calculating taxable income
Share of after-tax profits of associates and joint ventures 5.3 6.1
Non-assessable and other deductible items 25.9 7.1
Non-deductible and other assessable items (23.1) (16.5)
Impact of IBNA acquisition and PSF rebate offer - (32.3)
Under provision for income tax of prior periods (3.8) (2.3)
Income tax expense (64.2) (40.1)
B. Major components of income tax expense
Current tax (61.9) (64.1)
Movement in deferred tax assets (4.8) 17.6
Movement in deferred tax liabilities 5.3 8.6
Adjustments for current tax of prior periods (2.8) (2.3)
(64.2) (40.1)
C. Income tax on items recognised directly in equity
Deferred tax assets - 0.3
Deferred tax liabilities - 5.1
- 5.4
D. Deferred tax assets
I. Composition
Accrued expenses 8.5 8.1
Provisions 14.4 10.0
Employee share scheme - 2.1
Deferred income 9.3 9.6
Business related capital costs (including PSF Rebate) 10.4 14.6
AASB16 Leases 2.0 2.2
Other 8.2 8.5
52.8 55.0
116 Steadfast Group Annual Report 2021
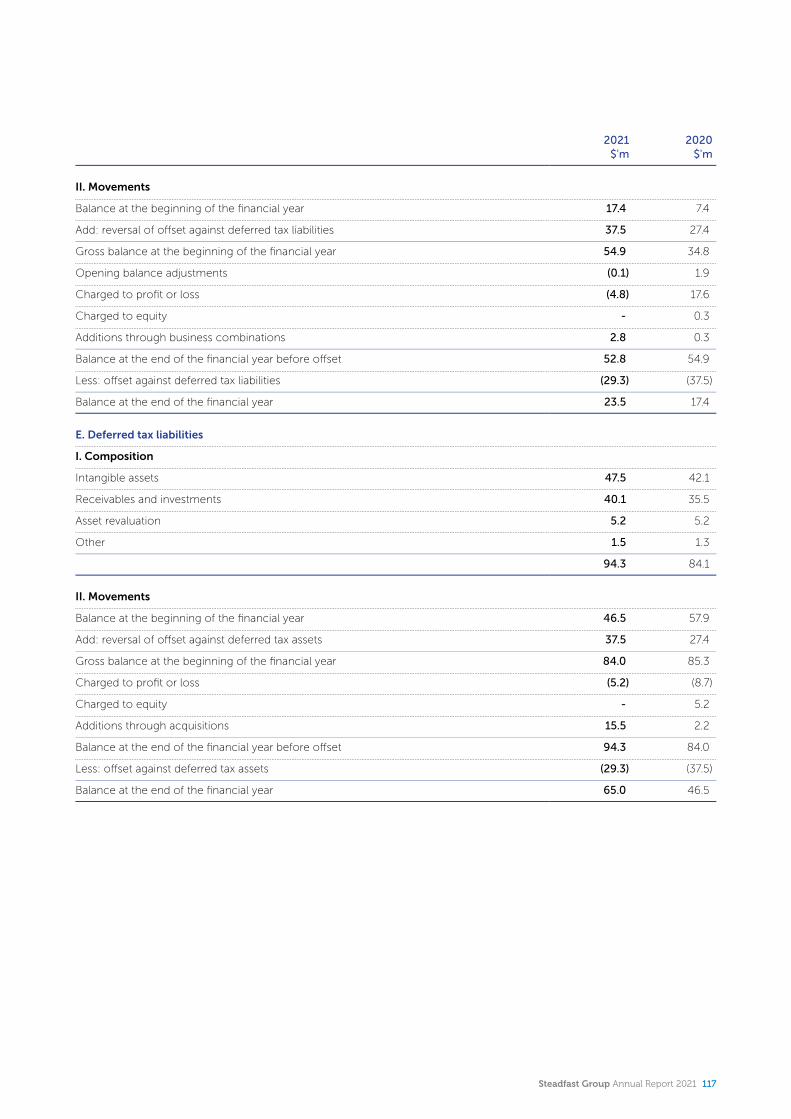
2021$'m
2020$'m
II. Movements
Balance at the beginning of the financial year 17.4 7.4
Add: reversal of offset against deferred tax liabilities 37.5 27.4
Gross balance at the beginning of the financial year 54.9 34.8
Opening balance adjustments (0.1) 1.9
Charged to profit or loss (4.8) 17.6
Charged to equity - 0.3
Additions through business combinations 2.8 0.3
Balance at the end of the financial year before offset 52.8 54.9
Less: offset against deferred tax liabilities (29.3) (37.5)
Balance at the end of the financial year 23.5 17.4
E. Deferred tax liabilities
I. Composition
Intangible assets 47.5 42.1
Receivables and investments 40.1 35.5
Asset revaluation 5.2 5.2
Other 1.5 1.3
94.3 84.1
II. Movements
Balance at the beginning of the financial year 46.5 57.9
Add: reversal of offset against deferred tax assets 37.5 27.4
Gross balance at the beginning of the financial year 84.0 85.3
Charged to profit or loss (5.2) (8.7)
Charged to equity - 5.2
Additions through acquisitions 15.5 2.2
Balance at the end of the financial year before offset 94.3 84.0
Less: offset against deferred tax assets (29.3) (37.5)
Balance at the end of the financial year 65.0 46.5
Steadfast Group Annual Report 2021 117
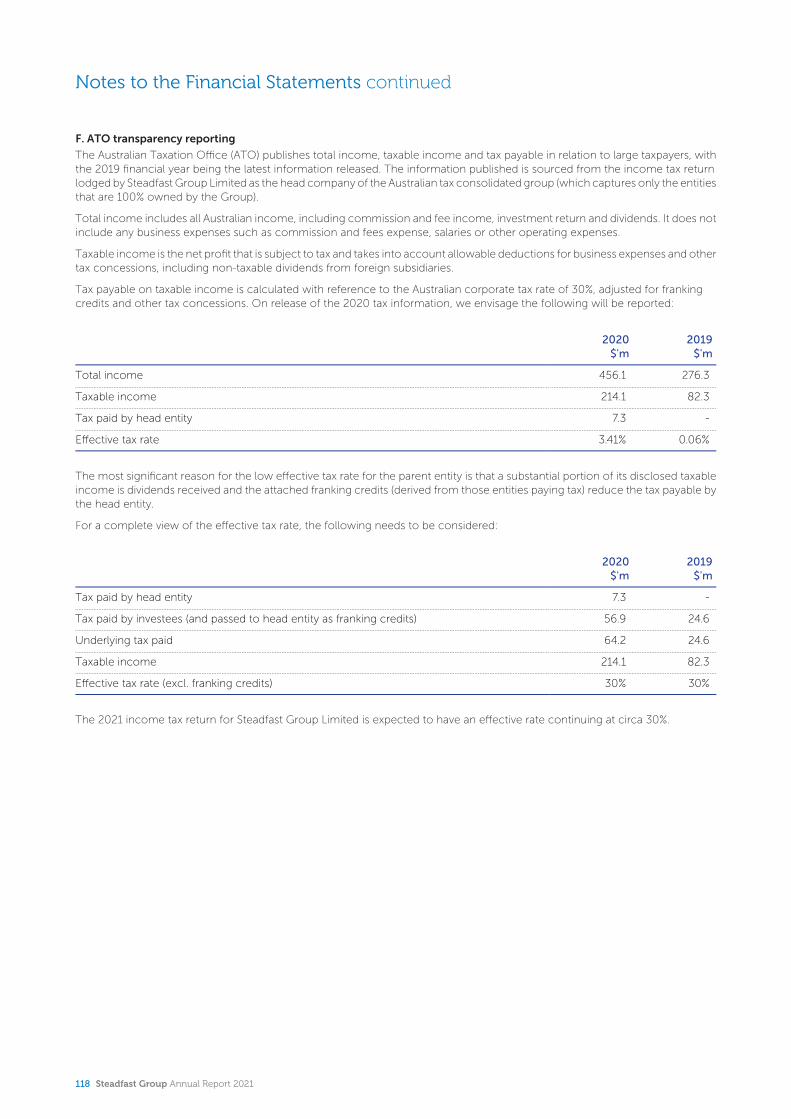
Notes to the Financial Statements continued
F. ATO transparency reporting
The Australian Taxation Office (ATO) publishes total income, taxable income and tax payable in relation to large taxpayers, with the 2019 financial year being the latest information released. The information published is sourced from the income tax return lodged by Steadfast Group Limited as the head company of the Australian tax consolidated group (which captures only the entities that are 100% owned by the Group).
Total income includes all Australian income, including commission and fee income, investment return and dividends. It does not include any business expenses such as commission and fees expense, salaries or other operating expenses.
Taxable income is the net profit that is subject to tax and takes into account allowable deductions for business expenses and other tax concessions, including non-taxable dividends from foreign subsidiaries.
Tax payable on taxable income is calculated with reference to the Australian corporate tax rate of 30%, adjusted for franking credits and other tax concessions. On release of the 2020 tax information, we envisage the following will be reported:
2020$'m
2019$'m
Total income 456.1 276.3
Taxable income 214.1 82.3
Tax paid by head entity 7.3 -
Effective tax rate 3.41% 0.06%
The most significant reason for the low effective tax rate for the parent entity is that a substantial portion of its disclosed taxable income is dividends received and the attached franking credits (derived from those entities paying tax) reduce the tax payable by the head entity.
For a complete view of the effective tax rate, the following needs to be considered:
2020$'m
2019$'m
Tax paid by head entity 7.3 -
Tax paid by investees (and passed to head entity as franking credits) 56.9 24.6
Underlying tax paid 64.2 24.6
Taxable income 214.1 82.3
Effective tax rate (excl. franking credits) 30% 30%
The 2021 income tax return for Steadfast Group Limited is expected to have an effective rate continuing at circa 30%.
118 Steadfast Group Annual Report 2021
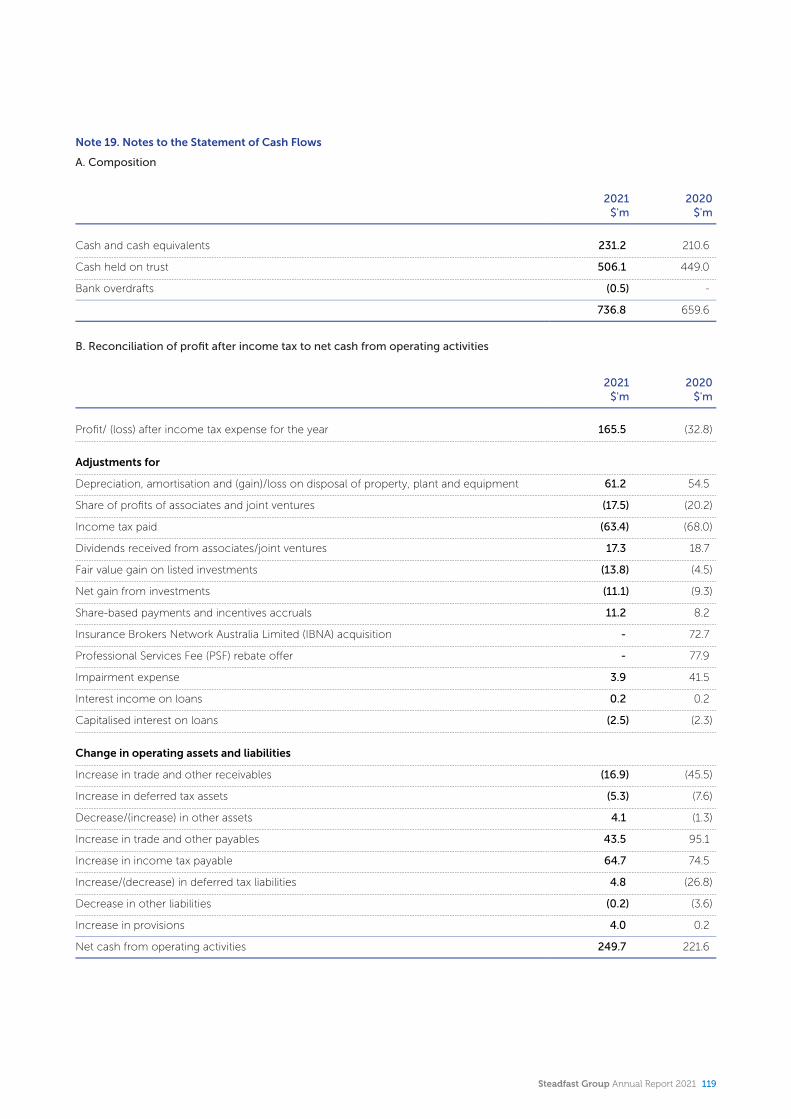
Note 19. Notes to the Statement of Cash Flows
A. Composition
2021$'m
2020$'m
Cash and cash equivalents 231.2 210.6
Cash held on trust 506.1 449.0
Bank overdrafts (0.5) -
736.8 659.6
B. Reconciliation of profit after income tax to net cash from operating activities
2021$'m
2020$'m
Profit/ (loss) after income tax expense for the year 165.5 (32.8)
Adjustments for
Depreciation, amortisation and (gain)/loss on disposal of property, plant and equipment 61.2 54.5
Share of profits of associates and joint ventures (17.5) (20.2)
Income tax paid (63.4) (68.0)
Dividends received from associates/joint ventures 17.3 18.7
Fair value gain on listed investments (13.8) (4.5)
Net gain from investments (11.1) (9.3)
Share-based payments and incentives accruals 11.2 8.2
Insurance Brokers Network Australia Limited (IBNA) acquisition - 72.7
Professional Services Fee (PSF) rebate offer - 77.9
Impairment expense 3.9 41.5
Interest income on loans 0.2 0.2
Capitalised interest on loans (2.5) (2.3)
Change in operating assets and liabilities
Increase in trade and other receivables (16.9) (45.5)
Increase in deferred tax assets (5.3) (7.6)
Decrease/(increase) in other assets 4.1 (1.3)
Increase in trade and other payables 43.5 95.1
Increase in income tax payable 64.7 74.5
Increase/(decrease) in deferred tax liabilities 4.8 (26.8)
Decrease in other liabilities (0.2) (3.6)
Increase in provisions 4.0 0.2
Net cash from operating activities 249.7 221.6
Steadfast Group Annual Report 2021 119
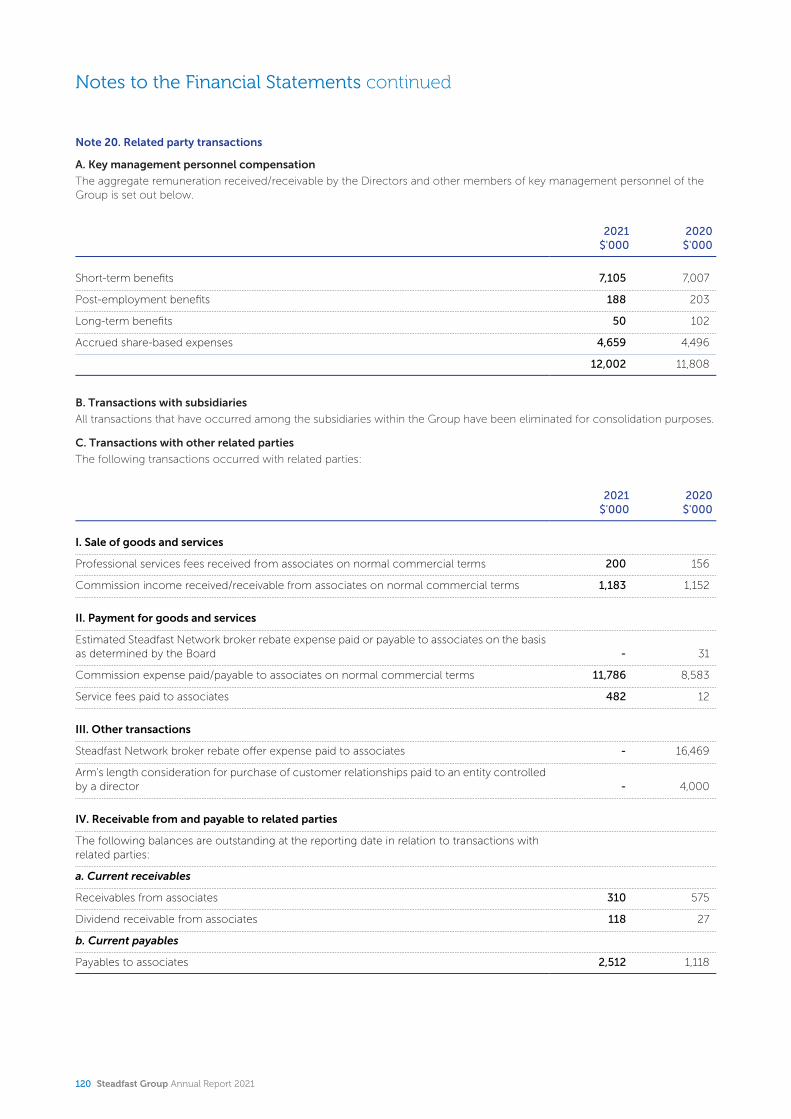
Notes to the Financial Statements continued
Note 20. Related party transactions
A. Key management personnel compensation
The aggregate remuneration received/receivable by the Directors and other members of key management personnel of the Group is set out below.
2021$'000
2020$'000
Short-term benefits 7,105 7,007
Post-employment benefits 188 203
Long-term benefits 50 102
Accrued share-based expenses 4,659 4,496
12,002 11,808
B. Transactions with subsidiaries
All transactions that have occurred among the subsidiaries within the Group have been eliminated for consolidation purposes.
C. Transactions with other related parties
The following transactions occurred with related parties:
2021$'000
2020$'000
I. Sale of goods and services
Professional services fees received from associates on normal commercial terms 200 156
Commission income received/receivable from associates on normal commercial terms 1,183 1,152
II. Payment for goods and services
Estimated Steadfast Network broker rebate expense paid or payable to associates on the basis as determined by the Board - 31
Commission expense paid/payable to associates on normal commercial terms 11,786 8,583
Service fees paid to associates 482 12
III. Other transactions
Steadfast Network broker rebate offer expense paid to associates - 16,469
Arm's length consideration for purchase of customer relationships paid to an entity controlled by a director - 4,000
IV. Receivable from and payable to related parties
The following balances are outstanding at the reporting date in relation to transactions with related parties:
a. Current receivables
Receivables from associates 310 575
Dividend receivable from associates 118 27
b. Current payables
Payables to associates 2,512 1,118
120 Steadfast Group Annual Report 2021
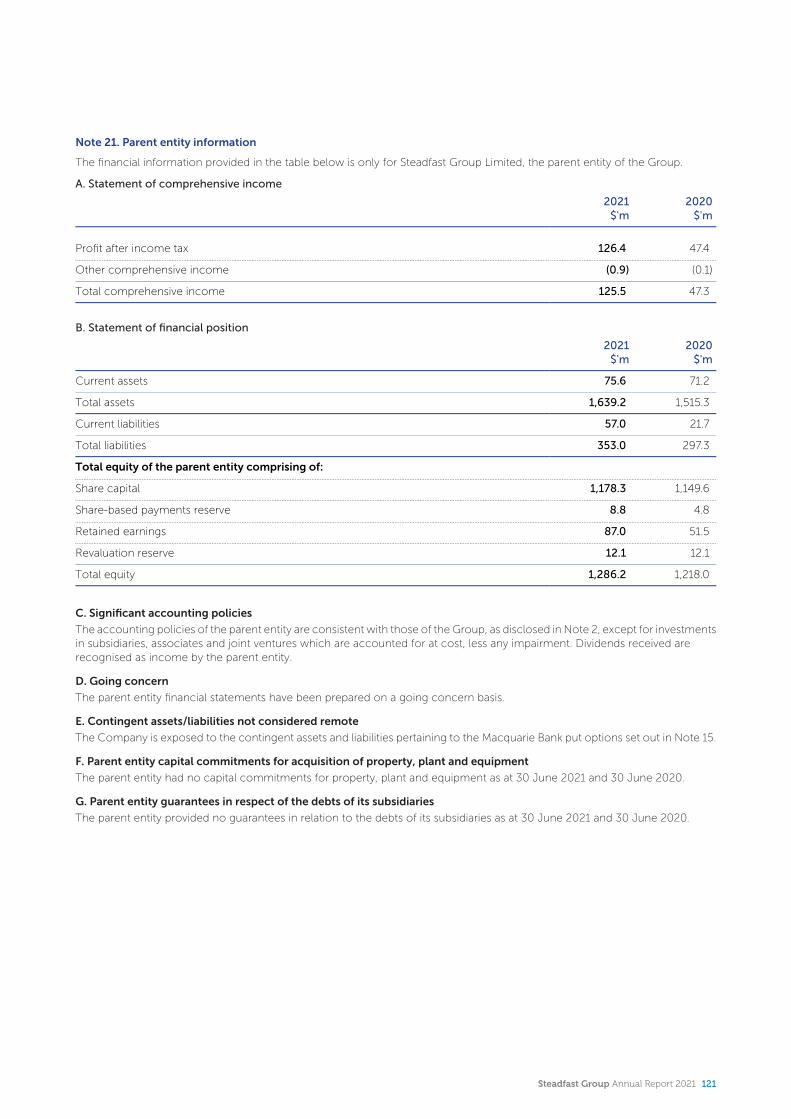
Note 21. Parent entity information
The financial information provided in the table below is only for Steadfast Group Limited, the parent entity of the Group.
A. Statement of comprehensive income
2021$'m
2020$'m
Profit after income tax 126.4 47.4
Other comprehensive income (0.9) (0.1)
Total comprehensive income 125.5 47.3
B. Statement of financial position
2021$'m
2020$'m
Current assets 75.6 71.2
Total assets 1,639.2 1,515.3
Current liabilities 57.0 21.7
Total liabilities 353.0 297.3
Total equity of the parent entity comprising of:
Share capital 1,178.3 1,149.6
Share-based payments reserve 8.8 4.8
Retained earnings 87.0 51.5
Revaluation reserve 12.1 12.1
Total equity 1,286.2 1,218.0
C. Significant accounting policies
The accounting policies of the parent entity are consistent with those of the Group, as disclosed in Note 2, except for investments in subsidiaries, associates and joint ventures which are accounted for at cost, less any impairment. Dividends received are recognised as income by the parent entity.
D. Going concern
The parent entity financial statements have been prepared on a going concern basis.
E. Contingent assets/liabilities not considered remote
The Company is exposed to the contingent assets and liabilities pertaining to the Macquarie Bank put options set out in Note 15.
F. Parent entity capital commitments for acquisition of property, plant and equipment
The parent entity had no capital commitments for property, plant and equipment as at 30 June 2021 and 30 June 2020.
G. Parent entity guarantees in respect of the debts of its subsidiaries
The parent entity provided no guarantees in relation to the debts of its subsidiaries as at 30 June 2021 and 30 June 2020.
Steadfast Group Annual Report 2021 121
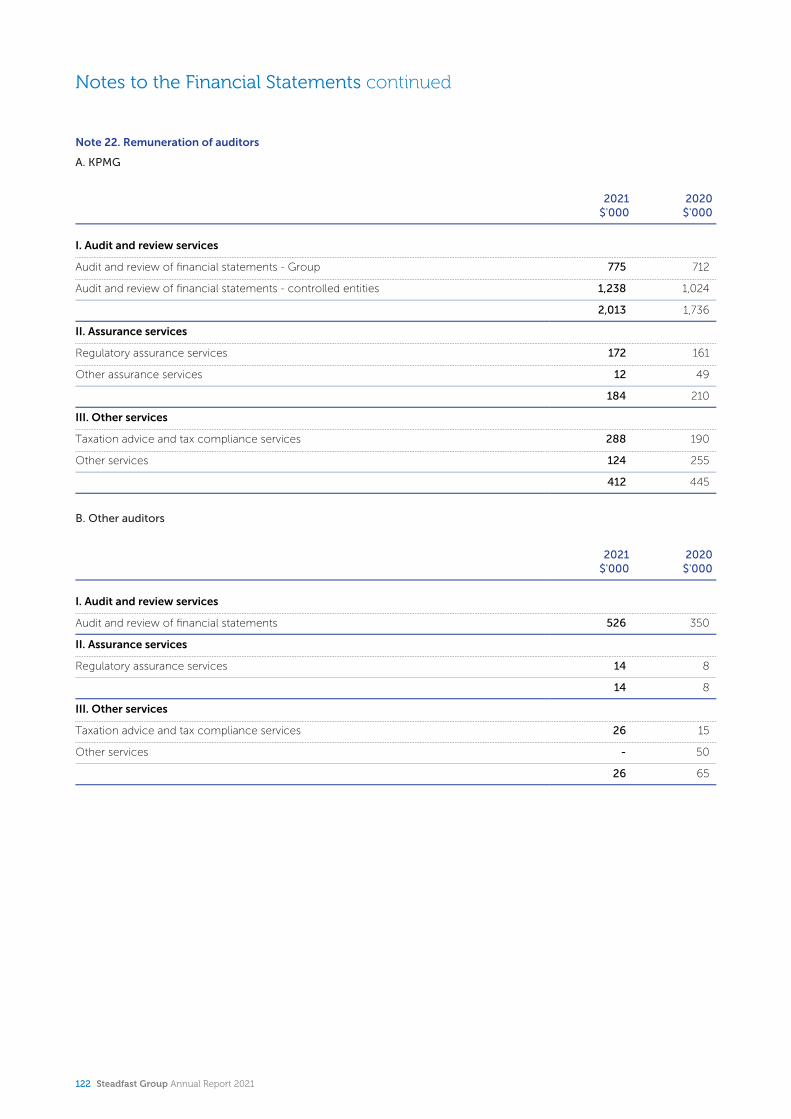
Notes to the Financial Statements continued
Note 22. Remuneration of auditors
A. KPMG
2021$'000
2020$'000
I. Audit and review services
Audit and review of financial statements - Group 775 712
Audit and review of financial statements - controlled entities 1,238 1,024
2,013 1,736
II. Assurance services
Regulatory assurance services 172 161
Other assurance services 12 49
184 210
III. Other services
Taxation advice and tax compliance services 288 190
Other services 124 255
412 445
B. Other auditors
2021$'000
2020$'000
I. Audit and review services
Audit and review of financial statements 526 350
II. Assurance services
Regulatory assurance services 14 8
14 8
III. Other services
Taxation advice and tax compliance services 26 15
Other services - 50
26 65
122 Steadfast Group Annual Report 2021
Steadfast Group Limited
Director's declaration
1. In the opinion of the Directors of Steadfast Group Limited (‘the Company’):a. the consolidated financial statements and notes that are set out on pages 76 to 122 and the Remuneration Report in the
Directors’ Report, are in accordance with the Corporations Act 2001, including:i. giving a true and fair view of the Group’s financial position as at 30 June 2021 and of its performance, for the financial year
ended on that date; andii. complying with Australian Accounting Standards and the Corporations Regulations 2001; and
b. there are reasonable grounds to believe that the Company will be able to pay its debts as and when they become due and payable.
2. The Directors have been given the declarations required by Section 295A of the Corporations Act 2001 from the chief executive officer and chief financial officer for the financial year ended 30 June 2021.
3. The Directors draw attention to Note 2A to the consolidated financial statements, which includes a statement of compliance with International Financial Reporting Standards.
Signed at Sydney on 16 August 2021 in accordance with a resolution of the Directors:
Frank O’Halloran, AMChairman
Robert KellyManaging Director & CEO
Steadfast Group Annual Report 2021 123

KPMG, an Australian partnership and a member firm of the KPMG global organisation of independent member firms affiliated with KPMG International Limited, a private English company limited by guarantee. All rights reserved. The KPMG name and logo are trademarks used under license by the independent member firms of the KPMG global organisation. Liability limited by a scheme approved under Professional Standards Legislation.
Independent Auditor’s Report
To the shareholders of Steadfast Group Limited
Report on the audit of the Financial Report
Opinion
We have audited the Financial Report of Steadfast Group Limited (the Company).
In our opinion, the accompanying Financial Report of the Company is in accordance with the Corporations Act 2001, including:
• giving a true and fair view of the Group's financial position as at 30 June 2021 and of its financial performance for the year ended on that date; and
• complying with Australian Accounting Standards and the Corporations Regulations 2001.
The Financial Report comprises:
• Consolidated Statement of Financial Position as at 30 June 2021;
• Consolidated Statement of Profit or Loss and Other Comprehensive Income, Consolidated Statement of Changes in Equity, and Consolidated Statement of Cash Flows for the year then ended;
• Notes including a summary of significant accounting policies; and
• Directors' Declaration.
The Group consists of the Company and the entities it controlled at the year end or from time to time during the financial year.
Basis for opinion
We conducted our audit in accordance with Australian Auditing Standards. We believe that the audit evidence we have obtained is sufficient and appropriate to provide a basis for our opinion.
Our responsibilities under those standards are further described in the Auditor’s responsibilities for the audit of the Financial Report section of our report.
We are independent of the Group in accordance with the Corporations Act 2001 and the ethical requirements of the Accounting Professional and Ethical Standards Board’s APES 110 Code of Ethics for Professional Accountants (including Independence Standards) (the Code) that are relevant to our audit of the Financial Report in Australia. We have fulfilled our other ethical responsibilities in accordance with the Code.
Key Audit Matters
The Key Audit Matters we identified are:
• Valuation of Goodwill, Intangible assets and Investments in associates & joint ventures; and
• Decentralised operations.
Key Audit Matters are those matters that, in our professional judgement, were of most significance in our audit of the Financial Report of the current period.
These matters were addressed in the context of our audit of the Financial Report as a whole, and in forming our opinion thereon, and we do not provide a separate opinion on these matters.
124 Steadfast Group Annual Report 2021
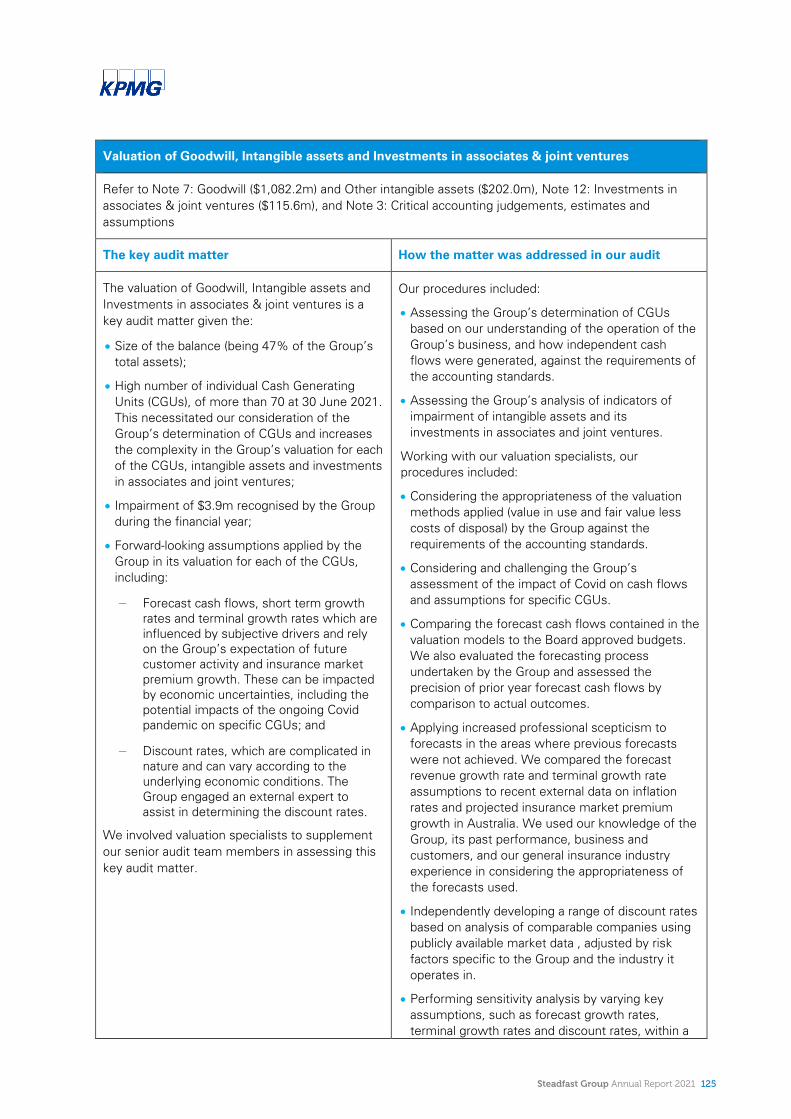
Valuation of Goodwill, Intangible assets and Investments in associates & joint ventures
Refer to Note 7: Goodwill ($1,082.2m) and Other intangible assets ($202.0m), Note 12: Investments in associates & joint ventures ($115.6m), and Note 3: Critical accounting judgements, estimates and assumptions
The key audit matter How the matter was addressed in our audit
The valuation of Goodwill, Intangible assets and Investments in associates & joint ventures is a key audit matter given the:
• Size of the balance (being 47% of the Group’s total assets);
• High number of individual Cash Generating Units (CGUs), of more than 70 at 30 June 2021. This necessitated our consideration of the Group’s determination of CGUs and increases the complexity in the Group’s valuation for each of the CGUs, intangible assets and investments in associates and joint ventures;
• Impairment of $3.9m recognised by the Group during the financial year;
• Forward-looking assumptions applied by the Group in its valuation for each of the CGUs, including:
− Forecast cash flows, short term growth rates and terminal growth rates which are influenced by subjective drivers and rely on the Group’s expectation of future customer activity and insurance market premium growth. These can be impacted by economic uncertainties, including the potential impacts of the ongoing Covid pandemic on specific CGUs; and
− Discount rates, which are complicated in nature and can vary according to the underlying economic conditions. The Group engaged an external expert to assist in determining the discount rates.
We involved valuation specialists to supplement our senior audit team members in assessing this key audit matter.
Our procedures included:
• Assessing the Group’s determination of CGUs based on our understanding of the operation of the Group’s business, and how independent cash flows were generated, against the requirements of the accounting standards.
• Assessing the Group’s analysis of indicators of impairment of intangible assets and its investments in associates and joint ventures.
Working with our valuation specialists, our procedures included:
• Considering the appropriateness of the valuation methods applied (value in use and fair value less costs of disposal) by the Group against the requirements of the accounting standards.
• Considering and challenging the Group’s assessment of the impact of Covid on cash flows and assumptions for specific CGUs.
• Comparing the forecast cash flows contained in the valuation models to the Board approved budgets. We also evaluated the forecasting process undertaken by the Group and assessed the precision of prior year forecast cash flows by comparison to actual outcomes.
• Applying increased professional scepticism to forecasts in the areas where previous forecasts were not achieved. We compared the forecast revenue growth rate and terminal growth rate assumptions to recent external data on inflation rates and projected insurance market premium growth in Australia. We used our knowledge of the Group, its past performance, business and customers, and our general insurance industry experience in considering the appropriateness of the forecasts used.
• Independently developing a range of discount rates based on analysis of comparable companies using publicly available market data , adjusted by risk factors specific to the Group and the industry it operates in.
• Performing sensitivity analysis by varying key assumptions, such as forecast growth rates, terminal growth rates and discount rates, within a
Steadfast Group Annual Report 2021 125
reasonably possible range, for key CGUs. We did this to identify those CGUs at higher risk of impairment, assumptions at higher risk of bias, and to focus our further audit procedures. Additionally, we cross checked the valuation results against earnings multiples inherent in the value of other comparable companies.
• We assessed the integrity of the value in use model used, including accuracy of the underlying calculation formulas.
Decentralised operations
Refer to Note 2: Significant accounting policies, Note 11: Subsidiaries, and Note 12: Investments in associates & joint ventures
The key audit matter How the matter was addressed in our audit
The Group comprises more than 130 subsidiaries, associates and joint ventures (components) whose operations are spread across Australia, New Zealand, and to a lesser degree, the United Kingdom, Singapore and Germany. The Group’s primary business is general insurance distribution, and the individual components are wide ranging in size, and in the customers and products of each business operation.
The decentralised and varied nature of these operations requires significant oversight by the Group to monitor the activities, review component financial reporting and undertake the Group consolidation. This is an extensive process due to the variety of accounting processes and systems used across the Group.
This was a key audit matter given the high number of subsidiaries, associates and joint ventures and the varied operations, accounting processes and systems.
We focused on:
• Understanding the components and identifying the significant risks of misstatement within each component;
• The scoping of relevant procedures consistent with the risks identified and to enable coverage of significant aggregated balances;
• The assessment of components compliance with the Group accounting policies; and
• The consolidation process and aggregation of results from component procedures.
Our procedures included:
• Instructing component audit teams to perform procedures on the financial information prepared for consolidation purposes by 34 components. The selected components were significant to the audit of the Group, either by size or by risk, and covered over 86% of the Group’s revenue and 88% of total assets. The objective of this approach was to gather evidence on significant balances that aggregate to form a large part of the Group’s financial reporting.
• The component audit teams performed audits of the financial information of these components which included specific Group reporting package information and local statutory financial reporting. We worked with the component audit teams to identify risks significant to the audit of the Group and to plan relevant procedures.
• Discussing the component audits as they progressed to identify and address any issues and working with the component audit teams as appropriate. We read the audit reports issued to us and the underlying memos explaining component results, including the impacts of the Covid pandemic on each component.
• Evaluating the work performed by the component audit teams for sufficiency for our overall audit purpose. We also considered the components’ compliance with the Group’s accounting policies, including those relating to the recognition of revenue as part of our evaluation of the component teams reporting to us.
• Testing the financial data used in the consolidation process for consistency with the financial data audited by component audit teams. We also
126 Steadfast Group Annual Report 2021

assessed the consolidation process for compliance with accounting standards.
• For the selected significant components, inspecting the component auditors’ files for consistency between the auditor’s opinion and the underlying audit work.
• For the other components not within the scope of component audit teams’ procedures, our head office audit procedures included testing the Group’s key monitoring controls and performance of analytical procedures. We inspected a sample of bank reconciliations, debtors’ reports, statutory financial reports and accompanying audit reports, and inquired of head office management. In our analytical procedures we compared actual financial results to budgets and the prior year results. We inquired of head office and considered trends within the insurance market.
Other Information
Other Information is financial and non-financial information in Steadfast Group Limited’s annual reporting which is provided in addition to the Financial Report and the Auditor’s Report. The Directors are responsible for the Other Information.
Our opinion on the Financial Report does not cover the Other Information and, accordingly, we do not express an audit opinion or any form of assurance conclusion thereon, with the exception of the Remuneration Report and our related assurance opinion.
In connection with our audit of the Financial Report, our responsibility is to read the Other Information. In doing so, we consider whether the Other Information is materially inconsistent with the Financial Report or our knowledge obtained in the audit, or otherwise appears to be materially misstated.
We are required to report if we conclude that there is a material misstatement of this Other Information, and based on the work we have performed on the Other Information that we obtained prior to the date of this Auditor’s Report we have nothing to report.
Responsibilities of the Directors for the Financial Report
The Directors are responsible for:
• preparing the Financial Report that gives a true and fair view in accordance with Australian Accounting Standards and the Corporations Act 2001;
• implementing necessary internal control to enable the preparation of a Financial Report that gives a true and fair view and is free from material misstatement, whether due to fraud or error; and
• assessing the Group and Company's ability to continue as a going concern and whether the use of the going concern basis of accounting is appropriate. This includes disclosing, as applicable, matters related to going concern and using the going concern basis of accounting unless they either intend to liquidate the Group and Company or to cease operations, or have no realistic alternative but to do so.
Steadfast Group Annual Report 2021 127
Auditor’s responsibilities for the audit of the Financial Report
Our objective is:
• to obtain reasonable assurance about whether the Financial Report as a whole is free from materialmisstatement, whether due to fraud or error; and
• to issue an Auditor’s Report that includes our opinion.
Reasonable assurance is a high level of assurance, but is not a guarantee that an audit conducted in accordance with Australian Auditing Standards will always detect a material misstatement when it exists.
Misstatements can arise from fraud or error. They are considered material if, individually or in the aggregate, they could reasonably be expected to influence the economic decisions of users taken on the basis of the Financial Report.
A further description of our responsibilities for the audit of the Financial Report is located at the Auditing and Assurance Standards Board website at: https://www.auasb.gov.au/admin/file/content102/c3/ar1_2020.pdf. This description forms part of our Auditor’s Report.
Report on the Remuneration Report
Opinion
In our opinion, the Remuneration Report of Steadfast Group Limited for the year ended 30 June 2021, complies with Section 300A of the Corporations Act 2001.
Directors’ responsibilities
The Directors of the Company are responsible for the preparation and presentation of the Remuneration Report in accordance with Section 300A of the Corporations Act 2001.
Our responsibilities
We have audited the Remuneration Report included in pages 53 to 73 of the Directors’ report for the year ended 30 June 2021.
Our responsibility is to express an opinion on the Remuneration Report, based on our audit conducted in accordance with Australian Auditing Standards.
KPMG
Scott Guse Partner
Sydney 16 August 2021
Julia Gunn Partner
128 Steadfast Group Annual Report 2021

Shareholders' informationAs at 30 July 2021
Ordinary share capital
There were 871,507,434 fully paid ordinary shares held by 7,380 shareholders. All the shares carry one vote per share and carry the rights to dividends.
Distribution of shareholders
The number of shareholders by size of holding are as follows:
Range No. of holders No. of shares % of issued capital
100,001 and over 386 806,809,625 92.58%
10,001 to 100,000 1,650 50,166,316 5.76%
5,001 to 10,000 1,035 7,532,072 0.86%
1,001 to 5,000 2,247 6,053,890 0.69%
1 to 1,000 2,062 945,531 0.11%
Total 7,380 871,507,434 100.00%
There were 230 shareholders holding less than a marketable parcel based on a market price of $4.44 at the close of trading on 30 July 2021.
Twenty largest shareholders
Name No. of shares % of issued capital
HSBC Custody Nominees (Australia) Limited 219,279,784 25.16%
J P Morgan Nominees Australia Pty Limited 174,440,041 20.02%
Citicorp Nominees Pty Limited 92,495,695 10.61%
National Nominees Limited 69,034,423 7.92%
Mackay Insurance Services Pty Ltd 34,459,756 3.95%
BNP Paribas Nominees Pty Ltd 26,123,090 3.00%
BNP Paribas Noms Pty Ltd 14,251,489 1.64%
Argo Investments Limited 13,478,079 1.55%
Citicorp Nominees Pty Limited 12,768,798 1.47%
HSBC Custody Nominees (Australia) Limited 6,383,510 0.73%
BNP Paribas Nominees Pty Ltd Hub24 Custodial Serv Ltd 4,576,878 0.53%
Steadfast Share Plan Nominee Pty Ltd 3,903,178 0.45%
Mr Robert Bernard Kelly 3,314,938 0.38%
RC & IP Gilbert Pty Ltd 3,100,000 0.36%
HSBC Custody Nominees (Australia) Limited 2,733,367 0.31%
Mr David Ingram 2,666,203 0.31%
BNP Paribas Nominees Pty Ltd Six Sis Ltd 2,394,821 0.27%
Netwealth Investments Limited 1,914,077 0.22%
AMP Life Limited 1,770,232 0.20%
Albert Bruce Richards 1,619,093 0.19%
Total 690,707,452 79.25%
Steadfast Group Annual Report 2021 129

Shareholders' information continued
Substantial shareholders
Name Date of notice No. of shares % of issued capital
Challenger Limited 5 March 2020 53,103,980 6.15%
IOOF Holdings Limited 31 May 2021 48,080,679 5.52%
This information is based on the most recent substantial holder notices lodged with the ASX.
Securities purchased on-market
The following securities were purchased on market during the financial year for the purpose of the employee incentive share scheme:
Number of shares purchased
Average price paid per share
Ordinary Shares 115,747 $3.71
Dividend details
Dividend Franking Amount per share DRP issue price Payment date
Interim Fully franked 4.4 cents $3.80 25 March 2021
Final Fully franked 7.0 cents 1 10 September 2021
1 The DRP issue price of the final dividend is scheduled to be announced on 1 September 2021.
The final dividend has an ex-dividend date of 19 August 2021, a record date of 20 August 2021, a payment date of 10 September 2021 and is eligible for Steadfast's Dividend Reinvestment Plan (DRP) which carries no discount.
130 Steadfast Group Annual Report 2021

Glossary of Terms
Term Explanation
AGM Annual General Meeting
Client Customer of broker/underwriting agency
CPS Cents per share
DPS Dividend per share
DRP Dividend reinvestment plan
EBITAEarnings before interest (after premium funding interest income and expense), tax and amortisation. To ensure comparability, underlying EBITA also deducts the interest expense on lease liabilities and depreciation of right-of-use assets
EPS (NPAT) Earnings per share that reference NPAT
EPS (NPATA) Earnings per share that reference NPATA
Equity Brokers An insurance broker who is a member of the Steadfast network, where Steadfast does have an equity interest
Group Steadfast Group Limited (ABN 98 073 659 677, AFSL 254928)
GWP Gross Written Premium – the amount paid by customers for insurance policies excluding taxes and levies
Hayne Royal Commission
Royal Commission into Misconduct in the Banking, Superannuation and Financial Services Industry
Hubbing The merger of two or more insurance intermediary businesses
IBNA IBNA Limited, an Australian general insurance broker network acquired by Steadfast in FY20
IFRS International Financial Reporting Standards
IPO An initial public offering of the Company’s fully paid ordinary shares
NCI Non controlling interests
Network The collective reference to the distribution network that is comprised of all Steadfast Network Brokers
Network Broker An insurance broker who is a member of the Steadfast network, where Steadfast has no equity interest
NPAT Net profit after tax
NPATA Net profit after tax adjusted for (post non controlling interests) amortisation of customer relationships
PSF Professional services fee
Rebate An annual payment made to Steadfast Network Brokers, at the discretion of the Board
SCTPSteadfast Client Trading Platform – a web based platform that is a digitally contestable market place providing Steadfast Network Brokers access to obtain multiple, detailed quotes from a variety of insurers, with only one data input as well as place and maintain policy contracts
SME Small to medium enterprise
Steadfast PSF Rebate offer
An offer by Steadfast to Steadfast Network brokerages to receive Steadfast shares or cash in exchange for renouncing their rights to professional service fee (PSF) rebates from the Group
Strategic PartnerPreferred product partners underwriting or arranging the general insurance policies and premium funding products which are placed by Steadfast Network Brokers
Underlying earnings
Statutory earnings adjusted for non trading items
Underwriting agency
Underwriting agencies act on behalf of general insurers to design, develop and provide specialised insurance products and services for specific market segments
Steadfast Group Annual Report 2021 131
Corporate Directory
Directors
Frank O’Halloran, AM (Chairman)
Robert Kelly (Managing Director & CEO)
Vicki Allen
David Liddy, AM
Gai McGrath
Anne O’Driscoll
Philip Purcell
Greg Rynenberg
Company secretaries
Linda Ellis
Peter Roberts
Notice of the AGM
The AGM will be a virtual meeting held on Friday,
22 October 2021.
Corporate Office
Steadfast Group Limited
Level 4
99 Bathurst Street
Sydney NSW 2000
Postal Address
PO Box A980
Sydney South NSW 1235
P 02 9495 6500
W steadfast.com.au
ACN 073 659 677
Share registry
Link Market Services
Level 12
680 George Street
Sydney NSW 2000
Postal Address
Locked Bag A14
Sydney South NSW 1235
P 1300 554 474
Stock Listing
Steadfast Group Limited ordinary shares are listed on the
Australian Securities Exchange (ASX code: SDF).
132 Steadfast Group Annual Report 2021

1
Ste
ad
fast G
rou
p Lim
ited
An
nu
al R
ep
ort 2
02
0