International Journal of Emerging Technologies in Learning (iJET ...
Upload
khangminh22Category
view
1download
0
For the year ended 31 December 2021
ANNUAL REPORT
2021
Learning Technologies Group plc
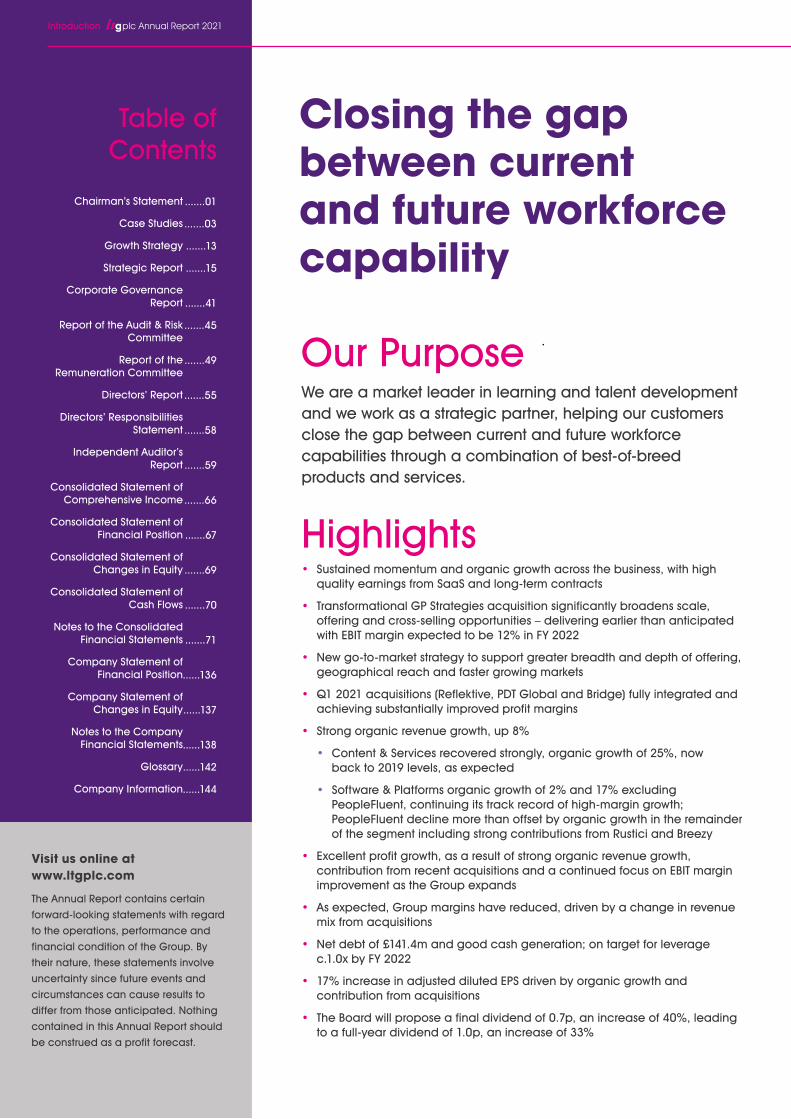
Closing the gap between current and future workforce capability
Our Purpose
Highlights
We are a market leader in learning and talent development and we work as a strategic partner, helping our customers close the gap between current and future workforce capabilities through a combination of best-of-breed products and services.
• Sustained momentum and organic growth across the business, with high quality earnings from SaaS and long-term contracts
• Transformational GP Strategies acquisition significantly broadens scale, offering and cross-selling opportunities – delivering earlier than anticipated with EBIT margin expected to be 12% in FY 2022
• New go-to-market strategy to support greater breadth and depth of offering, geographical reach and faster growing markets
• Q1 2021 acquisitions (Reflektive, PDT Global and Bridge) fully integrated and achieving substantially improved profit margins
• Strong organic revenue growth, up 8%
• Content & Services recovered strongly, organic growth of 25%, now back to 2019 levels, as expected
• Software & Platforms organic growth of 2% and 17% excluding PeopleFluent, continuing its track record of high-margin growth; PeopleFluent decline more than offset by organic growth in the remainder of the segment including strong contributions from Rustici and Breezy
• Excellent profit growth, as a result of strong organic revenue growth, contribution from recent acquisitions and a continued focus on EBIT margin improvement as the Group expands
• As expected, Group margins have reduced, driven by a change in revenue mix from acquisitions
• Net debt of £141.4m and good cash generation; on target for leverage c.1.0x by FY 2022
• 17% increase in adjusted diluted EPS driven by organic growth and contribution from acquisitions
• The Board will propose a final dividend of 0.7p, an increase of 40%, leading to a full-year dividend of 1.0p, an increase of 33%
Introduction plc Annual Report 2021
Table of Contents
Chairman’s Statement
Case Studies
Growth Strategy
Strategic Report
Corporate Governance Report
Report of the Audit & Risk Committee
Report of the Remuneration Committee
Directors’ Report
Directors’ Responsibilities Statement
Independent Auditor’s Report
Consolidated Statement of Comprehensive Income
Consolidated Statement of Financial Position
Consolidated Statement of Changes in Equity
Consolidated Statement of Cash Flows
Notes to the Consolidated Financial Statements
Company Statement of Financial Position
Company Statement of Changes in Equity
Notes to the Company Financial Statements
Glossary
Company Information
.......01
.......03
.......13
.......15
.......41
.......45
.......49
.......55
.......58
.......59
.......66
.......67
.......69
.......70
.......71
......136
......137
......138
......142
......144
Visit us online at www.ltgplc.com
The Annual Report contains certain
forward-looking statements with regard
to the operations, performance and
financial condition of the Group. By
their nature, these statements involve
uncertainty since future events and
circumstances can cause results to
differ from those anticipated. Nothing
contained in this Annual Report should
be construed as a profit forecast.
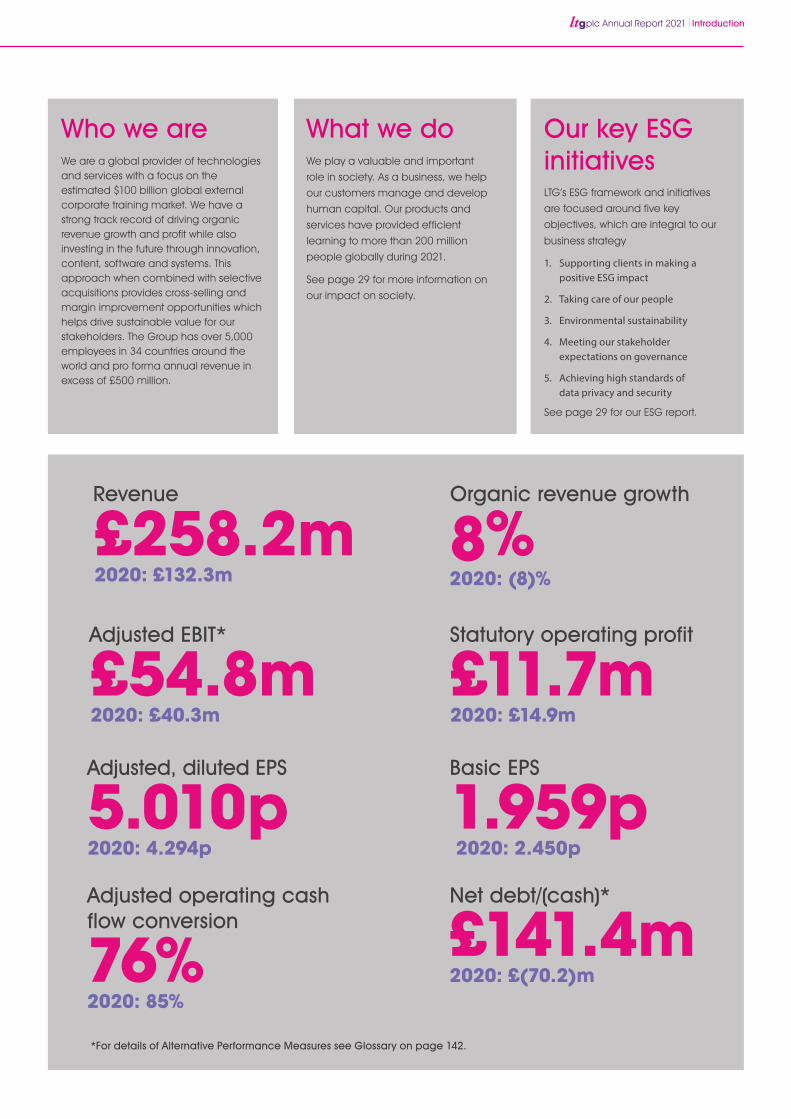
Who we are
Revenue
£258.2m2020: £132.3m
Adjusted EBIT*
£54.8m2020: £40.3m
Organic revenue growth
8%2020: (8)%
Adjusted operating cash flow conversion
76%2020: 85%
Statutory operating profit
£11.7m2020: £14.9m
Adjusted, diluted EPS
5.010p2020: 4.294p
What we do Our key ESG initiatives
*For details of Alternative Performance Measures see Glossary on page 142.
We are a global provider of technologies and services with a focus on the estimated $100 billion global external corporate training market. We have a strong track record of driving organic revenue growth and profit while also investing in the future through innovation, content, software and systems. This approach when combined with selective acquisitions provides cross-selling and margin improvement opportunities which helps drive sustainable value for our stakeholders. The Group has over 5,000 employees in 34 countries around the world and pro forma annual revenue in excess of £500 million.
We play a valuable and important
role in society. As a business, we help
our customers manage and develop
human capital. Our products and
services have provided efficient
learning to more than 200 million
people globally during 2021.
See page 29 for more information on
our impact on society.
LTG’s ESG framework and initiatives
are focused around five key
objectives, which are integral to our
business strategy
1. Supporting clients in making a positive ESG impact
2. Taking care of our people
3. Environmental sustainability
4. Meeting our stakeholder expectations on governance
5. Achieving high standards of data privacy and security
See page 29 for our ESG report.
plc Annual Report 2021 Introduction
Basic EPS
1.959p 2020: 2.450p
Net debt/(cash)*
£141.4m2020: £(70.2)m
1 plc Annual Report 2021
ESGThe Board is mindful just how important environmental, social and governance (ESG) issues are to all our stakeholders. Indeed, ESG is absolutely central to what we do, as we are a business that helps our customers manage and develop their human capital. Our digital solutions make learning more efficient, including removing the need to travel. We estimate our technology and services reached more than 200 million people globally in 2021.
The Board is also aware that focusing on LTG’s own performance, as well as what we provide to our customers, also has a beneficial impact for people and the planet. As well as supporting our customers to make a positive ESG impact, we prioritise taking care of our people, environmental sustainability, meeting governance expectations and achieving high standards of data privacy and security through continuous improvement. We have a number of new ESG initiatives in train, including a Board commitment to a net zero emissions target by 2050, or sooner. Further details of LTG’s environmental initiatives and performance in 2021 are set out on pages 29 to 40.
The BoardIn December 2021, we were pleased to welcome Kath Kearney-Croft to the Board as Chief Financial Officer (CFO), replacing Neil Elton.
Kath brings extensive experience in large public companies and in international financial leadership roles. She was previously Interim CFO at SIG plc and Group Finance Director at The Vitec Group plc. She has also held senior financial roles at Rexam plc and The BOC Group plc.
Neil stepped down from the Board after seven years’ service. The Board would like to thank him for his drive and support through a prolonged period of growth, international expansion and value creation.
The Board notes the recommendations of the Hampton-Alexander and Parker reviews in relation to increasing Board and senior management gender and ethnic diversity, and it
Introduction We are delighted to report that Learning Technologies Group plc (LTG) has delivered a robust full-year operational performance with strong organic revenue growth, continuing the swift recovery we saw in the first half, together with a significant increase in adjusted EBIT and adjusted diluted Earnings per Share.
LTG has delivered impressive and sustainable growth for shareholders over many years. The Board is proud that the Group has delivered a compound average growth rate (CAGR) in revenue over the last seven years (2014 to 2021) of 50%. It is testament to our ability to consistently deliver shareholder value - from organic growth and improvement, and from creating value from acquisitions - that our adjusted EBIT and adjusted diluted EPS CAGR over the same seven year period have been at similar levels of growth or higher, at 63% and 45% respectively.
During 2021, we have added significant momentum to this progress with the completion of the transformational acquisition of US-listed GP Strategies in October 2021 for a consideration of $392 million. The strategically compelling combination of LTG and GP Strategies has created a leading global workforce transformation business focused on learning and talent development. We now have global reach; enhanced and complementary service offerings; and deep, long-standing customer relationships. In the first quarter of 2021, we also acquired Bridge and Reflektive, two strategically important Software as a Service (SaaS) learning and talent platforms, and PDT Global, a specialist diversity and inclusion consultancy, resulting in a combined cash outflow of £52.1 million in the year. We also made the small acquisition of Moodle News in August 2021.
“LTG has delivered impressive and sustainable growth for shareholders over many years.”
Chairman’s statement
Revenue
50% CAGR 2014-2021
Adjusted EBIT
63% CAGR 2014-2021
Adjusted diluted EPS
45% CAGR 2014-2021

plc Annual Report 2021 2
Alongside this, our employees have shown dedication, hard work and an ability to drive our delivery and performance forward in challenging conditions, looking to get the job done well, and on time. I continue to be impressed by the culture of the business. On behalf of the Board I express appreciation and thanks to our employees for their dedication and hard work through the year.
Looking ForwardThe Board sees much to be excited about in 2022. Our business is well-positioned in attractive and sustainable learning and talent development markets, and it is driven by a culture of continuous improvement. It is in robust financial health with differentiated capabilities and technology, and this will help us continue our enviable, long-term record of value creation. We have made significant strategic progress in 2021, most notably the transformational acquisition of GP Strategies. The Board expects this acquisition to deliver substantial value, underpinned by margin enhancement as well as from cross-selling to the combined customer base. When taken together, these factors provide the Board with confidence in the Group’s near- and longer-term prospects.
Andrew BrodeChairman29 April 2022
takes these into consideration when making appointments. We have eight Board members and officers, of which four are Non-executive Directors. Kath’s appointment means this now includes four women, representing 50% of this total, exceeding the Hampton-Alexander target for FTSE 100 and FTSE 250 Boards. Not only this, but we are proud to have some 35% of our wider senior leadership positions held by women, also exceeding the Hampton-Alexander target.
As a Board, we take our governance responsibilities very seriously and believe these allow the Group to pursue its strategy with more pace and less risk. The approach to our wide range of responsibilities is set out in the Chairman’s Introduction to Governance on pages 41 to 44.
Dividend and Capital AllocationThe Board remains committed to a progressive dividend policy. Given the robust operational performance during the year, the Board is pleased to announce it is recommending a final dividend of 0.7 pence per share (2020: 0.5 pence).
Together with the interim payment of 0.3 pence, this gives a total dividend for the year of 1.0 pence, an increase of 33% on the prior year.
If approved the final dividend will be paid on 21 July 2022 to all shareholders on the register on 1 July 2022.
People On behalf of the Board, I would like to welcome to the LTG family our new colleagues from GP Strategies, as well as from Bridge, Reflektive, PDT Global and Moodle News. As a result of the substantial strategic progress made during 2021, LTG now has more than 5,000 employees in 34 countries.
As a business that exists to help our customers manage and develop their human capital, we rely on our employees to deliver much. This includes designing and delivering content, managing our clients’ learning services, and developing and delivering capabilities through our technology platforms. Our employees are the daily face of our business across the broad spectrum of our commercial and government customers.
Despite the many COVID-related difficulties encountered, particularly in the first half of the year, our employees have continued to serve customer needs. They have an abundance of technical expertise, deep domain knowledge, entrenched customer relationships and a willingness to continually improve. Even more importantly in the environment we have been working in, they have shown themselves to be adaptable, working according to new, flexible practices, including extensive home working, as well as additional constraints.
3 plc Annual Report 2021
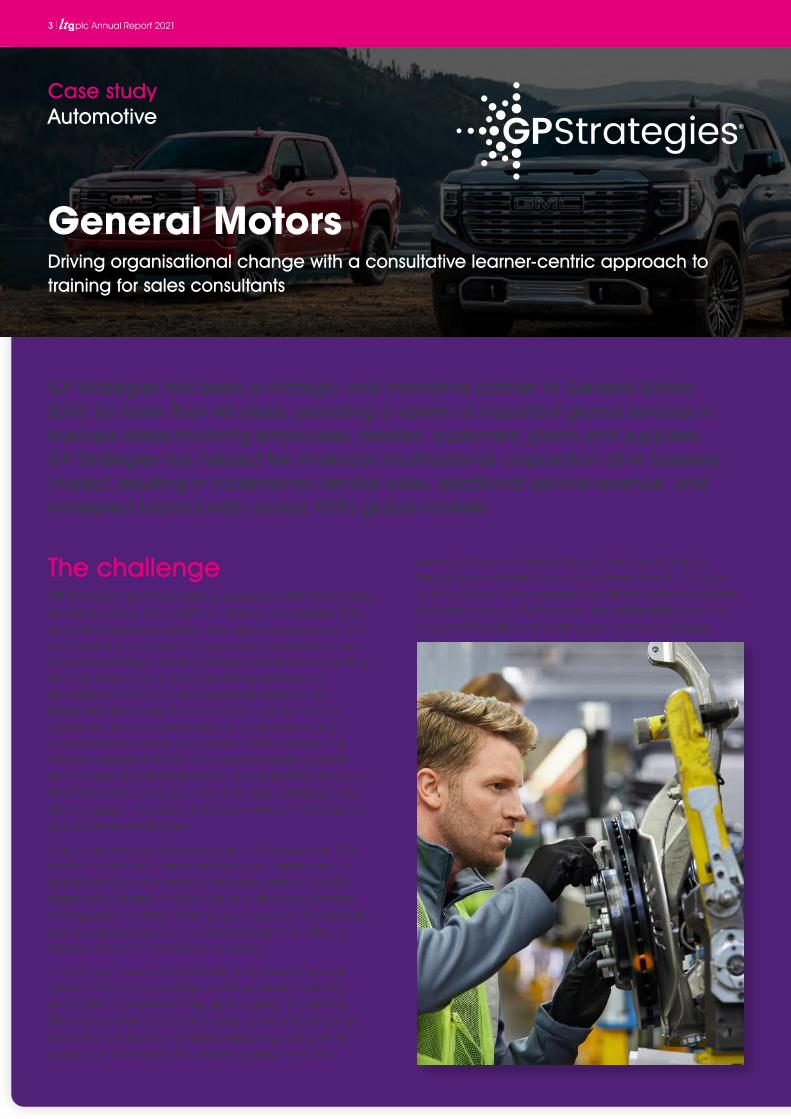
each GM brand (Chevrolet, Buick, GMC and Cadillac) frequently mandated topics and deliverables to CoL that didn’t consider if the approach would truly help consultants sell more vehicles. Furthermore, the deliverables were not presented to sales consultants as a cohesive package.
The challenge GP Strategies has been working extensively with GM’s Center of Learning (CoL) since 2015 on initiatives including in-field and online learning development, learning measurement and analytics, change management, product launches, innovation strategy, learning strategy and internal upskilling, among others. CoL is charged with the professional development of GM’s entire dealership network. GM knows that dealers are the face of the company to its customers. Thus a highly trained and skilled retail and wholesale workforce is a key driver in GM’s success. This network consists of 4,000+ US-based dealerships which employ over 100,000 individuals, as well as GM’s wholesale field force which employs more than 500 individuals who directly support the sales and service sides of the business alongside the dealerships.
Due to the vast and complex scale of its operations, CoL wanted to shift from being treated as an “order taker” to being seen as a true strategic business partner. The GM organisation tended to view CoL as a siloed department existing solely to deliver training upon request. The resulting learner experiences often lacked strategy and failed to address the root of performance issues.
In particular, sales consultants felt they needed specific types of product knowledge (and thus product training) at specific moments leading up to, during, and after a GM product launch. Over the years, product training had fallen into a set pattern of deliverables regardless of the product or the market. The marketing department for
General MotorsDriving organisational change with a consultative learner-centric approach to training for sales consultants
Case studyAutomotive
GP Strategies has been a strategic and innovative partner to General Motors (GM) for more than 40 years, providing a variety of important global services in business areas involving employees, dealers, customers, plants and suppliers. GP Strategies has helped the American multinational corporation drive business impact, resulting in incremental vehicle sales, additional service revenue, and increased brand loyalty across GM’s global markets.

plc Annual Report 2021 4
The solutionGP Strategies, with CoL, started with high-performer research for salespeople and sales managers, interviewing 80 sales consultants and 70 managers from across the US. The purpose was twofold:
1. To create a performance map (per role) of what high performers do to be so successful
2. To conduct a quantitative gap analysis of all performers to identify gaps and prioritise learning solutions
The team then conducted a design thinking process starting with empathy interviews with 75 retail (dealership) employees, both new hires and veterans, to uncover how they learn, how they wanted to learn and what they wanted to learn. The aim here was to help CoL define new modalities and learner personas.
The GM and GP Strategies teams developed an evidence-based framework for product training using this learner feedback as the foundation for the design. This roadmap is a visual framework for thinking about sales consultants’ need for information, communication and hands-on experience, as well as determining when and how to deliver on these needs. The roadmap focused on the following areas:
• Sales Consultant in Training – an onboarding curriculum
• Sales Manager Skills Curriculum – creating targeted learning opportunities for managers of differing experience levels to evolve “from bosses to leaders”
• A product training roadmap for product launches – a blueprint of critical touchpoints throughout the product lifecycle that reimagined product launches from a “one-size-fits-all” approach to tailored, collaborative experiences, including:
• Using 360 technology to let sales consultants “see” the inside of vehicles and “move around” to explore their features
• Employing chatbots for refresher training to support knowledge retention
The resultsCoL’s new “secret weapon” – knowing exactly what learners needed and when they needed it – meant new credibility with the GM brands that CoL could use as leverage to get buy-in for a new approach to product launches. The programme’s success marked the beginning of a true consultative relationship between CoL and its business partners, paving the way for the paradigm shift that would position CoL to add its greatest value to the organisation.
The revised product launch training has been very well received, with CoL producing over 60 experiences using the 360 technology for both GM and competitors’ vehicles. The 360 experiences are now standard for all GM product launches, and CoL delivered performance solutions for all product launch initiatives in 2021. Most importantly, research shows that product training leads to an increase in sales consultants’ average monthly sales volume and specifically, that sales consultants sell on average 2.4 more vehicles over the four months following the live product training than they would have without the training.
The Sales Consultant in Training programme was also a success and tackled two issues: employee retention and early sales productivity. The programme improved retention by 8 percentage points and participants showed higher sales growth than non-participants.
Preliminary indicators of success with the Sales Manager Curriculum include an impressive 67% response rate to invites for validation exercise participation among GM sales managers, demonstrating that the curriculum and approach were spot on. Within six months of launching the first element of the totally elective curriculum, over 2,000 managers had begun taking courses on their personalised training plan. On average, courses tied to the Sales Manager Curriculum earned a relevancy score of 4.9 out of 5.0.
In addition:
• CoL achieved an NPS score of 65 from its internal business partners, up from 31 in 2019.
• Since 2015, when GP Strategies became CoL’s training agency of record, the partnership has earned 19 Brandon Hall Awards including the Product Knowledge Roadmap strategy, and accolades for several product launch programmes, in-dealership product training, the 360 experiences and chatbots. The team has also won four gold Chief Learning Officer awards including one for business impact of new product launches, earned a spot on Training Industry’s Top 125 and achieved top-ten gold recognition in CLO’s Learning Elite.
• Furthermore, GP Strategies has received a “GM Supplier of the Year” award over the last five consecutive years.

5 plc Annual Report 2021
A professional accreditation associationHow LTG businesses have combined products and services to create a learning and accreditation ecosystem for a leading global financial association
Case studyFinance
implementation – worked backwards from the organisation’s business and technical requirements.
Working with the organisation, they determined that the majority of the requirements could be covered by two products:
• The Bridge LMS will handle learning content hosting for the organisation’s customers who are purchasing an all-in-one learning solution.
• Rustici Content Controller was needed to enforce content licensing in situations where the organisation’s customers want to serve content from their own LMS.
This latter component is particularly important to the organisation, which previously lacked a robust means to enforce content licensing. LTG’s proposal estimates that the new system will reclaim $2.5 million per year in previously lost content licensing revenue.
The remaining requirements were covered by LEO Learning and GP Strategies. LEO provided a compact but critical amount of custom code to track the organisation’s proprietary accreditation. GP Strategies helped to implement the plan, allowing the team to temporarily scale up for the substantial task of migrating from the legacy system, and assisting with all aspects of change management and testing. The programme is set to launch in the summer of 2022.
Our customer, a professional association in the financial industry, works with multiple businesses within LTG to deliver learning and accreditation services to more than 400,000 members worldwide. In 2020, the association identified the need to replace its existing learning ecosystem with one that could retain and enhance unique functionality while cutting maintenance costs, as well as allowing it to build, scale and innovate for the future. The organisation was extremely keen to provide an industry-leading user experience, which the combined LTG technologies made possible.
The challengeThe organisation had found that a decade of essential custom development on top of its existing solution had detached its learning environment from the basic support and functionality updates offered by its then provider. Compensating for these gaps in support, as well as the exponential growth in overall complexity, was pushing development costs higher.
As a small team of five in a highly-regulated, high-consequence industry, the organisation’s training department sought an off-the-shelf solution that would reduce these costs. However, it still had unique requirements with respect to its professional certifications, and the resale of learning content to customers with their own learning management systems (LMSs).
The solutionThe solution LTG is providing to this significant challenge involves not only the creation of a new learning ecosystem built around the Bridge LMS and Rustici Software’s Content Controller technology, but substantial implementation support from GP Strategies.
The opportunity first came to LTG partly as the result of trust built over seven years from working with Rustici, Gomo and Instilled. A team of experts from LTG businesses – all well versed in the technical knowledge required for system
plc Annual Report 2021 6
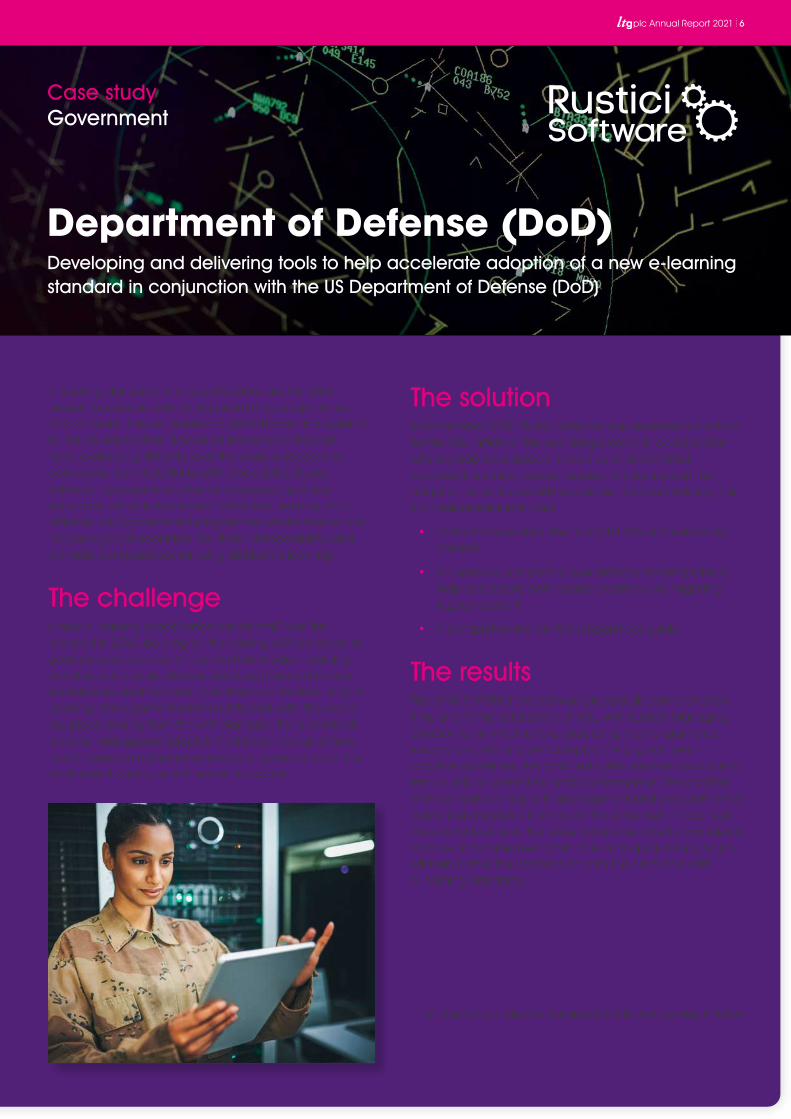
E-learning standards and specifications are the often-unseen backbone behind digital learning programmes and software. They’re needed to get software and systems to “talk to each other” (known as interoperability) and have evolved significantly over the years in scope and complexity, from SCORM to xAPI. Since 2002, Rustici Software has been instrumental in developing these standards, with the Advanced Distributed Learning (ADL) Initiative, a US government programme whose mission is to “encourage collaboration, facilitate interoperability, and promote best practices for using distributed learning.”
The challengeA new e-learning specification called cmi5 was first released in 2016, building on the existing xAPI standard. Its goal is to provide a set of rules for how modern learning activities, such as simulations, serious games and virtual experiences are imported, launched and tracked using a Learning Management System (LMS) and xAPI. This was a key piece missing from the xAPI standard. For a variety of reasons, widespread adoption had been slow and there hadn’t been an authoritative source or governance of the cmi5 specification, as with earlier standards.
The solutionIn September 2020, Rustici Software was awarded a contract for the ADL Initiative. This year-long project, in collaboration with key DoD stakeholders, known as cmi5 CATAPULT, provided the critical pieces needed to help support the adoption of cmi5 and xAPI across the DoD and industry. The final deliverables included:
• Conformance test suites for both LMSs and e-learning content
• An open-source cmi5 player and course templates to help accelerate both course creation and migrating legacy content
• A comprehensive cmi5 best practices guide
The resultsThe cmi5 CATAPULT project was successfully completed on time and to the satisfaction of ADL, with Rustici’s Managing Director, Tammy Rutherford, describing it as “a giant step forward for cmi5 and xAPI adoption.” Along with best-practice guidelines, the cmi5 test suites are now available to test an LMS or content for cmi5 conformance. The addition of these tools will help with development and procurement of content and systems that are cmi5 conformant. These tools are critical to ensure that stakeholders are able to confidently procure and implement cmi5 tools and applications, which will help further the adoption of both the cmi5 and xAPI e-learning standards.
“The resources delivered by Rustici for the cmi5 CATAPULT project will play an essential role in the acceleration of cmi5 adoption and support our necessary shift to a more distributed learning ecosystem approach.”
- Dr. Sae Schatz, Director, Advanced Distributed Learning Initiative
Department of Defense (DoD)Developing and delivering tools to help accelerate adoption of a new e-learning standard in conjunction with the US Department of Defense (DoD)
Case studyGovernment

7 plc Annual Report 2021
The challengeGonzaba Medical Group, a Texas-based medical corporation with over 700 employees, wanted to strengthen communication with its workforce and increase engagement. As its employees had diverse roles, it needed a platform with the flexibility to meet everyone’s needs. This meant a one-size-fits-all solution wouldn’t work, and the platforms it trialled lacked the flexibility needed to meet its needs.
The solutionSince 2019, Gonzaba Medical Group has used Bridge’s performance management, learning management, and employee engagement tools to strengthen the company at all levels. Bridge’s performance solutions allowed Gonzaba’s managers to have meaningful conversations with employees, ask relevant questions that addressed their personal circumstances and prompt managers on effective ways to guide them.
Not only did everyone have more meaningful communication but they were also able to communicate more frequently. Prior to the adoption of Bridge, Gonzaba had only yearly evaluations, but by using the suite of tools, it was able to introduce monthly one-to-ones and quarterly performance conversations.
With Bridge’s engagement surveys, Gonzaba was able to monitor the impact of its organisational changes. Adaptability meant that the questions asked could be more relevant and meaningful for each employee, and the feedback received allowed Gonzaba to make even greater improvements.
This quickly had a measurable impact on its engagement metrics. The measure of appreciation saw impressive gains. Using Bridge’s learning management system (LMS), Gonzaba made employee appreciation the focus of its company-wide training efforts in 2020, and managers were given the development they needed to better convey their regard for employees’ work.
The resultsGonzaba is currently seeing its highest engagement ever, with an average score of 84 out of 100. With personal development, managers who had engagement scores in the 50s and 60s saw their scores rise to 80s and 90s. Fifteen leaders now have engagement scores of 90 or above. Participation is also at an all-time high and currently stands at 64%. Appreciation scores have risen by 10% in a year.
This is good news for Gonzaba as research shows that better employee engagement translates to better performance. There’s as much as a 14% increase in productivity for companies with high engagement compared to those with the lowest levels.
“We have totally transformed as a result of having Bridge tools to help us do so.”
- Gonzaba’s former Training and Development Specialist
Gonzaba Medical GroupImproving employee engagement and appreciation metrics with Bridge’s platform suite
Case studyMedical
plc Annual Report 2021 8
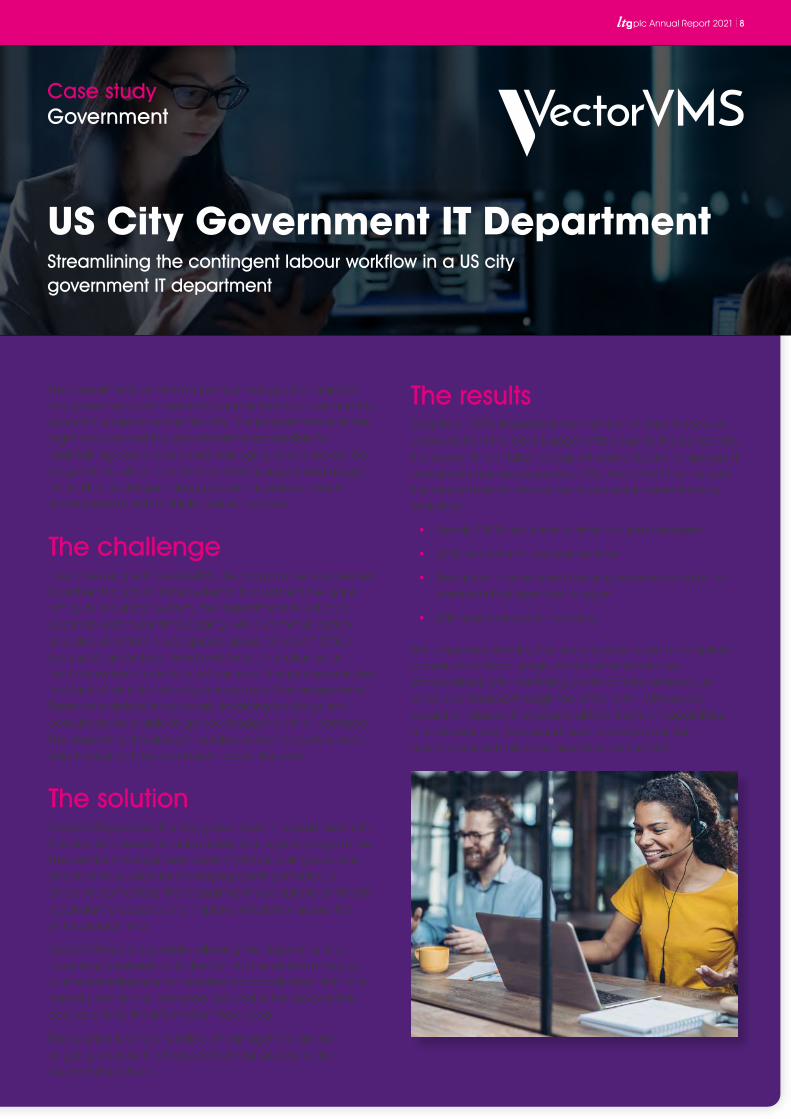
The Department of Information Technology at a major US city governing body uses staff augmentation on-demand to support IT projects across the city. The programme includes eight vendors and the department is responsible for maintaining compliance and managing spend across the programme, which has strict contract budgets and usage limits. Plus, its stringent hiring process includes a custom scoring system with multiple parties involved.
The challengePrior to working with VectorVMS, the programme was pieced together through multiple systems. To augment the gaps left by its requisition system, the department relied on a separate system for timekeeping, while communication and documentation was spread across Microsoft Office tools such as Outlook, Word and Excel. This reliance on multiple systems for individual pieces of the process resulted in a lack of visibility into citywide usage of the programme. There were delays in approvals, invoicing backlogs and consultants were able to go over budget on their contracts. The department realised it needed a way to capture each step throughout the contingent labour lifecycle.
The solutionVectorVMS provides this city government IT department with the visibility it needs to adequately manage its programme. The vendor management system (VMS) is a single-source, end-to-end solution for managing contingent labour. Once implemented, the department was able to eliminate redundant processes and improve efficiency across the entire programme.
VectorVMS is configurable, allowing the department to have its scoresheets built directly into the platform through business intelligence for interview standardisation. With role-based permissions, everyone involved in the process has access only to the information they need.
The solution is vendor-funded, meaning there are no ongoing costs to the IT department for access to the VectorVMS platform.
The resultsDespite a 120% increase in the number of days to receive approval from the city’s budget office due to the pandemic, the overall time it takes to request and onboard temporary IT consultants has decreased by 15%. VectorVMS has helped the department to streamline its process in several areas, including:
• Nearly 100% reduction in time to submit requests
• 30% reduction in processing time
• Reduction in time spent tracking down information for contracts that went over budget
• Minimised delays to invoicing
With improved visibility, the team is able to get a complete picture of contract usage. All documents are now standardised, with identifying contract data entered just once and tracked through the entire term. With several requisition classes that require different sets of capabilities and experience, the department is able to maintain compliance with all documentation on the VMS.
US City Government IT DepartmentStreamlining the contingent labour workflow in a US city government IT department
Case studyGovernment

9 plc Annual Report 2021
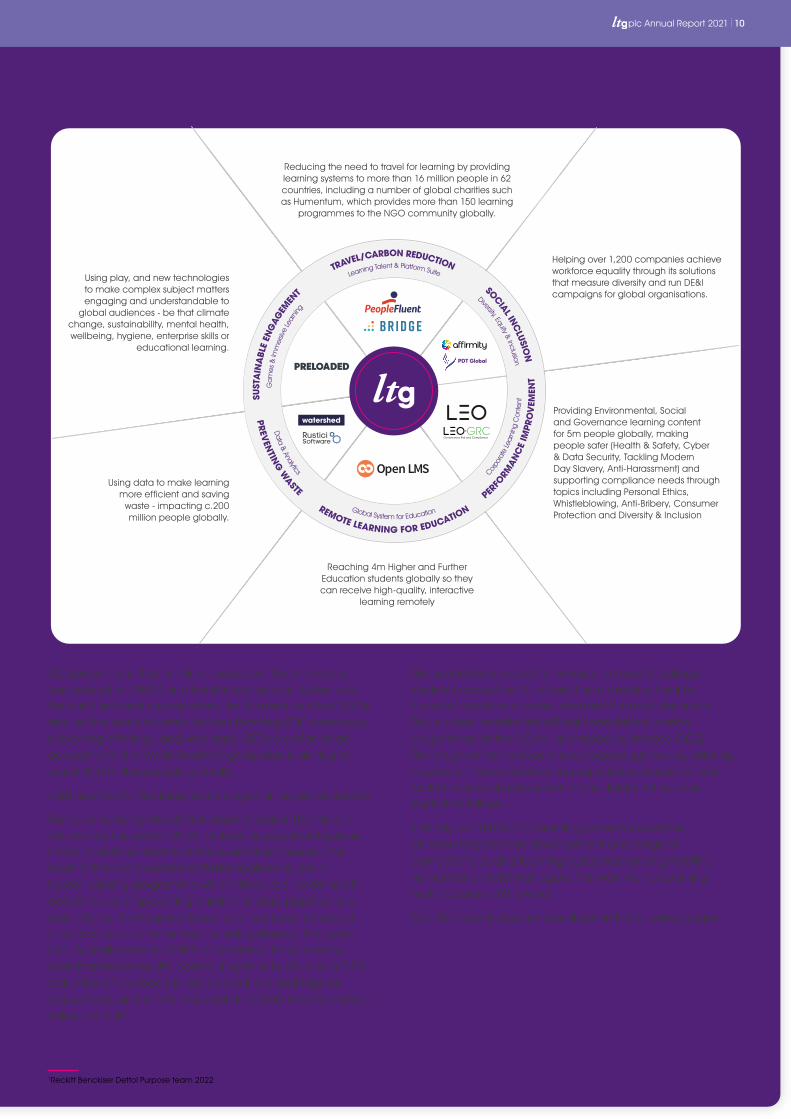
We empower our customers to achieve their ESG priorities
What Learning Technologies Group does for its customers is aligned with ESG principles. We provide our customers with solutions for Human Capital Development. We enhance our customers’ operational resilience through ethical compliance, organisational and technical performance solutions and systems security training. Affirmity and PDT Global help global companies measure diversity and build inclusive workforces.
ESG sits at the heart of LTG’s market provision. Our portfolio of digital learning, talent mobility, workforce transformation and talent management platforms advance the personal and professional development of millions of people worldwide. Through our global reach of Learning and Talent products and services, we help in the development of over 80 million people directly, and a further 192 million through Rustici’s interoperability software which connects more than 75% of the world’s learning systems. Our virtual and online training provides a travel-free solution that limits environmental impact, while also being both COVID-safe and aligned to flexible working models.
plc Annual Report 2021 10
LTG serves more than 6 million people in the charitable, free education, NGO and healthcare sectors. Systems by PeopleFluent and organisations like Humentum allow NGOs around the world to distribute their learning (300 workshops, e-learning offerings, and webinars). LEO’s creation of an academy for the World Health Organization is aiming to reach 200 million people globally.
2021 saw two further large-scale programmes get underway.
First, a scheme by Reckitt Benckiser to reach 100 million children by the end of 2022, by teaching positive hygiene habits to reduce deaths and preventable illnesses. The result of this collaboration is Dettol Hygiene Quest, a hybrid learning programme which drives real-world health outcomes by empowering children to play, practice and learn. So far, the Hygiene Quest pilot has been rolled out in schools and communities including Nigeria, Malaysia, UAE, Australia and at COP26 in Scotland. It has already seen impressive results, contributing to a 14.6% and a 7.3% reduction of diarrhoea in children in India and Nigeria respectively, and a 14% reduction in COVID infection rates in Italian schools1.
The second is a project for Invesco, aimed at college students across the US to help them develop healthy financial habits and make informed financial decisions. This is a free, mobile-first official financial education programme of the NCAA, sponsored by Invesco QQQ. The programme involves choice-based gameplay, offering players an interactive learning experience based on real-world financial situations with more details in the case study that follows.
Similarly, a PRELOADED learning game for Save the Children targeted the development of a range of competencies and learning outcomes among frontline humanitarian field managers. This work won a Learning Technologies 2021 award.
Two ESG case studies are described on the following pages.
1Reckitt Benckiser Dettol Purpose team 2022
Reducing the need to travel for learning by providing learning systems to more than 16 million people in 62 countries, including a number of global charities such as Humentum, which provides more than 150 learning
programmes to the NGO community globally.
Reaching 4m Higher and Further Education students globally so they can receive high-quality, interactive
learning remotely
Helping over 1,200 companies achieve workforce equality through its solutions that measure diversity and run DE&I campaigns for global organisations.
Using play, and new technologies to make complex subject matters engaging and understandable to
global audiences - be that climate change, sustainability, mental health, wellbeing, hygiene, enterprise skills or
educational learning.
Providing Environmental, Social and Governance learning content for 5m people globally, making people safer (Health & Safety, Cyber & Data Security, Tackling Modern Day Slavery, Anti-Harassment) and supporting compliance needs through topics including Personal Ethics, Whistleblowing, Anti-Bribery, Consumer Protection and Diversity & Inclusion
Using data to make learning more efficient and saving
waste - impacting c.200 million people globally.

11 plc Annual Report 2021
Invesco QQQHelping college students and student-athletes develop healthy financial habits and make informed financial decisions
Case study - ESGFinance
The solution Audience testing revealed that a character-led, narrative-driven game shape was the most successful in balancing playful game elements with content that was deeply educational. To achieve a relatable look and feel, renowned artist Jose Mendez’s tongue-in-cheek drawings were transformed into dynamic 3D characters and built out into an immersive world inspired by real neighbourhoods. How Not to Suck at Money (HNTSAM) is a free, mobile-first game that takes around 60-90 minutes to complete. Continuous gameplay isn’t essential and players can dip in and out of scenarios and topics, including buying their first car, budgeting and choosing a credit card.
The resultsHNTSAM launched in November 2021 as part of the wider sponsorship programme for Invesco QQQ and the NCAA, and received widespread media coverage, including from Forbes, Insider Inc., and CBS Mornings. Launching on digital billboards in New York City’s Times Square is a first for a digital learning programme. To measure its impact, granular data-tagging will allow Invesco QQQ to understand how players are using the game and how to best scale content over time. More content is currently being developed, with the aim of reaching 30 million people.
“To build something like this doesn’t take a village; it takes a town—of wonderfully talented, passionate people. Please take a moment to learn more about How Not to Suck at Money, the official financial education programme of the NCAA.”
- Emily Pachuta, Chief Marketing & Analytics Officer -
Americas at Invesco
The challenge Invesco QQQ, an exchange-traded fund based on the Nasdaq-100 Index®, wanted to enhance financial literacy among young people, particularly college students and student-athletes in the US. As the official sponsor of the National Collegiate Athletic Association (NCAA), Invesco QQQ’s research showed that while financial literacy is a critical skill for young people, it’s rarely taught in any formal setting. To reach an audience that historically hasn’t received much financial education, Invesco QQQ, LEO and PRELOADED identified a number of challenges and priorities that would inform the success of the project:
• Speaking to an audience with varied knowledge – from zero financial literacy to aspiring Warren Buffetts
• Balancing an experience that’s fun, expressive, and engaging while grounded in educational content and regulatory context
• Creating a resource that’s appealing to young individuals from diverse backgrounds
• Establishing a trusted voice on finance education in a digital world where students lack trustworthy sources
plc Annual Report 2021 12
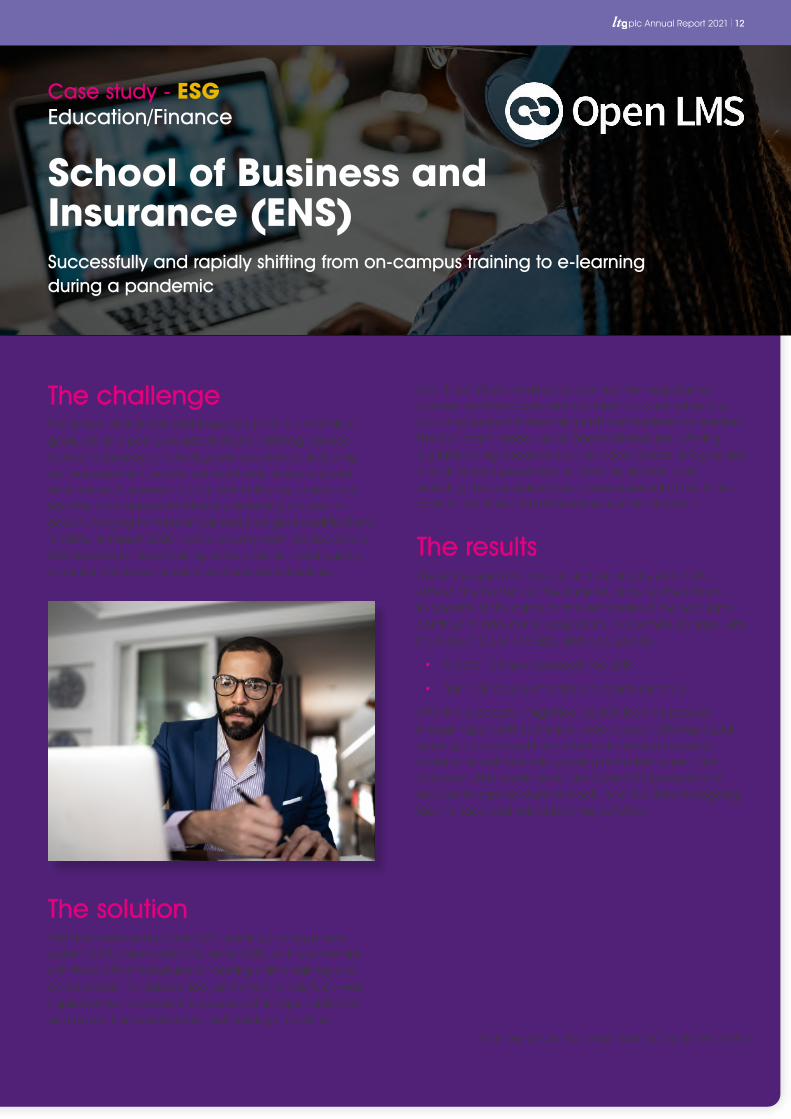
School of Business and Insurance (ENS)Successfully and rapidly shifting from on-campus training to e-learning during a pandemic
Case study - ESGEducation/Finance
EaD, the institution’s virtual school, led the migration of courses, working closely with academic coordinators and providing support to teaching staff and students as needed. The EaD team made use of Open LMS features, offering digital learning resources such as video lessons, infographics and animated presentations. Communication tools, including the discussion forum, were essential at the time in order to facilitate institution-learner communication.
The resultsThe entire operation was up and running by April 2020, without any burden on the students, allowing the school to operate 100% online for the remainder of the year (and continue to offer online education). In less than 30 days, with the help of Open LMS EDU, ENS was able to:
• Create 150 new courses in the LMS
• Train 100 faculty members to teach remotely
After the successful migration, 26,000 learners passed through Open LMS EDU in just under a year. Offering digital learning has allowed the institution to reduce its carbon footprint as well as scale, growing its student base. Post-lockdown, ENS continues to use Open LMS products and services to expand student reach, and facilitate its ongoing face-to-face and hybrid learning activities.
“We managed to perform, in less than a month, the complete migration of all students enrolled in face-to-face courses to EaD. Working closely with the academic coordinators, we were able to provide the necessary support to students and teachers. I would like to emphasise the importance of Open LMS EDU as a fundamental tool. Generally, the system remains stable and support is there for us when needed.”
- Matheus dos Santos, Virtual School Coordinator at ENS
The challengeThe School of Business and Insurance (ENS) is a technical, graduate and post-graduate institution offering courses related to business, marketing and economics, including risk management, private pension funds, insurance and reinsurance. It opened in 1971, with its Rio de Janeiro and São Paulo campuses traditionally delivering courses in-person, ranging from technical and post-grad qualifications to MBAs. In March 2020, as the country went into lockdown, ENS needed to move training entirely online – and quickly, so as not to interrupt student and teacher schedules.
The solutionENS had been using Open LMS’ learning management system (LMS), Open LMS EDU, since 2018, so it was familiar with the platform’s features for hosting online training and collaboration. As classes had just started, a task force was implemented to create the courses within Open LMS EDU and adapt the face-to-face methodology to online.
13 plc Annual Report 2021
Our Growth Strategy and Business Model
Our Growth DriversA C-suite priority
• The employee experience, including upskilling and reskilling, is now becoming a critical boardroom priority
End-to-end capabilities
• The provision of an end-to-end customer offering of services and products, digitally driven, with data and analytics underpinning our approach
Scale and reach
• Scale and geographic coverage – we are a global player who can deliver locally with offers suited to different market segments
Cross-sell
• A track record of cross-selling across our customer base
Deep customer relationships
• Deep and long-term customer relationships from which to leverage growth
Must-have expertise
• Capability and expertise in specialist, highly-regulated industries where training is mandatory
Growth through acquisition
• A strong track record of creating growth and value from selective, high-quality acquisitions
Our core focus has always been to develop and innovate in the attractive learning and talent development sector by extending our range of software and services to give customers a differentiated and comprehensive end-to-end offering. We have a particular strength in digital capability, which is in part driven by the need to reach dispersed audiences at speed and growing societal pressure to reduce business travel. Our customers also have a need to attract and retain staff through an enhanced employee value proposition, making LTG ideally positioned to help our customers operate in a hybrid-working world. Through our capacity to provide insight through measurement and analytics, our results orientation and first-class customer service, we have optimised the effectiveness of our customer offerings, and set ourselves apart from the competition.
In addition to the other acquisitions completed in the year, the acquisition of US-listed GP Strategies in October 2021, has opened up further exciting growth opportunities. GP Strategies brings additional global reach, with the Group now having offices in 34 countries. This enables us to serve customers not only in the UK and the US but in many other countries around the world, including faster-growing Asian
markets. Certain geographic markets are comparatively underserved by available learning and talent management expertise and this gives us a competitive edge with multinational customers who need a partner with a presence in and an understanding of local culture and needs across different markets.
We have demonstrated success over many years in cross-selling our services and software to customers. The combined business now has more than 6,100 customers worldwide, offering a further significant opportunity to cross-sell the combined Group’s complementary services and products. GP Strategies is embedded within many of its customers, often providing a comprehensive outsourced learning and talent management service, and has long-term relationships with many others. These deep relationships result in a solid platform from which to expand the range of offerings to our customer base, who are increasingly demanding joined-up solutions.
Not only this, but GP Strategies brings new and enhanced customer markets, including automotive, aerospace, healthcare and finance. This gives us opportunities to grow our presence in each, helping us avoid customer or market
LTG has a strong track record of driving growth, giving customers a differentiated and comprehensive end-to-end offering and a particular strength in digital capability.
plc Annual Report 2021 14
concentration, and giving us additional resilience in the event of weakness in any one of our markets. Many of our markets are ‘high consequence’, meaning they require mandatory training in specialist areas including engineering, technology and compliance-related disciplines.
The combination of LTG and GP Strategies has also given us the opportunity to further enhance commercial discipline, driving growth and new ways to go to market. This means taking the best practices from each business to enable us to deliver our growth potential. One enhancement to our growth strategy will be an expansion of the role of Client Service Leads across the customer base. These individuals are focused on particular customers and help them achieve their objectives. The aim is to increase the use of our suite of learning and talent management services and technologies across our customer base. We also aim to increase our presence in the leadership development market, where GP Strategies is well-established.
The acquisition has added complementary services to our existing portfolio of capabilities, deepening and broadening our service and product offering. This has reinforced our existing business model, enabling us to provide a holistic
offering to our customers. For example, combining LTG’s strong diversity, equity and inclusion capabilities with GP Strategies’s leadership capabilities in this area will provide a differentiated solution, as will the combination of our consulting, measurement and content creation capabilities.
Our business model delivers advantages for many different stakeholders. We provide our customers with a trained and capable workforce, making them more fulfilled and leading to improved employee retention rates. It enables customers to manage their talent in a more joined-up way, helping them expand their management bench strength, improve the performance of their business and serve their customers better.
Our growth also leads to increased revenue and profit and healthy levels of cash flow to fuel innovation and deliver further value-creating acquisitions in a market that remains fragmented.
For LTG’s business case, please see the Chief Executive’s Review on page 15.
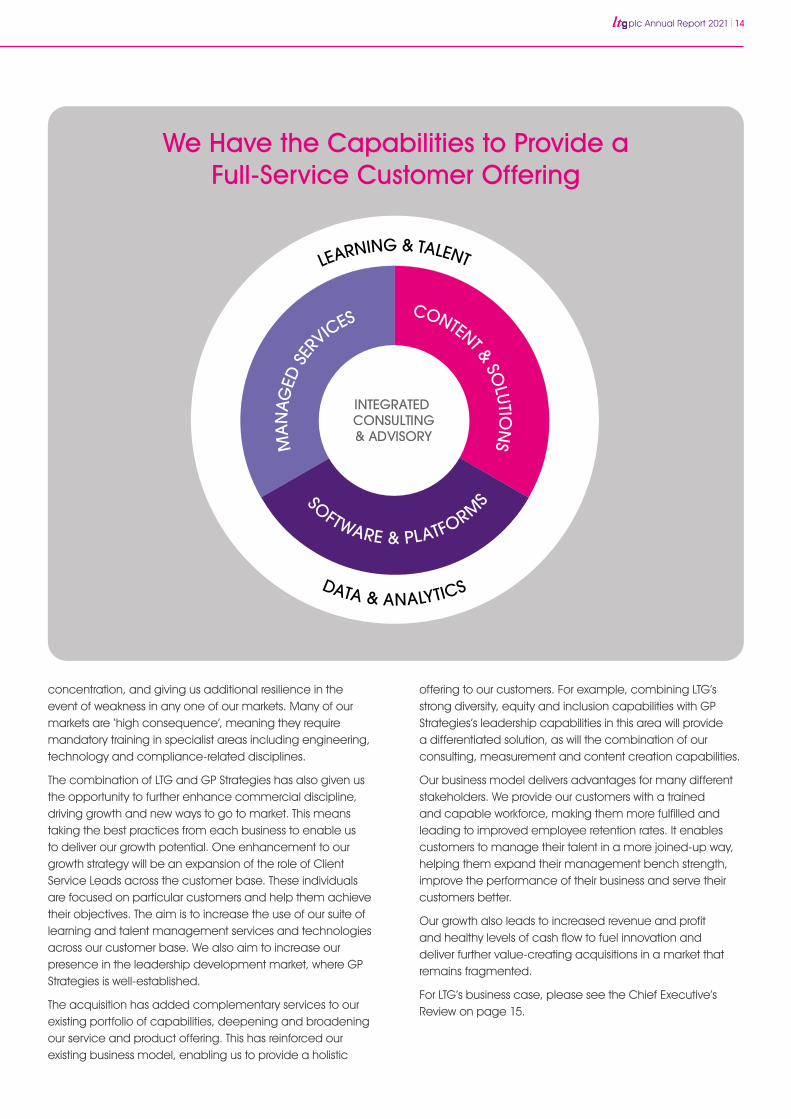
We Have the Capabilities to Provide a Full-Service Customer Offering
MA
NAG
EDSE
RVICES
LEARNING & TALENT
DATA & ANALYTICS
SOFTWARE & PLATFORM
S
CONTENT &SO
LUTION
S
INTEGRATEDCONSULTING& ADVISORY
15 plc Annual Report 2021
“We have an excellent track record of delivering value from acquisitions and after the first months of ownership of GP Strategies, we are very confident that it will create significant shareholder value.”
We have an excellent track record of delivering value from acquisitions and after the first months of ownership of GP Strategies, we are very confident that it will create significant shareholder value. It provides an outstanding margin enhancement opportunity and rich cross-selling prospects, some of which are already starting to show results. We continue to expect the combination to be significantly earnings accretive and there has been a swifter than anticipated improvement in GP Strategies’ margins. The task of integrating and unlocking its growth potential remains our primary focus for 2022.
These acquisitions offer added strength and resilience to our business model, continuing the evolution we’ve seen over the last several years.
As a result of the significant strategic and operational progress we made in 2021, we have exceeded our 2022 strategic financial goals, previously set in 2020. These were c.£230 million of run-rate revenue and c.£66 million run-rate adjusted EBIT.
Strategic Report: Chief Executive’s Review
IntroductionWe are a market leader in learning and talent development and we work as a strategic partner, helping our customers close the gap between current and future workforce capabilities through a combination of best-of-breed products and services.
We have a differentiated and well-integrated customer offering, including a leading digital presence. We have seen sustained business momentum through 2021 and this has helped us deliver strong Group organic revenue growth of 8% in the year, with both the Software & Platforms and Content & Services divisions contributing. We have also seen a significant increase in adjusted EBIT and adjusted diluted Earnings per Share, supported by the contribution of acquisitions in 2021.
For many of our customers, COVID-19 has resulted in increased remote and home working and there is a reduced appetite for business travel. As a result, we believe the long-term, favourable trends in our markets which define our strategy – namely a long-term shift towards digital learning blended with expert facilitation – are accelerating to our benefit.
In addition to our excellent operational performance in the year, we have made significant strategic progress. We acquired Bridge, Reflektive and PDT Global in the first quarter of 2021 and integrated them during the year. They are now meaningful contributors to Group adjusted EBIT.
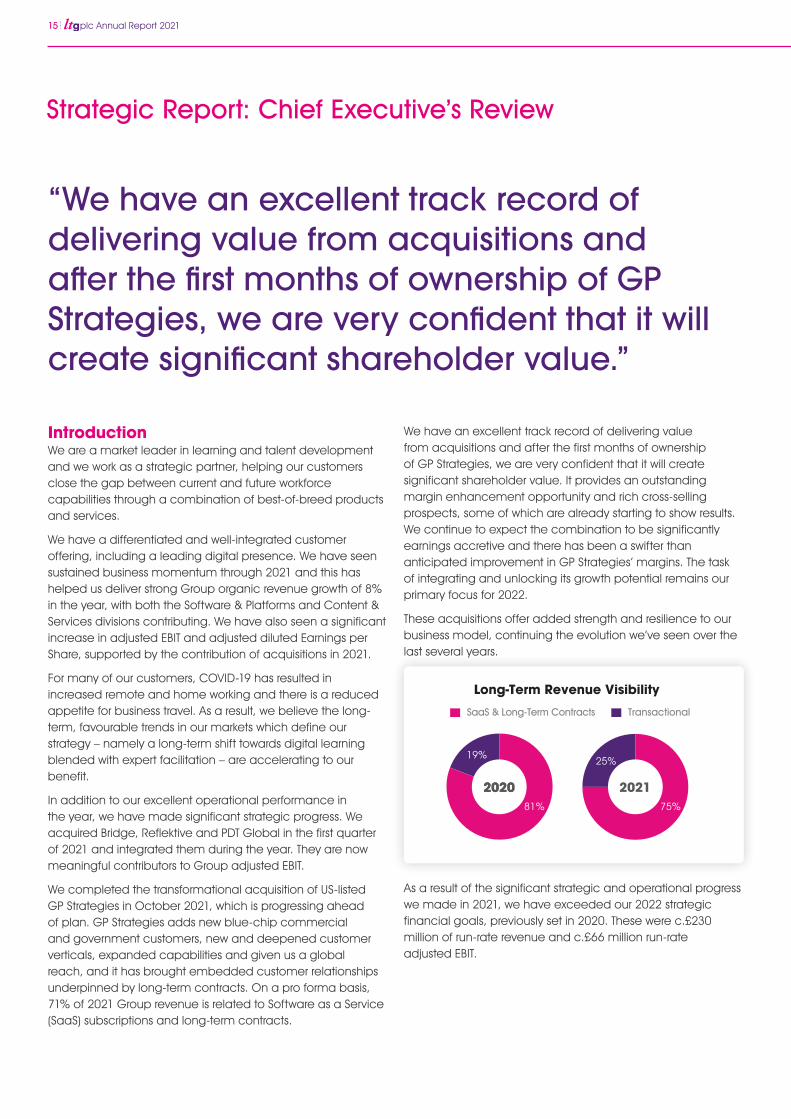
We completed the transformational acquisition of US-listed GP Strategies in October 2021, which is progressing ahead of plan. GP Strategies adds new blue-chip commercial and government customers, new and deepened customer verticals, expanded capabilities and given us a global reach, and it has brought embedded customer relationships underpinned by long-term contracts. On a pro forma basis, 71% of 2021 Group revenue is related to Software as a Service (SaaS) subscriptions and long-term contracts.
Long-Term Revenue Visibility
SaaS & Long-Term Contracts Transactional
2021
25%
75%
20202020
19%
81%
plc Annual Report 2021 16
fragmented market. Our suite of analytics tools enables us to track the performance of our learning and development solutions, demonstrating to customers the cost effectiveness of the services and software we provide. We are able to selectively bolt on technology capabilities, additional geographic reach or differentiated service offerings to further enhance our customer proposition. The Learning Services market is forecast to grow between 5-6% in 20223.
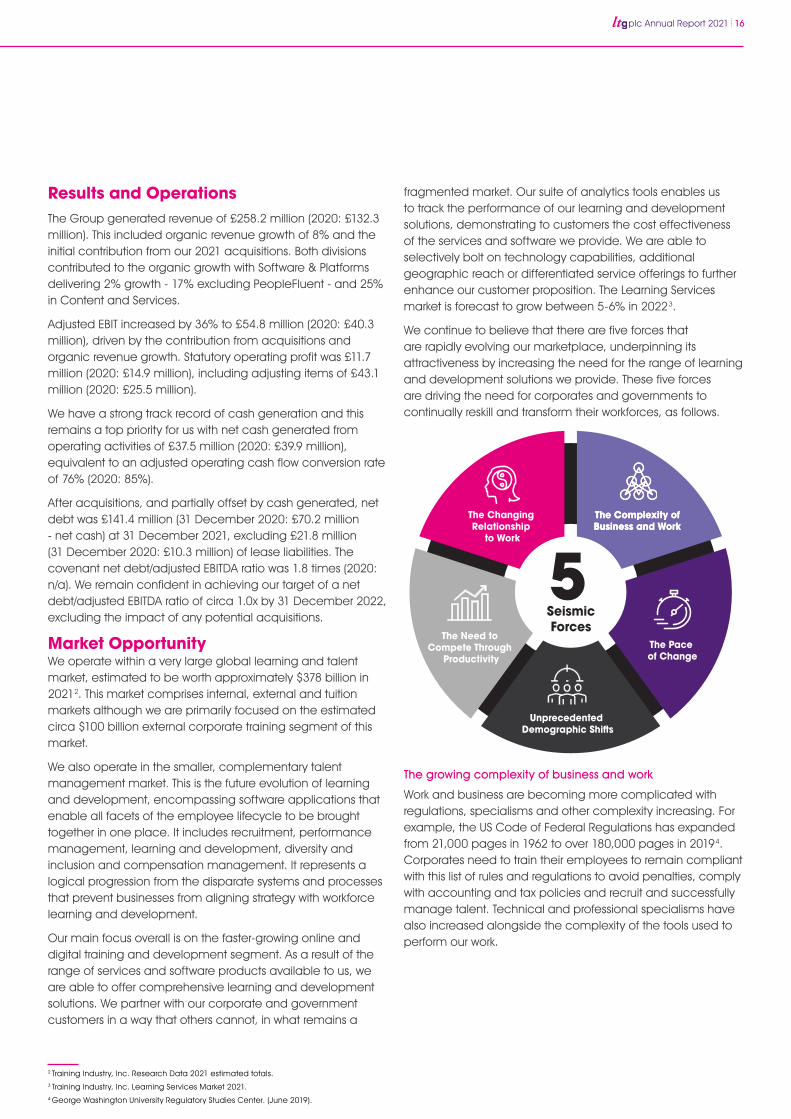
We continue to believe that there are five forces that are rapidly evolving our marketplace, underpinning its attractiveness by increasing the need for the range of learning and development solutions we provide. These five forces are driving the need for corporates and governments to continually reskill and transform their workforces, as follows.
The growing complexity of business and work
Work and business are becoming more complicated with regulations, specialisms and other complexity increasing. For example, the US Code of Federal Regulations has expanded from 21,000 pages in 1962 to over 180,000 pages in 20194. Corporates need to train their employees to remain compliant with this list of rules and regulations to avoid penalties, comply with accounting and tax policies and recruit and successfully manage talent. Technical and professional specialisms have also increased alongside the complexity of the tools used to perform our work.
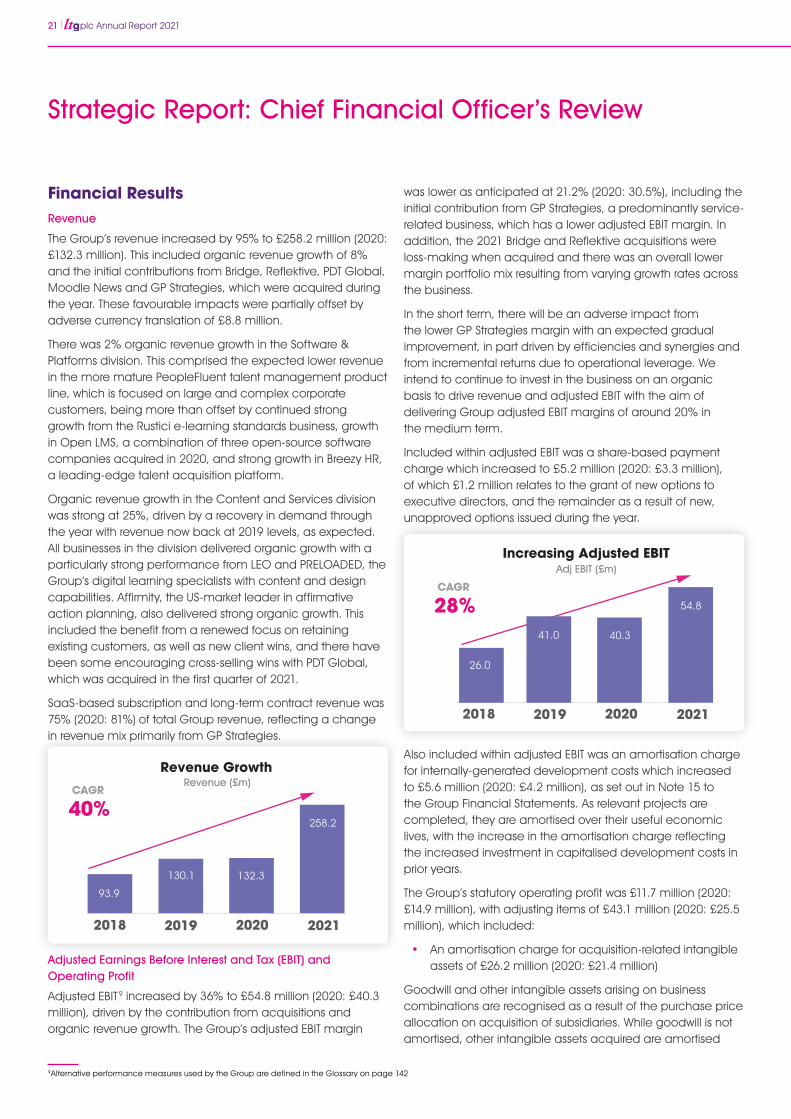
Results and OperationsThe Group generated revenue of £258.2 million (2020: £132.3 million). This included organic revenue growth of 8% and the initial contribution from our 2021 acquisitions. Both divisions contributed to the organic growth with Software & Platforms delivering 2% growth - 17% excluding PeopleFluent - and 25% in Content and Services.
Adjusted EBIT increased by 36% to £54.8 million (2020: £40.3 million), driven by the contribution from acquisitions and organic revenue growth. Statutory operating profit was £11.7 million (2020: £14.9 million), including adjusting items of £43.1 million (2020: £25.5 million).
We have a strong track record of cash generation and this remains a top priority for us with net cash generated from operating activities of £37.5 million (2020: £39.9 million), equivalent to an adjusted operating cash flow conversion rate of 76% (2020: 85%).
After acquisitions, and partially offset by cash generated, net debt was £141.4 million (31 December 2020: £70.2 million - net cash) at 31 December 2021, excluding £21.8 million (31 December 2020: £10.3 million) of lease liabilities. The covenant net debt/adjusted EBITDA ratio was 1.8 times (2020: n/a). We remain confident in achieving our target of a net debt/adjusted EBITDA ratio of circa 1.0x by 31 December 2022, excluding the impact of any potential acquisitions.
Market OpportunityWe operate within a very large global learning and talent market, estimated to be worth approximately $378 billion in 20212. This market comprises internal, external and tuition markets although we are primarily focused on the estimated circa $100 billion external corporate training segment of this market.
We also operate in the smaller, complementary talent management market. This is the future evolution of learning and development, encompassing software applications that enable all facets of the employee lifecycle to be brought together in one place. It includes recruitment, performance management, learning and development, diversity and inclusion and compensation management. It represents a logical progression from the disparate systems and processes that prevent businesses from aligning strategy with workforce learning and development.
Our main focus overall is on the faster-growing online and digital training and development segment. As a result of the range of services and software products available to us, we are able to offer comprehensive learning and development solutions. We partner with our corporate and government customers in a way that others cannot, in what remains a
2 Training Industry, Inc. Research Data 2021 estimated totals.3 Training Industry, Inc. Learning Services Market 2021.4 George Washington University Regulatory Studies Center. (June 2019).
17 plc Annual Report 2021
The pace of change
The pace of change in work is accelerating, in part driven by the revolution in technology, including digitalisation and automation. A recent survey 5 concluded that skills required for a single job are increasing 10% per annum. Furthermore, over 30% of the skills needed three years ago will soon be irrelevant5 . For employees to remain productive and effective, employers need to provide training so they can keep pace with changing roles.
Unprecedented demographic shifts
As populations get older, the pool of talent available is contracting - a pattern that is expected to accelerate, leaving an estimated deficit of 85 million workers globally 6. As a result, there will be intense competition to hire and retain employees, a dynamic which has proven to be particularly prevalent since COVID-19. A business has to make itself an employer of choice, and development and progression opportunities offered by training are vital.
The need to compete through productivity
Labour shortages and an ageing population mean that around 90% of future growth will have to come from productivity improvements7. Technology is needed to drive productivity, and learning is needed to develop and maintain human expertise. Steps needed to address global warming and other societal pressures mean business travel for training is becoming gradually less acceptable, with more digital training and consolidation in face-to-face training provision.
The changing relationship to work
Younger workers want meaningful work and autonomy. For this to happen, they need training to understand what they do and what the organisation needs8. COVID-19 has shifted the relationship between home and work. The expectation is of a hybrid work-world and, in this context, how we support learning and development is important, with the onus on employers to help employees thrive in this remote-working world.
We continue to be excited by our markets and the huge opportunities they provide.
Investment CaseWe have a strong track record of value creation. This includes a proven ability to grow organically and drive strong margins, as well as pursue an acquisition strategy that increases the Group’s capabilities and market reach, and delivers accretive earnings. All this has enabled us to generate strong cash flows, which has underpinned a progressive dividend policy.
The main drivers that have enabled us to deliver a robust financial performance over a sustained period of time are as follows:
• We have significant exposure to attractive digital training markets, which are the future of learning and development, and these markets are benefiting from structural growth trends. We support learning with rigorous data analytics, enabling our customers to measure effectiveness.
• Our portfolio of businesses has products that bring best-in-class specialist expertise, including recruitment, learning, performance, learning analytics, succession, compensation, vendor management, diversity & inclusion, immersive virtual, augmented and mixed reality experiences and consulting. This makes us well placed to help customers ‘join up’ their learning and talent management activities. We are regarded as a thought-leader in a fast-paced and evolving market.
• We have a highly skilled and experienced workforce that is able to bring together our rich product and content offerings to deliver integrated solutions for our customers’ workforce transformation needs.
• We leverage our global scale to attract new customers and expand with existing customers. We have more than 5,000 employees in 34 countries globally, including in attractive US and Asian markets. Using our local presence, we deliver training that is aligned with local culture and needs, for the best results.
• We have longstanding relationships and deep expertise in highly-regulated, high-consequence markets, which are difficult to enter, and where training needs are complex and mandatory. These include automotive, financial and insurance, defence, aerospace and technology markets.
• We invest in software-related learning innovation, in close partnership with customers, and focus on continuous improvement to optimise our performance.
For the year ended 31 December 2021
Strategic report (continued)
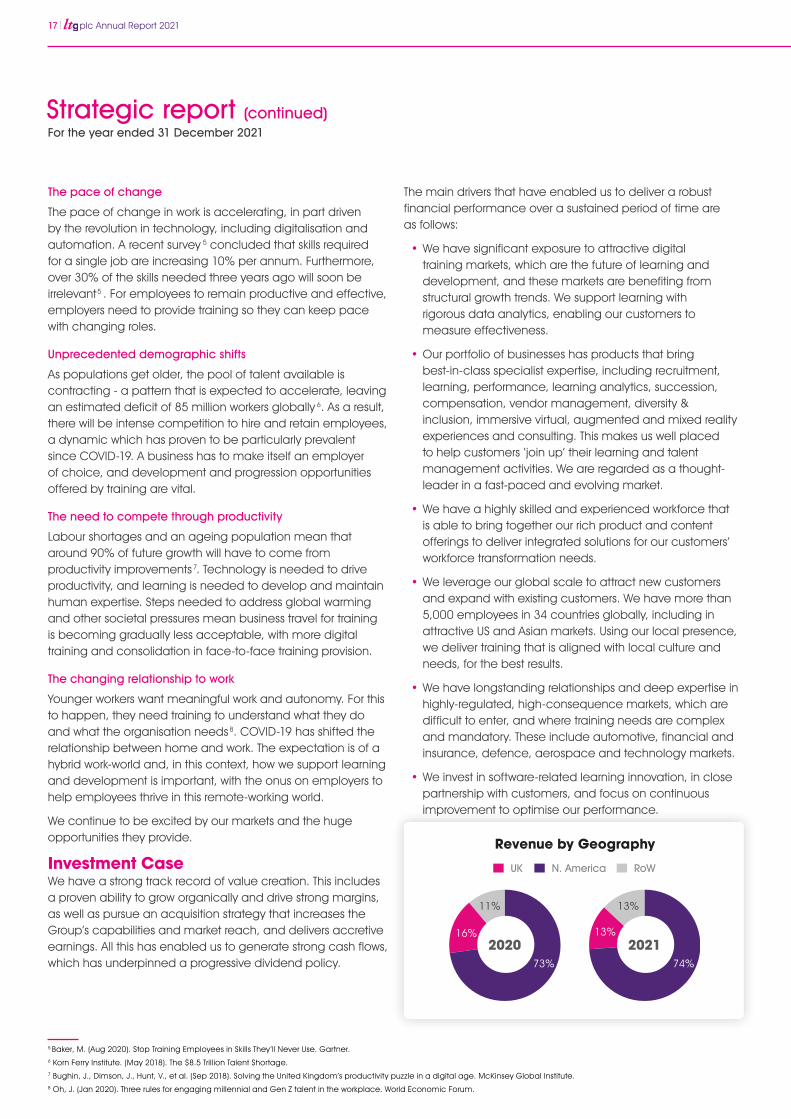
Revenue by Geography
UK N. America RoW
2020
11%
16%
73%
2021
13%
13%
74%
5 Baker, M. (Aug 2020). Stop Training Employees in Skills They’ll Never Use. Gartner. 6 Korn Ferry Institute. (May 2018). The $8.5 Trillion Talent Shortage.7 Bughin, J., Dimson, J., Hunt, V., et al. (Sep 2018). Solving the United Kingdom’s productivity puzzle in a digital age. McKinsey Global Institute.8 Oh, J. (Jan 2020). Three rules for engaging millennial and Gen Z talent in the workplace. World Economic Forum.
plc Annual Report 2021 18
Our ability to integrate our offerings enables us to offer holistic solutions and cross-sell to customers. We have had a particularly notable success providing a learning ecosystem for the partners, distributors and third-party audiences of a global energy business. This involved services and integrated software provision from six of our businesses, working together in close collaboration.
Creating Value Through Acquisitions - GP StrategiesAlongside organic growth we create value from acquisitions to help build our position as a global market leader in the growing digital learning and talent management sector. These acquisitions bring quality software or services offerings, enabling us to provide holistic learning and development solutions to our global customer base. We also invest in businesses with strong underlying assets where we can significantly improve the business model. To drive value we integrate our core capabilities, manage costs, including IT systems and back-office, and increase staff utilisation. These actions improve execution and delivery, and increase operating margins and cash generation.
Consistent with our strategy, in October 2021 we completed the transformational acquisition of US-listed GP Strategies. This is a global provider of organisational and technical performance solutions which transforms organisational effectiveness through innovative and superior training, consulting and business improvement services.
Total consideration for GP Strategies was $392 million (£288 million), representing an enterprise value on completion of $370 million (£271 million), including lease liabilities. The acquisition was partially funded by a mix of debt and an equity placing with gross proceeds of approximately £85 million (44.3 million shares). The acquisition is financially compelling and brings many strategic and customer benefits, including new and complementary capabilities; expertise in target customer markets in highly-regulated, complex industries; an expanded geographic footprint including in the US and faster-growing Asian markets; and an outstanding reputation servicing 125 of the US Fortune 500 and 121 constituents of the Fortune Global 500. Almost three quarters of its revenue is from customers of more than 10 years standing.
GP Strategies offers a significant opportunity to cross-sell products and services to a combined base of over 6,100 customers. We continue to work towards - and are confident we will achieve - our target of launching our combined strategic customer offer by the second half of 2022.
The requirement for our services and software is becoming more acute as training and development becomes a pressing need in many industries. This is delivered through a high proportion of predictable and recurring revenue streams, comprising SaaS-related subscriptions and long-term service contracts.
Creating Value Through Investment in InnovationInvestment in innovation is a high capital allocation priority and we have a strong track record of creating value in this area. We make our investments in partnership with customers, informed by a known customer need.
Part of our investment strategy is to leverage value from complementary technologies acquired through our selective M&A programme. We invest to consolidate products to provide integrated and cohesive solutions. In this way, our investment is aligned to the strategy of providing differentiated and comprehensive capabilities to customers. Where possible, we adopt a lower-risk approach to innovation by applying our existing technology to different markets.
During 2021, we have continued to make investments consistent with our strategy. Examples include:
• In our Rustici business, we delivered a test suite representing a significant step forward in the provision of the tools and resources needed to continue modernising standards across industry and government. This supports the development of more advanced approaches to learning and training, including simulation and extended reality.
• We have integrated our Open LMS technology with that of eCreators and eThink to create a shared code base, with the consolidation of the technology and hosting services enabling more efficient customer service.
• We have integrated the Reflektive product line with PeopleFluent’s enterprise talent management and talent marketplace to create modern performance management and engagement capabilities. In addition, we have integrated streamlined performance capabilities in the fast-growing Breezy HR brand, as well as an enhanced user experience.
• Within PeopleFluent, we have worked closely with customers to enhance its function-rich capabilities. These include people analytics, calibration, skills ontology, inclusion and bias filtering for recruitment, and content management for extended enterprise learning providers.
19 plc Annual Report 2021
With limited areas of service overlap, the cross-selling focus is primarily a means by which we can combine GP Strategies’ compelling services offerings with LTG’s software platforms, to provide a value-add solution to customers of both businesses. We have seen encouraging early customer interest in our combined service and software offerings. There are also some early cross-selling successes including a significant multi-year contract with a major US professional association in the financial services industry who delivers learning and accreditation services to more than 400,000 members worldwide. Neither business would have been able to provide the suite of services won, had it not been for the combined services and software within the Group.
We have an excellent track record of enhancing our margin over many years, including from acquisitions. The near-term priority for GP Strategies management has been to deliver cost efficiencies and savings from a range of actions including improved commercial governance and enhanced procurement controls, shared procurement efficiencies and a reduction of spend on third-party subcontractors.
Since the acquisition completed, listing costs have been eliminated and other corporate overheads reduced. GP Strategies’ management has put in place new commercial and supplier approvals and controls. It has also made substantial progress on the rationalisation of the supplier base, achieving significant supplier cost efficiencies.
Billable utilisation of customer-facing employees is also a focus, with work previously carried out by subcontractors now increasingly being done in-house. There is also a greater focus on winning higher value-add business. This includes, for example, a focus on work requiring more creative content and technical services.
In late 2021, there was a senior management reorganisation and, in January 2022, there was a planned reduction in staff, impacting 45 employees across GP Strategies. This has removed a layer of management and reduced back-office costs and underutilised staff. The reduction has helped efficiency without impacting the ability to serve customers.
Overall, we have seen a swifter than anticipated improvement in operational performance, with excellent progress being made. It is important to acknowledge the collegiate and co-operative approach of our GP Strategies’ colleagues in this crucial commercial initiative. As a result, we expect a GP Strategies’ adjusted EBIT margin of 12% in 2022. We remain confident there is further margin improvement potential for the business beyond this, such that we expect the run rate adjusted EBIT margin at the end of 2022 to be in the mid-teens.
During the year, GP Strategies incurred non-recurring costs of £2.9 million. This includes costs relating to the senior management reorganisation in late 2021, as well as legal, insurance and audit costs related to the transaction.
As a result of the acquisition of GP Strategies, LTG owned a 10% stake in National Aerospace Solutions LLC (“NAS”). Among other activities, NAS supports US Air Force test facilities at Arnold Engineering Development Complex, which operates 28 aerodynamic and propulsion wind tunnels and rocket and turbine engine test units. This shareholding was not considered core and on 18 April 2022 we divested it for $3.0 million proceeds. The GP Strategies employees supporting this business have transferred to NAS and, as such, LTG no longer holds an interest in NAS and its employees no longer support it.
Creating Value Through Acquisitions – Reflektive, PDT Global and BridgeAs well as GP Strategies, and the small acquisition of Moodle News in August 2021, we announced the Reflektive, PDT and Bridge acquisitions in the first quarter of 2021. These bring complementary software products as well as training and consulting in Diversity & Inclusion, enabling us to expand our offering to customers as follows:
• Reflektive completed in January 2021 for a cash consideration of $13.7 million (£10.0 million)
Reflektive brings agile performance management software, including engagement and analytics tools to the Group. It enables collaborative goal-setting, continuous feedback and analytics, providing measurable results for boosting productivity, engagement and improving employee retention. It serves the mid-market corporate customer base, complementing Bridge (see below).
• PDT Global completed in February 2021 for an initial cash consideration of £13.4 million, with further performance payments of up to £6.1 million payable in the three years to 2023
PDT Global brings diversity & inclusion offerings and is managed alongside our existing Affirmity brand, which offers affirmative action planning in the US in addition to a number of other diversity, equity, and inclusion software solutions and services. The two businesses’ highly complementary offerings enable customers to objectively measure and track their performance and implement the tools, processes and learning required to drive appropriate change.
• getBridge LLC (Bridge) also completed in February 2021 for a cash consideration of $47.5 million (£34.2 million)
For the year ended 31 December 2021
Strategic report (continued)
plc Annual Report 2021 20
impact of reduced office use during COVID-19. While our GHG emissions will increase in the short term, due to our significantly increased scale following the acquisition of GP Strategies, we have now committed to an ambition of Net Zero by 2050, or sooner. During 2022, we will be developing actions to support this ambition and we will provide an update in our 2022 results.
For more information on our ESG priorities and progress see page 29.
Update on RussiaThankfully, LTG has no staff or contractors based in Russia or Ukraine and we do minimal business in either market. In response to the conflict, we have decided not to conduct business with any customer which is Russian domiciled or predominantly Russian owned.
Outlook2021 was another exciting and successful year for LTG. Our strong organic revenue growth reflects the pressing and growing need for organisations to recruit, train, motivate and retain talent and LTG’s ability to meet these demands. We have also continued our track record of improving the operating model and performance of businesses we acquire.
Our transformational GP Strategies’ acquisition is progressing ahead of plan and enables us to upgrade our margin expectation for FY 2022. The enlarged Group provides a platform to capture a greater proportion of the circa $100 billion and growing addressable market in digital learning and talent management. Following the acquisition, we have a deeper offering to serve a global customer base facing greater complexity and change, creating further margin enhancement and cross-sell opportunities for LTG.
Current trading in Q1 2022 is strong, in line with management expectations. While mindful of the current macro environment, strong business momentum has continued into the new financial year and we have a robust balance sheet that will support further software company acquisitions in due course, underpinning the Board’s confidence of significant progress in FY 2022.
Jonathan SatchellChief Executive
29 April 2022
Bridge is a learning, performance and skills development platform for mid-enterprise organisations which operates on a single, easy-to-use, SaaS-based platform. It complements our PeopleFluent learning and talent platform for the large enterprise market. The addition of Bridge enables us to cover a broader corporate market and creates opportunities for further cross-selling across our customer base.
We have removed overheads across our acquisitions as appropriate and implemented LTG’s well-tested, rigorous commercial and operational processes. As a result of our actions during 2021, we have moved Reflektive and Bridge, which were significantly loss-making at the time of acquisition, quickly and sustainably into profit. There has also been initial success with our cross-selling strategy. We are pleased to be creating value from these acquisitions in the first year of ownership.
During 2022, our primary focus will continue to be on the successful transformation of GP Strategies, ahead of its integration into LTG. The Group will continue to look for additional bolt-on acquisition opportunities with an emphasis on the Software & Platforms division.
PeopleKath Kearney-Croft joined us as Chief Financial Officer and Board member on 1 December 2021, replacing Neil Elton after seven years in the role. Kath brings extensive public company experience in senior finance roles across a range of industries with operations in international markets.
The acquisition of GP Strategies brought 4,000 new colleagues, alongside LTG’s 1,100 people. Given the scale of this cultural integration, we decided to hire a new Chief People Officer with large, global company experience. Liz Freedman will join us on 23 May 2022, arriving from IHG Hotels & Resorts where she was Head of Global Talent. Prior to IHG, she held regional and global leadership roles at The Coca-Cola Company and Procter & Gamble.
Liz brings a unique combination of sales and customer marketing, operations, human capital management and large-scale transformational change experience with some of the world’s largest multinational companies. I look forward to welcoming her to LTG’s Executive Team.
Environmental, Social and Governance (ESG)What we provide to our customers enables them to manage and develop their human capital and is therefore fully aligned with ESG principles. We also focus on our own performance, including environmental sustainability. We report on our scope 1, 2 and 3 Greenhouse Gas (GHG) emissions and there was a 17% decrease in our total GHG emissions in 2021. In part, this was due to the mitigating actions taken, as well as the
21 plc Annual Report 2021
was lower as anticipated at 21.2% (2020: 30.5%), including the initial contribution from GP Strategies, a predominantly service-related business, which has a lower adjusted EBIT margin. In addition, the 2021 Bridge and Reflektive acquisitions were loss-making when acquired and there was an overall lower margin portfolio mix resulting from varying growth rates across the business.
In the short term, there will be an adverse impact from the lower GP Strategies margin with an expected gradual improvement, in part driven by efficiencies and synergies and from incremental returns due to operational leverage. We intend to continue to invest in the business on an organic basis to drive revenue and adjusted EBIT with the aim of delivering Group adjusted EBIT margins of around 20% in the medium term.
Included within adjusted EBIT was a share-based payment charge which increased to £5.2 million (2020: £3.3 million), of which £1.2 million relates to the grant of new options to executive directors, and the remainder as a result of new, unapproved options issued during the year.
Also included within adjusted EBIT was an amortisation charge for internally-generated development costs which increased to £5.6 million (2020: £4.2 million), as set out in Note 15 to the Group Financial Statements. As relevant projects are completed, they are amortised over their useful economic lives, with the increase in the amortisation charge reflecting the increased investment in capitalised development costs in prior years.
The Group’s statutory operating profit was £11.7 million (2020: £14.9 million), with adjusting items of £43.1 million (2020: £25.5 million), which included:
• An amortisation charge for acquisition-related intangible assets of £26.2 million (2020: £21.4 million)
Goodwill and other intangible assets arising on business combinations are recognised as a result of the purchase price allocation on acquisition of subsidiaries. While goodwill is not amortised, other intangible assets acquired are amortised
Financial ResultsRevenue
The Group’s revenue increased by 95% to £258.2 million (2020: £132.3 million). This included organic revenue growth of 8% and the initial contributions from Bridge, Reflektive, PDT Global, Moodle News and GP Strategies, which were acquired during the year. These favourable impacts were partially offset by adverse currency translation of £8.8 million.
There was 2% organic revenue growth in the Software & Platforms division. This comprised the expected lower revenue in the more mature PeopleFluent talent management product line, which is focused on large and complex corporate customers, being more than offset by continued strong growth from the Rustici e-learning standards business, growth in Open LMS, a combination of three open-source software companies acquired in 2020, and strong growth in Breezy HR, a leading-edge talent acquisition platform.
Organic revenue growth in the Content and Services division was strong at 25%, driven by a recovery in demand through the year with revenue now back at 2019 levels, as expected. All businesses in the division delivered organic growth with a particularly strong performance from LEO and PRELOADED, the Group’s digital learning specialists with content and design capabilities. Affirmity, the US-market leader in affirmative action planning, also delivered strong organic growth. This included the benefit from a renewed focus on retaining existing customers, as well as new client wins, and there have been some encouraging cross-selling wins with PDT Global, which was acquired in the first quarter of 2021.
SaaS-based subscription and long-term contract revenue was 75% (2020: 81%) of total Group revenue, reflecting a change in revenue mix primarily from GP Strategies.
Adjusted Earnings Before Interest and Tax (EBIT) and Operating Profit
Adjusted EBIT9 increased by 36% to £54.8 million (2020: £40.3 million), driven by the contribution from acquisitions and organic revenue growth. The Group’s adjusted EBIT margin
9Alternative performance measures used by the Group are defined in the Glossary on page 142
Strategic Report: Chief Financial Officer’s Review
2021202020192018
93.9
40%
130.1 132.3
258.2
Revenue GrowthRevenue (£m)
CAGR
2021202020192018
Increasing Adjusted EBITAdj EBIT (£m)
28%CAGR
26.0
41.0 40.3
54.8
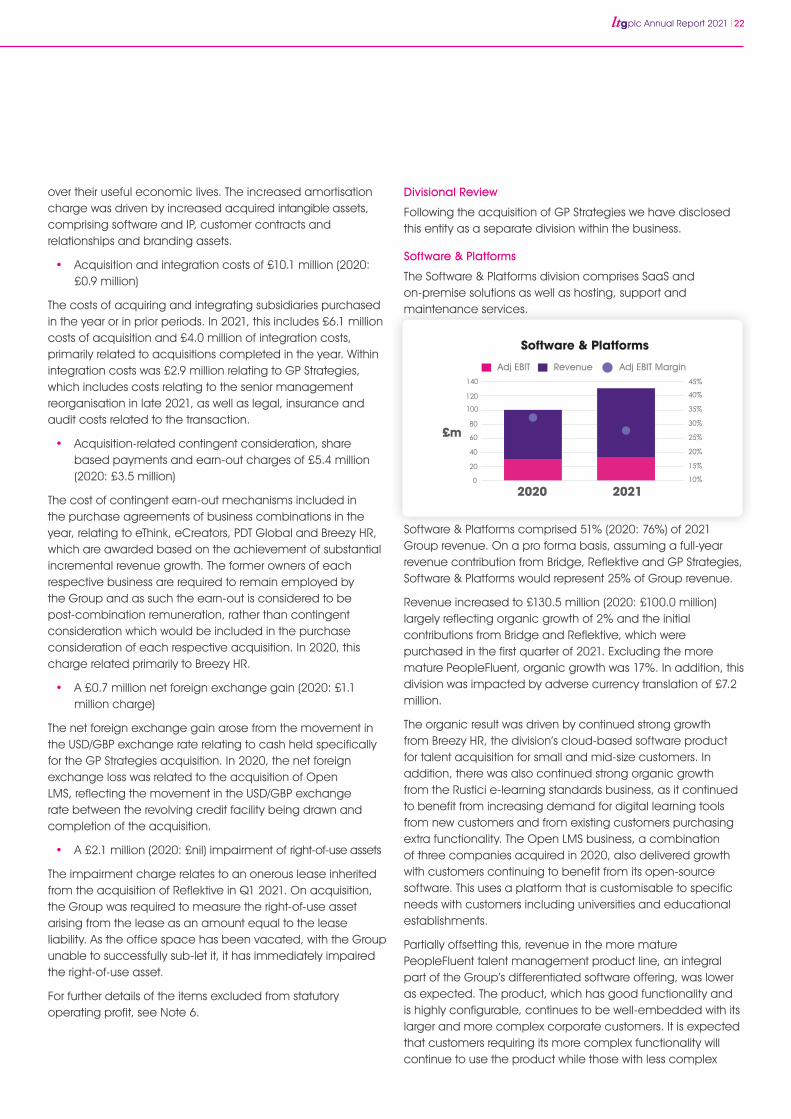
plc Annual Report 2021 22
over their useful economic lives. The increased amortisation charge was driven by increased acquired intangible assets, comprising software and IP, customer contracts and relationships and branding assets.
• Acquisition and integration costs of £10.1 million (2020: £0.9 million)
The costs of acquiring and integrating subsidiaries purchased in the year or in prior periods. In 2021, this includes £6.1 million costs of acquisition and £4.0 million of integration costs, primarily related to acquisitions completed in the year. Within integration costs was £2.9 million relating to GP Strategies, which includes costs relating to the senior management reorganisation in late 2021, as well as legal, insurance and audit costs related to the transaction.
• Acquisition-related contingent consideration, share based payments and earn-out charges of £5.4 million (2020: £3.5 million)
The cost of contingent earn-out mechanisms included in the purchase agreements of business combinations in the year, relating to eThink, eCreators, PDT Global and Breezy HR, which are awarded based on the achievement of substantial incremental revenue growth. The former owners of each respective business are required to remain employed by the Group and as such the earn-out is considered to be post-combination remuneration, rather than contingent consideration which would be included in the purchase consideration of each respective acquisition. In 2020, this charge related primarily to Breezy HR.
• A £0.7 million net foreign exchange gain (2020: £1.1 million charge)
The net foreign exchange gain arose from the movement in the USD/GBP exchange rate relating to cash held specifically for the GP Strategies acquisition. In 2020, the net foreign exchange loss was related to the acquisition of Open LMS, reflecting the movement in the USD/GBP exchange rate between the revolving credit facility being drawn and completion of the acquisition.
• A £2.1 million (2020: £nil) impairment of right-of-use assets
The impairment charge relates to an onerous lease inherited from the acquisition of Reflektive in Q1 2021. On acquisition, the Group was required to measure the right-of-use asset arising from the lease as an amount equal to the lease liability. As the office space has been vacated, with the Group unable to successfully sub-let it, it has immediately impaired the right-of-use asset.
For further details of the items excluded from statutory operating profit, see Note 6.
Divisional Review
Following the acquisition of GP Strategies we have disclosed this entity as a separate division within the business.
Software & Platforms
The Software & Platforms division comprises SaaS and on-premise solutions as well as hosting, support and maintenance services.
Software & Platforms comprised 51% (2020: 76%) of 2021 Group revenue. On a pro forma basis, assuming a full-year revenue contribution from Bridge, Reflektive and GP Strategies, Software & Platforms would represent 25% of Group revenue.
Revenue increased to £130.5 million (2020: £100.0 million) largely reflecting organic growth of 2% and the initial contributions from Bridge and Reflektive, which were purchased in the first quarter of 2021. Excluding the more mature PeopleFluent, organic growth was 17%. In addition, this division was impacted by adverse currency translation of £7.2 million.
The organic result was driven by continued strong growth from Breezy HR, the division’s cloud-based software product for talent acquisition for small and mid-size customers. In addition, there was also continued strong organic growth from the Rustici e-learning standards business, as it continued to benefit from increasing demand for digital learning tools from new customers and from existing customers purchasing extra functionality. The Open LMS business, a combination of three companies acquired in 2020, also delivered growth with customers continuing to benefit from its open-source software. This uses a platform that is customisable to specific needs with customers including universities and educational establishments.
Partially offsetting this, revenue in the more mature PeopleFluent talent management product line, an integral part of the Group’s differentiated software offering, was lower as expected. The product, which has good functionality and is highly configurable, continues to be well-embedded with its larger and more complex corporate customers. It is expected that customers requiring its more complex functionality will continue to use the product while those with less complex
0
20
40
60
80
100
120
140
10%
15%
20%
25%
30%
35%
40%
45%
Software & Platforms
Adj EBIT Revenue Adj EBIT Margin
20212020
£m
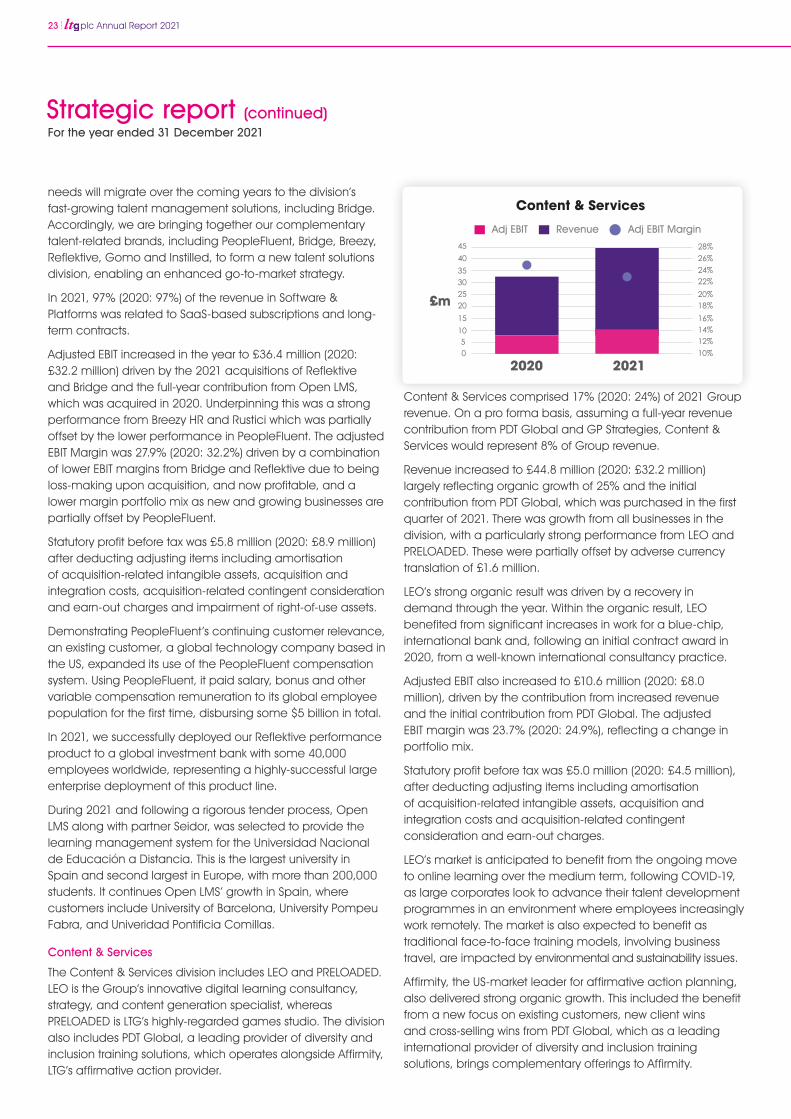
23 plc Annual Report 2021
For the year ended 31 December 2021
Strategic report (continued)
Content & Services comprised 17% (2020: 24%) of 2021 Group revenue. On a pro forma basis, assuming a full-year revenue contribution from PDT Global and GP Strategies, Content & Services would represent 8% of Group revenue.
Revenue increased to £44.8 million (2020: £32.2 million) largely reflecting organic growth of 25% and the initial contribution from PDT Global, which was purchased in the first quarter of 2021. There was growth from all businesses in the division, with a particularly strong performance from LEO and PRELOADED. These were partially offset by adverse currency translation of £1.6 million.
LEO’s strong organic result was driven by a recovery in demand through the year. Within the organic result, LEO benefited from significant increases in work for a blue-chip, international bank and, following an initial contract award in 2020, from a well-known international consultancy practice.
Adjusted EBIT also increased to £10.6 million (2020: £8.0 million), driven by the contribution from increased revenue and the initial contribution from PDT Global. The adjusted EBIT margin was 23.7% (2020: 24.9%), reflecting a change in portfolio mix.
Statutory profit before tax was £5.0 million (2020: £4.5 million), after deducting adjusting items including amortisation of acquisition-related intangible assets, acquisition and integration costs and acquisition-related contingent consideration and earn-out charges.
LEO’s market is anticipated to benefit from the ongoing move to online learning over the medium term, following COVID-19, as large corporates look to advance their talent development programmes in an environment where employees increasingly work remotely. The market is also expected to benefit as traditional face-to-face training models, involving business travel, are impacted by environmental and sustainability issues.
Affirmity, the US-market leader for affirmative action planning, also delivered strong organic growth. This included the benefit from a new focus on existing customers, new client wins and cross-selling wins from PDT Global, which as a leading international provider of diversity and inclusion training solutions, brings complementary offerings to Affirmity.
needs will migrate over the coming years to the division’s fast-growing talent management solutions, including Bridge. Accordingly, we are bringing together our complementary talent-related brands, including PeopleFluent, Bridge, Breezy, Reflektive, Gomo and Instilled, to form a new talent solutions division, enabling an enhanced go-to-market strategy.
In 2021, 97% (2020: 97%) of the revenue in Software & Platforms was related to SaaS-based subscriptions and long-term contracts.
Adjusted EBIT increased in the year to £36.4 million (2020: £32.2 million) driven by the 2021 acquisitions of Reflektive and Bridge and the full-year contribution from Open LMS, which was acquired in 2020. Underpinning this was a strong performance from Breezy HR and Rustici which was partially offset by the lower performance in PeopleFluent. The adjusted EBIT Margin was 27.9% (2020: 32.2%) driven by a combination of lower EBIT margins from Bridge and Reflektive due to being loss-making upon acquisition, and now profitable, and a lower margin portfolio mix as new and growing businesses are partially offset by PeopleFluent.
Statutory profit before tax was £5.8 million (2020: £8.9 million) after deducting adjusting items including amortisation of acquisition-related intangible assets, acquisition and integration costs, acquisition-related contingent consideration and earn-out charges and impairment of right-of-use assets.
Demonstrating PeopleFluent’s continuing customer relevance, an existing customer, a global technology company based in the US, expanded its use of the PeopleFluent compensation system. Using PeopleFluent, it paid salary, bonus and other variable compensation remuneration to its global employee population for the first time, disbursing some $5 billion in total.
In 2021, we successfully deployed our Reflektive performance product to a global investment bank with some 40,000 employees worldwide, representing a highly-successful large enterprise deployment of this product line.
During 2021 and following a rigorous tender process, Open LMS along with partner Seidor, was selected to provide the learning management system for the Universidad Nacional de Educación a Distancia. This is the largest university in Spain and second largest in Europe, with more than 200,000 students. It continues Open LMS’ growth in Spain, where customers include University of Barcelona, University Pompeu Fabra, and Univeridad Pontificia Comillas.
Content & Services
The Content & Services division includes LEO and PRELOADED. LEO is the Group’s innovative digital learning consultancy, strategy, and content generation specialist, whereas PRELOADED is LTG’s highly-regarded games studio. The division also includes PDT Global, a leading provider of diversity and inclusion training solutions, which operates alongside Affirmity, LTG’s affirmative action provider.
05
1015202530354045
10%12%14%16%18%20%22%24%26%28%
Content & Services
Adj EBIT Revenue Adj EBIT Margin
20212020
£m
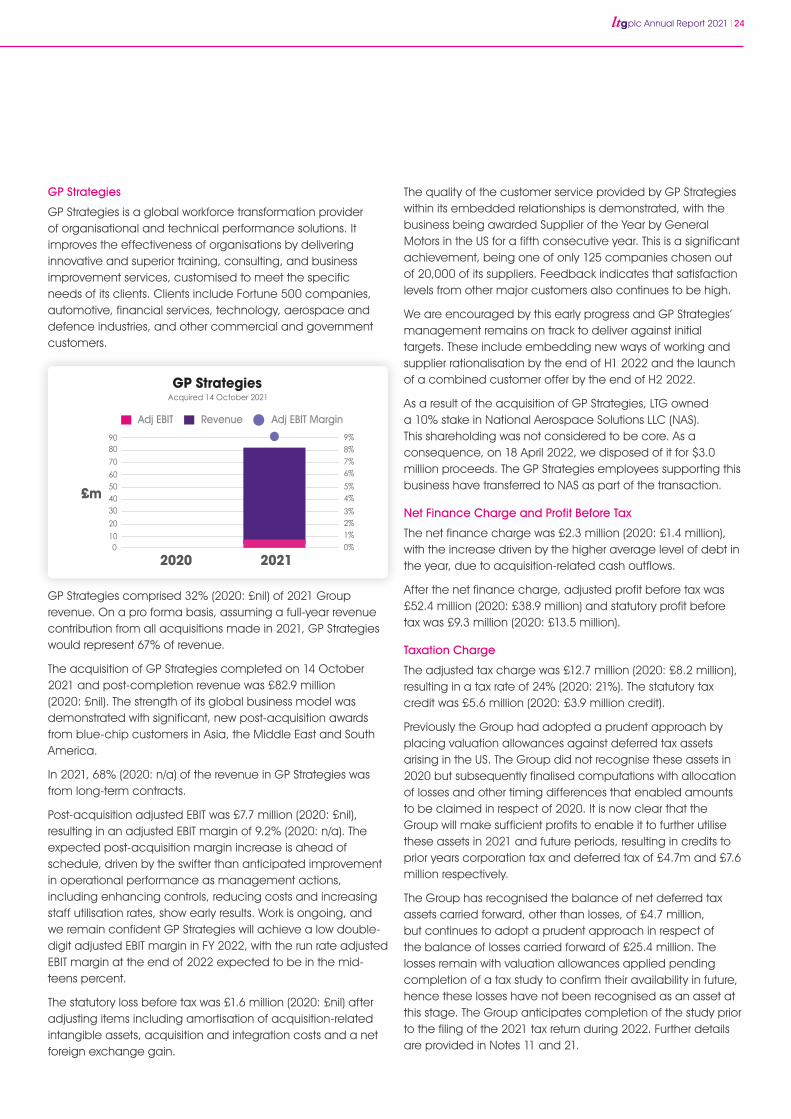
plc Annual Report 2021 24
GP Strategies
GP Strategies is a global workforce transformation provider of organisational and technical performance solutions. It improves the effectiveness of organisations by delivering innovative and superior training, consulting, and business improvement services, customised to meet the specific needs of its clients. Clients include Fortune 500 companies, automotive, financial services, technology, aerospace and defence industries, and other commercial and government customers.
GP Strategies comprised 32% (2020: £nil) of 2021 Group revenue. On a pro forma basis, assuming a full-year revenue contribution from all acquisitions made in 2021, GP Strategies would represent 67% of revenue.
The acquisition of GP Strategies completed on 14 October 2021 and post-completion revenue was £82.9 million (2020: £nil). The strength of its global business model was demonstrated with significant, new post-acquisition awards from blue-chip customers in Asia, the Middle East and South America.
In 2021, 68% (2020: n/a) of the revenue in GP Strategies was from long-term contracts.
Post-acquisition adjusted EBIT was £7.7 million (2020: £nil), resulting in an adjusted EBIT margin of 9.2% (2020: n/a). The expected post-acquisition margin increase is ahead of schedule, driven by the swifter than anticipated improvement in operational performance as management actions, including enhancing controls, reducing costs and increasing staff utilisation rates, show early results. Work is ongoing, and we remain confident GP Strategies will achieve a low double-digit adjusted EBIT margin in FY 2022, with the run rate adjusted EBIT margin at the end of 2022 expected to be in the mid-teens percent.
The statutory loss before tax was £1.6 million (2020: £nil) after adjusting items including amortisation of acquisition-related intangible assets, acquisition and integration costs and a net foreign exchange gain.
The quality of the customer service provided by GP Strategies within its embedded relationships is demonstrated, with the business being awarded Supplier of the Year by General Motors in the US for a fifth consecutive year. This is a significant achievement, being one of only 125 companies chosen out of 20,000 of its suppliers. Feedback indicates that satisfaction levels from other major customers also continues to be high.
We are encouraged by this early progress and GP Strategies’ management remains on track to deliver against initial targets. These include embedding new ways of working and supplier rationalisation by the end of H1 2022 and the launch of a combined customer offer by the end of H2 2022.
As a result of the acquisition of GP Strategies, LTG owned a 10% stake in National Aerospace Solutions LLC (NAS). This shareholding was not considered to be core. As a consequence, on 18 April 2022, we disposed of it for $3.0 million proceeds. The GP Strategies employees supporting this business have transferred to NAS as part of the transaction.
Net Finance Charge and Profit Before Tax
The net finance charge was £2.3 million (2020: £1.4 million), with the increase driven by the higher average level of debt in the year, due to acquisition-related cash outflows.
After the net finance charge, adjusted profit before tax was £52.4 million (2020: £38.9 million) and statutory profit before tax was £9.3 million (2020: £13.5 million).
Taxation Charge
The adjusted tax charge was £12.7 million (2020: £8.2 million), resulting in a tax rate of 24% (2020: 21%). The statutory tax credit was £5.6 million (2020: £3.9 million credit).
Previously the Group had adopted a prudent approach by placing valuation allowances against deferred tax assets arising in the US. The Group did not recognise these assets in 2020 but subsequently finalised computations with allocation of losses and other timing differences that enabled amounts to be claimed in respect of 2020. It is now clear that the Group will make sufficient profits to enable it to further utilise these assets in 2021 and future periods, resulting in credits to prior years corporation tax and deferred tax of £4.7m and £7.6 million respectively.
The Group has recognised the balance of net deferred tax assets carried forward, other than losses, of £4.7 million, but continues to adopt a prudent approach in respect of the balance of losses carried forward of £25.4 million. The losses remain with valuation allowances applied pending completion of a tax study to confirm their availability in future, hence these losses have not been recognised as an asset at this stage. The Group anticipates completion of the study prior to the filing of the 2021 tax return during 2022. Further details are provided in Notes 11 and 21.
0
Acquired 14 October 2021
102030405060708090
0%1%2%3%4%5%6%7%8%9%
GP Strategies
Adj EBIT Revenue Adj EBIT Margin
20212020
£m
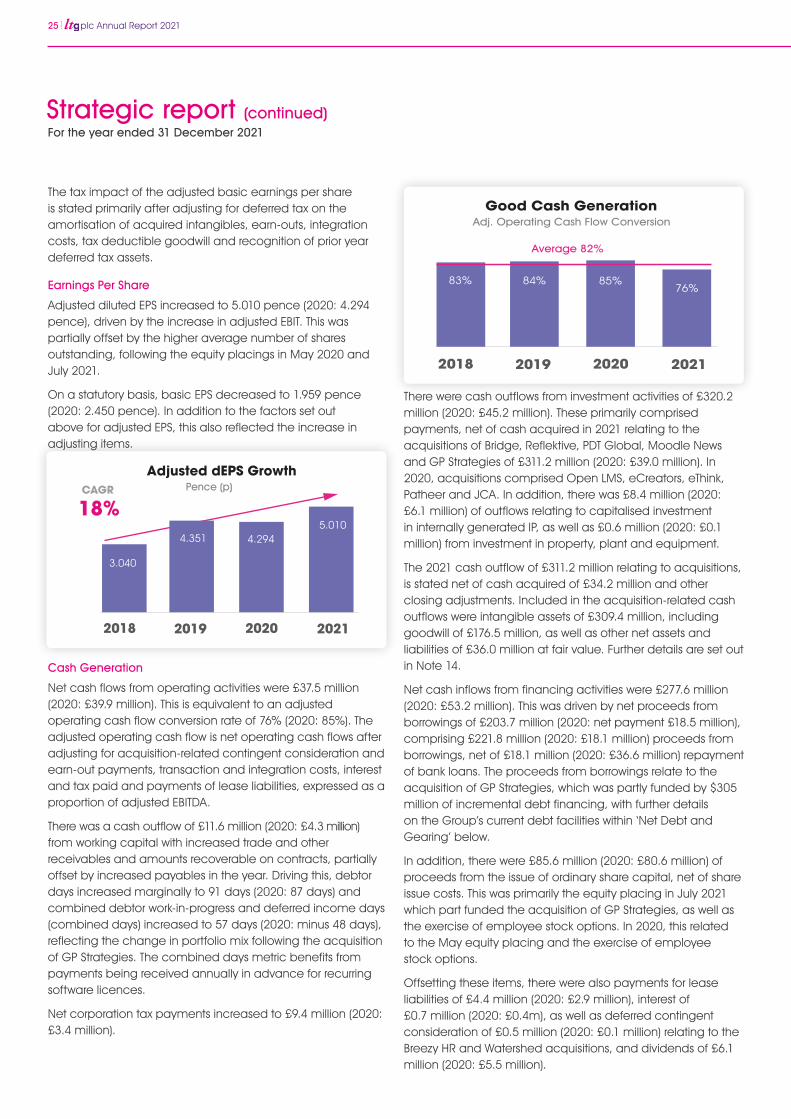
25 plc Annual Report 2021
For the year ended 31 December 2021
Strategic report (continued)
There were cash outflows from investment activities of £320.2 million (2020: £45.2 million). These primarily comprised payments, net of cash acquired in 2021 relating to the acquisitions of Bridge, Reflektive, PDT Global, Moodle News and GP Strategies of £311.2 million (2020: £39.0 million). In 2020, acquisitions comprised Open LMS, eCreators, eThink, Patheer and JCA. In addition, there was £8.4 million (2020: £6.1 million) of outflows relating to capitalised investment in internally generated IP, as well as £0.6 million (2020: £0.1 million) from investment in property, plant and equipment.
The 2021 cash outflow of £311.2 million relating to acquisitions, is stated net of cash acquired of £34.2 million and other closing adjustments. Included in the acquisition-related cash outflows were intangible assets of £309.4 million, including goodwill of £176.5 million, as well as other net assets and liabilities of £36.0 million at fair value. Further details are set out in Note 14.
Net cash inflows from financing activities were £277.6 million (2020: £53.2 million). This was driven by net proceeds from borrowings of £203.7 million (2020: net payment £18.5 million), comprising £221.8 million (2020: £18.1 million) proceeds from borrowings, net of £18.1 million (2020: £36.6 million) repayment of bank loans. The proceeds from borrowings relate to the acquisition of GP Strategies, which was partly funded by $305 million of incremental debt financing, with further details on the Group’s current debt facilities within ‘Net Debt and Gearing’ below.
In addition, there were £85.6 million (2020: £80.6 million) of proceeds from the issue of ordinary share capital, net of share issue costs. This was primarily the equity placing in July 2021 which part funded the acquisition of GP Strategies, as well as the exercise of employee stock options. In 2020, this related to the May equity placing and the exercise of employee stock options.
Offsetting these items, there were also payments for lease liabilities of £4.4 million (2020: £2.9 million), interest of £0.7 million (2020: £0.4m), as well as deferred contingent consideration of £0.5 million (2020: £0.1 million) relating to the Breezy HR and Watershed acquisitions, and dividends of £6.1 million (2020: £5.5 million).
The tax impact of the adjusted basic earnings per share is stated primarily after adjusting for deferred tax on the amortisation of acquired intangibles, earn-outs, integration costs, tax deductible goodwill and recognition of prior year deferred tax assets.
Earnings Per Share
Adjusted diluted EPS increased to 5.010 pence (2020: 4.294 pence), driven by the increase in adjusted EBIT. This was partially offset by the higher average number of shares outstanding, following the equity placings in May 2020 and July 2021.
On a statutory basis, basic EPS decreased to 1.959 pence (2020: 2.450 pence). In addition to the factors set out above for adjusted EPS, this also reflected the increase in adjusting items.
Cash Generation
Net cash flows from operating activities were £37.5 million (2020: £39.9 million). This is equivalent to an adjusted operating cash flow conversion rate of 76% (2020: 85%). The adjusted operating cash flow is net operating cash flows after adjusting for acquisition-related contingent consideration and earn-out payments, transaction and integration costs, interest and tax paid and payments of lease liabilities, expressed as a proportion of adjusted EBITDA.
There was a cash outflow of £11.6 million (2020: £4.3 million) from working capital with increased trade and other receivables and amounts recoverable on contracts, partially offset by increased payables in the year. Driving this, debtor days increased marginally to 91 days (2020: 87 days) and combined debtor work-in-progress and deferred income days (combined days) increased to 57 days (2020: minus 48 days), reflecting the change in portfolio mix following the acquisition of GP Strategies. The combined days metric benefits from payments being received annually in advance for recurring software licences.
Net corporation tax payments increased to £9.4 million (2020: £3.4 million).
2021202020192018
Good Cash GenerationAdj. Operating Cash Flow Conversion
83%
Average 82%
84% 85%76%
2021202020192018
Adjusted dEPS GrowthPence (p)
18%CAGR
3.040
4.351 4.2945.010
plc Annual Report 2021 26
Capital Allocation, Funding Priorities and Dividend
The Board remains committed to a capital allocation policy that prioritises investment in the business to drive growth, a progressive dividend policy, and selectively acquiring value-enhancing businesses.
The Board’s progressive dividend policy, while taking into account earnings cover, also takes into account other factors such as the expected underlying growth of the business, its capital and other investment requirements. The strength of the Group’s balance sheet and its ability to generate cash are also considered.
The Group considers these factors in the context of the Group’s Principal Risks, which are set out on page 27 to 28, and the overall risk profile of the Group.
Given the robust operational performance during the year, the Board is recommending a final dividend of 0.7 pence per share (2020: 0.5 pence). The total cash cost of the final dividend is approximately £5.5 million.
Together with the interim dividend of 0.3 pence, this gives a total dividend for the year of 1.0 pence, an increase of 33% on the prior year.
If approved, the final dividend will be paid on 21 July 2022 to all shareholders on the register at 1 July 2022.
Net Debt and Gearing
At 31 December 2021, the Group’s net debt was £141.4 million (31 December 2020: £70.2 million - net cash), excluding £21.8 million (31 December 2020: £10.3 million) of lease liabilities.
The Group’s net debt comprised £225.3 million of debt (31 December 2020: £18.4 million) and £83.9 million of cash (31 December 2020: £88.6 million).
On the acquisition of GP Strategies, the existing debt facility with Silicon Valley Bank (‘SVB’) was repaid and a new facility with SVB, Barclays Bank, Fifth Third Bank, HSBC UK Bank and the Bank of Ireland was entered into. This is made up of two variable rate committed term loans. The Term Facility A of $265.0 million (£196.3 million at the year-end exchange rate) is available to the Group until October 2025 with the Term Facility B of $40.0 million (£29.6 million at year-end exchange rates) available to the Group until April 2022. The Term Facility B was repaid in March 2022. The facilities also include a $50.0 million (£37.0 million at year-end exchange rates) Revolving Credit Facility and a $50.0 million (£37.0 million at year-end exchange rates) uncommitted accordion, both available to July 2025. For further details of the Group’s debt facility see Note 24.
The Group’s covenant basis net debt/adjusted EBITDA ratio was 1.8 times (2020: n/a).
Prior Year Adjustment
We have identified the need to make a correction to the presentation of the 2020 and 2019 balance sheets where trade receivables and contract liabilities (deferred income) of £6.2 million at 31 December 2020 and £7.4 million at 31 December 2019 had been presented ‘gross’ but should have been presented ‘net,’ in accordance with IFRS15. This relates to the timing of recognition of trade receivable balances which are not due for payment until the following year and revenue recognition has not commenced.
The Group has restated the presentation of the balance sheet and cash flow statement for the year, to reflect this requirement. For details of the presentational changes made, refer to note 4.
The presentational changes made have no impact on reported revenue, profit, net assets or cash generation in the year.
Balance Sheet
The Group has a strong balance sheet with total shareholder equity of £371.3 million at 31 December 2021 (31 December 2020: £269.1 million), reflecting the acquisition of GP Strategies and the other 2021 acquisitions. This is equivalent to 47.1 pence per share (2020: 36.4 pence per share).
Key Performance Indicators (KPIs)
The Group’s KPIs are revenue and organic revenue growth, adjusted EBIT, cash conversion and adjusted diluted EPS. A discussion of performance against each KPI is contained within the narrative above.
The profitability of the business, which has a relatively low fixed-cost base, is managed primarily via the divisional revenue review, with secondary measures addressing employee utilisation and project margin reviews in Content & Services and in GP Strategies.
Cash flow is reviewed at a Group level, aided by rolling cash forecasts. There is a focus on working capital which is reviewed primarily against debtor days and combined debtor, WIP and deferred income days measures.
Adjusted diluted EPS, as well as incorporating all the elements of the above KPIs, is additionally impacted by the Group’s treasury and taxation activities. These activities are carried out within the Group’s finance team, and seek to manage the Group’s net finance and taxation charge.
Kath Kearney-CroftChief Financial Officer
29 April 2022
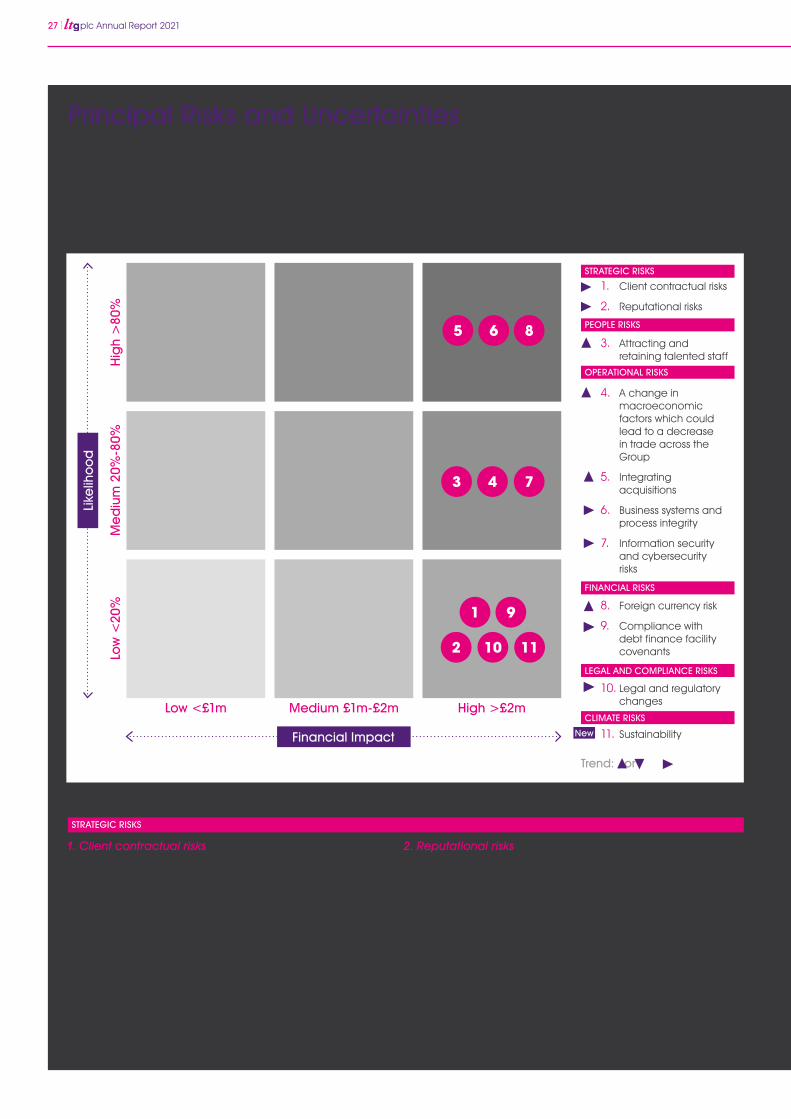
27 plc Annual Report 2021
Principal Risks and Uncertainties
The Directors undertake regular reviews of the risk and uncertainties facing the Group, including new and emerging risks, and consider the likelihood and impact on the Group of those risks in order to put in place mitigating actions. In addition to the financial risks discussed in Note 33, the Directors consider that the principal risks and uncertainties facing the Group and a summary of the key measures taken to mitigate those risks are as follows:
2. Reputational risksFailings in service provision are almost certainly going to be caused by human error. LTG continues to refine its ISO 9001 management processes and performs regular reviews and updates based on ‘lessons learned’. There is an increase in Business Units becoming ISO certified across the Group, with a number of portfolio businesses becoming certified and working towards ISO 27001 certification in 2021. Furthermore, in addition to client audits, all projects are reviewed regularly for performance against customer expectation, delivery milestones and forecast margins. Extensive work is undertaken in reviewing customer feedback and any unresolved complaints are reported to the Board.
1. Client contractual risksThe Group offers a wide variety of products and services with different risk profiles and in different countries, to a diverse customer base, many of which operate in regulated sectors and/or will seek to contract under their own terms and conditions. The Group continues to expand through acquisition including the transfer of customer contracts from the acquired business. With recent acquisitions, the business now has US Government contracts which increases the complexity within the Group’s contracting process and large customer contracts that represent a higher proportion of the Group’s revenue. The business is subject to client and government audits with respect to assurance around quality and compliance. The Group mitigates its client risks through the operation of its centralised legal function. Client contractual risks are assessed in acquisition due diligence and addressed as part of the integration work stream for acquired businesses. Contractual risk management processes and policies are kept under regular review.
Like
liho
od
Low
<20
%M
ed
ium
20%
-80%
Hig
h >
80%
Low <£1m Medium £1m-£2m High >£2m
3 4
8
7
1. Client contractual risks
2. Reputational risks
3. Attracting and retaining talented staff
4. A change in macroeconomic factors which could lead to a decrease in trade across the Group
5. Integrating acquisitions
6. Business systems and process integrity
7. Information security and cybersecurity risks
8. Foreign currency risk
9. Compliance with debt finance facility covenants
10. Legal and regulatory changes
11. Sustainability
1
10 11
9
2
5 6
New
STRATEGIC RISKS
STRATEGIC RISKS
PEOPLE RISKS
OPERATIONAL RISKS
FINANCIAL RISKS
LEGAL AND COMPLIANCE RISKS
CLIMATE RISKS
Trend: , or
Financial Impact
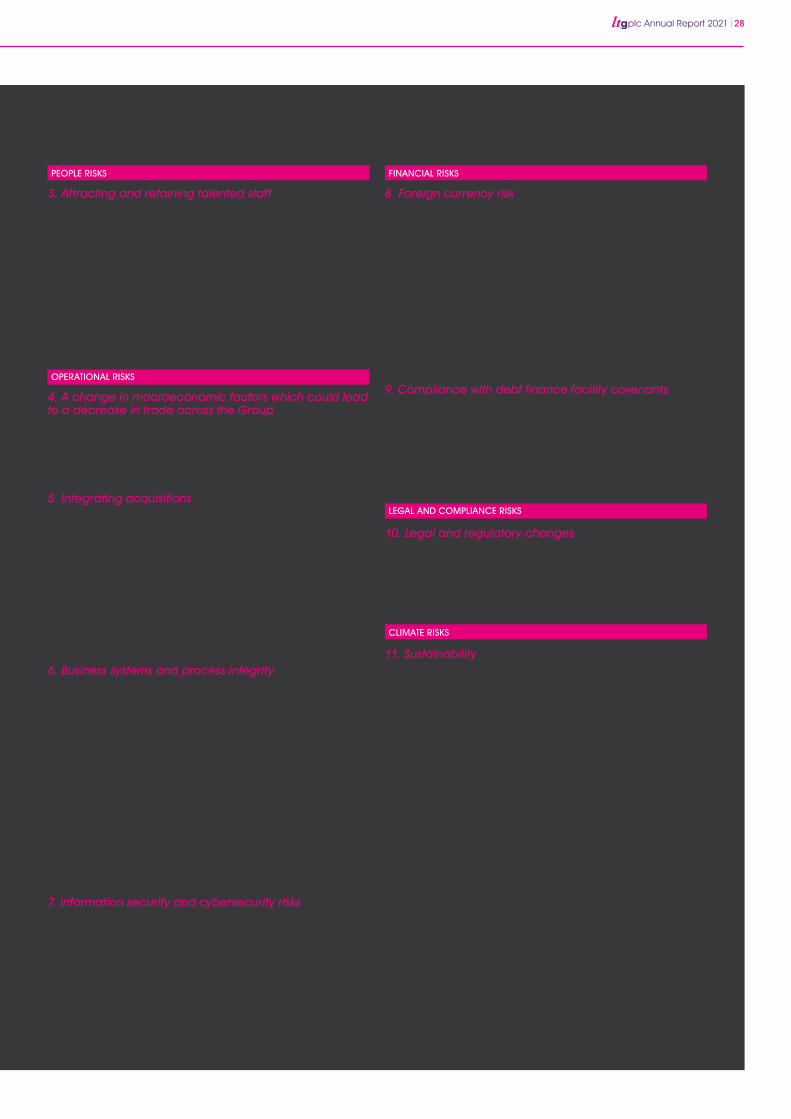
plc Annual Report 2021 28
8. Foreign currency riskThe Group is exposed to foreign currency risk on transactions and balances that are denominated in currencies other than Pounds Sterling (primarily the United States Dollar (USD) and the Euro). Foreign currency risk is monitored closely to ensure that net exposure is at an acceptable level. The Group maintains a natural hedge whenever possible, by matching the cash inflows (revenue stream) and cash outflows used for purposes such as capital and operational expenditure in the respective currencies. The Group is a net generator of USD and has partly offset this exposure by drawing down its debt finance facility in USD. Further, where appropriate, the Group contracts in USD and where there is a delay between signing and completing on material transactions, it may enter into short-term forward contracts to mitigate the foreign exchange risk. The Group does not currently use any foreign currency derivative hedge products.
9. Compliance with debt finance facility covenantsThe Group is required to comply with the covenants under its debt financing facility. If the covenants were breached, the lender could take action against the Group. This could include the lender using its security taken over the Group’s assets to repay the outstanding debt, thus adversely impacting shareholders. The Group regularly monitors its ongoing compliance with the terms of its debt financing facility. As at the end of December 2021, following the most recent acquisitions, the Group’s net debt position was £141.4m
10. Legal and regulatory changesThe Group’s executive team and legal team identify and monitor legislative and regulatory changes that will impact the business. The executive team develops and delivers strategies to ensure ongoing compliance with new legislation. The Group has a strategy in place to ensure compliance with its upcoming ESOS reporting requirements and with data privacy legislation in the jurisdictions in which it now operates.
11. SustainabilityThere is growing focus on sustainability from a range of our stakeholders, including customers, providers of capital (investors and banks) and employees, as well as increasing regulatory and reporting requirements related to sustainability and ESG. The Board and Executive recognise the need for the management and reporting of the Group’s sustainability framework, performance and targets, which if unmanaged, could impact our ability to attract and retain customers, employees and capital. The Group has a broad-reaching ESG response in place, which we are enhancing further through a number of initiatives and an improved ESG governance structure. Having made a commitment for a net zero target by 2050, or sooner, we are undertaking the necessary steps to develop our transition plan to reduce our emissions in line with a Paris Agreement-aligned pathway.
In addition to the principal risks and uncertainties above, the Group faces other risks that include but are not limited to increased competition, failure to retain customer contracts, technology leadership and counterparty risk.
3. Attracting and retaining talented staffAs a people business, we recognise the future success of our business is dependent on attracting, developing, motivating, improving and retaining talent. LTG is a market leader and we will always strive to ensure that all our operating companies are regarded as excellent employers within the talent and learning industries. Recruiting for software engineering and specialist roles has been somewhat challenging. However, adopting a headhunting approach and hiring in other countries has proven to be successful. We benchmark ourselves against our peers regularly and are satisfied we offer competitive compensation and outstanding personal development opportunities that are further enhanced by LTG’s ambitious growth plans. We support our employees in a number of ways, as detailed in the ESG report on pages 29 to 40
4. A change in macroeconomic factors which could lead to a decrease in trade across the GroupAt Board, Executive and Finance level, the Group remains apprised of macroeconomic factors which could affect the Group, such as COVID-19, geopolitical uncertainties and inflationary pressures, particularly wage inflation. The Executive Board will monitor movements in the macroeconomic factors and respond accordingly.
5. Integrating acquisitionsThe Group recognises the challenge of integrating acquisitions, which may require merging businesses with existing operations, without losing key staff or customers. The Group structures purchase terms to incentivise and retain key staff and focuses on improved customer experience. Having completed five acquisitions in the last 12 months, objectives are set for synergy realisation at the start of the integration process and monitors performance against these, including through management accounts and staff surveys. The acquisition of GP Strategies is a step change for LTG and a transformational integration plan is underway to ensure delivery of the expected benefits, including operating in line with protocols required for contracting with the US Government.
6. Business systems and process integrityThe speed of the Group’s growth means that there is a risk of ineffective use of IT systems and business processes, and systems being compromised through cyber-attacks, becoming out of date, or misuse of software terms of use. The NetSuite ERP system continues to be rolled out to replace smaller and older legacy systems to improve internal controls, help to manage acquisition integration and reduce risk. GP Strategies uses Oracle as its ERP system, with the business benefiting from the system’s aligned processes. Central IT functions are operated by LTG and GP Strategies respectively to monitor IT systems, reviewing the adequacy of systems and identifying and testing replacement products, where required, as well as compliance with terms of use. IT penetration testing is performed which provides added assurance. The IT function is involved in the due diligence and integration aspects of all acquisitions. Business processes are kept under review and the IT function carries out internal and external audits which include testing the Group’s disaster recovery and business continuity plans.
7. Information security and cybersecurity risksRisks related to cybercrime, malware, loss or theft of devices and data exposure are monitored by the Group’s IT and Legal functions, taking into consideration circumstances which may result in an increased risk. There are a number of administrative and technical controls deployed by the IT teams. All staff are required to undertake the information security training programme. The Legal team is also involved in privacy compliance strategies relating to the data of the Group’s customers and other third parties, as well as its employees in the various jurisdictions in which it operates.
PEOPLE RISKS FINANCIAL RISKS
LEGAL AND COMPLIANCE RISKS
OPERATIONAL RISKS
CLIMATE RISKS
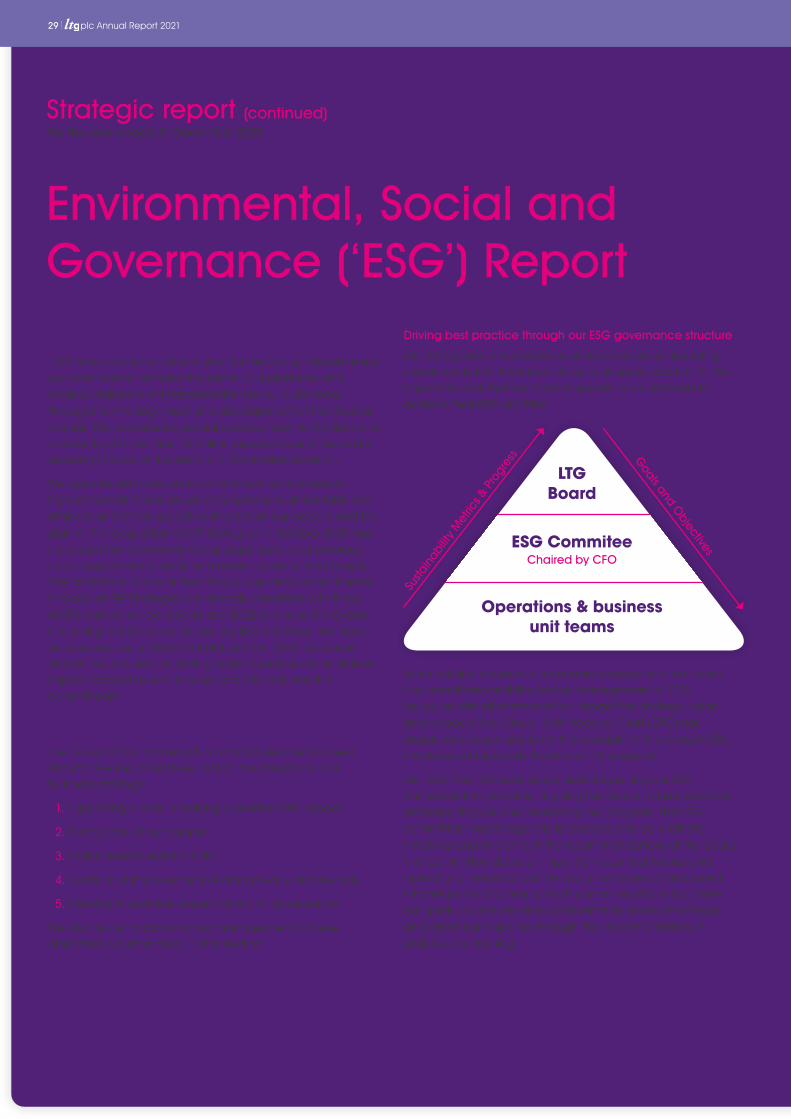
29 plc Annual Report 2021
Introduction 2021 was a transformational year for the Group. Nevertheless, our core mission remains the same. Our platforms and services deliver talent transformation to our customers, through the management and development of their human capital. This provides beneficial development to the lives and capability of more than 16 million people around the world, ensuring ESG sits at the heart of LTG’s market provision.
We operate with care and commitment and adhere to high standards to ensure we conduct our business fairly and ethically and make a positive impact on our people and the planet. The acquisition of GP Strategies in October 2021 has increased the complexity of our organisation but provides us an opportunity to revisit and refresh some of the Group’s ESG ambitions. Many of the ESG policies and commitments in place at GP Strategies are already consistent with those of LTG and we will be able to use 2022 to ensure the Group is fully aligned to deliver on our key ESG initiatives. We have announced our ambition for Net Zero by 2050, or sooner, and will be focused on finding ways to reduce our emissions impact across the whole value chain to achieve this commitment.
Our Key ESG InitiativesThe Group’s ESG framework and initiatives are focused around five key objectives, which are integral to our business strategy:
1. Supporting clients in making a positive ESG impact
2. Taking care of our people
3. Environmental sustainability
4. Continuous improvement of data privacy and security
5. Meeting stakeholder expectations on governance
We discuss our approach and management of these objectives in further detail in this section.
Driving best practice through our ESG governance structure
Our ESG governance structure ensures we are embedding sustainability into the fabric of our business in addition to the important work that we do to empower our customers to achieve their ESG priorities.
Sustainability is core to our business strategy and the Board has overall responsibility for our management of ESG issues, as with all matters which impact the strategy, vision, and values of the Group. Kath Kearney-Croft (CFO) has designated responsibility for the oversight of the Group’s ESG initiatives and supports the Board in this regard.
Our ESG Committee is responsible for putting our ESG framework into practice, aligning the Group to best practice and reporting on and monitoring our progress. The ESG committee meets regularly to oversee and co-ordinate initiatives and implement the recommendations of the Board. The Committee draws on input from business heads and operational leads across the Group and uses a dedicated intranet portal and regular staff communications to outline our goals, objectives and achievements across the Group and direct our response through the implementation of policies and training.
For the year ended 31 December 2021
Strategic report (continued)
Environmental, Social and Governance (‘ESG’) Report
LTG Board
ESG Commitee Chaired by CFO
Operations & business unit teams
Susta
inab
ility
Met
rics &
Pro
gres
s Goals and O
bjectives

plc Annual Report 2021 30
• Launch of a revised HSE, in collaboration with QHSE & ERGs
• PDT Global to advance our D&I strategy
• Implement additional data loss prevention (DLP) controls
• Achieve ISO 27001-2013 certification for Watershed and Open LMS
• Increase customer satisfaction survey results (i.e. target on scale, NPS)
Supporting clients to make a positive ESG impactESG sits at the heart of the Group’s customer proposition (see page 10). The core of our offering is the beneficial development of people, whether that be through our learning and training initiatives, corporate ESG and ethics learning content, or our talent management insights and affirmative action plans involving diversity and inclusion (D&I) in the workplace.
Including GP Strategies, LTG helps over 1,200 companies achieve workforce equity through solutions that optimise affirmative action and D&I programmes. GP Strategies’ Leadership, D&I and Allyship programmes enable our customers to work toward the shared goal of fairness, equity and social justice.
We produce content which enables customers to communicate ESG priorities and helps create change in their workforce, in their extended enterprise and in society. The Group provides specific ESG learning content for 5 million people globally, which improves the operating resilience, sustainability metrics and ethical culture of our customers through courses on Health & Safety, Cyber & Data Security, Tackling Modern Day Slavery and Anti-Harassment. We support our customers’ governance needs through topics such as Personal Ethics, Whistleblowing, Anti-Bribery, and Consumer Protection.
Our Learning and Talent products and services reach more than 16 million people. The shift to digital learning and virtual instructor-led training provides an engaging and enhanced learning experience while enabling our customers to reduce their emissions by eliminating the need to travel. Our virtual training products provided notable benefit in the context of COVID-19, where we were able to provide our customers a people-safe solution for their learning and development, which remains relevant post-pandemic given the structurally different way in which we continue to work.
Underpinned by best practice disclosure and policies
We employ best practice standards where possible in our sustainability management. We seek to work to the Ten Principles of the United Nations Global Compact (‘UNGC’) which encompass human and labour rights, anti-corruption and the environment. We disclose energy and carbon footprint information under the 2019 Streamlined Energy and Carbon Reporting (SECR) regulations. We acknowledge the recommendations of the Task Force on Climate-related Financial Disclosures (TCFD) and the Value Reporting Foundation SASB Standards for the Services and the Software & IT Services sectors and aim to report against these fully, subject to further development of our sustainability data, climate-related risk assessment and strategy. In addition, GP Strategies reports to CDP and EcoVadis in support of customer requirements.
Our values and principles are adopted in all locations where the Group does business. Appropriate Group initiatives are combined with local initiatives that support and celebrate the contribution that our employees make to projects in their communities.
Achievements in 2021
• Helped over 1,200 companies achieve workforce equity through solutions that optimise affirmative action and diversity & inclusion (D&I) programmes
• Provided specific ESG learning content for 5 million people globally
• Pulse survey employee engagement score of over 62% (2020: 59.5%)
• Maintained a COVID-19 safe work environment for our people
• Implemented a “mental health first aid” programme and launched our confidential stress email hotline
• Appointed a new global head of D&I
• Rolled out our enhanced global data privacy compliance programme
• Launched our confidential, anonymous whistleblowing programme
Targets for 2022
• Develop the actions for our Net Zero ambition for 2050, or sooner
• Review of our physical data centre reliance
• Employee completion of code of ethics training of 100%
• Implement sustainable procurement policy
• Quarterly Pulse surveys utilising our Bridge platform across all Group brands
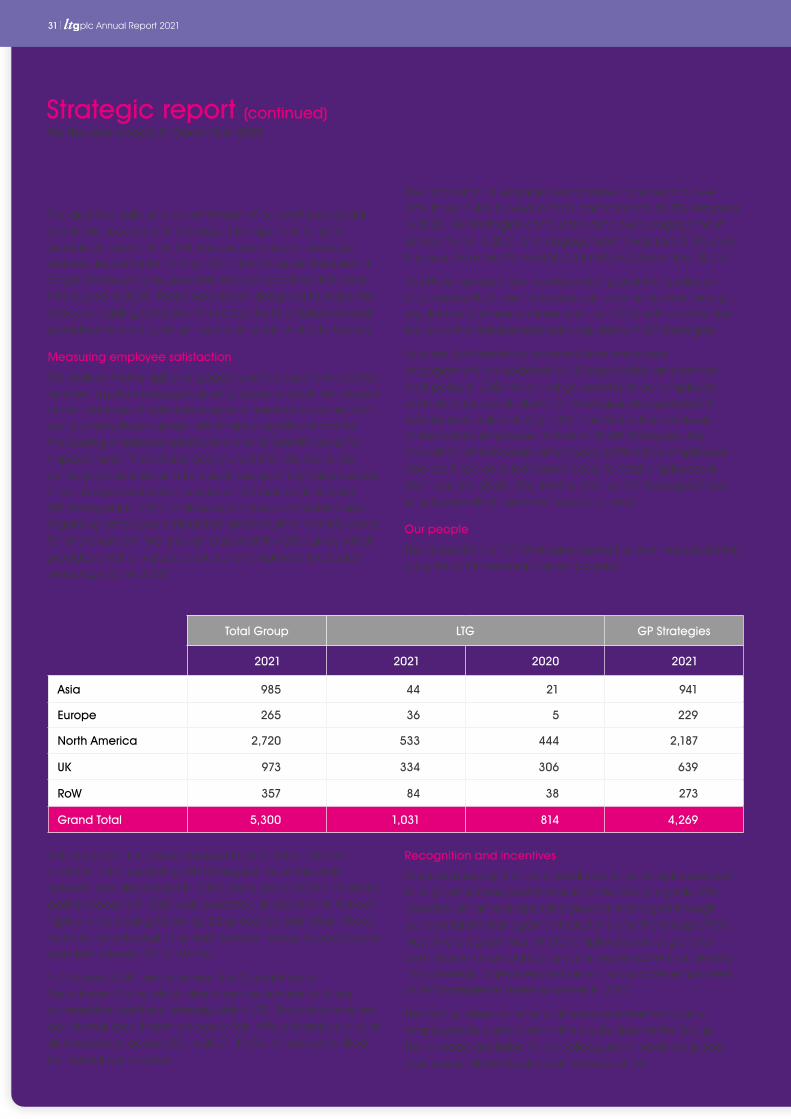
31 plc Annual Report 2021
The proportion of engaged employees increased to over 62% in our Pulse surveys in 2021 compared to 59.5% response in 2020. GP Strategies conducted employee engagement surveys twice in 2021 and engagement levels rose 0.3% over the year, from 58.7% (April 2021) to 59.0% (December 2021).
Our Pulse surveys have received strong positive feedback and, during 2021, we increased our communication through regular live business updates from our CEO, with a particular focus on the transformational acquisition of GP Strategies.
As a result of feedback received from employee engagement, we updated our Group flexible and remote work policy in 2021 which brings benefits to our employee work/life balance. Similarly, GP Strategies also updated its remote work policy during 2021. The Group has low levels of temporary employee utilisation. At GP Strategies, the proportion of temporary employees (defined as employees who are hired on a temporary basis) to total employees in 2021 was 3% (2020: 3%). Neither LTG nor GP Strategies have employees which are members of a union.
Our people
The acquisition of GP Strategies during the year has resulted in a significant increase in our employees:
Recognition and incentives
To provide recognition and feedback to our employees and to align employee performance to the Group’s goals, LTG operates an annual appraisal process managed through our own talent management solutions and the Group offers incentive programmes. All LTG employees are eligible for commission or annual bonus schemes linked with achieving LTG’s strategic objectives and we will incorporate employees of GP Strategies in these schemes in 2022.
The Group offers an annual Sharesave scheme to allow employees to participate in the equity story of the Group. This is made available for all colleagues of newly-acquired businesses, where local circumstances allow.
For the year ended 31 December 2021
Strategic report (continued)
Taking care of our peopleThe qualities, skills and commitment of our staff play a vital role in the success of the Group. It is important for us to provide an environment where our people can develop, feel secure and safe. During 2021, the Group embedded a range of new policies, procedures and practices that were introduced in 2020. These have been designed to make the Group a leading employer that cares for its employees and provides them an optimum environment in which to flourish.
Measuring employee satisfaction
We believe that a highly-engaged workforce performs better, and we regularly engage our employees to track the impact of our initiatives. A valuable source of feedback comes from our quarterly Pulse surveys, which are a significant tool for measuring employee satisfaction and to identify areas for improvement. These have been run at LTG, via Aspire, for some years and we aim to launch our quarterly Pulse surveys in our Bridge application across all LTG brands (including GP Strategies) in 2022 to allow us to have a consistent view regarding employee satisfaction and to further identify areas for improvement. We also run a six-monthly D&I survey which provides another valuable source of employee feedback (see page 32 and 33).
Voluntary staff turnover increased from 11.3% in 2020 to c.20% in 2021 (including GP Strategies). Voluntary staff turnover had decreased in 2020 because of COVID-19 and a partial rebound in 2021 was expected, in addition to turnover typically increasing following a business combination. These features have brought the staff turnover measure back to pre-pandemic levels (2019: 19.7%).
In October 2020, we launched the Global Internal Recruitment Policy which describes our process for filling competitive positions internally within LTG. This policy ensures our internal recruitment process is fair, efficient and applies to all employees across LTG. In 2021, 14.5% of roles were filled by internal candidates.
Total Group LTG GP Strategies
2021 2021 2020 2021
Asia 985 44 21 941
Europe 265 36 5 229
North America 2,720 533 444 2,187
UK 973 334 306 639
RoW 357 84 38 273
Grand Total 5,300 1,031 814 4,269

plc Annual Report 2021 32
age, race, ethnicity, gender, sexual orientation, religious affiliation, generation, disability, personality type, and thinking style. We believe that all our people have a fundamental right to respect and dignity in the workplace and we do not tolerate harassment or discrimination in any form, whether intentional or unintentional. During 2021, we appointed a new head of D&I for the Group to deliver our initiatives.
We use the expertise and experience of our D&I expert Group businesses, Affirmity and PDT, internally as well as for our customers. As a commitment to improving our practices and policies, LTG directly engaged PDT to assist in advancing our D&I strategy. In 2021, Affirmity provided the Group with a compensation study and diversity and inclusion surveys, and PDT provided ERG Masterclass, Making Inclusion Real and Effective Selection training sessions as part of the Leadership Programme Framework. Affirmity also completed an affirmative action plan (AAP) in the United States which outlines LTG’s efforts to provide equal employment opportunities and generally support the advancement of employees regardless of gender, race, disability, or veteran status. Equity, diversity and inclusion compliance training (including unconscious bias) is made available for all employees of LTG. We are also launching management training in diversity in recruitment in 2022.
Similarly, GP Strategies introduced the Inclusion, Diversity, Equity, Accountability (IDEA) Council in 2020 to better equip employees with increased self-awareness through advocacy, education and action. GP Strategies’ D&I training for VPs and above was launched in 2021 and a suite of D&I courses is made available to all employees. Additionally, all GP Strategies SVPs and above completed Inclusion & Belonging Training in 2021.
We regularly conduct diversity celebrations and programmes of continuous improvement for underrepresented groups, for instance, transgender employees. GP Strategies employees are invited to actively participate in monthly, voluntary, employee-led ERGs (Employee Resource Groups) that foster a diverse, inclusive workplace aligned with our organisational mission, values, goals, business practices, and objectives. Its ERGs currently include Asians & Asian Americans plus Allies; Black plus Allies; LGBTQ+ plus Allies; and Women plus Allies.
In 2021, Affirmity carried out a global pay equity study. All global roles were classified by department, years of service, location, business unit and then analysed to see if any groups are paid at a lower level than other employees. In 2021, we had three roles affected, based on gender (2020: 0), which were investigated and resolved.
LTG’s six-monthly D&I staff survey helps us guide our efforts to create a more diverse and inclusive LTG workforce. The response rate in 2021 was 49.5% and scores increased in every category. As a result of actions taken, GP Strategies’ employee favourability rating in their D&I survey increased by
The Group also operates share option schemes for senior managers that reward the achievement of demanding performance targets. Options typically vest over a period of four years. LTG has launched several other awards in recognition of outstanding achievements in product and service innovation, cross-selling initiatives, and successful hiring recommendations. We have also developed several initiatives including team social budgets, long-term service awards and regular staff ‘shout-outs’. These practices are also in place at GP Strategies.
Training and Talent Management
Retaining a highly-skilled workforce is key to our future success. We are committed to the continual development of our employees, investing time and money for the benefit of both the Group and our employees. We invest in training and developing our staff through internally arranged knowledge-sharing events, external courses, and an internal staff portal. We have a dedicated team that develops bespoke learning programmes for staff, leveraging the Group’s expertise and learning solutions.
The Group can leverage its own platforms and in 2021, we continued to use the PeopleFluent Aspire Talent Management platform and its data to drive our annual appraisal process, merit review process, succession planning and Leadership Development Programme. During 2021, the Group used Udemy, the open online course provider, for external learning and we provided 300 licences across LTG. Since implementation in January 2021, 76% of licence holders have enrolled on a course and spent 1,118 hours learning from a choice of over 527 development training courses.
We increased our overall training investment for 2021 to provide more opportunities for company-wide learning initiatives. These included support for:
• Developing the Leadership Framework, including Outstanding Team Leadership and The Connector Manager
• Reimagining Essential Learning
• Refining the support of managers during onboarding
Diversity and inclusion (‘D&I’)
We believe that the diversity of our workforce is a key point of strength, making the Group a more vibrant and dynamic place to work and hence more successful as a business. We aim to avoid any form of discrimination and aim to foster an environment where diversity is valued.
We take great care to ensure that our employment policies are non-discriminatory and that all appointments and promotions are based solely on merit. Our D&I policies are designed to ensure that our approach to business is to the benefit of all our stakeholders. All our employees and applicants are treated fairly and equally, regardless of their
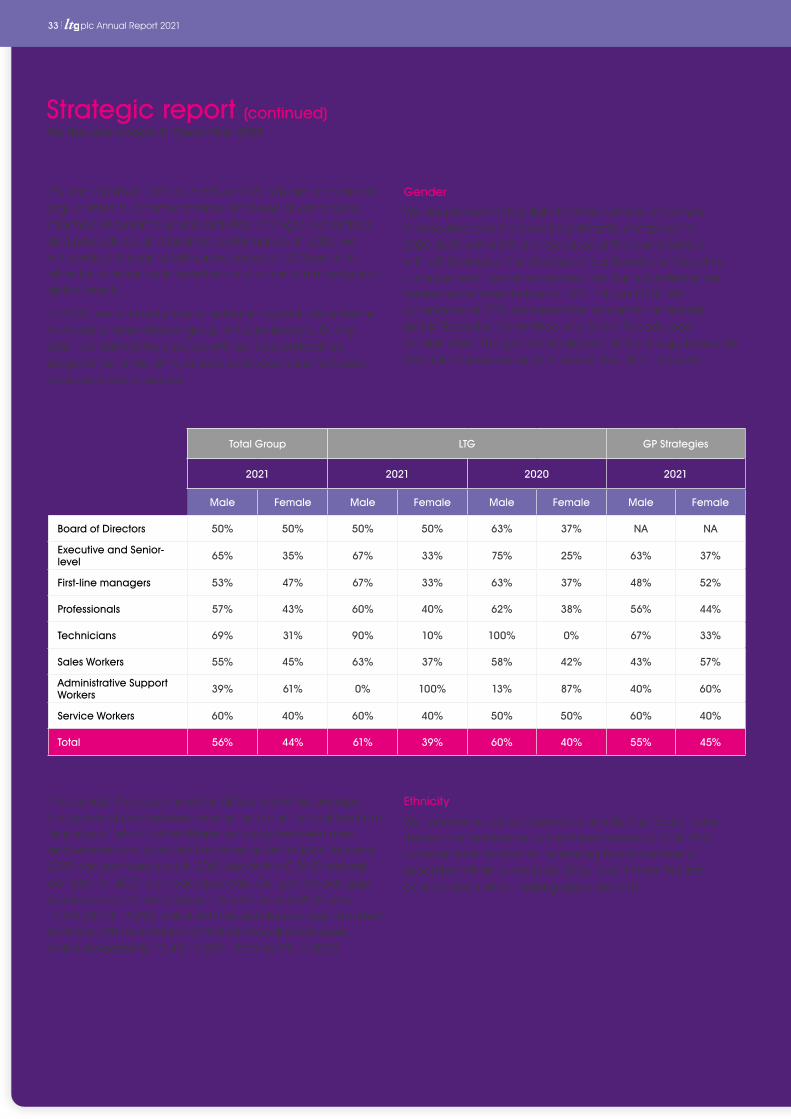
33 plc Annual Report 2021
For the year ended 31 December 2021
7% from 60.8% in 2020 to 67.8% in 2021. We aim to maintain regular internal communications and keep all employees informed of current business activities, changes in practices and procedures, and business performance. In 2022, we will conduct the same D&I survey across all LTG brands to allow for consistency in questions and a complete analysis of global results.
In 2020, we outlined plans to establish a graduate scheme to recruit a more diverse group of future leaders. During 2021, we started this process with our apprenticeships programme in the UK to enable us to reach less fortunate socio-economic groups.
The Gender Pay Gap shows the difference in the average hourly rate of pay between women and men and differs from ‘equal pay’, which is the difference in pay between men and women who carry out the same or similar jobs. As some 2019 bonuses were paid in 2021 due to the COVID deferral, our data for 2021 is on base pay only. Our gender pay gap (based on all LTG employees in the UK only) in 2021 was 15.6% (2020: 15.1%), in line with the gender pay gap reported by the UK Office for National Statistics for all employees, which increased to 15.4% in 2021, from 14.9% in 2020.
Gender
We are pleased to highlight that the number of women in executive roles increased significantly compared to 2020, both within LTG and because of the combination with GP Strategies. The structure of our Board and Executive management means we exceed the Hampton-Alexander Review recommendations for FTSE 100 and FTSE 250 companies of 33% representation of women on Boards and in Executive Committee and Direct Reports, post combination. The gender breakdown of the Group, based on EEO Job Categories as at 31 December 2021, is below.
Ethnicity
We monitor our ethnic diversity annually. The Board notes the recommendations of the Parker Review for FTSE 250 companies in relation to increasing Board and senior executive ethnic diversity by 2024, and it takes this into consideration when making appointments.
Strategic report (continued)
Total Group LTG GP Strategies
2021 2021 2020 2021
Male Female Male Female Male Female Male Female
Board of Directors 50% 50% 50% 50% 63% 37% NA NA
Executive and Senior-level 65% 35% 67% 33% 75% 25% 63% 37%
First-line managers 53% 47% 67% 33% 63% 37% 48% 52%
Professionals 57% 43% 60% 40% 62% 38% 56% 44%
Technicians 69% 31% 90% 10% 100% 0% 67% 33%
Sales Workers 55% 45% 63% 37% 58% 42% 43% 57%
Administrative Support Workers 39% 61% 0% 100% 13% 87% 40% 60%
Service Workers 60% 40% 60% 40% 50% 50% 60% 40%
Total 56% 44% 61% 39% 60% 40% 55% 45%
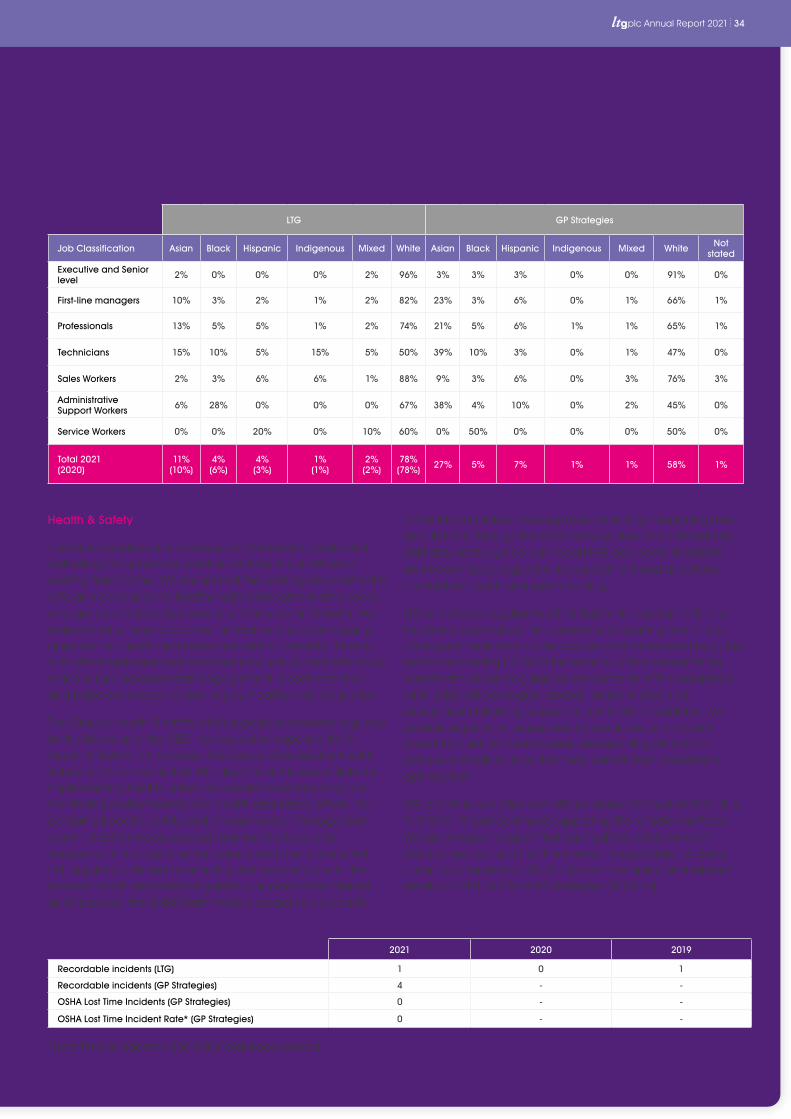
plc Annual Report 2021 34
to health and safety management including integrating new acquisitions. Through the QHSE Service desk and intranet site, staff around the globe can report HSE accidents, incidents and near misses, request a risk assessment and undertake mandatory health and safety training.
LTG undertakes regular Health & Safety risk assessments in all locations: event-driven risk assessments resulting from major changes in legislation or the way we work as required (e.g., last performed during H2 2020 for return-to-office assessments); workstream-driven (regular) risk assessments of the workplace (nil in 2021, offices largely closed); incident-driven risk assessments following serious incidents (nil). In addition, we provide ergonomic assessments to evaluate and correct workstation setups if employees are reporting discomfort or have a medical issue that may benefit from workstation optimisation.
LTG and its subsidiaries kept offices closed for most of 2021 due to COVID-19 and continued supporting the remote workforce. We are pleased to report that our health & safety incident statistics are low, and that there were no reportable incidents under local legislation (2020: nil) and no employment related deaths in 2021 at LTG or GP Strategies (2020: nil).
Health & Safety
The Group endeavours to safeguard the health, safety and wellbeing of our people, whether working in our offices or working from home. We ensure that the working environment is safe and conducive to healthy, safe and content employees who are able to balance work and family commitments. We believe that a more proactive, innovative and wide-ranging approach to health and safety has distinct benefits. It builds trust with employees and improves productivity and efficiency, which in turn increases staff engagement, boosts retention and helps employees to stay happy, healthy and productive.
The Group’s health & safety at Work policy is reviewed regularly by the Board and the CEO has executive responsibility for Health & Safety in the Group. The Group-wide Quality Health Safety and Environment (QHSE) department is responsible for implementing health, safety and environmental policy and monitoring environmental and health and safety efforts. Our combined health, safety and environmental management system (HSEMS) measures and monitors the type and frequency of accidents and incidents and compliance with HSE legislation. As well as ensuring that we comply with the relevant health and safety legislation, as part of the internal audit process, the QHSE team takes a proactive approach
*(Lost Time Incidents x 200,000)/Total hours worked
LTG GP Strategies
Job Classification Asian Black Hispanic Indigenous Mixed White Asian Black Hispanic Indigenous Mixed White Not stated
Executive and Senior level 2% 0% 0% 0% 2% 96% 3% 3% 3% 0% 0% 91% 0%
First-line managers 10% 3% 2% 1% 2% 82% 23% 3% 6% 0% 1% 66% 1%
Professionals 13% 5% 5% 1% 2% 74% 21% 5% 6% 1% 1% 65% 1%
Technicians 15% 10% 5% 15% 5% 50% 39% 10% 3% 0% 1% 47% 0%
Sales Workers 2% 3% 6% 6% 1% 88% 9% 3% 6% 0% 3% 76% 3%
Administrative Support Workers 6% 28% 0% 0% 0% 67% 38% 4% 10% 0% 2% 45% 0%
Service Workers 0% 0% 20% 0% 10% 60% 0% 50% 0% 0% 0% 50% 0%
Total 2021 (2020)
11% (10%)
4% (6%)
4% (3%)
1% (1%)
2% (2%)
78% (78%) 27% 5% 7% 1% 1% 58% 1%
2021 2020 2019
Recordable incidents (LTG) 1 0 1
Recordable incidents (GP Strategies) 4 - -
OSHA Lost Time Incidents (GP Strategies) 0 - -
OSHA Lost Time Incident Rate* (GP Strategies) 0 - -
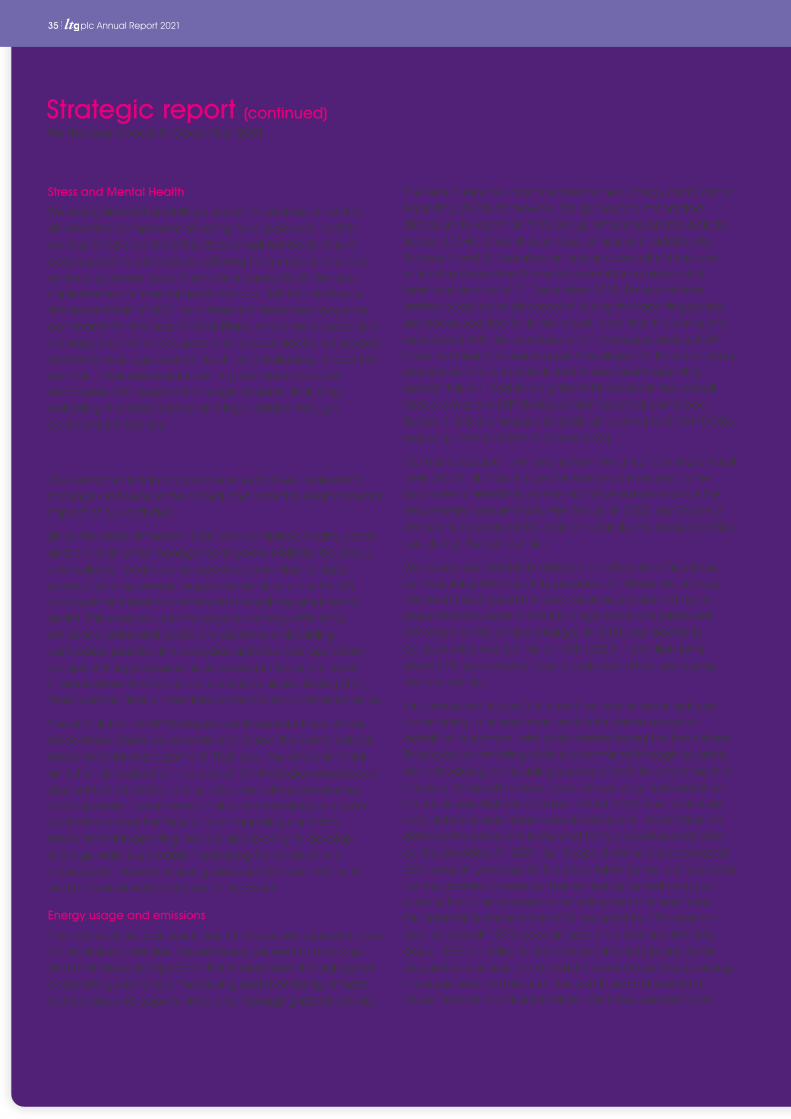
35 plc Annual Report 2021
Stress and Mental Health
We recognise that providing support for wellness at work is an essential component of caring for our people. In 2021, we launched a confidential stress email hotline to ensure early support to employees suffering from stress and will be reinforcing awareness of the hotline during 2022. We also implemented a “mental health first aid” (MHFA) initiative in the second half of 2021 and there is a dedicated page on our intranet for Wellness @ Work Plans, where employees and managers can find resources and request additional support on how to manage mental health and wellbeing. In addition, we offer Employee Assistance Programmes to provide employees with support in a range of areas, including wellbeing, financial advice and legal advice through confidential helplines.
Effective environmental sustainability LTG’s environmental policy is to ensure that we understand, manage and reduce the actual and potential environmental impact of our activities.
Since the establishment in 2020 of a combined health, safety and environmental management system (HSEMS), the Group now collects, monitors and reports on a number of data points, including energy usage and emissions. The HSEMS management system is monitored through regular internal audits. This enables us to manage our energy efficiency, emissions, water and waste and assists in embedding sustainable practice into everyday activities. Our operations comply with legal requirements relating to the environment in areas where the Group conducts its business. During 2021, there were no fines or penalties related to environmental issues.
The acquisition of GP Strategies has increased the number of locations where we operate and raised the complexity of environmental management. That said, the environmental ambition and direction in place at GP Strategies was broadly aligned to that at LTG. During 2022, we will be developing a Group-wide Environmental Policy, standardising our data collection across the Group, and improving our formal environmental reporting. We are also looking to develop a Group-wide Sustainable Purchasing Policy which will incorporate material sourcing risks and ESG commitments and/or operational objectives for suppliers.
Energy usage and emissions
The nature of our business means that our own operations are not emissions intensive. Nevertheless, we seek to manage and minimise our impact on the environment through good corporate governance, measuring and monitoring climate-related risks and opportunities and managing identified risks.
The Group reports under the Streamlined Energy and Carbon Reporting (SECR) framework. We go beyond mandated disclosure to report on total Group emissions and to include Scope 3 GHG (Greenhouse Gas) emissions in addition to Scopes 1 and 2. Reported emissions cover all entities over which the Group had financial control for a period of at least one year as of 31 December 2021. Emissions from entities acquired or disposed of during the reporting period are not accounted for in the report. Note that the emissions associated with the purchase of GP Strategies during 2021 have not been included as per the all-year GHG accounting procedure and will be included in next year’s reporting period. This will lead to a significant increase in the overall Group emissions (GP Strategies’ last reported combined Scope 1, 2 & 3 emissions for 2020 amounted to 5,734 tCO2e, reducing 33% to 3,855 tCO2e in 2021).
LTG has no Scope 1 emissions from the direct burning of fossil fuels (2020: nil). Our Scope 2 emissions are related to the purchase of electricity across our office estate which is the only energy consumed by the Group. In 2021, our Scope 2 emissions decreased 8% year-on-year due to reduced office use during the pandemic.
We source our electricity data on an office-by-office basis by consulting with our utility providers, or where we occupy offices in buildings with shared services, by estimating our proportionate share of the building’s emissions (often with reference to the service charge). In 2021, our electricity consumption was 1.4 million kWh (2020: 1.6 million kWh), down 11% year-on-year due to reduced office use during the pandemic.
Our measured Scope 3 (indirect) emissions are employee commuting, business travel and data centre usage on behalf of customers, with data centres being the lion’s share. Employee commuting data is determined through a variety of methodologies including surveys of staff to determine their mode of transport to work. Data on our long-haul and short-haul business flights is collated in the HSEMS from which we calculate business travel carbon emissions. Information on data centre emissions is sourced from our outsourced data centre providers. In 2021, our Scope 3 emissions decreased 56% year-on-year due to the steps taken by our primary data centre provider to reduce their emissions as well as in part a reduction in employee commuting and business travel. Our total GHG emissions in 2021 reduced by 17% year-on-year as a result (-58% year-on-year on a revenue intensity basis, -38% on a like-for-like revenue intensity basis). As an acquisitive business, an important driver of our Group energy management comes from the continued rationalisation of our network of office locations. We have created ‘core’
For the year ended 31 December 2021
Strategic report (continued)
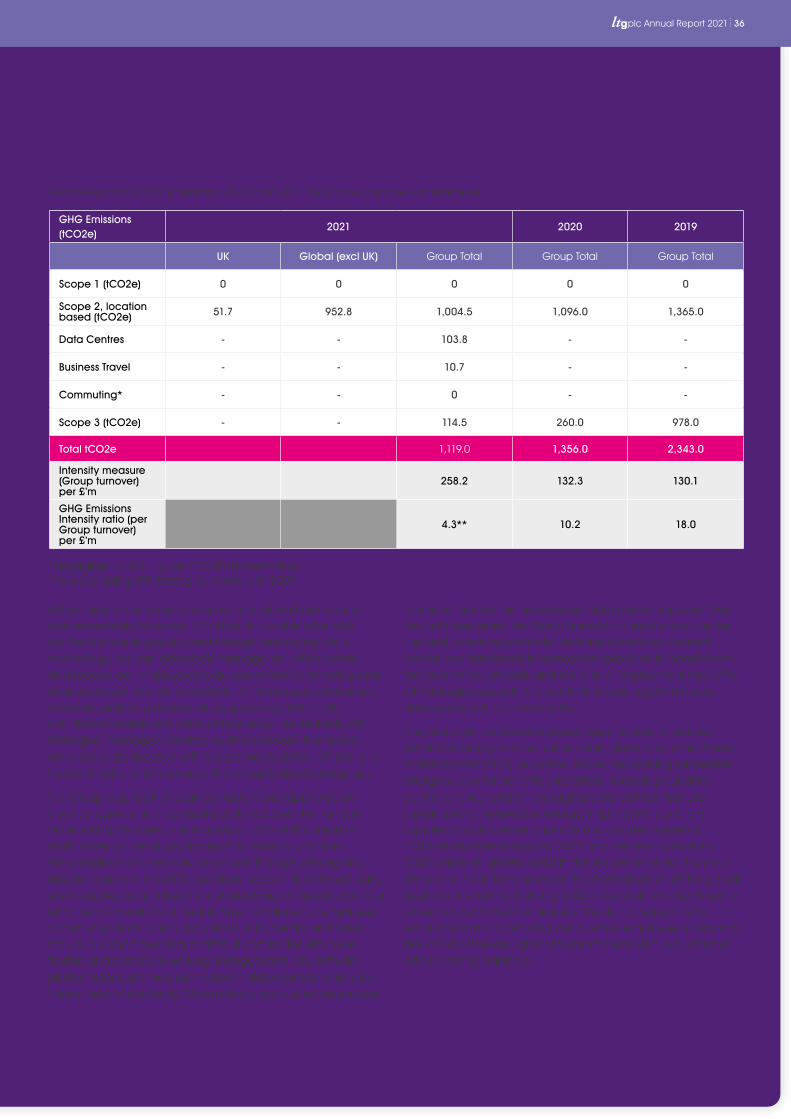
plc Annual Report 2021 36
to ensure that we minimise excess data centre capacity. Over the last three years, the Group has rationalised its data centre use and, where appropriate, we have closed own-hosted servers and transferred to outsourced providers to benefit from the economies of scale and flexibility of deployment they offer. GP Strategies expects to close its final and largest in-house data centre within 12-15 months.
The Group will continue to review opportunities to reduce emissions throughout our value chain given our commitment to Net Zero by 2050, or sooner. We will be seeking renewable energy supply for our office locations, reducing our data centre reliance and/or leveraging data centres that use sustainable or renewable energy. Importantly, our main supplier of data centre capacity has a stated target of 100% renewable energy by 2025 and net-zero carbon by 2040 which will greatly assist in the reduction of our Scope 3 emissions. Near-term however, the normalisation of the global business environment during 2022 may result in a rise in some of our Scope 2 and 3 emissions. We do not expect GHG emissions from commuting per full-time employee to return to pre-COVID-19 levels, given the permanent shift in our home/office working balance.
office hubs to centralise practices and all staff are able to work seamlessly from any LTG office. In combination with our flexible working policy and through leveraging virtual technology, we can effectively manage our office estate and reduce our employees’ requirement for commuting and business travel. In a similar fashion, GP Strategies rationalised its estate, reducing leased office space by 34% in 2021 with demonstrable reduction of its energy use. Notably, GP Strategies’ managed services business means that some employees are located within customer facilities, off-site, or a hybrid of both, which reduces the Group’s direct energy use.
The Group requires that business travel is pre-approved by line managers which has significantly reduced the number of aircraft flights taken. The majority of LTG’s staff outside of North America use public transport to travel to and from the workplace and we reduce car use through offering only bicycle spaces in most LTG locations, season ticket travel loans, encouraging car sharing and not providing company cars. Our QHSE Team conducts annual surveys to collate our employee commuting data, which also allows us to identify and assist individuals who have long or difficult commutes with more flexible and beneficial working arrangements. LTG software platforms for customers are hosted in data centres, which are heavy users of electricity. We employ a rigorous review process
GHG Emissions (tCO2e)
2021 2020 2019
UK Global (excl UK) Group Total Group Total Group Total
Scope 1 (tCO2e) 0 0 0 0 0
Scope 2, location based (tCO2e) 51.7 952.8 1,004.5 1,096.0 1,365.0
Data Centres - - 103.8 - -
Business Travel - - 10.7 - -
Commuting* - - 0 - -
Scope 3 (tCO2e) - - 114.5 260.0 978.0
Total tCO2e 1,119.0 1,356.0 2,343.0
Intensity measure (Group turnover) per £’m
258.2 132.3 130.1
GHG Emissions Intensity ratio (per Group turnover) per £’m
4.3** 10.2 18.0
Total Group tons CO2 emissions 2020 and 2021 by Scope and per £m revenues
*Negligible in 2021, given COVID-19 restrictions**6.4 excluding GP Strategies revenue in 2021

37 plc Annual Report 2021
Waste and recycling
LTG makes a concerted effort to reduce its waste and e-waste, to limit the amount of waste sent to landfill. All office locations have recycling facilities and office managers are encouraged to take advantage of local initiatives. For instance, in Brighton, a local recycling company provides online reports on the types and amounts of waste collected, while the Franklin, Tennessee office works with a local recycling company which helps train individuals with intellectual and developmental disabilities.
Working closely with the Facilities team in Central Services, LTG’s QHSE department audits all Group office locations for compliance with HSE requirements. Monitored requirements include the eradication of all single-use plastics, provision and use of different recycling facilities and the display of promotional and educational HSE material. We are seeking to establish regular reporting of Group office recycling statistics by waste stream (paper, plastic, electronics).
Recycling of business equipment (e-waste) is the responsibility of our Central Services IT team, with QHSE advising on the potential impact of ISO/IEC 27001:2013 relating to the disposal of equipment. In line with the WEEE directive, not all IT equipment is sent to recycling. From 2020, the IT Team has worked with Socialbox.biz to donate old IT equipment to charities for the homeless. At GP Strategies, old IT equipment is wiped of data and the equipment offered to employees.
Continuous Improvement of Data Privacy and Security Effective management of data privacy and security processes are a critical part of our service offering to our customers in Software as a Service (‘SaaS’) and hosted solutions. Furthermore, we enable our customers to meet their data privacy obligations where we process personal data on their behalf as part of our service offering.
The Board of Directors is responsible for the Group’s data security and information security policies. Information security and cyber risks are a principal risk at a Group level in recognition of the personal data handled both as a data controller and on behalf of customers as a result of the growth of the Group.
The safe, secure and compliant use and storage of data are important facets of our business. LTG and GP Strategies comply with applicable data protection laws in the collection and use of personal data of employees, as well as customers, prospects, partners, vendors and other third parties. Both GP Strategies and LTG have robust data privacy policies, publicly available on our website, applicable to all relevant subsidiaries which ensure compliant and transparent processes for personal data, including the right
of access, rectification, and deletion of individuals’ data. LTG and GP Strategies undertake regular benchmarking of third-party processor privacy standards as part of vendor risk management procedures.
We have a comprehensive internal global data privacy compliance programme and in 2021 put stronger emphasis on required annual compliance training to include security awareness and data privacy. All staff are trained on data privacy at LTG annually. In 2021, completion of Data Privacy and Records Management training at GP Strategies was 85.7%.
LTG carries out a data privacy risk assessment as part of the due diligence process for all acquisitions. LTG’s legal team is also carrying out a privacy compliance audit of each business unit that will include new privacy and security legislation applicable to the Group’s activities. Our recent acquisitions have increased our headcount in both legal and security, allowing us to provide best-in-class support for data privacy and security compliance. In 2021, GP Strategies achieved its recertification for GPSL and implemented quarterly phishing testing to establish a baseline, with an aim for 25% year-on-year improvement in staff responses in 2022. Following the decision by the Court of Justice of the Europe Union (CJEU) that the EU-US Privacy Shield was incompatible with GDPR, in 2021, we developed alternative data transfer mechanisms for EU-US personal data transfers.
We employ systems and measures to monitor and respond to data breaches and cyber-attacks. Centralised security protocols are kept under review by LTG’s IT team with input from the legal team and QHSE. All newly-acquired businesses are included in LTG’s cyber insurance coverage. The adequacy of the scope and limits of cover are assessed annually as part of LTG’s Group insurance renewal.
In 2021, there was a review of security certifications and quality assurance across all Group companies including ISO 27001, SSAE 18 SOC 2, Cyber Essentials Plus (CE Plus) and ISO 9001. LEO Learning and Gomo are externally audited for CE Plus certification annually and GP Strategies achieved CE recertification in December 2021. CE Plus principles are applied across the whole Group and a formal, documented Incident Management Standard and Standard Operating Procedure forms part of the GP Strategies Information security management system (ISMS) structure. Elements of the Group (e.g. LEO) are also audited by customers and GP Strategies’ systems are internally desktop tested every year and are regularly audited by customers.
Information security training is rolled out to all staff at LTG. In 2021, completion of Crisis Management training was 91.3% and Information Security Awareness training was 88.9% at GP Strategies.
For the year ended 31 December 2021
Strategic report (continued)

plc Annual Report 2021 38
We intend to extend these values to our suppliers. All suppliers will be required to have anti-corruption policies and programmes in place and the Group plans to update supplier requirements to include policies relating to anti-money laundering and fraud.
We are committed to an environment where employees are comfortable to bring any concerns forward where they believe violations of policies or standards have occurred. In 2021, we launched a well-publicised, confidential, anonymous whistleblowing programme, available in local languages and administered through an independent third party (SafeCall) to guarantee that any employee concerns on ethical conduct will be heard. Similarly, GP Strategies has a formal Business Conduct and Ethics Hotline programme administered by a third party (EthicsPoint), which allows employees to communicate anonymously and confidentially via the internet or telephone, 24 hours a day, seven days a week. In 2021, no cases were handled by SafeCall and 1 on EthicsPoint whistleblowing systems (2020: n/a and 3, respectively). The incident via EthicsPoint was investigated and determined not to involve a violation of the company’s Business Conduct & Ethics policy.
Federal Contractor Status
We comply with all additional obligations associated with being designated a ‘Federal Contractor’ where our businesses contract with US Federal agencies. These include ensuring that our recruitment practices support the hiring of a diverse workforce. As a prime contractor to the US federal government, GP Strategies complies with all regulations and requirements.
ISO certifications and audit
Our QHSE Team is highly experienced in ISO certifications and offers audit services across the Group as required. The QHSE team is also able to share best practice across the Group and provide project management and consultancy services across a range of ISO certifications. These services are particularly useful for Group companies holding or seeking to obtain ISO/IEC 27001:2013 and following GxP manufacturing practices.
During 2021, Breezy HR joined Rustici and PeopleFluent in achieving ISO 27001 accreditation, plus the ISO 27001 certification process was started for Open LMS and Watershed for completion in 2022. GP Strategies’ Information security management system complies with ISO 27001.
Our LEO business holds ISO 9001:2015, the international standard for quality management systems, managed by the QHSE Team, which carries out a comprehensive internal audit programme covering projects and bids as well as the
Meeting stakeholder expectations on governance
We are proud of our culture of honesty, integrity, trust and respect and we adhere to the highest levels of ethics and business conduct. We recognise the critical importance of meeting or exceeding the expectations of our customers, employees, investors and other stakeholders. All our members of staff are expected to operate in an ethical manner, in all their dealings, whether internal or external. Compliance with all applicable laws and regulations is of paramount importance in the avoidance of severe losses from reputational damage or fines.
Business ethics
Oversight for ethical conduct sits with the Audit Committee, which assists the Board in overseeing the Group’s internal controls. At an executive level, the ESG Committee ensures ethical practices and standards are upheld across the Group. The Committee regularly reviews, and audits (every three years) the Group’s Code of Business Conduct, internal processes, and training as well as the specific policies relating to anti-bribery and corruption, anti-slavery, business ethics and whistleblowing. Prior to acquisition, GP Strategies’ Governance Committee set the firm’s associated Charter ensuring that the governance documents state the operating principles of GP Strategies. This additionally ensures that these are reviewed, routinely updated, approved and readily available to employees. GP Strategies’ Business Conduct & Ethics policy covers anti-corruption, anti-bribery, human trafficking, business ethics and whistleblowing (ethics hotlines).
We take a zero-tolerance approach to bribery and corruption, and are committed to acting professionally, fairly and with integrity in all business dealings. We support the Modern Slavery Act 2015 and do not engage in any form of slavery or human trafficking activities. We are committed to respecting human rights in accordance with international human rights principles.
To live up to these standards, and to be seen as partner of choice, all our employees, directors and contractors are expected to comply with our ethical standards. All permanent employees receive annual training on business ethics, and our annual training requirement will be extended to all contractors and temporary staff in 2022. In 2021, LTG recorded no breaches of the Code of Business Conduct and GP Strategies had no violations of their Business Conduct & Ethics policy (2020: nil).
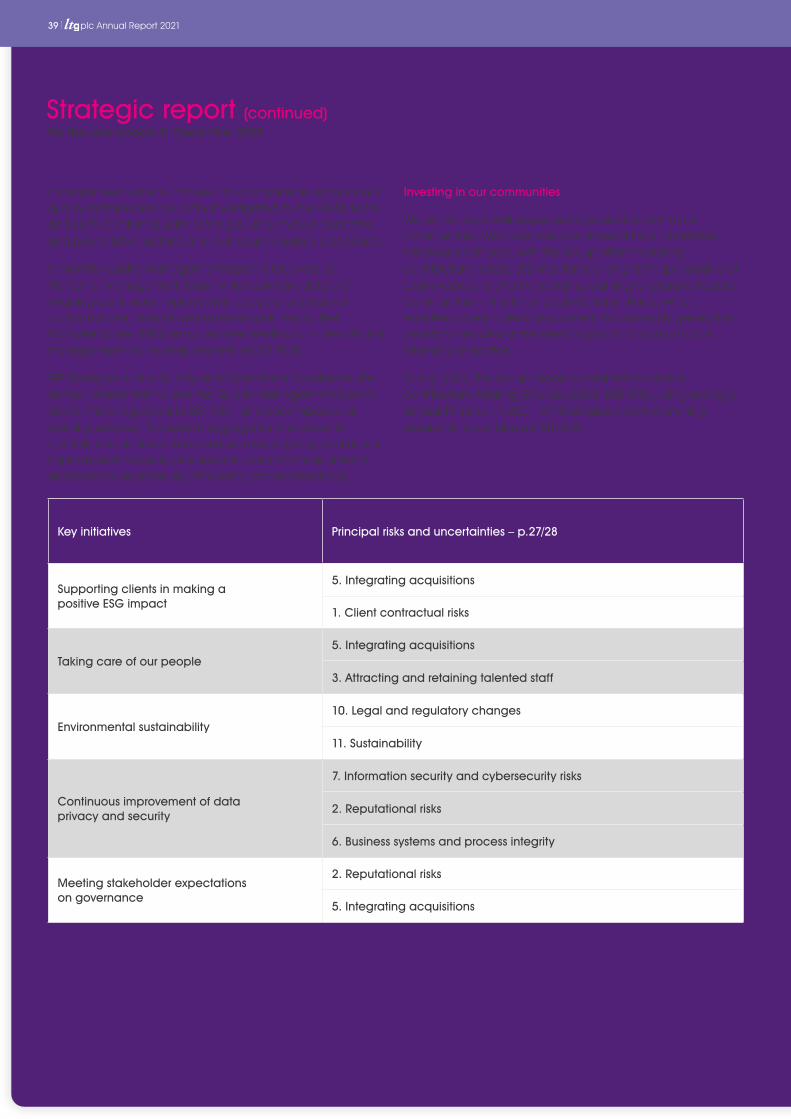
39 plc Annual Report 2021
management system. Process non-compliance and product quality deficiencies are jointly investigated by the QHSE team and LEO’s Content Quality Manager using mature corrective and preventative actions and root cause analysis procedures.
A monthly quality management report is received by the Senior Management Team which contains details of ongoing continuous improvement projects, process non-conformances, internal and external audit results, Net Promoter Scores (NPS) and customer feedback, in line with the management review requirements of ISO 9001.
GP Strategies runs a Quality and Operational Excellence site on the intranet that houses the Quality Management System (QMS). This is registered to ISO 9001 and encompasses all learning services. The system aggregates and presents monthly and annual metrics surrounding ongoing continuous improvement projects, process non-conformances, internal and external audit results, NPS and customer feedback.
Investing in our communities
We aim to be a well-respected organisation within our communities. We undertake a number of local charitable initiatives each year, with the Group often matching contributions raised. LTG maintains a long-term sponsorship of Learn Appeal, a charity providing learning to disadvantaged communities in the UK and sub-Saharan Africa, which enables access to learning content through early generation smartphones without the need to pay for a costly mobile internet connection.
During 2021, the Group made combined charitable contributions totalling £73,326 (2020: £82,500), using average annual FX rates. In 2021, GP Strategies charity matching programme contributed $10,000.
Key initiatives Principal risks and uncertainties – p.27/28
Supporting clients in making a positive ESG impact
5. Integrating acquisitions
1. Client contractual risks
Taking care of our people5. Integrating acquisitions
3. Attracting and retaining talented staff
Environmental sustainability10. Legal and regulatory changes
11. Sustainability
Continuous improvement of data privacy and security
7. Information security and cybersecurity risks
2. Reputational risks
6. Business systems and process integrity
Meeting stakeholder expectations on governance
2. Reputational risks
5. Integrating acquisitions
For the year ended 31 December 2021
Strategic report (continued)
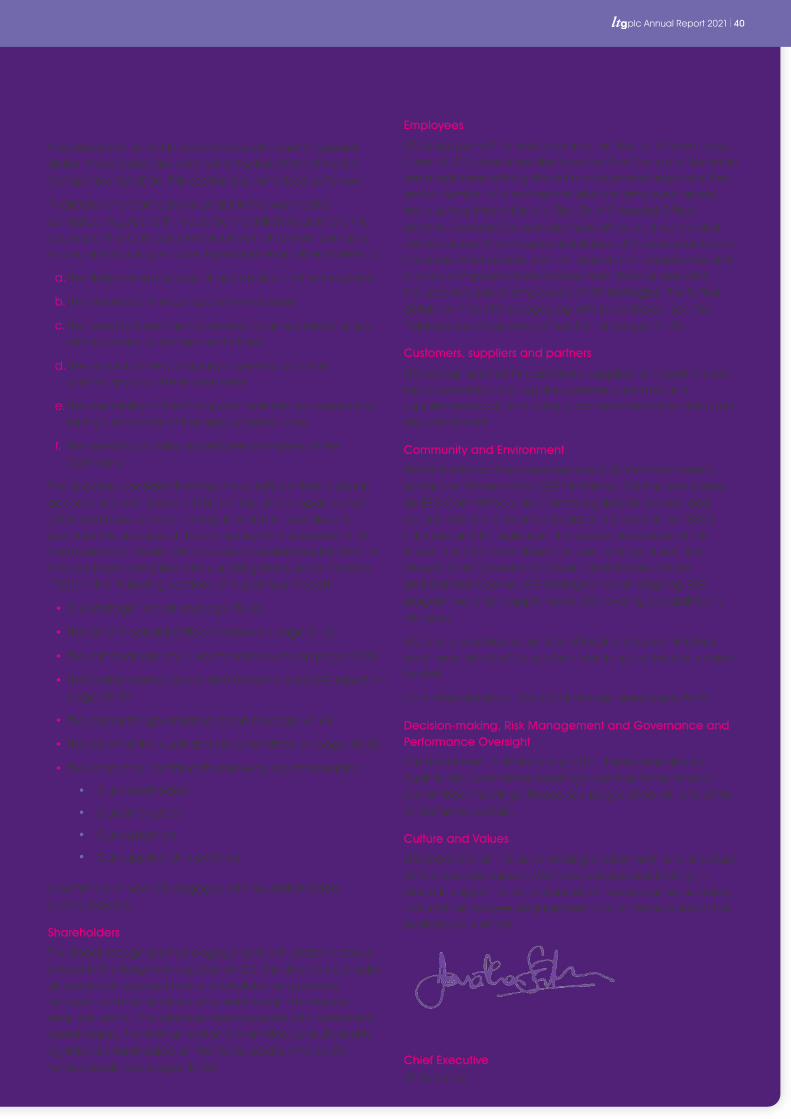
plc Annual Report 2021 40
Employees
LTG engages with its workforce in a number of different ways. Three of LTG’s executive directors and the Company Secretary are employees with significant management responsibilities and a number of direct reports who are employed across the business internationally. The Chief Financial Officer and the General Counsel also hold office as directors and officers across the Group’s subsidiaries. LTG’s executive board manages the business from an operational perspective and is solely comprised of employees from the business and includes two senior employees of GP Strategies. For further details on how LTG is engaging with its workforce, see the “Taking care of our people” section on pages 31-35.
Customers, suppliers and partners
LTG recognises that its customers, suppliers and partners are key stakeholders. LTG regularly reviews customer and supplier feedback, including customer satisfaction data and any complaints.
Community and Environment
At LTG, the Board has overall responsibility for Environmental, Social and Governance (‘ESG’) initiatives. LTG has established an ESG Committee which meets regularly to oversee and co-ordinate Environmental, Social and Governance (‘ESG’) initiatives and to implement the recommendations of the Board. The ESG Committee includes, among others, the Group’s Chief Operations Officer, Chief People Officer and General Counsel. GP Strategies has an ongoing ESG programme which supplements LTG’s existing capabilities in this area.
LTG also undertakes a number of local charitable initiatives each year, with the Group often matching contributions raised by staff.
For further details on LTG’s ESG initiatives, see pages 29-39.
Decision-making, Risk Management and Governance and Performance Oversight
The Board met 15 times during 2021. There were also six Audit & Risk Committee meetings and four Remuneration Committee meetings. Please see pages 45 to 48, and 49 to 54 for further details.
Culture and Values
LTG promotes an inclusive working environment and a culture of fairness and respect. We have policies and training in place in support of our culture which we recognise as being critical to employee engagement and to the success of the business as a whole.
Jonathan SatchellChief Executive29 April 2022
Section 172(1) Statement The directors must act in accordance with a set of general duties. These duties are detailed in Section 172(1) of the UK Companies Act 2006. This section is summarised as follows:
“A director of a Company must act in the way he/she considers, in good faith, would be most likely to promote the success of the Company for the benefit of its members as a whole, and in doing so have regard (amongst other matters) to:
a. The likely consequences of any decision in the long term
b. The interests of the Company’s employees
c. The need to foster the Company’s business relationships with suppliers, customers and others
d. The impact of the Company’s operations on the community and the environment
e. The desirability of the Company maintaining a reputation for high standards of business conduct, and,
f. The need to act fairly as between members of the Company”
The directors consider that they have fulfilled their duties in accordance with Section 172(1) of the UK Companies Act 2006 and have acted in a way in which is most likely to promote the success of the company for the benefit of its members as a whole. We provide a detailed explanation of how we have complied with our obligations under Section 172(1) in the following sections of our Annual Report:
• Our Strategic Report on page 15-40
• The Chief Financial Officer’s review on page 21-26
• The principal risks and uncertainties review on page 27/28
• The Environmental, Social and Governance (ESG) report on page 29-39
• The corporate governance report on page 41-44
• The report of the audit and risk committee on page 45-48
• The Board has identified the following key stakeholders:
• Our shareholders
• Our employees
• Our customers
• Our suppliers and partners
A summary of how LTG engages with key stakeholders is set out below.
Shareholders
The Board recognises that engagement with shareholders is critical to the long-term success of LTG. The directors consider all feedback received from shareholders and provide an open communications channel through the investor enquiries email. The directors meet regularly with institutional shareholders. The Remuneration Committee consulted with significant shareholders on the Remuneration Policy. For further details see pages 49-54.
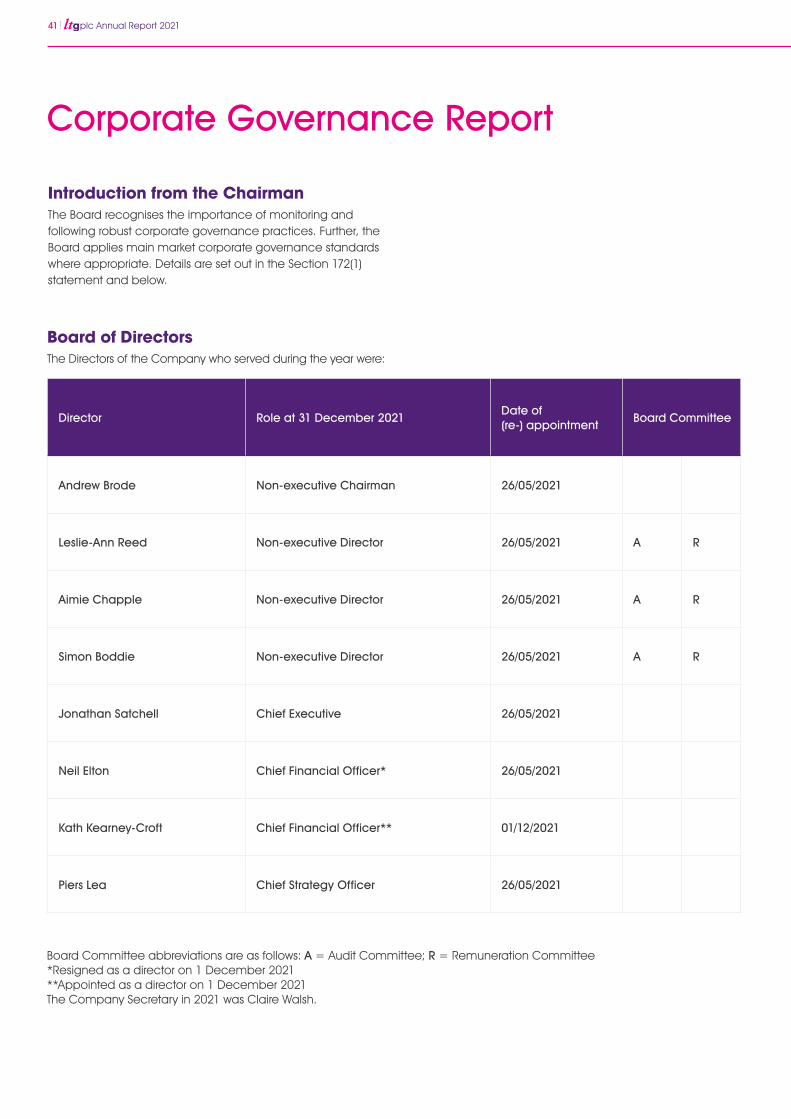
41 plc Annual Report 2021
Introduction from the ChairmanThe Board recognises the importance of monitoring and following robust corporate governance practices. Further, the Board applies main market corporate governance standards where appropriate. Details are set out in the Section 172(1) statement and below.
Corporate Governance Report
Board of DirectorsThe Directors of the Company who served during the year were:
Director Role at 31 December 2021Date of (re-) appointment
Board Committee
Andrew Brode Non-executive Chairman 26/05/2021
Leslie-Ann Reed Non-executive Director 26/05/2021 A R
Aimie Chapple Non-executive Director 26/05/2021 A R
Simon Boddie Non-executive Director 26/05/2021 A R
Jonathan Satchell Chief Executive 26/05/2021
Neil Elton Chief Financial Officer* 26/05/2021
Kath Kearney-Croft Chief Financial Officer** 01/12/2021
Piers Lea Chief Strategy Officer 26/05/2021
Board Committee abbreviations are as follows: A = Audit Committee; R = Remuneration Committee*Resigned as a director on 1 December 2021**Appointed as a director on 1 December 2021The Company Secretary in 2021 was Claire Walsh.

plc Annual Report 2021 42
Board of Directors
Jonathan SatchellChief Executive
Jonathan Satchell has worked in the training industry since 1992. In 1997 he acquired EBC, which he transformed from a training video provider to a bespoke e-learning company. The company was sold to Futuremedia in 2006. He became interim MD of Epic in 2007 and the following year he acquired the Company with Andrew Brode. He oversaw the transformation of Epic from a custom content e-learning company to the global, fast-growing, full-service learning and performance business that LTG has become.
Kath Kearney-CroftChief Financial Officer
Kath Kearney-Croft is a chartered management accountant and holds an MBA from Alliance Manchester Business School. Highly commercial with broad global experience in a series of financial leadership roles, Kath has a strong track record of relationship building and engagement.
Prior to joining LTG, Kath’s roles included Interim CFO at SIG, Group Finance Director of the Vitec Group, and a number of financial leadership roles at Rexam PLC, including Group Finance Director prior to its acquisition by Ball Corporation Inc. in July 2016. She also previously held a number of operational finance roles in the UK and US at The BOC Group plc.
Piers Lea Chief Strategy Officer
Piers Lea founded LINE Communications Holdings Limited in 1989, which was acquired by LTG in April 2014. He has over 30 years’ experience in distance learning and communications and is widely considered a thought leader in the field of learning and performance enabled by technology. He helps both government and large corporates work out how they deliver talent transformation and define the ingredients required to deliver. This experience underpins LTG’s strategic direction.
Claire Walsh Company Secretary
Claire Walsh was admitted as a Solicitor in England and Wales in 2006 and is General Counsel at LTG. Claire was appointed as Company Secretary on 1 December 2019. Her prior experience includes advising on corporate, technology and data protection matters as a Partner at City law firm Cannings Connolly, and serving as Deputy General Counsel and director at Liquidity Services, Inc. (NASDAQ: LQDT).
Andrew BrodeNon-executive Chairman
Andrew Brode is a Chartered Accountant and a former chief executive of Wolters Kluwer (UK) plc. In 1990, he led the management buy-out of the Eclipse Group, which was sold to Reed Elsevier in 2000. In 1995, he led the management buy-in, and is Executive Chairman of RWS Group plc, Europe’s largest technical translations group, listed in the Top 10 of AIM companies. He is also Non-executive Chairman of AIM quoted GRC International Group. He acquired Epic Group Limited (‘Epic’) together with Jonathan Satchell in 2008.
Leslie-Ann ReedIndependent Non-executive Director / Audit & Risk Committee Chair / Remuneration Committee
Leslie-Ann Reed is a Chartered Accountant and was formerly CFO of the online auctioneer Go Industry plc. Prior to this, she served as CFO of the B2B media group Metal Bulletin plc, and as an adviser to Marwyn Investment Management. After a career at Arthur Andersen, she held senior finance roles both in the UK and internationally at Universal Pictures, Polygram Music, Warner Communications Inc. and EMI Music. Her current Non-executive Directorships include Bloomsbury Publishing plc where she serves as SID; Induction Healthcare Group plc and Centaur Media plc. She also serves as Chair of the Audit Committee for the above companies.
Aimie Chapple Independent Non-executive Director / Remuneration Committee Chair / Audit & Risk Committee
Aimie Chapple was a Senior Partner at Accenture, working with clients in the UK, US and around the world for over 25 years. In 2019, Aimie was appointed Divisional Chief Executive Officer at Capita Customer Management with teams in the UK, Germany, Switzerland, Ireland, Poland, India and South Africa. She also continues to be active in the wellness area, and works as a coach with a number of tech and wellness entrepreneurs and start-up organisations.
Simon Boddie Independent Non-executive Director
Simon Boddie has been on the Boards of FTSE 250 businesses for 15 years. He is currently the Chief Financial Officer of the University of Oxford and Non-executive director of Oxford Science Enterprises, a company that funds science spin-outs, founded by leading academics from Oxford University. Previous positions include Chief Financial Officer at Coats Group plc, the world’s leading industrial thread manufacturer and FTSE 250 member and Group Finance Director of Electrocomponents plc, a FTSE 250 global multi-channel provider of industrial and electronic products and solutions.
43 plc Annual Report 2021
Corporate Governance Report (continued)
The Workings of the BoardBoard Composition and Roles
The Board is comprised of the Non-executive Chairman and three other Non-executive directors, together with the Chief Executive Officer, Chief Financial Officer and Chief Strategy Officer, who are all executive directors.
The Board meets at least 10 times a year and met 15 times during 2021 (2020: 13).
The Board meets regularly with senior leaders of the business and with the Company’s advisors.
Appointments
New Board members follow a thorough onboarding process including meeting with key management and receiving training from the nominated advisor.
The Board ran a competitive selection process for the appointment of a new Chief Financial Officer in 2021.
With effect from the 2021 AGM, all Directors are subject to annual re-election by shareholders.
The service agreements for each of the Directors are available for inspection at LTG’s registered office in London.
Directors’ and Officers’ Insurance
The Group holds appropriate insurance to cover its directors and officers against the costs of defending themselves in civil proceedings taken against them in their capacity as a director or officer of LTG and its subsidiaries.
Conflicts of Interest
Directors are required to make the relevant disclosures at each Board meeting on any conflicts of interest they may have with the Group. During the period ended 31 December 2021, no Director had a material interest in any contract with the Group other than their Service Contract and as set out in Note 31 on related party transactions.
Director Independence and Training
In early 2019, the Remuneration Committee ran a formal Board Effectiveness review. Evaluation criteria included a review of the Group’s strategy, its relationship with
shareholders and other key stakeholders, the performance of the Board and the standing committees, executive remuneration and incentives, governance, and performance and succession. A further review is tabled for 2022 and the Committee has undertaken to carry out a Board evaluation every three years.
Board committeesThe Board maintains two standing committees, namely the Audit & Risk and Remuneration Committees. Matters normally reserved for a Nominations Committee are considered by the full Board.
The minutes of all sub-committees are circulated for review and consideration by all relevant Directors, supplemented by oral reports from the Committee Chairs at Board meetings.
Audit & Risk Committee
The Audit & Risk Committee is chaired by Leslie-Ann Reed and currently comprises Leslie-Ann Reed, Aimie Chapple and Simon Boddie. The Audit & Risk Committee met six times during 2021 (2020: 3). The Company Secretary is invited to the Audit & Risk Committee meetings. Further details on the Audit & Risk Committee are provided in the Report of the Audit & Risk Committee.
Remuneration Committee
The Remuneration Committee is chaired by Aimie Chapple and currently comprises Aimie Chapple, Leslie-Ann Reed and Simon Boddie. The Remuneration Committee met four times during 2021 (2020: 4). Further details on the Remuneration Committee are provided in the Report of the Remuneration Committee.
Meetings of the Board and sub-committees during 2021 were as follows:
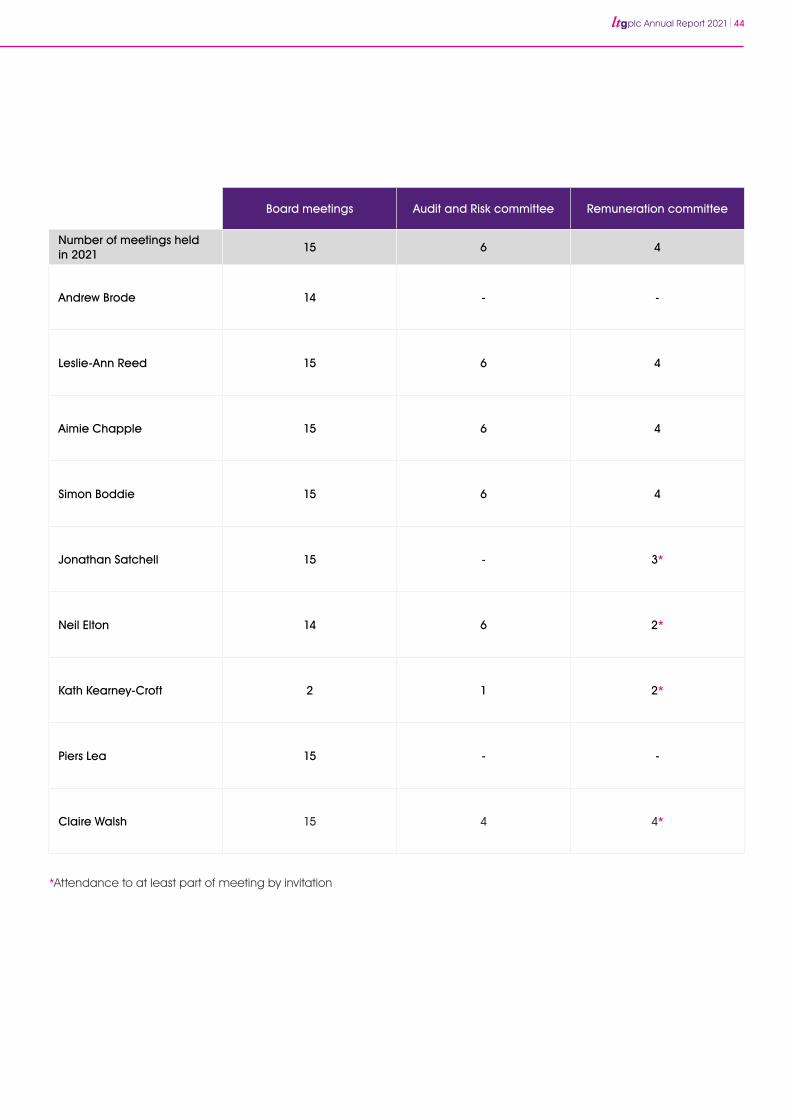
plc Annual Report 2021 44
Board meetings Audit and Risk committee Remuneration committee
Number of meetings held in 2021
15 6 4
Andrew Brode 14 - -
Leslie-Ann Reed 15 6 4
Aimie Chapple 15 6 4
Simon Boddie 15 6 4
Jonathan Satchell 15 - 3*
Neil Elton 14 6 2*
Kath Kearney-Croft 2 1 2*
Piers Lea 15 - -
Claire Walsh 15 4 4*
*Attendance to at least part of meeting by invitation
45 plc Annual Report 2021
Report of the Audit & Risk Committee
This is the report of the Audit & Risk Committee (‘the Committee’) for the year ended 31 December 2021. This report details the Audit & Risk Committee’s responsibilities and key activities over the period.
Composition
The Audit & Risk Committee comprises three independent non-executive Directors with diverse skills and experiences. The biographies are shown on page 42. All Committee members have significant current and past executive experience in various sectors and two members have recent and relevant financial experience as required by the provisions of the QCA Corporate Governance Code. This range and depth of financial and commercial experience enables the Committee to deal effectively with the matters they are required to address and to challenge management when necessary.
Meetings and reporting
The executive directors, representatives of the external auditor, the Company Secretary and other Group executives regularly attend meetings at the invitation of the Committee. The Committee members’ attendance can be seen on page 44 of the Annual Report.
Meetings are held throughout the year and timed to align with the overall financial reporting timetable. At least once during the year, the Committee meets separately with the external auditor without management, and the Chair is in regular direct contact with the external auditor and the Chief Financial Officer.
Terms of Reference
The Committee undertakes its duties in accordance with its terms of reference which are regularly reviewed to ensure that they remain fit for purpose and in line with best-practice guidelines. The terms of reference were updated in 2022 and are available on the Company’s website at www.ltgplc.com.
Roles and Responsibility
The Committee oversees LTG’s financial reporting process on behalf of the Board. LTG’s management has the primary responsibility for the financial statements and for maintaining effective internal controls over financial reporting. In fulfilling its oversight responsibilities, the Committee reviews and discusses the financial information published by the Group with the external auditor and management, to ensure it properly reports its activities to stakeholders in a way that is fair, balanced and understandable. The Committee has access to the financial expertise of the Group and its auditor and can seek professional advice at the Company’s expense if required.
Fair, balanced and understandable accounts
The Committee considers and reviews the accounting principles, policies and practices adopted in the preparation of public financial information and examines documentation relating to the Annual Report, Interim Report, preliminary announcements and other related reports. The Committee has given due consideration as to whether the Annual Report and Accounts, taken as a whole, are fair, balanced and understandable and provide the information necessary for shareholders to assess the Group’s position and performance, business model and strategy, and can confirm that this is the case.
Activities of the Committee.
During 2021 and up until the date of this report, the Audit Committee undertook the following activities to ensure the integrity of the Group’s financial statements and formal announcements:
• Reviewed and discussed with management and the Chief Financial Officer each financial reporting announcement made by the Group, including the annual and interim results
• Received reports and updates from management on the internal controls and discussed areas for improvement
• Reviewed the principal risks facing the Group which are described in the principal risks and uncertainties section on pages 27 to 28, which also explains how each risk is managed and mitigated
• Reviewed the independence and objectivity of the external auditor
• Reviewed and agreed upon the reappointment and remuneration of the external auditor
• Reviewed and agreed upon the external auditor’s strategy in advance of the audit for the year
• Discussed the report received from the external auditor regarding their audit in respect of the prior year, which included comments on significant financial reporting judgements and their findings on internal controls
• Assessed the external auditor’s effectiveness through meetings with management, the external auditor and a review of the completed audit
• Reviewed compliance with International Financial Reporting Standards (‘IFRS’)
• Reviewed and discussed the integration of acquisitions and impact on resourcing
• Regularly met with management and the Chief Financial Officer to discuss the ongoing results and performance of the business
plc Annual Report 2021 46
Going concern
The Committee received a report setting out the going concern review undertaken by management which forms the basis of the Board’s going concern conclusion.
In line with its strategy, during the year the Group made five acquisitions, with a combined purchase price of £345.4m, financed by a mix of existing cash reserves, equity placing and new debt. These acquisitions helped the Group deliver an exceptional performance with revenues of £258.2m up 95% on last year and adjusted EBIT up 36% to £54.8m (2020: £40.3m). The Group’s cash generation from operating activities remained strong at £37.5m (2020: £39.9m). The Group ended the year with net debt of £141.4m (2020: cash £70.2m).
The Committee has reviewed forecasts to cover the 12 months from signature date based on the Group’s Budget with downside scenarios explored. The Committee has also taken into consideration the $50m (£37m) of unused facilities which are available up to 15 July 2025. The Committee has concluded that the adoption of the going concern basis is appropriate.
Adjusting items
The adjusting items for 2021 are detailed on page 89.
The Committee assesses the appropriateness of all alternative performance measures disclosed as adjusting and the impact these have on the presentation of the Group’s results. The Committee is satisfied that they do not inappropriately replace or obscure IFRS measures. Further details on adjusting items are included in Notes 2(a) and 6 to the financial statements.
New accounting standards
No new accounting standards were introduced during the year.
Management and Internal controls
The Group’s corporate objective is to maximise long-term shareholder value. In doing so, the Directors recognise that creating value is the reward for taking business risks. The Board’s policy on risk management encompasses all significant business risks to the Group, including financial, operational and compliance risks, which could undermine the achievement of business objectives.
The Group’s management is responsible for the identification, assessment and management of risk and emerging risk, as well as for designing and operating the system of internal controls. While the Committee has delegated authority for internal control and risk, the Board is ultimately responsible. The Committee has assessed management’s identification of risk and concluded that appropriate mitigating actions are being taken.
The most significant financial reporting judgements considered by the Committee and discussed with the external auditor during the year were as follows:
Acquisition accounting including the valuation of goodwill and intangible assets
The Group made five acquisitions during the year including the transformational acquisition of the US-listed GP Strategies which was announced on 15 July 2021 and was completed on 14 October 2021. Acquisition accounting is inherently complex and highly judgemental. Acquired businesses give rise to material assets and liabilities at the point of acquisition that are based on estimates and judgements about future performance. The provisional recognition of goodwill, intangible assets, other assets and liabilities and estimates of the fair value of consideration transferred were based on a number of assumptions. Significant judgement is involved in assessing the relevant forecast, selecting the appropriate discount rates and useful economic lives.
The Committee has reviewed the acquisition accounting calculations and underlying estimates of this work, and understood the key drivers and financial information used in their work.
The Committee considered the work management performed on the opening balance sheet and provisional purchase price allocations and concurred with management’s recommendation.
Carrying value of goodwill and other intangibles
The Group considers the carrying value of goodwill on at least an annual basis or when there is an indicator of impairment. Management prepared a paper which concluded that no indicators exist and that sufficient headroom exists within the Group’s value-in-use models.
The Committee reviewed this paper which included challenging the key assumptions: revenue growth rates, forecasting accuracy, cash flow projections and discount rates. The Group has not recognised any goodwill impairment in the current or prior year. See note 3(ii) and 15 to the financial statements for further information.
Revenue recognition
The Committee has reviewed management reports on the revenue recognition policy applied during the year. In particular this includes, the treatment of Software as a Service (SaaS) licence contracts, term/perpetual licences, support and maintenance contracts, consulting/professional service contracts and platform development/project implementation contracts. The Committee also received and reviewed the report from the external auditor on its findings on the accounting treatment for revenue recognition. Further details on the Group’s Revenue Recognition policy are included in Note 2(m) to the financial statements.
47 plc Annual Report 2021
The Board considers risk assessment and control to be fundamental to achieving its corporate objectives within an acceptable risk/reward profile and confirms that there is an ongoing process for identifying, evaluating and managing the significant risks faced by the Group and the effectiveness of related controls. The principal risks and uncertainties of the Group are set out in the Strategic Report on pages 15-40.
The risk management process enables the identification, assessment and prioritisation of risk through discussions with executive management. Risks are reviewed by the executive team and other senior leadership teams to ensure that they continue to remain relevant. These risks are assessed on a continual basis and may be associated with a variety of internal and external sources, including infringement of IP, sales channels, investment risk, staff retention, disruption in information systems, natural catastrophe and regulatory requirements. LTG engages third-party advisors to carry out financial due diligence on acquisitions where appropriate. A risk that can seriously affect the performance or reputation of the Group is termed a principal risk and is aligned to the Group’s strategic objectives.
The risk-related reviews carried out by the Committee during the year included reviewing the output from the Group’s risk review process to identify, evaluate and mitigate risks and considered whether changes in risk profile were complete and adequately addressed.
The preparation of the consolidated financial statements of the Company is the responsibility of the Chief Financial Officer and is overseen by the Committee with overall responsibility resting with the Board. This includes responsibility for ensuring appropriate internal controls are in place over financial reporting processes and related IT systems. Due to the limitations that are inherent in any system of internal control, such a system is designed to manage rather than eliminate the risks of failure to achieve business objectives and provides only reasonable and not absolute assurance against material misstatement or loss.
The internal controls system is kept under regular review. Taking each of the areas of focus below:
Control environment – LTG is committed to high standards of business conduct and seeks to maintain these standards across all of its operations. There are policies in place for the reporting and resolution of suspected fraudulent activities. LTG has an appropriate organisational structure for planning, executing, controlling and monitoring business operations in order to achieve its objectives.
Management Information systems – Group businesses participate in periodic operational/strategic reviews and annual plans. The Board actively monitors performance against the plan. Forecasts and operational results are consolidated and presented to the Board on a regular basis. Through these mechanisms, performance is continually monitored, risks identified in a timely manner, their financial implications assessed, control procedures re-evaluated and corrective actions agreed and implemented.
Main control procedures – LTG has implemented control procedures designed to ensure complete and accurate accounting for financial transactions and to limit the exposure to loss of assets and fraud. Measures taken include segregation of duties and reviews by management. During 2021, we experienced turnover among finance and accounting staff concurrent with a transition to a new financial system, which inherently increased identified control risk. Measures taken to mitigate such risk included augmentation of personnel resources, ad hoc analysis procedures, and additional reviews by management.
Monitoring and corrective action – there are clear and consistent procedures in place for monitoring the system of internal financial controls.
This process, which operates in accordance with the FRC guidance, was maintained throughout the financial year, and has remained in place up to the date of the approval of these Financial Statements. The Board, via the Committee, has reviewed the systems and processes in place in meetings with the Chief Financial Officer and external auditors during 2021.
The auditor as part of their work has also considered internal controls relevant to the preparation of the financial statements. Where the auditor has highlighted any deficiencies in the internal controls, management takes responsibility to ensure the recommendations are reviewed and processes and policies are updated as appropriate. In addition, the Committee is rigorous in its challenges to both executive management and the external auditor as to the appropriateness of the operational and financial controls.
In addition to the key audit matters as set out in the Independent Auditor’s Report (see pages 59 to 65), the auditor also specifies other risks, estimates and judgements and details the work performed to satisfy themselves that these have been properly reflected in the financial statements. Details of financial risks are set out in Note 33.
Report of the Audit & Risk Committee (continued)
plc Annual Report 2021 48
Internal Audit
Following the acquisition of GP Strategies on 14 October 2021, which resulted in the Group substantially increasing in size and complexity, the Committee, in discussions with management, concluded that the Group’s internal controls would be significantly enhanced by establishing an internal audit function. This will be led by a senior leader from the GP Strategies internal audit team. The Head of Internal Audit will attend all Audit & Risk Committee meetings.
The internal audit mandate and plan for the relevant year will be approved by the Committee, and will be aligned to the Group’s greatest areas of risk.
External Audit and Independence
The Committee is responsible for approving the external auditor’s terms of engagement, scope of work, the process for the interim review and the annual audit. The Committee also meets with the auditor to review the written reports submitted and the findings of their work. The Committee has primary responsibility for making recommendations to the Board on the appointment, re-appointment and removal of the external auditor.
Outside of the formal Committee meetings, members also meet with the external auditor and with individual members of the Group’s executive management, principally to discuss the risks and challenges faced by the business and, most importantly, how these are being addressed. The auditors and senior finance team members regularly attend Committee meetings.
The Committee, at least annually, assesses the independence, tenure and quality of the external auditor.
Non-audit services
In order to safeguard the independence and objectivity of the external auditor, the Committee reviews the nature and extent of the non-audit services supplied. Pre-approval is required for any non-audit work from the Committee. During the year, BDO LLP provided services for c.£27,000 related to half-year review and covenant compliance sign off.
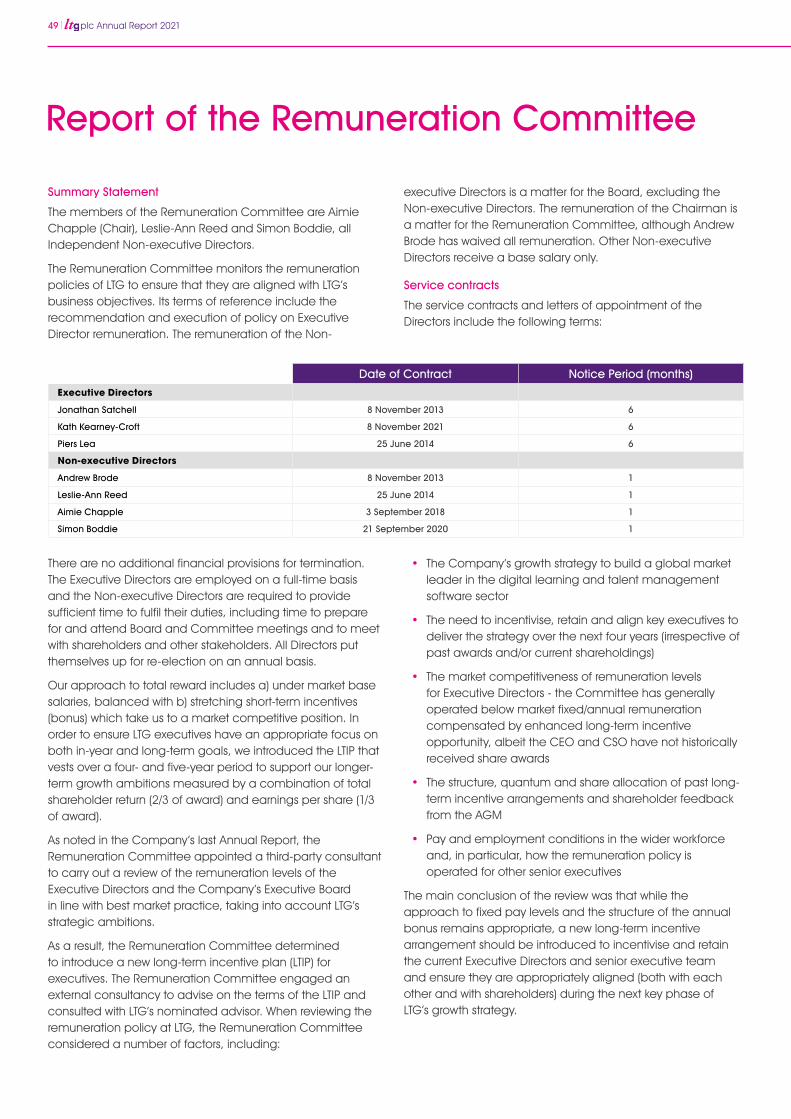
49 plc Annual Report 2021
Summary Statement
The members of the Remuneration Committee are Aimie Chapple (Chair), Leslie-Ann Reed and Simon Boddie, all Independent Non-executive Directors.
The Remuneration Committee monitors the remuneration policies of LTG to ensure that they are aligned with LTG’s business objectives. Its terms of reference include the recommendation and execution of policy on Executive Director remuneration. The remuneration of the Non-
There are no additional financial provisions for termination. The Executive Directors are employed on a full-time basis and the Non-executive Directors are required to provide sufficient time to fulfil their duties, including time to prepare for and attend Board and Committee meetings and to meet with shareholders and other stakeholders. All Directors put themselves up for re-election on an annual basis.
Our approach to total reward includes a) under market base salaries, balanced with b) stretching short-term incentives (bonus) which take us to a market competitive position. In order to ensure LTG executives have an appropriate focus on both in-year and long-term goals, we introduced the LTIP that vests over a four- and five-year period to support our longer-term growth ambitions measured by a combination of total shareholder return (2/3 of award) and earnings per share (1/3 of award).
As noted in the Company’s last Annual Report, the Remuneration Committee appointed a third-party consultant to carry out a review of the remuneration levels of the Executive Directors and the Company’s Executive Board in line with best market practice, taking into account LTG’s strategic ambitions.
As a result, the Remuneration Committee determined to introduce a new long-term incentive plan (LTIP) for executives. The Remuneration Committee engaged an external consultancy to advise on the terms of the LTIP and consulted with LTG’s nominated advisor. When reviewing the remuneration policy at LTG, the Remuneration Committee considered a number of factors, including:
executive Directors is a matter for the Board, excluding the Non-executive Directors. The remuneration of the Chairman is a matter for the Remuneration Committee, although Andrew Brode has waived all remuneration. Other Non-executive Directors receive a base salary only.
Service contracts
The service contracts and letters of appointment of the Directors include the following terms:
• The Company’s growth strategy to build a global market leader in the digital learning and talent management software sector
• The need to incentivise, retain and align key executives to deliver the strategy over the next four years (irrespective of past awards and/or current shareholdings)
• The market competitiveness of remuneration levels for Executive Directors - the Committee has generally operated below market fixed/annual remuneration compensated by enhanced long-term incentive opportunity, albeit the CEO and CSO have not historically received share awards
• The structure, quantum and share allocation of past long-term incentive arrangements and shareholder feedback from the AGM
• Pay and employment conditions in the wider workforce and, in particular, how the remuneration policy is operated for other senior executives
The main conclusion of the review was that while the approach to fixed pay levels and the structure of the annual bonus remains appropriate, a new long-term incentive arrangement should be introduced to incentivise and retain the current Executive Directors and senior executive team and ensure they are appropriately aligned (both with each other and with shareholders) during the next key phase of LTG’s growth strategy.
Date of Contract Notice Period (months)Executive Directors
Jonathan Satchell 8 November 2013 6
Kath Kearney-Croft 8 November 2021 6
Piers Lea 25 June 2014 6
Non-executive Directors
Andrew Brode 8 November 2013 1
Leslie-Ann Reed 25 June 2014 1
Aimie Chapple 3 September 2018 1
Simon Boddie 21 September 2020 1
Report of the Remuneration Committee
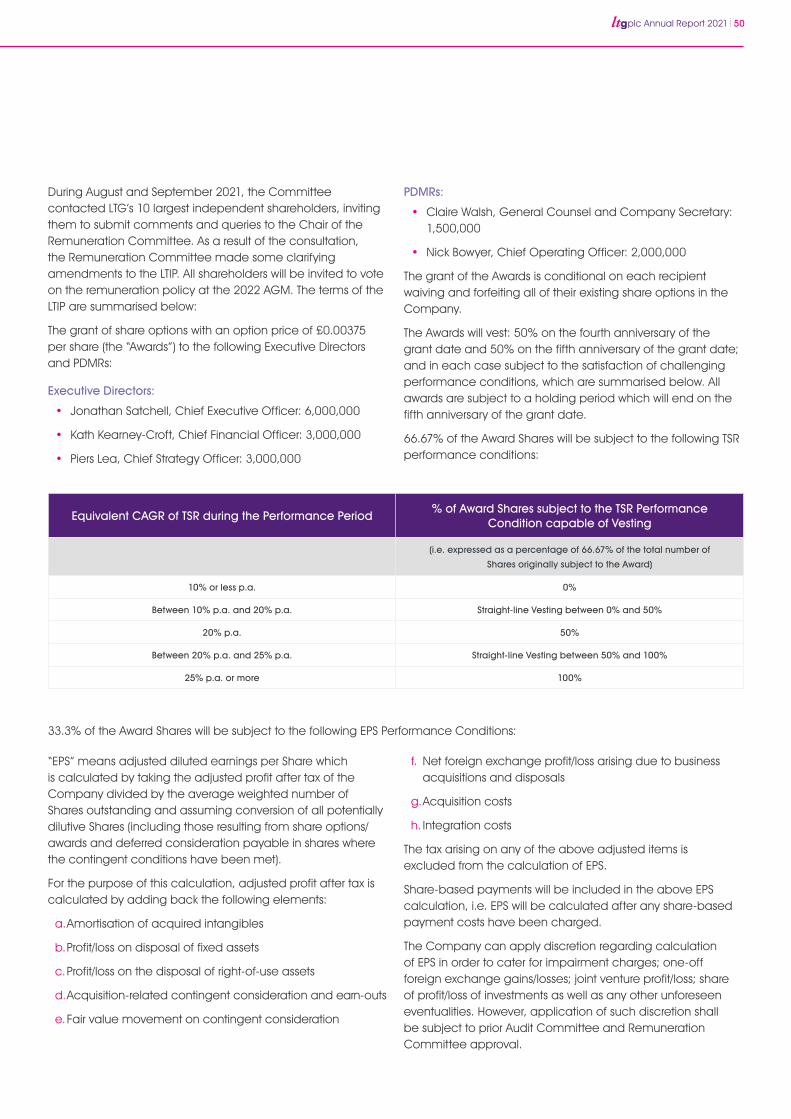
plc Annual Report 2021 50
PDMRs:
• Claire Walsh, General Counsel and Company Secretary: 1,500,000
• Nick Bowyer, Chief Operating Officer: 2,000,000
The grant of the Awards is conditional on each recipient waiving and forfeiting all of their existing share options in the Company.
The Awards will vest: 50% on the fourth anniversary of the grant date and 50% on the fifth anniversary of the grant date; and in each case subject to the satisfaction of challenging performance conditions, which are summarised below. All awards are subject to a holding period which will end on the fifth anniversary of the grant date.
66.67% of the Award Shares will be subject to the following TSR performance conditions:
During August and September 2021, the Committee contacted LTG’s 10 largest independent shareholders, inviting them to submit comments and queries to the Chair of the Remuneration Committee. As a result of the consultation, the Remuneration Committee made some clarifying amendments to the LTIP. All shareholders will be invited to vote on the remuneration policy at the 2022 AGM. The terms of the LTIP are summarised below:
The grant of share options with an option price of £0.00375 per share (the “Awards”) to the following Executive Directors and PDMRs:
Executive Directors:
• Jonathan Satchell, Chief Executive Officer: 6,000,000
• Kath Kearney-Croft, Chief Financial Officer: 3,000,000
• Piers Lea, Chief Strategy Officer: 3,000,000
33.3% of the Award Shares will be subject to the following EPS Performance Conditions:
Equivalent CAGR of TSR during the Performance Period% of Award Shares subject to the TSR Performance
Condition capable of Vesting
(i.e. expressed as a percentage of 66.67% of the total number of
Shares originally subject to the Award)
10% or less p.a. 0%
Between 10% p.a. and 20% p.a. Straight-line Vesting between 0% and 50%
20% p.a. 50%
Between 20% p.a. and 25% p.a. Straight-line Vesting between 50% and 100%
25% p.a. or more 100%
f. Net foreign exchange profit/loss arising due to business acquisitions and disposals
g. Acquisition costs
h. Integration costs
The tax arising on any of the above adjusted items is excluded from the calculation of EPS.
Share-based payments will be included in the above EPS calculation, i.e. EPS will be calculated after any share-based payment costs have been charged.
The Company can apply discretion regarding calculation of EPS in order to cater for impairment charges; one-off foreign exchange gains/losses; joint venture profit/loss; share of profit/loss of investments as well as any other unforeseen eventualities. However, application of such discretion shall be subject to prior Audit Committee and Remuneration Committee approval.
“EPS” means adjusted diluted earnings per Share which is calculated by taking the adjusted profit after tax of the Company divided by the average weighted number of Shares outstanding and assuming conversion of all potentially dilutive Shares (including those resulting from share options/ awards and deferred consideration payable in shares where the contingent conditions have been met).
For the purpose of this calculation, adjusted profit after tax is calculated by adding back the following elements:
a. Amortisation of acquired intangibles
b. Profit/loss on disposal of fixed assets
c. Profit/loss on the disposal of right-of-use assets
d. Acquisition-related contingent consideration and earn-outs
e. Fair value movement on contingent consideration
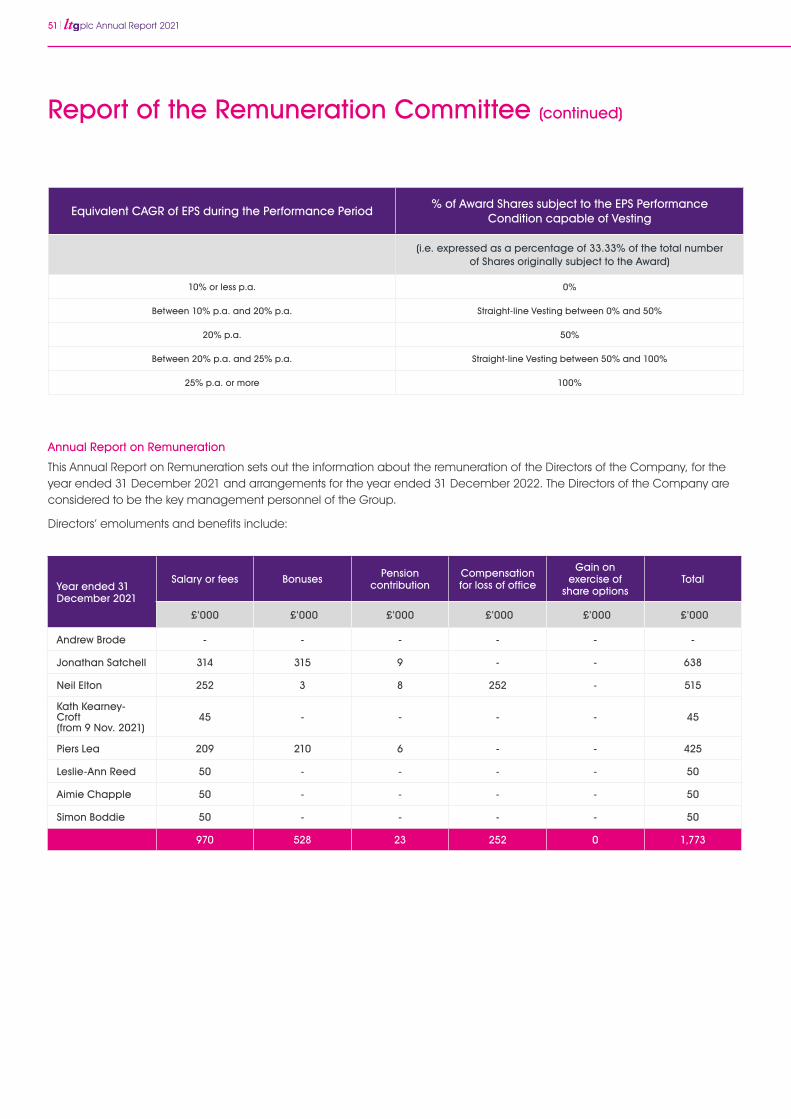
51 plc Annual Report 2021
Annual Report on Remuneration
This Annual Report on Remuneration sets out the information about the remuneration of the Directors of the Company, for the year ended 31 December 2021 and arrangements for the year ended 31 December 2022. The Directors of the Company are considered to be the key management personnel of the Group.
Directors’ emoluments and benefits include:
Year ended 31 December 2021
Salary or fees Bonuses Pension contribution
Compensation for loss of office
Gain on exercise of
share optionsTotal
£’000 £’000 £’000 £’000 £’000 £’000
Andrew Brode - - - - - -
Jonathan Satchell 314 315 9 - - 638
Neil Elton 252 3 8 252 - 515
Kath Kearney-Croft (from 9 Nov. 2021)
45 - - - - 45
Piers Lea 209 210 6 - - 425
Leslie-Ann Reed 50 - - - - 50
Aimie Chapple 50 - - - - 50
Simon Boddie 50 - - - - 50
970 528 23 252 0 1,773
Equivalent CAGR of EPS during the Performance Period% of Award Shares subject to the EPS Performance
Condition capable of Vesting
(i.e. expressed as a percentage of 33.33% of the total number of Shares originally subject to the Award)
10% or less p.a. 0%
Between 10% p.a. and 20% p.a. Straight-line Vesting between 0% and 50%
20% p.a. 50%
Between 20% p.a. and 25% p.a. Straight-line Vesting between 50% and 100%
25% p.a. or more 100%
Report of the Remuneration Committee (continued)
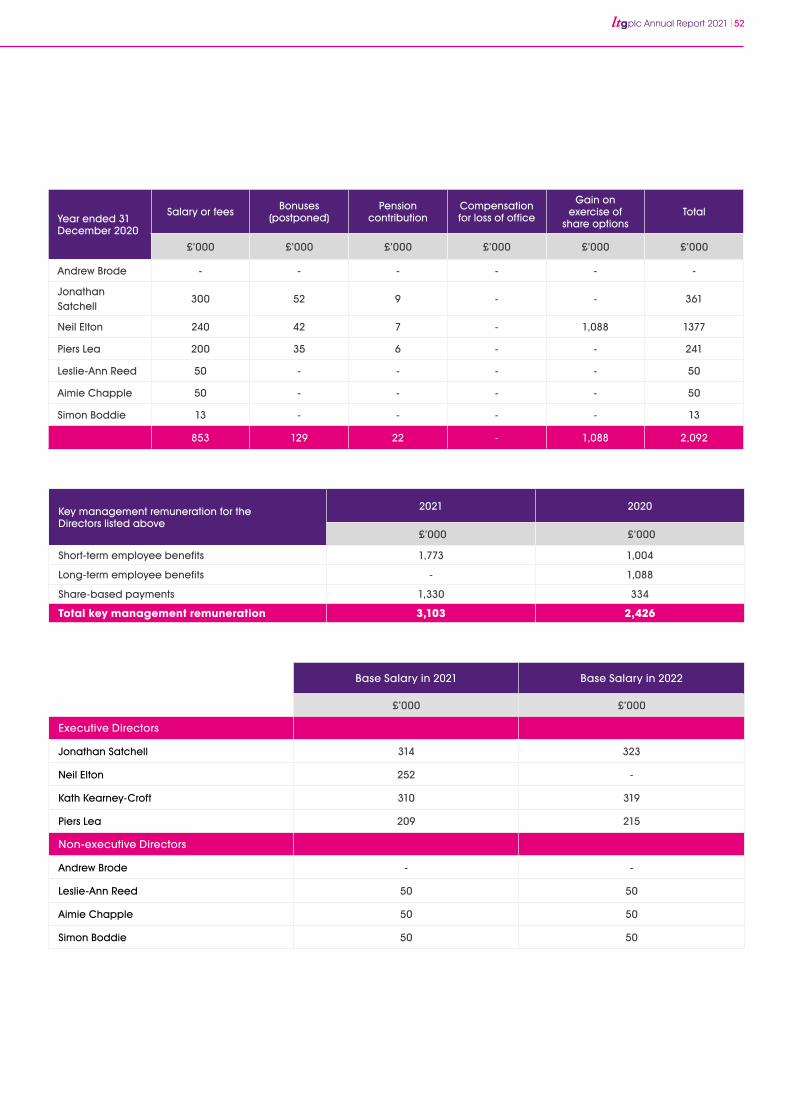
plc Annual Report 2021 52
Key management remuneration for the Directors listed above
2021 2020
£’000 £’000
Short-term employee benefits 1,773 1,004
Long-term employee benefits - 1,088
Share-based payments 1,330 334
Total key management remuneration 3,103 2,426
Year ended 31 December 2020
Salary or fees Bonuses(postponed)
Pension contribution
Compensation for loss of office
Gain on exercise of
share optionsTotal
£’000 £’000 £’000 £’000 £’000 £’000
Andrew Brode - - - - - -
Jonathan Satchell
300 52 9 - - 361
Neil Elton 240 42 7 - 1,088 1377
Piers Lea 200 35 6 - - 241
Leslie-Ann Reed 50 - - - - 50
Aimie Chapple 50 - - - - 50
Simon Boddie 13 - - - - 13
853 129 22 - 1,088 2,092
Base Salary in 2021 Base Salary in 2022
£’000 £’000
Executive Directors
Jonathan Satchell 314 323
Neil Elton 252 -
Kath Kearney-Croft 310 319
Piers Lea 209 215
Non-executive Directors
Andrew Brode - -
Leslie-Ann Reed 50 50
Aimie Chapple 50 50
Simon Boddie 50 50
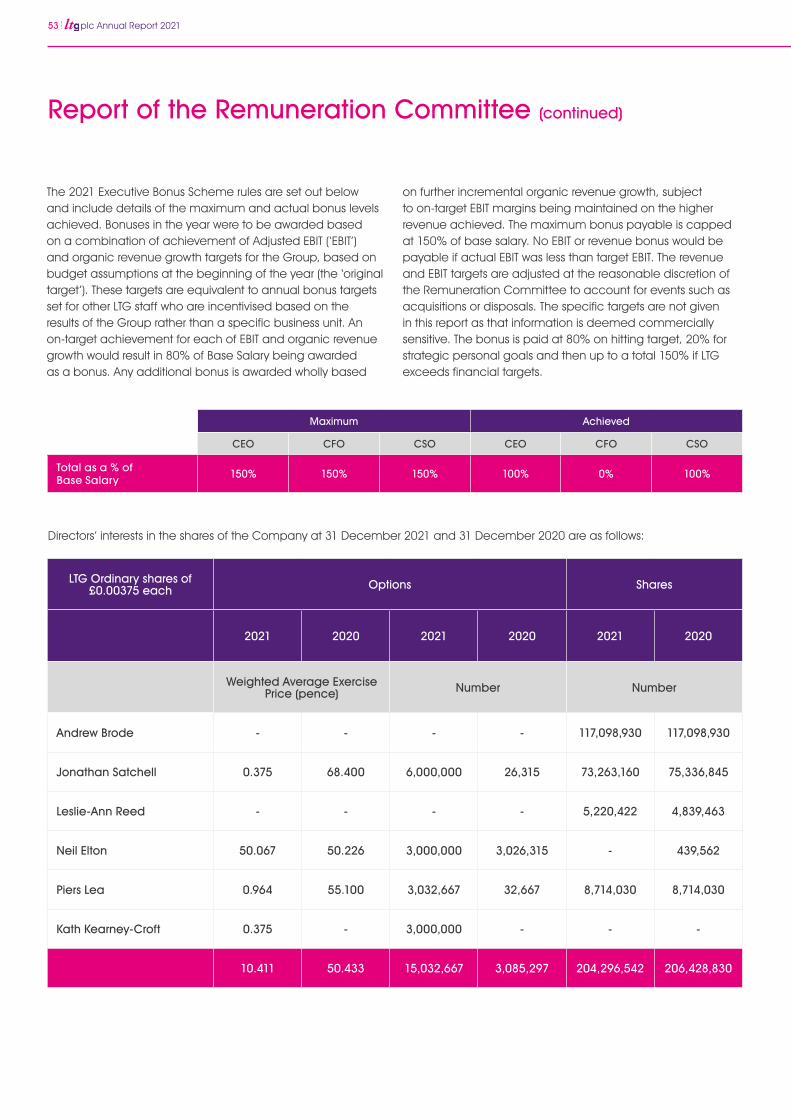
53 plc Annual Report 2021
LTG Ordinary shares of £0.00375 each Options Shares
2021 2020 2021 2020 2021 2020
Weighted Average Exercise Price (pence) Number Number
Andrew Brode - - - - 117,098,930 117,098,930
Jonathan Satchell 0.375 68.400 6,000,000 26,315 73,263,160 75,336,845
Leslie-Ann Reed - - - - 5,220,422 4,839,463
Neil Elton 50.067 50.226 3,000,000 3,026,315 - 439,562
Piers Lea 0.964 55.100 3,032,667 32,667 8,714,030 8,714,030
Kath Kearney-Croft 0.375 - 3,000,000 - - -
10.411 50.433 15,032,667 3,085,297 204,296,542 206,428,830
Report of the Remuneration Committee (continued)
The 2021 Executive Bonus Scheme rules are set out below and include details of the maximum and actual bonus levels achieved. Bonuses in the year were to be awarded based on a combination of achievement of Adjusted EBIT (‘EBIT’) and organic revenue growth targets for the Group, based on budget assumptions at the beginning of the year (the ‘original target’). These targets are equivalent to annual bonus targets set for other LTG staff who are incentivised based on the results of the Group rather than a specific business unit. An on-target achievement for each of EBIT and organic revenue growth would result in 80% of Base Salary being awarded as a bonus. Any additional bonus is awarded wholly based
on further incremental organic revenue growth, subject to on-target EBIT margins being maintained on the higher revenue achieved. The maximum bonus payable is capped at 150% of base salary. No EBIT or revenue bonus would be payable if actual EBIT was less than target EBIT. The revenue and EBIT targets are adjusted at the reasonable discretion of the Remuneration Committee to account for events such as acquisitions or disposals. The specific targets are not given in this report as that information is deemed commercially sensitive. The bonus is paid at 80% on hitting target, 20% for strategic personal goals and then up to a total 150% if LTG exceeds financial targets.
Maximum Achieved
CEO CFO CSO CEO CFO CSO
Total as a % of Base Salary 150% 150% 150% 100% 0% 100%
Directors’ interests in the shares of the Company at 31 December 2021 and 31 December 2020 are as follows:
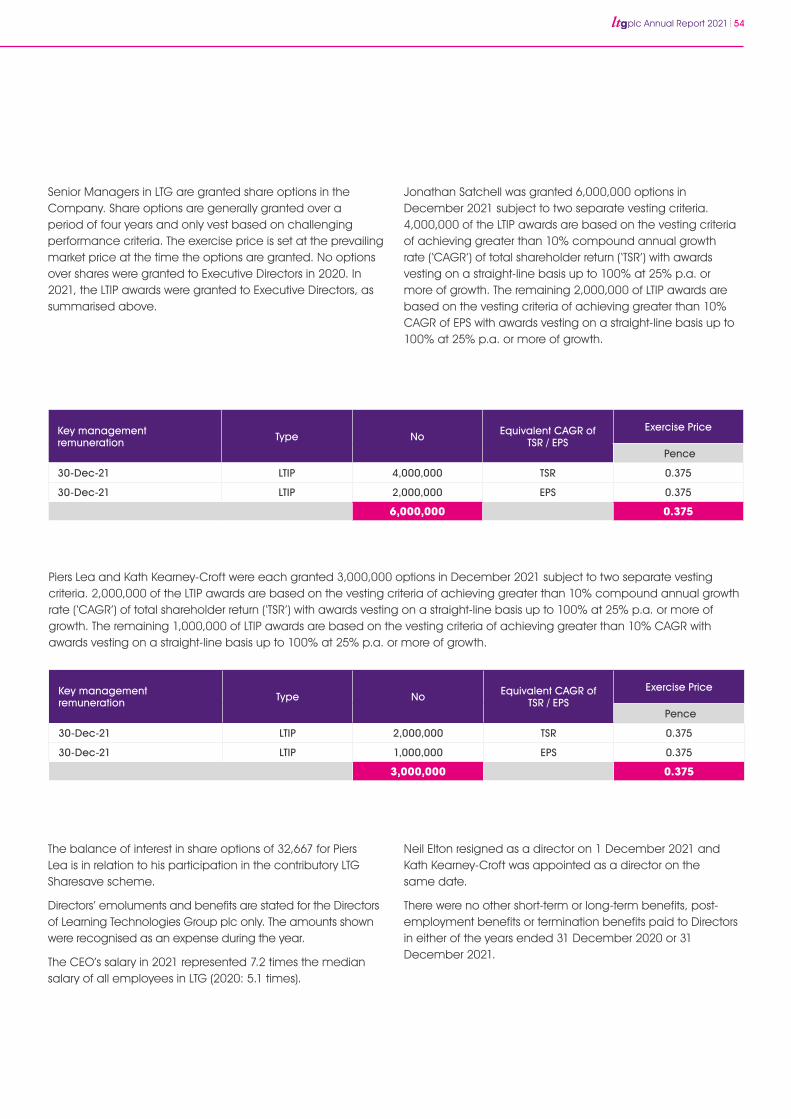
plc Annual Report 2021 54
Senior Managers in LTG are granted share options in the Company. Share options are generally granted over a period of four years and only vest based on challenging performance criteria. The exercise price is set at the prevailing market price at the time the options are granted. No options over shares were granted to Executive Directors in 2020. In 2021, the LTIP awards were granted to Executive Directors, as summarised above.
Jonathan Satchell was granted 6,000,000 options in December 2021 subject to two separate vesting criteria. 4,000,000 of the LTIP awards are based on the vesting criteria of achieving greater than 10% compound annual growth rate (‘CAGR’) of total shareholder return (‘TSR’) with awards vesting on a straight-line basis up to 100% at 25% p.a. or more of growth. The remaining 2,000,000 of LTIP awards are based on the vesting criteria of achieving greater than 10% CAGR of EPS with awards vesting on a straight-line basis up to 100% at 25% p.a. or more of growth.
Key management remuneration Type No Equivalent CAGR of
TSR / EPSExercise Price
Pence
30-Dec-21 LTIP 4,000,000 TSR 0.375
30-Dec-21 LTIP 2,000,000 EPS 0.375
6,000,000 0.375
Piers Lea and Kath Kearney-Croft were each granted 3,000,000 options in December 2021 subject to two separate vesting criteria. 2,000,000 of the LTIP awards are based on the vesting criteria of achieving greater than 10% compound annual growth rate (‘CAGR’) of total shareholder return (‘TSR’) with awards vesting on a straight-line basis up to 100% at 25% p.a. or more of growth. The remaining 1,000,000 of LTIP awards are based on the vesting criteria of achieving greater than 10% CAGR with awards vesting on a straight-line basis up to 100% at 25% p.a. or more of growth.
The balance of interest in share options of 32,667 for Piers Lea is in relation to his participation in the contributory LTG Sharesave scheme.
Directors’ emoluments and benefits are stated for the Directors of Learning Technologies Group plc only. The amounts shown were recognised as an expense during the year.
The CEO’s salary in 2021 represented 7.2 times the median salary of all employees in LTG (2020: 5.1 times).
Key management remuneration Type No Equivalent CAGR of
TSR / EPSExercise Price
Pence
30-Dec-21 LTIP 2,000,000 TSR 0.375
30-Dec-21 LTIP 1,000,000 EPS 0.375
3,000,000 0.375
Neil Elton resigned as a director on 1 December 2021 and Kath Kearney-Croft was appointed as a director on the same date.
There were no other short-term or long-term benefits, post-employment benefits or termination benefits paid to Directors in either of the years ended 31 December 2020 or 31 December 2021.
55 plc Annual Report 2021
The Directors present their report on the Group, together with the audited Consolidated Financial Statements for the year ended 31 December 2021.
Principal activities
The principal activity of the Group is the provision of talent and learning solutions; content, services and digital platforms to the corporate and government markets. The principal activity of LTG is that of a parent holding company which manages the Group’s strategic direction and underlying subsidiaries including GP Strategies Corporation.
Cautionary statement
The review of the business and its future development in the Strategic Report has been prepared solely to provide additional information to shareholders to assess the Group’s strategy and the potential for this strategy to succeed. It should not be relied on by any other party for any other purpose. The review contains forward-looking statements which are made by the Directors in good faith based on information available to them up to the time of the approval of the reports and should be treated with caution due to the inherent uncertainties associated with such statements.
Results and dividends
The results of the Group are set out in detail on page 66.
At the time of LTG’s admission to AIM in November 2013, the Board stated that they would pursue a progressive dividend policy. On 25 June 2021, the Company paid a final dividend of 0.50 pence per share in respect of the year ended December 2020. On 29 October 2021, the Company paid an interim dividend of 0.30 pence per share (2020: 0.25 pence per share) representing a 20% increase. The Directors propose to pay a final dividend of 0.70 pence per share for the year ended 31 December 2021, equating to a total payout in respect of the year of 1.0 pence per share.
Business review and future developments
Details of the business activities and acquisitions made during the year can be found in the Strategic Report and in Note 14 to the Consolidated Financial Statements.
Political donations
The Group made no political donations during the year (2020: £nil).
Financial instruments and risk management
Disclosures regarding financial instruments are provided within the Strategic Report and Note 33 to the Financial Statements.
Capital Structure
Details of the Company’s share capital, together with details of the movements therein are set out in Note 27 to the Financial Statements. The Company has one class of ordinary share which carries no right to fixed income.
Research and development
Please refer to the ‘Creating Value Through Investment in Innovation’ section of the Strategic Report on page 18.
Post-balance sheet events
Details of post-balance sheet events can be found in Note 34 to the Consolidated Financial Statements.
Workforce policies and employment engagement
We are committed to the investment in our staff at all levels to ensure a culture of continuous improvement. In order to attract and retain a high calibre of employees we provide various employee benefit packages including performance-related bonuses and Sharesave plans in order to align employee interests with the long-term strategic objectives of the Group. We are committed to our equality and diversity policies and seek regular feedback and engagement from our workforce. Further information regarding our work policies and engagement can be found in the Social section of the ESG report.
Directors’ interests in shares and contracts
Directors’ interests in the shares of LTG at 31 December 2021 and 31 December 2020 are disclosed in the Report of the Remuneration Committee. Directors’ interests in contracts of significance to which LTG was a party during the financial year are disclosed in Note 31.
For the year ended 31 December 2021
Directors’ Report
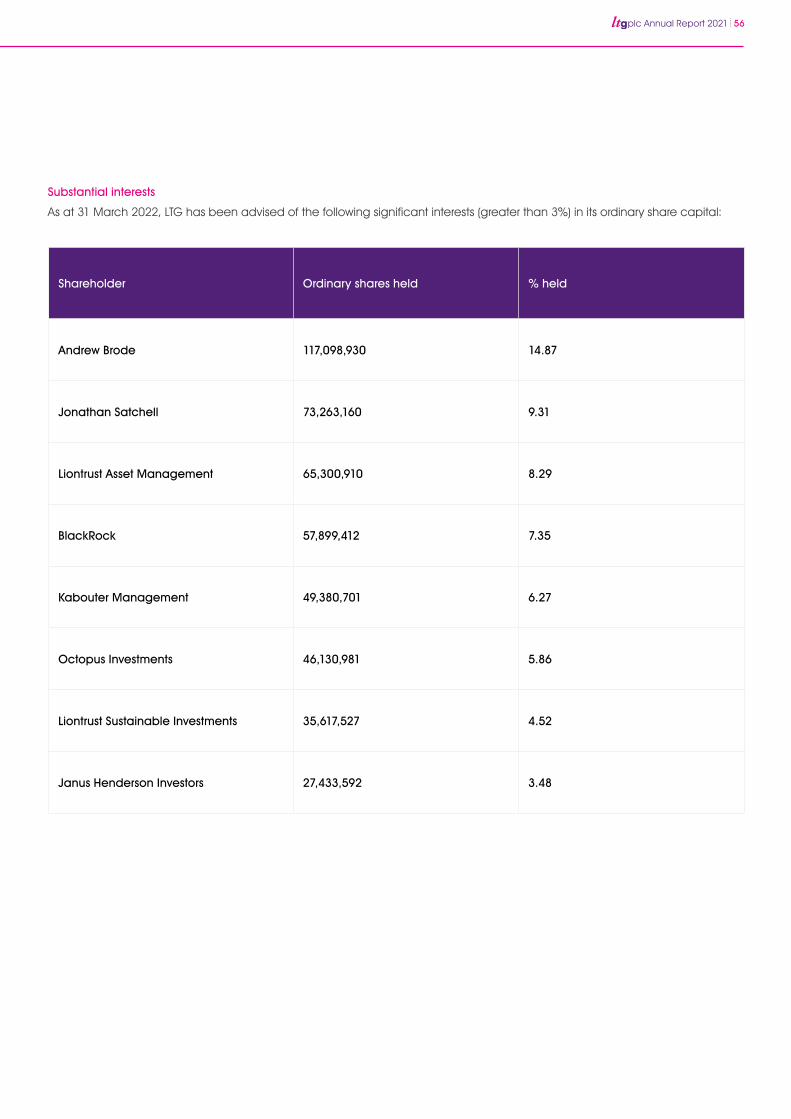
plc Annual Report 2021 56
Shareholder Ordinary shares held % held
Andrew Brode 117,098,930 14.87
Jonathan Satchell 73,263,160 9.31
Liontrust Asset Management 65,300,910 8.29
BlackRock 57,899,412 7.35
Kabouter Management 49,380,701 6.27
Octopus Investments 46,130,981 5.86
Liontrust Sustainable Investments 35,617,527 4.52
Janus Henderson Investors 27,433,592 3.48
Substantial interests
As at 31 March 2022, LTG has been advised of the following significant interests (greater than 3%) in its ordinary share capital:
57 plc Annual Report 2021
Except as referred to above, the Directors are not aware of any person who held an interest of 3% or more of the issued share capital of the company or could directly or indirectly, jointly or severally, exercise control.
Annual General Meeting
The Annual General Meeting (‘AGM’) will be held at 10am on 22 June 2022. The notice of the AGM which will be sent to shareholders in advance of the meeting will contain the full text of the resolutions to be proposed and the venue for the meeting.
Independent auditors
In accordance with Section 489 of the Companies Act 2006, a resolution proposing that BDO, LLP be reappointed will be proposed at the Annual General Meeting.
Provision of information to auditors
Each of the persons who are Directors at the time when this Directors’ Report is approved has confirmed that:
• So far as that Director is aware, there is no relevant audit information of which the Company’s auditors are unaware, and
• That Director has taken all steps that ought to have been taken as a Director in order to be aware of any information needed by the Company’s auditors in connection with preparing their report and to establish that the Company’s auditors are aware of that information.
Signed by order of the Board
Claire WalshCompany Secretary29 April 2022
For the year ended 31 December 2021
Directors’ Report (continued)
plc Annual Report 2021 58
The Directors are responsible for preparing the Annual Report and the Financial Statements in accordance with applicable law and regulations.
UK Company law requires the Directors to prepare Financial Statements for each financial year. Under that law, the Directors have elected to prepare the Consolidated Financial Statements in accordance with International Financial Reporting Standards (IFRSs) as adopted by the UK and applicable law, and the Company Financial Statements in accordance with UK Generally Accepted Accounting Practice including Financial Reporting Standard 102. Under UK company law the directors must not approve the Financial Statements unless they are satisfied that they give a true and fair view of the state of affairs of the Group and Company and of the profit or loss of the Group and Company for that period. The Directors are also required to prepare Financial Statements in accordance with the rules of the London Stock Exchange for companies trading securities on AIM. In preparing these Financial Statements, the Directors are required to:
• Select suitable accounting policies and apply them consistently
• Make judgements and accounting estimates that are reasonable and prudent
• State whether they have been prepared in accordance with IFRSs as adopted by the UK, subject to any material departures disclosed and explained in the Financial Statements
• Prepare the Financial Statements on the going concern basis unless it is not appropriate to assume that the Company and the Group will continue in business
The Directors are responsible for keeping adequate accounting records that are sufficient to show and explain the Company’s transactions and disclose with reasonable accuracy at any time the financial position of the Company and the Group and enable them to ensure that the Financial Statements comply with the Companies Act 2006. They are also responsible for safeguarding the assets of the Company and the Group and hence for taking reasonable steps for the prevention and detection of fraud and other irregularities.
Website publication The Directors are responsible for ensuring the annual report and the Financial Statements are made available on a website. Financial Statements are published on the Group’s website in accordance with legislation in the UK governing the preparation and dissemination of Financial Statements, which may vary from legislation in other jurisdictions. The maintenance and integrity of the Group’s website are the responsibility of the Directors. The Directors’ responsibility also extends to the ongoing integrity of the Financial Statements contained therein.
Directors’ Responsibilities Statement in Respect of the Annual Report and the Financial Statements
59 plc Annual Report 2021
Opinion on the financial statements In our opinion:
• The financial statements give a true and fair view of the state of the Group’s and of the Parent Company’s affairs as at 31 December 2021 and of the Group’s profit for the year then ended
• The Group financial statements have been properly prepared in accordance with UK adopted international accounting standards
• The Parent Company financial statements have been properly prepared in accordance with United Kingdom Generally Accepted Accounting Practice
• The financial statements have been prepared in accordance with the requirements of the Companies Act 2006
We have audited the financial statements of Learning Technologies Group plc (the ‘Parent Company’) and its subsidiaries (the ‘Group’) for the year ended 31 December 2021 which comprise the Consolidated Statement of Comprehensive Income, the Consolidated Statement of Financial Position, the Consolidated Statement of Changes in Equity, the Consolidated Statement of Cash Flows, the Company Statement of Financial Position, the Company Statement of Changes in Equity and notes to the financial statements, including a summary of significant accounting policies.
The financial reporting framework that has been applied in the preparation of the Group financial statements is applicable law and UK-adopted international accounting standards. The financial reporting framework that has been applied in the preparation of the Parent Company financial statements is applicable law and United Kingdom Accounting Standards, including Financial Reporting Standard 102 The Financial Reporting Standard in the United Kingdom and Republic of Ireland (United Kingdom Generally-Accepted Accounting Practice).
Basis for opinion
We conducted our audit in accordance with International Standards on Auditing (UK) (ISAs (UK)) and applicable law. Our responsibilities under those standards are further described in the Auditor’s responsibilities for the audit of the financial statements section of our report. We believe that the audit evidence we have obtained is sufficient and appropriate to provide a basis for our opinion.
Independence
We remain independent of the Group and the Parent Company in accordance with the ethical requirements that are relevant to our audit of the financial statements in the UK, including the FRC’s Ethical Standard as applied to listed
entities, and we have fulfilled our other ethical responsibilities in accordance with these requirements.
Conclusions relating to going concern
In auditing the financial statements, we have concluded that the Directors’ use of the going concern basis of accounting in the preparation of the financial statements is appropriate. Our evaluation of the Directors’ assessment of the Group and the Parent Company’s ability to continue to adopt the going concern basis of accounting included:
• A critical evaluation of the Director’s assessment of the entity’s ability to continue as a going concern, covering the period of 12 months from the date of approval of the financial statements by;
• Evaluating the process the Directors followed to make their assessment, including confirming the assessment and underlying projections were prepared by appropriate individuals with sufficient knowledge of the detailed figures as well as an understanding of the entities markets, strategies and risks.
• Testing the arithmetical accuracy of the going concern model to support the Directors’ assessment and the underlying calculations within it.
• Understanding, challenging and corroborating the key assumptions included in their cash flow forecasts against prior year, our knowledge of the business and industry, and other areas of the audit.
• Searching, through enquiry with the Directors, review of board minutes and review of external resources, for any key future events that may have been omitted from cash-flow forecasts and assessing the impact these could have on future cash flows and cash reserves.
• Assessing stress test scenarios and challenging whether other reasonably possible scenarios could occur and including these where appropriate.
• Confirming that sensitised cashflow forecasts prepared by the Directors included the preparation of a reverse stress test to analyse the level of reduction in trade that could be sustained before a covenant breach or liquidity shortfall would be indicated. We considered the reasonableness of the assumptions used in the sensitised cashflow forecasts.
• Confirming the financing facilities, repayment terms and financial covenants to supporting documentation. We reviewed the Director’s assessment of covenant compliance throughout the forecast period, including compliance within sensitised cash flow forecasts.
Independent Auditor’s Report to the Members of Learning Technologies Group plc
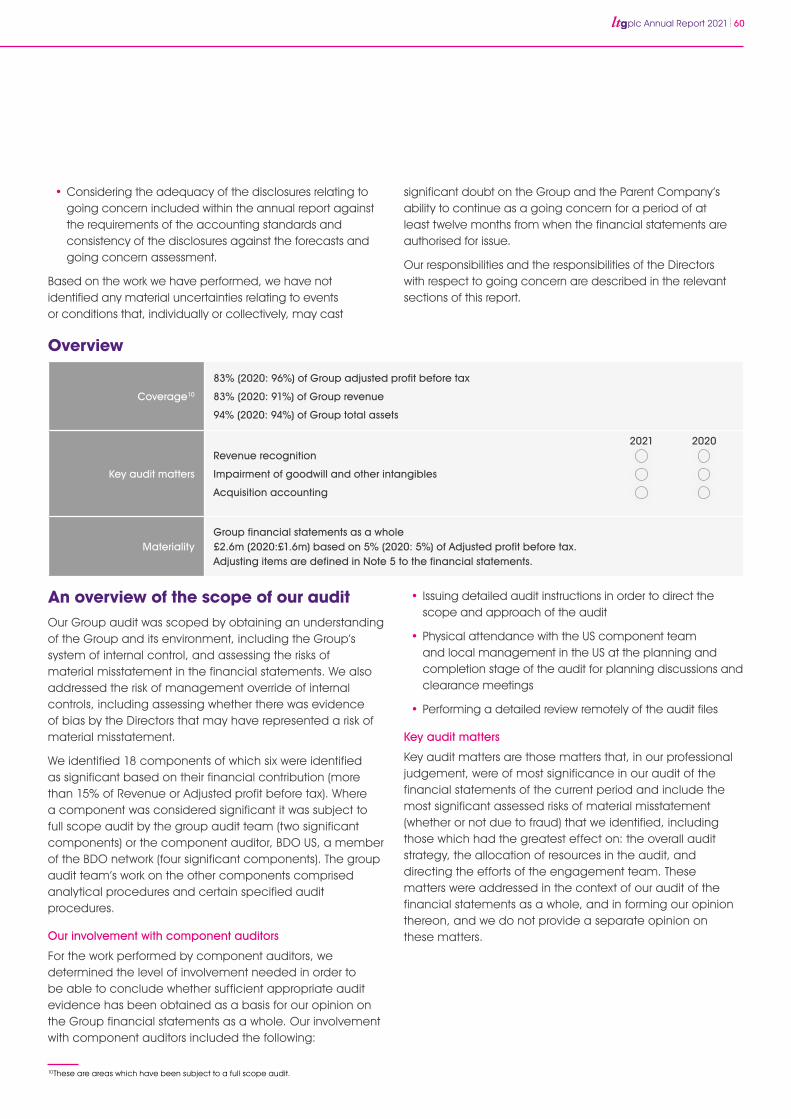
plc Annual Report 2021 60
• Considering the adequacy of the disclosures relating to going concern included within the annual report against the requirements of the accounting standards and consistency of the disclosures against the forecasts and going concern assessment.
Based on the work we have performed, we have not identified any material uncertainties relating to events or conditions that, individually or collectively, may cast
An overview of the scope of our auditOur Group audit was scoped by obtaining an understanding of the Group and its environment, including the Group’s system of internal control, and assessing the risks of material misstatement in the financial statements. We also addressed the risk of management override of internal controls, including assessing whether there was evidence of bias by the Directors that may have represented a risk of material misstatement.
We identified 18 components of which six were identified as significant based on their financial contribution (more than 15% of Revenue or Adjusted profit before tax). Where a component was considered significant it was subject to full scope audit by the group audit team (two significant components) or the component auditor, BDO US, a member of the BDO network (four significant components). The group audit team’s work on the other components comprised analytical procedures and certain specified audit procedures.
Our involvement with component auditors
For the work performed by component auditors, we determined the level of involvement needed in order to be able to conclude whether sufficient appropriate audit evidence has been obtained as a basis for our opinion on the Group financial statements as a whole. Our involvement with component auditors included the following:
• Issuing detailed audit instructions in order to direct the scope and approach of the audit
• Physical attendance with the US component team and local management in the US at the planning and completion stage of the audit for planning discussions and clearance meetings
• Performing a detailed review remotely of the audit files
Key audit matters
Key audit matters are those matters that, in our professional judgement, were of most significance in our audit of the financial statements of the current period and include the most significant assessed risks of material misstatement (whether or not due to fraud) that we identified, including those which had the greatest effect on: the overall audit strategy, the allocation of resources in the audit, and directing the efforts of the engagement team. These matters were addressed in the context of our audit of the financial statements as a whole, and in forming our opinion thereon, and we do not provide a separate opinion on these matters.
10These are areas which have been subject to a full scope audit.
significant doubt on the Group and the Parent Company’s ability to continue as a going concern for a period of at least twelve months from when the financial statements are authorised for issue.
Our responsibilities and the responsibilities of the Directors with respect to going concern are described in the relevant sections of this report.
Coverage10
83% (2020: 96%) of Group adjusted profit before tax
83% (2020: 91%) of Group revenue
94% (2020: 94%) of Group total assets
Key audit matters
Revenue recognition
Impairment of goodwill and other intangibles
Acquisition accounting
MaterialityGroup financial statements as a whole£2.6m (2020:£1.6m) based on 5% (2020: 5%) of Adjusted profit before tax. Adjusting items are defined in Note 5 to the financial statements.
20202021
Overview
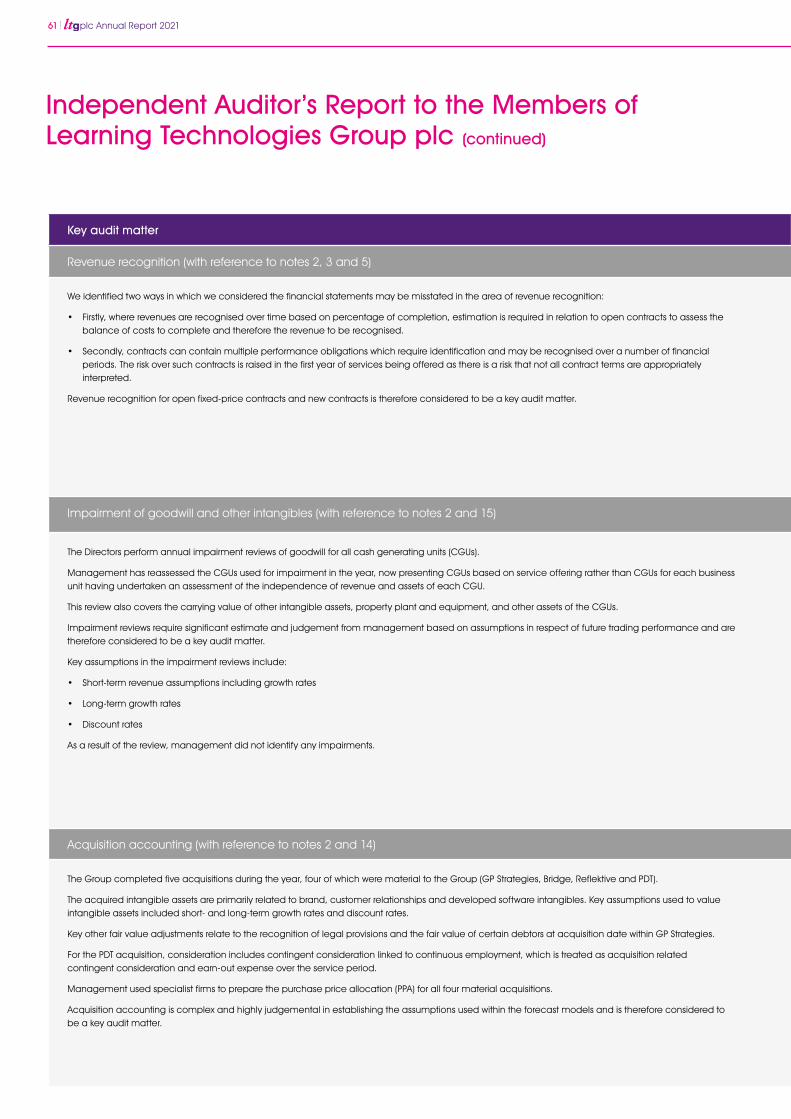
61 plc Annual Report 2021
Independent Auditor’s Report to the Members of Learning Technologies Group plc (continued)
Key audit matter How the scope of our audit addressed the key audit matter
Revenue recognition (with reference to notes 2, 3 and 5)
We identified two ways in which we considered the financial statements may be misstated in the area of revenue recognition:
• Firstly, where revenues are recognised over time based on percentage of completion, estimation is required in relation to open contracts to assess the balance of costs to complete and therefore the revenue to be recognised.
• Secondly, contracts can contain multiple performance obligations which require identification and may be recognised over a number of financial periods. The risk over such contracts is raised in the first year of services being offered as there is a risk that not all contract terms are appropriately interpreted.
Revenue recognition for open fixed-price contracts and new contracts is therefore considered to be a key audit matter.
We developed an understanding, through meeting with group management and local business unit management, of the key revenue processes from inception to disclosure in the financial statements and assessed the design and implementation of the controls over the Group’s revenue cycles.
For a sample of contracts where revenue was recognised based on percentage completion we obtained evidence of contract completion. For a sample of contracts ongoing at the year end we also verified the basis and accuracy of the revenue recognition by recalculating the percentage of completion and testing costs recognised to date to timesheet data or invoices and ensuring the costs were appropriately allocated to individual projects. We also obtained detailed confirmations from project managers, outside of the finance teams, to ensure the amounts accounted for were in line with their understanding of how the projects were progressed at the year-end date, and obtained post year-end data to evidence that the estimated costs to complete have not changed significantly from the position at year-end.
We selected a sample of contracts, including a focus on new contracts, and obtained the customer signed contracts to critically assess if all performance obligations and the relevant periods have been identified appropriately, in line with the requirements of IFRS 15.
Key observations:Through performing these procedures, we found that the judgements and estimates made in the identification of performance obligations and recognition of revenue were appropriate.
Impairment of goodwill and other intangibles (with reference to notes 2 and 15)
The Directors perform annual impairment reviews of goodwill for all cash generating units (CGUs).
Management has reassessed the CGUs used for impairment in the year, now presenting CGUs based on service offering rather than CGUs for each business unit having undertaken an assessment of the independence of revenue and assets of each CGU.
This review also covers the carrying value of other intangible assets, property plant and equipment, and other assets of the CGUs.
Impairment reviews require significant estimate and judgement from management based on assumptions in respect of future trading performance and are therefore considered to be a key audit matter.
Key assumptions in the impairment reviews include:
• Short-term revenue assumptions including growth rates
• Long-term growth rates
• Discount rates
As a result of the review, management did not identify any impairments.
We reviewed management’s assessment of CGUs to ensure that the new CGUs were appropriately identified in line with the requirements of IAS 36: Impairment of assets. This included consideration of potential revenue and asset separation for the business units included in each CGU which may have indicated they should be standalone CGUs; and we obtained evidence to support the existence of joint projects, existing cross-selling and combined go-to-market strategies, shared workforce usage, shared software delivery infrastructure and overlapping market presence between the business units in each CGU.
We tested management’s allocation of assets for each CGU and assessed the allocation based on our knowledge of the Group and its operations.
We challenged management’s assumptions and assessed the achievability of the forecasts included in the impairment model using a number of techniques including assessing accuracy of historic forecasting, industry trends and our knowledge of the business.
We also challenged management on any significant changes in assumptions compared to prior year and differences with forecasts used for acquisition and going concern purposes.
We utilised our own valuation specialists, to assess the mechanics and mathematical accuracy of the modelling and assessing the adequacy of the discount rates applied.
We considered management’s sensitivities and performed our own sensitivities in respect of key assumptions, including short- and-long term trading performance and revenue growth assumptions including contract renewal, to assess the potential impairment of goodwill.
Key Observations:Based on performance of these procedures, we consider the short-term growth, long-term growth and discount rate assumptions included within the impairment reviews to be appropriate.
Acquisition accounting (with reference to notes 2 and 14)
The Group completed five acquisitions during the year, four of which were material to the Group (GP Strategies, Bridge, Reflektive and PDT).
The acquired intangible assets are primarily related to brand, customer relationships and developed software intangibles. Key assumptions used to value intangible assets included short- and long-term growth rates and discount rates.
Key other fair value adjustments relate to the recognition of legal provisions and the fair value of certain debtors at acquisition date within GP Strategies.
For the PDT acquisition, consideration includes contingent consideration linked to continuous employment, which is treated as acquisition related contingent consideration and earn-out expense over the service period.
Management used specialist firms to prepare the purchase price allocation (PPA) for all four material acquisitions.
Acquisition accounting is complex and highly judgemental in establishing the assumptions used within the forecast models and is therefore considered to be a key audit matter.
For all acquisitions completed in the year, we obtained the acquisition agreements, PPAs, supporting documentation and management’s paper on the accounting treatment and key judgements. We also confirmed the independence and qualification of management’s experts.
For material acquisitions, the audit team, together with internal valuation specialists, critically assessed the acquisition accounting and PPA process, including discussion with management to understand the nature of the acquired businesses, so we could assess the completeness of the identified intangibles, and the reasonableness of the assumptions used to value them.
We also challenged management in relation to the appropriateness of all other fair value adjustments. For the GP Strategies’ acquisition in particular, this included considering the basis of the fair value of certain debtors and legal provisions, which involved reviewing correspondence with external legal advisors and discussion with internal legal counsel.
Further, we considered the treatment of contingent consideration for the PDT acquisition by reference to the contractual terms, including where linked to continuous employment, and confirmed the proposed accounting was appropriate.
Key Observations:Based on the audit procedures performed, we concluded that the identification and valuation of intangible assets, including the assumptions used within the valuation, and the accounting for other fair value adjustments and contingent consideration was appropriate.
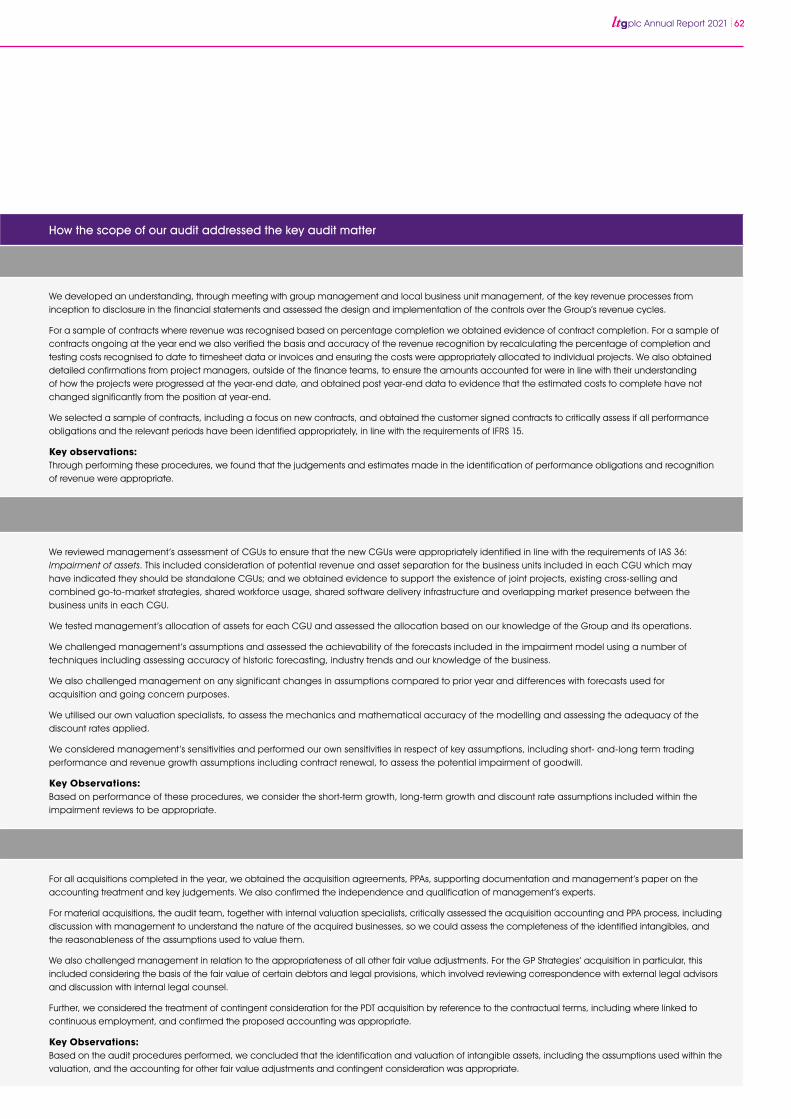
plc Annual Report 2021 62
Key audit matter How the scope of our audit addressed the key audit matter
Revenue recognition (with reference to notes 2, 3 and 5)
We identified two ways in which we considered the financial statements may be misstated in the area of revenue recognition:
• Firstly, where revenues are recognised over time based on percentage of completion, estimation is required in relation to open contracts to assess the balance of costs to complete and therefore the revenue to be recognised.
• Secondly, contracts can contain multiple performance obligations which require identification and may be recognised over a number of financial periods. The risk over such contracts is raised in the first year of services being offered as there is a risk that not all contract terms are appropriately interpreted.
Revenue recognition for open fixed-price contracts and new contracts is therefore considered to be a key audit matter.
We developed an understanding, through meeting with group management and local business unit management, of the key revenue processes from inception to disclosure in the financial statements and assessed the design and implementation of the controls over the Group’s revenue cycles.
For a sample of contracts where revenue was recognised based on percentage completion we obtained evidence of contract completion. For a sample of contracts ongoing at the year end we also verified the basis and accuracy of the revenue recognition by recalculating the percentage of completion and testing costs recognised to date to timesheet data or invoices and ensuring the costs were appropriately allocated to individual projects. We also obtained detailed confirmations from project managers, outside of the finance teams, to ensure the amounts accounted for were in line with their understanding of how the projects were progressed at the year-end date, and obtained post year-end data to evidence that the estimated costs to complete have not changed significantly from the position at year-end.
We selected a sample of contracts, including a focus on new contracts, and obtained the customer signed contracts to critically assess if all performance obligations and the relevant periods have been identified appropriately, in line with the requirements of IFRS 15.
Key observations:Through performing these procedures, we found that the judgements and estimates made in the identification of performance obligations and recognition of revenue were appropriate.
Impairment of goodwill and other intangibles (with reference to notes 2 and 15)
The Directors perform annual impairment reviews of goodwill for all cash generating units (CGUs).
Management has reassessed the CGUs used for impairment in the year, now presenting CGUs based on service offering rather than CGUs for each business unit having undertaken an assessment of the independence of revenue and assets of each CGU.
This review also covers the carrying value of other intangible assets, property plant and equipment, and other assets of the CGUs.
Impairment reviews require significant estimate and judgement from management based on assumptions in respect of future trading performance and are therefore considered to be a key audit matter.
Key assumptions in the impairment reviews include:
• Short-term revenue assumptions including growth rates
• Long-term growth rates
• Discount rates
As a result of the review, management did not identify any impairments.
We reviewed management’s assessment of CGUs to ensure that the new CGUs were appropriately identified in line with the requirements of IAS 36: Impairment of assets. This included consideration of potential revenue and asset separation for the business units included in each CGU which may have indicated they should be standalone CGUs; and we obtained evidence to support the existence of joint projects, existing cross-selling and combined go-to-market strategies, shared workforce usage, shared software delivery infrastructure and overlapping market presence between the business units in each CGU.
We tested management’s allocation of assets for each CGU and assessed the allocation based on our knowledge of the Group and its operations.
We challenged management’s assumptions and assessed the achievability of the forecasts included in the impairment model using a number of techniques including assessing accuracy of historic forecasting, industry trends and our knowledge of the business.
We also challenged management on any significant changes in assumptions compared to prior year and differences with forecasts used for acquisition and going concern purposes.
We utilised our own valuation specialists, to assess the mechanics and mathematical accuracy of the modelling and assessing the adequacy of the discount rates applied.
We considered management’s sensitivities and performed our own sensitivities in respect of key assumptions, including short- and-long term trading performance and revenue growth assumptions including contract renewal, to assess the potential impairment of goodwill.
Key Observations:Based on performance of these procedures, we consider the short-term growth, long-term growth and discount rate assumptions included within the impairment reviews to be appropriate.
Acquisition accounting (with reference to notes 2 and 14)
The Group completed five acquisitions during the year, four of which were material to the Group (GP Strategies, Bridge, Reflektive and PDT).
The acquired intangible assets are primarily related to brand, customer relationships and developed software intangibles. Key assumptions used to value intangible assets included short- and long-term growth rates and discount rates.
Key other fair value adjustments relate to the recognition of legal provisions and the fair value of certain debtors at acquisition date within GP Strategies.
For the PDT acquisition, consideration includes contingent consideration linked to continuous employment, which is treated as acquisition related contingent consideration and earn-out expense over the service period.
Management used specialist firms to prepare the purchase price allocation (PPA) for all four material acquisitions.
Acquisition accounting is complex and highly judgemental in establishing the assumptions used within the forecast models and is therefore considered to be a key audit matter.
For all acquisitions completed in the year, we obtained the acquisition agreements, PPAs, supporting documentation and management’s paper on the accounting treatment and key judgements. We also confirmed the independence and qualification of management’s experts.
For material acquisitions, the audit team, together with internal valuation specialists, critically assessed the acquisition accounting and PPA process, including discussion with management to understand the nature of the acquired businesses, so we could assess the completeness of the identified intangibles, and the reasonableness of the assumptions used to value them.
We also challenged management in relation to the appropriateness of all other fair value adjustments. For the GP Strategies’ acquisition in particular, this included considering the basis of the fair value of certain debtors and legal provisions, which involved reviewing correspondence with external legal advisors and discussion with internal legal counsel.
Further, we considered the treatment of contingent consideration for the PDT acquisition by reference to the contractual terms, including where linked to continuous employment, and confirmed the proposed accounting was appropriate.
Key Observations:Based on the audit procedures performed, we concluded that the identification and valuation of intangible assets, including the assumptions used within the valuation, and the accounting for other fair value adjustments and contingent consideration was appropriate.
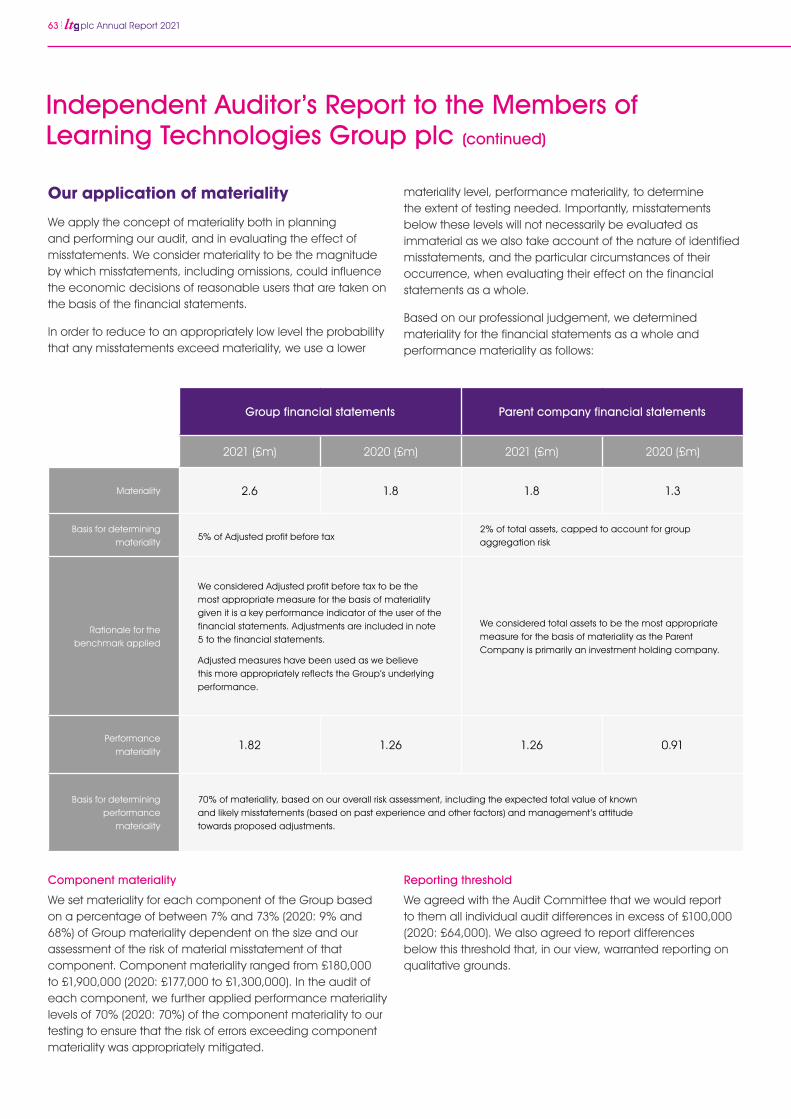
63 plc Annual Report 2021
Our application of materiality
We apply the concept of materiality both in planning and performing our audit, and in evaluating the effect of misstatements. We consider materiality to be the magnitude by which misstatements, including omissions, could influence the economic decisions of reasonable users that are taken on the basis of the financial statements.
In order to reduce to an appropriately low level the probability that any misstatements exceed materiality, we use a lower
Component materiality
We set materiality for each component of the Group based on a percentage of between 7% and 73% (2020: 9% and 68%) of Group materiality dependent on the size and our assessment of the risk of material misstatement of that component. Component materiality ranged from £180,000 to £1,900,000 (2020: £177,000 to £1,300,000). In the audit of each component, we further applied performance materiality levels of 70% (2020: 70%) of the component materiality to our testing to ensure that the risk of errors exceeding component materiality was appropriately mitigated.
materiality level, performance materiality, to determine the extent of testing needed. Importantly, misstatements below these levels will not necessarily be evaluated as immaterial as we also take account of the nature of identified misstatements, and the particular circumstances of their occurrence, when evaluating their effect on the financial statements as a whole.
Based on our professional judgement, we determined materiality for the financial statements as a whole and performance materiality as follows:
Reporting threshold
We agreed with the Audit Committee that we would report to them all individual audit differences in excess of £100,000 (2020: £64,000). We also agreed to report differences below this threshold that, in our view, warranted reporting on qualitative grounds.
Independent Auditor’s Report to the Members of Learning Technologies Group plc (continued)
Group financial statements Parent company financial statements
2021 (£m) 2020 (£m) 2021 (£m) 2020 (£m)
Materiality 2.6 1.8 1.8 1.3
Basis for determining materiality
5% of Adjusted profit before tax 2% of total assets, capped to account for group aggregation risk
Rationale for the benchmark applied
We considered Adjusted profit before tax to be the most appropriate measure for the basis of materiality given it is a key performance indicator of the user of the financial statements. Adjustments are included in note 5 to the financial statements.
Adjusted measures have been used as we believe this more appropriately reflects the Group’s underlying performance.
We considered total assets to be the most appropriate measure for the basis of materiality as the Parent Company is primarily an investment holding company.
Performance materiality
1.82 1.26 1.26 0.91
Basis for determining performance
materiality
70% of materiality, based on our overall risk assessment, including the expected total value of known and likely misstatements (based on past experience and other factors) and management’s attitude towards proposed adjustments.
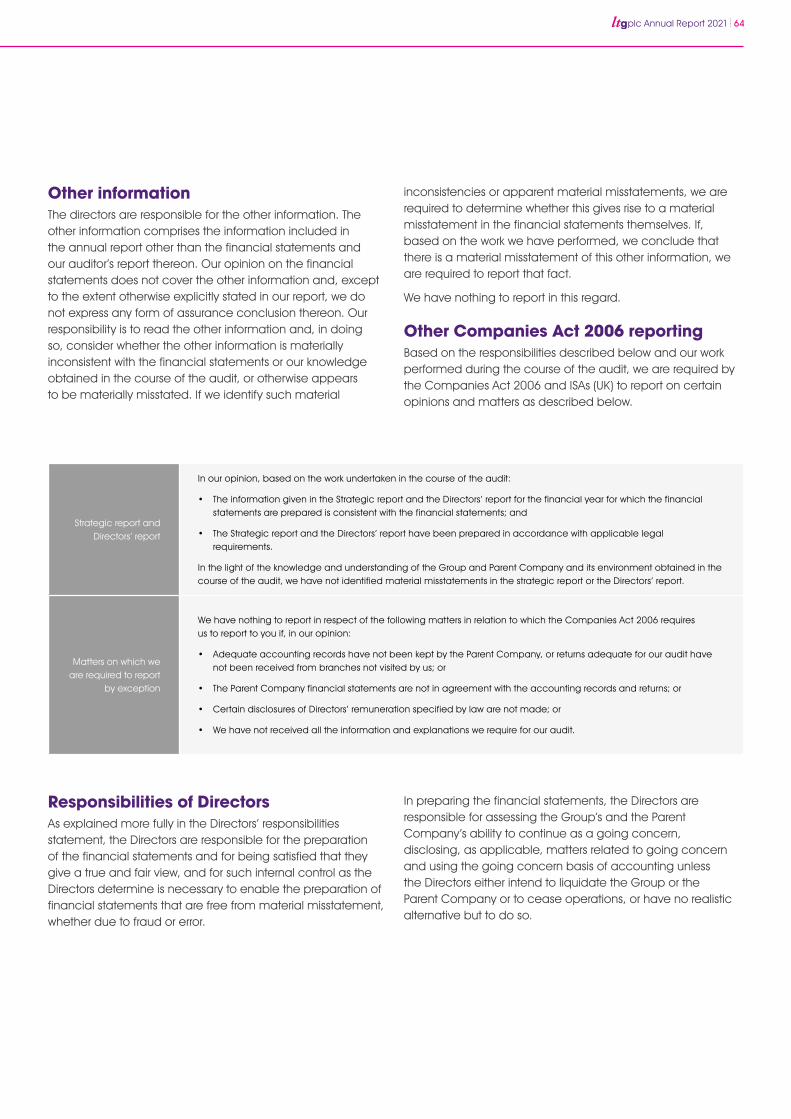
plc Annual Report 2021 64
Other information The directors are responsible for the other information. The other information comprises the information included in the annual report other than the financial statements and our auditor’s report thereon. Our opinion on the financial statements does not cover the other information and, except to the extent otherwise explicitly stated in our report, we do not express any form of assurance conclusion thereon. Our responsibility is to read the other information and, in doing so, consider whether the other information is materially inconsistent with the financial statements or our knowledge obtained in the course of the audit, or otherwise appears to be materially misstated. If we identify such material
inconsistencies or apparent material misstatements, we are required to determine whether this gives rise to a material misstatement in the financial statements themselves. If, based on the work we have performed, we conclude that there is a material misstatement of this other information, we are required to report that fact.
We have nothing to report in this regard.
Other Companies Act 2006 reportingBased on the responsibilities described below and our work performed during the course of the audit, we are required by the Companies Act 2006 and ISAs (UK) to report on certain opinions and matters as described below.
Strategic report and Directors’ report
In our opinion, based on the work undertaken in the course of the audit:
• The information given in the Strategic report and the Directors’ report for the financial year for which the financial statements are prepared is consistent with the financial statements; and
• The Strategic report and the Directors’ report have been prepared in accordance with applicable legal requirements.
In the light of the knowledge and understanding of the Group and Parent Company and its environment obtained in the course of the audit, we have not identified material misstatements in the strategic report or the Directors’ report.
Matters on which we are required to report
by exception
We have nothing to report in respect of the following matters in relation to which the Companies Act 2006 requires us to report to you if, in our opinion:
• Adequate accounting records have not been kept by the Parent Company, or returns adequate for our audit have not been received from branches not visited by us; or
• The Parent Company financial statements are not in agreement with the accounting records and returns; or
• Certain disclosures of Directors’ remuneration specified by law are not made; or
• We have not received all the information and explanations we require for our audit.
Responsibilities of DirectorsAs explained more fully in the Directors’ responsibilities statement, the Directors are responsible for the preparation of the financial statements and for being satisfied that they give a true and fair view, and for such internal control as the Directors determine is necessary to enable the preparation of financial statements that are free from material misstatement, whether due to fraud or error.
In preparing the financial statements, the Directors are responsible for assessing the Group’s and the Parent Company’s ability to continue as a going concern, disclosing, as applicable, matters related to going concern and using the going concern basis of accounting unless the Directors either intend to liquidate the Group or the Parent Company or to cease operations, or have no realistic alternative but to do so.
65 plc Annual Report 2021
Auditor’s responsibilities for the audit of the financial statementsOur objectives are to obtain reasonable assurance about whether the financial statements as a whole are free from material misstatement, whether due to fraud or error, and to issue an auditor’s report that includes our opinion. Reasonable assurance is a high level of assurance, but is not a guarantee that an audit conducted in accordance with ISAs (UK) will always detect a material misstatement when it exists. Misstatements can arise from fraud or error and are considered material if, individually or in the aggregate, they could reasonably be expected to influence the economic decisions of users taken on the basis of these financial statements.
Extent to which the audit was capable of detecting irregularities, including fraud
Irregularities, including fraud, are instances of non-compliance with laws and regulations. We design procedures in line with our responsibilities, outlined above, to detect material misstatements in respect of irregularities, including fraud. The extent to which our procedures are capable of detecting irregularities, including fraud is detailed below.
We assessed the susceptibility of the financial statements to material misstatement, including fraud and considered the fraud risk areas to be in relation to management override of controls, revenue recognition and acquisition accounting (see Key Audit Matters section above for the risks identified and procedures undertaken to address the risks in relation to revenue recognition and acquisition accounting).
We also focused on laws and regulations that could give rise to a material misstatement in the financial statements, including, but not limited to, the Companies Act 2006, Health and Safety legislation, International Financial Reporting Standards and tax legislation.
Our tests included:
• Enquiring of management and those charged with governance, including the Head of Legal, from across the Group to understand where they considered there was a susceptibility to fraud and whether they were aware of any actual or suspected frauds.
• Obtaining an understanding of and assessing the processes and controls that the Group has established to address fraud risks identified, or that otherwise prevent, deter and detect fraud; and how management monitors those processes and controls.
• Journal entry testing, with a focus on large or unusual transactions based on our knowledge of the business.
• Directing the testing plan of the component auditor to ensure consistency of approach, challenge and corroboration.
• Communicating relevant identified laws and regulations and potential fraud risks to all engagement team members including component auditors and internal specialists and remaining alert to any indications of fraud or non-compliance with laws and regulations throughout the audit.
Our audit procedures were designed to respond to risks of material misstatement in the financial statements, recognising that the risk of not detecting a material misstatement due to fraud is higher than the risk of not detecting one resulting from error, as fraud may involve deliberate concealment by, for example, forgery, misrepresentations or through collusion. There are inherent limitations in the audit procedures performed and the further removed non-compliance with laws and regulations is from the events and transactions reflected in the financial statements, the less likely we are to become aware of it.
A further description of our responsibilities is available on the Financial Reporting Council’s website at: https://www.frc.org.uk/auditorsresponsibilities This description forms part of our auditor’s report.
Use of our reportThis report is made solely to the Parent Company’s members, as a body, in accordance with Chapter 3 of Part 16 of the Companies Act 2006. Our audit work has been undertaken so that we might state to the Parent Company’s members those matters we are required to state to them in an auditor’s report and for no other purpose. To the fullest extent permitted by law, we do not accept or assume responsibility to anyone other than the Parent Company and the Parent Company’s members as a body, for our audit work, for this report, or for the opinions we have formed.
Kieran Storan (Senior Statutory Auditor)for and on behalf of
BDO LLP Statutory Auditor London29 April 2022
BDO LLP is a limited liability partnership registered in England and Wales (with registered number OC305127).
Independent Auditor’s Report to the Members of Learning Technologies Group plc (continued)
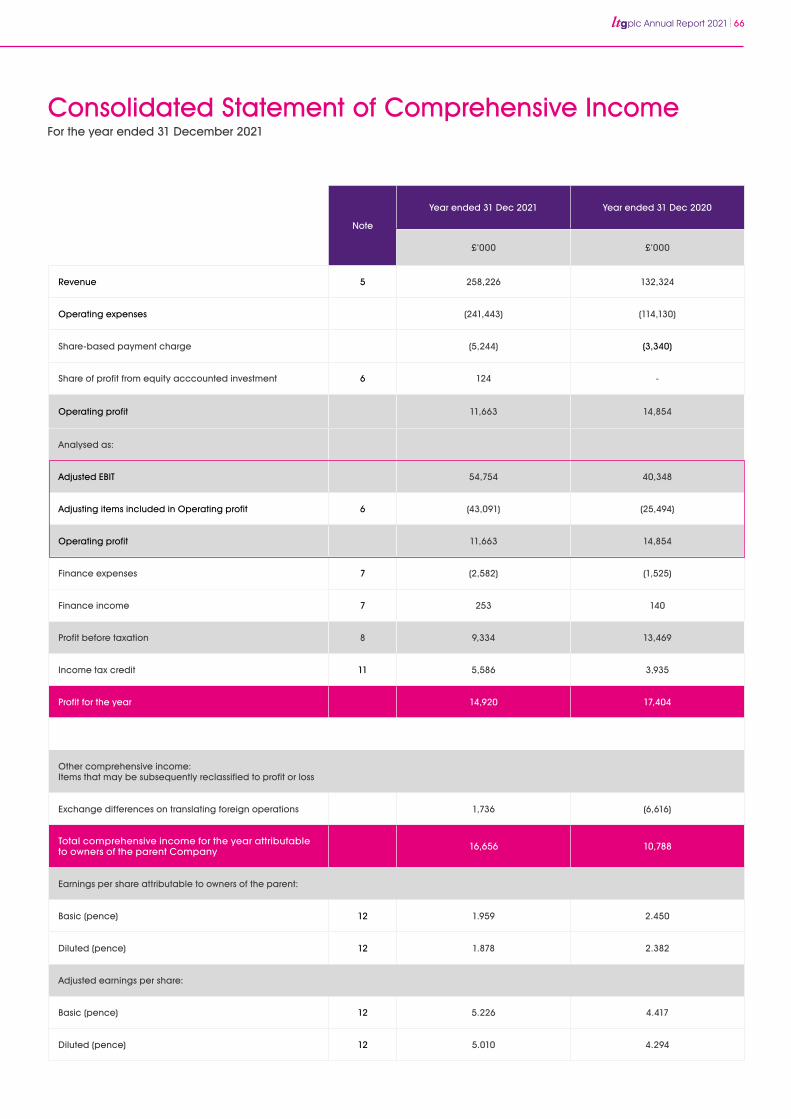
plc Annual Report 2021 66
Consolidated Statement of Comprehensive IncomeFor the year ended 31 December 2021
Note
Year ended 31 Dec 2021 Year ended 31 Dec 2020
£’000 £’000
Revenue 5 258,226 132,324
Operating expenses (241,443) (114,130)
Share-based payment charge (5,244) (3,340)
Share of profit from equity acccounted investment 6 124 -
Operating profit 11,663 14,854
Analysed as:
Adjusted EBIT 54,754 40,348
Adjusting items included in Operating profit 6 (43,091) (25,494)
Operating profit 11,663 14,854
Finance expenses 7 (2,582) (1,525)
Finance income 7 253 140
Profit before taxation 8 9,334 13,469
Income tax credit 11 5,586 3,935
Profit for the year 14,920 17,404
Other comprehensive income:Items that may be subsequently reclassified to profit or loss
Exchange differences on translating foreign operations 1,736 (6,616)
Total comprehensive income for the year attributable to owners of the parent Company 16,656 10,788
Earnings per share attributable to owners of the parent:
Basic (pence) 12 1.959 2.450
Diluted (pence) 12 1.878 2.382
Adjusted earnings per share:
Basic (pence) 12 5.226 4.417
Diluted (pence) 12 5.010 4.294
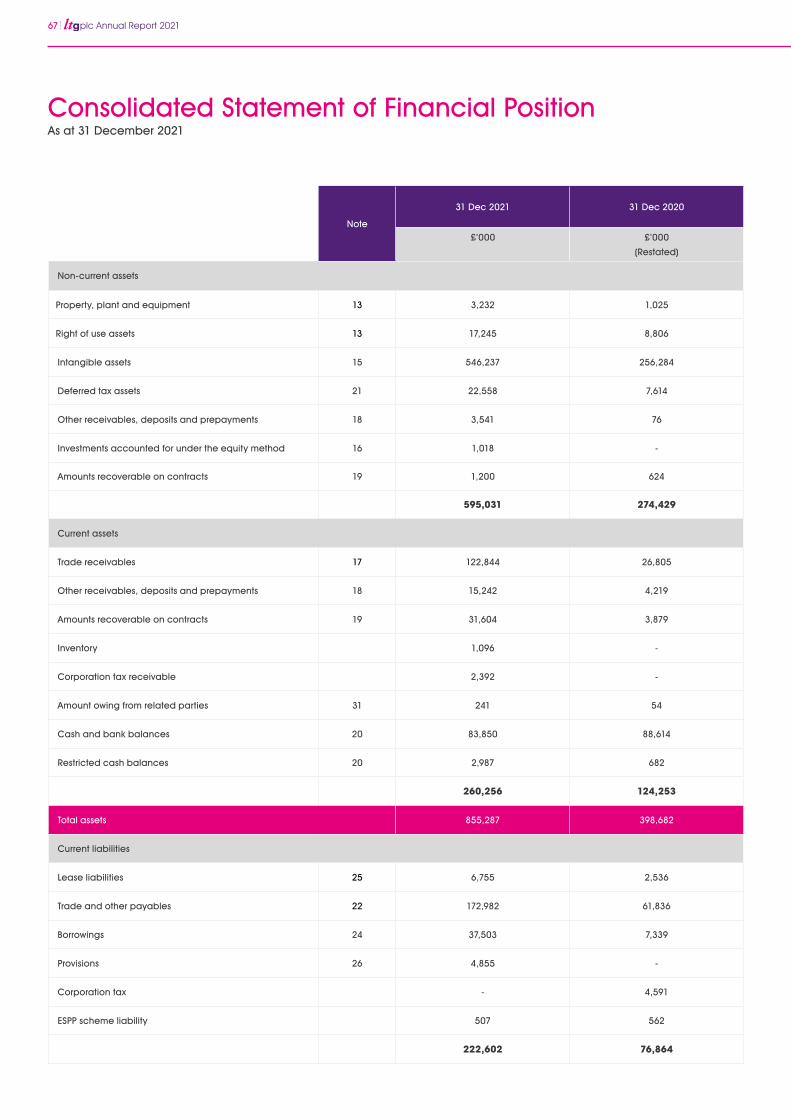
67 plc Annual Report 2021
As at 31 December 2021
Consolidated Statement of Financial Position
Note
31 Dec 2021 31 Dec 2020
£’000 £’000
(Restated)
Non-current assets
Property, plant and equipment 13 3,232 1,025
Right of use assets 13 17,245 8,806
Intangible assets 15 546,237 256,284
Deferred tax assets 21 22,558 7,614
Other receivables, deposits and prepayments 18 3,541 76
Investments accounted for under the equity method 16 1,018 -
Amounts recoverable on contracts 19 1,200 624
595,031 274,429
Current assets
Trade receivables 17 122,844 26,805
Other receivables, deposits and prepayments 18 15,242 4,219
Amounts recoverable on contracts 19 31,604 3,879
Inventory 1,096 -
Corporation tax receivable 2,392 -
Amount owing from related parties 31 241 54
Cash and bank balances 20 83,850 88,614
Restricted cash balances 20 2,987 682
260,256 124,253
Total assets 855,287 398,682
Current liabilities
Lease liabilities 25 6,755 2,536
Trade and other payables 22 172,982 61,836
Borrowings 24 37,503 7,339
Provisions 26 4,855 -
Corporation tax - 4,591
ESPP scheme liability 507 562
222,602 76,864
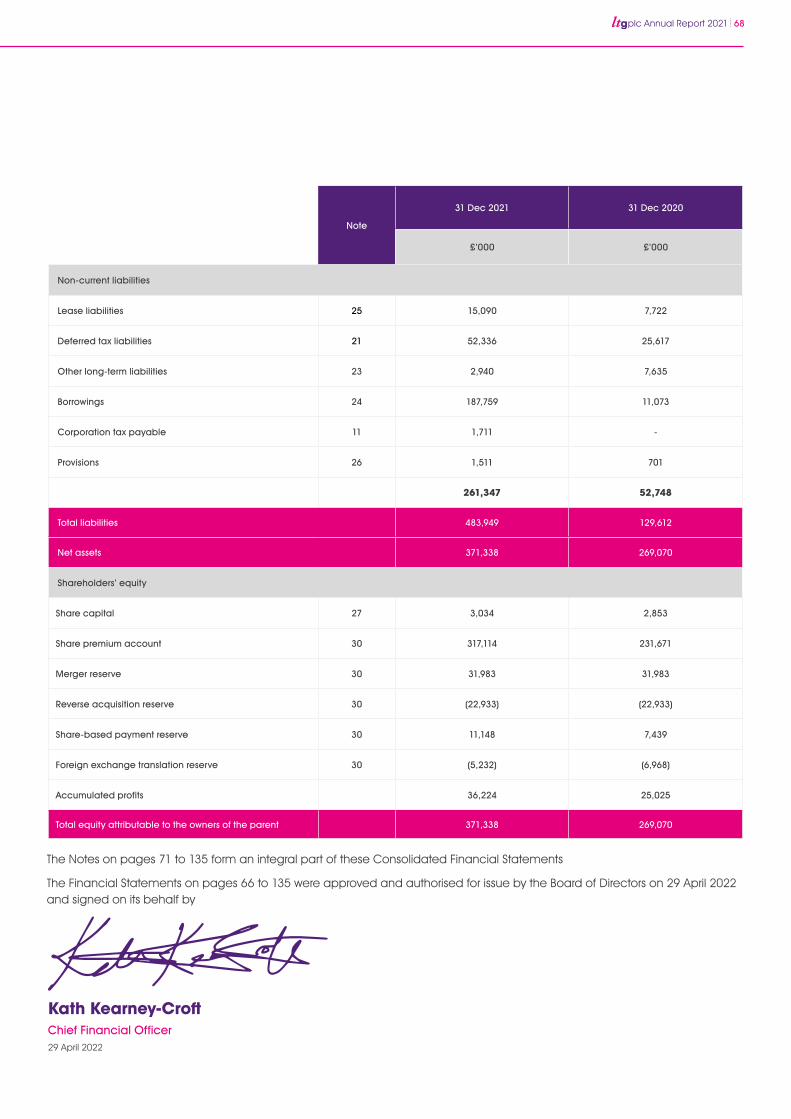
plc Annual Report 2021 68
Kath Kearney-CroftChief Financial Officer29 April 2022
The Notes on pages 71 to 135 form an integral part of these Consolidated Financial Statements
The Financial Statements on pages 66 to 135 were approved and authorised for issue by the Board of Directors on 29 April 2022 and signed on its behalf by
Note
31 Dec 2021 31 Dec 2020
£’000 £’000
Non-current liabilities
Lease liabilities 25 15,090 7,722
Deferred tax liabilities 21 52,336 25,617
Other long-term liabilities 23 2,940 7,635
Borrowings 24 187,759 11,073
Corporation tax payable 11 1,711 -
Provisions 26 1,511 701
261,347 52,748
Total liabilities 483,949 129,612
Net assets 371,338 269,070
Shareholders’ equity
Share capital 27 3,034 2,853
Share premium account 30 317,114 231,671
Merger reserve 30 31,983 31,983
Reverse acquisition reserve 30 (22,933) (22,933)
Share-based payment reserve 30 11,148 7,439
Foreign exchange translation reserve 30 (5,232) (6,968)
Accumulated profits 36,224 25,025
Total equity attributable to the owners of the parent 371,338 269,070
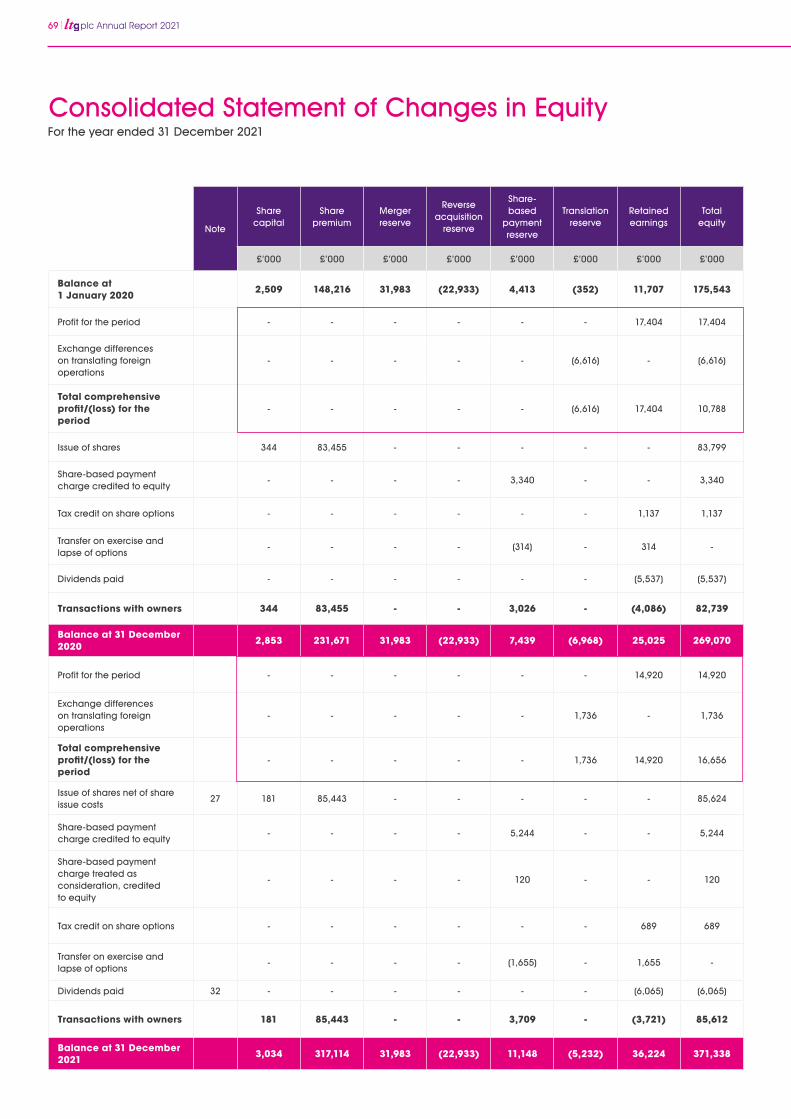
69 plc Annual Report 2021
Note
Share capital
Share premium
Merger reserve
Reverse acquisition
reserve
Share-based
payment reserve
Translationreserve
Retained earnings
Total equity
£’000 £’000 £’000 £’000 £’000 £’000 £’000 £’000
Balance at 1 January 2020
2,509 148,216 31,983 (22,933) 4,413 (352) 11,707 175,543
Profit for the period - - - - - - 17,404 17,404
Exchange differences on translating foreign operations
- - - - - (6,616) - (6,616)
Total comprehensive profit/(loss) for the period
- - - - - (6,616) 17,404 10,788
Issue of shares 344 83,455 - - - - - 83,799
Share-based payment charge credited to equity
- - - - 3,340 - - 3,340
Tax credit on share options - - - - - - 1,137 1,137
Transfer on exercise and lapse of options
- - - - (314) - 314 -
Dividends paid - - - - - - (5,537) (5,537)
Transactions with owners 344 83,455 - - 3,026 - (4,086) 82,739
Balance at 31 December 2020 2,853 231,671 31,983 (22,933) 7,439 (6,968) 25,025 269,070
Profit for the period - - - - - - 14,920 14,920
Exchange differences on translating foreign operations
- - - - - 1,736 - 1,736
Total comprehensive profit/(loss) for the period
- - - - - 1,736 14,920 16,656
Issue of shares net of share issue costs
27 181 85,443 - - - - - 85,624
Share-based payment charge credited to equity
- - - - 5,244 - - 5,244
Share-based payment charge treated as consideration, credited to equity
- - - - 120 - - 120
Tax credit on share options - - - - - - 689 689
Transfer on exercise and lapse of options
- - - - (1,655) - 1,655 -
Dividends paid 32 - - - - - - (6,065) (6,065)
Transactions with owners 181 85,443 - - 3,709 - (3,721) 85,612
Balance at 31 December 2021 3,034 317,114 31,983 (22,933) 11,148 (5,232) 36,224 371,338
For the year ended 31 December 2021
Consolidated Statement of Changes in Equity
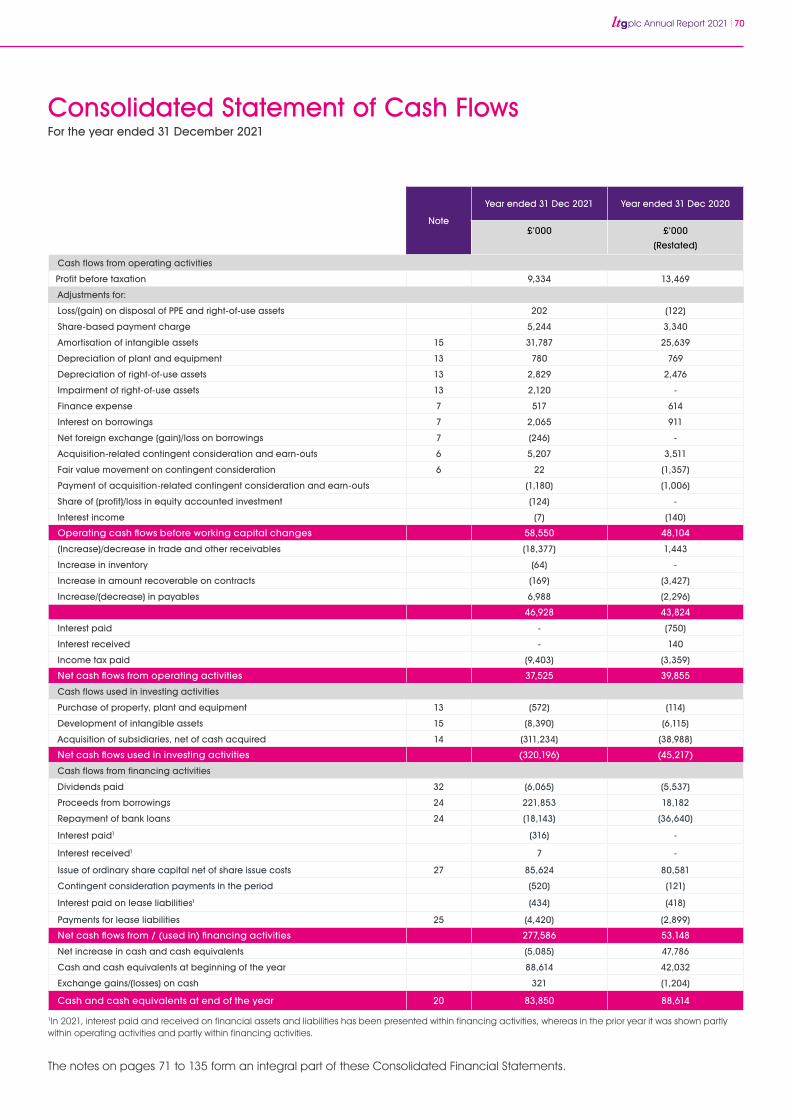
plc Annual Report 2021 70
Note
Year ended 31 Dec 2021 Year ended 31 Dec 2020
£’000 £’000
(Restated)
Cash flows from operating activities
Profit before taxation 9,334 13,469
Adjustments for:
Loss/(gain) on disposal of PPE and right-of-use assets 202 (122)
Share-based payment charge 5,244 3,340
Amortisation of intangible assets 15 31,787 25,639
Depreciation of plant and equipment 13 780 769
Depreciation of right-of-use assets 13 2,829 2,476
Impairment of right-of-use assets 13 2,120 -
Finance expense 7 517 614
Interest on borrowings 7 2,065 911
Net foreign exchange (gain)/loss on borrowings 7 (246) -
Acquisition-related contingent consideration and earn-outs 6 5,207 3,511
Fair value movement on contingent consideration 6 22 (1,357)
Payment of acquisition-related contingent consideration and earn-outs (1,180) (1,006)
Share of (profit)/loss in equity accounted investment (124) -
Interest income (7) (140)
Operating cash flows before working capital changes 58,550 48,104
(Increase)/decrease in trade and other receivables (18,377) 1,443
Increase in inventory (64) -
Increase in amount recoverable on contracts (169) (3,427)
Increase/(decrease) in payables 6,988 (2,296)
46,928 43,824
Interest paid - (750)
Interest received - 140
Income tax paid (9,403) (3,359)
Net cash flows from operating activities 37,525 39,855
Cash flows used in investing activities
Purchase of property, plant and equipment 13 (572) (114)
Development of intangible assets 15 (8,390) (6,115)
Acquisition of subsidiaries, net of cash acquired 14 (311,234) (38,988)
Net cash flows used in investing activities (320,196) (45,217)
Cash flows from financing activities
Dividends paid 32 (6,065) (5,537)
Proceeds from borrowings 24 221,853 18,182
Repayment of bank loans 24 (18,143) (36,640)
Interest paid1 (316) -
Interest received1 7 -
Issue of ordinary share capital net of share issue costs 27 85,624 80,581
Contingent consideration payments in the period (520) (121)
Interest paid on lease liabilities1 (434) (418)
Payments for lease liabilities 25 (4,420) (2,899)
Net cash flows from / (used in) financing activities 277,586 53,148
Net increase in cash and cash equivalents (5,085) 47,786
Cash and cash equivalents at beginning of the year 88,614 42,032
Exchange gains/(losses) on cash 321 (1,204)
Cash and cash equivalents at end of the year 20 83,850 88,614
For the year ended 31 December 2021
Consolidated Statement of Cash Flows
The notes on pages 71 to 135 form an integral part of these Consolidated Financial Statements.
1In 2021, interest paid and received on financial assets and liabilities has been presented within financing activities, whereas in the prior year it was shown partly within operating activities and partly within financing activities.
Consolidated Statement of Changes in Equity
71 plc Annual Report 2021
For the year ended 31 December 2021
Notes to the Consolidated Financial Statements
1. General informationLearning Technologies Group plc (‘the Company’) and its subsidiaries (together, ‘the Group’) provide a range of talent and learning solutions; content, services and digital platforms, to corporate and government clients. The principal activity of the Company is that of a holding company for the Group, as well as performing all administrative, corporate finance, strategic and governance functions of the Group.
The Company is a public limited company, which is listed on the AIM Market of the London Stock Exchange and domiciled in England and incorporated and registered in England and Wales. The address of its registered office is 15 Fetter Lane, London, EC4A 1BW. The registered number of the Company is 07176993.
2. Summary of significant accounting policies The principal accounting policies applied in the preparation of these Consolidated Financial Statements are set out below. These policies have been consistently applied unless otherwise stated.
a) Basis of preparation
The consolidated financial statements have been prepared in accordance with UK-adopted international accounting standards and with the requirements of the Companies Act 2006 as applicable to companies reporting under those standards.
On 31 December 2020, IFRS as adopted by the European Union at that date was brought into the UK law and became UK-adopted international accounting standards, with future changes being subject to endorsement by the UK Endorsement Board. The group transitioned to UK-adopted international accounting standards in its consolidated financial statements on 1 January 2021. There was no impact or changes in accounting from the transition.
Going concern
The Directors report that the going concern basis is appropriate from at least 12 months from the approval of these financial statements. The Group meets its day-to-day working capital requirements from the positive cash flows generated by its trading activities and its available cash resources. These are supplemented when required by additional drawings under the Group’s committed $50.0 million revolving credit facility (RCF) and an uncommitted $50.0 million accordion facility, which are available until 2025. In July 2021, the Group repaid the outstanding balance of the existing term loan and associated accrued
interest totalling $20.2 million (£14.6 million) in July. The Group has also agreed to a new multicurrency senior term and revolving facilities agreement. This new debt facility which is with Silicon Valley Bank (‘SVB’), Barclays Bank, Fifth Third Bank, HSBC UK Bank and the Bank of Ireland, comprises two committed term loans, Term Facility A of $265.0 million (£196.3 million at the year-end exchange rate), Term Facility B of $40.0 million (£29.6 million at the year-end exchange rate), a $50.0 million (£37.0 million at the year-end exchange rate) committed RCF and a $50.0 million (£37.0 million at the year-end exchange rate) uncommitted accordion facility. Term Facility B was fully repaid in March 2022 and Term Facility A is repayable by quarterly instalments of $9.6 million from December 2022 until October 2025, with the remaining balance payable therein. A 12-month extension request is available to the Group for Term Facility A and the RCF.
The Group continues to hold a strong liquidity position overall at 31 December 2021, with gross cash and cash equivalents of £83.9 million and net debt of £141.4 million (see Note 23) (31st December 2020: gross cash was £88.6 million and net funds £70.2 million). Whilst there are a number of risks to the Group’s trading performance, including from the COVID-19 pandemic and its impact on the global economy, as summarised in the ‘Principal risks and uncertainties’ section on pages 27 to 28, the Group is confident of its ability to continue to access sources of funding in the medium term.
The Directors report that they have re-assessed the principal risks, reviewed current performance and forecasts, combined with expenditure commitments, including capital expenditure, business acquisitions, and borrowing facilities. The Group’s forecasts demonstrate it will generate profits and cash in the year ending 31st December 2022 and beyond. In addition, following the completion of the acquisition of GP Strategies (refer to Note 13) in October 2021 for a total of £287.6 million, the Group continues to have sufficient cash reserves to enable it to meet its obligations as they fall due, as well as operate within its banking covenants, for a period of at least 12 months from the date of signing of these financial statements.
The Group has also assessed a range of downside scenarios to assess if there is a significant risk to the Group’s liquidity position. The forecasts and scenarios prepared consider our trading experience to date and we have modelled downside scenarios such as: I. 10% and 25% reductions in revenues; II. customer payment days (‘DSO’) of 100 days; III. combining 10% reduction in revenues and DSO of 100 days;
plc Annual Report 2021 72
IV. increasing staff costs by 7% and other costs by 8% from H1 2022; and V. modelling high-cost inflation above that in (IV) above to determine the level where a covenant breach could occur.
The directors have concluded that it is appropriate to adopt the going concern basis of accounting in preparing the Annual Report, having undertaken a review of a detailed forecast for 2022 and the impact this forecast has on the Group’s gross cash, net debt and ability to meet bank covenants under the existing facilities agreement.
Changes in accounting policies
(i) New standards, interpretations and amendments adopted from 1 January 2021
New standards impacting the Group that have been adopted in the annual financial statements for the year ended 31 December 2020 are:
The Group has considered the above new standards and amendments and has concluded that, they are either not relevant to the Group or they do not have a significant impact on the Group’s consolidated financial statements.
(ii) New standards, interpretations and amendments not yet effective
At the date of authorisation of these consolidated Group financial statements, the following standards and interpretations, which have not been applied in these financial statements, were in issue but not yet effective (and in some cases had not yet been adopted by the EU). Management is currently assessing the impact of these new standards on the group.
Alternative performance measures
The Group has identified certain alternative performance measures (“APMs”) that it believes will assist the understanding of the performance of the business. The Group believes that Adjusted EBIT, adjusting items, Shareholders’ funds and net cash / debt provide useful
information to users of the financial statements. The terms are not defined terms under IFRS and may therefore not be comparable with similarly titled measures reported by other companies. They are not intended to be a substitute for, or superior to, IFRS measures and are discussed further in the Glossary on page 142.
Adjusting items
The Group has chosen to present an adjusted measure of profit and earnings per share, which excludes certain items which are separately disclosed due to their size, nature or incidence, and are not considered to be part of the normal operating costs of the Group. These costs (refer to Note 6) may include the financial effect of adjusting items such as, inter alia, restructuring costs, impairment charges, amortisation of acquired intangibles, costs relating to business combinations, one-off foreign exchange gains or losses, integration costs, acquisition-related share-based payments charges, contingent consideration and earn-outs, joint venture profits and losses and fixed asset or right-of-use asset disposal gains or losses.
(b) Basis of consolidation
A subsidiary is defined as an entity over which the Group has control. The Group controls an entity when the Group is exposed to, or has rights to, variable returns from its involvement with the entity and has the ability to affect those returns through its power over the entity. Subsidiaries are fully consolidated from the date on which control is transferred to the Group. They are deconsolidated from the date that control ceases.
Business combinations other than the share-for-share acquisition of Epic Group Limited by In-Deed Online plc in 2013 are accounted for under the acquisition method and merger relief has been taken on recognising the shares issued on acquisition, where applicable.
Under the acquisition method, the results of the subsidiaries acquired or disposed of are included from the date of acquisition or up to the date of disposal. At the date of acquisition, the fair values of the subsidiaries’ net assets are determined and these values are reflected in the Consolidated Financial Statements. The cost of acquisition is measured at the aggregate of the fair values at the date of exchange, of assets given, liabilities incurred or assumed, and equity instruments issued by the Group in exchange for control of the acquiree. Any excess of the purchase consideration of the business combination over the fair value of the identifiable assets and liabilities acquired is recognised as goodwill. Goodwill, if any, is not amortised but reviewed for impairment at least annually. If the consideration is less than the fair value of assets and liabilities acquired, the difference is recognised directly
Amendments to IFRS 9, IAS 39 and IFRS 7
Interest Rate Benchmark Reform – Phase 2
Amendments to IAS 37Onerous Contracts – Cost of Fulfilling a Contract
Amendments to IAS 16Property, Plant and Equipment: Proceeds before Intended Use
Amendments to IFRS 3References to Conceptual Framework
Amendments to IFRS 1, 9, 16 and 41
Annual Improvements to IFRS Standards 2018–2020
73 plc Annual Report 2021
For the year ended 31 December 2021
Notes to the Consolidated Financial Statements (continued)
in the statement of comprehensive income. Acquisition-related costs are expensed as incurred.
Intra-group transactions, balances and unrealised gains on transactions are eliminated. Intragroup losses may indicate an impairment which may require recognition in the consolidated financial statements. Where necessary, adjustments are made to the Financial Statements of subsidiaries to ensure consistency of accounting policies with those of the Group.
(c) Joint arrangements and associates
Under IFRS 11 investments in joint arrangements are classified as either joint operations or joint ventures depending on the contractual rights and obligations of each investor. The Company has assessed the nature of its joint arrangements and determined them to be joint ventures and they are, along with the Group’s associates, accounted for using the equity method.
Interests in joint ventures and associates are recognised at cost adjusted by the Group’s share of the post-acquisition profits or losses and any impairments, where appropriate. When the Group’s share of losses in a joint venture equals or exceeds its interests in the joint ventures and associates, the Group does not recognise further losses, unless it has incurred obligations or made payments on behalf of joint ventures and associates.
(d) Intangible assets
All intangible assets, except goodwill, are stated at cost less accumulated amortisation and any accumulated impairment losses.
Goodwill
Goodwill represents the amount by which the fair value of the cost of a business combination exceeds the fair value of the net assets acquired. Goodwill is not amortised and is stated at cost less any accumulated impairment losses.
The recoverable amount of goodwill is tested for impairment annually or when events or changes in circumstance indicate that it might be impaired. Impairment charges are deducted from the carrying value and recognised immediately in the income statement. For the purpose of impairment testing, goodwill is allocated to each of the Group’s cash-generating units expected to benefit from the synergies of the combination. If the recoverable amount of the cash generating unit is less than the carrying amount of the unit, the impairment loss is allocated first to reduce the carrying amount of any goodwill allocated to the unit and then to the other assets of the unit pro-rata on the basis of the carrying amount of each asset in the unit. An impairment loss recognised for goodwill is not reversed in a subsequent period.
Acquisition-related intangible assets
Net assets acquired as part of a business combination includes an assessment of the fair value of separately identifiable acquisition-related intangible assets, in addition to other assets, liabilities and contingent liabilities purchased. These are amortised on a straight-line basis over their useful lives which are individually assessed.
Research and development expenditure
Research expenditure is recognised as an expense when it is incurred.
Development expenditure is recognised as an expense except that costs incurred on development projects are capitalised as long-term assets to the extent that such expenditure is expected to generate future economic benefits. Development expenditure is capitalised only if it meets the criteria for capitalisation under IAS 38.
Capitalised development expenditure is measured at cost less accumulated amortisation and impairment losses, if any. Development expenditure initially recognised as an expense is not recognised as assets in subsequent periods.
Capitalised development expenditure is amortised on a straight-line method over a period of between three and five years when the products or services are ready for sale or use. In the event that it is no longer probable that the expected future economic benefits will be recovered, the development expenditure is written down to its recoverable amount. The amortisation charge is recognised within operating expenses.
(e) Functional and foreign currencies
(i) Functional and presentation currency
The individual Financial Statements of each entity in the Group are presented in the currency of the primary economic environment in which the entity operates, which is the functional currency.
The Consolidated Financial Statements are presented in Pounds Sterling, which is the Group’s presentation currency.
(ii) Transactions and balances
Transactions in foreign currencies are converted into the respective functional currencies on initial recognition, using the exchange rates approximating those ruling at the transaction dates. Monetary assets and liabilities at the end of the reporting period are translated at the rates ruling as of that date. Non-monetary assets and liabilities
Branding 2-10 years
Customer contracts and relationships 2-12 years
Intellectual property 2-10 years
plc Annual Report 2021 74
are translated using exchange rates that existed when the values were determined. All exchange differences are recognised in profit or loss.
(iii) Foreign operations
Assets and liabilities of foreign operations are translated to Pounds Sterling at the rates of exchange ruling at the end of the reporting period. Revenues and expenses of foreign operations are translated at the average rate of exchange. All exchange differences arising from translation are taken directly to other comprehensive income and accumulated in equity under the foreign exchange translation reserve. On the disposal of a foreign operation, the cumulative amount recognised in other comprehensive income relating to that particular foreign operation is reclassified from equity to profit or loss.
Goodwill and fair value adjustments arising from the acquisition of foreign operations are treated as assets and liabilities of the foreign operations and are recorded in the functional currency of the foreign operations and translated at the closing rate at the end of the reporting period. Exchange differences are recognised in other comprehensive income.
(f) Financial instruments
Financial instruments are recognised in the statements of financial position when the Group has become a party to the contractual provisions of the instruments.
Financial assets are derecognised when the contractual rights to receive cash flows from the financial assets have expired or have been transferred and the Group has transferred substantially all the risks and rewards of ownership.
(i) Financial assets
On initial recognition, financial assets are classified as financial assets at amortised cost unless criteria are met for classifying and measuring the asset at fair value through profit or loss, or fair value through other comprehensive income.
Management determines the classification of its financial assets at initial recognition.
• Loans and receivables financial assets
Trade receivables and other receivables are held within a business model whose objective is to collect contractual cash flows which are solely payments of principals and interest and therefore classified as subsequently measured at amortised cost using the effective interest method, less any impairment loss. Interest income is recognised
by applying the effective interest rate, except for short-term receivables when the recognition of interest would be immaterial. The Group’s loans and receivables financial assets comprise ‘trade and other receivables’ and cash and cash equivalents included in the Consolidated Statement of Financial Position.
ii) Financial liabilities
Financial liabilities are recognised when, and only when, the Group becomes a party to the contractual provisions of the financial instrument.
All financial liabilities are recognised initially at fair value plus directly attributable transaction costs and subsequently measured at amortised cost using the effective interest method other than those categorised as fair value through profit or loss.
Fair value through the profit or loss category comprises financial liabilities that are either held for trading or are designated to eliminate or significantly reduce a measurement or recognition inconsistency that would otherwise arise. Derivatives are also classified as fair value through profit or loss unless they are designated as hedges.
A financial liability is derecognised when the obligation under the liability is discharged, cancelled or expires. When an existing financial liability is replaced by another from the same party on substantially different terms, or the terms of an existing liability are substantially modified, such an exchange or modification is treated as a derecognition of the original liability and the recognition of a new liability, and the difference in the respective carrying amounts is recognised in the profit or loss.
(iii) Equity instruments
Ordinary shares are classified as equity. Incremental costs directly attributable to the issue of new shares or options are shown in equity as a deduction, net of tax, from proceeds. Dividends on ordinary shares are recognised when paid.
Financial instruments are offset when the Group has a legally enforceable right to offset and intends to settle either on a net basis or to realise the asset and settle the liability simultaneously.
(g) Property, plant and equipment
Property, plant and equipment are stated at cost less accumulated depreciation and impairment losses, if any. The cost of an item of property, plant and equipment initially recognised includes its purchase price and any cost that is directly attributable to bringing the asset to the location and condition necessary for it to be capable of operating in the manner intended by management. Subsequent costs are included in the asset’s carrying
75 plc Annual Report 2021
amount only when the cost is incurred and it is probable that the future economic benefits associated with the asset will flow to the Group and the cost of the asset can be measured reliably.
Depreciation is calculated under the straight-line method to write off the depreciable amount of the assets over their estimated useful lives. The principal annual rates used for this purpose are:
The depreciation method, useful lives and residual values are reviewed, and adjusted if appropriate, at the end of each reporting period to ensure that the amounts, method and periods of depreciation are consistent with previous estimates and the expected pattern of consumption of the future economic benefits embodied in the items of the property, plant and equipment.
(h) Impairment
(i) Impairment of financial assets
All financial assets (other than those categorised at fair value through profit or loss), are assessed at the end of each reporting period based on the deterioration of credit risk since initial recognition. An allowance for credit losses is recognised based on potential shortfalls in future cash flows discounted to present value multiplied by the likelihood of the shortfalls occurring.
An impairment loss in respect of loans and receivables financial assets is recognised in profit or loss and is measured as the difference between the asset’s carrying amount and the present value of estimated future cash flows, discounted at the financial asset’s original effective interest rate.
In a subsequent period, if the amount of the impairment loss decreases and the decrease can be related objectively to an event occurring after the impairment was recognised, the previously recognised impairment loss is reversed through profit or loss to the extent that the carrying amount of the asset at the date the impairment is reversed does not exceed what the amortised cost would have been had the impairment not been recognised.
The Group has adopted the simplified expected credit loss model for its trade receivables and contract assets, as required by IFRS 9 to assess impairment. For further information see Note 33.
(ii) Impairment of non-financial assets
TThe carrying values of intangible assets are reviewed at the end of each reporting period for impairment when there is an indication that the assets might be impaired. Impairment is measured by comparing the carrying values of the assets with their recoverable amounts.
An impairment loss is recognised in profit or loss immediately.
In respect of assets other than goodwill, and when there is a change in the estimates used to determine the recoverable amount, a subsequent increase in the recoverable amount of an asset is treated as a reversal of the previous impairment loss and is recognised to the extent of the carrying amount of the asset that would have been determined (net of amortisation and depreciation) had no impairment loss been recognised. The reversal is recognised in profit or loss immediately.
(i) Income taxes
Income tax for each reporting period comprises current and deferred tax.
Current tax is the expected amount of income taxes payable in respect of the taxable profit for the year and is measured using the tax rates that have been enacted or substantively enacted at the end of the reporting period.
Deferred tax is provided in full, using the liability method, on temporary differences arising between the tax bases of assets and liabilities and their carrying amounts in the Financial Statements.
Deferred tax liabilities are recognised for all taxable temporary differences other than those that arise from goodwill or from the initial recognition of an asset or liability in a transaction which is not a business combination and at the time of the transaction, affects neither accounting profit nor taxable profit.
Deferred tax assets are recognised for all deductible temporary differences, unused tax losses and unused tax credits to the extent that it is probable that future taxable profits will be available against which the deductible temporary differences, unused tax losses and unused tax credits can be utilised. The carrying amounts of deferred tax assets are reviewed at the end of each reporting period and reduced to the extent that it is no longer probable that sufficient future taxable profits will be available to allow all or part of the deferred tax assets to be utilised.
Deferred tax assets and liabilities are measured at the tax rates that are expected to apply in the period when the asset is realised or the liability is settled, based on the tax rates that have been enacted or substantively enacted at the end of the reporting period.
Computer equipment 33%
Furniture and fittings 20%
Office equipment 20%
Leasehold improvements
Over the shorter of the remaining useful life and life of the lease
For the year ended 31 December 2021
Notes to the Consolidated Financial Statements (continued)
plc Annual Report 2021 76
Unrecognised deferred tax assets are reassessed at each reporting date and are recognised to the extent that it has become probable that future taxable profit will allow deferred tax assets to be recovered.
(j) Cash and cash equivalents
Cash and cash equivalents comprise cash in hand, bank balances, deposits with financial institutions and short-term, highly liquid investments that are readily convertible to known amounts of cash and which are subject to an insignificant risk of changes in value.
Reporting of cash flows
The Group reports cash inflows and outflows gross and the drawdowns and repayments of the Group’s RCF have been disclosed within financing activities in the prior year.
The Group has elected to present payments in relation to acquisition related contingent consideration as operating cash flows when they relate to payments made to employees in respect of post-combination remuneration. Acquisition-related contingent consideration paid to former owners that do not continued to be employed by the Group are disclosed within financing activities.
The Group has elected to present interest paid and interest received from financial assets held for cash management purposes as financing cashflows.
(k) Employee benefits
(i) Short-term benefits
Wages, salaries, paid annual leave and sick leave, bonuses and non-monetary benefits are accrued in the period in which the associated services are rendered by employees of the Group.
(ii) Defined contribution plans
A defined contribution plan is a pension plan under which the Group pays fixed contributions into a separate entity. The Group has no legal or constructive obligations to pay further amounts if the fund does not hold sufficient assets to pay all employees the benefits relating to employee service in the current and prior periods. The Group’s contributions to defined contribution plans are recognised in profit or loss in the period to which they relate.
(l) Provisions, contingent liabilities
Provisions for property lease dilapidations are recognised when the Group has a present or constructive obligation as a result of past events, when it is probable that an outflow of resources embodying economic benefits will be required to settle the obligation, and when a reliable estimate of the amount can be made. The cost is recognised as depreciation of leasehold improvements
over the remaining term of the lease. The main uncertainty relates to estimating the cost that will be incurred at the end of the lease. Provisions are reviewed at the end of each financial reporting period and adjusted to reflect the current best estimate. Where the effect of the time value of money is material, the provision is the present value of the estimated expenditure required to settle the obligation.
Provisions are recognised when the Group has a present obligation (legal or constructive) as a result of a past event, it is probable that an outflow of resources embodying economic benefits will be required to settle the obligation and a reliable estimate can be made of the amount of the obligation.
Provisions are measured at the Directors’ best estimate of the expenditure required to settle the obligation at the balance sheet date and are discounted to present value where the effect is material using a pre-tax rate that reflects current market assessments of the time value of money and the risks specific to the liability. The unwinding of the discount is recognised as a finance expense.
A contingent liability is not recognised but is disclosed in the Notes to the Financial Statements when there is a possible obligation which arises from past events whose outcome is uncertain or when it is not probable that there will be an outflow of economic resources. When a change in the probability of an outflow occurs so that the outflow is probable, it will then be recognised as a provision.
(m) Revenue from contracts with customers and other income
Group revenue represents the fair value of the consideration received or receivable for the rendering of services and sale of software licencing, net of value added tax and other similar sales-based taxes, rebates and discounts after eliminating intercompany sales. The nature of the Group’s sales means there are no refunds or returns, and no warranties are offered.
(i) Content & Services
Revenue within the Group’s Content & Services division comprises of content, consulting, platform development and the provision of training which are provided under fixed-price and time and materials contracts. Fixed-price contracts are recognised on the percentage of completion method unless the outcome of the contract cannot be reliably determined, in which case contract revenue is only recognised to the extent of contract costs incurred that are recoverable. This is because either the Group is creating an asset with no alternative use to it and the contract contains the right to payment for work completed to date, or the customer is simultaneously receiving and consuming the benefits of the Group’s services as it performs. Foreseeable losses, if any, are
77 plc Annual Report 2021
provided for in full as and when it can be reasonably ascertained that the contract will result in a loss. The stage of completion is determined based on the proportion of contract costs incurred compared to total estimated contract costs.
The cost-based method is used to determine the percentage of completion because, as management has significant expertise in this approach, they are able to assess the stage of completion and margin of a project on an accurate and consistent basis.
Business development costs incurred as part of our bid or tender process are expensed as incurred. Only if and when a project is won and contracted are project costs accounted for within long-term contracts through operating expenses. There are no material costs incurred during the period between the contract being awarded and service delivery commencing.
For fixed-price contracts, the customer pays the fixed amount based on a payment schedule. If the services rendered by the Group exceed the payment, an amount recoverable on contracts asset is recognised. Conversely, if the payments exceed the services rendered, a liability is recognised. If the contract is time- and materials-based and includes an hourly fee, revenue is recognised over time in the amount to which the Group has the right to invoice.
Contract work in progress is stated at costs incurred, less those amounts transferred to profit or loss, after deducting foreseeable losses and payments on account not matched with revenue.
Amounts recoverable on contracts are included in current assets and represent revenue recognised in excess of payments on account.
(ii) Software & Platforms
Revenue from subscriptions such as SaaS, “right to access” licences, hosting and support and maintenance is recognised evenly over the contractual period of the licence as the customer simultaneously receives and consumes the benefits of the Group’s services.
Perpetual licences and on-premise software licences where all material obligations of the Group to the customer have been met on the delivery of the licence are recognised at the point in time when the software has been delivered to the customer as these meet the definition of “right to use” licences.
Some contracts include multiple deliverables, such as professional service fees with the delivery of a licence. However, the professional services do not significantly customise the software and the promises in the contract are not highly interdependent, so these are recognised as separate performance obligations. Contracts may also
include an on-premise software licence with support and maintenance services. The customer can benefit from both services on their own or with other readily-available resources and the software is functional upon transfer of the licence key, so these are recognised as separate performance obligations. Where multiple deliverables are concluded not to be distinct, they are combined with another deliverable until the distinct performance obligation definition is met. Where a contract includes multiple performance obligations, the transaction price will be allocated to each performance obligation based on the stand-alone selling prices where available. Where these are not directly observable, they are estimated based on expected cost plus margin.
Incremental contract costs are capitalised and amortised on a consistent basis with the pattern of transfer of the service to which the asset relates.
(iii) GP Strategies
Revenue of GP Strategies is primarily derived from services provided to our customers for training, consulting, technical, and other services. A small proportion of revenue is derived from various other offerings including custom magazine publications and assembly of glovebox portfolios for automotive manufacturers, licences of software and other intellectual property, and software as a service (SaaS) arrangements.
GP Strategies’ primary contract basis are time-and-materials, fixed price (including fixed-fee per transaction) and cost reimbursable contracts. Each contract has different terms based on the scope, deliverables and complexity of the engagement, requiring the Group to make judgements and estimates about recognising revenue.
Under time-and-materials and cost-reimbursable contracts, the contractual billing schedules are based on the specified level of resources the Group is obligated to provide. Revenue under these contract types is recognised over time as services are performed as the client simultaneously receives and consumes the benefits provided by our performance throughout the engagement. The time and materials incurred for the period is the measure of performance and therefore revenue is recognised accordingly.
For fixed price contracts which typically involve a discrete project, such as development of training content and materials, design of training processes, software implementation, or engineering projects, the contractual billing schedules are not necessarily based on the specified level of resources we are obligated to provide. These discrete projects generally do not contain milestones or other measures of performance. The majority of our fixed-price contracts meet the criteria for over time revenue
For the year ended 31 December 2021
Notes to the Consolidated Financial Statements (continued)
plc Annual Report 2021 78
recognition. For these contracts, revenue is recognised using a costs incurred input method based on the relationship of costs incurred to total estimated costs expected to be incurred over the term of the contract. We believe this methodology is a reasonable measure of progress to depict the transfer of control to the customer since performance primarily involves personnel costs and services provided to the customer throughout the course of the projects through regular communications of progress toward completion and other project deliverables. In addition, the customer is required to pay the proportionate amount of fees in the event of contract termination. A small portion of the fixed-price contracts do not meet the criteria for over time revenue recognition. For these projects, we defer revenue recognition until the performance obligation is satisfied, which is generally when the final deliverable is provided to the client. The direct costs related to these projects are capitalised and then recognised as cost of revenue when the performance obligation is satisfied.
For certain fixed-fee per transaction contracts, such as delivering training courses or conducting workshops, revenue is recognised during the period in which services are delivered in accordance with the pricing outlined in the contracts. For certain fixed-fee per transaction and fixed price contracts, such as for the shipping of publications and print materials, revenue is recognised at the point in time at which control is transferred which is upon delivery.
Critical accounting estimates and judgements
For services revenue, the stage of completion is determined based on the proportion of contract costs incurred compared to total estimated contract costs. The outcome of a development project can be determined with reasonable certainty when a project budget is agreed which sets out milestones and costs for all project deliverables. Staff and contractors record their actual time and external costs spent on each project which is regularly reviewed against budget.
In making its estimation as to the amounts recoverable on contracts, management considers estimates of anticipated revenues and costs from each contract and monitors the need for any provisions for losses arising from adjustments to underlying assumptions if this indicates it is appropriate. The amount of profit or loss recognised on a contract has a direct impact on the Group’s results and carrying value of amounts recoverable on contracts. The Directors are satisfied that their judgement is based on a reasonable assessment of the future prospects for each contract.
During the year to 31 December 2021, management reviewed the contracts in place and did not note any contracts where there was specific increased estimation uncertainty. Management has reviewed contracts that were ongoing at the prior year end and there were no significant adjustments to the budgeted margin.
Where the stand-alone selling price of support and maintenance services bundled in an on-premise licence contract are not observable, management allocates the transaction price to the distinct performance obligations based on expected cost plus margin. The basis of this calculation is derived from historic experience and data.
(n) Operating segments
The Group operates as four reportable segments, the Software & Platforms division, the Content & Services division, the GP Strategies segment and the Other segment which includes rental income. An operating segment is a component of the Group that engages in business activities from which it may earn revenues and incur expenses, including revenues and expenses that relate to transactions with any of the Group’s other components. An operating segment’s operating results are reviewed regularly by the chief operating decision-maker to make decisions about resources to be allocated to the segment and assess its performance, and for which discrete financial information is available.
(o) Share-based payment arrangements
Equity-settled share-based payments to employees and others providing similar services are measured at the fair value of the equity instruments at the grant date. Details regarding the determination of the fair value of equity-settled share-based transactions are set out in Note 28 to the Consolidated Financial Statements.
(p) Leases
The Group as a lessee
The Group leases various offices and IT equipment. Rental contracts are typically made for fixed periods of six months to 12 years but may have extension options.
The Group assesses whether a contract is or contains a lease, at inception of the contract. The Group recognises a right-of-use asset and a corresponding lease liability with respect to all lease arrangements in which it is the lessee, except for short-term leases (defined as leases with a lease term of 12 months) and lease of low-value assets.
Assets and liabilities arising from a lease are initially measured on a present value basis. Lease liabilities include the net present value of the following lease payments:
• fixed payments (including in-substance fixed payments), less any lease incentives receivable
• variable lease payment that are based on an index or a rate, initially measured using the index or rate as at the commencement date
• amounts expected to be payable by the Group under residual value guarantees
79 plc Annual Report 2021
• the exercise price of a purchase option if the Group is reasonably certain to exercise that option, and
• payments of penalties for terminating the lease, if the lease term reflects the Group exercising that option.
Lease payments to be made under reasonably certain extension options are also included in the measurement of the liability.
On transition to IFRS 16, the weighted average incremental borrowing rate applied to the lease liabilities recognised under IFRS 16 was 3.5%. The incremental borrowing rate used was based on the three-month LIBOR rates in the respective asset territories (98% of which were based in either the US or UK) plus a 1.6% margin commensurate with the margin payable under the Group’s debt finance facility as at 1 January 2019.
Lease payments are allocated between principal and finance cost. The finance cost is charged to profit or loss over the lease period so as to produce a constant periodic rate of interest on the remaining balance of the liability for each period.
Right-of-use assets are measured at cost comprising the following:
• the amount of the initial measurement of lease liability
• any lease payments made at or before the commencement date less any lease incentives received
• any initial direct costs, and
• restoration costs.
Right-of-use assets are generally depreciated over the shorter of the asset’s useful life and the lease term on a straight-line basis.
The Group applies IAS 36 to determine whether a right-of-use asset is impaired and accounts for any identified impairment loss as described in the Impairment policy above.
For leases acquired as part of a business combination, the lease liability is measured at the present value of the remaining lease payments. The right-of-use asset is measured at the same amount as the lease liability adjusted to reflect favourable or unfavourable terms of the lease when compared to market terms.
Payments associated with short-term leases and leases of low-value assets are recognised on a straight-line basis as an expense in profit or loss. Short-term leases are leases with a lease term of 12 months or less without a purchase option. Low-value assets generally comprise IT equipment and small items of office furniture.
The Group as a lessor
The Group enters into lease agreements as an intermediate lessor with respect to some of its property leases. It accounts for the head lease and the sublease as two separate contracts.
The sublease is classified as finance lease or operating lease by reference to the right-of-use asset arising from the head lease. Whenever the terms of the lease transfer substantially all the risks and rewards of ownership to the lessee, the contract is classified as a finance lease. All other leases are classified as operating leases. Rents receivable from operating leases are recognised on a straight-line basis over the term of the relevant lease.
(q) Government grants
Government grants are not recognised until there is reasonable assurance that the grants will be received and that the Group will comply with any conditions attached to them.
Government grants are recognised in the income statement over the same period as the costs for which the grants are intended to compensate. Government grants that are receivable as compensation for expenses or losses already incurred or for the purpose of giving immediate financial support to the Group with no future related costs are recognised in profit or loss in the period in which they become receivable.
3. Summary of critical accounting estimates and judgementsThe preparation of financial information in conformity with IFRS requires the use of certain critical accounting estimates. It also requires the Directors to exercise their judgement in the process of applying the accounting policies which are detailed above. These judgements are continually evaluated by the Directors and management and are based on historical experience and other factors, including expectations of future events that are believed to be reasonable under the circumstances.
The key estimates and underlying assumptions concerning the future and other key sources of estimation uncertainty at the statement of financial position date, that have a significant risk of causing a material adjustment to the carrying amounts of assets and liabilities within the next financial period, are reviewed on an ongoing basis. Revisions to accounting estimates are recognised in the period in which the estimate is revised if the revision affects only that period, or in the period of the revision and future periods if the revision affects both current and future periods.
For the year ended 31 December 2021
Notes to the Consolidated Financial Statements (continued)
plc Annual Report 2021 80
(i) Judgements
Revenue recognition
See Note 2 (m).
Adjusting items
The Group has chosen to present an adjusted measure of profit and earnings per share, which excludes certain items which are separately disclosed due to their size, nature or incidence, and are not considered to be part of the normal operating costs of the Group. These costs may include the financial effect of adjusting items such as, inter alia, restructuring costs, impairment charges, amortisation of acquired intangibles, costs relating to business combinations, one-off foreign exchange gains or losses, integration costs, acquisition-related share-based payment charges, contingent consideration and earn-outs, fair value movements on contingent consideration, joint venture profits and losses and fixed asset, right-of-use asset and lease liability disposal gains or losses. The Group believes that it provides additional useful information to users of the financial statements to enable a better understanding of the Group’s underlying financial performance.
The classification of items as adjusting requires significant management judgement. The definition of adjusting items has been applied consistently year on year. Further details of adjusting items are provided in Note 6.
(ii) Estimates
Business combinations and associated acquisition accounting
Contingent Consideration
The agreements, made in 2021, to acquire The People Development Team Limited (‘PDT Global’) and Moodle News LLC, include provision for the Group to pay additional consideration to the selling shareholders in future years conditional on the achievement of challenging incremental revenue or other specific growth targets. We have evaluated each agreement in accordance with IFRS 3 to determine whether these payments should be included as part of the business combination or post-combination remuneration expensed to the income statement. All agreements, with the exception of Moodle News, include conditions for continuing employment, therefore we have concluded that these payments should be charged to the income statement.
The acquisition-related contingent consideration and earn-out liabilities usually include estimates of future financial performance against targets. When estimating the future financial performance, we use Board-approved budgets and, if the time frame goes beyond available budgets, reasonable growth rates are assessed for each business thereafter.
Identifiable assets acquired and liabilities assumed
As required by IFRS 3, we have measured the assets acquired and liabilities assumed of the acquisitions in the year at their fair value on acquisition. The fair values of contract liabilities at acquisition dates were estimated to obtain a price that would be paid to transfer the liability in an orderly transaction between market participants. The approach used was based on a market participant’s estimate of the costs that will be incurred to fulfil the obligation plus a normal profit margin, based on the overall cost profile over the life of the contract. This adjustment to all acquisitions in the year was immaterial.
Valuation of intangible assets
The determination of the fair value of assets and liabilities including goodwill arising on the acquisition of businesses, the acquisition of industry-specific knowledge, software technology, branding and customer relationships, whether arising from separate purchases or from the acquisition as part of business combinations, and development expenditure which is expected to generate future economic benefits, are based, to a considerable extent, on management’s estimations.
The fair value of these assets is determined by discounting estimated future net cash flows generated by the asset where no active market for the assets exists. The use of different assumptions for the expectations of future cash flows and the discount rate would change the valuation of the intangible assets.
During the year to 31 December 2021, the Group acquired Reflektive Inc (‘Reflektive), The People Development Team Limited (‘PDT Global’), Moodle News LLC (‘Moodle News’) getBridge LLC (‘Bridge’) and GP Strategies Corporation (‘GP Strategies’), see Note 14. We have outlined below the intangible assets recognised by the Group on acquisition of each of these businesses, the valuation model used to establish the fair value and the associated values. We have not disclosed anything further in relation to Moodle News on the grounds of it being de minimis.
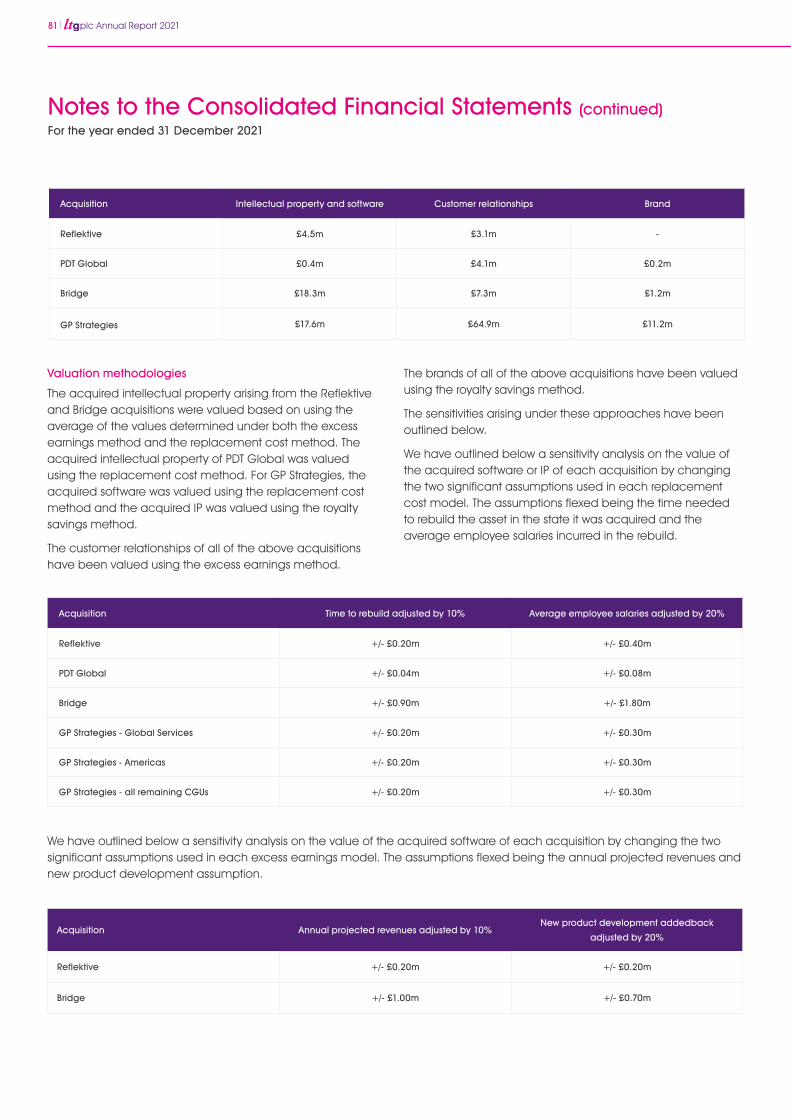
81 plc Annual Report 2021
Acquisition Intellectual property and software Customer relationships Brand
Reflektive £4.5m £3.1m -
PDT Global £0.4m £4.1m £0.2m
Bridge £18.3m £7.3m £1.2m
GP Strategies £17.6m £64.9m £11.2m
Acquisition Time to rebuild adjusted by 10% Average employee salaries adjusted by 20%
Reflektive +/- £0.20m +/- £0.40m
PDT Global +/- £0.04m +/- £0.08m
Bridge +/- £0.90m +/- £1.80m
GP Strategies - Global Services +/- £0.20m +/- £0.30m
GP Strategies - Americas +/- £0.20m +/- £0.30m
GP Strategies - all remaining CGUs +/- £0.20m +/- £0.30m
We have outlined below a sensitivity analysis on the value of the acquired software of each acquisition by changing the two significant assumptions used in each excess earnings model. The assumptions flexed being the annual projected revenues and new product development assumption.
Valuation methodologies
The acquired intellectual property arising from the Reflektive and Bridge acquisitions were valued based on using the average of the values determined under both the excess earnings method and the replacement cost method. The acquired intellectual property of PDT Global was valued using the replacement cost method. For GP Strategies, the acquired software was valued using the replacement cost method and the acquired IP was valued using the royalty savings method.
The customer relationships of all of the above acquisitions have been valued using the excess earnings method.
The brands of all of the above acquisitions have been valued using the royalty savings method.
The sensitivities arising under these approaches have been outlined below.
We have outlined below a sensitivity analysis on the value of the acquired software or IP of each acquisition by changing the two significant assumptions used in each replacement cost model. The assumptions flexed being the time needed to rebuild the asset in the state it was acquired and the average employee salaries incurred in the rebuild.
Acquisition Annual projected revenues adjusted by 10%New product development addedback
adjusted by 20%
Reflektive +/- £0.20m +/- £0.20m
Bridge +/- £1.00m +/- £0.70m
For the year ended 31 December 2021
Notes to the Consolidated Financial Statements (continued)
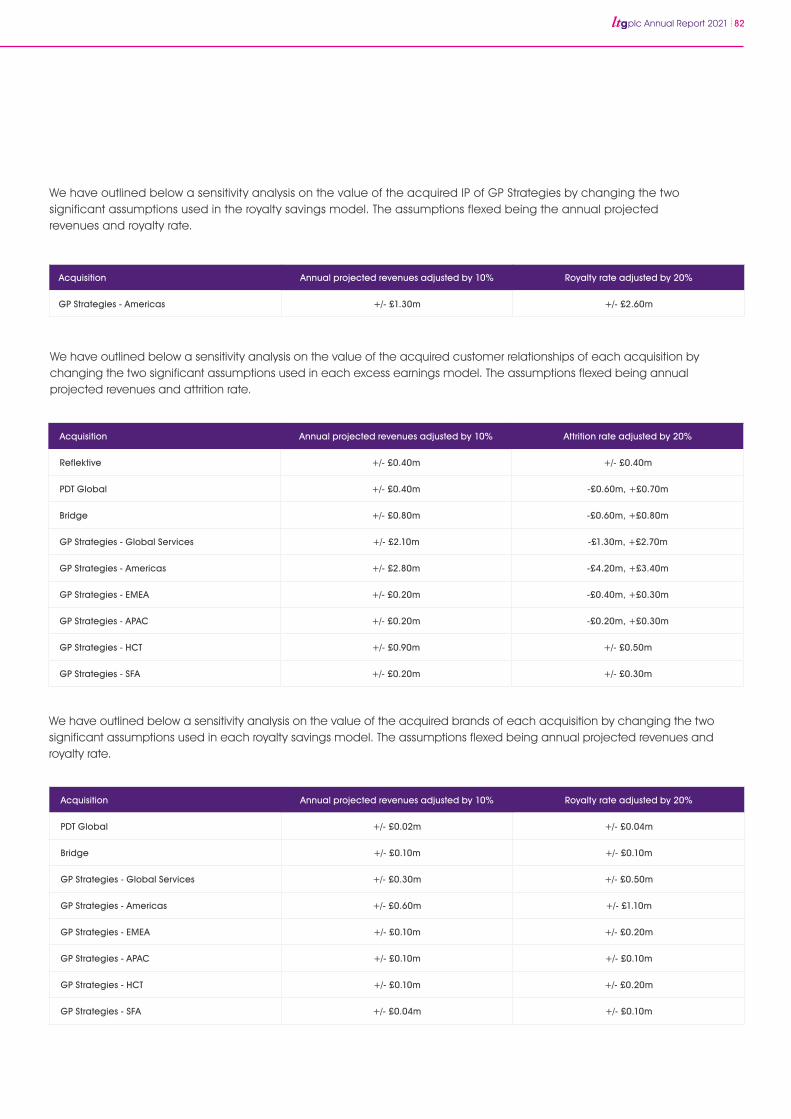
plc Annual Report 2021 82
We have outlined below a sensitivity analysis on the value of the acquired IP of GP Strategies by changing the two significant assumptions used in the royalty savings model. The assumptions flexed being the annual projected revenues and royalty rate.
Acquisition Annual projected revenues adjusted by 10% Royalty rate adjusted by 20%
GP Strategies - Americas +/- £1.30m +/- £2.60m
We have outlined below a sensitivity analysis on the value of the acquired customer relationships of each acquisition by changing the two significant assumptions used in each excess earnings model. The assumptions flexed being annual projected revenues and attrition rate.
Acquisition Annual projected revenues adjusted by 10% Attrition rate adjusted by 20%
Reflektive +/- £0.40m +/- £0.40m
PDT Global +/- £0.40m -£0.60m, +£0.70m
Bridge +/- £0.80m -£0.60m, +£0.80m
GP Strategies - Global Services +/- £2.10m -£1.30m, +£2.70m
GP Strategies - Americas +/- £2.80m -£4.20m, +£3.40m
GP Strategies - EMEA +/- £0.20m -£0.40m, +£0.30m
GP Strategies - APAC +/- £0.20m -£0.20m, +£0.30m
GP Strategies - HCT +/- £0.90m +/- £0.50m
GP Strategies - SFA +/- £0.20m +/- £0.30m
We have outlined below a sensitivity analysis on the value of the acquired brands of each acquisition by changing the two significant assumptions used in each royalty savings model. The assumptions flexed being annual projected revenues and royalty rate.
Acquisition Annual projected revenues adjusted by 10% Royalty rate adjusted by 20%
PDT Global +/- £0.02m +/- £0.04m
Bridge +/- £0.10m +/- £0.10m
GP Strategies - Global Services +/- £0.30m +/- £0.50m
GP Strategies - Americas +/- £0.60m +/- £1.10m
GP Strategies - EMEA +/- £0.10m +/- £0.20m
GP Strategies - APAC +/- £0.10m +/- £0.10m
GP Strategies - HCT +/- £0.10m +/- £0.20m
GP Strategies - SFA +/- £0.04m +/- £0.10m
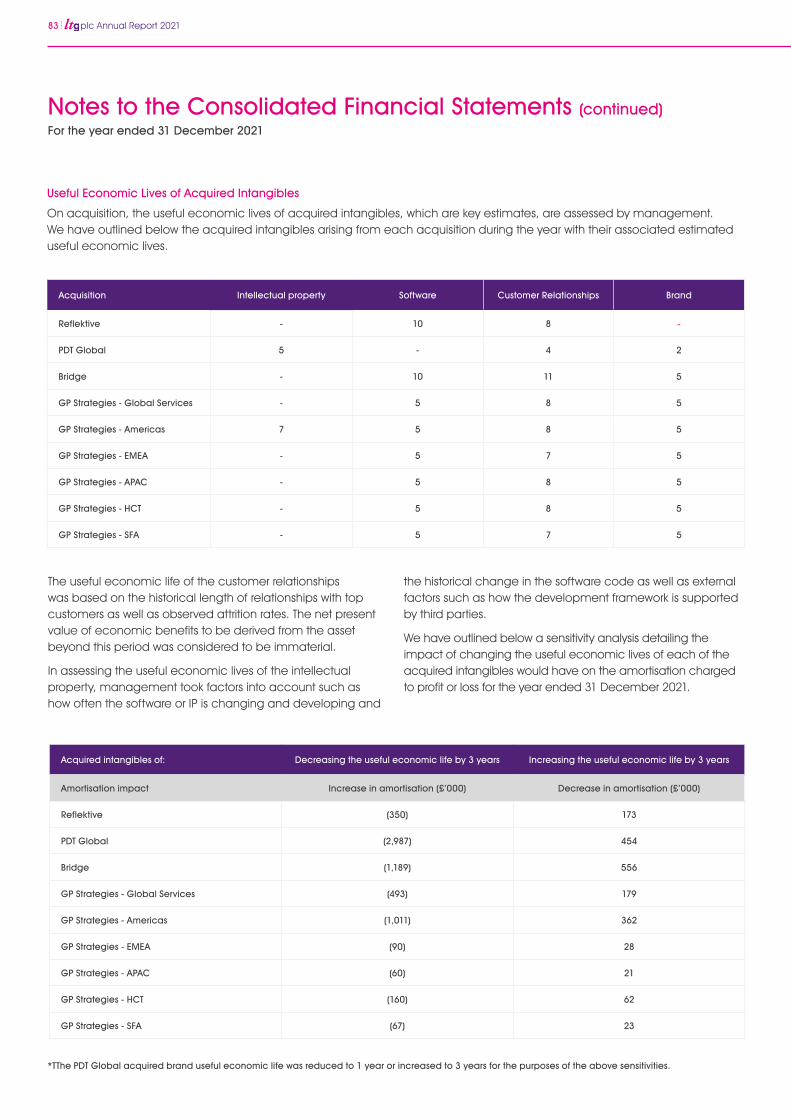
83 plc Annual Report 2021
Acquired intangibles of: Decreasing the useful economic life by 3 years Increasing the useful economic life by 3 years
Amortisation impact Increase in amortisation (£’000) Decrease in amortisation (£’000)
Reflektive (350) 173
PDT Global (2,987) 454
Bridge (1,189) 556
GP Strategies - Global Services (493) 179
GP Strategies - Americas (1,011) 362
GP Strategies - EMEA (90) 28
GP Strategies - APAC (60) 21
GP Strategies - HCT (160) 62
GP Strategies - SFA (67) 23
*TThe PDT Global acquired brand useful economic life was reduced to 1 year or increased to 3 years for the purposes of the above sensitivities.
The useful economic life of the customer relationships was based on the historical length of relationships with top customers as well as observed attrition rates. The net present value of economic benefits to be derived from the asset beyond this period was considered to be immaterial.
In assessing the useful economic lives of the intellectual property, management took factors into account such as how often the software or IP is changing and developing and
the historical change in the software code as well as external factors such as how the development framework is supported by third parties.
We have outlined below a sensitivity analysis detailing the impact of changing the useful economic lives of each of the acquired intangibles would have on the amortisation charged to profit or loss for the year ended 31 December 2021.
Acquisition Intellectual property Software Customer Relationships Brand
Reflektive - 10 8 -
PDT Global 5 - 4 2
Bridge - 10 11 5
GP Strategies - Global Services - 5 8 5
GP Strategies - Americas 7 5 8 5
GP Strategies - EMEA - 5 7 5
GP Strategies - APAC - 5 8 5
GP Strategies - HCT - 5 8 5
GP Strategies - SFA - 5 7 5
Useful Economic Lives of Acquired Intangibles
On acquisition, the useful economic lives of acquired intangibles, which are key estimates, are assessed by management. We have outlined below the acquired intangibles arising from each acquisition during the year with their associated estimated useful economic lives.
For the year ended 31 December 2021
Notes to the Consolidated Financial Statements (continued)
plc Annual Report 2021 84
Any acquired brand’s useful economic life was based on how long management expects to derive economic benefits from the asset, and the net present value of economic benefits beyond this life appear to be immaterial.
All useful economic lives were benchmarked against other guideline companies.
Impairment reviews
IFRS requires management to undertake an annual test for impairment of indefinite lived assets (goodwill) and, for finite lived assets, to test for impairment if events or changes in circumstances indicate that the carrying amount of an asset may not be recoverable.
Goodwill impairment testing is an area involving management estimates, requiring assessment as to whether the carrying value of assets can be supported by the net present value of future cash flows derived from such assets using cash flow projections which have been discounted at an appropriate rate. In calculating the net present value of the future cash flows, certain assumptions are required to be made in respect of highly uncertain matters including management’s expectations of:
• Growth in adjusted EBIT;
• Long-term growth rates; and
• The selection of discount rates to reflect the risks involved.
The adjusted EBIT is calculated on the same basis as the adjusted EBIT within the Statement of Comprehensive Income. The Group prepares and approves a detailed annual budget, which is used to prepare cash flow forecasts that extrapolate revenues, net margins and cash flows for the following four years based on forecast growth rates of the CGUs. Cash flows beyond this five-year period are also considered using the long-term growth rate.
See Note 15 for details of how these estimates and judgements have been applied.
Deferred Tax
Income tax expense, deferred tax assets and liabilities and liabilities for unrecognised tax benefits reflect management’s best estimate of current and future taxes to be paid. The Group is subject to income taxes in the UK and several other foreign jurisdictions.
The deferred tax balances relate to temporary differences arising between the tax bases of assets and liabilities and their carrying amounts in the Financial Statements. Deferred tax assets are recognised to the extent that it is probable that the future taxable profits will allow the deferred tax assets to be recovered. In evaluating the Group’s ability to recover deferred tax assets in the jurisdiction from which they arise, management considers all available positive and negative evidence, including historic and projected future performance, and external market factors.
See Note 21 for details of how these estimates and judgements have been applied.
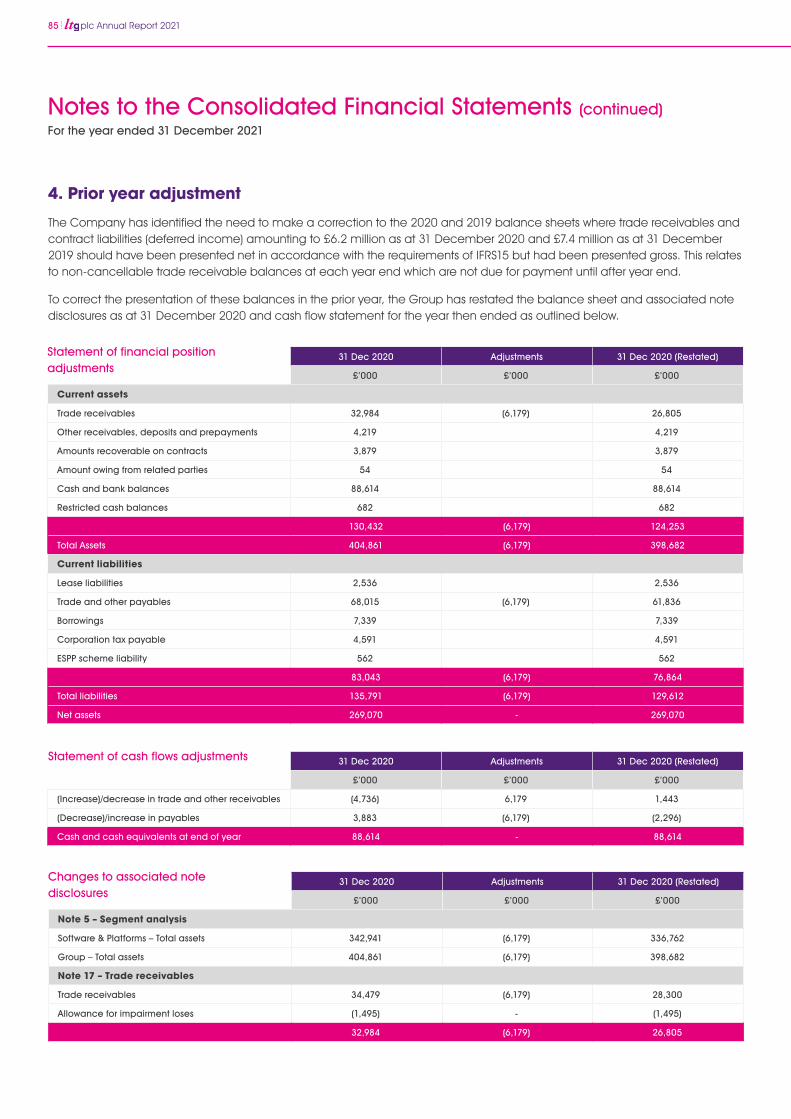
85 plc Annual Report 2021
4. Prior year adjustment
The Company has identified the need to make a correction to the 2020 and 2019 balance sheets where trade receivables and contract liabilities (deferred income) amounting to £6.2 million as at 31 December 2020 and £7.4 million as at 31 December 2019 should have been presented net in accordance with the requirements of IFRS15 but had been presented gross. This relates to non-cancellable trade receivable balances at each year end which are not due for payment until after year end.
To correct the presentation of these balances in the prior year, the Group has restated the balance sheet and associated note disclosures as at 31 December 2020 and cash flow statement for the year then ended as outlined below.
For the year ended 31 December 2021
Notes to the Consolidated Financial Statements (continued)
31 Dec 2020 Adjustments 31 Dec 2020 (Restated)
£’000 £’000 £’000
Current assets
Trade receivables 32,984 (6,179) 26,805
Other receivables, deposits and prepayments 4,219 4,219
Amounts recoverable on contracts 3,879 3,879
Amount owing from related parties 54 54
Cash and bank balances 88,614 88,614
Restricted cash balances 682 682
130,432 (6,179) 124,253
Total Assets 404,861 (6,179) 398,682
Current liabilities
Lease liabilities 2,536 2,536
Trade and other payables 68,015 (6,179) 61,836
Borrowings 7,339 7,339
Corporation tax payable 4,591 4,591
ESPP scheme liability 562 562
83,043 (6,179) 76,864
Total liabilities 135,791 (6,179) 129,612
Net assets 269,070 - 269,070
31 Dec 2020 Adjustments 31 Dec 2020 (Restated)
£’000 £’000 £’000
(Increase)/decrease in trade and other receivables (4,736) 6,179 1,443
(Decrease)/increase in payables 3,883 (6,179) (2,296)
Cash and cash equivalents at end of year 88,614 - 88,614
31 Dec 2020 Adjustments 31 Dec 2020 (Restated)
£’000 £’000 £’000
Note 5 – Segment analysis
Software & Platforms – Total assets 342,941 (6,179) 336,762
Group – Total assets 404,861 (6,179) 398,682
Note 17 – Trade receivables
Trade receivables 34,479 (6,179) 28,300
Allowance for impairment loses (1,495) - (1,495)
32,984 (6,179) 26,805
Statement of financial position adjustments
Statement of cash flows adjustments
Changes to associated note disclosures
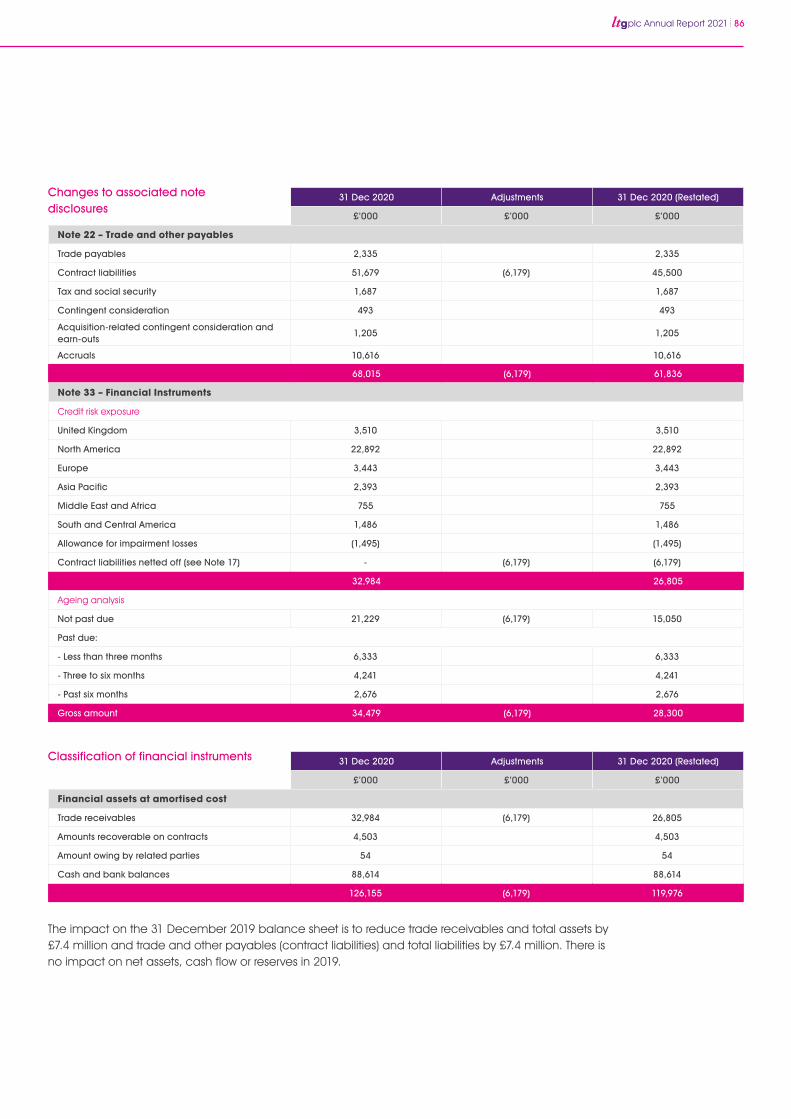
plc Annual Report 2021 86
31 Dec 2020 Adjustments 31 Dec 2020 (Restated)
£’000 £’000 £’000
Note 22 – Trade and other payables
Trade payables 2,335 2,335
Contract liabilities 51,679 (6,179) 45,500
Tax and social security 1,687 1,687
Contingent consideration 493 493
Acquisition-related contingent consideration and earn-outs
1,205 1,205
Accruals 10,616 10,616
68,015 (6,179) 61,836
Note 33 – Financial Instruments
Credit risk exposure
United Kingdom 3,510 3,510
North America 22,892 22,892
Europe 3,443 3,443
Asia Pacific 2,393 2,393
Middle East and Africa 755 755
South and Central America 1,486 1,486
Allowance for impairment losses (1,495) (1,495)
Contract liabilities netted off (see Note 17) - (6,179) (6,179)
32,984 26,805
Ageing analysis
Not past due 21,229 (6,179) 15,050
Past due:
- Less than three months 6,333 6,333
- Three to six months 4,241 4,241
- Past six months 2,676 2,676
Gross amount 34,479 (6,179) 28,300
31 Dec 2020 Adjustments 31 Dec 2020 (Restated)
£’000 £’000 £’000
Financial assets at amortised cost
Trade receivables 32,984 (6,179) 26,805
Amounts recoverable on contracts 4,503 4,503
Amount owing by related parties 54 54
Cash and bank balances 88,614 88,614
126,155 (6,179) 119,976
Changes to associated note disclosures
Classification of financial instruments
The impact on the 31 December 2019 balance sheet is to reduce trade receivables and total assets by £7.4 million and trade and other payables (contract liabilities) and total liabilities by £7.4 million. There is no impact on net assets, cash flow or reserves in 2019.
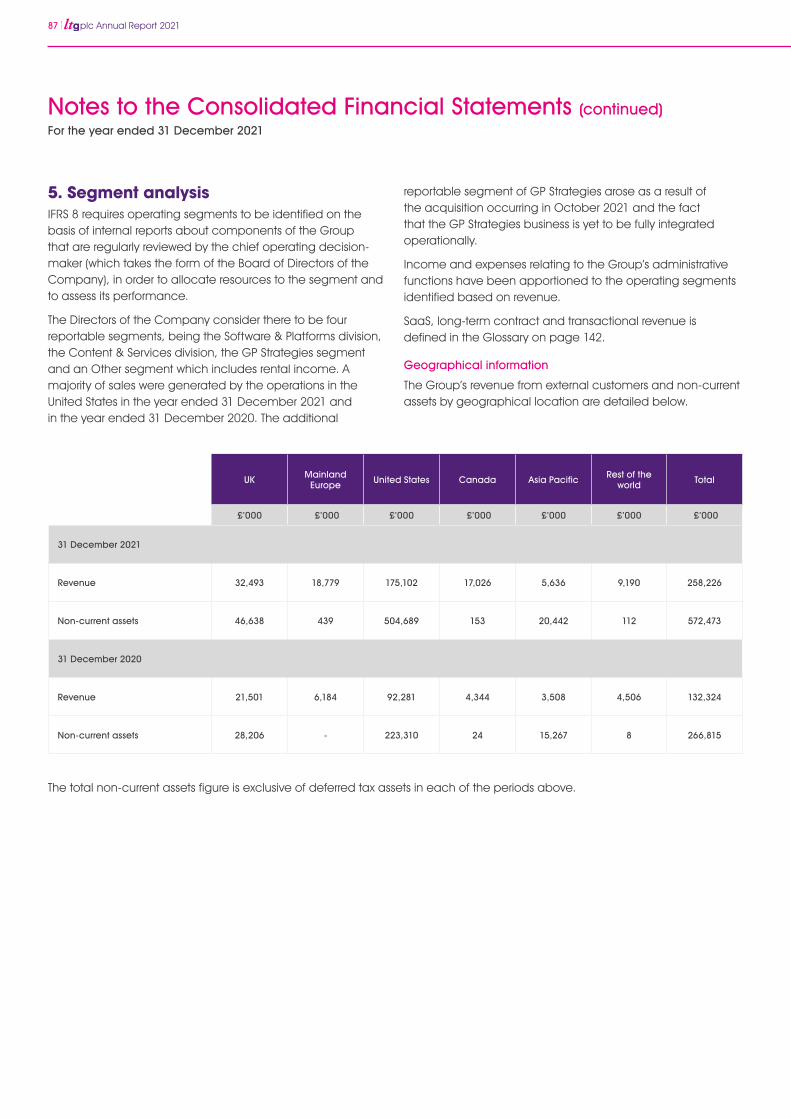
87 plc Annual Report 2021
5. Segment analysisIFRS 8 requires operating segments to be identified on the basis of internal reports about components of the Group that are regularly reviewed by the chief operating decision-maker (which takes the form of the Board of Directors of the Company), in order to allocate resources to the segment and to assess its performance.
The Directors of the Company consider there to be four reportable segments, being the Software & Platforms division, the Content & Services division, the GP Strategies segment and an Other segment which includes rental income. A majority of sales were generated by the operations in the United States in the year ended 31 December 2021 and in the year ended 31 December 2020. The additional
reportable segment of GP Strategies arose as a result of the acquisition occurring in October 2021 and the fact that the GP Strategies business is yet to be fully integrated operationally.
Income and expenses relating to the Group’s administrative functions have been apportioned to the operating segments identified based on revenue.
SaaS, long-term contract and transactional revenue is defined in the Glossary on page 142.
Geographical information
The Group’s revenue from external customers and non-current assets by geographical location are detailed below.
UK Mainland Europe United States Canada Asia Pacific Rest of the
world Total
£’000 £’000 £’000 £’000 £’000 £’000 £’000
31 December 2021
Revenue 32,493 18,779 175,102 17,026 5,636 9,190 258,226
Non-current assets 46,638 439 504,689 153 20,442 112 572,473
31 December 2020
Revenue 21,501 6,184 92,281 4,344 3,508 4,506 132,324
Non-current assets 28,206 - 223,310 24 15,267 8 266,815
The total non-current assets figure is exclusive of deferred tax assets in each of the periods above.
For the year ended 31 December 2021
Notes to the Consolidated Financial Statements (continued)
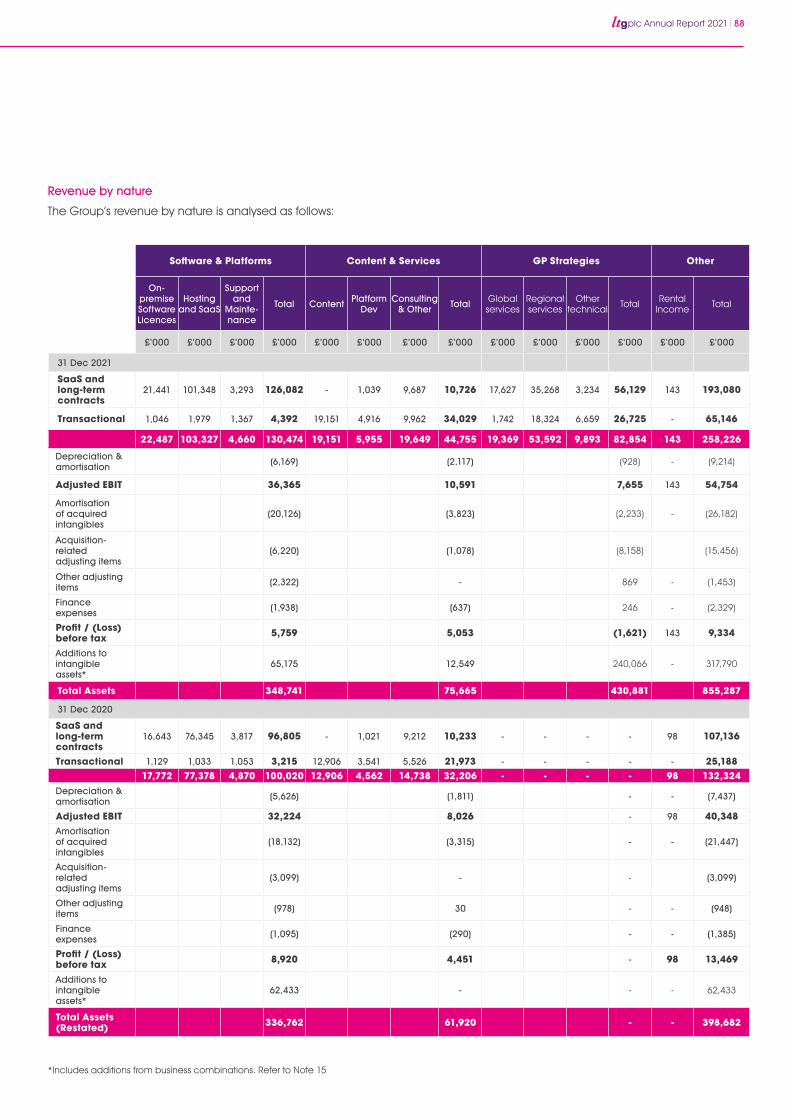
plc Annual Report 2021 88
Revenue by nature
The Group’s revenue by nature is analysed as follows:
*Includes additions from business combinations. Refer to Note 15
Software & Platforms Content & Services GP Strategies Other
On-premise Software Licences
Hosting and SaaS
Support and
Mainte-nance
Total Content Platform Dev
Consulting & Other Total Global
servicesRegional services
Other technical Total Rental
Income Total
£’000 £’000 £’000 £’000 £’000 £’000 £’000 £’000 £’000 £’000 £’000 £’000 £’000 £’000
31 Dec 2021
SaaS and long-term contracts
21,441 101,348 3,293 126,082 - 1,039 9,687 10,726 17,627 35,268 3,234 56,129 143 193,080
Transactional 1,046 1,979 1,367 4,392 19,151 4,916 9,962 34,029 1,742 18,324 6,659 26,725 - 65,146
22,487 103,327 4,660 130,474 19,151 5,955 19,649 44,755 19,369 53,592 9,893 82,854 143 258,226
Depreciation & amortisation (6,169) (2,117) (928) - (9,214)
Adjusted EBIT 36,365 10,591 7,655 143 54,754
Amortisation of acquired intangibles
(20,126) (3,823) (2,233) - (26,182)
Acquisition-related adjusting items
(6,220) (1,078) (8,158) (15,456)
Other adjusting items (2,322) - 869 - (1,453)
Finance expenses (1,938) (637) 246 - (2,329)
Profit / (Loss) before tax 5,759 5,053 (1,621) 143 9,334
Additions to intangible assets*
65,175 12,549 240,066 - 317,790
Total Assets 348,741 75,665 430,881 855,287
31 Dec 2020
SaaS and long-term contracts
16,643 76,345 3,817 96,805 - 1,021 9,212 10,233 - - - - 98 107,136
Transactional 1,129 1,033 1,053 3,215 12,906 3,541 5,526 21,973 - - - - - 25,18817,772 77,378 4,870 100,020 12,906 4,562 14,738 32,206 - - - - 98 132,324
Depreciation & amortisation (5,626) (1,811) - - (7,437)
Adjusted EBIT 32,224 8,026 - 98 40,348Amortisation of acquired intangibles
(18,132) (3,315) - - (21,447)
Acquisition-related adjusting items
(3,099) - - (3,099)
Other adjusting items (978) 30 - - (948)
Finance expenses (1,095) (290) - - (1,385)
Profit / (Loss) before tax 8,920 4,451 - 98 13,469
Additions to intangible assets*
62,433 - - - 62,433
Total Assets (Restated) 336,762 61,920 - - 398,682
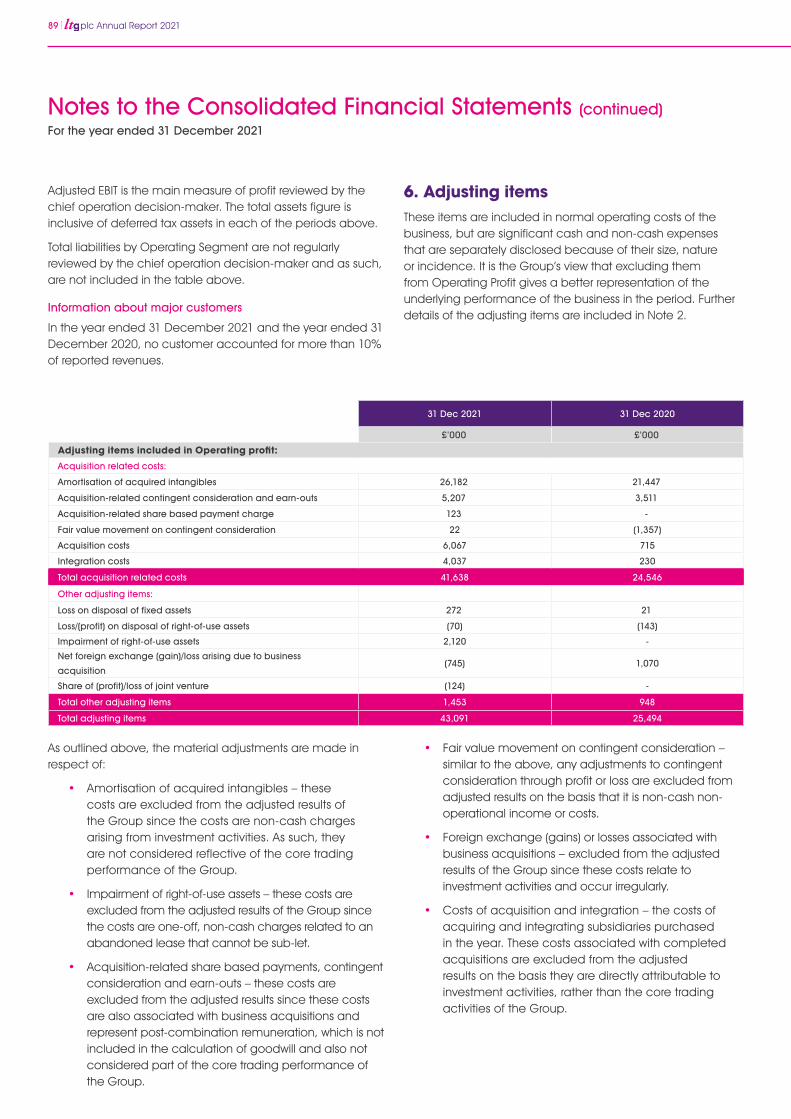
89 plc Annual Report 2021
31 Dec 2021 31 Dec 2020
£’000 £’000
Adjusting items included in Operating profit:
Acquisition related costs:
Amortisation of acquired intangibles 26,182 21,447
Acquisition-related contingent consideration and earn-outs 5,207 3,511
Acquisition-related share based payment charge 123 -
Fair value movement on contingent consideration 22 (1,357)
Acquisition costs 6,067 715
Integration costs 4,037 230
Total acquisition related costs 41,638 24,546
Other adjusting items:
Loss on disposal of fixed assets 272 21
Loss/(profit) on disposal of right-of-use assets (70) (143)
Impairment of right-of-use assets 2,120 -
Net foreign exchange (gain)/loss arising due to business
acquisition(745) 1,070
Share of (profit)/loss of joint venture (124) -
Total other adjusting items 1,453 948
Total adjusting items 43,091 25,494
Adjusted EBIT is the main measure of profit reviewed by the chief operation decision-maker. The total assets figure is inclusive of deferred tax assets in each of the periods above.
Total liabilities by Operating Segment are not regularly reviewed by the chief operation decision-maker and as such, are not included in the table above.
Information about major customers
In the year ended 31 December 2021 and the year ended 31 December 2020, no customer accounted for more than 10% of reported revenues.
As outlined above, the material adjustments are made in respect of:
• Amortisation of acquired intangibles – these costs are excluded from the adjusted results of the Group since the costs are non-cash charges arising from investment activities. As such, they are not considered reflective of the core trading performance of the Group.
• Impairment of right-of-use assets – these costs are excluded from the adjusted results of the Group since the costs are one-off, non-cash charges related to an abandoned lease that cannot be sub-let.
• Acquisition-related share based payments, contingent consideration and earn-outs – these costs are excluded from the adjusted results since these costs are also associated with business acquisitions and represent post-combination remuneration, which is not included in the calculation of goodwill and also not considered part of the core trading performance of the Group.
6. Adjusting itemsThese items are included in normal operating costs of the business, but are significant cash and non-cash expenses that are separately disclosed because of their size, nature or incidence. It is the Group’s view that excluding them from Operating Profit gives a better representation of the underlying performance of the business in the period. Further details of the adjusting items are included in Note 2.
• Fair value movement on contingent consideration – similar to the above, any adjustments to contingent consideration through profit or loss are excluded from adjusted results on the basis that it is non-cash non-operational income or costs.
• Foreign exchange (gains) or losses associated with business acquisitions – excluded from the adjusted results of the Group since these costs relate to investment activities and occur irregularly.
• Costs of acquisition and integration – the costs of acquiring and integrating subsidiaries purchased in the year. These costs associated with completed acquisitions are excluded from the adjusted results on the basis they are directly attributable to investment activities, rather than the core trading activities of the Group.
For the year ended 31 December 2021
Notes to the Consolidated Financial Statements (continued)
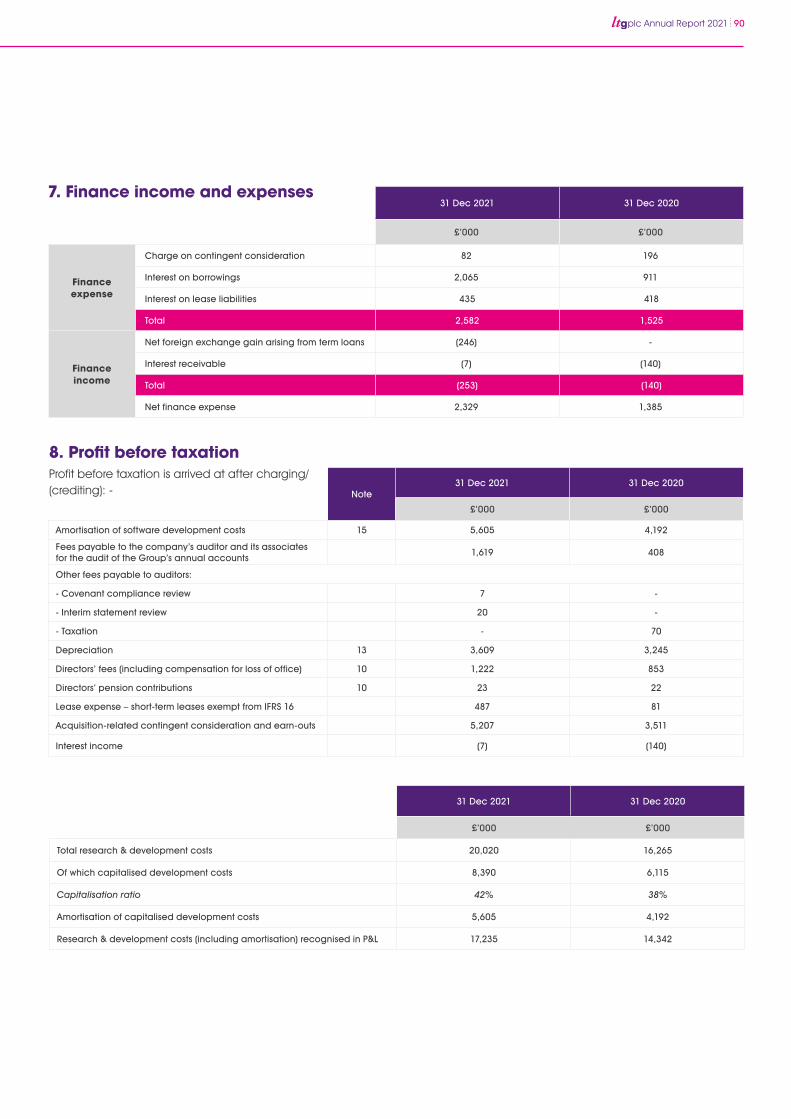
plc Annual Report 2021 90
31 Dec 2021 31 Dec 2020
£’000 £’000
Finance expense
Charge on contingent consideration 82 196
Interest on borrowings 2,065 911
Interest on lease liabilities 435 418
Total 2,582 1,525
Finance income
Net foreign exchange gain arising from term loans (246) -
Interest receivable (7) (140)
Total (253) (140)
Net finance expense 2,329 1,385
7. Finance income and expenses
Note31 Dec 2021 31 Dec 2020
£’000 £’000
Amortisation of software development costs 15 5,605 4,192
Fees payable to the company’s auditor and its associates for the audit of the Group’s annual accounts
1,619 408
Other fees payable to auditors:
- Covenant compliance review 7 -
- Interim statement review 20 -
- Taxation - 70
Depreciation 13 3,609 3,245
Directors’ fees (including compensation for loss of office) 10 1,222 853
Directors’ pension contributions 10 23 22
Lease expense – short-term leases exempt from IFRS 16 487 81
Acquisition-related contingent consideration and earn-outs 5,207 3,511
Interest income (7) (140)
8. Profit before taxationProfit before taxation is arrived at after charging/(crediting): -
31 Dec 2021 31 Dec 2020
£’000 £’000
Total research & development costs 20,020 16,265
Of which capitalised development costs 8,390 6,115
Capitalisation ratio 42% 38%
Amortisation of capitalised development costs 5,605 4,192
Research & development costs (including amortisation) recognised in P&L 17,235 14,342
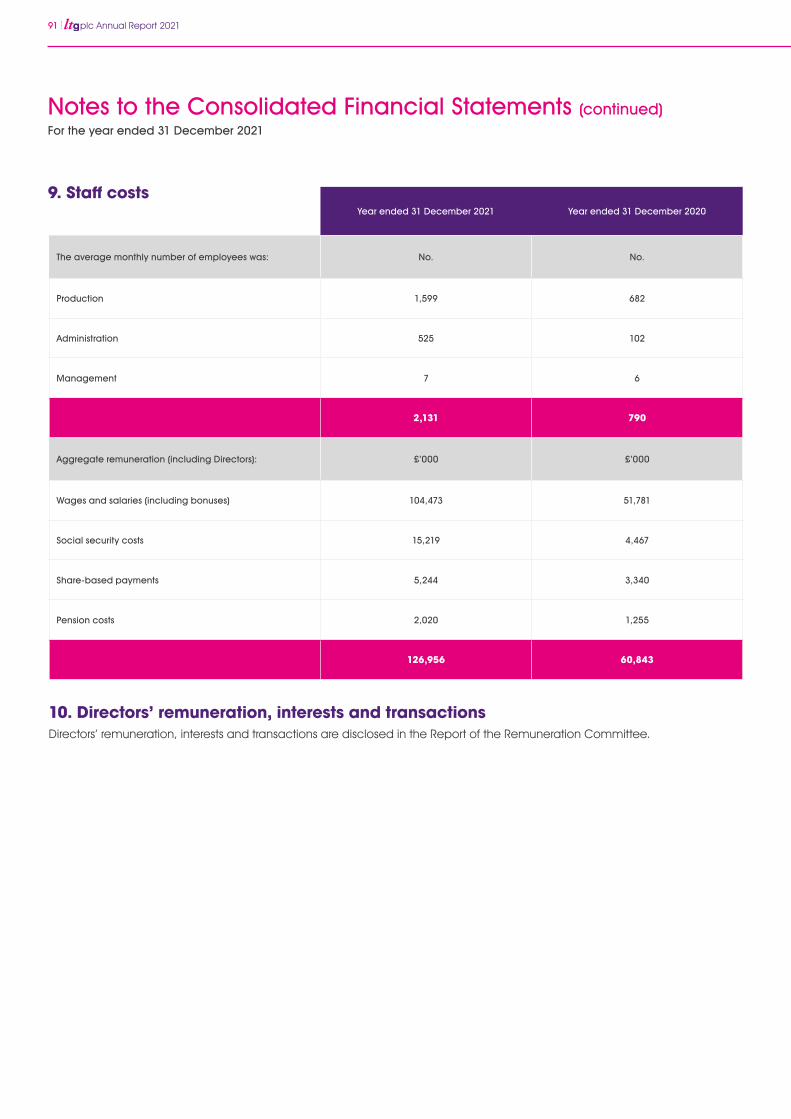
91 plc Annual Report 2021
Year ended 31 December 2021 Year ended 31 December 2020
The average monthly number of employees was: No. No.
Production 1,599 682
Administration 525 102
Management 7 6
2,131 790
Aggregate remuneration (including Directors): £’000 £’000
Wages and salaries (including bonuses) 104,473 51,781
Social security costs 15,219 4,467
Share-based payments 5,244 3,340
Pension costs 2,020 1,255
126,956 60,843
9. Staff costs
10. Directors’ remuneration, interests and transactionsDirectors’ remuneration, interests and transactions are disclosed in the Report of the Remuneration Committee.
For the year ended 31 December 2021
Notes to the Consolidated Financial Statements (continued)
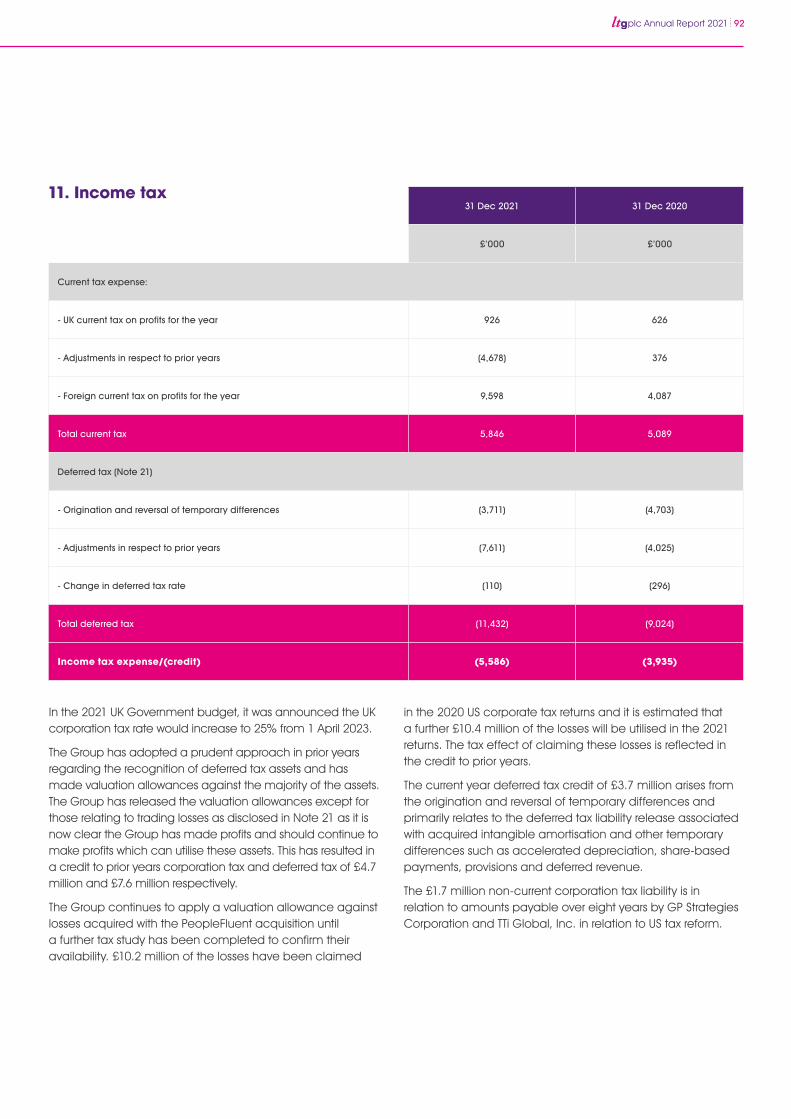
plc Annual Report 2021 92
31 Dec 2021 31 Dec 2020
£’000 £’000
Current tax expense:
- UK current tax on profits for the year 926 626
- Adjustments in respect to prior years (4,678) 376
- Foreign current tax on profits for the year 9,598 4,087
Total current tax 5,846 5,089
Deferred tax (Note 21)
- Origination and reversal of temporary differences (3,711) (4,703)
- Adjustments in respect to prior years (7,611) (4,025)
- Change in deferred tax rate (110) (296)
Total deferred tax (11,432) (9,024)
Income tax expense/(credit) (5,586) (3,935)
11. Income tax
In the 2021 UK Government budget, it was announced the UK corporation tax rate would increase to 25% from 1 April 2023.
The Group has adopted a prudent approach in prior years regarding the recognition of deferred tax assets and has made valuation allowances against the majority of the assets. The Group has released the valuation allowances except for those relating to trading losses as disclosed in Note 21 as it is now clear the Group has made profits and should continue to make profits which can utilise these assets. This has resulted in a credit to prior years corporation tax and deferred tax of £4.7 million and £7.6 million respectively.
The Group continues to apply a valuation allowance against losses acquired with the PeopleFluent acquisition until a further tax study has been completed to confirm their availability. £10.2 million of the losses have been claimed
in the 2020 US corporate tax returns and it is estimated that a further £10.4 million of the losses will be utilised in the 2021 returns. The tax effect of claiming these losses is reflected in the credit to prior years.
The current year deferred tax credit of £3.7 million arises from the origination and reversal of temporary differences and primarily relates to the deferred tax liability release associated with acquired intangible amortisation and other temporary differences such as accelerated depreciation, share-based payments, provisions and deferred revenue.
The £1.7 million non-current corporation tax liability is in relation to amounts payable over eight years by GP Strategies Corporation and TTi Global, Inc. in relation to US tax reform.
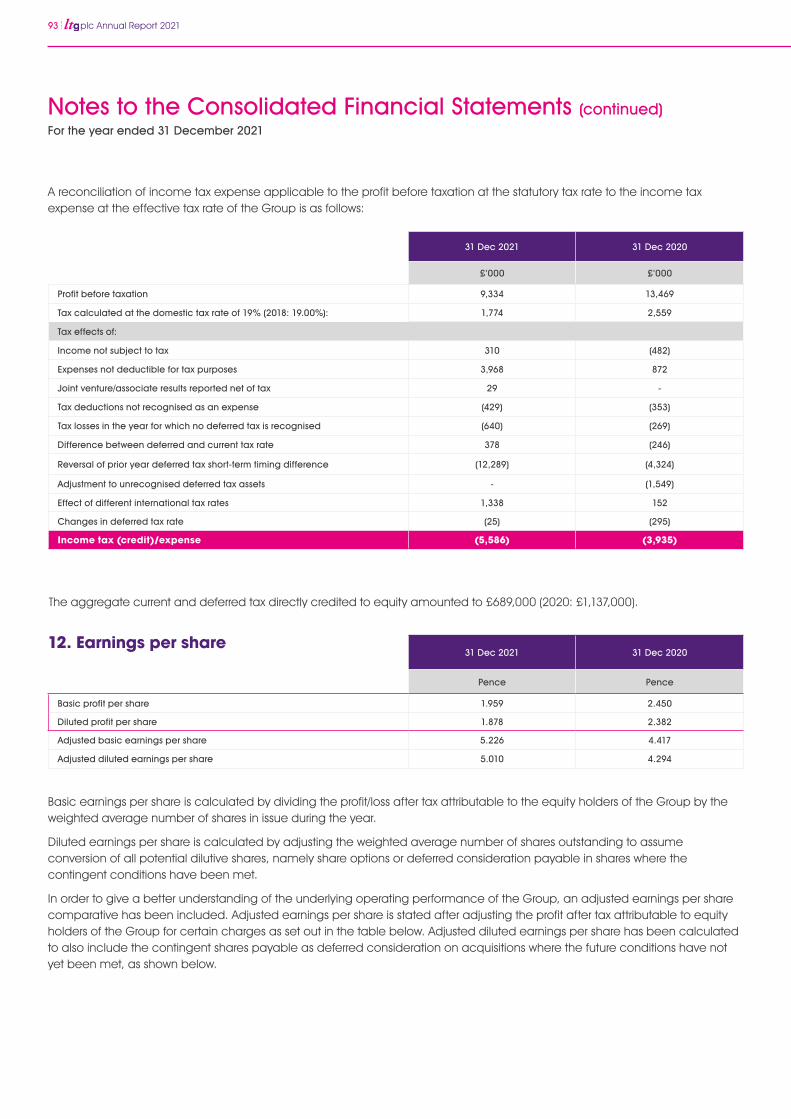
93 plc Annual Report 2021
31 Dec 2021 31 Dec 2020
Pence Pence
Basic profit per share 1.959 2.450
Diluted profit per share 1.878 2.382
Adjusted basic earnings per share 5.226 4.417
Adjusted diluted earnings per share 5.010 4.294
12. Earnings per share
Basic earnings per share is calculated by dividing the profit/loss after tax attributable to the equity holders of the Group by the weighted average number of shares in issue during the year.
Diluted earnings per share is calculated by adjusting the weighted average number of shares outstanding to assume conversion of all potential dilutive shares, namely share options or deferred consideration payable in shares where the contingent conditions have been met.
In order to give a better understanding of the underlying operating performance of the Group, an adjusted earnings per share comparative has been included. Adjusted earnings per share is stated after adjusting the profit after tax attributable to equity holders of the Group for certain charges as set out in the table below. Adjusted diluted earnings per share has been calculated to also include the contingent shares payable as deferred consideration on acquisitions where the future conditions have not yet been met, as shown below.
31 Dec 2021 31 Dec 2020
£’000 £’000
Profit before taxation 9,334 13,469
Tax calculated at the domestic tax rate of 19% (2018: 19.00%): 1,774 2,559
Tax effects of:
Income not subject to tax 310 (482)
Expenses not deductible for tax purposes 3,968 872
Joint venture/associate results reported net of tax 29 -
Tax deductions not recognised as an expense (429) (353)
Tax losses in the year for which no deferred tax is recognised (640) (269)
Difference between deferred and current tax rate 378 (246)
Reversal of prior year deferred tax short-term timing difference (12,289) (4,324)
Adjustment to unrecognised deferred tax assets - (1,549)
Effect of different international tax rates 1,338 152
Changes in deferred tax rate (25) (295)
Income tax (credit)/expense (5,586) (3,935)
A reconciliation of income tax expense applicable to the profit before taxation at the statutory tax rate to the income tax expense at the effective tax rate of the Group is as follows:
The aggregate current and deferred tax directly credited to equity amounted to £689,000 (2020: £1,137,000).
For the year ended 31 December 2021
Notes to the Consolidated Financial Statements (continued)
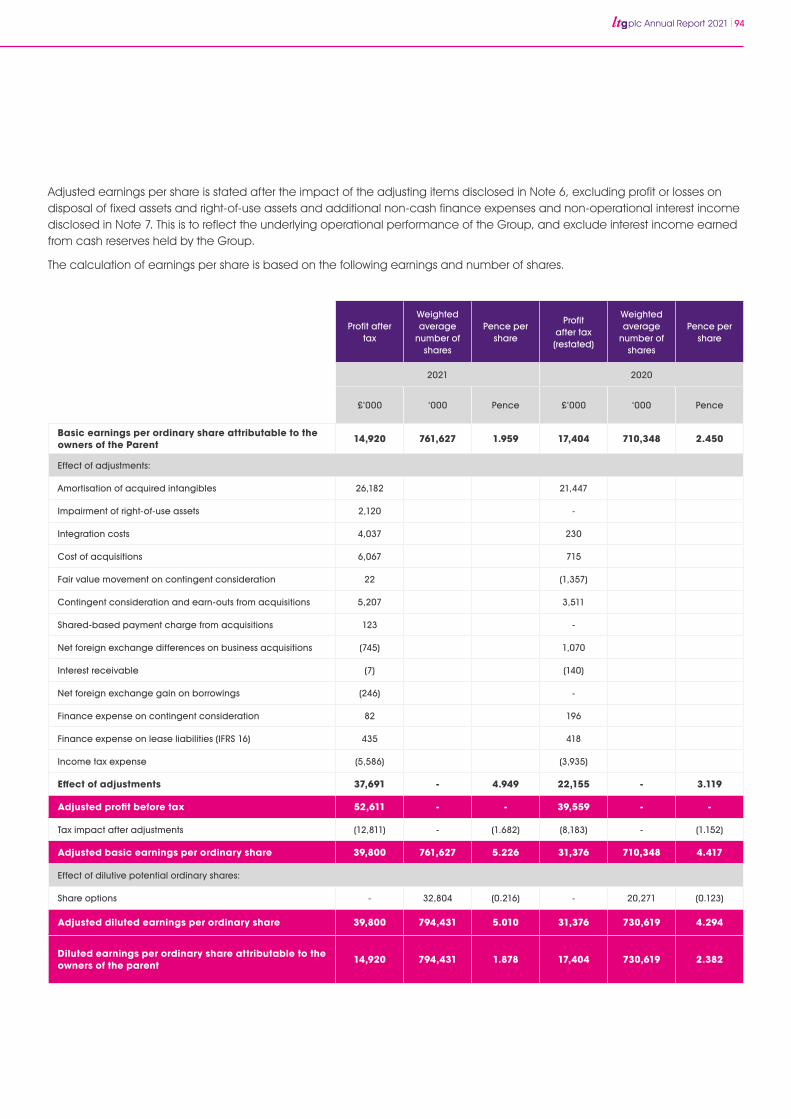
plc Annual Report 2021 94
Profit after tax
Weighted average
number of shares
Pence per share
Profit after tax (restated)
Weighted average
number of shares
Pence per share
2021 2020
£’000 ‘000 Pence £’000 ‘000 Pence
Basic earnings per ordinary share attributable to the owners of the Parent 14,920 761,627 1.959 17,404 710,348 2.450
Effect of adjustments:
Amortisation of acquired intangibles 26,182 21,447
Impairment of right-of-use assets 2,120 -
Integration costs 4,037 230
Cost of acquisitions 6,067 715
Fair value movement on contingent consideration 22 (1,357)
Contingent consideration and earn-outs from acquisitions 5,207 3,511
Shared-based payment charge from acquisitions 123 -
Net foreign exchange differences on business acquisitions (745) 1,070
Interest receivable (7) (140)
Net foreign exchange gain on borrowings (246) -
Finance expense on contingent consideration 82 196
Finance expense on lease liabilities (IFRS 16) 435 418
Income tax expense (5,586) (3,935)
Effect of adjustments 37,691 - 4.949 22,155 - 3.119
Adjusted profit before tax 52,611 - - 39,559 - -
Tax impact after adjustments (12,811) - (1.682) (8,183) - (1.152)
Adjusted basic earnings per ordinary share 39,800 761,627 5.226 31,376 710,348 4.417
Effect of dilutive potential ordinary shares:
Share options - 32,804 (0.216) - 20,271 (0.123)
Adjusted diluted earnings per ordinary share 39,800 794,431 5.010 31,376 730,619 4.294
Diluted earnings per ordinary share attributable to the owners of the parent 14,920 794,431 1.878 17,404 730,619 2.382
Adjusted earnings per share is stated after the impact of the adjusting items disclosed in Note 6, excluding profit or losses on disposal of fixed assets and right-of-use assets and additional non-cash finance expenses and non-operational interest income disclosed in Note 7. This is to reflect the underlying operational performance of the Group, and exclude interest income earned from cash reserves held by the Group.
The calculation of earnings per share is based on the following earnings and number of shares.
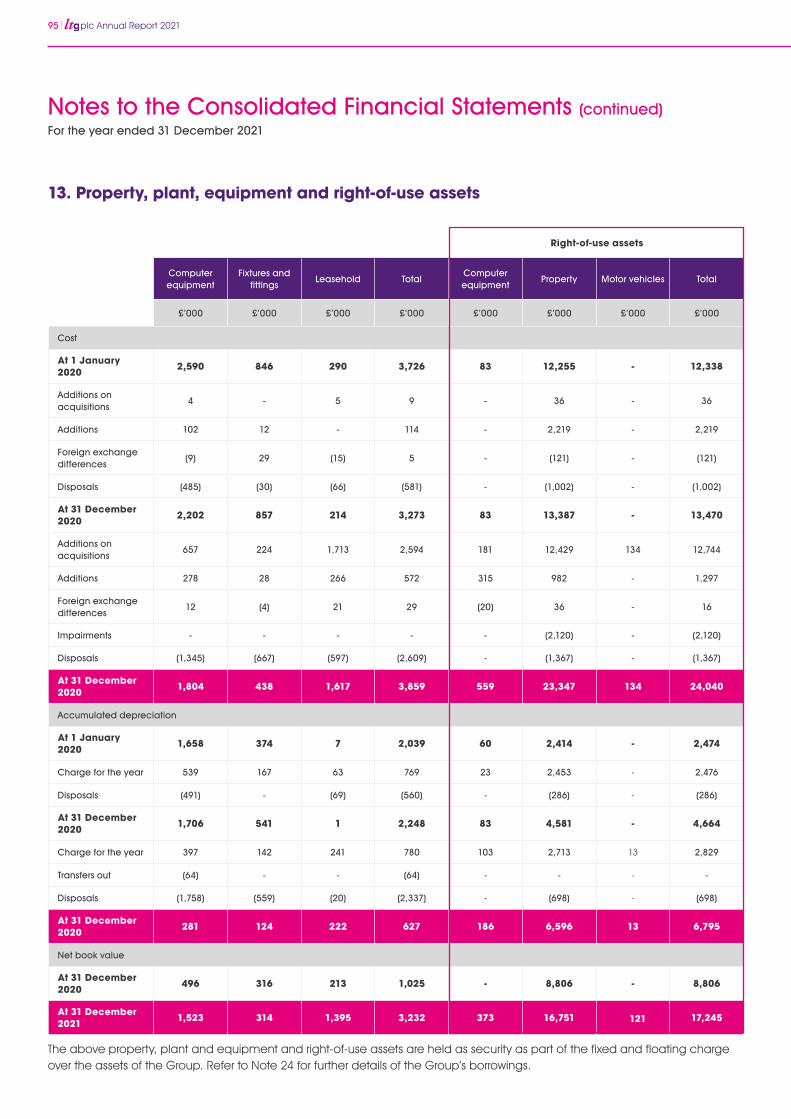
95 plc Annual Report 2021
13. Property, plant, equipment and right-of-use assets
CostComputer equipment
Fixtures andfittings
Leasehold TotalComputer equipment
Property Motor vehicles Total
£’000 £’000 £’000 £’000 £’000 £’000 £’000 £’000
Cost
At 1 January 2020 2,590 846 290 3,726 83 12,255 - 12,338
Additions on acquisitions
4 - 5 9 - 36 - 36
Additions 102 12 - 114 - 2,219 - 2,219
Foreign exchange differences
(9) 29 (15) 5 - (121) - (121)
Disposals (485) (30) (66) (581) - (1,002) - (1,002)
At 31 December 2020 2,202 857 214 3,273 83 13,387 - 13,470
Additions on acquisitions
657 224 1,713 2,594 181 12,429 134 12,744
Additions 278 28 266 572 315 982 - 1,297
Foreign exchange differences
12 (4) 21 29 (20) 36 - 16
Impairments - - - - - (2,120) - (2,120)
Disposals (1,345) (667) (597) (2,609) - (1,367) - (1,367)
At 31 December 2020 1,804 438 1,617 3,859 559 23,347 134 24,040
Accumulated depreciation
At 1 January 2020 1,658 374 7 2,039 60 2,414 - 2,474
Charge for the year 539 167 63 769 23 2,453 - 2,476
Disposals (491) - (69) (560) - (286) - (286)
At 31 December 2020 1,706 541 1 2,248 83 4,581 - 4,664
Charge for the year 397 142 241 780 103 2,713 13 2,829
Transfers out (64) - - (64) - - - -
Disposals (1,758) (559) (20) (2,337) - (698) - (698)
At 31 December 2020 281 124 222 627 186 6,596 13 6,795
Net book value
At 31 December 2020 496 316 213 1,025 - 8,806 - 8,806
At 31 December 2021 1,523 314 1,395 3,232 373 16,751 1 121 17,245
Right-of-use assets
For the year ended 31 December 2021
Notes to the Consolidated Financial Statements (continued)
The above property, plant and equipment and right-of-use assets are held as security as part of the fixed and floating charge over the assets of the Group. Refer to Note 24 for further details of the Group’s borrowings.
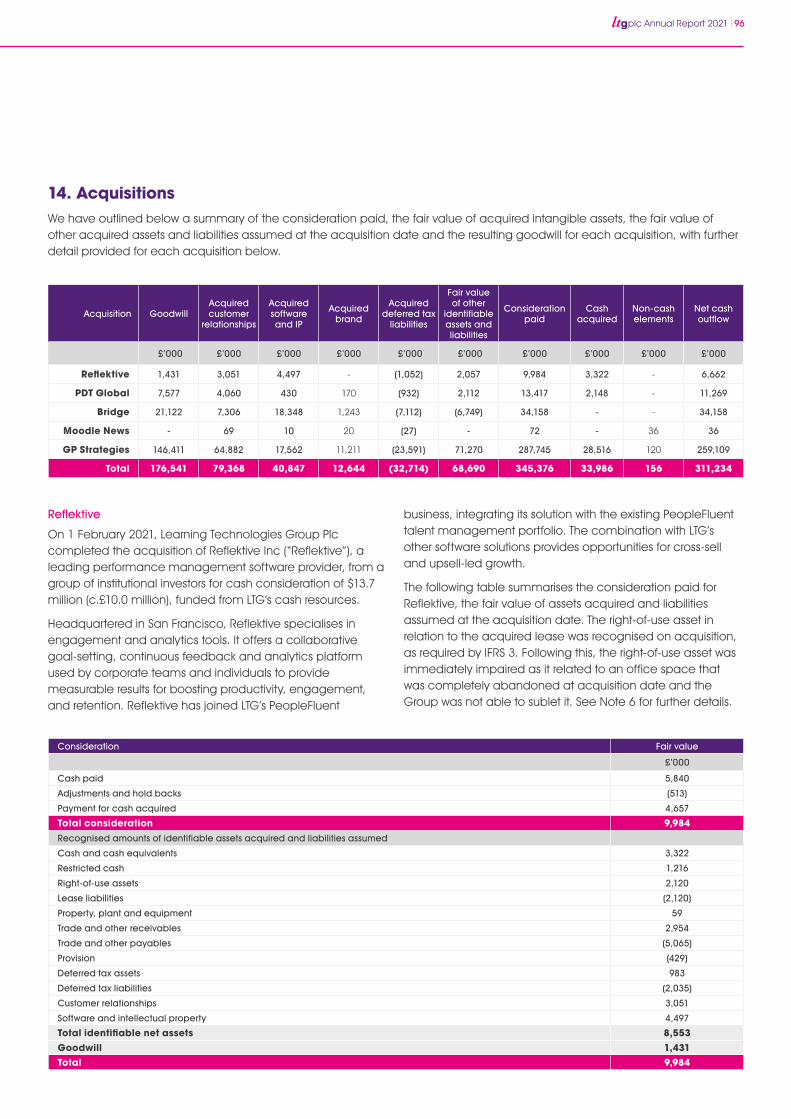
plc Annual Report 2021 96
14. AcquisitionsWe have outlined below a summary of the consideration paid, the fair value of acquired intangible assets, the fair value of other acquired assets and liabilities assumed at the acquisition date and the resulting goodwill for each acquisition, with further detail provided for each acquisition below.
Reflektive
On 1 February 2021, Learning Technologies Group Plc completed the acquisition of Reflektive Inc (“Reflektive”), a leading performance management software provider, from a group of institutional investors for cash consideration of $13.7 million (c.£10.0 million), funded from LTG’s cash resources.
Headquartered in San Francisco, Reflektive specialises in engagement and analytics tools. It offers a collaborative goal-setting, continuous feedback and analytics platform used by corporate teams and individuals to provide measurable results for boosting productivity, engagement, and retention. Reflektive has joined LTG’s PeopleFluent
business, integrating its solution with the existing PeopleFluent talent management portfolio. The combination with LTG’s other software solutions provides opportunities for cross-sell and upsell-led growth.
The following table summarises the consideration paid for Reflektive, the fair value of assets acquired and liabilities assumed at the acquisition date. The right-of-use asset in relation to the acquired lease was recognised on acquisition, as required by IFRS 3. Following this, the right-of-use asset was immediately impaired as it related to an office space that was completely abandoned at acquisition date and the Group was not able to sublet it. See Note 6 for further details.
Acquisition GoodwillAcquired customer
relationships
Acquired software and IP
Acquired brand
Acquired deferred tax
liabilities
Fair value of other
identifiable assets and liabilities
Consideration paid
Cash acquired
Non-cash elements
Net cash outflow
£’000 £’000 £’000 £’000 £’000 £’000 £’000 £’000 £’000 £’000
Reflektive 1,431 3,051 4,497 - (1,052) 2,057 9,984 3,322 - 6,662
PDT Global 7,577 4,060 430 170 (932) 2,112 13,417 2,148 - 11,269
Bridge 21,122 7,306 18,348 1,243 (7,112) (6,749) 34,158 - - 34,158
Moodle News - 69 10 20 (27) - 72 - 36 36
GP Strategies 146,411 64,882 17,562 11,211 (23,591) 71,270 287,745 28,516 120 259,109
Total 176,541 79,368 40,847 12,644 (32,714) 68,690 345,376 33,986 156 311,234
Consideration Fair value
£’000
Cash paid 5,840
Adjustments and hold backs (513)
Payment for cash acquired 4,657
Total consideration 9,984Recognised amounts of identifiable assets acquired and liabilities assumed
Cash and cash equivalents 3,322
Restricted cash 1,216
Right-of-use assets 2,120
Lease liabilities (2,120)
Property, plant and equipment 59
Trade and other receivables 2,954
Trade and other payables (5,065)
Provision (429)
Deferred tax assets 983
Deferred tax liabilities (2,035)
Customer relationships 3,051
Software and intellectual property 4,497
Total identifiable net assets 8,553Goodwill 1,431Total 9,984
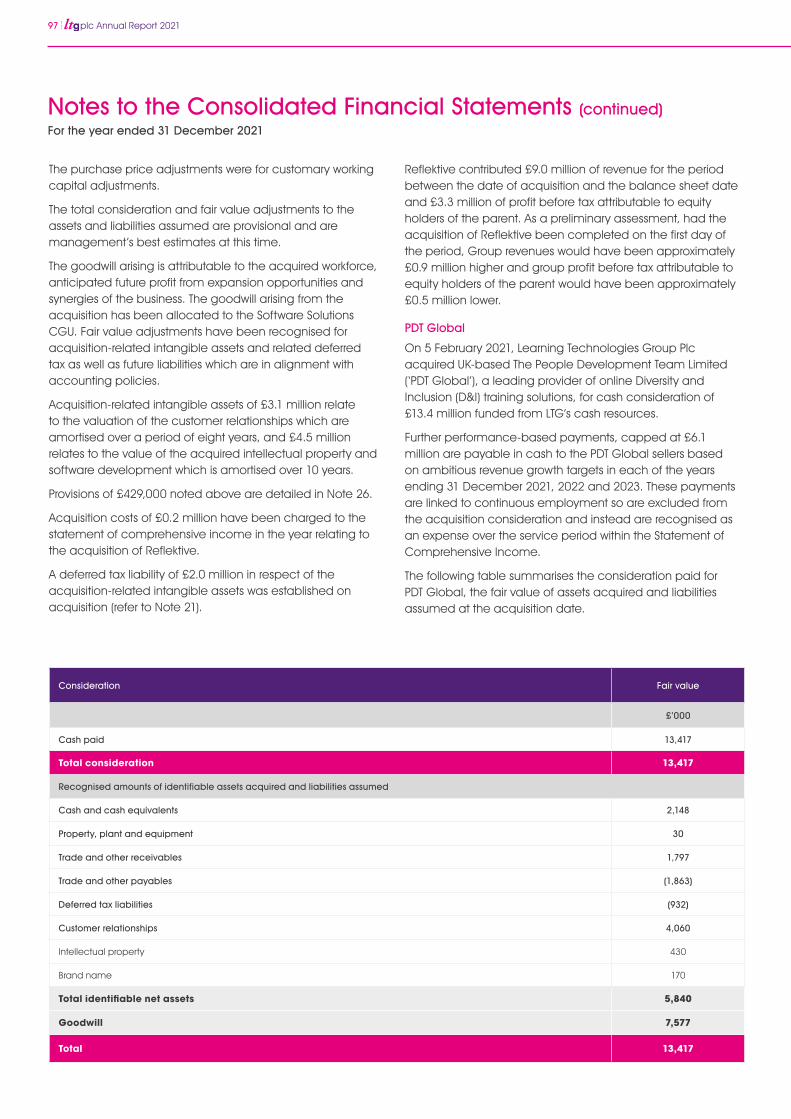
97 plc Annual Report 2021
The purchase price adjustments were for customary working capital adjustments.
The total consideration and fair value adjustments to the assets and liabilities assumed are provisional and are management’s best estimates at this time.
The goodwill arising is attributable to the acquired workforce, anticipated future profit from expansion opportunities and synergies of the business. The goodwill arising from the acquisition has been allocated to the Software Solutions CGU. Fair value adjustments have been recognised for acquisition-related intangible assets and related deferred tax as well as future liabilities which are in alignment with accounting policies.
Acquisition-related intangible assets of £3.1 million relate to the valuation of the customer relationships which are amortised over a period of eight years, and £4.5 million relates to the value of the acquired intellectual property and software development which is amortised over 10 years.
Provisions of £429,000 noted above are detailed in Note 26.
Acquisition costs of £0.2 million have been charged to the statement of comprehensive income in the year relating to the acquisition of Reflektive.
A deferred tax liability of £2.0 million in respect of the acquisition-related intangible assets was established on acquisition (refer to Note 21).
Reflektive contributed £9.0 million of revenue for the period between the date of acquisition and the balance sheet date and £3.3 million of profit before tax attributable to equity holders of the parent. As a preliminary assessment, had the acquisition of Reflektive been completed on the first day of the period, Group revenues would have been approximately £0.9 million higher and group profit before tax attributable to equity holders of the parent would have been approximately £0.5 million lower.
PDT Global
On 5 February 2021, Learning Technologies Group Plc acquired UK-based The People Development Team Limited (‘PDT Global’), a leading provider of online Diversity and Inclusion (D&I) training solutions, for cash consideration of £13.4 million funded from LTG’s cash resources.
Further performance-based payments, capped at £6.1 million are payable in cash to the PDT Global sellers based on ambitious revenue growth targets in each of the years ending 31 December 2021, 2022 and 2023. These payments are linked to continuous employment so are excluded from the acquisition consideration and instead are recognised as an expense over the service period within the Statement of Comprehensive Income.
The following table summarises the consideration paid for PDT Global, the fair value of assets acquired and liabilities assumed at the acquisition date.
Consideration Fair value
£’000
Cash paid 13,417
Total consideration 13,417
Recognised amounts of identifiable assets acquired and liabilities assumed
Cash and cash equivalents 2,148
Property, plant and equipment 30
Trade and other receivables 1,797
Trade and other payables (1,863)
Deferred tax liabilities (932)
Customer relationships 4,060
Intellectual property 430
Brand name 170
Total identifiable net assets 5,840
Goodwill 7,577
Total 13,417
For the year ended 31 December 2021
Notes to the Consolidated Financial Statements (continued)
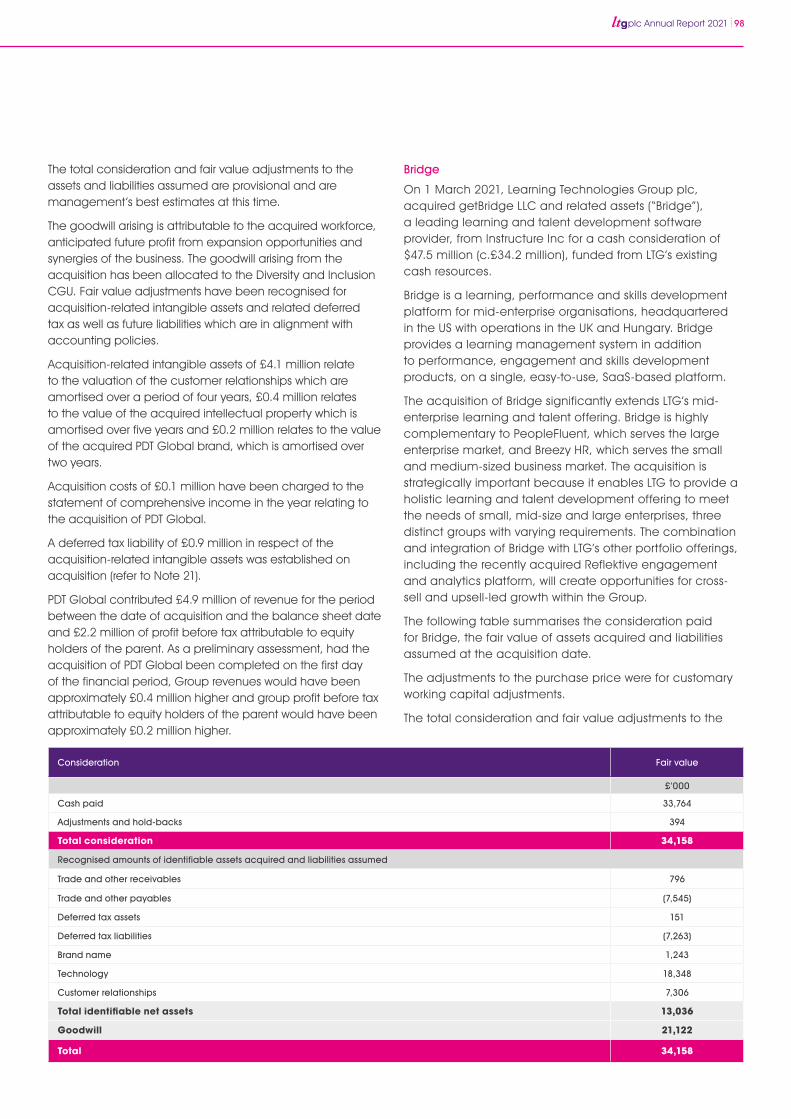
plc Annual Report 2021 98
The total consideration and fair value adjustments to the assets and liabilities assumed are provisional and are management’s best estimates at this time.
The goodwill arising is attributable to the acquired workforce, anticipated future profit from expansion opportunities and synergies of the business. The goodwill arising from the acquisition has been allocated to the Diversity and Inclusion CGU. Fair value adjustments have been recognised for acquisition-related intangible assets and related deferred tax as well as future liabilities which are in alignment with accounting policies.
Acquisition-related intangible assets of £4.1 million relate to the valuation of the customer relationships which are amortised over a period of four years, £0.4 million relates to the value of the acquired intellectual property which is amortised over five years and £0.2 million relates to the value of the acquired PDT Global brand, which is amortised over two years.
Acquisition costs of £0.1 million have been charged to the statement of comprehensive income in the year relating to the acquisition of PDT Global.
A deferred tax liability of £0.9 million in respect of the acquisition-related intangible assets was established on acquisition (refer to Note 21).
PDT Global contributed £4.9 million of revenue for the period between the date of acquisition and the balance sheet date and £2.2 million of profit before tax attributable to equity holders of the parent. As a preliminary assessment, had the acquisition of PDT Global been completed on the first day of the financial period, Group revenues would have been approximately £0.4 million higher and group profit before tax attributable to equity holders of the parent would have been approximately £0.2 million higher.
Bridge
On 1 March 2021, Learning Technologies Group plc, acquired getBridge LLC and related assets (“Bridge”), a leading learning and talent development software provider, from Instructure Inc for a cash consideration of $47.5 million (c.£34.2 million), funded from LTG’s existing cash resources.
Bridge is a learning, performance and skills development platform for mid-enterprise organisations, headquartered in the US with operations in the UK and Hungary. Bridge provides a learning management system in addition to performance, engagement and skills development products, on a single, easy-to-use, SaaS-based platform.
The acquisition of Bridge significantly extends LTG’s mid-enterprise learning and talent offering. Bridge is highly complementary to PeopleFluent, which serves the large enterprise market, and Breezy HR, which serves the small and medium-sized business market. The acquisition is strategically important because it enables LTG to provide a holistic learning and talent development offering to meet the needs of small, mid-size and large enterprises, three distinct groups with varying requirements. The combination and integration of Bridge with LTG’s other portfolio offerings, including the recently acquired Reflektive engagement and analytics platform, will create opportunities for cross-sell and upsell-led growth within the Group.
The following table summarises the consideration paid for Bridge, the fair value of assets acquired and liabilities assumed at the acquisition date.
The adjustments to the purchase price were for customary working capital adjustments.
The total consideration and fair value adjustments to the
Consideration Fair value
£’000
Cash paid 33,764
Adjustments and hold-backs 394
Total consideration 34,158
Recognised amounts of identifiable assets acquired and liabilities assumed
Trade and other receivables 796
Trade and other payables (7,545)
Deferred tax assets 151
Deferred tax liabilities (7,263)
Brand name 1,243
Technology 18,348
Customer relationships 7,306
Total identifiable net assets 13,036
Goodwill 21,122
Total 34,158
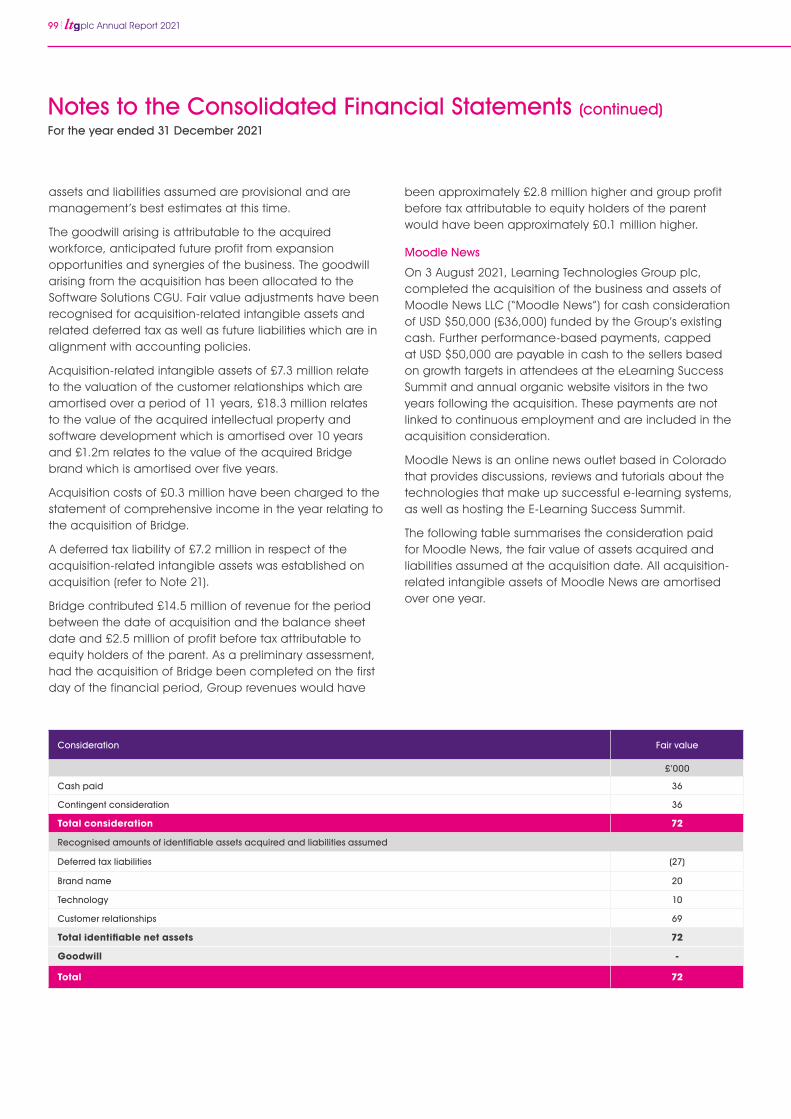
99 plc Annual Report 2021
assets and liabilities assumed are provisional and are management’s best estimates at this time.
The goodwill arising is attributable to the acquired workforce, anticipated future profit from expansion opportunities and synergies of the business. The goodwill arising from the acquisition has been allocated to the Software Solutions CGU. Fair value adjustments have been recognised for acquisition-related intangible assets and related deferred tax as well as future liabilities which are in alignment with accounting policies.
Acquisition-related intangible assets of £7.3 million relate to the valuation of the customer relationships which are amortised over a period of 11 years, £18.3 million relates to the value of the acquired intellectual property and software development which is amortised over 10 years and £1.2m relates to the value of the acquired Bridge brand which is amortised over five years.
Acquisition costs of £0.3 million have been charged to the statement of comprehensive income in the year relating to the acquisition of Bridge.
A deferred tax liability of £7.2 million in respect of the acquisition-related intangible assets was established on acquisition (refer to Note 21).
Bridge contributed £14.5 million of revenue for the period between the date of acquisition and the balance sheet date and £2.5 million of profit before tax attributable to equity holders of the parent. As a preliminary assessment, had the acquisition of Bridge been completed on the first day of the financial period, Group revenues would have
been approximately £2.8 million higher and group profit before tax attributable to equity holders of the parent would have been approximately £0.1 million higher.
Moodle News
On 3 August 2021, Learning Technologies Group plc, completed the acquisition of the business and assets of Moodle News LLC (“Moodle News”) for cash consideration of USD $50,000 (£36,000) funded by the Group’s existing cash. Further performance-based payments, capped at USD $50,000 are payable in cash to the sellers based on growth targets in attendees at the eLearning Success Summit and annual organic website visitors in the two years following the acquisition. These payments are not linked to continuous employment and are included in the acquisition consideration.
Moodle News is an online news outlet based in Colorado that provides discussions, reviews and tutorials about the technologies that make up successful e-learning systems, as well as hosting the E-Learning Success Summit.
The following table summarises the consideration paid for Moodle News, the fair value of assets acquired and liabilities assumed at the acquisition date. All acquisition-related intangible assets of Moodle News are amortised over one year.
Consideration Fair value
£’000
Cash paid 36
Contingent consideration 36
Total consideration 72
Recognised amounts of identifiable assets acquired and liabilities assumed
Deferred tax liabilities (27)
Brand name 20
Technology 10
Customer relationships 69
Total identifiable net assets 72
Goodwill -
Total 72
For the year ended 31 December 2021
Notes to the Consolidated Financial Statements (continued)
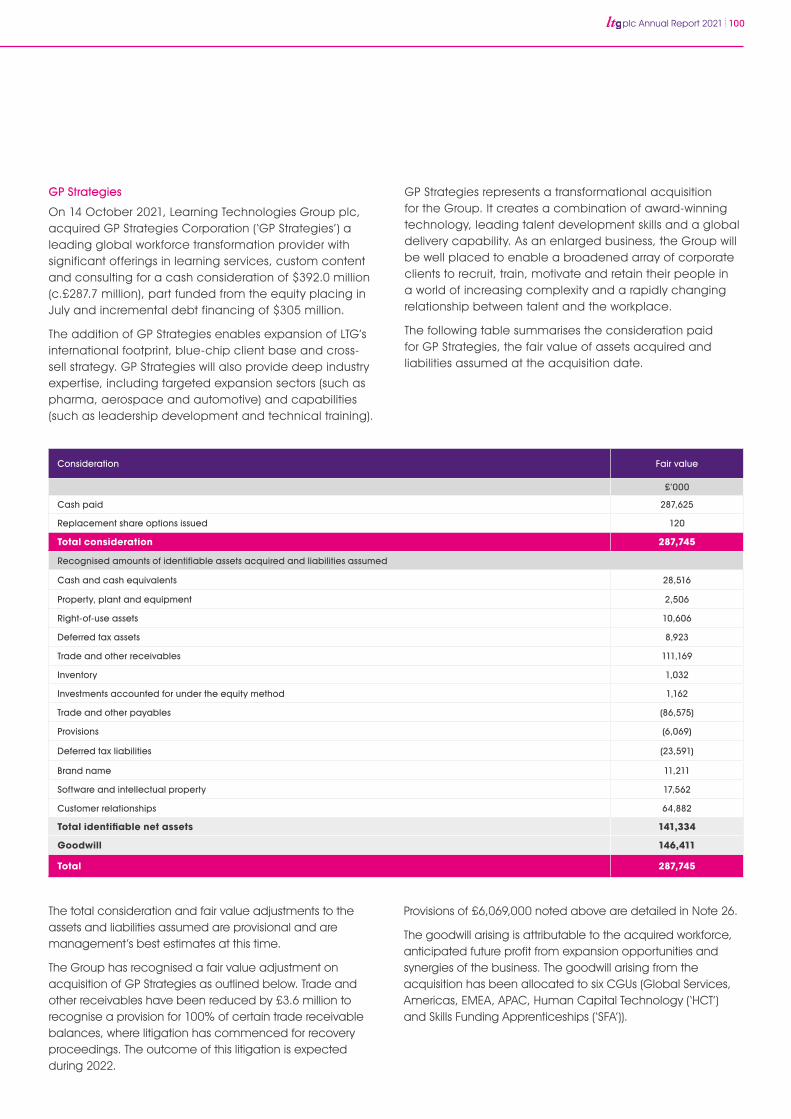
plc Annual Report 2021 100
GP Strategies
On 14 October 2021, Learning Technologies Group plc, acquired GP Strategies Corporation (‘GP Strategies’) a leading global workforce transformation provider with significant offerings in learning services, custom content and consulting for a cash consideration of $392.0 million (c.£287.7 million), part funded from the equity placing in July and incremental debt financing of $305 million.
The addition of GP Strategies enables expansion of LTG’s international footprint, blue-chip client base and cross-sell strategy. GP Strategies will also provide deep industry expertise, including targeted expansion sectors (such as pharma, aerospace and automotive) and capabilities (such as leadership development and technical training).
The total consideration and fair value adjustments to the assets and liabilities assumed are provisional and are management’s best estimates at this time.
The Group has recognised a fair value adjustment on acquisition of GP Strategies as outlined below. Trade and other receivables have been reduced by £3.6 million to recognise a provision for 100% of certain trade receivable balances, where litigation has commenced for recovery proceedings. The outcome of this litigation is expected during 2022.
GP Strategies represents a transformational acquisition for the Group. It creates a combination of award-winning technology, leading talent development skills and a global delivery capability. As an enlarged business, the Group will be well placed to enable a broadened array of corporate clients to recruit, train, motivate and retain their people in a world of increasing complexity and a rapidly changing relationship between talent and the workplace.
The following table summarises the consideration paid for GP Strategies, the fair value of assets acquired and liabilities assumed at the acquisition date.
Provisions of £6,069,000 noted above are detailed in Note 26.
The goodwill arising is attributable to the acquired workforce, anticipated future profit from expansion opportunities and synergies of the business. The goodwill arising from the acquisition has been allocated to six CGUs (Global Services, Americas, EMEA, APAC, Human Capital Technology (‘HCT’) and Skills Funding Apprenticeships (‘SFA’)).
Consideration Fair value
£’000
Cash paid 287,625
Replacement share options issued 120
Total consideration 287,745
Recognised amounts of identifiable assets acquired and liabilities assumed
Cash and cash equivalents 28,516
Property, plant and equipment 2,506
Right-of-use assets 10,606
Deferred tax assets 8,923
Trade and other receivables 111,169
Inventory 1,032
Investments accounted for under the equity method 1,162
Trade and other payables (86,575)
Provisions (6,069)
Deferred tax liabilities (23,591)
Brand name 11,211
Software and intellectual property 17,562
Customer relationships 64,882
Total identifiable net assets 141,334
Goodwill 146,411
Total 287,745
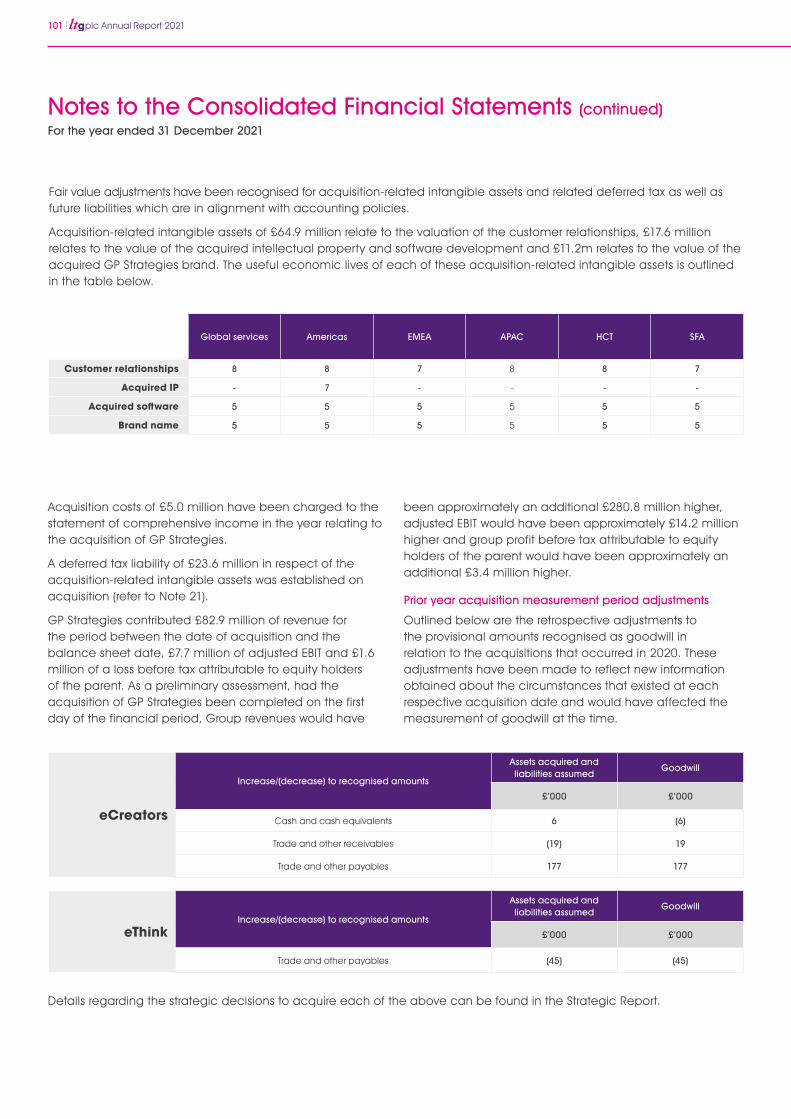
101 plc Annual Report 2021
Fair value adjustments have been recognised for acquisition-related intangible assets and related deferred tax as well as future liabilities which are in alignment with accounting policies.
Acquisition-related intangible assets of £64.9 million relate to the valuation of the customer relationships, £17.6 million relates to the value of the acquired intellectual property and software development and £11.2m relates to the value of the acquired GP Strategies brand. The useful economic lives of each of these acquisition-related intangible assets is outlined in the table below.
Details regarding the strategic decisions to acquire each of the above can be found in the Strategic Report.
Global services Americas EMEA APAC HCT SFA
Customer relationships 8 8 7 8 8 7
Acquired IP - 7 - - - -
Acquired software 5 5 5 5 5 5
Brand name 5 5 5 5 5 5
eCreators
Increase/(decrease) to recognised amounts
Assets acquired and liabilities assumed
Goodwill
£’000 £’000
Cash and cash equivalents 6 (6)
Trade and other receivables (19) 19
Trade and other payables 177 177
eThinkIncrease/(decrease) to recognised amounts
Assets acquired and liabilities assumed
Goodwill
£’000 £’000
Trade and other payables (45) (45)
Acquisition costs of £5.0 million have been charged to the statement of comprehensive income in the year relating to the acquisition of GP Strategies.
A deferred tax liability of £23.6 million in respect of the acquisition-related intangible assets was established on acquisition (refer to Note 21).
GP Strategies contributed £82.9 million of revenue for the period between the date of acquisition and the balance sheet date, £7.7 million of adjusted EBIT and £1.6 million of a loss before tax attributable to equity holders of the parent. As a preliminary assessment, had the acquisition of GP Strategies been completed on the first day of the financial period, Group revenues would have
been approximately an additional £280.8 million higher, adjusted EBIT would have been approximately £14.2 million higher and group profit before tax attributable to equity holders of the parent would have been approximately an additional £3.4 million higher.
Prior year acquisition measurement period adjustments
Outlined below are the retrospective adjustments to the provisional amounts recognised as goodwill in relation to the acquisitions that occurred in 2020. These adjustments have been made to reflect new information obtained about the circumstances that existed at each respective acquisition date and would have affected the measurement of goodwill at the time.
For the year ended 31 December 2021
Notes to the Consolidated Financial Statements (continued)
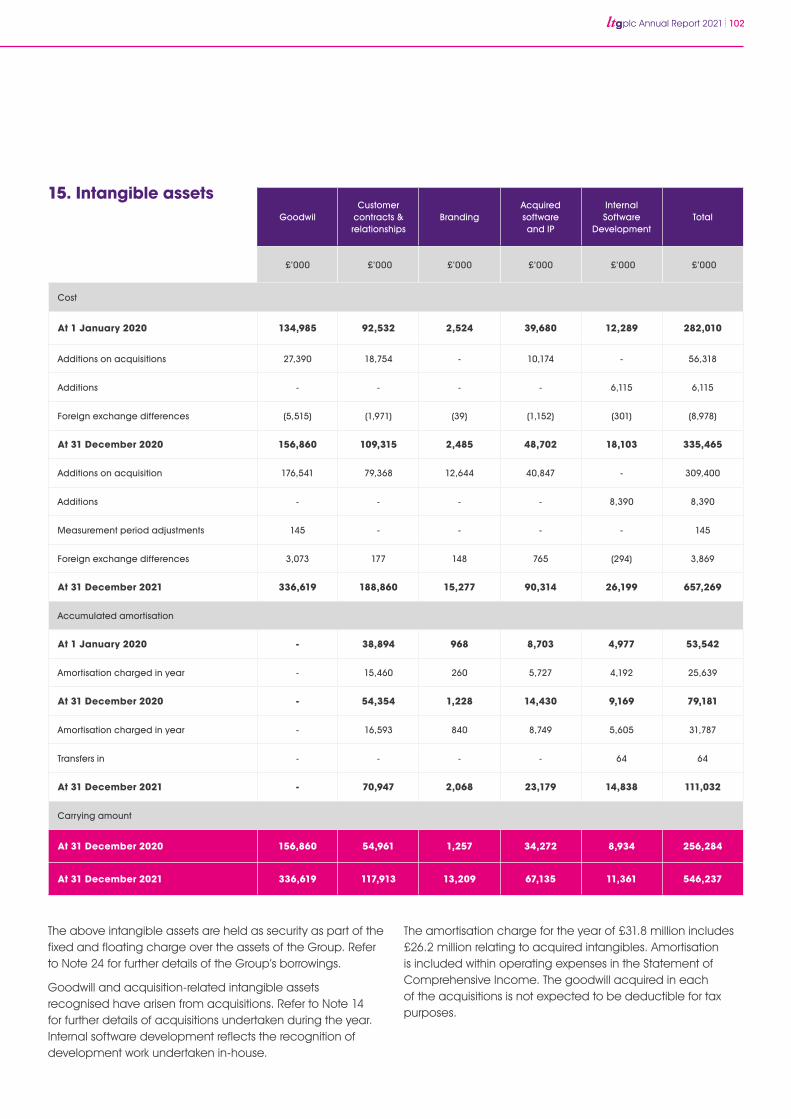
plc Annual Report 2021 102
GoodwilCustomer
contracts & relationships
BrandingAcquired software and IP
Internal Software
DevelopmentTotal
£’000 £’000 £’000 £’000 £’000 £’000
Cost
At 1 January 2020 134,985 92,532 2,524 39,680 12,289 282,010
Additions on acquisitions 27,390 18,754 - 10,174 - 56,318
Additions - - - - 6,115 6,115
Foreign exchange differences (5,515) (1,971) (39) (1,152) (301) (8,978)
At 31 December 2020 156,860 109,315 2,485 48,702 18,103 335,465
Additions on acquisition 176,541 79,368 12,644 40,847 - 309,400
Additions - - - - 8,390 8,390
Measurement period adjustments 145 - - - - 145
Foreign exchange differences 3,073 177 148 765 (294) 3,869
At 31 December 2021 336,619 188,860 15,277 90,314 26,199 657,269
Accumulated amortisation
At 1 January 2020 - 38,894 968 8,703 4,977 53,542
Amortisation charged in year - 15,460 260 5,727 4,192 25,639
At 31 December 2020 - 54,354 1,228 14,430 9,169 79,181
Amortisation charged in year - 16,593 840 8,749 5,605 31,787
Transfers in - - - - 64 64
At 31 December 2021 - 70,947 2,068 23,179 14,838 111,032
Carrying amount
At 31 December 2020 156,860 54,961 1,257 34,272 8,934 256,284
At 31 December 2021 336,619 117,913 13,209 67,135 11,361 546,237
The above intangible assets are held as security as part of the fixed and floating charge over the assets of the Group. Refer to Note 24 for further details of the Group’s borrowings.
Goodwill and acquisition-related intangible assets recognised have arisen from acquisitions. Refer to Note 14 for further details of acquisitions undertaken during the year. Internal software development reflects the recognition of development work undertaken in-house.
The amortisation charge for the year of £31.8 million includes £26.2 million relating to acquired intangibles. Amortisation is included within operating expenses in the Statement of Comprehensive Income. The goodwill acquired in each of the acquisitions is not expected to be deductible for tax purposes.
15. Intangible assets
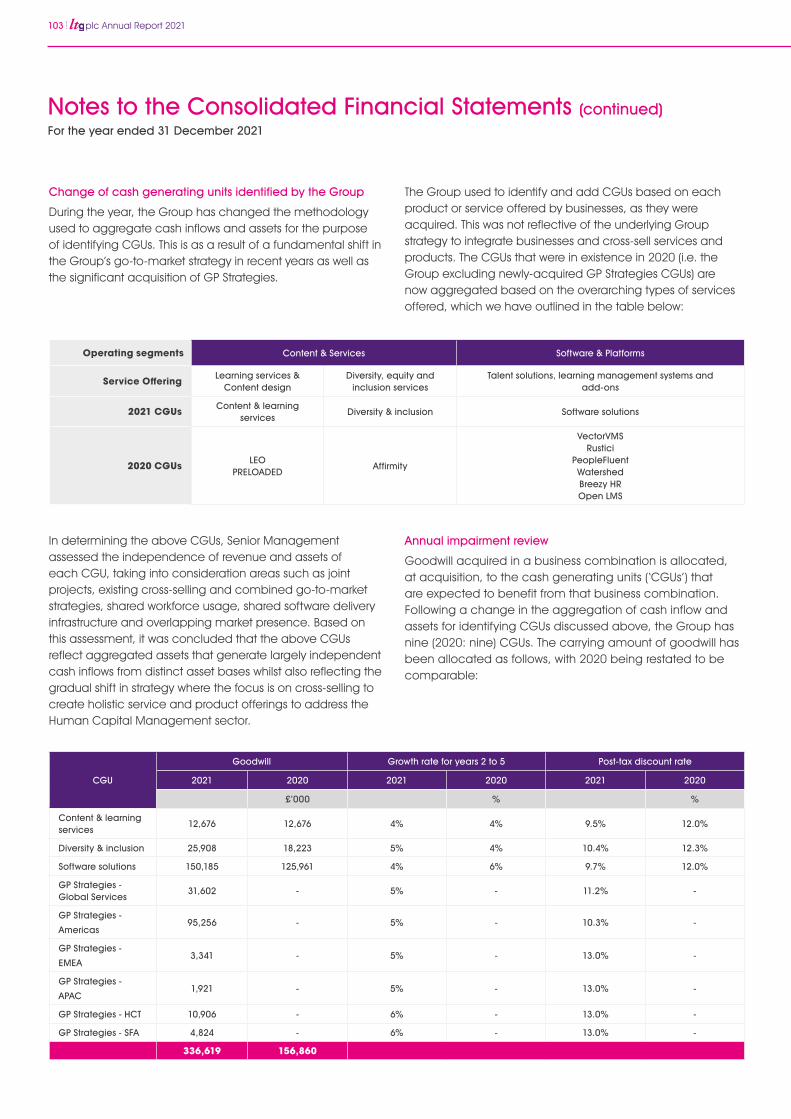
103 plc Annual Report 2021
CGU
Goodwill Growth rate for years 2 to 5 Post-tax discount rate
2021 2020 2021 2020 2021 2020
£’000 % %
Content & learning services
12,676 12,676 4% 4% 9.5% 12.0%
Diversity & inclusion 25,908 18,223 5% 4% 10.4% 12.3%
Software solutions 150,185 125,961 4% 6% 9.7% 12.0%
GP Strategies - Global Services
31,602 - 5% - 11.2% -
GP Strategies -
Americas95,256 - 5% - 10.3% -
GP Strategies -
EMEA3,341 - 5% - 13.0% -
GP Strategies -
APAC1,921 - 5% - 13.0% -
GP Strategies - HCT 10,906 - 6% - 13.0% -
GP Strategies - SFA 4,824 - 6% - 13.0% -
336,619 156,860
Operating segments Content & Services Software & Platforms
Service Offering Learning services & Content design
Diversity, equity and inclusion services
Talent solutions, learning management systems and add-ons
2021 CGUs Content & learning services
Diversity & inclusion Software solutions
2020 CGUs LEOPRELOADED
Affirmity
VectorVMSRustici
PeopleFluentWatershedBreezy HROpen LMS
Change of cash generating units identified by the Group
During the year, the Group has changed the methodology used to aggregate cash inflows and assets for the purpose of identifying CGUs. This is as a result of a fundamental shift in the Group’s go-to-market strategy in recent years as well as the significant acquisition of GP Strategies.
In determining the above CGUs, Senior Management assessed the independence of revenue and assets of each CGU, taking into consideration areas such as joint projects, existing cross-selling and combined go-to-market strategies, shared workforce usage, shared software delivery infrastructure and overlapping market presence. Based on this assessment, it was concluded that the above CGUs reflect aggregated assets that generate largely independent cash inflows from distinct asset bases whilst also reflecting the gradual shift in strategy where the focus is on cross-selling to create holistic service and product offerings to address the Human Capital Management sector.
The Group used to identify and add CGUs based on each product or service offered by businesses, as they were acquired. This was not reflective of the underlying Group strategy to integrate businesses and cross-sell services and products. The CGUs that were in existence in 2020 (i.e. the Group excluding newly-acquired GP Strategies CGUs) are now aggregated based on the overarching types of services offered, which we have outlined in the table below:
Annual impairment review
Goodwill acquired in a business combination is allocated, at acquisition, to the cash generating units (‘CGUs’) that are expected to benefit from that business combination. Following a change in the aggregation of cash inflow and assets for identifying CGUs discussed above, the Group has nine (2020: nine) CGUs. The carrying amount of goodwill has been allocated as follows, with 2020 being restated to be comparable:
For the year ended 31 December 2021
Notes to the Consolidated Financial Statements (continued)
plc Annual Report 2021 104
The Group tests goodwill annually for impairment or more frequently if there are indications that goodwill might be impaired. The recoverable amounts of the CGUs are determined from value in use. The key assumptions for the value in use calculations are those regarding the discount rates (being the companies cost of capital), growth rates (based on Board-approved forecasts for 2022 and estimated growth rates in years 2 to 5) and future EBIT margins (which are based on past experience). The Group monitors its pre-tax Weighted Average Cost of Capital and those of its competitors using market data. In considering the discount rates applying to CGUs, the Directors have considered the relative sizes, risks and the inter-dependencies of its CGUs. The impairment reviews use a discount rate adjusted for post-tax cash flows. The Group prepares cash flow forecasts derived from the 2022 financial plan approved by the Board and extrapolates revenues, net margins and cash flows for the following four years based on forecast growth rates of the CGUs. Cash flows beyond this five-year period are also considered in assessing the need for any impairment provisions. The growth rates are based on internal growth forecasts of between 4% and 6% for the first five years. The terminal rate used for the value-in-use calculation thereafter is 2.5%.
For all CGUs, there is substantial headroom between the calculated value-in-use and the net book value.
Sensitivity analysis
A reduction to 0% for the terminal rate applied to the cash flows (with other assumptions remaining constant) would not result in an impairment to any CGU.
A 10% decrease in the 2022 cash flows used in the discounted cash flow model for the value-in-use calculation (with other assumptions remaining constant) would not result in an impairment to any CGU.
A 250bps increase in discount rates used in the discounted cash flow model for the value-in-use calculation (with other assumptions remaining constant) would not result in an impairment to any CGU.
A 10% decrease in the 2022 cash flows and a 250bps increase in the discount rates used in the discounted cash flow model for the value-in-use calculation (with other assumptions remaining constant) would result in an impairment in the GP Strategies Americas CGU of c. £4.2 million. Our sensitivity analysis has concluded that, with the exception of the GP Strategies Americas CGU, these changes would not result in an impairment to any other CGU.
Management does not consider that any reasonably possible changes in the assumptions for the above CGUs would result in an impairment.
As disclosed in Note 2, Accounting policies, the forecast cash flows used within the impairment model are based on assumptions which are sources of estimation uncertainty and it is possible that significant changes to these assumptions could lead to an impairment of goodwill and acquired intangibles. Given the uncertainty surrounding the macroeconomic factors including the impact of COVID-19, geopolitical uncertainties and inflationary pressures on the Group’s operations and on the global economy, management has considered a range of sensitivities on each of the key assumptions, with other variables held constant. The sensitivities which were each assessed in isolation include; applying a 10% reduction in the revenue assumption in the next financial year from the base cash flow projections, representing a slower recovery from the impact of COVID-19; increases in the discount rate by 1% and reductions in the long-term growth rates to 0%. Under these severe scenarios, the estimated recoverable amount of goodwill and acquired intangibles still exceeded the carrying value of all CGUs.
The sensitivity analysis showed that no reasonably possible change in assumptions would lead to an impairment.
Customer contracts, relationships, branding and acquired IP
These intangible assets include the Group’s aggregate amounts spent on the acquisition of industry-specific knowledge, software technology, branding and customer relationships. These assets arose from acquisition as part of business combinations.
The fair value of these assets is determined by discounting estimated future net cash flows generated by the asset where no active market for the assets exists.
The cost of these intangible assets is amortised over the estimated useful life of each separate asset of between two and 12 years.
Internal software development
Internal software development costs principally comprise expenditure incurred on major software development projects and the production of generic e-learning content where it is reasonably anticipated that the costs will be recovered through future commercial activity.
Capitalised development costs are amortised over the estimated useful life of between two and 10 years.
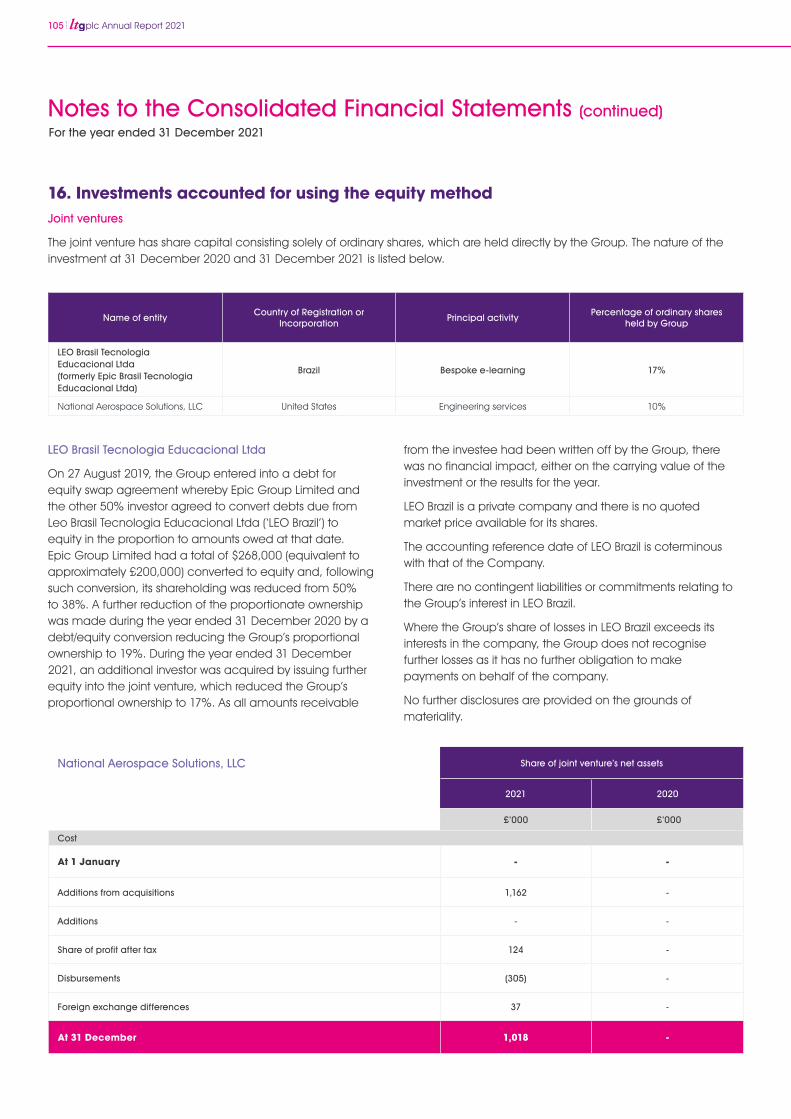
105 plc Annual Report 2021
LEO Brasil Tecnologia Educacional Ltda
On 27 August 2019, the Group entered into a debt for equity swap agreement whereby Epic Group Limited and the other 50% investor agreed to convert debts due from Leo Brasil Tecnologia Educacional Ltda (‘LEO Brazil’) to equity in the proportion to amounts owed at that date. Epic Group Limited had a total of $268,000 (equivalent to approximately £200,000) converted to equity and, following such conversion, its shareholding was reduced from 50% to 38%. A further reduction of the proportionate ownership was made during the year ended 31 December 2020 by a debt/equity conversion reducing the Group’s proportional ownership to 19%. During the year ended 31 December 2021, an additional investor was acquired by issuing further equity into the joint venture, which reduced the Group’s proportional ownership to 17%. As all amounts receivable
from the investee had been written off by the Group, there was no financial impact, either on the carrying value of the investment or the results for the year.
LEO Brazil is a private company and there is no quoted market price available for its shares.
The accounting reference date of LEO Brazil is coterminous with that of the Company.
There are no contingent liabilities or commitments relating to the Group’s interest in LEO Brazil.
Where the Group’s share of losses in LEO Brazil exceeds its interests in the company, the Group does not recognise further losses as it has no further obligation to make payments on behalf of the company.
No further disclosures are provided on the grounds of materiality.
16. Investments accounted for using the equity method Joint ventures
The joint venture has share capital consisting solely of ordinary shares, which are held directly by the Group. The nature of the investment at 31 December 2020 and 31 December 2021 is listed below.
Name of entityCountry of Registration or
IncorporationPrincipal activity
Percentage of ordinary shares held by Group
LEO Brasil TecnologiaEducacional Ltda (formerly Epic Brasil TecnologiaEducacional Ltda)
Brazil Bespoke e-learning 17%
National Aerospace Solutions, LLC United States Engineering services 10%
For the year ended 31 December 2021
Notes to the Consolidated Financial Statements (continued)
National Aerospace Solutions, LLC Share of joint venture’s net assets
2021 2020
£’000 £’000
Cost
At 1 January - -
Additions from acquisitions 1,162 -
Additions - -
Share of profit after tax 124 -
Disbursements (305) -
Foreign exchange differences 37 -
At 31 December 1,018 -
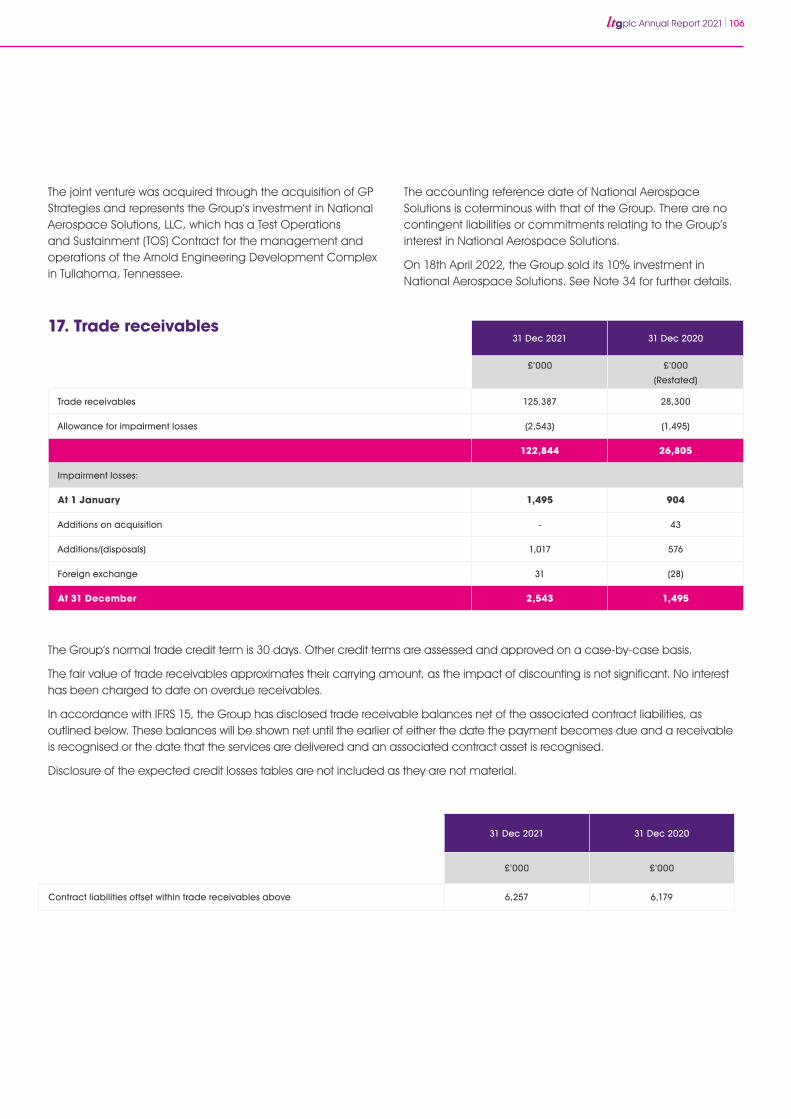
plc Annual Report 2021 106
The Group’s normal trade credit term is 30 days. Other credit terms are assessed and approved on a case-by-case basis.
The fair value of trade receivables approximates their carrying amount, as the impact of discounting is not significant. No interest has been charged to date on overdue receivables.
In accordance with IFRS 15, the Group has disclosed trade receivable balances net of the associated contract liabilities, as outlined below. These balances will be shown net until the earlier of either the date the payment becomes due and a receivable is recognised or the date that the services are delivered and an associated contract asset is recognised.
Disclosure of the expected credit losses tables are not included as they are not material.
31 Dec 2021 31 Dec 2020
£’000 £’000
(Restated)
Trade receivables 125,387 28,300
Allowance for impairment losses (2,543) (1,495)
122,844 26,805
Impairment losses:
At 1 January 1,495 904
Additions on acquisition - 43
Additions/(disposals) 1,017 576
Foreign exchange 31 (28)
At 31 December 2,543 1,495
17. Trade receivables
The joint venture was acquired through the acquisition of GP Strategies and represents the Group’s investment in National Aerospace Solutions, LLC, which has a Test Operations and Sustainment (TOS) Contract for the management and operations of the Arnold Engineering Development Complex in Tullahoma, Tennessee.
The accounting reference date of National Aerospace Solutions is coterminous with that of the Group. There are no contingent liabilities or commitments relating to the Group’s interest in National Aerospace Solutions.
On 18th April 2022, the Group sold its 10% investment in National Aerospace Solutions. See Note 34 for further details.
31 Dec 2021 31 Dec 2020
£’000 £’000
Contract liabilities offset within trade receivables above 6,257 6,179
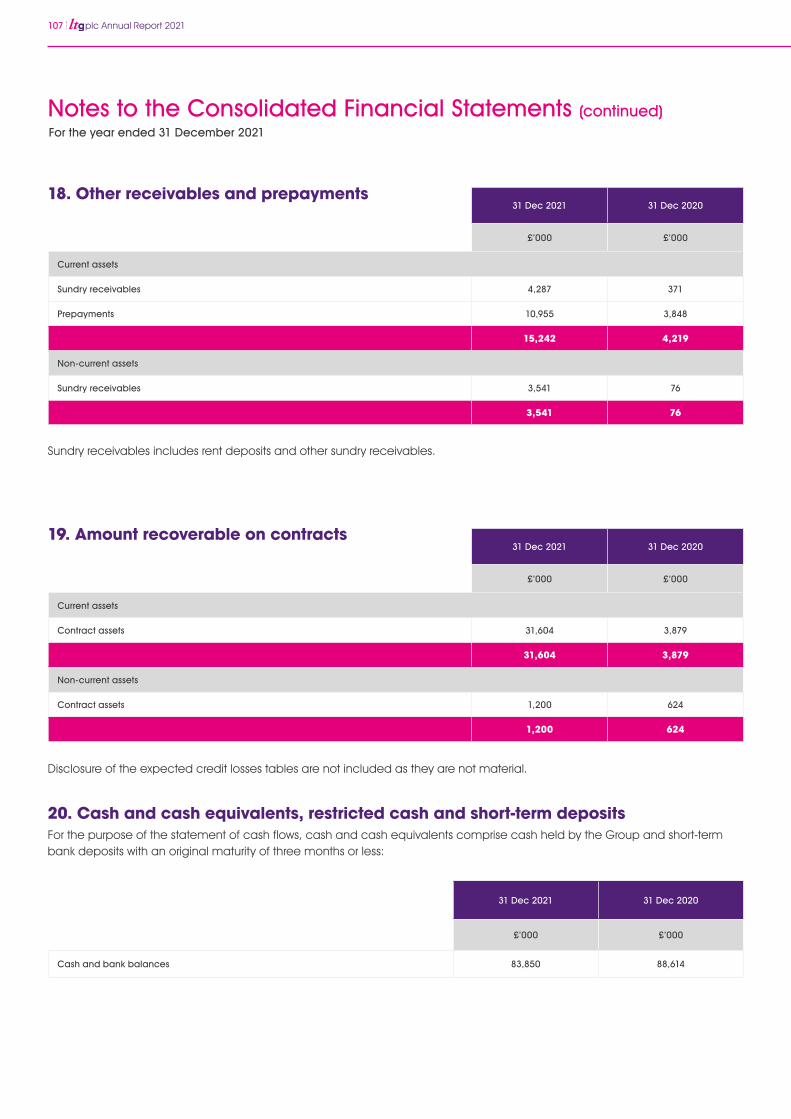
107 plc Annual Report 2021
31 Dec 2021 31 Dec 2020
£’000 £’000
Cash and bank balances 83,850 88,614
31 Dec 2021 31 Dec 2020
£’000 £’000
Current assets
Contract assets 31,604 3,879
31,604 3,879
Non-current assets
Contract assets 1,200 624
1,200 624
19. Amount recoverable on contracts
Disclosure of the expected credit losses tables are not included as they are not material.
20. Cash and cash equivalents, restricted cash and short-term depositsFor the purpose of the statement of cash flows, cash and cash equivalents comprise cash held by the Group and short-term bank deposits with an original maturity of three months or less:
31 Dec 2021 31 Dec 2020
£’000 £’000
Current assets
Sundry receivables 4,287 371
Prepayments 10,955 3,848
15,242 4,219
Non-current assets
Sundry receivables 3,541 76
3,541 76
18. Other receivables and prepayments
Sundry receivables includes rent deposits and other sundry receivables.
For the year ended 31 December 2021
Notes to the Consolidated Financial Statements (continued)
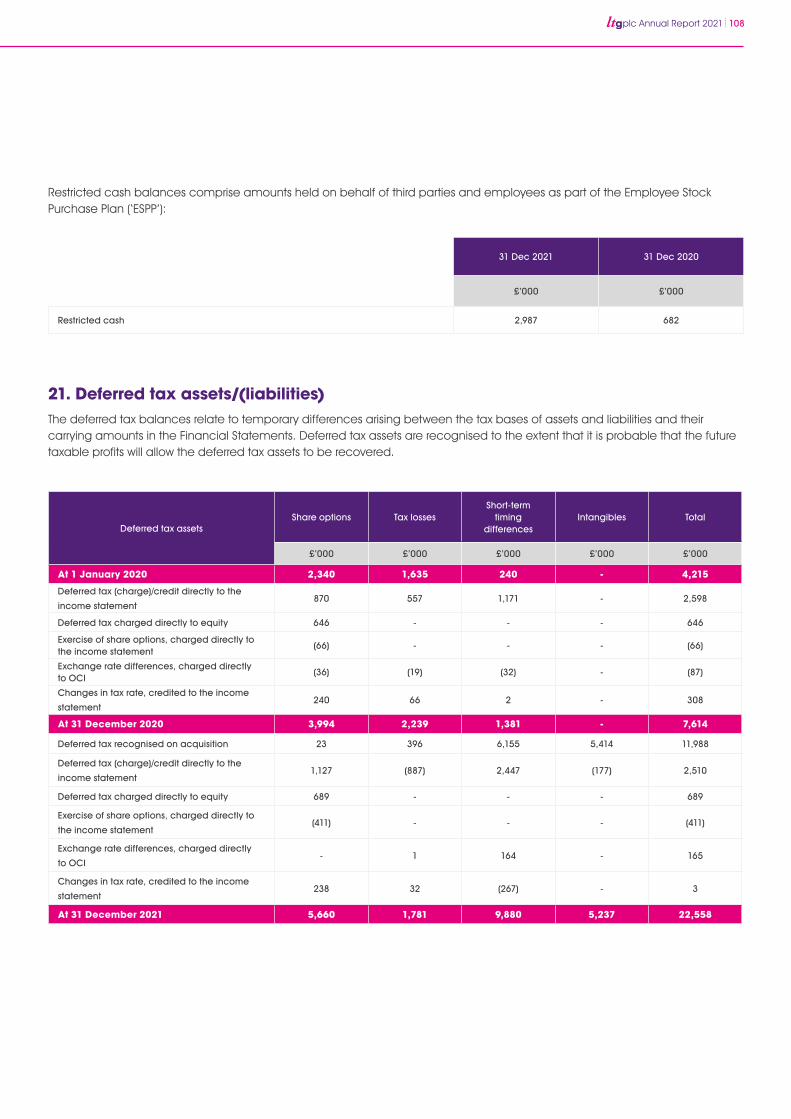
plc Annual Report 2021 108
31 Dec 2021 31 Dec 2020
£’000 £’000
Restricted cash 2,987 682
Restricted cash balances comprise amounts held on behalf of third parties and employees as part of the Employee Stock Purchase Plan (‘ESPP’):
21. Deferred tax assets/(liabilities) The deferred tax balances relate to temporary differences arising between the tax bases of assets and liabilities and their carrying amounts in the Financial Statements. Deferred tax assets are recognised to the extent that it is probable that the future taxable profits will allow the deferred tax assets to be recovered.
Deferred tax assetsShare options Tax losses
Short-termtiming
differences Intangibles Total
£’000 £’000 £’000 £’000 £’000
At 1 January 2020 2,340 1,635 240 - 4,215
Deferred tax (charge)/credit directly to the
income statement870 557 1,171 - 2,598
Deferred tax charged directly to equity 646 - - - 646
Exercise of share options, charged directly to the income statement
(66) - - - (66)
Exchange rate differences, charged directly to OCI
(36) (19) (32) - (87)
Changes in tax rate, credited to the income
statement240 66 2 - 308
At 31 December 2020 3,994 2,239 1,381 - 7,614
Deferred tax recognised on acquisition 23 396 6,155 5,414 11,988
Deferred tax (charge)/credit directly to the
income statement1,127 (887) 2,447 (177) 2,510
Deferred tax charged directly to equity 689 - - - 689
Exercise of share options, charged directly to
the income statement(411) - - - (411)
Exchange rate differences, charged directly
to OCI- 1 164 - 165
Changes in tax rate, credited to the income
statement238 32 (267) - 3
At 31 December 2021 5,660 1,781 9,880 5,237 22,558
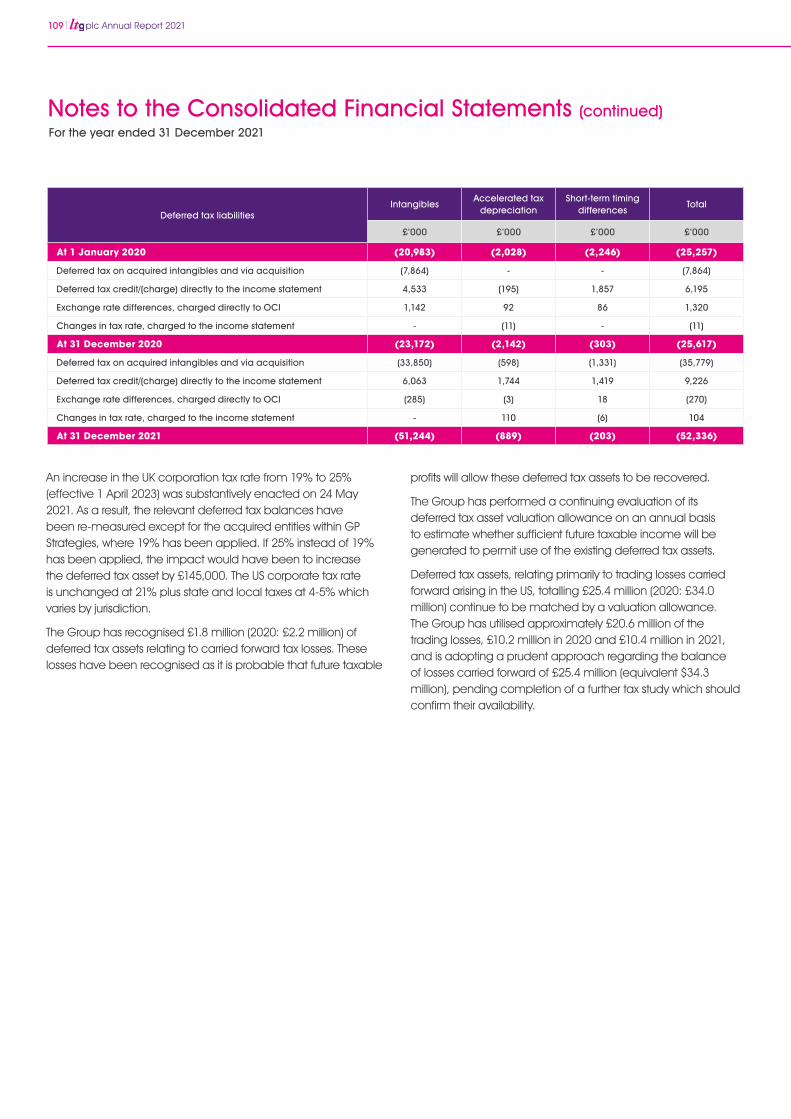
109 plc Annual Report 2021
Deferred tax liabilitiesIntangibles
Accelerated taxdepreciation
Short-term timingdifferences
Total
£’000 £’000 £’000 £’000
At 1 January 2020 (20,983) (2,028) (2,246) (25,257)
Deferred tax on acquired intangibles and via acquisition (7,864) - - (7,864)
Deferred tax credit/(charge) directly to the income statement 4,533 (195) 1,857 6,195
Exchange rate differences, charged directly to OCI 1,142 92 86 1,320
Changes in tax rate, charged to the income statement - (11) - (11)
At 31 December 2020 (23,172) (2,142) (303) (25,617)
Deferred tax on acquired intangibles and via acquisition (33,850) (598) (1,331) (35,779)
Deferred tax credit/(charge) directly to the income statement 6,063 1,744 1,419 9,226
Exchange rate differences, charged directly to OCI (285) (3) 18 (270)
Changes in tax rate, charged to the income statement - 110 (6) 104
At 31 December 2021 (51,244) (889) (203) (52,336)
An increase in the UK corporation tax rate from 19% to 25% (effective 1 April 2023) was substantively enacted on 24 May 2021. As a result, the relevant deferred tax balances have been re-measured except for the acquired entities within GP Strategies, where 19% has been applied. If 25% instead of 19% has been applied, the impact would have been to increase the deferred tax asset by £145,000. The US corporate tax rate is unchanged at 21% plus state and local taxes at 4-5% which varies by jurisdiction.
The Group has recognised £1.8 million (2020: £2.2 million) of deferred tax assets relating to carried forward tax losses. These losses have been recognised as it is probable that future taxable
profits will allow these deferred tax assets to be recovered.
The Group has performed a continuing evaluation of its deferred tax asset valuation allowance on an annual basis to estimate whether sufficient future taxable income will be generated to permit use of the existing deferred tax assets.
Deferred tax assets, relating primarily to trading losses carried forward arising in the US, totalling £25.4 million (2020: £34.0 million) continue to be matched by a valuation allowance. The Group has utilised approximately £20.6 million of the trading losses, £10.2 million in 2020 and £10.4 million in 2021, and is adopting a prudent approach regarding the balance of losses carried forward of £25.4 million (equivalent $34.3 million), pending completion of a further tax study which should confirm their availability.
For the year ended 31 December 2021
Notes to the Consolidated Financial Statements (continued)
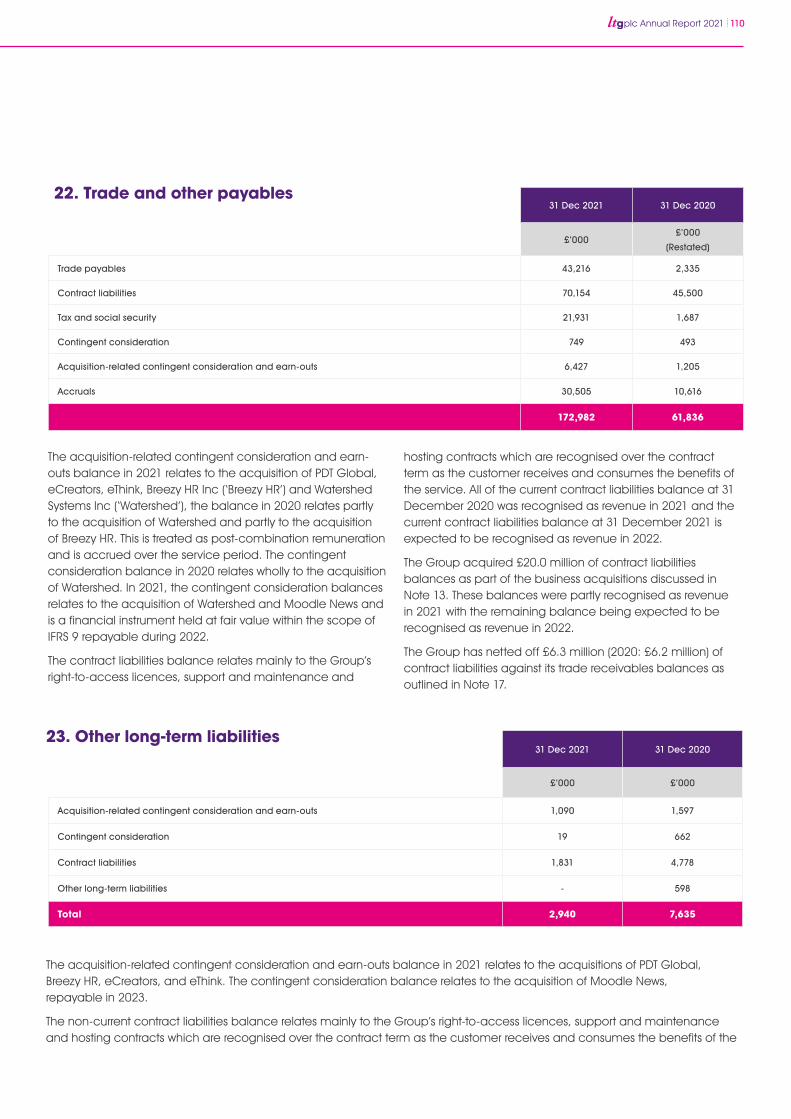
plc Annual Report 2021 110
31 Dec 2021 31 Dec 2020
£’000 £’000
Acquisition-related contingent consideration and earn-outs 1,090 1,597
Contingent consideration 19 662
Contract liabilities 1,831 4,778
Other long-term liabilities - 598
Total 2,940 7,635
31 Dec 2021 31 Dec 2020
£’000£’000
(Restated)
Trade payables 43,216 2,335
Contract liabilities 70,154 45,500
Tax and social security 21,931 1,687
Contingent consideration 749 493
Acquisition-related contingent consideration and earn-outs 6,427 1,205
Accruals 30,505 10,616
172,982 61,836
22. Trade and other payables
23. Other long-term liabilities
The acquisition-related contingent consideration and earn-outs balance in 2021 relates to the acquisition of PDT Global, eCreators, eThink, Breezy HR Inc (‘Breezy HR’) and Watershed Systems Inc (‘Watershed’), the balance in 2020 relates partly to the acquisition of Watershed and partly to the acquisition of Breezy HR. This is treated as post-combination remuneration and is accrued over the service period. The contingent consideration balance in 2020 relates wholly to the acquisition of Watershed. In 2021, the contingent consideration balances relates to the acquisition of Watershed and Moodle News and is a financial instrument held at fair value within the scope of IFRS 9 repayable during 2022.
The contract liabilities balance relates mainly to the Group’s right-to-access licences, support and maintenance and
The acquisition-related contingent consideration and earn-outs balance in 2021 relates to the acquisitions of PDT Global, Breezy HR, eCreators, and eThink. The contingent consideration balance relates to the acquisition of Moodle News, repayable in 2023.
The non-current contract liabilities balance relates mainly to the Group’s right-to-access licences, support and maintenance and hosting contracts which are recognised over the contract term as the customer receives and consumes the benefits of the
hosting contracts which are recognised over the contract term as the customer receives and consumes the benefits of the service. All of the current contract liabilities balance at 31 December 2020 was recognised as revenue in 2021 and the current contract liabilities balance at 31 December 2021 is expected to be recognised as revenue in 2022.
The Group acquired £20.0 million of contract liabilities balances as part of the business acquisitions discussed in Note 13. These balances were partly recognised as revenue in 2021 with the remaining balance being expected to be recognised as revenue in 2022.
The Group has netted off £6.3 million (2020: £6.2 million) of contract liabilities against its trade receivables balances as outlined in Note 17.
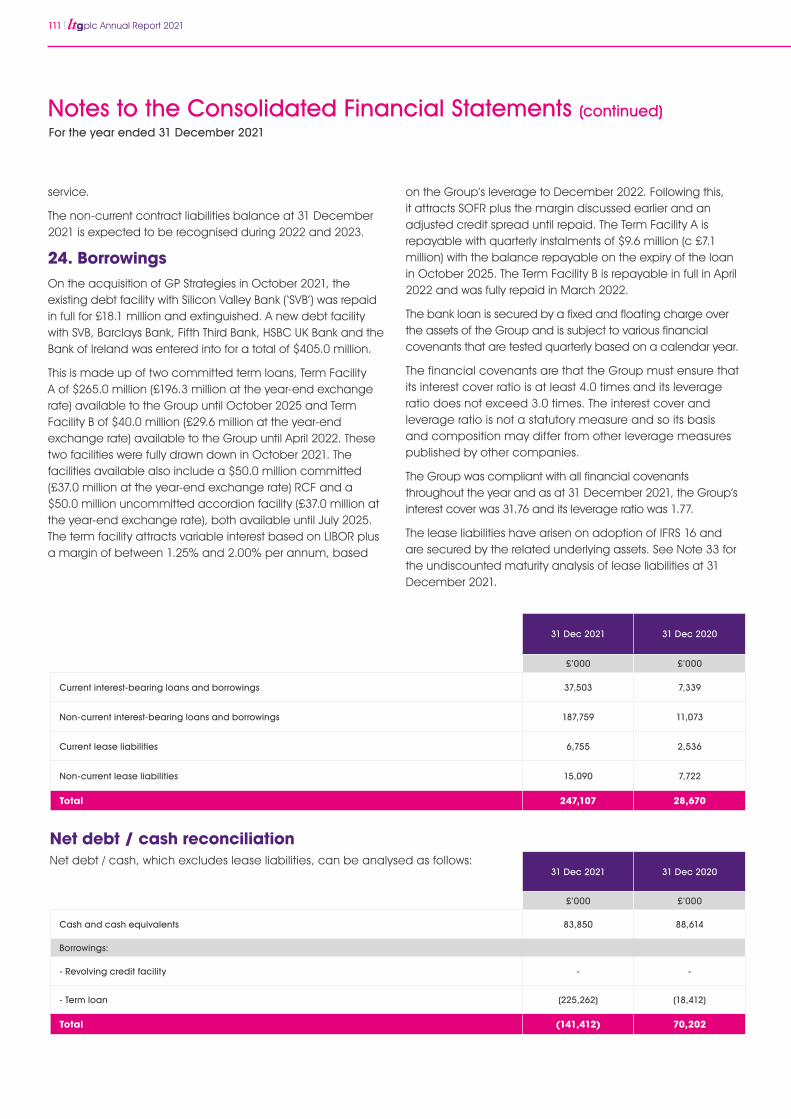
111 plc Annual Report 2021
service.
The non-current contract liabilities balance at 31 December 2021 is expected to be recognised during 2022 and 2023.
24. BorrowingsOn the acquisition of GP Strategies in October 2021, the existing debt facility with Silicon Valley Bank (‘SVB’) was repaid in full for £18.1 million and extinguished. A new debt facility with SVB, Barclays Bank, Fifth Third Bank, HSBC UK Bank and the Bank of Ireland was entered into for a total of $405.0 million.
This is made up of two committed term loans, Term Facility A of $265.0 million (£196.3 million at the year-end exchange rate) available to the Group until October 2025 and Term Facility B of $40.0 million (£29.6 million at the year-end exchange rate) available to the Group until April 2022. These two facilities were fully drawn down in October 2021. The facilities available also include a $50.0 million committed (£37.0 million at the year-end exchange rate) RCF and a $50.0 million uncommitted accordion facility (£37.0 million at the year-end exchange rate), both available until July 2025. The term facility attracts variable interest based on LIBOR plus a margin of between 1.25% and 2.00% per annum, based
on the Group’s leverage to December 2022. Following this, it attracts SOFR plus the margin discussed earlier and an adjusted credit spread until repaid. The Term Facility A is repayable with quarterly instalments of $9.6 million (c £7.1 million) with the balance repayable on the expiry of the loan in October 2025. The Term Facility B is repayable in full in April 2022 and was fully repaid in March 2022.
The bank loan is secured by a fixed and floating charge over the assets of the Group and is subject to various financial covenants that are tested quarterly based on a calendar year.
The financial covenants are that the Group must ensure that its interest cover ratio is at least 4.0 times and its leverage ratio does not exceed 3.0 times. The interest cover and leverage ratio is not a statutory measure and so its basis and composition may differ from other leverage measures published by other companies.
The Group was compliant with all financial covenants throughout the year and as at 31 December 2021, the Group’s interest cover was 31.76 and its leverage ratio was 1.77.
The lease liabilities have arisen on adoption of IFRS 16 and are secured by the related underlying assets. See Note 33 for the undiscounted maturity analysis of lease liabilities at 31 December 2021.
31 Dec 2021 31 Dec 2020
£’000 £’000
Current interest-bearing loans and borrowings 37,503 7,339
Non-current interest-bearing loans and borrowings 187,759 11,073
Current lease liabilities 6,755 2,536
Non-current lease liabilities 15,090 7,722
Total 247,107 28,670
31 Dec 2021 31 Dec 2020
£’000 £’000
Cash and cash equivalents 83,850 88,614
Borrowings:
- Revolving credit facility - -
- Term loan (225,262) (18,412)
Total (141,412) 70,202
Net debt / cash reconciliationNet debt / cash, which excludes lease liabilities, can be analysed as follows:
For the year ended 31 December 2021
Notes to the Consolidated Financial Statements (continued)
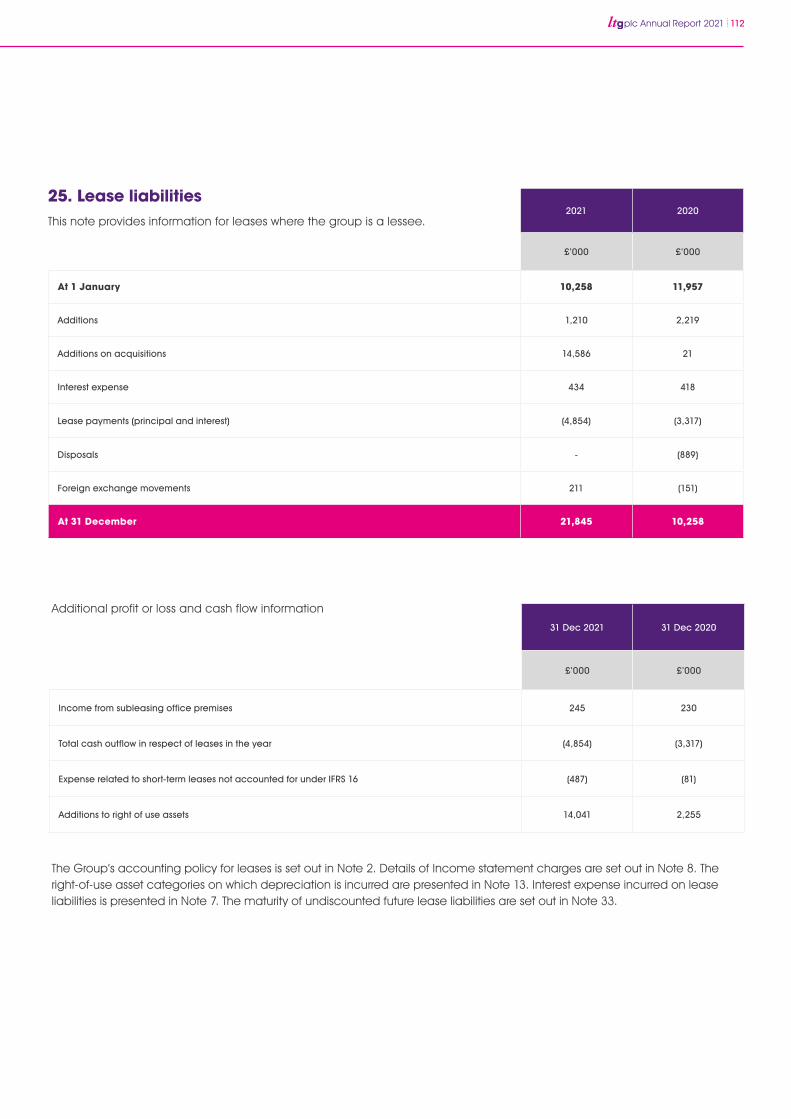
plc Annual Report 2021 112
31 Dec 2018 2021 2020
£’000 £’000
At 1 January 10,258 11,957
Additions 1,210 2,219
Additions on acquisitions 14,586 21
Interest expense 434 418
Lease payments (principal and interest) (4,854) (3,317)
Disposals - (889)
Foreign exchange movements 211 (151)
At 31 December 21,845 10,258
25. Lease liabilitiesThis note provides information for leases where the group is a lessee.
31 Dec 2018 31 Dec 2021 31 Dec 2020
£’000 £’000
Income from subleasing office premises 245 230
Total cash outflow in respect of leases in the year (4,854) (3,317)
Expense related to short-term leases not accounted for under IFRS 16 (487) (81)
Additions to right of use assets 14,041 2,255
Additional profit or loss and cash flow information
The Group’s accounting policy for leases is set out in Note 2. Details of Income statement charges are set out in Note 8. The right-of-use asset categories on which depreciation is incurred are presented in Note 13. Interest expense incurred on lease liabilities is presented in Note 7. The maturity of undiscounted future lease liabilities are set out in Note 33.
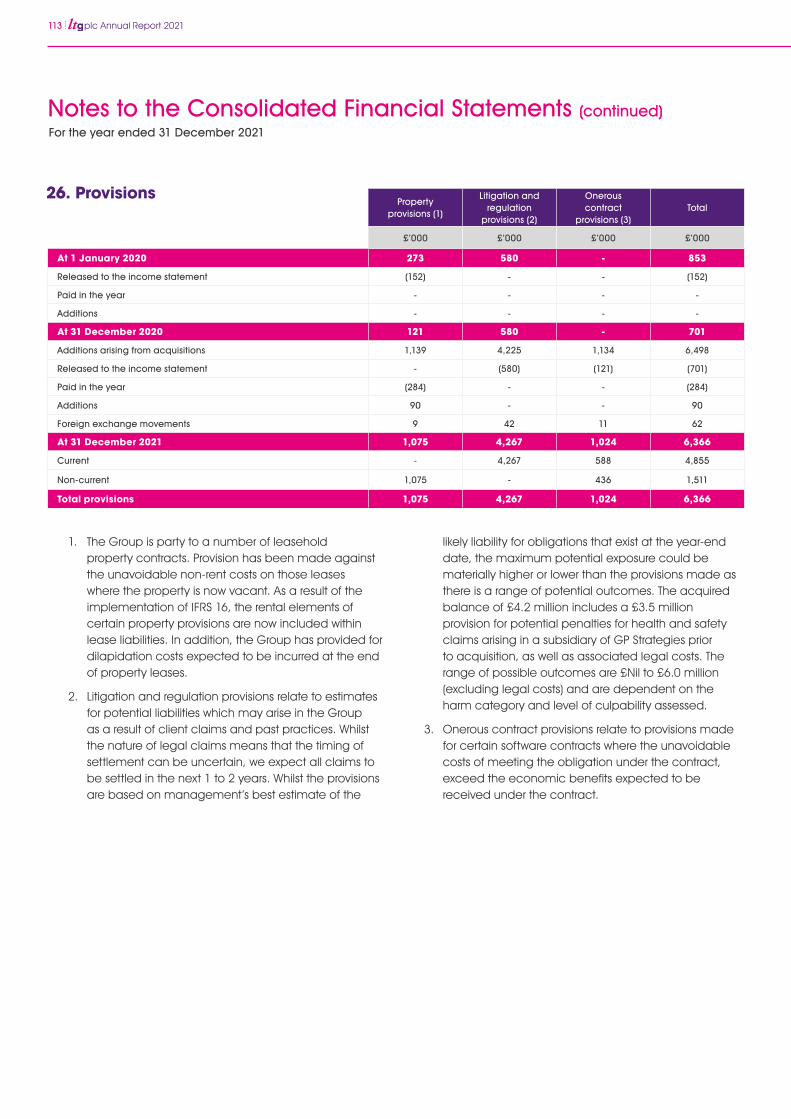
113 plc Annual Report 2021
Property provisions (1)
Litigation and regulation
provisions (2)
Onerous contract
provisions (3)Total
£’000 £’000 £’000 £’000
At 1 January 2020 273 580 - 853
Released to the income statement (152) - - (152)
Paid in the year - - - -
Additions - - - -
At 31 December 2020 121 580 - 701
Additions arising from acquisitions 1,139 4,225 1,134 6,498
Released to the income statement - (580) (121) (701)
Paid in the year (284) - - (284)
Additions 90 - - 90
Foreign exchange movements 9 42 11 62
At 31 December 2021 1,075 4,267 1,024 6,366
Current - 4,267 588 4,855
Non-current 1,075 - 436 1,511
Total provisions 1,075 4,267 1,024 6,366
26. Provisions
For the year ended 31 December 2021
Notes to the Consolidated Financial Statements (continued)
1. The Group is party to a number of leasehold property contracts. Provision has been made against the unavoidable non-rent costs on those leases where the property is now vacant. As a result of the implementation of IFRS 16, the rental elements of certain property provisions are now included within lease liabilities. In addition, the Group has provided for dilapidation costs expected to be incurred at the end of property leases.
2. Litigation and regulation provisions relate to estimates for potential liabilities which may arise in the Group as a result of client claims and past practices. Whilst the nature of legal claims means that the timing of settlement can be uncertain, we expect all claims to be settled in the next 1 to 2 years. Whilst the provisions are based on management’s best estimate of the
likely liability for obligations that exist at the year-end date, the maximum potential exposure could be materially higher or lower than the provisions made as there is a range of potential outcomes. The acquired balance of £4.2 million includes a £3.5 million provision for potential penalties for health and safety claims arising in a subsidiary of GP Strategies prior to acquisition, as well as associated legal costs. The range of possible outcomes are £Nil to £6.0 million (excluding legal costs) and are dependent on the harm category and level of culpability assessed.
3. Onerous contract provisions relate to provisions made for certain software contracts where the unavoidable costs of meeting the obligation under the contract, exceed the economic benefits expected to be received under the contract.
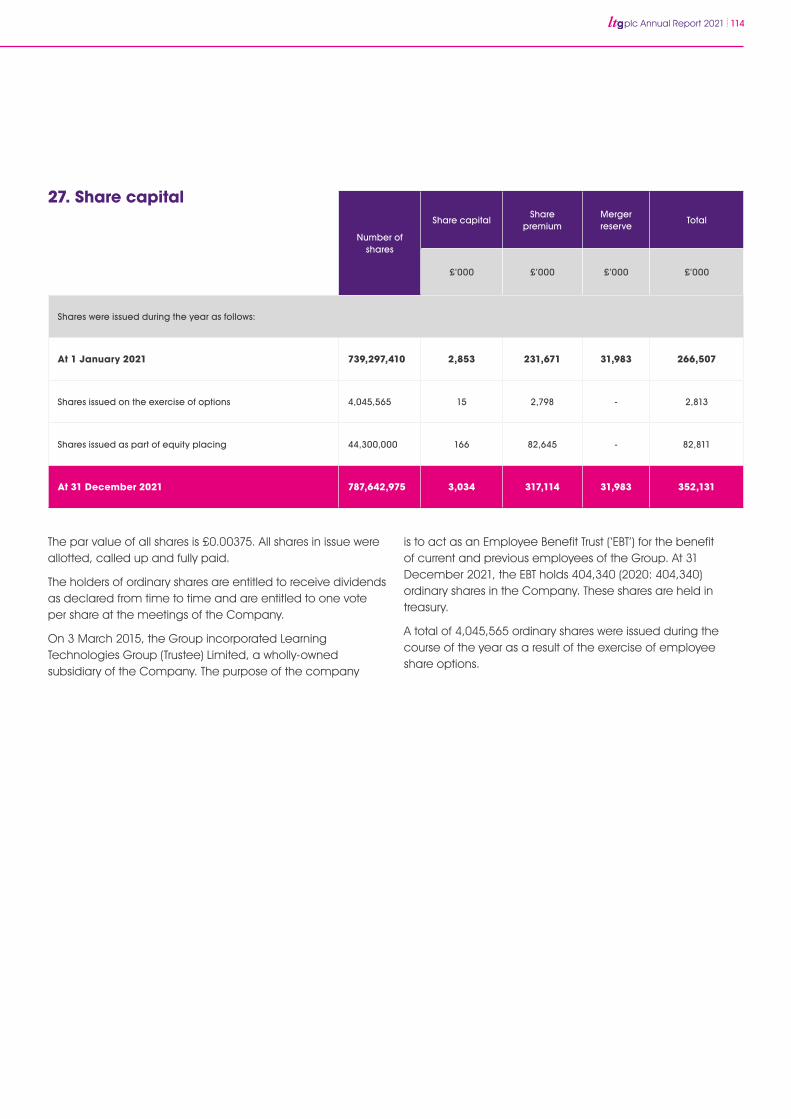
plc Annual Report 2021 114
Number of shares
Share capitalShare
premiumMerger reserve
Total
£’000 £’000 £’000 £’000
Shares were issued during the year as follows:
At 1 January 2021 739,297,410 2,853 231,671 31,983 266,507
Shares issued on the exercise of options 4,045,565 15 2,798 - 2,813
Shares issued as part of equity placing 44,300,000 166 82,645 - 82,811
At 31 December 2021 787,642,975 3,034 317,114 31,983 352,131
The par value of all shares is £0.00375. All shares in issue were allotted, called up and fully paid.
The holders of ordinary shares are entitled to receive dividends as declared from time to time and are entitled to one vote per share at the meetings of the Company.
On 3 March 2015, the Group incorporated Learning Technologies Group (Trustee) Limited, a wholly-owned subsidiary of the Company. The purpose of the company
is to act as an Employee Benefit Trust (‘EBT’) for the benefit of current and previous employees of the Group. At 31 December 2021, the EBT holds 404,340 (2020: 404,340) ordinary shares in the Company. These shares are held in treasury.
A total of 4,045,565 ordinary shares were issued during the course of the year as a result of the exercise of employee share options.
27. Share capital
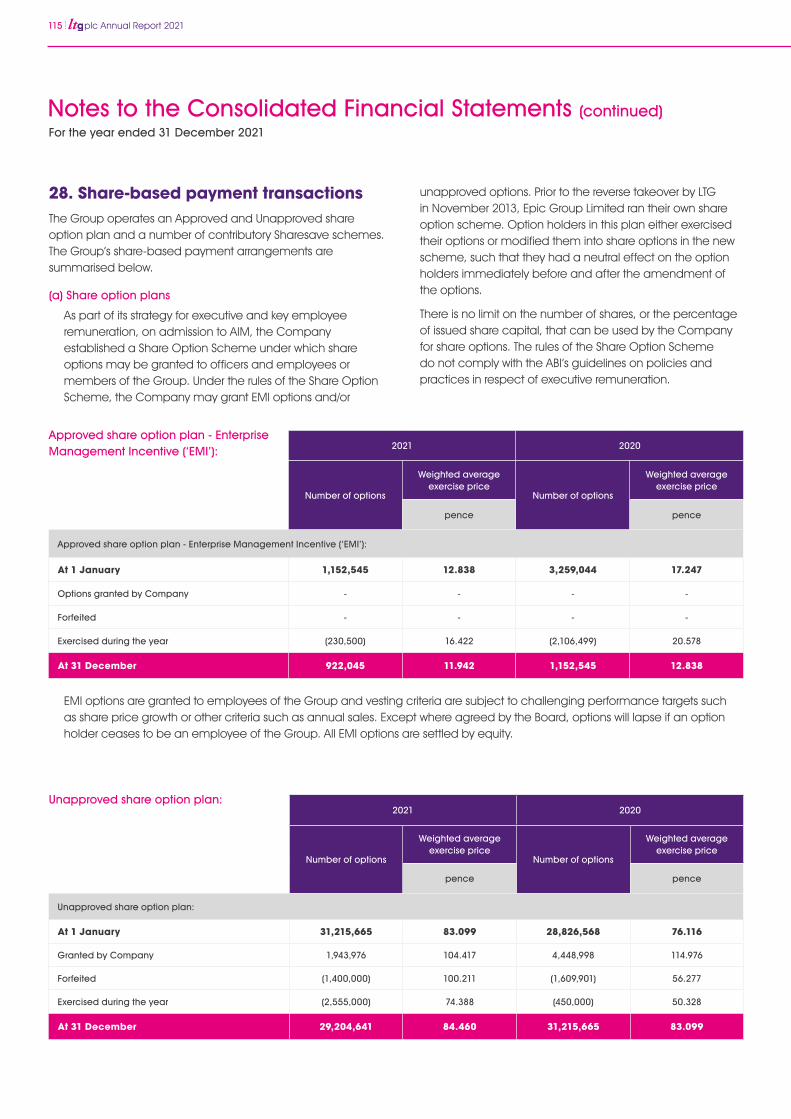
115 plc Annual Report 2021
2021 2020
Number of options
Weighted average exercise price
Number of options
Weighted average exercise price
pence pence
Unapproved share option plan:
At 1 January 31,215,665 83.099 28,826,568 76.116
Granted by Company 1,943,976 104.417 4,448,998 114.976
Forfeited (1,400,000) 100.211 (1,609,901) 56.277
Exercised during the year (2,555,000) 74.388 (450,000) 50.328
At 31 December 29,204,641 84.460 31,215,665 83.099
28. Share-based payment transactionsThe Group operates an Approved and Unapproved share option plan and a number of contributory Sharesave schemes. The Group’s share-based payment arrangements are summarised below.
(a) Share option plans
As part of its strategy for executive and key employee remuneration, on admission to AIM, the Company established a Share Option Scheme under which share options may be granted to officers and employees or members of the Group. Under the rules of the Share Option Scheme, the Company may grant EMI options and/or
unapproved options. Prior to the reverse takeover by LTG in November 2013, Epic Group Limited ran their own share option scheme. Option holders in this plan either exercised their options or modified them into share options in the new scheme, such that they had a neutral effect on the option holders immediately before and after the amendment of the options.
There is no limit on the number of shares, or the percentage of issued share capital, that can be used by the Company for share options. The rules of the Share Option Scheme do not comply with the ABI’s guidelines on policies and practices in respect of executive remuneration.
EMI options are granted to employees of the Group and vesting criteria are subject to challenging performance targets such as share price growth or other criteria such as annual sales. Except where agreed by the Board, options will lapse if an option holder ceases to be an employee of the Group. All EMI options are settled by equity.
2021 2020
Number of options
Weighted average exercise price
Number of options
Weighted average exercise price
pence pence
Approved share option plan - Enterprise Management Incentive (‘EMI’):
At 1 January 1,152,545 12.838 3,259,044 17.247
Options granted by Company - - - -
Forfeited - - - -
Exercised during the year (230,500) 16.422 (2,106,499) 20.578
At 31 December 922,045 11.942 1,152,545 12.838
Approved share option plan - Enterprise Management Incentive (‘EMI’):
Unapproved share option plan:
For the year ended 31 December 2021
Notes to the Consolidated Financial Statements (continued)
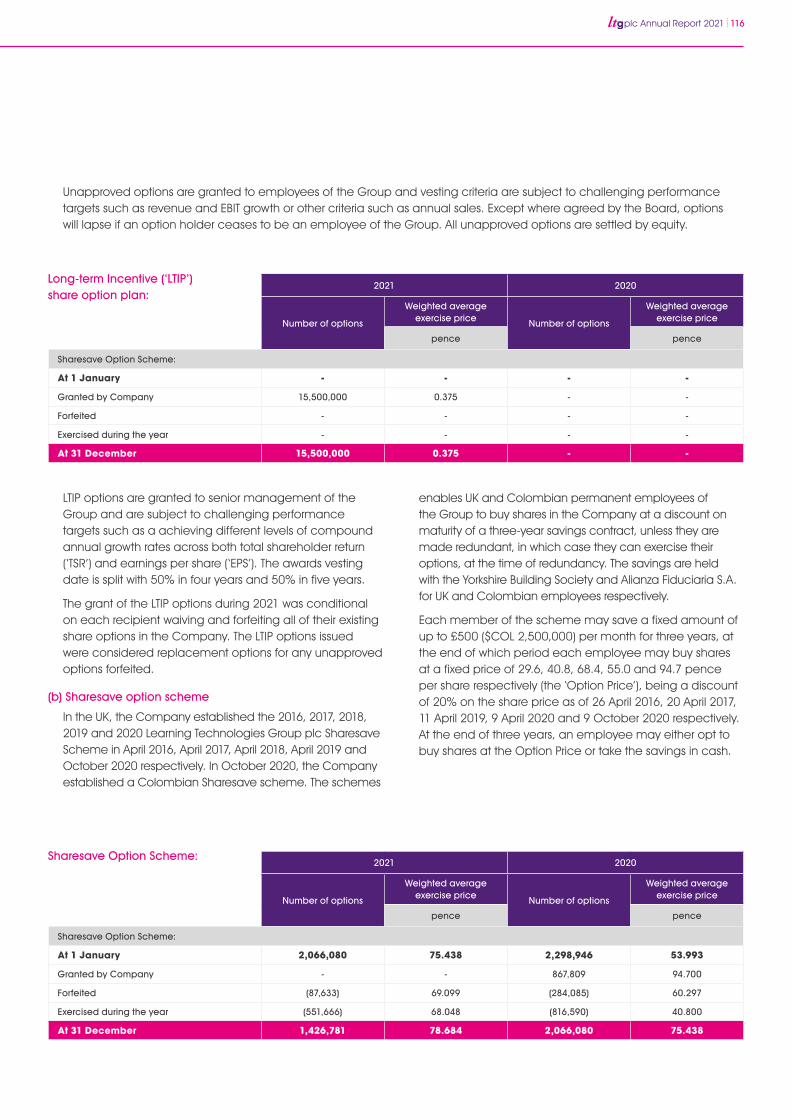
plc Annual Report 2021 116
Unapproved options are granted to employees of the Group and vesting criteria are subject to challenging performance targets such as revenue and EBIT growth or other criteria such as annual sales. Except where agreed by the Board, options will lapse if an option holder ceases to be an employee of the Group. All unapproved options are settled by equity.
2021 2020
Number of options
Weighted average exercise price Number of options
Weighted average exercise price
pence pence
Sharesave Option Scheme:
At 1 January - - - -
Granted by Company 15,500,000 0.375 - -
Forfeited - - - -
Exercised during the year - - - -
At 31 December 15,500,000 0.375 - -
2021 2020
Number of options
Weighted average exercise price Number of options
Weighted average exercise price
pence pence
Sharesave Option Scheme:
At 1 January 2,066,080 75.438 2,298,946 53.993
Granted by Company - - 867,809 94.700
Forfeited (87,633) 69.099 (284,085) 60.297
Exercised during the year (551,666) 68.048 (816,590) 40.800
At 31 December 1,426,781 78.684 2,066,080 75.438
Long-term Incentive (‘LTIP’) share option plan:
Sharesave Option Scheme:
LTIP options are granted to senior management of the Group and are subject to challenging performance targets such as a achieving different levels of compound annual growth rates across both total shareholder return (‘TSR’) and earnings per share (‘EPS’). The awards vesting date is split with 50% in four years and 50% in five years.
The grant of the LTIP options during 2021 was conditional on each recipient waiving and forfeiting all of their existing share options in the Company. The LTIP options issued were considered replacement options for any unapproved options forfeited.
(b) Sharesave option scheme
In the UK, the Company established the 2016, 2017, 2018, 2019 and 2020 Learning Technologies Group plc Sharesave Scheme in April 2016, April 2017, April 2018, April 2019 and October 2020 respectively. In October 2020, the Company established a Colombian Sharesave scheme. The schemes
enables UK and Colombian permanent employees of the Group to buy shares in the Company at a discount on maturity of a three-year savings contract, unless they are made redundant, in which case they can exercise their options, at the time of redundancy. The savings are held with the Yorkshire Building Society and Alianza Fiduciaria S.A. for UK and Colombian employees respectively.
Each member of the scheme may save a fixed amount of up to £500 ($COL 2,500,000) per month for three years, at the end of which period each employee may buy shares at a fixed price of 29.6, 40.8, 68.4, 55.0 and 94.7 pence per share respectively (the ‘Option Price’), being a discount of 20% on the share price as of 26 April 2016, 20 April 2017, 11 April 2019, 9 April 2020 and 9 October 2020 respectively. At the end of three years, an employee may either opt to buy shares at the Option Price or take the savings in cash.
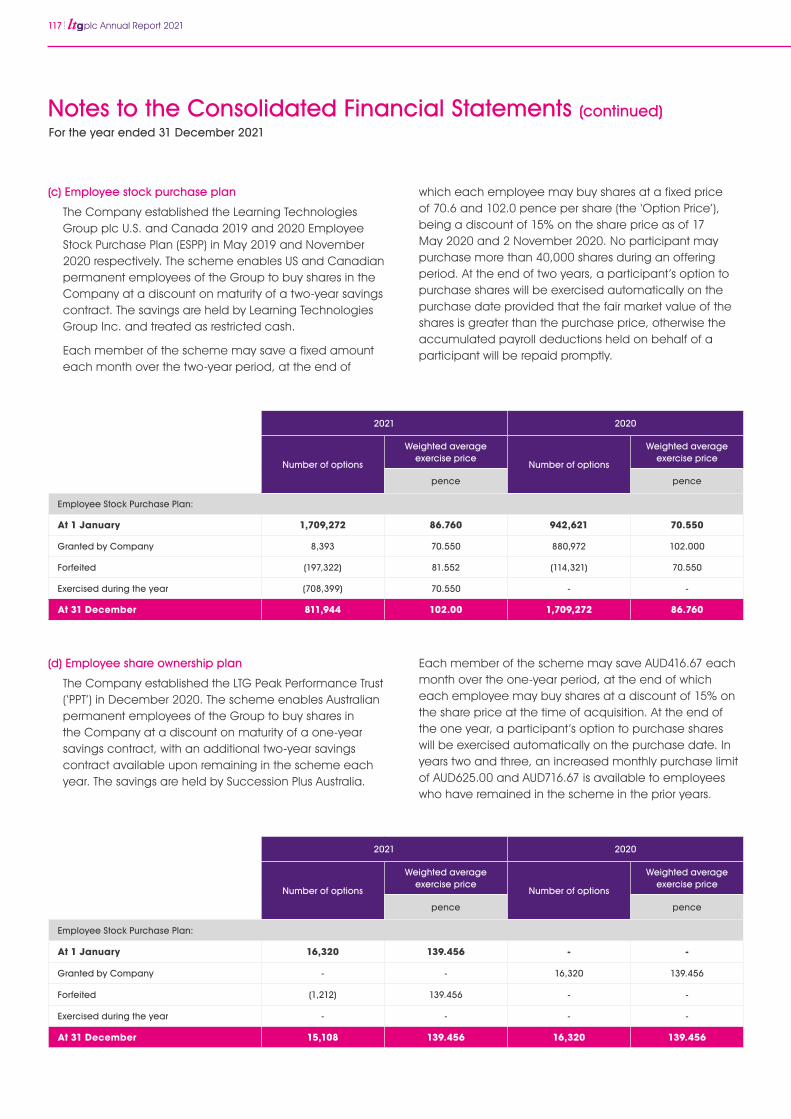
117 plc Annual Report 2021
(c) Employee stock purchase plan
The Company established the Learning Technologies Group plc U.S. and Canada 2019 and 2020 Employee Stock Purchase Plan (ESPP) in May 2019 and November 2020 respectively. The scheme enables US and Canadian permanent employees of the Group to buy shares in the Company at a discount on maturity of a two-year savings contract. The savings are held by Learning Technologies Group Inc. and treated as restricted cash.
Each member of the scheme may save a fixed amount each month over the two-year period, at the end of
(d) Employee share ownership plan
The Company established the LTG Peak Performance Trust (‘PPT’) in December 2020. The scheme enables Australian permanent employees of the Group to buy shares in the Company at a discount on maturity of a one-year savings contract, with an additional two-year savings contract available upon remaining in the scheme each year. The savings are held by Succession Plus Australia.
which each employee may buy shares at a fixed price of 70.6 and 102.0 pence per share (the ‘Option Price’), being a discount of 15% on the share price as of 17 May 2020 and 2 November 2020. No participant may purchase more than 40,000 shares during an offering period. At the end of two years, a participant’s option to purchase shares will be exercised automatically on the purchase date provided that the fair market value of the shares is greater than the purchase price, otherwise the accumulated payroll deductions held on behalf of a participant will be repaid promptly.
Each member of the scheme may save AUD416.67 each month over the one-year period, at the end of which each employee may buy shares at a discount of 15% on the share price at the time of acquisition. At the end of the one year, a participant’s option to purchase shares will be exercised automatically on the purchase date. In years two and three, an increased monthly purchase limit of AUD625.00 and AUD716.67 is available to employees who have remained in the scheme in the prior years.
2021 2020
Number of options
Weighted average exercise price
Number of options
Weighted average exercise price
pence pence
Employee Stock Purchase Plan:
At 1 January 1,709,272 86.760 942,621 70.550
Granted by Company 8,393 70.550 880,972 102.000
Forfeited (197,322) 81.552 (114,321) 70.550
Exercised during the year (708,399) 70.550 - -
At 31 December 811,944 102.00 1,709,272 86.760
2021 2020
Number of options
Weighted average exercise price
Number of options
Weighted average exercise price
pence pence
Employee Stock Purchase Plan:
At 1 January 16,320 139.456 - -
Granted by Company - - 16,320 139.456
Forfeited (1,212) 139.456 - -
Exercised during the year - - - -
At 31 December 15,108 139.456 16,320 139.456
For the year ended 31 December 2021
Notes to the Consolidated Financial Statements (continued)
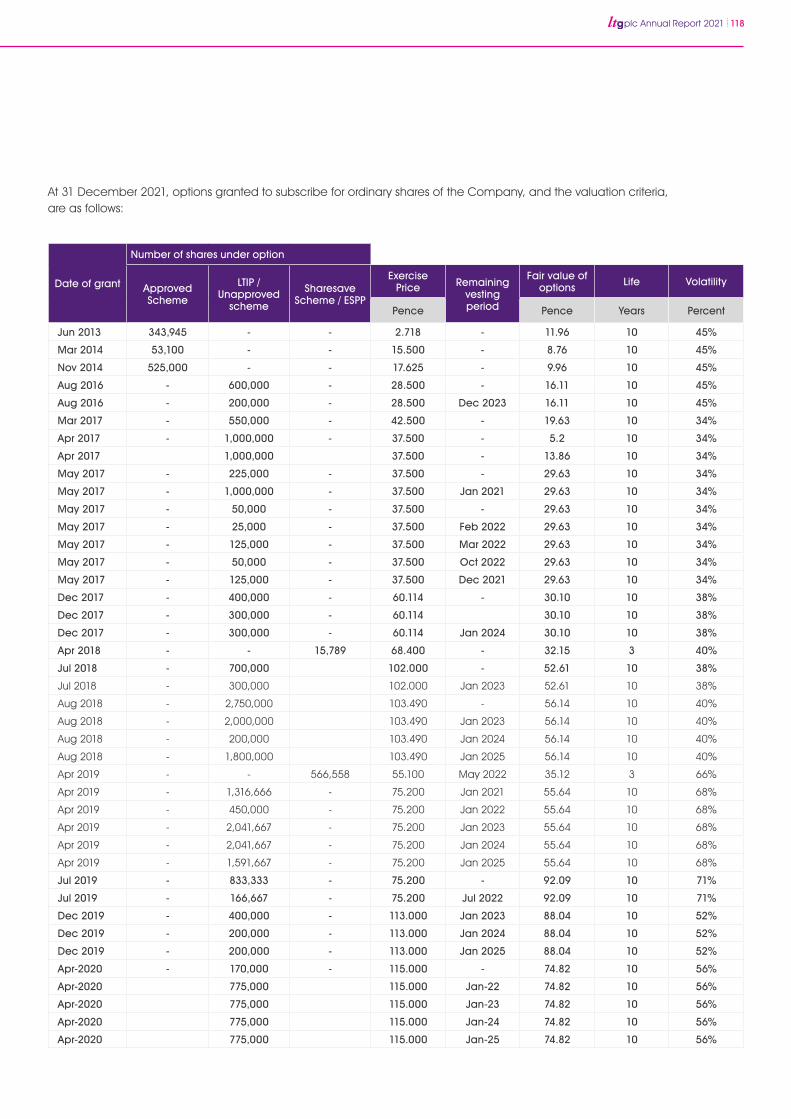
plc Annual Report 2021 118
Date of grant
Number of shares under option
Approved Scheme
LTIP / Unapproved
scheme
Sharesave Scheme / ESPP
Exercise Price Remaining
vesting period
Fair value of options Life Volatility
Pence Pence Years Percent
Jun 2013 343,945 - - 2.718 - 11.96 10 45%
Mar 2014 53,100 - - 15.500 - 8.76 10 45%
Nov 2014 525,000 - - 17.625 - 9.96 10 45%
Aug 2016 - 600,000 - 28.500 - 16.11 10 45%
Aug 2016 - 200,000 - 28.500 Dec 2023 16.11 10 45%
Mar 2017 - 550,000 - 42.500 - 19.63 10 34%
Apr 2017 - 1,000,000 - 37.500 - 5.2 10 34%
Apr 2017 1,000,000 37.500 - 13.86 10 34%
May 2017 - 225,000 - 37.500 - 29.63 10 34%
May 2017 - 1,000,000 - 37.500 Jan 2021 29.63 10 34%
May 2017 - 50,000 - 37.500 - 29.63 10 34%
May 2017 - 25,000 - 37.500 Feb 2022 29.63 10 34%
May 2017 - 125,000 - 37.500 Mar 2022 29.63 10 34%
May 2017 - 50,000 - 37.500 Oct 2022 29.63 10 34%
May 2017 - 125,000 - 37.500 Dec 2021 29.63 10 34%
Dec 2017 - 400,000 - 60.114 - 30.10 10 38%
Dec 2017 - 300,000 - 60.114 30.10 10 38%
Dec 2017 - 300,000 - 60.114 Jan 2024 30.10 10 38%
Apr 2018 - - 15,789 68.400 - 32.15 3 40%
Jul 2018 - 700,000 102.000 - 52.61 10 38%
Jul 2018 - 300,000 102.000 Jan 2023 52.61 10 38%
Aug 2018 - 2,750,000 103.490 - 56.14 10 40%
Aug 2018 - 2,000,000 103.490 Jan 2023 56.14 10 40%
Aug 2018 - 200,000 103.490 Jan 2024 56.14 10 40%
Aug 2018 - 1,800,000 103.490 Jan 2025 56.14 10 40%
Apr 2019 - - 566,558 55.100 May 2022 35.12 3 66%
Apr 2019 - 1,316,666 - 75.200 Jan 2021 55.64 10 68%
Apr 2019 - 450,000 - 75.200 Jan 2022 55.64 10 68%
Apr 2019 - 2,041,667 - 75.200 Jan 2023 55.64 10 68%
Apr 2019 - 2,041,667 - 75.200 Jan 2024 55.64 10 68%
Apr 2019 - 1,591,667 - 75.200 Jan 2025 55.64 10 68%
Jul 2019 - 833,333 - 75.200 - 92.09 10 71%
Jul 2019 - 166,667 - 75.200 Jul 2022 92.09 10 71%
Dec 2019 - 400,000 - 113.000 Jan 2023 88.04 10 52%
Dec 2019 - 200,000 - 113.000 Jan 2024 88.04 10 52%
Dec 2019 - 200,000 - 113.000 Jan 2025 88.04 10 52%
Apr-2020 - 170,000 - 115.000 - 74.82 10 56%
Apr-2020 775,000 115.000 Jan-22 74.82 10 56%
Apr-2020 775,000 115.000 Jan-23 74.82 10 56%
Apr-2020 775,000 115.000 Jan-24 74.82 10 56%
Apr-2020 775,000 115.000 Jan-25 74.82 10 56%
At 31 December 2021, options granted to subscribe for ordinary shares of the Company, and the valuation criteria, are as follows:
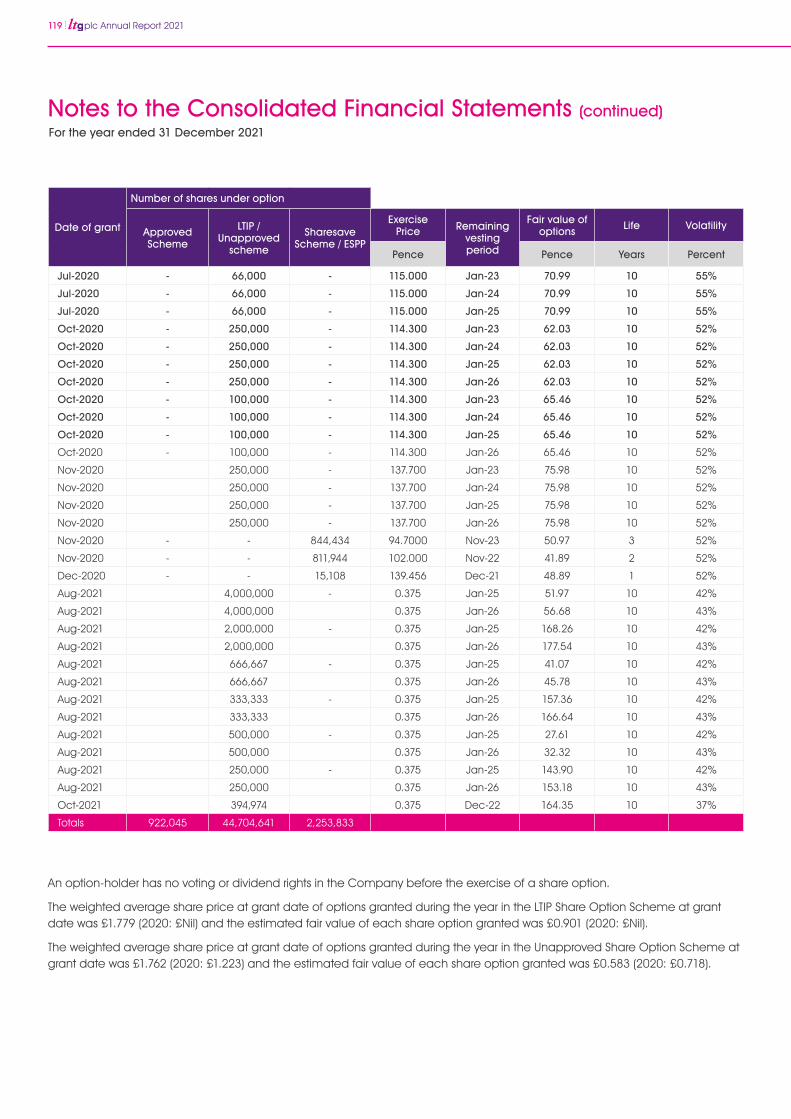
119 plc Annual Report 2021
Date of grant
Number of shares under option
Approved Scheme
LTIP / Unapproved
scheme
Sharesave Scheme / ESPP
Exercise Price Remaining
vesting period
Fair value of options Life Volatility
Pence Pence Years Percent
Jul-2020 - 66,000 - 115.000 Jan-23 70.99 10 55%
Jul-2020 - 66,000 - 115.000 Jan-24 70.99 10 55%
Jul-2020 - 66,000 - 115.000 Jan-25 70.99 10 55%
Oct-2020 - 250,000 - 114.300 Jan-23 62.03 10 52%
Oct-2020 - 250,000 - 114.300 Jan-24 62.03 10 52%
Oct-2020 - 250,000 - 114.300 Jan-25 62.03 10 52%
Oct-2020 - 250,000 - 114.300 Jan-26 62.03 10 52%
Oct-2020 - 100,000 - 114.300 Jan-23 65.46 10 52%
Oct-2020 - 100,000 - 114.300 Jan-24 65.46 10 52%
Oct-2020 - 100,000 - 114.300 Jan-25 65.46 10 52%
Oct-2020 - 100,000 - 114.300 Jan-26 65.46 10 52%
Nov-2020 250,000 - 137.700 Jan-23 75.98 10 52%
Nov-2020 250,000 - 137.700 Jan-24 75.98 10 52%
Nov-2020 250,000 - 137.700 Jan-25 75.98 10 52%
Nov-2020 250,000 - 137.700 Jan-26 75.98 10 52%
Nov-2020 - - 844,434 94.7000 Nov-23 50.97 3 52%
Nov-2020 - - 811,944 102.000 Nov-22 41.89 2 52%
Dec-2020 - - 15,108 139.456 Dec-21 48.89 1 52%
Aug-2021 4,000,000 - 0.375 Jan-25 51.97 10 42%
Aug-2021 4,000,000 0.375 Jan-26 56.68 10 43%
Aug-2021 2,000,000 - 0.375 Jan-25 168.26 10 42%
Aug-2021 2,000,000 0.375 Jan-26 177.54 10 43%
Aug-2021 666,667 - 0.375 Jan-25 41.07 10 42%
Aug-2021 666,667 0.375 Jan-26 45.78 10 43%
Aug-2021 333,333 - 0.375 Jan-25 157.36 10 42%
Aug-2021 333,333 0.375 Jan-26 166.64 10 43%
Aug-2021 500,000 - 0.375 Jan-25 27.61 10 42%
Aug-2021 500,000 0.375 Jan-26 32.32 10 43%
Aug-2021 250,000 - 0.375 Jan-25 143.90 10 42%
Aug-2021 250,000 0.375 Jan-26 153.18 10 43%
Oct-2021 394,974 0.375 Dec-22 164.35 10 37%
Totals 922,045 44,704,641 2,253,833
An option-holder has no voting or dividend rights in the Company before the exercise of a share option.
The weighted average share price at grant date of options granted during the year in the LTIP Share Option Scheme at grant date was £1.779 (2020: £Nil) and the estimated fair value of each share option granted was £0.901 (2020: £Nil).
The weighted average share price at grant date of options granted during the year in the Unapproved Share Option Scheme at grant date was £1.762 (2020: £1.223) and the estimated fair value of each share option granted was £0.583 (2020: £0.718).
For the year ended 31 December 2021
Notes to the Consolidated Financial Statements (continued)
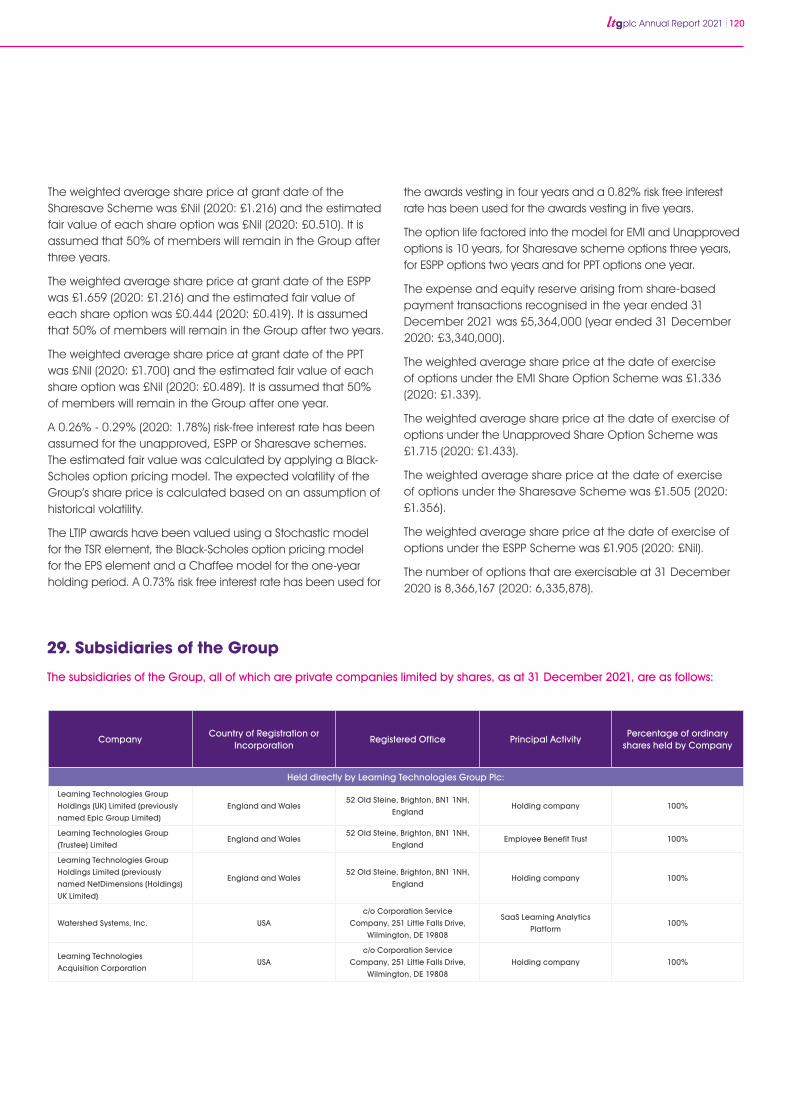
plc Annual Report 2021 120
The weighted average share price at grant date of the Sharesave Scheme was £Nil (2020: £1.216) and the estimated fair value of each share option was £Nil (2020: £0.510). It is assumed that 50% of members will remain in the Group after three years.
The weighted average share price at grant date of the ESPP was £1.659 (2020: £1.216) and the estimated fair value of each share option was £0.444 (2020: £0.419). It is assumed that 50% of members will remain in the Group after two years.
The weighted average share price at grant date of the PPT was £Nil (2020: £1.700) and the estimated fair value of each share option was £Nil (2020: £0.489). It is assumed that 50% of members will remain in the Group after one year.
A 0.26% - 0.29% (2020: 1.78%) risk-free interest rate has been assumed for the unapproved, ESPP or Sharesave schemes. The estimated fair value was calculated by applying a Black-Scholes option pricing model. The expected volatility of the Group’s share price is calculated based on an assumption of historical volatility.
The LTIP awards have been valued using a Stochastic model for the TSR element, the Black-Scholes option pricing model for the EPS element and a Chaffee model for the one-year holding period. A 0.73% risk free interest rate has been used for
the awards vesting in four years and a 0.82% risk free interest rate has been used for the awards vesting in five years.
The option life factored into the model for EMI and Unapproved options is 10 years, for Sharesave scheme options three years, for ESPP options two years and for PPT options one year.
The expense and equity reserve arising from share-based payment transactions recognised in the year ended 31 December 2021 was £5,364,000 (year ended 31 December 2020: £3,340,000).
The weighted average share price at the date of exercise of options under the EMI Share Option Scheme was £1.336 (2020: £1.339).
The weighted average share price at the date of exercise of options under the Unapproved Share Option Scheme was £1.715 (2020: £1.433).
The weighted average share price at the date of exercise of options under the Sharesave Scheme was £1.505 (2020: £1.356).
The weighted average share price at the date of exercise of options under the ESPP Scheme was £1.905 (2020: £Nil).
The number of options that are exercisable at 31 December 2020 is 8,366,167 (2020: 6,335,878).
29. Subsidiaries of the Group
The subsidiaries of the Group, all of which are private companies limited by shares, as at 31 December 2021, are as follows:
CompanyCountry of Registration or
IncorporationRegistered Office Principal Activity
Percentage of ordinary shares held by Company
Held directly by Learning Technologies Group Plc:
Learning Technologies Group
Holdings (UK) Limited (previously
named Epic Group Limited)
England and Wales52 Old Steine, Brighton, BN1 1NH,
EnglandHolding company 100%
Learning Technologies Group
(Trustee) LimitedEngland and Wales
52 Old Steine, Brighton, BN1 1NH,
EnglandEmployee Benefit Trust 100%
Learning Technologies Group
Holdings Limited (previously
named NetDimensions (Holdings)
UK Limited)
England and Wales52 Old Steine, Brighton, BN1 1NH,
EnglandHolding company 100%
Watershed Systems, Inc. USA
c/o Corporation Service
Company, 251 Little Falls Drive,
Wilmington, DE 19808
SaaS Learning Analytics
Platform100%
Learning Technologies
Acquisition CorporationUSA
c/o Corporation Service
Company, 251 Little Falls Drive,
Wilmington, DE 19808
Holding company 100%
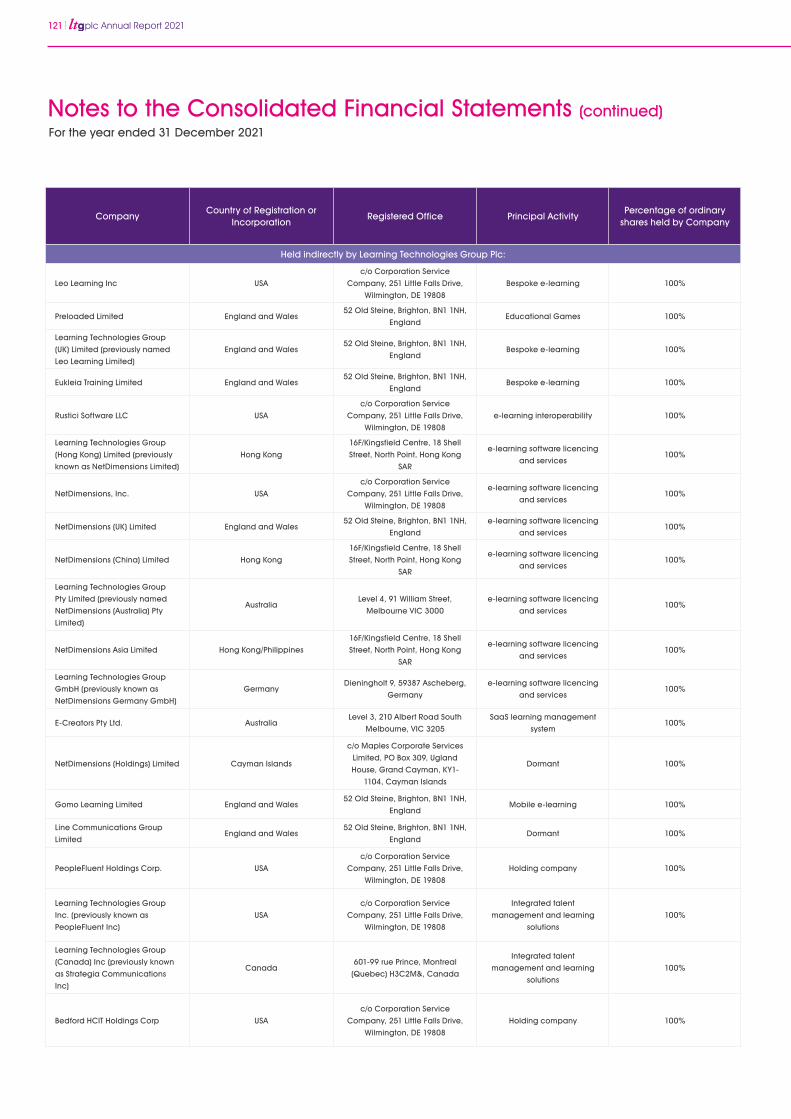
121 plc Annual Report 2021
CompanyCountry of Registration or
IncorporationRegistered Office Principal Activity
Percentage of ordinary shares held by Company
Held indirectly by Learning Technologies Group Plc:
Leo Learning Inc USA
c/o Corporation Service
Company, 251 Little Falls Drive,
Wilmington, DE 19808
Bespoke e-learning 100%
Preloaded Limited England and Wales52 Old Steine, Brighton, BN1 1NH,
EnglandEducational Games 100%
Learning Technologies Group
(UK) Limited (previously named
Leo Learning Limited)
England and Wales52 Old Steine, Brighton, BN1 1NH,
EnglandBespoke e-learning 100%
Eukleia Training Limited England and Wales52 Old Steine, Brighton, BN1 1NH,
EnglandBespoke e-learning 100%
Rustici Software LLC USA
c/o Corporation Service
Company, 251 Little Falls Drive,
Wilmington, DE 19808
e-learning interoperability 100%
Learning Technologies Group
(Hong Kong) Limited (previously
known as NetDimensions Limited)
Hong Kong
16F/Kingsfield Centre, 18 Shell
Street, North Point, Hong Kong
SAR
e-learning software licencing
and services100%
NetDimensions, Inc. USA
c/o Corporation Service
Company, 251 Little Falls Drive,
Wilmington, DE 19808
e-learning software licencing
and services100%
NetDimensions (UK) Limited England and Wales52 Old Steine, Brighton, BN1 1NH,
England
e-learning software licencing
and services100%
NetDimensions (China) Limited Hong Kong
16F/Kingsfield Centre, 18 Shell
Street, North Point, Hong Kong
SAR
e-learning software licencing
and services100%
Learning Technologies Group
Pty Limited (previously named
NetDimensions (Australia) Pty
Limited)
AustraliaLevel 4, 91 William Street,
Melbourne VIC 3000
e-learning software licencing
and services100%
NetDimensions Asia Limited Hong Kong/Philippines
16F/Kingsfield Centre, 18 Shell
Street, North Point, Hong Kong
SAR
e-learning software licencing
and services100%
Learning Technologies Group
GmbH (previously known as
NetDimensions Germany GmbH)
GermanyDieningholt 9, 59387 Ascheberg,
Germany
e-learning software licencing
and services100%
E-Creators Pty Ltd. AustraliaLevel 3, 210 Albert Road South
Melbourne, VIC 3205
SaaS learning management
system100%
NetDimensions (Holdings) Limited Cayman Islands
c/o Maples Corporate Services
Limited, PO Box 309, Ugland
House, Grand Cayman, KY1-
1104, Cayman Islands
Dormant 100%
Gomo Learning Limited England and Wales52 Old Steine, Brighton, BN1 1NH,
EnglandMobile e-learning 100%
Line Communications Group
LimitedEngland and Wales
52 Old Steine, Brighton, BN1 1NH,
EnglandDormant 100%
PeopleFluent Holdings Corp. USA
c/o Corporation Service
Company, 251 Little Falls Drive,
Wilmington, DE 19808
Holding company 100%
Learning Technologies Group
Inc. (previously known as
PeopleFluent Inc)
USA
c/o Corporation Service
Company, 251 Little Falls Drive,
Wilmington, DE 19808
Integrated talent
management and learning
solutions
100%
Learning Technologies Group
(Canada) Inc (previously known
as Strategia Communications
Inc)
Canada601-99 rue Prince, Montreal
(Quebec) H3C2M&, Canada
Integrated talent
management and learning
solutions
100%
Bedford HCIT Holdings Corp USA
c/o Corporation Service
Company, 251 Little Falls Drive,
Wilmington, DE 19808
Holding company 100%
For the year ended 31 December 2021
Notes to the Consolidated Financial Statements (continued)
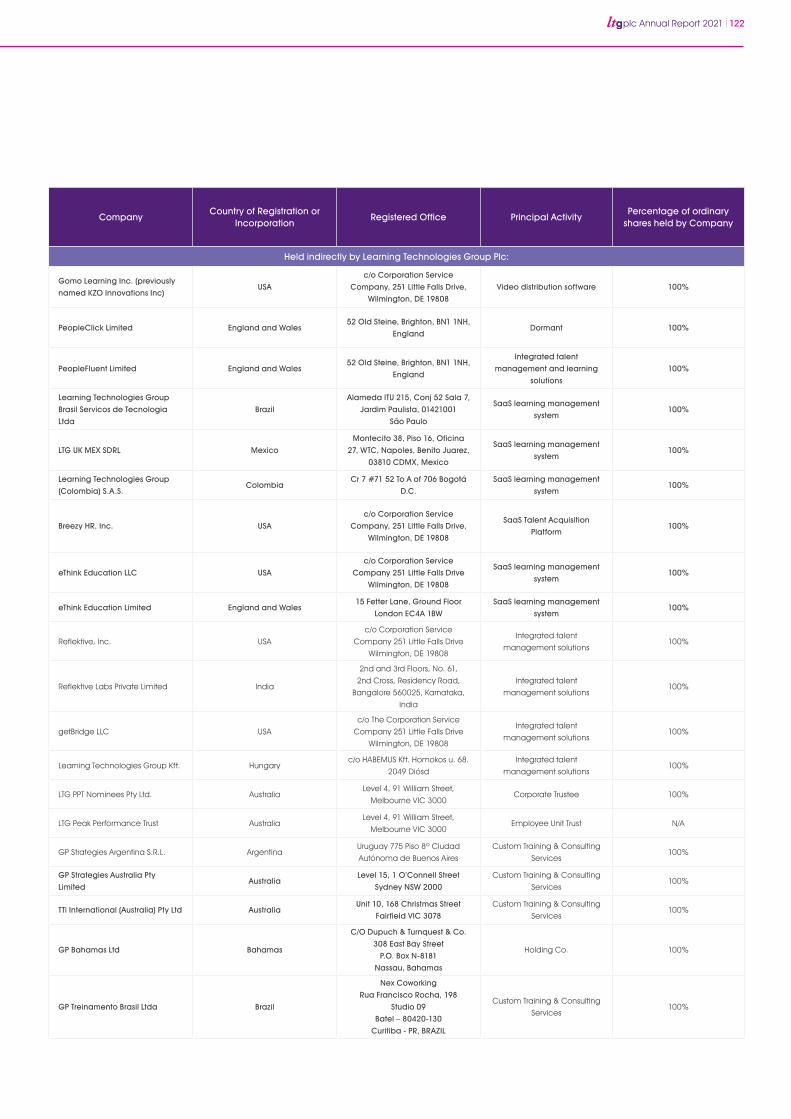
plc Annual Report 2021 122
CompanyCountry of Registration or
IncorporationRegistered Office Principal Activity
Percentage of ordinary shares held by Company
Held indirectly by Learning Technologies Group Plc:
Gomo Learning Inc. (previously
named KZO Innovations Inc)USA
c/o Corporation Service
Company, 251 Little Falls Drive,
Wilmington, DE 19808
Video distribution software 100%
PeopleClick Limited England and Wales52 Old Steine, Brighton, BN1 1NH,
EnglandDormant 100%
PeopleFluent Limited England and Wales52 Old Steine, Brighton, BN1 1NH,
England
Integrated talent
management and learning
solutions
100%
Learning Technologies Group
Brasil Servicos de Tecnologia
Ltda
Brazil
Alameda ITU 215, Conj 52 Sala 7,
Jardim Paulista, 01421001
São Paulo
SaaS learning management
system100%
LTG UK MEX SDRL Mexico
Montecito 38, Piso 16, Oficina
27, WTC, Napoles, Benito Juarez,
03810 CDMX, Mexico
SaaS learning management
system100%
Learning Technologies Group
(Colombia) S.A.S.Colombia
Cr 7 #71 52 To A of 706 Bogotá
D.C.
SaaS learning management
system100%
Breezy HR, Inc. USA
c/o Corporation Service
Company, 251 Little Falls Drive,
Wilmington, DE 19808
SaaS Talent Acquisition
Platform100%
eThink Education LLC USA
c/o Corporation Service
Company 251 Little Falls Drive
Wilmington, DE 19808
SaaS learning management
system100%
eThink Education Limited England and Wales15 Fetter Lane, Ground Floor
London EC4A 1BW
SaaS learning management
system100%
Reflektive, Inc. USA
c/o Corporation Service
Company 251 Little Falls Drive
Wilmington, DE 19808
Integrated talent
management solutions100%
Reflektive Labs Private Limited India
2nd and 3rd Floors, No. 61,
2nd Cross, Residency Road,
Bangalore 560025, Karnataka,
India
Integrated talent
management solutions100%
getBridge LLC USA
c/o The Corporation Service
Company 251 Little Falls Drive
Wilmington, DE 19808
Integrated talent
management solutions100%
Learning Technologies Group Kft. Hungaryc/o HABEMUS Kft. Homokos u. 68.
2049 Diósd
Integrated talent
management solutions100%
LTG PPT Nominees Pty Ltd. AustraliaLevel 4, 91 William Street,
Melbourne VIC 3000Corporate Trustee 100%
LTG Peak Performance Trust AustraliaLevel 4, 91 William Street,
Melbourne VIC 3000Employee Unit Trust N/A
GP Strategies Argentina S.R.L. ArgentinaUruguay 775 Piso 8º Ciudad
Autónoma de Buenos Aires
Custom Training & Consulting
Services100%
GP Strategies Australia Pty
LimitedAustralia
Level 15, 1 O’Connell Street
Sydney NSW 2000
Custom Training & Consulting
Services100%
TTi International (Australia) Pty Ltd AustraliaUnit 10, 168 Christmas Street
Fairfield VIC 3078
Custom Training & Consulting
Services100%
GP Bahamas Ltd Bahamas
C/O Dupuch & Turnquest & Co.
308 East Bay Street
P.O. Box N-8181
Nassau, Bahamas
Holding Co. 100%
GP Treinamento Brasil Ltda Brazil
Nex Coworking
Rua Francisco Rocha, 198
Studio 09
Batel – 80420-130
Curitiba - PR, BRAZIL
Custom Training & Consulting
Services100%
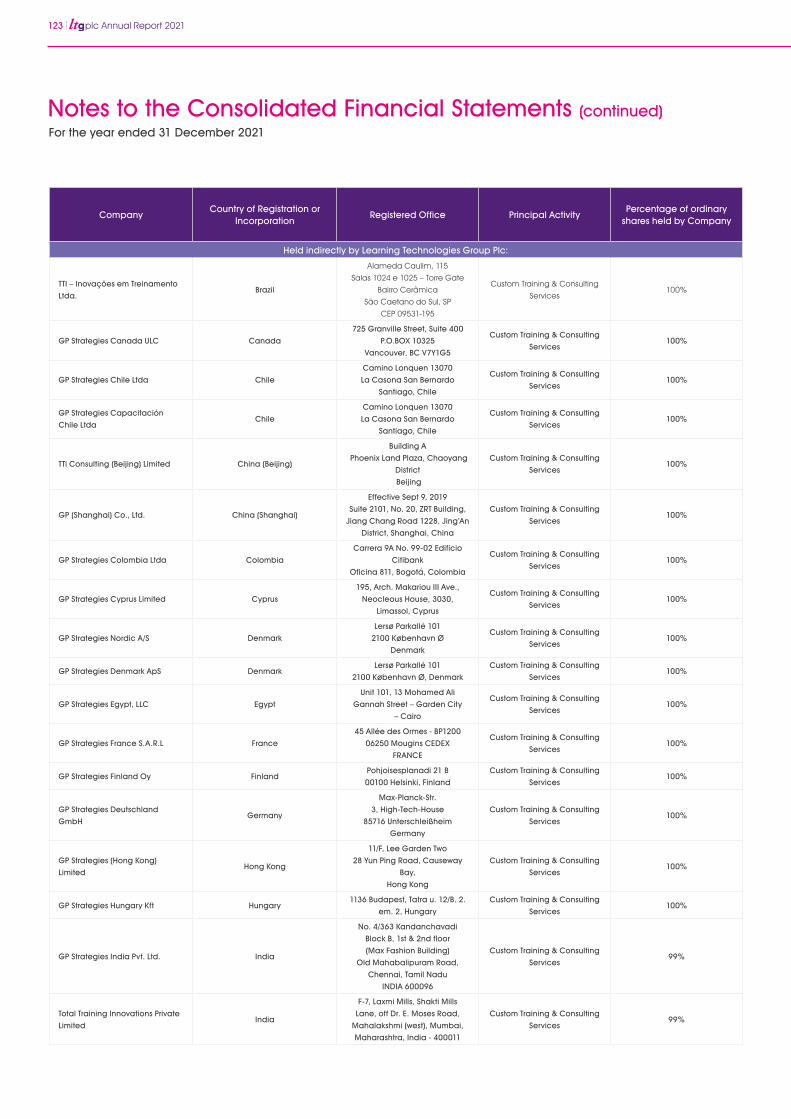
123 plc Annual Report 2021
CompanyCountry of Registration or
IncorporationRegistered Office Principal Activity
Percentage of ordinary shares held by Company
Held indirectly by Learning Technologies Group Plc:
TTI – Inovações em Treinamento
Ltda. Brazil
Alameda Caulim, 115
Salas 1024 e 1025 – Torre Gate
Bairro Cerâmica
São Caetano do Sul, SP
CEP 09531-195
Custom Training & Consulting
Services100%
GP Strategies Canada ULC Canada
725 Granville Street, Suite 400
P.O.BOX 10325
Vancouver, BC V7Y1G5
Custom Training & Consulting
Services100%
GP Strategies Chile Ltda Chile
Camino Lonquen 13070
La Casona San Bernardo
Santiago, Chile
Custom Training & Consulting
Services100%
GP Strategies Capacitación
Chile LtdaChile
Camino Lonquen 13070
La Casona San Bernardo
Santiago, Chile
Custom Training & Consulting
Services100%
TTi Consulting (Beijing) Limited China (Beijing)
Building A
Phoenix Land Plaza, Chaoyang
District
Beijing
Custom Training & Consulting
Services100%
GP (Shanghai) Co., Ltd. China (Shanghai)
Effective Sept 9, 2019
Suite 2101, No. 20, ZRT Building,
Jiang Chang Road 1228, Jing’An
District, Shanghai, China
Custom Training & Consulting
Services100%
GP Strategies Colombia Ltda Colombia
Carrera 9A No. 99-02 Edificio
Citibank
Oficina 811, Bogotá, Colombia
Custom Training & Consulting
Services100%
GP Strategies Cyprus Limited Cyprus
195, Arch. Makariou III Ave.,
Neocleous House, 3030,
Limassol, Cyprus
Custom Training & Consulting
Services100%
GP Strategies Nordic A/S Denmark
Lersø Parkallé 101
2100 København Ø
Denmark
Custom Training & Consulting
Services100%
GP Strategies Denmark ApS DenmarkLersø Parkallé 101
2100 København Ø, Denmark
Custom Training & Consulting
Services100%
GP Strategies Egypt, LLC Egypt
Unit 101, 13 Mohamed Ali
Gannah Street – Garden City
– Cairo
Custom Training & Consulting
Services100%
GP Strategies France S.A.R.L France
45 Allée des Ormes - BP1200
06250 Mougins CEDEX
FRANCE
Custom Training & Consulting
Services100%
GP Strategies Finland Oy FinlandPohjoisesplanadi 21 B
00100 Helsinki, Finland
Custom Training & Consulting
Services100%
GP Strategies Deutschland
GmbHGermany
Max-Planck-Str.
3, High-Tech-House
85716 Unterschleißheim
Germany
Custom Training & Consulting
Services100%
GP Strategies (Hong Kong)
LimitedHong Kong
11/F, Lee Garden Two
28 Yun Ping Road, Causeway
Bay,
Hong Kong
Custom Training & Consulting
Services100%
GP Strategies Hungary Kft Hungary1136 Budapest, Tatra u. 12/B. 2.
em. 2, Hungary
Custom Training & Consulting
Services100%
GP Strategies India Pvt. Ltd. India
No. 4/363 Kandanchavadi
Block B, 1st & 2nd floor
(Max Fashion Building)
Old Mahabalipuram Road,
Chennai, Tamil Nadu
INDIA 600096
Custom Training & Consulting
Services99%
Total Training Innovations Private
LimitedIndia
F-7, Laxmi Mills, Shakti Mills
Lane, off Dr. E. Moses Road,
Mahalakshmi (west), Mumbai,
Maharashtra, India - 400011
Custom Training & Consulting
Services99%
For the year ended 31 December 2021
Notes to the Consolidated Financial Statements (continued)
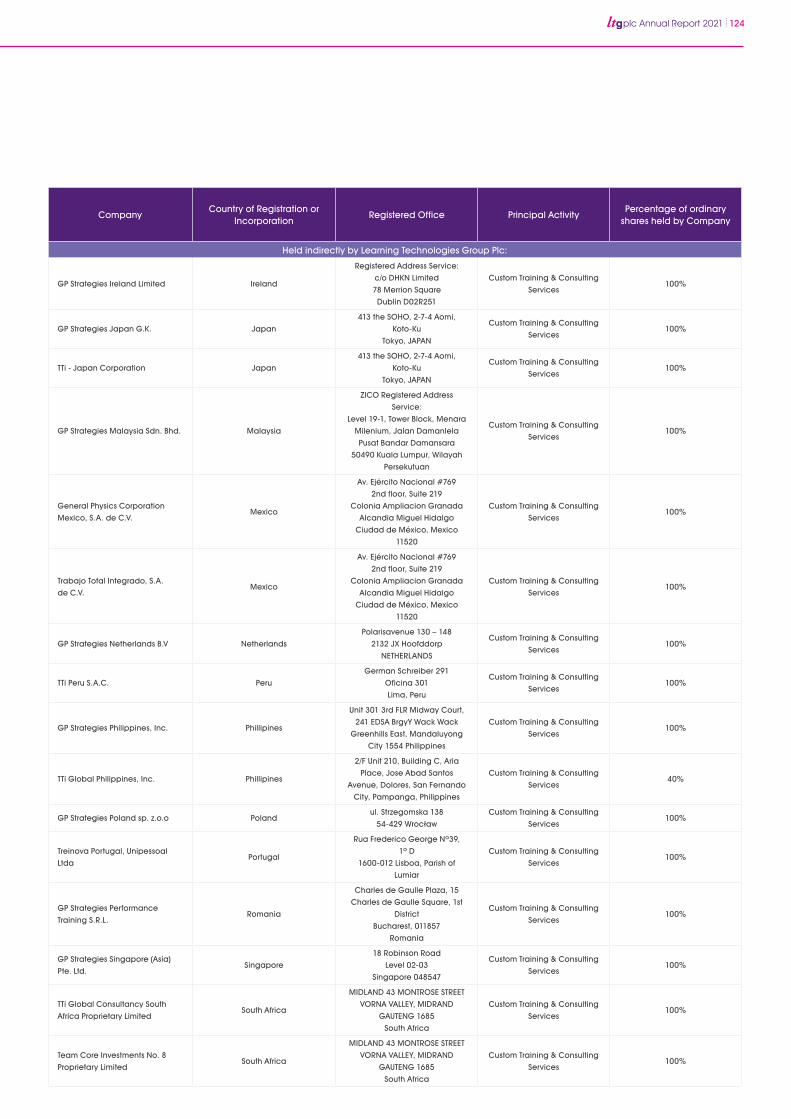
plc Annual Report 2021 124
CompanyCountry of Registration or
IncorporationRegistered Office Principal Activity
Percentage of ordinary shares held by Company
Held indirectly by Learning Technologies Group Plc:
GP Strategies Ireland Limited Ireland
Registered Address Service:
c/o DHKN Limited
78 Merrion Square
Dublin D02R251
Custom Training & Consulting
Services100%
GP Strategies Japan G.K. Japan
413 the SOHO, 2-7-4 Aomi,
Koto-Ku
Tokyo, JAPAN
Custom Training & Consulting
Services100%
TTi - Japan Corporation Japan
413 the SOHO, 2-7-4 Aomi,
Koto-Ku
Tokyo, JAPAN
Custom Training & Consulting
Services100%
GP Strategies Malaysia Sdn. Bhd. Malaysia
ZICO Registered Address
Service:
Level 19-1, Tower Block, Menara
Milenium, Jalan Damanlela
Pusat Bandar Damansara
50490 Kuala Lumpur, Wilayah
Persekutuan
Custom Training & Consulting
Services100%
General Physics Corporation
Mexico, S.A. de C.V.Mexico
Av. Ejército Nacional #769
2nd floor, Suite 219
Colonia Ampliacion Granada
Alcandia Miguel Hidalgo
Ciudad de México, Mexico
11520
Custom Training & Consulting
Services100%
Trabajo Total Integrado, S.A.
de C.V.Mexico
Av. Ejército Nacional #769
2nd floor, Suite 219
Colonia Ampliacion Granada
Alcandia Miguel Hidalgo
Ciudad de México, Mexico
11520
Custom Training & Consulting
Services100%
GP Strategies Netherlands B.V Netherlands
Polarisavenue 130 – 148
2132 JX Hoofddorp
NETHERLANDS
Custom Training & Consulting
Services100%
TTi Peru S.A.C. Peru
German Schreiber 291
Oficina 301
Lima, Peru
Custom Training & Consulting
Services100%
GP Strategies Philippines, Inc. Phillipines
Unit 301 3rd FLR Midway Court,
241 EDSA BrgyY Wack Wack
Greenhills East, Mandaluyong
City 1554 Philippines
Custom Training & Consulting
Services100%
TTi Global Philippines, Inc. Phillipines
2/F Unit 210, Building C, Aria
Place, Jose Abad Santos
Avenue, Dolores, San Fernando
City, Pampanga, Philippines
Custom Training & Consulting
Services40%
GP Strategies Poland sp. z.o.o Polandul. Strzegomska 138
54-429 Wrocław
Custom Training & Consulting
Services100%
Treinova Portugal, Unipessoal
LtdaPortugal
Rua Frederico George Nº39,
1º D
1600-012 Lisboa, Parish of
Lumiar
Custom Training & Consulting
Services100%
GP Strategies Performance
Training S.R.L.Romania
Charles de Gaulle Plaza, 15
Charles de Gaulle Square, 1st
District
Bucharest, 011857
Romania
Custom Training & Consulting
Services100%
GP Strategies Singapore (Asia)
Pte. Ltd.Singapore
18 Robinson Road
Level 02-03
Singapore 048547
Custom Training & Consulting
Services100%
TTi Global Consultancy South
Africa Proprietary LimitedSouth Africa
MIDLAND 43 MONTROSE STREET
VORNA VALLEY, MIDRAND
GAUTENG 1685
South Africa
Custom Training & Consulting
Services100%
Team Core Investments No. 8
Proprietary LimitedSouth Africa
MIDLAND 43 MONTROSE STREET
VORNA VALLEY, MIDRAND
GAUTENG 1685
South Africa
Custom Training & Consulting
Services100%
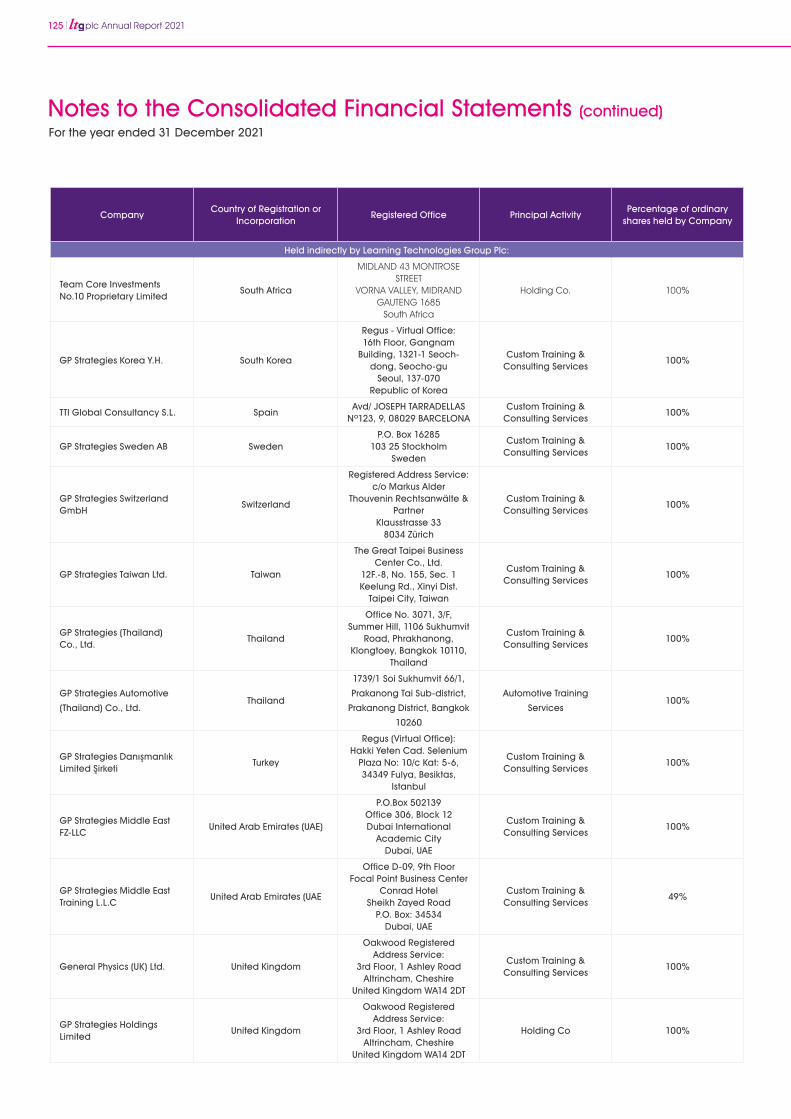
125 plc Annual Report 2021
CompanyCountry of Registration or
IncorporationRegistered Office Principal Activity
Percentage of ordinary shares held by Company
Held indirectly by Learning Technologies Group Plc:
Team Core Investments No.10 Proprietary Limited
South Africa
MIDLAND 43 MONTROSE STREET
VORNA VALLEY, MIDRANDGAUTENG 1685
South Africa
Holding Co. 100%
GP Strategies Korea Y.H. South Korea
Regus - Virtual Office:16th Floor, Gangnam
Building, 1321-1 Seoch-dong, Seocho-gu
Seoul, 137-070 Republic of Korea
Custom Training & Consulting Services
100%
TTI Global Consultancy S.L. SpainAvd/ JOSEPH TARRADELLAS
Nº123, 9, 08029 BARCELONACustom Training &
Consulting Services100%
GP Strategies Sweden AB SwedenP.O. Box 16285
103 25 StockholmSweden
Custom Training & Consulting Services
100%
GP Strategies Switzerland GmbH
Switzerland
Registered Address Service:c/o Markus Alder
Thouvenin Rechtsanwälte & Partner
Klausstrasse 338034 Zürich
Custom Training & Consulting Services
100%
GP Strategies Taiwan Ltd. Taiwan
The Great Taipei Business Center Co., Ltd.
12F.-8, No. 155, Sec. 1Keelung Rd., Xinyi Dist.
Taipei City, Taiwan
Custom Training & Consulting Services
100%
GP Strategies (Thailand) Co., Ltd.
Thailand
Office No. 3071, 3/F, Summer Hill, 1106 Sukhumvit
Road, Phrakhanong, Klongtoey, Bangkok 10110,
Thailand
Custom Training & Consulting Services
100%
GP Strategies Automotive
(Thailand) Co., Ltd.Thailand
1739/1 Soi Sukhumvit 66/1,
Prakanong Tai Sub-district,
Prakanong District, Bangkok
10260
Automotive Training
Services100%
GP Strategies Danışmanlık Limited Şirketi
Turkey
Regus (Virtual Office):Hakki Yeten Cad. Selenium
Plaza No: 10/c Kat: 5-6, 34349 Fulya, Besiktas,
Istanbul
Custom Training & Consulting Services
100%
GP Strategies Middle East FZ-LLC
United Arab Emirates (UAE)
P.O.Box 502139Office 306, Block 12Dubai International
Academic CityDubai, UAE
Custom Training & Consulting Services
100%
GP Strategies Middle East Training L.L.C
United Arab Emirates (UAE
Office D-09, 9th FloorFocal Point Business Center
Conrad HotelSheikh Zayed Road
P.O. Box: 34534Dubai, UAE
Custom Training & Consulting Services
49%
General Physics (UK) Ltd. United Kingdom
Oakwood Registered Address Service:
3rd Floor, 1 Ashley RoadAltrincham, Cheshire
United Kingdom WA14 2DT
Custom Training & Consulting Services
100%
GP Strategies Holdings Limited
United Kingdom
Oakwood Registered Address Service:
3rd Floor, 1 Ashley RoadAltrincham, Cheshire
United Kingdom WA14 2DT
Holding Co 100%
For the year ended 31 December 2021
Notes to the Consolidated Financial Statements (continued)
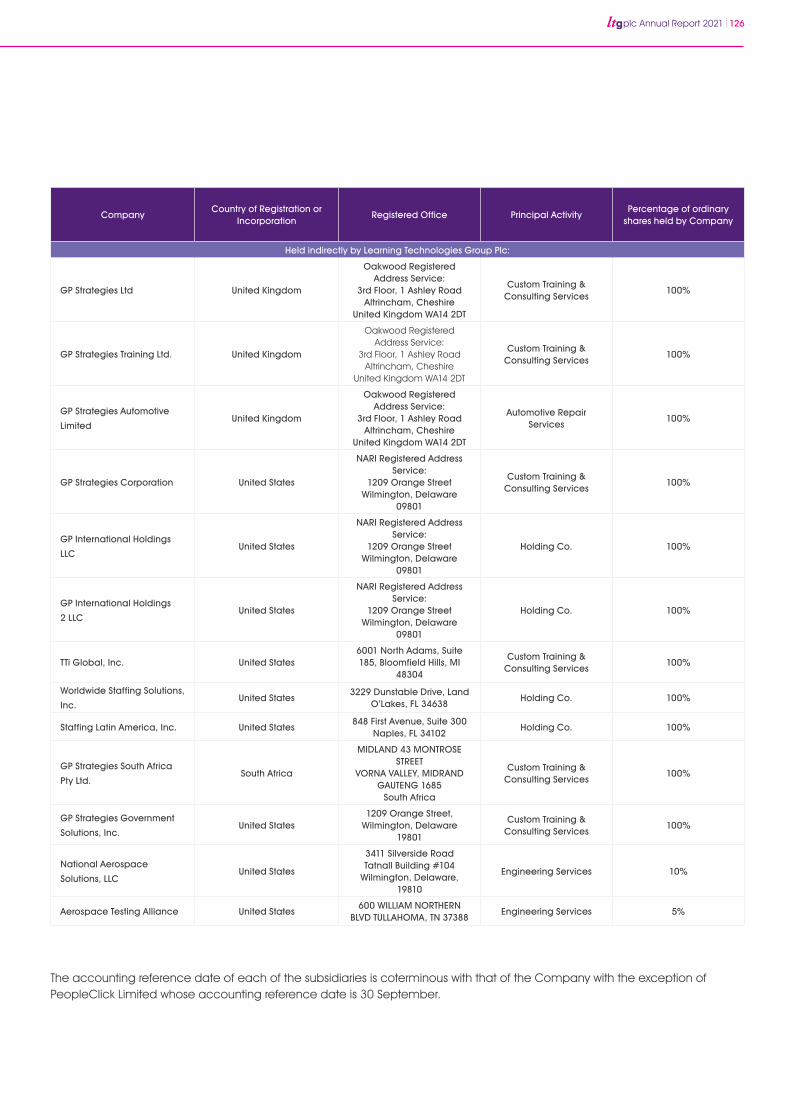
plc Annual Report 2021 126
CompanyCountry of Registration or
IncorporationRegistered Office Principal Activity
Percentage of ordinary shares held by Company
Held indirectly by Learning Technologies Group Plc:
GP Strategies Ltd United Kingdom
Oakwood Registered Address Service:
3rd Floor, 1 Ashley RoadAltrincham, Cheshire
United Kingdom WA14 2DT
Custom Training & Consulting Services
100%
GP Strategies Training Ltd. United Kingdom
Oakwood Registered Address Service:
3rd Floor, 1 Ashley RoadAltrincham, Cheshire
United Kingdom WA14 2DT
Custom Training & Consulting Services
100%
GP Strategies Automotive
LimitedUnited Kingdom
Oakwood Registered Address Service:
3rd Floor, 1 Ashley RoadAltrincham, Cheshire
United Kingdom WA14 2DT
Automotive Repair Services
100%
GP Strategies Corporation United States
NARI Registered Address Service:
1209 Orange StreetWilmington, Delaware
09801
Custom Training & Consulting Services
100%
GP International Holdings
LLCUnited States
NARI Registered Address Service:
1209 Orange StreetWilmington, Delaware
09801
Holding Co. 100%
GP International Holdings
2 LLCUnited States
NARI Registered Address Service:
1209 Orange StreetWilmington, Delaware
09801
Holding Co. 100%
TTi Global, Inc. United States6001 North Adams, Suite 185, Bloomfield Hills, MI
48304
Custom Training & Consulting Services
100%
Worldwide Staffing Solutions,
Inc.United States
3229 Dunstable Drive, Land O’Lakes, FL 34638
Holding Co. 100%
Staffing Latin America, Inc. United States848 First Avenue, Suite 300
Naples, FL 34102 Holding Co. 100%
GP Strategies South Africa
Pty Ltd.South Africa
MIDLAND 43 MONTROSE STREET
VORNA VALLEY, MIDRANDGAUTENG 1685
South Africa
Custom Training & Consulting Services
100%
GP Strategies Government
Solutions, Inc.United States
1209 Orange Street, Wilmington, Delaware
19801
Custom Training & Consulting Services
100%
National Aerospace
Solutions, LLCUnited States
3411 Silverside RoadTatnall Building #104
Wilmington, Delaware, 19810
Engineering Services 10%
Aerospace Testing Alliance United States600 WILLIAM NORTHERN
BLVD TULLAHOMA, TN 37388Engineering Services 5%
The accounting reference date of each of the subsidiaries is coterminous with that of the Company with the exception of PeopleClick Limited whose accounting reference date is 30 September.
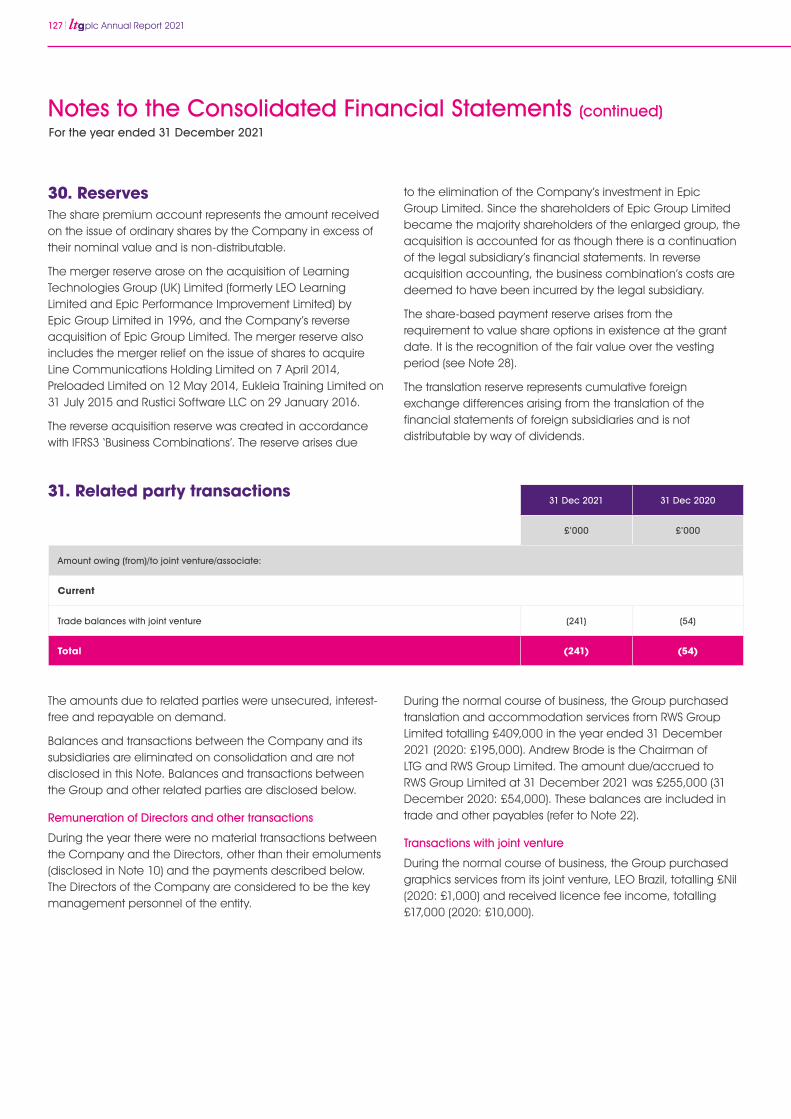
127 plc Annual Report 2021
31 Dec 2021 31 Dec 2020
£’000 £’000
Amount owing (from)/to joint venture/associate:
Current
Trade balances with joint venture (241) (54)
Total (241) (54)
30. ReservesThe share premium account represents the amount received on the issue of ordinary shares by the Company in excess of their nominal value and is non-distributable.
The merger reserve arose on the acquisition of Learning Technologies Group (UK) Limited (formerly LEO Learning Limited and Epic Performance Improvement Limited) by Epic Group Limited in 1996, and the Company’s reverse acquisition of Epic Group Limited. The merger reserve also includes the merger relief on the issue of shares to acquire Line Communications Holding Limited on 7 April 2014, Preloaded Limited on 12 May 2014, Eukleia Training Limited on 31 July 2015 and Rustici Software LLC on 29 January 2016.
The reverse acquisition reserve was created in accordance with IFRS3 ‘Business Combinations’. The reserve arises due
The amounts due to related parties were unsecured, interest-free and repayable on demand.
Balances and transactions between the Company and its subsidiaries are eliminated on consolidation and are not disclosed in this Note. Balances and transactions between the Group and other related parties are disclosed below.
Remuneration of Directors and other transactions
During the year there were no material transactions between the Company and the Directors, other than their emoluments (disclosed in Note 10) and the payments described below. The Directors of the Company are considered to be the key management personnel of the entity.
to the elimination of the Company’s investment in Epic Group Limited. Since the shareholders of Epic Group Limited became the majority shareholders of the enlarged group, the acquisition is accounted for as though there is a continuation of the legal subsidiary’s financial statements. In reverse acquisition accounting, the business combination’s costs are deemed to have been incurred by the legal subsidiary.
The share-based payment reserve arises from the requirement to value share options in existence at the grant date. It is the recognition of the fair value over the vesting period (see Note 28).
The translation reserve represents cumulative foreign exchange differences arising from the translation of the financial statements of foreign subsidiaries and is not distributable by way of dividends.
During the normal course of business, the Group purchased translation and accommodation services from RWS Group Limited totalling £409,000 in the year ended 31 December 2021 (2020: £195,000). Andrew Brode is the Chairman of LTG and RWS Group Limited. The amount due/accrued to RWS Group Limited at 31 December 2021 was £255,000 (31 December 2020: £54,000). These balances are included in trade and other payables (refer to Note 22).
Transactions with joint venture
During the normal course of business, the Group purchased graphics services from its joint venture, LEO Brazil, totalling £Nil (2020: £1,000) and received licence fee income, totalling £17,000 (2020: £10,000).
31. Related party transactions
For the year ended 31 December 2021
Notes to the Consolidated Financial Statements (continued)

plc Annual Report 2021 128
31 Dec 2021 31 Dec 2020
£’000 £’000
Final dividend paid 3,705 -
Interim dividend paid 2,360 5,537
Total 6,065 5,537
On 29 October 2021, the Company paid an interim dividend of 0.30 pence per share (2020: 0.25 pence per share) amounting to a total dividend payment of £2.4 million. Given the robust performance of the Group during the past year the Directors propose to pay a final dividend of 0.70 pence per share for the year ended 31 December 2021, equating to a total payment in respect of the year of 1.00 pence per share (2020: 0.75 pence per share).
The proposed final dividend of 0.70 pence per share, amounting to a final dividend of c. £5.5m, is not included as a liability in these financial statements and, subject to shareholder approval, will be paid on 21 July 2022 to shareholders on the register at the close of business on 1 July 2022. The final dividend will be paid gross.
33. Financial instruments The Group’s activities are exposed to a variety of market risk (including foreign currency risk, interest rate risk and equity price risk), credit risk and liquidity risk. The Group’s overall financial risk management policy focuses on the unpredictability of financial markets and seeks to minimise potential adverse effects on its financial performance.
(a) Financial risk management policies
The Group’s policies in respect of the major areas of treasury activity are as follows:-
(i) Market risk
(i) Foreign currency risk
The Group is exposed to foreign currency risk on transactions and balances that are denominated in currencies other than Pounds Sterling. The currencies giving rise to this risk are primarily the United States Dollar, Canadian Dollar and Euro. Foreign currency risk is monitored closely on an ongoing basis to ensure that the net exposure is at an acceptable level.
The Group maintains a natural hedge whenever possible, by matching the cash inflows (revenue stream) and cash outflows used for purposes such as capital and operational expenditure in the respective currencies.
The carrying amounts of the Group’s foreign currency denominated financial assets and liabilities at the end of year were as follows:
32. Dividends paid
31 Dec 2021 31 Dec 2020
£’000 £’000
Country CurrencyFinancial
assetsFinancial Liabilities
Financial assets
Financial Liabilities
United States Dollar 150,601 173,540 34,344 39,657
Brazilian Real 1,568 73 290 -
Hong Kong Dollar 2,034 401 459 379
Euro 14,435 5,051 4,889 25
Swiss Franc 1,414 2,490 377 -
Canadian Dollar 1,779 416 975 41
Australian Dollar 1,805 169 1,634 73
Philippines Peso 136 20 43 1
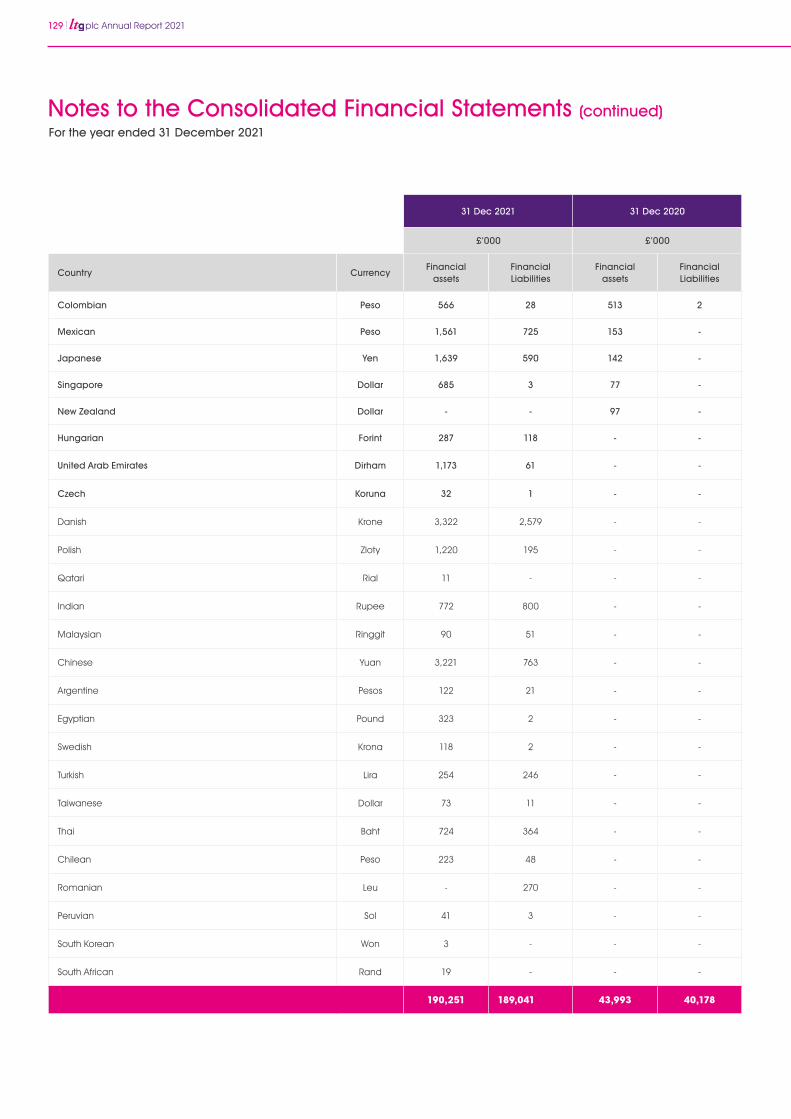
129 plc Annual Report 2021
31 Dec 2021 31 Dec 2020
£’000 £’000
Country CurrencyFinancial
assetsFinancial Liabilities
Financial assets
Financial Liabilities
Colombian Peso 566 28 513 2
Mexican Peso 1,561 725 153 -
Japanese Yen 1,639 590 142 -
Singapore Dollar 685 3 77 -
New Zealand Dollar - - 97 -
Hungarian Forint 287 118 - -
United Arab Emirates Dirham 1,173 61 - -
Czech Koruna 32 1 - -
Danish Krone 3,322 2,579 - -
Polish Zloty 1,220 195 - -
Qatari Rial 11 - - -
Indian Rupee 772 800 - -
Malaysian Ringgit 90 51 - -
Chinese Yuan 3,221 763 - -
Argentine Pesos 122 21 - -
Egyptian Pound 323 2 - -
Swedish Krona 118 2 - -
Turkish Lira 254 246 - -
Taiwanese Dollar 73 11 - -
Thai Baht 724 364 - -
Chilean Peso 223 48 - -
Romanian Leu - 270 - -
Peruvian Sol 41 3 - -
South Korean Won 3 - - -
South African Rand 19 - - -
190,251 189,041 43,993 40,178
For the year ended 31 December 2021
Notes to the Consolidated Financial Statements (continued)
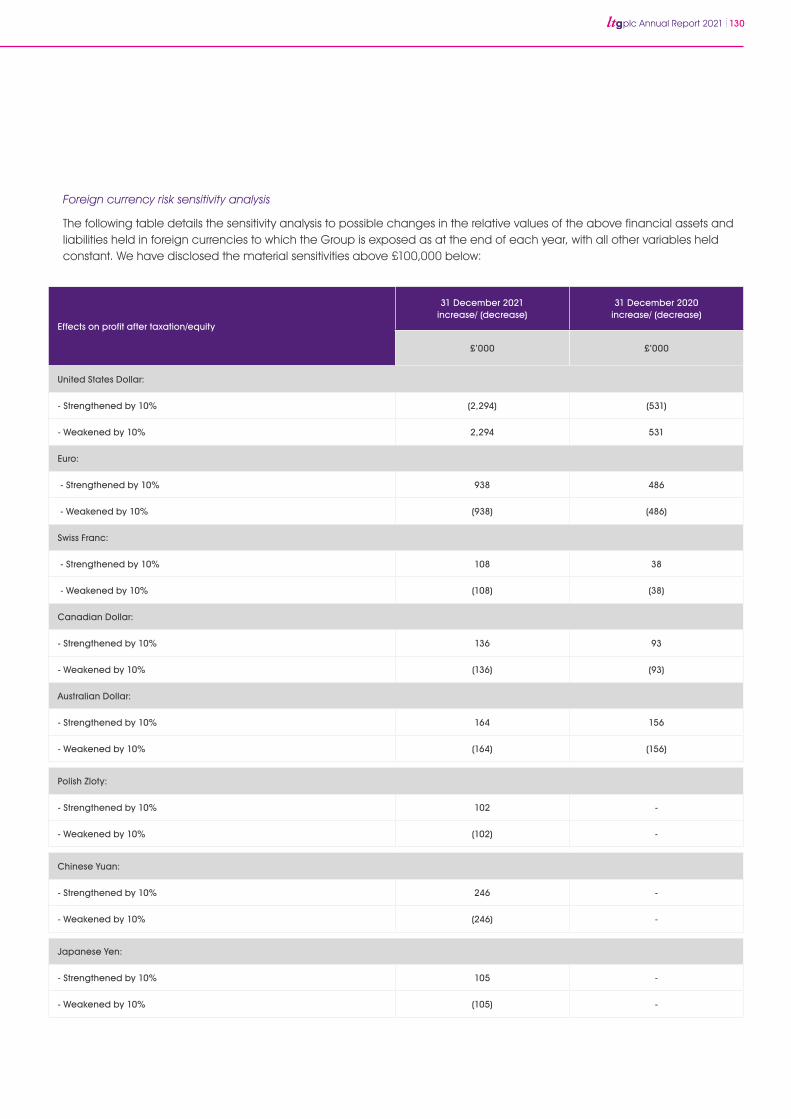
plc Annual Report 2021 130
Foreign currency risk sensitivity analysis
The following table details the sensitivity analysis to possible changes in the relative values of the above financial assets and liabilities held in foreign currencies to which the Group is exposed as at the end of each year, with all other variables held constant. We have disclosed the material sensitivities above £100,000 below:
Effects on profit after taxation/equity
31 December 2021 increase/ (decrease)
31 December 2020 increase/ (decrease)
£’000 £’000
United States Dollar:
- Strengthened by 10% (2,294) (531)
- Weakened by 10% 2,294 531
Euro:
- Strengthened by 10% 938 486
- Weakened by 10% (938) (486)
Swiss Franc:
- Strengthened by 10% 108 38
- Weakened by 10% (108) (38)
Canadian Dollar:
- Strengthened by 10% 136 93
- Weakened by 10% (136) (93)
Australian Dollar:
- Strengthened by 10% 164 156
- Weakened by 10% (164) (156)
Polish Zloty:
- Strengthened by 10% 102 -
- Weakened by 10% (102) -
Chinese Yuan:
- Strengthened by 10% 246 -
- Weakened by 10% (246) -
Japanese Yen:
- Strengthened by 10% 105 -
- Weakened by 10% (105) -
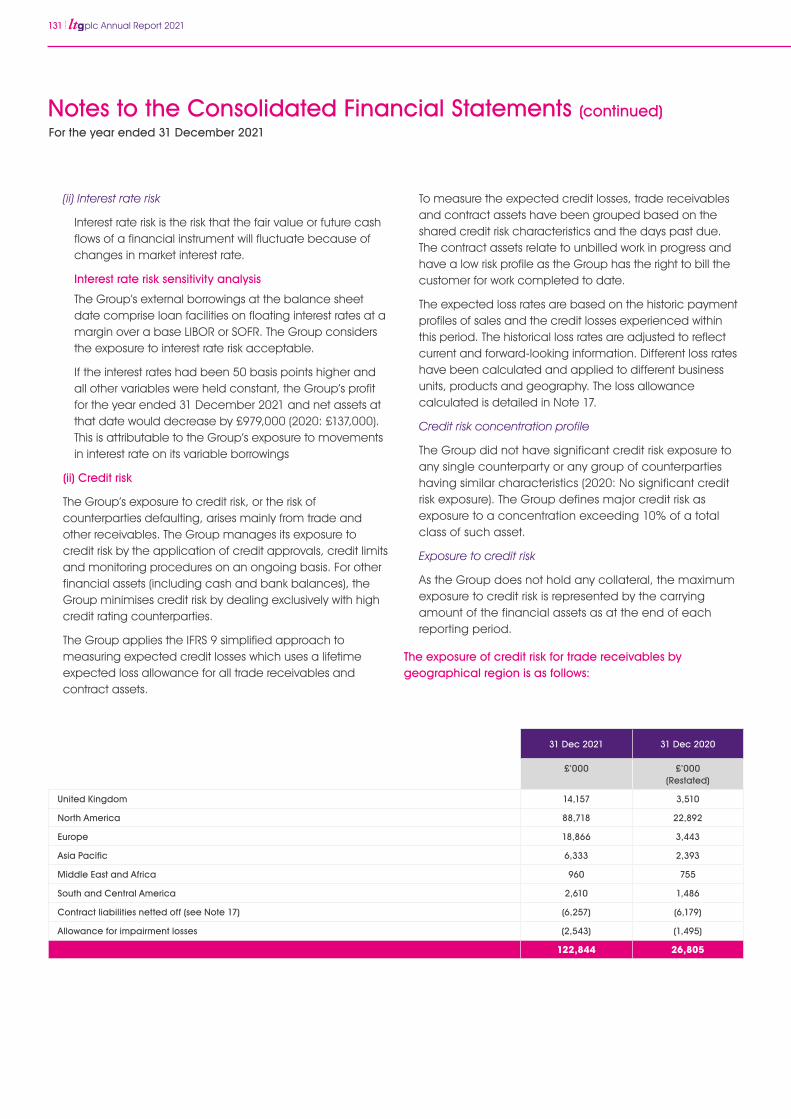
131 plc Annual Report 2021
(ii) Interest rate risk
Interest rate risk is the risk that the fair value or future cash flows of a financial instrument will fluctuate because of changes in market interest rate.
Interest rate risk sensitivity analysis
The Group’s external borrowings at the balance sheet date comprise loan facilities on floating interest rates at a margin over a base LIBOR or SOFR. The Group considers the exposure to interest rate risk acceptable.
If the interest rates had been 50 basis points higher and all other variables were held constant, the Group’s profit for the year ended 31 December 2021 and net assets at that date would decrease by £979,000 (2020: £137,000). This is attributable to the Group’s exposure to movements in interest rate on its variable borrowings
(ii) Credit risk
The Group’s exposure to credit risk, or the risk of counterparties defaulting, arises mainly from trade and other receivables. The Group manages its exposure to credit risk by the application of credit approvals, credit limits and monitoring procedures on an ongoing basis. For other financial assets (including cash and bank balances), the Group minimises credit risk by dealing exclusively with high credit rating counterparties.
The Group applies the IFRS 9 simplified approach to measuring expected credit losses which uses a lifetime expected loss allowance for all trade receivables and contract assets.
To measure the expected credit losses, trade receivables and contract assets have been grouped based on the shared credit risk characteristics and the days past due. The contract assets relate to unbilled work in progress and have a low risk profile as the Group has the right to bill the customer for work completed to date.
The expected loss rates are based on the historic payment profiles of sales and the credit losses experienced within this period. The historical loss rates are adjusted to reflect current and forward-looking information. Different loss rates have been calculated and applied to different business units, products and geography. The loss allowance calculated is detailed in Note 17.
Credit risk concentration profile
The Group did not have significant credit risk exposure to any single counterparty or any group of counterparties having similar characteristics (2020: No significant credit risk exposure). The Group defines major credit risk as exposure to a concentration exceeding 10% of a total class of such asset.
Exposure to credit risk
As the Group does not hold any collateral, the maximum exposure to credit risk is represented by the carrying amount of the financial assets as at the end of each reporting period.
The exposure of credit risk for trade receivables by geographical region is as follows:
31 Dec 2021 31 Dec 2020
£’000 £’000(Restated)
United Kingdom 14,157 3,510
North America 88,718 22,892
Europe 18,866 3,443
Asia Pacific 6,333 2,393
Middle East and Africa 960 755
South and Central America 2,610 1,486
Contract liabilities netted off (see Note 17) (6,257) (6,179)
Allowance for impairment losses (2,543) (1,495)
122,844 26,805
For the year ended 31 December 2021
Notes to the Consolidated Financial Statements (continued)
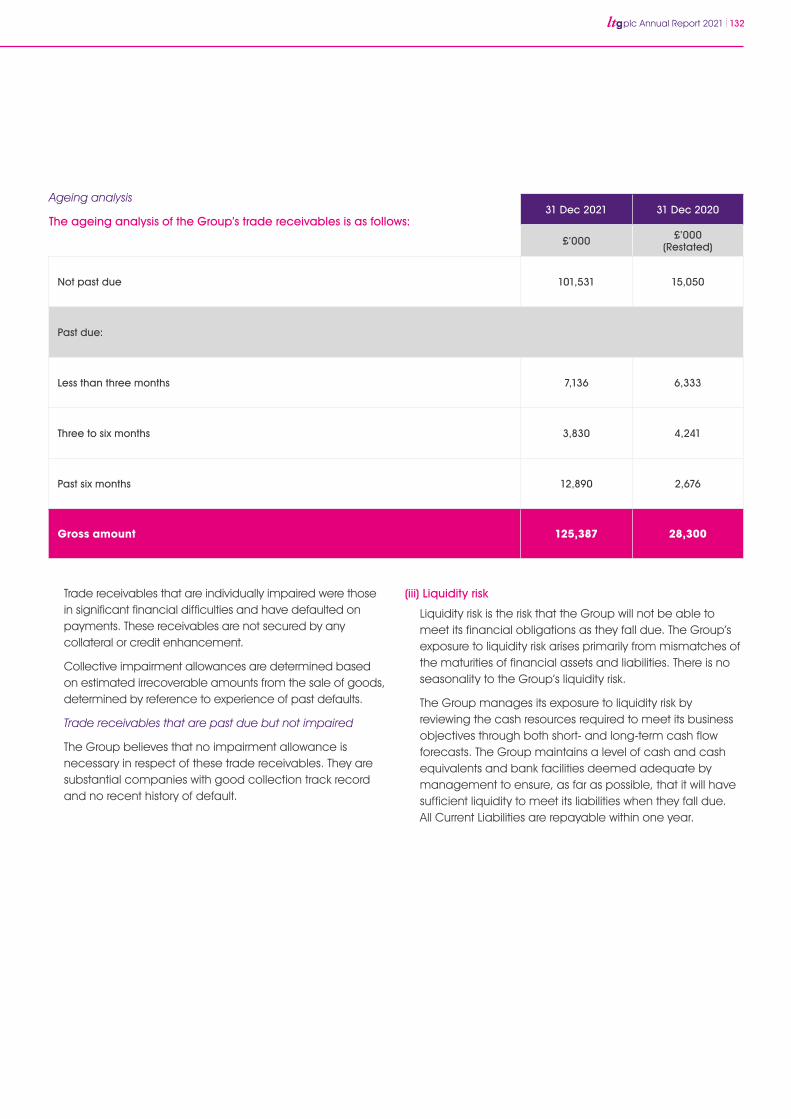
plc Annual Report 2021 132
31 Dec 2021 31 Dec 2020
£’000 £’000(Restated)
Not past due 101,531 15,050
Past due:
Less than three months 7,136 6,333
Three to six months 3,830 4,241
Past six months 12,890 2,676
Gross amount 125,387 28,300
Ageing analysis
The ageing analysis of the Group’s trade receivables is as follows:
Trade receivables that are individually impaired were those in significant financial difficulties and have defaulted on payments. These receivables are not secured by any collateral or credit enhancement.
Collective impairment allowances are determined based on estimated irrecoverable amounts from the sale of goods, determined by reference to experience of past defaults.
Trade receivables that are past due but not impaired
The Group believes that no impairment allowance is necessary in respect of these trade receivables. They are substantial companies with good collection track record and no recent history of default.
(iii) Liquidity risk
Liquidity risk is the risk that the Group will not be able to meet its financial obligations as they fall due. The Group’s exposure to liquidity risk arises primarily from mismatches of the maturities of financial assets and liabilities. There is no seasonality to the Group’s liquidity risk.
The Group manages its exposure to liquidity risk by reviewing the cash resources required to meet its business objectives through both short- and long-term cash flow forecasts. The Group maintains a level of cash and cash equivalents and bank facilities deemed adequate by management to ensure, as far as possible, that it will have sufficient liquidity to meet its liabilities when they fall due. All Current Liabilities are repayable within one year.
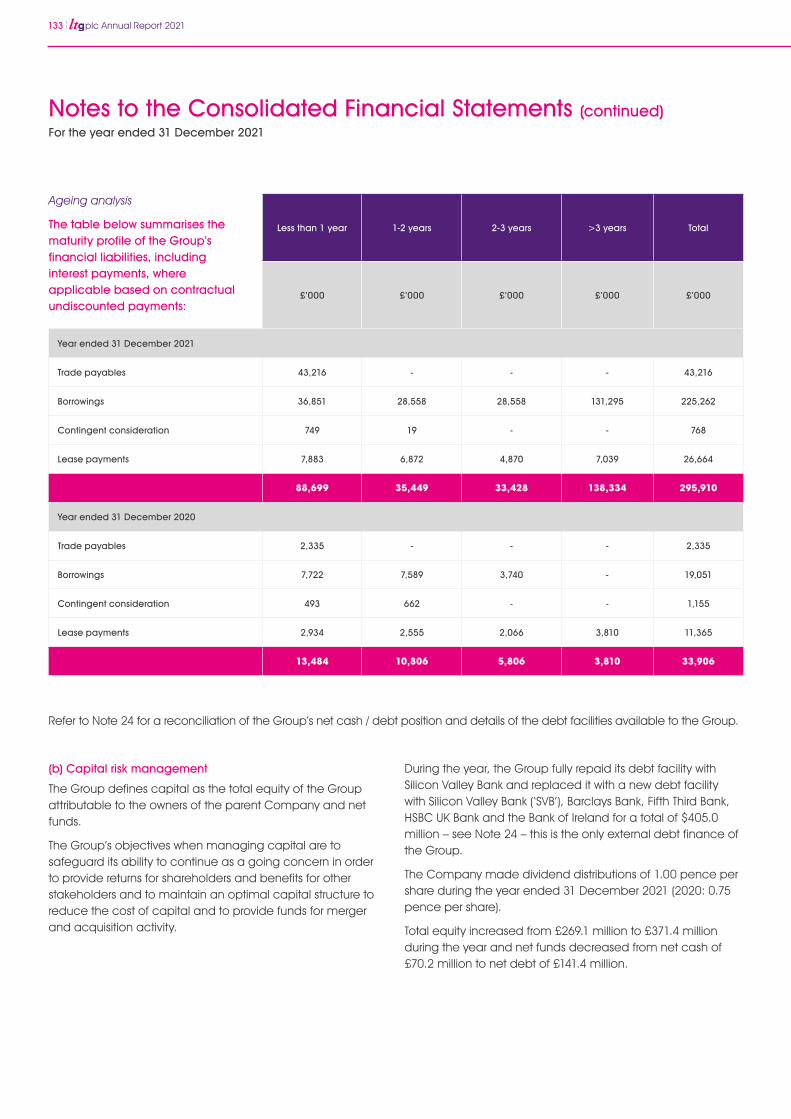
133 plc Annual Report 2021
During the year, the Group fully repaid its debt facility with Silicon Valley Bank and replaced it with a new debt facility with Silicon Valley Bank (‘SVB’), Barclays Bank, Fifth Third Bank, HSBC UK Bank and the Bank of Ireland for a total of $405.0 million – see Note 24 – this is the only external debt finance of the Group.
The Company made dividend distributions of 1.00 pence per share during the year ended 31 December 2021 (2020: 0.75 pence per share).
Total equity increased from £269.1 million to £371.4 million during the year and net funds decreased from net cash of £70.2 million to net debt of £141.4 million.
(b) Capital risk management
The Group defines capital as the total equity of the Group attributable to the owners of the parent Company and net funds.
The Group’s objectives when managing capital are to safeguard its ability to continue as a going concern in order to provide returns for shareholders and benefits for other stakeholders and to maintain an optimal capital structure to reduce the cost of capital and to provide funds for merger and acquisition activity.
Refer to Note 24 for a reconciliation of the Group’s net cash / debt position and details of the debt facilities available to the Group.
Less than 1 year 1-2 years 2-3 years >3 years Total
£’000 £’000 £’000 £’000 £’000
Year ended 31 December 2021
Trade payables 43,216 - - - 43,216
Borrowings 36,851 28,558 28,558 131,295 225,262
Contingent consideration 749 19 - - 768
Lease payments 7,883 6,872 4,870 7,039 26,664
88,699 35,449 33,428 138,334 295,910
Year ended 31 December 2020
Trade payables 2,335 - - - 2,335
Borrowings 7,722 7,589 3,740 - 19,051
Contingent consideration 493 662 - - 1,155
Lease payments 2,934 2,555 2,066 3,810 11,365
13,484 10,806 5,806 3,810 33,906
Ageing analysis
The table below summarises the maturity profile of the Group’s financial liabilities, including interest payments, where applicable based on contractual undiscounted payments:
For the year ended 31 December 2021
Notes to the Consolidated Financial Statements (continued)
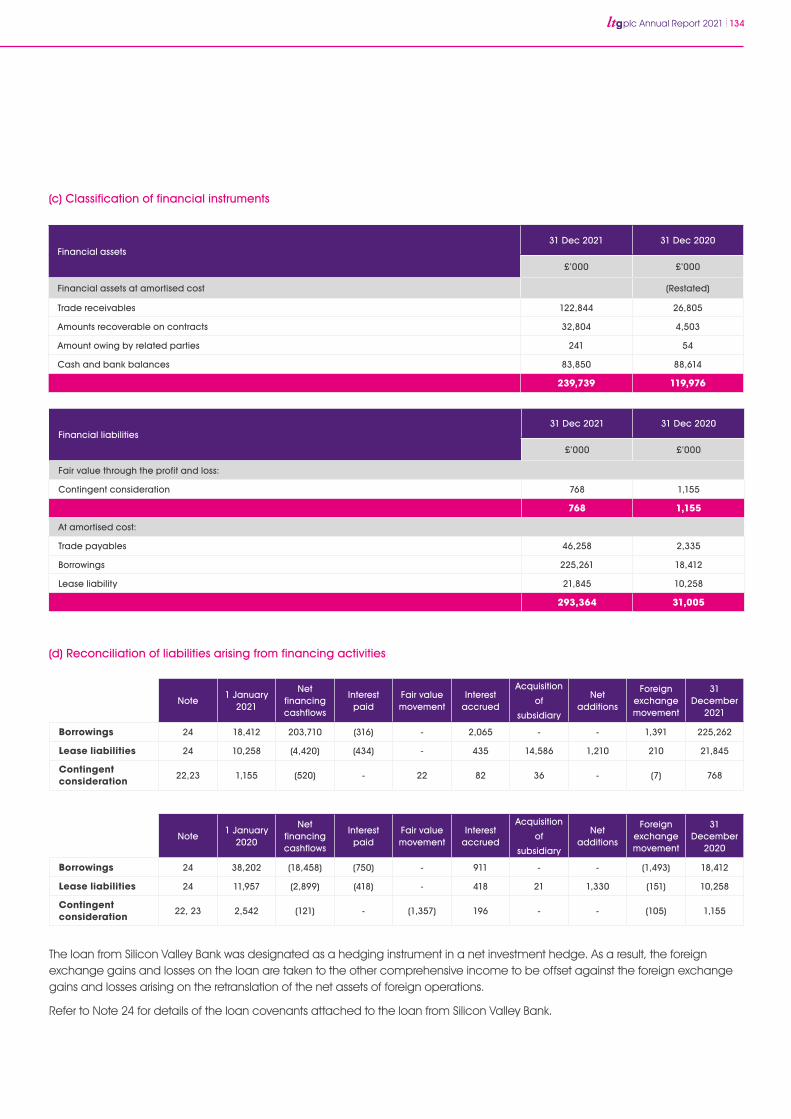
plc Annual Report 2021 134
(c) Classification of financial instruments
(d) Reconciliation of liabilities arising from financing activities
Financial assets31 Dec 2021 31 Dec 2020
£’000 £’000
Financial assets at amortised cost (Restated)
Trade receivables 122,844 26,805
Amounts recoverable on contracts 32,804 4,503
Amount owing by related parties 241 54
Cash and bank balances 83,850 88,614
239,739 119,976
Financial liabilities31 Dec 2021 31 Dec 2020
£’000 £’000
Fair value through the profit and loss:
Contingent consideration 768 1,155
768 1,155
At amortised cost:
Trade payables 46,258 2,335
Borrowings 225,261 18,412
Lease liability 21,845 10,258
293,364 31,005
Note1 January
2021
Net financing cashflows
Interest paid
Fair value movement
Interest accrued
Acquisition
of
subsidiary
Net additions
Foreign exchange movement
31 December
2021
Borrowings 24 18,412 203,710 (316) - 2,065 - - 1,391 225,262
Lease liabilities 24 10,258 (4,420) (434) - 435 14,586 1,210 210 21,845
Contingent consideration 22,23 1,155 (520) - 22 82 36 - (7) 768
Note1 January
2020
Net financing cashflows
Interest paid
Fair value movement
Interest accrued
Acquisition
of
subsidiary
Net additions
Foreign exchange movement
31 December
2020
Borrowings 24 38,202 (18,458) (750) - 911 - - (1,493) 18,412
Lease liabilities 24 11,957 (2,899) (418) - 418 21 1,330 (151) 10,258
Contingent consideration 22, 23 2,542 (121) - (1,357) 196 - - (105) 1,155
The loan from Silicon Valley Bank was designated as a hedging instrument in a net investment hedge. As a result, the foreign exchange gains and losses on the loan are taken to the other comprehensive income to be offset against the foreign exchange gains and losses arising on the retranslation of the net assets of foreign operations.
Refer to Note 24 for details of the loan covenants attached to the loan from Silicon Valley Bank.
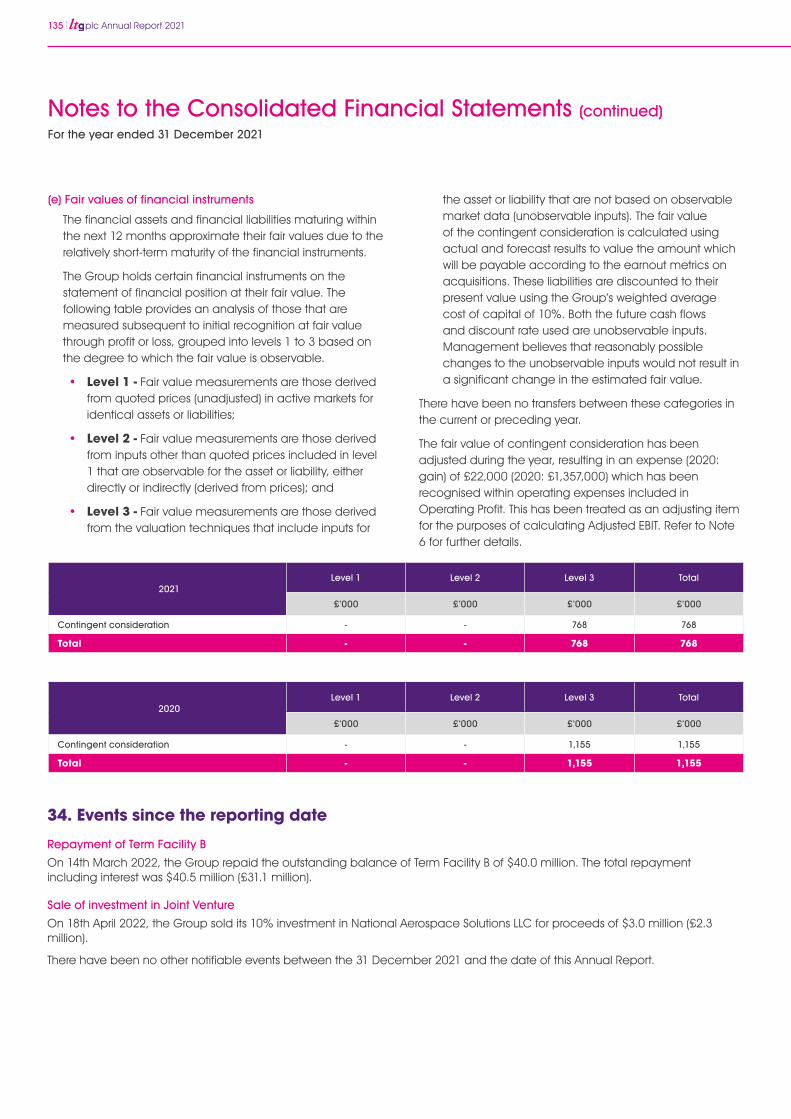
135 plc Annual Report 2021
2020Level 1 Level 2 Level 3 Total
£’000 £’000 £’000 £’000
Contingent consideration - - 1,155 1,155
Total - - 1,155 1,155
(e) Fair values of financial instruments
The financial assets and financial liabilities maturing within the next 12 months approximate their fair values due to the relatively short-term maturity of the financial instruments.
The Group holds certain financial instruments on the statement of financial position at their fair value. The following table provides an analysis of those that are measured subsequent to initial recognition at fair value through profit or loss, grouped into levels 1 to 3 based on the degree to which the fair value is observable.
• Level 1 - Fair value measurements are those derived from quoted prices (unadjusted) in active markets for identical assets or liabilities;
• Level 2 - Fair value measurements are those derived from inputs other than quoted prices included in level 1 that are observable for the asset or liability, either directly or indirectly (derived from prices); and
• Level 3 - Fair value measurements are those derived from the valuation techniques that include inputs for
the asset or liability that are not based on observable market data (unobservable inputs). The fair value of the contingent consideration is calculated using actual and forecast results to value the amount which will be payable according to the earnout metrics on acquisitions. These liabilities are discounted to their present value using the Group’s weighted average cost of capital of 10%. Both the future cash flows and discount rate used are unobservable inputs. Management believes that reasonably possible changes to the unobservable inputs would not result in a significant change in the estimated fair value.
There have been no transfers between these categories in the current or preceding year.
The fair value of contingent consideration has been adjusted during the year, resulting in an expense (2020: gain) of £22,000 (2020: £1,357,000) which has been recognised within operating expenses included in Operating Profit. This has been treated as an adjusting item for the purposes of calculating Adjusted EBIT. Refer to Note 6 for further details.
2021Level 1 Level 2 Level 3 Total
£’000 £’000 £’000 £’000
Contingent consideration - - 768 768
Total - - 768 768
34. Events since the reporting date
Repayment of Term Facility B
On 14th March 2022, the Group repaid the outstanding balance of Term Facility B of $40.0 million. The total repayment including interest was $40.5 million (£31.1 million).
Sale of investment in Joint Venture
On 18th April 2022, the Group sold its 10% investment in National Aerospace Solutions LLC for proceeds of $3.0 million (£2.3 million).
There have been no other notifiable events between the 31 December 2021 and the date of this Annual Report.
For the year ended 31 December 2021
Notes to the Consolidated Financial Statements (continued)
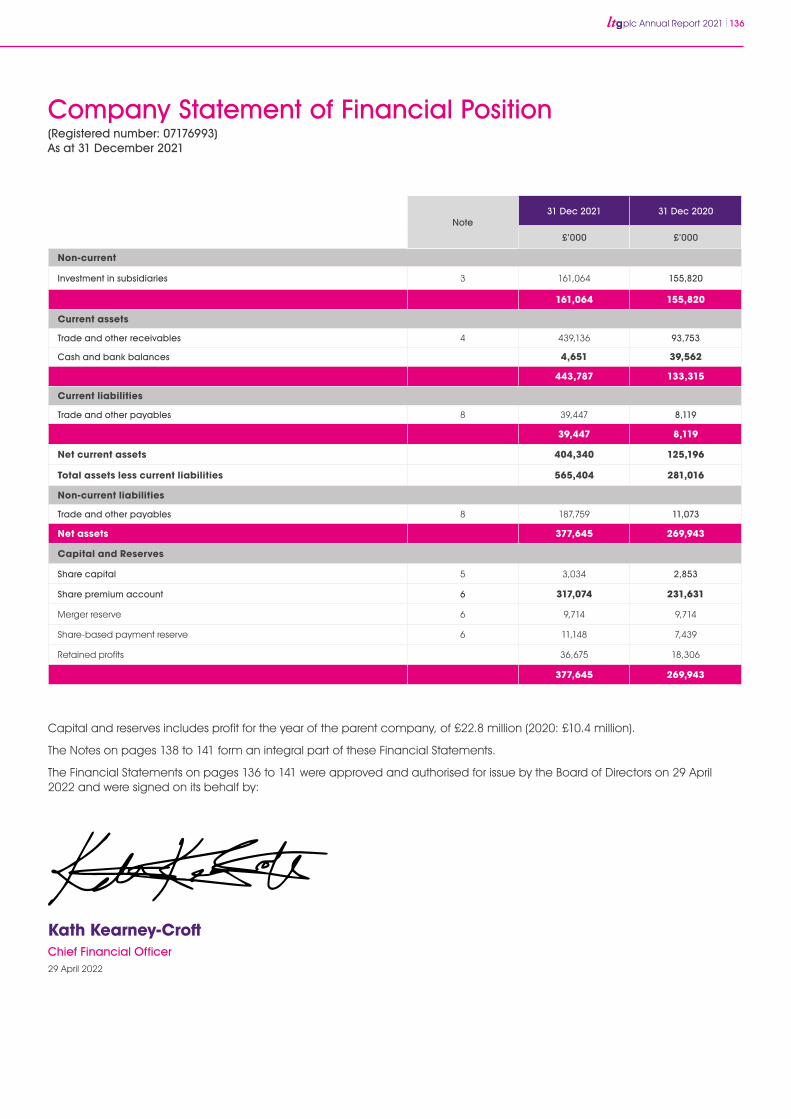
plc Annual Report 2021 136
Financial assets Note31 Dec 2021 31 Dec 2020
£’000 £’000
Non-current
Investment in subsidiaries 3 161,064 155,820
161,064 155,820
Current assets
Trade and other receivables 4 439,136 93,753
Cash and bank balances 4,651 39,562
443,787 133,315
Current liabilities
Trade and other payables 8 39,447 8,119
39,447 8,119
Net current assets 404,340 125,196
Total assets less current liabilities 565,404 281,016
Non-current liabilities
Trade and other payables 8 187,759 11,073
Net assets 377,645 269,943
Capital and Reserves
Share capital 5 3,034 2,853
Share premium account 6 317,074 231,631
Merger reserve 6 9,714 9,714
Share-based payment reserve 6 11,148 7,439
Retained profits 36,675 18,306
377,645 269,943
Kath Kearney-CroftChief Financial Officer29 April 2022
Capital and reserves includes profit for the year of the parent company, of £22.8 million (2020: £10.4 million).
The Notes on pages 138 to 141 form an integral part of these Financial Statements.
The Financial Statements on pages 136 to 141 were approved and authorised for issue by the Board of Directors on 29 April 2022 and were signed on its behalf by:
Company Statement of Financial Position(Registered number: 07176993)As at 31 December 2021
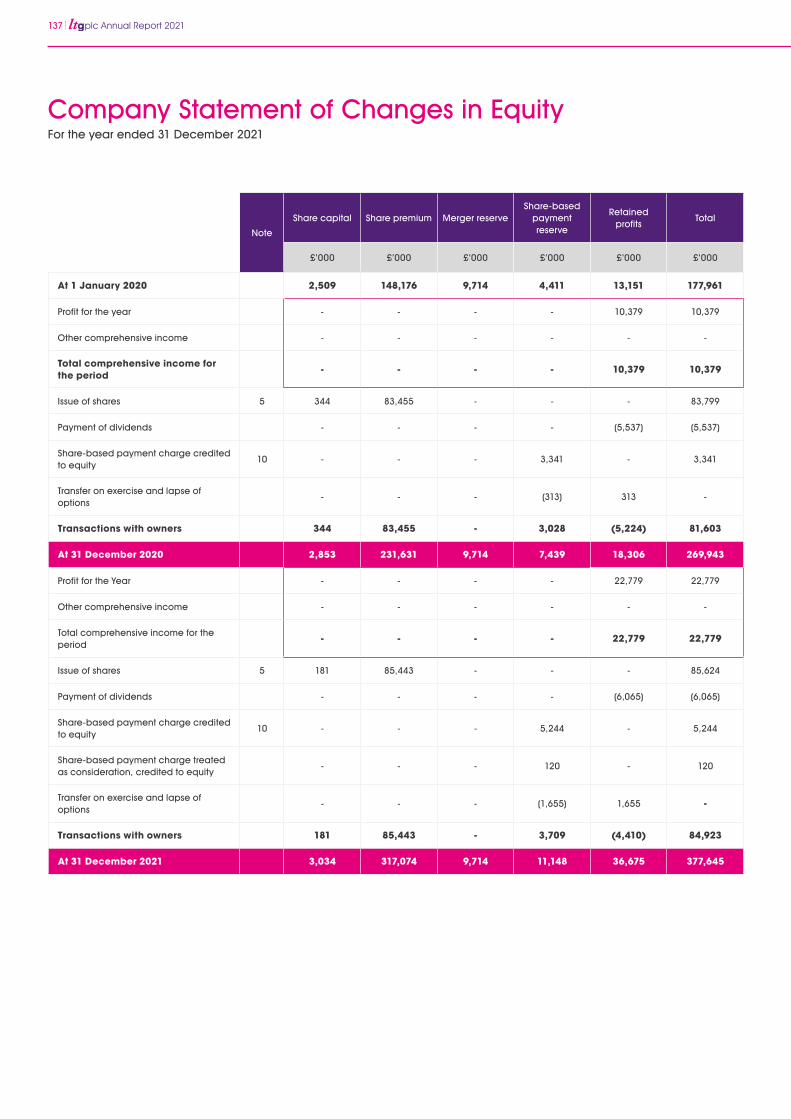
137 plc Annual Report 2021
For the year ended 31 December 2021
Company Statement of Changes in Equity
Note
Share capital Share premium Merger reserveShare-based
payment reserve
Retainedprofits
Total
£’000 £’000 £’000 £’000 £’000 £’000
At 1 January 2020 2,509 148,176 9,714 4,411 13,151 177,961
Profit for the year - - - - 10,379 10,379
Other comprehensive income - - - - - -
Total comprehensive income for the period - - - - 10,379 10,379
Issue of shares 5 344 83,455 - - - 83,799
Payment of dividends - - - - (5,537) (5,537)
Share-based payment charge credited to equity
10 - - - 3,341 - 3,341
Transfer on exercise and lapse of options
- - - (313) 313 -
Transactions with owners 344 83,455 - 3,028 (5,224) 81,603
At 31 December 2020 2,853 231,631 9,714 7,439 18,306 269,943
Profit for the Year - - - - 22,779 22,779
Other comprehensive income - - - - - -
Total comprehensive income for the period
- - - - 22,779 22,779
Issue of shares 5 181 85,443 - - - 85,624
Payment of dividends - - - - (6,065) (6,065)
Share-based payment charge credited to equity
10 - - - 5,244 - 5,244
Share-based payment charge treated as consideration, credited to equity
- - - 120 - 120
Transfer on exercise and lapse of options
- - - (1,655) 1,655 -
Transactions with owners 181 85,443 - 3,709 (4,410) 84,923
At 31 December 2021 3,034 317,074 9,714 11,148 36,675 377,645
plc Annual Report 2021 138
1. General information
The Company is a public limited company, which is listed on the AIM Market of the London Stock Exchange and domiciled in England and incorporated and registered in England and Wales. The address of its registered office is 15 Fetter Lane, London EC4A 1BW. The registered number of the Company is 07176993.
2. Summary of significant accounting policies
(a) Basis of preparation
The Company’s Financial Statements have been prepared in accordance with applicable law and accounting standards in the United Kingdom and under the historical cost accounting rules (Generally Accepted Accounting Practice in the United Kingdom).
The Directors have assessed the Company’s ability to continue in operational existence for the foreseeable future in accordance with the FRC guidance on the going concern basis of accounting and reporting on solvency and liquidity risks (April 2016). It is considered appropriate to continue to prepare the Financial Statements on a going concern basis.
These financial statements have been prepared in accordance with applicable United Kingdom accounting standards, including Financial Reporting Standard 102 – ‘The Financial Reporting Standard applicable in the United Kingdom and Republic of Ireland’ (‘FRS 102’), and with the Companies Act 2006. The financial statements have been prepared on the historical cost basis except for the modification to a fair value basis for certain financial instruments as specified in the accounting policies below.
The Company has taken advantage of Section 408 of the Companies Act 2006 and has not included a Profit and Loss account in these separate Financial Statements. The profit attributable to members of the Company for the year ended 31 December 2021 is £22,779,000 (year ended 31 December 2020: profit of £10,379,000).
The Company has taken advantage of the following disclosure exemptions in preparing these financial statements, as permitted by FRS 102 “The Financial Reporting Standard applicable in the UK and Republic of Ireland”:
• the requirements of Section 7 Statement of Cash Flows
• the requirements of Section 11 Financial Instruments
(b) Fixed asset investments
Fixed asset investments in Group undertakings are carried at cost less any provision for impairment.
(c) Foreign currencies
Transactions in foreign currencies are recorded using the rate of exchange ruling at the date of the transaction. Monetary assets and liabilities denominated in foreign currencies are translated using the contracted rate or the rate of exchange ruling at the balance sheet date and the gains or losses on translation are included in the profit and loss account.
(d) Cash and cash equivalents
Cash and cash equivalents comprise cash in hand, bank balances, deposits with financial institutions and short-term, highly liquid investments that are readily convertible to known amounts of cash and which are subject to an insignificant risk of change in value.
(e) Income taxes
The charge for taxation is based on the profit/loss for the year and takes into account taxation deferred because of timing differences between the treatment of certain items for taxation and accounting purposes.
Deferred tax is recognised in respect of all timing differences between the treatment of certain items for taxation and accounting purposes which have arisen but not reversed by the balance sheet date.
(f) Pensions
The policy for the Company’s defined contribution plan can be found in Note 2 of the Consolidated Accounts.
(g) Share-based payment arrangements
The policy for the Company’s share-based payment arrangements can be found in Note 2 of the Consolidated Financial Statements.
For the year ended 31 December 2021
Notes to the Company Financial Statements
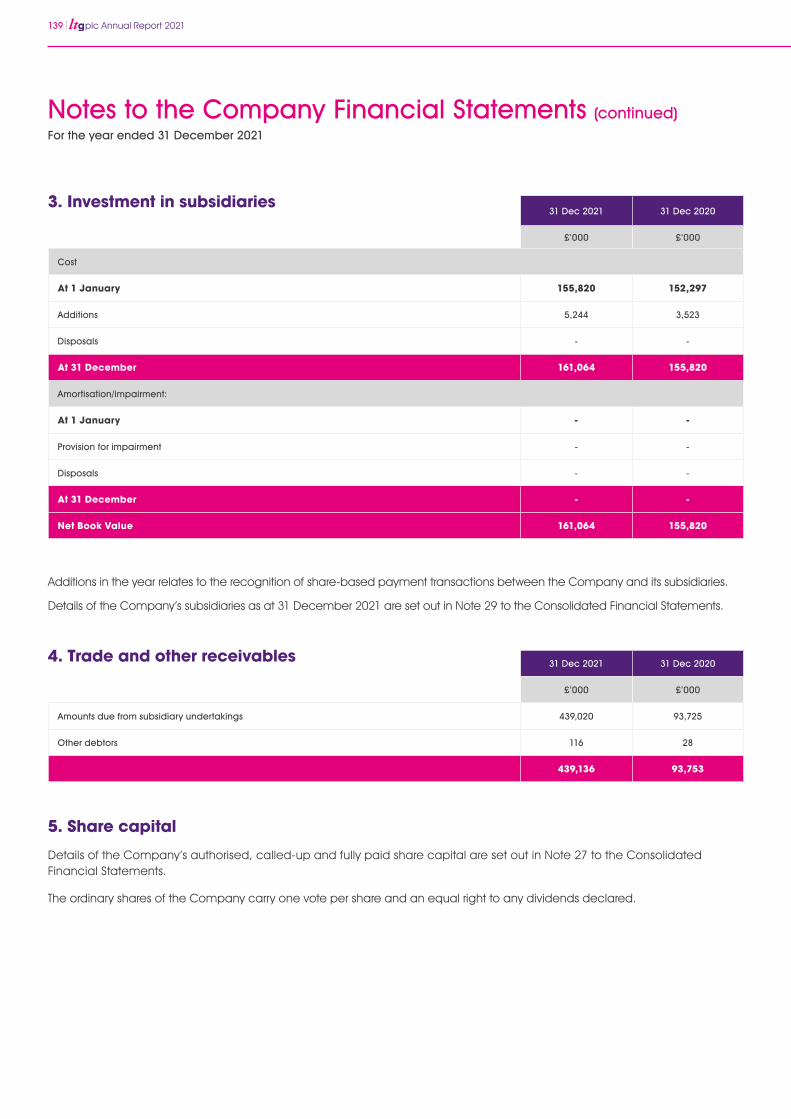
139 plc Annual Report 2021
31 Dec 2021 31 Dec 2020
£’000 £’000
Cost
At 1 January 155,820 152,297
Additions 5,244 3,523
Disposals - -
At 31 December 161,064 155,820
Amortisation/impairment:
At 1 January - -
Provision for impairment - -
Disposals - -
At 31 December - -
Net Book Value 161,064 155,820
3. Investment in subsidiaries
Additions in the year relates to the recognition of share-based payment transactions between the Company and its subsidiaries.
Details of the Company’s subsidiaries as at 31 December 2021 are set out in Note 29 to the Consolidated Financial Statements.
31 Dec 2021 31 Dec 2020
£’000 £’000
Amounts due from subsidiary undertakings 439,020 93,725
Other debtors 116 28
439,136 93,753
4. Trade and other receivables
5. Share capital
Details of the Company’s authorised, called-up and fully paid share capital are set out in Note 27 to the Consolidated Financial Statements.
The ordinary shares of the Company carry one vote per share and an equal right to any dividends declared.
For the year ended 31 December 2021
Notes to the Company Financial Statements (continued)
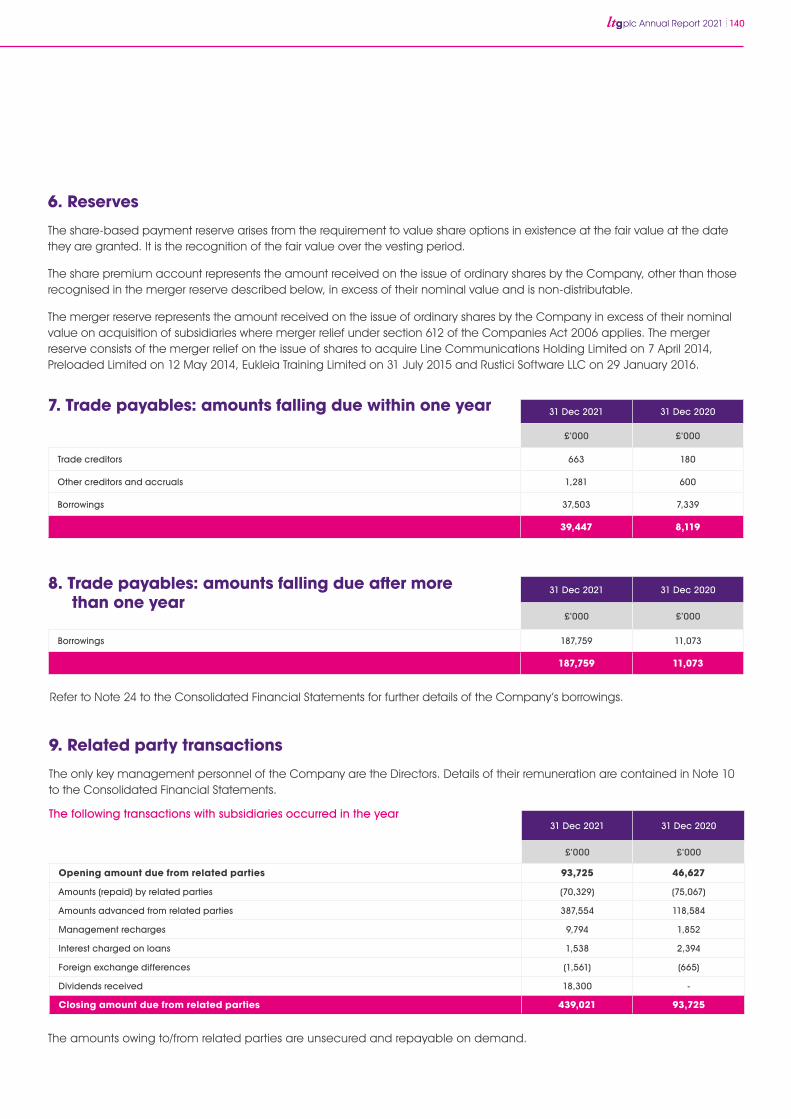
plc Annual Report 2021 140
31 Dec 2021 31 Dec 2020
£’000 £’000
Trade creditors 663 180
Other creditors and accruals 1,281 600
Borrowings 37,503 7,339
39,447 8,119
6. Reserves
The share-based payment reserve arises from the requirement to value share options in existence at the fair value at the date they are granted. It is the recognition of the fair value over the vesting period.
The share premium account represents the amount received on the issue of ordinary shares by the Company, other than those recognised in the merger reserve described below, in excess of their nominal value and is non-distributable.
The merger reserve represents the amount received on the issue of ordinary shares by the Company in excess of their nominal value on acquisition of subsidiaries where merger relief under section 612 of the Companies Act 2006 applies. The merger reserve consists of the merger relief on the issue of shares to acquire Line Communications Holding Limited on 7 April 2014, Preloaded Limited on 12 May 2014, Eukleia Training Limited on 31 July 2015 and Rustici Software LLC on 29 January 2016.
7. Trade payables: amounts falling due within one year
Refer to Note 24 to the Consolidated Financial Statements for further details of the Company’s borrowings.
31 Dec 2021 31 Dec 2020
£’000 £’000
Borrowings 187,759 11,073
187,759 11,073
8. Trade payables: amounts falling due after more than one year
31 Dec 2021 31 Dec 2020
£’000 £’000
Opening amount due from related parties 93,725 46,627
Amounts (repaid) by related parties (70,329) (75,067)
Amounts advanced from related parties 387,554 118,584
Management recharges 9,794 1,852
Interest charged on loans 1,538 2,394
Foreign exchange differences (1,561) (665)
Dividends received 18,300 -
Closing amount due from related parties 439,021 93,725
9. Related party transactions
The only key management personnel of the Company are the Directors. Details of their remuneration are contained in Note 10 to the Consolidated Financial Statements.
The following transactions with subsidiaries occurred in the year
The amounts owing to/from related parties are unsecured and repayable on demand.

141 plc Annual Report 2021
10. Share-based payments
Details of the group share-based plans are contained in Note 28 to the Consolidated Financial Statements.
The Company operates an approved share option plan. The Company’s share-based payment arrangements are summarised below.
An option-holder has no voting or dividend rights in the Company before the exercise of a share option.
No options were exercised during the year (2020: nil options). No options were granted, forfeited or expired during the year (2020: nil)
The number of options that are exercisable at 31 December 2021 is nil (2020: nil).
Share-based payments which were expensed in the entity and taken to equity in the year ended 31 December 2021, amounted to £nil (year ended 31 December 2020: £nil). The remaining difference between the share-based payments which were expensed as per Note 28 and the entity, relate to the options over the Company’s share capital held by employees of subsidiaries.
11. Dividends paid
Disclosure of dividends paid can be found in Note 32 to the Consolidated Financial Statements.
12. Subsequent events
Disclosures in relation to events after 31 December 2021 are shown in Note 34 to the Consolidated Financial Statements.
For the year ended 31 December 2021
Notes to the Company Financial Statements (continued)
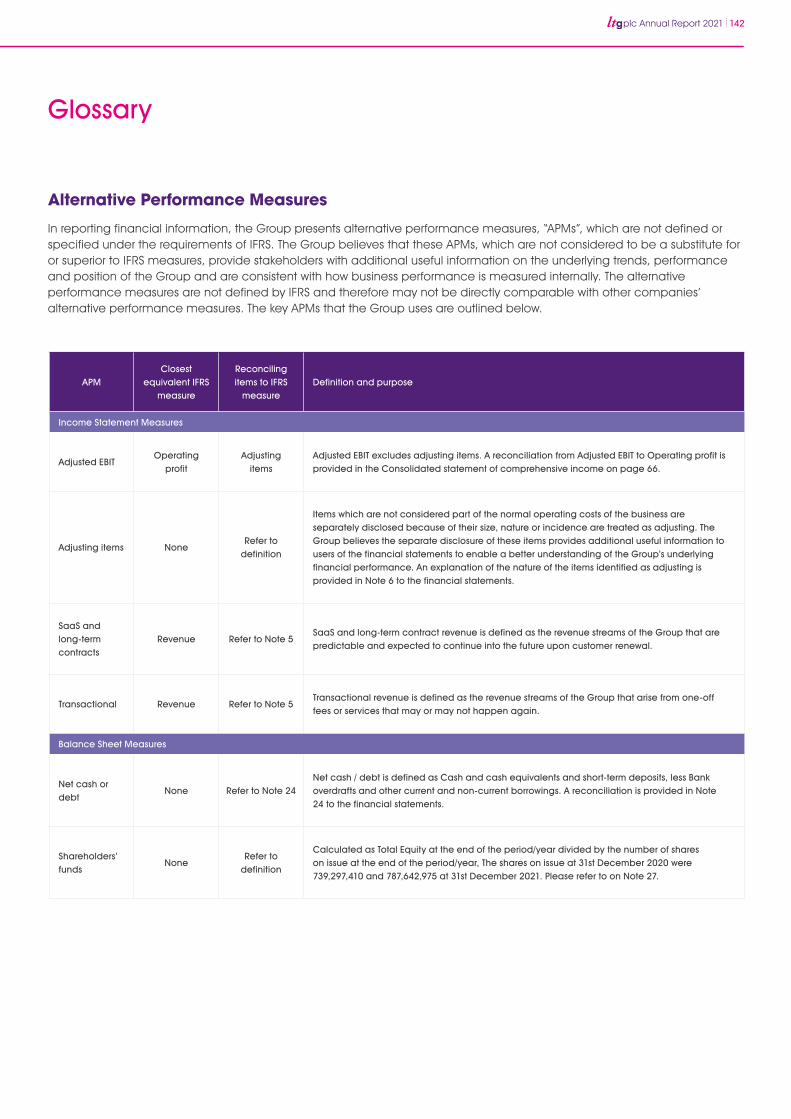
plc Annual Report 2021 142
Glossary
Alternative Performance Measures
In reporting financial information, the Group presents alternative performance measures, “APMs”, which are not defined or specified under the requirements of IFRS. The Group believes that these APMs, which are not considered to be a substitute for or superior to IFRS measures, provide stakeholders with additional useful information on the underlying trends, performance and position of the Group and are consistent with how business performance is measured internally. The alternative performance measures are not defined by IFRS and therefore may not be directly comparable with other companies’ alternative performance measures. The key APMs that the Group uses are outlined below.
APMClosest
equivalent IFRS measure
Reconciling items to IFRS
measureDefinition and purpose
Income Statement Measures
Adjusted EBITOperating
profitAdjusting
itemsAdjusted EBIT excludes adjusting items. A reconciliation from Adjusted EBIT to Operating profit is provided in the Consolidated statement of comprehensive income on page 66.
Adjusting items NoneRefer to
definition
Items which are not considered part of the normal operating costs of the business are separately disclosed because of their size, nature or incidence are treated as adjusting. The Group believes the separate disclosure of these items provides additional useful information to users of the financial statements to enable a better understanding of the Group’s underlying financial performance. An explanation of the nature of the items identified as adjusting is provided in Note 6 to the financial statements.
SaaS and long-term contracts
Revenue Refer to Note 5SaaS and long-term contract revenue is defined as the revenue streams of the Group that are predictable and expected to continue into the future upon customer renewal.
Transactional Revenue Refer to Note 5Transactional revenue is defined as the revenue streams of the Group that arise from one-off fees or services that may or may not happen again.
Balance Sheet Measures
Net cash or debt
None Refer to Note 24Net cash / debt is defined as Cash and cash equivalents and short-term deposits, less Bank overdrafts and other current and non-current borrowings. A reconciliation is provided in Note 24 to the financial statements.
Shareholders’ funds
NoneRefer to
definition
Calculated as Total Equity at the end of the period/year divided by the number of shares on issue at the end of the period/year, The shares on issue at 31st December 2020 were 739,297,410 and 787,642,975 at 31st December 2021. Please refer to on Note 27.

143 plc Annual Report 2021143 plc Annual Report 2021

plc Annual Report 2021 144
Directors
Simon Boddie, Non-executive DirectorAndrew Brode, Non-executive ChairmanAimie Chapple, Non-executive DirectorKath Kearney-Croft, Chief Financial OfficerPiers Lea, Chief Strategy OfficerLeslie-Ann Reed, Non-executive DirectorJonathan Satchell, Chief Executive
Company Secretary
Claire Walsh
Company number
07176993
Registered address
15 Fetter Lane London EC4A 1BW
Independent auditor
BDO LLP Chartered Accountants and Statutory Auditors 55 Baker Street London W1U 7EU
Nominated adviser and joint broker
Numis Securities Limited 10 Paternoster Square London EC4M 7LT
Joint broker
Goldman Sachs Plumtree Court 25 Shoe Lane London EC4A 4AU
Legal advisers
DLA Piper U.K. LLP 160 Aldersgate Street London EC1A 4HT
Registrar
Computershare Investor Services plc The Pavilions Bridgewater Road Bristol BS13 8AE
Principal banker
Silicon Valley Bank Alphabeta 14-18 Finsbury Square London EC2A 1BR
Communications consultancy
FTI Consulting LLP 200 Aldersgate Aldersgate Street London EC1A 4HD
Company Information
plc Annual Report 2021 144
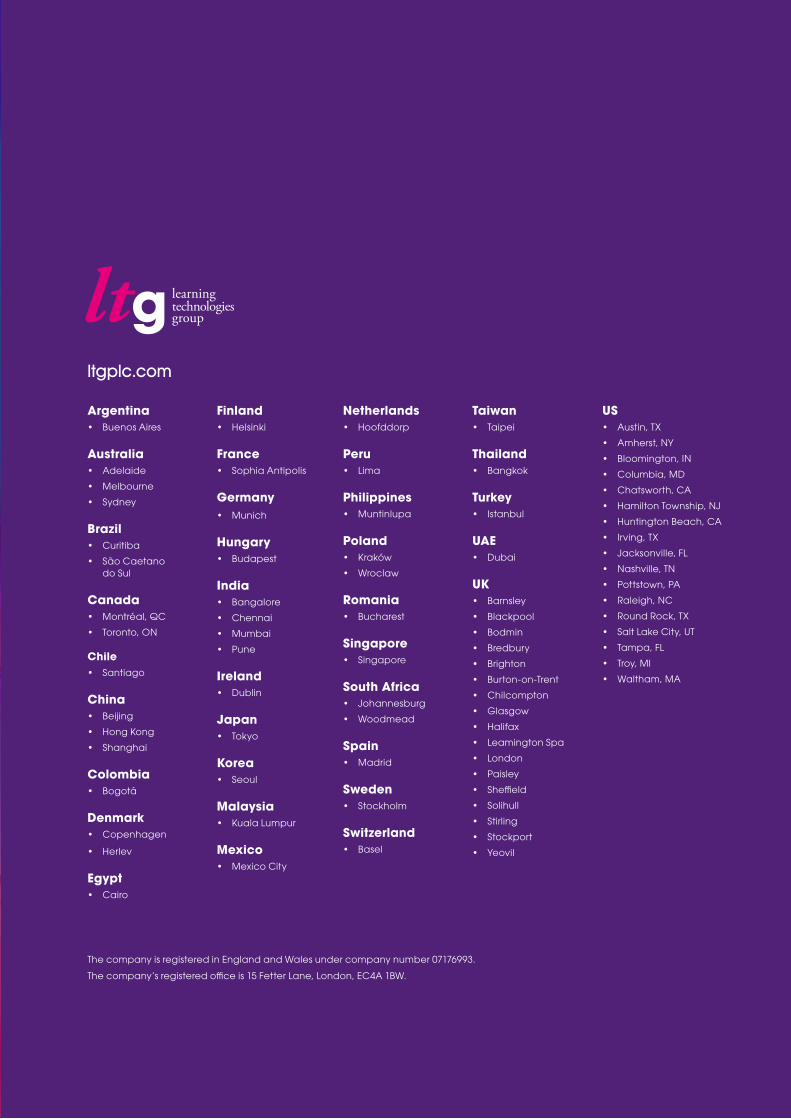
ltgplc.com
The company is registered in England and Wales under company number 07176993.
The company’s registered office is 15 Fetter Lane, London, EC4A 1BW.
Argentina• Buenos Aires
Australia• Adelaide
• Melbourne
• Sydney
Brazil• Curitiba
• São Caetano do Sul
Canada• Montréal, QC
• Toronto, ON
Chile• Santiago
China• Beijing
• Hong Kong
• Shanghai
Colombia• Bogotá
Denmark• Copenhagen
• Herlev
Egypt• Cairo
Finland• Helsinki
France• Sophia Antipolis
Germany• Munich
Hungary• Budapest
India• Bangalore
• Chennai
• Mumbai
• Pune
Ireland• Dublin
Japan• Tokyo
Korea• Seoul
Malaysia• Kuala Lumpur
Mexico• Mexico City
Netherlands• Hoofddorp
Peru• Lima
Philippines• Muntinlupa
Poland• Kraków
• Wroclaw
Romania• Bucharest
Singapore• Singapore
South Africa• Johannesburg
• Woodmead
Spain• Madrid
Sweden• Stockholm
Switzerland• Basel
Taiwan• Taipei
Thailand• Bangkok
Turkey• Istanbul
UAE• Dubai
UK• Barnsley
• Blackpool
• Bodmin
• Bredbury
• Brighton
• Burton-on-Trent
• Chilcompton
• Glasgow
• Halifax
• Leamington Spa
• London
• Paisley
• Sheffield
• Solihull
• Stirling
• Stockport
• Yeovil
US• Austin, TX
• Amherst, NY
• Bloomington, IN
• Columbia, MD
• Chatsworth, CA
• Hamilton Township, NJ
• Huntington Beach, CA
• Irving, TX
• Jacksonville, FL
• Nashville, TN
• Pottstown, PA
• Raleigh, NC
• Round Rock, TX
• Salt Lake City, UT
• Tampa, FL
• Troy, MI
• Waltham, MA
Copyright © 2022 FDOKUMEN