First Quarter Report_31March 2014_1.pdf - Prysmian Group
113
-
Upload
khangminh22 -
Category
Documents
-
view
7 -
download
0
Transcript of First Quarter Report_31March 2014_1.pdf - Prysmian Group


1
DisclaimerThis document contains forward-looking statements, specifically in the sections entitled "Significant events after the reporting
period" and "Business outlook", that relate to future events and future operating, economic and financial results of the
Prysmian Group. By their nature, forward-looking statements involve risk and uncertainty because they depend on the
occurrence of future events and circumstances. Actual results may differ materially from those reflected in forward-looking
statements due to a variety of factors.

PRYSMIAN GROUP | CONTENTS
2
CONTENTS
Directors’ report pg.
Directors and auditors.......................................................................................................................... 4
Significant events during the period ..................................................................................................... 6
Consolidated financial highlights .......................................................................................................... 7
Group performance and results............................................................................................................ 8
Segment performance ....................................................................................................................... 11
Group statement of financial position ................................................................................................. 24
Alternative performance indicators..................................................................................................... 28
Significant events after the reporting period ....................................................................................... 36
Business outlook................................................................................................................................ 38
Foreseeable risks in 2014 .................................................................................................................. 39
Stock option plans.............................................................................................................................. 46
Related party transactions ................................................................................................................. 46
Consolidated Financial Statements and Explanatory Notes pg.
Consolidated Statement of financial position………………………………………………………………..48
Consolidated income statement………………………………………………………………………………49
Consolidated statement of comprehensive income…………………………………………………………50
Consolidated statement of changes in equity……………………………………………………………….51
Consolidated statement of cash flows………………………………………………………………………..52
Explanatory notes………………………………………………………………………………………………53
Appendix A – Scope of consolidation……………………………………………………………………….102

DIRECTORS’ REPORT

PRYSMIAN GROUP | DIRECTORS’ REPORT
4
DIRECTORS AND AUDITORS
Board of Directors Chairman Massimo Tononi (*) (2)
Chief Executive Officer & General
Manager Valerio Battista
Directors Maria Elena Cappello (*) (**) (1) Pier Francesco Facchini
Cesare d'Amico (*) (**) Fritz Fröhlich (*) (**) (1)
Claudio De Conto(*) (**) (1) (2) Fabio Ignazio Romeo
Giulio Del Ninno (*) (**) (2) Giovanni Tamburi (*) (**)
Massimo Battaini(3)
Board of Statutory
Auditors Chairman Pellegrino Libroia
Standing Statutory Auditors Paolo Francesco Lazzati Maria Luisa Mosconi
Alternate Statutory Auditors Marcello Garzia Claudia Mezzabotta
Independent Auditors PricewaterhouseCoopers S.p.A.
(**)Independent directors as per Italy's Self-Regulatory Code of Corporate Governance
(2)Members of the Compensation and Nominations Committee
(*)Independent directors as per Italy's Unified Financial Act
(1)Members of Control and Risks Committee
(3)Appointed on 16 April 2014

PRYSMIAN GROUP | DIRECTORS’ REPORT
5
Introduction
This Quarterly Financial Report at 31 March 2014 (Interim management statement pursuant to art. 154-ter
of Italian Legislative Decree 58/1998) has been drawn up and prepared:
- in compliance with art. 154-ter of Italian Legislative Decree 58/1998 and subsequent amendments and with
the Issuer Regulations published by Consob (Italy's securities regulator);
- in compliance with the International Financial Reporting Standards (IFRS) issued by the International
Accounting Standards Board (IASB) and endorsed by the European Union, and in accordance with IAS 34
– Interim Financial Reporting, applying the same accounting standards and policies adopted to prepare the
consolidated financial statements at 31 December 2013, except as described in the Explanatory Notes in
the paragraph entitled "Accounting standards, amendments and interpretations applied from 1 January
2014".
The present Quarterly Financial Report is unaudited.
As a result of the changes introduced by IFRS 10 - Consolidated Financial Statements and IFRS 11- Joint
Arrangements, applicable retrospectively from 1 January 2014, the Group's consolidated figures have been
restated as from 1 January 2013.
The main effects of applying the new standards relate to use of the equity method to consolidate Yangtze
Optical Fibre and Cable Joint Stock Limited Co. and Power Cable Malaysia Sdn Bhd, previously
consolidated using the proportionate method, and Yangtze Optical Fibre & Cable (Shanghai) Co. Ltd.,
previously consolidated line-by-line.
In addition, the Group has adopted a new method of classifying its share of the net profit/(loss) of equity-
accounted companies, whereby it recognises this amount as a component of Operating income when
relating to companies that operate in the same sector as the Group.
Further details can be found in Section C. Restatement of comparative figures, contained in the Explanatory
Notes, and in the section on Alternative Performance Indicators contained in the present Directors' Report.

PRYSMIAN GROUP | DIRECTORS’ REPORT
6
SIGNIFICANT EVENTS DURING THE PERIOD
NEW INDUSTRIAL PROJECTS AND INITIATIVES
At the start of the first quarter of 2014, the Prysmian Group was awarded a new contract worth approximately
USD 24 million by Petrobras, the Brazilian oil company.
The contract refers to the supply of special Down Hole Technology (DHT) cable systems for the offshore oil
& gas industry, which will be manufactured at the Group's plants in Bridgewater, NJ (USA) and Cariacica
(Brazil), using Brazilian-sourced materials such as steel. Delivery is scheduled for July 2014.
FINANCE AND M&A ACTIVITIES
On 18 December 2013, Prysmian S.p.A. entered into a loan agreement with the European Investment Bank
(EIB) for Euro 100 million, to fund the Group's European research & development (R&D) programmes over
the period 2013-2016.
The EIB Loan is particularly intended to support projects developed in the Group's R&D centres in six
countries (France, Great Britain, the Netherlands, Spain, Germany and Italy) and represents about 50% of
the Prysmian Group's planned investment expenditure in Europe during the period concerned.
The EIB Loan was received on 5 February 2014; it will be repaid in 12 equal half-yearly instalments starting
on 5 August 2015 and ending on 5 February 2021.
On 19 February 2014, Prysmian S.p.A signed a credit agreement for Euro 100 million with Mediobanca -
Banca di Credito Finanziario S.p.A.. Under this five-year agreement, Mediobanca has provided the Group
with a line of credit intended to refinance existing debt and working capital requirements.
On 28 February 2014, the Prysmian Group prepaid the outstanding amount owed under the Term Loan
Facility 2010, amounting to Euro 184 million due on 31 December 2014.
The price adjustment process relating to the acquisition of Global Marine Systems Energy Ltd (now renamed
Prysmian PowerLink Services Ltd) was completed on 28 March 2014, with a price adjustment of GBP 20
million in the Prysmian Group's favour. Since this process was completed more than a year from the
acquisition date of 15 November 2012, the difference between the adjusted final price and that previously
estimated has been accounted for in the income statement with the recognition of Euro 21 million in non-
recurring income.
Western HVDC Link (UK) contract
During the last few days of April, the manufacture of the cables for the Western HVDC Link project in the
United Kingdom encountered some technical problems, which will be fully investigated in coming months. As
a result, the Directors believe they cannot reliably estimate the outcome of this contract, and so its revenues
have been recognised to the extent of the costs incurred. In the first quarter of 2014, this has resulted in the
recognition of a loss of Euro 26 million after tax (Euro 37 million before tax).
Despite the current uncertainty over the recently identified technical problems, the Directors believe at
present that there is no evidence to suggest that contract costs will exceed contract revenues. This does not
preclude that, after further analysis and technical testing in progress, evidence might emerge that will lead to
the recognition of additional losses in coming quarters.
In order to facilitate understanding of the Group's first-quarter results for 2014, the tables in the Directors'
report present the impact of this event in a separate column called "WL Submarine project effect".
PRYSMIAN GROUP | DIRECTORS’ REPORT
7
(in millions of Euro)
3 months 2014
before WL Submarine
project effect
WL Submarine
project effect
3 months 2014
after WL Submarine
project effect
3 months 2013 (**) % change FY 2013 (**)
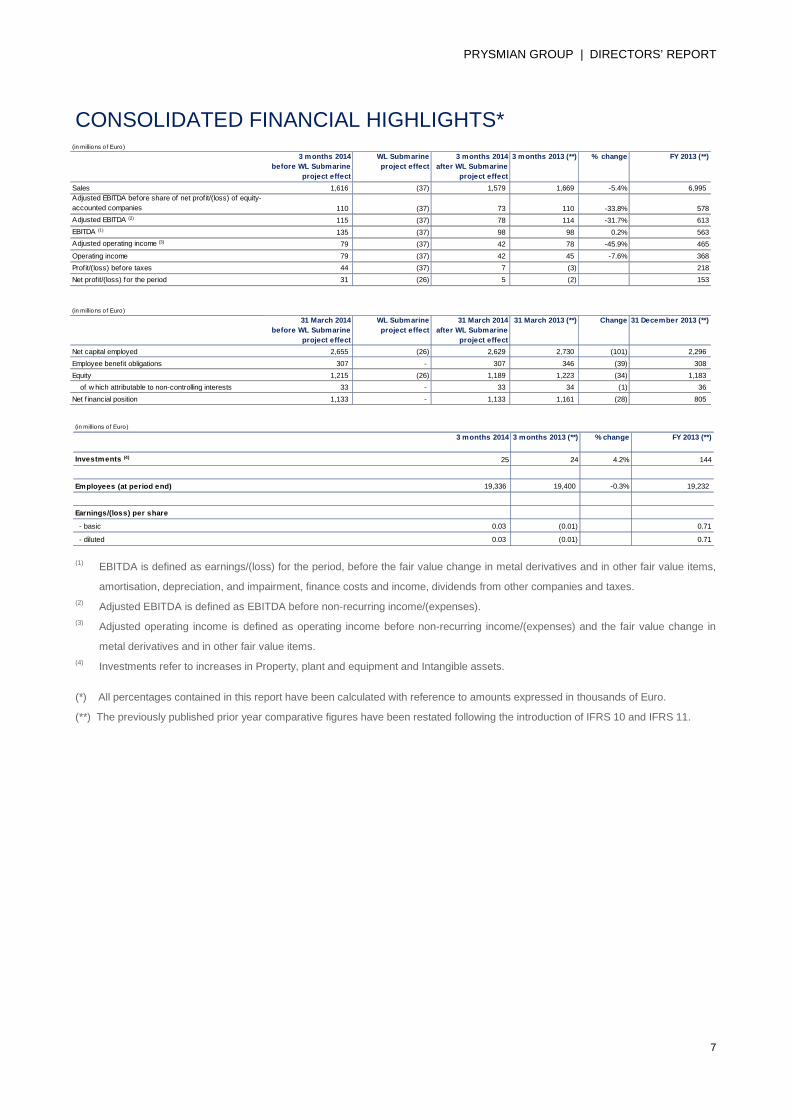
Sales 1,616 (37) 1,579 1,669 -5.4% 6,995
Adjusted EBITDA before share of net prof it/(loss) of equity-
accounted companies 110 (37) 73 110 -33.8% 578
Adjusted EBITDA (2) 115 (37) 78 114 -31.7% 613
EBITDA (1) 135 (37) 98 98 0.2% 563
Adjusted operating income (3) 79 (37) 42 78 -45.9% 465
Operating income 79 (37) 42 45 -7.6% 368
Profit/(loss) before taxes 44 (37) 7 (3) -311.6% 218
Net prof it/(loss) for the period 31 (26) 5 (2) -309.3% 153
(in millions of Euro)
31 March 2014
before WL Submarine
project effect
WL Submarine
project effect
31 March 2014
after WL Submarine
project effect
31 March 2013 (**) Change 31 December 2013 (**)
Net capital employed 2,655 (26) 2,629 2,730 (101) 2,296
Employee benefit obligations 307 - 307 346 (39) 308
Equity 1,215 (26) 1,189 1,223 (34) 1,183
of w hich attributable to non-controlling interests 33 - 33 34 (1) 36
Net f inancial position 1,133 - 1,133 1,161 (28) 805
(in millions of Euro)
3 months 2014 3 months 2013 (**) % change FY 2013 (**)
Investments (4) 25 24 4.2% 144
Employees (at period end) 19,336 19,400 -0.3% 19,232
Earnings/(loss) per share
- basic 0.03 (0.01) 0.71
- diluted 0.03 (0.01) 0.71
CONSOLIDATED FINANCIAL HIGHLIGHTS*
(1) EBITDA is defined as earnings/(loss) for the period, before the fair value change in metal derivatives and in other fair value items,
amortisation, depreciation, and impairment, finance costs and income, dividends from other companies and taxes.
(2) Adjusted EBITDA is defined as EBITDA before non-recurring income/(expenses).
(3) Adjusted operating income is defined as operating income before non-recurring income/(expenses) and the fair value change in
metal derivatives and in other fair value items.
(4) Investments refer to increases in Property, plant and equipment and Intangible assets.
(*) All percentages contained in this report have been calculated with reference to amounts expressed in thousands of Euro.
(**) The previously published prior year comparative figures have been restated following the introduction of IFRS 10 and IFRS 11.
PRYSMIAN GROUP | DIRECTORS’ REPORT
8
(in millions of Euro )
3 months 2014
before WL
Submarine
project effect
WL
Submarine
project effect
3 months 2014
after WL
Submarine
project effect
3 months 2013 (*) % change FY 2013 (*)
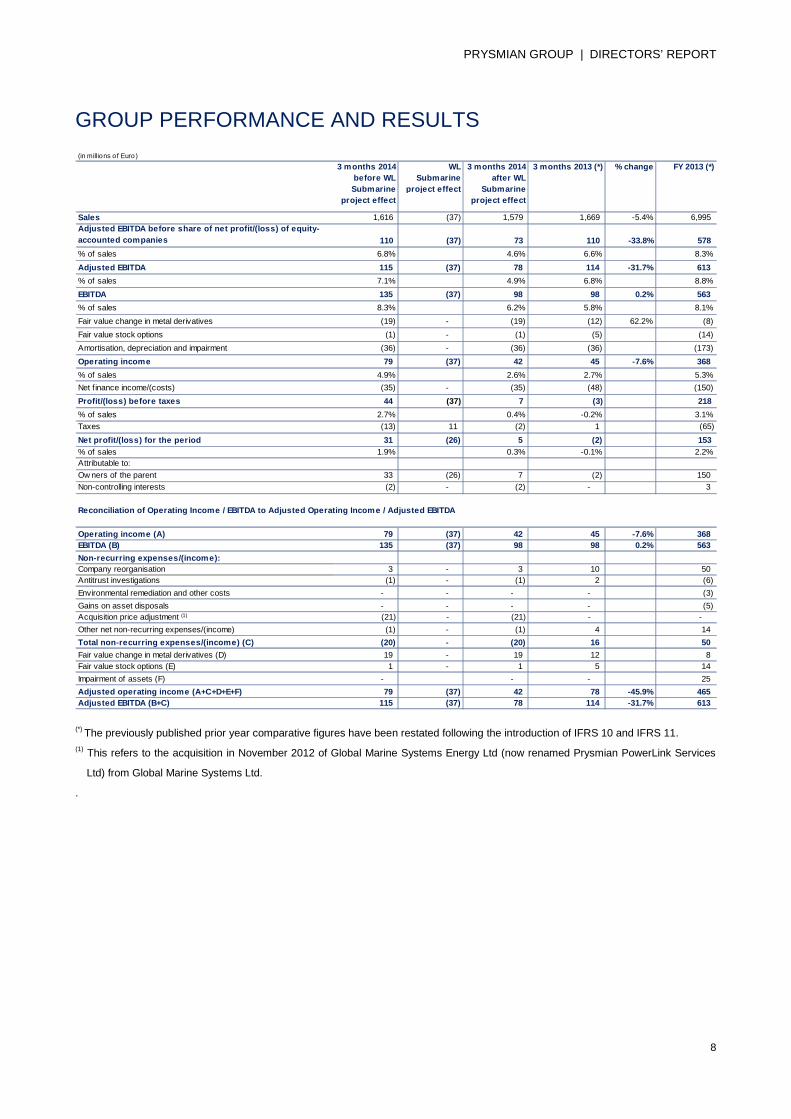
Sales 1,616 (37) 1,579 1,669 -5.4% 6,995
Adjusted EBITDA before share of net profit/(loss) of equity-
accounted companies 110 (37) 73 110 -33.8% 578
% of sales 6.8% 4.6% 6.6% 8.3%
Adjusted EBITDA 115 (37) 78 114 -31.7% 613
% of sales 7.1% 4.9% 6.8% 8.8%
EBITDA 135 (37) 98 98 0.2% 563
% of sales 8.3% 6.2% 5.8% 8.1%
Fair value change in metal derivatives (19) - (19) (12) 62.2% (8)
Fair value stock options (1) - (1) (5) (14)
Amortisation, depreciation and impairment (36) - (36) (36) (173)
Operating income 79 (37) 42 45 -7.6% 368
% of sales 4.9% 2.6% 2.7% 5.3%
Net f inance income/(costs) (35) - (35) (48) (150)
Profit/(loss) before taxes 44 (37) 7 (3) -311.6% 218
% of sales 2.7% 0.4% -0.2% 3.1%
Taxes (13) 11 (2) 1 -316.9% (65)
Net profit/(loss) for the period 31 (26) 5 (2) -309.3% 153
% of sales 1.9% 0.3% -0.1% 2.2%
Attributable to:
Ow ners of the parent 33 (26) 7 (2) 150
Non-controlling interests (2) - (2) - 3
Reconciliation of Operating Income / EBITDA to Adjusted Operating Income / Adjusted EBITDA
Operating income (A) 79 (37) 42 45 -7.6% 368
EBITDA (B) 135 (37) 98 98 0.2% 563
Non-recurring expenses/(income):
Company reorganisation 3 - 3 10 50
Antitrust investigations (1) - (1) 2 (6)
Environmental remediation and other costs - - - - (3)
Gains on asset disposals - - - - (5)
Acquisition price adjustment (1) (21) - (21) - -
Other net non-recurring expenses/(income) (1) - (1) 4 14
Total non-recurring expenses/(income) (C) (20) - (20) 16 50
Fair value change in metal derivatives (D) 19 - 19 12 8
Fair value stock options (E) 1 - 1 5 14
Impairment of assets (F) - - - 25
Adjusted operating income (A+C+D+E+F) 79 (37) 42 78 -45.9% 465
Adjusted EBITDA (B+C) 115 (37) 78 114 -31.7% 613
GROUP PERFORMANCE AND RESULTS
(*) The previously published prior year comparative figures have been restated following the introduction of IFRS 10 and IFRS 11.
(1) This refers to the acquisition in November 2012 of Global Marine Systems Energy Ltd (now renamed Prysmian PowerLink Services
Ltd) from Global Marine Systems Ltd.
.

PRYSMIAN GROUP | DIRECTORS’ REPORT
9
The Prysmian Group's sales in the first quarter of 2014 came to Euro 1,579 million, compared with Euro
1,669 million in the first quarter of 2013.
Excluding changes in metal prices and exchange rates, organic growth was a positive 3.2%. Excluding the
adjustments to take account of the extraordinary event relating to the Western HVDC Link project, organic
growth would have been 5.4%. Organic growth is analysed between the two operating segments as follows:
- Energy +3.6% (+6.2% excluding adjustments for the Western HVDC Link project);
- Telecom +0.7%.
The Energy Segment reported a moderate recovery in sales volumes, mainly in the traditional businesses
of Trade & Installers, underground transmission (High Voltage) and renewable energy, although adversely
affected to some extent by the decrease in Submarine sales for the adjustment in respect of the Western
HVDC Link project and by the negative performance in the Industrial business area. The Telecom segment
reported a positive trend in demand for optical cables, as partially counterbalanced by the slowdown in
markets for copper cables, due to the maturity of the products concerned, and for OPGW products, due to
the investment project phasing.
Group Adjusted EBITDA (before Euro 20 million in net non-recurring income) came to Euro 78 million,
posting a decrease of Euro 36 million on the corresponding figure of Euro 114 million (-31.7%) in 2013.
Excluding adjustments for the Western HVDC Link project, Adjusted EBITDA would have been Euro 115
million.
INCOME STATEMENT
The Group's sales came to Euro 1,579 million at the end of the first quarter of 2014, compared with Euro
1,669 million in the same period last year, posting a negative change of Euro 90 million (-5.4%). Excluding
the adjustments for the Western HVDC Link project, the Group's sales would have amounted to Euro 1,616
million (-3.2%).
The decrease is attributable to the following factors:
- positive organic growth of Euro 53 million, (+3.2%); before the adjustments for the Western HVDC
Link project, this would have been Euro 90 million (+5.4%);
- negative exchange rate effects of Euro 95 million (-5.8%);
- negative change of Euro 48 million (-2.8%) in sales prices due to fluctuations in metal prices
(copper, aluminium and lead).
Despite the low level of international demand for infrastructure and the continued delay in awarding
investment projects, the organic growth in sales confirms the strategic validity of the acquisition and
integration of the Draka Group. In fact, the enlargement of the Group's perimeter has made it possible to
improve the geographical distribution of sales, in favour of markets in Northern Europe, North America and
Asia in general, as well as to enlarge the range of products offered, especially in the Oil & Gas, Elevator,
Surf and Optical Cables and Fibres businesses. The high value-added businesses (Submarine, High
Voltage underground cables and in some Industrial cables sectors) enjoyed positive growth in spite of the
loss recognised on the Western HVDC Link contract and the continued slowdown in demand in the Power
Distribution business. The marginal organic growth reported by the Telecom business was mainly
PRYSMIAN GROUP | DIRECTORS’ REPORT
10
concentrated in the optical cables sector in Europe, counterbalanced by the weakness of global demand for
copper cables.
Adjusted EBITDA amounted to Euro 78 million, down 31.7% from Euro 114 million in the prior year first
quarter. Excluding the adjustments for the Western HVDC Link project, Adjusted EBITDA would have been
Euro 115 million. The decrease in Adjusted EBITDA of Euro 36 million is almost entirely attributable to the
Energy segment, with only a minor decline reported by the Telecom segment. The first-quarter result in
2014 was also affected by Euro 7 million in negative exchange rate effects compared with the same period
of 2013; these were particularly due to steep depreciation of the Argentine Peso, the Brazilian Real, the
Australian Dollar, the US Dollar and the Turkish Lira. This negative impact was partially offset by a
reduction in overhead costs, achieved thanks to synergies from integrating the Draka Group.
EBITDA includes Euro 20 million in net non-recurring income (versus Euro 16 million in net expenses in the
same period of 2013), mainly attributable to the price adjustment of Euro 21 million for the acquisition of
Global Marine Systems Energy Ltd (now renamed Prysmian PowerLink Services Ltd).
Group operating income was a positive Euro 42 million in the first quarter of 2014, compared with a positive
Euro 45 million in the corresponding period of 2013, posting a negative change of Euro 3 million. Excluding
the adjustments for the Western HVDC Link project, operating income would have been Euro 79 million.
Net finance costs came to Euro 35 million in the first quarter of 2014, down from Euro 48 million (-27.1%) at
the end of the same period last year.
Taxes amounted to Euro 2 million, representing an effective tax rate of around 30.0%.
The net result for the first quarter of 2014 was a profit of Euro 5 million, compared with a loss of Euro 2
million in the same period of 2013. Excluding the adjustments for the Western HVDC Link project, the net
result for the first quarter would have been a profit of Euro 31 million.
Adjusted net profit(1)
was Euro 12 million, compared with Euro 39 million in the previous year. Excluding the
adjustments for the Western HVDC Link project, adjusted net profit would have been Euro 38 million.
(1) Adjusted net profit is defined as net profit/(loss) before non-recurring income and expenses, the fair value change in metal
derivatives and in other fair value items, the effect of currency and interest rate derivatives, exchange rate differences, non-monetary
interest on the convertible bond and the related tax effects.

PRYSMIAN GROUP | DIRECTORS’ REPORT
11
(in millions o f Euro)
3 months 2014
before WL
Submarine
project effect
WL Submarine
project effect
3 months 2014
after WL
Submarine
project effect
3 months 2013 (*) % change FY 2013 (*)
Sales to third parties 1,380 (37) 1,343 1,416 -5.1% 6,009
Adjusted EBITDA before share of net profit/(loss) of equity-
accounted companies 93 (37) 56 91 -39.0% 491
% of sales 6.7% 4.2% 6.4% 8.2%
Adjusted EBITDA 97 (37) 60 94 -36.2% 507
% of sales 7.0% 4.5% 6.6% 8.4%
EBITDA 115 (37) 78 80 -2.1% 484
% of sales 8.3% 5.8% 5.6% 8.1%
Amortisation and depreciation (25) - (25) (26) -2.2% (105)
Adjusted operating income 72 (37) 35 68 -47.4% 402
% of sales 5.2% 2.6% 4.8% 6.7%
Reconciliation between EBITDA and Adjusted EBITDA
EBITDA (B) 115 (37) 78 80 -2.1% 484
Non-recurring expenses/(income):
Company reorganisation 3 - 3 10 33
Antitrust investigations (1) - (1) 2 (6)
Environmental remediation and other costs - - - - (3)
Gains on asset disposals - - - - (4)
Acquisition price adjustment (1) (21) - (21) - -
Other net non-recurring expenses/(income) 1 - 1 2 3
Total non-recurring expenses/(income) (C) (18) - (18) 14 23
Adjusted EBITDA (B+C) 97 (37) 60 94 -36.2% 507
SEGMENT PERFORMANCE
ENERGY BUSINESS
(*) The previously published prior year comparative figures have been restated following the introduction of IFRS 10 and IFRS 11.
(1) This refers to the acquisition in November 2012 of Global Marine Systems Energy Ltd (now renamed Prysmian PowerLink Services
Ltd) from Global Marine Systems Ltd.
Energy business sales to third parties amounted to Euro 1,343 million in the first quarter of 2014, compared
with Euro 1,416 million in the corresponding period of 2013, posting a negative change of Euro 73 million
(-5.1%). Excluding the adjustments for the Western HVDC Link project, Energy segment sales to third
parties would have been Euro 1,380 million.
This negative change is attributable to the following principal factors:
- negative exchange rate effects of Euro 80 million (-5.6%);
- positive organic growth of Euro 51 million (+3.6%); before the adjustments for the Western HVDC
Link project, this would have been Euro 88 million (+6.2% );
- negative change of Euro 44 million (-3.1%) in sales prices due to fluctuations in metal prices.
Adjusted EBITDA for the first quarter of 2014 came to Euro 60 million, posting a decrease of Euro 34 million
from Euro 94 million (-36.2%) in the corresponding period of 2013. Excluding the adjustments for the
Western HVDC Link project, Adjusted EBITDA would have been Euro 97 million.
The following paragraphs describe market trends and financial performance in each of the Energy segment's
business areas.

PRYSMIAN GROUP | DIRECTORS’ REPORT
12
(in millions of Euro)
3 months 2014
before WL
Submarine
project effect
WL Submarine
project effect
3 months 2014
after WL
Submarine
project effect
3 months 2013 (*) % change % organic
sales
change
FY 2013 (*)
Sales to third parties 499 (37) 462 490 -5.8% 0.1% 2,217
Adjusted EBITDA before share of net
profit/(loss) of equity-accounted companies 54 (37) 17 49 -65.3% 282
% of sales 10.8% 3.7% 10.0% 12.7%
Adjusted EBITDA 55 (37) 18 50 -64.0% 287
% of sales 11.1% 4.0% 10.2% 12.9%
Adjusted operating income 45 (37) 8 40 -80.0% 246
% of sales 9.1% 1.8% 8.1% 11.1%
UTILITIES
(*) The previously published prior year comparative figures have been restated following the introduction of IFRS 10 and IFRS 11.
The Utilities business area encompasses Prysmian's Energy segment activities involving the engineering,
production and installation of cables and accessories for power transmission and distribution. The Group
engineers, produces and installs high and extra high voltage cables to transport electricity from power
stations and within transmission and primary distribution grids. The highly customised, high-tech products
serving this market include cables insulated with oil or fluid-impregnated paper for voltages up to 1,100 kV
and extruded polymer insulated cables for voltages up to 500 kV. Prysmian also provides a number of
services relating to power transmission systems, including installation and post-installation services, grid
management and maintenance services, including grid performance monitoring, grid cable repair and
maintenance, as well as emergency services, such as reinstatement of service following damage. In
addition, Prysmian Group engineers, produces and installs turnkey submarine cable systems for power
transmission and distribution. The products offered include cables with different types of insulation (cables
insulated with oil or fluid-impregnated paper for transmission of up to 500 kV AC and DC; extruded polymer
insulated cables for transmission of up to 400 kV AC and up to 300 kV DC). The Group - able to offer
solutions satisfying the most stringent international standards (SATS/IEEE, IEC, NEK) - uses specific
technologies for power transmission and distribution in underwater environments. Prysmian also produces
medium voltage cables and systems to connect industrial and/or civilian buildings to primary distribution grids
and low voltage cables and systems for power distribution and the wiring of buildings. All the products
offered comply with international standards regarding insulation, fire resistance, smoke emissions and
halogen levels. Lastly, the Group also produces accessories such as joints and terminations for low,
medium, high and extra high voltage cables, as well as accessories to connect cables with each other and
with other network equipment, suitable for industrial, construction or infrastructure applications and for power
transmission and distribution systems.
MARKET OVERVIEW
During the first quarter of 2014, the markets in which the Prysmian Group's Utilities business area operates
saw a consolidation of the signs already emerging in the second half of 2013.
Both the power distribution and generation markets, in which demand declined throughout 2012 and 2013,
confirmed the differences between the various geographical areas and tougher competitive environment.
Activity levels in the High Voltage market - traditionally highly international both in terms of demand and
supply - were generally in line with the same period last year.
This was positive in view of the generally uncertain macroeconomic scenario regarding future energy
consumption and access to funding, in response to which the largest utilities, particularly in Europe and
PRYSMIAN GROUP | DIRECTORS’ REPORT
13
North America, have adopted a selective approach to new investment projects. The focus in Europe, and
North and South America has been on rationalisation and/or maintenance projects to improve efficiency and
reduce energy generation costs, while the focus in the Middle East and Southeast Asia has been on
extending and completing major projects. In addition, there was still significant competitive pressure on
prices for operators in growing economies, like China and India, not only due to surplus production capacity
in these regions, but also due to a large number of competitors and the need to limit financial exposure in the
face of uncertain investment returns.
With reference to the Submarine cables market, the first quarter of 2014 reported a growth on the second
half of 2012, thanks to investments by utilities to build new offshore wind farms and commence major new
interconnection projects.
However, during the last few days of April, the manufacture of the cables for the Western HVDC Link project
in the UK encountered some technical problems. After further analysis and technical testing in progress, it
cannot be ruled out that evidence might emerge that will lead to the recognition of additional losses in
coming months.
In contrast, demand in the Power Distribution market slowed even more in the period, confirming and
reinforcing the downward trend already seen during 2013.
Energy consumption trends in the principal European countries were basically flat, adversely affecting
demand by the major utilities. The latter, operating in a recessionary economic environment, have either
maintained an extremely cautious approach given the difficulties in forecasting future growth, or else they
have concentrated on restructuring to improve efficiency and reduce supply-side costs. As a result, the
competitive environment in terms of price and mix remained extremely challenging almost everywhere.
In contrast, markets in North America confirmed the signs of recovery seen during 2013, after a three-year
period during which operators had reduced work on grids to the bare minimum.
The Network Components market can be broadly divided into products for high and extra high voltage
networks and products for medium and low voltage use.
As regards High Voltage components, demand followed the trend in project developments, and so was up in
Northern Europe, North America and the Middle East, but down in China and stable elsewhere. In addition,
like in 2013, volumes were also affected by the mix of the High Voltage order book, reflecting a common
trend of more fragmented and erratic demand, concentrated on smaller scale but technologically more
complex projects than in the past, accompanied by more exacting requirements regarding quality and after-
sales service.
Demand for submarine accessories was stable with an upward tendency as a direct consequence of projects
currently in progress around the world.
Lastly, the market for medium and low voltage accessories recorded contrasting trends in different
geographical areas: weak in Europe, mainly due to the lack of grid investment projects; still positive on the
American continent, where routine maintenance of secondary distribution networks is supporting investments
by the main energy suppliers; down in China, where the market was affected by strong competitive price
pressures.

PRYSMIAN GROUP | DIRECTORS’ REPORT
14
FINANCIAL PERFORMANCE
Sales to third parties by the Utilities business area amounted to Euro 462 million in the first quarter of 2014,
compared with Euro 490 million in the same period of 2013, posting a negative change of Euro 28 million
(-5.8%). Excluding the adjustments for the Western HVDC Link project, sales to third parties would have
been Euro 499 million.
The decrease in sales can be broken down into the following main factors:
- positive organic growth of Euro 1 million (+0.1%); before the adjustments for the Western HVDC Link
project, this would have been Euro 38 million (+7.7%);
- negative exchange rate effects of Euro 20 million (-4.1%);
- negative change of Euro 9 million (-1.8%) in sales prices due to fluctuations in metal prices.
The positive organic growth in the first quarter of 2014 reflects a combination of opposing factors, such as
the positive trend in the Submarine Cables business line, partially offset by the growing weakness in the
other major business of Power Distribution.
The High Voltage and Network Components business lines both recorded positive trends compared with the
first quarter of 2013, despite displaying strong regional differences.
High Voltage reported a generally positive performance in the Middle East and Northern Europe, while
remaining still disappointing in Russia; this business line’s performance was the combined result of projects
awarded to Prysmian in markets with growing energy infrastructure requirements, such as the Middle and
Far East, along with a number of projects for European utilities on domestic markets (in particular TenneT,
Terna, EDF), and of the delay in implementing projects planned in Russia due to local political uncertainty.
Performance by the Network Components business line was slightly better than in the same period last year,
reflecting a decline in volumes of medium and low voltage accessories on the major European domestic
markets but steady volumes for high voltage products. In contrast, sales on the Chinese market continued to
decline due to lower demand accompanied by growing price pressure in the face of stiff local competition.
Sales by the Submarine Cables business line were in line with the same period last year, reflecting work on
the main projects in the order book. The main projects on which work was performed during the period were
Helwin 2, Sylwin 1 and Borwin 2 for offshore wind farms in Germany. With regard to progress in the Western
HVDC Link (UK) project, initiated in the third quarter of 2012, the manufacture of the cables has encountered
some technical problems resulting in a downward adjustment of Euro 37 million to the quarter’s sales.
The value of the Group’s Submarine order book at the end of the first quarter of 2014 was in line with the
level at the end of 2013, providing sales visibility for a period of about three years. The high level of this order
book is thanks to contracts for interconnectors in the English Channel (Normandie3), in the Balearic Islands
(Mallorca-Ibiza), over the Dardanelles Strait, between the island of Capri and Torre Annunziata and between
Montenegro and Italy (Monita), and to contracts for offshore wind platform connections (DolWin3, Deutsche
Bucht) and for the supply and installation of submarine cables for the offshore operations of ExxonMobil
Corporation in the United States.
In order to satisfy these contracts, investments have been made to expand production capacity at the Pikkala
plant in Finland, already operational at the end of 2011, and at the Arco Felice plant in Italy.

PRYSMIAN GROUP | DIRECTORS’ REPORT
15
(in millions of Euro)
3 months 2014 3 months 2013 (*) % change % organic sales
change
FY 2013 (*)
Sales to third parties 457 469 -2.6% 9.1% 1,914
Adjusted EBITDA before share of net profit/(loss) of equity-accounted
companies 11 14 -21.4% 71
% of sales 2.4% 3.0% 3.7%
Adjusted EBITDA 13 16 -18.8% 79
% of sales 2.9% 3.3% 3.8%
Adjusted operating income 8 9 -11.1% 54
% of sales 1.6% 2.0% 2.8%
As a result of the above-mentioned events in the Submarine Cables business, the project mix in the High
Voltage underground business and the persistent weakness of Power Distribution, Adjusted EBITDA for the
Utilities business area decreased to Euro 18 million, from Euro 50 million in the same period of 2013 (and
would have been Euro 55 million excluding the adjustment for the Western HVDC Link project).
TRADE & INSTALLERS
(*) The previously published prior year comparative figures have been restated following the introduction of IFRS 10 and IFRS 11.
The Prysmian Group produces a comprehensive range of rigid and flexible low voltage cables for distributing
power to and within residential and commercial buildings, always in full observance of international
standards. The Group concentrates product development and innovation activities on high performance
cables, such as Fire-Resistant and Low Smoke zero Halogen cables, capable of guaranteeing specified
safety standards. The product range has been recently expanded to satisfy cabling demands for
infrastructure such as airports, ports and railway stations, by customers as diverse as international
distributors, buying syndicates, installers and wholesalers.
MARKET OVERVIEW
The reference markets have distinct geographical characteristics (despite international product standards)
both in terms of customer and supplier fragmentation and the range of items produced and sold.
Construction industry demand, already under pressure throughout 2013, appears not to be showing any
clear signs of recovery; instead, it is being fuelled by isolated cases of development related to specific
geographical trends or projects.
Like in the second half of 2013, persistent uncertainty about the construction industry's future prospects
prevailed over the positive effects of lower metal and commodity prices; as a result, the largest industry
players continued to maintain low stocks and constant pressure on sales prices.
As described in the past, countries in Europe, such as Spain and Italy, have been particularly hard hit due to
the negative consequences for the property market of severe restrictions on bank credit. Even Germany and
the Netherlands have been affected by a stationary trend in demand for new build; this has led to growing
price pressure, also due to ever increasing competition by small foreign operators from Southern Europe and
North Africa seeking outlets for their surplus capacity in the richer markets of Central and Northern Europe.
The first quarter of 2014 also confirmed the uncertainty on the North American market – already affected by
flat demand for products serving infrastructure construction – due to delays in confirming tax incentives for
energy-efficient buildings.

PRYSMIAN GROUP | DIRECTORS’ REPORT
16
In the markets of South America, the first quarter of 2014 reported a reversal of the upward trend in volumes
seen last year, due to a slowdown in the industrial and residential construction sectors.
Lastly, the Australian construction market saw a decline in demand, and was characterised by strong
competitive pressures from Asian operators, despite the Australian dollar's depreciation during the period.
FINANCIAL PERFORMANCE
Sales to third parties by the Trade & Installers business area amounted to Euro 457 million in the first quarter
of 2014, compared with Euro 469 million in the corresponding period of 2013, posting a negative change of
Euro 12 million (-2.6%), due to the combined effect of the following main factors:
- negative change of Euro 22 million (-4.7%) in sales prices due to fluctuations in metal prices;
- positive organic growth of Euro 43 million (+9.1%), due to the recovery in volumes in Northern
Europe and the growth in market share in Central Mediterranean countries and North America that
was only partially offset by negative organic growth in South America;
- negative exchange rate effects of Euro 33 million (-7.0%).
During the first quarter of 2014, Prysmian Group continued its strategy of focusing on commercial
relationships with top international customers and its development of tactical actions to avoid losing sales
opportunities, by differentiating its offer in the various markets and by increasing its market share in specific
geographical areas.
This has led to a very complex commercial strategy, not only focused improving the sales mix in favour of
products for the "safety of people and property" (Fire resistant/LSOH), but also aimed at regaining market
share where sales margins so permit.
This strategy has been applied in Northern Europe, where market demand is still solid, and in Central and
Southern Europe, where market demand is less strong and competitive price pressure greater.
In North America, where demand appears to have stabilised compared with the past and the initial signs for
the current year are positive, Prysmian Group enjoyed an increase in profitability thanks to improved sales
mix and stabilisation of manufacturing and industrial performance by its Canadian production site in Prescott.
In Asia, Prysmian Group proved unable to grow in line with the still increasing demand by the construction
industry, resulting in a slight loss of market share.
Prysmian Group’s sales suffered in South America with a downturn in demand in the first quarter of 2014 and
where it has probably lost a small amount of market share while keeping prices at an acceptable level thanks
to its wide product range.
The combined factors described above led to an Adjusted EBITDA of Euro 13 million in the first quarter of
2014, down from Euro 16 million (-18.8%) in the same period last year.

PRYSMIAN GROUP | DIRECTORS’ REPORT
17
(in millions of Euro)
3 months 2014 3 months 2013 (*) % change % organic sales
change
FY 2013 (*)
Sales to third parties 401 429 -6.4% 2.5% 1,764
Adjusted EBITDA before share of net profit/(loss) of equity-accounted
companies26 27 -3.7% 134
% of sales 6.5% 6.3% 7.6%
Adjusted EBITDA 27 27 133
% of sales 6.7% 6.3% 7.5%
Adjusted operating income 18 19 -5.3% 97
% of sales 4.6% 4.4% 5.5%
INDUSTRIAL
(*) The previously published prior year comparative figures have been restated following the introduction of IFRS 10 and IFRS 11.
The extensive product range, developed specifically for the Industrial market, stands out for the highly
customised nature of the solutions offered. These products serve a broad range of industries, including Oil &
Gas, Transport, Infrastructure, Mining and Renewable Energy. The Group offers solutions to the Oil & Gas
industry for both upstream hydrocarbon research and refining activities and downstream exploration and
production activities. The product range is therefore very wide and includes low and medium voltage power
and instrumentation/control cables, as well as multipurpose umbilical cables for transporting energy,
telecommunications, fluids and chemicals when connecting submarine sources and collectors to FPSO
(Floating, Production, Storage and Offloading) platforms. In the Transport sector, the range of cables offered
by Prysmian is used in the construction of trains, ships and motor vehicles; in the infrastructure sector, the
principal applications for its cables are found in railways, docks and airports. The product range also includes
cables for the mining industry, the automotive industry and for elevators, cables for applications in the
renewable energy sector, cables for military applications and for nuclear power stations, able to withstand
high levels of radiation.
MARKET OVERVIEW
Trends on Industrial cable markets in the first quarter of 2014 displayed considerable inconsistencies
between the various business lines and large differences between the diverse geographical areas. As
already seen with the Accessories business line, the common trend, even in the Industrial cables business
area, was one of more fragmented and erratic demand, concentrated on smaller scale but technologically
more complex projects than in the past, accompanied by more exacting requirements regarding quality and
after-sales service.
Within the Industrial business, some market segments showed stable or growing demand, like the leading
edge application field of the OEM, the Elevator and the Automotive markets, while others experienced a
contraction in volumes, like the Onshore Oil & Gas segment affected by delays in investment projects, the
renewable energy market still suffering from low demand, and the OEM infrastructure market, where demand
depends on specific geographical factors.
As already mentioned, international demand declined in the Oil & Gas and port facilities sectors due to
delays in several projects in the Middle and Far East, while nonetheless remaining strong in South America
and Oceania. This decline was particularly pronounced during the second half of 2013, resulting in a low
order book, with a consequent impact on performance in the first quarter of 2014. This situation is rapidly
improving at present, leaving hope for a recovery in the second half of the current year.

PRYSMIAN GROUP | DIRECTORS’ REPORT
18
Demand in the industrial infrastructure and mineral resources sectors was weak and below the
corresponding period of 2013, primarily due to falling commodity prices and significant production
overcapacity.
As far as applications for the transport sector are concerned, the major European players have adopted a
cautious stance due to poor visibility as to when to resume investments and to recent deficit-cutting policies
in the Eurozone's major economies; demand in other parts of the world remained buoyant.
The divergent pattern of demand described above was also confirmed in the Automotive sector. While
volumes increased on the prior year in areas outside Europe, mainly the Americas and Asia, the restrictive
financial policies in Europe forced the ending of incentives in support of the automotive industry with a
consequent impact on the level of demand in local markets.
Lastly, renewable energy continued to be the sector within the industrial business most affected by the slump
in demand. This was primarily the case in Southern Europe, where the restrictive financial policies adopted
by the main governments either cut special incentives or made it more difficult to access credit for onshore
wind projects.
FINANCIAL PERFORMANCE
Sales to third parties by the Industrial business area amounted to Euro 401 million in the first quarter of 2014,
compared with Euro 429 million in the same period of 2013. The reduction of Euro 28 million (-6.4%) is due
to the following factors:
- positive organic growth of Euro 10 million (+2.5%), largely due to the growth in volumes in high value-
added businesses (Elevator, Automotive, high-end Specialties&OEM and partly Renewables) despite
the slowdown in the Oil & Gas and OEM Infrastructure sectors;
- negative exchange rate effects of Euro 25 million (-5.8%);
- negative change of Euro 13 million (-3.1%) in sales prices due to fluctuations in metal prices.
In Europe, Prysmian Group benefited from a solid order book for the high-end OEM sector (cables for
Cranes and Mining for South American and Asian markets) and continued to focus its commercial efforts on
the Oil & Gas industry, where it was able to benefit from the growth in demand by the North Sea oil industry
(Offshore), served by the Norwegian and British markets, despite a steep downturn in exports to energy-
producing nations in the Middle East, mainly in the Onshore sector.
On the other hand, despite the generally weak demand for Renewables, the Group nonetheless managed to
increase its share of the renewable energy market, particularly in Central and Northern Europe, offsetting the
weakness in Southern Europe.
The strategy of technological specialisation of the solutions offered has allowed Prysmian Group to
consolidate its Elevator market leadership in North America and to expand into the Chinese and European
markets, where its exposure is still marginal although growing since last year.
As for the SURF market segment, sales of umbilical cables and flexible pipes, manufactured for the South
American market at the Vila Velha plant, were slightly below the corresponding period of 2013 mainly

PRYSMIAN GROUP | DIRECTORS’ REPORT
19
(in millions of Euro)
3 months 2014 3 months 2013 (*) FY 2013 (*)
Sales to third parties 23 28 114
Adjusted EBITDA before share of net profit/(loss) of equity-accounted
companies2 1 5
Adjusted EBITDA 2 1 8
Adjusted operating income 1 - 4
because of the rescheduling of investment projects requiring flexible pipes. In contrast, the Down-Hole-
Technology (DHT) business continued to perform well in North America.
Asia Pacific, Brazil and China are the regions offering the Group the most attractive growth opportunities at
the outset of 2014, thanks to consolidation of its market share in Australia, growth in Brazil and the
development of Offshore projects in Singapore and China.
Adjusted EBITDA came to Euro 27 million in the first quarter of 2014, staying in line with the amount reported
in the corresponding period of 2013.
OTHER
(*) The previously published prior year comparative figures have been restated following the introduction of IFRS 10 and IFRS 11.
This business area encompasses occasional sales by Prysmian Group operating units of intermediate
goods, raw materials or other products forming part of the production process.
These sales are normally linked to local business situations, do not generate high margins and can vary in
size from period to period.

PRYSMIAN GROUP | DIRECTORS’ REPORT
20
(in millions of Euro)
3 months 2014 3 months 2013 (*) % change FY 2013 (*)
Sales to third parties 236 253 -6.7% 986
Adjusted EBITDA before share of net profit/(loss) of equity-accounted
companies17 19 -9.4% 87
% of sales 7.2% 7.6% 8.8%
Adjusted EBITDA 18 20 -10.9% 106
% of sales 7.6% 8.0% 10.8%
EBITDA 20 18 6.4% 86
% of sales 8.5% 7.1% 8.7%
Amortisation and depreciation (11) (10) 0.0% (43)
Adjusted operating income 7 10 -31.5% 63
% of sales 3.0% 3.8% 6.4%
Reconciliation betw een EBITDA and Adjusted EBITDA
EBITDA (B) 20 18 6.4% 86
Non-recurring expenses/(income):
Company reorganisation - - 13
Antitrust investigations - - -
Gains on asset disposals - - (1)
Other net non-recurring expenses/(income) (2) 2 8
Total non-recurring expenses/(income) (C) (2) 2 20
Adjusted EBITDA (B+C) 18 20 -10.9% 106
TELECOM BUSINESS
(*) The previously published prior year comparative figures have been restated following the introduction of IFRS 10 and IFRS 11.
As partner to leading telecom operators worldwide, Prysmian Group produces and manufactures a wide
range of cable systems and connectivity products used in telecommunication networks. The product portfolio
includes optical fibre, optical cables, connectivity components and accessories and copper cables.
Optical fibre
Prysmian Group is a leading manufacturer of the core component of every type of optical cable: optical fibre.
The Group is in the unique position of being able to use all existing manufacturing processes within its
plants: MCVD (Modified Chemical Vapour Deposition), OVD (Outside Vapour Deposition), VAD (Vapour
Axial Deposition) and PCVD (Plasma-activated Chemical Vapour Deposition). The result is an optimised
product range for different applications. With centres of excellence in Battipaglia (Italy), Eindhoven (the
Netherlands) and Douvrin (France), and 5 production sites around the world, Prysmian Group offers a wide
range of optical fibres, designed and manufactured to cater to the broadest possible spectrum of customer
applications, such as single-mode, multimode and specialty fibres.

PRYSMIAN GROUP | DIRECTORS’ REPORT
21
Optical cables
Optical fibres are employed in the production of standard optical cables or those specially designed for
challenging or inaccessible environments. The optical cables, constructed using just a single fibre or up to as
many as 1,728 fibres, can be pulled (or blown) into ducts, buried directly underground or suspended on
overhead devices such as telegraph poles or electricity pylons. Cables are also installed in road and rail tunnels,
gas and sewerage networks and inside various buildings where they must satisfy specific fire-resistant
requirements.
Prysmian Group operates in the telecommunications market with a wide range of cable solutions and systems
that respond to the demand for a wider bandwidth by major network operators and service providers. The
product portfolio covers every area of the industry, including long-distance and urban systems, and solutions
such as optical ground wire (OPGW), Rapier (easy break-out), JetNet (mini blown cable), Airbag (dielectric direct
buried cable) and many more.
Connectivity
Whether deployed in outdoor or indoor applications, Prysmian Group's OAsys connectivity solutions are
designed for versatility, covering all cable management needs whatever the network type.
These include aerial and underground installations, as well as cabling in central offices (or exchanges) or
customer premises.
Prysmian Group is at the forefront of designing next generation products specifically for Fibre-To-The-Home
(FTTH) networks.
FTTx
Increasing bandwidth requirements, from both business and residential customers, are having a profound effect
upon the optical network performance level required, which in turn demands high standards of fibre
management. Optimal fibre management in every section of the network is increasingly a matter of priority in
order to minimise power loss and overcome the problems caused by ever greater space limitations.
The Group has developed the suite of xsNet products for "last mile" access networks, which is also very suited
to optical fibre deployment in sparsely populated rural areas.
Most of the cables used in FTTx/FTTH systems feature Prysmian's bend-insensitive BendBrightxs optical fibre,
which has been specially developed for this application.
FTTA (Fibre-To-The-Antenna)
xsMobile, which offers Fibre-To-The-Antenna (FTTA) solutions, is an extensive optical fibre-based passive
portfolio which enables mobile operators to upgrade their networks easily and quickly. Incorporating Prysmian's
experience in Fibre-to-the-Home (FTTH) and its unique fibre innovations, xsMobile consists of different product
solutions for three applications: antenna towers, roof-top antennas and Distributed Antenna Systems (DAS) for
small cell deployment. The technology offers three access types for outdoor and indoor FTTA deployment, as
well as backhaul solutions – incorporating the latest fibre technologies.
Copper cables
Prysmian Group also produces a wide range of copper cables for underground and overhead cabling solutions
and for both residential and commercial buildings. The product portfolio comprises cables of different capacity,

PRYSMIAN GROUP | DIRECTORS’ REPORT
22
including broadband xDSL cables and those designed for high transmission, low interference and
electromagnetic compatibility.
Multimedia solutions
The Group produces cable solutions for a variety of applications serving communication needs in infrastructure,
industry and transport: cables for television and film studios, cables for rail networks such as underground cables
for long-distance telecommunications, light-signalling cables and cables for track switching devices, as well as
cables for mobile telecommunications antennae.
MARKET OVERVIEW
Forecasts for the optical fibre cables market made at the start of the year predict that the size of the global
market will grow although with large regional differences. In fact, the first quarter of 2014 saw demand grow in
fast-developing markets (China) and in those with high communication infrastructure needs (India), along with a
volume recovery in Europe. In Brazil, the volumes for the quarter started to grow once more even though the
benefits of the investment-friendly tax measures introduced by the government last year have yet to been seen.
North America reported a recovery in demand after the steep drop in 2013 with the ending of government
incentives.
The Access/Broadband/FTTx market has grown marginally in the first quarter of 2014, with demand driven by
the development of optical fibre communication infrastructure, although the low maturity of these products
implies different evolution in demand by geographical area.
The copper cables market continues to slow not only because of the economic downturn in the past two years,
causing some major operators to downsize their larger investment projects, but also because of product
maturity. The downturn in this market was increasingly evident in the first quarter of 2014, with high demand for
internet access leading the major operators to opt to renew their networks using optical fibre, rather than perform
maintenance or upgrade work on existing networks.
FINANCIAL PERFORMANCE
Telecom business sales to third parties amounted to Euro 236 million in the first quarter of 2014, compared with
Euro 253 million in the first quarter of 2013, posting a negative change of Euro 17 million(-6.7%).
This change is attributable to the following factors:
- negative exchange rate effects of Euro 15 million (-6.0%);
- positive organic growth of Euro 2 million (+0.7%), thanks to the recovery in volumes for optical fibre cables;
- negative change of Euro 4 million (-1.4%) in sales prices due to fluctuations in metal prices.
The positive organic growth in the first quarter of 2014 has mainly arisen from the recovery in demand for
optical fibre cables which more than offset lower demand for copper cables, due to product maturity, and for
OPGW products, due to investment project phasing.
The recovery in the optical fibre market is mainly due to demand generated by large-scale projects, such as
those started with BT (United Kingdom), Telefonica (Spain), Orange (France) and Free Infrastructure (France),
but also to demand from emerging markets and channels, such as Eastern Europe and India. In North America,

PRYSMIAN GROUP | DIRECTORS’ REPORT
23
although the competitive market environment has been affected by the ending of government incentives,
causing a reduction in average prices, Prysmian reported a reversal in the trend since the last quarter of 2013
with an increase in volumes during the quarter.
In Brazil, Prysmian posted a growth in volumes compared with the last quarter of 2013. Average prices have
continued to be low, staying at last year's levels in anticipation of implementation of the incentive programme for
new communications infrastructure, designed to incentivise the development of local technology and production
and which should be very beneficial for all telecom operators.
In Europe, the highly competitive nature of the market, with the presence of many small and medium-sized local
producers, put prices under strong pressure, despite growing volumes, causing the sector's profits to fall as a
result. In addition, the market for copper telecom cables continued to suffer from a gradual phasing out in favour
of next-generation networks. Lastly, the first quarter of 2014 saw a slight growth in the optical connectivity sector,
driven by the development of FTTx networks (last mile broadband access), particularly in France, the UK and the
Netherlands.
Adjusted EBITDA came to Euro 18 million in the first quarter of 2014, reporting a decrease of Euro 2 million
(-10.9%) from the corresponding figure of Euro 20 million in 2013.

PRYSMIAN GROUP | DIRECTORS’ REPORT
24
(in millions of Euro)
31 March 2014
before WL
Submarine
project effect
WL Submarine
project effect
31 March 2014
after WL
Submarine
project effect
31 March 2013 (*) Change 31 December 2013 (*)
Net fixed assets 2,188 - 2,188 2,298 (110) 2,207
Net working capital 734 (26) 708 739 (31) 386
Provisions (267) - (267) (307) 40 (297)
Net capital employed 2,655 (26) 2,629 2,730 (101) 2,296
Employee benefit obligations 307 - 307 346 (39) 308
Total equity 1,215 (26) 1,189 1,223 (34) 1,183
of which attributable to non-controlling
interests33 - 33 34 (1) 36
Net financial position 1,133 - 1,133 1,161 (28) 805
Total equity and sources of funds 2,655 (26) 2,629 2,730 (101) 2,296
GROUP STATEMENT OF FINANCIAL POSITION
RECLASSIFIED STATEMENT OF FINANCIAL POSITION
(*) The previously published prior year comparative figures have been restated following the introduction of IFRS 10 and IFRS 11.
Net fixed assets amounted to Euro 2,188 million at 31 March 2014, compared with Euro 2,207 million at 31
December 2013, posting a decrease of Euro 19 million mainly due to the combined effect of the following
factors:
- Euro 25 million in investments in property, plant and equipment and intangible assets;
- Euro 36 million in depreciation, amortisation and impairment charges for the period;
- Euro 3 million in positive currency translation differences;
- Euro 3 million in disposals of assets held for sale;
- Euro 8 million in dividends received from equity-accounted investments.
Net working capital of Euro 708 million at 31 March 2014 was Euro 322 million higher than the corresponding
figure of Euro 386 million at 31 December 2013 (or Euro 349 million higher excluding the impact of the fair
value change in derivatives). Excluding the adjustments for the Western HVDC Link project, net working capital
would have been Euro 734 million.
The change in net working capital is related to the following main factors:
- growth in working capital employed in multi-year Submarine projects, linked to their stage of completion
with respect to the agreed delivery dates;
- reduction of Euro 52 million in without-recourse factoring transactions;
- increase of Euro 21 million for the purchase price adjustment relating to Global Marine System Energy
Ltd (now renamed Prysmian PowerLink Services Ltd);
- reduction in the level of working capital related to strategic metal price trends compared with the previous
year;
- increase linked to the greater seasonality of sales in the quarter just ended and those expected in the
second quarter;
- increase of Euro 5 million for exchange rate differences.

PRYSMIAN GROUP | DIRECTORS’ REPORT
25
(in millions of Euro)
31 March 2014
before WL
Submarine
project effect
WL Submarine
project effect
31 March 2014
after WL
Submarine
project effect
31 March 2013 (*) Change 31 December 2013 (*)
Inventories 961 - 961 1,008 (47) 881
Trade receivables 1,051 - 1,051 1,174 (123) 933
Trade payables (1,318) - (1,318) (1,423) 105 (1,409)
Other receivables/(payables) 73 (26) 47 (1) 48 (13)
Net operating working capital 767 (26) 741 758 (17) 392
Derivatives (33) - (33) (19) (14) (6)
Net working capital 734 (26) 708 739 (31) 386
The net financial position of Euro 1,133 million at 31 March 2014 has increased by Euro 328 million since 31
December 2013 (Euro 805 million), mainly reflecting the following factors:
- negative impact of Euro 334 million from changes in working capital;
- payment of Euro 13 million in taxes;
- net operating investments of Euro 22 million;
- receipt of Euro 8 million in dividends from investments in equity-accounted companies;
- payment of Euro 13 million in net finance costs;
- positive cash flow from operating activities (before changes in net working capital) of Euro 58 million.
NET WORKING CAPITAL
The main components of net working capital are analysed in the following table:
(*) The previously published prior year comparative figures have been restated following the introduction of IFRS 10 and IFRS 11.
Net operating working capital amounted to Euro 741 million at 31 March 2014 (11.7% of the latest quarter's
annualised sales), compared with Euro 392 million at 31 December 2013 (5.8% of the latest quarter's annualised
sales).

PRYSMIAN GROUP | DIRECTORS’ REPORT
26
(in millions of Euro )
31 March 2014 31 March 2013 (*) Change 31 December 2013 (*)
Long-term financial payables
Term loan facility 400 585 (185) 400
Bank fees (3) (6) 3 (3)
EIB loan 100 - 100 -
Non-convertible bond 399 398 1 399
Convertible bond 265 257 8 263
Derivatives 4 30 (26) 4
Other financial payables 54 93 (39) 60
Total long-term financial payables 1,219 1,357 (138) 1,123
Short-term financial payables
Term loan facility - 2 (2) 183
Non-convertible bond 20 21 (1) 15
Convertible bond - - - 1
Securitization - 105 (105) -
Revolving facility - Credit Agreements 125 - 125 3
Revolving 2014 30 - 30 -
Derivatives 15 9 6 19
Other financial payables 165 152 13 90
Total short-term financial payables 355 289 66 311
Total financial liabilities 1,574 1,646 (72) 1,434
Long-term financial receivables 2 9 (7) 4
Long-term bank fees - 3 (3) -
Short-term financial receivables 19 7 12 12
Short-term derivatives 4 7 (3) 5
Short-term bank fees 4 5 (1) 5
Financial assets held for trading 71 54 17 93
Cash and cash equivalents 341 400 (59) 510
Total financial assets 441 485 (44) 629
Net financial position 1,133 1,161 (28) 805
NET FINANCIAL POSITION
The following table provides a detailed breakdown of the net financial position:
(*) The previously published prior year comparative figures have been restated following the introduction of IFRS 10 and IFRS 11.

PRYSMIAN GROUP | DIRECTORS’ REPORT
27
(in millions of Euro)
3 months 2014
before WL
Submarine project
effect
WL Submarine
project effect
3 months 2014
after WL
Submarine project
effect
3 months 2013 (*) Change FY 2013 (*)
EBITDA 135 (37) 98 98 - 563
Changes in provisions (including employee benefit obligations) (14) - (14) (24) 10 (69)
(Gains)/losses on disposal of property, plant and equipment, intangible assets
and non-current assets - - - - - (7)
Share of net profit/(loss) of equity-accounted companies (5) - (5) (4) (1) (35)
Acquisition price adjustment (1)(21) - (21) - (21) -
Net cash flow provided by operating activities (before changes in net
working capital) 95 (37) 58 70 (12) 452
Changes in net working capital (371) 37 (334) (331) (3) (6)
Taxes paid (13) - (13) (13) - (60)
Dividends from investments in equity-accounted companies 8 - 8 7 1 16
Net cash flow provided/(used) by operating activities (281) - (281) (267) (14) 402
Acquisitions - - - - - -
Net cash flow used in operational investing activities (22) - (22) (23) 1 (107)
Free cash flow (unlevered) (303) - (303) (290) (13) 295
Net finance costs (13) - (13) (15) 2 (124)
Free cash flow (levered) (316) - (316) (305) (11) 171
Dividend distribution - - - (1) 1 (92)
Net cash flow provided/(used) in the period (316) - (316) (306) (10) 79
Opening net financial position (805) - (805) (888) 83 (888)
Net cash flow provided/(used) in the period (316) - (316) (306) (10) 79
Convertible bond equity component - - - 39 (39) 39
Other changes (12) - (12) (6) (6) (35)
Closing net financial position (1,133) - (1,133) (1,161) 28 (805)
STATEMENT OF CASH FLOWS
(*) The previously published prior year comparative figures have been restated following the introduction of IFRS 10 and IFRS 11.
(1) This refers to the acquisition in November 2012 of Global Marine Systems Energy Ltd (now renamed Prysmian PowerLink Services Ltd)
from Global Marine Systems Ltd.
Net cash flow provided by operating activities (before changes in net working capital) amounted to Euro 58
million at the end of the first three months of 2014.
This cash flow was negatively impacted by the increase of Euro 334 million in net working capital described
earlier. Therefore, after deducting Euro 13 million in tax payments, net cash flow from operating activities in the
period was a negative Euro 281 million.
Net operating investments in the first three months of 2014 amounted to Euro 22 million and mainly refer to
expansion of production capacity for High Voltage cables in Russia and the United States, for Submarine
cables in Italy, and for Optical Fibre in France.

PRYSMIAN GROUP | DIRECTORS’ REPORT
28
ALTERNATIVE PERFORMANCE INDICATORS
In addition to the standard financial reporting formats and indicators required under IFRS, this document
contains a number of reclassified statements and alternative performance indicators. The purpose is to help
users better evaluate the Group's economic and financial performance. However, these statements and
indicators should not be treated as a substitute for the standard ones required by IFRS.
The alternative indicators used for reviewing the income statement include:
• Adjusted net profit/(loss): net profit/(loss) before non-recurring income and expenses, the fair value change
in metal derivatives and in other fair value items, the effect of currency and interest rate derivatives, exchange
rate differences, non-monetary interest on the convertible bond and the related tax effects;
• Adjusted operating income: operating income before non-recurring income and expenses and the fair value
change in metal derivatives and in other fair value items, as reported in the consolidated income statement. The
purpose of this indicator is to present the Group's operating profitability without the effects of events considered
to be outside its recurring operations;
• EBITDA: operating income before the fair value change in metal price derivatives and in other fair value items
and before amortisation, depreciation and impairment. The purpose of this indicator is to present the Group's
operating profitability before the main non-monetary items;
• Adjusted EBITDA: EBITDA as defined above calculated before non-recurring income and expenses, as
reported in the consolidated income statement. The purpose of this indicator is to present the Group's operating
profitability before the main non-monetary items, without the effects of events considered to be outside the
Group's recurring operations;
• EBITDA before share of net profit/(loss) of equity-accounted companies: Adjusted EBITDA as defined
above calculated before the share of net profit/(loss) of equity-accounted companies.
• Organic growth: growth in sales calculated net of changes in the scope of consolidation, changes in metal
prices and the effect of exchange rates.
The alternative indicators used for reviewing the reclassified statement of financial position include:
• Net fixed assets: sum of the following items contained in the statement of financial position:
- Intangible assets
- Property, plant and equipment
- Investments in associates
- Available-for-sale financial assets, net of non-current securities classified as long-term financial receivables
in the net financial position
• Net working capital: sum of the following items contained in the statement of financial position:
- Inventories
- Trade receivables
- Trade payables
- Other non-current receivables and payables, net of long-term financial receivables classified in the
net financial position

PRYSMIAN GROUP | DIRECTORS’ REPORT
29
- Other current receivables and payables, net of short-term financial receivables classified in the net
financial position
- Derivatives net of financial instruments for hedging interest rate and currency risks relating to financial
transactions, classified in the net financial position
- Current tax payables
• Net operating working capital: sum of the following items contained in the statement of financial position:
- Inventories
- Trade receivables
- Trade payables
- Other non-current receivables and payables, net of long-term financial receivables classified in the
net financial position
- Other current receivables and payables, net of short-term financial receivables classified in the net
financial position
- Current tax payables
• Provisions: sum of the following items contained in the statement of financial position:
- Provisions for risks and charges – current portion
- Provisions for risks and charges – non-current portion
- Provisions for deferred tax liabilities
- Deferred tax assets
• Net capital employed: sum of Net fixed assets, Net working capital and Provisions.
• Employee benefit obligations and Total equity: these indicators correspond to Employee benefit obligations
and Total equity reported in the statement of financial position.
• Net financial position: sum of the following items:
- Borrowings from banks and other lenders - non-current portion
- Borrowings from banks and other lenders - current portion
- Derivatives for financial transactions recorded as Non-current derivatives and classified under Long-term
financial receivables
- Derivatives for financial transactions recorded as Current derivatives and classified under Short-term
financial receivables
- Derivatives for financial transactions recorded as Non-current derivatives and classified under Long-term
financial payables
- Derivatives for financial transactions recorded as Current derivatives and classified under Short-term
financial payables
- Medium/long-term financial receivables recorded in Other non-current receivables
- Bank fees on loans recorded in Other non-current receivables
- Short-term financial receivables recorded in Other current receivables
- Bank fees on loans recorded in Other current receivables
- Short/long-term available-for-sale financial assets, not instrumental to the Group's activities
- Financial assets held for trading
- Cash and cash equivalents

PRYSMIAN GROUP | DIRECTORS’ REPORT
30
(in millions of Euro)
31 March 2014 31 December 2013 (*)
Note Partial amounts
from financial
statements
Total amounts
from financial
statements
Partial amounts
from financial
statements
Total amounts
from financial
statements
Net fixed assets
Property, plant and equipment 1,383 1,390
Intangible assets 586 588
Investments in associates 198 205
Available-for-sale financial assets 12 12
Assets held for sale 9 12
Total net fixed assets A 2,188 2,207
Net working capital
Inventories B 961 881
Trade receivables C 1,051 933
Trade payables D (1,318) (1,409)
Other receivables/payables - net E 47 (13)
of which:
Other receivables - non-current 3 23 24
Tax receivables 3 14 13Receivables from employees 3 2 2
Other 3 7 9
Other receivables - current 3 777 705
Tax receivables 3 128 109
Receivables from employees and pension plans 3 5 5
Advances to suppliers 3 18 17
Other 3 114 99
Construction contracts 3 512 475
Other payables - non-current 11 (21) (20)
Tax and social security payables 11 (12) (12)
Accrued expenses 11 (3) (3)
Other 11 (6) (5)
Other payables - current 11 (698) (688)
Tax and social security payables 11 (103) (99)
Advances from customers 11 (243) (241)
Payables to employees 11 (113) (98)
Accrued expenses 11 (138) (136)
Other 11 (101) (114)
Current tax payables (34) (34)
Total operating working capital F = B+C+D+E 741 392
Derivatives G (33) (6)
of which:
Forward currency contracts on commercial
transactions (cash flow hedges) - current 5- 1
Forward currency contracts on commercial
transactions - current 5- 6
Metal derivatives - non-current 5 (2) (1)
Metal derivatives - current 5 (31) (12)
Total net working capital H = F+G 708 386
Reconciliation between the Reclassified Statement of Financial Position presented in the Directors'Report and the Statement of Financial Position contained in the Consolidated Financial Statements andExplanatory Notes at 31 March 2014
(*) The previously published prior year comparative figures have been restated following the introduction of IFRS 10 and IFRS 11.

PRYSMIAN GROUP | DIRECTORS’ REPORT
31
(in millions of Euro)
Note Partial amounts
from financial
statements
Total amounts
from financial
statements
Partial amounts
from financial
statements
Total amounts
from financial
statements
Provisions for risks and charges - non-current (44) (51)
Provisions for risks and charges - current (273) (279)
Deferred tax assets 146 130
Deferred tax liabilities (96) (97)
Total provisions I (267) (297)
Net capital employed L = A+H+I 2,629 2,296
Employee benefit obligations M 307 308
Total equity N 1,189 1,183
Equity attributable to non-controlling interests 33 36
Net financial position
Total long-term financial payables O 1,219 1,123
Term loan facility 10 400 400
Bank fees 10 (3) (3)
Credit Agreements 10 397 397
EIB loan 10 100 -
Non-convertible bond 10 399 399
Convertible bond 10 265 263
Derivatives 4 4
of which:
Interest rate swaps 5 4 4
Other payables 54 60
of which:
Finance lease obligations 10 15 15
Other financial payables 10 39 45
Total short-term financial payables P 355 311
Term loan facility 10 - 184
Bank fees 10 - (1)
EIB loan 10 - -
Non-convertible bond 10 20 15
Convertible bond 10 - 1
Revolving facility - Credit Agreements 10 125 3
Revolving 2014 30 -
Derivatives 15 19
of which:
Interest rate swaps 5 10 14
Forward currency contracts on financial transactions 5 5 5
Other payables 165 90
of which:
Finance lease obligations 10 2 2
Other financial payables 10 163 88
Total financial liabilities Q = O+P 1,574 1,434
Long-term financial receivables R 3 (2) (4)
of which:
Short-term financial receivables R 3 (19) (12)
Short-term derivatives R (4) (5)
of which:
Forward currency contracts on financial transactions (current) 5 (4) (5)
Short-term bank fees R 3 (4) (5)
Available-for-sale financial assets (current) S - -
Financial assets held for trading T (71) (93)
Cash and cash equivalents U (341) (510)
Total financial assets V = R+S+T+U (441) (629)
Total net financial position W = Q+V 1,133 805
Total equity and sources of funds 2,629 2,296
31 December 2013 (*)31 March 2014
(*) The previously published prior year comparative figures have been restated following the introduction of IFRS 10 and IFRS 11.

PRYSMIAN GROUP | DIRECTORS’ REPORT
32
(in millions of Euro)
3 months 2014 3 months 2013 (*)
Note Amounts from
income statement
Amounts from
income statement
Sales of goods and services A 1,579 1,669Change in inventories of work in progress, semi-finished and finished
goods45 69
Other income 31 8
Raw materials, consumables used and goods for resale (1,053) (1,112)
Personnel costs (228) (240)
Other expenses (282) (305)
Operating costs B (1,487) (1,580)
Share of net profit/(loss) of equity-accounted operating companies C 5 4
Fair value stock options D 1 5
EBITDA E = A+B+C+D 98 98
Non-recurring other income F 21 -
Non-recurring personnel costs G (2) (5)
Non-recurring other expenses H 1 (11)
Adjusted EBITDA I = E-F-G-H 78 114
Share of net profit/(loss) of equity-accounted companies L 5 4
Adjusted EBITDA before share of net profit/(loss) of equity-
accounted companiesM = I-L 73 110
(in millions of Euro)
3 months 2014 3 months 2013 (*)
Note Amounts from
income statement
Amounts from
income statement
Operating income A 14 42 45
Non-recurring other income 21 -
Non-recurring personnel costs (2) (5)
Non-recurring other expenses 1 (11)
Change in inventories of work in progress, semi-finished and finished
goods- -
Total non-recurring expenses B 20 (16)
Fair value change in metal derivatives C (19) (12)
Fair value stock options D (1) (5)
Adjusted operating income E=A-B-C-D 42 78
Reconciliation between the principal income statement indicators and the Income Statement containedin the Consolidated Financial Statements and Explanatory Notes at 31 March 2014
(*)The previously published prior year comparative figures have been restated following the introduction of IFRS 10 and IFRS 11.
PRYSMIAN GROUP | DIRECTORS’ REPORT
33
Following the adoption of IFRS 10 - Consolidated Financial Statements and IFRS 11 - Joint Arrangements,
applicable retrospectively from 1 January 2014, the Group's consolidated figures have been restated as from 1
January 2013.
In particular, the changes introduced by IFRS 11 - Joint Arrangements have eliminated the possibility of
proportionate consolidation; accordingly, the companies Yangtze Optical Fibre and Cable Joint Stock Limited
Co., Yangtze Optical Fibre and Cable (Hong Kong) Co. Ltd., Precision Fiber Optics Ltd. and Power Cables
Malaysia Sdn Bhd, previously consolidated using the proportionate method, have now been consolidated using
the equity method.
In addition, further to the changes introduced by IFRS 10 – Consolidated Financial Statements, the Chinese
company Yangtze Optical Fibre & Cable (Shanghai) Co. Ltd., previously consolidated line-by-line, has now been
consolidated using the equity method; the Brazilian company Sociedade Produtora de Fibras Opticas S.A.,
previously consolidated line-by-line, has been defined as a "joint operation" and so is now being consolidated
according to the rights and obligations arising under the contractual arrangement.
The alternative performance indicators at 31 December 2013 and for 1st quarter 2013 have therefore been
restated as follows:

PRYSMIAN GROUP | DIRECTORS’ REPORT
34
(in millions of Euro)
31 March 2013
Published (*)
Effects application
IFRS 10-11
31 March 2013
Restated
Net fixed assets 2,294 4 2,298
Net working capital 810 (71) 739
Provisions (310) 3 (307)
Net capital employed 2,794 (64) 2,730
Employee benefit obligations 346 - 346
Total equity 1,235 (12) 1,223
of which attributable to non-controlling interests 46 (12) 34
Net financial position 1,213 (52) 1,161
Total equity and sources of funds 2,794 (64) 2,730
(in millions of Euro)
31 March 2013
Published (*)
Effects application
IFRS 10-11
31 March 2013
Restated
Inventories 1,047 (39) 1,008
Trade receivables 1,261 (87) 1,174
Trade payables (1,453) 30 (1,423)
Other receivables/(payables) (26) 25 (1)
Net operating working capital 829 (71) 758
Derivatives (19) - (19)
Net working capital 810 (71) 739
Alternative performance indicators at 31 March 2013:
Reclassified statement of financial position
(*) Restated following finalisation of the accounting for the business combination of Global Marine Systems Energy Ltd (now renamedPrysmian PowerLink Services Ltd) which had been accounted for provisionally at 31 March 2013. Further details can be found in the 2013Annual Report.
Net working capital
(*) Restated following finalisation of the accounting for the business combination of Global Marine Systems Energy Ltd (now renamedPrysmian PowerLink Services Ltd) which had been accounted for provisionally at 31 March 2013. Further details can be found in the 2013Annual Report.
Income statement(in millions of Euro)
3 months 2013
Published
Effects
application
IFRS 10-11
Other
reclassifications
3 months 2013
Restated
Adjusted EBITDA before share of net profit/(loss) of equity-
accounted companies115 (3) 2 114
Adjusted EBITDA 115 (3) (2) 110
EBITDA 99 (3) 2 98
Adjusted operating income 77 (1) 2 78

PRYSMIAN GROUP | DIRECTORS’ REPORT
35
(in millions of Euro)
31 December 2013
Published
Effects application
IFRS 10-11
31 December 2013
Restated
Inventories 920 (39) 881
Trade receivables 1,010 (77) 933
Trade payables (1,441) 32 (1,409)
Other receivables/(payables) (39) 26 (13)
Net operating working capital 450 (58) 392
Derivatives (6) - (6)
Net working capital 444 (58) 386
Alternative performance indicators at 31 December 2013
Reclassified statement of financial position
Net working capital
Income statement
(in millions of Euro)
31 December 2013
Published
Effects application
IFRS 10-11
31 December 2013
Restated
Net fixed assets 2,190 17 2,207
Net working capital 444 (58) 386
Provisions (297) - (297)
Net capital employed 2,337 41 2,296
Employee benefit obligations 308 - 308
Total equity 1,195 (12) 1,183
of which attributable to non-controlling interests 48 (12) 36
Net financial position 834 (29) 805
Total equity and sources of funds 2,337 (41) 2,296
(in millions of Euro)
2013
Published
Effects
application
IFRS 10-11
Other
reclassifications
2013 Restated
Adjusted EBITDA before share of net profit/(loss) of equity-
accounted companies612 (17) (17) 578
Adjusted EBITDA 612 (16) 17 613
EBITDA 562 (16) 17 563
Adjusted operating income 457 (9) 17 465

PRYSMIAN GROUP | DIRECTORS’ REPORT
36
SIGNIFICANT EVENTS AFTER THE REPORTING PERIOD
European Commission's decision relating to the Antitrust investigation
On 2 April 2014, the European Commission concluded the investigations started in January 2009 by
adopting a decision under which it found that, between 18 February 1999 and 28 January 2009, the world's
largest cable producers, including Prysmian Cavi e Sistemi S.r.l., one of the Group's Italian subsidiaries,
adopted anti-competitive practices in the European market for submarine energy cables and high voltage
underground energy cables.
The European Commission held Prysmian Cavi e Sistemi S.r.l. jointly liable with Pirelli & C. S.p.A. for the
disputed infringement in the period from 18 February 1999 to 28 July 2005, sentencing them to pay a fine of
Euro 67,310,000, and it held Prysmian Cavi e Sistemi S.r.l. jointly liable with Prysmian S.p.A. and The
Goldman Sachs Group Inc. for the disputed infringement in the period from 29 July 2005 to 28 January 2009,
sentencing them to pay a fine of Euro 37,303,000. Prysmian has said that it will appeal against this decision
to the General Court of the European Union. It should be noted that the Commission's decision may be
submitted to two levels of appeal.
Dividend distribution
On 16 April 2014, the shareholders of Prysmian S.p.A. approved the financial statements for 2013 and the
distribution of a gross dividend of Euro 0.42 per share, for a total of some Euro 89 million. The dividend was
paid out from 25 April 2014 to shares outstanding on the record date of 24 April 2014, with the shares going
ex-dividend on 22 April 2014.
Share buy-back and disposal programme and Employee incentive plan
The Shareholders' Meeting held on 16 April 2014 authorised a share buy-back and disposal programme,
revoking at the same time the previous authorisation under the shareholder resolution dated 16 April 2013.
This programme provides the opportunity to purchase, on one or more occasions, a maximum number of
ordinary shares whose total cannot exceed 10% of share capital, equal to 18,420,002 ordinary shares as at
the date of 16 April 2014, after deducting the treasury shares held by the Company.
The same Shareholders' Meeting also approved an incentive plan for employees of the Prysmian Group,
including members of the Board of Directors of Prysmian S.p.A., and granted the Board of Directors the
necessary powers to establish and implement this plan.
The reasons behind the introduction of the Plan are:
- to generate strong commitment by the Group's management to achieving the targets for additional
growth in profits and return on capital employed over the next three years;
- to align the interests of management with those of shareholders by using share-based incentives,
and promoting stable share ownership of the Company;
- to ensure the long-term sustainability of the Group's annual performance through the mechanism of
co-investing part of the annual bonus and consequent retention effect.
During the extraordinary session of the above meeting, the shareholders authorised an increase in share
capital by a maximum amount of Euro 536,480, through the issue of up to 5,364,800 new ordinary shares
with a nominal value of Euro 0.10 each, to be allotted for no consideration to Group employees who are
beneficiaries of the above incentive plan.

PRYSMIAN GROUP | DIRECTORS’ REPORT
37
Other subsequent events
On 9 April 2014, Prysmian Group was awarded a new contract by Energinet.dk, Denmark's grid operator, to
develop a high voltage cable system for the underground connection of the Horns Rev3 offshore wind farm.
The project involves supplying a High Voltage Alternate Current (HVAC) 245 kV power cable for a 45 km
underground route, Click-FitTM
network components and commissioning services to connect the wind farm
from the coastal substation to the 400 kV transmission station in Endrup. The underground cables for this
wind farm connection will be manufactured at the Pikkala plant (Finland), one of the Group's centres of
technological and manufacturing excellence for High Voltage cables. This project is due to be completed by
the end of 2015, with final delivery in 2016.
On 15 April 2014, Prysmian Group was awarded a new contract worth more than Euro 250 million by
TenneT, the Dutch-German grid operator, for the grid connection of offshore wind farms in the North Sea to
the German mainland.
The project involves the supply, installation and commissioning of a High Voltage Direct Current (HVDC) 320
kV extruded cable with a rating of 900 MW and associated optical fibre cable system, along a route running
29 km underground and 130 km underwater. The cable will connect the mainland converter station at the
Emden Ost power substation in Lower Saxony to BorWin gamma, the offshore converter platform in the
BorWin cluster, located approximately 120 km north of the German coast.
On 24 April 2014, Prysmian Group was awarded a new contract to supply, install and commission an HVAC
200 kV double circuit connection, comprising 21 km of submarine cable including spare lengths, an optical
fibre connection, network components and commissioning services. The cables for this project, known as the
"Shannon River Crossing" project, will be manufactured at the Pikkala plant (Finland), one of the Group's
centres of technological and manufacturing excellence for submarine cables.
Cable installation will be performed by one of Prysmian's own laying vessels, the "Cable Enterprise",
specialised in operations in extremely shallow waters and in offshore wind farm connections. The project is
due to be completed by early 2016.

PRYSMIAN GROUP | DIRECTORS’ REPORT
38
BUSINESS OUTLOOK
The macroeconomic environment in the first part of 2014, especially in those areas hardest hit by the crisis,
has shown signs of stabilisation and improvement compared with the recessionary trend experienced since
the second half of 2011.
In such an economic context, the Group is forecasting for 2014 that demand for medium voltage cables for
utilities will continue to slow, especially in the first half of the year, and that building wires and products in the
industrial market most exposed to cyclical trends will make a gradual recovery over the course of coming
quarters. It also confirms the positive trend in demand in the high value-added businesses of power
transmission and offshore Oil & Gas, as well as the steady recovery of demand for optical fibre cables from
the record lows reported in 2013.
During the last few days of April, the manufacture of the cables for the Western HVDC Link project in the UK
encountered some technical problems, which will be fully investigated in coming months. As a result, the
Directors believe they cannot reliably estimate the outcome of this contract, and so its revenues have been
recognised to the extent of the costs incurred. In the first quarter of 2014, this has resulted in the recognition
of a loss of Euro 26 million after tax (Euro 37 million before tax). Despite the current uncertainty over the
recently identified technical problems, the Directors believe at present that there is no evidence to suggest
that contract costs will exceed contract revenues. This does not preclude that, after further analysis and
technical testing in progress, evidence might emerge that will lead to the recognition of additional losses in
coming quarters.
Based on the existing order book and considering the negative impact of the technical problems with the
manufacture of cables for the Western Link project, as well as negative exchange rate effects, the Group is
forecasting Adjusted EBITDA for FY 2014 in the range of Euro 530-580 million (Euro 600-650 million
excluding the negative impact of the Western Link project estimated at Euro 70 million for the full year)
compared with Euro 613 million in 2013.
Lastly, the Prysmian Group will carry on during 2014 to integrate and rationalise activities with the goal of
achieving the projected cost synergies and of further strengthening its presence in all its areas of business.

PRYSMIAN GROUP | DIRECTORS’ REPORT
39
FORESEEABLE RISKS IN 2014*
The Prysmian Group is exposed in the normal conduct of its business to a number of financial and non-
financial risk factors which, if they should materialise, could also have a material impact on its results of
operations and financial condition. The Group has always worked to maximise value for its shareholders by
putting in place all necessary measures to prevent or mitigate the risks inherent in the Group's business,
which is why it adopts specific procedures to manage the risk factors that could influence its business results.
Given operating performance in the first three months of the year and the specific macroeconomic context,
the principal risk factors currently foreseeable for the next nine months of 2014 are described below
according to their nature.
Risks associated with market trends for the Group's products
Some of the markets for the Prysmian Group's products, mainly relating to the Trade & Installers business
area, the Power Distribution business line and certain applications in the Industrial business area, are subject
to cyclical fluctuations in demand and are influenced by overall trends in GDP. Although the diversified
nature of the Group's markets and products reduces its exposure to cyclical trends in demand on certain
markets, it is not possible to rule out that such market cycles could have a significant impact on the Group's
business, results of operations and financial condition.
In addition, demand for products in the Energy cables market is also influenced by the spending plans of
utilities companies and by overall energy consumption, and also in part by construction industry trends, while
demand for products in the Telecom cables industry is heavily influenced by the spending plans of telecom
operators.
The first quarter of 2014 reported an increase in the Prysmian Group's overall volumes compared with the
prior year equivalent period, thereby reversing the slowdown in demand underway since mid-2012. However,
despite the ongoing rationalisation of the manufacturing footprint and the growth in sales volumes, the level
of plant utilisation still remained well below pre-crisis levels, with a consequent maintenance of competitive
pressure on selling prices and therefore on margins.
Despite these conditions, the Prysmian Group achieved acceptable results both in terms of profits and cash
flow; however, if another significant deterioration in demand should recur in coming quarters in the Trade &
Installers, Power Distribution (partly linked to trends in the construction market), Industrial and Telecom
businesses, combined with a slowdown in order intake in the High Voltage underground cables business, the
Group cannot rule out that the consequent sharp downturn in business might have a material impact on its
business, results of operations and financial condition.
(*) The risks described in this section are those that, at the date of the present document, the Group believes, if they were to occur,
could have a material adverse near-term impact on its business, financial condition, earnings and future prospects. The Group is also
exposed to other risk factors and uncertainties that, at the date of the present document, nonetheless appear to be of limited
significance; these risks are described more fully in the Annual Report.
PRYSMIAN GROUP | DIRECTORS’ REPORT
40
Risks associated with the competitive environment
Primarily in the Trade & Installers business area and, to some extent, in the Power Distribution business
line, competitive pressure due to a possible further reduction in demand could translate into additional
pressure on prices. Many of the products offered by the Prysmian Group in this business are made in
compliance with specific industrial standards and are largely interchangeable with those offered by its major
competitors; in such cases, price is therefore a key factor in customer choice of supplier. Although the
competitive environment for this business may vary by country or region, one constant is the ever larger
number of competitors, ranging from those capable of competing globally to smaller ones whose presence,
in an individual country or region or an individual business line, may be comparable to that of the principal
players.
Even though the Prysmian Group believes it will be able to cut costs in the face of contracting sales
volumes, it may not be able to reduce them sufficiently to match the possible contraction in sales prices
imposed by competitors, with a consequently adverse impact on its business, results of operations and
financial condition.
In addition, in high value-added segments like High Voltage underground cables, Optical Cables, and, albeit
to a much lesser extent, Submarine cables, where barriers to entry, linked to difficult-to-replicate ownership
of technology, know-how and track record, limit the number of operators able to compete effectively on a
global scale, it is not possible to rule out potential new entrants in these market segments or an escalation in
competition from operators already on the market, with potentially negative impacts both on sales volumes
and sales prices.
M&A/JVs and integration processes - Risks relating to the Draka Group's integration process
The public offer for all the shares in Draka Holding N.V. was completed on 22 February 2011 with
acceptances received from more than 99% of the shares. After the integration process's preliminary
planning phase, the new organisational structure was officially launched with effect from July 2011 and will
guide the new Group with the goal of promoting both the Prysmian and Draka commercial brands and of
realising the expected synergies.
Over the course of the integration process the Group expects to incur a total of some Euro 250 million in
restructuring costs (net of any divestments) and to generate growing cost synergies starting from year one
of the integration with the goal of achieving total annual synergies of Euro 175 million by 2016, mainly by
reducing fixed costs, by optimising the industrial footprint and procurement, by making organisational
savings and improving operating efficiency and optical fibre sourcing, and by exploiting complementarities in
the product portfolios. However, the Group cannot rule out potential difficulties or delays in implementing the
new organisational structure and the new operating processes, with a possible consequent adverse impact
both on the timing and amount of expected synergies and restructuring costs.
Risks relating to changes in the legal and regulatory framework
The Prysmian Group, as a manufacturer and distributor of cables, is subject to numerous legal and
regulatory requirements in the various countries where it operates, as well as technical regulations, both
national and international, applicable to companies operating in the same sector and to products
manufactured and marketed by the Group. Environmental protection legislation is particularly important in
this regard. Although the Group is constantly engaged in reducing its exposure to environmental risks and
has taken out insurance against potential liabilities arising from third-party environmental damage, it is
nonetheless possible that not all environmental risks have been adequately identified and that not all the
insurance coverage is fully effective. In particular, the enactment of additional regulations applicable to the
Group or its products, or changes in the current national and international laws in the segments in which the
Group operates, could require the Group to adopt stricter standards or could limit its freedom of action in its

PRYSMIAN GROUP | DIRECTORS’ REPORT
41
specific areas of business. These factors could involve compliance costs, even of significant amount, for its
manufacturing facilities or product specifications.
Risks associated with activities in emerging markets
The Prysmian Group operates and has production facilities and/or companies in Asia and Latin America.
The Group's activities in these countries are exposed to different risks linked to local regulatory and legal
systems, the imposition of tariffs or taxes, political and economic instability, and exchange rate risks.
Significant changes in the macroeconomic, political, tax or legislative environment of such countries could
have an adverse impact on the Group's business, results of operations and financial condition.
Risks associated with availability of financial resources and their cost
The volatility of the international banking and financial system could represent a potential risk factor in terms
of raising finance and its associated cost. Prysmian Group believes that it has significantly mitigated such a
risk insofar as, in recent years, it has always been able to raise sufficient financial resources, and at a
competitive cost. In particular, in February 2014 the Group obtained a five-year revolving facility for Euro
100 million from Mediobanca – Banca di Credito Finanziario S.p.A. and in December 2013 a loan for Euro
100 million from the European Investment Bank (EIB) to fund the Group's European R&D plans over the
period 2013-2016; in March 2013, Prysmian completed the placement of a convertible bond with institutional
investors for Euro 300 million, with a 1.25% coupon and maturity in March 2018. Previously, in March 2011,
the Group had entered into a long-term loan agreement for Euro 800 million (Credit Agreement 2011) with a
syndicate of leading banks. This five-year agreement comprises a loan for Euro 400 million (Term Loan
Facility 2011) and a revolving facility for Euro 400 million (Revolving Credit Facility 2011). In addition, the
placement of an unrated bond with institutional investors on the Eurobond market was completed in March
2010 for a nominal total of Euro 400 million with a 5.25% coupon and maturity in April 2015. Lastly, it is
recalled that in January 2010 Prysmian entered into a forward start credit agreement for Euro 1,070 million
(Credit Agreement 2010), of which Euro 670 million related to a Term Loan Facility and Euro 400 million to a
Revolving Credit Facility, maturing on 31 December 2014. The Term Loan Facility, which had stood at Euro
184 million at 31 December 2014, was repaid in advance on 28 February 2014 (more details can be found
in the section on Significant Events During the Period).
The annual interest rate on the Credit Agreement is equal to the sum of:
EURIBOR; an annual spread determined on the basis of the ratio between consolidated net financial position and
consolidated EBITDA.
As at 31 March 2014, the Group's total financial resources, comprising cash and cash equivalents and
undrawn committed credit lines, came to in excess of Euro 1 billion.
A detailed analysis of "Borrowings from banks and other lenders" can be found in the Explanatory Notes to
the Consolidated Financial Statements.
Financial covenants
The credit agreements mentioned in the preceding paragraph both contain a series of financial and non-
financial covenants with which the Group must comply. These covenants could restrict the Group's ability to
increase its net debt, other conditions remaining equal; should it fail to satisfy one of the covenants, this
would lead to a default event which, unless resolved under the terms of the respective agreements, could
lead to their termination and/or an early repayment of any amounts drawn down. In such an eventuality, the
Group might be unable to repay the amounts demanded early, which in turn would give rise to a liquidity
risk.

PRYSMIAN GROUP | DIRECTORS’ REPORT
42
The financial covenants are measured at the half-year close on 30 June and at the full-year close on 31
December. All covenants, financial or otherwise, were fully observed at 31 December 2013. In particular:
(i) the ratio between EBITDA and Net finance costs, as defined in the credit agreements, was
6.91x (against a required covenant of not less than 5.50x);
(ii) the ratio between Net Financial Position and EBITDA, as defined in the credit agreements, was1.28x (against a required covenant of below 2.75x).
As things stand and in view of the level of the financial covenants reported above, Prysmian Group believes
that it will not have to face this risk in the near future.
Exchange rate fluctuation
The Prysmian Group operates internationally and is therefore exposed to exchange rate risk for the various
currencies in which it operates (principally the US Dollar, British Pound, Brazilian Real and Chinese
Renminbi). Exchange rate risk occurs when future transactions or assets and liabilities recognised in the
statement of financial position are denominated in a currency other than the functional currency of the
company which undertakes the transaction.
To manage exchange rate risk arising from future trade transactions and from the recognition of foreign
currency assets and liabilities, most Prysmian Group companies use forward contracts arranged by Group
Treasury, which manages the various positions in each currency.
However, since Prysmian prepares its consolidated financial statements in Euro, fluctuations in the
exchange rates used to translate the financial statements of subsidiaries, originally expressed in a foreign
currency, could affect the Group's results of operations and financial condition.
Interest rate fluctuation
Changes in interest rates affect the market value of the Prysmian Group's financial assets and liabilities as
well as its net finance costs. The interest rate risk to which the Group is exposed is mainly on long-term
financial liabilities, carrying both fixed and variable rates.
Fixed rate debt exposes the Group to a fair value risk. The Group does not operate any particular hedging
policies in relation to the risk arising from such contracts since it considers this risk to be immaterial.
Variable rate debt exposes the Group to a rate volatility risk (cash flow risk). The Group uses interest rate
swaps (IRS) to hedge this risk, which transform variable rates into fixed ones, thus reducing the rate
volatility risk. Under such IRS contracts, the Group agrees with the other parties to swap on specific dates
the difference between the contracted fixed rates and the variable rate calculated on the loan's notional
value. A potential rise in interest rates, from the record lows reached in recent years, is a risk factor in
coming quarters.
Risks associated with fluctuations in commodity prices
The principal raw material used for making the Prysmian Group's products is copper. The other raw
materials used are aluminium, lead and steel, as well as various petroleum derivatives, such as PVC and
polyethylene.
All raw materials have experienced particularly significant price fluctuations in recent years, which could
continue in coming quarters. The Group neutralises the impact of possible rises in the price of copper and
its other principal raw materials through automatic sales price adjustment mechanisms or through hedging
activities; the exception is petroleum derivatives (polyethylene, plastifying PVC, rubber and other chemical
products), where the risk cannot be offset through hedging. Established commercial practice and/or the
structural characteristics of the markets concerned mean that hedging of certain products (mainly in the

PRYSMIAN GROUP | DIRECTORS’ REPORT
43
Trade & Installers business area) involves the periodic updating of price lists (since it is not possible to use
automatic sales price adjustment mechanisms). In such cases, it is possible that, in the current market
context, the Prysmian Group would be unable to quickly pass on the impact of fluctuations in raw material
prices to sales prices. In particular, in the case of petroleum derivatives, it is standard practice for changes
in purchase price to systematically lag behind changes in the petroleum price.
More generally, depending on the size and speed of copper price fluctuations, such fluctuations may have a
significant impact on customers' buying decisions particularly in the Trade & Installers business area, the
Power Distribution business line and certain lines in the Industrial area more exposed to cyclical trends in
demand, and on the Group's margins and working capital. In particular, (i) significant, rapid increases and
decreases in the copper price may cause absolute increases and decreases respectively in the Group's
profit margins due to the nature of the commercial relationships and mechanisms for determining end
product prices and (ii) increases and decreases in the copper price may cause increases and decreases
respectively in working capital (with a consequent increase or decrease in the Group's net debt).
Risk hedging differs according to the type of business and supply contract, as shown in the following
diagram:

44
Contract performance/liability - Risks associated with delivery dates, product quality and execution
of turnkey contracts
Some supply and/or installation contracts entered into by the Prysmian Group include penalties if the agreed
delivery date or qualitative standards are not met.
Turnkey contracts, particularly those relating to the development of submarine links, can include penalties of
this kind. The application of such penalties, the obligation to compensate any damages as well as the impact
of any delayed delivery or any problems in production on the supply chain and operating costs, could
adversely affect the Group's business, results of operations and financial condition.
In order to avert or mitigate such risks the Group conducts extensive testing of cables and accessories
before they are delivered and installed, and always does its utmost to limit potential contractual liabilities for
penalties or damages; in addition, it also maintains project-specific insurance policies during the
transportation and assembly phases of all submarine turnkey projects. The scope and level of such
insurance policies, however, may in some cases be limited by the capacity of the relevant insurance markets.
As a result, some potential liabilities may not be insured or only insured up to a level which is below
contractually agreed limits.
It is not possible to guarantee that in the future the Group will manage to fully and promptly meet
commitments arising from the occurrence of such risks.
During the last few days of April, the manufacture of the cables for the Western HVDC Link project in the
United Kingdom encountered some technical problems, which will be fully investigated in coming months. As
a result, the Directors believe they cannot reliably estimate the outcome of this contract, and so its revenues
have been recognised to the extent of the costs incurred. In the first quarter of 2014, this has resulted in the
recognition of a loss of Euro 26 million after tax (Euro 37 million before tax). Despite the current uncertainty
over the recently identified technical problems, the Directors believe at present that there is no evidence to
suggest that contract costs will exceed contract revenues. This does not preclude that, after further analysis
and technical testing in progress, evidence might emerge that will lead to the recognition of additional losses
in coming quarters.
Business interruption/Catastrophic events - Risks relating to the operation of industrial facilities
Being an industrial group, the Prysmian Group is potentially exposed to the risk of stoppage of production at
one or more of its facilities, due, for example, to machinery breakdown, cancellation of or challenge to
permits and licences by the competent public authorities (also due to changes in legislation), strikes or
shortage of labour, natural disasters, major disruptions in the supply of raw materials or energy, sabotage or
terrorist attacks.
In addition, activities relating to the submarine cables business are closely dependent on certain specific
assets, such as the manufacturing facilities in Arco Felice (Italy) and Pikkala (Finland) and the cable-laying
ships, the "Giulio Verne" and the "Cable Enterprise". The Prysmian Group believes that a prolonged
stoppage in the operation of these assets could have a significant adverse impact on its business, results of
operations and financial condition.
Compliance risks associated with laws, regulations, Code of Ethics, Policies and Procedures
Compliance risk is the risk of incurring legal or administrative sanctions, material financial losses or
reputational damage as a result of violations of laws, regulations, procedures, codes of conduct and best
practices. Right at its inception, the Prysmian Group approved a Code of Ethics, a document which contains
ethical standards and guidelines for conduct to be observed by all those engaged in activities on behalf of

45
Prysmian or its subsidiaries, including managers, officers, employees, agents, representatives, contractors,
suppliers and consultants. In particular, the Code of Ethics requires full compliance with current regulations
and the avoidance of any kind of misconduct or illegal behaviour. The Group establishes organisational
mechanisms designed to prevent the violation of the principles of legality, transparency, fairness and honesty
and is committed to ensuring their observance and practical application. Although the Group is committed to
ongoing compliance with applicable regulations and to close supervision to identify any misconduct, it is not
possible to rule out episodes in the future of non-compliance or violations of laws, regulations, procedures or
codes of conduct by those engaged in performing activities on Prysmian's behalf, which could result in
judicial sanctions, fines or reputational damage, even on a material scale.
Risks relating to legal and tax proceedings
Prysmian S.p.A. and some Prysmian Group companies are currently involved in tax and legal proceedings in
connection with their business, involving civil, criminal and administrative actions. In some of these cases,
the company might not be able to accurately quantify the potential losses or penalties associated with such
proceedings. If the event of an adverse outcome to such proceedings, the Group cannot rule out an impact,
even for a material amount, on its business, results of operations and financial condition, as well as
reputational damages that are hard to estimate.
More specifically, the European Commission, the US Department of Justice and the Japanese antitrust
authority started investigations in late January 2009 into several European and Asian electrical cable
manufacturers to verify the existence of alleged anti-competitive practices in the high voltage underground
and submarine cables markets. Subsequently, the Australian Competition and Consumers Commission
("ACCC") and the New Zealand Commerce Commission also started similar investigations. During 2011, the
Canadian antitrust authority also started an investigation into a high voltage submarine project dating back to
2006. The investigations in Japan and New Zealand have ended without any sanctions for Prysmian. The
other investigations are still in progress.
In Australia, the ACCC has filed a case before the Federal Court arguing that Prysmian Cavi e Sistemi S.r.l.
and two other companies violated antitrust rules in connection with a high voltage underground cable project
awarded in 2003. Prysmian Cavi e Sistemi S.r.l. has filed its objections and presented its preliminary
defence.
In Brazil, the local antitrust authority has started an investigation into several cable manufacturers, including
Prysmian, in the high voltage underground and submarine cables market. Prysmian has taken steps to
present its preliminary defence. During the month of December 2013, the company ABB and one of its senior
managers signed an agreement with the Brazilian antitrust authority, under which they admitted the conduct
alleged by the authority and pledged to cooperate with it and to each pay an agreed fine.
At the start of July 2011, Prysmian received a statement of objection from the European Commission in
relation to the investigation started in January 2009 into the high voltage underground and submarine energy
cables market. This document contained the Commission's preliminary position on alleged anti-competitive
practices and did not prejudge its final decision. Prysmian subsequently submitted its defence which it was
also able to present at the hearing before the European Commission held during the month of June 2012. In
July 2013, Prysmian submitted information, at the Commission’s request, about its 2004 sales in the high
voltage underground and submarine cables businesses. In addition, a state of play meeting was held
between the Company and the European Commission at the start of October 2013. Subsequently, in
February 2014, the Commission requested the figures for the Group's consolidated sales at 31 December
2013.

46
On 2 April 2014, the European Commission adopted a decision under which it found that, between 18
February 1999 and 28 January 2009, the world's largest cable producers, including Prysmian Cavi e Sistemi
S.r.l., adopted anti-competitive practices in the European market for submarine energy cables and high
voltage underground energy cables. The European Commission held Prysmian Cavi e Sistemi S.r.l. jointly
liable with Pirelli & C. S.p.A. for the disputed infringement in the period from 18 February 1999 to 28 July
2005, sentencing them to pay a fine of Euro 67,310,000, and it held Prysmian Cavi e Sistemi S.r.l. jointly
liable with Prysmian S.p.A. and The Goldman Sachs Group Inc. for the disputed infringement in the period
from 29 July 2005 to 28 January 2009, sentencing them to pay a fine of Euro 37,303,000. The Prysmian
Group believes that the EU body's decision is deeply flawed because of superficial investigation, making it
therefore unfair and unlawful. Prysmian has said that it will appeal against this decision to the General Court
of the European Union.
As at 31 March 2014, the amount of the provision for the risks relating to the European Commission's ruling
and the investigations underway in the various jurisdictions, except for Brazil, is approximately Euro 198
million. This amount has been determined on the basis of partly subjective considerations and is only an
estimate since the outcome of the investigations in progress is still uncertain. It is therefore not possible to
rule out that the Group could be required to meet liabilities not covered by the provisions for risks should
such litigation have an adverse outcome, with a consequently negative, even material, impact on its
business, results of operations and financial condition.
STOCK OPTION PLANS
Information about the evolution of existing stock option plans can be found in Note 24 of the Explanatory
Notes.
RELATED PARTY TRANSACTIONS
Related party transactions do not qualify as either atypical or unusual but fall into the normal course of
business by Group companies. Such transactions take place under market terms and conditions, according
to the type of goods and services provided.
Information about related party transactions, including that required by the Consob Communication dated
28 July 2006, is presented in Note 21 of the Explanatory Notes.
Milan, 8 May 2014
ON BEHALF OF THE BOARD OF DIRECTORS
THE CHAIRMAN
Massimo Tononi

consoliDateD Financial statements anD explanatory notes

PRYSMIAN GROUP | CONSOLIDATED FINANCIAL STATEMENTS AND EXPLANATORY NOTES
48
(in millions of Euro)
Note 31 March
2014
of which
related
parties
(Note 21)
31 December
2013 (*)
of which
related
parties
(Note 21)
1 January
2013 (*)
of which
related
parties
Non-current assets
Property, plant and equipment 1 1,383 1,390 1,484
Intangible assets 1 586 588 608
Equity-accounted investments 2 198 198 205 205 193 193
Available-for-sale financial assets 12 12 12
Derivatives 5 1 2 3
Deferred tax assets 146 130 125
Other receivables 3 25 28 40
Total non-current assets 2,351 2,355 2,465
Current assets
Inventories 4 961 881 866
Trade receivables 3 1,051 11 933 10 1,083 17
Other receivables 3 800 1 722 2 560 4
Financial assets held for trading 6 71 93 78
Derivatives 5 11 23 16
Cash and cash equivalents 7 341 510 787
Total current assets 3,235 3,162 3,390
Assets held for sale 8 9 12 4
Total assets 5,595 5,529 5,859
Equity attributable to the Group: 1,156 1,147 1,112
Share capital 9 21 21 21
Reserves 9 1,128 977 925
Net profit/(loss) for the period 7 149 166
Equity attributable to non-controlling interests: 33 36 35
Share capital and reserves 35 33 33
Net profit/(loss) for the period (2) 3 2
Total equity 1,189 1,183 1,147
Non-current liabilities
Borrowings from banks and other lenders 10 1,215 1,119 1,428
Other payables 11 21 20 23
Provisions for risks and charges 12 44 51 73
Derivatives 5 7 7 41
Deferred tax liabilities 96 97 91
Employee benefit obligations 13 307 308 344 6
Total non-current liabilities 1,690 1,602 2,000
Current liabilities
Borrowings from banks and other lenders 10 340 292 311
Trade payables 11 1,318 2 1,409 3 1,416 4
Other payables 11 698 16 688 18 616 2
Derivatives 5 53 42 24
Provisions for risks and charges 12 273 279 317
Current tax payables 34 34 28
Total current liabilities 2,716 2,744 2,712
Total liabilities 4,406 4,346 4,712
Total equity and liabilities 5,595 5,529 5,859
CONSOLIDATED STATEMENT OF FINANCIAL POSITION
(*) The previously published prior year consolidated financial statements have been restated following the adoption of IFRS 10 and IFRS 11.Further details can be found in Section C. Restatement of comparative figures.

PRYSMIAN GROUP | CONSOLIDATED FINANCIAL STATEMENTS AND EXPLANATORY NOTES
49
(in millions of Euro)
Note 3 months 2014 of which
related
parties
(Note 21)
3 months 2013 (*) of which
related
parties
(Note 21)
Sales of goods and services 1,579 9 1,669 10Change in inventories of work in progress, semi-finished and finished
goods45 69
Other income 31 8 1
of which non-recurring other income 21 -
Raw materials, consumables used and goods for resale (1,053) (1) (1,112) (2)
Fair value change in metal derivatives (19) (12)
Personnel costs (228) (2) (240) (4)
of which non-recurring personnel costs (2) (5)
of which personnel costs for stock option fair value (1) (5)
Amortisation, depreciation and impairment (36) (36)
Other expenses (282) (305)
of which non-recurring other expenses 1 (11)
Share of net profit/(loss) of equity-accounted companies 5 5 4 4
Operating income 14 42 45
Finance costs 15 (95) (121)
of which non-recurring finance costs (5) (5)
Finance income 15 60 73
Dividends from other companies - -
Profit/(loss) before taxes 7 (3)
Taxes 16 (2) 1
Net profit/(loss) for the period 5 (2)
Attributable to:
Owners of the parent 7 (2)
Non-controlling interests (2) -
Basic earnings/(loss) per share (in Euro) 17 0.03 (0.01)
Diluted earnings/(loss) per share (in Euro) 17 0.03 (0.01)
CONSOLIDATED INCOME STATEMENT
(*) The previously published prior year consolidated financial statements have been restated following the adoption of IFRS 10 and IFRS 11.
Further details can be found in Section C. Restatement of comparative figures.

PRYSMIAN GROUP | CONSOLIDATED FINANCIAL STATEMENTS AND EXPLANATORY NOTES
50
(in millions of Euro)
3 months 2014 3 months 2013 (*)
Net profit/(loss) for the period 5 (2)
Comprehensive income/(loss) for the period:
- items that may be reclassified subsequently to profit or loss:
Fair value gains/(losses) on cash flow hedges - gross of tax 1 5
Fair value gains/(losses) on cash flow hedges - tax effect - (2)
Release of cash flow hedge reserve after discontinuing cash flow hedging -
gross of tax 4 15
Release of cash flow hedge reserve after discontinuing cash flow hedging - tax
effect (1) (5)
Currency translation differences (3) 22
Total items that may be reclassified, net of tax 1 35
- items that will NOT be reclassified subsequently to profit or loss:
Actuarial gains/(losses) on employee benefits - gross of tax - -
Actuarial gains/(losses) on employee benefits - tax effect - -
Total items that will NOT be reclassified, net of tax - -
Total comprehensive income/(loss) for the period 6 33
Attributable to:
Owners of the parent 8 33
Non-controlling interests (2) -
CONSOLIDATED STATEMENT OF COMPREHENSIVE INCOME
(*) The previously published prior year consolidated financial statements have been restated following the adoption of IFRS 10 and IFRS 11.
Further details can be found in Section C. Restatement of comparative figures.

PRYSMIAN GROUP | CONSOLIDATED FINANCIAL STATEMENTS AND EXPLANATORY NOTES
51
(in millions of Euro)
Share
capital
Cash flow
hedge
reserve
Currency
translation
reserve
Other
reserves
Net profit / (loss)
for the period
Equity
attributable to
the Group
Non-
controlling
interests
Total
Previously published balance at 31 December 2012 21 (23) (62) 1,010 166 1,112 47 1,159
Variation due to application of new standards - - - - - - (12) (12)
Balance at 1 January 2013 21 (23) (62) 1,010 166 1,112 35 1,147
Allocation of prior year net result - - - 166 (166) - - -
Fair value - stock options - - - 5 - 5 - 5
Dividend distribution - - - - - - (1) (1)
Non-monetary component of convertible bond - - - 39 - 39 - 39
Total comprehensive income/(loss) for the period - 13 22 - (2) 33 - 33
Balance at 31 March 2013 (*) 21 (10) (40) 1,220 (2) 1,189 34 1,223
(in millions of Euro)
Share
capital
Cash flow
hedge
reserve
Currency
translation
reserve
Other
reserves
Net profit / (loss)
for the period
Equity
attributable to
the Group
Non-
controlling
interests
Total
Balance at 31 December 2013 (*) 21 (8) (156) 1,141 149 1,147 36 1,183
Allocation of prior year net result - - - 149 (149) - - -
Dividend distribution - - - - - - (1) (1)
Fair value - stock options - - - 1 - 1 - 1
Total comprehensive income/(loss) for the period - 4 (3) - 7 8 (2) 6
Balance at 31 March 2014 21 (4) (159) 1,291 7 1,156 33 1,189
CONSOLIDATED STATEMENT OF CHANGES IN EQUITY
(*) The previously published prior year consolidated financial statements have been restated following the adoption of IFRS 10 and IFRS 11.
Further details can be found in Section C. Restatement of comparative figures.

PRYSMIAN GROUP | CONSOLIDATED FINANCIAL STATEMENTS AND EXPLANATORY NOTES
52
(in millions of Euro)
3 months 2014 of which related
parties (Note 21)
3 months 2013 (*) of which related
parties (Note 21)
Profit/(loss) before taxes 7 (3)Depreciation and impairment of property, plant and equipment 29 28Amortisation and impairment of intangible assets 7 8Share of net profit/(loss) of equity-accounted companies (5) (5) (4) (4)Share-based payments 1 5Fair value change in metal derivatives and other fair value items 19 12
Net finance costs 35 48Changes in inventories (82) (134)Changes in trade receivables/payables (209) (1) (85)Changes in other receivables/payables (64) (2) (112) (1)
Changes in receivables/payables for derivatives - -Taxes paid (13) (13)Dividends received from equity-accounted companies 8 8 7 7
Utilisation of provisions (including employee benefit obligations) (20) (34)Increases in provisions (including employee benefit obligations) 6 10
A. Net cash flow provided by/(used in) operating activities (281) (267)
Acquisitions - -
Investments in property, plant and equipment (22) (19)Disposals of property, plant and equipment and assets held for sale 3 -Investments in intangible assets (3) (4)Disposals of intangible assets - -Investments in financial assets held for trading (1) (3)Disposals of financial assets held for trading 24 30
B. Net cash flow provided by/(used in) investing activities 1 4
Dividend distribution - (1)EIB loan 100 -Proceeds from convertible bond (1)
- 296Early repayment of credit agreement (184) (486)Finance costs paid (2)
(71) (79)Finance income received (3)
58 64Changes in other net financial payables 212 79
C. Net cash flow provided by/(used in) financing activities 115 (127)
D. Currency translation gains/(losses) on cash and cash equivalents (4) 3
E. Total cash flow provided/(used) in the period (A+B+C+D) (169) (387)
F. Net cash and cash equivalents at the beginning of the period 510 787
G. Net cash and cash equivalents at the end of the period (E+F) 341 400
CONSOLIDATED STATEMENT OF CASH FLOWS
(*) The previously published prior year consolidated financial statements have been restated following the adoption of IFRS 10 and IFRS 11.
Further details can be found in Section C. Restatement of comparative figures.
(1) The Bond became convertible following the resolution adopted by the Shareholders' Meeting on 16 April 2013.
(2) Finance costs paid of Euro 71 million include Euro 8 million in interest payments in the first three months of 2014 (Euro 6 million in the first
three months of 2013).
(3) Finance income received of Euro 58 million includes Euro 2 million in interest income (Euro 2 million in the first three months of 2013).

PRYSMIAN GROUP | CONSOLIDATED FINANCIAL STATEMENTS AND EXPLANATORY NOTES
53
EXPLANATORY NOTES
A. GENERAL INFORMATION
Prysmian S.p.A. ("the Company") is a company incorporated and domiciled in Italy and organised under the laws
of the Republic of Italy.
The Company has its registered office in Viale Sarca, 222 - Milan (Italy).
Prysmian S.p.A. has been listed on the Italian Stock Exchange since 3 May 2007 and has been included since
September 2007 in the FTSE MIB index, comprising the top 40 Italian companies by capitalisation and stock
liquidity.
The Company and its subsidiaries (together "the Group" or "Prysmian Group") produce, distribute and sell
cables and systems and related accessories for the energy and telecommunications industries worldwide.
A.1 SIGNIFICANT EVENTS IN 2014
EIB Loan
On 18 December 2013, Prysmian S.p.A. entered into a loan agreement with the European Investment Bank
(EIB) for Euro 100 million, to fund the Group's European research & development (R&D) programmes over the
period 2013-2016.
The EIB Loan is particularly intended to support projects developed in the Group's R&D centres in six countries
(France, Great Britain, the Netherlands, Spain, Germany and Italy) and represents about 50% of the Prysmian
Group's planned investment expenditure in Europe during the period concerned.
The EIB Loan was received on 5 February 2014; it will be repaid in 12 equal half-yearly instalments starting on 5
August 2015 and ending on 5 February 2021.
Credit agreement with Mediobanca – Banca di Credito Finanziario S.p.A.
On 19 February 2014, Prysmian S.p.A signed a credit agreement for Euro 100 million with Mediobanca - Banca
di Credito Finanziario S.p.A.. Under this five-year agreement, Mediobanca has provided the Group with a line of
credit intended to refinance existing debt and working capital requirements.
Early Repayment of Credit Agreement 2010
On 28 February 2014, the Prysmian Group prepaid the outstanding amount owed under the Term Loan Facility
2010, amounting to Euro 184 million due on 31 December 2014.
Acquisition price adjustment: Global Marine Systems Energy Ltd (now renamed Prysmian
PowerLink Services Ltd)
The price adjustment process relating to the acquisition of Global Marine Systems Energy (now renamed
Prysmian PowerLink Services Ltd) was completed on 28 March 2014, with a price adjustment of GBP 20 million

PRYSMIAN GROUP | CONSOLIDATED FINANCIAL STATEMENTS AND EXPLANATORY NOTES
54
in the Prysmian Group's favour. Since this process was completed more than a year from the acquisition date of
15 November 2012, the difference between the adjusted final price and that previously estimated has been
accounted for in the income statement with the recognition of Euro 21 million in non-recurring income.
Western HVDC Link (UK) contract
During the last few days of April, the manufacture of the cables for the Western HVDC Link project in the United
Kingdom encountered some technical problems, which will be fully investigated in coming months. As a result,
the Directors believe they cannot reliably estimate the outcome of this contract, and so its revenues have been
recognised to the extent of the costs incurred. In the first quarter of 2014, this has resulted in the recognition of a
loss of Euro 26 million after tax (Euro 37 million before tax).
Despite the current uncertainty over the recently identified technical problems, the Directors believe at present
that there is no evidence to suggest that contract costs will exceed contract revenues. This does not preclude
that, after further analysis and technical testing in progress, evidence might emerge that will lead to the
recognition of additional losses in coming quarters.
The consolidated financial statements contained herein were approved by the Board of Directors on 8 May 2014.
Note: all the amounts shown in the tables in the following Notes are expressed in millions of Euro, unless otherwise stated.
B. FORM AND CONTENT
The present quarterly financial report has been prepared on a going concern basis, since the Directors have
assessed that there are no financial, operating or other kind of indicators that might provide evidence of the
Group's inability to meet its obligations in the foreseeable future and particularly in the next 12 months.
In particular, the Group's estimates and projections take account of the possible developments in the
investigations by the European Commission and other jurisdictions into alleged anti-competitive practices in the
High Voltage underground and Submarine cables market, as well as the risk factors described in the Directors'
Report, and confirm the Prysmian Group's ability to operate as a going concern and to comply with its financial
covenants.
The Company has prepared the present document in compliance with the International Financial Reporting
Standards (IFRS) issued by the IASB and recognised by the European Union in Regulation (EC) 1606/2002 of
the European Parliament and Council dated 19 July 2002, and specifically in accordance with IAS 34 – Interim
Financial Reporting, and the instructions issued in implementation of art. 9 of Italian Legislative Decree 38/2005.
As permitted by IAS 34, the Group has decided to publish its quarterly consolidated financial statements and
associated explanatory notes in a condensed format.
The information contained in the quarterly financial report must be read in conjunction with the annual IFRS
consolidated financial statements at 31 December 2013.

PRYSMIAN GROUP | CONSOLIDATED FINANCIAL STATEMENTS AND EXPLANATORY NOTES
55
B.1 FINANCIAL STATEMENTS AND DISCLOSURES
The Group has elected to present its income statement according to the nature of expenses, whereas assets
and liabilities in the statement of financial position are classified as current or non-current. The statement of cash
flows has been prepared using the indirect method. The Group has also applied the provisions of Consob
Resolution 15519 dated 27 July 2006 concerning financial statement formats and the requirements of Consob
Communication 6064293 dated 28 July 2006 regarding disclosures.
When preparing the quarterly financial report, management has made judgements, estimates and assumptions
that affect the value of revenues, costs, assets and liabilities and the disclosures relating to contingent assets
and liabilities at the reporting date. As estimates, these may differ from the actual results attained in the future.
Some valuation processes, particularly more complex ones such as the determination of any impairment losses
against the value of property, plant and equipment and intangible assets, are carried out fully only at year end,
when all the necessary information is available, unless there are indicators of impairment that require the
immediate recognition of a loss.
Amendment of financial statements
The consolidated financial statements for 2013, presented in this quarterly financial report for comparative
purposes, have been amended compared with the previously published figures due to the application of IFRS 10
and IFRS 11. Further details can be found in Section C. Restatement of comparative figures.
Following these amendments, investments in associates and joint ventures accounted for using the equity
method have been presented in a separate line of the consolidated statement of financial position; in addition,
the Group has adopted a new method of classifying its share of the net profit/(loss) of associates and joint
ventures, whereby it recognises this amount as a component of Operating income when relating to companies
that operate in the same market as the Group. The comparative figures have been reclassified accordingly.
Lastly, some reclassifications have been made between "Historical cost" and "Accumulated depreciation and
impairment" in "Property, plant and equipment", as shown in Note 1. Property, plant and equipment and
intangible assets.
B.2 ACCOUNTING STANDARDS
Accounting standards used to prepare the quarterly financial report
The basis of consolidation, the methods used to translate financial statements into the presentation currency, the
accounting standards and the accounting estimates and policies adopted are the same as those used for the
consolidated financial statements at 31 December 2013, to which reference should be made for more details,
except for:
1. income taxes, which have been recognised using the best estimate of the weighted average tax rate for
the full year;

PRYSMIAN GROUP | CONSOLIDATED FINANCIAL STATEMENTS AND EXPLANATORY NOTES
56
2. the accounting standards and amendments discussed below, which have been mandatorily applied with
effect from 1 January 2014 after receiving endorsement from the competent authorities.
Accounting standards, amendments and interpretations applied from 1 January 2014
On 12 May 2011, the IASB issued IFRS 10, IFRS 11 and IFRS 12 and amendments to IAS 27 and IAS 28.
The principal changes are as follows:
IFRS 10 - Consolidated Financial Statements
This standard supersedes SIC 12 - Consolidation: Special Purpose Entities and parts of IAS 27 -
Consolidated and Separate Financial Statements. The objective of the new standard is to define a single
control model, which is applicable to all companies, including special purpose entities.
The standard provides guidance on defining the new concept of control, which is more detailed than in the
past, in order to assist in the determination of control where this is difficult to assess.
IAS 27 - Separate Financial Statements
IAS 27 - Consolidated and Separate Financial Statements has been revised following publication of IFRS 10
- Consolidated Financial Statements. The new document, from which all references to consolidation have
been removed, prescribes the accounting treatment for investments when an entity prepares separate
financial statements.
IFRS 11 - Joint Arrangements
This document supersedes IAS 31 - Interests in Joint Ventures and SIC 13 - Jointly Controlled Entities: Non-
Monetary Contributions by Venturers and establishes principles for identifying a joint arrangement on the
basis of the rights and obligations arising from the arrangement, rather than its legal form. The accounting
treatment differs according to whether the arrangement is classified as a joint operation or a joint venture. In
addition, the existing policy choice of proportionate consolidation for joint ventures has been eliminated.
IFRS 12 - Disclosure of Interests in Other Entities
This document refers to the disclosures concerning interests in other entities, including subsidiaries,
associates and joint ventures.
The objective is to disclose information that enables users of financial statements to evaluate the nature of
risks associated with interests in strategic investments (consolidated and otherwise) intended to be held over
the medium to long term.
IFRSs 10, 11 and 12 and IAS 27 were published in the Official Journal of the European Union on 29 December
2012 and apply at the latest from the commencement date of the first financial year starting on or after 1 January
2014.
In November 2013, "Investment Entities (Amendments to IFRS 10, IFRS 12 and IAS 27)", a document issued by
the IASB on 31 October 2012, was published in the Official Journal of the European Union. These amendments
are intended to provide an exception from the consolidation obligations of IFRS 10 for companies that manage

PRYSMIAN GROUP | CONSOLIDATED FINANCIAL STATEMENTS AND EXPLANATORY NOTES
57
and measure their investments on a fair value basis. These amendments apply to financial years beginning on
or after 1 January 2014 and do not entail any significant effects for the Group.
Further details about the effects of the above amendments can be found in Section C. Restatement of
comparative figures.
On 16 December 2011, the IASB published amendments to IAS 32 - Financial Instruments: Presentation to
clarify the criteria for offsetting financial instruments.
The amendments clarify that:
- the right of set-off between financial assets and liabilities must be available at the financial reporting date and
not contingent on a future event;
- this right must be enforceable by all counterparties both in the normal course of business and in the event of
insolvency or bankruptcy.
The document was published in the Official Journal of the European Union on 29 December 2012. The
amendments apply to financial years beginning on or after 1 January 2014 and are required to be applied
retrospectively; they have not entailed any significant effects for the Group.
On 29 May 2013, the IASB issued an amendment to IAS 36 - Impairment of Assets: Recoverable Amount
Disclosures for Non-Financial Assets to clarify the disclosure requirements concerning the recoverable amount
of impaired assets, when such amount is based on fair value less costs of disposal. The amendment requires
disclosures about the recoverable amount of assets or cash-generating units only when impairment is
recognised or a previous impairment is reversed. In addition, the amendment clarifies the disclosure
requirements when an asset's recoverable amount has been determined on the basis of fair value less costs of
disposal.
This amendment applies to financial years beginning on or after 1 January 2014 and has not entailed any
significant effects for the Group.
On 27 June 2013, the IASB published an amendment to IAS 39 Financial Instruments: Recognition and
Measurement – Novation of Derivatives and Continuation of Hedge Accounting which clarifies that it is permitted
to continue hedge accounting for a derivative designated as a hedging instrument, where novation is required by
legislation/regulation, provided specific conditions are met. This amendment applies to financial years beginning
on or after 1 January 2014 and has not entailed any significant effects for the Group. The amendment will also
appear in IFRS 9 - Financial Instruments.
New standards, amendments and interpretations of existing standards, not yet mandatory and
not adopted early by the Group
On 12 November 2009, the IASB issued the first part of a new accounting standard IFRS 9 – Financial
Instruments, which will supersede IAS 39 - Financial Instruments: Recognition and Measurement. This initial
document addresses the classification of financial instruments and forms part of a three-phase project, whose
second and third phases will address the impairment methodology for financial assets and the application of
hedge accounting respectively. This new standard, whose purpose is to simplify and reduce the complexity of
accounting for financial instruments, classifies financial instruments in three categories that the reporting entity

PRYSMIAN GROUP | CONSOLIDATED FINANCIAL STATEMENTS AND EXPLANATORY NOTES
58
defines according to its business model, and to the contractual characteristics and related cash flows of the
instruments in question.
On 16 December 2011, the IASB postponed the effective date of IFRS 9 from 1 January 2013 to 1 January
2015, although earlier application is still permitted.
On 21 November 2013, the IASB published an amendment to IAS 19 - Employee Contributions with the aim of
providing more information about the accounting treatment of pension plans which require plan participants to
pay in contributions. As at the present document date, the European Union had not yet completed the
endorsement process needed for the application of this amendment.
On 12 December 2013, the IASB published the documents Annual Improvements 2010-2012 and Annual
Improvements 2011-2013 as part of its programme of annual improvements to its standards; most of the
changes involve clarifications or corrections to existing IFRSs or amendments resulting from other changes
previously made to the IFRSs. As at the present document date, the European Union had not yet completed the
endorsement process needed for the application of these amendments.
B.3 CHANGES IN THE SCOPE OF CONSOLIDATION
The Group's scope of consolidation includes the financial statements of Prysmian S.p.A. (the Parent Company)
and of the companies over which it exercises direct or indirect control, which are consolidated from the date
when control is obtained until the date when such control ceases.
The following changes took place during the first three months of 2014:
Mergers
On 1 February 2014, the merger was completed of Prysmian (Dutch) Holdings B.V. into Draka Holding N.V..
Name changes
On 13 February 2014, the Dutch company Draka Holding N.V. changed its name to Draka Holding B.V..
Appendix A to these notes contains a list of the companies included in the scope of consolidation at 31 March
2014.
C. RESTATEMENT OF COMPARATIVE FIGURES
Following the adoption of IFRS 10 - Consolidated Financial Statements and IFRS 11 - Joint Arrangements,
applicable retrospectively from 1 January 2014, the Group's consolidated figures have been restated as from 1
January 2013.
In particular, the changes introduced by IFRS 11 - Joint Arrangements have eliminated the possibility of
proportionate consolidation; accordingly, the companies Yangtze Optical Fibre and Cable Joint Stock Limited
Co., Yangtze Optical Fibre and Cable (Hong Kong) Co. Ltd., Precision Fiber Optics Ltd. and Power Cables

PRYSMIAN GROUP | CONSOLIDATED FINANCIAL STATEMENTS AND EXPLANATORY NOTES
59
31 December 2012 From 1 January 2013
China
Yangtze Optical Fibre and Cable Joint Stock Limited Co. Proportionate Equity
Yangtze Optical Fibre and Cable (Hong Kong) Co. Ltd. Proportionate Equity
Yangtze Optical Fibre & Cable (Shanghai) Co. Ltd. Line-by-line Equity
Japan
Precision Fiber Optics Ltd. Proportionate Equity
Malaysia
Power Cables Malaysia Sdn Bhd Proportionate Equity
Brazil
Sociedade Produtora de Fibras Opticas S.A. Line-by-line Line-by-line (*)
Method of consolidation
Malaysia Sdn Bhd, previously consolidated using the proportionate method, have now been consolidated using
the equity method.
In addition, further to the changes introduced by IFRS 10 – Consolidated Financial Statements, the Chinese
company Yangtze Optical Fibre & Cable (Shanghai) Co. Ltd., previously consolidated line-by-line, has now been
consolidated using the equity method; the Brazilian company Sociedade Produtora de Fibras Opticas S.A.,
previously consolidated line-by-line, has been defined as a "joint operation" and so is now being consolidated
according to the rights and obligations arising under the contractual arrangement.
The following table summarises the changes made to the scope of consolidation:
(*) Joint operation company consolidated according to the rights and obligations arising under the contractual arrangement.
The consolidated financial statements at 1 January 2013, at 31 December 2013 and for the first quarter of 2013
have therefore been restated as follows:

PRYSMIAN GROUP | CONSOLIDATED FINANCIAL STATEMENTS AND EXPLANATORY NOTES
60
(in millions of Euro)
1 January 2013
Published
Effects
application
IFRS 10-11
1 January 2013
Restated
Non-current assets
Property, plant and equipment 1,539 (55) 1,484
Intangible assets 644 (36) 608
Equity-accounted investments 99 94 193
Available-for-sale financial assets 14 (2) 12
Derivatives 3 - 3
Deferred tax assets 127 (2) 125
Other receivables 41 (1) 40
Total non-current assets 2,467 (2) 2,465
Current assets
Inventories 897 (31) 866
Trade receivables 1,163 (80) 1,083
Other receivables 573 (13) 560
Financial assets held for trading 78 - 78
Derivatives 16 - 16
Cash and cash equivalents 812 (25) 787
Total current assets 3,539 (149) 3,390
Assets held for sale 4 - 4
Total assets 6,010 (151) 5,859
Equity attributable to the Group: 1,112 - 1,112
Share capital 21 - 21
Reserves 925 - 925
Net profit/(loss) for the period 166 - 166
Equity attributable to non-controlling interests: 47 (12) 35
Share capital and reserves 44 (11) 33
Net profit/(loss) for the period 3 (1) 2
Total equity 1,159 (12) 1,147
Non-current liabilities
Borrowings from banks and other lenders 1,433 (5) 1,428
Other payables 27 (4) 23
Provisions for risks and charges 76 (3) 73
Derivatives 41 - 41
Deferred tax liabilities 95 (4) 91
Employee benefit obligations 344 - 344
Total non-current liabilities 2,016 (16) 2,000
Current liabilities
Borrowings from banks and other lenders 361 (50) 311
Trade payables 1,450 (34) 1,416
Other payables 654 (38) 616
Derivatives 24 - 24
Provisions for risks and charges 317 - 317
Current tax payables 29 (1) 28
Total current liabilities 2,835 (123) 2,712
Total liabilities 4,851 (139) 4,712
Total equity and liabilities 6,010 (151) 5,859
Consolidated statement of financial position at 1 January 2013:

PRYSMIAN GROUP | CONSOLIDATED FINANCIAL STATEMENTS AND EXPLANATORY NOTES
61
(in millions of Euro)
31 December 2013
Published
Effects
application
IFRS 10-11
31 December 2013
Restated
Non-current assets
Property, plant and equipment 1,441 (51) 1,390
Intangible assets 623 (35) 588
Equity-accounted investments 99 106 205
Available-for-sale financial assets 15 (3) 12
Derivatives 2 - 2
Deferred tax assets 134 (4) 130
Other receivables 29 (1) 28
Total non-current assets 2,343 12 2,355
Current assets
Inventories 920 (39) 881
Trade receivables 1,010 (77) 933
Other receivables 739 (17) 722
Financial assets held for trading 94 (1) 93
Derivatives 23 - 23
Cash and cash equivalents 561 (51) 510
Total current assets 3,347 (185) 3,162
Assets held for sale 12 - 12
Total assets 5,702 (173) 5,529
Equity attributable to the Group: 1,147 - 1,147
Share capital 21 - 21
Reserves 977 - 977
Net profit/(loss) for the period 149 - 149
Equity attributable to non-controlling interests: 48 (12) 36
Share capital and reserves 43 (10) 33
Net profit/(loss) for the period 5 (2) 3
Total equity 1,195 (12) 1,183
Non-current liabilities
Borrowings from banks and other lenders 1,154 (35) 1,119
Other payables 24 (4) 20
Provisions for risks and charges 52 (1) 51
Derivatives 7 - 7
Deferred tax liabilities 100 (3) 97
Employee benefit obligations 308 - 308
Total non-current liabilities 1,645 (43) 1,602
Current liabilities
Borrowings from banks and other lenders 338 (46) 292
Trade payables 1,441 (32) 1,409
Other payables 728 (40) 688
Derivatives 42 - 42
Provisions for risks and charges 279 - 279
Current tax payables 34 - 34
Total current liabilities 2,862 (118) 2,744
Total liabilities 4,507 (161) 4,346
Total equity and liabilities 5,702 (173) 5,529
Consolidated statement of financial position at 31 December 2013:

PRYSMIAN GROUP | CONSOLIDATED FINANCIAL STATEMENTS AND EXPLANATORY NOTES
62
(in millions of Euro)
3 months 2013
Published
Effects
application
IFRS 10-11
Other
reclassification
3 months 2013
Restated
Sales of goods and services 1,711 (42) - 1,669Change in inventories of work in progress, semi-finished and finished
goods71 (2) - 69
Other income 8 - - 8
Raw materials, consumables used and goods for resale (1,144) 32 - (1,112)
Fair value change in metal derivatives (12) - - (12)
Personnel costs (245) 5 - (240)
of which non-recurring personnel costs (5) - - (5)
of which personnel costs for stock option fair value (5) - - (5)
Amortisation, depreciation and impairment (38) 2 - (36)
of which non-recurring impairment - - - -
Other expenses (307) 2 - (305)
of which non-recurring other expenses (11) - - (11)
Share of net profit/(loss) of equity-accounted companies - 2 2 4
Operating income 44 (1) 2 45
Finance costs (122) 1 - (121)
of which non-recurring finance costs (5) - - (5)
Finance income 73 - - 73
Share of net profit/(loss) of associates and dividends from other
companies2 - (2) -
Profit/(loss) before taxes (3) - - (3)
Taxes 1 - - 1
Net profit/(loss) for the period (2) - - (2)
Attributable to:
Owners of the parent (2) - - (2)
Non-controlling interests - - - -
Consolidated income statement 3 months 2013:
It should be noted that the adoption of IFRS 10 and IFRS 11 has not resulted in any changes to the statement of
comprehensive income.
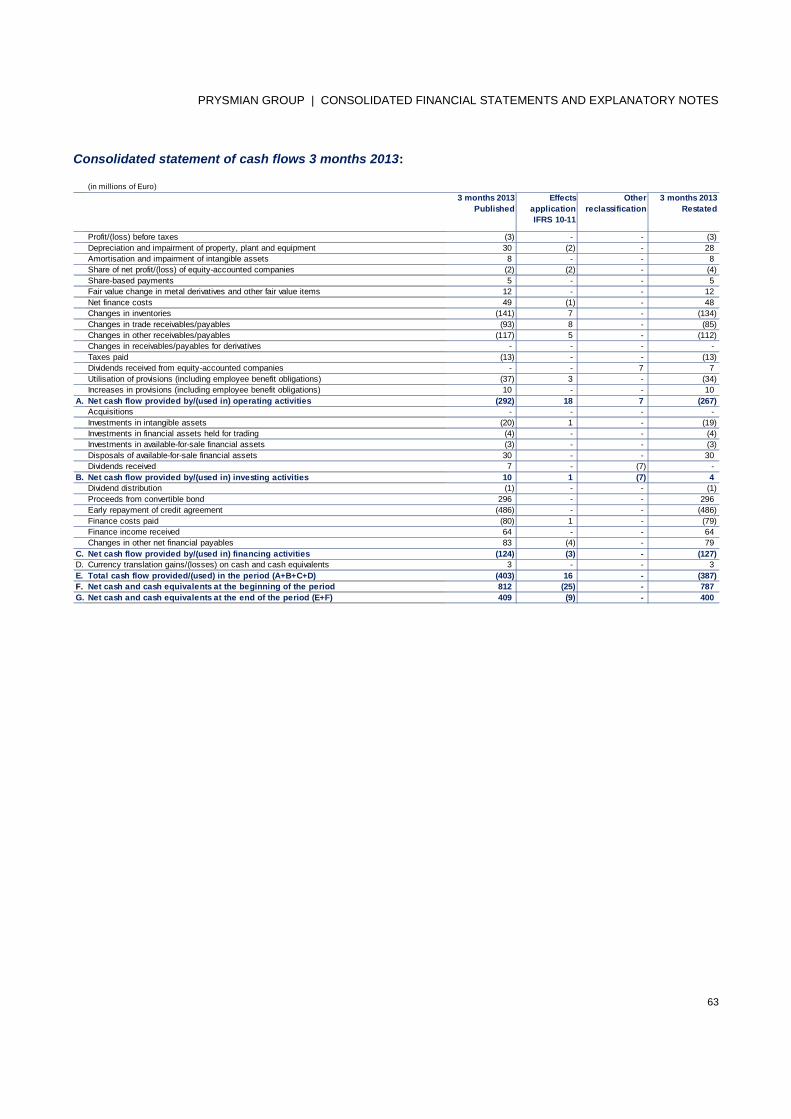
PRYSMIAN GROUP | CONSOLIDATED FINANCIAL STATEMENTS AND EXPLANATORY NOTES
63
(in millions of Euro)
3 months 2013
Published
Effects
application
IFRS 10-11
Other
reclassification
3 months 2013
Restated
Profit/(loss) before taxes (3) - - (3)
Depreciation and impairment of property, plant and equipment 30 (2) - 28
Amortisation and impairment of intangible assets 8 - - 8
Share of net profit/(loss) of equity-accounted companies (2) (2) - (4)
Share-based payments 5 - - 5
Fair value change in metal derivatives and other fair value items 12 - - 12
Net finance costs 49 (1) - 48
Changes in inventories (141) 7 - (134)
Changes in trade receivables/payables (93) 8 - (85)
Changes in other receivables/payables (117) 5 - (112)
Changes in receivables/payables for derivatives - - - -
Taxes paid (13) - - (13)
Dividends received from equity-accounted companies - - 7 7
Utilisation of provisions (including employee benefit obligations) (37) 3 - (34)
Increases in provisions (including employee benefit obligations) 10 - - 10
A. Net cash flow provided by/(used in) operating activities (292) 18 7 (267)
Acquisitions - - - -
Investments in intangible assets (20) 1 - (19)
Investments in financial assets held for trading (4) - - (4)
Investments in available-for-sale financial assets (3) - - (3)
Disposals of available-for-sale financial assets 30 - - 30
Dividends received 7 - (7) -
B. Net cash flow provided by/(used in) investing activities 10 1 (7) 4
Dividend distribution (1) - - (1)
Proceeds from convertible bond 296 - - 296
Early repayment of credit agreement (486) - - (486)
Finance costs paid (80) 1 - (79)
Finance income received 64 - - 64
Changes in other net financial payables 83 (4) - 79
C. Net cash flow provided by/(used in) financing activities (124) (3) - (127)
D. Currency translation gains/(losses) on cash and cash equivalents 3 - - 3
E. Total cash flow provided/(used) in the period (A+B+C+D) (403) 16 - (387)
F. Net cash and cash equivalents at the beginning of the period 812 (25) - 787
G. Net cash and cash equivalents at the end of the period (E+F) 409 (9) - 400
Consolidated statement of cash flows 3 months 2013:

PRYSMIAN GROUP | CONSOLIDATED FINANCIAL STATEMENTS AND EXPLANATORY NOTES
64
(in millions of Euro)
31 March 2014
Level 1 Level 2 Level 3 Total
Assets
Financial assets at fair value through profit or loss:
Derivatives 1 8 - 9
Financial assets held for trading 66 5 - 71
Hedging derivatives - 3 - 3
Available-for-sale financial assets - - 12 12
Total assets 67 16 12 95
Liabilities
Financial liabilities at fair value through profit or loss:
Derivatives 25 28 - 53
Hedging derivatives - 7 - 7
Total liabilities 25 35 - 60
C. FINANCIAL RISK MANAGEMENT
The Group's activities are exposed to various forms of risk: market risk (including exchange rate, interest rate
and price risks), credit risk and liquidity risk.
This quarterly financial report does not contain all the information about financial risks presented in the annual
financial report at 31 December 2013, which should be consulted for more detailed analysis.
With reference to the risks described in the annual financial report at 31 December 2013, there have been no
changes in the types of risks to which the Group is exposed or in its policies for managing such risks.
(a) Fair value estimation
With reference to assets and liabilities recognised in the statement of financial position, IFRS 13 requires that
such amounts are classified on the basis of a hierarchy that reflects the significance of the inputs used in
determining fair value.
Financial instruments are classified according to the following fair value hierarchy:
Level 1: fair value is determined with reference to quoted prices (unadjusted) in active markets for identical
financial instruments;
Level 2: fair value is determined using valuation techniques where the input is based on observable market
data;
Level 3: fair value is determined using valuation techniques where the input is not based on observable market
data.
Financial assets classified in fair value Level 3 have reported no significant movements in the period.
Given the short-term nature of trade receivables and payables, their book values, net of any allowance for
doubtful accounts, are treated as a good approximation of fair value.

PRYSMIAN GROUP | CONSOLIDATED FINANCIAL STATEMENTS AND EXPLANATORY NOTES
65
During the first quarter of 2014 there were no transfers of financial assets and liabilities between the different
levels of the fair value hierarchy.
(b) Valuation techniques
Level 1: The fair value of financial instruments quoted in an active market is based on market price at the
reporting date. The market price used for derivatives is the bid price, while for financial liabilities the ask price is
used.
Level 2: Derivative financial instruments classified in this category include interest rate swaps, forward currency
contracts and metal derivative contracts that are not quoted in active markets. Fair value is determined as
follows:
- for interest rate swaps, it is calculated on the basis of the present value of forecast future cash flows;
- for forward currency contracts, it is determined using the forward exchange rate at the reporting date,
appropriately discounted;
- for metal derivative contracts, it is determined using the prices of such metals at the reporting date,
appropriately discounted.
Level 3: The fair value of instruments not quoted in an active market is mainly determined using valuation
techniques based on estimated discounted cash flows.

PRYSMIAN GROUP | CONSOLIDATED FINANCIAL STATEMENTS AND EXPLANATORY NOTES
66
D. SEGMENT INFORMATION
The criteria used for identifying reportable segments are consistent with the way in which management runs the
Group.
In particular, segment information is structured in the same way as the report periodically reviewed by the Chief
Executive Officer for the purposes of managing the business. In fact, the Chief Executive Officer reviews
operating performance by macro type of business (Energy and Telecom), assesses the results of operating
segments primarily on the basis of Adjusted EBITDA, defined as earnings (loss) for the period before non-
recurring items (eg. restructuring costs), amortisation, depreciation and impairment, finance costs and income,
and taxes, and reviews the statement of financial position for the Group as a whole, and not by operating
segment.
In order to provide users of the financial statements with clearer information, certain economic data is also
reported for the following sales channels and business areas within the individual operating segments:
A) Energy operating segment:
1. Utilities: organised in four lines of business, comprising High Voltage, Power Distribution, Accessories and
Submarine;
2. Trade & Installers: cables and systems for the trade and installers market for the wiring of buildings and
distribution of electricity to or in commercial and residential buildings, including fire-resistant and low smoke
halogen-free cables as part of one of the widest and most comprehensive product ranges in the world;
3. Industrial: cables and accessories for special industrial applications based on specific requirements
(Specialties&OEM; Oil & Gas; Automotive; Renewables; Surf; Elevator);
4. Other: occasional sales of residual products.
B) Telecom operating segment: produces cable systems and connectivity products used in telecommunication
networks. The segment is organised in the following lines of business: optical fibre, optical cables, connectivity
components and accessories, OPGW (Optical Ground Wire) and copper cables.
All Corporate fixed costs are allocated to the Energy and Telecom segments. Revenues and costs are allocated
to each operating segment by identifying all revenues and costs directly attributable to that segment and by
allocating indirect costs on the basis of Corporate resources (personnel, space used, etc.) absorbed by the
operating segments.
Group operating activities are organised and managed separately based on the nature of the products and
services provided: each segment offers different products and services to different markets. Sales of goods and
services are analysed geographically on the basis of the location of the registered office of the company that
issues the invoices, regardless of the geographic destination of the products sold. This type of reporting does not
produce significantly results from the analysis of sales of goods and services by destination of the products sold.
Transfer pricing between segments is determined using the same conditions as applied between Group
companies and is generally determined by applying a mark-up to production costs.

PRYSMIAN GROUP | CONSOLIDATED FINANCIAL STATEMENTS AND EXPLANATORY NOTES
67
(in millions of Euro)
3 months 2014
Telecom Corporate Group total
Utilities Trade &
Installers
Industrial Other Total
Sales(1)462 457 401 23 1,343 236 - 1,579
Adjusted EBITDA before share of net profit/(loss) of equity accounted companies 17 11 26 2 56 17 - 73
% of sales 3.7% 2.4% 6.5% 4.2% 7.2% 4.6%
Adjusted EBITDA (A) 18 13 27 2 60 18 - 78
% of sales 4.0% 2.9% 6.7% 4.5% 7.6% 4.9%
EBITDA (B) 39 12 25 2 78 20 - 98
% of sales 8.4% 2.6% 6.2% 5.8% 8.5% 6.2%
Amortisation and depreciation (C) (10) (5) (9) (1) (25) (11) - (36)
Adjusted operating income (A+C) 8 8 18 1 35 7 - 42
% of sales 1.8% 1.6% 4.6% 2.6% 3.0% 2.6%
Fair value change in metal derivatives (D) (19)
Fair value - stock options (E) (1)
Impairment of assets (F) -
Operating income (B+C+D+E+F) 42
% of sales 2.6%
Finance income 60
Finance costs (95)
Taxes (2)
Net profit/(loss) for the period 5
% of sales 0.3%
Attributable to:
Owners of the parent 7
Non-controlling interests (2)
RECONCILIATION BETWEEN EBITDA AND ADJUSTED EBITDA
EBITDA (A) 39 12 25 2 78 20 - 98
Non-recurring expenses/(income):
Company reorganisation - 1 2 - 3 - - 3
Antitrust investigations (1) - - - (1) - - (1)
Acquisition price adjustment (21) - - - (21) - - (21)
Other net non-recurring expenses/(income) 1 - - - 1 (2) - (1)
Total non-recurring expenses/(income) (B) (21) 1 2 - (18) (2) - (20)
Adjusted EBITDA (A+B) 18 13 27 2 60 18 - 78
Energy
D.1 OPERATING SEGMENTS
The following tables present information by operating segment.
(1) Sales of the operating segments and business areas are reported net of intercompany transactions, consistent with the presentation
adopted in the regularly reviewed reports.

PRYSMIAN GROUP | CONSOLIDATED FINANCIAL STATEMENTS AND EXPLANATORY NOTES
68
(in millions of Euro)
3 months 2013 (*)
Telecom Corporate Group total
Utilities Trade &
Installers
Industrial Other Total
Sales(1)490 469 429 28 1,416 253 - 1,669
Adjusted EBITDA before share of net profit/(loss) of equity accounted companies 49 14 27 1 91 19 - 110
% of sales 10.0% 3.0% 6.3% 6.4% 7.6% 6.6%
Adjusted EBITDA (A) 50 16 27 1 94 20 - 114
% of sales 10.2% 3.3% 6.4% 6.6% 8.0% 6.8%
EBITDA (B) 45 9 26 - 80 18 - 98
% of sales 9.2% 1.9% 6.1% 0.0% 5.6% 7.1% 5.8%
Amortisation and depreciation (C) (10) (7) (8) (1) (26) (10) - (36)
Adjusted operating income (A+C) 40 9 19 - 68 10 - 78
% of sales 8.1% 2.0% 4.4% 4.8% 3.8% 4.7%
Fair value change in metal derivatives (D) (12)
Fair value - stock options (E) (5)
Operating income (B+C+D+E) 45
% of sales 2.7%
Finance income 73
Finance costs (121)
Taxes 1
Net profit/(loss) for the period (2)
% of sales -0.1%
Attributable to:
Owners of the parent (2)
Non-controlling interests -
RECONCILIATION BETWEEN EBITDA AND ADJUSTED EBITDA
EBITDA (A) 45 9 26 - 80 18 - 98
Non-recurring expenses/(income):
Company reorganisation 1 7 1 1 10 - - 10
Antitrust investigations 2 - - - 2 - - 2
Other net non-recurring expenses 2 - - - 2 2 - 4
Total non-recurring expenses/(income) (B) 5 7 1 1 14 2 - 16
Adjusted EBITDA (A+B) 50 16 27 1 94 20 - 114
Energy
(*) The previously published prior year consolidated financial statements have been restated following the adoption of IFRS 10 and IFRS 11.
Further details can be found in Section C. Restatement of comparative figures.
(1) Sales of the operating segments and business areas are reported net of intercompany transactions, consistent with the presentation
adopted in the regularly reviewed reports.

PRYSMIAN GROUP | CONSOLIDATED FINANCIAL STATEMENTS AND EXPLANATORY NOTES
69
(in millions of Euro)
3 months 2014 3 months 2013 (*)
Sales of goods and services 1,579 1,669
EMEA* 1,043 1,088
(of which Italy) 215 216
North America 235 239
Latin America 124 155
Asia Pacific 177 187
D.2 GEOGRAPHICAL AREAS
The following table presents sales of goods and services by geographical area.
* EMEA = Europe, Middle East and Africa
(*)The previously published prior year consolidated financial statements have been restated following the adoption of IFRS 10 and IFRS 11.
Further details can be found in Section C. Restatement of comparative figures.

PRYSMIAN GROUP | CONSOLIDATED FINANCIAL STATEMENTS AND EXPLANATORY NOTES
70
(in millions of Euro)
Property, plant and
equipment
Intangible
assets
of which
Goodwill
Balance at 31 December 2013 (*) 1,390 588 377
Movements in 2014:
- Investments 22 3 -
- Disposals - - -
- Depreciation and amortisation (29) (7) -
- Impairment - - -
- Currency translation differences - 2 1
- Other - - -
Total movements (7) (2) 1
Balance at 31 March 2014 1,383 586 378
Of which:
- Historical cost 2,215 794 398
- Accumulated depreciation/amortisation and
impairment(832) (208) (20)
Net book value 1,383 586 378
(in millions of Euro)
Property, plant and
equipment
Intangible
assets
of which
Goodwill
Balance at 31 December 2012 (*) 1,484 608 377
Movements in 2013:
- Business combinations - 1 2
- Investments 19 4 -
- Disposals - - -
- Depreciation and amortisation (28) (8) -
- Impairment - - -
- Currency translation differences 10 - (2)
Total movements 1 (3) -
Balance at 31 March 2013 (*) 1,485 605 377
Of which:
- Historical cost 2,150 782 397
- Accumulated depreciation/amortisation and
impairment
(665) (177) (20)
Net book value 1,485 605 377
1. PROPERTY, PLANT AND EQUIPMENT AND INTANGIBLE ASSETS
Details of these balances and related movements are as follows:
(*)The previously published prior year consolidated financial statements have been restated following the adoption of IFRS 10 and IFRS 11.
Further details can be found in Section C. Restatement of comparative figures.
A total of Euro 22 million has been invested in property, plant and equipment in the first three months of 2014.
These investments are analysed as follows:
- around 59%, or Euro 13 million, for projects to increase production capacity and develop new products;
- around 27%, or Euro 6 million, for projects to improve industrial efficiency;

PRYSMIAN GROUP | CONSOLIDATED FINANCIAL STATEMENTS AND EXPLANATORY NOTES
71
(in millions of Euro)
31 March 2014 31 December 2013 (*)
Investments in associates 73 78
Investments in joint ventures 125 127
Total equity-accounted investments 198 205
(in millions of Euro)
31 March 2014 31 December 2013 (*)
Oman Cables Industry (SAOG) 51 55
Kabeltrommel Gmbh & Co.K.G. 7 8
Elkat Ltd. 10 10
Rodco Ltd. 2 2
Eksa Sp.Zo.o 3 3
Total investments in associates 73 78
- around 9%, or Euro 2 million, for structural work, primarily to bring buildings or entire production lines
into line with the latest regulations;
- around 5%, or Euro 1 million, mainly for Research & Development lab equipment.
Machinery is subject to Euro 12 million in liens in connection with long-term loans (mainly in relation to the
Brazilian subsidiaries).
Investments in intangible assets amount to Euro 3 million, most of which in connection with the Brazilian
subsidiary's development of a prototype destined for flexible pipe production and with the "SAP Consolidation"
project, aimed at harmonising the information system across the Group.
There has been no need to recognise any impairment losses at 31 March 2014. This does not mean that
impairment losses, even significant ones, will not emerge when tests are performed in more detail for the
purposes of the annual financial statements.
2. EQUITY-ACCOUNTED INVESTMENTS
These are detailed as follows:
(*) The previously published prior year consolidated financial statements have been restated following the adoption of IFRS 10 and IFRS 11.
Further details can be found in Section C. Restatement of comparative figures.
Investments in associates
Details of the main investments in associates are as follows:
(*) The previously published prior year consolidated financial statements have been restated following the adoption of IFRS 10 and IFRS 11.
Further details can be found in Section C. Restatement of comparative figures.

PRYSMIAN GROUP | CONSOLIDATED FINANCIAL STATEMENTS AND EXPLANATORY NOTES
72
Company name Registered office % owned
Oman Cables Industry (SAOG) Sultanate of Oman 34.78%
Kabeltrommel Gmbh & Co.K.G. Germany 43.18%
Elkat Ltd. Russia 40.00%
(in millions of Euro)
31 March 2014 31 March 2013 31 March 2014 31 March 2013 31 March 2014 31 March 2013
Opening balance 55 50 8 8 10 11
Share of net profit/(loss) for the period 2 2 1 2 1 -
Dividends received (6) (4) (2) (3) - -
Currency translation differences - - - - (1) -
Other movements - - - - - -
Closing balance 51 48 7 7 10 11
% owned of company 34.78% 34.78% 43.18% 43.18% 40.00% 40.00%
Goodwill - - - - - -
Carrying amount of investment 51 48 7 7 10 11
Oman Cables Industry (SAOG) Kabeltrommel Gmbh & Co.K.G. Elkat Ltd.
Information about the nature of the main investments in associates:
Oman Cables Industry (SAOG) is based in the Sultanate of Oman and is listed on the local stock exchange. The
company and its subsidiaries manufacture and sell power cables and conductors and operate mainly in the local
market, the Middle East and North Africa.
Kabeltrommel Gmbh & Co. K.G. is a German company that heads a consortium for the production, procurement,
management and sale of disposable and reusable cable carrying devices (reels). The services offered by the
company include both the sale of such devices, and the complete management of logistics services such as
shipping, handling and the subsequent retrieval of cable carrying devices. The company operates primarily in the
German market.
Elkat Ltd. is based in Russia and manufactures and sells copper conductors; it is the only company certified by
the LME to test copper cathodes for the local market.
The following table reconciles the share of equity in the main associates with the corresponding carrying amount
of the investment:

PRYSMIAN GROUP | CONSOLIDATED FINANCIAL STATEMENTS AND EXPLANATORY NOTES
73
(in millions of Euro)
31 March 2014 31 December 2013 (*)
Yangtze Optical Fibre & Cable Joint Stock Limited Company 103 104
Yangtze Optical Fibre & Cable (Shanghai) Co. Ltd 16 17
Power Cables Malaysia Sdn Bhd 5 5
Precision Fiber Optics Ltd 1 1
Total investments in joint ventures 125 127
Company name Registered office % owned
Yangtze Optical Fibre & Cable Joint Stock Limited Company China 37.50%
Yangtze Optical Fibre & Cable (Shanghai) Co. Ltd China 53.125%
Power Cables Malaysia Sdn Bhd Malaysia 40.00%
Precision Fiber Optics Ltd Japan 50.00%
Investments in joint ventures
Details of the main investments in joint ventures are as follows:
(*) The previously published prior year consolidated financial statements have been restated following the adoption of IFRS 10 and IFRS 11.
Further details can be found in Section C. Restatement of comparative figures.
Information about the nature of the main investments in joint ventures:
Yangtze Optical Fibre & Cable Joint Stock Limited Company, a Chinese company formed in 1988, is a joint
venture between three partners: China Telecommunications Corporation, Wuhan Yangtze Communications
Industry Group Company Ltd. and the Prysmian Group. The company is the industry's most important
manufacturer of optical fibre and cables. The company's products and solutions are sold in more than 50
countries, including the United States, Japan, the Middle East and Africa.
Yangtze Optical Fibre & Cable (Shanghai) Co. Ltd, formed in 2002, is based in Shanghai (China) and is a joint
venture between Yangtze Optical Fibre & Cable Joint Stock Limited Company and the Prysmian Group. The
company specialises in the manufacture and sale of optical fibre and cables, offering a wide range of optical
fibre cables and accessories, services and FTTx solutions.
Power Cables Malaysia Sdn Bhd is a joint venture based in Malaysia between the Prysmian Group and the
Armed Forces Fund Board (LTAT), a Malaysian government retirement benefits fund. The company, a leader in
the local market, manufactures and sells power cables and conductors and is mainly specialised in high voltage
products.
Lastly, Precision Fiber Optics Ltd., based in Japan, manufactures and sells optical fibre cables in the local
market.

PRYSMIAN GROUP | CONSOLIDATED FINANCIAL STATEMENTS AND EXPLANATORY NOTES
74
(in millions of Euro)
31 March 2014
Attività non correnti Non-current Current Total
Trade receivables - 1,102 1,102
Allowance for doubtful accounts - (51) (51)
Total trade receivables - 1,051 1,051
Other receivables:
Tax receivables 14 128 142
Financial receivables 2 19 21
Prepaid finance costs - 4 4
Receivables from employees 2 3 5
Pension fund receivables - 2 2
Construction contracts - 512 512
Advances to suppliers - 18 18
Other 7 114 121
Total other receivables 25 800 825
Total 25 1,851 1,876
(in millions of Euro)
31 March 2014 31 March 2013 31 March 2014 31 March 2013 31 March 2014 31 March 2013
Opening balance 90 82 14 13 5 6
Share of net profit/(loss) for the period 1 1 - - - (1)
Dividends received - - - - -
Currency translation differences (2) 3 (1) - - -
Other movements - - - - -
Closing balance 89 86 13 13 5 5
% owned of company 37.50% 37.50% 53.125% 53.125% 40.00% 40.00%
Goodwill 14 14 3 3 - -
Carrying amount of investment 103 100 16 16 5 5
Yangtze Optical Fibre & Cable
Joint Stock Limited Company
Yangtze Optical Fibre & Cable
(Shanghai) Co. Ltd
Power Cables Malaysia Sdn
Bhd
The following table reconciles the share of equity for the main interests in joint ventures with the corresponding
carrying amount of the investment:
3. TRADE AND OTHER RECEIVABLES
These are detailed as follows:

PRYSMIAN GROUP | CONSOLIDATED FINANCIAL STATEMENTS AND EXPLANATORY NOTES
75
(in millions of Euro)
31 December 2013 (*)
Non-current Current Total
Trade receivables - 986 986
Allowance for doubtful accounts - (53) (53)
Total trade receivables - 933 933
Other receivables:
Tax receivables 13 109 122
Financial receivables 4 12 16
Prepaid finance costs - 5 5
Receivables from employees 2 3 5
Pension fund receivables - 2 2
Construction contracts - 475 475
Advances to suppliers - 17 17
Other 9 99 108
Total other receivables 28 722 750
Total 28 1,655 1,683
(*) The previously published prior year consolidated financial statements have been restated following the adoption of IFRS 10 and IFRS 11.
Further details can be found in Section C. Restatement of comparative figures.
4. INVENTORIES
These are detailed as follows:
(*) The previously published prior year consolidated financial statements have been restated following the adoption of IFRS 10 and IFRS 11.
Further details can be found in Section C. Restatement of comparative figures.
(**) Finished goods also include goods for resale.
(in millions of Euro)
31 March 2014 31 December 2013 (*)
Raw materials 267 249
of which allowance for obsolete and slow-moving raw materials (31) (29)
Work in progress and semi-finished goods 264 227of which allowance for obsolete and slow-moving work in progress and
semi-finished goods(7) (5)
Finished goods (**) 430 405
of which allowance for obsolete and slow-moving finished goods (51) (48)
Total 961 881

PRYSMIAN GROUP | CONSOLIDATED FINANCIAL STATEMENTS AND EXPLANATORY NOTES
76
(in millions of Euro)
31 March 2014
Asset Liability
Non-current
Interest rate swaps (cash flow hedges) - 4
Forward currency contracts on commercial transactions (cash flow hedges) 1 1
Total hedging derivatives 1 5
Metal derivatives - 2
Total other derivatives - 2
Total non-current 1 7
Current
Forward currency contracts on commercial transactions (cash flow hedges) 2 2
Total hedging derivatives 2 2
Forward currency contracts on commercial transactions 4 4
Forward currency contracts on financial transactions 4 5
Interest rate swaps - 10
Metal derivatives 1 32
Total other derivatives 9 51
Total current 11 53
Total 12 60
(in millions of Euro)
31 December 2013 (*)
Asset Liability
Non-current
Interest rate swaps (cash flow hedges) - 4
Forward currency contracts on commercial transactions (cash flow hedges) 1 1
Total hedging derivatives 1 5
Metal derivatives 1 2
Total other derivatives 1 2
Total non-current 2 7
Current
Interest rate swaps (cash flow hedges) - 5
Forward currency contracts on commercial transactions (cash flow hedges) 4 3
Total hedging derivatives 4 8
Forward currency contracts on commercial transactions 9 3
Forward currency contracts on financial transactions 5 5
Interest rate swaps - 9
Metal derivatives 5 17
Total other derivatives 19 34
Total current 23 42
Total 25 49
5. DERIVATIVES
These are detailed as follows:
(*) The previously published prior year consolidated financial statements have been restated following the adoption of IFRS 10 and IFRS 11.
Further details can be found in Section C. Restatement of comparative figures.

PRYSMIAN GROUP | CONSOLIDATED FINANCIAL STATEMENTS AND EXPLANATORY NOTES
77
(in millions of Euro)
31 March 2014 31 December 2013 (*)
Cash and cheques 17 -
Bank and postal deposits 324 510
Total 341 510
(in millions of Euro)
31 March 2014 31 December 2013 (*)
Land 6 6
Buildings 3 6
Total 9 12
6. FINANCIAL ASSETS HELD FOR TRADING
Financial assets held for trading basically refer to units in funds that mainly invest in short and medium-term
government securities. These assets are mostly held by subsidiaries in Brazil and Argentina as a result of
investing temporarily available liquidity in such funds.
7. CASH AND CASH EQUIVALENTS
These are detailed as follows:
(*) The previously published prior year consolidated financial statements have been restated following the adoption of IFRS 10 and IFRS 11.
Further details can be found in Section C. Restatement of comparative figures.
Cash and cash equivalents, deposited with major financial institutions, are managed through the Group's
treasury companies and in its various operating units.
Cash and cash equivalents managed by the Group's treasury companies amount to Euro 88 million at 31 March
2014, compared with Euro 208 million at 31 December 2013.
8. ASSETS HELD FOR SALE
These are detailed as follows:
(*) The previously published prior year consolidated financial statements have been restated following the adoption of IFRS 10 and IFRS 11.
Further details can be found in Section C. Restatement of comparative figures.
During the first quarter of 2014 the sale of the Eschweiler site in Germany was completed, with a consequent
reduction of Euro 3 million in this line item.

PRYSMIAN GROUP | CONSOLIDATED FINANCIAL STATEMENTS AND EXPLANATORY NOTES
78
Ordinary shares Treasury shares Total
Balance at 31 December 2012 214,508,781 (3,039,169) 211,469,612
Capital increase (1) 82,929 - 82,929
Treasury shares - - -
Balance at 31 December 2013 214,591,710 (3,039,169) 211,552,541
Ordinary shares Treasury shares Total
Balance at 31 December 2013 214,591,710 (3,039,169) 211,552,541
Capital increase - - -
Treasury shares - - -
Balance at 31 March 2014 214,591,710 (3,039,169) 211,552,541
9. SHARE CAPITAL AND RESERVES
Consolidated equity has recorded an increase of Euro 6 million since 31 December 2013, mainly reflecting the
net effect of:
- negative currency translation differences of Euro 3 million;
- the release of Euro 3 million from the cash flow hedge reserve as a result of discontinuing cash flow
hedging, following early repayment of the outstanding amount of the Term Loan Facility 2010;
- the positive post-tax change of Euro 1 million in the fair value of derivatives designated as cash flow
hedges;
- the positive change of Euro 1 million in the share-based compensation reserve linked to the stock option
plan;
- the net profit for the period of Euro 5 million;
- the distribution of Euro 1 million in dividends.
At 31 March 2014, the share capital of Prysmian S.p.A. comprises 214,591,710 shares with a total value of Euro
21,459,171.
Movements in the ordinary shares of Prysmian S.p.A. are as follows:
(1) Capital increase following exercise of part of the options under the Stock Option Plan 2007-2012.

PRYSMIAN GROUP | CONSOLIDATED FINANCIAL STATEMENTS AND EXPLANATORY NOTES
79
Number of
shares
Total
nominal
value
(in Euro)
% of
share
capital
Average
unit
value
(in Euro)
Total
carrying
value
(in Euro)
At 31 December 2012 3,039,169 303,917 1.42% 9.963 30,279,078
- Purchases - - - - -
- Sales - - - - -
At 31 December 2013 3,039,169 303,917 1.42% 9.963 30,279,078
- Purchases - - - - -
- Sales - - - -
At 31 March 2014 3,039,169 303,917 1.42% 9.963 30,279,078
Treasury shares
The treasury shares held at the beginning of the year were acquired under the shareholders' resolution dated 15
April 2008, which gave the Board of Directors the authority for an 18-month maximum period to buy up to 18
million shares. This period was subsequently extended to October 2010 under a resolution adopted on 9 April
2009. The number of treasury shares increased in 2011 following the acquisition of Draka Holding N.V., which
holds 10,669 Prysmian S.p.A. shares.
The Shareholders' Meeting held on 16 April 2013 authorised a share buy-back and disposal programme. This
programme provided the opportunity to purchase, on one or more occasions, a maximum number of ordinary
shares whose total cannot exceed 10% of share capital, equal to 18,411,709 ordinary shares as at the date of
16 April 2013, after deducting the treasury shares already held by the Company.
As stated in the section on Subsequent events, the Shareholders' Meeting held on 16 April 2014 authorised a
new share buy-back and disposal programme, and revoked the above programme at the same time. The new
programme provides the opportunity to purchase, on one or more occasions, a maximum number of ordinary
shares whose total cannot exceed 10% of share capital, equal to 18,420,002 ordinary shares as at the date of
the Shareholders' Meeting, after deducting the treasury shares already held by the Company. Purchases may
not exceed the amount of undistributed earnings and available reserves reported in the most recently approved
annual financial statements. The authorisation to buy back treasury shares will last for 18 months commencing
from the date of the Shareholders' Meeting; the authorisation to dispose of treasury shares has no time limit.

PRYSMIAN GROUP | CONSOLIDATED FINANCIAL STATEMENTS AND EXPLANATORY NOTES
80
(in millions of Euro)
31 March 2014
Non-current Current Total
Borrowings from banks and other financial institutions 536 318 854
Non-convertible bond 399 20 419
Convertible bond 265 - 265
Finance lease obligations 15 2 17
Total 1,215 340 1,555
(in millions of Euro)
31 December 2013 (*)
Non-current Current Total
Borrowings from banks and other financial institutions 442 274 716
Non-convertible bond 399 15 414
Convertible bond 263 1 264
Finance lease obligations 15 2 17
Total 1,119 292 1,411
(in millions of Euro)
31 March 2014 31 December 2013 (*)
Credit Agreements (1) 397 580
EIB loan 100 -
Revolving 2014 30 -
Other borrowings 327 136
Borrowings from banks and other financial institutions 854 716
Non-convertible bond 419 414
Convertible bond 265 264
Total 1,538 1,394
10. BORROWINGS FROM BANKS AND OTHER LENDERS
These are detailed as follows:
(*) The previously published prior year consolidated financial statements have been restated following the adoption of IFRS 10 and IFRS 11.
Further details can be found in Section C. Restatement of comparative figures.
Borrowings from banks and other financial institutions and Bonds are analysed as follows:
(*)The previously published prior year consolidated financial statements have been restated following the adoption of IFRS 10 and IFRS 11.
Further details can be found in Section C. Restatement of comparative figures.
(1) Credit Agreements refer to the following lines of credit: Term Loan Facility 2010 and Term Loan Facility 2011.
The Forward Start Credit Agreement (now termed Credit Agreement 2010) was activated on 3 May 2012 after
being entered into by the Group on 21 January 2010 with a syndicate of major national and international banks.
This credit agreement replaced the previous "Credit Agreement" entered into on 18 April 2007.
PRYSMIAN GROUP | CONSOLIDATED FINANCIAL STATEMENTS AND EXPLANATORY NOTES
81
The Credit Agreement 2010 is an agreement negotiated in advance of its period of use, under which the lenders
made available to Prysmian S.p.A. and some of its subsidiaries, loans and credit facilities totalling Euro 1,070
million, of which Euro 670 million in loans (Term Loan Facility 2010) and Euro 400 million in lines of credit
(Revolving Credit Facility 2010).
On 22 February 2013 and 15 March 2013, the Prysmian Group made early repayments of Euro 186 million and
Euro 300 million respectively against the Term Loan Facility 2010 disbursed on 3 May 2012. The first repayment
was in respect of repayments due in 2013 and in the first half of 2014, while the second referred to the
repayment due in December 2014. Subsequently, on 28 February 2014, the Group also prepaid the outstanding
amount of Euro 184 million, due on 31 December 2014; the Term Loan Facility 2010 has therefore now been
completely repaid.
The Credit Agreement 2011 is an agreement, entered into by Prysmian on 7 March 2011 with a syndicate of
major banks, for Euro 800 million with a five-year maturity. This agreement comprises a loan for Euro 400 million
(Term Loan Facility 2011) and a revolving facility for Euro 400 million (Revolving Credit Facility 2011). The entire
amount of the Term Loan Facility 2011 is scheduled for repayment on 7 March 2016; the loan has therefore
been classified in non-current liabilities.
At 31 March 2014, the fair value of the Credit Agreement 2011 approximated the related carrying amount. Fair
value has been determined using valuation techniques that refer to observable market data (Level 2 of the fair
value hierarchy).
EIB Loan
On 18 December 2013, Prysmian S.p.A. entered into a loan agreement with the European Investment Bank
(EIB) for Euro 100 million, to fund the Group's European research & development (R&D) programmes over the
period 2013-2016.
The EIB Loan is particularly intended to support projects developed in the Group's R&D centres in six countries
(France, Great Britain, the Netherlands, Spain, Germany and Italy) and represents about 50% of the Prysmian
Group's planned investment expenditure in Europe during the period concerned.
The EIB Loan was received on 5 February 2014; it will be repaid in 12 equal half-yearly instalments starting on 5
August 2015 and ending on 5 February 2021.
At 31 March 2014, the fair value of the EIB Loan approximated the related carrying amount. Fair value has been
determined using valuation techniques that refer to observable market data (Level 2 of the fair value hierarchy).
Credit Agreement with Mediobanca – Banca di Credito Finanziario S.p.A.
On 19 February 2014, Prysmian S.p.A signed a credit agreement for Euro 100 million with Mediobanca - Banca
di Credito Finanziario S.p.A.. Under this five-year agreement, Mediobanca has provided the Group with a line of
credit intended to refinance existing debt and working capital requirements.
This line of credit, known as Revolving 2014, had been drawn down by Euro 30 million at 31 March 2014.

PRYSMIAN GROUP | CONSOLIDATED FINANCIAL STATEMENTS AND EXPLANATORY NOTES
82
(in millions of Euro)
Total lines Used Unused
Term Loan Facility 2010 - - -
Term Loan Facility 2011 400 (400) -
Revolving Credit Facility 2010 400 (26) 374
Revolving Credit Facility 2011 400 (100) 300
Total Credit Agreements 1,200 (526) 674
EIB loan 100 (100) -
Revolving 2014 100 (30) 70
Total 1,400 (656) 744
31 March 2014
(in millions of Euro)
Total lines Used Unused
Term Loan Facility 2010 184 (184) -
Term Loan Facility 2011 400 (400) -
Revolving Credit Facility 2010 400 (3) 397
Revolving Credit Facility 2011 400 - 400
Total Credit Agreements 1,384 (587) 797
EIB loan 100 - 100
Revolving 2014 - - -
Total 1,484 (587) 897
31 December 2013 (*)
The following table summarises the committed lines available to the Group at 31 March 2014 and 31 December
2013:
(*) The previously published prior year consolidated financial statements have been restated following the adoption of IFRS 10 and IFRS 11.
Further details can be found in Section C. Restatement of comparative figures.
The Revolving Credit Facility 2010, the Revolving Credit Facility 2011 and the Revolving 2014 are intended to
finance ordinary working capital requirements, while only the Revolving Credit Facility 2010 can also be used for
the issue of guarantees.
Bonds
As at 31 March 2014, the Prysmian Group had issued the following bonds:
Non-convertible bond issued in 2010
On 31 March 2010, Prysmian S.p.A. completed the placement of an unrated bond with institutional investors on
the Eurobond market for a total nominal amount of Euro 400 million. The bond, with an issue price of Euro
99.674, has a 5-year term and pays a fixed annual coupon of 5.25%. The bond settlement date was 9 April
2010. The bond has been admitted to the Luxembourg Stock Exchange's official list and is traded on the related
regulated market.

PRYSMIAN GROUP | CONSOLIDATED FINANCIAL STATEMENTS AND EXPLANATORY NOTES
83
The non-convertible bond has a fair value of Euro 415 million at 31 March 2014 (Euro 417 million at 31
December 2013). Fair value has been determined with reference to the quoted price in the relevant market
(Level 1 of the fair value hierarchy).
Convertible bond
On 4 March 2013, the Board of Directors approved the placement of an Equity Linked Bond, referred to as
"€300,000,000 1.25 per cent. Equity Linked Bonds due 2018", maturing on 8 March 2018 and reserved for
institutional investors.
On 16 April 2013, the Shareholders' Meeting authorised the convertibility of the Bond at a value of Euro 22.3146
per share. As a result, the shareholders approved the proposal to increase share capital for cash, in single or
multiple issues, with the exclusion of pre-emptive rights under art. 2441, par. 5 of the Italian Civil Code, by a
maximum nominal amount of Euro 1,344,411.30, by issuing, in single or multiple instalments, up to 13,444,113
ordinary shares of the Company with the same characteristics as its other outstanding ordinary shares.
The Company will be entitled to redeem the bonds early and in full in the cases detailed in the Bond
Regulations, in line with market practice, including:
(i) at nominal value (plus accrued interest), starting from 23 March 2016, if the price of the Company's
ordinary shares rises 130% above the conversion price in a given period of time;
(ii) at nominal value (plus accrued interest), if at least 85% of the original nominal amount of the Bond is
converted, redeemed and/or repurchased;
(iii) at nominal value (plus accrued interest), if specific changes take place in the tax regime applying to the
Bonds.
In the event of a change of control, every bondholder will be entitled to request early redemption at nominal
value plus accrued interest.
The convertible Bond has a 5-year maturity ending on 8 March 2018 and pays a fixed annual coupon of 1.25%.
The placement of the Bonds was completed on 8 March 2013, while their settlement took place on 15 March
2013.
On 3 May 2013, the Company sent a physical settlement notice to holders of the Bonds, granting them the right,
with effect from 17 May 2013, to convert them into the Company's existing or new ordinary shares.
On 24 May 2013, the securities were admitted to trading on the unregulated Third Market (a multilateral trading
facility or MTF) on the Vienna Stock Exchange.
The accounting treatment for the convertible Bond has resulted in the recognition of an equity component of
Euro 39 million and a debt component of Euro 261 million, determined at the bond issue date.

PRYSMIAN GROUP | CONSOLIDATED FINANCIAL STATEMENTS AND EXPLANATORY NOTES
84
The fair value of the convertible bond (equity component and debt component) was Euro 338 million at 31 March
2014 (Euro 339 million at 31 December 2013),of which the fair value of the debt component was Euro 267
million (Euro 265 million at 31 December 2013). In the absence of trading on the relevant market, fair value has
been determined using valuation techniques that refer to observable market data (Level 2 of the fair value
hierarchy).
(in millions of Euro)
Issue value of convertible bond 300
Equity reserve for convertible bond (39)
Issue date net balance 261
Interest - non-monetary 8
Interest - monetary accrued 4
Interest - monetary paid (4)
Related costs (4)
Balance at 31 March 2014 265

PRYSMIAN GROUP | CONSOLIDATED FINANCIAL STATEMENTS AND EXPLANATORY NOTES
85
(in millions of Euro)
Credit
Agreements
EIB loan Non-convertible
bond
Convertible
bond
Other
borrowings/
Finance lease
obligations
Total
Balance at 31 December 2013 (*) 580 - 414 264 153 1,411
Currency translation differences - - - - 2 2
Drawdowns/New funds - 100 - - 272 372
Repayments (184) - - - (53) (237)
Amortisation of bank and financial fees and other
expenses (1)1 - - - - 1
Interest and other movements - - 5 1 - 6
Total movements (183) 100 5 1 221 144
Balance at 31 March 2014 397 100 419 265 374 1,555
Other borrowings from banks and financial institutions and Finance lease obligations
The following tables report movements in borrowings from banks and other lenders:
(*) The previously published prior year consolidated financial statements have been restated following the adoption of IFRS 10 and IFRS 11.
Further details can be found in Section C. Restatement of comparative figures.
(1)Includes the accelerated amortisation of Euro 1 million in bank fees following the early repayment of the Credit Agreement 2010.
(2)"Drawdowns/New funds" pertaining to the convertible bond are stated net of the equity component of Euro 39 million and of Euro 4 million
in related expenses.
(in millions of Euro)
Credit
Agreements
EIB loan Non-convertible
bond
Convertible
bond (2)
Other
borrowings/
Finance lease
obligations
Total
Balance at 31 December 2012 (*) 1,060 - 413 - 266 1,739
Currency translation differences - - - - - -
Drawdowns/New funds - - - 257 94 351
Repayments (486) - - - (10) (496)
Amortisation of bank and financial fees and other
expenses 7 - - - - 7
Interest and other movements - - 5 1 - 6
Total movements (479) - 5 258 84 (132)
Balance at 31 March 2013 (*) 581 - 418 258 350 1,607

PRYSMIAN GROUP | CONSOLIDATED FINANCIAL STATEMENTS AND EXPLANATORY NOTES
86
(in millions of Euro)
Note 31 March 2014 31 December 2013 (*)
Long-term financial payables
Term Loan Facilities 400 400
Bank fees (3) (3)
Credit Agreements 10 397 397
EIB loan 10 100 -
Non-convertible bond 10 399 399
Convertible bond 10 265 263
Finance leases 10 15 15
Interest rate swaps 5 4 4
Other financial payables 10 39 45
Total long-term financial payables 1,219 1,123
Short-term financial payables
Term Loan Facility 10 - 184
Bank fees 10 - (1)
Non-convertible bond 10 20 15
Convertible bond 10 - 1
Finance leases 10 2 2
Interest rate swaps 5 10 14
Forward currency contracts on financial transactions 5 5 5
Revolving facility - Credit Agreement 10 125 3
Revolving 2014 10 30 -
Other financial payables 10 163 88
Total short-term financial payables 355 311
Total financial liabilities 1,574 1,434
Long-term financial receivables 3 2 4
Forward currency contracts on financial transactions (current) 5 4 5
Short-term financial receivables 3 19 12
Short-term bank fees 3 4 5
Financial assets held for trading 6 71 93
Cash and cash equivalents 7 341 510
Net financial position 1,133 805
NET FINANCIAL POSITION
(*) The previously published prior year consolidated financial statements have been restated following the adoption of IFRS 10 and IFRS 11.
Further details can be found in Section C. Restatement of comparative figures.
The following table presents a reconciliation of the Group's net financial position to the amount that must be
reported under Consob Communication DEM/6064293 issued on 28 July 2006 and under the CESR
recommendation dated 10 February 2005 "Recommendations for the consistent implementation of the European
Commission's Regulation on Prospectuses":

PRYSMIAN GROUP | CONSOLIDATED FINANCIAL STATEMENTS AND EXPLANATORY NOTES
87
(in millions of Euro)
31 March 2014
Non-current Current Total
Trade payables - 1,318 1,318
Total trade payables - 1,318 1,318
Other payables:
Tax and social security payables 12 103 115
Advances from customers - 243 243
Payables to employees - 113 113
Accrued expenses 3 138 141
Other 6 101 107
Total other payables 21 698 719
Total 21 2,016 2,037
(in millions of Euro)
31 December 2013 (*)
Non-current Current Total
Trade payables - 1,409 1,409
Total trade payables - 1,409 1,409
Other payables:
Tax and social security payables 12 99 111
Advances from customers - 241 241
Payables to employees - 98 98
Accrued expenses 3 136 139
Other 5 114 119
Total other payables 20 688 708
Total 20 2,097 2,117
(in millions of Euro)
Note 31 March 2014 31 December 2013 (*)
Net financial position - as reported above 1,133 805
Long-term financial receivables 3 2 4
Net forward currency contracts on commercial transactions 5 - (7)
Net metal derivatives 5 33 13
Recalculated net financial position 1,168 815
(*) The previously published prior year consolidated financial statements have been restated following the adoption of IFRS 10 and IFRS 11.
Further details can be found in Section C. Restatement of comparative figures.
11. TRADE AND OTHER PAYABLES
These are detailed as follows:
(*) The previously published prior year consolidated financial statements have been restated following the adoption of IFRS 10 and IFRS 11.
Further details can be found in Section C. Restatement of comparative figures.

PRYSMIAN GROUP | CONSOLIDATED FINANCIAL STATEMENTS AND EXPLANATORY NOTES
88
(in millions of Euro)
31 March 2014Non-current Current Total
Restructuring costs 1 14 15Contractual and legal risks 19 232 251Environmental risks - 5 5Tax inspections 12 5 17Contingent liabilities 4 - 4Other risks and charges 8 17 25
Total 44 273 317
(in millions of Euro)
31 December 2013 (*)
Non-current Current TotalRestructuring costs 1 18 19Contractual and legal risks 23 234 257Environmental risks - 6 6Tax inspections 12 4 16Contingent liabilities 6 - 6Other risks and charges 9 17 26
Total 51 279 330
Trade payables include around Euro 172 million (Euro 183 million at 31 December 2013) for the supply of
strategic metals (copper, aluminium and lead), whose payment terms, in some cases, are longer than normal for
this type of transaction.
Advances from customers report the liability for construction contracts, amounting to Euro 158 million at 31
March 2014 compared with Euro 155 million at 31 December 2013. This liability represents the amount by which
work invoiced exceeds costs incurred plus accumulated profits (or losses) recognised using the percentage of
completion method.
Payables to employees at 31 March 2014 include Euro 36 million, the same as at 31 December 2013, in relation
to the liability for the long-term incentive plan 2011-2013, which will be settled in the first half of 2014.
12. PROVISIONS FOR RISKS AND CHARGES
These are detailed as follows:
(*) The previously published prior year consolidated financial statements have been restated following the adoption of IFRS 10 and IFRS 11.
Further details can be found in Section C. Restatement of comparative figures.

PRYSMIAN GROUP | CONSOLIDATED FINANCIAL STATEMENTS AND EXPLANATORY NOTES
89
(in millions of Euro)
Restructuring
costs
Contractual
and legal
risks
Environmental
risks
Tax
inspections
Contingent
liabilities
Other risks
and charges
Total
Balance at 31 December 2013 19 257 6 16 6 26 330
Increases 1 2 - - - - 3
Utilisations (5) (2) - - - - (7)
Releases - (4) - - (1) (1) (6)
Currency translation differences - - (1) 1 - - -
Other - (2) - - (1) - (3)
Total movements (4) (6) (1) 1 (2) (1) (13)
Balance at 31 March 2014 15 251 5 17 4 25 317
The following table reports the movements in these provisions during the period:
The provision for restructuring costs reports a net decrease of Euro 4 million. In particular, Euro 5 million hasbeen utilised in the period, mostly in connection with restructuring projects in the Netherlands, Germany, France,Italy and Spain.
At 31 March 2014, the provision for contractual and legal risks reports a net decrease of Euro 6 million due to:
- increases and releases involving a net decrease of Euro 2 million, relating to:
a) the risk regarding antitrust investigations underway in various jurisdictions, which has decreased by Euro 1
million, mainly due to exchange adjustments to the portion of the provision in foreign currency; this decrease
has taken the total provision to around Euro 198 million at 31 March 2014. More specifically, the European
Commission, the US Department of Justice and the Japanese antitrust authority started investigations in late
January 2009 into several European and Asian electrical cable manufacturers to verify the existence of
alleged anti-competitive practices in the high voltage underground and submarine cables markets.
Subsequently, the Australian Competition and Consumers Commission ("ACCC") and the New Zealand
Commerce Commission also started similar investigations. During 2011, the Canadian antitrust authority also
started an investigation into a high voltage submarine project dating back to 2006. The investigations in
Japan and New Zealand have ended without any sanctions for Prysmian. The other investigations are still in
progress.
In Australia, the ACCC has filed a case before the Federal Court arguing that Prysmian Cavi e Sistemi S.r.l.
and two other companies violated antitrust rules in connection with a high voltage underground cable project
awarded in 2003. Prysmian Cavi e Sistemi S.r.l. has filed its objections and presented its preliminary defence.
In Brazil, the local antitrust authority has started an investigation into several cable manufacturers, including
Prysmian, in the high voltage underground and submarine cables market. Prysmian has taken steps to
present its preliminary defence. During the month of December 2013, the company ABB and one of its senior
managers signed an agreement with the Brazilian antitrust authority, under which they admitted the conduct
alleged by the authority and pledged to cooperate with it and to each pay an agreed fine.
At the start of July 2011, Prysmian received a statement of objection from the European Commission in
relation to the investigation started in January 2009 into the high voltage underground and submarine energy
cables market. This document contained the Commission's preliminary position on alleged anti-competitive
practices and did not prejudge its final decision. Prysmian subsequently submitted its defence which it was
also able to present at the hearing before the European Commission held during the month of June 2012. In

PRYSMIAN GROUP | CONSOLIDATED FINANCIAL STATEMENTS AND EXPLANATORY NOTES
90
(in millions of Euro)
31 March 2014 31 December 2013 (*)
Pension plans 229 230
Employee indemnity liability (Italian TFR) 22 22
Medical assistance plans 24 23
Termination and other benefits 32 33
Incentive plans - -
Total 307 308
July 2013, Prysmian submitted information, at the Commission’s request, about its 2004 sales in the high
voltage underground and submarine cables businesses. In addition, a state of play meeting was held
between the Company and the European Commission at the start of October 2013. Subsequently, in
February 2014, the Commission requested the figures for the Group's consolidated sales at 31 December
2013.
On 2 April 2014, the European Commission adopted a decision under which it found that, between 18
February 1999 and 28 January 2009, the world's largest cable producers, including Prysmian Cavi e Sistemi
S.r.l., adopted anti-competitive practices in the European market for submarine energy cables and high
voltage underground energy cables. The European Commission held Prysmian Cavi e Sistemi S.r.l. jointly
liable with Pirelli & C. S.p.A. for the disputed infringement in the period from 18 February 1999 to 28 July
2005, sentencing them to pay a fine of Euro 67,310,000 and it held Prysmian Cavi e Sistemi S.r.l. jointly liable
with Prysmian S.p.A. and The Goldman Sachs Group Inc. for the disputed infringement in the period from 29
July 2005 to 28 January 2009, sentencing them to pay a fine of Euro 37,303,000. Prysmian has said that it
will appeal against this decision to the General Court of the European Union.
As at 31 March 2014, the amount of the provision for the risks relating to the European Commission's ruling
and the investigations underway in the various jurisdictions, except for Brazil, is approximately Euro 198
million. During the meeting of the Board of Directors of Prysmian S.p.A. held on 7 April, the amount of this
provision was reviewed and found to be reasonable. It should be noted, however, that the European
Commission's decision can be challenged and submitted to two more levels of appeal.
b) a net decrease of approximately Euro 1 million for contractual risks;
- utilisations of Euro 2 million mostly refer to employment disputes and risks relating to contractual penalties and
guarantees.
13. EMPLOYEE BENEFIT OBLIGATIONS
These are detailed as follows:
(*) The previously published prior year consolidated financial statements have been restated following the adoption of IFRS 10 and IFRS 11.
Further details can be found in Section C. Restatement of comparative figures.
PRYSMIAN GROUP | CONSOLIDATED FINANCIAL STATEMENTS AND EXPLANATORY NOTES
91
3 months 2014 3 months 2013 (*)
Average number 19,303 19,401
31 March 2014 31 December 2013 (*)
Closing number 19,336 19,232
(in millions of Euro)
3 months 2014 3 months 2013 (*)
Company reorganisation (3) (10)
Antitrust investigations 1 (2)
Acquisition price adjustment (1) 21 -
Other net non-recurring (expenses)/income 1 (4)
Total non-recurring (expenses)/income 20 (16)
Movements in employee benefit obligations have had an overall impact of Euro 5 million on the period's income
statement, of which Euro 2 million classified in personnel costs and Euro 3 million in finance costs.
The period average headcount and period-end closing headcount are shown below:
(*) The previously published prior year consolidated financial statements have been restated following the adoption of IFRS 10 and IFRS 11.
Further details can be found in Section C. Restatement of comparative figures.
14. OPERATING INCOME
Operating income is a profit of Euro 42 million in the first three months of 2014 (compared with a profit of Euro
45 million in the first three months of 2013) and includes the following non-recurring items:
(*) The previously published prior year consolidated financial statements have been restated following the adoption of IFRS 10 and IFRS 11.
Further details can be found in Section C. Restatement of comparative figures.
(1) This refers to the acquisition in November 2012 of Global Marine Systems Energy Ltd (now renamed Prysmian PowerLink Services Ltd)
from Global Marine Systems Ltd.

PRYSMIAN GROUP | CONSOLIDATED FINANCIAL STATEMENTS AND EXPLANATORY NOTES
92
(in millions of Euro)
3 months 2014 3 months 2013 (*)
Interest on syndicated loans 2 5
Interest on non-convertible bond 5 5
Interest on convertible bond - non-monetary component 2 -
Interest on convertible bond - monetary component 1 -
Amortisation of bank and financial fees and other expenses 2 2
Employee benefit interest costs 3 3
Other bank interest 4 5
Costs for undrawn credit lines 1 1
Sundry bank fees 3 4
Non-recurring other finance costs 1 5
Other 6 7
Finance costs 30 37
Net losses on forward currency contracts 5 -
Non-recurring net losses on interest rate swaps 4 15
Losses on derivatives 9 15
Foreign currency exchange losses 56 69
Total finance costs 95 121
15. FINANCE COSTS AND INCOME
Finance costs are detailed as follows:
(*) The previously published prior year consolidated financial statements have been restated following the adoption of IFRS 10 and IFRS 11.
Further details can be found in Section C. Restatement of comparative figures.
Non-recurring other finance costs report Euro 1 million for the accelerated amortisation of bank fees relating to
the Term Loan Facility 2010, after making a prepayment of Euro 184 million against this loan in February 2014.
This early repayment has also led to the discontinuance of cash flow hedge accounting, resulting in the
recognition of net losses of Euro 4 million on interest rate swaps, which have been classified in "Non-recurring
net losses on interest rate swaps".
"Other" finance costs include Euro 4 million for differentials accruing on interest rate swaps, of which Euro 3
million in relation to instruments for which hedge accounting was discontinued following the early repayment
above. This last figure is largely offset by the fair value measurement of the related derivatives, reported in "Net
gains on interest rate swaps".

PRYSMIAN GROUP | CONSOLIDATED FINANCIAL STATEMENTS AND EXPLANATORY NOTES
93
(in millions of Euro)
3 months 2014 3 months 2013 (*)
Interest income from banks and other financial institutions 2 2
Other finance income 1 1
Finance income 3 3
Net gains on interest rate swaps 3 1
Gains on derivatives 3 1
Foreign currency exchange gains 54 69
Total finance income 60 73
Finance income is detailed as follows:
(*) The previously published prior year consolidated financial statements have been restated following the adoption of IFRS 10 and IFRS 11.
Further details can be found in Section C. Restatement of comparative figures.
16. TAXES
Taxes have been estimated on the basis of the expected tax rate for the full year. Taxes for the first three
months of 2014 amount to Euro 2 million and have been calculated using a tax rate of 30% (29% in the first
three months of 2013).
17. EARNINGS/(LOSS) PER SHARE
Both basic and diluted earnings (loss) per share have been calculated by dividing the net result for the period
attributable to owners of the parent by the average number of the Company's outstanding shares.
The options under the Incentive Plan 2011-2013 have been considered for the purposes of determining both
basic and diluted earnings/(loss) per share, since they are grantable according to the level of cumulative EBITDA
achieved in the three-year target period.
Diluted earnings/(loss) per share are affected by the options relating to adherences to the employee share
purchase plan.
Instead diluted earnings/(loss) per share are not impacted by the options relating to the convertible bond which
would have an anti-dilutive effect since the conversion is currently "out of the money".

PRYSMIAN GROUP | CONSOLIDATED FINANCIAL STATEMENTS AND EXPLANATORY NOTES
94
(in millions of Euro)
3 months 2014 3 months 2013 (*)
Net profit/(loss) attributable to owners of the parent 7 (2)
Weighted average number of ordinary shares (thousands) 215,089 214,536
Basic earnings/(loss) per share (in Euro) 0.03 (0.01)
Net profit/(loss) attributable to owners of the parent 7 (2)
Weighted average number of ordinary shares (thousands) 215,089 214,536
Adjustments for:
Dilution from incremental shares arising from exercise of stock options
(thousands) 142 -
Weighted average number of ordinary shares to calculate diluted
earnings per share (thousands) 215,231 214,536
Diluted earnings/(loss) per share (in Euro) 0.03 (0.01)
(*) Earnings per share for the first quarter of 2013 have been restated with respect to the previously published figure. Further details can be
found in Section C. Restatement of comparative figures.
18. CONTINGENT LIABILITIES
As a global operator, the Group is exposed to legal risks primarily, by way of example, in the areas of product
liability and environmental, antitrust and tax rules and regulations. The outcome of legal disputes and
proceedings currently in progress cannot be predicted with certainty. An adverse outcome in one or more of
these proceedings could result in the payment of costs that are not covered, or not fully covered, by insurance,
which would therefore have a direct effect on the Group's financial position and results.
It is also reported, with reference to the antitrust investigations in the various jurisdictions involved, that the only
jurisdiction for which the Prysmian Group has been unable to estimate the related risk is Brazil.
19. RECEIVABLES FACTORING
The Group has made use of without-recourse factoring of trade receivables. The amount of receivables factored
but not yet paid by customers was Euro 238 million at 31 March 2014 (Euro 198 million at 31 March 2013 and
Euro 290 million at 31 December 2013).
20. SEASONALITY
The Group's business features a certain degree of seasonality in its revenues, which are usually higher in the
second and third quarters. This is due to the fact that utilities projects in the northern hemisphere are mostly
concentrated in the warmer months of the year. The Group's level of debt is generally higher in the period May-
July, with funds being absorbed by higher working capital.

PRYSMIAN GROUP | CONSOLIDATED FINANCIAL STATEMENTS AND EXPLANATORY NOTES
95
(in millions of Euro)
31 March 2014
Equity-accounted
investments
Trade and other
receivables
Trade and other
payables
Associates 198 12 4
Other related parties:
Compensation of directors, statutory auditors
and key management personnel - - 14
Total 198 12 18
(in millions of Euro)
31 December 2013 (*)
Equity-accounted
investments
Trade and other
receivables
Trade and other
payables
Associates 205 12 5
Other related parties:
Compensation of directors, statutory auditors
and key management personnel - - 16
Total 205 12 21
(in millions of Euro)
3 months 2014
Share of net
profit/(loss) of equity-
accounted companies
Sales of goods
and services and
other income
Personnel
costs
Raw materials,
consumables
used and goods
for resale
Associates 5 9 - 1
Other related parties:
Compensation of directors, statutory auditors and key
management personnel - - 2 -
Total 5 9 2 1
(in millions of Euro)
3 months 2013 (*)
Share of net
profit/(loss) of equity-
accounted companies
Sales of goods
and services and
other income
Personnel
costs
Raw materials,
consumables
used and goods
for resale
Associates 4 11 - 2
Other related parties:
Compensation of directors, statutory auditors and key
management personnel - - 4 -
Total 4 11 4 2
21. RELATED PARTY TRANSACTIONS
Transactions between Prysmian S.p.A. and its subsidiaries and associates mainly refer to:
trade relations involving intercompany purchases and sales of raw materials and finished goods;
services (technical, organisational and general) provided by head office to subsidiaries worldwide;
financial relations maintained by Group treasury companies on behalf of, and with, Group companies.
All the above transactions form part of the Group's continuing operations.
The following tables provide a summary of the related party transactions during the three months ended 31
March 2014:
(*) The previously published prior year consolidated financial statements have been restated following the adoption of IFRS 10 and IFRS 11.Further details can be found in Section C. Restatement of comparative figures.

PRYSMIAN GROUP | CONSOLIDATED FINANCIAL STATEMENTS AND EXPLANATORY NOTES
96
Transactions with associates
Trade and other payables refer to goods and services provided in the ordinary course of the Group's business.
Trade and other receivables refer to transactions carried out in the ordinary course of the Group's business.
Compensation of Directors, Statutory Auditors and Key Management Personnel
The compensation of the Directors, Statutory Auditors and Key Management Personnel amounts to Euro 2
million at 31 March 2014 (Euro 4 million in the first quarter of 2013).
22. ATYPICAL AND/OR UNUSUAL TRANSACTIONS
In accordance with the disclosures required by Consob Communication DEM/6064293 dated 28 July 2006, it is
reported that no atypical and/or unusual transactions were carried out during the first three months of 2014.
23. COMMITMENTS
Contractual commitments already entered into with third parties as at 31 March 2014 and not yet reflected in the
financial statements amount to Euro 31 million for investments in property, plant and equipment and to Euro 4
million for investments in intangible assets.
24. STOCK OPTION PLANS
Long-term incentive plan 2011-2013
On 14 April 2011, the Ordinary Shareholders' Meeting of Prysmian S.p.A. had approved, pursuant to art. 114-bis
of Legislative Decree 58/98, a long-term incentive plan for the period 2011-2013 for employees of the Prysmian
Group, including certain members of the Board of Directors of Prysmian S.p.A., and granted the Board of
Directors the necessary authority to establish and execute the plan. The plan's purpose was to incentivise the
process of integration following Prysmian's acquisition of the Draka Group, and was conditional upon the
achievement of performance targets, as detailed in the specific information memorandum.
The plan originally involved the participation of 290(*)
employees of group companies in Italy and abroad viewed
as key resources, and divided them into three categories, to whom the shares would be granted in the following
proportions:
CEO: to whom 7.70% of the total rights to receive Prysmian S.p.A. shares were allotted.
Senior Management: this category initially had 44 participants who held key positions within the Group
(including the Directors of Prysmian S.p.A. who held the positions of Chief Financial Officer, Energy
Business Executive Vice President and Chief Strategy Officer), to whom 41.64% of the total rights to
receive Prysmian shares were allotted.
Executives: this category initially had 245 participants from the various operating units and businesses
around the world, to whom 50.66% of the total rights to receive Prysmian shares were allotted.
(*)Following movements since the plan's issue, the number of plan participants amounted to 268 at 31 March
2014.

PRYSMIAN GROUP | CONSOLIDATED FINANCIAL STATEMENTS AND EXPLANATORY NOTES
97
The plan established that the number of options granted would depend on the achievement of common business
and financial performance objectives for all the participants.
The plan established that the participants' right to exercise the allotted options depended on achievement of the
Target (being a minimum performance objective of at least Euro 1.75 billion in cumulative Adj. EBITDA for the
Group in the period 2011-2013, assuming the same group perimeter) as well as continuation of a professional
relationship with the Group up until 31 December 2013. The plan also established an upper limit for Adj. EBITDA
as the Target plus 20% (ie. Euro 2.1 billion), assuming the same group perimeter, that would determine the
exercisability of the maximum number of options granted to each participant.
Access to the plan was conditional upon each participant's acceptance that part of their annual bonus would be
co-invested, if achieved and payable in relation to financial years 2011 and 2012.
The allotted options will carry the right to receive or subscribe to ordinary shares in Prysmian S.p.A., the Parent
Company. These shares may partly comprise treasury shares and partly new shares, obtained through a capital
increase that excludes pre-emptive rights under art. 2441, par. 8 of the Italian Civil Code. Such a capital
increase, involving the issue of up to 2,131,500 new ordinary shares of nominal value Euro 0.10 each, for a
maximum amount of Euro 213,150, was approved by the shareholders in the extraordinary session of their
meeting on 14 April 2011. The shares obtained from the Company's holding of treasury shares will be allotted for
zero consideration, while the shares obtained from the above capital increase will be allotted to participants upon
payment of an exercise price corresponding to the nominal value of the Company's shares.
In accordance with IFRS 2, for both new and treasury shares, the options granted have been measured at their
grant date fair value.
As at 31 March 2014 the options were fully vested, of which:
2,131,500 exercisable for consideration (exercise price of Euro 0.10)
1,890,875 exercisable for no consideration.
The number of options has been determined according to the actual result achieved, between the Target and the
Adj. EBITDA upper limit.
The information memorandum, prepared under art. 114-bis of Legislative Decree 58/98 and describing the
characteristics of the above incentive plan, is publicly available on the Company's website at
http://www.prysmiangroup.com/, from its registered offices and from Borsa Italiana S.p.A.
Group employee share purchase plan (YES Plan)
On 16 April 2013, the shareholders approved a share purchase plan reserved for employees of Prysmian S.p.A.
and/or of its subsidiaries, including some of the Company's Directors, and granted the Board of Directors the
relevant powers to establish and implement this plan.
The reasons behind the introduction of the Plan are:
- to strengthen the sense of belonging to the Group by offering employees an opportunity to share in its
successes, through equity ownership;
- to align the interests of the Prysmian Group's stakeholders (its employees and shareholders), by
identifying a common goal of creating long-term value;
- to help consolidate the integration process started in the wake of the Draka Group's acquisition.

PRYSMIAN GROUP | CONSOLIDATED FINANCIAL STATEMENTS AND EXPLANATORY NOTES
98
Number of
options
Options at start of period -
Granted (*) 300,682
Cancelled -
Exercised -
Options at end of period 300,682
of which vested at end of period -
of which exercisable -
of which not vested at end of period 300,682
The Plan offers the opportunity to purchase Prysmian's ordinary shares on preferential terms, with a maximum
discount of 25% on the stock price, funded in the form of treasury shares, except for the Chief Executive Officer,
the Chief Financial Officer, the Chief Strategy Officer and two key managers, for whom the discount is equal to
1% of the stock price.
The shares purchased will be subject to a retention period, during which they cannot be sold. The Plan
envisages three purchase windows: 2014, 2015 and 2016.
The Plan therefore qualifies as "of particular relevance" within the meaning of art. 84-bis, par. 2 of the Issuer
Regulations.
A maximum number of 500,000 treasury shares have been earmarked to serve the discounted purchases
envisaged by the Plan.
During the month of October 2013, the plan was presented and explained to some 16,000 of the Group's
employees in 27 countries. Employees had until the end of December 2013 to communicate their desire to
participate in the Plan, the amount they intended to invest in the first purchase window and the method of
payment. The amount received, totalling Euro 7.6 million, will be used to make purchases of the Company's
ordinary shares on the Milan Stock Exchange (MTA) over a period of 5 consecutive business days during the
month of May 2014. The number of shares assigned to each participant will then be determined by taking into
account the average purchase price of the shares acquired on behalf of participants, the individual investment
and the applicable discount percentage.
All those who have adhered to the plan will also receive an entry bonus of six free shares, taken from the
Company's portfolio of treasury shares, only available at the time of first purchase.
The shares purchased by participants, as well as those received by way of discount and entry bonus, will
generally be subject to a retention period during which they cannot be sold and the length of which varies
according to local regulations.
A total of Euro 1 million in costs have been recognised in the first quarter 2014 income statement under
"Personnel costs" in relation to the fair value of the options granted under this plan.
(*) The number of options has been determined on the basis of the expected employee adherences in the three purchase windows.
The information memorandum, prepared under art. 114-bis of Legislative Decree 58/98 and describing the
characteristics of the above incentive plan, is publicly available on the Company's website at
http://www.prysmiangroup.com/, from its registered offices and from Borsa Italiana S.p.A..

PRYSMIAN GROUP | CONSOLIDATED FINANCIAL STATEMENTS AND EXPLANATORY NOTES
99
Closing rates at Average rates in
31 March 2014 31 December 2013 3 months 2014 3 months 2013
Europe
British Pound 0.828 0.834 0.828 0.851
Swiss Franc 1.219 1.228 1.224 1.228
Hungarian Forint 307.180 297.040 307.932 296.627
Norwegian Krone 8.255 8.363 8.347 7.430
Swedish Krona 8.948 8.859 8.857 8.494
Czech Koruna 27.442 27.427 27.442 25.568
Danish Krone 7.466 7.459 7.462 7.459
Romanian Leu 4.459 4.471 4.502 4.387
Turkish Lira 3.013 2.942 3.040 2.359
Polish Zloty 4.172 4.154 4.184 4.156
Russian Rouble 48.780 45.325 48.043 40.146
North America
US Dollar 1.379 1.379 1.370 1.320
Canadian Dollar 1.523 1.467 1.511 1.331
South America
Brazilian Real 3.120 3.231 3.239 2.637
Argentine Peso 11.033 8.993 10.416 6.618
Chilean Peso 762.270 724.372 755.908 623.259
Mexican Peso 17.996 18.068 18.128 16.687
Oceania
Australian Dollar 1.494 1.542 1.527 1.271
New Zealand Dollar 1.595 1.676 1.637 1.581
Africa
CFA Franc 655.957 655.957 655.957 655.957
Tunisian Dinar 2.175 2.260 2.194 2.064
Asia
Chinese Renminbi (Yuan) 8.575 8.349 8.358 8.217
United Arab Emirates Dirham 5.064 5.065 5.030 4.848
Hong Kong Dollar 10.697 10.693 10.629 10.238
Singapore Dollar 1.737 1.741 1.738 1.634
Indian Rupee 82.666 85.417 84.565 71.484
Indonesian Rupiah 15,663.170 16,764.780 16,179.207 12,783.664
Japanese Yen 142.420 144.720 140.798 121.780
Thai Baht 44.709 45.178 44.722 39.331
Philippine Peso 61.726 61.289 61.468 53.746
Omani Rial 0.531 0.531 0.527 0.508
Malaysian Ringgit 4.498 4.522 4.518 4.068
Saudi Riyal 5.171 5.172 5.136 4.950
25. EXCHANGE RATES
The main exchange rates used to translate financial statements in foreign currencies for consolidation purposes
are reported below:

PRYSMIAN GROUP | CONSOLIDATED FINANCIAL STATEMENTS AND EXPLANATORY NOTES
100
26. SUBSEQUENT EVENTS
European Commission's decision relating to the Antitrust investigation
On 2 April 2014, the European Commission concluded the investigations started in January 2009 by adopting a
decision under which it found that, between 18 February 1999 and 28 January 2009, the world's largest cable
producers, including Prysmian Cavi e Sistemi S.r.l., one of the Group's Italian subsidiaries, adopted anti-
competitive practices in the European market for submarine energy cables and high voltage underground energy
cables.
The European Commission held Prysmian Cavi e Sistemi S.r.l. jointly liable with Pirelli & C. S.p.A. for the
disputed infringement in the period from 18 February 1999 to 28 July 2005, sentencing them to pay a fine of
Euro 67,310,000, and it held Prysmian Cavi e Sistemi S.r.l. jointly liable with Prysmian S.p.A. and The Goldman
Sachs Group Inc. for the disputed infringement in the period from 29 July 2005 to 28 January 2009, sentencing
them to pay a fine of Euro 37,303,000. Prysmian has said that it will appeal against this decision to the General
Court of the European Union. It should be noted that the Commission's decision may be submitted to two more
levels of appeal.
Dividend distribution
On 16 April 2014, the shareholders of Prysmian S.p.A. approved the financial statements for 2013 and the
distribution of a gross dividend of Euro 0.42 per share, for a total of some Euro 89 million. The dividend was paid
out from 25 April 2014 to shares outstanding on the record date of 24 April 2014, with the shares going ex-
dividend on 22 April 2014.
Share buy-back and disposal programme and Employee incentive plan
The Shareholders' Meeting held on 16 April 2014 authorised a share buy-back and disposal programme,
revoking at the same time the previous authorisation under the shareholder resolution dated 16 April 2013. This
programme provides the opportunity to purchase, on one or more occasions, a maximum number of ordinary
shares whose total cannot exceed 10% of share capital, equal to 18,420,002 ordinary shares as at the date of
16 April 2014, after deducting the treasury shares held by the Company.
The same Shareholders' Meeting also approved an incentive plan for employees of the Prysmian Group,
including members of the Board of Directors of Prysmian S.p.A., and granted the Board of Directors the
necessary powers to establish and implement this plan.
The reasons behind the introduction of the Plan are:
- to generate strong commitment by the Group's management to achieving the targets for additional
growth in profits and return on capital employed over the next three years;
- to align the interests of management with those of shareholders by using share-based incentives, and
promoting stable share ownership of the Company;
- to ensure the long-term sustainability of the Group's annual performance through the mechanism of co-
investing part of the annual bonus and consequent retention effect.
During the extraordinary session of the above meeting, the shareholders authorised an increase in share
capital by a maximum amount of Euro 536,480, through the issue of up to 5,364,800 new ordinary shares with

PRYSMIAN GROUP | CONSOLIDATED FINANCIAL STATEMENTS AND EXPLANATORY NOTES
101
a nominal value of Euro 0.10 each, to be allotted for no consideration to Group employees who are
beneficiaries of the above incentive plan.
Other subsequent events
On 9 April 2014, Prysmian Group was awarded a new contract by Energinet.dk, Denmark's grid operator, to
develop a high voltage cable system for the underground connection of the Horns Rev3 offshore wind farm.
The project involves supplying a High Voltage Alternate Current (HVAC) 245 kV power cable for a 45 km
underground route, Click-FitTM
network components and commissioning services to connect the wind farm from
the coastal substation to the 400 kV transmission station in Endrup. The underground cables for this wind farm
connection will be manufactured at the Pikkala plant (Finland), one of the Group's centres of technological and
manufacturing excellence for High Voltage cables. This project is due to be completed by the end of 2015, with
final delivery in 2016.
On 15 April 2014, Prysmian Group was awarded a new contract worth more than Euro 250 million by TenneT,
the Dutch-German grid operator, for the grid connection of offshore wind farms in the North Sea to the German
mainland.
The project involves the supply, installation and commissioning of a High Voltage Direct Current (HVDC) 320 kV
extruded cable with a rating of 900 MW and associated optical fibre cable system, along a route running 29 km
underground and 130 km underwater. The cable will connect the mainland converter station at the Emden Ost
power substation in Lower Saxony to BorWin gamma, the offshore converter platform in the BorWin cluster,
located approximately 120 km north of the German coast.
On 24 April 2014, Prysmian Group was awarded a new contract to supply, install and commission an HVAC 200
kV double circuit connection, comprising 21 km of submarine cable including spare lengths, an optical fibre
connection, network components and commissioning services. The cables for this project, known as the
"Shannon River Crossing" project, will be manufactured at the Pikkala plant (Finland), one of the Group's centres
of technological and manufacturing excellence for submarine cables.
Cable installation will be performed by one of Prysmian's own laying vessels, the "Cable Enterprise", specialised
in operations in extremely shallow waters and in offshore wind farm connections. The project is due to be
completed by early 2016.
***********
Pursuant to art. 154-bis par. 2 of Italy's Unified Financial Act (TUF), Carlo Soprano and Andreas Bott, as
managers responsible for preparing corporate accounting documents, declare that the information contained in
this quarterly financial report corresponds to the underlying documents, accounting books and records.
Milan, 8 May 2014
ON BEHALF OF THE BOARD OF DIRECTORS
THE CHAIRMAN
Massimo Tononi
PRYSMIAN GROUP | CONSOLIDATED FINANCIAL STATEMENTS AND EXPLANATORY NOTES
102
SCOPE OF CONSOLIDATION – APPENDIX AThe following companies have been consolidated line-by-line:Legal name Office Currency Share capital Direct parent company
Europe
Austria
Prysmian OEKW GmbH Wien Euro 2,053,008 100.00% Prysmian Cavi e Sistemi S.r.l.
Belgium
Draka Belgium N.V. Antwerpen Euro 61,973 98.52% Draka Holding B.V.
1.48% Draka Kabel B.V.
Denmark
Prysmian Denmark A/S Brøndby Danish Krone 40,000,000 100.00% Draka Denmark Holding A/S
Draka Denmark Holding A/S Brøndby Danish Krone 88,734,000 100.00% Draka Holding B.V.
Estonia
AS Draka Keila Cables Keila Euro 1,661,703 66.00% Prysmian Finland OY
34.00% Third parties
Finland
Prysmian Finland OY Kirkkonummi Euro 100,000 77.80% Prysmian Cavi e Sistemi S.r.l.
19.93% Draka Holding B.V.
2.27% Draka Comteq B.V.
France
Prysmian (French) Holdings S.A.S. Paron Euro 173,487,250 100.00% Prysmian Cavi e Sistemi S.r.l.
GSCP Athena (French) Holdings II S.A.S. Paron Euro 47,000 100.00% Prysmian (French) Holdings S.A.S.
Prysmian Cables et Systèmes France S.A.S. Paron Euro 136,800,000 100.00% Prysmian (French) Holdings S.A.S.
Draka Comteq France Paron Euro 246,554,316 100.00% Draka France S.A.S.
Draka Fileca S.A.S. Sainte Geneviève Euro 5,439,700 100.00% Draka France S.A.S.
Draka Paricable S.A.S. Sainte Geneviève Euro 5,177,985 100.00% Draka France S.A.S.
Draka France S.A.S. Marne La Vallée Euro 261,551,700 100.00% Draka Holding B.V.
Quoroon S.A.S. Paron Euro 10,000 100.00% Prysmian Cables et Systèmes France S.A.S.
Germany
Prysmian Kabel und Systeme GmbH Berlin Euro 15,000,000 93.75% Draka Cable Wuppertal GmbH
6.25% Prysmian S.p.A.
Prysmian Unterstuetzungseinrichtung Lynen GmbH Eschweiler Deutsche Mark 50,000 100.00% Prysmian Kabel und Systeme GmbH
Draka Cable Wuppertal GmbH Wuppertal Euro 25,000 100.00% Draka Deutschland GmbH
Draka Comteq Berlin GmbH & Co. KG Berlin Deutsche Mark 46,000,000 50.10% Kabelbedrijven Draka Nederland B.V.
Euro 1 49.90% Draka Deutschland GmbH
Draka Comteq Germany Verwaltungs GmbH Koln Euro 25,000 100.00% Draka Comteq B.V.
Draka Comteq Germany GmbH & Co. KG Koln Euro 26,000 100.00% Draka Comteq B.V.
Draka Deutschland Erste Beteiligungs GmbH Wuppertal Euro 25,000 100.00% Draka Holding B.V.
Draka Deutschland GmbH Wuppertal Euro 25,000 90.00% Draka Deutschland Erste Beteiligungs GmbH
10.00% Draka Deutschland Zweite Beteiligungs- GmbH
% ownership
PRYSMIAN GROUP | CONSOLIDATED FINANCIAL STATEMENTS AND EXPLANATORY NOTES
103
Legal name Office Currency Share capital % ownership Direct parent company
Draka Deutschland Verwaltungs- GmbH Wuppertal Deutsche Mark 50,000 100.00% Draka Cable Wuppertal GmbH
Draka Deutschland Zweite Beteiligungs- GmbH Wuppertal Euro 25,000 100.00% Kabelbedrijven Draka Nederland B.V.
Draka Kabeltechnik GmbH Wuppertal Euro 25,000 100.00% Draka Cable Wuppertal GmbH
Draka Service GmbH Nurnmberg Euro 25,000 100.00% Draka Cable Wuppertal GmbH
Höhn GmbH Wuppertal Deutsche Mark 1,000,000 100.00% Draka Deutschland GmbH
Kaiser Kabel GmbH Wuppertal Deutsche Mark 9,000,000 100.00% Draka Deutschland GmbH
Kaiser Kabel Vertriebs GmbH i.L. Wuppertal Euro 25,100 100.00% Kaiser Kabel GmbH
NKF Holding (Deutschland) GmbH Wuppertal Euro 25,000 100.00% Kabelbedrijven Draka Nederland B.V.
usb-elektro Kabelkonfektions- GmbH i.L. Bendorf Deutsche Mark 2,750,000 100.00% Draka Holding B.V.
Wagner Management-und Projektgesellschaft mit beschränkter Haftung i.L. Berlin Deutsche Mark 50,000 60.00% Draka Cable Wuppertal GmbH
40.00% Third parties
U.K.
Prysmian Cables & Systems Ltd. Eastleigh British Pound 45,292,120 100.00% Prysmian UK Group Ltd.
Prysmian Construction Company Ltd. Eastleigh British Pound 1 100.00% Prysmian Cables & Systems Ltd.
Prysmian Cables (2000) Ltd. Eastleigh British Pound 1 100.00% Prysmian Cables & Systems Ltd.
Prysmian Cables (Industrial) Ltd. Eastleigh British Pound 1 100.00% Prysmian Cables & Systems Ltd.
Prysmian Cables (Supertension) Ltd. Eastleigh British Pound 1 100.00% Prysmian Cables & Systems Ltd.
Prysmian Cables and Systems International Ltd. Eastleigh Euro 100,000 100.00% Prysmian Cavi e Sistemi S.r.l.
Cable Makers Properties & Services Ltd. Hampton British Pound 33 74.99% Prysmian Cables & Systems Ltd.
25.01% Third parties
Prysmian Telecom Cables and Systems UK Ltd. Eastleigh British Pound 1 100.00% Prysmian Cables & Systems Ltd.
Prysmian Metals Ltd. Eastleigh British Pound 1 100.00% Prysmian Cables & Systems Ltd.
Comergy Ltd. Eastleigh British Pound 1,000,000 100.00% Prysmian Cavi e Sistemi S.r.l.
Prysmian Pension Scheme Trustee Limited Eastleigh British Pound 1 100.00% Prysmian S.p.A.
Prysmian UK Group Ltd. Eastleigh British Pound 40,011,000 100.00% Draka Holding B.V.
Draka Distribution Aberdeen Ltd. Eastleigh British Pound 1 100.00% Draka UK Group Ltd.
Draka Comteq UK Ltd. Eastleigh British Pound 9,000,002 100.00% Prysmian UK Group Ltd.
Draka UK Ltd. Eastleigh British Pound 202,000 100.00% Draka UK Group Ltd.
Draka UK Group Ltd. Eastleigh British Pound 10,000,103 99.99999% Prysmian UK Group Ltd.
0.00001% Third parties
Draka UK Pension Plan Trust Company Ltd. Eastleigh British Pound 1 100.00% Draka UK Ltd.
Prysmian PowerLink Services Ltd. Eastleigh British Pound 16,000,100 100.00% Prysmian UK Group Ltd.
Ireland
Prysmian Financial Services Ireland Limited Dublin Euro 1,000 100.00% Third parties
Prysmian Re Company Limited Dublin Euro 3,000,000 100.00% Draka Holding B.V.
Italy
Prysmian Cavi e Sistemi S.r.l. Milan Euro 100,000,000 100.00% Prysmian S.p.A.
Prysmian Cavi e Sistemi Italia S.r.l. Milan Euro 77,143,249 100.00% Prysmian S.p.A.
Prysmian Treasury S.r.l. Milan Euro 30,000,000 100.00% Prysmian S.p.A.
Prysmian PowerLink S.r.l. Milan Euro 50,000,000 100.00% Prysmian S.p.A.
Fibre Ottiche Sud - F.O.S. S.r.l. Battipaglia Euro 47,700,000 100.00% Prysmian S.p.A.
Prysmian Electronics S.r.l. Milan Euro 10,000 80.00% Prysmian Cavi e Sistemi S.r.l.
20.00% Third parties

PRYSMIAN GROUP | CONSOLIDATED FINANCIAL STATEMENTS AND EXPLANATORY NOTES
104
Legal name Office Currency Share capital % ownership Direct parent company
Luxembourg
Prysmian Treasury (Lux) S.à r.l. Luxembourg Euro 3,050,000 100.00% Prysmian Cavi e Sistemi S.r.l.
Norway
Prysmian Kabler og Systemer A.S. Ski Norwegian Krone 100,000 100.00% Prysmian Finland OY
Draka Norsk Kabel A.S. Drammen Norwegian Krone 22,500,000 100.00% Draka Norway A.S.
Draka Norway A.S. Drammen Norwegian Krone 112,000 100.00% Draka Holding B.V.
The Netherlands
Draka Comteq B.V. Amsterdam Euro 1,000,000 100.00% Draka Holding B.V.
Draka Comteq Fibre B.V. Eindhoven Euro 18,000 100.00% Prysmian Netherlands Holding B.V.
Draka Holding B.V. Amsterdam Euro 52,229,321 52.165% Prysmian S.p.A.
47.835% Prysmian Cavi e Sistemi S.r.l.
Draka Kabel B.V. Amsterdam Euro 2,277,977 100.00% Kabelbedrijven Draka Nederland B.V.
Donne Draad B.V. Nieuw Bergen Euro 28,134 100.00% Kabelbedrijven Draka Nederland B.V.
Prysmian Treasury (The Netherlands) B.V. Delft Euro 2,268,901 100.00% Draka Holding B.V.
Kabelbedrijven Draka Nederland B.V. Amsterdam Euro 18,151 100.00% Prysmian Netherlands Holding B.V.
NK China Investments B.V. Delft Euro 19,000 100.00% Kabelbedrijven Draka Nederland B.V.
NKF Vastgoed I B.V. Delft Euro 18,151 99.00% Draka Holding B.V.
1.00% Kabelbedrijven Draka Nederland B.V.
NKF Vastgoed III B.V. Amsterdam Euro 18,151 99.00% Draka Deutschland GmbH
1.00% Kabelbedrijven Draka Nederland B.V.
Draka Sarphati B.V. Amsterdam Euro 18,151 100.00% Draka Holding B.V.
Prysmian Netherlands B.V. Delft Euro 1 100.00% Prysmian Netherlands Holding B.V.
Prysmian Netherlands Holding B.V. Amsterdam Euro 1 100.00% Draka Holding B.V.
Czech Republic
Draka Kabely, s.r.o. Velke Mezirici Czech Koruna 255,000,000 100.00% Draka Holding B.V.
Romania
Prysmian Cabluri Si Sisteme S.A. Slatina Romanian Leu 103,850,920 99.9995% Draka Holding B.V.
0.0005% Prysmian Cavi e Sistemi S.r.l.
Russia
Limited Liability Company Prysmian RUS Rybinsk city Russian Rouble 230,000,000 99.00% Draka Holding B.V.
1.00% Prysmian Cavi e Sistemi S.r.l.
Limited Liability Company "Rybinskelektrokabel" Rybinsk city Russian Rouble 90,312,000 100.00% Limited Liability Company Prysmian RUS
Draka Industrial Cable Russia LLC St. Petersburg Russian Rouble 100,000 100.00% Draka Holding B.V.
Neva Cables Ltd St. Petersburg Russian Rouble 194,000 100.00% Prysmian Finland OY

PRYSMIAN GROUP | CONSOLIDATED FINANCIAL STATEMENTS AND EXPLANATORY NOTES
105
Legal name Office Currency Share capital % ownership Direct parent company
Slovakia
Prysmian Kablo s.r.o. Bratislava Euro 21,246,001 99.995% Prysmian Cavi e Sistemi S.r.l.
0.005% Prysmian S.p.A.
Draka Comteq Slovakia s.r.o. Prešov Euro 1,506,639 100.00% Draka Comteq B.V.
Spain
Prysmian Spain S.A.U. Vilanova I la Geltrù Euro 58,178,234 100.00% Draka Holding N.V. Y CIA Soc. Col.
Marmavil.S.L.U. Santa Perpetua de Mogoda Euro 3,006 100.00% Draka Holding B.V.
Draka Holding N.V. Y CIA Soc. Col. Santa Perpetua de Mogoda Euro 24,000,000 99.99999% Draka Holding B.V.
0.00001% Marmavil.S.L.U.
Draka Comteq Iberica, S.L.U. Maliaño Euro 4,000,040 100.00% Draka Holding N.V. Y CIA Soc. Col.
Sweden
Prysmian Kablar och System AB Hoganas Swedish Krona 100,000 100.00% Prysmian Finland OY
Draka Comteq Sweden AB Nässjö Swedish Krona 100,000 100.00% Draka Comteq B.V.
NK Cables Sverige AB Orebro Swedish Krona 100,000 100.00% Prysmian Finland OY
Draka Sweden AB Nässjö Swedish Krona 100,100 100.00% Draka Holding B.V.
Draka Kabel Sverige AB Nässjö Swedish Krona 100,000 100.00% Draka Sweden AB
Fastighets Spännbucklan AB Nässjö Swedish Krona 25,000,000 100.00% Draka Sweden AB
Fastighets Hygget AB Nässjö Swedish Krona 100,000 100.00% Fastighets Spännbucklan AB
Switzerland
Prysmian Cables and Systems SA Manno Swiss Franc 500,000 100.00% Draka Holding B.V.
Turkey
Turk Prysmian Kablo Ve Sistemleri A.S. Mudanya Turkish new Lira 112,233,652 83.746% Draka Holding B.V.
16.254% Third parties
Draka Istanbul Asansor İthalat İhracat Üretim Ticaret Ltd. Şti. Istanbul Turkish new Lira 180,000 100.00% Draka Holding B.V.
Draka Comteq Kablo Limited Sirketi Istanbul Turkish new Lira 45,818,775 99.50% Draka Comteq B.V.
0.50% Prysmian Netherlands B.V.
Hungary
Prysmian MKM Magyar Kabel Muvek Kft. Budapest Hungarian Forint 5,000,000,000 100.00% Prysmian Cavi e Sistemi S.r.l.
North America
Canada
Prysmian Power Cables and Systems Canada Ltd. Saint John Canadian Dollar 1,000,000 100.00% Draka Holding B.V.
Draka Elevator Products, Inc. Brantford Canadian Dollar n/a 100.00% Draka Cableteq USA, Inc.
U.S.A.
Prysmian Cables and Systems (US) Inc. Carson City US Dollar 330,517,608 100.00% Draka Holding B.V.
Prysmian Cables and Systems USA, LLC Wilmington US Dollar 10 100.00% Prysmian Cables and Systems (US) Inc.
Prysmian Construction Services Inc. Wilmington US Dollar 1,000 100.00% Prysmian Cables and Systems USA, LLC
Prysmian Power Financial Services US LLC Wilmington US Dollar 100 100.00% Prysmian Cables and Systems USA, LLC
Prysmian Communications Financial Services US LLC Wilmington US Dollar 100 100.00% Prysmian Cables and Systems USA, LLC
Draka Cableteq USA, Inc. Boston US Dollar 10 100.00% Prysmian Cables and Systems (US) Inc.
Draka Elevator Products, Inc. Boston US Dollar 1 100.00% Draka Cableteq USA, Inc.
Draka Transport USA, LLC Boston US Dollar n/a 100.00% Draka Cableteq USA, Inc.

PRYSMIAN GROUP | CONSOLIDATED FINANCIAL STATEMENTS AND EXPLANATORY NOTES
106
Legal name Office Currency Share capital % ownership Direct parent company
Central/South America
Argentina
Prysmian Energia Cables y Sistemas de Argentina S.A. Buenos Aires Argentine Peso 66,966,667 94.68% Prysmian Consultora Conductores e Instalaciones SAIC
5.00% Draka Holding B.V.
0.32% Third parties
Prysmian Consultora Conductores e Instalaciones SAIC Buenos Aires Argentine Peso 48,571,242 95.00% Draka Holding B.V.
5.00% Prysmian Cavi e Sistemi S.r.l.
Cables Ópticos y Metálicos para Telecomunicaciones Telcon S.R.L. Buenos Aires Argentine Peso 500,000 100.00% Prysmian Draka Brasil S.A.
Brazil
Prysmian Energia Cabos e Sistemas do Brasil S.A. Sorocaba Brazilian Real 153,794,214 99.857% Prysmian Cavi e Sistemi S.r.l.
0,143% Prysmian S.p.A.
Sociedade Produtora de Fibras Opticas S.A. (1) Sorocaba Brazilian Real 1,500,100 51.00% Prysmian Draka Brasil S.A.
49.00% Third parties
Prysmian Surflex Umbilicais e Tubos Flexìveis do Brasil Ltda Vila Velha Brazilian Real 158,385,677 99.999999% Prysmian Cavi e Sistemi S.r.l.
0.000001% Prysmian S.p.A.
Prysmian Draka Brasil S.A. Sorocaba Brazilian Real 207,784,953 55.885510% Prysmian Energia Cabos e Sistemas do Brasil S.A.
34.849900% Draka Comteq B.V.
9.206810% Draka Holding B.V.
0.057040% Prysmian Cavi e Sistemi S.r.l.
0.000630% Kabelbedrijven Draka Nederland B.V.
0.000120% Draka Kabel B.V.
Doiter Industria e Comércio Ltda Espirito Santo, Vitoria Brazilian Real 118,000 99.9992% Draka Comteq Cabos Brasil S.A.
0.0008% Third parties
Prysmian Fibras Oticas Brasil Ltda Sorocaba Brazilian Real 42,628,104 99.99% Prysmian Draka Brasil S.A.
0.01% Prysmian Energia Cabos e Sistemas do Brasil S.A .
Draka Comteq Cabos Brasil S.A Santa Catarina Brazilian Real 17,429,703 77.836% Draka Comteq B.V.
22.164% Prysmian Energia Cabos e Sistemas do Brasil S.A.
Chile
Prysmian Instalaciones Chile S.A. Santiago Chilean Peso 1,147,127,679 99.80% Prysmian Consultora Conductores e Instalaciones SAIC
0.20% Third parties
Mexico
Draka Durango S. de R.L. de C.V. Durango Mexican Peso 163,471,787 99.996% Draka Mexico Holdings S.A. de C.V.
0.004% Draka Holding B.V.
Draka Mexico Holdings S.A. de C.V. Durango Mexican Peso 57,036,501 99.999998% Draka Holding B.V.
0.000002% Draka Comteq B.V.
NK Mexico Holdings S.A. de C.V. Mexico City Mexican Peso n/a 100.00% Prysmian Finland OY
Prysmian Cables y Sistemas de Mexico S. de R. L. de C. V. Durango Mexican Peso 3,000 0.033% Draka Holding B.V.
99.967% Draka Mexico Holdings S.A. de C.V.
Africa
Ivory Coast
SICABLE - Sociète Ivoirienne de Cables S.A. Abidjan CFA Franc 740,000,000 51.00% Prysmian Cables et Systèmes France S.A.S.
49.00% Third parties
Tunisia
Auto Cables Tunisie S.A. Grombalia Tunisian Dinar 4,050,000 50.998% Prysmian Cables et Systèmes France S.A.S.
49.002% Third parties
Eurelectric Tunisie S.A. Soliman Tunisian Dinar 510,000 99.8824% Prysmian Cables et Systèmes France S.A.S.
0.0196% Prysmian (French) Holdings S.A.S.
0.0196% Prysmian Cavi e Sistemi S.r.l.
0.0784% Third parties(1) Entity considered as joint operation as described in section C. Restatement of comparative figures

PRYSMIAN GROUP | CONSOLIDATED FINANCIAL STATEMENTS AND EXPLANATORY NOTES
107
Legal name Office Currency Share capital % ownership Direct parent company
Oceania
Australia
Prysmian Power Cables & Systems Australia Pty Ltd. Liverpool Australian Dollar 15,000,000 100.00% Prysmian Cavi e Sistemi S.r.l.
Prysmian Telecom Cables & Systems Australia Pty Ltd. Liverpool Australian Dollar 38,500,000 100.00% Prysmian Cavi e Sistemi S.r.l.
New Zealand
Prysmian Power Cables & Systems New Zealand Ltd. Auckland New Zealand Dollar 10,000 100.00% Prysmian Power Cables & Systems Australia Pty Ltd.
Asia
Saudi Arabia
Prysmian Powerlink Saudi LLC Al Khoabar Saudi Arabian Riyal 500,000 95.00% Prysmian PowerLink S.r.l.
5.00% Third parties
China
Prysmian Tianjin Cables Co. Ltd. Tianjin US Dollar 28,400,000 67.00% Prysmian (China) Investment Company Ltd.
33.00% Third parties
Prysmian Cable (Shanghai) Co.Ltd. Shanghai US Dollar 5,000,000 100.00% Prysmian (China) Investment Company Ltd.
Prysmian Baosheng Cable Co.Ltd. Jiangsu US Dollar 35,000,000 67.00% Prysmian (China) Investment Company Ltd.
33.00% Third parties
Prysmian Wuxi Cable Co. Ltd. Wuxi US Dollar 29,941,250 100.00% Prysmian (China) Investment Company Ltd.
Prysmian Angel Tianjin Cable Co. Ltd. Tianjin US Dollar 14,000,000 100.00% Prysmian (China) Investment Company Ltd.
Prysmian Hong Kong Holding Ltd. Hong Kong Euro 55,000,000 100.00% Prysmian Cavi e Sistemi S.r.l.
Prysmian (China) Investment Company Ltd. Beijing Euro 55,000,000 100.00% Prysmian Hong Kong Holding Ltd.
Nantong Haixun Draka Elevator Products Co. LTD Nantong US Dollar 2,400,000 75.00% Draka Elevator Products, Inc.
25.00% Third parties
Nantong Zhongyao Draka Elevator Products Co. LTD Nantong US Dollar 2,000,000 75.00% Draka Elevator Products, Inc.
25.00% Third parties
Draka Cables (Hong Kong) Limited Hong Kong Hong Kong Dollar 6,500,000 100.00% Draka Cableteq Asia Pacific Holding Pte Ltd.
Draka Shanghai Optical Fibre Cable Co Ltd. Shanghai US Dollar 15,580,000 55.00% Draka Comteq Germany GmbH & Co. KG
45.00% Third parties
Suzhou Draka Cable Co. Ltd. Suzhou Chinese Renminbi (Yuan) 174,500,000 100.00% Draka Cableteq Asia Pacific Holding Pte Ltd.
NK Wuhan Cable Co. Ltd. Wuhan US Dollar 12,000,000 60.00% NK China Investments B.V.
20.00% Yangtze Optical Fibre and Cable Joint Stock Limited Co.
20.00% Third parties
Philippines
Draka Philippines Inc. Cebu Philippine Peso 253,652,000 99.9999975% Draka Holding B.V.
0.0000025% Third parties
India
Associated Cables Pvt. Ltd. Mumbai Indian Rupee 61,261,900 32.00% Draka UK Group Ltd.
28.00% Prysmian Treasury (The Netherlands) B.V.
40.00% Oman Cables Industry (SAOG)
Jaguar Communication Consultancy Services Private Ltd. Mumbai Indian Rupee 34,432,100 99.99997% Prysmian Cavi e Sistemi S.r.l.
0.00003% Prysmian S.p.A.
Indonesia
P.T.Prysmian Cables Indonesia Cikampek US Dollar 67,300,000 99.48% Draka Holding B.V.
0.52% Prysmian Cavi e Sistemi S.r.l.

PRYSMIAN GROUP | CONSOLIDATED FINANCIAL STATEMENTS AND EXPLANATORY NOTES
108
Legal name Office Currency Share capital % ownership Direct parent company
Malaysia
Submarine Cable Installation Sdn Bhd Kuala Lumpur Malaysian Ringgit 10,000 100.00% Prysmian Cavi e Sistemi S.r.l.
Sindutch Cable Manufacturer Sdn Bhd Malacca Malaysian Ringgit 500,000 100.00% Draka Cableteq Asia Pacific Holding Pte Ltd.
Draka Marketing and Services Sdn Bhd Malacca Malaysian Ringgit 500,000 100.00% Cable Supply and Consulting Company Pte Ltd.
Draka (Malaysia) Sdn Bhd Malacca Malaysian Ringgit 8,000,002 100.00% Cable Supply and Consulting Company Pte Ltd.
Singapore
Prysmian Cables Asia-Pacific Pte Ltd. Singapore Singapore Dollar 213,324,290 100.00% Draka Holding B.V.
Prysmian Cable Systems Pte Ltd. Singapore Singapore Dollar 25,000 50.00% Draka Holding B.V.
50.00% Prysmian Cables & Systems Ltd.
Draka Offshore Asia Pacific Pte Ltd. Singapore Singapore Dollar 51,000 100.00% Draka Cableteq Asia Pacific Holding Pte Ltd.
Draka Cableteq Asia Pacific Holding Pte Ltd. Singapore Singapore Dollar 28,630,542 100.00% Draka Holding B.V.
Singapore Cables Manufacturers Pte Ltd. Singapore Singapore Dollar 990,000 100.00% Draka Cableteq Asia Pacific Holding Pte Ltd.
Cable Supply and Consulting Company Pte Ltd. Singapore Singapore Dollar 50,000 100.00% Draka Cableteq Asia Pacific Holding Pte Ltd.
Draka Comteq Singapore Pte Ltd. Singapore Singapore Dollar 500,000 100.00% Draka Comteq B.V.
Draka NK Cables (Asia) pte ltd. Singapore Singapore Dollar 200,000 100.00% Prysmian Finland OY
Thailand
MCI-Draka Cable Co. Ltd. Bangkok Thai Baht 435,900,000 70.250172% Draka Cableteq Asia Pacific Holding Pte Ltd.
0.000023% Draka (Malaysia) Sdn Bhd
0.000023% Sindutch Cable Manufacturer Sdn Bhd
0.000023% Singapore Cables Manufacturers Pte Ltd.
29.749759% Third parties

PRYSMIAN GROUP | CONSOLIDATED FINANCIAL STATEMENTS AND EXPLANATORY NOTES
109
Legal name Office Currency Share capital % ownership Direct parent company
Europe
Germany
Kabeltrommel GmbH & CO.KG Troisdorf Euro 10,225,838 29.68% Prysmian Kabel und Systeme GmbH
13.50% Draka Cable Wuppertal GmbH
56.82% Third parties
Kabeltrommel GmbH Troisdorf Deutsche Mark 51,000 17.65% Prysmian Kabel und Systeme GmbH
23.53% Draka Cable Wuppertal GmbH
58.82% Third parties
KTG Europe GmbH Troisdorf Euro 100,000 100.00% Kabeltrommel GmbH & CO.KG
U.K.
Rodco Ltd. Weybridge British Pound 5,000,000 40.00% Prysmian Cables & Systems Ltd.
60.00% Third parties
Poland
Eksa Sp.z.o.o Sokolów Polish Zloty 394,000 29.949% Prysmian Cavi e Sistemi S.r.l.
70.051% Third parties
Russia
Elkat Ltd. Moscow Russian Rouble 10,000 40.00% Prysmian Finland OY
60.00% Third parties
Asia
China
Yangtze Optical Fibre and Cable Joint Stock Limited Co. Wuhan Chinese Renminbi (Yuan) 479,592,598 37.50% Draka Comteq B.V.
62.50% Third parties
Yangtze Optical Fibre and Cable Company (Hong Kong) Ltd. Hong Kong Hong Kong Dollar 80,000 100.00% Yangtze Optical Fibre and Cable Joint Stock Limited Co.
Yangtze Optical Fibre & Cable (Shanghai) Co. Ltd. Shanghai US Dollar 12,000,000 75.000% Yangtze Optical Fibre and Cable Joint Stock Limited Co.
25.00% Draka Comteq B.V.
EverPro Technologies Company Limited Wuhan Chinese Renminbi (Yuan) 325,000,000 69.23% Yangtze Optical Fibre and Cable Joint Stock Limited Co.
30.77% Third parties
Jiangsu Yangtze Zhongli Optical Fibre & Cable Co., Ltd. Changshu Chinese Renminbi (Yuan) 92,880,000 51.00% Yangtze Optical Fibre and Cable Joint Stock Limited Co.
49.00% Third parties
Yangtze Optical Fibre & Cable Sichuan Co. Ltd. Emeishan City Chinese Renminbi (Yuan) 53,800,000 51.00% Yangtze Optical Fibre and Cable Joint Stock Limited Co.
49.00% Third parties
Tianjin YOFC XMKJ Optical Communications Co.,Ltd. Tianjin Chinese Renminbi (Yuan) 220,000,000 49.00% Yangtze Optical Fibre and Cable Joint Stock Limited Co.
51.00% Third parties
Yangtze (Wuhan) Optical System Corp., Ltd. Wuhan Chinese Renminbi (Yuan) 47,500,000 46.32% Yangtze Optical Fibre and Cable Joint Stock Limited Co.
53.68% Third parties
Shantou Hi-Tech Zone Aoxing Optical Communication EquipmentsCo.,Ltd. Shantou Chinese Renminbi (Yuan) 170,558,817 42.42% Yangtze Optical Fibre and Cable Joint Stock Limited Co.
57.58% Third parties
Shenzhen SDGI Optical Fibre Co., Ltd. Shenzhen Chinese Renminbi (Yuan) 206,518,320 35.36% Yangtze Optical Fibre and Cable Joint Stock Limited Co.
64.64% Third parties
Tianjin YOFC XMKJ Optical Cable Co., Ltd. Tianjin Chinese Renminbi (Yuan) 100,000,000 20.00% Yangtze Optical Fibre and Cable Joint Stock Limited Co.
80.00% Third parties
Wuhan Guanyuan Electronic Technology Co. Ltd. Wuhan Chinese Renminbi (Yuan) 5,000,000 20.00% Yangtze Optical Fibre and Cable Joint Stock Limited Co.
80.00% Third parties
Japan
Precision Fiber Optics Ltd. Chiba Japanese Yen 360,000,000 50.00% Draka Comteq Fibre B.V.
50.00% Third parties
Malaysia
Power Cables Malaysia Sdn Bhd Selangor Darul Eshan Malaysian Ringgit 8,000,000 40.00% Draka Holding B.V.
60.00% Third parties
Oman
Oman Cables Industry (SAOG) Al Rusayl Industrial Zone Omani Rial 8,970,000 34.78% Draka Holding B.V.
65.22% Third parties
The following companies have been accounted for using the equity method:

PRYSMIAN GROUP | CONSOLIDATED FINANCIAL STATEMENTS AND EXPLANATORY NOTES
110
Legal name Direct parent company
Asia
India
Ravin Cables Limited 51.00% Prysmian Cavi e Sistemi S.r.l.
49.00% Third parties
United Arab Emirates
Power Plus Cable CO. LLC 49.00% Ravin Cables Limited
51.00% Third parties
Africa
South Africa
Pirelli Cables & Systems (Proprietary) Ltd. 100.00% Prysmian Cavi e Sistemi S.r.l.
% ownership
List of unconsolidated other investments: