BlackRock Global Funds Annual Report 31 August 2019
806
31 August 2019 Annual Report and Audited Financial Statements BlackRock Global Funds (BGF) R.C.S. Luxembourg: B.6317
-
Upload
khangminh22 -
Category
Documents
-
view
1 -
download
0
Transcript of BlackRock Global Funds Annual Report 31 August 2019
31 August 2019
Annual Report and Audited Financial StatementsBlackRock Global Funds (BGF)R.C.S. Luxembourg: B.6317


Annual Report and Audited Financial Statements [1]
Contents
Subscriptions may be made only on the basis of the current Prospectus and relevant KIID for the Funds, together with the most recent annual report and audited financial statements and interim report and unaudited financial statements. Copies are available from the Investor Services Centre, the Transfer Agent, the Management Company or any of the Distributors.
Board of Directors 2
Management and Administration 2
General Information 3
Chairman’s Letter to Shareholders 6
Investment Adviser’s Report 8
Directors’ Report 15
Report on Remuneration 19
Statement of Net Assets 23
Three Year Summary of Net Asset Values 30
Statement of Operations and Changes in Net Assets 64
Statement of Changes in Shares Outstanding 78
Portfolio of InvestmentsASEAN Leaders Fund 108Asia Pacific Equity Income Fund 110Asian Dragon Fund 112Asian Growth Leaders Fund 114Asian High Yield Bond Fund 116Asian Multi-Asset Growth Fund 118Asian Tiger Bond Fund 125China A-Share Opportunities Fund 133China Bond Fund 136China Flexible Equity Fund 141China Fund 143Continental European Flexible Fund 145Dynamic High Income Fund 147Emerging Europe Fund 170Emerging Markets Bond Fund 172Emerging Markets Corporate Bond Fund 180Emerging Markets Equity Income Fund 184Emerging Markets Fund 187Emerging Markets Local Currency Bond Fund 190ESG Emerging Markets Blended Bond Fund 196ESG Emerging Markets Bond Fund 201ESG Emerging Markets Corporate Bond Fund 208ESG Emerging Markets Local Currency Bond Fund 211ESG Multi-Asset Fund(1) 215Euro Bond Fund 230Euro Corporate Bond Fund 247Euro Reserve Fund 258Euro Short Duration Bond Fund 260Euro-Markets Fund 273European Equity Income Fund 275European Focus Fund 277European Fund 279European High Yield Bond Fund 281European Special Situations Fund 287European Value Fund 289FinTech Fund(2) 291Fixed Income Global Opportunities Fund 293Future Of Transport Fund(2) 378
Global Allocation Fund 380Global Bond Income Fund 394Global Conservative Income Fund(2) 401Global Corporate Bond Fund 419Global Dynamic Equity Fund 431Global Enhanced Equity Yield Fund 436Global Equity Income Fund 440Global Government Bond Fund 442Global High Yield Bond Fund 460Global Inflation Linked Bond Fund 480Global Long-Horizon Equity Fund(1) 488Global Multi-Asset Income Fund 490Global SmallCap Fund 548India Fund 558Japan Flexible Equity Fund 560Japan Small & MidCap Opportunities Fund 562Latin American Fund 564Market Navigator Fund(2) 566Natural Resources Growth & Income Fund 573Next Generation Technology Fund(2) 575North American Equity Income Fund 577Nutrition Fund(1) 579Pacific Equity Fund 581Sustainable Energy Fund(1) 583Swiss Small & MidCap Opportunities Fund(3) 585United Kingdom Fund 587US Basic Value Fund 589US Dollar Bond Fund 591US Dollar High Yield Bond Fund 634US Dollar Reserve Fund 651US Dollar Short Duration Bond Fund 653US Flexible Equity Fund 666US Government Mortgage Fund 668US Growth Fund 677US Small & MidCap Opportunities Fund 679World Bond Fund 681World Energy Fund 712World Financials Fund 714World Gold Fund 716World Healthscience Fund 718World Mining Fund 720World Real Estate Securities Fund 722World Technology Fund 725
Notes to the Financial Statements 728
Audit Report 742
Appendix I – Share Classes (Unaudited) 744
Appendix II – Global Exposure and Leverage (Unaudited) 750
Appendix III – Eligibility for French “Plan d’Epargne en Actions” (“PEA”) (Unaudited) 754
Appendix IV – Supplementary Information (Unaudited) 755(1) Fund name changed during the year, see Note 1, for further details.(2) Fund launched during the year, see Note 1, for further details.(3) Fund closed to subscriptions, see Note 1, for further details.

[2] BlackRock Global Funds (BGF)
Paul Freeman, (Chairman)Geoffrey RadcliffeFrancine KeiserBarry O’DwyerRobert HayesMichael Gruener Martha Boeckenfeld (resigned effective 31 October 2019)
(1) All Directors of BlackRock Global Funds are non-executive Directors.(2) Geoffrey Radcliffe, Barry O’Dwyer, Robert Hayes and Michael Gruener are employees
of the BlackRock Group (of which the Management Company, Investment Advisers and Principal Distributor are part), and Paul Freeman is a former employee of the BlackRock Group.
(3) Francine Keiser and Martha Boeckenfeld are independent Directors.
Management and Administration
Management CompanyBlackRock (Luxembourg) S.A.35A, avenue J.F. Kennedy, L-1855 Luxembourg,Grand Duchy of Luxembourg
Investment AdvisersBlackRock Financial Management, Inc.Park Avenue Plaza, 55 East 52nd Street, New York, NY 10055, USA
BlackRock Investment Management, LLC100 Bellevue Parkway, Wilmington, Delaware 19809, USA
BlackRock Investment Management (UK) Limited12 Throgmorton Avenue, London EC2N 2DL, UK
BlackRock (Singapore) Limited# 18-01 Twenty Anson, 20 Anson Road, Singapore, 079912
Sub-Investment AdvisersBlackRock Asset Management North Asia Limited16/F Champion Tower, 3 Garden Road, Central, Hong Kong
BlackRock Japan Co. Limited1-8-3 Marunouchi, Chiyoda-ku, Tokyo 100-8217, Japan
BlackRock Investment Management (Australia) LimitedLevel 26, 101 Collins Street, Melbourne 3000, Australia
Principal DistributorBlackRock Investment Management (UK) Limited12 Throgmorton AvenueLondon EC2N 2DLUK
DepositaryThe Bank of New York Mellon SA / NV, Luxembourg Branch*2-4, rue Eugène RuppertL-2453 LuxembourgGrand Duchy of Luxembourg
AdministratorThe Bank of New York Mellon SA / NV, Luxembourg Branch*2-4, rue Eugène RuppertL-2453 LuxembourgGrand Duchy of Luxembourg
Transfer Agent and RegistrarJ.P. Morgan Bank Luxembourg S.A.European Bank & Business Center6, route de Trèves, Building CL-2633 SenningerbergGrand Duchy of Luxembourg
AuditorErnst & Young S.A.*35E avenue John F. Kennedy,L-1855 Luxembourg,Grand Duchy of Luxembourg
Legal AdvisersLinklaters LLP35 avenue John F. Kennedy, L-1855 LuxembourgGrand Duchy of Luxembourg
Listing AgentJ.P. Morgan Bank Luxembourg S.A.European Bank & Business Center6, route de Trèves, Building CL-2633 SenningerbergGrand Duchy of Luxembourg
Securities Lending Agent BlackRock Advisors (UK) Limited 12 Throgmorton Avenue London EC2N 2DL UK
Paying AgentsA list of Paying Agents is to be found on pages 3 and 4.
Registered Office2-4, rue Eugène RuppertL-2453 LuxembourgGrand Duchy of Luxembourg
EnquiriesIn the absence of other arrangements, enquiries regarding the Company should be addressed as follows:Written enquiries:BlackRock Investment Management (UK) Limitedc/o BlackRock (Luxembourg) S.A.P.O. Box 1058L-1010 LuxembourgGrand Duchy of Luxembourg
All other enquiries:Telephone: + 44 207 743 3300Fax: + 44 207 743 1143Website: www.blackrockinternational.comEmail: [email protected]
Board of Directors(1)(2)(3) Management and Administration continued
Board of DirectorsManagement and Administration
* Refer to Note 1, Significant Events.
Annual Report and Audited Financial Statements [3]
Current ProspectusBlackRock Global Funds (the “Company”) Prospectus and addendum, and the relevant KIID for the Funds along with copies of the Account Opening and Dealing Form may be obtained from the Local Investor Services Centre, the Management Company or any of the Representatives or Distributors. Copies of the Company’s Articles of Association and the Annual Report and Audited Financial Statements and Interim Report and Unaudited Financial Statements may also be obtained free of charge from any of these offices and from the Paying Agents. All these documents are also available from www.blackrockinternational.com.
RepresentativesThe representative in Hong Kong is BlackRock Asset Management North Asia Limited, 16/F, Champion Tower, 3 Garden Road Central Hong Kong.
The representative in Switzerland is BlackRock Asset Management Schweiz AG, Bahnhofstrasse 39, 8001 Zurich, Switzerland.
The representative in Poland is Dubiński Jeleński Masiarz and Partners Sp.K ul. Zielna 37, 00-108 Warszawa, Poland.
The representative in Israel is Altshuler Shaham Mutual Funds Management Ltd.
The facilities agent in Ireland is BlackRock Investment Management (Dublin) Limited and BlackRock Investment Management (UK) Limited acts as UK facilities agent.
Authorised StatusThe Company is an Undertaking for Collective Investment in Transferable Securities (“UCITS”) under the Luxembourg law of 17 December 2010 as amended. Regulatory consents have been obtained or appropriate notifications have been made for the distribution of shares of the Company’s Funds in the umbrella in the following countries:
Austria, Czech Republic, Denmark, Finland, France, Germany, Gibraltar, Hungary, Iceland, Ireland, Liechtenstein, Luxembourg, Netherlands, Norway, Poland, Slovakia, Spain, Sweden and the United Kingdom.
Regulatory consents have been obtained or appropriate notifications have been made for the distribution of shares of certain Funds in the umbrella in the following countries:
Belgium, Brunei, Chile, China, Greece, Hong Kong, Israel, Italy, Japan, Korea, Macau, Portugal, Singapore, Switzerland, Taiwan and UAE.
Shares of certain Funds in the umbrella may also be offered in certain other jurisdictions from time to time on a private placement basis.
The Company is duly registered with the Comisión Nacional de Mercado de Valores in Spain under number 140.
General Information
Paying AgentsAustriaRaiffeisen BankInternational AGAm Stadtpark 91030 Vienna
BelgiumJ.P. Morgan Chase Bank N.A. Brussels Branch1 Boulevard du Roi Albert IIBrusselsB1210
Czech RepublicUniCredit Bank Czech Republic and Slovakia, A.S.Prague 4 - Michle, Zeletavská 1525/1,140 92
FranceCACEIS Bank1/3, Place Valhubert 75013, Paris
Luxembourg(Central Paying Agent)J.P. Morgan BankLuxembourg S.A. European Bank & Business Center,6, route de Trèves, Building CL-2633 Senningerberg
SwitzerlandState Street Bank International GmbH,Munich, Zurich branchBeethovenstrasse 19,CH-8027 Zurich
ItalyAllfunds Bank S.A. Succursale di MilanoVia Santa Margherita 720121 Milan
Banca Monte dei Paschi di Siena S.p.A.Piazza Salimbeni 353100 Siena
Banca Sella Holding S.p.A.Piazza Gaudenzio Sella 113900 Biella
General Information
[4] BlackRock Global Funds (BGF)
General Information continued
Paying Agents continuedItaly continuedBNP Paribas SecuritiesServicesSuccursale di MilanoVia Ansperto 520123 Milan
RBC Investor Services Bank S.A.Succursale di MilanoVia Vittor Pisani, 26I-20121 Milan
Société Générale Securities Services S.p.A.Via Benigno Crespi, 19/A, MAC II20159 Milan
Italy continued State Street Bank GmbH – Succursale ItaliaRegistered OfficeVia Ferrante Aporti, 1020125 Milan
CACEIS Bank S.A.Registered OfficePiazza Cavour,20121 Milan
ICCREA Banca S.p.A.Via Lucrezia Romana 41-4700178 Rome
PolandBank Handlowy w Warszawie Spólka Akcyjna ul. Senatorska 1600-923 Warszawa
United KingdomJ.P. Morgan Trustee and Depositary Company Limited Hampshire Building, 1st FloorChasesideBournemouthBH7 7DA
GermanyJ.P. Morgan AGCIB/Investor Services - Trustee & FiduciaryTaunustor 1 (Taunus Turm)60310 Frankfurt am Main
LiechtensteinVP Bank AG9490 Vaduz,(FL-0001.007.080-0)represented byVP Fund Solutions (Liechtenstein) AG9490 Vaduz, (FL-0002.000.772-7)
Mauritius Subsidiary
Directors Mauritian Auditor to the SubsidiaryPeter Nagle (appointed effective 26 September 2018) EY MauritiusCouldip Basanta Lala (resigned effective 26 September 2018) Level 9, Tower 1,Geoffrey Radcliffe NexTeracom, Cybercity,Dilshaad Rajabalee EbèneRobert Hayes Republic of MauritiusPaul Freeman
Investment ManagerBlackRock Investment Management (UK) Limited12 Throgmorton AvenueLondon EC2N 2DLUnited Kingdom
Mauritian AdministratorSanne Group plcIFS Court, Bank StreetTwentyEight, CybercityEbène 72201Republic of Mauritius
Publication of Prices and Notices to ShareholdersNotices are sent to registered shareholders and (when legally required) published in such newspapers as decided by the Directors and in the Recueil des Sociétés et Associations du Mémorial Luxembourg. The previous Dealing Day’s prices for shares may be obtained during business hours from the local Investor Servicing team and are also available from the BlackRock website. They will also be published in such countries as required under applicable law and at the discretion of the Directors in a number of newspapers or electronic platforms worldwide. The Company cannot accept any responsibility for error or delay in the publication or non-publication of prices. Historic dealing prices for all shares are available from the Administrator or local Investor Servicing team.

Annual Report and Audited Financial Statements [5]
Purchases and SalesA detailed list of investments purchased and sold for any Fund during the year is available upon request, free of charge, from the Registered office as mentioned on page 2, or the offices of the Representatives as mentioned on page 3.
Disclosure PolicyDetails of month end holdings and valuations for all BlackRock Global Funds will be made available upon request from the Investor Services Centre to any BlackRock Global Funds shareholder no earlier than 10 business days after a given month end. BlackRock Global Funds reserves the right to require shareholders to sign an appropriate non-disclosure document prior to providing such information.
For German investorsThis annual report and audited financial statements (the “Report and Financial Statements”) may be translated into other languages. Any such translation shall only contain the same information and have the same meaning as the English language Report and Financial Statements. To the extent that there is any inconsistency between the English language Report and Financial Statements and the Report and Financial Statements in another language, the English language Report and Financial Statements will prevail, except to the extent (and only to the extent) that it is required by law of any jurisdiction where the shares are sold, that in an action based upon disclosure in a Report and Financial Statements in a language other than English, the language of the Report and Financial Statements on which such action is based shall prevail. Any disputes as to the terms of the Report and Financial Statements, regardless of the language of the Report and Financial Statements, shall be governed by and construed in accordance with the laws of Luxembourg.
The prospectus, the KIID and a full statement of portfolio changes are available free of charge, from the German Paying Agent.
Please note that a notification regarding the distribution of shares in the Federal Republic of Germany pursuant to section 310 of the German Capital Investment Code (Kapitalanlagegesetzbuch) has not been filed in respect of the following Sub-Fund: Asian Multi-Asset Growth Fund. Therefore, shares of this Sub-Fund may not be distributed in the Federal Republic of Germany.
General Information continued
The information stated in this report is historical and not necessarily indicative of future performance.
[6] BlackRock Global Funds (BGF)
Chairman’s Letter to Shareholders1 September 2018 to 31 August 2019
Dear Shareholder,
I am writing to update you on the activities of BlackRock Global Funds (“BGF”) over the twelve months to the end of August 2019. The BGF range comprised 81 funds (each a “Fund”, together the “Funds”) as at 31 August 2019.
The individual Funds’ performance is covered in more detail in the separate Investment Adviser’s report. It has been an unsettled year in financial markets. The global economy has perceptibly started to slow, while the tensions between the US and China have started to look less like a squabble over trade and more like a more fundamental realignment of political and economic power. At the same time, central bank policy has notably changed direction. This has left investors uncertain and created significant volatility.
In its July update, the International Monetary Fund (“IMF”) lowered its global growth forecast to 3.2% in 2019, picking up to 3.5% in 2020. This is 0.1% lower than in the April World Economic Outlook projections for both years. The agency said: “Gross domestic product (“GDP”) releases so far this year, together with generally softening inflation, point to weaker-than-anticipated global activity. Investment and demand for consumer durables have been subdued across advanced and emerging market economies as firms and households continue to hold back on long-range spending.”
The backdrop of US/China trade tensions – with protectionist measures on both sides and the threat of higher tariffs – has played a significant role in weakening global growth. The manufacturing sector has been hit particularly hard. Export-led economies such as Germany have felt considerable pain. Europe’s largest economy is likely to slip into recession this year as a result.
Talks between the two nations are ongoing and US president Donald Trump will be aware that re-election is looming in 2020. However, the problem is starting to look like a battle for global economic supremacy, rather than simply a spat over tariffs. With that in mind, it is difficult to see a short-term resolution and uncertainty is likely to continue.
US economic strength started to wane as the impact of tax reform diminished. It grew at a rate of 2% in the second quarter, a significant slow-down from the first quarter and a little behind estimates. The weakness was largely attributable to falling business investment, while consumer spending remained robust.
European leaders were forced to contend with populism on the one hand and Brexit on the other. At the same time, the Eurozone economy remained lacklustre, with inflation sluggish. French president Emmanuel Macron was forced to face down the ‘Gilets Jaunes’, as protestors took to the streets. Italy’s populist coalition collapsed. Germany too was struggling with the rise of the far right.
Japan’s economy continued to grow, rising 1.3% in the April-June quarter. This was driven by public investment, but consumer and business spending held up. The Bank of Japan remains committed to loose monetary policy and retains some optimism that the economy will continue to expand.
Another potential crisis loomed in emerging markets as Argentina’s economy ran into difficulties. However, there was limited contagion. China’s economic growth hit a near-30 year low, but, at 6.2%, was still faster than any developed market.
Economic weakness brought a volte-face from central bankers. The Federal Reserve (“Fed”) cut rates in July for the first time in a decade. The European Central Bank (“ECB”) was sufficiently worried to revive the quantitative easing policy that it had only just brought to an end. A number of emerging markets also cut rates in response to the Fed’s move.
Stock markets were highly volatile over the twelve month period. Although they recovered from the weakness seen at the end of 2018, they continued to prove vulnerable to macroeconomic factors, such as the trade war.
Within fixed income markets, there was a reversion to ‘safety’ and yield on developed market government bonds began to fall. In October, yields on the 10-year US treasury bond had edged over 3%, but they were back down to around 1.5% by the end of August. In the meantime, corporate credit has been relatively weak as investors started to fear debt levels in US corporates and a slowdown in growth.
Regulatory change continued throughout Europe and a number of these future changes could have implications for investors. Key changes included:
} On 21 July 2018, new rules came into effect to make money market funds (“MMFs”) more resilient against financial market difficulties, reduce the risk posed by significant and rapid redemptions and limit cross-border contagion. They applied to newly issued MMFs in the EU immediately, and existing MMFs were required to show compliance by 21 January 2019. The Money Market Funds Regulation (“MMFR”) introduced stricter liquidity requirements for MMFs to meet any sudden withdrawals,
Chairman’s Letter to Shareholders

The information stated in this report is historical and not necessarily indicative of future performance.
Annual Report and Audited Financial Statements [7]
Chairman’s Letter to Shareholders1 September 2018 to 31 August 2019 continued
establishes rules on portfolio diversification and valuation of assets while also increasing credit quality requirements. MMFR introduced four new fund types. Effective 20 May 2019, the Euro Reserve Fund and the US Dollar Reserve Fund were subject to MMFR and are both categorised as short-term variable net asset value money market funds (“ST VNAV”). The NAV of such funds will be calculated to four decimal places.
} Packaged Retail Investment and Insurance-based Investment Products (PRIIPs): The European Commission published guidelines on 7 July 2017 on key information documents for packaged retail and insurance-based investment products. The new legislation – which governs the marketing and distribution of financial products – came into effect for all funds, with the exception of UCITS funds, at the start of 2018. The Company will benefit from the transitional period available for a UCITS, and the legislation will not be applicable to the Company until 31 December 2021.
The assets under management (“AUM”) in the BGF range dropped 10.6% from US$145.80 billion to US$130.41 billion over the period, with weakness across almost all asset classes as markets remained volatile and investors nervous.
There were pockets of strength. The range of specialist funds, for example, drew assets. The World Technology Fund saw assets rise 21.8% to US$1.85 billion, while the World Gold Fund benefitted from a search for ‘safe haven’ assets, rising 62.5% to US$5.67 billion. The Global Government Bond Fund rose 25.2% to US$739.89 million.
Amid mainstream equity funds, there was a marked preference for more stable areas, with equity income funds losing fewer assets than higher risk funds, such as emerging markets or smaller companies. For example, the US Small & MidCap Opportunities Fund dropped 28.7% to US$162.74 million, while the North American Equity Income Fund dropped just 10.4% (to US$91.53 million).
Within Asia and Emerging Markets there was a notable rotation from equities. The Asian Dragon Fund and Asian Growth Leaders Fund lost 36.4% and 34.5% respectively (to US$2.33 billion and US$2.32 billion respectively). In contrast, the Asian Tiger Bond Fund grew 19.6% to US$3.02 billion, while the China Bond Fund grew 105.0% to CNH1.33 billion. Emerging market bond funds generally fared well.
Multi-asset funds also played to investors’ desire for safety. In particular, the ESG Multi-Asset Fund (formerly the Flexible Multi-Asset Fund) saw assets rise 64.2% to EUR560.74 million.
There were a number of changes to the range over the period. We launched a series of ‘future-focused’ funds – the Future Of Transport Fund, the FinTech Fund and the Next Generation Technology Fund. We also launched the Global Conservative Income Fund to meet investors growing need for low-risk income options and the Market Navigator Fund, designed as a flexible multi-asset fund, managed by Adam Ryan and Rupert Harrison. The Flexible Multi-Asset Fund changed to an environmental, social and governance (“ESG”) mandate, renamed the ESG Multi-Asset Fund.
We closed the Global Long-Horizon Equity Fund and the Strategic Global Bond Fund over the twelve month period.
Should you have any questions on any of this material, please contact us via our website: www.blackrockinternational.com or via email: [email protected].
Yours faithfully,
Paul Freeman Chairman
17 December 2019
The information stated in this report is historical and not necessarily indicative of future performance.
[8] BlackRock Global Funds (BGF)
Investment Adviser’s ReportPerformance overview1 September 2018 to 31 August 2019
Market ReviewIt has been a difficult year for equity markets. Although most markets are marginally ahead over the twelve-month period, there has been considerable volatility in between, with sentiment knocked by slowing global growth and geopolitical tensions.
The reversal of the Federal Reserve (“Fed”) policy of monetary tightening has helped support markets over the period. Having slumped in the final quarter of 2018, an apparent change of heart on future interest rate rises helped markets recover in the first half of 2019. From there, they have been broadly flat.
The US market has led the way once again and there continued to be a significant disparity between the performance of dependable growth stocks, which did well, and ‘value’ names, which were weak. The rating of growth stocks continued to cause concern, with valuations looking increasingly stretched. Emerging markets had a tougher time, particularly in Asia.
Bond yields had been rising throughout much of 2018, but this abruptly reversed in the last few months of the year as investors retreated to ‘safe havens’. Falling government bond yields continued into 2019 – the yield on the 10-year US treasury halved over the period under review. It was a similar picture in Europe, with European government bonds providing a safe haven.
Investors have started to grow increasingly worried about the flattening of the yield curve – this is when expectations of long-term interest rates fall below those of short-term interest rates. It is typically a harbinger of recession. This inversion happened periodically over the year and continues to suggest recession may be looming in the medium term.
Investors will be watching the progression of the US/China trade talks and the response of central banks will be important. However, it is becoming clear that central banks can’t do everything on their own and there is mounting pressure on governments to implement fiscal policy to shore up the ailing global economy.
Fund PerformancePerformance data stated is for the main (A) share class of the relevant Fund, stated in the base currency of the Fund, net of fees and expenses.
Equity Fund PerformanceGlobal equities were volatile over the period, but trended marginally higher. The Global Equity Income Fund rose by 1.00%; this was ahead of its benchmark, the MSCI All Country World Index, which fell by 0.28%.
Shares of small and medium sized companies were hit hard by the general risk aversion, as investors worried about global economic growth. The Global SmallCap Fund fell by 8.77%, in line with its benchmark, the MSCI AC World Small Cap Index, which fell by 8.84%.
Of the individual country funds, the Japan Small & MidCap Opportunities Fund was particularly weak, dropping 20.29%, well behind the S&P Japan Mid Small Cap Index, which dropped 13.04%. The Swiss Small & MidCap Opportunities Fund fell by 3.88%, ahead of its benchmark, the SPI Extra Index, which fell by 5.43%. US small caps were slightly more resilient: the US Small & MidCap Opportunities Fund dropped by 4.25%, underperforming the S&P US Mid Small Cap Index, which fell by 3.83%.
The Continental European Flexible Fund rose by 0.42%, significantly behind its benchmark the FTSE World Europe ex UK Index, which rose by 3.75%. The European Value Fund struggled, dropping 7.43% compared to a fall of 2.96% in the MSCI Europe Value Index. The European Equity Income Fund rose 3.90%. This was ahead of its benchmark, the MSCI Europe Index, which rose by 2.45%. The European Focus Fund was flat, while the European Special Situations Fund rose by 5.41%. Both are benchmarked to the MSCI Europe Index, which rose by 2.45%.
Funds with a focus on US equities sustained their strength through the year. The US Growth Fund rose by 3.92%, just behind the Russell 1000 Growth Index, which rose by 4.27%. The US Basic Value Fund fell by 5.66% underperforming the Russell 1000 Value Index, which was up by 0.62% over the period.
Japanese funds had a difficult time over the twelve months under review. The Japan Flexible Equity Fund dropped 10.66%, behind the MSCI Japan Index, which fell by 9.65%.
Performance across emerging markets funds was mixed. The Asian Growth Leaders Fund fell by 5.78% just behind its benchmark, the MSCI All Country Asia ex Japan Index, which fell by 6.34%. The Asian Dragon Fund dropped 2.79% (against the same benchmark).
The India Fund dropped 7.67%, in line with its MSCI India Index benchmark. The Emerging Markets Fund, which has a more broad exposure across the emerging markets investment universe, rose by 4.70%, well ahead of its benchmark, the MSCI Emerging Markets Index, which was down 4.36%. The Emerging Markets Equity Income Fund, which shares the same benchmark, was up 4.89%.
The Latin American Fund rose by 12.06%, buoyed by a strong performance from Brazilian markets. This was ahead of its benchmark, the MSCI Emerging Markets Latin America Index, which rose by 8.86%.
In natural resources, the World Energy Fund struggled, falling 23.17%, behind its benchmark, the MSCI World Index (Net) (USD), which was down 18.99% over the period. In contrast, the World Mining Fund rose by 1.89% but underperformed its benchmark, the Euromoney Global Mining Constrained Weights Net Total Return Index, which rose by 12.49%.
Investment Adviser’s Report
The information stated in this report is historical and not necessarily indicative of future performance.
Annual Report and Audited Financial Statements [9]
Investment Adviser’s ReportPerformance overview1 September 2018 to 31 August 2019 continued
The World Gold Fund benefited from a rising gold price amid stock market volatility, rising 49.22%, behind its benchmark, the FTSE Gold Mines Index, which rose by 66.28%.
Mixed Asset Fund PerformanceThe diversified Global Allocation Fund – which invests in a mixture of equity, fixed income, commodity-related and cash equivalent securities – returned +0.65%, lagging its reference benchmark, which rose +4.03% (the benchmark is comprised of 36% S&P 500 Index, 24% FTSE World Index (Ex-US) Index, 24% BofA ML Cur 5-Yr US Treasury Index, 16% FTSE Non-USD World Government Bond Index). The Global Dynamic Equity Fund returned -2.74%, behind its reference benchmark, which rose by +0.60% (the benchmark is comprised of 60% S&P 500 Index/40% FTSE World (ex US) Index).
The Global Multi-Asset Income Fund rose by 5.29% over the period. The Fund combines the ability to allocate actively across a full range of asset classes and geographies at a top-down level with a focus on adding value through bottom-up security selection by specialist teams in each key asset class.
Fixed Income Fund PerformanceIn fixed income, investors moved to quality government bonds as worries mounted over the strength of the global economy. The Global Government Bond Fund rose by 11.21%, marginally behind its benchmark, the FTSE World Government Bond USD Hedged Index, which rose by 11.93%. The Euro Corporate Bond Fund rose by 6.22%, compared to a rise of 6.63% for its benchmark, the BofA Merrill Lynch Euro Corporate Index. The Global Corporate Bond Fund rose by 11.35%, compared to a rise of 11.92% for its benchmark, the Bloomberg Barclays Global Aggregate Corporate Bond USD Hedged Index.
The Euro Bond Fund rose by 9.11%, while its benchmark, the Bloomberg Barclays Euro-Aggregate 500mm+ Bond Index, rose by 9.71%. The Euro Short Duration Bond Fund rose by 0.44%.
The Global High Yield Bond Fund rose by 6.16%, behind its benchmark, the BofA Merrill Lynch Global High Yield Constrained USD Hedged Index, which rose by 7.96%. The Emerging Markets Local Currency Bond Fund rose by 10.34% over the period as emerging market currencies sold off. This was behind its benchmark, the JP Morgan GBI-EM Global Diversified Index, which rose by 11.91%. The broader ESG Emerging Markets Bond Fund rose by 11.24%, compared to its benchmark, the JP Morgan EMBI Global Diversified Index, which rose by 14.49%.
The Asian Tiger Bond Fund rose by 10.22%, against 10.86% for its benchmark, the JP Morgan Asia Credit Index.
The Fixed Income Global Opportunities Fund delivered a positive absolute return of 4.73%.
OutlookLooking ahead to the remainder of 2019, trade and geopolitical frictions are likely to be the principal driver of the global
economy and markets. Central banks may be able to cushion the blow and prolong the cycle, but there will need to be progress on fiscal stimulus and trade concessions to realise any real progress.
A wider danger is increasing protectionism and the rolling back of decades-long globalisation trends that have helped lower inflation, boost corporate profits and encourage employment. Populism is emerging across the globe, challenging the existing order and established institutions. If this goes unchecked, there may be longer-term consequences for financial markets.
The shift in monetary policy to defend against weakening growth has already started. The Fed has cut rates already, while the ECB has signalled its willingness to cut rates and resume quantitative easing should the Eurozone’s weaker economy demand it. China is also taking steps to shore up economic growth, though this may not be the panacea that many expect.
With this in mind, recession still looks unlikely in the short-term. There are few signs of inflation, for example, which would prompt a snap rise in rates and therefore a recession.
The BlackRock Investment Institute identified three key themes likely to drive investment markets through 2019 and into 2020:
1. Protectionist push – Trade disputes and broader geopolitical tensions are likely to stoke greater macro uncertainty. The range of potential economic and market outcomes has widened. We see a lull in China’s growth due to the fallout of US tariffs.
2. Stretching the cycle – The shift by central banks towards lower interest rates has depressed long-term yields on government bonds and should help extend the long expansion in the economic cycle. This means that risk assets, such as equities can continue to make progress, though the outlook is less certain and selectivity more important.
3. Raising resilience – We believe portfolio resilience is crucial at a time of elevated macro uncertainty. We define resilience as the ability of a portfolio to withstand a variety of adverse conditions – both on a tactically defensive basis and strategically across cycles.
Against this backdrop, we believe risk assets can run further, but consider a defensive stance more appropriate. This means being careful where we take equity risk, while ensuring that it is balanced with some government bonds and cash. It is a climate in which prudent diversification is likely to be vitally important. We continue to believe investors are likely to need greater resilience against shocks. Discernment is important to avoid significant volatility and diversification, incorporating a wider range of assets, will also be important.
December 2019
The information stated in this report is historical and not necessarily indicative of future performance.
[10] BlackRock Global Funds (BGF)
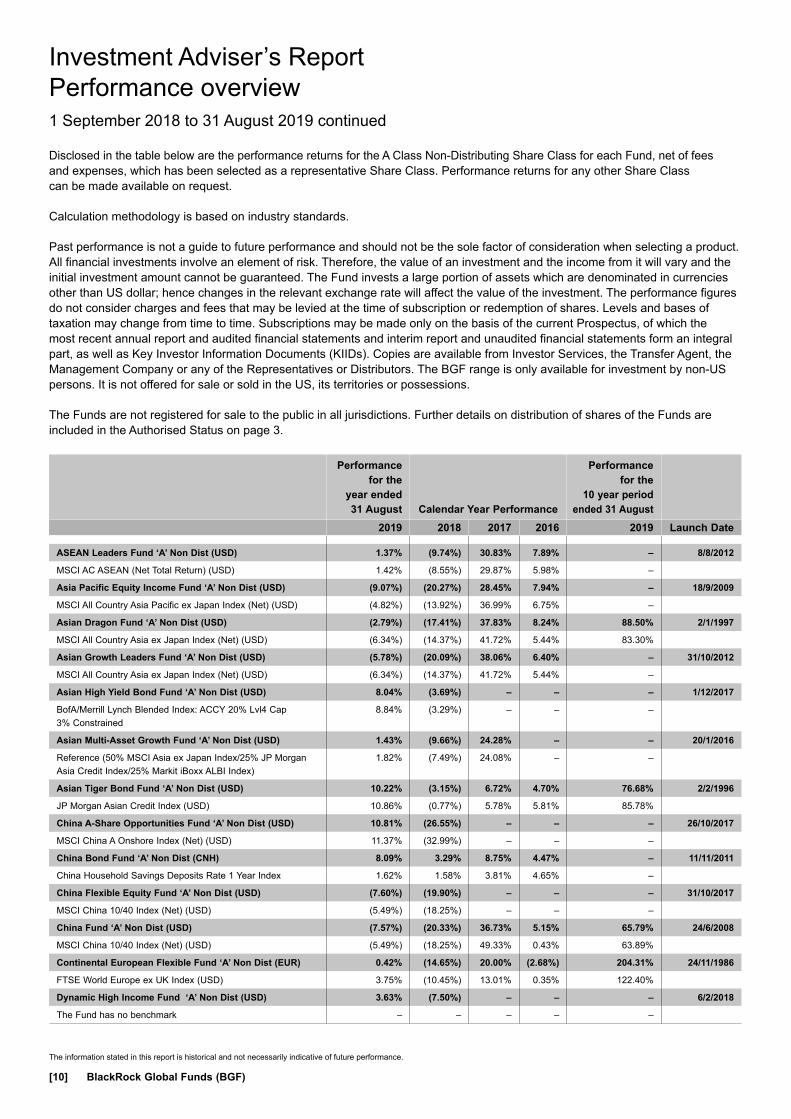
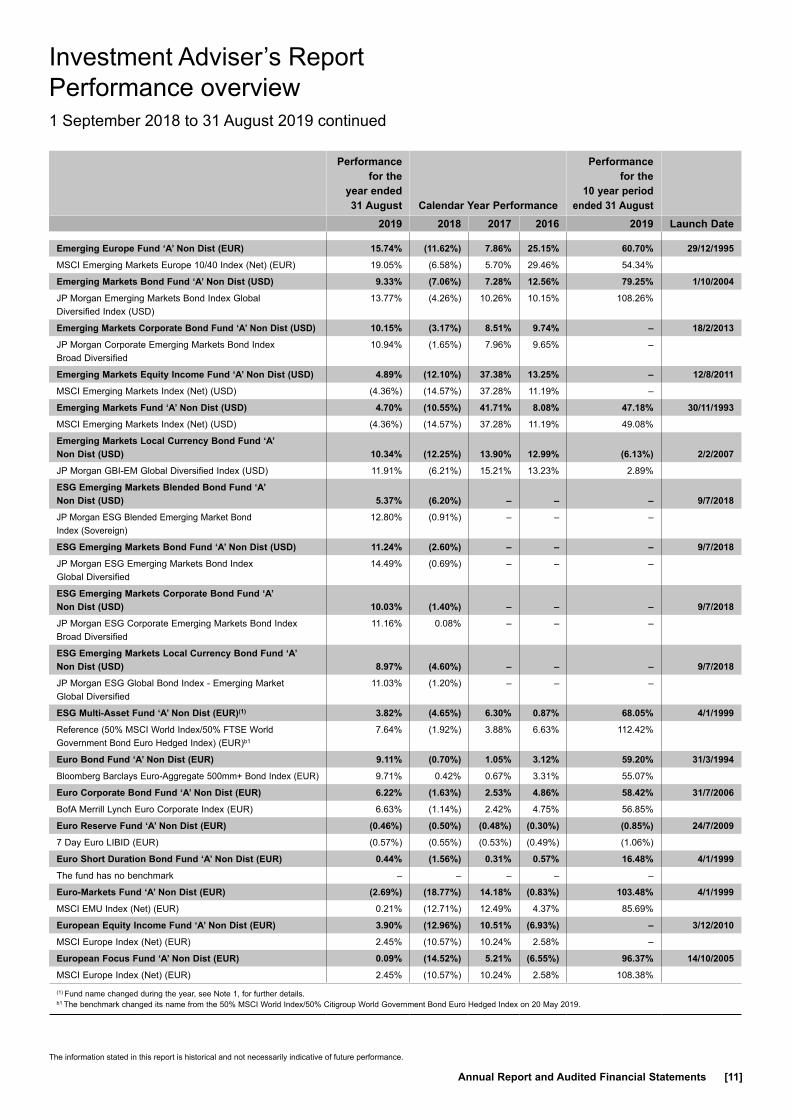
Disclosed in the table below are the performance returns for the A Class Non-Distributing Share Class for each Fund, net of fees and expenses, which has been selected as a representative Share Class. Performance returns for any other Share Class can be made available on request.
Calculation methodology is based on industry standards.
Past performance is not a guide to future performance and should not be the sole factor of consideration when selecting a product. All financial investments involve an element of risk. Therefore, the value of an investment and the income from it will vary and the initial investment amount cannot be guaranteed. The Fund invests a large portion of assets which are denominated in currencies other than US dollar; hence changes in the relevant exchange rate will affect the value of the investment. The performance figures do not consider charges and fees that may be levied at the time of subscription or redemption of shares. Levels and bases of taxation may change from time to time. Subscriptions may be made only on the basis of the current Prospectus, of which the most recent annual report and audited financial statements and interim report and unaudited financial statements form an integral part, as well as Key Investor Information Documents (KIIDs). Copies are available from Investor Services, the Transfer Agent, the Management Company or any of the Representatives or Distributors. The BGF range is only available for investment by non-US persons. It is not offered for sale or sold in the US, its territories or possessions.
The Funds are not registered for sale to the public in all jurisdictions. Further details on distribution of shares of the Funds are included in the Authorised Status on page 3.
Performance for the
year ended 31 August Calendar Year Performance
Performance for the
10 year period ended 31 August
2019 2018 2017 2016 2019 Launch Date
ASEAN Leaders Fund ‘A’ Non Dist (USD) 1.37% (9.74%) 30.83% 7.89% – 8/8/2012
MSCI AC ASEAN (Net Total Return) (USD) 1.42% (8.55%) 29.87% 5.98% –
Asia Pacific Equity Income Fund ‘A’ Non Dist (USD) (9.07%) (20.27%) 28.45% 7.94% – 18/9/2009
MSCI All Country Asia Pacific ex Japan Index (Net) (USD) (4.82%) (13.92%) 36.99% 6.75% –
Asian Dragon Fund ‘A’ Non Dist (USD) (2.79%) (17.41%) 37.83% 8.24% 88.50% 2/1/1997
MSCI All Country Asia ex Japan Index (Net) (USD) (6.34%) (14.37%) 41.72% 5.44% 83.30%
Asian Growth Leaders Fund ‘A’ Non Dist (USD) (5.78%) (20.09%) 38.06% 6.40% – 31/10/2012
MSCI All Country Asia ex Japan Index (Net) (USD) (6.34%) (14.37%) 41.72% 5.44% –
Asian High Yield Bond Fund ‘A’ Non Dist (USD) 8.04% (3.69%) – – – 1/12/2017
BofA/Merrill Lynch Blended Index: ACCY 20% Lvl4 Cap 3% Constrained
8.84% (3.29%) – – –
Asian Multi-Asset Growth Fund ‘A’ Non Dist (USD) 1.43% (9.66%) 24.28% – – 20/1/2016
Reference (50% MSCI Asia ex Japan Index/25% JP Morgan Asia Credit Index/25% Markit iBoxx ALBI Index)
1.82% (7.49%) 24.08% – –
Asian Tiger Bond Fund ‘A’ Non Dist (USD) 10.22% (3.15%) 6.72% 4.70% 76.68% 2/2/1996
JP Morgan Asian Credit Index (USD) 10.86% (0.77%) 5.78% 5.81% 85.78%
China A-Share Opportunities Fund ‘A’ Non Dist (USD) 10.81% (26.55%) – – – 26/10/2017
MSCI China A Onshore Index (Net) (USD) 11.37% (32.99%) – – –
China Bond Fund ‘A’ Non Dist (CNH) 8.09% 3.29% 8.75% 4.47% – 11/11/2011
China Household Savings Deposits Rate 1 Year Index 1.62% 1.58% 3.81% 4.65% –
China Flexible Equity Fund ‘A’ Non Dist (USD) (7.60%) (19.90%) – – – 31/10/2017
MSCI China 10/40 Index (Net) (USD) (5.49%) (18.25%) – – –
China Fund ‘A’ Non Dist (USD) (7.57%) (20.33%) 36.73% 5.15% 65.79% 24/6/2008
MSCI China 10/40 Index (Net) (USD) (5.49%) (18.25%) 49.33% 0.43% 63.89%
Continental European Flexible Fund ‘A’ Non Dist (EUR) 0.42% (14.65%) 20.00% (2.68%) 204.31% 24/11/1986
FTSE World Europe ex UK Index (USD) 3.75% (10.45%) 13.01% 0.35% 122.40%
Dynamic High Income Fund ‘A’ Non Dist (USD) 3.63% (7.50%) – – – 6/2/2018
The Fund has no benchmark – – – – –
Investment Adviser’s ReportPerformance overview1 September 2018 to 31 August 2019 continued
The information stated in this report is historical and not necessarily indicative of future performance.
Annual Report and Audited Financial Statements [11]
Investment Adviser’s ReportPerformance overview1 September 2018 to 31 August 2019 continued
Performance for the
year ended 31 August Calendar Year Performance
Performance for the
10 year period ended 31 August
2019 2018 2017 2016 2019 Launch Date
Emerging Europe Fund ‘A’ Non Dist (EUR) 15.74% (11.62%) 7.86% 25.15% 60.70% 29/12/1995
MSCI Emerging Markets Europe 10/40 Index (Net) (EUR) 19.05% (6.58%) 5.70% 29.46% 54.34%
Emerging Markets Bond Fund ‘A’ Non Dist (USD) 9.33% (7.06%) 7.28% 12.56% 79.25% 1/10/2004
JP Morgan Emerging Markets Bond Index Global Diversified Index (USD)
13.77% (4.26%) 10.26% 10.15% 108.26%
Emerging Markets Corporate Bond Fund ‘A’ Non Dist (USD) 10.15% (3.17%) 8.51% 9.74% – 18/2/2013
JP Morgan Corporate Emerging Markets Bond Index Broad Diversified
10.94% (1.65%) 7.96% 9.65% –
Emerging Markets Equity Income Fund ‘A’ Non Dist (USD) 4.89% (12.10%) 37.38% 13.25% – 12/8/2011
MSCI Emerging Markets Index (Net) (USD) (4.36%) (14.57%) 37.28% 11.19% –
Emerging Markets Fund ‘A’ Non Dist (USD) 4.70% (10.55%) 41.71% 8.08% 47.18% 30/11/1993
MSCI Emerging Markets Index (Net) (USD) (4.36%) (14.57%) 37.28% 11.19% 49.08%
Emerging Markets Local Currency Bond Fund ‘A’ Non Dist (USD) 10.34% (12.25%) 13.90% 12.99% (6.13%) 2/2/2007
JP Morgan GBI-EM Global Diversified Index (USD) 11.91% (6.21%) 15.21% 13.23% 2.89%
ESG Emerging Markets Blended Bond Fund ‘A’ Non Dist (USD) 5.37% (6.20%) – – – 9/7/2018
JP Morgan ESG Blended Emerging Market Bond Index (Sovereign)
12.80% (0.91%) – – –
ESG Emerging Markets Bond Fund ‘A’ Non Dist (USD) 11.24% (2.60%) – – – 9/7/2018
JP Morgan ESG Emerging Markets Bond Index Global Diversified
14.49% (0.69%) – – –
ESG Emerging Markets Corporate Bond Fund ‘A’ Non Dist (USD) 10.03% (1.40%) – – – 9/7/2018
JP Morgan ESG Corporate Emerging Markets Bond Index Broad Diversified
11.16% 0.08% – – –
ESG Emerging Markets Local Currency Bond Fund ‘A’ Non Dist (USD) 8.97% (4.60%) – – – 9/7/2018
JP Morgan ESG Global Bond Index - Emerging Market Global Diversified
11.03% (1.20%) – – –
ESG Multi-Asset Fund ‘A’ Non Dist (EUR)(1) 3.82% (4.65%) 6.30% 0.87% 68.05% 4/1/1999
Reference (50% MSCI World Index/50% FTSE World Government Bond Euro Hedged Index) (EUR)b1
7.64% (1.92%) 3.88% 6.63% 112.42%
Euro Bond Fund ‘A’ Non Dist (EUR) 9.11% (0.70%) 1.05% 3.12% 59.20% 31/3/1994
Bloomberg Barclays Euro-Aggregate 500mm+ Bond Index (EUR) 9.71% 0.42% 0.67% 3.31% 55.07%
Euro Corporate Bond Fund ‘A’ Non Dist (EUR) 6.22% (1.63%) 2.53% 4.86% 58.42% 31/7/2006
BofA Merrill Lynch Euro Corporate Index (EUR) 6.63% (1.14%) 2.42% 4.75% 56.85%
Euro Reserve Fund ‘A’ Non Dist (EUR) (0.46%) (0.50%) (0.48%) (0.30%) (0.85%) 24/7/2009
7 Day Euro LIBID (EUR) (0.57%) (0.55%) (0.53%) (0.49%) (1.06%)
Euro Short Duration Bond Fund ‘A’ Non Dist (EUR) 0.44% (1.56%) 0.31% 0.57% 16.48% 4/1/1999
The fund has no benchmark – – – – –
Euro-Markets Fund ‘A’ Non Dist (EUR) (2.69%) (18.77%) 14.18% (0.83%) 103.48% 4/1/1999
MSCI EMU Index (Net) (EUR) 0.21% (12.71%) 12.49% 4.37% 85.69%
European Equity Income Fund ‘A’ Non Dist (EUR) 3.90% (12.96%) 10.51% (6.93%) – 3/12/2010
MSCI Europe Index (Net) (EUR) 2.45% (10.57%) 10.24% 2.58% –
European Focus Fund ‘A’ Non Dist (EUR) 0.09% (14.52%) 5.21% (6.55%) 96.37% 14/10/2005
MSCI Europe Index (Net) (EUR) 2.45% (10.57%) 10.24% 2.58% 108.38%
(1) Fund name changed during the year, see Note 1, for further details.b1 The benchmark changed its name from the 50% MSCI World Index/50% Citigroup World Government Bond Euro Hedged Index on 20 May 2019.

The information stated in this report is historical and not necessarily indicative of future performance.
[12] BlackRock Global Funds (BGF)
Investment Adviser’s ReportPerformance overview1 September 2018 to 31 August 2019 continued
Performance for the
year ended 31 August Calendar Year Performance
Performance for the
10 year period ended 31 August
2019 2018 2017 2016 2019 Launch Date
European Fund ‘A’ Non Dist (EUR) 2.17% (14.54%) 6.80% (5.60%) 87.33% 30/11/1993
MSCI Europe Index (Net) (EUR) 2.45% (10.57%) 10.24% 2.58% 108.38%
European High Yield Bond Fund ‘A’ Non Dist (EUR) 5.35% (4.23%) 6.92% 7.00% – 23/7/2015
Bloomberg Barclays Pan European High Yield 3% Issuer Constrained Index EUR Hedged (EUR)
5.55% (3.59%) 6.77% 9.02% –
European Special Situations Fund ‘A’ Non Dist (EUR) 5.41% (14.07%) 17.21% (7.12%) 210.09% 14/10/2002
MSCI Europe Index (Net) (EUR) 2.45% (10.57%) 10.24% 2.58% 126.87%
European Value Fund ‘A’ Non Dist (EUR) (7.43%) (19.16%) 6.35% (0.35%) 81.65% 8/1/1997
MSCI Europe Value Index (Net) (EUR) (2.96%) (11.64%) 8.26% 7.41% 63.42%
FinTech Fund ‘A’ Non Dist (USD)(2) 5.30% (18.70%) – – – 4/9/2018
The Fund has no benchmark – – – – –
Fixed Income Global Opportunities Fund ‘A’ Non Dist (USD) 4.73% (1.21%) 4.09% 2.44% 47.43% 31/1/2007
No Index. Absolute Return Style Fund. – – – – –
Future Of Transport Fund ‘A’ Non Dist (USD)(2) (18.00%) (20.40%) – – – 4/9/2018
The Fund has no benchmark – – – – –
Global Allocation Fund ‘A’ Non Dist (USD) 0.65% (8.87%) 12.83% 3.24% 58.80% 3/1/1997
Reference (36% S&P 500 Index/24% FTSE World (Ex-US) Index/24% ICE BofAML Current 5Yr US Treasury Index/16% FTSE Non-USD World Government Bond Index) (USD)
4.03% (4.68%) 15.69% 6.06% 101.36%
Global Bond Income Fund ‘A’ Non Dist (USD) 6.91% (0.80%) – – – 16/7/2018
The Fund has no benchmark – – – – –
Global Conservative Income Fund ‘A’ Non Dist (EUR)(2) 2.60% (3.40%) – – – 12/9/2018
Reference (30% MSCI World Index EUR Hedged/70% Bloomberg Barclays Global Aggregate Bond Index EUR Hedged)
5.65% 3.35% – – –
Global Corporate Bond Fund ‘A’ Non Dist (USD) 11.35% (2.71%) 5.65% 4.36% 62.42% 19/10/2007
Bloomberg Barclays Global Aggregate Corporate Bond USD Hedged Index (USD)
11.92% (1.00%) 5.70% 6.22% 72.19%
Global Dynamic Equity Fund ‘A’ Non Dist (USD) (2.74%) (12.49%) 19.08% 5.41% 98.24% 28/2/2006
Reference (60% S&P 500 Index/40% FTSE World (ex US) Index) (USD)
0.60% (8.17%) 23.74% 9.13% 163.68%
Global Enhanced Equity Yield Fund ‘A’ Non Dist (USD) 0.35% (9.53%) 18.35% 5.04% 72.02% 13/10/2006
The Fund has no benchmark – – – – –
Global Equity Income Fund ‘A’ Non Dist (USD) 1.00% (12.17%) 18.48% 4.31% – 12/11/2010
MSCI All Country World Index (Net) (USD) (0.28%) (9.41%) 23.97% 7.86% –
Global Government Bond Fund ‘A’ Non Dist (USD) 11.21% 0.49% 2.33% 2.87% 45.48% 13/5/1987
FTSE World Government Bond USD Hedged Index (USD)b2 11.93% 2.60% 2.14% 3.75% 50.12%
Global High Yield Bond Fund ‘A’ Non Dist (USD) 6.16% (3.36%) 7.58% 12.22% 103.60% 8/6/2007
BofA Merrill Lynch Global High Yield Constrained USD Hedged Index (USD)
7.96% (1.90%) 7.99% 16.21% 133.70%
Global Inflation Linked Bond Fund ‘A’ Non Dist (USD) 6.04% 0.14% 2.89% 8.83% 50.29% 19/6/2009
Bloomberg Barclays World Government Inflation-Linked 1-20yr Index USD Hedged (USD)
8.28% 0.99% 2.91% 10.22% 60.30%
Global Long-Horizon Equity Fund ‘A’ Non Dist (USD)(3) – 1.00% 24.22% – – 19/7/2016
MSCI All Country World Index (Net) (USD) – (9.41%) 23.97% – –
(2) Fund launched during the year, see Note 1, for further details.(3) Fund terminated during the year, see Note 1, for further details.b2 The benchmark changed its name from the Citigroup World Government Bond USD Hedged Index on 20 May 2019.
The information stated in this report is historical and not necessarily indicative of future performance.
Annual Report and Audited Financial Statements [13]
Investment Adviser’s ReportPerformance overview1 September 2018 to 31 August 2019 continued
Performance for the
year ended 31 August Calendar Year Performance
Performance for the
10 year period ended 31 August
2019 2018 2017 2016 2019 Launch Date
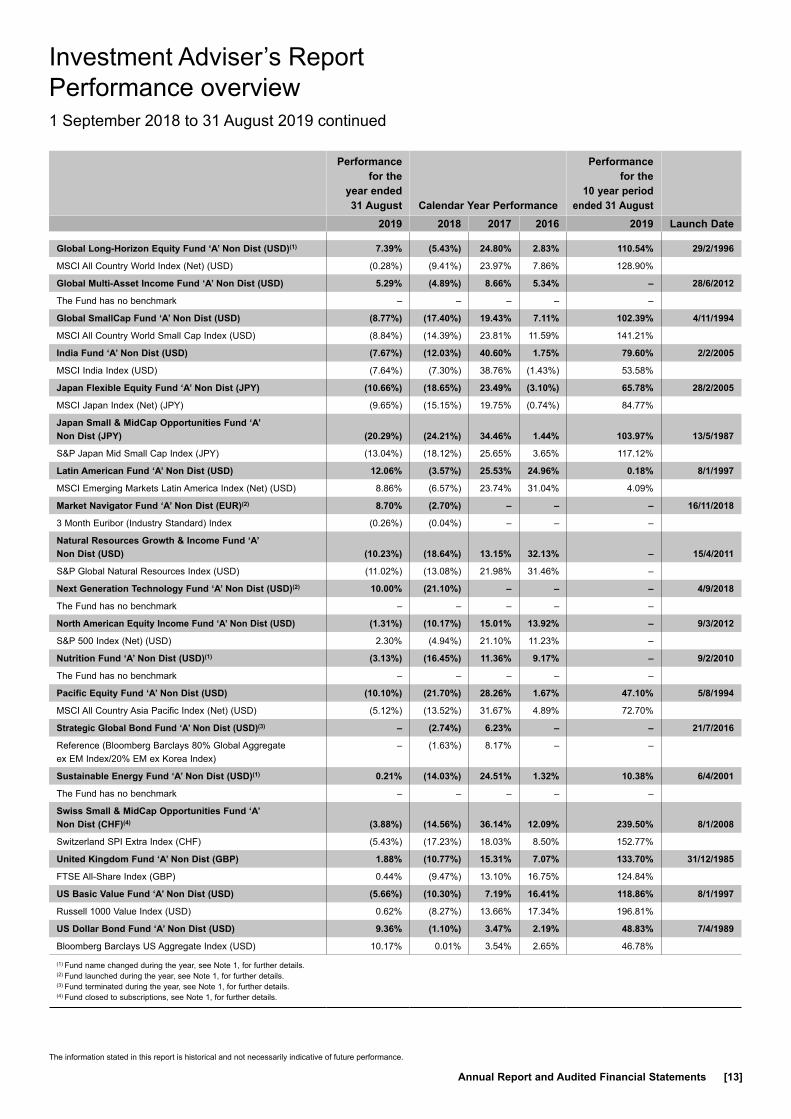
Global Long-Horizon Equity Fund ‘A’ Non Dist (USD)(1) 7.39% (5.43%) 24.80% 2.83% 110.54% 29/2/1996
MSCI All Country World Index (Net) (USD) (0.28%) (9.41%) 23.97% 7.86% 128.90%
Global Multi-Asset Income Fund ‘A’ Non Dist (USD) 5.29% (4.89%) 8.66% 5.34% – 28/6/2012
The Fund has no benchmark – – – – –
Global SmallCap Fund ‘A’ Non Dist (USD) (8.77%) (17.40%) 19.43% 7.11% 102.39% 4/11/1994
MSCI All Country World Small Cap Index (USD) (8.84%) (14.39%) 23.81% 11.59% 141.21%
India Fund ‘A’ Non Dist (USD) (7.67%) (12.03%) 40.60% 1.75% 79.60% 2/2/2005
MSCI India Index (USD) (7.64%) (7.30%) 38.76% (1.43%) 53.58%
Japan Flexible Equity Fund ‘A’ Non Dist (JPY) (10.66%) (18.65%) 23.49% (3.10%) 65.78% 28/2/2005
MSCI Japan Index (Net) (JPY) (9.65%) (15.15%) 19.75% (0.74%) 84.77%
Japan Small & MidCap Opportunities Fund ‘A’ Non Dist (JPY) (20.29%) (24.21%) 34.46% 1.44% 103.97% 13/5/1987
S&P Japan Mid Small Cap Index (JPY) (13.04%) (18.12%) 25.65% 3.65% 117.12%
Latin American Fund ‘A’ Non Dist (USD) 12.06% (3.57%) 25.53% 24.96% 0.18% 8/1/1997
MSCI Emerging Markets Latin America Index (Net) (USD) 8.86% (6.57%) 23.74% 31.04% 4.09%
Market Navigator Fund ‘A’ Non Dist (EUR)(2) 8.70% (2.70%) – – – 16/11/2018
3 Month Euribor (Industry Standard) Index (0.26%) (0.04%) – – –
Natural Resources Growth & Income Fund ‘A’ Non Dist (USD) (10.23%) (18.64%) 13.15% 32.13% – 15/4/2011
S&P Global Natural Resources Index (USD) (11.02%) (13.08%) 21.98% 31.46% –
Next Generation Technology Fund ‘A’ Non Dist (USD)(2) 10.00% (21.10%) – – – 4/9/2018
The Fund has no benchmark – – – – –
North American Equity Income Fund ‘A’ Non Dist (USD) (1.31%) (10.17%) 15.01% 13.92% – 9/3/2012
S&P 500 Index (Net) (USD) 2.30% (4.94%) 21.10% 11.23% –
Nutrition Fund ‘A’ Non Dist (USD)(1) (3.13%) (16.45%) 11.36% 9.17% – 9/2/2010
The Fund has no benchmark – – – – –
Pacific Equity Fund ‘A’ Non Dist (USD) (10.10%) (21.70%) 28.26% 1.67% 47.10% 5/8/1994
MSCI All Country Asia Pacific Index (Net) (USD) (5.12%) (13.52%) 31.67% 4.89% 72.70%
Strategic Global Bond Fund ‘A’ Non Dist (USD)(3) – (2.74%) 6.23% – – 21/7/2016
Reference (Bloomberg Barclays 80% Global Aggregate ex EM Index/20% EM ex Korea Index)
– (1.63%) 8.17% – –
Sustainable Energy Fund ‘A’ Non Dist (USD)(1) 0.21% (14.03%) 24.51% 1.32% 10.38% 6/4/2001
The Fund has no benchmark – – – – –
Swiss Small & MidCap Opportunities Fund ‘A’ Non Dist (CHF)(4) (3.88%) (14.56%) 36.14% 12.09% 239.50% 8/1/2008
Switzerland SPI Extra Index (CHF) (5.43%) (17.23%) 18.03% 8.50% 152.77%
United Kingdom Fund ‘A’ Non Dist (GBP) 1.88% (10.77%) 15.31% 7.07% 133.70% 31/12/1985
FTSE All-Share Index (GBP) 0.44% (9.47%) 13.10% 16.75% 124.84%
US Basic Value Fund ‘A’ Non Dist (USD) (5.66%) (10.30%) 7.19% 16.41% 118.86% 8/1/1997
Russell 1000 Value Index (USD) 0.62% (8.27%) 13.66% 17.34% 196.81%
US Dollar Bond Fund ‘A’ Non Dist (USD) 9.36% (1.10%) 3.47% 2.19% 48.83% 7/4/1989
Bloomberg Barclays US Aggregate Index (USD) 10.17% 0.01% 3.54% 2.65% 46.78%
(1) Fund name changed during the year, see Note 1, for further details.(2) Fund launched during the year, see Note 1, for further details.(3) Fund terminated during the year, see Note 1, for further details.(4) Fund closed to subscriptions, see Note 1, for further details.
The information stated in this report is historical and not necessarily indicative of future performance.
[14] BlackRock Global Funds (BGF)
Performance for the
year ended 31 August Calendar Year Performance
Performance for the
10 year period ended 31 August
2019 2018 2017 2016 2019 Launch Date
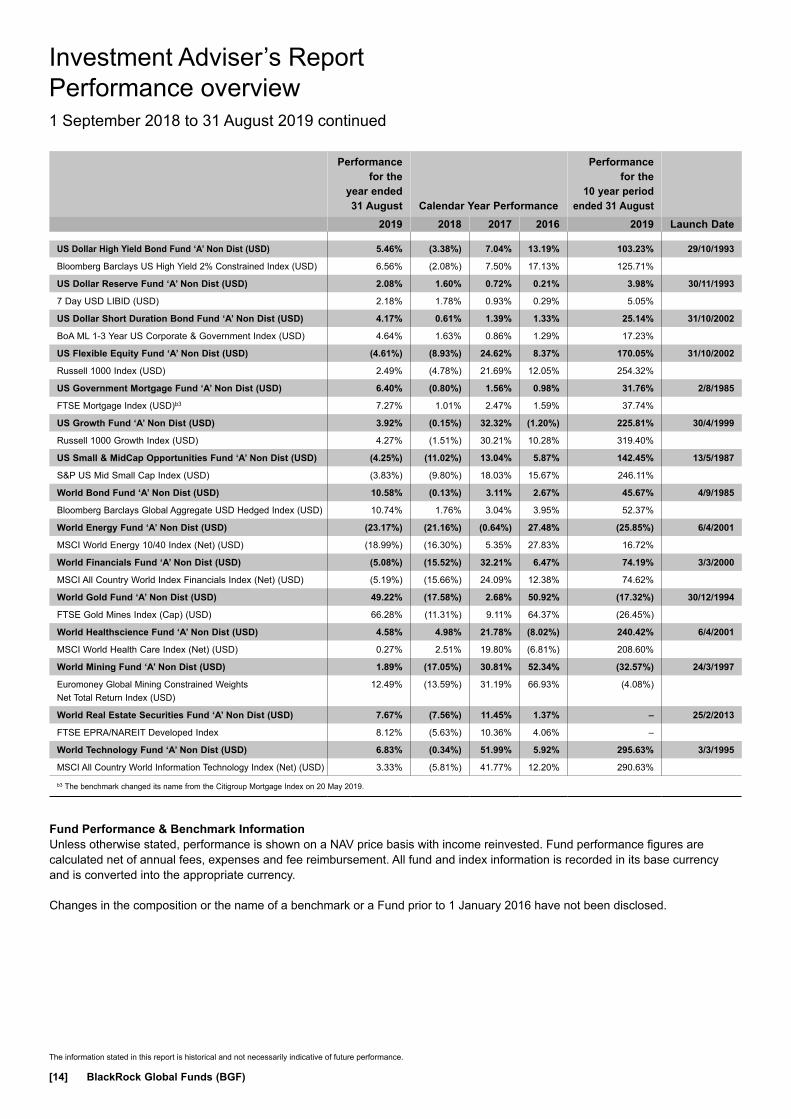
US Dollar High Yield Bond Fund ‘A’ Non Dist (USD) 5.46% (3.38%) 7.04% 13.19% 103.23% 29/10/1993
Bloomberg Barclays US High Yield 2% Constrained Index (USD) 6.56% (2.08%) 7.50% 17.13% 125.71%
US Dollar Reserve Fund ‘A’ Non Dist (USD) 2.08% 1.60% 0.72% 0.21% 3.98% 30/11/1993
7 Day USD LIBID (USD) 2.18% 1.78% 0.93% 0.29% 5.05%
US Dollar Short Duration Bond Fund ‘A’ Non Dist (USD) 4.17% 0.61% 1.39% 1.33% 25.14% 31/10/2002
BoA ML 1-3 Year US Corporate & Government Index (USD) 4.64% 1.63% 0.86% 1.29% 17.23%
US Flexible Equity Fund ‘A’ Non Dist (USD) (4.61%) (8.93%) 24.62% 8.37% 170.05% 31/10/2002
Russell 1000 Index (USD) 2.49% (4.78%) 21.69% 12.05% 254.32%
US Government Mortgage Fund ‘A’ Non Dist (USD) 6.40% (0.80%) 1.56% 0.98% 31.76% 2/8/1985
FTSE Mortgage Index (USD)b3 7.27% 1.01% 2.47% 1.59% 37.74%
US Growth Fund ‘A’ Non Dist (USD) 3.92% (0.15%) 32.32% (1.20%) 225.81% 30/4/1999
Russell 1000 Growth Index (USD) 4.27% (1.51%) 30.21% 10.28% 319.40%
US Small & MidCap Opportunities Fund ‘A’ Non Dist (USD) (4.25%) (11.02%) 13.04% 5.87% 142.45% 13/5/1987
S&P US Mid Small Cap Index (USD) (3.83%) (9.80%) 18.03% 15.67% 246.11%
World Bond Fund ‘A’ Non Dist (USD) 10.58% (0.13%) 3.11% 2.67% 45.67% 4/9/1985
Bloomberg Barclays Global Aggregate USD Hedged Index (USD) 10.74% 1.76% 3.04% 3.95% 52.37%
World Energy Fund ‘A’ Non Dist (USD) (23.17%) (21.16%) (0.64%) 27.48% (25.85%) 6/4/2001
MSCI World Energy 10/40 Index (Net) (USD) (18.99%) (16.30%) 5.35% 27.83% 16.72%
World Financials Fund ‘A’ Non Dist (USD) (5.08%) (15.52%) 32.21% 6.47% 74.19% 3/3/2000
MSCI All Country World Index Financials Index (Net) (USD) (5.19%) (15.66%) 24.09% 12.38% 74.62%
World Gold Fund ‘A’ Non Dist (USD) 49.22% (17.58%) 2.68% 50.92% (17.32%) 30/12/1994
FTSE Gold Mines Index (Cap) (USD) 66.28% (11.31%) 9.11% 64.37% (26.45%)
World Healthscience Fund ‘A’ Non Dist (USD) 4.58% 4.98% 21.78% (8.02%) 240.42% 6/4/2001
MSCI World Health Care Index (Net) (USD) 0.27% 2.51% 19.80% (6.81%) 208.60%
World Mining Fund ‘A’ Non Dist (USD) 1.89% (17.05%) 30.81% 52.34% (32.57%) 24/3/1997
Euromoney Global Mining Constrained Weights Net Total Return Index (USD)
12.49% (13.59%) 31.19% 66.93% (4.08%)
World Real Estate Securities Fund ‘A’ Non Dist (USD) 7.67% (7.56%) 11.45% 1.37% – 25/2/2013
FTSE EPRA/NAREIT Developed Index 8.12% (5.63%) 10.36% 4.06% –
World Technology Fund ‘A’ Non Dist (USD) 6.83% (0.34%) 51.99% 5.92% 295.63% 3/3/1995
MSCI All Country World Information Technology Index (Net) (USD) 3.33% (5.81%) 41.77% 12.20% 290.63%
b3 The benchmark changed its name from the Citigroup Mortgage Index on 20 May 2019.
Fund Performance & Benchmark InformationUnless otherwise stated, performance is shown on a NAV price basis with income reinvested. Fund performance figures are calculated net of annual fees, expenses and fee reimbursement. All fund and index information is recorded in its base currency and is converted into the appropriate currency.
Changes in the composition or the name of a benchmark or a Fund prior to 1 January 2016 have not been disclosed.
Investment Adviser’s ReportPerformance overview1 September 2018 to 31 August 2019 continued
Annual Report and Audited Financial Statements [15]
Directors’ ReportCorporate Governance Statement
IntroductionBlackRock Global Funds (the “Company”) is a public limited company (société anonyme) established under the laws of the Grand Duchy of Luxembourg as an open ended variable capital investment company (société d’investissement à capital variable). The Company has been authorised by the Commission de Surveillance du Secteur Financier (the “CSSF”) as an undertaking for collective investment in transferable securities (“UCITS”) pursuant to the provisions of Part I of the law of 17 December 2010, as amended from time to time and is regulated pursuant to such law. The Company complies with the principles set out in the Association of the Luxembourg Fund Industry (“ALFI”) Code of Conduct Revision 2013 (the “Code”) issued by ALFI in June 2013.
The Board of Directors of the Company (the “Board”) is committed to maintaining the highest standards of corporate governance and is accountable to shareholders for the governance of the Company’s affairs. The Board has considered the principles and recommendations of the Code and has put in place a framework for corporate governance which it believes is appropriate for adherence to the principles of the Code given the nature of its structure as an Investment Company. This statement summarises the corporate governance structure and processes in place for the Company for the period under review from 1 September 2018 to 31 August 2019.
Board CompositionThe Board currently consists of six non-executive Directors, (including one independent Director). The Board is committed to maintaining an appropriate balance of skills, experience, independence and knowledge amongst its members.
The Directors’ biographies, on pages 17 and 18, collectively demonstrate a breadth of investment knowledge and experience, business and financial skills and legal and regulatory familiarity which enables them to provide effective strategic leadership, oversight and proper governance of the Company. BlackRock considers the current compositions to be a suitable and appropriate balance for the Board.
Article 13 of the Company’s Articles of Incorporation, in accordance with Luxembourg law, provides that Directors shall be elected by the shareholders at their annual general meeting for a period ending at the next annual general meeting and until their successors are elected. Any Director who resigns his/her position is obliged to confirm to the Board and the CSSF that the resignation is not connected with any issues with or claims against the Company.
The Board supports a planned and progressive renewal of the Board. BlackRock is committed to ensuring that Directors put forward for election by the shareholders possess the skills needed to maintain this balance. The Board is committed to carrying out an annual review of its performance and activities.
The Directors have a continuing obligation to ensure they have sufficient time to discharge their duties. The details of each Director’s (including the Chairman), other appointments and
commitments are made available to the Board and BlackRock Investment Management (U.K.) Limited (“BIM UK”) for inspection. All new appointments or significant commitments require the prior approval of BIM UK.
Before a new Director is proposed to the shareholders for appointment he or she will receive a full induction incorporating relevant information regarding the Company and his or her duties and responsibilities as a Director. In addition, a new Director is required to spend some time with representatives of BIM UK so that the new Director will become familiar with the various processes which are considered necessary for the proper performance of his or her duties and responsibilities to the Company.
The Company’s policy is to encourage Directors to keep up to date with developments relevant to the Company. The Directors have attended and will continue to attend updates and briefings run by BIM UK and affiliated entities in the U.S. and elsewhere. The Directors also receive regular briefings from, amongst others, the auditors, investment strategists, risk specialists, depositary and legal advisers regarding any proposed product developments or changes in laws or regulations that could affect the Company.
Board’s ResponsibilitiesThe Board meets at least quarterly and also on an ad hoc basis as required. The Board is supplied with information in a timely manner and in a form and of a quality appropriate to enable it to discharge its duties. The Board is responsible for the long-term success of the Company and recognises its responsibility to provide leadership, direction and control to the Company within a framework of prudent and effective controls which enables risk to be assessed and managed. The Board reserves to itself decisions relating to the determination of investment policy and objectives, any change in investment strategy and entering into any material contracts. The Board also approves the prospectus and any addenda to it, circulars to shareholders, financial statements and other relevant legal documentation.
The Chairman’s main responsibility is to lead and manage the Board, encourage critical discussions and promote effective communication within the Board. In addition, he is responsible for promoting best practice corporate governance and effective communication with shareholders.
The Directors have access to the advice and services of external counsel and the resources of BIM UK and BlackRock (Luxembourg) S.A. (the “Management Company”) should they be needed. Where necessary, in the furtherance of their duties, the Board and individual Directors may seek independent professional advice. The Board has responsibility for ensuring that the Company keeps proper accounting records which disclose with reasonable accuracy at any time the financial position of the Company and which enable it to ensure that the financial statements comply with relevant accounting standards. It is the Board’s responsibility to present a balanced and understandable assessment of the Company’s financial position, which extends to interim financial statements and other reports made available to shareholders and the public. The Board is responsible for taking reasonable steps for
Directors’ Report
[16] BlackRock Global Funds (BGF)
Directors’ Report continued
safeguarding the assets of the Company and for taking reasonable steps in the prevention and detection of fraud and other irregularities.
InsuranceThe Company maintains appropriate Directors’ and Officers’ liability insurance cover.
Delegation of ResponsibilitiesAs an open ended variable capital investment company most of the Company’s day-to-day management and administration is delegated to BlackRock group companies such as the Management Company which employs dedicated compliance and risk professionals, the Investment Advisers and other third party service providers. The Board has delegated the following areas of responsibility:
Management and Administration
The Board has delegated the investment management, distribution and administration of the Company and its Funds to the Management Company. The Management Company has delegated the management of the investment portfolio to the Investment Advisers. The Investment Advisers operate under guidelines determined by the Board and as detailed in the Company’s prospectus relating to the Company’s Funds. The relevant Investment Advisers have direct responsibility for the decisions relating to the day-to-day running of the Company’s Funds and are accountable to both the Management Company and the Company for the investment performance of the Funds. The Board has also delegated the exercise of voting rights attaching to the securities held in the portfolio to the respective Investment Advisers who may in turn delegate to BIM UK. Voting on behalf of shareholders is done in a manner which is believed to be in the best economic interest of shareholders as long-term investors.
The Management Company has delegated its role as Fund Accountant of the Company and its Funds to The Bank of New York Mellon (International) Limited. The Fund Accountant has the responsibility for the administration of the Company’s affairs including the calculation of the net asset value and preparation of the accounts of the Company, subject to the overall supervision of the Board and the Management Company. The Fund Accountant is a subsidiary of The Bank of New York Mellon Corporation. The Company has appointed The Bank of New York Mellon (International) Limited as Depositary of its assets, which has responsibility for safe-keeping of such assets, pursuant to the regulations. The Depositary is a subsidiary of The Bank of New York Mellon Corporation. The Management Company has delegated transfer agent and share registration services to J.P. Morgan Bank Luxembourg S.A.
The Management Company reports to the Board on a quarterly basis and by exception where necessary. Reporting is in place to ensure that the Board can effectively oversee the actions of its delegates.
The Management Company is responsible for the risk management and internal controls of the Company and for reviewing their effectiveness, for ensuring that financial information published or used within the business is reliable,
and for regularly monitoring compliance with regulations governing the operation of the Company. The Management Company reviews the effectiveness of the internal control and risk management systems on an ongoing basis to identify, evaluate and manage the Company’s significant risks. As part of that process, there are procedures designed to capture and evaluate any failings or weaknesses. Should a case be categorised by the Board as significant, procedures exist to ensure that necessary action is taken to remedy the failings.
The Board is also responsible for establishing and maintaining adequate internal control and risk management systems of the Company in relation to the financial reporting process. Such systems are designed to manage rather than eliminate the risk of failure to achieve the Company’s financial reporting objectives. The Company has procedures in place to ensure all relevant accounting records are properly maintained and are readily available, including production of annual and half-yearly financial statements. These procedures include appointing the Fund Accountant to maintain the accounting records of the Company independently of the Investment Manager and the Depositary. The financial statements are prepared in accordance with applicable law and Generally Accepted Accounting Principles (“GAAP”) and are approved by the Board of Directors of the Company. The accounting information given in the annual report is required to be audited and the Audit Report, including any qualifications, is reproduced in full in the annual report of the Company.
The control processes over the risks identified, covering financial, operational, compliance and risk management, is embedded in the operations of the Management Company, BIM UK and other parties including the Fund Accountant and the Depositary. There is a monitoring and reporting process to review these controls, which has been in place throughout the period under review and up to the date of this report, carried out by BIM UK’s corporate audit department.
BIM UK’s internal audit and operational risk units report to the Board through the Management Company on a quarterly basis. The Management Company also receives a report from the Fund Accountant and the Depositary on the internal controls of the administrative and custodial operations of the Company. The Board recognises that these control systems can only be designed to manage rather than eliminate the risk of failure to achieve fund objectives, and to provide reasonable, but not absolute, assurance against material misstatement or loss, and relies on the operating controls established by the service providers.
Financial ReportingThe Company prepares its financial statements under Luxembourg GAAP and on a going concern basis.
RemunerationThe Company is an investment company and has no employees or executive Directors. No Director (past or present) has any entitlement to a pension from the Company, and the Company has not awarded any share options or long-term performance incentives. No element of Directors’ remuneration is performance-related. Those Directors who are also employees of the BlackRock group are not entitled to receive a Director’s

Annual Report and Audited Financial Statements [17]
Directors’ Report continued
fee. All other Directors are paid fees which are submitted for approval by the shareholders at the annual general meeting and are disclosed on page 735. The Board believes that the level of remuneration for those Directors who take a fee properly reflects the time commitment and responsibilities of their roles. The maximum amount of remuneration payable to the Directors is approved by the Board.
Communication with ShareholdersThe Board is responsible for convening the annual general meeting and all other general meetings of the Company. Shareholders have the opportunity to, and are encouraged to attend and vote at general meetings. Notice of general meetings is issued in accordance with the Articles of Incorporation of the Company and notice of the annual general meeting is sent out at least 8 days in advance of the meeting. All substantive matters put before a general meeting are dealt with by way of separate resolution. Proxy voting figures are noted by the chairman of the general meeting.
The proceedings of general meetings are governed by Luxembourg company law and the Articles of Incorporation of the Company.
The Board has reporting procedures in place such that client communication with BIM UK is reported to the Board, including shareholder complaints. BIM UK has been appointed Principal Distributor and is tasked with actively managing the relationship between the Company and its shareholders.
Directors’ Biographies
Paul Freeman (Chairman) (British): Mr Freeman currently serves as a director on the boards of a number of BlackRock Group companies and investment funds. He was until December 2015 a Managing Director of BlackRock, which he had joined in August 2005 (which then was Merrill Lynch Investment Managers). Up until July 2011 Mr Freeman was the Head of Product Development and Range Management for the EMEA region with responsibility for the development and ongoing product management of all funds domiciled in EMEA and distributed on a cross-border basis by BlackRock. Between July 2011 and December 2015 Mr Freeman worked closely with BlackRock’s Government affairs team and served on various internal governance committees and on the boards of a number of group subsidiaries and managed funds. Mr Freeman has worked in the financial services industry for over 35 years and, prior to BlackRock, has held senior management positions at Schroders, Rothschild Asset Management, Henderson Investors and GT Management (now part of Invesco). Mr Freeman is a Chartered Accountant.
Francine Keiser (Luxembourger): Ms Keiser is a former Partner of Linklaters LLP and is now a consultant to the firm. She has been a member of the Luxembourg Bar since 1989. Ms Keiser is an experienced investment funds lawyer with wide expertise in all legal aspects of investment management, in particular in the UCITS area. She serves as a Director on the Boards of flagship funds of several major fund promoters, including BlackRock Global Index Funds and BlackRock Strategic Funds.
Geoffrey D. Radcliffe (British & Luxembourger dual nationality, Luxembourg resident): Mr Radcliffe is a Managing Director of BlackRock and is based in Luxembourg. He is a member of the BlackRock Business Operations & Technology, Global Accounting and Product Services team and heads Product Oversight and Governance International and Alternatives International for BlackRock EMEA & Asia Pacific. Mr Radcliffe is a Fellow of The Institute of Chartered Accountants in England and Wales and an Associate of The Chartered Institute of Bankers. He has 30+ years of mutual fund, accounting and banking experience in Luxembourg, Bermuda, London and the Isle of Man. Mr Radcliffe joined the BlackRock Group in 1998. He serves as a Director on the Boards of BlackRock Luxembourg S.A. and BlackRock Fund Management Company S.A. and also on the Boards of a number of BlackRock investment funds. He has been a Member of the Board of Directors of ALFI (Luxembourg Fund Industry Association) since 2013.
Barry O’Dwyer (Irish): Mr O’Dwyer is a Managing Director at BlackRock. He is the Head of Fund Governance for BlackRock’s European open-ended fund ranges and is the Chief Operating Officer for BlackRock’s Irish business. He serves as a director on the boards of a number of BlackRock corporate, fund, and management companies domiciled in Ireland, Luxembourg, Switzerland and Germany and on the board of BlackRock’s UK Life company. He was the chairman of the Irish Funds Industry Association 2014-2015, is a board director of Financial Services Ireland and is a member of An Taoiseach’s Financial Services Industry Advisory Committee. He joined BlackRock Advisors (UK) Limited in 1999 as head of risk management and moved to his present role in 2006. Prior to joining BlackRock Advisors (UK) Limited, Mr O’Dwyer worked as risk manager at Gartmore Investment Management and at HypoVereinsbank and National Westminster Bank. Mr O’Dwyer graduated from Trinity College Dublin with a degree in Business Studies and Economics in 1991. He holds a Chartered Association of Certified Accountants qualification and an MBA from London City University Business School.
Robert Hayes (British): Mr Hayes is a Managing Director, Head of Investment Oversight for the BlackRock EMEA business and CEO of BlackRock Fund Managers Limited. The Investment Oversight team, which is part of Strategic Product Management, is responsible for establishing and reviewing investment expectations for all BlackRock’s Retail Funds in the EMEA region. He also chairs the Investment Committee and serves as a Director of BlackRock Life Limited, BlackRock Strategic Funds SICAV and BlackRock Index Funds SICAV. Mr. Hayes’ service with the firm dates back to 2001, including his years with Merrill Lynch Investment Managers (MLIM), which merged with BlackRock in 2006. At MLIM he was Head of Strategic Advice and immediately before his current role he was Head of Client Strategy in our Client Solutions business. Prior to joining the firm, Mr. Hayes was a Partner with Watson Wyatt Partners, as an investment consultant for large pension funds and institutional investors. Earlier in his career, Mr Hayes was a UK Equity Investment Manager at ICI Pension Fund and Head of Institutional Investment at M&G Investment Management. Mr. Hayes earned a BSc degree in Mathematics from Southampton University in 1983.
[18] BlackRock Global Funds (BGF)
Directors’ Report continued
Michael Gruener (German) (appointed 21 December 2017): Mr Gruener is a Managing Director of BlackRock and is Head of Europe, Middle East and Africa Retail business. He is a member of BlackRock’s European Executive Committee and the BlackRock European Steer Co. Mr. Gruener joined BlackRock in January 2012 as the Head of BlackRock’s German, Austria & Eastern Europe iShares sales team and became Head of the iShares Wealth and Retail client segment in EMEA in January 2014. In 2015 he became the Co-Head of the EMEA Sales for iShares. Michael began his current role in July 2017. Mr. Gruener has more than 20 years of experience in the financial services industry. Prior to joining BlackRock, Michael worked for 10 years at Goldman Sachs Asset Management in multiple distribution roles in Chicago, London and Frankfurt. Mr. Gruener holds a German Banker qualification and a BA honors degree from the Cambridge Polytechnic University in Finance and Controlling. He also holds a degree from the Berlin School of Economics in Business Administration and Finance.

Annual Report and Audited Financial Statements [19]
Report on RemunerationThe below disclosures are made in respect of the remuneration policies of the BlackRock Group (“BlackRock”), as they apply to BlackRock (Luxembourg) S.A. (the “Management Company”). The disclosures are made in accordance with the Directive 2009/65/EC on the coordination of laws, regulations and administrative provisions relating to undertakings for collective investment in transferable securities (“UCITS”), as amended, including in particular by Directive 2014/91/EU of the European Parliament and of the council of 23 July 2014, (the “Directive”), and the “Guidelines on sound remuneration policies under the UCITS Directive and AIFMD” issued by the European Securities and Markets Authority.
BlackRock’s UCITS Remuneration Policy (the “UCITS Remuneration Policy”) will apply to the European Economic Area (“EEA”) entities within the BlackRock Group authorised as a management company of UCITS funds in accordance with the Directive, and will ensure compliance with the requirements of Article 14b of the Directive.
The Management Company has adopted the UCITS Remuneration Policy, a summary of which is set out below.
Remuneration GovernanceBlackRock’s remuneration governance in EMEA operates as a tiered structure which includes: (a) the Management Development and Compensation Committee (“MDCC”) (which is the global, independent remuneration committee for Blackrock, Inc. and all of its subsidiaries, including the Management Company) and (b) the Management Company’s Board of Directors (the “Management Company’s Board”). These bodies are responsible for the determination of BlackRock’s remuneration policies.
(a) MDCC The MDCC’s purposes include:
}providing oversight of:}BlackRock’s executive compensation programmes;}BlackRock’s employee benefit plans; and}such other compensation plans as may be established
by BlackRock from time to time for which the MDCC is deemed as administrator;
}reviewing and discussing the compensation discussion and analysis included in the BlackRock, Inc. annual proxy statement with management and approving of the MDCC’s report for inclusion in the proxy statement;
}reviewing, assessing, and making reports and recommendations to the BlackRock, Inc. Board of Directors (the “Blackrock, Inc. Board”) as appropriate on BlackRock’s talent development and succession planning, with the emphasis on performance and succession at the highest management levels; and
}in accordance with applicable UK and European regulations and guidance, to act as the Remuneration Committee for BlackRock’s EMEA regulated entities.
The MDCC directly retains an independent compensation consultant, Semler Brossy Consulting Group LLC, who has no relationship with BlackRock, Inc. or the BlackRock, Inc. Board that would interfere with its ability to provide independent advice to the MDCC on compensation matters.
The BlackRock, Inc. Board has determined that all of the members of the MDCC are “independent” within the meaning of the listing standards of the New York Stock Exchange (NYSE), which requires each meet a “non-employee director” standard.
The MDCC held 10 meetings during 2018. The MDCC charter is available on BlackRock, Inc.’s website (www.blackrock.com).
Through its regular reviews, the MDCC continues to be satisfied with the principles of BlackRock’s compensation policy and approach.
(b) The Management Company’s BoardThe Management Company’s Board has the task of supervising and providing oversight of the UCITS Remuneration Policy as it applies to the Management Company and its Identified Staff.
The Management Company’s Board (through independent review by the relevant control functions) remains satisfied with the implementation of the UCITS Remuneration Policy as it applies to the Management Company and its Identified Staff.
Decision-making process Remuneration decisions for employees are made once annually in January following the end of the performance year. This timing allows full-year financial results to be considered along with other non-financial goals and objectives. Although the framework for compensation decision-making is tied to financial performance, significant discretion is used to determine individual variable remuneration based on achievement of strategic and operating results and other considerations such as management and leadership capabilities.
No set formulas are established and no fixed benchmarks are used in determining annual incentive awards. In determining specific individual remuneration amounts, a number of factors are considered including non-financial goals and objectives and overall financial and investment performance. These results are viewed in the aggregate without any specific weighting, and there is no direct correlation between any particular performance measure and the resulting annual incentive award. The variable remuneration awarded to any individual(s) for a particular performance year may also be zero.
Annual incentive awards are paid from a bonus pool.
The size of the projected bonus pool, including cash and equity awards, is reviewed throughout the year by the MDCC and the final total bonus pool is approved after year-end. As part of this review, the MDCC receives actual and projected financial information over the course of the year as well as final year-end information. The financial information that the MDCC receives and considers includes the current year
Report on Remuneration
[20] BlackRock Global Funds (BGF)
Report on Remuneration continued
projected income statement and other financial measures compared with prior year results and the current year budget. The MDCC additionally reviews other metrics of Blackrock’s financial performance (e.g., net inflows of Assets Under Management (“AUM”) and investment performance) as well as information regarding market conditions and competitive compensation levels.
The MDCC regularly considers management’s recommendation as to the percentage of pre-incentive operating income that will be accrued and reflected as a compensation expense throughout the year for the cash portion of the total annual bonus pool (the “accrual rate”). The accrual rate of the cash portion of the total annual bonus pool may be modified by the MDCC during the year based on its review of the financial information described above. The MDCC does not apply any particular weighting or formula to the information it considers when determining the size of the total bonus pool or the accruals made for the cash portion of the total bonus pool.
Following the end of the performance year, the MDCC approves the final bonus pool amount.
As part of the year-end review process the Enterprise Risk and Regulatory Compliance departments report to the MDCC on any activities, incidents or events that warrant consideration in making compensation decisions.
Individuals are not involved in setting their own remuneration.
Control functionsEach of the control functions (Enterprise Risk, Legal & Compliance, and Internal Audit) has its own organisational structure which is independent of the business units. The head of each control function is either a member of the Global Executive Committee (“GEC”), the global management committee, or has a reporting obligation to the board of directors of BlackRock Group Limited, the parent company of all of BlackRock’s EMEA regulated entities, including the Management Company.
Functional bonus pools are determined with reference to the performance of each individual function. The remuneration of the senior members of control functions is directly overseen by the MDCC.
Link between pay and performance There is a clear and well defined pay-for-performance philosophy and compensation programmes which are designed to meet the following key objectives as detailed below:
}appropriately balance BlackRock’s financial results between shareholders and employees;
}attract, retain and motivate employees capable of making significant contributions to the long-term success of the business;
}align the interests of senior employees with those of shareholders by awarding BlackRock, Inc.’s stock as a significant part of both annual and long-term incentive awards;
}control fixed costs by ensuring that compensation expense varies with profitability;
}link a significant portion of an employee’s total compensation to the financial and operational performance of the business as well as its common stock performance;
}discouraging excessive risk-taking; and
}ensure that client interests are not negatively impacted by remuneration awarded on a short-term, mid-term and/or long-term basis.
Driving a high-performance culture is dependent on the ability to measure performance against objectives, values and behaviours in a clear and consistent way. Management Companies use a 5-point rating scale to provide an overall assessment of an employee’s performance, and employees also provide a self-evaluation. The overall, final rating is reconciled during each employee’s performance appraisal. Employees are assessed on the manner in which performance is attained as well as the absolute performance itself.
In keeping with the pay-for-performance philosophy, ratings are used to differentiate and reward individual performance – but don’t pre-determine compensation outcomes. Compensation decisions remain discretionary and are made as part of the year-end compensation process.

Annual Report and Audited Financial Statements [21]
Report on Remuneration continued
(1) As Adjusted Operating Margin: As reported in BlackRock’s external filings, reflects adjusted Operating Income divided by Total Revenue net of distribution and servicing expenses and amortisation of deferred sales commissions.
(2) Organic Revenue Growth: Equal to net new base fees plus net new Aladdin revenue generated in the year (in US dollars).
When setting remuneration levels other factors are considered, as well as individual performance, which may include:
}the performance of the Management Company, the funds managed by the Management Company and/or the relevant functional department;
}factors relevant to an employee individually; relationships with clients and colleagues; teamwork; skills; any conduct issues; and, subject to any applicable policy, the impact that any relevant leave of absence may have on contribution to the business);
}the management of risk within the risk profiles appropriate for BlackRock’s clients;
}strategic business needs, including intentions regarding retention;
}market intelligence; and
}criticality to business.
A primary product tool is risk management and, while employees are compensated for strong performance in their management of client assets, they are required to manage risk within the risk profiles appropriate for their clients. Therefore, employees are not rewarded for engaging in high-risk transactions outside of established parameters. Remuneration practices do not provide undue incentives for short-term planning or short-term financial rewards, do not reward unreasonable risk and provide a reasonable balance between the many and substantial risks inherent within the business of investment management, risk management and advisory services.
BlackRock operates a total compensation model for remuneration which includes a base salary, which is contractual, and a discretionary bonus scheme.
BlackRock operates an annual discretionary bonus scheme. Although all employees are eligible to be considered for a discretionary bonus, there is no contractual obligation to make any award to an employee under its discretionary bonus scheme. In exercising discretion to award a discretionary bonus, the factors listed above (under the heading “Link between pay and performance”) may be taken into account in addition to any other matters which become relevant to the exercise of discretion in the course of the performance year.
Discretionary bonus awards for all employees, including executive officers, are subject to a guideline that determines the portion paid in cash and the portion paid in BlackRock, Inc’s stock and subject to additional vesting/clawback
conditions. Stock awards are subject to further performance adjustment through variation in BlackRock, Inc’s share price over the vesting period. As total annual compensation increases, a greater portion is deferred in stock. The MDCC adopted this approach in 2006 to substantially increase the retention value and shareholder alignment of the compensation package for eligible employees, including the executive officers. The portion deferred into stock vests in equal instalments over the three years following grant.
Supplementary to the annual discretionary bonus as described above, equity awards from the “Partner Plan” and “Targeted Equity Award Plan” are made to select senior leaders to provide greater linkage with future business results. The long-term incentive awards have been established individually to provide meaningful incentive for continued performance over a multi-year period recognising the scope of the individual’s role, business expertise and leadership skills.
Selected senior leaders are eligible to receive performance-adjusted equity-based awards from the “BlackRock Performance Incentive Plan” (“BPIP”). Awards made from the BPIP have a three-year performance period based on a measurement of As Adjusted Operating Margin(1) and Organic Revenue Growth(2). Determination of pay-out will be made based on the firm’s achievement relative to target financial results at the conclusion of the performance period. The maximum number of shares that can be earned is 165% of the award in those situations where both metrics achieve pre-determined financial targets. No shares will be earned where the firm’s financial performance in both of the above metrics is below a pre-determined performance threshold. These metrics have been selected as key measures of shareholder value which endure across market cycles.
A limited number of investment professionals have a portion of their annual discretionary bonus (as described above) awarded as deferred cash that notionally tracks investment in selected products managed by the relevant employee. The intention of these awards is to align investment professionals with the investment returns of the products they manage through the deferral of compensation into those products. Clients and external evaluators have increasingly viewed more favourably those products where key investors have “skin in the game” through significant personal investments.
Identified StaffThe UCITS Remuneration Policy sets out the process that will be applied to identify staff as Identified Staff, being categories of staff of the Management Company, including senior management, risk takers, control functions and any employee receiving total remuneration that takes them into the same remuneration bracket as senior management and risk takers, whose professional activities have a material impact on the risk profiles of the Management Company or of the funds it manages.
[22] BlackRock Global Funds (BGF)
Report on Remuneration continued
The list of Identified Staff will be subject to regular review, being formally reviewed in the event of, but not limited to:
}organisational changes;
}new business initiatives;
}changes in significant influence function lists;
}changes in role responsibilities; and
}revised regulatory direction
Quantitative Remuneration DisclosureThe Management Company is required under UCITS to make quantitative disclosures of remuneration. These disclosures are made in line with BlackRock’s interpretation of currently available regulatory guidance on quantitative remuneration disclosures. As market or regulatory practice develops BlackRock may consider it appropriate to make changes to the way in which quantitative remuneration disclosures are calculated. Where such changes are made, this may result in disclosures in relation to a fund not being comparable to the disclosures made in the prior year, or in relation to other BlackRock fund disclosures in that same year.
Disclosures are provided in relation to (a) the staff of the Management Company (b) staff who are senior management; and (c) staff who have the ability to materially affect the risk profile of the Company, including individuals who, although not directly employed by the Management Company, are assigned by their employer to carry out services directly for the Management Company.
All individuals included in the aggregated figures disclosed are rewarded in line with BlackRock’s remuneration policy for their responsibilities across the relevant BlackRock business area.As all individuals have a number of areas of responsibilities, only the portion of remuneration for those individuals’ services attributable to the Company is included in the aggregate figures disclosed.
Members of staff and senior management of the Management Company typically provide both UCITS and non-UCITS related services in respect of multiple funds, clients and functions of the Management Company and across the broader BlackRock Group. Therefore, the figures disclosed are a sum of each individual’s portion of remuneration attributable to the Management Company according to an objective apportionment methodology which acknowledges the multiple-service nature of the Management Company. Accordingly the figures are not representative of any individual’s actual remuneration or their remuneration structure.
The amount of the total remuneration awarded by the Management Company to its staff which has been attributed to the Management Company’s UCITS-related business in respect of the Management Company’s financial year ending 31 December 2018 is USD 88.6 million. This figure is compromised of fixed remuneration of USD 4.6 million and variable remuneration of USD 84.0 million. There were a total of 102 beneficiaries of the remuneration described above.
The amount of the aggregate remuneration awarded by the Management Company, which has been attributed to the Management Company’s UCITS-related business in respect of the Management Company’s financial year ending 31 December 2018, to its senior management was USD 0.4 million, and to other members of its staff whose actions have a material impact on the risk profile of the Management Company’s UCITS-related business was USD 88.2 million.
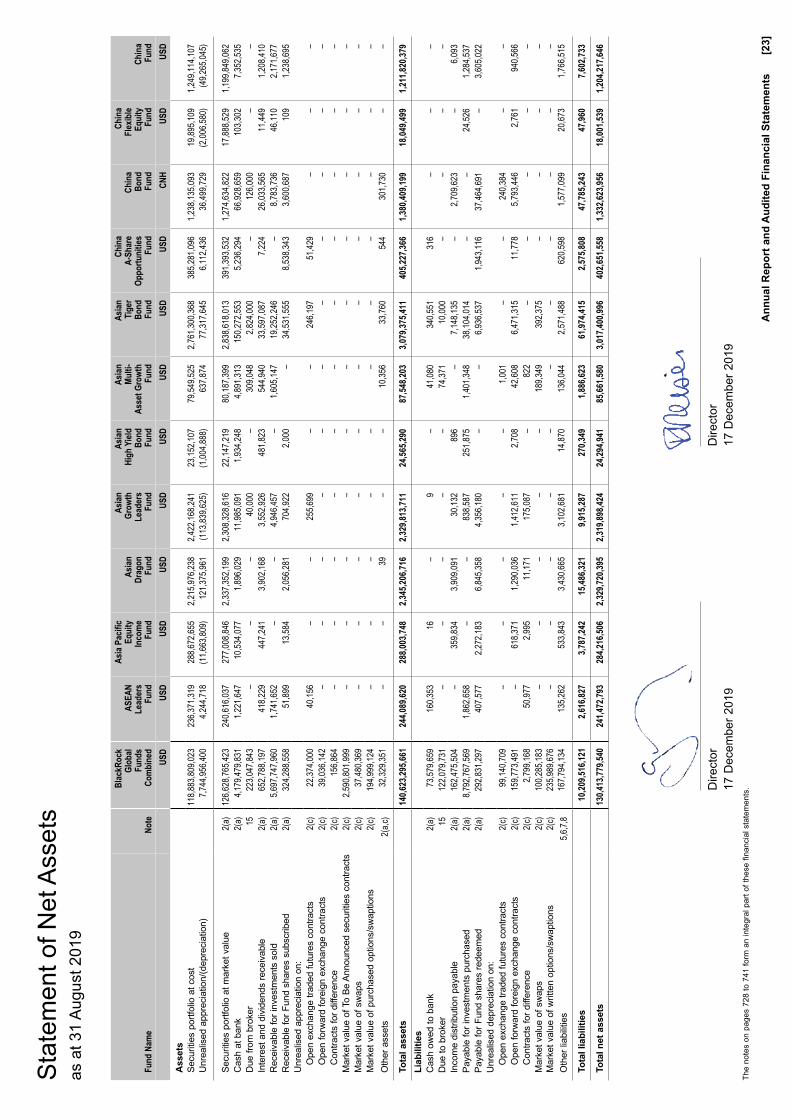
A
nnua
l Rep
ort a
nd A
udite
d Fi
nanc
ial S
tate
men
ts
[23]
The
note
s on
pag
es 7
28 to
741
form
an
inte
gral
par
t of t
hese
fina
ncia
l sta
tem
ents
.
Sta
tem
ent o
f Net
Ass
ets
as a
t 31
Aug
ust 2
019
Fund
Nam
eNo
te
Blac
kRoc
k Gl
obal
Fund
s Co
mbi
ned
AS
EAN
Lead
ers
Fund
Asia
Pacif
ic Eq
uity
In
com
e Fu
nd
As
ian
Drag
on
Fund
Asian
Gr
owth
L
eade
rs
Fund
Asian
Hi
gh Y
ield
Bond
Fu
nd
Asian
Mu
lti-
Asse
t Gro
wth
Fund
Asian
Ti
ger
Bond
Fu
nd
Chi
na
A-S
hare
O
ppor
tuni
ties
Fund
Ch
ina
Bond
Fu
nd
Chin
a Fl
exib
le
Equi
ty
Fund
C
hina
F
und
USD
USD
USD
USD
USD
USD
USD
USD
USD
CNH
USD
USD
Ass
ets
Secu
ritie
s po
rtfol
io a
t cos
t11
8,883
,809,0
2323
6,371
,319
288,6
72,65
52,2
15,97
6,238
2,422
,168,2
4123
,152,1
0779
,549,5
252,7
61,30
0,368
385,2
81,09
61,2
38,13
5,093
19,89
5,109
1,249
,114,1
07
Unr
ealis
ed a
ppre
ciat
ion/
(dep
reci
atio
n)7,7
44,95
6,400
4,244
,718
(11,6
63,80
9)12
1,375
,961
(113
,839,6
25)
(1,00
4,888
)63
7,874
77,31
7,645
6,112
,436
36,49
9,729
(2,00
6,580
)(4
9,265
,045)
Secu
ritie
s po
rtfol
io a
t mar
ket v
alue
2(a)
126,6
28,76
5,423
240,6
16,03
727
7,008
,846
2,337
,352,1
992,3
08,32
8,616
22,14
7,219
80,18
7,399
2,838
,618,0
1339
1,393
,532
1,274
,634,8
2217
,888,5
291,1
99,84
9,062
C
ash
at b
ank
2(a)
4,179
,479,8
311,2
21,64
710
,534,0
771,8
96,02
911
,985,0
911,9
34,24
84,8
91,31
315
0,272
,553
5,236
,294
66,92
8,659
103,3
027,3
52,53
5 D
ue fr
om b
roke
r15
223,0
47,84
3–
––
40,00
0–
309,0
482,8
24,00
0–
126,0
00–
– In
tere
st a
nd d
ivid
ends
rece
ivab
le2(
a)65
2,788
,197
418,2
2944
7,241
3,902
,168
3,552
,926
481,8
2354
4,940
33,59
7,087
7,224
26,03
3,565
11,44
91,2
08,41
0 R
ecei
vabl
e fo
r inv
estm
ents
sol
d2(
a)5,6
97,74
7,960
1,741
,652
––
4,946
,457
–1,6
05,14
719
,252,2
46–
8,783
,736
46,11
02,1
71,67
7 R
ecei
vabl
e fo
r Fun
d sh
ares
sub
scrib
ed2(
a)32
4,288
,558
51,89
913
,584
2,056
,281
704,9
222,0
00–
34,53
1,555
8,538
,343
3,600
,687
109
1,238
,695
Unr
ealis
ed a
ppre
ciat
ion
on:
Ope
n ex
chan
ge tr
aded
futu
res
cont
ract
s2(
c)22
,374,0
0040
,156
––
255,6
99–
–24
6,197
51,42
9–
––
Ope
n fo
rwar
d fo
reig
n ex
chan
ge c
ontra
cts
2(c)
39,03
6,142
––
––
––
––
––
– C
ontra
cts
for d
iffer
ence
2(c)
156,8
64–
––
––
––
––
––
Mar
ket v
alue
of T
o Be
Ann
ounc
ed s
ecur
ities
con
tract
s2(
c)2,5
90,80
1,999
––
––
––
––
––
– M
arke
t val
ue o
f sw
aps
2(c)
37,48
0,369
––
––
––
––
––
– M
arke
t val
ue o
f pur
chas
ed o
ptio
ns/s
wap
tions
2(c)
194,9
99,12
4–
––
––
––
––
––
Oth
er a
sset
s2(
a,c)
32,32
9,351
––
39–
–10
,356
33,76
054
430
1,730
––
Tota
l ass
ets
140,6
23,29
5,661
244,0
89,62
028
8,003
,748
2,345
,206,7
162,3
29,81
3,711
24,56
5,290
87,54
8,203
3,079
,375,4
1140
5,227
,366
1,380
,409,1
9918
,049,4
991,2
11,82
0,379
Li
abili
ties
Cas
h ow
ed to
ban
k2(
a)73
,579,6
5916
0,353
16–
9–
41,08
034
0,551
316
––
– D
ue to
bro
ker
1512
2,079
,731
––
––
–74
,371
10,00
0–
––
– In
com
e di
strib
utio
n pa
yabl
e2(
a)16
2,475
,504
–35
9,834
3,909
,091
30,13
289
6–
7,148
,135
–2,7
09,62
3–
6,093
Pa
yabl
e fo
r inv
estm
ents
pur
chas
ed2(
a)8,7
92,76
7,569
1,862
,658
––
838,5
8725
1,875
1,401
,348
38,10
4,014
––
24,52
61,2
84,53
7 Pa
yabl
e fo
r Fun
d sh
ares
rede
emed
2(a)
292,8
31,29
740
7,577
2,272
,183
6,845
,358
4,356
,180
––
6,936
,537
1,943
,116
37,46
4,691
–3,6
05,02
2 U
nrea
lised
dep
reci
atio
n on
:O
pen
exch
ange
trad
ed fu
ture
s co
ntra
cts
2(c)
99,14
0,709
––
––
–1,0
01–
–24
0,384
––
Ope
n fo
rwar
d fo
reig
n ex
chan
ge c
ontra
cts
2(c)
159,7
73,49
1–
618,3
711,2
90,03
61,4
12,61
12,7
0842
,608
6,471
,315
11,77
85,7
93,44
62,7
6194
0,566
C
ontra
cts
for d
iffer
ence
2(c)
2,799
,168
50,97
72,9
9511
,171
175,0
87–
822
––
––
– M
arke
t val
ue o
f sw
aps
2(c)
100,2
85,18
3–
––
––
189,3
4939
2,375
––
––
Mar
ket v
alue
of w
ritte
n op
tions
/sw
aptio
ns2(
c)23
5,989
,676
––
––
––
––
––
– O
ther
liab
ilitie
s5,6
,7,8
167,7
94,13
413
5,262
533,8
433,4
30,66
53,1
02,68
114
,870
136,0
442,5
71,48
862
0,598
1,577
,099
20,67
31,7
66,51
5
Tota
l lia
bilit
ies
10,20
9,516
,121
2,616
,827
3,787
,242
15,48
6,321
9,915
,287
270,3
491,8
86,62
361
,974,4
152,5
75,80
847
,785,2
4347
,960
7,602
,733
Tota
l net
ass
ets
130,4
13,77
9,540
241,4
72,79
328
4,216
,506
2,329
,720,3
952,3
19,89
8,424
24,29
4,941
85,66
1,580
3,017
,400,9
9640
2,651
,558
1,332
,623,9
5618
,001,5
391,2
04,21
7,646
Statement of Net Assets
Dire
ctor
17 D
ecem
ber 2
019
Dire
ctor
17 D
ecem
ber 2
019

[24]
B
lack
Roc
k G
loba
l Fun
ds (B
GF)
The
note
s on
pag
es 7
28 to
741
form
an
inte
gral
par
t of t
hese
fina
ncia
l sta
tem
ents
.
Sta
tem
ent o
f Net
Ass
ets
as a
t 31
Aug
ust 2
019
cont
inue
d
Fund
Nam
eNo
te
Con
tinen
tal
Eur
opea
n
Flex
ible
Fun
d
Dyn
amic
H
igh
In
com
e Fu
nd
Emer
ging
Eu
rope
Fu
nd
Emer
ging
Ma
rket
s Bo
nd
Fund
Emer
ging
Ma
rket
s Co
rpor
ate
Bond
Fu
nd
Emer
ging
Ma
rket
s Eq
uity
Inco
me
Fund
Em
ergi
ng
Mark
ets
Fund
Emer
ging
Ma
rket
s Loc
al Cu
rrenc
y Bo
nd
Fund
ESG
Emer
ging
Ma
rket
s Bl
ende
d Bo
nd
Fund
ESG
Emer
ging
Ma
rket
s Bo
nd
Fund
ESG
Emer
ging
Ma
rket
s Co
rpor
ate
Bond
Fu
nd
ESG
Emer
ging
Ma
rket
s Loc
al Cu
rrenc
y Bo
nd
Fund
EUR
US
D E
UR
USD
USD
USD
USD
USD
USD
USD
USD
USD
Ass
ets
Secu
ritie
s po
rtfol
io a
t cos
t2,9
80,44
2,023
2,935
,459,2
7470
6,966
,204
2,360
,643,9
1026
9,221
,081
455,6
64,92
172
0,544
,376
3,763
,788,7
4829
,386,6
6624
2,309
,391
25,92
9,949
235,4
59,99
0 U
nrea
lised
app
reci
atio
n/(d
epre
ciat
ion)
563,0
81,88
5(8
06,00
6)(4
,452,6
14)
(27,3
38,34
4)10
,819,4
05(2
,907,5
03)
21,20
1,398
(130
,312,5
72)
916,6
5816
,995,8
921,2
14,61
22,4
96,25
6
Secu
ritie
s po
rtfol
io a
t mar
ket v
alue
2(a)
3,543
,523,9
082,9
34,65
3,268
702,5
13,59
02,3
33,30
5,566
280,0
40,48
645
2,757
,418
741,7
45,77
43,6
33,47
6,176
30,30
3,324
259,3
05,28
327
,144,5
6123
7,956
,246
Cas
h at
ban
k2(
a)1,9
6716
9,468
,939
5,228
,380
161,8
38,65
010
,203
29,60
7,409
6,757
,354
280,0
11,02
13,0
04,81
022
,787,6
7474
,498
23,28
0,050
D
ue fr
om b
roke
r15
––
––
–1,0
00,00
051
0,000
5,736
,969
1,766
,397
––
1,042
,000
Inte
rest
and
div
iden
ds re
ceiv
able
2(a)
284,0
2224
,554,8
911,4
60,06
531
,830,9
363,7
43,19
097
6,786
1,814
,941
57,75
7,928
458,4
003,6
89,86
638
1,161
3,122
,943
Rec
eiva
ble
for i
nves
tmen
ts s
old
2(a)
–37
8,755
3,915
,221
–8,0
25,25
983
,404
56,93
3,453
17,86
2,249
254,2
85–
526,7
431,3
17,53
1 R
ecei
vabl
e fo
r Fun
d sh
ares
sub
scrib
ed2(
a)15
,058,8
5112
,190,6
2026
4,421
4,521
,622
21,85
411
1,815
269,6
652,8
49,74
45,0
0856
2,514
––
Unr
ealis
ed a
ppre
ciat
ion
on:
Ope
n ex
chan
ge tr
aded
futu
res
cont
ract
s2(
c)–
7,864
,285
––
––
––
––
––
Ope
n fo
rwar
d fo
reig
n ex
chan
ge c
ontra
cts
2(c)
8,138
,559
–1,2
45,35
3–
––
––
99,76
8–
–31
1,540
C
ontra
cts
for d
iffer
ence
2(c)
––
––
––
––
––
––
Mar
ket v
alue
of T
o Be
Ann
ounc
ed s
ecur
ities
con
tract
s2(
c)–
––
––
––
––
––
– M
arke
t val
ue o
f sw
aps
2(c)
––
–15
,663,3
9510
1,125
––
5,667
,300
–1,7
74,62
910
,390
116,9
19
Mar
ket v
alue
of p
urch
ased
opt
ions
/sw
aptio
ns2(
c)–
––
––
––
––
––
– O
ther
ass
ets
2(a,c
)5,0
26,03
295
,978
911,2
676,3
9119
397
,686
25,02
31,4
42,77
722
,929
3,066
2,090
94,96
3
Tota
l ass
ets
3,572
,033,3
393,1
49,20
6,736
715,5
38,29
72,5
47,16
6,560
291,9
42,31
048
4,634
,518
808,0
56,21
04,0
04,80
4,164
35,91
4,921
288,1
23,03
228
,139,4
4326
7,242
,192
Liab
ilitie
sC
ash
owed
to b
ank
2(a)
––
245
05,3
72,69
012
603,5
7082
,921
–55
9,230
–68
9,842
D
ue to
bro
ker
15–
810,0
00–
15,75
8,440
––
510,0
007,8
03,40
317
2,515
1,390
,000
–22
3,009
In
com
e di
strib
utio
n pa
yabl
e2(
a)5,2
13,11
416
,160,5
6014
0,378
7,372
,835
773
92,76
0–
3,061
,275
––
––
Paya
ble
for i
nves
tmen
ts p
urch
ased
2(a)
6,581
,050
71,49
0,708
4,502
,681
–1,6
93,52
91,0
27,84
32,5
77,50
338
,979,7
501,0
17,03
5–
29,16
02,8
64,32
5 Pa
yabl
e fo
r Fun
d sh
ares
rede
emed
2(a)
1,863
,330
9,168
,977
4,582
,958
2,185
,531
3,932
79,85
497
1,316
13,57
4,773
–56
2,310
––
Unr
ealis
ed d
epre
ciat
ion
on:
Ope
n ex
chan
ge tr
aded
futu
res
cont
ract
s2(
c)–
––
–1,1
8231
9,251
61,50
577
1,739
103,3
15–
–52
,183
Ope
n fo
rwar
d fo
reig
n ex
chan
ge c
ontra
cts
2(c)
–11
,638,9
72–
12,22
8,408
167,6
768,5
8412
2,761
4,562
,802
–3,8
30,20
93,9
33–
Con
tract
s fo
r diff
eren
ce2(
c)–
––
––
854,4
3756
5,630
––
––
– M
arke
t val
ue o
f sw
aps
2(c)
––
––
––
––
1,783
,587
––
– M
arke
t val
ue o
f writ
ten
optio
ns/s
wap
tions
2(c)
––
––
––
––
––
––
Oth
er li
abilit
ies
5,6,7,
83,8
95,38
64,6
92,78
82,0
03,00
42,3
11,80
961
0,697
437,5
201,0
72,72
94,5
52,32
936
,220
216,1
5417
,276
334,0
67
Tota
l lia
bilit
ies
17,55
2,880
113,9
62,00
511
,229,0
2339
,857,4
737,8
50,47
92,8
20,26
16,4
85,01
473
,388,9
923,1
12,67
26,5
57,90
350
,369
4,163
,426
Tota
l net
ass
ets
3,554
,480,4
593,0
35,24
4,731
704,3
09,27
42,5
07,30
9,087
284,0
91,83
148
1,814
,257
801,5
71,19
63,9
31,41
5,172
32,80
2,249
281,5
65,12
928
,089,0
7426
3,078
,766

A
nnua
l Rep
ort a
nd A
udite
d Fi
nanc
ial S
tate
men
ts
[25]
The
note
s on
pag
es 7
28 to
741
form
an
inte
gral
par
t of t
hese
fina
ncia
l sta
tem
ents
.
Sta
tem
ent o
f Net
Ass
ets
as a
t 31
Aug
ust 2
019
cont
inue
d
Fund
Nam
eNo
te
ESG
Mu
lti-A
sset
Fu
nd(1
)
Euro
Bo
nd
Fund
Euro
Co
rpor
ate
Bond
Fu
nd
Eu
ro
Rese
rve
Fund
Euro
Sh
ort
Dura
tion
Bond
Fu
nd
Eu
ro-
Mark
ets
Fund
Euro
pean
Eq
uity
In
com
e Fu
nd
Eu
rope
an
Focu
s Fu
nd
Eu
rope
an
Fund
Euro
pean
Hi
gh
Yield
Bo
nd
Fund
Euro
pean
Sp
ecial
Si
tuat
ions
Fu
nd
Euro
pean
Va
lue
Fund
EUR
EUR
EUR
EUR
EUR
EUR
EUR
EUR
EUR
EUR
EUR
EUR
Ass
ets
Secu
ritie
s po
rtfol
io a
t cos
t49
4,460
,827
5,232
,085,1
212,8
30,37
1,665
73,02
4,755
11,35
3,528
,016
1,664
,301,7
951,5
92,39
1,961
360,0
86,60
21,0
04,78
3,459
65,38
6,984
995,5
57,59
9 89
3,345
,452
Unr
ealis
ed a
ppre
ciat
ion/
(dep
reci
atio
n)26
,654,2
6241
1,004
,444
145,1
66,32
89,4
7118
8,760
,661
192,3
79,73
810
7,427
,901
28,99
7,468
136,9
07,41
81,1
86,67
525
8,011
,346
(15,8
61,71
2)
Secu
ritie
s po
rtfol
io a
t mar
ket v
alue
2(a)
521,1
15,08
95,6
43,08
9,565
2,975
,537,9
9373
,034,2
2611
,542,2
88,67
71,8
56,68
1,533
1,699
,819,8
6238
9,084
,070
1,141
,690,8
7766
,573,6
591,2
53,56
8,945
87
7,483
,740
Cas
h at
ban
k2(
a)41
,178,3
2031
,039,5
8238
,581,7
931
68,30
7,973
7,772
,794
36,98
1,552
1,049
,957
2,178
,117
4,562
,896
– 1
Due
from
bro
ker
1517
1,660
29,94
1,015
13,57
6,615
–42
,756,2
03–
––
–32
,000
– –
Inte
rest
and
div
iden
ds re
ceiv
able
2(a)
1,163
,161
28,97
7,384
18,86
5,279
972
44,35
9,107
434,3
452,9
01,36
641
9,148
1,152
,706
894,7
522,3
43,37
8 1,7
30,52
5R
ecei
vabl
e fo
r inv
estm
ents
sol
d2(
a)2,4
61,32
76,6
04,03
17,0
85,43
819
,700,0
0034
3,441
,360
–6,4
05,91
821
5,629
638,6
8410
4,446
– 1,5
52,75
7R
ecei
vabl
e fo
r Fun
d sh
ares
sub
scrib
ed2(
a)57
3,064
15,22
0,625
2,796
,878
1,611
,209
15,51
8,006
1,596
,999
2,335
,985
84,99
419
8,028
151,0
4551
8,205
78
,198
Unr
ealis
ed a
ppre
ciat
ion
on:
Ope
n ex
chan
ge tr
aded
futu
res
cont
ract
s2(
c)–
––
––
––
––
––
–O
pen
forw
ard
fore
ign
exch
ange
con
tract
s2(
c)–
7,251
,365
––
1,855
,815
1,681
,131
6,267
,915
153,3
082,6
23,69
4–
1,935
,475
859,0
39C
ontra
cts
for d
iffer
ence
2(c)
––
––
––
––
––
– –
Mar
ket v
alue
of T
o Be
Ann
ounc
ed s
ecur
ities
con
tract
s2(
c)–
––
––
––
––
––
–M
arke
t val
ue o
f sw
aps
2(c)
––
––
––
––
––
– –
Mar
ket v
alue
of p
urch
ased
opt
ions
/sw
aptio
ns2(
c)1,0
24,76
72,8
62,09
71,0
00,43
8–
6,122
,174
––
––
1,716
– –
Oth
er a
sset
s2(
a,c)
118,5
95–
18,00
532
,713
125,9
221,7
02,70
53,8
90,06
11,1
67,51
52,4
45,01
925
01,6
63,65
0 2,2
79,77
8
Tota
l ass
ets
567,8
05,98
35,7
64,98
5,664
3,057
,462,4
3994
,379,1
2112
,064,7
75,23
71,8
69,86
9,507
1,758
,602,6
5939
2,174
,621
1,150
,927,1
2572
,320,7
641,2
60,02
9,653
88
3,984
,038
Liab
ilitie
sC
ash
owed
to b
ank
2(a)
117
1,243
,886
–94
3,957
865,4
43–
–1
–17
4,072
,282
14,45
2,696
Due
to b
roke
r15
710,6
361,8
25,83
510
,504,1
64–
6,847
,034
––
––
71,15
9–
–In
com
e di
strib
utio
n pa
yabl
e2(
a)–
1,026
,906
22,84
7–
189,6
0759
0,123
23,79
2,486
–59
,832
96,12
1–
367,0
95Pa
yabl
e fo
r inv
estm
ents
pur
chas
ed2(
a)2,3
22,39
792
,975,0
8242
,906,0
28–
346,8
44,55
4–
13,52
1,338
––
1,087
,290
– 78
1,949
Paya
ble
for F
und
shar
es re
deem
ed2(
a)15
6,804
7,422
,169
5,359
,135
233,6
0715
,389,6
944,3
22,88
43,2
86,18
240
5,458
2,837
,112
58,98
71,3
11,21
5 1,5
70,82
3U
nrea
lised
dep
reci
atio
n on
:O
pen
exch
ange
trad
ed fu
ture
s co
ntra
cts
2(c)
388,0
355,3
82,91
211
,233,9
18–
52,26
0,623
––
––
55,68
7–
–O
pen
forw
ard
fore
ign
exch
ange
con
tract
s2(
c)2,2
88,99
7–
1,279
,177
––
––
––
262,3
39–
–C
ontra
cts
for d
iffer
ence
2(c)
––
––
––
––
––
– –
Mar
ket v
alue
of s
wap
s2(
c)72
1,103
18,53
9,924
2,857
,756
–25
,481,1
52–
––
–11
9,292
– –
Mar
ket v
alue
of w
ritte
n op
tions
/sw
aptio
ns2(
c)42
,032
2,778
,901
1,018
,479
–4,0
02,01
6–
––
––
– –
Oth
er li
abilit
ies
5,6,7,
843
6,242
3,454
,740
1,758
,826
55,45
68,5
00,30
92,4
29,82
42,6
04,56
573
9,449
1,432
,522
60,42
71,5
15,25
8 1,2
73,02
5
Tota
l lia
bilit
ies
7,066
,363
134,6
50,35
576
,940,3
301,2
33,02
046
0,380
,432
7,342
,831
43,20
4,571
1,144
,908
4,329
,466
1,811
,319
6,898
,755
18,44
5,588
Tota
l net
ass
ets
560,7
39,62
05,6
30,33
5,309
2,980
,522,1
0993
,146,1
0111
,604,3
94,80
51,8
62,52
6,676
1,715
,398,0
8839
1,029
,713
1,146
,597,6
5970
,509,4
451,2
53,13
0,898
86
5,538
,450
(1) F
und
nam
e ch
ange
d du
ring
the
year
, see
Not
e 1,
for f
urth
er d
etai
ls.
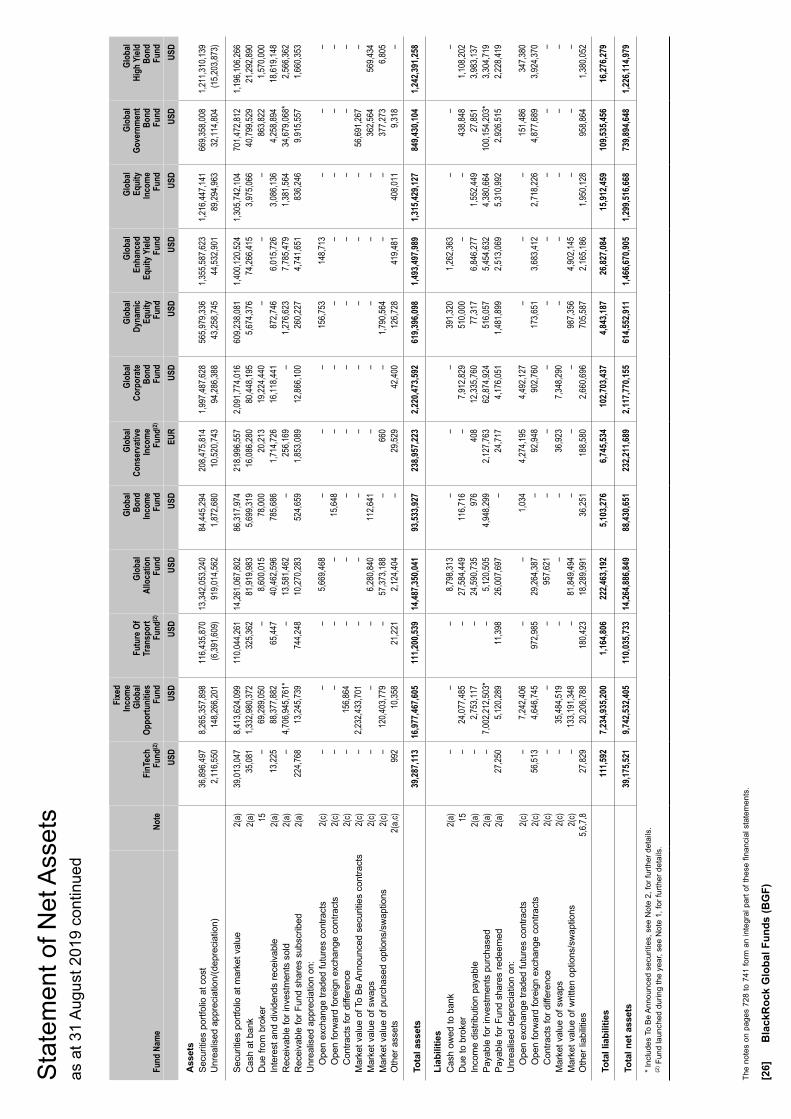
[26]
B
lack
Roc
k G
loba
l Fun
ds (B
GF)
The
note
s on
pag
es 7
28 to
741
form
an
inte
gral
par
t of t
hese
fina
ncia
l sta
tem
ents
.
Sta
tem
ent o
f Net
Ass
ets
as a
t 31
Aug
ust 2
019
cont
inue
d
Fund
Nam
eNo
teFi
nTec
h
Fund
(2)
Fixe
d
Inco
me
Glob
al Op
portu
nitie
s Fu
nd
Fu
ture
Of
Tran
spor
t Fu
nd(2
)
Gl
obal
Allo
catio
n Fu
nd
Gl
obal
Bond
In
com
e Fu
nd
Glob
al Co
nser
vativ
e In
com
e Fu
nd(2
)
Glob
al Co
rpor
ate
Bond
Fu
nd
Glob
al Dy
nam
ic Eq
uity
Fu
nd
Glob
al
Enha
nced
Eq
uity
Yiel
d Fu
nd
Glob
al Eq
uity
In
com
e Fu
nd
Glob
al Go
vern
men
t Bo
nd
Fund
Glob
al
High
Yiel
d Bo
nd
Fund
USD
USD
USD
USD
USD
EUR
USD
USD
USD
USD
USD
USD
Ass
ets
Secu
ritie
s po
rtfol
io a
t cos
t36
,896,4
978,2
65,35
7,898
116,4
35,87
013
,342,0
53,24
084
,445,2
9420
8,475
,814
1,997
,487,6
2856
5,979
,336
1,355
,587,6
231,2
16,44
7,141
669,3
58,00
8 1,2
11,31
0,139
Unr
ealis
ed a
ppre
ciat
ion/
(dep
reci
atio
n)2,1
16,55
014
8,266
,201
(6,39
1,609
)91
9,014
,562
1,872
,680
10,52
0,743
94,28
6,388
43,25
8,745
44,53
2,901
89,29
4,963
32,11
4,804
(1
5,203
,873)
Secu
ritie
s po
rtfol
io a
t mar
ket v
alue
2(a)
39,01
3,047
8,413
,624,0
9911
0,044
,261
14,26
1,067
,802
86,31
7,974
218,9
96,55
72,0
91,77
4,016
609,2
38,08
11,4
00,12
0,524
1,305
,742,1
0470
1,472
,812
1,196
,106,2
66C
ash
at b
ank
2(a)
35,08
11,3
32,98
0,372
325,3
6281
,919,9
835,6
99,31
916
,086,2
8080
,448,1
955,6
74,37
674
,266,4
153,9
75,06
640
,799,5
29
21,29
2,890
Due
from
bro
ker
15–
69,28
9,050
–8,6
00,01
578
,000
20,21
319
,224,4
40–
––
863,8
22
1,570
,000
Inte
rest
and
div
iden
ds re
ceiv
able
2(a)
13,22
588
,377,8
8265
,447
40,46
2,596
785,6
861,7
14,72
616
,118,4
4187
2,746
6,015
,726
3,086
,136
4,258
,894
18,61
9,148
Rec
eiva
ble
for i
nves
tmen
ts s
old
2(a)
–4,7
06,94
5,761
*–
13,58
1,462
–25
6,169
–1,2
76,62
37,7
85,47
91,3
81,56
434
,679,0
68*
2,566
,362
Rec
eiva
ble
for F
und
shar
es s
ubsc
ribed
2(a)
224,7
6813
,245,7
3974
4,248
10,27
0,283
524,6
591,8
53,08
912
,866,1
0026
0,227
4,741
,651
836,2
469,9
15,55
7 1,6
60,35
3U
nrea
lised
app
reci
atio
n on
:O
pen
exch
ange
trad
ed fu
ture
s co
ntra
cts
2(c)
––
–5,6
69,46
8–
––
156,7
5314
8,713
––
–O
pen
forw
ard
fore
ign
exch
ange
con
tract
s2(
c)–
––
–15
,648
––
––
––
–C
ontra
cts
for d
iffer
ence
2(c)
–15
6,864
––
––
––
––
– –
Mar
ket v
alue
of T
o Be
Ann
ounc
ed s
ecur
ities
con
tract
s2(
c)–
2,232
,433,7
01–
––
––
––
–56
,691,2
67
–M
arke
t val
ue o
f sw
aps
2(c)
––
–6,2
80,84
011
2,641
––
––
–36
2,564
56
9,434
Mar
ket v
alue
of p
urch
ased
opt
ions
/sw
aptio
ns2(
c)–
120,4
03,77
9–
57,37
3,188
–66
0–
1,790
,564
––
377,2
73
6,805
Oth
er a
sset
s2(
a,c)
992
10,35
821
,221
2,124
,404
–29
,529
42,40
012
6,728
419,4
8140
8,011
9,318
–
Tota
l ass
ets
39,28
7,113
16,97
7,467
,605
111,2
00,53
914
,487,3
50,04
193
,533,9
2723
8,957
,223
2,220
,473,5
9261
9,396
,098
1,493
,497,9
891,3
15,42
9,127
849,4
30,10
4 1,2
42,39
1,258
Liab
ilitie
sC
ash
owed
to b
ank
2(a)
––
–8,7
98,31
3–
––
391,3
201,2
62,36
3–
– –
Due
to b
roke
r15
–24
,077,4
85–
27,58
4,449
116,7
16–
7,912
,829
510,0
00–
–43
8,848
1,1
08,20
2In
com
e di
strib
utio
n pa
yabl
e2(
a)–
2,753
,117
–24
,590,7
3597
640
812
,335,7
6077
,317
6,846
,277
1,552
,449
27,85
1 3,9
83,13
7Pa
yabl
e fo
r inv
estm
ents
pur
chas
ed2(
a)–
7,002
,212,5
03*
–5,1
20,50
54,9
48,29
92,1
27,76
362
,874,9
2451
6,057
5,454
,632
4,380
,664
100,1
54,20
3*3,3
04,71
9Pa
yabl
e fo
r Fun
d sh
ares
rede
emed
2(a)
27,25
05,1
20,28
911
,398
26,00
7,697
–24
,717
4,176
,051
1,481
,899
2,513
,069
5,310
,992
2,926
,515
2,228
,419
Unr
ealis
ed d
epre
ciat
ion
on:
Ope
n ex
chan
ge tr
aded
futu
res
cont
ract
s2(
c)–
7,242
,406
––
1,034
4,274
,195
4,492
,127
––
–15
1,486
34
7,380
Ope
n fo
rwar
d fo
reig
n ex
chan
ge c
ontra
cts
2(c)
56,51
34,6
46,74
597
2,985
29,26
4,387
–92
,948
902,7
6017
3,651
3,683
,412
2,718
,226
4,877
,689
3,924
,370
Con
tract
s fo
r diff
eren
ce2(
c)–
––
957,6
21–
––
––
––
–M
arke
t val
ue o
f sw
aps
2(c)
–35
,484,5
19–
––
36,92
37,3
48,29
0–
––
– –
Mar
ket v
alue
of w
ritte
n op
tions
/sw
aptio
ns2(
c)–
133,1
91,34
8–
81,84
9,494
––
–98
7,356
4,902
,145
––
–O
ther
liab
ilitie
s5,6
,7,8
27,82
920
,206,7
8818
0,423
18,28
9,991
36,25
118
8,580
2,660
,696
705,5
872,1
65,18
61,9
50,12
895
8,864
1,3
80,05
2
Tota
l lia
bilit
ies
111,5
927,2
34,93
5,200
1,164
,806
222,4
63,19
25,1
03,27
66,7
45,53
410
2,703
,437
4,843
,187
26,82
7,084
15,91
2,459
109,5
35,45
6 16
,276,2
79
Tota
l net
ass
ets
39,17
5,521
9,742
,532,4
0511
0,035
,733
14,26
4,886
,849
88,43
0,651
232,2
11,68
92,1
17,77
0,155
614,5
52,91
11,4
66,67
0,905
1,299
,516,6
6873
9,894
,648
1,226
,114,9
79
* In
clud
es T
o B
e A
nnou
nced
sec
uriti
es, s
ee N
ote
2, fo
r fur
ther
det
ails
.(2
) Fun
d la
unch
ed d
urin
g th
e ye
ar, s
ee N
ote
1, fo
r fur
ther
det
ails
.

A
nnua
l Rep
ort a
nd A
udite
d Fi
nanc
ial S
tate
men
ts
[27]
The
note
s on
pag
es 7
28 to
741
form
an
inte
gral
par
t of t
hese
fina
ncia
l sta
tem
ents
.
Sta
tem
ent o
f Net
Ass
ets
as a
t 31
Aug
ust 2
019
cont
inue
d
Fund
Nam
eNo
te
Glob
al
Infla
tion
Link
ed B
ond
Fund
Glob
al
Long
-Hor
izon
Eq
uity
Fu
nd(1
)
Glob
al
Multi
-Ass
et
Inco
me
Fund
Gl
obal
Small
Cap
Fund
In
dia
Fund
Japa
n Fl
exib
le Eq
uity
Fu
nd
Japa
n Sm
all &
Mi
dCap
Op
portu
nitie
s Fu
nd
La
tin
Amer
ican
Fund
Ma
rket
Na
vigat
or
Fund
(2)
Natu
ral
Reso
urce
s Gr
owth
&
Inco
me
Fund
Next
Ge
nera
tion
Te
chno
logy
Fu
nd(2
)
USD
USD
USD
USD
USD
JPY
JPY
USD
EUR
USD
USD
Ass
ets
Secu
ritie
s po
rtfol
io a
t cos
t12
5,883
,968
342,6
79,79
27,3
82,54
4,052
198,2
18,14
138
1,186
,151
13,44
1,932
,439
31,25
6,308
,834
918,1
31,58
331
,047,8
2910
8,273
,900
76,66
6,017
U
nrea
lised
app
reci
atio
n/(d
epre
ciat
ion)
4,963
,601
51,70
9,060
106,5
05,13
1(5
,226,8
05)
53,20
9,319
445,3
00,51
1(6
45,76
6,934
)93
,938,1
281,4
71,00
5(5
,268,9
37)
9,656
,793
Secu
ritie
s po
rtfol
io a
t mar
ket v
alue
2(a)
130,8
47,56
939
4,388
,852
7,489
,049,1
8319
2,991
,336
434,3
95,47
013
,887,2
32,95
030
,610,5
41,90
01,0
12,06
9,711
32,51
8,834
103,0
04,96
386
,322,8
10
Cas
h at
ban
k2(
a)1,9
71,08
26,7
09,53
241
7,382
,460
6,951
,163
2,266
,127
378,3
72,51
777
8,032
,573
12,38
3,111
1,506
,970
188,6
819,3
88,93
7 D
ue fr
om b
roke
r15
2,218
,816
–67
8,000
––
––
–53
2,709
––
Inte
rest
and
div
iden
ds re
ceiv
able
2(a)
248,5
9354
9,554
62,49
7,127
238,9
0444
0,654
31,13
9,802
48,15
0,704
4,706
,691
103,7
3442
9,754
19,27
7 R
ecei
vabl
e fo
r inv
estm
ents
sol
d2(
a)16
5,750
388,8
235,2
48,24
64,9
06,81
269
,947
–35
9,697
,734
5,535
,100
––
– R
ecei
vabl
e fo
r Fun
d sh
ares
sub
scrib
ed2(
a)59
,281
2,456
,169
7,331
,451
136,8
21–
32,63
5,162
24,17
6,043
1,041
,724
–54
,370
1,244
,380
Unr
ealis
ed a
ppre
ciat
ion
on:
O
pen
exch
ange
trad
ed fu
ture
s co
ntra
cts
2(c)
––
7,800
,740
––
––
–12
7,246
––
Ope
n fo
rwar
d fo
reig
n ex
chan
ge c
ontra
cts
2(c)
––
––
––
2,936
,753
––
––
Con
tract
s fo
r diff
eren
ce2(
c)–
––
––
––
––
––
Mar
ket v
alue
of T
o Be
Ann
ounc
ed s
ecur
ities
con
tract
s2(
c)–
––
––
––
––
––
Mar
ket v
alue
of s
wap
s2(
c)–
––
––
––
–44
7,818
––
Mar
ket v
alue
of p
urch
ased
opt
ions
/sw
aptio
ns2(
c)11
8,847
–3,0
13–
––
––
111,2
01–
– O
ther
ass
ets
2(a,c
)–
214,0
811,2
28,87
989
,460
––
––
18,26
339
,242
4,653
Tota
l ass
ets
135,6
29,93
840
4,707
,011
7,991
,219,0
9920
5,314
,496
437,1
72,19
814
,329,3
80,43
131
,823,5
35,70
71,0
35,73
6,337
35,36
6,775
103,7
17,01
096
,980,0
57
Liab
ilitie
sC
ash
owed
to b
ank
2(a)
552,1
79–
6,493
450,0
1020
1,031
–48
919
,459
––
Due
to b
roke
r15
––
136,2
45–
––
––
777,9
22–
– In
com
e di
strib
utio
n pa
yabl
e2(
a)12
83,8
4325
,635,8
86–
–44
2,611
52,00
241
,591
–1,5
23,59
1–
Paya
ble
for i
nves
tmen
ts p
urch
ased
2(a)
––
128,6
66,19
24,7
81,95
1–
–20
0,070
,490
1,037
,091
––
1,503
,800
Paya
ble
for F
und
shar
es re
deem
ed2(
a)29
9,722
352,6
1214
,260,5
8329
6,345
513,6
8918
0,958
,419
436,5
93,63
31,3
55,16
3–
28,94
822
2,467
U
nrea
lised
dep
reci
atio
n on
:
Ope
n ex
chan
ge tr
aded
futu
res
cont
ract
s2(
c)1,0
39,63
1–
–13
0,136
––
––
––
– O
pen
forw
ard
fore
ign
exch
ange
con
tract
s2(
c)81
6,476
174
39,64
1,022
3,203
–33
,296,9
40–
160,3
5822
3,122
44,26
399
,802
Con
tract
s fo
r diff
eren
ce2(
c)–
–16
4,160
––
––
––
––
Mar
ket v
alue
of s
wap
s2(
c)1,4
15,33
6–
339,2
39–
––
––
––
– M
arke
t val
ue o
f writ
ten
optio
ns/s
wap
tions
2(c)
131,2
12–
––
––
––
––
– O
ther
liab
ilitie
s5,6
,7,8
86,74
264
1,867
9,738
,098
418,6
3194
2,146
20,49
3,966
50,74
6,876
1,961
,990
22,86
313
8,653
91,31
9
Tota
l lia
bilit
ies
4,341
,426
998,4
9621
8,587
,918
6,080
,276
1,455
,855
235,1
92,96
768
7,463
,001
4,556
,682
1,043
,366
1,735
,455
1,917
,388
Tota
l net
ass
ets
131,2
88,51
240
3,708
,515
7,772
,631,1
8119
9,234
,220
435,7
16,34
314
,094,1
87,46
431
,136,0
72,70
61,0
31,17
9,655
34,32
3,409
101,9
81,55
595
,062,6
69
(1) F
und
nam
e ch
ange
d du
ring
the
year
, see
Not
e 1,
for f
urth
er d
etai
ls.
(2) F
und
laun
ched
dur
ing
the
year
, see
Not
e 1,
for f
urth
er d
etai
ls.
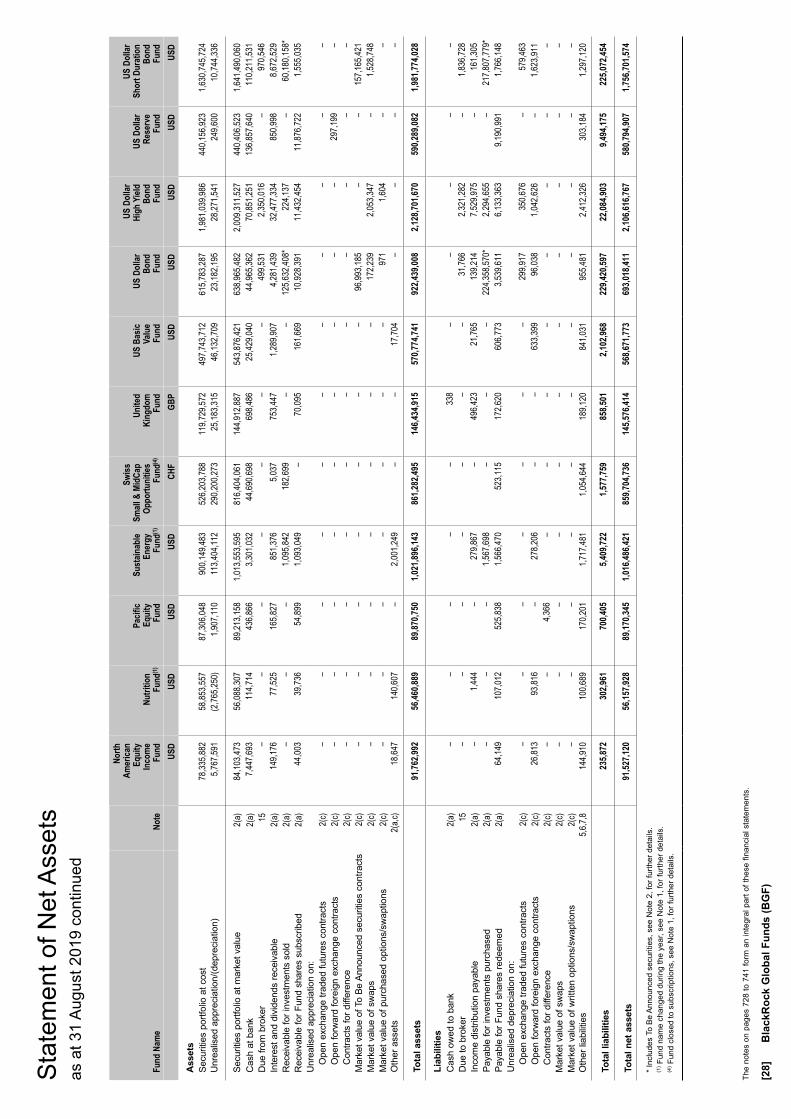
[28]
B
lack
Roc
k G
loba
l Fun
ds (B
GF)
The
note
s on
pag
es 7
28 to
741
form
an
inte
gral
par
t of t
hese
fina
ncia
l sta
tem
ents
.
Sta
tem
ent o
f Net
Ass
ets
as a
t 31
Aug
ust 2
019
cont
inue
d
Fund
Nam
eNo
te
North
Am
erica
n Eq
uity
In
com
e Fu
ndNu
tritio
n Fu
nd(1
)
Pacif
ic Eq
uity
Fu
nd
Sust
ainab
le
Ener
gy
Fund
(1)
Swiss
Sm
all &
Mid
Cap
Oppo
rtuni
ties
Fund
(4)
Un
ited
King
dom
Fu
nd
US B
asic
Valu
e Fu
nd
US D
ollar
Bo
nd
Fund
US D
ollar
Hi
gh Y
ield
Bond
Fu
nd
US D
ollar
Re
serv
e Fu
nd
US D
ollar
Sh
ort D
urat
ion
Bo
nd
Fund
USD
USD
USD
USD
CHF
GBP
USD
USD
USD
USD
USD
Ass
ets
Secu
ritie
s po
rtfol
io a
t cos
t78
,335,8
82
58,85
3,557
87
,306,0
48
900,1
49,48
3 52
6,203
,788
119,7
29,57
2 49
7,743
,712
615,7
83,28
7 1,9
81,03
9,986
44
0,156
,923
1,630
,745,7
24
Unr
ealis
ed a
ppre
ciat
ion/
(dep
reci
atio
n)5,7
67,59
1 (2
,765,2
50)
1,907
,110
113,4
04,11
2 29
0,200
,273
25,18
3,315
46
,132,7
09
23,18
2,195
28
,271,5
41
249,6
00
10,74
4,336
Secu
ritie
s po
rtfol
io a
t mar
ket v
alue
2(a)
84,10
3,473
56
,088,3
07
89,21
3,158
1,0
13,55
3,595
81
6,404
,061
144,9
12,88
7 54
3,876
,421
638,9
65,48
2 2,0
09,31
1,527
44
0,406
,523
1,641
,490,0
60
Cas
h at
ban
k2(
a)7,4
47,69
3 11
4,714
43
6,866
3,3
01,03
2 44
,690,6
98
698,4
86
25,42
9,040
44
,965,3
62
70,85
1,251
13
6,857
,640
110,2
11,53
1 D
ue fr
om b
roke
r15
– –
– –
– –
– 49
9,531
2,3
50,01
6 –
970,5
46
Inte
rest
and
div
iden
ds re
ceiv
able
2(a)
149,1
76
77,52
5 16
5,827
85
1,376
5,0
37
753,4
47
1,289
,907
4,281
,439
32,47
7,334
85
0,998
8,6
72,52
9 R
ecei
vabl
e fo
r inv
estm
ents
sol
d2(
a)–
– –
1,095
,842
182,6
99
– –
125,6
32,40
8*22
4,137
–
60,18
0,158
*R
ecei
vabl
e fo
r Fun
d sh
ares
sub
scrib
ed2(
a)44
,003
39,73
6 54
,899
1,093
,049
– 70
,095
161,6
69
10,92
8,391
11
,432,4
54
11,87
6,722
1,5
55,03
5 U
nrea
lised
app
reci
atio
n on
:
Ope
n ex
chan
ge tr
aded
futu
res
cont
ract
s2(
c)–
– –
– –
– –
– –
– –
Ope
n fo
rwar
d fo
reig
n ex
chan
ge c
ontra
cts
2(c)
– –
– –
– –
– –
– 29
7,199
–
Con
tract
s fo
r diff
eren
ce2(
c)–
– –
– –
– –
– –
– –
Mar
ket v
alue
of T
o Be
Ann
ounc
ed s
ecur
ities
con
tract
s2(
c)–
– –
– –
– –
96,99
3,185
–
– 15
7,165
,421
Mar
ket v
alue
of s
wap
s2(
c)–
– –
– –
– –
172,2
39
2,053
,347
– 1,5
28,74
8 M
arke
t val
ue o
f pur
chas
ed o
ptio
ns/s
wap
tions
2(c)
– –
– –
– –
– 97
1 1,6
04
– –
Oth
er a
sset
s2(
a,c)
18,64
7 14
0,607
–
2,001
,249
– –
17,70
4 –
– –
–
Tota
l ass
ets
91,76
2,992
56
,460,8
89
89,87
0,750
1,0
21,89
6,143
86
1,282
,495
146,4
34,91
5 57
0,774
,741
922,4
39,00
8 2,1
28,70
1,670
59
0,289
,082
1,981
,774,0
28
Liab
ilitie
sC
ash
owed
to b
ank
2(a)
– –
– –
– 33
8 –
– –
– –
Due
to b
roke
r15
– –
– –
– –
– 31
,766
2,321
,282
– 1,8
36,72
8 In
com
e di
strib
utio
n pa
yabl
e2(
a)–
1,444
–
279,8
67
– 49
6,423
21
,765
139,2
14
7,529
,975
– 16
1,305
Pa
yabl
e fo
r inv
estm
ents
pur
chas
ed2(
a)–
– –
1,567
,698
– –
– 22
4,358
,570*
2,294
,655
– 21
7,807
,779*
Paya
ble
for F
und
shar
es re
deem
ed2(
a)64
,149
107,0
12
525,8
38
1,566
,470
523,1
15
172,6
20
606,7
73
3,539
,611
6,133
,363
9,190
,991
1,766
,148
Unr
ealis
ed d
epre
ciat
ion
on:
O
pen
exch
ange
trad
ed fu
ture
s co
ntra
cts
2(c)
– –
– –
– –
– 29
9,917
35
0,676
–
579,4
63
Ope
n fo
rwar
d fo
reig
n ex
chan
ge c
ontra
cts
2(c)
26,81
3 93
,816
– 27
8,206
–
– 63
3,399
96
,038
1,042
,626
– 1,6
23,91
1 C
ontra
cts
for d
iffer
ence
2(c)
– –
4,366
–
– –
– –
– –
– M
arke
t val
ue o
f sw
aps
2(c)
– –
– –
– –
– –
– –
– M
arke
t val
ue o
f writ
ten
optio
ns/s
wap
tions
2(c)
– –
– –
– –
– –
– –
– O
ther
liab
ilitie
s5,6
,7,8
144,9
10
100,6
89
170,2
01
1,717
,481
1,054
,644
189,1
20
841,0
31
955,4
81
2,412
,326
303,1
84
1,297
,120
Tota
l lia
bilit
ies
235,8
72
302,9
61
700,4
05
5,409
,722
1,577
,759
858,5
01
2,102
,968
229,4
20,59
7 22
,084,9
03
9,494
,175
225,0
72,45
4
Tota
l net
ass
ets
91,52
7,120
56
,157,9
28
89,17
0,345
1,0
16,48
6,421
85
9,704
,736
145,5
76,41
4 56
8,671
,773
693,0
18,41
1 2,1
06,61
6,767
58
0,794
,907
1,756
,701,5
74
* In
clud
es T
o B
e A
nnou
nced
sec
uriti
es, s
ee N
ote
2, fo
r fur
ther
det
ails
.(1
) Fun
d na
me
chan
ged
durin
g th
e ye
ar, s
ee N
ote
1, fo
r fur
ther
det
ails
.(4
) Fun
d cl
osed
to s
ubsc
riptio
ns, s
ee N
ote
1, fo
r fur
ther
det
ails
.
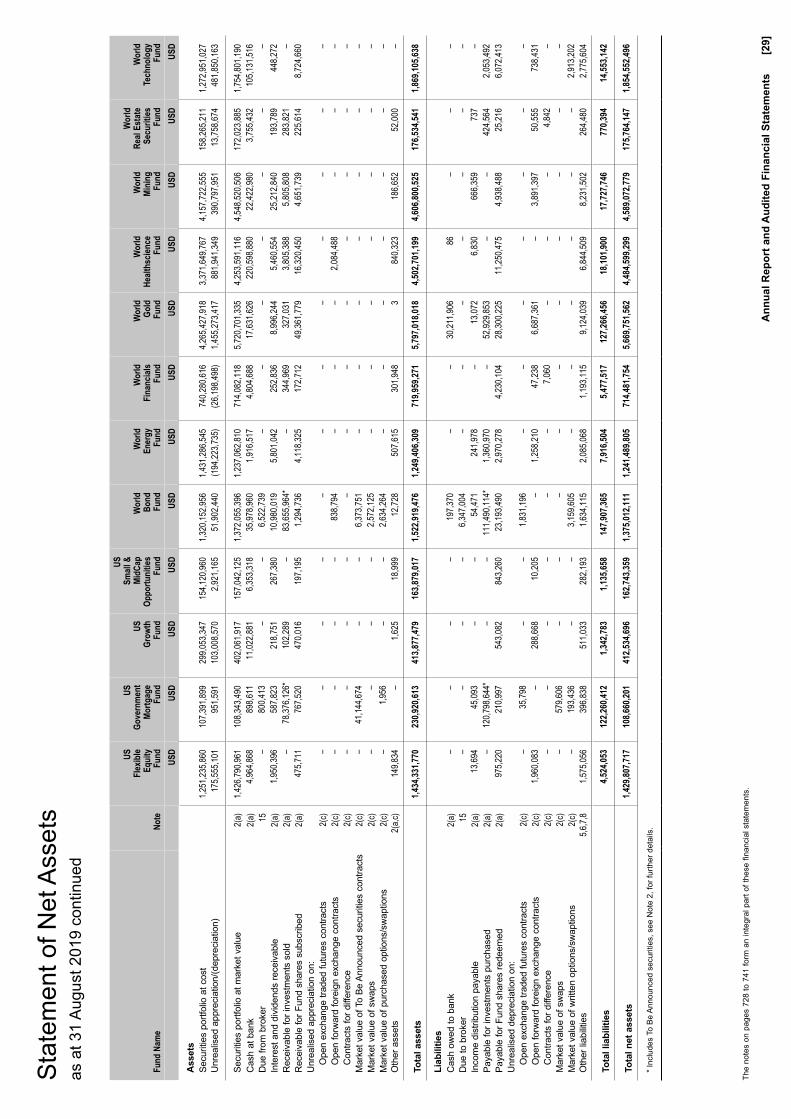
A
nnua
l Rep
ort a
nd A
udite
d Fi
nanc
ial S
tate
men
ts
[29]
The
note
s on
pag
es 7
28 to
741
form
an
inte
gral
par
t of t
hese
fina
ncia
l sta
tem
ents
.
Sta
tem
ent o
f Net
Ass
ets
as a
t 31
Aug
ust 2
019
cont
inue
d
Fund
Nam
eNo
te
US
Flex
ible
Eq
uity
Fu
nd
US
Gove
rnm
ent
Mortg
age
Fund
US
Grow
th
Fund
US
Small
&
MidC
ap
Oppo
rtuni
ties
Fund
W
orld
Bo
nd
Fund
W
orld
En
ergy
Fu
nd
W
orld
Fi
nanc
ials
Fund
W
orld
Go
ld
Fund
W
orld
He
alths
cienc
e Fu
nd
Wor
ld
Mini
ng
Fund
Wor
ld
Real
Esta
te
Secu
rities
Fu
nd
W
orld
Te
chno
logy
Fu
ndUS
DUS
DUS
DUS
DUS
DUS
DUS
DUS
DUS
DUS
DUS
DUS
D
Ass
ets
Secu
ritie
s po
rtfol
io a
t cos
t1,2
51,23
5,860
10
7,391
,899
299,0
53,34
7 15
4,120
,960
1,320
,152,9
56
1,431
,286,5
45
740,2
80,61
6 4,2
65,42
7,918
3,3
71,64
9,767
4,1
57,72
2,555
15
8,265
,211
1,272
,951,0
27
Unr
ealis
ed a
ppre
ciat
ion/
(dep
reci
atio
n)17
5,555
,101
951,5
91
103,0
08,57
0 2,9
21,16
5 51
,902,4
40
(194
,223,7
35)
(26,1
98,49
8)1,4
55,27
3,417
88
1,941
,349
390,7
97,95
1 13
,758,6
74
481,8
50,16
3
Secu
ritie
s po
rtfol
io a
t mar
ket v
alue
2(a)
1,426
,790,9
61
108,3
43,49
0 40
2,061
,917
157,0
42,12
5 1,3
72,05
5,396
1,2
37,06
2,810
71
4,082
,118
5,720
,701,3
35
4,253
,591,1
16
4,548
,520,5
06
172,0
23,88
5 1,7
54,80
1,190
C
ash
at b
ank
2(a)
4,964
,868
898,6
11
11,02
2,881
6,3
53,31
8 35
,978,9
60
1,916
,517
4,804
,688
17,63
1,626
22
0,598
,880
22,42
2,980
3,7
55,43
2 10
5,131
,516
Due
from
bro
ker
15–
800,4
13
– –
6,522
,739
– –
– –
– –
– In
tere
st a
nd d
ivid
ends
rece
ivab
le2(
a)1,9
50,39
6 58
7,823
21
8,751
26
7,380
10
,980,0
19
5,801
,042
252,8
36
8,996
,244
5,460
,554
25,21
2,840
19
3,789
44
8,272
R
ecei
vabl
e fo
r inv
estm
ents
sol
d2(
a)–
78,37
6,126
*10
2,289
–
83,65
5,964
*–
344,9
69
327,0
31
3,805
,388
5,805
,808
283,8
21
– R
ecei
vabl
e fo
r Fun
d sh
ares
sub
scrib
ed2(
a)47
5,711
76
7,520
47
0,016
19
7,195
1,2
94,73
6 4,1
18,32
5 17
2,712
49
,361,7
79
16,32
0,450
4,6
51,73
9 22
5,614
8,7
24,66
0 U
nrea
lised
app
reci
atio
n on
:O
pen
exch
ange
trad
ed fu
ture
s co
ntra
cts
2(c)
– –
– –
– –
– –
– –
– –
Ope
n fo
rwar
d fo
reig
n ex
chan
ge c
ontra
cts
2(c)
– –
– –
838,7
94
– –
– 2,0
84,48
8 –
– –
Con
tract
s fo
r diff
eren
ce2(
c)–
– –
– –
– –
– –
– –
– M
arke
t val
ue o
f To
Be A
nnou
nced
sec
uriti
es c
ontra
cts
2(c)
– 41
,144,6
74
– –
6,373
,751
– –
– –
– –
– M
arke
t val
ue o
f sw
aps
2(c)
– –
– –
2,572
,125
– –
– –
– –
– M
arke
t val
ue o
f pur
chas
ed o
ptio
ns/s
wap
tions
2(c)
– 1,9
56
– –
2,634
,264
– –
– –
– –
– O
ther
ass
ets
2(a,c
)14
9,834
–
1,625
18
,999
12,72
8 50
7,615
30
1,948
3
840,3
23
186,6
52
52,00
0 –
Tota
l ass
ets
1,434
,331,7
70
230,9
20,61
3 41
3,877
,479
163,8
79,01
7 1,5
22,91
9,476
1,2
49,40
6,309
71
9,959
,271
5,797
,018,0
18
4,502
,701,1
99
4,606
,800,5
25
176,5
34,54
1 1,8
69,10
5,638
Liab
ilitie
sC
ash
owed
to b
ank
2(a)
– –
– –
197,3
70
– –
30,21
1,906
86
–
– –
Due
to b
roke
r15
– –
– –
6,347
,004
– –
– –
– –
– In
com
e di
strib
utio
n pa
yabl
e2(
a)13
,694
45,09
3 –
– 54
,471
241,9
78
– 13
,072
6,830
66
6,359
73
7 –
Paya
ble
for i
nves
tmen
ts p
urch
ased
2(a)
– 12
0,798
,644*
– –
111,4
90,11
4*1,3
60,97
0 –
52,92
9,853
–
– 42
4,564
2,0
53,49
2 Pa
yabl
e fo
r Fun
d sh
ares
rede
emed
2(a)
975,2
20
210,9
97
543,0
82
843,2
60
23,19
3,490
2,9
70,27
8 4,2
30,10
4 28
,300,2
25
11,25
0,475
4,9
38,48
8 25
,216
6,072
,413
Unr
ealis
ed d
epre
ciat
ion
on:
Ope
n ex
chan
ge tr
aded
futu
res
cont
ract
s2(
c)–
35,79
8 –
– 1,8
31,19
6 –
– –
– –
– –
Ope
n fo
rwar
d fo
reig
n ex
chan
ge c
ontra
cts
2(c)
1,960
,083
– 28
8,668
10
,205
– 1,2
58,21
0 47
,238
6,687
,361
– 3,8
91,39
7 50
,555
738,4
31
Con
tract
s fo
r diff
eren
ce2(
c)–
– –
– –
– 7,0
60
– –
– 4,8
42
– M
arke
t val
ue o
f sw
aps
2(c)
– 57
9,606
–
– –
– –
– –
– –
– M
arke
t val
ue o
f writ
ten
optio
ns/s
wap
tions
2(c)
– 19
3,436
–
– 3,1
59,60
5 –
– –
– –
– 2,9
13,20
2 O
ther
liab
ilitie
s5,6
,7,8
1,575
,056
396,8
38
511,0
33
282,1
93
1,634
,115
2,085
,068
1,193
,115
9,124
,039
6,844
,509
8,231
,502
264,4
80
2,775
,604
Tota
l lia
bilit
ies
4,524
,053
122,2
60,41
2 1,3
42,78
3 1,1
35,65
8 14
7,907
,365
7,916
,504
5,477
,517
127,2
66,45
6 18
,101,9
00
17,72
7,746
77
0,394
14
,553,1
42
Tota
l net
ass
ets
1,429
,807,7
17
108,6
60,20
1 41
2,534
,696
162,7
43,35
9 1,3
75,01
2,111
1,2
41,48
9,805
71
4,481
,754
5,669
,751,5
62
4,484
,599,2
99
4,589
,072,7
79
175,7
64,14
7 1,8
54,55
2,496
* In
clud
es T
o B
e A
nnou
nced
sec
uriti
es, s
ee N
ote
2, fo
r fur
ther
det
ails
.
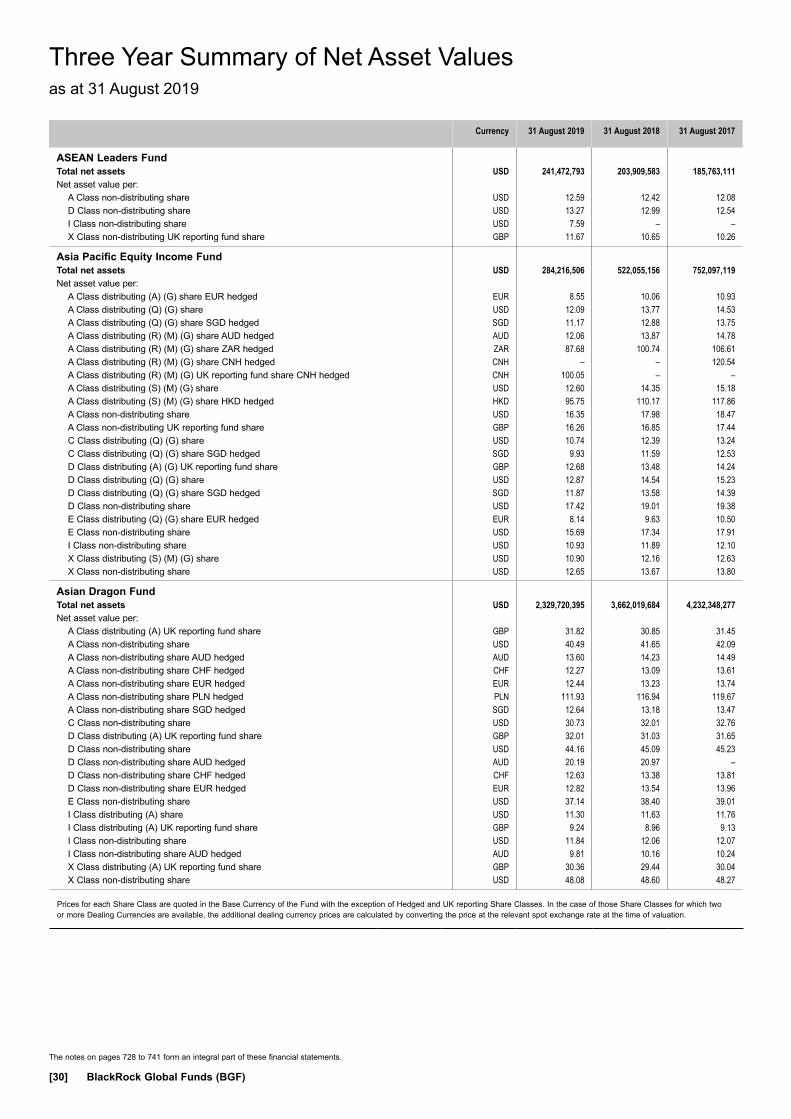
The notes on pages 728 to 741 form an integral part of these financial statements.
[30] BlackRock Global Funds (BGF)
Three Year Summary of Net Asset Valuesas at 31 August 2019
Three Year Summary of Net Asset Values
Currency 31 August 2019 31 August 2018 31 August 2017
ASEAN Leaders Fund Total net assets USD 241,472,793 203,909,583 185,763,111Net asset value per:
A Class non-distributing share USD 12.59 12.42 12.08D Class non-distributing share USD 13.27 12.99 12.54I Class non-distributing share USD 7.59 – –X Class non-distributing UK reporting fund share GBP 11.67 10.65 10.26
Asia Pacific Equity Income Fund Total net assets USD 284,216,506 522,055,156 752,097,119Net asset value per:
A Class distributing (A) (G) share EUR hedged EUR 8.55 10.06 10.93A Class distributing (Q) (G) share USD 12.09 13.77 14.53A Class distributing (Q) (G) share SGD hedged SGD 11.17 12.88 13.75A Class distributing (R) (M) (G) share AUD hedged AUD 12.06 13.87 14.78A Class distributing (R) (M) (G) share ZAR hedged ZAR 87.68 100.74 106.61A Class distributing (R) (M) (G) share CNH hedged CNH – – 120.54A Class distributing (R) (M) (G) UK reporting fund share CNH hedged CNH 100.05 – –A Class distributing (S) (M) (G) share USD 12.60 14.35 15.18A Class distributing (S) (M) (G) share HKD hedged HKD 95.75 110.17 117.86A Class non-distributing share USD 16.35 17.98 18.47A Class non-distributing UK reporting fund share GBP 16.26 16.85 17.44C Class distributing (Q) (G) share USD 10.74 12.39 13.24C Class distributing (Q) (G) share SGD hedged SGD 9.93 11.59 12.53D Class distributing (A) (G) UK reporting fund share GBP 12.68 13.48 14.24D Class distributing (Q) (G) share USD 12.87 14.54 15.23D Class distributing (Q) (G) share SGD hedged SGD 11.87 13.58 14.39D Class non-distributing share USD 17.42 19.01 19.38E Class distributing (Q) (G) share EUR hedged EUR 8.14 9.63 10.50E Class non-distributing share USD 15.69 17.34 17.91I Class non-distributing share USD 10.93 11.89 12.10X Class distributing (S) (M) (G) share USD 10.90 12.16 12.63X Class non-distributing share USD 12.65 13.67 13.80
Asian Dragon Fund Total net assets USD 2,329,720,395 3,662,019,684 4,232,348,277Net asset value per:
A Class distributing (A) UK reporting fund share GBP 31.82 30.85 31.45A Class non-distributing share USD 40.49 41.65 42.09A Class non-distributing share AUD hedged AUD 13.60 14.23 14.49A Class non-distributing share CHF hedged CHF 12.27 13.09 13.61A Class non-distributing share EUR hedged EUR 12.44 13.23 13.74A Class non-distributing share PLN hedged PLN 111.93 116.94 119.67A Class non-distributing share SGD hedged SGD 12.64 13.18 13.47C Class non-distributing share USD 30.73 32.01 32.76D Class distributing (A) UK reporting fund share GBP 32.01 31.03 31.65D Class non-distributing share USD 44.16 45.09 45.23D Class non-distributing share AUD hedged AUD 20.19 20.97 –D Class non-distributing share CHF hedged CHF 12.63 13.38 13.81D Class non-distributing share EUR hedged EUR 12.82 13.54 13.96E Class non-distributing share USD 37.14 38.40 39.01I Class distributing (A) share USD 11.30 11.63 11.76I Class distributing (A) UK reporting fund share GBP 9.24 8.96 9.13I Class non-distributing share USD 11.84 12.06 12.07I Class non-distributing share AUD hedged AUD 9.81 10.16 10.24X Class distributing (A) UK reporting fund share GBP 30.36 29.44 30.04X Class non-distributing share USD 48.08 48.60 48.27
Prices for each Share Class are quoted in the Base Currency of the Fund with the exception of Hedged and UK reporting Share Classes. In the case of those Share Classes for which two or more Dealing Currencies are available, the additional dealing currency prices are calculated by converting the price at the relevant spot exchange rate at the time of valuation.

The notes on pages 728 to 741 form an integral part of these financial statements.
Annual Report and Audited Financial Statements [31]
Three Year Summary of Net Asset Valuesas at 31 August 2019 continued
Currency 31 August 2019 31 August 2018 31 August 2017
Asian Growth Leaders Fund Total net assets USD 2,319,898,424 3,543,465,617 2,912,750,391Net asset value per:
A Class non-distributing share AUD hedged AUD 12.38 13.36 14.38A Class non-distributing share CHF hedged CHF 11.39 12.54 13.83A Class non-distributing share EUR hedged EUR 11.61 12.74 13.98A Class non-distributing share SGD hedged SGD 12.85 13.81 14.92A Class non-distributing UK reporting fund share GBP 14.28 14.27 15.34D Class distributing (M) share USD 8.21 8.74 –D Class non-distributing share CHF hedged CHF 11.74 12.83 14.04D Class non-distributing share EUR hedged EUR 11.97 13.04 14.20D Class non-distributing share SGD hedged SGD 9.11 9.71 –D Class non-distributing UK reporting fund share GBP 14.80 14.68 15.66E Class non-distributing share USD 21.44 22.86 24.51I Class distributing (A) UK reporting fund share GBP 6.94 6.95 –I Class non-distributing share USD 12.98 13.64 14.40S Class non-distributing share USD 10.02 – –S Class non-distributing share CHF hedged CHF 9.92 – –S Class non-distributing share EUR hedged EUR 9.93 – –S Class non-distributing share GBP hedged GBP 10.08 – –S Class non-distributing share SGD hedged SGD 10.12 – –X Class non-distributing share USD 19.70 20.54 21.53
Asian High Yield Bond Fund Total net assets USD 24,294,941 20,289,564 –Net asset value per:
A Class distributing (R) (M) (G) UK reporting fund share CNH hedged CNH 104.07 – –A Class distributing (S) (M) (G) share USD 9.49 9.42 –A Class non-distributing share USD 10.61 9.82 –D Class non-distributing share USD 10.71 9.86 –E Class distributing (Q) share EUR hedged EUR 9.22 9.44 –E Class non-distributing share USD 12.98 12.07 –E Class non-distributing share EUR hedged EUR 9.98 9.58 –X Class non-distributing share USD 10.84 9.91 –
Asian Multi-Asset Growth Fund Total net assets USD 85,661,580 83,265,859 80,341,712Net asset value per:
A Class non-distributing share USD 12.80 12.62 12.74I Class non-distributing share USD 13.25 12.94 12.93X Class non-distributing share USD 13.61 13.19 13.09
Prices for each Share Class are quoted in the Base Currency of the Fund with the exception of Hedged and UK reporting Share Classes. In the case of those Share Classes for which two or more Dealing Currencies are available, the additional dealing currency prices are calculated by converting the price at the relevant spot exchange rate at the time of valuation.
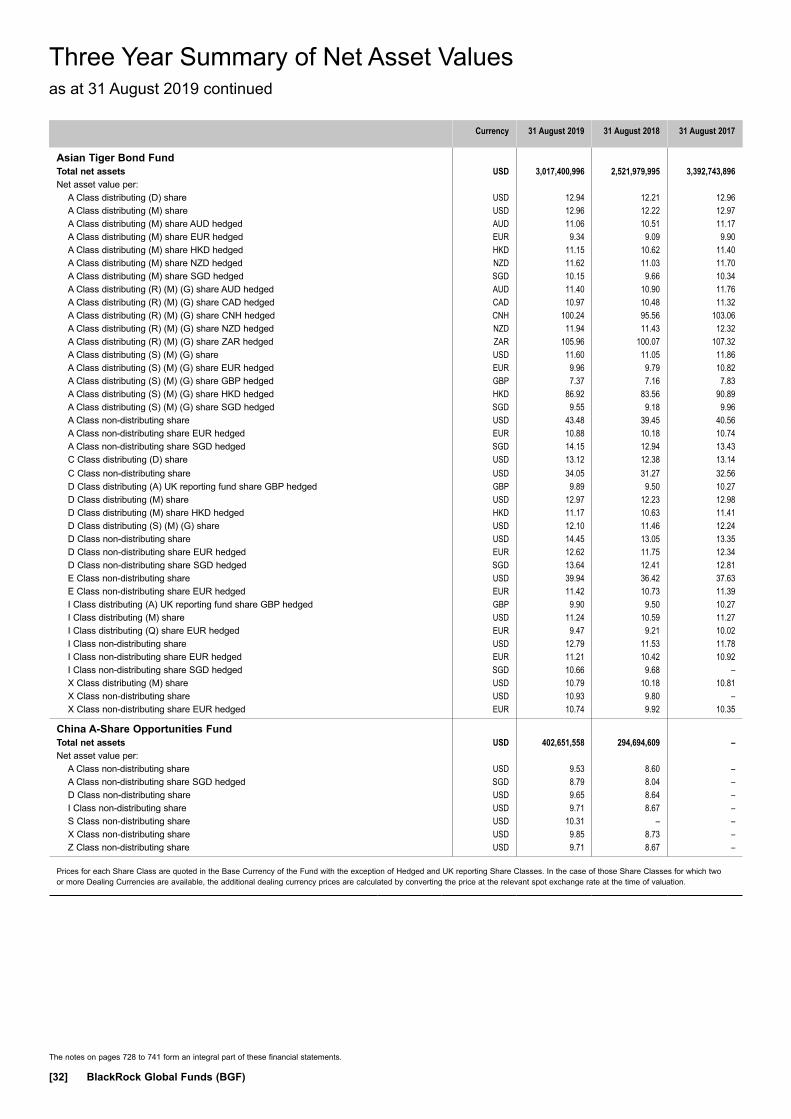
The notes on pages 728 to 741 form an integral part of these financial statements.
[32] BlackRock Global Funds (BGF)
Three Year Summary of Net Asset Valuesas at 31 August 2019 continued
Currency 31 August 2019 31 August 2018 31 August 2017
Asian Tiger Bond Fund Total net assets USD 3,017,400,996 2,521,979,995 3,392,743,896Net asset value per:
A Class distributing (D) share USD 12.94 12.21 12.96A Class distributing (M) share USD 12.96 12.22 12.97A Class distributing (M) share AUD hedged AUD 11.06 10.51 11.17A Class distributing (M) share EUR hedged EUR 9.34 9.09 9.90A Class distributing (M) share HKD hedged HKD 11.15 10.62 11.40A Class distributing (M) share NZD hedged NZD 11.62 11.03 11.70A Class distributing (M) share SGD hedged SGD 10.15 9.66 10.34A Class distributing (R) (M) (G) share AUD hedged AUD 11.40 10.90 11.76A Class distributing (R) (M) (G) share CAD hedged CAD 10.97 10.48 11.32A Class distributing (R) (M) (G) share CNH hedged CNH 100.24 95.56 103.06A Class distributing (R) (M) (G) share NZD hedged NZD 11.94 11.43 12.32A Class distributing (R) (M) (G) share ZAR hedged ZAR 105.96 100.07 107.32A Class distributing (S) (M) (G) share USD 11.60 11.05 11.86A Class distributing (S) (M) (G) share EUR hedged EUR 9.96 9.79 10.82A Class distributing (S) (M) (G) share GBP hedged GBP 7.37 7.16 7.83A Class distributing (S) (M) (G) share HKD hedged HKD 86.92 83.56 90.89A Class distributing (S) (M) (G) share SGD hedged SGD 9.55 9.18 9.96A Class non-distributing share USD 43.48 39.45 40.56A Class non-distributing share EUR hedged EUR 10.88 10.18 10.74A Class non-distributing share SGD hedged SGD 14.15 12.94 13.43C Class distributing (D) share USD 13.12 12.38 13.14C Class non-distributing share USD 34.05 31.27 32.56D Class distributing (A) UK reporting fund share GBP hedged GBP 9.89 9.50 10.27D Class distributing (M) share USD 12.97 12.23 12.98D Class distributing (M) share HKD hedged HKD 11.17 10.63 11.41D Class distributing (S) (M) (G) share USD 12.10 11.46 12.24D Class non-distributing share USD 14.45 13.05 13.35D Class non-distributing share EUR hedged EUR 12.62 11.75 12.34D Class non-distributing share SGD hedged SGD 13.64 12.41 12.81E Class non-distributing share USD 39.94 36.42 37.63E Class non-distributing share EUR hedged EUR 11.42 10.73 11.39I Class distributing (A) UK reporting fund share GBP hedged GBP 9.90 9.50 10.27I Class distributing (M) share USD 11.24 10.59 11.27I Class distributing (Q) share EUR hedged EUR 9.47 9.21 10.02I Class non-distributing share USD 12.79 11.53 11.78I Class non-distributing share EUR hedged EUR 11.21 10.42 10.92I Class non-distributing share SGD hedged SGD 10.66 9.68 –X Class distributing (M) share USD 10.79 10.18 10.81X Class non-distributing share USD 10.93 9.80 –X Class non-distributing share EUR hedged EUR 10.74 9.92 10.35
China A-Share Opportunities Fund Total net assets USD 402,651,558 294,694,609 –Net asset value per:
A Class non-distributing share USD 9.53 8.60 –A Class non-distributing share SGD hedged SGD 8.79 8.04 –D Class non-distributing share USD 9.65 8.64 –I Class non-distributing share USD 9.71 8.67 –S Class non-distributing share USD 10.31 – –X Class non-distributing share USD 9.85 8.73 –Z Class non-distributing share USD 9.71 8.67 –
Prices for each Share Class are quoted in the Base Currency of the Fund with the exception of Hedged and UK reporting Share Classes. In the case of those Share Classes for which two or more Dealing Currencies are available, the additional dealing currency prices are calculated by converting the price at the relevant spot exchange rate at the time of valuation.

The notes on pages 728 to 741 form an integral part of these financial statements.
Annual Report and Audited Financial Statements [33]
Three Year Summary of Net Asset Valuesas at 31 August 2019 continued
Currency 31 August 2019 31 August 2018 31 August 2017
China Bond Fund Total net assets CNH 1,332,623,956 650,161,882 441,610,178Net asset value per:
A Class distributing (M) share CNH 71.25 69.36 69.91A Class distributing (S) (M) (G) share CNH 103.44 100.98 –A Class distributing (S) (M) (G) share AUD hedged AUD 10.18 10.06 –A Class distributing (S) (M) (G) share EUR hedged EUR 9.88 10.02 –A Class distributing (S) (M) (G) share HKD hedged HKD 100.03 – –A Class distributing (S) (M) (G) share SGD hedged SGD 10.22 10.13 –A Class distributing (S) (M) (G) share USD hedged USD 10.21 10.06 –A Class non-distributing share CNH 95.00 87.89 85.27C Class distributing (M) share CNH – – 69.89C Class non-distributing share CNH 86.23 80.77 79.36D Class distributing (M) share CNH 71.58 69.68 70.23D Class non-distributing share CNH 94.75 87.35 84.43E Class distributing (Q) share CNH 79.88 – –E Class distributing (Q) share EUR hedged EUR 10.05 – –E Class non-distributing share CNH 118.46 110.14 107.41E Class non-distributing share EUR hedged EUR 10.50 10.13 10.28I Class distributing (M) share CNH 69.14 67.31 67.83I Class distributing (S) (M) (G) share CNH 101.88 – –I Class non-distributing share CNH 118.83 109.39 105.60X Class distributing (S) (M) (G) share USD hedged USD – – 9.64X Class non-distributing share CNH 74.03 67.89 –
China Flexible Equity Fund Total net assets USD 18,001,539 17,714,567 –Net asset value per:
A Class non-distributing share USD 8.39 9.08 –A Class non-distributing share EUR hedged EUR 7.88 8.83 –D Class non-distributing share USD 8.50 9.13 –E Class distributing (Q) share EUR hedged EUR 7.45 8.44 –E Class non-distributing share USD 9.80 10.66 –E Class non-distributing share EUR hedged EUR 7.81 8.79 –I Class non-distributing share USD 8.56 9.16 –X Class non-distributing share USD 8.67 9.22 –Z Class non-distributing share USD 8.55 9.16 –
China Fund Total net assets USD 1,204,217,646 1,412,408,354 1,743,604,303Net asset value per:
A Class distributing (A) UK reporting fund share GBP hedged GBP 14.45 16.13 17.74A Class non-distributing share USD 16.96 18.35 19.83A Class non-distributing share AUD hedged AUD 13.98 15.43 16.82A Class non-distributing share CNH hedged CNH 111.74 121.34 129.91A Class non-distributing share EUR hedged EUR 14.35 16.07 17.85A Class non-distributing share HKD HKD 17.41 18.86 20.33A Class non-distributing share SGD hedged SGD 15.12 16.60 18.17C Class non-distributing share USD 14.71 16.12 17.63C Class non-distributing share SGD hedged SGD – – 16.19D Class distributing (A) UK reporting fund share GBP hedged GBP 14.49 16.18 17.81D Class non-distributing share USD 18.27 19.62 21.04D Class non-distributing share EUR hedged EUR 15.11 16.81 18.53D Class non-distributing share HKD HKD 143.01 153.81 164.59D Class non-distributing share SGD hedged SGD 15.93 17.36 18.85D Class non-distributing UK reporting fund share GBP hedged GBP 10.51 11.60 12.63E Class non-distributing share EUR hedged EUR 13.61 15.32 17.10I Class non-distributing share USD 18.69 20.02 21.42X Class non-distributing share USD 18.01 19.15 20.32
Prices for each Share Class are quoted in the Base Currency of the Fund with the exception of Hedged and UK reporting Share Classes. In the case of those Share Classes for which two or more Dealing Currencies are available, the additional dealing currency prices are calculated by converting the price at the relevant spot exchange rate at the time of valuation.
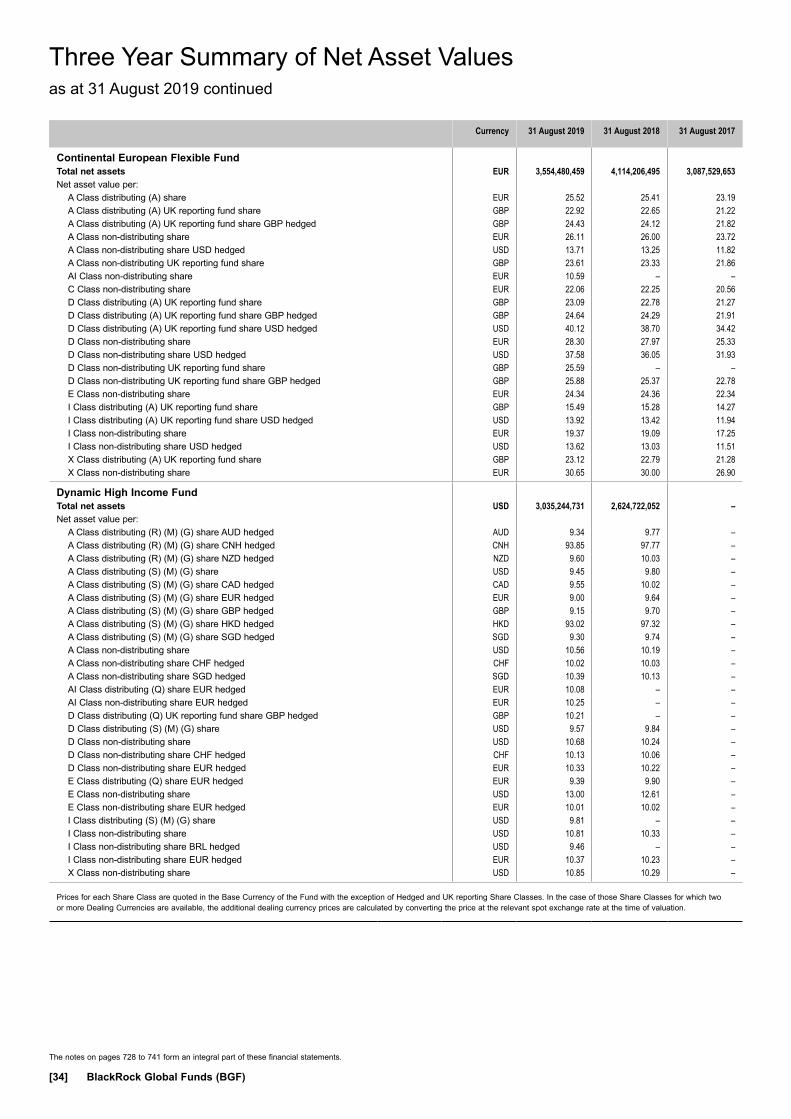
The notes on pages 728 to 741 form an integral part of these financial statements.
[34] BlackRock Global Funds (BGF)
Three Year Summary of Net Asset Valuesas at 31 August 2019 continued
Currency 31 August 2019 31 August 2018 31 August 2017
Continental European Flexible Fund Total net assets EUR 3,554,480,459 4,114,206,495 3,087,529,653Net asset value per:
A Class distributing (A) share EUR 25.52 25.41 23.19A Class distributing (A) UK reporting fund share GBP 22.92 22.65 21.22A Class distributing (A) UK reporting fund share GBP hedged GBP 24.43 24.12 21.82A Class non-distributing share EUR 26.11 26.00 23.72A Class non-distributing share USD hedged USD 13.71 13.25 11.82A Class non-distributing UK reporting fund share GBP 23.61 23.33 21.86AI Class non-distributing share EUR 10.59 – –C Class non-distributing share EUR 22.06 22.25 20.56D Class distributing (A) UK reporting fund share GBP 23.09 22.78 21.27D Class distributing (A) UK reporting fund share GBP hedged GBP 24.64 24.29 21.91D Class distributing (A) UK reporting fund share USD hedged USD 40.12 38.70 34.42D Class non-distributing share EUR 28.30 27.97 25.33D Class non-distributing share USD hedged USD 37.58 36.05 31.93D Class non-distributing UK reporting fund share GBP 25.59 – –D Class non-distributing UK reporting fund share GBP hedged GBP 25.88 25.37 22.78E Class non-distributing share EUR 24.34 24.36 22.34I Class distributing (A) UK reporting fund share GBP 15.49 15.28 14.27I Class distributing (A) UK reporting fund share USD hedged USD 13.92 13.42 11.94I Class non-distributing share EUR 19.37 19.09 17.25I Class non-distributing share USD hedged USD 13.62 13.03 11.51X Class distributing (A) UK reporting fund share GBP 23.12 22.79 21.28X Class non-distributing share EUR 30.65 30.00 26.90
Dynamic High Income Fund Total net assets USD 3,035,244,731 2,624,722,052 –Net asset value per:
A Class distributing (R) (M) (G) share AUD hedged AUD 9.34 9.77 –A Class distributing (R) (M) (G) share CNH hedged CNH 93.85 97.77 –A Class distributing (R) (M) (G) share NZD hedged NZD 9.60 10.03 –A Class distributing (S) (M) (G) share USD 9.45 9.80 –A Class distributing (S) (M) (G) share CAD hedged CAD 9.55 10.02 –A Class distributing (S) (M) (G) share EUR hedged EUR 9.00 9.64 –A Class distributing (S) (M) (G) share GBP hedged GBP 9.15 9.70 –A Class distributing (S) (M) (G) share HKD hedged HKD 93.02 97.32 –A Class distributing (S) (M) (G) share SGD hedged SGD 9.30 9.74 –A Class non-distributing share USD 10.56 10.19 –A Class non-distributing share CHF hedged CHF 10.02 10.03 –A Class non-distributing share SGD hedged SGD 10.39 10.13 –AI Class distributing (Q) share EUR hedged EUR 10.08 – –AI Class non-distributing share EUR hedged EUR 10.25 – –D Class distributing (Q) UK reporting fund share GBP hedged GBP 10.21 – –D Class distributing (S) (M) (G) share USD 9.57 9.84 –D Class non-distributing share USD 10.68 10.24 –D Class non-distributing share CHF hedged CHF 10.13 10.06 –D Class non-distributing share EUR hedged EUR 10.33 10.22 –E Class distributing (Q) share EUR hedged EUR 9.39 9.90 –E Class non-distributing share USD 13.00 12.61 –E Class non-distributing share EUR hedged EUR 10.01 10.02 –I Class distributing (S) (M) (G) share USD 9.81 – –I Class non-distributing share USD 10.81 10.33 –I Class non-distributing share BRL hedged USD 9.46 – –I Class non-distributing share EUR hedged EUR 10.37 10.23 –X Class non-distributing share USD 10.85 10.29 –
Prices for each Share Class are quoted in the Base Currency of the Fund with the exception of Hedged and UK reporting Share Classes. In the case of those Share Classes for which two or more Dealing Currencies are available, the additional dealing currency prices are calculated by converting the price at the relevant spot exchange rate at the time of valuation.

The notes on pages 728 to 741 form an integral part of these financial statements.
Annual Report and Audited Financial Statements [35]
Three Year Summary of Net Asset Valuesas at 31 August 2019 continued
Currency 31 August 2019 31 August 2018 31 August 2017
Emerging Europe Fund Total net assets EUR 704,309,274 790,688,678 988,357,206Net asset value per:
A Class distributing (A) share EUR 99.16 87.33 96.12A Class distributing (A) UK reporting fund share GBP 89.95 78.60 88.83A Class non-distributing share EUR 108.36 93.62 101.66A Class non-distributing share SGD hedged SGD 10.39 8.80 9.41C Class non-distributing share EUR 83.42 72.98 80.24D Class distributing (A) UK reporting fund share GBP 89.70 78.37 88.63D Class non-distributing share EUR 120.80 103.60 111.65D Class non-distributing UK reporting fund share GBP hedged GBP 93.05 78.95 84.21E Class non-distributing share EUR 97.74 84.87 92.62I Class non-distributing share EUR 10.28 – –J Class non-distributing share EUR 141.87 120.15 127.87X Class distributing (A) UK reporting fund share GBP 89.52 78.17 88.52X Class non-distributing share EUR 12.80 10.84 11.54
Emerging Markets Bond Fund Total net assets USD 2,507,309,087 3,273,710,571 3,915,570,468Net asset value per:
A Class distributing (A) share USD 13.79 13.11 14.37A Class distributing (D) share USD 9.80 9.32 10.20A Class distributing (M) share USD 10.12 9.63 10.54A Class distributing (R) (M) (G) share AUD hedged AUD 8.66 8.40 9.46A Class distributing (R) (M) (G) share NZD hedged NZD 9.57 9.31 10.52A Class distributing (R) (M) (G) share ZAR hedged ZAR 95.78 92.06 103.77A Class distributing (R) (M) (G) UK reporting fund share CNH hedged CNH 106.27 – –A Class distributing (S) (M) (G) share USD 8.86 8.52 9.58A Class distributing (S) (M) (G) share CAD hedged CAD 9.52 9.26 10.50A Class distributing (S) (M) (G) share GBP hedged GBP 9.23 9.07 10.36A Class distributing (S) (M) (G) share HKD hedged HKD 66.03 64.16 72.95A Class non-distributing share USD 18.75 17.15 18.14A Class non-distributing share EUR hedged EUR 16.69 15.75 17.13A Class non-distributing share GBP hedged GBP 11.83 11.04 11.89AI Class distributing (Q) share EUR hedged EUR 10.03 – –AI Class non-distributing share EUR hedged EUR 10.12 – –C Class distributing (D) share USD 9.79 9.32 10.19C Class non-distributing share USD 15.56 14.41 15.43D Class distributing (M) share USD 10.14 9.65 10.56D Class non-distributing share USD 20.15 18.32 19.26D Class non-distributing share EUR hedged EUR 17.38 16.31 17.63D Class non-distributing UK reporting fund share GBP 16.50 14.13 14.97E Class distributing (Q) share EUR hedged EUR 9.36 9.18 10.34E Class non-distributing share USD 17.45 16.04 17.05E Class non-distributing share EUR hedged EUR 10.91 10.35 11.31I Class distributing (A) share USD 9.94 9.45 –I Class distributing (Q) share EUR hedged EUR 9.63 9.45 10.64I Class non-distributing share USD 18.16 16.48 17.30I Class non-distributing share EUR hedged EUR 11.79 11.05 11.92I Class non-distributing UK reporting fund share CHF hedged CHF 9.86 9.28 10.05I Class non-distributing UK reporting fund share GBP hedged GBP 10.25 9.50 –X Class distributing (Q) share CHF hedged CHF 10.51 – –X Class distributing (Q) share EUR hedged EUR 9.28 9.11 –X Class non-distributing share USD 21.93 19.77 20.63X Class non-distributing share CHF Hedged CHF 10.98 10.26 11.05X Class non-distributing share EUR hedged EUR 19.35 18.01 19.31X Class non-distributing share GBP hedged GBP 12.11 11.13 11.82
Prices for each Share Class are quoted in the Base Currency of the Fund with the exception of Hedged and UK reporting Share Classes. In the case of those Share Classes for which two or more Dealing Currencies are available, the additional dealing currency prices are calculated by converting the price at the relevant spot exchange rate at the time of valuation.

The notes on pages 728 to 741 form an integral part of these financial statements.
[36] BlackRock Global Funds (BGF)
Three Year Summary of Net Asset Valuesas at 31 August 2019 continued
Currency 31 August 2019 31 August 2018 31 August 2017
Emerging Markets Corporate Bond Fund Total net assets USD 284,091,831 216,169,992 165,550,078Net asset value per:
A Class non-distributing share USD 12.80 11.62 11.80A Class non-distributing share EUR hedged EUR 11.68 10.93 11.40AI Class non-distributing share USD 11.99 – –D Class distributing (M) UK reporting fund share GBP hedged GBP 10.39 9.97 10.61D Class non-distributing share USD 13.47 12.14 12.23D Class non-distributing share EUR hedged EUR 10.29 9.56 –E Class distributing (Q) share EUR hedged EUR 9.78 9.50 10.21E Class non-distributing share USD 16.53 15.08 15.39E Class non-distributing share EUR hedged EUR 11.26 10.60 11.11I Class distributing (M) UK reporting fund share GBP hedged GBP 10.39 9.97 10.61I Class non-distributing share USD 13.57 12.21 12.29I Class non-distributing share EUR hedged EUR 12.59 11.68 12.08X Class non-distributing share USD 14.26 12.73 12.72
Emerging Markets Equity Income Fund Total net assets USD 481,814,257 509,626,290 412,964,866Net asset value per:
A Class distributing (Q) (G) share USD 11.53 11.42 12.00A Class distributing (R) (M) (G) share AUD hedged AUD 12.06 12.03 12.72A Class distributing (R) (M) (G) share CNH hedged CNH 121.99 121.23 127.73A Class distributing (R) (M) (G) share NZD hedged NZD 12.18 12.12 12.83A Class distributing (S) (M) (G) share USD 12.45 12.27 12.91A Class distributing (S) (M) (G) share CAD hedged CAD 12.01 12.01 12.79A Class distributing (S) (M) (G) share EUR hedged EUR 11.14 11.37 12.34A Class distributing (S) (M) (G) share GBP hedged GBP 11.73 11.84 12.74A Class distributing (S) (M) (G) share HKD hedged HKD 94.16 93.69 99.49A Class distributing (S) (M) (G) share SGD hedged SGD 11.95 11.92 12.68A Class non-distributing share USD 15.02 14.32 14.62AI Class distributing (Q) (G) share EUR hedged EUR 9.49 – –AI Class non-distributing share USD 10.94 – –D Class non-distributing UK reporting fund share GBP 13.04 11.62 11.87E Class distributing (Q) (G) share EUR hedged EUR 9.88 10.17 11.07E Class non-distributing share EUR hedged EUR 12.80 12.68 13.40I Class non-distributing share USD 10.57 – –I Class non-distributing share CHF hedged CHF 10.95 10.71 11.20X Class distributing (S) (M) (G) share USD 11.44 11.07 11.43X Class non-distributing share USD 14.99 14.04 14.08
Emerging Markets Fund Total net assets USD 801,571,196 707,928,461 656,607,248Net asset value per:
A Class non-distributing share USD 35.19 33.61 33.78AI Class non-distributing share USD 11.05 – –C Class non-distributing share USD 27.44 26.54 27.01D Class non-distributing share USD 38.92 36.91 36.82E Class non-distributing share USD 31.76 30.49 30.79I Class distributing (Q) UK reporting fund share GBP 8.57 7.74 –I Class non-distributing share USD 13.46 12.73 12.67X Class non-distributing share USD 14.00 13.14 12.98
Prices for each Share Class are quoted in the Base Currency of the Fund with the exception of Hedged and UK reporting Share Classes. In the case of those Share Classes for which two or more Dealing Currencies are available, the additional dealing currency prices are calculated by converting the price at the relevant spot exchange rate at the time of valuation.

The notes on pages 728 to 741 form an integral part of these financial statements.
Annual Report and Audited Financial Statements [37]
Three Year Summary of Net Asset Valuesas at 31 August 2019 continued
Currency 31 August 2019 31 August 2018 31 August 2017
Emerging Markets Local Currency Bond Fund Total net assets USD 3,931,415,172 5,309,278,928 4,625,553,953Net asset value per:
A Class distributing (A) share USD 15.13 14.40* 18.30A Class distributing (D) share USD 3.79 3.61* 4.54A Class distributing (M) share USD 3.82 3.63* 4.56A Class distributing (M) share AUD hedged AUD 6.39 6.15* 7.78A Class distributing (R) (M) (G) share AUD hedged AUD 6.87 6.79* 8.71A Class distributing (R) (M) (G) share NZD hedged NZD 8.55 8.43* 10.83A Class distributing (R) (M) (G) share ZAR hedged ZAR – – 88.97A Class distributing (S) (M) (G) share USD 8.49 8.31* 10.60A Class distributing (S) (M) (G) share CAD hedged CAD 8.45 8.37* 10.79A Class distributing (S) (M) (G) share GBP hedged GBP 8.01 8.02* 10.45A Class distributing (S) (M) (G) share HKD hedged HKD 84.63 83.67* 107.97A Class distributing (S) (M) (G) share SGD hedged SGD 7.78 7.69* –A Class non-distributing share USD 23.58 21.37* 25.42A Class non-distributing share CHF hedged CHF 7.34 6.90* 8.49A Class non-distributing share EUR hedged EUR 7.51 7.03* 8.64A Class non-distributing share PLN hedged PLN 9.72 8.93* 10.81A Class non-distributing share SEK hedged SEK 89.08 83.56* –A Class non-distributing share SGD hedged SGD 8.24 7.55* 9.09AI Class distributing (Q) share USD 11.39 – –AI Class non-distributing share USD 11.40 – –C Class distributing (D) share USD 3.79 3.61* 4.53C Class non-distributing share USD 20.15 18.49* 22.27D Class distributing (A) share USD 15.15 14.42* 18.33D Class distributing (M) share USD 15.78 15.02* 18.88D Class distributing (M) share AUD hedged AUD 6.39 6.15* 7.78D Class distributing (M) UK reporting fund share GBP hedged GBP 6.75 6.57* 8.44D Class distributing (Q) UK reporting fund share GBP 9.23 8.30* –D Class non-distributing share USD 25.02 22.55* 26.70D Class non-distributing share CHF hedged CHF 8.77 8.21* –D Class non-distributing share EUR hedged EUR 7.66 7.14* 8.73D Class non-distributing share PLN hedged PLN 10.06 9.20* 11.08D Class non-distributing share SGD hedged SGD 8.55 7.78* 9.32D Class non-distributing UK reporting fund share GBP hedged GBP 14.30 13.16* 15.93E Class distributing (Q) share EUR hedged EUR 6.45 6.36* 8.26E Class non-distributing share USD 22.15 20.17* 24.11E Class non-distributing share EUR hedged EUR 7.16 6.74* 8.32I Class distributing (M) UK reporting fund share GBP hedged GBP 6.78 6.59* 8.47I Class distributing (Q) share USD 9.51 9.07* 11.40I Class non-distributing share USD 25.04 22.54* 26.64I Class non-distributing share EUR hedged EUR 7.89 7.34* 8.96S Class distributing (M) UK reporting fund share GBP hedged GBP 10.24 – –X Class distributing (Q) share GBP hedged GBP 9.94 – –X Class non-distributing share USD 7.05 6.31* 7.42X Class non-distributing share GBP hedged GBP 9.88 9.04* 10.86
ESG Emerging Markets Blended Bond Fund Total net assets USD 32,802,249 23,840,695 –Net asset value per:
A Class non-distributing share USD 10.01 9.50 –A Class non-distributing share EUR hedged EUR 9.65 9.45 –D Class non-distributing share CHF hedged CHF 9.70 9.47 –D Class non-distributing share EUR hedged EUR 9.74 9.46 –D Class non-distributing UK reporting fund share GBP 8.27 7.33 –E Class distributing (Q) share EUR hedged EUR 9.92 9.96 –E Class non-distributing share EUR hedged EUR 10.11 9.96 –I Class non-distributing share USD 10.60 9.96 –I Class non-distributing share EUR hedged EUR 10.26 9.96 –X Class non-distributing share USD 10.21 9.52 –Z Class non-distributing UK reporting fund share GBP 9.95 – –
Prices for each Share Class are quoted in the Base Currency of the Fund with the exception of Hedged and UK reporting Share Classes. In the case of those Share Classes for which two or more Dealing Currencies are available, the additional dealing currency prices are calculated by converting the price at the relevant spot exchange rate at the time of valuation.* Dilution adjustment included, see Note 2(g), for further details.

The notes on pages 728 to 741 form an integral part of these financial statements.
[38] BlackRock Global Funds (BGF)
Currency 31 August 2019 31 August 2018 31 August 2017
ESG Emerging Markets Bond Fund Total net assets USD 281,565,129 24,627,036 –Net asset value per:
A Class non-distributing share USD 10.89 9.79 –A Class non-distributing share EUR hedged EUR 10.55 9.78 –D Class non-distributing share CHF hedged CHF 10.57 9.79 –D Class non-distributing share EUR hedged EUR 10.63 9.79 –D Class non-distributing UK reporting fund share GBP 9.01 7.59 –E Class distributing (Q) share EUR hedged EUR 10.50 – –E Class non-distributing share EUR hedged EUR 10.81 – –I Class non-distributing share USD 11.28 – –I Class non-distributing share EUR hedged EUR 10.95 – –X Class non-distributing share USD 11.11 9.85 –
ESG Emerging Markets Corporate Bond Fund Total net assets USD 28,089,074 24,928,313 –Net asset value per:
A Class non-distributing share USD 10.86 9.87 –A Class non-distributing share EUR hedged EUR 10.56 9.89 –D Class non-distributing share CHF hedged CHF 10.60 9.90 –D Class non-distributing share EUR hedged EUR 10.64 9.90 –D Class non-distributing UK reporting fund share GBP 9.02 7.67 –E Class distributing (Q) share EUR hedged EUR 10.32 9.97 –E Class non-distributing share EUR hedged EUR 10.58 9.97 –I Class non-distributing share USD 11.09 9.99 –I Class non-distributing share EUR hedged EUR 10.75 9.98 –X Class non-distributing share USD 11.14 9.96 –
ESG Emerging Markets Local Currency Bond Fund Total net assets USD 263,078,766 22,842,519 –Net asset value per:
A Class non-distributing share USD 9.96 9.14 –A Class non-distributing share EUR hedged EUR 9.60 9.07 –D Class non-distributing share CHF hedged CHF 9.59 9.08 –D Class non-distributing share EUR hedged EUR 9.65 9.07 –D Class non-distributing UK reporting fund share GBP 8.19 7.04 –E Class distributing (Q) share EUR hedged EUR 10.44 – –E Class non-distributing share EUR hedged EUR 10.75 – –I Class non-distributing share USD 11.19 – –I Class non-distributing share EUR hedged EUR 10.41 9.76 –X Class non-distributing share USD 10.07 9.13 –
ESG Multi-Asset Fund(1) Total net assets EUR 560,739,620 341,514,970 274,547,368Net asset value per:
A Class non-distributing share EUR 15.78 15.20 14.23A Class non-distributing share USD hedged USD 40.19 37.60 34.42AI Class non-distributing share EUR 10.21 – –C Class non-distributing share EUR 13.35 13.03 12.35C Class non-distributing share USD hedged USD 31.12 29.48 27.32D Class non-distributing share EUR 16.94 16.21 15.06D Class non-distributing share USD hedged USD 42.24 39.27 35.67E Class non-distributing share EUR 14.25 13.79 12.98E Class non-distributing share USD hedged USD 36.28 34.12 31.38I Class non-distributing share EUR 10.71 10.23 –
Prices for each Share Class are quoted in the Base Currency of the Fund with the exception of Hedged and UK reporting Share Classes. In the case of those Share Classes for which two or more Dealing Currencies are available, the additional dealing currency prices are calculated by converting the price at the relevant spot exchange rate at the time of valuation.(1) Fund name changed during the year, see Note 1, for further details.
Three Year Summary of Net Asset Valuesas at 31 August 2019 continued
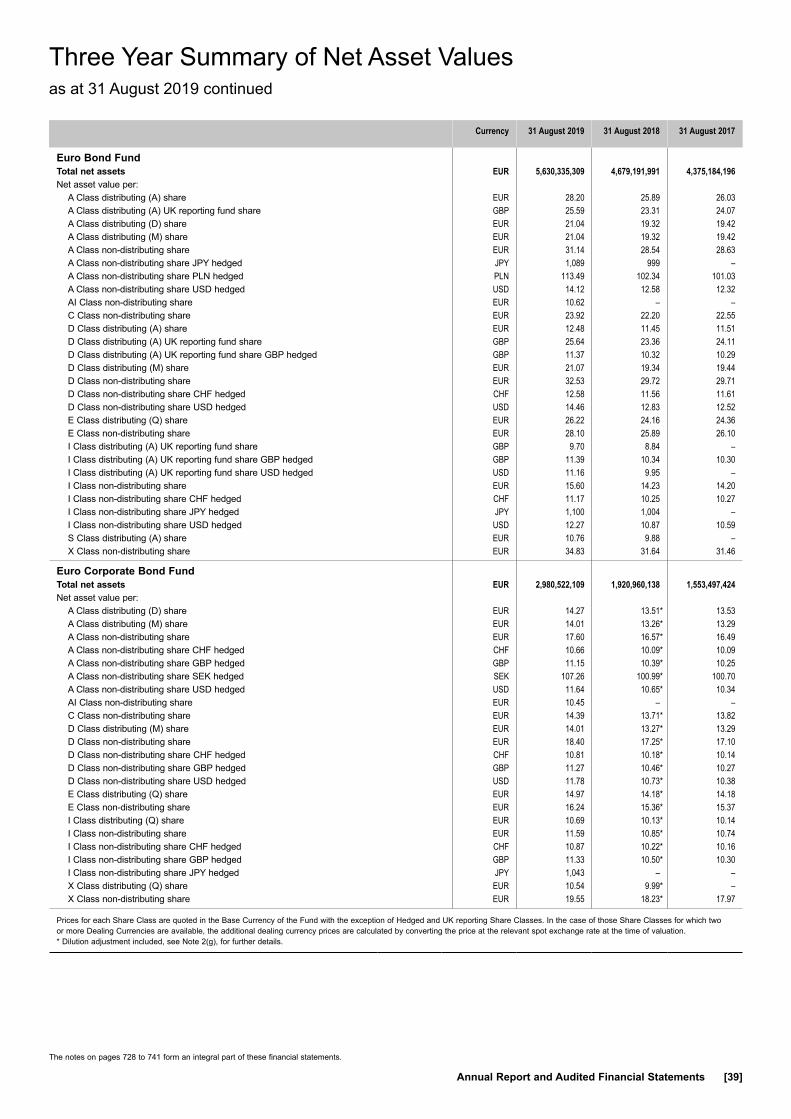
The notes on pages 728 to 741 form an integral part of these financial statements.
Annual Report and Audited Financial Statements [39]
Currency 31 August 2019 31 August 2018 31 August 2017
Euro Bond Fund Total net assets EUR 5,630,335,309 4,679,191,991 4,375,184,196Net asset value per:
A Class distributing (A) share EUR 28.20 25.89 26.03A Class distributing (A) UK reporting fund share GBP 25.59 23.31 24.07A Class distributing (D) share EUR 21.04 19.32 19.42A Class distributing (M) share EUR 21.04 19.32 19.42A Class non-distributing share EUR 31.14 28.54 28.63A Class non-distributing share JPY hedged JPY 1,089 999 –A Class non-distributing share PLN hedged PLN 113.49 102.34 101.03A Class non-distributing share USD hedged USD 14.12 12.58 12.32AI Class non-distributing share EUR 10.62 – –C Class non-distributing share EUR 23.92 22.20 22.55D Class distributing (A) share EUR 12.48 11.45 11.51D Class distributing (A) UK reporting fund share GBP 25.64 23.36 24.11D Class distributing (A) UK reporting fund share GBP hedged GBP 11.37 10.32 10.29D Class distributing (M) share EUR 21.07 19.34 19.44D Class non-distributing share EUR 32.53 29.72 29.71D Class non-distributing share CHF hedged CHF 12.58 11.56 11.61D Class non-distributing share USD hedged USD 14.46 12.83 12.52E Class distributing (Q) share EUR 26.22 24.16 24.36E Class non-distributing share EUR 28.10 25.89 26.10I Class distributing (A) UK reporting fund share GBP 9.70 8.84 –I Class distributing (A) UK reporting fund share GBP hedged GBP 11.39 10.34 10.30I Class distributing (A) UK reporting fund share USD hedged USD 11.16 9.95 –I Class non-distributing share EUR 15.60 14.23 14.20I Class non-distributing share CHF hedged CHF 11.17 10.25 10.27I Class non-distributing share JPY hedged JPY 1,100 1,004 –I Class non-distributing share USD hedged USD 12.27 10.87 10.59S Class distributing (A) share EUR 10.76 9.88 –X Class non-distributing share EUR 34.83 31.64 31.46
Euro Corporate Bond Fund Total net assets EUR 2,980,522,109 1,920,960,138 1,553,497,424Net asset value per:
A Class distributing (D) share EUR 14.27 13.51* 13.53A Class distributing (M) share EUR 14.01 13.26* 13.29A Class non-distributing share EUR 17.60 16.57* 16.49A Class non-distributing share CHF hedged CHF 10.66 10.09* 10.09A Class non-distributing share GBP hedged GBP 11.15 10.39* 10.25A Class non-distributing share SEK hedged SEK 107.26 100.99* 100.70A Class non-distributing share USD hedged USD 11.64 10.65* 10.34AI Class non-distributing share EUR 10.45 – –C Class non-distributing share EUR 14.39 13.71* 13.82D Class distributing (M) share EUR 14.01 13.27* 13.29D Class non-distributing share EUR 18.40 17.25* 17.10D Class non-distributing share CHF hedged CHF 10.81 10.18* 10.14D Class non-distributing share GBP hedged GBP 11.27 10.46* 10.27D Class non-distributing share USD hedged USD 11.78 10.73* 10.38E Class distributing (Q) share EUR 14.97 14.18* 14.18E Class non-distributing share EUR 16.24 15.36* 15.37I Class distributing (Q) share EUR 10.69 10.13* 10.14I Class non-distributing share EUR 11.59 10.85* 10.74I Class non-distributing share CHF hedged CHF 10.87 10.22* 10.16I Class non-distributing share GBP hedged GBP 11.33 10.50* 10.30I Class non-distributing share JPY hedged JPY 1,043 – –X Class distributing (Q) share EUR 10.54 9.99* –X Class non-distributing share EUR 19.55 18.23* 17.97
Prices for each Share Class are quoted in the Base Currency of the Fund with the exception of Hedged and UK reporting Share Classes. In the case of those Share Classes for which two or more Dealing Currencies are available, the additional dealing currency prices are calculated by converting the price at the relevant spot exchange rate at the time of valuation.* Dilution adjustment included, see Note 2(g), for further details.
Three Year Summary of Net Asset Valuesas at 31 August 2019 continued

The notes on pages 728 to 741 form an integral part of these financial statements.
[40] BlackRock Global Funds (BGF)
Currency 31 August 2019 31 August 2018 31 August 2017
Euro Reserve Fund Total net assets EUR 93,146,101 84,105,770 128,753,188Net asset value per:
A Class non-distributing share EUR 72.72 73.06 73.44C Class non-distributing share EUR 69.58 69.90 70.26D Class non-distributing share EUR 73.21 73.55 73.93E Class non-distributing share EUR 69.35 69.85 70.38X Class non-distributing share EUR 9.87 9.91 9.96
Euro Short Duration Bond Fund Total net assets EUR 11,604,394,805 11,766,812,938 10,575,463,334Net asset value per:
A Class distributing (A) UK reporting fund share GBP 13.50 13.34 13.82A Class distributing (A) UK reporting fund share GBP hedged GBP 11.15 10.98 10.99A Class distributing (A) UK reporting fund share USD hedged USD 11.61 11.23 11.06A Class distributing (D) share EUR 12.22 12.18 12.29A Class distributing (M) share EUR 12.24 12.19 12.30A Class non-distributing share EUR 15.90 15.83 15.98A Class non-distributing share CHF hedged CHF 10.74 10.75 10.90A Class non-distributing share USD hedged USD 12.37 11.97 11.79AI Class non-distributing share EUR 10.06 – –C Class non-distributing share EUR 12.29 12.40 12.67D Class distributing (A) UK reporting fund share GBP 13.55 13.37 13.84D Class distributing (A) UK reporting fund share GBP hedged GBP 11.25 11.06 11.05D Class distributing (A) UK reporting fund share USD hedged USD 11.20 10.81 10.64D Class distributing (M) UK reporting fund share GBP 11.12 10.97 11.35D Class distributing (M) UK reporting fund share GBP hedged GBP 10.26 10.08 10.08D Class non-distributing share EUR 16.56 16.44 16.53D Class non-distributing share CHF hedged CHF 11.00 10.98 11.09D Class non-distributing share USD hedged USD 11.02 10.62 10.42E Class non-distributing share EUR 14.45 14.46 14.67I Class distributing (Q) share EUR 16.37 16.29 16.42I Class non-distributing share EUR 16.53 16.39 16.47I Class non-distributing share USD hedged USD 10.84 10.43 10.23SI Class non-distributing share EUR 10.08 – –SI Class non-distributing share USD hedged USD 10.21 – –X Class non-distributing share EUR 17.24 17.02 17.04
Euro-Markets Fund Total net assets EUR 1,862,526,676 3,347,603,395 3,020,386,936Net asset value per:
A Class distributing (A) share EUR 24.80 25.59 25.48A Class distributing (A) UK reporting fund share GBP 24.14 24.73 25.28A Class non-distributing share EUR 28.63 29.42 29.17A Class non-distributing share CHF hedged CHF 17.19 17.74 17.61A Class non-distributing share GBP hedged GBP 13.32 13.58 13.35A Class non-distributing share HKD hedged HKD 102.40 103.02 –A Class non-distributing share SGD hedged SGD 19.86 20.01 19.54A Class non-distributing share USD hedged USD 14.36 14.32 13.87AI Class non-distributing share EUR 10.04 – –C Class non-distributing share EUR 22.28 23.18 23.27D Class distributing (A) share EUR 24.81 25.59 25.49D Class distributing (A) UK reporting fund share GBP 22.44 22.97 23.49D Class non-distributing share EUR 31.71 32.34 31.83D Class non-distributing share USD hedged USD 13.09 12.95 12.46D Class non-distributing UK reporting fund share GBP 28.68 29.02 29.33D Class non-distributing UK reporting fund share CHF hedged CHF 14.99 15.35 15.13E Class non-distributing share EUR 25.94 26.78 26.69I Class distributing (A) share EUR 11.39 11.75 11.70I Class non-distributing share EUR 31.63 32.18 31.58S Class distributing (A) share EUR 9.29 9.58 –S Class non-distributing share EUR 9.54 9.72 –X Class non-distributing share EUR 33.76 34.10 33.22
Prices for each Share Class are quoted in the Base Currency of the Fund with the exception of Hedged and UK reporting Share Classes. In the case of those Share Classes for which two or more Dealing Currencies are available, the additional dealing currency prices are calculated by converting the price at the relevant spot exchange rate at the time of valuation.
Three Year Summary of Net Asset Valuesas at 31 August 2019 continued

The notes on pages 728 to 741 form an integral part of these financial statements.
Annual Report and Audited Financial Statements [41]
Currency 31 August 2019 31 August 2018 31 August 2017
European Equity Income Fund Total net assets EUR 1,715,398,088 2,249,872,721 2,556,865,404Net asset value per:
A Class distributing (A) (G) share EUR 14.09 14.28 14.83A Class distributing (Q) (G) share EUR 13.47 13.62 14.18A Class distributing (Q) (G) share USD hedged USD 19.77 19.40 19.75A Class distributing (R) (M) (G) share AUD hedged AUD 10.74 10.85 11.23A Class distributing (R) (M) (G) share CAD hedged CAD 8.68 8.73 9.06A Class distributing (R) (M) (G) share CNH hedged CNH 90.74 91.36 94.92A Class distributing (R) (M) (G) share NZD hedged NZD 8.67 8.75 9.06A Class distributing (S) (M) (G) share EUR 10.20 10.28 10.67A Class distributing (S) (M) (G) share GBP hedged GBP 13.04 13.00 13.39A Class distributing (S) (M) (G) share HKD hedged HKD 174.06 171.64 176.07A Class distributing (S) (M) (G) share SGD hedged SGD 11.05 10.92 11.17A Class distributing (S) (M) (G) share USD hedged USD 11.23 10.98 11.14A Class non-distributing share EUR 19.70 18.96 18.87A Class non-distributing share USD hedged USD 13.28 12.41 12.08AI Class distributing (Q) (G) share EUR 10.20 – –AI Class non-distributing share EUR 10.49 – –D Class distributing (A) (G) share EUR 13.05 13.12 13.52D Class distributing (Q) (G) UK reporting fund share GBP 11.87 11.81 12.53D Class distributing (Q) (G) UK reporting fund share GBP hedged GBP 12.16 12.08 12.38D Class distributing (S) (M) (G) share USD hedged USD 9.33 9.05 9.12D Class non-distributing share EUR 20.86 19.93 19.69D Class non-distributing UK reporting fund share USD hedged USD 11.69 10.84 10.47E Class distributing (Q) (G) share EUR 12.97 13.18 13.79E Class non-distributing share EUR 18.91 18.30 18.30I Class distributing (A) (G) share EUR 13.10 13.13 13.50I Class non-distributing share EUR 10.75 10.25 10.10X Class distributing (Q) (G) UK reporting fund share GBP 12.58 12.40 13.02X Class non-distributing share EUR 13.55 12.82 12.54
European Focus Fund Total net assets EUR 391,029,713 667,704,333 1,093,787,468Net asset value per:
A Class non-distributing share EUR 23.25 23.23 22.96A Class non-distributing share SGD hedged SGD 17.80 17.44 16.99A Class non-distributing share USD hedged USD 12.87 12.48 12.06AI Class non-distributing share EUR 10.30 – –C Class non-distributing share EUR 19.85 20.08 20.10D Class non-distributing share EUR 25.28 25.07 24.59D Class non-distributing UK reporting fund share GBP 22.86 22.50 22.66E Class non-distributing share EUR 21.84 21.93 21.78I Class non-distributing share EUR 25.42 25.15 24.61X Class non-distributing share EUR – – 26.54
Prices for each Share Class are quoted in the Base Currency of the Fund with the exception of Hedged and UK reporting Share Classes. In the case of those Share Classes for which two or more Dealing Currencies are available, the additional dealing currency prices are calculated by converting the price at the relevant spot exchange rate at the time of valuation.
Three Year Summary of Net Asset Valuesas at 31 August 2019 continued
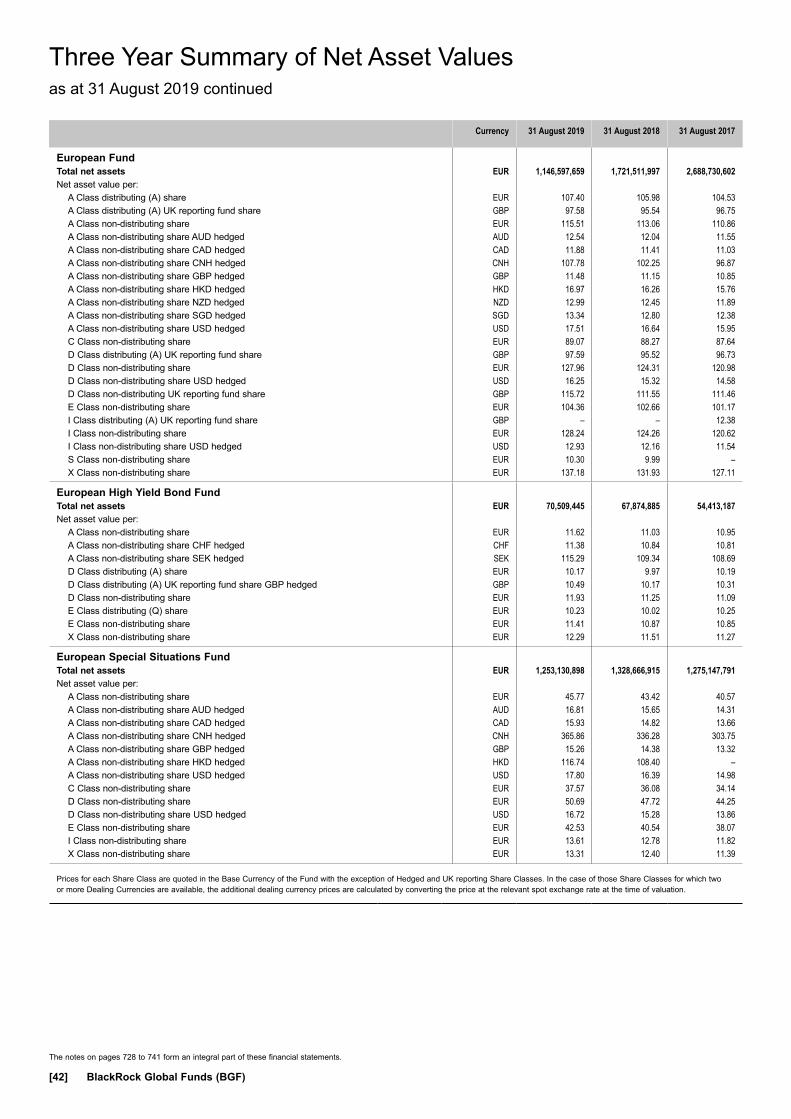
The notes on pages 728 to 741 form an integral part of these financial statements.
[42] BlackRock Global Funds (BGF)
Currency 31 August 2019 31 August 2018 31 August 2017
European Fund Total net assets EUR 1,146,597,659 1,721,511,997 2,688,730,602Net asset value per:
A Class distributing (A) share EUR 107.40 105.98 104.53A Class distributing (A) UK reporting fund share GBP 97.58 95.54 96.75A Class non-distributing share EUR 115.51 113.06 110.86A Class non-distributing share AUD hedged AUD 12.54 12.04 11.55A Class non-distributing share CAD hedged CAD 11.88 11.41 11.03A Class non-distributing share CNH hedged CNH 107.78 102.25 96.87A Class non-distributing share GBP hedged GBP 11.48 11.15 10.85A Class non-distributing share HKD hedged HKD 16.97 16.26 15.76A Class non-distributing share NZD hedged NZD 12.99 12.45 11.89A Class non-distributing share SGD hedged SGD 13.34 12.80 12.38A Class non-distributing share USD hedged USD 17.51 16.64 15.95C Class non-distributing share EUR 89.07 88.27 87.64D Class distributing (A) UK reporting fund share GBP 97.59 95.52 96.73D Class non-distributing share EUR 127.96 124.31 120.98D Class non-distributing share USD hedged USD 16.25 15.32 14.58D Class non-distributing UK reporting fund share GBP 115.72 111.55 111.46E Class non-distributing share EUR 104.36 102.66 101.17I Class distributing (A) UK reporting fund share GBP – – 12.38I Class non-distributing share EUR 128.24 124.26 120.62I Class non-distributing share USD hedged USD 12.93 12.16 11.54S Class non-distributing share EUR 10.30 9.99 –X Class non-distributing share EUR 137.18 131.93 127.11
European High Yield Bond Fund Total net assets EUR 70,509,445 67,874,885 54,413,187Net asset value per:
A Class non-distributing share EUR 11.62 11.03 10.95A Class non-distributing share CHF hedged CHF 11.38 10.84 10.81A Class non-distributing share SEK hedged SEK 115.29 109.34 108.69D Class distributing (A) share EUR 10.17 9.97 10.19D Class distributing (A) UK reporting fund share GBP hedged GBP 10.49 10.17 10.31D Class non-distributing share EUR 11.93 11.25 11.09E Class distributing (Q) share EUR 10.23 10.02 10.25E Class non-distributing share EUR 11.41 10.87 10.85X Class non-distributing share EUR 12.29 11.51 11.27
European Special Situations Fund Total net assets EUR 1,253,130,898 1,328,666,915 1,275,147,791Net asset value per:
A Class non-distributing share EUR 45.77 43.42 40.57A Class non-distributing share AUD hedged AUD 16.81 15.65 14.31A Class non-distributing share CAD hedged CAD 15.93 14.82 13.66A Class non-distributing share CNH hedged CNH 365.86 336.28 303.75A Class non-distributing share GBP hedged GBP 15.26 14.38 13.32A Class non-distributing share HKD hedged HKD 116.74 108.40 –A Class non-distributing share USD hedged USD 17.80 16.39 14.98C Class non-distributing share EUR 37.57 36.08 34.14D Class non-distributing share EUR 50.69 47.72 44.25D Class non-distributing share USD hedged USD 16.72 15.28 13.86E Class non-distributing share EUR 42.53 40.54 38.07I Class non-distributing share EUR 13.61 12.78 11.82X Class non-distributing share EUR 13.31 12.40 11.39
Prices for each Share Class are quoted in the Base Currency of the Fund with the exception of Hedged and UK reporting Share Classes. In the case of those Share Classes for which two or more Dealing Currencies are available, the additional dealing currency prices are calculated by converting the price at the relevant spot exchange rate at the time of valuation.
Three Year Summary of Net Asset Valuesas at 31 August 2019 continued
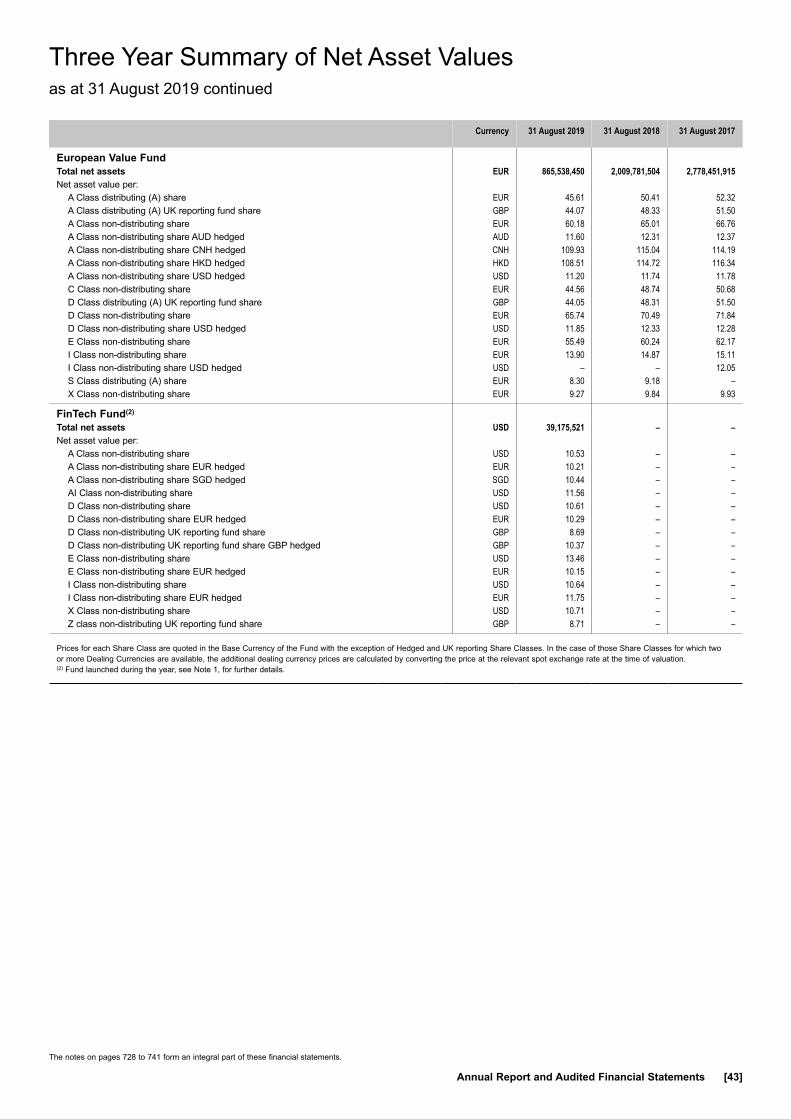
The notes on pages 728 to 741 form an integral part of these financial statements.
Annual Report and Audited Financial Statements [43]
Currency 31 August 2019 31 August 2018 31 August 2017
European Value Fund Total net assets EUR 865,538,450 2,009,781,504 2,778,451,915Net asset value per:
A Class distributing (A) share EUR 45.61 50.41 52.32A Class distributing (A) UK reporting fund share GBP 44.07 48.33 51.50A Class non-distributing share EUR 60.18 65.01 66.76A Class non-distributing share AUD hedged AUD 11.60 12.31 12.37A Class non-distributing share CNH hedged CNH 109.93 115.04 114.19A Class non-distributing share HKD hedged HKD 108.51 114.72 116.34A Class non-distributing share USD hedged USD 11.20 11.74 11.78C Class non-distributing share EUR 44.56 48.74 50.68D Class distributing (A) UK reporting fund share GBP 44.05 48.31 51.50D Class non-distributing share EUR 65.74 70.49 71.84D Class non-distributing share USD hedged USD 11.85 12.33 12.28E Class non-distributing share EUR 55.49 60.24 62.17I Class non-distributing share EUR 13.90 14.87 15.11I Class non-distributing share USD hedged USD – – 12.05S Class distributing (A) share EUR 8.30 9.18 –X Class non-distributing share EUR 9.27 9.84 9.93
FinTech Fund(2) Total net assets USD 39,175,521 – –Net asset value per:
A Class non-distributing share USD 10.53 – –A Class non-distributing share EUR hedged EUR 10.21 – –A Class non-distributing share SGD hedged SGD 10.44 – –AI Class non-distributing share USD 11.56 – –D Class non-distributing share USD 10.61 – –D Class non-distributing share EUR hedged EUR 10.29 – –D Class non-distributing UK reporting fund share GBP 8.69 – –D Class non-distributing UK reporting fund share GBP hedged GBP 10.37 – –E Class non-distributing share USD 13.46 – –E Class non-distributing share EUR hedged EUR 10.15 – –I Class non-distributing share USD 10.64 – –I Class non-distributing share EUR hedged EUR 11.75 – –X Class non-distributing share USD 10.71 – –Z class non-distributing UK reporting fund share GBP 8.71 – –
Prices for each Share Class are quoted in the Base Currency of the Fund with the exception of Hedged and UK reporting Share Classes. In the case of those Share Classes for which two or more Dealing Currencies are available, the additional dealing currency prices are calculated by converting the price at the relevant spot exchange rate at the time of valuation.(2) Fund launched during the year, see Note 1, for further details.
Three Year Summary of Net Asset Valuesas at 31 August 2019 continued
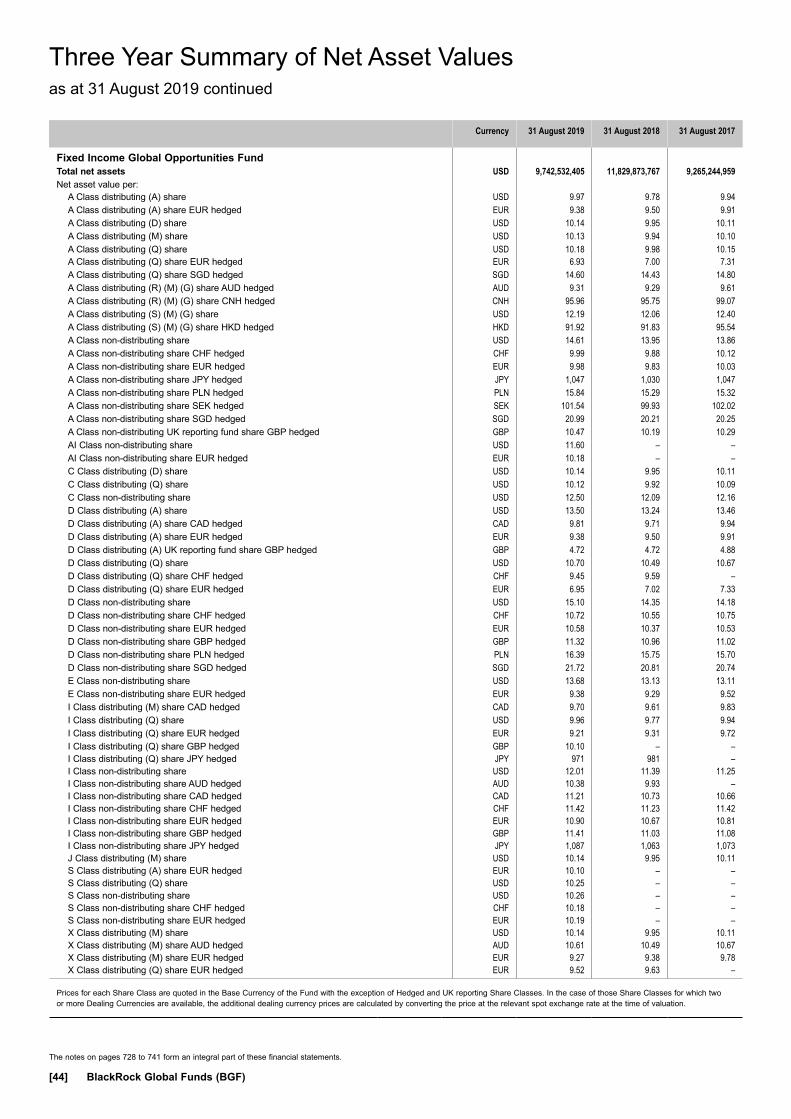
The notes on pages 728 to 741 form an integral part of these financial statements.
[44] BlackRock Global Funds (BGF)
Currency 31 August 2019 31 August 2018 31 August 2017
Fixed Income Global Opportunities Fund Total net assets USD 9,742,532,405 11,829,873,767 9,265,244,959Net asset value per:
A Class distributing (A) share USD 9.97 9.78 9.94A Class distributing (A) share EUR hedged EUR 9.38 9.50 9.91A Class distributing (D) share USD 10.14 9.95 10.11A Class distributing (M) share USD 10.13 9.94 10.10A Class distributing (Q) share USD 10.18 9.98 10.15A Class distributing (Q) share EUR hedged EUR 6.93 7.00 7.31A Class distributing (Q) share SGD hedged SGD 14.60 14.43 14.80A Class distributing (R) (M) (G) share AUD hedged AUD 9.31 9.29 9.61A Class distributing (R) (M) (G) share CNH hedged CNH 95.96 95.75 99.07A Class distributing (S) (M) (G) share USD 12.19 12.06 12.40A Class distributing (S) (M) (G) share HKD hedged HKD 91.92 91.83 95.54A Class non-distributing share USD 14.61 13.95 13.86A Class non-distributing share CHF hedged CHF 9.99 9.88 10.12A Class non-distributing share EUR hedged EUR 9.98 9.83 10.03A Class non-distributing share JPY hedged JPY 1,047 1,030 1,047A Class non-distributing share PLN hedged PLN 15.84 15.29 15.32A Class non-distributing share SEK hedged SEK 101.54 99.93 102.02A Class non-distributing share SGD hedged SGD 20.99 20.21 20.25A Class non-distributing UK reporting fund share GBP hedged GBP 10.47 10.19 10.29AI Class non-distributing share USD 11.60 – –AI Class non-distributing share EUR hedged EUR 10.18 – –C Class distributing (D) share USD 10.14 9.95 10.11C Class distributing (Q) share USD 10.12 9.92 10.09C Class non-distributing share USD 12.50 12.09 12.16D Class distributing (A) share USD 13.50 13.24 13.46D Class distributing (A) share CAD hedged CAD 9.81 9.71 9.94D Class distributing (A) share EUR hedged EUR 9.38 9.50 9.91D Class distributing (A) UK reporting fund share GBP hedged GBP 4.72 4.72 4.88D Class distributing (Q) share USD 10.70 10.49 10.67D Class distributing (Q) share CHF hedged CHF 9.45 9.59 –D Class distributing (Q) share EUR hedged EUR 6.95 7.02 7.33D Class non-distributing share USD 15.10 14.35 14.18D Class non-distributing share CHF hedged CHF 10.72 10.55 10.75D Class non-distributing share EUR hedged EUR 10.58 10.37 10.53D Class non-distributing share GBP hedged GBP 11.32 10.96 11.02D Class non-distributing share PLN hedged PLN 16.39 15.75 15.70D Class non-distributing share SGD hedged SGD 21.72 20.81 20.74E Class non-distributing share USD 13.68 13.13 13.11E Class non-distributing share EUR hedged EUR 9.38 9.29 9.52I Class distributing (M) share CAD hedged CAD 9.70 9.61 9.83I Class distributing (Q) share USD 9.96 9.77 9.94I Class distributing (Q) share EUR hedged EUR 9.21 9.31 9.72I Class distributing (Q) share GBP hedged GBP 10.10 – –I Class distributing (Q) share JPY hedged JPY 971 981 –I Class non-distributing share USD 12.01 11.39 11.25I Class non-distributing share AUD hedged AUD 10.38 9.93 –I Class non-distributing share CAD hedged CAD 11.21 10.73 10.66I Class non-distributing share CHF hedged CHF 11.42 11.23 11.42I Class non-distributing share EUR hedged EUR 10.90 10.67 10.81I Class non-distributing share GBP hedged GBP 11.41 11.03 11.08I Class non-distributing share JPY hedged JPY 1,087 1,063 1,073J Class distributing (M) share USD 10.14 9.95 10.11S Class distributing (A) share EUR hedged EUR 10.10 – –S Class distributing (Q) share USD 10.25 – –S Class non-distributing share USD 10.26 – –S Class non-distributing share CHF hedged CHF 10.18 – –S Class non-distributing share EUR hedged EUR 10.19 – –X Class distributing (M) share USD 10.14 9.95 10.11X Class distributing (M) share AUD hedged AUD 10.61 10.49 10.67X Class distributing (M) share EUR hedged EUR 9.27 9.38 9.78X Class distributing (Q) share EUR hedged EUR 9.52 9.63 –
Prices for each Share Class are quoted in the Base Currency of the Fund with the exception of Hedged and UK reporting Share Classes. In the case of those Share Classes for which two or more Dealing Currencies are available, the additional dealing currency prices are calculated by converting the price at the relevant spot exchange rate at the time of valuation.
Three Year Summary of Net Asset Valuesas at 31 August 2019 continued
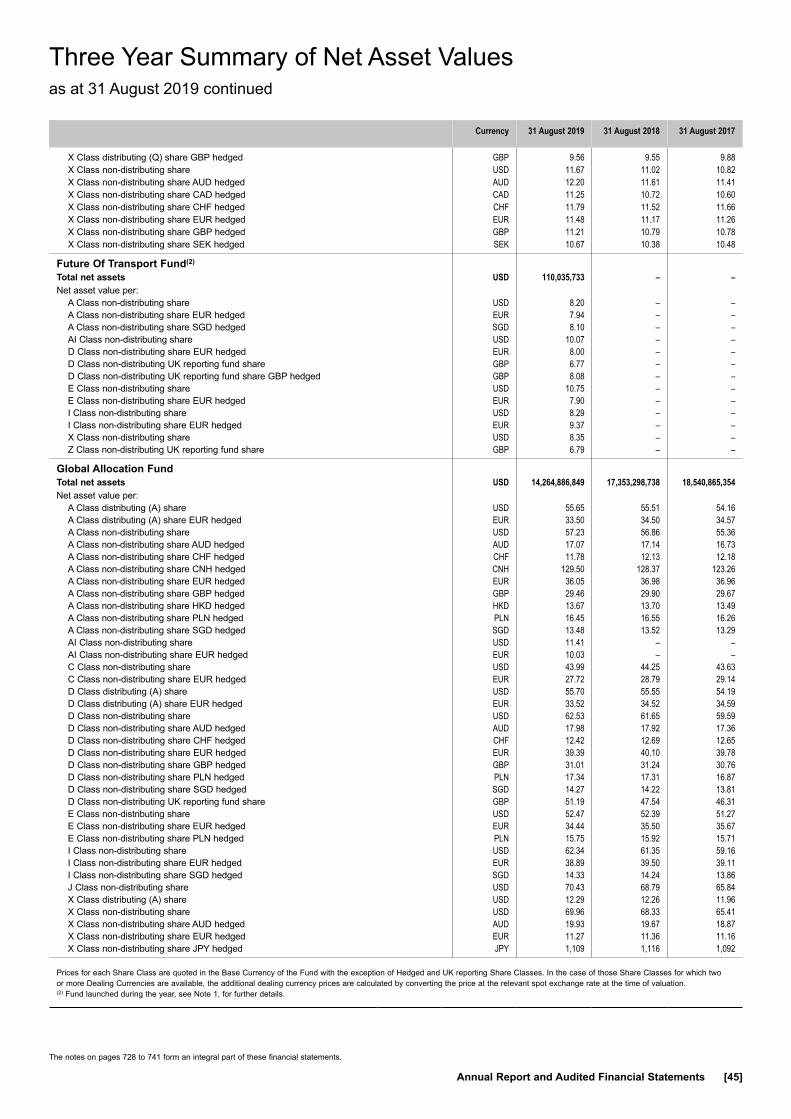
The notes on pages 728 to 741 form an integral part of these financial statements.
Annual Report and Audited Financial Statements [45]
Currency 31 August 2019 31 August 2018 31 August 2017
X Class distributing (Q) share GBP hedged GBP 9.56 9.55 9.88X Class non-distributing share USD 11.67 11.02 10.82X Class non-distributing share AUD hedged AUD 12.20 11.61 11.41X Class non-distributing share CAD hedged CAD 11.25 10.72 10.60X Class non-distributing share CHF hedged CHF 11.79 11.52 11.66X Class non-distributing share EUR hedged EUR 11.48 11.17 11.26X Class non-distributing share GBP hedged GBP 11.21 10.79 10.78X Class non-distributing share SEK hedged SEK 10.67 10.38 10.48
Future Of Transport Fund(2) Total net assets USD 110,035,733 – –Net asset value per:
A Class non-distributing share USD 8.20 – –A Class non-distributing share EUR hedged EUR 7.94 – –A Class non-distributing share SGD hedged SGD 8.10 – –AI Class non-distributing share USD 10.07 – –D Class non-distributing share EUR hedged EUR 8.00 – –D Class non-distributing UK reporting fund share GBP 6.77 – –D Class non-distributing UK reporting fund share GBP hedged GBP 8.08 – –E Class non-distributing share USD 10.75 – –E Class non-distributing share EUR hedged EUR 7.90 – –I Class non-distributing share USD 8.29 – –I Class non-distributing share EUR hedged EUR 9.37 – –X Class non-distributing share USD 8.35 – –Z Class non-distributing UK reporting fund share GBP 6.79 – –
Global Allocation Fund Total net assets USD 14,264,886,849 17,353,298,738 18,540,865,354Net asset value per:
A Class distributing (A) share USD 55.65 55.51 54.16A Class distributing (A) share EUR hedged EUR 33.50 34.50 34.57A Class non-distributing share USD 57.23 56.86 55.36A Class non-distributing share AUD hedged AUD 17.07 17.14 16.73A Class non-distributing share CHF hedged CHF 11.78 12.13 12.18A Class non-distributing share CNH hedged CNH 129.50 128.37 123.26A Class non-distributing share EUR hedged EUR 36.05 36.98 36.96A Class non-distributing share GBP hedged GBP 29.46 29.90 29.67A Class non-distributing share HKD hedged HKD 13.67 13.70 13.49A Class non-distributing share PLN hedged PLN 16.45 16.55 16.26A Class non-distributing share SGD hedged SGD 13.48 13.52 13.29AI Class non-distributing share USD 11.41 – –AI Class non-distributing share EUR hedged EUR 10.03 – –C Class non-distributing share USD 43.99 44.25 43.63C Class non-distributing share EUR hedged EUR 27.72 28.79 29.14D Class distributing (A) share USD 55.70 55.55 54.19D Class distributing (A) share EUR hedged EUR 33.52 34.52 34.59D Class non-distributing share USD 62.53 61.65 59.59D Class non-distributing share AUD hedged AUD 17.98 17.92 17.36D Class non-distributing share CHF hedged CHF 12.42 12.69 12.65D Class non-distributing share EUR hedged EUR 39.39 40.10 39.78D Class non-distributing share GBP hedged GBP 31.01 31.24 30.76D Class non-distributing share PLN hedged PLN 17.34 17.31 16.87D Class non-distributing share SGD hedged SGD 14.27 14.22 13.81D Class non-distributing UK reporting fund share GBP 51.19 47.54 46.31E Class non-distributing share USD 52.47 52.39 51.27E Class non-distributing share EUR hedged EUR 34.44 35.50 35.67E Class non-distributing share PLN hedged PLN 15.75 15.92 15.71I Class non-distributing share USD 62.34 61.35 59.16I Class non-distributing share EUR hedged EUR 38.89 39.50 39.11I Class non-distributing share SGD hedged SGD 14.33 14.24 13.86J Class non-distributing share USD 70.43 68.79 65.84X Class distributing (A) share USD 12.29 12.26 11.96X Class non-distributing share USD 69.96 68.33 65.41X Class non-distributing share AUD hedged AUD 19.93 19.67 18.87X Class non-distributing share EUR hedged EUR 11.27 11.36 11.16X Class non-distributing share JPY hedged JPY 1,109 1,116 1,092
Prices for each Share Class are quoted in the Base Currency of the Fund with the exception of Hedged and UK reporting Share Classes. In the case of those Share Classes for which two or more Dealing Currencies are available, the additional dealing currency prices are calculated by converting the price at the relevant spot exchange rate at the time of valuation.(2) Fund launched during the year, see Note 1, for further details.
Three Year Summary of Net Asset Valuesas at 31 August 2019 continued
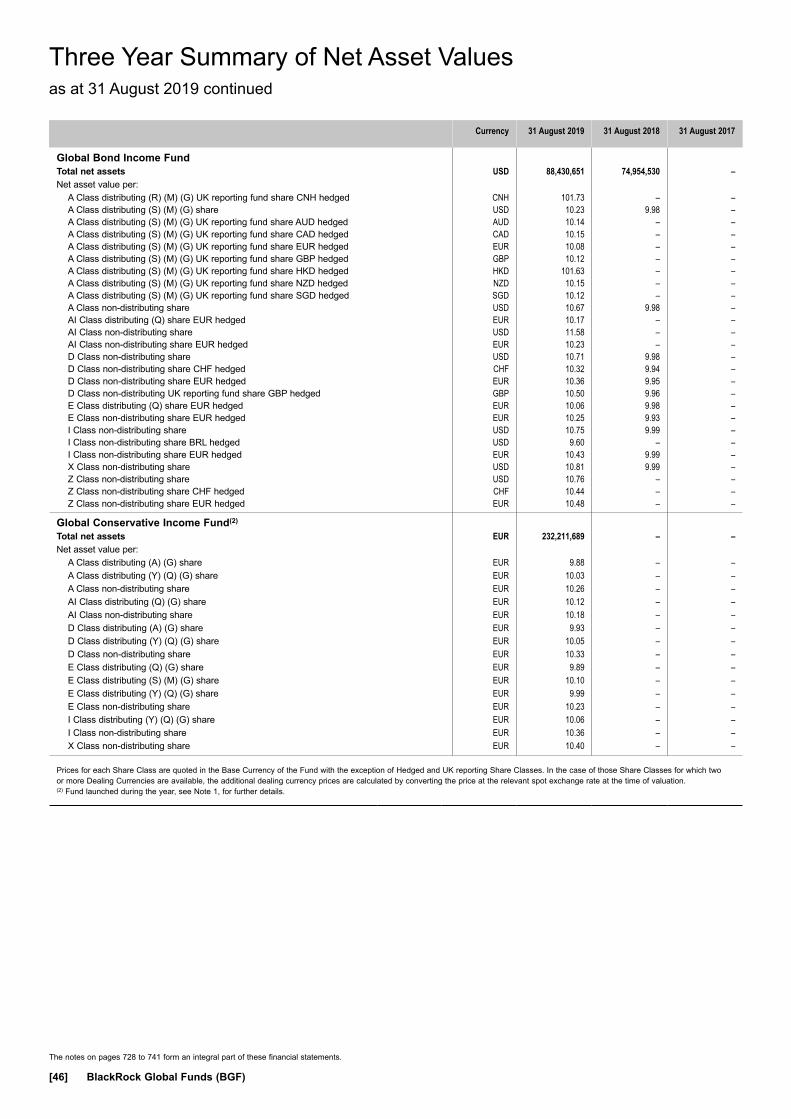
The notes on pages 728 to 741 form an integral part of these financial statements.
[46] BlackRock Global Funds (BGF)
Currency 31 August 2019 31 August 2018 31 August 2017
Global Bond Income Fund Total net assets USD 88,430,651 74,954,530 –Net asset value per:
A Class distributing (R) (M) (G) UK reporting fund share CNH hedged CNH 101.73 – –A Class distributing (S) (M) (G) share USD 10.23 9.98 –A Class distributing (S) (M) (G) UK reporting fund share AUD hedged AUD 10.14 – –A Class distributing (S) (M) (G) UK reporting fund share CAD hedged CAD 10.15 – –A Class distributing (S) (M) (G) UK reporting fund share EUR hedged EUR 10.08 – –A Class distributing (S) (M) (G) UK reporting fund share GBP hedged GBP 10.12 – –A Class distributing (S) (M) (G) UK reporting fund share HKD hedged HKD 101.63 – –A Class distributing (S) (M) (G) UK reporting fund share NZD hedged NZD 10.15 – –A Class distributing (S) (M) (G) UK reporting fund share SGD hedged SGD 10.12 – –A Class non-distributing share USD 10.67 9.98 –AI Class distributing (Q) share EUR hedged EUR 10.17 – –AI Class non-distributing share USD 11.58 – –AI Class non-distributing share EUR hedged EUR 10.23 – –D Class non-distributing share USD 10.71 9.98 –D Class non-distributing share CHF hedged CHF 10.32 9.94 –D Class non-distributing share EUR hedged EUR 10.36 9.95 –D Class non-distributing UK reporting fund share GBP hedged GBP 10.50 9.96 –E Class distributing (Q) share EUR hedged EUR 10.06 9.98 –E Class non-distributing share EUR hedged EUR 10.25 9.93 –I Class non-distributing share USD 10.75 9.99 –I Class non-distributing share BRL hedged USD 9.60 – –I Class non-distributing share EUR hedged EUR 10.43 9.99 –X Class non-distributing share USD 10.81 9.99 –Z Class non-distributing share USD 10.76 – –Z Class non-distributing share CHF hedged CHF 10.44 – –Z Class non-distributing share EUR hedged EUR 10.48 – –
Global Conservative Income Fund(2) Total net assets EUR 232,211,689 – –Net asset value per:
A Class distributing (A) (G) share EUR 9.88 – –A Class distributing (Y) (Q) (G) share EUR 10.03 – –A Class non-distributing share EUR 10.26 – –AI Class distributing (Q) (G) share EUR 10.12 – –AI Class non-distributing share EUR 10.18 – –D Class distributing (A) (G) share EUR 9.93 – –D Class distributing (Y) (Q) (G) share EUR 10.05 – –D Class non-distributing share EUR 10.33 – –E Class distributing (Q) (G) share EUR 9.89 – –E Class distributing (S) (M) (G) share EUR 10.10 – –E Class distributing (Y) (Q) (G) share EUR 9.99 – –E Class non-distributing share EUR 10.23 – –I Class distributing (Y) (Q) (G) share EUR 10.06 – –I Class non-distributing share EUR 10.36 – –X Class non-distributing share EUR 10.40 – –
Prices for each Share Class are quoted in the Base Currency of the Fund with the exception of Hedged and UK reporting Share Classes. In the case of those Share Classes for which two or more Dealing Currencies are available, the additional dealing currency prices are calculated by converting the price at the relevant spot exchange rate at the time of valuation.(2) Fund launched during the year, see Note 1, for further details.
Three Year Summary of Net Asset Valuesas at 31 August 2019 continued
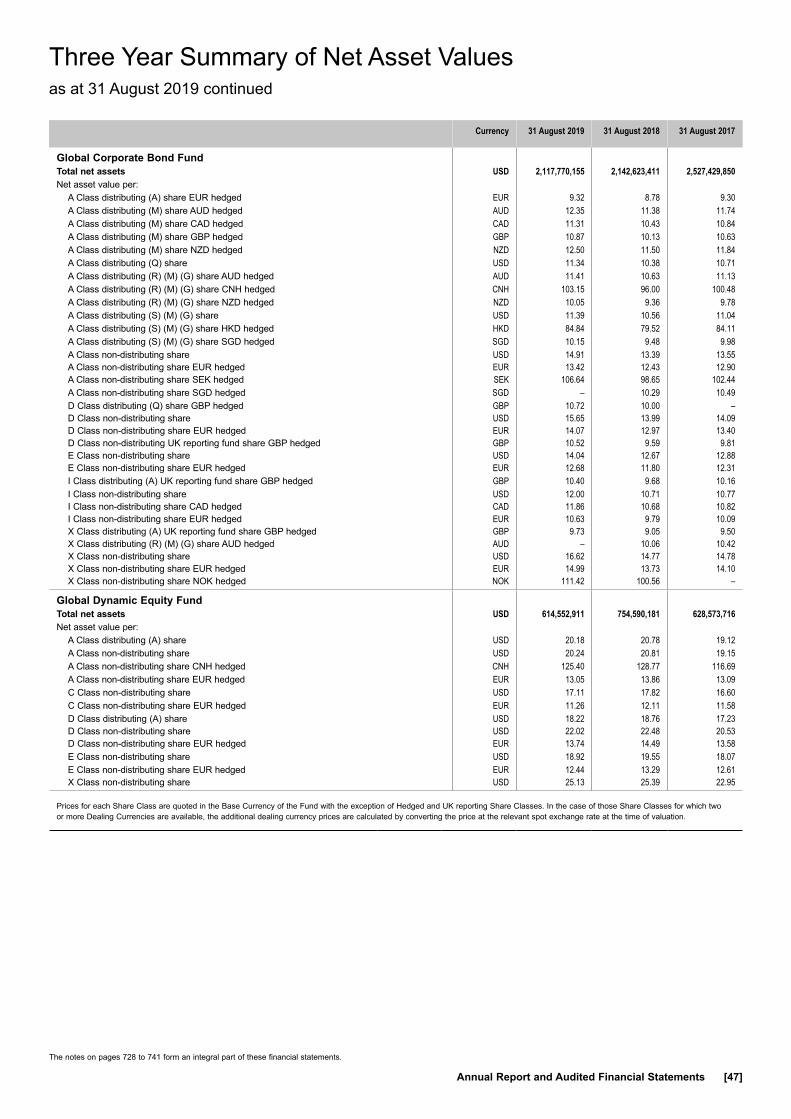
The notes on pages 728 to 741 form an integral part of these financial statements.
Annual Report and Audited Financial Statements [47]
Currency 31 August 2019 31 August 2018 31 August 2017
Global Corporate Bond Fund Total net assets USD 2,117,770,155 2,142,623,411 2,527,429,850Net asset value per:
A Class distributing (A) share EUR hedged EUR 9.32 8.78 9.30A Class distributing (M) share AUD hedged AUD 12.35 11.38 11.74A Class distributing (M) share CAD hedged CAD 11.31 10.43 10.84A Class distributing (M) share GBP hedged GBP 10.87 10.13 10.63A Class distributing (M) share NZD hedged NZD 12.50 11.50 11.84A Class distributing (Q) share USD 11.34 10.38 10.71A Class distributing (R) (M) (G) share AUD hedged AUD 11.41 10.63 11.13A Class distributing (R) (M) (G) share CNH hedged CNH 103.15 96.00 100.48A Class distributing (R) (M) (G) share NZD hedged NZD 10.05 9.36 9.78A Class distributing (S) (M) (G) share USD 11.39 10.56 11.04A Class distributing (S) (M) (G) share HKD hedged HKD 84.84 79.52 84.11A Class distributing (S) (M) (G) share SGD hedged SGD 10.15 9.48 9.98A Class non-distributing share USD 14.91 13.39 13.55A Class non-distributing share EUR hedged EUR 13.42 12.43 12.90A Class non-distributing share SEK hedged SEK 106.64 98.65 102.44A Class non-distributing share SGD hedged SGD – 10.29 10.49D Class distributing (Q) share GBP hedged GBP 10.72 10.00 –D Class non-distributing share USD 15.65 13.99 14.09D Class non-distributing share EUR hedged EUR 14.07 12.97 13.40D Class non-distributing UK reporting fund share GBP hedged GBP 10.52 9.59 9.81E Class non-distributing share USD 14.04 12.67 12.88E Class non-distributing share EUR hedged EUR 12.68 11.80 12.31I Class distributing (A) UK reporting fund share GBP hedged GBP 10.40 9.68 10.16I Class non-distributing share USD 12.00 10.71 10.77I Class non-distributing share CAD hedged CAD 11.86 10.68 10.82I Class non-distributing share EUR hedged EUR 10.63 9.79 10.09X Class distributing (A) UK reporting fund share GBP hedged GBP 9.73 9.05 9.50X Class distributing (R) (M) (G) share AUD hedged AUD – 10.06 10.42X Class non-distributing share USD 16.62 14.77 14.78X Class non-distributing share EUR hedged EUR 14.99 13.73 14.10X Class non-distributing share NOK hedged NOK 111.42 100.56 –
Global Dynamic Equity Fund Total net assets USD 614,552,911 754,590,181 628,573,716Net asset value per:
A Class distributing (A) share USD 20.18 20.78 19.12A Class non-distributing share USD 20.24 20.81 19.15A Class non-distributing share CNH hedged CNH 125.40 128.77 116.69A Class non-distributing share EUR hedged EUR 13.05 13.86 13.09C Class non-distributing share USD 17.11 17.82 16.60C Class non-distributing share EUR hedged EUR 11.26 12.11 11.58D Class distributing (A) share USD 18.22 18.76 17.23D Class non-distributing share USD 22.02 22.48 20.53D Class non-distributing share EUR hedged EUR 13.74 14.49 13.58E Class non-distributing share USD 18.92 19.55 18.07E Class non-distributing share EUR hedged EUR 12.44 13.29 12.61X Class non-distributing share USD 25.13 25.39 22.95
Prices for each Share Class are quoted in the Base Currency of the Fund with the exception of Hedged and UK reporting Share Classes. In the case of those Share Classes for which two or more Dealing Currencies are available, the additional dealing currency prices are calculated by converting the price at the relevant spot exchange rate at the time of valuation.
Three Year Summary of Net Asset Valuesas at 31 August 2019 continued

The notes on pages 728 to 741 form an integral part of these financial statements.
[48] BlackRock Global Funds (BGF)
Currency 31 August 2019 31 August 2018 31 August 2017
Global Enhanced Equity Yield Fund Total net assets USD 1,466,670,905 1,485,761,780 1,019,668,887Net asset value per:
A Class distributing (Q) (G) share USD 5.10 5.45 5.46A Class distributing (Q) (G) share EUR hedged EUR 3.71 4.10 4.20A Class distributing (R) (M) (G) share AUD hedged AUD 8.40 9.09 9.15A Class distributing (R) (M) (G) share CAD hedged CAD 8.37 9.03 9.10A Class distributing (R) (M) (G) share CNH hedged CNH 86.33 93.29 93.76A Class distributing (R) (M) (G) share NZD hedged NZD 8.43 9.11 9.15A Class distributing (S) (M) (G) share USD 8.58 9.22 9.24A Class distributing (S) (M) (G) share HKD hedged HKD 83.18 90.15 91.40A Class distributing (S) (M) (G) UK reporting fund share GBP hedged GBP 8.11 8.92 9.12A Class non-distributing share USD 14.14 14.09 13.18A Class non-distributing share EUR hedged EUR 8.78 9.03 8.67A Class non-distributing share SGD hedged SGD 11.57 11.65 11.01C Class distributing (Q) (G) share USD 5.09 5.44 5.45C Class non-distributing share USD 12.03 12.14 11.50D Class distributing (Q) (G) share USD 5.48 5.81 5.78D Class non-distributing share EUR hedged EUR 9.23 9.43 8.99D Class non-distributing UK reporting fund share GBP 12.60 11.74 10.98E Class distributing (Q) (G) share EUR hedged EUR 8.45 9.32 9.60E Class non-distributing share USD 12.98 13.00 12.22E Class non-distributing share EUR hedged EUR 8.25 8.53 8.23I Class distributing (M) (G) share USD 10.13 10.74 10.62I Class distributing (Q) (G) share USD 10.21 10.80 10.73I Class non-distributing share USD 13.01 12.84 –X Class non-distributing share USD 10.53 10.31 –
Prices for each Share Class are quoted in the Base Currency of the Fund with the exception of Hedged and UK reporting Share Classes. In the case of those Share Classes for which two or more Dealing Currencies are available, the additional dealing currency prices are calculated by converting the price at the relevant spot exchange rate at the time of valuation.
Three Year Summary of Net Asset Valuesas at 31 August 2019 continued
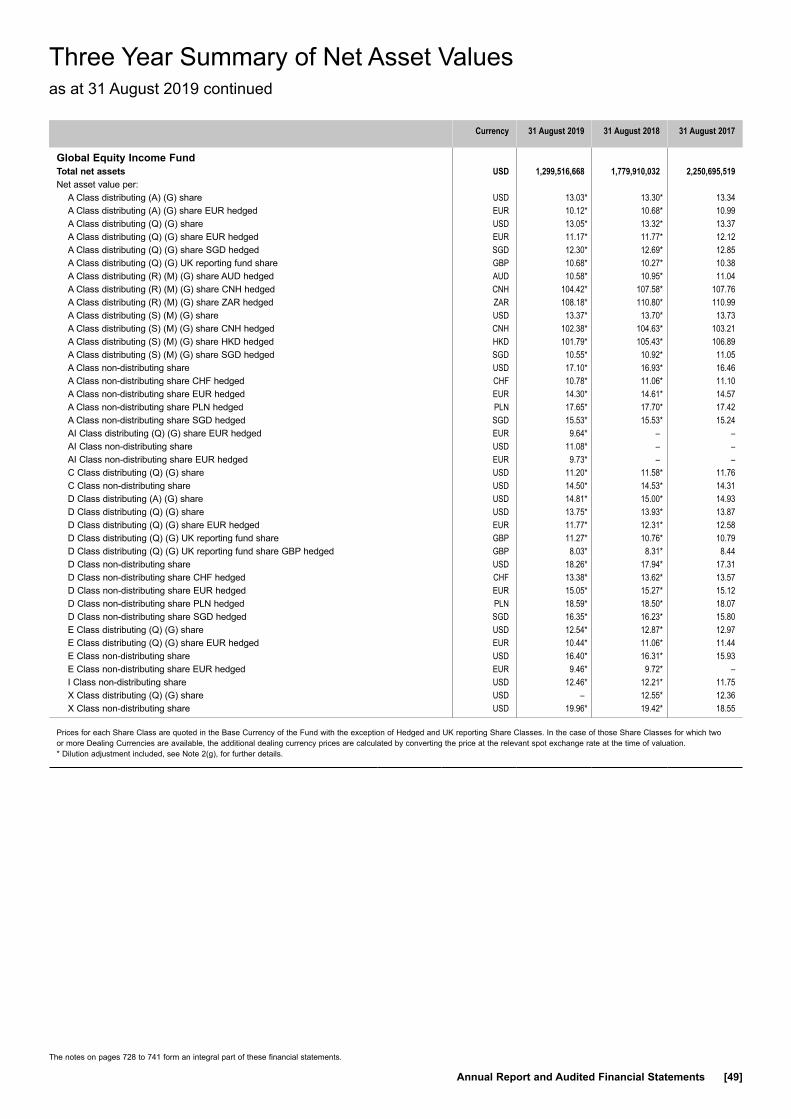
The notes on pages 728 to 741 form an integral part of these financial statements.
Annual Report and Audited Financial Statements [49]
Currency 31 August 2019 31 August 2018 31 August 2017
Global Equity Income Fund Total net assets USD 1,299,516,668 1,779,910,032 2,250,695,519Net asset value per:
A Class distributing (A) (G) share USD 13.03* 13.30* 13.34A Class distributing (A) (G) share EUR hedged EUR 10.12* 10.68* 10.99A Class distributing (Q) (G) share USD 13.05* 13.32* 13.37A Class distributing (Q) (G) share EUR hedged EUR 11.17* 11.77* 12.12A Class distributing (Q) (G) share SGD hedged SGD 12.30* 12.69* 12.85A Class distributing (Q) (G) UK reporting fund share GBP 10.68* 10.27* 10.38A Class distributing (R) (M) (G) share AUD hedged AUD 10.58* 10.95* 11.04A Class distributing (R) (M) (G) share CNH hedged CNH 104.42* 107.58* 107.76A Class distributing (R) (M) (G) share ZAR hedged ZAR 108.18* 110.80* 110.99A Class distributing (S) (M) (G) share USD 13.37* 13.70* 13.73A Class distributing (S) (M) (G) share CNH hedged CNH 102.38* 104.63* 103.21A Class distributing (S) (M) (G) share HKD hedged HKD 101.79* 105.43* 106.89A Class distributing (S) (M) (G) share SGD hedged SGD 10.55* 10.92* 11.05A Class non-distributing share USD 17.10* 16.93* 16.46A Class non-distributing share CHF hedged CHF 10.78* 11.06* 11.10A Class non-distributing share EUR hedged EUR 14.30* 14.61* 14.57A Class non-distributing share PLN hedged PLN 17.65* 17.70* 17.42A Class non-distributing share SGD hedged SGD 15.53* 15.53* 15.24AI Class distributing (Q) (G) share EUR hedged EUR 9.64* – –AI Class non-distributing share USD 11.08* – –AI Class non-distributing share EUR hedged EUR 9.73* – –C Class distributing (Q) (G) share USD 11.20* 11.58* 11.76C Class non-distributing share USD 14.50* 14.53* 14.31D Class distributing (A) (G) share USD 14.81* 15.00* 14.93D Class distributing (Q) (G) share USD 13.75* 13.93* 13.87D Class distributing (Q) (G) share EUR hedged EUR 11.77* 12.31* 12.58D Class distributing (Q) (G) UK reporting fund share GBP 11.27* 10.76* 10.79D Class distributing (Q) (G) UK reporting fund share GBP hedged GBP 8.03* 8.31* 8.44D Class non-distributing share USD 18.26* 17.94* 17.31D Class non-distributing share CHF hedged CHF 13.38* 13.62* 13.57D Class non-distributing share EUR hedged EUR 15.05* 15.27* 15.12D Class non-distributing share PLN hedged PLN 18.59* 18.50* 18.07D Class non-distributing share SGD hedged SGD 16.35* 16.23* 15.80E Class distributing (Q) (G) share USD 12.54* 12.87* 12.97E Class distributing (Q) (G) share EUR hedged EUR 10.44* 11.06* 11.44E Class non-distributing share USD 16.40* 16.31* 15.93E Class non-distributing share EUR hedged EUR 9.46* 9.72* –I Class non-distributing share USD 12.46* 12.21* 11.75X Class distributing (Q) (G) share USD – 12.55* 12.36X Class non-distributing share USD 19.96* 19.42* 18.55
Prices for each Share Class are quoted in the Base Currency of the Fund with the exception of Hedged and UK reporting Share Classes. In the case of those Share Classes for which two or more Dealing Currencies are available, the additional dealing currency prices are calculated by converting the price at the relevant spot exchange rate at the time of valuation.* Dilution adjustment included, see Note 2(g), for further details.
Three Year Summary of Net Asset Valuesas at 31 August 2019 continued

The notes on pages 728 to 741 form an integral part of these financial statements.
[50] BlackRock Global Funds (BGF)
Currency 31 August 2019 31 August 2018 31 August 2017
Global Government Bond Fund Total net assets USD 739,894,648 591,019,929 760,875,689Net asset value per:
A Class distributing (D) share USD 22.26 20.19 20.62A Class distributing (D) share EUR hedged EUR 19.50 18.24 19.10A Class distributing (M) share USD 22.29 20.22 20.65A Class distributing (M) share EUR hedged EUR 19.33 18.08 18.94A Class distributing (M) share GBP hedged GBP 10.31 9.52 9.89A Class distributing (M) share HKD hedged HKD 104.87 95.99 99.10A Class non-distributing share USD 31.54 28.36 28.71A Class non-distributing share EUR hedged EUR 27.18 25.20 26.17C Class distributing (D) share USD 20.74 18.89 19.36C Class distributing (D) share EUR hedged EUR 18.38 17.25 18.14C Class distributing (M) share USD 21.76 19.82 20.31C Class non-distributing share USD 24.24 22.07 22.63C Class non-distributing share EUR hedged EUR 20.94 19.65 20.66D Class distributing (M) share USD 22.32 20.24 20.67D Class distributing (M) share EUR hedged EUR 19.35 18.10 18.96D Class non-distributing share USD 32.57 29.19 29.45D Class non-distributing share EUR hedged EUR 28.43 26.26 27.17E Class non-distributing share USD 28.58 25.83 26.27E Class non-distributing share EUR hedged EUR 24.54 22.86 23.86I Class distributing (A) share EUR hedged EUR 10.54 9.85 –I Class non-distributing share USD 11.47 10.27 10.34X Class non-distributing share EUR hedged EUR 11.53 10.59 10.90X Class non-distributing share NOK hedged NOK 110.04 99.53 –X Class non-distributing share SEK hedged SEK 105.34 96.74 99.65X Class non-distributing UK reporting fund share GBP 9.37 7.87 7.95
Prices for each Share Class are quoted in the Base Currency of the Fund with the exception of Hedged and UK reporting Share Classes. In the case of those Share Classes for which two or more Dealing Currencies are available, the additional dealing currency prices are calculated by converting the price at the relevant spot exchange rate at the time of valuation.
Three Year Summary of Net Asset Valuesas at 31 August 2019 continued
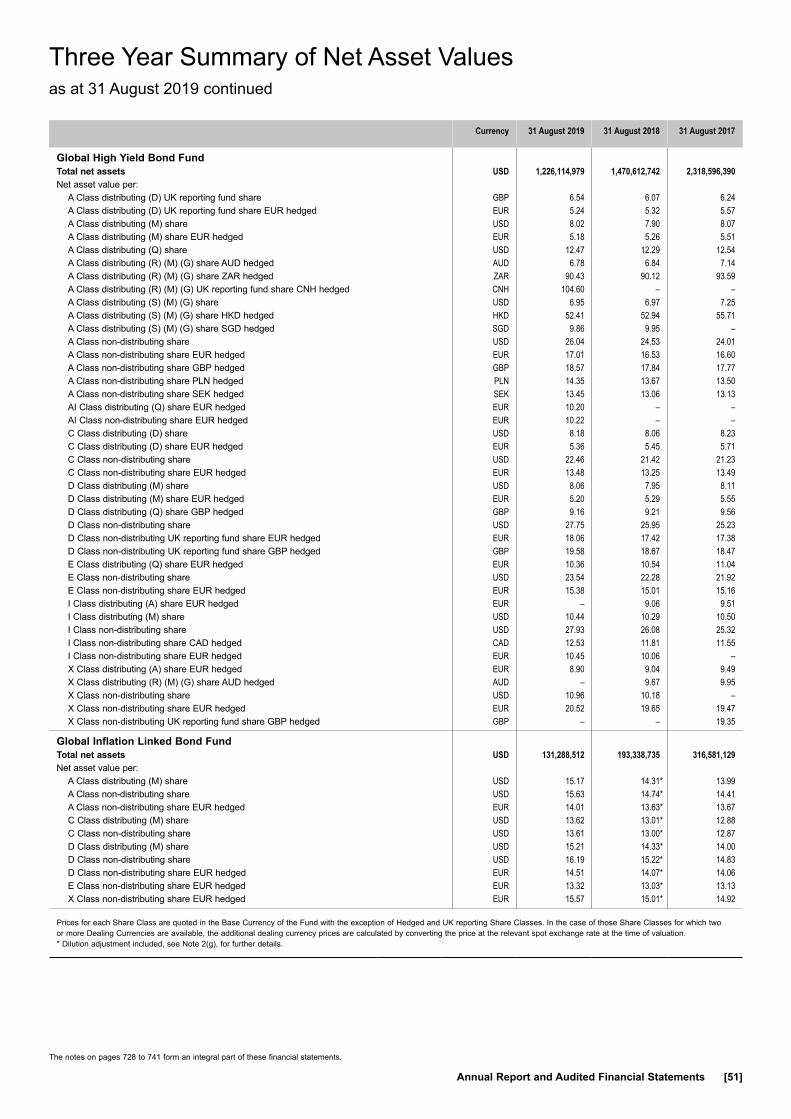
The notes on pages 728 to 741 form an integral part of these financial statements.
Annual Report and Audited Financial Statements [51]
Currency 31 August 2019 31 August 2018 31 August 2017
Global High Yield Bond Fund Total net assets USD 1,226,114,979 1,470,612,742 2,318,596,390Net asset value per:
A Class distributing (D) UK reporting fund share GBP 6.54 6.07 6.24A Class distributing (D) UK reporting fund share EUR hedged EUR 5.24 5.32 5.57A Class distributing (M) share USD 8.02 7.90 8.07A Class distributing (M) share EUR hedged EUR 5.18 5.26 5.51A Class distributing (Q) share USD 12.47 12.29 12.54A Class distributing (R) (M) (G) share AUD hedged AUD 6.78 6.84 7.14A Class distributing (R) (M) (G) share ZAR hedged ZAR 90.43 90.12 93.59A Class distributing (R) (M) (G) UK reporting fund share CNH hedged CNH 104.60 – –A Class distributing (S) (M) (G) share USD 6.95 6.97 7.25A Class distributing (S) (M) (G) share HKD hedged HKD 52.41 52.94 55.71A Class distributing (S) (M) (G) share SGD hedged SGD 9.86 9.95 –A Class non-distributing share USD 26.04 24.53 24.01A Class non-distributing share EUR hedged EUR 17.01 16.53 16.60A Class non-distributing share GBP hedged GBP 18.57 17.84 17.77A Class non-distributing share PLN hedged PLN 14.35 13.67 13.50A Class non-distributing share SEK hedged SEK 13.45 13.06 13.13AI Class distributing (Q) share EUR hedged EUR 10.20 – –AI Class non-distributing share EUR hedged EUR 10.22 – –C Class distributing (D) share USD 8.18 8.06 8.23C Class distributing (D) share EUR hedged EUR 5.36 5.45 5.71C Class non-distributing share USD 22.46 21.42 21.23C Class non-distributing share EUR hedged EUR 13.48 13.25 13.49D Class distributing (M) share USD 8.06 7.95 8.11D Class distributing (M) share EUR hedged EUR 5.20 5.29 5.55D Class distributing (Q) share GBP hedged GBP 9.16 9.21 9.56D Class non-distributing share USD 27.75 25.95 25.23D Class non-distributing UK reporting fund share EUR hedged EUR 18.06 17.42 17.38D Class non-distributing UK reporting fund share GBP hedged GBP 19.58 18.67 18.47E Class distributing (Q) share EUR hedged EUR 10.36 10.54 11.04E Class non-distributing share USD 23.54 22.28 21.92E Class non-distributing share EUR hedged EUR 15.38 15.01 15.16I Class distributing (A) share EUR hedged EUR – 9.06 9.51I Class distributing (M) share USD 10.44 10.29 10.50I Class non-distributing share USD 27.93 26.08 25.32I Class non-distributing share CAD hedged CAD 12.53 11.81 11.55I Class non-distributing share EUR hedged EUR 10.45 10.06 –X Class distributing (A) share EUR hedged EUR 8.90 9.04 9.49X Class distributing (R) (M) (G) share AUD hedged AUD – 9.67 9.95X Class non-distributing share USD 10.96 10.18 –X Class non-distributing share EUR hedged EUR 20.52 19.65 19.47X Class non-distributing UK reporting fund share GBP hedged GBP – – 19.35
Global Inflation Linked Bond Fund Total net assets USD 131,288,512 193,338,735 316,581,129Net asset value per:
A Class distributing (M) share USD 15.17 14.31* 13.99A Class non-distributing share USD 15.63 14.74* 14.41A Class non-distributing share EUR hedged EUR 14.01 13.63* 13.67C Class distributing (M) share USD 13.62 13.01* 12.88C Class non-distributing share USD 13.61 13.00* 12.87D Class distributing (M) share USD 15.21 14.33* 14.00D Class non-distributing share USD 16.19 15.22* 14.83D Class non-distributing share EUR hedged EUR 14.51 14.07* 14.06E Class non-distributing share EUR hedged EUR 13.32 13.03* 13.13X Class non-distributing share EUR hedged EUR 15.57 15.01* 14.92
Prices for each Share Class are quoted in the Base Currency of the Fund with the exception of Hedged and UK reporting Share Classes. In the case of those Share Classes for which two or more Dealing Currencies are available, the additional dealing currency prices are calculated by converting the price at the relevant spot exchange rate at the time of valuation.* Dilution adjustment included, see Note 2(g), for further details.
Three Year Summary of Net Asset Valuesas at 31 August 2019 continued

The notes on pages 728 to 741 form an integral part of these financial statements.
[52] BlackRock Global Funds (BGF)
Currency 31 August 2019 31 August 2018 31 August 2017
Global Long-Horizon Equity Fund(3) Total net assets USD 6,430,325◊ 6,632,840 5,588,991Net asset value per:
A Class non-distributing share USD 12.07◊ 12.61 10.94A Class non-distributing share EUR hedged EUR 11.48◊ 12.07 10.73D Class non-distributing share USD 12.27◊ 12.82 11.03D Class non-distributing share EUR hedged EUR 11.89◊ 12.48 11.01E Class non-distributing share USD 13.15◊ 13.75 11.99E Class non-distributing share EUR hedged EUR 11.35◊ 11.94 10.67X Class non-distributing share USD 12.55◊ 13.09 11.16
Global Long-Horizon Equity Fund(1) Total net assets USD 403,708,515 325,693,535 296,643,221Net asset value per:
A Class distributing (A) share USD 14.86 13.84 12.00A Class distributing (A) UK reporting fund share GBP 18.35 16.10 14.06A Class non-distributing share USD 60.72 56.54 49.01A Class non-distributing share SGD hedged SGD 14.57 13.72 11.99AI Class non-distributing share USD 11.68 – –C Class non-distributing share USD 47.22 44.52 39.08D Class distributing (A) UK reporting fund share GBP 18.52 16.21 14.12D Class non-distributing share USD 64.25 59.39 51.09E Class non-distributing share USD 54.95 51.43 44.80
Prices for each Share Class are quoted in the Base Currency of the Fund with the exception of Hedged and UK reporting Share Classes. In the case of those Share Classes for which two or more Dealing Currencies are available, the additional dealing currency prices are calculated by converting the price at the relevant spot exchange rate at the time of valuation.(1) Fund name changed during the year, see Note 1, for further details.(3) Fund terminated during the year, see Note 1, for further details.◊ The Total net assets and Net asset value per share class have been disclosed for the final valuation date of 29 October 2018.
Three Year Summary of Net Asset Valuesas at 31 August 2019 continued
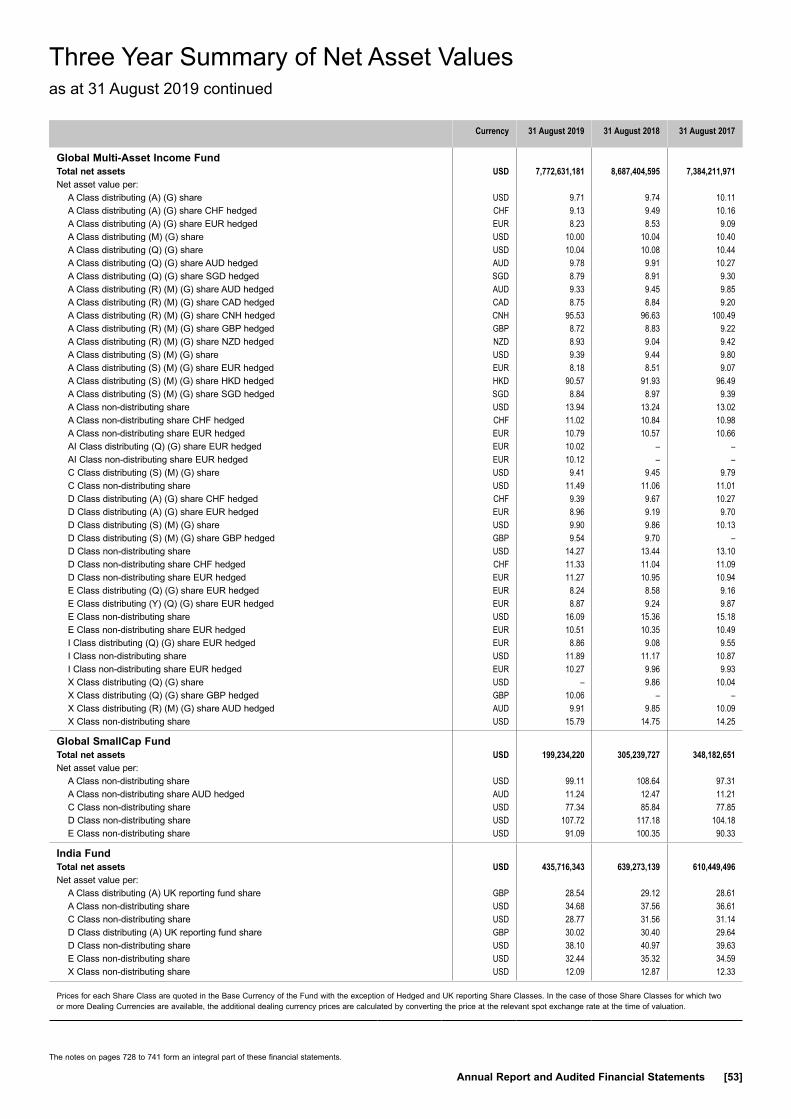
The notes on pages 728 to 741 form an integral part of these financial statements.
Annual Report and Audited Financial Statements [53]
Currency 31 August 2019 31 August 2018 31 August 2017
Global Multi-Asset Income Fund Total net assets USD 7,772,631,181 8,687,404,595 7,384,211,971Net asset value per:
A Class distributing (A) (G) share USD 9.71 9.74 10.11A Class distributing (A) (G) share CHF hedged CHF 9.13 9.49 10.16A Class distributing (A) (G) share EUR hedged EUR 8.23 8.53 9.09A Class distributing (M) (G) share USD 10.00 10.04 10.40A Class distributing (Q) (G) share USD 10.04 10.08 10.44A Class distributing (Q) (G) share AUD hedged AUD 9.78 9.91 10.27A Class distributing (Q) (G) share SGD hedged SGD 8.79 8.91 9.30A Class distributing (R) (M) (G) share AUD hedged AUD 9.33 9.45 9.85A Class distributing (R) (M) (G) share CAD hedged CAD 8.75 8.84 9.20A Class distributing (R) (M) (G) share CNH hedged CNH 95.53 96.63 100.49A Class distributing (R) (M) (G) share GBP hedged GBP 8.72 8.83 9.22A Class distributing (R) (M) (G) share NZD hedged NZD 8.93 9.04 9.42A Class distributing (S) (M) (G) share USD 9.39 9.44 9.80A Class distributing (S) (M) (G) share EUR hedged EUR 8.18 8.51 9.07A Class distributing (S) (M) (G) share HKD hedged HKD 90.57 91.93 96.49A Class distributing (S) (M) (G) share SGD hedged SGD 8.84 8.97 9.39A Class non-distributing share USD 13.94 13.24 13.02A Class non-distributing share CHF hedged CHF 11.02 10.84 10.98A Class non-distributing share EUR hedged EUR 10.79 10.57 10.66AI Class distributing (Q) (G) share EUR hedged EUR 10.02 – –AI Class non-distributing share EUR hedged EUR 10.12 – –C Class distributing (S) (M) (G) share USD 9.41 9.45 9.79C Class non-distributing share USD 11.49 11.06 11.01D Class distributing (A) (G) share CHF hedged CHF 9.39 9.67 10.27D Class distributing (A) (G) share EUR hedged EUR 8.96 9.19 9.70D Class distributing (S) (M) (G) share USD 9.90 9.86 10.13D Class distributing (S) (M) (G) share GBP hedged GBP 9.54 9.70 –D Class non-distributing share USD 14.27 13.44 13.10D Class non-distributing share CHF hedged CHF 11.33 11.04 11.09D Class non-distributing share EUR hedged EUR 11.27 10.95 10.94E Class distributing (Q) (G) share EUR hedged EUR 8.24 8.58 9.16E Class distributing (Y) (Q) (G) share EUR hedged EUR 8.87 9.24 9.87E Class non-distributing share USD 16.09 15.36 15.18E Class non-distributing share EUR hedged EUR 10.51 10.35 10.49I Class distributing (Q) (G) share EUR hedged EUR 8.86 9.08 9.55I Class non-distributing share USD 11.89 11.17 10.87I Class non-distributing share EUR hedged EUR 10.27 9.96 9.93X Class distributing (Q) (G) share USD – 9.86 10.04X Class distributing (Q) (G) share GBP hedged GBP 10.06 – –X Class distributing (R) (M) (G) share AUD hedged AUD 9.91 9.85 10.09X Class non-distributing share USD 15.79 14.75 14.25
Global SmallCap Fund Total net assets USD 199,234,220 305,239,727 348,182,651Net asset value per:
A Class non-distributing share USD 99.11 108.64 97.31A Class non-distributing share AUD hedged AUD 11.24 12.47 11.21C Class non-distributing share USD 77.34 85.84 77.85D Class non-distributing share USD 107.72 117.18 104.18E Class non-distributing share USD 91.09 100.35 90.33
India Fund Total net assets USD 435,716,343 639,273,139 610,449,496Net asset value per:
A Class distributing (A) UK reporting fund share GBP 28.54 29.12 28.61A Class non-distributing share USD 34.68 37.56 36.61C Class non-distributing share USD 28.77 31.56 31.14D Class distributing (A) UK reporting fund share GBP 30.02 30.40 29.64D Class non-distributing share USD 38.10 40.97 39.63E Class non-distributing share USD 32.44 35.32 34.59X Class non-distributing share USD 12.09 12.87 12.33
Prices for each Share Class are quoted in the Base Currency of the Fund with the exception of Hedged and UK reporting Share Classes. In the case of those Share Classes for which two or more Dealing Currencies are available, the additional dealing currency prices are calculated by converting the price at the relevant spot exchange rate at the time of valuation.
Three Year Summary of Net Asset Valuesas at 31 August 2019 continued
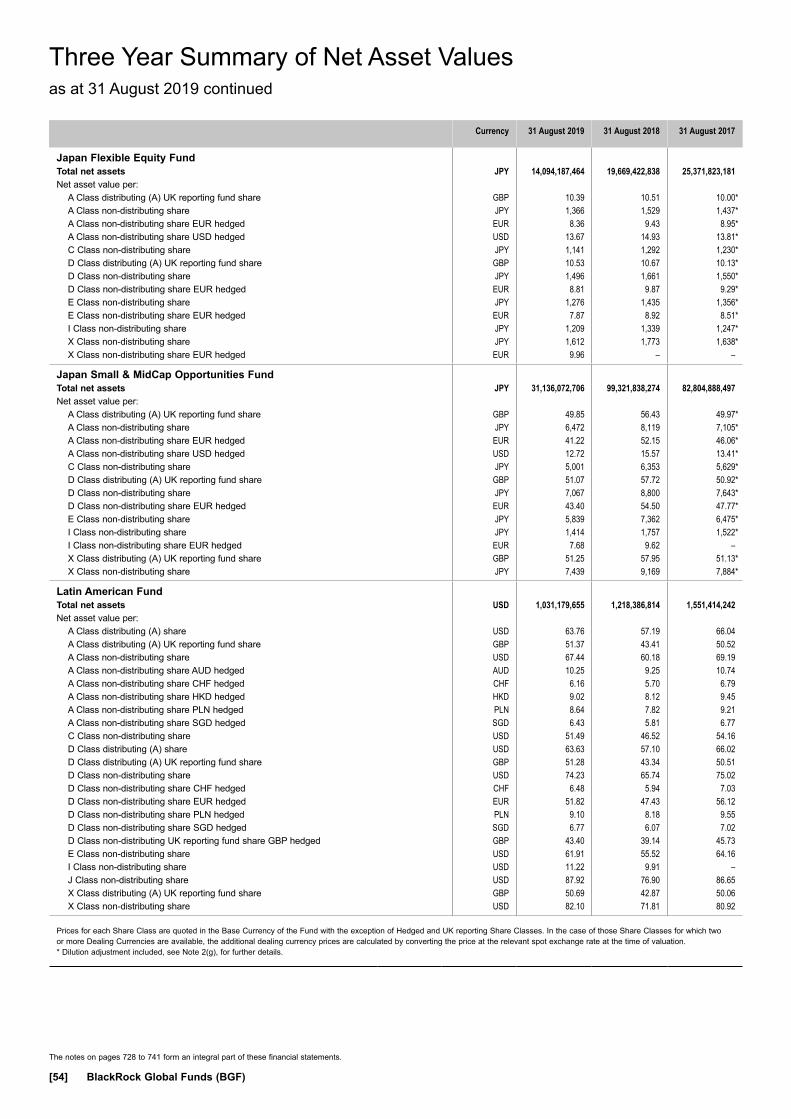
The notes on pages 728 to 741 form an integral part of these financial statements.
[54] BlackRock Global Funds (BGF)
Currency 31 August 2019 31 August 2018 31 August 2017
Japan Flexible Equity Fund Total net assets JPY 14,094,187,464 19,669,422,838 25,371,823,181Net asset value per:
A Class distributing (A) UK reporting fund share GBP 10.39 10.51 10.00*A Class non-distributing share JPY 1,366 1,529 1,437*A Class non-distributing share EUR hedged EUR 8.36 9.43 8.95*A Class non-distributing share USD hedged USD 13.67 14.93 13.81*C Class non-distributing share JPY 1,141 1,292 1,230*D Class distributing (A) UK reporting fund share GBP 10.53 10.67 10.13*D Class non-distributing share JPY 1,496 1,661 1,550*D Class non-distributing share EUR hedged EUR 8.81 9.87 9.29*E Class non-distributing share JPY 1,276 1,435 1,356*E Class non-distributing share EUR hedged EUR 7.87 8.92 8.51*I Class non-distributing share JPY 1,209 1,339 1,247*X Class non-distributing share JPY 1,612 1,773 1,638*X Class non-distributing share EUR hedged EUR 9.96 – –
Japan Small & MidCap Opportunities Fund Total net assets JPY 31,136,072,706 99,321,838,274 82,804,888,497Net asset value per:
A Class distributing (A) UK reporting fund share GBP 49.85 56.43 49.97*A Class non-distributing share JPY 6,472 8,119 7,105*A Class non-distributing share EUR hedged EUR 41.22 52.15 46.06*A Class non-distributing share USD hedged USD 12.72 15.57 13.41*C Class non-distributing share JPY 5,001 6,353 5,629*D Class distributing (A) UK reporting fund share GBP 51.07 57.72 50.92*D Class non-distributing share JPY 7,067 8,800 7,643*D Class non-distributing share EUR hedged EUR 43.40 54.50 47.77*E Class non-distributing share JPY 5,839 7,362 6,475*I Class non-distributing share JPY 1,414 1,757 1,522*I Class non-distributing share EUR hedged EUR 7.68 9.62 –X Class distributing (A) UK reporting fund share GBP 51.25 57.95 51.13*X Class non-distributing share JPY 7,439 9,169 7,884*
Latin American Fund Total net assets USD 1,031,179,655 1,218,386,814 1,551,414,242Net asset value per:
A Class distributing (A) share USD 63.76 57.19 66.04A Class distributing (A) UK reporting fund share GBP 51.37 43.41 50.52A Class non-distributing share USD 67.44 60.18 69.19A Class non-distributing share AUD hedged AUD 10.25 9.25 10.74A Class non-distributing share CHF hedged CHF 6.16 5.70 6.79A Class non-distributing share HKD hedged HKD 9.02 8.12 9.45A Class non-distributing share PLN hedged PLN 8.64 7.82 9.21A Class non-distributing share SGD hedged SGD 6.43 5.81 6.77C Class non-distributing share USD 51.49 46.52 54.16D Class distributing (A) share USD 63.63 57.10 66.02D Class distributing (A) UK reporting fund share GBP 51.28 43.34 50.51D Class non-distributing share USD 74.23 65.74 75.02D Class non-distributing share CHF hedged CHF 6.48 5.94 7.03D Class non-distributing share EUR hedged EUR 51.82 47.43 56.12D Class non-distributing share PLN hedged PLN 9.10 8.18 9.55D Class non-distributing share SGD hedged SGD 6.77 6.07 7.02D Class non-distributing UK reporting fund share GBP hedged GBP 43.40 39.14 45.73E Class non-distributing share USD 61.91 55.52 64.16I Class non-distributing share USD 11.22 9.91 –J Class non-distributing share USD 87.92 76.90 86.65X Class distributing (A) UK reporting fund share GBP 50.69 42.87 50.06X Class non-distributing share USD 82.10 71.81 80.92
Prices for each Share Class are quoted in the Base Currency of the Fund with the exception of Hedged and UK reporting Share Classes. In the case of those Share Classes for which two or more Dealing Currencies are available, the additional dealing currency prices are calculated by converting the price at the relevant spot exchange rate at the time of valuation.* Dilution adjustment included, see Note 2(g), for further details.
Three Year Summary of Net Asset Valuesas at 31 August 2019 continued
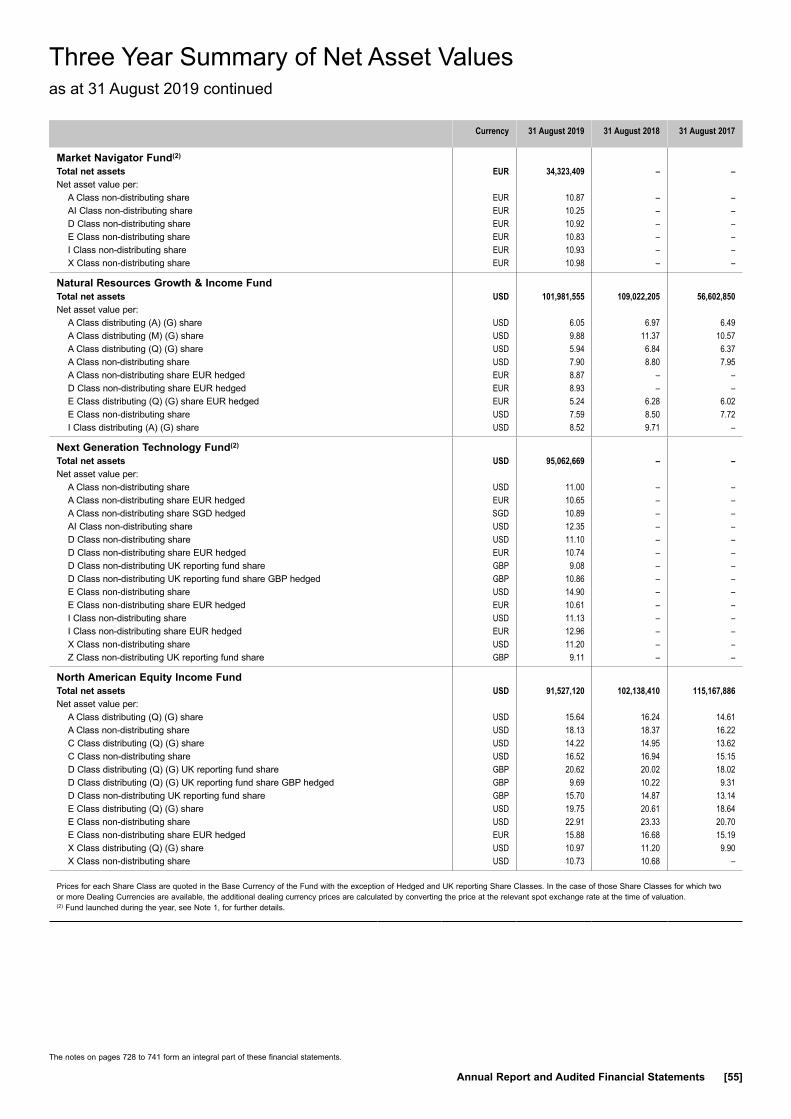
The notes on pages 728 to 741 form an integral part of these financial statements.
Annual Report and Audited Financial Statements [55]
Currency 31 August 2019 31 August 2018 31 August 2017
Market Navigator Fund(2) Total net assets EUR 34,323,409 – –Net asset value per:
A Class non-distributing share EUR 10.87 – –AI Class non-distributing share EUR 10.25 – –D Class non-distributing share EUR 10.92 – –E Class non-distributing share EUR 10.83 – –I Class non-distributing share EUR 10.93 – –X Class non-distributing share EUR 10.98 – –
Natural Resources Growth & Income Fund Total net assets USD 101,981,555 109,022,205 56,602,850Net asset value per:
A Class distributing (A) (G) share USD 6.05 6.97 6.49A Class distributing (M) (G) share USD 9.88 11.37 10.57A Class distributing (Q) (G) share USD 5.94 6.84 6.37A Class non-distributing share USD 7.90 8.80 7.95A Class non-distributing share EUR hedged EUR 8.87 – –D Class non-distributing share EUR hedged EUR 8.93 – –E Class distributing (Q) (G) share EUR hedged EUR 5.24 6.28 6.02E Class non-distributing share USD 7.59 8.50 7.72I Class distributing (A) (G) share USD 8.52 9.71 –
Next Generation Technology Fund(2) Total net assets USD 95,062,669 – –Net asset value per:
A Class non-distributing share USD 11.00 – –A Class non-distributing share EUR hedged EUR 10.65 – –A Class non-distributing share SGD hedged SGD 10.89 – –AI Class non-distributing share USD 12.35 – –D Class non-distributing share USD 11.10 – –D Class non-distributing share EUR hedged EUR 10.74 – –D Class non-distributing UK reporting fund share GBP 9.08 – –D Class non-distributing UK reporting fund share GBP hedged GBP 10.86 – –E Class non-distributing share USD 14.90 – –E Class non-distributing share EUR hedged EUR 10.61 – –I Class non-distributing share USD 11.13 – –I Class non-distributing share EUR hedged EUR 12.96 – –X Class non-distributing share USD 11.20 – –Z Class non-distributing UK reporting fund share GBP 9.11 – –
North American Equity Income Fund Total net assets USD 91,527,120 102,138,410 115,167,886Net asset value per:
A Class distributing (Q) (G) share USD 15.64 16.24 14.61A Class non-distributing share USD 18.13 18.37 16.22C Class distributing (Q) (G) share USD 14.22 14.95 13.62C Class non-distributing share USD 16.52 16.94 15.15D Class distributing (Q) (G) UK reporting fund share GBP 20.62 20.02 18.02D Class distributing (Q) (G) UK reporting fund share GBP hedged GBP 9.69 10.22 9.31D Class non-distributing UK reporting fund share GBP 15.70 14.87 13.14E Class distributing (Q) (G) share USD 19.75 20.61 18.64E Class non-distributing share USD 22.91 23.33 20.70E Class non-distributing share EUR hedged EUR 15.88 16.68 15.19X Class distributing (Q) (G) share USD 10.97 11.20 9.90X Class non-distributing share USD 10.73 10.68 –
Prices for each Share Class are quoted in the Base Currency of the Fund with the exception of Hedged and UK reporting Share Classes. In the case of those Share Classes for which two or more Dealing Currencies are available, the additional dealing currency prices are calculated by converting the price at the relevant spot exchange rate at the time of valuation.(2) Fund launched during the year, see Note 1, for further details.
Three Year Summary of Net Asset Valuesas at 31 August 2019 continued
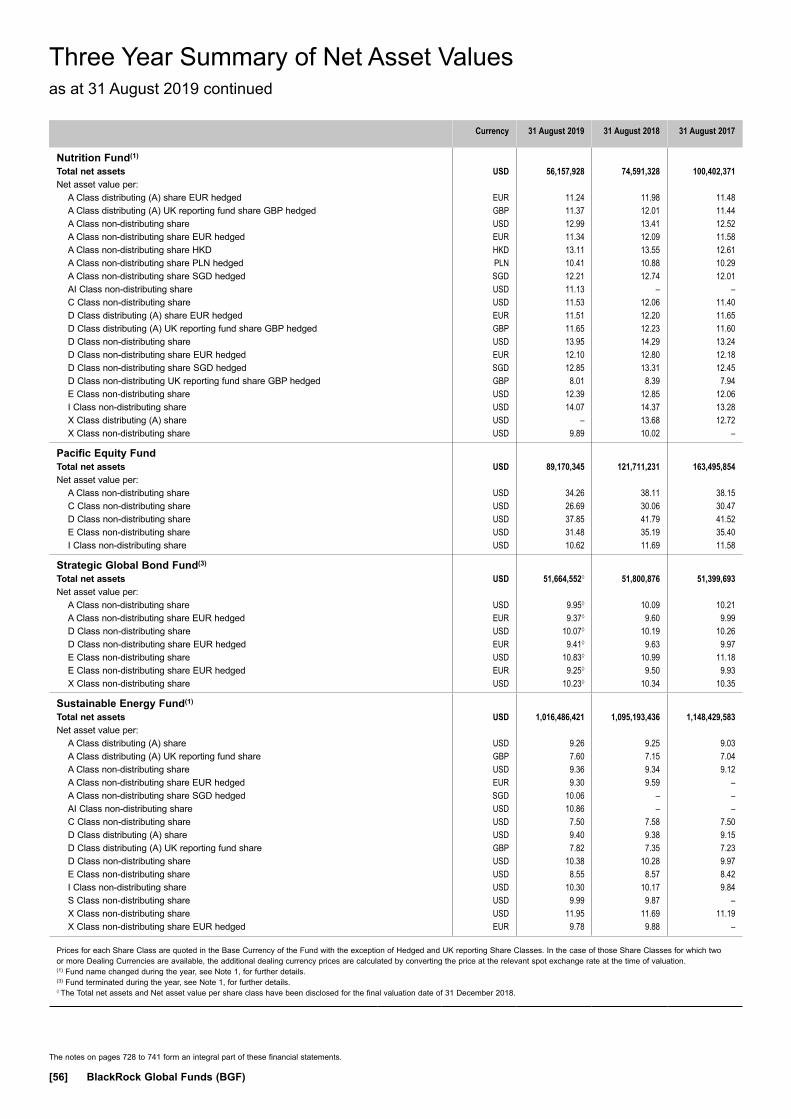
The notes on pages 728 to 741 form an integral part of these financial statements.
[56] BlackRock Global Funds (BGF)
Currency 31 August 2019 31 August 2018 31 August 2017
Nutrition Fund(1) Total net assets USD 56,157,928 74,591,328 100,402,371Net asset value per:
A Class distributing (A) share EUR hedged EUR 11.24 11.98 11.48A Class distributing (A) UK reporting fund share GBP hedged GBP 11.37 12.01 11.44A Class non-distributing share USD 12.99 13.41 12.52A Class non-distributing share EUR hedged EUR 11.34 12.09 11.58A Class non-distributing share HKD HKD 13.11 13.55 12.61A Class non-distributing share PLN hedged PLN 10.41 10.88 10.29A Class non-distributing share SGD hedged SGD 12.21 12.74 12.01AI Class non-distributing share USD 11.13 – –C Class non-distributing share USD 11.53 12.06 11.40D Class distributing (A) share EUR hedged EUR 11.51 12.20 11.65D Class distributing (A) UK reporting fund share GBP hedged GBP 11.65 12.23 11.60D Class non-distributing share USD 13.95 14.29 13.24D Class non-distributing share EUR hedged EUR 12.10 12.80 12.18D Class non-distributing share SGD hedged SGD 12.85 13.31 12.45D Class non-distributing UK reporting fund share GBP hedged GBP 8.01 8.39 7.94E Class non-distributing share USD 12.39 12.85 12.06I Class non-distributing share USD 14.07 14.37 13.28X Class distributing (A) share USD – 13.68 12.72X Class non-distributing share USD 9.89 10.02 –
Pacific Equity Fund Total net assets USD 89,170,345 121,711,231 163,495,854Net asset value per:
A Class non-distributing share USD 34.26 38.11 38.15C Class non-distributing share USD 26.69 30.06 30.47D Class non-distributing share USD 37.85 41.79 41.52E Class non-distributing share USD 31.48 35.19 35.40I Class non-distributing share USD 10.62 11.69 11.58
Strategic Global Bond Fund(3) Total net assets USD 51,664,552◊ 51,800,876 51,399,693Net asset value per:
A Class non-distributing share USD 9.95◊ 10.09 10.21A Class non-distributing share EUR hedged EUR 9.37◊ 9.60 9.99D Class non-distributing share USD 10.07◊ 10.19 10.26D Class non-distributing share EUR hedged EUR 9.41◊ 9.63 9.97E Class non-distributing share USD 10.83◊ 10.99 11.18E Class non-distributing share EUR hedged EUR 9.25◊ 9.50 9.93X Class non-distributing share USD 10.23◊ 10.34 10.35
Sustainable Energy Fund(1) Total net assets USD 1,016,486,421 1,095,193,436 1,148,429,583Net asset value per:
A Class distributing (A) share USD 9.26 9.25 9.03A Class distributing (A) UK reporting fund share GBP 7.60 7.15 7.04A Class non-distributing share USD 9.36 9.34 9.12A Class non-distributing share EUR hedged EUR 9.30 9.59 –A Class non-distributing share SGD hedged SGD 10.06 – –AI Class non-distributing share USD 10.86 – –C Class non-distributing share USD 7.50 7.58 7.50D Class distributing (A) share USD 9.40 9.38 9.15D Class distributing (A) UK reporting fund share GBP 7.82 7.35 7.23D Class non-distributing share USD 10.38 10.28 9.97E Class non-distributing share USD 8.55 8.57 8.42I Class non-distributing share USD 10.30 10.17 9.84S Class non-distributing share USD 9.99 9.87 –X Class non-distributing share USD 11.95 11.69 11.19X Class non-distributing share EUR hedged EUR 9.78 9.88 –
Prices for each Share Class are quoted in the Base Currency of the Fund with the exception of Hedged and UK reporting Share Classes. In the case of those Share Classes for which two or more Dealing Currencies are available, the additional dealing currency prices are calculated by converting the price at the relevant spot exchange rate at the time of valuation.(1) Fund name changed during the year, see Note 1, for further details.(3) Fund terminated during the year, see Note 1, for further details.◊ The Total net assets and Net asset value per share class have been disclosed for the final valuation date of 31 December 2018.
Three Year Summary of Net Asset Valuesas at 31 August 2019 continued

The notes on pages 728 to 741 form an integral part of these financial statements.
Annual Report and Audited Financial Statements [57]
Currency 31 August 2019 31 August 2018 31 August 2017
Swiss Small & MidCap Opportunities Fund(4) Total net assets CHF 859,704,736 1,087,930,083 1,079,221,446Net asset value per:
A Class non-distributing share CHF 492.88 512.77 447.29D Class distributing (M) UK reporting fund share GBP 14.08 13.99 12.24D Class non-distributing UK reporting fund share GBP 443.85 440.08 385.12I Class non-distributing share CHF 26.31 27.10 23.40X Class non-distributing share CHF – 18.44 15.80
United Kingdom Fund Total net assets GBP 145,576,414 164,947,751 157,781,165Net asset value per:
A Class distributing (A) UK reporting fund share GBP 97.85 97.20 86.89A Class non-distributing share GBP 117.34 115.18 102.35C Class non-distributing share GBP 91.11 90.56 81.48D Class distributing (A) UK reporting fund share GBP 98.11 97.40 87.03D Class non-distributing share GBP 128.16 124.85 110.13D Class non-distributing UK reporting fund share GBP – – 106.18D Class non-distributing UK reporting fund share GBP 128.16 124.85 110.13E Class non-distributing share GBP 105.99 104.56 93.38I Class non-distributing share GBP 13.44 13.06 11.49X Class non-distributing share GBP 139.04 134.11 117.09
US Basic Value Fund Total net assets USD 568,671,773 734,549,668 868,284,348Net asset value per:
A Class distributing (A) share USD 84.94 90.35 78.94A Class distributing (A) UK reporting fund share GBP 69.44 69.57 61.26A Class non-distributing share USD 85.77 90.92 79.37A Class non-distributing share CNH hedged CNH 136.61 144.54 124.11A Class non-distributing share EUR hedged EUR 55.60 60.88 54.52A Class non-distributing share SGD hedged SGD 16.49 17.66 15.57C Class non-distributing share USD 63.13 67.75 59.89C Class non-distributing share EUR hedged EUR 48.70 53.99 48.95D Class distributing (A) share USD 85.65 91.11 79.57D Class distributing (A) UK reporting fund share GBP 69.98 70.12 61.72D Class non-distributing share USD 94.67 99.60 86.31D Class non-distributing share EUR hedged EUR 58.54 63.59 56.52E Class non-distributing share USD 78.59 83.72 73.46E Class non-distributing share EUR hedged EUR 47.52 52.29 47.06I Class non-distributing share USD 93.24 97.84 84.57X Class non-distributing share USD 107.34 111.79 95.90
US Dollar Bond Fund Total net assets USD 693,018,411 555,517,455 479,098,575Net asset value per:
A Class distributing (D) share USD 17.47 16.39 17.06A Class distributing (M) share USD 17.48 16.39 17.07A Class distributing (S) (M) (G) share GBP hedged GBP 9.35 9.04 9.68A Class distributing (S) (M) (G) share HKD hedged HKD 96.01 91.95 97.99A Class non-distributing share USD 34.47 31.52 32.04C Class distributing (D) share USD 16.44 15.42 16.05C Class non-distributing share USD 26.11 24.17 24.88D Class distributing (M) share USD 17.47 16.39 17.06D Class non-distributing share USD 35.76 32.57 32.98D Class non-distributing UK reporting fund share GBP hedged GBP 11.02 10.21 10.51E Class non-distributing share USD 31.45 28.90 29.53I Class distributing (Q) share USD 10.41 9.77 –I Class non-distributing share USD 11.50 10.46 10.57I Class non-distributing share EUR hedged EUR 10.50 9.85 10.21X Class distributing (Q) share USD 10.35 9.71 –X Class non-distributing share USD 10.99 9.95 –
Three Year Summary of Net Asset Valuesas at 31 August 2019 continued
Prices for each Share Class are quoted in the Base Currency of the Fund with the exception of Hedged and UK reporting Share Classes. In the case of those Share Classes for which two or more Dealing Currencies are available, the additional dealing currency prices are calculated by converting the price at the relevant spot exchange rate at the time of valuation.(4) Fund closed to subscriptions, see Note 1, for further details.

The notes on pages 728 to 741 form an integral part of these financial statements.
[58] BlackRock Global Funds (BGF)
Prices for each Share Class are quoted in the Base Currency of the Fund with the exception of Hedged and UK reporting Share Classes. In the case of those Share Classes for which two or more Dealing Currencies are available, the additional dealing currency prices are calculated by converting the price at the relevant spot exchange rate at the time of valuation.
Three Year Summary of Net Asset Valuesas at 31 August 2019 continued
Currency 31 August 2019 31 August 2018 31 August 2017
US Dollar High Yield Bond Fund Total net assets USD 2,106,616,767 2,489,192,280 3,565,072,601Net asset value per:
A Class distributing (A) UK reporting fund share GBP hedged GBP 10.58 10.73 11.08A Class distributing (D) share USD 5.80 5.77 5.86A Class distributing (M) share USD 5.86 5.83 5.91A Class distributing (M) share AUD hedged AUD 11.42 11.46 11.64A Class distributing (M) share CAD hedged CAD 10.11 10.16 10.38A Class distributing (M) share EUR hedged EUR 9.30 9.55 9.95A Class distributing (M) share GBP hedged GBP 9.75 9.89 10.21A Class distributing (M) share NZD hedged NZD 11.18 11.20 11.34A Class distributing (M) share SGD hedged SGD 9.80 9.84 10.07A Class distributing (R) (M) (G) share AUD hedged AUD 9.30 9.50 9.86A Class distributing (R) (M) (G) share ZAR hedged ZAR 90.54 91.29 93.90A Class distributing (R) (M) (G) UK reporting fund share CNH hedged CNH 104.11 – –A Class distributing (S) (M) (G) share USD 5.07 5.13 5.30A Class distributing (S) (M) (G) share HKD hedged HKD 37.90 38.85 40.60A Class distributing (S) (M) (G) share SGD hedged SGD 9.40 9.60 10.01A Class non-distributing share USD 34.57 32.78 31.76A Class non-distributing share AUD hedged AUD 17.38 16.62 16.10A Class non-distributing share CHF hedged CHF 10.85 10.66 10.64A Class non-distributing share EUR hedged EUR 211.16 206.59 205.46A Class non-distributing share SGD hedged SGD 14.91 14.26 13.93C Class distributing (D) share USD 5.82 5.79 5.87C Class non-distributing share USD 26.90 25.83 25.34D Class distributing (A) UK reporting fund share GBP hedged GBP 10.53 10.68 11.03D Class distributing (M) share USD 10.04 9.98 10.13D Class distributing (M) share SGD hedged SGD 9.84 9.88 10.11D Class non-distributing share AUD hedged AUD 18.17 17.26 16.61D Class non-distributing share CHF hedged CHF 11.20 10.92 10.83D Class non-distributing share EUR hedged EUR 223.14 216.81 214.14D Class non-distributing share SGD hedged SGD 15.55 14.77 14.33D Class non-distributing UK reporting fund share GBP 29.90 26.52 25.72E Class non-distributing share USD 31.72 30.24 29.44I Class distributing (A) UK reporting fund share GBP hedged GBP 9.12 9.25 9.56I Class distributing (M) share USD 9.45 9.40 9.54I Class non-distributing share USD 14.81 13.92 13.37I Class non-distributing share EUR hedged EUR 11.47 11.13 10.98X Class distributing (S) (M) (G) share USD 10.83 10.80 10.98X Class non-distributing share USD 40.37 37.76 36.06
US Dollar Reserve Fund Total net assets USD 580,794,907 573,911,575 499,389,866Net asset value per:
A Class non-distributing share USD 156.92 153.73 151.81A Class non-distributing share GBP hedged GBP 189.25 188.94 189.58C Class non-distributing share USD 156.20 153.02 151.11D Class non-distributing share GBP hedged GBP 190.44 189.81 190.11E Class non-distributing share USD 149.97 147.28 145.81E Class non-distributing share GBP hedged GBP 180.30 180.45 181.52X Class non-distributing share USD 10.56 10.29 10.12
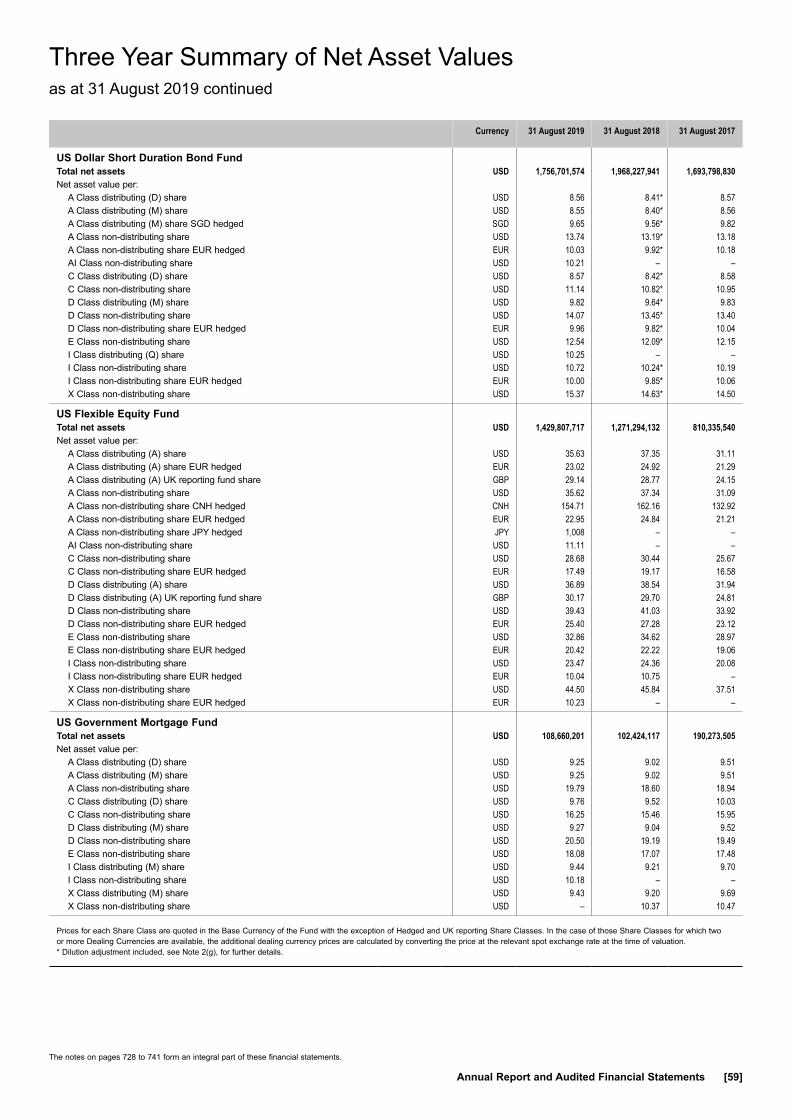
The notes on pages 728 to 741 form an integral part of these financial statements.
Annual Report and Audited Financial Statements [59]
Three Year Summary of Net Asset Valuesas at 31 August 2019 continued
Prices for each Share Class are quoted in the Base Currency of the Fund with the exception of Hedged and UK reporting Share Classes. In the case of those Share Classes for which two or more Dealing Currencies are available, the additional dealing currency prices are calculated by converting the price at the relevant spot exchange rate at the time of valuation.* Dilution adjustment included, see Note 2(g), for further details.
Currency 31 August 2019 31 August 2018 31 August 2017
US Dollar Short Duration Bond Fund Total net assets USD 1,756,701,574 1,968,227,941 1,693,798,830Net asset value per:
A Class distributing (D) share USD 8.56 8.41* 8.57A Class distributing (M) share USD 8.55 8.40* 8.56A Class distributing (M) share SGD hedged SGD 9.65 9.56* 9.82A Class non-distributing share USD 13.74 13.19* 13.18A Class non-distributing share EUR hedged EUR 10.03 9.92* 10.18AI Class non-distributing share USD 10.21 – –C Class distributing (D) share USD 8.57 8.42* 8.58C Class non-distributing share USD 11.14 10.82* 10.95D Class distributing (M) share USD 9.82 9.64* 9.83D Class non-distributing share USD 14.07 13.45* 13.40D Class non-distributing share EUR hedged EUR 9.96 9.82* 10.04E Class non-distributing share USD 12.54 12.09* 12.15I Class distributing (Q) share USD 10.25 – –I Class non-distributing share USD 10.72 10.24* 10.19I Class non-distributing share EUR hedged EUR 10.00 9.85* 10.06X Class non-distributing share USD 15.37 14.63* 14.50
US Flexible Equity Fund Total net assets USD 1,429,807,717 1,271,294,132 810,335,540Net asset value per:
A Class distributing (A) share USD 35.63 37.35 31.11A Class distributing (A) share EUR hedged EUR 23.02 24.92 21.29A Class distributing (A) UK reporting fund share GBP 29.14 28.77 24.15A Class non-distributing share USD 35.62 37.34 31.09A Class non-distributing share CNH hedged CNH 154.71 162.16 132.92A Class non-distributing share EUR hedged EUR 22.95 24.84 21.21A Class non-distributing share JPY hedged JPY 1,008 – –AI Class non-distributing share USD 11.11 – –C Class non-distributing share USD 28.68 30.44 25.67C Class non-distributing share EUR hedged EUR 17.49 19.17 16.58D Class distributing (A) share USD 36.89 38.54 31.94D Class distributing (A) UK reporting fund share GBP 30.17 29.70 24.81D Class non-distributing share USD 39.43 41.03 33.92D Class non-distributing share EUR hedged EUR 25.40 27.28 23.12E Class non-distributing share USD 32.86 34.62 28.97E Class non-distributing share EUR hedged EUR 20.42 22.22 19.06I Class non-distributing share USD 23.47 24.36 20.08I Class non-distributing share EUR hedged EUR 10.04 10.75 –X Class non-distributing share USD 44.50 45.84 37.51X Class non-distributing share EUR hedged EUR 10.23 – –
US Government Mortgage Fund Total net assets USD 108,660,201 102,424,117 190,273,505Net asset value per:
A Class distributing (D) share USD 9.25 9.02 9.51A Class distributing (M) share USD 9.25 9.02 9.51A Class non-distributing share USD 19.79 18.60 18.94C Class distributing (D) share USD 9.76 9.52 10.03C Class non-distributing share USD 16.25 15.46 15.95D Class distributing (M) share USD 9.27 9.04 9.52D Class non-distributing share USD 20.50 19.19 19.49E Class non-distributing share USD 18.08 17.07 17.48I Class distributing (M) share USD 9.44 9.21 9.70I Class non-distributing share USD 10.18 – –X Class distributing (M) share USD 9.43 9.20 9.69X Class non-distributing share USD – 10.37 10.47

The notes on pages 728 to 741 form an integral part of these financial statements.
[60] BlackRock Global Funds (BGF)
Prices for each Share Class are quoted in the Base Currency of the Fund with the exception of Hedged and UK reporting Share Classes. In the case of those Share Classes for which two or more Dealing Currencies are available, the additional dealing currency prices are calculated by converting the price at the relevant spot exchange rate at the time of valuation.* Dilution adjustment included, see Note 2(g), for further details.
Three Year Summary of Net Asset Valuesas at 31 August 2019 continued
Currency 31 August 2019 31 August 2018 31 August 2017
US Growth Fund Total net assets USD 412,534,696 465,453,042 409,372,931Net asset value per:
A Class distributing (A) share USD 30.18 29.04* 22.59*A Class non-distributing share USD 24.11 23.20* 18.05*A Class non-distributing share EUR hedged EUR 20.91 20.78* 16.57*A Class non-distributing UK reporting fund share GBP 19.74 17.89* 14.03*AI Class non-distributing share USD 11.64 – –C Class non-distributing share USD 19.06 18.56* 14.62*D Class distributing (A) share USD 29.65 28.32* 21.86*D Class non-distributing share USD 26.32 25.13* 19.40*D Class non-distributing UK reporting fund share GBP 21.54 19.38* 15.08*E Class non-distributing share USD 22.18 21.44* 16.76*I Class non-distributing share USD 16.40 15.63* 12.04*
US Small & MidCap Opportunities Fund Total net assets USD 162,743,359 228,355,254 302,916,653Net asset value per:
A Class non-distributing share USD 225.72 235.73 204.62A Class non-distributing share AUD hedged AUD 13.36 14.13 12.29C Class non-distributing share USD 174.67 184.70 162.35D Class non-distributing share USD 246.35 255.35 220.01E Class non-distributing share USD 203.85 213.96 186.65I Class non-distributing share USD 12.54 12.96 –
World Bond Fund Total net assets USD 1,375,012,111 1,340,682,994 1,501,876,263Net asset value per:
A Class distributing (D) share USD 60.26 55.29 56.51A Class distributing (M) share USD 60.11 55.15 56.37A Class distributing (R) (M) (G) share CNH hedged CNH 106.35 99.04 102.67A Class distributing (S) (M) (G) share GBP hedged GBP 9.76 9.22 9.68A Class distributing (S) (M) (G) share HKD hedged HKD 100.27 93.83 98.02A Class distributing (S) (M) (G) share SGD hedged SGD 10.65 9.95 –A Class non-distributing share USD 82.58 74.68 75.31A Class non-distributing share EUR hedged EUR 197.72 184.41 190.81A Class non-distributing UK reporting fund share GBP hedged GBP 12.25 11.28 11.56C Class distributing (D) share USD 60.67 55.66 56.90D Class distributing (M) share USD 60.18 55.21 56.43D Class non-distributing share USD 86.74 78.14 78.49D Class non-distributing share CHF hedged CHF 10.72 10.01 10.36D Class non-distributing share EUR hedged EUR 203.02 188.60 194.38D Class non-distributing UK reporting fund share GBP hedged GBP 12.27 11.26 11.50E Class non-distributing share USD 76.53 69.56 70.50I Class non-distributing share USD 11.23 10.10 10.13X Class non-distributing share USD 92.73 83.02 82.88X Class non-distributing share CHF hedged CHF 15.06 13.97 14.37X Class non-distributing share DKK hedged DKK 119.15 110.29 113.19X Class non-distributing share EUR hedged EUR 213.36 197.00 201.80X Class non-distributing share GBP hedged GBP 13.18 12.02 12.20X Class non-distributing share NOK hedged NOK 14.14 12.85 13.01X Class non-distributing share NZD hedged NZD 12.35 11.13 11.08

The notes on pages 728 to 741 form an integral part of these financial statements.
Annual Report and Audited Financial Statements [61]
Three Year Summary of Net Asset Valuesas at 31 August 2019 continued
Currency 31 August 2019 31 August 2018 31 August 2017
World Energy Fund Total net assets USD 1,241,489,805 1,653,787,091 2,122,207,395Net asset value per:
A Class distributing (A) share USD 14.35 18.91 15.28A Class distributing (A) UK reporting fund share GBP 11.71 14.53 11.84A Class non-distributing share USD 14.89 19.38 15.61A Class non-distributing share AUD hedged AUD 6.12 8.10 6.52A Class non-distributing share CHF hedged CHF 4.34 5.86 4.85A Class non-distributing share EUR hedged EUR 4.08 5.50 4.55A Class non-distributing share HKD hedged HKD 6.98 9.18 7.47A Class non-distributing share SGD hedged SGD 4.25 5.60 4.55AI Class non-distributing share USD 9.73 – –C Class non-distributing share USD 11.83 15.60 12.72C Class non-distributing share EUR hedged EUR 3.52 4.81 4.03D Class distributing (A) share USD 14.37 18.96 15.32D Class distributing (A) UK reporting fund share GBP 11.81 14.67 11.94D Class non-distributing share USD 16.48 21.29 17.02D Class non-distributing share CHF hedged CHF 4.57 6.12 5.02D Class non-distributing share EUR hedged EUR 4.43 5.94 4.87D Class non-distributing share SGD hedged SGD – – 4.71E Class non-distributing share USD 13.58 17.77 14.39E Class non-distributing share EUR hedged EUR 3.84 5.21 4.33I Class non-distributing share USD 16.39 21.12 16.84I Class non-distributing share EUR hedged EUR 4.52 6.05 4.95S Class non-distributing share USD 8.88 11.45 –X Class non-distributing share USD 19.77 25.23 19.92
World Financials Fund Total net assets USD 714,481,754 1,613,066,299 727,205,772Net asset value per:
A Class non-distributing share HKD hedged HKD 92.35 98.29 –A Class non-distributing share SGD hedged SGD 10.24 10.92 –A Class non-distributing UK reporting fund share GBP 22.05 21.88 20.23AI Class non-distributing share USD 10.90 – –C Class non-distributing share USD 21.68 23.12 21.48D Class non-distributing UK reporting fund share GBP 24.13 23.76 21.81E Class non-distributing share USD 24.73 26.19 24.15I Class non-distributing share USD 10.22 – –X Class non-distributing share USD 14.50 15.01 13.53
World Gold Fund Total net assets USD 5,669,751,562 3,488,346,156 5,083,420,581Net asset value per:
A Class distributing (A) share USD 34.32 23.00 31.74A Class distributing (A) UK reporting fund share GBP 28.10 17.73 24.67A Class non-distributing share USD 34.32 23.00 31.74A Class non-distributing share AUD hedged AUD 10.71 7.26 10.08A Class non-distributing share CHF hedged CHF 5.41 3.78 5.39A Class non-distributing share EUR hedged EUR 5.22 3.62 5.13A Class non-distributing share HKD hedged HKD 6.66 4.50 6.28A Class non-distributing share PLN hedged PLN 99.42 67.65 94.80A Class non-distributing share SGD hedged SGD 5.94 4.02 5.60A Class non-distributing UK reporting fund share GBP 28.10 17.74 24.67AI Class non-distributing share USD 14.14 – –AI Class non-distributing share EUR hedged EUR 13.67 – –C Class non-distributing share USD 26.61 18.06 25.23C Class non-distributing share EUR hedged EUR 4.50 3.16 4.53D Class distributing (A) share USD 35.97 23.99 32.86D Class non-distributing share USD 37.99 25.27 34.61D Class non-distributing share CHF hedged CHF 5.75 3.98 5.64D Class non-distributing share EUR hedged EUR 5.71 3.93 5.53D Class non-distributing share SGD hedged SGD 6.25 4.20 5.81D Class non-distributing UK reporting fund share GBP hedged GBP 21.29 14.41 20.17E Class non-distributing share USD 31.00 20.88 28.96E Class non-distributing share EUR hedged EUR 4.92 3.43 4.89I Class non-distributing share USD 37.83 25.10 34.29I Class non-distributing share EUR hedged EUR 5.78 3.97 5.57S Class non-distributing share USD 11.76 7.80 –X Class non-distributing share USD 44.96 29.53 39.94
Prices for each Share Class are quoted in the Base Currency of the Fund with the exception of Hedged and UK reporting Share Classes. In the case of those Share Classes for which two or more Dealing Currencies are available, the additional dealing currency prices are calculated by converting the price at the relevant spot exchange rate at the time of valuation.
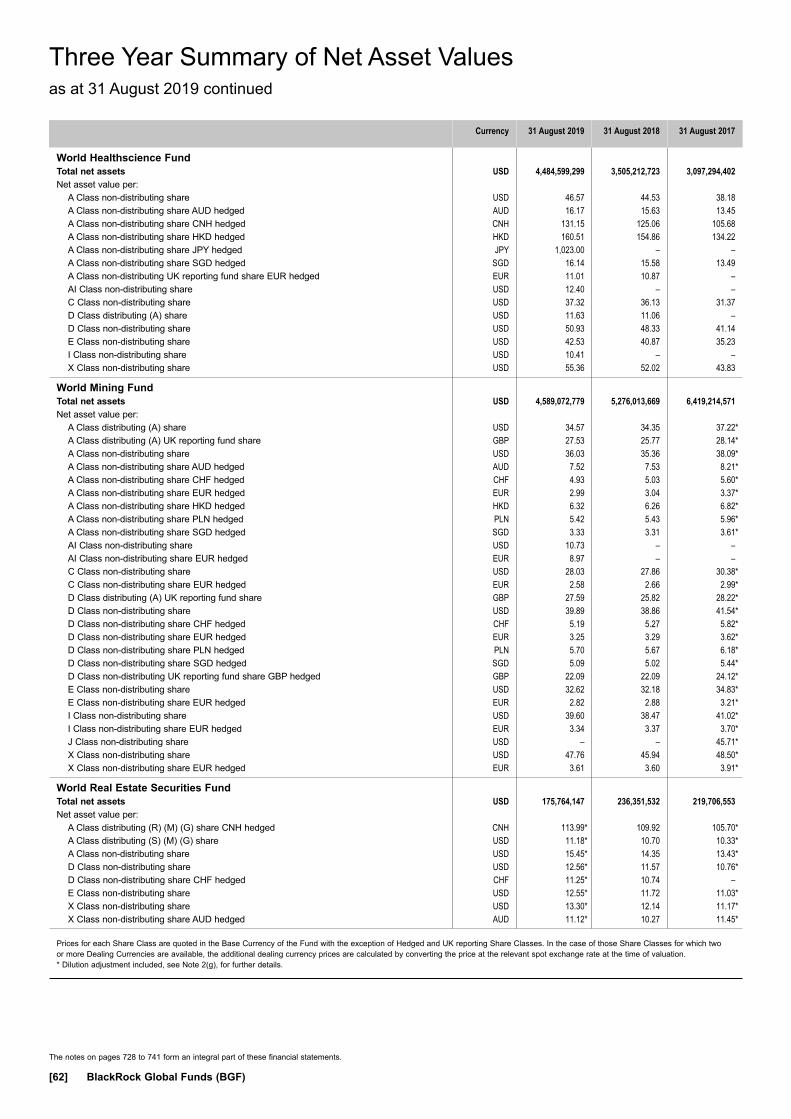
The notes on pages 728 to 741 form an integral part of these financial statements.
[62] BlackRock Global Funds (BGF)
Three Year Summary of Net Asset Valuesas at 31 August 2019 continued
Prices for each Share Class are quoted in the Base Currency of the Fund with the exception of Hedged and UK reporting Share Classes. In the case of those Share Classes for which two or more Dealing Currencies are available, the additional dealing currency prices are calculated by converting the price at the relevant spot exchange rate at the time of valuation.* Dilution adjustment included, see Note 2(g), for further details.
Currency 31 August 2019 31 August 2018 31 August 2017
World Healthscience Fund Total net assets USD 4,484,599,299 3,505,212,723 3,097,294,402Net asset value per:
A Class non-distributing share USD 46.57 44.53 38.18A Class non-distributing share AUD hedged AUD 16.17 15.63 13.45A Class non-distributing share CNH hedged CNH 131.15 125.06 105.68A Class non-distributing share HKD hedged HKD 160.51 154.86 134.22A Class non-distributing share JPY hedged JPY 1,023.00 – –A Class non-distributing share SGD hedged SGD 16.14 15.58 13.49A Class non-distributing UK reporting fund share EUR hedged EUR 11.01 10.87 –AI Class non-distributing share USD 12.40 – –C Class non-distributing share USD 37.32 36.13 31.37D Class distributing (A) share USD 11.63 11.06 –D Class non-distributing share USD 50.93 48.33 41.14E Class non-distributing share USD 42.53 40.87 35.23I Class non-distributing share USD 10.41 – –X Class non-distributing share USD 55.36 52.02 43.83
World Mining Fund Total net assets USD 4,589,072,779 5,276,013,669 6,419,214,571Net asset value per:
A Class distributing (A) share USD 34.57 34.35 37.22*A Class distributing (A) UK reporting fund share GBP 27.53 25.77 28.14*A Class non-distributing share USD 36.03 35.36 38.09*A Class non-distributing share AUD hedged AUD 7.52 7.53 8.21*A Class non-distributing share CHF hedged CHF 4.93 5.03 5.60*A Class non-distributing share EUR hedged EUR 2.99 3.04 3.37*A Class non-distributing share HKD hedged HKD 6.32 6.26 6.82*A Class non-distributing share PLN hedged PLN 5.42 5.43 5.96*A Class non-distributing share SGD hedged SGD 3.33 3.31 3.61*AI Class non-distributing share USD 10.73 – –AI Class non-distributing share EUR hedged EUR 8.97 – –C Class non-distributing share USD 28.03 27.86 30.38*C Class non-distributing share EUR hedged EUR 2.58 2.66 2.99*D Class distributing (A) UK reporting fund share GBP 27.59 25.82 28.22*D Class non-distributing share USD 39.89 38.86 41.54*D Class non-distributing share CHF hedged CHF 5.19 5.27 5.82*D Class non-distributing share EUR hedged EUR 3.25 3.29 3.62*D Class non-distributing share PLN hedged PLN 5.70 5.67 6.18*D Class non-distributing share SGD hedged SGD 5.09 5.02 5.44*D Class non-distributing UK reporting fund share GBP hedged GBP 22.09 22.09 24.12*E Class non-distributing share USD 32.62 32.18 34.83*E Class non-distributing share EUR hedged EUR 2.82 2.88 3.21*I Class non-distributing share USD 39.60 38.47 41.02*I Class non-distributing share EUR hedged EUR 3.34 3.37 3.70*J Class non-distributing share USD – – 45.71*X Class non-distributing share USD 47.76 45.94 48.50*X Class non-distributing share EUR hedged EUR 3.61 3.60 3.91*
World Real Estate Securities Fund Total net assets USD 175,764,147 236,351,532 219,706,553Net asset value per:
A Class distributing (R) (M) (G) share CNH hedged CNH 113.99* 109.92 105.70*A Class distributing (S) (M) (G) share USD 11.18* 10.70 10.33*A Class non-distributing share USD 15.45* 14.35 13.43*D Class non-distributing share USD 12.56* 11.57 10.76*D Class non-distributing share CHF hedged CHF 11.25* 10.74 –E Class non-distributing share USD 12.55* 11.72 11.03*X Class non-distributing share USD 13.30* 12.14 11.17*X Class non-distributing share AUD hedged AUD 11.12* 10.27 11.45*
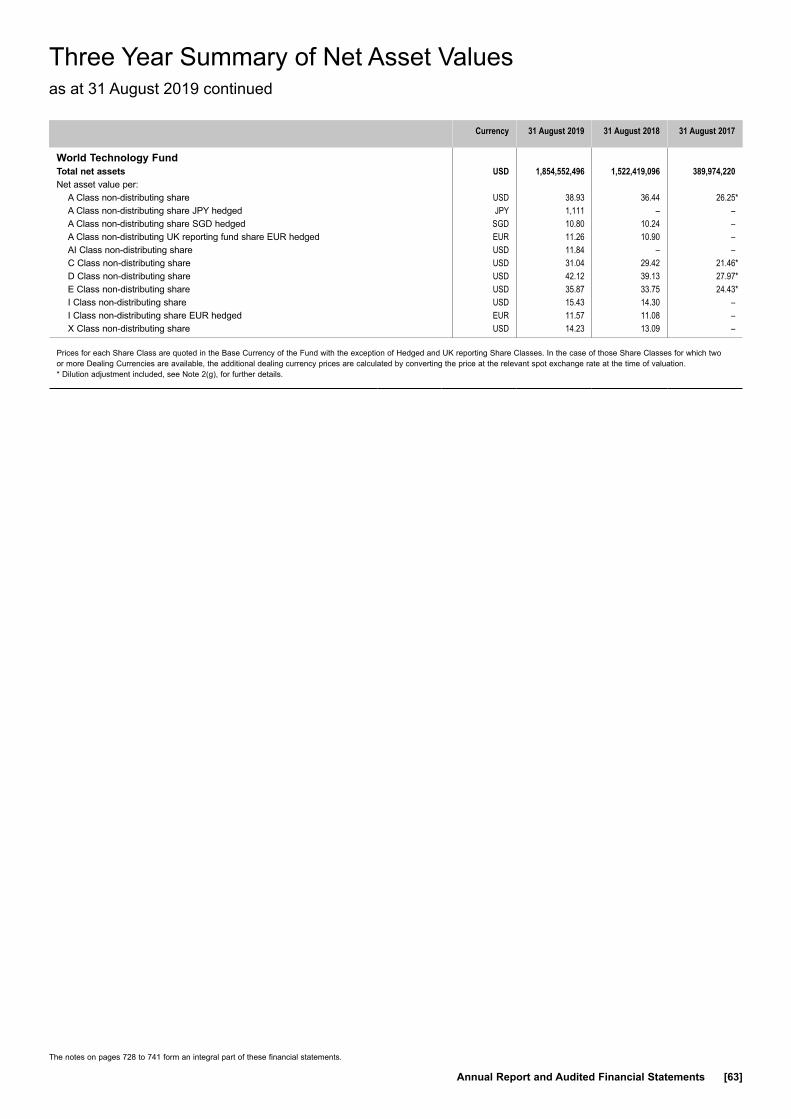
The notes on pages 728 to 741 form an integral part of these financial statements.
Annual Report and Audited Financial Statements [63]
Three Year Summary of Net Asset Valuesas at 31 August 2019 continued
Currency 31 August 2019 31 August 2018 31 August 2017
World Technology Fund Total net assets USD 1,854,552,496 1,522,419,096 389,974,220Net asset value per:
A Class non-distributing share USD 38.93 36.44 26.25*A Class non-distributing share JPY hedged JPY 1,111 – –A Class non-distributing share SGD hedged SGD 10.80 10.24 –A Class non-distributing UK reporting fund share EUR hedged EUR 11.26 10.90 –AI Class non-distributing share USD 11.84 – –C Class non-distributing share USD 31.04 29.42 21.46*D Class non-distributing share USD 42.12 39.13 27.97*E Class non-distributing share USD 35.87 33.75 24.43*I Class non-distributing share USD 15.43 14.30 –I Class non-distributing share EUR hedged EUR 11.57 11.08 –X Class non-distributing share USD 14.23 13.09 –
Prices for each Share Class are quoted in the Base Currency of the Fund with the exception of Hedged and UK reporting Share Classes. In the case of those Share Classes for which two or more Dealing Currencies are available, the additional dealing currency prices are calculated by converting the price at the relevant spot exchange rate at the time of valuation.* Dilution adjustment included, see Note 2(g), for further details.
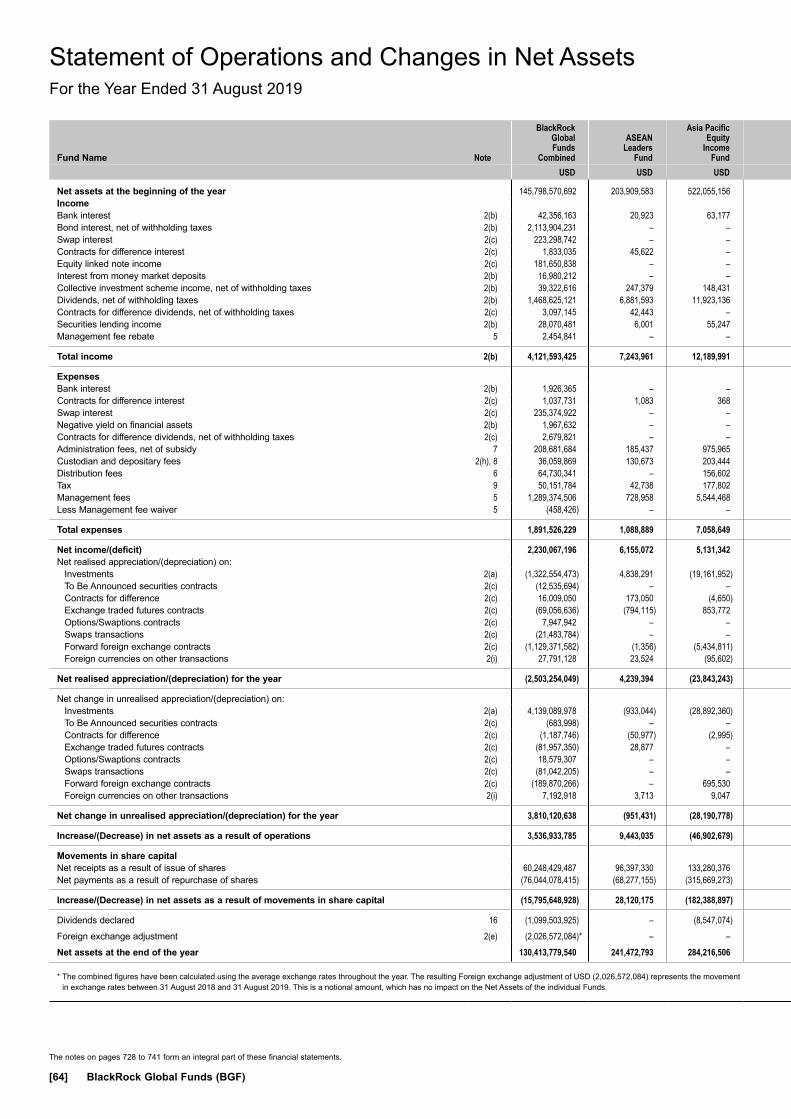
The notes on pages 728 to 741 form an integral part of these financial statements.
[64] BlackRock Global Funds (BGF)
Statement of Operations and Changes in Net AssetsFor the Year Ended 31 August 2019
Statement of Operations and Changes in Net Assets
Fund Name Note
BlackRock Global Funds
Combined
ASEAN
Leaders Fund
Asia Pacific Equity
Income Fund
Asian Dragon
Fund
Asian Growth
Leaders Fund
Asian High Yield
Bond Fund
Asian Multi-
Asset Growth Fund
Asian Tiger Bond Fund
China A-Share
Opportunities Fund
China Bond Fund
China Flexible
Equity Fund
China Fund
USD USD USD USD USD USD USD USD USD CNH USD USD
Net assets at the beginning of the year 145,798,570,692 203,909,583 522,055,156 3,662,019,684 3,543,465,617 20,289,564 83,265,859 2,521,979,995 294,694,609 650,161,882 17,714,567 1,412,408,354 Income Bank interest 2(b) 42,356,163 20,923 63,177 379,555 578,624 22,455 99,138 2,209,501 109,264 264,416 3,291 272,196 Bond interest, net of withholding taxes 2(b) 2,113,904,231 – – – – 1,964,948 1,920,017 121,411,661 – 53,145,807 – – Swap interest 2(c) 223,298,742 – – – – – 17,743 580,424 – – – – Contracts for difference interest 2(c) 1,833,035 45,622 – – 50,751 – – – – – – – Equity linked note income 2(c) 181,650,838 – – – – – – – – – – – Interest from money market deposits 2(b) 16,980,212 – – – – – – – – 241,640 – – Collective investment scheme income, net of withholding taxes 2(b) 39,322,616 247,379 148,431 424,843 2,776,185 – 13,877 – – – 12,781 1,324,073 Dividends, net of withholding taxes 2(b) 1,468,625,121 6,881,593 11,923,136 51,347,823 55,460,796 – 800,408 – 8,800,059 – 360,266 25,950,647 Contracts for difference dividends, net of withholding taxes 2(c) 3,097,145 42,443 – – 512,509 – 3,178 – – – – – Securities lending income 2(b) 28,070,481 6,001 55,247 431,040 101,936 10,035 5,215 982,387 – 213,813 1,418 186,145 Management fee rebate 5 2,454,841 – – – – – – – – - – –
Total income 2(b) 4,121,593,425 7,243,961 12,189,991 52,583,261 59,480,801 1,997,438 2,859,576 125,183,973 8,909,323 53,865,676 377,756 27,733,061
Expenses Bank interest 2(b) 1,926,365 – – – – – – – – – – – Contracts for difference interest 2(c) 1,037,731 1,083 368 8,545 175,905 – 1,255 – – – – – Swap interest 2(c) 235,374,922 – – – – – 14,782 537,790 – – – – Negative yield on financial assets 2(b) 1,967,632 – – – – – – – – – – – Contracts for difference dividends, net of withholding taxes 2(c) 2,679,821 – – – – – – – – – – – Administration fees, net of subsidy 7 208,681,684 185,437 975,965 6,486,124 6,548,094 9,334 (160,183) 3,441,223 670,226 1,001,761 16,490 2,773,575 Custodian and depositary fees 2(h), 8 36,059,869 130,673 203,444 1,531,037 1,517,014 23,954 148,468 468,571 98,572 813,992 35,008 417,874 Distribution fees 6 64,730,341 – 156,602 906,130 239,562 627 – 350,261 – 1,060,709 1,158 229,386 Tax 9 50,151,784 42,738 177,802 1,249,790 1,275,834 3,045 8,222 1,174,596 159,756 366,791 3,894 555,625 Management fees 5 1,289,374,506 728,958 5,544,468 32,028,787 31,206,246 12,994 124,545 21,967,051 3,320,417 5,214,540 30,632 16,867,656 Less Management fee waiver 5 (458,426) – – – – – – – – – – –
Total expenses 1,891,526,229 1,088,889 7,058,649 42,210,413 40,962,655 49,954 137,089 27,939,492 4,248,971 8,457,793 87,182 20,844,116
Net income/(deficit) 2,230,067,196 6,155,072 5,131,342 10,372,848 18,518,146 1,947,484 2,722,487 97,244,481 4,660,352 45,407,883 290,574 6,888,945 Net realised appreciation/(depreciation) on:
Investments 2(a) (1,322,554,473) 4,838,291 (19,161,952) 50,199,818 (366,819,155) 245,289 (1,839,799) (23,123,531) (9,710,415) 31,426,613 (1,391,229) (71,365,333)To Be Announced securities contracts 2(c) (12,535,694) – – – – – – – – – – – Contracts for difference 2(c) 16,009,050 173,050 (4,650) (96,302) (786,894) – (7,994) – – – 2,017 4,358 Exchange traded futures contracts 2(c) (69,056,636) (794,115) 853,772 1,150,068 2,064,818 (7,665) (150,394) 8,184,036 656,126 (8,630,052) (27,421) (1,084,384)Options/Swaptions contracts 2(c) 7,947,942 – – (6,706,886) (9,501,390) – – 422,834 – – (45,529) (4,502,401)Swaps transactions 2(c) (21,483,784) – – – – – 297,495 (1,927,190) – – – – Forward foreign exchange contracts 2(c) (1,129,371,582) (1,356) (5,434,811) (6,376,952) (8,719,699) (719) 1,320 (42,204,865) (82,952) (23,478,780) (7,748) (9,833,830)Foreign currencies on other transactions 2(i) 27,791,128 23,524 (95,602) (2,632,551) (3,181,230) 27 (69,320) (679,407) (84,044) 1,454,386 603 162,740
Net realised appreciation/(depreciation) for the year (2,503,254,049) 4,239,394 (23,843,243) 35,537,195 (386,943,550) 236,932 (1,768,692) (59,328,123) (9,221,285) 772,167 (1,469,307) (86,618,850)
Net change in unrealised appreciation/(depreciation) on: Investments 2(a) 4,139,089,978 (933,044) (28,892,360) (153,792,089) 182,613,029 (64,322) 1,830,891 160,697,884 48,378,421 31,678,481 43,808 (27,054,294)To Be Announced securities contracts 2(c) (683,998) – – – – – – – – – – – Contracts for difference 2(c) (1,187,746) (50,977) (2,995) (11,171) (175,087) – (822) – – – – – Exchange traded futures contracts 2(c) (81,957,350) 28,877 – – 255,699 – (10,353) 568,656 51,429 (261,492) – – Options/Swaptions contracts 2(c) 18,579,307 – – – – – – – – – – – Swaps transactions 2(c) (81,042,205) – – – – – (227,319) 544,540 – – – – Forward foreign exchange contracts 2(c) (189,870,266) – 695,530 (797,467) (1,051,769) (8,993) (46,754) (3,105,356) (9,087) (6,368,766) (2,850) 332,562 Foreign currencies on other transactions 2(i) 7,192,918 3,713 9,047 23,903 (60,896) 227 2,102 (50,429) (6,371) 236,772 1,961 (17,134)
Net change in unrealised appreciation/(depreciation) for the year 3,810,120,638 (951,431) (28,190,778) (154,576,824) 181,580,976 (73,088) 1,547,745 158,655,295 48,414,392 25,284,995 42,919 (26,738,866)
Increase/(Decrease) in net assets as a result of operations 3,536,933,785 9,443,035 (46,902,679) (108,666,781) (186,844,428) 2,111,328 2,501,540 196,571,653 43,853,459 71,465,045 (1,135,814) (106,468,771)
Movements in share capital Net receipts as a result of issue of shares 60,248,429,487 96,397,330 133,280,376 908,854,590 578,853,097 10,120,687 185,137 1,839,339,209 290,959,081 941,492,619 2,023,613 781,763,376 Net payments as a result of repurchase of shares (76,044,078,415) (68,277,155) (315,669,273) (2,128,578,007) (1,615,523,458) (8,211,158) (290,956) (1,468,212,651) (226,855,591) (309,711,197) (600,784) (883,478,920)
Increase/(Decrease) in net assets as a result of movements in share capital (15,795,648,928) 28,120,175 (182,388,897) (1,219,723,417) (1,036,670,361) 1,909,529 (105,819) 371,126,558 64,103,490 631,781,422 1,422,829 (101,715,544)
Dividends declared 16 (1,099,503,925) – (8,547,074) (3,909,091) (52,404) (15,480) – (72,277,210) – (20,784,393) (43) (6,393)Foreign exchange adjustment 2(e) (2,026,572,084)* – – – – – – – – – – – Net assets at the end of the year 130,413,779,540 241,472,793 284,216,506 2,329,720,395 2,319,898,424 24,294,941 85,661,580 3,017,400,996 402,651,558 1,332,623,956 18,001,539 1,204,217,646
* The combined figures have been calculated using the average exchange rates throughout the year. The resulting Foreign exchange adjustment of USD (2,026,572,084) represents the movement in exchange rates between 31 August 2018 and 31 August 2019. This is a notional amount, which has no impact on the Net Assets of the individual Funds.
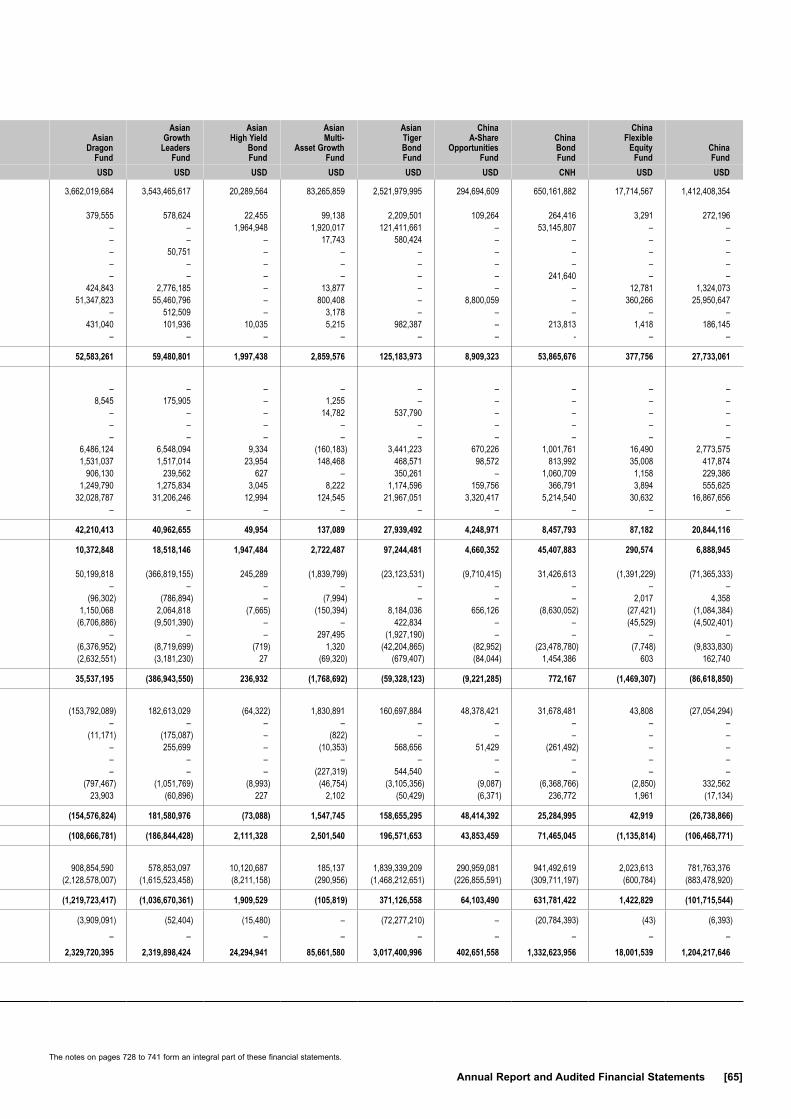
The notes on pages 728 to 741 form an integral part of these financial statements.
Annual Report and Audited Financial Statements [65]
Fund Name Note
BlackRock Global Funds
Combined
ASEAN
Leaders Fund
Asia Pacific Equity
Income Fund
Asian Dragon
Fund
Asian Growth
Leaders Fund
Asian High Yield
Bond Fund
Asian Multi-
Asset Growth Fund
Asian Tiger Bond Fund
China A-Share
Opportunities Fund
China Bond Fund
China Flexible
Equity Fund
China Fund
USD USD USD USD USD USD USD USD USD CNH USD USD
Net assets at the beginning of the year 145,798,570,692 203,909,583 522,055,156 3,662,019,684 3,543,465,617 20,289,564 83,265,859 2,521,979,995 294,694,609 650,161,882 17,714,567 1,412,408,354 Income Bank interest 2(b) 42,356,163 20,923 63,177 379,555 578,624 22,455 99,138 2,209,501 109,264 264,416 3,291 272,196 Bond interest, net of withholding taxes 2(b) 2,113,904,231 – – – – 1,964,948 1,920,017 121,411,661 – 53,145,807 – – Swap interest 2(c) 223,298,742 – – – – – 17,743 580,424 – – – – Contracts for difference interest 2(c) 1,833,035 45,622 – – 50,751 – – – – – – – Equity linked note income 2(c) 181,650,838 – – – – – – – – – – – Interest from money market deposits 2(b) 16,980,212 – – – – – – – – 241,640 – – Collective investment scheme income, net of withholding taxes 2(b) 39,322,616 247,379 148,431 424,843 2,776,185 – 13,877 – – – 12,781 1,324,073 Dividends, net of withholding taxes 2(b) 1,468,625,121 6,881,593 11,923,136 51,347,823 55,460,796 – 800,408 – 8,800,059 – 360,266 25,950,647 Contracts for difference dividends, net of withholding taxes 2(c) 3,097,145 42,443 – – 512,509 – 3,178 – – – – – Securities lending income 2(b) 28,070,481 6,001 55,247 431,040 101,936 10,035 5,215 982,387 – 213,813 1,418 186,145 Management fee rebate 5 2,454,841 – – – – – – – – - – –
Total income 2(b) 4,121,593,425 7,243,961 12,189,991 52,583,261 59,480,801 1,997,438 2,859,576 125,183,973 8,909,323 53,865,676 377,756 27,733,061
Expenses Bank interest 2(b) 1,926,365 – – – – – – – – – – – Contracts for difference interest 2(c) 1,037,731 1,083 368 8,545 175,905 – 1,255 – – – – – Swap interest 2(c) 235,374,922 – – – – – 14,782 537,790 – – – – Negative yield on financial assets 2(b) 1,967,632 – – – – – – – – – – – Contracts for difference dividends, net of withholding taxes 2(c) 2,679,821 – – – – – – – – – – – Administration fees, net of subsidy 7 208,681,684 185,437 975,965 6,486,124 6,548,094 9,334 (160,183) 3,441,223 670,226 1,001,761 16,490 2,773,575 Custodian and depositary fees 2(h), 8 36,059,869 130,673 203,444 1,531,037 1,517,014 23,954 148,468 468,571 98,572 813,992 35,008 417,874 Distribution fees 6 64,730,341 – 156,602 906,130 239,562 627 – 350,261 – 1,060,709 1,158 229,386 Tax 9 50,151,784 42,738 177,802 1,249,790 1,275,834 3,045 8,222 1,174,596 159,756 366,791 3,894 555,625 Management fees 5 1,289,374,506 728,958 5,544,468 32,028,787 31,206,246 12,994 124,545 21,967,051 3,320,417 5,214,540 30,632 16,867,656 Less Management fee waiver 5 (458,426) – – – – – – – – – – –
Total expenses 1,891,526,229 1,088,889 7,058,649 42,210,413 40,962,655 49,954 137,089 27,939,492 4,248,971 8,457,793 87,182 20,844,116
Net income/(deficit) 2,230,067,196 6,155,072 5,131,342 10,372,848 18,518,146 1,947,484 2,722,487 97,244,481 4,660,352 45,407,883 290,574 6,888,945 Net realised appreciation/(depreciation) on:
Investments 2(a) (1,322,554,473) 4,838,291 (19,161,952) 50,199,818 (366,819,155) 245,289 (1,839,799) (23,123,531) (9,710,415) 31,426,613 (1,391,229) (71,365,333)To Be Announced securities contracts 2(c) (12,535,694) – – – – – – – – – – – Contracts for difference 2(c) 16,009,050 173,050 (4,650) (96,302) (786,894) – (7,994) – – – 2,017 4,358 Exchange traded futures contracts 2(c) (69,056,636) (794,115) 853,772 1,150,068 2,064,818 (7,665) (150,394) 8,184,036 656,126 (8,630,052) (27,421) (1,084,384)Options/Swaptions contracts 2(c) 7,947,942 – – (6,706,886) (9,501,390) – – 422,834 – – (45,529) (4,502,401)Swaps transactions 2(c) (21,483,784) – – – – – 297,495 (1,927,190) – – – – Forward foreign exchange contracts 2(c) (1,129,371,582) (1,356) (5,434,811) (6,376,952) (8,719,699) (719) 1,320 (42,204,865) (82,952) (23,478,780) (7,748) (9,833,830)Foreign currencies on other transactions 2(i) 27,791,128 23,524 (95,602) (2,632,551) (3,181,230) 27 (69,320) (679,407) (84,044) 1,454,386 603 162,740
Net realised appreciation/(depreciation) for the year (2,503,254,049) 4,239,394 (23,843,243) 35,537,195 (386,943,550) 236,932 (1,768,692) (59,328,123) (9,221,285) 772,167 (1,469,307) (86,618,850)
Net change in unrealised appreciation/(depreciation) on: Investments 2(a) 4,139,089,978 (933,044) (28,892,360) (153,792,089) 182,613,029 (64,322) 1,830,891 160,697,884 48,378,421 31,678,481 43,808 (27,054,294)To Be Announced securities contracts 2(c) (683,998) – – – – – – – – – – – Contracts for difference 2(c) (1,187,746) (50,977) (2,995) (11,171) (175,087) – (822) – – – – – Exchange traded futures contracts 2(c) (81,957,350) 28,877 – – 255,699 – (10,353) 568,656 51,429 (261,492) – – Options/Swaptions contracts 2(c) 18,579,307 – – – – – – – – – – – Swaps transactions 2(c) (81,042,205) – – – – – (227,319) 544,540 – – – – Forward foreign exchange contracts 2(c) (189,870,266) – 695,530 (797,467) (1,051,769) (8,993) (46,754) (3,105,356) (9,087) (6,368,766) (2,850) 332,562 Foreign currencies on other transactions 2(i) 7,192,918 3,713 9,047 23,903 (60,896) 227 2,102 (50,429) (6,371) 236,772 1,961 (17,134)
Net change in unrealised appreciation/(depreciation) for the year 3,810,120,638 (951,431) (28,190,778) (154,576,824) 181,580,976 (73,088) 1,547,745 158,655,295 48,414,392 25,284,995 42,919 (26,738,866)
Increase/(Decrease) in net assets as a result of operations 3,536,933,785 9,443,035 (46,902,679) (108,666,781) (186,844,428) 2,111,328 2,501,540 196,571,653 43,853,459 71,465,045 (1,135,814) (106,468,771)
Movements in share capital Net receipts as a result of issue of shares 60,248,429,487 96,397,330 133,280,376 908,854,590 578,853,097 10,120,687 185,137 1,839,339,209 290,959,081 941,492,619 2,023,613 781,763,376 Net payments as a result of repurchase of shares (76,044,078,415) (68,277,155) (315,669,273) (2,128,578,007) (1,615,523,458) (8,211,158) (290,956) (1,468,212,651) (226,855,591) (309,711,197) (600,784) (883,478,920)
Increase/(Decrease) in net assets as a result of movements in share capital (15,795,648,928) 28,120,175 (182,388,897) (1,219,723,417) (1,036,670,361) 1,909,529 (105,819) 371,126,558 64,103,490 631,781,422 1,422,829 (101,715,544)
Dividends declared 16 (1,099,503,925) – (8,547,074) (3,909,091) (52,404) (15,480) – (72,277,210) – (20,784,393) (43) (6,393)Foreign exchange adjustment 2(e) (2,026,572,084)* – – – – – – – – – – – Net assets at the end of the year 130,413,779,540 241,472,793 284,216,506 2,329,720,395 2,319,898,424 24,294,941 85,661,580 3,017,400,996 402,651,558 1,332,623,956 18,001,539 1,204,217,646
* The combined figures have been calculated using the average exchange rates throughout the year. The resulting Foreign exchange adjustment of USD (2,026,572,084) represents the movement in exchange rates between 31 August 2018 and 31 August 2019. This is a notional amount, which has no impact on the Net Assets of the individual Funds.
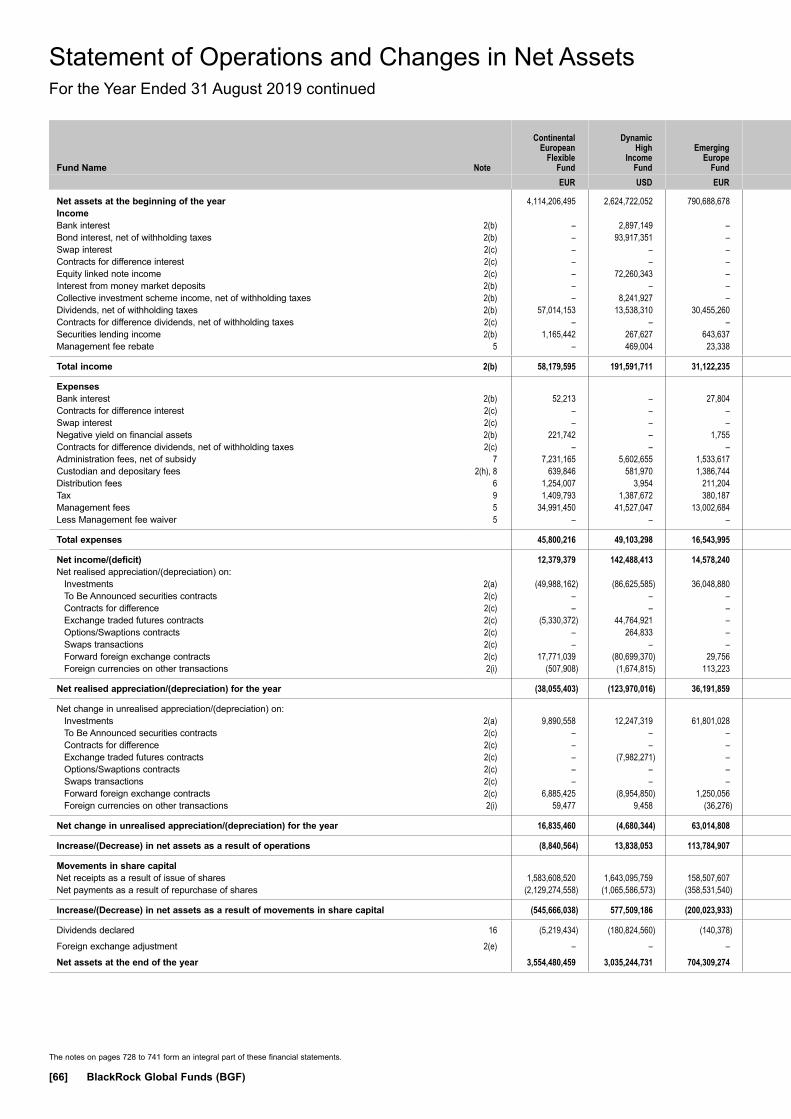
The notes on pages 728 to 741 form an integral part of these financial statements.
[66] BlackRock Global Funds (BGF)
Statement of Operations and Changes in Net AssetsFor the Year Ended 31 August 2019 continued
Fund Name Note
Continental European
Flexible Fund
Dynamic High
Income Fund
Emerging
Europe Fund
Emerging Markets
Bond Fund
Emerging Markets
Corporate Bond Fund
Emerging Markets
Equity Income Fund
Emerging
Markets Fund
Emerging Markets Local
Currency Bond Fund
ESG Emerging Markets Blended
Bond Fund
ESG Emerging Markets
Bond Fund
ESG Emerging Markets
Corporate Bond Fund
ESG Emerging Markets Local
Currency Bond Fund
EUR USD EUR USD USD USD USD USD USD USD USD USD
Net assets at the beginning of the year 4,114,206,495 2,624,722,052 790,688,678 3,273,710,571 216,169,992 509,626,290 707,928,461 5,309,278,928 23,840,695 24,627,036 24,928,313 22,842,519 Income Bank interest 2(b) – 2,897,149 – 1,297,382 127,246 113,405 151,573 3,126,471 21,743 136,800 17,254 147,420 Bond interest, net of withholding taxes 2(b) – 93,917,351 – 152,796,995 12,454,580 – – 285,956,723 1,405,851 12,149,708 1,374,627 10,710,188 Swap interest 2(c) – – – 607,572 – – – 1,316,226 235,482 56,407 – 24,322 Contracts for difference interest 2(c) – – – – – – – – – – – – Equity linked note income 2(c) – 72,260,343 – – – – – – – – – – Interest from money market deposits 2(b) – – – – – – – – – – – – Collective investment scheme income, net of withholding taxes 2(b) – 8,241,927 – – 178,165 656,324 857,531 – – – 14,084 – Dividends, net of withholding taxes 2(b) 57,014,153 13,538,310 30,455,260 – – 15,758,995 19,244,779 – – – – – Contracts for difference dividends, net of withholding taxes 2(c) – – – – – 982,338 636,126 – – – – – Securities lending income 2(b) 1,165,442 267,627 643,637 520,528 180,579 81,947 479,191 305,622 1,449 17,832 2,499 – Management fee rebate 5 – 469,004 23,338 – – – – – – – – –
Total income 2(b) 58,179,595 191,591,711 31,122,235 155,222,477 12,940,570 17,593,009 21,369,200 290,705,042 1,664,525 12,360,747 1,408,464 10,881,930
Expenses Bank interest 2(b) 52,213 – 27,804 – – – – – – – – – Contracts for difference interest 2(c) – – – – – 370,510 324,805 – – – – – Swap interest 2(c) – – – 6,374,333 103,262 – – 1,353,471 541,660 396,897 13,386 23,554 Negative yield on financial assets 2(b) 221,742 – 1,755 – – – – – – – – – Contracts for difference dividends, net of withholding taxes 2(c) – – – – – – – – – – – – Administration fees, net of subsidy 7 7,231,165 5,602,655 1,533,617 2,690,335 138,871 686,232 1,495,209 4,207,627 (18,476) 50,965 3,815 32,926 Custodian and depositary fees 2(h), 8 639,846 581,970 1,386,744 446,619 55,428 337,648 445,869 4,269,823 44,809 96,371 18,655 349,152 Distribution fees 6 1,254,007 3,954 211,204 893,328 31,389 72,951 481,725 292,004 79 454 310 109 Tax 9 1,409,793 1,387,672 380,187 820,711 48,984 140,998 311,336 1,327,865 3,127 24,478 2,698 23,673 Management fees 5 34,991,450 41,527,047 13,002,684 22,400,231 863,415 2,831,837 8,091,825 25,099,110 2,695 1,200,596 1,330 200,620 Less Management fee waiver 5 – – – – – – – – – – – –
Total expenses 45,800,216 49,103,298 16,543,995 33,625,557 1,241,349 4,440,176 11,150,769 36,549,900 573,894 1,769,761 40,194 630,034
Net income/(deficit) 12,379,379 142,488,413 14,578,240 121,596,920 11,699,221 13,152,833 10,218,431 254,155,142 1,090,631 10,590,986 1,368,270 10,251,896 Net realised appreciation/(depreciation) on:
Investments 2(a) (49,988,162) (86,625,585) 36,048,880 (35,658,099) 826,578 11,217,209 13,349,997 (500,515,117) (503,946) 4,195,056 224,123 3,225,415 To Be Announced securities contracts 2(c) – – – – – – – – – – – – Contracts for difference 2(c) – – – – – 148,696 (1,548,455) – – – – – Exchange traded futures contracts 2(c) (5,330,372) 44,764,921 – 1,187,195 (482,702) (513,728) (2,537,143) 781,009 (64,219) (528,264) (42,171) (17,825)Options/Swaptions contracts 2(c) – 264,833 – – – – (1,164,683) (12,614,292) 77,103 – – (706,013)Swaps transactions 2(c) – – – (711,272) 265,586 – – (5,408,857) 572,888 (422,890) 38,623 (116,919)Forward foreign exchange contracts 2(c) 17,771,039 (80,699,370) 29,756 (69,692,947) (412,860) (2,101,200) 2,082,075 (136,645,098) (631,929) (9,075,915) (2,923) (1,193,794)Foreign currencies on other transactions 2(i) (507,908) (1,674,815) 113,223 (2,035,488) 38,850 (266,719) (713,250) (12,413,422) 85,351 (101,090) (956) (761,040)
Net realised appreciation/(depreciation) for the year (38,055,403) (123,970,016) 36,191,859 (106,910,611) 235,452 8,484,258 9,468,541 (666,815,777) (464,752) (5,933,103) 216,696 429,824
Net change in unrealised appreciation/(depreciation) on: Investments 2(a) 9,890,558 12,247,319 61,801,028 151,568,762 14,545,930 6,994,304 21,241,326 755,880,753 1,465,293 17,486,459 1,411,266 4,044,168 To Be Announced securities contracts 2(c) – – – – – – – – – – – – Contracts for difference 2(c) – – – – – (854,437) (565,630) – – – – – Exchange traded futures contracts 2(c) – (7,982,271) – 188,062 24,591 (767,766) 449,227 (76,765) (90,955) 1,443 – (48,913)Options/Swaptions contracts 2(c) – – – – – – – – – – – – Swaps transactions 2(c) – – – (2,257,798) (330,265) – – 6,588,910 (719,323) 201,297 (44,051) 116,919 Forward foreign exchange contracts 2(c) 6,885,425 (8,954,850) 1,250,056 (9,000,133) (191,065) 134,059 (346,520) 36,963,216 347,966 (3,829,655) (4,078) 485,226 Foreign currencies on other transactions 2(i) 59,477 9,458 (36,276) 91,675 3,120 3,615 105,650 8,013,375 (2,165) 3,826 (66) (67,326)
Net change in unrealised appreciation/(depreciation) for the year 16,835,460 (4,680,344) 63,014,808 140,590,568 14,052,311 5,509,775 20,884,053 807,369,489 1,000,816 13,863,370 1,363,071 4,530,074
Increase/(Decrease) in net assets as a result of operations (8,840,564) 13,838,053 113,784,907 155,276,877 25,986,984 27,146,866 40,571,025 394,708,854 1,626,695 18,521,253 2,948,037 15,211,794
Movements in share capital Net receipts as a result of issue of shares 1,583,608,520 1,643,095,759 158,507,607 1,514,577,138 105,578,991 132,952,841 445,093,985 2,173,959,495 7,338,458 252,718,899 212,850 278,223,945 Net payments as a result of repurchase of shares (2,129,274,558) (1,065,586,573) (358,531,540) (2,413,368,745) (63,577,499) (186,158,960) (391,530,064) (3,890,965,209) (3,497) (14,301,911) – (53,198,975)
Increase/(Decrease) in net assets as a result of movements in share capital (545,666,038) 577,509,186 (200,023,933) (898,791,607) 42,001,492 (53,206,119) 53,563,921 (1,717,005,714) 7,334,961 238,416,988 212,850 225,024,970
Dividends declared 16 (5,219,434) (180,824,560) (140,378) (22,886,754) (66,637) (1,752,780) (492,211) (55,566,896) (102) (148) (126) (517)Foreign exchange adjustment 2(e) – – – – – – – – – – – – Net assets at the end of the year 3,554,480,459 3,035,244,731 704,309,274 2,507,309,087 284,091,831 481,814,257 801,571,196 3,931,415,172 32,802,249 281,565,129 28,089,074 263,078,766
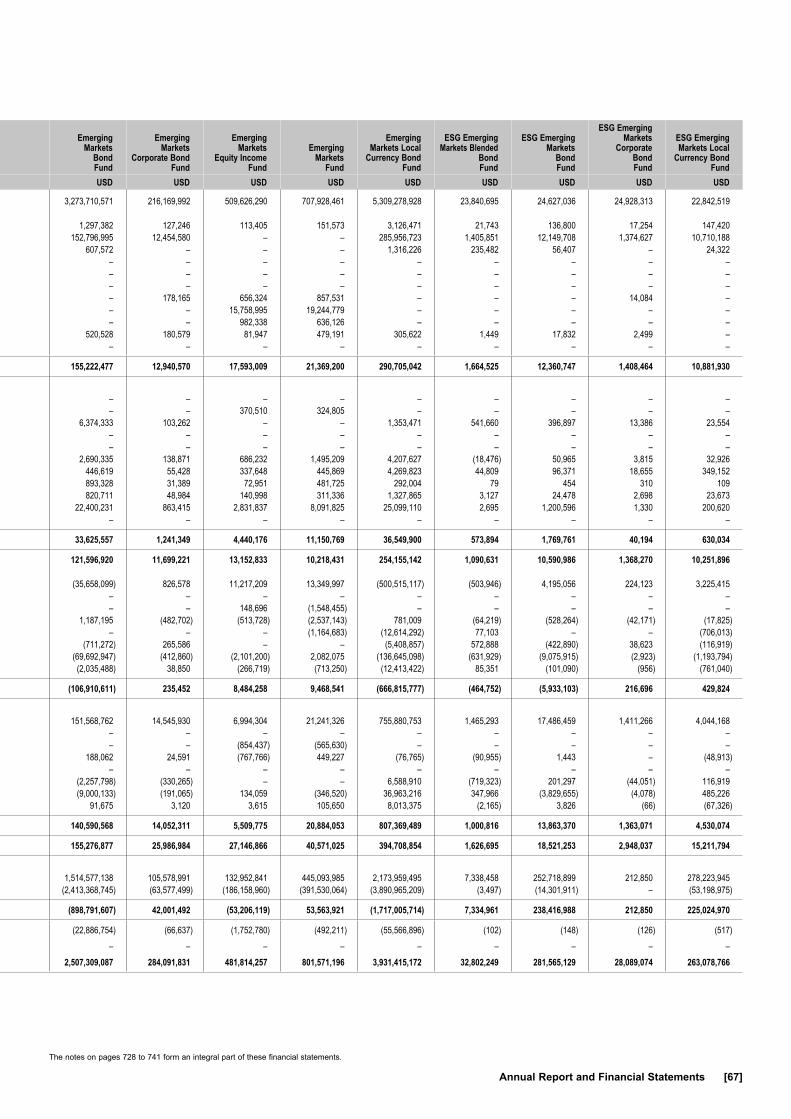
The notes on pages 728 to 741 form an integral part of these financial statements.
Annual Report and Financial Statements [67]
Fund Name Note
Continental European
Flexible Fund
Dynamic High
Income Fund
Emerging
Europe Fund
Emerging Markets
Bond Fund
Emerging Markets
Corporate Bond Fund
Emerging Markets
Equity Income Fund
Emerging
Markets Fund
Emerging Markets Local
Currency Bond Fund
ESG Emerging Markets Blended
Bond Fund
ESG Emerging Markets
Bond Fund
ESG Emerging Markets
Corporate Bond Fund
ESG Emerging Markets Local
Currency Bond Fund
EUR USD EUR USD USD USD USD USD USD USD USD USD
Net assets at the beginning of the year 4,114,206,495 2,624,722,052 790,688,678 3,273,710,571 216,169,992 509,626,290 707,928,461 5,309,278,928 23,840,695 24,627,036 24,928,313 22,842,519 Income Bank interest 2(b) – 2,897,149 – 1,297,382 127,246 113,405 151,573 3,126,471 21,743 136,800 17,254 147,420 Bond interest, net of withholding taxes 2(b) – 93,917,351 – 152,796,995 12,454,580 – – 285,956,723 1,405,851 12,149,708 1,374,627 10,710,188 Swap interest 2(c) – – – 607,572 – – – 1,316,226 235,482 56,407 – 24,322 Contracts for difference interest 2(c) – – – – – – – – – – – – Equity linked note income 2(c) – 72,260,343 – – – – – – – – – – Interest from money market deposits 2(b) – – – – – – – – – – – – Collective investment scheme income, net of withholding taxes 2(b) – 8,241,927 – – 178,165 656,324 857,531 – – – 14,084 – Dividends, net of withholding taxes 2(b) 57,014,153 13,538,310 30,455,260 – – 15,758,995 19,244,779 – – – – – Contracts for difference dividends, net of withholding taxes 2(c) – – – – – 982,338 636,126 – – – – – Securities lending income 2(b) 1,165,442 267,627 643,637 520,528 180,579 81,947 479,191 305,622 1,449 17,832 2,499 – Management fee rebate 5 – 469,004 23,338 – – – – – – – – –
Total income 2(b) 58,179,595 191,591,711 31,122,235 155,222,477 12,940,570 17,593,009 21,369,200 290,705,042 1,664,525 12,360,747 1,408,464 10,881,930
Expenses Bank interest 2(b) 52,213 – 27,804 – – – – – – – – – Contracts for difference interest 2(c) – – – – – 370,510 324,805 – – – – – Swap interest 2(c) – – – 6,374,333 103,262 – – 1,353,471 541,660 396,897 13,386 23,554 Negative yield on financial assets 2(b) 221,742 – 1,755 – – – – – – – – – Contracts for difference dividends, net of withholding taxes 2(c) – – – – – – – – – – – – Administration fees, net of subsidy 7 7,231,165 5,602,655 1,533,617 2,690,335 138,871 686,232 1,495,209 4,207,627 (18,476) 50,965 3,815 32,926 Custodian and depositary fees 2(h), 8 639,846 581,970 1,386,744 446,619 55,428 337,648 445,869 4,269,823 44,809 96,371 18,655 349,152 Distribution fees 6 1,254,007 3,954 211,204 893,328 31,389 72,951 481,725 292,004 79 454 310 109 Tax 9 1,409,793 1,387,672 380,187 820,711 48,984 140,998 311,336 1,327,865 3,127 24,478 2,698 23,673 Management fees 5 34,991,450 41,527,047 13,002,684 22,400,231 863,415 2,831,837 8,091,825 25,099,110 2,695 1,200,596 1,330 200,620 Less Management fee waiver 5 – – – – – – – – – – – –
Total expenses 45,800,216 49,103,298 16,543,995 33,625,557 1,241,349 4,440,176 11,150,769 36,549,900 573,894 1,769,761 40,194 630,034
Net income/(deficit) 12,379,379 142,488,413 14,578,240 121,596,920 11,699,221 13,152,833 10,218,431 254,155,142 1,090,631 10,590,986 1,368,270 10,251,896 Net realised appreciation/(depreciation) on:
Investments 2(a) (49,988,162) (86,625,585) 36,048,880 (35,658,099) 826,578 11,217,209 13,349,997 (500,515,117) (503,946) 4,195,056 224,123 3,225,415 To Be Announced securities contracts 2(c) – – – – – – – – – – – – Contracts for difference 2(c) – – – – – 148,696 (1,548,455) – – – – – Exchange traded futures contracts 2(c) (5,330,372) 44,764,921 – 1,187,195 (482,702) (513,728) (2,537,143) 781,009 (64,219) (528,264) (42,171) (17,825)Options/Swaptions contracts 2(c) – 264,833 – – – – (1,164,683) (12,614,292) 77,103 – – (706,013)Swaps transactions 2(c) – – – (711,272) 265,586 – – (5,408,857) 572,888 (422,890) 38,623 (116,919)Forward foreign exchange contracts 2(c) 17,771,039 (80,699,370) 29,756 (69,692,947) (412,860) (2,101,200) 2,082,075 (136,645,098) (631,929) (9,075,915) (2,923) (1,193,794)Foreign currencies on other transactions 2(i) (507,908) (1,674,815) 113,223 (2,035,488) 38,850 (266,719) (713,250) (12,413,422) 85,351 (101,090) (956) (761,040)
Net realised appreciation/(depreciation) for the year (38,055,403) (123,970,016) 36,191,859 (106,910,611) 235,452 8,484,258 9,468,541 (666,815,777) (464,752) (5,933,103) 216,696 429,824
Net change in unrealised appreciation/(depreciation) on: Investments 2(a) 9,890,558 12,247,319 61,801,028 151,568,762 14,545,930 6,994,304 21,241,326 755,880,753 1,465,293 17,486,459 1,411,266 4,044,168 To Be Announced securities contracts 2(c) – – – – – – – – – – – – Contracts for difference 2(c) – – – – – (854,437) (565,630) – – – – – Exchange traded futures contracts 2(c) – (7,982,271) – 188,062 24,591 (767,766) 449,227 (76,765) (90,955) 1,443 – (48,913)Options/Swaptions contracts 2(c) – – – – – – – – – – – – Swaps transactions 2(c) – – – (2,257,798) (330,265) – – 6,588,910 (719,323) 201,297 (44,051) 116,919 Forward foreign exchange contracts 2(c) 6,885,425 (8,954,850) 1,250,056 (9,000,133) (191,065) 134,059 (346,520) 36,963,216 347,966 (3,829,655) (4,078) 485,226 Foreign currencies on other transactions 2(i) 59,477 9,458 (36,276) 91,675 3,120 3,615 105,650 8,013,375 (2,165) 3,826 (66) (67,326)
Net change in unrealised appreciation/(depreciation) for the year 16,835,460 (4,680,344) 63,014,808 140,590,568 14,052,311 5,509,775 20,884,053 807,369,489 1,000,816 13,863,370 1,363,071 4,530,074
Increase/(Decrease) in net assets as a result of operations (8,840,564) 13,838,053 113,784,907 155,276,877 25,986,984 27,146,866 40,571,025 394,708,854 1,626,695 18,521,253 2,948,037 15,211,794
Movements in share capital Net receipts as a result of issue of shares 1,583,608,520 1,643,095,759 158,507,607 1,514,577,138 105,578,991 132,952,841 445,093,985 2,173,959,495 7,338,458 252,718,899 212,850 278,223,945 Net payments as a result of repurchase of shares (2,129,274,558) (1,065,586,573) (358,531,540) (2,413,368,745) (63,577,499) (186,158,960) (391,530,064) (3,890,965,209) (3,497) (14,301,911) – (53,198,975)
Increase/(Decrease) in net assets as a result of movements in share capital (545,666,038) 577,509,186 (200,023,933) (898,791,607) 42,001,492 (53,206,119) 53,563,921 (1,717,005,714) 7,334,961 238,416,988 212,850 225,024,970
Dividends declared 16 (5,219,434) (180,824,560) (140,378) (22,886,754) (66,637) (1,752,780) (492,211) (55,566,896) (102) (148) (126) (517)Foreign exchange adjustment 2(e) – – – – – – – – – – – – Net assets at the end of the year 3,554,480,459 3,035,244,731 704,309,274 2,507,309,087 284,091,831 481,814,257 801,571,196 3,931,415,172 32,802,249 281,565,129 28,089,074 263,078,766

The notes on pages 728 to 741 form an integral part of these financial statements.
[68] BlackRock Global Funds (BGF)
Statement of Operations and Changes in Net AssetsFor the Year Ended 31 August 2019 continued
Fund Name Note
ESG Multi-Asset
Fund(1)
Euro Bond Fund
Euro Corporate
Bond Fund
Euro
Reserve Fund
Euro Short Duration
Bond Fund
Euro-
Markets Fund
European Equity
Income Fund
European
Focus Fund
European Fund
European High
Yield Bond Fund
European Special
Situations Fund
European
Value Fund
EUR EUR EUR EUR EUR EUR EUR EUR EUR EUR EUR EUR
Net assets at the beginning of the year 341,514,970 4,679,191,991 1,920,960,138 84,105,770 11,766,812,938 3,347,603,395 2,249,872,721 667,704,333 1,721,511,997 67,874,885 1,328,666,915 2,009,781,504 Income Bank interest 2(b) – – 67,002 – – – – – – – – – Bond interest, net of withholding taxes 2(b) 2,127,841 56,455,718 38,579,778 8,899 85,024,051 – – – – 2,945,826 – – Swap interest 2(c) 82,170 4,929,973 3,469,472 – 11,607,789 – – – – 53,425 – – Contracts for difference interest 2(c) – – – – – – – – – – – – Equity linked note income 2(c) – – – – – – – – – – – – Interest from money market deposits 2(b) – – – – – – – – – – – – Collective investment scheme income, net of withholding taxes 2(b) 715,544 42,315 495,493 – 400,910 – – – – – – – Dividends, net of withholding taxes 2(b) 4,061,111 – – – – 48,906,431 99,819,804 13,633,104 34,874,411 1,170 24,031,898 53,626,646 Contracts for difference dividends, net of withholding taxes 2(c) – – – – – – – – – – – – Securities lending income 2(b) 71,363 575,600 285,235 – 652,049 593,646 352,057 75,810 302,961 39,314 242,751 420,695 Management fee rebate 5 97,936 10,507 82,634 – 119,273 – – – – – – –
Total income 2(b) 7,155,965 62,014,113 42,979,614 8,899 97,804,072 49,500,077 100,171,861 13,708,914 35,177,372 3,039,735 24,274,649 54,047,341
Expenses Bank interest 2(b) 165,675 36,145 – 1,201 113,477 22,380 25,256 3,916 14,306 8,975 26,684 19,160 Contracts for difference interest 2(c) – – – – – – – – – – – – Swap interest 2(c) 447,647 5,464,187 2,724,193 66 14,288,688 – – – – 3,249 – – Negative yield on financial assets 2(b) – 227,364 182,939 326,912 526,882 53,439 57,093 21,420 32,279 – 29,557 49,909 Contracts for difference dividends, net of withholding taxes 2(c) – – – – – – – – – – – – Administration fees, net of subsidy 7 524,215 4,574,947 1,944,958 71,960 6,001,745 4,658,936 4,648,051 1,262,949 2,834,398 47,775 2,283,725 2,650,142 Custodian and depositary fees 2(h), 8 324,621 1,154,477 587,828 28,208 2,607,649 449,316 338,767 117,778 273,689 33,373 209,514 281,031 Distribution fees 6 770,051 642,111 437,055 38,275 1,972,124 785,633 1,622,427 1,026,347 672,816 27,654 618,782 566,382 Tax 9 157,521 1,520,500 657,319 9,285 3,283,623 854,665 866,454 221,317 533,395 17,419 450,285 494,888 Management fees 5 4,062,670 21,968,761 10,994,392 404,540 49,052,245 27,015,723 25,832,262 7,545,838 14,706,880 287,267 13,124,007 15,933,229 Less Management fee waiver 5 – – – (404,540) – – – – – – – –
Total expenses 6,452,400 35,588,492 17,528,684 475,907 77,846,433 33,840,092 33,390,310 10,199,565 19,067,763 425,712 16,742,554 19,994,741
Net income/(deficit) 703,565 26,425,621 25,450,930 (467,008) 19,957,639 15,659,985 66,781,551 3,509,349 16,109,609 2,614,023 7,532,095 34,052,600 Net realised appreciation/(depreciation) on:
Investments 2(a) 15,157,918 66,663,713 50,247,225 (5,843) 52,918,314 (207,654,345) (65,291,990) (19,797,400) (49,099,173) (73,823) (28,914,734) (99,830,312)To Be Announced securities contracts 2(c) – – – – – – – – – – – – Contracts for difference 2(c) – – – – – – – – – – – – Exchange traded futures contracts 2(c) 511,976 (15,403,251) (23,837,629) – (152,969,727) – – 224,986 1,778,919 (106,521) – – Options/Swaptions contracts 2(c) (53,428) (1,807,432) (539,742) – (3,905,238) – – – – (35,370) – – Swaps transactions 2(c) 4,444,324 12,058,600 (2,110,219) – 2,751,196 – – – – (352,089) – – Forward foreign exchange contracts 2(c) (1,843,509) 25,168,085 1,024,973 – 5,339,032 6,641,540 27,136,017 1,014,528 17,599,058 (128,481) 5,878,221 5,178,918 Foreign currencies on other transactions 2(i) 230,970 4,126,970 1,041,208 – 13,838,230 (59,851) 67,923 (313,822) (970,754) 116,423 229,070 (174,077)
Net realised appreciation/(depreciation) for the year 18,448,251 90,806,685 25,825,816 (5,843) (82,028,193) (201,072,656) (38,088,050) (18,871,708) (30,691,950) (579,861) (22,807,443) (94,825,471)
Net change in unrealised appreciation/(depreciation) on: Investments 2(a) 12,362,658 414,597,442 149,021,664 6,662 246,430,111 19,120,417 54,623,863 8,010,847 37,453,051 2,204,751 72,752,527 (57,840,247)To Be Announced securities contracts 2(c) – – – – – – – – – – – – Contracts for difference 2(c) – – – – – – – – – – – – Exchange traded futures contracts 2(c) (673,264) 673,508 (10,492,954) – (40,571,155) – – – – (42,511) – – Options/Swaptions contracts 2(c) 488,585 1,053,498 293,412 – 3,200,291 – – – – 1,259 – – Swaps transactions 2(c) (3,822,946) (18,386,133) 2,169,856 – (21,022,127) – – – – 93,649 – – Forward foreign exchange contracts 2(c) (2,052,285) (1,541,486) (162,345) – (23,490,106) 1,216,974 9,688,615 177,437 3,275,329 (410,371) 2,131,401 1,056,165 Foreign currencies on other transactions 2(i) (5,863) 521,092 39,372 – 538,620 (954) 14,900 (9,347) (19,526) (4,207) 29,850 (10,213)
Net change in unrealised appreciation/(depreciation) for the year 6,296,885 396,917,921 140,869,005 6,662 165,085,634 20,336,437 64,327,378 8,178,937 40,708,854 1,842,570 74,913,778 (56,794,295)
Increase/(Decrease) in net assets as a result of operations 25,448,701 514,150,227 192,145,751 (466,189) 103,015,080 (165,076,234) 93,020,879 (7,183,422) 26,126,513 3,876,732 59,638,430 (117,567,166)
Movements in share capital Net receipts as a result of issue of shares 479,660,554 3,137,075,840 2,142,028,943 80,145,406 8,022,447,538 632,409,548 227,662,520 21,809,126 185,014,814 14,835,493 396,478,827 166,303,335 Net payments as a result of repurchase of shares (285,884,605) (2,699,012,102) (1,270,380,784) (70,638,886) (8,287,660,468) (1,951,819,910) (787,436,940) (291,300,324) (785,995,833) (15,919,976) (531,653,274) (1,192,612,128)
Increase/(Decrease) in net assets as a result of movements in share capital 193,775,949 438,063,738 871,648,159 9,506,520 (265,212,930) (1,319,410,362) (559,774,420) (269,491,198) (600,981,019) (1,084,483) (135,174,447) (1,026,308,793)
Dividends declared 16 – (1,070,647) (4,231,939) – (220,283) (590,123) (67,721,092) – (59,832) (157,689) – (367,095)Foreign exchange adjustment 2(e) – – – – – – – – – – – – Net assets at the end of the year 560,739,620 5,630,335,309 2,980,522,109 93,146,101 11,604,394,805 1,862,526,676 1,715,398,088 391,029,713 1,146,597,659 70,509,445 1,253,130,898 865,538,450
(1) Fund name changed during the year, see Note 1, for further details.

The notes on pages 728 to 741 form an integral part of these financial statements.
Annual Report and Financial Statements [69]
Fund Name Note
ESG Multi-Asset
Fund(1)
Euro Bond Fund
Euro Corporate
Bond Fund
Euro
Reserve Fund
Euro Short Duration
Bond Fund
Euro-
Markets Fund
European Equity
Income Fund
European
Focus Fund
European Fund
European High
Yield Bond Fund
European Special
Situations Fund
European
Value Fund
EUR EUR EUR EUR EUR EUR EUR EUR EUR EUR EUR EUR
Net assets at the beginning of the year 341,514,970 4,679,191,991 1,920,960,138 84,105,770 11,766,812,938 3,347,603,395 2,249,872,721 667,704,333 1,721,511,997 67,874,885 1,328,666,915 2,009,781,504 Income Bank interest 2(b) – – 67,002 – – – – – – – – – Bond interest, net of withholding taxes 2(b) 2,127,841 56,455,718 38,579,778 8,899 85,024,051 – – – – 2,945,826 – – Swap interest 2(c) 82,170 4,929,973 3,469,472 – 11,607,789 – – – – 53,425 – – Contracts for difference interest 2(c) – – – – – – – – – – – – Equity linked note income 2(c) – – – – – – – – – – – – Interest from money market deposits 2(b) – – – – – – – – – – – – Collective investment scheme income, net of withholding taxes 2(b) 715,544 42,315 495,493 – 400,910 – – – – – – – Dividends, net of withholding taxes 2(b) 4,061,111 – – – – 48,906,431 99,819,804 13,633,104 34,874,411 1,170 24,031,898 53,626,646 Contracts for difference dividends, net of withholding taxes 2(c) – – – – – – – – – – – – Securities lending income 2(b) 71,363 575,600 285,235 – 652,049 593,646 352,057 75,810 302,961 39,314 242,751 420,695 Management fee rebate 5 97,936 10,507 82,634 – 119,273 – – – – – – –
Total income 2(b) 7,155,965 62,014,113 42,979,614 8,899 97,804,072 49,500,077 100,171,861 13,708,914 35,177,372 3,039,735 24,274,649 54,047,341
Expenses Bank interest 2(b) 165,675 36,145 – 1,201 113,477 22,380 25,256 3,916 14,306 8,975 26,684 19,160 Contracts for difference interest 2(c) – – – – – – – – – – – – Swap interest 2(c) 447,647 5,464,187 2,724,193 66 14,288,688 – – – – 3,249 – – Negative yield on financial assets 2(b) – 227,364 182,939 326,912 526,882 53,439 57,093 21,420 32,279 – 29,557 49,909 Contracts for difference dividends, net of withholding taxes 2(c) – – – – – – – – – – – – Administration fees, net of subsidy 7 524,215 4,574,947 1,944,958 71,960 6,001,745 4,658,936 4,648,051 1,262,949 2,834,398 47,775 2,283,725 2,650,142 Custodian and depositary fees 2(h), 8 324,621 1,154,477 587,828 28,208 2,607,649 449,316 338,767 117,778 273,689 33,373 209,514 281,031 Distribution fees 6 770,051 642,111 437,055 38,275 1,972,124 785,633 1,622,427 1,026,347 672,816 27,654 618,782 566,382 Tax 9 157,521 1,520,500 657,319 9,285 3,283,623 854,665 866,454 221,317 533,395 17,419 450,285 494,888 Management fees 5 4,062,670 21,968,761 10,994,392 404,540 49,052,245 27,015,723 25,832,262 7,545,838 14,706,880 287,267 13,124,007 15,933,229 Less Management fee waiver 5 – – – (404,540) – – – – – – – –
Total expenses 6,452,400 35,588,492 17,528,684 475,907 77,846,433 33,840,092 33,390,310 10,199,565 19,067,763 425,712 16,742,554 19,994,741
Net income/(deficit) 703,565 26,425,621 25,450,930 (467,008) 19,957,639 15,659,985 66,781,551 3,509,349 16,109,609 2,614,023 7,532,095 34,052,600 Net realised appreciation/(depreciation) on:
Investments 2(a) 15,157,918 66,663,713 50,247,225 (5,843) 52,918,314 (207,654,345) (65,291,990) (19,797,400) (49,099,173) (73,823) (28,914,734) (99,830,312)To Be Announced securities contracts 2(c) – – – – – – – – – – – – Contracts for difference 2(c) – – – – – – – – – – – – Exchange traded futures contracts 2(c) 511,976 (15,403,251) (23,837,629) – (152,969,727) – – 224,986 1,778,919 (106,521) – – Options/Swaptions contracts 2(c) (53,428) (1,807,432) (539,742) – (3,905,238) – – – – (35,370) – – Swaps transactions 2(c) 4,444,324 12,058,600 (2,110,219) – 2,751,196 – – – – (352,089) – – Forward foreign exchange contracts 2(c) (1,843,509) 25,168,085 1,024,973 – 5,339,032 6,641,540 27,136,017 1,014,528 17,599,058 (128,481) 5,878,221 5,178,918 Foreign currencies on other transactions 2(i) 230,970 4,126,970 1,041,208 – 13,838,230 (59,851) 67,923 (313,822) (970,754) 116,423 229,070 (174,077)
Net realised appreciation/(depreciation) for the year 18,448,251 90,806,685 25,825,816 (5,843) (82,028,193) (201,072,656) (38,088,050) (18,871,708) (30,691,950) (579,861) (22,807,443) (94,825,471)
Net change in unrealised appreciation/(depreciation) on: Investments 2(a) 12,362,658 414,597,442 149,021,664 6,662 246,430,111 19,120,417 54,623,863 8,010,847 37,453,051 2,204,751 72,752,527 (57,840,247)To Be Announced securities contracts 2(c) – – – – – – – – – – – – Contracts for difference 2(c) – – – – – – – – – – – – Exchange traded futures contracts 2(c) (673,264) 673,508 (10,492,954) – (40,571,155) – – – – (42,511) – – Options/Swaptions contracts 2(c) 488,585 1,053,498 293,412 – 3,200,291 – – – – 1,259 – – Swaps transactions 2(c) (3,822,946) (18,386,133) 2,169,856 – (21,022,127) – – – – 93,649 – – Forward foreign exchange contracts 2(c) (2,052,285) (1,541,486) (162,345) – (23,490,106) 1,216,974 9,688,615 177,437 3,275,329 (410,371) 2,131,401 1,056,165 Foreign currencies on other transactions 2(i) (5,863) 521,092 39,372 – 538,620 (954) 14,900 (9,347) (19,526) (4,207) 29,850 (10,213)
Net change in unrealised appreciation/(depreciation) for the year 6,296,885 396,917,921 140,869,005 6,662 165,085,634 20,336,437 64,327,378 8,178,937 40,708,854 1,842,570 74,913,778 (56,794,295)
Increase/(Decrease) in net assets as a result of operations 25,448,701 514,150,227 192,145,751 (466,189) 103,015,080 (165,076,234) 93,020,879 (7,183,422) 26,126,513 3,876,732 59,638,430 (117,567,166)
Movements in share capital Net receipts as a result of issue of shares 479,660,554 3,137,075,840 2,142,028,943 80,145,406 8,022,447,538 632,409,548 227,662,520 21,809,126 185,014,814 14,835,493 396,478,827 166,303,335 Net payments as a result of repurchase of shares (285,884,605) (2,699,012,102) (1,270,380,784) (70,638,886) (8,287,660,468) (1,951,819,910) (787,436,940) (291,300,324) (785,995,833) (15,919,976) (531,653,274) (1,192,612,128)
Increase/(Decrease) in net assets as a result of movements in share capital 193,775,949 438,063,738 871,648,159 9,506,520 (265,212,930) (1,319,410,362) (559,774,420) (269,491,198) (600,981,019) (1,084,483) (135,174,447) (1,026,308,793)
Dividends declared 16 – (1,070,647) (4,231,939) – (220,283) (590,123) (67,721,092) – (59,832) (157,689) – (367,095)Foreign exchange adjustment 2(e) – – – – – – – – – – – – Net assets at the end of the year 560,739,620 5,630,335,309 2,980,522,109 93,146,101 11,604,394,805 1,862,526,676 1,715,398,088 391,029,713 1,146,597,659 70,509,445 1,253,130,898 865,538,450
(1) Fund name changed during the year, see Note 1, for further details.
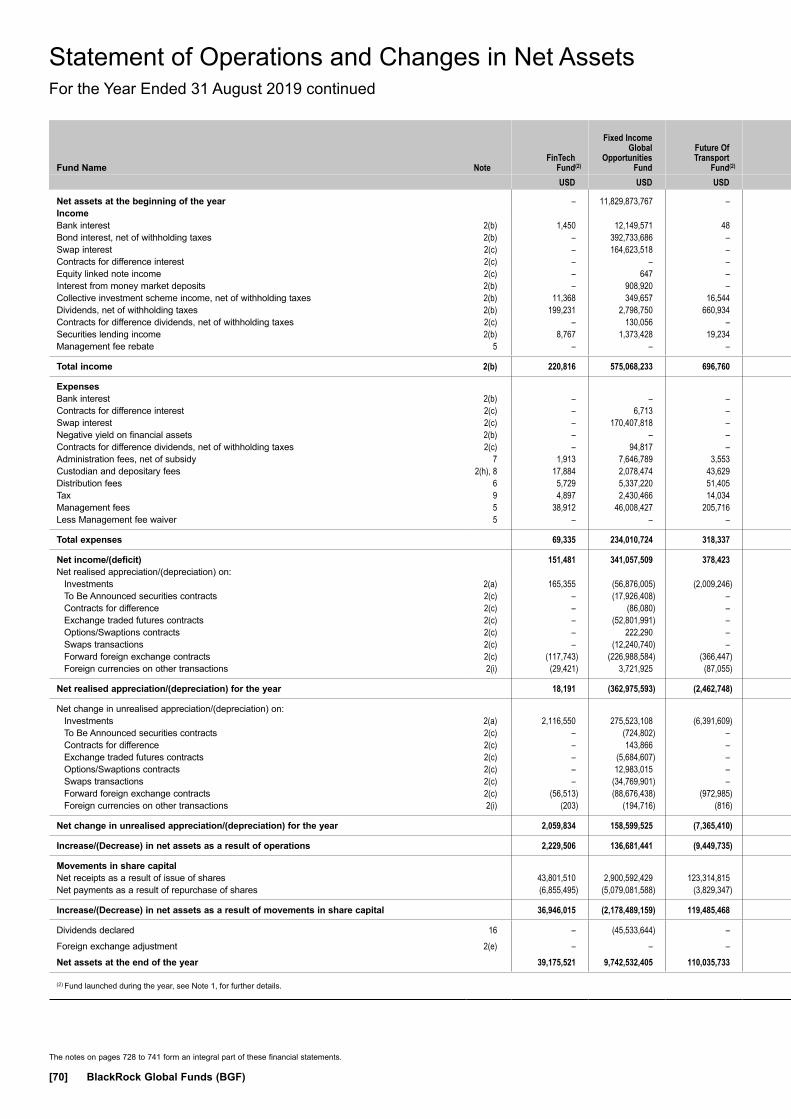
The notes on pages 728 to 741 form an integral part of these financial statements.
[70] BlackRock Global Funds (BGF)
Fund Name Note
FinTech Fund(2)
Fixed Income Global
Opportunities Fund
Future Of Transport
Fund(2)
Global Allocation
Fund
Global Bond Income
Fund
Global
Conservative Income
Fund(2)
Global
Corporate Bond Fund
Global
Dynamic Equity
Fund
Global Enhanced
Equity Yield Fund
Global Equity
Income Fund
Global
Government Bond Fund
Global
High Yield Bond Fund
USD USD USD USD USD EUR USD USD USD USD USD USD
Net assets at the beginning of the year – 11,829,873,767 – 17,353,298,738 74,954,530 – 2,142,623,411 754,590,181 1,485,761,780 1,779,910,032 591,019,929 1,470,612,742 Income Bank interest 2(b) 1,450 12,149,571 48 945,503 33,592 38,704 684,786 162,915 1,411,741 62,895 114,319 868,300 Bond interest, net of withholding taxes 2(b) – 392,733,686 – 155,596,363 3,669,411 4,018,407 57,464,232 607,446 – – 11,482,431 73,126,066 Swap interest 2(c) – 164,623,518 – 13,008,066 47,880 14,427 3,599,202 – – – 593,868 1,946,156 Contracts for difference interest 2(c) – – – 1,602,996 – – – 94,678 – – – – Equity linked note income 2(c) – 647 – – – 633,977 – – – – – – Interest from money market deposits 2(b) – 908,920 – – – 6,991 12,375 – – – – – Collective investment scheme income, net of withholding taxes 2(b) 11,368 349,657 16,544 501,886 – 72,179 1,435,288 – – 147,856 406,392 – Dividends, net of withholding taxes 2(b) 199,231 2,798,750 660,934 178,019,618 – 525,269 – 11,927,198 50,724,525 43,002,135 – 523,748Contracts for difference dividends, net of withholding taxes 2(c) – 130,056 – 83 – – – – – – – – Securities lending income 2(b) 8,767 1,373,428 19,234 4,003,253 2,279 1,484 221,395 169,433 341,410 240,987 95,728 605,216 Management fee rebate 5 – – – 296,760 – 20,158 159,484 – – – 31,579 –
Total income 2(b) 220,816 575,068,233 696,760 353,974,528 3,753,162 5,331,596 63,576,762 12,961,670 52,477,676 43,453,873 12,724,317 77,069,486
Expenses Bank interest 2(b) – – – – – – – – – – – – Contracts for difference interest 2(c) – 6,713 – – – – – – – – – – Swap interest 2(c) – 170,407,818 – 14,624,454 – 5,667 4,867,302 – – – 818,784 11,812Negative yield on financial assets 2(b) – – – – – – – – – – – – Contracts for difference dividends, net of withholding taxes 2(c) – 94,817 – 2,458,994 – – – 126,010 – – – – Administration fees, net of subsidy 7 1,913 7,646,789 3,553 26,245,948 27,417 93,210 1,437,171 1,103,333 3,212,763 3,492,818 762,429 1,688,765 Custodian and depositary fees 2(h), 8 17,884 2,078,474 43,629 2,487,591 41,514 45,208 355,793 301,514 304,556 175,094 201,293 270,897 Distribution fees 6 5,729 5,337,220 51,405 14,098,740 821 158,989 100,635 540,738 105,211 1,417,523 212,382 1,443,283 Tax 9 4,897 2,430,466 14,034 6,048,404 9,668 35,145 484,009 217,369 641,769 664,813 259,121 542,711 Management fees 5 38,912 46,008,427 205,716 172,127,683 18,022 325,697 7,530,268 5,598,324 20,127,627 18,246,393 3,110,809 13,009,479 Less Management fee waiver 5 – – – – – – – – – – – –
Total expenses 69,335 234,010,724 318,337 238,091,814 97,442 663,916 14,775,178 7,887,288 24,391,926 23,996,641 5,364,818 16,966,947
Net income/(deficit) 151,481 341,057,509 378,423 115,882,714 3,655,720 4,667,680 48,801,584 5,074,382 28,085,750 19,457,232 7,359,499 60,102,539 Net realised appreciation/(depreciation) on:
Investments 2(a) 165,355 (56,876,005) (2,009,246) 462,770,359 443,530 796,890 (22,178,981) 4,492,999 (70,503,740) 109,981,539 2,782,272 (27,594,434)To Be Announced securities contracts 2(c) – (17,926,408) – – – – – – – – 313,607 – Contracts for difference 2(c) – (86,080) – 12,145,206 – – – 863,353 – – – – Exchange traded futures contracts 2(c) – (52,801,991) – 13,505,907 (62,478) (5,696,646) 2,252,231 642,101 (398,902) – 3,032,229 (1,368,301)Options/Swaptions contracts 2(c) – 222,290 – 10,855,113 20,311 2,088 – (2,023,122) 47,334,260 – (1,075,893) (455,350)Swaps transactions 2(c) – (12,240,740) – (23,218,908) (110,926) (2,513) (499,076) 496,139 – – (457,761) (1,628,641)Forward foreign exchange contracts 2(c) (117,743) (226,988,584) (366,447) (201,986,756) (68,817) (56,937) (43,054,987) 2,270,410 (19,319,447) (13,734,935) (8,524,917) (15,287,780)Foreign currencies on other transactions 2(i) (29,421) 3,721,925 (87,055) 12,546,054 (599) 39,089 6,629,011 303,116 (90,536) (281,418) 2,582,499 1,505,453
Net realised appreciation/(depreciation) for the year 18,191 (362,975,593) (2,462,748) 286,616,975 221,021 (4,918,029) (56,851,802) 7,044,996 (42,978,365) 95,965,186 (1,347,964) (44,829,053)
Net change in unrealised appreciation/(depreciation) on: Investments 2(a) 2,116,550 275,523,108 (6,391,609) (538,168,186) 2,134,175 10,520,743 134,438,141 (33,281,013) 157,427 (123,224,539) 41,079,322 21,234,556 To Be Announced securities contracts 2(c) – (724,802) – – – – – – – – 107,845 – Contracts for difference 2(c) – 143,866 – 210,185 – – – 78,671 – – – – Exchange traded futures contracts 2(c) – (5,684,607) – 2,564,547 (2,252) (4,274,195) (4,375,765) (731,100) (1,819,944) – 422,214 336,147 Options/Swaptions contracts 2(c) – 12,983,015 – (7,201,277) – (2,028) – 2,651,163 3,340,857 – 437,757 14,608 Swaps transactions 2(c) – (34,769,901) – 4,094,673 79,586 8,261 (1,955,278) (627,767) – – (101,102) 161,697 Forward foreign exchange contracts 2(c) (56,513) (88,676,438) (972,985) (18,800,227) (10,050) (92,948) (13,625,289) (979,235) (1,040,838) (2,266,124) (6,798,085) (5,994,869)Foreign currencies on other transactions 2(i) (203) (194,716) (816) (931,594) 3,431 47,238 (488,476) (51,293) (38,886) (19,577) (246,239) 66,498
Net change in unrealised appreciation/(depreciation) for the year 2,059,834 158,599,525 (7,365,410) (558,231,879) 2,204,890 6,207,071 113,993,333 (32,940,574) 598,616 (125,510,240) 34,901,712 15,818,637
Increase/(Decrease) in net assets as a result of operations 2,229,506 136,681,441 (9,449,735) (155,732,190) 6,081,631 5,956,722 105,943,115 (20,821,196) (14,293,999) (10,087,822) 40,913,247 31,092,123
Movements in share capital Net receipts as a result of issue of shares 43,801,510 2,900,592,429 123,314,815 1,649,155,106 17,784,871 229,990,240 679,563,091 42,881,860 1,130,582,084 288,925,288 582,732,201 569,373,885 Net payments as a result of repurchase of shares (6,855,495) (5,079,081,588) (3,829,347) (4,557,232,935) (10,368,432) (2,985,284) (786,889,292) (162,020,617) (1,037,768,617) (742,434,725) (474,420,199) (809,635,337)
Increase/(Decrease) in net assets as a result of movements in share capital 36,946,015 (2,178,489,159) 119,485,468 (2,908,077,829) 7,416,439 227,004,956 (107,326,201) (119,138,757) 92,813,467 (453,509,437) 108,312,002 (240,261,452)
Dividends declared 16 – (45,533,644) – (24,601,870) (21,949) (749,989) (23,470,170) (77,317) (97,610,343) (16,796,105) (350,530) (35,328,434)Foreign exchange adjustment 2(e) – – – – – – – – – – – – Net assets at the end of the year 39,175,521 9,742,532,405 110,035,733 14,264,886,849 88,430,651 232,211,689 2,117,770,155 614,552,911 1,466,670,905 1,299,516,668 739,894,648 1,226,114,979
(2) Fund launched during the year, see Note 1, for further details.
Statement of Operations and Changes in Net AssetsFor the Year Ended 31 August 2019 continued

The notes on pages 728 to 741 form an integral part of these financial statements.
Annual Report and Financial Statements [71]
Fund Name Note
FinTech Fund(2)
Fixed Income Global
Opportunities Fund
Future Of Transport
Fund(2)
Global Allocation
Fund
Global Bond Income
Fund
Global
Conservative Income
Fund(2)
Global
Corporate Bond Fund
Global
Dynamic Equity
Fund
Global Enhanced
Equity Yield Fund
Global Equity
Income Fund
Global
Government Bond Fund
Global
High Yield Bond Fund
USD USD USD USD USD EUR USD USD USD USD USD USD
Net assets at the beginning of the year – 11,829,873,767 – 17,353,298,738 74,954,530 – 2,142,623,411 754,590,181 1,485,761,780 1,779,910,032 591,019,929 1,470,612,742 Income Bank interest 2(b) 1,450 12,149,571 48 945,503 33,592 38,704 684,786 162,915 1,411,741 62,895 114,319 868,300 Bond interest, net of withholding taxes 2(b) – 392,733,686 – 155,596,363 3,669,411 4,018,407 57,464,232 607,446 – – 11,482,431 73,126,066 Swap interest 2(c) – 164,623,518 – 13,008,066 47,880 14,427 3,599,202 – – – 593,868 1,946,156 Contracts for difference interest 2(c) – – – 1,602,996 – – – 94,678 – – – – Equity linked note income 2(c) – 647 – – – 633,977 – – – – – – Interest from money market deposits 2(b) – 908,920 – – – 6,991 12,375 – – – – – Collective investment scheme income, net of withholding taxes 2(b) 11,368 349,657 16,544 501,886 – 72,179 1,435,288 – – 147,856 406,392 – Dividends, net of withholding taxes 2(b) 199,231 2,798,750 660,934 178,019,618 – 525,269 – 11,927,198 50,724,525 43,002,135 – 523,748Contracts for difference dividends, net of withholding taxes 2(c) – 130,056 – 83 – – – – – – – – Securities lending income 2(b) 8,767 1,373,428 19,234 4,003,253 2,279 1,484 221,395 169,433 341,410 240,987 95,728 605,216 Management fee rebate 5 – – – 296,760 – 20,158 159,484 – – – 31,579 –
Total income 2(b) 220,816 575,068,233 696,760 353,974,528 3,753,162 5,331,596 63,576,762 12,961,670 52,477,676 43,453,873 12,724,317 77,069,486
Expenses Bank interest 2(b) – – – – – – – – – – – – Contracts for difference interest 2(c) – 6,713 – – – – – – – – – – Swap interest 2(c) – 170,407,818 – 14,624,454 – 5,667 4,867,302 – – – 818,784 11,812Negative yield on financial assets 2(b) – – – – – – – – – – – – Contracts for difference dividends, net of withholding taxes 2(c) – 94,817 – 2,458,994 – – – 126,010 – – – – Administration fees, net of subsidy 7 1,913 7,646,789 3,553 26,245,948 27,417 93,210 1,437,171 1,103,333 3,212,763 3,492,818 762,429 1,688,765 Custodian and depositary fees 2(h), 8 17,884 2,078,474 43,629 2,487,591 41,514 45,208 355,793 301,514 304,556 175,094 201,293 270,897 Distribution fees 6 5,729 5,337,220 51,405 14,098,740 821 158,989 100,635 540,738 105,211 1,417,523 212,382 1,443,283 Tax 9 4,897 2,430,466 14,034 6,048,404 9,668 35,145 484,009 217,369 641,769 664,813 259,121 542,711 Management fees 5 38,912 46,008,427 205,716 172,127,683 18,022 325,697 7,530,268 5,598,324 20,127,627 18,246,393 3,110,809 13,009,479 Less Management fee waiver 5 – – – – – – – – – – – –
Total expenses 69,335 234,010,724 318,337 238,091,814 97,442 663,916 14,775,178 7,887,288 24,391,926 23,996,641 5,364,818 16,966,947
Net income/(deficit) 151,481 341,057,509 378,423 115,882,714 3,655,720 4,667,680 48,801,584 5,074,382 28,085,750 19,457,232 7,359,499 60,102,539 Net realised appreciation/(depreciation) on:
Investments 2(a) 165,355 (56,876,005) (2,009,246) 462,770,359 443,530 796,890 (22,178,981) 4,492,999 (70,503,740) 109,981,539 2,782,272 (27,594,434)To Be Announced securities contracts 2(c) – (17,926,408) – – – – – – – – 313,607 – Contracts for difference 2(c) – (86,080) – 12,145,206 – – – 863,353 – – – – Exchange traded futures contracts 2(c) – (52,801,991) – 13,505,907 (62,478) (5,696,646) 2,252,231 642,101 (398,902) – 3,032,229 (1,368,301)Options/Swaptions contracts 2(c) – 222,290 – 10,855,113 20,311 2,088 – (2,023,122) 47,334,260 – (1,075,893) (455,350)Swaps transactions 2(c) – (12,240,740) – (23,218,908) (110,926) (2,513) (499,076) 496,139 – – (457,761) (1,628,641)Forward foreign exchange contracts 2(c) (117,743) (226,988,584) (366,447) (201,986,756) (68,817) (56,937) (43,054,987) 2,270,410 (19,319,447) (13,734,935) (8,524,917) (15,287,780)Foreign currencies on other transactions 2(i) (29,421) 3,721,925 (87,055) 12,546,054 (599) 39,089 6,629,011 303,116 (90,536) (281,418) 2,582,499 1,505,453
Net realised appreciation/(depreciation) for the year 18,191 (362,975,593) (2,462,748) 286,616,975 221,021 (4,918,029) (56,851,802) 7,044,996 (42,978,365) 95,965,186 (1,347,964) (44,829,053)
Net change in unrealised appreciation/(depreciation) on: Investments 2(a) 2,116,550 275,523,108 (6,391,609) (538,168,186) 2,134,175 10,520,743 134,438,141 (33,281,013) 157,427 (123,224,539) 41,079,322 21,234,556 To Be Announced securities contracts 2(c) – (724,802) – – – – – – – – 107,845 – Contracts for difference 2(c) – 143,866 – 210,185 – – – 78,671 – – – – Exchange traded futures contracts 2(c) – (5,684,607) – 2,564,547 (2,252) (4,274,195) (4,375,765) (731,100) (1,819,944) – 422,214 336,147 Options/Swaptions contracts 2(c) – 12,983,015 – (7,201,277) – (2,028) – 2,651,163 3,340,857 – 437,757 14,608 Swaps transactions 2(c) – (34,769,901) – 4,094,673 79,586 8,261 (1,955,278) (627,767) – – (101,102) 161,697 Forward foreign exchange contracts 2(c) (56,513) (88,676,438) (972,985) (18,800,227) (10,050) (92,948) (13,625,289) (979,235) (1,040,838) (2,266,124) (6,798,085) (5,994,869)Foreign currencies on other transactions 2(i) (203) (194,716) (816) (931,594) 3,431 47,238 (488,476) (51,293) (38,886) (19,577) (246,239) 66,498
Net change in unrealised appreciation/(depreciation) for the year 2,059,834 158,599,525 (7,365,410) (558,231,879) 2,204,890 6,207,071 113,993,333 (32,940,574) 598,616 (125,510,240) 34,901,712 15,818,637
Increase/(Decrease) in net assets as a result of operations 2,229,506 136,681,441 (9,449,735) (155,732,190) 6,081,631 5,956,722 105,943,115 (20,821,196) (14,293,999) (10,087,822) 40,913,247 31,092,123
Movements in share capital Net receipts as a result of issue of shares 43,801,510 2,900,592,429 123,314,815 1,649,155,106 17,784,871 229,990,240 679,563,091 42,881,860 1,130,582,084 288,925,288 582,732,201 569,373,885 Net payments as a result of repurchase of shares (6,855,495) (5,079,081,588) (3,829,347) (4,557,232,935) (10,368,432) (2,985,284) (786,889,292) (162,020,617) (1,037,768,617) (742,434,725) (474,420,199) (809,635,337)
Increase/(Decrease) in net assets as a result of movements in share capital 36,946,015 (2,178,489,159) 119,485,468 (2,908,077,829) 7,416,439 227,004,956 (107,326,201) (119,138,757) 92,813,467 (453,509,437) 108,312,002 (240,261,452)
Dividends declared 16 – (45,533,644) – (24,601,870) (21,949) (749,989) (23,470,170) (77,317) (97,610,343) (16,796,105) (350,530) (35,328,434)Foreign exchange adjustment 2(e) – – – – – – – – – – – – Net assets at the end of the year 39,175,521 9,742,532,405 110,035,733 14,264,886,849 88,430,651 232,211,689 2,117,770,155 614,552,911 1,466,670,905 1,299,516,668 739,894,648 1,226,114,979
(2) Fund launched during the year, see Note 1, for further details.

The notes on pages 728 to 741 form an integral part of these financial statements.
[72] BlackRock Global Funds (BGF)
Statement of Operations and Changes in Net AssetsFor the Year Ended 31 August 2019 continued
Fund Name Note
Global Inflation
Linked Bond Fund
Global Long
Horizon Equity
Fund(3)
Global Long-
Horizon Equity
Fund(1)
Global
Multi-Asset Income
Fund
Global SmallCap
Fund
India Fund
Japan
Flexible Equity
Fund
Japan
Small & MidCap Opportunities
Fund
Latin American
Fund
Market Navigator
Fund(2)
Natural
Resources Growth & Income
Fund
Next
Generation Technology
Fund(2)
USD USD USD USD USD USD JPY JPY USD EUR USD USD
Net assets at the beginning of the year 193,338,735 6,632,840 325,693,535 8,687,404,595 305,239,727 639,273,139 19,669,422,838 99,321,838,274 1,218,386,814 – 109,022,205 – Income Bank interest 2(b) 19,400 3,610 237,148 5,600,494 78,680 94,769 – – 253,757 – 5,649 53,108 Bond interest, net of withholding taxes 2(b) 1,503,026 – – 251,202,941 – – – – – 96,111 584 – Swap interest 2(c) 405,201 – – 169,927 – – – – – 291,376 – – Contracts for difference interest 2(c) – – – – – – – – – – – – Equity linked note income 2(c) – – – 108,671,989 – – – – – – – – Interest from money market deposits 2(b) – – – – – – – – – – – – Collective investment scheme income, net of withholding taxes 2(b) 36,199 – – 15,243,492 – – – – – – 48,700 – Dividends, net of withholding taxes 2(b) – 9,416 5,436,814 51,693,677 4,640,455 7,136,796 369,793,100 963,030,036 31,193,682 43,228 3,348,765 59,261 Contracts for difference dividends, net of withholding taxes 2(c) – – – 407,897 – – – – – – – – Securities lending income 2(b) 25,616 – 43,780 1,421,466 81,624 – 6,211,373 57,407,346 157,794 24 29,422 26,124 Management fee rebate 5 – – - 1,033,823 - - - - - 417 - –
Total income 2(b) 1,989,442 13,026 5,717,742 435,445,706 4,800,759 7,231,565 376,004,473 1,020,437,382 31,605,233 431,156 3,433,120 138,493
Expenses Bank interest 2(b) – – – – – – 1,793,688 4,291,578 – 3,117 – – Contracts for difference interest 2(c) – – – 140,357 – – – – – – – – Swap interest 2(c) 485,486 – – 32,434 – – – – – 130,764 – – Negative yield on financial assets 2(b) – – – – – – – – 5,726 – – – Contracts for difference dividends, net of withholding taxes 2(c) – – – – – – – – – – – – Administration fees, net of subsidy 7 229,748 (987) 891,065 14,478,933 520,699 1,771,090 40,841,217 142,395,797 2,980,321 (26,516) 141,237 21,675 Custodian and depositary fees 2(h), 8 84,703 5,114 66,783 1,475,307 237,445 591,350 5,089,600 22,386,692 504,649 36,891 41,037 25,981 Distribution fees 6 263,462 138 191,873 9,576,979 150,555 367,221 22,663,562 13,051,752 320,621 457 58,632 14,727 Tax 9 72,340 67 179,381 3,438,188 105,741 278,179 7,946,324 24,686,894 581,096 3,067 37,444 13,598 Management fees 5 919,738 416 5,091,016 101,475,506 3,266,638 7,707,497 194,294,008 607,112,792 20,249,378 1,051 1,297,481 162,226 Less Management fee waiver 5 – – – – – – – – – – – –
Total expenses 2,055,477 4,748 6,420,118 130,617,704 4,281,078 10,715,337 272,628,399 813,925,505 24,641,791 148,831 1,575,831 238,207
Net income/(deficit) (66,035) 8,278 (702,376) 304,828,002 519,681 (3,483,772) 103,376,074 206,511,877 6,963,442 282,325 1,857,289 (99,714)Net realised appreciation/(depreciation) on:
Investments 2(a) (1,361,589) 954,305 30,047,063 (165,874,744) (12,126,626) 12,413,379 (500,688,760) (9,282,950,009) 64,805,076 334,968 (7,098,723) (3,240,692)To Be Announced securities contracts 2(c) – – – – – – – – – – – – Contracts for difference 2(c) – – – 186,291 – – – – – – – – Exchange traded futures contracts 2(c) (1,620,020) – – 124,450,736 (425,751) – – – – 1,218,822 – – Options/Swaptions contracts 2(c) 133,371 – – 56,200 – – – – – (76,218) – (13,836)Swaps transactions 2(c) 856,535 – – (849,006) – – – – – (99,945) – – Forward foreign exchange contracts 2(c) (2,618,328) (964) 30,814 (231,903,490) (64,984) (60) (588,213,475) (145,573,669) (605,552) (181,767) (182,543) (175,732)Foreign currencies on other transactions 2(i) 1,179,148 (9,908) 5,393 (92,381) (20,262) (1,487,871) 12,788,733 2,235,148 (215,119) 77,928 79,790 (39,839)
Net realised appreciation/(depreciation) for the year (3,430,883) 943,433 30,083,270 (274,026,394) (12,637,623) 10,925,448 (1,076,113,502) (9,426,288,530) 63,984,405 1,273,788 (7,201,476) (3,470,099)
Net change in unrealised appreciation/(depreciation) on: Investments 2(a) 7,201,720 (1,226,762) (2,998,260) 108,036,992 (12,712,686) (49,025,814) (1,551,472,659) (9,088,831,605) 95,744,368 1,471,005 (7,544,043) 9,656,793 To Be Announced securities contracts 2(c) – – – – – – – – – – – – Contracts for difference 2(c) – – – (164,160) – – – – – – – – Exchange traded futures contracts 2(c) (1,062,596) – – 70,161 (240,661) – – – – 127,246 – – Options/Swaptions contracts 2(c) (52,356) – – 9,105 – – – – – (37,024) – – Swaps transactions 2(c) (1,371,106) – – 201,370 – – – – – 137,749 – – Forward foreign exchange contracts 2(c) (2,132,449) (83) 1,372 (31,501,385) 11,631 – (34,635,355) 1,048,656 3,952 (223,122) (46,133) (99,802)Foreign currencies on other transactions 2(i) 5,162 (553) (12,201) 246,206 (15,200) 139,250 (242,683) 1,398,224 55,032 1,270 (1,572) (221)
Net change in unrealised appreciation/(depreciation) for the year 2,588,375 (1,227,398) (3,009,089) 76,898,289 (12,956,916) (48,886,564) (1,586,350,697) (9,086,384,725) 95,803,352 1,477,124 (7,591,748) 9,556,770
Increase/(Decrease) in net assets as a result of operations (908,543) (275,687) 26,371,805 107,699,897 (25,074,858) (41,444,888) (2,559,088,125) (18,306,161,378) 166,751,199 3,033,237 (12,935,935) 5,986,957
Movements in share capital Net receipts as a result of issue of shares 62,563,138 96,733 152,685,361 3,388,507,369 30,218,268 283,095,100 18,968,262,187 24,180,114,597 448,201,563 31,290,182 35,679,162 101,438,867 Net payments as a result of repurchase of shares (123,701,322) (6,453,886) (101,038,343) (4,096,369,043) (111,148,917) (445,207,008) (21,983,966,825) (74,059,666,785) (802,118,330) (10) (28,102,283) (12,363,155)
Increase/(Decrease) in net assets as a result of movements in share capital (61,138,184) (6,357,153) 51,647,018 (707,861,674) (80,930,649) (162,111,908) (3,015,704,638) (49,879,552,188) (353,916,767) 31,290,172 7,576,879 89,075,712
Dividends declared 16 (3,496) – (3,843) (314,611,637) – – (442,611) (52,002) (41,591) – (1,681,594) – Foreign exchange adjustment 2(e) – – – – – – – – – – – – Net assets at the end of the year 131,288,512 – 403,708,515 7,772,631,181 199,234,220 435,716,343 14,094,187,464 31,136,072,706 1,031,179,655 34,323,409 101,981,555 95,062,669
(1) Fund name changed during the year, see Note 1, for further details.(2) Fund launched during the year, see Note 1, for further details.(3) Fund terminated during the year, see Note 1, for further details.
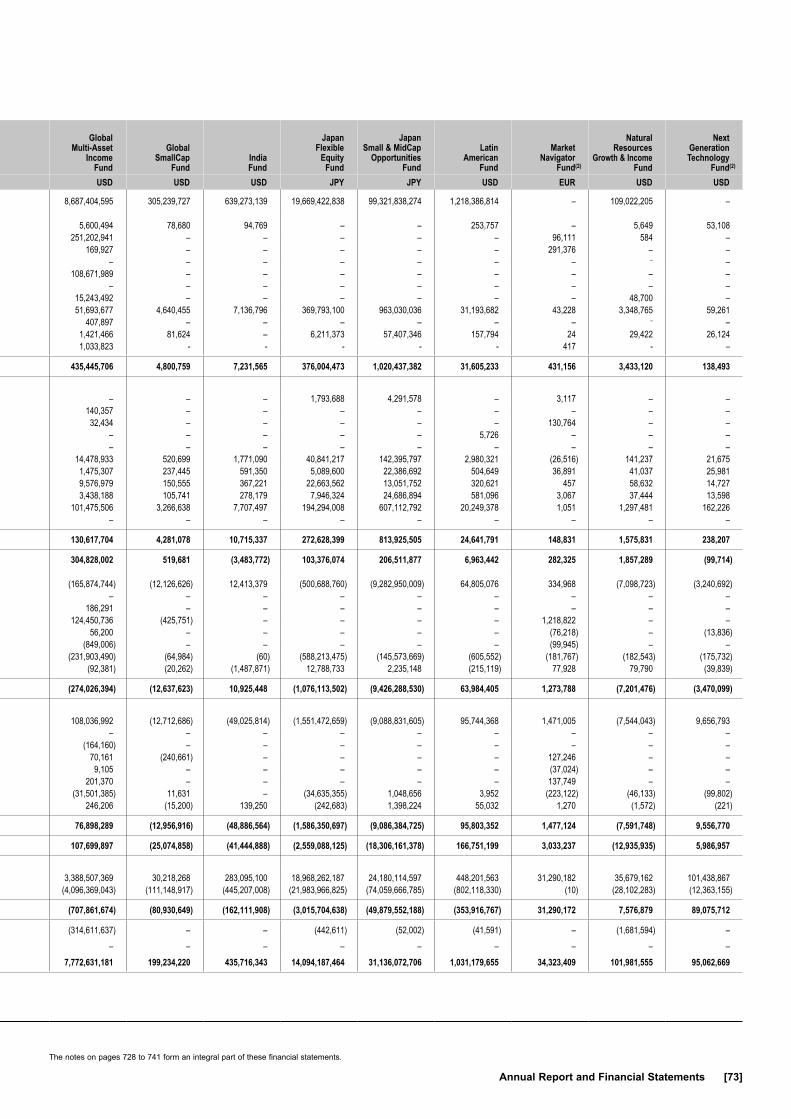
The notes on pages 728 to 741 form an integral part of these financial statements.
Annual Report and Financial Statements [73]
Fund Name Note
Global Inflation
Linked Bond Fund
Global Long
Horizon Equity
Fund(3)
Global Long-
Horizon Equity
Fund(1)
Global
Multi-Asset Income
Fund
Global SmallCap
Fund
India Fund
Japan
Flexible Equity
Fund
Japan
Small & MidCap Opportunities
Fund
Latin American
Fund
Market Navigator
Fund(2)
Natural
Resources Growth & Income
Fund
Next
Generation Technology
Fund(2)
USD USD USD USD USD USD JPY JPY USD EUR USD USD
Net assets at the beginning of the year 193,338,735 6,632,840 325,693,535 8,687,404,595 305,239,727 639,273,139 19,669,422,838 99,321,838,274 1,218,386,814 – 109,022,205 – Income Bank interest 2(b) 19,400 3,610 237,148 5,600,494 78,680 94,769 – – 253,757 – 5,649 53,108 Bond interest, net of withholding taxes 2(b) 1,503,026 – – 251,202,941 – – – – – 96,111 584 – Swap interest 2(c) 405,201 – – 169,927 – – – – – 291,376 – – Contracts for difference interest 2(c) – – – – – – – – – – – – Equity linked note income 2(c) – – – 108,671,989 – – – – – – – – Interest from money market deposits 2(b) – – – – – – – – – – – – Collective investment scheme income, net of withholding taxes 2(b) 36,199 – – 15,243,492 – – – – – – 48,700 – Dividends, net of withholding taxes 2(b) – 9,416 5,436,814 51,693,677 4,640,455 7,136,796 369,793,100 963,030,036 31,193,682 43,228 3,348,765 59,261 Contracts for difference dividends, net of withholding taxes 2(c) – – – 407,897 – – – – – – – – Securities lending income 2(b) 25,616 – 43,780 1,421,466 81,624 – 6,211,373 57,407,346 157,794 24 29,422 26,124 Management fee rebate 5 – – - 1,033,823 - - - - - 417 - –
Total income 2(b) 1,989,442 13,026 5,717,742 435,445,706 4,800,759 7,231,565 376,004,473 1,020,437,382 31,605,233 431,156 3,433,120 138,493
Expenses Bank interest 2(b) – – – – – – 1,793,688 4,291,578 – 3,117 – – Contracts for difference interest 2(c) – – – 140,357 – – – – – – – – Swap interest 2(c) 485,486 – – 32,434 – – – – – 130,764 – – Negative yield on financial assets 2(b) – – – – – – – – 5,726 – – – Contracts for difference dividends, net of withholding taxes 2(c) – – – – – – – – – – – – Administration fees, net of subsidy 7 229,748 (987) 891,065 14,478,933 520,699 1,771,090 40,841,217 142,395,797 2,980,321 (26,516) 141,237 21,675 Custodian and depositary fees 2(h), 8 84,703 5,114 66,783 1,475,307 237,445 591,350 5,089,600 22,386,692 504,649 36,891 41,037 25,981 Distribution fees 6 263,462 138 191,873 9,576,979 150,555 367,221 22,663,562 13,051,752 320,621 457 58,632 14,727 Tax 9 72,340 67 179,381 3,438,188 105,741 278,179 7,946,324 24,686,894 581,096 3,067 37,444 13,598 Management fees 5 919,738 416 5,091,016 101,475,506 3,266,638 7,707,497 194,294,008 607,112,792 20,249,378 1,051 1,297,481 162,226 Less Management fee waiver 5 – – – – – – – – – – – –
Total expenses 2,055,477 4,748 6,420,118 130,617,704 4,281,078 10,715,337 272,628,399 813,925,505 24,641,791 148,831 1,575,831 238,207
Net income/(deficit) (66,035) 8,278 (702,376) 304,828,002 519,681 (3,483,772) 103,376,074 206,511,877 6,963,442 282,325 1,857,289 (99,714)Net realised appreciation/(depreciation) on:
Investments 2(a) (1,361,589) 954,305 30,047,063 (165,874,744) (12,126,626) 12,413,379 (500,688,760) (9,282,950,009) 64,805,076 334,968 (7,098,723) (3,240,692)To Be Announced securities contracts 2(c) – – – – – – – – – – – – Contracts for difference 2(c) – – – 186,291 – – – – – – – – Exchange traded futures contracts 2(c) (1,620,020) – – 124,450,736 (425,751) – – – – 1,218,822 – – Options/Swaptions contracts 2(c) 133,371 – – 56,200 – – – – – (76,218) – (13,836)Swaps transactions 2(c) 856,535 – – (849,006) – – – – – (99,945) – – Forward foreign exchange contracts 2(c) (2,618,328) (964) 30,814 (231,903,490) (64,984) (60) (588,213,475) (145,573,669) (605,552) (181,767) (182,543) (175,732)Foreign currencies on other transactions 2(i) 1,179,148 (9,908) 5,393 (92,381) (20,262) (1,487,871) 12,788,733 2,235,148 (215,119) 77,928 79,790 (39,839)
Net realised appreciation/(depreciation) for the year (3,430,883) 943,433 30,083,270 (274,026,394) (12,637,623) 10,925,448 (1,076,113,502) (9,426,288,530) 63,984,405 1,273,788 (7,201,476) (3,470,099)
Net change in unrealised appreciation/(depreciation) on: Investments 2(a) 7,201,720 (1,226,762) (2,998,260) 108,036,992 (12,712,686) (49,025,814) (1,551,472,659) (9,088,831,605) 95,744,368 1,471,005 (7,544,043) 9,656,793 To Be Announced securities contracts 2(c) – – – – – – – – – – – – Contracts for difference 2(c) – – – (164,160) – – – – – – – – Exchange traded futures contracts 2(c) (1,062,596) – – 70,161 (240,661) – – – – 127,246 – – Options/Swaptions contracts 2(c) (52,356) – – 9,105 – – – – – (37,024) – – Swaps transactions 2(c) (1,371,106) – – 201,370 – – – – – 137,749 – – Forward foreign exchange contracts 2(c) (2,132,449) (83) 1,372 (31,501,385) 11,631 – (34,635,355) 1,048,656 3,952 (223,122) (46,133) (99,802)Foreign currencies on other transactions 2(i) 5,162 (553) (12,201) 246,206 (15,200) 139,250 (242,683) 1,398,224 55,032 1,270 (1,572) (221)
Net change in unrealised appreciation/(depreciation) for the year 2,588,375 (1,227,398) (3,009,089) 76,898,289 (12,956,916) (48,886,564) (1,586,350,697) (9,086,384,725) 95,803,352 1,477,124 (7,591,748) 9,556,770
Increase/(Decrease) in net assets as a result of operations (908,543) (275,687) 26,371,805 107,699,897 (25,074,858) (41,444,888) (2,559,088,125) (18,306,161,378) 166,751,199 3,033,237 (12,935,935) 5,986,957
Movements in share capital Net receipts as a result of issue of shares 62,563,138 96,733 152,685,361 3,388,507,369 30,218,268 283,095,100 18,968,262,187 24,180,114,597 448,201,563 31,290,182 35,679,162 101,438,867 Net payments as a result of repurchase of shares (123,701,322) (6,453,886) (101,038,343) (4,096,369,043) (111,148,917) (445,207,008) (21,983,966,825) (74,059,666,785) (802,118,330) (10) (28,102,283) (12,363,155)
Increase/(Decrease) in net assets as a result of movements in share capital (61,138,184) (6,357,153) 51,647,018 (707,861,674) (80,930,649) (162,111,908) (3,015,704,638) (49,879,552,188) (353,916,767) 31,290,172 7,576,879 89,075,712
Dividends declared 16 (3,496) – (3,843) (314,611,637) – – (442,611) (52,002) (41,591) – (1,681,594) – Foreign exchange adjustment 2(e) – – – – – – – – – – – – Net assets at the end of the year 131,288,512 – 403,708,515 7,772,631,181 199,234,220 435,716,343 14,094,187,464 31,136,072,706 1,031,179,655 34,323,409 101,981,555 95,062,669
(1) Fund name changed during the year, see Note 1, for further details.(2) Fund launched during the year, see Note 1, for further details.(3) Fund terminated during the year, see Note 1, for further details.
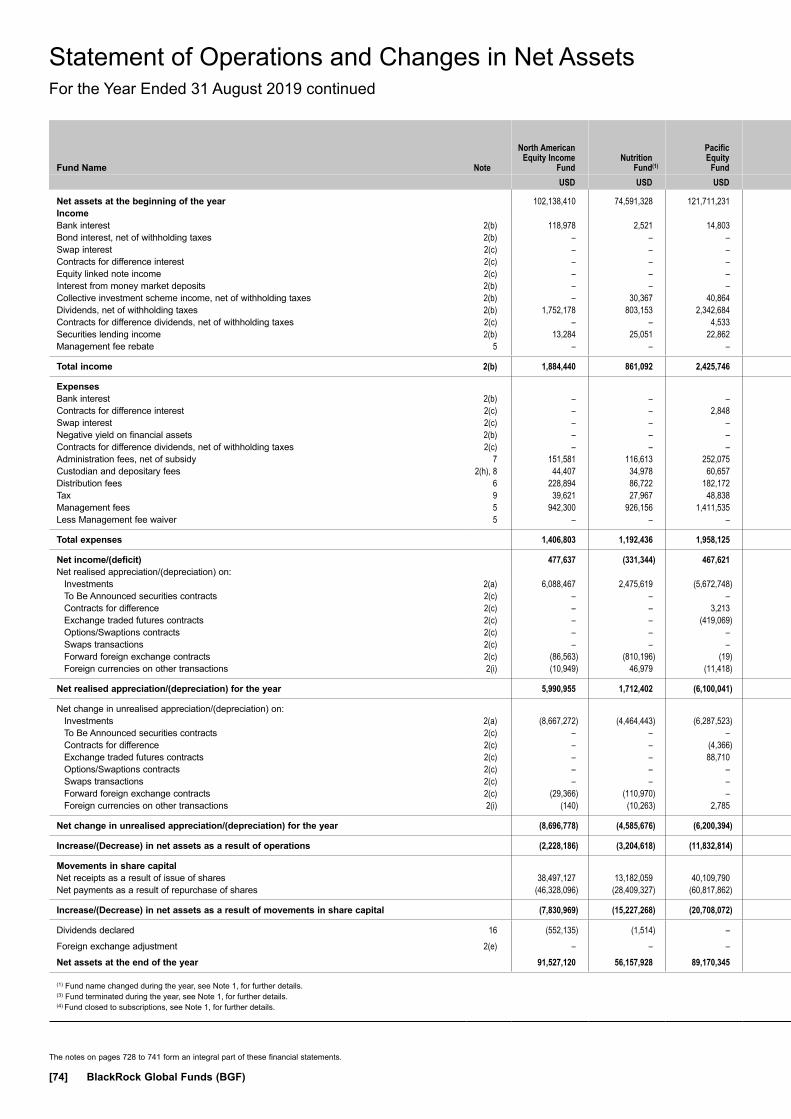
The notes on pages 728 to 741 form an integral part of these financial statements.
[74] BlackRock Global Funds (BGF)
Fund Name Note
North American Equity Income
Fund
Nutrition
Fund(1)
Pacific Equity
Fund
Strategic
Global Bond
Fund(3)
Sustainable Energy
Fund(1)
Swiss
Small & MidCap Opportunities
Fund(4)
United Kingdom
Fund
US
Basic Value Fund
US Dollar Bond Fund
US Dollar
High Yield Bond Fund
US Dollar Reserve
Fund
US Dollar
Short Duration Bond Fund
USD USD USD USD USD CHF GBP USD USD USD USD USD
Net assets at the beginning of the year 102,138,410 74,591,328 121,711,231 51,800,876 1,095,193,436 1,087,930,083 164,947,751 734,549,668 555,517,455 2,489,192,280 573,911,575 1,968,227,941 Income Bank interest 2(b) 118,978 2,521 14,803 58,211 48,342 – 549 461,783 510,592 1,279,614 4,931 424,735 Bond interest, net of withholding taxes 2(b) – – – 369,164 – – – – 20,142,212 133,723,295 – 56,070,188 Swap interest 2(c) – – – 643,114 – – – – 941,385 2,983,752 – 4,089,545 Contracts for difference interest 2(c) – – – 154 – – – – – – – 38,834 Equity linked note income 2(c) – – – – – – – – – – – – Interest from money market deposits 2(b) – – – 855 – – – – 30,100 – 15,389,715 595,115 Collective investment scheme income, net of withholding taxes 2(b) – 30,367 40,864 4,392 593,938 – 12,742 – – – – – Dividends, net of withholding taxes 2(b) 1,752,178 803,153 2,342,684 – 21,127,680 8,863,512 4,290,294 13,134,512 – 2,516,416 – – Contracts for difference dividends, net of withholding taxes 2(c) – – 4,533 – – – – – – – – – Securities lending income 2(b) 13,284 25,051 22,862 2,189 625,697 329,475 12,551 134,903 25,714 665,039 – 100,417 Management fee rebate 5 – – – – – – – – – – – –
Total income 2(b) 1,884,440 861,092 2,425,746 1,078,079 22,395,657 9,192,987 4,316,136 13,731,198 21,650,003 141,168,116 15,394,646 61,318,834
Expenses Bank interest 2(b) – – – – – 1,104,187 – – – – – – Contracts for difference interest 2(c) – – 2,848 – – – – – – – – – Swap interest 2(c) – – – 652,219 – – – – 1,131,201 932,897 – 1,848,773 Negative yield on financial assets 2(b) – – – – – – – – – – – – Contracts for difference dividends, net of withholding taxes 2(c) – – – – – – – – – – – – Administration fees, net of subsidy 7 151,581 116,613 252,075 (38,756) 2,395,944 1,749,299 292,850 1,425,320 556,446 2,803,782 458,640 1,007,543 Custodian and depositary fees 2(h), 8 44,407 34,978 60,657 104,366 181,752 177,850 36,330 92,372 209,906 343,835 87,996 247,834 Distribution fees 6 228,894 86,722 182,172 1,214 677,615 – 60,136 510,652 305,326 360,400 126,548 837,064 Tax 9 39,621 27,967 48,838 416 465,672 348,124 58,084 271,164 189,075 901,634 60,556 573,585 Management fees 5 942,300 926,156 1,411,535 2,454 16,485,763 9,688,876 1,603,141 8,216,689 3,062,591 22,835,141 2,710,841 6,807,725 Less Management fee waiver 5 – – – – – – – – – – – –
Total expenses 1,406,803 1,192,436 1,958,125 721,913 20,206,746 13,068,336 2,050,541 10,516,197 5,454,545 28,177,689 3,444,581 11,322,524
Net income/(deficit) 477,637 (331,344) 467,621 356,166 2,188,911 (3,875,349) 2,265,595 3,215,001 16,195,458 112,990,427 11,950,065 49,996,310 Net realised appreciation/(depreciation) on:
Investments 2(a) 6,088,467 2,475,619 (5,672,748) (3,146,474) 13,941,666 81,791,469 6,274,776 51,451,096 2,619,282 (53,673,966) 523,981 (6,557,476)To Be Announced securities contracts 2(c) – – – – – – – – 1,257,742 – – 2,494,327 Contracts for difference 2(c) – – 3,213 – – – – – – – – – Exchange traded futures contracts 2(c) – – (419,069) (54,549) – – – – 5,301,105 (1,550,414) – (2,056,595)Options/Swaptions contracts 2(c) – – – 182,963 – – – – (123,768) (612,033) – (398,796)Swaps transactions 2(c) – – – 2,689,303 – – – – 320,185 2,243,508 – (1,816,491)Forward foreign exchange contracts 2(c) (86,563) (810,196) (19) 186,581 (1,147,938) – – (3,446,728) (1,932,125) (11,136,770) (2,715,221) (6,718,915)Foreign currencies on other transactions 2(i) (10,949) 46,979 (11,418) (48,607) (124,544) 496 32,736 20,307 191,387 1,265,736 38,119 231,303
Net realised appreciation/(depreciation) for the year 5,990,955 1,712,402 (6,100,041) (190,783) 12,669,184 81,791,965 6,307,512 48,024,675 7,633,808 (63,463,939) (2,153,121) (14,822,643)
Net change in unrealised appreciation/(depreciation) on: Investments 2(a) (8,667,272) (4,464,443) (6,287,523) 1,061,344 (13,144,755) (130,055,737) (7,475,509) (92,023,451) 29,855,341 43,996,332 149,293 37,396,829 To Be Announced securities contracts 2(c) – – – (13,235) – – – – 60,617 – – (148,039)Contracts for difference 2(c) – – (4,366) – – – – – – – – – Exchange traded futures contracts 2(c) – – 88,710 (7,097) – – – – (386,163) 1,008,380 – (516,173)Options/Swaptions contracts 2(c) – – – (31,373) – – – – 120,764 9,174 – 319,216 Swaps transactions 2(c) – – – (1,303,697) – – – – (380,467) (977,916) – (1,104,384)Forward foreign exchange contracts 2(c) (29,366) (110,970) – (488,387) (300,121) – – (675,028) (915,045) 485,027 75,250 (2,101,843)Foreign currencies on other transactions 2(i) (140) (10,263) 2,785 40,565 (91,738) 61 2,249 (59,632) 35,533 (15,748) 379 (24,698)
Net change in unrealised appreciation/(depreciation) for the year (8,696,778) (4,585,676) (6,200,394) (741,880) (13,536,614) (130,055,676) (7,473,260) (92,758,111) 28,390,580 44,505,249 224,922 33,820,908
Increase/(Decrease) in net assets as a result of operations (2,228,186) (3,204,618) (11,832,814) (576,497) 1,321,481 (52,139,060) 1,099,847 (41,518,435) 52,219,846 94,031,737 10,021,866 68,994,575
Movements in share capital Net receipts as a result of issue of shares 38,497,127 13,182,059 40,109,790 806,977 180,521,237 10,701,010 54,120,004 189,536,328 423,527,032 1,229,778,264 1,282,816,480 612,617,752 Net payments as a result of repurchase of shares (46,328,096) (28,409,327) (60,817,862) (52,031,356) (260,269,866) (186,723,344) (74,094,765) (313,874,023) (336,192,507) (1,616,184,182) (1,285,955,014) (890,420,608)
Increase/(Decrease) in net assets as a result of movements in share capital (7,830,969) (15,227,268) (20,708,072) (51,224,379) (79,748,629) (176,022,334) (19,974,761) (124,337,695) 87,334,525 (386,405,918) (3,138,534) (277,802,856)
Dividends declared 16 (552,135) (1,514) – – (279,867) (63,953) (496,423) (21,765) (2,053,415) (90,201,332) – (2,718,086)Foreign exchange adjustment 2(e) – – – – – – – – – – – – Net assets at the end of the year 91,527,120 56,157,928 89,170,345 – 1,016,486,421 859,704,736 145,576,414 568,671,773 693,018,411 2,106,616,767 580,794,907 1,756,701,574
(1) Fund name changed during the year, see Note 1, for further details.(3) Fund terminated during the year, see Note 1, for further details.(4) Fund closed to subscriptions, see Note 1, for further details.
Statement of Operations and Changes in Net AssetsFor the Year Ended 31 August 2019 continued

The notes on pages 728 to 741 form an integral part of these financial statements.
Annual Report and Financial Statements [75]
Fund Name Note
North American Equity Income
Fund
Nutrition
Fund(1)
Pacific Equity
Fund
Strategic
Global Bond
Fund(3)
Sustainable Energy
Fund(1)
Swiss
Small & MidCap Opportunities
Fund(4)
United Kingdom
Fund
US
Basic Value Fund
US Dollar Bond Fund
US Dollar
High Yield Bond Fund
US Dollar Reserve
Fund
US Dollar
Short Duration Bond Fund
USD USD USD USD USD CHF GBP USD USD USD USD USD
Net assets at the beginning of the year 102,138,410 74,591,328 121,711,231 51,800,876 1,095,193,436 1,087,930,083 164,947,751 734,549,668 555,517,455 2,489,192,280 573,911,575 1,968,227,941 Income Bank interest 2(b) 118,978 2,521 14,803 58,211 48,342 – 549 461,783 510,592 1,279,614 4,931 424,735 Bond interest, net of withholding taxes 2(b) – – – 369,164 – – – – 20,142,212 133,723,295 – 56,070,188 Swap interest 2(c) – – – 643,114 – – – – 941,385 2,983,752 – 4,089,545 Contracts for difference interest 2(c) – – – 154 – – – – – – – 38,834 Equity linked note income 2(c) – – – – – – – – – – – – Interest from money market deposits 2(b) – – – 855 – – – – 30,100 – 15,389,715 595,115 Collective investment scheme income, net of withholding taxes 2(b) – 30,367 40,864 4,392 593,938 – 12,742 – – – – – Dividends, net of withholding taxes 2(b) 1,752,178 803,153 2,342,684 – 21,127,680 8,863,512 4,290,294 13,134,512 – 2,516,416 – – Contracts for difference dividends, net of withholding taxes 2(c) – – 4,533 – – – – – – – – – Securities lending income 2(b) 13,284 25,051 22,862 2,189 625,697 329,475 12,551 134,903 25,714 665,039 – 100,417 Management fee rebate 5 – – – – – – – – – – – –
Total income 2(b) 1,884,440 861,092 2,425,746 1,078,079 22,395,657 9,192,987 4,316,136 13,731,198 21,650,003 141,168,116 15,394,646 61,318,834
Expenses Bank interest 2(b) – – – – – 1,104,187 – – – – – – Contracts for difference interest 2(c) – – 2,848 – – – – – – – – – Swap interest 2(c) – – – 652,219 – – – – 1,131,201 932,897 – 1,848,773 Negative yield on financial assets 2(b) – – – – – – – – – – – – Contracts for difference dividends, net of withholding taxes 2(c) – – – – – – – – – – – – Administration fees, net of subsidy 7 151,581 116,613 252,075 (38,756) 2,395,944 1,749,299 292,850 1,425,320 556,446 2,803,782 458,640 1,007,543 Custodian and depositary fees 2(h), 8 44,407 34,978 60,657 104,366 181,752 177,850 36,330 92,372 209,906 343,835 87,996 247,834 Distribution fees 6 228,894 86,722 182,172 1,214 677,615 – 60,136 510,652 305,326 360,400 126,548 837,064 Tax 9 39,621 27,967 48,838 416 465,672 348,124 58,084 271,164 189,075 901,634 60,556 573,585 Management fees 5 942,300 926,156 1,411,535 2,454 16,485,763 9,688,876 1,603,141 8,216,689 3,062,591 22,835,141 2,710,841 6,807,725 Less Management fee waiver 5 – – – – – – – – – – – –
Total expenses 1,406,803 1,192,436 1,958,125 721,913 20,206,746 13,068,336 2,050,541 10,516,197 5,454,545 28,177,689 3,444,581 11,322,524
Net income/(deficit) 477,637 (331,344) 467,621 356,166 2,188,911 (3,875,349) 2,265,595 3,215,001 16,195,458 112,990,427 11,950,065 49,996,310 Net realised appreciation/(depreciation) on:
Investments 2(a) 6,088,467 2,475,619 (5,672,748) (3,146,474) 13,941,666 81,791,469 6,274,776 51,451,096 2,619,282 (53,673,966) 523,981 (6,557,476)To Be Announced securities contracts 2(c) – – – – – – – – 1,257,742 – – 2,494,327 Contracts for difference 2(c) – – 3,213 – – – – – – – – – Exchange traded futures contracts 2(c) – – (419,069) (54,549) – – – – 5,301,105 (1,550,414) – (2,056,595)Options/Swaptions contracts 2(c) – – – 182,963 – – – – (123,768) (612,033) – (398,796)Swaps transactions 2(c) – – – 2,689,303 – – – – 320,185 2,243,508 – (1,816,491)Forward foreign exchange contracts 2(c) (86,563) (810,196) (19) 186,581 (1,147,938) – – (3,446,728) (1,932,125) (11,136,770) (2,715,221) (6,718,915)Foreign currencies on other transactions 2(i) (10,949) 46,979 (11,418) (48,607) (124,544) 496 32,736 20,307 191,387 1,265,736 38,119 231,303
Net realised appreciation/(depreciation) for the year 5,990,955 1,712,402 (6,100,041) (190,783) 12,669,184 81,791,965 6,307,512 48,024,675 7,633,808 (63,463,939) (2,153,121) (14,822,643)
Net change in unrealised appreciation/(depreciation) on: Investments 2(a) (8,667,272) (4,464,443) (6,287,523) 1,061,344 (13,144,755) (130,055,737) (7,475,509) (92,023,451) 29,855,341 43,996,332 149,293 37,396,829 To Be Announced securities contracts 2(c) – – – (13,235) – – – – 60,617 – – (148,039)Contracts for difference 2(c) – – (4,366) – – – – – – – – – Exchange traded futures contracts 2(c) – – 88,710 (7,097) – – – – (386,163) 1,008,380 – (516,173)Options/Swaptions contracts 2(c) – – – (31,373) – – – – 120,764 9,174 – 319,216 Swaps transactions 2(c) – – – (1,303,697) – – – – (380,467) (977,916) – (1,104,384)Forward foreign exchange contracts 2(c) (29,366) (110,970) – (488,387) (300,121) – – (675,028) (915,045) 485,027 75,250 (2,101,843)Foreign currencies on other transactions 2(i) (140) (10,263) 2,785 40,565 (91,738) 61 2,249 (59,632) 35,533 (15,748) 379 (24,698)
Net change in unrealised appreciation/(depreciation) for the year (8,696,778) (4,585,676) (6,200,394) (741,880) (13,536,614) (130,055,676) (7,473,260) (92,758,111) 28,390,580 44,505,249 224,922 33,820,908
Increase/(Decrease) in net assets as a result of operations (2,228,186) (3,204,618) (11,832,814) (576,497) 1,321,481 (52,139,060) 1,099,847 (41,518,435) 52,219,846 94,031,737 10,021,866 68,994,575
Movements in share capital Net receipts as a result of issue of shares 38,497,127 13,182,059 40,109,790 806,977 180,521,237 10,701,010 54,120,004 189,536,328 423,527,032 1,229,778,264 1,282,816,480 612,617,752 Net payments as a result of repurchase of shares (46,328,096) (28,409,327) (60,817,862) (52,031,356) (260,269,866) (186,723,344) (74,094,765) (313,874,023) (336,192,507) (1,616,184,182) (1,285,955,014) (890,420,608)
Increase/(Decrease) in net assets as a result of movements in share capital (7,830,969) (15,227,268) (20,708,072) (51,224,379) (79,748,629) (176,022,334) (19,974,761) (124,337,695) 87,334,525 (386,405,918) (3,138,534) (277,802,856)
Dividends declared 16 (552,135) (1,514) – – (279,867) (63,953) (496,423) (21,765) (2,053,415) (90,201,332) – (2,718,086)Foreign exchange adjustment 2(e) – – – – – – – – – – – – Net assets at the end of the year 91,527,120 56,157,928 89,170,345 – 1,016,486,421 859,704,736 145,576,414 568,671,773 693,018,411 2,106,616,767 580,794,907 1,756,701,574
(1) Fund name changed during the year, see Note 1, for further details.(3) Fund terminated during the year, see Note 1, for further details.(4) Fund closed to subscriptions, see Note 1, for further details.

The notes on pages 728 to 741 form an integral part of these financial statements.
[76] BlackRock Global Funds (BGF)
Statement of Operations and Changes in Net AssetsFor the Year Ended 31 August 2019 continued
Fund Name Note
US Flexible
Equity Fund
US Government
Mortgage Fund
US
Growth Fund
US
Small & MidCap Opportunities
Fund
World Bond Fund
World Energy
Fund
World Financials
Fund
World Gold Fund
World Healthscience
Fund
World Mining
Fund
World
Real Estate Securities
Fund
World Technology
FundUSD USD USD USD USD USD USD USD USD USD USD USD
Net assets at the beginning of the year 1,271,294,132 102,424,117 465,453,042 228,355,254 1,340,682,994 1,653,787,091 1,613,066,299 3,488,346,156 3,505,212,723 5,276,013,669 236,351,532 1,522,419,096 Income Bank interest 2(b) 191,907 25,367 97,346 123,659 193,843 67,628 – 173,000 2,697,158 201,970 117,864 806,618 Bond interest, net of withholding taxes 2(b) – 4,449,244 – – 33,493,724 – – – – – – – Swap interest 2(c) – 628,234 – – 3,609,754 – – – – – – – Contracts for difference interest 2(c) – – – – – – – – – – – – Equity linked note income 2(c) – – – – – – – – – – – – Interest from money market deposits 2(b) – – – – – – – – – – – – Collective investment scheme income, net of withholding taxes 2(b) – – – – 653,994 453,798 377,710 938,205 – 1,163,691 – – Dividends, net of withholding taxes 2(b) 20,821,867 – 2,341,208 3,321,650 – 41,872,172 21,117,945 69,325,049 50,599,146 164,406,972 5,570,340 3,761,521 Contracts for difference dividends, net of withholding taxes 2(c) – – – – – – 377,982 – – – – – Securities lending income 2(b) 232,831 – 60,390 36,432 150,279 895,720 647,609 831,027 1,131,239 1,213,475 37,364 1,615,895 Management fee rebate 5 – – – – 62,759 – – – – – – –
Total income 2(b) 21,246,605 5,102,845 2,498,944 3,481,741 38,164,353 43,289,318 22,521,246 71,267,281 54,427,543 166,986,108 5,725,568 6,184,034
Expenses Bank interest 2(b) – – – – – – 170,157 – – – – – Contracts for difference interest 2(c) – – – – – – 3,933 – – – 1,409 – Swap interest 2(c) – 655,812 – – 3,410,734 – – – – – – – Negative yield on financial assets 2(b) – – – – – – – – – – – – Contracts for difference dividends, net of withholding taxes 2(c) – – – – – – – – – – – – Administration fees, net of subsidy 7 2,485,781 135,340 827,779 474,848 812,655 3,382,297 2,908,889 10,276,888 9,788,944 12,249,973 462,547 3,603,500 Custodian and depositary fees 2(h), 8 197,259 89,400 70,871 70,787 375,830 189,375 272,936 657,794 522,434 1,080,438 85,128 265,941 Distribution fees 6 545,536 93,818 264,869 175,044 82,382 540,222 490,759 1,985,461 3,300,485 1,255,385 24,741 1,938,628 Tax 9 501,838 45,156 165,655 88,671 276,550 646,365 483,222 2,203,120 2,001,641 2,454,329 90,675 729,955 Management fees 5 14,519,491 592,479 4,401,822 2,667,178 2,362,059 22,851,172 15,303,822 70,155,613 53,976,248 85,496,290 2,594,980 19,866,916 Less Management fee waiver 5 – – – – – – – – – – – –
Total expenses 18,249,905 1,612,005 5,730,996 3,476,528 7,320,210 27,609,431 19,633,718 85,278,876 69,589,752 102,536,415 3,259,480 26,404,940
Net income/(deficit) 2,996,700 3,490,840 (3,232,052) 5,213 30,844,143 15,679,887 2,887,528 (14,011,595) (15,162,209) 64,449,693 2,466,088 (20,220,906)Net realised appreciation/(depreciation) on:
Investments 2(a) 59,488,979 (3,204,917) 38,139,636 7,316,839 (9,174,876) (66,553,849) (23,138,421) (248,619,456) 124,612,811 (122,832,367) 8,204,655 (54,534,491)To Be Announced securities contracts 2(c) – 1,781,987 – – (456,949) – – – – – – – Contracts for difference 2(c) – – – – – – 4,952,735 – – – 60,506 – Exchange traded futures contracts 2(c) – (751,429) – – 17,124,510 – 214,019 – – – (4,839) – Options/Swaptions contracts 2(c) – 74,927 – – (2,622,018) – – – 150,150 – – (2,010,903)Swaps transactions 2(c) – 455,747 – – 775,931 – – – – – – – Forward foreign exchange contracts 2(c) (9,572,481) – (1,268,787) (120,059) (13,872,905) (8,019,757) (433,020) (24,619,836) 24,014 (22,029,460) (336,803) (2,810,308)Foreign currencies on other transactions 2(i) (481,268) (9,653) (2,931) 821 4,147,054 (38,589) (429,703) (136,538) (92,112) 974,874 (52,277) (109,981)
Net realised appreciation/(depreciation) for the year 49,435,230 (1,653,338) 36,867,918 7,197,601 (4,079,253) (74,612,195) (18,834,390) (273,375,830) 124,694,863 (143,886,953) 7,871,242 (59,465,683)
Net change in unrealised appreciation/(depreciation) on: Investments 2(a) (108,804,441) 4,531,687 (28,241,477) (18,137,784) 83,785,406 (317,350,375) (59,977,655) 2,097,168,795 88,139,747 193,318,631 4,073,028 171,234,403 To Be Announced securities contracts 2(c) – 43,582 – – (9,966) – – – – – – – Contracts for difference 2(c) – – – – – – 214,019 – – – (4,842) – Exchange traded futures contracts 2(c) – (13,050) – – (1,550,838) – – – – – – – Options/Swaptions contracts 2(c) – (129,670) – – (1,032,415) – – – – – – 1,476,803 Swaps transactions 2(c) – (708,228) – – 107,413 – – – – – – – Forward foreign exchange contracts 2(c) (2,187,728) – (319,478) 25,077 (10,547,753) (824,506) 114,886 (6,237,453) 2,713,515 (2,597,399) 23,356 (771,127)Foreign currencies on other transactions 2(i) (4,442) (22) (118) 580 (582,410) (43,920) (58,909) 21,067 (7,469) 61,518 (12,767) (7,091)
Net change in unrealised appreciation/(depreciation) for the year (110,996,611) 3,724,299 (28,561,073) (18,112,127) 70,169,437 (318,218,801) (59,707,659) 2,090,952,409 90,845,793 190,782,750 4,078,775 171,932,988
Increase/(Decrease) in net assets as a result of operations (58,564,681) 5,561,801 5,074,793 (10,909,313) 96,934,327 (377,151,109) (75,654,521) 1,803,564,984 200,378,447 111,345,490 14,416,105 92,246,399
Movements in share capital Net receipts as a result of issue of shares 1,035,400,487 126,208,629 325,927,110 62,863,451 319,661,603 700,790,375 187,409,141 3,665,183,136 2,974,197,337 949,651,070 42,820,190 1,670,854,423 Net payments as a result of repurchase of shares (818,308,527) (124,847,897) (383,920,249) (117,566,033) (381,774,090) (735,694,574) (1,010,339,165) (3,287,329,642) (2,195,182,378) (1,747,271,091) (117,788,593) (1,430,967,422)
Increase/(Decrease) in net assets as a result of movements in share capital 217,091,960 1,360,732 (57,993,139) (54,702,582) (62,112,487) (34,904,199) (822,930,024) 377,853,494 779,014,959 (797,620,021) (74,968,403) 239,887,001
Dividends declared 16 (13,694) (686,449) – – (492,723) (241,978) – (13,072) (6,830) (666,359) (35,087) – Foreign exchange adjustment 2(e) – – – – – – – – – – – – Net assets at the end of the year 1,429,807,717 108,660,201 412,534,696 162,743,359 1,375,012,111 1,241,489,805 714,481,754 5,669,751,562 4,484,599,299 4,589,072,779 175,764,147 1,854,552,496

The notes on pages 728 to 741 form an integral part of these financial statements.
Annual Report and Financial Statements [77]
Fund Name Note
US Flexible
Equity Fund
US Government
Mortgage Fund
US
Growth Fund
US
Small & MidCap Opportunities
Fund
World Bond Fund
World Energy
Fund
World Financials
Fund
World Gold Fund
World Healthscience
Fund
World Mining
Fund
World
Real Estate Securities
Fund
World Technology
FundUSD USD USD USD USD USD USD USD USD USD USD USD
Net assets at the beginning of the year 1,271,294,132 102,424,117 465,453,042 228,355,254 1,340,682,994 1,653,787,091 1,613,066,299 3,488,346,156 3,505,212,723 5,276,013,669 236,351,532 1,522,419,096 Income Bank interest 2(b) 191,907 25,367 97,346 123,659 193,843 67,628 – 173,000 2,697,158 201,970 117,864 806,618 Bond interest, net of withholding taxes 2(b) – 4,449,244 – – 33,493,724 – – – – – – – Swap interest 2(c) – 628,234 – – 3,609,754 – – – – – – – Contracts for difference interest 2(c) – – – – – – – – – – – – Equity linked note income 2(c) – – – – – – – – – – – – Interest from money market deposits 2(b) – – – – – – – – – – – – Collective investment scheme income, net of withholding taxes 2(b) – – – – 653,994 453,798 377,710 938,205 – 1,163,691 – – Dividends, net of withholding taxes 2(b) 20,821,867 – 2,341,208 3,321,650 – 41,872,172 21,117,945 69,325,049 50,599,146 164,406,972 5,570,340 3,761,521 Contracts for difference dividends, net of withholding taxes 2(c) – – – – – – 377,982 – – – – – Securities lending income 2(b) 232,831 – 60,390 36,432 150,279 895,720 647,609 831,027 1,131,239 1,213,475 37,364 1,615,895 Management fee rebate 5 – – – – 62,759 – – – – – – –
Total income 2(b) 21,246,605 5,102,845 2,498,944 3,481,741 38,164,353 43,289,318 22,521,246 71,267,281 54,427,543 166,986,108 5,725,568 6,184,034
Expenses Bank interest 2(b) – – – – – – 170,157 – – – – – Contracts for difference interest 2(c) – – – – – – 3,933 – – – 1,409 – Swap interest 2(c) – 655,812 – – 3,410,734 – – – – – – – Negative yield on financial assets 2(b) – – – – – – – – – – – – Contracts for difference dividends, net of withholding taxes 2(c) – – – – – – – – – – – – Administration fees, net of subsidy 7 2,485,781 135,340 827,779 474,848 812,655 3,382,297 2,908,889 10,276,888 9,788,944 12,249,973 462,547 3,603,500 Custodian and depositary fees 2(h), 8 197,259 89,400 70,871 70,787 375,830 189,375 272,936 657,794 522,434 1,080,438 85,128 265,941 Distribution fees 6 545,536 93,818 264,869 175,044 82,382 540,222 490,759 1,985,461 3,300,485 1,255,385 24,741 1,938,628 Tax 9 501,838 45,156 165,655 88,671 276,550 646,365 483,222 2,203,120 2,001,641 2,454,329 90,675 729,955 Management fees 5 14,519,491 592,479 4,401,822 2,667,178 2,362,059 22,851,172 15,303,822 70,155,613 53,976,248 85,496,290 2,594,980 19,866,916 Less Management fee waiver 5 – – – – – – – – – – – –
Total expenses 18,249,905 1,612,005 5,730,996 3,476,528 7,320,210 27,609,431 19,633,718 85,278,876 69,589,752 102,536,415 3,259,480 26,404,940
Net income/(deficit) 2,996,700 3,490,840 (3,232,052) 5,213 30,844,143 15,679,887 2,887,528 (14,011,595) (15,162,209) 64,449,693 2,466,088 (20,220,906)Net realised appreciation/(depreciation) on:
Investments 2(a) 59,488,979 (3,204,917) 38,139,636 7,316,839 (9,174,876) (66,553,849) (23,138,421) (248,619,456) 124,612,811 (122,832,367) 8,204,655 (54,534,491)To Be Announced securities contracts 2(c) – 1,781,987 – – (456,949) – – – – – – – Contracts for difference 2(c) – – – – – – 4,952,735 – – – 60,506 – Exchange traded futures contracts 2(c) – (751,429) – – 17,124,510 – 214,019 – – – (4,839) – Options/Swaptions contracts 2(c) – 74,927 – – (2,622,018) – – – 150,150 – – (2,010,903)Swaps transactions 2(c) – 455,747 – – 775,931 – – – – – – – Forward foreign exchange contracts 2(c) (9,572,481) – (1,268,787) (120,059) (13,872,905) (8,019,757) (433,020) (24,619,836) 24,014 (22,029,460) (336,803) (2,810,308)Foreign currencies on other transactions 2(i) (481,268) (9,653) (2,931) 821 4,147,054 (38,589) (429,703) (136,538) (92,112) 974,874 (52,277) (109,981)
Net realised appreciation/(depreciation) for the year 49,435,230 (1,653,338) 36,867,918 7,197,601 (4,079,253) (74,612,195) (18,834,390) (273,375,830) 124,694,863 (143,886,953) 7,871,242 (59,465,683)
Net change in unrealised appreciation/(depreciation) on: Investments 2(a) (108,804,441) 4,531,687 (28,241,477) (18,137,784) 83,785,406 (317,350,375) (59,977,655) 2,097,168,795 88,139,747 193,318,631 4,073,028 171,234,403 To Be Announced securities contracts 2(c) – 43,582 – – (9,966) – – – – – – – Contracts for difference 2(c) – – – – – – 214,019 – – – (4,842) – Exchange traded futures contracts 2(c) – (13,050) – – (1,550,838) – – – – – – – Options/Swaptions contracts 2(c) – (129,670) – – (1,032,415) – – – – – – 1,476,803 Swaps transactions 2(c) – (708,228) – – 107,413 – – – – – – – Forward foreign exchange contracts 2(c) (2,187,728) – (319,478) 25,077 (10,547,753) (824,506) 114,886 (6,237,453) 2,713,515 (2,597,399) 23,356 (771,127)Foreign currencies on other transactions 2(i) (4,442) (22) (118) 580 (582,410) (43,920) (58,909) 21,067 (7,469) 61,518 (12,767) (7,091)
Net change in unrealised appreciation/(depreciation) for the year (110,996,611) 3,724,299 (28,561,073) (18,112,127) 70,169,437 (318,218,801) (59,707,659) 2,090,952,409 90,845,793 190,782,750 4,078,775 171,932,988
Increase/(Decrease) in net assets as a result of operations (58,564,681) 5,561,801 5,074,793 (10,909,313) 96,934,327 (377,151,109) (75,654,521) 1,803,564,984 200,378,447 111,345,490 14,416,105 92,246,399
Movements in share capital Net receipts as a result of issue of shares 1,035,400,487 126,208,629 325,927,110 62,863,451 319,661,603 700,790,375 187,409,141 3,665,183,136 2,974,197,337 949,651,070 42,820,190 1,670,854,423 Net payments as a result of repurchase of shares (818,308,527) (124,847,897) (383,920,249) (117,566,033) (381,774,090) (735,694,574) (1,010,339,165) (3,287,329,642) (2,195,182,378) (1,747,271,091) (117,788,593) (1,430,967,422)
Increase/(Decrease) in net assets as a result of movements in share capital 217,091,960 1,360,732 (57,993,139) (54,702,582) (62,112,487) (34,904,199) (822,930,024) 377,853,494 779,014,959 (797,620,021) (74,968,403) 239,887,001
Dividends declared 16 (13,694) (686,449) – – (492,723) (241,978) – (13,072) (6,830) (666,359) (35,087) – Foreign exchange adjustment 2(e) – – – – – – – – – – – – Net assets at the end of the year 1,429,807,717 108,660,201 412,534,696 162,743,359 1,375,012,111 1,241,489,805 714,481,754 5,669,751,562 4,484,599,299 4,589,072,779 175,764,147 1,854,552,496
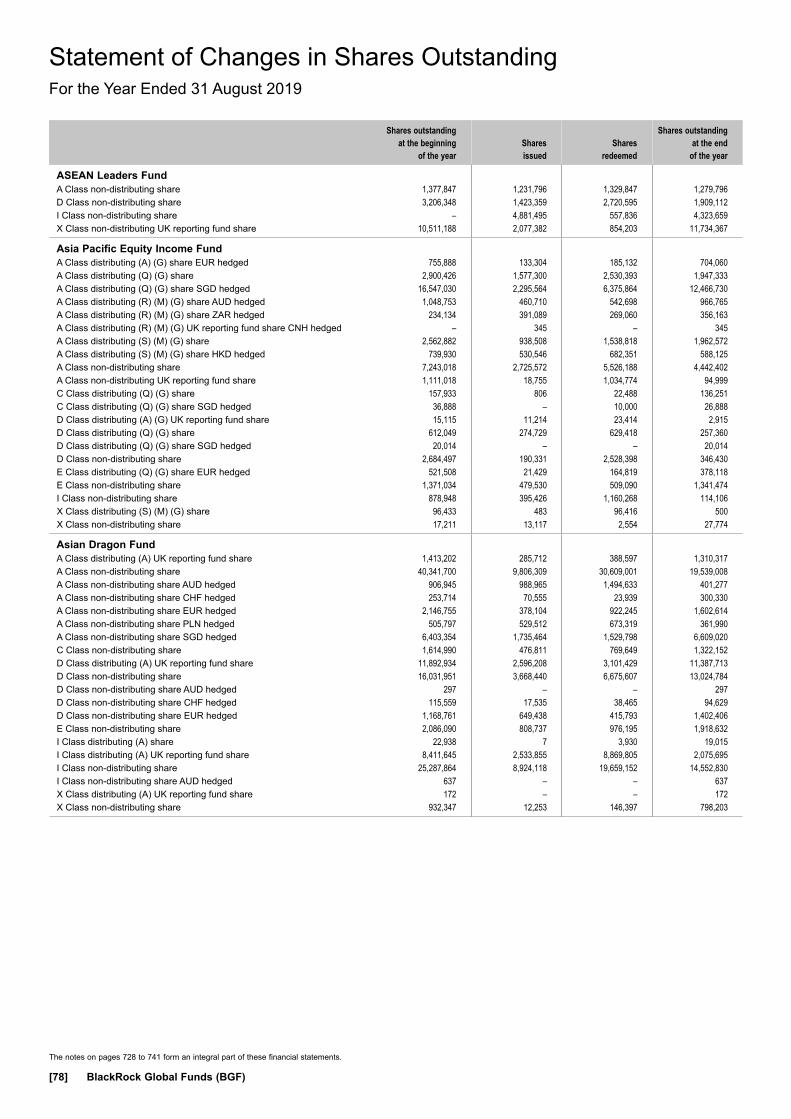
The notes on pages 728 to 741 form an integral part of these financial statements.
[78] BlackRock Global Funds (BGF)
Statement of Changes in Shares OutstandingFor the Year Ended 31 August 2019
Statement of Changes in Shares Outstanding
Shares outstanding at the beginning
of the yearShares issued
Shares redeemed
Shares outstanding at the end
of the year
ASEAN Leaders FundA Class non-distributing share 1,377,847 1,231,796 1,329,847 1,279,796D Class non-distributing share 3,206,348 1,423,359 2,720,595 1,909,112I Class non-distributing share – 4,881,495 557,836 4,323,659X Class non-distributing UK reporting fund share 10,511,188 2,077,382 854,203 11,734,367
Asia Pacific Equity Income Fund A Class distributing (A) (G) share EUR hedged 755,888 133,304 185,132 704,060A Class distributing (Q) (G) share 2,900,426 1,577,300 2,530,393 1,947,333A Class distributing (Q) (G) share SGD hedged 16,547,030 2,295,564 6,375,864 12,466,730A Class distributing (R) (M) (G) share AUD hedged 1,048,753 460,710 542,698 966,765A Class distributing (R) (M) (G) share ZAR hedged 234,134 391,089 269,060 356,163A Class distributing (R) (M) (G) UK reporting fund share CNH hedged – 345 – 345A Class distributing (S) (M) (G) share 2,562,882 938,508 1,538,818 1,962,572A Class distributing (S) (M) (G) share HKD hedged 739,930 530,546 682,351 588,125A Class non-distributing share 7,243,018 2,725,572 5,526,188 4,442,402A Class non-distributing UK reporting fund share 1,111,018 18,755 1,034,774 94,999C Class distributing (Q) (G) share 157,933 806 22,488 136,251C Class distributing (Q) (G) share SGD hedged 36,888 – 10,000 26,888D Class distributing (A) (G) UK reporting fund share 15,115 11,214 23,414 2,915D Class distributing (Q) (G) share 612,049 274,729 629,418 257,360D Class distributing (Q) (G) share SGD hedged 20,014 – – 20,014D Class non-distributing share 2,684,497 190,331 2,528,398 346,430E Class distributing (Q) (G) share EUR hedged 521,508 21,429 164,819 378,118E Class non-distributing share 1,371,034 479,530 509,090 1,341,474I Class non-distributing share 878,948 395,426 1,160,268 114,106X Class distributing (S) (M) (G) share 96,433 483 96,416 500X Class non-distributing share 17,211 13,117 2,554 27,774
Asian Dragon Fund A Class distributing (A) UK reporting fund share 1,413,202 285,712 388,597 1,310,317A Class non-distributing share 40,341,700 9,806,309 30,609,001 19,539,008A Class non-distributing share AUD hedged 906,945 988,965 1,494,633 401,277A Class non-distributing share CHF hedged 253,714 70,555 23,939 300,330A Class non-distributing share EUR hedged 2,146,755 378,104 922,245 1,602,614A Class non-distributing share PLN hedged 505,797 529,512 673,319 361,990A Class non-distributing share SGD hedged 6,403,354 1,735,464 1,529,798 6,609,020C Class non-distributing share 1,614,990 476,811 769,649 1,322,152D Class distributing (A) UK reporting fund share 11,892,934 2,596,208 3,101,429 11,387,713D Class non-distributing share 16,031,951 3,668,440 6,675,607 13,024,784D Class non-distributing share AUD hedged 297 – – 297D Class non-distributing share CHF hedged 115,559 17,535 38,465 94,629D Class non-distributing share EUR hedged 1,168,761 649,438 415,793 1,402,406E Class non-distributing share 2,086,090 808,737 976,195 1,918,632I Class distributing (A) share 22,938 7 3,930 19,015I Class distributing (A) UK reporting fund share 8,411,645 2,533,855 8,869,805 2,075,695I Class non-distributing share 25,287,864 8,924,118 19,659,152 14,552,830I Class non-distributing share AUD hedged 637 – – 637X Class distributing (A) UK reporting fund share 172 – – 172X Class non-distributing share 932,347 12,253 146,397 798,203
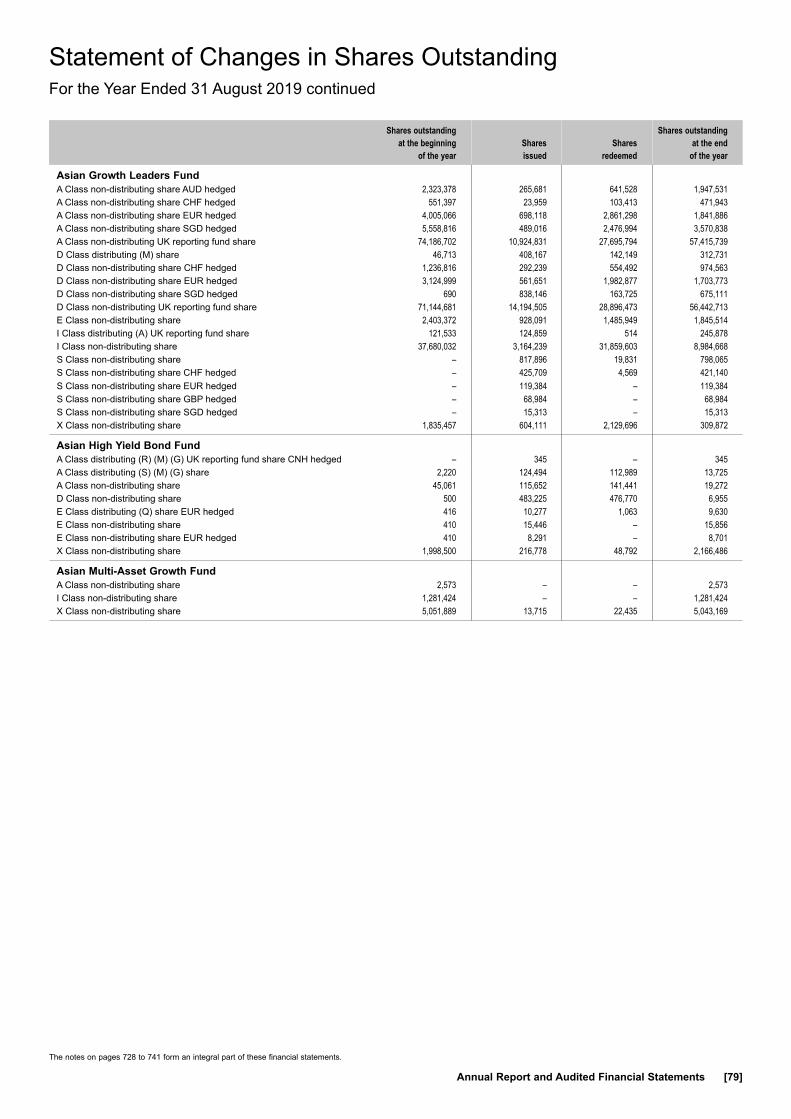
The notes on pages 728 to 741 form an integral part of these financial statements.
Annual Report and Audited Financial Statements [79]
Statement of Changes in Shares OutstandingFor the Year Ended 31 August 2019 continued
Shares outstanding at the beginning
of the yearShares issued
Shares redeemed
Shares outstanding at the end
of the year
Asian Growth Leaders Fund A Class non-distributing share AUD hedged 2,323,378 265,681 641,528 1,947,531A Class non-distributing share CHF hedged 551,397 23,959 103,413 471,943A Class non-distributing share EUR hedged 4,005,066 698,118 2,861,298 1,841,886A Class non-distributing share SGD hedged 5,558,816 489,016 2,476,994 3,570,838A Class non-distributing UK reporting fund share 74,186,702 10,924,831 27,695,794 57,415,739D Class distributing (M) share 46,713 408,167 142,149 312,731D Class non-distributing share CHF hedged 1,236,816 292,239 554,492 974,563D Class non-distributing share EUR hedged 3,124,999 561,651 1,982,877 1,703,773D Class non-distributing share SGD hedged 690 838,146 163,725 675,111D Class non-distributing UK reporting fund share 71,144,681 14,194,505 28,896,473 56,442,713E Class non-distributing share 2,403,372 928,091 1,485,949 1,845,514I Class distributing (A) UK reporting fund share 121,533 124,859 514 245,878I Class non-distributing share 37,680,032 3,164,239 31,859,603 8,984,668S Class non-distributing share – 817,896 19,831 798,065S Class non-distributing share CHF hedged – 425,709 4,569 421,140S Class non-distributing share EUR hedged – 119,384 – 119,384S Class non-distributing share GBP hedged – 68,984 – 68,984S Class non-distributing share SGD hedged – 15,313 – 15,313X Class non-distributing share 1,835,457 604,111 2,129,696 309,872
Asian High Yield Bond Fund A Class distributing (R) (M) (G) UK reporting fund share CNH hedged – 345 – 345A Class distributing (S) (M) (G) share 2,220 124,494 112,989 13,725A Class non-distributing share 45,061 115,652 141,441 19,272D Class non-distributing share 500 483,225 476,770 6,955E Class distributing (Q) share EUR hedged 416 10,277 1,063 9,630E Class non-distributing share 410 15,446 – 15,856E Class non-distributing share EUR hedged 410 8,291 – 8,701X Class non-distributing share 1,998,500 216,778 48,792 2,166,486
Asian Multi-Asset Growth Fund A Class non-distributing share 2,573 – – 2,573I Class non-distributing share 1,281,424 – – 1,281,424X Class non-distributing share 5,051,889 13,715 22,435 5,043,169

The notes on pages 728 to 741 form an integral part of these financial statements.
[80] BlackRock Global Funds (BGF)
Statement of Changes in Shares OutstandingFor the Year Ended 31 August 2019 continued
Shares outstanding at the beginning
of the yearShares issued
Shares redeemed
Shares outstanding at the end
of the year
Asian Tiger Bond Fund A Class distributing (D) share 4,054,606 322,656 800,012 3,577,250A Class distributing (M) share 14,164,111 13,500,483 10,165,325 17,499,269A Class distributing (M) share AUD hedged 1,188,245 642,389 253,114 1,577,520A Class distributing (M) share EUR hedged 1,362,583 1,073,043 309,383 2,126,243A Class distributing (M) share HKD hedged 41,937,455 25,419,454 27,416,611 39,940,298A Class distributing (M) share NZD hedged 468,023 221,206 144,244 544,985A Class distributing (M) share SGD hedged 2,477,415 269,617 874,702 1,872,330A Class distributing (R) (M) (G) share AUD hedged 15,297,796 13,837,288 9,905,759 19,229,325A Class distributing (R) (M) (G) share CAD hedged 6,263,477 4,705,242 3,346,301 7,622,418A Class distributing (R) (M) (G) share CNH hedged 1,263,511 1,992,707 267,549 2,988,669A Class distributing (R) (M) (G) share NZD hedged 3,166,806 2,894,928 1,945,743 4,115,991A Class distributing (R) (M) (G) share ZAR hedged 1,269,746 850,107 584,335 1,535,518A Class distributing (S) (M) (G) share 46,636,781 33,082,933 32,154,788 47,564,926A Class distributing (S) (M) (G) share EUR hedged 5,492,026 3,866,367 2,593,572 6,764,821A Class distributing (S) (M) (G) share GBP hedged 6,899,336 8,070,421 3,390,537 11,579,220A Class distributing (S) (M) (G) share HKD hedged 17,970,779 14,539,642 11,911,220 20,599,201A Class distributing (S) (M) (G) share SGD hedged 19,068,503 8,688,530 9,953,255 17,803,778A Class non-distributing share 11,544,406 9,048,428 6,010,870 14,581,964A Class non-distributing share EUR hedged 840,232 1,339,719 552,860 1,627,091A Class non-distributing share SGD hedged 2,662,417 1,736,141 1,083,041 3,315,517C Class distributing (D) share 221,906 1,289 73,182 150,013C Class non-distributing share 245,016 34,674 95,455 184,235D Class distributing (A) UK reporting fund share GBP hedged 275,781 23,740 48,848 250,673D Class distributing (M) share 1,787,048 997,630 1,210,461 1,574,217D Class distributing (M) share HKD hedged 20,443 2,461,835 – 2,482,278D Class distributing (S) (M) (G) share 3,161,062 1,393,441 1,544,150 3,010,353D Class non-distributing share 11,359,961 4,913,784 5,548,527 10,725,218D Class non-distributing share EUR hedged 3,555,443 5,145,586 4,482,566 4,218,463D Class non-distributing share SGD hedged 855,695 920,551 480,688 1,295,558E Class non-distributing share 1,088,219 362,388 281,160 1,169,447E Class non-distributing share EUR hedged 900,041 240,140 576,044 564,137I Class distributing (A) UK reporting fund share GBP hedged 122,290 14,328 10,300 126,318I Class distributing (M) share 56,947 2,747,359 10,840 2,793,466I Class distributing (Q) share EUR hedged 3,548,350 14,375 – 3,562,725I Class non-distributing share 7,864,457 4,876,932 5,941,596 6,799,793I Class non-distributing share EUR hedged 1,108,003 83,435 456,243 735,195I Class non-distributing share SGD hedged 3,491,983 – – 3,491,983X Class distributing (M) share 1,014,210 44,223 324,502 733,931X Class non-distributing share 2,000,455 29,734 213,341 1,816,848X Class non-distributing share EUR hedged 472 – – 472
China A-Share Opportunities Fund A Class non-distributing share 15,961,038 13,544,663 17,296,486 12,209,215A Class non-distributing share SGD hedged 72,969 989,087 609,144 452,912D Class non-distributing share 5,011,301 9,457,688 3,585,523 10,883,466I Class non-distributing share 3,656,925 7,569,856 1,457,715 9,769,066S Class non-distributing share – 637,275 16,032 621,243X Class non-distributing share 29,635 67,408 44,720 52,323Z Class non-distributing share 9,429,843 – 1,545,131 7,884,712

The notes on pages 728 to 741 form an integral part of these financial statements.
Annual Report and Audited Financial Statements [81]
Statement of Changes in Shares OutstandingFor the Year Ended 31 August 2019 continued
Shares outstanding at the beginning
of the yearShares issued
Shares redeemed
Shares outstanding at the end
of the year
China Bond Fund A Class distributing (M) share 657,280 773,041 156,384 1,273,937A Class distributing (S) (M) (G) share 327 80,196 – 80,523A Class distributing (S) (M) (G) share AUD hedged 680 155,232 – 155,912A Class distributing (S) (M) (G) share EUR hedged 432 201,704 – 202,136A Class distributing (S) (M) (G) share HKD hedged – 15,293 10,000 5,293A Class distributing (S) (M) (G) share SGD hedged 684 468,893 179,994 289,583A Class distributing (S) (M) (G) share USD hedged 39,412 1,386,761 38,912 1,387,261A Class non-distributing share 1,823,231 1,261,317 1,029,206 2,055,342C Class non-distributing share 9,010 1 1 9,010D Class distributing (M) share 17,210 65,827 – 83,037D Class non-distributing share 825,355 1,738,242 1,048,164 1,515,433E Class distributing (Q) share – 452 – 452E Class distributing (Q) share EUR hedged – 452 – 452E Class non-distributing share 997,737 2,341,608 487,732 2,851,613E Class non-distributing share EUR hedged 69,955 644,253 21,669 692,539I Class distributing (M) share 3,716,936 191,122 507,562 3,400,496I Class distributing (S) (M) (G) share – 1,092,249 – 1,092,249I Class non-distributing share 11,140 27,917 – 39,057X Class non-distributing share 7,709 12,006 4,179 15,536
China Flexible Equity Fund A Class non-distributing share 47,810 1,113 47,733 1,190A Class non-distributing share EUR hedged 2,520 106 1,457 1,169D Class non-distributing share 5,084 14,989 4,558 15,515E Class distributing (Q) share EUR hedged 753 23,056 3,726 20,083E Class non-distributing share 410 37,969 10,234 28,145E Class non-distributing share EUR hedged 430 – – 430I Class non-distributing share 500 – – 500X Class non-distributing share 1,497,000 696 2 1,497,694Z Class non-distributing share 369,958 147,076 – 517,034
China Fund A Class distributing (A) UK reporting fund share GBP hedged 108,086 59,096 81,415 85,767A Class non-distributing share 45,855,390 31,158,559 34,749,036 42,264,913A Class non-distributing share AUD hedged 4,263,179 2,948,392 3,409,169 3,802,402A Class non-distributing share CNH hedged 124,059 495,537 216,841 402,755A Class non-distributing share EUR hedged 1,228,447 1,086,829 1,001,668 1,313,608A Class non-distributing share HKD 26,912,569 8,670,649 16,513,860 19,069,358A Class non-distributing share SGD hedged 1,079,655 535,565 440,102 1,175,118C Class non-distributing share 941,496 211,031 319,632 832,895D Class distributing (A) UK reporting fund share GBP hedged 3,933 165 235 3,863D Class non-distributing share 5,434,703 4,257,083 4,266,124 5,425,662D Class non-distributing share EUR hedged 80,283 598,614 149,107 529,790D Class non-distributing share HKD 510 – 36 474D Class non-distributing share SGD hedged 642 – – 642D Class non-distributing UK reporting fund share GBP hedged 1,646,674 197,579 362,656 1,481,597E Class non-distributing share EUR hedged 706,118 287,047 265,639 727,526I Class non-distributing share 12,745,273 1,449,597 2,593,566 11,601,304X Class non-distributing share 113,869 13,228 95,098 31,999

The notes on pages 728 to 741 form an integral part of these financial statements.
[82] BlackRock Global Funds (BGF)
Statement of Changes in Shares OutstandingFor the Year Ended 31 August 2019 continued
Shares outstanding at the beginning
of the yearShares issued
Shares redeemed
Shares outstanding at the end
of the year
Continental European Flexible Fund A Class distributing (A) share 1,620,400 765,147 692,560 1,692,987A Class distributing (A) UK reporting fund share 1,633,517 11,541 187,065 1,457,993A Class distributing (A) UK reporting fund share GBP hedged 645,478 40,997 165,567 520,908A Class non-distributing share 3,557,700 830,300 1,820,578 2,567,422A Class non-distributing share USD hedged 18,959,851 2,561,134 14,058,037 7,462,948A Class non-distributing UK reporting fund share 33,650,859 7,393,896 19,596,981 21,447,774AI Class non-distributing share – 440 – 440C Class non-distributing share 1,688,438 225,688 589,285 1,324,841D Class distributing (A) UK reporting fund share 16,208,419 7,377,519 7,727,801 15,858,137D Class distributing (A) UK reporting fund share GBP hedged 4,129,760 1,101,347 3,211,345 2,019,762D Class distributing (A) UK reporting fund share USD hedged 231,883 175,953 210,018 197,818D Class non-distributing share 39,597,881 14,963,281 23,169,319 31,391,843D Class non-distributing share USD hedged 4,109,333 886,186 1,979,332 3,016,187D Class non-distributing UK reporting fund share – 26,955 – 26,955D Class non-distributing UK reporting fund share GBP hedged 5,782,025 2,103,595 3,211,398 4,674,222E Class non-distributing share 8,071,266 1,058,111 2,476,273 6,653,104I Class distributing (A) UK reporting fund share 8,696,781 12,660,464 4,063,793 17,293,452I Class distributing (A) UK reporting fund share USD hedged 104,957 12,832 106,223 11,566I Class non-distributing share 24,950,010 21,783,306 15,124,505 31,608,811I Class non-distributing share USD hedged 1,813,141 346,633 1,722,878 436,896X Class distributing (A) UK reporting fund share 216 10,000 10,000 216X Class non-distributing share 729,474 794,117 121,558 1,402,033
Dynamic High Income Fund A Class distributing (R) (M) (G) share AUD hedged 17,310,962 19,381,149 11,034,761 25,657,350A Class distributing (R) (M) (G) share CNH hedged 294,632 1,605,643 158,784 1,741,491A Class distributing (R) (M) (G) share NZD hedged 216,550 1,375,529 594,364 997,715A Class distributing (S) (M) (G) share 84,268,083 63,247,932 35,030,921 112,485,094A Class distributing (S) (M) (G) share CAD hedged 335,004 1,627,067 940,279 1,021,792A Class distributing (S) (M) (G) share EUR hedged 64,797,048 20,781,064 21,749,900 63,828,212A Class distributing (S) (M) (G) share GBP hedged 5,419,003 7,287,253 2,058,482 10,647,774A Class distributing (S) (M) (G) share HKD hedged 17,565,569 17,420,908 11,042,220 23,944,257A Class distributing (S) (M) (G) share SGD hedged 40,030,427 27,339,923 10,393,440 56,976,910A Class non-distributing share 28,146,700 7,731,678 14,684,702 21,193,676A Class non-distributing share CHF hedged 485 4,166 4,166 485A Class non-distributing share SGD hedged 2,462,451 723,722 660,684 2,525,489AI Class distributing (Q) share EUR hedged – 447 – 447AI Class non-distributing share EUR hedged – 440 – 440D Class distributing (Q) UK reporting fund share GBP Hedged – 390 – 390D Class distributing (S) (M) (G) share 3,714,421 3,170,580 1,869,530 5,015,471D Class non-distributing share 1,298,774 1,091,526 939,807 1,450,493D Class non-distributing share CHF hedged 8,985 1,000 9,500 485D Class non-distributing share EUR hedged 415 155,179 9,882 145,712E Class distributing (Q) share EUR hedged 6,070 34,705 7,130 33,645E Class non-distributing share 599 162,657 8,930 154,326E Class non-distributing share EUR hedged 938 17,920 528 18,330I Class distributing (S) (M) (G) share – 1,919,684 22,500 1,897,184I Class non-distributing share 500 122,887 27,194 96,193I Class non-distributing share BRL hedged – 345,543 – 345,543I Class non-distributing share EUR hedged 415 – – 415X Class non-distributing share 1,629,007 1,937,987 1,641,705 1,925,289

The notes on pages 728 to 741 form an integral part of these financial statements.
Annual Report and Audited Financial Statements [83]
Statement of Changes in Shares OutstandingFor the Year Ended 31 August 2019 continued
Shares outstanding at the beginning
of the yearShares issued
Shares redeemed
Shares outstanding at the end
of the year
Emerging Europe Fund A Class distributing (A) share 73,742 8,527 23,836 58,433A Class distributing (A) UK reporting fund share 9,777 171 840 9,108A Class non-distributing share 7,244,962 1,154,998 2,835,457 5,564,503A Class non-distributing share SGD hedged 128,584 75,673 89,705 114,552C Class non-distributing share 78,291 15,378 33,316 60,353D Class distributing (A) UK reporting fund share 36,065 2,437 34,348 4,154D Class non-distributing share 604,618 253,650 391,463 466,805D Class non-distributing UK reporting fund share GBP hedged 1,084 25 25 1,084E Class non-distributing share 347,226 40,119 90,129 297,216I Class non-distributing share – 452 – 452J Class non-distributing share 21,022 1,730 6,038 16,714X Class distributing (A) UK reporting fund share 1,186 – 1,146 40X Class non-distributing share 62,790 1,371 25,187 38,974
Emerging Markets Bond Fund A Class distributing (A) share 6,997,671 4,271,061 848,000 10,420,732A Class distributing (D) share 1,932,815 125,751 784,515 1,274,051A Class distributing (M) share 5,823,386 3,337,163 4,082,651 5,077,898A Class distributing (R) (M) (G) share AUD hedged 4,338,057 4,762,149 5,291,771 3,808,435A Class distributing (R) (M) (G) share NZD hedged 874,367 1,731,713 1,237,228 1,368,852A Class distributing (R) (M) (G) share ZAR hedged 279,739 315,809 159,086 436,462A Class distributing (R) (M) (G) UK reporting fund share CNH hedged – 345 – 345A Class distributing (S) (M) (G) share 13,208,204 11,610,293 12,889,246 11,929,251A Class distributing (S) (M) (G) share CAD hedged 1,574,999 1,100,291 1,292,707 1,382,583A Class distributing (S) (M) (G) share GBP hedged 1,312,011 1,250,651 1,061,318 1,501,344A Class distributing (S) (M) (G) share HKD hedged 10,938,250 7,004,810 9,847,633 8,095,427A Class non-distributing share 38,997,421 17,079,668 40,256,932 15,820,157A Class non-distributing share EUR hedged 16,330,197 6,998,365 12,505,167 10,823,395A Class non-distributing share GBP hedged 1,730,784 558,029 183,464 2,105,349AI Class distributing (Q) share EUR hedged – 444 – 444AI Class non-distributing share EUR hedged – 440 – 440C Class distributing (D) share 453,780 57,515 87,439 423,856C Class non-distributing share 1,963,693 529,124 564,640 1,928,177D Class distributing (M) share 662,996 430,011 371,784 721,223D Class non-distributing share 454,790 420,853 319,472 556,171D Class non-distributing share EUR hedged 4,449,200 5,800,228 3,117,747 7,131,681D Class non-distributing UK reporting fund share 5,045,507 4,743,358 4,723,166 5,065,699E Class distributing (Q) share EUR hedged 532,570 227,542 129,342 630,770E Class non-distributing share 4,743,839 1,157,643 1,134,763 4,766,719E Class non-distributing share EUR hedged 1,140,233 349,470 237,698 1,252,005I Class distributing (A) share 1,868,500 23,172 998,000 893,672I Class distributing (Q) share EUR hedged 968,551 1,020,274 152,148 1,836,677I Class non-distributing share 40,706,547 11,621,192 19,446,654 32,881,085I Class non-distributing share EUR hedged 27,541,439 14,154,350 30,281,820 11,413,969I Class non-distributing UK reporting fund share CHF hedged 2,182,779 3,738,168 2,389,973 3,530,974I Class non-distributing UK reporting fund share GBP hedged 185,524 427,462 208,884 404,102X Class distributing (Q) share CHF hedged – 1,268,307 – 1,268,307X Class distributing (Q) share EUR hedged 441 24 – 465X Class non-distributing share 9,809,982 1,901,399 5,978,768 5,732,613X Class non-distributing share CHF hedged 1,769,758 – 1,341,629 428,129X Class non-distributing share EUR hedged 11,642,580 429,766 3,448,341 8,624,005X Class non-distributing share GBP hedged 11 – – 11
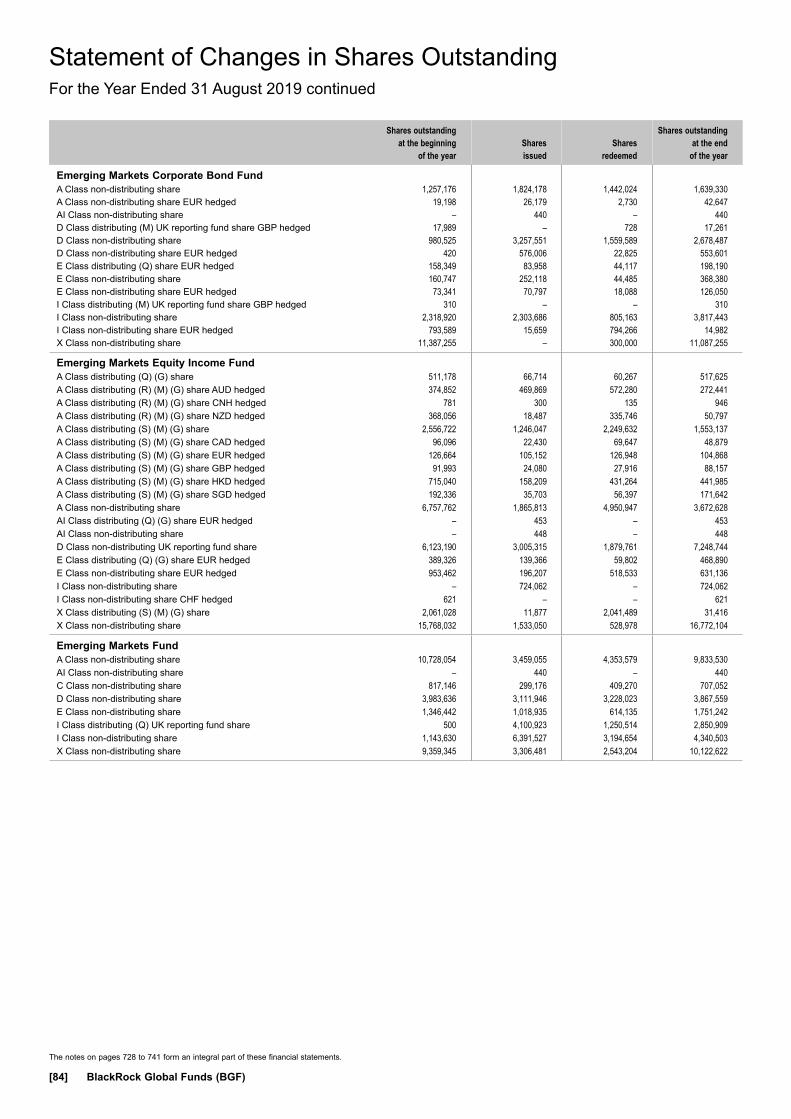
The notes on pages 728 to 741 form an integral part of these financial statements.
[84] BlackRock Global Funds (BGF)
Statement of Changes in Shares OutstandingFor the Year Ended 31 August 2019 continued
Shares outstanding at the beginning
of the yearShares issued
Shares redeemed
Shares outstanding at the end
of the year
Emerging Markets Corporate Bond Fund A Class non-distributing share 1,257,176 1,824,178 1,442,024 1,639,330A Class non-distributing share EUR hedged 19,198 26,179 2,730 42,647AI Class non-distributing share – 440 – 440D Class distributing (M) UK reporting fund share GBP hedged 17,989 – 728 17,261D Class non-distributing share 980,525 3,257,551 1,559,589 2,678,487D Class non-distributing share EUR hedged 420 576,006 22,825 553,601E Class distributing (Q) share EUR hedged 158,349 83,958 44,117 198,190E Class non-distributing share 160,747 252,118 44,485 368,380E Class non-distributing share EUR hedged 73,341 70,797 18,088 126,050I Class distributing (M) UK reporting fund share GBP hedged 310 – – 310I Class non-distributing share 2,318,920 2,303,686 805,163 3,817,443I Class non-distributing share EUR hedged 793,589 15,659 794,266 14,982X Class non-distributing share 11,387,255 – 300,000 11,087,255
Emerging Markets Equity Income Fund A Class distributing (Q) (G) share 511,178 66,714 60,267 517,625A Class distributing (R) (M) (G) share AUD hedged 374,852 469,869 572,280 272,441A Class distributing (R) (M) (G) share CNH hedged 781 300 135 946A Class distributing (R) (M) (G) share NZD hedged 368,056 18,487 335,746 50,797A Class distributing (S) (M) (G) share 2,556,722 1,246,047 2,249,632 1,553,137A Class distributing (S) (M) (G) share CAD hedged 96,096 22,430 69,647 48,879A Class distributing (S) (M) (G) share EUR hedged 126,664 105,152 126,948 104,868A Class distributing (S) (M) (G) share GBP hedged 91,993 24,080 27,916 88,157A Class distributing (S) (M) (G) share HKD hedged 715,040 158,209 431,264 441,985A Class distributing (S) (M) (G) share SGD hedged 192,336 35,703 56,397 171,642A Class non-distributing share 6,757,762 1,865,813 4,950,947 3,672,628AI Class distributing (Q) (G) share EUR hedged – 453 – 453AI Class non-distributing share – 448 – 448D Class non-distributing UK reporting fund share 6,123,190 3,005,315 1,879,761 7,248,744E Class distributing (Q) (G) share EUR hedged 389,326 139,366 59,802 468,890E Class non-distributing share EUR hedged 953,462 196,207 518,533 631,136I Class non-distributing share – 724,062 – 724,062I Class non-distributing share CHF hedged 621 – – 621X Class distributing (S) (M) (G) share 2,061,028 11,877 2,041,489 31,416X Class non-distributing share 15,768,032 1,533,050 528,978 16,772,104
Emerging Markets Fund A Class non-distributing share 10,728,054 3,459,055 4,353,579 9,833,530AI Class non-distributing share – 440 – 440C Class non-distributing share 817,146 299,176 409,270 707,052D Class non-distributing share 3,983,636 3,111,946 3,228,023 3,867,559E Class non-distributing share 1,346,442 1,018,935 614,135 1,751,242I Class distributing (Q) UK reporting fund share 500 4,100,923 1,250,514 2,850,909I Class non-distributing share 1,143,630 6,391,527 3,194,654 4,340,503X Class non-distributing share 9,359,345 3,306,481 2,543,204 10,122,622
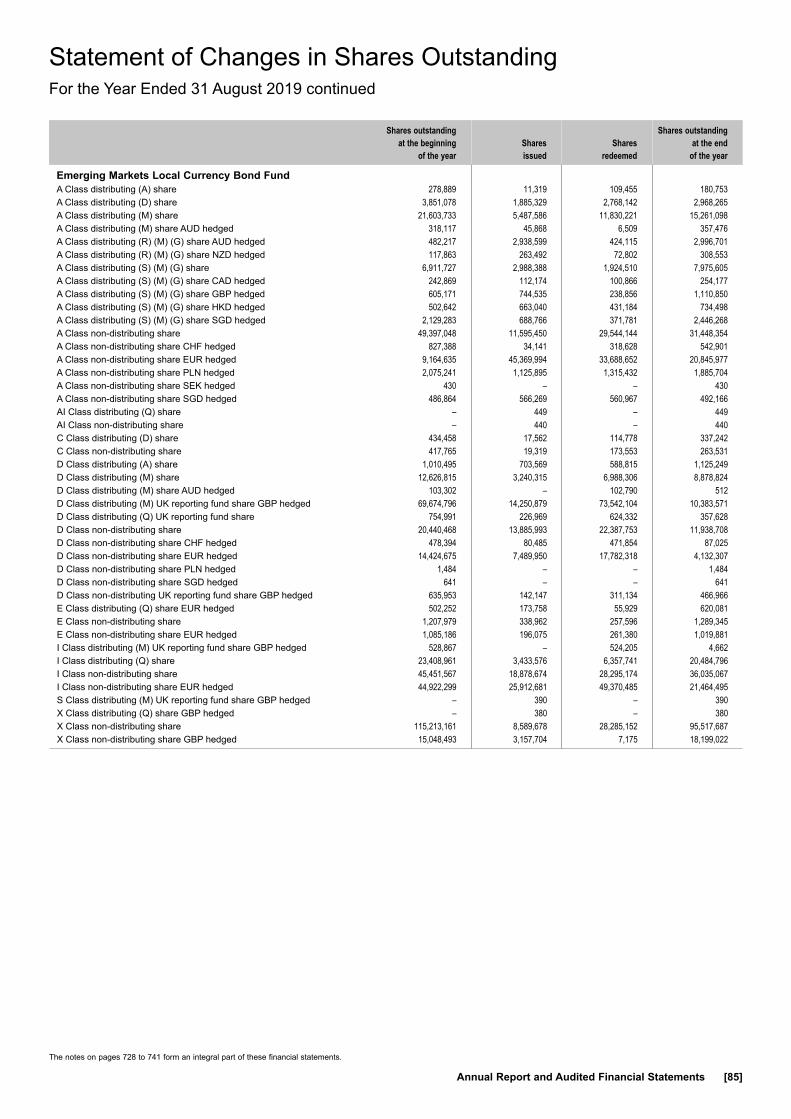
The notes on pages 728 to 741 form an integral part of these financial statements.
Annual Report and Audited Financial Statements [85]
Statement of Changes in Shares OutstandingFor the Year Ended 31 August 2019 continued
Shares outstanding at the beginning
of the yearShares issued
Shares redeemed
Shares outstanding at the end
of the year
Emerging Markets Local Currency Bond Fund A Class distributing (A) share 278,889 11,319 109,455 180,753A Class distributing (D) share 3,851,078 1,885,329 2,768,142 2,968,265A Class distributing (M) share 21,603,733 5,487,586 11,830,221 15,261,098A Class distributing (M) share AUD hedged 318,117 45,868 6,509 357,476A Class distributing (R) (M) (G) share AUD hedged 482,217 2,938,599 424,115 2,996,701A Class distributing (R) (M) (G) share NZD hedged 117,863 263,492 72,802 308,553A Class distributing (S) (M) (G) share 6,911,727 2,988,388 1,924,510 7,975,605A Class distributing (S) (M) (G) share CAD hedged 242,869 112,174 100,866 254,177A Class distributing (S) (M) (G) share GBP hedged 605,171 744,535 238,856 1,110,850A Class distributing (S) (M) (G) share HKD hedged 502,642 663,040 431,184 734,498A Class distributing (S) (M) (G) share SGD hedged 2,129,283 688,766 371,781 2,446,268A Class non-distributing share 49,397,048 11,595,450 29,544,144 31,448,354A Class non-distributing share CHF hedged 827,388 34,141 318,628 542,901A Class non-distributing share EUR hedged 9,164,635 45,369,994 33,688,652 20,845,977A Class non-distributing share PLN hedged 2,075,241 1,125,895 1,315,432 1,885,704A Class non-distributing share SEK hedged 430 – – 430A Class non-distributing share SGD hedged 486,864 566,269 560,967 492,166AI Class distributing (Q) share – 449 – 449AI Class non-distributing share – 440 – 440C Class distributing (D) share 434,458 17,562 114,778 337,242C Class non-distributing share 417,765 19,319 173,553 263,531D Class distributing (A) share 1,010,495 703,569 588,815 1,125,249D Class distributing (M) share 12,626,815 3,240,315 6,988,306 8,878,824D Class distributing (M) share AUD hedged 103,302 – 102,790 512D Class distributing (M) UK reporting fund share GBP hedged 69,674,796 14,250,879 73,542,104 10,383,571D Class distributing (Q) UK reporting fund share 754,991 226,969 624,332 357,628D Class non-distributing share 20,440,468 13,885,993 22,387,753 11,938,708D Class non-distributing share CHF hedged 478,394 80,485 471,854 87,025D Class non-distributing share EUR hedged 14,424,675 7,489,950 17,782,318 4,132,307D Class non-distributing share PLN hedged 1,484 – – 1,484D Class non-distributing share SGD hedged 641 – – 641D Class non-distributing UK reporting fund share GBP hedged 635,953 142,147 311,134 466,966E Class distributing (Q) share EUR hedged 502,252 173,758 55,929 620,081E Class non-distributing share 1,207,979 338,962 257,596 1,289,345E Class non-distributing share EUR hedged 1,085,186 196,075 261,380 1,019,881I Class distributing (M) UK reporting fund share GBP hedged 528,867 – 524,205 4,662I Class distributing (Q) share 23,408,961 3,433,576 6,357,741 20,484,796I Class non-distributing share 45,451,567 18,878,674 28,295,174 36,035,067I Class non-distributing share EUR hedged 44,922,299 25,912,681 49,370,485 21,464,495S Class distributing (M) UK reporting fund share GBP hedged – 390 – 390X Class distributing (Q) share GBP hedged – 380 – 380X Class non-distributing share 115,213,161 8,589,678 28,285,152 95,517,687X Class non-distributing share GBP hedged 15,048,493 3,157,704 7,175 18,199,022
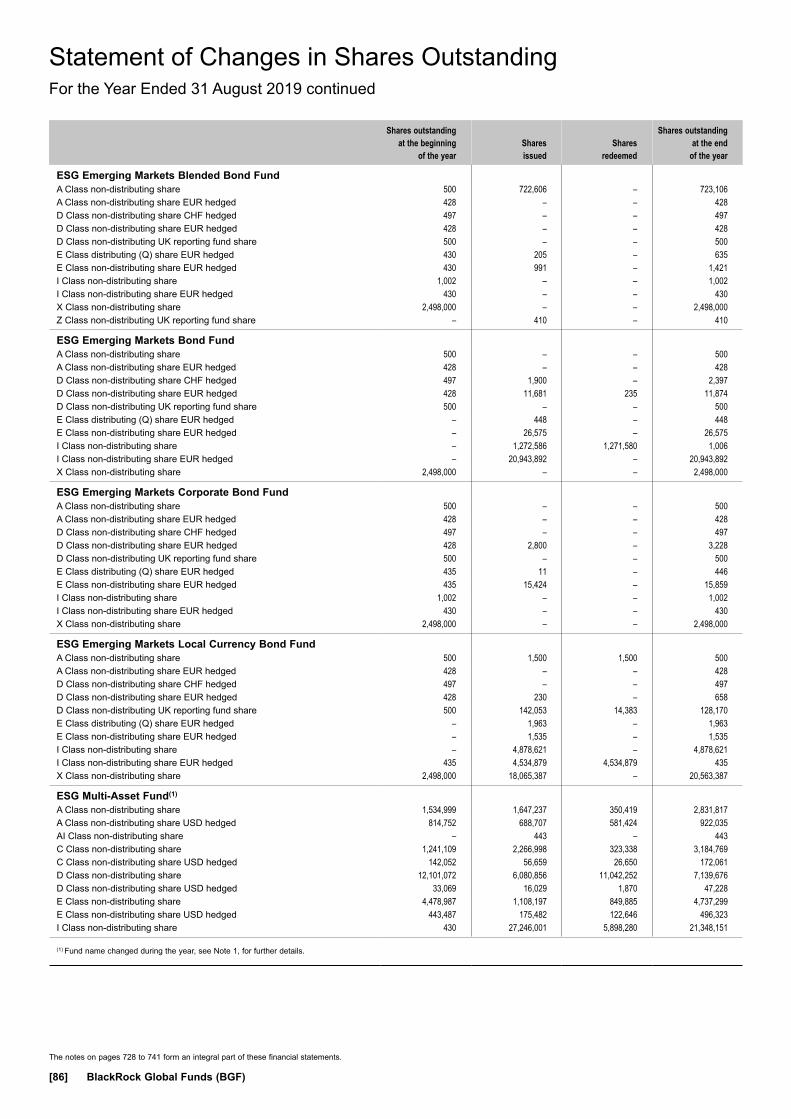
The notes on pages 728 to 741 form an integral part of these financial statements.
[86] BlackRock Global Funds (BGF)
Statement of Changes in Shares OutstandingFor the Year Ended 31 August 2019 continued
Shares outstanding at the beginning
of the yearShares issued
Shares redeemed
Shares outstanding at the end
of the year
ESG Emerging Markets Blended Bond Fund A Class non-distributing share 500 722,606 – 723,106A Class non-distributing share EUR hedged 428 – – 428D Class non-distributing share CHF hedged 497 – – 497D Class non-distributing share EUR hedged 428 – – 428D Class non-distributing UK reporting fund share 500 – – 500E Class distributing (Q) share EUR hedged 430 205 – 635E Class non-distributing share EUR hedged 430 991 – 1,421I Class non-distributing share 1,002 – – 1,002I Class non-distributing share EUR hedged 430 – – 430X Class non-distributing share 2,498,000 – – 2,498,000Z Class non-distributing UK reporting fund share – 410 – 410
ESG Emerging Markets Bond Fund A Class non-distributing share 500 – – 500A Class non-distributing share EUR hedged 428 – – 428D Class non-distributing share CHF hedged 497 1,900 – 2,397D Class non-distributing share EUR hedged 428 11,681 235 11,874D Class non-distributing UK reporting fund share 500 – – 500E Class distributing (Q) share EUR hedged – 448 – 448E Class non-distributing share EUR hedged – 26,575 – 26,575I Class non-distributing share – 1,272,586 1,271,580 1,006I Class non-distributing share EUR hedged – 20,943,892 – 20,943,892X Class non-distributing share 2,498,000 – – 2,498,000
ESG Emerging Markets Corporate Bond Fund A Class non-distributing share 500 – – 500A Class non-distributing share EUR hedged 428 – – 428D Class non-distributing share CHF hedged 497 – – 497D Class non-distributing share EUR hedged 428 2,800 – 3,228D Class non-distributing UK reporting fund share 500 – – 500E Class distributing (Q) share EUR hedged 435 11 – 446E Class non-distributing share EUR hedged 435 15,424 – 15,859I Class non-distributing share 1,002 – – 1,002I Class non-distributing share EUR hedged 430 – – 430X Class non-distributing share 2,498,000 – – 2,498,000
ESG Emerging Markets Local Currency Bond Fund A Class non-distributing share 500 1,500 1,500 500A Class non-distributing share EUR hedged 428 – – 428D Class non-distributing share CHF hedged 497 – – 497D Class non-distributing share EUR hedged 428 230 – 658D Class non-distributing UK reporting fund share 500 142,053 14,383 128,170E Class distributing (Q) share EUR hedged – 1,963 – 1,963E Class non-distributing share EUR hedged – 1,535 – 1,535I Class non-distributing share – 4,878,621 – 4,878,621I Class non-distributing share EUR hedged 435 4,534,879 4,534,879 435X Class non-distributing share 2,498,000 18,065,387 – 20,563,387
ESG Multi-Asset Fund(1) A Class non-distributing share 1,534,999 1,647,237 350,419 2,831,817A Class non-distributing share USD hedged 814,752 688,707 581,424 922,035AI Class non-distributing share – 443 – 443C Class non-distributing share 1,241,109 2,266,998 323,338 3,184,769C Class non-distributing share USD hedged 142,052 56,659 26,650 172,061D Class non-distributing share 12,101,072 6,080,856 11,042,252 7,139,676D Class non-distributing share USD hedged 33,069 16,029 1,870 47,228E Class non-distributing share 4,478,987 1,108,197 849,885 4,737,299E Class non-distributing share USD hedged 443,487 175,482 122,646 496,323I Class non-distributing share 430 27,246,001 5,898,280 21,348,151
(1) Fund name changed during the year, see Note 1, for further details.

The notes on pages 728 to 741 form an integral part of these financial statements.
Annual Report and Audited Financial Statements [87]
Statement of Changes in Shares OutstandingFor the Year Ended 31 August 2019 continued
Shares outstanding at the beginning
of the yearShares issued
Shares redeemed
Shares outstanding at the end
of the year
Euro Bond Fund A Class distributing (A) share 2,222,368 3,635,024 714,567 5,142,825A Class distributing (A) UK reporting fund share 11,098 388 – 11,486A Class distributing (D) share 558,231 286,783 249,524 595,490A Class distributing (M) share 255,959 254,364 157,427 352,896A Class non-distributing share 43,715,173 21,324,731 35,342,019 29,697,885A Class non-distributing share JPY hedged 548 1,251,233 986,047 265,734A Class non-distributing share PLN hedged 56,162 532,419 322,833 265,748A Class non-distributing share USD hedged 539,045 1,083,422 911,105 711,362AI Class non-distributing share – 445 – 445C Class non-distributing share 551,892 82,405 153,117 481,180D Class distributing (A) share 3,135,259 1,548,095 994,228 3,689,126D Class distributing (A) UK reporting fund share 135,559 29,258 99,139 65,678D Class distributing (A) UK reporting fund share GBP hedged 29,716 38,600 26,490 41,826D Class distributing (M) share 209,482 44,256 36,771 216,967D Class non-distributing share 40,814,658 19,893,050 23,125,573 37,582,135D Class non-distributing share CHF hedged 151,890 145,359 86,748 210,501D Class non-distributing share USD hedged 2,781,969 1,357,395 930,895 3,208,469E Class distributing (Q) share 759,412 216,730 174,210 801,932E Class non-distributing share 3,198,400 1,094,940 877,439 3,415,901I Class distributing (A) UK reporting fund share 410 5,817,454 44,002 5,773,862I Class distributing (A) UK reporting fund share GBP hedged 1,503,082 451,282 240,396 1,713,968I Class distributing (A) UK reporting fund share USD hedged 1,151,293 767,029 808,382 1,109,940I Class non-distributing share 80,067,656 86,523,333 48,226,926 118,364,063I Class non-distributing share CHF hedged 179,341 17,740 29,430 167,651I Class non-distributing share JPY hedged 548 – – 548I Class non-distributing share USD hedged 39,656,963 10,229,468 8,328,329 41,558,102S Class distributing (A) share 315,754 118,714 9,565 424,903X Class non-distributing share 12,854,929 8,143,893 1,907,914 19,090,908
Euro Corporate Bond Fund A Class distributing (D) share 1,224,661 202,746 339,209 1,088,198A Class distributing (M) share 242,939 132,499 46,308 329,130A Class non-distributing share 23,646,827 11,066,411 10,497,858 24,215,380A Class non-distributing share CHF hedged 23,695 5,958 13,900 15,753A Class non-distributing share GBP hedged 19,211 8,584 – 27,795A Class non-distributing share SEK hedged 14,873,370 6,761,651 14,774,442 6,860,579A Class non-distributing share USD hedged 19,896 63,828 12,072 71,652AI Class non-distributing share – 445 – 445C Class non-distributing share 671,949 123,116 206,263 588,802D Class distributing (M) share 1,838,793 631,081 330,889 2,138,985D Class non-distributing share 16,380,813 18,373,836 11,184,293 23,570,356D Class non-distributing share CHF hedged 495 – – 495D Class non-distributing share GBP hedged 14,803 82,803 9,500 88,106D Class non-distributing share USD hedged 500 31,023 1,715 29,808E Class distributing (Q) share 1,377,723 1,096,793 344,699 2,129,817E Class non-distributing share 3,142,078 1,150,367 990,210 3,302,235I Class distributing (Q) share 3,755,170 4,914,018 62,497 8,606,691I Class non-distributing share 61,894,098 109,187,120 57,591,902 113,489,316I Class non-distributing share CHF hedged 495 – – 495I Class non-distributing share GBP hedged 3,844,626 37,815 3,858,286 24,155I Class non-distributing share JPY hedged – 4,791,194 – 4,791,194X Class distributing (Q) share 9,277,707 16,146,859 2,189,897 23,234,669X Class non-distributing share 7,647,201 3,656,777 520,347 10,783,631
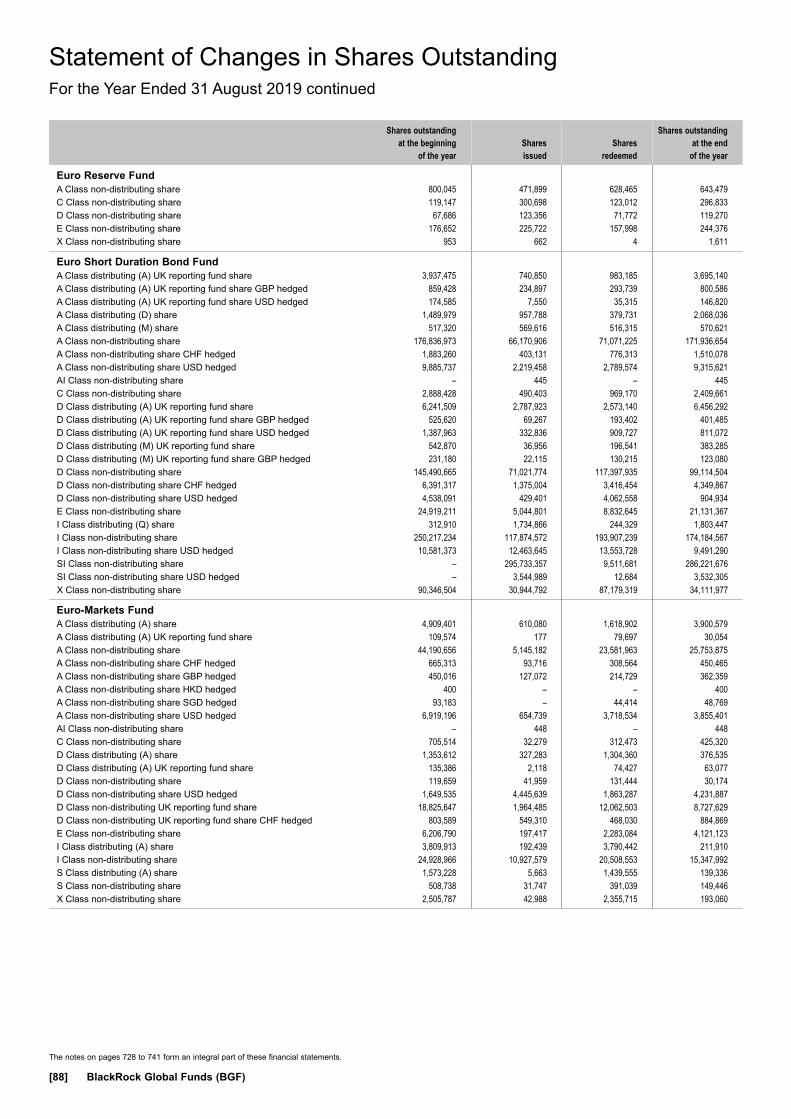
The notes on pages 728 to 741 form an integral part of these financial statements.
[88] BlackRock Global Funds (BGF)
Statement of Changes in Shares OutstandingFor the Year Ended 31 August 2019 continued
Shares outstanding at the beginning
of the yearShares issued
Shares redeemed
Shares outstanding at the end
of the year
Euro Reserve Fund A Class non-distributing share 800,045 471,899 628,465 643,479C Class non-distributing share 119,147 300,698 123,012 296,833D Class non-distributing share 67,686 123,356 71,772 119,270E Class non-distributing share 176,652 225,722 157,998 244,376X Class non-distributing share 953 662 4 1,611
Euro Short Duration Bond Fund A Class distributing (A) UK reporting fund share 3,937,475 740,850 983,185 3,695,140A Class distributing (A) UK reporting fund share GBP hedged 859,428 234,897 293,739 800,586A Class distributing (A) UK reporting fund share USD hedged 174,585 7,550 35,315 146,820A Class distributing (D) share 1,489,979 957,788 379,731 2,068,036A Class distributing (M) share 517,320 569,616 516,315 570,621A Class non-distributing share 176,836,973 66,170,906 71,071,225 171,936,654A Class non-distributing share CHF hedged 1,883,260 403,131 776,313 1,510,078A Class non-distributing share USD hedged 9,885,737 2,219,458 2,789,574 9,315,621AI Class non-distributing share – 445 – 445C Class non-distributing share 2,888,428 490,403 969,170 2,409,661D Class distributing (A) UK reporting fund share 6,241,509 2,787,923 2,573,140 6,456,292D Class distributing (A) UK reporting fund share GBP hedged 525,620 69,267 193,402 401,485D Class distributing (A) UK reporting fund share USD hedged 1,387,963 332,836 909,727 811,072D Class distributing (M) UK reporting fund share 542,870 36,956 196,541 383,285D Class distributing (M) UK reporting fund share GBP hedged 231,180 22,115 130,215 123,080D Class non-distributing share 145,490,665 71,021,774 117,397,935 99,114,504D Class non-distributing share CHF hedged 6,391,317 1,375,004 3,416,454 4,349,867D Class non-distributing share USD hedged 4,538,091 429,401 4,062,558 904,934E Class non-distributing share 24,919,211 5,044,801 8,832,645 21,131,367I Class distributing (Q) share 312,910 1,734,866 244,329 1,803,447I Class non-distributing share 250,217,234 117,874,572 193,907,239 174,184,567I Class non-distributing share USD hedged 10,581,373 12,463,645 13,553,728 9,491,290SI Class non-distributing share – 295,733,357 9,511,681 286,221,676SI Class non-distributing share USD hedged – 3,544,989 12,684 3,532,305X Class non-distributing share 90,346,504 30,944,792 87,179,319 34,111,977
Euro-Markets Fund A Class distributing (A) share 4,909,401 610,080 1,618,902 3,900,579A Class distributing (A) UK reporting fund share 109,574 177 79,697 30,054A Class non-distributing share 44,190,656 5,145,182 23,581,963 25,753,875A Class non-distributing share CHF hedged 665,313 93,716 308,564 450,465A Class non-distributing share GBP hedged 450,016 127,072 214,729 362,359A Class non-distributing share HKD hedged 400 – – 400A Class non-distributing share SGD hedged 93,183 – 44,414 48,769A Class non-distributing share USD hedged 6,919,196 654,739 3,718,534 3,855,401AI Class non-distributing share – 448 – 448C Class non-distributing share 705,514 32,279 312,473 425,320D Class distributing (A) share 1,353,612 327,283 1,304,360 376,535D Class distributing (A) UK reporting fund share 135,386 2,118 74,427 63,077D Class non-distributing share 119,659 41,959 131,444 30,174D Class non-distributing share USD hedged 1,649,535 4,445,639 1,863,287 4,231,887D Class non-distributing UK reporting fund share 18,825,647 1,964,485 12,062,503 8,727,629D Class non-distributing UK reporting fund share CHF hedged 803,589 549,310 468,030 884,869E Class non-distributing share 6,206,790 197,417 2,283,084 4,121,123I Class distributing (A) share 3,809,913 192,439 3,790,442 211,910I Class non-distributing share 24,928,966 10,927,579 20,508,553 15,347,992S Class distributing (A) share 1,573,228 5,663 1,439,555 139,336S Class non-distributing share 508,738 31,747 391,039 149,446X Class non-distributing share 2,505,787 42,988 2,355,715 193,060

The notes on pages 728 to 741 form an integral part of these financial statements.
Annual Report and Audited Financial Statements [89]
Statement of Changes in Shares OutstandingFor the Year Ended 31 August 2019 continued
Shares outstanding at the beginning
of the yearShares issued
Shares redeemed
Shares outstanding at the end
of the year
European Equity Income Fund A Class distributing (A) (G) share 24,886,531 1,861,655 5,041,357 21,706,829A Class distributing (Q) (G) share 6,224,562 431,840 1,527,796 5,128,606A Class distributing (Q) (G) share USD hedged 1,810,951 21,071 716,499 1,115,523A Class distributing (R) (M) (G) share AUD hedged 8,073,116 798,866 2,482,845 6,389,137A Class distributing (R) (M) (G) share CAD hedged 349,934 184,961 157,028 377,867A Class distributing (R) (M) (G) share CNH hedged 202,673 10,588 161,536 51,725A Class distributing (R) (M) (G) share NZD hedged 820,960 63,804 270,376 614,388A Class distributing (S) (M) (G) share 15,500,574 1,031,607 4,572,072 11,960,109A Class distributing (S) (M) (G) share GBP hedged 900,824 130,729 293,157 738,396A Class distributing (S) (M) (G) share HKD hedged 660,303 48,290 314,820 393,773A Class distributing (S) (M) (G) share SGD hedged 26,836,699 941,200 9,526,531 18,251,368A Class distributing (S) (M) (G) share USD hedged 28,766,456 497,152 12,882,899 16,380,709A Class non-distributing share 11,061,386 1,098,196 4,126,766 8,032,816A Class non-distributing share USD hedged 6,062,329 187,546 2,772,051 3,477,824AI Class distributing (Q) (G) share – 458 – 458AI Class non-distributing share – 445 – 445D Class distributing (A) (G) share 1,464,578 408,514 887,573 985,519D Class distributing (Q) (G) UK reporting fund share 3,502,135 559,552 1,160,536 2,901,151D Class distributing (Q) (G) UK reporting fund share GBP hedged 2,251,852 2,067,288 2,867,697 1,451,443D Class distributing (S) (M) (G) share USD hedged 1,285,460 150,239 1,024,396 411,303D Class non-distributing share 7,120,546 1,299,116 3,031,093 5,388,569D Class non-distributing UK reporting fund share USD hedged 429,949 600,399 541,908 488,440E Class distributing (Q) (G) share 16,676,478 843,892 4,709,366 12,811,004E Class non-distributing share 9,057,845 528,255 3,073,172 6,512,928I Class distributing (A) (G) share 6,545,880 1,450,679 356,949 7,639,610I Class non-distributing share 4,193,980 41,007 4,199,291 35,696X Class distributing (Q) (G) UK reporting fund share 1,690,446 2,180,510 1,272,394 2,598,562X Class non-distributing share 1,036,603 201,664 17,796 1,220,471
European Focus Fund A Class non-distributing share 9,570,043 183,618 3,813,665 5,939,996A Class non-distributing share SGD hedged 392 – – 392A Class non-distributing share USD hedged 1,836,721 – 981,184 855,537AI Class non-distributing share – 445 – 445C Class non-distributing share 758,902 14,223 186,242 586,883D Class non-distributing share 167,318 124,764 138,529 153,553D Class non-distributing UK reporting fund share 4,775,450 336,027 1,894,211 3,217,266E Class non-distributing share 9,672,003 305,408 3,295,736 6,681,675I Class non-distributing share 2,958,592 8,303 2,958,047 8,848
European Fund A Class distributing (A) share 71,827 874 27,099 45,602A Class distributing (A) UK reporting fund share 11,328 543 438 11,433A Class non-distributing share 5,346,677 333,732 1,550,481 4,129,928A Class non-distributing share AUD hedged 549,293 144,857 420,148 274,002A Class non-distributing share CAD hedged 164,301 5,072 86,466 82,907A Class non-distributing share CNH hedged 306 1,023 – 1,329A Class non-distributing share GBP hedged 327,991 4,507 87,050 245,448A Class non-distributing share HKD hedged 11,767,910 266,021 3,806,333 8,227,598A Class non-distributing share NZD hedged 187,847 13,487 129,688 71,646A Class non-distributing share SGD hedged 1,023,671 18,729 282,968 759,432A Class non-distributing share USD hedged 20,028,718 1,800,196 13,949,757 7,879,157C Class non-distributing share 317,168 6,434 95,248 228,354D Class distributing (A) UK reporting fund share 10,202 344 4,515 6,031D Class non-distributing share 141,327 12,251 79,139 74,439D Class non-distributing share USD hedged 971,286 990 555,056 417,220D Class non-distributing UK reporting fund share 2,331,294 650,700 2,200,814 781,180E Class non-distributing share 928,804 38,371 307,926 659,249I Class non-distributing share 104,149 264,528 43,012 325,665I Class non-distributing share USD hedged 500 – – 500S Class non-distributing share 420 – – 420X Class non-distributing share 2,458,936 60,167 608,236 1,910,867
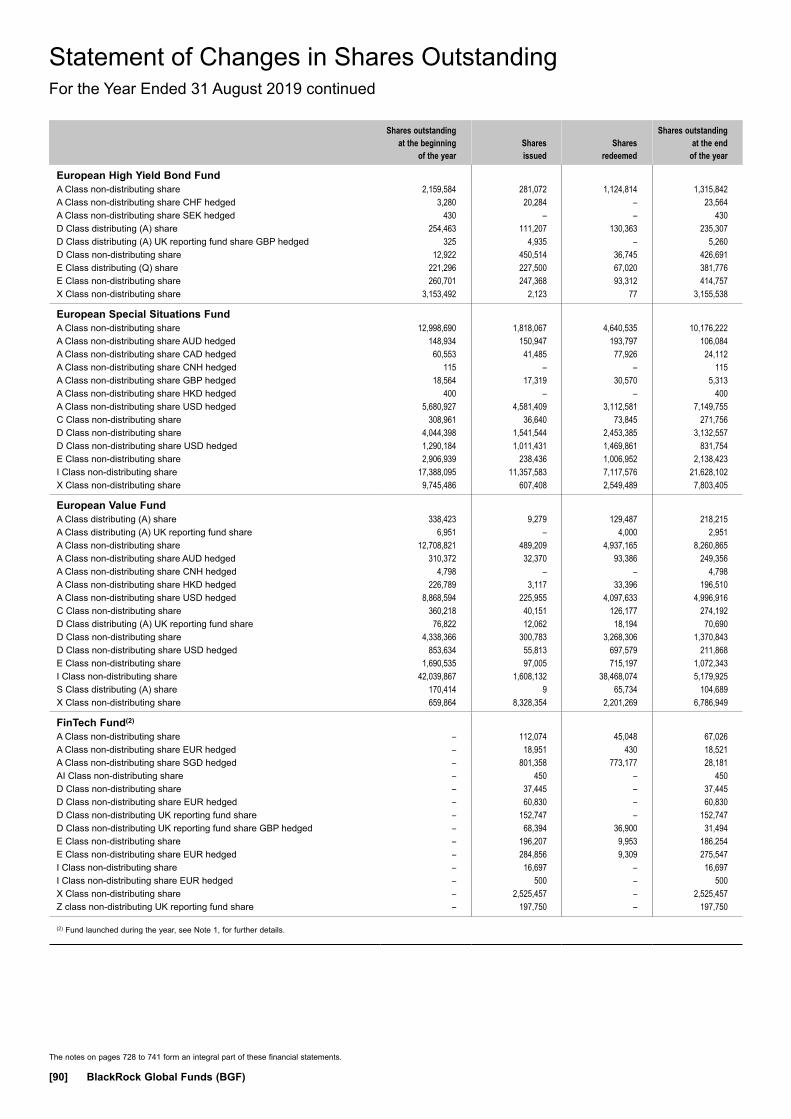
The notes on pages 728 to 741 form an integral part of these financial statements.
[90] BlackRock Global Funds (BGF)
Statement of Changes in Shares OutstandingFor the Year Ended 31 August 2019 continued
Shares outstanding at the beginning
of the yearShares issued
Shares redeemed
Shares outstanding at the end
of the year
European High Yield Bond Fund A Class non-distributing share 2,159,584 281,072 1,124,814 1,315,842A Class non-distributing share CHF hedged 3,280 20,284 – 23,564A Class non-distributing share SEK hedged 430 – – 430D Class distributing (A) share 254,463 111,207 130,363 235,307D Class distributing (A) UK reporting fund share GBP hedged 325 4,935 – 5,260D Class non-distributing share 12,922 450,514 36,745 426,691E Class distributing (Q) share 221,296 227,500 67,020 381,776E Class non-distributing share 260,701 247,368 93,312 414,757X Class non-distributing share 3,153,492 2,123 77 3,155,538
European Special Situations Fund A Class non-distributing share 12,998,690 1,818,067 4,640,535 10,176,222A Class non-distributing share AUD hedged 148,934 150,947 193,797 106,084A Class non-distributing share CAD hedged 60,553 41,485 77,926 24,112A Class non-distributing share CNH hedged 115 – – 115A Class non-distributing share GBP hedged 18,564 17,319 30,570 5,313A Class non-distributing share HKD hedged 400 – – 400A Class non-distributing share USD hedged 5,680,927 4,581,409 3,112,581 7,149,755C Class non-distributing share 308,961 36,640 73,845 271,756D Class non-distributing share 4,044,398 1,541,544 2,453,385 3,132,557D Class non-distributing share USD hedged 1,290,184 1,011,431 1,469,861 831,754E Class non-distributing share 2,906,939 238,436 1,006,952 2,138,423I Class non-distributing share 17,388,095 11,357,583 7,117,576 21,628,102X Class non-distributing share 9,745,486 607,408 2,549,489 7,803,405
European Value Fund A Class distributing (A) share 338,423 9,279 129,487 218,215A Class distributing (A) UK reporting fund share 6,951 – 4,000 2,951A Class non-distributing share 12,708,821 489,209 4,937,165 8,260,865A Class non-distributing share AUD hedged 310,372 32,370 93,386 249,356A Class non-distributing share CNH hedged 4,798 – – 4,798A Class non-distributing share HKD hedged 226,789 3,117 33,396 196,510A Class non-distributing share USD hedged 8,868,594 225,955 4,097,633 4,996,916C Class non-distributing share 360,218 40,151 126,177 274,192D Class distributing (A) UK reporting fund share 76,822 12,062 18,194 70,690D Class non-distributing share 4,338,366 300,783 3,268,306 1,370,843D Class non-distributing share USD hedged 853,634 55,813 697,579 211,868E Class non-distributing share 1,690,535 97,005 715,197 1,072,343I Class non-distributing share 42,039,867 1,608,132 38,468,074 5,179,925S Class distributing (A) share 170,414 9 65,734 104,689X Class non-distributing share 659,864 8,328,354 2,201,269 6,786,949
FinTech Fund(2) A Class non-distributing share – 112,074 45,048 67,026A Class non-distributing share EUR hedged – 18,951 430 18,521A Class non-distributing share SGD hedged – 801,358 773,177 28,181AI Class non-distributing share – 450 – 450D Class non-distributing share – 37,445 – 37,445D Class non-distributing share EUR hedged – 60,830 – 60,830D Class non-distributing UK reporting fund share – 152,747 – 152,747D Class non-distributing UK reporting fund share GBP hedged – 68,394 36,900 31,494E Class non-distributing share – 196,207 9,953 186,254E Class non-distributing share EUR hedged – 284,856 9,309 275,547I Class non-distributing share – 16,697 – 16,697I Class non-distributing share EUR hedged – 500 – 500X Class non-distributing share – 2,525,457 – 2,525,457Z class non-distributing UK reporting fund share – 197,750 – 197,750
(2) Fund launched during the year, see Note 1, for further details.
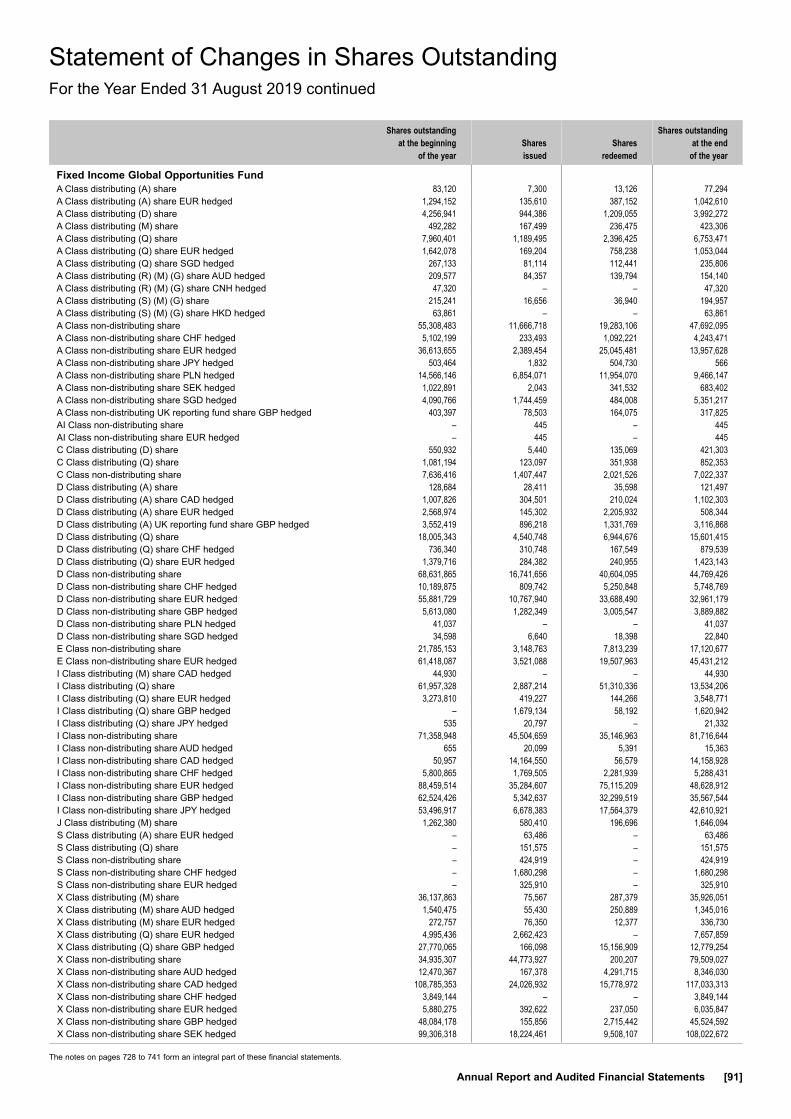
The notes on pages 728 to 741 form an integral part of these financial statements.
Annual Report and Audited Financial Statements [91]
Statement of Changes in Shares OutstandingFor the Year Ended 31 August 2019 continued
Shares outstanding at the beginning
of the yearShares issued
Shares redeemed
Shares outstanding at the end
of the year
Fixed Income Global Opportunities Fund A Class distributing (A) share 83,120 7,300 13,126 77,294A Class distributing (A) share EUR hedged 1,294,152 135,610 387,152 1,042,610A Class distributing (D) share 4,256,941 944,386 1,209,055 3,992,272A Class distributing (M) share 492,282 167,499 236,475 423,306A Class distributing (Q) share 7,960,401 1,189,495 2,396,425 6,753,471A Class distributing (Q) share EUR hedged 1,642,078 169,204 758,238 1,053,044A Class distributing (Q) share SGD hedged 267,133 81,114 112,441 235,806A Class distributing (R) (M) (G) share AUD hedged 209,577 84,357 139,794 154,140A Class distributing (R) (M) (G) share CNH hedged 47,320 – – 47,320A Class distributing (S) (M) (G) share 215,241 16,656 36,940 194,957A Class distributing (S) (M) (G) share HKD hedged 63,861 – – 63,861A Class non-distributing share 55,308,483 11,666,718 19,283,106 47,692,095A Class non-distributing share CHF hedged 5,102,199 233,493 1,092,221 4,243,471A Class non-distributing share EUR hedged 36,613,655 2,389,454 25,045,481 13,957,628A Class non-distributing share JPY hedged 503,464 1,832 504,730 566A Class non-distributing share PLN hedged 14,566,146 6,854,071 11,954,070 9,466,147A Class non-distributing share SEK hedged 1,022,891 2,043 341,532 683,402A Class non-distributing share SGD hedged 4,090,766 1,744,459 484,008 5,351,217A Class non-distributing UK reporting fund share GBP hedged 403,397 78,503 164,075 317,825AI Class non-distributing share – 445 – 445AI Class non-distributing share EUR hedged – 445 – 445C Class distributing (D) share 550,932 5,440 135,069 421,303C Class distributing (Q) share 1,081,194 123,097 351,938 852,353C Class non-distributing share 7,636,416 1,407,447 2,021,526 7,022,337D Class distributing (A) share 128,684 28,411 35,598 121,497D Class distributing (A) share CAD hedged 1,007,826 304,501 210,024 1,102,303D Class distributing (A) share EUR hedged 2,568,974 145,302 2,205,932 508,344D Class distributing (A) UK reporting fund share GBP hedged 3,552,419 896,218 1,331,769 3,116,868D Class distributing (Q) share 18,005,343 4,540,748 6,944,676 15,601,415D Class distributing (Q) share CHF hedged 736,340 310,748 167,549 879,539D Class distributing (Q) share EUR hedged 1,379,716 284,382 240,955 1,423,143D Class non-distributing share 68,631,865 16,741,656 40,604,095 44,769,426D Class non-distributing share CHF hedged 10,189,875 809,742 5,250,848 5,748,769D Class non-distributing share EUR hedged 55,881,729 10,767,940 33,688,490 32,961,179D Class non-distributing share GBP hedged 5,613,080 1,282,349 3,005,547 3,889,882D Class non-distributing share PLN hedged 41,037 – – 41,037D Class non-distributing share SGD hedged 34,598 6,640 18,398 22,840E Class non-distributing share 21,785,153 3,148,763 7,813,239 17,120,677E Class non-distributing share EUR hedged 61,418,087 3,521,088 19,507,963 45,431,212I Class distributing (M) share CAD hedged 44,930 – – 44,930I Class distributing (Q) share 61,957,328 2,887,214 51,310,336 13,534,206I Class distributing (Q) share EUR hedged 3,273,810 419,227 144,266 3,548,771I Class distributing (Q) share GBP hedged – 1,679,134 58,192 1,620,942I Class distributing (Q) share JPY hedged 535 20,797 – 21,332I Class non-distributing share 71,358,948 45,504,659 35,146,963 81,716,644I Class non-distributing share AUD hedged 655 20,099 5,391 15,363I Class non-distributing share CAD hedged 50,957 14,164,550 56,579 14,158,928I Class non-distributing share CHF hedged 5,800,865 1,769,505 2,281,939 5,288,431I Class non-distributing share EUR hedged 88,459,514 35,284,607 75,115,209 48,628,912I Class non-distributing share GBP hedged 62,524,426 5,342,637 32,299,519 35,567,544I Class non-distributing share JPY hedged 53,496,917 6,678,383 17,564,379 42,610,921J Class distributing (M) share 1,262,380 580,410 196,696 1,646,094S Class distributing (A) share EUR hedged – 63,486 – 63,486S Class distributing (Q) share – 151,575 – 151,575S Class non-distributing share – 424,919 – 424,919S Class non-distributing share CHF hedged – 1,680,298 – 1,680,298S Class non-distributing share EUR hedged – 325,910 – 325,910X Class distributing (M) share 36,137,863 75,567 287,379 35,926,051X Class distributing (M) share AUD hedged 1,540,475 55,430 250,889 1,345,016X Class distributing (M) share EUR hedged 272,757 76,350 12,377 336,730X Class distributing (Q) share EUR hedged 4,995,436 2,662,423 – 7,657,859X Class distributing (Q) share GBP hedged 27,770,065 166,098 15,156,909 12,779,254X Class non-distributing share 34,935,307 44,773,927 200,207 79,509,027X Class non-distributing share AUD hedged 12,470,367 167,378 4,291,715 8,346,030X Class non-distributing share CAD hedged 108,785,353 24,026,932 15,778,972 117,033,313X Class non-distributing share CHF hedged 3,849,144 – – 3,849,144X Class non-distributing share EUR hedged 5,880,275 392,622 237,050 6,035,847X Class non-distributing share GBP hedged 48,084,178 155,856 2,715,442 45,524,592X Class non-distributing share SEK hedged 99,306,318 18,224,461 9,508,107 108,022,672

The notes on pages 728 to 741 form an integral part of these financial statements.
[92] BlackRock Global Funds (BGF)
Statement of Changes in Shares OutstandingFor the Year Ended 31 August 2019 continued
Shares outstanding at the beginning
of the yearShares issued
Shares redeemed
Shares outstanding at the end
of the year
Future Of Transport Fund(2) A Class non-distributing share – 376,722 40,885 335,837A Class non-distributing share EUR hedged – 179,358 8,655 170,703A Class non-distributing share SGD hedged – 387,295 382,465 4,830AI Class non-distributing share – 448 – 448D Class non-distributing share EUR hedged – 17,281 364 16,917D Class non-distributing UK reporting fund share – 1,273,739 21,959 1,251,780D Class non-distributing UK reporting fund share GBP hedged – 53,993 21,478 32,515E Class non-distributing share – 999,937 7,385 992,552E Class non-distributing share EUR hedged – 7,280,544 65,978 7,214,566I Class non-distributing share – 1,156 – 1,156I Class non-distributing share EUR hedged – 500 – 500X Class non-distributing share – 2,550,498 – 2,550,498Z Class non-distributing UK reporting fund share – 500 – 500
Global Allocation Fund A Class distributing (A) share 14,696,923 1,433,844 2,323,119 13,807,648A Class distributing (A) share EUR hedged 2,518,674 162,405 541,579 2,139,500A Class non-distributing share 122,651,950 11,326,696 32,443,523 101,535,123A Class non-distributing share AUD hedged 7,752,215 1,259,813 1,792,858 7,219,170A Class non-distributing share CHF hedged 2,690,881 125,490 732,696 2,083,675A Class non-distributing share CNH hedged 173,655 149,491 127,566 195,580A Class non-distributing share EUR hedged 29,348,346 2,858,409 10,284,488 21,922,267A Class non-distributing share GBP hedged 2,289,327 226,762 588,099 1,927,990A Class non-distributing share HKD hedged 11,517,580 2,133,100 5,923,788 7,726,892A Class non-distributing share PLN hedged 2,723,494 709,565 1,758,907 1,674,152A Class non-distributing share SGD hedged 7,153,172 447,256 1,569,273 6,031,155AI Class non-distributing share – 448 – 448AI Class non-distributing share EUR hedged – 448 – 448C Class non-distributing share 13,178,559 404,265 3,657,885 9,924,939C Class non-distributing share EUR hedged 2,561,571 65,202 559,337 2,067,436D Class distributing (A) share 243,128 1,445,175 911,249 777,054D Class distributing (A) share EUR hedged 451,057 48,774 276,237 223,594D Class non-distributing share 3,451,819 907,920 1,334,821 3,024,918D Class non-distributing share AUD hedged 46,241 52,096 4,916 93,421D Class non-distributing share CHF hedged 306,723 154,314 281,400 179,637D Class non-distributing share EUR hedged 8,531,506 1,599,690 3,389,657 6,741,539D Class non-distributing share GBP hedged 1,414,572 98,869 292,431 1,221,010D Class non-distributing share PLN hedged 1,362 – – 1,362D Class non-distributing share SGD hedged 17,778 10,986 7,516 21,248D Class non-distributing UK reporting fund share 12,413,028 2,941,077 4,746,043 10,608,062E Class non-distributing share 18,744,475 1,697,481 3,989,243 16,452,713E Class non-distributing share EUR hedged 14,527,349 1,039,069 3,822,115 11,744,303E Class non-distributing share PLN hedged 343,408 72,728 156,632 259,504I Class non-distributing share 15,179,805 1,467,300 6,850,764 9,796,341I Class non-distributing share EUR hedged 5,211,456 724,651 3,541,691 2,394,416I Class non-distributing share SGD hedged 8,031,415 – – 8,031,415J Class non-distributing share 398,987 – 126,975 272,012X Class distributing (A) share 91,224,626 687,955 11,694,963 80,217,618X Class non-distributing share 23,746,053 1,591,094 3,665,153 21,671,994X Class non-distributing share AUD hedged 5,972,069 715,630 1,619,564 5,068,135X Class non-distributing share EUR hedged 450 – – 450X Class non-distributing share JPY hedged 4,495,743 240,418 1,954,083 2,782,078
(2) Fund launched during the year, see Note 1, for further details.

The notes on pages 728 to 741 form an integral part of these financial statements.
Annual Report and Audited Financial Statements [93]
Statement of Changes in Shares OutstandingFor the Year Ended 31 August 2019 continued
Shares outstanding at the beginning
of the yearShares issued
Shares redeemed
Shares outstanding at the end
of the year
Global Bond Income Fund A Class distributing (R) (M) (G) UK reporting fund share CNH hedged – 344 – 344A Class distributing (S) (M) (G) share 500 27,249 7,738 20,011A Class distributing (S) (M) (G) UK reporting fund share AUD hedged – 718 – 718A Class distributing (S) (M) (G) UK reporting fund share CAD hedged – 673 – 673A Class distributing (S) (M) (G) UK reporting fund share EUR hedged – 451 – 451A Class distributing (S) (M) (G) UK reporting fund share GBP hedged – 385 – 385A Class distributing (S) (M) (G) UK reporting fund share HKD hedged – 394 – 394A Class distributing (S) (M) (G) UK reporting fund share NZD hedged – 760 – 760A Class distributing (S) (M) (G) UK reporting fund share SGD hedged – 829,706 827,926 1,780A Class non-distributing share 500 328,353 318,607 10,246AI Class distributing (Q) share EUR hedged – 453 – 453AI Class non-distributing share – 450 – 450AI Class non-distributing share EUR hedged – 450 – 450D Class non-distributing share 500 124,849 69,806 55,543D Class non-distributing share CHF hedged 503 – – 503D Class non-distributing share EUR hedged 430 – – 430D Class non-distributing UK reporting fund share GBP hedged 381 – – 381E Class distributing (Q) share EUR hedged 435 1,482 – 1,917E Class non-distributing share EUR hedged 430 22,945 810 22,565I Class non-distributing share 1,005 – – 1,005I Class non-distributing share BRL hedged – 297,964 – 297,964I Class non-distributing share EUR hedged 435 – – 435X Class non-distributing share 7,496,500 – – 7,496,500Z Class non-distributing share – 147,488 – 147,488Z Class non-distributing share CHF hedged – 50,500 – 50,500Z Class non-distributing share EUR hedged – 108,935 8,000 100,935
Global Conservative Income Fund(2) A Class distributing (A) (G) share – 500 – 500A Class distributing (Y) (Q) (G) share – 441 – 441A Class non-distributing share – 500 – 500AI Class distributing (Q) (G) share – 503 – 503AI Class non-distributing share – 500 – 500D Class distributing (A) (G) share – 500 – 500D Class distributing (Y) (Q) (G) share – 442 – 442D Class non-distributing share – 21,419 – 21,419E Class distributing (Q) (G) share – 9,386,965 214,293 9,172,672E Class distributing (S) (M) (G) share – 446 – 446E Class distributing (Y) (Q) (G) share – 4,841 – 4,841E Class non-distributing share – 2,739,685 87,493 2,652,192I Class distributing (Y) (Q) (G) share – 443 – 443I Class non-distributing share – 970,432 – 970,432X Class non-distributing share – 9,996,500 – 9,996,500
(2) Fund launched during the year, see Note 1, for further details.

The notes on pages 728 to 741 form an integral part of these financial statements.
[94] BlackRock Global Funds (BGF)
Statement of Changes in Shares OutstandingFor the Year Ended 31 August 2019 continued
Shares outstanding at the beginning
of the yearShares issued
Shares redeemed
Shares outstanding at the end
of the year
Global Corporate Bond Fund A Class distributing (A) share EUR hedged 327,580 7,103 107,222 227,461A Class distributing (M) share AUD hedged 144,109 55,095 19,740 179,464A Class distributing (M) share CAD hedged 225,650 42,676 34,948 233,378A Class distributing (M) share GBP hedged 311,608 19,470 131,959 199,119A Class distributing (M) share NZD hedged 241,295 37,190 7,230 271,255A Class distributing (Q) share 147,969 3,533 48,627 102,875A Class distributing (R) (M) (G) share AUD hedged 4,076,373 2,456,895 2,071,921 4,461,347A Class distributing (R) (M) (G) share CNH hedged 2,525,554 3,867,660 2,000,322 4,392,892A Class distributing (R) (M) (G) share NZD hedged 156,279 29,192 106,026 79,445A Class distributing (S) (M) (G) share 25,613,801 18,763,235 17,517,467 26,859,569A Class distributing (S) (M) (G) share HKD hedged 886,904 442,156 436,528 892,532A Class distributing (S) (M) (G) share SGD hedged 151,094 152,497 143,018 160,573A Class non-distributing share 6,906,923 8,477,287 6,928,915 8,455,295A Class non-distributing share EUR hedged 2,637,186 759,576 1,220,991 2,175,771A Class non-distributing share SEK hedged 37,512 17,394 37,503 17,403A Class non-distributing share SGD hedged 7,216 – 7,216 –D Class distributing (Q) share GBP hedged 370 – – 370D Class non-distributing share 3,178,376 1,942,826 2,349,606 2,771,596D Class non-distributing share EUR hedged 11,090,200 5,837,421 7,717,904 9,209,717D Class non-distributing UK reporting fund share GBP hedged 200,427 107,170 31,245 276,352E Class non-distributing share 598,069 109,218 126,269 581,018E Class non-distributing share EUR hedged 1,165,227 131,318 408,488 888,057I Class distributing (A) UK reporting fund share GBP hedged 32,575,545 3,638,779 7,570,657 28,643,667I Class non-distributing share 5,069,894 1,745,116 3,517,401 3,297,609I Class non-distributing share CAD hedged 590 – – 590I Class non-distributing share EUR hedged 7,724,667 3,418,354 4,308,542 6,834,479X Class distributing (A) UK reporting fund share GBP hedged 8,334,551 1,793,804 1,275,148 8,853,207X Class distributing (R) (M) (G) share AUD hedged 3,871,951 – 3,871,951 –X Class non-distributing share 6,423,513 386,828 1,592,368 5,217,973X Class non-distributing share EUR hedged 39,666,183 750,609 1,749,908 38,666,884X Class non-distributing share NOK hedged 501,251 – – 501,251
Global Dynamic Equity Fund A Class distributing (A) share 88,912 12,883 25,894 75,901A Class non-distributing share 16,054,734 1,437,589 6,270,347 11,221,976A Class non-distributing share CNH hedged 310 – – 310A Class non-distributing share EUR hedged 435,124 46,159 156,595 324,688C Class non-distributing share 1,420,879 217,736 241,470 1,397,145C Class non-distributing share EUR hedged 101,139 5,096 9,985 96,250D Class distributing (A) share 547,899 25,266 97,825 475,340D Class non-distributing share 2,887,785 213,858 861,336 2,240,307D Class non-distributing share EUR hedged 56,428 7,210 8,663 54,975E Class non-distributing share 2,408,152 213,134 501,335 2,119,951E Class non-distributing share EUR hedged 398,358 33,256 114,921 316,693X Class non-distributing share 10,061,089 – – 10,061,089
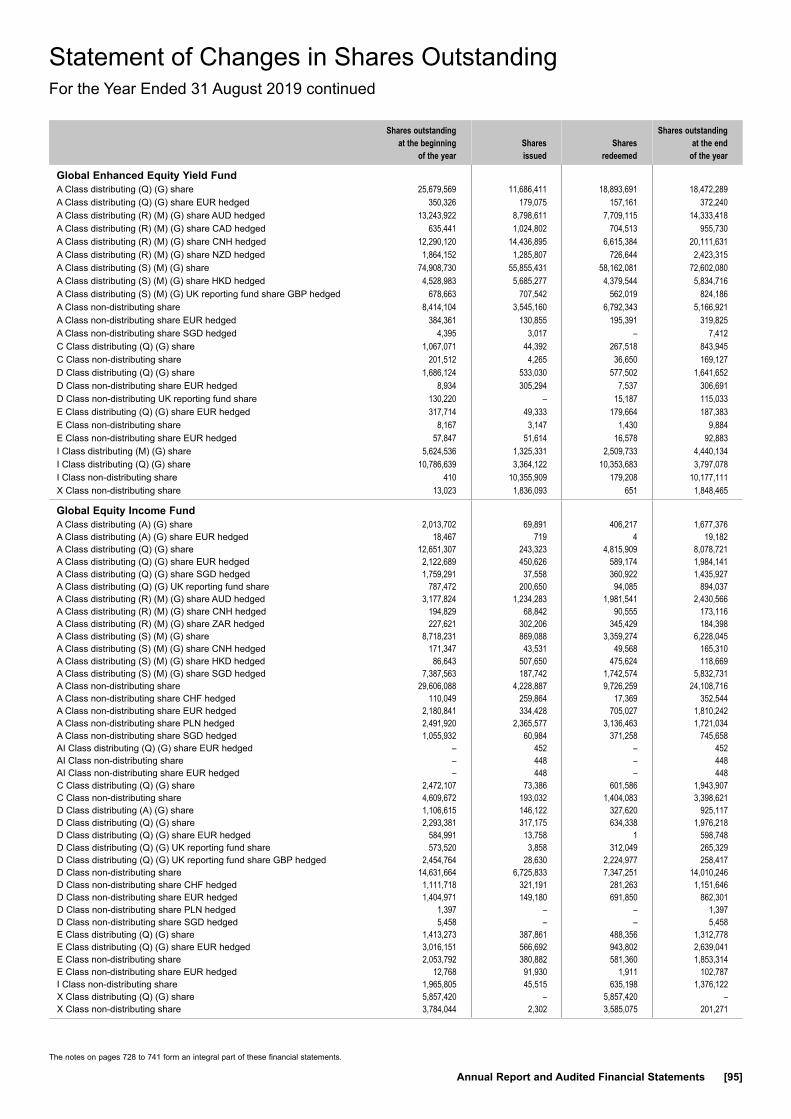
The notes on pages 728 to 741 form an integral part of these financial statements.
Annual Report and Audited Financial Statements [95]
Statement of Changes in Shares OutstandingFor the Year Ended 31 August 2019 continued
Shares outstanding at the beginning
of the yearShares issued
Shares redeemed
Shares outstanding at the end
of the year
Global Enhanced Equity Yield Fund A Class distributing (Q) (G) share 25,679,569 11,686,411 18,893,691 18,472,289A Class distributing (Q) (G) share EUR hedged 350,326 179,075 157,161 372,240A Class distributing (R) (M) (G) share AUD hedged 13,243,922 8,798,611 7,709,115 14,333,418A Class distributing (R) (M) (G) share CAD hedged 635,441 1,024,802 704,513 955,730A Class distributing (R) (M) (G) share CNH hedged 12,290,120 14,436,895 6,615,384 20,111,631A Class distributing (R) (M) (G) share NZD hedged 1,864,152 1,285,807 726,644 2,423,315A Class distributing (S) (M) (G) share 74,908,730 55,855,431 58,162,081 72,602,080A Class distributing (S) (M) (G) share HKD hedged 4,528,983 5,685,277 4,379,544 5,834,716A Class distributing (S) (M) (G) UK reporting fund share GBP hedged 678,663 707,542 562,019 824,186A Class non-distributing share 8,414,104 3,545,160 6,792,343 5,166,921A Class non-distributing share EUR hedged 384,361 130,855 195,391 319,825A Class non-distributing share SGD hedged 4,395 3,017 – 7,412C Class distributing (Q) (G) share 1,067,071 44,392 267,518 843,945C Class non-distributing share 201,512 4,265 36,650 169,127D Class distributing (Q) (G) share 1,686,124 533,030 577,502 1,641,652D Class non-distributing share EUR hedged 8,934 305,294 7,537 306,691D Class non-distributing UK reporting fund share 130,220 – 15,187 115,033E Class distributing (Q) (G) share EUR hedged 317,714 49,333 179,664 187,383E Class non-distributing share 8,167 3,147 1,430 9,884E Class non-distributing share EUR hedged 57,847 51,614 16,578 92,883I Class distributing (M) (G) share 5,624,536 1,325,331 2,509,733 4,440,134I Class distributing (Q) (G) share 10,786,639 3,364,122 10,353,683 3,797,078I Class non-distributing share 410 10,355,909 179,208 10,177,111X Class non-distributing share 13,023 1,836,093 651 1,848,465
Global Equity Income Fund A Class distributing (A) (G) share 2,013,702 69,891 406,217 1,677,376A Class distributing (A) (G) share EUR hedged 18,467 719 4 19,182A Class distributing (Q) (G) share 12,651,307 243,323 4,815,909 8,078,721A Class distributing (Q) (G) share EUR hedged 2,122,689 450,626 589,174 1,984,141A Class distributing (Q) (G) share SGD hedged 1,759,291 37,558 360,922 1,435,927A Class distributing (Q) (G) UK reporting fund share 787,472 200,650 94,085 894,037A Class distributing (R) (M) (G) share AUD hedged 3,177,824 1,234,283 1,981,541 2,430,566A Class distributing (R) (M) (G) share CNH hedged 194,829 68,842 90,555 173,116A Class distributing (R) (M) (G) share ZAR hedged 227,621 302,206 345,429 184,398A Class distributing (S) (M) (G) share 8,718,231 869,088 3,359,274 6,228,045A Class distributing (S) (M) (G) share CNH hedged 171,347 43,531 49,568 165,310A Class distributing (S) (M) (G) share HKD hedged 86,643 507,650 475,624 118,669A Class distributing (S) (M) (G) share SGD hedged 7,387,563 187,742 1,742,574 5,832,731A Class non-distributing share 29,606,088 4,228,887 9,726,259 24,108,716A Class non-distributing share CHF hedged 110,049 259,864 17,369 352,544A Class non-distributing share EUR hedged 2,180,841 334,428 705,027 1,810,242A Class non-distributing share PLN hedged 2,491,920 2,365,577 3,136,463 1,721,034A Class non-distributing share SGD hedged 1,055,932 60,984 371,258 745,658AI Class distributing (Q) (G) share EUR hedged – 452 – 452AI Class non-distributing share – 448 – 448AI Class non-distributing share EUR hedged – 448 – 448C Class distributing (Q) (G) share 2,472,107 73,386 601,586 1,943,907C Class non-distributing share 4,609,672 193,032 1,404,083 3,398,621D Class distributing (A) (G) share 1,106,615 146,122 327,620 925,117D Class distributing (Q) (G) share 2,293,381 317,175 634,338 1,976,218D Class distributing (Q) (G) share EUR hedged 584,991 13,758 1 598,748D Class distributing (Q) (G) UK reporting fund share 573,520 3,858 312,049 265,329D Class distributing (Q) (G) UK reporting fund share GBP hedged 2,454,764 28,630 2,224,977 258,417D Class non-distributing share 14,631,664 6,725,833 7,347,251 14,010,246D Class non-distributing share CHF hedged 1,111,718 321,191 281,263 1,151,646D Class non-distributing share EUR hedged 1,404,971 149,180 691,850 862,301D Class non-distributing share PLN hedged 1,397 – – 1,397D Class non-distributing share SGD hedged 5,458 – – 5,458E Class distributing (Q) (G) share 1,413,273 387,861 488,356 1,312,778E Class distributing (Q) (G) share EUR hedged 3,016,151 566,692 943,802 2,639,041E Class non-distributing share 2,053,792 380,882 581,360 1,853,314E Class non-distributing share EUR hedged 12,768 91,930 1,911 102,787I Class non-distributing share 1,965,805 45,515 635,198 1,376,122X Class distributing (Q) (G) share 5,857,420 – 5,857,420 –X Class non-distributing share 3,784,044 2,302 3,585,075 201,271
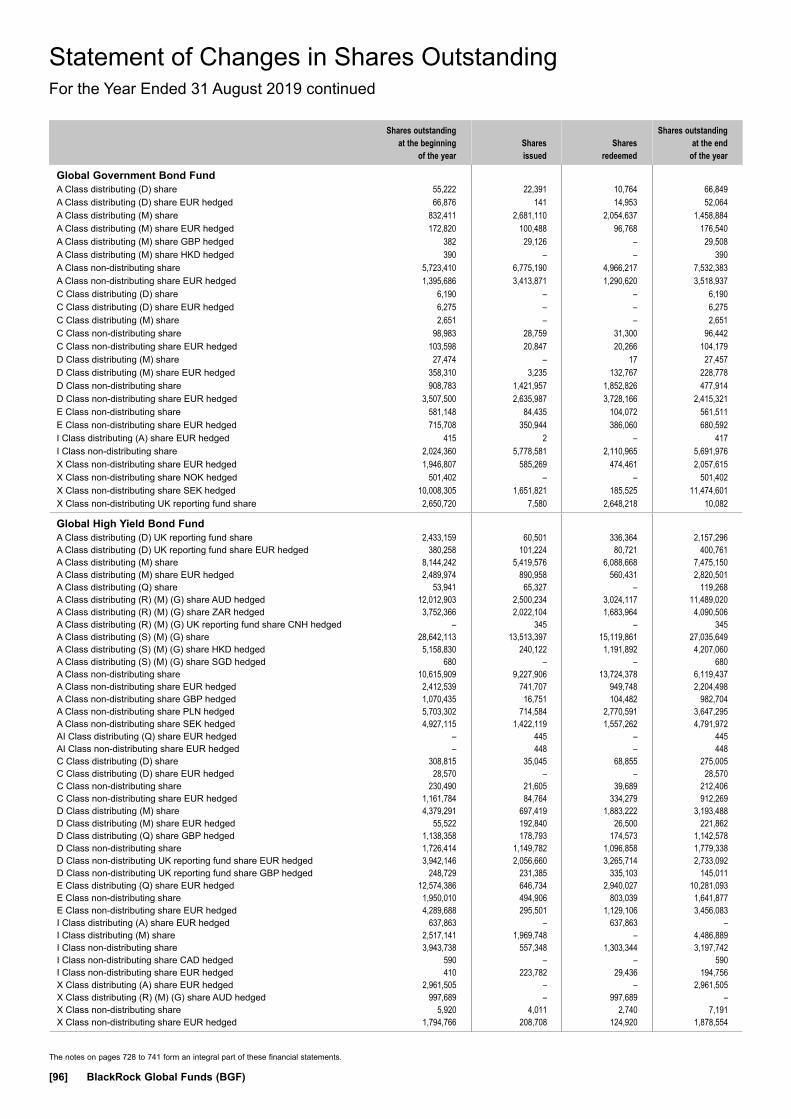
The notes on pages 728 to 741 form an integral part of these financial statements.
[96] BlackRock Global Funds (BGF)
Statement of Changes in Shares OutstandingFor the Year Ended 31 August 2019 continued
Shares outstanding at the beginning
of the yearShares issued
Shares redeemed
Shares outstanding at the end
of the year
Global Government Bond Fund A Class distributing (D) share 55,222 22,391 10,764 66,849A Class distributing (D) share EUR hedged 66,876 141 14,953 52,064A Class distributing (M) share 832,411 2,681,110 2,054,637 1,458,884A Class distributing (M) share EUR hedged 172,820 100,488 96,768 176,540A Class distributing (M) share GBP hedged 382 29,126 – 29,508A Class distributing (M) share HKD hedged 390 – – 390A Class non-distributing share 5,723,410 6,775,190 4,966,217 7,532,383A Class non-distributing share EUR hedged 1,395,686 3,413,871 1,290,620 3,518,937C Class distributing (D) share 6,190 – – 6,190C Class distributing (D) share EUR hedged 6,275 – – 6,275C Class distributing (M) share 2,651 – – 2,651C Class non-distributing share 98,983 28,759 31,300 96,442C Class non-distributing share EUR hedged 103,598 20,847 20,266 104,179D Class distributing (M) share 27,474 – 17 27,457D Class distributing (M) share EUR hedged 358,310 3,235 132,767 228,778D Class non-distributing share 908,783 1,421,957 1,852,826 477,914D Class non-distributing share EUR hedged 3,507,500 2,635,987 3,728,166 2,415,321E Class non-distributing share 581,148 84,435 104,072 561,511E Class non-distributing share EUR hedged 715,708 350,944 386,060 680,592I Class distributing (A) share EUR hedged 415 2 – 417I Class non-distributing share 2,024,360 5,778,581 2,110,965 5,691,976X Class non-distributing share EUR hedged 1,946,807 585,269 474,461 2,057,615X Class non-distributing share NOK hedged 501,402 – – 501,402X Class non-distributing share SEK hedged 10,008,305 1,651,821 185,525 11,474,601X Class non-distributing UK reporting fund share 2,650,720 7,580 2,648,218 10,082
Global High Yield Bond Fund A Class distributing (D) UK reporting fund share 2,433,159 60,501 336,364 2,157,296A Class distributing (D) UK reporting fund share EUR hedged 380,258 101,224 80,721 400,761A Class distributing (M) share 8,144,242 5,419,576 6,088,668 7,475,150A Class distributing (M) share EUR hedged 2,489,974 890,958 560,431 2,820,501A Class distributing (Q) share 53,941 65,327 – 119,268A Class distributing (R) (M) (G) share AUD hedged 12,012,903 2,500,234 3,024,117 11,489,020A Class distributing (R) (M) (G) share ZAR hedged 3,752,366 2,022,104 1,683,964 4,090,506A Class distributing (R) (M) (G) UK reporting fund share CNH hedged – 345 – 345A Class distributing (S) (M) (G) share 28,642,113 13,513,397 15,119,861 27,035,649A Class distributing (S) (M) (G) share HKD hedged 5,158,830 240,122 1,191,892 4,207,060A Class distributing (S) (M) (G) share SGD hedged 680 – – 680A Class non-distributing share 10,615,909 9,227,906 13,724,378 6,119,437A Class non-distributing share EUR hedged 2,412,539 741,707 949,748 2,204,498A Class non-distributing share GBP hedged 1,070,435 16,751 104,482 982,704A Class non-distributing share PLN hedged 5,703,302 714,584 2,770,591 3,647,295A Class non-distributing share SEK hedged 4,927,115 1,422,119 1,557,262 4,791,972AI Class distributing (Q) share EUR hedged – 445 – 445AI Class non-distributing share EUR hedged – 448 – 448C Class distributing (D) share 308,815 35,045 68,855 275,005C Class distributing (D) share EUR hedged 28,570 – – 28,570C Class non-distributing share 230,490 21,605 39,689 212,406C Class non-distributing share EUR hedged 1,161,784 84,764 334,279 912,269D Class distributing (M) share 4,379,291 697,419 1,883,222 3,193,488D Class distributing (M) share EUR hedged 55,522 192,840 26,500 221,862D Class distributing (Q) share GBP hedged 1,138,358 178,793 174,573 1,142,578D Class non-distributing share 1,726,414 1,149,782 1,096,858 1,779,338D Class non-distributing UK reporting fund share EUR hedged 3,942,146 2,056,660 3,265,714 2,733,092D Class non-distributing UK reporting fund share GBP hedged 248,729 231,385 335,103 145,011E Class distributing (Q) share EUR hedged 12,574,386 646,734 2,940,027 10,281,093E Class non-distributing share 1,950,010 494,906 803,039 1,641,877E Class non-distributing share EUR hedged 4,289,688 295,501 1,129,106 3,456,083I Class distributing (A) share EUR hedged 637,863 – 637,863 –I Class distributing (M) share 2,517,141 1,969,748 – 4,486,889I Class non-distributing share 3,943,738 557,348 1,303,344 3,197,742I Class non-distributing share CAD hedged 590 – – 590I Class non-distributing share EUR hedged 410 223,782 29,436 194,756X Class distributing (A) share EUR hedged 2,961,505 – – 2,961,505X Class distributing (R) (M) (G) share AUD hedged 997,689 – 997,689 –X Class non-distributing share 5,920 4,011 2,740 7,191X Class non-distributing share EUR hedged 1,794,766 208,708 124,920 1,878,554
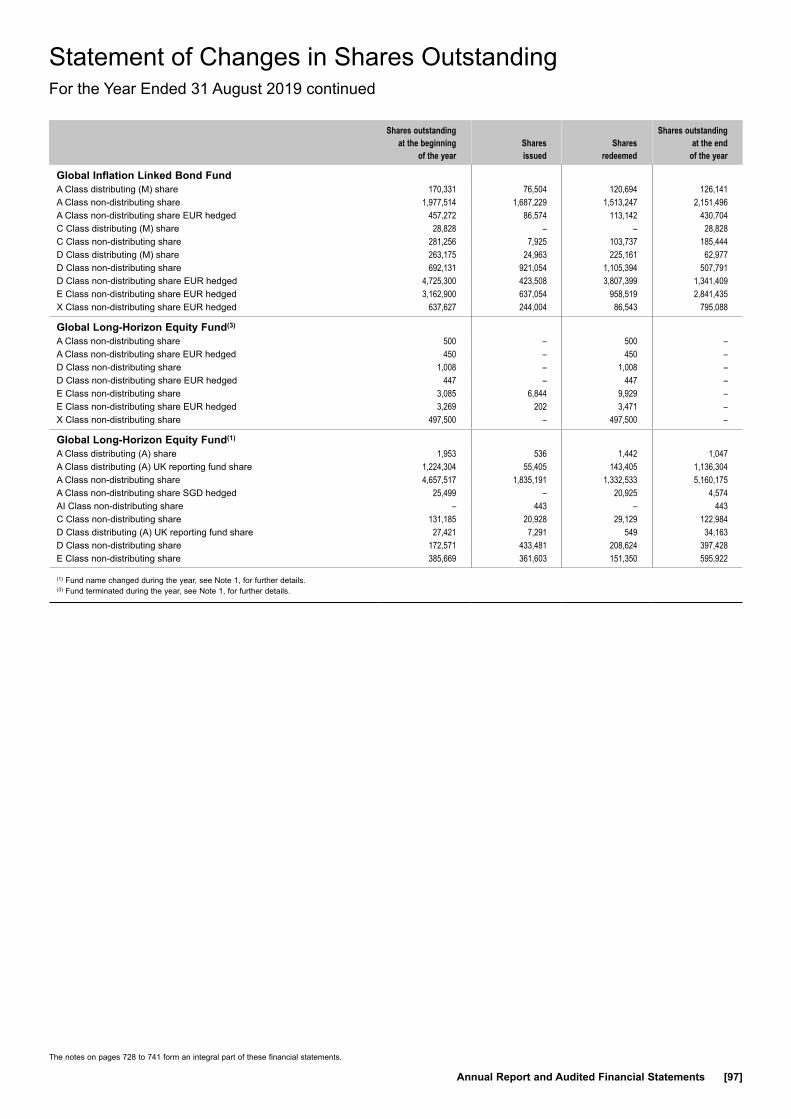
The notes on pages 728 to 741 form an integral part of these financial statements.
Annual Report and Audited Financial Statements [97]
Statement of Changes in Shares OutstandingFor the Year Ended 31 August 2019 continued
Shares outstanding at the beginning
of the yearShares issued
Shares redeemed
Shares outstanding at the end
of the year
Global Inflation Linked Bond Fund A Class distributing (M) share 170,331 76,504 120,694 126,141A Class non-distributing share 1,977,514 1,687,229 1,513,247 2,151,496A Class non-distributing share EUR hedged 457,272 86,574 113,142 430,704C Class distributing (M) share 28,828 – – 28,828C Class non-distributing share 281,256 7,925 103,737 185,444D Class distributing (M) share 263,175 24,963 225,161 62,977D Class non-distributing share 692,131 921,054 1,105,394 507,791D Class non-distributing share EUR hedged 4,725,300 423,508 3,807,399 1,341,409E Class non-distributing share EUR hedged 3,162,900 637,054 958,519 2,841,435X Class non-distributing share EUR hedged 637,627 244,004 86,543 795,088
Global Long-Horizon Equity Fund(3) A Class non-distributing share 500 – 500 –A Class non-distributing share EUR hedged 450 – 450 –D Class non-distributing share 1,008 – 1,008 –D Class non-distributing share EUR hedged 447 – 447 –E Class non-distributing share 3,085 6,844 9,929 –E Class non-distributing share EUR hedged 3,269 202 3,471 –X Class non-distributing share 497,500 – 497,500 –
Global Long-Horizon Equity Fund(1) A Class distributing (A) share 1,953 536 1,442 1,047A Class distributing (A) UK reporting fund share 1,224,304 55,405 143,405 1,136,304A Class non-distributing share 4,657,517 1,835,191 1,332,533 5,160,175A Class non-distributing share SGD hedged 25,499 – 20,925 4,574AI Class non-distributing share – 443 – 443C Class non-distributing share 131,185 20,928 29,129 122,984D Class distributing (A) UK reporting fund share 27,421 7,291 549 34,163D Class non-distributing share 172,571 433,481 208,624 397,428E Class non-distributing share 385,669 361,603 151,350 595,922
(1) Fund name changed during the year, see Note 1, for further details.(3) Fund terminated during the year, see Note 1, for further details.
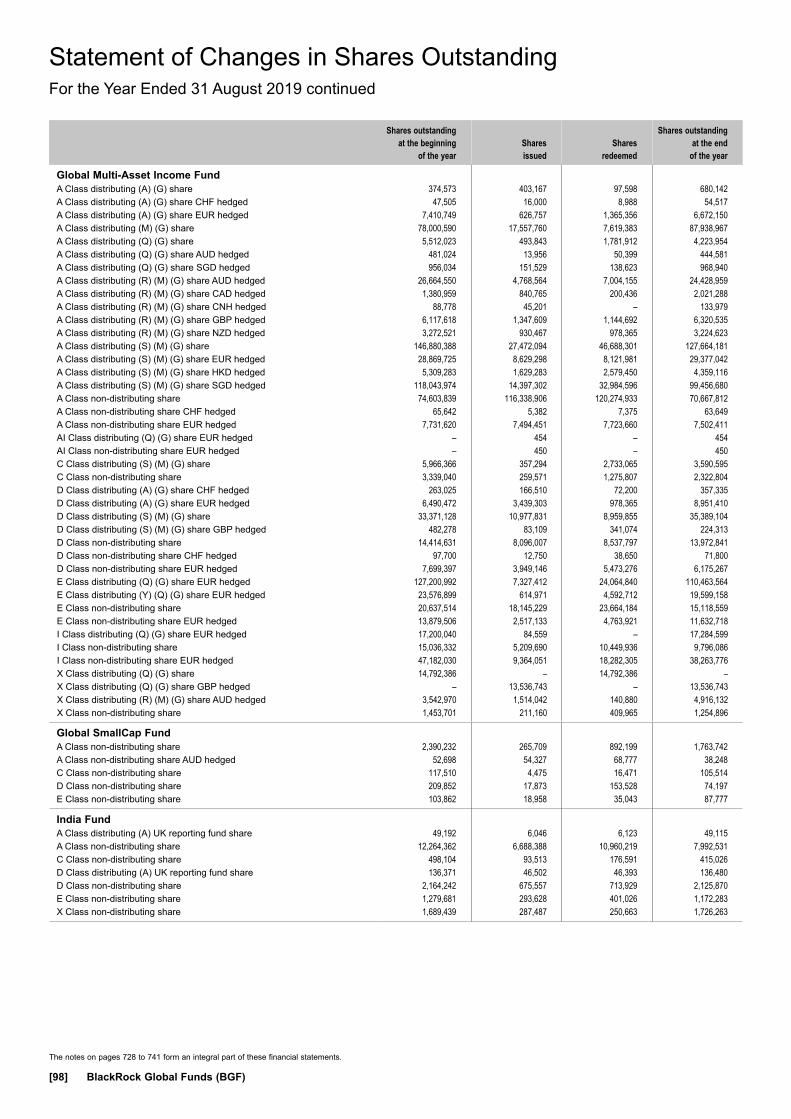
The notes on pages 728 to 741 form an integral part of these financial statements.
[98] BlackRock Global Funds (BGF)
Statement of Changes in Shares OutstandingFor the Year Ended 31 August 2019 continued
Shares outstanding at the beginning
of the yearShares issued
Shares redeemed
Shares outstanding at the end
of the year
Global Multi-Asset Income Fund A Class distributing (A) (G) share 374,573 403,167 97,598 680,142A Class distributing (A) (G) share CHF hedged 47,505 16,000 8,988 54,517A Class distributing (A) (G) share EUR hedged 7,410,749 626,757 1,365,356 6,672,150A Class distributing (M) (G) share 78,000,590 17,557,760 7,619,383 87,938,967A Class distributing (Q) (G) share 5,512,023 493,843 1,781,912 4,223,954A Class distributing (Q) (G) share AUD hedged 481,024 13,956 50,399 444,581A Class distributing (Q) (G) share SGD hedged 956,034 151,529 138,623 968,940A Class distributing (R) (M) (G) share AUD hedged 26,664,550 4,768,564 7,004,155 24,428,959A Class distributing (R) (M) (G) share CAD hedged 1,380,959 840,765 200,436 2,021,288A Class distributing (R) (M) (G) share CNH hedged 88,778 45,201 – 133,979A Class distributing (R) (M) (G) share GBP hedged 6,117,618 1,347,609 1,144,692 6,320,535A Class distributing (R) (M) (G) share NZD hedged 3,272,521 930,467 978,365 3,224,623A Class distributing (S) (M) (G) share 146,880,388 27,472,094 46,688,301 127,664,181A Class distributing (S) (M) (G) share EUR hedged 28,869,725 8,629,298 8,121,981 29,377,042A Class distributing (S) (M) (G) share HKD hedged 5,309,283 1,629,283 2,579,450 4,359,116A Class distributing (S) (M) (G) share SGD hedged 118,043,974 14,397,302 32,984,596 99,456,680A Class non-distributing share 74,603,839 116,338,906 120,274,933 70,667,812A Class non-distributing share CHF hedged 65,642 5,382 7,375 63,649A Class non-distributing share EUR hedged 7,731,620 7,494,451 7,723,660 7,502,411AI Class distributing (Q) (G) share EUR hedged – 454 – 454AI Class non-distributing share EUR hedged – 450 – 450C Class distributing (S) (M) (G) share 5,966,366 357,294 2,733,065 3,590,595C Class non-distributing share 3,339,040 259,571 1,275,807 2,322,804D Class distributing (A) (G) share CHF hedged 263,025 166,510 72,200 357,335D Class distributing (A) (G) share EUR hedged 6,490,472 3,439,303 978,365 8,951,410D Class distributing (S) (M) (G) share 33,371,128 10,977,831 8,959,855 35,389,104D Class distributing (S) (M) (G) share GBP hedged 482,278 83,109 341,074 224,313D Class non-distributing share 14,414,631 8,096,007 8,537,797 13,972,841D Class non-distributing share CHF hedged 97,700 12,750 38,650 71,800D Class non-distributing share EUR hedged 7,699,397 3,949,146 5,473,276 6,175,267E Class distributing (Q) (G) share EUR hedged 127,200,992 7,327,412 24,064,840 110,463,564E Class distributing (Y) (Q) (G) share EUR hedged 23,576,899 614,971 4,592,712 19,599,158E Class non-distributing share 20,637,514 18,145,229 23,664,184 15,118,559E Class non-distributing share EUR hedged 13,879,506 2,517,133 4,763,921 11,632,718I Class distributing (Q) (G) share EUR hedged 17,200,040 84,559 – 17,284,599I Class non-distributing share 15,036,332 5,209,690 10,449,936 9,796,086I Class non-distributing share EUR hedged 47,182,030 9,364,051 18,282,305 38,263,776X Class distributing (Q) (G) share 14,792,386 – 14,792,386 –X Class distributing (Q) (G) share GBP hedged – 13,536,743 – 13,536,743X Class distributing (R) (M) (G) share AUD hedged 3,542,970 1,514,042 140,880 4,916,132X Class non-distributing share 1,453,701 211,160 409,965 1,254,896
Global SmallCap Fund A Class non-distributing share 2,390,232 265,709 892,199 1,763,742A Class non-distributing share AUD hedged 52,698 54,327 68,777 38,248C Class non-distributing share 117,510 4,475 16,471 105,514D Class non-distributing share 209,852 17,873 153,528 74,197E Class non-distributing share 103,862 18,958 35,043 87,777
India Fund A Class distributing (A) UK reporting fund share 49,192 6,046 6,123 49,115A Class non-distributing share 12,264,362 6,688,388 10,960,219 7,992,531C Class non-distributing share 498,104 93,513 176,591 415,026D Class distributing (A) UK reporting fund share 136,371 46,502 46,393 136,480D Class non-distributing share 2,164,242 675,557 713,929 2,125,870E Class non-distributing share 1,279,681 293,628 401,026 1,172,283X Class non-distributing share 1,689,439 287,487 250,663 1,726,263
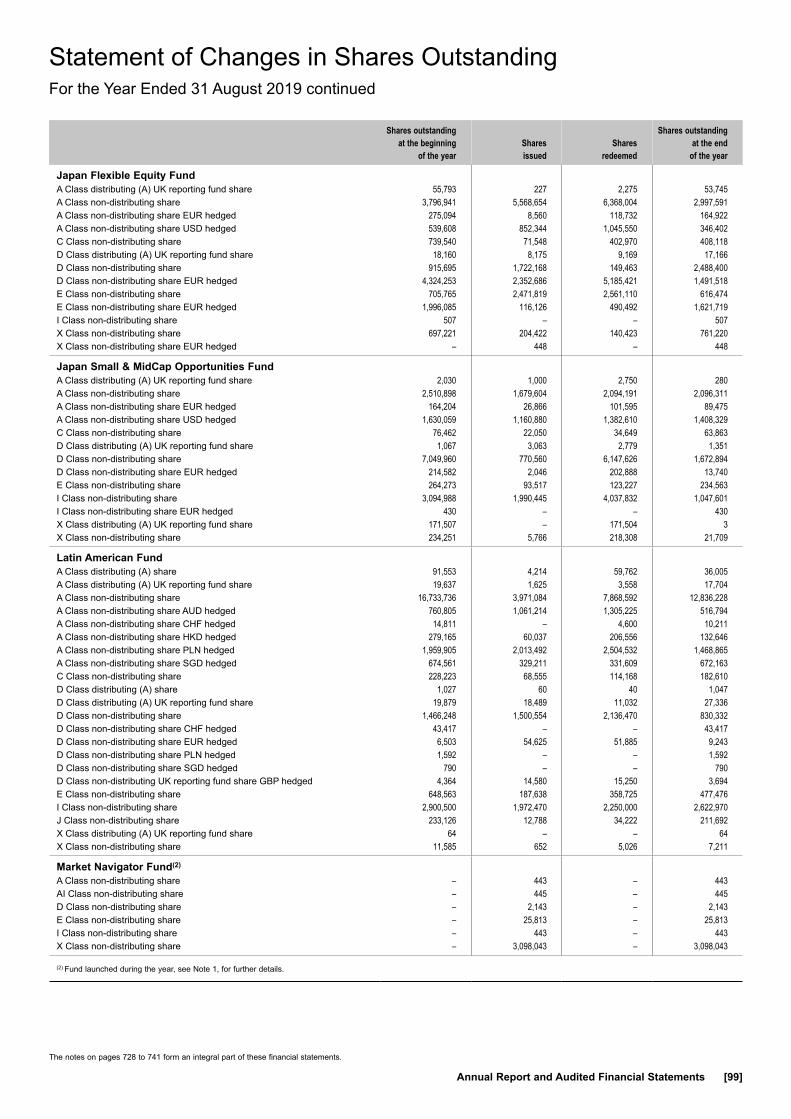
The notes on pages 728 to 741 form an integral part of these financial statements.
Annual Report and Audited Financial Statements [99]
Statement of Changes in Shares OutstandingFor the Year Ended 31 August 2019 continued
Shares outstanding at the beginning
of the yearShares issued
Shares redeemed
Shares outstanding at the end
of the year
Japan Flexible Equity Fund A Class distributing (A) UK reporting fund share 55,793 227 2,275 53,745A Class non-distributing share 3,796,941 5,568,654 6,368,004 2,997,591A Class non-distributing share EUR hedged 275,094 8,560 118,732 164,922A Class non-distributing share USD hedged 539,608 852,344 1,045,550 346,402C Class non-distributing share 739,540 71,548 402,970 408,118D Class distributing (A) UK reporting fund share 18,160 8,175 9,169 17,166D Class non-distributing share 915,695 1,722,168 149,463 2,488,400D Class non-distributing share EUR hedged 4,324,253 2,352,686 5,185,421 1,491,518E Class non-distributing share 705,765 2,471,819 2,561,110 616,474E Class non-distributing share EUR hedged 1,996,085 116,126 490,492 1,621,719I Class non-distributing share 507 – – 507X Class non-distributing share 697,221 204,422 140,423 761,220X Class non-distributing share EUR hedged – 448 – 448
Japan Small & MidCap Opportunities Fund A Class distributing (A) UK reporting fund share 2,030 1,000 2,750 280A Class non-distributing share 2,510,898 1,679,604 2,094,191 2,096,311A Class non-distributing share EUR hedged 164,204 26,866 101,595 89,475A Class non-distributing share USD hedged 1,630,059 1,160,880 1,382,610 1,408,329C Class non-distributing share 76,462 22,050 34,649 63,863D Class distributing (A) UK reporting fund share 1,067 3,063 2,779 1,351D Class non-distributing share 7,049,960 770,560 6,147,626 1,672,894D Class non-distributing share EUR hedged 214,582 2,046 202,888 13,740E Class non-distributing share 264,273 93,517 123,227 234,563I Class non-distributing share 3,094,988 1,990,445 4,037,832 1,047,601I Class non-distributing share EUR hedged 430 – – 430X Class distributing (A) UK reporting fund share 171,507 – 171,504 3X Class non-distributing share 234,251 5,766 218,308 21,709
Latin American Fund A Class distributing (A) share 91,553 4,214 59,762 36,005A Class distributing (A) UK reporting fund share 19,637 1,625 3,558 17,704A Class non-distributing share 16,733,736 3,971,084 7,868,592 12,836,228A Class non-distributing share AUD hedged 760,805 1,061,214 1,305,225 516,794A Class non-distributing share CHF hedged 14,811 – 4,600 10,211A Class non-distributing share HKD hedged 279,165 60,037 206,556 132,646A Class non-distributing share PLN hedged 1,959,905 2,013,492 2,504,532 1,468,865A Class non-distributing share SGD hedged 674,561 329,211 331,609 672,163C Class non-distributing share 228,223 68,555 114,168 182,610D Class distributing (A) share 1,027 60 40 1,047D Class distributing (A) UK reporting fund share 19,879 18,489 11,032 27,336D Class non-distributing share 1,466,248 1,500,554 2,136,470 830,332D Class non-distributing share CHF hedged 43,417 – – 43,417D Class non-distributing share EUR hedged 6,503 54,625 51,885 9,243D Class non-distributing share PLN hedged 1,592 – – 1,592D Class non-distributing share SGD hedged 790 – – 790D Class non-distributing UK reporting fund share GBP hedged 4,364 14,580 15,250 3,694E Class non-distributing share 648,563 187,638 358,725 477,476I Class non-distributing share 2,900,500 1,972,470 2,250,000 2,622,970J Class non-distributing share 233,126 12,788 34,222 211,692X Class distributing (A) UK reporting fund share 64 – – 64X Class non-distributing share 11,585 652 5,026 7,211
Market Navigator Fund(2) A Class non-distributing share – 443 – 443AI Class non-distributing share – 445 – 445D Class non-distributing share – 2,143 – 2,143E Class non-distributing share – 25,813 – 25,813I Class non-distributing share – 443 – 443X Class non-distributing share – 3,098,043 – 3,098,043
(2) Fund launched during the year, see Note 1, for further details.
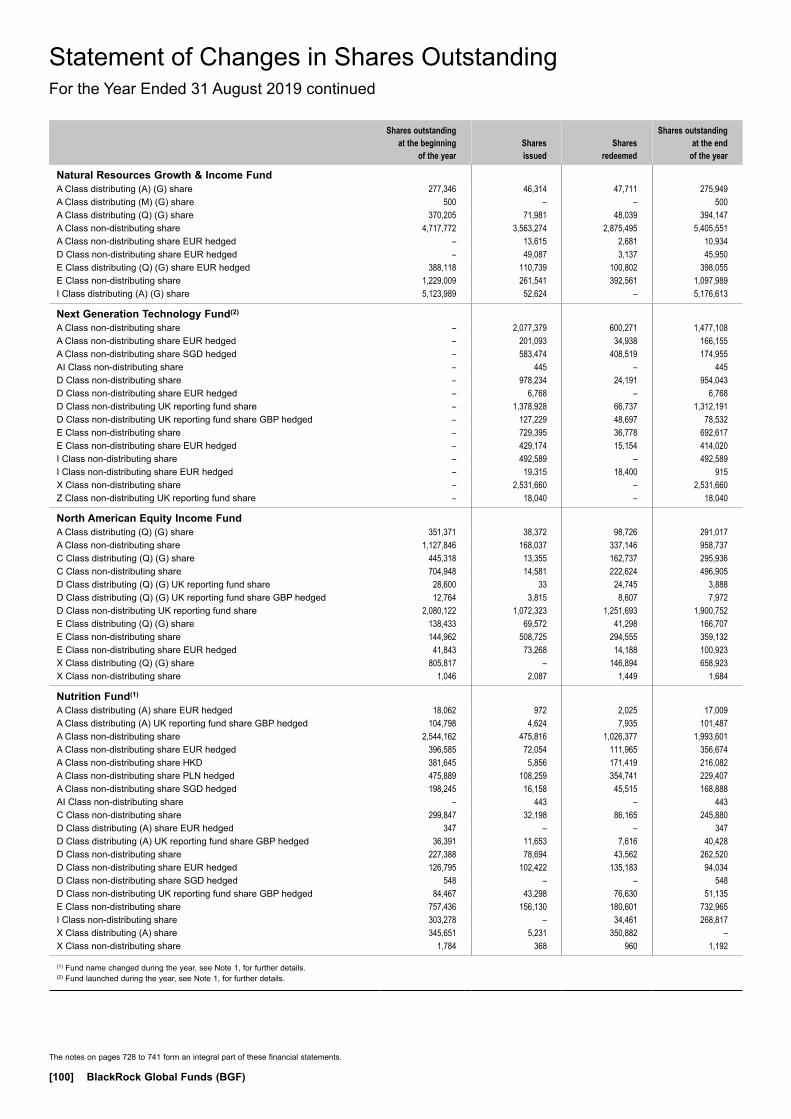
The notes on pages 728 to 741 form an integral part of these financial statements.
[100] BlackRock Global Funds (BGF)
Statement of Changes in Shares OutstandingFor the Year Ended 31 August 2019 continued
Shares outstanding at the beginning
of the yearShares issued
Shares redeemed
Shares outstanding at the end
of the year
Natural Resources Growth & Income Fund A Class distributing (A) (G) share 277,346 46,314 47,711 275,949A Class distributing (M) (G) share 500 – – 500A Class distributing (Q) (G) share 370,205 71,981 48,039 394,147A Class non-distributing share 4,717,772 3,563,274 2,875,495 5,405,551A Class non-distributing share EUR hedged – 13,615 2,681 10,934D Class non-distributing share EUR hedged – 49,087 3,137 45,950E Class distributing (Q) (G) share EUR hedged 388,118 110,739 100,802 398,055E Class non-distributing share 1,229,009 261,541 392,561 1,097,989I Class distributing (A) (G) share 5,123,989 52,624 – 5,176,613
Next Generation Technology Fund(2) A Class non-distributing share – 2,077,379 600,271 1,477,108A Class non-distributing share EUR hedged – 201,093 34,938 166,155A Class non-distributing share SGD hedged – 583,474 408,519 174,955AI Class non-distributing share – 445 – 445D Class non-distributing share – 978,234 24,191 954,043D Class non-distributing share EUR hedged – 6,768 – 6,768D Class non-distributing UK reporting fund share – 1,378,928 66,737 1,312,191D Class non-distributing UK reporting fund share GBP hedged – 127,229 48,697 78,532E Class non-distributing share – 729,395 36,778 692,617E Class non-distributing share EUR hedged – 429,174 15,154 414,020I Class non-distributing share – 492,589 – 492,589I Class non-distributing share EUR hedged – 19,315 18,400 915X Class non-distributing share – 2,531,660 – 2,531,660Z Class non-distributing UK reporting fund share – 18,040 – 18,040
North American Equity Income Fund A Class distributing (Q) (G) share 351,371 38,372 98,726 291,017A Class non-distributing share 1,127,846 168,037 337,146 958,737C Class distributing (Q) (G) share 445,318 13,355 162,737 295,936C Class non-distributing share 704,948 14,581 222,624 496,905D Class distributing (Q) (G) UK reporting fund share 28,600 33 24,745 3,888D Class distributing (Q) (G) UK reporting fund share GBP hedged 12,764 3,815 8,607 7,972D Class non-distributing UK reporting fund share 2,080,122 1,072,323 1,251,693 1,900,752E Class distributing (Q) (G) share 138,433 69,572 41,298 166,707E Class non-distributing share 144,962 508,725 294,555 359,132E Class non-distributing share EUR hedged 41,843 73,268 14,188 100,923X Class distributing (Q) (G) share 805,817 – 146,894 658,923X Class non-distributing share 1,046 2,087 1,449 1,684
Nutrition Fund(1) A Class distributing (A) share EUR hedged 18,062 972 2,025 17,009A Class distributing (A) UK reporting fund share GBP hedged 104,798 4,624 7,935 101,487A Class non-distributing share 2,544,162 475,816 1,026,377 1,993,601A Class non-distributing share EUR hedged 396,585 72,054 111,965 356,674A Class non-distributing share HKD 381,645 5,856 171,419 216,082A Class non-distributing share PLN hedged 475,889 108,259 354,741 229,407A Class non-distributing share SGD hedged 198,245 16,158 45,515 168,888AI Class non-distributing share – 443 – 443C Class non-distributing share 299,847 32,198 86,165 245,880D Class distributing (A) share EUR hedged 347 – – 347D Class distributing (A) UK reporting fund share GBP hedged 36,391 11,653 7,616 40,428D Class non-distributing share 227,388 78,694 43,562 262,520D Class non-distributing share EUR hedged 126,795 102,422 135,183 94,034D Class non-distributing share SGD hedged 548 – – 548D Class non-distributing UK reporting fund share GBP hedged 84,467 43,298 76,630 51,135E Class non-distributing share 757,436 156,130 180,601 732,965I Class non-distributing share 303,278 – 34,461 268,817X Class distributing (A) share 345,651 5,231 350,882 –X Class non-distributing share 1,784 368 960 1,192
(1) Fund name changed during the year, see Note 1, for further details.(2) Fund launched during the year, see Note 1, for further details.
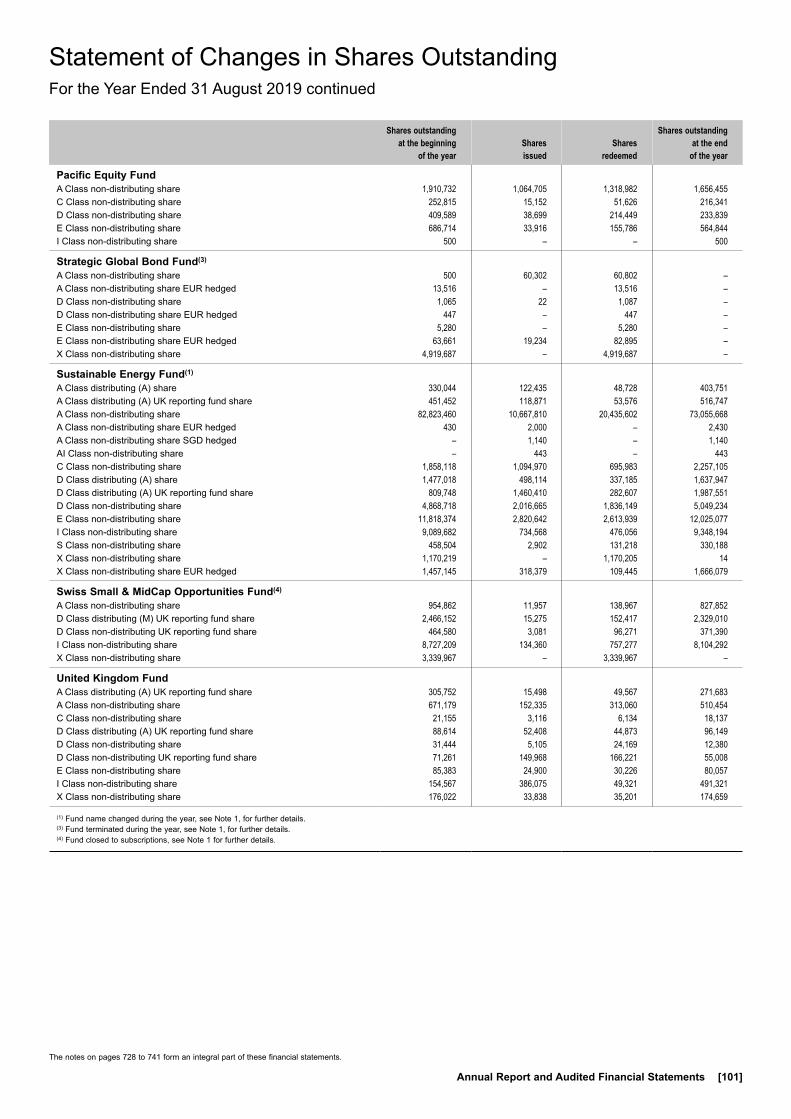
The notes on pages 728 to 741 form an integral part of these financial statements.
Annual Report and Audited Financial Statements [101]
Statement of Changes in Shares OutstandingFor the Year Ended 31 August 2019 continued
Shares outstanding at the beginning
of the yearShares issued
Shares redeemed
Shares outstanding at the end
of the year
Pacific Equity Fund A Class non-distributing share 1,910,732 1,064,705 1,318,982 1,656,455C Class non-distributing share 252,815 15,152 51,626 216,341D Class non-distributing share 409,589 38,699 214,449 233,839E Class non-distributing share 686,714 33,916 155,786 564,844I Class non-distributing share 500 – – 500
Strategic Global Bond Fund(3) A Class non-distributing share 500 60,302 60,802 –A Class non-distributing share EUR hedged 13,516 – 13,516 –D Class non-distributing share 1,065 22 1,087 –D Class non-distributing share EUR hedged 447 – 447 –E Class non-distributing share 5,280 – 5,280 –E Class non-distributing share EUR hedged 63,661 19,234 82,895 –X Class non-distributing share 4,919,687 – 4,919,687 –
Sustainable Energy Fund(1) A Class distributing (A) share 330,044 122,435 48,728 403,751A Class distributing (A) UK reporting fund share 451,452 118,871 53,576 516,747A Class non-distributing share 82,823,460 10,667,810 20,435,602 73,055,668A Class non-distributing share EUR hedged 430 2,000 – 2,430A Class non-distributing share SGD hedged – 1,140 – 1,140AI Class non-distributing share – 443 – 443C Class non-distributing share 1,858,118 1,094,970 695,983 2,257,105D Class distributing (A) share 1,477,018 498,114 337,185 1,637,947D Class distributing (A) UK reporting fund share 809,748 1,460,410 282,607 1,987,551D Class non-distributing share 4,868,718 2,016,665 1,836,149 5,049,234E Class non-distributing share 11,818,374 2,820,642 2,613,939 12,025,077I Class non-distributing share 9,089,682 734,568 476,056 9,348,194S Class non-distributing share 458,504 2,902 131,218 330,188X Class non-distributing share 1,170,219 – 1,170,205 14X Class non-distributing share EUR hedged 1,457,145 318,379 109,445 1,666,079
Swiss Small & MidCap Opportunities Fund(4) A Class non-distributing share 954,862 11,957 138,967 827,852D Class distributing (M) UK reporting fund share 2,466,152 15,275 152,417 2,329,010D Class non-distributing UK reporting fund share 464,580 3,081 96,271 371,390I Class non-distributing share 8,727,209 134,360 757,277 8,104,292X Class non-distributing share 3,339,967 – 3,339,967 –
United Kingdom Fund A Class distributing (A) UK reporting fund share 305,752 15,498 49,567 271,683A Class non-distributing share 671,179 152,335 313,060 510,454C Class non-distributing share 21,155 3,116 6,134 18,137D Class distributing (A) UK reporting fund share 88,614 52,408 44,873 96,149D Class non-distributing share 31,444 5,105 24,169 12,380D Class non-distributing UK reporting fund share 71,261 149,968 166,221 55,008E Class non-distributing share 85,383 24,900 30,226 80,057I Class non-distributing share 154,567 386,075 49,321 491,321X Class non-distributing share 176,022 33,838 35,201 174,659
(1) Fund name changed during the year, see Note 1, for further details.(3) Fund terminated during the year, see Note 1, for further details.(4) Fund closed to subscriptions, see Note 1 for further details.

The notes on pages 728 to 741 form an integral part of these financial statements.
[102] BlackRock Global Funds (BGF)
Statement of Changes in Shares OutstandingFor the Year Ended 31 August 2019 continued
Shares outstanding at the beginning
of the yearShares issued
Shares redeemed
Shares outstanding at the end
of the year
US Basic Value Fund A Class distributing (A) share 19,181 49,579 52,979 15,781A Class distributing (A) UK reporting fund share 10,754 58 49 10,763A Class non-distributing share 4,574,239 1,017,471 1,665,014 3,926,696A Class non-distributing share CNH hedged 328 – – 328A Class non-distributing share EUR hedged 588,855 97,091 144,269 541,677A Class non-distributing share SGD hedged 32,875 18,464 1,907 49,432C Class non-distributing share 309,927 60,282 81,926 288,283C Class non-distributing share EUR hedged 6,850 1,161 2,493 5,518D Class distributing (A) share 5,616 345 2,629 3,332D Class distributing (A) UK reporting fund share 13,217 3,578 5,743 11,052D Class non-distributing share 1,026,311 239,024 726,070 539,265D Class non-distributing share EUR hedged 122,941 128,988 225,956 25,973E Class non-distributing share 599,590 38,489 100,642 537,437E Class non-distributing share EUR hedged 126,212 39,470 70,893 94,789I Class non-distributing share 731,724 537,838 542,799 726,763X Class non-distributing share 88,510 3,796 14,874 77,432
US Dollar Bond Fund A Class distributing (D) share 903,381 140,206 225,071 818,516A Class distributing (M) share 523,319 3,441,514 3,236,335 728,498A Class distributing (S) (M) (G) share GBP hedged 378 – – 378A Class distributing (S) (M) (G) share HKD hedged 390 – – 390A Class non-distributing share 2,417,017 4,331,200 4,054,042 2,694,175C Class distributing (D) share 811,369 9,330 88,345 732,354C Class non-distributing share 480,596 53,083 131,224 402,455D Class distributing (M) share 2,549,043 339,580 468,228 2,420,395D Class non-distributing share 4,354,855 3,585,198 2,316,773 5,623,280D Class non-distributing UK reporting fund share GBP hedged 48,392 316 5,098 43,610E Class non-distributing share 223,005 69,861 69,463 223,403I Class distributing (Q) share 2,002,092 16,322 2,016,869 1,545I Class non-distributing share 18,946,996 5,428,467 2,768,905 21,606,558I Class non-distributing share EUR hedged 2,036,004 1,922,906 157,392 3,801,518X Class distributing (Q) share 500 – – 500X Class non-distributing share 1,317 982,762 357,553 626,526

The notes on pages 728 to 741 form an integral part of these financial statements.
Annual Report and Audited Financial Statements [103]
Statement of Changes in Shares OutstandingFor the Year Ended 31 August 2019 continued
Shares outstanding at the beginning
of the yearShares issued
Shares redeemed
Shares outstanding at the end
of the year
US Dollar High Yield Bond Fund A Class distributing (A) UK reporting fund share GBP hedged 184,163 17,557 43,931 157,789A Class distributing (D) share 10,060,766 1,893,326 3,642,999 8,311,093A Class distributing (M) share 20,569,525 10,013,736 13,336,127 17,247,134A Class distributing (M) share AUD hedged 1,802,211 786,412 1,220,094 1,368,529A Class distributing (M) share CAD hedged 812,772 726,864 483,289 1,056,347A Class distributing (M) share EUR hedged 379,314 757,452 192,209 944,557A Class distributing (M) share GBP hedged 576,766 774,273 513,922 837,117A Class distributing (M) share NZD hedged 353,796 349,963 339,210 364,549A Class distributing (M) share SGD hedged 2,005,447 1,360,494 1,067,452 2,298,489A Class distributing (R) (M) (G) share AUD hedged 14,871,646 1,807,885 2,911,755 13,767,776A Class distributing (R) (M) (G) share ZAR hedged 1,592,362 2,236,375 1,179,795 2,648,942A Class distributing (R) (M) (G) UK reporting fund share CNH hedged – 345 – 345A Class distributing (S) (M) (G) share 185,574,824 38,076,281 62,630,719 161,020,386A Class distributing (S) (M) (G) share HKD hedged 8,820,761 3,795,202 4,489,534 8,126,429A Class distributing (S) (M) (G) share SGD hedged 1,300,355 188,384 326,287 1,162,452A Class non-distributing share 10,985,138 13,149,117 14,464,656 9,669,599A Class non-distributing share AUD hedged 457,082 104,112 210,579 350,615A Class non-distributing share CHF hedged 102,135 26,730 15,606 113,259A Class non-distributing share EUR hedged 124,869 6,385 61,886 69,368A Class non-distributing share SGD hedged 87,829 261,733 197,919 151,643C Class distributing (D) share 1,515,604 208,027 245,048 1,478,583C Class non-distributing share 576,816 77,837 148,357 506,296D Class distributing (A) UK reporting fund share GBP hedged 465,759 271,232 128,050 608,941D Class distributing (M) share 3,124,752 4,420,755 2,068,776 5,476,731D Class distributing (M) share SGD hedged 611 110,100 – 110,711D Class non-distributing share AUD hedged 49,251 156,411 – 205,662D Class non-distributing share CHF hedged 167,371 113,564 29,434 251,501D Class non-distributing share EUR hedged 99,372 35,291 35,480 99,183D Class non-distributing share SGD hedged 557 – – 557D Class non-distributing UK reporting fund share 3,501,724 2,533,502 3,849,923 2,185,303E Class non-distributing share 553,316 266,569 209,180 610,705I Class distributing (A) UK reporting fund share GBP hedged 931,234 106,226 1,037,451 9I Class distributing (M) share 2,369,313 12,027,928 6,610,342 7,786,899I Class non-distributing share 17,431,827 8,301,898 13,870,247 11,863,478I Class non-distributing share EUR hedged 7,567,527 2,321,142 8,803,078 1,085,591X Class distributing (S) (M) (G) share 13,389,915 809,860 6,660,173 7,539,602X Class non-distributing share 1,374 399,038 110 400,302
US Dollar Reserve Fund A Class non-distributing share 2,973,636 7,997,285 7,987,062 2,983,859A Class non-distributing share GBP hedged 96,734 76,195 55,597 117,332C Class non-distributing share 240,329 25,676 78,102 187,903D Class non-distributing share GBP hedged 17 – – 17E Class non-distributing share 324,704 42,703 97,285 270,122E Class non-distributing share GBP hedged 27,210 5,140 11,040 21,310X Class non-distributing share 205,455 1,116,096 291,090 1,030,461
US Dollar Short Duration Bond Fund A Class distributing (D) share 3,490,520 1,669,254 1,829,097 3,330,677A Class distributing (M) share 1,436,415 3,067,424 3,217,576 1,286,263A Class distributing (M) share SGD hedged 28,560 45,445 16,380 57,625A Class non-distributing share 30,410,346 15,789,018 11,745,281 34,454,083A Class non-distributing share EUR hedged 1,717,003 1,348,611 843,605 2,222,009AI Class non-distributing share – 1,000 – 1,000C Class distributing (D) share 364,556 114,139 211,168 267,527C Class non-distributing share 722,920 865,845 744,022 844,743D Class distributing (M) share 5,576,303 1,194,433 2,758,642 4,012,094D Class non-distributing share 23,038,804 10,523,497 11,336,621 22,225,680D Class non-distributing share EUR hedged 539,765 202,145 453,942 287,968E Class non-distributing share 11,856,720 3,360,647 4,586,608 10,630,759I Class distributing (Q) share – 2,949,440 – 2,949,440I Class non-distributing share 2,764,255 2,597,852 3,225,864 2,136,243I Class non-distributing share EUR hedged 11,291,151 6,687,272 5,879,726 12,098,697X Class non-distributing share 56,253,134 334,751 21,999,020 34,588,865

The notes on pages 728 to 741 form an integral part of these financial statements.
[104] BlackRock Global Funds (BGF)
Statement of Changes in Shares OutstandingFor the Year Ended 31 August 2019 continued
Shares outstanding at the beginning
of the yearShares issued
Shares redeemed
Shares outstanding at the end
of the year
US Flexible Equity Fund A Class distributing (A) share 10,321 34,369 9,290 35,400A Class distributing (A) share EUR hedged 144,268 73,304 115,042 102,530A Class distributing (A) UK reporting fund share 318,592 2,686 28,203 293,075A Class non-distributing share 12,912,778 2,995,962 4,812,506 11,096,234A Class non-distributing share CNH hedged 3,794 – 3,466 328A Class non-distributing share EUR hedged 2,019,331 634,760 881,105 1,772,986A Class non-distributing share JPY hedged – 251,753 222,672 29,081AI Class non-distributing share – 445 – 445C Class non-distributing share 854,279 151,022 166,164 839,137C Class non-distributing share EUR hedged 56,866 13,074 19,457 50,483D Class distributing (A) share 339 32 – 371D Class distributing (A) UK reporting fund share 89,124 17,370 20,039 86,455D Class non-distributing share 10,310,444 4,636,277 7,827,931 7,118,790D Class non-distributing share EUR hedged 1,841,186 381,992 1,013,530 1,209,648E Class non-distributing share 1,055,575 258,139 349,737 963,977E Class non-distributing share EUR hedged 560,325 93,168 172,687 480,806I Class non-distributing share 4,300,824 27,734,017 9,835,542 22,199,299I Class non-distributing share EUR hedged 430 6,666,367 3,892,017 2,774,780X Class non-distributing share 1,008,136 8,458 166,894 849,700X Class non-distributing share EUR hedged – 448 – 448
US Government Mortgage Fund A Class distributing (D) share 794,377 15,432 181,176 628,633A Class distributing (M) share 1,117,297 950,141 1,291,303 776,135A Class non-distributing share 2,247,062 4,683,469 4,802,041 2,128,490C Class distributing (D) share 215,339 16,909 1,795 230,453C Class non-distributing share 235,429 25,180 46,944 213,665D Class distributing (M) share 297,780 84,381 128,171 253,990D Class non-distributing share 1,034,962 488,267 370,539 1,152,690E Class non-distributing share 219,125 257,219 114,398 361,946I Class distributing (M) share 500 – – 500I Class non-distributing share – 1,500,500 – 1,500,500X Class distributing (M) share 500 – – 500X Class non-distributing share 1,098,734 – 1,098,734 –
US Growth Fund A Class distributing (A) share 45,098 9,954 31,058 23,994A Class non-distributing share 774,532 581,682 874,591 481,623A Class non-distributing share EUR hedged 842,394 32,466 74,590 800,270A Class non-distributing UK reporting fund share 6,747,751 3,895,461 5,827,547 4,815,665AI Class non-distributing share – 445 – 445C Class non-distributing share 719,690 158,447 184,524 693,613D Class distributing (A) share 1,112,957 129,976 361,050 881,883D Class non-distributing share 1,778,594 893,413 729,459 1,942,548D Class non-distributing UK reporting fund share 3,814,950 3,011,371 4,761,534 2,064,787E Class non-distributing share 873,214 596,627 368,307 1,101,534I Class non-distributing share 4,169,800 7,051,757 5,348,350 5,873,207
US Small & MidCap Opportunities Fund A Class non-distributing share 690,667 209,292 346,904 553,055A Class non-distributing share AUD hedged 111,547 178,131 184,874 104,804C Class non-distributing share 56,429 7,436 28,519 35,346D Class non-distributing share 114,330 14,437 62,155 66,612E Class non-distributing share 88,419 46,436 64,329 70,526I Class non-distributing share 453,440 316,000 769,000 440
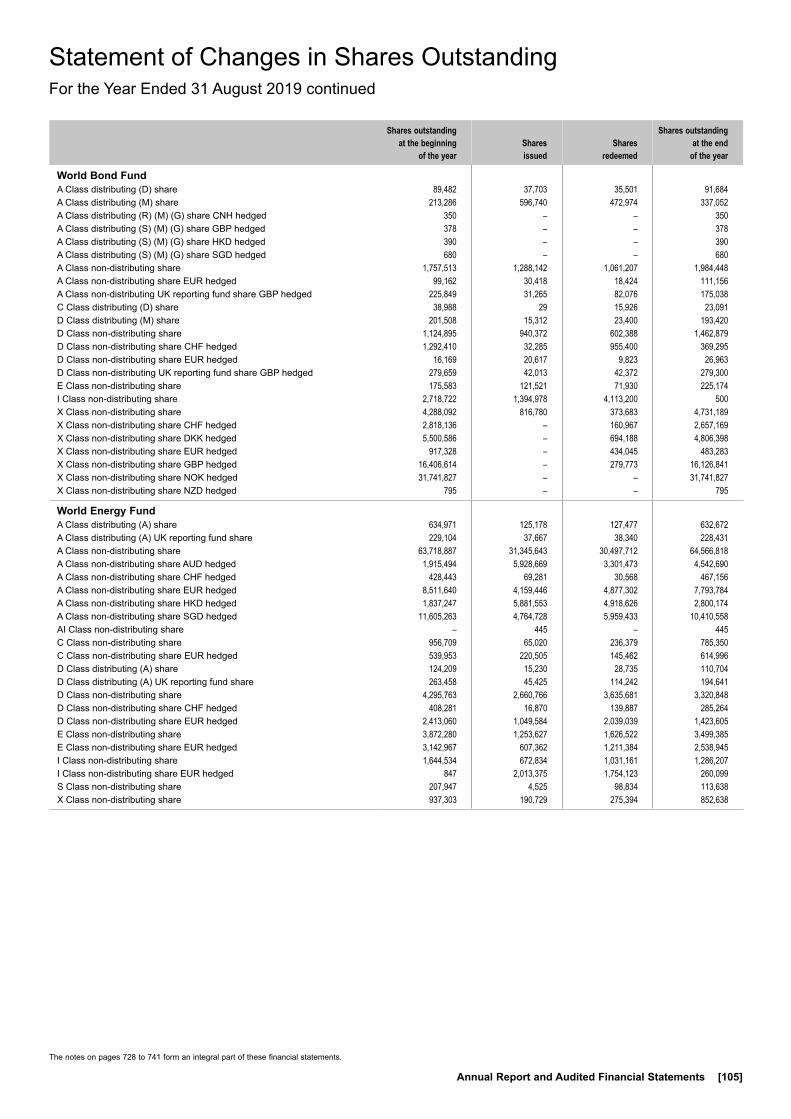
The notes on pages 728 to 741 form an integral part of these financial statements.
Annual Report and Audited Financial Statements [105]
Statement of Changes in Shares OutstandingFor the Year Ended 31 August 2019 continued
Shares outstanding at the beginning
of the yearShares issued
Shares redeemed
Shares outstanding at the end
of the year
World Bond Fund A Class distributing (D) share 89,482 37,703 35,501 91,684A Class distributing (M) share 213,286 596,740 472,974 337,052A Class distributing (R) (M) (G) share CNH hedged 350 – – 350A Class distributing (S) (M) (G) share GBP hedged 378 – – 378A Class distributing (S) (M) (G) share HKD hedged 390 – – 390A Class distributing (S) (M) (G) share SGD hedged 680 – – 680A Class non-distributing share 1,757,513 1,288,142 1,061,207 1,984,448A Class non-distributing share EUR hedged 99,162 30,418 18,424 111,156A Class non-distributing UK reporting fund share GBP hedged 225,849 31,265 82,076 175,038C Class distributing (D) share 38,988 29 15,926 23,091D Class distributing (M) share 201,508 15,312 23,400 193,420D Class non-distributing share 1,124,895 940,372 602,388 1,462,879D Class non-distributing share CHF hedged 1,292,410 32,285 955,400 369,295D Class non-distributing share EUR hedged 16,169 20,617 9,823 26,963D Class non-distributing UK reporting fund share GBP hedged 279,659 42,013 42,372 279,300E Class non-distributing share 175,583 121,521 71,930 225,174I Class non-distributing share 2,718,722 1,394,978 4,113,200 500X Class non-distributing share 4,288,092 816,780 373,683 4,731,189X Class non-distributing share CHF hedged 2,818,136 – 160,967 2,657,169X Class non-distributing share DKK hedged 5,500,586 – 694,188 4,806,398X Class non-distributing share EUR hedged 917,328 – 434,045 483,283X Class non-distributing share GBP hedged 16,406,614 – 279,773 16,126,841X Class non-distributing share NOK hedged 31,741,827 – – 31,741,827X Class non-distributing share NZD hedged 795 – – 795
World Energy Fund A Class distributing (A) share 634,971 125,178 127,477 632,672A Class distributing (A) UK reporting fund share 229,104 37,667 38,340 228,431A Class non-distributing share 63,718,887 31,345,643 30,497,712 64,566,818A Class non-distributing share AUD hedged 1,915,494 5,928,669 3,301,473 4,542,690A Class non-distributing share CHF hedged 428,443 69,281 30,568 467,156A Class non-distributing share EUR hedged 8,511,640 4,159,446 4,877,302 7,793,784A Class non-distributing share HKD hedged 1,837,247 5,881,553 4,918,626 2,800,174A Class non-distributing share SGD hedged 11,605,263 4,764,728 5,959,433 10,410,558AI Class non-distributing share – 445 – 445C Class non-distributing share 956,709 65,020 236,379 785,350C Class non-distributing share EUR hedged 539,953 220,505 145,462 614,996D Class distributing (A) share 124,209 15,230 28,735 110,704D Class distributing (A) UK reporting fund share 263,458 45,425 114,242 194,641D Class non-distributing share 4,295,763 2,660,766 3,635,681 3,320,848D Class non-distributing share CHF hedged 408,281 16,870 139,887 285,264D Class non-distributing share EUR hedged 2,413,060 1,049,584 2,039,039 1,423,605E Class non-distributing share 3,872,280 1,253,627 1,626,522 3,499,385E Class non-distributing share EUR hedged 3,142,967 607,362 1,211,384 2,538,945I Class non-distributing share 1,644,534 672,834 1,031,161 1,286,207I Class non-distributing share EUR hedged 847 2,013,375 1,754,123 260,099S Class non-distributing share 207,947 4,525 98,834 113,638X Class non-distributing share 937,303 190,729 275,394 852,638
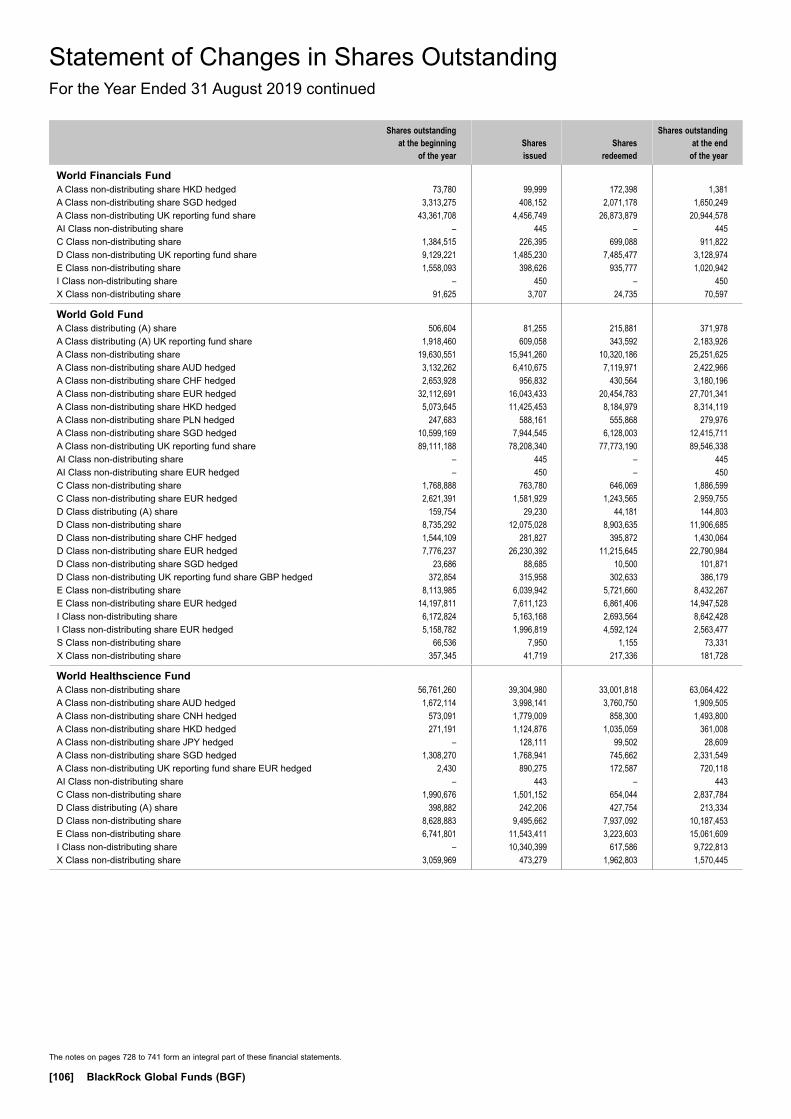
The notes on pages 728 to 741 form an integral part of these financial statements.
[106] BlackRock Global Funds (BGF)
Statement of Changes in Shares OutstandingFor the Year Ended 31 August 2019 continued
Shares outstanding at the beginning
of the yearShares issued
Shares redeemed
Shares outstanding at the end
of the year
World Financials Fund A Class non-distributing share HKD hedged 73,780 99,999 172,398 1,381A Class non-distributing share SGD hedged 3,313,275 408,152 2,071,178 1,650,249A Class non-distributing UK reporting fund share 43,361,708 4,456,749 26,873,879 20,944,578AI Class non-distributing share – 445 – 445C Class non-distributing share 1,384,515 226,395 699,088 911,822D Class non-distributing UK reporting fund share 9,129,221 1,485,230 7,485,477 3,128,974E Class non-distributing share 1,558,093 398,626 935,777 1,020,942I Class non-distributing share – 450 – 450X Class non-distributing share 91,625 3,707 24,735 70,597
World Gold Fund A Class distributing (A) share 506,604 81,255 215,881 371,978A Class distributing (A) UK reporting fund share 1,918,460 609,058 343,592 2,183,926A Class non-distributing share 19,630,551 15,941,260 10,320,186 25,251,625A Class non-distributing share AUD hedged 3,132,262 6,410,675 7,119,971 2,422,966A Class non-distributing share CHF hedged 2,653,928 956,832 430,564 3,180,196A Class non-distributing share EUR hedged 32,112,691 16,043,433 20,454,783 27,701,341A Class non-distributing share HKD hedged 5,073,645 11,425,453 8,184,979 8,314,119A Class non-distributing share PLN hedged 247,683 588,161 555,868 279,976A Class non-distributing share SGD hedged 10,599,169 7,944,545 6,128,003 12,415,711A Class non-distributing UK reporting fund share 89,111,188 78,208,340 77,773,190 89,546,338AI Class non-distributing share – 445 – 445AI Class non-distributing share EUR hedged – 450 – 450C Class non-distributing share 1,768,888 763,780 646,069 1,886,599C Class non-distributing share EUR hedged 2,621,391 1,581,929 1,243,565 2,959,755D Class distributing (A) share 159,754 29,230 44,181 144,803D Class non-distributing share 8,735,292 12,075,028 8,903,635 11,906,685D Class non-distributing share CHF hedged 1,544,109 281,827 395,872 1,430,064D Class non-distributing share EUR hedged 7,776,237 26,230,392 11,215,645 22,790,984D Class non-distributing share SGD hedged 23,686 88,685 10,500 101,871D Class non-distributing UK reporting fund share GBP hedged 372,854 315,958 302,633 386,179E Class non-distributing share 8,113,985 6,039,942 5,721,660 8,432,267E Class non-distributing share EUR hedged 14,197,811 7,611,123 6,861,406 14,947,528I Class non-distributing share 6,172,824 5,163,168 2,693,564 8,642,428I Class non-distributing share EUR hedged 5,158,782 1,996,819 4,592,124 2,563,477S Class non-distributing share 66,536 7,950 1,155 73,331X Class non-distributing share 357,345 41,719 217,336 181,728
World Healthscience Fund A Class non-distributing share 56,761,260 39,304,980 33,001,818 63,064,422A Class non-distributing share AUD hedged 1,672,114 3,998,141 3,760,750 1,909,505A Class non-distributing share CNH hedged 573,091 1,779,009 858,300 1,493,800A Class non-distributing share HKD hedged 271,191 1,124,876 1,035,059 361,008A Class non-distributing share JPY hedged – 128,111 99,502 28,609A Class non-distributing share SGD hedged 1,308,270 1,768,941 745,662 2,331,549A Class non-distributing UK reporting fund share EUR hedged 2,430 890,275 172,587 720,118AI Class non-distributing share – 443 – 443C Class non-distributing share 1,990,676 1,501,152 654,044 2,837,784D Class distributing (A) share 398,882 242,206 427,754 213,334D Class non-distributing share 8,628,883 9,495,662 7,937,092 10,187,453E Class non-distributing share 6,741,801 11,543,411 3,223,603 15,061,609I Class non-distributing share – 10,340,399 617,586 9,722,813X Class non-distributing share 3,059,969 473,279 1,962,803 1,570,445
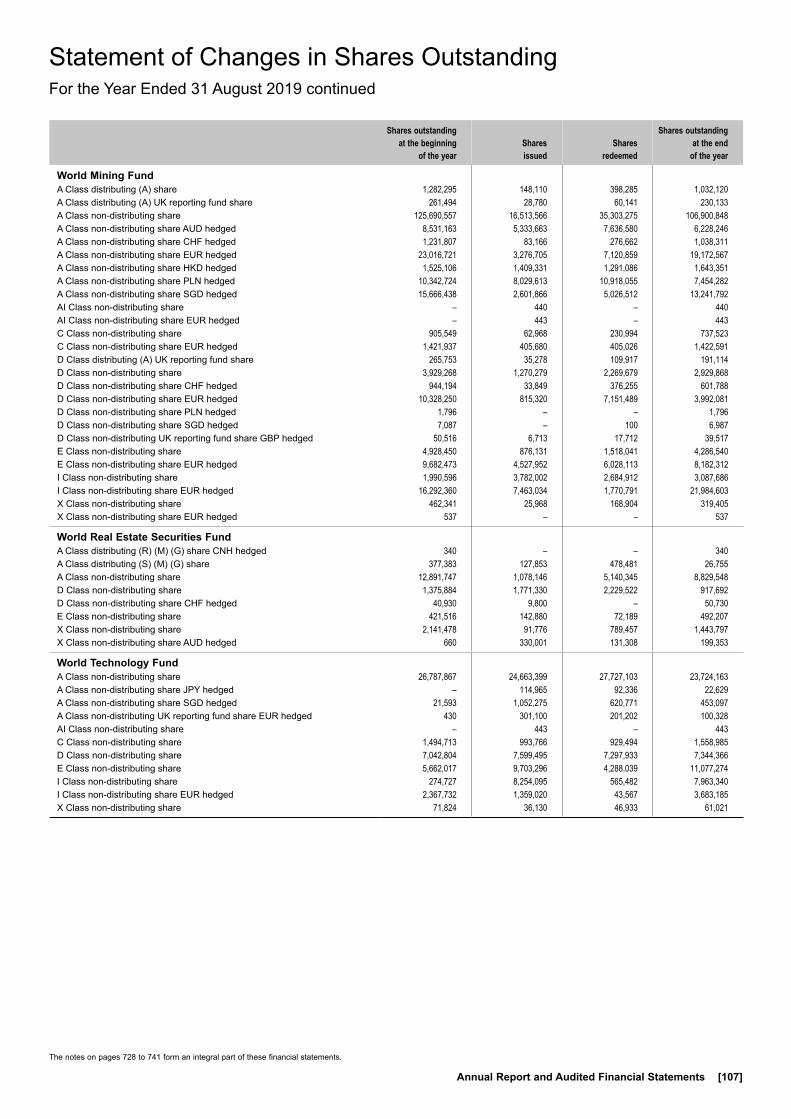
The notes on pages 728 to 741 form an integral part of these financial statements.
Annual Report and Audited Financial Statements [107]
Statement of Changes in Shares OutstandingFor the Year Ended 31 August 2019 continued
Shares outstanding at the beginning
of the yearShares issued
Shares redeemed
Shares outstanding at the end
of the year
World Mining Fund A Class distributing (A) share 1,282,295 148,110 398,285 1,032,120A Class distributing (A) UK reporting fund share 261,494 28,780 60,141 230,133A Class non-distributing share 125,690,557 16,513,566 35,303,275 106,900,848A Class non-distributing share AUD hedged 8,531,163 5,333,663 7,636,580 6,228,246A Class non-distributing share CHF hedged 1,231,807 83,166 276,662 1,038,311A Class non-distributing share EUR hedged 23,016,721 3,276,705 7,120,859 19,172,567A Class non-distributing share HKD hedged 1,525,106 1,409,331 1,291,086 1,643,351A Class non-distributing share PLN hedged 10,342,724 8,029,613 10,918,055 7,454,282A Class non-distributing share SGD hedged 15,666,438 2,601,866 5,026,512 13,241,792AI Class non-distributing share – 440 – 440AI Class non-distributing share EUR hedged – 443 – 443C Class non-distributing share 905,549 62,968 230,994 737,523C Class non-distributing share EUR hedged 1,421,937 405,680 405,026 1,422,591D Class distributing (A) UK reporting fund share 265,753 35,278 109,917 191,114D Class non-distributing share 3,929,268 1,270,279 2,269,679 2,929,868D Class non-distributing share CHF hedged 944,194 33,849 376,255 601,788D Class non-distributing share EUR hedged 10,328,250 815,320 7,151,489 3,992,081D Class non-distributing share PLN hedged 1,796 – – 1,796D Class non-distributing share SGD hedged 7,087 – 100 6,987D Class non-distributing UK reporting fund share GBP hedged 50,516 6,713 17,712 39,517E Class non-distributing share 4,928,450 876,131 1,518,041 4,286,540E Class non-distributing share EUR hedged 9,682,473 4,527,952 6,028,113 8,182,312I Class non-distributing share 1,990,596 3,782,002 2,684,912 3,087,686I Class non-distributing share EUR hedged 16,292,360 7,463,034 1,770,791 21,984,603X Class non-distributing share 462,341 25,968 168,904 319,405X Class non-distributing share EUR hedged 537 – – 537
World Real Estate Securities Fund A Class distributing (R) (M) (G) share CNH hedged 340 – – 340A Class distributing (S) (M) (G) share 377,383 127,853 478,481 26,755A Class non-distributing share 12,891,747 1,078,146 5,140,345 8,829,548D Class non-distributing share 1,375,884 1,771,330 2,229,522 917,692D Class non-distributing share CHF hedged 40,930 9,800 – 50,730E Class non-distributing share 421,516 142,880 72,189 492,207X Class non-distributing share 2,141,478 91,776 789,457 1,443,797X Class non-distributing share AUD hedged 660 330,001 131,308 199,353
World Technology Fund A Class non-distributing share 26,787,867 24,663,399 27,727,103 23,724,163A Class non-distributing share JPY hedged – 114,965 92,336 22,629A Class non-distributing share SGD hedged 21,593 1,052,275 620,771 453,097A Class non-distributing UK reporting fund share EUR hedged 430 301,100 201,202 100,328AI Class non-distributing share – 443 – 443C Class non-distributing share 1,494,713 993,766 929,494 1,558,985D Class non-distributing share 7,042,804 7,599,495 7,297,933 7,344,366E Class non-distributing share 5,662,017 9,703,296 4,288,039 11,077,274I Class non-distributing share 274,727 8,254,095 565,482 7,963,340I Class non-distributing share EUR hedged 2,367,732 1,359,020 43,567 3,683,185X Class non-distributing share 71,824 36,130 46,933 61,021

Transferable Securities and Money Market Instruments Admitted to an Official Stock Exchange Listing or Dealt in on Another Regulated Market
Transferable Securities and Money Market Instruments Admitted to an Official Stock Exchange Listing or Dealt in on Another Regulated Market
Holding
Description
Market Value (USD)
% of Net
Assets
Holding
Description
Market Value (USD)
% of Net
Assets
~ Investment in connected party fund, see further information in Note 11.° Wts is an abbreviation for warrants.* All or a portion of this security represents a security on loan.
The notes on pages 728 to 741 form an integral part of these financial statements.
[108] BlackRock Global Funds (BGF)
ASEAN Leaders Fund
Portfolio of Investments 31 August 2019
FUNDS
Ireland 110,966 BlackRock ICS US Dollar Liquid
Environmentally Aware Fund~ 11,099,821 4.60Total Funds 11,099,821 4.60
COMMON STOCKS (SHARES), WARRANTS & P NOTES
Indonesia 19,240,700 Astra International Tbk PT 9,054,047 3.75 3,518,600 Bank Central Asia Tbk PT 7,565,548 3.13 15,555,600 Bank Mandiri Persero Tbk PT 7,950,518 3.29 23,928,800 Bank Rakyat Indonesia Persero
Tbk PT 7,203,100 2.98 23,476,846 Cikarang Listrindo Tbk PT 1,729,524 0.72 21,258,624 Ciputra Development Tbk PT 1,641,043 0.68 1,429,500 Indo Tambangraya Megah Tbk PT 1,310,081 0.54 2,043,300 Indocement Tunggal Prakarsa
Tbk PT 3,129,411 1.30 3,488,000 Indofood CBP Sukses Makmur
Tbk PT 2,963,017 1.23 38,420,600 Mitra Adiperkasa Tbk PT 2,681,452 1.11 4,406,700 Semen Indonesia Persero Tbk PT 4,116,233 1.71 27,569,500 Telekomunikasi Indonesia Persero
Tbk PT 8,648,873 3.58 57,992,847 24.02
Malaysia 702,900 British American Tobacco
Malaysia Bhd 3,295,978 1.36 3,730,067 CIMB Group Holdings Bhd 4,487,981 1.86 5,081,600 Genting Malaysia Bhd 3,794,146 1.57 929,900 Malaysia Airports Holdings Bhd 1,819,785 0.75 823,000 Malaysia Airports Holdings Bhd
(Wts° 19/2/2020) 1,610,579 0.67 2,480,900 Maxis Bhd 3,285,855 1.36 2,827,900 RHB Bank Bhd 3,832,859 1.59 33,446,900 Sapura Energy Bhd 2,187,119 0.91 24,314,302 10.07
Philippines 214,110 Ayala Corp 3,804,480 1.57 2,809,826 Bank of the Philippine Islands 4,747,138 1.97 11,343,400 Bloomberry Resorts Corp 2,253,100 0.93 304,457 GT Capital Holdings Inc 5,310,414 2.20 1,200,130 International Container Terminal
Services Inc 3,130,723 1.30 9,846,400 LT Group Inc 2,795,558 1.16 1,823,170 Robinsons Retail Holdings Inc 2,731,734 1.13 24,773,147 10.26
Singapore 626,342 Citigroup Global Markets Hold
(P Note 19/2/2020 - Oversea-Chinese Banking Corp Ltd) 4,806,039 1.99
816,466 DBS Group Holdings Ltd 14,442,466 5.98 46,254 DBS Group Holdings Ltd
(Wts 19/2/2020) 817,472 0.34 10,937,200 Genting Singapore Ltd 7,019,430 2.91 1,220,202 Oversea-Chinese Banking Corp Ltd 9,371,024 3.88 5,794,800 Singapore Telecommunications Ltd 13,246,569 5.49 415,807 United Overseas Bank Ltd 7,484,143 3.10 1,118,134 UOL Group Ltd* 5,926,345 2.45 3,662,400 Yanlord Land Group Ltd 2,905,121 1.20 66,018,609 27.34
Thailand 11,672,500 Bangkok Dusit Medical Services PCL 9,010,420 3.73 4,665,700 CP ALL PCL 12,819,328 5.31 32,394,200 IRPC PCL* 4,195,962 1.74 3,162,700 Land & Houses PCL 1,117,251 0.46 9,384,900 Land & Houses PCL NVDR 3,315,298 1.37 2,575,000 PTT PCL 3,727,002 1.54 263,600 Siam Cement PCL/The 3,586,806 1.49 1,565,700 Siam Commercial Bank PCL/The 6,324,769 2.62 8,051,600 Thai Beverage PCL 5,225,531 2.16 2,460,900 Total Access Communication PCL 4,950,376 2.05 54,272,743 22.47
Vietnam 1,443,366 Deutsche Bank AG London
(P Note 12/11/2027 - Vincom Retail JSC) 2,144,568 0.89
Total Common Stocks (Shares), Warrants & P Notes 229,516,216 95.05Total Transferable Securities and Money Market Instruments Admitted to an Official Stock Exchange Listing or Dealt in on Another Regulated Market 240,616,037 99.65Total Portfolio 240,616,037 99.65
Other Net Assets 856,756 0.35Total Net Assets (USD) 241,472,793 100.00
ASEAN Leaders FundPortfolio of Investments
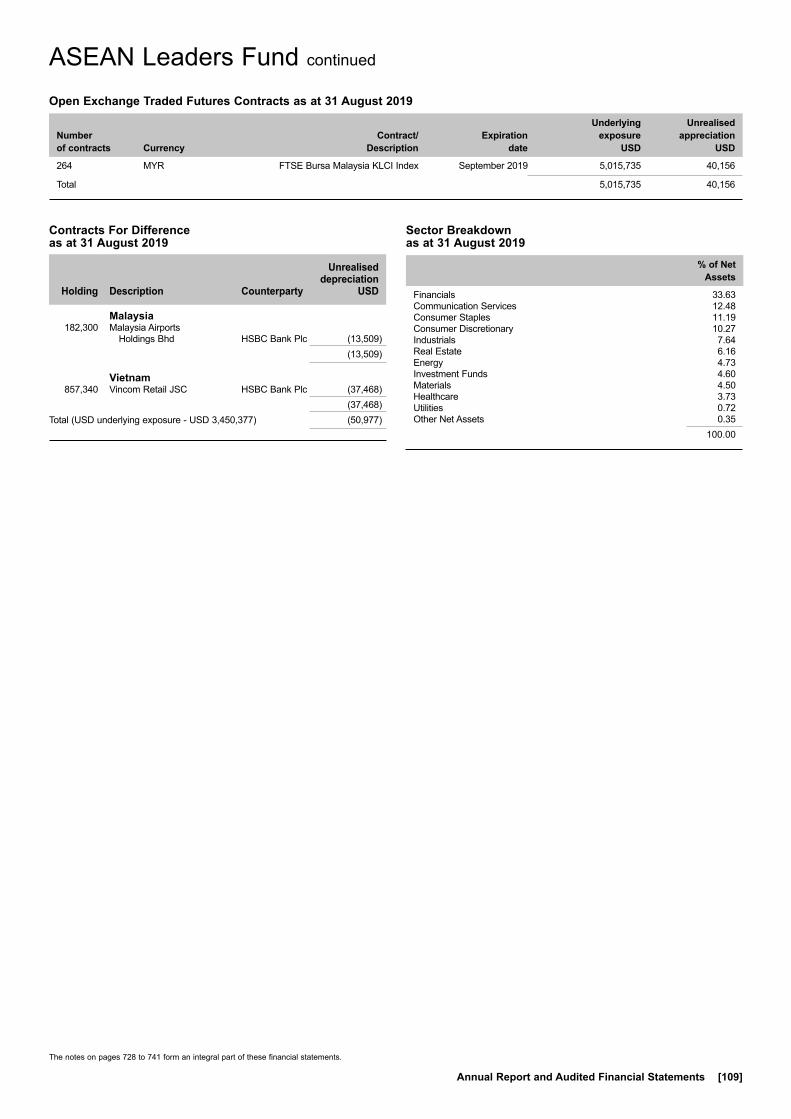
The notes on pages 728 to 741 form an integral part of these financial statements.
Annual Report and Audited Financial Statements [109]
ASEAN Leaders Fund continued
Sector Breakdown as at 31 August 2019
% of Net Assets
Financials 33.63Communication Services 12.48Consumer Staples 11.19Consumer Discretionary 10.27Industrials 7.64Real Estate 6.16Energy 4.73Investment Funds 4.60Materials 4.50Healthcare 3.73Utilities 0.72Other Net Assets 0.35
100.00
Open Exchange Traded Futures Contracts as at 31 August 2019
Number of contracts Currency
Contract/ Description
Expiration date
Underlying exposure
USD
Unrealised appreciation
USD
264 MYR FTSE Bursa Malaysia KLCI Index September 2019 5,015,735 40,156
Total 5,015,735 40,156
Holding
Description Counterparty
Unrealised depreciation
USD
Malaysia 182,300 Malaysia Airports
Holdings Bhd HSBC Bank Plc (13,509) (13,509)
Vietnam 857,340 Vincom Retail JSC HSBC Bank Plc (37,468) (37,468)Total (USD underlying exposure - USD 3,450,377) (50,977)
Contracts For Difference as at 31 August 2019
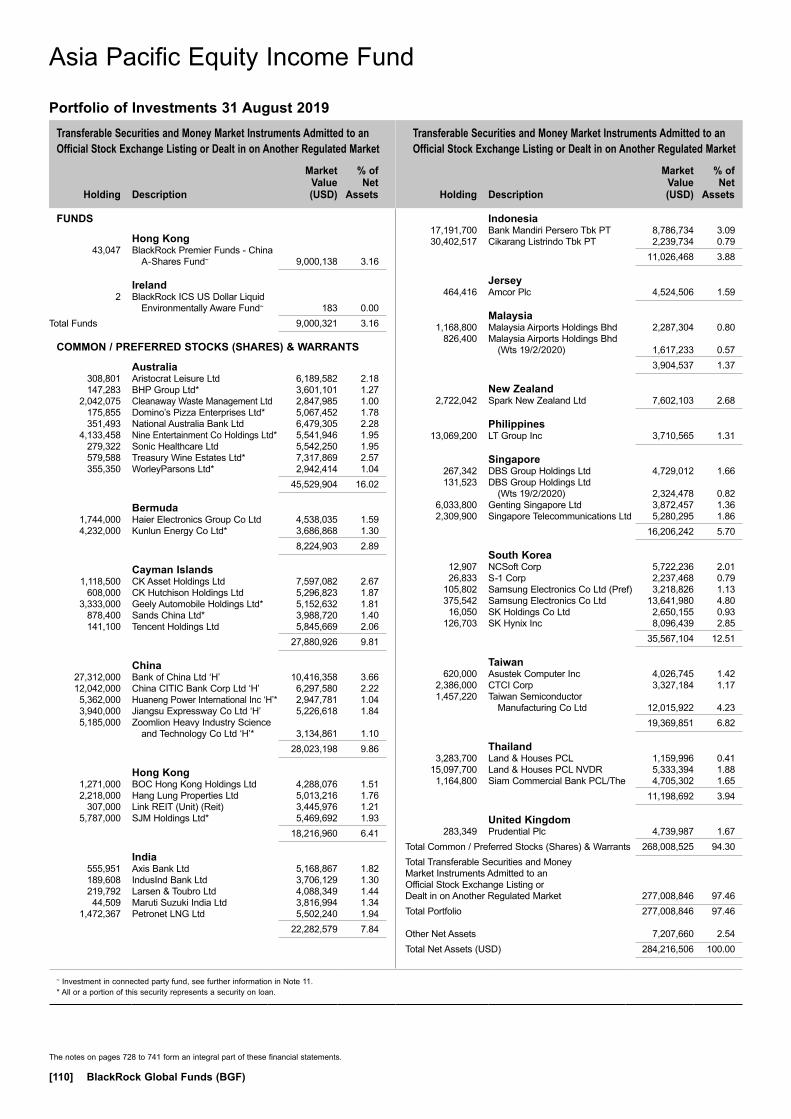
Transferable Securities and Money Market Instruments Admitted to an Official Stock Exchange Listing or Dealt in on Another Regulated Market
Transferable Securities and Money Market Instruments Admitted to an Official Stock Exchange Listing or Dealt in on Another Regulated Market
Holding
Description
Market Value (USD)
% of Net
Assets
Holding
Description
Market Value (USD)
% of Net
Assets
~ Investment in connected party fund, see further information in Note 11.* All or a portion of this security represents a security on loan.
The notes on pages 728 to 741 form an integral part of these financial statements.
[110] BlackRock Global Funds (BGF)
Portfolio of Investments 31 August 2019
FUNDS
Hong Kong 43,047 BlackRock Premier Funds - China
A-Shares Fund~ 9,000,138 3.16
Ireland 2 BlackRock ICS US Dollar Liquid
Environmentally Aware Fund~ 183 0.00Total Funds 9,000,321 3.16
COMMON / PREFERRED STOCKS (SHARES) & WARRANTS
Australia 308,801 Aristocrat Leisure Ltd 6,189,582 2.18 147,283 BHP Group Ltd* 3,601,101 1.27 2,042,075 Cleanaway Waste Management Ltd 2,847,985 1.00 175,855 Domino’s Pizza Enterprises Ltd* 5,067,452 1.78 351,493 National Australia Bank Ltd 6,479,305 2.28 4,133,458 Nine Entertainment Co Holdings Ltd* 5,541,946 1.95 279,322 Sonic Healthcare Ltd 5,542,250 1.95 579,588 Treasury Wine Estates Ltd* 7,317,869 2.57 355,350 WorleyParsons Ltd* 2,942,414 1.04 45,529,904 16.02
Bermuda 1,744,000 Haier Electronics Group Co Ltd 4,538,035 1.59 4,232,000 Kunlun Energy Co Ltd* 3,686,868 1.30 8,224,903 2.89
Cayman Islands 1,118,500 CK Asset Holdings Ltd 7,597,082 2.67 608,000 CK Hutchison Holdings Ltd 5,296,823 1.87 3,333,000 Geely Automobile Holdings Ltd* 5,152,632 1.81 878,400 Sands China Ltd* 3,988,720 1.40 141,100 Tencent Holdings Ltd 5,845,669 2.06 27,880,926 9.81
China 27,312,000 Bank of China Ltd ‘H’ 10,416,358 3.66 12,042,000 China CITIC Bank Corp Ltd ‘H’ 6,297,580 2.22 5,362,000 Huaneng Power International Inc ‘H’* 2,947,781 1.04 3,940,000 Jiangsu Expressway Co Ltd ‘H’ 5,226,618 1.84 5,185,000 Zoomlion Heavy Industry Science
and Technology Co Ltd ‘H’* 3,134,861 1.10 28,023,198 9.86
Hong Kong 1,271,000 BOC Hong Kong Holdings Ltd 4,288,076 1.51 2,218,000 Hang Lung Properties Ltd 5,013,216 1.76 307,000 Link REIT (Unit) (Reit) 3,445,976 1.21 5,787,000 SJM Holdings Ltd* 5,469,692 1.93 18,216,960 6.41
India 555,951 Axis Bank Ltd 5,168,867 1.82 189,608 IndusInd Bank Ltd 3,706,129 1.30 219,792 Larsen & Toubro Ltd 4,088,349 1.44 44,509 Maruti Suzuki India Ltd 3,816,994 1.34 1,472,367 Petronet LNG Ltd 5,502,240 1.94 22,282,579 7.84
Indonesia 17,191,700 Bank Mandiri Persero Tbk PT 8,786,734 3.09 30,402,517 Cikarang Listrindo Tbk PT 2,239,734 0.79 11,026,468 3.88
Jersey 464,416 Amcor Plc 4,524,506 1.59
Malaysia 1,168,800 Malaysia Airports Holdings Bhd 2,287,304 0.80 826,400 Malaysia Airports Holdings Bhd
(Wts 19/2/2020) 1,617,233 0.57 3,904,537 1.37
New Zealand 2,722,042 Spark New Zealand Ltd 7,602,103 2.68
Philippines 13,069,200 LT Group Inc 3,710,565 1.31
Singapore 267,342 DBS Group Holdings Ltd 4,729,012 1.66 131,523 DBS Group Holdings Ltd
(Wts 19/2/2020) 2,324,478 0.82 6,033,800 Genting Singapore Ltd 3,872,457 1.36 2,309,900 Singapore Telecommunications Ltd 5,280,295 1.86 16,206,242 5.70
South Korea 12,907 NCSoft Corp 5,722,236 2.01 26,833 S-1 Corp 2,237,468 0.79 105,802 Samsung Electronics Co Ltd (Pref) 3,218,826 1.13 375,542 Samsung Electronics Co Ltd 13,641,980 4.80 16,050 SK Holdings Co Ltd 2,650,155 0.93 126,703 SK Hynix Inc 8,096,439 2.85 35,567,104 12.51
Taiwan 620,000 Asustek Computer Inc 4,026,745 1.42 2,386,000 CTCI Corp 3,327,184 1.17 1,457,220 Taiwan Semiconductor
Manufacturing Co Ltd 12,015,922 4.23 19,369,851 6.82
Thailand 3,283,700 Land & Houses PCL 1,159,996 0.41 15,097,700 Land & Houses PCL NVDR 5,333,394 1.88 1,164,800 Siam Commercial Bank PCL/The 4,705,302 1.65 11,198,692 3.94
United Kingdom 283,349 Prudential Plc 4,739,987 1.67Total Common / Preferred Stocks (Shares) & Warrants 268,008,525 94.30Total Transferable Securities and Money Market Instruments Admitted to an Official Stock Exchange Listing or Dealt in on Another Regulated Market 277,008,846 97.46Total Portfolio 277,008,846 97.46
Other Net Assets 7,207,660 2.54Total Net Assets (USD) 284,216,506 100.00
Asia Pacific Equity Income Fund
Asia Pacific Equity Income Fund

The notes on pages 728 to 741 form an integral part of these financial statements.
Annual Report and Audited Financial Statements [111]
Asia Pacific Equity Income Fund continued
Open Forward Foreign Exchange Contracts as at 31 August 2019
Currency
Purchases Currency
Sales Counterparty
Maturity date
Unrealised appreciation/
(depreciation) USD
AUD Hedged Share Class
AUD 12,117,489 USD 8,257,441 BNY Mellon 12/9/2019 (91,030)USD 380,203 AUD 559,952 BNY Mellon 12/9/2019 2,831Net unrealised depreciation (88,199)
CNH Hedged Share Class
CNY 35,380 USD 4,992 BNY Mellon 12/9/2019 (45)USD 156 CNY 1,104 BNY Mellon 12/9/2019 1Net unrealised depreciation (44)
EUR Hedged Share Class
EUR 9,657,501 USD 10,841,303 BNY Mellon 12/9/2019 (165,766)USD 508,292 EUR 455,612 BNY Mellon 12/9/2019 4,655Net unrealised depreciation (161,111)
HKD Hedged Share Class
HKD 60,363,531 USD 7,703,846 BNY Mellon 12/9/2019 (4,047)USD 567,296 HKD 4,449,824 BNY Mellon 12/9/2019 (310)Net unrealised depreciation (4,357)
SGD Hedged Share Class
SGD 147,473,505 USD 106,729,844 BNY Mellon 12/9/2019 (373,063)USD 6,626,584 SGD 9,182,650 BNY Mellon 12/9/2019 4,128Net unrealised depreciation (368,935)
ZAR Hedged Share Class
USD 185,792 ZAR 2,833,080 BNY Mellon 12/9/2019 144ZAR 33,943,307 USD 2,220,127 BNY Mellon 12/9/2019 4,131Net unrealised appreciation 4,275
Total net unrealised depreciation (USD underlying exposure - USD 143,368,052) (618,371)
Sector Breakdown as at 31 August 2019
% of Net Assets
Financials 21.68Information Technology 14.43Consumer Discretionary 13.39Industrials 12.83Communication Services 10.55Real Estate 7.93Investment Funds 3.16Utilities 3.13Energy 2.98Materials 2.86Consumer Staples 2.57Healthcare 1.95Other Net Assets 2.54
100.00
Holding
Description Counterparty
Unrealised depreciation
USD
Malaysia 41,500 Malaysia Airports Holdings Bhd JP Morgan (2,995)Total (USD underlying exposure - USD 2,368,510) (2,995)
Contracts For Difference as at 31 August 2019

Transferable Securities and Money Market Instruments Admitted to an Official Stock Exchange Listing or Dealt in on Another Regulated Market
Transferable Securities and Money Market Instruments Admitted to an Official Stock Exchange Listing or Dealt in on Another Regulated Market
Holding
Description
Market Value (USD)
% of Net
Assets
Holding
Description
Market Value (USD)
% of Net
Assets
~ Investment in connected party fund, see further information in Note 11.* All or a portion of this security represents a security on loan.
The notes on pages 728 to 741 form an integral part of these financial statements.
[112] BlackRock Global Funds (BGF)
Portfolio of Investments 31 August 2019
FUNDS
Ireland 253,976 BlackRock ICS US Dollar Liquid
Environmentally Aware Fund~ 25,404,910 1.09 34,142 BlackRock ICS US Dollar
Liquidity Fund~ 34,142 0.00Total Funds 25,439,052 1.09
COMMON / PREFERRED STOCKS (SHARES) & WARRANTS
Cayman Islands 550,988 Alibaba Group Holding Ltd ADR 96,130,876 4.13 8,512,666 China Resources Land Ltd* 34,637,574 1.49 7,727,500 CK Asset Holdings Ltd 52,486,766 2.25 797,005 Ctrip.com International Ltd ADR 26,014,243 1.12 18,690,000 Geely Automobile Holdings Ltd* 28,893,697 1.24 13,118,916 Li Ning Co Ltd 38,738,263 1.66 3,204,800 Meituan Dianping 30,392,967 1.30 1,223,347 Melco Resorts & Entertainment
Ltd ADR 25,726,987 1.10 1,138,832 Momo Inc ADR* 40,952,399 1.76 197,770 NetEase Inc ADR* 50,431,350 2.17 494,381 New Oriental Education &
Technology Group Inc ADR* 56,992,242 2.45 3,482,880 Tencent Holdings Ltd 144,293,154 6.19 625,690,518 26.86
China 33,394,000 China CITIC Bank Corp Ltd ‘H’* 17,463,991 0.75 19,723,000 China Construction Bank Corp ‘H’ 14,641,553 0.63 26,154,000 China Oilfield Services Ltd ‘H’* 32,359,444 1.39 9,048,585 China Vanke Co Ltd ‘H’* 31,278,157 1.34 18,199,000 Chongqing Rural Commercial
Bank Co Ltd ‘H’ 8,797,878 0.38 43,791,000 Guangshen Railway Co Ltd ‘H’ 13,405,632 0.57 2,395,056 Hangzhou Tigermed Consulting
Co Ltd 20,433,170 0.88 236,582 Jiangsu Hengli Hydraulic Co Ltd 1,092,569 0.05 5,655,000 Ping An Insurance Group Co of
China Ltd ‘H’* 64,846,045 2.78 1,133,800 Shenzhen Mindray Bio-Medical
Electronics Co Ltd 29,549,904 1.27 233,868,343 10.04
Germany 3,887,895 Jiangsu Hengli Hydraulic Co Ltd
(Wts 11/5/2027) 17,980,154 0.77
Hong Kong 4,625,000 AIA Group Ltd 44,982,416 1.93 6,494,500 BOC Hong Kong Holdings Ltd 21,911,020 0.94 4,526,000 Link REIT (Unit) (Reit) 50,802,890 2.18 19,817,000 SJM Holdings Ltd* 18,730,411 0.81 136,426,737 5.86
India 2,561,306 Axis Bank Ltd 23,813,343 1.02 4,499,358 Bharat Petroleum Corp Ltd 22,384,163 0.96 8,622,088 Bharti Airtel Ltd 41,874,320 1.80 13,053,435 Fortis Healthcare Ltd 22,694,873 0.97 3,269,766 Godrej Industries Ltd 19,234,189 0.83 1,741,832 Havells India Ltd 16,563,963 0.71 3,242,515 HDFC Life Insurance Co Ltd 25,299,408 1.09 1,166,657 IndusInd Bank Ltd 22,803,791 0.98 769,876 J Kumar Infraprojects Ltd 1,271,132 0.05 11,273,555 Jindal Steel & Power Ltd 15,250,857 0.65 2,401,324 Larsen & Toubro Ltd 44,667,003 1.92
6,157,536 Mahindra & Mahindra Financial Services Ltd 27,589,594 1.18
1,863,342 Oberoi Realty Ltd 14,820,365 0.64 4,872,689 Tech Mahindra Ltd 47,333,140 2.03 3,091,796 UPL Ltd 24,385,390 1.05 369,985,531 15.88
Indonesia 55,773,400 Astra International Tbk PT 26,245,148 1.13 27,457,200 Bank Central Asia Tbk PT 59,037,332 2.53 53,276,600 Bank Mandiri Persero Tbk PT 27,229,843 1.17 173,300,375 Cikarang Listrindo Tbk PT 12,766,929 0.55 125,279,252 5.38
Malaysia 8,182,300 Malaysia Airports Holdings Bhd 16,012,500 0.68 5,336,400 Malaysia Airports Holdings Bhd
(Wts 19/2/2020) 10,443,127 0.45 26,455,627 1.13
Singapore 4,682,539 Oversea-Chinese Banking
Corp Ltd 35,961,410 1.54 23,930,900 Singapore
Telecommunications Ltd 54,704,619 2.35 90,666,029 3.89
South Korea 829,908 Daewoo Shipbuilding & Marine
Engineering Co Ltd 18,705,047 0.80 1,451,160 Doosan Bobcat Inc 42,950,741 1.84 113,059 NCSoft Corp 50,123,989 2.15 96,377 Samsung Biologics Co Ltd 21,403,849 0.92 1,115,400 Samsung Electronics Co Ltd (Pref) 33,933,944 1.46 2,738,115 Samsung Electronics Co Ltd 99,465,063 4.27 654,553 SK Hynix Inc 41,826,544 1.80 308,409,177 13.24
Taiwan 3,721,772 Merry Electronics Co Ltd 17,299,552 0.74 10,864,000 Nanya Technology Corp 24,349,758 1.05 9,970,952 Taiwan Semiconductor
Manufacturing Co Ltd 82,218,324 3.53 123,867,634 5.32
Thailand 35,015,200 Bangkok Dusit Medical
Services PCL 27,029,484 1.16 71,497,500 Land & Houses PCL 25,257,116 1.08 15,448,200 Land & Houses PCL NVDR 5,457,212 0.24 78,273,500 Thai Beverage PCL* 50,799,913 2.18 108,543,725 4.66
United Kingdom 2,414,232 Prudential Plc 40,386,341 1.73
United States 1,269,842 Yum China Holdings Inc 58,082,573 2.49Total Common / Preferred Stocks (Shares) & Warrants 2,265,641,641 97.25
Total Transferable Securities and Money Market Instruments Admitted to an Official Stock Exchange Listing or Dealt in on Another Regulated Market 2,291,080,693 98.34
Asian Dragon Fund
Asian Dragon Fund
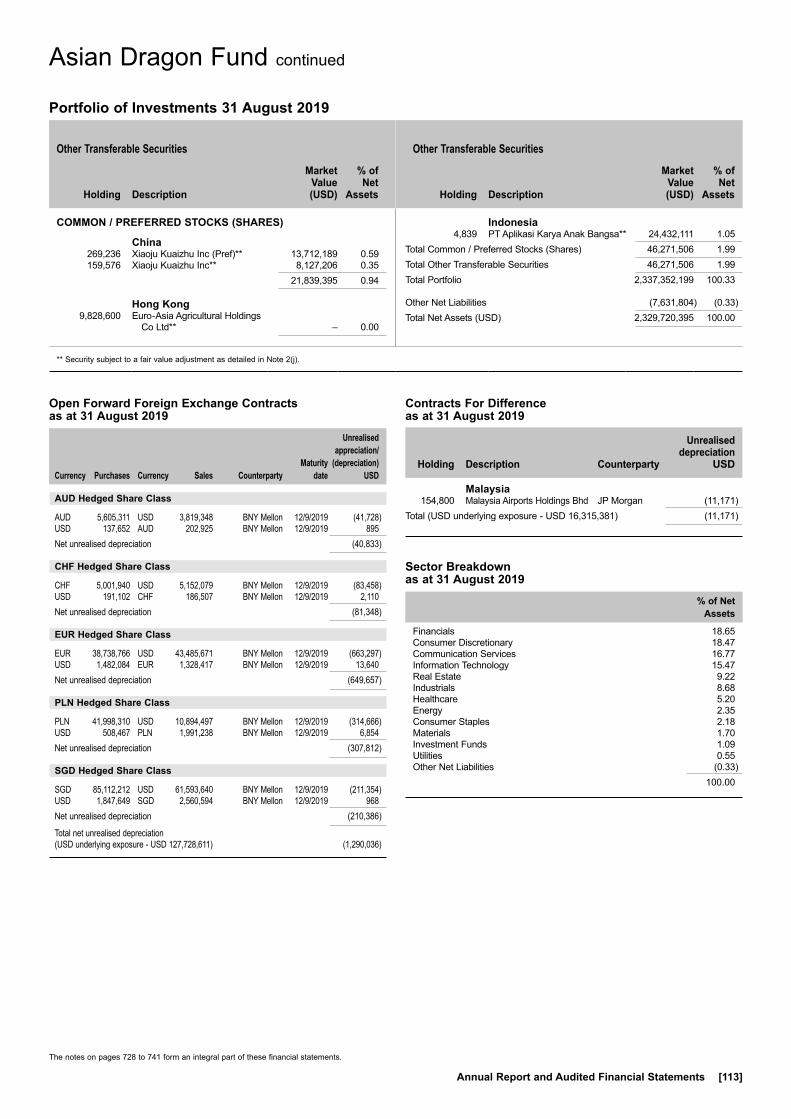
Other Transferable Securities Other Transferable Securities
Holding
Description
Market Value (USD)
% of Net
Assets
Holding
Description
Market Value (USD)
% of Net
Assets
** Security subject to a fair value adjustment as detailed in Note 2(j).
The notes on pages 728 to 741 form an integral part of these financial statements.
Annual Report and Audited Financial Statements [113]
Portfolio of Investments 31 August 2019
COMMON / PREFERRED STOCKS (SHARES)
China 269,236 Xiaoju Kuaizhu Inc (Pref)** 13,712,189 0.59 159,576 Xiaoju Kuaizhu Inc** 8,127,206 0.35 21,839,395 0.94
Hong Kong 9,828,600 Euro-Asia Agricultural Holdings
Co Ltd** – 0.00
Indonesia 4,839 PT Aplikasi Karya Anak Bangsa** 24,432,111 1.05Total Common / Preferred Stocks (Shares) 46,271,506 1.99Total Other Transferable Securities 46,271,506 1.99Total Portfolio 2,337,352,199 100.33
Other Net Liabilities (7,631,804) (0.33)Total Net Assets (USD) 2,329,720,395 100.00
Asian Dragon Fund continued
Open Forward Foreign Exchange Contracts as at 31 August 2019
Currency
Purchases Currency
Sales Counterparty
Maturity date
Unrealised appreciation/
(depreciation) USD
AUD Hedged Share Class
AUD 5,605,311 USD 3,819,348 BNY Mellon 12/9/2019 (41,728)USD 137,652 AUD 202,925 BNY Mellon 12/9/2019 895Net unrealised depreciation (40,833)
CHF Hedged Share Class
CHF 5,001,940 USD 5,152,079 BNY Mellon 12/9/2019 (83,458)USD 191,102 CHF 186,507 BNY Mellon 12/9/2019 2,110Net unrealised depreciation (81,348)
EUR Hedged Share Class
EUR 38,738,766 USD 43,485,671 BNY Mellon 12/9/2019 (663,297)USD 1,482,084 EUR 1,328,417 BNY Mellon 12/9/2019 13,640Net unrealised depreciation (649,657)
PLN Hedged Share Class
PLN 41,998,310 USD 10,894,497 BNY Mellon 12/9/2019 (314,666)USD 508,467 PLN 1,991,238 BNY Mellon 12/9/2019 6,854Net unrealised depreciation (307,812)
SGD Hedged Share Class
SGD 85,112,212 USD 61,593,640 BNY Mellon 12/9/2019 (211,354)USD 1,847,649 SGD 2,560,594 BNY Mellon 12/9/2019 968Net unrealised depreciation (210,386)
Total net unrealised depreciation (USD underlying exposure - USD 127,728,611) (1,290,036)
Sector Breakdown as at 31 August 2019
% of Net Assets
Financials 18.65Consumer Discretionary 18.47Communication Services 16.77Information Technology 15.47Real Estate 9.22Industrials 8.68Healthcare 5.20Energy 2.35Consumer Staples 2.18Materials 1.70Investment Funds 1.09Utilities 0.55Other Net Liabilities (0.33)
100.00
Holding
Description Counterparty
Unrealised depreciation
USD
Malaysia 154,800 Malaysia Airports Holdings Bhd JP Morgan (11,171) Total (USD underlying exposure - USD 16,315,381) (11,171)
Contracts For Difference as at 31 August 2019

Transferable Securities and Money Market Instruments Admitted to an Official Stock Exchange Listing or Dealt in on Another Regulated Market
Transferable Securities and Money Market Instruments Admitted to an Official Stock Exchange Listing or Dealt in on Another Regulated Market
Holding
Description
Market Value (USD)
% of Net
Assets
Holding
Description
Market Value (USD)
% of Net
Assets
~ Investment in connected party fund, see further information in Note 11.* All or a portion of this security represents a security on loan.** Security subject to a fair value adjustment as detailed in Note 2(j).
The notes on pages 728 to 741 form an integral part of these financial statements.
[114] BlackRock Global Funds (BGF)
Portfolio of Investments 31 August 2019
FUNDS
Ireland 1,383,386 BlackRock ICS US Dollar Liquid
Environmentally Aware Fund~ 138,378,330 5.96Total Funds 138,378,330 5.96
COMMON STOCKS (SHARES), WARRANTS & P NOTES
Cayman Islands 12,971,000 CK Asset Holdings Ltd 88,101,695 3.80 43,686,000 Geely Automobile Holdings Ltd* 67,536,118 2.91 10,761,700 Meituan Dianping* 102,059,409 4.40 2,295,044 Momo Inc ADR 82,529,782 3.56 247,463 NetEase Inc ADR 63,103,065 2.72 420,849 New Oriental Education &
Technology Group Inc ADR 48,515,473 2.09 3,487,900 Tencent Holdings Ltd* 144,501,129 6.23 28,885,000 Wynn Macau Ltd* 57,770,965 2.49 654,117,636 28.20
China 571,800 China Oilfield Services Ltd 964,454 0.04 65,409,000 Chongqing Rural Commercial Bank
Co Ltd ‘H’ 31,620,440 1.36 3,998,341 Hangzhou Tigermed Consulting
Co Ltd 34,111,428 1.47 3,989,154 Jiangsu Hengli Hydraulic Co Ltd 18,422,480 0.79 6,544,321 Ping An Insurance Group Co
of China Ltd 79,922,406 3.45 1,499,351 Shenzhen Mindray Bio-Medical
Electronics Co Ltd 39,077,155 1.69 204,118,363 8.80
Germany 7,585,403 Jiangsu Hengli Hydraulic Co Ltd
(Wts 11/5/2027) 35,079,834 1.51
Hong Kong 4,808,500 Link REIT (Unit) (Reit) 53,973,861 2.33
India 7,962,798 Bharti Airtel Ltd 38,672,390 1.67 1,458,237 HDFC Bank Ltd 45,497,735 1.96 10,917,634 Jindal Steel & Power Ltd 14,769,367 0.64 2,176,095 Larsen & Toubro Ltd 40,477,521 1.74 4,219,237 Mahindra & Mahindra Financial
Services Ltd 18,904,808 0.81 6,277,758 Tech Mahindra Ltd 60,981,933 2.63 1,992,513 Titan Co Ltd 30,836,066 1.33 250,139,820 10.78
Indonesia 96,106,500 Astra International Tbk PT 45,224,593 1.95 49,976,900 Bank Central Asia Tbk PT 107,458,256 4.63 284,324,397 Cikarang Listrindo Tbk PT 20,945,998 0.90 173,628,847 7.48
Malaysia 15,626,000 Malaysia Airports Holdings Bhd 30,579,583 1.32 8,222,900 Malaysia Airports Holdings Bhd
(Wts 19/2/2020) 16,091,895 0.69 46,671,478 2.01
Singapore 3,206,264 Citigroup Global Markets Hold
(P Note 19/2/2020 - Oversea-Chinese Banking Corp Ltd) 24,602,263 1.06
3,178,388 Oversea-Chinese Banking Corp Ltd 24,409,688 1.05 29,983,800 Singapore Telecommunications Ltd 68,541,190 2.96 117,553,141 5.07
South Korea 1,129,740 Daewoo Shipbuilding & Marine
Engineering Co Ltd 25,462,870 1.10 511,073 Kumho Petrochemical Co Ltd 29,662,275 1.28 214,633 NCSoft Corp 95,156,177 4.10 4,990,113 Samsung Electronics Co Ltd 181,271,388 7.81 331,552,710 14.29
Taiwan 33,220,000 CTCI Corp 46,323,991 2.00 23,442,000 Nanya Technology Corp 52,541,148 2.26 98,865,139 4.26
Thailand 102,933,443 Bangkok Dusit Medical Services PCL 79,458,004 3.43
United Kingdom 3,880,790 Prudential Plc 64,919,572 2.80
United States 1,000,603 Yum China Holdings Inc 45,767,581 1.97Total Common Stocks (Shares), Warrants & P Notes 2,155,845,986 92.93Total Transferable Securities and Money Market Instruments Admitted to an Official Stock Exchange Listing or Dealt in on Another Regulated Market 2,294,224,316 98.89
Other Transferable Securities
COMMON / PREFERRED STOCKS (SHARES)
China 97,382 Xiaoju Kuaizhu Inc (Pref)** 4,959,665 0.21 179,553 Xiaoju Kuaizhu Inc** 9,144,635 0.40 14,104,300 0.61Total Common / Preferred Stocks (Shares) 14,104,300 0.61Total Other Transferable Securities 14,104,300 0.61Total Portfolio 2,308,328,616 99.50
Other Net Assets 11,569,808 0.50Total Net Assets (USD) 2,319,898,424 100.00
Asian Growth Leaders Fund
Asian Growth Leaders Fund
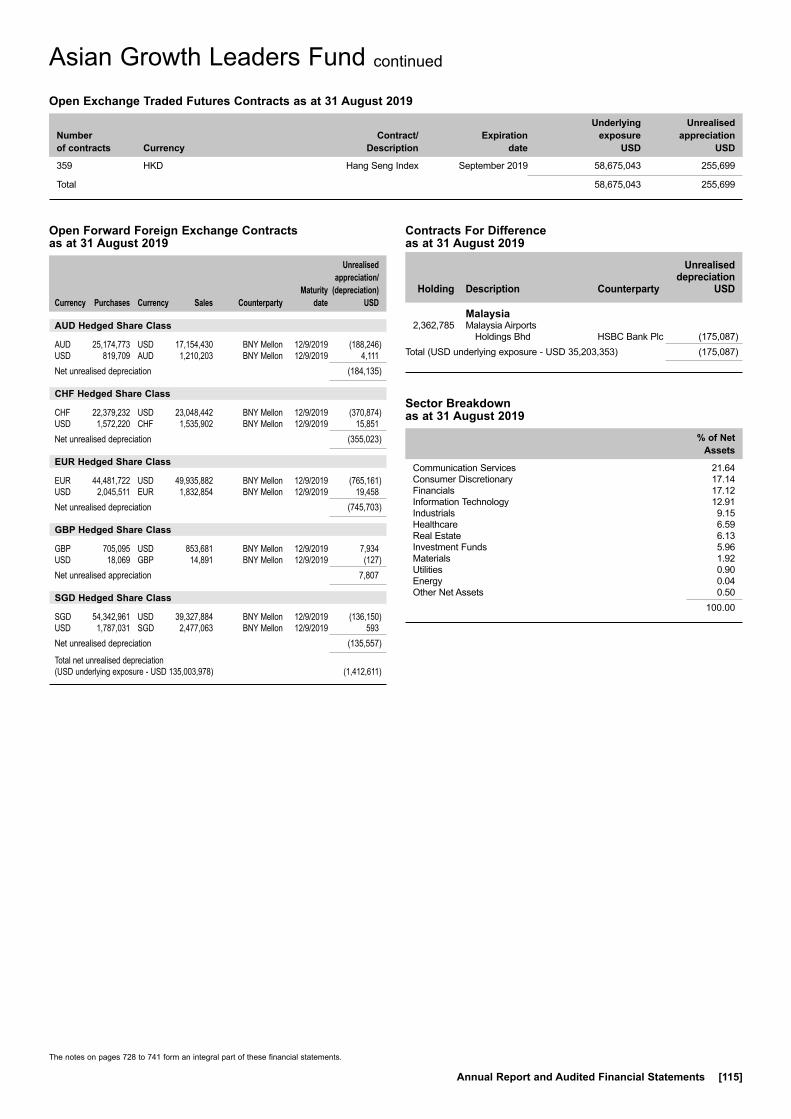
The notes on pages 728 to 741 form an integral part of these financial statements.
Annual Report and Audited Financial Statements [115]
Open Forward Foreign Exchange Contracts as at 31 August 2019
Currency
Purchases Currency
Sales Counterparty
Maturity date
Unrealised appreciation/
(depreciation) USD
AUD Hedged Share Class
AUD 25,174,773 USD 17,154,430 BNY Mellon 12/9/2019 (188,246)USD 819,709 AUD 1,210,203 BNY Mellon 12/9/2019 4,111Net unrealised depreciation (184,135)
CHF Hedged Share Class
CHF 22,379,232 USD 23,048,442 BNY Mellon 12/9/2019 (370,874)USD 1,572,220 CHF 1,535,902 BNY Mellon 12/9/2019 15,851Net unrealised depreciation (355,023)
EUR Hedged Share Class
EUR 44,481,722 USD 49,935,882 BNY Mellon 12/9/2019 (765,161)USD 2,045,511 EUR 1,832,854 BNY Mellon 12/9/2019 19,458Net unrealised depreciation (745,703)
GBP Hedged Share Class
GBP 705,095 USD 853,681 BNY Mellon 12/9/2019 7,934USD 18,069 GBP 14,891 BNY Mellon 12/9/2019 (127)Net unrealised appreciation 7,807
SGD Hedged Share Class
SGD 54,342,961 USD 39,327,884 BNY Mellon 12/9/2019 (136,150)USD 1,787,031 SGD 2,477,063 BNY Mellon 12/9/2019 593Net unrealised depreciation (135,557)
Total net unrealised depreciation (USD underlying exposure - USD 135,003,978) (1,412,611)
Sector Breakdown as at 31 August 2019
% of Net Assets
Communication Services 21.64Consumer Discretionary 17.14Financials 17.12Information Technology 12.91Industrials 9.15Healthcare 6.59Real Estate 6.13Investment Funds 5.96Materials 1.92Utilities 0.90Energy 0.04Other Net Assets 0.50
100.00
Asian Growth Leaders Fund continued
Open Exchange Traded Futures Contracts as at 31 August 2019
Number of contracts Currency
Contract/ Description
Expiration date
Underlying exposure
USD
Unrealised appreciation
USD
359 HKD Hang Seng Index September 2019 58,675,043 255,699
Total 58,675,043 255,699
Holding
Description Counterparty
Unrealised depreciation
USD
Malaysia 2,362,785 Malaysia Airports
Holdings Bhd HSBC Bank Plc (175,087) Total (USD underlying exposure - USD 35,203,353) (175,087)
Contracts For Difference as at 31 August 2019
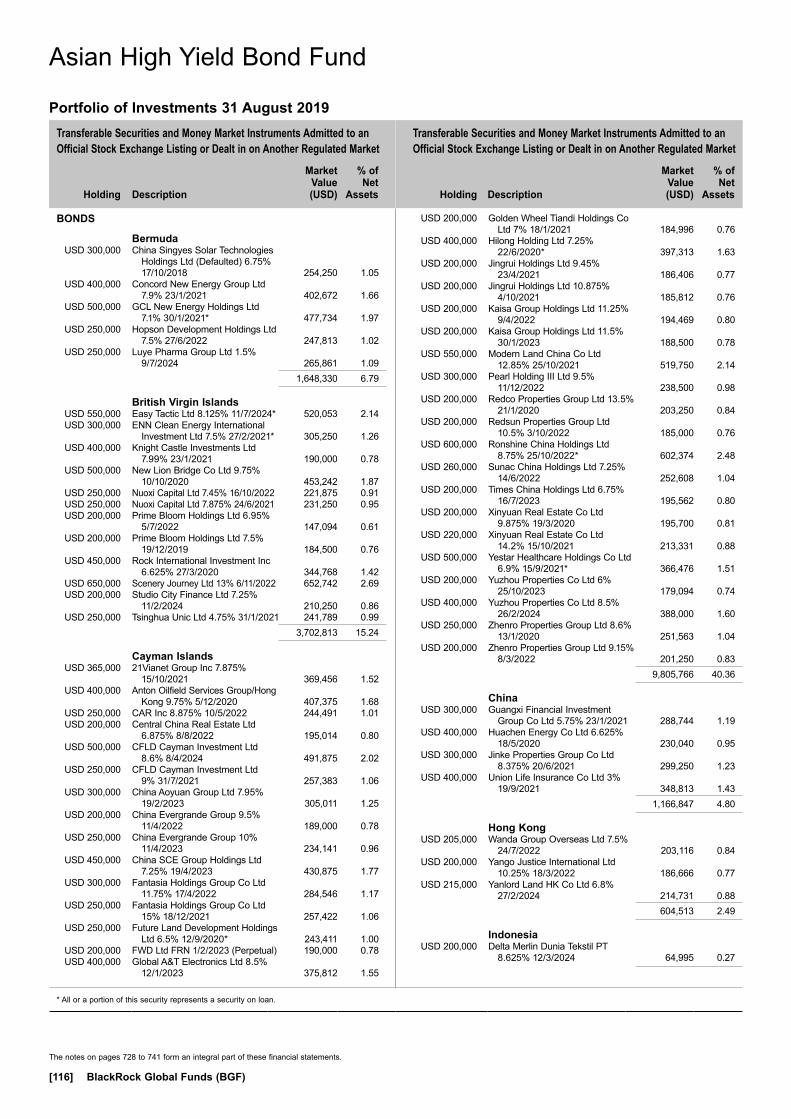
Transferable Securities and Money Market Instruments Admitted to an Official Stock Exchange Listing or Dealt in on Another Regulated Market
Transferable Securities and Money Market Instruments Admitted to an Official Stock Exchange Listing or Dealt in on Another Regulated Market
Holding
Description
Market Value (USD)
% of Net
Assets
Holding
Description
Market Value (USD)
% of Net
Assets
* All or a portion of this security represents a security on loan.
The notes on pages 728 to 741 form an integral part of these financial statements.
[116] BlackRock Global Funds (BGF)
Portfolio of Investments 31 August 2019
BONDS
Bermuda USD 300,000 China Singyes Solar Technologies
Holdings Ltd (Defaulted) 6.75% 17/10/2018 254,250 1.05
USD 400,000 Concord New Energy Group Ltd 7.9% 23/1/2021 402,672 1.66
USD 500,000 GCL New Energy Holdings Ltd 7.1% 30/1/2021* 477,734 1.97
USD 250,000 Hopson Development Holdings Ltd 7.5% 27/6/2022 247,813 1.02
USD 250,000 Luye Pharma Group Ltd 1.5% 9/7/2024 265,861 1.09
1,648,330 6.79
British Virgin Islands USD 550,000 Easy Tactic Ltd 8.125% 11/7/2024* 520,053 2.14 USD 300,000 ENN Clean Energy International
Investment Ltd 7.5% 27/2/2021* 305,250 1.26 USD 400,000 Knight Castle Investments Ltd
7.99% 23/1/2021 190,000 0.78 USD 500,000 New Lion Bridge Co Ltd 9.75%
10/10/2020 453,242 1.87 USD 250,000 Nuoxi Capital Ltd 7.45% 16/10/2022 221,875 0.91 USD 250,000 Nuoxi Capital Ltd 7.875% 24/6/2021 231,250 0.95 USD 200,000 Prime Bloom Holdings Ltd 6.95%
5/7/2022 147,094 0.61 USD 200,000 Prime Bloom Holdings Ltd 7.5%
19/12/2019 184,500 0.76 USD 450,000 Rock International Investment Inc
6.625% 27/3/2020 344,768 1.42 USD 650,000 Scenery Journey Ltd 13% 6/11/2022 652,742 2.69 USD 200,000 Studio City Finance Ltd 7.25%
11/2/2024 210,250 0.86 USD 250,000 Tsinghua Unic Ltd 4.75% 31/1/2021 241,789 0.99 3,702,813 15.24
Cayman Islands USD 365,000 21Vianet Group Inc 7.875%
15/10/2021 369,456 1.52 USD 400,000 Anton Oilfield Services Group/Hong
Kong 9.75% 5/12/2020 407,375 1.68 USD 250,000 CAR Inc 8.875% 10/5/2022 244,491 1.01 USD 200,000 Central China Real Estate Ltd
6.875% 8/8/2022 195,014 0.80 USD 500,000 CFLD Cayman Investment Ltd
8.6% 8/4/2024 491,875 2.02 USD 250,000 CFLD Cayman Investment Ltd
9% 31/7/2021 257,383 1.06 USD 300,000 China Aoyuan Group Ltd 7.95%
19/2/2023 305,011 1.25 USD 200,000 China Evergrande Group 9.5%
11/4/2022 189,000 0.78 USD 250,000 China Evergrande Group 10%
11/4/2023 234,141 0.96 USD 450,000 China SCE Group Holdings Ltd
7.25% 19/4/2023 430,875 1.77 USD 300,000 Fantasia Holdings Group Co Ltd
11.75% 17/4/2022 284,546 1.17 USD 250,000 Fantasia Holdings Group Co Ltd
15% 18/12/2021 257,422 1.06 USD 250,000 Future Land Development Holdings
Ltd 6.5% 12/9/2020* 243,411 1.00 USD 200,000 FWD Ltd FRN 1/2/2023 (Perpetual) 190,000 0.78 USD 400,000 Global A&T Electronics Ltd 8.5%
12/1/2023 375,812 1.55
USD 200,000 Golden Wheel Tiandi Holdings Co Ltd 7% 18/1/2021 184,996 0.76
USD 400,000 Hilong Holding Ltd 7.25% 22/6/2020* 397,313 1.63
USD 200,000 Jingrui Holdings Ltd 9.45% 23/4/2021 186,406 0.77
USD 200,000 Jingrui Holdings Ltd 10.875% 4/10/2021 185,812 0.76
USD 200,000 Kaisa Group Holdings Ltd 11.25% 9/4/2022 194,469 0.80
USD 200,000 Kaisa Group Holdings Ltd 11.5% 30/1/2023 188,500 0.78
USD 550,000 Modern Land China Co Ltd 12.85% 25/10/2021 519,750 2.14
USD 300,000 Pearl Holding III Ltd 9.5% 11/12/2022 238,500 0.98
USD 200,000 Redco Properties Group Ltd 13.5% 21/1/2020 203,250 0.84
USD 200,000 Redsun Properties Group Ltd 10.5% 3/10/2022 185,000 0.76
USD 600,000 Ronshine China Holdings Ltd 8.75% 25/10/2022* 602,374 2.48
USD 260,000 Sunac China Holdings Ltd 7.25% 14/6/2022 252,608 1.04
USD 200,000 Times China Holdings Ltd 6.75% 16/7/2023 195,562 0.80
USD 200,000 Xinyuan Real Estate Co Ltd 9.875% 19/3/2020 195,700 0.81
USD 220,000 Xinyuan Real Estate Co Ltd 14.2% 15/10/2021 213,331 0.88
USD 500,000 Yestar Healthcare Holdings Co Ltd 6.9% 15/9/2021* 366,476 1.51
USD 200,000 Yuzhou Properties Co Ltd 6% 25/10/2023 179,094 0.74
USD 400,000 Yuzhou Properties Co Ltd 8.5% 26/2/2024 388,000 1.60
USD 250,000 Zhenro Properties Group Ltd 8.6% 13/1/2020 251,563 1.04
USD 200,000 Zhenro Properties Group Ltd 9.15% 8/3/2022 201,250 0.83
9,805,766 40.36
China USD 300,000 Guangxi Financial Investment
Group Co Ltd 5.75% 23/1/2021 288,744 1.19 USD 400,000 Huachen Energy Co Ltd 6.625%
18/5/2020 230,040 0.95 USD 300,000 Jinke Properties Group Co Ltd
8.375% 20/6/2021 299,250 1.23 USD 400,000 Union Life Insurance Co Ltd 3%
19/9/2021 348,813 1.43 1,166,847 4.80
Hong Kong USD 205,000 Wanda Group Overseas Ltd 7.5%
24/7/2022 203,116 0.84 USD 200,000 Yango Justice International Ltd
10.25% 18/3/2022 186,666 0.77 USD 215,000 Yanlord Land HK Co Ltd 6.8%
27/2/2024 214,731 0.88 604,513 2.49
Indonesia USD 200,000 Delta Merlin Dunia Tekstil PT
8.625% 12/3/2024 64,995 0.27
Asian High Yield Bond Fund
Asian High Yield Bond Fund
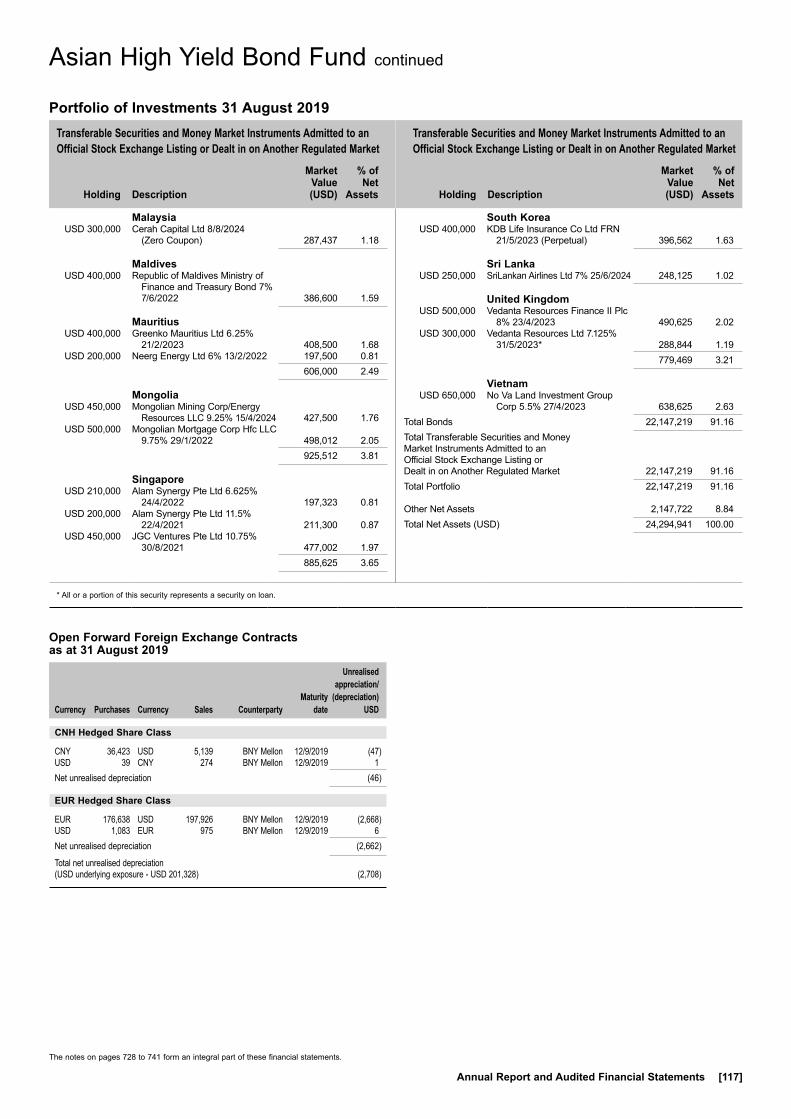
Transferable Securities and Money Market Instruments Admitted to an Official Stock Exchange Listing or Dealt in on Another Regulated Market
Transferable Securities and Money Market Instruments Admitted to an Official Stock Exchange Listing or Dealt in on Another Regulated Market
Holding
Description
Market Value (USD)
% of Net
Assets
Holding
Description
Market Value (USD)
% of Net
Assets
* All or a portion of this security represents a security on loan.
The notes on pages 728 to 741 form an integral part of these financial statements.
Annual Report and Audited Financial Statements [117]
Portfolio of Investments 31 August 2019
Malaysia USD 300,000 Cerah Capital Ltd 8/8/2024
(Zero Coupon) 287,437 1.18
Maldives USD 400,000 Republic of Maldives Ministry of
Finance and Treasury Bond 7% 7/6/2022 386,600 1.59
Mauritius USD 400,000 Greenko Mauritius Ltd 6.25%
21/2/2023 408,500 1.68 USD 200,000 Neerg Energy Ltd 6% 13/2/2022 197,500 0.81 606,000 2.49
Mongolia USD 450,000 Mongolian Mining Corp/Energy
Resources LLC 9.25% 15/4/2024 427,500 1.76 USD 500,000 Mongolian Mortgage Corp Hfc LLC
9.75% 29/1/2022 498,012 2.05 925,512 3.81
Singapore USD 210,000 Alam Synergy Pte Ltd 6.625%
24/4/2022 197,323 0.81 USD 200,000 Alam Synergy Pte Ltd 11.5%
22/4/2021 211,300 0.87 USD 450,000 JGC Ventures Pte Ltd 10.75%
30/8/2021 477,002 1.97 885,625 3.65
South Korea USD 400,000 KDB Life Insurance Co Ltd FRN
21/5/2023 (Perpetual) 396,562 1.63
Sri Lanka USD 250,000 SriLankan Airlines Ltd 7% 25/6/2024 248,125 1.02
United Kingdom USD 500,000 Vedanta Resources Finance II Plc
8% 23/4/2023 490,625 2.02 USD 300,000 Vedanta Resources Ltd 7.125%
31/5/2023* 288,844 1.19 779,469 3.21
Vietnam USD 650,000 No Va Land Investment Group
Corp 5.5% 27/4/2023 638,625 2.63Total Bonds 22,147,219 91.16Total Transferable Securities and Money Market Instruments Admitted to an Official Stock Exchange Listing or Dealt in on Another Regulated Market 22,147,219 91.16Total Portfolio 22,147,219 91.16
Other Net Assets 2,147,722 8.84Total Net Assets (USD) 24,294,941 100.00
Asian High Yield Bond Fund continued
Open Forward Foreign Exchange Contracts as at 31 August 2019
Currency
Purchases Currency
Sales Counterparty
Maturity date
Unrealised appreciation/
(depreciation) USD
CNH Hedged Share Class
CNY 36,423 USD 5,139 BNY Mellon 12/9/2019 (47)USD 39 CNY 274 BNY Mellon 12/9/2019 1Net unrealised depreciation (46)
EUR Hedged Share Class
EUR 176,638 USD 197,926 BNY Mellon 12/9/2019 (2,668)USD 1,083 EUR 975 BNY Mellon 12/9/2019 6Net unrealised depreciation (2,662)
Total net unrealised depreciation (USD underlying exposure - USD 201,328) (2,708)
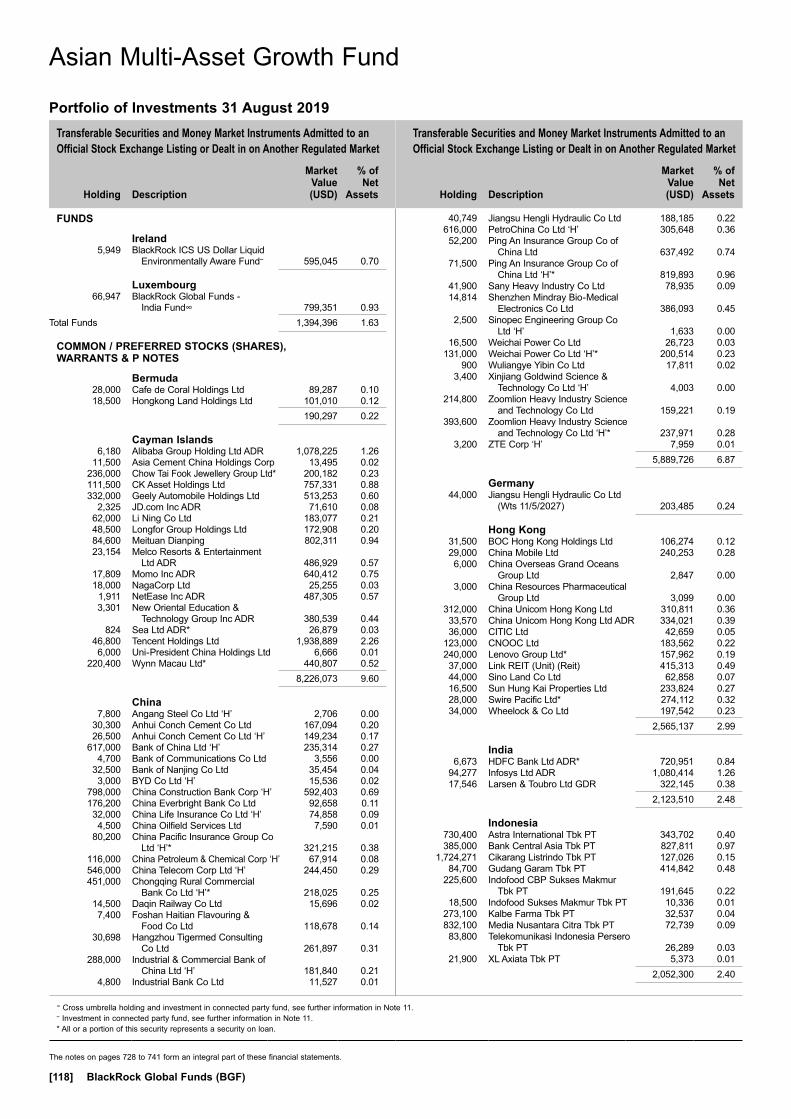
Transferable Securities and Money Market Instruments Admitted to an Official Stock Exchange Listing or Dealt in on Another Regulated Market
Transferable Securities and Money Market Instruments Admitted to an Official Stock Exchange Listing or Dealt in on Another Regulated Market
Holding
Description
Market Value (USD)
% of Net
Assets
Holding
Description
Market Value (USD)
% of Net
Assets
∞ Cross umbrella holding and investment in connected party fund, see further information in Note 11.~ Investment in connected party fund, see further information in Note 11.* All or a portion of this security represents a security on loan.
The notes on pages 728 to 741 form an integral part of these financial statements.
[118] BlackRock Global Funds (BGF)
Portfolio of Investments 31 August 2019
FUNDS
Ireland 5,949 BlackRock ICS US Dollar Liquid
Environmentally Aware Fund~ 595,045 0.70
Luxembourg 66,947 BlackRock Global Funds -
India Fund∞ 799,351 0.93Total Funds 1,394,396 1.63
COMMON / PREFERRED STOCKS (SHARES), WARRANTS & P NOTES
Bermuda 28,000 Cafe de Coral Holdings Ltd 89,287 0.10 18,500 Hongkong Land Holdings Ltd 101,010 0.12 190,297 0.22
Cayman Islands 6,180 Alibaba Group Holding Ltd ADR 1,078,225 1.26 11,500 Asia Cement China Holdings Corp 13,495 0.02 236,000 Chow Tai Fook Jewellery Group Ltd* 200,182 0.23 111,500 CK Asset Holdings Ltd 757,331 0.88 332,000 Geely Automobile Holdings Ltd 513,253 0.60 2,325 JD.com Inc ADR 71,610 0.08 62,000 Li Ning Co Ltd 183,077 0.21 48,500 Longfor Group Holdings Ltd 172,908 0.20 84,600 Meituan Dianping 802,311 0.94 23,154 Melco Resorts & Entertainment
Ltd ADR 486,929 0.57 17,809 Momo Inc ADR 640,412 0.75 18,000 NagaCorp Ltd 25,255 0.03 1,911 NetEase Inc ADR 487,305 0.57 3,301 New Oriental Education &
Technology Group Inc ADR 380,539 0.44 824 Sea Ltd ADR* 26,879 0.03 46,800 Tencent Holdings Ltd 1,938,889 2.26 6,000 Uni-President China Holdings Ltd 6,666 0.01 220,400 Wynn Macau Ltd* 440,807 0.52 8,226,073 9.60
China 7,800 Angang Steel Co Ltd ‘H’ 2,706 0.00 30,300 Anhui Conch Cement Co Ltd 167,094 0.20 26,500 Anhui Conch Cement Co Ltd ‘H’ 149,234 0.17 617,000 Bank of China Ltd ‘H’ 235,314 0.27 4,700 Bank of Communications Co Ltd 3,556 0.00 32,500 Bank of Nanjing Co Ltd 35,454 0.04 3,000 BYD Co Ltd ‘H’ 15,536 0.02 798,000 China Construction Bank Corp ‘H’ 592,403 0.69 176,200 China Everbright Bank Co Ltd 92,658 0.11 32,000 China Life Insurance Co Ltd ‘H’ 74,858 0.09 4,500 China Oilfield Services Ltd 7,590 0.01 80,200 China Pacific Insurance Group Co
Ltd ‘H’* 321,215 0.38 116,000 China Petroleum & Chemical Corp ‘H’ 67,914 0.08 546,000 China Telecom Corp Ltd ‘H’ 244,450 0.29 451,000 Chongqing Rural Commercial
Bank Co Ltd ‘H’* 218,025 0.25 14,500 Daqin Railway Co Ltd 15,696 0.02 7,400 Foshan Haitian Flavouring &
Food Co Ltd 118,678 0.14 30,698 Hangzhou Tigermed Consulting
Co Ltd 261,897 0.31 288,000 Industrial & Commercial Bank of
China Ltd ‘H’ 181,840 0.21 4,800 Industrial Bank Co Ltd 11,527 0.01
40,749 Jiangsu Hengli Hydraulic Co Ltd 188,185 0.22 616,000 PetroChina Co Ltd ‘H’ 305,648 0.36 52,200 Ping An Insurance Group Co of
China Ltd 637,492 0.74 71,500 Ping An Insurance Group Co of
China Ltd ‘H’* 819,893 0.96 41,900 Sany Heavy Industry Co Ltd 78,935 0.09 14,814 Shenzhen Mindray Bio-Medical
Electronics Co Ltd 386,093 0.45 2,500 Sinopec Engineering Group Co
Ltd ‘H’ 1,633 0.00 16,500 Weichai Power Co Ltd 26,723 0.03 131,000 Weichai Power Co Ltd ‘H’* 200,514 0.23 900 Wuliangye Yibin Co Ltd 17,811 0.02 3,400 Xinjiang Goldwind Science &
Technology Co Ltd ‘H’ 4,003 0.00 214,800 Zoomlion Heavy Industry Science
and Technology Co Ltd 159,221 0.19 393,600 Zoomlion Heavy Industry Science
and Technology Co Ltd ‘H’* 237,971 0.28 3,200 ZTE Corp ‘H’ 7,959 0.01 5,889,726 6.87
Germany 44,000 Jiangsu Hengli Hydraulic Co Ltd
(Wts 11/5/2027) 203,485 0.24
Hong Kong 31,500 BOC Hong Kong Holdings Ltd 106,274 0.12 29,000 China Mobile Ltd 240,253 0.28 6,000 China Overseas Grand Oceans
Group Ltd 2,847 0.00 3,000 China Resources Pharmaceutical
Group Ltd 3,099 0.00 312,000 China Unicom Hong Kong Ltd 310,811 0.36 33,570 China Unicom Hong Kong Ltd ADR 334,021 0.39 36,000 CITIC Ltd 42,659 0.05 123,000 CNOOC Ltd 183,562 0.22 240,000 Lenovo Group Ltd* 157,962 0.19 37,000 Link REIT (Unit) (Reit) 415,313 0.49 44,000 Sino Land Co Ltd 62,858 0.07 16,500 Sun Hung Kai Properties Ltd 233,824 0.27 28,000 Swire Pacific Ltd* 274,112 0.32 34,000 Wheelock & Co Ltd 197,542 0.23 2,565,137 2.99
India 6,673 HDFC Bank Ltd ADR* 720,951 0.84 94,277 Infosys Ltd ADR 1,080,414 1.26 17,546 Larsen & Toubro Ltd GDR 322,145 0.38 2,123,510 2.48
Indonesia 730,400 Astra International Tbk PT 343,702 0.40 385,000 Bank Central Asia Tbk PT 827,811 0.97 1,724,271 Cikarang Listrindo Tbk PT 127,026 0.15 84,700 Gudang Garam Tbk PT 414,842 0.48 225,600 Indofood CBP Sukses Makmur
Tbk PT 191,645 0.22 18,500 Indofood Sukses Makmur Tbk PT 10,336 0.01 273,100 Kalbe Farma Tbk PT 32,537 0.04 832,100 Media Nusantara Citra Tbk PT 72,739 0.09 83,800 Telekomunikasi Indonesia Persero
Tbk PT 26,289 0.03 21,900 XL Axiata Tbk PT 5,373 0.01 2,052,300 2.40
Asian Multi-Asset Growth Fund
Asian Multi-Asset Growth Fund
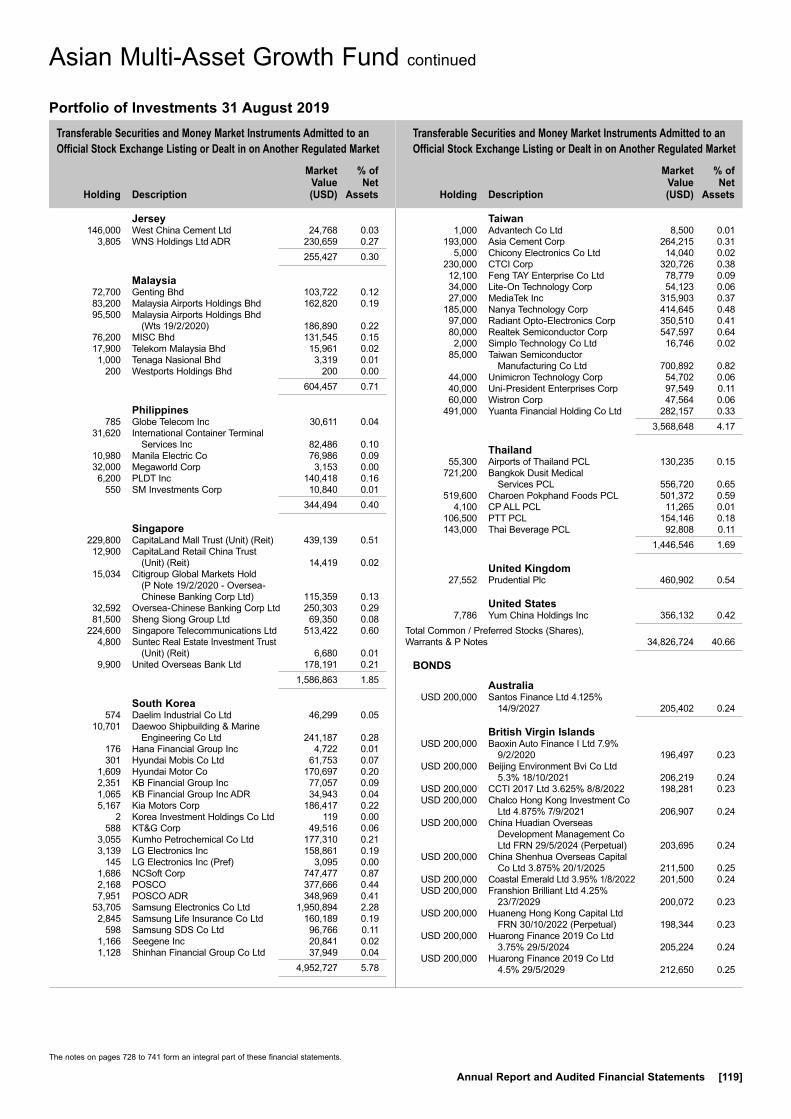
Transferable Securities and Money Market Instruments Admitted to an Official Stock Exchange Listing or Dealt in on Another Regulated Market
Transferable Securities and Money Market Instruments Admitted to an Official Stock Exchange Listing or Dealt in on Another Regulated Market
Holding
Description
Market Value (USD)
% of Net
Assets
Holding
Description
Market Value (USD)
% of Net
Assets
The notes on pages 728 to 741 form an integral part of these financial statements.
Annual Report and Audited Financial Statements [119]
Asian Multi-Asset Growth Fund continued
Portfolio of Investments 31 August 2019
Jersey 146,000 West China Cement Ltd 24,768 0.03 3,805 WNS Holdings Ltd ADR 230,659 0.27 255,427 0.30
Malaysia 72,700 Genting Bhd 103,722 0.12 83,200 Malaysia Airports Holdings Bhd 162,820 0.19 95,500 Malaysia Airports Holdings Bhd
(Wts 19/2/2020) 186,890 0.22 76,200 MISC Bhd 131,545 0.15 17,900 Telekom Malaysia Bhd 15,961 0.02 1,000 Tenaga Nasional Bhd 3,319 0.01 200 Westports Holdings Bhd 200 0.00 604,457 0.71
Philippines 785 Globe Telecom Inc 30,611 0.04 31,620 International Container Terminal
Services Inc 82,486 0.10 10,980 Manila Electric Co 76,986 0.09 32,000 Megaworld Corp 3,153 0.00 6,200 PLDT Inc 140,418 0.16 550 SM Investments Corp 10,840 0.01 344,494 0.40
Singapore 229,800 CapitaLand Mall Trust (Unit) (Reit) 439,139 0.51 12,900 CapitaLand Retail China Trust
(Unit) (Reit) 14,419 0.02 15,034 Citigroup Global Markets Hold
(P Note 19/2/2020 - Oversea-Chinese Banking Corp Ltd) 115,359 0.13
32,592 Oversea-Chinese Banking Corp Ltd 250,303 0.29 81,500 Sheng Siong Group Ltd 69,350 0.08 224,600 Singapore Telecommunications Ltd 513,422 0.60 4,800 Suntec Real Estate Investment Trust
(Unit) (Reit) 6,680 0.01 9,900 United Overseas Bank Ltd 178,191 0.21 1,586,863 1.85
South Korea 574 Daelim Industrial Co Ltd 46,299 0.05 10,701 Daewoo Shipbuilding & Marine
Engineering Co Ltd 241,187 0.28 176 Hana Financial Group Inc 4,722 0.01 301 Hyundai Mobis Co Ltd 61,753 0.07 1,609 Hyundai Motor Co 170,697 0.20 2,351 KB Financial Group Inc 77,057 0.09 1,065 KB Financial Group Inc ADR 34,943 0.04 5,167 Kia Motors Corp 186,417 0.22 2 Korea Investment Holdings Co Ltd 119 0.00 588 KT&G Corp 49,516 0.06 3,055 Kumho Petrochemical Co Ltd 177,310 0.21 3,139 LG Electronics Inc 158,861 0.19 145 LG Electronics Inc (Pref) 3,095 0.00 1,686 NCSoft Corp 747,477 0.87 2,168 POSCO 377,666 0.44 7,951 POSCO ADR 348,969 0.41 53,705 Samsung Electronics Co Ltd 1,950,894 2.28 2,845 Samsung Life Insurance Co Ltd 160,189 0.19 598 Samsung SDS Co Ltd 96,766 0.11 1,166 Seegene Inc 20,841 0.02 1,128 Shinhan Financial Group Co Ltd 37,949 0.04 4,952,727 5.78
Taiwan 1,000 Advantech Co Ltd 8,500 0.01 193,000 Asia Cement Corp 264,215 0.31 5,000 Chicony Electronics Co Ltd 14,040 0.02 230,000 CTCI Corp 320,726 0.38 12,100 Feng TAY Enterprise Co Ltd 78,779 0.09 34,000 Lite-On Technology Corp 54,123 0.06 27,000 MediaTek Inc 315,903 0.37 185,000 Nanya Technology Corp 414,645 0.48 97,000 Radiant Opto-Electronics Corp 350,510 0.41 80,000 Realtek Semiconductor Corp 547,597 0.64 2,000 Simplo Technology Co Ltd 16,746 0.02 85,000 Taiwan Semiconductor
Manufacturing Co Ltd 700,892 0.82 44,000 Unimicron Technology Corp 54,702 0.06 40,000 Uni-President Enterprises Corp 97,549 0.11 60,000 Wistron Corp 47,564 0.06 491,000 Yuanta Financial Holding Co Ltd 282,157 0.33 3,568,648 4.17
Thailand 55,300 Airports of Thailand PCL 130,235 0.15 721,200 Bangkok Dusit Medical
Services PCL 556,720 0.65 519,600 Charoen Pokphand Foods PCL 501,372 0.59 4,100 CP ALL PCL 11,265 0.01 106,500 PTT PCL 154,146 0.18 143,000 Thai Beverage PCL 92,808 0.11 1,446,546 1.69
United Kingdom 27,552 Prudential Plc 460,902 0.54
United States 7,786 Yum China Holdings Inc 356,132 0.42Total Common / Preferred Stocks (Shares), Warrants & P Notes 34,826,724 40.66
BONDS
Australia USD 200,000 Santos Finance Ltd 4.125%
14/9/2027 205,402 0.24
British Virgin Islands USD 200,000 Baoxin Auto Finance I Ltd 7.9%
9/2/2020 196,497 0.23 USD 200,000 Beijing Environment Bvi Co Ltd
5.3% 18/10/2021 206,219 0.24 USD 200,000 CCTI 2017 Ltd 3.625% 8/8/2022 198,281 0.23 USD 200,000 Chalco Hong Kong Investment Co
Ltd 4.875% 7/9/2021 206,907 0.24 USD 200,000 China Huadian Overseas
Development Management Co Ltd FRN 29/5/2024 (Perpetual) 203,695 0.24
USD 200,000 China Shenhua Overseas Capital Co Ltd 3.875% 20/1/2025 211,500 0.25
USD 200,000 Coastal Emerald Ltd 3.95% 1/8/2022 201,500 0.24 USD 200,000 Franshion Brilliant Ltd 4.25%
23/7/2029 200,072 0.23 USD 200,000 Huaneng Hong Kong Capital Ltd
FRN 30/10/2022 (Perpetual) 198,344 0.23 USD 200,000 Huarong Finance 2019 Co Ltd
3.75% 29/5/2024 205,224 0.24 USD 200,000 Huarong Finance 2019 Co Ltd
4.5% 29/5/2029 212,650 0.25
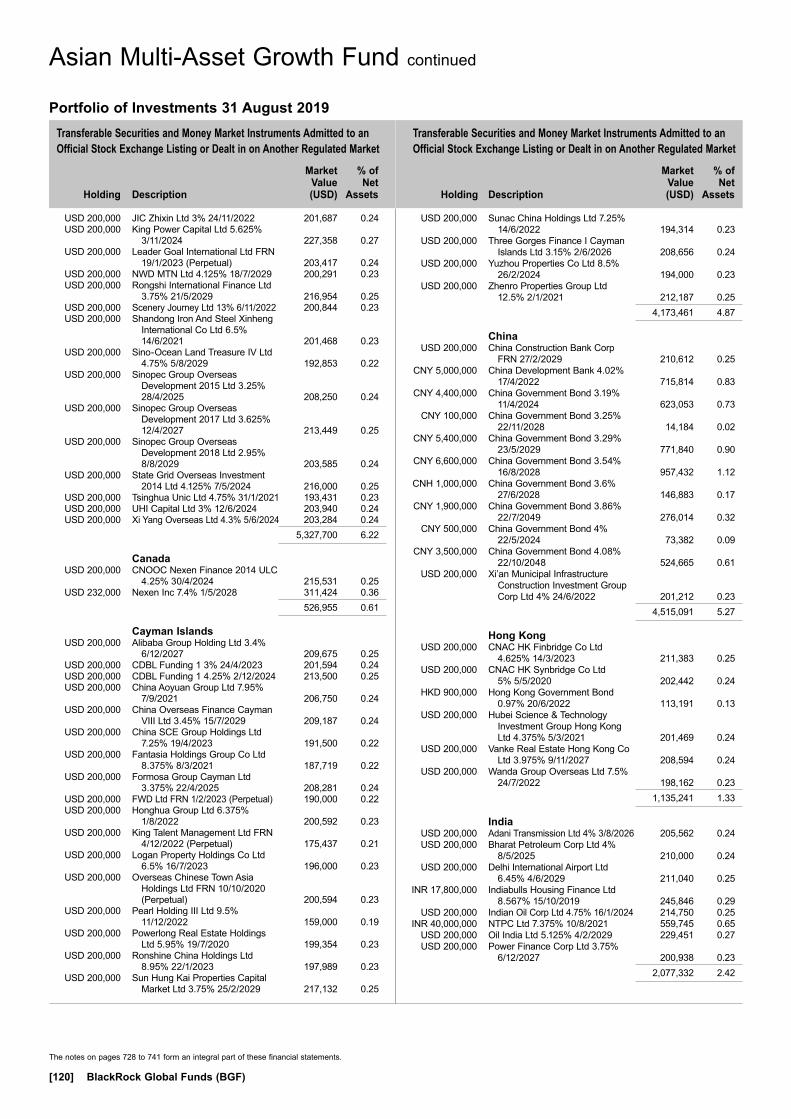
Transferable Securities and Money Market Instruments Admitted to an Official Stock Exchange Listing or Dealt in on Another Regulated Market
Transferable Securities and Money Market Instruments Admitted to an Official Stock Exchange Listing or Dealt in on Another Regulated Market
Holding
Description
Market Value (USD)
% of Net
Assets
Holding
Description
Market Value (USD)
% of Net
Assets
The notes on pages 728 to 741 form an integral part of these financial statements.
[120] BlackRock Global Funds (BGF)
Asian Multi-Asset Growth Fund continued
Portfolio of Investments 31 August 2019
USD 200,000 JIC Zhixin Ltd 3% 24/11/2022 201,687 0.24 USD 200,000 King Power Capital Ltd 5.625%
3/11/2024 227,358 0.27 USD 200,000 Leader Goal International Ltd FRN
19/1/2023 (Perpetual) 203,417 0.24 USD 200,000 NWD MTN Ltd 4.125% 18/7/2029 200,291 0.23 USD 200,000 Rongshi International Finance Ltd
3.75% 21/5/2029 216,954 0.25 USD 200,000 Scenery Journey Ltd 13% 6/11/2022 200,844 0.23 USD 200,000 Shandong Iron And Steel Xinheng
International Co Ltd 6.5% 14/6/2021 201,468 0.23
USD 200,000 Sino-Ocean Land Treasure IV Ltd 4.75% 5/8/2029 192,853 0.22
USD 200,000 Sinopec Group Overseas Development 2015 Ltd 3.25% 28/4/2025 208,250 0.24
USD 200,000 Sinopec Group Overseas Development 2017 Ltd 3.625% 12/4/2027 213,449 0.25
USD 200,000 Sinopec Group Overseas Development 2018 Ltd 2.95% 8/8/2029 203,585 0.24
USD 200,000 State Grid Overseas Investment 2014 Ltd 4.125% 7/5/2024 216,000 0.25
USD 200,000 Tsinghua Unic Ltd 4.75% 31/1/2021 193,431 0.23 USD 200,000 UHI Capital Ltd 3% 12/6/2024 203,940 0.24 USD 200,000 Xi Yang Overseas Ltd 4.3% 5/6/2024 203,284 0.24 5,327,700 6.22
Canada USD 200,000 CNOOC Nexen Finance 2014 ULC
4.25% 30/4/2024 215,531 0.25 USD 232,000 Nexen Inc 7.4% 1/5/2028 311,424 0.36 526,955 0.61
Cayman Islands USD 200,000 Alibaba Group Holding Ltd 3.4%
6/12/2027 209,675 0.25 USD 200,000 CDBL Funding 1 3% 24/4/2023 201,594 0.24 USD 200,000 CDBL Funding 1 4.25% 2/12/2024 213,500 0.25 USD 200,000 China Aoyuan Group Ltd 7.95%
7/9/2021 206,750 0.24 USD 200,000 China Overseas Finance Cayman
VIII Ltd 3.45% 15/7/2029 209,187 0.24 USD 200,000 China SCE Group Holdings Ltd
7.25% 19/4/2023 191,500 0.22 USD 200,000 Fantasia Holdings Group Co Ltd
8.375% 8/3/2021 187,719 0.22 USD 200,000 Formosa Group Cayman Ltd
3.375% 22/4/2025 208,281 0.24 USD 200,000 FWD Ltd FRN 1/2/2023 (Perpetual) 190,000 0.22 USD 200,000 Honghua Group Ltd 6.375%
1/8/2022 200,592 0.23 USD 200,000 King Talent Management Ltd FRN
4/12/2022 (Perpetual) 175,437 0.21 USD 200,000 Logan Property Holdings Co Ltd
6.5% 16/7/2023 196,000 0.23 USD 200,000 Overseas Chinese Town Asia
Holdings Ltd FRN 10/10/2020 (Perpetual) 200,594 0.23
USD 200,000 Pearl Holding III Ltd 9.5% 11/12/2022 159,000 0.19
USD 200,000 Powerlong Real Estate Holdings Ltd 5.95% 19/7/2020 199,354 0.23
USD 200,000 Ronshine China Holdings Ltd 8.95% 22/1/2023 197,989 0.23
USD 200,000 Sun Hung Kai Properties Capital Market Ltd 3.75% 25/2/2029 217,132 0.25
USD 200,000 Sunac China Holdings Ltd 7.25% 14/6/2022 194,314 0.23
USD 200,000 Three Gorges Finance I Cayman Islands Ltd 3.15% 2/6/2026 208,656 0.24
USD 200,000 Yuzhou Properties Co Ltd 8.5% 26/2/2024 194,000 0.23
USD 200,000 Zhenro Properties Group Ltd 12.5% 2/1/2021 212,187 0.25
4,173,461 4.87
China USD 200,000 China Construction Bank Corp
FRN 27/2/2029 210,612 0.25 CNY 5,000,000 China Development Bank 4.02%
17/4/2022 715,814 0.83 CNY 4,400,000 China Government Bond 3.19%
11/4/2024 623,053 0.73 CNY 100,000 China Government Bond 3.25%
22/11/2028 14,184 0.02 CNY 5,400,000 China Government Bond 3.29%
23/5/2029 771,840 0.90 CNY 6,600,000 China Government Bond 3.54%
16/8/2028 957,432 1.12 CNH 1,000,000 China Government Bond 3.6%
27/6/2028 146,883 0.17 CNY 1,900,000 China Government Bond 3.86%
22/7/2049 276,014 0.32 CNY 500,000 China Government Bond 4%
22/5/2024 73,382 0.09 CNY 3,500,000 China Government Bond 4.08%
22/10/2048 524,665 0.61 USD 200,000 Xi’an Municipal Infrastructure
Construction Investment Group Corp Ltd 4% 24/6/2022 201,212 0.23
4,515,091 5.27
Hong Kong USD 200,000 CNAC HK Finbridge Co Ltd
4.625% 14/3/2023 211,383 0.25 USD 200,000 CNAC HK Synbridge Co Ltd
5% 5/5/2020 202,442 0.24 HKD 900,000 Hong Kong Government Bond
0.97% 20/6/2022 113,191 0.13 USD 200,000 Hubei Science & Technology
Investment Group Hong Kong Ltd 4.375% 5/3/2021 201,469 0.24
USD 200,000 Vanke Real Estate Hong Kong Co Ltd 3.975% 9/11/2027 208,594 0.24
USD 200,000 Wanda Group Overseas Ltd 7.5% 24/7/2022 198,162 0.23
1,135,241 1.33
India USD 200,000 Adani Transmission Ltd 4% 3/8/2026 205,562 0.24 USD 200,000 Bharat Petroleum Corp Ltd 4%
8/5/2025 210,000 0.24 USD 200,000 Delhi International Airport Ltd
6.45% 4/6/2029 211,040 0.25 INR 17,800,000 Indiabulls Housing Finance Ltd
8.567% 15/10/2019 245,846 0.29 USD 200,000 Indian Oil Corp Ltd 4.75% 16/1/2024 214,750 0.25 INR 40,000,000 NTPC Ltd 7.375% 10/8/2021 559,745 0.65 USD 200,000 Oil India Ltd 5.125% 4/2/2029 229,451 0.27 USD 200,000 Power Finance Corp Ltd 3.75%
6/12/2027 200,938 0.23 2,077,332 2.42
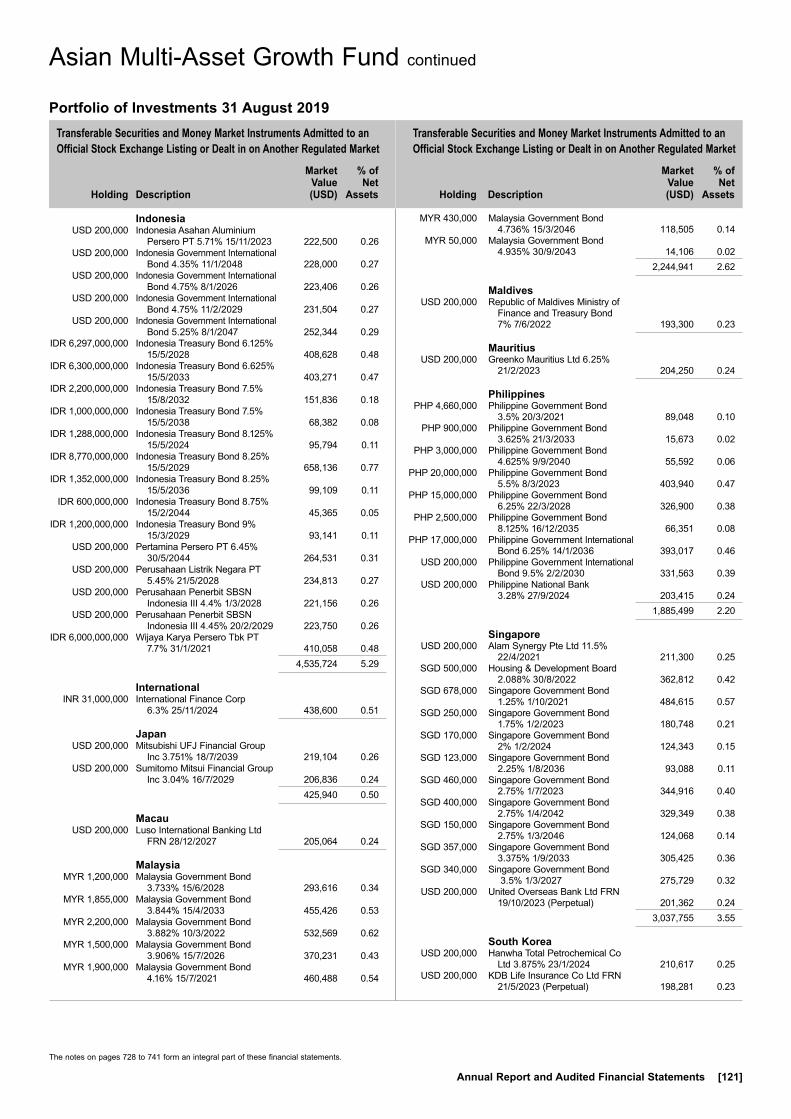
Transferable Securities and Money Market Instruments Admitted to an Official Stock Exchange Listing or Dealt in on Another Regulated Market
Transferable Securities and Money Market Instruments Admitted to an Official Stock Exchange Listing or Dealt in on Another Regulated Market
Holding
Description
Market Value (USD)
% of Net
Assets
Holding
Description
Market Value (USD)
% of Net
Assets
The notes on pages 728 to 741 form an integral part of these financial statements.
Annual Report and Audited Financial Statements [121]
Asian Multi-Asset Growth Fund continued
Portfolio of Investments 31 August 2019
Indonesia USD 200,000 Indonesia Asahan Aluminium
Persero PT 5.71% 15/11/2023 222,500 0.26 USD 200,000 Indonesia Government International
Bond 4.35% 11/1/2048 228,000 0.27 USD 200,000 Indonesia Government International
Bond 4.75% 8/1/2026 223,406 0.26 USD 200,000 Indonesia Government International
Bond 4.75% 11/2/2029 231,504 0.27 USD 200,000 Indonesia Government International
Bond 5.25% 8/1/2047 252,344 0.29 IDR 6,297,000,000 Indonesia Treasury Bond 6.125%
15/5/2028 408,628 0.48 IDR 6,300,000,000 Indonesia Treasury Bond 6.625%
15/5/2033 403,271 0.47 IDR 2,200,000,000 Indonesia Treasury Bond 7.5%
15/8/2032 151,836 0.18 IDR 1,000,000,000 Indonesia Treasury Bond 7.5%
15/5/2038 68,382 0.08 IDR 1,288,000,000 Indonesia Treasury Bond 8.125%
15/5/2024 95,794 0.11 IDR 8,770,000,000 Indonesia Treasury Bond 8.25%
15/5/2029 658,136 0.77 IDR 1,352,000,000 Indonesia Treasury Bond 8.25%
15/5/2036 99,109 0.11 IDR 600,000,000 Indonesia Treasury Bond 8.75%
15/2/2044 45,365 0.05 IDR 1,200,000,000 Indonesia Treasury Bond 9%
15/3/2029 93,141 0.11 USD 200,000 Pertamina Persero PT 6.45%
30/5/2044 264,531 0.31 USD 200,000 Perusahaan Listrik Negara PT
5.45% 21/5/2028 234,813 0.27 USD 200,000 Perusahaan Penerbit SBSN
Indonesia III 4.4% 1/3/2028 221,156 0.26 USD 200,000 Perusahaan Penerbit SBSN
Indonesia III 4.45% 20/2/2029 223,750 0.26 IDR 6,000,000,000 Wijaya Karya Persero Tbk PT
7.7% 31/1/2021 410,058 0.48 4,535,724 5.29
International INR 31,000,000 International Finance Corp
6.3% 25/11/2024 438,600 0.51
Japan USD 200,000 Mitsubishi UFJ Financial Group
Inc 3.751% 18/7/2039 219,104 0.26 USD 200,000 Sumitomo Mitsui Financial Group
Inc 3.04% 16/7/2029 206,836 0.24 425,940 0.50
Macau USD 200,000 Luso International Banking Ltd
FRN 28/12/2027 205,064 0.24
Malaysia MYR 1,200,000 Malaysia Government Bond
3.733% 15/6/2028 293,616 0.34 MYR 1,855,000 Malaysia Government Bond
3.844% 15/4/2033 455,426 0.53 MYR 2,200,000 Malaysia Government Bond
3.882% 10/3/2022 532,569 0.62 MYR 1,500,000 Malaysia Government Bond
3.906% 15/7/2026 370,231 0.43 MYR 1,900,000 Malaysia Government Bond
4.16% 15/7/2021 460,488 0.54
MYR 430,000 Malaysia Government Bond 4.736% 15/3/2046 118,505 0.14
MYR 50,000 Malaysia Government Bond 4.935% 30/9/2043 14,106 0.02
2,244,941 2.62
Maldives USD 200,000 Republic of Maldives Ministry of
Finance and Treasury Bond 7% 7/6/2022 193,300 0.23
Mauritius USD 200,000 Greenko Mauritius Ltd 6.25%
21/2/2023 204,250 0.24
Philippines PHP 4,660,000 Philippine Government Bond
3.5% 20/3/2021 89,048 0.10 PHP 900,000 Philippine Government Bond
3.625% 21/3/2033 15,673 0.02 PHP 3,000,000 Philippine Government Bond
4.625% 9/9/2040 55,592 0.06 PHP 20,000,000 Philippine Government Bond
5.5% 8/3/2023 403,940 0.47 PHP 15,000,000 Philippine Government Bond
6.25% 22/3/2028 326,900 0.38 PHP 2,500,000 Philippine Government Bond
8.125% 16/12/2035 66,351 0.08 PHP 17,000,000 Philippine Government International
Bond 6.25% 14/1/2036 393,017 0.46 USD 200,000 Philippine Government International
Bond 9.5% 2/2/2030 331,563 0.39 USD 200,000 Philippine National Bank
3.28% 27/9/2024 203,415 0.24 1,885,499 2.20
Singapore USD 200,000 Alam Synergy Pte Ltd 11.5%
22/4/2021 211,300 0.25 SGD 500,000 Housing & Development Board
2.088% 30/8/2022 362,812 0.42 SGD 678,000 Singapore Government Bond
1.25% 1/10/2021 484,615 0.57 SGD 250,000 Singapore Government Bond
1.75% 1/2/2023 180,748 0.21 SGD 170,000 Singapore Government Bond
2% 1/2/2024 124,343 0.15 SGD 123,000 Singapore Government Bond
2.25% 1/8/2036 93,088 0.11 SGD 460,000 Singapore Government Bond
2.75% 1/7/2023 344,916 0.40 SGD 400,000 Singapore Government Bond
2.75% 1/4/2042 329,349 0.38 SGD 150,000 Singapore Government Bond
2.75% 1/3/2046 124,068 0.14 SGD 357,000 Singapore Government Bond
3.375% 1/9/2033 305,425 0.36 SGD 340,000 Singapore Government Bond
3.5% 1/3/2027 275,729 0.32 USD 200,000 United Overseas Bank Ltd FRN
19/10/2023 (Perpetual) 201,362 0.24 3,037,755 3.55
South Korea USD 200,000 Hanwha Total Petrochemical Co
Ltd 3.875% 23/1/2024 210,617 0.25 USD 200,000 KDB Life Insurance Co Ltd FRN
21/5/2023 (Perpetual) 198,281 0.23
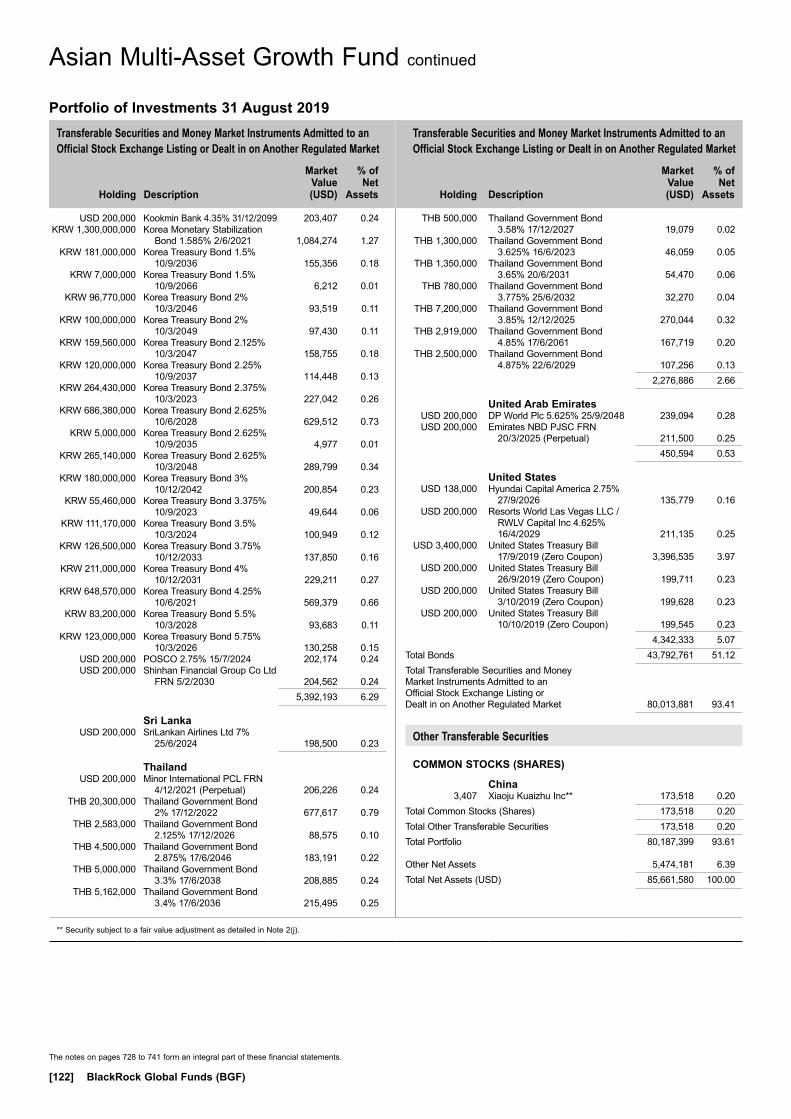
Transferable Securities and Money Market Instruments Admitted to an Official Stock Exchange Listing or Dealt in on Another Regulated Market
Transferable Securities and Money Market Instruments Admitted to an Official Stock Exchange Listing or Dealt in on Another Regulated Market
Holding
Description
Market Value (USD)
% of Net
Assets
Holding
Description
Market Value (USD)
% of Net
Assets
** Security subject to a fair value adjustment as detailed in Note 2(j).
The notes on pages 728 to 741 form an integral part of these financial statements.
[122] BlackRock Global Funds (BGF)
Asian Multi-Asset Growth Fund continued
Portfolio of Investments 31 August 2019
USD 200,000 Kookmin Bank 4.35% 31/12/2099 203,407 0.24 KRW 1,300,000,000 Korea Monetary Stabilization
Bond 1.585% 2/6/2021 1,084,274 1.27 KRW 181,000,000 Korea Treasury Bond 1.5%
10/9/2036 155,356 0.18 KRW 7,000,000 Korea Treasury Bond 1.5%
10/9/2066 6,212 0.01 KRW 96,770,000 Korea Treasury Bond 2%
10/3/2046 93,519 0.11 KRW 100,000,000 Korea Treasury Bond 2%
10/3/2049 97,430 0.11 KRW 159,560,000 Korea Treasury Bond 2.125%
10/3/2047 158,755 0.18 KRW 120,000,000 Korea Treasury Bond 2.25%
10/9/2037 114,448 0.13 KRW 264,430,000 Korea Treasury Bond 2.375%
10/3/2023 227,042 0.26 KRW 686,380,000 Korea Treasury Bond 2.625%
10/6/2028 629,512 0.73 KRW 5,000,000 Korea Treasury Bond 2.625%
10/9/2035 4,977 0.01 KRW 265,140,000 Korea Treasury Bond 2.625%
10/3/2048 289,799 0.34 KRW 180,000,000 Korea Treasury Bond 3%
10/12/2042 200,854 0.23 KRW 55,460,000 Korea Treasury Bond 3.375%
10/9/2023 49,644 0.06 KRW 111,170,000 Korea Treasury Bond 3.5%
10/3/2024 100,949 0.12 KRW 126,500,000 Korea Treasury Bond 3.75%
10/12/2033 137,850 0.16 KRW 211,000,000 Korea Treasury Bond 4%
10/12/2031 229,211 0.27 KRW 648,570,000 Korea Treasury Bond 4.25%
10/6/2021 569,379 0.66 KRW 83,200,000 Korea Treasury Bond 5.5%
10/3/2028 93,683 0.11 KRW 123,000,000 Korea Treasury Bond 5.75%
10/3/2026 130,258 0.15 USD 200,000 POSCO 2.75% 15/7/2024 202,174 0.24 USD 200,000 Shinhan Financial Group Co Ltd
FRN 5/2/2030 204,562 0.24 5,392,193 6.29
Sri Lanka USD 200,000 SriLankan Airlines Ltd 7%
25/6/2024 198,500 0.23
Thailand USD 200,000 Minor International PCL FRN
4/12/2021 (Perpetual) 206,226 0.24 THB 20,300,000 Thailand Government Bond
2% 17/12/2022 677,617 0.79 THB 2,583,000 Thailand Government Bond
2.125% 17/12/2026 88,575 0.10 THB 4,500,000 Thailand Government Bond
2.875% 17/6/2046 183,191 0.22 THB 5,000,000 Thailand Government Bond
3.3% 17/6/2038 208,885 0.24 THB 5,162,000 Thailand Government Bond
3.4% 17/6/2036 215,495 0.25
THB 500,000 Thailand Government Bond 3.58% 17/12/2027 19,079 0.02
THB 1,300,000 Thailand Government Bond 3.625% 16/6/2023 46,059 0.05
THB 1,350,000 Thailand Government Bond 3.65% 20/6/2031 54,470 0.06
THB 780,000 Thailand Government Bond 3.775% 25/6/2032 32,270 0.04
THB 7,200,000 Thailand Government Bond 3.85% 12/12/2025 270,044 0.32
THB 2,919,000 Thailand Government Bond 4.85% 17/6/2061 167,719 0.20
THB 2,500,000 Thailand Government Bond 4.875% 22/6/2029 107,256 0.13
2,276,886 2.66
United Arab Emirates USD 200,000 DP World Plc 5.625% 25/9/2048 239,094 0.28 USD 200,000 Emirates NBD PJSC FRN
20/3/2025 (Perpetual) 211,500 0.25 450,594 0.53
United States USD 138,000 Hyundai Capital America 2.75%
27/9/2026 135,779 0.16 USD 200,000 Resorts World Las Vegas LLC /
RWLV Capital Inc 4.625% 16/4/2029 211,135 0.25
USD 3,400,000 United States Treasury Bill 17/9/2019 (Zero Coupon) 3,396,535 3.97
USD 200,000 United States Treasury Bill 26/9/2019 (Zero Coupon) 199,711 0.23
USD 200,000 United States Treasury Bill 3/10/2019 (Zero Coupon) 199,628 0.23
USD 200,000 United States Treasury Bill 10/10/2019 (Zero Coupon) 199,545 0.23
4,342,333 5.07Total Bonds 43,792,761 51.12Total Transferable Securities and Money Market Instruments Admitted to an Official Stock Exchange Listing or Dealt in on Another Regulated Market 80,013,881 93.41
Other Transferable Securities
COMMON STOCKS (SHARES)
China 3,407 Xiaoju Kuaizhu Inc** 173,518 0.20Total Common Stocks (Shares) 173,518 0.20Total Other Transferable Securities 173,518 0.20Total Portfolio 80,187,399 93.61
Other Net Assets 5,474,181 6.39Total Net Assets (USD) 85,661,580 100.00
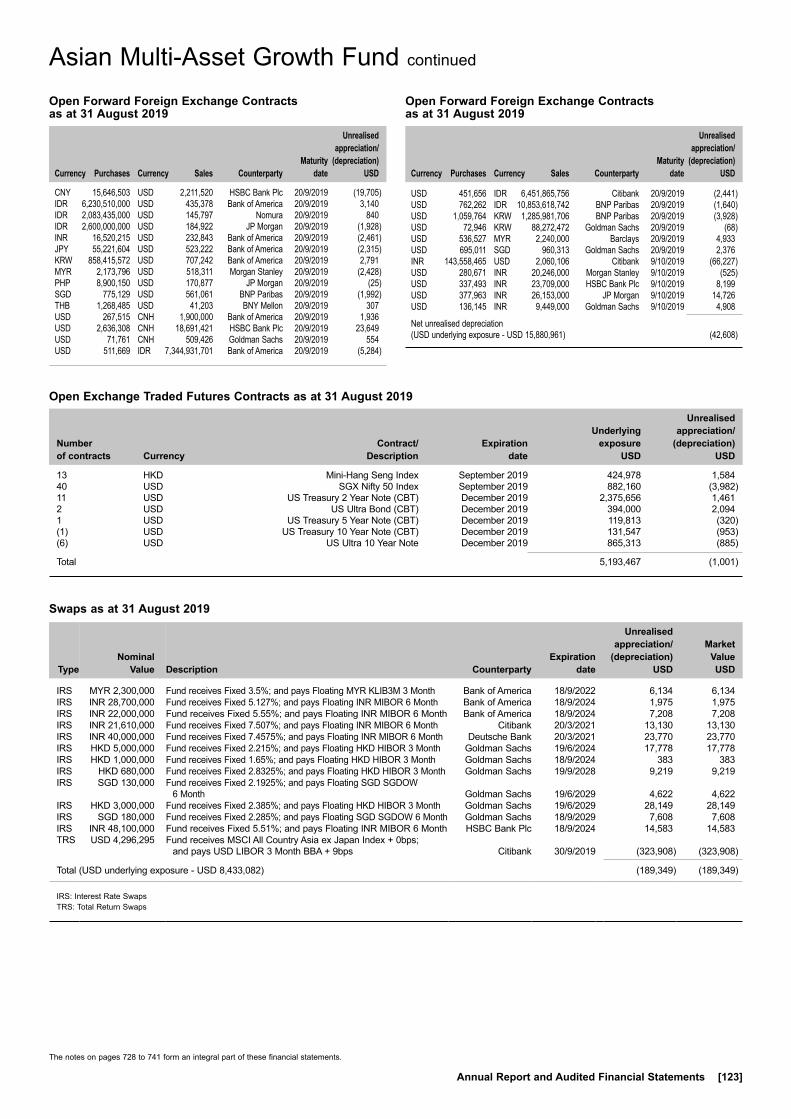
The notes on pages 728 to 741 form an integral part of these financial statements.
Annual Report and Audited Financial Statements [123]
Asian Multi-Asset Growth Fund continued
Open Forward Foreign Exchange Contracts as at 31 August 2019
Currency
Purchases Currency
Sales Counterparty
Maturity date
Unrealised appreciation/
(depreciation) USD
CNY 15,646,503 USD 2,211,520 HSBC Bank Plc 20/9/2019 (19,705)IDR 6,230,510,000 USD 435,378 Bank of America 20/9/2019 3,140IDR 2,083,435,000 USD 145,797 Nomura 20/9/2019 840IDR 2,600,000,000 USD 184,922 JP Morgan 20/9/2019 (1,928)INR 16,520,215 USD 232,843 Bank of America 20/9/2019 (2,461)JPY 55,221,604 USD 523,222 Bank of America 20/9/2019 (2,315)KRW 858,415,572 USD 707,242 Bank of America 20/9/2019 2,791MYR 2,173,796 USD 518,311 Morgan Stanley 20/9/2019 (2,428)PHP 8,900,150 USD 170,877 JP Morgan 20/9/2019 (25)SGD 775,129 USD 561,061 BNP Paribas 20/9/2019 (1,992)THB 1,268,485 USD 41,203 BNY Mellon 20/9/2019 307USD 267,515 CNH 1,900,000 Bank of America 20/9/2019 1,936USD 2,636,308 CNH 18,691,421 HSBC Bank Plc 20/9/2019 23,649USD 71,761 CNH 509,426 Goldman Sachs 20/9/2019 554USD 511,669 IDR 7,344,931,701 Bank of America 20/9/2019 (5,284)
Open Forward Foreign Exchange Contracts as at 31 August 2019
Currency
Purchases Currency
Sales Counterparty
Maturity date
Unrealised appreciation/
(depreciation) USD
USD 451,656 IDR 6,451,865,756 Citibank 20/9/2019 (2,441)USD 762,262 IDR 10,853,618,742 BNP Paribas 20/9/2019 (1,640)USD 1,059,764 KRW 1,285,981,706 BNP Paribas 20/9/2019 (3,928)USD 72,946 KRW 88,272,472 Goldman Sachs 20/9/2019 (68)USD 536,527 MYR 2,240,000 Barclays 20/9/2019 4,933USD 695,011 SGD 960,313 Goldman Sachs 20/9/2019 2,376INR 143,558,465 USD 2,060,106 Citibank 9/10/2019 (66,227)USD 280,671 INR 20,246,000 Morgan Stanley 9/10/2019 (525)USD 337,493 INR 23,709,000 HSBC Bank Plc 9/10/2019 8,199USD 377,963 INR 26,153,000 JP Morgan 9/10/2019 14,726USD 136,145 INR 9,449,000 Goldman Sachs 9/10/2019 4,908
Net unrealised depreciation (USD underlying exposure - USD 15,880,961) (42,608)
Swaps as at 31 August 2019
TypeNominal
Value Description Counterparty
Expiration date
Unrealised appreciation/
(depreciation) USD
Market Value USD
IRS MYR 2,300,000 Fund receives Fixed 3.5%; and pays Floating MYR KLIB3M 3 Month Bank of America 18/9/2022 6,134 6,134IRS INR 28,700,000 Fund receives Fixed 5.127%; and pays Floating INR MIBOR 6 Month Bank of America 18/9/2024 1,975 1,975IRS INR 22,000,000 Fund receives Fixed 5.55%; and pays Floating INR MIBOR 6 Month Bank of America 18/9/2024 7,208 7,208IRS INR 21,610,000 Fund receives Fixed 7.507%; and pays Floating INR MIBOR 6 Month Citibank 20/3/2021 13,130 13,130IRS INR 40,000,000 Fund receives Fixed 7.4575%; and pays Floating INR MIBOR 6 Month Deutsche Bank 20/3/2021 23,770 23,770IRS HKD 5,000,000 Fund receives Fixed 2.215%; and pays Floating HKD HIBOR 3 Month Goldman Sachs 19/6/2024 17,778 17,778IRS HKD 1,000,000 Fund receives Fixed 1.65%; and pays Floating HKD HIBOR 3 Month Goldman Sachs 18/9/2024 383 383IRS HKD 680,000 Fund receives Fixed 2.8325%; and pays Floating HKD HIBOR 3 Month Goldman Sachs 19/9/2028 9,219 9,219IRS SGD 130,000 Fund receives Fixed 2.1925%; and pays Floating SGD SGDOW
6 Month Goldman Sachs 19/6/2029 4,622 4,622IRS HKD 3,000,000 Fund receives Fixed 2.385%; and pays Floating HKD HIBOR 3 Month Goldman Sachs 19/6/2029 28,149 28,149IRS SGD 180,000 Fund receives Fixed 2.285%; and pays Floating SGD SGDOW 6 Month Goldman Sachs 18/9/2029 7,608 7,608IRS INR 48,100,000 Fund receives Fixed 5.51%; and pays Floating INR MIBOR 6 Month HSBC Bank Plc 18/9/2024 14,583 14,583TRS USD 4,296,295 Fund receives MSCI All Country Asia ex Japan Index + 0bps;
and pays USD LIBOR 3 Month BBA + 9bps Citibank 30/9/2019 (323,908) (323,908)
Total (USD underlying exposure - USD 8,433,082) (189,349) (189,349)
IRS: Interest Rate SwapsTRS: Total Return Swaps
Open Exchange Traded Futures Contracts as at 31 August 2019
Number of contracts Currency
Contract/ Description
Expiration date
Underlying exposure
USD
Unrealised appreciation/
(depreciation) USD
13 HKD Mini-Hang Seng Index September 2019 424,978 1,58440 USD SGX Nifty 50 Index September 2019 882,160 (3,982)11 USD US Treasury 2 Year Note (CBT) December 2019 2,375,656 1,4612 USD US Ultra Bond (CBT) December 2019 394,000 2,0941 USD US Treasury 5 Year Note (CBT) December 2019 119,813 (320)(1) USD US Treasury 10 Year Note (CBT) December 2019 131,547 (953)(6) USD US Ultra 10 Year Note December 2019 865,313 (885)
Total 5,193,467 (1,001)

The notes on pages 728 to 741 form an integral part of these financial statements.
[124] BlackRock Global Funds (BGF)
Asian Multi-Asset Growth Fund continued
Contracts For Difference as at 31 August 2019
Holding
Description Counterparty
Unrealised depreciation
USD
Malaysia 11,100 Malaysia Airports
Holdings Bhd HSBC Bank Plc (822)Total (USD underlying exposure - USD 184,541) (822)
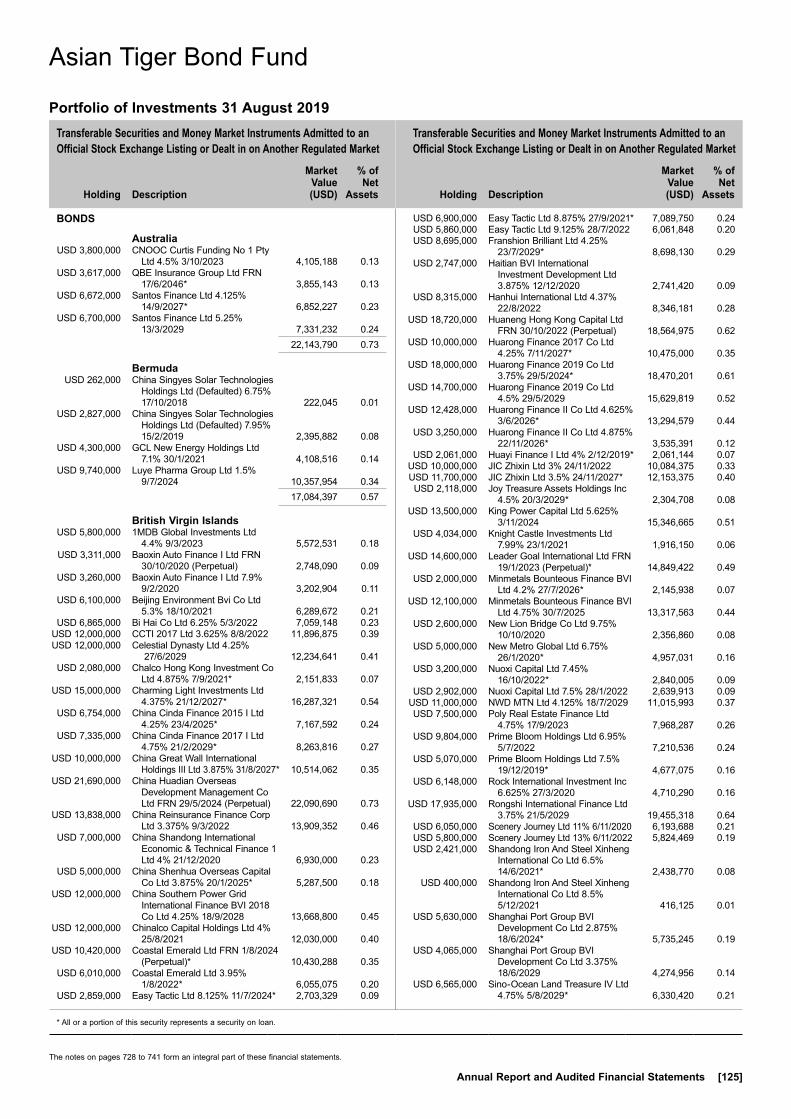
Transferable Securities and Money Market Instruments Admitted to an Official Stock Exchange Listing or Dealt in on Another Regulated Market
Transferable Securities and Money Market Instruments Admitted to an Official Stock Exchange Listing or Dealt in on Another Regulated Market
Holding
Description
Market Value (USD)
% of Net
Assets
Holding
Description
Market Value (USD)
% of Net
Assets
* All or a portion of this security represents a security on loan.
The notes on pages 728 to 741 form an integral part of these financial statements.
Annual Report and Audited Financial Statements [125]
Asian Tiger Bond Fund
BONDS
Australia USD 3,800,000 CNOOC Curtis Funding No 1 Pty
Ltd 4.5% 3/10/2023 4,105,188 0.13 USD 3,617,000 QBE Insurance Group Ltd FRN
17/6/2046* 3,855,143 0.13 USD 6,672,000 Santos Finance Ltd 4.125%
14/9/2027* 6,852,227 0.23 USD 6,700,000 Santos Finance Ltd 5.25%
13/3/2029 7,331,232 0.24 22,143,790 0.73
Bermuda USD 262,000 China Singyes Solar Technologies
Holdings Ltd (Defaulted) 6.75% 17/10/2018 222,045 0.01
USD 2,827,000 China Singyes Solar Technologies Holdings Ltd (Defaulted) 7.95% 15/2/2019 2,395,882 0.08
USD 4,300,000 GCL New Energy Holdings Ltd 7.1% 30/1/2021 4,108,516 0.14
USD 9,740,000 Luye Pharma Group Ltd 1.5% 9/7/2024 10,357,954 0.34
17,084,397 0.57
British Virgin Islands USD 5,800,000 1MDB Global Investments Ltd
4.4% 9/3/2023 5,572,531 0.18 USD 3,311,000 Baoxin Auto Finance I Ltd FRN
30/10/2020 (Perpetual) 2,748,090 0.09 USD 3,260,000 Baoxin Auto Finance I Ltd 7.9%
9/2/2020 3,202,904 0.11 USD 6,100,000 Beijing Environment Bvi Co Ltd
5.3% 18/10/2021 6,289,672 0.21 USD 6,865,000 Bi Hai Co Ltd 6.25% 5/3/2022 7,059,148 0.23 USD 12,000,000 CCTI 2017 Ltd 3.625% 8/8/2022 11,896,875 0.39 USD 12,000,000 Celestial Dynasty Ltd 4.25%
27/6/2029 12,234,641 0.41 USD 2,080,000 Chalco Hong Kong Investment Co
Ltd 4.875% 7/9/2021* 2,151,833 0.07 USD 15,000,000 Charming Light Investments Ltd
4.375% 21/12/2027* 16,287,321 0.54 USD 6,754,000 China Cinda Finance 2015 I Ltd
4.25% 23/4/2025* 7,167,592 0.24 USD 7,335,000 China Cinda Finance 2017 I Ltd
4.75% 21/2/2029* 8,263,816 0.27 USD 10,000,000 China Great Wall International
Holdings III Ltd 3.875% 31/8/2027* 10,514,062 0.35 USD 21,690,000 China Huadian Overseas
Development Management Co Ltd FRN 29/5/2024 (Perpetual) 22,090,690 0.73
USD 13,838,000 China Reinsurance Finance Corp Ltd 3.375% 9/3/2022 13,909,352 0.46
USD 7,000,000 China Shandong International Economic & Technical Finance 1 Ltd 4% 21/12/2020 6,930,000 0.23
USD 5,000,000 China Shenhua Overseas Capital Co Ltd 3.875% 20/1/2025* 5,287,500 0.18
USD 12,000,000 China Southern Power Grid International Finance BVI 2018 Co Ltd 4.25% 18/9/2028 13,668,800 0.45
USD 12,000,000 Chinalco Capital Holdings Ltd 4% 25/8/2021 12,030,000 0.40
USD 10,420,000 Coastal Emerald Ltd FRN 1/8/2024 (Perpetual)* 10,430,288 0.35
USD 6,010,000 Coastal Emerald Ltd 3.95% 1/8/2022* 6,055,075 0.20
USD 2,859,000 Easy Tactic Ltd 8.125% 11/7/2024* 2,703,329 0.09
USD 6,900,000 Easy Tactic Ltd 8.875% 27/9/2021* 7,089,750 0.24 USD 5,860,000 Easy Tactic Ltd 9.125% 28/7/2022 6,061,848 0.20 USD 8,695,000 Franshion Brilliant Ltd 4.25%
23/7/2029* 8,698,130 0.29 USD 2,747,000 Haitian BVI International
Investment Development Ltd 3.875% 12/12/2020 2,741,420 0.09
USD 8,315,000 Hanhui International Ltd 4.37% 22/8/2022 8,346,181 0.28
USD 18,720,000 Huaneng Hong Kong Capital Ltd FRN 30/10/2022 (Perpetual) 18,564,975 0.62
USD 10,000,000 Huarong Finance 2017 Co Ltd 4.25% 7/11/2027* 10,475,000 0.35
USD 18,000,000 Huarong Finance 2019 Co Ltd 3.75% 29/5/2024* 18,470,201 0.61
USD 14,700,000 Huarong Finance 2019 Co Ltd 4.5% 29/5/2029 15,629,819 0.52
USD 12,428,000 Huarong Finance II Co Ltd 4.625% 3/6/2026* 13,294,579 0.44
USD 3,250,000 Huarong Finance II Co Ltd 4.875% 22/11/2026* 3,535,391 0.12
USD 2,061,000 Huayi Finance I Ltd 4% 2/12/2019* 2,061,144 0.07 USD 10,000,000 JIC Zhixin Ltd 3% 24/11/2022 10,084,375 0.33 USD 11,700,000 JIC Zhixin Ltd 3.5% 24/11/2027* 12,153,375 0.40 USD 2,118,000 Joy Treasure Assets Holdings Inc
4.5% 20/3/2029* 2,304,708 0.08 USD 13,500,000 King Power Capital Ltd 5.625%
3/11/2024 15,346,665 0.51 USD 4,034,000 Knight Castle Investments Ltd
7.99% 23/1/2021 1,916,150 0.06 USD 14,600,000 Leader Goal International Ltd FRN
19/1/2023 (Perpetual)* 14,849,422 0.49 USD 2,000,000 Minmetals Bounteous Finance BVI
Ltd 4.2% 27/7/2026* 2,145,938 0.07 USD 12,100,000 Minmetals Bounteous Finance BVI
Ltd 4.75% 30/7/2025 13,317,563 0.44 USD 2,600,000 New Lion Bridge Co Ltd 9.75%
10/10/2020 2,356,860 0.08 USD 5,000,000 New Metro Global Ltd 6.75%
26/1/2020* 4,957,031 0.16 USD 3,200,000 Nuoxi Capital Ltd 7.45%
16/10/2022* 2,840,005 0.09 USD 2,902,000 Nuoxi Capital Ltd 7.5% 28/1/2022 2,639,913 0.09 USD 11,000,000 NWD MTN Ltd 4.125% 18/7/2029 11,015,993 0.37 USD 7,500,000 Poly Real Estate Finance Ltd
4.75% 17/9/2023 7,968,287 0.26 USD 9,804,000 Prime Bloom Holdings Ltd 6.95%
5/7/2022 7,210,536 0.24 USD 5,070,000 Prime Bloom Holdings Ltd 7.5%
19/12/2019* 4,677,075 0.16 USD 6,148,000 Rock International Investment Inc
6.625% 27/3/2020 4,710,290 0.16 USD 17,935,000 Rongshi International Finance Ltd
3.75% 21/5/2029 19,455,318 0.64 USD 6,050,000 Scenery Journey Ltd 11% 6/11/2020 6,193,688 0.21 USD 5,800,000 Scenery Journey Ltd 13% 6/11/2022 5,824,469 0.19 USD 2,421,000 Shandong Iron And Steel Xinheng
International Co Ltd 6.5% 14/6/2021* 2,438,770 0.08
USD 400,000 Shandong Iron And Steel Xinheng International Co Ltd 8.5% 5/12/2021 416,125 0.01
USD 5,630,000 Shanghai Port Group BVI Development Co Ltd 2.875% 18/6/2024* 5,735,245 0.19
USD 4,065,000 Shanghai Port Group BVI Development Co Ltd 3.375% 18/6/2029 4,274,956 0.14
USD 6,565,000 Sino-Ocean Land Treasure IV Ltd 4.75% 5/8/2029* 6,330,420 0.21
Asian Tiger Bond Fund
Portfolio of Investments 31 August 2019
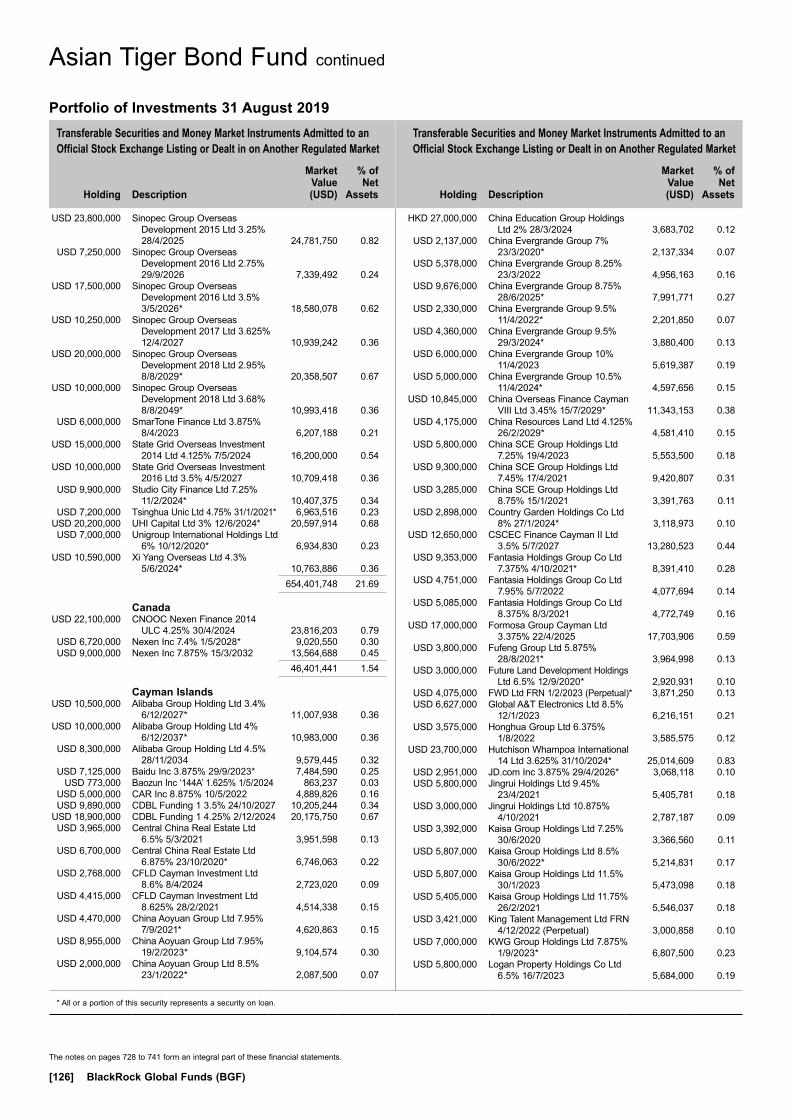
Transferable Securities and Money Market Instruments Admitted to an Official Stock Exchange Listing or Dealt in on Another Regulated Market
Transferable Securities and Money Market Instruments Admitted to an Official Stock Exchange Listing or Dealt in on Another Regulated Market
Holding
Description
Market Value (USD)
% of Net
Assets
Holding
Description
Market Value (USD)
% of Net
Assets
* All or a portion of this security represents a security on loan.
The notes on pages 728 to 741 form an integral part of these financial statements.
[126] BlackRock Global Funds (BGF)
USD 23,800,000 Sinopec Group Overseas Development 2015 Ltd 3.25% 28/4/2025 24,781,750 0.82
USD 7,250,000 Sinopec Group Overseas Development 2016 Ltd 2.75% 29/9/2026 7,339,492 0.24
USD 17,500,000 Sinopec Group Overseas Development 2016 Ltd 3.5% 3/5/2026* 18,580,078 0.62
USD 10,250,000 Sinopec Group Overseas Development 2017 Ltd 3.625% 12/4/2027 10,939,242 0.36
USD 20,000,000 Sinopec Group Overseas Development 2018 Ltd 2.95% 8/8/2029* 20,358,507 0.67
USD 10,000,000 Sinopec Group Overseas Development 2018 Ltd 3.68% 8/8/2049* 10,993,418 0.36
USD 6,000,000 SmarTone Finance Ltd 3.875% 8/4/2023 6,207,188 0.21
USD 15,000,000 State Grid Overseas Investment 2014 Ltd 4.125% 7/5/2024 16,200,000 0.54
USD 10,000,000 State Grid Overseas Investment 2016 Ltd 3.5% 4/5/2027 10,709,418 0.36
USD 9,900,000 Studio City Finance Ltd 7.25% 11/2/2024* 10,407,375 0.34
USD 7,200,000 Tsinghua Unic Ltd 4.75% 31/1/2021* 6,963,516 0.23 USD 20,200,000 UHI Capital Ltd 3% 12/6/2024* 20,597,914 0.68 USD 7,000,000 Unigroup International Holdings Ltd
6% 10/12/2020* 6,934,830 0.23 USD 10,590,000 Xi Yang Overseas Ltd 4.3%
5/6/2024* 10,763,886 0.36 654,401,748 21.69
Canada USD 22,100,000 CNOOC Nexen Finance 2014
ULC 4.25% 30/4/2024 23,816,203 0.79 USD 6,720,000 Nexen Inc 7.4% 1/5/2028* 9,020,550 0.30 USD 9,000,000 Nexen Inc 7.875% 15/3/2032 13,564,688 0.45 46,401,441 1.54
Cayman Islands USD 10,500,000 Alibaba Group Holding Ltd 3.4%
6/12/2027* 11,007,938 0.36 USD 10,000,000 Alibaba Group Holding Ltd 4%
6/12/2037* 10,983,000 0.36 USD 8,300,000 Alibaba Group Holding Ltd 4.5%
28/11/2034 9,579,445 0.32 USD 7,125,000 Baidu Inc 3.875% 29/9/2023* 7,484,590 0.25 USD 773,000 Baozun Inc ‘144A’ 1.625% 1/5/2024 863,237 0.03 USD 5,000,000 CAR Inc 8.875% 10/5/2022 4,889,826 0.16 USD 9,890,000 CDBL Funding 1 3.5% 24/10/2027 10,205,244 0.34 USD 18,900,000 CDBL Funding 1 4.25% 2/12/2024 20,175,750 0.67 USD 3,965,000 Central China Real Estate Ltd
6.5% 5/3/2021 3,951,598 0.13 USD 6,700,000 Central China Real Estate Ltd
6.875% 23/10/2020* 6,746,063 0.22 USD 2,768,000 CFLD Cayman Investment Ltd
8.6% 8/4/2024 2,723,020 0.09 USD 4,415,000 CFLD Cayman Investment Ltd
8.625% 28/2/2021 4,514,338 0.15 USD 4,470,000 China Aoyuan Group Ltd 7.95%
7/9/2021* 4,620,863 0.15 USD 8,955,000 China Aoyuan Group Ltd 7.95%
19/2/2023* 9,104,574 0.30 USD 2,000,000 China Aoyuan Group Ltd 8.5%
23/1/2022* 2,087,500 0.07
HKD 27,000,000 China Education Group Holdings Ltd 2% 28/3/2024 3,683,702 0.12
USD 2,137,000 China Evergrande Group 7% 23/3/2020* 2,137,334 0.07
USD 5,378,000 China Evergrande Group 8.25% 23/3/2022 4,956,163 0.16
USD 9,676,000 China Evergrande Group 8.75% 28/6/2025* 7,991,771 0.27
USD 2,330,000 China Evergrande Group 9.5% 11/4/2022* 2,201,850 0.07
USD 4,360,000 China Evergrande Group 9.5% 29/3/2024* 3,880,400 0.13
USD 6,000,000 China Evergrande Group 10% 11/4/2023 5,619,387 0.19
USD 5,000,000 China Evergrande Group 10.5% 11/4/2024* 4,597,656 0.15
USD 10,845,000 China Overseas Finance Cayman VIII Ltd 3.45% 15/7/2029* 11,343,153 0.38
USD 4,175,000 China Resources Land Ltd 4.125% 26/2/2029* 4,581,410 0.15
USD 5,800,000 China SCE Group Holdings Ltd 7.25% 19/4/2023 5,553,500 0.18
USD 9,300,000 China SCE Group Holdings Ltd 7.45% 17/4/2021 9,420,807 0.31
USD 3,285,000 China SCE Group Holdings Ltd 8.75% 15/1/2021 3,391,763 0.11
USD 2,898,000 Country Garden Holdings Co Ltd 8% 27/1/2024* 3,118,973 0.10
USD 12,650,000 CSCEC Finance Cayman II Ltd 3.5% 5/7/2027 13,280,523 0.44
USD 9,353,000 Fantasia Holdings Group Co Ltd 7.375% 4/10/2021* 8,391,410 0.28
USD 4,751,000 Fantasia Holdings Group Co Ltd 7.95% 5/7/2022 4,077,694 0.14
USD 5,085,000 Fantasia Holdings Group Co Ltd 8.375% 8/3/2021 4,772,749 0.16
USD 17,000,000 Formosa Group Cayman Ltd 3.375% 22/4/2025 17,703,906 0.59
USD 3,800,000 Fufeng Group Ltd 5.875% 28/8/2021* 3,964,998 0.13
USD 3,000,000 Future Land Development Holdings Ltd 6.5% 12/9/2020* 2,920,931 0.10
USD 4,075,000 FWD Ltd FRN 1/2/2023 (Perpetual)* 3,871,250 0.13 USD 6,627,000 Global A&T Electronics Ltd 8.5%
12/1/2023 6,216,151 0.21 USD 3,575,000 Honghua Group Ltd 6.375%
1/8/2022 3,585,575 0.12 USD 23,700,000 Hutchison Whampoa International
14 Ltd 3.625% 31/10/2024* 25,014,609 0.83 USD 2,951,000 JD.com Inc 3.875% 29/4/2026* 3,068,118 0.10 USD 5,800,000 Jingrui Holdings Ltd 9.45%
23/4/2021 5,405,781 0.18 USD 3,000,000 Jingrui Holdings Ltd 10.875%
4/10/2021 2,787,187 0.09 USD 3,392,000 Kaisa Group Holdings Ltd 7.25%
30/6/2020 3,366,560 0.11 USD 5,807,000 Kaisa Group Holdings Ltd 8.5%
30/6/2022* 5,214,831 0.17 USD 5,807,000 Kaisa Group Holdings Ltd 11.5%
30/1/2023 5,473,098 0.18 USD 5,405,000 Kaisa Group Holdings Ltd 11.75%
26/2/2021 5,546,037 0.18 USD 3,421,000 King Talent Management Ltd FRN
4/12/2022 (Perpetual) 3,000,858 0.10 USD 7,000,000 KWG Group Holdings Ltd 7.875%
1/9/2023* 6,807,500 0.23 USD 5,800,000 Logan Property Holdings Co Ltd
6.5% 16/7/2023 5,684,000 0.19
Asian Tiger Bond Fund continued
Portfolio of Investments 31 August 2019

Transferable Securities and Money Market Instruments Admitted to an Official Stock Exchange Listing or Dealt in on Another Regulated Market
Transferable Securities and Money Market Instruments Admitted to an Official Stock Exchange Listing or Dealt in on Another Regulated Market
Holding
Description
Market Value (USD)
% of Net
Assets
Holding
Description
Market Value (USD)
% of Net
Assets
* All or a portion of this security represents a security on loan.
The notes on pages 728 to 741 form an integral part of these financial statements.
Annual Report and Audited Financial Statements [127]
USD 7,430,000 Logan Property Holdings Co Ltd 6.875% 24/4/2021* 7,579,232 0.25
USD 3,370,000 Logan Property Holdings Co Ltd 7.5% 25/8/2022* 3,473,338 0.12
USD 6,285,000 Longfor Group Holdings Ltd 4.5% 16/1/2028* 6,548,184 0.22
USD 4,000,000 Modern Land China Co Ltd 12.85% 25/10/2021 3,780,000 0.13
USD 5,000,000 New World China Land Ltd 4.75% 23/1/2027 5,324,219 0.18
USD 23,140,000 Overseas Chinese Town Asia Holdings Ltd FRN 10/10/2020 (Perpetual) 23,208,697 0.77
USD 7,100,000 Pearl Holding III Ltd 9.5% 11/12/2022 5,644,500 0.19
USD 5,690,000 Poseidon Finance 1 Ltd 1/2/2025 (Zero Coupon) 5,599,671 0.19
USD 7,600,000 Powerlong Real Estate Holdings Ltd 5.95% 19/7/2020 7,575,452 0.25
USD 2,500,000 Powerlong Real Estate Holdings Ltd 6.95% 17/4/2021* 2,477,405 0.08
USD 3,245,000 Redco Properties Group Ltd 13.5% 21/1/2020 3,297,731 0.11
USD 3,000,000 Redsun Properties Group Ltd 9.95% 11/4/2022* 2,808,750 0.09
USD 2,850,000 Redsun Properties Group Ltd 10.5% 3/10/2022* 2,636,250 0.09
USD 5,260,000 Ronshine China Holdings Ltd 8.75% 25/10/2022* 5,280,812 0.18
USD 5,080,000 Ronshine China Holdings Ltd 8.95% 22/1/2023 5,028,922 0.17
USD 3,887,000 Ronshine China Holdings Ltd 10.5% 1/3/2022 4,058,765 0.13
USD 2,630,000 Ronshine China Holdings Ltd 11.25% 22/8/2021 2,795,498 0.09
USD 2,330,000 Shimao Property Holdings Ltd 5.6% 15/7/2026* 2,345,963 0.08
USD 7,690,000 Sun Hung Kai Properties Capital Market Ltd 3.75% 25/2/2029* 8,348,714 0.28
USD 5,420,000 Sunac China Holdings Ltd 7.25% 14/6/2022 5,265,903 0.17
USD 4,055,000 Sunac China Holdings Ltd 8.375% 15/1/2021 4,133,252 0.14
USD 4,125,000 Sunac China Holdings Ltd 8.625% 27/7/2020 4,212,657 0.14
USD 10,000,000 Tencent Holdings Ltd 3.8% 11/2/2025 10,623,676 0.35
USD 17,000,000 Tencent Holdings Ltd 3.975% 11/4/2029* 18,418,166 0.61
USD 2,575,000 Tencent Holdings Ltd 4.525% 11/4/2049* 3,124,347 0.10
USD 11,600,000 Three Gorges Finance I Cayman Islands Ltd 3.15% 2/6/2026 12,102,062 0.40
USD 4,484,000 Times China Holdings Ltd 6.25% 17/1/2021* 4,504,132 0.15
USD 4,100,000 Times China Holdings Ltd 7.625% 21/2/2022* 4,206,465 0.14
USD 7,200,000 Weibo Corp 3.5% 5/7/2024* 7,333,875 0.24 USD 3,786,000 Xinyuan Real Estate Co Ltd
9.875% 19/3/2020 3,704,601 0.12 USD 8,915,000 Yankuang Group Cayman Ltd
4.75% 30/11/2020* 8,965,726 0.30 USD 3,020,000 Yuzhou Properties Co Ltd 6%
25/10/2023 2,704,316 0.09 USD 2,540,000 Yuzhou Properties Co Ltd 7.9%
11/5/2021 2,590,800 0.09 USD 6,000,000 Yuzhou Properties Co Ltd 8.5%
26/2/2024* 5,820,000 0.19 USD 3,350,000 Yuzhou Properties Co Ltd 8.625%
23/1/2022* 3,417,000 0.11
USD 2,220,000 Zhenro Properties Group Ltd 9.15% 8/3/2022 2,233,875 0.07
USD 6,100,000 Zhenro Properties Group Ltd 12.5% 2/1/2021 6,471,719 0.21
539,213,296 17.87
China USD 15,000,000 Bank of China Ltd 5% 13/11/2024 16,417,969 0.54 USD 8,470,000 China Construction Bank Corp
FRN 27/2/2029* 8,919,418 0.30 CNY 62,100,000 China Government Bond 3.25%
22/11/2028 8,808,578 0.29 CNY 100,000,000 China Government Bond 3.29%
23/5/2029 14,293,337 0.47 CNY 267,900,000 China Government Bond 3.54%
16/8/2028 38,863,032 1.29 CNY 140,000,000 China Government Bond 3.86%
22/7/2049 20,337,838 0.67 CNY 127,500,000 China Government Bond 4.08%
22/10/2048 19,112,788 0.63 USD 6,100,000 Guangxi Financial Investment
Group Co Ltd 5.75% 23/1/2021 5,871,126 0.20 USD 12,766,000 Huachen Energy Co Ltd 6.625%
18/5/2020 7,341,727 0.24 USD 6,432,000 Inner Mongolia High-Grade
High Way Construction And Development Co Ltd 4.375% 4/12/2020 6,392,636 0.21
USD 6,175,000 Sichuan Railway Investment Group Co Ltd 3.8% 27/6/2022 6,214,491 0.21
USD 6,139,000 Union Life Insurance Co Ltd 3% 19/9/2021 5,353,407 0.18
USD 5,875,000 Xi’an Municipal Infrastructure Construction Investment Group Corp Ltd 4% 24/6/2022 5,910,601 0.20
163,836,948 5.43
Hong Kong CNH 2,989,562 China City Construction
International Co Ltd (Defaulted) 5.35% 3/7/2017 18,815 0.00
USD 5,681,000 Chong Hing Bank Ltd FRN 26/7/2027 5,708,517 0.19
USD 5,000,000 CITIC Ltd 4% 11/1/2028* 5,357,031 0.18 USD 12,000,000 CNAC HK Finbridge Co Ltd
3.875% 19/6/2029* 12,605,740 0.42 USD 9,345,000 CNAC HK Finbridge Co Ltd
4.625% 14/3/2023 9,876,895 0.33 USD 11,463,000 CNAC HK Finbridge Co Ltd
4.875% 14/3/2025* 12,496,461 0.41 USD 29,330,000 CNAC HK Synbridge Co Ltd
5% 5/5/2020 29,688,119 0.98 USD 4,550,000 Far East Horizon Ltd 4.375%
27/2/2023 4,694,030 0.15 USD 9,165,000 GLP China Holdings Ltd 4.974%
26/2/2024 9,709,172 0.32 USD 1,607,000 Hubei Science & Technology
Investment Group Hong Kong Ltd 4.375% 5/3/2021 1,618,802 0.05
USD 5,000,000 ICBCIL Finance Co Ltd 3.625% 15/11/2027* 5,210,125 0.17
USD 11,950,000 Industrial & Commercial Bank of China Asia Ltd FRN 21/7/2021 (Perpetual) 11,991,078 0.40
USD 6,000,000 Shanhai Hong Kong International Investments Ltd 3.875% 20/4/2020* 5,995,313 0.20
Asian Tiger Bond Fund continued
Portfolio of Investments 31 August 2019
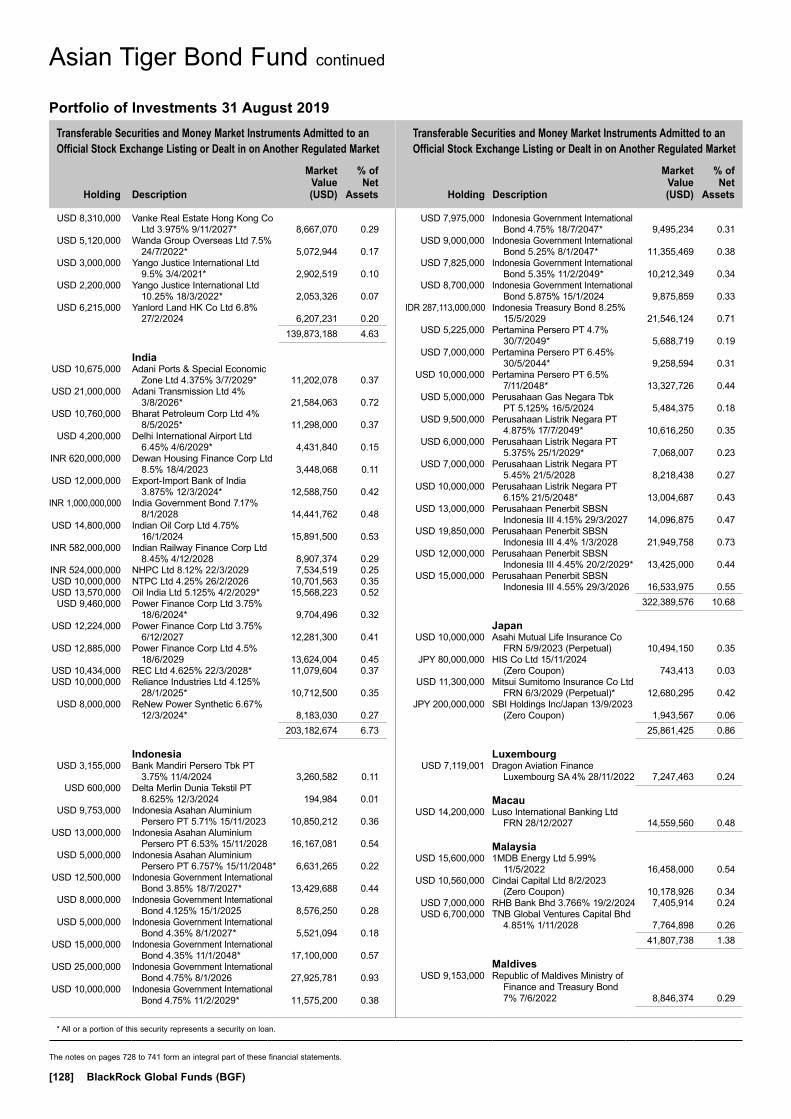
Transferable Securities and Money Market Instruments Admitted to an Official Stock Exchange Listing or Dealt in on Another Regulated Market
Transferable Securities and Money Market Instruments Admitted to an Official Stock Exchange Listing or Dealt in on Another Regulated Market
Holding
Description
Market Value (USD)
% of Net
Assets
Holding
Description
Market Value (USD)
% of Net
Assets
* All or a portion of this security represents a security on loan.
The notes on pages 728 to 741 form an integral part of these financial statements.
[128] BlackRock Global Funds (BGF)
USD 8,310,000 Vanke Real Estate Hong Kong Co Ltd 3.975% 9/11/2027* 8,667,070 0.29
USD 5,120,000 Wanda Group Overseas Ltd 7.5% 24/7/2022* 5,072,944 0.17
USD 3,000,000 Yango Justice International Ltd 9.5% 3/4/2021* 2,902,519 0.10
USD 2,200,000 Yango Justice International Ltd 10.25% 18/3/2022* 2,053,326 0.07
USD 6,215,000 Yanlord Land HK Co Ltd 6.8% 27/2/2024 6,207,231 0.20
139,873,188 4.63
India USD 10,675,000 Adani Ports & Special Economic
Zone Ltd 4.375% 3/7/2029* 11,202,078 0.37 USD 21,000,000 Adani Transmission Ltd 4%
3/8/2026* 21,584,063 0.72 USD 10,760,000 Bharat Petroleum Corp Ltd 4%
8/5/2025* 11,298,000 0.37 USD 4,200,000 Delhi International Airport Ltd
6.45% 4/6/2029* 4,431,840 0.15 INR 620,000,000 Dewan Housing Finance Corp Ltd
8.5% 18/4/2023 3,448,068 0.11 USD 12,000,000 Export-Import Bank of India
3.875% 12/3/2024* 12,588,750 0.42 INR 1,000,000,000 India Government Bond 7.17%
8/1/2028 14,441,762 0.48 USD 14,800,000 Indian Oil Corp Ltd 4.75%
16/1/2024 15,891,500 0.53 INR 582,000,000 Indian Railway Finance Corp Ltd
8.45% 4/12/2028 8,907,374 0.29 INR 524,000,000 NHPC Ltd 8.12% 22/3/2029 7,534,519 0.25 USD 10,000,000 NTPC Ltd 4.25% 26/2/2026 10,701,563 0.35 USD 13,570,000 Oil India Ltd 5.125% 4/2/2029* 15,568,223 0.52 USD 9,460,000 Power Finance Corp Ltd 3.75%
18/6/2024* 9,704,496 0.32 USD 12,224,000 Power Finance Corp Ltd 3.75%
6/12/2027 12,281,300 0.41 USD 12,885,000 Power Finance Corp Ltd 4.5%
18/6/2029 13,624,004 0.45 USD 10,434,000 REC Ltd 4.625% 22/3/2028* 11,079,604 0.37 USD 10,000,000 Reliance Industries Ltd 4.125%
28/1/2025* 10,712,500 0.35 USD 8,000,000 ReNew Power Synthetic 6.67%
12/3/2024* 8,183,030 0.27 203,182,674 6.73
Indonesia USD 3,155,000 Bank Mandiri Persero Tbk PT
3.75% 11/4/2024 3,260,582 0.11 USD 600,000 Delta Merlin Dunia Tekstil PT
8.625% 12/3/2024 194,984 0.01 USD 9,753,000 Indonesia Asahan Aluminium
Persero PT 5.71% 15/11/2023 10,850,212 0.36 USD 13,000,000 Indonesia Asahan Aluminium
Persero PT 6.53% 15/11/2028 16,167,081 0.54 USD 5,000,000 Indonesia Asahan Aluminium
Persero PT 6.757% 15/11/2048* 6,631,265 0.22 USD 12,500,000 Indonesia Government International
Bond 3.85% 18/7/2027* 13,429,688 0.44 USD 8,000,000 Indonesia Government International
Bond 4.125% 15/1/2025 8,576,250 0.28 USD 5,000,000 Indonesia Government International
Bond 4.35% 8/1/2027* 5,521,094 0.18 USD 15,000,000 Indonesia Government International
Bond 4.35% 11/1/2048* 17,100,000 0.57 USD 25,000,000 Indonesia Government International
Bond 4.75% 8/1/2026 27,925,781 0.93 USD 10,000,000 Indonesia Government International
Bond 4.75% 11/2/2029* 11,575,200 0.38
USD 7,975,000 Indonesia Government International Bond 4.75% 18/7/2047* 9,495,234 0.31
USD 9,000,000 Indonesia Government International Bond 5.25% 8/1/2047* 11,355,469 0.38
USD 7,825,000 Indonesia Government International Bond 5.35% 11/2/2049* 10,212,349 0.34
USD 8,700,000 Indonesia Government International Bond 5.875% 15/1/2024 9,875,859 0.33
IDR 287,113,000,000 Indonesia Treasury Bond 8.25% 15/5/2029 21,546,124 0.71
USD 5,225,000 Pertamina Persero PT 4.7% 30/7/2049* 5,688,719 0.19
USD 7,000,000 Pertamina Persero PT 6.45% 30/5/2044* 9,258,594 0.31
USD 10,000,000 Pertamina Persero PT 6.5% 7/11/2048* 13,327,726 0.44
USD 5,000,000 Perusahaan Gas Negara Tbk PT 5.125% 16/5/2024 5,484,375 0.18
USD 9,500,000 Perusahaan Listrik Negara PT 4.875% 17/7/2049* 10,616,250 0.35
USD 6,000,000 Perusahaan Listrik Negara PT 5.375% 25/1/2029* 7,068,007 0.23
USD 7,000,000 Perusahaan Listrik Negara PT 5.45% 21/5/2028 8,218,438 0.27
USD 10,000,000 Perusahaan Listrik Negara PT 6.15% 21/5/2048* 13,004,687 0.43
USD 13,000,000 Perusahaan Penerbit SBSN Indonesia III 4.15% 29/3/2027 14,096,875 0.47
USD 19,850,000 Perusahaan Penerbit SBSN Indonesia III 4.4% 1/3/2028 21,949,758 0.73
USD 12,000,000 Perusahaan Penerbit SBSN Indonesia III 4.45% 20/2/2029* 13,425,000 0.44
USD 15,000,000 Perusahaan Penerbit SBSN Indonesia III 4.55% 29/3/2026 16,533,975 0.55
322,389,576 10.68
Japan USD 10,000,000 Asahi Mutual Life Insurance Co
FRN 5/9/2023 (Perpetual) 10,494,150 0.35 JPY 80,000,000 HIS Co Ltd 15/11/2024
(Zero Coupon) 743,413 0.03 USD 11,300,000 Mitsui Sumitomo Insurance Co Ltd
FRN 6/3/2029 (Perpetual)* 12,680,295 0.42 JPY 200,000,000 SBI Holdings Inc/Japan 13/9/2023
(Zero Coupon) 1,943,567 0.06 25,861,425 0.86
Luxembourg USD 7,119,001 Dragon Aviation Finance
Luxembourg SA 4% 28/11/2022 7,247,463 0.24
Macau USD 14,200,000 Luso International Banking Ltd
FRN 28/12/2027 14,559,560 0.48
Malaysia USD 15,600,000 1MDB Energy Ltd 5.99%
11/5/2022 16,458,000 0.54 USD 10,560,000 Cindai Capital Ltd 8/2/2023
(Zero Coupon) 10,178,926 0.34 USD 7,000,000 RHB Bank Bhd 3.766% 19/2/2024 7,405,914 0.24 USD 6,700,000 TNB Global Ventures Capital Bhd
4.851% 1/11/2028 7,764,898 0.26 41,807,738 1.38
Maldives USD 9,153,000 Republic of Maldives Ministry of
Finance and Treasury Bond 7% 7/6/2022 8,846,374 0.29
Asian Tiger Bond Fund continued
Portfolio of Investments 31 August 2019
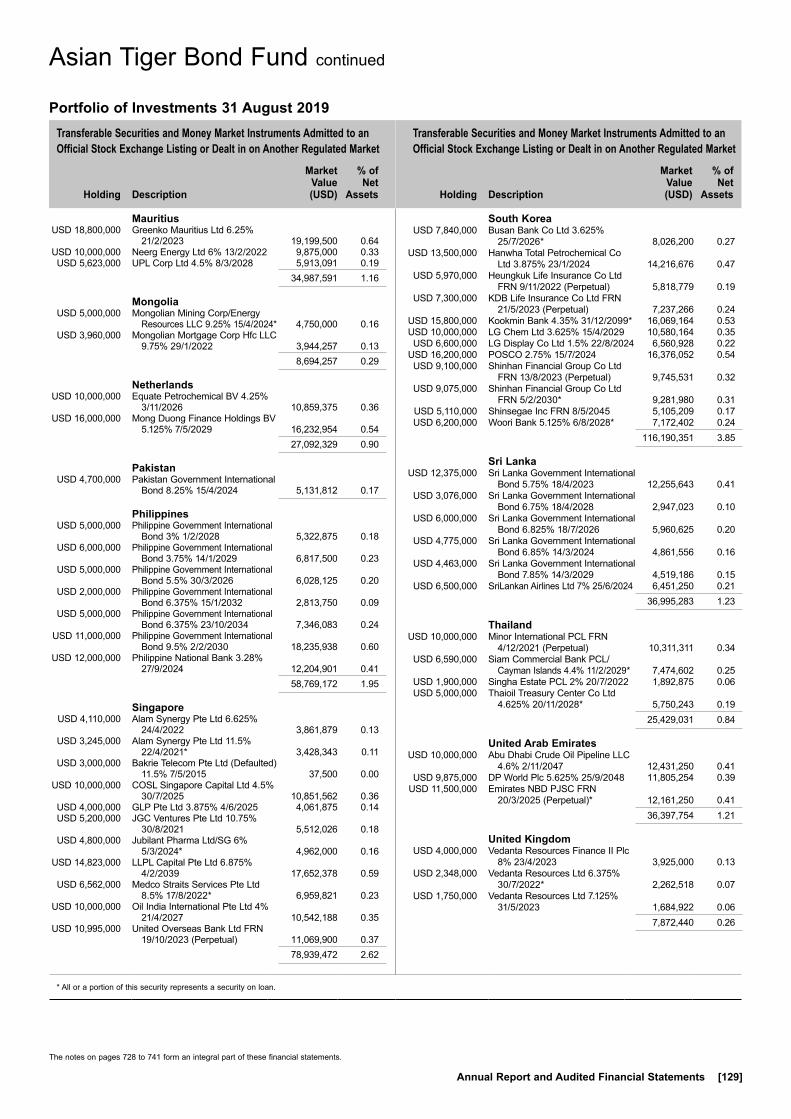
Transferable Securities and Money Market Instruments Admitted to an Official Stock Exchange Listing or Dealt in on Another Regulated Market
Transferable Securities and Money Market Instruments Admitted to an Official Stock Exchange Listing or Dealt in on Another Regulated Market
Holding
Description
Market Value (USD)
% of Net
Assets
Holding
Description
Market Value (USD)
% of Net
Assets
* All or a portion of this security represents a security on loan.
The notes on pages 728 to 741 form an integral part of these financial statements.
Annual Report and Audited Financial Statements [129]
Mauritius USD 18,800,000 Greenko Mauritius Ltd 6.25%
21/2/2023 19,199,500 0.64 USD 10,000,000 Neerg Energy Ltd 6% 13/2/2022 9,875,000 0.33 USD 5,623,000 UPL Corp Ltd 4.5% 8/3/2028 5,913,091 0.19 34,987,591 1.16
Mongolia USD 5,000,000 Mongolian Mining Corp/Energy
Resources LLC 9.25% 15/4/2024* 4,750,000 0.16 USD 3,960,000 Mongolian Mortgage Corp Hfc LLC
9.75% 29/1/2022 3,944,257 0.13 8,694,257 0.29
Netherlands USD 10,000,000 Equate Petrochemical BV 4.25%
3/11/2026 10,859,375 0.36 USD 16,000,000 Mong Duong Finance Holdings BV
5.125% 7/5/2029 16,232,954 0.54 27,092,329 0.90
Pakistan USD 4,700,000 Pakistan Government International
Bond 8.25% 15/4/2024 5,131,812 0.17
Philippines USD 5,000,000 Philippine Government International
Bond 3% 1/2/2028 5,322,875 0.18 USD 6,000,000 Philippine Government International
Bond 3.75% 14/1/2029 6,817,500 0.23 USD 5,000,000 Philippine Government International
Bond 5.5% 30/3/2026 6,028,125 0.20 USD 2,000,000 Philippine Government International
Bond 6.375% 15/1/2032 2,813,750 0.09 USD 5,000,000 Philippine Government International
Bond 6.375% 23/10/2034 7,346,083 0.24 USD 11,000,000 Philippine Government International
Bond 9.5% 2/2/2030 18,235,938 0.60 USD 12,000,000 Philippine National Bank 3.28%
27/9/2024 12,204,901 0.41 58,769,172 1.95
Singapore USD 4,110,000 Alam Synergy Pte Ltd 6.625%
24/4/2022 3,861,879 0.13 USD 3,245,000 Alam Synergy Pte Ltd 11.5%
22/4/2021* 3,428,343 0.11 USD 3,000,000 Bakrie Telecom Pte Ltd (Defaulted)
11.5% 7/5/2015 37,500 0.00 USD 10,000,000 COSL Singapore Capital Ltd 4.5%
30/7/2025 10,851,562 0.36 USD 4,000,000 GLP Pte Ltd 3.875% 4/6/2025 4,061,875 0.14 USD 5,200,000 JGC Ventures Pte Ltd 10.75%
30/8/2021 5,512,026 0.18 USD 4,800,000 Jubilant Pharma Ltd/SG 6%
5/3/2024* 4,962,000 0.16 USD 14,823,000 LLPL Capital Pte Ltd 6.875%
4/2/2039 17,652,378 0.59 USD 6,562,000 Medco Straits Services Pte Ltd
8.5% 17/8/2022* 6,959,821 0.23 USD 10,000,000 Oil India International Pte Ltd 4%
21/4/2027 10,542,188 0.35 USD 10,995,000 United Overseas Bank Ltd FRN
19/10/2023 (Perpetual) 11,069,900 0.37 78,939,472 2.62
South Korea USD 7,840,000 Busan Bank Co Ltd 3.625%
25/7/2026* 8,026,200 0.27 USD 13,500,000 Hanwha Total Petrochemical Co
Ltd 3.875% 23/1/2024 14,216,676 0.47 USD 5,970,000 Heungkuk Life Insurance Co Ltd
FRN 9/11/2022 (Perpetual) 5,818,779 0.19 USD 7,300,000 KDB Life Insurance Co Ltd FRN
21/5/2023 (Perpetual) 7,237,266 0.24 USD 15,800,000 Kookmin Bank 4.35% 31/12/2099* 16,069,164 0.53 USD 10,000,000 LG Chem Ltd 3.625% 15/4/2029 10,580,164 0.35 USD 6,600,000 LG Display Co Ltd 1.5% 22/8/2024 6,560,928 0.22 USD 16,200,000 POSCO 2.75% 15/7/2024 16,376,052 0.54 USD 9,100,000 Shinhan Financial Group Co Ltd
FRN 13/8/2023 (Perpetual) 9,745,531 0.32 USD 9,075,000 Shinhan Financial Group Co Ltd
FRN 5/2/2030* 9,281,980 0.31 USD 5,110,000 Shinsegae Inc FRN 8/5/2045 5,105,209 0.17 USD 6,200,000 Woori Bank 5.125% 6/8/2028* 7,172,402 0.24 116,190,351 3.85
Sri Lanka USD 12,375,000 Sri Lanka Government International
Bond 5.75% 18/4/2023 12,255,643 0.41 USD 3,076,000 Sri Lanka Government International
Bond 6.75% 18/4/2028 2,947,023 0.10 USD 6,000,000 Sri Lanka Government International
Bond 6.825% 18/7/2026 5,960,625 0.20 USD 4,775,000 Sri Lanka Government International
Bond 6.85% 14/3/2024 4,861,556 0.16 USD 4,463,000 Sri Lanka Government International
Bond 7.85% 14/3/2029 4,519,186 0.15 USD 6,500,000 SriLankan Airlines Ltd 7% 25/6/2024 6,451,250 0.21 36,995,283 1.23
Thailand USD 10,000,000 Minor International PCL FRN
4/12/2021 (Perpetual) 10,311,311 0.34 USD 6,590,000 Siam Commercial Bank PCL/
Cayman Islands 4.4% 11/2/2029* 7,474,602 0.25 USD 1,900,000 Singha Estate PCL 2% 20/7/2022 1,892,875 0.06 USD 5,000,000 Thaioil Treasury Center Co Ltd
4.625% 20/11/2028* 5,750,243 0.19 25,429,031 0.84
United Arab Emirates USD 10,000,000 Abu Dhabi Crude Oil Pipeline LLC
4.6% 2/11/2047 12,431,250 0.41 USD 9,875,000 DP World Plc 5.625% 25/9/2048 11,805,254 0.39 USD 11,500,000 Emirates NBD PJSC FRN
20/3/2025 (Perpetual)* 12,161,250 0.41 36,397,754 1.21
United Kingdom USD 4,000,000 Vedanta Resources Finance II Plc
8% 23/4/2023 3,925,000 0.13 USD 2,348,000 Vedanta Resources Ltd 6.375%
30/7/2022* 2,262,518 0.07 USD 1,750,000 Vedanta Resources Ltd 7.125%
31/5/2023 1,684,922 0.06 7,872,440 0.26
Asian Tiger Bond Fund continued
Portfolio of Investments 31 August 2019

Transferable Securities and Money Market Instruments Admitted to an Official Stock Exchange Listing or Dealt in on Another Regulated Market
Transferable Securities and Money Market Instruments Admitted to an Official Stock Exchange Listing or Dealt in on Another Regulated Market
Holding
Description
Market Value (USD)
% of Net
Assets
Holding
Description
Market Value (USD)
% of Net
Assets
* All or a portion of this security represents a security on loan.
The notes on pages 728 to 741 form an integral part of these financial statements.
[130] BlackRock Global Funds (BGF)
United States USD 10,000,000 CNOOC Finance 2015 USA LLC
4.375% 2/5/2028 11,260,938 0.37 USD 12,385,000 Hyundai Capital America 2.75%
27/9/2026* 12,185,679 0.40 USD 12,000,000 Resorts World Las Vegas LLC /
RWLV Capital Inc 4.625% 16/4/2029* 12,668,100 0.42
USD 14,000,000 United States Treasury Note/Bond 1.125% 31/7/2021 13,883,242 0.46
USD 14,000,000 United States Treasury Note/Bond 1.75% 31/7/2021* 14,050,586 0.47
USD 4,000,000 United States Treasury Note/Bond 1.75% 30/6/2024 4,059,062 0.13
USD 14,000,000 United States Treasury Note/Bond 2% 30/4/2024 14,356,289 0.48
USD 14,000,000 United States Treasury Note/Bond 2.125% 29/2/2024 14,418,632 0.48
USD 14,000,000 United States Treasury Note/Bond 2.125% 31/3/2024 14,421,641 0.48
USD 14,000,000 United States Treasury Note/Bond 2.25% 31/1/2024 14,485,624 0.48
USD 14,000,000 United States Treasury Note/Bond 2.25% 30/4/2024 14,514,882 0.48
USD 14,000,000 United States Treasury Note/Bond 2.375% 29/2/2024 14,571,484 0.48
USD 14,000,000 United States Treasury Note/Bond 2.5% 31/1/2024 14,632,461 0.49
USD 14,000,000 United States Treasury Note/Bond 2.75% 15/8/2021 14,319,922 0.47
183,828,542 6.09
Vietnam USD 7,350,000 No Va Land Investment Group
Corp 5.5% 27/4/2023 7,221,375 0.24 USD 3,800,000 Vinpearl JSC 3.5% 14/6/2023 4,218,986 0.14 11,440,361 0.38Total Bonds 2,838,618,013 94.07Total Transferable Securities and Money Market Instruments Admitted to an Official Stock Exchange Listing or Dealt in on Another Regulated Market 2,838,618,013 94.07Total Portfolio 2,838,618,013 94.07
Other Net Assets 178,782,983 5.93Total Net Assets (USD) 3,017,400,996 100.00
Asian Tiger Bond Fund continued
Portfolio of Investments 31 August 2019
Swaps as at 31 August 2019
TypeNominal
Value Description Counterparty
Expiration date
Unrealised appreciation/
(depreciation) USD
Market Value USD
CDS JPY 769,230,770 Fund receives default protection on ITRAXX.JPN.25.V1; and pays Fixed 1% Bank of America 20/6/2021 (83,602) (110,305)
CDS JPY 1,230,769,230 Fund receives default protection on ITRAXX.JPN.25.V1; and pays Fixed 1% Bank of America 20/6/2021 (136,183) (176,488)
CDS JPY 461,538,462 Fund receives default protection on ITRAXX.JPN.25.V1; and pays Fixed 1% Barclays 20/6/2021 (49,699) (66,183)
CDS USD (10,000,000) Fund provides default protection on PCCW-HKT Telephone Ltd; and receives Fixed 1% BNP Paribas 20/6/2020 179,273 68,971
CDS EUR 1,740,000 Fund receives default protection on Standard Chartered Bank; and pays Fixed 1% BNP Paribas 20/12/2020 (33,209) (21,961)
CDS EUR 890,000 Fund receives default protection on Standard Chartered Bank; and pays Fixed 1% BNP Paribas 20/12/2020 (17,145) (11,233)
CDS USD (5,000,000) Fund provides default protection on Reliance Industries Ltd; and receives Fixed 1% Citibank 20/6/2020 199,676 32,850
CDS USD (10,000,000) Fund provides default protection on Reliance Industries Ltd; and receives Fixed 1% Citibank 20/6/2020 355,429 65,701
CDS USD (5,000,000) Fund provides default protection on Hongkong Land Co Ltd; and receives Fixed 1% Citibank 20/9/2020 97,951 37,953
CDS USD (5,000,000) Fund provides default protection on Hongkong Land Co Ltd; and receives Fixed 1% Citibank 20/9/2020 67,611 37,953
CDS USD (10,000,000) Fund provides default protection on PCCW-HKT Telephone Ltd; and receives Fixed 1% Deutsche Bank 20/6/2020 165,090 68,970
CDS USD (5,000,000) Fund provides default protection on Reliance Industries Ltd; and receives Fixed 1% Goldman Sachs 20/9/2020 222,408 39,844
CDS EUR 1,350,000 Fund receives default protection on Standard Chartered Bank; and pays Fixed 1% Goldman Sachs 20/12/2020 (20,917) (17,039)
CDS USD 6,023,857 Fund receives default protection on Australia & New Zealand Banking Group Ltd; and pays Fixed 1% JP Morgan 20/12/2020 (61,921) (69,270)
CDS USD 3,976,143 Fund receives default protection on Australia & New Zealand Banking Group Ltd; and pays Fixed 1% JP Morgan 20/12/2020 (40,378) (45,723)
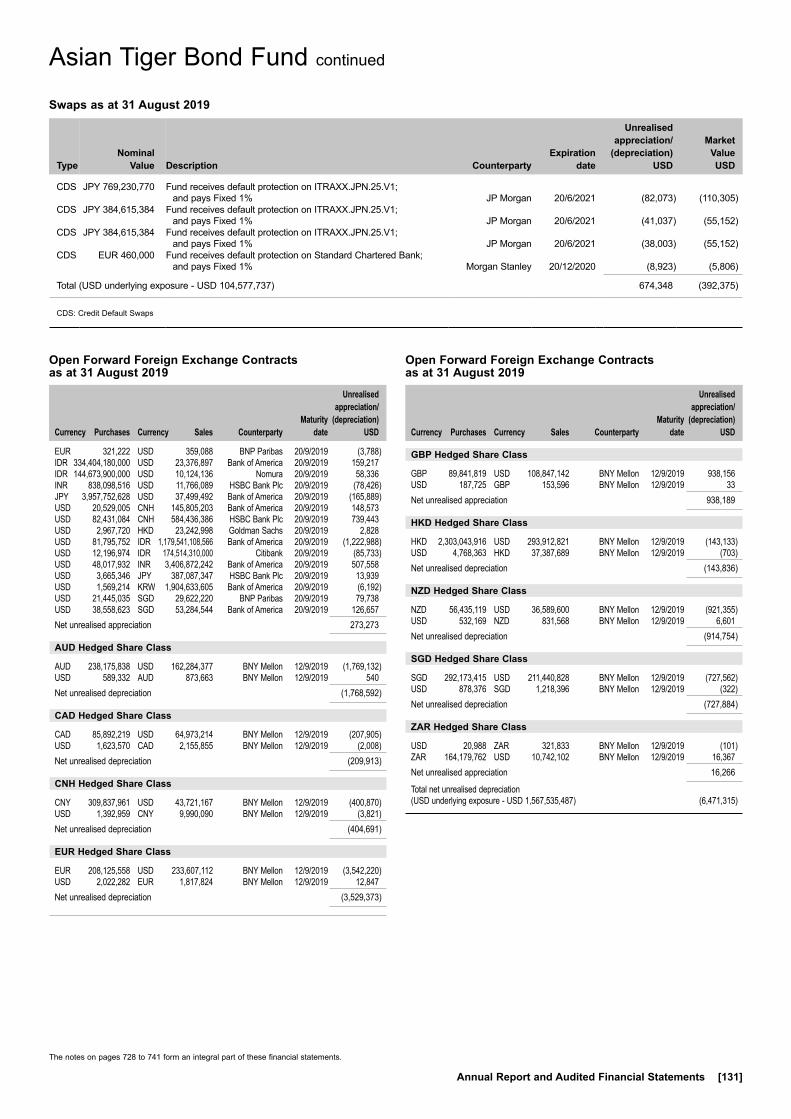
The notes on pages 728 to 741 form an integral part of these financial statements.
Annual Report and Audited Financial Statements [131]
Asian Tiger Bond Fund continued
Open Forward Foreign Exchange Contracts as at 31 August 2019
Currency
Purchases Currency
Sales Counterparty
Maturity date
Unrealised appreciation/
(depreciation) USD
EUR 321,222 USD 359,088 BNP Paribas 20/9/2019 (3,788)IDR 334,404,180,000 USD 23,376,897 Bank of America 20/9/2019 159,217IDR 144,673,900,000 USD 10,124,136 Nomura 20/9/2019 58,336INR 838,098,516 USD 11,766,089 HSBC Bank Plc 20/9/2019 (78,426)JPY 3,957,752,628 USD 37,499,492 Bank of America 20/9/2019 (165,889)USD 20,529,005 CNH 145,805,203 Bank of America 20/9/2019 148,573USD 82,431,084 CNH 584,436,386 HSBC Bank Plc 20/9/2019 739,443USD 2,967,720 HKD 23,242,998 Goldman Sachs 20/9/2019 2,828USD 81,795,752 IDR 1,179,541,108,566 Bank of America 20/9/2019 (1,222,988)USD 12,196,974 IDR 174,514,310,000 Citibank 20/9/2019 (85,733)USD 48,017,932 INR 3,406,872,242 Bank of America 20/9/2019 507,558USD 3,665,346 JPY 387,087,347 HSBC Bank Plc 20/9/2019 13,939USD 1,569,214 KRW 1,904,633,605 Bank of America 20/9/2019 (6,192)USD 21,445,035 SGD 29,622,220 BNP Paribas 20/9/2019 79,738USD 38,558,623 SGD 53,284,544 Bank of America 20/9/2019 126,657Net unrealised appreciation 273,273
AUD Hedged Share Class
AUD 238,175,838 USD 162,284,377 BNY Mellon 12/9/2019 (1,769,132)USD 589,332 AUD 873,663 BNY Mellon 12/9/2019 540Net unrealised depreciation (1,768,592)
CAD Hedged Share Class
CAD 85,892,219 USD 64,973,214 BNY Mellon 12/9/2019 (207,905)USD 1,623,570 CAD 2,155,855 BNY Mellon 12/9/2019 (2,008)Net unrealised depreciation (209,913)
CNH Hedged Share Class
CNY 309,837,961 USD 43,721,167 BNY Mellon 12/9/2019 (400,870)USD 1,392,959 CNY 9,990,090 BNY Mellon 12/9/2019 (3,821)Net unrealised depreciation (404,691)
EUR Hedged Share Class
EUR 208,125,558 USD 233,607,112 BNY Mellon 12/9/2019 (3,542,220)USD 2,022,282 EUR 1,817,824 BNY Mellon 12/9/2019 12,847Net unrealised depreciation (3,529,373)
Open Forward Foreign Exchange Contracts as at 31 August 2019
Currency
Purchases Currency
Sales Counterparty
Maturity date
Unrealised appreciation/
(depreciation) USD
GBP Hedged Share Class
GBP 89,841,819 USD 108,847,142 BNY Mellon 12/9/2019 938,156USD 187,725 GBP 153,596 BNY Mellon 12/9/2019 33Net unrealised appreciation 938,189
HKD Hedged Share Class
HKD 2,303,043,916 USD 293,912,821 BNY Mellon 12/9/2019 (143,133)USD 4,768,363 HKD 37,387,689 BNY Mellon 12/9/2019 (703)Net unrealised depreciation (143,836)
NZD Hedged Share Class
NZD 56,435,119 USD 36,589,600 BNY Mellon 12/9/2019 (921,355)USD 532,169 NZD 831,568 BNY Mellon 12/9/2019 6,601Net unrealised depreciation (914,754)
SGD Hedged Share Class
SGD 292,173,415 USD 211,440,828 BNY Mellon 12/9/2019 (727,562)USD 878,376 SGD 1,218,396 BNY Mellon 12/9/2019 (322)Net unrealised depreciation (727,884)
ZAR Hedged Share Class
USD 20,988 ZAR 321,833 BNY Mellon 12/9/2019 (101)ZAR 164,179,762 USD 10,742,102 BNY Mellon 12/9/2019 16,367Net unrealised appreciation 16,266
Total net unrealised depreciation (USD underlying exposure - USD 1,567,535,487) (6,471,315)
Swaps as at 31 August 2019
TypeNominal
Value Description Counterparty
Expiration date
Unrealised appreciation/
(depreciation) USD
Market Value USD
CDS JPY 769,230,770 Fund receives default protection on ITRAXX.JPN.25.V1; and pays Fixed 1% JP Morgan 20/6/2021 (82,073) (110,305)
CDS JPY 384,615,384 Fund receives default protection on ITRAXX.JPN.25.V1; and pays Fixed 1% JP Morgan 20/6/2021 (41,037) (55,152)
CDS JPY 384,615,384 Fund receives default protection on ITRAXX.JPN.25.V1; and pays Fixed 1% JP Morgan 20/6/2021 (38,003) (55,152)
CDS EUR 460,000 Fund receives default protection on Standard Chartered Bank; and pays Fixed 1% Morgan Stanley 20/12/2020 (8,923) (5,806)
Total (USD underlying exposure - USD 104,577,737) 674,348 (392,375)
CDS: Credit Default Swaps

The notes on pages 728 to 741 form an integral part of these financial statements.
[132] BlackRock Global Funds (BGF)
Asian Tiger Bond Fund continued
Open Exchange Traded Futures Contracts as at 31 August 2019
Number of contracts Currency
Contract/ Description
Expiration date
Underlying exposure
USD
Unrealised appreciation/
(depreciation) USD
1,462 USD US Treasury 2 Year Note (CBT) December 2019 315,746,313 239,859305 USD US Long Bond (CBT) December 2019 50,353,594 524,219264 USD US Ultra Bond (CBT) December 2019 52,008,000 236,547(78) USD US Treasury 5 Year Note (CBT) December 2019 9,345,375 10,000(1,418) USD US Ultra 10 Year Note December 2019 204,502,187 (764,428)
Total 631,955,469 246,197

Transferable Securities and Money Market Instruments Admitted to an Official Stock Exchange Listing or Dealt in on Another Regulated Market
Transferable Securities and Money Market Instruments Admitted to an Official Stock Exchange Listing or Dealt in on Another Regulated Market
Holding
Description
Market Value (USD)
% of Net
Assets
Holding
Description
Market Value (USD)
% of Net
Assets
The notes on pages 728 to 741 form an integral part of these financial statements.
Annual Report and Audited Financial Statements [133]
COMMON STOCKS (SHARES)
China 953,800 Addsino Co Ltd 1,455,366 0.36 1,617,382 Advanced Technology &
Materials Co Ltd 1,612,844 0.40 158,574 Aier Eye Hospital Group Co Ltd 749,173 0.19 85,300 Air China Ltd 94,127 0.02 1,378,556 Angang Steel Co Ltd 601,547 0.15 2,235,526 Anhui Conch Cement Co Ltd 12,328,117 3.06 717,420 Anhui Expressway Co Ltd 549,850 0.14 117,439 Anhui Gujing Distillery Co Ltd 2,053,112 0.51 763,336 Anhui Hengyuan Coal Industry and
Electricity Power Co Ltd 614,934 0.15 642,643 Anhui Jianghuai Automobile Group
Corp Ltd 437,713 0.11 53,600 Aoshikang Technology Co Ltd 367,625 0.09 2,820,476 Apeloa Pharmaceutical Co Ltd 4,260,263 1.06 37,800 Avary Holding Shenzhen Co Ltd 179,377 0.04 344,893 AVIC Jonhon Optronic Technology
Co Ltd 2,091,047 0.52 693,938 AVICOPTER Plc 4,668,270 1.16 1,350,800 Bank of Beijing Co Ltd 991,838 0.25 113,156 Bank of Chengdu Co Ltd 129,614 0.03 508,300 Bank of China Ltd 250,949 0.06 7,459,261 Bank of Communications Co Ltd 5,643,952 1.40 3,900,621 Bank of Hangzhou Co Ltd 4,353,383 1.08 5,992,764 Bank of Nanjing Co Ltd 6,537,505 1.62 2,147,326 Baoshan Iron & Steel Co Ltd 1,744,875 0.43 396,100 Beijing Capital Development Co Ltd 424,350 0.11 638,760 Beijing Join-Cheer Software Co Ltd 605,700 0.15 601,500 Beiqi Foton Motor Co Ltd 178,345 0.04 294,070 Biem.L.Fdlkk Garment Co Ltd 978,443 0.24 390,800 Bluefocus Intelligent
Communications Group Co Ltd 327,395 0.08 34,000 C&S Paper Co Ltd 64,623 0.02 1,166,395 Chacha Food Co Ltd 3,954,290 0.98 5,100 Changchun High & New
Technology Industry Group Inc 250,825 0.06 8,920,296 Changjiang Securities Co Ltd 8,670,703 2.15 1,136,140 Chengdu Hongqi Chain Co Ltd 1,083,693 0.27 839,200 Chengdu Xingrong Environment
Co Ltd 544,595 0.13 1,339,266 China CITIC Bank Corp Ltd 1,047,054 0.26 97,700 China Coal Energy Co Ltd 65,862 0.02 619,803 China Construction Bank Corp 598,126 0.15 24,223,558 China Everbright Bank Co Ltd 12,738,433 3.16 375,347 China International Travel Service
Corp Ltd 5,012,283 1.24 1,138,965 China Merchants Bank Co Ltd 5,460,613 1.36 895,299 China Merchants Securities Co Ltd 2,000,945 0.50 233,880 China Minsheng Banking Corp Ltd 190,046 0.05 234,751 China National Accord Medicines
Corp Ltd 1,561,491 0.39 1,642,932 China National Chemical
Engineering Co Ltd 1,270,676 0.32 322,100 China Oilfield Services Ltd 543,286 0.13 860,389 China Pacific Insurance Group
Co Ltd 4,548,591 1.13 4,169,011 China Railway Tielong Container
Logistics Co Ltd 3,469,287 0.86 1,889,842 China Resources Double Crane
Pharmaceutical Co Ltd 3,531,199 0.88 389,189 China Resources Sanjiu Medical &
Pharmaceutical Co Ltd 1,607,364 0.40 178,901 China Shenhua Energy Co Ltd 467,641 0.12 9,747,302 China State Construction
Engineering Corp Ltd 7,456,963 1.85 4,485,979 China Union Holdings Ltd 2,804,497 0.70
339,891 China United Network Communications Ltd 278,090 0.07
55,300 China Vanke Co Ltd 199,542 0.05 2,158,709 Chinese Universe Publishing and
Media Group Co Ltd 3,786,011 0.94 1,292,900 Chongqing Dima Industry Co Ltd 643,732 0.16 1,389,827 CMST Development Co Ltd 1,034,100 0.26 4,781,933 Daqin Railway Co Ltd 5,176,482 1.29 2,717,902 DHC Software Co Ltd 2,603,842 0.65 7,700 Digital China Information Service
Co Ltd 11,254 0.00 2,625,002 Everbright Jiabao Co Ltd 1,479,534 0.37 152,300 Fangda Special Steel Technology
Co Ltd 176,581 0.04 3,100 Fiberhome Telecommunication
Technologies Co Ltd 11,667 0.00 5,800 Financial Street Holdings Co Ltd 5,946 0.00 97,900 First Capital Securities Co Ltd 86,261 0.02 1,100 Foshan Gas Group Co Ltd 2,169 0.00 419,511 Foshan Haitian Flavouring & Food
Co Ltd 6,727,960 1.67 129,200 Founder Securities Co Ltd 119,803 0.03 312,200 Foxconn Industrial Internet Co Ltd 620,465 0.15 258,803 Fujian Star-net Communication
Co Ltd 925,891 0.23 807,899 Gansu Qilianshan Cement Group
Co Ltd 993,199 0.25 61,011 G-bits Network Technology Xiamen
Co Ltd 2,286,570 0.57 386,582 Gemdale Corp 607,172 0.15 388,787 Glodon Co Ltd 1,962,950 0.49 279,200 GoerTek Inc 513,880 0.13 717,908 Gree Electric Appliances Inc of
Zhuhai 5,572,525 1.38 5,372,279 Greenland Holdings Corp Ltd 4,981,525 1.24 385,600 GRG Banking Equipment Co Ltd 367,261 0.09 1,000 Guangdong Golden Dragon
Development Inc 1,649 0.00 6,200 Guangdong Xinbao Electrical
Appliances Holdings Co Ltd 10,059 0.00 142,940 Guangxi Liuzhou Pharmaceutical
Co Ltd 748,679 0.19 163,400 Guangzhou Haige Communications
Group Inc Co 226,701 0.06 622,625 Guangzhou Shiyuan Electronic
Technology Co Ltd 7,459,845 1.85 1,204,853 Guosen Securities Co Ltd 2,177,142 0.54 1,732,541 Guotai Junan Securities Co Ltd 4,141,101 1.03 744,201 Haier Smart Home Co Ltd 1,655,963 0.41 420,400 Hangzhou Hikvision Digital
Technology Co Ltd 1,817,994 0.45 43,550 Hangzhou Tigermed Consulting
Co Ltd 371,542 0.09 23,100 Harbin Boshi Automation Co Ltd 28,883 0.01 283,900 Henan Pinggao Electric Co Ltd 278,736 0.07 6,831,691 Hesteel Co Ltd 2,446,011 0.61 217,310 Hexing Electrical Co Ltd 478,382 0.12 700 HLA Corp Ltd 824 0.00 63,100 Huaan Securities Co Ltd 56,481 0.01 508,966 Hualan Biological Engineering Inc 2,320,580 0.58 169,389 Huaneng Lancang River
Hydropower Inc 108,029 0.03 232,652 Huaxi Securities Co Ltd 318,877 0.08 80,189 Huaxin Cement Co Ltd 208,377 0.05 134,280 Hubei Kaile Science &
Technology Co Ltd 223,485 0.06 203,241 Hundsun Technologies Inc 2,111,983 0.52 5,113,733 Industrial Bank Co Ltd 12,280,006 3.05 4,050,929 Industrial Securities Co Ltd 3,439,011 0.85
China A-Share Opportunities Fund
Portfolio of Investments 31 August 2019
China A-Share Opportunities Fund
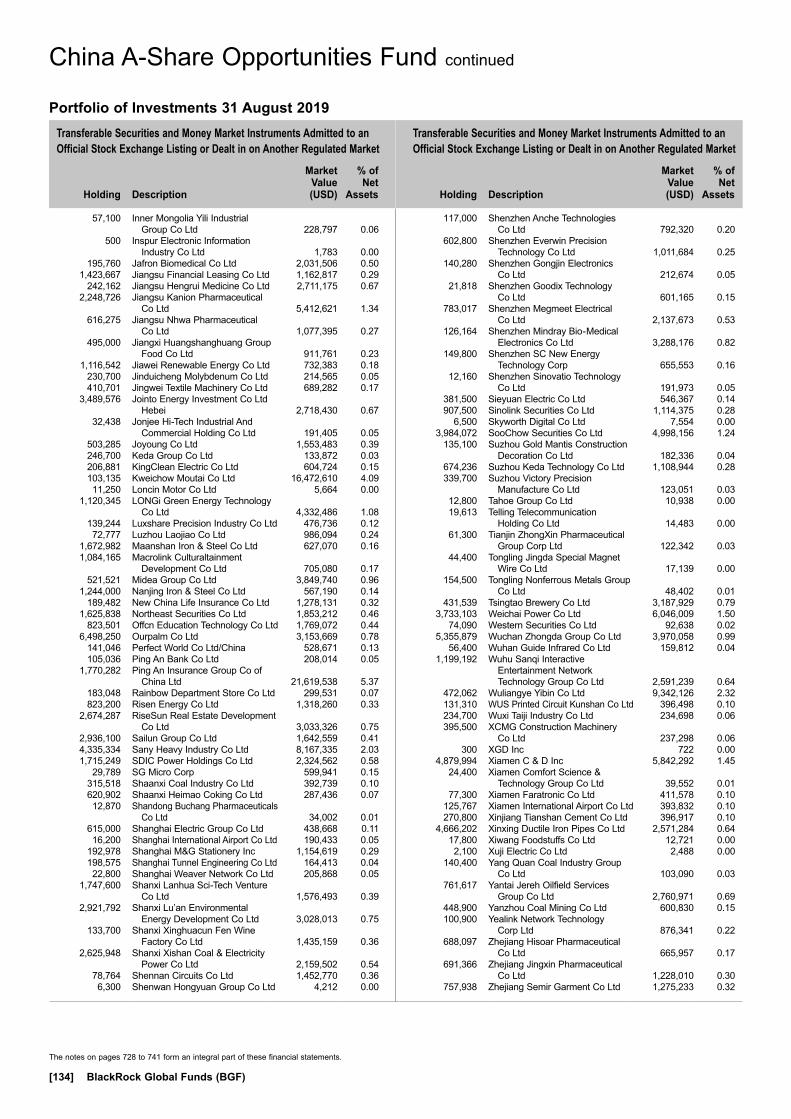
Transferable Securities and Money Market Instruments Admitted to an Official Stock Exchange Listing or Dealt in on Another Regulated Market
Transferable Securities and Money Market Instruments Admitted to an Official Stock Exchange Listing or Dealt in on Another Regulated Market
Holding
Description
Market Value (USD)
% of Net
Assets
Holding
Description
Market Value (USD)
% of Net
Assets
The notes on pages 728 to 741 form an integral part of these financial statements.
[134] BlackRock Global Funds (BGF)
57,100 Inner Mongolia Yili Industrial Group Co Ltd 228,797 0.06
500 Inspur Electronic Information Industry Co Ltd 1,783 0.00
195,760 Jafron Biomedical Co Ltd 2,031,506 0.50 1,423,667 Jiangsu Financial Leasing Co Ltd 1,162,817 0.29 242,162 Jiangsu Hengrui Medicine Co Ltd 2,711,175 0.67 2,248,726 Jiangsu Kanion Pharmaceutical
Co Ltd 5,412,621 1.34 616,275 Jiangsu Nhwa Pharmaceutical
Co Ltd 1,077,395 0.27 495,000 Jiangxi Huangshanghuang Group
Food Co Ltd 911,761 0.23 1,116,542 Jiawei Renewable Energy Co Ltd 732,383 0.18 230,700 Jinduicheng Molybdenum Co Ltd 214,565 0.05 410,701 Jingwei Textile Machinery Co Ltd 689,282 0.17 3,489,576 Jointo Energy Investment Co Ltd
Hebei 2,718,430 0.67 32,438 Jonjee Hi-Tech Industrial And
Commercial Holding Co Ltd 191,405 0.05 503,285 Joyoung Co Ltd 1,553,483 0.39 246,700 Keda Group Co Ltd 133,872 0.03 206,881 KingClean Electric Co Ltd 604,724 0.15 103,135 Kweichow Moutai Co Ltd 16,472,610 4.09 11,250 Loncin Motor Co Ltd 5,664 0.00 1,120,345 LONGi Green Energy Technology
Co Ltd 4,332,486 1.08 139,244 Luxshare Precision Industry Co Ltd 476,736 0.12 72,777 Luzhou Laojiao Co Ltd 986,094 0.24 1,672,982 Maanshan Iron & Steel Co Ltd 627,070 0.16 1,084,165 Macrolink Culturaltainment
Development Co Ltd 705,080 0.17 521,521 Midea Group Co Ltd 3,849,740 0.96 1,244,000 Nanjing Iron & Steel Co Ltd 567,190 0.14 189,482 New China Life Insurance Co Ltd 1,278,131 0.32 1,625,838 Northeast Securities Co Ltd 1,853,212 0.46 823,501 Offcn Education Technology Co Ltd 1,769,072 0.44 6,498,250 Ourpalm Co Ltd 3,153,669 0.78 141,046 Perfect World Co Ltd/China 528,671 0.13 105,036 Ping An Bank Co Ltd 208,014 0.05 1,770,282 Ping An Insurance Group Co of
China Ltd 21,619,538 5.37 183,048 Rainbow Department Store Co Ltd 299,531 0.07 823,200 Risen Energy Co Ltd 1,318,260 0.33 2,674,287 RiseSun Real Estate Development
Co Ltd 3,033,326 0.75 2,936,100 Sailun Group Co Ltd 1,642,559 0.41 4,335,334 Sany Heavy Industry Co Ltd 8,167,335 2.03 1,715,249 SDIC Power Holdings Co Ltd 2,324,562 0.58 29,789 SG Micro Corp 599,941 0.15 315,518 Shaanxi Coal Industry Co Ltd 392,739 0.10 620,902 Shaanxi Heimao Coking Co Ltd 287,436 0.07 12,870 Shandong Buchang Pharmaceuticals
Co Ltd 34,002 0.01 615,000 Shanghai Electric Group Co Ltd 438,668 0.11 16,200 Shanghai International Airport Co Ltd 190,433 0.05 192,978 Shanghai M&G Stationery Inc 1,154,619 0.29 198,575 Shanghai Tunnel Engineering Co Ltd 164,413 0.04 22,800 Shanghai Weaver Network Co Ltd 205,868 0.05 1,747,600 Shanxi Lanhua Sci-Tech Venture
Co Ltd 1,576,493 0.39 2,921,792 Shanxi Lu’an Environmental
Energy Development Co Ltd 3,028,013 0.75 133,700 Shanxi Xinghuacun Fen Wine
Factory Co Ltd 1,435,159 0.36 2,625,948 Shanxi Xishan Coal & Electricity
Power Co Ltd 2,159,502 0.54 78,764 Shennan Circuits Co Ltd 1,452,770 0.36 6,300 Shenwan Hongyuan Group Co Ltd 4,212 0.00
117,000 Shenzhen Anche Technologies Co Ltd 792,320 0.20
602,800 Shenzhen Everwin Precision Technology Co Ltd 1,011,684 0.25
140,280 Shenzhen Gongjin Electronics Co Ltd 212,674 0.05
21,818 Shenzhen Goodix Technology Co Ltd 601,165 0.15
783,017 Shenzhen Megmeet Electrical Co Ltd 2,137,673 0.53
126,164 Shenzhen Mindray Bio-Medical Electronics Co Ltd 3,288,176 0.82
149,800 Shenzhen SC New Energy Technology Corp 655,553 0.16
12,160 Shenzhen Sinovatio Technology Co Ltd 191,973 0.05
381,500 Sieyuan Electric Co Ltd 546,367 0.14 907,500 Sinolink Securities Co Ltd 1,114,375 0.28 6,500 Skyworth Digital Co Ltd 7,554 0.00 3,984,072 SooChow Securities Co Ltd 4,998,156 1.24 135,100 Suzhou Gold Mantis Construction
Decoration Co Ltd 182,336 0.04 674,236 Suzhou Keda Technology Co Ltd 1,108,944 0.28 339,700 Suzhou Victory Precision
Manufacture Co Ltd 123,051 0.03 12,800 Tahoe Group Co Ltd 10,938 0.00 19,613 Telling Telecommunication
Holding Co Ltd 14,483 0.00 61,300 Tianjin ZhongXin Pharmaceutical
Group Corp Ltd 122,342 0.03 44,400 Tongling Jingda Special Magnet
Wire Co Ltd 17,139 0.00 154,500 Tongling Nonferrous Metals Group
Co Ltd 48,402 0.01 431,539 Tsingtao Brewery Co Ltd 3,187,929 0.79 3,733,103 Weichai Power Co Ltd 6,046,009 1.50 74,090 Western Securities Co Ltd 92,638 0.02 5,355,879 Wuchan Zhongda Group Co Ltd 3,970,058 0.99 56,400 Wuhan Guide Infrared Co Ltd 159,812 0.04 1,199,192 Wuhu Sanqi Interactive
Entertainment Network Technology Group Co Ltd 2,591,239 0.64
472,062 Wuliangye Yibin Co Ltd 9,342,126 2.32 131,310 WUS Printed Circuit Kunshan Co Ltd 396,498 0.10 234,700 Wuxi Taiji Industry Co Ltd 234,698 0.06 395,500 XCMG Construction Machinery
Co Ltd 237,298 0.06 300 XGD Inc 722 0.00 4,879,994 Xiamen C & D Inc 5,842,292 1.45 24,400 Xiamen Comfort Science &
Technology Group Co Ltd 39,552 0.01 77,300 Xiamen Faratronic Co Ltd 411,578 0.10 125,767 Xiamen International Airport Co Ltd 393,832 0.10 270,800 Xinjiang Tianshan Cement Co Ltd 396,917 0.10 4,666,202 Xinxing Ductile Iron Pipes Co Ltd 2,571,284 0.64 17,800 Xiwang Foodstuffs Co Ltd 12,721 0.00 2,100 Xuji Electric Co Ltd 2,488 0.00 140,400 Yang Quan Coal Industry Group
Co Ltd 103,090 0.03 761,617 Yantai Jereh Oilfield Services
Group Co Ltd 2,760,971 0.69 448,900 Yanzhou Coal Mining Co Ltd 600,830 0.15 100,900 Yealink Network Technology
Corp Ltd 876,341 0.22 688,097 Zhejiang Hisoar Pharmaceutical
Co Ltd 665,957 0.17 691,366 Zhejiang Jingxin Pharmaceutical
Co Ltd 1,228,010 0.30 757,938 Zhejiang Semir Garment Co Ltd 1,275,233 0.32
China A-Share Opportunities Fund continued
Portfolio of Investments 31 August 2019
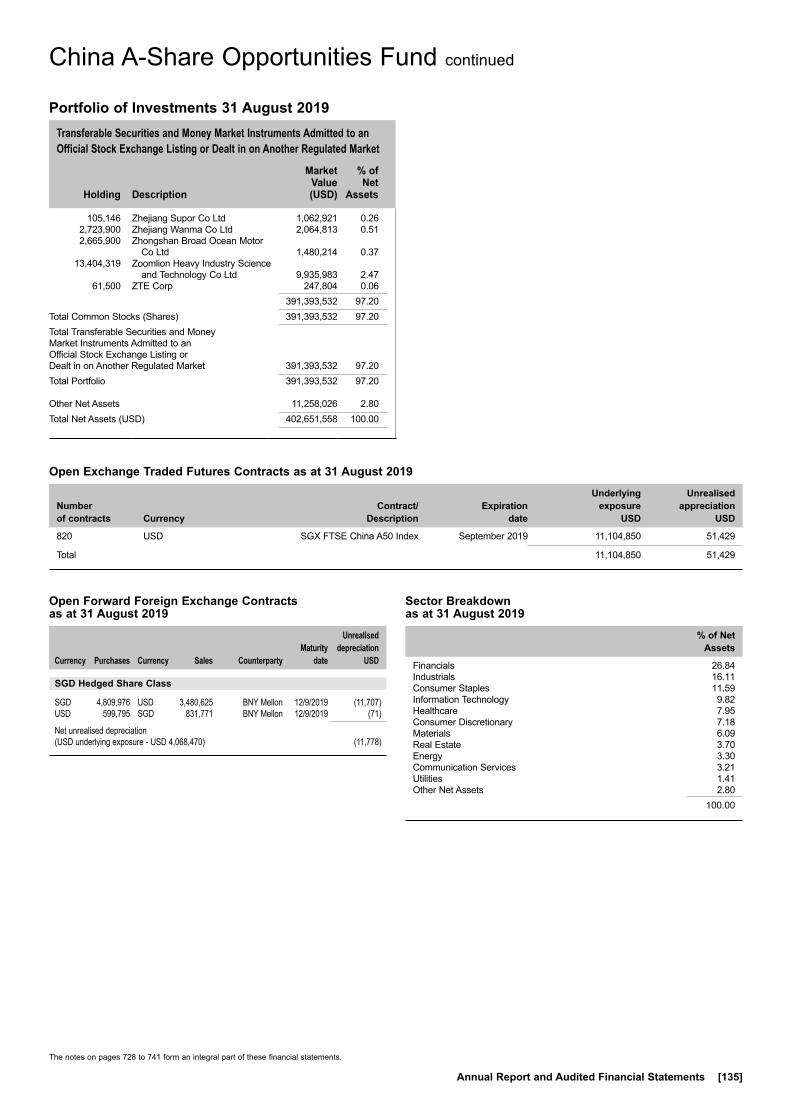
Transferable Securities and Money Market Instruments Admitted to an Official Stock Exchange Listing or Dealt in on Another Regulated Market
Holding
Description
Market Value (USD)
% of Net
Assets
Portfolio of Investments 31 August 2019
The notes on pages 728 to 741 form an integral part of these financial statements.
Annual Report and Audited Financial Statements [135]
China A-Share Opportunities Fund continued
105,146 Zhejiang Supor Co Ltd 1,062,921 0.26 2,723,900 Zhejiang Wanma Co Ltd 2,064,813 0.51 2,665,900 Zhongshan Broad Ocean Motor
Co Ltd 1,480,214 0.37 13,404,319 Zoomlion Heavy Industry Science
and Technology Co Ltd 9,935,983 2.47 61,500 ZTE Corp 247,804 0.06 391,393,532 97.20Total Common Stocks (Shares) 391,393,532 97.20Total Transferable Securities and Money Market Instruments Admitted to an Official Stock Exchange Listing or Dealt in on Another Regulated Market 391,393,532 97.20Total Portfolio 391,393,532 97.20
Other Net Assets 11,258,026 2.80Total Net Assets (USD) 402,651,558 100.00
Sector Breakdown as at 31 August 2019
% of Net Assets
Financials 26.84Industrials 16.11Consumer Staples 11.59Information Technology 9.82Healthcare 7.95Consumer Discretionary 7.18Materials 6.09Real Estate 3.70Energy 3.30Communication Services 3.21Utilities 1.41Other Net Assets 2.80
100.00
Open Forward Foreign Exchange Contracts as at 31 August 2019
Currency
Purchases Currency
Sales Counterparty
Maturity date
Unrealised depreciation
USD
SGD Hedged Share Class
SGD 4,809,976 USD 3,480,625 BNY Mellon 12/9/2019 (11,707)USD 599,795 SGD 831,771 BNY Mellon 12/9/2019 (71)
Net unrealised depreciation (USD underlying exposure - USD 4,068,470) (11,778)
Open Exchange Traded Futures Contracts as at 31 August 2019
Number of contracts Currency
Contract/ Description
Expiration date
Underlying exposure
USD
Unrealised appreciation
USD
820 USD SGX FTSE China A50 Index September 2019 11,104,850 51,429
Total 11,104,850 51,429
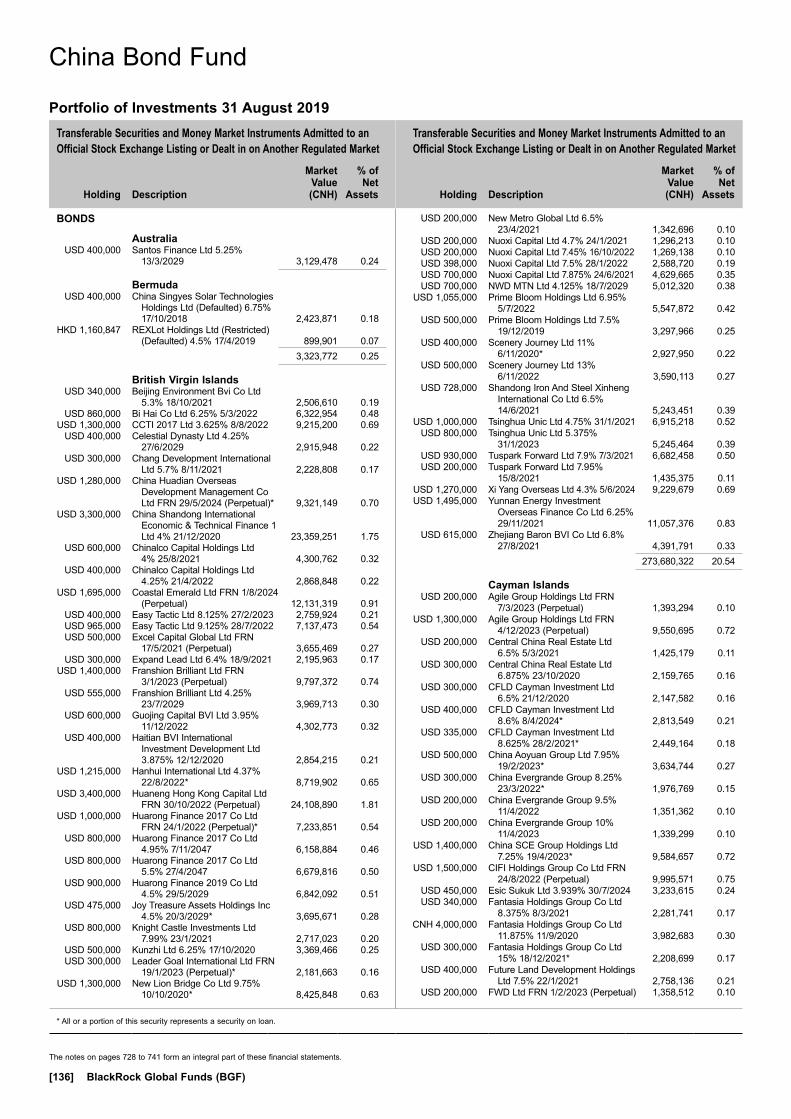
Transferable Securities and Money Market Instruments Admitted to an Official Stock Exchange Listing or Dealt in on Another Regulated Market
Transferable Securities and Money Market Instruments Admitted to an Official Stock Exchange Listing or Dealt in on Another Regulated Market
Holding
Description
Market Value (CNH)
% of Net
Assets
Holding
Description
Market Value (CNH)
% of Net
Assets
* All or a portion of this security represents a security on loan.
The notes on pages 728 to 741 form an integral part of these financial statements.
[136] BlackRock Global Funds (BGF)
BONDS
Australia USD 400,000 Santos Finance Ltd 5.25%
13/3/2029 3,129,478 0.24
Bermuda USD 400,000 China Singyes Solar Technologies
Holdings Ltd (Defaulted) 6.75% 17/10/2018 2,423,871 0.18
HKD 1,160,847 REXLot Holdings Ltd (Restricted) (Defaulted) 4.5% 17/4/2019 899,901 0.07
3,323,772 0.25
British Virgin Islands USD 340,000 Beijing Environment Bvi Co Ltd
5.3% 18/10/2021 2,506,610 0.19 USD 860,000 Bi Hai Co Ltd 6.25% 5/3/2022 6,322,954 0.48 USD 1,300,000 CCTI 2017 Ltd 3.625% 8/8/2022 9,215,200 0.69 USD 400,000 Celestial Dynasty Ltd 4.25%
27/6/2029 2,915,948 0.22 USD 300,000 Chang Development International
Ltd 5.7% 8/11/2021 2,228,808 0.17 USD 1,280,000 China Huadian Overseas
Development Management Co Ltd FRN 29/5/2024 (Perpetual)* 9,321,149 0.70
USD 3,300,000 China Shandong International Economic & Technical Finance 1 Ltd 4% 21/12/2020 23,359,251 1.75
USD 600,000 Chinalco Capital Holdings Ltd 4% 25/8/2021 4,300,762 0.32
USD 400,000 Chinalco Capital Holdings Ltd 4.25% 21/4/2022 2,868,848 0.22
USD 1,695,000 Coastal Emerald Ltd FRN 1/8/2024 (Perpetual) 12,131,319 0.91
USD 400,000 Easy Tactic Ltd 8.125% 27/2/2023 2,759,924 0.21 USD 965,000 Easy Tactic Ltd 9.125% 28/7/2022 7,137,473 0.54 USD 500,000 Excel Capital Global Ltd FRN
17/5/2021 (Perpetual) 3,655,469 0.27 USD 300,000 Expand Lead Ltd 6.4% 18/9/2021 2,195,963 0.17 USD 1,400,000 Franshion Brilliant Ltd FRN
3/1/2023 (Perpetual) 9,797,372 0.74 USD 555,000 Franshion Brilliant Ltd 4.25%
23/7/2029 3,969,713 0.30 USD 600,000 Guojing Capital BVI Ltd 3.95%
11/12/2022 4,302,773 0.32 USD 400,000 Haitian BVI International
Investment Development Ltd 3.875% 12/12/2020 2,854,215 0.21
USD 1,215,000 Hanhui International Ltd 4.37% 22/8/2022* 8,719,902 0.65
USD 3,400,000 Huaneng Hong Kong Capital Ltd FRN 30/10/2022 (Perpetual) 24,108,890 1.81
USD 1,000,000 Huarong Finance 2017 Co Ltd FRN 24/1/2022 (Perpetual)* 7,233,851 0.54
USD 800,000 Huarong Finance 2017 Co Ltd 4.95% 7/11/2047 6,158,884 0.46
USD 800,000 Huarong Finance 2017 Co Ltd 5.5% 27/4/2047 6,679,816 0.50
USD 900,000 Huarong Finance 2019 Co Ltd 4.5% 29/5/2029 6,842,092 0.51
USD 475,000 Joy Treasure Assets Holdings Inc 4.5% 20/3/2029* 3,695,671 0.28
USD 800,000 Knight Castle Investments Ltd 7.99% 23/1/2021 2,717,023 0.20
USD 500,000 Kunzhi Ltd 6.25% 17/10/2020 3,369,466 0.25 USD 300,000 Leader Goal International Ltd FRN
19/1/2023 (Perpetual)* 2,181,663 0.16 USD 1,300,000 New Lion Bridge Co Ltd 9.75%
10/10/2020* 8,425,848 0.63
USD 200,000 New Metro Global Ltd 6.5% 23/4/2021 1,342,696 0.10
USD 200,000 Nuoxi Capital Ltd 4.7% 24/1/2021 1,296,213 0.10 USD 200,000 Nuoxi Capital Ltd 7.45% 16/10/2022 1,269,138 0.10 USD 398,000 Nuoxi Capital Ltd 7.5% 28/1/2022 2,588,720 0.19 USD 700,000 Nuoxi Capital Ltd 7.875% 24/6/2021 4,629,665 0.35 USD 700,000 NWD MTN Ltd 4.125% 18/7/2029 5,012,320 0.38 USD 1,055,000 Prime Bloom Holdings Ltd 6.95%
5/7/2022 5,547,872 0.42 USD 500,000 Prime Bloom Holdings Ltd 7.5%
19/12/2019 3,297,966 0.25 USD 400,000 Scenery Journey Ltd 11%
6/11/2020* 2,927,950 0.22 USD 500,000 Scenery Journey Ltd 13%
6/11/2022 3,590,113 0.27 USD 728,000 Shandong Iron And Steel Xinheng
International Co Ltd 6.5% 14/6/2021 5,243,451 0.39
USD 1,000,000 Tsinghua Unic Ltd 4.75% 31/1/2021 6,915,218 0.52 USD 800,000 Tsinghua Unic Ltd 5.375%
31/1/2023 5,245,464 0.39 USD 930,000 Tuspark Forward Ltd 7.9% 7/3/2021 6,682,458 0.50 USD 200,000 Tuspark Forward Ltd 7.95%
15/8/2021 1,435,375 0.11 USD 1,270,000 Xi Yang Overseas Ltd 4.3% 5/6/2024 9,229,679 0.69 USD 1,495,000 Yunnan Energy Investment
Overseas Finance Co Ltd 6.25% 29/11/2021 11,057,376 0.83
USD 615,000 Zhejiang Baron BVI Co Ltd 6.8% 27/8/2021 4,391,791 0.33
273,680,322 20.54
Cayman Islands USD 200,000 Agile Group Holdings Ltd FRN
7/3/2023 (Perpetual) 1,393,294 0.10 USD 1,300,000 Agile Group Holdings Ltd FRN
4/12/2023 (Perpetual) 9,550,695 0.72 USD 200,000 Central China Real Estate Ltd
6.5% 5/3/2021 1,425,179 0.11 USD 300,000 Central China Real Estate Ltd
6.875% 23/10/2020 2,159,765 0.16 USD 300,000 CFLD Cayman Investment Ltd
6.5% 21/12/2020 2,147,582 0.16 USD 400,000 CFLD Cayman Investment Ltd
8.6% 8/4/2024* 2,813,549 0.21 USD 335,000 CFLD Cayman Investment Ltd
8.625% 28/2/2021* 2,449,164 0.18 USD 500,000 China Aoyuan Group Ltd 7.95%
19/2/2023* 3,634,744 0.27 USD 300,000 China Evergrande Group 8.25%
23/3/2022* 1,976,769 0.15 USD 200,000 China Evergrande Group 9.5%
11/4/2022 1,351,362 0.10 USD 200,000 China Evergrande Group 10%
11/4/2023 1,339,299 0.10 USD 1,400,000 China SCE Group Holdings Ltd
7.25% 19/4/2023* 9,584,657 0.72 USD 1,500,000 CIFI Holdings Group Co Ltd FRN
24/8/2022 (Perpetual) 9,995,571 0.75 USD 450,000 Esic Sukuk Ltd 3.939% 30/7/2024 3,233,615 0.24 USD 340,000 Fantasia Holdings Group Co Ltd
8.375% 8/3/2021 2,281,741 0.17 CNH 4,000,000 Fantasia Holdings Group Co Ltd
11.875% 11/9/2020 3,982,683 0.30 USD 300,000 Fantasia Holdings Group Co Ltd
15% 18/12/2021* 2,208,699 0.17 USD 400,000 Future Land Development Holdings
Ltd 7.5% 22/1/2021 2,758,136 0.21 USD 200,000 FWD Ltd FRN 1/2/2023 (Perpetual) 1,358,512 0.10
China Bond Fund
Portfolio of Investments 31 August 2019
China Bond Fund

Transferable Securities and Money Market Instruments Admitted to an Official Stock Exchange Listing or Dealt in on Another Regulated Market
Transferable Securities and Money Market Instruments Admitted to an Official Stock Exchange Listing or Dealt in on Another Regulated Market
Holding
Description
Market Value (CNH)
% of Net
Assets
Holding
Description
Market Value (CNH)
% of Net
Assets
* All or a portion of this security represents a security on loan.
The notes on pages 728 to 741 form an integral part of these financial statements.
Annual Report and Audited Financial Statements [137]
USD 615,000 Golden Wheel Tiandi Holdings Co Ltd 7% 18/1/2021 4,067,411 0.30
USD 200,000 Hilong Holding Ltd 7.25% 22/6/2020 1,420,404 0.11 USD 215,000 Honghua Group Ltd 6.375%
1/8/2022 1,541,811 0.12 USD 400,000 Jingrui Holdings Ltd 9.45% 23/4/2021 2,665,632 0.20 USD 300,000 Jingrui Holdings Ltd 13% 31/7/2020* 2,134,964 0.16 USD 300,000 Kaisa Group Holdings Ltd 8.5%
30/6/2022 1,926,280 0.14 USD 400,000 Kaisa Group Holdings Ltd 9.375%
30/6/2024* 2,414,039 0.18 USD 800,000 Kaisa Group Holdings Ltd 11.5%
30/1/2023 5,391,146 0.40 USD 800,000 KWG Group Holdings Ltd 5.875%
10/11/2024 4,954,099 0.37 USD 600,000 Longfor Group Holdings Ltd 4.5%
16/1/2028 4,469,682 0.34 USD 800,000 Modern Land China Co Ltd
12.85% 25/10/2021 5,405,446 0.41 USD 1,200,000 Overseas Chinese Town Asia
Holdings Ltd FRN 10/10/2020 (Perpetual) 8,605,546 0.65
USD 1,100,000 Pearl Holding III Ltd 9.5% 11/12/2022 6,252,729 0.47 USD 200,000 Powerlong Real Estate Holdings
Ltd 5.95% 19/7/2020 1,425,393 0.11 USD 200,000 Powerlong Real Estate Holdings
Ltd 6.95% 17/4/2021 1,417,088 0.11 USD 625,000 Redco Properties Group Ltd 13.5%
21/1/2020 4,541,406 0.34 USD 700,000 Redsun Properties Group Ltd
9.95% 11/4/2022 4,685,972 0.35 USD 215,000 Redsun Properties Group Ltd
10.5% 3/10/2022 1,421,968 0.11 USD 355,000 Ronshine China Holdings Ltd
8.75% 25/10/2022 2,548,315 0.19 USD 555,000 Ronshine China Holdings Ltd
8.95% 22/1/2023 3,928,384 0.29 USD 200,000 Ronshine China Holdings Ltd
11.25% 22/8/2021 1,519,999 0.11 USD 300,000 Ronshine China Holdings Ltd
11.5% 3/7/2020 2,228,138 0.17 USD 200,000 Shimao Property Holdings Ltd
5.6% 15/7/2026 1,439,809 0.11 USD 430,000 Sunac China Holdings Ltd 7.25%
14/6/2022 2,987,114 0.22 USD 300,000 Sunac China Holdings Ltd 7.95%
8/8/2022* 2,114,519 0.16 USD 1,700,000 Sunrise Cayman Ltd 5.25%
11/3/2024 12,485,934 0.94 USD 200,000 Xinyuan Real Estate Co Ltd
9.875% 19/3/2020 1,399,267 0.10 USD 200,000 Xinyuan Real Estate Co Ltd
14.2% 15/10/2021 1,386,664 0.10 USD 200,000 Yuzhou Properties Co Ltd 6%
25/10/2023 1,280,531 0.10 USD 400,000 Yuzhou Properties Co Ltd 7.9%
11/5/2021 2,917,225 0.22 USD 500,000 Yuzhou Properties Co Ltd 8.5%
26/2/2024* 3,467,780 0.26 USD 400,000 Zhenro Properties Group Ltd
8.65% 21/1/2023* 2,788,524 0.21 USD 200,000 Zhenro Properties Group Ltd
9.15% 8/3/2022 1,438,950 0.11 USD 430,000 Zhenro Properties Group Ltd
9.8% 20/8/2021 3,184,223 0.24 USD 200,000 Zhenro Properties Group Ltd
12.5% 2/1/2021 1,517,154 0.11 179,018,562 13.43
China CNY 10,000,000 Agricultural Development Bank of
China 3.75% 25/1/2029 10,083,270 0.76 CNY 1,000,000 Anhui Nanxiang Trading Group Co
Ltd 6.9% 19/12/2021 999,985 0.07 CNY 5,000,000 Aoyuan Corp Group Ltd 8%
24/7/2021 4,982,195 0.37 CNY 2,500,000 Beijing Etrol Tech Co Ltd 4.3%
24/10/2021 2,486,825 0.19 CNY 10,000,000 Beijing Grain Group Co Ltd
3.69% 11/8/2167 9,832,325 0.74 CNY 3,000,000 Car Inc 5.5% 26/4/2022 2,964,195 0.22 CNY 5,000,000 Car Inc 6.3% 25/4/2021 4,964,050 0.37 USD 800,000 Chengdu Tianfu New Area
Investment Group Co Ltd 4.65% 7/5/2024 5,777,250 0.43
EUR 500,000 Chengdu Xingcheng Investment Group Co Ltd 2.5% 20/3/2021 3,907,147 0.29
CNY 3,000,000 China Baoan Group Co Ltd 5.6% 28/3/2021 2,959,740 0.22
CNY 3,000,000 China Government Bond 3.27% 22/8/2046 2,851,501 0.21
CNY 2,000,000 China Government Bond 3.27% 22/8/2046 1,871,290 0.14
CNY 2,389,000 China Government Bond 3.52% 25/4/2046 2,363,689 0.18
CNY 2,300,000 China Government Bond 3.7% 23/5/2066 2,269,647 0.17
CNY 80,000,000 China Government Bond 3.86% 22/7/2049 83,040,128 6.23
CNY 10,000,000 China Government Bond 4.08% 22/10/2048 10,711,126 0.80
CNY 1,795,000 China Grand Automative Services Group Co Ltd 7.2% 20/9/2021 1,782,534 0.13
CNY 5,000,000 China Grand Automotive Services Group Co Ltd 6.5% 26/11/2019 4,978,083 0.37
CNY 10,000,000 China Merchants Group Ltd 4.28% 26/7/2168 10,099,945 0.76
USD 400,000 China Minmetals Corp FRN 13/11/2022 (Perpetual) 2,866,728 0.21
CNY 10,000,000 China Nonferrous Metals Co Ltd 5.3% 16/10/2167 10,129,900 0.76
CNY 10,000,000 China Nuclear Engineering Corp Ltd 4.47% 15/1/2168 10,046,955 0.75
CNY 7,000,000 China Railway Construction Corp Ltd 1.5% 21/12/2021 6,877,520 0.52
CNY 1,999,000 China Wanda Group Co Ltd 5.2% 8/9/2021 1,941,403 0.15
USD 400,000 Chongqing International Logistics Hub Industry Zone Construction Co Ltd 3.25% 6/9/2021 2,782,268 0.21
CNY 10,000,000 Chongqing International Logistics Hub Industry Zone Construction Co Ltd 6.5% 10/9/2023 10,632,795 0.80
CNY 2,500,000 Chongqing Road & Bridge Co Ltd 5.84% 27/4/2020 2,415,210 0.18
CNY 1,880,000 Dalian Rongqiang Investment Co Ltd 6.5% 3/11/2021 1,885,462 0.14
CNY 3,500,000 Dian Diagnostics Co Ltd 3.25% 27/9/2021 3,472,193 0.26
CNY 2,500,000 Eternal Asia Supply Chain Management Ltd 7.5% 29/9/2019 2,495,013 0.19
CNY 6,400,000 Export-Import Bank of China/The 4.59% 1/8/2038 7,151,750 0.54
CNY 1,498,000 Fantasia Group China Co Ltd 7.95% 16/9/2020 1,498,085 0.11
USD 1,000,000 Gansu Province Electric Power Investment Group Co Ltd 6.25% 4/12/2021 7,382,438 0.55
China Bond Fund continued
Portfolio of Investments 31 August 2019

Transferable Securities and Money Market Instruments Admitted to an Official Stock Exchange Listing or Dealt in on Another Regulated Market
Transferable Securities and Money Market Instruments Admitted to an Official Stock Exchange Listing or Dealt in on Another Regulated Market
Holding
Description
Market Value (CNH)
% of Net
Assets
Holding
Description
Market Value (CNH)
% of Net
Assets
The notes on pages 728 to 741 form an integral part of these financial statements.
[138] BlackRock Global Funds (BGF)
CNY 9,000,000 GEM Co Ltd 4% 22/9/2021 8,998,335 0.68 CNY 2,000,000 GEM Co Ltd 6.65% 21/12/2020 2,020,240 0.15 CNY 4,000,000 Greattown Holdings Ltd 7.88%
4/11/2020 4,001,726 0.30 CNY 500,000 Guanghou Times Holding Group
Co Ltd 8.1% 10/12/2023 524,478 0.04 CNY 2,000,000 Guangxi Financial Investment
Group Co Ltd FRN 21/8/2023 1,964,332 0.15 USD 1,200,000 Guangxi Financial Investment
Group Co Ltd 5.75% 23/1/2021 8,258,146 0.62 CNY 3,414,000 Guangzhou Tianjian Real Estate
Development Co Ltd FRN 28/3/2026 3,282,121 0.25
CNY 4,000,000 Guiyang Industry Investment Group Co Ltd 6.5% 19/11/2019 3,976,227 0.30
CNY 1,400,000 Hainan Airlines Holding Co Ltd 6.2% 24/5/2021 1,242,213 0.09
CNY 10,000,000 HBIS Group Co Ltd 6.24% 8/9/2167 10,520,070 0.79 CNY 6,500,000 Hefei Huatai Group Co Ltd FRN
9/11/2021 6,426,712 0.48 CNY 10,000,000 Henan Energy & Chemical Industry
Group Co Ltd 7.2% 6/9/2021 10,221,750 0.77 CNY 3,000,000 Hengtong Optic-electric Co Ltd
6.2% 23/6/2020 2,924,038 0.22 CNY 10,000,000 Huachen Automotive Group
Holding Co Ltd 5.8% 20/3/2024 10,100,510 0.76 USD 200,000 Huachen Energy Co Ltd 6.625%
18/5/2020 822,400 0.06 CNY 10,000,000 Huadian Power International Corp
Ltd 4.6% 26/6/2168 10,130,370 0.76 CNY 3,999,100 Hubei Fuxing Science and
Technology Co Ltd 7.5% 19/1/2020 3,838,336 0.29 CNY 3,500,000 Hubei Hengxindelong Industrial Co
Ltd 6.5% 12/12/2021 3,506,968 0.26 CNY 3,000,000 Hubei Supply and Marketing
General Cooperative Asset Management Co 6.18% 10/10/2019 2,997,835 0.22
CNY 500,000 Hunan Friendship & Apollo Holdings Co Ltd 5.7% 24/8/2021 496,722 0.04
CNY 10,000,000 Huzhou Communications Investment Group Co Ltd 4.7% 25/3/2024 10,236,525 0.77
USD 1,315,000 Inner Mongolia High-Grade High Way Construction And Development Co Ltd 4.375% 4/12/2020 9,344,788 0.70
CNY 10,000,000 Inner Mongolia High-Grade High Way Construction And Development Co Ltd 6.3% 23/4/2167 10,065,085 0.76
CNY 10,000,000 Jiangsu Shagang Group Co Ltd 3.8% 20/10/2021 10,014,775 0.75
CNY 8,500,000 Jiangsu Zhongnan Construction Industry Group Co Ltd 6.48% 7/11/2021 8,435,425 0.63
CNY 3,000,000 Jiayuan Chuangsheng Holding Group Co Ltd 7.2% 18/10/2019 3,000,506 0.22
CNY 10,000,000 Jilin Expressway Group Co Ltd 6.19% 19/12/2022 10,633,700 0.80
USD 800,000 Jinke Properties Group Co Ltd 8.375% 20/6/2021 5,705,749 0.43
CNY 3,000,000 Jinling Construction Group Of Jiangsu Province 6.2% 15/12/2021 2,912,565 0.22
CNY 4,499,700 Jinshiqi Holding Co Ltd 5.7% 20/1/2022 4,488,383 0.34
CNY 100,000 Kingfa Sci & Tech Co Ltd 3.1% 21/10/2021 99,478 0.01
CNY 5,000,000 Kunming Irona and Steel Holdings Co Ltd 8% 14/11/2021 4,996,175 0.37
CNY 10,000,000 Legend Holdings Corp 5.5% 21/6/2024 10,106,100 0.76
CNY 10,000,000 Lianyungang Port Group Co Ltd 6.35% 28/2/2023 10,600,500 0.80
CNY 10,000,000 Liaoning Zhongwang Group Co Ltd FRN 26/9/2021 10,331,710 0.78
CNY 2,499,900 Macrolink Culturaltainment Development Co Ltd 7.5% 1/4/2022 2,393,879 0.18
CNY 10,000,000 Nanjing Southeast State-owned Asset Investment Group Co Ltd 5.1% 8/11/2167 10,080,455 0.76
CNY 10,000,000 Nanjing Yangzi State-owned Investment Group Co Ltd 4.47% 19/3/2024 10,266,955 0.77
CNY 4,000,000 Narada Power Source Co Ltd 5.98% 15/9/2020 3,982,940 0.30
CNY 1,238,000 Ningxia Baofeng Energy Group Co Ltd 7.2% 19/11/2019 1,239,840 0.09
CNY 6,600,000 Order Group Co Ltd 4.1% 18/11/2021 6,582,609 0.49 CNY 3,000,000 Poten Environment Group Co Ltd
FRN 12/10/2021 2,993,936 0.22 CNY 2,500,000 Realcan Pharmaceutical Group Co
Ltd 5.7% 18/10/2020 2,358,625 0.18 CNY 1,000,000 Realcan Pharmaceutical Group Co
Ltd 6.8% 19/4/2021 992,570 0.08 CNY 9,000,000 Seazen Holdings Co Ltd FRN
3/11/2020 8,275,209 0.62 CNY 2,500,000 Sh Power 7.5% 18/1/2021 2,514,763 0.19 CNY 10,000,000 Shaanxi Provincial Communication
Construction Group 6.5% 23/10/2167 10,433,430 0.78
CNY 5,500,000 Shandong Commercial Group Co Ltd 3.66% 8/4/2023 4,655,887 0.35
CNY 500,000 Shandong Provincial State-owned Enterprise Collecting Note 7.5% 25/4/2020 503,903 0.04
CNY 1,000,000 Shandong Ruyi Technology Group Co Ltd 7.9% 23/10/2020 997,466 0.07
CNY 101,000 Shandong Yuhuang Chemical Co Ltd 6% 21/11/2021 96,818 0.01
CNY 500,000 Shandong Yuhuang Chemical Co Ltd 7% 12/12/2021 475,280 0.04
CNY 5,835,000 Shanghai Changfeng Group Co Ltd 3.64% 14/10/2021 5,781,172 0.43
CNY 1,600,000 Shanghai Changfeng Group Co Ltd 5.95% 24/3/2022 1,568,000 0.12
CNY 6,000,000 Shanghai Kinghill Ltd 7.5% 27/3/2021 6,022,353 0.45 CNY 10,000,000 Shanxi Guoxin Energy Co Ltd
7.8% 12/10/2167 10,100,575 0.76 CNY 4,000,000 Shenzhen Cloud Popular Electronic
Co Ltd 7% 17/9/2019 4,000,460 0.30 CNY 2,500,000 Shenzhen Grandland Group Co
Ltd 7.2% 9/4/2020 2,509,857 0.19 CNY 2,500,000 Shenzhen Heungkong Holding Co
Ltd 8.48% 10/12/2019 2,464,055 0.18 CNY 10,000,000 Sichuan Energy Industry Investment
Group Co Ltd 4.74% 31/5/2024 10,258,160 0.77 CNY 2,000,000 Sichuan Hebang Biotechnology Co
Ltd FRN 22/4/2020 1,998,976 0.15 CNY 2,500,000 Sichuan Hebang Biotechnology Co
Ltd 6.4% 25/11/2019 2,503,234 0.19 CNY 1,700,000 Sichuan Languang Development
Co Ltd 5.5% 14/9/2021 1,700,153 0.13 CNY 10,000,000 State Power Investment Corp Ltd
4.47% 16/1/2168 10,184,600 0.76 CNY 5,000,000 Sunac Real Estate Group Co Ltd
4% 16/8/2023 4,830,340 0.36 USD 600,000 Sunshine Life Insurance Corp Ltd
4.5% 20/4/2026 4,109,233 0.31
China Bond Fund continued
Portfolio of Investments 31 August 2019
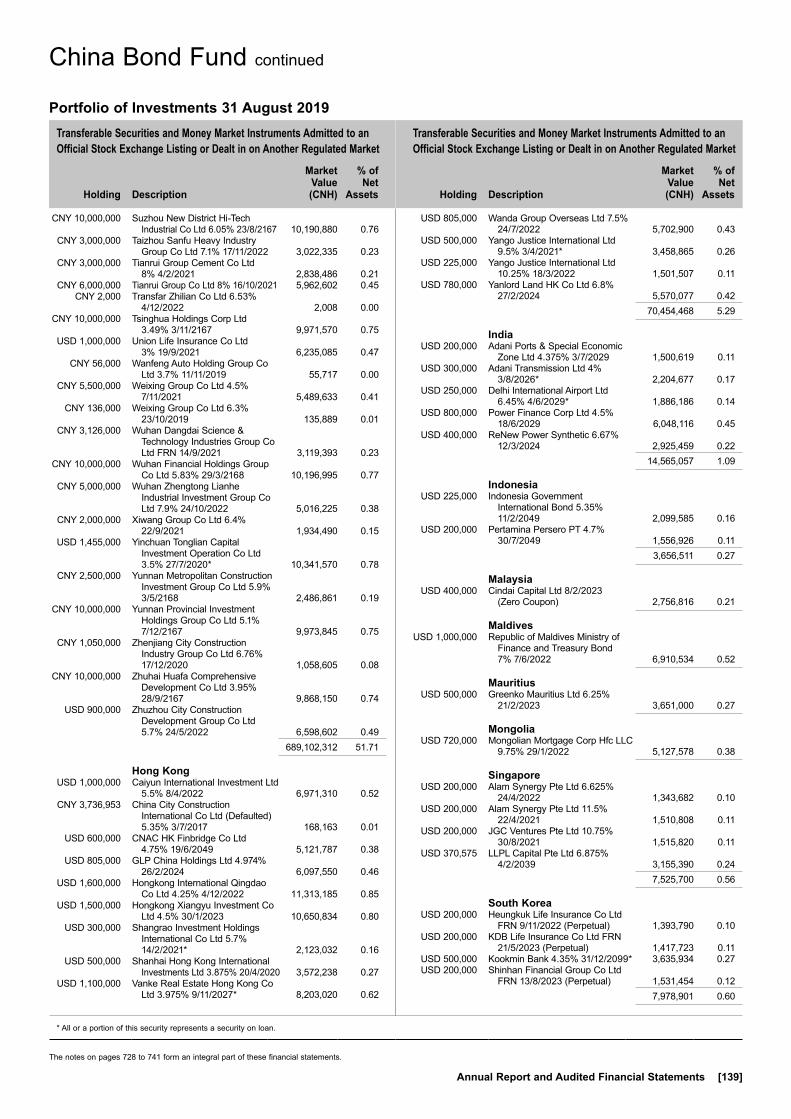
Transferable Securities and Money Market Instruments Admitted to an Official Stock Exchange Listing or Dealt in on Another Regulated Market
Transferable Securities and Money Market Instruments Admitted to an Official Stock Exchange Listing or Dealt in on Another Regulated Market
Holding
Description
Market Value (CNH)
% of Net
Assets
Holding
Description
Market Value (CNH)
% of Net
Assets
* All or a portion of this security represents a security on loan.
The notes on pages 728 to 741 form an integral part of these financial statements.
Annual Report and Audited Financial Statements [139]
CNY 10,000,000 Suzhou New District Hi-Tech Industrial Co Ltd 6.05% 23/8/2167 10,190,880 0.76
CNY 3,000,000 Taizhou Sanfu Heavy Industry Group Co Ltd 7.1% 17/11/2022 3,022,335 0.23
CNY 3,000,000 Tianrui Group Cement Co Ltd 8% 4/2/2021 2,838,486 0.21
CNY 6,000,000 Tianrui Group Co Ltd 8% 16/10/2021 5,962,602 0.45 CNY 2,000 Transfar Zhilian Co Ltd 6.53%
4/12/2022 2,008 0.00 CNY 10,000,000 Tsinghua Holdings Corp Ltd
3.49% 3/11/2167 9,971,570 0.75 USD 1,000,000 Union Life Insurance Co Ltd
3% 19/9/2021 6,235,085 0.47 CNY 56,000 Wanfeng Auto Holding Group Co
Ltd 3.7% 11/11/2019 55,717 0.00 CNY 5,500,000 Weixing Group Co Ltd 4.5%
7/11/2021 5,489,633 0.41 CNY 136,000 Weixing Group Co Ltd 6.3%
23/10/2019 135,889 0.01 CNY 3,126,000 Wuhan Dangdai Science &
Technology Industries Group Co Ltd FRN 14/9/2021 3,119,393 0.23
CNY 10,000,000 Wuhan Financial Holdings Group Co Ltd 5.83% 29/3/2168 10,196,995 0.77
CNY 5,000,000 Wuhan Zhengtong Lianhe Industrial Investment Group Co Ltd 7.9% 24/10/2022 5,016,225 0.38
CNY 2,000,000 Xiwang Group Co Ltd 6.4% 22/9/2021 1,934,490 0.15
USD 1,455,000 Yinchuan Tonglian Capital Investment Operation Co Ltd 3.5% 27/7/2020* 10,341,570 0.78
CNY 2,500,000 Yunnan Metropolitan Construction Investment Group Co Ltd 5.9% 3/5/2168 2,486,861 0.19
CNY 10,000,000 Yunnan Provincial Investment Holdings Group Co Ltd 5.1% 7/12/2167 9,973,845 0.75
CNY 1,050,000 Zhenjiang City Construction Industry Group Co Ltd 6.76% 17/12/2020 1,058,605 0.08
CNY 10,000,000 Zhuhai Huafa Comprehensive Development Co Ltd 3.95% 28/9/2167 9,868,150 0.74
USD 900,000 Zhuzhou City Construction Development Group Co Ltd 5.7% 24/5/2022 6,598,602 0.49
689,102,312 51.71
Hong Kong USD 1,000,000 Caiyun International Investment Ltd
5.5% 8/4/2022 6,971,310 0.52 CNY 3,736,953 China City Construction
International Co Ltd (Defaulted) 5.35% 3/7/2017 168,163 0.01
USD 600,000 CNAC HK Finbridge Co Ltd 4.75% 19/6/2049 5,121,787 0.38
USD 805,000 GLP China Holdings Ltd 4.974% 26/2/2024 6,097,550 0.46
USD 1,600,000 Hongkong International Qingdao Co Ltd 4.25% 4/12/2022 11,313,185 0.85
USD 1,500,000 Hongkong Xiangyu Investment Co Ltd 4.5% 30/1/2023 10,650,834 0.80
USD 300,000 Shangrao Investment Holdings International Co Ltd 5.7% 14/2/2021* 2,123,032 0.16
USD 500,000 Shanhai Hong Kong International Investments Ltd 3.875% 20/4/2020 3,572,238 0.27
USD 1,100,000 Vanke Real Estate Hong Kong Co Ltd 3.975% 9/11/2027* 8,203,020 0.62
USD 805,000 Wanda Group Overseas Ltd 7.5% 24/7/2022 5,702,900 0.43
USD 500,000 Yango Justice International Ltd 9.5% 3/4/2021* 3,458,865 0.26
USD 225,000 Yango Justice International Ltd 10.25% 18/3/2022 1,501,507 0.11
USD 780,000 Yanlord Land HK Co Ltd 6.8% 27/2/2024 5,570,077 0.42
70,454,468 5.29
India USD 200,000 Adani Ports & Special Economic
Zone Ltd 4.375% 3/7/2029 1,500,619 0.11 USD 300,000 Adani Transmission Ltd 4%
3/8/2026* 2,204,677 0.17 USD 250,000 Delhi International Airport Ltd
6.45% 4/6/2029* 1,886,186 0.14 USD 800,000 Power Finance Corp Ltd 4.5%
18/6/2029 6,048,116 0.45 USD 400,000 ReNew Power Synthetic 6.67%
12/3/2024 2,925,459 0.22 14,565,057 1.09
Indonesia USD 225,000 Indonesia Government
International Bond 5.35% 11/2/2049 2,099,585 0.16
USD 200,000 Pertamina Persero PT 4.7% 30/7/2049 1,556,926 0.11
3,656,511 0.27
Malaysia USD 400,000 Cindai Capital Ltd 8/2/2023
(Zero Coupon) 2,756,816 0.21
Maldives USD 1,000,000 Republic of Maldives Ministry of
Finance and Treasury Bond 7% 7/6/2022 6,910,534 0.52
Mauritius USD 500,000 Greenko Mauritius Ltd 6.25%
21/2/2023 3,651,000 0.27
Mongolia USD 720,000 Mongolian Mortgage Corp Hfc LLC
9.75% 29/1/2022 5,127,578 0.38
Singapore USD 200,000 Alam Synergy Pte Ltd 6.625%
24/4/2022 1,343,682 0.10 USD 200,000 Alam Synergy Pte Ltd 11.5%
22/4/2021 1,510,808 0.11 USD 200,000 JGC Ventures Pte Ltd 10.75%
30/8/2021 1,515,820 0.11 USD 370,575 LLPL Capital Pte Ltd 6.875%
4/2/2039 3,155,390 0.24 7,525,700 0.56
South Korea USD 200,000 Heungkuk Life Insurance Co Ltd
FRN 9/11/2022 (Perpetual) 1,393,790 0.10 USD 200,000 KDB Life Insurance Co Ltd FRN
21/5/2023 (Perpetual) 1,417,723 0.11 USD 500,000 Kookmin Bank 4.35% 31/12/2099* 3,635,934 0.27 USD 200,000 Shinhan Financial Group Co Ltd
FRN 13/8/2023 (Perpetual) 1,531,454 0.12 7,978,901 0.60
China Bond Fund continued
Portfolio of Investments 31 August 2019
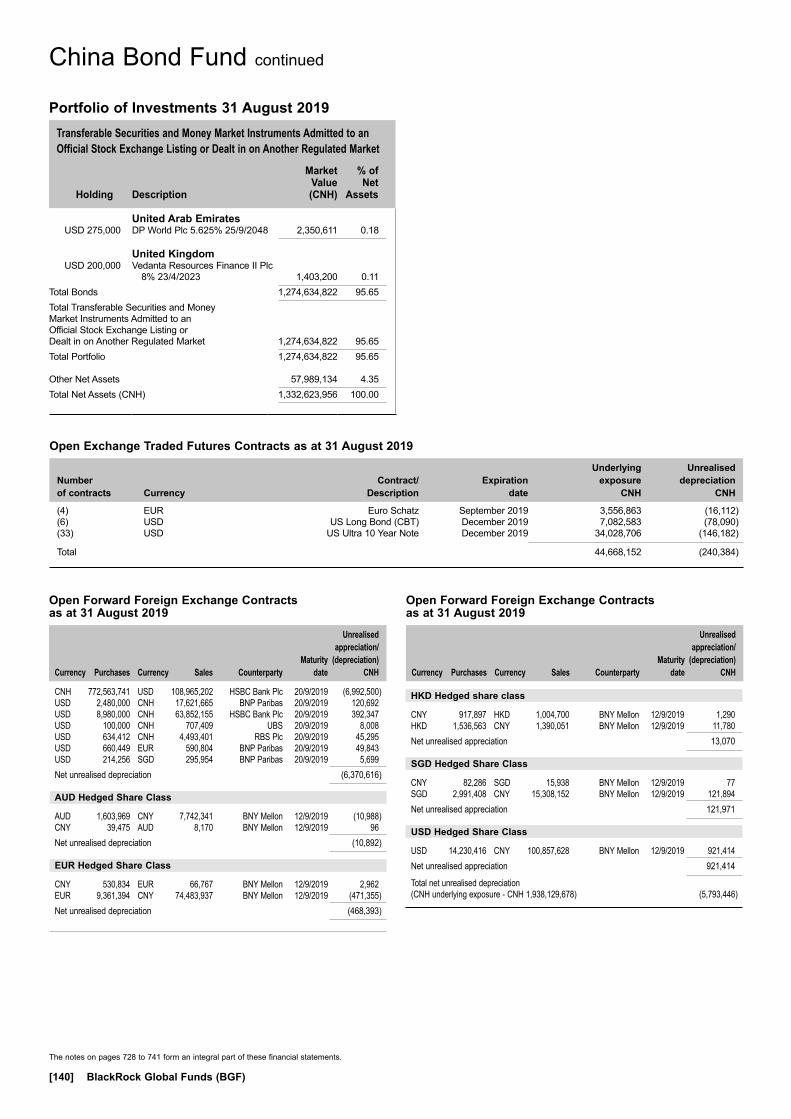
Transferable Securities and Money Market Instruments Admitted to an Official Stock Exchange Listing or Dealt in on Another Regulated Market
Holding
Description
Market Value (CNH)
% of Net
Assets
The notes on pages 728 to 741 form an integral part of these financial statements.
[140] BlackRock Global Funds (BGF)
Open Forward Foreign Exchange Contracts as at 31 August 2019
Currency
Purchases Currency
Sales Counterparty
Maturity date
Unrealised appreciation/
(depreciation) CNH
CNH 772,563,741 USD 108,965,202 HSBC Bank Plc 20/9/2019 (6,992,500)USD 2,480,000 CNH 17,621,665 BNP Paribas 20/9/2019 120,692USD 8,980,000 CNH 63,852,155 HSBC Bank Plc 20/9/2019 392,347USD 100,000 CNH 707,409 UBS 20/9/2019 8,008USD 634,412 CNH 4,493,401 RBS Plc 20/9/2019 45,295USD 660,449 EUR 590,804 BNP Paribas 20/9/2019 49,843USD 214,256 SGD 295,954 BNP Paribas 20/9/2019 5,699Net unrealised depreciation (6,370,616)
AUD Hedged Share Class
AUD 1,603,969 CNY 7,742,341 BNY Mellon 12/9/2019 (10,988)CNY 39,475 AUD 8,170 BNY Mellon 12/9/2019 96Net unrealised depreciation (10,892)
EUR Hedged Share Class
CNY 530,834 EUR 66,767 BNY Mellon 12/9/2019 2,962EUR 9,361,394 CNY 74,483,937 BNY Mellon 12/9/2019 (471,355)Net unrealised depreciation (468,393)
Open Exchange Traded Futures Contracts as at 31 August 2019
Number of contracts Currency
Contract/ Description
Expiration date
Underlying exposure
CNH
Unrealised depreciation
CNH
(4) EUR Euro Schatz September 2019 3,556,863 (16,112)(6) USD US Long Bond (CBT) December 2019 7,082,583 (78,090)(33) USD US Ultra 10 Year Note December 2019 34,028,706 (146,182)
Total 44,668,152 (240,384)
United Arab Emirates USD 275,000 DP World Plc 5.625% 25/9/2048 2,350,611 0.18
United Kingdom USD 200,000 Vedanta Resources Finance II Plc
8% 23/4/2023 1,403,200 0.11Total Bonds 1,274,634,822 95.65Total Transferable Securities and Money Market Instruments Admitted to an Official Stock Exchange Listing or Dealt in on Another Regulated Market 1,274,634,822 95.65Total Portfolio 1,274,634,822 95.65
Other Net Assets 57,989,134 4.35Total Net Assets (CNH) 1,332,623,956 100.00
China Bond Fund continued
Portfolio of Investments 31 August 2019
Open Forward Foreign Exchange Contracts as at 31 August 2019
Currency
Purchases Currency
Sales Counterparty
Maturity date
Unrealised appreciation/
(depreciation) CNH
HKD Hedged share class
CNY 917,897 HKD 1,004,700 BNY Mellon 12/9/2019 1,290HKD 1,536,563 CNY 1,390,051 BNY Mellon 12/9/2019 11,780Net unrealised appreciation 13,070
SGD Hedged Share Class
CNY 82,286 SGD 15,938 BNY Mellon 12/9/2019 77SGD 2,991,408 CNY 15,308,152 BNY Mellon 12/9/2019 121,894Net unrealised appreciation 121,971
USD Hedged Share Class
USD 14,230,416 CNY 100,857,628 BNY Mellon 12/9/2019 921,414Net unrealised appreciation 921,414
Total net unrealised depreciation (CNH underlying exposure - CNH 1,938,129,678) (5,793,446)

Transferable Securities and Money Market Instruments Admitted to an Official Stock Exchange Listing or Dealt in on Another Regulated Market
Transferable Securities and Money Market Instruments Admitted to an Official Stock Exchange Listing or Dealt in on Another Regulated Market
Holding
Description
Market Value (USD)
% of Net
Assets
Holding
Description
Market Value (USD)
% of Net
Assets
~ Investment in connected party fund, see further information in Note 11.* All or a portion of this security represents a security on loan.
The notes on pages 728 to 741 form an integral part of these financial statements.
Annual Report and Audited Financial Statements [141]
FUNDS
Ireland 1,167 BlackRock ICS US Dollar Liquid
Environmentally Aware Fund~ 116,731 0.65Total Funds 116,731 0.65
COMMON STOCKS (SHARES)
Bermuda 97,000 Haier Electronics Group Co Ltd 252,402 1.40 384,000 Kunlun Energy Co Ltd 334,536 1.86 1,402,000 Pacific Basin Shipping Ltd 273,609 1.52 860,547 4.78
Cayman Islands 9,916 Alibaba Group Holding Ltd ADR 1,730,045 9.61 2,274,000 Anton Oilfield Services
Group/Hong Kong 232,045 1.29 23,200 ASM Pacific Technology Ltd 265,887 1.48 4,181 Baidu Inc ADR 438,252 2.43 18,331 Ctrip.com International Ltd ADR 598,324 3.32 37,800 ENN Energy Holdings Ltd* 431,525 2.40 297,000 Geely Automobile Holdings Ltd* 459,145 2.55 170,000 Koolearn Technology Holding Ltd 273,219 1.52 514,500 KWG Group Holdings Ltd 448,226 2.49 40,500 Meituan Dianping 384,085 2.13 18,267 Momo Inc ADR 656,881 3.65 39,500 Tencent Holdings Ltd* 1,636,456 9.09 164,400 Wynn Macau Ltd* 328,806 1.83 7,882,896 43.79
China 80,803 Anhui Conch Cement Co Ltd 445,599 2.48 22,027 Asymchem Laboratories
Tianjin Co Ltd 337,580 1.88 1,762,000 Bank of China Ltd ‘H’ 671,998 3.73 681,000 China CITIC Bank Corp Ltd ‘H’ 356,141 1.98 1,039,000 China Construction Bank Corp ‘H’ 771,311 4.28 294,000 China Life Insurance Co Ltd ‘H’ 687,762 3.82
770,000 China Telecom Corp Ltd ‘H’ 344,738 1.91 972,000 COSCO SHIPPING Energy
Transportation Co Ltd ‘H’ 550,479 3.06 12,800 Guangzhou R&F Properties
Co Ltd ‘H’ 20,604 0.11 330,800 Haitong Securities Co Ltd ‘H’ 315,194 1.75 880,000 Huaneng Power International Inc ‘H’ 483,784 2.69 120,000 Industrial Bank Co Ltd 288,165 1.60 2,500 Kweichow Moutai Co Ltd 399,297 2.22 848,000 PetroChina Co Ltd ‘H’ 420,762 2.34 12,100 Shenzhen Mindray Bio-Medical
Electronics Co Ltd 315,359 1.75 262,900 Zhejiang Huace Film & TV Co Ltd 235,321 1.31 451,386 Zhengzhou Coal Mining Machinery
Group Co Ltd 356,687 1.98 392,000 Zoomlion Heavy Industry Science
and Technology Co Ltd ‘H’ 237,004 1.32 7,237,785 40.21
Hong Kong 195,000 Cathay Pacific Airways Ltd 254,201 1.41 340,000 China Unicom Hong Kong Ltd 338,705 1.88 96,000 Hang Lung Group Ltd 238,534 1.32 167,000 SJM Holdings Ltd* 157,843 0.88 974,000 Yuexiu Property Co Ltd 209,960 1.17 1,199,243 6.66
United States 12,928 Yum China Holdings Inc 591,327 3.28Total Common Stocks (Shares) 17,771,798 98.72Total Transferable Securities and Money Market Instruments Admitted to an Official Stock Exchange Listing or Dealt in on Another Regulated Market 17,888,529 99.37Total Portfolio 17,888,529 99.37
Other Net Assets 113,010 0.63Total Net Assets (USD) 18,001,539 100.00
China Flexible Equity Fund
Portfolio of Investments 31 August 2019
China Flexible Equity Fund
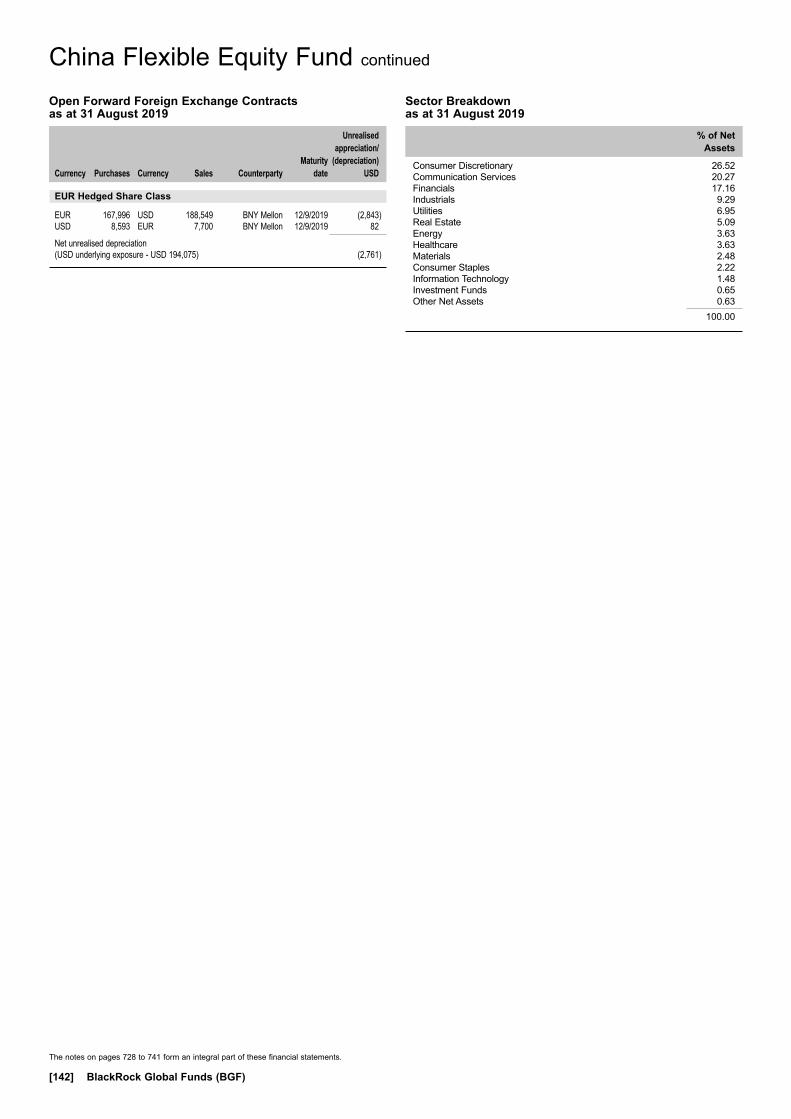
The notes on pages 728 to 741 form an integral part of these financial statements.
[142] BlackRock Global Funds (BGF)
China Flexible Equity Fund continued
Open Forward Foreign Exchange Contracts as at 31 August 2019
Currency
Purchases Currency
Sales Counterparty
Maturity date
Unrealised appreciation/
(depreciation) USD
EUR Hedged Share Class
EUR 167,996 USD 188,549 BNY Mellon 12/9/2019 (2,843)USD 8,593 EUR 7,700 BNY Mellon 12/9/2019 82
Net unrealised depreciation (USD underlying exposure - USD 194,075) (2,761)
Sector Breakdown as at 31 August 2019
% of Net Assets
Consumer Discretionary 26.52Communication Services 20.27Financials 17.16Industrials 9.29Utilities 6.95Real Estate 5.09Energy 3.63Healthcare 3.63Materials 2.48Consumer Staples 2.22Information Technology 1.48Investment Funds 0.65Other Net Assets 0.63
100.00

Transferable Securities and Money Market Instruments Admitted to an Official Stock Exchange Listing or Dealt in on Another Regulated Market
Transferable Securities and Money Market Instruments Admitted to an Official Stock Exchange Listing or Dealt in on Another Regulated Market
Holding
Description
Market Value (USD)
% of Net
Assets
Holding
Description
Market Value (USD)
% of Net
Assets
~ Investment in connected party fund, see further information in Note 11.* All or a portion of this security represents a security on loan.** Security subject to a fair value adjustment as detailed in Note 2(j).
The notes on pages 728 to 741 form an integral part of these financial statements.
Annual Report and Audited Financial Statements [143]
FUNDS
Ireland 389,263 BlackRock ICS US Dollar Liquid
Environmentally Aware Fund~ 38,937,459 3.23Total Funds 38,937,459 3.23
COMMON STOCKS (SHARES)
Bermuda 6,002,000 Haier Electronics Group Co Ltd* 15,617,710 1.30 12,726,000 Kunlun Energy Co Ltd 11,086,739 0.92 26,704,449 2.22
Cayman Islands 670,681 Alibaba Group Holding Ltd ADR 117,013,714 9.72 1,369,300 ASM Pacific Technology Ltd* 15,693,069 1.30 239,650 Baidu Inc ADR 25,120,113 2.09 3,900,000 China Resources Land Ltd 15,868,888 1.32 914,063 Ctrip.com International Ltd ADR 29,835,016 2.48 16,896,000 Geely Automobile Holdings Ltd 26,120,273 2.17 4,794,000 Koolearn Technology Holding Ltd 7,704,772 0.64 24,735,000 KWG Group Holdings Ltd* 21,548,836 1.79 3,940,400 Meituan Dianping* 37,369,086 3.10 646,670 Momo Inc ADR* 23,254,253 1.93 70,067 NetEase Inc ADR* 17,867,085 1.48 300,876 New Oriental Education &
Technology Group Inc ADR 34,684,985 2.88 2,606,600 Tencent Holdings Ltd 107,989,518 8.97 438,713 Vipshop Holdings Ltd ADR* 3,667,641 0.30 8,209,600 Wynn Macau Ltd* 16,419,474 1.36 500,156,723 41.53
China 1,120,838 Asymchem Laboratories Tianjin
Co Ltd 17,177,675 1.43 134,774,900 Bank of China Ltd ‘H’ 51,400,980 4.27 42,753,000 China CITIC Bank Corp Ltd ‘H’ 22,358,447 1.86 21,752,000 China Communications
Construction Co Ltd ‘H’ 16,869,180 1.40 61,730,820 China Construction Bank Corp ‘H’ 45,826,451 3.80 6,356,000 China Eastern Airlines Corp Ltd ‘H’ 2,991,586 0.25 14,937,000 China Life Insurance Co Ltd ‘H’ 34,942,494 2.90 11,488,350 China National Building Material
Co Ltd ‘H’ 9,847,322 0.82 14,464,000 China Oilfield Services Ltd ‘H’* 17,895,809 1.49 38,558,000 China Telecom Corp Ltd ‘H’ 17,262,862 1.43 22,200,915 COSCO SHIPPING Energy
Transportation Co Ltd 22,138,624 1.84 65,872,000 Guangshen Railway Co Ltd ‘H’ 20,165,235 1.67 585,200 Guangzhou R&F Properties
Co Ltd ‘H’* 942,009 0.08
18,632,800 Haitong Securities Co Ltd ‘H’* 17,753,743 1.47 117,464,000 Huadian Fuxin Energy Corp Ltd ‘H’ 19,627,603 1.63 47,988,000 Huaneng Power International Inc ‘H’ 26,381,599 2.19 40,439,000 Industrial & Commercial Bank
of China Ltd ‘H’ 25,532,703 2.12 4,851,880 Industrial Bank Co Ltd 11,651,198 0.97 3,271,154 Inner Mongolia Yili Industrial
Group Co Ltd 13,107,379 1.09 127,963 Kweichow Moutai Co Ltd 20,438,111 1.70 1,611,500 Ping An Insurance Group Co
of China Ltd ‘H’* 18,479,116 1.53 659,050 Shenzhen Mindray Bio-Medical
Electronics Co Ltd 17,176,631 1.43 13,884,327 Zhejiang Huace Film & TV Co Ltd 12,427,822 1.03 462,394,579 38.40
Hong Kong 3,222,216 China Mobile Ltd 26,694,697 2.22 22,614,000 China Unicom Hong Kong Ltd 22,527,843 1.87 1,980,000 Galaxy Entertainment Group Ltd 12,425,718 1.03 4,818,000 Hang Lung Group Ltd 11,971,455 0.99 1,266,500 Link REIT (Unit) (Reit) 14,216,054 1.18 20,832,000 MMG Ltd 4,304,643 0.36 8,894,000 SJM Holdings Ltd 8,406,332 0.70 64,246,069 Yuexiu Property Co Ltd 13,849,193 1.15 114,395,935 9.50
United States 796,504 Yum China Holdings Inc 36,432,093 3.03Total Common Stocks (Shares) 1,140,083,779 94.68Total Transferable Securities and Money Market Instruments Admitted to an Official Stock Exchange Listing or Dealt in on Another Regulated Market 1,179,021,238 97.91
Other Transferable Securities
COMMON / PREFERRED STOCKS (SHARES)
China 298,383 Xiaoju Kuaizhu Inc (Pref)** 15,196,646 1.26 110,567 Xiaoju Kuaizhu Inc** 5,631,178 0.47 20,827,824 1.73Total Common / Preferred Stocks (Shares) 20,827,824 1.73Total Other Transferable Securities 20,827,824 1.73Total Portfolio 1,199,849,062 99.64
Other Net Assets 4,368,584 0.36Total Net Assets (USD) 1,204,217,646 100.00
China Fund
Portfolio of Investments 31 August 2019
China Fund
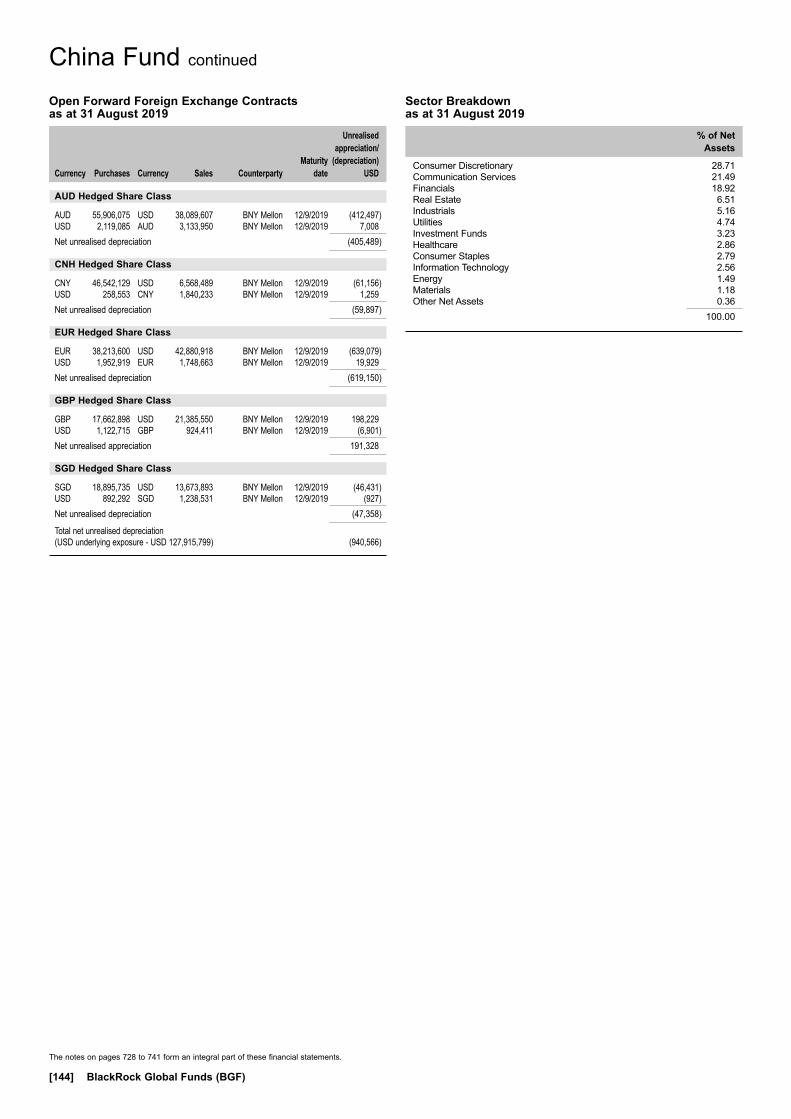
The notes on pages 728 to 741 form an integral part of these financial statements.
[144] BlackRock Global Funds (BGF)
China Fund continued
Open Forward Foreign Exchange Contracts as at 31 August 2019
Currency
Purchases Currency
Sales Counterparty
Maturity date
Unrealised appreciation/
(depreciation) USD
AUD Hedged Share Class
AUD 55,906,075 USD 38,089,607 BNY Mellon 12/9/2019 (412,497)USD 2,119,085 AUD 3,133,950 BNY Mellon 12/9/2019 7,008Net unrealised depreciation (405,489)
CNH Hedged Share Class
CNY 46,542,129 USD 6,568,489 BNY Mellon 12/9/2019 (61,156)USD 258,553 CNY 1,840,233 BNY Mellon 12/9/2019 1,259Net unrealised depreciation (59,897)
EUR Hedged Share Class
EUR 38,213,600 USD 42,880,918 BNY Mellon 12/9/2019 (639,079)USD 1,952,919 EUR 1,748,663 BNY Mellon 12/9/2019 19,929Net unrealised depreciation (619,150)
GBP Hedged Share Class
GBP 17,662,898 USD 21,385,550 BNY Mellon 12/9/2019 198,229USD 1,122,715 GBP 924,411 BNY Mellon 12/9/2019 (6,901)Net unrealised appreciation 191,328
SGD Hedged Share Class
SGD 18,895,735 USD 13,673,893 BNY Mellon 12/9/2019 (46,431)USD 892,292 SGD 1,238,531 BNY Mellon 12/9/2019 (927)Net unrealised depreciation (47,358)
Total net unrealised depreciation (USD underlying exposure - USD 127,915,799) (940,566)
Sector Breakdown as at 31 August 2019
% of Net Assets
Consumer Discretionary 28.71Communication Services 21.49Financials 18.92Real Estate 6.51Industrials 5.16Utilities 4.74Investment Funds 3.23Healthcare 2.86Consumer Staples 2.79Information Technology 2.56Energy 1.49Materials 1.18Other Net Assets 0.36
100.00

Transferable Securities and Money Market Instruments Admitted to an Official Stock Exchange Listing or Dealt in on Another Regulated Market
Transferable Securities and Money Market Instruments Admitted to an Official Stock Exchange Listing or Dealt in on Another Regulated Market
Holding
Description
Market Value (EUR)
% of Net
Assets
Holding
Description
Market Value (EUR)
% of Net
Assets
~ Investment in connected party fund, see further information in Note 11.* All or a portion of this security represents a security on loan.** Security subject to a fair value adjustment as detailed in Note 2(j).
The notes on pages 728 to 741 form an integral part of these financial statements.
Annual Report and Audited Financial Statements [145]
FUNDS
Ireland 217,692 BlackRock ICS Euro Liquid
Environmentally Aware Fund~ 21,718,033 0.61Total Funds 21,718,033 0.61
COMMON STOCKS (SHARES)
Belgium 715,058 KBC Group NV* 37,769,364 1.06
Denmark 911,451 Danske Bank A/S 10,903,758 0.31 1,554,696 DSV A/S* 139,867,419 3.94 4,125,000 Novo Nordisk A/S 194,569,313 5.47 345,340,490 9.72
Finland 1,440,333 Neste Oyj* 41,222,330 1.16
France 412,803 Eiffage SA* 39,009,883 1.10 720,381 Ingenico Group SA* 65,007,181 1.83 563,729 LVMH Moet Hennessy
Louis Vuitton SE* 205,169,170 5.77 561,973 Pernod Ricard SA* 97,333,724 2.74 550,179 Remy Cointreau SA* 75,539,577 2.13 1,338,199 Safran SA* 176,441,538 4.96 138,786 Teleperformance* 27,493,507 0.77 568,608 Thales SA* 59,845,992 1.68 952,036 Vinci SA* 94,575,256 2.66 840,415,828 23.64
Germany 254,368 adidas AG* 68,908,291 1.94 1,555,748 Deutsche Wohnen SE 50,499,580 1.42 219,851 MTU Aero Engines AG* 54,764,884 1.54 740,486 Puma SE 51,611,874 1.45 2,515,706 RWE AG* 65,031,000 1.83 1,966,378 SAP SE* 214,453,185 6.03 281,089 Wirecard AG* 40,743,851 1.15 546,012,665 15.36
Ireland 1,218,003 Kingspan Group Plc 51,083,046 1.44 412,079 Linde Plc 70,197,657 1.97 121,280,703 3.41
Italy 227,746 DiaSorin SpA* 24,596,568 0.69 6,206,907 FinecoBank Banca Fineco SpA 59,015,272 1.66 2,019,425 Moncler SpA* 69,589,385 1.96 153,201,225 4.31
Netherlands 1,142,182 Airbus SE 143,640,808 4.04 685,994 ASML Holding NV 138,776,586 3.90 906,277 Ferrari NV 130,639,830 3.68 1,954,574 ING Groep NV 17,077,113 0.48 1,740,703 Qiagen NV 54,866,959 1.54 4,860,958 STMicroelectronics NV 78,407,252 2.21 563,408,548 15.85
Spain 1,497,806 Amadeus IT Group SA 101,371,510 2.85 1,461,144 Grifols SA* 41,803,330 1.18 143,174,840 4.03
Sweden 1,763,202 Assa Abloy AB* 33,321,112 0.94 2,089,460 Hexagon AB* 84,198,572 2.37 117,519,684 3.31
Switzerland 427,513 Lonza Group AG* 137,185,653 3.86 755,455 Nestle SA 77,012,061 2.17 63,208 Partners Group Holding AG 46,475,275 1.31 421,804 Roche Holding AG* 104,617,839 2.94 1,151,269 Sika AG* 150,421,976 4.23 56,110 Straumann Holding AG 40,011,711 1.12 555,724,515 15.63Total Common Stocks (Shares) 3,465,070,192 97.48Total Transferable Securities and Money Market Instruments Admitted to an Official Stock Exchange Listing or Dealt in on Another Regulated Market 3,486,788,225 98.09
Other Transferable Securities
COMMON STOCKS (SHARES)
United Kingdom 103,486 Hut Group ‘B’** 55,134,696 1.55 3,005 Hut Group ‘D’** 1,600,987 0.05 56,735,683 1.60Total Common Stocks (Shares) 56,735,683 1.60Total Other Transferable Securities 56,735,683 1.60Total Portfolio 3,543,523,908 99.69
Other Net Assets 10,956,551 0.31Total Net Assets (EUR) 3,554,480,459 100.00
Continental European Flexible Fund
Portfolio of Investments 31 August 2019
Continental European Flexible Fund

The notes on pages 728 to 741 form an integral part of these financial statements.
[146] BlackRock Global Funds (BGF)
Continental European Flexible Fund continued
Open Forward Foreign Exchange Contracts as at 31 August 2019
Currency
Purchases Currency
Sales Counterparty
Maturity date
Unrealised appreciation/
(depreciation) EUR
GBP Hedged Share Class
EUR 9,901,384 GBP 9,050,658 BNY Mellon 12/9/2019 (103,876)GBP 191,433,526 EUR 206,576,783 BNY Mellon 12/9/2019 5,048,700Net unrealised appreciation 4,944,824
USD Hedged Share Class
EUR 14,394,070 USD 16,021,563 BNY Mellon 12/9/2019 (99,879)USD 244,165,981 EUR 217,593,009 BNY Mellon 12/9/2019 3,293,614Net unrealised appreciation 3,193,735
Total net unrealised appreciation (EUR underlying exposure - EUR 457,250,074) 8,138,559
Sector Breakdown as at 31 August 2019
% of Net Assets
Industrials 23.06Information Technology 20.34Healthcare 16.81Consumer Discretionary 16.40Consumer Staples 7.04Materials 6.20Financials 4.82Utilities 1.83Real Estate 1.42Energy 1.16Investment Funds 0.61Other Net Assets 0.31
100.00
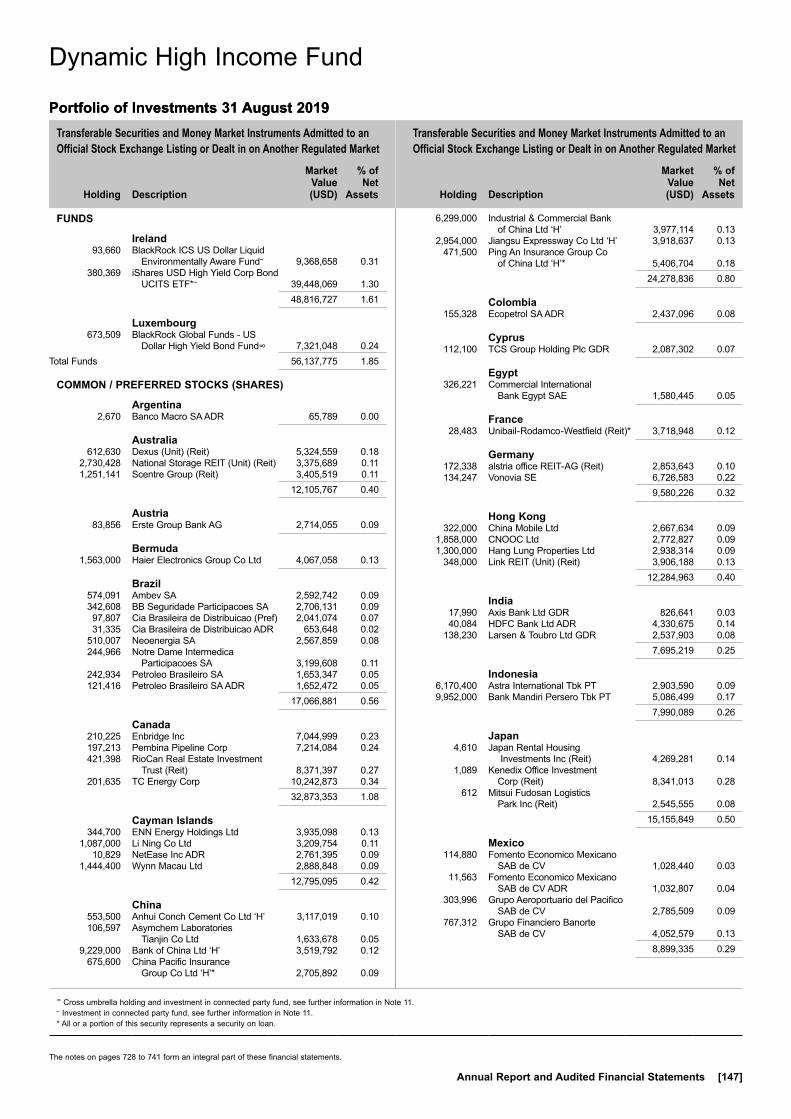
Transferable Securities and Money Market Instruments Admitted to an Official Stock Exchange Listing or Dealt in on Another Regulated Market
Transferable Securities and Money Market Instruments Admitted to an Official Stock Exchange Listing or Dealt in on Another Regulated Market
Holding
Description
Market Value (USD)
% of Net
Assets
Holding
Description
Market Value (USD)
% of Net
Assets
∞ Cross umbrella holding and investment in connected party fund, see further information in Note 11.~ Investment in connected party fund, see further information in Note 11.* All or a portion of this security represents a security on loan.
The notes on pages 728 to 741 form an integral part of these financial statements.
Annual Report and Audited Financial Statements [147]
FUNDS
Ireland 93,660 BlackRock ICS US Dollar Liquid
Environmentally Aware Fund~ 9,368,658 0.31 380,369 iShares USD High Yield Corp Bond
UCITS ETF*~ 39,448,069 1.30 48,816,727 1.61
Luxembourg 673,509 BlackRock Global Funds - US
Dollar High Yield Bond Fund∞ 7,321,048 0.24Total Funds 56,137,775 1.85
COMMON / PREFERRED STOCKS (SHARES)
Argentina 2,670 Banco Macro SA ADR 65,789 0.00
Australia 612,630 Dexus (Unit) (Reit) 5,324,559 0.18 2,730,428 National Storage REIT (Unit) (Reit) 3,375,689 0.11 1,251,141 Scentre Group (Reit) 3,405,519 0.11 12,105,767 0.40
Austria 83,856 Erste Group Bank AG 2,714,055 0.09
Bermuda 1,563,000 Haier Electronics Group Co Ltd 4,067,058 0.13
Brazil 574,091 Ambev SA 2,592,742 0.09 342,608 BB Seguridade Participacoes SA 2,706,131 0.09 97,807 Cia Brasileira de Distribuicao (Pref) 2,041,074 0.07 31,335 Cia Brasileira de Distribuicao ADR 653,648 0.02 510,007 Neoenergia SA 2,567,859 0.08 244,966 Notre Dame Intermedica
Participacoes SA 3,199,608 0.11 242,934 Petroleo Brasileiro SA 1,653,347 0.05 121,416 Petroleo Brasileiro SA ADR 1,652,472 0.05 17,066,881 0.56
Canada 210,225 Enbridge Inc 7,044,999 0.23 197,213 Pembina Pipeline Corp 7,214,084 0.24 421,398 RioCan Real Estate Investment
Trust (Reit) 8,371,397 0.27 201,635 TC Energy Corp 10,242,873 0.34 32,873,353 1.08
Cayman Islands 344,700 ENN Energy Holdings Ltd 3,935,098 0.13 1,087,000 Li Ning Co Ltd 3,209,754 0.11 10,829 NetEase Inc ADR 2,761,395 0.09 1,444,400 Wynn Macau Ltd 2,888,848 0.09 12,795,095 0.42
China 553,500 Anhui Conch Cement Co Ltd ‘H’ 3,117,019 0.10 106,597 Asymchem Laboratories
Tianjin Co Ltd 1,633,678 0.05 9,229,000 Bank of China Ltd ‘H’ 3,519,792 0.12 675,600 China Pacific Insurance
Group Co Ltd ‘H’* 2,705,892 0.09
6,299,000 Industrial & Commercial Bank of China Ltd ‘H’ 3,977,114 0.13
2,954,000 Jiangsu Expressway Co Ltd ‘H’ 3,918,637 0.13 471,500 Ping An Insurance Group Co
of China Ltd ‘H’* 5,406,704 0.18 24,278,836 0.80
Colombia 155,328 Ecopetrol SA ADR 2,437,096 0.08
Cyprus 112,100 TCS Group Holding Plc GDR 2,087,302 0.07
Egypt 326,221 Commercial International
Bank Egypt SAE 1,580,445 0.05
France 28,483 Unibail-Rodamco-Westfield (Reit)* 3,718,948 0.12
Germany 172,338 alstria office REIT-AG (Reit) 2,853,643 0.10 134,247 Vonovia SE 6,726,583 0.22 9,580,226 0.32
Hong Kong 322,000 China Mobile Ltd 2,667,634 0.09 1,858,000 CNOOC Ltd 2,772,827 0.09 1,300,000 Hang Lung Properties Ltd 2,938,314 0.09 348,000 Link REIT (Unit) (Reit) 3,906,188 0.13 12,284,963 0.40
India 17,990 Axis Bank Ltd GDR 826,641 0.03 40,084 HDFC Bank Ltd ADR 4,330,675 0.14 138,230 Larsen & Toubro Ltd GDR 2,537,903 0.08 7,695,219 0.25
Indonesia 6,170,400 Astra International Tbk PT 2,903,590 0.09 9,952,000 Bank Mandiri Persero Tbk PT 5,086,499 0.17 7,990,089 0.26
Japan 4,610 Japan Rental Housing
Investments Inc (Reit) 4,269,281 0.14 1,089 Kenedix Office Investment
Corp (Reit) 8,341,013 0.28 612 Mitsui Fudosan Logistics
Park Inc (Reit) 2,545,555 0.08 15,155,849 0.50
Mexico 114,880 Fomento Economico Mexicano
SAB de CV 1,028,440 0.03 11,563 Fomento Economico Mexicano
SAB de CV ADR 1,032,807 0.04 303,996 Grupo Aeroportuario del Pacifico
SAB de CV 2,785,509 0.09 767,312 Grupo Financiero Banorte
SAB de CV 4,052,579 0.13 8,899,335 0.29
Dynamic High Income Fund
Portfolio of Investments 31 August 2019
Dynamic High Income Fund
Portfolio of Investments 31 August 2019

Transferable Securities and Money Market Instruments Admitted to an Official Stock Exchange Listing or Dealt in on Another Regulated Market
Transferable Securities and Money Market Instruments Admitted to an Official Stock Exchange Listing or Dealt in on Another Regulated Market
Holding
Description
Market Value (USD)
% of Net
Assets
Holding
Description
Market Value (USD)
% of Net
Assets
* All or a portion of this security represents a security on loan.
The notes on pages 728 to 741 form an integral part of these financial statements.
[148] BlackRock Global Funds (BGF)
Dynamic High Income Fund continued
Norway 274,394 Entra ASA 4,118,972 0.14
Panama 29,752 Copa Holdings SA 3,069,514 0.10
Philippines 1,881,810 Bank of the Philippine Islands 3,179,276 0.10
Poland 44,803 Bank Polska Kasa Opieki SA 1,091,660 0.04
Qatar 4,501,170 Qatar Gas Transport Co Ltd 2,941,657 0.10
Russian Federation 252,651 Sberbank of Russia PJSC ADR 3,476,478 0.11 194,566 Severstal PJSC GDR 2,908,761 0.10 6,385,239 0.21
Singapore 2,574,107 Ascendas Real Estate Investment
Trust (Unit) (Reit) 5,717,195 0.19 3,735,700 Genting Singapore Ltd 2,397,550 0.08 1,237,600 Sabana Shari’ah Compliant
Industrial Real Estate Investment Trust (Unit) (Reit) 401,605 0.01
8,516,350 0.28
South Africa 1,411,244 Old Mutual Ltd Npv 1,668,327 0.06
South Korea 8,347 NCSoft Corp 3,700,589 0.12 34,782 S-1 Corp 2,900,295 0.10 381,447 Samsung Electronics Co Ltd (Pref) 11,604,806 0.38 16,841 Samsung SDI Co Ltd 3,469,003 0.11 15,721 SK Holdings Co Ltd 2,595,831 0.09 24,270,524 0.80
Taiwan 1,232,000 Nanya Technology Corp 2,761,312 0.09 502,000 Taiwan Semiconductor
Manufacturing Co Ltd 4,139,384 0.14 112,186 Taiwan Semiconductor
Manufacturing Co Ltd ADR* 4,784,733 0.16 11,685,429 0.39
Thailand 565,900 Kasikornbank PCL 2,961,617 0.10 6,722,000 Land & Houses PCL NVDR 2,374,605 0.08 5,336,222 0.18
United Arab Emirates 184,981 DP World Plc 2,589,734 0.09
United Kingdom 7,960,114 Assura Plc (Reit) 6,728,509 0.22 868,751 Hansteen Holdings Plc (Reit) 984,775 0.03 39,495 Mediclinic International Plc 162,618 0.01 5,664 Mediclinic International Plc 23,350 0.00 1,238,366 PRS REIT Plc/The (Reit) 1,361,398 0.04 182,233 Prudential Plc 3,048,474 0.10 462,478 Secure Income REIT Plc (Reit) 2,451,739 0.08 307,311 Segro Plc (Reit) 2,943,733 0.10
2,022,066 Target Healthcare REIT Plc (Reit) 2,896,021 0.10 847,251 Vivo Energy Plc 1,258,459 0.04 21,859,076 0.72
United States 56,880 Alexandria Real Estate Equities
Inc (Reit) 8,507,542 0.28 170,000 Allstate Corp/The (Pref) 4,442,100 0.15 156,977 Antero Midstream Corp 1,139,653 0.04 36,051 AvalonBay Communities Inc (Reit) 7,642,812 0.25 58,985 Boston Properties Inc (Reit) 7,548,900 0.25 54,621 Cheniere Energy Inc* 3,281,630 0.11 76,753 Cognizant Technology
Solutions Corp 4,723,380 0.16 31,777 Community Healthcare
Trust Inc (Reit) 1,366,729 0.04 42,615 Crown Castle International
Corp (Reit) 6,185,993 0.20 161,432 EnLink Midstream LLC 1,287,420 0.04 75,000 Entergy Arkansas LLC (Pref) 1,974,750 0.07 75,000 Entergy Mississippi LLC (Pref) 2,018,250 0.07 68,683 EPR Properties (Reit) 5,366,203 0.18 11,946 Equinix Inc (Reit) 6,639,467 0.22 99,397 Equitrans Midstream Corp* 1,337,884 0.04 155,025 Highwoods Properties Inc (Reit) 6,687,778 0.22 104,377 Hudson Pacific Properties Inc (Reit) 3,542,555 0.12 479,669 Kinder Morgan Inc/DE* 9,785,248 0.32 60,639 Macquarie Infrastructure Corp* 2,289,122 0.08 102,132 Medical Properties Trust Inc (Reit) 1,899,655 0.06 300,000 Morgan Stanley (Pref) 8,112,000 0.27 74,042 Omega Healthcare Investors
Inc (Reit)* 3,004,624 0.10 121,718 ONEOK Inc 8,645,630 0.28 404,464 Plains GP Holdings LP ‘A’ 8,922,476 0.29 61,313 Plymouth Industrial REIT Inc (Reit) 1,149,619 0.04 102,505 Prologis Inc (Reit) 8,574,543 0.28 53,094 Regency Centers Corp (Reit) 3,408,635 0.11 25,377 Simon Property Group Inc (Reit) 3,777,366 0.12 25,000 SLM Corp (Pref) 1,448,750 0.05 172,840 Spirit Realty Capital Inc (Reit) 8,261,752 0.27 62,197 STAG Industrial Inc (Reit) 1,807,445 0.06 150,000 State Street Corp (Pref) 3,967,500 0.13 38,196 Sun Communities Inc (Reit) 5,639,639 0.19 171,807 Tallgrass Energy LP ‘A’ 3,345,082 0.11 198,827 Targa Resources Corp* 7,165,725 0.24 103,000 US Bancorp (Pref) 2,839,710 0.09 322,915 VEREIT Inc (Reit) 3,138,734 0.10 230,746 VICI Properties Inc (Reit) 5,115,639 0.17 317,251 Williams Cos Inc/The 7,531,539 0.25 183,523,479 6.05Total Common / Preferred Stocks (Shares) 457,631,765 15.08
BONDS
Argentina USD 1,492,500 Aeropuertos Argentina 2000 SA
‘144A’ 6.875% 1/2/2027 1,335,788 0.04 USD 284,000 AES Argentina Generacion SA
‘144A’ 7.75% 2/2/2024 193,120 0.01 USD 790,000 Arcor SAIC ‘144A’ 6% 6/7/2023 675,055 0.02 USD 381,000 Argentine Republic Government
International Bond 4.625% 11/1/2023 153,948 0.01
USD 763,000 Argentine Republic Government International Bond 6.875% 22/4/2021 338,581 0.01
USD 2,107,000 Genneia SA ‘144A’ 8.75% 20/1/2022 1,261,566 0.04
Portfolio of Investments 31 August 2019
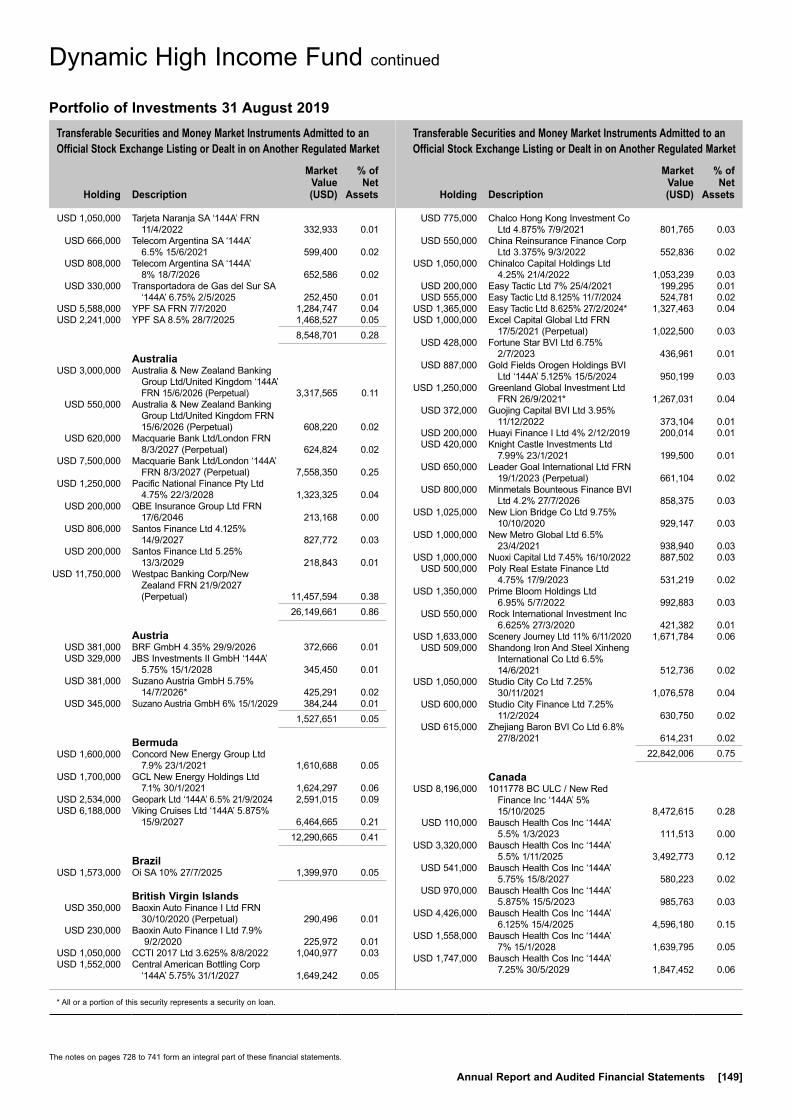
Transferable Securities and Money Market Instruments Admitted to an Official Stock Exchange Listing or Dealt in on Another Regulated Market
Transferable Securities and Money Market Instruments Admitted to an Official Stock Exchange Listing or Dealt in on Another Regulated Market
Holding
Description
Market Value (USD)
% of Net
Assets
Holding
Description
Market Value (USD)
% of Net
Assets
* All or a portion of this security represents a security on loan.
The notes on pages 728 to 741 form an integral part of these financial statements.
Annual Report and Audited Financial Statements [149]
Dynamic High Income Fund continued
USD 1,050,000 Tarjeta Naranja SA ‘144A’ FRN 11/4/2022 332,933 0.01
USD 666,000 Telecom Argentina SA ‘144A’ 6.5% 15/6/2021 599,400 0.02
USD 808,000 Telecom Argentina SA ‘144A’ 8% 18/7/2026 652,586 0.02
USD 330,000 Transportadora de Gas del Sur SA ‘144A’ 6.75% 2/5/2025 252,450 0.01
USD 5,588,000 YPF SA FRN 7/7/2020 1,284,747 0.04 USD 2,241,000 YPF SA 8.5% 28/7/2025 1,468,527 0.05 8,548,701 0.28
Australia USD 3,000,000 Australia & New Zealand Banking
Group Ltd/United Kingdom ‘144A’ FRN 15/6/2026 (Perpetual) 3,317,565 0.11
USD 550,000 Australia & New Zealand Banking Group Ltd/United Kingdom FRN 15/6/2026 (Perpetual) 608,220 0.02
USD 620,000 Macquarie Bank Ltd/London FRN 8/3/2027 (Perpetual) 624,824 0.02
USD 7,500,000 Macquarie Bank Ltd/London ‘144A’ FRN 8/3/2027 (Perpetual) 7,558,350 0.25
USD 1,250,000 Pacific National Finance Pty Ltd 4.75% 22/3/2028 1,323,325 0.04
USD 200,000 QBE Insurance Group Ltd FRN 17/6/2046 213,168 0.00
USD 806,000 Santos Finance Ltd 4.125% 14/9/2027 827,772 0.03
USD 200,000 Santos Finance Ltd 5.25% 13/3/2029 218,843 0.01
USD 11,750,000 Westpac Banking Corp/New Zealand FRN 21/9/2027 (Perpetual) 11,457,594 0.38
26,149,661 0.86
Austria USD 381,000 BRF GmbH 4.35% 29/9/2026 372,666 0.01 USD 329,000 JBS Investments II GmbH ‘144A’
5.75% 15/1/2028 345,450 0.01 USD 381,000 Suzano Austria GmbH 5.75%
14/7/2026* 425,291 0.02 USD 345,000 Suzano Austria GmbH 6% 15/1/2029 384,244 0.01 1,527,651 0.05
Bermuda USD 1,600,000 Concord New Energy Group Ltd
7.9% 23/1/2021 1,610,688 0.05 USD 1,700,000 GCL New Energy Holdings Ltd
7.1% 30/1/2021 1,624,297 0.06 USD 2,534,000 Geopark Ltd ‘144A’ 6.5% 21/9/2024 2,591,015 0.09 USD 6,188,000 Viking Cruises Ltd ‘144A’ 5.875%
15/9/2027 6,464,665 0.21 12,290,665 0.41
Brazil USD 1,573,000 Oi SA 10% 27/7/2025 1,399,970 0.05
British Virgin Islands USD 350,000 Baoxin Auto Finance I Ltd FRN
30/10/2020 (Perpetual) 290,496 0.01 USD 230,000 Baoxin Auto Finance I Ltd 7.9%
9/2/2020 225,972 0.01 USD 1,050,000 CCTI 2017 Ltd 3.625% 8/8/2022 1,040,977 0.03 USD 1,552,000 Central American Bottling Corp
‘144A’ 5.75% 31/1/2027 1,649,242 0.05
USD 775,000 Chalco Hong Kong Investment Co Ltd 4.875% 7/9/2021 801,765 0.03
USD 550,000 China Reinsurance Finance Corp Ltd 3.375% 9/3/2022 552,836 0.02
USD 1,050,000 Chinalco Capital Holdings Ltd 4.25% 21/4/2022 1,053,239 0.03
USD 200,000 Easy Tactic Ltd 7% 25/4/2021 199,295 0.01 USD 555,000 Easy Tactic Ltd 8.125% 11/7/2024 524,781 0.02 USD 1,365,000 Easy Tactic Ltd 8.625% 27/2/2024* 1,327,463 0.04 USD 1,000,000 Excel Capital Global Ltd FRN
17/5/2021 (Perpetual) 1,022,500 0.03 USD 428,000 Fortune Star BVI Ltd 6.75%
2/7/2023 436,961 0.01 USD 887,000 Gold Fields Orogen Holdings BVI
Ltd ‘144A’ 5.125% 15/5/2024 950,199 0.03 USD 1,250,000 Greenland Global Investment Ltd
FRN 26/9/2021* 1,267,031 0.04 USD 372,000 Guojing Capital BVI Ltd 3.95%
11/12/2022 373,104 0.01 USD 200,000 Huayi Finance I Ltd 4% 2/12/2019 200,014 0.01 USD 420,000 Knight Castle Investments Ltd
7.99% 23/1/2021 199,500 0.01 USD 650,000 Leader Goal International Ltd FRN
19/1/2023 (Perpetual) 661,104 0.02 USD 800,000 Minmetals Bounteous Finance BVI
Ltd 4.2% 27/7/2026 858,375 0.03 USD 1,025,000 New Lion Bridge Co Ltd 9.75%
10/10/2020 929,147 0.03 USD 1,000,000 New Metro Global Ltd 6.5%
23/4/2021 938,940 0.03 USD 1,000,000 Nuoxi Capital Ltd 7.45% 16/10/2022 887,502 0.03 USD 500,000 Poly Real Estate Finance Ltd
4.75% 17/9/2023 531,219 0.02 USD 1,350,000 Prime Bloom Holdings Ltd
6.95% 5/7/2022 992,883 0.03 USD 550,000 Rock International Investment Inc
6.625% 27/3/2020 421,382 0.01 USD 1,633,000 Scenery Journey Ltd 11% 6/11/2020 1,671,784 0.06 USD 509,000 Shandong Iron And Steel Xinheng
International Co Ltd 6.5% 14/6/2021 512,736 0.02
USD 1,050,000 Studio City Co Ltd 7.25% 30/11/2021 1,076,578 0.04
USD 600,000 Studio City Finance Ltd 7.25% 11/2/2024 630,750 0.02
USD 615,000 Zhejiang Baron BVI Co Ltd 6.8% 27/8/2021 614,231 0.02
22,842,006 0.75
Canada USD 8,196,000 1011778 BC ULC / New Red
Finance Inc ‘144A’ 5% 15/10/2025 8,472,615 0.28
USD 110,000 Bausch Health Cos Inc ‘144A’ 5.5% 1/3/2023 111,513 0.00
USD 3,320,000 Bausch Health Cos Inc ‘144A’ 5.5% 1/11/2025 3,492,773 0.12
USD 541,000 Bausch Health Cos Inc ‘144A’ 5.75% 15/8/2027 580,223 0.02
USD 970,000 Bausch Health Cos Inc ‘144A’ 5.875% 15/5/2023 985,763 0.03
USD 4,426,000 Bausch Health Cos Inc ‘144A’ 6.125% 15/4/2025 4,596,180 0.15
USD 1,558,000 Bausch Health Cos Inc ‘144A’ 7% 15/1/2028 1,639,795 0.05
USD 1,747,000 Bausch Health Cos Inc ‘144A’ 7.25% 30/5/2029 1,847,452 0.06
Portfolio of Investments 31 August 2019

Transferable Securities and Money Market Instruments Admitted to an Official Stock Exchange Listing or Dealt in on Another Regulated Market
Transferable Securities and Money Market Instruments Admitted to an Official Stock Exchange Listing or Dealt in on Another Regulated Market
Holding
Description
Market Value (USD)
% of Net
Assets
Holding
Description
Market Value (USD)
% of Net
Assets
* All or a portion of this security represents a security on loan.
The notes on pages 728 to 741 form an integral part of these financial statements.
[150] BlackRock Global Funds (BGF)
Dynamic High Income Fund continued
USD 2,299,000 Bausch Health Cos Inc ‘144A’ 9% 15/12/2025 2,605,043 0.09
USD 76,000 Bombardier Inc ‘144A’ 5.75% 15/3/2022 76,950 0.00
USD 316,000 Bombardier Inc ‘144A’ 6.125% 15/1/2023 315,210 0.01
USD 2,841,000 Bombardier Inc ‘144A’ 7.5% 1/12/2024 2,833,897 0.09
USD 678,000 Bombardier Inc ‘144A’ 7.5% 15/3/2025 663,593 0.02
USD 5,727,000 Bombardier Inc ‘144A’ 7.875% 15/4/2027 5,569,507 0.18
USD 3,505,000 Emera Inc FRN 15/6/2076 3,817,015 0.13 USD 4,825,000 Enbridge Inc FRN 15/1/2077 5,058,916 0.17 USD 7,925,000 Enbridge Inc FRN 1/3/2078 8,273,859 0.27 USD 147,000 Fairstone Financial Inc ‘144A’
7.875% 15/7/2024 153,707 0.01 USD 2,755,000 Frontera Energy Corp ‘144A’
9.7% 25/6/2023 2,934,075 0.10 USD 1,102,000 GFL Environmental Inc ‘144A’
7% 1/6/2026 1,137,815 0.04 USD 552,000 GFL Environmental Inc ‘144A’
8.5% 1/5/2027 605,820 0.02 USD 275,000 Intertape Polymer Group Inc
‘144A’ 7% 15/10/2026 286,687 0.01 USD 185,000 Mattamy Group Corp ‘144A’
6.5% 1/10/2025 195,637 0.01 USD 312,000 Mattamy Group Corp ‘144A’
6.875% 15/12/2023 326,430 0.01 USD 587,000 MDC Partners Inc ‘144A’
6.5% 1/5/2024 537,105 0.02 USD 274,000 MEG Energy Corp ‘144A’
6.375% 30/1/2023 259,957 0.01 USD 1,277,000 MEG Energy Corp ‘144A’
6.5% 15/1/2025 1,288,174 0.04 USD 109,000 MEG Energy Corp ‘144A’
7% 31/3/2024 104,231 0.00 USD 1,125,000 New Gold Inc ‘144A’ 6.25%
15/11/2022 1,102,500 0.04 USD 383,000 Parkland Fuel Corp ‘144A’
5.875% 15/7/2027 404,544 0.01 USD 110,000 Ritchie Bros Auctioneers Inc
‘144A’ 5.375% 15/1/2025 115,087 0.00 USD 1,900,062 Stoneway Capital Corp ‘144A’
10% 1/3/2027 1,186,399 0.04 USD 221,000 Telesat Canada / Telesat LLC
‘144A’ 8.875% 15/11/2024 239,646 0.01 USD 606,000 Tervita Corp ‘144A’ 7.625%
1/12/2021 618,120 0.02 USD 12,600,000 Transcanada Trust FRN 15/8/2076 13,312,152 0.44 USD 686,518 Xplornet Communications Inc
‘144A’ 9.625% 1/6/2022 698,532 0.02 76,446,922 2.52
Cayman Islands USD 1,205,000 21Vianet Group Inc 7.875%
15/10/2021 1,219,711 0.04 USD 300,000 Agile Group Holdings Ltd FRN
7/3/2023 (Perpetual) 292,297 0.01 USD 400,000 Agile Group Holdings Ltd 8.5%
18/7/2021 421,000 0.01 USD 700,000 Anton Oilfield Services Group/Hong
Kong 9.75% 5/12/2020 712,906 0.02 USD 860,000 Bright Scholar Education Holdings
Ltd 7.45% 31/7/2022 884,725 0.03 USD 1,000,000 CDBL Funding 1 3.5% 24/10/2027* 1,031,875 0.03 USD 800,000 Central China Real Estate Ltd
6.5% 5/3/2021 797,296 0.03 USD 600,000 Central China Real Estate Ltd
6.875% 23/10/2020 604,125 0.02
USD 260,000 Central China Real Estate Ltd 7.325% 27/1/2020 260,455 0.01
USD 580,000 CFLD Cayman Investment Ltd 8.6% 8/4/2024 570,575 0.02
USD 800,000 China Aoyuan Group Ltd 7.5% 10/5/2021 815,316 0.03
USD 853,000 China Aoyuan Group Ltd 7.95% 7/9/2021 881,789 0.03
USD 2,807,000 China Aoyuan Group Ltd 7.95% 19/2/2023 2,853,885 0.09
USD 365,000 China Aoyuan Group Ltd 8.5% 23/1/2022 380,969 0.01
HKD 12,000,000 China Evergrande Group 4.25% 14/2/2023 1,367,768 0.04
USD 804,000 China Evergrande Group 6.25% 28/6/2021* 740,308 0.02
USD 570,000 China Evergrande Group 7.5% 28/6/2023 494,386 0.02
USD 1,100,000 China Evergrande Group 8.75% 28/6/2025* 908,531 0.03
USD 775,000 China Evergrande Group 9.5% 11/4/2022 732,375 0.02
USD 1,000,000 China Evergrande Group 10% 11/4/2023 936,564 0.03
USD 805,000 China Hongqiao Group Ltd 7.125% 22/7/2022 804,497 0.03
USD 1,500,000 China SCE Group Holdings Ltd 7.25% 19/4/2023 1,436,250 0.05
USD 240,000 China SCE Group Holdings Ltd 7.375% 9/4/2024 227,387 0.01
USD 800,000 China SCE Group Holdings Ltd 7.45% 17/4/2021 810,392 0.03
USD 1,100,000 CIFI Holdings Group Co Ltd 5.5% 23/1/2022 1,082,125 0.04
USD 400,000 CIFI Holdings Group Co Ltd 6.375% 2/5/2020 403,000 0.01
USD 700,000 CIFI Holdings Group Co Ltd 6.875% 23/4/2021 713,741 0.02
USD 811,000 Country Garden Holdings Co Ltd 7.25% 4/4/2021 813,796 0.03
USD 1,015,000 Energuate Trust ‘144A’ 5.875% 3/5/2027 1,017,548 0.03
USD 1,050,000 ENN Energy Holdings Ltd 3.25% 24/7/2022 1,064,438 0.04
USD 570,000 Fantasia Holdings Group Co Ltd 7.95% 5/7/2022 489,220 0.02
USD 200,000 Fantasia Holdings Group Co Ltd 8.375% 8/3/2021 187,719 0.01
USD 2,090,000 Fantasia Holdings Group Co Ltd 11.75% 17/4/2022 1,982,334 0.07
USD 665,000 Fufeng Group Ltd 5.875% 28/8/2021 693,875 0.02 USD 400,000 Future Land Development Holdings
Ltd 5% 16/2/2020* 392,687 0.01 USD 500,000 Future Land Development Holdings
Ltd 6.5% 12/9/2020 486,822 0.02 USD 400,000 Future Land Development Holdings
Ltd 7.5% 22/1/2021 385,750 0.01 USD 350,000 FWD Ltd FRN 1/2/2023 (Perpetual) 332,500 0.01 USD 1,150,000 Global A&T Electronics Ltd 8.5%
12/1/2023 1,080,461 0.04 USD 990,000 Global Aircraft Leasing Co Ltd
‘144A’ 6.5% 15/9/2024 982,575 0.03 USD 2,732,000 Gol Finance Inc ‘144A’ 7% 31/1/2025 2,694,435 0.09 USD 1,050,000 Golden Wheel Tiandi Holdings Co
Ltd 7% 18/1/2021 971,231 0.03 USD 1,030,000 Gran Tierra Energy International
Holdings Ltd ‘144A’ 6.25% 15/2/2025 957,900 0.03
USD 800,000 Hilong Holding Ltd 7.25% 22/6/2020* 794,625 0.03
Portfolio of Investments 31 August 2019
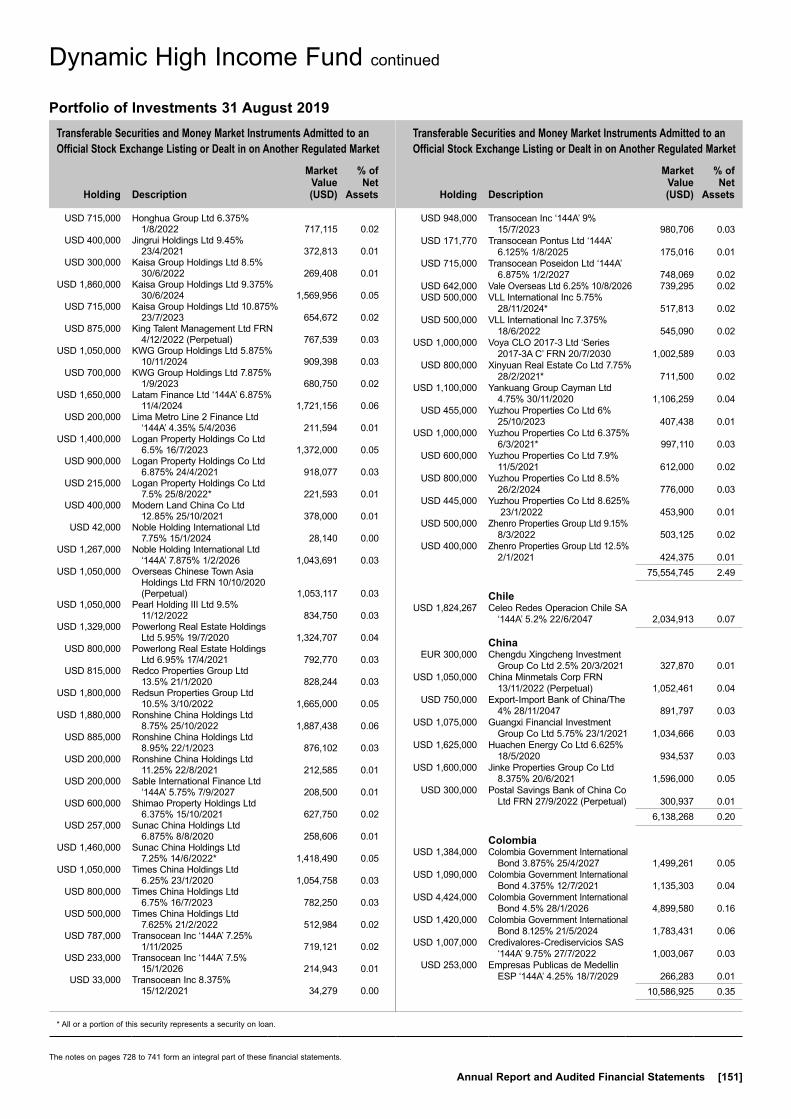
Transferable Securities and Money Market Instruments Admitted to an Official Stock Exchange Listing or Dealt in on Another Regulated Market
Transferable Securities and Money Market Instruments Admitted to an Official Stock Exchange Listing or Dealt in on Another Regulated Market
Holding
Description
Market Value (USD)
% of Net
Assets
Holding
Description
Market Value (USD)
% of Net
Assets
* All or a portion of this security represents a security on loan.
The notes on pages 728 to 741 form an integral part of these financial statements.
Annual Report and Audited Financial Statements [151]
Dynamic High Income Fund continued
USD 715,000 Honghua Group Ltd 6.375% 1/8/2022 717,115 0.02
USD 400,000 Jingrui Holdings Ltd 9.45% 23/4/2021 372,813 0.01
USD 300,000 Kaisa Group Holdings Ltd 8.5% 30/6/2022 269,408 0.01
USD 1,860,000 Kaisa Group Holdings Ltd 9.375% 30/6/2024 1,569,956 0.05
USD 715,000 Kaisa Group Holdings Ltd 10.875% 23/7/2023 654,672 0.02
USD 875,000 King Talent Management Ltd FRN 4/12/2022 (Perpetual) 767,539 0.03
USD 1,050,000 KWG Group Holdings Ltd 5.875% 10/11/2024 909,398 0.03
USD 700,000 KWG Group Holdings Ltd 7.875% 1/9/2023 680,750 0.02
USD 1,650,000 Latam Finance Ltd ‘144A’ 6.875% 11/4/2024 1,721,156 0.06
USD 200,000 Lima Metro Line 2 Finance Ltd ‘144A’ 4.35% 5/4/2036 211,594 0.01
USD 1,400,000 Logan Property Holdings Co Ltd 6.5% 16/7/2023 1,372,000 0.05
USD 900,000 Logan Property Holdings Co Ltd 6.875% 24/4/2021 918,077 0.03
USD 215,000 Logan Property Holdings Co Ltd 7.5% 25/8/2022* 221,593 0.01
USD 400,000 Modern Land China Co Ltd 12.85% 25/10/2021 378,000 0.01
USD 42,000 Noble Holding International Ltd 7.75% 15/1/2024 28,140 0.00
USD 1,267,000 Noble Holding International Ltd ‘144A’ 7.875% 1/2/2026 1,043,691 0.03
USD 1,050,000 Overseas Chinese Town Asia Holdings Ltd FRN 10/10/2020 (Perpetual) 1,053,117 0.03
USD 1,050,000 Pearl Holding III Ltd 9.5% 11/12/2022 834,750 0.03
USD 1,329,000 Powerlong Real Estate Holdings Ltd 5.95% 19/7/2020 1,324,707 0.04
USD 800,000 Powerlong Real Estate Holdings Ltd 6.95% 17/4/2021 792,770 0.03
USD 815,000 Redco Properties Group Ltd 13.5% 21/1/2020 828,244 0.03
USD 1,800,000 Redsun Properties Group Ltd 10.5% 3/10/2022 1,665,000 0.05
USD 1,880,000 Ronshine China Holdings Ltd 8.75% 25/10/2022 1,887,438 0.06
USD 885,000 Ronshine China Holdings Ltd 8.95% 22/1/2023 876,102 0.03
USD 200,000 Ronshine China Holdings Ltd 11.25% 22/8/2021 212,585 0.01
USD 200,000 Sable International Finance Ltd ‘144A’ 5.75% 7/9/2027 208,500 0.01
USD 600,000 Shimao Property Holdings Ltd 6.375% 15/10/2021 627,750 0.02
USD 257,000 Sunac China Holdings Ltd 6.875% 8/8/2020 258,606 0.01
USD 1,460,000 Sunac China Holdings Ltd 7.25% 14/6/2022* 1,418,490 0.05
USD 1,050,000 Times China Holdings Ltd 6.25% 23/1/2020 1,054,758 0.03
USD 800,000 Times China Holdings Ltd 6.75% 16/7/2023 782,250 0.03
USD 500,000 Times China Holdings Ltd 7.625% 21/2/2022 512,984 0.02
USD 787,000 Transocean Inc ‘144A’ 7.25% 1/11/2025 719,121 0.02
USD 233,000 Transocean Inc ‘144A’ 7.5% 15/1/2026 214,943 0.01
USD 33,000 Transocean Inc 8.375% 15/12/2021 34,279 0.00
USD 948,000 Transocean Inc ‘144A’ 9% 15/7/2023 980,706 0.03
USD 171,770 Transocean Pontus Ltd ‘144A’ 6.125% 1/8/2025 175,016 0.01
USD 715,000 Transocean Poseidon Ltd ‘144A’ 6.875% 1/2/2027 748,069 0.02
USD 642,000 Vale Overseas Ltd 6.25% 10/8/2026 739,295 0.02 USD 500,000 VLL International Inc 5.75%
28/11/2024* 517,813 0.02 USD 500,000 VLL International Inc 7.375%
18/6/2022 545,090 0.02 USD 1,000,000 Voya CLO 2017-3 Ltd ‘Series
2017-3A C’ FRN 20/7/2030 1,002,589 0.03 USD 800,000 Xinyuan Real Estate Co Ltd 7.75%
28/2/2021* 711,500 0.02 USD 1,100,000 Yankuang Group Cayman Ltd
4.75% 30/11/2020 1,106,259 0.04 USD 455,000 Yuzhou Properties Co Ltd 6%
25/10/2023 407,438 0.01 USD 1,000,000 Yuzhou Properties Co Ltd 6.375%
6/3/2021* 997,110 0.03 USD 600,000 Yuzhou Properties Co Ltd 7.9%
11/5/2021 612,000 0.02 USD 800,000 Yuzhou Properties Co Ltd 8.5%
26/2/2024 776,000 0.03 USD 445,000 Yuzhou Properties Co Ltd 8.625%
23/1/2022 453,900 0.01 USD 500,000 Zhenro Properties Group Ltd 9.15%
8/3/2022 503,125 0.02 USD 400,000 Zhenro Properties Group Ltd 12.5%
2/1/2021 424,375 0.01 75,554,745 2.49
Chile USD 1,824,267 Celeo Redes Operacion Chile SA
‘144A’ 5.2% 22/6/2047 2,034,913 0.07
China EUR 300,000 Chengdu Xingcheng Investment
Group Co Ltd 2.5% 20/3/2021 327,870 0.01 USD 1,050,000 China Minmetals Corp FRN
13/11/2022 (Perpetual) 1,052,461 0.04 USD 750,000 Export-Import Bank of China/The
4% 28/11/2047 891,797 0.03 USD 1,075,000 Guangxi Financial Investment
Group Co Ltd 5.75% 23/1/2021 1,034,666 0.03 USD 1,625,000 Huachen Energy Co Ltd 6.625%
18/5/2020 934,537 0.03 USD 1,600,000 Jinke Properties Group Co Ltd
8.375% 20/6/2021 1,596,000 0.05 USD 300,000 Postal Savings Bank of China Co
Ltd FRN 27/9/2022 (Perpetual) 300,937 0.01 6,138,268 0.20
Colombia USD 1,384,000 Colombia Government International
Bond 3.875% 25/4/2027 1,499,261 0.05 USD 1,090,000 Colombia Government International
Bond 4.375% 12/7/2021 1,135,303 0.04 USD 4,424,000 Colombia Government International
Bond 4.5% 28/1/2026 4,899,580 0.16 USD 1,420,000 Colombia Government International
Bond 8.125% 21/5/2024 1,783,431 0.06 USD 1,007,000 Credivalores-Crediservicios SAS
‘144A’ 9.75% 27/7/2022 1,003,067 0.03 USD 253,000 Empresas Publicas de Medellin
ESP ‘144A’ 4.25% 18/7/2029 266,283 0.01 10,586,925 0.35
Portfolio of Investments 31 August 2019
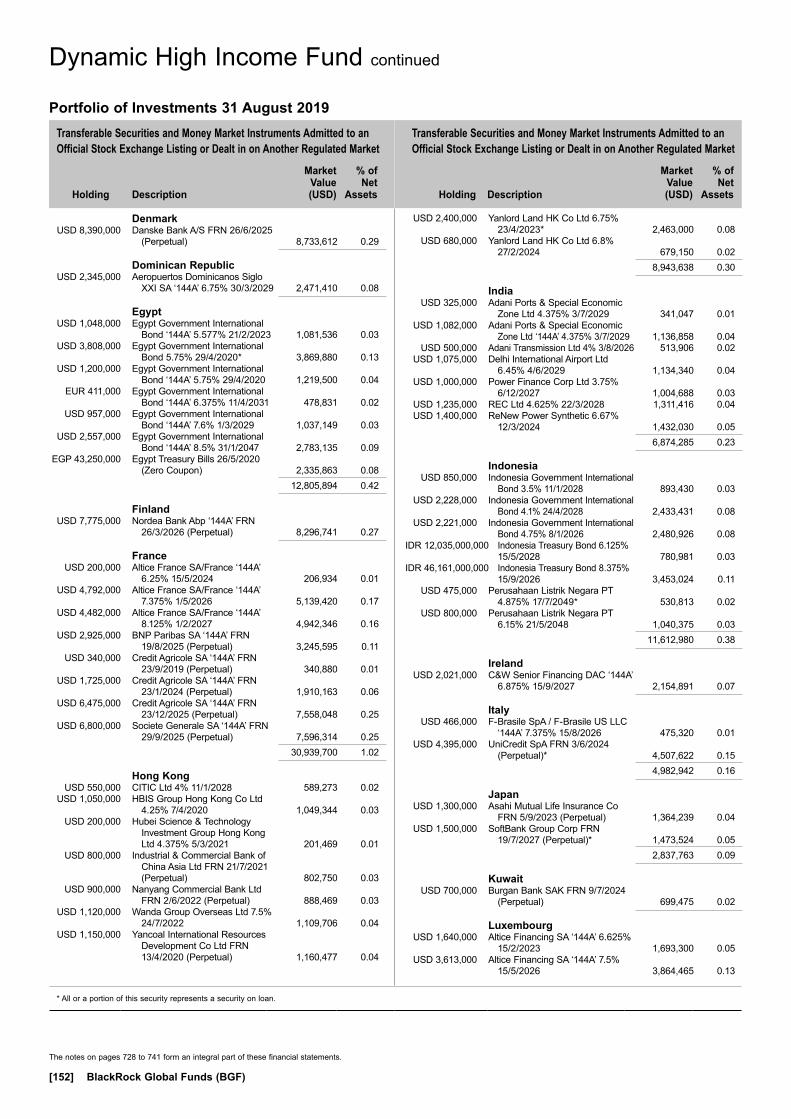
Transferable Securities and Money Market Instruments Admitted to an Official Stock Exchange Listing or Dealt in on Another Regulated Market
Transferable Securities and Money Market Instruments Admitted to an Official Stock Exchange Listing or Dealt in on Another Regulated Market
Holding
Description
Market Value (USD)
% of Net
Assets
Holding
Description
Market Value (USD)
% of Net
Assets
* All or a portion of this security represents a security on loan.
The notes on pages 728 to 741 form an integral part of these financial statements.
[152] BlackRock Global Funds (BGF)
Dynamic High Income Fund continued
Denmark USD 8,390,000 Danske Bank A/S FRN 26/6/2025
(Perpetual) 8,733,612 0.29
Dominican Republic USD 2,345,000 Aeropuertos Dominicanos Siglo
XXI SA ‘144A’ 6.75% 30/3/2029 2,471,410 0.08
Egypt USD 1,048,000 Egypt Government International
Bond ‘144A’ 5.577% 21/2/2023 1,081,536 0.03 USD 3,808,000 Egypt Government International
Bond 5.75% 29/4/2020* 3,869,880 0.13 USD 1,200,000 Egypt Government International
Bond ‘144A’ 5.75% 29/4/2020 1,219,500 0.04 EUR 411,000 Egypt Government International
Bond ‘144A’ 6.375% 11/4/2031 478,831 0.02 USD 957,000 Egypt Government International
Bond ‘144A’ 7.6% 1/3/2029 1,037,149 0.03 USD 2,557,000 Egypt Government International
Bond ‘144A’ 8.5% 31/1/2047 2,783,135 0.09 EGP 43,250,000 Egypt Treasury Bills 26/5/2020
(Zero Coupon) 2,335,863 0.08 12,805,894 0.42
Finland USD 7,775,000 Nordea Bank Abp ‘144A’ FRN
26/3/2026 (Perpetual) 8,296,741 0.27
France USD 200,000 Altice France SA/France ‘144A’
6.25% 15/5/2024 206,934 0.01 USD 4,792,000 Altice France SA/France ‘144A’
7.375% 1/5/2026 5,139,420 0.17 USD 4,482,000 Altice France SA/France ‘144A’
8.125% 1/2/2027 4,942,346 0.16 USD 2,925,000 BNP Paribas SA ‘144A’ FRN
19/8/2025 (Perpetual) 3,245,595 0.11 USD 340,000 Credit Agricole SA ‘144A’ FRN
23/9/2019 (Perpetual) 340,880 0.01 USD 1,725,000 Credit Agricole SA ‘144A’ FRN
23/1/2024 (Perpetual) 1,910,163 0.06 USD 6,475,000 Credit Agricole SA ‘144A’ FRN
23/12/2025 (Perpetual) 7,558,048 0.25 USD 6,800,000 Societe Generale SA ‘144A’ FRN
29/9/2025 (Perpetual) 7,596,314 0.25 30,939,700 1.02
Hong Kong USD 550,000 CITIC Ltd 4% 11/1/2028 589,273 0.02 USD 1,050,000 HBIS Group Hong Kong Co Ltd
4.25% 7/4/2020 1,049,344 0.03 USD 200,000 Hubei Science & Technology
Investment Group Hong Kong Ltd 4.375% 5/3/2021 201,469 0.01
USD 800,000 Industrial & Commercial Bank of China Asia Ltd FRN 21/7/2021 (Perpetual) 802,750 0.03
USD 900,000 Nanyang Commercial Bank Ltd FRN 2/6/2022 (Perpetual) 888,469 0.03
USD 1,120,000 Wanda Group Overseas Ltd 7.5% 24/7/2022 1,109,706 0.04
USD 1,150,000 Yancoal International Resources Development Co Ltd FRN 13/4/2020 (Perpetual) 1,160,477 0.04
USD 2,400,000 Yanlord Land HK Co Ltd 6.75% 23/4/2023* 2,463,000 0.08
USD 680,000 Yanlord Land HK Co Ltd 6.8% 27/2/2024 679,150 0.02
8,943,638 0.30
India USD 325,000 Adani Ports & Special Economic
Zone Ltd 4.375% 3/7/2029 341,047 0.01 USD 1,082,000 Adani Ports & Special Economic
Zone Ltd ‘144A’ 4.375% 3/7/2029 1,136,858 0.04 USD 500,000 Adani Transmission Ltd 4% 3/8/2026 513,906 0.02 USD 1,075,000 Delhi International Airport Ltd
6.45% 4/6/2029 1,134,340 0.04 USD 1,000,000 Power Finance Corp Ltd 3.75%
6/12/2027 1,004,688 0.03 USD 1,235,000 REC Ltd 4.625% 22/3/2028 1,311,416 0.04 USD 1,400,000 ReNew Power Synthetic 6.67%
12/3/2024 1,432,030 0.05 6,874,285 0.23
Indonesia USD 850,000 Indonesia Government International
Bond 3.5% 11/1/2028 893,430 0.03 USD 2,228,000 Indonesia Government International
Bond 4.1% 24/4/2028 2,433,431 0.08 USD 2,221,000 Indonesia Government International
Bond 4.75% 8/1/2026 2,480,926 0.08 IDR 12,035,000,000 Indonesia Treasury Bond 6.125%
15/5/2028 780,981 0.03 IDR 46,161,000,000 Indonesia Treasury Bond 8.375%
15/9/2026 3,453,024 0.11 USD 475,000 Perusahaan Listrik Negara PT
4.875% 17/7/2049* 530,813 0.02 USD 800,000 Perusahaan Listrik Negara PT
6.15% 21/5/2048 1,040,375 0.03 11,612,980 0.38
Ireland USD 2,021,000 C&W Senior Financing DAC ‘144A’
6.875% 15/9/2027 2,154,891 0.07
Italy USD 466,000 F-Brasile SpA / F-Brasile US LLC
‘144A’ 7.375% 15/8/2026 475,320 0.01 USD 4,395,000 UniCredit SpA FRN 3/6/2024
(Perpetual)* 4,507,622 0.15 4,982,942 0.16
Japan USD 1,300,000 Asahi Mutual Life Insurance Co
FRN 5/9/2023 (Perpetual) 1,364,239 0.04 USD 1,500,000 SoftBank Group Corp FRN
19/7/2027 (Perpetual)* 1,473,524 0.05 2,837,763 0.09
Kuwait USD 700,000 Burgan Bank SAK FRN 9/7/2024
(Perpetual) 699,475 0.02
Luxembourg USD 1,640,000 Altice Financing SA ‘144A’ 6.625%
15/2/2023 1,693,300 0.05 USD 3,613,000 Altice Financing SA ‘144A’ 7.5%
15/5/2026 3,864,465 0.13
Portfolio of Investments 31 August 2019

Transferable Securities and Money Market Instruments Admitted to an Official Stock Exchange Listing or Dealt in on Another Regulated Market
Transferable Securities and Money Market Instruments Admitted to an Official Stock Exchange Listing or Dealt in on Another Regulated Market
Holding
Description
Market Value (USD)
% of Net
Assets
Holding
Description
Market Value (USD)
% of Net
Assets
* All or a portion of this security represents a security on loan.
The notes on pages 728 to 741 form an integral part of these financial statements.
Annual Report and Audited Financial Statements [153]
Dynamic High Income Fund continued
USD 2,130,000 Altice Luxembourg SA ‘144A’ 7.625% 15/2/2025 2,204,550 0.07
USD 576,000 Altice Luxembourg SA ‘144A’ 7.75% 15/5/2022 592,128 0.02
USD 2,501,000 Altice Luxembourg SA ‘144A’ 10.5% 15/5/2027 2,719,837 0.09
USD 636,000 Gilex Holding Sarl ‘144A’ 8.5% 2/5/2023* 681,315 0.02
USD 2,871,000 Intelsat Jackson Holdings SA 5.5% 1/8/2023 2,623,376 0.09
USD 1,728,000 Intelsat Jackson Holdings SA ‘144A’ 8.5% 15/10/2024 1,712,880 0.06
USD 3,380,000 Intelsat Jackson Holdings SA ‘144A’ 9.75% 15/7/2025 3,485,625 0.11
USD 1,391,000 Minerva Luxembourg SA ‘144A’ 6.5% 20/9/2026 1,437,294 0.05
USD 1,857,000 Nexa Resources SA ‘144A’ 5.375% 4/5/2027 1,941,726 0.06
USD 232,000 Nielsen Co Luxembourg SARL/The ‘144A’ 5% 1/2/2025 229,100 0.01
USD 1,895,000 Pacific Drilling SA ‘144A’ 8.375% 1/10/2023 1,745,769 0.06
USD 2,350,000 Rumo Luxembourg Sarl ‘144A’ 7.375% 9/2/2024 2,523,313 0.08
USD 1,400,000 Telenet Finance Luxembourg Notes Sarl ‘144A’ 5.5% 1/3/2028* 1,430,800 0.05
USD 381,000 Usiminas International Sarl ‘144A’ 5.875% 18/7/2026 386,715 0.01
29,272,193 0.96
Malaysia USD 2,000,000 1MDB Energy Ltd 5.99% 11/5/2022 2,110,000 0.07 USD 800,000 Press Metal Labuan Ltd 4.8%
30/10/2022 793,250 0.03 2,903,250 0.10
Maldives USD 1,075,000 Republic of Maldives Ministry of
Finance and Treasury Bond 7% 7/6/2022 1,038,987 0.03
Mauritius USD 725,000 Greenko Investment Co 4.875%
16/8/2023 721,148 0.02 USD 300,000 Greenko Mauritius Ltd 6.25%
21/2/2023 306,375 0.01 USD 300,000 HT Global IT Solutions Holdings
Ltd 7% 14/7/2021 308,719 0.01 1,336,242 0.04
Mexico USD 2,491,000 Axtel SAB de CV ‘144A’ 6.375%
14/11/2024 2,527,976 0.08 USD 500,000 Banco Mercantil del Norte SA/
Grand Cayman ‘144A’ FRN 27/9/2024 (Perpetual) 496,406 0.02
USD 1,179,000 BBVA Bancomer SA/Texas ‘144A’ 6.75% 30/9/2022 1,279,399 0.04
USD 1,061,000 Controladora Mabe SA de CV ‘144A’ 5.6% 23/10/2028 1,133,944 0.04
USD 2,044,000 Cydsa SAB de CV ‘144A’ 6.25% 4/10/2027 2,054,220 0.07
USD 2,010,000 Grupo Bimbo SAB de CV ‘144A’ FRN 17/4/2023 (Perpetual) 2,107,491 0.07
USD 1,597,000 Grupo Posadas SAB de CV ‘144A’ 7.875% 30/6/2022 1,597,000 0.05
USD 1,191,000 Mexichem SAB de CV ‘144A’ 5.5% 15/1/2048 1,225,055 0.04
USD 1,410,000 Mexico Government International Bond 3.75% 11/1/2028 1,475,565 0.05
USD 1,380,000 Mexico Government International Bond 4.15% 28/3/2027 1,483,500 0.05
USD 103,000 Mexico Government International Bond 8.3% 15/8/2031 152,199 0.00
USD 115,000 Petroleos Mexicanos 5.35% 12/2/2028 108,729 0.00
USD 519,000 Petroleos Mexicanos 6.375% 4/2/2021 534,830 0.02
USD 1,065,000 Petroleos Mexicanos 6.5% 13/3/2027 1,084,702 0.04
USD 2,633,000 Trust F/1401 6.95% 30/1/2044* 3,063,331 0.10 20,324,347 0.67
Mongolia USD 800,000 Mongolian Mining Corp/Energy
Resources LLC 9.25% 15/4/2024 760,000 0.03 USD 1,350,000 Mongolian Mortgage Corp Hfc LLC
9.75% 29/1/2022 1,344,633 0.04 2,104,633 0.07
Netherlands USD 1,137,000 Alpha 2 BV ‘144A’ 8.75% 1/6/2023 1,104,311 0.04 USD 6,096,000 Alpha 3 BV / Alpha US Bidco Inc
‘144A’ 6.25% 1/2/2025 6,080,760 0.20 USD 2,886,000 Constellium SE ‘144A’ 5.75%
15/5/2024 2,979,795 0.10 USD 4,740,000 Constellium SE ‘144A’ 5.875%
15/2/2026 4,929,600 0.16 USD 1,209,000 Constellium SE ‘144A’ 6.625%
1/3/2025 1,263,405 0.04 USD 7,500,000 ING Groep NV FRN 16/4/2020
(Perpetual) 7,579,500 0.25 USD 1,325,000 Jababeka International BV 6.5%
5/10/2023 1,190,466 0.04 USD 1,469,000 JBS USA LUX SA / JBS USA Food
Co / JBS USA Finance Inc ‘144A’ 6.5% 15/4/2029 1,623,245 0.05
USD 650,000 Minejesa Capital BV 4.625% 10/8/2030 685,387 0.02
USD 1,300,000 Mong Duong Finance Holdings BV 5.125% 7/5/2029 1,318,927 0.04
USD 1,027,000 Petrobras Global Finance BV 5.299% 27/1/2025 1,110,444 0.04
USD 1,722,000 Petrobras Global Finance BV 5.999% 27/1/2028 1,899,108 0.06
USD 55,000 Petrobras Global Finance BV 6.125% 17/1/2022 59,108 0.00
USD 1,400,000 Petrobras Global Finance BV 7.25% 17/3/2044 1,660,750 0.05
USD 381,000 Petrobras Global Finance BV 7.375% 17/1/2027 453,390 0.01
USD 1,710,000 Petrobras Global Finance BV 8.75% 23/5/2026 2,150,325 0.07
USD 507,000 Royal Capital BV 5.875% 5/5/2022 (Perpetual) 512,308 0.02
USD 1,918,000 Trivium Packaging Finance BV ‘144A’ 5.5% 15/8/2026 2,033,080 0.07
USD 2,415,000 Trivium Packaging Finance BV ‘144A’ 8.5% 15/8/2027 2,602,162 0.09
USD 3,395,000 Ziggo Bond Co BV ‘144A’ 5.875% 15/1/2025 3,526,556 0.12
USD 150,000 Ziggo Bond Co BV ‘144A’ 6% 15/1/2027 157,125 0.01
44,919,752 1.48
Portfolio of Investments 31 August 2019

Transferable Securities and Money Market Instruments Admitted to an Official Stock Exchange Listing or Dealt in on Another Regulated Market
Transferable Securities and Money Market Instruments Admitted to an Official Stock Exchange Listing or Dealt in on Another Regulated Market
Holding
Description
Market Value (USD)
% of Net
Assets
Holding
Description
Market Value (USD)
% of Net
Assets
* All or a portion of this security represents a security on loan.
The notes on pages 728 to 741 form an integral part of these financial statements.
[154] BlackRock Global Funds (BGF)
Dynamic High Income Fund continued
Nigeria USD 2,315,000 Nigeria Government International
Bond 7.625% 21/11/2025 2,546,138 0.08 NGN 583,209,000 Nigeria Treasury Bill 27/2/2020
(Zero Coupon) 1,507,440 0.05 4,053,578 0.13
Panama USD 1,111,000 Avianca Holdings SA / Avianca
Leasing LLC / Grupo Taca Holdings Ltd (Restricted) 8.375% 10/5/2020* 878,384 0.03
USD 200,000 Promerica Financial Corp ‘144A’ 9.7% 14/5/2024 214,002 0.01
1,092,386 0.04
Paraguay USD 1,095,000 Paraguay Government
International Bond ‘144A’ 5.4% 30/3/2050 1,294,810 0.04
Qatar USD 2,550,000 Qatar Government International
Bond ‘144A’ 4% 14/3/2029 2,921,742 0.10 USD 2,810,000 Qatar Government International
Bond 4.5% 23/4/2028 3,301,750 0.11 6,223,492 0.21
Russian Federation USD 2,200,000 Russian Foreign Bond - Eurobond
4.25% 23/6/2027 2,341,900 0.08 USD 2,400,000 Russian Foreign Bond - Eurobond
4.75% 27/5/2026 2,620,875 0.08 4,962,775 0.16
Saint Lucia USD 467,000 Digicel International Finance Ltd /
Digicel Holdings Bermuda Ltd ‘144A’ 8.75% 25/5/2024 440,366 0.01
Saudi Arabia USD 650,000 Saudi Arabian Oil Co ‘144A’
3.5% 16/4/2029 695,175 0.02 USD 741,000 Saudi Government International
Bond ‘144A’ 4.375% 16/4/2029 855,114 0.03 USD 2,800,000 Saudi Government International
Bond 4.5% 17/4/2030 3,277,400 0.11 4,827,689 0.16
Singapore USD 1,215,000 Alam Synergy Pte Ltd 6.625%
24/4/2022 1,141,650 0.03 USD 235,000 Alam Synergy Pte Ltd 11.5%
22/4/2021 248,278 0.01 USD 631,000 BPRL International Singapore Pte
Ltd 4.375% 18/1/2027 678,830 0.02 USD 1,200,000 Global Prime Capital Pte Ltd
7.25% 26/4/2021 1,244,928 0.04 USD 800,000 JGC Ventures Pte Ltd 10.75%
30/8/2021 848,004 0.03 USD 600,000 Jubilant Pharma Ltd/SG 6%
5/3/2024 620,250 0.02 USD 1,650,000 Medco Straits Services Pte Ltd
8.5% 17/8/2022 1,750,031 0.06
USD 1,350,000 Modernland Overseas Pte Ltd 6.95% 13/4/2024 1,234,926 0.04
USD 545,000 United Overseas Bank Ltd FRN 19/10/2023 (Perpetual) 548,713 0.02
8,315,610 0.27
South Africa USD 2,715,000 Republic of South Africa
Government International Bond 5.875% 30/5/2022 2,903,353 0.10
South Korea USD 250,000 Heungkuk Life Insurance Co Ltd
FRN 9/11/2022 (Perpetual) 243,668 0.01 USD 800,000 KDB Life Insurance Co Ltd FRN
21/5/2023 (Perpetual) 793,125 0.02 USD 800,000 Shinhan Financial Group Co Ltd
FRN 13/8/2023 (Perpetual) 856,750 0.03 USD 800,000 Woori Bank 5.125% 6/8/2028 925,471 0.03 2,819,014 0.09
Spain USD 4,400,000 Banco Bilbao Vizcaya Argentaria
SA FRN 16/11/2027 (Perpetual) 4,134,460 0.14
Sri Lanka USD 1,000,000 Sri Lanka Government International
Bond 5.875% 25/7/2022 1,002,969 0.03 USD 1,400,000 Sri Lanka Government International
Bond 6.25% 4/10/2020 1,423,187 0.05 USD 375,000 Sri Lanka Government International
Bond 6.85% 14/3/2024 381,798 0.01 USD 813,000 Sri Lanka Government International
Bond 7.85% 14/3/2029 823,235 0.03 USD 1,400,000 SriLankan Airlines Ltd 7% 25/6/2024 1,389,500 0.05 5,020,689 0.17
Switzerland USD 2,125,000 Credit Suisse Group AG ‘144A’
FRN 11/12/2023 (Perpetual) 2,347,976 0.08 USD 8,029,000 Credit Suisse Group AG ‘144A’
FRN 18/12/2024 (Perpetual) 8,485,136 0.28 USD 2,500,000 Credit Suisse Group AG ‘144A’
FRN 21/8/2026 (Perpetual) 2,584,375 0.09 USD 9,475,000 UBS Group Funding Switzerland
AG FRN 22/3/2021 (Perpetual) 9,864,896 0.32 USD 8,000,000 UBS Group Funding Switzerland
AG FRN 7/8/2025 (Perpetual) 8,545,200 0.28 31,827,583 1.05
Turkey USD 918,000 Petkim Petrokimya Holding AS
‘144A’ 5.875% 26/1/2023 890,460 0.03 USD 346,000 Turkey Government International
Bond 4.875% 16/4/2043 268,582 0.01 1,159,042 0.04
Ukraine USD 381,000 Ukraine Government International
Bond 7.75% 1/9/2022 404,241 0.01 USD 763,000 Ukraine Government International
Bond 9.75% 1/11/2028 887,941 0.03 1,292,182 0.04
Portfolio of Investments 31 August 2019

Transferable Securities and Money Market Instruments Admitted to an Official Stock Exchange Listing or Dealt in on Another Regulated Market
Transferable Securities and Money Market Instruments Admitted to an Official Stock Exchange Listing or Dealt in on Another Regulated Market
Holding
Description
Market Value (USD)
% of Net
Assets
Holding
Description
Market Value (USD)
% of Net
Assets
The notes on pages 728 to 741 form an integral part of these financial statements.
Annual Report and Audited Financial Statements [155]
Dynamic High Income Fund continued
United Arab Emirates USD 1,600,000 Emirates NBD PJSC FRN
20/3/2025 (Perpetual) 1,692,000 0.06 USD 600,000 Emirates Semb Corp Water &
Power Co PJSC 4.45% 1/8/2035 665,156 0.02 2,357,156 0.08
United Kingdom USD 2,223,000 Algeco Global Finance Plc ‘144A’
8% 15/2/2023 2,235,782 0.07 USD 396,000 Ardonagh Midco 3 Plc ‘144A’
8.625% 15/7/2023 385,110 0.01 USD 170,000 Avon International Capital Plc
‘144A’ 6.5% 15/8/2022 175,525 0.01 USD 6,332,000 Barclays Plc FRN 15/3/2022
(Perpetual) 6,605,701 0.22 USD 1,187,000 eG Global Finance Plc ‘144A’
6.75% 7/2/2025 1,149,906 0.04 USD 5,675,000 HSBC Holdings Plc FRN
22/5/2027 (Perpetual) 5,697,813 0.19 USD 9,540,000 HSBC Holdings Plc FRN
23/3/2028 (Perpetual) 9,781,839 0.32 USD 1,645,000 Lloyds Banking Group Plc FRN
27/6/2026 (Perpetual) 1,669,675 0.05 USD 2,471,000 MARB BondCo Plc ‘144A’ 6.875%
19/1/2025 2,525,439 0.08 USD 477,000 MARB BondCo Plc 7% 15/3/2024 491,310 0.02 USD 9,120,000 Royal Bank of Scotland Group Plc
FRN 15/8/2021 (Perpetual) 9,678,600 0.32 USD 7,500,000 Standard Chartered Plc ‘144A’ FRN
2/4/2020 (Perpetual) 7,567,125 0.25 USD 3,875,000 Standard Chartered Plc ‘144A’ FRN
2/4/2022 (Perpetual) 4,073,594 0.13 USD 2,200,000 Vedanta Resources Ltd 7.125%
31/5/2023 2,118,188 0.07 USD 300,000 Vedanta Resources Ltd 8.25%
7/6/2021 311,813 0.01 USD 1,969,000 Virgin Media Finance Plc ‘144A’
5.75% 15/1/2025 2,050,221 0.07 USD 4,930,000 Vodafone Group Plc FRN 4/4/2079 5,619,597 0.19 62,137,238 2.05
United States USD 1,495,000 ACI Worldwide Inc ‘144A’ 5.75%
15/8/2026 1,573,488 0.05 USD 251,000 Acrisure LLC / Acrisure Finance Inc
‘144A’ 8.125% 15/2/2024 270,923 0.01 USD 778,000 ADT Security Corp/The ‘144A’
4.875% 15/7/2032 681,722 0.02 USD 783,000 AHP Health Partners Inc ‘144A’
9.75% 15/7/2026 844,955 0.03 USD 1,000,000 AIMCO CLO Series 2017-A ‘Series
2017-AA C’ ‘144A’ FRN 20/7/2029 995,881 0.03 USD 500,000 AIMCO CLO Series 2018-A ‘Series
2018-AA C’ ‘144A’ FRN 17/4/2031 475,769 0.02 USD 1,169,111 Ajax Mortgage Loan Trust 2018-E
‘Series 2018-E A’ ‘144A’ FRN 25/6/2058 1,215,596 0.04
USD 1,270,648 Ajax Mortgage Loan Trust 2018-F ‘Series 2018-F A’ ‘144A’ FRN 25/11/2058 1,319,154 0.04
USD 1,708,606 Ajax Mortgage Loan Trust 2018-G ‘Series 2018-G A’ ‘144A’ FRN 25/6/2057 1,768,235 0.06
USD 1,040,000 Albertsons Cos LLC / Safeway Inc / New Albertsons LP / Albertson’s LLC ‘144A’ 5.875% 15/2/2028 1,099,800 0.04
USD 340,000 Albertsons Cos LLC / Safeway Inc / New Albertsons LP / Albertson’s LLC 6.625% 15/6/2024 357,850 0.01
USD 300,000 Albertsons Cos LLC / Safeway Inc / New Albertsons LP / Albertson’s LLC ‘144A’ 7.5% 15/3/2026 334,500 0.01
USD 1,000,000 Allegro CLO II-S Ltd ‘Series 2014-1RA B’ ‘144A’ FRN 21/10/2028 992,548 0.03
USD 1,000,000 Allegro CLO VIII Ltd ‘Series 2018-2A C’ ‘144A’ FRN 15/7/2031 976,280 0.03
USD 1,997,000 Alliant Holdings Intermediate LLC / Alliant Holdings Co-Issuer ‘144A’ 8.25% 1/8/2023 2,044,429 0.07
USD 2,882,000 Allied Universal Holdco LLC / Allied Universal Finance Corp ‘144A’ 6.625% 15/7/2026 3,062,125 0.10
USD 4,408,000 Ally Financial Inc 8% 1/11/2031 6,182,220 0.20 USD 1,500,000 ALM VI Ltd ‘Series 2012-6A BR3’
‘144A’ FRN 15/7/2026 1,483,021 0.05 USD 3,200,000 ALM VII R-2 Ltd ‘Series 2013-
7R2A A2R2’ ‘144A’ FRN 15/10/2027 3,184,260 0.10
USD 550,000 ALM VII R-2 Ltd ‘Series 2013-7R2A BR2’ ‘144A’ FRN 15/10/2027 540,431 0.02
USD 1,500,000 ALM XVI Ltd/ALM XVI LLC ‘Series 2015-16A BR2’ ‘144A’ FRN 15/7/2027 1,485,042 0.05
USD 323,000 American Builders & Contractors Supply Co Inc ‘144A’ 5.875% 15/5/2026 343,591 0.01
USD 1,000,000 Ammc Clo 19 Ltd ‘Series 2016-19A D’ ‘144A’ FRN 15/10/2028 1,000,568 0.03
USD 2,600,000 AMMC CLO 22 Ltd ‘Series 2018-22A D’ ‘144A’ FRN 25/4/2031 2,435,201 0.08
USD 182,000 AmWINS Group Inc ‘144A’ 7.75% 1/7/2026 192,010 0.01
USD 2,000,000 ANCHORAGE CAPITAL CLO 1-R Ltd ‘Series 2018-1RA C’ ‘144A’ FRN 13/4/2031 1,923,549 0.06
USD 1,000,000 Anchorage Capital CLO 3-R Ltd ‘Series 2014-3RA B’ ‘144A’ FRN 28/1/2031 982,526 0.03
USD 800,000 Anchorage Capital CLO 4-R Ltd ‘Series 2014-4RA C’ ‘144A’ FRN 28/1/2031 770,709 0.03
USD 1,500,000 Anchorage Capital CLO 8 Ltd ‘Series 2016-8A DR’ ‘144A’ FRN 28/7/2028 1,479,450 0.05
USD 461,000 Anixter Inc 6% 1/12/2025 511,134 0.02 USD 163,000 Antero Resources Corp 5.375%
1/11/2021 158,518 0.01 USD 494,000 Apergy Corp 6.375% 1/5/2026 498,940 0.02 USD 500,000 Apidos CLO XI ‘Series 2012-11A
CR’ ‘144A’ FRN 17/1/2028 500,997 0.02 USD 1,000,000 Apidos CLO XV ‘Series 2013-15A
CRR’ ‘144A’ FRN 20/4/2031 969,462 0.03 USD 1,000,000 Apidos CLO XV ‘Series 2013-15A
ERR’ ‘144A’ FRN 20/4/2031 915,425 0.03 USD 1,750,000 Apidos CLO XXIV ‘Series 2016-
24A BR’ ‘144A’ FRN 20/10/2030 1,729,162 0.06 USD 1,000,000 Apidos CLO XXIX ‘Series 2018-
29A B’ ‘144A’ FRN 25/7/2030 969,023 0.03 USD 293,000 APX Group Inc 8.75% 1/12/2020 278,716 0.01 USD 1,034,000 Archrock Partners LP / Archrock
Partners Finance Corp ‘144A’ 6.875% 1/4/2027 1,083,115 0.04
USD 950,000 Ares XLI Clo Ltd ‘Series 2016-41A C’ ‘144A’ FRN 15/1/2029 950,145 0.03
Portfolio of Investments 31 August 2019

Transferable Securities and Money Market Instruments Admitted to an Official Stock Exchange Listing or Dealt in on Another Regulated Market
Transferable Securities and Money Market Instruments Admitted to an Official Stock Exchange Listing or Dealt in on Another Regulated Market
Holding
Description
Market Value (USD)
% of Net
Assets
Holding
Description
Market Value (USD)
% of Net
Assets
The notes on pages 728 to 741 form an integral part of these financial statements.
[156] BlackRock Global Funds (BGF)
Dynamic High Income Fund continued
USD 1,000,000 ARES XLIV CLO Ltd ‘Series 2017-44A C’ ‘144A’ FRN 15/10/2029 990,712 0.03
USD 500,000 Ares XLIX CLO Ltd ‘Series 2018-49A D’ ‘144A’ FRN 22/7/2030 474,834 0.02
USD 1,000,000 Ares XLIX CLO Ltd ‘Series 2018-49A E’ ‘144A’ FRN 22/7/2030 932,496 0.03
USD 4,000,000 ARES XLV CLO Ltd ‘Series 2017-45A D’ ‘144A’ FRN 15/10/2030 3,900,546 0.13
USD 1,250,000 ARES XLVII CLO Ltd ‘Series 2018-47A B’ ‘144A’ FRN 15/4/2030 1,225,373 0.04
USD 3,700,000 ARES XLVII CLO Ltd ‘Series 2018-47A C’ ‘144A’ FRN 15/4/2030 3,563,723 0.12
USD 7,500,000 ARES XLVII CLO Ltd ‘Series 2018-47A D’ ‘144A’ FRN 15/4/2030 7,008,597 0.23
USD 500,000 Ares XLVIII CLO ‘Series 2018-48A C’ ‘144A’ FRN 20/7/2030 481,415 0.02
USD 1,045,000 Ares XXVII CLO Ltd ‘Series 2013-2A CR’ ‘144A’ FRN 28/7/2029 1,050,442 0.03
USD 750,000 Ares XXVII CLO Ltd ‘Series 2013-2A DR’ ‘144A’ FRN 28/7/2029 751,381 0.02
USD 500,000 Ares XXXIIR CLO Ltd ‘Series 2014-32RA B’ ‘144A’ FRN 15/5/2030 479,670 0.02
USD 500,000 Ares XXXIIR CLO Ltd ‘Series 2014-32RA C’ ‘144A’ FRN 15/5/2030 469,779 0.02
USD 1,800,000 Ares XXXVIII CLO Ltd ‘Series 2015-38A CR’ ‘144A’ FRN 20/4/2030 1,727,683 0.06
USD 736,000 Asbury Automotive Group Inc 6% 15/12/2024 764,520 0.03
USD 3,824,000 Ascend Learning LLC ‘144A’ 6.875% 1/8/2025 3,976,960 0.13
USD 536,000 Ascent Resources Utica Holdings LLC / ARU Finance Corp ‘144A’ 10% 1/4/2022 540,690 0.02
USD 5,000,000 Ashford Hospitality Trust 2018-ASHF ‘Series 2018-ASHF D’ ‘144A’ FRN 15/4/2035 5,023,197 0.17
USD 3,500,000 ASSURANT CLO I Ltd ‘Series 2017-1A B’ ‘144A’ FRN 20/10/2029 3,490,890 0.11
USD 1,000,000 ASSURANT CLO I Ltd ‘Series 2017-1A C’ ‘144A’ FRN 20/10/2029 981,549 0.03
USD 1,000,000 ASSURANT CLO II Ltd ‘Series 2018-1A D’ ‘144A’ FRN 20/4/2031 945,401 0.03
USD 1,000,000 Atlas Senior Loan Fund VII Ltd ‘Series 2016-7A B1R’ ‘144A’ FRN 27/11/2031 991,825 0.03
USD 3,000,000 Atrium Hotel Portfolio Trust 2018-ATRM ‘Series 2018-ATRM E’ ‘144A’ FRN 15/6/2035 3,022,663 0.10
USD 1,000,000 Atrium IX ‘144A’ FRN 28/5/2030 998,243 0.03 USD 1,500,000 Atrium XIV LLC ‘144A’ FRN
23/8/2030 1,462,617 0.05 USD 500,000 Atrium XV ‘144A’ FRN 23/1/2031 497,506 0.02 USD 3,250,000 Atrium XV ‘144A’ FRN 23/1/2031 3,207,369 0.11 USD 1,250,000 Atrium XV ‘144A’ FRN 23/1/2031 1,179,066 0.04 USD 5,491,000 Avantor Inc ‘144A’ 6% 1/10/2024 5,902,825 0.19 USD 5,045,000 Avantor Inc ‘144A’ 9% 1/10/2025 5,681,931 0.19 USD 317,000 Avis Budget Car Rental LLC / Avis
Budget Finance Inc ‘144A’ 5.75% 15/7/2027 323,641 0.01
USD 4,481,704 BAMLL Commercial Mortgage Securities Trust 2018-DSNY ‘Series 2018-DSNY D’ ‘144A’ FRN 15/9/2034 4,482,493 0.15
USD 679,271 Banc of America Mortgage 2007-4 Trust ‘Series 2007-4 1A1’ 6.25% 28/12/2037 664,922 0.02
USD 4,854,000 Banff Merger Sub Inc ‘144A’ 9.75% 1/9/2026 4,509,366 0.15
USD 10,000,000 Bank of America Corp FRN 5/9/2024 (Perpetual) 10,932,150 0.36
USD 1,875,000 Bank of America Corp FRN 17/3/2025 (Perpetual) 2,045,091 0.07
USD 3,250,000 Bank of New York Mellon Corp/The FRN 20/9/2026 (Perpetual) 3,271,190 0.11
USD 1,012,000 Bausch Health Americas Inc ‘144A’ 8.5% 31/1/2027 1,124,585 0.04
USD 138,000 Bausch Health Americas Inc ‘144A’ 9.25% 1/4/2026 156,975 0.01
USD 5,436,819 Bayview Commercial Asset Trust 2006-3 ‘Series 2006-3A A1’ ‘144A’ FRN 25/10/2036 5,227,915 0.17
USD 6,061,198 Bayview Commercial Asset Trust 2007-4 ‘Series 2007-4A A1’ ‘144A’ FRN 25/9/2037 5,789,689 0.19
USD 550,000 BBCMS 2017-DELC Mortgage Trust ‘Series 2017-DELC F’ ‘144A’ FRN 15/8/2036 552,508 0.02
USD 1,570,000 BBCMS 2018-CHRS Mortgage Trust ‘Series 2018-CHRS E’ ‘144A’ FRN 5/8/2038 1,498,714 0.05
USD 1,000,000 BBCMS 2018-TALL Mortgage Trust ‘Series 2018-TALL E’ ‘144A’ FRN 15/3/2037 1,004,873 0.03
USD 27,000 Beacon Roofing Supply Inc ‘144A’ 4.875% 1/11/2025 26,629 0.00
USD 841,149 Bear Stearns Commercial Mortgage Securities Trust 2007-PWR18 ‘Series 2007-PW18 B’ ‘144A’ FRN 11/6/2050 869,672 0.03
USD 1,000,000 BENCHMARK 2018-B2 Mortgage Trust ‘Series 2018-B2 D’ ‘144A’ FRN 15/2/2051 932,112 0.03
USD 2,500,000 BENCHMARK 2018-B3 Mortgage Trust ‘Series 2018-B3 D’ ‘144A’ FRN 10/4/2051 2,383,496 0.08
USD 4,414,000 Benchmark 2018-B5 Mortgage Trust ‘Series 2018-B5 D’ ‘144A’ FRN 15/7/2051 4,226,824 0.14
USD 1,786,778 BENCHMARK 2018-B7 Mortgage Trust ‘Series 2018-B7 C’ FRN 15/5/2053 2,044,708 0.07
USD 1,000,000 Benefit Street Partners CLO XI ‘Series 2017-11A B’ ‘144A’ FRN 15/4/2029 996,734 0.03
USD 362,000 Berry Petroleum Co LLC ‘144A’ 7% 15/2/2026 335,302 0.01
USD 1,506,000 Big River Steel LLC / BRS Finance Corp ‘144A’ 7.25% 1/9/2025 1,596,360 0.05
USD 1,350,000 Booz Allen Hamilton Inc ‘144A’ 5.125% 1/5/2025 1,390,500 0.05
USD 227,000 Boyne USA Inc ‘144A’ 7.25% 1/5/2025 248,849 0.01
USD 859,000 Brand Industrial Services Inc ‘144A’ 8.5% 15/7/2025 766,657 0.03
USD 464,000 Brazos Valley Longhorn LLC / Brazos Valley Longhorn Finance Corp 6.875% 1/2/2025 414,120 0.01
USD 237,000 Builders FirstSource Inc ‘144A’ 6.75% 1/6/2027 260,108 0.01
USD 657,000 BWX Technologies Inc ‘144A’ 5.375% 15/7/2026 697,241 0.02
USD 5,035,167 BX Commercial Mortgage Trust 2018-IND ‘Series 2018-IND G’ ‘144A’ FRN 15/11/2035 5,055,157 0.17
USD 5,035,167 BX Commercial Mortgage Trust 2018-IND ‘Series 2018-IND H’ ‘144A’ FRN 15/11/2035 5,057,512 0.17
USD 2,000,000 BX Trust ‘Series 2018-MCSF E’ FRN 15/4/2035 2,009,410 0.07
Portfolio of Investments 31 August 2019
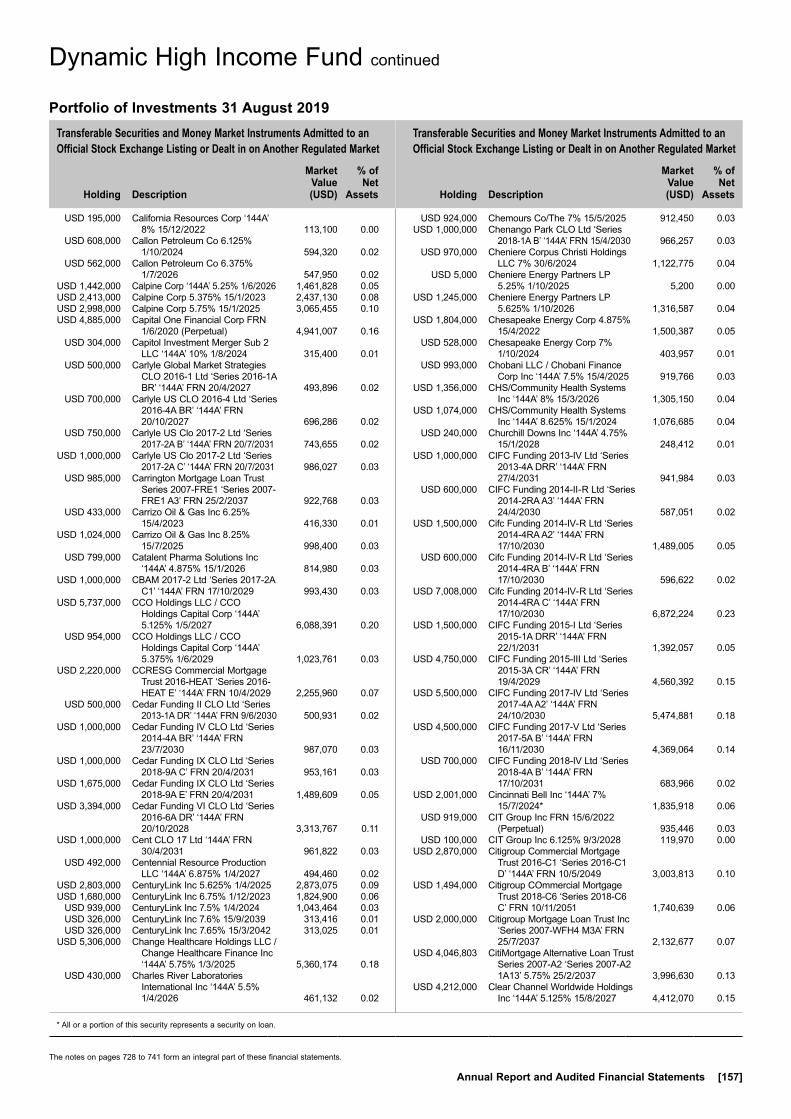
Transferable Securities and Money Market Instruments Admitted to an Official Stock Exchange Listing or Dealt in on Another Regulated Market
Transferable Securities and Money Market Instruments Admitted to an Official Stock Exchange Listing or Dealt in on Another Regulated Market
Holding
Description
Market Value (USD)
% of Net
Assets
Holding
Description
Market Value (USD)
% of Net
Assets
* All or a portion of this security represents a security on loan.
The notes on pages 728 to 741 form an integral part of these financial statements.
Annual Report and Audited Financial Statements [157]
Dynamic High Income Fund continued
USD 195,000 California Resources Corp ‘144A’ 8% 15/12/2022 113,100 0.00
USD 608,000 Callon Petroleum Co 6.125% 1/10/2024 594,320 0.02
USD 562,000 Callon Petroleum Co 6.375% 1/7/2026 547,950 0.02
USD 1,442,000 Calpine Corp ‘144A’ 5.25% 1/6/2026 1,461,828 0.05 USD 2,413,000 Calpine Corp 5.375% 15/1/2023 2,437,130 0.08 USD 2,998,000 Calpine Corp 5.75% 15/1/2025 3,065,455 0.10 USD 4,885,000 Capital One Financial Corp FRN
1/6/2020 (Perpetual) 4,941,007 0.16 USD 304,000 Capitol Investment Merger Sub 2
LLC ‘144A’ 10% 1/8/2024 315,400 0.01 USD 500,000 Carlyle Global Market Strategies
CLO 2016-1 Ltd ‘Series 2016-1A BR’ ‘144A’ FRN 20/4/2027 493,896 0.02
USD 700,000 Carlyle US CLO 2016-4 Ltd ‘Series 2016-4A BR’ ‘144A’ FRN 20/10/2027 696,286 0.02
USD 750,000 Carlyle US Clo 2017-2 Ltd ‘Series 2017-2A B’ ‘144A’ FRN 20/7/2031 743,655 0.02
USD 1,000,000 Carlyle US Clo 2017-2 Ltd ‘Series 2017-2A C’ ‘144A’ FRN 20/7/2031 986,027 0.03
USD 985,000 Carrington Mortgage Loan Trust Series 2007-FRE1 ‘Series 2007-FRE1 A3’ FRN 25/2/2037 922,768 0.03
USD 433,000 Carrizo Oil & Gas Inc 6.25% 15/4/2023 416,330 0.01
USD 1,024,000 Carrizo Oil & Gas Inc 8.25% 15/7/2025 998,400 0.03
USD 799,000 Catalent Pharma Solutions Inc ‘144A’ 4.875% 15/1/2026 814,980 0.03
USD 1,000,000 CBAM 2017-2 Ltd ‘Series 2017-2A C1’ ‘144A’ FRN 17/10/2029 993,430 0.03
USD 5,737,000 CCO Holdings LLC / CCO Holdings Capital Corp ‘144A’ 5.125% 1/5/2027 6,088,391 0.20
USD 954,000 CCO Holdings LLC / CCO Holdings Capital Corp ‘144A’ 5.375% 1/6/2029 1,023,761 0.03
USD 2,220,000 CCRESG Commercial Mortgage Trust 2016-HEAT ‘Series 2016-HEAT E’ ‘144A’ FRN 10/4/2029 2,255,960 0.07
USD 500,000 Cedar Funding II CLO Ltd ‘Series 2013-1A DR’ ‘144A’ FRN 9/6/2030 500,931 0.02
USD 1,000,000 Cedar Funding IV CLO Ltd ‘Series 2014-4A BR’ ‘144A’ FRN 23/7/2030 987,070 0.03
USD 1,000,000 Cedar Funding IX CLO Ltd ‘Series 2018-9A C’ FRN 20/4/2031 953,161 0.03
USD 1,675,000 Cedar Funding IX CLO Ltd ‘Series 2018-9A E’ FRN 20/4/2031 1,489,609 0.05
USD 3,394,000 Cedar Funding VI CLO Ltd ‘Series 2016-6A DR’ ‘144A’ FRN 20/10/2028 3,313,767 0.11
USD 1,000,000 Cent CLO 17 Ltd ‘144A’ FRN 30/4/2031 961,822 0.03
USD 492,000 Centennial Resource Production LLC ‘144A’ 6.875% 1/4/2027 494,460 0.02
USD 2,803,000 CenturyLink Inc 5.625% 1/4/2025 2,873,075 0.09 USD 1,680,000 CenturyLink Inc 6.75% 1/12/2023 1,824,900 0.06 USD 939,000 CenturyLink Inc 7.5% 1/4/2024 1,043,464 0.03 USD 326,000 CenturyLink Inc 7.6% 15/9/2039 313,416 0.01 USD 326,000 CenturyLink Inc 7.65% 15/3/2042 313,025 0.01 USD 5,306,000 Change Healthcare Holdings LLC /
Change Healthcare Finance Inc ‘144A’ 5.75% 1/3/2025 5,360,174 0.18
USD 430,000 Charles River Laboratories International Inc ‘144A’ 5.5% 1/4/2026 461,132 0.02
USD 924,000 Chemours Co/The 7% 15/5/2025 912,450 0.03 USD 1,000,000 Chenango Park CLO Ltd ‘Series
2018-1A B’ ‘144A’ FRN 15/4/2030 966,257 0.03 USD 970,000 Cheniere Corpus Christi Holdings
LLC 7% 30/6/2024 1,122,775 0.04 USD 5,000 Cheniere Energy Partners LP
5.25% 1/10/2025 5,200 0.00 USD 1,245,000 Cheniere Energy Partners LP
5.625% 1/10/2026 1,316,587 0.04 USD 1,804,000 Chesapeake Energy Corp 4.875%
15/4/2022 1,500,387 0.05 USD 528,000 Chesapeake Energy Corp 7%
1/10/2024 403,957 0.01 USD 993,000 Chobani LLC / Chobani Finance
Corp Inc ‘144A’ 7.5% 15/4/2025 919,766 0.03 USD 1,356,000 CHS/Community Health Systems
Inc ‘144A’ 8% 15/3/2026 1,305,150 0.04 USD 1,074,000 CHS/Community Health Systems
Inc ‘144A’ 8.625% 15/1/2024 1,076,685 0.04 USD 240,000 Churchill Downs Inc ‘144A’ 4.75%
15/1/2028 248,412 0.01 USD 1,000,000 CIFC Funding 2013-IV Ltd ‘Series
2013-4A DRR’ ‘144A’ FRN 27/4/2031 941,984 0.03
USD 600,000 CIFC Funding 2014-II-R Ltd ‘Series 2014-2RA A3’ ‘144A’ FRN 24/4/2030 587,051 0.02
USD 1,500,000 Cifc Funding 2014-IV-R Ltd ‘Series 2014-4RA A2’ ‘144A’ FRN 17/10/2030 1,489,005 0.05
USD 600,000 Cifc Funding 2014-IV-R Ltd ‘Series 2014-4RA B’ ‘144A’ FRN 17/10/2030 596,622 0.02
USD 7,008,000 Cifc Funding 2014-IV-R Ltd ‘Series 2014-4RA C’ ‘144A’ FRN 17/10/2030 6,872,224 0.23
USD 1,500,000 CIFC Funding 2015-I Ltd ‘Series 2015-1A DRR’ ‘144A’ FRN 22/1/2031 1,392,057 0.05
USD 4,750,000 CIFC Funding 2015-III Ltd ‘Series 2015-3A CR’ ‘144A’ FRN 19/4/2029 4,560,392 0.15
USD 5,500,000 CIFC Funding 2017-IV Ltd ‘Series 2017-4A A2’ ‘144A’ FRN 24/10/2030 5,474,881 0.18
USD 4,500,000 CIFC Funding 2017-V Ltd ‘Series 2017-5A B’ ‘144A’ FRN 16/11/2030 4,369,064 0.14
USD 700,000 CIFC Funding 2018-IV Ltd ‘Series 2018-4A B’ ‘144A’ FRN 17/10/2031 683,966 0.02
USD 2,001,000 Cincinnati Bell Inc ‘144A’ 7% 15/7/2024* 1,835,918 0.06
USD 919,000 CIT Group Inc FRN 15/6/2022 (Perpetual) 935,446 0.03
USD 100,000 CIT Group Inc 6.125% 9/3/2028 119,970 0.00 USD 2,870,000 Citigroup Commercial Mortgage
Trust 2016-C1 ‘Series 2016-C1 D’ ‘144A’ FRN 10/5/2049 3,003,813 0.10
USD 1,494,000 Citigroup COmmercial Mortgage Trust 2018-C6 ‘Series 2018-C6 C’ FRN 10/11/2051 1,740,639 0.06
USD 2,000,000 Citigroup Mortgage Loan Trust Inc ‘Series 2007-WFH4 M3A’ FRN 25/7/2037 2,132,677 0.07
USD 4,046,803 CitiMortgage Alternative Loan Trust Series 2007-A2 ‘Series 2007-A2 1A13’ 5.75% 25/2/2037 3,996,630 0.13
USD 4,212,000 Clear Channel Worldwide Holdings Inc ‘144A’ 5.125% 15/8/2027 4,412,070 0.15
Portfolio of Investments 31 August 2019
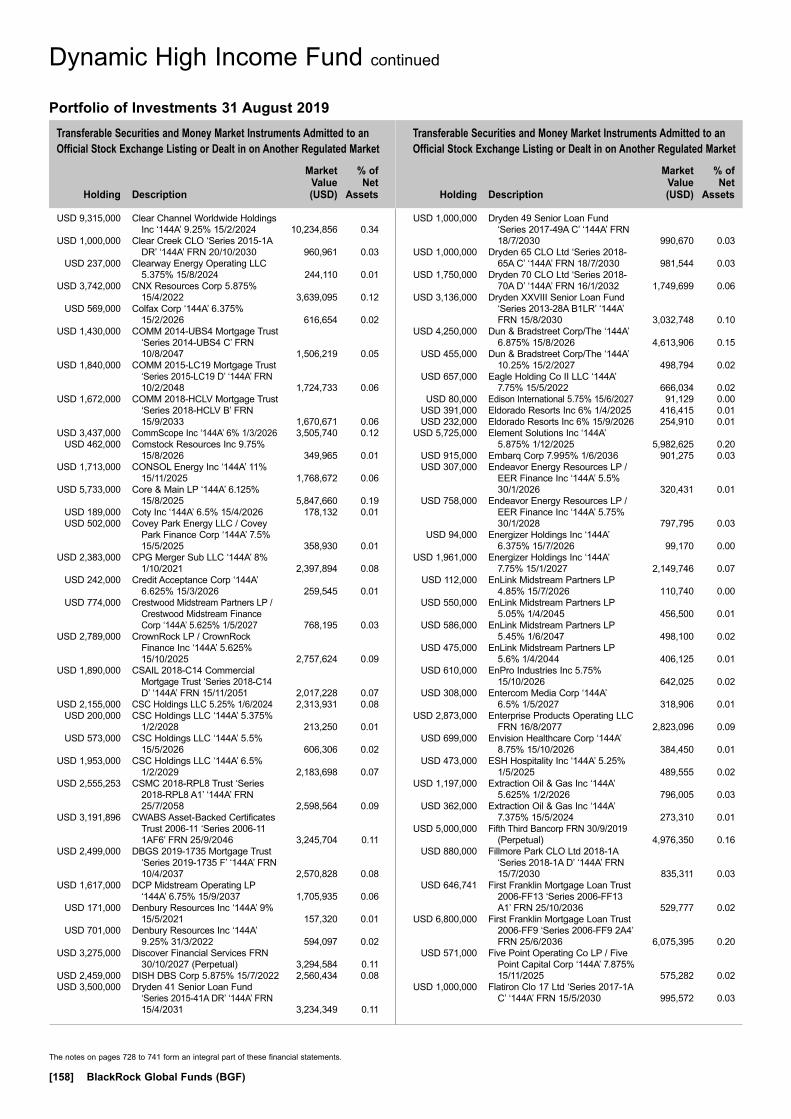
Transferable Securities and Money Market Instruments Admitted to an Official Stock Exchange Listing or Dealt in on Another Regulated Market
Transferable Securities and Money Market Instruments Admitted to an Official Stock Exchange Listing or Dealt in on Another Regulated Market
Holding
Description
Market Value (USD)
% of Net
Assets
Holding
Description
Market Value (USD)
% of Net
Assets
The notes on pages 728 to 741 form an integral part of these financial statements.
[158] BlackRock Global Funds (BGF)
Dynamic High Income Fund continued
USD 9,315,000 Clear Channel Worldwide Holdings Inc ‘144A’ 9.25% 15/2/2024 10,234,856 0.34
USD 1,000,000 Clear Creek CLO ‘Series 2015-1A DR’ ‘144A’ FRN 20/10/2030 960,961 0.03
USD 237,000 Clearway Energy Operating LLC 5.375% 15/8/2024 244,110 0.01
USD 3,742,000 CNX Resources Corp 5.875% 15/4/2022 3,639,095 0.12
USD 569,000 Colfax Corp ‘144A’ 6.375% 15/2/2026 616,654 0.02
USD 1,430,000 COMM 2014-UBS4 Mortgage Trust ‘Series 2014-UBS4 C’ FRN 10/8/2047 1,506,219 0.05
USD 1,840,000 COMM 2015-LC19 Mortgage Trust ‘Series 2015-LC19 D’ ‘144A’ FRN 10/2/2048 1,724,733 0.06
USD 1,672,000 COMM 2018-HCLV Mortgage Trust ‘Series 2018-HCLV B’ FRN 15/9/2033 1,670,671 0.06
USD 3,437,000 CommScope Inc ‘144A’ 6% 1/3/2026 3,505,740 0.12 USD 462,000 Comstock Resources Inc 9.75%
15/8/2026 349,965 0.01 USD 1,713,000 CONSOL Energy Inc ‘144A’ 11%
15/11/2025 1,768,672 0.06 USD 5,733,000 Core & Main LP ‘144A’ 6.125%
15/8/2025 5,847,660 0.19 USD 189,000 Coty Inc ‘144A’ 6.5% 15/4/2026 178,132 0.01 USD 502,000 Covey Park Energy LLC / Covey
Park Finance Corp ‘144A’ 7.5% 15/5/2025 358,930 0.01
USD 2,383,000 CPG Merger Sub LLC ‘144A’ 8% 1/10/2021 2,397,894 0.08
USD 242,000 Credit Acceptance Corp ‘144A’ 6.625% 15/3/2026 259,545 0.01
USD 774,000 Crestwood Midstream Partners LP / Crestwood Midstream Finance Corp ‘144A’ 5.625% 1/5/2027 768,195 0.03
USD 2,789,000 CrownRock LP / CrownRock Finance Inc ‘144A’ 5.625% 15/10/2025 2,757,624 0.09
USD 1,890,000 CSAIL 2018-C14 Commercial Mortgage Trust ‘Series 2018-C14 D’ ‘144A’ FRN 15/11/2051 2,017,228 0.07
USD 2,155,000 CSC Holdings LLC 5.25% 1/6/2024 2,313,931 0.08 USD 200,000 CSC Holdings LLC ‘144A’ 5.375%
1/2/2028 213,250 0.01 USD 573,000 CSC Holdings LLC ‘144A’ 5.5%
15/5/2026 606,306 0.02 USD 1,953,000 CSC Holdings LLC ‘144A’ 6.5%
1/2/2029 2,183,698 0.07 USD 2,555,253 CSMC 2018-RPL8 Trust ‘Series
2018-RPL8 A1’ ‘144A’ FRN 25/7/2058 2,598,564 0.09
USD 3,191,896 CWABS Asset-Backed Certificates Trust 2006-11 ‘Series 2006-11 1AF6’ FRN 25/9/2046 3,245,704 0.11
USD 2,499,000 DBGS 2019-1735 Mortgage Trust ‘Series 2019-1735 F’ ‘144A’ FRN 10/4/2037 2,570,828 0.08
USD 1,617,000 DCP Midstream Operating LP ‘144A’ 6.75% 15/9/2037 1,705,935 0.06
USD 171,000 Denbury Resources Inc ‘144A’ 9% 15/5/2021 157,320 0.01
USD 701,000 Denbury Resources Inc ‘144A’ 9.25% 31/3/2022 594,097 0.02
USD 3,275,000 Discover Financial Services FRN 30/10/2027 (Perpetual) 3,294,584 0.11
USD 2,459,000 DISH DBS Corp 5.875% 15/7/2022 2,560,434 0.08 USD 3,500,000 Dryden 41 Senior Loan Fund
‘Series 2015-41A DR’ ‘144A’ FRN 15/4/2031 3,234,349 0.11
USD 1,000,000 Dryden 49 Senior Loan Fund ‘Series 2017-49A C’ ‘144A’ FRN 18/7/2030 990,670 0.03
USD 1,000,000 Dryden 65 CLO Ltd ‘Series 2018-65A C’ ‘144A’ FRN 18/7/2030 981,544 0.03
USD 1,750,000 Dryden 70 CLO Ltd ‘Series 2018-70A D’ ‘144A’ FRN 16/1/2032 1,749,699 0.06
USD 3,136,000 Dryden XXVIII Senior Loan Fund ‘Series 2013-28A B1LR’ ‘144A’ FRN 15/8/2030 3,032,748 0.10
USD 4,250,000 Dun & Bradstreet Corp/The ‘144A’ 6.875% 15/8/2026 4,613,906 0.15
USD 455,000 Dun & Bradstreet Corp/The ‘144A’ 10.25% 15/2/2027 498,794 0.02
USD 657,000 Eagle Holding Co II LLC ‘144A’ 7.75% 15/5/2022 666,034 0.02
USD 80,000 Edison International 5.75% 15/6/2027 91,129 0.00 USD 391,000 Eldorado Resorts Inc 6% 1/4/2025 416,415 0.01 USD 232,000 Eldorado Resorts Inc 6% 15/9/2026 254,910 0.01 USD 5,725,000 Element Solutions Inc ‘144A’
5.875% 1/12/2025 5,982,625 0.20 USD 915,000 Embarq Corp 7.995% 1/6/2036 901,275 0.03 USD 307,000 Endeavor Energy Resources LP /
EER Finance Inc ‘144A’ 5.5% 30/1/2026 320,431 0.01
USD 758,000 Endeavor Energy Resources LP / EER Finance Inc ‘144A’ 5.75% 30/1/2028 797,795 0.03
USD 94,000 Energizer Holdings Inc ‘144A’ 6.375% 15/7/2026 99,170 0.00
USD 1,961,000 Energizer Holdings Inc ‘144A’ 7.75% 15/1/2027 2,149,746 0.07
USD 112,000 EnLink Midstream Partners LP 4.85% 15/7/2026 110,740 0.00
USD 550,000 EnLink Midstream Partners LP 5.05% 1/4/2045 456,500 0.01
USD 586,000 EnLink Midstream Partners LP 5.45% 1/6/2047 498,100 0.02
USD 475,000 EnLink Midstream Partners LP 5.6% 1/4/2044 406,125 0.01
USD 610,000 EnPro Industries Inc 5.75% 15/10/2026 642,025 0.02
USD 308,000 Entercom Media Corp ‘144A’ 6.5% 1/5/2027 318,906 0.01
USD 2,873,000 Enterprise Products Operating LLC FRN 16/8/2077 2,823,096 0.09
USD 699,000 Envision Healthcare Corp ‘144A’ 8.75% 15/10/2026 384,450 0.01
USD 473,000 ESH Hospitality Inc ‘144A’ 5.25% 1/5/2025 489,555 0.02
USD 1,197,000 Extraction Oil & Gas Inc ‘144A’ 5.625% 1/2/2026 796,005 0.03
USD 362,000 Extraction Oil & Gas Inc ‘144A’ 7.375% 15/5/2024 273,310 0.01
USD 5,000,000 Fifth Third Bancorp FRN 30/9/2019 (Perpetual) 4,976,350 0.16
USD 880,000 Fillmore Park CLO Ltd 2018-1A ‘Series 2018-1A D’ ‘144A’ FRN 15/7/2030 835,311 0.03
USD 646,741 First Franklin Mortgage Loan Trust 2006-FF13 ‘Series 2006-FF13 A1’ FRN 25/10/2036 529,777 0.02
USD 6,800,000 First Franklin Mortgage Loan Trust 2006-FF9 ‘Series 2006-FF9 2A4’ FRN 25/6/2036 6,075,395 0.20
USD 571,000 Five Point Operating Co LP / Five Point Capital Corp ‘144A’ 7.875% 15/11/2025 575,282 0.02
USD 1,000,000 Flatiron Clo 17 Ltd ‘Series 2017-1A C’ ‘144A’ FRN 15/5/2030 995,572 0.03
Portfolio of Investments 31 August 2019
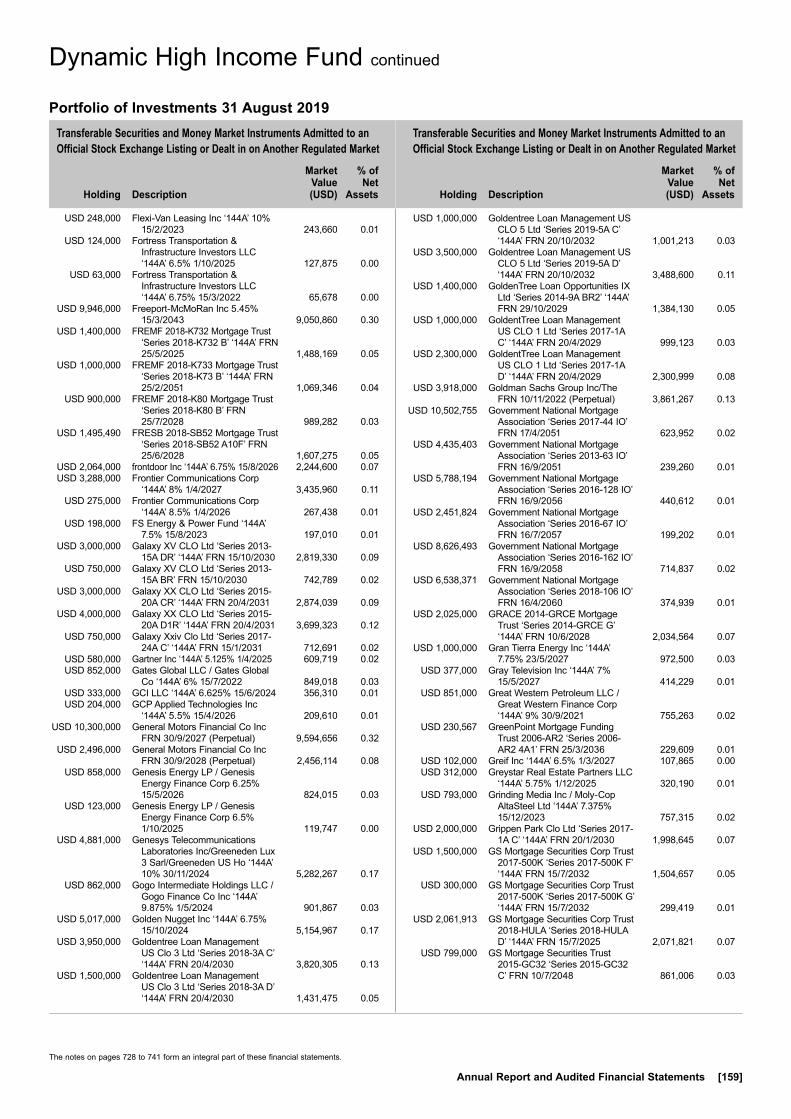
Transferable Securities and Money Market Instruments Admitted to an Official Stock Exchange Listing or Dealt in on Another Regulated Market
Transferable Securities and Money Market Instruments Admitted to an Official Stock Exchange Listing or Dealt in on Another Regulated Market
Holding
Description
Market Value (USD)
% of Net
Assets
Holding
Description
Market Value (USD)
% of Net
Assets
The notes on pages 728 to 741 form an integral part of these financial statements.
Annual Report and Audited Financial Statements [159]
Dynamic High Income Fund continued
USD 248,000 Flexi-Van Leasing Inc ‘144A’ 10% 15/2/2023 243,660 0.01
USD 124,000 Fortress Transportation & Infrastructure Investors LLC ‘144A’ 6.5% 1/10/2025 127,875 0.00
USD 63,000 Fortress Transportation & Infrastructure Investors LLC ‘144A’ 6.75% 15/3/2022 65,678 0.00
USD 9,946,000 Freeport-McMoRan Inc 5.45% 15/3/2043 9,050,860 0.30
USD 1,400,000 FREMF 2018-K732 Mortgage Trust ‘Series 2018-K732 B’ ‘144A’ FRN 25/5/2025 1,488,169 0.05
USD 1,000,000 FREMF 2018-K733 Mortgage Trust ‘Series 2018-K73 B’ ‘144A’ FRN 25/2/2051 1,069,346 0.04
USD 900,000 FREMF 2018-K80 Mortgage Trust ‘Series 2018-K80 B’ FRN 25/7/2028 989,282 0.03
USD 1,495,490 FRESB 2018-SB52 Mortgage Trust ‘Series 2018-SB52 A10F’ FRN 25/6/2028 1,607,275 0.05
USD 2,064,000 frontdoor Inc ‘144A’ 6.75% 15/8/2026 2,244,600 0.07 USD 3,288,000 Frontier Communications Corp
‘144A’ 8% 1/4/2027 3,435,960 0.11 USD 275,000 Frontier Communications Corp
‘144A’ 8.5% 1/4/2026 267,438 0.01 USD 198,000 FS Energy & Power Fund ‘144A’
7.5% 15/8/2023 197,010 0.01 USD 3,000,000 Galaxy XV CLO Ltd ‘Series 2013-
15A DR’ ‘144A’ FRN 15/10/2030 2,819,330 0.09 USD 750,000 Galaxy XV CLO Ltd ‘Series 2013-
15A BR’ FRN 15/10/2030 742,789 0.02 USD 3,000,000 Galaxy XX CLO Ltd ‘Series 2015-
20A CR’ ‘144A’ FRN 20/4/2031 2,874,039 0.09 USD 4,000,000 Galaxy XX CLO Ltd ‘Series 2015-
20A D1R’ ‘144A’ FRN 20/4/2031 3,699,323 0.12 USD 750,000 Galaxy Xxiv Clo Ltd ‘Series 2017-
24A C’ ‘144A’ FRN 15/1/2031 712,691 0.02 USD 580,000 Gartner Inc ‘144A’ 5.125% 1/4/2025 609,719 0.02 USD 852,000 Gates Global LLC / Gates Global
Co ‘144A’ 6% 15/7/2022 849,018 0.03 USD 333,000 GCI LLC ‘144A’ 6.625% 15/6/2024 356,310 0.01 USD 204,000 GCP Applied Technologies Inc
‘144A’ 5.5% 15/4/2026 209,610 0.01 USD 10,300,000 General Motors Financial Co Inc
FRN 30/9/2027 (Perpetual) 9,594,656 0.32 USD 2,496,000 General Motors Financial Co Inc
FRN 30/9/2028 (Perpetual) 2,456,114 0.08 USD 858,000 Genesis Energy LP / Genesis
Energy Finance Corp 6.25% 15/5/2026 824,015 0.03
USD 123,000 Genesis Energy LP / Genesis Energy Finance Corp 6.5% 1/10/2025 119,747 0.00
USD 4,881,000 Genesys Telecommunications Laboratories Inc/Greeneden Lux 3 Sarl/Greeneden US Ho ‘144A’ 10% 30/11/2024 5,282,267 0.17
USD 862,000 Gogo Intermediate Holdings LLC / Gogo Finance Co Inc ‘144A’ 9.875% 1/5/2024 901,867 0.03
USD 5,017,000 Golden Nugget Inc ‘144A’ 6.75% 15/10/2024 5,154,967 0.17
USD 3,950,000 Goldentree Loan Management US Clo 3 Ltd ‘Series 2018-3A C’ ‘144A’ FRN 20/4/2030 3,820,305 0.13
USD 1,500,000 Goldentree Loan Management US Clo 3 Ltd ‘Series 2018-3A D’ ‘144A’ FRN 20/4/2030 1,431,475 0.05
USD 1,000,000 Goldentree Loan Management US CLO 5 Ltd ‘Series 2019-5A C’ ‘144A’ FRN 20/10/2032 1,001,213 0.03
USD 3,500,000 Goldentree Loan Management US CLO 5 Ltd ‘Series 2019-5A D’ ‘144A’ FRN 20/10/2032 3,488,600 0.11
USD 1,400,000 GoldenTree Loan Opportunities IX Ltd ‘Series 2014-9A BR2’ ‘144A’ FRN 29/10/2029 1,384,130 0.05
USD 1,000,000 GoldentTree Loan Management US CLO 1 Ltd ‘Series 2017-1A C’ ‘144A’ FRN 20/4/2029 999,123 0.03
USD 2,300,000 GoldentTree Loan Management US CLO 1 Ltd ‘Series 2017-1A D’ ‘144A’ FRN 20/4/2029 2,300,999 0.08
USD 3,918,000 Goldman Sachs Group Inc/The FRN 10/11/2022 (Perpetual) 3,861,267 0.13
USD 10,502,755 Government National Mortgage Association ‘Series 2017-44 IO’ FRN 17/4/2051 623,952 0.02
USD 4,435,403 Government National Mortgage Association ‘Series 2013-63 IO’ FRN 16/9/2051 239,260 0.01
USD 5,788,194 Government National Mortgage Association ‘Series 2016-128 IO’ FRN 16/9/2056 440,612 0.01
USD 2,451,824 Government National Mortgage Association ‘Series 2016-67 IO’ FRN 16/7/2057 199,202 0.01
USD 8,626,493 Government National Mortgage Association ‘Series 2016-162 IO’ FRN 16/9/2058 714,837 0.02
USD 6,538,371 Government National Mortgage Association ‘Series 2018-106 IO’ FRN 16/4/2060 374,939 0.01
USD 2,025,000 GRACE 2014-GRCE Mortgage Trust ‘Series 2014-GRCE G’ ‘144A’ FRN 10/6/2028 2,034,564 0.07
USD 1,000,000 Gran Tierra Energy Inc ‘144A’ 7.75% 23/5/2027 972,500 0.03
USD 377,000 Gray Television Inc ‘144A’ 7% 15/5/2027 414,229 0.01
USD 851,000 Great Western Petroleum LLC / Great Western Finance Corp ‘144A’ 9% 30/9/2021 755,263 0.02
USD 230,567 GreenPoint Mortgage Funding Trust 2006-AR2 ‘Series 2006-AR2 4A1’ FRN 25/3/2036 229,609 0.01
USD 102,000 Greif Inc ‘144A’ 6.5% 1/3/2027 107,865 0.00 USD 312,000 Greystar Real Estate Partners LLC
‘144A’ 5.75% 1/12/2025 320,190 0.01 USD 793,000 Grinding Media Inc / Moly-Cop
AltaSteel Ltd ‘144A’ 7.375% 15/12/2023 757,315 0.02
USD 2,000,000 Grippen Park Clo Ltd ‘Series 2017-1A C’ ‘144A’ FRN 20/1/2030 1,998,645 0.07
USD 1,500,000 GS Mortgage Securities Corp Trust 2017-500K ‘Series 2017-500K F’ ‘144A’ FRN 15/7/2032 1,504,657 0.05
USD 300,000 GS Mortgage Securities Corp Trust 2017-500K ‘Series 2017-500K G’ ‘144A’ FRN 15/7/2032 299,419 0.01
USD 2,061,913 GS Mortgage Securities Corp Trust 2018-HULA ‘Series 2018-HULA D’ ‘144A’ FRN 15/7/2025 2,071,821 0.07
USD 799,000 GS Mortgage Securities Trust 2015-GC32 ‘Series 2015-GC32 C’ FRN 10/7/2048 861,006 0.03
Portfolio of Investments 31 August 2019

Transferable Securities and Money Market Instruments Admitted to an Official Stock Exchange Listing or Dealt in on Another Regulated Market
Transferable Securities and Money Market Instruments Admitted to an Official Stock Exchange Listing or Dealt in on Another Regulated Market
Holding
Description
Market Value (USD)
% of Net
Assets
Holding
Description
Market Value (USD)
% of Net
Assets
The notes on pages 728 to 741 form an integral part of these financial statements.
[160] BlackRock Global Funds (BGF)
Dynamic High Income Fund continued
USD 153,280 GSAA Home Equity Trust 2005-14 ‘Series 2005-14 1A2’ FRN 25/12/2035 66,251 0.00
USD 706,225 GSAA Home Equity Trust 2006-4 ‘Series 2006-4 1A1’ FRN 25/3/2036 613,151 0.02
USD 708,729 GSAA Home Equity Trust 2006-5 ‘Series 2006-5 1A1’ FRN 25/3/2036 348,096 0.01
USD 1,313,134 GSAMP Trust 2006-FM3 ‘Series 2006-FM3 A1’ FRN 25/11/2036 776,078 0.03
USD 1,893,068 GSMPS Mortgage Loan Trust 2005-RP1 ‘Series 2005-RP1 2A1’ ‘144A’ FRN 25/1/2035 1,898,140 0.06
USD 1,557,063 GSMPS Mortgage Loan Trust 2005-RP3 ‘Series 2005-RP3 2A1’ ‘144A’ FRN 25/9/2035 1,534,878 0.05
USD 4,443,200 GSR Mortgage Loan Trust 2006-OA1 ‘Series 2006-OA1 1A1’ FRN 25/8/2046 1,786,943 0.06
USD 1,400,000 GT Loan Financing I Ltd 2013-1 ‘Series 2013-1A CR’ ‘144A’ FRN 28/7/2031 1,368,600 0.05
USD 803,000 GTCR AP Finance Inc ‘144A’ 8% 15/5/2027 819,060 0.03
USD 356,000 Harland Clarke Holdings Corp ‘144A’ 8.375% 15/8/2022 281,240 0.01
USD 1,006,000 Hertz Corp/The ‘144A’ 7.625% 1/6/2022 1,046,240 0.03
USD 1,000,000 Highbridge Loan Management 12-2018 Ltd ‘Series 12A-18 B’ ‘144A’ FRN 18/7/2031 969,257 0.03
USD 1,000,000 Highbridge Loan Management 12-2018 Ltd ‘Series 12A-18 C’ ‘144A’ FRN 18/7/2031 936,999 0.03
USD 1,000,000 Highbridge Loan Management 3-2014 ‘Series 3A-2014 CR’ ‘144A’ FRN 18/7/2029 988,496 0.03
USD 2,000,000 Highbridge Loan Management 6-2015 Ltd ‘Series 6A-2015 BR’ ‘144A’ FRN 5/2/2031 1,914,981 0.06
USD 1,250,000 Highbridge Loan Management 6-2015 Ltd ‘Series 6A-2015 CR’ ‘144A’ FRN 5/2/2031 1,143,328 0.04
USD 2,500,000 Highbridge Loan Management 7-2015 Ltd ‘Series 7A-2015 CR’ ‘144A’ FRN 15/3/2027 2,463,750 0.08
USD 235,000 Howard Hughes Corp/The ‘144A’ 5.375% 15/3/2025 242,637 0.01
USD 2,000,000 HPS Loan Management 11-2017 Ltd ‘Series 11A-17 C’ ‘144A’ FRN 6/5/2030 1,987,413 0.07
USD 3,972,000 HUB International Ltd ‘144A’ 7% 1/5/2026 4,046,475 0.13
USD 829,000 IAA Inc ‘144A’ 5.5% 15/6/2027 891,589 0.03 USD 1,676,000 Icahn Enterprises LP / Icahn
Enterprises Finance Corp ‘144A’ 6.25% 15/5/2026 1,757,705 0.06
USD 3,000,000 ILFC E-Capital Trust I ‘144A’ FRN 21/12/2065 2,104,560 0.07
USD 3,000,000 ILFC E-Capital Trust II ‘144A’ FRN 21/12/2065 2,145,000 0.07
USD 471,000 Immucor Inc ‘144A’ 11.125% 15/2/2022 479,808 0.02
USD 715,000 Indigo Natural Resources LLC ‘144A’ 6.875% 15/2/2026 593,450 0.02
USD 4,242,000 Informatica LLC ‘144A’ 7.125% 15/7/2023 4,326,840 0.14
USD 3,625,000 Invitation Homes 2018-SFR2 Trust ‘Series 2018-SFR2 E’ ‘144A’ FRN 17/6/2037 3,631,286 0.12
USD 3,000,000 Invitation Homes 2018-SFR2 Trust ‘Series 2018-SFR2 F’ FRN 17/6/2037 2,991,264 0.10
USD 2,826,672 Invitation Homes 2018-SFR3 Trust ‘Series 2018-SFR3 E’ ‘144A’ FRN 17/7/2037 2,828,721 0.09
USD 1,955,000 Invitation Homes 2018-SFR3 Trust ‘Series 2018-SFR3 F’ ‘144A’ FRN 17/7/2037 1,956,306 0.06
USD 1,143,425 Invitation Homes 2018-SFR4 Trust ‘Series 2018-SFR4 A’ ‘144A’ FRN 17/1/2038 1,148,342 0.04
USD 966,667 Invitation Homes 2018-SFR4 Trust ‘Series 2018-SFR4 C’ ‘144A’ FRN 17/1/2038 966,817 0.03
USD 481,000 IRB Holding Corp ‘144A’ 6.75% 15/2/2026 487,012 0.02
USD 342,000 Itron Inc ‘144A’ 5% 15/1/2026 349,695 0.01 USD 3,990,000 J.P. Morgan Chase Commercial
Mortgage Securities Trust 2018-ASH8 ‘Series 2018-ASH8 E’ ‘144A’ FRN 15/2/2035 4,017,351 0.13
USD 6,117,000 Jaguar Holding Co II / Pharmaceutical Product Development LLC ‘144A’ 6.375% 1/8/2023 6,331,095 0.21
USD 1,500,000 Jay Park CLO Ltd ‘Series 2016-1A CR’ ‘144A’ FRN 20/10/2027 1,431,619 0.05
USD 4,599,000 JBS USA LUX SA / JBS USA Finance Inc ‘144A’ 5.75% 15/6/2025 4,810,985 0.16
USD 202,000 JBS USA LUX SA / JBS USA Finance Inc ‘144A’ 5.875% 15/7/2024 208,546 0.01
USD 2,008,000 JBS USA LUX SA / JBS USA Finance Inc ‘144A’ 6.75% 15/2/2028 2,236,410 0.07
USD 379,000 JELD-WEN Inc ‘144A’ 4.625% 15/12/2025 372,367 0.01
USD 518,000 Joseph T Ryerson & Son Inc ‘144A’ 11% 15/5/2022 544,062 0.02
USD 2,360,000 JP Morgan Chase Commercial Mortgage Securities Trust 2015-JP1 ‘Series 2015-JP1 E’ ‘144A’ FRN 15/1/2049 2,319,835 0.08
USD 3,950,000 JP Morgan Chase Commercial Mortgage Securities Trust 2018-WPT ‘Series 2018-WPT FFX’ ‘144A’ 5.542% 5/7/2033 4,126,492 0.14
USD 260,000 JP Morgan Mortgage Acquisition Trust 2006-CH1 ‘Series 2006-CH1 M7’ FRN 25/7/2036 247,753 0.01
USD 1,933,000 JPMCC Commercial Mortgage Securities Trust 2017-JP5 ‘Series 2017-JP5 C’ FRN 15/3/2050 2,049,547 0.07
USD 558,000 JPMCC Commercial Mortgage Securities Trust 2017-JP5 ‘Series 2017-JP5 D’ ‘144A’ FRN 15/3/2050 596,494 0.02
USD 558,000 JPMDB Commercial Mortgage Securities Trust 2017-C5 ‘Series 2017-C5 C’ FRN 15/3/2050 609,251 0.02
USD 1,428,000 JPMDB Commercial Mortgage Securities Trust 2017-C5 ‘Series 2017-C5 D’ ‘144A’ FRN 15/3/2050 1,501,604 0.05
Portfolio of Investments 31 August 2019
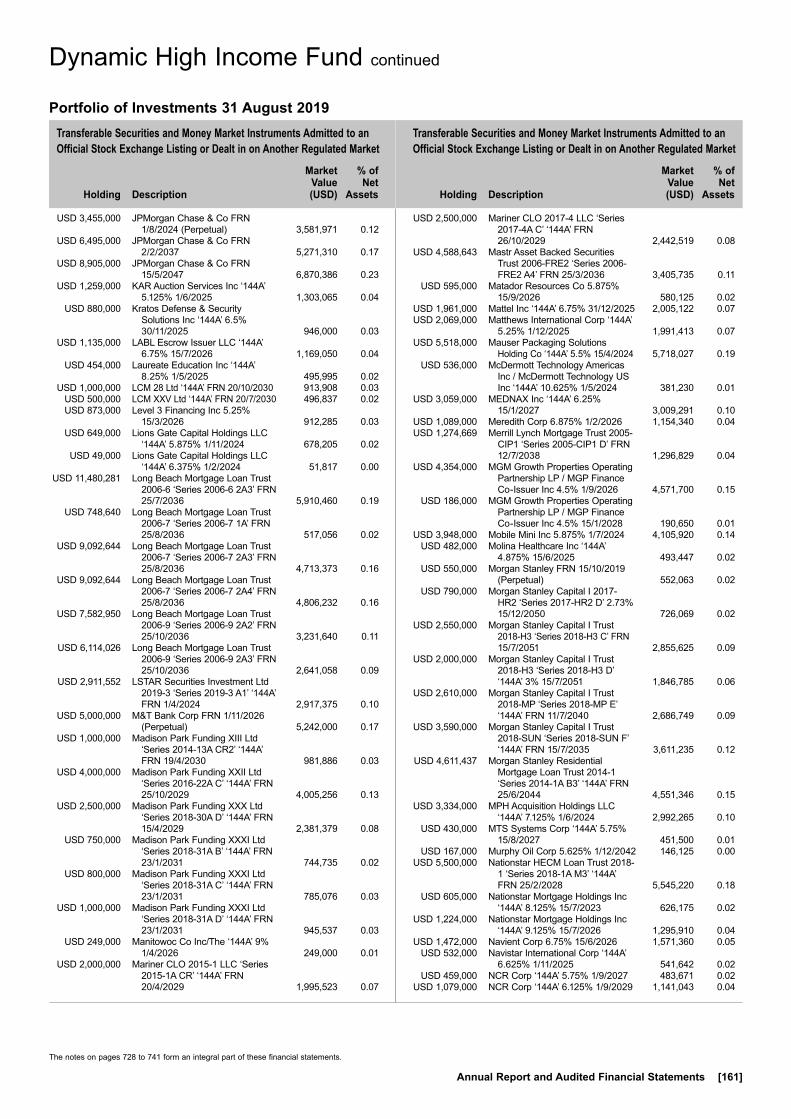
Transferable Securities and Money Market Instruments Admitted to an Official Stock Exchange Listing or Dealt in on Another Regulated Market
Transferable Securities and Money Market Instruments Admitted to an Official Stock Exchange Listing or Dealt in on Another Regulated Market
Holding
Description
Market Value (USD)
% of Net
Assets
Holding
Description
Market Value (USD)
% of Net
Assets
The notes on pages 728 to 741 form an integral part of these financial statements.
Annual Report and Audited Financial Statements [161]
Dynamic High Income Fund continued
Portfolio of Investments 31 August 2019
USD 3,455,000 JPMorgan Chase & Co FRN 1/8/2024 (Perpetual) 3,581,971 0.12
USD 6,495,000 JPMorgan Chase & Co FRN 2/2/2037 5,271,310 0.17
USD 8,905,000 JPMorgan Chase & Co FRN 15/5/2047 6,870,386 0.23
USD 1,259,000 KAR Auction Services Inc ‘144A’ 5.125% 1/6/2025 1,303,065 0.04
USD 880,000 Kratos Defense & Security Solutions Inc ‘144A’ 6.5% 30/11/2025 946,000 0.03
USD 1,135,000 LABL Escrow Issuer LLC ‘144A’ 6.75% 15/7/2026 1,169,050 0.04
USD 454,000 Laureate Education Inc ‘144A’ 8.25% 1/5/2025 495,995 0.02
USD 1,000,000 LCM 28 Ltd ‘144A’ FRN 20/10/2030 913,908 0.03 USD 500,000 LCM XXV Ltd ‘144A’ FRN 20/7/2030 496,837 0.02 USD 873,000 Level 3 Financing Inc 5.25%
15/3/2026 912,285 0.03 USD 649,000 Lions Gate Capital Holdings LLC
‘144A’ 5.875% 1/11/2024 678,205 0.02 USD 49,000 Lions Gate Capital Holdings LLC
‘144A’ 6.375% 1/2/2024 51,817 0.00 USD 11,480,281 Long Beach Mortgage Loan Trust
2006-6 ‘Series 2006-6 2A3’ FRN 25/7/2036 5,910,460 0.19
USD 748,640 Long Beach Mortgage Loan Trust 2006-7 ‘Series 2006-7 1A’ FRN 25/8/2036 517,056 0.02
USD 9,092,644 Long Beach Mortgage Loan Trust 2006-7 ‘Series 2006-7 2A3’ FRN 25/8/2036 4,713,373 0.16
USD 9,092,644 Long Beach Mortgage Loan Trust 2006-7 ‘Series 2006-7 2A4’ FRN 25/8/2036 4,806,232 0.16
USD 7,582,950 Long Beach Mortgage Loan Trust 2006-9 ‘Series 2006-9 2A2’ FRN 25/10/2036 3,231,640 0.11
USD 6,114,026 Long Beach Mortgage Loan Trust 2006-9 ‘Series 2006-9 2A3’ FRN 25/10/2036 2,641,058 0.09
USD 2,911,552 LSTAR Securities Investment Ltd 2019-3 ‘Series 2019-3 A1’ ‘144A’ FRN 1/4/2024 2,917,375 0.10
USD 5,000,000 M&T Bank Corp FRN 1/11/2026 (Perpetual) 5,242,000 0.17
USD 1,000,000 Madison Park Funding XIII Ltd ‘Series 2014-13A CR2’ ‘144A’ FRN 19/4/2030 981,886 0.03
USD 4,000,000 Madison Park Funding XXII Ltd ‘Series 2016-22A C’ ‘144A’ FRN 25/10/2029 4,005,256 0.13
USD 2,500,000 Madison Park Funding XXX Ltd ‘Series 2018-30A D’ ‘144A’ FRN 15/4/2029 2,381,379 0.08
USD 750,000 Madison Park Funding XXXI Ltd ‘Series 2018-31A B’ ‘144A’ FRN 23/1/2031 744,735 0.02
USD 800,000 Madison Park Funding XXXI Ltd ‘Series 2018-31A C’ ‘144A’ FRN 23/1/2031 785,076 0.03
USD 1,000,000 Madison Park Funding XXXI Ltd ‘Series 2018-31A D’ ‘144A’ FRN 23/1/2031 945,537 0.03
USD 249,000 Manitowoc Co Inc/The ‘144A’ 9% 1/4/2026 249,000 0.01
USD 2,000,000 Mariner CLO 2015-1 LLC ‘Series 2015-1A CR’ ‘144A’ FRN 20/4/2029 1,995,523 0.07
USD 2,500,000 Mariner CLO 2017-4 LLC ‘Series 2017-4A C’ ‘144A’ FRN 26/10/2029 2,442,519 0.08
USD 4,588,643 Mastr Asset Backed Securities Trust 2006-FRE2 ‘Series 2006-FRE2 A4’ FRN 25/3/2036 3,405,735 0.11
USD 595,000 Matador Resources Co 5.875% 15/9/2026 580,125 0.02
USD 1,961,000 Mattel Inc ‘144A’ 6.75% 31/12/2025 2,005,122 0.07 USD 2,069,000 Matthews International Corp ‘144A’
5.25% 1/12/2025 1,991,413 0.07 USD 5,518,000 Mauser Packaging Solutions
Holding Co ‘144A’ 5.5% 15/4/2024 5,718,027 0.19 USD 536,000 McDermott Technology Americas
Inc / McDermott Technology US Inc ‘144A’ 10.625% 1/5/2024 381,230 0.01
USD 3,059,000 MEDNAX Inc ‘144A’ 6.25% 15/1/2027 3,009,291 0.10
USD 1,089,000 Meredith Corp 6.875% 1/2/2026 1,154,340 0.04 USD 1,274,669 Merrill Lynch Mortgage Trust 2005-
CIP1 ‘Series 2005-CIP1 D’ FRN 12/7/2038 1,296,829 0.04
USD 4,354,000 MGM Growth Properties Operating Partnership LP / MGP Finance Co-Issuer Inc 4.5% 1/9/2026 4,571,700 0.15
USD 186,000 MGM Growth Properties Operating Partnership LP / MGP Finance Co-Issuer Inc 4.5% 15/1/2028 190,650 0.01
USD 3,948,000 Mobile Mini Inc 5.875% 1/7/2024 4,105,920 0.14 USD 482,000 Molina Healthcare Inc ‘144A’
4.875% 15/6/2025 493,447 0.02 USD 550,000 Morgan Stanley FRN 15/10/2019
(Perpetual) 552,063 0.02 USD 790,000 Morgan Stanley Capital I 2017-
HR2 ‘Series 2017-HR2 D’ 2.73% 15/12/2050 726,069 0.02
USD 2,550,000 Morgan Stanley Capital I Trust 2018-H3 ‘Series 2018-H3 C’ FRN 15/7/2051 2,855,625 0.09
USD 2,000,000 Morgan Stanley Capital I Trust 2018-H3 ‘Series 2018-H3 D’ ‘144A’ 3% 15/7/2051 1,846,785 0.06
USD 2,610,000 Morgan Stanley Capital I Trust 2018-MP ‘Series 2018-MP E’ ‘144A’ FRN 11/7/2040 2,686,749 0.09
USD 3,590,000 Morgan Stanley Capital I Trust 2018-SUN ‘Series 2018-SUN F’ ‘144A’ FRN 15/7/2035 3,611,235 0.12
USD 4,611,437 Morgan Stanley Residential Mortgage Loan Trust 2014-1 ‘Series 2014-1A B3’ ‘144A’ FRN 25/6/2044 4,551,346 0.15
USD 3,334,000 MPH Acquisition Holdings LLC ‘144A’ 7.125% 1/6/2024 2,992,265 0.10
USD 430,000 MTS Systems Corp ‘144A’ 5.75% 15/8/2027 451,500 0.01
USD 167,000 Murphy Oil Corp 5.625% 1/12/2042 146,125 0.00 USD 5,500,000 Nationstar HECM Loan Trust 2018-
1 ‘Series 2018-1A M3’ ‘144A’ FRN 25/2/2028 5,545,220 0.18
USD 605,000 Nationstar Mortgage Holdings Inc ‘144A’ 8.125% 15/7/2023 626,175 0.02
USD 1,224,000 Nationstar Mortgage Holdings Inc ‘144A’ 9.125% 15/7/2026 1,295,910 0.04
USD 1,472,000 Navient Corp 6.75% 15/6/2026 1,571,360 0.05 USD 532,000 Navistar International Corp ‘144A’
6.625% 1/11/2025 541,642 0.02 USD 459,000 NCR Corp ‘144A’ 5.75% 1/9/2027 483,671 0.02 USD 1,079,000 NCR Corp ‘144A’ 6.125% 1/9/2029 1,141,043 0.04
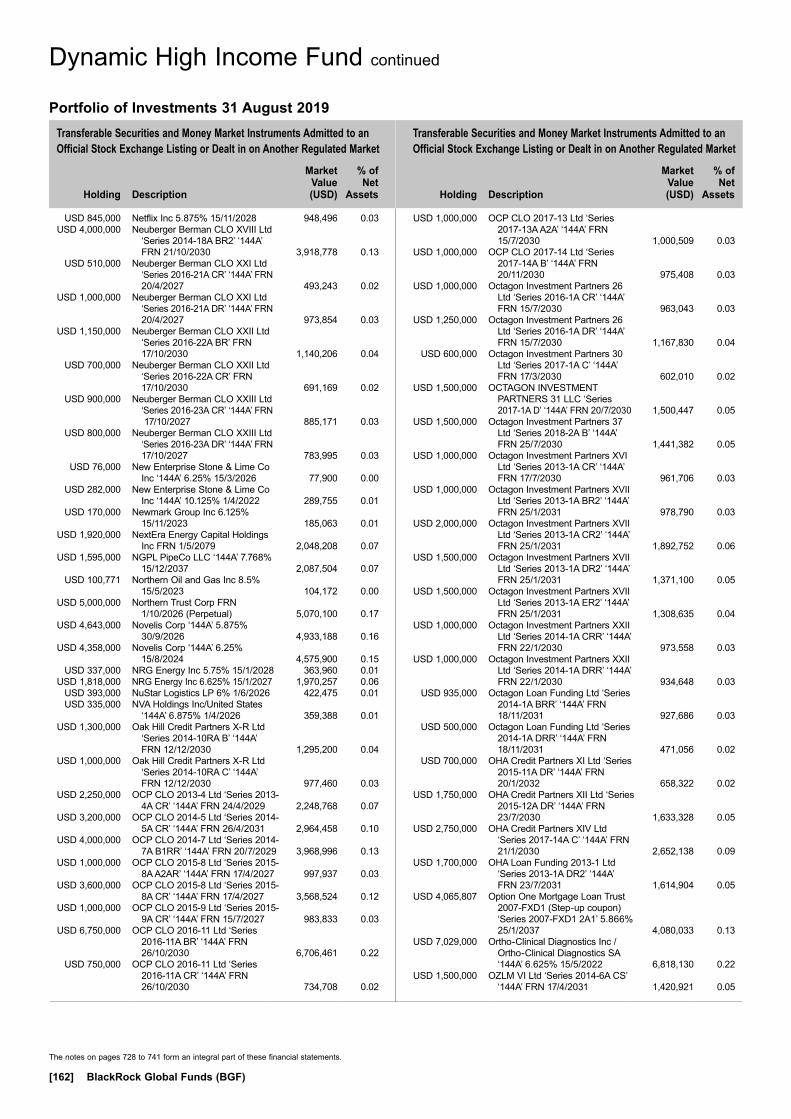
Transferable Securities and Money Market Instruments Admitted to an Official Stock Exchange Listing or Dealt in on Another Regulated Market
Transferable Securities and Money Market Instruments Admitted to an Official Stock Exchange Listing or Dealt in on Another Regulated Market
Holding
Description
Market Value (USD)
% of Net
Assets
Holding
Description
Market Value (USD)
% of Net
Assets
The notes on pages 728 to 741 form an integral part of these financial statements.
[162] BlackRock Global Funds (BGF)
Dynamic High Income Fund continued
Portfolio of Investments 31 August 2019
USD 845,000 Netflix Inc 5.875% 15/11/2028 948,496 0.03 USD 4,000,000 Neuberger Berman CLO XVIII Ltd
‘Series 2014-18A BR2’ ‘144A’ FRN 21/10/2030 3,918,778 0.13
USD 510,000 Neuberger Berman CLO XXI Ltd ‘Series 2016-21A CR’ ‘144A’ FRN 20/4/2027 493,243 0.02
USD 1,000,000 Neuberger Berman CLO XXI Ltd ‘Series 2016-21A DR’ ‘144A’ FRN 20/4/2027 973,854 0.03
USD 1,150,000 Neuberger Berman CLO XXII Ltd ‘Series 2016-22A BR’ FRN 17/10/2030 1,140,206 0.04
USD 700,000 Neuberger Berman CLO XXII Ltd ‘Series 2016-22A CR’ FRN 17/10/2030 691,169 0.02
USD 900,000 Neuberger Berman CLO XXIII Ltd ‘Series 2016-23A CR’ ‘144A’ FRN 17/10/2027 885,171 0.03
USD 800,000 Neuberger Berman CLO XXIII Ltd ‘Series 2016-23A DR’ ‘144A’ FRN 17/10/2027 783,995 0.03
USD 76,000 New Enterprise Stone & Lime Co Inc ‘144A’ 6.25% 15/3/2026 77,900 0.00
USD 282,000 New Enterprise Stone & Lime Co Inc ‘144A’ 10.125% 1/4/2022 289,755 0.01
USD 170,000 Newmark Group Inc 6.125% 15/11/2023 185,063 0.01
USD 1,920,000 NextEra Energy Capital Holdings Inc FRN 1/5/2079 2,048,208 0.07
USD 1,595,000 NGPL PipeCo LLC ‘144A’ 7.768% 15/12/2037 2,087,504 0.07
USD 100,771 Northern Oil and Gas Inc 8.5% 15/5/2023 104,172 0.00
USD 5,000,000 Northern Trust Corp FRN 1/10/2026 (Perpetual) 5,070,100 0.17
USD 4,643,000 Novelis Corp ‘144A’ 5.875% 30/9/2026 4,933,188 0.16
USD 4,358,000 Novelis Corp ‘144A’ 6.25% 15/8/2024 4,575,900 0.15
USD 337,000 NRG Energy Inc 5.75% 15/1/2028 363,960 0.01 USD 1,818,000 NRG Energy Inc 6.625% 15/1/2027 1,970,257 0.06 USD 393,000 NuStar Logistics LP 6% 1/6/2026 422,475 0.01 USD 335,000 NVA Holdings Inc/United States
‘144A’ 6.875% 1/4/2026 359,388 0.01 USD 1,300,000 Oak Hill Credit Partners X-R Ltd
‘Series 2014-10RA B’ ‘144A’ FRN 12/12/2030 1,295,200 0.04
USD 1,000,000 Oak Hill Credit Partners X-R Ltd ‘Series 2014-10RA C’ ‘144A’ FRN 12/12/2030 977,460 0.03
USD 2,250,000 OCP CLO 2013-4 Ltd ‘Series 2013-4A CR’ ‘144A’ FRN 24/4/2029 2,248,768 0.07
USD 3,200,000 OCP CLO 2014-5 Ltd ‘Series 2014-5A CR’ ‘144A’ FRN 26/4/2031 2,964,458 0.10
USD 4,000,000 OCP CLO 2014-7 Ltd ‘Series 2014-7A B1RR’ ‘144A’ FRN 20/7/2029 3,968,996 0.13
USD 1,000,000 OCP CLO 2015-8 Ltd ‘Series 2015-8A A2AR’ ‘144A’ FRN 17/4/2027 997,937 0.03
USD 3,600,000 OCP CLO 2015-8 Ltd ‘Series 2015-8A CR’ ‘144A’ FRN 17/4/2027 3,568,524 0.12
USD 1,000,000 OCP CLO 2015-9 Ltd ‘Series 2015-9A CR’ ‘144A’ FRN 15/7/2027 983,833 0.03
USD 6,750,000 OCP CLO 2016-11 Ltd ‘Series 2016-11A BR’ ‘144A’ FRN 26/10/2030 6,706,461 0.22
USD 750,000 OCP CLO 2016-11 Ltd ‘Series 2016-11A CR’ ‘144A’ FRN 26/10/2030 734,708 0.02
USD 1,000,000 OCP CLO 2017-13 Ltd ‘Series 2017-13A A2A’ ‘144A’ FRN 15/7/2030 1,000,509 0.03
USD 1,000,000 OCP CLO 2017-14 Ltd ‘Series 2017-14A B’ ‘144A’ FRN 20/11/2030 975,408 0.03
USD 1,000,000 Octagon Investment Partners 26 Ltd ‘Series 2016-1A CR’ ‘144A’ FRN 15/7/2030 963,043 0.03
USD 1,250,000 Octagon Investment Partners 26 Ltd ‘Series 2016-1A DR’ ‘144A’ FRN 15/7/2030 1,167,830 0.04
USD 600,000 Octagon Investment Partners 30 Ltd ‘Series 2017-1A C’ ‘144A’ FRN 17/3/2030 602,010 0.02
USD 1,500,000 OCTAGON INVESTMENT PARTNERS 31 LLC ‘Series 2017-1A D’ ‘144A’ FRN 20/7/2030 1,500,447 0.05
USD 1,500,000 Octagon Investment Partners 37 Ltd ‘Series 2018-2A B’ ‘144A’ FRN 25/7/2030 1,441,382 0.05
USD 1,000,000 Octagon Investment Partners XVI Ltd ‘Series 2013-1A CR’ ‘144A’ FRN 17/7/2030 961,706 0.03
USD 1,000,000 Octagon Investment Partners XVII Ltd ‘Series 2013-1A BR2’ ‘144A’ FRN 25/1/2031 978,790 0.03
USD 2,000,000 Octagon Investment Partners XVII Ltd ‘Series 2013-1A CR2’ ‘144A’ FRN 25/1/2031 1,892,752 0.06
USD 1,500,000 Octagon Investment Partners XVII Ltd ‘Series 2013-1A DR2’ ‘144A’ FRN 25/1/2031 1,371,100 0.05
USD 1,500,000 Octagon Investment Partners XVII Ltd ‘Series 2013-1A ER2’ ‘144A’ FRN 25/1/2031 1,308,635 0.04
USD 1,000,000 Octagon Investment Partners XXII Ltd ‘Series 2014-1A CRR’ ‘144A’ FRN 22/1/2030 973,558 0.03
USD 1,000,000 Octagon Investment Partners XXII Ltd ‘Series 2014-1A DRR’ ‘144A’ FRN 22/1/2030 934,648 0.03
USD 935,000 Octagon Loan Funding Ltd ‘Series 2014-1A BRR’ ‘144A’ FRN 18/11/2031 927,686 0.03
USD 500,000 Octagon Loan Funding Ltd ‘Series 2014-1A DRR’ ‘144A’ FRN 18/11/2031 471,056 0.02
USD 700,000 OHA Credit Partners XI Ltd ‘Series 2015-11A DR’ ‘144A’ FRN 20/1/2032 658,322 0.02
USD 1,750,000 OHA Credit Partners XII Ltd ‘Series 2015-12A DR’ ‘144A’ FRN 23/7/2030 1,633,328 0.05
USD 2,750,000 OHA Credit Partners XIV Ltd ‘Series 2017-14A C’ ‘144A’ FRN 21/1/2030 2,652,138 0.09
USD 1,700,000 OHA Loan Funding 2013-1 Ltd ‘Series 2013-1A DR2’ ‘144A’ FRN 23/7/2031 1,614,904 0.05
USD 4,065,807 Option One Mortgage Loan Trust 2007-FXD1 (Step-up coupon) ‘Series 2007-FXD1 2A1’ 5.866% 25/1/2037 4,080,033 0.13
USD 7,029,000 Ortho-Clinical Diagnostics Inc / Ortho-Clinical Diagnostics SA ‘144A’ 6.625% 15/5/2022 6,818,130 0.22
USD 1,500,000 OZLM VI Ltd ‘Series 2014-6A CS’ ‘144A’ FRN 17/4/2031 1,420,921 0.05

Transferable Securities and Money Market Instruments Admitted to an Official Stock Exchange Listing or Dealt in on Another Regulated Market
Transferable Securities and Money Market Instruments Admitted to an Official Stock Exchange Listing or Dealt in on Another Regulated Market
Holding
Description
Market Value (USD)
% of Net
Assets
Holding
Description
Market Value (USD)
% of Net
Assets
* All or a portion of this security represents a security on loan.
The notes on pages 728 to 741 form an integral part of these financial statements.
Annual Report and Audited Financial Statements [163]
Dynamic High Income Fund continued
Portfolio of Investments 31 August 2019
USD 1,000,000 OZLM XX Ltd ‘Series 2018-20A B’ ‘144A’ FRN 20/4/2031 973,628 0.03
USD 1,250,000 OZLM XX Ltd ‘Series 2018-20A C’ ‘144A’ FRN 20/4/2031 1,180,635 0.04
USD 2,250,000 Palmer Square CLO 2013-2 Ltd ‘Series 2013-2A A2RR’ ‘144A’ FRN 17/10/2031 2,228,590 0.07
USD 2,400,000 Palmer Square CLO 2013-2 Ltd ‘Series 2013-2A BRR’ ‘144A’ FRN 17/10/2031 2,315,583 0.08
USD 1,500,000 Palmer Square CLO 2013-2 Ltd ‘Series 2013-2A CRR’ ‘144A’ FRN 17/10/2031 1,446,061 0.05
USD 1,000,000 Palmer Square CLO 2018-1 Ltd ‘Series 2018-1A B’ ‘144A’ FRN 18/4/2031 956,211 0.03
USD 2,500,000 Palmer Square CLO 2018-1 Ltd ‘Series 2018-1A C’ ‘144A’ FRN 18/4/2031 2,314,355 0.08
USD 1,000,000 Palmer Square CLO 2018-2 Ltd ‘Series 2018-2A D’ ‘144A’ FRN 16/7/2031 899,309 0.03
USD 1,165,000 Palmer Square Loan Funding 2018-5 Ltd ‘Series 2018-5A B’ ‘144A’ FRN 20/1/2027 1,160,686 0.04
USD 2,717,000 Panther BF Aggregator 2 LP / Panther Finance Co Inc ‘144A’ 6.25% 15/5/2026 2,815,491 0.09
USD 2,850,000 Panther BF Aggregator 2 LP / Panther Finance Co Inc ‘144A’ 8.5% 15/5/2027 2,778,750 0.09
USD 1,517,000 Par Pharmaceutical Inc ‘144A’ 7.5% 1/4/2027 1,418,395 0.05
USD 1,700,000 Park Avenue Institutional Advisers CLO Ltd 2016-1 ‘Series 2016-1A A2R’ ‘144A’ FRN 23/8/2031 1,685,023 0.06
USD 5,000,000 Park Avenue Institutional Advisers CLO Ltd 2017-1 ‘Series 2017-1A B’ ‘144A’ FRN 14/11/2029 4,935,382 0.16
USD 944,000 Parsley Energy LLC / Parsley Finance Corp ‘144A’ 5.25% 15/8/2025 962,880 0.03
USD 1,333,000 Parsley Energy LLC / Parsley Finance Corp ‘144A’ 5.375% 15/1/2025 1,362,992 0.04
USD 189,000 Parsley Energy LLC / Parsley Finance Corp ‘144A’ 5.625% 15/10/2027 195,615 0.01
USD 102,000 Parsley Energy LLC / Parsley Finance Corp ‘144A’ 6.25% 1/6/2024 105,315 0.00
USD 529,000 PBF Holding Co LLC / PBF Finance Corp 7.25% 15/6/2025 546,854 0.02
USD 339,000 PDC Energy Inc 5.75% 15/5/2026 332,186 0.01 USD 183,000 PDC Energy Inc 6.125% 15/9/2024 182,542 0.01 USD 754,000 Penske Automotive Group Inc 5.5%
15/5/2026 791,700 0.03 USD 1,387,000 PetSmart Inc ‘144A’ 5.875%
1/6/2025 1,366,195 0.04 USD 364,000 PetSmart Inc ‘144A’ 7.125%
15/3/2023 338,520 0.01 USD 135,000 PGT Escrow Issuer Inc ‘144A’
6.75% 1/8/2026 145,800 0.00 USD 1,682,333 Polaris Intermediate Corp ‘144A’
8.5% 1/12/2022 1,413,328 0.05 USD 1,041,000 Post Holdings Inc ‘144A’ 5.5%
1/3/2025 1,093,050 0.04 USD 554,000 Post Holdings Inc ‘144A’ 5.5%
15/12/2029 587,240 0.02 USD 4,352,000 PQ Corp ‘144A’ 5.75% 15/12/2025 4,482,560 0.15
USD 3,932,969 Pretium Mortgage Credit Partners I 2019-NPL1 LLC (Step-up coupon) ‘Series 2019-NPL1 A1’ ‘144A’ 4.213% 25/7/2060 3,975,303 0.13
USD 1,775,868 Pretium Mortgage Credit Partners I 2019-NPL2 LLC (Step-up coupon) ‘Series 2019-NPL2 A1’ ‘144A’ 3.844% 25/12/2058 1,785,827 0.06
USD 6,700,000 Prima Capital CRE Securitization 2016-VI Ltd ‘Series 2016-6A C’ ‘144A’ 4% 24/8/2040 6,706,700 0.22
USD 66,000 Prime Security Services Borrower LLC / Prime Finance Inc ‘144A’ 5.75% 15/4/2026 68,970 0.00
USD 1,660,000 Progress Residential 2017-SFR1 Trust ‘Series 2017-SFR1 E’ ‘144A’ 4.261% 17/8/2034 1,714,477 0.06
USD 833,000 Progress Residential 2017-SFR2 Trust ‘Series 2017-SFR2 D’ ‘144A’ 3.595% 17/12/2034 845,211 0.03
USD 4,000,000 Progress Residential 2017-SFR2 Trust ‘Series 2017-SFR2 F’ ‘144A’ 4.836% 17/12/2034 4,103,050 0.14
USD 1,500,000 Progress Residential 2018-SFR1 Trust ‘Series 2018-SFR1 F’ ‘144A’ 4.778% 17/3/2035 1,538,738 0.05
USD 2,500,000 Progress Residential 2018-SFR2 Trust ‘Series 2018-SFR2 F’ ‘144A’ 4.953% 17/8/2035 2,600,054 0.09
USD 5,259,000 Progress Residential 2018-SFR3 Trust ‘Series 2018-SFR3 F’ ‘144A’ 5.368% 17/10/2035 5,540,383 0.18
USD 2,040,000 Progress Residential 2019-SFR2 Trust ‘Series 2019-SFR2 E’ ‘144A’ 4.142% 17/5/2036 2,114,311 0.07
USD 845,000 Progress Residential 2019-SFR2 Trust ‘Series 2019-SFR2 F’ ‘144A’ 4.837% 17/5/2036 882,727 0.03
USD 1,630,000 Progressive Corp/The FRN 15/3/2023 (Perpetual) 1,685,453 0.06
USD 79,000 QEP Resources Inc 5.25% 1/5/2023 69,125 0.00 USD 151,000 QEP Resources Inc 5.375%
1/10/2022 136,466 0.00 USD 96,000 QEP Resources Inc 5.625%
1/3/2026 78,240 0.00 USD 121,000 QEP Resources Inc 6.875%
1/3/2021 120,697 0.00 USD 1,495,000 Qualitytech LP / QTS Finance Corp
‘144A’ 4.75% 15/11/2025 1,524,900 0.05 USD 4,000,000 Race Point VIII CLO Ltd ‘Series
2013-8A DR’ ‘144A’ FRN 20/2/2030 4,002,911 0.13
USD 342,000 Rackspace Hosting Inc ‘144A’ 8.625% 15/11/2024* 313,357 0.01
USD 353,000 Radiate Holdco LLC / Radiate Finance Inc ‘144A’ 6.625% 15/2/2025 352,118 0.01
USD 316,000 Radiate Holdco LLC / Radiate Finance Inc ‘144A’ 6.875% 15/2/2023 323,900 0.01
USD 11,000 Range Resources Corp 4.875% 15/5/2025* 9,185 0.00
USD 736,000 Range Resources Corp 5.75% 1/6/2021 734,160 0.02
USD 1,198,000 RBS Global Inc / Rexnord LLC ‘144A’ 4.875% 15/12/2025 1,236,935 0.04
USD 4,406,000 Refinitiv US Holdings Inc ‘144A’ 6.25% 15/5/2026 4,808,047 0.16
USD 5,436,000 Refinitiv US Holdings Inc ‘144A’ 8.25% 15/11/2026 6,142,680 0.20

Transferable Securities and Money Market Instruments Admitted to an Official Stock Exchange Listing or Dealt in on Another Regulated Market
Transferable Securities and Money Market Instruments Admitted to an Official Stock Exchange Listing or Dealt in on Another Regulated Market
Holding
Description
Market Value (USD)
% of Net
Assets
Holding
Description
Market Value (USD)
% of Net
Assets
The notes on pages 728 to 741 form an integral part of these financial statements.
[164] BlackRock Global Funds (BGF)
Dynamic High Income Fund continued
Portfolio of Investments 31 August 2019
USD 500,000 Regatta IX Funding Ltd ‘Series 2017-1A D’ ‘144A’ FRN 17/4/2030 503,258 0.02
USD 1,000,000 Regatta VI Funding Ltd ‘Series 2016-1A CR’ ‘144A’ FRN 20/7/2028 980,314 0.03
USD 500,000 Regatta VII Funding Ltd ‘Series 2016-1A CR’ ‘144A’ FRN 20/12/2028 492,328 0.02
USD 2,000,000 Regatta VII Funding Ltd ‘Series 2016-1A DR’ ‘144A’ FRN 20/12/2028 1,937,615 0.06
USD 1,000,000 Regatta X Funding Ltd ‘Series 2017-3A C’ ‘144A’ FRN 17/1/2031 970,263 0.03
USD 1,000,000 Regatta X Funding Ltd ‘Series 2017-3A D’ ‘144A’ FRN 17/1/2031 933,513 0.03
USD 333,000 RegionalCare Hospital Partners Holdings Inc ‘144A’ 8.25% 1/5/2023 356,202 0.01
USD 256,892 Renaissance Home Equity Loan Trust 2005-1 ‘Series 2005-1 AV3’ FRN 25/5/2035 249,829 0.01
USD 1,798,549 Renaissance Home Equity Loan Trust 2005-3 (Step-up coupon) ‘Series 2005-3 AF4’ 5.14% 25/11/2035 1,907,077 0.06
USD 150,000 Reynolds Group Issuer Inc / Reynolds Group Issuer LLC / Reynolds Group Issuer Lu ‘144A’ 5.125% 15/7/2023 154,313 0.01
USD 1,566,000 Reynolds Group Issuer Inc / Reynolds Group Issuer LLC / Reynolds Group Issuer Lu ‘144A’ 7% 15/7/2024 1,619,831 0.05
USD 600,000 Rockford Tower CLO 2018-2 Ltd ‘Series 2018-2A C’ ‘144A’ FRN 20/10/2031 594,399 0.02
USD 700,000 Rockford Tower CLO 2018-2 Ltd ‘Series 2018-2A D’ ‘144A’ FRN 20/10/2031 667,703 0.02
USD 1,200,000 Rockford Tower CLO 2018-2 Ltd ‘Series 2018-2A E’ ‘144A’ FRN 20/10/2031 1,083,967 0.04
USD 779,000 Rowan Cos Inc 4.875% 1/6/2022 641,896 0.02 USD 2,978,000 RP Crown Parent LLC ‘144A’
7.375% 15/10/2024 3,111,146 0.10 USD 2,250,000 RR 2 Ltd ‘Series 2017-2A C’ ‘144A’
FRN 15/10/2029 2,207,684 0.07 USD 800,000 RR 5 Ltd ‘Series 2018-5A B’ FRN
15/10/2031 785,590 0.03 USD 2,895,000 Scientific Games International Inc
‘144A’ 5% 15/10/2025 2,998,467 0.10 USD 3,282,000 Scientific Games International Inc
‘144A’ 8.25% 15/3/2026 3,487,125 0.11 USD 1,835,191 Seasoned Credit Risk Transfer
Trust Series 2018-1 ‘Series 2018-1 BX’ FRN 25/5/2057 955,845 0.03
USD 847,000 ServiceMaster Co LLC/The ‘144A’ 5.125% 15/11/2024 887,487 0.03
USD 3,000,000 Silver Creek CLO Ltd ‘Series 2014-1A CR’ ‘144A’ FRN 20/7/2030 2,970,161 0.10
USD 245,000 Simmons Foods Inc ‘144A’ 7.75% 15/1/2024 265,825 0.01
USD 230,000 SM Energy Co 5% 15/1/2024 202,400 0.01 USD 239,000 SM Energy Co 5.625% 1/6/2025 204,345 0.01 USD 92,000 SM Energy Co 6.125% 15/11/2022 86,020 0.00 USD 32,000 SM Energy Co 6.75% 15/9/2026 27,360 0.00 USD 3,941,000 Solera LLC / Solera Finance Inc
‘144A’ 10.5% 1/3/2024 4,197,165 0.14 USD 558,000 Sophia LP / Sophia Finance Inc
‘144A’ 9% 30/9/2023 576,135 0.02
USD 1,228,000 Sotera Health Holdings LLC ‘144A’ 6.5% 15/5/2023 1,252,560 0.04
USD 1,000,000 Southern Co/The FRN 15/3/2057 1,037,795 0.03 USD 8,000 Southwestern Energy Co 7.75%
1/10/2027 7,020 0.00 USD 1,161,000 Springleaf Finance Corp 6.625%
15/1/2028 1,282,905 0.04 USD 775,000 Springleaf Finance Corp 6.875%
15/3/2025 883,500 0.03 USD 42,000 Springleaf Finance Corp 7.125%
15/3/2026 48,064 0.00 USD 829,000 Sprint Capital Corp 6.875%
15/11/2028 922,437 0.03 USD 558,000 Sprint Capital Corp 8.75%
15/3/2032 698,895 0.02 USD 1,885,000 Sprint Corp 7.125% 15/6/2024 2,092,916 0.07 USD 1,355,000 Sprint Corp 7.625% 15/2/2025 1,524,375 0.05 USD 338,000 Sprint Corp 7.625% 1/3/2026 381,729 0.01 USD 1,227,000 Sprint Corp 7.875% 15/9/2023 1,383,443 0.05 USD 244,000 SPX FLOW Inc ‘144A’ 5.625%
15/8/2024 255,895 0.01 USD 319,000 SPX FLOW Inc ‘144A’ 5.875%
15/8/2026 338,140 0.01 USD 234,000 SRC Energy Inc 6.25% 1/12/2025 230,490 0.01 USD 964,000 SRS Distribution Inc ‘144A’ 8.25%
1/7/2026 947,130 0.03 USD 2,508,000 Staples Inc ‘144A’ 7.5% 15/4/2026 2,545,620 0.08 USD 297,000 Staples Inc ‘144A’ 10.75% 15/4/2027 300,713 0.01 USD 2,100,000 State Street Corp FRN 15/12/2023
(Perpetual) 2,163,567 0.07 USD 12,955,000 State Street Corp FRN 15/6/2047 9,964,900 0.33 USD 470,000 Station Casinos LLC ‘144A’ 5%
1/10/2025 480,622 0.02 USD 345,000 Stevens Holding Co Inc ‘144A’
6.125% 1/10/2026 362,250 0.01 USD 133,487 Structured Asset Mortgage
Investments II Trust 2006-AR6 ‘Series 2006-AR6 2A1’ FRN 25/7/2046 115,823 0.00
USD 209,000 Sunoco LP / Sunoco Finance Corp 5.5% 15/2/2026 217,360 0.01
USD 63,000 Sunoco LP / Sunoco Finance Corp 6% 15/4/2027 66,465 0.00
USD 11,350,000 SunTrust Banks Inc FRN 15/6/2022 (Perpetual) 11,460,436 0.38
USD 2,039,000 Surgery Center Holdings Inc ‘144A’ 6.75% 1/7/2025 1,717,857 0.06
USD 369,000 Surgery Center Holdings Inc ‘144A’ 10% 15/4/2027 354,240 0.01
USD 454,000 Syneos Health Inc / inVentiv Health Inc / inVentiv Health Clinical Inc ‘144A’ 7.5% 1/10/2024 472,727 0.02
USD 78,000 Talen Energy Supply LLC 6.5% 1/6/2025 59,670 0.00
USD 78,000 Talen Energy Supply LLC ‘144A’ 10.5% 15/1/2026 71,097 0.00
USD 4,104,000 Tallgrass Energy Partners LP / Tallgrass Energy Finance Corp ‘144A’ 5.5% 15/1/2028 3,888,540 0.13
USD 415,000 Team Health Holdings Inc ‘144A’ 6.375% 1/2/2025 280,125 0.01
USD 2,657,000 Tempo Acquisition LLC / Tempo Acquisition Finance Corp ‘144A’ 6.75% 1/6/2025 2,741,705 0.09
USD 369,000 Tempur Sealy International Inc 5.5% 15/6/2026 386,989 0.01
USD 3,076,000 Tenet Healthcare Corp ‘144A’ 4.875% 1/1/2026 3,169,203 0.10
USD 2,106,000 Tenet Healthcare Corp ‘144A’ 5.125% 1/11/2027 2,182,343 0.07

Transferable Securities and Money Market Instruments Admitted to an Official Stock Exchange Listing or Dealt in on Another Regulated Market
Transferable Securities and Money Market Instruments Admitted to an Official Stock Exchange Listing or Dealt in on Another Regulated Market
Holding
Description
Market Value (USD)
% of Net
Assets
Holding
Description
Market Value (USD)
% of Net
Assets
The notes on pages 728 to 741 form an integral part of these financial statements.
Annual Report and Audited Financial Statements [165]
Dynamic High Income Fund continued
Portfolio of Investments 31 August 2019
USD 5,440,000 Tenet Healthcare Corp ‘144A’ 6.25% 1/2/2027 5,671,200 0.19
USD 1,150,000 Tenet Healthcare Corp 8.125% 1/4/2022 1,243,438 0.04
USD 3,189,000 Terex Corp ‘144A’ 5.625% 1/2/2025 3,252,780 0.11
USD 1,153,000 TerraForm Power Operating LLC ‘144A’ 5% 31/1/2028 1,199,120 0.04
USD 451,000 Tesla Inc ‘144A’ 5.3% 15/8/2025 401,390 0.01 USD 800,000 THL Credit Wind River 2017-3 Clo
Ltd ‘Series 2017-3A C’ ‘144A’ FRN 15/10/2030 791,478 0.03
USD 500,000 TIAA CLO IV Ltd ‘Series 2018-1A A2’ ‘144A’ FRN 20/1/2032 493,783 0.02
USD 645,000 TIBCO Software Inc ‘144A’ 11.375% 1/12/2021 677,653 0.02
USD 1,000,000 TICP CLO IX Ltd ‘Series 2017-9A D’ ‘144A’ FRN 20/1/2031 948,778 0.03
USD 1,250,000 TICP CLO VII Ltd ‘Series 2017-7A C’ ‘144A’ FRN 15/7/2029 1,256,153 0.04
USD 1,500,000 TICP CLO VIII Ltd ‘Series 2017-8A C’ ‘144A’ FRN 20/10/2030 1,487,971 0.05
USD 4,500,000 TICP CLO XI Ltd ‘Series 2018-11A C’ ‘144A’ FRN 20/10/2031 4,413,763 0.15
USD 1,000,000 TICP CLO XI Ltd ‘Series 2018-11A D’ ‘144A’ FRN 20/10/2031 956,094 0.03
USD 1,750,000 TICP CLO XI Ltd ‘Series 2018-11A E’ ‘144A’ FRN 20/10/2031 1,703,022 0.06
USD 500,000 TICP CLO XII Ltd ‘Series 2018-12A C’ ‘144A’ FRN 15/1/2031 488,635 0.02
USD 500,000 TICP CLO XII Ltd ‘Series 2018-12A D’ ‘144A’ FRN 15/1/2031 484,858 0.02
USD 3,258,000 Titan Acquisition Ltd / Titan Co-Borrower LLC ‘144A’ 7.75% 15/4/2026 2,956,635 0.10
USD 197,000 T-Mobile USA Inc 4.75% 1/2/2028 207,469 0.01 USD 657,000 TPC Group Inc ‘144A’ 10.5%
1/8/2024 693,135 0.02 USD 1,000,000 Treman Park CLO Ltd ‘Series
2015-1A DRR’ ‘144A’ FRN 20/10/2028 977,532 0.03
USD 750,000 TRESTLES CLO II Ltd ‘Series 2018-2A A2’ ‘144A’ FRN 25/7/2031 737,255 0.02
USD 500,000 TRESTLES CLO II Ltd ‘Series 2018-2A B’ ‘144A’ FRN 25/7/2031 480,149 0.02
USD 750,000 TRESTLES CLO II Ltd ‘Series 2018-2A C’ ‘144A’ FRN 25/7/2031 708,864 0.02
USD 1,000,000 Tricon American Homes 2016-SFR1 Trust ‘Series 2016-SFR1 F’ ‘144A’ 5.769% 17/11/2033 1,034,142 0.03
USD 460,000 Tricon American Homes 2017-SFR1 Trust ‘Series 2017-SFR1 D’ ‘144A’ 3.414% 17/9/2034 468,434 0.02
USD 695,000 Tricon American Homes 2017-SFR2 Trust ‘Series 2017-SFR2 F’ ‘144A’ 5.104% 17/1/2036 730,054 0.02
USD 595,000 Uber Technologies Inc ‘144A’ 7.5% 1/11/2023 623,262 0.02
USD 970,000 Uber Technologies Inc ‘144A’ 8% 1/11/2026 1,020,925 0.03
USD 106,000 Univision Communications Inc ‘144A’ 5.125% 15/5/2023 105,470 0.00
USD 1,258,000 Univision Communications Inc ‘144A’ 5.125% 15/2/2025 1,223,405 0.04
USD 2,260,000 US 2018-USDC ‘Series 2018-USDC F’ ‘144A’ FRN 13/5/2038 2,342,417 0.08
USD 1,564,000 USA Compression Partners LP / USA Compression Finance Corp 6.875% 1/4/2026 1,610,920 0.05
USD 4,704,000 USA Compression Partners LP / USA Compression Finance Corp ‘144A’ 6.875% 1/9/2027 4,861,960 0.16
USD 717,000 Veritas US Inc / Veritas Bermuda Ltd ‘144A’ 7.5% 1/2/2023 713,415 0.02
USD 6,005,000 Verscend Escrow Corp ‘144A’ 9.75% 15/8/2026 6,463,482 0.21
USD 1,651,000 Vertiv Group Corp ‘144A’ 9.25% 15/10/2024 1,576,705 0.05
USD 7,965,000 Viacom Inc FRN 28/2/2057 8,341,585 0.27 USD 552,000 Vizient Inc ‘144A’ 6.25% 15/5/2027 594,780 0.02 USD 1,000,000 Voya CLO 2014-2 Ltd ‘Series
2014-2A A2AR’ ‘144A’ FRN 17/4/2030 992,560 0.03
USD 700,000 Voya CLO 2014-4 Ltd ‘Series 2014-4A BR2’ ‘144A’ FRN 14/7/2031 690,422 0.02
USD 4,800,000 Voya CLO 2018-1 Ltd ‘Series 2018-1A B’ ‘144A’ FRN 19/4/2031 4,633,605 0.15
USD 3,500,000 Voya CLO 2018-1 Ltd ‘Series 2018-1A C’ ‘144A’ FRN 19/4/2031 3,233,495 0.11
USD 3,760,000 Voya Financial Inc FRN 15/9/2023 (Perpetual) 3,992,988 0.13
USD 670,000 Wabash National Corp ‘144A’ 5.5% 1/10/2025 659,113 0.02
USD 490,000 Wachovia Capital Trust II FRN 15/1/2027 457,709 0.02
USD 900,088 WaMu Mortgage Pass-Through Certificates Series 2007-OA5 Trust ‘Series 2007-OA5 1A’ FRN 25/6/2047 863,607 0.03
USD 1,181,474 Washington Mutual Mortgage Pass-Through Certificates WMALT Series 2007-OA3 Trust ‘Series 2007-OA3 4A2’ FRN 25/4/2047 1,005,069 0.03
USD 713,000 Waste Pro USA Inc ‘144A’ 5.5% 15/2/2026 745,085 0.02
USD 2,155,000 Wells Fargo & Co FRN 15/6/2024 (Perpetual) 2,309,697 0.08
USD 900,000 Wells Fargo Commercial Mortgage Trust 2015-C28 ‘Series 2015-C28 D’ FRN 15/5/2048 855,594 0.03
USD 3,288,000 Wells Fargo Commercial Mortgage Trust 2015-NXS1 ‘Series 2015-NXS1 D’ FRN 15/5/2048 3,356,513 0.11
USD 1,074,000 Wells Fargo Commercial Mortgage Trust 2015-NXS4 ‘Series 2015-NXS4 D’ FRN 15/12/2048 1,096,001 0.04
USD 467,000 Wells Fargo Commercial Mortgage Trust 2017-C39 ‘Series 2017-C39 C’ 4.118% 15/9/2050 498,696 0.02
USD 1,390,000 Wells Fargo Commercial Mortgage Trust 2018-C44 ‘Series 2018-C44 C’ FRN 15/5/2051 1,543,979 0.05
USD 1,910,000 Wells Fargo Commercial Mortgage Trust 2018-C44 ‘Series 2018-C44 D’ ‘144A’ 3% 15/5/2051 1,803,146 0.06
USD 1,400,000 Wells Fargo Commercial Mortgage Trust 2018-C45 ‘Series 2018-C45 D’ ‘144A’ 3% 15/6/2051 1,287,165 0.04
USD 920,000 Wells Fargo Commercial Mortgage Trust 2018-C45 ‘Series 2018-C45 C’ 4.727% 15/6/2051 1,008,969 0.03
USD 518,000 WeWork Cos Inc ‘144A’ 7.875% 1/5/2025 532,245 0.02
USD 941,000 Williams Scotsman International Inc ‘144A’ 6.875% 15/8/2023 988,050 0.03
USD 1,226,000 Williams Scotsman International Inc ‘144A’ 7.875% 15/12/2022 1,291,530 0.04

Transferable Securities and Money Market Instruments Admitted to an Official Stock Exchange Listing or Dealt in on Another Regulated Market
Transferable Securities and Money Market Instruments Admitted to an Official Stock Exchange Listing or Dealt in on Another Regulated Market
Holding
Description
Market Value (USD)
% of Net
Assets
Holding
Description
Market Value (USD)
% of Net
Assets
The notes on pages 728 to 741 form an integral part of these financial statements.
[166] BlackRock Global Funds (BGF)
Dynamic High Income Fund continued
Portfolio of Investments 31 August 2019
USD 808,000 WPX Energy Inc 5.25% 15/9/2024 825,016 0.03 USD 71,000 WPX Energy Inc 8.25% 1/8/2023 79,342 0.00 USD 28,000 XPO Logistics Inc ‘144A’ 6.75%
15/8/2024 30,310 0.00 USD 1,850,000 York CLO 1 Ltd ‘Series 2014-1A
CRR’ ‘144A’ FRN 22/10/2029 1,816,325 0.06 USD 1,460,000 York CLO 1 Ltd ‘Series 2014-1A
DRR’ ‘144A’ FRN 22/10/2029 1,451,634 0.05 USD 1,000,000 York CLO-2 Ltd ‘Series 2015-1A
BR’ ‘144A’ FRN 22/1/2031 986,391 0.03 USD 1,000,000 York CLO-2 Ltd ‘Series 2015-1A
CR’ ‘144A’ FRN 22/1/2031 970,806 0.03 USD 2,000,000 York Clo-3 Ltd ‘Series 2016-1A DR’
‘144A’ FRN 20/10/2029 1,999,596 0.07 USD 10,000 Yum! Brands Inc 5.35% 1/11/2043 9,550 0.00 USD 2,970,000 Zayo Group LLC / Zayo Capital Inc
‘144A’ 5.75% 15/1/2027 3,055,833 0.10 USD 5,140,000 Zayo Group LLC / Zayo Capital Inc
6% 1/4/2023 5,311,573 0.17 1,094,180,040 36.05Total Bonds 1,685,814,625 55.54
EQUITY LINKED NOTES
USD 151,970 BNP Paribas (Fund receives 10.26% Fixed; and receives/pays return on Oracle Corp) (10/9/2019) 7,928,920 0.26
USD 72,607 BNP Paribas (Fund receives 10.32% Fixed; and receives/pays return on Darden Restaurants Inc) (10/9/2019) 8,898,033 0.29
USD 87,359 BNP Paribas (Fund receives 10.95% Fixed; and receives/pays return on Walmart Inc) (4/10/2019) 9,986,426 0.33
USD 79,316 BNP Paribas (Fund receives 11.02% Fixed; and receives/pays return on Zoetis Inc) (28/10/2019) 9,923,585 0.33
USD 169,286 BNP Paribas (Fund receives 11.7% Fixed; and receives/pays return on Fifth Third Bancorp) (22/10/2019) 4,543,586 0.15
USD 169,286 BNP Paribas (Fund receives 11.75% Fixed; and receives/pays return on Fifth Third Bancorp) (21/10/2019) 4,545,071 0.15
USD 102,591 BNP Paribas (Fund receives 12.09% Fixed; and receives/pays return on Nike Inc) (17/9/2019) 8,810,887 0.29
USD 45,002 BNP Paribas (Fund receives 12.58% Fixed; and receives/pays return on McDonald’s Corp) (21/10/2019) 9,891,059 0.33
USD 73,318 BNP Paribas (Fund receives 13.48% Fixed; and receives/pays return on United Technologies Corp) (3/9/2019) 9,504,270 0.31
USD 5,515 BNP Paribas (Fund receives 13.95% Fixed; and receives/pays return on Amazon.com Inc) (21/10/2019) 9,897,079 0.33
USD 73,556 BNP Paribas (Fund receives 15.35% Fixed; and receives/pays return on Total System Services Inc) (19/9/2019) 9,860,703 0.32
USD 417,643 BNP Paribas (Fund receives 15.69% Fixed; and receives/pays return on Halliburton Co) (22/10/2019) 7,986,308 0.26
USD 75,232 BNP Paribas (Fund receives 16.94% Fixed; and receives/pays return on Johnson & Johnson) (10/10/2019) 9,733,842 0.32
USD 185,074 BNP Paribas (Fund receives 20.79% Fixed; and receives/pays return on Occidental Petroleum Corp) (19/9/2019) 8,047,683 0.27
USD 78,369 BNP Paribas (Fund receives 8.17% Fixed; and receives/pays return on Ingersoll-Rand Plc) (23/10/2019) 9,506,113 0.31
USD 40,537 BNP Paribas (Fund receives 8.6% Fixed; and receives/pays return on Biogen Inc) (22/10/2019) 8,953,627 0.30
USD 83,778 Citigroup (Fund receives 10.28% Fixed; and receives/pays return on Waste Management Inc) (12/9/2019) 9,954,210 0.33
USD 247,536 Citigroup (Fund receives 11.09% Fixed; and receives/pays return on eBay Inc) (6/9/2019) 10,028,612 0.33
USD 33,825 Citigroup (Fund receives 11.46% Fixed; and receives/pays return on Thermo Fisher Scientific Inc) (12/9/2019) 9,772,686 0.32
USD 295,097 Citigroup (Fund receives 11.76% Fixed; and receives/pays return on Ally Financial Inc) (3/9/2019) 9,279,415 0.31
USD 136,956 Citigroup (Fund receives 11.97% Fixed; and receives/pays return on DuPont de Nemours Inc) (19/9/2019) 9,450,428 0.31
USD 149,140 Citigroup (Fund receives 14.89% Fixed; and receives/pays return on SunTrust Banks Inc ) (6/9/2019) 9,251,553 0.30
USD 83,690 Citigroup (Fund receives 8.56% Fixed; and receives/pays return on Yum! Brands Inc) (19/9/2019) 9,785,477 0.32
USD 68,573 Citigroup (Fund receives 8.64% Fixed; and receives/pays return on Danaher Corp) (3/9/2019) 9,720,180 0.32
USD 332,987 Citigroup (Fund receives 9.44% Fixed; and receives/pays return on Bank of America Corp) (3/9/2019) 9,106,097 0.30
USD 56,691 Citigroup (Fund receives 9.75% Fixed; and receives/pays return on Union Pacific Corp) (6/9/2019) 9,271,451 0.31
USD 103,298 Citigroup (Fund receives 9.96% Fixed; and receives/pays return on Starbucks Corp) (30/10/2019) 9,906,501 0.33
USD 141,515 Credit Suisse (Fund receives 11.5% Fixed; and receives/pays return on Shares of Comerica Inc) (3/9/2019) 8,705,367 0.29
USD 73,066 Credit Suisse (Fund receives 12.6% Fixed; and receives/pays return on Microsoft Corp) (17/10/2019) 9,980,096 0.33
USD 221,311 Credit Suisse (Fund receives 13.8% Fixed; and receives/pays return on Morgan Stanley) (3/9/2019) 9,135,779 0.30
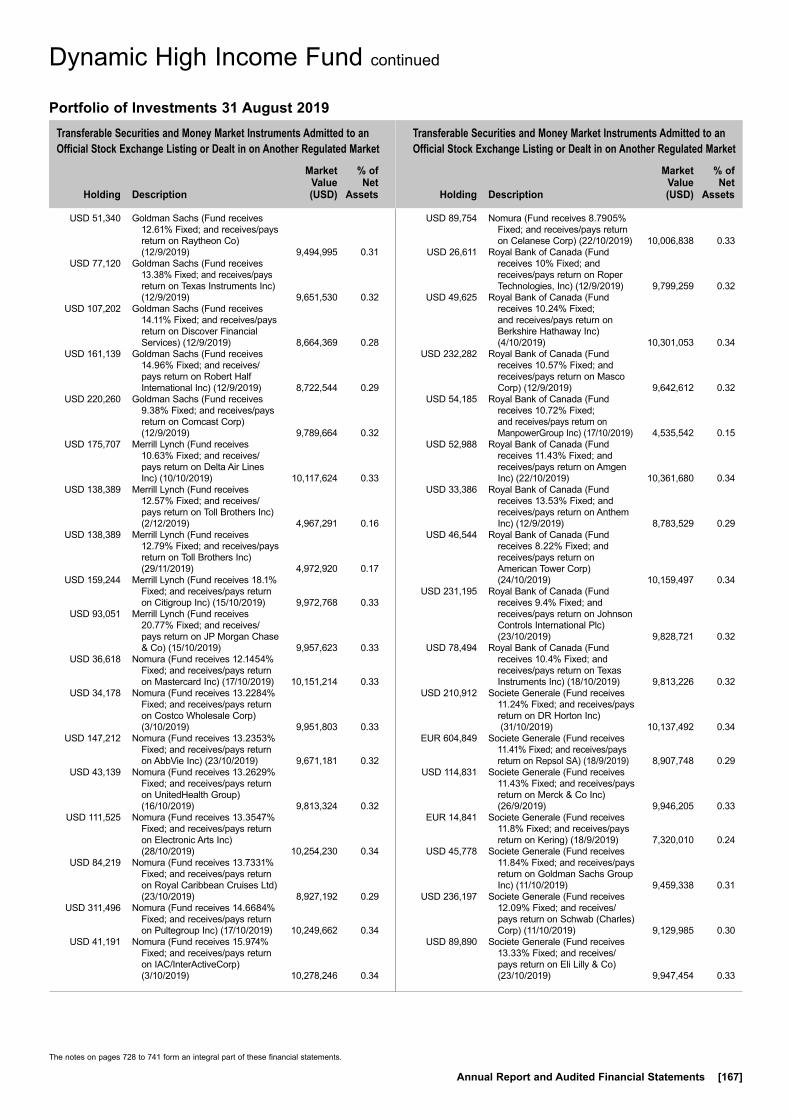
Transferable Securities and Money Market Instruments Admitted to an Official Stock Exchange Listing or Dealt in on Another Regulated Market
Transferable Securities and Money Market Instruments Admitted to an Official Stock Exchange Listing or Dealt in on Another Regulated Market
Holding
Description
Market Value (USD)
% of Net
Assets
Holding
Description
Market Value (USD)
% of Net
Assets
The notes on pages 728 to 741 form an integral part of these financial statements.
Annual Report and Audited Financial Statements [167]
Dynamic High Income Fund continued
Portfolio of Investments 31 August 2019
USD 51,340 Goldman Sachs (Fund receives 12.61% Fixed; and receives/pays return on Raytheon Co) (12/9/2019) 9,494,995 0.31
USD 77,120 Goldman Sachs (Fund receives 13.38% Fixed; and receives/pays return on Texas Instruments Inc) (12/9/2019) 9,651,530 0.32
USD 107,202 Goldman Sachs (Fund receives 14.11% Fixed; and receives/pays return on Discover Financial Services) (12/9/2019) 8,664,369 0.28
USD 161,139 Goldman Sachs (Fund receives 14.96% Fixed; and receives/pays return on Robert Half International Inc) (12/9/2019) 8,722,544 0.29
USD 220,260 Goldman Sachs (Fund receives 9.38% Fixed; and receives/pays return on Comcast Corp) (12/9/2019) 9,789,664 0.32
USD 175,707 Merrill Lynch (Fund receives 10.63% Fixed; and receives/pays return on Delta Air Lines Inc) (10/10/2019) 10,117,624 0.33
USD 138,389 Merrill Lynch (Fund receives 12.57% Fixed; and receives/pays return on Toll Brothers Inc) (2/12/2019) 4,967,291 0.16
USD 138,389 Merrill Lynch (Fund receives 12.79% Fixed; and receives/pays return on Toll Brothers Inc) (29/11/2019) 4,972,920 0.17
USD 159,244 Merrill Lynch (Fund receives 18.1% Fixed; and receives/pays return on Citigroup Inc) (15/10/2019) 9,972,768 0.33
USD 93,051 Merrill Lynch (Fund receives 20.77% Fixed; and receives/pays return on JP Morgan Chase & Co) (15/10/2019) 9,957,623 0.33
USD 36,618 Nomura (Fund receives 12.1454% Fixed; and receives/pays return on Mastercard Inc) (17/10/2019) 10,151,214 0.33
USD 34,178 Nomura (Fund receives 13.2284% Fixed; and receives/pays return on Costco Wholesale Corp) (3/10/2019) 9,951,803 0.33
USD 147,212 Nomura (Fund receives 13.2353% Fixed; and receives/pays return on AbbVie Inc) (23/10/2019) 9,671,181 0.32
USD 43,139 Nomura (Fund receives 13.2629% Fixed; and receives/pays return on UnitedHealth Group) (16/10/2019) 9,813,324 0.32
USD 111,525 Nomura (Fund receives 13.3547% Fixed; and receives/pays return on Electronic Arts Inc) (28/10/2019) 10,254,230 0.34
USD 84,219 Nomura (Fund receives 13.7331% Fixed; and receives/pays return on Royal Caribbean Cruises Ltd) (23/10/2019) 8,927,192 0.29
USD 311,496 Nomura (Fund receives 14.6684% Fixed; and receives/pays return on Pultegroup Inc) (17/10/2019) 10,249,662 0.34
USD 41,191 Nomura (Fund receives 15.974% Fixed; and receives/pays return on IAC/InterActiveCorp) (3/10/2019) 10,278,246 0.34
USD 89,754 Nomura (Fund receives 8.7905% Fixed; and receives/pays return on Celanese Corp) (22/10/2019) 10,006,838 0.33
USD 26,611 Royal Bank of Canada (Fund receives 10% Fixed; and receives/pays return on Roper Technologies, Inc) (12/9/2019) 9,799,259 0.32
USD 49,625 Royal Bank of Canada (Fund receives 10.24% Fixed; and receives/pays return on Berkshire Hathaway Inc) (4/10/2019) 10,301,053 0.34
USD 232,282 Royal Bank of Canada (Fund receives 10.57% Fixed; and receives/pays return on Masco Corp) (12/9/2019) 9,642,612 0.32
USD 54,185 Royal Bank of Canada (Fund receives 10.72% Fixed; and receives/pays return on ManpowerGroup Inc) (17/10/2019) 4,535,542 0.15
USD 52,988 Royal Bank of Canada (Fund receives 11.43% Fixed; and receives/pays return on Amgen Inc) (22/10/2019) 10,361,680 0.34
USD 33,386 Royal Bank of Canada (Fund receives 13.53% Fixed; and receives/pays return on Anthem Inc) (12/9/2019) 8,783,529 0.29
USD 46,544 Royal Bank of Canada (Fund receives 8.22% Fixed; and receives/pays return on American Tower Corp) (24/10/2019) 10,159,497 0.34
USD 231,195 Royal Bank of Canada (Fund receives 9.4% Fixed; and receives/pays return on Johnson Controls International Plc) (23/10/2019) 9,828,721 0.32
USD 78,494 Royal Bank of Canada (Fund receives 10.4% Fixed; and receives/pays return on Texas Instruments Inc) (18/10/2019) 9,813,226 0.32
USD 210,912 Societe Generale (Fund receives 11.24% Fixed; and receives/pays return on DR Horton Inc) (31/10/2019) 10,137,492 0.34
EUR 604,849 Societe Generale (Fund receives 11.41% Fixed; and receives/pays return on Repsol SA) (18/9/2019) 8,907,748 0.29
USD 114,831 Societe Generale (Fund receives 11.43% Fixed; and receives/pays return on Merck & Co Inc) (26/9/2019) 9,946,205 0.33
EUR 14,841 Societe Generale (Fund receives 11.8% Fixed; and receives/pays return on Kering) (18/9/2019) 7,320,010 0.24
USD 45,778 Societe Generale (Fund receives 11.84% Fixed; and receives/pays return on Goldman Sachs Group Inc) (11/10/2019) 9,459,338 0.31
USD 236,197 Societe Generale (Fund receives 12.09% Fixed; and receives/pays return on Schwab (Charles) Corp) (11/10/2019) 9,129,985 0.30
USD 89,890 Societe Generale (Fund receives 13.33% Fixed; and receives/pays return on Eli Lilly & Co) (23/10/2019) 9,947,454 0.33
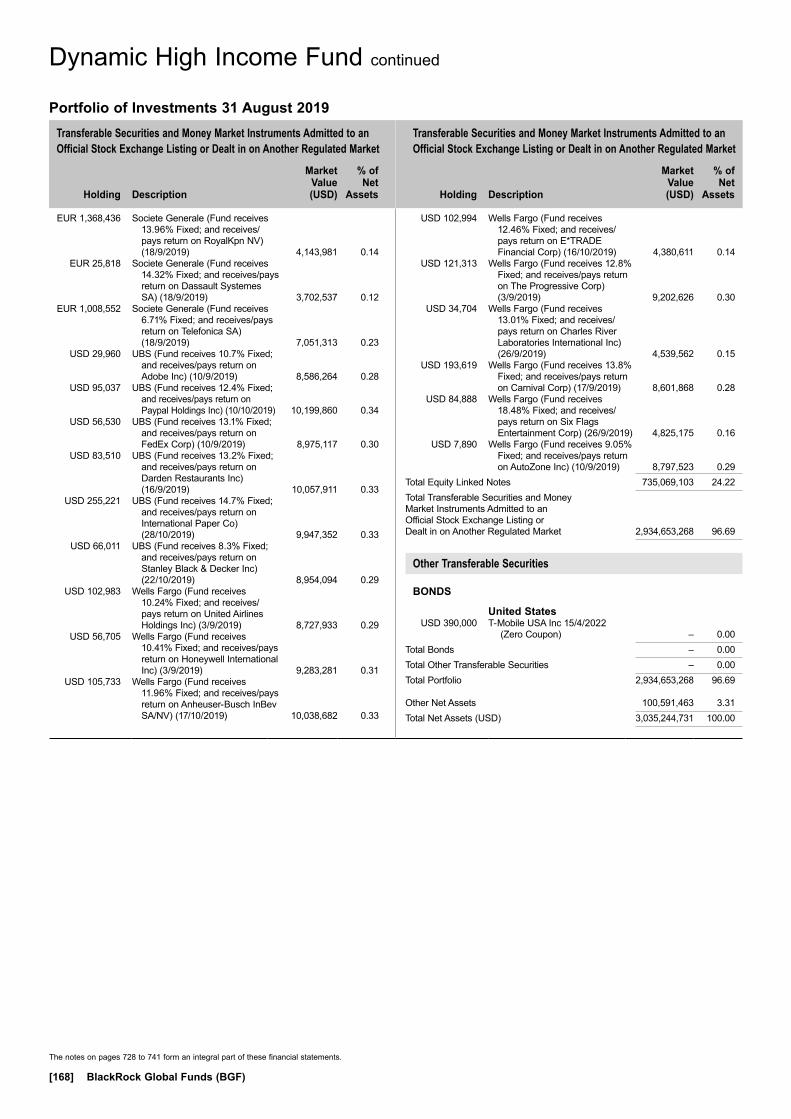
Transferable Securities and Money Market Instruments Admitted to an Official Stock Exchange Listing or Dealt in on Another Regulated Market
Transferable Securities and Money Market Instruments Admitted to an Official Stock Exchange Listing or Dealt in on Another Regulated Market
Holding
Description
Market Value (USD)
% of Net
Assets
Holding
Description
Market Value (USD)
% of Net
Assets
The notes on pages 728 to 741 form an integral part of these financial statements.
[168] BlackRock Global Funds (BGF)
Dynamic High Income Fund continued
Portfolio of Investments 31 August 2019
EUR 1,368,436 Societe Generale (Fund receives 13.96% Fixed; and receives/pays return on RoyalKpn NV) (18/9/2019) 4,143,981 0.14
EUR 25,818 Societe Generale (Fund receives 14.32% Fixed; and receives/pays return on Dassault Systemes SA) (18/9/2019) 3,702,537 0.12
EUR 1,008,552 Societe Generale (Fund receives 6.71% Fixed; and receives/pays return on Telefonica SA) (18/9/2019) 7,051,313 0.23
USD 29,960 UBS (Fund receives 10.7% Fixed; and receives/pays return on Adobe Inc) (10/9/2019) 8,586,264 0.28
USD 95,037 UBS (Fund receives 12.4% Fixed; and receives/pays return on Paypal Holdings Inc) (10/10/2019) 10,199,860 0.34
USD 56,530 UBS (Fund receives 13.1% Fixed; and receives/pays return on FedEx Corp) (10/9/2019) 8,975,117 0.30
USD 83,510 UBS (Fund receives 13.2% Fixed; and receives/pays return on Darden Restaurants Inc) (16/9/2019) 10,057,911 0.33
USD 255,221 UBS (Fund receives 14.7% Fixed; and receives/pays return on International Paper Co) (28/10/2019) 9,947,352 0.33
USD 66,011 UBS (Fund receives 8.3% Fixed; and receives/pays return on Stanley Black & Decker Inc) (22/10/2019) 8,954,094 0.29
USD 102,983 Wells Fargo (Fund receives 10.24% Fixed; and receives/pays return on United Airlines Holdings Inc) (3/9/2019) 8,727,933 0.29
USD 56,705 Wells Fargo (Fund receives 10.41% Fixed; and receives/pays return on Honeywell International Inc) (3/9/2019) 9,283,281 0.31
USD 105,733 Wells Fargo (Fund receives 11.96% Fixed; and receives/pays return on Anheuser-Busch InBev SA/NV) (17/10/2019) 10,038,682 0.33
USD 102,994 Wells Fargo (Fund receives 12.46% Fixed; and receives/pays return on E*TRADE Financial Corp) (16/10/2019) 4,380,611 0.14
USD 121,313 Wells Fargo (Fund receives 12.8% Fixed; and receives/pays return on The Progressive Corp) (3/9/2019) 9,202,626 0.30
USD 34,704 Wells Fargo (Fund receives 13.01% Fixed; and receives/pays return on Charles River Laboratories International Inc) (26/9/2019) 4,539,562 0.15
USD 193,619 Wells Fargo (Fund receives 13.8% Fixed; and receives/pays return on Carnival Corp) (17/9/2019) 8,601,868 0.28
USD 84,888 Wells Fargo (Fund receives 18.48% Fixed; and receives/pays return on Six Flags Entertainment Corp) (26/9/2019) 4,825,175 0.16
USD 7,890 Wells Fargo (Fund receives 9.05% Fixed; and receives/pays return on AutoZone Inc) (10/9/2019) 8,797,523 0.29
Total Equity Linked Notes 735,069,103 24.22Total Transferable Securities and Money Market Instruments Admitted to an Official Stock Exchange Listing or Dealt in on Another Regulated Market 2,934,653,268 96.69
Other Transferable Securities
BONDS
United States USD 390,000 T-Mobile USA Inc 15/4/2022
(Zero Coupon) – 0.00Total Bonds – 0.00Total Other Transferable Securities – 0.00Total Portfolio 2,934,653,268 96.69
Other Net Assets 100,591,463 3.31Total Net Assets (USD) 3,035,244,731 100.00
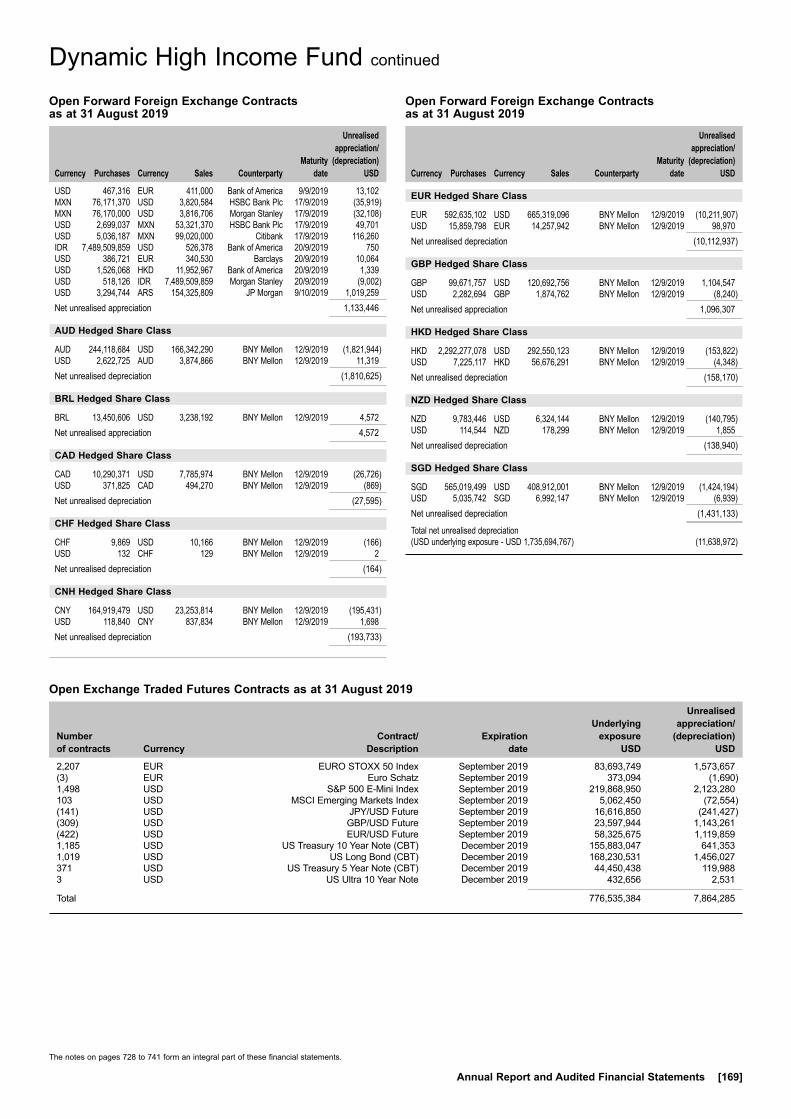
The notes on pages 728 to 741 form an integral part of these financial statements.
Annual Report and Audited Financial Statements [169]
Dynamic High Income Fund continued
Open Exchange Traded Futures Contracts as at 31 August 2019
Number of contracts Currency
Contract/ Description
Expiration date
Underlying exposure
USD
Unrealised appreciation/
(depreciation) USD
2,207 EUR EURO STOXX 50 Index September 2019 83,693,749 1,573,657(3) EUR Euro Schatz September 2019 373,094 (1,690)1,498 USD S&P 500 E-Mini Index September 2019 219,868,950 2,123,280103 USD MSCI Emerging Markets Index September 2019 5,062,450 (72,554)(141) USD JPY/USD Future September 2019 16,616,850 (241,427)(309) USD GBP/USD Future September 2019 23,597,944 1,143,261(422) USD EUR/USD Future September 2019 58,325,675 1,119,8591,185 USD US Treasury 10 Year Note (CBT) December 2019 155,883,047 641,3531,019 USD US Long Bond (CBT) December 2019 168,230,531 1,456,027371 USD US Treasury 5 Year Note (CBT) December 2019 44,450,438 119,9883 USD US Ultra 10 Year Note December 2019 432,656 2,531
Total 776,535,384 7,864,285
Open Forward Foreign Exchange Contracts as at 31 August 2019
Currency
Purchases Currency
Sales Counterparty
Maturity date
Unrealised appreciation/
(depreciation) USD
USD 467,316 EUR 411,000 Bank of America 9/9/2019 13,102MXN 76,171,370 USD 3,820,584 HSBC Bank Plc 17/9/2019 (35,919)MXN 76,170,000 USD 3,816,706 Morgan Stanley 17/9/2019 (32,108)USD 2,699,037 MXN 53,321,370 HSBC Bank Plc 17/9/2019 49,701USD 5,036,187 MXN 99,020,000 Citibank 17/9/2019 116,260IDR 7,489,509,859 USD 526,378 Bank of America 20/9/2019 750USD 386,721 EUR 340,530 Barclays 20/9/2019 10,064USD 1,526,068 HKD 11,952,967 Bank of America 20/9/2019 1,339USD 518,126 IDR 7,489,509,859 Morgan Stanley 20/9/2019 (9,002)USD 3,294,744 ARS 154,325,809 JP Morgan 9/10/2019 1,019,259Net unrealised appreciation 1,133,446
AUD Hedged Share Class
AUD 244,118,684 USD 166,342,290 BNY Mellon 12/9/2019 (1,821,944)USD 2,622,725 AUD 3,874,866 BNY Mellon 12/9/2019 11,319Net unrealised depreciation (1,810,625)
BRL Hedged Share Class
BRL 13,450,606 USD 3,238,192 BNY Mellon 12/9/2019 4,572Net unrealised appreciation 4,572
CAD Hedged Share Class
CAD 10,290,371 USD 7,785,974 BNY Mellon 12/9/2019 (26,726)USD 371,825 CAD 494,270 BNY Mellon 12/9/2019 (869)Net unrealised depreciation (27,595)
CHF Hedged Share Class
CHF 9,869 USD 10,166 BNY Mellon 12/9/2019 (166)USD 132 CHF 129 BNY Mellon 12/9/2019 2Net unrealised depreciation (164)
CNH Hedged Share Class
CNY 164,919,479 USD 23,253,814 BNY Mellon 12/9/2019 (195,431)USD 118,840 CNY 837,834 BNY Mellon 12/9/2019 1,698Net unrealised depreciation (193,733)
Open Forward Foreign Exchange Contracts as at 31 August 2019
Currency
Purchases Currency
Sales Counterparty
Maturity date
Unrealised appreciation/
(depreciation) USD
EUR Hedged Share Class
EUR 592,635,102 USD 665,319,096 BNY Mellon 12/9/2019 (10,211,907)USD 15,859,798 EUR 14,257,942 BNY Mellon 12/9/2019 98,970Net unrealised depreciation (10,112,937)
GBP Hedged Share Class
GBP 99,671,757 USD 120,692,756 BNY Mellon 12/9/2019 1,104,547USD 2,282,694 GBP 1,874,762 BNY Mellon 12/9/2019 (8,240)Net unrealised appreciation 1,096,307
HKD Hedged Share Class
HKD 2,292,277,078 USD 292,550,123 BNY Mellon 12/9/2019 (153,822)USD 7,225,117 HKD 56,676,291 BNY Mellon 12/9/2019 (4,348)Net unrealised depreciation (158,170)
NZD Hedged Share Class
NZD 9,783,446 USD 6,324,144 BNY Mellon 12/9/2019 (140,795)USD 114,544 NZD 178,299 BNY Mellon 12/9/2019 1,855Net unrealised depreciation (138,940)
SGD Hedged Share Class
SGD 565,019,499 USD 408,912,001 BNY Mellon 12/9/2019 (1,424,194)USD 5,035,742 SGD 6,992,147 BNY Mellon 12/9/2019 (6,939)Net unrealised depreciation (1,431,133)
Total net unrealised depreciation (USD underlying exposure - USD 1,735,694,767) (11,638,972)
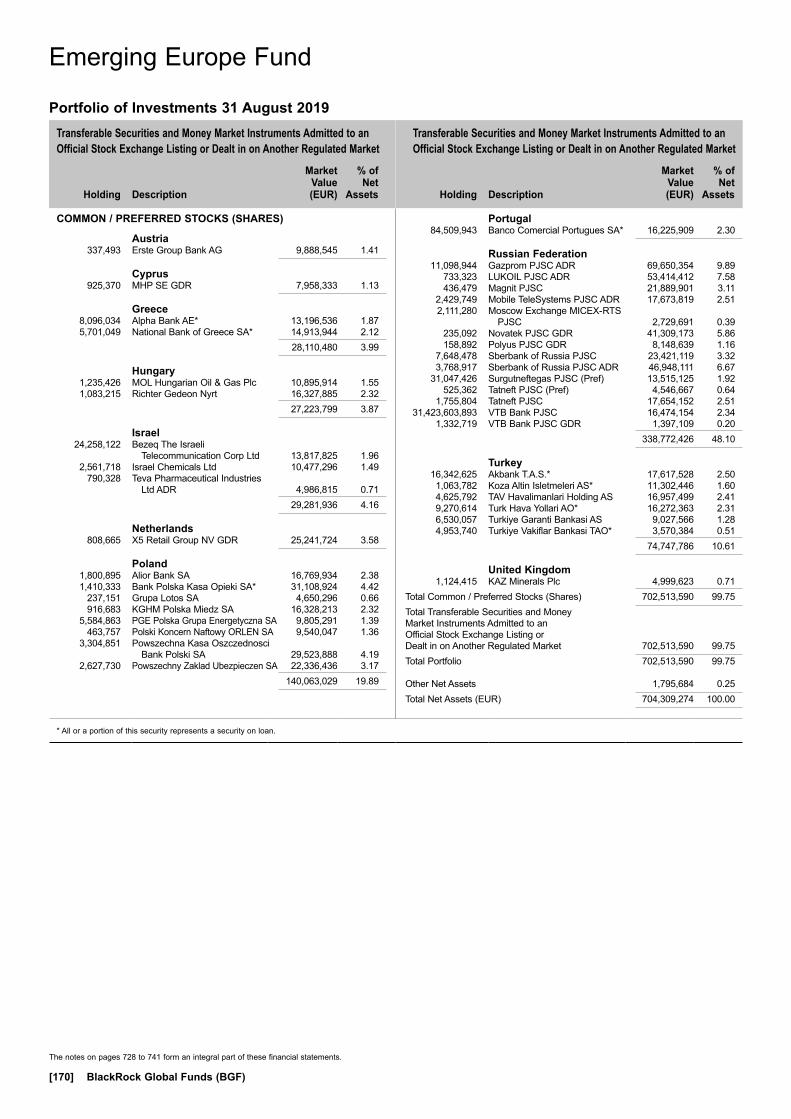
Transferable Securities and Money Market Instruments Admitted to an Official Stock Exchange Listing or Dealt in on Another Regulated Market
Transferable Securities and Money Market Instruments Admitted to an Official Stock Exchange Listing or Dealt in on Another Regulated Market
Holding
Description
Market Value (EUR)
% of Net
Assets
Holding
Description
Market Value (EUR)
% of Net
Assets
* All or a portion of this security represents a security on loan.
The notes on pages 728 to 741 form an integral part of these financial statements.
[170] BlackRock Global Funds (BGF)
COMMON / PREFERRED STOCKS (SHARES)
Austria 337,493 Erste Group Bank AG 9,888,545 1.41
Cyprus 925,370 MHP SE GDR 7,958,333 1.13
Greece 8,096,034 Alpha Bank AE* 13,196,536 1.87 5,701,049 National Bank of Greece SA* 14,913,944 2.12 28,110,480 3.99
Hungary 1,235,426 MOL Hungarian Oil & Gas Plc 10,895,914 1.55 1,083,215 Richter Gedeon Nyrt 16,327,885 2.32 27,223,799 3.87
Israel 24,258,122 Bezeq The Israeli
Telecommunication Corp Ltd 13,817,825 1.96 2,561,718 Israel Chemicals Ltd 10,477,296 1.49 790,328 Teva Pharmaceutical Industries
Ltd ADR 4,986,815 0.71 29,281,936 4.16
Netherlands 808,665 X5 Retail Group NV GDR 25,241,724 3.58
Poland 1,800,895 Alior Bank SA 16,769,934 2.38 1,410,333 Bank Polska Kasa Opieki SA* 31,108,924 4.42 237,151 Grupa Lotos SA 4,650,296 0.66 916,683 KGHM Polska Miedz SA 16,328,213 2.32 5,584,863 PGE Polska Grupa Energetyczna SA 9,805,291 1.39 463,757 Polski Koncern Naftowy ORLEN SA 9,540,047 1.36 3,304,851 Powszechna Kasa Oszczednosci
Bank Polski SA 29,523,888 4.19 2,627,730 Powszechny Zaklad Ubezpieczen SA 22,336,436 3.17 140,063,029 19.89
Portugal 84,509,943 Banco Comercial Portugues SA* 16,225,909 2.30
Russian Federation 11,098,944 Gazprom PJSC ADR 69,650,354 9.89 733,323 LUKOIL PJSC ADR 53,414,412 7.58 436,479 Magnit PJSC 21,889,901 3.11 2,429,749 Mobile TeleSystems PJSC ADR 17,673,819 2.51 2,111,280 Moscow Exchange MICEX-RTS
PJSC 2,729,691 0.39 235,092 Novatek PJSC GDR 41,309,173 5.86 158,892 Polyus PJSC GDR 8,148,639 1.16 7,648,478 Sberbank of Russia PJSC 23,421,119 3.32 3,768,917 Sberbank of Russia PJSC ADR 46,948,111 6.67 31,047,426 Surgutneftegas PJSC (Pref) 13,515,125 1.92 525,362 Tatneft PJSC (Pref) 4,546,667 0.64 1,755,804 Tatneft PJSC 17,654,152 2.51 31,423,603,893 VTB Bank PJSC 16,474,154 2.34 1,332,719 VTB Bank PJSC GDR 1,397,109 0.20 338,772,426 48.10
Turkey 16,342,625 Akbank T.A.S.* 17,617,528 2.50 1,063,782 Koza Altin Isletmeleri AS* 11,302,446 1.60 4,625,792 TAV Havalimanlari Holding AS 16,957,499 2.41 9,270,614 Turk Hava Yollari AO* 16,272,363 2.31 6,530,057 Turkiye Garanti Bankasi AS 9,027,566 1.28 4,953,740 Turkiye Vakiflar Bankasi TAO* 3,570,384 0.51 74,747,786 10.61
United Kingdom 1,124,415 KAZ Minerals Plc 4,999,623 0.71Total Common / Preferred Stocks (Shares) 702,513,590 99.75Total Transferable Securities and Money Market Instruments Admitted to an Official Stock Exchange Listing or Dealt in on Another Regulated Market 702,513,590 99.75Total Portfolio 702,513,590 99.75
Other Net Assets 1,795,684 0.25Total Net Assets (EUR) 704,309,274 100.00
Emerging Europe Fund
Portfolio of Investments 31 August 2019
Emerging Europe Fund
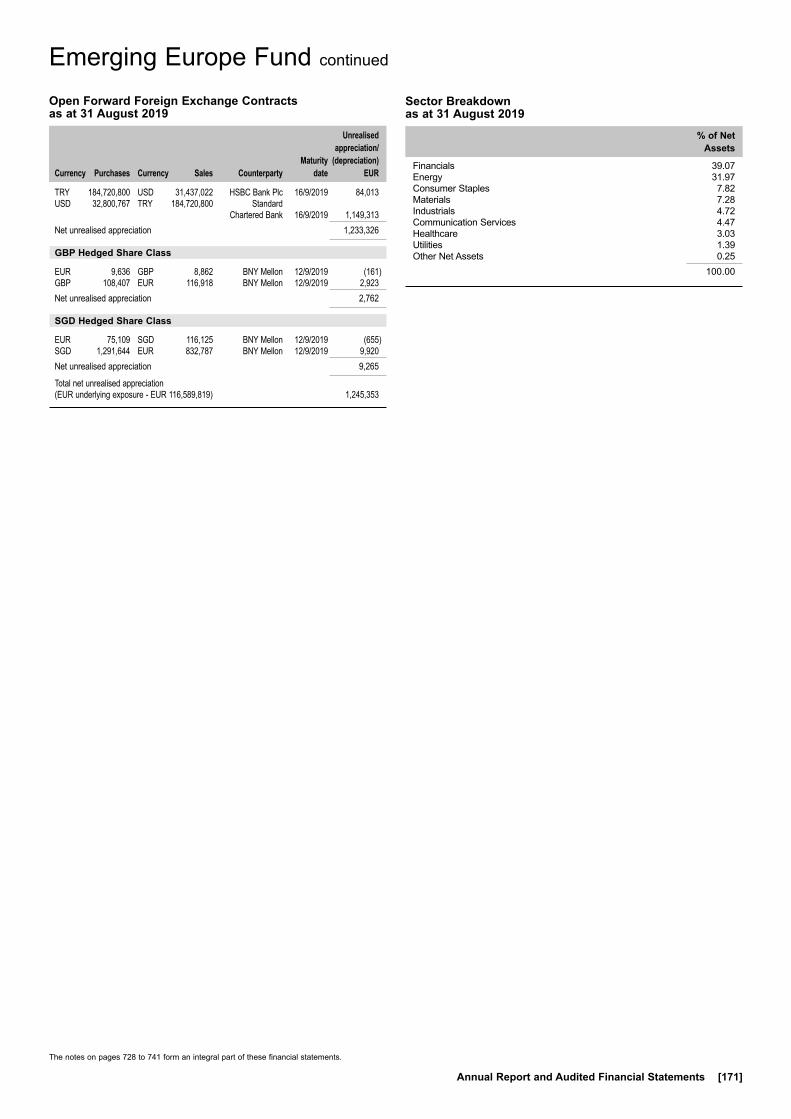
The notes on pages 728 to 741 form an integral part of these financial statements.
Annual Report and Audited Financial Statements [171]
Emerging Europe Fund continued
Open Forward Foreign Exchange Contracts as at 31 August 2019
Currency
Purchases Currency
Sales Counterparty
Maturity date
Unrealised appreciation/
(depreciation) EUR
TRY 184,720,800 USD 31,437,022 HSBC Bank Plc 16/9/2019 84,013USD 32,800,767 TRY 184,720,800 Standard Chartered Bank 16/9/2019 1,149,313Net unrealised appreciation 1,233,326
GBP Hedged Share Class
EUR 9,636 GBP 8,862 BNY Mellon 12/9/2019 (161)GBP 108,407 EUR 116,918 BNY Mellon 12/9/2019 2,923Net unrealised appreciation 2,762
SGD Hedged Share Class
EUR 75,109 SGD 116,125 BNY Mellon 12/9/2019 (655)SGD 1,291,644 EUR 832,787 BNY Mellon 12/9/2019 9,920Net unrealised appreciation 9,265
Total net unrealised appreciation (EUR underlying exposure - EUR 116,589,819) 1,245,353
Sector Breakdown as at 31 August 2019
% of Net Assets
Financials 39.07Energy 31.97Consumer Staples 7.82Materials 7.28Industrials 4.72Communication Services 4.47Healthcare 3.03Utilities 1.39Other Net Assets 0.25
100.00
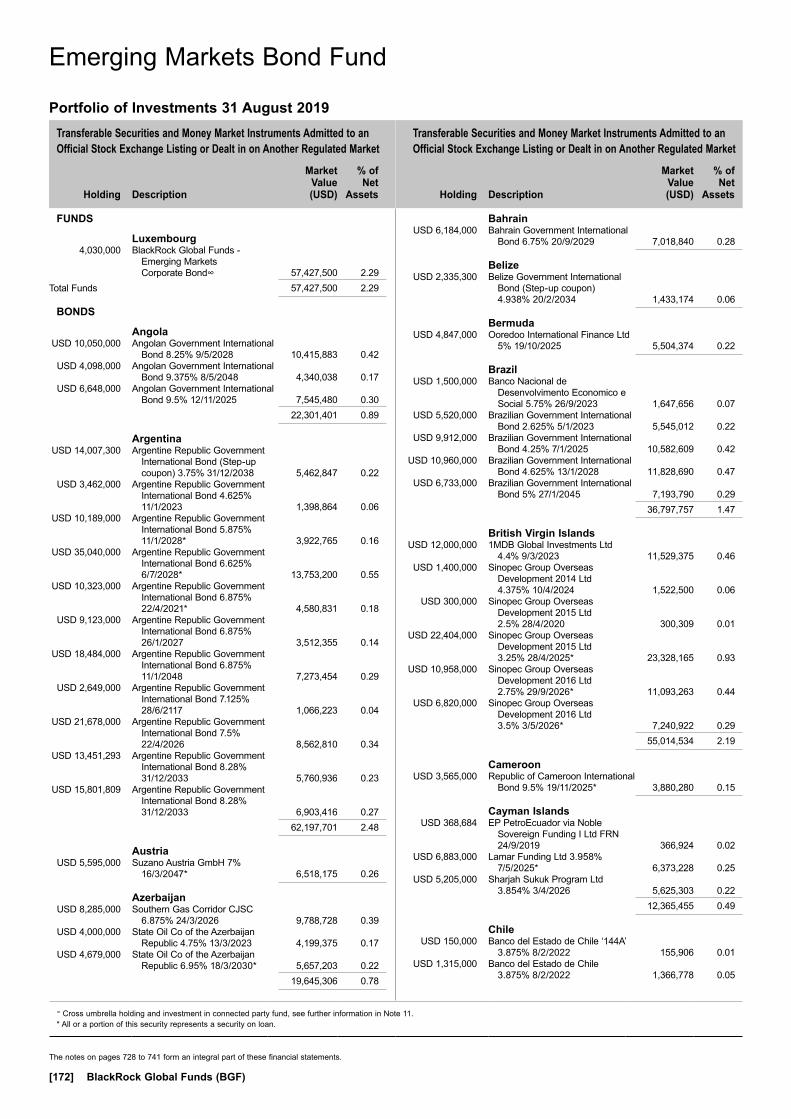
Transferable Securities and Money Market Instruments Admitted to an Official Stock Exchange Listing or Dealt in on Another Regulated Market
Transferable Securities and Money Market Instruments Admitted to an Official Stock Exchange Listing or Dealt in on Another Regulated Market
Holding
Description
Market Value (USD)
% of Net
Assets
Holding
Description
Market Value (USD)
% of Net
Assets
∞ Cross umbrella holding and investment in connected party fund, see further information in Note 11.* All or a portion of this security represents a security on loan.
The notes on pages 728 to 741 form an integral part of these financial statements.
[172] BlackRock Global Funds (BGF)
FUNDS
Luxembourg 4,030,000 BlackRock Global Funds -
Emerging Markets Corporate Bond∞ 57,427,500 2.29
Total Funds 57,427,500 2.29
BONDS
Angola USD 10,050,000 Angolan Government International
Bond 8.25% 9/5/2028 10,415,883 0.42 USD 4,098,000 Angolan Government International
Bond 9.375% 8/5/2048 4,340,038 0.17 USD 6,648,000 Angolan Government International
Bond 9.5% 12/11/2025 7,545,480 0.30 22,301,401 0.89
Argentina USD 14,007,300 Argentine Republic Government
International Bond (Step-up coupon) 3.75% 31/12/2038 5,462,847 0.22
USD 3,462,000 Argentine Republic Government International Bond 4.625% 11/1/2023 1,398,864 0.06
USD 10,189,000 Argentine Republic Government International Bond 5.875% 11/1/2028* 3,922,765 0.16
USD 35,040,000 Argentine Republic Government International Bond 6.625% 6/7/2028* 13,753,200 0.55
USD 10,323,000 Argentine Republic Government International Bond 6.875% 22/4/2021* 4,580,831 0.18
USD 9,123,000 Argentine Republic Government International Bond 6.875% 26/1/2027 3,512,355 0.14
USD 18,484,000 Argentine Republic Government International Bond 6.875% 11/1/2048 7,273,454 0.29
USD 2,649,000 Argentine Republic Government International Bond 7.125% 28/6/2117 1,066,223 0.04
USD 21,678,000 Argentine Republic Government International Bond 7.5% 22/4/2026 8,562,810 0.34
USD 13,451,293 Argentine Republic Government International Bond 8.28% 31/12/2033 5,760,936 0.23
USD 15,801,809 Argentine Republic Government International Bond 8.28% 31/12/2033 6,903,416 0.27
62,197,701 2.48
Austria USD 5,595,000 Suzano Austria GmbH 7%
16/3/2047* 6,518,175 0.26
Azerbaijan USD 8,285,000 Southern Gas Corridor CJSC
6.875% 24/3/2026 9,788,728 0.39 USD 4,000,000 State Oil Co of the Azerbaijan
Republic 4.75% 13/3/2023 4,199,375 0.17 USD 4,679,000 State Oil Co of the Azerbaijan
Republic 6.95% 18/3/2030* 5,657,203 0.22 19,645,306 0.78
Bahrain USD 6,184,000 Bahrain Government International
Bond 6.75% 20/9/2029 7,018,840 0.28
Belize USD 2,335,300 Belize Government International
Bond (Step-up coupon) 4.938% 20/2/2034 1,433,174 0.06
Bermuda USD 4,847,000 Ooredoo International Finance Ltd
5% 19/10/2025 5,504,374 0.22
Brazil USD 1,500,000 Banco Nacional de
Desenvolvimento Economico e Social 5.75% 26/9/2023 1,647,656 0.07
USD 5,520,000 Brazilian Government International Bond 2.625% 5/1/2023 5,545,012 0.22
USD 9,912,000 Brazilian Government International Bond 4.25% 7/1/2025 10,582,609 0.42
USD 10,960,000 Brazilian Government International Bond 4.625% 13/1/2028 11,828,690 0.47
USD 6,733,000 Brazilian Government International Bond 5% 27/1/2045 7,193,790 0.29
36,797,757 1.47
British Virgin Islands USD 12,000,000 1MDB Global Investments Ltd
4.4% 9/3/2023 11,529,375 0.46 USD 1,400,000 Sinopec Group Overseas
Development 2014 Ltd 4.375% 10/4/2024 1,522,500 0.06
USD 300,000 Sinopec Group Overseas Development 2015 Ltd 2.5% 28/4/2020 300,309 0.01
USD 22,404,000 Sinopec Group Overseas Development 2015 Ltd 3.25% 28/4/2025* 23,328,165 0.93
USD 10,958,000 Sinopec Group Overseas Development 2016 Ltd 2.75% 29/9/2026* 11,093,263 0.44
USD 6,820,000 Sinopec Group Overseas Development 2016 Ltd 3.5% 3/5/2026* 7,240,922 0.29
55,014,534 2.19
Cameroon USD 3,565,000 Republic of Cameroon International
Bond 9.5% 19/11/2025* 3,880,280 0.15
Cayman Islands USD 368,684 EP PetroEcuador via Noble
Sovereign Funding I Ltd FRN 24/9/2019 366,924 0.02
USD 6,883,000 Lamar Funding Ltd 3.958% 7/5/2025* 6,373,228 0.25
USD 5,205,000 Sharjah Sukuk Program Ltd 3.854% 3/4/2026 5,625,303 0.22
12,365,455 0.49
Chile USD 150,000 Banco del Estado de Chile ‘144A’
3.875% 8/2/2022 155,906 0.01 USD 1,315,000 Banco del Estado de Chile
3.875% 8/2/2022 1,366,778 0.05
Emerging Markets Bond Fund
Portfolio of Investments 31 August 2019
Emerging Markets Bond Fund

Transferable Securities and Money Market Instruments Admitted to an Official Stock Exchange Listing or Dealt in on Another Regulated Market
Transferable Securities and Money Market Instruments Admitted to an Official Stock Exchange Listing or Dealt in on Another Regulated Market
Holding
Description
Market Value (USD)
% of Net
Assets
Holding
Description
Market Value (USD)
% of Net
Assets
* All or a portion of this security represents a security on loan.
The notes on pages 728 to 741 form an integral part of these financial statements.
Annual Report and Audited Financial Statements [173]
USD 1,805,000 Banco del Estado de Chile 4.125% 7/10/2020 1,844,484 0.07
USD 6,274,000 Cencosud SA 5.15% 12/2/2025 6,569,074 0.26 USD 5,781,000 Corp Nacional del Cobre de Chile
3% 17/7/2022 5,896,620 0.24 USD 9,219,000 Corp Nacional del Cobre de Chile
3.625% 1/8/2027 9,900,342 0.39 USD 2,197,000 Corp Nacional del Cobre de Chile
4.25% 17/7/2042 2,468,879 0.10 USD 6,760,000 Corp Nacional del Cobre de Chile
4.5% 16/9/2025 7,487,756 0.30 USD 2,128,000 Corp Nacional del Cobre de Chile
5.625% 21/9/2035* 2,790,673 0.11 USD 2,708,000 Corp Nacional del Cobre de Chile
5.625% 18/10/2043 3,638,875 0.15 USD 6,293,000 Empresa Nacional de
Telecomunicaciones SA 4.875% 30/10/2024 6,661,731 0.27
USD 3,453,000 Empresa Nacional del Petroleo 3.75% 5/8/2026 3,606,766 0.14
USD 852,000 Empresa Nacional del Petroleo 4.75% 6/12/2021 896,219 0.04
53,284,103 2.13
China USD 9,784,000 Export-Import Bank of China/The
2.875% 26/4/2026* 10,118,796 0.40
Colombia USD 7,620,000 Colombia Government International
Bond 3.875% 25/4/2027 8,254,603 0.33 USD 6,242,000 Colombia Government International
Bond 4% 26/2/2024 6,665,286 0.26 USD 7,009,000 Colombia Government International
Bond 4.5% 28/1/2026 7,762,467 0.31 USD 10,336,000 Colombia Government International
Bond 5% 15/6/2045 12,504,028 0.50 USD 7,689,000 Colombia Government International
Bond 5.625% 26/2/2044* 9,924,817 0.40 USD 5,577,000 Colombia Government International
Bond 6.125% 18/1/2041 7,469,694 0.30 USD 7,707,000 Ecopetrol SA 5.875% 28/5/2045* 9,106,302 0.36 USD 5,621,000 SURA Asset Management SA
4.875% 17/4/2024* 6,057,506 0.24 67,744,703 2.70
Costa Rica USD 3,016,000 Costa Rica Government
International Bond 4.25% 26/1/2023 2,978,300 0.12
USD 3,045,000 Costa Rica Government International Bond 4.375% 30/4/2025 2,930,813 0.12
USD 1,982,000 Costa Rica Government International Bond 5.625% 30/4/2043* 1,737,243 0.07
USD 4,086,000 Costa Rica Government International Bond 7% 4/4/2044* 4,110,899 0.16
USD 9,177,000 Costa Rica Government International Bond 7.158% 12/3/2045 9,341,899 0.37
USD 4,480,000 Instituto Costarricense de Electricidad 6.375% 15/5/2043 3,725,400 0.15
USD 2,297,000 Instituto Costarricense de Electricidad 6.95% 10/11/2021 2,400,365 0.10
27,224,919 1.09
Cote d’Ivoire (Ivory Coast) USD 3,350,000 Ivory Coast Government
International Bond 5.375% 23/7/2024 3,422,234 0.14
USD 8,076,640 Ivory Coast Government International Bond (Step-up coupon) 5.75% 31/12/2032 8,034,995 0.32
USD 4,666,000 Ivory Coast Government International Bond 6.375% 3/3/2028* 4,741,823 0.19
16,199,052 0.65
Croatia USD 3,000,000 Croatia Government International
Bond 6% 26/1/2024 3,476,719 0.14
Dominican Republic USD 7,057,000 Dominican Republic International
Bond 5.5% 27/1/2025 7,543,271 0.30 USD 5,984,000 Dominican Republic International
Bond 5.875% 18/4/2024 6,402,880 0.26 USD 8,881,000 Dominican Republic International
Bond 5.95% 25/1/2027 9,764,937 0.39 USD 19,296,000 Dominican Republic International
Bond 6.5% 15/2/2048 21,394,440 0.85 USD 9,406,000 Dominican Republic International
Bond 6.85% 27/1/2045 10,846,294 0.43 55,951,822 2.23
Ecuador USD 19,544,000 Ecuador Government International
Bond 7.875% 23/1/2028* 18,334,715 0.73 USD 27,582,000 Ecuador Government International
Bond 7.95% 20/6/2024* 27,875,059 1.11 USD 5,002,000 Ecuador Government International
Bond 8.75% 2/6/2023* 5,240,846 0.21 USD 13,866,000 Ecuador Government International
Bond 8.875% 23/10/2027 13,766,338 0.55 USD 9,546,000 Ecuador Government International
Bond 9.65% 13/12/2026 9,893,534 0.39 USD 743,000 Ecuador Government International
Bond 10.5% 24/3/2020 765,058 0.03 USD 5,599,000 Ecuador Government International
Bond 10.75% 28/3/2022 6,118,657 0.24 USD 7,070,000 Ecuador Government International
Bond 10.75% 31/1/2029 7,637,809 0.31 89,632,016 3.57
Egypt EGP 196,646,000 Egypt Government Bond 16.1%
7/5/2029 12,786,113 0.51 USD 9,071,000 Egypt Government International
Bond 5.875% 11/6/2025* 9,392,737 0.37 USD 9,565,000 Egypt Government International
Bond 6.125% 31/1/2022 9,975,996 0.40 USD 8,425,000 Egypt Government International
Bond 6.2% 1/3/2024* 8,867,312 0.35 EUR 4,050,000 Egypt Government International
Bond 6.375% 11/4/2031 4,718,410 0.19 USD 11,202,000 Egypt Government International
Bond 6.588% 21/2/2028* 11,503,054 0.46 USD 9,257,000 Egypt Government International
Bond 7.5% 31/1/2027 10,041,531 0.40 USD 6,530,000 Egypt Government International
Bond 7.6% 1/3/2029 7,076,888 0.28 USD 4,019,000 Egypt Government International
Bond 7.903% 21/2/2048 4,164,689 0.17
Emerging Markets Bond Fund continued
Portfolio of Investments 31 August 2019
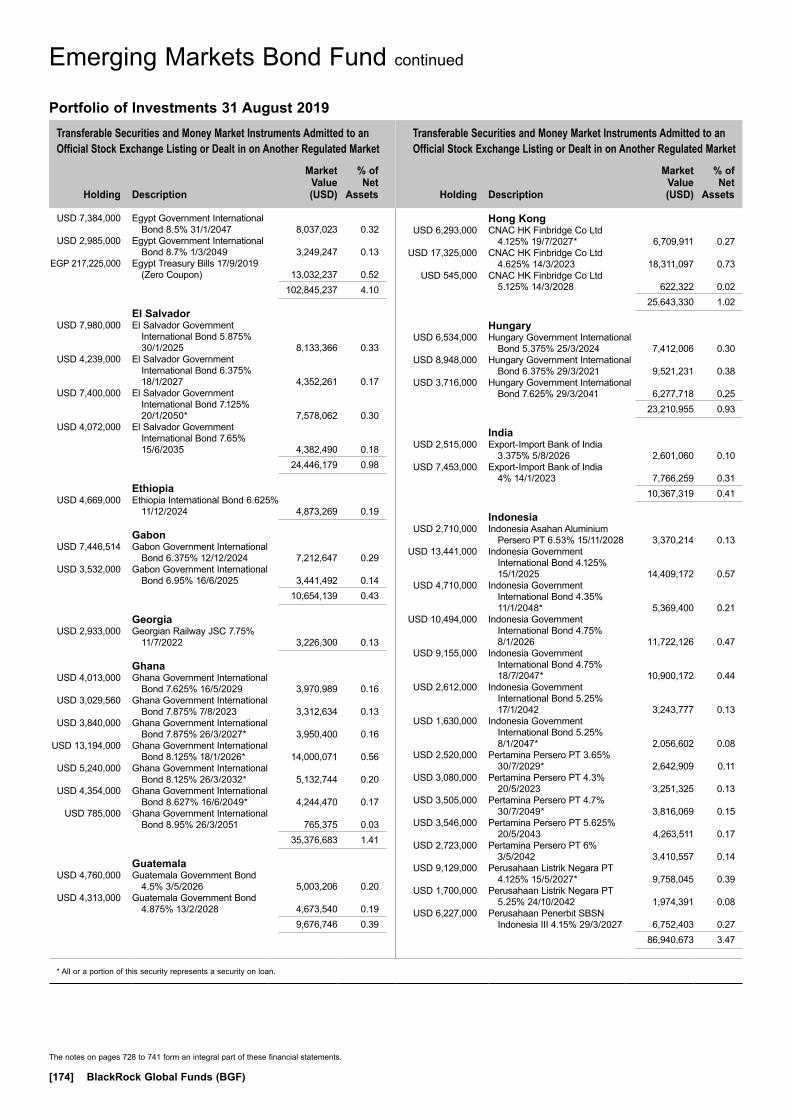
Transferable Securities and Money Market Instruments Admitted to an Official Stock Exchange Listing or Dealt in on Another Regulated Market
Transferable Securities and Money Market Instruments Admitted to an Official Stock Exchange Listing or Dealt in on Another Regulated Market
Holding
Description
Market Value (USD)
% of Net
Assets
Holding
Description
Market Value (USD)
% of Net
Assets
* All or a portion of this security represents a security on loan.
The notes on pages 728 to 741 form an integral part of these financial statements.
[174] BlackRock Global Funds (BGF)
USD 7,384,000 Egypt Government International Bond 8.5% 31/1/2047 8,037,023 0.32
USD 2,985,000 Egypt Government International Bond 8.7% 1/3/2049 3,249,247 0.13
EGP 217,225,000 Egypt Treasury Bills 17/9/2019 (Zero Coupon) 13,032,237 0.52
102,845,237 4.10
El Salvador USD 7,980,000 El Salvador Government
International Bond 5.875% 30/1/2025 8,133,366 0.33
USD 4,239,000 El Salvador Government International Bond 6.375% 18/1/2027 4,352,261 0.17
USD 7,400,000 El Salvador Government International Bond 7.125% 20/1/2050* 7,578,062 0.30
USD 4,072,000 El Salvador Government International Bond 7.65% 15/6/2035 4,382,490 0.18
24,446,179 0.98
Ethiopia USD 4,669,000 Ethiopia International Bond 6.625%
11/12/2024 4,873,269 0.19
Gabon USD 7,446,514 Gabon Government International
Bond 6.375% 12/12/2024 7,212,647 0.29 USD 3,532,000 Gabon Government International
Bond 6.95% 16/6/2025 3,441,492 0.14 10,654,139 0.43
Georgia USD 2,933,000 Georgian Railway JSC 7.75%
11/7/2022 3,226,300 0.13
Ghana USD 4,013,000 Ghana Government International
Bond 7.625% 16/5/2029 3,970,989 0.16 USD 3,029,560 Ghana Government International
Bond 7.875% 7/8/2023 3,312,634 0.13 USD 3,840,000 Ghana Government International
Bond 7.875% 26/3/2027* 3,950,400 0.16 USD 13,194,000 Ghana Government International
Bond 8.125% 18/1/2026* 14,000,071 0.56 USD 5,240,000 Ghana Government International
Bond 8.125% 26/3/2032* 5,132,744 0.20 USD 4,354,000 Ghana Government International
Bond 8.627% 16/6/2049* 4,244,470 0.17 USD 785,000 Ghana Government International
Bond 8.95% 26/3/2051 765,375 0.03 35,376,683 1.41
Guatemala USD 4,760,000 Guatemala Government Bond
4.5% 3/5/2026 5,003,206 0.20 USD 4,313,000 Guatemala Government Bond
4.875% 13/2/2028 4,673,540 0.19 9,676,746 0.39
Hong Kong USD 6,293,000 CNAC HK Finbridge Co Ltd
4.125% 19/7/2027* 6,709,911 0.27 USD 17,325,000 CNAC HK Finbridge Co Ltd
4.625% 14/3/2023 18,311,097 0.73 USD 545,000 CNAC HK Finbridge Co Ltd
5.125% 14/3/2028 622,322 0.02 25,643,330 1.02
Hungary USD 6,534,000 Hungary Government International
Bond 5.375% 25/3/2024 7,412,006 0.30 USD 8,948,000 Hungary Government International
Bond 6.375% 29/3/2021 9,521,231 0.38 USD 3,716,000 Hungary Government International
Bond 7.625% 29/3/2041 6,277,718 0.25 23,210,955 0.93
India USD 2,515,000 Export-Import Bank of India
3.375% 5/8/2026 2,601,060 0.10 USD 7,453,000 Export-Import Bank of India
4% 14/1/2023 7,766,259 0.31 10,367,319 0.41
Indonesia USD 2,710,000 Indonesia Asahan Aluminium
Persero PT 6.53% 15/11/2028 3,370,214 0.13 USD 13,441,000 Indonesia Government
International Bond 4.125% 15/1/2025 14,409,172 0.57
USD 4,710,000 Indonesia Government International Bond 4.35% 11/1/2048* 5,369,400 0.21
USD 10,494,000 Indonesia Government International Bond 4.75% 8/1/2026 11,722,126 0.47
USD 9,155,000 Indonesia Government International Bond 4.75% 18/7/2047* 10,900,172 0.44
USD 2,612,000 Indonesia Government International Bond 5.25% 17/1/2042 3,243,777 0.13
USD 1,630,000 Indonesia Government International Bond 5.25% 8/1/2047* 2,056,602 0.08
USD 2,520,000 Pertamina Persero PT 3.65% 30/7/2029* 2,642,909 0.11
USD 3,080,000 Pertamina Persero PT 4.3% 20/5/2023 3,251,325 0.13
USD 3,505,000 Pertamina Persero PT 4.7% 30/7/2049* 3,816,069 0.15
USD 3,546,000 Pertamina Persero PT 5.625% 20/5/2043 4,263,511 0.17
USD 2,723,000 Pertamina Persero PT 6% 3/5/2042 3,410,557 0.14
USD 9,129,000 Perusahaan Listrik Negara PT 4.125% 15/5/2027* 9,758,045 0.39
USD 1,700,000 Perusahaan Listrik Negara PT 5.25% 24/10/2042 1,974,391 0.08
USD 6,227,000 Perusahaan Penerbit SBSN Indonesia III 4.15% 29/3/2027 6,752,403 0.27
86,940,673 3.47
Portfolio of Investments 31 August 2019
Emerging Markets Bond Fund continued

Transferable Securities and Money Market Instruments Admitted to an Official Stock Exchange Listing or Dealt in on Another Regulated Market
Transferable Securities and Money Market Instruments Admitted to an Official Stock Exchange Listing or Dealt in on Another Regulated Market
Holding
Description
Market Value (USD)
% of Net
Assets
Holding
Description
Market Value (USD)
% of Net
Assets
* All or a portion of this security represents a security on loan.
The notes on pages 728 to 741 form an integral part of these financial statements.
Annual Report and Audited Financial Statements [175]
International UAH 356,000,000 European Bank for Reconstruction
& Development 16.95% 3/4/2020 14,133,378 0.56 UAH 164,200,000 International Finance Corp
15.75% 13/5/2020 6,539,230 0.26 20,672,608 0.82
Iraq USD 3,778,000 Iraq International Bond 5.8%
15/1/2028 3,716,607 0.15 USD 5,000,000 Iraq International Bond 6.752%
9/3/2023* 5,133,594 0.20 8,850,201 0.35
Jamaica USD 6,529,000 Jamaica Government International
Bond 6.75% 28/4/2028 7,641,990 0.31 USD 4,714,000 Jamaica Government International
Bond 7.875% 28/7/2045 6,125,254 0.24 13,767,244 0.55
Jordan USD 6,200,000 Jordan Government International
Bond 5.75% 31/1/2027* 6,316,250 0.25 USD 1,387,000 Jordan Government International
Bond 6.125% 29/1/2026 1,448,548 0.06 USD 5,290,000 Jordan Government International
Bond 7.375% 10/10/2047 5,526,397 0.22 13,291,195 0.53
Kazakhstan USD 4,287,000 Development Bank of Kazakhstan
JSC 4.125% 10/12/2022 4,458,480 0.18 KZT 3,823,000,000 Development Bank of Kazakhstan
JSC 9.5% 14/12/2020 9,745,182 0.39 USD 8,900,000 Kazakhstan Government
International Bond 4.875% 14/10/2044 10,825,025 0.43
USD 232,000 Kazakhstan Government International Bond ‘144A’ 4.875% 14/10/2044 282,180 0.01
USD 6,514,000 Kazakhstan Government International Bond 5.125% 21/7/2025 7,425,960 0.30
USD 3,027,000 Kazakhstan Temir Zholy National Co JSC 4.85% 17/11/2027 3,386,456 0.14
USD 1,944,000 KazMunayGas National Co JSC 4.75% 24/4/2025 2,124,306 0.08
USD 5,935,000 KazMunayGas National Co JSC 4.75% 19/4/2027 6,504,760 0.26
USD 6,322,000 KazMunayGas National Co JSC 5.75% 19/4/2047 7,562,693 0.30
USD 5,050,000 KazMunayGas National Co JSC 6.375% 24/10/2048 6,382,727 0.25
58,697,769 2.34
Kenya USD 9,537,000 Kenya Government International
Bond 6.875% 24/6/2024 10,202,835 0.41 USD 5,499,000 Kenya Government International
Bond 7.25% 28/2/2028* 5,763,639 0.23 USD 4,650,000 Kenya Government International
Bond 8% 22/5/2032 4,923,188 0.20 USD 3,467,000 Kenya Government International
Bond 8.25% 28/2/2048 3,587,262 0.14 24,476,924 0.98
Lebanon USD 11,420,000 Lebanon Government International
Bond 6.2% 26/2/2025 7,927,978 0.32 USD 13,467,000 Lebanon Government International
Bond 6.6% 27/11/2026 9,086,017 0.36 USD 13,521,000 Lebanon Government International
Bond 6.65% 22/4/2024 9,627,375 0.38 USD 5,380,000 Lebanon Government International
Bond 6.65% 3/11/2028 3,614,687 0.14 USD 12,612,000 Lebanon Government International
Bond 6.65% 26/2/2030 8,440,187 0.34 38,696,244 1.54
Malaysia USD 9,365,000 Petronas Capital Ltd 3.5%
18/3/2025 9,967,872 0.40 USD 3,100,000 Petronas Capital Ltd 7.875%
22/5/2022 3,556,281 0.14 13,524,153 0.54
Mexico USD 2,134,000 Comision Federal de Electricidad
4.875% 26/5/2021 2,216,693 0.09 USD 1,500,000 Comision Federal de Electricidad
5.75% 14/2/2042* 1,637,578 0.07 USD 1,062,000 Mexico City Airport Trust 5.5%
31/7/2047 1,067,310 0.04 USD 4,967,000 Mexico Government International
Bond 3.6% 30/1/2025* 5,180,581 0.21 USD 5,683,000 Mexico Government International
Bond 4.125% 21/1/2026 6,046,712 0.24 USD 8,360,000 Mexico Government International
Bond 4.15% 28/3/2027* 8,987,000 0.36 USD 2,760,000 Mexico Government International
Bond 4.5% 22/4/2029 3,055,320 0.12 USD 4,370,000 Mexico Government International
Bond 4.75% 8/3/2044 4,834,313 0.19 USD 11,650,000 Mexico Government International
Bond 5.75% 12/10/2110 13,807,070 0.55 USD 2,698,000 Petroleos Mexicanos 3.5%
30/1/2023 2,618,409 0.10 USD 6,831,000 Petroleos Mexicanos 4.25%
15/1/2025 6,544,781 0.26 USD 5,983,000 Petroleos Mexicanos 4.5%
23/1/2026 5,638,977 0.22 USD 1,870,000 Petroleos Mexicanos 4.625%
21/9/2023 1,879,350 0.08 USD 2,698,000 Petroleos Mexicanos 4.875%
24/1/2022 2,735,772 0.11 USD 5,713,000 Petroleos Mexicanos 5.35%
12/2/2028 5,401,463 0.22 USD 11,440,000 Petroleos Mexicanos 5.625%
23/1/2046* 9,747,237 0.39 USD 18,735,000 Petroleos Mexicanos 6.35%
12/2/2048 17,171,798 0.68 USD 8,178,000 Petroleos Mexicanos 6.5%
13/3/2027 8,329,293 0.33 USD 2,030,000 Petroleos Mexicanos 6.5%
23/1/2029 2,038,323 0.08 USD 4,047,000 Petroleos Mexicanos 6.5%
2/6/2041 3,720,205 0.15 USD 6,068,000 Petroleos Mexicanos 6.75%
21/9/2047 5,749,430 0.23 118,407,615 4.72
Portfolio of Investments 31 August 2019
Emerging Markets Bond Fund continued

Transferable Securities and Money Market Instruments Admitted to an Official Stock Exchange Listing or Dealt in on Another Regulated Market
Transferable Securities and Money Market Instruments Admitted to an Official Stock Exchange Listing or Dealt in on Another Regulated Market
Holding
Description
Market Value (USD)
% of Net
Assets
Holding
Description
Market Value (USD)
% of Net
Assets
* All or a portion of this security represents a security on loan.
The notes on pages 728 to 741 form an integral part of these financial statements.
[176] BlackRock Global Funds (BGF)
Mongolia USD 7,184,000 Mongolia Government International
Bond 5.125% 5/12/2022 7,195,225 0.29 USD 5,077,000 Mongolia Government International
Bond 5.625% 1/5/2023 5,138,876 0.20 USD 700,000 Mongolia Government International
Bond 8.75% 9/3/2024 781,812 0.03 13,115,913 0.52
Morocco USD 1,634,000 Morocco Government International
Bond 4.25% 11/12/2022 1,720,296 0.07 USD 5,144,000 OCP SA 4.5% 22/10/2025* 5,478,360 0.22 7,198,656 0.29
Namibia USD 9,081,000 Namibia International Bonds
5.25% 29/10/2025* 9,151,945 0.36 USD 1,640,000 Namibia International Bonds
5.5% 3/11/2021 1,697,400 0.07 10,849,345 0.43
Netherlands USD 3,964,000 Kazakhstan Temir Zholy Finance
BV 6.95% 10/7/2042* 5,435,016 0.22
Nigeria USD 3,266,000 Nigeria Government International
Bond 6.375% 12/7/2023 3,439,506 0.14 USD 13,568,000 Nigeria Government International
Bond 6.5% 28/11/2027 13,563,760 0.54 USD 16,442,000 Nigeria Government International
Bond 7.143% 23/2/2030* 16,580,730 0.66 USD 8,244,000 Nigeria Government International
Bond 7.625% 28/11/2047* 7,970,918 0.32 USD 6,050,000 Nigeria Government International
Bond 7.875% 16/2/2032 6,180,831 0.25 USD 3,070,000 Nigeria Government International
Bond 9.248% 21/1/2049 3,390,431 0.13 51,126,176 2.04
Oman USD 2,856,000 Oman Government International
Bond 3.625% 15/6/2021 2,847,521 0.11 USD 5,889,000 Oman Government International
Bond 4.125% 17/1/2023* 5,881,639 0.23 USD 21,653,000 Oman Government International
Bond 4.75% 15/6/2026 21,030,476 0.84 USD 10,018,000 Oman Government International
Bond 5.375% 8/3/2027 9,866,165 0.39 USD 7,332,000 Oman Government International
Bond 5.625% 17/1/2028* 7,231,185 0.29 USD 18,490,000 Oman Government International
Bond 6% 1/8/2029 18,420,755 0.74 USD 5,452,000 Oman Government International
Bond 6.5% 8/3/2047 5,096,768 0.20 USD 3,316,000 Oman Government International
Bond 6.75% 17/1/2048 3,131,029 0.13 USD 5,021,000 Oman Sovereign Sukuk SAOC
4.397% 1/6/2024 5,052,507 0.20 78,558,045 3.13
Pakistan USD 10,380,000 Pakistan Government International
Bond 6.875% 5/12/2027* 10,431,900 0.42 USD 5,279,000 Third Pakistan International Sukuk
Co Ltd/The 5.625% 5/12/2022 5,335,089 0.21 15,766,989 0.63
Panama USD 17,868,000 Panama Government International
Bond 3.875% 17/3/2028 19,861,399 0.79 USD 10,388,000 Panama Government International
Bond 4% 22/9/2024 11,249,879 0.45 USD 10,755,000 Panama Government International
Bond 4.3% 29/4/2053 13,216,887 0.53 USD 487,000 Panama Government International
Bond 4.5% 16/4/2050 607,000 0.02 44,935,165 1.79
Paraguay USD 8,027,000 Paraguay Government
International Bond 4.7% 27/3/2027 8,874,852 0.35
USD 3,094,000 Paraguay Government International Bond 5% 15/4/2026 3,409,944 0.14
USD 300,000 Paraguay Government International Bond 6.1% 11/8/2044 376,781 0.02
12,661,577 0.51
Peru USD 2,957,000 Corp Financiera de Desarrollo SA
4.75% 15/7/2025* 3,249,004 0.13 USD 3,349,000 Fondo MIVIVIENDA SA 3.5%
31/1/2023 3,446,854 0.14 USD 3,432,000 Peruvian Government International
Bond 5.625% 18/11/2050 5,242,380 0.21 USD 9,805,000 Petroleos del Peru SA 4.75%
19/6/2032 11,052,073 0.44 USD 8,820,000 Petroleos del Peru SA 5.625%
19/6/2047 10,683,225 0.42 33,673,536 1.34
Philippines USD 9,933,000 Philippine Government
International Bond 3% 1/2/2028 10,574,423 0.42
USD 4,433,000 Philippine Government International Bond 3.7% 1/3/2041* 5,212,931 0.21
USD 9,924,000 Philippine Government International Bond 3.7% 2/2/2042* 11,756,839 0.47
USD 455,000 Philippine Government International Bond 5.5% 30/3/2026 548,559 0.02
28,092,752 1.12
Poland USD 14,031,000 Republic of Poland Government
International Bond 3% 17/3/2023* 14,587,855 0.58 USD 6,947,000 Republic of Poland Government
International Bond 3.25% 6/4/2026* 7,461,512 0.30
USD 2,717,000 Republic of Poland Government International Bond 4% 22/1/2024 2,960,145 0.12
25,009,512 1.00
Qatar USD 2,260,000 Qatar Government International
Bond 4% 14/3/2029 2,589,466 0.10 USD 25,700,000 Qatar Government International
Bond 4.817% 14/3/2049 33,141,820 1.32 USD 3,063,000 Qatar Government International
Bond 5.103% 23/4/2048 4,095,805 0.17 39,827,091 1.59
Portfolio of Investments 31 August 2019
Emerging Markets Bond Fund continued

Transferable Securities and Money Market Instruments Admitted to an Official Stock Exchange Listing or Dealt in on Another Regulated Market
Transferable Securities and Money Market Instruments Admitted to an Official Stock Exchange Listing or Dealt in on Another Regulated Market
Holding
Description
Market Value (USD)
% of Net
Assets
Holding
Description
Market Value (USD)
% of Net
Assets
* All or a portion of this security represents a security on loan.
The notes on pages 728 to 741 form an integral part of these financial statements.
Annual Report and Audited Financial Statements [177]
Romania USD 4,002,000 Romanian Government
International Bond 4.375% 22/8/2023 4,289,644 0.17
Russian Federation USD 14,800,000 Russian Foreign Bond - Eurobond
4.25% 23/6/2027 15,754,600 0.63 USD 5,400,000 Russian Foreign Bond - Eurobond
4.5% 4/4/2022 5,725,377 0.23 USD 8,800,000 Russian Foreign Bond - Eurobond
4.75% 27/5/2026 9,609,875 0.38 USD 7,000,000 Russian Foreign Bond - Eurobond
4.875% 16/9/2023 7,661,718 0.31 USD 7,000,000 Russian Foreign Bond - Eurobond
5% 29/4/2020 7,140,035 0.28 USD 23,000,000 Russian Foreign Bond - Eurobond
5.25% 23/6/2047 27,441,875 1.09 USD 3,473,100 Russian Foreign Bond - Eurobond
(Step-up coupon) 7.5% 31/3/2030 3,938,170 0.16 77,271,650 3.08
Saudi Arabia USD 6,550,000 Saudi Arabian Oil Co 4.375%
16/4/2049* 7,458,812 0.30 USD 6,705,000 Saudi Government International
Bond 4.375% 16/4/2029 7,745,080 0.31 USD 11,210,000 Saudi Government International
Bond 4.625% 4/10/2047* 13,267,035 0.53 USD 19,033,000 Saudi Government International
Bond 5% 17/4/2049 23,838,832 0.95 USD 6,780,000 Saudi Government International
Bond 5.25% 16/1/2050* 8,769,625 0.35 61,079,384 2.44
Senegal USD 2,766,000 Senegal Government International
Bond 6.25% 30/7/2024* 2,995,492 0.12 USD 4,422,000 Senegal Government International
Bond 6.25% 23/5/2033* 4,389,526 0.17 USD 4,946,000 Senegal Government International
Bond 6.75% 13/3/2048 4,729,612 0.19 12,114,630 0.48
Serbia USD 2,851,000 Serbia International Bond 4.875%
25/2/2020 2,880,935 0.12
South Africa USD 9,608,000 Eskom Holdings SOC Ltd 5.75%
26/1/2021* 9,656,040 0.39 USD 1,800,000 Eskom Holdings SOC Ltd 6.75%
6/8/2023 1,847,250 0.07 USD 4,398,000 Eskom Holdings SOC Ltd 7.125%
11/2/2025* 4,535,437 0.18 USD 1,711,000 Eskom Holdings SOC Ltd 8.45%
10/8/2028* 1,881,833 0.07 USD 4,005,000 Republic of South Africa
Government International Bond 4.3% 12/10/2028 3,987,779 0.16
USD 8,720,000 Republic of South Africa Government International Bond 4.665% 17/1/2024 9,179,163 0.37
USD 9,131,000 Republic of South Africa Government International Bond 4.875% 14/4/2026 9,567,576 0.38
USD 3,523,000 Republic of South Africa Government International Bond 5.5% 9/3/2020 3,572,322 0.14
USD 7,213,000 Republic of South Africa Government International Bond 5.65% 27/9/2047 7,589,428 0.30
USD 3,829,000 Republic of South Africa Government International Bond 5.875% 16/9/2025 4,235,831 0.17
USD 5,497,000 Republic of South Africa Government International Bond 5.875% 22/6/2030* 6,046,700 0.24
USD 8,104,000 Transnet SOC Ltd 4% 26/7/2022 8,182,507 0.33 70,281,866 2.80
Sri Lanka USD 5,991,000 Sri Lanka Government International
Bond 5.75% 18/1/2022 6,003,169 0.24 USD 7,427,000 Sri Lanka Government International
Bond 5.875% 25/7/2022 7,449,049 0.30 USD 10,899,000 Sri Lanka Government International
Bond 6.125% 3/6/2025* 10,578,353 0.42 USD 16,794,000 Sri Lanka Government International
Bond 6.2% 11/5/2027 15,778,488 0.63 USD 3,004,000 Sri Lanka Government International
Bond 6.25% 27/7/2021 3,053,754 0.12 USD 5,490,000 Sri Lanka Government International
Bond 6.85% 3/11/2025 5,504,247 0.22 USD 10,914,000 Sri Lanka Government International
Bond 7.55% 28/3/2030 10,822,517 0.43 59,189,577 2.36
Sweden EUR 651,000 East Renewable AB 13.5%
21/5/2021 714,875 0.03
Trinidad and Tobago USD 6,354,000 Trinidad & Tobago Government
International Bond 4.5% 4/8/2026* 6,562,491 0.26 USD 2,640,000 Trinidad Generation UnLtd 5.25%
4/11/2027* 2,701,875 0.11 USD 2,025,000 Trinidad Petroleum Holdings Ltd
‘144A’ 9.75% 15/6/2026* 2,300,906 0.09 11,565,272 0.46
Tunisia USD 5,816,000 Banque Centrale de Tunisie
International Bond 5.75% 30/1/2025 5,321,640 0.21
Turkey USD 15,900,000 Turkey Government International
Bond 4.25% 14/4/2026* 13,972,125 0.56 USD 6,249,000 Turkey Government International
Bond 4.875% 16/4/2043 4,850,786 0.19 USD 4,136,000 Turkey Government International
Bond 6% 14/1/2041 3,537,573 0.14 22,360,484 0.89
Ukraine USD 38,422,000 Ukraine Government International
Bond FRN 31/5/2040 33,781,343 1.35 USD 20,100,000 Ukraine Government International
Bond 7.375% 25/9/2032 20,718,075 0.83 USD 4,374,000 Ukraine Government International
Bond 7.75% 1/9/2020* 4,498,385 0.18
Portfolio of Investments 31 August 2019
Emerging Markets Bond Fund continued

Transferable Securities and Money Market Instruments Admitted to an Official Stock Exchange Listing or Dealt in on Another Regulated Market
Transferable Securities and Money Market Instruments Admitted to an Official Stock Exchange Listing or Dealt in on Another Regulated Market
Holding
Description
Market Value (USD)
% of Net
Assets
Holding
Description
Market Value (USD)
% of Net
Assets
* All or a portion of this security represents a security on loan.** Security subject to a fair value adjustment as detailed in Note 2(j).
The notes on pages 728 to 741 form an integral part of these financial statements.
[178] BlackRock Global Funds (BGF)
USD 12,402,000 Ukraine Government International Bond 7.75% 1/9/2021 12,953,951 0.52
USD 10,207,000 Ukraine Government International Bond 7.75% 1/9/2022 10,829,627 0.43
USD 7,457,000 Ukraine Government International Bond 7.75% 1/9/2023* 7,941,705 0.32
USD 13,244,000 Ukraine Government International Bond 7.75% 1/9/2024* 14,194,257 0.56
USD 9,380,000 Ukraine Government International Bond 7.75% 1/9/2025* 9,980,367 0.40
USD 4,572,000 Ukraine Government International Bond 7.75% 1/9/2027 4,857,750 0.19
119,755,460 4.78
United Arab Emirates USD 10,205,000 Abu Dhabi Crude Oil Pipeline LLC
4.6% 2/11/2047 12,686,091 0.51 USD 6,609,000 DP World Plc 5.625% 25/9/2048* 7,900,853 0.31 20,586,944 0.82
United Kingdom USD 7,415,000 Ukraine Railways Via Rail Capital
Markets Plc 8.25% 9/7/2024* 7,591,143 0.30 USD 3,172,000 Ukreximbank Via Biz Finance Plc
9.625% 27/4/2022 3,323,479 0.13 USD 4,118,000 Ukreximbank Via Biz Finance Plc
9.75% 22/1/2025 4,365,080 0.18 15,279,702 0.61
United States USD 6,550,000 SASOL Financing USA LLC 6.5%
27/9/2028 7,279,711 0.29 USD 55,000,000 United States Treasury Bill
12/9/2019 (Zero Coupon) 54,962,393 2.19 USD 25,486,000 United States Treasury Note/Bond
2.5% 31/1/2021 25,775,207 1.03 88,017,311 3.51
Uruguay USD 3,883,670 Uruguay Government International
Bond 4.125% 20/11/2045 4,293,276 0.17 USD 8,811,081 Uruguay Government International
Bond 4.375% 27/10/2027 9,783,054 0.39 USD 1,500,000 Uruguay Government International
Bond 4.375% 23/1/2031 1,693,828 0.07 USD 8,766,100 Uruguay Government International
Bond 4.975% 20/4/2055 10,738,560 0.43 USD 14,391,641 Uruguay Government International
Bond 5.1% 18/6/2050 17,865,873 0.71 44,374,591 1.77
Venezuela USD 2,936,500 Petroleos de Venezuela SA
27/10/2020 (Zero Coupon) 1,233,330 0.05 USD 54,633,022 Petroleos de Venezuela SA
17/11/2021 (Zero Coupon) 7,238,875 0.29 USD 76,618,400 Petroleos de Venezuela SA
17/2/2022 (Zero Coupon) 10,151,938 0.41 USD 131,497,923 Petroleos de Venezuela SA
16/5/2024 (Zero Coupon) 17,752,220 0.71 USD 15,499,059 Petroleos de Venezuela SA
15/11/2026 (Zero Coupon) 2,053,625 0.08 USD 127,413,677 Petroleos de Venezuela SA
17/5/2035 (Zero Coupon) 16,882,312 0.67 USD 7,000 Venezuela Government
International Bond FRN 15/4/2020 158 0.00 55,312,458 2.21
Zambia USD 9,654,000 Zambia Government International
Bond 5.375% 20/9/2022 6,358,064 0.26 USD 27,082,000 Zambia Government International
Bond 8.5% 14/4/2024 18,314,203 0.73 USD 15,807,000 Zambia Government International
Bond 8.97% 30/7/2027 10,605,509 0.42 35,277,776 1.41Total Bonds 2,275,877,882 90.77Total Transferable Securities and Money Market Instruments Admitted to an Official Stock Exchange Listing or Dealt in on Another Regulated Market 2,333,305,382 93.06
Other Transferable Securities
BONDS
United States USD 16,111 Lehman Brothers Holdings Inc
31/12/2049 (Zero Coupon)** 184 0.00 USD 16,111 Lehman Brothers Special Finance
31/12/2049 (Zero Coupon)** – 0.00 184 0.00Total Bonds 184 0.00Total Other Transferable Securities 184 0.00Total Portfolio 2,333,305,566 93.06
Other Net Assets 174,003,521 6.94Total Net Assets (USD) 2,507,309,087 100.00
Portfolio of Investments 31 August 2019
Emerging Markets Bond Fund continued

The notes on pages 728 to 741 form an integral part of these financial statements.
Annual Report and Audited Financial Statements [179]
Swaps as at 31 August 2019
TypeNominal
Value Description Counterparty
Expiration date
Unrealised appreciation/
(depreciation) USD
Market Value USD
CDS USD 26,000,000 Fund receives default protection on Turkey Government International Bond; and pays Fixed 1% Bank of America 20/6/2024 146,318 3,522,626
CDS USD 35,085,000 Fund receives default protection on Brazilian Government International Bond; and pays Fixed 1% Bank of America 20/6/2024 (493,175) 535,393
CDS USD 37,724,000 Fund receives default protection on Russian Foreign Bond - Eurobond; and pays Fixed 1% Bank of America 20/6/2024 (630,672) (19,020)
CDS USD 10,000,000 Fund receives default protection on Turkey Government International Bond; and pays Fixed 1% Bank of America 20/6/2024 21,860 1,354,856
CDS USD 6,700,000 Fund receives default protection on Turkey Government International Bond; and pays Fixed 1% Barclays 20/6/2024 66,454 907,754
CDS USD 35,923,000 Fund receives default protection on Turkey Government International Bond; and pays Fixed 1% Barclays 20/6/2024 1,548,983 4,867,050
CDS USD 34,947,000 Fund receives default protection on Colombia Government International Bond; and pays Fixed 1% BNP Paribas 20/6/2024 (375,242) (111,775)
CDS USD 20,000,000 Fund receives default protection on Turkey Government International Bond; and pays Fixed 1% JP Morgan 20/6/2024 350,769 2,709,712
CDS USD 14,000,000 Fund receives default protection on Turkey Government International Bond; and pays Fixed 1% Morgan Stanley 20/6/2024 6,846 1,896,799
Total (USD underlying exposure - USD 287,666,101) 642,141 15,663,395
CDS: Credit Default Swaps
Emerging Markets Bond Fund continued
Open Forward Foreign Exchange Contracts as at 31 August 2019
Currency
Purchases Currency
Sales Counterparty
Maturity date
Unrealised appreciation/
(depreciation) USD
EUR 1,520,000 USD 1,687,798 BNP Paribas 23/9/2019 (6,152)GBP 520,000 USD 632,959 Toronto Dominion 23/9/2019 2,786USD 4,130,527 EUR 3,720,000 JP Morgan 23/9/2019 14,919USD 690,817 PLN 2,700,000 JP Morgan 23/9/2019 10,525JPY 5,509,800,000 USD 51,937,739 BNP Paribas 24/9/2019 51,897RUB 409,258,000 USD 6,196,485 Barclays 24/9/2019 (55,966)USD 23,745,489 JPY 2,506,280,000 JP Morgan 24/9/2019 96,611USD 24,977,304 JPY 2,660,460,000 RBS Plc 24/9/2019 (126,393)USD 3,233,831 JPY 343,060,000 BNP Paribas 24/9/2019 (3,231)Net unrealised depreciation (15,004)
AUD Hedged Share Class
AUD 36,842,306 USD 25,106,257 BNY Mellon 12/9/2019 (276,903)USD 2,528,449 AUD 3,725,609 BNY Mellon 12/9/2019 17,630Net unrealised depreciation (259,273)
CAD Hedged Share Class
CAD 14,881,919 USD 11,260,905 BNY Mellon 12/9/2019 (39,492)USD 1,248,368 CAD 1,651,411 BNY Mellon 12/9/2019 3,154Net unrealised depreciation (36,338)
CHF Hedged Share Class
CHF 54,077,915 USD 55,714,495 BNY Mellon 12/9/2019 (915,654)USD 1,370,267 CHF 1,333,164 BNY Mellon 12/9/2019 19,333Net unrealised depreciation (896,321)
CNH Hedged Share Class
CNY 37,454 USD 5,285 BNY Mellon 12/9/2019 (48)USD 87 CNY 617 BNY Mellon 12/9/2019 1Net unrealised depreciation (47)
Open Forward Foreign Exchange Contracts as at 31 August 2019
Currency
Purchases Currency
Sales Counterparty
Maturity date
Unrealised appreciation/
(depreciation) USD
EUR Hedged Share Class
EUR 662,626,996 USD 744,028,987 BNY Mellon 12/9/2019 (11,551,677)USD 22,730,464 EUR 20,279,411 BNY Mellon 12/9/2019 313,343Net unrealised depreciation (11,238,334)
GBP Hedged Share Class
GBP 44,168,888 USD 53,466,894 BNY Mellon 12/9/2019 506,780USD 1,467,920 GBP 1,209,094 BNY Mellon 12/9/2019 (9,574)Net unrealised appreciation 497,206
HKD Hedged Share Class
HKD 613,469,535 USD 78,295,436 BNY Mellon 12/9/2019 (43,019)USD 9,720,401 HKD 76,224,520 BNY Mellon 12/9/2019 (2,580)Net unrealised depreciation (45,599)
NZD Hedged Share Class
NZD 14,111,218 USD 9,163,771 BNY Mellon 12/9/2019 (245,164)USD 614,215 NZD 962,803 BNY Mellon 12/9/2019 5,704Net unrealised depreciation (239,460)
ZAR Hedged Share Class
USD 36,084 ZAR 551,097 BNY Mellon 12/9/2019 (28)ZAR 42,696,984 USD 2,793,084 BNY Mellon 12/9/2019 4,790Net unrealised appreciation 4,762
Total net unrealised depreciation (USD underlying exposure - USD 1,123,086,705) (12,228,408)

Transferable Securities and Money Market Instruments Admitted to an Official Stock Exchange Listing or Dealt in on Another Regulated Market
Transferable Securities and Money Market Instruments Admitted to an Official Stock Exchange Listing or Dealt in on Another Regulated Market
Holding
Description
Market Value (USD)
% of Net
Assets
Holding
Description
Market Value (USD)
% of Net
Assets
~ Investment in connected party fund, see further information in Note 11.* All or a portion of this security represents a security on loan.
The notes on pages 728 to 741 form an integral part of these financial statements.
[180] BlackRock Global Funds (BGF)
FUNDS
Ireland 10,849,080 BlackRock ICS US Dollar
Liquidity Fund~ 10,849,080 3.82Total Funds 10,849,080 3.82
BONDS
Argentina USD 2,612,000 Argentine Republic Government
International Bond 6.875% 11/1/2048 1,027,822 0.36
USD 2,177,000 YPF SA 7% 15/12/2047 1,288,145 0.46 2,315,967 0.82
Austria USD 2,600,000 Klabin Austria GmbH ‘144A’ 5.75%
3/4/2029* 2,740,156 0.97 USD 1,200,000 Suzano Austria GmbH 5%
15/1/2030 1,233,000 0.43 USD 1,200,000 Suzano Austria GmbH 5.75%
14/7/2026* 1,339,500 0.47 USD 2,110,000 Suzano Austria GmbH 6%
15/1/2029 2,350,013 0.83 7,662,669 2.70
Bahamas USD 4,270,000 Intercorp Peru Ltd 3.875%
15/8/2029 4,307,363 1.52
Bermuda USD 2,200,000 CBQ Finance Ltd 5% 24/5/2023 2,363,625 0.83 USD 240,000 Digicel Group One Ltd 8.25%
30/12/2022 133,200 0.05 USD 2,969,459 Digicel Group Two Ltd 8.25%
30/9/2022 608,739 0.22 USD 2,405,000 Inkia Energy Ltd 5.875% 9/11/2027 2,510,970 0.88 USD 2,300,000 Tengizchevroil Finance Co
International Ltd 4% 15/8/2026 2,385,100 0.84 8,001,634 2.82
Brazil USD 2,550,000 Banco do Brasil SA/Cayman
4.75% 20/3/2024 2,673,914 0.94 USD 3,069,000 Globo Comunicacao e
Participacoes SA (Step-up coupon) 4.843% 8/6/2025* 3,195,596 1.13
5,869,510 2.07
British Virgin Islands USD 2,302,000 Central American Bottling Corp
5.75% 31/1/2027 2,446,235 0.86 USD 2,842,000 Franshion Brilliant Ltd 4.25%
23/7/2029 2,843,023 1.00 USD 2,600,000 Gerdau Trade Inc 4.875%
24/10/2027* 2,780,781 0.98 USD 2,072,154 Star Energy Geothermal Wayang
Windu Ltd 6.75% 24/4/2033* 2,141,488 0.75 10,211,527 3.59
Canada USD 2,585,000 Canacol Energy Ltd 7.25%
3/5/2025 2,725,155 0.96
Cayman Islands USD 2,550,000 ADCB Finance Cayman Ltd 4%
29/3/2023 2,677,898 0.94 USD 2,500,000 AHB Sukuk Co Ltd 4.375%
19/9/2023 2,650,781 0.93 USD 2,543,000 Almarai Sukuk Ltd 4.311%
5/3/2024 2,716,415 0.96 USD 2,500,000 China Overseas Finance Cayman
VII Ltd 4.25% 26/4/2023* 2,640,913 0.93 USD 1,480,000 Country Garden Holdings Co Ltd
5.125% 17/1/2025* 1,428,903 0.50 USD 2,700,000 DP World Crescent Ltd 3.875%
18/7/2029 2,778,975 0.98 USD 2,800,000 GEMS MENASA Cayman Ltd /
GEMS Education Delaware LLC 7.125% 31/7/2026 2,856,000 1.01
USD 1,300,000 KWG Group Holdings Ltd 7.875% 9/8/2021* 1,340,210 0.47
USD 2,728,000 Lima Metro Line 2 Finance Ltd 4.35% 5/4/2036* 2,886,139 1.02
USD 1,375,000 Lima Metro Line 2 Finance Ltd ‘144A’ 4.35% 5/4/2036* 1,454,707 0.51
USD 2,158,000 Lima Metro Line 2 Finance Ltd 5.875% 5/7/2034 2,359,638 0.83
USD 1,397,000 Logan Property Holdings Co Ltd 5.25% 23/2/2023 1,329,333 0.47
USD 2,400,000 MAF Global Securities Ltd FRN 20/3/2026 (Perpetual) 2,406,375 0.85
USD 1,400,000 MAF Sukuk Ltd 4.638% 14/5/2029 1,533,000 0.54 USD 2,065,000 Melco Resorts Finance Ltd 5.625%
17/7/2027* 2,111,907 0.74 USD 1,348,000 MGM China Holdings Ltd 5.875%
15/5/2026 1,403,184 0.49 USD 1,450,000 NMC Healthcare Sukuk Ltd 5.95%
21/11/2023* 1,536,362 0.54 USD 2,343,000 QIIB Senior Sukuk Ltd 4.264%
5/3/2024 2,488,627 0.88 USD 500,000 Vale Overseas Ltd 6.875%
21/11/2036 625,859 0.22 USD 1,350,000 Yuzhou Properties Co Ltd 8.625%
23/1/2022 1,377,000 0.48 40,602,226 14.29
Chile USD 2,500,000 Banco de Credito e Inversiones SA
4% 11/2/2023 2,631,641 0.93 USD 1,645,000 Celulosa Arauco y Constitucion SA
4.25% 30/4/2029 1,735,475 0.61 USD 419,000 Celulosa Arauco y Constitucion SA
5.5% 30/4/2049 463,519 0.16 USD 476,000 Cencosud SA 6.625% 12/2/2045 507,981 0.18 USD 1,360,000 Empresa Nacional de
Telecomunicaciones SA 4.75% 1/8/2026 1,439,263 0.51
USD 1,164,000 Empresa Nacional de Telecomunicaciones SA 4.875% 30/10/2024 1,232,203 0.43
USD 2,000,000 Empresa Nacional del Petroleo 3.75% 5/8/2026 2,089,062 0.73
USD 550,000 Empresa Nacional del Petroleo 4.375% 30/10/2024 590,219 0.21
USD 1,353,000 Empresa Nacional del Petroleo 4.5% 14/9/2047* 1,474,582 0.52
USD 1,122,000 SACI Falabella 3.75% 30/4/2023 1,156,361 0.41 USD 3,300,000 SACI Falabella 3.75% 30/10/2027* 3,411,375 1.20 USD 1,099,000 SACI Falabella 4.375% 27/1/2025 1,168,546 0.41
Emerging Markets Corporate Bond Fund
Portfolio of Investments 31 August 2019
Emerging Markets Corporate Bond Fund
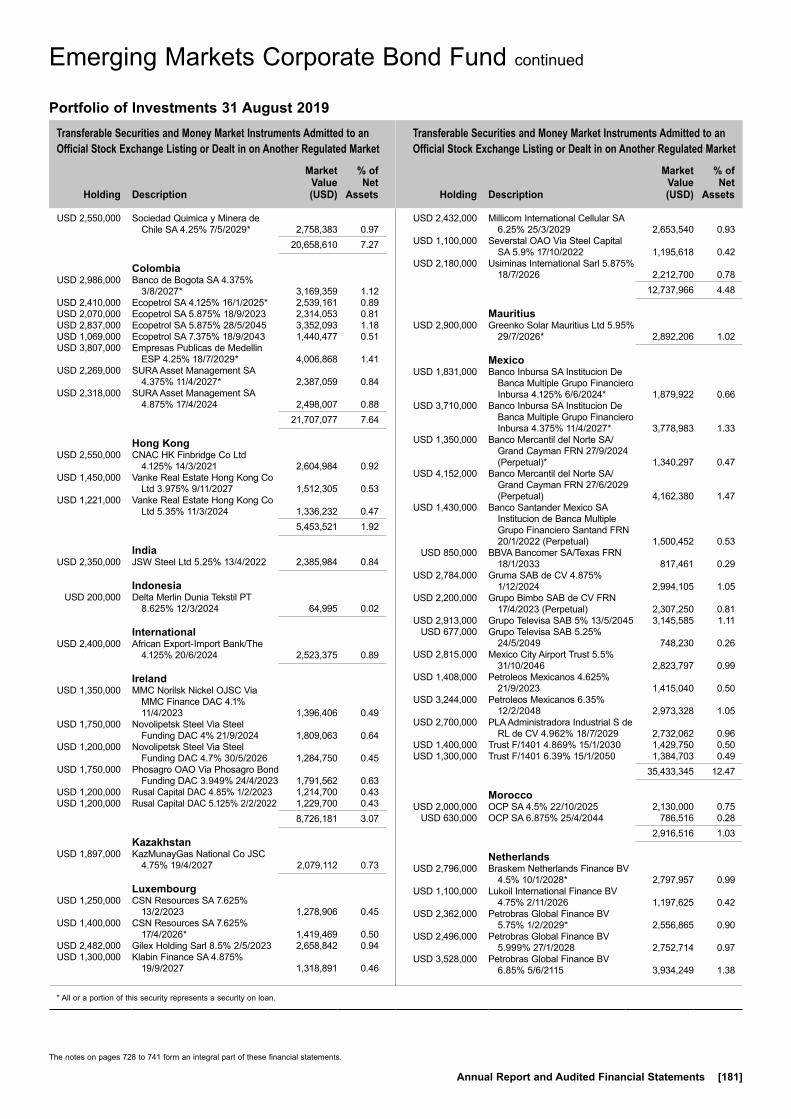
Transferable Securities and Money Market Instruments Admitted to an Official Stock Exchange Listing or Dealt in on Another Regulated Market
Transferable Securities and Money Market Instruments Admitted to an Official Stock Exchange Listing or Dealt in on Another Regulated Market
Holding
Description
Market Value (USD)
% of Net
Assets
Holding
Description
Market Value (USD)
% of Net
Assets
* All or a portion of this security represents a security on loan.
The notes on pages 728 to 741 form an integral part of these financial statements.
Annual Report and Audited Financial Statements [181]
USD 2,550,000 Sociedad Quimica y Minera de Chile SA 4.25% 7/5/2029* 2,758,383 0.97
20,658,610 7.27
Colombia USD 2,986,000 Banco de Bogota SA 4.375%
3/8/2027* 3,169,359 1.12 USD 2,410,000 Ecopetrol SA 4.125% 16/1/2025* 2,539,161 0.89 USD 2,070,000 Ecopetrol SA 5.875% 18/9/2023 2,314,053 0.81 USD 2,837,000 Ecopetrol SA 5.875% 28/5/2045 3,352,093 1.18 USD 1,069,000 Ecopetrol SA 7.375% 18/9/2043 1,440,477 0.51 USD 3,807,000 Empresas Publicas de Medellin
ESP 4.25% 18/7/2029* 4,006,868 1.41 USD 2,269,000 SURA Asset Management SA
4.375% 11/4/2027* 2,387,059 0.84 USD 2,318,000 SURA Asset Management SA
4.875% 17/4/2024 2,498,007 0.88 21,707,077 7.64
Hong Kong USD 2,550,000 CNAC HK Finbridge Co Ltd
4.125% 14/3/2021 2,604,984 0.92 USD 1,450,000 Vanke Real Estate Hong Kong Co
Ltd 3.975% 9/11/2027 1,512,305 0.53 USD 1,221,000 Vanke Real Estate Hong Kong Co
Ltd 5.35% 11/3/2024 1,336,232 0.47 5,453,521 1.92
India USD 2,350,000 JSW Steel Ltd 5.25% 13/4/2022 2,385,984 0.84
Indonesia USD 200,000 Delta Merlin Dunia Tekstil PT
8.625% 12/3/2024 64,995 0.02
International USD 2,400,000 African Export-Import Bank/The
4.125% 20/6/2024 2,523,375 0.89
Ireland USD 1,350,000 MMC Norilsk Nickel OJSC Via
MMC Finance DAC 4.1% 11/4/2023 1,396,406 0.49
USD 1,750,000 Novolipetsk Steel Via Steel Funding DAC 4% 21/9/2024 1,809,063 0.64
USD 1,200,000 Novolipetsk Steel Via Steel Funding DAC 4.7% 30/5/2026 1,284,750 0.45
USD 1,750,000 Phosagro OAO Via Phosagro Bond Funding DAC 3.949% 24/4/2023 1,791,562 0.63
USD 1,200,000 Rusal Capital DAC 4.85% 1/2/2023 1,214,700 0.43 USD 1,200,000 Rusal Capital DAC 5.125% 2/2/2022 1,229,700 0.43 8,726,181 3.07
Kazakhstan USD 1,897,000 KazMunayGas National Co JSC
4.75% 19/4/2027 2,079,112 0.73
Luxembourg USD 1,250,000 CSN Resources SA 7.625%
13/2/2023 1,278,906 0.45 USD 1,400,000 CSN Resources SA 7.625%
17/4/2026* 1,419,469 0.50 USD 2,482,000 Gilex Holding Sarl 8.5% 2/5/2023 2,658,842 0.94 USD 1,300,000 Klabin Finance SA 4.875%
19/9/2027 1,318,891 0.46
USD 2,432,000 Millicom International Cellular SA 6.25% 25/3/2029 2,653,540 0.93
USD 1,100,000 Severstal OAO Via Steel Capital SA 5.9% 17/10/2022 1,195,618 0.42
USD 2,180,000 Usiminas International Sarl 5.875% 18/7/2026 2,212,700 0.78
12,737,966 4.48
Mauritius USD 2,900,000 Greenko Solar Mauritius Ltd 5.95%
29/7/2026* 2,892,206 1.02
Mexico USD 1,831,000 Banco Inbursa SA Institucion De
Banca Multiple Grupo Financiero Inbursa 4.125% 6/6/2024* 1,879,922 0.66
USD 3,710,000 Banco Inbursa SA Institucion De Banca Multiple Grupo Financiero Inbursa 4.375% 11/4/2027* 3,778,983 1.33
USD 1,350,000 Banco Mercantil del Norte SA/Grand Cayman FRN 27/9/2024 (Perpetual)* 1,340,297 0.47
USD 4,152,000 Banco Mercantil del Norte SA/Grand Cayman FRN 27/6/2029 (Perpetual) 4,162,380 1.47
USD 1,430,000 Banco Santander Mexico SA Institucion de Banca Multiple Grupo Financiero Santand FRN 20/1/2022 (Perpetual) 1,500,452 0.53
USD 850,000 BBVA Bancomer SA/Texas FRN 18/1/2033 817,461 0.29
USD 2,784,000 Gruma SAB de CV 4.875% 1/12/2024 2,994,105 1.05
USD 2,200,000 Grupo Bimbo SAB de CV FRN 17/4/2023 (Perpetual) 2,307,250 0.81
USD 2,913,000 Grupo Televisa SAB 5% 13/5/2045 3,145,585 1.11 USD 677,000 Grupo Televisa SAB 5.25%
24/5/2049 748,230 0.26 USD 2,815,000 Mexico City Airport Trust 5.5%
31/10/2046 2,823,797 0.99 USD 1,408,000 Petroleos Mexicanos 4.625%
21/9/2023 1,415,040 0.50 USD 3,244,000 Petroleos Mexicanos 6.35%
12/2/2048 2,973,328 1.05 USD 2,700,000 PLA Administradora Industrial S de
RL de CV 4.962% 18/7/2029 2,732,062 0.96 USD 1,400,000 Trust F/1401 4.869% 15/1/2030 1,429,750 0.50 USD 1,300,000 Trust F/1401 6.39% 15/1/2050 1,384,703 0.49 35,433,345 12.47
Morocco USD 2,000,000 OCP SA 4.5% 22/10/2025 2,130,000 0.75 USD 630,000 OCP SA 6.875% 25/4/2044 786,516 0.28 2,916,516 1.03
Netherlands USD 2,796,000 Braskem Netherlands Finance BV
4.5% 10/1/2028* 2,797,957 0.99 USD 1,100,000 Lukoil International Finance BV
4.75% 2/11/2026 1,197,625 0.42 USD 2,362,000 Petrobras Global Finance BV
5.75% 1/2/2029* 2,556,865 0.90 USD 2,496,000 Petrobras Global Finance BV
5.999% 27/1/2028 2,752,714 0.97 USD 3,528,000 Petrobras Global Finance BV
6.85% 5/6/2115 3,934,249 1.38
Emerging Markets Corporate Bond Fund continued
Portfolio of Investments 31 August 2019

Transferable Securities and Money Market Instruments Admitted to an Official Stock Exchange Listing or Dealt in on Another Regulated Market
Transferable Securities and Money Market Instruments Admitted to an Official Stock Exchange Listing or Dealt in on Another Regulated Market
Holding
Description
Market Value (USD)
% of Net
Assets
Holding
Description
Market Value (USD)
% of Net
Assets
* All or a portion of this security represents a security on loan.
Swaps as at 31 August 2019
TypeNominal
Value Description Counterparty
Expiration date
Unrealised depreciation
USD
Market Value USD
CDS USD 4,295,003 Fund receives default protection on Brazilian Government International Bond; and pays Fixed 1% Bank of America 20/6/2024 (13,364) 65,541
CDS USD 5,400,000 Fund receives default protection on Mexico Government International Bond; and pays Fixed 1% Barclays 20/6/2024 (17,241) 28,941
CDS USD 1,239,385 Fund receives default protection on Mexico Government International Bond; and pays Fixed 1% JP Morgan 20/6/2024 (6,569) 6,643
Total (USD underlying exposure - USD 11,660,586) (37,174) 101,125
CDS: Credit Default Swaps
The notes on pages 728 to 741 form an integral part of these financial statements.
[182] BlackRock Global Funds (BGF)
Emerging Markets Corporate Bond Fund continued
USD 2,317,000 Sigma Finance Netherlands BV 4.875% 27/3/2028* 2,456,020 0.86
USD 2,405,000 Teva Pharmaceutical Finance Netherlands III BV 2.2% 21/7/2021 2,260,324 0.80
USD 1,165,000 Teva Pharmaceutical Finance Netherlands III BV 3.15% 1/10/2026 878,883 0.31
18,834,637 6.63
Panama USD 2,986,000 Banco General SA 4.125% 7/8/2027* 3,124,103 1.10 USD 2,400,000 Banistmo SA 3.65% 19/9/2022 2,415,750 0.85 USD 2,223,000 Intercorp Financial Services Inc
4.125% 19/10/2027* 2,300,805 0.81 7,840,658 2.76
Paraguay USD 2,640,000 Telefonica Celular del Paraguay SA
5.875% 15/4/2027 2,813,663 0.99
Peru USD 2,558,000 Banco de Credito del Peru 4.25%
1/4/2023 2,698,290 0.95 USD 1,408,000 Petroleos del Peru SA 4.75%
19/6/2032 1,587,080 0.56 USD 3,576,000 Petroleos del Peru SA 5.625%
19/6/2047* 4,331,430 1.52 8,616,800 3.03
Russian Federation USD 2,800,000 Russian Foreign Bond - Eurobond
4.375% 21/3/2029 3,012,800 1.06
Saint Lucia USD 357,000 Digicel International Finance Ltd /
Digicel Holdings Bermuda Ltd 8.75% 25/5/2024* 336,640 0.12
Singapore USD 2,217,000 Indika Energy Capital III Pte Ltd
5.875% 9/11/2024* 2,114,117 0.74
South Africa USD 2,300,000 Growthpoint Properties International
Pty Ltd 5.872% 2/5/2023 2,463,156 0.87 USD 2,400,000 Transnet SOC Ltd 4% 26/7/2022 2,423,250 0.85 4,886,406 1.72
Turkey USD 2,350,000 KOC Holding AS 6.5% 11/3/2025 2,361,611 0.83 USD 1,700,000 Turkiye Garanti Bankasi AS
5.875% 16/3/2023 1,663,078 0.59 USD 344,000 Turkiye Sise ve Cam Fabrikalari AS
4.25% 9/5/2020 344,860 0.12 USD 2,700,000 Turkiye Sise ve Cam Fabrikalari AS
6.95% 14/3/2026 2,704,219 0.95 7,073,768 2.49
United Arab Emirates USD 2,450,000 Burgan Senior SPC Ltd 3.125%
14/9/2021 2,472,586 0.87 USD 2,700,000 Oztel Holdings SPC Ltd 6.625%
24/4/2028 2,720,250 0.96 USD 2,400,000 Tabreed Sukuk Spc Ltd 5.5%
31/10/2025* 2,713,944 0.95 7,906,780 2.78
United Kingdom USD 1,095,000 Evraz Plc 5.25% 2/4/2024 1,174,935 0.41 USD 1,100,000 Evraz Plc 5.375% 20/3/2023 1,177,000 0.41 USD 1,400,000 Polyus Finance Plc 4.7% 29/1/2024 1,466,500 0.52 USD 2,600,000 Ukraine Railways Via Rail Capital
Markets Plc 8.25% 9/7/2024 2,661,763 0.94 6,480,198 2.28Total Bonds 269,191,406 94.75Total Transferable Securities and Money Market Instruments Admitted to an Official Stock Exchange Listing or Dealt in on Another Regulated Market 280,040,486 98.57Total Portfolio 280,040,486 98.57
Other Net Assets 4,051,345 1.43Total Net Assets (USD) 284,091,831 100.00
Portfolio of Investments 31 August 2019

The notes on pages 728 to 741 form an integral part of these financial statements.
Annual Report and Audited Financial Statements [183]
Emerging Markets Corporate Bond Fund continued
Open Exchange Traded Futures Contracts as at 31 August 2019
Number of contracts Currency
Contract/ Description
Expiration date
Underlying exposure
USD
Unrealised depreciation
USD
(19) USD US Treasury 10 Year Note (CBT) December 2019 2,499,391 (1,182)
Total 2,499,391 (1,182)
Open Forward Foreign Exchange Contracts as at 31 August 2019
Currency
Purchases Currency
Sales Counterparty
Maturity date
Unrealised appreciation/
(depreciation) USD
GBP 40,000 USD 48,468 Nomura 23/9/2019 436Net unrealised appreciation 436
EUR Hedged Share Class
EUR 9,879,456 USD 11,092,951 BNY Mellon 12/9/2019 (172,059)USD 199,034 EUR 178,367 BNY Mellon 12/9/2019 1,865Net unrealised depreciation (170,194)
GBP Hedged Share Class
GBP 183,225 USD 221,800 BNY Mellon 12/9/2019 2,097USD 1,166 GBP 966 BNY Mellon 12/9/2019 (15)Net unrealised appreciation 2,082
Total net unrealised depreciation (USD underlying exposure - USD 11,383,772) (167,676)
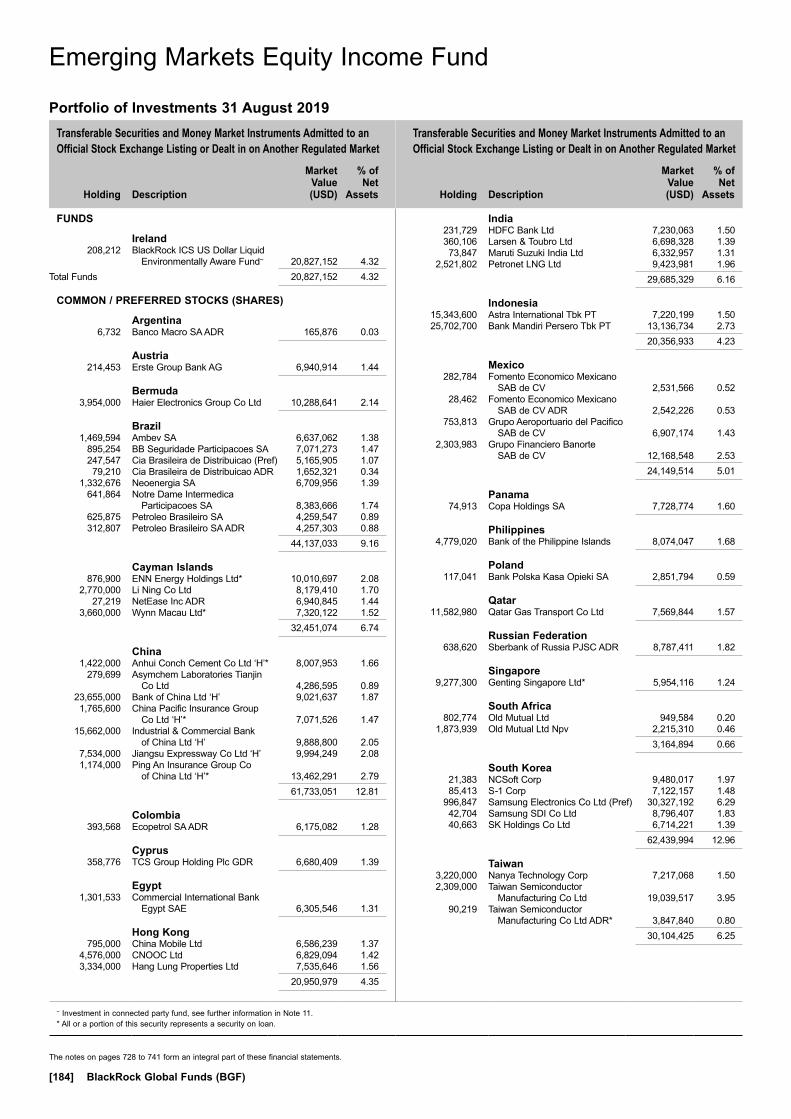
Transferable Securities and Money Market Instruments Admitted to an Official Stock Exchange Listing or Dealt in on Another Regulated Market
Transferable Securities and Money Market Instruments Admitted to an Official Stock Exchange Listing or Dealt in on Another Regulated Market
Holding
Description
Market Value (USD)
% of Net
Assets
Holding
Description
Market Value (USD)
% of Net
Assets
~ Investment in connected party fund, see further information in Note 11.* All or a portion of this security represents a security on loan.
The notes on pages 728 to 741 form an integral part of these financial statements.
[184] BlackRock Global Funds (BGF)
FUNDS
Ireland 208,212 BlackRock ICS US Dollar Liquid
Environmentally Aware Fund~ 20,827,152 4.32Total Funds 20,827,152 4.32
COMMON / PREFERRED STOCKS (SHARES)
Argentina 6,732 Banco Macro SA ADR 165,876 0.03
Austria 214,453 Erste Group Bank AG 6,940,914 1.44
Bermuda 3,954,000 Haier Electronics Group Co Ltd 10,288,641 2.14
Brazil 1,469,594 Ambev SA 6,637,062 1.38 895,254 BB Seguridade Participacoes SA 7,071,273 1.47 247,547 Cia Brasileira de Distribuicao (Pref) 5,165,905 1.07 79,210 Cia Brasileira de Distribuicao ADR 1,652,321 0.34 1,332,676 Neoenergia SA 6,709,956 1.39 641,864 Notre Dame Intermedica
Participacoes SA 8,383,666 1.74 625,875 Petroleo Brasileiro SA 4,259,547 0.89 312,807 Petroleo Brasileiro SA ADR 4,257,303 0.88 44,137,033 9.16
Cayman Islands 876,900 ENN Energy Holdings Ltd* 10,010,697 2.08 2,770,000 Li Ning Co Ltd 8,179,410 1.70 27,219 NetEase Inc ADR 6,940,845 1.44 3,660,000 Wynn Macau Ltd* 7,320,122 1.52 32,451,074 6.74
China 1,422,000 Anhui Conch Cement Co Ltd ‘H’* 8,007,953 1.66 279,699 Asymchem Laboratories Tianjin
Co Ltd 4,286,595 0.89 23,655,000 Bank of China Ltd ‘H’ 9,021,637 1.87 1,765,600 China Pacific Insurance Group
Co Ltd ‘H’* 7,071,526 1.47 15,662,000 Industrial & Commercial Bank
of China Ltd ‘H’ 9,888,800 2.05 7,534,000 Jiangsu Expressway Co Ltd ‘H’ 9,994,249 2.08 1,174,000 Ping An Insurance Group Co
of China Ltd ‘H’* 13,462,291 2.79 61,733,051 12.81
Colombia 393,568 Ecopetrol SA ADR 6,175,082 1.28
Cyprus 358,776 TCS Group Holding Plc GDR 6,680,409 1.39
Egypt 1,301,533 Commercial International Bank
Egypt SAE 6,305,546 1.31
Hong Kong 795,000 China Mobile Ltd 6,586,239 1.37 4,576,000 CNOOC Ltd 6,829,094 1.42 3,334,000 Hang Lung Properties Ltd 7,535,646 1.56 20,950,979 4.35
India 231,729 HDFC Bank Ltd 7,230,063 1.50 360,106 Larsen & Toubro Ltd 6,698,328 1.39 73,847 Maruti Suzuki India Ltd 6,332,957 1.31 2,521,802 Petronet LNG Ltd 9,423,981 1.96 29,685,329 6.16
Indonesia 15,343,600 Astra International Tbk PT 7,220,199 1.50 25,702,700 Bank Mandiri Persero Tbk PT 13,136,734 2.73 20,356,933 4.23
Mexico 282,784 Fomento Economico Mexicano
SAB de CV 2,531,566 0.52 28,462 Fomento Economico Mexicano
SAB de CV ADR 2,542,226 0.53 753,813 Grupo Aeroportuario del Pacifico
SAB de CV 6,907,174 1.43 2,303,983 Grupo Financiero Banorte
SAB de CV 12,168,548 2.53 24,149,514 5.01
Panama 74,913 Copa Holdings SA 7,728,774 1.60
Philippines 4,779,020 Bank of the Philippine Islands 8,074,047 1.68
Poland 117,041 Bank Polska Kasa Opieki SA 2,851,794 0.59
Qatar 11,582,980 Qatar Gas Transport Co Ltd 7,569,844 1.57
Russian Federation 638,620 Sberbank of Russia PJSC ADR 8,787,411 1.82
Singapore 9,277,300 Genting Singapore Ltd* 5,954,116 1.24
South Africa 802,774 Old Mutual Ltd 949,584 0.20 1,873,939 Old Mutual Ltd Npv 2,215,310 0.46 3,164,894 0.66
South Korea 21,383 NCSoft Corp 9,480,017 1.97 85,413 S-1 Corp 7,122,157 1.48 996,847 Samsung Electronics Co Ltd (Pref) 30,327,192 6.29 42,704 Samsung SDI Co Ltd 8,796,407 1.83 40,663 SK Holdings Co Ltd 6,714,221 1.39 62,439,994 12.96
Taiwan 3,220,000 Nanya Technology Corp 7,217,068 1.50 2,309,000 Taiwan Semiconductor
Manufacturing Co Ltd 19,039,517 3.95 90,219 Taiwan Semiconductor
Manufacturing Co Ltd ADR* 3,847,840 0.80 30,104,425 6.25
Emerging Markets Equity Income Fund
Portfolio of Investments 31 August 2019
Emerging Markets Equity Income Fund

Transferable Securities and Money Market Instruments Admitted to an Official Stock Exchange Listing or Dealt in on Another Regulated Market
Holding
Description
Market Value (USD)
% of Net
Assets
The notes on pages 728 to 741 form an integral part of these financial statements.
Annual Report and Audited Financial Statements [185]
Thailand 1,432,200 Kasikornbank PCL 7,495,365 1.55 16,884,000 Land & Houses PCL NVDR 5,964,421 1.24 13,459,786 2.79
United Arab Emirates 465,541 DP World Plc 6,517,574 1.35
United Kingdom 103,248 Mediclinic International Plc 425,117 0.09 3,253,192 Vivo Energy Plc 4,832,109 1.00 5,257,226 1.09Total Common / Preferred Stocks (Shares) 431,930,266 89.65Total Transferable Securities and Money Market Instruments Admitted to an Official Stock Exchange Listing or Dealt in on Another Regulated Market 452,757,418 93.97Total Portfolio 452,757,418 93.97
Other Net Assets 29,056,839 6.03Total Net Assets (USD) 481,814,257 100.00
Emerging Markets Equity Income Fund continued
Portfolio of Investments 31 August 2019
Open Forward Foreign Exchange Contracts as at 31 August 2019
Currency
Purchases Currency
Sales Counterparty
Maturity date
Unrealised appreciation/
(depreciation) USD
MXN 208,480,000 USD 10,446,460 Morgan Stanley 17/9/2019 (87,882)MXN 208,478,796 USD 10,456,827 HSBC Bank Plc 17/9/2019 (98,309)USD 7,386,921 MXN 145,933,796 HSBC Bank Plc 17/9/2019 136,026USD 13,784,413 MXN 271,025,000 Citibank 17/9/2019 318,213Net unrealised appreciation 268,048
AUD Hedged Share Class
AUD 3,656,563 USD 2,491,857 BNY Mellon 12/9/2019 (27,568)USD 274,279 AUD 405,975 BNY Mellon 12/9/2019 678Net unrealised depreciation (26,890)
CAD Hedged Share Class
CAD 634,002 USD 479,702 BNY Mellon 12/9/2019 (1,646)USD 39,695 CAD 52,707 BNY Mellon 12/9/2019 (47)Net unrealised depreciation (1,693)
CHF Hedged Share Class
CHF 6,926 USD 7,135 BNY Mellon 12/9/2019 (116)USD 237 CHF 230 BNY Mellon 12/9/2019 4Net unrealised depreciation (112)
CNH Hedged Share Class
CNY 117,891 USD 16,634 BNY Mellon 12/9/2019 (151)USD 503 CNY 3,575 BNY Mellon 12/9/2019 3Net unrealised depreciation (148)
EUR Hedged Share Class
EUR 14,240,937 USD 15,988,866 BNY Mellon 12/9/2019 (246,732)USD 598,729 EUR 535,776 BNY Mellon 12/9/2019 6,476Net unrealised depreciation (240,256)
GBP Hedged Share Class
GBP 1,057,568 USD 1,280,374 BNY Mellon 12/9/2019 11,957USD 40,803 GBP 33,623 BNY Mellon 12/9/2019 (283)Net unrealised appreciation 11,674
HKD Hedged Share Class
HKD 42,573,615 USD 5,433,454 BNY Mellon 12/9/2019 (2,886)USD 173,388 HKD 1,360,254 BNY Mellon 12/9/2019 (122)Net unrealised depreciation (3,008)
NZD Hedged Share Class
NZD 631,772 USD 410,223 BNY Mellon 12/9/2019 (10,929)USD 12,920 NZD 20,101 BNY Mellon 12/9/2019 216Net unrealised depreciation (10,713)
SGD Hedged Share Class
SGD 2,138,434 USD 1,547,678 BNY Mellon 12/9/2019 (5,455)USD 77,864 SGD 108,009 BNY Mellon 12/9/2019 (31)Net unrealised depreciation (5,486)
Total net unrealised depreciation (USD underlying exposure - USD 70,105,147) (8,584)
Open Forward Foreign Exchange Contracts as at 31 August 2019
Currency
Purchases Currency
Sales Counterparty
Maturity date
Unrealised appreciation/
(depreciation) USD
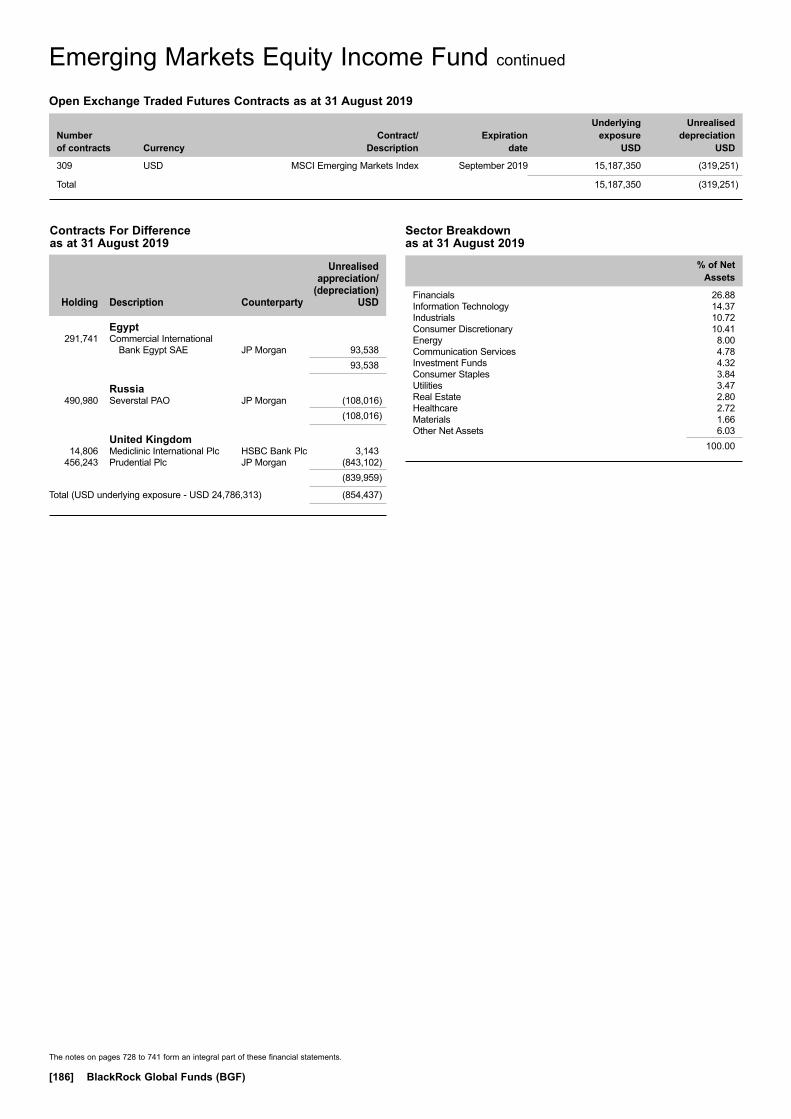
The notes on pages 728 to 741 form an integral part of these financial statements.
[186] BlackRock Global Funds (BGF)
Emerging Markets Equity Income Fund continued
Sector Breakdown as at 31 August 2019
% of Net Assets
Financials 26.88Information Technology 14.37Industrials 10.72Consumer Discretionary 10.41Energy 8.00Communication Services 4.78Investment Funds 4.32Consumer Staples 3.84Utilities 3.47Real Estate 2.80Healthcare 2.72Materials 1.66Other Net Assets 6.03
100.00
Open Exchange Traded Futures Contracts as at 31 August 2019
Number of contracts Currency
Contract/ Description
Expiration date
Underlying exposure
USD
Unrealised depreciation
USD
309 USD MSCI Emerging Markets Index September 2019 15,187,350 (319,251)
Total 15,187,350 (319,251)
Holding
Description Counterparty
Unrealised appreciation/
(depreciation) USD
Egypt 291,741 Commercial International
Bank Egypt SAE JP Morgan 93,538 93,538
Russia 490,980 Severstal PAO JP Morgan (108,016) (108,016)
United Kingdom 14,806 Mediclinic International Plc HSBC Bank Plc 3,143 456,243 Prudential Plc JP Morgan (843,102) (839,959)
Total (USD underlying exposure - USD 24,786,313) (854,437)
Contracts For Difference as at 31 August 2019

Transferable Securities and Money Market Instruments Admitted to an Official Stock Exchange Listing or Dealt in on Another Regulated Market
Transferable Securities and Money Market Instruments Admitted to an Official Stock Exchange Listing or Dealt in on Another Regulated Market
Holding
Description
Market Value (USD)
% of Net
Assets
Holding
Description
Market Value (USD)
% of Net
Assets
~ Investment in connected party fund, see further information in Note 11.* All or a portion of this security represents a security on loan.
The notes on pages 728 to 741 form an integral part of these financial statements.
Annual Report and Audited Financial Statements [187]
FUNDS
Ireland 367,355 BlackRock ICS US Dollar Liquid
Environmentally Aware Fund~ 36,746,082 4.58Total Funds 36,746,082 4.58
COMMON / PREFERRED STOCKS (SHARES) & P NOTES
Argentina 51,012 Grupo Financiero Galicia SA ADR 603,727 0.08
Bermuda 16,382,000 Kunlun Energy Co Ltd* 14,271,802 1.78
Brazil 82,899 B2W Cia Digital 930,983 0.11 8,692 B2W Cia Digital (Right 22/9/2019) 16,482 0.00 1,631,282 BB Seguridade Participacoes SA 12,884,880 1.61 471,040 Cia Brasileira de Distribuicao (Pref) 9,829,843 1.23 137,129 Cia Brasileira de Distribuicao ADR* 2,860,511 0.36 867,490 Itau Unibanco Holding SA ADR 7,148,118 0.89 2,559,226 Neoenergia SA 12,885,574 1.61 1,700,718 Notre Dame Intermedica
Participacoes SA 22,213,819 2.77 1,396,229 Petroleo Brasileiro SA ADR 19,002,677 2.37 87,772,887 10.95
Cayman Islands 198,492 Alibaba Group Holding Ltd ADR 34,630,899 4.32 1,709,000 Health & Happiness H&H
International Holdings Ltd 7,117,319 0.89 596,285 iQIYI Inc ADR 10,965,681 1.37 4,791,000 Li Ning Co Ltd 14,147,130 1.76 1,489,200 Meituan Dianping* 14,122,943 1.76 448,530 Momo Inc ADR 16,129,139 2.01 361,145 Silicon Motion Technology Corp ADR 11,664,984 1.46 5 Tencent Holdings Ltd 207 0.00 108,778,302 13.57
China 715,024 Asymchem Laboratories Tianjin
Co Ltd 10,958,274 1.37 11,093,900 Bank of China Ltd ‘H’ 4,231,035 0.53 1,975,500 Ping An Insurance Group Co of
China Ltd ‘H’* 22,653,115 2.82 391,000 Shenzhen Mindray Bio-Medical
Electronics Co Ltd 10,190,521 1.27 50,307 Wuhan Raycus Fiber Laser
Technologies Co Ltd 643,009 0.08 48,675,954 6.07
Egypt 2,678,690 Commercial International Bank
Egypt SAE 12,977,468 1.62
Hong Kong 2,666,000 China Overseas Land &
Investment Ltd* 8,433,406 1.05 5,678,000 CNOOC Ltd* 8,473,688 1.06 15,605,000 SJM Holdings Ltd* 14,749,360 1.84 31,656,454 3.95
India 4,442,389 Fortis Healthcare Ltd 7,723,596 0.96 401,887 HDFC Bank Ltd 12,539,079 1.57 3,624,830 Jindal Steel & Power Ltd 4,903,667 0.61 3,035,679 Petronet LNG Ltd 11,344,341 1.42 1,535,904 Tech Mahindra Ltd 14,919,721 1.86 51,430,404 6.42
Indonesia 32,307,800 Astra International Tbk PT 15,203,000 1.90 20,568,900 Bank Mandiri Persero Tbk PT 10,512,831 1.31 25,715,831 3.21
Israel 1,209,806 Israel Chemicals Ltd 5,465,759 0.68
Italy 1,614,200 PRADA SpA* 4,529,719 0.56
Mexico 210,898 Cemex SAB de CV ADR 772,941 0.10 916,144 Fomento Economico Mexicano
SAB de CV 8,201,594 1.02 121,625 Fomento Economico Mexicano
SAB de CV ADR 10,863,545 1.36 58,740 Grupo Aeroportuario del Pacifico
SAB de CV ADR 5,380,584 0.67 590,306 Grupo Aeroportuario del Pacifico
SAB de CV ‘B’ 5,408,962 0.67 2,764,269 Grupo Financiero Banorte SAB
de CV 14,599,561 1.82 45,227,187 5.64
Panama 160,735 Copa Holdings SA 16,583,030 2.07
Philippines 8,412,340 Bank of the Philippine Islands 14,212,460 1.77
Poland 203,751 Bank Polska Kasa Opieki SA 4,964,551 0.62 672,899 Powszechna Kasa Oszczednosci
Bank Polski SA 6,640,311 0.83 11,604,862 1.45
Russian Federation 1,566,792 Mobile TeleSystems PJSC 6,280,845 0.78 1,116,325 Mobile TeleSystems PJSC ADR 8,969,671 1.12 40,987 Polyus PJSC 4,651,630 0.58 79,115 Polyus PJSC GDR 4,481,865 0.56 1,607,228 Sberbank of Russia PJSC 5,436,595 0.68 1,210,999 Sberbank of Russia PJSC ADR 16,663,346 2.08 15,532,792 Surgutneftegas PJSC (Pref) 7,468,973 0.93 53,952,925 6.73
South Korea 42,586 NCSoft Corp 18,880,232 2.36 1,157,015 Samsung Electronics Co Ltd 42,029,853 5.24 56,182 Samsung SDI Co Ltd 11,572,680 1.44 55,736 SK Holdings Co Ltd 9,203,055 1.15 271,545 SK Hynix Inc 17,351,977 2.17 99,037,797 12.36
Emerging Markets Fund
Portfolio of Investments 31 August 2019
Emerging Markets Fund
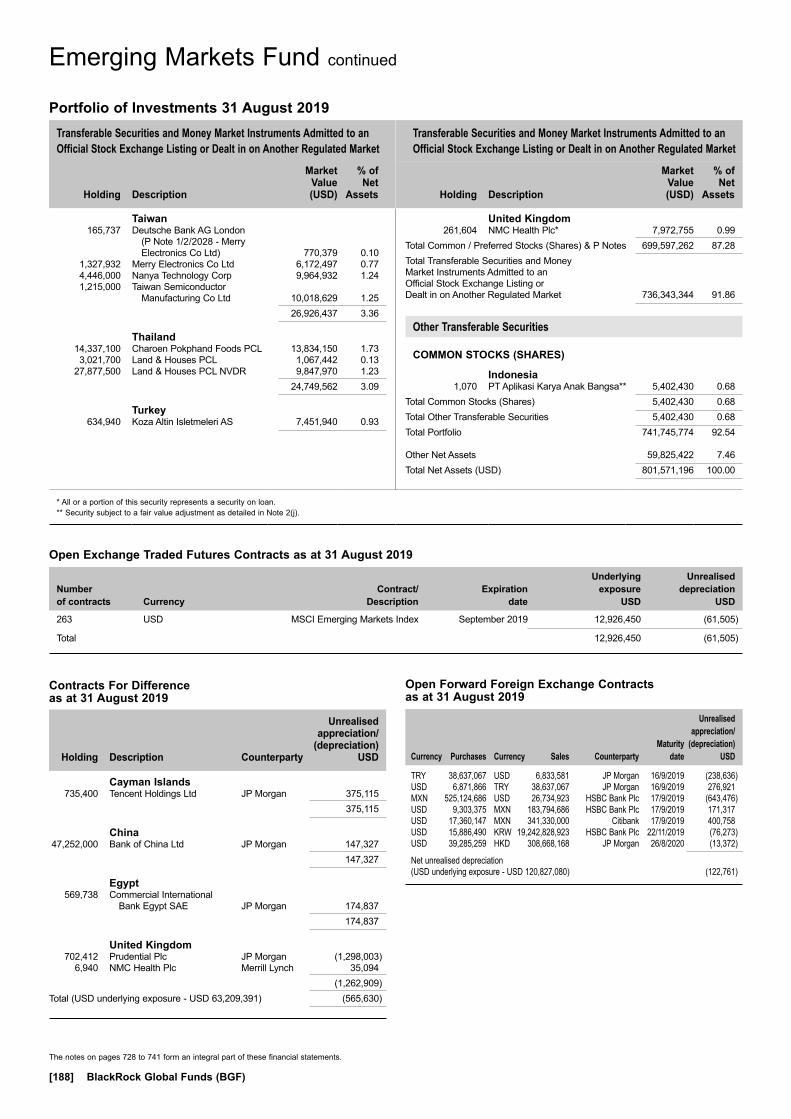
Transferable Securities and Money Market Instruments Admitted to an Official Stock Exchange Listing or Dealt in on Another Regulated Market
Transferable Securities and Money Market Instruments Admitted to an Official Stock Exchange Listing or Dealt in on Another Regulated Market
Holding
Description
Market Value (USD)
% of Net
Assets
Holding
Description
Market Value (USD )
% of Net
Assets
* All or a portion of this security represents a security on loan.** Security subject to a fair value adjustment as detailed in Note 2(j).
The notes on pages 728 to 741 form an integral part of these financial statements.
[188] BlackRock Global Funds (BGF)
Taiwan 165,737 Deutsche Bank AG London
(P Note 1/2/2028 - Merry Electronics Co Ltd) 770,379 0.10
1,327,932 Merry Electronics Co Ltd 6,172,497 0.77 4,446,000 Nanya Technology Corp 9,964,932 1.24 1,215,000 Taiwan Semiconductor
Manufacturing Co Ltd 10,018,629 1.25 26,926,437 3.36
Thailand 14,337,100 Charoen Pokphand Foods PCL 13,834,150 1.73 3,021,700 Land & Houses PCL 1,067,442 0.13 27,877,500 Land & Houses PCL NVDR 9,847,970 1.23 24,749,562 3.09
Turkey 634,940 Koza Altin Isletmeleri AS 7,451,940 0.93
United Kingdom 261,604 NMC Health Plc* 7,972,755 0.99Total Common / Preferred Stocks (Shares) & P Notes 699,597,262 87.28Total Transferable Securities and Money Market Instruments Admitted to an Official Stock Exchange Listing or Dealt in on Another Regulated Market 736,343,344 91.86
Other Transferable Securities
COMMON STOCKS (SHARES)
Indonesia 1,070 PT Aplikasi Karya Anak Bangsa** 5,402,430 0.68Total Common Stocks (Shares) 5,402,430 0.68Total Other Transferable Securities 5,402,430 0.68Total Portfolio 741,745,774 92.54
Other Net Assets 59,825,422 7.46Total Net Assets (USD) 801,571,196 100.00
Emerging Markets Fund continued
Portfolio of Investments 31 August 2019
Open Exchange Traded Futures Contracts as at 31 August 2019
Number of contracts Currency
Contract/ Description
Expiration date
Underlying exposure
USD
Unrealised depreciation
USD
263 USD MSCI Emerging Markets Index September 2019 12,926,450 (61,505)
Total 12,926,450 (61,505)
Holding
Description Counterparty
Unrealised appreciation/
(depreciation) USD
Cayman Islands 735,400 Tencent Holdings Ltd JP Morgan 375,115 375,115
China 47,252,000 Bank of China Ltd JP Morgan 147,327 147,327
Egypt 569,738 Commercial International
Bank Egypt SAE JP Morgan 174,837 174,837
United Kingdom 702,412 Prudential Plc JP Morgan (1,298,003) 6,940 NMC Health Plc Merrill Lynch 35,094 (1,262,909)Total (USD underlying exposure - USD 63,209,391) (565,630)
Contracts For Difference as at 31 August 2019
Open Forward Foreign Exchange Contracts as at 31 August 2019
Currency
Purchases Currency
Sales Counterparty
Maturity date
Unrealised appreciation/
(depreciation) USD
TRY 38,637,067 USD 6,833,581 JP Morgan 16/9/2019 (238,636)USD 6,871,866 TRY 38,637,067 JP Morgan 16/9/2019 276,921MXN 525,124,686 USD 26,734,923 HSBC Bank Plc 17/9/2019 (643,476)USD 9,303,375 MXN 183,794,686 HSBC Bank Plc 17/9/2019 171,317USD 17,360,147 MXN 341,330,000 Citibank 17/9/2019 400,758USD 15,886,490 KRW 19,242,828,923 HSBC Bank Plc 22/11/2019 (76,273)USD 39,285,259 HKD 308,668,168 JP Morgan 26/8/2020 (13,372)
Net unrealised depreciation (USD underlying exposure - USD 120,827,080) (122,761)
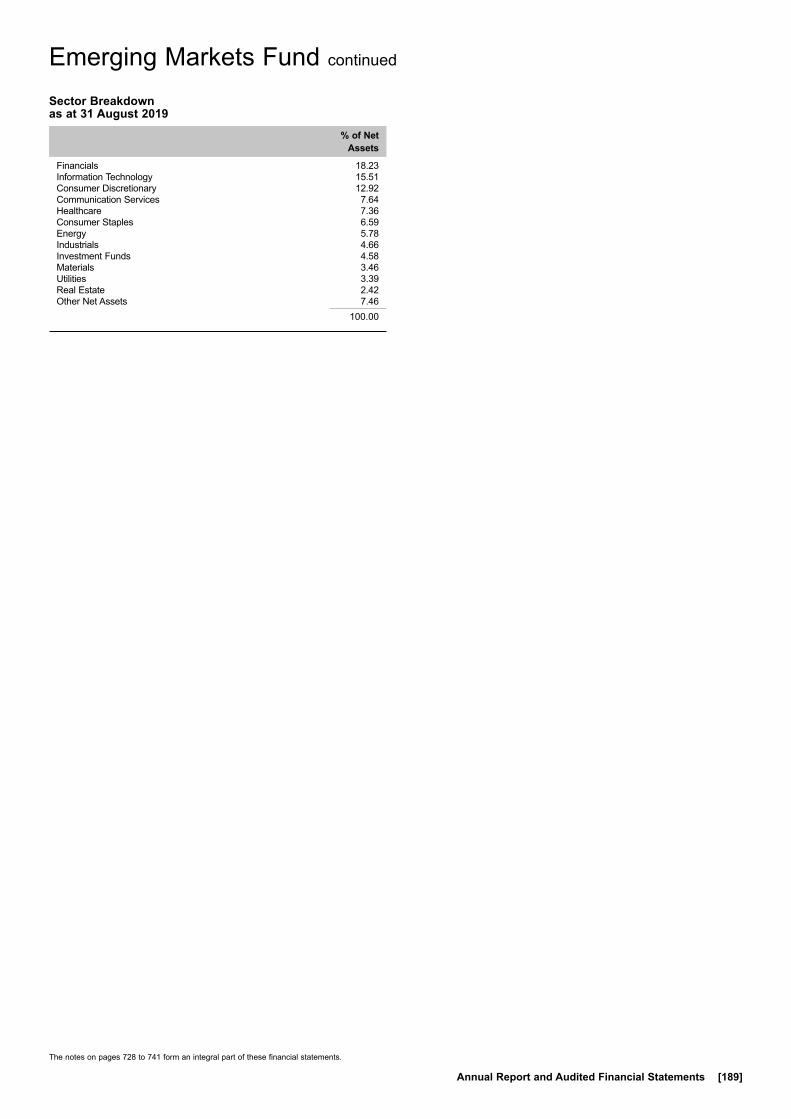
The notes on pages 728 to 741 form an integral part of these financial statements.
Annual Report and Audited Financial Statements [189]
Emerging Markets Fund continued
Sector Breakdown as at 31 August 2019
% of Net Assets
Financials 18.23Information Technology 15.51Consumer Discretionary 12.92Communication Services 7.64Healthcare 7.36Consumer Staples 6.59Energy 5.78Industrials 4.66Investment Funds 4.58Materials 3.46Utilities 3.39Real Estate 2.42Other Net Assets 7.46
100.00

Transferable Securities and Money Market Instruments Admitted to an Official Stock Exchange Listing or Dealt in on Another Regulated Market
Transferable Securities and Money Market Instruments Admitted to an Official Stock Exchange Listing or Dealt in on Another Regulated Market
Holding
Description
Market Value (USD)
% of Net
Assets
Holding
Description
Market Value (USD)
% of Net
Assets
~ Investment in connected party fund, see further information in Note 11.* All or a portion of this security represents a security on loan.
The notes on pages 728 to 741 form an integral part of these financial statements.
[190] BlackRock Global Funds (BGF)
FUNDS
Luxembourg 140,000 BlackRock Strategic Funds -
Emerging Markets Flexi Dynamic Bond Fund~ 17,437,000 0.44
Total Funds 17,437,000 0.44
BONDS
Argentina ARS 54,478,240 Argentina Bonar Bonds FRN
3/4/2022* 508,082 0.01 ARS 123,741,713 Argentina Treasury Bond
BONCER 2.5% 22/7/2021 1,683,116 0.04 USD 4,342,000 Tarjeta Naranja SA FRN 11/4/2022 1,302,600 0.04 3,493,798 0.09
Brazil BRL 1,153,610 Brazil Letras do Tesouro Nacional
1/1/2022 (Zero Coupon) 24,119,940 0.61 BRL 1,446,520 Brazil Notas do Tesouro Nacional
Serie F 10% 1/1/2021 36,743,389 0.94 BRL 4,845,160 Brazil Notas do Tesouro Nacional
Serie F 10% 1/1/2023 128,010,628 3.26 BRL 1,677,550 Brazil Notas do Tesouro Nacional
Serie F 10% 1/1/2025 45,495,970 1.16 BRL 735,030 Brazil Notas do Tesouro Nacional
Serie F 10% 1/1/2025 20,211,807 0.51 BRL 1,868,830 Brazil Notas do Tesouro Nacional
Serie F 10% 1/1/2027 51,567,445 1.31 BRL 521,600 Brazil Notas do Tesouro Nacional
Serie F 10% 1/1/2029 14,585,619 0.37 320,734,798 8.16
Chile CLP 2,785,000,000 Bonos de la Tesoreria de la
Republica en pesos ‘144A’ 4% 1/3/2023 4,103,644 0.10
CLP 18,860,000,000 Bonos de la Tesoreria de la Republica en pesos 4.5% 1/3/2026 29,344,403 0.75
CLP 23,285,000,000 Bonos de la Tesoreria de la Republica en pesos 5% 1/3/2035 41,396,754 1.05
CLP 20,050,000,000 Bonos de la Tesoreria de la Republica en pesos 6% 1/1/2043 42,785,446 1.09
CLP 778,500,000 Chile Government International Bond 5.5% 5/8/2020 1,109,479 0.03
118,739,726 3.02
China CNY 100,000 China Government Bond 3.25%
22/11/2028 14,184 0.00
Colombia COP 897,000,000 Colombia Government
International Bond 9.85% 28/6/2027* 334,550 0.01
COP 160,494,700,000 Colombian TES 6% 28/4/2028 47,111,781 1.20 COP 26,051,600,000 Colombian TES 6.25%
26/11/2025 7,896,923 0.20 COP 51,962,300,000 Colombian TES 7% 4/5/2022 15,977,419 0.41 COP 111,925,000,000 Colombian TES 7% 30/6/2032 34,824,859 0.89 COP 33,901,000,000 Colombian TES 7.25% 18/10/2034 10,756,057 0.27 COP 156,242,800,000 Colombian TES 7.5% 26/8/2026 50,478,685 1.28
COP 83,926,000,000 Colombian TES 7.75% 18/9/2030 27,695,958 0.70 COP 162,783,400,000 Colombian TES 10% 24/7/2024 57,214,094 1.46 252,290,326 6.42
Czech Republic CZK 1,612,400,000 Czech Republic Government
Bond 0.95% 15/5/2030 67,636,687 1.72 CZK 384,480,000 Czech Republic Government
Bond 1% 26/6/2026 16,414,476 0.42 CZK 110,800,000 Czech Republic Government
Bond 2% 13/10/2033 5,216,476 0.13 CZK 389,150,000 Czech Republic Government
Bond 2.4% 17/9/2025 17,948,014 0.46 CZK 2,020,000 Czech Republic Government
Bond 2.5% 25/8/2028 95,809 0.00 CZK 451,700,000 Czech Republic Government
Bond 2.75% 23/7/2029 22,323,884 0.57 CZK 1,060,000 Czech Republic Government
Bond 5.7% 25/5/2024 55,457 0.00 129,690,803 3.30
Dominican Republic DOP 767,200,000 Dominican Republic International
Bond 8.9% 15/2/2023 15,170,466 0.39
Egypt EGP 656,474,000 Egypt Government Bond 16.1%
7/5/2029 42,684,575 1.08
Hungary HUF 5,864,400,000 Hungary Government Bond
0.5% 21/4/2021* 19,686,558 0.50 HUF 3,866,000,000 Hungary Government Bond
1.75% 26/10/2022 13,403,629 0.34 HUF 5,804,120,000 Hungary Government Bond
2.5% 24/10/2024* 20,863,592 0.53 HUF 4,407,850,000 Hungary Government Bond
2.75% 22/12/2026 16,128,050 0.41 HUF 20,633,880,000 Hungary Government Bond
3% 26/6/2024 75,739,256 1.93 HUF 4,179,190,000 Hungary Government Bond
3% 27/10/2027 15,559,502 0.39 HUF 2,401,780,000 Hungary Government Bond
3% 21/8/2030 8,878,722 0.23 HUF 7,166,990,000 Hungary Government Bond
5.5% 24/6/2025* 29,792,401 0.76 HUF 3,420,880,000 Hungary Government Bond
6.75% 22/10/2028 16,338,646 0.41 HUF 5,129,840,000 Hungary Government Bond
7% 24/6/2022* 20,305,969 0.52 236,696,325 6.02
India INR 770,260,000 India Government Bond 6.79%
15/5/2027 10,855,909 0.28
Indonesia IDR 229,607,000,000 Indonesia Treasury Bond
6.125% 15/5/2028 14,899,770 0.38 IDR 114,524,000,000 Indonesia Treasury Bond
6.625% 15/5/2033 7,330,827 0.18 IDR 258,235,000,000 Indonesia Treasury Bond
7% 15/5/2027 17,868,004 0.45 IDR 317,822,000,000 Indonesia Treasury Bond
7.5% 15/8/2032 21,934,982 0.56 IDR 82,650,000,000 Indonesia Treasury Bond
7.5% 15/5/2038 5,651,780 0.14
Emerging Markets Local Currency Bond Fund
Portfolio of Investments 31 August 2019
Emerging Markets Local Currency Bond Fund
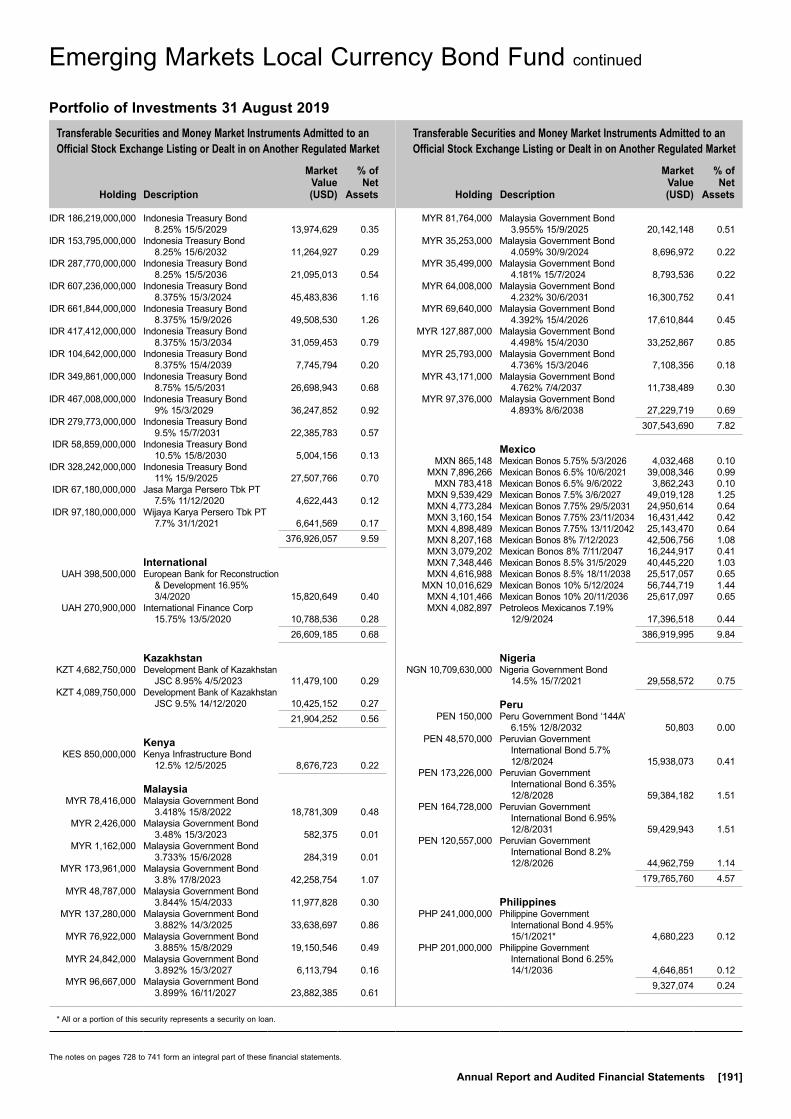
Transferable Securities and Money Market Instruments Admitted to an Official Stock Exchange Listing or Dealt in on Another Regulated Market
Transferable Securities and Money Market Instruments Admitted to an Official Stock Exchange Listing or Dealt in on Another Regulated Market
Holding
Description
Market Value (USD)
% of Net
Assets
Holding
Description
Market Value (USD)
% of Net
Assets
* All or a portion of this security represents a security on loan.
The notes on pages 728 to 741 form an integral part of these financial statements.
Annual Report and Audited Financial Statements [191]
IDR 186,219,000,000 Indonesia Treasury Bond 8.25% 15/5/2029 13,974,629 0.35
IDR 153,795,000,000 Indonesia Treasury Bond 8.25% 15/6/2032 11,264,927 0.29
IDR 287,770,000,000 Indonesia Treasury Bond 8.25% 15/5/2036 21,095,013 0.54
IDR 607,236,000,000 Indonesia Treasury Bond 8.375% 15/3/2024 45,483,836 1.16
IDR 661,844,000,000 Indonesia Treasury Bond 8.375% 15/9/2026 49,508,530 1.26
IDR 417,412,000,000 Indonesia Treasury Bond 8.375% 15/3/2034 31,059,453 0.79
IDR 104,642,000,000 Indonesia Treasury Bond 8.375% 15/4/2039 7,745,794 0.20
IDR 349,861,000,000 Indonesia Treasury Bond 8.75% 15/5/2031 26,698,943 0.68
IDR 467,008,000,000 Indonesia Treasury Bond 9% 15/3/2029 36,247,852 0.92
IDR 279,773,000,000 Indonesia Treasury Bond 9.5% 15/7/2031 22,385,783 0.57
IDR 58,859,000,000 Indonesia Treasury Bond 10.5% 15/8/2030 5,004,156 0.13
IDR 328,242,000,000 Indonesia Treasury Bond 11% 15/9/2025 27,507,766 0.70
IDR 67,180,000,000 Jasa Marga Persero Tbk PT 7.5% 11/12/2020 4,622,443 0.12
IDR 97,180,000,000 Wijaya Karya Persero Tbk PT 7.7% 31/1/2021 6,641,569 0.17
376,926,057 9.59
International UAH 398,500,000 European Bank for Reconstruction
& Development 16.95% 3/4/2020 15,820,649 0.40
UAH 270,900,000 International Finance Corp 15.75% 13/5/2020 10,788,536 0.28
26,609,185 0.68
Kazakhstan KZT 4,682,750,000 Development Bank of Kazakhstan
JSC 8.95% 4/5/2023 11,479,100 0.29 KZT 4,089,750,000 Development Bank of Kazakhstan
JSC 9.5% 14/12/2020 10,425,152 0.27 21,904,252 0.56
Kenya KES 850,000,000 Kenya Infrastructure Bond
12.5% 12/5/2025 8,676,723 0.22
Malaysia MYR 78,416,000 Malaysia Government Bond
3.418% 15/8/2022 18,781,309 0.48 MYR 2,426,000 Malaysia Government Bond
3.48% 15/3/2023 582,375 0.01 MYR 1,162,000 Malaysia Government Bond
3.733% 15/6/2028 284,319 0.01 MYR 173,961,000 Malaysia Government Bond
3.8% 17/8/2023 42,258,754 1.07 MYR 48,787,000 Malaysia Government Bond
3.844% 15/4/2033 11,977,828 0.30 MYR 137,280,000 Malaysia Government Bond
3.882% 14/3/2025 33,638,697 0.86 MYR 76,922,000 Malaysia Government Bond
3.885% 15/8/2029 19,150,546 0.49 MYR 24,842,000 Malaysia Government Bond
3.892% 15/3/2027 6,113,794 0.16 MYR 96,667,000 Malaysia Government Bond
3.899% 16/11/2027 23,882,385 0.61
MYR 81,764,000 Malaysia Government Bond 3.955% 15/9/2025 20,142,148 0.51
MYR 35,253,000 Malaysia Government Bond 4.059% 30/9/2024 8,696,972 0.22
MYR 35,499,000 Malaysia Government Bond 4.181% 15/7/2024 8,793,536 0.22
MYR 64,008,000 Malaysia Government Bond 4.232% 30/6/2031 16,300,752 0.41
MYR 69,640,000 Malaysia Government Bond 4.392% 15/4/2026 17,610,844 0.45
MYR 127,887,000 Malaysia Government Bond 4.498% 15/4/2030 33,252,867 0.85
MYR 25,793,000 Malaysia Government Bond 4.736% 15/3/2046 7,108,356 0.18
MYR 43,171,000 Malaysia Government Bond 4.762% 7/4/2037 11,738,489 0.30
MYR 97,376,000 Malaysia Government Bond 4.893% 8/6/2038 27,229,719 0.69
307,543,690 7.82
Mexico MXN 865,148 Mexican Bonos 5.75% 5/3/2026 4,032,468 0.10 MXN 7,896,266 Mexican Bonos 6.5% 10/6/2021 39,008,346 0.99 MXN 783,418 Mexican Bonos 6.5% 9/6/2022 3,862,243 0.10 MXN 9,539,429 Mexican Bonos 7.5% 3/6/2027 49,019,128 1.25 MXN 4,773,284 Mexican Bonos 7.75% 29/5/2031 24,950,614 0.64 MXN 3,160,154 Mexican Bonos 7.75% 23/11/2034 16,431,442 0.42 MXN 4,898,489 Mexican Bonos 7.75% 13/11/2042 25,143,470 0.64 MXN 8,207,168 Mexican Bonos 8% 7/12/2023 42,506,756 1.08 MXN 3,079,202 Mexican Bonos 8% 7/11/2047 16,244,917 0.41 MXN 7,348,446 Mexican Bonos 8.5% 31/5/2029 40,445,220 1.03 MXN 4,616,988 Mexican Bonos 8.5% 18/11/2038 25,517,057 0.65 MXN 10,016,629 Mexican Bonos 10% 5/12/2024 56,744,719 1.44 MXN 4,101,466 Mexican Bonos 10% 20/11/2036 25,617,097 0.65 MXN 4,082,897 Petroleos Mexicanos 7.19%
12/9/2024 17,396,518 0.44 386,919,995 9.84
Nigeria NGN 10,709,630,000 Nigeria Government Bond
14.5% 15/7/2021 29,558,572 0.75
Peru PEN 150,000 Peru Government Bond ‘144A’
6.15% 12/8/2032 50,803 0.00 PEN 48,570,000 Peruvian Government
International Bond 5.7% 12/8/2024 15,938,073 0.41
PEN 173,226,000 Peruvian Government International Bond 6.35% 12/8/2028 59,384,182 1.51
PEN 164,728,000 Peruvian Government International Bond 6.95% 12/8/2031 59,429,943 1.51
PEN 120,557,000 Peruvian Government International Bond 8.2% 12/8/2026 44,962,759 1.14
179,765,760 4.57
Philippines PHP 241,000,000 Philippine Government
International Bond 4.95% 15/1/2021* 4,680,223 0.12
PHP 201,000,000 Philippine Government International Bond 6.25% 14/1/2036 4,646,851 0.12
9,327,074 0.24
Emerging Markets Local Currency Bond Fund continued
Portfolio of Investments 31 August 2019
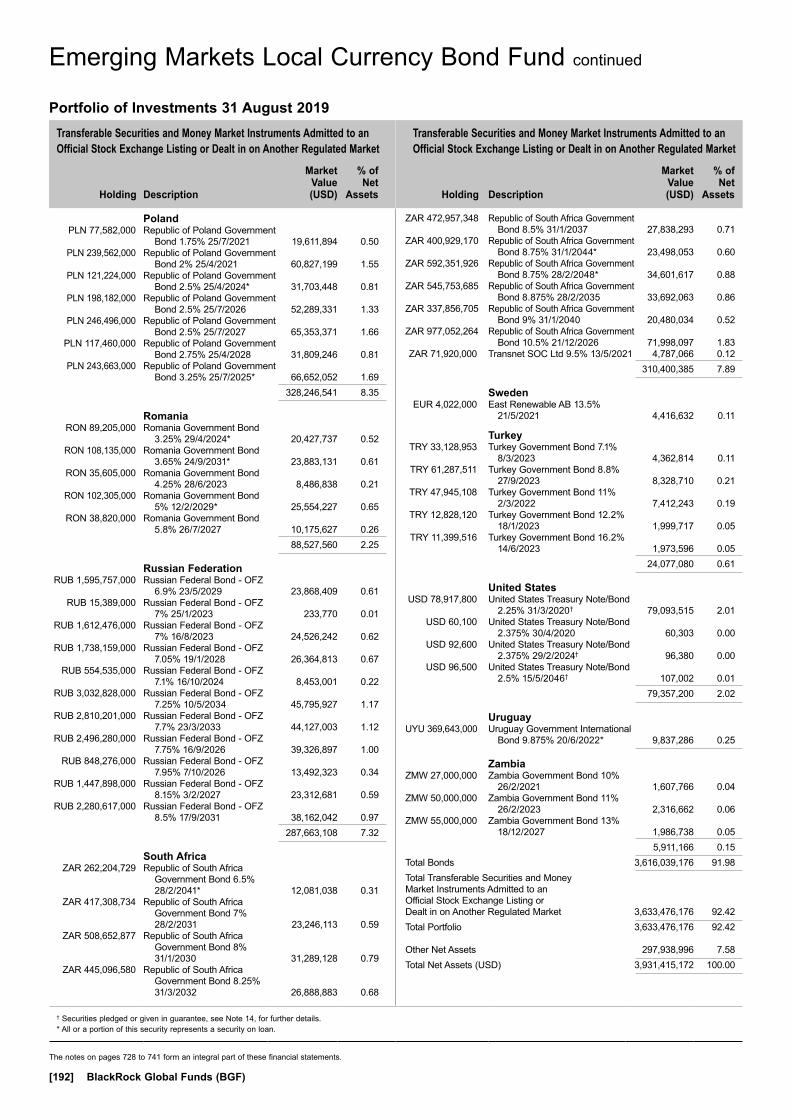
Transferable Securities and Money Market Instruments Admitted to an Official Stock Exchange Listing or Dealt in on Another Regulated Market
Transferable Securities and Money Market Instruments Admitted to an Official Stock Exchange Listing or Dealt in on Another Regulated Market
Holding
Description
Market Value (USD)
% of Net
Assets
Holding
Description
Market Value (USD)
% of Net
Assets
† Securities pledged or given in guarantee, see Note 14, for further details.* All or a portion of this security represents a security on loan.
The notes on pages 728 to 741 form an integral part of these financial statements.
[192] BlackRock Global Funds (BGF)
Poland PLN 77,582,000 Republic of Poland Government
Bond 1.75% 25/7/2021 19,611,894 0.50 PLN 239,562,000 Republic of Poland Government
Bond 2% 25/4/2021 60,827,199 1.55 PLN 121,224,000 Republic of Poland Government
Bond 2.5% 25/4/2024* 31,703,448 0.81 PLN 198,182,000 Republic of Poland Government
Bond 2.5% 25/7/2026 52,289,331 1.33 PLN 246,496,000 Republic of Poland Government
Bond 2.5% 25/7/2027 65,353,371 1.66 PLN 117,460,000 Republic of Poland Government
Bond 2.75% 25/4/2028 31,809,246 0.81 PLN 243,663,000 Republic of Poland Government
Bond 3.25% 25/7/2025* 66,652,052 1.69 328,246,541 8.35
Romania RON 89,205,000 Romania Government Bond
3.25% 29/4/2024* 20,427,737 0.52 RON 108,135,000 Romania Government Bond
3.65% 24/9/2031* 23,883,131 0.61 RON 35,605,000 Romania Government Bond
4.25% 28/6/2023 8,486,838 0.21 RON 102,305,000 Romania Government Bond
5% 12/2/2029* 25,554,227 0.65 RON 38,820,000 Romania Government Bond
5.8% 26/7/2027 10,175,627 0.26 88,527,560 2.25
Russian Federation RUB 1,595,757,000 Russian Federal Bond - OFZ
6.9% 23/5/2029 23,868,409 0.61 RUB 15,389,000 Russian Federal Bond - OFZ
7% 25/1/2023 233,770 0.01 RUB 1,612,476,000 Russian Federal Bond - OFZ
7% 16/8/2023 24,526,242 0.62 RUB 1,738,159,000 Russian Federal Bond - OFZ
7.05% 19/1/2028 26,364,813 0.67 RUB 554,535,000 Russian Federal Bond - OFZ
7.1% 16/10/2024 8,453,001 0.22 RUB 3,032,828,000 Russian Federal Bond - OFZ
7.25% 10/5/2034 45,795,927 1.17 RUB 2,810,201,000 Russian Federal Bond - OFZ
7.7% 23/3/2033 44,127,003 1.12 RUB 2,496,280,000 Russian Federal Bond - OFZ
7.75% 16/9/2026 39,326,897 1.00 RUB 848,276,000 Russian Federal Bond - OFZ
7.95% 7/10/2026 13,492,323 0.34 RUB 1,447,898,000 Russian Federal Bond - OFZ
8.15% 3/2/2027 23,312,681 0.59 RUB 2,280,617,000 Russian Federal Bond - OFZ
8.5% 17/9/2031 38,162,042 0.97 287,663,108 7.32
South Africa ZAR 262,204,729 Republic of South Africa
Government Bond 6.5% 28/2/2041* 12,081,038 0.31
ZAR 417,308,734 Republic of South Africa Government Bond 7% 28/2/2031 23,246,113 0.59
ZAR 508,652,877 Republic of South Africa Government Bond 8% 31/1/2030 31,289,128 0.79
ZAR 445,096,580 Republic of South Africa Government Bond 8.25% 31/3/2032 26,888,883 0.68
ZAR 472,957,348 Republic of South Africa Government Bond 8.5% 31/1/2037 27,838,293 0.71
ZAR 400,929,170 Republic of South Africa Government Bond 8.75% 31/1/2044* 23,498,053 0.60
ZAR 592,351,926 Republic of South Africa Government Bond 8.75% 28/2/2048* 34,601,617 0.88
ZAR 545,753,685 Republic of South Africa Government Bond 8.875% 28/2/2035 33,692,063 0.86
ZAR 337,856,705 Republic of South Africa Government Bond 9% 31/1/2040 20,480,034 0.52
ZAR 977,052,264 Republic of South Africa Government Bond 10.5% 21/12/2026 71,998,097 1.83
ZAR 71,920,000 Transnet SOC Ltd 9.5% 13/5/2021 4,787,066 0.12 310,400,385 7.89
Sweden EUR 4,022,000 East Renewable AB 13.5%
21/5/2021 4,416,632 0.11
Turkey TRY 33,128,953 Turkey Government Bond 7.1%
8/3/2023 4,362,814 0.11 TRY 61,287,511 Turkey Government Bond 8.8%
27/9/2023 8,328,710 0.21 TRY 47,945,108 Turkey Government Bond 11%
2/3/2022 7,412,243 0.19 TRY 12,828,120 Turkey Government Bond 12.2%
18/1/2023 1,999,717 0.05 TRY 11,399,516 Turkey Government Bond 16.2%
14/6/2023 1,973,596 0.05 24,077,080 0.61
United States USD 78,917,800 United States Treasury Note/Bond
2.25% 31/3/2020† 79,093,515 2.01 USD 60,100 United States Treasury Note/Bond
2.375% 30/4/2020 60,303 0.00 USD 92,600 United States Treasury Note/Bond
2.375% 29/2/2024† 96,380 0.00 USD 96,500 United States Treasury Note/Bond
2.5% 15/5/2046† 107,002 0.01 79,357,200 2.02
Uruguay UYU 369,643,000 Uruguay Government International
Bond 9.875% 20/6/2022* 9,837,286 0.25
Zambia ZMW 27,000,000 Zambia Government Bond 10%
26/2/2021 1,607,766 0.04 ZMW 50,000,000 Zambia Government Bond 11%
26/2/2023 2,316,662 0.06 ZMW 55,000,000 Zambia Government Bond 13%
18/12/2027 1,986,738 0.05 5,911,166 0.15Total Bonds 3,616,039,176 91.98Total Transferable Securities and Money Market Instruments Admitted to an Official Stock Exchange Listing or Dealt in on Another Regulated Market 3,633,476,176 92.42Total Portfolio 3,633,476,176 92.42
Other Net Assets 297,938,996 7.58Total Net Assets (USD) 3,931,415,172 100.00
Emerging Markets Local Currency Bond Fund continued
Portfolio of Investments 31 August 2019
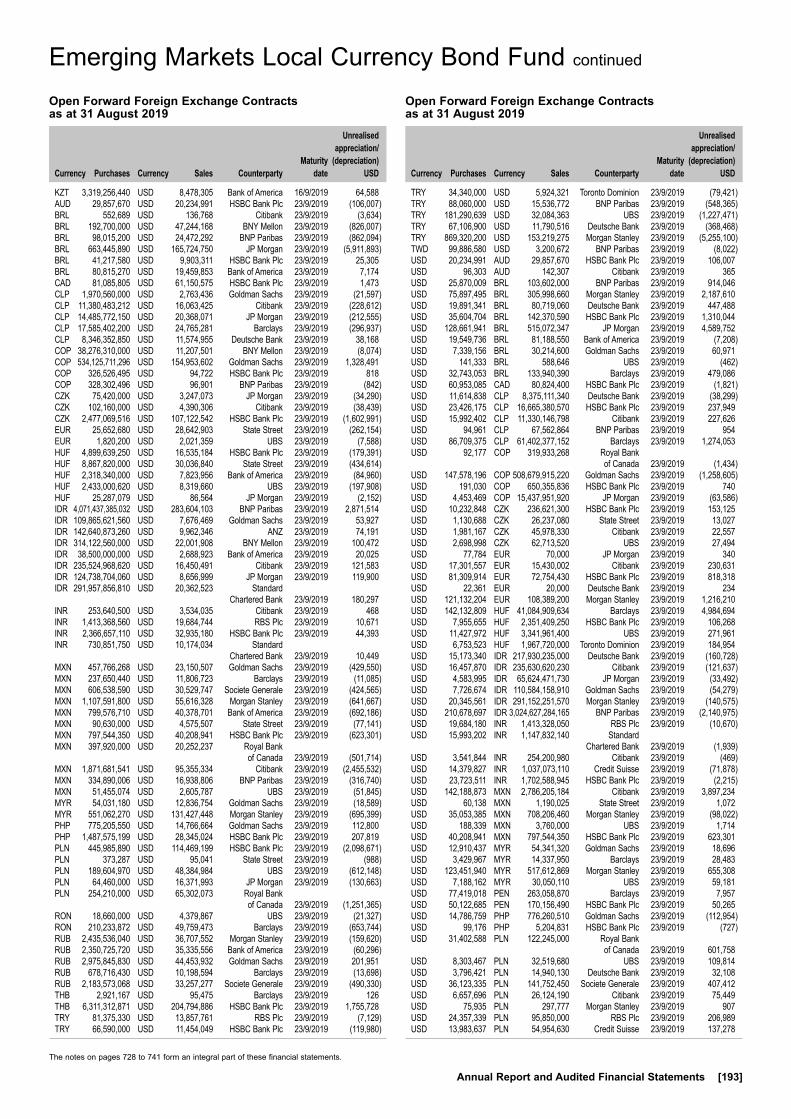
The notes on pages 728 to 741 form an integral part of these financial statements.
Annual Report and Audited Financial Statements [193]
Emerging Markets Local Currency Bond Fund continued
Open Forward Foreign Exchange Contracts as at 31 August 2019
Currency
Purchases Currency
Sales Counterparty
Maturity date
Unrealised appreciation/
(depreciation) USD
KZT 3,319,256,440 USD 8,478,305 Bank of America 16/9/2019 64,588AUD 29,857,670 USD 20,234,991 HSBC Bank Plc 23/9/2019 (106,007)BRL 552,689 USD 136,768 Citibank 23/9/2019 (3,634)BRL 192,700,000 USD 47,244,168 BNY Mellon 23/9/2019 (826,007)BRL 98,015,200 USD 24,472,292 BNP Paribas 23/9/2019 (862,094)BRL 663,445,890 USD 165,724,750 JP Morgan 23/9/2019 (5,911,893)BRL 41,217,580 USD 9,903,311 HSBC Bank Plc 23/9/2019 25,305BRL 80,815,270 USD 19,459,853 Bank of America 23/9/2019 7,174CAD 81,085,805 USD 61,150,575 HSBC Bank Plc 23/9/2019 1,473CLP 1,970,560,000 USD 2,763,436 Goldman Sachs 23/9/2019 (21,597)CLP 11,380,483,212 USD 16,063,425 Citibank 23/9/2019 (228,612)CLP 14,485,772,150 USD 20,368,071 JP Morgan 23/9/2019 (212,555)CLP 17,585,402,200 USD 24,765,281 Barclays 23/9/2019 (296,937)CLP 8,346,352,850 USD 11,574,955 Deutsche Bank 23/9/2019 38,168COP 38,276,310,000 USD 11,207,501 BNY Mellon 23/9/2019 (8,074)COP 534,125,711,296 USD 154,953,602 Goldman Sachs 23/9/2019 1,328,491COP 326,526,495 USD 94,722 HSBC Bank Plc 23/9/2019 818COP 328,302,496 USD 96,901 BNP Paribas 23/9/2019 (842)CZK 75,420,000 USD 3,247,073 JP Morgan 23/9/2019 (34,290)CZK 102,160,000 USD 4,390,306 Citibank 23/9/2019 (38,439)CZK 2,477,069,516 USD 107,122,542 HSBC Bank Plc 23/9/2019 (1,602,991)EUR 25,652,680 USD 28,642,903 State Street 23/9/2019 (262,154)EUR 1,820,200 USD 2,021,359 UBS 23/9/2019 (7,588)HUF 4,899,639,250 USD 16,535,184 HSBC Bank Plc 23/9/2019 (179,391)HUF 8,867,820,000 USD 30,036,840 State Street 23/9/2019 (434,614)HUF 2,318,340,000 USD 7,823,956 Bank of America 23/9/2019 (84,960)HUF 2,433,000,620 USD 8,319,660 UBS 23/9/2019 (197,908)HUF 25,287,079 USD 86,564 JP Morgan 23/9/2019 (2,152)IDR 4,071,437,385,032 USD 283,604,103 BNP Paribas 23/9/2019 2,871,514IDR 109,865,621,560 USD 7,676,469 Goldman Sachs 23/9/2019 53,927IDR 142,640,873,260 USD 9,962,346 ANZ 23/9/2019 74,191IDR 314,122,560,000 USD 22,001,908 BNY Mellon 23/9/2019 100,472IDR 38,500,000,000 USD 2,688,923 Bank of America 23/9/2019 20,025IDR 235,524,968,620 USD 16,450,491 Citibank 23/9/2019 121,583IDR 124,738,704,060 USD 8,656,999 JP Morgan 23/9/2019 119,900IDR 291,957,856,810 USD 20,362,523 Standard Chartered Bank 23/9/2019 180,297INR 253,640,500 USD 3,534,035 Citibank 23/9/2019 468INR 1,413,368,560 USD 19,684,744 RBS Plc 23/9/2019 10,671INR 2,366,657,110 USD 32,935,180 HSBC Bank Plc 23/9/2019 44,393INR 730,851,750 USD 10,174,034 Standard Chartered Bank 23/9/2019 10,449MXN 457,766,268 USD 23,150,507 Goldman Sachs 23/9/2019 (429,550)MXN 237,650,440 USD 11,806,723 Barclays 23/9/2019 (11,085)MXN 606,538,590 USD 30,529,747 Societe Generale 23/9/2019 (424,565)MXN 1,107,591,800 USD 55,616,328 Morgan Stanley 23/9/2019 (641,667)MXN 799,576,710 USD 40,378,701 Bank of America 23/9/2019 (692,186)MXN 90,630,000 USD 4,575,507 State Street 23/9/2019 (77,141)MXN 797,544,350 USD 40,208,941 HSBC Bank Plc 23/9/2019 (623,301)MXN 397,920,000 USD 20,252,237 Royal Bank of Canada 23/9/2019 (501,714)MXN 1,871,681,541 USD 95,355,334 Citibank 23/9/2019 (2,455,532)MXN 334,890,006 USD 16,938,806 BNP Paribas 23/9/2019 (316,740)MXN 51,455,074 USD 2,605,787 UBS 23/9/2019 (51,845)MYR 54,031,180 USD 12,836,754 Goldman Sachs 23/9/2019 (18,589)MYR 551,062,270 USD 131,427,448 Morgan Stanley 23/9/2019 (695,399)PHP 775,205,550 USD 14,766,664 Goldman Sachs 23/9/2019 112,800PHP 1,487,575,199 USD 28,345,024 HSBC Bank Plc 23/9/2019 207,819PLN 445,985,890 USD 114,469,199 HSBC Bank Plc 23/9/2019 (2,098,671)PLN 373,287 USD 95,041 State Street 23/9/2019 (988)PLN 189,604,970 USD 48,384,984 UBS 23/9/2019 (612,148)PLN 64,460,000 USD 16,371,993 JP Morgan 23/9/2019 (130,663)PLN 254,210,000 USD 65,302,073 Royal Bank of Canada 23/9/2019 (1,251,365)RON 18,660,000 USD 4,379,867 UBS 23/9/2019 (21,327)RON 210,233,872 USD 49,759,473 Barclays 23/9/2019 (653,744)RUB 2,435,536,040 USD 36,707,552 Morgan Stanley 23/9/2019 (159,620)RUB 2,350,725,720 USD 35,335,556 Bank of America 23/9/2019 (60,296)RUB 2,975,845,830 USD 44,453,932 Goldman Sachs 23/9/2019 201,951RUB 678,716,430 USD 10,198,594 Barclays 23/9/2019 (13,698)RUB 2,183,573,068 USD 33,257,277 Societe Generale 23/9/2019 (490,330)THB 2,921,167 USD 95,475 Barclays 23/9/2019 126THB 6,311,312,871 USD 204,794,886 HSBC Bank Plc 23/9/2019 1,755,728TRY 81,375,330 USD 13,857,761 RBS Plc 23/9/2019 (7,129)TRY 66,590,000 USD 11,454,049 HSBC Bank Plc 23/9/2019 (119,980)
Open Forward Foreign Exchange Contracts as at 31 August 2019
Currency
Purchases Currency
Sales Counterparty
Maturity date
Unrealised appreciation/
(depreciation) USD
TRY 34,340,000 USD 5,924,321 Toronto Dominion 23/9/2019 (79,421)TRY 88,060,000 USD 15,536,772 BNP Paribas 23/9/2019 (548,365)TRY 181,290,639 USD 32,084,363 UBS 23/9/2019 (1,227,471)TRY 67,106,900 USD 11,790,516 Deutsche Bank 23/9/2019 (368,468)TRY 869,320,200 USD 153,219,275 Morgan Stanley 23/9/2019 (5,255,100)TWD 99,886,580 USD 3,200,672 BNP Paribas 23/9/2019 (8,022)USD 20,234,991 AUD 29,857,670 HSBC Bank Plc 23/9/2019 106,007USD 96,303 AUD 142,307 Citibank 23/9/2019 365USD 25,870,009 BRL 103,602,000 BNP Paribas 23/9/2019 914,046USD 75,897,495 BRL 305,998,660 Morgan Stanley 23/9/2019 2,187,610USD 19,891,341 BRL 80,719,060 Deutsche Bank 23/9/2019 447,488USD 35,604,704 BRL 142,370,590 HSBC Bank Plc 23/9/2019 1,310,044USD 128,661,941 BRL 515,072,347 JP Morgan 23/9/2019 4,589,752USD 19,549,736 BRL 81,188,550 Bank of America 23/9/2019 (7,208)USD 7,339,156 BRL 30,214,600 Goldman Sachs 23/9/2019 60,971USD 141,333 BRL 588,646 UBS 23/9/2019 (462)USD 32,743,053 BRL 133,940,390 Barclays 23/9/2019 479,086USD 60,953,085 CAD 80,824,400 HSBC Bank Plc 23/9/2019 (1,821)USD 11,614,838 CLP 8,375,111,340 Deutsche Bank 23/9/2019 (38,299)USD 23,426,175 CLP 16,665,380,570 HSBC Bank Plc 23/9/2019 237,949USD 15,992,402 CLP 11,330,146,798 Citibank 23/9/2019 227,626USD 94,961 CLP 67,562,864 BNP Paribas 23/9/2019 954USD 86,709,375 CLP 61,402,377,152 Barclays 23/9/2019 1,274,053USD 92,177 COP 319,933,268 Royal Bank of Canada 23/9/2019 (1,434)USD 147,578,196 COP 508,679,915,220 Goldman Sachs 23/9/2019 (1,258,605)USD 191,030 COP 650,355,836 HSBC Bank Plc 23/9/2019 740USD 4,453,469 COP 15,437,951,920 JP Morgan 23/9/2019 (63,586)USD 10,232,848 CZK 236,621,300 HSBC Bank Plc 23/9/2019 153,125USD 1,130,688 CZK 26,237,080 State Street 23/9/2019 13,027USD 1,981,167 CZK 45,978,330 Citibank 23/9/2019 22,557USD 2,698,998 CZK 62,713,520 UBS 23/9/2019 27,494USD 77,784 EUR 70,000 JP Morgan 23/9/2019 340USD 17,301,557 EUR 15,430,002 Citibank 23/9/2019 230,631USD 81,309,914 EUR 72,754,430 HSBC Bank Plc 23/9/2019 818,318USD 22,361 EUR 20,000 Deutsche Bank 23/9/2019 234USD 121,132,204 EUR 108,389,200 Morgan Stanley 23/9/2019 1,216,210USD 142,132,809 HUF 41,084,909,634 Barclays 23/9/2019 4,984,694USD 7,955,655 HUF 2,351,409,250 HSBC Bank Plc 23/9/2019 106,268USD 11,427,972 HUF 3,341,961,400 UBS 23/9/2019 271,961USD 6,753,523 HUF 1,967,720,000 Toronto Dominion 23/9/2019 184,954USD 15,173,340 IDR 217,930,235,000 Deutsche Bank 23/9/2019 (160,728)USD 16,457,870 IDR 235,630,620,230 Citibank 23/9/2019 (121,637)USD 4,583,995 IDR 65,624,471,730 JP Morgan 23/9/2019 (33,492)USD 7,726,674 IDR 110,584,158,910 Goldman Sachs 23/9/2019 (54,279)USD 20,345,561 IDR 291,152,251,570 Morgan Stanley 23/9/2019 (140,575)USD 210,678,697 IDR 3,024,627,284,165 BNP Paribas 23/9/2019 (2,140,975)USD 19,684,180 INR 1,413,328,050 RBS Plc 23/9/2019 (10,670)USD 15,993,202 INR 1,147,832,140 Standard Chartered Bank 23/9/2019 (1,939)USD 3,541,844 INR 254,200,980 Citibank 23/9/2019 (469)USD 14,379,827 INR 1,037,073,110 Credit Suisse 23/9/2019 (71,878)USD 23,723,511 INR 1,702,588,945 HSBC Bank Plc 23/9/2019 (2,215)USD 142,188,873 MXN 2,786,205,184 Citibank 23/9/2019 3,897,234USD 60,138 MXN 1,190,025 State Street 23/9/2019 1,072USD 35,053,385 MXN 708,206,460 Morgan Stanley 23/9/2019 (98,022)USD 188,339 MXN 3,760,000 UBS 23/9/2019 1,714USD 40,208,941 MXN 797,544,350 HSBC Bank Plc 23/9/2019 623,301USD 12,910,437 MYR 54,341,320 Goldman Sachs 23/9/2019 18,696USD 3,429,967 MYR 14,337,950 Barclays 23/9/2019 28,483USD 123,451,940 MYR 517,612,869 Morgan Stanley 23/9/2019 655,308USD 7,188,162 MYR 30,050,110 UBS 23/9/2019 59,181USD 77,419,018 PEN 263,058,870 Barclays 23/9/2019 7,957USD 50,122,685 PEN 170,156,490 HSBC Bank Plc 23/9/2019 50,265USD 14,786,759 PHP 776,260,510 Goldman Sachs 23/9/2019 (112,954)USD 99,176 PHP 5,204,831 HSBC Bank Plc 23/9/2019 (727)USD 31,402,588 PLN 122,245,000 Royal Bank of Canada 23/9/2019 601,758USD 8,303,467 PLN 32,519,680 UBS 23/9/2019 109,814USD 3,796,421 PLN 14,940,130 Deutsche Bank 23/9/2019 32,108USD 36,123,335 PLN 141,752,450 Societe Generale 23/9/2019 407,412USD 6,657,696 PLN 26,124,190 Citibank 23/9/2019 75,449USD 75,935 PLN 297,777 Morgan Stanley 23/9/2019 907USD 24,357,339 PLN 95,850,000 RBS Plc 23/9/2019 206,989USD 13,983,637 PLN 54,954,630 Credit Suisse 23/9/2019 137,278
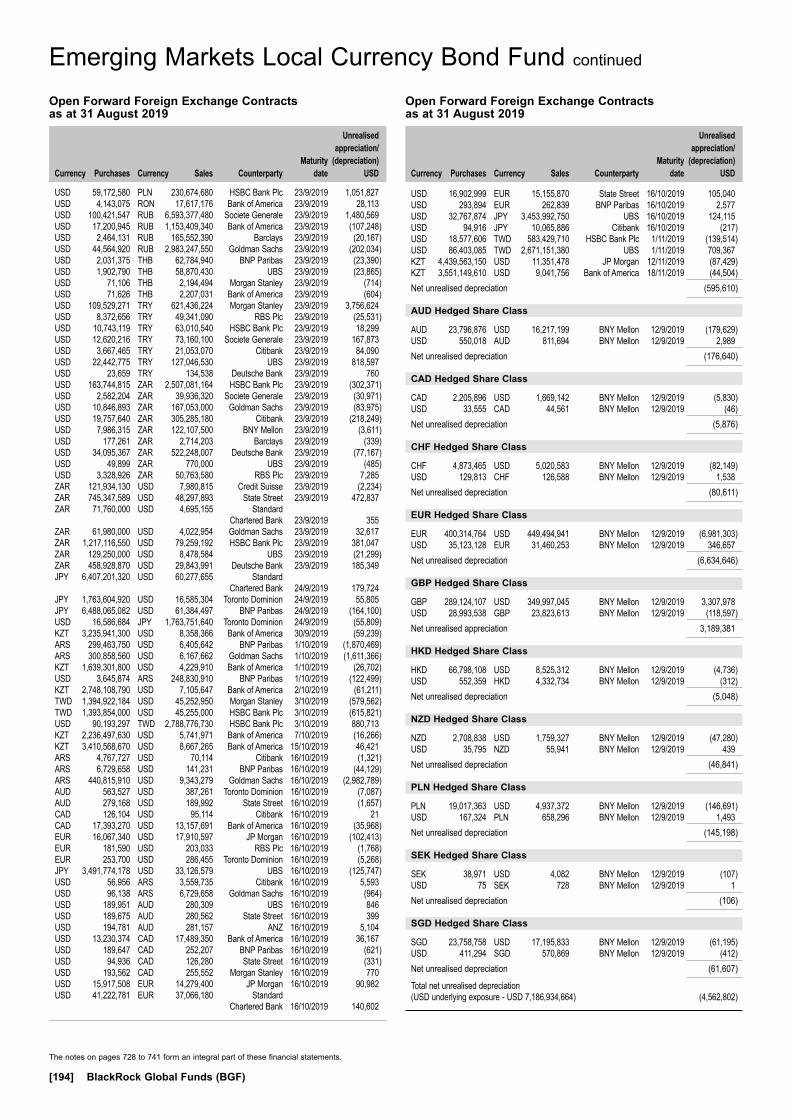
The notes on pages 728 to 741 form an integral part of these financial statements.
[194] BlackRock Global Funds (BGF)
Emerging Markets Local Currency Bond Fund continued
USD 59,172,580 PLN 230,674,680 HSBC Bank Plc 23/9/2019 1,051,827USD 4,143,075 RON 17,617,176 Bank of America 23/9/2019 28,113USD 100,421,547 RUB 6,593,377,480 Societe Generale 23/9/2019 1,480,569USD 17,200,945 RUB 1,153,409,340 Bank of America 23/9/2019 (107,248)USD 2,464,131 RUB 165,552,390 Barclays 23/9/2019 (20,167)USD 44,564,920 RUB 2,983,247,550 Goldman Sachs 23/9/2019 (202,034)USD 2,031,375 THB 62,784,940 BNP Paribas 23/9/2019 (23,390)USD 1,902,790 THB 58,870,430 UBS 23/9/2019 (23,865)USD 71,106 THB 2,194,494 Morgan Stanley 23/9/2019 (714)USD 71,626 THB 2,207,031 Bank of America 23/9/2019 (604)USD 109,529,271 TRY 621,436,224 Morgan Stanley 23/9/2019 3,756,624USD 8,372,656 TRY 49,341,090 RBS Plc 23/9/2019 (25,531)USD 10,743,119 TRY 63,010,540 HSBC Bank Plc 23/9/2019 18,299USD 12,620,216 TRY 73,160,100 Societe Generale 23/9/2019 167,873USD 3,667,465 TRY 21,053,070 Citibank 23/9/2019 84,090USD 22,442,775 TRY 127,046,530 UBS 23/9/2019 818,597USD 23,659 TRY 134,538 Deutsche Bank 23/9/2019 760USD 163,744,815 ZAR 2,507,081,164 HSBC Bank Plc 23/9/2019 (302,371)USD 2,582,204 ZAR 39,936,320 Societe Generale 23/9/2019 (30,971)USD 10,846,893 ZAR 167,053,000 Goldman Sachs 23/9/2019 (83,975)USD 19,757,640 ZAR 305,285,180 Citibank 23/9/2019 (218,249)USD 7,986,315 ZAR 122,107,500 BNY Mellon 23/9/2019 (3,611)USD 177,261 ZAR 2,714,203 Barclays 23/9/2019 (339)USD 34,095,367 ZAR 522,248,007 Deutsche Bank 23/9/2019 (77,167)USD 49,899 ZAR 770,000 UBS 23/9/2019 (485)USD 3,328,926 ZAR 50,763,580 RBS Plc 23/9/2019 7,285ZAR 121,934,130 USD 7,980,815 Credit Suisse 23/9/2019 (2,234)ZAR 745,347,589 USD 48,297,893 State Street 23/9/2019 472,837ZAR 71,760,000 USD 4,695,155 Standard Chartered Bank 23/9/2019 355ZAR 61,980,000 USD 4,022,954 Goldman Sachs 23/9/2019 32,617ZAR 1,217,116,550 USD 79,259,192 HSBC Bank Plc 23/9/2019 381,047ZAR 129,250,000 USD 8,478,584 UBS 23/9/2019 (21,299)ZAR 458,928,870 USD 29,843,991 Deutsche Bank 23/9/2019 185,349JPY 6,407,201,320 USD 60,277,655 Standard Chartered Bank 24/9/2019 179,724JPY 1,763,604,920 USD 16,585,304 Toronto Dominion 24/9/2019 55,805JPY 6,488,065,082 USD 61,384,497 BNP Paribas 24/9/2019 (164,100)USD 16,586,684 JPY 1,763,751,640 Toronto Dominion 24/9/2019 (55,809)KZT 3,235,941,300 USD 8,358,366 Bank of America 30/9/2019 (59,239)ARS 299,463,750 USD 6,405,642 BNP Paribas 1/10/2019 (1,870,469)ARS 300,858,560 USD 6,167,662 Goldman Sachs 1/10/2019 (1,611,366)KZT 1,639,301,800 USD 4,229,910 Bank of America 1/10/2019 (26,702)USD 3,645,874 ARS 248,830,910 BNP Paribas 1/10/2019 (122,499)KZT 2,748,108,790 USD 7,105,647 Bank of America 2/10/2019 (61,211)TWD 1,394,922,184 USD 45,252,950 Morgan Stanley 3/10/2019 (579,562)TWD 1,393,854,000 USD 45,255,000 HSBC Bank Plc 3/10/2019 (615,821)USD 90,193,297 TWD 2,788,776,730 HSBC Bank Plc 3/10/2019 880,713KZT 2,236,497,630 USD 5,741,971 Bank of America 7/10/2019 (16,266)KZT 3,410,568,670 USD 8,667,265 Bank of America 15/10/2019 46,421ARS 4,767,727 USD 70,114 Citibank 16/10/2019 (1,321)ARS 6,729,658 USD 141,231 BNP Paribas 16/10/2019 (44,129)ARS 440,815,910 USD 9,343,279 Goldman Sachs 16/10/2019 (2,982,789)AUD 563,527 USD 387,261 Toronto Dominion 16/10/2019 (7,087)AUD 279,168 USD 189,992 State Street 16/10/2019 (1,657)CAD 126,104 USD 95,114 Citibank 16/10/2019 21CAD 17,393,270 USD 13,157,691 Bank of America 16/10/2019 (35,968)EUR 16,067,340 USD 17,910,597 JP Morgan 16/10/2019 (102,413)EUR 181,590 USD 203,033 RBS Plc 16/10/2019 (1,768)EUR 253,700 USD 286,455 Toronto Dominion 16/10/2019 (5,268)JPY 3,491,774,178 USD 33,126,579 UBS 16/10/2019 (125,747)USD 56,956 ARS 3,559,735 Citibank 16/10/2019 5,593USD 96,138 ARS 6,729,658 Goldman Sachs 16/10/2019 (964)USD 189,951 AUD 280,309 UBS 16/10/2019 846USD 189,675 AUD 280,562 State Street 16/10/2019 399USD 194,781 AUD 281,157 ANZ 16/10/2019 5,104USD 13,230,374 CAD 17,489,350 Bank of America 16/10/2019 36,167USD 189,647 CAD 252,207 BNP Paribas 16/10/2019 (621)USD 94,936 CAD 126,280 State Street 16/10/2019 (331)USD 193,562 CAD 255,552 Morgan Stanley 16/10/2019 770USD 15,917,508 EUR 14,279,400 JP Morgan 16/10/2019 90,982USD 41,222,781 EUR 37,066,180 Standard Chartered Bank 16/10/2019 140,602
Open Forward Foreign Exchange Contracts as at 31 August 2019
Currency
Purchases Currency
Sales Counterparty
Maturity date
Unrealised appreciation/
(depreciation) USD
Open Forward Foreign Exchange Contracts as at 31 August 2019
Currency
Purchases Currency
Sales Counterparty
Maturity date
Unrealised appreciation/
(depreciation) USD
USD 16,902,999 EUR 15,155,870 State Street 16/10/2019 105,040USD 293,894 EUR 262,839 BNP Paribas 16/10/2019 2,577USD 32,767,874 JPY 3,453,992,750 UBS 16/10/2019 124,115USD 94,916 JPY 10,065,886 Citibank 16/10/2019 (217)USD 18,577,606 TWD 583,429,710 HSBC Bank Plc 1/11/2019 (139,514)USD 86,403,085 TWD 2,671,151,380 UBS 1/11/2019 709,367KZT 4,439,563,150 USD 11,351,478 JP Morgan 12/11/2019 (87,429)KZT 3,551,149,610 USD 9,041,756 Bank of America 18/11/2019 (44,504)Net unrealised depreciation (595,610)
AUD Hedged Share Class
AUD 23,796,876 USD 16,217,199 BNY Mellon 12/9/2019 (179,629)USD 550,018 AUD 811,694 BNY Mellon 12/9/2019 2,989Net unrealised depreciation (176,640)
CAD Hedged Share Class
CAD 2,205,896 USD 1,669,142 BNY Mellon 12/9/2019 (5,830)USD 33,555 CAD 44,561 BNY Mellon 12/9/2019 (46)Net unrealised depreciation (5,876)
CHF Hedged Share Class
CHF 4,873,465 USD 5,020,583 BNY Mellon 12/9/2019 (82,149)USD 129,813 CHF 126,588 BNY Mellon 12/9/2019 1,538Net unrealised depreciation (80,611)
EUR Hedged Share Class
EUR 400,314,764 USD 449,494,941 BNY Mellon 12/9/2019 (6,981,303)USD 35,123,128 EUR 31,460,253 BNY Mellon 12/9/2019 346,657Net unrealised depreciation (6,634,646)
GBP Hedged Share Class
GBP 289,124,107 USD 349,997,045 BNY Mellon 12/9/2019 3,307,978USD 28,993,538 GBP 23,823,613 BNY Mellon 12/9/2019 (118,597)Net unrealised appreciation 3,189,381
HKD Hedged Share Class
HKD 66,798,108 USD 8,525,312 BNY Mellon 12/9/2019 (4,736)USD 552,359 HKD 4,332,734 BNY Mellon 12/9/2019 (312)Net unrealised depreciation (5,048)
NZD Hedged Share Class
NZD 2,708,838 USD 1,759,327 BNY Mellon 12/9/2019 (47,280)USD 35,795 NZD 55,941 BNY Mellon 12/9/2019 439Net unrealised depreciation (46,841)
PLN Hedged Share Class
PLN 19,017,363 USD 4,937,372 BNY Mellon 12/9/2019 (146,691)USD 167,324 PLN 658,296 BNY Mellon 12/9/2019 1,493Net unrealised depreciation (145,198)
SEK Hedged Share Class
SEK 38,971 USD 4,082 BNY Mellon 12/9/2019 (107)USD 75 SEK 728 BNY Mellon 12/9/2019 1Net unrealised depreciation (106)
SGD Hedged Share Class
SGD 23,758,758 USD 17,195,833 BNY Mellon 12/9/2019 (61,195)USD 411,294 SGD 570,869 BNY Mellon 12/9/2019 (412)Net unrealised depreciation (61,607)
Total net unrealised depreciation (USD underlying exposure - USD 7,186,934,664) (4,562,802)

The notes on pages 728 to 741 form an integral part of these financial statements.
Annual Report and Audited Financial Statements [195]
Emerging Markets Local Currency Bond Fund continued
Swaps as at 31 August 2019
TypeNominal
Value Description Counterparty
Expiration date
Unrealised appreciation/
(depreciation) USD
Market Value USD
IRS BRL 44,219,742 Fund receives Fixed 10.6725%; and pays Floating BRL BROIS 1 Day HSBC Bank Plc 2/1/2025 3,609,992 3,609,992IRS MXN 406,213,543 Fund receives Fixed 7.4425%; and pays Floating MXN
MXIBTIIE 1 Month Morgan Stanley 27/6/2029 736,162 736,162IRS HUF 2,837,477,839 Fund receives Fixed 1.65%; and pays Floating HUF BUBOR 6 Month Morgan Stanley 5/7/2029 431,388 431,388IRS PLN 37,536,664 Fund receives Fixed 1.99%; and pays Floating PLN WIBOR 6 Month Morgan Stanley 5/7/2029 387,455 387,455IRS PLN 48,795,308 Fund receives Fixed 2%; and pays Floating PLN WIBOR 6 Month Morgan Stanley 8/7/2029 515,181 515,181IRS ZAR 237,277,837 Fund receives Fixed 7.6025%; and pays Floating ZAR JIBAR 3 Month Morgan Stanley 9/7/2029 58,089 58,089IRS CZK 190,775,380 Fund receives Fixed 1.545%; and pays Floating CZK Interbank 6 Month Morgan Stanley 18/9/2029 388,522 388,522IRS EUR 7,822,030 Fund receives Floating EUR EURIBOR 6 Month;
and pays Fixed 0.234% Morgan Stanley 18/9/2029 (459,489) (459,489)
Total (USD underlying exposure - USD 100,782,174) 5,667,300 5,667,300
IRS: Interest Rate Swaps
Open Exchange Traded Futures Contracts as at 31 August 2019
Number of contracts Currency
Contract/ Description
Expiration date
Underlying exposure
USD
Unrealised appreciation/
(depreciation) USD
(241) EUR Euro BUXL September 2019 59,664,299 (771,960)2 USD US Treasury 10 Year Note (CBT) December 2019 263,094 221
Total 59,927,393 (771,739)
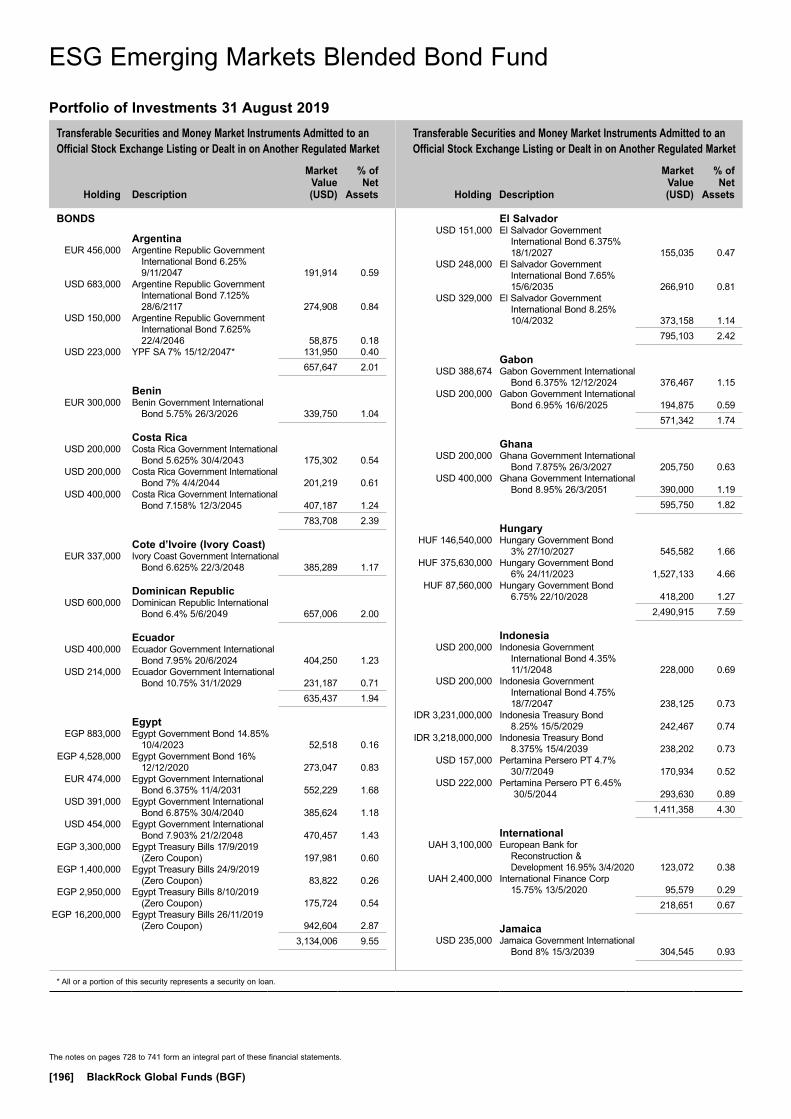
Transferable Securities and Money Market Instruments Admitted to an Official Stock Exchange Listing or Dealt in on Another Regulated Market
Transferable Securities and Money Market Instruments Admitted to an Official Stock Exchange Listing or Dealt in on Another Regulated Market
Holding
Description
Market Value (USD)
% of Net
Assets
Holding
Description
Market Value (USD)
% of Net
Assets
* All or a portion of this security represents a security on loan.
The notes on pages 728 to 741 form an integral part of these financial statements.
[196] BlackRock Global Funds (BGF)
BONDS
Argentina EUR 456,000 Argentine Republic Government
International Bond 6.25% 9/11/2047 191,914 0.59
USD 683,000 Argentine Republic Government International Bond 7.125% 28/6/2117 274,908 0.84
USD 150,000 Argentine Republic Government International Bond 7.625% 22/4/2046 58,875 0.18
USD 223,000 YPF SA 7% 15/12/2047* 131,950 0.40 657,647 2.01
Benin EUR 300,000 Benin Government International
Bond 5.75% 26/3/2026 339,750 1.04
Costa Rica USD 200,000 Costa Rica Government International
Bond 5.625% 30/4/2043 175,302 0.54 USD 200,000 Costa Rica Government International
Bond 7% 4/4/2044 201,219 0.61 USD 400,000 Costa Rica Government International
Bond 7.158% 12/3/2045 407,187 1.24 783,708 2.39
Cote d’Ivoire (Ivory Coast) EUR 337,000 Ivory Coast Government International
Bond 6.625% 22/3/2048 385,289 1.17
Dominican Republic USD 600,000 Dominican Republic International
Bond 6.4% 5/6/2049 657,006 2.00
Ecuador USD 400,000 Ecuador Government International
Bond 7.95% 20/6/2024 404,250 1.23 USD 214,000 Ecuador Government International
Bond 10.75% 31/1/2029 231,187 0.71 635,437 1.94
Egypt EGP 883,000 Egypt Government Bond 14.85%
10/4/2023 52,518 0.16 EGP 4,528,000 Egypt Government Bond 16%
12/12/2020 273,047 0.83 EUR 474,000 Egypt Government International
Bond 6.375% 11/4/2031 552,229 1.68 USD 391,000 Egypt Government International
Bond 6.875% 30/4/2040 385,624 1.18 USD 454,000 Egypt Government International
Bond 7.903% 21/2/2048 470,457 1.43 EGP 3,300,000 Egypt Treasury Bills 17/9/2019
(Zero Coupon) 197,981 0.60 EGP 1,400,000 Egypt Treasury Bills 24/9/2019
(Zero Coupon) 83,822 0.26 EGP 2,950,000 Egypt Treasury Bills 8/10/2019
(Zero Coupon) 175,724 0.54 EGP 16,200,000 Egypt Treasury Bills 26/11/2019
(Zero Coupon) 942,604 2.87 3,134,006 9.55
El Salvador USD 151,000 El Salvador Government
International Bond 6.375% 18/1/2027 155,035 0.47
USD 248,000 El Salvador Government International Bond 7.65% 15/6/2035 266,910 0.81
USD 329,000 El Salvador Government International Bond 8.25% 10/4/2032 373,158 1.14
795,103 2.42
Gabon USD 388,674 Gabon Government International
Bond 6.375% 12/12/2024 376,467 1.15 USD 200,000 Gabon Government International
Bond 6.95% 16/6/2025 194,875 0.59 571,342 1.74
Ghana USD 200,000 Ghana Government International
Bond 7.875% 26/3/2027 205,750 0.63 USD 400,000 Ghana Government International
Bond 8.95% 26/3/2051 390,000 1.19 595,750 1.82
Hungary HUF 146,540,000 Hungary Government Bond
3% 27/10/2027 545,582 1.66 HUF 375,630,000 Hungary Government Bond
6% 24/11/2023 1,527,133 4.66 HUF 87,560,000 Hungary Government Bond
6.75% 22/10/2028 418,200 1.27 2,490,915 7.59
Indonesia USD 200,000 Indonesia Government
International Bond 4.35% 11/1/2048 228,000 0.69
USD 200,000 Indonesia Government International Bond 4.75% 18/7/2047 238,125 0.73
IDR 3,231,000,000 Indonesia Treasury Bond 8.25% 15/5/2029 242,467 0.74
IDR 3,218,000,000 Indonesia Treasury Bond 8.375% 15/4/2039 238,202 0.73
USD 157,000 Pertamina Persero PT 4.7% 30/7/2049 170,934 0.52
USD 222,000 Pertamina Persero PT 6.45% 30/5/2044 293,630 0.89
1,411,358 4.30
International UAH 3,100,000 European Bank for
Reconstruction & Development 16.95% 3/4/2020 123,072 0.38
UAH 2,400,000 International Finance Corp 15.75% 13/5/2020 95,579 0.29
218,651 0.67
Jamaica USD 235,000 Jamaica Government International
Bond 8% 15/3/2039 304,545 0.93
ESG Emerging Markets Blended Bond Fund
Portfolio of Investments 31 August 2019
ESG Emerging Markets Blended Bond Fund
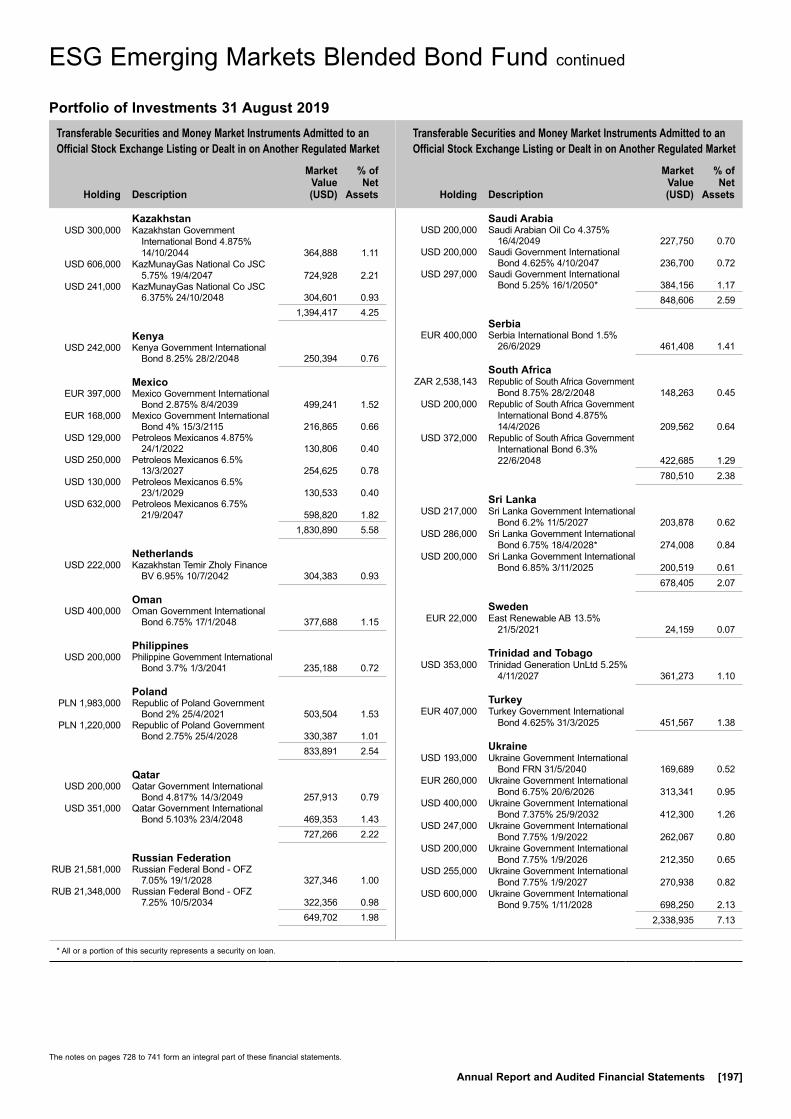
The notes on pages 728 to 741 form an integral part of these financial statements.
Annual Report and Audited Financial Statements [197]
ESG Emerging Markets Blended Bond Fund continued
Transferable Securities and Money Market Instruments Admitted to an Official Stock Exchange Listing or Dealt in on Another Regulated Market
Transferable Securities and Money Market Instruments Admitted to an Official Stock Exchange Listing or Dealt in on Another Regulated Market
Holding
Description
Market Value (USD)
% of Net
Assets
Holding
Description
Market Value (USD)
% of Net
Assets
* All or a portion of this security represents a security on loan.
Kazakhstan USD 300,000 Kazakhstan Government
International Bond 4.875% 14/10/2044 364,888 1.11
USD 606,000 KazMunayGas National Co JSC 5.75% 19/4/2047 724,928 2.21
USD 241,000 KazMunayGas National Co JSC 6.375% 24/10/2048 304,601 0.93
1,394,417 4.25
Kenya USD 242,000 Kenya Government International
Bond 8.25% 28/2/2048 250,394 0.76
Mexico EUR 397,000 Mexico Government International
Bond 2.875% 8/4/2039 499,241 1.52 EUR 168,000 Mexico Government International
Bond 4% 15/3/2115 216,865 0.66 USD 129,000 Petroleos Mexicanos 4.875%
24/1/2022 130,806 0.40 USD 250,000 Petroleos Mexicanos 6.5%
13/3/2027 254,625 0.78 USD 130,000 Petroleos Mexicanos 6.5%
23/1/2029 130,533 0.40 USD 632,000 Petroleos Mexicanos 6.75%
21/9/2047 598,820 1.82 1,830,890 5.58
Netherlands USD 222,000 Kazakhstan Temir Zholy Finance
BV 6.95% 10/7/2042 304,383 0.93
Oman USD 400,000 Oman Government International
Bond 6.75% 17/1/2048 377,688 1.15
Philippines USD 200,000 Philippine Government International
Bond 3.7% 1/3/2041 235,188 0.72
Poland PLN 1,983,000 Republic of Poland Government
Bond 2% 25/4/2021 503,504 1.53 PLN 1,220,000 Republic of Poland Government
Bond 2.75% 25/4/2028 330,387 1.01 833,891 2.54
Qatar USD 200,000 Qatar Government International
Bond 4.817% 14/3/2049 257,913 0.79 USD 351,000 Qatar Government International
Bond 5.103% 23/4/2048 469,353 1.43 727,266 2.22
Russian Federation RUB 21,581,000 Russian Federal Bond - OFZ
7.05% 19/1/2028 327,346 1.00 RUB 21,348,000 Russian Federal Bond - OFZ
7.25% 10/5/2034 322,356 0.98 649,702 1.98
Saudi Arabia USD 200,000 Saudi Arabian Oil Co 4.375%
16/4/2049 227,750 0.70 USD 200,000 Saudi Government International
Bond 4.625% 4/10/2047 236,700 0.72 USD 297,000 Saudi Government International
Bond 5.25% 16/1/2050* 384,156 1.17 848,606 2.59
Serbia EUR 400,000 Serbia International Bond 1.5%
26/6/2029 461,408 1.41
South Africa ZAR 2,538,143 Republic of South Africa Government
Bond 8.75% 28/2/2048 148,263 0.45 USD 200,000 Republic of South Africa Government
International Bond 4.875% 14/4/2026 209,562 0.64
USD 372,000 Republic of South Africa Government International Bond 6.3% 22/6/2048 422,685 1.29
780,510 2.38
Sri Lanka USD 217,000 Sri Lanka Government International
Bond 6.2% 11/5/2027 203,878 0.62 USD 286,000 Sri Lanka Government International
Bond 6.75% 18/4/2028* 274,008 0.84 USD 200,000 Sri Lanka Government International
Bond 6.85% 3/11/2025 200,519 0.61 678,405 2.07
Sweden EUR 22,000 East Renewable AB 13.5%
21/5/2021 24,159 0.07
Trinidad and Tobago USD 353,000 Trinidad Generation UnLtd 5.25%
4/11/2027 361,273 1.10
Turkey EUR 407,000 Turkey Government International
Bond 4.625% 31/3/2025 451,567 1.38
Ukraine USD 193,000 Ukraine Government International
Bond FRN 31/5/2040 169,689 0.52 EUR 260,000 Ukraine Government International
Bond 6.75% 20/6/2026 313,341 0.95 USD 400,000 Ukraine Government International
Bond 7.375% 25/9/2032 412,300 1.26 USD 247,000 Ukraine Government International
Bond 7.75% 1/9/2022 262,067 0.80 USD 200,000 Ukraine Government International
Bond 7.75% 1/9/2026 212,350 0.65 USD 255,000 Ukraine Government International
Bond 7.75% 1/9/2027 270,938 0.82 USD 600,000 Ukraine Government International
Bond 9.75% 1/11/2028 698,250 2.13 2,338,935 7.13
Portfolio of Investments 31 August 2019

The notes on pages 728 to 741 form an integral part of these financial statements.
[198] BlackRock Global Funds (BGF)
ESG Emerging Markets Blended Bond Fund continued
Transferable Securities and Money Market Instruments Admitted to an Official Stock Exchange Listing or Dealt in on Another Regulated Market
Holding
Description
Market Value (USD)
% of Net
Assets
† Securities pledged or given in guarantee, see Note 14, for further details.
United States USD 1,789,300 United States Treasury Note/Bond
2.25% 29/2/2020 1,792,340 5.46 USD 2,953,700 United States Treasury Note/Bond
2.25% 31/3/2021† 2,981,795 9.09 4,774,135 14.55Total Bonds 30,303,324 92.38Total Transferable Securities and Money Market Instruments Admitted to an Official Stock Exchange Listing or Dealt in on Another Regulated Market 30,303,324 92.38Total Portfolio 30,303,324 92.38
Other Net Assets 2,498,925 7.62Total Net Assets (USD) 32,802,249 100.00
Portfolio of Investments 31 August 2019
Open Exchange Traded Futures Contracts as at 31 August 2019
Number of contracts Currency
Contract/ Description
Expiration date
Underlying exposure
USD
Unrealised appreciation/
(depreciation) USD
(5) EUR Euro BUXL September 2019 1,237,849 (42,318)(21) EUR Euro Bund September 2019 4,154,856 (58,378)8 USD US Ultra Bond (CBT) December 2019 1,576,000 (9,603)(2) USD US Treasury 5 Year Note (CBT) December 2019 239,625 422(7) USD US Long Bond (CBT) December 2019 1,155,656 6,562
Total 8,363,986 (103,315)
Swaps as at 31 August 2019
TypeNominal
Value Description Counterparty
Expiration date
Unrealised appreciation/
(depreciation) USD
Market Value USD
CDS USD 265,000 Fund receives default protection on Mexico Government International Bond; and pays Fixed 1% Barclays 20/6/2024 (1,488) 1,420
CDS USD 267,709 Fund receives default protection on Mexico Government International Bond; and pays Fixed 1% Barclays 20/6/2024 (1,101) 1,435
CDS USD (400,000) Fund provides default protection on Argentine Republic Government International Bond; and receives Fixed 5% Barclays 20/6/2024 (42,913) (234,913)
CDS USD 803,868 Fund receives default protection on Turkey Government International Bond; and pays Fixed 1% Barclays 20/6/2024 16,999 108,913
CDS USD (45,000) Fund provides default protection on Argentine Republic Government International Bond; and receives Fixed 5% Barclays 20/6/2024 (9,765) (26,428)
CDS USD 476,000 Fund receives default protection on Turkey Government International Bond; and pays Fixed 1% Barclays 20/6/2024 20,525 64,491
CDS USD 1,811,964 Fund receives default protection on Mexico Government International Bond; and pays Fixed 1% Barclays 20/6/2024 (5,870) 9,711
CDS USD 501,752 Fund receives default protection on Colombia Government International Bond; and pays Fixed 1% Barclays 20/6/2024 (1,605) (1,605)
CDS USD 673,323 Fund receives default protection on Mexico Government International Bond; and pays Fixed 1% Barclays 20/6/2024 192 3,609
CDS USD 1,156,000 Fund receives default protection on Colombia Government International Bond; and pays Fixed 1% BNP Paribas 20/6/2024 (12,161) (3,697)
CDS USD (81,203) Fund provides default protection on Argentine Republic Government International Bond; and receives Fixed 5% BNP Paribas 20/6/2024 (27,488) (47,689)

The notes on pages 728 to 741 form an integral part of these financial statements.
Annual Report and Audited Financial Statements [199]
ESG Emerging Markets Blended Bond Fund continued
Swaps as at 31 August 2019
TypeNominal
Value Description Counterparty
Expiration date
Unrealised appreciation/
(depreciation) USD
Market Value USD
CDS USD (79,797) Fund provides default protection on Argentine Republic Government International Bond; and receives Fixed 5% BNP Paribas 20/6/2024 (26,692) (46,863)
CDS EUR 3,002,810 Fund receives default protection on ITRAXX.XO.31.V1; and pays Fixed 5% Goldman Sachs 20/6/2024 (31,817) (371,917)
CDS USD 9,596,881 Fund provides default protection on CDX.NA.HY.32.V2; and receives Fixed 5% Goldman Sachs 20/6/2024 (53,234) (659,599)
CDS USD (63,613) Fund provides default protection on Argentine Republic Government International Bond; and receives Fixed 5% Goldman Sachs 20/6/2024 (23,797) (37,359)
CDS USD 133,376 Fund receives default protection on Turkey Government International Bond; and pays Fixed 1% Goldman Sachs 20/6/2024 2,012 18,070
CDS USD 161,000 Fund receives default protection on Turkey Government International Bond; and pays Fixed 1% HSBC Bank Plc 20/6/2024 (1,428) 21,813
CDS USD 65,000 Fund receives default protection on Turkey Government International Bond; and pays Fixed 1% HSBC Bank Plc 20/6/2024 294 8,807
CDS USD 162,208 Fund receives default protection on Turkey Government International Bond; and pays Fixed 1% HSBC Bank Plc 20/6/2024 1,634 21,977
CDS USD (434,000) Fund provides default protection on Argentine Republic Government International Bond; and receives Fixed 5% HSBC Bank Plc 20/6/2024 (94,180) (254,880)
CDS USD (479,264) Fund provides default protection on Argentine Republic Government International Bond; and receives Fixed 5% HSBC Bank Plc 20/6/2024 (96,813) (281,463)
CDS USD (479,825) Fund provides default protection on Argentine Republic Government International Bond; and receives Fixed 5% HSBC Bank Plc 20/6/2024 (90,929) (281,792)
CDS USD 324,416 Fund receives default protection on Turkey Government International Bond; and pays Fixed 1% HSBC Bank Plc 20/6/2024 4,545 43,954
CDS USD 960,187 Fund receives default protection on Turkey Government International Bond; and pays Fixed 1% HSBC Bank Plc 20/6/2024 4,595 130,091
CDS USD 284,588 Fund receives default protection on Turkey Government International Bond; and pays Fixed 1% JP Morgan 20/6/2024 (3,210) 38,558
CDS USD 181,000 Fund receives default protection on Turkey Government International Bond; and pays Fixed 1% JP Morgan 20/6/2024 (2,042) 24,523
CDS USD 2,054,000 Fund receives default protection on Mexico Government International Bond; and pays Fixed 1% Morgan Stanley 20/6/2024 (19,943) 11,008
CDS USD (302,810) Fund provides default protection on Argentine Republic Government International Bond; and receives Fixed 5% Morgan Stanley 20/6/2024 (115,548) (177,835)
IRS BRL 1,100,000 Fund receives Fixed 8.27%; and pays Floating BRL BROIS 1 Day Bank of America 2/1/2023 18,404 18,404IRS BRL 2,600,000 Fund receives Fixed 8.4825%; and pays Floating BRL BROIS 1 Day Bank of America 2/1/2023 49,492 49,492IRS BRL 700,000 Fund receives Fixed 7.39%; and pays Floating BRL BROIS 1 Day Bank of America 4/1/2027 2,498 2,498IRS MXN 7,800,000 Fund receives Fixed 8.96%; and pays Floating MXN MXIBTIIE 1 Month Bank of America 11/12/2028 54,875 54,875IRS ZAR 2,500,000 Fund receives Fixed 8.22%; and pays Floating ZAR JIBAR 3 Month Bank of America 21/12/2028 8,116 8,116IRS ZAR 1,200,000 Fund receives Fixed 8.1975%; and pays Floating ZAR JIBAR 3 Month Bank of America 2/1/2029 3,761 3,761IRS ZAR 4,300,000 Fund receives Fixed 8.1%; and pays Floating ZAR JIBAR 3 Month Bank of America 4/1/2029 11,598 11,598IRS MXN 7,540,000 Fund receives Fixed 7.775%; and pays Floating MXN
MXIBTIIE 1 Month Bank of America 29/5/2029 22,600 22,600IRS MXN 7,404,805 Fund receives Fixed 7.57%; and pays Floating MXN MXIBTIIE 1 Month Bank of America 8/6/2029 16,773 16,773IRS MXN 7,454,730 Fund receives Fixed 7.485%; and pays Floating MXN
MXIBTIIE 1 Month Bank of America 20/6/2029 14,649 14,649IRS ZAR 5,488,323 Fund receives Fixed 7.7%; and pays Floating ZAR JIBAR 3 Month Bank of America 2/7/2029 3,869 3,869IRS PLN 1,091,181 Fund receives Fixed 2.0625%; and pays Floating PLN WIBOR 6 Month Bank of America 4/7/2029 13,068 13,068IRS USD 586,691 Fund receives Floating USD LIBOR 3 Month; and pays Fixed 2.225% Bank of America 11/7/2049 (99,508) (99,995)IRS EUR 23,667 Fund receives Floating EUR EURIBOR 6 Month;
and pays Fixed 0.809% Bank of America 16/7/2049 (5,778) (5,790)IRS BRL 1,500,000 Fund receives Fixed 7.085%; and pays Floating BRL BROIS 6 Month HSBC Bank Plc 2/1/2023 6,646 6,646IRS BRL 698,558 Fund receives Fixed 8.2575%; and pays Floating BRL BROIS 1 Day Morgan Stanley 4/1/2027 13,509 13,509
Total (USD underlying exposure - USD 34,498,164) (476,656) (1,783,587)
CDS: Credit Default SwapsIRS: Interest Rate Swaps

The notes on pages 728 to 741 form an integral part of these financial statements.
[200] BlackRock Global Funds (BGF)
ESG Emerging Markets Blended Bond Fund continued
Open Forward Foreign Exchange Contracts as at 31 August 2019
Currency
Purchases Currency
Sales Counterparty
Maturity date
Unrealised appreciation/
(depreciation) USD
AUD 383,493 USD 260,471 JP Morgan 12/9/2019 (2,022)BRL 837,323 USD 204,855 HSBC Bank Plc 12/9/2019 (2,987)BRL 4,672,618 USD 1,157,950 Barclays 12/9/2019 (31,445)CHF 821,404 USD 835,485 JP Morgan 12/9/2019 (3,143)CLP 183,838,742 USD 258,204 HSBC Bank Plc 12/9/2019 (2,435)COP 678,921,208 USD 197,309 HSBC Bank Plc 12/9/2019 1,437CZK 89,945 USD 3,873 Goldman Sachs 12/9/2019 (42)EUR 1,492,125 USD 1,655,987 Royal Bank of Canada 12/9/2019 (6,589)EUR 10,000 USD 11,084 UBS 12/9/2019 (30)EUR 1,012,251 USD 1,125,014 Bank of America 12/9/2019 (6,070)EUR 811,568 USD 902,465 JP Morgan 12/9/2019 (5,356)EUR 687,408 USD 764,270 HSBC Bank Plc 12/9/2019 (4,408)GBP 201,248 USD 246,238 HSBC Bank Plc 12/9/2019 (315)GBP 211,244 USD 257,968 Royal Bank of Canada 12/9/2019 170HUF 48,290,000 USD 162,472 UBS 12/9/2019 (1,379)HUF 144,963,886 USD 490,454 Bank of America 12/9/2019 (6,862)HUF 82,690,147 USD 280,423 Barclays 12/9/2019 (4,573)IDR 6,338,118,928 USD 444,780 HSBC Bank Plc 12/9/2019 1,648IDR 18,970,643,044 USD 1,327,129 BNP Paribas 12/9/2019 9,076INR 16,724,670 USD 232,888 RBS Plc 12/9/2019 807INR 54,802,204 USD 763,262 Goldman Sachs 12/9/2019 2,494JPY 96,680,227 USD 908,845 Morgan Stanley 12/9/2019 2,598JPY 342,685,292 USD 3,222,172 BNP Paribas 12/9/2019 8,460MXN 25,525,626 USD 1,289,531 UBS 12/9/2019 (20,159)PEN 1,324,099 USD 390,797 Goldman Sachs 12/9/2019 (920)PHP 27,596,493 USD 527,204 BNP Paribas 12/9/2019 2,722PLN 257,851 USD 65,499 Toronto Dominion 12/9/2019 (544)PLN 1,005,897 USD 256,597 HSBC Bank Plc 12/9/2019 (3,202)PLN 1,506,956 USD 382,826 JP Morgan 12/9/2019 (3,209)RUB 13,024,237 USD 196,789 Goldman Sachs 12/9/2019 (1,047)RUB 19,665,803 USD 293,563 Barclays 12/9/2019 1,995THB 2,790,412 USD 90,821 HSBC Bank Plc 12/9/2019 474THB 12,484,895 USD 403,977 Standard Chartered Bank 12/9/2019 4,494TRY 363,794 USD 62,564 BNP Paribas 12/9/2019 (368)TRY 4,441,067 USD 777,838 HSBC Bank Plc 12/9/2019 (18,570)USD 898,695 AUD 1,325,509 JP Morgan 12/9/2019 5,390USD 636,203 BRL 2,589,348 BNP Paribas 12/9/2019 11,946USD 2,649 CAD 3,517 BNP Paribas 12/9/2019 (3)USD 9,765 CHF 9,558 JP Morgan 12/9/2019 80USD 1,280,598 EUR 1,154,190 Royal Bank of Canada 12/9/2019 4,754USD 5,258,975 EUR 4,731,986 JP Morgan 12/9/2019 28,227
Open Forward Foreign Exchange Contracts as at 31 August 2019
Currency
Purchases Currency
Sales Counterparty
Maturity date
Unrealised appreciation/
(depreciation) USD
USD 1,510,424 EUR 1,359,732 Bank of America 12/9/2019 7,374USD 33,214 EUR 30,000 BNY Mellon 12/9/2019 52USD 675,674 GBP 556,310 Barclays 12/9/2019 (4,131)USD 239,285 HUF 70,810,000 JP Morgan 12/9/2019 3,066USD 2,207,658 HUF 649,409,060 Barclays 12/9/2019 41,263USD 5,724 HUF 1,690,000 HSBC Bank Plc 12/9/2019 86USD 118,027 IDR 1,687,780,000 Bank of America 12/9/2019 (853)USD 640,590 MXN 12,689,507 Toronto Dominion 12/9/2019 9,550USD 14,052 MXN 280,000 Goldman Sachs 12/9/2019 127USD 1,268,740 MXN 25,234,988 Royal Bank of Canada 12/9/2019 13,821USD 187,313 MXN 3,733,770 Barclays 12/9/2019 1,635USD 1,016,527 NZD 1,594,314 HSBC Bank Plc 12/9/2019 8,892USD 640,045 NZD 995,763 Bank of America 12/9/2019 10,705USD 213,669 PLN 840,000 Bank of America 12/9/2019 2,065USD 515,751 PLN 2,030,000 RBS Plc 12/9/2019 4,374USD 33,254 ZAR 510,000 Goldman Sachs 12/9/2019 (166)ZAR 100,000 USD 6,561 UBS 12/9/2019 (8)ZAR 23,314,923 USD 1,513,861 Barclays 12/9/2019 13,931CNH 1,843,063 USD 259,311 Societe Generale 16/9/2019 (1,655)CNH 5,172,291 USD 731,462 HSBC Bank Plc 16/9/2019 (8,389)USD 2,655,628 CNH 18,750,860 HSBC Bank Plc 16/9/2019 34,306USD 321,454 KRW 388,958,981 HSBC Bank Plc 16/9/2019 (130)USD 339,258 KRW 411,360,001 JP Morgan 16/9/2019 (846)UAH 991,540 USD 33,118 Morgan Stanley 17/9/2019 6,058KZT 122,922,824 USD 316,322 JP Morgan 25/9/2019 (667)KZT 128,569,579 USD 331,630 Bank of America 25/9/2019 (1,475)KZT 198,781,657 USD 510,089 HSBC Bank Plc 25/9/2019 365Net unrealised appreciation 100,444
CHF Hedged Share Class
CHF 5,145 USD 5,300 BNY Mellon 12/9/2019 (87)USD 312 CHF 303 BNY Mellon 12/9/2019 5Net unrealised depreciation (82)
EUR Hedged Share Class
EUR 35,686 USD 40,067 BNY Mellon 12/9/2019 (619)USD 2,376 EUR 2,126 BNY Mellon 12/9/2019 25Net unrealised depreciation (594)
Total net unrealised appreciation (USD underlying exposure - USD 44,669,558) 99,768
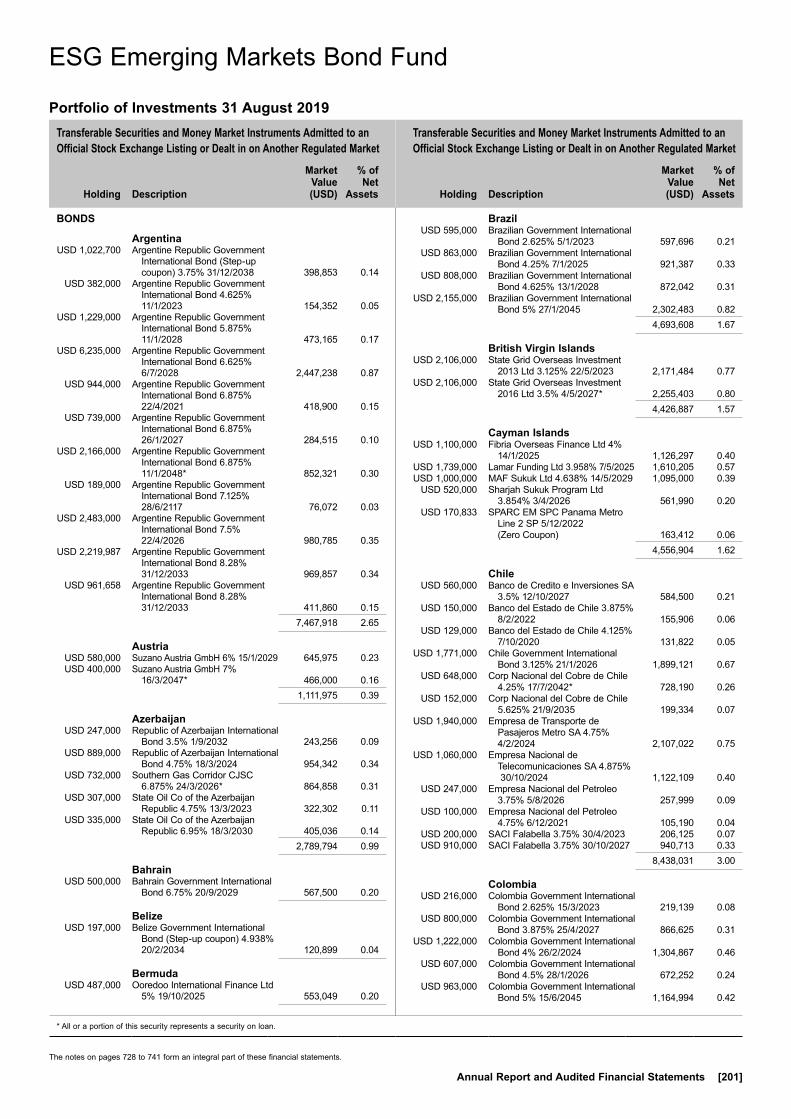
Transferable Securities and Money Market Instruments Admitted to an Official Stock Exchange Listing or Dealt in on Another Regulated Market
Transferable Securities and Money Market Instruments Admitted to an Official Stock Exchange Listing or Dealt in on Another Regulated Market
Holding
Description
Market Value (USD)
% of Net
Assets
Holding
Description
Market Value (USD)
% of Net
Assets
* All or a portion of this security represents a security on loan.
The notes on pages 728 to 741 form an integral part of these financial statements.
Annual Report and Audited Financial Statements [201]
BONDS
Argentina USD 1,022,700 Argentine Republic Government
International Bond (Step-up coupon) 3.75% 31/12/2038 398,853 0.14
USD 382,000 Argentine Republic Government International Bond 4.625% 11/1/2023 154,352 0.05
USD 1,229,000 Argentine Republic Government International Bond 5.875% 11/1/2028 473,165 0.17
USD 6,235,000 Argentine Republic Government International Bond 6.625% 6/7/2028 2,447,238 0.87
USD 944,000 Argentine Republic Government International Bond 6.875% 22/4/2021 418,900 0.15
USD 739,000 Argentine Republic Government International Bond 6.875% 26/1/2027 284,515 0.10
USD 2,166,000 Argentine Republic Government International Bond 6.875% 11/1/2048* 852,321 0.30
USD 189,000 Argentine Republic Government International Bond 7.125% 28/6/2117 76,072 0.03
USD 2,483,000 Argentine Republic Government International Bond 7.5% 22/4/2026 980,785 0.35
USD 2,219,987 Argentine Republic Government International Bond 8.28% 31/12/2033 969,857 0.34
USD 961,658 Argentine Republic Government International Bond 8.28% 31/12/2033 411,860 0.15
7,467,918 2.65
Austria USD 580,000 Suzano Austria GmbH 6% 15/1/2029 645,975 0.23 USD 400,000 Suzano Austria GmbH 7%
16/3/2047* 466,000 0.16 1,111,975 0.39
Azerbaijan USD 247,000 Republic of Azerbaijan International
Bond 3.5% 1/9/2032 243,256 0.09 USD 889,000 Republic of Azerbaijan International
Bond 4.75% 18/3/2024 954,342 0.34 USD 732,000 Southern Gas Corridor CJSC
6.875% 24/3/2026* 864,858 0.31 USD 307,000 State Oil Co of the Azerbaijan
Republic 4.75% 13/3/2023 322,302 0.11 USD 335,000 State Oil Co of the Azerbaijan
Republic 6.95% 18/3/2030 405,036 0.14 2,789,794 0.99
Bahrain USD 500,000 Bahrain Government International
Bond 6.75% 20/9/2029 567,500 0.20
Belize USD 197,000 Belize Government International
Bond (Step-up coupon) 4.938% 20/2/2034 120,899 0.04
Bermuda USD 487,000 Ooredoo International Finance Ltd
5% 19/10/2025 553,049 0.20
Brazil USD 595,000 Brazilian Government International
Bond 2.625% 5/1/2023 597,696 0.21 USD 863,000 Brazilian Government International
Bond 4.25% 7/1/2025 921,387 0.33 USD 808,000 Brazilian Government International
Bond 4.625% 13/1/2028 872,042 0.31 USD 2,155,000 Brazilian Government International
Bond 5% 27/1/2045 2,302,483 0.82 4,693,608 1.67
British Virgin Islands USD 2,106,000 State Grid Overseas Investment
2013 Ltd 3.125% 22/5/2023 2,171,484 0.77 USD 2,106,000 State Grid Overseas Investment
2016 Ltd 3.5% 4/5/2027* 2,255,403 0.80 4,426,887 1.57
Cayman Islands USD 1,100,000 Fibria Overseas Finance Ltd 4%
14/1/2025 1,126,297 0.40 USD 1,739,000 Lamar Funding Ltd 3.958% 7/5/2025 1,610,205 0.57 USD 1,000,000 MAF Sukuk Ltd 4.638% 14/5/2029 1,095,000 0.39 USD 520,000 Sharjah Sukuk Program Ltd
3.854% 3/4/2026 561,990 0.20 USD 170,833 SPARC EM SPC Panama Metro
Line 2 SP 5/12/2022 (Zero Coupon) 163,412 0.06
4,556,904 1.62
Chile USD 560,000 Banco de Credito e Inversiones SA
3.5% 12/10/2027 584,500 0.21 USD 150,000 Banco del Estado de Chile 3.875%
8/2/2022 155,906 0.06 USD 129,000 Banco del Estado de Chile 4.125%
7/10/2020 131,822 0.05 USD 1,771,000 Chile Government International
Bond 3.125% 21/1/2026 1,899,121 0.67 USD 648,000 Corp Nacional del Cobre de Chile
4.25% 17/7/2042* 728,190 0.26 USD 152,000 Corp Nacional del Cobre de Chile
5.625% 21/9/2035 199,334 0.07 USD 1,940,000 Empresa de Transporte de
Pasajeros Metro SA 4.75% 4/2/2024 2,107,022 0.75
USD 1,060,000 Empresa Nacional de Telecomunicaciones SA 4.875% 30/10/2024 1,122,109 0.40
USD 247,000 Empresa Nacional del Petroleo 3.75% 5/8/2026 257,999 0.09
USD 100,000 Empresa Nacional del Petroleo 4.75% 6/12/2021 105,190 0.04
USD 200,000 SACI Falabella 3.75% 30/4/2023 206,125 0.07 USD 910,000 SACI Falabella 3.75% 30/10/2027 940,713 0.33 8,438,031 3.00
Colombia USD 216,000 Colombia Government International
Bond 2.625% 15/3/2023 219,139 0.08 USD 800,000 Colombia Government International
Bond 3.875% 25/4/2027 866,625 0.31 USD 1,222,000 Colombia Government International
Bond 4% 26/2/2024 1,304,867 0.46 USD 607,000 Colombia Government International
Bond 4.5% 28/1/2026 672,252 0.24 USD 963,000 Colombia Government International
Bond 5% 15/6/2045 1,164,994 0.42
ESG Emerging Markets Bond Fund
Portfolio of Investments 31 August 2019
ESG Emerging Markets Bond Fund
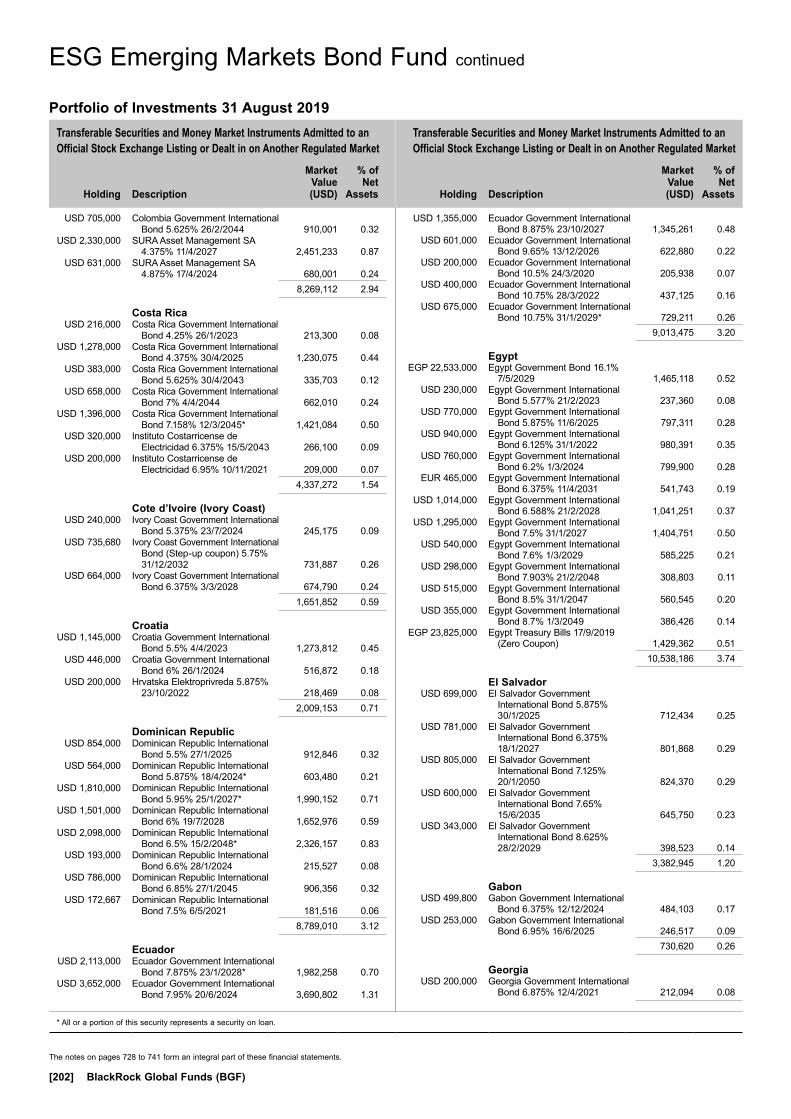
Transferable Securities and Money Market Instruments Admitted to an Official Stock Exchange Listing or Dealt in on Another Regulated Market
Transferable Securities and Money Market Instruments Admitted to an Official Stock Exchange Listing or Dealt in on Another Regulated Market
Holding
Description
Market Value (USD)
% of Net
Assets
Holding
Description
Market Value (USD)
% of Net
Assets
* All or a portion of this security represents a security on loan.
The notes on pages 728 to 741 form an integral part of these financial statements.
[202] BlackRock Global Funds (BGF)
USD 705,000 Colombia Government International Bond 5.625% 26/2/2044 910,001 0.32
USD 2,330,000 SURA Asset Management SA 4.375% 11/4/2027 2,451,233 0.87
USD 631,000 SURA Asset Management SA 4.875% 17/4/2024 680,001 0.24
8,269,112 2.94
Costa Rica USD 216,000 Costa Rica Government International
Bond 4.25% 26/1/2023 213,300 0.08 USD 1,278,000 Costa Rica Government International
Bond 4.375% 30/4/2025 1,230,075 0.44 USD 383,000 Costa Rica Government International
Bond 5.625% 30/4/2043 335,703 0.12 USD 658,000 Costa Rica Government International
Bond 7% 4/4/2044 662,010 0.24 USD 1,396,000 Costa Rica Government International
Bond 7.158% 12/3/2045* 1,421,084 0.50 USD 320,000 Instituto Costarricense de
Electricidad 6.375% 15/5/2043 266,100 0.09 USD 200,000 Instituto Costarricense de
Electricidad 6.95% 10/11/2021 209,000 0.07 4,337,272 1.54
Cote d’Ivoire (Ivory Coast) USD 240,000 Ivory Coast Government International
Bond 5.375% 23/7/2024 245,175 0.09 USD 735,680 Ivory Coast Government International
Bond (Step-up coupon) 5.75% 31/12/2032 731,887 0.26
USD 664,000 Ivory Coast Government International Bond 6.375% 3/3/2028 674,790 0.24
1,651,852 0.59
Croatia USD 1,145,000 Croatia Government International
Bond 5.5% 4/4/2023 1,273,812 0.45 USD 446,000 Croatia Government International
Bond 6% 26/1/2024 516,872 0.18 USD 200,000 Hrvatska Elektroprivreda 5.875%
23/10/2022 218,469 0.08 2,009,153 0.71
Dominican Republic USD 854,000 Dominican Republic International
Bond 5.5% 27/1/2025 912,846 0.32 USD 564,000 Dominican Republic International
Bond 5.875% 18/4/2024* 603,480 0.21 USD 1,810,000 Dominican Republic International
Bond 5.95% 25/1/2027* 1,990,152 0.71 USD 1,501,000 Dominican Republic International
Bond 6% 19/7/2028 1,652,976 0.59 USD 2,098,000 Dominican Republic International
Bond 6.5% 15/2/2048* 2,326,157 0.83 USD 193,000 Dominican Republic International
Bond 6.6% 28/1/2024 215,527 0.08 USD 786,000 Dominican Republic International
Bond 6.85% 27/1/2045 906,356 0.32 USD 172,667 Dominican Republic International
Bond 7.5% 6/5/2021 181,516 0.06 8,789,010 3.12
Ecuador USD 2,113,000 Ecuador Government International
Bond 7.875% 23/1/2028* 1,982,258 0.70 USD 3,652,000 Ecuador Government International
Bond 7.95% 20/6/2024 3,690,802 1.31
USD 1,355,000 Ecuador Government International Bond 8.875% 23/10/2027 1,345,261 0.48
USD 601,000 Ecuador Government International Bond 9.65% 13/12/2026 622,880 0.22
USD 200,000 Ecuador Government International Bond 10.5% 24/3/2020 205,938 0.07
USD 400,000 Ecuador Government International Bond 10.75% 28/3/2022 437,125 0.16
USD 675,000 Ecuador Government International Bond 10.75% 31/1/2029* 729,211 0.26
9,013,475 3.20
Egypt EGP 22,533,000 Egypt Government Bond 16.1%
7/5/2029 1,465,118 0.52 USD 230,000 Egypt Government International
Bond 5.577% 21/2/2023 237,360 0.08 USD 770,000 Egypt Government International
Bond 5.875% 11/6/2025 797,311 0.28 USD 940,000 Egypt Government International
Bond 6.125% 31/1/2022 980,391 0.35 USD 760,000 Egypt Government International
Bond 6.2% 1/3/2024 799,900 0.28 EUR 465,000 Egypt Government International
Bond 6.375% 11/4/2031 541,743 0.19 USD 1,014,000 Egypt Government International
Bond 6.588% 21/2/2028 1,041,251 0.37 USD 1,295,000 Egypt Government International
Bond 7.5% 31/1/2027 1,404,751 0.50 USD 540,000 Egypt Government International
Bond 7.6% 1/3/2029 585,225 0.21 USD 298,000 Egypt Government International
Bond 7.903% 21/2/2048 308,803 0.11 USD 515,000 Egypt Government International
Bond 8.5% 31/1/2047 560,545 0.20 USD 355,000 Egypt Government International
Bond 8.7% 1/3/2049 386,426 0.14 EGP 23,825,000 Egypt Treasury Bills 17/9/2019
(Zero Coupon) 1,429,362 0.51 10,538,186 3.74
El Salvador USD 699,000 El Salvador Government
International Bond 5.875% 30/1/2025 712,434 0.25
USD 781,000 El Salvador Government International Bond 6.375% 18/1/2027 801,868 0.29
USD 805,000 El Salvador Government International Bond 7.125% 20/1/2050 824,370 0.29
USD 600,000 El Salvador Government International Bond 7.65% 15/6/2035 645,750 0.23
USD 343,000 El Salvador Government International Bond 8.625% 28/2/2029 398,523 0.14
3,382,945 1.20
Gabon USD 499,800 Gabon Government International
Bond 6.375% 12/12/2024 484,103 0.17 USD 253,000 Gabon Government International
Bond 6.95% 16/6/2025 246,517 0.09 730,620 0.26
Georgia USD 200,000 Georgia Government International
Bond 6.875% 12/4/2021 212,094 0.08
Portfolio of Investments 31 August 2019
ESG Emerging Markets Bond Fund continued

Transferable Securities and Money Market Instruments Admitted to an Official Stock Exchange Listing or Dealt in on Another Regulated Market
Transferable Securities and Money Market Instruments Admitted to an Official Stock Exchange Listing or Dealt in on Another Regulated Market
Holding
Description
Market Value (USD)
% of Net
Assets
Holding
Description
Market Value (USD)
% of Net
Assets
* All or a portion of this security represents a security on loan.
The notes on pages 728 to 741 form an integral part of these financial statements.
Annual Report and Audited Financial Statements [203]
Ghana USD 1,665,000 Ghana Government International
Bond 7.625% 16/5/2029 1,647,569 0.59 USD 308,615 Ghana Government International
Bond 7.875% 7/8/2023 337,451 0.12 USD 385,000 Ghana Government International
Bond 7.875% 26/3/2027 396,069 0.14 USD 606,000 Ghana Government International
Bond 8.125% 18/1/2026 643,023 0.23 USD 700,000 Ghana Government International
Bond 8.125% 26/3/2032 685,672 0.24 USD 416,000 Ghana Government International
Bond 8.627% 16/6/2049 405,535 0.14 USD 284,000 Ghana Government International
Bond 8.95% 26/3/2051 276,900 0.10 4,392,219 1.56
Guatemala USD 340,000 Guatemala Government Bond
4.5% 3/5/2026* 357,372 0.13 USD 308,000 Guatemala Government Bond
4.875% 13/2/2028 333,747 0.12 691,119 0.25
Hungary USD 4,264,000 Hungary Government International
Bond 5.375% 21/2/2023 4,716,384 1.67 USD 1,088,000 Hungary Government International
Bond 5.375% 25/3/2024 1,234,200 0.44 USD 1,898,000 Hungary Government International
Bond 5.75% 22/11/2023 2,160,754 0.77 USD 453,000 Hungary Government International
Bond 6.25% 29/1/2020 460,998 0.16 USD 676,000 Hungary Government International
Bond 6.375% 29/3/2021 719,306 0.26 USD 664,000 Hungary Government International
Bond 7.625% 29/3/2041 1,121,745 0.40 USD 524,000 MFB Magyar Fejlesztesi Bank Zrt
6.25% 21/10/2020 548,399 0.19 10,961,786 3.89
Indonesia USD 1,220,000 Indonesia Government International
Bond 3.85% 18/7/2027 1,310,738 0.47 USD 1,655,000 Indonesia Government International
Bond 4.125% 15/1/2025 1,774,212 0.63 USD 530,000 Indonesia Government International
Bond 4.35% 11/1/2048 604,200 0.21 USD 1,289,000 Indonesia Government International
Bond 4.75% 8/1/2026 1,439,853 0.51 USD 300,000 Indonesia Government International
Bond 4.75% 18/7/2047 357,187 0.13 USD 521,000 Indonesia Government International
Bond 5.25% 17/1/2042 647,017 0.23 USD 200,000 Pertamina Persero PT 3.65%
30/7/2029 209,755 0.07 USD 830,000 Pertamina Persero PT 4.3%
20/5/2023 876,169 0.31 USD 230,000 Pertamina Persero PT 4.7%
30/7/2049 250,412 0.09 USD 604,000 Pertamina Persero PT 5.625%
20/5/2043* 726,216 0.26 USD 462,000 Perusahaan Penerbit SBSN
Indonesia III 4.15% 29/3/2027 500,981 0.18 8,696,740 3.09
International UAH 35,700,000 European Bank for Reconstruction
& Development 16.95% 3/4/2020 1,417,308 0.51 UAH 17,200,000 International Finance Corp 15.75%
13/5/2020 684,986 0.24 2,102,294 0.75
Ireland USD 200,000 GTLK Europe DAC 5.125%
31/5/2024 206,063 0.07
Jamaica USD 3,120,000 Jamaica Government International
Bond 6.75% 28/4/2028 3,651,862 1.30 USD 316,000 Jamaica Government International
Bond 7.875% 28/7/2045 410,603 0.14 USD 200,000 Jamaica Government International
Bond 8% 15/3/2039 259,187 0.09 4,321,652 1.53
Jordan USD 760,000 Jordan Government International
Bond 5.75% 31/1/2027* 774,250 0.28 USD 973,000 Jordan Government International
Bond 7.375% 10/10/2047 1,016,481 0.36 1,790,731 0.64
Kazakhstan USD 408,000 Development Bank of Kazakhstan
JSC 4.125% 10/12/2022 424,320 0.15 KZT 273,250,000 Development Bank of Kazakhstan
JSC 9.5% 14/12/2020 696,540 0.25 USD 826,000 Kazakhstan Government
International Bond 4.875% 14/10/2044 1,004,660 0.36
USD 483,000 Kazakhstan Government International Bond 5.125% 21/7/2025 550,620 0.19
USD 286,000 Kazakhstan Temir Zholy National Co JSC 4.85% 17/11/2027 319,962 0.11
USD 200,000 KazMunayGas National Co JSC 3.875% 19/4/2022 205,700 0.07
USD 306,000 KazMunayGas National Co JSC 4.75% 24/4/2025 334,381 0.12
USD 691,000 KazMunayGas National Co JSC 4.75% 19/4/2027 757,336 0.27
USD 869,000 KazMunayGas National Co JSC 5.75% 19/4/2047 1,039,541 0.37
USD 866,000 KazMunayGas National Co JSC 6.375% 24/10/2048* 1,094,543 0.39
6,427,603 2.28
Kenya USD 1,315,000 Kenya Government International
Bond 6.875% 24/6/2024 1,406,808 0.50 USD 540,000 Kenya Government International
Bond 8% 22/5/2032 571,725 0.20 USD 380,000 Kenya Government International
Bond 8.25% 28/2/2048 393,181 0.14 2,371,714 0.84
Mexico USD 2,587,000 BBVA Bancomer SA/Texas 4.375%
10/4/2024 2,707,457 0.96 USD 200,000 Comision Federal de Electricidad
4.875% 26/5/2021 207,750 0.07
ESG Emerging Markets Bond Fund continued
Portfolio of Investments 31 August 2019
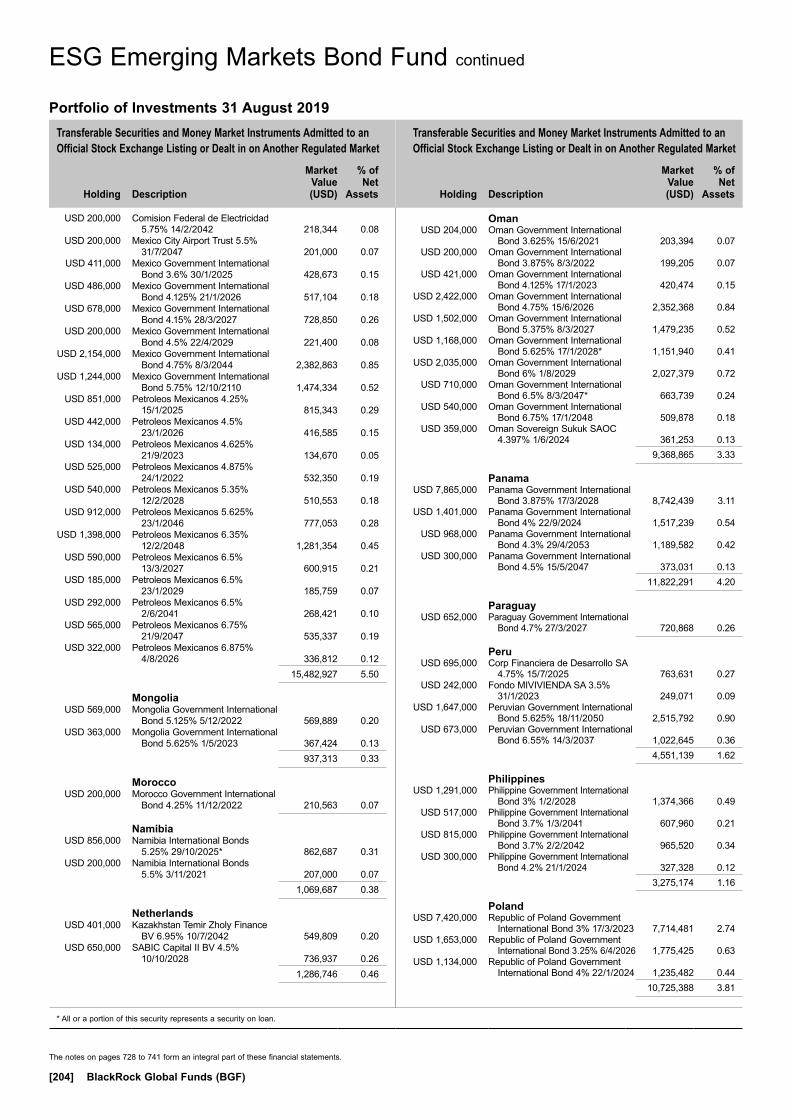
Transferable Securities and Money Market Instruments Admitted to an Official Stock Exchange Listing or Dealt in on Another Regulated Market
Transferable Securities and Money Market Instruments Admitted to an Official Stock Exchange Listing or Dealt in on Another Regulated Market
Holding
Description
Market Value (USD)
% of Net
Assets
Holding
Description
Market Value (USD)
% of Net
Assets
* All or a portion of this security represents a security on loan.
The notes on pages 728 to 741 form an integral part of these financial statements.
[204] BlackRock Global Funds (BGF)
USD 200,000 Comision Federal de Electricidad 5.75% 14/2/2042 218,344 0.08
USD 200,000 Mexico City Airport Trust 5.5% 31/7/2047 201,000 0.07
USD 411,000 Mexico Government International Bond 3.6% 30/1/2025 428,673 0.15
USD 486,000 Mexico Government International Bond 4.125% 21/1/2026 517,104 0.18
USD 678,000 Mexico Government International Bond 4.15% 28/3/2027 728,850 0.26
USD 200,000 Mexico Government International Bond 4.5% 22/4/2029 221,400 0.08
USD 2,154,000 Mexico Government International Bond 4.75% 8/3/2044 2,382,863 0.85
USD 1,244,000 Mexico Government International Bond 5.75% 12/10/2110 1,474,334 0.52
USD 851,000 Petroleos Mexicanos 4.25% 15/1/2025 815,343 0.29
USD 442,000 Petroleos Mexicanos 4.5% 23/1/2026 416,585 0.15
USD 134,000 Petroleos Mexicanos 4.625% 21/9/2023 134,670 0.05
USD 525,000 Petroleos Mexicanos 4.875% 24/1/2022 532,350 0.19
USD 540,000 Petroleos Mexicanos 5.35% 12/2/2028 510,553 0.18
USD 912,000 Petroleos Mexicanos 5.625% 23/1/2046 777,053 0.28
USD 1,398,000 Petroleos Mexicanos 6.35% 12/2/2048 1,281,354 0.45
USD 590,000 Petroleos Mexicanos 6.5% 13/3/2027 600,915 0.21
USD 185,000 Petroleos Mexicanos 6.5% 23/1/2029 185,759 0.07
USD 292,000 Petroleos Mexicanos 6.5% 2/6/2041 268,421 0.10
USD 565,000 Petroleos Mexicanos 6.75% 21/9/2047 535,337 0.19
USD 322,000 Petroleos Mexicanos 6.875% 4/8/2026 336,812 0.12
15,482,927 5.50
Mongolia USD 569,000 Mongolia Government International
Bond 5.125% 5/12/2022 569,889 0.20 USD 363,000 Mongolia Government International
Bond 5.625% 1/5/2023 367,424 0.13 937,313 0.33
Morocco USD 200,000 Morocco Government International
Bond 4.25% 11/12/2022 210,563 0.07
Namibia USD 856,000 Namibia International Bonds
5.25% 29/10/2025* 862,687 0.31 USD 200,000 Namibia International Bonds
5.5% 3/11/2021 207,000 0.07 1,069,687 0.38
Netherlands USD 401,000 Kazakhstan Temir Zholy Finance
BV 6.95% 10/7/2042 549,809 0.20 USD 650,000 SABIC Capital II BV 4.5%
10/10/2028 736,937 0.26 1,286,746 0.46
Oman USD 204,000 Oman Government International
Bond 3.625% 15/6/2021 203,394 0.07 USD 200,000 Oman Government International
Bond 3.875% 8/3/2022 199,205 0.07 USD 421,000 Oman Government International
Bond 4.125% 17/1/2023 420,474 0.15 USD 2,422,000 Oman Government International
Bond 4.75% 15/6/2026 2,352,368 0.84 USD 1,502,000 Oman Government International
Bond 5.375% 8/3/2027 1,479,235 0.52 USD 1,168,000 Oman Government International
Bond 5.625% 17/1/2028* 1,151,940 0.41 USD 2,035,000 Oman Government International
Bond 6% 1/8/2029 2,027,379 0.72 USD 710,000 Oman Government International
Bond 6.5% 8/3/2047* 663,739 0.24 USD 540,000 Oman Government International
Bond 6.75% 17/1/2048 509,878 0.18 USD 359,000 Oman Sovereign Sukuk SAOC
4.397% 1/6/2024 361,253 0.13 9,368,865 3.33
Panama USD 7,865,000 Panama Government International
Bond 3.875% 17/3/2028 8,742,439 3.11 USD 1,401,000 Panama Government International
Bond 4% 22/9/2024 1,517,239 0.54 USD 968,000 Panama Government International
Bond 4.3% 29/4/2053 1,189,582 0.42 USD 300,000 Panama Government International
Bond 4.5% 15/5/2047 373,031 0.13 11,822,291 4.20
Paraguay USD 652,000 Paraguay Government International
Bond 4.7% 27/3/2027 720,868 0.26
Peru USD 695,000 Corp Financiera de Desarrollo SA
4.75% 15/7/2025 763,631 0.27 USD 242,000 Fondo MIVIVIENDA SA 3.5%
31/1/2023 249,071 0.09 USD 1,647,000 Peruvian Government International
Bond 5.625% 18/11/2050 2,515,792 0.90 USD 673,000 Peruvian Government International
Bond 6.55% 14/3/2037 1,022,645 0.36 4,551,139 1.62
Philippines USD 1,291,000 Philippine Government International
Bond 3% 1/2/2028 1,374,366 0.49 USD 517,000 Philippine Government International
Bond 3.7% 1/3/2041 607,960 0.21 USD 815,000 Philippine Government International
Bond 3.7% 2/2/2042 965,520 0.34 USD 300,000 Philippine Government International
Bond 4.2% 21/1/2024 327,328 0.12 3,275,174 1.16
Poland USD 7,420,000 Republic of Poland Government
International Bond 3% 17/3/2023 7,714,481 2.74 USD 1,653,000 Republic of Poland Government
International Bond 3.25% 6/4/2026 1,775,425 0.63 USD 1,134,000 Republic of Poland Government
International Bond 4% 22/1/2024 1,235,482 0.44 10,725,388 3.81
Portfolio of Investments 31 August 2019
ESG Emerging Markets Bond Fund continued
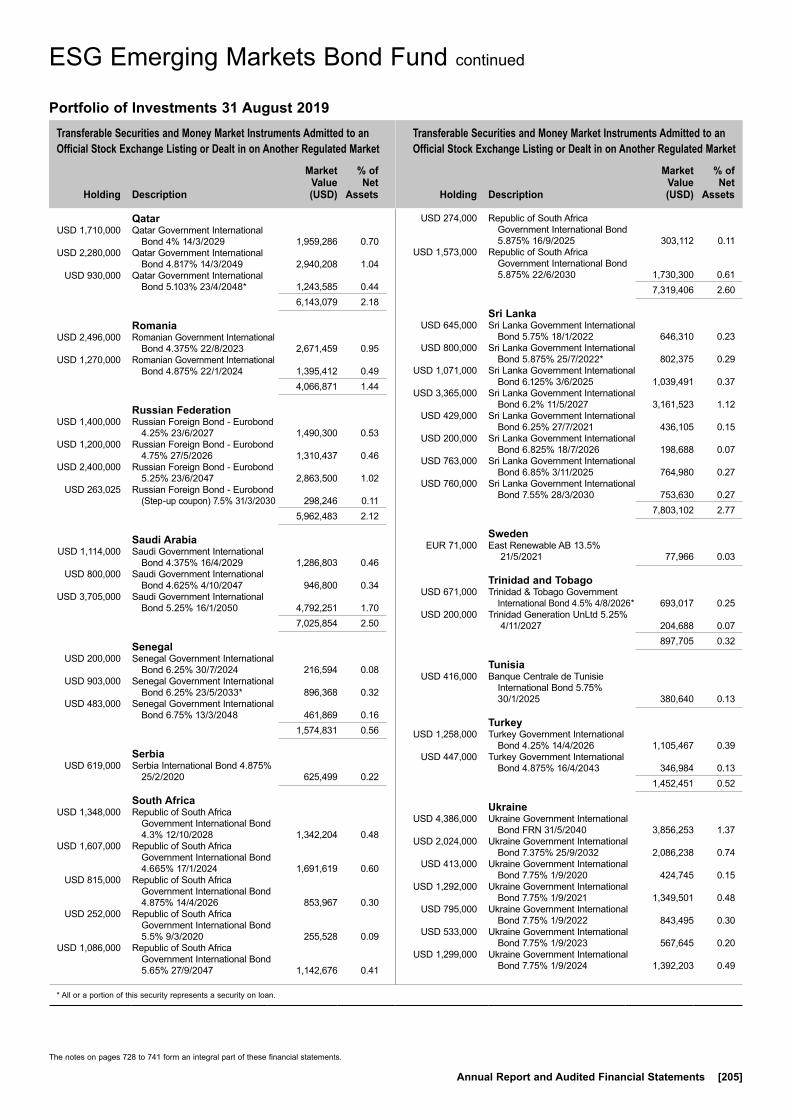
Transferable Securities and Money Market Instruments Admitted to an Official Stock Exchange Listing or Dealt in on Another Regulated Market
Transferable Securities and Money Market Instruments Admitted to an Official Stock Exchange Listing or Dealt in on Another Regulated Market
Holding
Description
Market Value (USD)
% of Net
Assets
Holding
Description
Market Value (USD)
% of Net
Assets
* All or a portion of this security represents a security on loan.
The notes on pages 728 to 741 form an integral part of these financial statements.
Annual Report and Audited Financial Statements [205]
Qatar USD 1,710,000 Qatar Government International
Bond 4% 14/3/2029 1,959,286 0.70 USD 2,280,000 Qatar Government International
Bond 4.817% 14/3/2049 2,940,208 1.04 USD 930,000 Qatar Government International
Bond 5.103% 23/4/2048* 1,243,585 0.44 6,143,079 2.18
Romania USD 2,496,000 Romanian Government International
Bond 4.375% 22/8/2023 2,671,459 0.95 USD 1,270,000 Romanian Government International
Bond 4.875% 22/1/2024 1,395,412 0.49 4,066,871 1.44
Russian Federation USD 1,400,000 Russian Foreign Bond - Eurobond
4.25% 23/6/2027 1,490,300 0.53 USD 1,200,000 Russian Foreign Bond - Eurobond
4.75% 27/5/2026 1,310,437 0.46 USD 2,400,000 Russian Foreign Bond - Eurobond
5.25% 23/6/2047 2,863,500 1.02 USD 263,025 Russian Foreign Bond - Eurobond
(Step-up coupon) 7.5% 31/3/2030 298,246 0.11 5,962,483 2.12
Saudi Arabia USD 1,114,000 Saudi Government International
Bond 4.375% 16/4/2029 1,286,803 0.46 USD 800,000 Saudi Government International
Bond 4.625% 4/10/2047 946,800 0.34 USD 3,705,000 Saudi Government International
Bond 5.25% 16/1/2050 4,792,251 1.70 7,025,854 2.50
Senegal USD 200,000 Senegal Government International
Bond 6.25% 30/7/2024 216,594 0.08 USD 903,000 Senegal Government International
Bond 6.25% 23/5/2033* 896,368 0.32 USD 483,000 Senegal Government International
Bond 6.75% 13/3/2048 461,869 0.16 1,574,831 0.56
Serbia USD 619,000 Serbia International Bond 4.875%
25/2/2020 625,499 0.22
South Africa USD 1,348,000 Republic of South Africa
Government International Bond 4.3% 12/10/2028 1,342,204 0.48
USD 1,607,000 Republic of South Africa Government International Bond 4.665% 17/1/2024 1,691,619 0.60
USD 815,000 Republic of South Africa Government International Bond 4.875% 14/4/2026 853,967 0.30
USD 252,000 Republic of South Africa Government International Bond 5.5% 9/3/2020 255,528 0.09
USD 1,086,000 Republic of South Africa Government International Bond 5.65% 27/9/2047 1,142,676 0.41
USD 274,000 Republic of South Africa Government International Bond 5.875% 16/9/2025 303,112 0.11
USD 1,573,000 Republic of South Africa Government International Bond 5.875% 22/6/2030 1,730,300 0.61
7,319,406 2.60
Sri Lanka USD 645,000 Sri Lanka Government International
Bond 5.75% 18/1/2022 646,310 0.23 USD 800,000 Sri Lanka Government International
Bond 5.875% 25/7/2022* 802,375 0.29 USD 1,071,000 Sri Lanka Government International
Bond 6.125% 3/6/2025 1,039,491 0.37 USD 3,365,000 Sri Lanka Government International
Bond 6.2% 11/5/2027 3,161,523 1.12 USD 429,000 Sri Lanka Government International
Bond 6.25% 27/7/2021 436,105 0.15 USD 200,000 Sri Lanka Government International
Bond 6.825% 18/7/2026 198,688 0.07 USD 763,000 Sri Lanka Government International
Bond 6.85% 3/11/2025 764,980 0.27 USD 760,000 Sri Lanka Government International
Bond 7.55% 28/3/2030 753,630 0.27 7,803,102 2.77
Sweden EUR 71,000 East Renewable AB 13.5%
21/5/2021 77,966 0.03
Trinidad and Tobago USD 671,000 Trinidad & Tobago Government
International Bond 4.5% 4/8/2026* 693,017 0.25 USD 200,000 Trinidad Generation UnLtd 5.25%
4/11/2027 204,688 0.07 897,705 0.32
Tunisia USD 416,000 Banque Centrale de Tunisie
International Bond 5.75% 30/1/2025 380,640 0.13
Turkey USD 1,258,000 Turkey Government International
Bond 4.25% 14/4/2026 1,105,467 0.39 USD 447,000 Turkey Government International
Bond 4.875% 16/4/2043 346,984 0.13 1,452,451 0.52
Ukraine USD 4,386,000 Ukraine Government International
Bond FRN 31/5/2040 3,856,253 1.37 USD 2,024,000 Ukraine Government International
Bond 7.375% 25/9/2032 2,086,238 0.74 USD 413,000 Ukraine Government International
Bond 7.75% 1/9/2020 424,745 0.15 USD 1,292,000 Ukraine Government International
Bond 7.75% 1/9/2021 1,349,501 0.48 USD 795,000 Ukraine Government International
Bond 7.75% 1/9/2022 843,495 0.30 USD 533,000 Ukraine Government International
Bond 7.75% 1/9/2023 567,645 0.20 USD 1,299,000 Ukraine Government International
Bond 7.75% 1/9/2024 1,392,203 0.49
ESG Emerging Markets Bond Fund continued
Portfolio of Investments 31 August 2019

Transferable Securities and Money Market Instruments Admitted to an Official Stock Exchange Listing or Dealt in on Another Regulated Market
Transferable Securities and Money Market Instruments Admitted to an Official Stock Exchange Listing or Dealt in on Another Regulated Market
Holding
Description
Market Value (USD)
% of Net
Assets
Holding
Description
Market Value (USD)
% of Net
Assets
* All or a portion of this security represents a security on loan.
The notes on pages 728 to 741 form an integral part of these financial statements.
[206] BlackRock Global Funds (BGF)
USD 1,760,000 Ukraine Government International Bond 7.75% 1/9/2025* 1,872,649 0.67
USD 920,000 Ukraine Government International Bond 7.75% 1/9/2027* 977,500 0.35
13,370,229 4.75
United Arab Emirates USD 1,160,000 Abu Dhabi Crude Oil Pipeline LLC
4.6% 2/11/2047 1,442,025 0.51 USD 768,000 DP World Plc 5.625% 25/9/2048 918,120 0.33 2,360,145 0.84
United Kingdom USD 227,000 Ukreximbank Via Biz Finance Plc
9.625% 27/4/2022 237,840 0.08 USD 294,000 Ukreximbank Via Biz Finance Plc
9.75% 22/1/2025 311,640 0.11 549,480 0.19
Uruguay USD 288,400 Uruguay Government International
Bond 4.125% 20/11/2045 318,817 0.11 USD 4,210,000 Uruguay Government International
Bond 4.375% 27/10/2027 4,674,416 1.66
USD 954,900 Uruguay Government International Bond 4.975% 20/4/2055 1,173,483 0.42
USD 3,771,300 Uruguay Government International Bond 5.1% 18/6/2050 4,681,715 1.66
10,848,431 3.85
Zambia USD 339,000 Zambia Government International
Bond 5.375% 20/9/2022 223,264 0.08 USD 3,425,000 Zambia Government International
Bond 8.5% 14/4/2024 2,316,156 0.82 USD 1,840,000 Zambia Government International
Bond 8.97% 30/7/2027 1,234,525 0.44 3,773,945 1.34Total Bonds 259,305,283 92.09Total Transferable Securities and Money Market Instruments Admitted to an Official Stock Exchange Listing or Dealt in on Another Regulated Market 259,305,283 92.09Total Portfolio 259,305,283 92.09
Other Net Assets 22,259,846 7.91Total Net Assets (USD) 281,565,129 100.00
Portfolio of Investments 31 August 2019
ESG Emerging Markets Bond Fund continued
Swaps as at 31 August 2019
TypeNominal
Value Description Counterparty
Expiration date
Unrealised appreciation/
(depreciation) USD
Market Value USD
CDS USD 3,000,000 Fund receives default protection on Turkey Government International Bond; and pays Fixed 1% Bank of America 20/6/2024 16,883 406,457
CDS USD 2,817,000 Fund receives default protection on Brazilian Government International Bond; and pays Fixed 1% Bank of America 20/6/2024 (39,597) 42,987
CDS USD 1,150,000 Fund receives default protection on Turkey Government International Bond; and pays Fixed 1% Bank of America 20/6/2024 2,514 155,808
CDS USD 750,000 Fund receives default protection on Turkey Government International Bond; and pays Fixed 1% Barclays 20/6/2024 7,439 101,614
CDS USD 4,031,000 Fund receives default protection on Turkey Government International Bond; and pays Fixed 1% Barclays 20/6/2024 173,815 546,143
CDS USD 2,250,000 Fund receives default protection on Turkey Government International Bond; and pays Fixed 1% JP Morgan 20/6/2024 39,461 304,843
CDS USD 1,600,000 Fund receives default protection on Turkey Government International Bond; and pays Fixed 1% Morgan Stanley 20/6/2024 782 216,777
Total (USD underlying exposure - USD 17,930,423) 201,297 1,774,629
CDS: Credit Default Swaps

The notes on pages 728 to 741 form an integral part of these financial statements.
Annual Report and Audited Financial Statements [207]
Open Forward Foreign Exchange Contracts as at 31 August 2019
Currency
Purchases
Currency
Sales CounterpartyMaturity
date
Unrealised appreciation/
(depreciation) USD
EUR 510,000 USD 565,160 Goldman Sachs 23/9/2019 (923)USD 288,690 EUR 260,000 JP Morgan 23/9/2019 1,040JPY 584,950,000 USD 5,513,993 BNP Paribas 24/9/2019 5,506RUB 46,902,000 USD 710,133 Barclays 24/9/2019 (6,414)USD 2,821,102 JPY 300,490,000 RBS Plc 24/9/2019 (14,275)USD 2,695,087 JPY 284,460,000 JP Morgan 24/9/2019 10,965Net unrealised depreciation (4,101)
CHF Hedged Share Class
CHF 25,819 USD 26,600 BNY Mellon 12/9/2019 (437)USD 539 CHF 523 BNY Mellon 12/9/2019 9Net unrealised depreciation (428)
EUR Hedged Share Class
EUR 233,132,511 USD 261,597,910 BNY Mellon 12/9/2019 (3,890,038)USD 4,265,230 EUR 3,800,270 BNY Mellon 12/9/2019 64,358Net unrealised depreciation (3,825,680)
Total net unrealised depreciation (USD underlying exposure - USD 274,322,124) (3,830,209)
ESG Emerging Markets Bond Fund continued
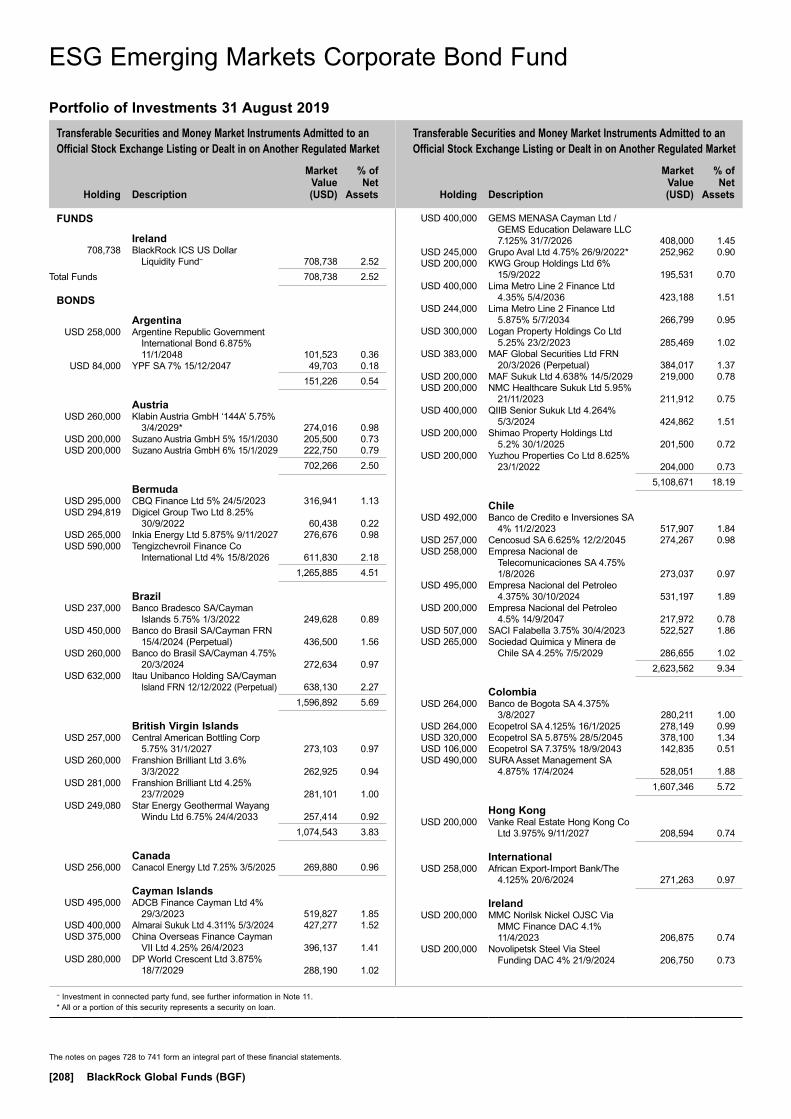
Transferable Securities and Money Market Instruments Admitted to an Official Stock Exchange Listing or Dealt in on Another Regulated Market
Transferable Securities and Money Market Instruments Admitted to an Official Stock Exchange Listing or Dealt in on Another Regulated Market
Holding
Description
Market Value (USD)
% of Net
Assets
Holding
Description
Market Value (USD)
% of Net
Assets
~ Investment in connected party fund, see further information in Note 11.* All or a portion of this security represents a security on loan.
The notes on pages 728 to 741 form an integral part of these financial statements.
[208] BlackRock Global Funds (BGF)
FUNDS
Ireland 708,738 BlackRock ICS US Dollar
Liquidity Fund~ 708,738 2.52Total Funds 708,738 2.52
BONDS
Argentina USD 258,000 Argentine Republic Government
International Bond 6.875% 11/1/2048 101,523 0.36
USD 84,000 YPF SA 7% 15/12/2047 49,703 0.18 151,226 0.54
Austria USD 260,000 Klabin Austria GmbH ‘144A’ 5.75%
3/4/2029* 274,016 0.98 USD 200,000 Suzano Austria GmbH 5% 15/1/2030 205,500 0.73 USD 200,000 Suzano Austria GmbH 6% 15/1/2029 222,750 0.79 702,266 2.50
Bermuda USD 295,000 CBQ Finance Ltd 5% 24/5/2023 316,941 1.13 USD 294,819 Digicel Group Two Ltd 8.25%
30/9/2022 60,438 0.22 USD 265,000 Inkia Energy Ltd 5.875% 9/11/2027 276,676 0.98 USD 590,000 Tengizchevroil Finance Co
International Ltd 4% 15/8/2026 611,830 2.18 1,265,885 4.51
Brazil USD 237,000 Banco Bradesco SA/Cayman
Islands 5.75% 1/3/2022 249,628 0.89 USD 450,000 Banco do Brasil SA/Cayman FRN
15/4/2024 (Perpetual) 436,500 1.56 USD 260,000 Banco do Brasil SA/Cayman 4.75%
20/3/2024 272,634 0.97 USD 632,000 Itau Unibanco Holding SA/Cayman
Island FRN 12/12/2022 (Perpetual) 638,130 2.27 1,596,892 5.69
British Virgin Islands USD 257,000 Central American Bottling Corp
5.75% 31/1/2027 273,103 0.97 USD 260,000 Franshion Brilliant Ltd 3.6%
3/3/2022 262,925 0.94 USD 281,000 Franshion Brilliant Ltd 4.25%
23/7/2029 281,101 1.00 USD 249,080 Star Energy Geothermal Wayang
Windu Ltd 6.75% 24/4/2033 257,414 0.92 1,074,543 3.83
Canada USD 256,000 Canacol Energy Ltd 7.25% 3/5/2025 269,880 0.96
Cayman Islands USD 495,000 ADCB Finance Cayman Ltd 4%
29/3/2023 519,827 1.85 USD 400,000 Almarai Sukuk Ltd 4.311% 5/3/2024 427,277 1.52 USD 375,000 China Overseas Finance Cayman
VII Ltd 4.25% 26/4/2023 396,137 1.41 USD 280,000 DP World Crescent Ltd 3.875%
18/7/2029 288,190 1.02
USD 400,000 GEMS MENASA Cayman Ltd / GEMS Education Delaware LLC 7.125% 31/7/2026 408,000 1.45
USD 245,000 Grupo Aval Ltd 4.75% 26/9/2022* 252,962 0.90 USD 200,000 KWG Group Holdings Ltd 6%
15/9/2022 195,531 0.70 USD 400,000 Lima Metro Line 2 Finance Ltd
4.35% 5/4/2036 423,188 1.51 USD 244,000 Lima Metro Line 2 Finance Ltd
5.875% 5/7/2034 266,799 0.95 USD 300,000 Logan Property Holdings Co Ltd
5.25% 23/2/2023 285,469 1.02 USD 383,000 MAF Global Securities Ltd FRN
20/3/2026 (Perpetual) 384,017 1.37 USD 200,000 MAF Sukuk Ltd 4.638% 14/5/2029 219,000 0.78 USD 200,000 NMC Healthcare Sukuk Ltd 5.95%
21/11/2023 211,912 0.75 USD 400,000 QIIB Senior Sukuk Ltd 4.264%
5/3/2024 424,862 1.51 USD 200,000 Shimao Property Holdings Ltd
5.2% 30/1/2025 201,500 0.72 USD 200,000 Yuzhou Properties Co Ltd 8.625%
23/1/2022 204,000 0.73 5,108,671 18.19
Chile USD 492,000 Banco de Credito e Inversiones SA
4% 11/2/2023 517,907 1.84 USD 257,000 Cencosud SA 6.625% 12/2/2045 274,267 0.98 USD 258,000 Empresa Nacional de
Telecomunicaciones SA 4.75% 1/8/2026 273,037 0.97
USD 495,000 Empresa Nacional del Petroleo 4.375% 30/10/2024 531,197 1.89
USD 200,000 Empresa Nacional del Petroleo 4.5% 14/9/2047 217,972 0.78
USD 507,000 SACI Falabella 3.75% 30/4/2023 522,527 1.86 USD 265,000 Sociedad Quimica y Minera de
Chile SA 4.25% 7/5/2029 286,655 1.02 2,623,562 9.34
Colombia USD 264,000 Banco de Bogota SA 4.375%
3/8/2027 280,211 1.00 USD 264,000 Ecopetrol SA 4.125% 16/1/2025 278,149 0.99 USD 320,000 Ecopetrol SA 5.875% 28/5/2045 378,100 1.34 USD 106,000 Ecopetrol SA 7.375% 18/9/2043 142,835 0.51 USD 490,000 SURA Asset Management SA
4.875% 17/4/2024 528,051 1.88 1,607,346 5.72
Hong Kong USD 200,000 Vanke Real Estate Hong Kong Co
Ltd 3.975% 9/11/2027 208,594 0.74
International USD 258,000 African Export-Import Bank/The
4.125% 20/6/2024 271,263 0.97
Ireland USD 200,000 MMC Norilsk Nickel OJSC Via
MMC Finance DAC 4.1% 11/4/2023 206,875 0.74
USD 200,000 Novolipetsk Steel Via Steel Funding DAC 4% 21/9/2024 206,750 0.73
ESG Emerging Markets Corporate Bond Fund
Portfolio of Investments 31 August 2019
ESG Emerging Markets Corporate Bond Fund

Transferable Securities and Money Market Instruments Admitted to an Official Stock Exchange Listing or Dealt in on Another Regulated Market
Transferable Securities and Money Market Instruments Admitted to an Official Stock Exchange Listing or Dealt in on Another Regulated Market
Holding
Description
Market Value (USD)
% of Net
Assets
Holding
Description
Market Value (USD)
% of Net
Assets
* All or a portion of this security represents a security on loan.
The notes on pages 728 to 741 form an integral part of these financial statements.
Annual Report and Audited Financial Statements [209]
USD 200,000 Novolipetsk Steel Via Steel Funding DAC 4.7% 30/5/2026 214,125 0.76
USD 200,000 Phosagro OAO Via Phosagro Bond Funding DAC 3.949% 24/4/2023 204,750 0.73
832,500 2.96
Luxembourg USD 300,000 CSN Resources SA 7.625%
17/4/2026* 304,172 1.08 USD 235,000 Gilex Holding Sarl 8.5% 2/5/2023 251,744 0.90 USD 200,000 Klabin Finance SA 4.875%
19/9/2027 202,906 0.72 USD 350,000 Millicom International Cellular SA
6.25% 25/3/2029 381,883 1.36 1,140,705 4.06
Mauritius USD 345,000 Greenko Solar Mauritius Ltd 5.95%
29/7/2026 344,073 1.22
Mexico USD 200,000 America Movil SAB de CV 3.625%
22/4/2029 216,156 0.77 USD 200,000 America Movil SAB de CV 4.375%
22/4/2049 237,688 0.85 USD 265,000 Banco Inbursa SA Institucion De
Banca Multiple Grupo Financiero Inbursa 4.125% 6/6/2024 272,080 0.97
USD 273,000 Banco Inbursa SA Institucion De Banca Multiple Grupo Financiero Inbursa 4.375% 11/4/2027 278,076 0.99
USD 275,000 Banco Mercantil del Norte SA/Grand Cayman FRN 27/9/2024 (Perpetual) 273,023 0.97
USD 475,000 Banco Mercantil del Norte SA/Grand Cayman FRN 27/6/2029 (Perpetual) 476,187 1.70
USD 322,000 Coca-Cola Femsa SAB de CV 5.25% 26/11/2043 421,468 1.50
USD 367,000 Gruma SAB de CV 4.875% 1/12/2024 394,697 1.40
USD 373,000 Grupo Bimbo SAB de CV FRN 17/4/2023 (Perpetual) 391,184 1.39
USD 277,000 Mexico City Airport Trust 5.5% 31/10/2046 277,866 0.99
USD 300,000 PLA Administradora Industrial S de RL de CV 4.962% 18/7/2029 303,563 1.08
USD 200,000 Trust F/1401 4.869% 15/1/2030 204,250 0.73 3,746,238 13.34
Netherlands USD 275,000 Braskem Netherlands Finance BV
4.5% 10/1/2028 275,193 0.98 USD 200,000 Lukoil International Finance BV
4.75% 2/11/2026 217,750 0.78 USD 258,000 Sigma Finance Netherlands BV
4.875% 27/3/2028 273,480 0.97 USD 125,000 Teva Pharmaceutical Finance
Netherlands III BV 4.1% 1/10/2046 81,621 0.29 848,044 3.02
Panama USD 393,000 Banistmo SA 3.65% 19/9/2022* 395,579 1.41 USD 271,000 Intercorp Financial Services Inc
4.125% 19/10/2027 280,485 1.00 676,064 2.41
Paraguay USD 305,000 Telefonica Celular del Paraguay
SA 5.875% 15/4/2027 325,063 1.16
Peru USD 372,000 Banco de Credito del Peru 4.25%
1/4/2023 392,402 1.40 USD 233,000 Banco de Credito del Peru/Panama
FRN 24/4/2027 251,385 0.89 USD 241,000 Corp Financiera de Desarrollo SA
4.75% 15/7/2025 264,799 0.94 908,586 3.23
South Africa USD 366,000 Growthpoint Properties
International Pty Ltd 5.872% 2/5/2023 391,963 1.40
South Korea USD 200,000 Korea Gas Corp 2.75% 20/7/2022 203,500 0.72
Turkey USD 200,000 Tupras Turkiye Petrol Rafinerileri
AS 4.5% 18/10/2024 183,939 0.65 USD 255,000 Turk Telekomunikasyon AS
6.875% 28/2/2025 260,459 0.93 USD 200,000 Turkiye Garanti Bankasi AS
5.875% 16/3/2023 195,656 0.70 USD 400,000 Turkiye Sise ve Cam Fabrikalari AS
6.95% 14/3/2026 400,625 1.42 1,040,679 3.70
United Arab Emirates USD 400,000 Oztel Holdings SPC Ltd 6.625%
24/4/2028 403,000 1.43
United Kingdom USD 200,000 Evraz Plc 5.25% 2/4/2024 214,600 0.77 USD 200,000 Evraz Plc 5.375% 20/3/2023 214,000 0.76 428,600 1.53
United States USD 250,000 Reliance Holding USA Inc 5.4%
14/2/2022 266,680 0.95Total Bonds 26,435,823 94.12Total Transferable Securities and Money Market Instruments Admitted to an Official Stock Exchange Listing or Dealt in on Another Regulated Market 27,144,561 96.64Total Portfolio 27,144,561 96.64
Other Net Assets 944,513 3.36Total Net Assets (USD) 28,089,074 100.00
ESG Emerging Markets Corporate Bond Fund continued
Portfolio of Investments 31 August 2019

The notes on pages 728 to 741 form an integral part of these financial statements.
[210] BlackRock Global Funds (BGF)
ESG Emerging Markets Corporate Bond Fund continued
Open Forward Foreign Exchange Contracts as at 31 August 2019
Currency
Purchases
Currency
Sales CounterpartyMaturity
date
Unrealised appreciation/
(depreciation) USD
CHF Hedged Share Class
CHF 5,261 USD 5,420 BNY Mellon 12/9/2019 (89)Net unrealised depreciation (89)
EUR Hedged Share Class
EUR 216,349 USD 243,013 BNY Mellon 12/9/2019 (3,857)USD 1,465 EUR 1,313 BNY Mellon 12/9/2019 13Net unrealised depreciation (3,844)
Total net unrealised depreciation (USD underlying exposure - USD 245,757) (3,933)
Swaps as at 31 August 2019
TypeNominal
Value Description Counterparty
Expiration date
Unrealised depreciation
USD
Market Value USD
CDS USD 254,233 Fund receives default protection on Mexico Government International Bond; and pays Fixed 1% Bank of America 20/12/2023 (5,191) 192
CDS USD 424,224 Fund receives default protection on Brazilian Government International Bond; and pays Fixed 1% Bank of America 20/6/2024 (1,320) 6,474
CDS USD 540,000 Fund receives default protection on Mexico Government International Bond; and pays Fixed 1% Barclays 20/6/2024 (1,724) 2,894
CDS USD 129,428 Fund receives default protection on Mexico Government International Bond; and pays Fixed 1% JP Morgan 20/12/2023 (2,249) 98
CDS USD 136,649 Fund receives default protection on Mexico Government International Bond; and pays Fixed 1% JP Morgan 20/6/2024 (724) 732
Total (USD underlying exposure - USD 1,583,571) (11,208) 10,390
CDS: Credit Default Swaps

Transferable Securities and Money Market Instruments Admitted to an Official Stock Exchange Listing or Dealt in on Another Regulated Market
Transferable Securities and Money Market Instruments Admitted to an Official Stock Exchange Listing or Dealt in on Another Regulated Market
Holding
Description
Market Value (USD)
% of Net
Assets
Holding
Description
Market Value (USD)
% of Net
Assets
The notes on pages 728 to 741 form an integral part of these financial statements.
Annual Report and Audited Financial Statements [211]
BONDS
Brazil BRL 54,520 Brazil Letras do Tesouro Nacional
1/7/2021 (Zero Coupon) 1,182,376 0.45 BRL 49,430 Brazil Letras do Tesouro Nacional
1/1/2022 (Zero Coupon) 1,033,494 0.39 BRL 154,200 Brazil Notas do Tesouro Nacional
Serie F 10% 1/1/2021 3,975,072 1.51 BRL 339,340 Brazil Notas do Tesouro Nacional
Serie F 10% 1/1/2023 9,066,135 3.45 BRL 143,960 Brazil Notas do Tesouro Nacional
Serie F 10% 1/1/2025 3,958,602 1.51 BRL 186,350 Brazil Notas do Tesouro Nacional
Serie F 10% 1/1/2027 5,212,375 1.98 BRL 43,670 Brazil Notas do Tesouro Nacional
Serie F 10% 1/1/2029 1,221,154 0.46 25,649,208 9.75
Chile CLP 1,315,000,000 Bonos de la Tesoreria de la
Republica en pesos ‘144A’ 4% 1/3/2023 1,937,627 0.74
CLP 470,000,000 Bonos de la Tesoreria de la Republica en pesos 4.5% 1/3/2021 678,436 0.26
CLP 1,710,000,000 Bonos de la Tesoreria de la Republica en pesos 4.5% 1/3/2026 2,660,601 1.01
CLP 1,775,000,000 Bonos de la Tesoreria de la Republica en pesos 5% 1/3/2035 3,155,647 1.20
CLP 1,570,000,000 Bonos de la Tesoreria de la Republica en pesos 6% 1/1/2043 3,350,282 1.27
11,782,593 4.48
Colombia COP 11,335,900,000 Colombian TES 6% 28/4/2028 3,327,552 1.27 COP 704,400,000 Colombian TES 6.25%
26/11/2025 213,522 0.08 COP 5,137,500,000 Colombian TES 7% 4/5/2022 1,579,683 0.60 COP 7,966,500,000 Colombian TES 7% 30/6/2032 2,478,733 0.94 COP 2,029,800,000 Colombian TES 7.25%
18/10/2034 644,012 0.24 COP 11,617,400,000 Colombian TES 7.5% 26/8/2026 3,753,332 1.43 COP 3,918,600,000 Colombian TES 7.75% 18/9/2030 1,293,156 0.49 COP 11,315,100,000 Colombian TES 10% 24/7/2024 3,976,961 1.51 17,266,951 6.56
Czech Republic CZK 152,780,000 Czech Republic Government
Bond 0.95% 15/5/2030 6,408,790 2.43 CZK 66,370,000 Czech Republic Government
Bond 1% 26/6/2026 2,833,512 1.08 CZK 7,170,000 Czech Republic Government
Bond 2% 13/10/2033 337,564 0.13 CZK 15,860,000 Czech Republic Government
Bond 2.4% 17/9/2025 731,480 0.28 CZK 26,720,000 Czech Republic Government
Bond 2.5% 25/8/2028 1,267,340 0.48 CZK 61,090,000 Czech Republic Government
Bond 2.75% 23/7/2029 3,019,186 1.15 14,597,872 5.55
Hungary HUF 1,299,020,000 Hungary Government Bond
0.5% 21/4/2021 4,360,758 1.66 HUF 394,160,000 Hungary Government Bond
1.75% 26/10/2022 1,366,574 0.52 HUF 348,400,000 Hungary Government Bond
2.5% 24/10/2024 1,252,365 0.48 HUF 272,380,000 Hungary Government Bond
2.75% 22/12/2026 996,622 0.38 HUF 1,453,340,000 Hungary Government Bond
3% 26/6/2024 5,334,668 2.03 HUF 581,040,000 Hungary Government Bond
3% 27/10/2027 2,163,264 0.82 HUF 6,030,000 Hungary Government Bond
3% 21/8/2030 22,291 0.01 HUF 558,520,000 Hungary Government Bond
5.5% 24/6/2025 2,321,707 0.88 HUF 225,970,000 Hungary Government Bond
6.75% 22/10/2028 1,079,267 0.41 HUF 739,950,000 Hungary Government Bond
7% 24/6/2022 2,929,020 1.11 21,826,536 8.30
Indonesia IDR 17,712,000,000 Indonesia Treasury Bond
6.125% 15/5/2028 1,149,376 0.44 IDR 8,877,000,000 Indonesia Treasury Bond
7% 15/5/2027 614,224 0.23 IDR 11,121,000,000 Indonesia Treasury Bond
7.5% 15/8/2032 767,533 0.29 IDR 4,088,000,000 Indonesia Treasury Bond
7.5% 15/5/2038 279,546 0.11 IDR 26,247,000,000 Indonesia Treasury Bond
8.25% 15/5/2029 1,969,681 0.75 IDR 15,639,000,000 Indonesia Treasury Bond
8.25% 15/5/2036 1,146,419 0.44 IDR 34,954,000,000 Indonesia Treasury Bond
8.375% 15/3/2024 2,618,162 0.99 IDR 9,773,000,000 Indonesia Treasury Bond
8.375% 15/9/2026 731,059 0.28 IDR 16,191,000,000 Indonesia Treasury Bond
8.375% 15/3/2034 1,204,765 0.46 IDR 12,316,000,000 Indonesia Treasury Bond
8.375% 15/4/2039 911,653 0.35 IDR 15,957,000,000 Indonesia Treasury Bond
8.75% 15/5/2031 1,217,726 0.46 IDR 16,260,000,000 Indonesia Treasury Bond
9% 15/3/2029 1,262,056 0.48 IDR 15,595,000,000 Indonesia Treasury Bond
9.5% 15/7/2031 1,247,820 0.47 IDR 3,040,000,000 Indonesia Treasury Bond
10.5% 15/8/2030 258,459 0.10 IDR 11,973,000,000 Indonesia Treasury Bond
11% 15/9/2025 1,003,377 0.38 16,381,856 6.23
International UAH 23,100,000 European Bank for Reconstruction
& Development 16.95% 3/4/2020 917,081 0.35
UAH 22,300,000 International Finance Corp 15.75% 13/5/2020 888,093 0.34
1,805,174 0.69
ESG Emerging Markets Local Currency Bond Fund
Portfolio of Investments 31 August 2019
ESG Emerging Markets Local Currency Bond Fund
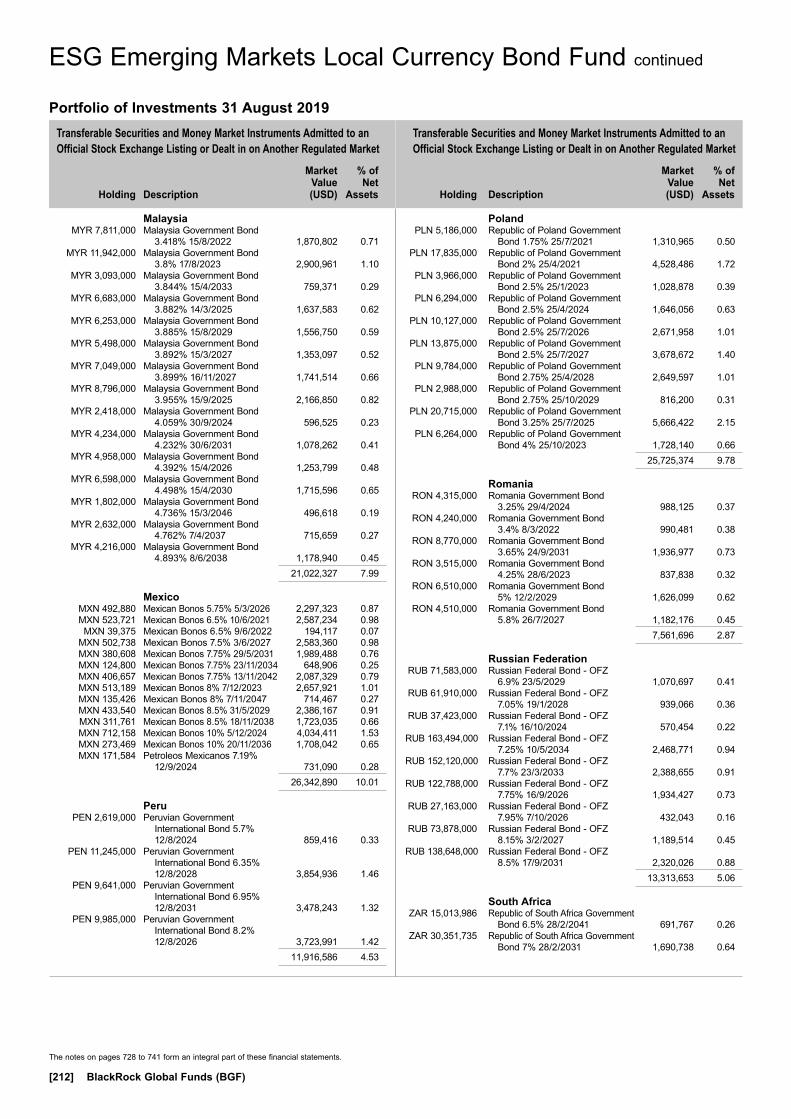
Transferable Securities and Money Market Instruments Admitted to an Official Stock Exchange Listing or Dealt in on Another Regulated Market
Transferable Securities and Money Market Instruments Admitted to an Official Stock Exchange Listing or Dealt in on Another Regulated Market
Holding
Description
Market Value (USD)
% of Net
Assets
Holding
Description
Market Value (USD)
% of Net
Assets
The notes on pages 728 to 741 form an integral part of these financial statements.
[212] BlackRock Global Funds (BGF)
Malaysia MYR 7,811,000 Malaysia Government Bond
3.418% 15/8/2022 1,870,802 0.71 MYR 11,942,000 Malaysia Government Bond
3.8% 17/8/2023 2,900,961 1.10 MYR 3,093,000 Malaysia Government Bond
3.844% 15/4/2033 759,371 0.29 MYR 6,683,000 Malaysia Government Bond
3.882% 14/3/2025 1,637,583 0.62 MYR 6,253,000 Malaysia Government Bond
3.885% 15/8/2029 1,556,750 0.59 MYR 5,498,000 Malaysia Government Bond
3.892% 15/3/2027 1,353,097 0.52 MYR 7,049,000 Malaysia Government Bond
3.899% 16/11/2027 1,741,514 0.66 MYR 8,796,000 Malaysia Government Bond
3.955% 15/9/2025 2,166,850 0.82 MYR 2,418,000 Malaysia Government Bond
4.059% 30/9/2024 596,525 0.23 MYR 4,234,000 Malaysia Government Bond
4.232% 30/6/2031 1,078,262 0.41 MYR 4,958,000 Malaysia Government Bond
4.392% 15/4/2026 1,253,799 0.48 MYR 6,598,000 Malaysia Government Bond
4.498% 15/4/2030 1,715,596 0.65 MYR 1,802,000 Malaysia Government Bond
4.736% 15/3/2046 496,618 0.19 MYR 2,632,000 Malaysia Government Bond
4.762% 7/4/2037 715,659 0.27 MYR 4,216,000 Malaysia Government Bond
4.893% 8/6/2038 1,178,940 0.45 21,022,327 7.99
Mexico MXN 492,880 Mexican Bonos 5.75% 5/3/2026 2,297,323 0.87 MXN 523,721 Mexican Bonos 6.5% 10/6/2021 2,587,234 0.98 MXN 39,375 Mexican Bonos 6.5% 9/6/2022 194,117 0.07 MXN 502,738 Mexican Bonos 7.5% 3/6/2027 2,583,360 0.98 MXN 380,608 Mexican Bonos 7.75% 29/5/2031 1,989,488 0.76 MXN 124,800 Mexican Bonos 7.75% 23/11/2034 648,906 0.25 MXN 406,657 Mexican Bonos 7.75% 13/11/2042 2,087,329 0.79 MXN 513,189 Mexican Bonos 8% 7/12/2023 2,657,921 1.01 MXN 135,426 Mexican Bonos 8% 7/11/2047 714,467 0.27 MXN 433,540 Mexican Bonos 8.5% 31/5/2029 2,386,167 0.91 MXN 311,761 Mexican Bonos 8.5% 18/11/2038 1,723,035 0.66 MXN 712,158 Mexican Bonos 10% 5/12/2024 4,034,411 1.53 MXN 273,469 Mexican Bonos 10% 20/11/2036 1,708,042 0.65 MXN 171,584 Petroleos Mexicanos 7.19%
12/9/2024 731,090 0.28 26,342,890 10.01
Peru PEN 2,619,000 Peruvian Government
International Bond 5.7% 12/8/2024 859,416 0.33
PEN 11,245,000 Peruvian Government International Bond 6.35% 12/8/2028 3,854,936 1.46
PEN 9,641,000 Peruvian Government International Bond 6.95% 12/8/2031 3,478,243 1.32
PEN 9,985,000 Peruvian Government International Bond 8.2% 12/8/2026 3,723,991 1.42
11,916,586 4.53
Poland PLN 5,186,000 Republic of Poland Government
Bond 1.75% 25/7/2021 1,310,965 0.50 PLN 17,835,000 Republic of Poland Government
Bond 2% 25/4/2021 4,528,486 1.72 PLN 3,966,000 Republic of Poland Government
Bond 2.5% 25/1/2023 1,028,878 0.39 PLN 6,294,000 Republic of Poland Government
Bond 2.5% 25/4/2024 1,646,056 0.63 PLN 10,127,000 Republic of Poland Government
Bond 2.5% 25/7/2026 2,671,958 1.01 PLN 13,875,000 Republic of Poland Government
Bond 2.5% 25/7/2027 3,678,672 1.40 PLN 9,784,000 Republic of Poland Government
Bond 2.75% 25/4/2028 2,649,597 1.01 PLN 2,988,000 Republic of Poland Government
Bond 2.75% 25/10/2029 816,200 0.31 PLN 20,715,000 Republic of Poland Government
Bond 3.25% 25/7/2025 5,666,422 2.15 PLN 6,264,000 Republic of Poland Government
Bond 4% 25/10/2023 1,728,140 0.66 25,725,374 9.78
Romania RON 4,315,000 Romania Government Bond
3.25% 29/4/2024 988,125 0.37 RON 4,240,000 Romania Government Bond
3.4% 8/3/2022 990,481 0.38 RON 8,770,000 Romania Government Bond
3.65% 24/9/2031 1,936,977 0.73 RON 3,515,000 Romania Government Bond
4.25% 28/6/2023 837,838 0.32 RON 6,510,000 Romania Government Bond
5% 12/2/2029 1,626,099 0.62 RON 4,510,000 Romania Government Bond
5.8% 26/7/2027 1,182,176 0.45 7,561,696 2.87
Russian Federation RUB 71,583,000 Russian Federal Bond - OFZ
6.9% 23/5/2029 1,070,697 0.41 RUB 61,910,000 Russian Federal Bond - OFZ
7.05% 19/1/2028 939,066 0.36 RUB 37,423,000 Russian Federal Bond - OFZ
7.1% 16/10/2024 570,454 0.22 RUB 163,494,000 Russian Federal Bond - OFZ
7.25% 10/5/2034 2,468,771 0.94 RUB 152,120,000 Russian Federal Bond - OFZ
7.7% 23/3/2033 2,388,655 0.91 RUB 122,788,000 Russian Federal Bond - OFZ
7.75% 16/9/2026 1,934,427 0.73 RUB 27,163,000 Russian Federal Bond - OFZ
7.95% 7/10/2026 432,043 0.16 RUB 73,878,000 Russian Federal Bond - OFZ
8.15% 3/2/2027 1,189,514 0.45 RUB 138,648,000 Russian Federal Bond - OFZ
8.5% 17/9/2031 2,320,026 0.88 13,313,653 5.06
South Africa ZAR 15,013,986 Republic of South Africa Government
Bond 6.5% 28/2/2041 691,767 0.26 ZAR 30,351,735 Republic of South Africa Government
Bond 7% 28/2/2031 1,690,738 0.64
ESG Emerging Markets Local Currency Bond Fund continued
Portfolio of Investments 31 August 2019

Transferable Securities and Money Market Instruments Admitted to an Official Stock Exchange Listing or Dealt in on Another Regulated Market
Transferable Securities and Money Market Instruments Admitted to an Official Stock Exchange Listing or Dealt in on Another Regulated Market
Holding
Description
Market Value (USD)
% of Net
Assets
Holding
Description
Market Value (USD)
% of Net
Assets
The notes on pages 728 to 741 form an integral part of these financial statements.
Annual Report and Audited Financial Statements [213]
ZAR 3,704,874 Republic of South Africa Government Bond 7.75% 28/2/2023 246,637 0.10
ZAR 44,075,710 Republic of South Africa Government Bond 8% 31/1/2030 2,711,261 1.03
ZAR 26,604,313 Republic of South Africa Government Bond 8.25% 31/3/2032 1,607,202 0.61
ZAR 50,818,355 Republic of South Africa Government Bond 8.5% 31/1/2037 2,991,171 1.14
ZAR 26,662,109 Republic of South Africa Government Bond 8.75% 31/1/2044 1,562,639 0.60
ZAR 38,425,529 Republic of South Africa Government Bond 8.75% 28/2/2048 2,244,587 0.85
ZAR 23,112,634 Republic of South Africa Government Bond 8.875% 28/2/2035 1,426,857 0.54
ZAR 20,776,790 Republic of South Africa Government Bond 9% 31/1/2040 1,259,437 0.48
ZAR 55,092,429 Republic of South Africa Government Bond 10.5% 21/12/2026 4,059,711 1.54
20,492,007 7.79
Sweden EUR 227,000 East Renewable AB 13.5%
21/5/2021 249,273 0.09
Turkey TRY 1,982,383 Turkey Government Bond 7.1%
8/3/2023 261,064 0.10 TRY 2,404,856 Turkey Government Bond 8.8%
27/9/2023 326,809 0.12
TRY 1,809,763 Turkey Government Bond 11% 2/3/2022 279,787 0.11
TRY 811,774 Turkey Government Bond 12.2% 18/1/2023 126,544 0.05
TRY 721,368 Turkey Government Bond 16.2% 14/6/2023 124,890 0.05
1,119,094 0.43
United States USD 268,000 United States Treasury Note/Bond
2.25% 31/3/2020 268,597 0.10
Uruguay UYU 23,844,000 Uruguay Government International
Bond 9.875% 20/6/2022 634,559 0.24Total Bonds 237,956,246 90.45Total Transferable Securities and Money Market Instruments Admitted to an Official Stock Exchange Listing or Dealt in on Another Regulated Market 237,956,246 90.45Total Portfolio 237,956,246 90.45
Other Net Assets 25,122,520 9.55Total Net Assets (USD) 263,078,766 100.00
ESG Emerging Markets Local Currency Bond Fund continued
Portfolio of Investments 31 August 2019
Open Forward Foreign Exchange Contracts as at 31 August 2019
Currency
Purchases Currency
Sales Counterparty
Maturity date
Unrealised appreciation/
(depreciation) USD
KZT 43,446,900 USD 110,975 Bank of America 16/9/2019 845BRL 9,490,000 USD 2,324,552 BNY Mellon 23/9/2019 (38,572)BRL 2,768,150 USD 665,101 HSBC Bank Plc 23/9/2019 1,699CLP 943,707,350 USD 1,326,923 JP Morgan 23/9/2019 (13,847)CLP 943,710,000 USD 1,328,234 Barclays 23/9/2019 (15,155)COP 843,700,000 USD 243,598 BNY Mellon 23/9/2019 3,264COP 3,530,283,598 USD 1,024,013 HSBC Bank Plc 23/9/2019 8,928CZK 188,181,170 USD 8,138,022 HSBC Bank Plc 23/9/2019 (121,778)HUF 610,880,000 USD 2,065,199 HSBC Bank Plc 23/9/2019 (25,982)HUF 307,030,000 USD 1,036,168 Bank of America 23/9/2019 (11,252)IDR 5,798,990,000 USD 406,433 BNY Mellon 23/9/2019 1,597IDR 6,200,000,000 USD 432,870 Bank of America 23/9/2019 3,376IDR 24,643,579,310 USD 1,718,581 BNP Paribas 23/9/2019 15,398IDR 11,383,329,880 USD 790,015 JP Morgan 23/9/2019 10,942IDR 61,471,494,305 USD 4,274,791 HSBC Bank Plc 23/9/2019 50,483INR 47,372,560 USD 659,548 RBS Plc 23/9/2019 593INR 95,225,680 USD 1,324,145 HSBC Bank Plc 23/9/2019 2,833MXN 31,819,190 USD 1,596,445 Societe Generale 23/9/2019 (17,118)MXN 15,832,530 USD 786,480 Barclays 23/9/2019 (642)MXN 59,497,210 USD 3,002,975 Bank of America 23/9/2019 (49,866)MXN 52,426,000 USD 2,639,713 Morgan Stanley 23/9/2019 (37,579)MXN 44,046,970 USD 2,238,113 Royal Bank of Canada 23/9/2019 (51,868)MXN 26,126,720 USD 1,328,914 JP Morgan 23/9/2019 (32,130)MXN 52,259,770 USD 2,645,088 Goldman Sachs 23/9/2019 (51,205)MXN 7,570,000 USD 382,628 BNP Paribas 23/9/2019 (6,896)PHP 127,266,730 USD 2,425,006 HSBC Bank Plc 23/9/2019 17,780PLN 8,900,000 USD 2,270,648 Goldman Sachs 23/9/2019 (28,205)PLN 3,230,000 USD 820,378 JP Morgan 23/9/2019 (6,547)
Open Forward Foreign Exchange Contracts as at 31 August 2019
Currency
Purchases Currency
Sales Counterparty
Maturity date
Unrealised appreciation/
(depreciation) USD
PLN 22,379,799 USD 5,748,306 Royal Bank of Canada 23/9/2019 (109,496)RON 15,767,020 USD 3,731,837 Barclays 23/9/2019 (49,029)RUB 166,349,240 USD 2,507,012 Morgan Stanley 23/9/2019 (10,757)RUB 71,512,830 USD 1,070,038 Bank of America 23/9/2019 3,091RUB 35,309,220 USD 530,567 Barclays 23/9/2019 (712)THB 410,828,820 USD 13,330,862 HSBC Bank Plc 23/9/2019 114,351TRY 5,590,000 USD 975,060 HSBC Bank Plc 23/9/2019 (23,605)TRY 1,290,000 USD 220,924 RBS Plc 23/9/2019 (1,357)TRY 1,340,000 USD 231,176 Toronto Dominion 23/9/2019 (3,099)TRY 1,610,000 USD 284,223 BNP Paribas 23/9/2019 (10,190)TRY 1,470,000 USD 261,278 UBS 23/9/2019 (11,074)TRY 4,611,610 USD 808,914 Royal Bank of Canada 23/9/2019 (23,987)TRY 5,701,860 USD 1,004,963 Morgan Stanley 23/9/2019 (34,468)USD 2,709,696 BRL 10,859,424 HSBC Bank Plc 23/9/2019 93,845USD 1,934,580 BRL 7,827,926 BNP Paribas 23/9/2019 48,966USD 274,369 BRL 1,141,870 Goldman Sachs 23/9/2019 (688)USD 2,101,831 BRL 8,595,560 Barclays 23/9/2019 31,307USD 4,412,012 BRL 17,785,620 Morgan Stanley 23/9/2019 127,758USD 1,447,431 CLP 1,029,702,200 HSBC Bank Plc 23/9/2019 14,702USD 6,366,559 CLP 4,508,415,200 Barclays 23/9/2019 93,546USD 862,555 COP 2,980,560,000 BNY Mellon 23/9/2019 (9,539)USD 2,719,863 EUR 2,449,680 Royal Bank of Canada 23/9/2019 9,668USD 5,296,524 EUR 4,739,220 HSBC Bank Plc 23/9/2019 53,305USD 7,964,387 EUR 7,126,540 Morgan Stanley 23/9/2019 79,965USD 247,617 EUR 220,820 Barclays 23/9/2019 3,313USD 434,786 HUF 126,680,000 Toronto Dominion 23/9/2019 11,907
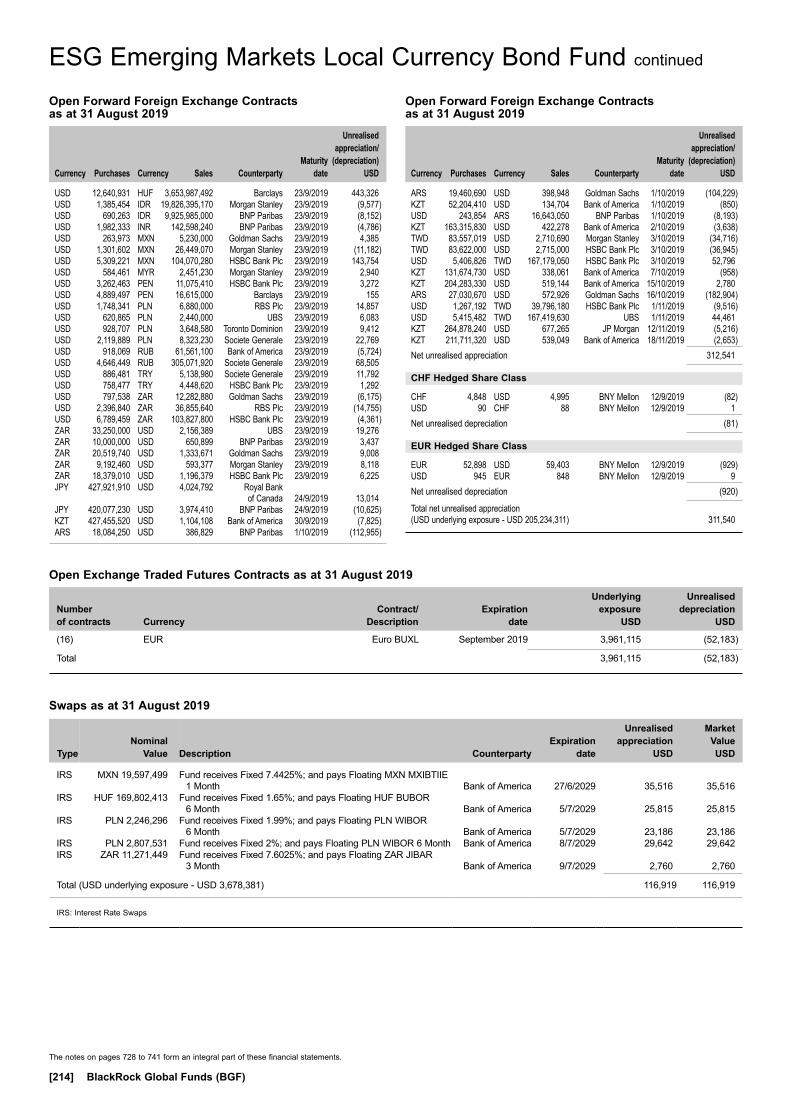
The notes on pages 728 to 741 form an integral part of these financial statements.
[214] BlackRock Global Funds (BGF)
ESG Emerging Markets Local Currency Bond Fund continued
Open Forward Foreign Exchange Contracts as at 31 August 2019
Currency
Purchases Currency
Sales Counterparty
Maturity date
Unrealised appreciation/
(depreciation) USD
Open Forward Foreign Exchange Contracts as at 31 August 2019
Currency
Purchases Currency
Sales Counterparty
Maturity date
Unrealised appreciation/
(depreciation) USD
USD 12,640,931 HUF 3,653,987,492 Barclays 23/9/2019 443,326USD 1,385,454 IDR 19,826,395,170 Morgan Stanley 23/9/2019 (9,577)USD 690,263 IDR 9,925,985,000 BNP Paribas 23/9/2019 (8,152)USD 1,982,333 INR 142,598,240 BNP Paribas 23/9/2019 (4,786)USD 263,973 MXN 5,230,000 Goldman Sachs 23/9/2019 4,385USD 1,301,602 MXN 26,449,070 Morgan Stanley 23/9/2019 (11,182)USD 5,309,221 MXN 104,070,280 HSBC Bank Plc 23/9/2019 143,754USD 584,461 MYR 2,451,230 Morgan Stanley 23/9/2019 2,940USD 3,262,463 PEN 11,075,410 HSBC Bank Plc 23/9/2019 3,272USD 4,889,497 PEN 16,615,000 Barclays 23/9/2019 155USD 1,748,341 PLN 6,880,000 RBS Plc 23/9/2019 14,857USD 620,865 PLN 2,440,000 UBS 23/9/2019 6,083USD 928,707 PLN 3,648,580 Toronto Dominion 23/9/2019 9,412USD 2,119,889 PLN 8,323,230 Societe Generale 23/9/2019 22,769USD 918,069 RUB 61,561,100 Bank of America 23/9/2019 (5,724)USD 4,646,449 RUB 305,071,920 Societe Generale 23/9/2019 68,505USD 886,481 TRY 5,138,980 Societe Generale 23/9/2019 11,792USD 758,477 TRY 4,448,620 HSBC Bank Plc 23/9/2019 1,292USD 797,538 ZAR 12,282,880 Goldman Sachs 23/9/2019 (6,175)USD 2,396,840 ZAR 36,855,640 RBS Plc 23/9/2019 (14,755)USD 6,789,459 ZAR 103,827,800 HSBC Bank Plc 23/9/2019 (4,361)ZAR 33,250,000 USD 2,156,389 UBS 23/9/2019 19,276ZAR 10,000,000 USD 650,899 BNP Paribas 23/9/2019 3,437ZAR 20,519,740 USD 1,333,671 Goldman Sachs 23/9/2019 9,008ZAR 9,192,460 USD 593,377 Morgan Stanley 23/9/2019 8,118ZAR 18,379,010 USD 1,196,379 HSBC Bank Plc 23/9/2019 6,225JPY 427,921,910 USD 4,024,792 Royal Bank of Canada 24/9/2019 13,014JPY 420,077,230 USD 3,974,410 BNP Paribas 24/9/2019 (10,625)KZT 427,455,520 USD 1,104,108 Bank of America 30/9/2019 (7,825)ARS 18,084,250 USD 386,829 BNP Paribas 1/10/2019 (112,955)
ARS 19,460,690 USD 398,948 Goldman Sachs 1/10/2019 (104,229)KZT 52,204,410 USD 134,704 Bank of America 1/10/2019 (850)USD 243,854 ARS 16,643,050 BNP Paribas 1/10/2019 (8,193)KZT 163,315,830 USD 422,278 Bank of America 2/10/2019 (3,638)TWD 83,557,019 USD 2,710,690 Morgan Stanley 3/10/2019 (34,716)TWD 83,622,000 USD 2,715,000 HSBC Bank Plc 3/10/2019 (36,945)USD 5,406,826 TWD 167,179,050 HSBC Bank Plc 3/10/2019 52,796KZT 131,674,730 USD 338,061 Bank of America 7/10/2019 (958)KZT 204,283,330 USD 519,144 Bank of America 15/10/2019 2,780ARS 27,030,670 USD 572,926 Goldman Sachs 16/10/2019 (182,904)USD 1,267,192 TWD 39,796,180 HSBC Bank Plc 1/11/2019 (9,516)USD 5,415,482 TWD 167,419,630 UBS 1/11/2019 44,461KZT 264,878,240 USD 677,265 JP Morgan 12/11/2019 (5,216)KZT 211,711,320 USD 539,049 Bank of America 18/11/2019 (2,653)Net unrealised appreciation 312,541
CHF Hedged Share Class
CHF 4,848 USD 4,995 BNY Mellon 12/9/2019 (82)USD 90 CHF 88 BNY Mellon 12/9/2019 1Net unrealised depreciation (81)
EUR Hedged Share Class
EUR 52,898 USD 59,403 BNY Mellon 12/9/2019 (929)USD 945 EUR 848 BNY Mellon 12/9/2019 9Net unrealised depreciation (920)
Total net unrealised appreciation (USD underlying exposure - USD 205,234,311) 311,540
Open Exchange Traded Futures Contracts as at 31 August 2019
Number of contracts Currency
Contract/ Description
Expiration date
Underlying exposure
USD
Unrealised depreciation
USD
(16) EUR Euro BUXL September 2019 3,961,115 (52,183)
Total 3,961,115 (52,183)
Swaps as at 31 August 2019
TypeNominal
Value Description Counterparty
Expiration date
Unrealised appreciation
USD
Market Value USD
IRS MXN 19,597,499 Fund receives Fixed 7.4425%; and pays Floating MXN MXIBTIIE 1 Month Bank of America 27/6/2029 35,516 35,516
IRS HUF 169,802,413 Fund receives Fixed 1.65%; and pays Floating HUF BUBOR 6 Month Bank of America 5/7/2029 25,815 25,815
IRS PLN 2,246,296 Fund receives Fixed 1.99%; and pays Floating PLN WIBOR 6 Month Bank of America 5/7/2029 23,186 23,186
IRS PLN 2,807,531 Fund receives Fixed 2%; and pays Floating PLN WIBOR 6 Month Bank of America 8/7/2029 29,642 29,642IRS ZAR 11,271,449 Fund receives Fixed 7.6025%; and pays Floating ZAR JIBAR
3 Month Bank of America 9/7/2029 2,760 2,760
Total (USD underlying exposure - USD 3,678,381) 116,919 116,919
IRS: Interest Rate Swaps
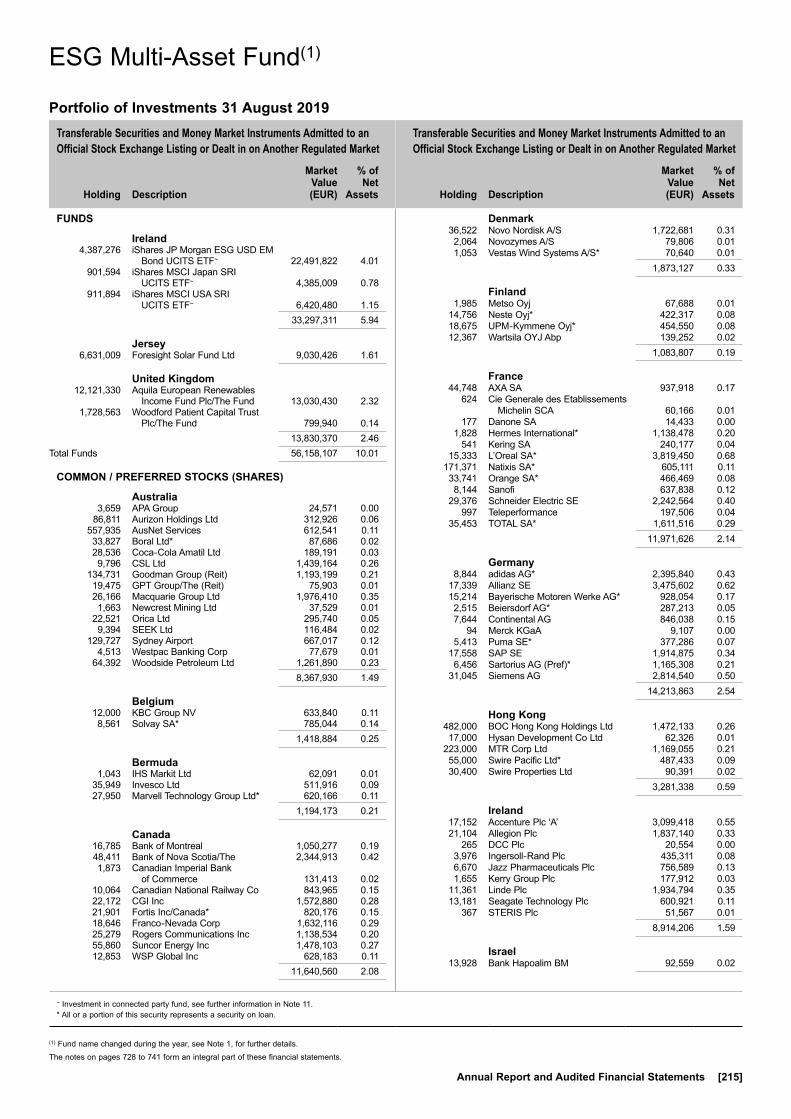
Transferable Securities and Money Market Instruments Admitted to an Official Stock Exchange Listing or Dealt in on Another Regulated Market
Transferable Securities and Money Market Instruments Admitted to an Official Stock Exchange Listing or Dealt in on Another Regulated Market
Holding
Description
Market Value (EUR)
% of Net
Assets
Holding
Description
Market Value (EUR)
% of Net
Assets
~ Investment in connected party fund, see further information in Note 11.* All or a portion of this security represents a security on loan.
The notes on pages 728 to 741 form an integral part of these financial statements.
Annual Report and Audited Financial Statements [215]
FUNDS
Ireland 4,387,276 iShares JP Morgan ESG USD EM
Bond UCITS ETF~ 22,491,822 4.01 901,594 iShares MSCI Japan SRI
UCITS ETF~ 4,385,009 0.78 911,894 iShares MSCI USA SRI
UCITS ETF~ 6,420,480 1.15 33,297,311 5.94
Jersey 6,631,009 Foresight Solar Fund Ltd 9,030,426 1.61
United Kingdom 12,121,330 Aquila European Renewables
Income Fund Plc/The Fund 13,030,430 2.32 1,728,563 Woodford Patient Capital Trust
Plc/The Fund 799,940 0.14 13,830,370 2.46Total Funds 56,158,107 10.01
COMMON / PREFERRED STOCKS (SHARES)
Australia 3,659 APA Group 24,571 0.00 86,811 Aurizon Holdings Ltd 312,926 0.06 557,935 AusNet Services 612,541 0.11 33,827 Boral Ltd* 87,686 0.02 28,536 Coca-Cola Amatil Ltd 189,191 0.03 9,796 CSL Ltd 1,439,164 0.26 134,731 Goodman Group (Reit) 1,193,199 0.21 19,475 GPT Group/The (Reit) 75,903 0.01 26,166 Macquarie Group Ltd 1,976,410 0.35 1,663 Newcrest Mining Ltd 37,529 0.01 22,521 Orica Ltd 295,740 0.05 9,394 SEEK Ltd 116,484 0.02 129,727 Sydney Airport 667,017 0.12 4,513 Westpac Banking Corp 77,679 0.01 64,392 Woodside Petroleum Ltd 1,261,890 0.23 8,367,930 1.49
Belgium 12,000 KBC Group NV 633,840 0.11 8,561 Solvay SA* 785,044 0.14 1,418,884 0.25
Bermuda 1,043 IHS Markit Ltd 62,091 0.01 35,949 Invesco Ltd 511,916 0.09 27,950 Marvell Technology Group Ltd* 620,166 0.11 1,194,173 0.21
Canada 16,785 Bank of Montreal 1,050,277 0.19 48,411 Bank of Nova Scotia/The 2,344,913 0.42 1,873 Canadian Imperial Bank
of Commerce 131,413 0.02 10,064 Canadian National Railway Co 843,965 0.15 22,172 CGI Inc 1,572,880 0.28 21,901 Fortis Inc/Canada* 820,176 0.15 18,646 Franco-Nevada Corp 1,632,116 0.29 25,279 Rogers Communications Inc 1,138,534 0.20 55,860 Suncor Energy Inc 1,478,103 0.27 12,853 WSP Global Inc 628,183 0.11 11,640,560 2.08
Denmark 36,522 Novo Nordisk A/S 1,722,681 0.31 2,064 Novozymes A/S 79,806 0.01 1,053 Vestas Wind Systems A/S* 70,640 0.01 1,873,127 0.33
Finland 1,985 Metso Oyj 67,688 0.01 14,756 Neste Oyj* 422,317 0.08 18,675 UPM-Kymmene Oyj* 454,550 0.08 12,367 Wartsila OYJ Abp 139,252 0.02 1,083,807 0.19
France 44,748 AXA SA 937,918 0.17 624 Cie Generale des Etablissements
Michelin SCA 60,166 0.01 177 Danone SA 14,433 0.00 1,828 Hermes International* 1,138,478 0.20 541 Kering SA 240,177 0.04 15,333 L’Oreal SA* 3,819,450 0.68 171,371 Natixis SA* 605,111 0.11 33,741 Orange SA* 466,469 0.08 8,144 Sanofi 637,838 0.12 29,376 Schneider Electric SE 2,242,564 0.40 997 Teleperformance 197,506 0.04 35,453 TOTAL SA* 1,611,516 0.29 11,971,626 2.14
Germany 8,844 adidas AG* 2,395,840 0.43 17,339 Allianz SE 3,475,602 0.62 15,214 Bayerische Motoren Werke AG* 928,054 0.17 2,515 Beiersdorf AG* 287,213 0.05 7,644 Continental AG 846,038 0.15 94 Merck KGaA 9,107 0.00 5,413 Puma SE* 377,286 0.07 17,558 SAP SE 1,914,875 0.34 6,456 Sartorius AG (Pref)* 1,165,308 0.21 31,045 Siemens AG 2,814,540 0.50 14,213,863 2.54
Hong Kong 482,000 BOC Hong Kong Holdings Ltd 1,472,133 0.26 17,000 Hysan Development Co Ltd 62,326 0.01 223,000 MTR Corp Ltd 1,169,055 0.21 55,000 Swire Pacific Ltd* 487,433 0.09 30,400 Swire Properties Ltd 90,391 0.02 3,281,338 0.59
Ireland 17,152 Accenture Plc ‘A’ 3,099,418 0.55 21,104 Allegion Plc 1,837,140 0.33 265 DCC Plc 20,554 0.00 3,976 Ingersoll-Rand Plc 435,311 0.08 6,670 Jazz Pharmaceuticals Plc 756,589 0.13 1,655 Kerry Group Plc 177,912 0.03 11,361 Linde Plc 1,934,794 0.35 13,181 Seagate Technology Plc 600,921 0.11 367 STERIS Plc 51,567 0.01 8,914,206 1.59
Israel 13,928 Bank Hapoalim BM 92,559 0.02
ESG Multi-Asset Fund(1)
Portfolio of Investments 31 August 2019
ESG Multi-Asset Fund(1)
(1) Fund name changed during the year, see Note 1, for further details.

Transferable Securities and Money Market Instruments Admitted to an Official Stock Exchange Listing or Dealt in on Another Regulated Market
Transferable Securities and Money Market Instruments Admitted to an Official Stock Exchange Listing or Dealt in on Another Regulated Market
Holding
Description
Market Value (EUR)
% of Net
Assets
Holding
Description
Market Value (EUR)
% of Net
Assets
* All or a portion of this security represents a security on loan.
The notes on pages 728 to 741 form an integral part of these financial statements.
[216] BlackRock Global Funds (BGF)
Italy 281,772 Snam SpA 1,311,367 0.23
Japan 26,300 Asahi Kasei Corp 215,602 0.04 137,700 Astellas Pharma Inc 1,728,722 0.31 23,000 Benesse Holdings Inc* 533,164 0.09 1,100 Daikin Industries Ltd 123,415 0.02 13,500 Daiwa House Industry Co Ltd 383,639 0.07 11,300 Eisai Co Ltd 523,313 0.09 43,600 Honda Motor Co Ltd 938,368 0.17 17,700 Kao Corp 1,158,453 0.21 77,800 KDDI Corp 1,881,118 0.34 21,500 Konica Minolta Inc 138,626 0.02 13,900 Nikon Corp 155,892 0.03 300 Nintendo Co Ltd 103,087 0.02 14,100 Nippon Express Co Ltd 660,199 0.12 26,300 Nitto Denko Corp 1,109,413 0.20 54,500 NTT DOCOMO Inc 1,246,633 0.22 24,200 Obayashi Corp 202,061 0.04 700 Osaka Gas Co Ltd 11,355 0.00 22,300 Sekisui Chemical Co Ltd 291,181 0.05 12,900 Sekisui House Ltd 207,443 0.04 47,400 Shimizu Corp 358,175 0.06 7,600 Sompo Holdings Inc* 275,088 0.05 9,200 Sony Corp 474,080 0.08 400 Stanley Electric Co Ltd 9,010 0.00 183,500 Sumitomo Chemical Co Ltd 727,734 0.13 9,200 Suntory Beverage & Food Ltd 359,366 0.06 6,600 Teijin Ltd 107,513 0.02 2,600 Tokyo Electron Ltd 421,429 0.08 19,300 Toyota Motor Corp 1,145,645 0.20 3,700 Yokogawa Electric Corp 60,904 0.01 15,550,628 2.77
Liberia 8,353 Royal Caribbean Cruises Ltd 794,217 0.14
Netherlands 7,432 ASML Holding NV 1,503,494 0.27 2,721 Koninklijke DSM NV 307,881 0.05 1,811,375 0.32
New Zealand 10,953 Auckland International Airport Ltd 60,271 0.01 5,085 Fletcher Building Ltd 12,914 0.00 24,040 Meridian Energy Ltd 68,480 0.01 17,665 Ryman Healthcare Ltd 131,560 0.03 273,225 0.05
Norway 13,654 Mowi ASA 296,823 0.05 75,138 Orkla ASA* 623,573 0.11 792 Schibsted ASA ‘B’ 20,737 0.01 941,133 0.17
Portugal 61,687 Galp Energia SGPS SA 801,931 0.14
Spain 332,433 Banco Bilbao Vizcaya Argentaria SA 1,436,609 0.26 251,052 Banco Santander SA* 870,649 0.16 25,992 Industria de Diseno Textil SA 735,574 0.13 16,026 Red Electrica Corp SA 289,830 0.05 61,055 Repsol SA* 809,589 0.14 4,142,251 0.74
Sweden 82,495 Skandinaviska Enskilda Banken AB* 643,999 0.12 6,445 Telia Co AB 25,543 0.00 669,542 0.12
Switzerland 5,456 Chubb Ltd 769,924 0.14 169 Givaudan SA* 414,670 0.07 202 Kuehne + Nagel International AG 26,624 0.00 11,508 Nestle SA 1,173,140 0.21 25,756 Roche Holding AG* 6,388,126 1.14 1,660 Swiss Re AG* 144,605 0.03 912 Swisscom AG* 412,942 0.07 9,330,031 1.66
United Kingdom 186,785 Barratt Developments Plc* 1,309,094 0.23 25,331 Berkeley Group Holdings Plc 1,092,990 0.20 46,422 Burberry Group Plc* 1,110,856 0.20 5,416 Coca-Cola European Partners Plc* 274,568 0.05 602 Croda International Plc 31,261 0.01 20,251 InterContinental Hotels Group Plc* 1,144,311 0.20 1,211 Intertek Group Plc 72,982 0.01 41,884 ITV Plc 53,957 0.01 28,977 John Wood Group Plc* 122,499 0.02 9,789 National Grid Plc 93,257 0.02 7,194 Reckitt Benckiser Group Plc 507,696 0.09 29,162 RELX Plc 637,324 0.11 8,844 Segro Plc (Reit) 76,692 0.01 16,748,901 Triple Point Social Housing
Reit Plc (Reit) 15,668,711 2.80 14,375 Unilever Plc 825,950 0.15 549,520 Wm Morrison Supermarkets Plc* 1,115,055 0.20 24,137,203 4.31
United States 950 Acuity Brands Inc 109,119 0.02 25,517 Adobe Inc 6,620,009 1.18 8,998 Agilent Technologies Inc 580,301 0.10 36,747 Ally Financial Inc 1,048,222 0.19 1,732 Alphabet Inc ‘A’ 1,879,277 0.34 30,515 American Express Co 3,346,172 0.60 11,351 American Tower Corp (Reit)* 2,365,395 0.42 15,062 AmerisourceBergen Corp ‘A’* 1,116,597 0.20 17,009 Amgen Inc 3,199,687 0.57 9,376 Analog Devices Inc 936,471 0.17 4,250 ANSYS Inc 801,230 0.14 9,061 Apple Inc 1,717,245 0.31 2,255 Arista Networks Inc* 463,114 0.08 2,856 Ball Corp 207,278 0.04 12,557 Bank of New York Mellon Corp/The* 476,303 0.09 377 Best Buy Co Inc 21,744 0.00 4,185 Biogen Inc 826,975 0.15 12,358 Booz Allen Hamilton Holding Corp ‘A’ 843,758 0.15 11,815 Boston Properties Inc (Reit) 1,368,860 0.24 13,306 Cadence Design Systems Inc 834,885 0.15 6,783 Cardinal Health Inc 261,709 0.05 4,045 Caterpillar Inc 436,201 0.08 18,288 Centene Corp 776,465 0.14 19,749 CH Robinson Worldwide Inc* 1,526,635 0.27 11,452 Cigna Corp 1,600,707 0.29 19,152 Cisco Systems Inc 818,177 0.15 635 Clorox Co/The 91,798 0.02 3,724 CME Group Inc 727,182 0.13 4,009 CMS Energy Corp* 228,971 0.04 9,457 Coca-Cola Co/The 471,296 0.08 19,405 Colgate-Palmolive Co* 1,304,347 0.23
ESG Multi-Asset Fund(1) continued
Portfolio of Investments 31 August 2019
(1) Fund name changed during the year, see Note 1, for further details.

Transferable Securities and Money Market Instruments Admitted to an Official Stock Exchange Listing or Dealt in on Another Regulated Market
Transferable Securities and Money Market Instruments Admitted to an Official Stock Exchange Listing or Dealt in on Another Regulated Market
Holding
Description
Market Value (EUR)
% of Net
Assets
Holding
Description
Market Value (EUR)
% of Net
Assets
* All or a portion of this security represents a security on loan.
The notes on pages 728 to 741 form an integral part of these financial statements.
Annual Report and Audited Financial Statements [217]
28,052 Comerica Inc 1,580,580 0.28 17,704 CommScope Holding Co Inc* 176,618 0.03 27,435 Conduent Inc* 162,678 0.03 43,905 ConocoPhillips 2,085,888 0.37 17,127 Consolidated Edison Inc 1,369,688 0.24 3,943 CSX Corp 240,586 0.04 8,806 Ecolab Inc 1,650,980 0.29 2,574 Edwards Lifesciences Corp 514,763 0.09 268 Eversource Energy 19,514 0.00 14,810 Expeditors International of
Washington Inc* 961,833 0.17 3,315 F5 Networks Inc 386,649 0.07 1,156 Facebook Inc ‘A’ 193,980 0.04 4,639 FactSet Research Systems Inc 1,137,502 0.20 2,879 Fair Isaac Corp* 917,418 0.16 8,043 Fortinet Inc* 573,975 0.10 10,209 Fortune Brands Home & Security Inc 472,914 0.08 10,337 Franklin Resources Inc 247,235 0.04 46,769 General Mills Inc 2,282,075 0.41 27,581 Gilead Sciences Inc 1,586,002 0.28 6,004 Goldman Sachs Group Inc/The* 1,110,922 0.20 11,123 HCA Healthcare Inc 1,217,898 0.22 24,973 Home Depot Inc/The* 5,166,733 0.92 2,637 IDEX Corp 396,088 0.07 2,203 IDEXX Laboratories Inc 576,282 0.10 29,033 Intel Corp 1,250,545 0.22 5,477 International Business
Machines Corp 670,351 0.12 4,024 International Flavors &
Fragrances Inc 400,968 0.07 3,963 Intuit Inc* 1,031,048 0.18 3,787 Iron Mountain Inc (Reit) 109,466 0.02 8,904 Johnson & Johnson 1,032,404 0.18 8,138 Kellogg Co 467,226 0.08 9,782 Kimberly-Clark Corp 1,255,969 0.22 4,379 Mastercard Inc 1,119,100 0.20 10,387 McCormick & Co Inc/MD 1,534,312 0.27 1,242 Mettler-Toledo International Inc 737,051 0.13 164,765 Microsoft Corp 20,645,031 3.68 793 Moody’s Corp 155,724 0.03 38,944 NIKE Inc 3,015,381 0.54 11,602 Nordstrom Inc* 310,365 0.06 4,664 Norfolk Southern Corp 746,785 0.13 17,513 NVIDIA Corp 2,699,332 0.48 17,255 ON Semiconductor Corp 281,483 0.05 19,116 Oracle Corp 902,820 0.16 34,661 PepsiCo Inc 4,276,183 0.76 2,863 Phillips 66 256,512 0.05 66,871 Procter & Gamble Co/The 7,330,426 1.31 23,411 Prologis Inc (Reit) 1,772,838 0.32 26,092 Prudential Financial Inc 1,898,386 0.34 6,799 PTC Inc* 403,522 0.07 17,639 Quest Diagnostics Inc 1,637,862 0.29 32,276 Robert Half International Inc 1,572,265 0.28 23,879 Sabre Corp* 509,950 0.09 35,421 salesforce.com Inc* 5,057,440 0.90 4,479 Sempra Energy 575,126 0.10 2,437 Splunk Inc* 249,782 0.05 9,359 Starbucks Corp 823,444 0.15 19,854 State Street Corp 928,867 0.17 1,417 SVB Financial Group 252,310 0.05 19,158 Symantec Corp 404,967 0.07 82 Tesla Inc 17,074 0.00 5,575 Tractor Supply Co* 524,528 0.09 5,701 Travelers Cos Inc/The* 755,726 0.14 8,662 United Parcel Service Inc ‘B’ 938,083 0.17 2,864 Vail Resorts Inc 615,046 0.11 3,635 Varian Medical Systems Inc 351,018 0.06 5,517 Vertex Pharmaceuticals Inc 900,047 0.16
16,890 VF Corp 1,270,462 0.23 14,523 Visa Inc ‘A’* 2,385,199 0.43 7,183 VMware Inc* 927,275 0.17 40,237 Walt Disney Co/The 5,032,584 0.90 189 Waters Corp 36,245 0.01 3,528 WW Grainger Inc* 880,858 0.16 3,253 Zebra Technologies Corp 606,851 0.11 46,426 Zions Bancorp NA* 1,731,996 0.31 21,191 Zoetis Inc 2,431,930 0.43 147,755,094 26.35Total Common / Preferred Stocks (Shares) 271,570,070 48.43
BONDS
Australia AUD 320,000 Australia Government Bond
2.75% 21/11/2028 227,116 0.04 AUD 260,000 Australia Government Bond
2.75% 21/11/2029 187,067 0.03 AUD 135,000 Australia Government Bond
2.75% 21/5/2041 103,783 0.02 AUD 155,000 Australia Government Bond
3% 21/3/2047 127,277 0.02 AUD 210,000 Australia Government Bond
3.25% 21/4/2025 145,844 0.03 AUD 270,000 Australia Government Bond
4.25% 21/4/2026 201,478 0.04 AUD 120,000 Australia Government Bond
4.5% 21/4/2033 105,555 0.02 AUD 400,000 Australia Government Bond
4.75% 21/4/2027 314,488 0.06 EUR 430,000 Telstra Corp Ltd 3.5% 21/9/2022 480,153 0.08 USD 185,000 Westpac Banking Corp
3.3% 26/2/2024 176,405 0.03 USD 200,000 Westpac Banking Corp
3.65% 15/5/2023 191,697 0.03 2,260,863 0.40
Austria EUR 107,000 Republic of Austria Government
Bond ‘144A’ 20/9/2022 (Zero Coupon) 109,714 0.02
EUR 180,000 Republic of Austria Government Bond ‘144A’ 15/7/2023 (Zero Coupon) 185,681 0.03
EUR 485,000 Republic of Austria Government Bond ‘144A’ 0.75% 20/10/2026 533,355 0.10
EUR 75,000 Republic of Austria Government Bond ‘144A’ 1.5% 20/2/2047* 102,317 0.02
EUR 120,000 Republic of Austria Government Bond ‘144A’ 1.65% 21/10/2024 135,061 0.02
EUR 100,000 Republic of Austria Government Bond ‘144A’ 3.15% 20/6/2044 176,185 0.03
EUR 112,000 Republic of Austria Government Bond ‘144A’ 3.65% 20/4/2022 125,398 0.02
EUR 94,000 Republic of Austria Government Bond ‘144A’ 3.8% 26/1/2062 224,223 0.04
EUR 110,000 Republic of Austria Government Bond ‘144A’ 4.15% 15/3/2037 192,683 0.04
1,784,617 0.32
Belgium EUR 330,000 Kingdom of Belgium Government
Bond ‘144A’ 0.2% 22/10/2023 343,367 0.06 EUR 60,000 Kingdom of Belgium Government
Bond ‘144A’ 0.5% 22/10/2024 63,576 0.01
ESG Multi-Asset Fund(1) continued
Portfolio of Investments 31 August 2019
(1) Fund name changed during the year, see Note 1, for further details.
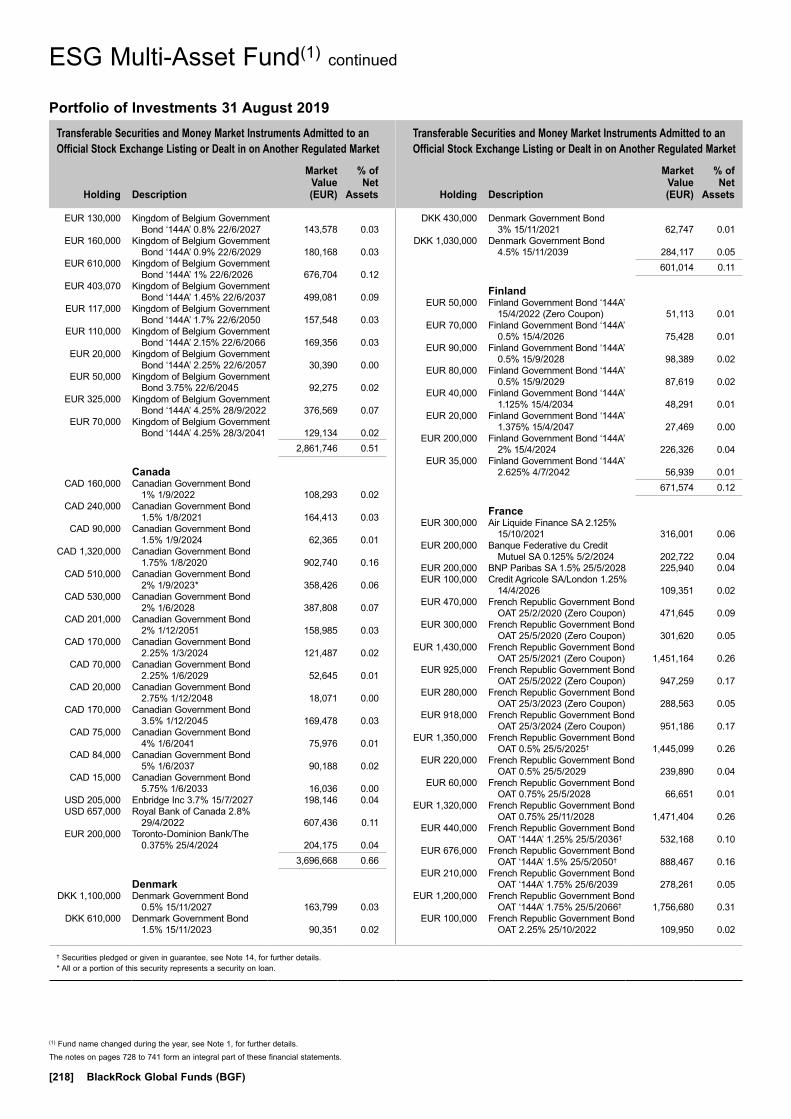
Transferable Securities and Money Market Instruments Admitted to an Official Stock Exchange Listing or Dealt in on Another Regulated Market
Transferable Securities and Money Market Instruments Admitted to an Official Stock Exchange Listing or Dealt in on Another Regulated Market
Holding
Description
Market Value (EUR)
% of Net
Assets
Holding
Description
Market Value (EUR)
% of Net
Assets
† Securities pledged or given in guarantee, see Note 14, for further details.* All or a portion of this security represents a security on loan.
The notes on pages 728 to 741 form an integral part of these financial statements.
[218] BlackRock Global Funds (BGF)
EUR 130,000 Kingdom of Belgium Government Bond ‘144A’ 0.8% 22/6/2027 143,578 0.03
EUR 160,000 Kingdom of Belgium Government Bond ‘144A’ 0.9% 22/6/2029 180,168 0.03
EUR 610,000 Kingdom of Belgium Government Bond ‘144A’ 1% 22/6/2026 676,704 0.12
EUR 403,070 Kingdom of Belgium Government Bond ‘144A’ 1.45% 22/6/2037 499,081 0.09
EUR 117,000 Kingdom of Belgium Government Bond ‘144A’ 1.7% 22/6/2050 157,548 0.03
EUR 110,000 Kingdom of Belgium Government Bond ‘144A’ 2.15% 22/6/2066 169,356 0.03
EUR 20,000 Kingdom of Belgium Government Bond ‘144A’ 2.25% 22/6/2057 30,390 0.00
EUR 50,000 Kingdom of Belgium Government Bond 3.75% 22/6/2045 92,275 0.02
EUR 325,000 Kingdom of Belgium Government Bond ‘144A’ 4.25% 28/9/2022 376,569 0.07
EUR 70,000 Kingdom of Belgium Government Bond ‘144A’ 4.25% 28/3/2041 129,134 0.02
2,861,746 0.51
Canada CAD 160,000 Canadian Government Bond
1% 1/9/2022 108,293 0.02 CAD 240,000 Canadian Government Bond
1.5% 1/8/2021 164,413 0.03 CAD 90,000 Canadian Government Bond
1.5% 1/9/2024 62,365 0.01 CAD 1,320,000 Canadian Government Bond
1.75% 1/8/2020 902,740 0.16 CAD 510,000 Canadian Government Bond
2% 1/9/2023* 358,426 0.06 CAD 530,000 Canadian Government Bond
2% 1/6/2028 387,808 0.07 CAD 201,000 Canadian Government Bond
2% 1/12/2051 158,985 0.03 CAD 170,000 Canadian Government Bond
2.25% 1/3/2024 121,487 0.02 CAD 70,000 Canadian Government Bond
2.25% 1/6/2029 52,645 0.01 CAD 20,000 Canadian Government Bond
2.75% 1/12/2048 18,071 0.00 CAD 170,000 Canadian Government Bond
3.5% 1/12/2045 169,478 0.03 CAD 75,000 Canadian Government Bond
4% 1/6/2041 75,976 0.01 CAD 84,000 Canadian Government Bond
5% 1/6/2037 90,188 0.02 CAD 15,000 Canadian Government Bond
5.75% 1/6/2033 16,036 0.00 USD 205,000 Enbridge Inc 3.7% 15/7/2027 198,146 0.04 USD 657,000 Royal Bank of Canada 2.8%
29/4/2022 607,436 0.11 EUR 200,000 Toronto-Dominion Bank/The
0.375% 25/4/2024 204,175 0.04 3,696,668 0.66
Denmark DKK 1,100,000 Denmark Government Bond
0.5% 15/11/2027 163,799 0.03 DKK 610,000 Denmark Government Bond
1.5% 15/11/2023 90,351 0.02
DKK 430,000 Denmark Government Bond 3% 15/11/2021 62,747 0.01
DKK 1,030,000 Denmark Government Bond 4.5% 15/11/2039 284,117 0.05
601,014 0.11
Finland EUR 50,000 Finland Government Bond ‘144A’
15/4/2022 (Zero Coupon) 51,113 0.01 EUR 70,000 Finland Government Bond ‘144A’
0.5% 15/4/2026 75,428 0.01 EUR 90,000 Finland Government Bond ‘144A’
0.5% 15/9/2028 98,389 0.02 EUR 80,000 Finland Government Bond ‘144A’
0.5% 15/9/2029 87,619 0.02 EUR 40,000 Finland Government Bond ‘144A’
1.125% 15/4/2034 48,291 0.01 EUR 20,000 Finland Government Bond ‘144A’
1.375% 15/4/2047 27,469 0.00 EUR 200,000 Finland Government Bond ‘144A’
2% 15/4/2024 226,326 0.04 EUR 35,000 Finland Government Bond ‘144A’
2.625% 4/7/2042 56,939 0.01 671,574 0.12
France EUR 300,000 Air Liquide Finance SA 2.125%
15/10/2021 316,001 0.06 EUR 200,000 Banque Federative du Credit
Mutuel SA 0.125% 5/2/2024 202,722 0.04 EUR 200,000 BNP Paribas SA 1.5% 25/5/2028 225,940 0.04 EUR 100,000 Credit Agricole SA/London 1.25%
14/4/2026 109,351 0.02 EUR 470,000 French Republic Government Bond
OAT 25/2/2020 (Zero Coupon) 471,645 0.09 EUR 300,000 French Republic Government Bond
OAT 25/5/2020 (Zero Coupon) 301,620 0.05 EUR 1,430,000 French Republic Government Bond
OAT 25/5/2021 (Zero Coupon) 1,451,164 0.26 EUR 925,000 French Republic Government Bond
OAT 25/5/2022 (Zero Coupon) 947,259 0.17 EUR 280,000 French Republic Government Bond
OAT 25/3/2023 (Zero Coupon) 288,563 0.05 EUR 918,000 French Republic Government Bond
OAT 25/3/2024 (Zero Coupon) 951,186 0.17 EUR 1,350,000 French Republic Government Bond
OAT 0.5% 25/5/2025† 1,445,099 0.26 EUR 220,000 French Republic Government Bond
OAT 0.5% 25/5/2029 239,890 0.04 EUR 60,000 French Republic Government Bond
OAT 0.75% 25/5/2028 66,651 0.01 EUR 1,320,000 French Republic Government Bond
OAT 0.75% 25/11/2028 1,471,404 0.26 EUR 440,000 French Republic Government Bond
OAT ‘144A’ 1.25% 25/5/2036† 532,168 0.10 EUR 676,000 French Republic Government Bond
OAT ‘144A’ 1.5% 25/5/2050† 888,467 0.16 EUR 210,000 French Republic Government Bond
OAT ‘144A’ 1.75% 25/6/2039 278,261 0.05 EUR 1,200,000 French Republic Government Bond
OAT ‘144A’ 1.75% 25/5/2066† 1,756,680 0.31 EUR 100,000 French Republic Government Bond
OAT 2.25% 25/10/2022 109,950 0.02
ESG Multi-Asset Fund(1) continued
Portfolio of Investments 31 August 2019
(1) Fund name changed during the year, see Note 1, for further details.
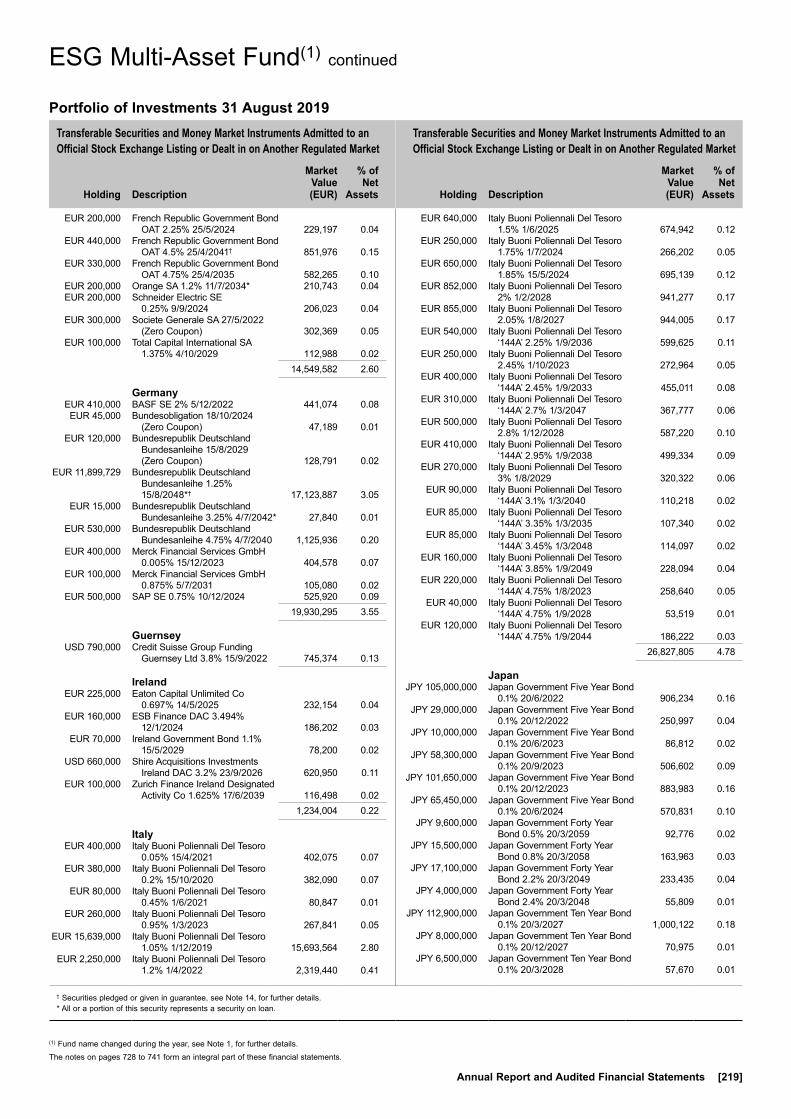
Transferable Securities and Money Market Instruments Admitted to an Official Stock Exchange Listing or Dealt in on Another Regulated Market
Transferable Securities and Money Market Instruments Admitted to an Official Stock Exchange Listing or Dealt in on Another Regulated Market
Holding
Description
Market Value (EUR)
% of Net
Assets
Holding
Description
Market Value (EUR)
% of Net
Assets
† Securities pledged or given in guarantee, see Note 14, for further details.* All or a portion of this security represents a security on loan.
The notes on pages 728 to 741 form an integral part of these financial statements.
Annual Report and Audited Financial Statements [219]
EUR 200,000 French Republic Government Bond OAT 2.25% 25/5/2024 229,197 0.04
EUR 440,000 French Republic Government Bond OAT 4.5% 25/4/2041† 851,976 0.15
EUR 330,000 French Republic Government Bond OAT 4.75% 25/4/2035 582,265 0.10
EUR 200,000 Orange SA 1.2% 11/7/2034* 210,743 0.04 EUR 200,000 Schneider Electric SE
0.25% 9/9/2024 206,023 0.04 EUR 300,000 Societe Generale SA 27/5/2022
(Zero Coupon) 302,369 0.05 EUR 100,000 Total Capital International SA
1.375% 4/10/2029 112,988 0.02 14,549,582 2.60
Germany EUR 410,000 BASF SE 2% 5/12/2022 441,074 0.08 EUR 45,000 Bundesobligation 18/10/2024
(Zero Coupon) 47,189 0.01 EUR 120,000 Bundesrepublik Deutschland
Bundesanleihe 15/8/2029 (Zero Coupon) 128,791 0.02
EUR 11,899,729 Bundesrepublik Deutschland Bundesanleihe 1.25% 15/8/2048*† 17,123,887 3.05
EUR 15,000 Bundesrepublik Deutschland Bundesanleihe 3.25% 4/7/2042* 27,840 0.01
EUR 530,000 Bundesrepublik Deutschland Bundesanleihe 4.75% 4/7/2040 1,125,936 0.20
EUR 400,000 Merck Financial Services GmbH 0.005% 15/12/2023 404,578 0.07
EUR 100,000 Merck Financial Services GmbH 0.875% 5/7/2031 105,080 0.02
EUR 500,000 SAP SE 0.75% 10/12/2024 525,920 0.09 19,930,295 3.55
Guernsey USD 790,000 Credit Suisse Group Funding
Guernsey Ltd 3.8% 15/9/2022 745,374 0.13
Ireland EUR 225,000 Eaton Capital Unlimited Co
0.697% 14/5/2025 232,154 0.04 EUR 160,000 ESB Finance DAC 3.494%
12/1/2024 186,202 0.03 EUR 70,000 Ireland Government Bond 1.1%
15/5/2029 78,200 0.02 USD 660,000 Shire Acquisitions Investments
Ireland DAC 3.2% 23/9/2026 620,950 0.11 EUR 100,000 Zurich Finance Ireland Designated
Activity Co 1.625% 17/6/2039 116,498 0.02 1,234,004 0.22
Italy EUR 400,000 Italy Buoni Poliennali Del Tesoro
0.05% 15/4/2021 402,075 0.07 EUR 380,000 Italy Buoni Poliennali Del Tesoro
0.2% 15/10/2020 382,090 0.07 EUR 80,000 Italy Buoni Poliennali Del Tesoro
0.45% 1/6/2021 80,847 0.01 EUR 260,000 Italy Buoni Poliennali Del Tesoro
0.95% 1/3/2023 267,841 0.05 EUR 15,639,000 Italy Buoni Poliennali Del Tesoro
1.05% 1/12/2019 15,693,564 2.80 EUR 2,250,000 Italy Buoni Poliennali Del Tesoro
1.2% 1/4/2022 2,319,440 0.41
EUR 640,000 Italy Buoni Poliennali Del Tesoro 1.5% 1/6/2025 674,942 0.12
EUR 250,000 Italy Buoni Poliennali Del Tesoro 1.75% 1/7/2024 266,202 0.05
EUR 650,000 Italy Buoni Poliennali Del Tesoro 1.85% 15/5/2024 695,139 0.12
EUR 852,000 Italy Buoni Poliennali Del Tesoro 2% 1/2/2028 941,277 0.17
EUR 855,000 Italy Buoni Poliennali Del Tesoro 2.05% 1/8/2027 944,005 0.17
EUR 540,000 Italy Buoni Poliennali Del Tesoro ‘144A’ 2.25% 1/9/2036 599,625 0.11
EUR 250,000 Italy Buoni Poliennali Del Tesoro 2.45% 1/10/2023 272,964 0.05
EUR 400,000 Italy Buoni Poliennali Del Tesoro ‘144A’ 2.45% 1/9/2033 455,011 0.08
EUR 310,000 Italy Buoni Poliennali Del Tesoro ‘144A’ 2.7% 1/3/2047 367,777 0.06
EUR 500,000 Italy Buoni Poliennali Del Tesoro 2.8% 1/12/2028 587,220 0.10
EUR 410,000 Italy Buoni Poliennali Del Tesoro ‘144A’ 2.95% 1/9/2038 499,334 0.09
EUR 270,000 Italy Buoni Poliennali Del Tesoro 3% 1/8/2029 320,322 0.06
EUR 90,000 Italy Buoni Poliennali Del Tesoro ‘144A’ 3.1% 1/3/2040 110,218 0.02
EUR 85,000 Italy Buoni Poliennali Del Tesoro ‘144A’ 3.35% 1/3/2035 107,340 0.02
EUR 85,000 Italy Buoni Poliennali Del Tesoro ‘144A’ 3.45% 1/3/2048 114,097 0.02
EUR 160,000 Italy Buoni Poliennali Del Tesoro ‘144A’ 3.85% 1/9/2049 228,094 0.04
EUR 220,000 Italy Buoni Poliennali Del Tesoro ‘144A’ 4.75% 1/8/2023 258,640 0.05
EUR 40,000 Italy Buoni Poliennali Del Tesoro ‘144A’ 4.75% 1/9/2028 53,519 0.01
EUR 120,000 Italy Buoni Poliennali Del Tesoro ‘144A’ 4.75% 1/9/2044 186,222 0.03
26,827,805 4.78
Japan JPY 105,000,000 Japan Government Five Year Bond
0.1% 20/6/2022 906,234 0.16 JPY 29,000,000 Japan Government Five Year Bond
0.1% 20/12/2022 250,997 0.04 JPY 10,000,000 Japan Government Five Year Bond
0.1% 20/6/2023 86,812 0.02 JPY 58,300,000 Japan Government Five Year Bond
0.1% 20/9/2023 506,602 0.09 JPY 101,650,000 Japan Government Five Year Bond
0.1% 20/12/2023 883,983 0.16 JPY 65,450,000 Japan Government Five Year Bond
0.1% 20/6/2024 570,831 0.10 JPY 9,600,000 Japan Government Forty Year
Bond 0.5% 20/3/2059 92,776 0.02 JPY 15,500,000 Japan Government Forty Year
Bond 0.8% 20/3/2058 163,963 0.03 JPY 17,100,000 Japan Government Forty Year
Bond 2.2% 20/3/2049 233,435 0.04 JPY 4,000,000 Japan Government Forty Year
Bond 2.4% 20/3/2048 55,809 0.01 JPY 112,900,000 Japan Government Ten Year Bond
0.1% 20/3/2027 1,000,122 0.18 JPY 8,000,000 Japan Government Ten Year Bond
0.1% 20/12/2027 70,975 0.01 JPY 6,500,000 Japan Government Ten Year Bond
0.1% 20/3/2028 57,670 0.01
ESG Multi-Asset Fund(1) continued
Portfolio of Investments 31 August 2019
(1) Fund name changed during the year, see Note 1, for further details.
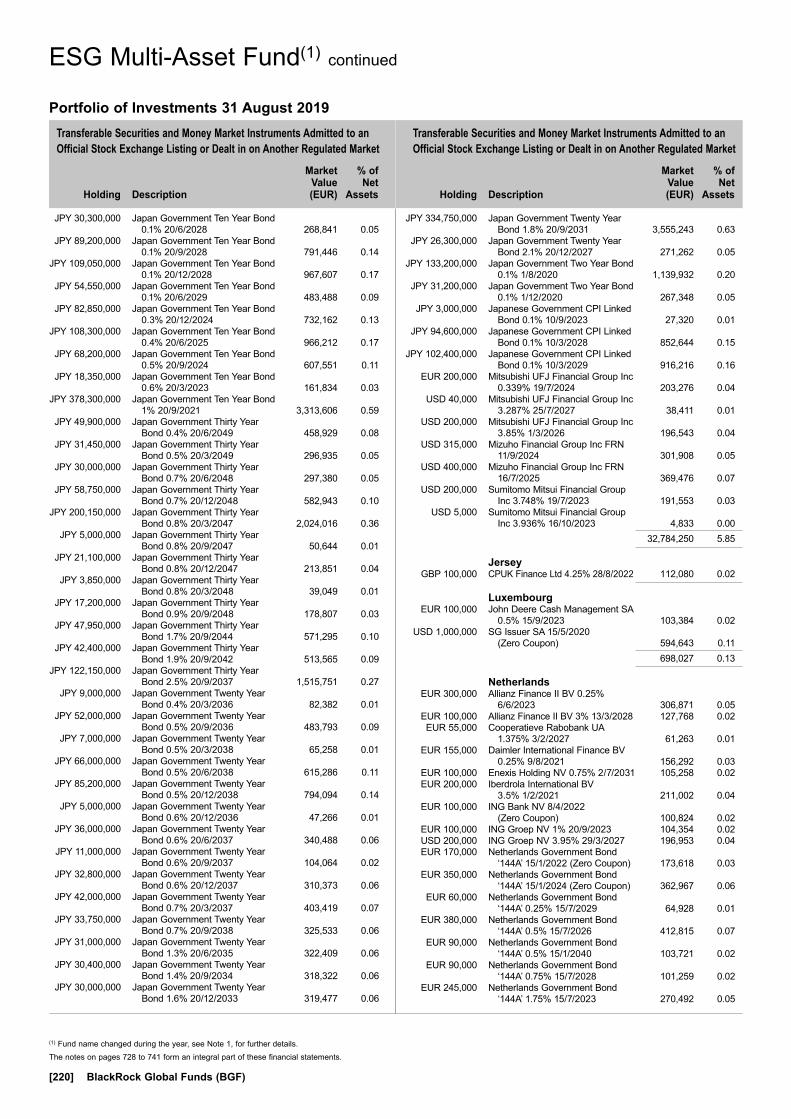
Transferable Securities and Money Market Instruments Admitted to an Official Stock Exchange Listing or Dealt in on Another Regulated Market
Transferable Securities and Money Market Instruments Admitted to an Official Stock Exchange Listing or Dealt in on Another Regulated Market
Holding
Description
Market Value (EUR)
% of Net
Assets
Holding
Description
Market Value (EUR)
% of Net
Assets
The notes on pages 728 to 741 form an integral part of these financial statements.
[220] BlackRock Global Funds (BGF)
JPY 30,300,000 Japan Government Ten Year Bond 0.1% 20/6/2028 268,841 0.05
JPY 89,200,000 Japan Government Ten Year Bond 0.1% 20/9/2028 791,446 0.14
JPY 109,050,000 Japan Government Ten Year Bond 0.1% 20/12/2028 967,607 0.17
JPY 54,550,000 Japan Government Ten Year Bond 0.1% 20/6/2029 483,488 0.09
JPY 82,850,000 Japan Government Ten Year Bond 0.3% 20/12/2024 732,162 0.13
JPY 108,300,000 Japan Government Ten Year Bond 0.4% 20/6/2025 966,212 0.17
JPY 68,200,000 Japan Government Ten Year Bond 0.5% 20/9/2024 607,551 0.11
JPY 18,350,000 Japan Government Ten Year Bond 0.6% 20/3/2023 161,834 0.03
JPY 378,300,000 Japan Government Ten Year Bond 1% 20/9/2021 3,313,606 0.59
JPY 49,900,000 Japan Government Thirty Year Bond 0.4% 20/6/2049 458,929 0.08
JPY 31,450,000 Japan Government Thirty Year Bond 0.5% 20/3/2049 296,935 0.05
JPY 30,000,000 Japan Government Thirty Year Bond 0.7% 20/6/2048 297,380 0.05
JPY 58,750,000 Japan Government Thirty Year Bond 0.7% 20/12/2048 582,943 0.10
JPY 200,150,000 Japan Government Thirty Year Bond 0.8% 20/3/2047 2,024,016 0.36
JPY 5,000,000 Japan Government Thirty Year Bond 0.8% 20/9/2047 50,644 0.01
JPY 21,100,000 Japan Government Thirty Year Bond 0.8% 20/12/2047 213,851 0.04
JPY 3,850,000 Japan Government Thirty Year Bond 0.8% 20/3/2048 39,049 0.01
JPY 17,200,000 Japan Government Thirty Year Bond 0.9% 20/9/2048 178,807 0.03
JPY 47,950,000 Japan Government Thirty Year Bond 1.7% 20/9/2044 571,295 0.10
JPY 42,400,000 Japan Government Thirty Year Bond 1.9% 20/9/2042 513,565 0.09
JPY 122,150,000 Japan Government Thirty Year Bond 2.5% 20/9/2037 1,515,751 0.27
JPY 9,000,000 Japan Government Twenty Year Bond 0.4% 20/3/2036 82,382 0.01
JPY 52,000,000 Japan Government Twenty Year Bond 0.5% 20/9/2036 483,793 0.09
JPY 7,000,000 Japan Government Twenty Year Bond 0.5% 20/3/2038 65,258 0.01
JPY 66,000,000 Japan Government Twenty Year Bond 0.5% 20/6/2038 615,286 0.11
JPY 85,200,000 Japan Government Twenty Year Bond 0.5% 20/12/2038 794,094 0.14
JPY 5,000,000 Japan Government Twenty Year Bond 0.6% 20/12/2036 47,266 0.01
JPY 36,000,000 Japan Government Twenty Year Bond 0.6% 20/6/2037 340,488 0.06
JPY 11,000,000 Japan Government Twenty Year Bond 0.6% 20/9/2037 104,064 0.02
JPY 32,800,000 Japan Government Twenty Year Bond 0.6% 20/12/2037 310,373 0.06
JPY 42,000,000 Japan Government Twenty Year Bond 0.7% 20/3/2037 403,419 0.07
JPY 33,750,000 Japan Government Twenty Year Bond 0.7% 20/9/2038 325,533 0.06
JPY 31,000,000 Japan Government Twenty Year Bond 1.3% 20/6/2035 322,409 0.06
JPY 30,400,000 Japan Government Twenty Year Bond 1.4% 20/9/2034 318,322 0.06
JPY 30,000,000 Japan Government Twenty Year Bond 1.6% 20/12/2033 319,477 0.06
JPY 334,750,000 Japan Government Twenty Year Bond 1.8% 20/9/2031 3,555,243 0.63
JPY 26,300,000 Japan Government Twenty Year Bond 2.1% 20/12/2027 271,262 0.05
JPY 133,200,000 Japan Government Two Year Bond 0.1% 1/8/2020 1,139,932 0.20
JPY 31,200,000 Japan Government Two Year Bond 0.1% 1/12/2020 267,348 0.05
JPY 3,000,000 Japanese Government CPI Linked Bond 0.1% 10/9/2023 27,320 0.01
JPY 94,600,000 Japanese Government CPI Linked Bond 0.1% 10/3/2028 852,644 0.15
JPY 102,400,000 Japanese Government CPI Linked Bond 0.1% 10/3/2029 916,216 0.16
EUR 200,000 Mitsubishi UFJ Financial Group Inc 0.339% 19/7/2024 203,276 0.04
USD 40,000 Mitsubishi UFJ Financial Group Inc 3.287% 25/7/2027 38,411 0.01
USD 200,000 Mitsubishi UFJ Financial Group Inc 3.85% 1/3/2026 196,543 0.04
USD 315,000 Mizuho Financial Group Inc FRN 11/9/2024 301,908 0.05
USD 400,000 Mizuho Financial Group Inc FRN 16/7/2025 369,476 0.07
USD 200,000 Sumitomo Mitsui Financial Group Inc 3.748% 19/7/2023 191,553 0.03
USD 5,000 Sumitomo Mitsui Financial Group Inc 3.936% 16/10/2023 4,833 0.00
32,784,250 5.85
Jersey GBP 100,000 CPUK Finance Ltd 4.25% 28/8/2022 112,080 0.02
Luxembourg EUR 100,000 John Deere Cash Management SA
0.5% 15/9/2023 103,384 0.02 USD 1,000,000 SG Issuer SA 15/5/2020
(Zero Coupon) 594,643 0.11 698,027 0.13
Netherlands EUR 300,000 Allianz Finance II BV 0.25%
6/6/2023 306,871 0.05 EUR 100,000 Allianz Finance II BV 3% 13/3/2028 127,768 0.02 EUR 55,000 Cooperatieve Rabobank UA
1.375% 3/2/2027 61,263 0.01 EUR 155,000 Daimler International Finance BV
0.25% 9/8/2021 156,292 0.03 EUR 100,000 Enexis Holding NV 0.75% 2/7/2031 105,258 0.02 EUR 200,000 Iberdrola International BV
3.5% 1/2/2021 211,002 0.04 EUR 100,000 ING Bank NV 8/4/2022
(Zero Coupon) 100,824 0.02 EUR 100,000 ING Groep NV 1% 20/9/2023 104,354 0.02 USD 200,000 ING Groep NV 3.95% 29/3/2027 196,953 0.04 EUR 170,000 Netherlands Government Bond
‘144A’ 15/1/2022 (Zero Coupon) 173,618 0.03 EUR 350,000 Netherlands Government Bond
‘144A’ 15/1/2024 (Zero Coupon) 362,967 0.06 EUR 60,000 Netherlands Government Bond
‘144A’ 0.25% 15/7/2029 64,928 0.01 EUR 380,000 Netherlands Government Bond
‘144A’ 0.5% 15/7/2026 412,815 0.07 EUR 90,000 Netherlands Government Bond
‘144A’ 0.5% 15/1/2040 103,721 0.02 EUR 90,000 Netherlands Government Bond
‘144A’ 0.75% 15/7/2028 101,259 0.02 EUR 245,000 Netherlands Government Bond
‘144A’ 1.75% 15/7/2023 270,492 0.05
ESG Multi-Asset Fund(1) continued
Portfolio of Investments 31 August 2019
(1) Fund name changed during the year, see Note 1, for further details.
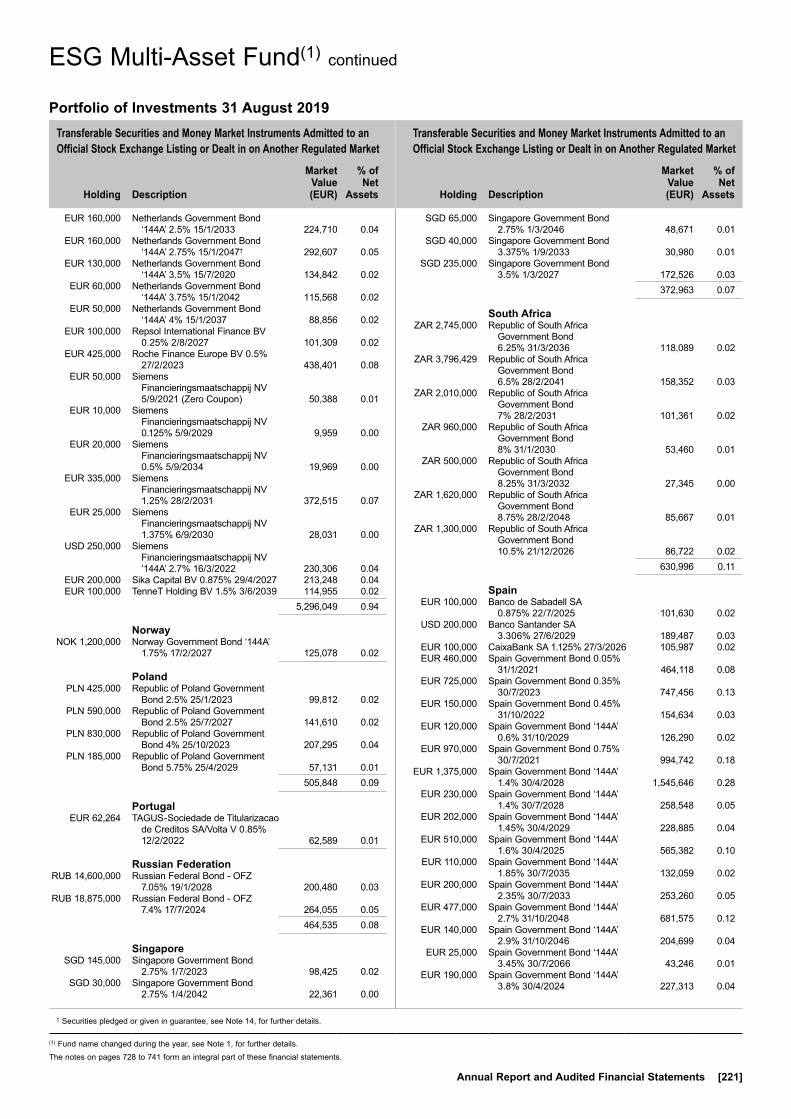
Transferable Securities and Money Market Instruments Admitted to an Official Stock Exchange Listing or Dealt in on Another Regulated Market
Transferable Securities and Money Market Instruments Admitted to an Official Stock Exchange Listing or Dealt in on Another Regulated Market
Holding
Description
Market Value (EUR)
% of Net
Assets
Holding
Description
Market Value (EUR)
% of Net
Assets
† Securities pledged or given in guarantee, see Note 14, for further details.
The notes on pages 728 to 741 form an integral part of these financial statements.
Annual Report and Audited Financial Statements [221]
EUR 160,000 Netherlands Government Bond ‘144A’ 2.5% 15/1/2033 224,710 0.04
EUR 160,000 Netherlands Government Bond ‘144A’ 2.75% 15/1/2047† 292,607 0.05
EUR 130,000 Netherlands Government Bond ‘144A’ 3.5% 15/7/2020 134,842 0.02
EUR 60,000 Netherlands Government Bond ‘144A’ 3.75% 15/1/2042 115,568 0.02
EUR 50,000 Netherlands Government Bond ‘144A’ 4% 15/1/2037 88,856 0.02
EUR 100,000 Repsol International Finance BV 0.25% 2/8/2027 101,309 0.02
EUR 425,000 Roche Finance Europe BV 0.5% 27/2/2023 438,401 0.08
EUR 50,000 Siemens Financieringsmaatschappij NV 5/9/2021 (Zero Coupon) 50,388 0.01
EUR 10,000 Siemens Financieringsmaatschappij NV 0.125% 5/9/2029 9,959 0.00
EUR 20,000 Siemens Financieringsmaatschappij NV 0.5% 5/9/2034 19,969 0.00
EUR 335,000 Siemens Financieringsmaatschappij NV 1.25% 28/2/2031 372,515 0.07
EUR 25,000 Siemens Financieringsmaatschappij NV 1.375% 6/9/2030 28,031 0.00
USD 250,000 Siemens Financieringsmaatschappij NV ‘144A’ 2.7% 16/3/2022 230,306 0.04
EUR 200,000 Sika Capital BV 0.875% 29/4/2027 213,248 0.04 EUR 100,000 TenneT Holding BV 1.5% 3/6/2039 114,955 0.02 5,296,049 0.94
Norway NOK 1,200,000 Norway Government Bond ‘144A’
1.75% 17/2/2027 125,078 0.02
Poland PLN 425,000 Republic of Poland Government
Bond 2.5% 25/1/2023 99,812 0.02 PLN 590,000 Republic of Poland Government
Bond 2.5% 25/7/2027 141,610 0.02 PLN 830,000 Republic of Poland Government
Bond 4% 25/10/2023 207,295 0.04 PLN 185,000 Republic of Poland Government
Bond 5.75% 25/4/2029 57,131 0.01 505,848 0.09
Portugal EUR 62,264 TAGUS-Sociedade de Titularizacao
de Creditos SA/Volta V 0.85% 12/2/2022 62,589 0.01
Russian Federation RUB 14,600,000 Russian Federal Bond - OFZ
7.05% 19/1/2028 200,480 0.03 RUB 18,875,000 Russian Federal Bond - OFZ
7.4% 17/7/2024 264,055 0.05 464,535 0.08
Singapore SGD 145,000 Singapore Government Bond
2.75% 1/7/2023 98,425 0.02 SGD 30,000 Singapore Government Bond
2.75% 1/4/2042 22,361 0.00
SGD 65,000 Singapore Government Bond 2.75% 1/3/2046 48,671 0.01
SGD 40,000 Singapore Government Bond 3.375% 1/9/2033 30,980 0.01
SGD 235,000 Singapore Government Bond 3.5% 1/3/2027 172,526 0.03
372,963 0.07
South Africa ZAR 2,745,000 Republic of South Africa
Government Bond 6.25% 31/3/2036 118,089 0.02
ZAR 3,796,429 Republic of South Africa Government Bond 6.5% 28/2/2041 158,352 0.03
ZAR 2,010,000 Republic of South Africa Government Bond 7% 28/2/2031 101,361 0.02
ZAR 960,000 Republic of South Africa Government Bond 8% 31/1/2030 53,460 0.01
ZAR 500,000 Republic of South Africa Government Bond 8.25% 31/3/2032 27,345 0.00
ZAR 1,620,000 Republic of South Africa Government Bond 8.75% 28/2/2048 85,667 0.01
ZAR 1,300,000 Republic of South Africa Government Bond 10.5% 21/12/2026 86,722 0.02
630,996 0.11
Spain EUR 100,000 Banco de Sabadell SA
0.875% 22/7/2025 101,630 0.02 USD 200,000 Banco Santander SA
3.306% 27/6/2029 189,487 0.03 EUR 100,000 CaixaBank SA 1.125% 27/3/2026 105,987 0.02 EUR 460,000 Spain Government Bond 0.05%
31/1/2021 464,118 0.08 EUR 725,000 Spain Government Bond 0.35%
30/7/2023 747,456 0.13 EUR 150,000 Spain Government Bond 0.45%
31/10/2022 154,634 0.03 EUR 120,000 Spain Government Bond ‘144A’
0.6% 31/10/2029 126,290 0.02 EUR 970,000 Spain Government Bond 0.75%
30/7/2021 994,742 0.18 EUR 1,375,000 Spain Government Bond ‘144A’
1.4% 30/4/2028 1,545,646 0.28 EUR 230,000 Spain Government Bond ‘144A’
1.4% 30/7/2028 258,548 0.05 EUR 202,000 Spain Government Bond ‘144A’
1.45% 30/4/2029 228,885 0.04 EUR 510,000 Spain Government Bond ‘144A’
1.6% 30/4/2025 565,382 0.10 EUR 110,000 Spain Government Bond ‘144A’
1.85% 30/7/2035 132,059 0.02 EUR 200,000 Spain Government Bond ‘144A’
2.35% 30/7/2033 253,260 0.05 EUR 477,000 Spain Government Bond ‘144A’
2.7% 31/10/2048 681,575 0.12 EUR 140,000 Spain Government Bond ‘144A’
2.9% 31/10/2046 204,699 0.04 EUR 25,000 Spain Government Bond ‘144A’
3.45% 30/7/2066 43,246 0.01 EUR 190,000 Spain Government Bond ‘144A’
3.8% 30/4/2024 227,313 0.04
ESG Multi-Asset Fund(1) continued
Portfolio of Investments 31 August 2019
(1) Fund name changed during the year, see Note 1, for further details.

Transferable Securities and Money Market Instruments Admitted to an Official Stock Exchange Listing or Dealt in on Another Regulated Market
Transferable Securities and Money Market Instruments Admitted to an Official Stock Exchange Listing or Dealt in on Another Regulated Market
Holding
Description
Market Value (EUR)
% of Net
Assets
Holding
Description
Market Value (EUR)
% of Net
Assets
* All or a portion of this security represents a security on loan.
The notes on pages 728 to 741 form an integral part of these financial statements.
[222] BlackRock Global Funds (BGF)
EUR 175,000 Spain Government Bond ‘144A’ 4.2% 31/1/2037 280,717 0.05
EUR 290,000 Spain Government Bond ‘144A’ 4.7% 30/7/2041 519,529 0.09
EUR 120,000 Spain Government Bond ‘144A’ 5.15% 31/10/2044 235,631 0.04
EUR 141,000 Spain Government Bond ‘144A’ 5.4% 31/1/2023 169,568 0.03
EUR 71,000 Spain Government Bond ‘144A’ 5.5% 30/4/2021 78,201 0.01
8,308,603 1.48
Sweden EUR 380,000 Atlas Copco AB 2.5% 28/2/2023 419,136 0.07 SEK 900,000 Sweden Government Bond 0.75%
12/5/2028* 92,113 0.02 SEK 1,100,000 Sweden Government Bond ‘144A’
1.5% 13/11/2023* 111,143 0.02 SEK 245,000 Sweden Government Bond 3.5%
30/3/2039 37,834 0.01 660,226 0.12
Switzerland USD 920,000 Credit Suisse Group AG ‘144A’
FRN 14/12/2023 844,088 0.15 EUR 145,000 UBS AG FRN 12/2/2026 154,367 0.03 USD 865,000 UBS Group Funding Switzerland
AG ‘144A’ FRN 15/8/2023 794,298 0.14 USD 720,000 UBS Group Funding Switzerland
AG 3.491% 23/5/2023 671,540 0.12 USD 400,000 UBS Group Funding Switzerland
AG ‘144A’ 3.491% 23/5/2023 373,078 0.07 2,837,371 0.51
United Kingdom USD 410,000 Anglo American Capital Plc ‘144A’
4.875% 14/5/2025 403,221 0.07 EUR 225,000 BP Capital Markets Plc 1.526%
26/9/2022 237,384 0.04 USD 145,000 BP Capital Markets Plc 3.279%
19/9/2027 139,166 0.02 USD 95,000 BP Capital Markets Plc 3.814%
10/2/2024 92,050 0.02 EUR 100,000 Coca-Cola European Partners Plc
1.875% 18/3/2030 114,541 0.02 GBP 37,190 Greene King Finance Plc FRN
15/12/2033 41,389 0.01 GBP 100,000 Motor 2016-1 Plc 3.75% 25/11/2025 112,368 0.02 EUR 37,353 Paragon Mortgages No 11 Plc FRN
15/10/2041 35,303 0.01 GBP 100,000 Residential Mortgage Securities 29
Plc FRN 20/12/2046 110,563 0.02 GBP 54,889 Unique Pub Finance Co Plc/The
5.659% 30/6/2027 69,264 0.01 GBP 165,000 United Kingdom Gilt 0.75%
22/7/2023 185,463 0.03 GBP 130,000 United Kingdom Gilt 0.875%
22/10/2029 149,761 0.03 GBP 300,000 United Kingdom Gilt 1%
22/4/2024 342,329 0.06 GBP 80,000 United Kingdom Gilt 1.25%
22/7/2027 94,896 0.02 GBP 710,000 United Kingdom Gilt 1.5%
22/1/2021 796,753 0.14 GBP 75,000 United Kingdom Gilt 1.5%
22/7/2026* 89,848 0.02
GBP 332,429 United Kingdom Gilt 1.5% 22/7/2047 413,962 0.07
GBP 625,000 United Kingdom Gilt 1.625% 22/10/2028 768,293 0.14
GBP 50,000 United Kingdom Gilt 1.625% 22/10/2054 66,336 0.01
GBP 130,000 United Kingdom Gilt 1.625% 22/10/2071 188,554 0.03
GBP 292,000 United Kingdom Gilt 1.75% 22/1/2049 387,666 0.07
GBP 350,000 United Kingdom Gilt 1.75% 22/7/2057 490,576 0.09
GBP 150,000 United Kingdom Gilt 2.25% 7/9/2023 178,645 0.03
GBP 55,000 United Kingdom Gilt 2.5% 22/7/2065 97,391 0.02
GBP 310,000 United Kingdom Gilt 2.75% 7/9/2024 384,583 0.07
GBP 290,500 United Kingdom Gilt 3.25% 22/1/2044 478,979 0.09
GBP 363,500 United Kingdom Gilt 3.5% 22/1/2045* 629,437 0.11
GBP 90,000 United Kingdom Gilt 3.75% 22/7/2052 177,987 0.03
GBP 150,000 United Kingdom Gilt 4.25% 7/3/2036 255,595 0.05
GBP 595,000 United Kingdom Gilt 4.25% 7/9/2039 1,064,505 0.19
GBP 255,000 United Kingdom Gilt 4.5% 7/12/2042 491,165 0.09
GBP 102,000 United Kingdom Gilt 5% 7/3/2025 141,818 0.02
GBP 100,000 Warwick Finance Residential Mortgages No One Plc FRN 21/9/2049 110,749 0.02
9,340,540 1.67
United States USD 35,000 AbbVie Inc 3.2% 6/11/2022 32,489 0.01 USD 8,000 AbbVie Inc 4.3% 14/5/2036 7,735 0.00 USD 112,000 AbbVie Inc 4.5% 14/5/2035 110,479 0.02 USD 125,000 American Tower Corp 2.25%
15/1/2022 113,576 0.02 USD 70,000 American Tower Corp 2.95%
15/1/2025 64,874 0.01 USD 71,000 American Tower Corp 3%
15/6/2023 66,150 0.01 USD 70,000 American Tower Corp 3.375%
15/10/2026 66,332 0.01 USD 107,000 American Tower Corp 3.5%
31/1/2023 100,658 0.02 USD 5,000 American Tower Corp 3.6%
15/1/2028 4,793 0.00 USD 62,000 American Tower Corp 3.95%
15/3/2029 61,303 0.01 USD 2,000 American Tower Corp 4.4%
15/2/2026 1,994 0.00 USD 93,000 American Tower Corp 5% 15/2/2024 93,445 0.02 USD 80,000 Analog Devices Inc 3.5% 5/12/2026 76,503 0.01 USD 36,000 Analog Devices Inc 3.9% 15/12/2025 35,089 0.01 EUR 750,000 Apple Inc 1% 10/11/2022 784,036 0.14 USD 15,000 Apple Inc 2.5% 9/2/2025 13,961 0.00 USD 60,000 Apple Inc 3.2% 13/5/2025 57,828 0.01 USD 37,000 Apple Inc 3.2% 11/5/2027 35,835 0.01 USD 80,000 Apple Inc 3.35% 9/2/2027 78,262 0.01 USD 18,000 Apple Inc 3.85% 4/5/2043 18,610 0.00 USD 35,000 Applied Materials Inc 3.3% 1/4/2027 34,134 0.01 USD 95,000 Applied Materials Inc 3.9% 1/10/2025 94,315 0.02
ESG Multi-Asset Fund(1) continued
Portfolio of Investments 31 August 2019
(1) Fund name changed during the year, see Note 1, for further details.
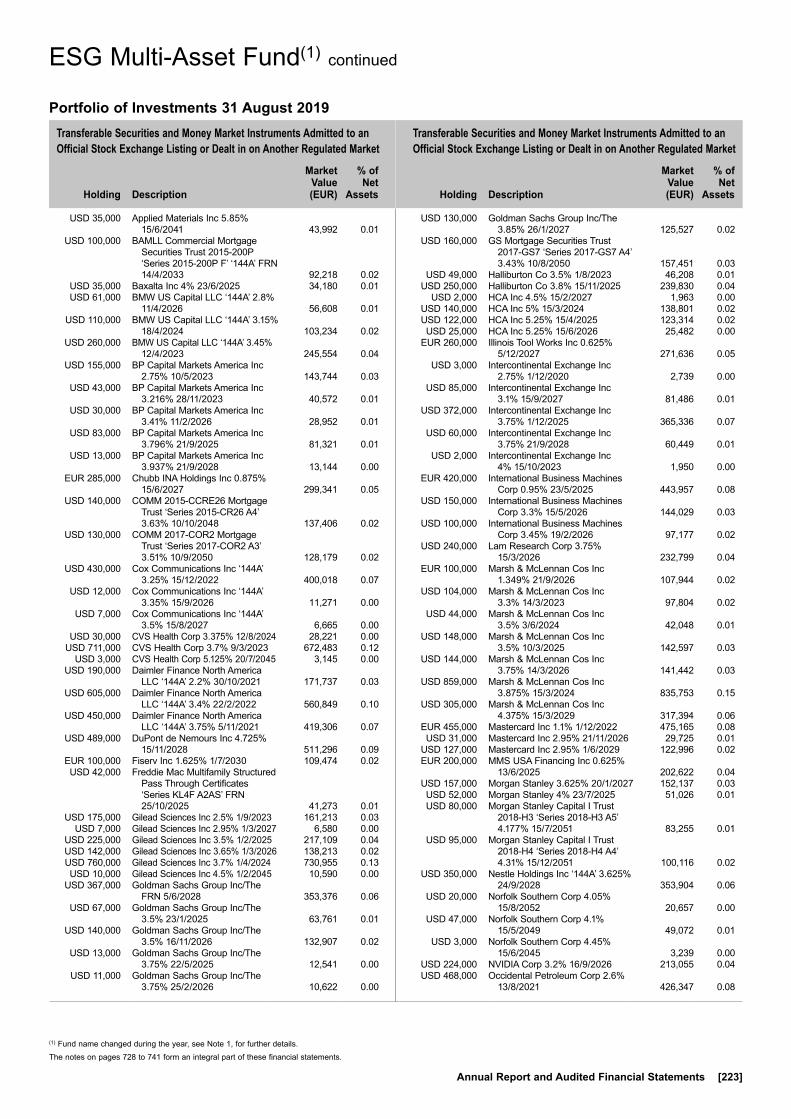
Transferable Securities and Money Market Instruments Admitted to an Official Stock Exchange Listing or Dealt in on Another Regulated Market
Transferable Securities and Money Market Instruments Admitted to an Official Stock Exchange Listing or Dealt in on Another Regulated Market
Holding
Description
Market Value (EUR)
% of Net
Assets
Holding
Description
Market Value (EUR)
% of Net
Assets
The notes on pages 728 to 741 form an integral part of these financial statements.
Annual Report and Audited Financial Statements [223]
USD 35,000 Applied Materials Inc 5.85% 15/6/2041 43,992 0.01
USD 100,000 BAMLL Commercial Mortgage Securities Trust 2015-200P ‘Series 2015-200P F’ ‘144A’ FRN 14/4/2033 92,218 0.02
USD 35,000 Baxalta Inc 4% 23/6/2025 34,180 0.01 USD 61,000 BMW US Capital LLC ‘144A’ 2.8%
11/4/2026 56,608 0.01 USD 110,000 BMW US Capital LLC ‘144A’ 3.15%
18/4/2024 103,234 0.02 USD 260,000 BMW US Capital LLC ‘144A’ 3.45%
12/4/2023 245,554 0.04 USD 155,000 BP Capital Markets America Inc
2.75% 10/5/2023 143,744 0.03 USD 43,000 BP Capital Markets America Inc
3.216% 28/11/2023 40,572 0.01 USD 30,000 BP Capital Markets America Inc
3.41% 11/2/2026 28,952 0.01 USD 83,000 BP Capital Markets America Inc
3.796% 21/9/2025 81,321 0.01 USD 13,000 BP Capital Markets America Inc
3.937% 21/9/2028 13,144 0.00 EUR 285,000 Chubb INA Holdings Inc 0.875%
15/6/2027 299,341 0.05 USD 140,000 COMM 2015-CCRE26 Mortgage
Trust ‘Series 2015-CR26 A4’ 3.63% 10/10/2048 137,406 0.02
USD 130,000 COMM 2017-COR2 Mortgage Trust ‘Series 2017-COR2 A3’ 3.51% 10/9/2050 128,179 0.02
USD 430,000 Cox Communications Inc ‘144A’ 3.25% 15/12/2022 400,018 0.07
USD 12,000 Cox Communications Inc ‘144A’ 3.35% 15/9/2026 11,271 0.00
USD 7,000 Cox Communications Inc ‘144A’ 3.5% 15/8/2027 6,665 0.00
USD 30,000 CVS Health Corp 3.375% 12/8/2024 28,221 0.00 USD 711,000 CVS Health Corp 3.7% 9/3/2023 672,483 0.12 USD 3,000 CVS Health Corp 5.125% 20/7/2045 3,145 0.00 USD 190,000 Daimler Finance North America
LLC ‘144A’ 2.2% 30/10/2021 171,737 0.03 USD 605,000 Daimler Finance North America
LLC ‘144A’ 3.4% 22/2/2022 560,849 0.10 USD 450,000 Daimler Finance North America
LLC ‘144A’ 3.75% 5/11/2021 419,306 0.07 USD 489,000 DuPont de Nemours Inc 4.725%
15/11/2028 511,296 0.09 EUR 100,000 Fiserv Inc 1.625% 1/7/2030 109,474 0.02 USD 42,000 Freddie Mac Multifamily Structured
Pass Through Certificates ‘Series KL4F A2AS’ FRN 25/10/2025 41,273 0.01
USD 175,000 Gilead Sciences Inc 2.5% 1/9/2023 161,213 0.03 USD 7,000 Gilead Sciences Inc 2.95% 1/3/2027 6,580 0.00 USD 225,000 Gilead Sciences Inc 3.5% 1/2/2025 217,109 0.04 USD 142,000 Gilead Sciences Inc 3.65% 1/3/2026 138,213 0.02 USD 760,000 Gilead Sciences Inc 3.7% 1/4/2024 730,955 0.13 USD 10,000 Gilead Sciences Inc 4.5% 1/2/2045 10,590 0.00 USD 367,000 Goldman Sachs Group Inc/The
FRN 5/6/2028 353,376 0.06 USD 67,000 Goldman Sachs Group Inc/The
3.5% 23/1/2025 63,761 0.01 USD 140,000 Goldman Sachs Group Inc/The
3.5% 16/11/2026 132,907 0.02 USD 13,000 Goldman Sachs Group Inc/The
3.75% 22/5/2025 12,541 0.00 USD 11,000 Goldman Sachs Group Inc/The
3.75% 25/2/2026 10,622 0.00
USD 130,000 Goldman Sachs Group Inc/The 3.85% 26/1/2027 125,527 0.02
USD 160,000 GS Mortgage Securities Trust 2017-GS7 ‘Series 2017-GS7 A4’ 3.43% 10/8/2050 157,451 0.03
USD 49,000 Halliburton Co 3.5% 1/8/2023 46,208 0.01 USD 250,000 Halliburton Co 3.8% 15/11/2025 239,830 0.04 USD 2,000 HCA Inc 4.5% 15/2/2027 1,963 0.00 USD 140,000 HCA Inc 5% 15/3/2024 138,801 0.02 USD 122,000 HCA Inc 5.25% 15/4/2025 123,314 0.02 USD 25,000 HCA Inc 5.25% 15/6/2026 25,482 0.00 EUR 260,000 Illinois Tool Works Inc 0.625%
5/12/2027 271,636 0.05 USD 3,000 Intercontinental Exchange Inc
2.75% 1/12/2020 2,739 0.00 USD 85,000 Intercontinental Exchange Inc
3.1% 15/9/2027 81,486 0.01 USD 372,000 Intercontinental Exchange Inc
3.75% 1/12/2025 365,336 0.07 USD 60,000 Intercontinental Exchange Inc
3.75% 21/9/2028 60,449 0.01 USD 2,000 Intercontinental Exchange Inc
4% 15/10/2023 1,950 0.00 EUR 420,000 International Business Machines
Corp 0.95% 23/5/2025 443,957 0.08 USD 150,000 International Business Machines
Corp 3.3% 15/5/2026 144,029 0.03 USD 100,000 International Business Machines
Corp 3.45% 19/2/2026 97,177 0.02 USD 240,000 Lam Research Corp 3.75%
15/3/2026 232,799 0.04 EUR 100,000 Marsh & McLennan Cos Inc
1.349% 21/9/2026 107,944 0.02 USD 104,000 Marsh & McLennan Cos Inc
3.3% 14/3/2023 97,804 0.02 USD 44,000 Marsh & McLennan Cos Inc
3.5% 3/6/2024 42,048 0.01 USD 148,000 Marsh & McLennan Cos Inc
3.5% 10/3/2025 142,597 0.03 USD 144,000 Marsh & McLennan Cos Inc
3.75% 14/3/2026 141,442 0.03 USD 859,000 Marsh & McLennan Cos Inc
3.875% 15/3/2024 835,753 0.15 USD 305,000 Marsh & McLennan Cos Inc
4.375% 15/3/2029 317,394 0.06 EUR 455,000 Mastercard Inc 1.1% 1/12/2022 475,165 0.08 USD 31,000 Mastercard Inc 2.95% 21/11/2026 29,725 0.01 USD 127,000 Mastercard Inc 2.95% 1/6/2029 122,996 0.02 EUR 200,000 MMS USA Financing Inc 0.625%
13/6/2025 202,622 0.04 USD 157,000 Morgan Stanley 3.625% 20/1/2027 152,137 0.03 USD 52,000 Morgan Stanley 4% 23/7/2025 51,026 0.01 USD 80,000 Morgan Stanley Capital I Trust
2018-H3 ‘Series 2018-H3 A5’ 4.177% 15/7/2051 83,255 0.01
USD 95,000 Morgan Stanley Capital I Trust 2018-H4 ‘Series 2018-H4 A4’ 4.31% 15/12/2051 100,116 0.02
USD 350,000 Nestle Holdings Inc ‘144A’ 3.625% 24/9/2028 353,904 0.06
USD 20,000 Norfolk Southern Corp 4.05% 15/8/2052 20,657 0.00
USD 47,000 Norfolk Southern Corp 4.1% 15/5/2049 49,072 0.01
USD 3,000 Norfolk Southern Corp 4.45% 15/6/2045 3,239 0.00
USD 224,000 NVIDIA Corp 3.2% 16/9/2026 213,055 0.04 USD 468,000 Occidental Petroleum Corp 2.6%
13/8/2021 426,347 0.08
ESG Multi-Asset Fund(1) continued
Portfolio of Investments 31 August 2019
(1) Fund name changed during the year, see Note 1, for further details.
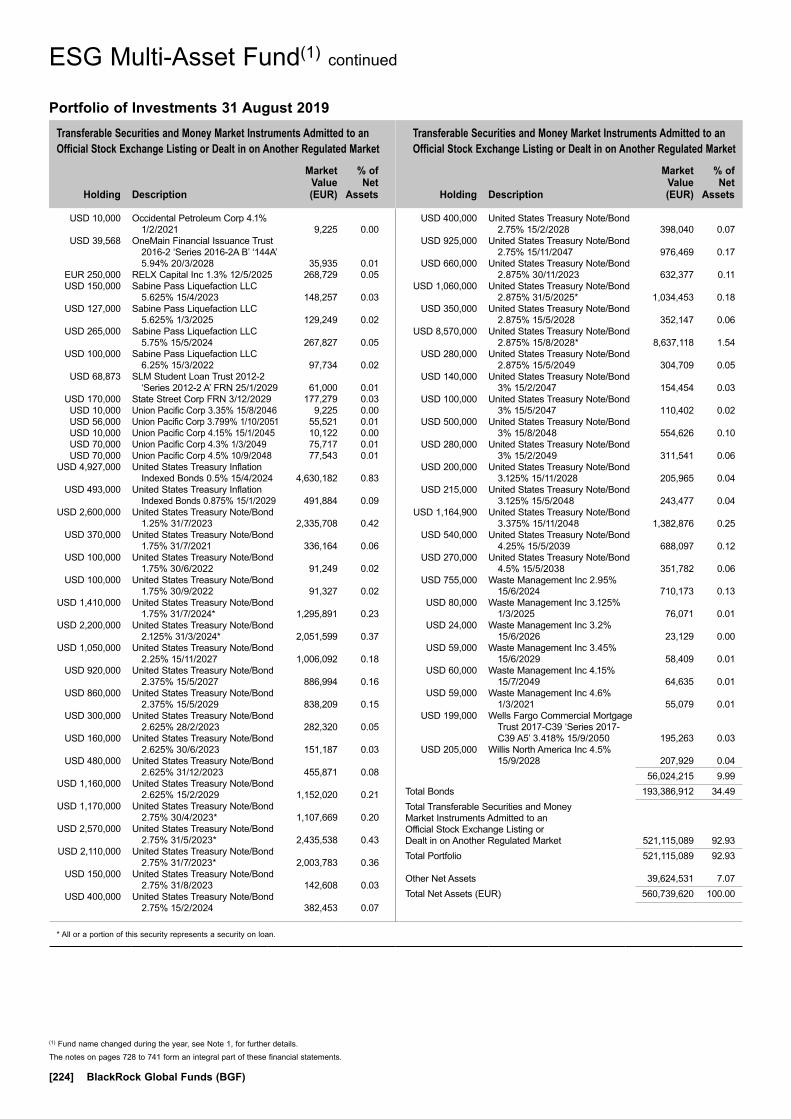
Transferable Securities and Money Market Instruments Admitted to an Official Stock Exchange Listing or Dealt in on Another Regulated Market
Transferable Securities and Money Market Instruments Admitted to an Official Stock Exchange Listing or Dealt in on Another Regulated Market
Holding
Description
Market Value (EUR)
% of Net
Assets
Holding
Description
Market Value (EUR)
% of Net
Assets
* All or a portion of this security represents a security on loan.
The notes on pages 728 to 741 form an integral part of these financial statements.
[224] BlackRock Global Funds (BGF)
USD 10,000 Occidental Petroleum Corp 4.1% 1/2/2021 9,225 0.00
USD 39,568 OneMain Financial Issuance Trust 2016-2 ‘Series 2016-2A B’ ‘144A’ 5.94% 20/3/2028 35,935 0.01
EUR 250,000 RELX Capital Inc 1.3% 12/5/2025 268,729 0.05 USD 150,000 Sabine Pass Liquefaction LLC
5.625% 15/4/2023 148,257 0.03 USD 127,000 Sabine Pass Liquefaction LLC
5.625% 1/3/2025 129,249 0.02 USD 265,000 Sabine Pass Liquefaction LLC
5.75% 15/5/2024 267,827 0.05 USD 100,000 Sabine Pass Liquefaction LLC
6.25% 15/3/2022 97,734 0.02 USD 68,873 SLM Student Loan Trust 2012-2
‘Series 2012-2 A’ FRN 25/1/2029 61,000 0.01 USD 170,000 State Street Corp FRN 3/12/2029 177,279 0.03 USD 10,000 Union Pacific Corp 3.35% 15/8/2046 9,225 0.00 USD 56,000 Union Pacific Corp 3.799% 1/10/2051 55,521 0.01 USD 10,000 Union Pacific Corp 4.15% 15/1/2045 10,122 0.00 USD 70,000 Union Pacific Corp 4.3% 1/3/2049 75,717 0.01 USD 70,000 Union Pacific Corp 4.5% 10/9/2048 77,543 0.01 USD 4,927,000 United States Treasury Inflation
Indexed Bonds 0.5% 15/4/2024 4,630,182 0.83 USD 493,000 United States Treasury Inflation
Indexed Bonds 0.875% 15/1/2029 491,884 0.09 USD 2,600,000 United States Treasury Note/Bond
1.25% 31/7/2023 2,335,708 0.42 USD 370,000 United States Treasury Note/Bond
1.75% 31/7/2021 336,164 0.06 USD 100,000 United States Treasury Note/Bond
1.75% 30/6/2022 91,249 0.02 USD 100,000 United States Treasury Note/Bond
1.75% 30/9/2022 91,327 0.02 USD 1,410,000 United States Treasury Note/Bond
1.75% 31/7/2024* 1,295,891 0.23 USD 2,200,000 United States Treasury Note/Bond
2.125% 31/3/2024* 2,051,599 0.37 USD 1,050,000 United States Treasury Note/Bond
2.25% 15/11/2027 1,006,092 0.18 USD 920,000 United States Treasury Note/Bond
2.375% 15/5/2027 886,994 0.16 USD 860,000 United States Treasury Note/Bond
2.375% 15/5/2029 838,209 0.15 USD 300,000 United States Treasury Note/Bond
2.625% 28/2/2023 282,320 0.05 USD 160,000 United States Treasury Note/Bond
2.625% 30/6/2023 151,187 0.03 USD 480,000 United States Treasury Note/Bond
2.625% 31/12/2023 455,871 0.08 USD 1,160,000 United States Treasury Note/Bond
2.625% 15/2/2029 1,152,020 0.21 USD 1,170,000 United States Treasury Note/Bond
2.75% 30/4/2023* 1,107,669 0.20 USD 2,570,000 United States Treasury Note/Bond
2.75% 31/5/2023* 2,435,538 0.43 USD 2,110,000 United States Treasury Note/Bond
2.75% 31/7/2023* 2,003,783 0.36 USD 150,000 United States Treasury Note/Bond
2.75% 31/8/2023 142,608 0.03 USD 400,000 United States Treasury Note/Bond
2.75% 15/2/2024 382,453 0.07
USD 400,000 United States Treasury Note/Bond 2.75% 15/2/2028 398,040 0.07
USD 925,000 United States Treasury Note/Bond 2.75% 15/11/2047 976,469 0.17
USD 660,000 United States Treasury Note/Bond 2.875% 30/11/2023 632,377 0.11
USD 1,060,000 United States Treasury Note/Bond 2.875% 31/5/2025* 1,034,453 0.18
USD 350,000 United States Treasury Note/Bond 2.875% 15/5/2028 352,147 0.06
USD 8,570,000 United States Treasury Note/Bond 2.875% 15/8/2028* 8,637,118 1.54
USD 280,000 United States Treasury Note/Bond 2.875% 15/5/2049 304,709 0.05
USD 140,000 United States Treasury Note/Bond 3% 15/2/2047 154,454 0.03
USD 100,000 United States Treasury Note/Bond 3% 15/5/2047 110,402 0.02
USD 500,000 United States Treasury Note/Bond 3% 15/8/2048 554,626 0.10
USD 280,000 United States Treasury Note/Bond 3% 15/2/2049 311,541 0.06
USD 200,000 United States Treasury Note/Bond 3.125% 15/11/2028 205,965 0.04
USD 215,000 United States Treasury Note/Bond 3.125% 15/5/2048 243,477 0.04
USD 1,164,900 United States Treasury Note/Bond 3.375% 15/11/2048 1,382,876 0.25
USD 540,000 United States Treasury Note/Bond 4.25% 15/5/2039 688,097 0.12
USD 270,000 United States Treasury Note/Bond 4.5% 15/5/2038 351,782 0.06
USD 755,000 Waste Management Inc 2.95% 15/6/2024 710,173 0.13
USD 80,000 Waste Management Inc 3.125% 1/3/2025 76,071 0.01
USD 24,000 Waste Management Inc 3.2% 15/6/2026 23,129 0.00
USD 59,000 Waste Management Inc 3.45% 15/6/2029 58,409 0.01
USD 60,000 Waste Management Inc 4.15% 15/7/2049 64,635 0.01
USD 59,000 Waste Management Inc 4.6% 1/3/2021 55,079 0.01
USD 199,000 Wells Fargo Commercial Mortgage Trust 2017-C39 ‘Series 2017-C39 A5’ 3.418% 15/9/2050 195,263 0.03
USD 205,000 Willis North America Inc 4.5% 15/9/2028 207,929 0.04
56,024,215 9.99Total Bonds 193,386,912 34.49Total Transferable Securities and Money Market Instruments Admitted to an Official Stock Exchange Listing or Dealt in on Another Regulated Market 521,115,089 92.93Total Portfolio 521,115,089 92.93
Other Net Assets 39,624,531 7.07Total Net Assets (EUR) 560,739,620 100.00
ESG Multi-Asset Fund(1) continued
Portfolio of Investments 31 August 2019
(1) Fund name changed during the year, see Note 1, for further details.
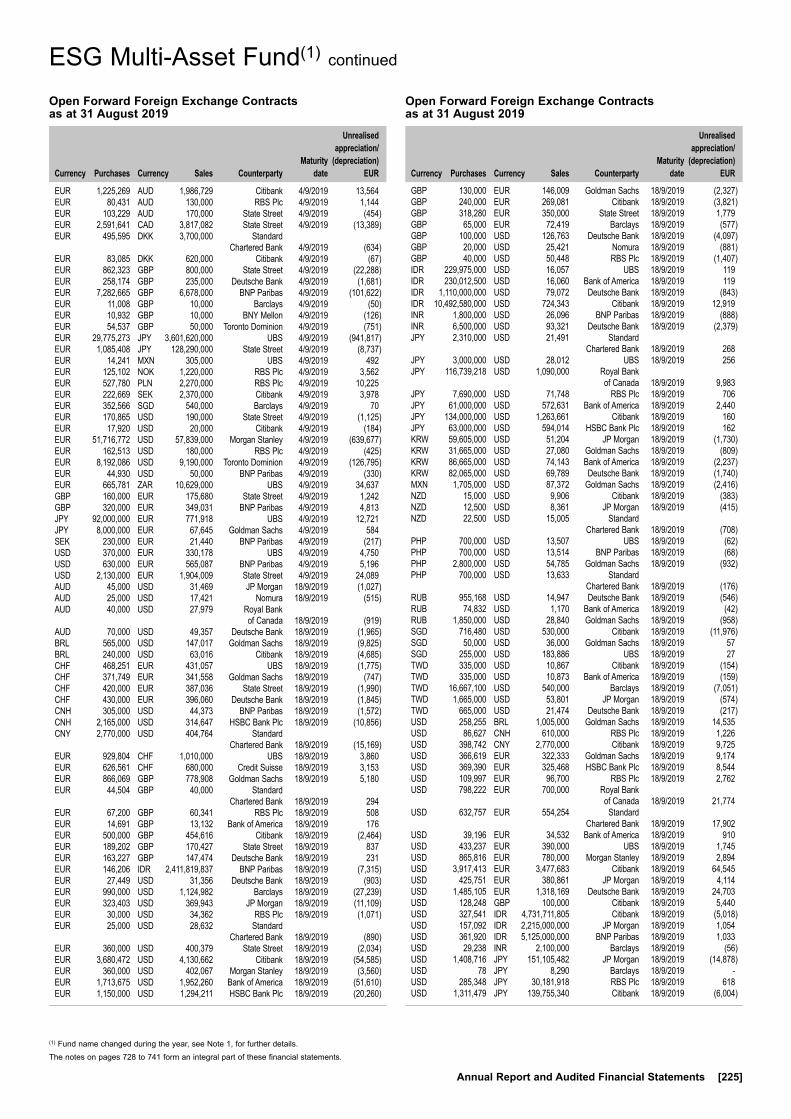
The notes on pages 728 to 741 form an integral part of these financial statements.
Annual Report and Audited Financial Statements [225]
ESG Multi-Asset Fund(1) continued
(1) Fund name changed during the year, see Note 1, for further details.
Open Forward Foreign Exchange Contracts as at 31 August 2019
Currency
Purchases Currency
Sales Counterparty
Maturity date
Unrealised appreciation/
(depreciation) EUR
EUR 1,225,269 AUD 1,986,729 Citibank 4/9/2019 13,564 EUR 80,431 AUD 130,000 RBS Plc 4/9/2019 1,144 EUR 103,229 AUD 170,000 State Street 4/9/2019 (454)EUR 2,591,641 CAD 3,817,082 State Street 4/9/2019 (13,389)EUR 495,595 DKK 3,700,000 Standard Chartered Bank 4/9/2019 (634)EUR 83,085 DKK 620,000 Citibank 4/9/2019 (67)EUR 862,323 GBP 800,000 State Street 4/9/2019 (22,288)EUR 258,174 GBP 235,000 Deutsche Bank 4/9/2019 (1,681)EUR 7,282,665 GBP 6,678,000 BNP Paribas 4/9/2019 (101,622)EUR 11,008 GBP 10,000 Barclays 4/9/2019 (50)EUR 10,932 GBP 10,000 BNY Mellon 4/9/2019 (126)EUR 54,537 GBP 50,000 Toronto Dominion 4/9/2019 (751)EUR 29,775,273 JPY 3,601,620,000 UBS 4/9/2019 (941,817)EUR 1,085,408 JPY 128,290,000 State Street 4/9/2019 (8,737)EUR 14,241 MXN 305,000 UBS 4/9/2019 492 EUR 125,102 NOK 1,220,000 RBS Plc 4/9/2019 3,562 EUR 527,780 PLN 2,270,000 RBS Plc 4/9/2019 10,225 EUR 222,669 SEK 2,370,000 Citibank 4/9/2019 3,978 EUR 352,566 SGD 540,000 Barclays 4/9/2019 70 EUR 170,865 USD 190,000 State Street 4/9/2019 (1,125)EUR 17,920 USD 20,000 Citibank 4/9/2019 (184)EUR 51,716,772 USD 57,839,000 Morgan Stanley 4/9/2019 (639,677)EUR 162,513 USD 180,000 RBS Plc 4/9/2019 (425)EUR 8,192,086 USD 9,190,000 Toronto Dominion 4/9/2019 (126,795)EUR 44,930 USD 50,000 BNP Paribas 4/9/2019 (330)EUR 665,781 ZAR 10,629,000 UBS 4/9/2019 34,637 GBP 160,000 EUR 175,680 State Street 4/9/2019 1,242 GBP 320,000 EUR 349,031 BNP Paribas 4/9/2019 4,813 JPY 92,000,000 EUR 771,918 UBS 4/9/2019 12,721 JPY 8,000,000 EUR 67,645 Goldman Sachs 4/9/2019 584 SEK 230,000 EUR 21,440 BNP Paribas 4/9/2019 (217)USD 370,000 EUR 330,178 UBS 4/9/2019 4,750 USD 630,000 EUR 565,087 BNP Paribas 4/9/2019 5,196 USD 2,130,000 EUR 1,904,009 State Street 4/9/2019 24,089 AUD 45,000 USD 31,469 JP Morgan 18/9/2019 (1,027)AUD 25,000 USD 17,421 Nomura 18/9/2019 (515)AUD 40,000 USD 27,979 Royal Bank of Canada 18/9/2019 (919)AUD 70,000 USD 49,357 Deutsche Bank 18/9/2019 (1,965)BRL 565,000 USD 147,017 Goldman Sachs 18/9/2019 (9,825)BRL 240,000 USD 63,016 Citibank 18/9/2019 (4,685)CHF 468,251 EUR 431,057 UBS 18/9/2019 (1,775)CHF 371,749 EUR 341,558 Goldman Sachs 18/9/2019 (747)CHF 420,000 EUR 387,036 State Street 18/9/2019 (1,990)CHF 430,000 EUR 396,060 Deutsche Bank 18/9/2019 (1,845)CNH 305,000 USD 44,373 BNP Paribas 18/9/2019 (1,572)CNH 2,165,000 USD 314,647 HSBC Bank Plc 18/9/2019 (10,856)CNY 2,770,000 USD 404,764 Standard Chartered Bank 18/9/2019 (15,169)EUR 929,804 CHF 1,010,000 UBS 18/9/2019 3,860 EUR 626,561 CHF 680,000 Credit Suisse 18/9/2019 3,153 EUR 866,069 GBP 778,908 Goldman Sachs 18/9/2019 5,180 EUR 44,504 GBP 40,000 Standard Chartered Bank 18/9/2019 294 EUR 67,200 GBP 60,341 RBS Plc 18/9/2019 508 EUR 14,691 GBP 13,132 Bank of America 18/9/2019 176 EUR 500,000 GBP 454,616 Citibank 18/9/2019 (2,464)EUR 189,202 GBP 170,427 State Street 18/9/2019 837 EUR 163,227 GBP 147,474 Deutsche Bank 18/9/2019 231 EUR 146,206 IDR 2,411,819,837 BNP Paribas 18/9/2019 (7,315)EUR 27,449 USD 31,356 Deutsche Bank 18/9/2019 (903)EUR 990,000 USD 1,124,982 Barclays 18/9/2019 (27,239)EUR 323,403 USD 369,943 JP Morgan 18/9/2019 (11,109)EUR 30,000 USD 34,362 RBS Plc 18/9/2019 (1,071)EUR 25,000 USD 28,632 Standard Chartered Bank 18/9/2019 (890)EUR 360,000 USD 400,379 State Street 18/9/2019 (2,034)EUR 3,680,472 USD 4,130,662 Citibank 18/9/2019 (54,585)EUR 360,000 USD 402,067 Morgan Stanley 18/9/2019 (3,560)EUR 1,713,675 USD 1,952,260 Bank of America 18/9/2019 (51,610)EUR 1,150,000 USD 1,294,211 HSBC Bank Plc 18/9/2019 (20,260)
GBP 130,000 EUR 146,009 Goldman Sachs 18/9/2019 (2,327)GBP 240,000 EUR 269,081 Citibank 18/9/2019 (3,821)GBP 318,280 EUR 350,000 State Street 18/9/2019 1,779 GBP 65,000 EUR 72,419 Barclays 18/9/2019 (577)GBP 100,000 USD 126,763 Deutsche Bank 18/9/2019 (4,097)GBP 20,000 USD 25,421 Nomura 18/9/2019 (881)GBP 40,000 USD 50,448 RBS Plc 18/9/2019 (1,407)IDR 229,975,000 USD 16,057 UBS 18/9/2019 119 IDR 230,012,500 USD 16,060 Bank of America 18/9/2019 119 IDR 1,110,000,000 USD 79,072 Deutsche Bank 18/9/2019 (843)IDR 10,492,580,000 USD 724,343 Citibank 18/9/2019 12,919 INR 1,800,000 USD 26,096 BNP Paribas 18/9/2019 (888)INR 6,500,000 USD 93,321 Deutsche Bank 18/9/2019 (2,379)JPY 2,310,000 USD 21,491 Standard Chartered Bank 18/9/2019 268 JPY 3,000,000 USD 28,012 UBS 18/9/2019 256 JPY 116,739,218 USD 1,090,000 Royal Bank of Canada 18/9/2019 9,983 JPY 7,690,000 USD 71,748 RBS Plc 18/9/2019 706 JPY 61,000,000 USD 572,631 Bank of America 18/9/2019 2,440 JPY 134,000,000 USD 1,263,661 Citibank 18/9/2019 160 JPY 63,000,000 USD 594,014 HSBC Bank Plc 18/9/2019 162 KRW 59,605,000 USD 51,204 JP Morgan 18/9/2019 (1,730)KRW 31,665,000 USD 27,080 Goldman Sachs 18/9/2019 (809)KRW 86,665,000 USD 74,143 Bank of America 18/9/2019 (2,237)KRW 82,065,000 USD 69,789 Deutsche Bank 18/9/2019 (1,740)MXN 1,705,000 USD 87,372 Goldman Sachs 18/9/2019 (2,416)NZD 15,000 USD 9,906 Citibank 18/9/2019 (383)NZD 12,500 USD 8,361 JP Morgan 18/9/2019 (415)NZD 22,500 USD 15,005 Standard Chartered Bank 18/9/2019 (708)PHP 700,000 USD 13,507 UBS 18/9/2019 (62)PHP 700,000 USD 13,514 BNP Paribas 18/9/2019 (68)PHP 2,800,000 USD 54,785 Goldman Sachs 18/9/2019 (932)PHP 700,000 USD 13,633 Standard Chartered Bank 18/9/2019 (176)RUB 955,168 USD 14,947 Deutsche Bank 18/9/2019 (546)RUB 74,832 USD 1,170 Bank of America 18/9/2019 (42)RUB 1,850,000 USD 28,840 Goldman Sachs 18/9/2019 (958)SGD 716,480 USD 530,000 Citibank 18/9/2019 (11,976)SGD 50,000 USD 36,000 Goldman Sachs 18/9/2019 57 SGD 255,000 USD 183,886 UBS 18/9/2019 27 TWD 335,000 USD 10,867 Citibank 18/9/2019 (154)TWD 335,000 USD 10,873 Bank of America 18/9/2019 (159)TWD 16,667,100 USD 540,000 Barclays 18/9/2019 (7,051)TWD 1,665,000 USD 53,801 JP Morgan 18/9/2019 (574)TWD 665,000 USD 21,474 Deutsche Bank 18/9/2019 (217)USD 258,255 BRL 1,005,000 Goldman Sachs 18/9/2019 14,535 USD 86,627 CNH 610,000 RBS Plc 18/9/2019 1,226 USD 398,742 CNY 2,770,000 Citibank 18/9/2019 9,725 USD 366,619 EUR 322,333 Goldman Sachs 18/9/2019 9,174 USD 369,390 EUR 325,468 HSBC Bank Plc 18/9/2019 8,544 USD 109,997 EUR 96,700 RBS Plc 18/9/2019 2,762 USD 798,222 EUR 700,000 Royal Bank of Canada 18/9/2019 21,774 USD 632,757 EUR 554,254 Standard Chartered Bank 18/9/2019 17,902 USD 39,196 EUR 34,532 Bank of America 18/9/2019 910 USD 433,237 EUR 390,000 UBS 18/9/2019 1,745 USD 865,816 EUR 780,000 Morgan Stanley 18/9/2019 2,894 USD 3,917,413 EUR 3,477,683 Citibank 18/9/2019 64,545 USD 425,751 EUR 380,861 JP Morgan 18/9/2019 4,114 USD 1,485,105 EUR 1,318,169 Deutsche Bank 18/9/2019 24,703 USD 128,248 GBP 100,000 Citibank 18/9/2019 5,440 USD 327,541 IDR 4,731,711,805 Citibank 18/9/2019 (5,018)USD 157,092 IDR 2,215,000,000 JP Morgan 18/9/2019 1,054 USD 361,920 IDR 5,125,000,000 BNP Paribas 18/9/2019 1,033 USD 29,238 INR 2,100,000 Barclays 18/9/2019 (56)USD 1,408,716 JPY 151,105,482 JP Morgan 18/9/2019 (14,878)USD 78 JPY 8,290 Barclays 18/9/2019 - USD 285,348 JPY 30,181,918 RBS Plc 18/9/2019 618 USD 1,311,479 JPY 139,755,340 Citibank 18/9/2019 (6,004)
Open Forward Foreign Exchange Contracts as at 31 August 2019
Currency
Purchases Currency
Sales Counterparty
Maturity date
Unrealised appreciation/
(depreciation) EUR

The notes on pages 728 to 741 form an integral part of these financial statements.
[226] BlackRock Global Funds (BGF)
ESG Multi-Asset Fund(1) continued
Open Exchange Traded Futures Contracts as at 31 August 2019
Number of contracts Currency
Contract/ Description
Expiration date
Underlying exposure
EUR
Unrealised appreciation/
(depreciation) EUR
12 AUD Australian 3 Year Bond September 2019 847,231 6,253(1) AUD Australian 10 Year Bond September 2019 90,640 (640)1 CHF Swiss Market Index September 2019 90,823 1,8617 EUR EURO STOXX 50 Index September 2019 240,310 6,1907 EUR Euro-OAT September 2019 1,192,800 28,1703 EUR Short-Term Euro-BPT September 2019 338,850 8,190(7) EUR Euro Schatz September 2019 788,095 (197)(8) EUR Euro Bund September 2019 1,432,880 (12,846)(13) EUR Euro BUXL September 2019 2,913,560 (96,500)(20) EUR Euro BOBL September 2019 2,724,000 (11,337)(565) EUR EURO STOXX 50 Index September 2019 19,396,450 (262,987)2 GBP FTSE 100 Index September 2019 159,401 9342 JPY Nikkei 225 (Yen) September 2019 176,715 996(2) JPY Japanese 10 Year Bond (OSE) September 2019 2,645,777 (28,571)9 USD S&P 500 E-Mini Index September 2019 1,195,853 13,9606 CAD Canadian 10 Year Bond December 2019 594,847 (1,188)49 USD US Treasury 2 Year Note (CBT) December 2019 9,580,102 (7,624)27 USD US Ultra Bond (CBT) December 2019 4,815,186 (40,865)24 USD US Ultra 10 Year Note December 2019 3,133,402 (14,258)7 USD US Long Bond (CBT) December 2019 1,046,193 (6,380)(54) USD US Treasury 10 Year Note (CBT) December 2019 6,430,688 14,934(62) USD US Treasury 5 Year Note (CBT) December 2019 6,724,762 13,870
Total 66,558,565 (388,035)
(1) Fund name changed during the year, see Note 1, for further details.
MXN 1,255,754 USD 65,000 State Street 7/10/2019 (2,548)USD 65,000 BRL 246,357 Citibank 7/10/2019 5,162 USD 65,000 INR 4,508,886 BNP Paribas 7/10/2019 2,130 USD 65,000 MXN 1,253,326 State Street 7/10/2019 2,657 USD 65,000 ZAR 912,901 State Street 7/10/2019 4,854 ZAR 924,833 USD 65,000 State Street 7/10/2019 (4,150)BRL 277,000 USD 73,323 HSBC Bank Plc 9/10/2019 (6,026)USD 72,135 BRL 277,000 BNP Paribas 9/10/2019 4,954 USD 2,857,000 EUR 2,544,896 State Street 9/10/2019 34,248 USD 17,500,000 TWD 549,500,000 UBS 9/10/2019 (94,278)USD 12,520,000 TWD 392,126,400 Morgan Stanley 9/10/2019 (38,481)USD 63,340 ZAR 904,000 Citibank 9/10/2019 3,893 ZAR 904,000 USD 64,119 RBS Plc 9/10/2019 (4,596)BRL 8,700,900 USD 2,300,000 HSBC Bank Plc 10/10/2019 (186,535)BRL 21,786,750 USD 5,750,000 Goldman Sachs 10/10/2019 (458,846)BRL 15,690,138 USD 4,125,000 Barclays 10/10/2019 (316,031)BRL 20,036,875 USD 5,275,000 Morgan Stanley 10/10/2019 (410,104)EUR 20,431,379 GBP 18,383,542 Citibank 10/10/2019 128,785 EUR 5,550,000 GBP 5,162,999 RBS Plc 10/10/2019 (151,962)EUR 12,660,000 JPY 1,540,499,184 Citibank 10/10/2019 (476,620)EUR 13,060,000 USD 14,814,232 RBS Plc 10/10/2019 (312,419)GBP 6,275,000 USD 7,908,213 RBS Plc 10/10/2019 (208,492)JPY 883,222,018 GBP 6,530,722 Bank of America 10/10/2019 319,221 USD 12,413,058 GBP 10,250,000 RBS Plc 10/10/2019 (115,052)USD 221,452 ZAR 3,125,374 Morgan Stanley 10/10/2019 15,710 USD 928,548 ZAR 13,106,625 RBS Plc 10/10/2019 65,760 USD 2,975,000 ZAR 42,658,525 Bank of America 10/10/2019 171,448 USD 13,325,000 ZAR 188,679,945 Citibank 10/10/2019 908,600 Net unrealised depreciation (3,161,550)
USD Hedged Share Class
EUR 3,772,778 USD 4,220,668 BNY Mellon 12/9/2019 (45,473)USD 66,556,226 EUR 59,292,588 BNY Mellon 12/9/2019 918,026 Net unrealised appreciation 872,553
Total net unrealised depreciation (EUR underlying exposure - EUR 559,620,844) (2,288,997)
USD 343,287 JPY 36,304,452 Goldman Sachs 18/9/2019 793 USD 28,876 KRW 35,000,000 Barclays 18/9/2019 (62)USD 87,653 MXN 1,705,000 State Street 18/9/2019 2,670 USD 371,481 RUB 24,340,000 Barclays 18/9/2019 5,406 USD 141,426 RUB 9,011,000 HSBC Bank Plc 18/9/2019 5,526 USD 273,490 SGD 372,390 UBS 18/9/2019 4,437 USD 22,148 SGD 30,000 Deutsche Bank 18/9/2019 462 USD 530,000 SGD 716,423 RBS Plc 18/9/2019 12,013 USD 209,905 SGD 290,000 Goldman Sachs 18/9/2019 673 USD 1,785,073 SGD 2,425,000 Bank of America 18/9/2019 32,606 USD 531,619 SGD 722,610 Citibank 18/9/2019 9,442 USD 540,000 TWD 16,654,140 Goldman Sachs 18/9/2019 7,425 USD 47,812 ZAR 670,000 RBS Plc 18/9/2019 3,565 USD 152,473 ZAR 2,200,000 UBS 18/9/2019 7,618 USD 81,895 ZAR 1,232,500 Citibank 18/9/2019 1,081 USD 97,195 ZAR 1,470,000 Bank of America 18/9/2019 854 USD 100,014 ZAR 1,490,000 Goldman Sachs 18/9/2019 2,219 USD 48,491 ZAR 680,000 JP Morgan 18/9/2019 3,587 ZAR 3,142,500 USD 218,692 JP Morgan 18/9/2019 (11,693)ZAR 2,030,000 USD 135,346 UBS 18/9/2019 (2,195)ZAR 1,770,000 USD 115,054 Royal Bank of Canada 18/9/2019 759 ZAR 700,000 USD 48,945 BNP Paribas 18/9/2019 (2,814)EUR 111,504 GBP 100,000 Citibank 19/9/2019 983 EUR 1,390,675 AUD 2,286,729 State Street 2/10/2019 (2,186)EUR 2,590,941 CAD 3,817,082 State Street 2/10/2019 (9,619)EUR 579,399 DKK 4,320,000 State Street 2/10/2019 (74)EUR 8,034,156 GBP 7,303,000 State Street 2/10/2019 (33,736)EUR 30,845,698 JPY 3,629,910,000 State Street 2/10/2019 (110,067)EUR 13,585 MXN 305,000 BNP Paribas 2/10/2019 (68)EUR 121,351 NOK 1,220,000 State Street 2/10/2019 (14)EUR 516,770 PLN 2,270,000 Goldman Sachs 2/10/2019 76 EUR 198,414 SEK 2,140,000 State Street 2/10/2019 997 EUR 350,638 SGD 540,000 State Street 2/10/2019 (1,207)EUR 57,968,547 USD 64,339,000 Toronto Dominion 2/10/2019 (145,318)EUR 622,454 ZAR 10,629,000 Toronto Dominion 2/10/2019 (5,000)BRL 250,894 USD 65,000 Morgan Stanley 7/10/2019 (4,177)INR 4,522,050 USD 65,000 Goldman Sachs 7/10/2019 (1,965)
Open Forward Foreign Exchange Contracts as at 31 August 2019
Currency
Purchases Currency
Sales Counterparty
Maturity date
Unrealised appreciation/
(depreciation) EUR
Open Forward Foreign Exchange Contracts as at 31 August 2019
Currency
Purchases Currency
Sales Counterparty
Maturity date
Unrealised appreciation/
(depreciation) EUR
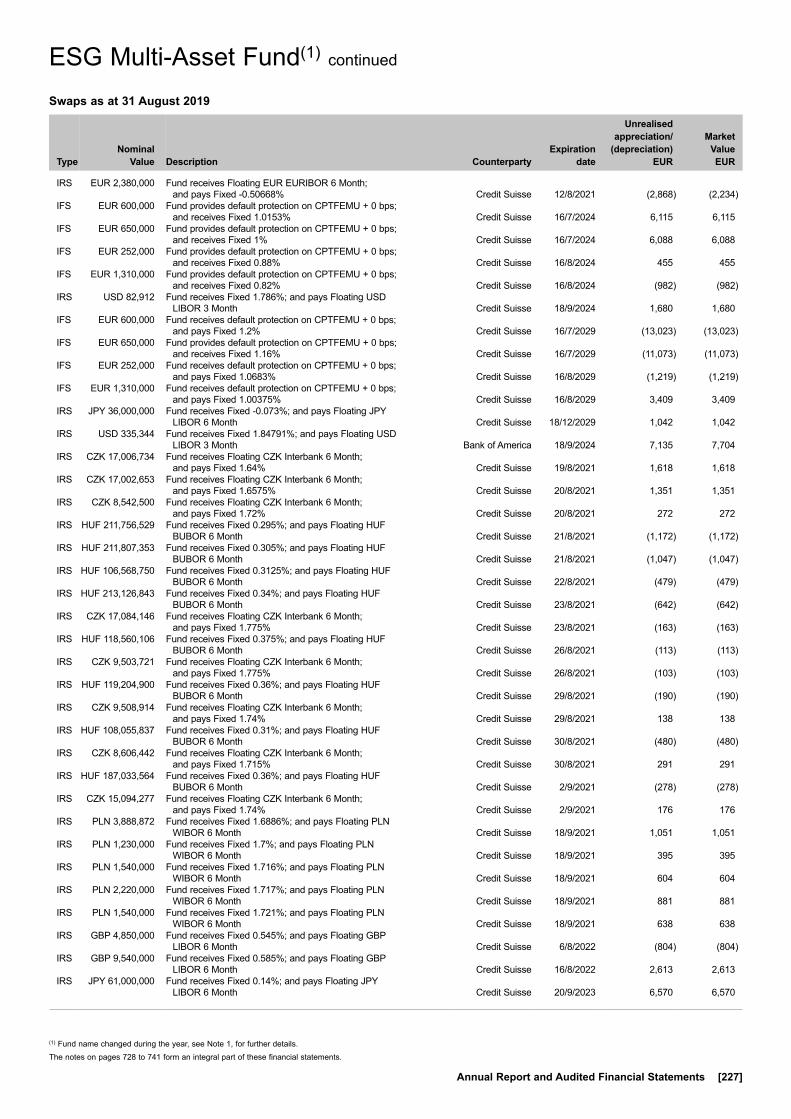
The notes on pages 728 to 741 form an integral part of these financial statements.
Annual Report and Audited Financial Statements [227]
ESG Multi-Asset Fund(1) continued
Swaps as at 31 August 2019
TypeNominal
Value Description Counterparty
Expiration date
Unrealised appreciation/
(depreciation) EUR
Market Value EUR
IRS EUR 2,380,000 Fund receives Floating EUR EURIBOR 6 Month; and pays Fixed -0.50668% Credit Suisse 12/8/2021 (2,868) (2,234)
IFS EUR 600,000 Fund provides default protection on CPTFEMU + 0 bps; and receives Fixed 1.0153% Credit Suisse 16/7/2024 6,115 6,115
IFS EUR 650,000 Fund provides default protection on CPTFEMU + 0 bps; and receives Fixed 1% Credit Suisse 16/7/2024 6,088 6,088
IFS EUR 252,000 Fund provides default protection on CPTFEMU + 0 bps; and receives Fixed 0.88% Credit Suisse 16/8/2024 455 455
IFS EUR 1,310,000 Fund provides default protection on CPTFEMU + 0 bps; and receives Fixed 0.82% Credit Suisse 16/8/2024 (982) (982)
IRS USD 82,912 Fund receives Fixed 1.786%; and pays Floating USD LIBOR 3 Month Credit Suisse 18/9/2024 1,680 1,680
IFS EUR 600,000 Fund receives default protection on CPTFEMU + 0 bps; and pays Fixed 1.2% Credit Suisse 16/7/2029 (13,023) (13,023)
IFS EUR 650,000 Fund provides default protection on CPTFEMU + 0 bps; and receives Fixed 1.16% Credit Suisse 16/7/2029 (11,073) (11,073)
IFS EUR 252,000 Fund receives default protection on CPTFEMU + 0 bps; and pays Fixed 1.0683% Credit Suisse 16/8/2029 (1,219) (1,219)
IFS EUR 1,310,000 Fund receives default protection on CPTFEMU + 0 bps; and pays Fixed 1.00375% Credit Suisse 16/8/2029 3,409 3,409
IRS JPY 36,000,000 Fund receives Fixed -0.073%; and pays Floating JPY LIBOR 6 Month Credit Suisse 18/12/2029 1,042 1,042
IRS USD 335,344 Fund receives Fixed 1.84791%; and pays Floating USD LIBOR 3 Month Bank of America 18/9/2024 7,135 7,704
IRS CZK 17,006,734 Fund receives Floating CZK Interbank 6 Month; and pays Fixed 1.64% Credit Suisse 19/8/2021 1,618 1,618
IRS CZK 17,002,653 Fund receives Floating CZK Interbank 6 Month; and pays Fixed 1.6575% Credit Suisse 20/8/2021 1,351 1,351
IRS CZK 8,542,500 Fund receives Floating CZK Interbank 6 Month; and pays Fixed 1.72% Credit Suisse 20/8/2021 272 272
IRS HUF 211,756,529 Fund receives Fixed 0.295%; and pays Floating HUF BUBOR 6 Month Credit Suisse 21/8/2021 (1,172) (1,172)
IRS HUF 211,807,353 Fund receives Fixed 0.305%; and pays Floating HUF BUBOR 6 Month Credit Suisse 21/8/2021 (1,047) (1,047)
IRS HUF 106,568,750 Fund receives Fixed 0.3125%; and pays Floating HUF BUBOR 6 Month Credit Suisse 22/8/2021 (479) (479)
IRS HUF 213,126,843 Fund receives Fixed 0.34%; and pays Floating HUF BUBOR 6 Month Credit Suisse 23/8/2021 (642) (642)
IRS CZK 17,084,146 Fund receives Floating CZK Interbank 6 Month; and pays Fixed 1.775% Credit Suisse 23/8/2021 (163) (163)
IRS HUF 118,560,106 Fund receives Fixed 0.375%; and pays Floating HUF BUBOR 6 Month Credit Suisse 26/8/2021 (113) (113)
IRS CZK 9,503,721 Fund receives Floating CZK Interbank 6 Month; and pays Fixed 1.775% Credit Suisse 26/8/2021 (103) (103)
IRS HUF 119,204,900 Fund receives Fixed 0.36%; and pays Floating HUF BUBOR 6 Month Credit Suisse 29/8/2021 (190) (190)
IRS CZK 9,508,914 Fund receives Floating CZK Interbank 6 Month; and pays Fixed 1.74% Credit Suisse 29/8/2021 138 138
IRS HUF 108,055,837 Fund receives Fixed 0.31%; and pays Floating HUF BUBOR 6 Month Credit Suisse 30/8/2021 (480) (480)
IRS CZK 8,606,442 Fund receives Floating CZK Interbank 6 Month; and pays Fixed 1.715% Credit Suisse 30/8/2021 291 291
IRS HUF 187,033,564 Fund receives Fixed 0.36%; and pays Floating HUF BUBOR 6 Month Credit Suisse 2/9/2021 (278) (278)
IRS CZK 15,094,277 Fund receives Floating CZK Interbank 6 Month; and pays Fixed 1.74% Credit Suisse 2/9/2021 176 176
IRS PLN 3,888,872 Fund receives Fixed 1.6886%; and pays Floating PLN WIBOR 6 Month Credit Suisse 18/9/2021 1,051 1,051
IRS PLN 1,230,000 Fund receives Fixed 1.7%; and pays Floating PLN WIBOR 6 Month Credit Suisse 18/9/2021 395 395
IRS PLN 1,540,000 Fund receives Fixed 1.716%; and pays Floating PLN WIBOR 6 Month Credit Suisse 18/9/2021 604 604
IRS PLN 2,220,000 Fund receives Fixed 1.717%; and pays Floating PLN WIBOR 6 Month Credit Suisse 18/9/2021 881 881
IRS PLN 1,540,000 Fund receives Fixed 1.721%; and pays Floating PLN WIBOR 6 Month Credit Suisse 18/9/2021 638 638
IRS GBP 4,850,000 Fund receives Fixed 0.545%; and pays Floating GBP LIBOR 6 Month Credit Suisse 6/8/2022 (804) (804)
IRS GBP 9,540,000 Fund receives Fixed 0.585%; and pays Floating GBP LIBOR 6 Month Credit Suisse 16/8/2022 2,613 2,613
IRS JPY 61,000,000 Fund receives Fixed 0.14%; and pays Floating JPY LIBOR 6 Month Credit Suisse 20/9/2023 6,570 6,570
(1) Fund name changed during the year, see Note 1, for further details.
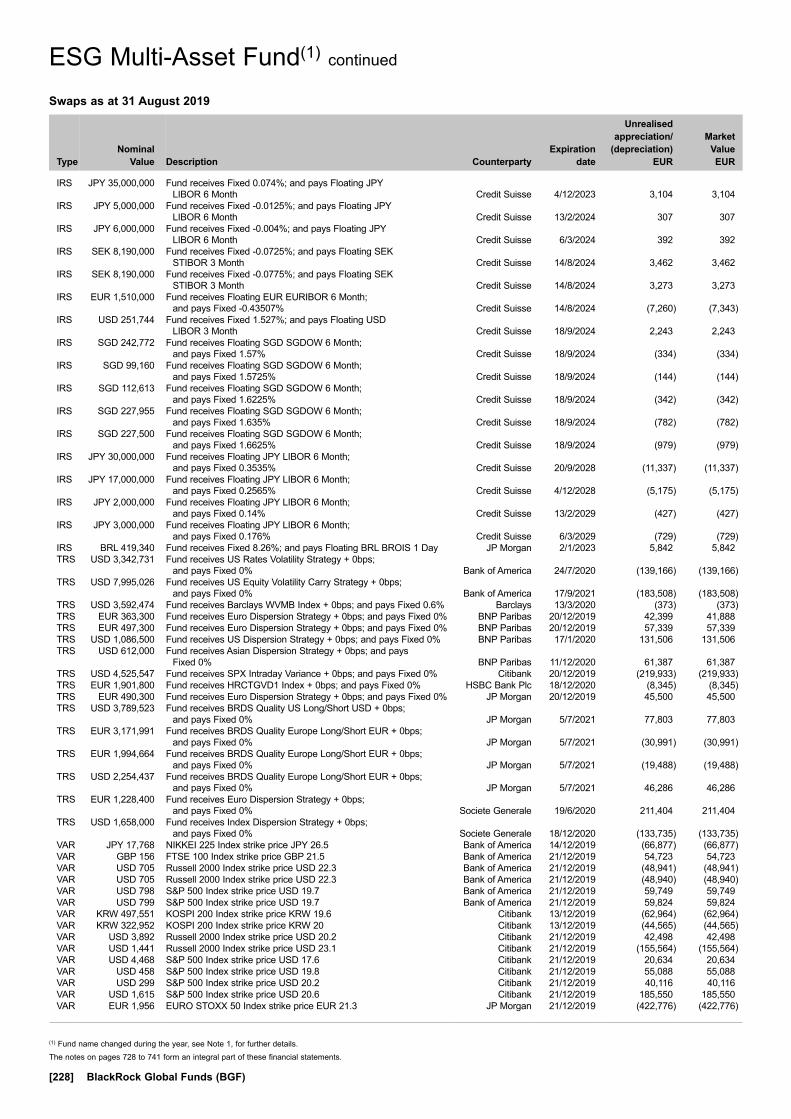
The notes on pages 728 to 741 form an integral part of these financial statements.
[228] BlackRock Global Funds (BGF)
ESG Multi-Asset Fund(1) continued
Swaps as at 31 August 2019
TypeNominal
Value Description Counterparty
Expiration date
Unrealised appreciation/
(depreciation) EUR
Market Value EUR
IRS JPY 35,000,000 Fund receives Fixed 0.074%; and pays Floating JPY LIBOR 6 Month Credit Suisse 4/12/2023 3,104 3,104
IRS JPY 5,000,000 Fund receives Fixed -0.0125%; and pays Floating JPY LIBOR 6 Month Credit Suisse 13/2/2024 307 307
IRS JPY 6,000,000 Fund receives Fixed -0.004%; and pays Floating JPY LIBOR 6 Month Credit Suisse 6/3/2024 392 392
IRS SEK 8,190,000 Fund receives Fixed -0.0725%; and pays Floating SEK STIBOR 3 Month Credit Suisse 14/8/2024 3,462 3,462
IRS SEK 8,190,000 Fund receives Fixed -0.0775%; and pays Floating SEK STIBOR 3 Month Credit Suisse 14/8/2024 3,273 3,273
IRS EUR 1,510,000 Fund receives Floating EUR EURIBOR 6 Month; and pays Fixed -0.43507% Credit Suisse 14/8/2024 (7,260) (7,343)
IRS USD 251,744 Fund receives Fixed 1.527%; and pays Floating USD LIBOR 3 Month Credit Suisse 18/9/2024 2,243 2,243
IRS SGD 242,772 Fund receives Floating SGD SGDOW 6 Month; and pays Fixed 1.57% Credit Suisse 18/9/2024 (334) (334)
IRS SGD 99,160 Fund receives Floating SGD SGDOW 6 Month; and pays Fixed 1.5725% Credit Suisse 18/9/2024 (144) (144)
IRS SGD 112,613 Fund receives Floating SGD SGDOW 6 Month; and pays Fixed 1.6225% Credit Suisse 18/9/2024 (342) (342)
IRS SGD 227,955 Fund receives Floating SGD SGDOW 6 Month; and pays Fixed 1.635% Credit Suisse 18/9/2024 (782) (782)
IRS SGD 227,500 Fund receives Floating SGD SGDOW 6 Month; and pays Fixed 1.6625% Credit Suisse 18/9/2024 (979) (979)
IRS JPY 30,000,000 Fund receives Floating JPY LIBOR 6 Month; and pays Fixed 0.3535% Credit Suisse 20/9/2028 (11,337) (11,337)
IRS JPY 17,000,000 Fund receives Floating JPY LIBOR 6 Month; and pays Fixed 0.2565% Credit Suisse 4/12/2028 (5,175) (5,175)
IRS JPY 2,000,000 Fund receives Floating JPY LIBOR 6 Month; and pays Fixed 0.14% Credit Suisse 13/2/2029 (427) (427)
IRS JPY 3,000,000 Fund receives Floating JPY LIBOR 6 Month; and pays Fixed 0.176% Credit Suisse 6/3/2029 (729) (729)
IRS BRL 419,340 Fund receives Fixed 8.26%; and pays Floating BRL BROIS 1 Day JP Morgan 2/1/2023 5,842 5,842TRS USD 3,342,731 Fund receives US Rates Volatility Strategy + 0bps;
and pays Fixed 0% Bank of America 24/7/2020 (139,166) (139,166)TRS USD 7,995,026 Fund receives US Equity Volatility Carry Strategy + 0bps;
and pays Fixed 0% Bank of America 17/9/2021 (183,508) (183,508)TRS USD 3,592,474 Fund receives Barclays WVMB Index + 0bps; and pays Fixed 0.6% Barclays 13/3/2020 (373) (373)TRS EUR 363,300 Fund receives Euro Dispersion Strategy + 0bps; and pays Fixed 0% BNP Paribas 20/12/2019 42,399 41,888TRS EUR 497,300 Fund receives Euro Dispersion Strategy + 0bps; and pays Fixed 0% BNP Paribas 20/12/2019 57,339 57,339TRS USD 1,086,500 Fund receives US Dispersion Strategy + 0bps; and pays Fixed 0% BNP Paribas 17/1/2020 131,506 131,506TRS USD 612,000 Fund receives Asian Dispersion Strategy + 0bps; and pays
Fixed 0% BNP Paribas 11/12/2020 61,387 61,387TRS USD 4,525,547 Fund receives SPX Intraday Variance + 0bps; and pays Fixed 0% Citibank 20/12/2019 (219,933) (219,933)TRS EUR 1,901,800 Fund receives HRCTGVD1 Index + 0bps; and pays Fixed 0% HSBC Bank Plc 18/12/2020 (8,345) (8,345)TRS EUR 490,300 Fund receives Euro Dispersion Strategy + 0bps; and pays Fixed 0% JP Morgan 20/12/2019 45,500 45,500TRS USD 3,789,523 Fund receives BRDS Quality US Long/Short USD + 0bps;
and pays Fixed 0% JP Morgan 5/7/2021 77,803 77,803TRS EUR 3,171,991 Fund receives BRDS Quality Europe Long/Short EUR + 0bps;
and pays Fixed 0% JP Morgan 5/7/2021 (30,991) (30,991)TRS EUR 1,994,664 Fund receives BRDS Quality Europe Long/Short EUR + 0bps;
and pays Fixed 0% JP Morgan 5/7/2021 (19,488) (19,488)TRS USD 2,254,437 Fund receives BRDS Quality Europe Long/Short EUR + 0bps;
and pays Fixed 0% JP Morgan 5/7/2021 46,286 46,286TRS EUR 1,228,400 Fund receives Euro Dispersion Strategy + 0bps;
and pays Fixed 0% Societe Generale 19/6/2020 211,404 211,404TRS USD 1,658,000 Fund receives Index Dispersion Strategy + 0bps;
and pays Fixed 0% Societe Generale 18/12/2020 (133,735) (133,735)VAR JPY 17,768 NIKKEI 225 Index strike price JPY 26.5 Bank of America 14/12/2019 (66,877) (66,877)VAR GBP 156 FTSE 100 Index strike price GBP 21.5 Bank of America 21/12/2019 54,723 54,723VAR USD 705 Russell 2000 Index strike price USD 22.3 Bank of America 21/12/2019 (48,941) (48,941)VAR USD 705 Russell 2000 Index strike price USD 22.3 Bank of America 21/12/2019 (48,940) (48,940)VAR USD 798 S&P 500 Index strike price USD 19.7 Bank of America 21/12/2019 59,749 59,749VAR USD 799 S&P 500 Index strike price USD 19.7 Bank of America 21/12/2019 59,824 59,824VAR KRW 497,551 KOSPI 200 Index strike price KRW 19.6 Citibank 13/12/2019 (62,964) (62,964)VAR KRW 322,952 KOSPI 200 Index strike price KRW 20 Citibank 13/12/2019 (44,565) (44,565)VAR USD 3,892 Russell 2000 Index strike price USD 20.2 Citibank 21/12/2019 42,498 42,498VAR USD 1,441 Russell 2000 Index strike price USD 23.1 Citibank 21/12/2019 (155,564) (155,564)VAR USD 4,468 S&P 500 Index strike price USD 17.6 Citibank 21/12/2019 20,634 20,634VAR USD 458 S&P 500 Index strike price USD 19.8 Citibank 21/12/2019 55,088 55,088VAR USD 299 S&P 500 Index strike price USD 20.2 Citibank 21/12/2019 40,116 40,116VAR USD 1,615 S&P 500 Index strike price USD 20.6 Citibank 21/12/2019 185,550 185,550VAR EUR 1,956 EURO STOXX 50 Index strike price EUR 21.3 JP Morgan 21/12/2019 (422,776) (422,776)
(1) Fund name changed during the year, see Note 1, for further details.
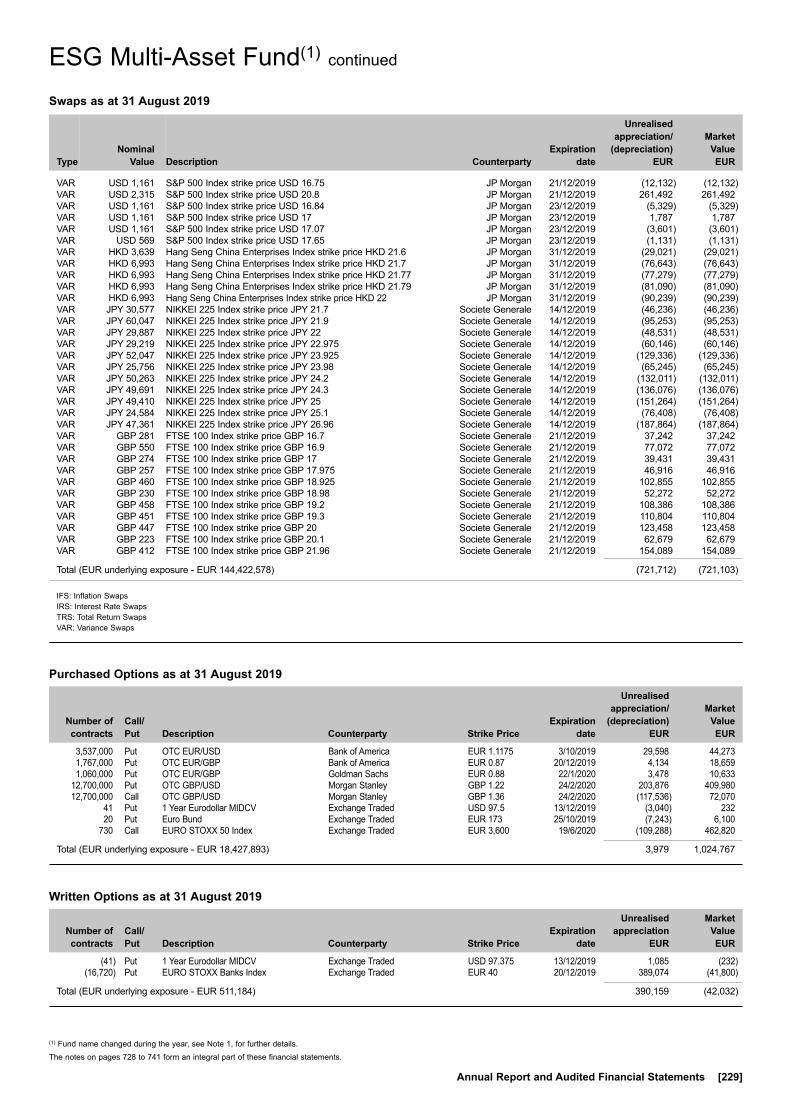
The notes on pages 728 to 741 form an integral part of these financial statements.
Annual Report and Audited Financial Statements [229]
ESG Multi-Asset Fund(1) continued
Swaps as at 31 August 2019
TypeNominal
Value Description Counterparty
Expiration date
Unrealised appreciation/
(depreciation) EUR
Market Value EUR
VAR USD 1,161 S&P 500 Index strike price USD 16.75 JP Morgan 21/12/2019 (12,132) (12,132)VAR USD 2,315 S&P 500 Index strike price USD 20.8 JP Morgan 21/12/2019 261,492 261,492VAR USD 1,161 S&P 500 Index strike price USD 16.84 JP Morgan 23/12/2019 (5,329) (5,329)VAR USD 1,161 S&P 500 Index strike price USD 17 JP Morgan 23/12/2019 1,787 1,787VAR USD 1,161 S&P 500 Index strike price USD 17.07 JP Morgan 23/12/2019 (3,601) (3,601)VAR USD 569 S&P 500 Index strike price USD 17.65 JP Morgan 23/12/2019 (1,131) (1,131)VAR HKD 3,639 Hang Seng China Enterprises Index strike price HKD 21.6 JP Morgan 31/12/2019 (29,021) (29,021)VAR HKD 6,993 Hang Seng China Enterprises Index strike price HKD 21.7 JP Morgan 31/12/2019 (76,643) (76,643)VAR HKD 6,993 Hang Seng China Enterprises Index strike price HKD 21.77 JP Morgan 31/12/2019 (77,279) (77,279)VAR HKD 6,993 Hang Seng China Enterprises Index strike price HKD 21.79 JP Morgan 31/12/2019 (81,090) (81,090)VAR HKD 6,993 Hang Seng China Enterprises Index strike price HKD 22 JP Morgan 31/12/2019 (90,239) (90,239)VAR JPY 30,577 NIKKEI 225 Index strike price JPY 21.7 Societe Generale 14/12/2019 (46,236) (46,236)VAR JPY 60,047 NIKKEI 225 Index strike price JPY 21.9 Societe Generale 14/12/2019 (95,253) (95,253)VAR JPY 29,887 NIKKEI 225 Index strike price JPY 22 Societe Generale 14/12/2019 (48,531) (48,531)VAR JPY 29,219 NIKKEI 225 Index strike price JPY 22.975 Societe Generale 14/12/2019 (60,146) (60,146)VAR JPY 52,047 NIKKEI 225 Index strike price JPY 23.925 Societe Generale 14/12/2019 (129,336) (129,336)VAR JPY 25,756 NIKKEI 225 Index strike price JPY 23.98 Societe Generale 14/12/2019 (65,245) (65,245)VAR JPY 50,263 NIKKEI 225 Index strike price JPY 24.2 Societe Generale 14/12/2019 (132,011) (132,011)VAR JPY 49,691 NIKKEI 225 Index strike price JPY 24.3 Societe Generale 14/12/2019 (136,076) (136,076)VAR JPY 49,410 NIKKEI 225 Index strike price JPY 25 Societe Generale 14/12/2019 (151,264) (151,264)VAR JPY 24,584 NIKKEI 225 Index strike price JPY 25.1 Societe Generale 14/12/2019 (76,408) (76,408)VAR JPY 47,361 NIKKEI 225 Index strike price JPY 26.96 Societe Generale 14/12/2019 (187,864) (187,864)VAR GBP 281 FTSE 100 Index strike price GBP 16.7 Societe Generale 21/12/2019 37,242 37,242VAR GBP 550 FTSE 100 Index strike price GBP 16.9 Societe Generale 21/12/2019 77,072 77,072VAR GBP 274 FTSE 100 Index strike price GBP 17 Societe Generale 21/12/2019 39,431 39,431VAR GBP 257 FTSE 100 Index strike price GBP 17.975 Societe Generale 21/12/2019 46,916 46,916VAR GBP 460 FTSE 100 Index strike price GBP 18.925 Societe Generale 21/12/2019 102,855 102,855VAR GBP 230 FTSE 100 Index strike price GBP 18.98 Societe Generale 21/12/2019 52,272 52,272VAR GBP 458 FTSE 100 Index strike price GBP 19.2 Societe Generale 21/12/2019 108,386 108,386VAR GBP 451 FTSE 100 Index strike price GBP 19.3 Societe Generale 21/12/2019 110,804 110,804VAR GBP 447 FTSE 100 Index strike price GBP 20 Societe Generale 21/12/2019 123,458 123,458VAR GBP 223 FTSE 100 Index strike price GBP 20.1 Societe Generale 21/12/2019 62,679 62,679VAR GBP 412 FTSE 100 Index strike price GBP 21.96 Societe Generale 21/12/2019 154,089 154,089
Total (EUR underlying exposure - EUR 144,422,578) (721,712) (721,103)
IFS: Inflation Swaps IRS: Interest Rate Swaps TRS: Total Return Swaps VAR: Variance Swaps
(1) Fund name changed during the year, see Note 1, for further details.
Purchased Options as at 31 August 2019
Number of contracts
Call/ Put
Description Counterparty
Strike Price
Expiration date
Unrealised appreciation/
(depreciation) EUR
Market Value EUR
3,537,000 Put OTC EUR/USD Bank of America EUR 1.1175 3/10/2019 29,598 44,273 1,767,000 Put OTC EUR/GBP Bank of America EUR 0.87 20/12/2019 4,134 18,659 1,060,000 Put OTC EUR/GBP Goldman Sachs EUR 0.88 22/1/2020 3,478 10,633 12,700,000 Put OTC GBP/USD Morgan Stanley GBP 1.22 24/2/2020 203,876 409,980 12,700,000 Call OTC GBP/USD Morgan Stanley GBP 1.36 24/2/2020 (117,536) 72,070 41 Put 1 Year Eurodollar MIDCV Exchange Traded USD 97.5 13/12/2019 (3,040) 232 20 Put Euro Bund Exchange Traded EUR 173 25/10/2019 (7,243) 6,100 730 Call EURO STOXX 50 Index Exchange Traded EUR 3,600 19/6/2020 (109,288) 462,820
Total (EUR underlying exposure - EUR 18,427,893) 3,979 1,024,767
Written Options as at 31 August 2019
Number of contracts
Call/ Put
Description Counterparty
Strike Price
Expiration date
Unrealised appreciation
EUR
Market Value EUR
(41) Put 1 Year Eurodollar MIDCV Exchange Traded USD 97.375 13/12/2019 1,085 (232) (16,720) Put EURO STOXX Banks Index Exchange Traded EUR 40 20/12/2019 389,074 (41,800)
Total (EUR underlying exposure - EUR 511,184) 390,159 (42,032)

Transferable Securities and Money Market Instruments Admitted to an Official Stock Exchange Listing or Dealt in on Another Regulated Market
Transferable Securities and Money Market Instruments Admitted to an Official Stock Exchange Listing or Dealt in on Another Regulated Market
Holding
Description
Market Value (EUR)
% of Net
Assets
Holding
Description
Market Value (EUR)
% of Net
Assets
~ Investment in connected party fund, see further information in Note 11.* All or a portion of this security represents a security on loan.
The notes on pages 728 to 741 form an integral part of these financial statements.
[230] BlackRock Global Funds (BGF)
FUNDS
Ireland 2,319,369 BlackRock ICS Euro Liquid
Environmentally Aware Fund~ 231,391,595 4.11Total Funds 231,391,595 4.11
BONDS
Argentina USD 4,542,512 Argentina Bonar Bonds 7.625%
18/4/2037 1,328,392 0.02 EUR 1,640,000 Argentine Republic Government
International Bond 3.875% 15/1/2022 651,900 0.01
EUR 3,695,000 Argentine Republic Government International Bond 5% 15/1/2027 1,394,862 0.03
3,375,154 0.06
Australia EUR 250,000 Australia & New Zealand Banking
Group Ltd 0.45% 22/11/2023 259,831 0.00 EUR 429,000 Commonwealth Bank of Australia
0.5% 27/7/2026 453,693 0.01 EUR 1,900,000 Commonwealth Bank of Australia
3% 3/5/2022 2,080,425 0.04 EUR 8,275,000 Westpac Banking Corp 0.5%
4/12/2023 8,620,812 0.15 EUR 4,225,000 Westpac Banking Corp 0.5%
17/5/2024 4,410,942 0.08 EUR 5,410,000 Westpac Banking Corp 0.75%
22/7/2021 5,538,477 0.10 21,364,180 0.38
Austria EUR 200,000 Erste Group Bank AG 0.625%
18/1/2027 215,503 0.00 EUR 200,000 Raiffeisen Bank International AG
FRN 15/12/2022 (Perpetual) 211,250 0.00 EUR 100,000 Raiffeisen Bank International AG
FRN 21/2/2025 102,383 0.00 EUR 6,600,000 Raiffeisen Bank International AG
0.25% 5/7/2021* 6,657,057 0.12 EUR 30,100,000 Republic of Austria Government
Bond ‘144A’ 0.5% 20/4/2027 32,664,771 0.58 EUR 4,000,000 Republic of Austria Government
Bond ‘144A’ 0.5% 20/2/2029 4,370,000 0.08 EUR 7,666,000 Republic of Austria Government
Bond ‘144A’ 1.5% 20/2/2047 10,458,187 0.19 EUR 13,161,000 Republic of Austria Government
Bond ‘144A’ 2.1% 20/9/2117 26,452,294 0.47 EUR 2,186,000 Republic of Austria Government
Bond ‘144A’ 3.8% 26/1/2062 5,214,389 0.09 EUR 5,100,000 Republic of Austria Government
Bond ‘144A’ 4.15% 15/3/2037 8,933,483 0.16 EUR 5,400,000 UniCredit Bank Austria AG
0.625% 20/3/2029 5,865,426 0.11 EUR 100,000 UNIQA Insurance Group AG
FRN 27/7/2046 125,733 0.00 101,270,476 1.80
Belgium EUR 1,815,000 Anheuser-Busch InBev SA/NV
1.125% 1/7/2027 1,952,132 0.03 EUR 665,000 Anheuser-Busch InBev SA/NV
1.5% 17/3/2025 723,326 0.01 EUR 6,169,000 Anheuser-Busch InBev SA/NV
1.65% 28/3/2031 6,975,831 0.12
GBP 701,000 Anheuser-Busch InBev SA/NV 1.75% 7/3/2025 797,642 0.01
EUR 1,720,000 Anheuser-Busch InBev SA/NV 2% 17/3/2028* 1,982,013 0.03
EUR 2,870,000 Anheuser-Busch InBev SA/NV 2.75% 17/3/2036 3,706,533 0.07
EUR 11,500,000 Argenta Spaarbank NV 1% 6/2/2024 12,031,588 0.21 EUR 200,000 Belfius Bank SA 0.125% 14/9/2026* 207,517 0.00 EUR 6,400,000 Belfius Bank SA 0.625% 14/10/2021 6,566,468 0.12 EUR 1,800,000 Belfius Bank SA 1% 12/6/2028* 2,002,725 0.04 EUR 9,900,000 BNP Paribas Fortis SA 24/10/2023
(Zero Coupon) 10,119,864 0.18 EUR 400,000 BNP Paribas Fortis SA 0.875%
22/3/2028 440,292 0.01 EUR 5,900,000 Fluxys Belgium SA 1.75% 5/10/2027 6,209,514 0.11 EUR 700,000 KBC Bank NV 0.375% 1/9/2022 720,710 0.01 EUR 2,900,000 KBC Bank NV 2% 31/1/2023 3,160,311 0.06 EUR 514,074 Kingdom of Belgium Government
Bond ‘144A’ 0.5% 22/10/2024 544,713 0.01 EUR 10,906,348 Kingdom of Belgium Government
Bond ‘144A’ 0.9% 22/6/2029 12,281,093 0.22 EUR 4,407,000 Kingdom of Belgium Government
Bond ‘144A’ 1.45% 22/6/2037 5,456,747 0.10 EUR 23,114,933 Kingdom of Belgium Government
Bond ‘144A’ 1.6% 22/6/2047* 30,261,504 0.54 EUR 14,686,977 Kingdom of Belgium Government
Bond ‘144A’ 1.7% 22/6/2050 19,776,969 0.35 EUR 9,964,000 Kingdom of Belgium Government
Bond ‘144A’ 1.9% 22/6/2038 13,256,106 0.24 139,173,598 2.47
Bermuda GBP 800,000 Fidelity International Ltd 7.125%
13/2/2024 1,090,770 0.02
Canada EUR 6,325,000 Canadian Imperial Bank of
Commerce 0.04% 9/7/2027 6,510,544 0.12 EUR 14,125,000 Canadian Imperial Bank of
Commerce 0.25% 24/1/2023 14,498,889 0.26 EUR 9,998,000 CPPIB Capital Inc 0.375% 20/6/2024 10,422,165 0.18 EUR 9,995,000 CPPIB Capital Inc 0.875% 6/2/2029 11,059,710 0.20 EUR 700,000 National Bank of Canada 0.25%
24/7/2023 721,378 0.01 EUR 484,000 National Bank of Canada 0.75%
13/3/2025 516,312 0.01 EUR 7,850,000 Toronto-Dominion Bank/The 0.1%
19/7/2027 8,114,624 0.14 51,843,622 0.92
Cayman Islands GBP 500,000 Trafford Centre Finance Ltd/The
FRN 28/7/2035 488,160 0.01
Cyprus EUR 4,626,000 Cyprus Government International
Bond 3.75% 26/7/2023 5,325,738 0.09 EUR 1,860,000 Cyprus Government International
Bond 3.875% 6/5/2022 2,062,880 0.04 7,388,618 0.13
Czech Republic EUR 7,210,000 Raiffeisenbank AS 0.75% 5/11/2019 7,217,498 0.13 EUR 400,000 UniCredit Bank Czech Republic &
Slovakia AS 0.625% 30/4/2020 402,799 0.01 7,620,297 0.14
Euro Bond Fund
Portfolio of Investments 31 August 2019
Euro Bond Fund
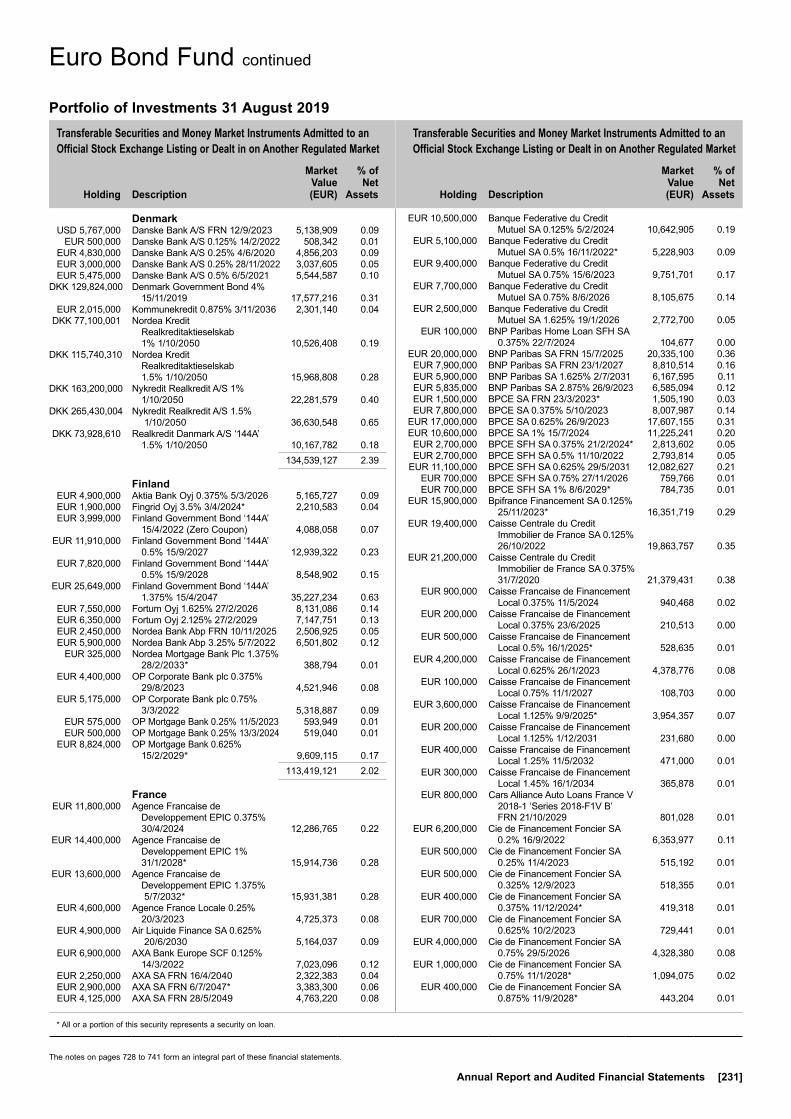
Transferable Securities and Money Market Instruments Admitted to an Official Stock Exchange Listing or Dealt in on Another Regulated Market
Transferable Securities and Money Market Instruments Admitted to an Official Stock Exchange Listing or Dealt in on Another Regulated Market
Holding
Description
Market Value (EUR)
% of Net
Assets
Holding
Description
Market Value (EUR)
% of Net
Assets
* All or a portion of this security represents a security on loan.
The notes on pages 728 to 741 form an integral part of these financial statements.
Annual Report and Audited Financial Statements [231]
Denmark USD 5,767,000 Danske Bank A/S FRN 12/9/2023 5,138,909 0.09 EUR 500,000 Danske Bank A/S 0.125% 14/2/2022 508,342 0.01 EUR 4,830,000 Danske Bank A/S 0.25% 4/6/2020 4,856,203 0.09 EUR 3,000,000 Danske Bank A/S 0.25% 28/11/2022 3,037,605 0.05 EUR 5,475,000 Danske Bank A/S 0.5% 6/5/2021 5,544,587 0.10 DKK 129,824,000 Denmark Government Bond 4%
15/11/2019 17,577,216 0.31 EUR 2,015,000 Kommunekredit 0.875% 3/11/2036 2,301,140 0.04 DKK 77,100,001 Nordea Kredit
Realkreditaktieselskab 1% 1/10/2050 10,526,408 0.19
DKK 115,740,310 Nordea Kredit Realkreditaktieselskab 1.5% 1/10/2050 15,968,808 0.28
DKK 163,200,000 Nykredit Realkredit A/S 1% 1/10/2050 22,281,579 0.40
DKK 265,430,004 Nykredit Realkredit A/S 1.5% 1/10/2050 36,630,548 0.65
DKK 73,928,610 Realkredit Danmark A/S ‘144A’ 1.5% 1/10/2050 10,167,782 0.18
134,539,127 2.39
Finland EUR 4,900,000 Aktia Bank Oyj 0.375% 5/3/2026 5,165,727 0.09 EUR 1,900,000 Fingrid Oyj 3.5% 3/4/2024* 2,210,583 0.04 EUR 3,999,000 Finland Government Bond ‘144A’
15/4/2022 (Zero Coupon) 4,088,058 0.07 EUR 11,910,000 Finland Government Bond ‘144A’
0.5% 15/9/2027 12,939,322 0.23 EUR 7,820,000 Finland Government Bond ‘144A’
0.5% 15/9/2028 8,548,902 0.15 EUR 25,649,000 Finland Government Bond ‘144A’
1.375% 15/4/2047 35,227,234 0.63 EUR 7,550,000 Fortum Oyj 1.625% 27/2/2026 8,131,086 0.14 EUR 6,350,000 Fortum Oyj 2.125% 27/2/2029 7,147,751 0.13 EUR 2,450,000 Nordea Bank Abp FRN 10/11/2025 2,506,925 0.05 EUR 5,900,000 Nordea Bank Abp 3.25% 5/7/2022 6,501,802 0.12 EUR 325,000 Nordea Mortgage Bank Plc 1.375%
28/2/2033* 388,794 0.01 EUR 4,400,000 OP Corporate Bank plc 0.375%
29/8/2023 4,521,946 0.08 EUR 5,175,000 OP Corporate Bank plc 0.75%
3/3/2022 5,318,887 0.09 EUR 575,000 OP Mortgage Bank 0.25% 11/5/2023 593,949 0.01 EUR 500,000 OP Mortgage Bank 0.25% 13/3/2024 519,040 0.01 EUR 8,824,000 OP Mortgage Bank 0.625%
15/2/2029* 9,609,115 0.17 113,419,121 2.02
France EUR 11,800,000 Agence Francaise de
Developpement EPIC 0.375% 30/4/2024 12,286,765 0.22
EUR 14,400,000 Agence Francaise de Developpement EPIC 1% 31/1/2028* 15,914,736 0.28
EUR 13,600,000 Agence Francaise de Developpement EPIC 1.375% 5/7/2032* 15,931,381 0.28
EUR 4,600,000 Agence France Locale 0.25% 20/3/2023 4,725,373 0.08
EUR 4,900,000 Air Liquide Finance SA 0.625% 20/6/2030 5,164,037 0.09
EUR 6,900,000 AXA Bank Europe SCF 0.125% 14/3/2022 7,023,096 0.12
EUR 2,250,000 AXA SA FRN 16/4/2040 2,322,383 0.04 EUR 2,900,000 AXA SA FRN 6/7/2047* 3,383,300 0.06 EUR 4,125,000 AXA SA FRN 28/5/2049 4,763,220 0.08
EUR 10,500,000 Banque Federative du Credit Mutuel SA 0.125% 5/2/2024 10,642,905 0.19
EUR 5,100,000 Banque Federative du Credit Mutuel SA 0.5% 16/11/2022* 5,228,903 0.09
EUR 9,400,000 Banque Federative du Credit Mutuel SA 0.75% 15/6/2023 9,751,701 0.17
EUR 7,700,000 Banque Federative du Credit Mutuel SA 0.75% 8/6/2026 8,105,675 0.14
EUR 2,500,000 Banque Federative du Credit Mutuel SA 1.625% 19/1/2026 2,772,700 0.05
EUR 100,000 BNP Paribas Home Loan SFH SA 0.375% 22/7/2024 104,677 0.00
EUR 20,000,000 BNP Paribas SA FRN 15/7/2025 20,335,100 0.36 EUR 7,900,000 BNP Paribas SA FRN 23/1/2027 8,810,514 0.16 EUR 5,900,000 BNP Paribas SA 1.625% 2/7/2031 6,167,595 0.11 EUR 5,835,000 BNP Paribas SA 2.875% 26/9/2023 6,585,094 0.12 EUR 1,500,000 BPCE SA FRN 23/3/2023* 1,505,190 0.03 EUR 7,800,000 BPCE SA 0.375% 5/10/2023 8,007,987 0.14 EUR 17,000,000 BPCE SA 0.625% 26/9/2023 17,607,155 0.31 EUR 10,600,000 BPCE SA 1% 15/7/2024 11,225,241 0.20 EUR 2,700,000 BPCE SFH SA 0.375% 21/2/2024* 2,813,602 0.05 EUR 2,700,000 BPCE SFH SA 0.5% 11/10/2022 2,793,814 0.05 EUR 11,100,000 BPCE SFH SA 0.625% 29/5/2031 12,082,627 0.21 EUR 700,000 BPCE SFH SA 0.75% 27/11/2026 759,766 0.01 EUR 700,000 BPCE SFH SA 1% 8/6/2029* 784,735 0.01 EUR 15,900,000 Bpifrance Financement SA 0.125%
25/11/2023* 16,351,719 0.29 EUR 19,400,000 Caisse Centrale du Credit
Immobilier de France SA 0.125% 26/10/2022 19,863,757 0.35
EUR 21,200,000 Caisse Centrale du Credit Immobilier de France SA 0.375% 31/7/2020 21,379,431 0.38
EUR 900,000 Caisse Francaise de Financement Local 0.375% 11/5/2024 940,468 0.02
EUR 200,000 Caisse Francaise de Financement Local 0.375% 23/6/2025 210,513 0.00
EUR 500,000 Caisse Francaise de Financement Local 0.5% 16/1/2025* 528,635 0.01
EUR 4,200,000 Caisse Francaise de Financement Local 0.625% 26/1/2023 4,378,776 0.08
EUR 100,000 Caisse Francaise de Financement Local 0.75% 11/1/2027 108,703 0.00
EUR 3,600,000 Caisse Francaise de Financement Local 1.125% 9/9/2025* 3,954,357 0.07
EUR 200,000 Caisse Francaise de Financement Local 1.125% 1/12/2031 231,680 0.00
EUR 400,000 Caisse Francaise de Financement Local 1.25% 11/5/2032 471,000 0.01
EUR 300,000 Caisse Francaise de Financement Local 1.45% 16/1/2034 365,878 0.01
EUR 800,000 Cars Alliance Auto Loans France V 2018-1 ‘Series 2018-F1V B’ FRN 21/10/2029 801,028 0.01
EUR 6,200,000 Cie de Financement Foncier SA 0.2% 16/9/2022 6,353,977 0.11
EUR 500,000 Cie de Financement Foncier SA 0.25% 11/4/2023 515,192 0.01
EUR 500,000 Cie de Financement Foncier SA 0.325% 12/9/2023 518,355 0.01
EUR 400,000 Cie de Financement Foncier SA 0.375% 11/12/2024* 419,318 0.01
EUR 700,000 Cie de Financement Foncier SA 0.625% 10/2/2023 729,441 0.01
EUR 4,000,000 Cie de Financement Foncier SA 0.75% 29/5/2026 4,328,380 0.08
EUR 1,000,000 Cie de Financement Foncier SA 0.75% 11/1/2028* 1,094,075 0.02
EUR 400,000 Cie de Financement Foncier SA 0.875% 11/9/2028* 443,204 0.01
Euro Bond Fund continued
Portfolio of Investments 31 August 2019

Transferable Securities and Money Market Instruments Admitted to an Official Stock Exchange Listing or Dealt in on Another Regulated Market
Transferable Securities and Money Market Instruments Admitted to an Official Stock Exchange Listing or Dealt in on Another Regulated Market
Holding
Description
Market Value (EUR)
% of Net
Assets
Holding
Description
Market Value (EUR)
% of Net
Assets
† Securities pledged or given in guarantee, see Note 14, for further details.* All or a portion of this security represents a security on loan.
The notes on pages 728 to 741 form an integral part of these financial statements.
[232] BlackRock Global Funds (BGF)
EUR 6,800,000 Cie de Financement Foncier SA 1.125% 24/6/2025 7,457,294 0.13
EUR 300,000 Cie de Financement Foncier SA 1.25% 15/11/2032 354,282 0.01
EUR 2,300,000 Cie de Saint-Gobain 0.625% 15/3/2024 2,380,308 0.04
EUR 3,100,000 Cie de Saint-Gobain 0.875% 21/9/2023 3,236,167 0.06
EUR 4,400,000 Cie de Saint-Gobain 1.125% 23/3/2026 4,719,770 0.08
EUR 1,200,000 Credit Agricole Assurances SA FRN 27/9/2048 1,454,250 0.03
EUR 1,800,000 Credit Agricole Home Loan SFH SA 0.25% 23/2/2024 1,867,755 0.03
EUR 900,000 Credit Agricole Home Loan SFH SA 0.375% 24/3/2023 931,954 0.02
EUR 800,000 Credit Agricole Home Loan SFH SA 0.375% 30/9/2024 838,788 0.02
EUR 600,000 Credit Agricole Home Loan SFH SA 0.5% 3/4/2025* 634,778 0.01
EUR 3,845,000 Credit Agricole Home Loan SFH SA 0.625% 11/9/2023 4,037,383 0.07
EUR 300,000 Credit Agricole Home Loan SFH SA 1% 16/1/2029 336,612 0.01
EUR 2,800,000 Credit Agricole SA/London 0.875% 19/1/2022 2,881,544 0.05
EUR 11,000,000 Credit Mutuel - CIC Home Loan SFH SA 0.25% 30/4/2024 11,424,160 0.20
EUR 455,000 Credit Mutuel - CIC Home Loan SFH SA 0.375% 12/9/2022 468,791 0.01
EUR 5,100,000 Credit Mutuel Arkea SA 1.375% 17/1/2025 5,494,638 0.10
EUR 18,100,000 Dexia Credit Local SA 0.625% 17/1/2026* 19,286,726 0.34
EUR 400,000 Electricite de France SA FRN 22/1/2026 (Perpetual) 457,094 0.01
EUR 8,900,000 Engie SA 4/3/2027 (Zero Coupon) 8,886,116 0.16 EUR 1,700,000 Engie SA 0.875% 27/3/2024 1,783,164 0.03 EUR 287,348 FCT Noria 2018-1 FRN 25/6/2038 288,819 0.01 EUR 478,913 FCT Noria 2018-1 FRN 25/6/2038 477,351 0.01 EUR 478,913 FCT Noria 2018-1 FRN 25/6/2038 482,219 0.01 EUR 287,348 FCT Noria 2018-1 FRN 25/6/2038 288,626 0.01 EUR 236,523 FCT SapphireOne Auto 2017-1
‘Series 2017-1 A’ FRN 24/1/2034 236,935 0.00 EUR 15,049,550 French Republic Government Bond
OAT 25/3/2023 (Zero Coupon) 15,509,822 0.28 EUR 21,475,000 French Republic Government Bond
OAT 0.1% 1/3/2028 24,954,129 0.44 EUR 11,534,950 French Republic Government Bond
OAT 0.25% 25/11/2020 11,683,847 0.21 EUR 15,658,761 French Republic Government Bond
OAT 0.5% 25/5/2025 16,761,820 0.30 EUR 17,301,340 French Republic Government Bond
OAT 1.25% 25/5/2034 20,777,343 0.37 EUR 48,820,416 French Republic Government Bond
OAT ‘144A’ 1.5% 25/5/2050† 64,164,673 1.14 EUR 55,446,907 French Republic Government Bond
OAT ‘144A’ 1.75% 25/6/2039† 73,469,924 1.31 EUR 20,385,000 French Republic Government Bond
OAT ‘144A’ 1.75% 25/5/2066 29,841,601 0.53 EUR 59,771,233 French Republic Government Bond
OAT ‘144A’ 2% 25/5/2048 86,719,093 1.54 EUR 5,650,000 French Republic Government Bond
OAT 2.5% 25/5/2030 7,416,192 0.13 EUR 2,496,000 French Republic Government Bond
OAT 2.75% 25/10/2027 3,187,540 0.06 EUR 5,962,000 French Republic Government Bond
OAT 4% 25/4/2055 12,792,516 0.23 EUR 10,041,000 French Republic Government Bond
OAT 4% 25/4/2060 22,629,730 0.40
EUR 5,296,966 French Republic Government Bond OAT 5.75% 25/10/2032 9,547,281 0.17
EUR 300,000 HSBC SFH France SA 2% 16/10/2023 332,508 0.01
EUR 1,600,000 La Poste SA FRN 29/10/2025 (Perpetual) 1,716,688 0.03
EUR 499,000 Orange SA FRN 7/2/2020 (Perpetual) 507,730 0.01
EUR 9,000,000 Orange SA 0.5% 4/9/2032 8,966,925 0.16 EUR 5,400,000 Orange SA 1.375% 4/9/2049 5,293,064 0.09 EUR 900,000 Orange SA 1.875% 12/9/2030 1,041,583 0.02 EUR 3,800,000 RCI Banque SA FRN 12/3/2025* 3,680,832 0.07 EUR 4,600,000 Sanofi 1.125% 5/4/2028 5,070,028 0.09 EUR 6,900,000 Societe Generale SA 0.875%
1/7/2026 7,137,395 0.13 EUR 12,400,000 Societe Generale SFH SA 0.125%
18/7/2029 12,878,950 0.23 EUR 14,400,000 Societe Generale SFH SA 0.5%
2/6/2025 15,228,864 0.27 EUR 6,000,000 Societe Generale SFH SA 0.5%
28/1/2026* 6,369,000 0.11 EUR 200,000 Societe Generale SFH SA 0.75%
29/1/2027 217,300 0.00 EUR 4,500,000 Suez FRN 30/3/2022 (Perpetual) 4,731,979 0.08 EUR 4,800,000 Teleperformance 1.875% 2/7/2025 5,168,472 0.09 EUR 13,000,000 Total Capital International SA
0.696% 31/5/2028 13,807,365 0.25 EUR 3,000,000 Total Capital International SA
1.535% 31/5/2039 3,515,295 0.06 EUR 300,000 TOTAL SA FRN 26/2/2025
(Perpetual) 328,035 0.01 EUR 13,700,000 UNEDIC ASSEO 0.875% 25/5/2028 15,173,503 0.27 EUR 3,500,000 Unibail-Rodamco-Westfield SE
1.75% 1/7/2049 3,840,638 0.07 EUR 6,700,000 Veolia Environnement SA 0.892%
14/1/2024 6,998,150 0.12 893,752,498 15.87
Germany EUR 500,000 Bertelsmann SE & Co KGaA FRN
23/4/2075 534,053 0.01 EUR 2,500,000 Bertelsmann SE & Co KGaA
0.25% 26/5/2021 2,522,950 0.04 EUR 7,000,000 Bundesrepublik Deutschland
Bundesanleihe 0.25% 15/2/2027 7,600,011 0.13 EUR 229,000 Bundesrepublik Deutschland
Bundesanleihe 0.5% 15/2/2028 255,118 0.00 EUR 6,752,626 Bundesrepublik Deutschland
Bundesanleihe 1.5% 15/5/2024 7,552,156 0.13 EUR 8,825,000 Bundesrepublik Deutschland
Bundesanleihe 3% 4/7/2020 9,107,797 0.16 EUR 5,982,864 Bundesrepublik Deutschland
Bundesanleihe 3.25% 4/7/2042* 11,104,293 0.20 EUR 8,998,401 Bundesrepublik Deutschland
Bundesanleihe 4% 4/1/2037 16,310,742 0.29 EUR 16,874,000 Bundesrepublik Deutschland
Bundesanleihe 5.5% 4/1/2031* 29,261,851 0.52 EUR 133,230,793 Bundesschatzanweisungen
12/3/2021 (Zero Coupon) 135,104,018 2.40 EUR 284,000 Commerzbank AG 0.125%
23/2/2023 291,335 0.01 EUR 158,000 Commerzbank AG 0.125%
15/12/2026 164,926 0.00 EUR 11,075,000 Commerzbank AG 0.5% 9/6/2026 11,827,934 0.21 EUR 4,200,000 Deutsche Bahn Finance GMBH
1.125% 18/12/2028 4,704,399 0.08 EUR 4,600,000 Deutsche Bahn Finance GMBH
1.375% 28/3/2031* 5,251,705 0.09 EUR 6,600,000 Deutsche Pfandbriefbank AG
0.5% 22/5/2024 6,932,046 0.12
Euro Bond Fund continued
Portfolio of Investments 31 August 2019

Transferable Securities and Money Market Instruments Admitted to an Official Stock Exchange Listing or Dealt in on Another Regulated Market
Transferable Securities and Money Market Instruments Admitted to an Official Stock Exchange Listing or Dealt in on Another Regulated Market
Holding
Description
Market Value (EUR)
% of Net
Assets
Holding
Description
Market Value (EUR)
% of Net
Assets
* All or a portion of this security represents a security on loan.
The notes on pages 728 to 741 form an integral part of these financial statements.
Annual Report and Audited Financial Statements [233]
EUR 5,800,000 Deutsche Pfandbriefbank AG 0.75% 7/2/2023 5,960,225 0.11
EUR 6,400,000 Deutsche Telekom AG 1.75% 25/3/2031 7,239,424 0.13
EUR 300,000 DZ HYP AG 0.1% 31/8/2026 312,611 0.01 EUR 300,000 DZ HYP AG 0.125% 1/3/2024 309,768 0.01 EUR 9,295,000 DZ HYP AG 0.5% 30/9/2026 9,951,876 0.18 EUR 5,175,000 DZ HYP AG 0.875% 30/1/2029 5,771,341 0.10 EUR 4,400,000 DZ HYP AG 0.875% 17/4/2034 5,017,716 0.09 EUR 300,000 DZ HYP AG 2.5% 29/3/2022 324,258 0.01 EUR 15,500,000 FMS Wertmanagement 0.375%
29/4/2030 16,785,802 0.30 EUR 11,495,000 Gemeinsame Deutsche
Bundeslaender 0.625% 13/2/2029* 12,658,926 0.22
EUR 960,000 Globaldrive Auto Receivables 2016-B BV ‘Series 2016-B B’ FRN 20/8/2024 969,248 0.02
EUR 2,200,000 Hamburg Commercial Bank AG 0.5% 23/5/2022 2,229,212 0.04
EUR 2,355,000 HeidelbergCement AG 2.25% 3/6/2024 2,593,714 0.05
EUR 500,000 ING-DiBa AG 0.25% 9/10/2023 517,652 0.01 EUR 3,800,000 ING-DiBa AG 0.25% 16/11/2026 4,004,068 0.07 EUR 20,695,000 Kreditanstalt fuer Wiederaufbau
15/12/2022 (Zero Coupon) 21,171,709 0.38 EUR 31,196,000 Kreditanstalt fuer Wiederaufbau
0.125% 7/6/2023 32,193,336 0.57 EUR 2,291,000 Kreditanstalt fuer Wiederaufbau
0.125% 4/10/2024 2,384,725 0.04 EUR 47,190,000 Kreditanstalt fuer Wiederaufbau
0.75% 15/1/2029* 52,600,296 0.93 EUR 7,483,000 Land Berlin 0.625% 15/7/2039 8,328,242 0.15 EUR 150,000 Landesbank Baden-Wuerttemberg
25/10/2022 (Zero Coupon) 152,969 0.00 EUR 7,200,000 Landesbank Baden-Wuerttemberg
0.25% 10/1/2025* 7,509,384 0.13 EUR 9,000,000 Landesbank Baden-Wuerttemberg
0.375% 14/1/2026 9,513,862 0.17 EUR 9,100,000 Landesbank Hessen-Thueringen
Girozentrale 12/1/2022 (Zero Coupon) 9,232,451 0.16
EUR 12,365,000 Landwirtschaftliche Rentenbank 0.05% 12/6/2023 12,718,268 0.23
EUR 4,000,000 Merck Financial Services GmbH 0.875% 5/7/2031 4,203,212 0.07
EUR 6,800,000 Muenchener Rueckversicherungs-Gesellschaft AG in Muenchen FRN 26/5/2049 8,262,986 0.15
EUR 334,000 Norddeutsche Landesbank-Girozentrale 0.625% 18/1/2027 360,154 0.01
EUR 6,460,000 NRW Bank 0.375% 16/5/2029 6,929,626 0.12 EUR 9,525,000 NRW Bank 0.625% 2/2/2029 10,444,258 0.19 EUR 6,200,000 Santander Consumer Bank AG
0.25% 5/12/2024 6,432,562 0.11 EUR 4,000,000 SAP SE 1.625% 10/3/2031 4,606,720 0.08 EUR 24,225,000 State of Hesse 25/4/2025
(Zero Coupon) 25,049,740 0.44 EUR 8,890,000 State of Hesse 0.375% 6/7/2026 9,465,227 0.17 EUR 1,889,000 State of Lower Saxony 1/3/2021
(Zero Coupon) 1,906,983 0.03 EUR 22,613,000 State of Lower Saxony 0.125%
7/3/2025 23,586,377 0.42 EUR 24,710,000 State of Lower Saxony 0.125%
8/4/2027* 25,979,353 0.46 EUR 27,589,000 State of Lower Saxony 0.375%
14/5/2029 29,736,666 0.53 EUR 6,245,000 State of North Rhine-Westphalia
Germany 0.625% 17/11/2023 6,585,267 0.12 EUR 14,448,000 State of North Rhine-Westphalia
Germany 0.8% 30/7/2049 16,626,686 0.30
EUR 1,050,000 State of North Rhine-Westphalia Germany 1% 16/1/2025 1,142,311 0.02
EUR 21,910,000 State of North Rhine-Westphalia Germany 1.1% 13/3/2034* 25,651,899 0.46
EUR 5,098,000 State of North Rhine-Westphalia Germany 1.5% 12/6/2040 6,523,350 0.12
EUR 4,900,000 Volkswagen Bank GmbH FRN 8/12/2021 4,928,690 0.09
EUR 7,400,000 Volkswagen Bank GmbH 1.25% 10/6/2024 7,675,428 0.14
EUR 6,190,000 Volkswagen Financial Services AG 0.875% 12/4/2023 6,330,544 0.11
EUR 6,700,000 Volkswagen Financial Services AG 1.5% 1/10/2024 7,018,183 0.12
EUR 3,035,000 Volkswagen Leasing GmbH 1.625% 15/8/2025* 3,204,930 0.06
721,627,569 12.82
Greece EUR 2,600,000 Alpha Bank AE 2.5% 5/2/2023 2,756,910 0.05 EUR 18,450,000 Hellenic Republic Government
Bond ‘144A’ 1.875% 23/7/2026 19,168,258 0.34 EUR 4,725,000 National Bank of Greece SA
2.75% 19/10/2020 4,862,616 0.09 26,787,784 0.48
Guernsey USD 275,000 EFG International Guernsey Ltd
FRN 5/4/2027 252,564 0.01
India INR 2,093,320,000 India Government Bond 7.17%
8/1/2028 27,367,739 0.48 INR 793,930,000 India Government Bond 7.27%
8/4/2026 10,513,076 0.19 37,880,815 0.67
Indonesia IDR 65,792,000,000 Indonesia Treasury Bond 8.25%
15/5/2029 4,469,671 0.08
International EUR 7,675,000 African Development Bank 0.5%
21/3/2029 8,311,872 0.15 EUR 16,813,000 European Investment Bank 0.1%
15/10/2026 17,644,151 0.31 EUR 1,725,000 European Investment Bank
0.375% 15/5/2026 1,845,974 0.03
EUR 14,184,000 European Investment Bank 0.875% 14/1/2028 15,865,513 0.28
EUR 26,890,000 European Investment Bank 1.125% 13/4/2033 31,898,358 0.57
EUR 13,086,000 European Stability Mechanism 17/1/2022 (Zero Coupon) 13,300,414 0.24
EUR 8,720,000 European Stability Mechanism 0.1% 31/7/2023 8,980,728 0.16
EUR 13,481,000 European Stability Mechanism 0.5% 5/3/2029 14,686,673 0.26
EUR 5,170,164 European Stability Mechanism 0.75% 15/3/2027* 5,679,397 0.10
EUR 10,508,000 European Stability Mechanism 1.8% 2/11/2046* 15,150,329 0.27
EUR 20,565,000 European Union 0.5% 4/4/2025 21,884,553 0.39 EUR 5,575,000 European Union 0.75% 4/4/2031 6,273,557 0.11 EUR 4,705,000 European Union 1.25% 4/4/2033 5,649,882 0.10 EUR 6,265,000 European Union 1.375% 4/10/2029 7,407,344 0.13 174,578,745 3.10
Euro Bond Fund continued
Portfolio of Investments 31 August 2019
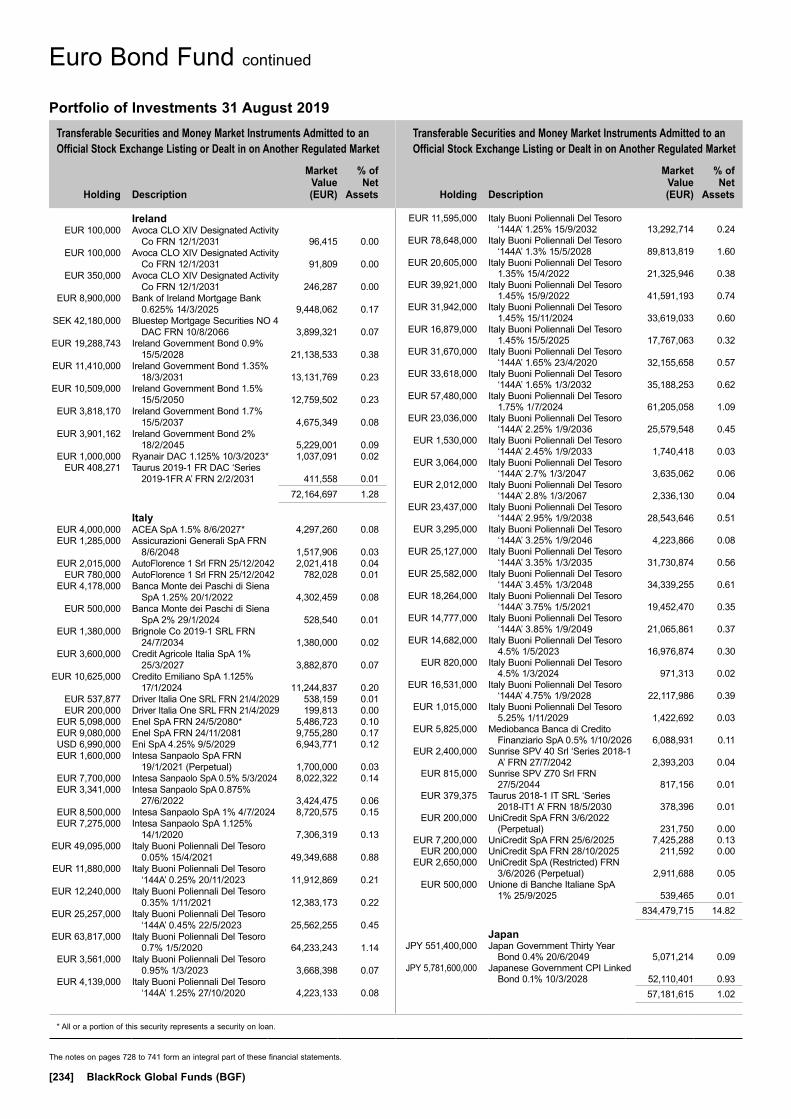
Transferable Securities and Money Market Instruments Admitted to an Official Stock Exchange Listing or Dealt in on Another Regulated Market
Transferable Securities and Money Market Instruments Admitted to an Official Stock Exchange Listing or Dealt in on Another Regulated Market
Holding
Description
Market Value (EUR)
% of Net
Assets
Holding
Description
Market Value (EUR)
% of Net
Assets
* All or a portion of this security represents a security on loan.
The notes on pages 728 to 741 form an integral part of these financial statements.
[234] BlackRock Global Funds (BGF)
Ireland EUR 100,000 Avoca CLO XIV Designated Activity
Co FRN 12/1/2031 96,415 0.00 EUR 100,000 Avoca CLO XIV Designated Activity
Co FRN 12/1/2031 91,809 0.00 EUR 350,000 Avoca CLO XIV Designated Activity
Co FRN 12/1/2031 246,287 0.00 EUR 8,900,000 Bank of Ireland Mortgage Bank
0.625% 14/3/2025 9,448,062 0.17 SEK 42,180,000 Bluestep Mortgage Securities NO 4
DAC FRN 10/8/2066 3,899,321 0.07 EUR 19,288,743 Ireland Government Bond 0.9%
15/5/2028 21,138,533 0.38 EUR 11,410,000 Ireland Government Bond 1.35%
18/3/2031 13,131,769 0.23 EUR 10,509,000 Ireland Government Bond 1.5%
15/5/2050 12,759,502 0.23 EUR 3,818,170 Ireland Government Bond 1.7%
15/5/2037 4,675,349 0.08 EUR 3,901,162 Ireland Government Bond 2%
18/2/2045 5,229,001 0.09 EUR 1,000,000 Ryanair DAC 1.125% 10/3/2023* 1,037,091 0.02 EUR 408,271 Taurus 2019-1 FR DAC ‘Series
2019-1FR A’ FRN 2/2/2031 411,558 0.01 72,164,697 1.28
Italy EUR 4,000,000 ACEA SpA 1.5% 8/6/2027* 4,297,260 0.08 EUR 1,285,000 Assicurazioni Generali SpA FRN
8/6/2048 1,517,906 0.03 EUR 2,015,000 AutoFlorence 1 Srl FRN 25/12/2042 2,021,418 0.04 EUR 780,000 AutoFlorence 1 Srl FRN 25/12/2042 782,028 0.01 EUR 4,178,000 Banca Monte dei Paschi di Siena
SpA 1.25% 20/1/2022 4,302,459 0.08 EUR 500,000 Banca Monte dei Paschi di Siena
SpA 2% 29/1/2024 528,540 0.01 EUR 1,380,000 Brignole Co 2019-1 SRL FRN
24/7/2034 1,380,000 0.02 EUR 3,600,000 Credit Agricole Italia SpA 1%
25/3/2027 3,882,870 0.07 EUR 10,625,000 Credito Emiliano SpA 1.125%
17/1/2024 11,244,837 0.20 EUR 537,877 Driver Italia One SRL FRN 21/4/2029 538,159 0.01 EUR 200,000 Driver Italia One SRL FRN 21/4/2029 199,813 0.00 EUR 5,098,000 Enel SpA FRN 24/5/2080* 5,486,723 0.10 EUR 9,080,000 Enel SpA FRN 24/11/2081 9,755,280 0.17 USD 6,990,000 Eni SpA 4.25% 9/5/2029 6,943,771 0.12 EUR 1,600,000 Intesa Sanpaolo SpA FRN
19/1/2021 (Perpetual) 1,700,000 0.03 EUR 7,700,000 Intesa Sanpaolo SpA 0.5% 5/3/2024 8,022,322 0.14 EUR 3,341,000 Intesa Sanpaolo SpA 0.875%
27/6/2022 3,424,475 0.06 EUR 8,500,000 Intesa Sanpaolo SpA 1% 4/7/2024 8,720,575 0.15 EUR 7,275,000 Intesa Sanpaolo SpA 1.125%
14/1/2020 7,306,319 0.13 EUR 49,095,000 Italy Buoni Poliennali Del Tesoro
0.05% 15/4/2021 49,349,688 0.88 EUR 11,880,000 Italy Buoni Poliennali Del Tesoro
‘144A’ 0.25% 20/11/2023 11,912,869 0.21 EUR 12,240,000 Italy Buoni Poliennali Del Tesoro
0.35% 1/11/2021 12,383,173 0.22 EUR 25,257,000 Italy Buoni Poliennali Del Tesoro
‘144A’ 0.45% 22/5/2023 25,562,255 0.45 EUR 63,817,000 Italy Buoni Poliennali Del Tesoro
0.7% 1/5/2020 64,233,243 1.14 EUR 3,561,000 Italy Buoni Poliennali Del Tesoro
0.95% 1/3/2023 3,668,398 0.07 EUR 4,139,000 Italy Buoni Poliennali Del Tesoro
‘144A’ 1.25% 27/10/2020 4,223,133 0.08
EUR 11,595,000 Italy Buoni Poliennali Del Tesoro ‘144A’ 1.25% 15/9/2032 13,292,714 0.24
EUR 78,648,000 Italy Buoni Poliennali Del Tesoro ‘144A’ 1.3% 15/5/2028 89,813,819 1.60
EUR 20,605,000 Italy Buoni Poliennali Del Tesoro 1.35% 15/4/2022 21,325,946 0.38
EUR 39,921,000 Italy Buoni Poliennali Del Tesoro 1.45% 15/9/2022 41,591,193 0.74
EUR 31,942,000 Italy Buoni Poliennali Del Tesoro 1.45% 15/11/2024 33,619,033 0.60
EUR 16,879,000 Italy Buoni Poliennali Del Tesoro 1.45% 15/5/2025 17,767,063 0.32
EUR 31,670,000 Italy Buoni Poliennali Del Tesoro ‘144A’ 1.65% 23/4/2020 32,155,658 0.57
EUR 33,618,000 Italy Buoni Poliennali Del Tesoro ‘144A’ 1.65% 1/3/2032 35,188,253 0.62
EUR 57,480,000 Italy Buoni Poliennali Del Tesoro 1.75% 1/7/2024 61,205,058 1.09
EUR 23,036,000 Italy Buoni Poliennali Del Tesoro ‘144A’ 2.25% 1/9/2036 25,579,548 0.45
EUR 1,530,000 Italy Buoni Poliennali Del Tesoro ‘144A’ 2.45% 1/9/2033 1,740,418 0.03
EUR 3,064,000 Italy Buoni Poliennali Del Tesoro ‘144A’ 2.7% 1/3/2047 3,635,062 0.06
EUR 2,012,000 Italy Buoni Poliennali Del Tesoro ‘144A’ 2.8% 1/3/2067 2,336,130 0.04
EUR 23,437,000 Italy Buoni Poliennali Del Tesoro ‘144A’ 2.95% 1/9/2038 28,543,646 0.51
EUR 3,295,000 Italy Buoni Poliennali Del Tesoro ‘144A’ 3.25% 1/9/2046 4,223,866 0.08
EUR 25,127,000 Italy Buoni Poliennali Del Tesoro ‘144A’ 3.35% 1/3/2035 31,730,874 0.56
EUR 25,582,000 Italy Buoni Poliennali Del Tesoro ‘144A’ 3.45% 1/3/2048 34,339,255 0.61
EUR 18,264,000 Italy Buoni Poliennali Del Tesoro ‘144A’ 3.75% 1/5/2021 19,452,470 0.35
EUR 14,777,000 Italy Buoni Poliennali Del Tesoro ‘144A’ 3.85% 1/9/2049 21,065,861 0.37
EUR 14,682,000 Italy Buoni Poliennali Del Tesoro 4.5% 1/5/2023 16,976,874 0.30
EUR 820,000 Italy Buoni Poliennali Del Tesoro 4.5% 1/3/2024 971,313 0.02
EUR 16,531,000 Italy Buoni Poliennali Del Tesoro ‘144A’ 4.75% 1/9/2028 22,117,986 0.39
EUR 1,015,000 Italy Buoni Poliennali Del Tesoro 5.25% 1/11/2029 1,422,692 0.03
EUR 5,825,000 Mediobanca Banca di Credito Finanziario SpA 0.5% 1/10/2026 6,088,931 0.11
EUR 2,400,000 Sunrise SPV 40 Srl ‘Series 2018-1 A’ FRN 27/7/2042 2,393,203 0.04
EUR 815,000 Sunrise SPV Z70 Srl FRN 27/5/2044 817,156 0.01
EUR 379,375 Taurus 2018-1 IT SRL ‘Series 2018-IT1 A’ FRN 18/5/2030 378,396 0.01
EUR 200,000 UniCredit SpA FRN 3/6/2022 (Perpetual) 231,750 0.00
EUR 7,200,000 UniCredit SpA FRN 25/6/2025 7,425,288 0.13 EUR 200,000 UniCredit SpA FRN 28/10/2025 211,592 0.00 EUR 2,650,000 UniCredit SpA (Restricted) FRN
3/6/2026 (Perpetual) 2,911,688 0.05 EUR 500,000 Unione di Banche Italiane SpA
1% 25/9/2025 539,465 0.01 834,479,715 14.82
Japan JPY 551,400,000 Japan Government Thirty Year
Bond 0.4% 20/6/2049 5,071,214 0.09 JPY 5,781,600,000 Japanese Government CPI Linked
Bond 0.1% 10/3/2028 52,110,401 0.93 57,181,615 1.02
Euro Bond Fund continued
Portfolio of Investments 31 August 2019
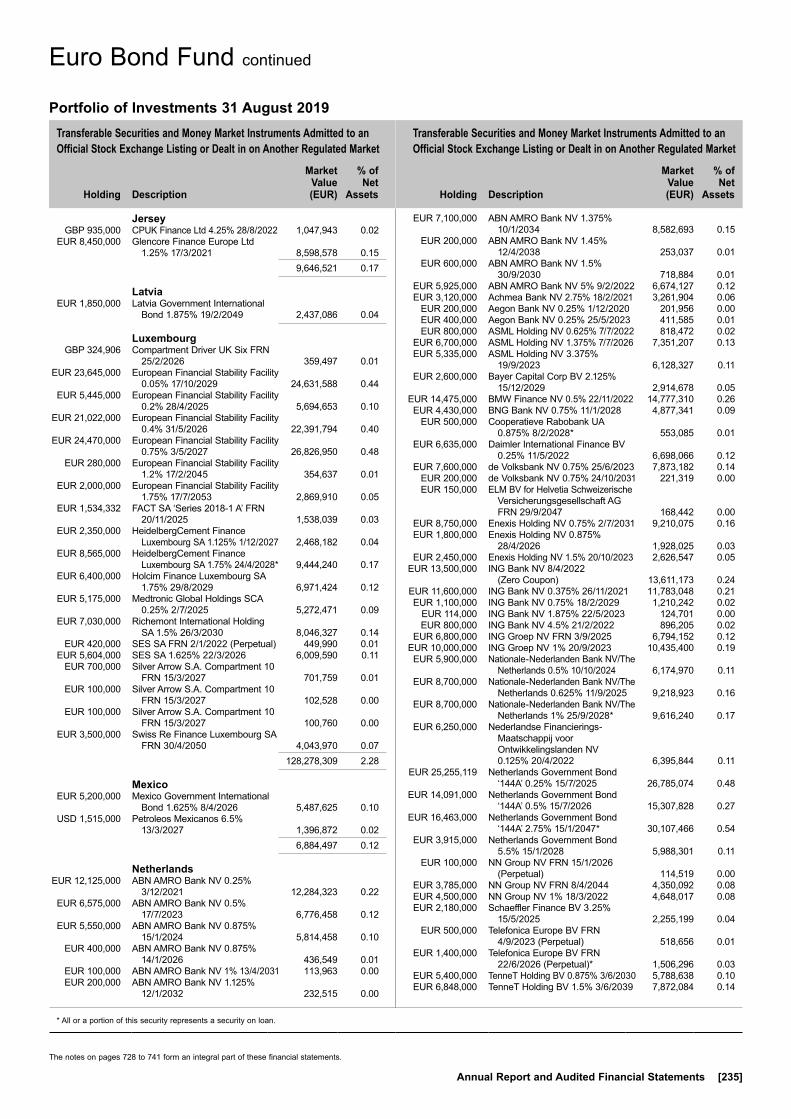
Transferable Securities and Money Market Instruments Admitted to an Official Stock Exchange Listing or Dealt in on Another Regulated Market
Transferable Securities and Money Market Instruments Admitted to an Official Stock Exchange Listing or Dealt in on Another Regulated Market
Holding
Description
Market Value (EUR)
% of Net
Assets
Holding
Description
Market Value (EUR)
% of Net
Assets
* All or a portion of this security represents a security on loan.
The notes on pages 728 to 741 form an integral part of these financial statements.
Annual Report and Audited Financial Statements [235]
Jersey GBP 935,000 CPUK Finance Ltd 4.25% 28/8/2022 1,047,943 0.02 EUR 8,450,000 Glencore Finance Europe Ltd
1.25% 17/3/2021 8,598,578 0.15 9,646,521 0.17
Latvia EUR 1,850,000 Latvia Government International
Bond 1.875% 19/2/2049 2,437,086 0.04
Luxembourg GBP 324,906 Compartment Driver UK Six FRN
25/2/2026 359,497 0.01 EUR 23,645,000 European Financial Stability Facility
0.05% 17/10/2029 24,631,588 0.44 EUR 5,445,000 European Financial Stability Facility
0.2% 28/4/2025 5,694,653 0.10 EUR 21,022,000 European Financial Stability Facility
0.4% 31/5/2026 22,391,794 0.40 EUR 24,470,000 European Financial Stability Facility
0.75% 3/5/2027 26,826,950 0.48 EUR 280,000 European Financial Stability Facility
1.2% 17/2/2045 354,637 0.01 EUR 2,000,000 European Financial Stability Facility
1.75% 17/7/2053 2,869,910 0.05 EUR 1,534,332 FACT SA ‘Series 2018-1 A’ FRN
20/11/2025 1,538,039 0.03 EUR 2,350,000 HeidelbergCement Finance
Luxembourg SA 1.125% 1/12/2027 2,468,182 0.04 EUR 8,565,000 HeidelbergCement Finance
Luxembourg SA 1.75% 24/4/2028* 9,444,240 0.17 EUR 6,400,000 Holcim Finance Luxembourg SA
1.75% 29/8/2029 6,971,424 0.12 EUR 5,175,000 Medtronic Global Holdings SCA
0.25% 2/7/2025 5,272,471 0.09 EUR 7,030,000 Richemont International Holding
SA 1.5% 26/3/2030 8,046,327 0.14 EUR 420,000 SES SA FRN 2/1/2022 (Perpetual) 449,990 0.01 EUR 5,604,000 SES SA 1.625% 22/3/2026 6,009,590 0.11 EUR 700,000 Silver Arrow S.A. Compartment 10
FRN 15/3/2027 701,759 0.01 EUR 100,000 Silver Arrow S.A. Compartment 10
FRN 15/3/2027 102,528 0.00 EUR 100,000 Silver Arrow S.A. Compartment 10
FRN 15/3/2027 100,760 0.00 EUR 3,500,000 Swiss Re Finance Luxembourg SA
FRN 30/4/2050 4,043,970 0.07 128,278,309 2.28
Mexico EUR 5,200,000 Mexico Government International
Bond 1.625% 8/4/2026 5,487,625 0.10 USD 1,515,000 Petroleos Mexicanos 6.5%
13/3/2027 1,396,872 0.02 6,884,497 0.12
Netherlands EUR 12,125,000 ABN AMRO Bank NV 0.25%
3/12/2021 12,284,323 0.22 EUR 6,575,000 ABN AMRO Bank NV 0.5%
17/7/2023 6,776,458 0.12 EUR 5,550,000 ABN AMRO Bank NV 0.875%
15/1/2024 5,814,458 0.10 EUR 400,000 ABN AMRO Bank NV 0.875%
14/1/2026 436,549 0.01 EUR 100,000 ABN AMRO Bank NV 1% 13/4/2031 113,963 0.00 EUR 200,000 ABN AMRO Bank NV 1.125%
12/1/2032 232,515 0.00
EUR 7,100,000 ABN AMRO Bank NV 1.375% 10/1/2034 8,582,693 0.15
EUR 200,000 ABN AMRO Bank NV 1.45% 12/4/2038 253,037 0.01
EUR 600,000 ABN AMRO Bank NV 1.5% 30/9/2030 718,884 0.01
EUR 5,925,000 ABN AMRO Bank NV 5% 9/2/2022 6,674,127 0.12 EUR 3,120,000 Achmea Bank NV 2.75% 18/2/2021 3,261,904 0.06 EUR 200,000 Aegon Bank NV 0.25% 1/12/2020 201,956 0.00 EUR 400,000 Aegon Bank NV 0.25% 25/5/2023 411,585 0.01 EUR 800,000 ASML Holding NV 0.625% 7/7/2022 818,472 0.02 EUR 6,700,000 ASML Holding NV 1.375% 7/7/2026 7,351,207 0.13 EUR 5,335,000 ASML Holding NV 3.375%
19/9/2023 6,128,327 0.11 EUR 2,600,000 Bayer Capital Corp BV 2.125%
15/12/2029 2,914,678 0.05 EUR 14,475,000 BMW Finance NV 0.5% 22/11/2022 14,777,310 0.26 EUR 4,430,000 BNG Bank NV 0.75% 11/1/2028 4,877,341 0.09 EUR 500,000 Cooperatieve Rabobank UA
0.875% 8/2/2028* 553,085 0.01 EUR 6,635,000 Daimler International Finance BV
0.25% 11/5/2022 6,698,066 0.12 EUR 7,600,000 de Volksbank NV 0.75% 25/6/2023 7,873,182 0.14 EUR 200,000 de Volksbank NV 0.75% 24/10/2031 221,319 0.00 EUR 150,000 ELM BV for Helvetia Schweizerische
Versicherungsgesellschaft AG FRN 29/9/2047 168,442 0.00
EUR 8,750,000 Enexis Holding NV 0.75% 2/7/2031 9,210,075 0.16 EUR 1,800,000 Enexis Holding NV 0.875%
28/4/2026 1,928,025 0.03 EUR 2,450,000 Enexis Holding NV 1.5% 20/10/2023 2,626,547 0.05 EUR 13,500,000 ING Bank NV 8/4/2022
(Zero Coupon) 13,611,173 0.24 EUR 11,600,000 ING Bank NV 0.375% 26/11/2021 11,783,048 0.21 EUR 1,100,000 ING Bank NV 0.75% 18/2/2029 1,210,242 0.02 EUR 114,000 ING Bank NV 1.875% 22/5/2023 124,701 0.00 EUR 800,000 ING Bank NV 4.5% 21/2/2022 896,205 0.02 EUR 6,800,000 ING Groep NV FRN 3/9/2025 6,794,152 0.12 EUR 10,000,000 ING Groep NV 1% 20/9/2023 10,435,400 0.19 EUR 5,900,000 Nationale-Nederlanden Bank NV/The
Netherlands 0.5% 10/10/2024 6,174,970 0.11 EUR 8,700,000 Nationale-Nederlanden Bank NV/The
Netherlands 0.625% 11/9/2025 9,218,923 0.16 EUR 8,700,000 Nationale-Nederlanden Bank NV/The
Netherlands 1% 25/9/2028* 9,616,240 0.17 EUR 6,250,000 Nederlandse Financierings-
Maatschappij voor Ontwikkelingslanden NV 0.125% 20/4/2022 6,395,844 0.11
EUR 25,255,119 Netherlands Government Bond ‘144A’ 0.25% 15/7/2025 26,785,074 0.48
EUR 14,091,000 Netherlands Government Bond ‘144A’ 0.5% 15/7/2026 15,307,828 0.27
EUR 16,463,000 Netherlands Government Bond ‘144A’ 2.75% 15/1/2047* 30,107,466 0.54
EUR 3,915,000 Netherlands Government Bond 5.5% 15/1/2028 5,988,301 0.11
EUR 100,000 NN Group NV FRN 15/1/2026 (Perpetual) 114,519 0.00
EUR 3,785,000 NN Group NV FRN 8/4/2044 4,350,092 0.08 EUR 4,500,000 NN Group NV 1% 18/3/2022 4,648,017 0.08 EUR 2,180,000 Schaeffler Finance BV 3.25%
15/5/2025 2,255,199 0.04 EUR 500,000 Telefonica Europe BV FRN
4/9/2023 (Perpetual) 518,656 0.01 EUR 1,400,000 Telefonica Europe BV FRN
22/6/2026 (Perpetual)* 1,506,296 0.03 EUR 5,400,000 TenneT Holding BV 0.875% 3/6/2030 5,788,638 0.10 EUR 6,848,000 TenneT Holding BV 1.5% 3/6/2039 7,872,084 0.14
Euro Bond Fund continued
Portfolio of Investments 31 August 2019
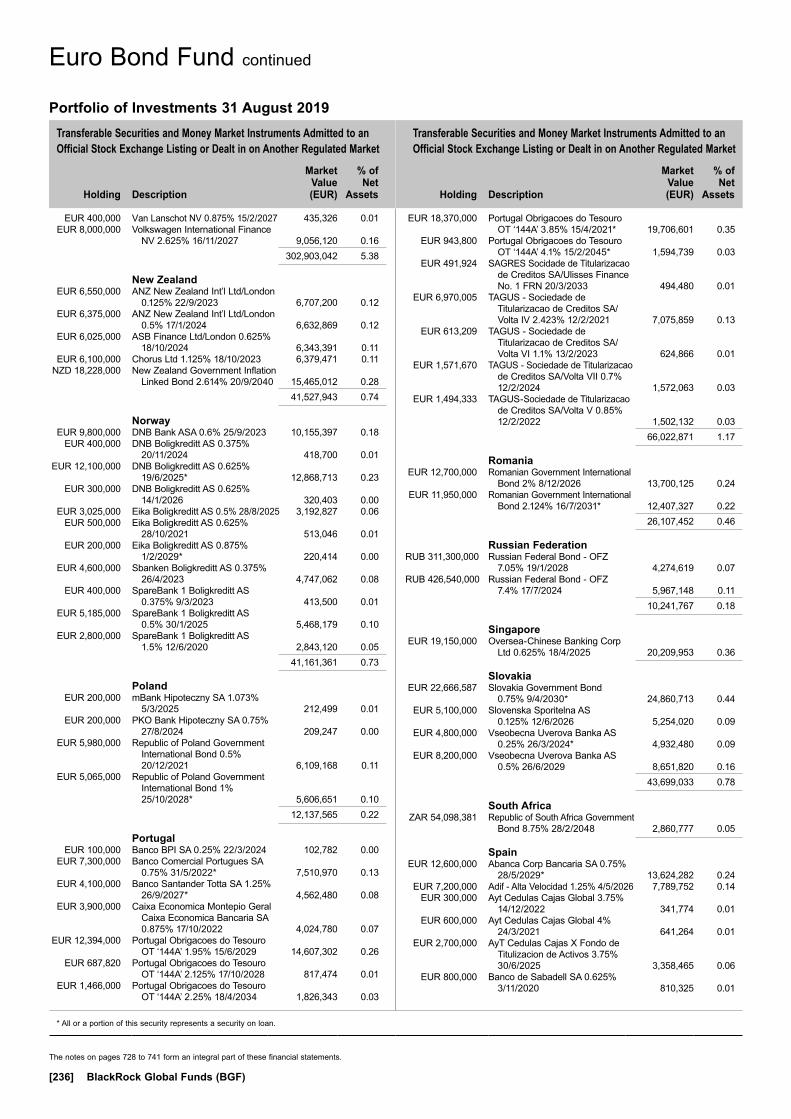
Transferable Securities and Money Market Instruments Admitted to an Official Stock Exchange Listing or Dealt in on Another Regulated Market
Transferable Securities and Money Market Instruments Admitted to an Official Stock Exchange Listing or Dealt in on Another Regulated Market
Holding
Description
Market Value (EUR)
% of Net
Assets
Holding
Description
Market Value (EUR)
% of Net
Assets
* All or a portion of this security represents a security on loan.
The notes on pages 728 to 741 form an integral part of these financial statements.
[236] BlackRock Global Funds (BGF)
EUR 400,000 Van Lanschot NV 0.875% 15/2/2027 435,326 0.01 EUR 8,000,000 Volkswagen International Finance
NV 2.625% 16/11/2027 9,056,120 0.16 302,903,042 5.38
New Zealand EUR 6,550,000 ANZ New Zealand Int’l Ltd/London
0.125% 22/9/2023 6,707,200 0.12 EUR 6,375,000 ANZ New Zealand Int’l Ltd/London
0.5% 17/1/2024 6,632,869 0.12 EUR 6,025,000 ASB Finance Ltd/London 0.625%
18/10/2024 6,343,391 0.11 EUR 6,100,000 Chorus Ltd 1.125% 18/10/2023 6,379,471 0.11 NZD 18,228,000 New Zealand Government Inflation
Linked Bond 2.614% 20/9/2040 15,465,012 0.28 41,527,943 0.74
Norway EUR 9,800,000 DNB Bank ASA 0.6% 25/9/2023 10,155,397 0.18 EUR 400,000 DNB Boligkreditt AS 0.375%
20/11/2024 418,700 0.01 EUR 12,100,000 DNB Boligkreditt AS 0.625%
19/6/2025* 12,868,713 0.23 EUR 300,000 DNB Boligkreditt AS 0.625%
14/1/2026 320,403 0.00 EUR 3,025,000 Eika Boligkreditt AS 0.5% 28/8/2025 3,192,827 0.06 EUR 500,000 Eika Boligkreditt AS 0.625%
28/10/2021 513,046 0.01 EUR 200,000 Eika Boligkreditt AS 0.875%
1/2/2029* 220,414 0.00 EUR 4,600,000 Sbanken Boligkreditt AS 0.375%
26/4/2023 4,747,062 0.08 EUR 400,000 SpareBank 1 Boligkreditt AS
0.375% 9/3/2023 413,500 0.01 EUR 5,185,000 SpareBank 1 Boligkreditt AS
0.5% 30/1/2025 5,468,179 0.10 EUR 2,800,000 SpareBank 1 Boligkreditt AS
1.5% 12/6/2020 2,843,120 0.05 41,161,361 0.73
Poland EUR 200,000 mBank Hipoteczny SA 1.073%
5/3/2025 212,499 0.01 EUR 200,000 PKO Bank Hipoteczny SA 0.75%
27/8/2024 209,247 0.00 EUR 5,980,000 Republic of Poland Government
International Bond 0.5% 20/12/2021 6,109,168 0.11
EUR 5,065,000 Republic of Poland Government International Bond 1% 25/10/2028* 5,606,651 0.10
12,137,565 0.22
Portugal EUR 100,000 Banco BPI SA 0.25% 22/3/2024 102,782 0.00 EUR 7,300,000 Banco Comercial Portugues SA
0.75% 31/5/2022* 7,510,970 0.13 EUR 4,100,000 Banco Santander Totta SA 1.25%
26/9/2027* 4,562,480 0.08 EUR 3,900,000 Caixa Economica Montepio Geral
Caixa Economica Bancaria SA 0.875% 17/10/2022 4,024,780 0.07
EUR 12,394,000 Portugal Obrigacoes do Tesouro OT ‘144A’ 1.95% 15/6/2029 14,607,302 0.26
EUR 687,820 Portugal Obrigacoes do Tesouro OT ‘144A’ 2.125% 17/10/2028 817,474 0.01
EUR 1,466,000 Portugal Obrigacoes do Tesouro OT ‘144A’ 2.25% 18/4/2034 1,826,343 0.03
EUR 18,370,000 Portugal Obrigacoes do Tesouro OT ‘144A’ 3.85% 15/4/2021* 19,706,601 0.35
EUR 943,800 Portugal Obrigacoes do Tesouro OT ‘144A’ 4.1% 15/2/2045* 1,594,739 0.03
EUR 491,924 SAGRES Socidade de Titularizacao de Creditos SA/Ulisses Finance No. 1 FRN 20/3/2033 494,480 0.01
EUR 6,970,005 TAGUS - Sociedade de Titularizacao de Creditos SA/Volta IV 2.423% 12/2/2021 7,075,859 0.13
EUR 613,209 TAGUS - Sociedade de Titularizacao de Creditos SA/Volta VI 1.1% 13/2/2023 624,866 0.01
EUR 1,571,670 TAGUS - Sociedade de Titularizacao de Creditos SA/Volta VII 0.7% 12/2/2024 1,572,063 0.03
EUR 1,494,333 TAGUS-Sociedade de Titularizacao de Creditos SA/Volta V 0.85% 12/2/2022 1,502,132 0.03
66,022,871 1.17
Romania EUR 12,700,000 Romanian Government International
Bond 2% 8/12/2026 13,700,125 0.24 EUR 11,950,000 Romanian Government International
Bond 2.124% 16/7/2031* 12,407,327 0.22 26,107,452 0.46
Russian Federation RUB 311,300,000 Russian Federal Bond - OFZ
7.05% 19/1/2028 4,274,619 0.07 RUB 426,540,000 Russian Federal Bond - OFZ
7.4% 17/7/2024 5,967,148 0.11 10,241,767 0.18
Singapore EUR 19,150,000 Oversea-Chinese Banking Corp
Ltd 0.625% 18/4/2025 20,209,953 0.36
Slovakia EUR 22,666,587 Slovakia Government Bond
0.75% 9/4/2030* 24,860,713 0.44 EUR 5,100,000 Slovenska Sporitelna AS
0.125% 12/6/2026 5,254,020 0.09 EUR 4,800,000 Vseobecna Uverova Banka AS
0.25% 26/3/2024* 4,932,480 0.09 EUR 8,200,000 Vseobecna Uverova Banka AS
0.5% 26/6/2029 8,651,820 0.16 43,699,033 0.78
South Africa ZAR 54,098,381 Republic of South Africa Government
Bond 8.75% 28/2/2048 2,860,777 0.05
Spain EUR 12,600,000 Abanca Corp Bancaria SA 0.75%
28/5/2029* 13,624,282 0.24 EUR 7,200,000 Adif - Alta Velocidad 1.25% 4/5/2026 7,789,752 0.14 EUR 300,000 Ayt Cedulas Cajas Global 3.75%
14/12/2022 341,774 0.01 EUR 600,000 Ayt Cedulas Cajas Global 4%
24/3/2021 641,264 0.01 EUR 2,700,000 AyT Cedulas Cajas X Fondo de
Titulizacion de Activos 3.75% 30/6/2025 3,358,465 0.06
EUR 800,000 Banco de Sabadell SA 0.625% 3/11/2020 810,325 0.01
Euro Bond Fund continued
Portfolio of Investments 31 August 2019
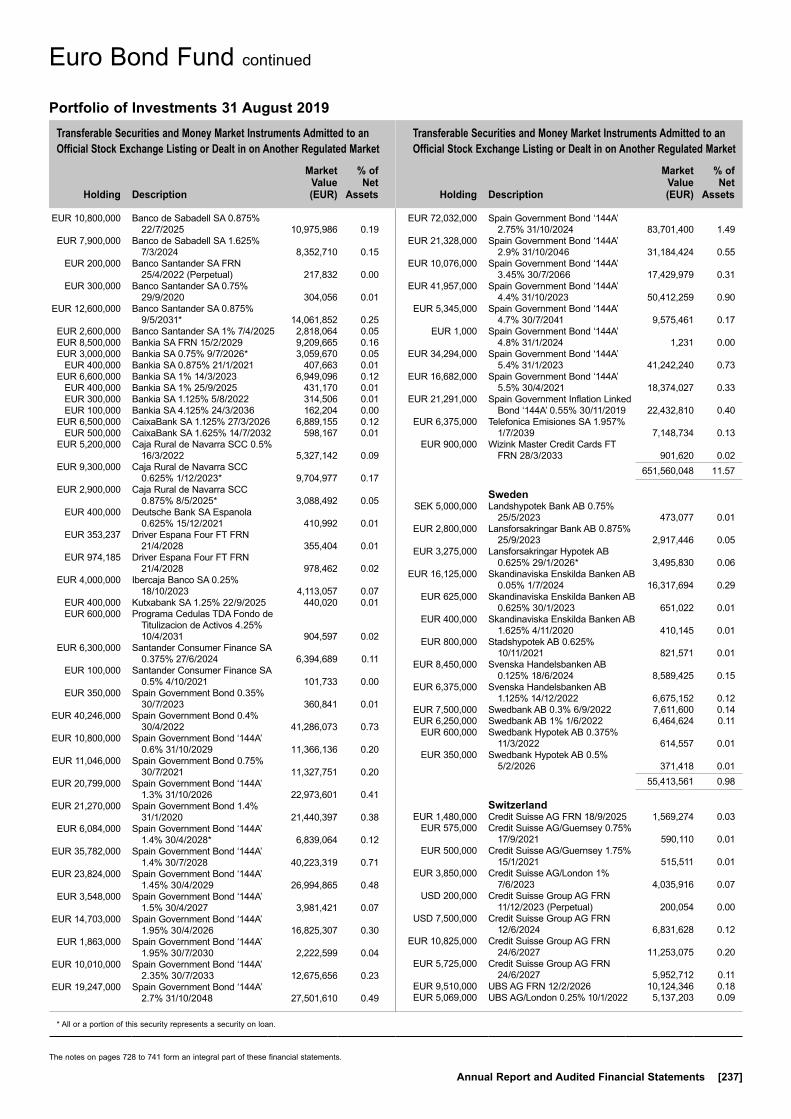
Transferable Securities and Money Market Instruments Admitted to an Official Stock Exchange Listing or Dealt in on Another Regulated Market
Transferable Securities and Money Market Instruments Admitted to an Official Stock Exchange Listing or Dealt in on Another Regulated Market
Holding
Description
Market Value (EUR)
% of Net
Assets
Holding
Description
Market Value (EUR)
% of Net
Assets
* All or a portion of this security represents a security on loan.
The notes on pages 728 to 741 form an integral part of these financial statements.
Annual Report and Audited Financial Statements [237]
EUR 10,800,000 Banco de Sabadell SA 0.875% 22/7/2025 10,975,986 0.19
EUR 7,900,000 Banco de Sabadell SA 1.625% 7/3/2024 8,352,710 0.15
EUR 200,000 Banco Santander SA FRN 25/4/2022 (Perpetual) 217,832 0.00
EUR 300,000 Banco Santander SA 0.75% 29/9/2020 304,056 0.01
EUR 12,600,000 Banco Santander SA 0.875% 9/5/2031* 14,061,852 0.25
EUR 2,600,000 Banco Santander SA 1% 7/4/2025 2,818,064 0.05 EUR 8,500,000 Bankia SA FRN 15/2/2029 9,209,665 0.16 EUR 3,000,000 Bankia SA 0.75% 9/7/2026* 3,059,670 0.05 EUR 400,000 Bankia SA 0.875% 21/1/2021 407,663 0.01 EUR 6,600,000 Bankia SA 1% 14/3/2023 6,949,096 0.12 EUR 400,000 Bankia SA 1% 25/9/2025 431,170 0.01 EUR 300,000 Bankia SA 1.125% 5/8/2022 314,506 0.01 EUR 100,000 Bankia SA 4.125% 24/3/2036 162,204 0.00 EUR 6,500,000 CaixaBank SA 1.125% 27/3/2026 6,889,155 0.12 EUR 500,000 CaixaBank SA 1.625% 14/7/2032 598,167 0.01 EUR 5,200,000 Caja Rural de Navarra SCC 0.5%
16/3/2022 5,327,142 0.09 EUR 9,300,000 Caja Rural de Navarra SCC
0.625% 1/12/2023* 9,704,977 0.17 EUR 2,900,000 Caja Rural de Navarra SCC
0.875% 8/5/2025* 3,088,492 0.05 EUR 400,000 Deutsche Bank SA Espanola
0.625% 15/12/2021 410,992 0.01 EUR 353,237 Driver Espana Four FT FRN
21/4/2028 355,404 0.01 EUR 974,185 Driver Espana Four FT FRN
21/4/2028 978,462 0.02 EUR 4,000,000 Ibercaja Banco SA 0.25%
18/10/2023 4,113,057 0.07 EUR 400,000 Kutxabank SA 1.25% 22/9/2025 440,020 0.01 EUR 600,000 Programa Cedulas TDA Fondo de
Titulizacion de Activos 4.25% 10/4/2031 904,597 0.02
EUR 6,300,000 Santander Consumer Finance SA 0.375% 27/6/2024 6,394,689 0.11
EUR 100,000 Santander Consumer Finance SA 0.5% 4/10/2021 101,733 0.00
EUR 350,000 Spain Government Bond 0.35% 30/7/2023 360,841 0.01
EUR 40,246,000 Spain Government Bond 0.4% 30/4/2022 41,286,073 0.73
EUR 10,800,000 Spain Government Bond ‘144A’ 0.6% 31/10/2029 11,366,136 0.20
EUR 11,046,000 Spain Government Bond 0.75% 30/7/2021 11,327,751 0.20
EUR 20,799,000 Spain Government Bond ‘144A’ 1.3% 31/10/2026 22,973,601 0.41
EUR 21,270,000 Spain Government Bond 1.4% 31/1/2020 21,440,397 0.38
EUR 6,084,000 Spain Government Bond ‘144A’ 1.4% 30/4/2028* 6,839,064 0.12
EUR 35,782,000 Spain Government Bond ‘144A’ 1.4% 30/7/2028 40,223,319 0.71
EUR 23,824,000 Spain Government Bond ‘144A’ 1.45% 30/4/2029 26,994,865 0.48
EUR 3,548,000 Spain Government Bond ‘144A’ 1.5% 30/4/2027 3,981,421 0.07
EUR 14,703,000 Spain Government Bond ‘144A’ 1.95% 30/4/2026 16,825,307 0.30
EUR 1,863,000 Spain Government Bond ‘144A’ 1.95% 30/7/2030 2,222,599 0.04
EUR 10,010,000 Spain Government Bond ‘144A’ 2.35% 30/7/2033 12,675,656 0.23
EUR 19,247,000 Spain Government Bond ‘144A’ 2.7% 31/10/2048 27,501,610 0.49
EUR 72,032,000 Spain Government Bond ‘144A’ 2.75% 31/10/2024 83,701,400 1.49
EUR 21,328,000 Spain Government Bond ‘144A’ 2.9% 31/10/2046 31,184,424 0.55
EUR 10,076,000 Spain Government Bond ‘144A’ 3.45% 30/7/2066 17,429,979 0.31
EUR 41,957,000 Spain Government Bond ‘144A’ 4.4% 31/10/2023 50,412,259 0.90
EUR 5,345,000 Spain Government Bond ‘144A’ 4.7% 30/7/2041 9,575,461 0.17
EUR 1,000 Spain Government Bond ‘144A’ 4.8% 31/1/2024 1,231 0.00
EUR 34,294,000 Spain Government Bond ‘144A’ 5.4% 31/1/2023 41,242,240 0.73
EUR 16,682,000 Spain Government Bond ‘144A’ 5.5% 30/4/2021 18,374,027 0.33
EUR 21,291,000 Spain Government Inflation Linked Bond ‘144A’ 0.55% 30/11/2019 22,432,810 0.40
EUR 6,375,000 Telefonica Emisiones SA 1.957% 1/7/2039 7,148,734 0.13
EUR 900,000 Wizink Master Credit Cards FT FRN 28/3/2033 901,620 0.02
651,560,048 11.57
Sweden SEK 5,000,000 Landshypotek Bank AB 0.75%
25/5/2023 473,077 0.01 EUR 2,800,000 Lansforsakringar Bank AB 0.875%
25/9/2023 2,917,446 0.05 EUR 3,275,000 Lansforsakringar Hypotek AB
0.625% 29/1/2026* 3,495,830 0.06 EUR 16,125,000 Skandinaviska Enskilda Banken AB
0.05% 1/7/2024 16,317,694 0.29 EUR 625,000 Skandinaviska Enskilda Banken AB
0.625% 30/1/2023 651,022 0.01 EUR 400,000 Skandinaviska Enskilda Banken AB
1.625% 4/11/2020 410,145 0.01 EUR 800,000 Stadshypotek AB 0.625%
10/11/2021 821,571 0.01 EUR 8,450,000 Svenska Handelsbanken AB
0.125% 18/6/2024 8,589,425 0.15 EUR 6,375,000 Svenska Handelsbanken AB
1.125% 14/12/2022 6,675,152 0.12 EUR 7,500,000 Swedbank AB 0.3% 6/9/2022 7,611,600 0.14 EUR 6,250,000 Swedbank AB 1% 1/6/2022 6,464,624 0.11 EUR 600,000 Swedbank Hypotek AB 0.375%
11/3/2022 614,557 0.01 EUR 350,000 Swedbank Hypotek AB 0.5%
5/2/2026 371,418 0.01 55,413,561 0.98
Switzerland EUR 1,480,000 Credit Suisse AG FRN 18/9/2025 1,569,274 0.03 EUR 575,000 Credit Suisse AG/Guernsey 0.75%
17/9/2021 590,110 0.01 EUR 500,000 Credit Suisse AG/Guernsey 1.75%
15/1/2021 515,511 0.01 EUR 3,850,000 Credit Suisse AG/London 1%
7/6/2023 4,035,916 0.07 USD 200,000 Credit Suisse Group AG FRN
11/12/2023 (Perpetual) 200,054 0.00 USD 7,500,000 Credit Suisse Group AG FRN
12/6/2024 6,831,628 0.12 EUR 10,825,000 Credit Suisse Group AG FRN
24/6/2027 11,253,075 0.20 EUR 5,725,000 Credit Suisse Group AG FRN
24/6/2027 5,952,712 0.11 EUR 9,510,000 UBS AG FRN 12/2/2026 10,124,346 0.18 EUR 5,069,000 UBS AG/London 0.25% 10/1/2022 5,137,203 0.09
Euro Bond Fund continued
Portfolio of Investments 31 August 2019
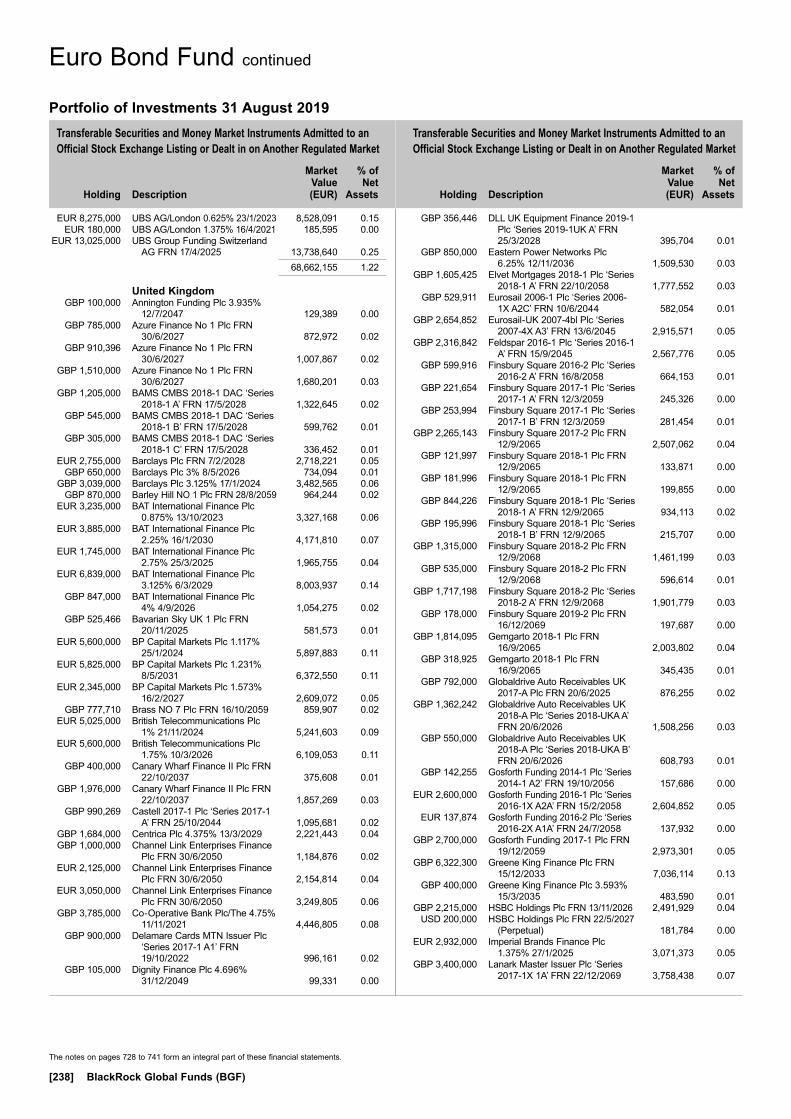
Transferable Securities and Money Market Instruments Admitted to an Official Stock Exchange Listing or Dealt in on Another Regulated Market
Transferable Securities and Money Market Instruments Admitted to an Official Stock Exchange Listing or Dealt in on Another Regulated Market
Holding
Description
Market Value (EUR)
% of Net
Assets
Holding
Description
Market Value (EUR)
% of Net
Assets
The notes on pages 728 to 741 form an integral part of these financial statements.
[238] BlackRock Global Funds (BGF)
EUR 8,275,000 UBS AG/London 0.625% 23/1/2023 8,528,091 0.15 EUR 180,000 UBS AG/London 1.375% 16/4/2021 185,595 0.00 EUR 13,025,000 UBS Group Funding Switzerland
AG FRN 17/4/2025 13,738,640 0.25 68,662,155 1.22
United Kingdom GBP 100,000 Annington Funding Plc 3.935%
12/7/2047 129,389 0.00 GBP 785,000 Azure Finance No 1 Plc FRN
30/6/2027 872,972 0.02 GBP 910,396 Azure Finance No 1 Plc FRN
30/6/2027 1,007,867 0.02 GBP 1,510,000 Azure Finance No 1 Plc FRN
30/6/2027 1,680,201 0.03 GBP 1,205,000 BAMS CMBS 2018-1 DAC ‘Series
2018-1 A’ FRN 17/5/2028 1,322,645 0.02 GBP 545,000 BAMS CMBS 2018-1 DAC ‘Series
2018-1 B’ FRN 17/5/2028 599,762 0.01 GBP 305,000 BAMS CMBS 2018-1 DAC ‘Series
2018-1 C’ FRN 17/5/2028 336,452 0.01 EUR 2,755,000 Barclays Plc FRN 7/2/2028 2,718,221 0.05 GBP 650,000 Barclays Plc 3% 8/5/2026 734,094 0.01 GBP 3,039,000 Barclays Plc 3.125% 17/1/2024 3,482,565 0.06 GBP 870,000 Barley Hill NO 1 Plc FRN 28/8/2059 964,244 0.02 EUR 3,235,000 BAT International Finance Plc
0.875% 13/10/2023 3,327,168 0.06 EUR 3,885,000 BAT International Finance Plc
2.25% 16/1/2030 4,171,810 0.07 EUR 1,745,000 BAT International Finance Plc
2.75% 25/3/2025 1,965,755 0.04 EUR 6,839,000 BAT International Finance Plc
3.125% 6/3/2029 8,003,937 0.14 GBP 847,000 BAT International Finance Plc
4% 4/9/2026 1,054,275 0.02 GBP 525,466 Bavarian Sky UK 1 Plc FRN
20/11/2025 581,573 0.01 EUR 5,600,000 BP Capital Markets Plc 1.117%
25/1/2024 5,897,883 0.11 EUR 5,825,000 BP Capital Markets Plc 1.231%
8/5/2031 6,372,550 0.11 EUR 2,345,000 BP Capital Markets Plc 1.573%
16/2/2027 2,609,072 0.05 GBP 777,710 Brass NO 7 Plc FRN 16/10/2059 859,907 0.02 EUR 5,025,000 British Telecommunications Plc
1% 21/11/2024 5,241,603 0.09 EUR 5,600,000 British Telecommunications Plc
1.75% 10/3/2026 6,109,053 0.11 GBP 400,000 Canary Wharf Finance II Plc FRN
22/10/2037 375,608 0.01 GBP 1,976,000 Canary Wharf Finance II Plc FRN
22/10/2037 1,857,269 0.03 GBP 990,269 Castell 2017-1 Plc ‘Series 2017-1
A’ FRN 25/10/2044 1,095,681 0.02 GBP 1,684,000 Centrica Plc 4.375% 13/3/2029 2,221,443 0.04 GBP 1,000,000 Channel Link Enterprises Finance
Plc FRN 30/6/2050 1,184,876 0.02 EUR 2,125,000 Channel Link Enterprises Finance
Plc FRN 30/6/2050 2,154,814 0.04 EUR 3,050,000 Channel Link Enterprises Finance
Plc FRN 30/6/2050 3,249,805 0.06 GBP 3,785,000 Co-Operative Bank Plc/The 4.75%
11/11/2021 4,446,805 0.08 GBP 900,000 Delamare Cards MTN Issuer Plc
‘Series 2017-1 A1’ FRN 19/10/2022 996,161 0.02
GBP 105,000 Dignity Finance Plc 4.696% 31/12/2049 99,331 0.00
GBP 356,446 DLL UK Equipment Finance 2019-1 Plc ‘Series 2019-1UK A’ FRN 25/3/2028 395,704 0.01
GBP 850,000 Eastern Power Networks Plc 6.25% 12/11/2036 1,509,530 0.03
GBP 1,605,425 Elvet Mortgages 2018-1 Plc ‘Series 2018-1 A’ FRN 22/10/2058 1,777,552 0.03
GBP 529,911 Eurosail 2006-1 Plc ‘Series 2006-1X A2C’ FRN 10/6/2044 582,054 0.01
GBP 2,654,852 Eurosail-UK 2007-4bl Plc ‘Series 2007-4X A3’ FRN 13/6/2045 2,915,571 0.05
GBP 2,316,842 Feldspar 2016-1 Plc ‘Series 2016-1 A’ FRN 15/9/2045 2,567,776 0.05
GBP 599,916 Finsbury Square 2016-2 Plc ‘Series 2016-2 A’ FRN 16/8/2058 664,153 0.01
GBP 221,654 Finsbury Square 2017-1 Plc ‘Series 2017-1 A’ FRN 12/3/2059 245,326 0.00
GBP 253,994 Finsbury Square 2017-1 Plc ‘Series 2017-1 B’ FRN 12/3/2059 281,454 0.01
GBP 2,265,143 Finsbury Square 2017-2 Plc FRN 12/9/2065 2,507,062 0.04
GBP 121,997 Finsbury Square 2018-1 Plc FRN 12/9/2065 133,871 0.00
GBP 181,996 Finsbury Square 2018-1 Plc FRN 12/9/2065 199,855 0.00
GBP 844,226 Finsbury Square 2018-1 Plc ‘Series 2018-1 A’ FRN 12/9/2065 934,113 0.02
GBP 195,996 Finsbury Square 2018-1 Plc ‘Series 2018-1 B’ FRN 12/9/2065 215,707 0.00
GBP 1,315,000 Finsbury Square 2018-2 Plc FRN 12/9/2068 1,461,199 0.03
GBP 535,000 Finsbury Square 2018-2 Plc FRN 12/9/2068 596,614 0.01
GBP 1,717,198 Finsbury Square 2018-2 Plc ‘Series 2018-2 A’ FRN 12/9/2068 1,901,779 0.03
GBP 178,000 Finsbury Square 2019-2 Plc FRN 16/12/2069 197,687 0.00
GBP 1,814,095 Gemgarto 2018-1 Plc FRN 16/9/2065 2,003,802 0.04
GBP 318,925 Gemgarto 2018-1 Plc FRN 16/9/2065 345,435 0.01
GBP 792,000 Globaldrive Auto Receivables UK 2017-A Plc FRN 20/6/2025 876,255 0.02
GBP 1,362,242 Globaldrive Auto Receivables UK 2018-A Plc ‘Series 2018-UKA A’ FRN 20/6/2026 1,508,256 0.03
GBP 550,000 Globaldrive Auto Receivables UK 2018-A Plc ‘Series 2018-UKA B’ FRN 20/6/2026 608,793 0.01
GBP 142,255 Gosforth Funding 2014-1 Plc ‘Series 2014-1 A2’ FRN 19/10/2056 157,686 0.00
EUR 2,600,000 Gosforth Funding 2016-1 Plc ‘Series 2016-1X A2A’ FRN 15/2/2058 2,604,852 0.05
EUR 137,874 Gosforth Funding 2016-2 Plc ‘Series 2016-2X A1A’ FRN 24/7/2058 137,932 0.00
GBP 2,700,000 Gosforth Funding 2017-1 Plc FRN 19/12/2059 2,973,301 0.05
GBP 6,322,300 Greene King Finance Plc FRN 15/12/2033 7,036,114 0.13
GBP 400,000 Greene King Finance Plc 3.593% 15/3/2035 483,590 0.01
GBP 2,215,000 HSBC Holdings Plc FRN 13/11/2026 2,491,929 0.04 USD 200,000 HSBC Holdings Plc FRN 22/5/2027
(Perpetual) 181,784 0.00 EUR 2,932,000 Imperial Brands Finance Plc
1.375% 27/1/2025 3,071,373 0.05 GBP 3,400,000 Lanark Master Issuer Plc ‘Series
2017-1X 1A’ FRN 22/12/2069 3,758,438 0.07
Euro Bond Fund continued
Portfolio of Investments 31 August 2019
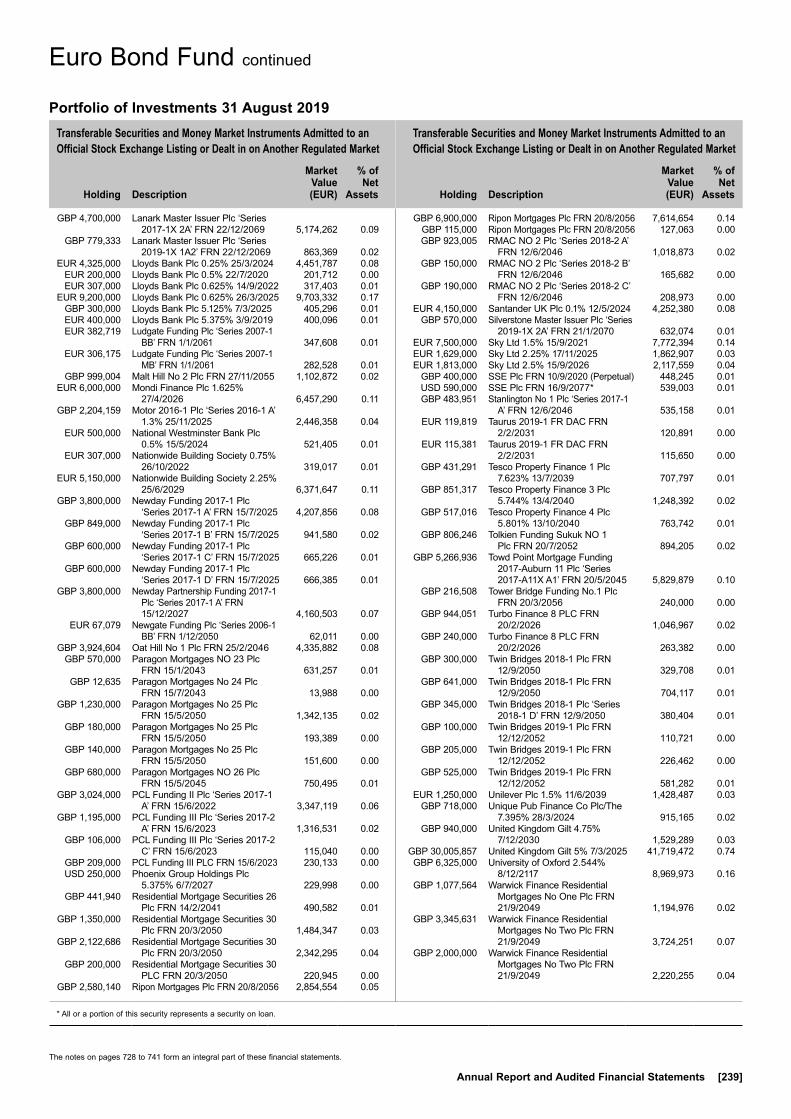
Transferable Securities and Money Market Instruments Admitted to an Official Stock Exchange Listing or Dealt in on Another Regulated Market
Transferable Securities and Money Market Instruments Admitted to an Official Stock Exchange Listing or Dealt in on Another Regulated Market
Holding
Description
Market Value (EUR)
% of Net
Assets
Holding
Description
Market Value (EUR)
% of Net
Assets
* All or a portion of this security represents a security on loan.
The notes on pages 728 to 741 form an integral part of these financial statements.
Annual Report and Audited Financial Statements [239]
GBP 4,700,000 Lanark Master Issuer Plc ‘Series 2017-1X 2A’ FRN 22/12/2069 5,174,262 0.09
GBP 779,333 Lanark Master Issuer Plc ‘Series 2019-1X 1A2’ FRN 22/12/2069 863,369 0.02
EUR 4,325,000 Lloyds Bank Plc 0.25% 25/3/2024 4,451,787 0.08 EUR 200,000 Lloyds Bank Plc 0.5% 22/7/2020 201,712 0.00 EUR 307,000 Lloyds Bank Plc 0.625% 14/9/2022 317,403 0.01 EUR 9,200,000 Lloyds Bank Plc 0.625% 26/3/2025 9,703,332 0.17 GBP 300,000 Lloyds Bank Plc 5.125% 7/3/2025 405,296 0.01 EUR 400,000 Lloyds Bank Plc 5.375% 3/9/2019 400,096 0.01 EUR 382,719 Ludgate Funding Plc ‘Series 2007-1
BB’ FRN 1/1/2061 347,608 0.01 EUR 306,175 Ludgate Funding Plc ‘Series 2007-1
MB’ FRN 1/1/2061 282,528 0.01 GBP 999,004 Malt Hill No 2 Plc FRN 27/11/2055 1,102,872 0.02 EUR 6,000,000 Mondi Finance Plc 1.625%
27/4/2026 6,457,290 0.11 GBP 2,204,159 Motor 2016-1 Plc ‘Series 2016-1 A’
1.3% 25/11/2025 2,446,358 0.04 EUR 500,000 National Westminster Bank Plc
0.5% 15/5/2024 521,405 0.01 EUR 307,000 Nationwide Building Society 0.75%
26/10/2022 319,017 0.01 EUR 5,150,000 Nationwide Building Society 2.25%
25/6/2029 6,371,647 0.11 GBP 3,800,000 Newday Funding 2017-1 Plc
‘Series 2017-1 A’ FRN 15/7/2025 4,207,856 0.08 GBP 849,000 Newday Funding 2017-1 Plc
‘Series 2017-1 B’ FRN 15/7/2025 941,580 0.02 GBP 600,000 Newday Funding 2017-1 Plc
‘Series 2017-1 C’ FRN 15/7/2025 665,226 0.01 GBP 600,000 Newday Funding 2017-1 Plc
‘Series 2017-1 D’ FRN 15/7/2025 666,385 0.01 GBP 3,800,000 Newday Partnership Funding 2017-1
Plc ‘Series 2017-1 A’ FRN 15/12/2027 4,160,503 0.07
EUR 67,079 Newgate Funding Plc ‘Series 2006-1 BB’ FRN 1/12/2050 62,011 0.00
GBP 3,924,604 Oat Hill No 1 Plc FRN 25/2/2046 4,335,882 0.08 GBP 570,000 Paragon Mortgages NO 23 Plc
FRN 15/1/2043 631,257 0.01 GBP 12,635 Paragon Mortgages No 24 Plc
FRN 15/7/2043 13,988 0.00 GBP 1,230,000 Paragon Mortgages No 25 Plc
FRN 15/5/2050 1,342,135 0.02 GBP 180,000 Paragon Mortgages No 25 Plc
FRN 15/5/2050 193,389 0.00 GBP 140,000 Paragon Mortgages No 25 Plc
FRN 15/5/2050 151,600 0.00 GBP 680,000 Paragon Mortgages NO 26 Plc
FRN 15/5/2045 750,495 0.01 GBP 3,024,000 PCL Funding II Plc ‘Series 2017-1
A’ FRN 15/6/2022 3,347,119 0.06 GBP 1,195,000 PCL Funding III Plc ‘Series 2017-2
A’ FRN 15/6/2023 1,316,531 0.02 GBP 106,000 PCL Funding III Plc ‘Series 2017-2
C’ FRN 15/6/2023 115,040 0.00 GBP 209,000 PCL Funding III PLC FRN 15/6/2023 230,133 0.00 USD 250,000 Phoenix Group Holdings Plc
5.375% 6/7/2027 229,998 0.00 GBP 441,940 Residential Mortgage Securities 26
Plc FRN 14/2/2041 490,582 0.01 GBP 1,350,000 Residential Mortgage Securities 30
Plc FRN 20/3/2050 1,484,347 0.03 GBP 2,122,686 Residential Mortgage Securities 30
Plc FRN 20/3/2050 2,342,295 0.04 GBP 200,000 Residential Mortgage Securities 30
PLC FRN 20/3/2050 220,945 0.00 GBP 2,580,140 Ripon Mortgages Plc FRN 20/8/2056 2,854,554 0.05
GBP 6,900,000 Ripon Mortgages Plc FRN 20/8/2056 7,614,654 0.14 GBP 115,000 Ripon Mortgages Plc FRN 20/8/2056 127,063 0.00 GBP 923,005 RMAC NO 2 Plc ‘Series 2018-2 A’
FRN 12/6/2046 1,018,873 0.02 GBP 150,000 RMAC NO 2 Plc ‘Series 2018-2 B’
FRN 12/6/2046 165,682 0.00 GBP 190,000 RMAC NO 2 Plc ‘Series 2018-2 C’
FRN 12/6/2046 208,973 0.00 EUR 4,150,000 Santander UK Plc 0.1% 12/5/2024 4,252,380 0.08 GBP 570,000 Silverstone Master Issuer Plc ‘Series
2019-1X 2A’ FRN 21/1/2070 632,074 0.01 EUR 7,500,000 Sky Ltd 1.5% 15/9/2021 7,772,394 0.14 EUR 1,629,000 Sky Ltd 2.25% 17/11/2025 1,862,907 0.03 EUR 1,813,000 Sky Ltd 2.5% 15/9/2026 2,117,559 0.04 GBP 400,000 SSE Plc FRN 10/9/2020 (Perpetual) 448,245 0.01 USD 590,000 SSE Plc FRN 16/9/2077* 539,003 0.01 GBP 483,951 Stanlington No 1 Plc ‘Series 2017-1
A’ FRN 12/6/2046 535,158 0.01 EUR 119,819 Taurus 2019-1 FR DAC FRN
2/2/2031 120,891 0.00 EUR 115,381 Taurus 2019-1 FR DAC FRN
2/2/2031 115,650 0.00 GBP 431,291 Tesco Property Finance 1 Plc
7.623% 13/7/2039 707,797 0.01 GBP 851,317 Tesco Property Finance 3 Plc
5.744% 13/4/2040 1,248,392 0.02 GBP 517,016 Tesco Property Finance 4 Plc
5.801% 13/10/2040 763,742 0.01 GBP 806,246 Tolkien Funding Sukuk NO 1
Plc FRN 20/7/2052 894,205 0.02 GBP 5,266,936 Towd Point Mortgage Funding
2017-Auburn 11 Plc ‘Series 2017-A11X A1’ FRN 20/5/2045 5,829,879 0.10
GBP 216,508 Tower Bridge Funding No.1 Plc FRN 20/3/2056 240,000 0.00
GBP 944,051 Turbo Finance 8 PLC FRN 20/2/2026 1,046,967 0.02
GBP 240,000 Turbo Finance 8 PLC FRN 20/2/2026 263,382 0.00
GBP 300,000 Twin Bridges 2018-1 Plc FRN 12/9/2050 329,708 0.01
GBP 641,000 Twin Bridges 2018-1 Plc FRN 12/9/2050 704,117 0.01
GBP 345,000 Twin Bridges 2018-1 Plc ‘Series 2018-1 D’ FRN 12/9/2050 380,404 0.01
GBP 100,000 Twin Bridges 2019-1 Plc FRN 12/12/2052 110,721 0.00
GBP 205,000 Twin Bridges 2019-1 Plc FRN 12/12/2052 226,462 0.00
GBP 525,000 Twin Bridges 2019-1 Plc FRN 12/12/2052 581,282 0.01
EUR 1,250,000 Unilever Plc 1.5% 11/6/2039 1,428,487 0.03 GBP 718,000 Unique Pub Finance Co Plc/The
7.395% 28/3/2024 915,165 0.02 GBP 940,000 United Kingdom Gilt 4.75%
7/12/2030 1,529,289 0.03 GBP 30,005,857 United Kingdom Gilt 5% 7/3/2025 41,719,472 0.74 GBP 6,325,000 University of Oxford 2.544%
8/12/2117 8,969,973 0.16 GBP 1,077,564 Warwick Finance Residential
Mortgages No One Plc FRN 21/9/2049 1,194,976 0.02
GBP 3,345,631 Warwick Finance Residential Mortgages No Two Plc FRN 21/9/2049 3,724,251 0.07
GBP 2,000,000 Warwick Finance Residential Mortgages No Two Plc FRN 21/9/2049 2,220,255 0.04
Euro Bond Fund continued
Portfolio of Investments 31 August 2019

Transferable Securities and Money Market Instruments Admitted to an Official Stock Exchange Listing or Dealt in on Another Regulated Market
Transferable Securities and Money Market Instruments Admitted to an Official Stock Exchange Listing or Dealt in on Another Regulated Market
Holding
Description
Market Value (EUR)
% of Net
Assets
Holding
Description
Market Value (EUR)
% of Net
Assets
* All or a portion of this security represents a security on loan.
The notes on pages 728 to 741 form an integral part of these financial statements.
[240] BlackRock Global Funds (BGF)
EUR 4,700,000 WPP Finance 2016 1.375% 20/3/2025 4,987,029 0.09
EUR 3,525,000 Yorkshire Building Society 0.375% 11/4/2023 3,629,710 0.06
EUR 679,000 Yorkshire Building Society 0.75% 10/11/2022 705,534 0.01
307,053,876 5.45
United States USD 3,400,000 Anheuser-Busch InBev Worldwide
Inc 5.45% 23/1/2039 3,934,082 0.07 EUR 2,700,000 Apple Inc 1.625% 10/11/2026 3,058,681 0.05 EUR 3,760,000 AT&T Inc 1.05% 5/9/2023 3,923,616 0.07 EUR 8,600,000 AT&T Inc 3.15% 4/9/2036* 10,650,068 0.19 EUR 6,000,000 Bank of America Corp FRN 7/2/2025 6,365,184 0.11 EUR 7,575,000 Bank of America Corp FRN
8/8/2029* 7,699,647 0.14 EUR 8,350,000 Chubb INA Holdings Inc 1.4%
15/6/2031 9,099,371 0.16 EUR 8,445,000 Citigroup Inc FRN 24/7/2026 9,084,118 0.16 EUR 10,975,000 Coca-Cola Co/The 0.75% 22/9/2026 11,625,763 0.21 USD 3,818,000 CRH America Finance Inc 3.95%
4/4/2028 3,728,056 0.07 EUR 10,975,000 Fidelity National Information
Services Inc 2% 21/5/2030 12,492,458 0.22 EUR 8,675,000 Fidelity National Information
Services Inc 2.95% 21/5/2039 10,985,152 0.20 EUR 3,675,000 Fiserv Inc 1.125% 1/7/2027 3,872,733 0.07 EUR 3,475,000 Goldman Sachs Group Inc/The
0.125% 19/8/2024 3,481,481 0.06 EUR 3,840,000 Goldman Sachs Group Inc/The
1.375% 26/7/2022 4,012,346 0.07 EUR 10,170,000 International Business Machines
Corp 1.25% 29/1/2027 11,062,875 0.20 EUR 10,650,000 International Flavors & Fragrances
Inc 1.8% 25/9/2026 11,466,642 0.20 USD 660,440 Lanark Master Issuer Plc FRN
22/12/2069 597,323 0.01 EUR 4,015,000 Levi Strauss & Co 3.375% 15/3/2027 4,343,547 0.08 EUR 11,029,000 Morgan Stanley FRN 8/11/2022 11,109,126 0.20
EUR 7,250,000 Morgan Stanley FRN 26/7/2024 7,411,747 0.13 EUR 500,000 Morgan Stanley 1.75% 11/3/2024 538,289 0.01 EUR 8,050,000 National Grid North America Inc
0.75% 8/8/2023 8,325,753 0.15 USD 64,321 Paragon Mortgages No 13 Plc
FRN 15/1/2039 54,591 0.00 EUR 8,675,000 PVH Corp 3.125% 15/12/2027 9,771,390 0.17 USD 12,600,000 United States Treasury Inflation
Indexed Bonds 0.875% 15/1/2029 12,571,479 0.22 USD 13,875,000 United States Treasury Inflation
Indexed Bonds 1% 15/2/2048* 15,412,631 0.27 USD 10,040,000 United States Treasury Inflation
Indexed Bonds 1% 15/2/2049 11,029,410 0.20 EUR 2,325,000 US Bancorp 0.85% 7/6/2024 2,433,798 0.04 210,141,357 3.73Total Bonds 5,411,697,970 96.12Total Transferable Securities and Money Market Instruments Admitted to an Official Stock Exchange Listing or Dealt in on Another Regulated Market 5,643,089,565 100.23
Other Transferable Securities
BONDS
Denmark DKK 1 Nordea Kredit Realkreditaktieselskab
2% 1/10/2047 – 0.00 DKK 1 Nykredit Realkredit A/S 2%
1/10/2050 – 0.00 – 0.00Total Bonds – 0.00Total Other Transferable Securities – 0.00Total Portfolio 5,643,089,565 100.23
Other Net Liabilities (12,754,256) (0.23)Total Net Assets (EUR) 5,630,335,309 100.00
Euro Bond Fund continued
Portfolio of Investments 31 August 2019
Open Forward Foreign Exchange Contracts as at 31 August 2019
Currency
Purchases Currency
Sales Counterparty
Maturity date
Unrealised appreciation/
(depreciation) EUR
AUD 19,380,000 NZD 20,515,610 JP Morgan 6/9/2019 85,448AUD 50,348,619 USD 34,999,472 Bank of America 6/9/2019 (972,198)AUD 23,720,000 USD 16,301,691 Morgan Stanley 6/9/2019 (288,685)AUD 385,933 USD 268,772 BNP Paribas 6/9/2019 (7,898)AUD 8,115,448 USD 5,715,088 Citibank 6/9/2019 (223,401)AUD 12,890,000 USD 9,085,684 JP Morgan 6/9/2019 (362,298)AUD 13,160,000 USD 9,186,601 Toronto Dominion 6/9/2019 (288,977)CAD 24,706,480 USD 18,557,613 Toronto Dominion 6/9/2019 63,343CAD 35,519,937 USD 26,700,335 Royal Bank of Canada 6/9/2019 72,528CAD 1,979,586 USD 1,485,771 BNP Paribas 6/9/2019 6,110CAD 11,852,597 USD 8,891,424 HSBC Bank Plc 6/9/2019 40,650CAD 5,991,401 USD 4,497,836 State Street 6/9/2019 17,574CAD 11,720,000 USD 8,917,830 Citibank 6/9/2019 (73,732)CAD 9,038,756 USD 6,897,944 Morgan Stanley 6/9/2019 (75,229)CAD 15,361,244 USD 11,571,447 Barclays 6/9/2019 9,282
Open Forward Foreign Exchange Contracts as at 31 August 2019
Currency
Purchases Currency
Sales Counterparty
Maturity date
Unrealised appreciation/
(depreciation) EUR
CAD 21,580,000 USD 16,285,773 Bank of America 6/9/2019 (13,940)CHF 15,750,000 EUR 14,348,596 Goldman Sachs 6/9/2019 88,077CHF 1,454,332 EUR 1,331,824 Royal Bank of Canada 6/9/2019 1,237CHF 9,825,668 EUR 8,995,146 Toronto Dominion 6/9/2019 11,200CHF 4,510,000 EUR 4,085,756 State Street 6/9/2019 48,174CHF 17,052,380 USD 17,403,183 HSBC Bank Plc 6/9/2019 (120,640)CHF 9,019,912 USD 9,163,425 Morgan Stanley 6/9/2019 (25,759)CHF 304,999 USD 310,022 RBS Plc 6/9/2019 (1,024)CHF 34,864,648 USD 35,322,392 Toronto Dominion 6/9/2019 (11,794)CHF 891,007 USD 903,107 BNP Paribas 6/9/2019 (666)CHF 392,646 USD 398,081 Royal Bank of Canada 6/9/2019 (386)CHF 35,620,000 USD 36,049,909 JP Morgan 6/9/2019 22,118CHF 284,409 USD 288,638 Citibank 6/9/2019 (544)CNH 18,305,000 USD 2,656,664 Barclays 6/9/2019 (87,616)

The notes on pages 728 to 741 form an integral part of these financial statements.
Annual Report and Audited Financial Statements [241]
Euro Bond Fund continued
Open Forward Foreign Exchange Contracts as at 31 August 2019
Currency
Purchases Currency
Sales Counterparty
Maturity date
Unrealised appreciation/
(depreciation) EUR
Open Forward Foreign Exchange Contracts as at 31 August 2019
Currency
Purchases Currency
Sales Counterparty
Maturity date
Unrealised appreciation/
(depreciation) EUR
NZD 17,606,039 USD 11,287,959 Credit Suisse 6/9/2019 (147,121)NZD 25,423,961 USD 16,303,751 Morgan Stanley 6/9/2019 (215,526)NZD 34,720,000 USD 22,458,800 HSBC Bank Plc 6/9/2019 (469,671)NZD 14,176,154 USD 9,313,592 Citibank 6/9/2019 (321,805)NZD 3,753,846 USD 2,465,113 RBS Plc 6/9/2019 (84,195)PLN 87,525,000 EUR 20,259,633 BNP Paribas 6/9/2019 (306,468)PLN 84,200,000 EUR 19,584,711 Credit Suisse 6/9/2019 (389,550)PLN 17,150,000 EUR 3,992,634 Barclays 6/9/2019 (82,931)PLN 17,000,000 EUR 3,954,316 Societe Generale 6/9/2019 (78,808)PLN 18,450,000 EUR 4,286,678 Bank of America 6/9/2019 (80,612)SEK 44,750,000 EUR 4,170,304 Barclays 6/9/2019 (41,079)SEK 87,150,000 EUR 8,175,619 Toronto Dominion 6/9/2019 (134,012)SEK 44,700,000 EUR 4,151,682 Standard Chartered Bank 6/9/2019 (27,071)SEK 302,900,000 EUR 28,349,814 Credit Suisse 6/9/2019 (400,270)SEK 217,800,000 EUR 20,610,230 JP Morgan 6/9/2019 (513,133)SEK 58,600,000 EUR 5,522,308 Citibank 6/9/2019 (115,100)SEK 37,396,404 EUR 3,517,340 Royal Bank of Canada 6/9/2019 (66,655)SEK 13,803,596 EUR 1,298,282 RBS Plc 6/9/2019 (24,581)SEK 106,700,000 USD 11,342,593 JP Morgan 6/9/2019 (420,289)USD 325,982 AUD 482,444 JP Morgan 6/9/2019 821USD 9,210,997 AUD 13,640,000 Morgan Stanley 6/9/2019 18,332USD 44,941,582 AUD 65,877,569 Bank of America 6/9/2019 500,275USD 19,107,208 AUD 28,260,000 Citibank 6/9/2019 59,185USD 243,946 AUD 359,987 Royal Bank of Canada 6/9/2019 1,252USD 8,789,713 CAD 11,529,818 Citibank 6/9/2019 87,554USD 17,116,703 CAD 22,380,000 HSBC Bank Plc 6/9/2019 220,082USD 26,787,071 CAD 35,270,000 Royal Bank of Canada 6/9/2019 176,525USD 369,095 CAD 487,449 BNP Paribas 6/9/2019 1,430USD 260,953 CAD 346,871 Morgan Stanley 6/9/2019 (518)USD 1,240,954 CAD 1,647,792 Bank of America 6/9/2019 (1,275)USD 36,211,664 CAD 47,751,221 JP Morgan 6/9/2019 189,469USD 9,478,043 CAD 12,370,657 Toronto Dominion 6/9/2019 136,766USD 4,514,077 CAD 5,966,192 State Street 6/9/2019 14,327USD 8,538,602 CHF 8,445,232 HSBC Bank Plc 6/9/2019 (12,990)USD 256,910 CHF 252,964 RBS Plc 6/9/2019 651USD 8,709,596 CHF 8,577,036 Toronto Dominion 6/9/2019 20,958USD 11,778,472 CHF 11,582,495 JP Morgan 6/9/2019 43,658USD 8,954,648 CHF 8,870,000 Standard Chartered Bank 6/9/2019 (25,787)USD 18,203,759 CHF 17,800,000 Morgan Stanley 6/9/2019 159,938USD 18,587,246 CHF 18,080,000 UBS 6/9/2019 250,368USD 1,032,527 CHF 1,017,094 BNP Paribas 6/9/2019 2,227USD 18,158,638 CHF 17,717,674 Goldman Sachs 6/9/2019 194,561USD 6,221,403 CHF 6,087,505 Citibank 6/9/2019 50,910USD 7,922,502 CNH 56,070,000 JP Morgan 6/9/2019 73,678USD 20,569,955 EUR 18,151,989 HSBC Bank Plc 6/9/2019 465,253USD 624,055 EUR 548,204 BNP Paribas 6/9/2019 16,609USD 24,113,845 EUR 21,682,972 Citibank 6/9/2019 141,737USD 9,774,568 EUR 8,685,038 Barclays 6/9/2019 161,626USD 24,238,965 EUR 21,381,796 Bank of America 6/9/2019 556,156USD 54,554,566 JPY 5,867,000,000 Citibank 6/9/2019 (661,828)USD 9,196,467 JPY 975,000,000 Barclays 6/9/2019 8,022USD 8,967,118 JPY 964,000,000 Standard Chartered Bank 6/9/2019 (105,739)USD 3,482,537 JPY 373,633,379 RBS Plc 6/9/2019 (34,645)USD 777,050 JPY 83,366,621 UBS 6/9/2019 (7,719)USD 9,123,765 JPY 981,000,000 Bank of America 6/9/2019 (108,949)USD 4,327,957 MXN 84,382,179 Societe Generale 6/9/2019 115,235USD 9,472,923 MXN 186,517,821 Morgan Stanley 6/9/2019 170,032USD 11,142,176 NOK 96,900,000 Morgan Stanley 6/9/2019 431,945USD 6,909,724 NOK 61,950,000 Credit Suisse 6/9/2019 82,756USD 6,907,048 NOK 61,950,000 BNP Paribas 6/9/2019 80,333USD 15,051,451 NZD 22,788,059 Morgan Stanley 6/9/2019 589,637USD 9,449,509 NZD 14,590,000 HSBC Bank Plc 6/9/2019 208,133USD 8,774,358 NZD 13,401,941 UBS 6/9/2019 276,550USD 4,505,345 NZD 6,650,000 Citibank 6/9/2019 274,375USD 9,058,601 NZD 13,420,000 JP Morgan 6/9/2019 523,481USD 6,529,809 NZD 9,820,000 Standard Chartered Bank 6/9/2019 293,665USD 9,990,326 NZD 15,010,000 Toronto Dominion 6/9/2019 457,403
CNH 37,765,000 USD 5,448,141 Bank of America 6/9/2019 (151,060)CZK 222,630,846 EUR 8,658,263 Credit Suisse 6/9/2019 (76,924)CZK 164,595,544 EUR 6,397,439 BNP Paribas 6/9/2019 (53,079)CZK 22,162,487 EUR 861,214 Morgan Stanley 6/9/2019 (6,958)EUR 25,147,471 CHF 27,446,436 Goldman Sachs 6/9/2019 (10,321)EUR 3,716,335 CHF 4,093,564 Morgan Stanley 6/9/2019 (35,884)EUR 8,399,661 CZK 217,500,000 BNP Paribas 6/9/2019 16,091EUR 7,371,403 CZK 189,674,416 Bank of America 6/9/2019 60,374EUR 5,123,087 CZK 132,025,584 Citibank 6/9/2019 34,141EUR 3,375,708 CZK 87,688,877 RBS Plc 6/9/2019 (4,273)EUR 1,516,879 GBP 1,374,634 Bank of America 6/9/2019 (3,040)EUR 10,298,355 GBP 9,315,912 Morgan Stanley 6/9/2019 (2,155)EUR 5,634,777 GBP 5,150,000 RBS Plc 6/9/2019 (59,527)EUR 8,896,436 GBP 7,949,454 Toronto Dominion 6/9/2019 106,803EUR 4,569,534 HUF 1,475,000,000 Bank of America 6/9/2019 117,729EUR 3,963,746 HUF 1,277,000,000 Societe Generale 6/9/2019 109,539EUR 4,104,692 HUF 1,319,000,000 Barclays 6/9/2019 123,722EUR 26,544,783 HUF 8,614,766,106 BNP Paribas 6/9/2019 543,928EUR 2,600,089 HUF 844,404,763 RBS Plc 6/9/2019 51,529EUR 7,383,727 HUF 2,396,829,131 Credit Suisse 6/9/2019 149,682EUR 3,445,528 HUF 1,122,000,000 Citibank 6/9/2019 59,138EUR 5,476,815 NOK 53,100,000 Citibank 6/9/2019 187,364EUR 6,748,538 NOK 66,200,000 Morgan Stanley 6/9/2019 154,157EUR 10,420,318 NOK 101,600,000 JP Morgan 6/9/2019 299,637EUR 12,071,400 NOK 116,600,000 Toronto Dominion 6/9/2019 456,524EUR 4,538,579 NOK 43,900,000 Standard Chartered Bank 6/9/2019 165,568EUR 4,142,458 NOK 41,500,000 Credit Suisse 6/9/2019 8,518EUR 16,406,640 NOK 161,800,000 BNP Paribas 6/9/2019 289,256EUR 8,412,101 NOK 84,200,000 HSBC Bank Plc 6/9/2019 24,686EUR 2,051,601 NOK 19,900,000 Goldman Sachs 6/9/2019 69,302EUR 16,159,682 PLN 69,075,000 BNP Paribas 6/9/2019 412,583EUR 36,071,097 PLN 155,250,000 JP Morgan 6/9/2019 678,593EUR 8,316,307 SEK 89,200,000 Credit Suisse 6/9/2019 85,540EUR 16,384,276 SEK 173,500,000 Toronto Dominion 6/9/2019 374,880EUR 3,465,712 SEK 37,134,898 RBS Plc 6/9/2019 39,157EUR 678,099 SEK 7,265,102 Societe Generale 6/9/2019 7,725EUR 35,007,014 SEK 370,800,000 BNP Paribas 6/9/2019 792,121EUR 15,843,223 SEK 167,300,000 JP Morgan 6/9/2019 405,922EUR 4,825,134 SEK 51,200,000 Bank of America 6/9/2019 100,747EUR 7,970,000 USD 9,020,087 RBS Plc 6/9/2019 (193,807)EUR 3,960,000 USD 4,482,443 State Street 6/9/2019 (96,923)EUR 8,311,856 USD 9,435,848 Bank of America 6/9/2019 (228,243)EUR 26,665,000 USD 29,813,379 Citibank 6/9/2019 (318,184)EUR 22,215,000 USD 24,779,622 Barclays 6/9/2019 (212,283)EUR 17,788,144 USD 20,218,242 JP Morgan 6/9/2019 (510,773)GBP 9,560,000 EUR 10,537,652 Barclays 6/9/2019 32,745GBP 9,690,000 EUR 10,603,700 RBS Plc 6/9/2019 110,436GBP 635,818 EUR 708,666 Bank of America 6/9/2019 (5,649)GBP 3,904,182 EUR 4,351,712 JP Morgan 6/9/2019 (34,897)HUF 11,997,484,271 EUR 36,678,862 BNP Paribas 6/9/2019 (468,378)HUF 967,945,953 EUR 2,959,616 Morgan Stanley 6/9/2019 (38,188)HUF 4,908,586,263 EUR 14,999,632 Credit Suisse 6/9/2019 (184,670)HUF 11,984,517,496 EUR 36,984,931 Barclays 6/9/2019 (813,584)HUF 1,132,407,961 EUR 3,466,477 RBS Plc 6/9/2019 (48,674)HUF 1,292,933,056 EUR 3,966,296 Bank of America 6/9/2019 (64,000)JPY 62,331,317 USD 574,071 Toronto Dominion 6/9/2019 12,027JPY 6,271,668,683 USD 58,001,617 Citibank 6/9/2019 993,279JPY 2,434,000,000 USD 22,454,206 Standard Chartered Bank 6/9/2019 436,081JPY 476,000,000 USD 4,428,154 JP Morgan 6/9/2019 51,843MXN 254,569,914 USD 12,933,620 Royal Bank of Canada 6/9/2019 (236,095)MXN 10,762,271 USD 546,021 RBS Plc 6/9/2019 (9,289)MXN 5,567,814 USD 283,586 Toronto Dominion 6/9/2019 (5,805)NOK 82,900,000 EUR 8,294,393 Morgan Stanley 6/9/2019 (36,475)NOK 262,000,000 EUR 26,798,658 BNP Paribas 6/9/2019 (700,052)NOK 143,300,000 EUR 14,701,382 JP Morgan 6/9/2019 (426,838)NOK 116,400,000 EUR 12,038,980 Toronto Dominion 6/9/2019 (444,027)NOK 92,150,000 USD 10,501,389 JP Morgan 6/9/2019 (325,150)NOK 80,200,000 USD 9,040,185 BNP Paribas 6/9/2019 (193,034)NOK 48,450,000 USD 5,574,982 Citibank 6/9/2019 (219,497)NZD 20,554,661 AUD 19,380,000 Royal Bank of Canada 6/9/2019 (63,114)
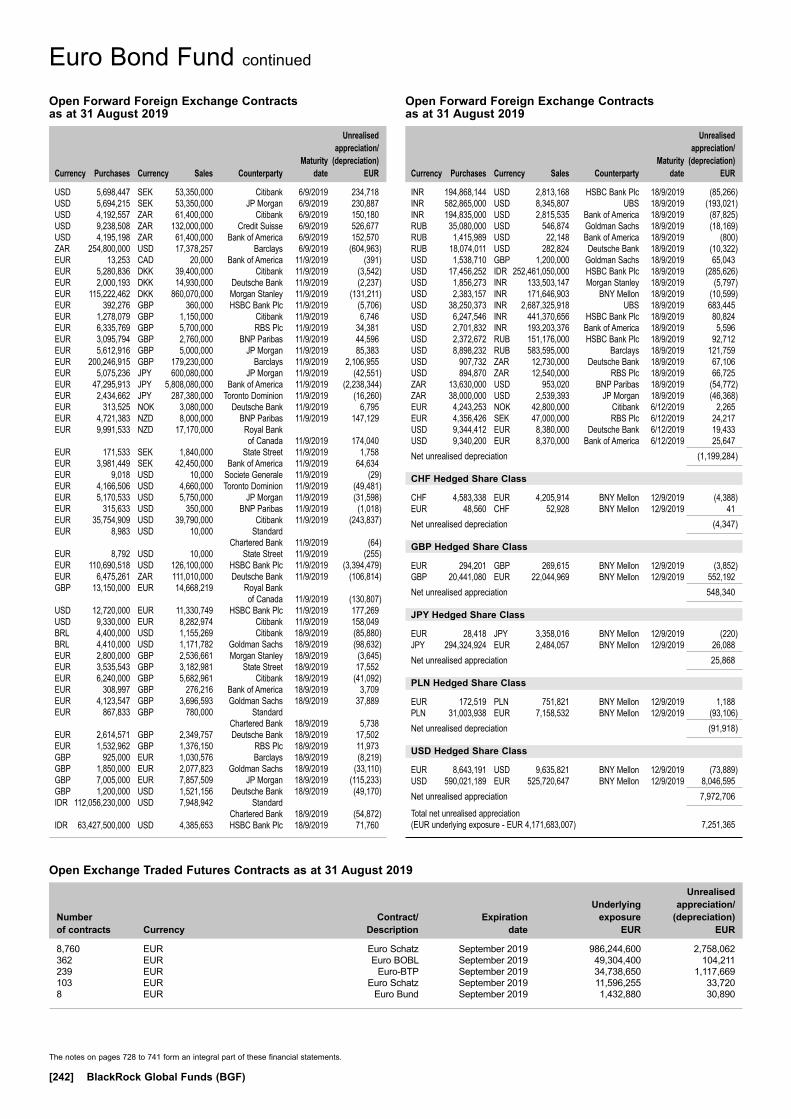
The notes on pages 728 to 741 form an integral part of these financial statements.
[242] BlackRock Global Funds (BGF)
Euro Bond Fund continued
Open Forward Foreign Exchange Contracts as at 31 August 2019
Currency
Purchases Currency
Sales Counterparty
Maturity date
Unrealised appreciation/
(depreciation) EUR
Open Forward Foreign Exchange Contracts as at 31 August 2019
Currency
Purchases Currency
Sales Counterparty
Maturity date
Unrealised appreciation/
(depreciation) EUR
USD 5,698,447 SEK 53,350,000 Citibank 6/9/2019 234,718USD 5,694,215 SEK 53,350,000 JP Morgan 6/9/2019 230,887USD 4,192,557 ZAR 61,400,000 Citibank 6/9/2019 150,180USD 9,238,508 ZAR 132,000,000 Credit Suisse 6/9/2019 526,677USD 4,195,198 ZAR 61,400,000 Bank of America 6/9/2019 152,570ZAR 254,800,000 USD 17,378,257 Barclays 6/9/2019 (604,963)EUR 13,253 CAD 20,000 Bank of America 11/9/2019 (391)EUR 5,280,836 DKK 39,400,000 Citibank 11/9/2019 (3,542)EUR 2,000,193 DKK 14,930,000 Deutsche Bank 11/9/2019 (2,237)EUR 115,222,462 DKK 860,070,000 Morgan Stanley 11/9/2019 (131,211)EUR 392,276 GBP 360,000 HSBC Bank Plc 11/9/2019 (5,706)EUR 1,278,079 GBP 1,150,000 Citibank 11/9/2019 6,746EUR 6,335,769 GBP 5,700,000 RBS Plc 11/9/2019 34,381EUR 3,095,794 GBP 2,760,000 BNP Paribas 11/9/2019 44,596EUR 5,612,916 GBP 5,000,000 JP Morgan 11/9/2019 85,383EUR 200,246,915 GBP 179,230,000 Barclays 11/9/2019 2,106,955EUR 5,075,236 JPY 600,080,000 JP Morgan 11/9/2019 (42,551)EUR 47,295,913 JPY 5,808,080,000 Bank of America 11/9/2019 (2,238,344)EUR 2,434,662 JPY 287,380,000 Toronto Dominion 11/9/2019 (16,260)EUR 313,525 NOK 3,080,000 Deutsche Bank 11/9/2019 6,795EUR 4,721,383 NZD 8,000,000 BNP Paribas 11/9/2019 147,129EUR 9,991,533 NZD 17,170,000 Royal Bank of Canada 11/9/2019 174,040EUR 171,533 SEK 1,840,000 State Street 11/9/2019 1,758EUR 3,981,449 SEK 42,450,000 Bank of America 11/9/2019 64,634EUR 9,018 USD 10,000 Societe Generale 11/9/2019 (29)EUR 4,166,506 USD 4,660,000 Toronto Dominion 11/9/2019 (49,481)EUR 5,170,533 USD 5,750,000 JP Morgan 11/9/2019 (31,598)EUR 315,633 USD 350,000 BNP Paribas 11/9/2019 (1,018)EUR 35,754,909 USD 39,790,000 Citibank 11/9/2019 (243,837)EUR 8,983 USD 10,000 Standard Chartered Bank 11/9/2019 (64)EUR 8,792 USD 10,000 State Street 11/9/2019 (255)EUR 110,690,518 USD 126,100,000 HSBC Bank Plc 11/9/2019 (3,394,479)EUR 6,475,261 ZAR 111,010,000 Deutsche Bank 11/9/2019 (106,814)GBP 13,150,000 EUR 14,668,219 Royal Bank of Canada 11/9/2019 (130,807)USD 12,720,000 EUR 11,330,749 HSBC Bank Plc 11/9/2019 177,269USD 9,330,000 EUR 8,282,974 Citibank 11/9/2019 158,049BRL 4,400,000 USD 1,155,269 Citibank 18/9/2019 (85,880)BRL 4,410,000 USD 1,171,782 Goldman Sachs 18/9/2019 (98,632)EUR 2,800,000 GBP 2,536,661 Morgan Stanley 18/9/2019 (3,645)EUR 3,535,543 GBP 3,182,981 State Street 18/9/2019 17,552EUR 6,240,000 GBP 5,682,961 Citibank 18/9/2019 (41,092)EUR 308,997 GBP 276,216 Bank of America 18/9/2019 3,709EUR 4,123,547 GBP 3,696,593 Goldman Sachs 18/9/2019 37,889EUR 867,833 GBP 780,000 Standard Chartered Bank 18/9/2019 5,738EUR 2,614,571 GBP 2,349,757 Deutsche Bank 18/9/2019 17,502EUR 1,532,962 GBP 1,376,150 RBS Plc 18/9/2019 11,973GBP 925,000 EUR 1,030,576 Barclays 18/9/2019 (8,219)GBP 1,850,000 EUR 2,077,823 Goldman Sachs 18/9/2019 (33,110)GBP 7,005,000 EUR 7,857,509 JP Morgan 18/9/2019 (115,233)GBP 1,200,000 USD 1,521,156 Deutsche Bank 18/9/2019 (49,170)IDR 112,056,230,000 USD 7,948,942 Standard Chartered Bank 18/9/2019 (54,872)IDR 63,427,500,000 USD 4,385,653 HSBC Bank Plc 18/9/2019 71,760
INR 194,868,144 USD 2,813,168 HSBC Bank Plc 18/9/2019 (85,266)INR 582,865,000 USD 8,345,807 UBS 18/9/2019 (193,021)INR 194,835,000 USD 2,815,535 Bank of America 18/9/2019 (87,825)RUB 35,080,000 USD 546,874 Goldman Sachs 18/9/2019 (18,169)RUB 1,415,989 USD 22,148 Bank of America 18/9/2019 (800)RUB 18,074,011 USD 282,824 Deutsche Bank 18/9/2019 (10,322)USD 1,538,710 GBP 1,200,000 Goldman Sachs 18/9/2019 65,043USD 17,456,252 IDR 252,461,050,000 HSBC Bank Plc 18/9/2019 (285,626)USD 1,856,273 INR 133,503,147 Morgan Stanley 18/9/2019 (5,797)USD 2,383,157 INR 171,646,903 BNY Mellon 18/9/2019 (10,599)USD 38,250,373 INR 2,687,325,918 UBS 18/9/2019 683,445USD 6,247,546 INR 441,370,656 HSBC Bank Plc 18/9/2019 80,824USD 2,701,832 INR 193,203,376 Bank of America 18/9/2019 5,596USD 2,372,672 RUB 151,176,000 HSBC Bank Plc 18/9/2019 92,712USD 8,898,232 RUB 583,595,000 Barclays 18/9/2019 121,759USD 907,732 ZAR 12,730,000 Deutsche Bank 18/9/2019 67,106USD 894,870 ZAR 12,540,000 RBS Plc 18/9/2019 66,725ZAR 13,630,000 USD 953,020 BNP Paribas 18/9/2019 (54,772)ZAR 38,000,000 USD 2,539,393 JP Morgan 18/9/2019 (46,368)EUR 4,243,253 NOK 42,800,000 Citibank 6/12/2019 2,265EUR 4,356,426 SEK 47,000,000 RBS Plc 6/12/2019 24,217USD 9,344,412 EUR 8,380,000 Deutsche Bank 6/12/2019 19,433USD 9,340,200 EUR 8,370,000 Bank of America 6/12/2019 25,647Net unrealised depreciation (1,199,284)
CHF Hedged Share Class
CHF 4,583,338 EUR 4,205,914 BNY Mellon 12/9/2019 (4,388)EUR 48,560 CHF 52,928 BNY Mellon 12/9/2019 41 Net unrealised depreciation (4,347)
GBP Hedged Share Class
EUR 294,201 GBP 269,615 BNY Mellon 12/9/2019 (3,852)GBP 20,441,080 EUR 22,044,969 BNY Mellon 12/9/2019 552,192 Net unrealised appreciation 548,340
JPY Hedged Share Class
EUR 28,418 JPY 3,358,016 BNY Mellon 12/9/2019 (220)JPY 294,324,924 EUR 2,484,057 BNY Mellon 12/9/2019 26,088 Net unrealised appreciation 25,868
PLN Hedged Share Class
EUR 172,519 PLN 751,821 BNY Mellon 12/9/2019 1,188 PLN 31,003,938 EUR 7,158,532 BNY Mellon 12/9/2019 (93,106)Net unrealised depreciation (91,918)
USD Hedged Share Class
EUR 8,643,191 USD 9,635,821 BNY Mellon 12/9/2019 (73,889)USD 590,021,189 EUR 525,720,647 BNY Mellon 12/9/2019 8,046,595 Net unrealised appreciation 7,972,706
Total net unrealised appreciation (EUR underlying exposure - EUR 4,171,683,007) 7,251,365
Open Exchange Traded Futures Contracts as at 31 August 2019
Number of contracts Currency
Contract/ Description
Expiration date
Underlying exposure
EUR
Unrealised appreciation/
(depreciation) EUR
8,760 EUR Euro Schatz September 2019 986,244,600 2,758,062362 EUR Euro BOBL September 2019 49,304,400 104,211239 EUR Euro-BTP September 2019 34,738,650 1,117,669103 EUR Euro Schatz September 2019 11,596,255 33,7208 EUR Euro Bund September 2019 1,432,880 30,890

The notes on pages 728 to 741 form an integral part of these financial statements.
Annual Report and Audited Financial Statements [243]
Swaps as at 31 August 2019
TypeNominal
Value Description Counterparty
Expiration date
Unrealised appreciation/
(depreciation) EUR
Market Value EUR
CDS EUR (668,000) Fund provides default protection on BNP Paribas SA; and receives Fixed 1% Barclays 20/6/2022 13,755 15,670
CDS EUR 3,623,000 Fund receives default protection on Barclays Bank Plc; and pays Fixed 1% BNP Paribas 20/6/2024 18,706 (5,901)
CDS EUR 3,483,000 Fund receives default protection on Lloyds Banking Group Plc; and pays Fixed 1% BNP Paribas 20/6/2024 12,423 (13,833)
CDS EUR (375,000) Fund provides default protection on ITRAXX.EUR.26.V1; and receives Fixed 1% Citibank 20/12/2021 2,972 7,251
CDS EUR 400,000 Fund receives default protection on ITRAXX.EUR.26.V1; and pays Fixed 1% Citibank 20/12/2021 (5,194) (7,734)
CDS EUR (2,505,500) Fund provides default protection on BNP Paribas SA; and receives Fixed 1% Citibank 20/6/2022 50,322 58,775
CDS EUR (2,004,407) Fund provides default protection on BNP Paribas SA; and receives Fixed 1% Citibank 20/6/2022 41,274 47,021
CDS EUR (2,338,794) Fund provides default protection on BNP Paribas SA; and receives Fixed 1% Citibank 20/6/2022 46,977 54,865
CDS EUR 1,517,000 Fund receives default protection on Lloyds Banking Group Plc; and pays Fixed 1% Citibank 20/6/2024 4,681 (6,025)
CDS USD 7,000,000 Fund receives default protection on Brazilian Government International Bond; and pays Fixed 1% HSBC Bank Plc 20/12/2023 (296,840) 54,650
CDS EUR 1,791,000 Fund receives default protection on UBS Group AG; and pays Fixed 1% JP Morgan 20/6/2023 (30,819) (47,390)
CDS EUR 4,377,000 Fund receives default protection on Barclays Bank Plc; and pays Fixed 1% JP Morgan 20/6/2024 21,539 (7,129)
IFS GBP 10,890,000 Fund provides default protection on UKRPI + 0 bps; and receives Fixed 3.6% Goldman Sachs 17/6/2024 (92,949) (92,949)
IFS GBP 10,120,000 Fund provides default protection on UKRPI + 0 bps; and receives Fixed 3.5975% Goldman Sachs 17/6/2024 (87,960) (87,960)
IFS GBP 10,370,000 Fund provides default protection on UKRPI + 0 bps; and receives Fixed 3.611% Goldman Sachs 17/6/2024 (88,733) (81,371)
IFS GBP 5,055,000 Fund provides default protection on UKRPI + 0 bps; and receives Fixed 3.595% Goldman Sachs 15/7/2024 (49,615) (49,615)
IFS GBP 6,265,000 Fund provides default protection on UKRPI + 0 bps; and receives Fixed 3.655% Goldman Sachs 16/7/2024 (37,952) (37,952)
IFS GBP 4,213,000 Fund provides default protection on UKRPI + 0 bps; and receives Fixed 3.81% Goldman Sachs 16/8/2024 4,315 4,315
Euro Bond Fund continued
Open Exchange Traded Futures Contracts as at 31 August 2019
Number of contracts Currency
Contract/ Description
Expiration date
Underlying exposure
EUR
Unrealised appreciation/
(depreciation) EUR
1 EUR Euro BOBL September 2019 136,200 1,390(1) EUR Euro-BTP September 2019 145,350 720(12) EUR Euro BUXL September 2019 2,689,440 (316,714)(13) EUR Short-Term Euro-BPT September 2019 1,468,350 (9,360)(45) EUR Euro-OAT September 2019 7,668,000 (342,270)(106) EUR Euro Bund September 2019 18,985,660 (11,027)(448) EUR Euro BUXL September 2019 100,405,760 (5,674,550)(538) EUR Euro-OAT September 2019 91,675,200 (3,191,372)(24) JPY Japanese 10 Year Bond (OSE) September 2019 31,749,324 1,791806 CAD Canadian 10 Year Bond December 2019 79,907,775 398,79610 CAD Canadian 10 Year Bond December 2019 991,412 4,914(1) GBP Long Gilt December 2019 148,796 (2,156)(253) GBP Long Gilt December 2019 37,645,501 (545,547)668 USD US Treasury 2 Year Note (CBT) December 2019 130,602,200 (66,143)10 USD US Treasury 2 Year Note (CBT) December 2019 1,955,123 (990)(1) USD US Ultra Bond (CBT) December 2019 178,340 2,165(3) USD US Treasury 10 Year Note (CBT) December 2019 357,260 1,286(4) USD US Ultra 10 Year Note December 2019 522,234 1,464(26) USD US Long Bond (CBT) December 2019 3,885,859 14,711(36) USD US Treasury 5 Year Note (CBT) December 2019 3,904,701 8,657(119) USD US Ultra Bond (CBT) December 2019 21,222,488 95,104(230) USD US Treasury 10 Year Note (CBT) December 2019 27,389,966 98,557(282) USD US Ultra 10 Year Note December 2019 36,817,471 103,110
Total 1,683,769,195 (5,382,912)

The notes on pages 728 to 741 form an integral part of these financial statements.
[244] BlackRock Global Funds (BGF)
Euro Bond Fund continued
Swaps as at 31 August 2019
TypeNominal
Value Description Counterparty
Expiration date
Unrealised appreciation/
(depreciation) EUR
Market Value EUR
IFS GBP 4,267,000 Fund provides default protection on UKRPI + 0 bps; and receives Fixed 3.826% Goldman Sachs 16/8/2024 8,677 8,677
IFS GBP 8,452,500 Fund provides default protection on UKRPI + 0bps; and receives Fixed 3.655% Goldman Sachs 16/12/2028 (3,167) (3,167)
IFS GBP 4,250,000 Fund provides default protection on UKRPI + 0bps; and receives Fixed 3.65% Goldman Sachs 16/12/2028 (4,732) (4,732)
IFS GBP 4,202,500 Fund receives default protection on UKRPI + 0bps; and pays Fixed 3.64% Goldman Sachs 16/12/2028 (10,884) (10,884)
IFS GBP 8,860,000 Fund provides default protection on UKRPI + 0 bps: and receives Fixed 3.5025% Goldman Sachs 16/3/2029 (277,257) (277,257)
IFS GBP 14,960,000 Fund provides default protection on UKRPI + 0 bps; and receives Fixed 3.49% Goldman Sachs 16/3/2029 (495,373) (495,373)
IFS EUR 19,330,000 Fund provides default protection on CPTFEMU + 0 bps: and receives Fixed 1.2895% Goldman Sachs 16/3/2029 (597,597) (597,597)
IFS GBP 8,485,000 Fund provides default protection on UKRPI + 0 bps; and receives Fixed 3.67% Goldman Sachs 18/6/2029 (37,929) (37,929)
IFS GBP 8,485,000 Fund provides default protection on UKRPI + 0 bps; and receives Fixed 3.675% Goldman Sachs 18/6/2029 (31,662) (31,662)
IFS GBP 11,397,000 Fund provides default protection on UKRPI + 0 bps; and receives Fixed 3.725% Goldman Sachs 15/8/2029 – –
IFS EUR 16,960,000 Fund receives default protection on CPTFEMU + 0 bps: and pays Fixed 1.066% Goldman Sachs 16/8/2029 (77,529) (77,529)
IFS GBP 11,227,000 Fund provides default protection on UKRPI + 0 bps; and receives Fixed 3.745% Goldman Sachs 16/8/2029 33,322 33,322
IFS GBP 11,396,000 Fund provides default protection on UKRPI + 0 bps; and receives Fixed 3.71% Goldman Sachs 16/8/2029 (25,329) (25,329)
IFS GBP 1,230,000 Fund receives default protection on UKRPI + 0 bps; and pays Fixed 3.42% Goldman Sachs 16/6/2049 (86,118) (86,118)
IFS GBP 2,590,000 Fund receives default protection on UKRPI + 0 bps; and pays Fixed 3.43% Goldman Sachs 16/6/2049 (209,850) (201,610)
IFS GBP 615,000 Fund receives default protection on UKRPI + 0 bps; and pays Fixed 3.394% Goldman Sachs 15/7/2049 (30,893) (30,893)
IRS INR 870,626,616 Fund receives Floating INR MIBOR 6 Month; and pays Fixed 5.507% Citibank 18/9/2024 (237,500) (237,500)
IRS GBP 4,099,819 Fund receives Floating GBP LIBOR 6 Month; and pays Fixed 1.4505% Citigroup 1/12/2067 (1,606,945) (1,606,945)
IRS GBP 1,221,720 Fund receives Floating GBP LIBOR 6 Month; and pays Fixed 1.246% Citigroup 20/12/2067 (357,871) (357,871)
IRS EUR 33,190,000 Fund receives Floating EUR EURIBOR 6 Month; and pays Fixed -0.40536% Goldman Sachs 10/7/2021 (90,992) (87,344)
IRS PLN 37,784,561 Fund receives Fixed 1.6775%; and pays Floating PLN WIBOR 6 Month Goldman Sachs 18/9/2021 8,340 8,340
IRS PLN 75,691,998 Fund receives Fixed 1.6825%; and pays Floating PLN WIBOR 6 Month Goldman Sachs 18/9/2021 18,393 18,393
IRS PLN 83,126,033 Fund receives Fixed 1.6886%; and pays Floating PLN WIBOR 6 Month Goldman Sachs 18/9/2021 22,459 22,459
IRS PLN 55,559,988 Fund receives Fixed 1.705%; and pays Floating PLN WIBOR 6 Month Goldman Sachs 18/9/2021 19,072 19,072
IRS PLN 37,627,420 Fund receives Fixed 1.725%; and pays Floating PLN WIBOR 6 Month Goldman Sachs 18/9/2021 16,270 16,270
IRS USD 74,525,000 Fund receives Floating USD LIBOR 3 Month; and pays Fixed 2.2169% Goldman Sachs 31/8/2023 (2,262,201) (2,262,201)
IRS USD 1,604,000 Fund receives Floating USD LIBOR 3 Month; and pays Fixed 2.58287% Goldman Sachs 31/8/2023 (69,421) (69,421)
IRS EUR 23,829,057 Fund receives Floating EUR EURIBOR 6 Month; and pays Fixed 0.1815% Goldman Sachs 15/3/2024 (802,065) (802,065)
IRS EUR 20,856,450 Fund receives Floating EUR EURIBOR 6 Month; and pays Fixed 0.1808% Goldman Sachs 2/4/2024 (707,176) (705,427)
IRS INR 322,012,584 Fund receives Floating INR MIBOR 6 Month; and pays Fixed 5.55% Goldman Sachs 18/9/2024 (95,512) (95,512)
IRS EUR 4,890,000 Fund receives Fixed 0.903%; and pays Floating EUR EURIBOR 6 Month Goldman Sachs 14/6/2027 510,515 510,515
IRS EUR 23,338,377 Fund receives Floating EUR EURIBOR 6 Month; and pays Fixed 0.39969% Goldman Sachs 15/2/2028 (1,558,740) (1,558,740)
IRS EUR 23,348,377 Fund receives Floating EUR EURIBOR 6 Month; and pays Fixed 0.43467% Goldman Sachs 15/2/2028 (1,630,689) (1,630,689)
IRS USD 5,760,000 Fund receives Floating USD LIBOR 3 Month; and pays Fixed 2.86% Goldman Sachs 3/4/2028 (637,734) (637,734)
IRS USD 5,710,000 Fund receives Floating USD LIBOR 3 Month; and pays Fixed 2.974% Goldman Sachs 3/5/2028 (685,087) (685,087)

The notes on pages 728 to 741 form an integral part of these financial statements.
Annual Report and Audited Financial Statements [245]
Euro Bond Fund continued
Swaps as at 31 August 2019
TypeNominal
Value Description Counterparty
Expiration date
Unrealised appreciation/
(depreciation) EUR
Market Value EUR
IRS USD 2,031,853 Fund receives Floating USD LIBOR 3 Month; and pays Fixed 3.018% Goldman Sachs 10/5/2028 (251,241) (251,241)
IRS NZD 10,935,750 Fund receives Floating NZD BBR FRA 3 Month; and pays Fixed 3.219% Goldman Sachs 24/5/2028 (1,087,100) (1,087,100)
IRS NZD 10,935,750 Fund receives Floating NZD BBR FRA 3 Month; and pays Fixed 3.22% Goldman Sachs 24/5/2028 (1,087,623) (1,087,623)
IRS EUR 16,095,000 Fund receives Floating EUR EURIBOR 6 Month; and pays Fixed 0.1755% Goldman Sachs 15/1/2029 (761,397) (761,397)
IRS EUR 14,265,644 Fund receives Floating EUR EURIBOR 6 Month; and pays Fixed 0.647% Goldman Sachs 5/3/2029 (1,341,101) (1,341,101)
IRS EUR 3,325,000 Fund receives Floating EUR EURIBOR 6 Month; and pays Fixed 0.098% Goldman Sachs 10/7/2029 (130,568) (130,568)
IRS HUF 1,186,602,500 Fund receives Fixed 1.695%; and pays Floating HUF BUBOR 6 Month Goldman Sachs 18/9/2029 172,933 172,933
IRS HUF 1,174,736,475 Fund receives Fixed 1.71%; and pays Floating HUF BUBOR 6 Month Goldman Sachs 18/9/2029 176,276 176,276
IRS EUR 6,100,000 Fund receives Fixed 1.0755%; and pays Floating EUR EURIBOR 6 Month Goldman Sachs 3/6/2030 894,668 894,668
IRS EUR 3,325,000 Fund receives Fixed 1.2545%; and pays Floating EUR EURIBOR 6 Month Goldman Sachs 1/6/2033 646,271 646,271
IRS EUR 3,325,000 Fund receives Fixed 1.3025%; and pays Floating EUR EURIBOR 6 Month Goldman Sachs 4/6/2033 669,488 669,488
IRS EUR 7,464,960 Fund receives Floating EUR EURIBOR 6 Month; and pays Fixed 0.663% Goldman Sachs 15/7/2039 (954,484) (954,484)
IRS EUR 112,000 Fund receives Fixed 1.5225%; and pays Floating EUR EURIBOR 6 Month Goldman Sachs 4/7/2044 41,407 41,407
IRS EUR 11,625,416 Fund receives Floating EUR EURIBOR 6 Month; and pays Fixed 0.3925% Goldman Sachs 4/7/2044 (921,797) (921,797)
IRS EUR 13,647,213 Fund receives Floating EUR EURIBOR 6 Month; and pays Fixed 0.671% Goldman Sachs 30/7/2049 (2,446,456) (2,446,456)
IRS EUR 18,300,000 Fund receives Floating EUR EURIBOR 6 Month; and pays Fixed 0.076% Goldman Sachs 30/8/2049 79,523 79,523
IRS BRL 11,763,952 Fund receives Fixed 8.26%; and pays Floating BRL BROIS 1 Day JP Morgan 2/1/2023 163,892 163,892IRS INR 766,360,800 Fund receives Floating INR MIBOR 6 Month;
and pays Fixed 5.551% JP Morgan 18/9/2024 (227,735) (227,735)
Total (EUR underlying exposure - EUR 666,900,650) (18,831,347) (18,539,924)
CDS: Credit Default Swaps IFS: Inflation SwapsIRS: Interest Rate Swaps
Purchased Options as at 31 August 2019
Number of contracts
Call/ Put
Description Counterparty
Strike Price
Expiration date
Unrealised appreciation/
(depreciation) EUR
Market Value EUR
33,421,000 Put OTC EUR/GBP Bank of America EUR 0.87 20/12/2019 78,190 352,911 20,120,000 Put OTC EUR/GBP Goldman Sachs EUR 0.88 22/1/2020 66,014 201,824 13,050,000 Call OTC USD/JPY HSBC Bank Plc USD 103 13/11/2019 (31,618) 371,986 26,430,000 Put OTC EUR/GBP Morgan Stanley EUR 0.879 23/1/2020 (17,492) 381,997 26,430,000 Call OTC EUR/GBP Morgan Stanley EUR 0.92 23/1/2020 242,439 641,928 33,560,000 Put OTC GBP/USD RBS Plc GBP 1.22 20/11/2019 473,577 911,451
Total (EUR underlying exposure - EUR 61,121,903) 811,110 2,862,097
Written Options as at 31 August 2019
Number of contracts
Call/ Put
Description Counterparty
Strike Price
Expiration date
Unrealised appreciation
EUR
Market Value EUR
(13,050,000) Call OTC USD/JPY HSBC Bank Plc USD 98 13/11/2019 17,840 (872,167)
Total (EUR underlying exposure - EUR 11,093,321) 17,840 (872,167)
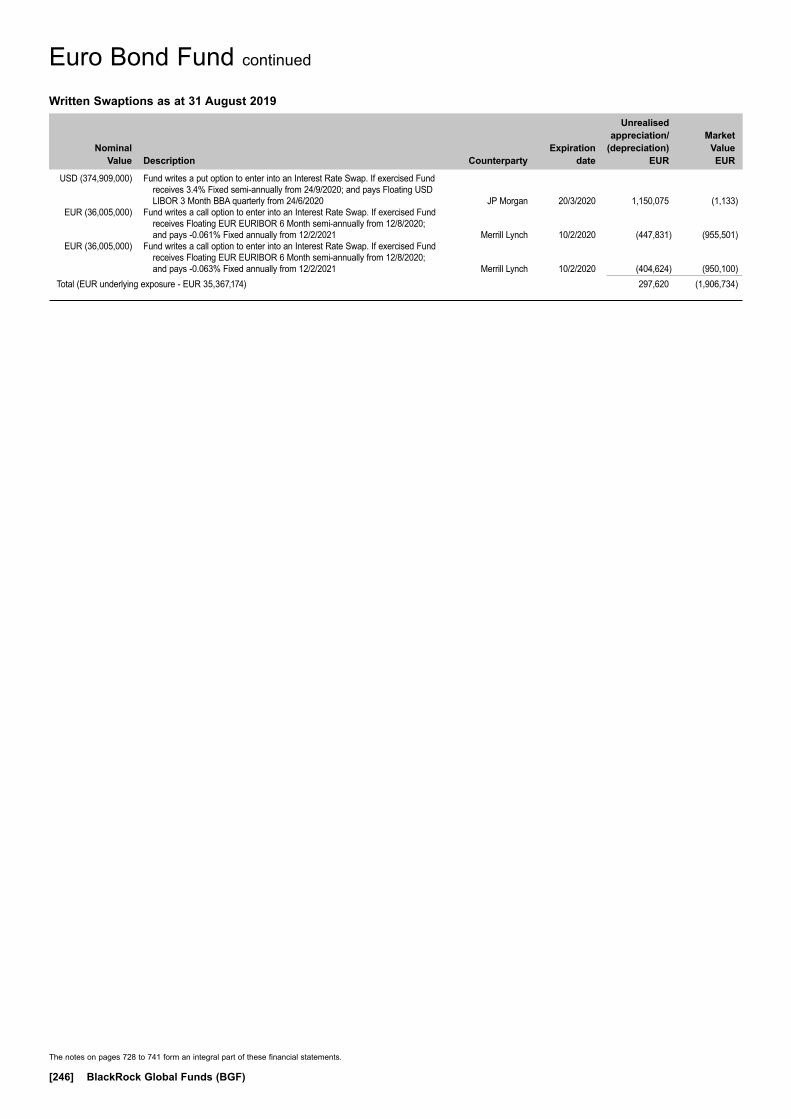
The notes on pages 728 to 741 form an integral part of these financial statements.
[246] BlackRock Global Funds (BGF)
Euro Bond Fund continued
Written Swaptions as at 31 August 2019
Nominal Value
Description Counterparty
Expiration date
Unrealised appreciation/
(depreciation) EUR
Market Value EUR
USD (374,909,000) Fund writes a put option to enter into an Interest Rate Swap. If exercised Fund receives 3.4% Fixed semi-annually from 24/9/2020; and pays Floating USD LIBOR 3 Month BBA quarterly from 24/6/2020 JP Morgan 20/3/2020 1,150,075 (1,133)
EUR (36,005,000) Fund writes a call option to enter into an Interest Rate Swap. If exercised Fund receives Floating EUR EURIBOR 6 Month semi-annually from 12/8/2020; and pays -0.061% Fixed annually from 12/2/2021 Merrill Lynch 10/2/2020 (447,831) (955,501)
EUR (36,005,000) Fund writes a call option to enter into an Interest Rate Swap. If exercised Fund receives Floating EUR EURIBOR 6 Month semi-annually from 12/8/2020; and pays -0.063% Fixed annually from 12/2/2021 Merrill Lynch 10/2/2020 (404,624) (950,100)
Total (EUR underlying exposure - EUR 35,367,174) 297,620 (1,906,734)

Transferable Securities and Money Market Instruments Admitted to an Official Stock Exchange Listing or Dealt in on Another Regulated Market
Transferable Securities and Money Market Instruments Admitted to an Official Stock Exchange Listing or Dealt in on Another Regulated Market
Holding
Description
Market Value (EUR)
% of Net
Assets
Holding
Description
Market Value (EUR)
% of Net
Assets
~ Investment in connected party fund, see further information in Note 11.* All or a portion of this security represents a security on loan.
The notes on pages 728 to 741 form an integral part of these financial statements.
Annual Report and Audited Financial Statements [247]
FUNDS
Ireland 1,524,501 BlackRock ICS Euro Liquid
Environmentally Aware Fund~ 152,091,649 5.10 367,070 iShares USD Corp Bond UCITS
ETF~ 41,128,929 1.38 299,942 iShares USD High Yield Corp Bond
UCITS ETF*~ 28,160,543 0.95Total Funds 221,381,121 7.43
BONDS
Australia EUR 2,764,000 Telstra Corp Ltd 1.375% 26/3/2029 3,079,995 0.10 EUR 5,554,000 Westpac Banking Corp 0.75%
17/10/2023 5,787,287 0.20 8,867,282 0.30
Austria EUR 10,600,000 BAWAG Group AG FRN 26/3/2029 11,031,155 0.37 EUR 3,200,000 Raiffeisen Bank International AG
FRN 15/6/2025 (Perpetual) 2,916,000 0.10 EUR 2,600,000 Raiffeisen Bank International AG
0.25% 5/7/2021 2,622,477 0.09 16,569,632 0.56
Belgium EUR 3,145,000 Anheuser-Busch InBev SA/NV
1.5% 17/3/2025 3,420,844 0.11 EUR 1,597,000 Anheuser-Busch InBev SA/NV
1.65% 28/3/2031 1,805,869 0.06 GBP 3,335,000 Anheuser-Busch InBev SA/NV
1.75% 7/3/2025 3,794,772 0.13 EUR 1,189,000 Anheuser-Busch InBev SA/NV
2% 17/3/2028 1,370,124 0.04 EUR 15,639,000 Anheuser-Busch InBev SA/NV
2.75% 17/3/2036 20,197,374 0.68 EUR 18,800,000 Argenta Spaarbank NV 1%
6/2/2024 19,669,030 0.66 EUR 1,600,000 Belfius Bank SA FRN 16/4/2025
(Perpetual) 1,427,920 0.05 EUR 1,900,000 Elia System Operator SA/NV
1.375% 14/1/2026 2,072,387 0.07 EUR 4,100,000 Elia System Operator SA/NV
1.375% 7/4/2027 4,415,167 0.15 EUR 9,300,000 Fluxys Belgium SA 1.75% 5/10/2027 9,787,878 0.33 EUR 3,600,000 Groupe Bruxelles Lambert SA
1.375% 23/5/2024 3,759,048 0.12 EUR 1,400,000 KBC Group NV FRN 24/11/2022 1,411,032 0.05 EUR 3,600,000 KBC Group NV FRN 24/10/2025
(Perpetual) 3,560,400 0.12 EUR 5,100,000 KBC Group NV 0.625% 10/4/2025* 5,267,050 0.18 EUR 4,000,000 KBC Group NV 1.125% 25/1/2024 4,207,300 0.14 EUR 1,900,000 Proximus SADP 1.875% 1/10/2025* 2,123,826 0.07 88,290,021 2.96
Canada EUR 3,000,000 Total Capital Canada Ltd 2.125%
18/9/2029 3,620,604 0.12
Denmark USD 2,195,000 Danske Bank A/S FRN 12/9/2023 1,955,940 0.07 EUR 1,650,000 Danske Bank A/S FRN 21/6/2029 1,749,544 0.06 EUR 331,000 Danske Bank A/S 0.5% 6/5/2021 335,207 0.01 DKK 40,900,000 Nordea Kredit Realkreditaktieselskab
1% 1/10/2050 5,584,048 0.19
DKK 14,155,721 Nordea Kredit Realkreditaktieselskab 1.5% 1/10/2050 1,953,079 0.06
DKK 86,600,000 Nykredit Realkredit A/S 1% 1/10/2050 11,823,436 0.40
DKK 157,432,416 Nykredit Realkredit A/S 1.5% 1/10/2050 21,726,389 0.73
DKK 24,381,352 Realkredit Danmark A/S ‘144A’ 1.5% 1/10/2050 3,353,293 0.11
48,480,936 1.63
Estonia EUR 2,764,000 Elering AS 0.875% 3/5/2023 2,848,883 0.10
Finland EUR 1,800,000 CRH Finland Services Oyj
2.75% 15/10/2020 1,846,395 0.06 EUR 13,893,000 Fortum Oyj 1.625% 27/2/2026 14,962,275 0.50 EUR 5,739,000 Fortum Oyj 2.125% 27/2/2029 6,459,991 0.22 EUR 14,000,000 Nordea Bank Abp 0.375% 28/5/2026 14,445,480 0.49 EUR 4,629,000 Nordea Bank Abp 3.25% 5/7/2022 5,101,159 0.17 EUR 8,435,000 OP Corporate Bank plc 0.375%
29/8/2023 8,668,776 0.29 51,484,076 1.73
France EUR 4,900,000 Air Liquide Finance SA 0.625%
20/6/2030 5,164,037 0.17 EUR 4,300,000 Arkea Home Loans SFH SA
0.125% 12/7/2029 4,466,905 0.15 EUR 200,000 Arkema SA FRN 29/10/2020
(Perpetual) 210,740 0.01 EUR 3,962,000 AXA SA FRN 28/5/2049 4,575,001 0.15 EUR 14,800,000 Banque Federative du Credit
Mutuel SA 0.125% 5/2/2024 15,001,428 0.50 EUR 4,200,000 Banque Federative du Credit
Mutuel SA 0.5% 16/11/2022 4,306,155 0.14 EUR 8,300,000 Banque Federative du Credit
Mutuel SA 0.75% 15/6/2023 8,610,544 0.29 EUR 4,800,000 Banque Federative du Credit
Mutuel SA 0.75% 17/7/2025 5,038,892 0.17 EUR 12,100,000 Banque Federative du Credit
Mutuel SA 0.75% 8/6/2026 12,737,488 0.43 EUR 3,200,000 Banque Federative du Credit
Mutuel SA 1.625% 19/1/2026 3,549,056 0.12 EUR 200,000 Banque Federative du Credit
Mutuel SA 2.625% 24/2/2021 208,991 0.01 EUR 3,200,000 Banque Federative du Credit
Mutuel SA 2.625% 18/3/2024 3,616,418 0.12 EUR 5,800,000 BNP Paribas Cardif SA FRN
25/11/2025 (Perpetual)* 6,578,037 0.22 EUR 10,600,000 BNP Paribas SA FRN 15/7/2025 10,777,603 0.36 EUR 4,765,000 BNP Paribas SA FRN 20/3/2026 4,978,163 0.17 EUR 4,500,000 BNP Paribas SA FRN 23/1/2027 5,018,647 0.17 EUR 7,624,000 BNP Paribas SA 1.5% 25/5/2028* 8,612,838 0.29 EUR 13,900,000 BNP Paribas SA 1.625% 2/7/2031 14,530,435 0.49 EUR 1,200,000 BPCE SA FRN 23/3/2023 1,204,152 0.04 EUR 4,800,000 BPCE SA 0.375% 5/10/2023 4,927,992 0.17 EUR 11,200,000 BPCE SA 0.625% 26/9/2023 11,600,008 0.39 EUR 9,500,000 BPCE SA 0.625% 26/9/2024 9,731,373 0.33 EUR 12,200,000 BPCE SA 1% 15/7/2024 12,919,617 0.43 EUR 3,800,000 Capgemini SE 1% 18/10/2024 3,993,437 0.13 EUR 1,100,000 Capgemini SE 1.75% 1/7/2020 1,112,964 0.04 EUR 12,500,000 Capgemini SE 2.5% 1/7/2023 13,709,938 0.46 EUR 2,764,000 Carrefour SA 1.75% 15/7/2022 2,910,506 0.10 EUR 800,000 Cie de Saint-Gobain 27/3/2020
(Zero Coupon)* 800,880 0.03 EUR 1,900,000 Cie de Saint-Gobain 0.625%
15/3/2024 1,966,341 0.07
Euro Corporate Bond Fund
Portfolio of Investments 31 August 2019
Euro Corporate Bond Fund

Transferable Securities and Money Market Instruments Admitted to an Official Stock Exchange Listing or Dealt in on Another Regulated Market
Transferable Securities and Money Market Instruments Admitted to an Official Stock Exchange Listing or Dealt in on Another Regulated Market
Holding
Description
Market Value (EUR)
% of Net
Assets
Holding
Description
Market Value (EUR)
% of Net
Assets
† Securities pledged or given in guarantee, see Note 14, for further details.* All or a portion of this security represents a security on loan.
The notes on pages 728 to 741 form an integral part of these financial statements.
[248] BlackRock Global Funds (BGF)
EUR 6,400,000 Cie de Saint-Gobain 1.125% 23/3/2026 6,865,120 0.23
EUR 5,200,000 CNP Assurances FRN 5/6/2045 6,056,096 0.20 EUR 4,700,000 CNP Assurances FRN 10/6/2047* 5,658,481 0.19 EUR 1,400,000 Coentreprise de Transport
d'Electricite SA 0.875% 29/9/2024 1,474,507 0.05 EUR 3,100,000 Credit Agricole Assurances SA
FRN 29/1/2048* 3,185,250 0.11 EUR 6,700,000 Credit Agricole Assurances SA
FRN 27/9/2048 8,119,563 0.27 EUR 4,200,000 Credit Agricole SA/London 0.75%
1/12/2022 4,350,801 0.15 EUR 7,100,000 Credit Agricole SA/London 0.875%
19/1/2022 7,306,773 0.25 EUR 2,800,000 Credit Agricole SA/London 2.375%
20/5/2024 3,141,814 0.11 EUR 8,300,000 Credit Mutuel Arkea SA 1.375%
17/1/2025 8,942,254 0.30 EUR 5,800,000 Credit Mutuel Arkea SA 3.25%
1/6/2026 6,683,765 0.22 EUR 2,200,000 Credit Mutuel Arkea SA 3.375%
11/3/2031 2,609,860 0.09 EUR 2,400,000 Danone SA 0.167% 3/11/2020 2,413,704 0.08 EUR 4,800,000 Electricite de France SA FRN
22/1/2022 (Perpetual)* 5,180,328 0.17 EUR 2,100,000 Electricite de France SA FRN
4/7/2024 (Perpetual)* 2,305,842 0.08 EUR 2,000,000 Electricite de France SA FRN
22/1/2026 (Perpetual) 2,285,472 0.08 EUR 800,000 Electricite de France SA 4.5%
12/11/2040 1,305,531 0.04 EUR 7,000,000 Engie SA FRN 16/1/2023
(Perpetual)* 7,122,640 0.24 EUR 9,600,000 Engie SA 4/3/2027 (Zero Coupon) 9,585,024 0.32 EUR 4,600,000 Engie SA 0.875% 27/3/2024 4,825,032 0.16 EUR 3,300,000 Engie SA 1.375% 21/6/2039 3,687,552 0.12 EUR 2,100,000 Eutelsat SA 2.625% 13/1/2020 2,105,975 0.07 EUR 10,324,371 French Republic Government Bond
OAT 0.1% 1/3/2028† 11,997,005 0.40 EUR 5,952,142 French Republic Government Bond
OAT ‘144A’ 1.5% 25/5/2050† 7,822,900 0.26 EUR 3,000,000 HSBC France SA 0.2% 4/9/2021 3,032,055 0.10 EUR 4,500,000 HSBC France SA 0.6% 20/3/2023 4,634,437 0.16 EUR 6,700,000 La Banque Postale SA FRN
23/4/2026* 6,996,274 0.23 EUR 16,000,000 La Banque Postale SA 0.25%
12/7/2026 16,282,240 0.55 EUR 1,900,000 La Poste SA FRN 29/10/2025
(Perpetual) 2,038,567 0.07 EUR 16,000,000 LVMH Moet Hennessy Louis
Vuitton SE 0.125% 28/2/2023 16,248,160 0.54 EUR 2,611,000 LVMH Moet Hennessy Louis
Vuitton SE 0.375% 26/5/2022 2,660,792 0.09 EUR 1,863,000 Orange SA FRN 7/2/2020
(Perpetual) 1,895,593 0.06 EUR 4,258,000 Orange SA FRN 1/10/2026
(Perpetual) 5,242,654 0.18 EUR 4,800,000 Orange SA 0.5% 4/9/2032 4,782,360 0.16 EUR 2,900,000 Orange SA 1.375% 4/9/2049 2,842,571 0.10 EUR 3,400,000 Orange SA 1.875% 12/9/2030 3,934,870 0.13 EUR 12,900,000 Orange SA 2% 15/1/2029 14,958,582 0.50 EUR 2,049,000 PSA Banque France SA 0.5%
12/4/2022 2,081,415 0.07 EUR 9,400,000 RCI Banque SA FRN 12/3/2025 9,105,216 0.31 EUR 3,500,000 RTE Reseau de Transport
d'Electricite SADIR 1% 19/10/2026 3,769,342 0.13 EUR 1,450,000 RTE Reseau de Transport
d'Electricite SADIR 3.875% 28/6/2022 1,619,073 0.05
EUR 12,700,000 Sanofi 0.5% 21/3/2023 13,069,470 0.44 USD 1,000,000 Societe Generale SA FRN
27/1/2020 (Perpetual) 909,480 0.03 EUR 6,900,000 Societe Generale SA 0.875%
1/7/2026 7,137,395 0.24 EUR 9,500,000 Societe Generale SA 1.25%
15/2/2024 9,954,765 0.33 EUR 12,300,000 Suez FRN 30/3/2022 (Perpetual) 12,934,077 0.43 EUR 1,000,000 Suez FRN 19/1/2024 (Perpetual) 1,067,311 0.04 EUR 14,000,000 Teleperformance 1.875% 2/7/2025 15,074,710 0.51 EUR 7,100,000 Total Capital International SA
0.696% 31/5/2028 7,540,945 0.25 EUR 192,000 TOTAL SA FRN 26/2/2021
(Perpetual) 198,127 0.01 EUR 2,000,000 TOTAL SA FRN 26/2/2025
(Perpetual) 2,186,897 0.07 EUR 8,700,000 TOTAL SA FRN 6/10/2026
(Perpetual) 10,023,872 0.34 EUR 13,100,000 Unibail-Rodamco-Westfield SE
1.75% 1/7/2049 14,374,958 0.48 EUR 5,600,000 Veolia Environnement SA
0.672% 30/3/2022 5,719,186 0.19 EUR 2,600,000 Veolia Environnement SA
0.892% 14/1/2024 2,715,700 0.09 EUR 1,800,000 Vinci SA 1% 26/9/2025 1,932,003 0.06 EUR 14,400,000 Vinci SA 1.625% 18/1/2029 16,493,904 0.55 531,346,876 17.83
Germany EUR 5,250,000 Bayer AG FRN 1/7/2075 5,291,245 0.18 EUR 11,100,000 Bertelsmann SE & Co KGaA FRN
23/4/2075* 11,855,982 0.40 EUR 5,637,000 Commerzbank AG 1% 4/3/2026 5,950,925 0.20 EUR 3,000,000 Daimler AG 0.75% 8/2/2030 3,040,635 0.10 EUR 13,885,000 Deutsche Bahn Finance GMBH
1.125% 18/12/2028 15,552,519 0.52 EUR 2,287,000 Deutsche Bahn Finance GMBH
1.375% 28/3/2031 2,611,011 0.09 EUR 6,900,000 Deutsche Bank AG 1.5% 20/1/2022 6,991,080 0.23 EUR 6,909,000 Deutsche Telekom AG 1.75%
25/3/2031 7,815,184 0.26 EUR 2,495,000 DZ HYP AG 0.5% 30/9/2026 2,671,321 0.09 EUR 4,765,000 E.ON SE 0.375% 23/8/2021* 4,817,253 0.16 EUR 10,500,000 Eurogrid GmbH 1.625% 3/11/2023 11,279,940 0.38 EUR 4,300,000 Eurogrid GmbH 1.875% 10/6/2025 4,782,052 0.16 EUR 1,800,000 Eurogrid GmbH 3.875% 22/10/2020 1,886,358 0.06 EUR 2,700,000 Hamburg Commercial Bank AG
0.5% 23/5/2022 2,735,851 0.09 EUR 2,859,000 HeidelbergCement AG 2.25%
3/6/2024 3,148,802 0.11 EUR 8,300,000 IKB Deutsche Industriebank AG
FRN 31/1/2028 8,117,317 0.27 EUR 9,100,000 Landesbank Baden-Wuerttemberg
2.2% 9/5/2029 9,904,941 0.33 EUR 7,500,000 Merck Financial Services GmbH
0.875% 5/7/2031 7,881,022 0.26 EUR 3,900,000 Merck KGaA FRN 25/6/2079 4,234,952 0.14 EUR 4,700,000 Muenchener Rueckversicherungs-
Gesellschaft AG in Muenchen FRN 26/5/2042 5,512,140 0.19
EUR 6,500,000 Muenchener Rueckversicherungs-Gesellschaft AG in Muenchen FRN 26/5/2049 7,898,443 0.27
EUR 5,310,000 RWE AG FRN 21/4/2075 5,425,413 0.18 EUR 3,500,000 SAP SE 1.375% 13/3/2030 3,946,250 0.13 EUR 7,100,000 SAP SE 1.625% 10/3/2031 8,176,928 0.27 EUR 5,400,000 Volkswagen Bank GmbH 1.25%
10/6/2024 5,600,988 0.19
Euro Corporate Bond Fund continued
Portfolio of Investments 31 August 2019
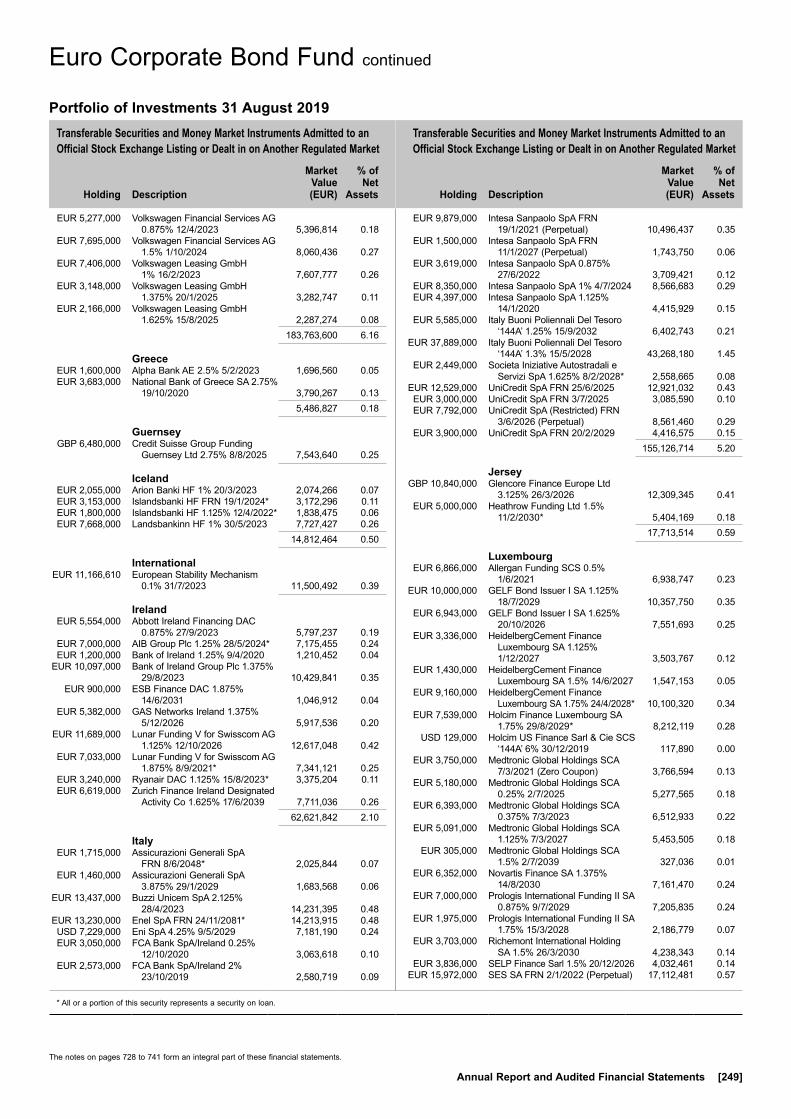
Transferable Securities and Money Market Instruments Admitted to an Official Stock Exchange Listing or Dealt in on Another Regulated Market
Transferable Securities and Money Market Instruments Admitted to an Official Stock Exchange Listing or Dealt in on Another Regulated Market
Holding
Description
Market Value (EUR)
% of Net
Assets
Holding
Description
Market Value (EUR)
% of Net
Assets
* All or a portion of this security represents a security on loan.
The notes on pages 728 to 741 form an integral part of these financial statements.
Annual Report and Audited Financial Statements [249]
EUR 5,277,000 Volkswagen Financial Services AG 0.875% 12/4/2023 5,396,814 0.18
EUR 7,695,000 Volkswagen Financial Services AG 1.5% 1/10/2024 8,060,436 0.27
EUR 7,406,000 Volkswagen Leasing GmbH 1% 16/2/2023 7,607,777 0.26
EUR 3,148,000 Volkswagen Leasing GmbH 1.375% 20/1/2025 3,282,747 0.11
EUR 2,166,000 Volkswagen Leasing GmbH 1.625% 15/8/2025 2,287,274 0.08
183,763,600 6.16
Greece EUR 1,600,000 Alpha Bank AE 2.5% 5/2/2023 1,696,560 0.05 EUR 3,683,000 National Bank of Greece SA 2.75%
19/10/2020 3,790,267 0.13 5,486,827 0.18
Guernsey GBP 6,480,000 Credit Suisse Group Funding
Guernsey Ltd 2.75% 8/8/2025 7,543,640 0.25
Iceland EUR 2,055,000 Arion Banki HF 1% 20/3/2023 2,074,266 0.07 EUR 3,153,000 Islandsbanki HF FRN 19/1/2024* 3,172,296 0.11 EUR 1,800,000 Islandsbanki HF 1.125% 12/4/2022* 1,838,475 0.06 EUR 7,668,000 Landsbankinn HF 1% 30/5/2023 7,727,427 0.26 14,812,464 0.50
International EUR 11,166,610 European Stability Mechanism
0.1% 31/7/2023 11,500,492 0.39
Ireland EUR 5,554,000 Abbott Ireland Financing DAC
0.875% 27/9/2023 5,797,237 0.19 EUR 7,000,000 AIB Group Plc 1.25% 28/5/2024* 7,175,455 0.24 EUR 1,200,000 Bank of Ireland 1.25% 9/4/2020 1,210,452 0.04 EUR 10,097,000 Bank of Ireland Group Plc 1.375%
29/8/2023 10,429,841 0.35 EUR 900,000 ESB Finance DAC 1.875%
14/6/2031 1,046,912 0.04 EUR 5,382,000 GAS Networks Ireland 1.375%
5/12/2026 5,917,536 0.20 EUR 11,689,000 Lunar Funding V for Swisscom AG
1.125% 12/10/2026 12,617,048 0.42 EUR 7,033,000 Lunar Funding V for Swisscom AG
1.875% 8/9/2021* 7,341,121 0.25 EUR 3,240,000 Ryanair DAC 1.125% 15/8/2023* 3,375,204 0.11 EUR 6,619,000 Zurich Finance Ireland Designated
Activity Co 1.625% 17/6/2039 7,711,036 0.26 62,621,842 2.10
Italy EUR 1,715,000 Assicurazioni Generali SpA
FRN 8/6/2048* 2,025,844 0.07 EUR 1,460,000 Assicurazioni Generali SpA
3.875% 29/1/2029 1,683,568 0.06 EUR 13,437,000 Buzzi Unicem SpA 2.125%
28/4/2023 14,231,395 0.48 EUR 13,230,000 Enel SpA FRN 24/11/2081* 14,213,915 0.48 USD 7,229,000 Eni SpA 4.25% 9/5/2029 7,181,190 0.24 EUR 3,050,000 FCA Bank SpA/Ireland 0.25%
12/10/2020 3,063,618 0.10 EUR 2,573,000 FCA Bank SpA/Ireland 2%
23/10/2019 2,580,719 0.09
EUR 9,879,000 Intesa Sanpaolo SpA FRN 19/1/2021 (Perpetual) 10,496,437 0.35
EUR 1,500,000 Intesa Sanpaolo SpA FRN 11/1/2027 (Perpetual) 1,743,750 0.06
EUR 3,619,000 Intesa Sanpaolo SpA 0.875% 27/6/2022 3,709,421 0.12
EUR 8,350,000 Intesa Sanpaolo SpA 1% 4/7/2024 8,566,683 0.29 EUR 4,397,000 Intesa Sanpaolo SpA 1.125%
14/1/2020 4,415,929 0.15 EUR 5,585,000 Italy Buoni Poliennali Del Tesoro
‘144A’ 1.25% 15/9/2032 6,402,743 0.21 EUR 37,889,000 Italy Buoni Poliennali Del Tesoro
‘144A’ 1.3% 15/5/2028 43,268,180 1.45 EUR 2,449,000 Societa Iniziative Autostradali e
Servizi SpA 1.625% 8/2/2028* 2,558,665 0.08 EUR 12,529,000 UniCredit SpA FRN 25/6/2025 12,921,032 0.43 EUR 3,000,000 UniCredit SpA FRN 3/7/2025 3,085,590 0.10 EUR 7,792,000 UniCredit SpA (Restricted) FRN
3/6/2026 (Perpetual) 8,561,460 0.29 EUR 3,900,000 UniCredit SpA FRN 20/2/2029 4,416,575 0.15 155,126,714 5.20
Jersey GBP 10,840,000 Glencore Finance Europe Ltd
3.125% 26/3/2026 12,309,345 0.41 EUR 5,000,000 Heathrow Funding Ltd 1.5%
11/2/2030* 5,404,169 0.18 17,713,514 0.59
Luxembourg EUR 6,866,000 Allergan Funding SCS 0.5%
1/6/2021 6,938,747 0.23 EUR 10,000,000 GELF Bond Issuer I SA 1.125%
18/7/2029 10,357,750 0.35 EUR 6,943,000 GELF Bond Issuer I SA 1.625%
20/10/2026 7,551,693 0.25 EUR 3,336,000 HeidelbergCement Finance
Luxembourg SA 1.125% 1/12/2027 3,503,767 0.12
EUR 1,430,000 HeidelbergCement Finance Luxembourg SA 1.5% 14/6/2027 1,547,153 0.05
EUR 9,160,000 HeidelbergCement Finance Luxembourg SA 1.75% 24/4/2028* 10,100,320 0.34
EUR 7,539,000 Holcim Finance Luxembourg SA 1.75% 29/8/2029* 8,212,119 0.28
USD 129,000 Holcim US Finance Sarl & Cie SCS ‘144A’ 6% 30/12/2019 117,890 0.00
EUR 3,750,000 Medtronic Global Holdings SCA 7/3/2021 (Zero Coupon) 3,766,594 0.13
EUR 5,180,000 Medtronic Global Holdings SCA 0.25% 2/7/2025 5,277,565 0.18
EUR 6,393,000 Medtronic Global Holdings SCA 0.375% 7/3/2023 6,512,933 0.22
EUR 5,091,000 Medtronic Global Holdings SCA 1.125% 7/3/2027 5,453,505 0.18
EUR 305,000 Medtronic Global Holdings SCA 1.5% 2/7/2039 327,036 0.01
EUR 6,352,000 Novartis Finance SA 1.375% 14/8/2030 7,161,470 0.24
EUR 7,000,000 Prologis International Funding II SA 0.875% 9/7/2029 7,205,835 0.24
EUR 1,975,000 Prologis International Funding II SA 1.75% 15/3/2028 2,186,779 0.07
EUR 3,703,000 Richemont International Holding SA 1.5% 26/3/2030 4,238,343 0.14
EUR 3,836,000 SELP Finance Sarl 1.5% 20/12/2026 4,032,461 0.14 EUR 15,972,000 SES SA FRN 2/1/2022 (Perpetual) 17,112,481 0.57
Euro Corporate Bond Fund continued
Portfolio of Investments 31 August 2019
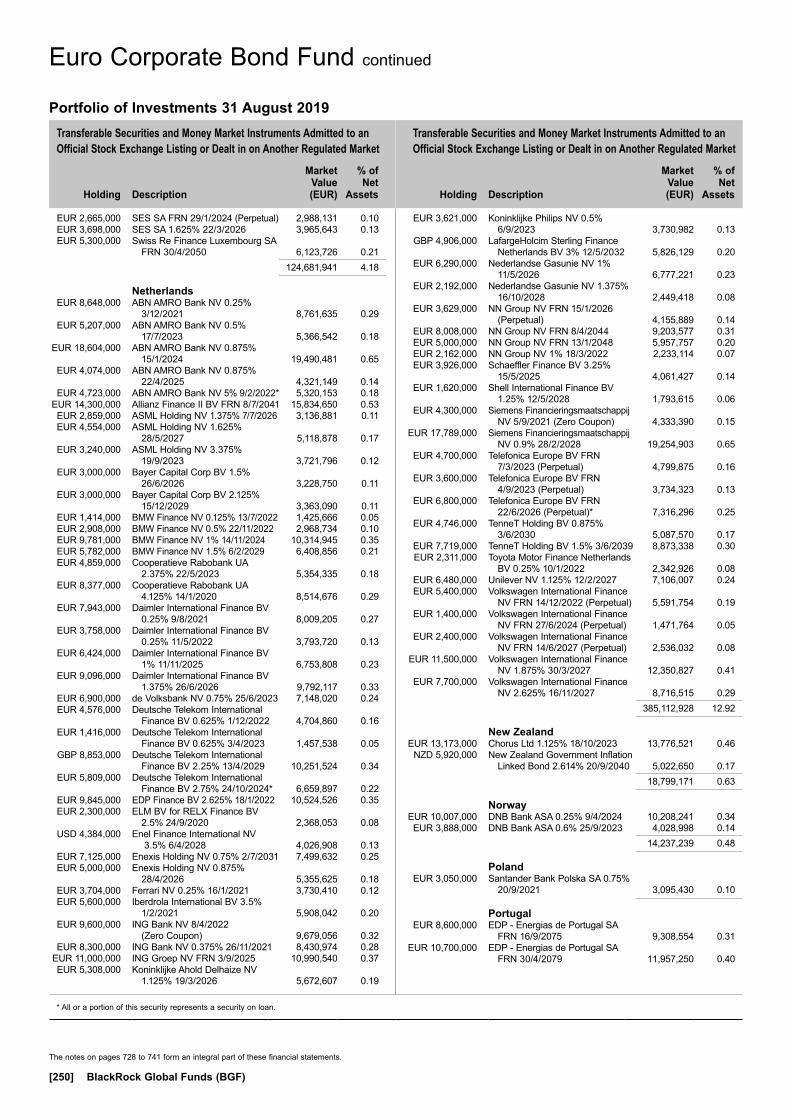
Transferable Securities and Money Market Instruments Admitted to an Official Stock Exchange Listing or Dealt in on Another Regulated Market
Transferable Securities and Money Market Instruments Admitted to an Official Stock Exchange Listing or Dealt in on Another Regulated Market
Holding
Description
Market Value (EUR)
% of Net
Assets
Holding
Description
Market Value (EUR)
% of Net
Assets
* All or a portion of this security represents a security on loan.
The notes on pages 728 to 741 form an integral part of these financial statements.
[250] BlackRock Global Funds (BGF)
EUR 2,665,000 SES SA FRN 29/1/2024 (Perpetual) 2,988,131 0.10 EUR 3,698,000 SES SA 1.625% 22/3/2026 3,965,643 0.13 EUR 5,300,000 Swiss Re Finance Luxembourg SA
FRN 30/4/2050 6,123,726 0.21 124,681,941 4.18
Netherlands EUR 8,648,000 ABN AMRO Bank NV 0.25%
3/12/2021 8,761,635 0.29 EUR 5,207,000 ABN AMRO Bank NV 0.5%
17/7/2023 5,366,542 0.18 EUR 18,604,000 ABN AMRO Bank NV 0.875%
15/1/2024 19,490,481 0.65 EUR 4,074,000 ABN AMRO Bank NV 0.875%
22/4/2025 4,321,149 0.14 EUR 4,723,000 ABN AMRO Bank NV 5% 9/2/2022* 5,320,153 0.18 EUR 14,300,000 Allianz Finance II BV FRN 8/7/2041 15,834,650 0.53 EUR 2,859,000 ASML Holding NV 1.375% 7/7/2026 3,136,881 0.11 EUR 4,554,000 ASML Holding NV 1.625%
28/5/2027 5,118,878 0.17 EUR 3,240,000 ASML Holding NV 3.375%
19/9/2023 3,721,796 0.12 EUR 3,000,000 Bayer Capital Corp BV 1.5%
26/6/2026 3,228,750 0.11 EUR 3,000,000 Bayer Capital Corp BV 2.125%
15/12/2029 3,363,090 0.11 EUR 1,414,000 BMW Finance NV 0.125% 13/7/2022 1,425,666 0.05 EUR 2,908,000 BMW Finance NV 0.5% 22/11/2022 2,968,734 0.10 EUR 9,781,000 BMW Finance NV 1% 14/11/2024 10,314,945 0.35 EUR 5,782,000 BMW Finance NV 1.5% 6/2/2029 6,408,856 0.21 EUR 4,859,000 Cooperatieve Rabobank UA
2.375% 22/5/2023 5,354,335 0.18 EUR 8,377,000 Cooperatieve Rabobank UA
4.125% 14/1/2020 8,514,676 0.29 EUR 7,943,000 Daimler International Finance BV
0.25% 9/8/2021 8,009,205 0.27 EUR 3,758,000 Daimler International Finance BV
0.25% 11/5/2022 3,793,720 0.13 EUR 6,424,000 Daimler International Finance BV
1% 11/11/2025 6,753,808 0.23 EUR 9,096,000 Daimler International Finance BV
1.375% 26/6/2026 9,792,117 0.33 EUR 6,900,000 de Volksbank NV 0.75% 25/6/2023 7,148,020 0.24 EUR 4,576,000 Deutsche Telekom International
Finance BV 0.625% 1/12/2022 4,704,860 0.16 EUR 1,416,000 Deutsche Telekom International
Finance BV 0.625% 3/4/2023 1,457,538 0.05 GBP 8,853,000 Deutsche Telekom International
Finance BV 2.25% 13/4/2029 10,251,524 0.34 EUR 5,809,000 Deutsche Telekom International
Finance BV 2.75% 24/10/2024* 6,659,897 0.22 EUR 9,845,000 EDP Finance BV 2.625% 18/1/2022 10,524,526 0.35 EUR 2,300,000 ELM BV for RELX Finance BV
2.5% 24/9/2020 2,368,053 0.08 USD 4,384,000 Enel Finance International NV
3.5% 6/4/2028 4,026,908 0.13 EUR 7,125,000 Enexis Holding NV 0.75% 2/7/2031 7,499,632 0.25 EUR 5,000,000 Enexis Holding NV 0.875%
28/4/2026 5,355,625 0.18 EUR 3,704,000 Ferrari NV 0.25% 16/1/2021 3,730,410 0.12 EUR 5,600,000 Iberdrola International BV 3.5%
1/2/2021 5,908,042 0.20 EUR 9,600,000 ING Bank NV 8/4/2022
(Zero Coupon) 9,679,056 0.32 EUR 8,300,000 ING Bank NV 0.375% 26/11/2021 8,430,974 0.28 EUR 11,000,000 ING Groep NV FRN 3/9/2025 10,990,540 0.37 EUR 5,308,000 Koninklijke Ahold Delhaize NV
1.125% 19/3/2026 5,672,607 0.19
EUR 3,621,000 Koninklijke Philips NV 0.5% 6/9/2023 3,730,982 0.13
GBP 4,906,000 LafargeHolcim Sterling Finance Netherlands BV 3% 12/5/2032 5,826,129 0.20
EUR 6,290,000 Nederlandse Gasunie NV 1% 11/5/2026 6,777,221 0.23
EUR 2,192,000 Nederlandse Gasunie NV 1.375% 16/10/2028 2,449,418 0.08
EUR 3,629,000 NN Group NV FRN 15/1/2026 (Perpetual) 4,155,889 0.14
EUR 8,008,000 NN Group NV FRN 8/4/2044 9,203,577 0.31 EUR 5,000,000 NN Group NV FRN 13/1/2048 5,957,757 0.20 EUR 2,162,000 NN Group NV 1% 18/3/2022 2,233,114 0.07 EUR 3,926,000 Schaeffler Finance BV 3.25%
15/5/2025 4,061,427 0.14 EUR 1,620,000 Shell International Finance BV
1.25% 12/5/2028 1,793,615 0.06 EUR 4,300,000 Siemens Financieringsmaatschappij
NV 5/9/2021 (Zero Coupon) 4,333,390 0.15 EUR 17,789,000 Siemens Financieringsmaatschappij
NV 0.9% 28/2/2028 19,254,903 0.65 EUR 4,700,000 Telefonica Europe BV FRN
7/3/2023 (Perpetual) 4,799,875 0.16 EUR 3,600,000 Telefonica Europe BV FRN
4/9/2023 (Perpetual) 3,734,323 0.13 EUR 6,800,000 Telefonica Europe BV FRN
22/6/2026 (Perpetual)* 7,316,296 0.25 EUR 4,746,000 TenneT Holding BV 0.875%
3/6/2030 5,087,570 0.17 EUR 7,719,000 TenneT Holding BV 1.5% 3/6/2039 8,873,338 0.30 EUR 2,311,000 Toyota Motor Finance Netherlands
BV 0.25% 10/1/2022 2,342,926 0.08 EUR 6,480,000 Unilever NV 1.125% 12/2/2027 7,106,007 0.24 EUR 5,400,000 Volkswagen International Finance
NV FRN 14/12/2022 (Perpetual) 5,591,754 0.19 EUR 1,400,000 Volkswagen International Finance
NV FRN 27/6/2024 (Perpetual) 1,471,764 0.05 EUR 2,400,000 Volkswagen International Finance
NV FRN 14/6/2027 (Perpetual) 2,536,032 0.08 EUR 11,500,000 Volkswagen International Finance
NV 1.875% 30/3/2027 12,350,827 0.41 EUR 7,700,000 Volkswagen International Finance
NV 2.625% 16/11/2027 8,716,515 0.29 385,112,928 12.92
New Zealand EUR 13,173,000 Chorus Ltd 1.125% 18/10/2023 13,776,521 0.46 NZD 5,920,000 New Zealand Government Inflation
Linked Bond 2.614% 20/9/2040 5,022,650 0.17 18,799,171 0.63
Norway EUR 10,007,000 DNB Bank ASA 0.25% 9/4/2024 10,208,241 0.34 EUR 3,888,000 DNB Bank ASA 0.6% 25/9/2023 4,028,998 0.14 14,237,239 0.48
Poland EUR 3,050,000 Santander Bank Polska SA 0.75%
20/9/2021 3,095,430 0.10
Portugal EUR 8,600,000 EDP - Energias de Portugal SA
FRN 16/9/2075 9,308,554 0.31 EUR 10,700,000 EDP - Energias de Portugal SA
FRN 30/4/2079 11,957,250 0.40
Euro Corporate Bond Fund continued
Portfolio of Investments 31 August 2019
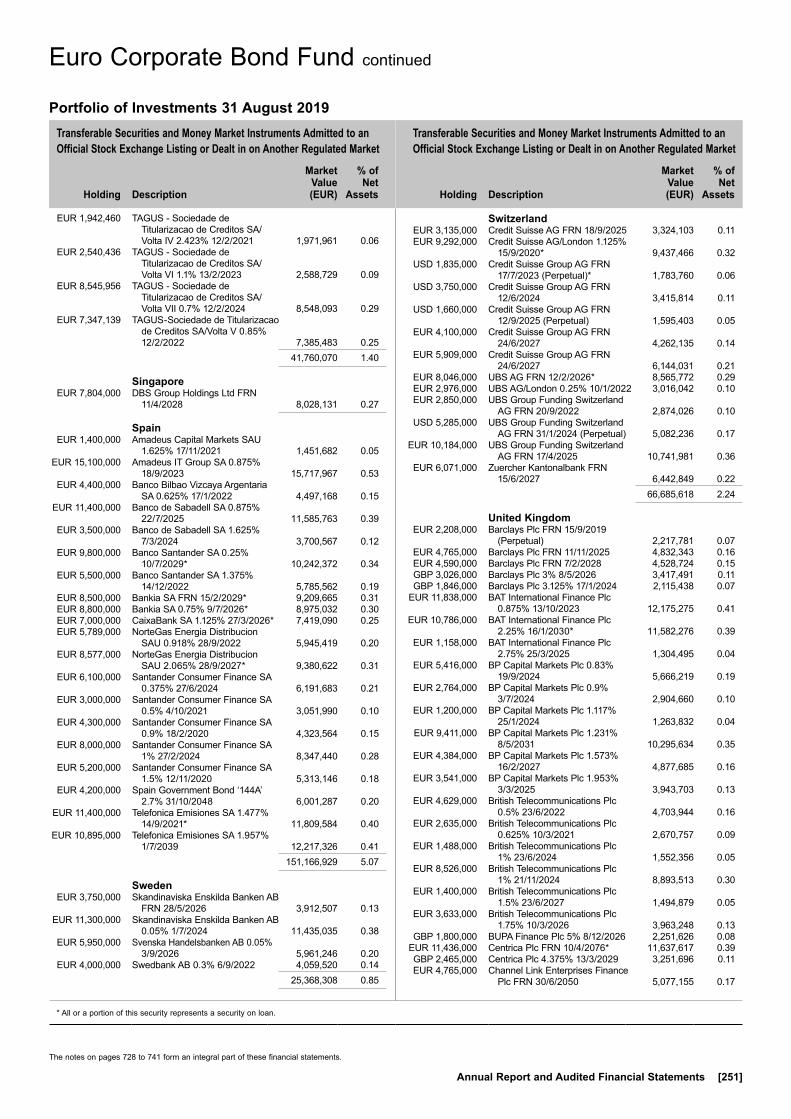
Transferable Securities and Money Market Instruments Admitted to an Official Stock Exchange Listing or Dealt in on Another Regulated Market
Transferable Securities and Money Market Instruments Admitted to an Official Stock Exchange Listing or Dealt in on Another Regulated Market
Holding
Description
Market Value (EUR)
% of Net
Assets
Holding
Description
Market Value (EUR)
% of Net
Assets
* All or a portion of this security represents a security on loan.
The notes on pages 728 to 741 form an integral part of these financial statements.
Annual Report and Audited Financial Statements [251]
EUR 1,942,460 TAGUS - Sociedade de Titularizacao de Creditos SA/Volta IV 2.423% 12/2/2021 1,971,961 0.06
EUR 2,540,436 TAGUS - Sociedade de Titularizacao de Creditos SA/Volta VI 1.1% 13/2/2023 2,588,729 0.09
EUR 8,545,956 TAGUS - Sociedade de Titularizacao de Creditos SA/Volta VII 0.7% 12/2/2024 8,548,093 0.29
EUR 7,347,139 TAGUS-Sociedade de Titularizacao de Creditos SA/Volta V 0.85% 12/2/2022 7,385,483 0.25
41,760,070 1.40
Singapore EUR 7,804,000 DBS Group Holdings Ltd FRN
11/4/2028 8,028,131 0.27
Spain EUR 1,400,000 Amadeus Capital Markets SAU
1.625% 17/11/2021 1,451,682 0.05 EUR 15,100,000 Amadeus IT Group SA 0.875%
18/9/2023 15,717,967 0.53 EUR 4,400,000 Banco Bilbao Vizcaya Argentaria
SA 0.625% 17/1/2022 4,497,168 0.15 EUR 11,400,000 Banco de Sabadell SA 0.875%
22/7/2025 11,585,763 0.39 EUR 3,500,000 Banco de Sabadell SA 1.625%
7/3/2024 3,700,567 0.12 EUR 9,800,000 Banco Santander SA 0.25%
10/7/2029* 10,242,372 0.34 EUR 5,500,000 Banco Santander SA 1.375%
14/12/2022 5,785,562 0.19 EUR 8,500,000 Bankia SA FRN 15/2/2029* 9,209,665 0.31 EUR 8,800,000 Bankia SA 0.75% 9/7/2026* 8,975,032 0.30 EUR 7,000,000 CaixaBank SA 1.125% 27/3/2026* 7,419,090 0.25 EUR 5,789,000 NorteGas Energia Distribucion
SAU 0.918% 28/9/2022 5,945,419 0.20 EUR 8,577,000 NorteGas Energia Distribucion
SAU 2.065% 28/9/2027* 9,380,622 0.31 EUR 6,100,000 Santander Consumer Finance SA
0.375% 27/6/2024 6,191,683 0.21 EUR 3,000,000 Santander Consumer Finance SA
0.5% 4/10/2021 3,051,990 0.10 EUR 4,300,000 Santander Consumer Finance SA
0.9% 18/2/2020 4,323,564 0.15 EUR 8,000,000 Santander Consumer Finance SA
1% 27/2/2024 8,347,440 0.28 EUR 5,200,000 Santander Consumer Finance SA
1.5% 12/11/2020 5,313,146 0.18 EUR 4,200,000 Spain Government Bond ‘144A’
2.7% 31/10/2048 6,001,287 0.20 EUR 11,400,000 Telefonica Emisiones SA 1.477%
14/9/2021* 11,809,584 0.40 EUR 10,895,000 Telefonica Emisiones SA 1.957%
1/7/2039 12,217,326 0.41 151,166,929 5.07
Sweden EUR 3,750,000 Skandinaviska Enskilda Banken AB
FRN 28/5/2026 3,912,507 0.13 EUR 11,300,000 Skandinaviska Enskilda Banken AB
0.05% 1/7/2024 11,435,035 0.38 EUR 5,950,000 Svenska Handelsbanken AB 0.05%
3/9/2026 5,961,246 0.20 EUR 4,000,000 Swedbank AB 0.3% 6/9/2022 4,059,520 0.14 25,368,308 0.85
Switzerland EUR 3,135,000 Credit Suisse AG FRN 18/9/2025 3,324,103 0.11 EUR 9,292,000 Credit Suisse AG/London 1.125%
15/9/2020* 9,437,466 0.32 USD 1,835,000 Credit Suisse Group AG FRN
17/7/2023 (Perpetual)* 1,783,760 0.06 USD 3,750,000 Credit Suisse Group AG FRN
12/6/2024 3,415,814 0.11 USD 1,660,000 Credit Suisse Group AG FRN
12/9/2025 (Perpetual) 1,595,403 0.05 EUR 4,100,000 Credit Suisse Group AG FRN
24/6/2027 4,262,135 0.14 EUR 5,909,000 Credit Suisse Group AG FRN
24/6/2027 6,144,031 0.21 EUR 8,046,000 UBS AG FRN 12/2/2026* 8,565,772 0.29 EUR 2,976,000 UBS AG/London 0.25% 10/1/2022 3,016,042 0.10 EUR 2,850,000 UBS Group Funding Switzerland
AG FRN 20/9/2022 2,874,026 0.10 USD 5,285,000 UBS Group Funding Switzerland
AG FRN 31/1/2024 (Perpetual) 5,082,236 0.17 EUR 10,184,000 UBS Group Funding Switzerland
AG FRN 17/4/2025 10,741,981 0.36 EUR 6,071,000 Zuercher Kantonalbank FRN
15/6/2027 6,442,849 0.22 66,685,618 2.24
United Kingdom EUR 2,208,000 Barclays Plc FRN 15/9/2019
(Perpetual) 2,217,781 0.07 EUR 4,765,000 Barclays Plc FRN 11/11/2025 4,832,343 0.16 EUR 4,590,000 Barclays Plc FRN 7/2/2028 4,528,724 0.15 GBP 3,026,000 Barclays Plc 3% 8/5/2026 3,417,491 0.11 GBP 1,846,000 Barclays Plc 3.125% 17/1/2024 2,115,438 0.07 EUR 11,838,000 BAT International Finance Plc
0.875% 13/10/2023 12,175,275 0.41 EUR 10,786,000 BAT International Finance Plc
2.25% 16/1/2030* 11,582,276 0.39 EUR 1,158,000 BAT International Finance Plc
2.75% 25/3/2025 1,304,495 0.04 EUR 5,416,000 BP Capital Markets Plc 0.83%
19/9/2024 5,666,219 0.19 EUR 2,764,000 BP Capital Markets Plc 0.9%
3/7/2024 2,904,660 0.10 EUR 1,200,000 BP Capital Markets Plc 1.117%
25/1/2024 1,263,832 0.04 EUR 9,411,000 BP Capital Markets Plc 1.231%
8/5/2031 10,295,634 0.35 EUR 4,384,000 BP Capital Markets Plc 1.573%
16/2/2027 4,877,685 0.16 EUR 3,541,000 BP Capital Markets Plc 1.953%
3/3/2025 3,943,703 0.13 EUR 4,629,000 British Telecommunications Plc
0.5% 23/6/2022 4,703,944 0.16 EUR 2,635,000 British Telecommunications Plc
0.625% 10/3/2021 2,670,757 0.09 EUR 1,488,000 British Telecommunications Plc
1% 23/6/2024 1,552,356 0.05 EUR 8,526,000 British Telecommunications Plc
1% 21/11/2024 8,893,513 0.30 EUR 1,400,000 British Telecommunications Plc
1.5% 23/6/2027 1,494,879 0.05 EUR 3,633,000 British Telecommunications Plc
1.75% 10/3/2026 3,963,248 0.13 GBP 1,800,000 BUPA Finance Plc 5% 8/12/2026 2,251,626 0.08 EUR 11,436,000 Centrica Plc FRN 10/4/2076* 11,637,617 0.39 GBP 2,465,000 Centrica Plc 4.375% 13/3/2029 3,251,696 0.11 EUR 4,765,000 Channel Link Enterprises Finance
Plc FRN 30/6/2050 5,077,155 0.17
Euro Corporate Bond Fund continued
Portfolio of Investments 31 August 2019
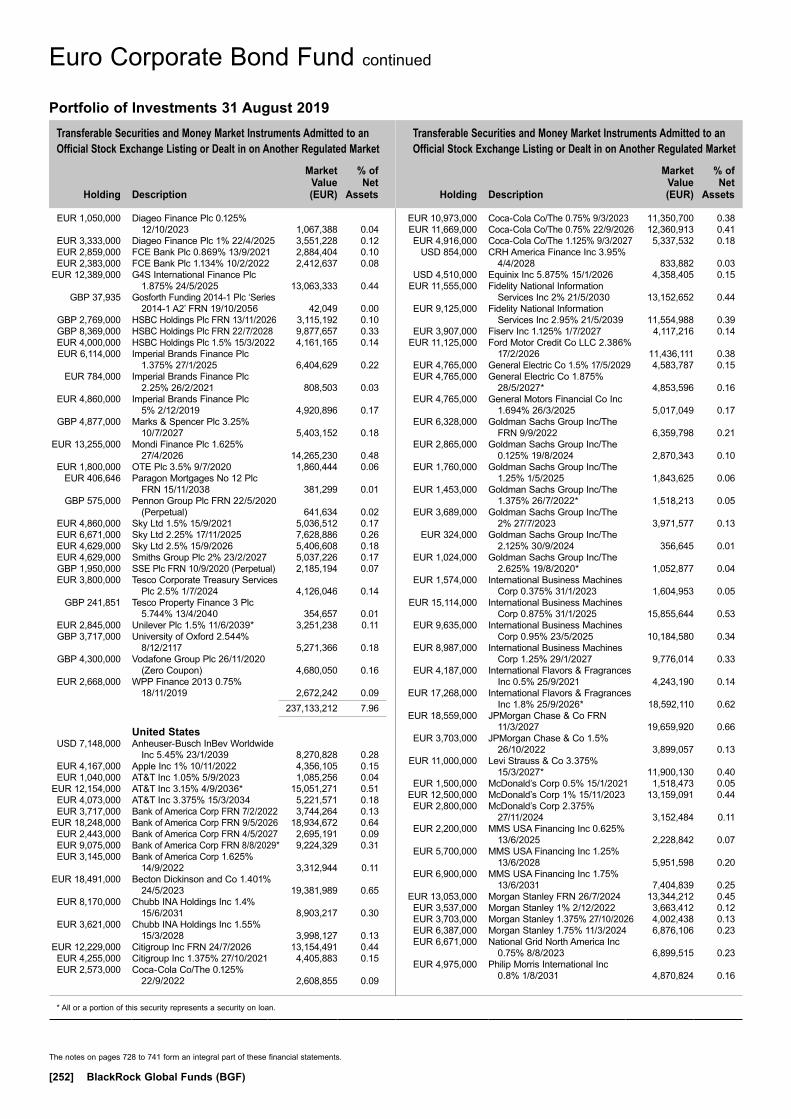
Transferable Securities and Money Market Instruments Admitted to an Official Stock Exchange Listing or Dealt in on Another Regulated Market
Transferable Securities and Money Market Instruments Admitted to an Official Stock Exchange Listing or Dealt in on Another Regulated Market
Holding
Description
Market Value (EUR)
% of Net
Assets
Holding
Description
Market Value (EUR)
% of Net
Assets
* All or a portion of this security represents a security on loan.
The notes on pages 728 to 741 form an integral part of these financial statements.
[252] BlackRock Global Funds (BGF)
EUR 1,050,000 Diageo Finance Plc 0.125% 12/10/2023 1,067,388 0.04
EUR 3,333,000 Diageo Finance Plc 1% 22/4/2025 3,551,228 0.12 EUR 2,859,000 FCE Bank Plc 0.869% 13/9/2021 2,884,404 0.10 EUR 2,383,000 FCE Bank Plc 1.134% 10/2/2022 2,412,637 0.08 EUR 12,389,000 G4S International Finance Plc
1.875% 24/5/2025 13,063,333 0.44 GBP 37,935 Gosforth Funding 2014-1 Plc ‘Series
2014-1 A2’ FRN 19/10/2056 42,049 0.00 GBP 2,769,000 HSBC Holdings Plc FRN 13/11/2026 3,115,192 0.10 GBP 8,369,000 HSBC Holdings Plc FRN 22/7/2028 9,877,657 0.33 EUR 4,000,000 HSBC Holdings Plc 1.5% 15/3/2022 4,161,165 0.14 EUR 6,114,000 Imperial Brands Finance Plc
1.375% 27/1/2025 6,404,629 0.22 EUR 784,000 Imperial Brands Finance Plc
2.25% 26/2/2021 808,503 0.03 EUR 4,860,000 Imperial Brands Finance Plc
5% 2/12/2019 4,920,896 0.17 GBP 4,877,000 Marks & Spencer Plc 3.25%
10/7/2027 5,403,152 0.18 EUR 13,255,000 Mondi Finance Plc 1.625%
27/4/2026 14,265,230 0.48 EUR 1,800,000 OTE Plc 3.5% 9/7/2020 1,860,444 0.06 EUR 406,646 Paragon Mortgages No 12 Plc
FRN 15/11/2038 381,299 0.01 GBP 575,000 Pennon Group Plc FRN 22/5/2020
(Perpetual) 641,634 0.02 EUR 4,860,000 Sky Ltd 1.5% 15/9/2021 5,036,512 0.17 EUR 6,671,000 Sky Ltd 2.25% 17/11/2025 7,628,886 0.26 EUR 4,629,000 Sky Ltd 2.5% 15/9/2026 5,406,608 0.18 EUR 4,629,000 Smiths Group Plc 2% 23/2/2027 5,037,226 0.17 GBP 1,950,000 SSE Plc FRN 10/9/2020 (Perpetual) 2,185,194 0.07 EUR 3,800,000 Tesco Corporate Treasury Services
Plc 2.5% 1/7/2024 4,126,046 0.14 GBP 241,851 Tesco Property Finance 3 Plc
5.744% 13/4/2040 354,657 0.01 EUR 2,845,000 Unilever Plc 1.5% 11/6/2039* 3,251,238 0.11 GBP 3,717,000 University of Oxford 2.544%
8/12/2117 5,271,366 0.18 GBP 4,300,000 Vodafone Group Plc 26/11/2020
(Zero Coupon) 4,680,050 0.16 EUR 2,668,000 WPP Finance 2013 0.75%
18/11/2019 2,672,242 0.09 237,133,212 7.96
United States USD 7,148,000 Anheuser-Busch InBev Worldwide
Inc 5.45% 23/1/2039 8,270,828 0.28 EUR 4,167,000 Apple Inc 1% 10/11/2022 4,356,105 0.15 EUR 1,040,000 AT&T Inc 1.05% 5/9/2023 1,085,256 0.04 EUR 12,154,000 AT&T Inc 3.15% 4/9/2036* 15,051,271 0.51 EUR 4,073,000 AT&T Inc 3.375% 15/3/2034 5,221,571 0.18 EUR 3,717,000 Bank of America Corp FRN 7/2/2022 3,744,264 0.13 EUR 18,248,000 Bank of America Corp FRN 9/5/2026 18,934,672 0.64 EUR 2,443,000 Bank of America Corp FRN 4/5/2027 2,695,191 0.09 EUR 9,075,000 Bank of America Corp FRN 8/8/2029* 9,224,329 0.31 EUR 3,145,000 Bank of America Corp 1.625%
14/9/2022 3,312,944 0.11 EUR 18,491,000 Becton Dickinson and Co 1.401%
24/5/2023 19,381,989 0.65 EUR 8,170,000 Chubb INA Holdings Inc 1.4%
15/6/2031 8,903,217 0.30 EUR 3,621,000 Chubb INA Holdings Inc 1.55%
15/3/2028 3,998,127 0.13 EUR 12,229,000 Citigroup Inc FRN 24/7/2026 13,154,491 0.44 EUR 4,255,000 Citigroup Inc 1.375% 27/10/2021 4,405,883 0.15 EUR 2,573,000 Coca-Cola Co/The 0.125%
22/9/2022 2,608,855 0.09
EUR 10,973,000 Coca-Cola Co/The 0.75% 9/3/2023 11,350,700 0.38 EUR 11,669,000 Coca-Cola Co/The 0.75% 22/9/2026 12,360,913 0.41 EUR 4,916,000 Coca-Cola Co/The 1.125% 9/3/2027 5,337,532 0.18 USD 854,000 CRH America Finance Inc 3.95%
4/4/2028 833,882 0.03 USD 4,510,000 Equinix Inc 5.875% 15/1/2026 4,358,405 0.15 EUR 11,555,000 Fidelity National Information
Services Inc 2% 21/5/2030 13,152,652 0.44 EUR 9,125,000 Fidelity National Information
Services Inc 2.95% 21/5/2039 11,554,988 0.39 EUR 3,907,000 Fiserv Inc 1.125% 1/7/2027 4,117,216 0.14 EUR 11,125,000 Ford Motor Credit Co LLC 2.386%
17/2/2026 11,436,111 0.38 EUR 4,765,000 General Electric Co 1.5% 17/5/2029 4,583,787 0.15 EUR 4,765,000 General Electric Co 1.875%
28/5/2027* 4,853,596 0.16 EUR 4,765,000 General Motors Financial Co Inc
1.694% 26/3/2025 5,017,049 0.17 EUR 6,328,000 Goldman Sachs Group Inc/The
FRN 9/9/2022 6,359,798 0.21 EUR 2,865,000 Goldman Sachs Group Inc/The
0.125% 19/8/2024 2,870,343 0.10 EUR 1,760,000 Goldman Sachs Group Inc/The
1.25% 1/5/2025 1,843,625 0.06 EUR 1,453,000 Goldman Sachs Group Inc/The
1.375% 26/7/2022* 1,518,213 0.05 EUR 3,689,000 Goldman Sachs Group Inc/The
2% 27/7/2023 3,971,577 0.13 EUR 324,000 Goldman Sachs Group Inc/The
2.125% 30/9/2024 356,645 0.01 EUR 1,024,000 Goldman Sachs Group Inc/The
2.625% 19/8/2020* 1,052,877 0.04 EUR 1,574,000 International Business Machines
Corp 0.375% 31/1/2023 1,604,953 0.05 EUR 15,114,000 International Business Machines
Corp 0.875% 31/1/2025 15,855,644 0.53 EUR 9,635,000 International Business Machines
Corp 0.95% 23/5/2025 10,184,580 0.34 EUR 8,987,000 International Business Machines
Corp 1.25% 29/1/2027 9,776,014 0.33 EUR 4,187,000 International Flavors & Fragrances
Inc 0.5% 25/9/2021 4,243,190 0.14 EUR 17,268,000 International Flavors & Fragrances
Inc 1.8% 25/9/2026* 18,592,110 0.62 EUR 18,559,000 JPMorgan Chase & Co FRN
11/3/2027 19,659,920 0.66 EUR 3,703,000 JPMorgan Chase & Co 1.5%
26/10/2022 3,899,057 0.13 EUR 11,000,000 Levi Strauss & Co 3.375%
15/3/2027* 11,900,130 0.40 EUR 1,500,000 McDonald’s Corp 0.5% 15/1/2021 1,518,473 0.05 EUR 12,500,000 McDonald’s Corp 1% 15/11/2023 13,159,091 0.44 EUR 2,800,000 McDonald’s Corp 2.375%
27/11/2024 3,152,484 0.11 EUR 2,200,000 MMS USA Financing Inc 0.625%
13/6/2025 2,228,842 0.07 EUR 5,700,000 MMS USA Financing Inc 1.25%
13/6/2028 5,951,598 0.20 EUR 6,900,000 MMS USA Financing Inc 1.75%
13/6/2031 7,404,839 0.25 EUR 13,053,000 Morgan Stanley FRN 26/7/2024 13,344,212 0.45 EUR 3,537,000 Morgan Stanley 1% 2/12/2022 3,663,412 0.12 EUR 3,703,000 Morgan Stanley 1.375% 27/10/2026 4,002,438 0.13 EUR 6,387,000 Morgan Stanley 1.75% 11/3/2024 6,876,106 0.23 EUR 6,671,000 National Grid North America Inc
0.75% 8/8/2023 6,899,515 0.23 EUR 4,975,000 Philip Morris International Inc
0.8% 1/8/2031 4,870,824 0.16
Euro Corporate Bond Fund continued
Portfolio of Investments 31 August 2019

Transferable Securities and Money Market Instruments Admitted to an Official Stock Exchange Listing or Dealt in on Another Regulated Market
Transferable Securities and Money Market Instruments Admitted to an Official Stock Exchange Listing or Dealt in on Another Regulated Market
Holding
Description
Market Value (EUR)
% of Net
Assets
Holding
Description
Market Value (EUR)
% of Net
Assets
The notes on pages 728 to 741 form an integral part of these financial statements.
Annual Report and Audited Financial Statements [253]
EUR 8,814,000 PVH Corp 3.125% 15/12/2027 9,927,957 0.33 EUR 14,290,000 RELX Capital Inc 1.3% 12/5/2025 15,360,577 0.52 EUR 115,998 SLM Student Loan Trust 2003-7
‘Series 2003-7X A5B’ FRN 15/12/2033 113,472 0.00
EUR 5,000,000 Toyota Motor Credit Corp 0.75% 21/7/2022 5,151,099 0.17
USD 6,600,000 United States Treasury Inflation Indexed Bonds 0.875% 15/1/2029 6,585,061 0.22
USD 5,315,000 United States Treasury Inflation Indexed Bonds 1% 15/2/2049 5,838,776 0.20
EUR 3,888,000 Verizon Communications Inc 0.875% 2/4/2025 4,080,986 0.14
EUR 2,766,000 Verizon Communications Inc 1.25% 8/4/2030 2,979,838 0.10
EUR 7,100,000 Verizon Communications Inc 1.375% 27/10/2026 7,736,174 0.26
GBP 4,813,000 Verizon Communications Inc 2.5% 8/4/2031 5,731,547 0.19
EUR 1,000,000 Verizon Communications Inc 2.625% 1/12/2031 1,235,574 0.04
EUR 3,050,000 Wells Fargo & Co 1.5% 12/9/2022 3,203,097 0.11 468,010,492 15.70Total Bonds 2,754,156,872 92.40Total Transferable Securities and Money Market Instruments Admitted to an Official Stock Exchange Listing or Dealt in on Another Regulated Market 2,975,537,993 99.83Total Portfolio 2,975,537,993 99.83
Other Net Assets 4,984,116 0.17Total Net Assets (EUR) 2,980,522,109 100.00
Euro Corporate Bond Fund continued
Portfolio of Investments 31 August 2019
Open Forward Foreign Exchange Contracts as at 31 August 2019
Currency
Purchases Currency
Sales Counterparty
Maturity date
Unrealised appreciation/
(depreciation) EUR
AUD 9,950,000 NZD 10,533,040 JP Morgan 6/9/2019 43,870AUD 26,960,442 USD 18,736,861 Bank of America 6/9/2019 (516,521)AUD 12,910,000 USD 8,859,478 Morgan Stanley 6/9/2019 (145,370)AUD 201,381 USD 140,246 BNP Paribas 6/9/2019 (4,121)AUD 3,978,177 USD 2,800,933 Citibank 6/9/2019 (108,975)AUD 6,730,000 USD 4,743,728 JP Morgan 6/9/2019 (189,160)AUD 6,370,000 USD 4,446,706 Toronto Dominion 6/9/2019 (139,877)CAD 18,962,197 USD 14,253,877 Royal Bank of Canada 6/9/2019 38,725CAD 1,035,280 USD 777,035 BNP Paribas 6/9/2019 3,186CAD 8,104,163 USD 6,104,232 Barclays 6/9/2019 5,386CAD 13,158,592 USD 9,883,720 Toronto Dominion 6/9/2019 33,741CAD 5,982,829 USD 4,488,119 HSBC Bank Plc 6/9/2019 20,519CAD 6,331,102 USD 4,782,506 State Street 6/9/2019 (8,266)CAD 6,140,000 USD 4,671,969 Citibank 6/9/2019 (38,628)CAD 4,635,837 USD 3,537,848 Morgan Stanley 6/9/2019 (38,584)CAD 7,580,000 USD 5,710,657 Bank of America 6/9/2019 3,919CHF 8,250,000 EUR 7,516,652 Goldman Sachs 6/9/2019 45,414CHF 765,845 EUR 701,333 Royal Bank of Canada 6/9/2019 652CHF 5,174,155 EUR 4,736,806 Toronto Dominion 6/9/2019 5,898CHF 2,400,000 EUR 2,174,238 State Street 6/9/2019 25,636CHF 8,901,285 USD 9,084,438 HSBC Bank Plc 6/9/2019 (63,004)CHF 4,659,224 USD 4,733,338 Morgan Stanley 6/9/2019 (13,290)CHF 159,057 USD 161,676 RBS Plc 6/9/2019 (534)CHF 18,098,702 USD 18,336,396 Toronto Dominion 6/9/2019 (6,189)CHF 460,219 USD 466,477 BNP Paribas 6/9/2019 (352)CHF 201,284 USD 204,060 Royal Bank of Canada 6/9/2019 (189)CHF 18,270,000 USD 18,491,064 JP Morgan 6/9/2019 10,840CHF 150,230 USD 152,463 Citibank 6/9/2019 (287)CNH 9,200,000 USD 1,335,226 Barclays 6/9/2019 (44,035)CNH 20,695,000 USD 2,985,550 Bank of America 6/9/2019 (82,780)CZK 113,454,557 EUR 4,412,340 Credit Suisse 6/9/2019 (39,217)CZK 83,344,079 EUR 3,239,397 BNP Paribas 6/9/2019 (26,887)CZK 11,333,767 EUR 440,420 Morgan Stanley 6/9/2019 (3,558)EUR 13,243,593 CHF 14,453,700 Goldman Sachs 6/9/2019 (4,873)EUR 1,939,437 CHF 2,136,300 Morgan Stanley 6/9/2019 (18,727)EUR 4,464,372 CZK 115,600,000 BNP Paribas 6/9/2019 8,552EUR 3,704,316 CZK 95,313,544 Bank of America 6/9/2019 30,441EUR 2,513,957 CZK 64,786,456 Citibank 6/9/2019 16,753EUR 1,849,076 CZK 48,032,403 RBS Plc 6/9/2019 (2,341)EUR 809,214 GBP 733,330 Bank of America 6/9/2019 (1,622)EUR 5,471,046 GBP 4,949,374 Morgan Stanley 6/9/2019 (1,427)
Open Forward Foreign Exchange Contracts as at 31 August 2019
Currency
Purchases Currency
Sales Counterparty
Maturity date
Unrealised appreciation/
(depreciation) EUR
EUR 3,008,861 GBP 2,750,000 RBS Plc 6/9/2019 (31,786)EUR 4,585,387 GBP 4,097,296 Toronto Dominion 6/9/2019 55,048EUR 2,766,505 HUF 893,000,000 Bank of America 6/9/2019 71,276EUR 1,930,658 HUF 622,000,000 Societe Generale 6/9/2019 53,354EUR 2,088,134 HUF 671,000,000 Barclays 6/9/2019 62,940EUR 11,333,662 HUF 3,679,534,198 BNP Paribas 6/9/2019 228,191EUR 1,356,879 HUF 440,659,892 RBS Plc 6/9/2019 26,891EUR 3,853,261 HUF 1,250,805,909 Credit Suisse 6/9/2019 78,113EUR 2,297,019 HUF 748,000,000 Citibank 6/9/2019 39,425EUR 820,000 NOK 7,900,000 Citibank 6/9/2019 33,057EUR 3,700,482 NOK 36,300,000 Morgan Stanley 6/9/2019 84,530EUR 5,384,760 NOK 52,500,000 JP Morgan 6/9/2019 155,078EUR 6,552,108 NOK 63,300,000 Toronto Dominion 6/9/2019 246,605EUR 2,176,038 NOK 21,800,000 Credit Suisse 6/9/2019 4,474EUR 9,678,877 NOK 95,300,000 BNP Paribas 6/9/2019 185,758EUR 4,475,797 NOK 44,800,000 HSBC Bank Plc 6/9/2019 13,135EUR 2,326,151 NOK 22,500,000 Standard Chartered Bank 6/9/2019 84,858EUR 6,438,519 PLN 27,530,000 BNP Paribas 6/9/2019 162,477EUR 18,622,212 PLN 80,150,000 JP Morgan 6/9/2019 350,333EUR 4,419,204 SEK 47,400,000 Credit Suisse 6/9/2019 45,455EUR 7,800,742 SEK 82,600,000 Toronto Dominion 6/9/2019 178,978EUR 1,842,135 SEK 19,738,369 RBS Plc 6/9/2019 20,813EUR 360,431 SEK 3,861,631 Societe Generale 6/9/2019 4,106EUR 18,323,152 SEK 194,100,000 BNP Paribas 6/9/2019 412,930EUR 7,179,532 SEK 75,800,000 JP Morgan 6/9/2019 185,226EUR 2,421,991 SEK 25,700,000 Bank of America 6/9/2019 50,570EUR 4,200,000 USD 4,753,371 RBS Plc 6/9/2019 (102,132)EUR 2,100,000 USD 2,377,053 State Street 6/9/2019 (51,398)EUR 4,305,067 USD 4,887,179 Bank of America 6/9/2019 (118,169)EUR 14,060,000 USD 15,720,842 Citibank 6/9/2019 (168,457)EUR 11,530,000 USD 12,861,240 Barclays 6/9/2019 (110,317)EUR 8,974,933 USD 10,201,006 JP Morgan 6/9/2019 (257,688)GBP 5,100,000 EUR 5,621,551 Barclays 6/9/2019 17,468GBP 5,090,000 EUR 5,568,244 RBS Plc 6/9/2019 59,718GBP 327,712 EUR 365,260 Bank of America 6/9/2019 (2,911)GBP 2,012,288 EUR 2,242,953 JP Morgan 6/9/2019 (17,987)HUF 5,650,577,771 EUR 17,258,113 BNP Paribas 6/9/2019 (203,691)HUF 509,557,382 EUR 1,558,016 Morgan Stanley 6/9/2019 (20,084)HUF 2,598,616,127 EUR 7,940,747 Credit Suisse 6/9/2019 (97,674)HUF 6,189,304,988 EUR 19,100,436 Barclays 6/9/2019 (420,043)HUF 590,956,840 EUR 1,809,011 RBS Plc 6/9/2019 (25,401)HUF 862,286,892 EUR 2,645,214 Bank of America 6/9/2019 (42,683)JPY 32,229,387 USD 296,832 Toronto Dominion 6/9/2019 6,219
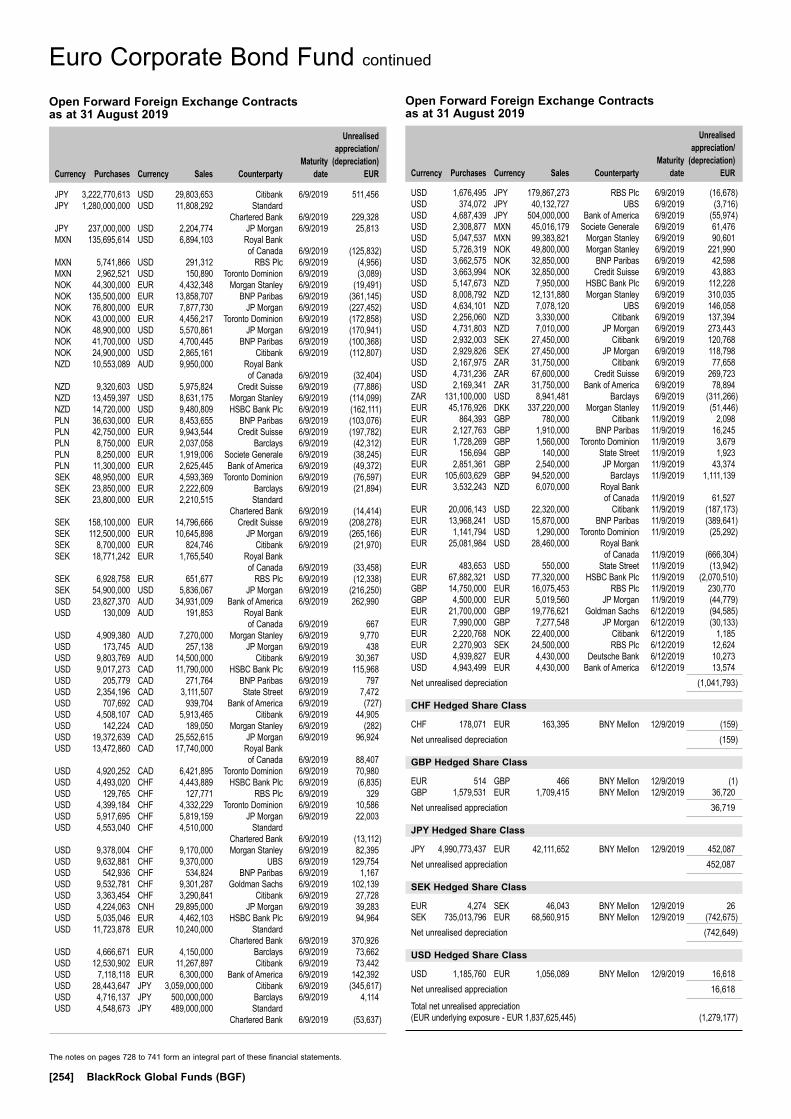
The notes on pages 728 to 741 form an integral part of these financial statements.
[254] BlackRock Global Funds (BGF)
Euro Corporate Bond Fund continued
Open Forward Foreign Exchange Contracts as at 31 August 2019
Currency
Purchases Currency
Sales Counterparty
Maturity date
Unrealised appreciation/
(depreciation) EUR
USD 1,676,495 JPY 179,867,273 RBS Plc 6/9/2019 (16,678)USD 374,072 JPY 40,132,727 UBS 6/9/2019 (3,716)USD 4,687,439 JPY 504,000,000 Bank of America 6/9/2019 (55,974)USD 2,308,877 MXN 45,016,179 Societe Generale 6/9/2019 61,476USD 5,047,537 MXN 99,383,821 Morgan Stanley 6/9/2019 90,601USD 5,726,319 NOK 49,800,000 Morgan Stanley 6/9/2019 221,990USD 3,662,575 NOK 32,850,000 BNP Paribas 6/9/2019 42,598USD 3,663,994 NOK 32,850,000 Credit Suisse 6/9/2019 43,883USD 5,147,673 NZD 7,950,000 HSBC Bank Plc 6/9/2019 112,228USD 8,008,792 NZD 12,131,880 Morgan Stanley 6/9/2019 310,035USD 4,634,101 NZD 7,078,120 UBS 6/9/2019 146,058USD 2,256,060 NZD 3,330,000 Citibank 6/9/2019 137,394USD 4,731,803 NZD 7,010,000 JP Morgan 6/9/2019 273,443USD 2,932,003 SEK 27,450,000 Citibank 6/9/2019 120,768USD 2,929,826 SEK 27,450,000 JP Morgan 6/9/2019 118,798USD 2,167,975 ZAR 31,750,000 Citibank 6/9/2019 77,658USD 4,731,236 ZAR 67,600,000 Credit Suisse 6/9/2019 269,723USD 2,169,341 ZAR 31,750,000 Bank of America 6/9/2019 78,894ZAR 131,100,000 USD 8,941,481 Barclays 6/9/2019 (311,266)EUR 45,176,926 DKK 337,220,000 Morgan Stanley 11/9/2019 (51,446)EUR 864,393 GBP 780,000 Citibank 11/9/2019 2,098EUR 2,127,763 GBP 1,910,000 BNP Paribas 11/9/2019 16,245EUR 1,728,269 GBP 1,560,000 Toronto Dominion 11/9/2019 3,679EUR 156,694 GBP 140,000 State Street 11/9/2019 1,923EUR 2,851,361 GBP 2,540,000 JP Morgan 11/9/2019 43,374EUR 105,603,629 GBP 94,520,000 Barclays 11/9/2019 1,111,139EUR 3,532,243 NZD 6,070,000 Royal Bank of Canada 11/9/2019 61,527EUR 20,006,143 USD 22,320,000 Citibank 11/9/2019 (187,173)EUR 13,968,241 USD 15,870,000 BNP Paribas 11/9/2019 (389,641)EUR 1,141,794 USD 1,290,000 Toronto Dominion 11/9/2019 (25,292)EUR 25,081,984 USD 28,460,000 Royal Bank of Canada 11/9/2019 (666,304)EUR 483,653 USD 550,000 State Street 11/9/2019 (13,942)EUR 67,882,321 USD 77,320,000 HSBC Bank Plc 11/9/2019 (2,070,510)GBP 14,750,000 EUR 16,075,453 RBS Plc 11/9/2019 230,770GBP 4,500,000 EUR 5,019,560 JP Morgan 11/9/2019 (44,779)EUR 21,700,000 GBP 19,776,621 Goldman Sachs 6/12/2019 (94,585)EUR 7,990,000 GBP 7,277,548 JP Morgan 6/12/2019 (30,133)EUR 2,220,768 NOK 22,400,000 Citibank 6/12/2019 1,185EUR 2,270,903 SEK 24,500,000 RBS Plc 6/12/2019 12,624USD 4,939,827 EUR 4,430,000 Deutsche Bank 6/12/2019 10,273USD 4,943,499 EUR 4,430,000 Bank of America 6/12/2019 13,574Net unrealised depreciation (1,041,793)
CHF Hedged Share Class
CHF 178,071 EUR 163,395 BNY Mellon 12/9/2019 (159)Net unrealised depreciation (159)
GBP Hedged Share Class
EUR 514 GBP 466 BNY Mellon 12/9/2019 (1)GBP 1,579,531 EUR 1,709,415 BNY Mellon 12/9/2019 36,720Net unrealised appreciation 36,719
JPY Hedged Share Class
JPY 4,990,773,437 EUR 42,111,652 BNY Mellon 12/9/2019 452,087Net unrealised appreciation 452,087
SEK Hedged Share Class
EUR 4,274 SEK 46,043 BNY Mellon 12/9/2019 26SEK 735,013,796 EUR 68,560,915 BNY Mellon 12/9/2019 (742,675)Net unrealised depreciation (742,649)
USD Hedged Share Class
USD 1,185,760 EUR 1,056,089 BNY Mellon 12/9/2019 16,618Net unrealised appreciation 16,618
Total net unrealised appreciation (EUR underlying exposure - EUR 1,837,625,445) (1,279,177)
Open Forward Foreign Exchange Contracts as at 31 August 2019
Currency
Purchases Currency
Sales Counterparty
Maturity date
Unrealised appreciation/
(depreciation) EUR
JPY 3,222,770,613 USD 29,803,653 Citibank 6/9/2019 511,456JPY 1,280,000,000 USD 11,808,292 Standard Chartered Bank 6/9/2019 229,328JPY 237,000,000 USD 2,204,774 JP Morgan 6/9/2019 25,813MXN 135,695,614 USD 6,894,103 Royal Bank of Canada 6/9/2019 (125,832)MXN 5,741,866 USD 291,312 RBS Plc 6/9/2019 (4,956)MXN 2,962,521 USD 150,890 Toronto Dominion 6/9/2019 (3,089)NOK 44,300,000 EUR 4,432,348 Morgan Stanley 6/9/2019 (19,491)NOK 135,500,000 EUR 13,858,707 BNP Paribas 6/9/2019 (361,145)NOK 76,800,000 EUR 7,877,730 JP Morgan 6/9/2019 (227,452)NOK 43,000,000 EUR 4,456,217 Toronto Dominion 6/9/2019 (172,858)NOK 48,900,000 USD 5,570,861 JP Morgan 6/9/2019 (170,941)NOK 41,700,000 USD 4,700,445 BNP Paribas 6/9/2019 (100,368)NOK 24,900,000 USD 2,865,161 Citibank 6/9/2019 (112,807)NZD 10,553,089 AUD 9,950,000 Royal Bank of Canada 6/9/2019 (32,404)NZD 9,320,603 USD 5,975,824 Credit Suisse 6/9/2019 (77,886)NZD 13,459,397 USD 8,631,175 Morgan Stanley 6/9/2019 (114,099)NZD 14,720,000 USD 9,480,809 HSBC Bank Plc 6/9/2019 (162,111)PLN 36,630,000 EUR 8,453,655 BNP Paribas 6/9/2019 (103,076)PLN 42,750,000 EUR 9,943,544 Credit Suisse 6/9/2019 (197,782)PLN 8,750,000 EUR 2,037,058 Barclays 6/9/2019 (42,312)PLN 8,250,000 EUR 1,919,006 Societe Generale 6/9/2019 (38,245)PLN 11,300,000 EUR 2,625,445 Bank of America 6/9/2019 (49,372)SEK 48,950,000 EUR 4,593,369 Toronto Dominion 6/9/2019 (76,597)SEK 23,850,000 EUR 2,222,609 Barclays 6/9/2019 (21,894)SEK 23,800,000 EUR 2,210,515 Standard Chartered Bank 6/9/2019 (14,414)SEK 158,100,000 EUR 14,796,666 Credit Suisse 6/9/2019 (208,278)SEK 112,500,000 EUR 10,645,898 JP Morgan 6/9/2019 (265,166)SEK 8,700,000 EUR 824,746 Citibank 6/9/2019 (21,970)SEK 18,771,242 EUR 1,765,540 Royal Bank of Canada 6/9/2019 (33,458)SEK 6,928,758 EUR 651,677 RBS Plc 6/9/2019 (12,338)SEK 54,900,000 USD 5,836,067 JP Morgan 6/9/2019 (216,250)USD 23,827,370 AUD 34,931,009 Bank of America 6/9/2019 262,990USD 130,009 AUD 191,853 Royal Bank of Canada 6/9/2019 667USD 4,909,380 AUD 7,270,000 Morgan Stanley 6/9/2019 9,770USD 173,745 AUD 257,138 JP Morgan 6/9/2019 438USD 9,803,769 AUD 14,500,000 Citibank 6/9/2019 30,367USD 9,017,273 CAD 11,790,000 HSBC Bank Plc 6/9/2019 115,968USD 205,779 CAD 271,764 BNP Paribas 6/9/2019 797USD 2,354,196 CAD 3,111,507 State Street 6/9/2019 7,472USD 707,692 CAD 939,704 Bank of America 6/9/2019 (727)USD 4,508,107 CAD 5,913,465 Citibank 6/9/2019 44,905USD 142,224 CAD 189,050 Morgan Stanley 6/9/2019 (282)USD 19,372,639 CAD 25,552,615 JP Morgan 6/9/2019 96,924USD 13,472,860 CAD 17,740,000 Royal Bank of Canada 6/9/2019 88,407USD 4,920,252 CAD 6,421,895 Toronto Dominion 6/9/2019 70,980USD 4,493,020 CHF 4,443,889 HSBC Bank Plc 6/9/2019 (6,835)USD 129,765 CHF 127,771 RBS Plc 6/9/2019 329USD 4,399,184 CHF 4,332,229 Toronto Dominion 6/9/2019 10,586USD 5,917,695 CHF 5,819,159 JP Morgan 6/9/2019 22,003USD 4,553,040 CHF 4,510,000 Standard Chartered Bank 6/9/2019 (13,112)USD 9,378,004 CHF 9,170,000 Morgan Stanley 6/9/2019 82,395USD 9,632,881 CHF 9,370,000 UBS 6/9/2019 129,754USD 542,936 CHF 534,824 BNP Paribas 6/9/2019 1,167USD 9,532,781 CHF 9,301,287 Goldman Sachs 6/9/2019 102,139USD 3,363,454 CHF 3,290,841 Citibank 6/9/2019 27,728USD 4,224,063 CNH 29,895,000 JP Morgan 6/9/2019 39,283USD 5,035,046 EUR 4,462,103 HSBC Bank Plc 6/9/2019 94,964USD 11,723,878 EUR 10,240,000 Standard Chartered Bank 6/9/2019 370,926USD 4,666,671 EUR 4,150,000 Barclays 6/9/2019 73,662USD 12,530,902 EUR 11,267,897 Citibank 6/9/2019 73,442USD 7,118,118 EUR 6,300,000 Bank of America 6/9/2019 142,392USD 28,443,647 JPY 3,059,000,000 Citibank 6/9/2019 (345,617)USD 4,716,137 JPY 500,000,000 Barclays 6/9/2019 4,114USD 4,548,673 JPY 489,000,000 Standard Chartered Bank 6/9/2019 (53,637)

The notes on pages 728 to 741 form an integral part of these financial statements.
Annual Report and Audited Financial Statements [255]
Open Exchange Traded Futures Contracts as at 31 August 2019
Number of contracts Currency
Contract/ Description
Expiration date
Underlying exposure
EUR
Unrealised appreciation/
(depreciation) EUR
161 EUR Euro Schatz September 2019 18,126,185 82,110(74) EUR Euro BUXL September 2019 16,584,880 (315,911)(392) EUR Euro-OAT September 2019 66,796,800 (3,179,120)(403) EUR Euro-BTP September 2019 58,576,050 (6,241,510)(671) EUR Euro Bund September 2019 120,182,810 (1,034,613)(783) EUR Euro BOBL September 2019 106,644,600 (127,870)371 CAD Canadian 10 Year Bond December 2019 36,781,370 183,479(462) GBP Long Gilt December 2019 68,743,959 (991,106)(19) USD US Treasury 2 Year Note (CBT) December 2019 3,714,733 3,222(35) USD US Long Bond (CBT) December 2019 5,230,965 19,803(49) USD US Ultra Bond (CBT) December 2019 8,738,672 39,160(156) USD US Treasury 5 Year Note (CBT) December 2019 16,920,369 37,513(219) USD US Treasury 10 Year Note (CBT) December 2019 26,080,011 93,843(539) USD US Ultra 10 Year Note December 2019 70,370,981 197,082
Total 623,492,385 (11,233,918)
Euro Corporate Bond Fund continued
Swaps as at 31 August 2019
TypeNominal
Value Description Counterparty
Expiration date
Unrealised appreciation/
(depreciation) EUR
Market Value EUR
CDS EUR 1,580,000 Fund receives default protection on British Telecommunications Plc; and pays Fixed 1% Bank of America 20/12/2023 (10,374) (19,595)
CDS EUR (8,000,000) Fund provides default protection on ITRAXX.EUR.25.V1; and receives Fixed 1% Barclays 20/6/2021 (1,034) 128,148
CDS EUR (10,000,000) Fund provides default protection on Siemens AG; and receives Fixed 1% Barclays 20/6/2021 (136,178) 169,793
CDS EUR (401,000) Fund provides default protection on BNP Paribas SA; and receives Fixed 1% Barclays 20/6/2022 8,257 9,407
CDS USD 5,000,000 Fund receives default protection on Brazilian Government International Bond; and pays Fixed 1% Barclays 20/12/2023 (161,144) 39,036
CDS EUR 1,740,000 Fund receives default protection on British Telecommunications Plc; and pays Fixed 1% Barclays 20/12/2023 (12,894) (21,579)
CDS EUR 1,435,000 Fund receives default protection on Imperial Brands Plc; and pays Fixed 1% Barclays 20/12/2023 (6,627) (15,599)
CDS EUR 2,000,000 Fund receives default protection on Barclays Bank Plc; and pays Fixed 1% BNP Paribas 20/6/2021 (65,890) (16,624)
CDS EUR (7,400,000) Fund provides default protection on ING Bank NV; and receives Fixed 1% BNP Paribas 20/6/2021 17,479 123,703
CDS EUR 3,483,000 Fund receives default protection on Lloyds Banking Group Plc; and pays Fixed 1% BNP Paribas 20/6/2024 12,423 (13,833)
CDS USD 3,182,000 Fund receives default protection on General Motors Co; and pays Fixed 5% Citibank 20/12/2020 (67,223) (175,880)
CDS EUR (1,402,979) Fund provides default protection on BNP Paribas SA; and receives Fixed 1% Citibank 20/6/2022 28,181 32,912
CDS EUR (1,202,542) Fund provides default protection on BNP Paribas SA; and receives Fixed 1% Citibank 20/6/2022 24,762 28,210
CDS EUR (1,503,500) Fund provides default protection on BNP Paribas SA; and receives Fixed 1% Citibank 20/6/2022 30,197 35,270
CDS EUR 1,517,000 Fund receives default protection on Lloyds Banking Group Plc; and pays Fixed 1% Citibank 20/6/2024 4,681 (6,025)
CDS EUR 260,000 Fund receives default protection on Louis Dreyfus Co BV; and pays Fixed 5% Credit Suisse 20/12/2019 (1,408) (3,702)
CDS USD 2,200,000 Fund receives default protection on National Australia Bank Ltd; and pays Fixed 1% Deutsche Bank 20/12/2020 (18,618) (22,839)
CDS EUR 740,000 Fund receives default protection on Louis Dreyfus Co BV; and pays Fixed 5% Goldman Sachs 20/12/2019 (3,987) (10,535)
CDS USD 1,996,335 Fund receives default protection on Australia & New Zealand Banking Group Ltd; and pays Fixed 1% Goldman Sachs 20/12/2020 (18,122) (20,782)
CDS EUR 13,900,000 Fund receives default protection on Bayer AG; and pays Fixed 1% Goldman Sachs 20/12/2023 (252,561) (268,708)CDS EUR 3,200,000 Fund receives default protection on SES SA; and pays Fixed 1% Goldman Sachs 20/12/2023 (29,667) (60,377)CDS EUR 2,400,000 Fund receives default protection on Marks & Spencer Plc;
and pays Fixed 1% Goldman Sachs 20/6/2024 31,253 111,819CDS EUR 23,000,000 Fund receives default protection on ITRAXX.XO.31.V1;
and pays Fixed 5% Goldman Sachs 20/6/2024 (17,453) (2,578,866)CDS USD 90,481,310 Fund provides default protection on CDX.NA.IG.32.V1;
and receives Fixed 1% Goldman Sachs 20/6/2024 (335,665) (1,764,092)CDS USD 20,517,871 Fund provides default protection on CDX.NA.HY.32.V2;
and receives Fixed 5% Goldman Sachs 20/6/2024 90,332 (1,276,631)

The notes on pages 728 to 741 form an integral part of these financial statements.
[256] BlackRock Global Funds (BGF)
Euro Corporate Bond Fund continued
Swaps as at 31 August 2019
TypeNominal
Value Description Counterparty
Expiration date
Unrealised appreciation/
(depreciation) EUR
Market Value EUR
CDS USD 5,700,000 Fund receives default protection on Brazilian Government International Bond; and pays Fixed 1% HSBC Bank Plc 20/12/2023 (241,713) 44,501
CDS EUR 4,735,000 Fund receives default protection on Renault SA; and pays Fixed 1% HSBC Bank Plc 20/6/2024 (51,709) (26,806)CDS USD 2,300,000 Fund receives default protection on Commonwealth Bank of
Australia; and pays Fixed 1% JP Morgan 20/12/2020 (22,569) (24,049)CDS USD 203,665 Fund receives default protection on Australia & New Zealand
Banking Group Ltd; and pays Fixed 1% JP Morgan 20/12/2020 (1,989) (2,120)CDS USD 2,300,000 Fund receives default protection on Westpac Banking Corp;
and pays Fixed 1% JP Morgan 20/12/2020 (21,807) (23,808)CDS EUR (2,500,000) Fund provides default protection on Skandinaviska Enskilda
Banken AB; and receives Fixed 1% JP Morgan 20/6/2021 (3,040) 41,408CDS EUR (14,400,000) Fund provides default protection on BNP Paribas SA;
and receives Fixed 1% JP Morgan 20/6/2021 29,944 230,151CDS EUR 2,081,000 Fund receives default protection on UBS Group AG;
and pays Fixed 1% JP Morgan 20/6/2023 (35,810) (55,064)CDS USD 6,000,000 Fund receives default protection on General Motors Co;
and pays Fixed 5% JP Morgan 20/12/2023 (223,058) (880,214)CDS EUR 1,713,000 Fund receives default protection on Renault SA; and pays Fixed 1% JP Morgan 20/6/2024 (17,731) (9,698)CDS EUR 6,566,000 Fund receives default protection on Barclays Bank Plc;
and pays Fixed 1% JP Morgan 20/6/2024 32,311 (10,694)CDS EUR 1,552,000 Fund receives default protection on Renault SA; and pays Fixed 1% JP Morgan 20/6/2024 (16,064) (8,786)CDS EUR (5,000,000) Fund provides default protection on Engie SA;
and receives Fixed 1% Societe Generale 20/12/2020 89,339 62,834CDS EUR 3,556,000 Fund receives default protection on British Telecommunications
Plc; and pays Fixed 1% Societe Generale 20/12/2023 (901) (44,101)IFS GBP 5,370,000 Fund provides default protection on UKRPI + 0 bps;
and receives Fixed 3.6% Goldman Sachs 17/6/2024 (45,834) (45,834)IFS GBP 4,980,000 Fund provides default protection on UKRPI + 0 bps;
and receives Fixed 3.5975% Goldman Sachs 17/6/2024 (43,285) (43,285)IFS GBP 5,110,000 Fund provides default protection on UKRPI + 0 bps;
and receives Fixed 3.611% Goldman Sachs 17/6/2024 (43,725) (40,097)IFS GBP 2,490,000 Fund provides default protection on UKRPI + 0 bps;
and receives Fixed 3.595% Goldman Sachs 15/7/2024 (24,439) (24,439)IFS GBP 3,630,000 Fund provides default protection on UKRPI + 0 bps;
and receives Fixed 3.655% Goldman Sachs 16/7/2024 (21,990) (21,990)IFS GBP 2,663,000 Fund provides default protection on UKRPI + 0 bps;
and receives Fixed 3.81% Goldman Sachs 16/8/2024 2,728 2,728IFS GBP 2,697,000 Fund provides default protection on UKRPI + 0 bps;
and receives Fixed 3.826% Goldman Sachs 16/8/2024 5,484 5,484IFS GBP 3,717,500 Fund provides default protection on UKRPI + 0bps;
and receives Fixed 3.655% Goldman Sachs 16/12/2028 (1,393) (1,393)IFS GBP 1,850,000 Fund provides default protection on UKRPI + 0bps;
and receives Fixed 3.65% Goldman Sachs 16/12/2028 (2,060) (2,060)IFS GBP 1,867,500 Fund receives default protection on UKRPI + 0bps;
and pays Fixed 3.64% Goldman Sachs 16/12/2028 (4,837) (4,837)IFS EUR 9,860,000 Fund provides default protection on CPTFEMU + 0 bps:
and receives Fixed 1.2895% Goldman Sachs 16/3/2029 (304,827) (304,827)IFS GBP 7,250,000 Fund provides default protection on UKRPI + 0 bps:
and receives Fixed 3.5025% Goldman Sachs 16/3/2029 (226,875) (226,875)IFS GBP 7,630,000 Fund provides default protection on UKRPI + 0 bps;
and receives Fixed 3.49% Goldman Sachs 16/3/2029 (252,653) (252,653)IFS GBP 3,245,000 Fund provides default protection on UKRPI + 0 bps;
and receives Fixed 3.675% Goldman Sachs 18/6/2029 (12,109) (12,109)IFS GBP 3,245,000 Fund provides default protection on UKRPI + 0 bps;
and receives Fixed 3.67% Goldman Sachs 18/6/2029 (14,505) (14,505)IFS GBP 6,560,000 Fund provides default protection on UKRPI + 0 bps;
and receives Fixed 3.725% Goldman Sachs 15/8/2029 – –IFS GBP 6,461,000 Fund provides default protection on UKRPI + 0 bps;
and receives Fixed 3.745% Goldman Sachs 16/8/2029 19,176 19,176IFS GBP 6,559,000 Fund provides default protection on UKRPI + 0 bps;
and receives Fixed 3.71% Goldman Sachs 16/8/2029 (14,578) (14,578)IFS EUR 8,920,000 Fund receives default protection on CPTFEMU + 0 bps:
and pays Fixed 1.066% Goldman Sachs 16/8/2029 (40,776) (40,776)IFS GBP 610,000 Fund receives default protection on UKRPI + 0 bps;
and pays Fixed 3.42% Goldman Sachs 16/6/2049 (42,709) (42,709)IFS GBP 1,270,000 Fund receives default protection on UKRPI + 0 bps;
and pays Fixed 3.43% Goldman Sachs 16/6/2049 (102,913) (98,859)IFS GBP 305,000 Fund receives default protection on UKRPI + 0 bps;
and pays Fixed 3.394% Goldman Sachs 15/7/2049 (15,321) (15,321)IRS GBP 5,000,000 Fund receives Floating GBP LIBOR 6 Month;
and pays Fixed 1.031% Citigroup 20/12/2021 (48,772) (48,772)IRS GBP 2,424,866 Fund receives Floating GBP LIBOR 6 Month;
and pays Fixed 1.4505% Citigroup 1/12/2067 (950,439) (950,439)

The notes on pages 728 to 741 form an integral part of these financial statements.
Annual Report and Audited Financial Statements [257]
Euro Corporate Bond Fund continued
Swaps as at 31 August 2019
TypeNominal
Value Description Counterparty
Expiration date
Unrealised appreciation/
(depreciation) EUR
Market Value EUR
IRS EUR 5,300,000 Fund receives Fixed 0.298%; and pays Floating EUR EURIBOR 6 Month Goldman Sachs 26/2/2020 18,874 18,874
IRS USD 9,800,000 Fund receives Floating USD LIBOR 3 Month; and pays Fixed 2.9725% Goldman Sachs 10/5/2027 (1,058,621) (1,058,621)
IRS EUR 2,475,000 Fund receives Fixed 0.903%; and pays Floating EUR EURIBOR 6 Month Goldman Sachs 14/6/2027 258,390 258,390
IRS USD 4,656,000 Fund receives Floating USD LIBOR 3 Month; and pays Fixed 2.86% Goldman Sachs 3/4/2028 (515,502) (515,502)IRS USD 1,116,000 Fund receives Floating USD LIBOR 3 Month;
and pays Fixed 2.974% Goldman Sachs 3/5/2028 (133,898) (133,898)IRS USD 438,460 Fund receives Floating USD LIBOR 3 Month;
and pays Fixed 3.018% Goldman Sachs 10/5/2028 (54,216) (54,216)IRS NZD 3,932,250 Fund receives Floating NZD BBR FRA 3 Month;
and pays Fixed 3.219% Goldman Sachs 24/5/2028 (390,897) (390,897)IRS NZD 3,932,250 Fund receives Floating NZD BBR FRA 3 Month;
and pays Fixed 3.22% Goldman Sachs 24/5/2028 (391,084) (391,084)IRS EUR 41,000,000 Fund receives Fixed 0.868%; and pays Floating EUR
EURIBOR 6 Month Goldman Sachs 10/7/2028 4,535,726 4,535,726IRS EUR 22,900,000 Fund receives Fixed 0.8545%; and pays Floating EUR
EURIBOR 6 Month Goldman Sachs 13/12/2028 2,572,168 2,572,168IRS EUR 2,800,000 Fund receives Fixed 1.0755%; and pays Floating EUR
EURIBOR 6 Month Goldman Sachs 3/6/2030 410,667 410,667IRS EUR 2,888,000 Fund receives Fixed 1.2545%; and pays Floating EUR
EURIBOR 6 Month Goldman Sachs 1/6/2033 561,333 561,333IRS EUR 2,887,000 Fund receives Fixed 1.3025%; and pays Floating EUR
EURIBOR 6 Month Goldman Sachs 4/6/2033 581,296 581,296IRS GBP 1,000,000 Fund receives Floating GBP LIBOR 6 Month;
and pays Fixed 1.416% Goldman Sachs 19/3/2068 (377,524) (377,524)IRS GBP 1,000,000 Fund receives Floating GBP LIBOR 6 Month;
and pays Fixed 1.445% Goldman Sachs 19/3/2068 (391,683) (391,683)
Total (EUR underlying exposure - EUR 492,823,669) 2,062,300 (2,857,756)
CDS: Credit Default Swaps IFS: Inflation SwapsIRS: Interest Rate Swaps
Written Swaptions as at 31 August 2019
Nominal Value
Description Counterparty
Expiration date
Unrealised appreciation/
(depreciation) EUR
Market Value EUR
USD (147,944,000) Fund writes a put option to enter into an Interest Rate Swap. If exercised Fund receives 3.4% Fixed semi-annually from 24/9/2020; and pays Floating USD LIBOR 3 Month BBA quarterly from 24/6/2020 JP Morgan 20/3/2020 453,835 (447)
EUR (19,235,000) Fund writes a call option to enter into an Interest Rate Swap. If exercised Fund receives Floating EUR EURIBOR 6 Month semi-annually from 12/8/2020; and pays -0.061% Fixed annually from 12/2/2021 Merrill Lynch 10/2/2020 (239,245) (510,459)
EUR (19,235,000) Fund writes a call option to enter into an Interest Rate Swap. If exercised Fund receives Floating EUR EURIBOR 6 Month semi-annually from 12/8/2020; and pays -0.063% Fixed annually from 12/2/2021 Merrill Lynch 10/2/2020 (216,163) (507,573)
Total (EUR underlying exposure - EUR 18,870,376) (1,573) (1,018,479)
Purchased Options as at 31 August 2019
Number of contracts
Call/ Put
Description Counterparty
Strike Price
Expiration date
Unrealised appreciation/
(depreciation) EUR
Market Value EUR
13,822,000 Put OTC EUR/GBP Morgan Stanley EUR 0.879 23/1/2020 (9,148) 199,772 13,822,000 Call OTC EUR/GBP Morgan Stanley EUR 0.92 23/1/2020 126,787 335,707 17,120,000 Put OTC GBP/USD RBS Plc GBP 1.22 20/11/2019 241,587 464,959
Total (EUR underlying exposure - EUR 9,042,791) 359,226 1,000,438

Transferable Securities and Money Market Instruments Admitted to an Official Stock Exchange Listing or Dealt in on Another Regulated Market
Transferable Securities and Money Market Instruments Admitted to an Official Stock Exchange Listing or Dealt in on Another Regulated Market
Holding
Description
Market Value (EUR)
% of Net
Assets
Holding
Description
Market Value (EUR)
% of Net
Assets
~ Investment in connected party fund, see further information in Note 11.
The notes on pages 728 to 741 form an integral part of these financial statements.
[258] BlackRock Global Funds (BGF)
FUNDS
Ireland 39,665 BlackRock ICS Euro Liquid
Environmentally Aware Fund~ 3,957,135 4.25Total Funds 3,957,135 4.25
COMMERCIAL PAPER
Austria EUR 500,000 Oesterreichische Kontrollbank AG
21/10/2019 (Zero Coupon) 500,464 0.54 EUR 500,000 Oesterreichische Kontrollbank AG
28/10/2019 (Zero Coupon) 500,526 0.54 1,000,990 1.08
Finland EUR 2,500,000 OP Corporate Bank Plc 30/9/2019
(Zero Coupon) 2,501,100 2.68 EUR 500,000 OP Corporate Bank Plc 13/2/2020
(Zero Coupon) 502,418 0.54 3,003,518 3.22
France EUR 1,500,000 Antalis SA 9/9/2019 (Zero Coupon) 1,500,227 1.61 EUR 2,500,000 Antalis SA 29/10/2019
(Zero Coupon) 2,502,099 2.68 EUR 2,000,000 Banques Populaires et Caisses
d'Epargne 31/10/2019 (Zero Coupon) 2,001,702 2.15
EUR 500,000 Groupe BPCE 2/1/2020 (Zero Coupon) 500,836 0.54
6,504,864 6.98
Germany EUR 500,000 Dekabank Deutsche Girozentrale
5/11/2019 (Zero Coupon) 500,468 0.54 EUR 1,000,000 Dekabank Deutsche Girozentrale
23/9/2019 (Zero Coupon) 1,000,344 1.07 EUR 500,000 Dekabank Deutsche Girozentrale
22/10/2019 (Zero Coupon) 500,371 0.54 EUR 500,000 Landesbank Hessen-Thüringen
Girozentrale 23/12/2019 (Zero Coupon) 500,975 0.54
EUR 2,000,000 Toyota Kreditbank GmbH 11/11/2019 (Zero Coupon) 2,002,037 2.15
4,504,195 4.84
Ireland EUR 2,000,000 Matchpoint Finance Plc 2/12/2019
(Zero Coupon) 2,002,616 2.15 EUR 1,000,000 Matchpoint Finance Plc 17/2/2020
(Zero Coupon) 1,002,371 1.08 3,004,987 3.23
Netherlands EUR 500,000 BMW Finance NV 12/9/2019
(Zero Coupon) 500,096 0.54 EUR 1,000,000 ING US Funding LLC 26/9/2019
(Zero Coupon) 1,000,370 1.07 EUR 500,000 Nieuw Amsterdam 17/9/2019
(Zero Coupon) 500,166 0.54 2,000,632 2.15
Sweden EUR 1,000,000 Nordea Bank AB 18/11/2019
(Zero Coupon) 1,001,160 1.07 EUR 2,000,000 Nordea Bank AB 29/11/2019
(Zero Coupon) 2,002,625 2.15 EUR 500,000 Svenska Handelsbanken AB
20/11/2019 (Zero Coupon) 500,569 0.53 EUR 500,000 Svenska Handelsbanken AB
20/1/2020 (Zero Coupon) 500,982 0.54 EUR 500,000 Svenska Handelsbanken AB
14/2/2020 (Zero Coupon) 501,153 0.54 EUR 500,000 Svenska Handelsbanken AB
21/2/2020 (Zero Coupon) 501,201 0.54 EUR 500,000 Svenska Handelsbanken AB
28/2/2020 (Zero Coupon) 501,248 0.54 5,508,938 5.91
Switzerland EUR 500,000 UBS AG 25/10/2019 (Zero Coupon) 500,303 0.53 EUR 500,000 UBS AG 31/10/2019 (Zero Coupon) 500,330 0.54 EUR 2,000,000 UBS AG 10/1/2020 (Zero Coupon) 2,002,460 2.15 3,003,093 3.22
United Kingdom EUR 2,000,000 Albion Capital Corp SA 15/10/2019
(Zero Coupon) 2,001,646 2.15 EUR 2,000,000 Standard Chartered Bank Plc
24/1/2020 (Zero Coupon) 2,004,739 2.15 4,006,385 4.30
United States EUR 500,000 Colgate-Palmolive Co 26/9/2019
(Zero Coupon) 500,201 0.54 EUR 1,000,000 Collateralized Commercial Paper
11/9/2019 (Zero Coupon) 1,000,179 1.07 EUR 500,000 Collateralized Commercial Paper
13/9/2019 (Zero Coupon) 500,103 0.54 EUR 4,000,000 Honeywell International Inc
9/9/2019 (Zero Coupon) 4,000,578 4.29 EUR 500,000 Procter & Gamble Co 18/10/2019
(Zero Coupon) 500,344 0.54 EUR 2,000,000 Procter & Gamble Co 7/11/2019
(Zero Coupon) 2,001,927 2.15 EUR 1,500,000 Procter & Gamble Co 15/11/2019
(Zero Coupon) 1,501,610 1.61 10,004,942 10.74Total Commercial Paper 42,542,544 45.67
CERTIFICATES OF DEPOSIT
France EUR 1,000,000 BNP Paribas Fortis NV/SA
29/11/2019 (Zero Coupon) 1,001,190 1.08 EUR 1,000,000 Credit Agricole SA 6/11/2019
(Zero Coupon) 1,000,902 1.07 EUR 1,000,000 Credit Agricole SA (London
Branch) 22/10/2019 (Zero Coupon) 1,000,705 1.07
EUR 1,000,000 Credit Agricole SA (London Branch) 7/2/2020 (Zero Coupon) 1,002,119 1.08
4,004,916 4.30
Euro Reserve Fund
Portfolio of Investments 31 August 2019
Euro Reserve Fund
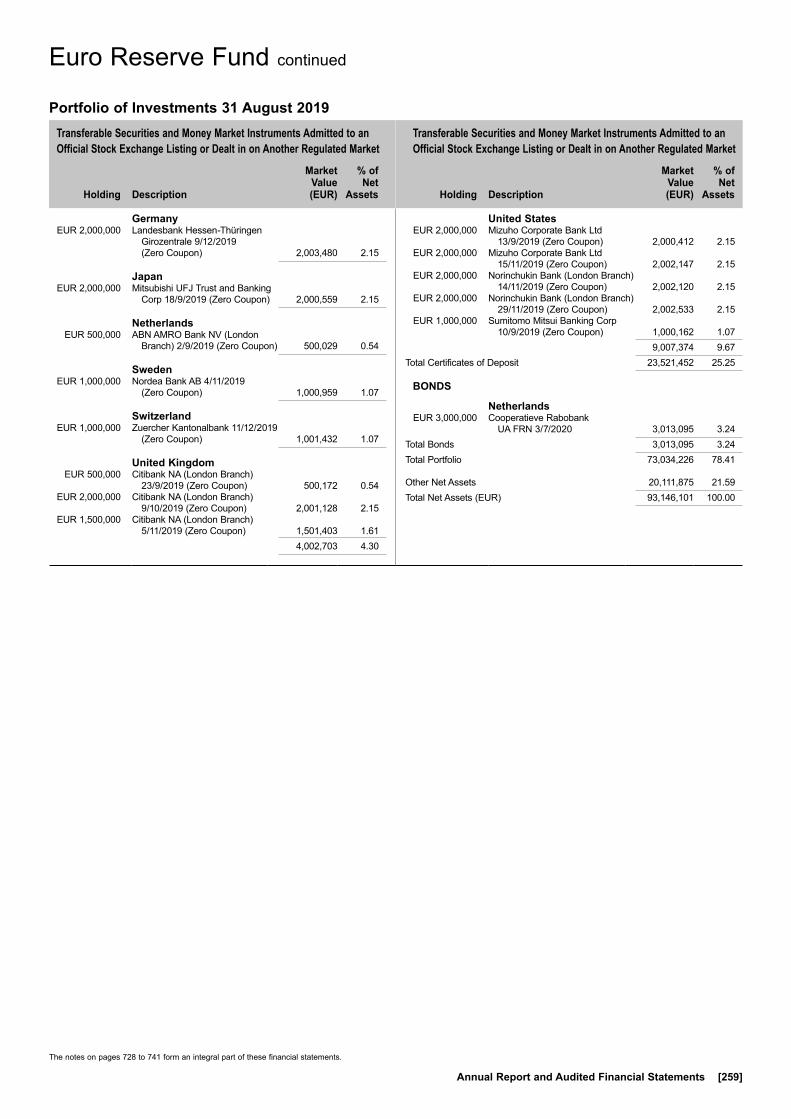
Transferable Securities and Money Market Instruments Admitted to an Official Stock Exchange Listing or Dealt in on Another Regulated Market
Transferable Securities and Money Market Instruments Admitted to an Official Stock Exchange Listing or Dealt in on Another Regulated Market
Holding
Description
Market Value (EUR)
% of Net
Assets
Holding
Description
Market Value (EUR)
% of Net
Assets
The notes on pages 728 to 741 form an integral part of these financial statements.
Annual Report and Audited Financial Statements [259]
Germany EUR 2,000,000 Landesbank Hessen-Thüringen
Girozentrale 9/12/2019 (Zero Coupon) 2,003,480 2.15
Japan EUR 2,000,000 Mitsubishi UFJ Trust and Banking
Corp 18/9/2019 (Zero Coupon) 2,000,559 2.15
Netherlands EUR 500,000 ABN AMRO Bank NV (London
Branch) 2/9/2019 (Zero Coupon) 500,029 0.54
Sweden EUR 1,000,000 Nordea Bank AB 4/11/2019
(Zero Coupon) 1,000,959 1.07
Switzerland EUR 1,000,000 Zuercher Kantonalbank 11/12/2019
(Zero Coupon) 1,001,432 1.07
United Kingdom EUR 500,000 Citibank NA (London Branch)
23/9/2019 (Zero Coupon) 500,172 0.54 EUR 2,000,000 Citibank NA (London Branch)
9/10/2019 (Zero Coupon) 2,001,128 2.15 EUR 1,500,000 Citibank NA (London Branch)
5/11/2019 (Zero Coupon) 1,501,403 1.61 4,002,703 4.30
United States EUR 2,000,000 Mizuho Corporate Bank Ltd
13/9/2019 (Zero Coupon) 2,000,412 2.15 EUR 2,000,000 Mizuho Corporate Bank Ltd
15/11/2019 (Zero Coupon) 2,002,147 2.15 EUR 2,000,000 Norinchukin Bank (London Branch)
14/11/2019 (Zero Coupon) 2,002,120 2.15 EUR 2,000,000 Norinchukin Bank (London Branch)
29/11/2019 (Zero Coupon) 2,002,533 2.15 EUR 1,000,000 Sumitomo Mitsui Banking Corp
10/9/2019 (Zero Coupon) 1,000,162 1.07 9,007,374 9.67Total Certificates of Deposit 23,521,452 25.25
BONDS
Netherlands EUR 3,000,000 Cooperatieve Rabobank
UA FRN 3/7/2020 3,013,095 3.24Total Bonds 3,013,095 3.24Total Portfolio 73,034,226 78.41
Other Net Assets 20,111,875 21.59Total Net Assets (EUR) 93,146,101 100.00
Euro Reserve Fund continued
Portfolio of Investments 31 August 2019

Transferable Securities and Money Market Instruments Admitted to an Official Stock Exchange Listing or Dealt in on Another Regulated Market
Transferable Securities and Money Market Instruments Admitted to an Official Stock Exchange Listing or Dealt in on Another Regulated Market
Holding
Description
Market Value (EUR)
% of Net
Assets
Holding
Description
Market Value (EUR)
% of Net
Assets
~ Investment in connected party fund, see further information in Note 11.* All or a portion of this security represents a security on loan.
The notes on pages 728 to 741 form an integral part of these financial statements.
[260] BlackRock Global Funds (BGF)
FUNDS
Ireland 892,680 BlackRock ICS Euro Liquid
Environmentally Aware Fund~ 89,058,151 0.77 416,307 iShares EUR Corp Bond 1-5yr
UCITS ETF*~ 46,692,993 0.40Total Funds 135,751,144 1.17
BONDS
Australia EUR 28,075,000 Australia & New Zealand Banking
Group Ltd 0.375% 19/11/2019 28,122,026 0.24
Austria EUR 29,000,000 Raiffeisen Bank International AG
0.25% 5/7/2021 29,250,705 0.25 EUR 14,501,000 Republic of Austria Government
Bond ‘144A’ 2.1% 20/9/2117 29,145,560 0.25 58,396,265 0.50
Belgium EUR 4,471,000 Anheuser-Busch InBev SA/NV
FRN 17/3/2020* 4,486,045 0.04 EUR 7,900,000 Anheuser-Busch InBev SA/NV
2.875% 25/9/2024 9,113,023 0.08 EUR 19,100,000 Argenta Spaarbank NV 1% 6/2/2024 19,982,898 0.17 EUR 11,200,000 Belfius Bank SA 0.75% 12/9/2022* 11,511,024 0.10 EUR 10,000,000 Euroclear Bank SA 0.5% 10/7/2023 10,305,000 0.09 EUR 8,100,000 KBC Bank NV 1.25% 28/5/2020 8,203,599 0.07 63,601,589 0.55
Canada EUR 19,850,000 Bank of Nova Scotia/The 0.5%
23/7/2020 20,020,710 0.17 EUR 10,125,000 Canadian Imperial Bank of
Commerce 0.375% 15/10/2019 10,134,264 0.09 EUR 42,850,000 National Bank of Canada 0.25%
24/7/2023 44,158,639 0.38 EUR 24,800,000 Royal Bank of Canada 0.125%
11/3/2021 25,048,588 0.21 EUR 33,700,000 Toronto-Dominion Bank/The
9/2/2024 (Zero Coupon) 34,440,558 0.30 EUR 27,225,000 Toronto-Dominion Bank/The
0.375% 12/1/2021* 27,558,039 0.24 161,360,798 1.39
Cayman Islands GBP 900,000 Trafford Centre Finance Ltd/The
FRN 28/7/2035 878,688 0.01
Cyprus EUR 15,538,000 Cyprus Government International
Bond 3.75% 26/7/2023 17,888,310 0.15 EUR 5,090,000 Cyprus Government International
Bond 3.875% 6/5/2022 5,645,192 0.05 EUR 3,974,000 Cyprus Government International
Bond ‘144A’ 4.625% 3/2/2020 4,054,593 0.04 27,588,095 0.24
Czech Republic CZK 2,561,170,000 Czech Republic Government Bond
10/2/2020 (Zero Coupon)* 98,245,689 0.85 CZK 993,470,000 Czech Republic Government Bond
0.75% 23/2/2021 38,205,145 0.33
EUR 33,065,000 Raiffeisenbank AS 0.75% 5/11/2019 33,099,388 0.28 EUR 24,100,000 UniCredit Bank Czech Republic &
Slovakia AS 0.625% 30/4/2020 24,268,611 0.21 193,818,833 1.67
Denmark USD 16,507,000 Danske Bank A/S FRN 12/9/2023* 14,709,202 0.13 EUR 9,900,000 Danske Bank A/S 0.25% 28/11/2022 10,024,096 0.09 DKK 77,500,000 Nordea Kredit
Realkreditaktieselskab 1% 1/10/2050 10,581,019 0.09
DKK 306,088,107 Nordea Kredit Realkreditaktieselskab 2% 1/10/2019 41,140,151 0.36
DKK 91,498,587 Nordea Kredit Realkreditaktieselskab 2% 1/4/2020 12,473,216 0.11
DKK 153,967,981 Nykredit Realkredit A/S 1% 1/1/2021 21,129,031 0.18
DKK 163,800,000 Nykredit Realkredit A/S 1% 1/10/2050 22,363,496 0.19
DKK 146,057,222 Nykredit Realkredit A/S 1.5% 1/10/2050 20,156,561 0.17
DKK 221,292,109 Realkredit Danmark A/S ‘144A’ 1.5% 1/10/2050 30,435,442 0.26
DKK 1 Realkredit Danmark A/S 2% 1/10/2047 – 0.00
183,012,214 1.58
Finland EUR 23,050,000 Fortum Oyj 0.875% 27/2/2023 23,713,033 0.20 EUR 19,900,000 Nordea Bank Abp FRN 10/11/2025* 20,362,368 0.18 EUR 8,555,000 Nordea Bank Abp 0.875% 26/6/2023 8,870,466 0.08 EUR 24,050,000 OP Corporate Bank plc 0.375%
29/8/2023 24,716,546 0.21 77,662,413 0.67
France EUR 6,100,000 Air Liquide Finance SA 0.125%
13/6/2020 6,118,178 0.05 EUR 22,800,000 Banque Federative du Credit
Mutuel SA 0.125% 5/2/2024 23,110,308 0.20 EUR 27,500,000 Banque Federative du Credit
Mutuel SA 0.375% 13/1/2022 27,958,425 0.24 EUR 22,500,000 Banque Federative du Credit
Mutuel SA 0.75% 15/6/2023 23,341,838 0.20 GBP 16,700,000 Banque Federative du Credit
Mutuel SA 1.375% 20/12/2021 18,595,112 0.16 EUR 21,400,000 BNP Paribas SA FRN 15/7/2025 21,758,557 0.19 EUR 6,900,000 BNP Paribas SA 1.125% 28/8/2024 7,280,432 0.06 EUR 3,200,000 BPCE SA FRN 23/3/2023* 3,211,072 0.03 EUR 7,900,000 BPCE SA 0.375% 5/10/2023 8,110,654 0.07 EUR 12,300,000 BPCE SA 0.625% 20/4/2020 12,373,984 0.11 EUR 3,900,000 BPCE SA 0.625% 26/9/2023 4,039,289 0.03 EUR 1,800,000 BPCE SA 0.625% 26/9/2024 1,843,839 0.02 EUR 17,600,000 BPCE SFH SA 1.5% 30/1/2020 17,742,384 0.15 EUR 33,800,000 BPCE SFH SA 1.75% 29/11/2019 33,978,802 0.29 EUR 14,900,000 BPCE SFH SA 2.125% 17/9/2020 15,313,074 0.13 EUR 600,000 BPCE SFH SA 3.75% 13/9/2021 653,357 0.01 EUR 36,900,000 Bpifrance Financement SA 0.125%
25/11/2023* 37,948,329 0.33 EUR 9,800,000 Caisse Centrale du Credit
Immobilier de France SA 0.125% 1/3/2021 9,905,840 0.08
EUR 55,000,000 Caisse Centrale du Credit Immobilier de France SA 0.375% 31/7/2020 55,465,506 0.48
Euro Short Duration Bond Fund
Portfolio of Investments 31 August 2019
Euro Short Duration Bond Fund

Transferable Securities and Money Market Instruments Admitted to an Official Stock Exchange Listing or Dealt in on Another Regulated Market
Transferable Securities and Money Market Instruments Admitted to an Official Stock Exchange Listing or Dealt in on Another Regulated Market
Holding
Description
Market Value (EUR)
% of Net
Assets
Holding
Description
Market Value (EUR)
% of Net
Assets
† Securities pledged or given in guarantee, see Note 14, for further details.* All or a portion of this security represents a security on loan.
The notes on pages 728 to 741 form an integral part of these financial statements.
Annual Report and Audited Financial Statements [261]
EUR 10,300,000 Caisse Francaise de Financement Local 0.375% 16/9/2019 10,303,399 0.09
EUR 1,200,000 Caisse Francaise de Financement Local 1.75% 16/7/2020 1,223,580 0.01
EUR 7,950,000 Carrefour SA 4% 9/4/2020* 8,148,313 0.07 EUR 8,800,000 Cars Alliance Auto Loans France V
2018-1 ‘Series 2018-F1V A’ FRN 21/10/2029 8,833,162 0.08
EUR 4,900,000 Cars Alliance Auto Loans France V 2018-1 ‘Series 2018-F1V B’ FRN 21/10/2029 4,906,295 0.04
EUR 47,000,000 Cie de Financement Foncier SA 0.2% 16/9/2022 48,167,245 0.41
EUR 79,750,000 Cie de Financement Foncier SA 0.375% 29/10/2020 80,586,179 0.69
EUR 2,100,000 Cie de Saint-Gobain 27/3/2020 (Zero Coupon)* 2,102,310 0.02
EUR 10,400,000 Cie de Saint-Gobain 0.625% 15/3/2024 10,763,132 0.09
EUR 1,700,000 Cie de Saint-Gobain 0.875% 21/9/2023 1,774,673 0.01
EUR 17,600,000 Credit Agricole SA/London 0.5% 24/6/2024 18,004,008 0.15
EUR 9,900,000 Credit Agricole SA/London 0.75% 1/12/2022 10,255,460 0.09
EUR 5,000,000 Credit Agricole SA/London 0.875% 19/1/2022 5,145,615 0.04
EUR 25,400,000 Credit Mutuel - CIC Home Loan SFH SA 0.25% 30/4/2024 26,379,424 0.23
EUR 15,500,000 Credit Mutuel Arkea SA 1.375% 17/1/2025 16,699,390 0.14
EUR 24,200,000 Danone SA 0.167% 3/11/2020 24,338,182 0.21 GBP 32,700,000 Dexia Credit Local SA 0.875%
7/9/2021 36,222,035 0.31 EUR 117,384 Driver France FCT Compartment
Driver France Three FRN 21/6/2024 117,767 0.00
EUR 15,100,000 Engie SA FRN 16/1/2023 (Perpetual) 15,364,552 0.13 EUR 16,000,000 Engie SA 1.375% 19/5/2020 16,191,040 0.14 EUR 2,203,001 FCT Noria 2018-1 FRN 25/6/2038 2,218,205 0.02 EUR 862,044 FCT Noria 2018-1 FRN 25/6/2038 866,456 0.01 EUR 957,827 FCT Noria 2018-1 FRN 25/6/2038 962,088 0.01 EUR 2,586,132 FCT Noria 2018-1 FRN 25/6/2038 2,577,695 0.02 EUR 1,419,135 FCT SapphireOne Auto 2017-1
‘Series 2017-1 A’ FRN 24/1/2034 1,421,612 0.01 EUR 49,555,000 French Republic Government Bond
OAT 0.1% 1/3/2028 57,583,322 0.50 EUR 62,250,000 French Republic Government Bond
OAT 0.5% 25/5/2026*† 67,105,307 0.58 EUR 27,261,753 French Republic Government Bond
OAT ‘144A’ 1.5% 25/5/2050† 35,830,122 0.31 EUR 23,100,000 French Republic Government Bond
OAT ‘144A’ 1.75% 25/5/2066 33,816,090 0.29 EUR 36,785,031 French Republic Government Bond
OAT ‘144A’ 2% 25/5/2048† 53,369,562 0.46 EUR 17,700,000 Gecina SA FRN 30/6/2022 17,727,524 0.15 EUR 19,200,000 HSBC France SA 0.25% 17/5/2024 19,564,128 0.17 EUR 39,000,000 HSBC France SA 0.6% 20/3/2023 40,165,125 0.35 EUR 22,200,000 LVMH Moet Hennessy Louis
Vuitton SE 0.125% 28/2/2023 22,544,322 0.19 EUR 1,259,000 Orange SA FRN 1/10/2021
(Perpetual)* 1,360,232 0.01 EUR 14,300,000 Orange SA 1.125% 15/7/2024 15,151,686 0.13 EUR 4,275,000 PSA Banque France SA 0.5%
12/4/2022* 4,342,630 0.04 EUR 8,743,000 RCI Banque SA FRN 8/7/2020 8,753,492 0.08 EUR 12,294,000 RCI Banque SA FRN 12/4/2021* 12,347,540 0.11 EUR 7,054,000 RCI Banque SA FRN 14/3/2022 7,078,230 0.06 EUR 9,900,000 Sanofi 21/3/2020 (Zero Coupon) 9,917,374 0.09
EUR 11,200,000 Sanofi 0.5% 21/3/2023 11,525,832 0.10 EUR 7,200,000 Societe Generale SA FRN
7/4/2021 (Perpetual) 7,723,152 0.07 EUR 14,200,000 Societe Generale SA FRN 1/4/2022 14,377,145 0.12 EUR 9,000,000 Societe Generale SA 27/5/2022
(Zero Coupon) 9,071,055 0.08 EUR 24,600,000 Societe Generale SA 0.25%
18/1/2022 24,930,132 0.21 EUR 17,400,000 Societe Generale SA 0.5%
13/1/2023 17,702,412 0.15 EUR 9,000,000 Societe Generale SA 0.75%
25/11/2020 9,128,699 0.08 EUR 12,800,000 Societe Generale SA 1.25%
15/2/2024 13,412,736 0.12 EUR 21,000,000 Societe Generale SFH SA 0.75%
29/1/2027 22,816,479 0.20 EUR 2,100,000 Suez FRN 30/3/2022 (Perpetual) 2,208,257 0.02 EUR 3,000,000 Veolia Environnement SA 0.672%
30/3/2022 3,063,850 0.03 EUR 5,350,000 Veolia Environnement SA 4.247%
6/1/2021 5,675,413 0.05 1,230,612,645 10.60
Germany EUR 9,239,000 Bayer AG FRN 1/7/2075 9,311,584 0.08 EUR 221,143,969 Bundesobligation 9/4/2021
(Zero Coupon)* 224,400,988 1.93 EUR 184,578,289 Bundesobligation 8/10/2021
(Zero Coupon)*† 188,284,030 1.62 EUR 33,742,993 Bundesrepublik Deutschland
Bundesanleihe 2% 4/1/2022*† 36,111,414 0.31 EUR 6,209,000 Continental AG 5/2/2020
(Zero Coupon)* 6,215,613 0.05 EUR 10,800,000 Deutsche Pfandbriefbank AG
0.75% 7/2/2023 11,098,350 0.10 EUR 47,500,000 Erste Abwicklungsanstalt
12/6/2020 (Zero Coupon) 47,706,862 0.41 EUR 7,950,000 Eurogrid GmbH 3.875% 22/10/2020 8,331,416 0.07 EUR 28,600,000 FMS Wertmanagement 13/11/2020
(Zero Coupon) 28,823,080 0.25 EUR 1,500,000 Globaldrive Auto Receivables
2016-B BV ‘Series 2016-B B’ FRN 20/8/2024 1,514,450 0.01
EUR 5,700,000 Hamburg Commercial Bank AG 0.5% 23/5/2022 5,775,686 0.05
EUR 90,000,000 Kreditanstalt fuer Wiederaufbau 25/5/2021 (Zero Coupon) 91,092,398 0.78
EUR 217,244,000 Kreditanstalt fuer Wiederaufbau 30/6/2021 (Zero Coupon) 220,038,323 1.90
EUR 224,572,000 Kreditanstalt fuer Wiederaufbau 30/6/2022 (Zero Coupon) 229,239,729 1.98
EUR 113,507,000 Kreditanstalt fuer Wiederaufbau 0.125% 7/6/2023* 117,135,819 1.01
EUR 112,288,000 Kreditanstalt fuer Wiederaufbau 0.125% 7/11/2023 116,202,736 1.00
EUR 113,087,000 Kreditanstalt fuer Wiederaufbau 0.625% 4/7/2022 117,476,285 1.01
EUR 1,400,000 Landesbank Baden-Wuerttemberg FRN 27/5/2026* 1,459,126 0.01
EUR 28,600,000 Merck Financial Services GmbH 0.005% 15/12/2023 28,927,327 0.25
EUR 53,647,000 State of Lower Saxony 0.4% 10/7/2020* 54,134,453 0.47
EUR 11,900,000 Volkswagen Bank GmbH FRN 15/6/2021 11,907,556 0.10
EUR 17,100,000 Volkswagen Bank GmbH FRN 8/12/2021 17,200,120 0.15
EUR 10,903,000 Volkswagen Financial Services AG 0.875% 12/4/2023 11,150,553 0.10
Euro Short Duration Bond Fund continued
Portfolio of Investments 31 August 2019
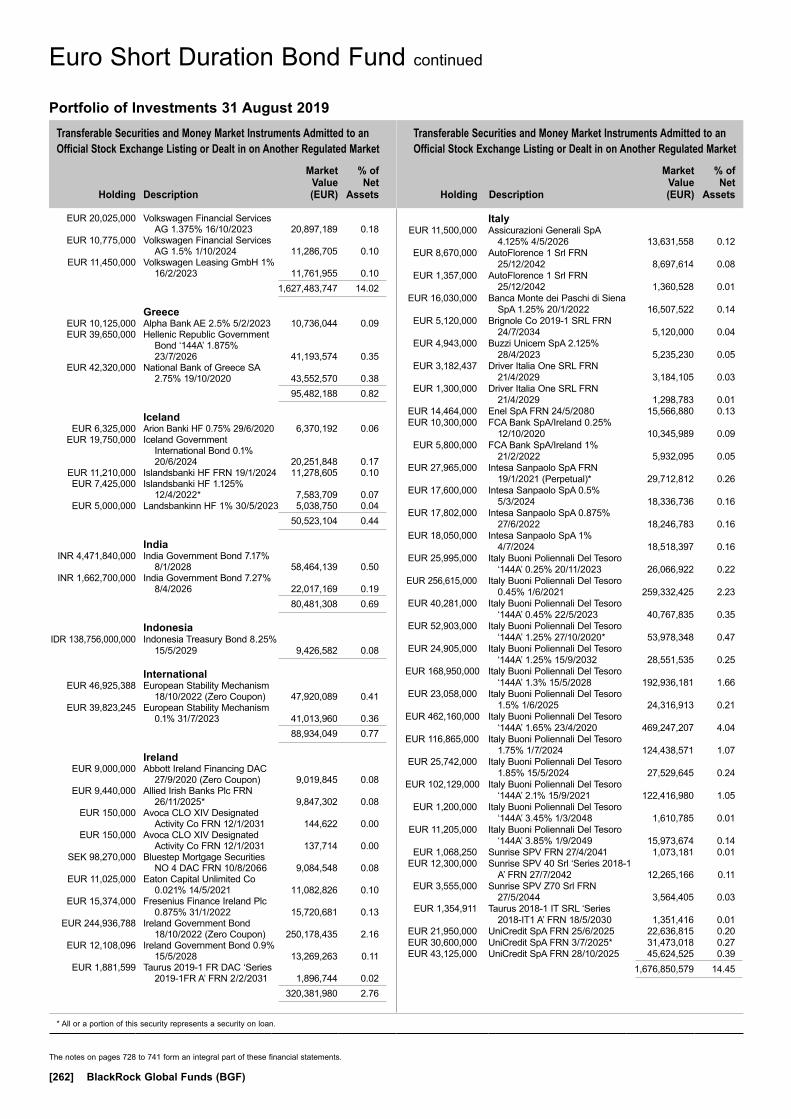
Transferable Securities and Money Market Instruments Admitted to an Official Stock Exchange Listing or Dealt in on Another Regulated Market
Transferable Securities and Money Market Instruments Admitted to an Official Stock Exchange Listing or Dealt in on Another Regulated Market
Holding
Description
Market Value (EUR)
% of Net
Assets
Holding
Description
Market Value (EUR)
% of Net
Assets
* All or a portion of this security represents a security on loan.
The notes on pages 728 to 741 form an integral part of these financial statements.
[262] BlackRock Global Funds (BGF)
EUR 20,025,000 Volkswagen Financial Services AG 1.375% 16/10/2023 20,897,189 0.18
EUR 10,775,000 Volkswagen Financial Services AG 1.5% 1/10/2024 11,286,705 0.10
EUR 11,450,000 Volkswagen Leasing GmbH 1% 16/2/2023 11,761,955 0.10
1,627,483,747 14.02
Greece EUR 10,125,000 Alpha Bank AE 2.5% 5/2/2023 10,736,044 0.09 EUR 39,650,000 Hellenic Republic Government
Bond ‘144A’ 1.875% 23/7/2026 41,193,574 0.35
EUR 42,320,000 National Bank of Greece SA 2.75% 19/10/2020 43,552,570 0.38
95,482,188 0.82
Iceland EUR 6,325,000 Arion Banki HF 0.75% 29/6/2020 6,370,192 0.06 EUR 19,750,000 Iceland Government
International Bond 0.1% 20/6/2024 20,251,848 0.17
EUR 11,210,000 Islandsbanki HF FRN 19/1/2024 11,278,605 0.10 EUR 7,425,000 Islandsbanki HF 1.125%
12/4/2022* 7,583,709 0.07 EUR 5,000,000 Landsbankinn HF 1% 30/5/2023 5,038,750 0.04 50,523,104 0.44
India INR 4,471,840,000 India Government Bond 7.17%
8/1/2028 58,464,139 0.50 INR 1,662,700,000 India Government Bond 7.27%
8/4/2026 22,017,169 0.19 80,481,308 0.69
Indonesia IDR 138,756,000,000 Indonesia Treasury Bond 8.25%
15/5/2029 9,426,582 0.08
International EUR 46,925,388 European Stability Mechanism
18/10/2022 (Zero Coupon) 47,920,089 0.41 EUR 39,823,245 European Stability Mechanism
0.1% 31/7/2023 41,013,960 0.36 88,934,049 0.77
Ireland EUR 9,000,000 Abbott Ireland Financing DAC
27/9/2020 (Zero Coupon) 9,019,845 0.08 EUR 9,440,000 Allied Irish Banks Plc FRN
26/11/2025* 9,847,302 0.08 EUR 150,000 Avoca CLO XIV Designated
Activity Co FRN 12/1/2031 144,622 0.00 EUR 150,000 Avoca CLO XIV Designated
Activity Co FRN 12/1/2031 137,714 0.00 SEK 98,270,000 Bluestep Mortgage Securities
NO 4 DAC FRN 10/8/2066 9,084,548 0.08 EUR 11,025,000 Eaton Capital Unlimited Co
0.021% 14/5/2021 11,082,826 0.10 EUR 15,374,000 Fresenius Finance Ireland Plc
0.875% 31/1/2022 15,720,681 0.13 EUR 244,936,788 Ireland Government Bond
18/10/2022 (Zero Coupon) 250,178,435 2.16 EUR 12,108,096 Ireland Government Bond 0.9%
15/5/2028 13,269,263 0.11 EUR 1,881,599 Taurus 2019-1 FR DAC ‘Series
2019-1FR A’ FRN 2/2/2031 1,896,744 0.02 320,381,980 2.76
Italy EUR 11,500,000 Assicurazioni Generali SpA
4.125% 4/5/2026 13,631,558 0.12 EUR 8,670,000 AutoFlorence 1 Srl FRN
25/12/2042 8,697,614 0.08 EUR 1,357,000 AutoFlorence 1 Srl FRN
25/12/2042 1,360,528 0.01 EUR 16,030,000 Banca Monte dei Paschi di Siena
SpA 1.25% 20/1/2022 16,507,522 0.14 EUR 5,120,000 Brignole Co 2019-1 SRL FRN
24/7/2034 5,120,000 0.04 EUR 4,943,000 Buzzi Unicem SpA 2.125%
28/4/2023 5,235,230 0.05 EUR 3,182,437 Driver Italia One SRL FRN
21/4/2029 3,184,105 0.03 EUR 1,300,000 Driver Italia One SRL FRN
21/4/2029 1,298,783 0.01 EUR 14,464,000 Enel SpA FRN 24/5/2080 15,566,880 0.13 EUR 10,300,000 FCA Bank SpA/Ireland 0.25%
12/10/2020 10,345,989 0.09 EUR 5,800,000 FCA Bank SpA/Ireland 1%
21/2/2022 5,932,095 0.05 EUR 27,965,000 Intesa Sanpaolo SpA FRN
19/1/2021 (Perpetual)* 29,712,812 0.26 EUR 17,600,000 Intesa Sanpaolo SpA 0.5%
5/3/2024 18,336,736 0.16 EUR 17,802,000 Intesa Sanpaolo SpA 0.875%
27/6/2022 18,246,783 0.16 EUR 18,050,000 Intesa Sanpaolo SpA 1%
4/7/2024 18,518,397 0.16 EUR 25,995,000 Italy Buoni Poliennali Del Tesoro
‘144A’ 0.25% 20/11/2023 26,066,922 0.22 EUR 256,615,000 Italy Buoni Poliennali Del Tesoro
0.45% 1/6/2021 259,332,425 2.23 EUR 40,281,000 Italy Buoni Poliennali Del Tesoro
‘144A’ 0.45% 22/5/2023 40,767,835 0.35 EUR 52,903,000 Italy Buoni Poliennali Del Tesoro
‘144A’ 1.25% 27/10/2020* 53,978,348 0.47 EUR 24,905,000 Italy Buoni Poliennali Del Tesoro
‘144A’ 1.25% 15/9/2032 28,551,535 0.25 EUR 168,950,000 Italy Buoni Poliennali Del Tesoro
‘144A’ 1.3% 15/5/2028 192,936,181 1.66 EUR 23,058,000 Italy Buoni Poliennali Del Tesoro
1.5% 1/6/2025 24,316,913 0.21 EUR 462,160,000 Italy Buoni Poliennali Del Tesoro
‘144A’ 1.65% 23/4/2020 469,247,207 4.04 EUR 116,865,000 Italy Buoni Poliennali Del Tesoro
1.75% 1/7/2024 124,438,571 1.07 EUR 25,742,000 Italy Buoni Poliennali Del Tesoro
1.85% 15/5/2024 27,529,645 0.24 EUR 102,129,000 Italy Buoni Poliennali Del Tesoro
‘144A’ 2.1% 15/9/2021 122,416,980 1.05 EUR 1,200,000 Italy Buoni Poliennali Del Tesoro
‘144A’ 3.45% 1/3/2048 1,610,785 0.01 EUR 11,205,000 Italy Buoni Poliennali Del Tesoro
‘144A’ 3.85% 1/9/2049 15,973,674 0.14 EUR 1,068,250 Sunrise SPV FRN 27/4/2041 1,073,181 0.01 EUR 12,300,000 Sunrise SPV 40 Srl ‘Series 2018-1
A’ FRN 27/7/2042 12,265,166 0.11 EUR 3,555,000 Sunrise SPV Z70 Srl FRN
27/5/2044 3,564,405 0.03 EUR 1,354,911 Taurus 2018-1 IT SRL ‘Series
2018-IT1 A’ FRN 18/5/2030 1,351,416 0.01 EUR 21,950,000 UniCredit SpA FRN 25/6/2025 22,636,815 0.20 EUR 30,600,000 UniCredit SpA FRN 3/7/2025* 31,473,018 0.27 EUR 43,125,000 UniCredit SpA FRN 28/10/2025 45,624,525 0.39 1,676,850,579 14.45
Euro Short Duration Bond Fund continued
Portfolio of Investments 31 August 2019
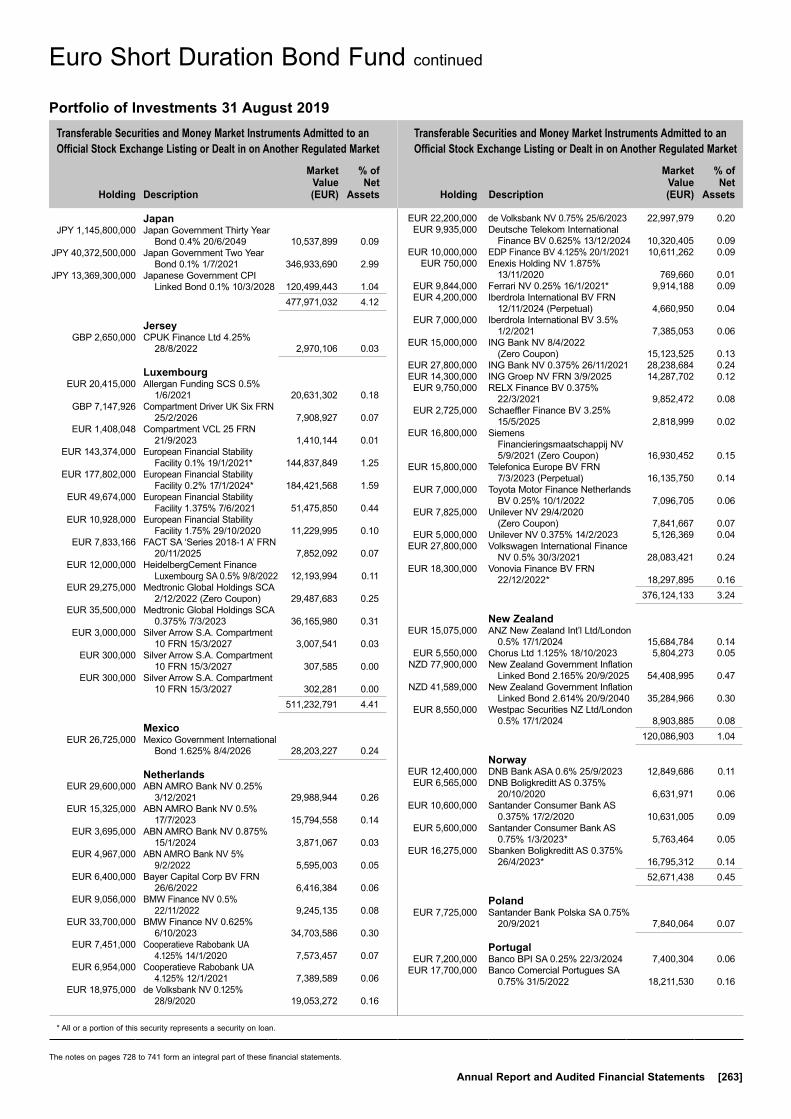
Transferable Securities and Money Market Instruments Admitted to an Official Stock Exchange Listing or Dealt in on Another Regulated Market
Transferable Securities and Money Market Instruments Admitted to an Official Stock Exchange Listing or Dealt in on Another Regulated Market
Holding
Description
Market Value (EUR)
% of Net
Assets
Holding
Description
Market Value (EUR)
% of Net
Assets
* All or a portion of this security represents a security on loan.
The notes on pages 728 to 741 form an integral part of these financial statements.
Annual Report and Audited Financial Statements [263]
Japan JPY 1,145,800,000 Japan Government Thirty Year
Bond 0.4% 20/6/2049 10,537,899 0.09 JPY 40,372,500,000 Japan Government Two Year
Bond 0.1% 1/7/2021 346,933,690 2.99 JPY 13,369,300,000 Japanese Government CPI
Linked Bond 0.1% 10/3/2028 120,499,443 1.04 477,971,032 4.12
Jersey GBP 2,650,000 CPUK Finance Ltd 4.25%
28/8/2022 2,970,106 0.03
Luxembourg EUR 20,415,000 Allergan Funding SCS 0.5%
1/6/2021 20,631,302 0.18 GBP 7,147,926 Compartment Driver UK Six FRN
25/2/2026 7,908,927 0.07 EUR 1,408,048 Compartment VCL 25 FRN
21/9/2023 1,410,144 0.01 EUR 143,374,000 European Financial Stability
Facility 0.1% 19/1/2021* 144,837,849 1.25 EUR 177,802,000 European Financial Stability
Facility 0.2% 17/1/2024* 184,421,568 1.59 EUR 49,674,000 European Financial Stability
Facility 1.375% 7/6/2021 51,475,850 0.44 EUR 10,928,000 European Financial Stability
Facility 1.75% 29/10/2020 11,229,995 0.10 EUR 7,833,166 FACT SA ‘Series 2018-1 A’ FRN
20/11/2025 7,852,092 0.07 EUR 12,000,000 HeidelbergCement Finance
Luxembourg SA 0.5% 9/8/2022 12,193,994 0.11 EUR 29,275,000 Medtronic Global Holdings SCA
2/12/2022 (Zero Coupon) 29,487,683 0.25 EUR 35,500,000 Medtronic Global Holdings SCA
0.375% 7/3/2023 36,165,980 0.31 EUR 3,000,000 Silver Arrow S.A. Compartment
10 FRN 15/3/2027 3,007,541 0.03 EUR 300,000 Silver Arrow S.A. Compartment
10 FRN 15/3/2027 307,585 0.00 EUR 300,000 Silver Arrow S.A. Compartment
10 FRN 15/3/2027 302,281 0.00 511,232,791 4.41
Mexico EUR 26,725,000 Mexico Government International
Bond 1.625% 8/4/2026 28,203,227 0.24
Netherlands EUR 29,600,000 ABN AMRO Bank NV 0.25%
3/12/2021 29,988,944 0.26 EUR 15,325,000 ABN AMRO Bank NV 0.5%
17/7/2023 15,794,558 0.14 EUR 3,695,000 ABN AMRO Bank NV 0.875%
15/1/2024 3,871,067 0.03 EUR 4,967,000 ABN AMRO Bank NV 5%
9/2/2022 5,595,003 0.05 EUR 6,400,000 Bayer Capital Corp BV FRN
26/6/2022 6,416,384 0.06 EUR 9,056,000 BMW Finance NV 0.5%
22/11/2022 9,245,135 0.08 EUR 33,700,000 BMW Finance NV 0.625%
6/10/2023 34,703,586 0.30 EUR 7,451,000 Cooperatieve Rabobank UA
4.125% 14/1/2020 7,573,457 0.07 EUR 6,954,000 Cooperatieve Rabobank UA
4.125% 12/1/2021 7,389,589 0.06 EUR 18,975,000 de Volksbank NV 0.125%
28/9/2020 19,053,272 0.16
EUR 22,200,000 de Volksbank NV 0.75% 25/6/2023 22,997,979 0.20 EUR 9,935,000 Deutsche Telekom International
Finance BV 0.625% 13/12/2024 10,320,405 0.09 EUR 10,000,000 EDP Finance BV 4.125% 20/1/2021 10,611,262 0.09 EUR 750,000 Enexis Holding NV 1.875%
13/11/2020 769,660 0.01 EUR 9,844,000 Ferrari NV 0.25% 16/1/2021* 9,914,188 0.09 EUR 4,200,000 Iberdrola International BV FRN
12/11/2024 (Perpetual) 4,660,950 0.04 EUR 7,000,000 Iberdrola International BV 3.5%
1/2/2021 7,385,053 0.06 EUR 15,000,000 ING Bank NV 8/4/2022
(Zero Coupon) 15,123,525 0.13 EUR 27,800,000 ING Bank NV 0.375% 26/11/2021 28,238,684 0.24 EUR 14,300,000 ING Groep NV FRN 3/9/2025 14,287,702 0.12 EUR 9,750,000 RELX Finance BV 0.375%
22/3/2021 9,852,472 0.08 EUR 2,725,000 Schaeffler Finance BV 3.25%
15/5/2025 2,818,999 0.02 EUR 16,800,000 Siemens
Financieringsmaatschappij NV 5/9/2021 (Zero Coupon) 16,930,452 0.15
EUR 15,800,000 Telefonica Europe BV FRN 7/3/2023 (Perpetual) 16,135,750 0.14
EUR 7,000,000 Toyota Motor Finance Netherlands BV 0.25% 10/1/2022 7,096,705 0.06
EUR 7,825,000 Unilever NV 29/4/2020 (Zero Coupon) 7,841,667 0.07
EUR 5,000,000 Unilever NV 0.375% 14/2/2023 5,126,369 0.04 EUR 27,800,000 Volkswagen International Finance
NV 0.5% 30/3/2021 28,083,421 0.24 EUR 18,300,000 Vonovia Finance BV FRN
22/12/2022* 18,297,895 0.16 376,124,133 3.24
New Zealand EUR 15,075,000 ANZ New Zealand Int’l Ltd/London
0.5% 17/1/2024 15,684,784 0.14 EUR 5,550,000 Chorus Ltd 1.125% 18/10/2023 5,804,273 0.05 NZD 77,900,000 New Zealand Government Inflation
Linked Bond 2.165% 20/9/2025 54,408,995 0.47 NZD 41,589,000 New Zealand Government Inflation
Linked Bond 2.614% 20/9/2040 35,284,966 0.30 EUR 8,550,000 Westpac Securities NZ Ltd/London
0.5% 17/1/2024 8,903,885 0.08 120,086,903 1.04
Norway EUR 12,400,000 DNB Bank ASA 0.6% 25/9/2023 12,849,686 0.11 EUR 6,565,000 DNB Boligkreditt AS 0.375%
20/10/2020 6,631,971 0.06 EUR 10,600,000 Santander Consumer Bank AS
0.375% 17/2/2020 10,631,005 0.09 EUR 5,600,000 Santander Consumer Bank AS
0.75% 1/3/2023* 5,763,464 0.05 EUR 16,275,000 Sbanken Boligkreditt AS 0.375%
26/4/2023* 16,795,312 0.14 52,671,438 0.45
Poland EUR 7,725,000 Santander Bank Polska SA 0.75%
20/9/2021 7,840,064 0.07
Portugal EUR 7,200,000 Banco BPI SA 0.25% 22/3/2024 7,400,304 0.06 EUR 17,700,000 Banco Comercial Portugues SA
0.75% 31/5/2022 18,211,530 0.16
Euro Short Duration Bond Fund continued
Portfolio of Investments 31 August 2019

Transferable Securities and Money Market Instruments Admitted to an Official Stock Exchange Listing or Dealt in on Another Regulated Market
Transferable Securities and Money Market Instruments Admitted to an Official Stock Exchange Listing or Dealt in on Another Regulated Market
Holding
Description
Market Value (EUR)
% of Net
Assets
Holding
Description
Market Value (EUR)
% of Net
Assets
* All or a portion of this security represents a security on loan.
The notes on pages 728 to 741 form an integral part of these financial statements.
[264] BlackRock Global Funds (BGF)
EUR 49,200,000 Caixa Economica Montepio Geral Caixa Economica Bancaria SA 0.875% 17/10/2022 50,774,154 0.44
EUR 1,414,281 SAGRES Socidade de Titularizacao de Creditos SA/Ulisses Finance No. 1 FRN 20/3/2033 1,421,629 0.01
EUR 12,721,211 TAGUS - Sociedade de Titularizacao de Creditos SA/Volta IV 2.423% 12/2/2021 12,914,408 0.11
EUR 8,760,123 TAGUS - Sociedade de Titularizacao de Creditos SA/Volta VI 1.1% 13/2/2023 8,926,653 0.08
EUR 28,486,521 TAGUS - Sociedade de Titularizacao de Creditos SA/Volta VII 0.7% 12/2/2024 28,493,643 0.24
EUR 30,758,360 TAGUS-Sociedade de Titularizacao de Creditos SA/Volta V 0.85% 12/2/2022 30,918,888 0.27
159,061,209 1.37
Russian Federation RUB 664,800,000 Russian Federal Bond - OFZ
7.05% 19/1/2028 9,128,708 0.08 RUB 920,590,000 Russian Federal Bond - OFZ
7.4% 17/7/2024 12,878,738 0.11 22,007,446 0.19
Slovakia EUR 10,400,000 Slovenska Sporitelna AS 0.125%
12/6/2026 10,714,080 0.09 EUR 10,100,000 Vseobecna Uverova Banka AS
0.25% 26/3/2024* 10,378,760 0.09 21,092,840 0.18
South Africa ZAR 115,402,611 Republic of South Africa
Government Bond 8.75% 28/2/2048 6,102,606 0.05
Spain EUR 5,100,000 Amadeus Capital Markets SAU
0.125% 6/10/2020 5,116,779 0.04 EUR 14,100,000 Amadeus IT Group SA 0.875%
18/9/2023 14,677,043 0.13 EUR 2,100,000 Banco Bilbao Vizcaya Argentaria
SA 0.625% 17/1/2022 2,146,375 0.02 EUR 23,200,000 Banco de Sabadell SA 0.875%
22/7/2025 23,578,044 0.20 EUR 15,700,000 Banco de Sabadell SA 1.625%
7/3/2024 16,599,688 0.14 EUR 3,500,000 Banco Santander SA 1% 3/3/2022 3,640,599 0.03 EUR 16,900,000 Bankia SA FRN 15/3/2027 17,847,583 0.15 EUR 17,000,000 Bankinter SA 0.625% 9/10/2020 17,208,733 0.15 EUR 3,850,000 CaixaBank SA 3.625% 18/1/2021 4,071,173 0.04 EUR 4,300,000 Cedulas TDA 5 Fondo de
Titulizacion de Activos 4.125% 29/11/2019 4,346,685 0.04
EUR 3,615,652 Driver Espana Five FDT FRN 21/12/2028 3,631,793 0.03
EUR 1,600,000 Driver Espana Five FDT 0.131% 21/12/2028 1,602,560 0.01
EUR 883,092 Driver Espana Four FT FRN 21/4/2028 888,509 0.01
EUR 2,419,750 Driver Espana Four FT FRN 21/4/2028 2,430,373 0.02
EUR 12,775,000 NorteGas Energia Distribucion SAU 0.918% 28/9/2022 13,120,181 0.11
EUR 9,900,000 PITCH1 5.125% 20/7/2022 11,482,257 0.10 EUR 26,700,000 Santander Consumer Finance SA
0.375% 27/6/2024 27,101,301 0.23 EUR 12,000,000 Santander Consumer Finance SA
0.5% 4/10/2021 12,207,960 0.11 EUR 9,900,000 Santander Consumer Finance SA
1% 26/5/2021 10,123,576 0.09 EUR 8,100,000 Santander Consumer Finance SA
1% 27/2/2024 8,451,783 0.07 EUR 5,300,000 Santander Consumer Finance SA
1.5% 12/11/2020 5,415,322 0.05 EUR 90,609,000 Spain Government Bond 0.05%
31/1/2021 91,420,064 0.79 EUR 219,135,000 Spain Government Bond ‘144A’
0.25% 30/7/2024 225,806,784 1.95 EUR 418,514,000 Spain Government Bond 0.35%
30/7/2023 431,477,136 3.72 EUR 265,527,000 Spain Government Bond 0.75%
30/7/2021 272,299,824 2.35 EUR 179,752,000 Spain Government Bond 1.15%
30/7/2020 182,511,058 1.57 EUR 6,575,000 Spain Government Bond ‘144A’
2.7% 31/10/2048 9,394,871 0.08 EUR 100,396,000 Spain Government Bond ‘144A’
4.4% 31/10/2023 120,628,003 1.04 EUR 68,075,000 Spain Government Bond ‘144A’
4.8% 31/1/2024 83,795,995 0.72 EUR 33,401,000 Spain Government Bond ‘144A’
5.5% 30/4/2021 36,788,807 0.32 EUR 85,705,000 Spain Government Inflation Linked
Bond ‘144A’ 0.55% 30/11/2019 90,301,254 0.78 EUR 21,900,000 Telefonica Emisiones SA 0.318%
17/10/2020 22,060,450 0.19 EUR 9,900,000 Telefonica Emisiones SA 4.71%
20/1/2020 10,088,347 0.09 EUR 3,900,000 Wizink Master Credit Cards FT
FRN 26/12/2031 3,914,131 0.03 EUR 4,000,000 Wizink Master Credit Cards FT
FRN 28/3/2033 4,007,200 0.03 1,790,182,241 15.43
Sweden EUR 10,000,000 Lansforsakringar Bank AB 0.875%
25/9/2023 10,419,450 0.09 EUR 9,900,000 Skandinaviska Enskilda Banken AB
FRN 28/5/2026 10,329,018 0.09 EUR 48,675,000 Skandinaviska Enskilda Banken AB
0.05% 1/7/2024 49,256,666 0.42 SEK 278,000,000 Stadshypotek AB 1.5% 1/3/2024 27,487,073 0.24 SEK 609,000,000 Stadshypotek AB 4.5% 21/9/2022 64,295,435 0.55 EUR 33,375,000 Svenska Handelsbanken AB
0.125% 18/6/2024 33,925,688 0.29 EUR 17,900,000 Svenska Handelsbanken AB
0.25% 28/2/2022 18,168,948 0.16 EUR 9,975,000 Svenska Handelsbanken AB
0.375% 3/7/2023 10,240,634 0.09 EUR 5,000,000 Swedbank AB 0.3% 6/9/2022 5,074,400 0.04 EUR 6,825,000 Swedbank Hypotek AB 0.15%
10/2/2021 6,894,478 0.06 236,091,790 2.03
Switzerland EUR 9,050,000 Credit Suisse AG FRN 18/9/2025 9,595,896 0.08 EUR 18,125,000 Credit Suisse AG/London 1.125%
15/9/2020 18,408,747 0.16
Euro Short Duration Bond Fund continued
Portfolio of Investments 31 August 2019

Transferable Securities and Money Market Instruments Admitted to an Official Stock Exchange Listing or Dealt in on Another Regulated Market
Transferable Securities and Money Market Instruments Admitted to an Official Stock Exchange Listing or Dealt in on Another Regulated Market
Holding
Description
Market Value (EUR)
% of Net
Assets
Holding
Description
Market Value (EUR)
% of Net
Assets
* All or a portion of this security represents a security on loan.
The notes on pages 728 to 741 form an integral part of these financial statements.
Annual Report and Audited Financial Statements [265]
USD 21,250,000 Credit Suisse Group AG FRN 12/6/2024 19,356,280 0.17
EUR 35,362,000 UBS AG FRN 12/2/2026 37,646,385 0.32 EUR 6,770,000 UBS AG/London 0.125% 5/11/2021 6,837,429 0.06 EUR 31,823,000 UBS AG/London 0.25% 10/1/2022 32,251,178 0.28 EUR 23,100,000 UBS AG/London 0.625% 23/1/2023 23,806,514 0.20 EUR 18,100,000 UBS Group Funding Switzerland
AG FRN 20/9/2022 18,252,583 0.16 166,155,012 1.43
United Kingdom GBP 4,812,655 Azure Finance No 1 Plc FRN
30/6/2027 5,327,922 0.05 GBP 2,725,000 Azure Finance No 1 Plc FRN
30/6/2027 3,030,380 0.03 GBP 8,111,000 Azure Finance No 1 Plc FRN
30/6/2027 9,025,237 0.08 GBP 6,692,000 BAMS CMBS 2018-1 DAC ‘Series
2018-1 A’ FRN 17/5/2028 7,345,346 0.06 GBP 1,870,000 BAMS CMBS 2018-1 DAC ‘Series
2018-1 B’ FRN 17/5/2028 2,057,900 0.02 GBP 1,100,000 BAMS CMBS 2018-1 DAC ‘Series
2018-1 C’ FRN 17/5/2028 1,213,435 0.01 EUR 41,735,000 Barclays Plc FRN 11/11/2025 42,324,830 0.36 EUR 9,900,000 Barclays Plc 1.5% 1/4/2022* 10,254,808 0.09 GBP 3,845,000 Barley Hill NO 1 Plc FRN 28/8/2059 4,261,513 0.04 EUR 18,545,000 BAT International Finance Plc
0.875% 13/10/2023 19,073,364 0.16 EUR 5,000,000 BAT International Finance Plc
1% 23/5/2022 5,136,621 0.04 EUR 4,700,000 BAT International Finance Plc
3.625% 9/11/2021 5,090,834 0.04 EUR 3,300,000 BAT International Finance Plc
4% 7/7/2020 3,419,394 0.03 EUR 2,000,000 BAT International Finance Plc
4.875% 24/2/2021* 2,149,457 0.02 GBP 4,009,000 BAT International Finance Plc
6.375% 12/12/2019 4,495,305 0.04 EUR 14,765,000 BP Capital Markets Plc 0.9%
3/7/2024 15,516,391 0.13 EUR 17,535,000 BP Capital Markets Plc 1.526%
26/9/2022 18,500,098 0.16 GBP 3,530,000 Brass NO 6 Plc FRN 16/12/2060 3,891,428 0.03 EUR 5,000,000 British Telecommunications Plc
0.625% 10/3/2021 5,067,850 0.04 EUR 16,375,000 British Telecommunications Plc
0.875% 26/9/2023 16,933,060 0.15 EUR 19,900,000 British Telecommunications Plc
1.125% 10/3/2023 20,742,255 0.18 GBP 3,600,000 Bumper 8 UK Finance Plc FRN
20/11/2027 3,984,821 0.03 GBP 400,000 Canary Wharf Finance II Plc FRN
22/10/2037 375,608 0.00 GBP 4,476,000 Canary Wharf Finance II Plc FRN
22/10/2037 4,207,053 0.04 GBP 2,444,728 Castell 2017-1 Plc ‘Series 2017-1
A’ FRN 25/10/2044 2,704,962 0.02 EUR 20,400,000 Centrica Plc FRN 10/4/2076* 20,759,652 0.18 EUR 10,025,000 Channel Link Enterprises Finance
Plc FRN 30/6/2050 10,165,651 0.09 GBP 2,350,000 Channel Link Enterprises Finance
Plc FRN 30/6/2050 2,784,458 0.02 EUR 3,375,000 Channel Link Enterprises Finance
Plc FRN 30/6/2050 3,596,096 0.03 GBP 3,067,934 Compartment Driver UK Five FRN
25/7/2025 3,399,357 0.03 GBP 3,377,369 Compartment Driver UK Four FRN
25/3/2025 3,757,295 0.03
GBP 8,158,000 Delamare Cards MTN Issuer Plc ‘Series 2017-1 A1’ FRN 19/10/2022 9,029,650 0.08
EUR 3,925,000 Diageo Finance Plc 17/11/2020 (Zero Coupon) 3,941,721 0.03
EUR 15,415,000 Diageo Finance Plc 0.125% 12/10/2023 15,670,272 0.14
EUR 9,675,000 Diageo Finance Plc 0.25% 22/10/2021 9,798,937 0.08
GBP 735,418 Dignity Finance Plc 3.546% 31/12/2034 899,582 0.01
GBP 190,000 Dignity Finance Plc 4.696% 31/12/2049 179,742 0.00
GBP 1,612,107 DLL UK Equipment Finance 2019-1 Plc ‘Series 2019-1UK A’ FRN 25/3/2028 1,789,660 0.02
GBP 1,820,794 E-CARAT 9 Plc FRN 18/9/2024 2,014,512 0.02 GBP 525,000 EI Group Plc 6.375% 15/2/2022 589,134 0.01 GBP 8,185,803 Elvet Mortgages 2018-1 Plc ‘Series
2018-1 A’ FRN 22/10/2058 9,063,446 0.08 GBP 1,145,929 Eurosail 2006-1 Plc ‘Series 2006-
1X A2C’ FRN 10/6/2044 1,258,689 0.01 GBP 4,455,660 Feldspar 2016-1 Plc ‘Series 2016-1
A’ FRN 15/9/2045 4,938,246 0.04 GBP 1,087,013 Finsbury Square 2016-2 Plc ‘Series
2016-2 A’ FRN 16/8/2058 1,203,406 0.01 GBP 490,056 Finsbury Square 2017-1 Plc ‘Series
2017-1 A’ FRN 12/3/2059 542,392 0.00 GBP 543,988 Finsbury Square 2017-1 Plc ‘Series
2017-1 B’ FRN 12/3/2059 602,800 0.01 GBP 1,229,973 Finsbury Square 2017-1 Plc ‘Series
2017-1 C’ FRN 12/3/2059 1,364,349 0.01 GBP 5,797,232 Finsbury Square 2017-2 Plc FRN
12/9/2065 6,416,378 0.06 GBP 681,985 Finsbury Square 2018-1 Plc FRN
12/9/2065 748,905 0.01 GBP 464,990 Finsbury Square 2018-1 Plc FRN
12/9/2065 510,246 0.00 GBP 5,294,767 Finsbury Square 2018-1 Plc ‘Series
2018-1 A’ FRN 12/9/2065 5,858,513 0.05 GBP 729,984 Finsbury Square 2018-1 Plc ‘Series
2018-1 B’ FRN 12/9/2065 803,399 0.01 GBP 2,705,000 Finsbury Square 2018-2 Plc FRN
12/9/2068 2,987,534 0.03 GBP 4,485,000 Finsbury Square 2018-2 Plc FRN
12/9/2068 4,983,633 0.04 GBP 950,000 Finsbury Square 2018-2 Plc FRN
12/9/2068 1,059,408 0.01 GBP 8,735,941 Finsbury Square 2018-2 Plc ‘Series
2018-2 A’ FRN 12/9/2068 9,674,965 0.08 GBP 112,000 Finsbury Square 2019-2 Plc FRN
16/12/2069 124,387 0.00 GBP 125,000 Finsbury Square 2019-2 Plc FRN
16/12/2069 138,650 0.00 GBP 2,899,200 Friary No 4 Plc FRN 21/1/2050 3,195,024 0.03 GBP 1,056,753 Gemgarto 2018-1 Plc FRN
16/9/2065 1,144,593 0.01 GBP 9,184,637 Gemgarto 2018-1 Plc FRN
16/9/2065 10,145,109 0.09 GBP 144,966 Gemgarto 2018-1 Plc FRN
16/9/2065 157,550 0.00 GBP 528,876 Gemgarto 2018-1 Plc FRN
16/9/2065 571,266 0.00 GBP 4,899,000 Globaldrive Auto Receivables UK
2017-A Plc FRN 20/6/2025 5,420,170 0.05 GBP 7,394,422 Globaldrive Auto Receivables UK
2018-A Plc ‘Series 2018-UKA A’ FRN 20/6/2026 8,187,002 0.07
Euro Short Duration Bond Fund continued
Portfolio of Investments 31 August 2019
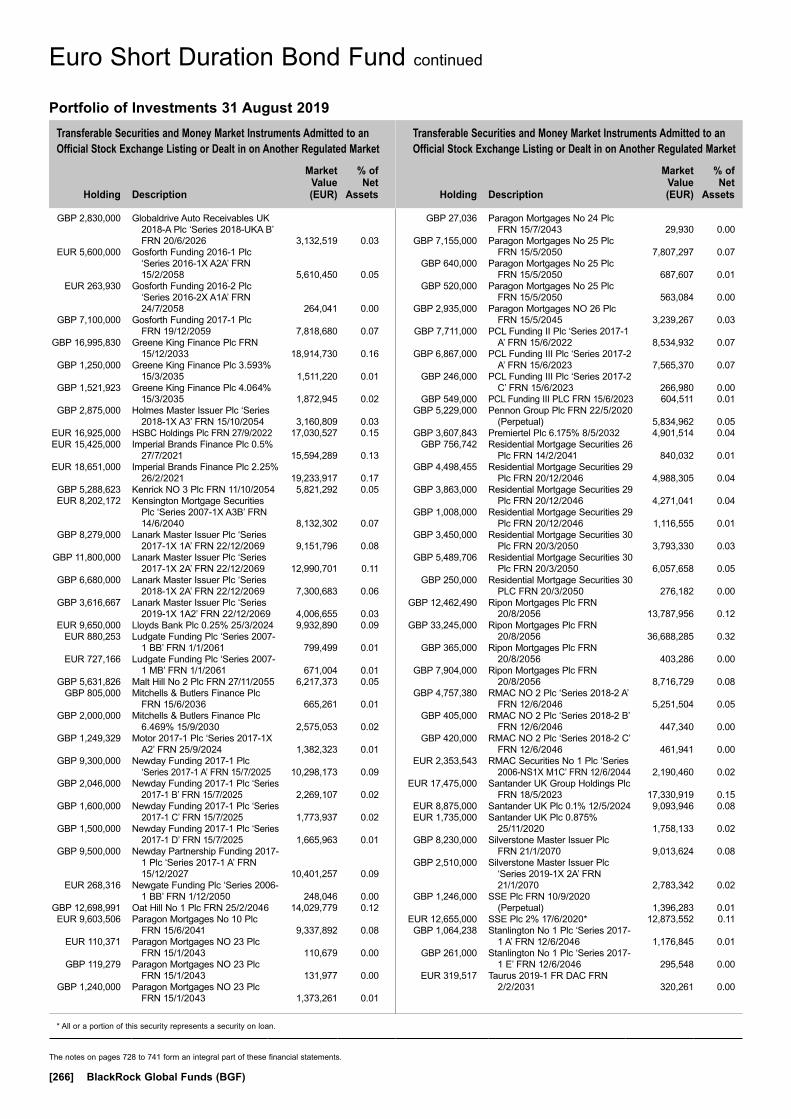
Transferable Securities and Money Market Instruments Admitted to an Official Stock Exchange Listing or Dealt in on Another Regulated Market
Transferable Securities and Money Market Instruments Admitted to an Official Stock Exchange Listing or Dealt in on Another Regulated Market
Holding
Description
Market Value (EUR)
% of Net
Assets
Holding
Description
Market Value (EUR)
% of Net
Assets
* All or a portion of this security represents a security on loan.
The notes on pages 728 to 741 form an integral part of these financial statements.
[266] BlackRock Global Funds (BGF)
GBP 2,830,000 Globaldrive Auto Receivables UK 2018-A Plc ‘Series 2018-UKA B’ FRN 20/6/2026 3,132,519 0.03
EUR 5,600,000 Gosforth Funding 2016-1 Plc ‘Series 2016-1X A2A’ FRN 15/2/2058 5,610,450 0.05
EUR 263,930 Gosforth Funding 2016-2 Plc ‘Series 2016-2X A1A’ FRN 24/7/2058 264,041 0.00
GBP 7,100,000 Gosforth Funding 2017-1 Plc FRN 19/12/2059 7,818,680 0.07
GBP 16,995,830 Greene King Finance Plc FRN 15/12/2033 18,914,730 0.16
GBP 1,250,000 Greene King Finance Plc 3.593% 15/3/2035 1,511,220 0.01
GBP 1,521,923 Greene King Finance Plc 4.064% 15/3/2035 1,872,945 0.02
GBP 2,875,000 Holmes Master Issuer Plc ‘Series 2018-1X A3’ FRN 15/10/2054 3,160,809 0.03
EUR 16,925,000 HSBC Holdings Plc FRN 27/9/2022 17,030,527 0.15 EUR 15,425,000 Imperial Brands Finance Plc 0.5%
27/7/2021 15,594,289 0.13 EUR 18,651,000 Imperial Brands Finance Plc 2.25%
26/2/2021 19,233,917 0.17 GBP 5,288,623 Kenrick NO 3 Plc FRN 11/10/2054 5,821,292 0.05 EUR 8,202,172 Kensington Mortgage Securities
Plc ‘Series 2007-1X A3B’ FRN 14/6/2040 8,132,302 0.07
GBP 8,279,000 Lanark Master Issuer Plc ‘Series 2017-1X 1A’ FRN 22/12/2069 9,151,796 0.08
GBP 11,800,000 Lanark Master Issuer Plc ‘Series 2017-1X 2A’ FRN 22/12/2069 12,990,701 0.11
GBP 6,680,000 Lanark Master Issuer Plc ‘Series 2018-1X 2A’ FRN 22/12/2069 7,300,683 0.06
GBP 3,616,667 Lanark Master Issuer Plc ‘Series 2019-1X 1A2’ FRN 22/12/2069 4,006,655 0.03
EUR 9,650,000 Lloyds Bank Plc 0.25% 25/3/2024 9,932,890 0.09 EUR 880,253 Ludgate Funding Plc ‘Series 2007-
1 BB’ FRN 1/1/2061 799,499 0.01 EUR 727,166 Ludgate Funding Plc ‘Series 2007-
1 MB’ FRN 1/1/2061 671,004 0.01 GBP 5,631,826 Malt Hill No 2 Plc FRN 27/11/2055 6,217,373 0.05 GBP 805,000 Mitchells & Butlers Finance Plc
FRN 15/6/2036 665,261 0.01 GBP 2,000,000 Mitchells & Butlers Finance Plc
6.469% 15/9/2030 2,575,053 0.02 GBP 1,249,329 Motor 2017-1 Plc ‘Series 2017-1X
A2’ FRN 25/9/2024 1,382,323 0.01 GBP 9,300,000 Newday Funding 2017-1 Plc
‘Series 2017-1 A’ FRN 15/7/2025 10,298,173 0.09 GBP 2,046,000 Newday Funding 2017-1 Plc ‘Series
2017-1 B’ FRN 15/7/2025 2,269,107 0.02 GBP 1,600,000 Newday Funding 2017-1 Plc ‘Series
2017-1 C’ FRN 15/7/2025 1,773,937 0.02 GBP 1,500,000 Newday Funding 2017-1 Plc ‘Series
2017-1 D’ FRN 15/7/2025 1,665,963 0.01 GBP 9,500,000 Newday Partnership Funding 2017-
1 Plc ‘Series 2017-1 A’ FRN 15/12/2027 10,401,257 0.09
EUR 268,316 Newgate Funding Plc ‘Series 2006-1 BB’ FRN 1/12/2050 248,046 0.00
GBP 12,698,991 Oat Hill No 1 Plc FRN 25/2/2046 14,029,779 0.12 EUR 9,603,506 Paragon Mortgages No 10 Plc
FRN 15/6/2041 9,337,892 0.08 EUR 110,371 Paragon Mortgages NO 23 Plc
FRN 15/1/2043 110,679 0.00 GBP 119,279 Paragon Mortgages NO 23 Plc
FRN 15/1/2043 131,977 0.00 GBP 1,240,000 Paragon Mortgages NO 23 Plc
FRN 15/1/2043 1,373,261 0.01
GBP 27,036 Paragon Mortgages No 24 Plc FRN 15/7/2043 29,930 0.00
GBP 7,155,000 Paragon Mortgages No 25 Plc FRN 15/5/2050 7,807,297 0.07
GBP 640,000 Paragon Mortgages No 25 Plc FRN 15/5/2050 687,607 0.01
GBP 520,000 Paragon Mortgages No 25 Plc FRN 15/5/2050 563,084 0.00
GBP 2,935,000 Paragon Mortgages NO 26 Plc FRN 15/5/2045 3,239,267 0.03
GBP 7,711,000 PCL Funding II Plc ‘Series 2017-1 A’ FRN 15/6/2022 8,534,932 0.07
GBP 6,867,000 PCL Funding III Plc ‘Series 2017-2 A’ FRN 15/6/2023 7,565,370 0.07
GBP 246,000 PCL Funding III Plc ‘Series 2017-2 C’ FRN 15/6/2023 266,980 0.00
GBP 549,000 PCL Funding III PLC FRN 15/6/2023 604,511 0.01 GBP 5,229,000 Pennon Group Plc FRN 22/5/2020
(Perpetual) 5,834,962 0.05 GBP 3,607,843 Premiertel Plc 6.175% 8/5/2032 4,901,514 0.04 GBP 756,742 Residential Mortgage Securities 26
Plc FRN 14/2/2041 840,032 0.01 GBP 4,498,455 Residential Mortgage Securities 29
Plc FRN 20/12/2046 4,988,305 0.04 GBP 3,863,000 Residential Mortgage Securities 29
Plc FRN 20/12/2046 4,271,041 0.04 GBP 1,008,000 Residential Mortgage Securities 29
Plc FRN 20/12/2046 1,116,555 0.01 GBP 3,450,000 Residential Mortgage Securities 30
Plc FRN 20/3/2050 3,793,330 0.03 GBP 5,489,706 Residential Mortgage Securities 30
Plc FRN 20/3/2050 6,057,658 0.05 GBP 250,000 Residential Mortgage Securities 30
PLC FRN 20/3/2050 276,182 0.00 GBP 12,462,490 Ripon Mortgages Plc FRN
20/8/2056 13,787,956 0.12 GBP 33,245,000 Ripon Mortgages Plc FRN
20/8/2056 36,688,285 0.32 GBP 365,000 Ripon Mortgages Plc FRN
20/8/2056 403,286 0.00 GBP 7,904,000 Ripon Mortgages Plc FRN
20/8/2056 8,716,729 0.08 GBP 4,757,380 RMAC NO 2 Plc ‘Series 2018-2 A’
FRN 12/6/2046 5,251,504 0.05 GBP 405,000 RMAC NO 2 Plc ‘Series 2018-2 B’
FRN 12/6/2046 447,340 0.00 GBP 420,000 RMAC NO 2 Plc ‘Series 2018-2 C’
FRN 12/6/2046 461,941 0.00 EUR 2,353,543 RMAC Securities No 1 Plc ‘Series
2006-NS1X M1C’ FRN 12/6/2044 2,190,460 0.02 EUR 17,475,000 Santander UK Group Holdings Plc
FRN 18/5/2023 17,330,919 0.15 EUR 8,875,000 Santander UK Plc 0.1% 12/5/2024 9,093,946 0.08 EUR 1,735,000 Santander UK Plc 0.875%
25/11/2020 1,758,133 0.02 GBP 8,230,000 Silverstone Master Issuer Plc
FRN 21/1/2070 9,013,624 0.08 GBP 2,510,000 Silverstone Master Issuer Plc
‘Series 2019-1X 2A’ FRN 21/1/2070 2,783,342 0.02
GBP 1,246,000 SSE Plc FRN 10/9/2020 (Perpetual) 1,396,283 0.01
EUR 12,655,000 SSE Plc 2% 17/6/2020* 12,873,552 0.11 GBP 1,064,238 Stanlington No 1 Plc ‘Series 2017-
1 A’ FRN 12/6/2046 1,176,845 0.01 GBP 261,000 Stanlington No 1 Plc ‘Series 2017-
1 E’ FRN 12/6/2046 295,548 0.00 EUR 319,517 Taurus 2019-1 FR DAC FRN
2/2/2031 320,261 0.00
Euro Short Duration Bond Fund continued
Portfolio of Investments 31 August 2019
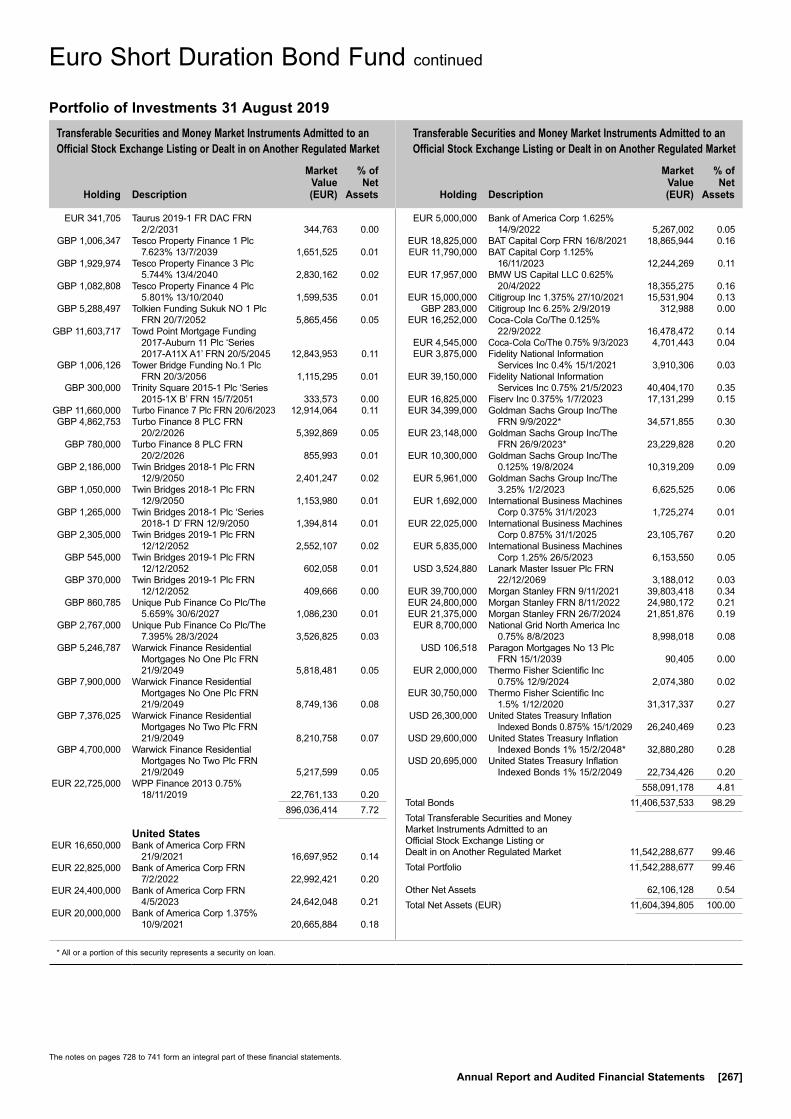
Transferable Securities and Money Market Instruments Admitted to an Official Stock Exchange Listing or Dealt in on Another Regulated Market
Transferable Securities and Money Market Instruments Admitted to an Official Stock Exchange Listing or Dealt in on Another Regulated Market
Holding
Description
Market Value (EUR)
% of Net
Assets
Holding
Description
Market Value (EUR)
% of Net
Assets
* All or a portion of this security represents a security on loan.
The notes on pages 728 to 741 form an integral part of these financial statements.
Annual Report and Audited Financial Statements [267]
EUR 341,705 Taurus 2019-1 FR DAC FRN 2/2/2031 344,763 0.00
GBP 1,006,347 Tesco Property Finance 1 Plc 7.623% 13/7/2039 1,651,525 0.01
GBP 1,929,974 Tesco Property Finance 3 Plc 5.744% 13/4/2040 2,830,162 0.02
GBP 1,082,808 Tesco Property Finance 4 Plc 5.801% 13/10/2040 1,599,535 0.01
GBP 5,288,497 Tolkien Funding Sukuk NO 1 Plc FRN 20/7/2052 5,865,456 0.05
GBP 11,603,717 Towd Point Mortgage Funding 2017-Auburn 11 Plc ‘Series 2017-A11X A1’ FRN 20/5/2045 12,843,953 0.11
GBP 1,006,126 Tower Bridge Funding No.1 Plc FRN 20/3/2056 1,115,295 0.01
GBP 300,000 Trinity Square 2015-1 Plc ‘Series 2015-1X B’ FRN 15/7/2051 333,573 0.00
GBP 11,660,000 Turbo Finance 7 Plc FRN 20/6/2023 12,914,064 0.11 GBP 4,862,753 Turbo Finance 8 PLC FRN
20/2/2026 5,392,869 0.05 GBP 780,000 Turbo Finance 8 PLC FRN
20/2/2026 855,993 0.01 GBP 2,186,000 Twin Bridges 2018-1 Plc FRN
12/9/2050 2,401,247 0.02 GBP 1,050,000 Twin Bridges 2018-1 Plc FRN
12/9/2050 1,153,980 0.01 GBP 1,265,000 Twin Bridges 2018-1 Plc ‘Series
2018-1 D’ FRN 12/9/2050 1,394,814 0.01 GBP 2,305,000 Twin Bridges 2019-1 Plc FRN
12/12/2052 2,552,107 0.02 GBP 545,000 Twin Bridges 2019-1 Plc FRN
12/12/2052 602,058 0.01 GBP 370,000 Twin Bridges 2019-1 Plc FRN
12/12/2052 409,666 0.00 GBP 860,785 Unique Pub Finance Co Plc/The
5.659% 30/6/2027 1,086,230 0.01 GBP 2,767,000 Unique Pub Finance Co Plc/The
7.395% 28/3/2024 3,526,825 0.03 GBP 5,246,787 Warwick Finance Residential
Mortgages No One Plc FRN 21/9/2049 5,818,481 0.05
GBP 7,900,000 Warwick Finance Residential Mortgages No One Plc FRN 21/9/2049 8,749,136 0.08
GBP 7,376,025 Warwick Finance Residential Mortgages No Two Plc FRN 21/9/2049 8,210,758 0.07
GBP 4,700,000 Warwick Finance Residential Mortgages No Two Plc FRN 21/9/2049 5,217,599 0.05
EUR 22,725,000 WPP Finance 2013 0.75% 18/11/2019 22,761,133 0.20
896,036,414 7.72
United States EUR 16,650,000 Bank of America Corp FRN
21/9/2021 16,697,952 0.14 EUR 22,825,000 Bank of America Corp FRN
7/2/2022 22,992,421 0.20 EUR 24,400,000 Bank of America Corp FRN
4/5/2023 24,642,048 0.21 EUR 20,000,000 Bank of America Corp 1.375%
10/9/2021 20,665,884 0.18
EUR 5,000,000 Bank of America Corp 1.625% 14/9/2022 5,267,002 0.05
EUR 18,825,000 BAT Capital Corp FRN 16/8/2021 18,865,944 0.16 EUR 11,790,000 BAT Capital Corp 1.125%
16/11/2023 12,244,269 0.11 EUR 17,957,000 BMW US Capital LLC 0.625%
20/4/2022 18,355,275 0.16 EUR 15,000,000 Citigroup Inc 1.375% 27/10/2021 15,531,904 0.13 GBP 283,000 Citigroup Inc 6.25% 2/9/2019 312,988 0.00 EUR 16,252,000 Coca-Cola Co/The 0.125%
22/9/2022 16,478,472 0.14 EUR 4,545,000 Coca-Cola Co/The 0.75% 9/3/2023 4,701,443 0.04 EUR 3,875,000 Fidelity National Information
Services Inc 0.4% 15/1/2021 3,910,306 0.03 EUR 39,150,000 Fidelity National Information
Services Inc 0.75% 21/5/2023 40,404,170 0.35 EUR 16,825,000 Fiserv Inc 0.375% 1/7/2023 17,131,299 0.15 EUR 34,399,000 Goldman Sachs Group Inc/The
FRN 9/9/2022* 34,571,855 0.30 EUR 23,148,000 Goldman Sachs Group Inc/The
FRN 26/9/2023* 23,229,828 0.20 EUR 10,300,000 Goldman Sachs Group Inc/The
0.125% 19/8/2024 10,319,209 0.09 EUR 5,961,000 Goldman Sachs Group Inc/The
3.25% 1/2/2023 6,625,525 0.06 EUR 1,692,000 International Business Machines
Corp 0.375% 31/1/2023 1,725,274 0.01 EUR 22,025,000 International Business Machines
Corp 0.875% 31/1/2025 23,105,767 0.20 EUR 5,835,000 International Business Machines
Corp 1.25% 26/5/2023 6,153,550 0.05 USD 3,524,880 Lanark Master Issuer Plc FRN
22/12/2069 3,188,012 0.03 EUR 39,700,000 Morgan Stanley FRN 9/11/2021 39,803,418 0.34 EUR 24,800,000 Morgan Stanley FRN 8/11/2022 24,980,172 0.21 EUR 21,375,000 Morgan Stanley FRN 26/7/2024 21,851,876 0.19 EUR 8,700,000 National Grid North America Inc
0.75% 8/8/2023 8,998,018 0.08 USD 106,518 Paragon Mortgages No 13 Plc
FRN 15/1/2039 90,405 0.00 EUR 2,000,000 Thermo Fisher Scientific Inc
0.75% 12/9/2024 2,074,380 0.02 EUR 30,750,000 Thermo Fisher Scientific Inc
1.5% 1/12/2020 31,317,337 0.27 USD 26,300,000 United States Treasury Inflation
Indexed Bonds 0.875% 15/1/2029 26,240,469 0.23 USD 29,600,000 United States Treasury Inflation
Indexed Bonds 1% 15/2/2048* 32,880,280 0.28 USD 20,695,000 United States Treasury Inflation
Indexed Bonds 1% 15/2/2049 22,734,426 0.20 558,091,178 4.81Total Bonds 11,406,537,533 98.29Total Transferable Securities and Money Market Instruments Admitted to an Official Stock Exchange Listing or Dealt in on Another Regulated Market 11,542,288,677 99.46Total Portfolio 11,542,288,677 99.46
Other Net Assets 62,106,128 0.54Total Net Assets (EUR) 11,604,394,805 100.00
Euro Short Duration Bond Fund continued
Portfolio of Investments 31 August 2019

The notes on pages 728 to 741 form an integral part of these financial statements.
[268] BlackRock Global Funds (BGF)
Euro Short Duration Bond Fund continued
Open Forward Foreign Exchange Contracts as at 31 August 2019
Currency
Purchases Currency
Sales Counterparty
Maturity date
Unrealised appreciation/
(depreciation) EUR
AUD 41,490,000 NZD 43,921,190 JP Morgan 6/9/2019 182,932 AUD 106,229,450 USD 73,840,849 Bank of America 6/9/2019 (2,047,803)AUD 48,220,000 USD 33,163,361 Morgan Stanley 6/9/2019 (608,513)AUD 738,770 USD 514,494 BNP Paribas 6/9/2019 (15,119)AUD 16,541,780 USD 11,651,430 Citibank 6/9/2019 (457,463)AUD 27,220,000 USD 19,186,371 JP Morgan 6/9/2019 (765,070)AUD 27,840,000 USD 19,434,269 Toronto Dominion 6/9/2019 (611,332)CAD 74,068,157 USD 55,677,197 Royal Bank of Canada 6/9/2019 151,091 CAD 4,094,368 USD 3,073,025 BNP Paribas 6/9/2019 12,624 CAD 31,930,543 USD 24,054,416 Barclays 6/9/2019 17,930 CAD 51,493,532 USD 38,678,013 Toronto Dominion 6/9/2019 132,001 CAD 24,213,969 USD 18,164,514 HSBC Bank Plc 6/9/2019 83,044 CAD 12,499,975 USD 9,383,922 State Street 6/9/2019 36,664 CAD 24,580,000 USD 18,703,095 Citibank 6/9/2019 (154,636)CAD 19,159,457 USD 14,621,578 Morgan Stanley 6/9/2019 (159,463)CAD 45,700,000 USD 34,487,554 Bank of America 6/9/2019 (28,747)CHF 32,900,000 EUR 29,972,263 Goldman Sachs 6/9/2019 184,343 CHF 3,031,148 EUR 2,775,815 Royal Bank of Canada 6/9/2019 2,578 CHF 20,478,852 EUR 18,747,862 Toronto Dominion 6/9/2019 23,344 CHF 9,580,000 EUR 8,678,833 State Street 6/9/2019 102,330 CHF 35,264,862 USD 35,990,084 HSBC Bank Plc 6/9/2019 (249,261)CHF 18,934,032 USD 19,235,035 Morgan Stanley 6/9/2019 (53,845)CHF 631,857 USD 642,261 RBS Plc 6/9/2019 (2,122)CHF 73,108,562 USD 74,066,863 Toronto Dominion 6/9/2019 (23,325)CHF 1,864,865 USD 1,890,156 BNP Paribas 6/9/2019 (1,360)CHF 824,262 USD 835,659 Royal Bank of Canada 6/9/2019 (800)CHF 76,720,000 USD 77,645,208 JP Morgan 6/9/2019 48,317 CHF 601,560 USD 610,504 Citibank 6/9/2019 (1,150)CNH 37,950,000 USD 5,507,806 Barclays 6/9/2019 (181,645)CNH 81,425,000 USD 11,746,720 Bank of America 6/9/2019 (325,700)CZK 350,746,631 EUR 13,632,689 BNP Paribas 6/9/2019 (113,106)CZK 474,206,214 EUR 18,442,194 Credit Suisse 6/9/2019 (163,844)CZK 47,194,791 EUR 1,833,947 Morgan Stanley 6/9/2019 (14,817)EUR 52,573,261 CHF 57,381,073 Goldman Sachs 6/9/2019 (23,042)EUR 7,815,599 CHF 8,608,927 Morgan Stanley 6/9/2019 (75,465)EUR 17,363,162 CZK 449,600,000 BNP Paribas 6/9/2019 33,262 EUR 15,599,686 CZK 401,400,658 Bank of America 6/9/2019 127,637 EUR 10,919,348 CZK 281,399,342 Citibank 6/9/2019 72,767 EUR 7,289,207 CZK 189,347,636 RBS Plc 6/9/2019 (9,227)EUR 3,152,761 GBP 2,857,111 Bank of America 6/9/2019 (6,318)EUR 21,433,575 GBP 19,388,529 Morgan Stanley 6/9/2019 (4,128)EUR 11,805,678 GBP 10,790,000 RBS Plc 6/9/2019 (124,717)EUR 18,694,272 GBP 16,704,360 Toronto Dominion 6/9/2019 224,428 EUR 9,290,870 HUF 2,999,000,000 Bank of America 6/9/2019 239,370 EUR 8,287,550 HUF 2,670,000,000 Societe Generale 6/9/2019 229,028 EUR 9,435,501 HUF 3,032,000,000 Barclays 6/9/2019 284,400 EUR 55,662,313 HUF 18,065,506,216 BNP Paribas 6/9/2019 1,137,489 EUR 5,469,734 HUF 1,776,350,863 RBS Plc 6/9/2019 108,400 EUR 15,532,941 HUF 5,042,142,921 Credit Suisse 6/9/2019 314,881 EUR 8,386,575 HUF 2,731,000,000 Citibank 6/9/2019 143,944 EUR 11,561,942 NOK 112,100,000 Citibank 6/9/2019 395,324 EUR 14,557,268 NOK 142,800,000 Morgan Stanley 6/9/2019 332,531 EUR 22,153,934 NOK 216,000,000 JP Morgan 6/9/2019 637,525 EUR 25,498,937 NOK 246,300,000 Toronto Dominion 6/9/2019 964,254 EUR 8,584,370 NOK 86,000,000 Credit Suisse 6/9/2019 17,652 EUR 38,645,528 NOK 380,400,000 BNP Paribas 6/9/2019 752,741 EUR 17,393,667 NOK 174,100,000 HSBC Bank Plc 6/9/2019 51,044 EUR 9,521,710 NOK 92,100,000 Standard Chartered Bank 6/9/2019 347,353 EUR 33,903,560 PLN 144,920,000 BNP Paribas 6/9/2019 865,997 EUR 77,032,993 PLN 331,550,000 JP Morgan 6/9/2019 1,449,195 EUR 17,341,179 SEK 186,000,000 Credit Suisse 6/9/2019 178,369 EUR 34,519,243 SEK 365,500,000 Toronto Dominion 6/9/2019 793,398 EUR 1,417,288 SEK 15,184,717 Societe Generale 6/9/2019 16,146 EUR 7,243,651 SEK 77,615,283 RBS Plc 6/9/2019 81,842 EUR 73,443,023 SEK 777,900,000 BNP Paribas 6/9/2019 1,663,722 EUR 33,363,344 SEK 352,300,000 JP Morgan 6/9/2019 855,506 EUR 10,338,226 SEK 109,700,000 Bank of America 6/9/2019 215,859 EUR 16,890,000 USD 19,115,342 RBS Plc 6/9/2019 (410,715)
Open Forward Foreign Exchange Contracts as at 31 August 2019
Currency
Purchases Currency
Sales Counterparty
Maturity date
Unrealised appreciation/
(depreciation) EUR
EUR 8,450,000 USD 9,564,809 State Street 6/9/2019 (206,818)EUR 17,755,816 USD 20,156,847 Bank of America 6/9/2019 (487,535)EUR 55,745,000 USD 62,326,786 Citibank 6/9/2019 (665,081)EUR 46,745,000 USD 52,143,537 Barclays 6/9/2019 (448,532)EUR 37,894,184 USD 43,070,851 JP Morgan 6/9/2019 (1,087,935)GBP 19,870,000 EUR 21,902,002 Barclays 6/9/2019 68,058 GBP 20,330,000 EUR 22,247,546 RBS Plc 6/9/2019 231,132 GBP 1,336,058 EUR 1,489,135 Bank of America 6/9/2019 (11,869)GBP 8,203,942 EUR 9,144,347 JP Morgan 6/9/2019 (73,330)HUF 24,800,554,205 EUR 75,832,802 BNP Paribas 6/9/2019 (980,439)HUF 2,026,685,629 EUR 6,196,887 Morgan Stanley 6/9/2019 (79,999)HUF 10,246,123,900 EUR 31,310,248 Credit Suisse 6/9/2019 (385,674)HUF 25,577,369,561 EUR 78,933,692 Barclays 6/9/2019 (1,736,767)HUF 2,382,215,198 EUR 7,292,332 RBS Plc 6/9/2019 (102,394)HUF 2,778,811,507 EUR 8,524,485 Bank of America 6/9/2019 (137,551)JPY 130,663,966 USD 1,203,413 Toronto Dominion 6/9/2019 25,213 JPY 13,228,336,034 USD 122,343,094 Citibank 6/9/2019 2,090,647 JPY 5,149,000,000 USD 47,500,701 Standard Chartered Bank 6/9/2019 922,506 JPY 1,033,000,000 USD 9,609,838 JP Morgan 6/9/2019 112,509 MXN 532,540,229 USD 27,055,980 Royal Bank of Canada 6/9/2019 (493,768)MXN 22,556,052 USD 1,144,375 RBS Plc 6/9/2019 (19,468)MXN 11,603,719 USD 591,013 Toronto Dominion 6/9/2019 (12,099)NOK 172,900,000 EUR 17,299,163 Morgan Stanley 6/9/2019 (76,074)NOK 549,800,000 EUR 56,239,546 BNP Paribas 6/9/2019 (1,472,317)NOK 305,900,000 EUR 31,380,418 JP Morgan 6/9/2019 (908,800)NOK 247,100,000 EUR 25,556,915 Toronto Dominion 6/9/2019 (942,542)NOK 196,200,000 USD 22,362,270 JP Morgan 6/9/2019 (695,341)NOK 167,400,000 USD 18,869,413 BNP Paribas 6/9/2019 (402,916)NOK 104,700,000 USD 12,047,485 Citibank 6/9/2019 (474,332)NZD 44,004,792 AUD 41,490,000 Royal Bank of Canada 6/9/2019 (135,118)NZD 36,738,235 USD 23,554,400 Credit Suisse 6/9/2019 (306,995)NZD 53,051,765 USD 34,020,771 Morgan Stanley 6/9/2019 (449,734)NZD 72,290,000 USD 46,763,310 HSBC Bank Plc 6/9/2019 (979,865)NZD 30,044,276 USD 19,738,789 Citibank 6/9/2019 (682,019)NZD 7,955,724 USD 5,224,445 RBS Plc 6/9/2019 (178,438)PLN 184,120,000 EUR 42,619,950 BNP Paribas 6/9/2019 (645,922)PLN 179,850,000 EUR 41,832,664 Credit Suisse 6/9/2019 (832,073)PLN 39,500,000 EUR 9,195,863 Barclays 6/9/2019 (191,007)PLN 35,550,000 EUR 8,269,173 Societe Generale 6/9/2019 (164,802)PLN 37,450,000 EUR 8,701,143 Bank of America 6/9/2019 (163,628)SEK 93,400,000 EUR 8,704,053 Barclays 6/9/2019 (85,738)SEK 183,200,000 EUR 17,186,846 Toronto Dominion 6/9/2019 (282,401)SEK 93,100,000 EUR 8,647,016 Standard Chartered Bank 6/9/2019 (56,384)SEK 633,900,000 EUR 59,329,759 Credit Suisse 6/9/2019 (837,795)SEK 461,300,000 EUR 43,651,899 JP Morgan 6/9/2019 (1,086,285)SEK 124,100,000 EUR 11,694,847 Citibank 6/9/2019 (243,747)SEK 80,124,718 EUR 7,536,176 Royal Bank of Canada 6/9/2019 (142,813)SEK 29,575,282 EUR 2,781,671 RBS Plc 6/9/2019 (52,666)SEK 230,600,000 USD 24,513,607 JP Morgan 6/9/2019 (908,328)USD 94,421,888 AUD 138,395,752 Bank of America 6/9/2019 1,058,677 USD 508,785 AUD 750,807 Royal Bank of Canada 6/9/2019 2,611 USD 19,158,062 AUD 28,370,000 Morgan Stanley 6/9/2019 38,129 USD 678,014 AUD 1,003,441 JP Morgan 6/9/2019 1,708 USD 39,397,629 AUD 58,270,000 Citibank 6/9/2019 122,035 USD 36,260,290 CAD 47,410,000 HSBC Bank Plc 6/9/2019 466,323 USD 724,580 CAD 956,925 BNP Paribas 6/9/2019 2,807 USD 9,349,520 CAD 12,357,129 State Street 6/9/2019 29,675 USD 2,709,498 CAD 3,597,788 Bank of America 6/9/2019 (2,784)USD 18,631,561 CAD 24,439,764 Citibank 6/9/2019 185,587 USD 537,849 CAD 714,934 Morgan Stanley 6/9/2019 (1,067)USD 75,529,167 CAD 99,599,541 JP Morgan 6/9/2019 394,149 USD 55,186,082 CAD 72,650,000 Royal Bank of Canada 6/9/2019 372,141 USD 19,931,077 CAD 26,013,918 Toronto Dominion 6/9/2019 287,564 USD 18,531,376 CHF 18,328,735 HSBC Bank Plc 6/9/2019 (28,193)USD 553,681 CHF 545,177 RBS Plc 6/9/2019 1,403
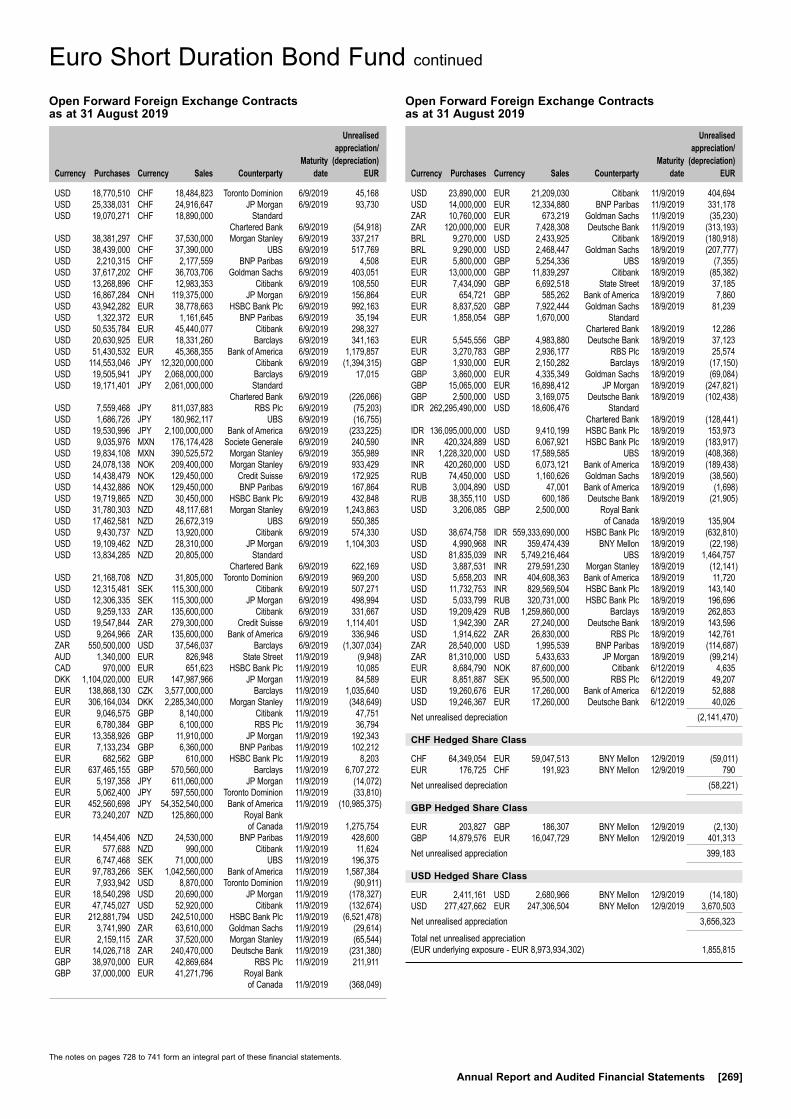
The notes on pages 728 to 741 form an integral part of these financial statements.
Annual Report and Audited Financial Statements [269]
Open Forward Foreign Exchange Contracts as at 31 August 2019
Currency
Purchases Currency
Sales Counterparty
Maturity date
Unrealised appreciation/
(depreciation) EUR
Open Forward Foreign Exchange Contracts as at 31 August 2019
Currency
Purchases Currency
Sales Counterparty
Maturity date
Unrealised appreciation/
(depreciation) EUR
USD 18,770,510 CHF 18,484,823 Toronto Dominion 6/9/2019 45,168 USD 25,338,031 CHF 24,916,647 JP Morgan 6/9/2019 93,730 USD 19,070,271 CHF 18,890,000 Standard Chartered Bank 6/9/2019 (54,918)USD 38,381,297 CHF 37,530,000 Morgan Stanley 6/9/2019 337,217 USD 38,439,000 CHF 37,390,000 UBS 6/9/2019 517,769 USD 2,210,315 CHF 2,177,559 BNP Paribas 6/9/2019 4,508 USD 37,617,202 CHF 36,703,706 Goldman Sachs 6/9/2019 403,051 USD 13,268,896 CHF 12,983,353 Citibank 6/9/2019 108,550 USD 16,867,284 CNH 119,375,000 JP Morgan 6/9/2019 156,864 USD 43,942,282 EUR 38,778,663 HSBC Bank Plc 6/9/2019 992,163 USD 1,322,372 EUR 1,161,645 BNP Paribas 6/9/2019 35,194 USD 50,535,784 EUR 45,440,077 Citibank 6/9/2019 298,327 USD 20,630,925 EUR 18,331,260 Barclays 6/9/2019 341,163 USD 51,430,532 EUR 45,368,355 Bank of America 6/9/2019 1,179,857 USD 114,553,046 JPY 12,320,000,000 Citibank 6/9/2019 (1,394,315)USD 19,505,941 JPY 2,068,000,000 Barclays 6/9/2019 17,015 USD 19,171,401 JPY 2,061,000,000 Standard Chartered Bank 6/9/2019 (226,066)USD 7,559,468 JPY 811,037,883 RBS Plc 6/9/2019 (75,203)USD 1,686,726 JPY 180,962,117 UBS 6/9/2019 (16,755)USD 19,530,996 JPY 2,100,000,000 Bank of America 6/9/2019 (233,225)USD 9,035,976 MXN 176,174,428 Societe Generale 6/9/2019 240,590 USD 19,834,108 MXN 390,525,572 Morgan Stanley 6/9/2019 355,989 USD 24,078,138 NOK 209,400,000 Morgan Stanley 6/9/2019 933,429 USD 14,438,479 NOK 129,450,000 Credit Suisse 6/9/2019 172,925 USD 14,432,886 NOK 129,450,000 BNP Paribas 6/9/2019 167,864 USD 19,719,865 NZD 30,450,000 HSBC Bank Plc 6/9/2019 432,848 USD 31,780,303 NZD 48,117,681 Morgan Stanley 6/9/2019 1,243,863 USD 17,462,581 NZD 26,672,319 UBS 6/9/2019 550,385 USD 9,430,737 NZD 13,920,000 Citibank 6/9/2019 574,330 USD 19,109,462 NZD 28,310,000 JP Morgan 6/9/2019 1,104,303 USD 13,834,285 NZD 20,805,000 Standard Chartered Bank 6/9/2019 622,169 USD 21,168,708 NZD 31,805,000 Toronto Dominion 6/9/2019 969,200 USD 12,315,481 SEK 115,300,000 Citibank 6/9/2019 507,271 USD 12,306,335 SEK 115,300,000 JP Morgan 6/9/2019 498,994 USD 9,259,133 ZAR 135,600,000 Citibank 6/9/2019 331,667 USD 19,547,844 ZAR 279,300,000 Credit Suisse 6/9/2019 1,114,401 USD 9,264,966 ZAR 135,600,000 Bank of America 6/9/2019 336,946 ZAR 550,500,000 USD 37,546,037 Barclays 6/9/2019 (1,307,034)AUD 1,340,000 EUR 826,948 State Street 11/9/2019 (9,948)CAD 970,000 EUR 651,623 HSBC Bank Plc 11/9/2019 10,085 DKK 1,104,020,000 EUR 147,987,966 JP Morgan 11/9/2019 84,589 EUR 138,868,130 CZK 3,577,000,000 Barclays 11/9/2019 1,035,640 EUR 306,164,034 DKK 2,285,340,000 Morgan Stanley 11/9/2019 (348,649)EUR 9,046,575 GBP 8,140,000 Citibank 11/9/2019 47,751 EUR 6,780,384 GBP 6,100,000 RBS Plc 11/9/2019 36,794 EUR 13,358,926 GBP 11,910,000 JP Morgan 11/9/2019 192,343 EUR 7,133,234 GBP 6,360,000 BNP Paribas 11/9/2019 102,212 EUR 682,562 GBP 610,000 HSBC Bank Plc 11/9/2019 8,203 EUR 637,465,155 GBP 570,560,000 Barclays 11/9/2019 6,707,272 EUR 5,197,358 JPY 611,060,000 JP Morgan 11/9/2019 (14,072)EUR 5,062,400 JPY 597,550,000 Toronto Dominion 11/9/2019 (33,810)EUR 452,560,698 JPY 54,352,540,000 Bank of America 11/9/2019 (10,985,375)EUR 73,240,207 NZD 125,860,000 Royal Bank of Canada 11/9/2019 1,275,754 EUR 14,454,406 NZD 24,530,000 BNP Paribas 11/9/2019 428,600 EUR 577,688 NZD 990,000 Citibank 11/9/2019 11,624 EUR 6,747,468 SEK 71,000,000 UBS 11/9/2019 196,375 EUR 97,783,266 SEK 1,042,560,000 Bank of America 11/9/2019 1,587,384 EUR 7,933,942 USD 8,870,000 Toronto Dominion 11/9/2019 (90,911)EUR 18,540,298 USD 20,690,000 JP Morgan 11/9/2019 (178,327)EUR 47,745,027 USD 52,920,000 Citibank 11/9/2019 (132,674)EUR 212,881,794 USD 242,510,000 HSBC Bank Plc 11/9/2019 (6,521,478)EUR 3,741,990 ZAR 63,610,000 Goldman Sachs 11/9/2019 (29,614)EUR 2,159,115 ZAR 37,520,000 Morgan Stanley 11/9/2019 (65,544)EUR 14,026,718 ZAR 240,470,000 Deutsche Bank 11/9/2019 (231,380)GBP 38,970,000 EUR 42,869,684 RBS Plc 11/9/2019 211,911 GBP 37,000,000 EUR 41,271,796 Royal Bank of Canada 11/9/2019 (368,049)
Euro Short Duration Bond Fund continued
USD 23,890,000 EUR 21,209,030 Citibank 11/9/2019 404,694 USD 14,000,000 EUR 12,334,880 BNP Paribas 11/9/2019 331,178 ZAR 10,760,000 EUR 673,219 Goldman Sachs 11/9/2019 (35,230)ZAR 120,000,000 EUR 7,428,308 Deutsche Bank 11/9/2019 (313,193)BRL 9,270,000 USD 2,433,925 Citibank 18/9/2019 (180,918)BRL 9,290,000 USD 2,468,447 Goldman Sachs 18/9/2019 (207,777)EUR 5,800,000 GBP 5,254,336 UBS 18/9/2019 (7,355)EUR 13,000,000 GBP 11,839,297 Citibank 18/9/2019 (85,382)EUR 7,434,090 GBP 6,692,518 State Street 18/9/2019 37,185 EUR 654,721 GBP 585,262 Bank of America 18/9/2019 7,860 EUR 8,837,520 GBP 7,922,444 Goldman Sachs 18/9/2019 81,239 EUR 1,858,054 GBP 1,670,000 Standard Chartered Bank 18/9/2019 12,286 EUR 5,545,556 GBP 4,983,880 Deutsche Bank 18/9/2019 37,123 EUR 3,270,783 GBP 2,936,177 RBS Plc 18/9/2019 25,574 GBP 1,930,000 EUR 2,150,282 Barclays 18/9/2019 (17,150)GBP 3,860,000 EUR 4,335,349 Goldman Sachs 18/9/2019 (69,084)GBP 15,065,000 EUR 16,898,412 JP Morgan 18/9/2019 (247,821)GBP 2,500,000 USD 3,169,075 Deutsche Bank 18/9/2019 (102,438)IDR 262,295,490,000 USD 18,606,476 Standard Chartered Bank 18/9/2019 (128,441)IDR 136,095,000,000 USD 9,410,199 HSBC Bank Plc 18/9/2019 153,973 INR 420,324,889 USD 6,067,921 HSBC Bank Plc 18/9/2019 (183,917)INR 1,228,320,000 USD 17,589,585 UBS 18/9/2019 (408,368)INR 420,260,000 USD 6,073,121 Bank of America 18/9/2019 (189,438)RUB 74,450,000 USD 1,160,626 Goldman Sachs 18/9/2019 (38,560)RUB 3,004,890 USD 47,001 Bank of America 18/9/2019 (1,698)RUB 38,355,110 USD 600,186 Deutsche Bank 18/9/2019 (21,905)USD 3,206,085 GBP 2,500,000 Royal Bank of Canada 18/9/2019 135,904 USD 38,674,758 IDR 559,333,690,000 HSBC Bank Plc 18/9/2019 (632,810)USD 4,990,968 INR 359,474,439 BNY Mellon 18/9/2019 (22,198)USD 81,835,039 INR 5,749,216,464 UBS 18/9/2019 1,464,757 USD 3,887,531 INR 279,591,230 Morgan Stanley 18/9/2019 (12,141)USD 5,658,203 INR 404,608,363 Bank of America 18/9/2019 11,720 USD 11,732,753 INR 829,569,504 HSBC Bank Plc 18/9/2019 143,140 USD 5,033,799 RUB 320,731,000 HSBC Bank Plc 18/9/2019 196,696 USD 19,209,429 RUB 1,259,860,000 Barclays 18/9/2019 262,853 USD 1,942,390 ZAR 27,240,000 Deutsche Bank 18/9/2019 143,596 USD 1,914,622 ZAR 26,830,000 RBS Plc 18/9/2019 142,761 ZAR 28,540,000 USD 1,995,539 BNP Paribas 18/9/2019 (114,687)ZAR 81,310,000 USD 5,433,633 JP Morgan 18/9/2019 (99,214)EUR 8,684,790 NOK 87,600,000 Citibank 6/12/2019 4,635 EUR 8,851,887 SEK 95,500,000 RBS Plc 6/12/2019 49,207 USD 19,260,676 EUR 17,260,000 Bank of America 6/12/2019 52,888 USD 19,246,367 EUR 17,260,000 Deutsche Bank 6/12/2019 40,026 Net unrealised depreciation (2,141,470)
CHF Hedged Share Class
CHF 64,349,054 EUR 59,047,513 BNY Mellon 12/9/2019 (59,011)EUR 176,725 CHF 191,923 BNY Mellon 12/9/2019 790 Net unrealised depreciation (58,221)
GBP Hedged Share Class
EUR 203,827 GBP 186,307 BNY Mellon 12/9/2019 (2,130)GBP 14,879,576 EUR 16,047,729 BNY Mellon 12/9/2019 401,313 Net unrealised appreciation 399,183
USD Hedged Share Class
EUR 2,411,161 USD 2,680,966 BNY Mellon 12/9/2019 (14,180)USD 277,427,662 EUR 247,306,504 BNY Mellon 12/9/2019 3,670,503 Net unrealised appreciation 3,656,323
Total net unrealised appreciation (EUR underlying exposure - EUR 8,973,934,302) 1,855,815
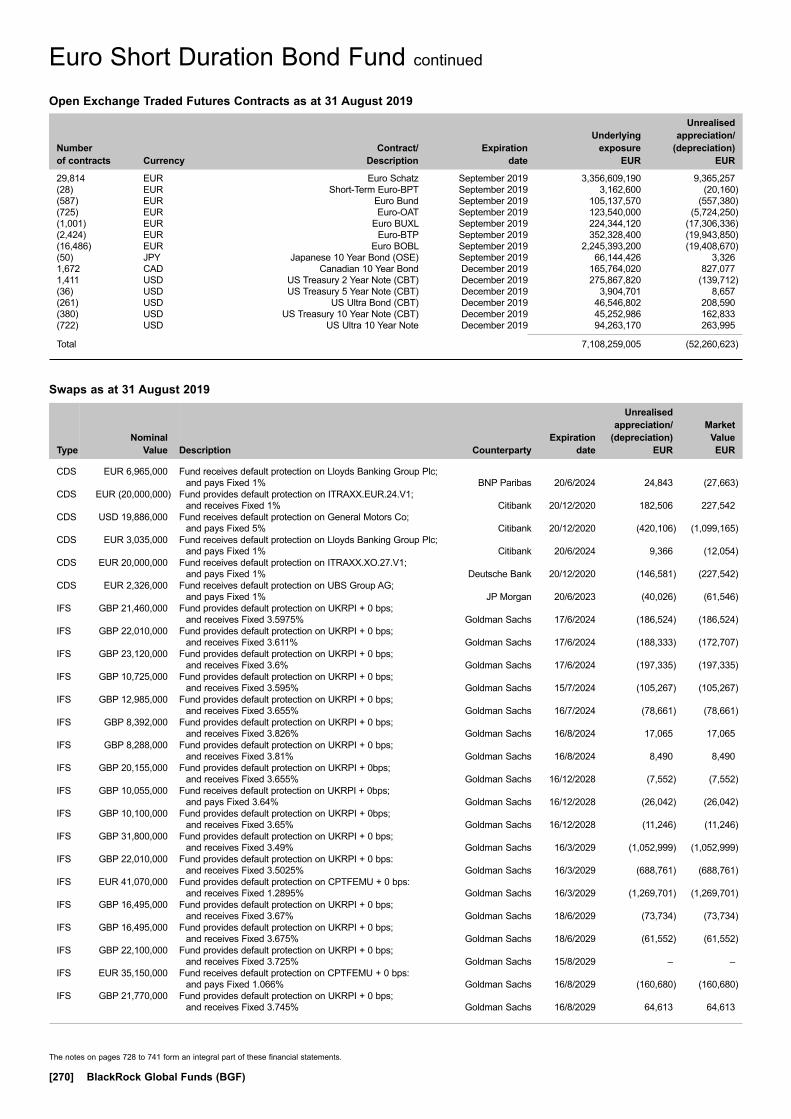
The notes on pages 728 to 741 form an integral part of these financial statements.
[270] BlackRock Global Funds (BGF)
Euro Short Duration Bond Fund continued
Swaps as at 31 August 2019
TypeNominal
Value Description Counterparty
Expiration date
Unrealised appreciation/
(depreciation) EUR
Market Value EUR
CDS EUR 6,965,000 Fund receives default protection on Lloyds Banking Group Plc; and pays Fixed 1% BNP Paribas 20/6/2024 24,843 (27,663)
CDS EUR (20,000,000) Fund provides default protection on ITRAXX.EUR.24.V1; and receives Fixed 1% Citibank 20/12/2020 182,506 227,542
CDS USD 19,886,000 Fund receives default protection on General Motors Co; and pays Fixed 5% Citibank 20/12/2020 (420,106) (1,099,165)
CDS EUR 3,035,000 Fund receives default protection on Lloyds Banking Group Plc; and pays Fixed 1% Citibank 20/6/2024 9,366 (12,054)
CDS EUR 20,000,000 Fund receives default protection on ITRAXX.XO.27.V1; and pays Fixed 1% Deutsche Bank 20/12/2020 (146,581) (227,542)
CDS EUR 2,326,000 Fund receives default protection on UBS Group AG; and pays Fixed 1% JP Morgan 20/6/2023 (40,026) (61,546)
IFS GBP 21,460,000 Fund provides default protection on UKRPI + 0 bps; and receives Fixed 3.5975% Goldman Sachs 17/6/2024 (186,524) (186,524)
IFS GBP 22,010,000 Fund provides default protection on UKRPI + 0 bps; and receives Fixed 3.611% Goldman Sachs 17/6/2024 (188,333) (172,707)
IFS GBP 23,120,000 Fund provides default protection on UKRPI + 0 bps; and receives Fixed 3.6% Goldman Sachs 17/6/2024 (197,335) (197,335)
IFS GBP 10,725,000 Fund provides default protection on UKRPI + 0 bps; and receives Fixed 3.595% Goldman Sachs 15/7/2024 (105,267) (105,267)
IFS GBP 12,985,000 Fund provides default protection on UKRPI + 0 bps; and receives Fixed 3.655% Goldman Sachs 16/7/2024 (78,661) (78,661)
IFS GBP 8,392,000 Fund provides default protection on UKRPI + 0 bps; and receives Fixed 3.826% Goldman Sachs 16/8/2024 17,065 17,065
IFS GBP 8,288,000 Fund provides default protection on UKRPI + 0 bps; and receives Fixed 3.81% Goldman Sachs 16/8/2024 8,490 8,490
IFS GBP 20,155,000 Fund provides default protection on UKRPI + 0bps; and receives Fixed 3.655% Goldman Sachs 16/12/2028 (7,552) (7,552)
IFS GBP 10,055,000 Fund receives default protection on UKRPI + 0bps; and pays Fixed 3.64% Goldman Sachs 16/12/2028 (26,042) (26,042)
IFS GBP 10,100,000 Fund provides default protection on UKRPI + 0bps; and receives Fixed 3.65% Goldman Sachs 16/12/2028 (11,246) (11,246)
IFS GBP 31,800,000 Fund provides default protection on UKRPI + 0 bps; and receives Fixed 3.49% Goldman Sachs 16/3/2029 (1,052,999) (1,052,999)
IFS GBP 22,010,000 Fund provides default protection on UKRPI + 0 bps: and receives Fixed 3.5025% Goldman Sachs 16/3/2029 (688,761) (688,761)
IFS EUR 41,070,000 Fund provides default protection on CPTFEMU + 0 bps: and receives Fixed 1.2895% Goldman Sachs 16/3/2029 (1,269,701) (1,269,701)
IFS GBP 16,495,000 Fund provides default protection on UKRPI + 0 bps; and receives Fixed 3.67% Goldman Sachs 18/6/2029 (73,734) (73,734)
IFS GBP 16,495,000 Fund provides default protection on UKRPI + 0 bps; and receives Fixed 3.675% Goldman Sachs 18/6/2029 (61,552) (61,552)
IFS GBP 22,100,000 Fund provides default protection on UKRPI + 0 bps; and receives Fixed 3.725% Goldman Sachs 15/8/2029 – –
IFS EUR 35,150,000 Fund receives default protection on CPTFEMU + 0 bps: and pays Fixed 1.066% Goldman Sachs 16/8/2029 (160,680) (160,680)
IFS GBP 21,770,000 Fund provides default protection on UKRPI + 0 bps; and receives Fixed 3.745% Goldman Sachs 16/8/2029 64,613 64,613
Open Exchange Traded Futures Contracts as at 31 August 2019
Number of contracts Currency
Contract/ Description
Expiration date
Underlying exposure
EUR
Unrealised appreciation/
(depreciation) EUR
29,814 EUR Euro Schatz September 2019 3,356,609,190 9,365,257(28) EUR Short-Term Euro-BPT September 2019 3,162,600 (20,160)(587) EUR Euro Bund September 2019 105,137,570 (557,380)(725) EUR Euro-OAT September 2019 123,540,000 (5,724,250)(1,001) EUR Euro BUXL September 2019 224,344,120 (17,306,336)(2,424) EUR Euro-BTP September 2019 352,328,400 (19,943,850)(16,486) EUR Euro BOBL September 2019 2,245,393,200 (19,408,670)(50) JPY Japanese 10 Year Bond (OSE) September 2019 66,144,426 3,3261,672 CAD Canadian 10 Year Bond December 2019 165,764,020 827,0771,411 USD US Treasury 2 Year Note (CBT) December 2019 275,867,820 (139,712)(36) USD US Treasury 5 Year Note (CBT) December 2019 3,904,701 8,657(261) USD US Ultra Bond (CBT) December 2019 46,546,802 208,590(380) USD US Treasury 10 Year Note (CBT) December 2019 45,252,986 162,833(722) USD US Ultra 10 Year Note December 2019 94,263,170 263,995
Total 7,108,259,005 (52,260,623)

The notes on pages 728 to 741 form an integral part of these financial statements.
Annual Report and Audited Financial Statements [271]
Euro Short Duration Bond Fund continued
Swaps as at 31 August 2019
TypeNominal
Value Description Counterparty
Expiration date
Unrealised appreciation/
(depreciation) EUR
Market Value EUR
IFS GBP 22,100,000 Fund provides default protection on UKRPI + 0 bps; and receives Fixed 3.71% Goldman Sachs 16/8/2029 (49,120) (49,120)
IFS GBP 2,610,000 Fund receives default protection on UKRPI + 0 bps; and pays Fixed 3.42% Goldman Sachs 16/6/2049 (182,737) (182,737)
IFS GBP 5,490,000 Fund receives default protection on UKRPI + 0 bps; and pays Fixed 3.43% Goldman Sachs 16/6/2049 (444,877) (427,351)
IFS GBP 1,305,000 Fund receives default protection on UKRPI + 0 bps; and pays Fixed 3.394% Goldman Sachs 15/7/2049 (65,553) (65,553)
IRS INR 1,904,823,485 Fund receives Floating INR MIBOR 6 Month; and pays Fixed 5.507% Citibank 18/9/2024 (519,621) (519,621)
IRS GBP 16,800,000 Fund receives Floating GBP LIBOR 6 Month; and pays Fixed 1.031% Citigroup 20/12/2021 (163,874) (163,874)
IRS EUR 69,920,000 Fund receives Floating EUR EURIBOR 6 Month; and pays Fixed -0.40536% Goldman Sachs 10/7/2021 (191,688) (184,004)
IRS PLN 79,600,657 Fund receives Fixed 1.6775%; and pays Floating PLN WIBOR 6 Month Goldman Sachs 18/9/2021 17,569 17,569
IRS PLN 159,460,177 Fund receives Fixed 1.6825%; and pays Floating PLN WIBOR 6 Month Goldman Sachs 18/9/2021 38,749 38,749
IRS PLN 175,121,444 Fund receives Fixed 1.6886%; and pays Floating PLN WIBOR 6 Month Goldman Sachs 18/9/2021 47,315 47,315
IRS PLN 117,048,112 Fund receives Fixed 1.705%; and pays Floating PLN WIBOR 6 Month Goldman Sachs 18/9/2021 40,179 40,179
IRS PLN 79,269,610 Fund receives Fixed 1.725%; and pays Floating PLN WIBOR 6 Month Goldman Sachs 18/9/2021 34,276 34,276
IRS USD 161,790,000 Fund receives Floating USD LIBOR 3 Month; and pays Fixed 2.2169% Goldman Sachs 31/8/2023 (4,911,125) (4,911,125)
IRS INR 704,523,755 Fund receives Floating INR MIBOR 6 Month; and pays Fixed 5.55% Goldman Sachs 18/9/2024 (208,969) (208,969)
IRS EUR 47,726,685 Fund receives Floating EUR EURIBOR 6 Month; and pays Fixed 0.39969% Goldman Sachs 15/2/2028 (3,187,604) (3,187,604)
IRS EUR 50,176,685 Fund receives Floating EUR EURIBOR 6 Month; and pays Fixed 0.43467% Goldman Sachs 15/2/2028 (3,504,423) (3,504,423)
IRS NZD 28,425,250 Fund receives Floating NZD BBR FRA 3 Month; and pays Fixed 3.219% Goldman Sachs 24/5/2028 (2,825,696) (2,825,696)
IRS NZD 28,425,250 Fund receives Floating NZD BBR FRA 3 Month; and pays Fixed 3.22% Goldman Sachs 24/5/2028 (2,827,052) (2,827,052)
IRS EUR 6,970,000 Fund receives Floating EUR EURIBOR 6 Month; and pays Fixed 0.098% Goldman Sachs 10/7/2029 (273,702) (273,702)
IRS HUF 2,488,662,500 Fund receives Fixed 1.695%; and pays Floating HUF BUBOR 6 Month Goldman Sachs 18/9/2029 362,693 362,693
IRS HUF 2,463,775,875 Fund receives Fixed 1.71%; and pays Floating HUF BUBOR 6 Month Goldman Sachs 18/9/2029 369,703 369,703
IRS EUR 23,738,696 Fund receives Floating EUR EURIBOR 6 Month; and pays Fixed 0.3925% Goldman Sachs 4/7/2044 (1,882,278) (1,882,278)
IRS EUR 37,310,000 Fund receives Floating EUR EURIBOR 6 Month; and pays Fixed 0.076% Goldman Sachs 30/8/2049 162,131 162,131
IRS BRL 25,884,656 Fund receives Fixed 8.26%; and pays Floating BRL BROIS 1 Day JP Morgan 2/1/2023 360,619 360,619
IRS INR 1,676,702,760 Fund receives Floating INR MIBOR 6 Month; and pays Fixed 5.551% JP Morgan 18/9/2024 (498,256) (498,256)
Total (EUR underlying exposure - EUR 1,136,607,845) (24,711,558) (25,481,152)
CDS: Credit Default SwapsIFS: Inflation SwapsIRS: Interest Rate Swaps
Purchased Options as at 31 August 2019
Number of contracts
Call/ Put
Description Counterparty
Strike Price
Expiration date
Unrealised appreciation/
(depreciation) EUR
Market Value EUR
70,910,000 Put OTC EUR/GBP Bank of America EUR 0.87 20/12/2019 165,898 748,779 42,520,000 Put OTC EUR/GBP Goldman Sachs EUR 0.88 22/1/2020 139,508 426,518 27,700,000 Call OTC USD/JPY HSBC Bank Plc USD 103 13/11/2019 (67,113) 789,580 56,583,000 Put OTC EUR/GBP Morgan Stanley EUR 0.879 23/1/2020 (37,447) 817,804 56,583,000 Call OTC EUR/GBP Morgan Stanley EUR 0.92 23/1/2020 519,028 1,374,280 72,360,000 Put OTC GBP/USD RBS Plc GBP 1.22 20/11/2019 1,021,098 1,965,213
Total (EUR underlying exposure - EUR 56,553,103) 1,740,972 6,122,174
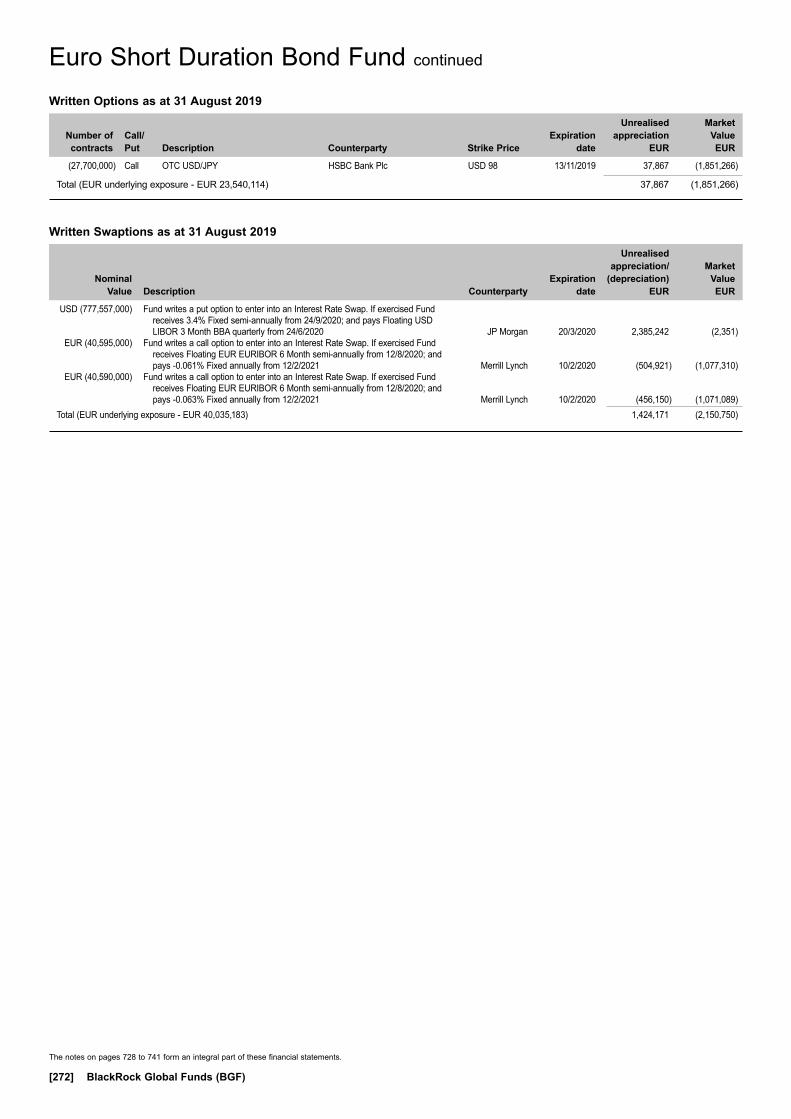
The notes on pages 728 to 741 form an integral part of these financial statements.
[272] BlackRock Global Funds (BGF)
Euro Short Duration Bond Fund continued
Written Options as at 31 August 2019
Number of contracts
Call/ Put
Description Counterparty
Strike Price
Expiration date
Unrealised appreciation
EUR
Market Value EUR
(27,700,000) Call OTC USD/JPY HSBC Bank Plc USD 98 13/11/2019 37,867 (1,851,266)
Total (EUR underlying exposure - EUR 23,540,114) 37,867 (1,851,266)
Written Swaptions as at 31 August 2019
Nominal Value
Description Counterparty
Expiration date
Unrealised appreciation/
(depreciation) EUR
Market Value EUR
USD (777,557,000) Fund writes a put option to enter into an Interest Rate Swap. If exercised Fund receives 3.4% Fixed semi-annually from 24/9/2020; and pays Floating USD LIBOR 3 Month BBA quarterly from 24/6/2020 JP Morgan 20/3/2020 2,385,242 (2,351)
EUR (40,595,000) Fund writes a call option to enter into an Interest Rate Swap. If exercised Fund receives Floating EUR EURIBOR 6 Month semi-annually from 12/8/2020; and pays -0.061% Fixed annually from 12/2/2021 Merrill Lynch 10/2/2020 (504,921) (1,077,310)
EUR (40,590,000) Fund writes a call option to enter into an Interest Rate Swap. If exercised Fund receives Floating EUR EURIBOR 6 Month semi-annually from 12/8/2020; and pays -0.063% Fixed annually from 12/2/2021 Merrill Lynch 10/2/2020 (456,150) (1,071,089)
Total (EUR underlying exposure - EUR 40,035,183) 1,424,171 (2,150,750)

Transferable Securities and Money Market Instruments Admitted to an Official Stock Exchange Listing or Dealt in on Another Regulated Market
Transferable Securities and Money Market Instruments Admitted to an Official Stock Exchange Listing or Dealt in on Another Regulated Market
Holding
Description
Market Value (EUR)
% of Net
Assets
Holding
Description
Market Value (EUR)
% of Net
Assets
~ Investment in connected party fund, see further information in Note 11.* All or a portion of this security represents a security on loan.
The notes on pages 728 to 741 form an integral part of these financial statements.
Annual Report and Audited Financial Statements [273]
FUNDS
Ireland 103,274 BlackRock ICS Euro Liquid
Environmentally Aware Fund~ 10,303,167 0.56Total Funds 10,303,167 0.56
COMMON STOCKS (SHARES)
Belgium 884,893 KBC Group NV 46,740,048 2.51
Denmark 571,788 DSV A/S 51,440,611 2.76
Finland 798,348 Konecranes Oyj ‘A’* 21,595,314 1.16 823,661 Neste Oyj 23,573,178 1.27 898,875 Sampo Oyj ‘A’ 32,494,331 1.74 77,662,823 4.17
France 270,953 Capgemini SE* 29,669,353 1.59 283,309 Dassault Systemes SE* 36,532,696 1.96 292,022 Eiffage SA* 27,596,079 1.48 192,169 Ipsen SA* 18,361,748 0.99 321,991 LVMH Moet Hennessy
Louis Vuitton SE 117,188,624 6.29 324,714 Pernod Ricard SA* 56,240,465 3.02 261,053 Remy Cointreau SA* 35,842,577 1.92 779,101 Safran SA 102,724,467 5.52 1,202,678 Sanofi* 94,193,741 5.06 303,430 Thales SA* 31,936,008 1.71 336,806 Ubisoft Entertainment SA* 24,721,560 1.33 696,532 Vinci SA* 69,193,489 3.72 644,200,807 34.59
Germany 167,766 adidas AG* 45,447,809 2.44 397,814 Allianz SE 79,741,816 4.28 290,707 Deutsche Boerse AG* 39,041,950 2.10 1,202,875 Deutsche Wohnen SE 39,045,322 2.10 433,006 Knorr-Bremse AG* 36,827,160 1.98 92,313 MorphoSys AG* 9,923,648 0.53 122,836 MTU Aero Engines AG 30,598,448 1.64 439,778 Puma SE 30,652,527 1.64 729,651 SAP SE 79,575,738 4.27 552,918 Symrise AG ‘A’* 46,953,797 2.52 437,808,215 23.50
Ireland 600,988 Kingspan Group Plc 25,205,437 1.35 315,473 Linde Plc 53,740,825 2.89 78,946,262 4.24
Italy 5,269,874 FinecoBank Banca Fineco SpA* 50,105,962 2.69 944,621 Moncler SpA 32,551,640 1.75 82,657,602 4.44
Luxembourg 2,639,198 Tenaris SA* 26,302,247 1.41
Netherlands 672,720 Airbus SE 84,601,267 4.54 367,800 ASML Holding NV 74,405,940 4.00 497,235 IMCD NV 31,798,178 1.71 1,017,635 Koninklijke Philips NV 43,631,101 2.34 234,436,486 12.59
Portugal 1,551,143 Galp Energia SGPS SA* 20,164,859 1.08
Spain 491,837 Amadeus IT Group SA 33,287,528 1.79 5,635,101 Iberdrola SA 52,936,139 2.84 86,223,667 4.63
Switzerland 39,503 Straumann Holding AG* 28,169,357 1.51
United Kingdom 1,447,082 RELX Plc 31,625,382 1.70Total Common Stocks (Shares) 1,846,378,366 99.13Total Transferable Securities and Money Market Instruments Admitted to an Official Stock Exchange Listing or Dealt in on Another Regulated Market 1,856,681,533 99.69Total Portfolio 1,856,681,533 99.69
Other Net Assets 5,845,143 0.31Total Net Assets (EUR) 1,862,526,676 100.00
Euro-Markets Fund
Portfolio of Investments 31 August 2019
Euro-Markets Fund

The notes on pages 728 to 741 form an integral part of these financial statements.
[274] BlackRock Global Funds (BGF)
Euro-Markets Fund continued
Open Forward Foreign Exchange Contracts as at 31 August 2019
Currency
Purchases Currency
Sales Counterparty
Maturity date
Unrealised appreciation/
(depreciation) EUR
CHF Hedged Share Class
CHF 22,910,050 EUR 21,022,847 BNY Mellon 12/9/2019 (21,302)EUR 1,974,465 CHF 2,146,603 BNY Mellon 12/9/2019 6,683Net unrealised depreciation (14,619)
GBP Hedged Share Class
EUR 304,862 GBP 279,469 BNY Mellon 12/9/2019 (4,084)GBP 5,054,883 EUR 5,454,078 BNY Mellon 12/9/2019 133,982Net unrealised appreciation 129,898
HKD Hedged Share Class
EUR 255 HKD 2,234 BNY Mellon 12/9/2019 (2)HKD 42,783 EUR 4,866 BNY Mellon 12/9/2019 71Net unrealised appreciation 69
SGD Hedged Share Class
EUR 34,165 SGD 52,868 BNY Mellon 12/9/2019 (327)SGD 1,011,654 EUR 652,394 BNY Mellon 12/9/2019 7,639Net unrealised appreciation 7,312
USD Hedged Share Class
EUR 9,420,434 USD 10,482,557 BNY Mellon 12/9/2019 (62,636)USD 120,096,400 EUR 107,025,020 BNY Mellon 12/9/2019 1,621,107Net unrealised appreciation 1,558,471
Total net unrealised appreciation (EUR underlying exposure - EUR 147,779,500) 1,681,131
Sector Breakdown as at 31 August 2019
% of Net Assets
Industrials 29.27Information Technology 13.61Financials 13.32Consumer Discretionary 12.13Healthcare 10.43Materials 5.40Consumer Staples 4.94Energy 3.76Utilities 2.84Real Estate 2.10Communication Services 1.33Investment Funds 0.56Other Net Assets 0.31
100.00
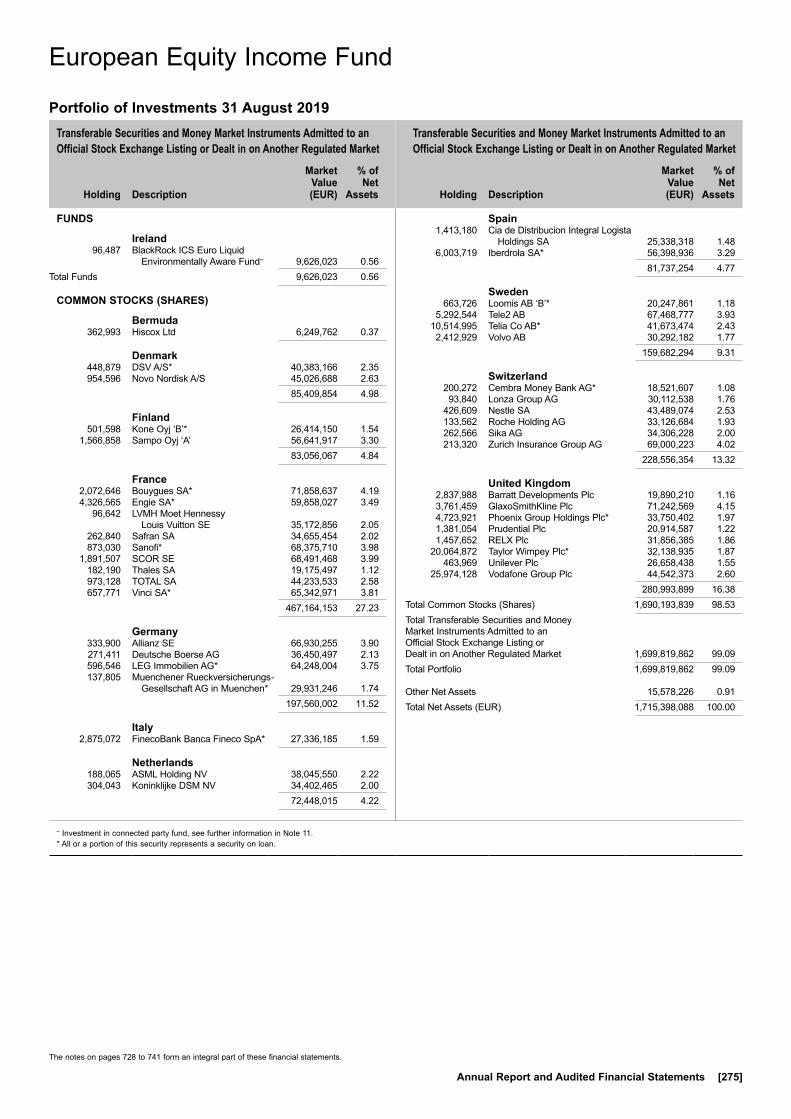
Transferable Securities and Money Market Instruments Admitted to an Official Stock Exchange Listing or Dealt in on Another Regulated Market
Transferable Securities and Money Market Instruments Admitted to an Official Stock Exchange Listing or Dealt in on Another Regulated Market
Holding
Description
Market Value (EUR)
% of Net
Assets
Holding
Description
Market Value (EUR)
% of Net
Assets
~ Investment in connected party fund, see further information in Note 11.* All or a portion of this security represents a security on loan.
The notes on pages 728 to 741 form an integral part of these financial statements.
Annual Report and Audited Financial Statements [275]
FUNDS
Ireland 96,487 BlackRock ICS Euro Liquid
Environmentally Aware Fund~ 9,626,023 0.56Total Funds 9,626,023 0.56
COMMON STOCKS (SHARES)
Bermuda 362,993 Hiscox Ltd 6,249,762 0.37
Denmark 448,879 DSV A/S* 40,383,166 2.35 954,596 Novo Nordisk A/S 45,026,688 2.63 85,409,854 4.98
Finland 501,598 Kone Oyj ‘B’* 26,414,150 1.54 1,566,858 Sampo Oyj ‘A’ 56,641,917 3.30 83,056,067 4.84
France 2,072,646 Bouygues SA* 71,858,637 4.19 4,326,565 Engie SA* 59,858,027 3.49 96,642 LVMH Moet Hennessy
Louis Vuitton SE 35,172,856 2.05 262,840 Safran SA 34,655,454 2.02 873,030 Sanofi* 68,375,710 3.98 1,891,507 SCOR SE 68,491,468 3.99 182,190 Thales SA 19,175,497 1.12 973,128 TOTAL SA 44,233,533 2.58 657,771 Vinci SA* 65,342,971 3.81 467,164,153 27.23
Germany 333,900 Allianz SE 66,930,255 3.90 271,411 Deutsche Boerse AG 36,450,497 2.13 596,546 LEG Immobilien AG* 64,248,004 3.75 137,805 Muenchener Rueckversicherungs-
Gesellschaft AG in Muenchen* 29,931,246 1.74 197,560,002 11.52
Italy 2,875,072 FinecoBank Banca Fineco SpA* 27,336,185 1.59
Netherlands 188,065 ASML Holding NV 38,045,550 2.22 304,043 Koninklijke DSM NV 34,402,465 2.00 72,448,015 4.22
Spain 1,413,180 Cia de Distribucion Integral Logista
Holdings SA 25,338,318 1.48 6,003,719 Iberdrola SA* 56,398,936 3.29 81,737,254 4.77
Sweden 663,726 Loomis AB ‘B’* 20,247,861 1.18 5,292,544 Tele2 AB 67,468,777 3.93 10,514,995 Telia Co AB* 41,673,474 2.43 2,412,929 Volvo AB 30,292,182 1.77 159,682,294 9.31
Switzerland 200,272 Cembra Money Bank AG* 18,521,607 1.08 93,840 Lonza Group AG 30,112,538 1.76 426,609 Nestle SA 43,489,074 2.53 133,562 Roche Holding AG 33,126,684 1.93 262,566 Sika AG 34,306,228 2.00 213,320 Zurich Insurance Group AG 69,000,223 4.02 228,556,354 13.32
United Kingdom 2,837,988 Barratt Developments Plc 19,890,210 1.16 3,761,459 GlaxoSmithKline Plc 71,242,569 4.15 4,723,921 Phoenix Group Holdings Plc* 33,750,402 1.97 1,381,054 Prudential Plc 20,914,587 1.22 1,457,652 RELX Plc 31,856,385 1.86 20,064,872 Taylor Wimpey Plc* 32,138,935 1.87 463,969 Unilever Plc 26,658,438 1.55 25,974,128 Vodafone Group Plc 44,542,373 2.60 280,993,899 16.38Total Common Stocks (Shares) 1,690,193,839 98.53Total Transferable Securities and Money Market Instruments Admitted to an Official Stock Exchange Listing or Dealt in on Another Regulated Market 1,699,819,862 99.09Total Portfolio 1,699,819,862 99.09
Other Net Assets 15,578,226 0.91Total Net Assets (EUR) 1,715,398,088 100.00
European Equity Income Fund
Portfolio of Investments 31 August 2019
European Equity Income Fund
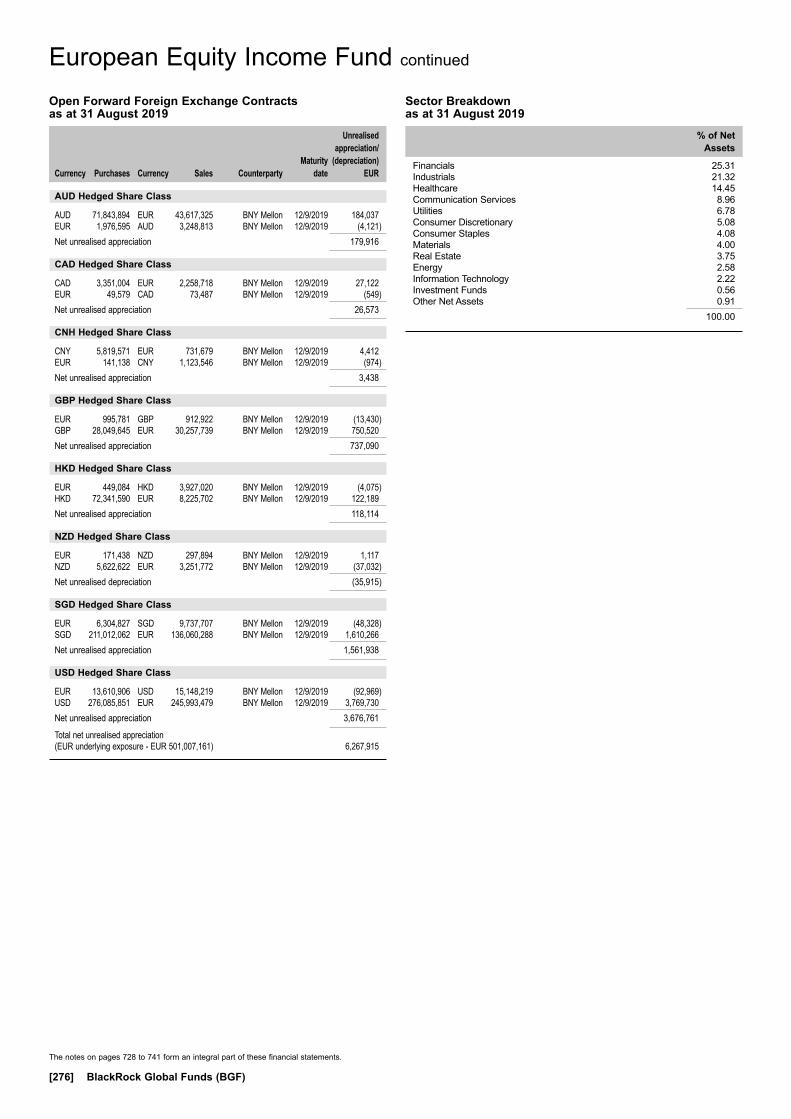
The notes on pages 728 to 741 form an integral part of these financial statements.
[276] BlackRock Global Funds (BGF)
European Equity Income Fund continued
Open Forward Foreign Exchange Contracts as at 31 August 2019
Currency
Purchases Currency
Sales Counterparty
Maturity date
Unrealised appreciation/
(depreciation) EUR
AUD Hedged Share Class
AUD 71,843,894 EUR 43,617,325 BNY Mellon 12/9/2019 184,037EUR 1,976,595 AUD 3,248,813 BNY Mellon 12/9/2019 (4,121)Net unrealised appreciation 179,916
CAD Hedged Share Class
CAD 3,351,004 EUR 2,258,718 BNY Mellon 12/9/2019 27,122EUR 49,579 CAD 73,487 BNY Mellon 12/9/2019 (549)Net unrealised appreciation 26,573
CNH Hedged Share Class
CNY 5,819,571 EUR 731,679 BNY Mellon 12/9/2019 4,412EUR 141,138 CNY 1,123,546 BNY Mellon 12/9/2019 (974)Net unrealised appreciation 3,438
GBP Hedged Share Class
EUR 995,781 GBP 912,922 BNY Mellon 12/9/2019 (13,430)GBP 28,049,645 EUR 30,257,739 BNY Mellon 12/9/2019 750,520Net unrealised appreciation 737,090
HKD Hedged Share Class
EUR 449,084 HKD 3,927,020 BNY Mellon 12/9/2019 (4,075)HKD 72,341,590 EUR 8,225,702 BNY Mellon 12/9/2019 122,189Net unrealised appreciation 118,114
NZD Hedged Share Class
EUR 171,438 NZD 297,894 BNY Mellon 12/9/2019 1,117NZD 5,622,622 EUR 3,251,772 BNY Mellon 12/9/2019 (37,032)Net unrealised depreciation (35,915)
SGD Hedged Share Class
EUR 6,304,827 SGD 9,737,707 BNY Mellon 12/9/2019 (48,328)SGD 211,012,062 EUR 136,060,288 BNY Mellon 12/9/2019 1,610,266Net unrealised appreciation 1,561,938
USD Hedged Share Class
EUR 13,610,906 USD 15,148,219 BNY Mellon 12/9/2019 (92,969)USD 276,085,851 EUR 245,993,479 BNY Mellon 12/9/2019 3,769,730Net unrealised appreciation 3,676,761
Total net unrealised appreciation (EUR underlying exposure - EUR 501,007,161) 6,267,915
Sector Breakdown as at 31 August 2019
% of Net Assets
Financials 25.31Industrials 21.32Healthcare 14.45Communication Services 8.96Utilities 6.78Consumer Discretionary 5.08Consumer Staples 4.08Materials 4.00Real Estate 3.75Energy 2.58Information Technology 2.22Investment Funds 0.56Other Net Assets 0.91
100.00
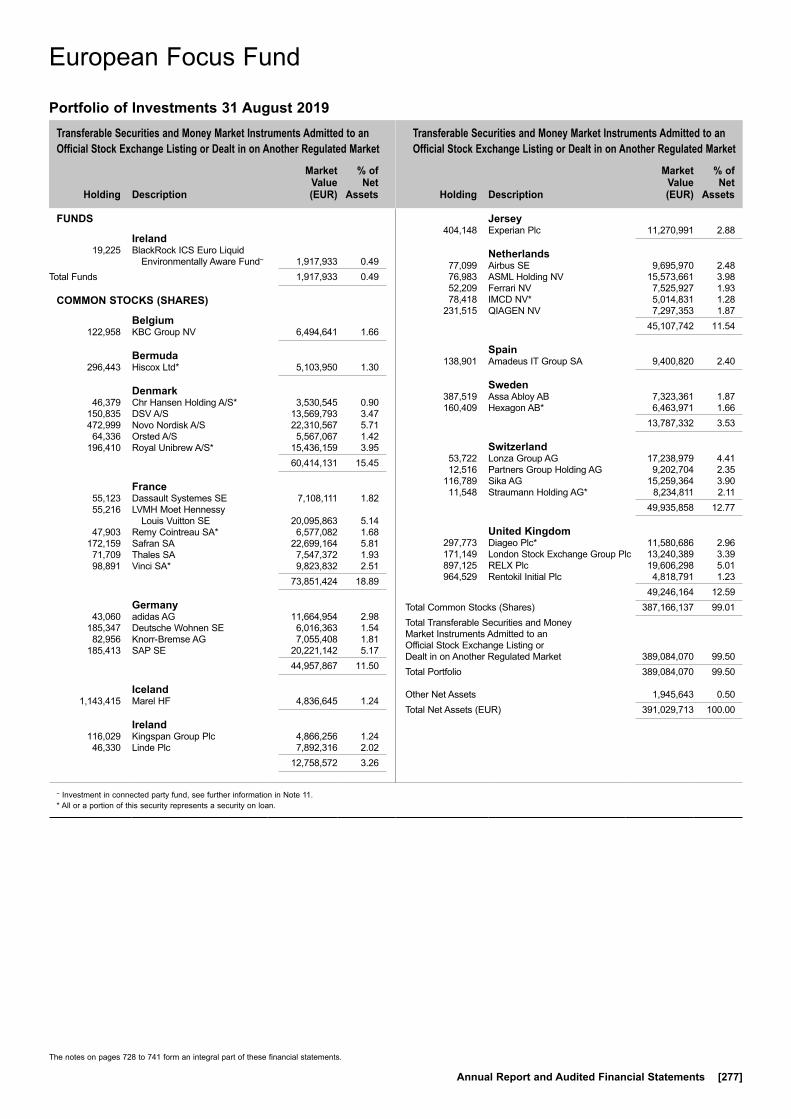
Transferable Securities and Money Market Instruments Admitted to an Official Stock Exchange Listing or Dealt in on Another Regulated Market
Transferable Securities and Money Market Instruments Admitted to an Official Stock Exchange Listing or Dealt in on Another Regulated Market
Holding
Description
Market Value (EUR)
% of Net
Assets
Holding
Description
Market Value (EUR)
% of Net
Assets
~ Investment in connected party fund, see further information in Note 11.* All or a portion of this security represents a security on loan.
The notes on pages 728 to 741 form an integral part of these financial statements.
Annual Report and Audited Financial Statements [277]
FUNDS
Ireland 19,225 BlackRock ICS Euro Liquid
Environmentally Aware Fund~ 1,917,933 0.49Total Funds 1,917,933 0.49
COMMON STOCKS (SHARES)
Belgium 122,958 KBC Group NV 6,494,641 1.66
Bermuda 296,443 Hiscox Ltd* 5,103,950 1.30
Denmark 46,379 Chr Hansen Holding A/S* 3,530,545 0.90 150,835 DSV A/S 13,569,793 3.47 472,999 Novo Nordisk A/S 22,310,567 5.71 64,336 Orsted A/S 5,567,067 1.42 196,410 Royal Unibrew A/S* 15,436,159 3.95 60,414,131 15.45
France 55,123 Dassault Systemes SE 7,108,111 1.82 55,216 LVMH Moet Hennessy
Louis Vuitton SE 20,095,863 5.14 47,903 Remy Cointreau SA* 6,577,082 1.68 172,159 Safran SA 22,699,164 5.81 71,709 Thales SA 7,547,372 1.93 98,891 Vinci SA* 9,823,832 2.51 73,851,424 18.89
Germany 43,060 adidas AG 11,664,954 2.98 185,347 Deutsche Wohnen SE 6,016,363 1.54 82,956 Knorr-Bremse AG 7,055,408 1.81 185,413 SAP SE 20,221,142 5.17 44,957,867 11.50
Iceland 1,143,415 Marel HF 4,836,645 1.24
Ireland 116,029 Kingspan Group Plc 4,866,256 1.24 46,330 Linde Plc 7,892,316 2.02 12,758,572 3.26
Jersey 404,148 Experian Plc 11,270,991 2.88
Netherlands 77,099 Airbus SE 9,695,970 2.48 76,983 ASML Holding NV 15,573,661 3.98 52,209 Ferrari NV 7,525,927 1.93 78,418 IMCD NV* 5,014,831 1.28 231,515 QIAGEN NV 7,297,353 1.87 45,107,742 11.54
Spain 138,901 Amadeus IT Group SA 9,400,820 2.40
Sweden 387,519 Assa Abloy AB 7,323,361 1.87 160,409 Hexagon AB* 6,463,971 1.66 13,787,332 3.53
Switzerland 53,722 Lonza Group AG 17,238,979 4.41 12,516 Partners Group Holding AG 9,202,704 2.35 116,789 Sika AG 15,259,364 3.90 11,548 Straumann Holding AG* 8,234,811 2.11 49,935,858 12.77
United Kingdom 297,773 Diageo Plc* 11,580,686 2.96 171,149 London Stock Exchange Group Plc 13,240,389 3.39 897,125 RELX Plc 19,606,298 5.01 964,529 Rentokil Initial Plc 4,818,791 1.23 49,246,164 12.59Total Common Stocks (Shares) 387,166,137 99.01Total Transferable Securities and Money Market Instruments Admitted to an Official Stock Exchange Listing or Dealt in on Another Regulated Market 389,084,070 99.50Total Portfolio 389,084,070 99.50
Other Net Assets 1,945,643 0.50Total Net Assets (EUR) 391,029,713 100.00
European Focus Fund
Portfolio of Investments 31 August 2019
European Focus Fund

The notes on pages 728 to 741 form an integral part of these financial statements.
[278] BlackRock Global Funds (BGF)
European Focus Fund continued
Open Forward Foreign Exchange Contracts as at 31 August 2019
Currency
Purchases Currency
Sales Counterparty
Maturity date
Unrealised appreciation/
(depreciation) EUR
SGD Hedged Share Class
EUR 172 SGD 266 BNY Mellon 12/9/2019 (1)SGD 7,200 EUR 4,643 BNY Mellon 12/9/2019 54Net unrealised appreciation 53
USD Hedged Share Class
EUR 560,773 USD 623,778 BNY Mellon 12/9/2019 (3,529)USD 11,563,369 EUR 10,304,107 BNY Mellon 12/9/2019 156,784Net unrealised appreciation 153,255
Total net unrealised appreciation (EUR underlying exposure - EUR 11,037,960) 153,308
Sector Breakdown as at 31 August 2019
% of Net Assets
Industrials 31.52Information Technology 15.03Healthcare 14.10Consumer Discretionary 10.05Financials 8.70Consumer Staples 8.59Materials 6.82Real Estate 1.54Utilities 1.42Industrial 1.24Investment Funds 0.49Other Net Assets 0.50
100.00

Transferable Securities and Money Market Instruments Admitted to an Official Stock Exchange Listing or Dealt in on Another Regulated Market
Transferable Securities and Money Market Instruments Admitted to an Official Stock Exchange Listing or Dealt in on Another Regulated Market
Holding
Description
Market Value (EUR)
% of Net
Assets
Holding
Description
Market Value (EUR)
% of Net
Assets
~ Investment in connected party fund, see further information in Note 11.* All or a portion of this security represents a security on loan.
The notes on pages 728 to 741 form an integral part of these financial statements.
Annual Report and Audited Financial Statements [279]
FUNDS
Ireland 47,063 BlackRock ICS Euro Liquid
Environmentally Aware Fund~ 4,695,212 0.41Total Funds 4,695,212 0.41
COMMON STOCKS (SHARES)
Belgium 358,600 KBC Group NV 18,941,252 1.65
Bermuda 378,374 Hiscox Ltd 6,514,581 0.57
Denmark 141,258 Chr Hansen Holding A/S* 10,753,095 0.94 439,108 DSV A/S* 39,504,123 3.44 91,636 Genmab A/S* 17,039,781 1.49 1,063,129 Novo Nordisk A/S 50,146,007 4.37 188,209 Orsted A/S* 16,285,938 1.42 577,681 Royal Unibrew A/S* 45,400,823 3.96 179,129,767 15.62
France 160,394 Dassault Systemes SE* 20,682,806 1.80 160,744 LVMH Moet Hennessy
Louis Vuitton SE 58,502,779 5.10 139,454 Remy Cointreau SA* 19,147,034 1.67 501,186 Safran SA 66,081,374 5.76 210,268 Thales SA* 22,130,707 1.93 287,890 Vinci SA 28,598,993 2.50 215,143,693 18.76
Germany 124,085 adidas AG 33,614,627 2.93 547,796 Deutsche Wohnen SE 17,781,458 1.55 244,632 Knorr-Bremse AG* 20,805,952 1.82 539,770 SAP SE* 58,867,316 5.13 131,069,353 11.43
Iceland 3,295,836 Marel HF 13,941,386 1.22
Ireland 338,350 Kingspan Group Plc 14,190,399 1.24 136,717 Linde Plc 23,289,741 2.03 37,480,140 3.27
Jersey 1,176,547 Experian Plc 32,811,868 2.86
Netherlands 225,679 Airbus SE 28,381,391 2.48 226,664 ASML Holding NV 45,854,127 4.00 151,989 Ferrari NV 21,909,214 1.91 228,324 IMCD NV 14,601,320 1.27 178,334 Koninklijke DSM NV 20,178,492 1.76 559,798 QIAGEN NV 17,644,833 1.54 148,569,377 12.96
Spain 332,608 Amadeus IT Group SA* 22,510,909 1.96
Sweden 1,128,315 Assa Abloy AB 21,322,974 1.86 466,510 Hexagon AB 18,798,865 1.64 40,121,839 3.50
Switzerland 156,393 Lonza Group AG* 50,185,318 4.38 36,437 Partners Group Holding AG 26,791,222 2.34 340,586 Sika AG* 44,500,129 3.88 34,026 Straumann Holding AG 24,263,741 2.11 145,740,410 12.71
United Kingdom 866,870 Diageo Plc 33,713,429 2.94 501,191 London Stock Exchange Group Plc* 38,773,022 3.38 2,611,690 RELX Plc 57,077,411 4.98 3,093,918 Rentokil Initial Plc 15,457,228 1.35 145,021,090 12.65Total Common Stocks (Shares) 1,136,995,665 99.16Total Transferable Securities and Money Market Instruments Admitted to an Official Stock Exchange Listing or Dealt in on Another Regulated Market 1,141,690,877 99.57Total Portfolio 1,141,690,877 99.57
Other Net Assets 4,906,782 0.43Total Net Assets (EUR) 1,146,597,659 100.00
European Fund
Portfolio of Investments 31 August 2019
European Fund

The notes on pages 728 to 741 form an integral part of these financial statements.
[280] BlackRock Global Funds (BGF)
European Fund continued
Open Forward Foreign Exchange Contracts as at 31 August 2019
Currency
Purchases Currency
Sales Counterparty
Maturity date
Unrealised appreciation/
(depreciation) EUR
AUD Hedged Share Class
AUD 3,541,673 EUR 2,150,321 BNY Mellon 12/9/2019 8,945EUR 81,000 AUD 133,327 BNY Mellon 12/9/2019 (286)Net unrealised appreciation 8,659
CAD Hedged Share Class
CAD 1,013,669 EUR 683,309 BNY Mellon 12/9/2019 8,152EUR 24,806 CAD 36,693 BNY Mellon 12/9/2019 (224)Net unrealised appreciation 7,928
CNH Hedged Share Class
CNY 147,124 EUR 18,497 BNY Mellon 12/9/2019 112EUR 633 CNY 5,021 BNY Mellon 12/9/2019 (2)Net unrealised appreciation 110
GBP Hedged Share Class
EUR 144,982 GBP 132,361 BNY Mellon 12/9/2019 (1,339)GBP 2,928,709 EUR 3,160,030 BNY Mellon 12/9/2019 77,592Net unrealised appreciation 76,253
HKD Hedged Share Class
EUR 859,784 HKD 7,498,468 BNY Mellon 12/9/2019 (5,500)HKD 146,069,542 EUR 16,611,200 BNY Mellon 12/9/2019 244,561Net unrealised appreciation 239,061
NZD Hedged Share Class
EUR 20,458 NZD 35,597 BNY Mellon 12/9/2019 105NZD 958,664 EUR 554,372 BNY Mellon 12/9/2019 (6,255)Net unrealised depreciation (6,150)
SGD Hedged Share Class
EUR 500,881 SGD 773,594 BNY Mellon 12/9/2019 (3,834)SGD 10,828,276 EUR 6,982,755 BNY Mellon 12/9/2019 81,935Net unrealised appreciation 78,101
USD Hedged Share Class
EUR 28,955,278 USD 32,198,962 BNY Mellon 12/9/2019 (173,578)USD 175,910,525 EUR 156,745,506 BNY Mellon 12/9/2019 2,393,310Net unrealised appreciation 2,219,732
Total net unrealised appreciation (EUR underlying exposure - EUR 220,640,642) 2,623,694
Sector Breakdown as at 31 August 2019
% of Net Assets
Industrials 31.49Information Technology 14.53Healthcare 13.89Consumer Discretionary 9.94Materials 8.61Consumer Staples 8.57Financials 7.94Real Estate 1.55Utilities 1.42Industrial 1.22Investment Funds 0.41Other Net Assets 0.43
100.00
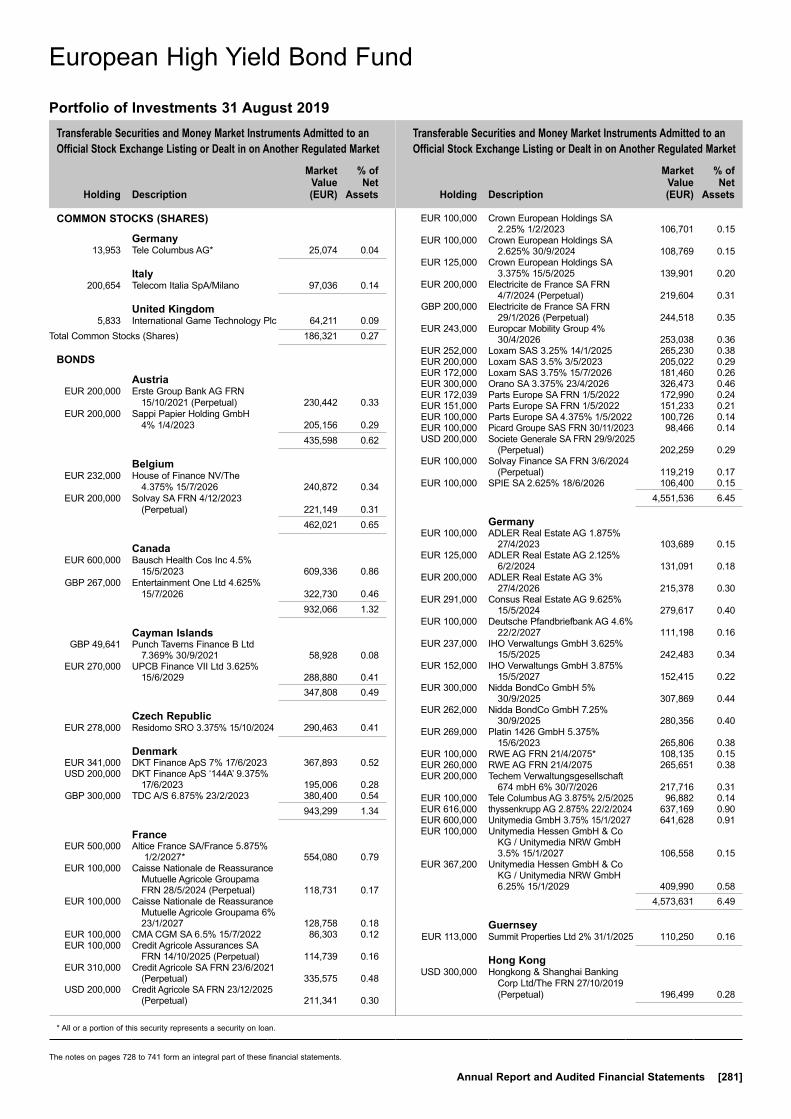
Transferable Securities and Money Market Instruments Admitted to an Official Stock Exchange Listing or Dealt in on Another Regulated Market
Transferable Securities and Money Market Instruments Admitted to an Official Stock Exchange Listing or Dealt in on Another Regulated Market
Holding
Description
Market Value (EUR)
% of Net
Assets
Holding
Description
Market Value (EUR)
% of Net
Assets
* All or a portion of this security represents a security on loan.
The notes on pages 728 to 741 form an integral part of these financial statements.
Annual Report and Audited Financial Statements [281]
COMMON STOCKS (SHARES)
Germany 13,953 Tele Columbus AG* 25,074 0.04
Italy 200,654 Telecom Italia SpA/Milano 97,036 0.14
United Kingdom 5,833 International Game Technology Plc 64,211 0.09Total Common Stocks (Shares) 186,321 0.27
BONDS
Austria EUR 200,000 Erste Group Bank AG FRN
15/10/2021 (Perpetual) 230,442 0.33 EUR 200,000 Sappi Papier Holding GmbH
4% 1/4/2023 205,156 0.29 435,598 0.62
Belgium EUR 232,000 House of Finance NV/The
4.375% 15/7/2026 240,872 0.34 EUR 200,000 Solvay SA FRN 4/12/2023
(Perpetual) 221,149 0.31 462,021 0.65
Canada EUR 600,000 Bausch Health Cos Inc 4.5%
15/5/2023 609,336 0.86 GBP 267,000 Entertainment One Ltd 4.625%
15/7/2026 322,730 0.46 932,066 1.32
Cayman Islands GBP 49,641 Punch Taverns Finance B Ltd
7.369% 30/9/2021 58,928 0.08 EUR 270,000 UPCB Finance VII Ltd 3.625%
15/6/2029 288,880 0.41 347,808 0.49
Czech Republic EUR 278,000 Residomo SRO 3.375% 15/10/2024 290,463 0.41
Denmark EUR 341,000 DKT Finance ApS 7% 17/6/2023 367,893 0.52 USD 200,000 DKT Finance ApS ‘144A’ 9.375%
17/6/2023 195,006 0.28 GBP 300,000 TDC A/S 6.875% 23/2/2023 380,400 0.54 943,299 1.34
France EUR 500,000 Altice France SA/France 5.875%
1/2/2027* 554,080 0.79 EUR 100,000 Caisse Nationale de Reassurance
Mutuelle Agricole Groupama FRN 28/5/2024 (Perpetual) 118,731 0.17
EUR 100,000 Caisse Nationale de Reassurance Mutuelle Agricole Groupama 6% 23/1/2027 128,758 0.18
EUR 100,000 CMA CGM SA 6.5% 15/7/2022 86,303 0.12 EUR 100,000 Credit Agricole Assurances SA
FRN 14/10/2025 (Perpetual) 114,739 0.16 EUR 310,000 Credit Agricole SA FRN 23/6/2021
(Perpetual) 335,575 0.48 USD 200,000 Credit Agricole SA FRN 23/12/2025
(Perpetual) 211,341 0.30
EUR 100,000 Crown European Holdings SA 2.25% 1/2/2023 106,701 0.15
EUR 100,000 Crown European Holdings SA 2.625% 30/9/2024 108,769 0.15
EUR 125,000 Crown European Holdings SA 3.375% 15/5/2025 139,901 0.20
EUR 200,000 Electricite de France SA FRN 4/7/2024 (Perpetual) 219,604 0.31
GBP 200,000 Electricite de France SA FRN 29/1/2026 (Perpetual) 244,518 0.35
EUR 243,000 Europcar Mobility Group 4% 30/4/2026 253,038 0.36
EUR 252,000 Loxam SAS 3.25% 14/1/2025 265,230 0.38 EUR 200,000 Loxam SAS 3.5% 3/5/2023 205,022 0.29 EUR 172,000 Loxam SAS 3.75% 15/7/2026 181,460 0.26 EUR 300,000 Orano SA 3.375% 23/4/2026 326,473 0.46 EUR 172,039 Parts Europe SA FRN 1/5/2022 172,990 0.24 EUR 151,000 Parts Europe SA FRN 1/5/2022 151,233 0.21 EUR 100,000 Parts Europe SA 4.375% 1/5/2022 100,726 0.14 EUR 100,000 Picard Groupe SAS FRN 30/11/2023 98,466 0.14 USD 200,000 Societe Generale SA FRN 29/9/2025
(Perpetual) 202,259 0.29 EUR 100,000 Solvay Finance SA FRN 3/6/2024
(Perpetual) 119,219 0.17 EUR 100,000 SPIE SA 2.625% 18/6/2026 106,400 0.15 4,551,536 6.45
Germany EUR 100,000 ADLER Real Estate AG 1.875%
27/4/2023 103,689 0.15 EUR 125,000 ADLER Real Estate AG 2.125%
6/2/2024 131,091 0.18 EUR 200,000 ADLER Real Estate AG 3%
27/4/2026 215,378 0.30 EUR 291,000 Consus Real Estate AG 9.625%
15/5/2024 279,617 0.40 EUR 100,000 Deutsche Pfandbriefbank AG 4.6%
22/2/2027 111,198 0.16 EUR 237,000 IHO Verwaltungs GmbH 3.625%
15/5/2025 242,483 0.34 EUR 152,000 IHO Verwaltungs GmbH 3.875%
15/5/2027 152,415 0.22 EUR 300,000 Nidda BondCo GmbH 5%
30/9/2025 307,869 0.44 EUR 262,000 Nidda BondCo GmbH 7.25%
30/9/2025 280,356 0.40 EUR 269,000 Platin 1426 GmbH 5.375%
15/6/2023 265,806 0.38 EUR 100,000 RWE AG FRN 21/4/2075* 108,135 0.15 EUR 260,000 RWE AG FRN 21/4/2075 265,651 0.38 EUR 200,000 Techem Verwaltungsgesellschaft
674 mbH 6% 30/7/2026 217,716 0.31 EUR 100,000 Tele Columbus AG 3.875% 2/5/2025 96,882 0.14 EUR 616,000 thyssenkrupp AG 2.875% 22/2/2024 637,169 0.90 EUR 600,000 Unitymedia GmbH 3.75% 15/1/2027 641,628 0.91 EUR 100,000 Unitymedia Hessen GmbH & Co
KG / Unitymedia NRW GmbH 3.5% 15/1/2027 106,558 0.15
EUR 367,200 Unitymedia Hessen GmbH & Co KG / Unitymedia NRW GmbH 6.25% 15/1/2029 409,990 0.58
4,573,631 6.49
Guernsey EUR 113,000 Summit Properties Ltd 2% 31/1/2025 110,250 0.16
Hong Kong USD 300,000 Hongkong & Shanghai Banking
Corp Ltd/The FRN 27/10/2019 (Perpetual) 196,499 0.28
European High Yield Bond Fund
Portfolio of Investments 31 August 2019
European High Yield Bond Fund

Transferable Securities and Money Market Instruments Admitted to an Official Stock Exchange Listing or Dealt in on Another Regulated Market
Transferable Securities and Money Market Instruments Admitted to an Official Stock Exchange Listing or Dealt in on Another Regulated Market
Holding
Description
Market Value (EUR)
% of Net
Assets
Holding
Description
Market Value (EUR)
% of Net
Assets
* All or a portion of this security represents a security on loan.
The notes on pages 728 to 741 form an integral part of these financial statements.
[282] BlackRock Global Funds (BGF)
Ireland EUR 200,000 Allied Irish Banks Plc FRN
3/12/2020 (Perpetual) 213,930 0.30 EUR 342,000 Allied Irish Banks Plc FRN
26/11/2025 356,756 0.51 EUR 138,000 Arbour CLO IV DAC FRN
15/1/2030 138,730 0.20 GBP 212,000 Ardagh Packaging Finance Plc /
Ardagh Holdings USA Inc 4.75% 15/7/2027 238,507 0.34
EUR 425,000 Ardagh Packaging Finance Plc / Ardagh Holdings USA Inc 6.75% 15/5/2024 450,326 0.64
EUR 350,000 Aurium CLO II DAC FRN 13/10/2029 350,583 0.50 EUR 200,000 Avoca CLO XV DAC FRN 15/4/2031 186,233 0.26 EUR 100,000 Avoca CLO XVII Designated
Activity Co FRN 15/1/2030 100,825 0.14 EUR 100,000 Avoca CLO XVIII DAC FRN
15/4/2031 94,848 0.13 EUR 400,000 Bank of Ireland FRN 18/6/2020
(Perpetual) 419,228 0.59 EUR 155,000 Cadogan Square CLO VIII DAC
FRN 15/1/2030 155,670 0.22 EUR 129,000 Carlyle Global Market Strategies
Euro CLO 2014-2 Ltd FRN 17/11/2031 125,049 0.18
EUR 190,000 eircom Finance DAC 3.5% 15/5/2026 202,948 0.29
EUR 150,000 Harvest CLO XXII DAC FRN 15/1/2032 148,448 0.21
EUR 150,000 OCP Euro 2017-1 DAC ‘Series 2017-1X E’ FRN 18/6/2030 149,116 0.21
EUR 148,000 OCP Euro CLO 2017-2 DAC FRN 15/1/2032 147,169 0.21
EUR 100,000 OCP Euro CLO 2017-2 DAC FRN 15/1/2032 93,717 0.13
EUR 119,000 OZLME BV FRN 18/1/2030 119,000 0.17 EUR 119,000 OZLME BV FRN 18/1/2030 119,993 0.17 EUR 100,000 Ozlme II DAC FRN 15/10/2030 98,207 0.14 EUR 150,000 Providus Clo III DAC FRN
20/7/2032 145,545 0.21 EUR 150,000 RRE 1 Loan Management DAC
FRN 15/4/2032 148,423 0.21 GBP 284,000 Virgin Media Receivables
Financing Notes I DAC 5.5% 15/9/2024 323,475 0.46
4,526,726 6.42
Italy GBP 100,000 Assicurazioni Generali SpA FRN
8/2/2022 (Perpetual) 117,564 0.17 EUR 400,000 Assicurazioni Generali SpA FRN
27/10/2047 482,789 0.68 EUR 100,000 Banca Carige SpA 0.75% 26/7/2020 100,438 0.14 EUR 200,000 Banco BPM SpA 1.75% 24/4/2023 203,354 0.29 EUR 400,000 Banco BPM SpA 2.5% 21/6/2024 412,974 0.59 EUR 146,000 Diocle Spa FRN 30/6/2026 148,891 0.21 EUR 600,000 Intesa Sanpaolo SpA FRN
11/1/2027 (Perpetual) 697,500 0.99 EUR 300,000 Sisal Group SpA 7% 31/7/2023 311,973 0.44 EUR 500,000 Telecom Italia SpA/Milano 1.125%
26/3/2022 502,935 0.71 EUR 608,000 Telecom Italia SpA/Milano 2.75%
15/4/2025 638,202 0.91 EUR 100,000 Telecom Italia SpA/Milano 2.875%
28/1/2026 104,439 0.15 EUR 100,000 Telecom Italia SpA/Milano 3%
30/9/2025 105,691 0.15
EUR 716,000 Telecom Italia SpA/Milano 4% 11/4/2024 794,667 1.13
EUR 400,000 UniCredit SpA FRN 10/9/2021 (Perpetual)* 422,000 0.60
EUR 250,000 UniCredit SpA FRN 3/6/2022 (Perpetual) 289,688 0.41
EUR 600,000 UniCredit SpA (Restricted) FRN 3/6/2026 (Perpetual) 659,250 0.93
5,992,355 8.50
Japan EUR 100,000 SoftBank Group Corp 3.125%
19/9/2025 106,117 0.15 EUR 640,000 SoftBank Group Corp 4% 20/4/2023 698,742 0.99 EUR 100,000 SoftBank Group Corp 4% 19/9/2029 108,861 0.15 EUR 100,000 SoftBank Group Corp 4.5%
20/4/2025 113,671 0.16 EUR 505,000 SoftBank Group Corp 4.75%
30/7/2025 576,970 0.82 EUR 400,000 SoftBank Group Corp 5% 15/4/2028 463,840 0.66 2,068,201 2.93
Jersey GBP 100,000 AA Bond Co Ltd 4.249% 31/7/2020 111,892 0.16 EUR 530,000 Avis Budget Finance Plc 4.75%
30/1/2026 572,220 0.81 GBP 350,000 CPUK Finance Ltd 4.25%
28/8/2022 392,278 0.56 GBP 105,000 Galaxy Bidco Ltd 6.5% 31/7/2026 111,755 0.16 USD 400,000 HBOS Capital Funding LP 6.85%
23/12/2019 (Perpetual) 369,807 0.52 EUR 492,000 LHC3 Plc 4.125% 15/8/2024 511,011 0.72 2,068,963 2.93
Luxembourg USD 400,000 Altice Financing SA ‘144A’ 6.625%
15/2/2023 373,881 0.53 USD 800,000 Altice Financing SA ‘144A’ 7.5%
15/5/2026 774,630 1.10 EUR 100,000 Altice Finco SA 4.75% 15/1/2028 95,385 0.14 EUR 100,000 Altice Luxembourg SA 8% 15/5/2027 107,735 0.15 USD 350,000 Altice Luxembourg SA ‘144A’ 10.5%
15/5/2027 344,572 0.49 GBP 100,000 B&M European Value Retail SA
4.125% 1/2/2022 112,301 0.16 GBP 700,000 Cabot Financial Luxembourg SA
7.5% 1/10/2023 805,688 1.14 EUR 100,000 Cirsa Finance International Sarl
4.75% 22/5/2025 106,203 0.15 USD 200,000 Cirsa Finance International Sarl
‘144A’ 7.875% 20/12/2023 191,808 0.27 EUR 100,000 Codere Finance 2 Luxembourg SA
6.75% 1/11/2021 98,354 0.14 USD 400,000 Codere Finance 2 Luxembourg SA
‘144A’ 7.625% 1/11/2021 353,950 0.50 EUR 293,000 ContourGlobal Power Holdings SA
3.375% 1/8/2023 305,104 0.43 EUR 200,000 ContourGlobal Power Holdings SA
4.125% 1/8/2025 213,685 0.30 EUR 191,000 ContourGlobal Power Holdings SA
4.125% 1/8/2025 205,131 0.29 EUR 200,000 European TopSoho Sarl 4%
21/9/2021 186,610 0.26 GBP 100,000 Garfunkelux Holdco 2 SA 11%
1/11/2023 102,823 0.15 EUR 520,000 Garfunkelux Holdco 3 SA 7.5%
1/8/2022* 498,550 0.71
European High Yield Bond Fund continued
Portfolio of Investments 31 August 2019

Transferable Securities and Money Market Instruments Admitted to an Official Stock Exchange Listing or Dealt in on Another Regulated Market
Transferable Securities and Money Market Instruments Admitted to an Official Stock Exchange Listing or Dealt in on Another Regulated Market
Holding
Description
Market Value (EUR)
% of Net
Assets
Holding
Description
Market Value (EUR)
% of Net
Assets
* All or a portion of this security represents a security on loan.
The notes on pages 728 to 741 form an integral part of these financial statements.
Annual Report and Audited Financial Statements [283]
EUR 150,000 Holcim Finance Luxembourg SA FRN 5/7/2024 (Perpetual) 157,897 0.22
EUR 100,000 Horizon Parent Holdings Sarl 8.25% 15/2/2022 103,018 0.15
EUR 100,000 INEOS Group Holdings SA 5. 375% 1/8/2024 102,902 0.15
EUR 20,000 Matterhorn Telecom SA FRN 1/2/2023* 20,019 0.03
EUR 420,000 Matterhorn Telecom SA 3.875% 1/5/2022 426,111 0.60
EUR 200,000 Matterhorn Telecom SA 4% 15/11/2027 205,944 0.29
EUR 800,000 Rossini Sarl 6.75% 30/10/2025* 876,020 1.24 EUR 100,000 SES SA FRN 2/1/2022 (Perpetual) 107,140 0.15 EUR 500,000 SES SA FRN 29/1/2024 (Perpetual) 560,625 0.80 EUR 268,000 Swissport Financing Sarl 5.25%
15/8/2024 276,104 0.39 EUR 100,000 Telecom Italia Finance SA 7.75%
24/1/2033 148,893 0.21 EUR 196,000 Telenet Finance VI Luxembourg
SCA 4.875% 15/7/2027 215,865 0.31 EUR 300,000 Vivion Investments Sarl 3%
8/8/2024 299,840 0.43 8,376,788 11.88
Mexico EUR 200,000 Cemex SAB de CV 3.125%
19/3/2026 207,087 0.29
Netherlands EUR 400,000 ABN AMRO Bank NV FRN
22/9/2020 (Perpetual) 418,812 0.59 EUR 100,000 Ares European CLO VIII BV FRN
17/2/2030 100,571 0.14 EUR 100,000 Cairn CLO IV BV FRN 30/4/2031 100,249 0.14 EUR 100,000 Cairn CLO VII BV ‘Series 2016-7X
E’ FRN 31/1/2030 100,698 0.14 EUR 200,000 Constellium SE 4.25% 15/2/2026 210,429 0.30 EUR 200,000 Diamond BC BV 5.625% 15/8/2025 159,028 0.23 EUR 160,000 Dryden 32 Euro CLO 2014 B.V.
FRN 15/8/2031 155,270 0.22 EUR 100,000 Encavis Finance BV FRN 13/9/2023
(Perpetual) 120,925 0.17 EUR 200,000 Ferrovial Netherlands BV FRN
4/2/2023 (Perpetual) 193,930 0.28 EUR 310,000 Hertz Holdings Netherlands BV
5.5% 30/3/2023 327,515 0.46 USD 325,000 ING Groep NV FRN 16/4/2024
(Perpetual) 308,883 0.44 EUR 487,000 Intertrust Group BV 3.375%
15/11/2025 518,234 0.74 EUR 300,000 InterXion Holding NV 4.75%
15/6/2025 327,180 0.46 EUR 200,000 LeasePlan Corp NV FRN 29/5/2024
(Perpetual) 212,948 0.30 EUR 500,000 Naturgy Finance BV FRN
18/11/2022 (Perpetual) 545,495 0.77 EUR 100,000 Naturgy Finance BV FRN 24/4/2024
(Perpetual) 106,942 0.15 EUR 110,000 NN Group NV FRN 13/6/2024
(Perpetual) 123,850 0.18 EUR 110,000 OCI NV 5% 15/4/2023 115,468 0.16 EUR 200,000 Repsol International Finance BV
FRN 25/3/2021 (Perpetual) 211,002 0.30 EUR 350,000 Repsol International Finance BV
FRN 25/3/2075 402,948 0.57 EUR 274,000 Summer BidCo BV 9% 15/11/2025 292,381 0.42 GBP 200,000 Telefonica Europe BV FRN
26/11/2020 (Perpetual) 234,905 0.33
EUR 300,000 Telefonica Europe BV FRN 15/3/2022 (Perpetual) 319,351 0.45
EUR 100,000 Telefonica Europe BV FRN 7/3/2023 (Perpetual) 102,125 0.15
EUR 400,000 Telefonica Europe BV FRN 31/3/2024 (Perpetual) 467,935 0.66
EUR 800,000 Telefonica Europe BV FRN 14/12/2024 (Perpetual) 887,000 1.26
EUR 100,000 Teva Pharmaceutical Finance Netherlands II BV 4.5% 1/3/2025 89,781 0.13
EUR 100,000 Trivium Packaging Finance BV FRN 15/8/2026 102,612 0.15
EUR 548,000 Trivium Packaging Finance BV 3.75% 15/8/2026 585,831 0.83
EUR 200,000 United Group BV 4.375% 1/7/2022 205,428 0.29 EUR 302,000 United Group BV 4.875% 1/7/2024 317,046 0.45 EUR 123,000 United Group BV 4.875% 1/7/2024 129,260 0.18 EUR 300,000 UPC Holding BV 3.875% 15/6/2029 318,327 0.45 EUR 100,000 Ziggo Bond Co BV 4.625%
15/1/2025 103,846 0.15 USD 200,000 Ziggo Bond Co BV ‘144A’ 5.875%
15/1/2025 188,072 0.27 USD 150,000 Ziggo Bond Co BV ‘144A’ 6%
15/1/2027 142,242 0.20 EUR 288,000 Ziggo BV 4.25% 15/1/2027 313,963 0.45 9,560,482 13.56
Portugal EUR 600,000 Banco Espirito Santo SA
(Restricted) (Defaulted) 4% 21/1/2019 147,000 0.21
EUR 200,000 Banco Espirito Santo SA (Restricted) (Defaulted) 4.75% 15/1/2018 49,000 0.07
EUR 100,000 EDP - Energias de Portugal SA FRN 30/4/2079 111,750 0.16
307,750 0.44
Singapore EUR 387,000 Mulhacen Pte Ltd 6.5% 1/8/2023* 321,489 0.46
Spain EUR 200,000 Banco Bilbao Vizcaya Argentaria
SA FRN 14/4/2021 (Perpetual) 222,758 0.32 EUR 600,000 Banco de Sabadell SA FRN
18/5/2022 (Perpetual) 596,214 0.85 EUR 100,000 Banco de Sabadell SA FRN
12/12/2028 109,924 0.16 EUR 200,000 Banco Santander SA FRN
25/4/2022 (Perpetual) 217,832 0.31 EUR 200,000 Banco Santander SA FRN
19/3/2025 (Perpetual) 190,374 0.27 EUR 400,000 Bankia SA FRN 18/7/2022
(Perpetual) 405,680 0.57 EUR 400,000 Bankia SA FRN 19/9/2023
(Perpetual) 415,364 0.59 EUR 200,000 Bilbao CLO I DAC FRN 20/7/2031 190,348 0.27 EUR 400,000 CaixaBank SA FRN 13/6/2024
(Perpetual) 432,132 0.61 EUR 400,000 CaixaBank SA FRN 23/3/2026
(Perpetual) 374,468 0.53 EUR 200,000 Distribuidora Internacional de
Alimentacion SA 1% 28/4/2021 162,034 0.23 EUR 200,000 Hipercor SA 3.875% 19/1/2022 214,805 0.30 EUR 200,000 Mapfre SA FRN 7/9/2048 232,178 0.33 EUR 115,098 NH Hotel Group SA 3.75% 1/10/2023 117,791 0.17 EUR 230,000 Tendam Brands SAU 5% 15/9/2024* 236,553 0.33 4,118,455 5.84
European High Yield Bond Fund continued
Portfolio of Investments 31 August 2019

Transferable Securities and Money Market Instruments Admitted to an Official Stock Exchange Listing or Dealt in on Another Regulated Market
Transferable Securities and Money Market Instruments Admitted to an Official Stock Exchange Listing or Dealt in on Another Regulated Market
Holding
Description
Market Value (EUR)
% of Net
Assets
Holding
Description
Market Value (EUR)
% of Net
Assets
* All or a portion of this security represents a security on loan.
The notes on pages 728 to 741 form an integral part of these financial statements.
[284] BlackRock Global Funds (BGF)
Sweden EUR 300,000 Corral Petroleum Holdings AB
11.75% 15/5/2021 315,792 0.45 EUR 292,000 Intrum AB 2.75% 15/7/2022 298,456 0.42 EUR 401,000 Intrum AB 3.5% 15/7/2026 420,434 0.60 EUR 100,000 Telefonaktiebolaget LM Ericsson
1.875% 1/3/2024 106,316 0.15 EUR 234,000 Verisure Holding AB 3.5% 15/5/2023* 244,481 0.35 EUR 300,000 Verisure Midholding AB 5.75%
1/12/2023 311,586 0.44 1,697,065 2.41
Switzerland USD 250,000 Credit Suisse Group AG ‘144A’
FRN 17/7/2023 (Perpetual) 243,019 0.35 USD 200,000 Credit Suisse Group AG FRN
11/12/2023 (Perpetual) 200,054 0.28 EUR 200,000 UBS Group Funding Switzerland
AG FRN 19/2/2022 (Perpetual) 219,390 0.31 662,463 0.94
United Kingdom EUR 100,000 Arrow Global Finance Plc FRN
1/3/2026 100,137 0.14 GBP 200,000 Arrow Global Finance Plc 5.125%
15/9/2024* 219,917 0.31 EUR 300,000 Barclays Plc FRN 11/11/2025 304,240 0.43 EUR 300,000 Barclays Plc FRN 7/2/2028 295,995 0.42 GBP 100,000 Boparan Finance Plc 5.5%
15/7/2021 55,685 0.08 EUR 185,000 EC Finance Plc 2.375% 15/11/2022 188,421 0.27 EUR 262,000 eG Global Finance Plc 3.625%
7/2/2024 254,858 0.36 EUR 344,000 eG Global Finance Plc 4.375%
7/2/2025 334,781 0.48 GBP 300,000 GKN Holdings Ltd 4.625%
12/5/2032 341,603 0.48 GBP 200,000 GKN Holdings Ltd 5.375%
19/9/2022* 241,604 0.34 GBP 200,000 Iceland Bondco Plc 4.625%
15/3/2025 191,248 0.27 EUR 122,000 International Game Technology Plc
3.5% 15/6/2026 129,840 0.18 GBP 210,000 Iron Mountain UK Plc 3.875%
15/11/2025* 232,815 0.33 USD 200,000 Ithaca Energy North Sea Plc ‘144A’
9.375% 15/7/2024 186,497 0.27 USD 200,000 National Westminster Bank Plc
FRN 28/11/2019 (Perpetual) 145,976 0.21 USD 600,000 Neptune Energy Bondco Plc ‘144A’
6.625% 15/5/2025 543,440 0.77 EUR 125,000 NGG Finance Plc FRN 5/12/2079 125,240 0.18 EUR 175,000 NGG Finance Plc FRN 5/9/2082 175,385 0.25 EUR 100,000 Nomad Foods Bondco Plc 3.25%
15/5/2024 103,909 0.15 GBP 113,000 Pinnacle Bidco Plc 6.375%
15/2/2025 132,734 0.19 GBP 100,000 Premier Foods Finance Plc 6.25%
15/10/2023 113,910 0.16 GBP 166,000 Stonegate Pub Co Financing Plc
FRN 15/3/2022 186,105 0.26 GBP 150,000 Stonegate Pub Co Financing Plc
FRN 15/3/2022 167,378 0.24 EUR 100,000 Synlab Unsecured Bondco Plc
8.25% 1/7/2023 104,668 0.15
GBP 187,000 Tesco Corporate Treasury Services Plc 2.5% 2/5/2025 212,402 0.30
GBP 103,320 Unique Pub Finance Co Plc/The 5.659% 30/6/2027 130,380 0.19
GBP 100,000 Unique Pub Finance Co Plc/The 6.464% 30/3/2032 125,745 0.18
GBP 176,000 Virgin Media Secured Finance Plc 4.875% 15/1/2027 203,824 0.29
GBP 200,000 Virgin Media Secured Finance Plc 5% 15/4/2027 232,598 0.33
GBP 100,000 Virgin Media Secured Finance Plc 5.125% 15/1/2025 114,940 0.16
GBP 360,000 Virgin Media Secured Finance Plc 6.25% 28/3/2029 424,163 0.60
GBP 100,000 Vodafone Group Plc 26/11/2020 (Zero Coupon) 108,838 0.15
EUR 300,000 Vodafone Group Plc FRN 3/10/2078* 340,620 0.48
EUR 400,000 Vodafone Group Plc FRN 3/1/2079 421,306 0.60 7,191,202 10.20
United States EUR 340,000 Anchorage Capital Europe CLO
2 DAC FRN 15/5/2031 334,739 0.47 EUR 300,000 Banff Merger Sub Inc 8.375%
1/9/2026* 270,540 0.38 EUR 310,000 Belden Inc 4.125% 15/10/2026* 328,355 0.47 EUR 100,000 CEMEX Finance LLC 4.625%
15/6/2024 105,250 0.15 EUR 100,000 Coty Inc 4% 15/4/2023 99,649 0.14 EUR 100,000 Equinix Inc 2.875% 15/3/2024 104,113 0.15 EUR 510,000 Equinix Inc 2.875% 1/10/2025 531,280 0.75 EUR 200,000 Equinix Inc 2.875% 1/2/2026 209,980 0.30 EUR 460,000 IQVIA Inc 3.25% 15/3/2025 474,262 0.67 EUR 100,000 IQVIA Inc 3.5% 15/10/2024 102,396 0.15 EUR 210,000 Iron Mountain Inc 3% 15/1/2025* 217,281 0.31 EUR 299,000 Mauser Packaging Solutions
Holding Co 4.75% 15/4/2024 309,601 0.44 EUR 594,000 Netflix Inc 3.875% 15/11/2029* 647,543 0.92 EUR 767,000 Panther BF Aggregator 2 LP /
Panther Finance Co Inc 4.375% 15/5/2026 783,506 1.11
EUR 887,000 Refinitiv US Holdings Inc 4.5% 15/5/2026 968,165 1.37
EUR 194,000 Refinitiv US Holdings Inc 6.875% 15/11/2026 221,244 0.31
EUR 100,000 Sealed Air Corp 4.5% 15/9/2023 114,634 0.16 EUR 184,000 UGI International LLC 3.25%
1/11/2025 194,468 0.28 EUR 137,000 WMG Acquisition Corp 3.625%
15/10/2026 146,852 0.21 EUR 270,000 WMG Acquisition Corp 4.125%
1/11/2024 281,283 0.40 6,445,141 9.14Total Bonds 66,387,338 94.15Total Transferable Securities and Money Market Instruments Admitted to an Official Stock Exchange Listing or Dealt in on Another Regulated Market 66,573,659 94.42Total Portfolio 66,573,659 94.42
Other Net Assets 3,935,786 5.58Total Net Assets (EUR) 70,509,445 100.00
European High Yield Bond Fund continued
Portfolio of Investments 31 August 2019

The notes on pages 728 to 741 form an integral part of these financial statements.
Annual Report and Audited Financial Statements [285]
Open Forward Foreign Exchange Contracts as at 31 August 2019
Currency
Purchases Currency
Sales Counterparty
Maturity date
Unrealised appreciation/
(depreciation) EUR
EUR 6,619,936 GBP 6,150,000 JP Morgan 13/9/2019 (178,479)EUR 109,930 GBP 100,000 Societe Generale 13/9/2019 (613)EUR 4,917,939 USD 5,530,000 JP Morgan 13/9/2019 (84,377)Net unrealised depreciation (263,469)
CHF Hedged Share Class
CHF 269,477 EUR 247,265 BNY Mellon 12/9/2019 (237)EUR 1,386 CHF 1,502 BNY Mellon 12/9/2019 8Net unrealised depreciation (229)
GBP Hedged Share Class
GBP 57,167 EUR 61,789 BNY Mellon 12/9/2019 1,409Net unrealised appreciation 1,409
SEK Hedged Share Class
SEK 49,449 EUR 4,613 BNY Mellon 12/9/2019 (50)Net unrealised depreciation (50)
Total net unrealised depreciation (EUR underlying exposure - EUR 12,233,917) (262,339)
Open Forward Foreign Exchange Contracts as at 31 August 2019
Currency
Purchases Currency
Sales Counterparty
Maturity date
Unrealised appreciation/
(depreciation) EUR
European High Yield Bond Fund continued
Open Exchange Traded Futures Contracts as at 31 August 2019
Number of contracts Currency
Contract/ Description
Expiration date
Underlying exposure
EUR
Unrealised appreciation/
(depreciation) EUR
11 EUR EURO STOXX 600 Bank Index September 2019 44,605 (2,420)3 EUR EURO STOXX 50 Index September 2019 102,990 1,8201 EUR EURO STOXX 600 Bank Index September 2019 6,070 (430)(5) EUR Euro BOBL September 2019 681,000 (11,650)(5) EUR Euro Bund September 2019 895,550 (40,600)(2) GBP Long Gilt December 2019 297,593 (2,499)(1) USD US Treasury 5 Year Note (CBT) December 2019 108,464 92
Total 2,136,272 (55,687)
Swaps as at 31 August 2019
TypeNominal
Value Description Counterparty
Expiration date
Unrealised appreciation/
(depreciation) EUR
Market Value EUR
CDS EUR 120,000 Fund receives default protection on UPC Holding BV; and pays Fixed 5% Bank of America 20/6/2024 (27) (25,307)
CDS EUR (37,497) Fund provides default protection on Telecom Italia Spa; and receives Fixed 1% Bank of America 20/6/2024 (16) (1,165)
CDS EUR (90,361) Fund provides default protection on Casino Guichard Perrachon SA; and receives Fixed 1% Barclays 20/6/2023 (8,314) (18,383)
CDS EUR (139,639) Fund provides default protection on Casino Guichard Perrachon SA; and receives Fixed 1% Barclays 20/6/2023 (13,181) (28,408)
CDS EUR (100,000) Fund provides default protection on Garfunkelux Holdco 2 SA; and receives Fixed 5% Barclays 20/6/2024 10,678 (3,877)
CDS EUR (70,000) Fund provides default protection on Garfunkelux Holdco 2 SA; and receives Fixed 5% Barclays 20/6/2024 2,555 (2,714)
CDS EUR (100,000) Fund provides default protection on Tesco Plc; and receives Fixed 1% Barclays 20/12/2025 144 (2,526)
CDS EUR (20,000) Fund provides default protection on Casino Guichard Perrachon SA; and receives Fixed 1% BNP Paribas 20/6/2023 (2,330) (4,069)
CDS EUR 35,100 Fund receives default protection on UPC Holding BV; and pays Fixed 5% BNP Paribas 20/6/2024 (15) (7,402)
CDS EUR (43,001) Fund provides default protection on Casino Guichard Perrachon SA; and receives Fixed 1% Citibank 20/6/2023 (3,338) (8,748)
CDS EUR (37,994) Fund provides default protection on Telecom Italia Spa; and receives Fixed 1% Citibank 20/6/2024 18 (1,181)
CDS EUR (38,032) Fund provides default protection on Telecom Italia Spa; and receives Fixed 1% Citibank 20/6/2024 (17) (1,182)
CDS EUR (71,383) Fund provides default protection on Telecom Italia SpA/Milano; and receives Fixed 1% Citibank 20/6/2026 3,615 (5,914)
CDS EUR (590,000) Fund receives default protection on ITRAXX.XO.31.V1; and pays Fixed 5% Goldman Sachs 20/6/2024 7,582 66,153
CDS EUR (140,000) Fund provides default protection on Telecom Italia SpA/Milano; and receives Fixed 1% Goldman Sachs 20/6/2024 7,188 (4,351)

The notes on pages 728 to 741 form an integral part of these financial statements.
[286] BlackRock Global Funds (BGF)
European High Yield Bond Fund continued
Swaps as at 31 August 2019
TypeNominal
Value Description Counterparty
Expiration date
Unrealised appreciation/
(depreciation) EUR
Market Value EUR
CDS EUR 190,000 Fund receives default protection on UPC Holding BV; and pays Fixed 5% JP Morgan 20/6/2024 (1,735) (40,069)
CDS EUR (80,000) Fund provides default protection on Garfunkelux Holdco 2 SA; and receives Fixed 5% Morgan Stanley 20/6/2023 (1,229) (1,905)
CDS EUR (36,477) Fund provides default protection on Telecom Italia Spa; and receives Fixed 1% Morgan Stanley 20/6/2024 50 (1,134)
CDS EUR (410,000) Fund provides default protection on Tesco Plc; and receives Fixed 1% Morgan Stanley 20/12/2028 8,677 (27,110)
Total (EUR underlying exposure - EUR 2,483,752) 10,305 (119,292)
CDS: Credit Default Swaps
Purchased Options as at 31 August 2019
Number of contracts
Call/ Put
Description Counterparty
Strike Price
Expiration date
Unrealised depreciation
EUR
Market Value EUR
39 Call EURO STOXX 50 Index Exchange Traded EUR 3,800 20/12/2019 (5,274) 1,716
Total (EUR underlying exposure - EUR 60,086) (5,274) 1,716
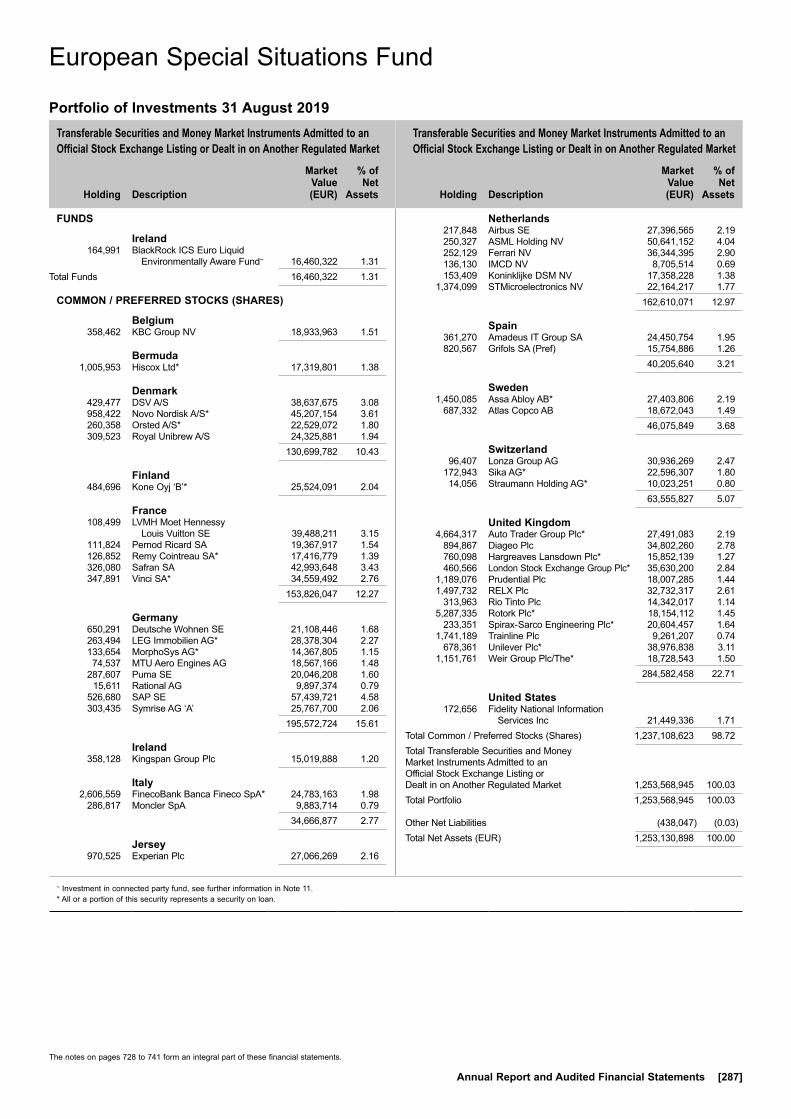
Transferable Securities and Money Market Instruments Admitted to an Official Stock Exchange Listing or Dealt in on Another Regulated Market
Transferable Securities and Money Market Instruments Admitted to an Official Stock Exchange Listing or Dealt in on Another Regulated Market
Holding
Description
Market Value (EUR)
% of Net
Assets
Holding
Description
Market Value (EUR)
% of Net
Assets
~ Investment in connected party fund, see further information in Note 11.* All or a portion of this security represents a security on loan.
The notes on pages 728 to 741 form an integral part of these financial statements.
Annual Report and Audited Financial Statements [287]
FUNDS
Ireland 164,991 BlackRock ICS Euro Liquid
Environmentally Aware Fund~ 16,460,322 1.31Total Funds 16,460,322 1.31
COMMON / PREFERRED STOCKS (SHARES)
Belgium 358,462 KBC Group NV 18,933,963 1.51
Bermuda 1,005,953 Hiscox Ltd* 17,319,801 1.38
Denmark 429,477 DSV A/S 38,637,675 3.08 958,422 Novo Nordisk A/S* 45,207,154 3.61 260,358 Orsted A/S* 22,529,072 1.80 309,523 Royal Unibrew A/S 24,325,881 1.94 130,699,782 10.43
Finland 484,696 Kone Oyj ‘B’* 25,524,091 2.04
France 108,499 LVMH Moet Hennessy
Louis Vuitton SE 39,488,211 3.15 111,824 Pernod Ricard SA 19,367,917 1.54 126,852 Remy Cointreau SA* 17,416,779 1.39 326,080 Safran SA 42,993,648 3.43 347,891 Vinci SA* 34,559,492 2.76 153,826,047 12.27
Germany 650,291 Deutsche Wohnen SE 21,108,446 1.68 263,494 LEG Immobilien AG* 28,378,304 2.27 133,654 MorphoSys AG* 14,367,805 1.15 74,537 MTU Aero Engines AG 18,567,166 1.48 287,607 Puma SE 20,046,208 1.60 15,611 Rational AG 9,897,374 0.79 526,680 SAP SE 57,439,721 4.58 303,435 Symrise AG ‘A’ 25,767,700 2.06 195,572,724 15.61
Ireland 358,128 Kingspan Group Plc 15,019,888 1.20
Italy 2,606,559 FinecoBank Banca Fineco SpA* 24,783,163 1.98 286,817 Moncler SpA 9,883,714 0.79 34,666,877 2.77
Jersey 970,525 Experian Plc 27,066,269 2.16
Netherlands 217,848 Airbus SE 27,396,565 2.19 250,327 ASML Holding NV 50,641,152 4.04 252,129 Ferrari NV 36,344,395 2.90 136,130 IMCD NV 8,705,514 0.69 153,409 Koninklijke DSM NV 17,358,228 1.38 1,374,099 STMicroelectronics NV 22,164,217 1.77 162,610,071 12.97
Spain 361,270 Amadeus IT Group SA 24,450,754 1.95 820,567 Grifols SA (Pref) 15,754,886 1.26 40,205,640 3.21
Sweden 1,450,085 Assa Abloy AB* 27,403,806 2.19 687,332 Atlas Copco AB 18,672,043 1.49 46,075,849 3.68
Switzerland 96,407 Lonza Group AG 30,936,269 2.47 172,943 Sika AG* 22,596,307 1.80 14,056 Straumann Holding AG* 10,023,251 0.80 63,555,827 5.07
United Kingdom 4,664,317 Auto Trader Group Plc* 27,491,083 2.19 894,867 Diageo Plc 34,802,260 2.78 760,098 Hargreaves Lansdown Plc* 15,852,139 1.27 460,566 London Stock Exchange Group Plc* 35,630,200 2.84 1,189,076 Prudential Plc 18,007,285 1.44 1,497,732 RELX Plc 32,732,317 2.61 313,963 Rio Tinto Plc 14,342,017 1.14 5,287,335 Rotork Plc* 18,154,112 1.45 233,351 Spirax-Sarco Engineering Plc* 20,604,457 1.64 1,741,189 Trainline Plc 9,261,207 0.74 678,361 Unilever Plc* 38,976,838 3.11 1,151,761 Weir Group Plc/The* 18,728,543 1.50 284,582,458 22.71
United States 172,656 Fidelity National Information
Services Inc 21,449,336 1.71Total Common / Preferred Stocks (Shares) 1,237,108,623 98.72Total Transferable Securities and Money Market Instruments Admitted to an Official Stock Exchange Listing or Dealt in on Another Regulated Market 1,253,568,945 100.03Total Portfolio 1,253,568,945 100.03
Other Net Liabilities (438,047) (0.03)Total Net Assets (EUR) 1,253,130,898 100.00
European Special Situations Fund
Portfolio of Investments 31 August 2019
European Special Situations Fund
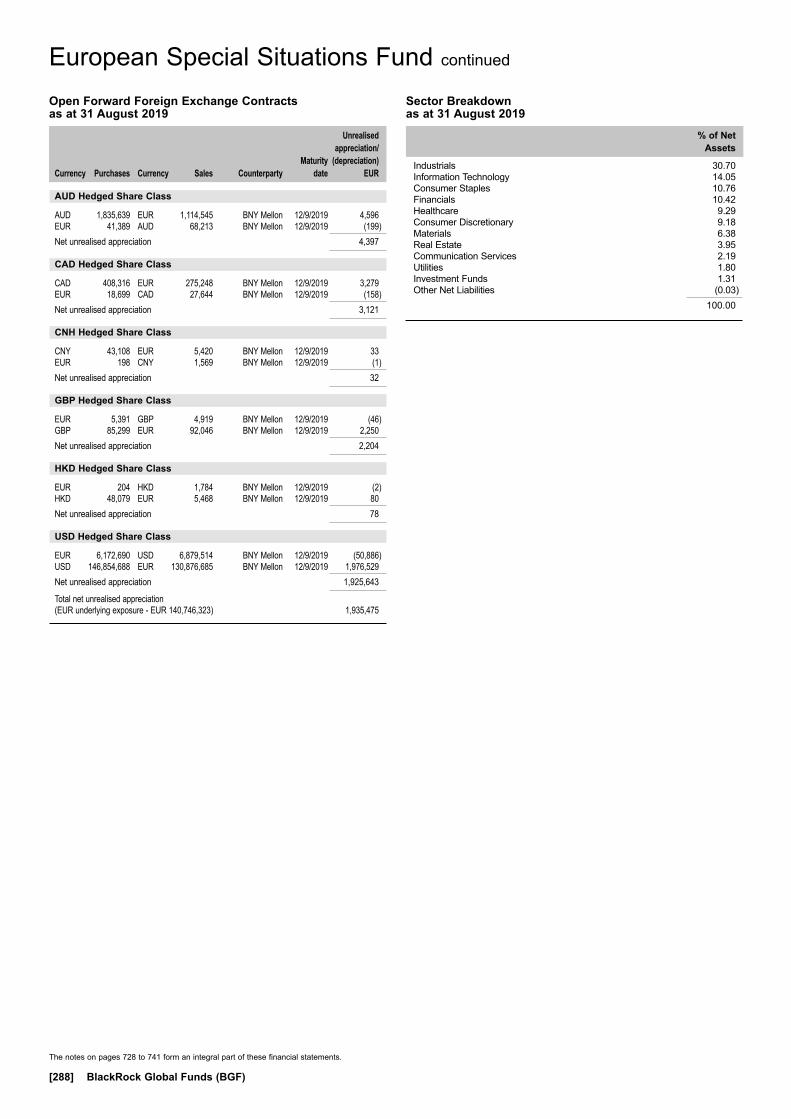
The notes on pages 728 to 741 form an integral part of these financial statements.
[288] BlackRock Global Funds (BGF)
European Special Situations Fund continued
Open Forward Foreign Exchange Contracts as at 31 August 2019
Currency
Purchases Currency
Sales Counterparty
Maturity date
Unrealised appreciation/
(depreciation) EUR
AUD Hedged Share Class
AUD 1,835,639 EUR 1,114,545 BNY Mellon 12/9/2019 4,596EUR 41,389 AUD 68,213 BNY Mellon 12/9/2019 (199)Net unrealised appreciation 4,397
CAD Hedged Share Class
CAD 408,316 EUR 275,248 BNY Mellon 12/9/2019 3,279EUR 18,699 CAD 27,644 BNY Mellon 12/9/2019 (158)Net unrealised appreciation 3,121
CNH Hedged Share Class
CNY 43,108 EUR 5,420 BNY Mellon 12/9/2019 33EUR 198 CNY 1,569 BNY Mellon 12/9/2019 (1)Net unrealised appreciation 32
GBP Hedged Share Class
EUR 5,391 GBP 4,919 BNY Mellon 12/9/2019 (46)GBP 85,299 EUR 92,046 BNY Mellon 12/9/2019 2,250Net unrealised appreciation 2,204
HKD Hedged Share Class
EUR 204 HKD 1,784 BNY Mellon 12/9/2019 (2)HKD 48,079 EUR 5,468 BNY Mellon 12/9/2019 80Net unrealised appreciation 78
USD Hedged Share Class
EUR 6,172,690 USD 6,879,514 BNY Mellon 12/9/2019 (50,886)USD 146,854,688 EUR 130,876,685 BNY Mellon 12/9/2019 1,976,529Net unrealised appreciation 1,925,643
Total net unrealised appreciation (EUR underlying exposure - EUR 140,746,323) 1,935,475
Sector Breakdown as at 31 August 2019
% of Net Assets
Industrials 30.70Information Technology 14.05Consumer Staples 10.76Financials 10.42Healthcare 9.29Consumer Discretionary 9.18Materials 6.38Real Estate 3.95Communication Services 2.19Utilities 1.80Investment Funds 1.31Other Net Liabilities (0.03)
100.00
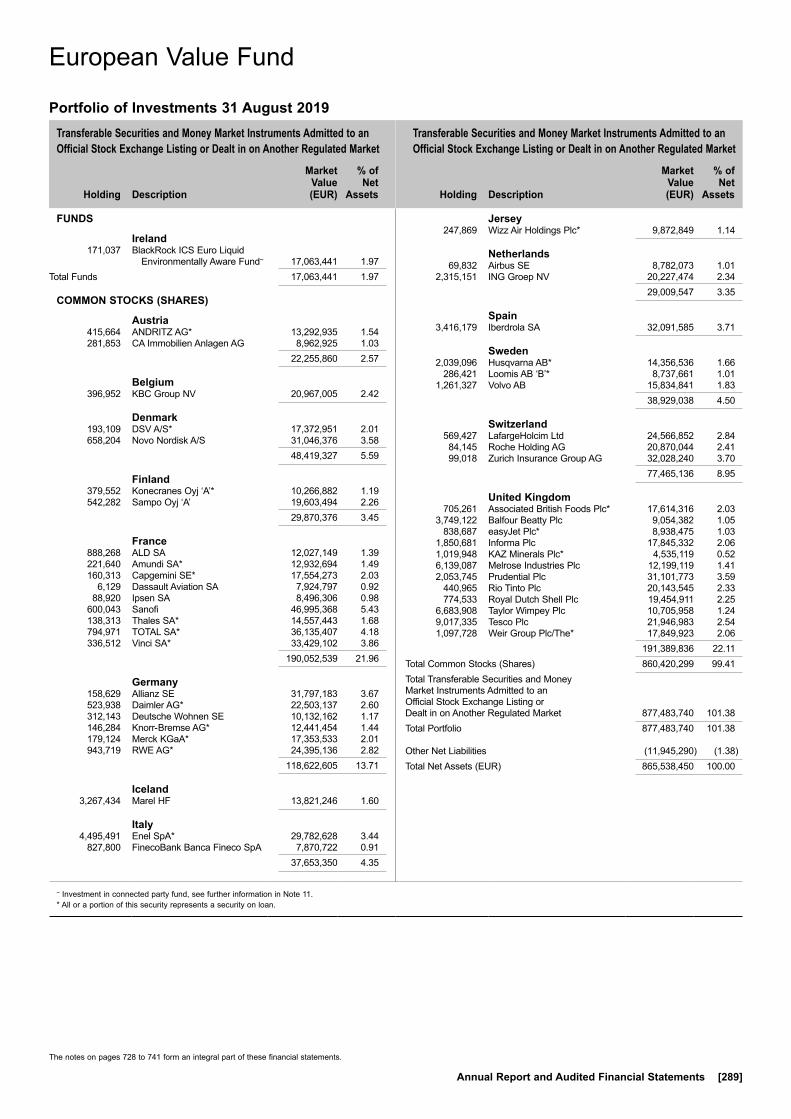
Transferable Securities and Money Market Instruments Admitted to an Official Stock Exchange Listing or Dealt in on Another Regulated Market
Transferable Securities and Money Market Instruments Admitted to an Official Stock Exchange Listing or Dealt in on Another Regulated Market
Holding
Description
Market Value (EUR)
% of Net
Assets
Holding
Description
Market Value (EUR)
% of Net
Assets
~ Investment in connected party fund, see further information in Note 11.* All or a portion of this security represents a security on loan.
The notes on pages 728 to 741 form an integral part of these financial statements.
Annual Report and Audited Financial Statements [289]
FUNDS
Ireland 171,037 BlackRock ICS Euro Liquid
Environmentally Aware Fund~ 17,063,441 1.97Total Funds 17,063,441 1.97
COMMON STOCKS (SHARES)
Austria 415,664 ANDRITZ AG* 13,292,935 1.54 281,853 CA Immobilien Anlagen AG 8,962,925 1.03 22,255,860 2.57
Belgium 396,952 KBC Group NV 20,967,005 2.42
Denmark 193,109 DSV A/S* 17,372,951 2.01 658,204 Novo Nordisk A/S 31,046,376 3.58 48,419,327 5.59
Finland 379,552 Konecranes Oyj ‘A’* 10,266,882 1.19 542,282 Sampo Oyj ‘A’ 19,603,494 2.26 29,870,376 3.45
France 888,268 ALD SA 12,027,149 1.39 221,640 Amundi SA* 12,932,694 1.49 160,313 Capgemini SE* 17,554,273 2.03 6,129 Dassault Aviation SA 7,924,797 0.92 88,920 Ipsen SA 8,496,306 0.98 600,043 Sanofi 46,995,368 5.43 138,313 Thales SA* 14,557,443 1.68 794,971 TOTAL SA* 36,135,407 4.18 336,512 Vinci SA* 33,429,102 3.86 190,052,539 21.96
Germany 158,629 Allianz SE 31,797,183 3.67 523,938 Daimler AG* 22,503,137 2.60 312,143 Deutsche Wohnen SE 10,132,162 1.17 146,284 Knorr-Bremse AG* 12,441,454 1.44 179,124 Merck KGaA* 17,353,533 2.01 943,719 RWE AG* 24,395,136 2.82 118,622,605 13.71
Iceland 3,267,434 Marel HF 13,821,246 1.60
Italy 4,495,491 Enel SpA* 29,782,628 3.44 827,800 FinecoBank Banca Fineco SpA 7,870,722 0.91 37,653,350 4.35
Jersey 247,869 Wizz Air Holdings Plc* 9,872,849 1.14
Netherlands 69,832 Airbus SE 8,782,073 1.01 2,315,151 ING Groep NV 20,227,474 2.34 29,009,547 3.35
Spain 3,416,179 Iberdrola SA 32,091,585 3.71
Sweden 2,039,096 Husqvarna AB* 14,356,536 1.66 286,421 Loomis AB ‘B’* 8,737,661 1.01 1,261,327 Volvo AB 15,834,841 1.83 38,929,038 4.50
Switzerland 569,427 LafargeHolcim Ltd 24,566,852 2.84 84,145 Roche Holding AG 20,870,044 2.41 99,018 Zurich Insurance Group AG 32,028,240 3.70 77,465,136 8.95
United Kingdom 705,261 Associated British Foods Plc* 17,614,316 2.03 3,749,122 Balfour Beatty Plc 9,054,382 1.05 838,687 easyJet Plc* 8,938,475 1.03 1,850,681 Informa Plc 17,845,332 2.06 1,019,948 KAZ Minerals Plc* 4,535,119 0.52 6,139,087 Melrose Industries Plc 12,199,119 1.41 2,053,745 Prudential Plc 31,101,773 3.59 440,965 Rio Tinto Plc 20,143,545 2.33 774,533 Royal Dutch Shell Plc 19,454,911 2.25 6,683,908 Taylor Wimpey Plc 10,705,958 1.24 9,017,335 Tesco Plc 21,946,983 2.54 1,097,728 Weir Group Plc/The* 17,849,923 2.06 191,389,836 22.11Total Common Stocks (Shares) 860,420,299 99.41Total Transferable Securities and Money Market Instruments Admitted to an Official Stock Exchange Listing or Dealt in on Another Regulated Market 877,483,740 101.38Total Portfolio 877,483,740 101.38
Other Net Liabilities (11,945,290) (1.38)Total Net Assets (EUR) 865,538,450 100.00
European Value Fund
Portfolio of Investments 31 August 2019
European Value Fund
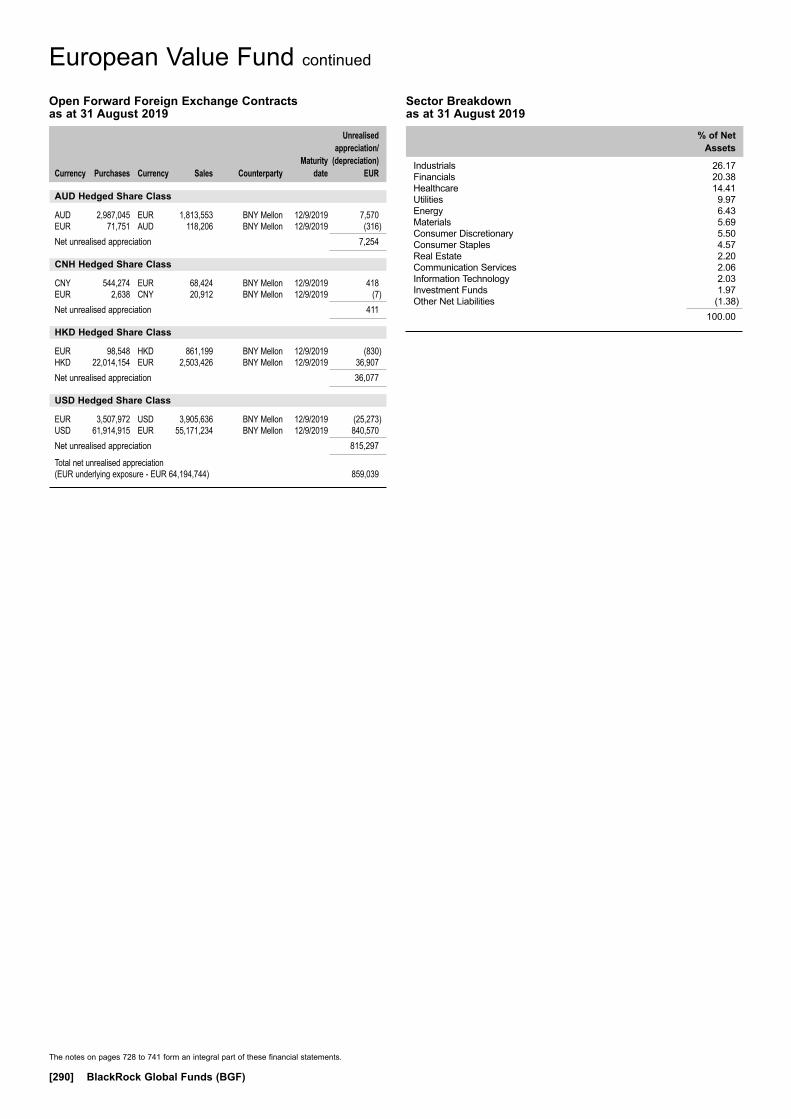
The notes on pages 728 to 741 form an integral part of these financial statements.
[290] BlackRock Global Funds (BGF)
European Value Fund continued
Open Forward Foreign Exchange Contracts as at 31 August 2019
Currency
Purchases Currency
Sales Counterparty
Maturity date
Unrealised appreciation/
(depreciation) EUR
AUD Hedged Share Class
AUD 2,987,045 EUR 1,813,553 BNY Mellon 12/9/2019 7,570EUR 71,751 AUD 118,206 BNY Mellon 12/9/2019 (316)Net unrealised appreciation 7,254
CNH Hedged Share Class
CNY 544,274 EUR 68,424 BNY Mellon 12/9/2019 418EUR 2,638 CNY 20,912 BNY Mellon 12/9/2019 (7)Net unrealised appreciation 411
HKD Hedged Share Class
EUR 98,548 HKD 861,199 BNY Mellon 12/9/2019 (830)HKD 22,014,154 EUR 2,503,426 BNY Mellon 12/9/2019 36,907Net unrealised appreciation 36,077
USD Hedged Share Class
EUR 3,507,972 USD 3,905,636 BNY Mellon 12/9/2019 (25,273)USD 61,914,915 EUR 55,171,234 BNY Mellon 12/9/2019 840,570Net unrealised appreciation 815,297
Total net unrealised appreciation (EUR underlying exposure - EUR 64,194,744) 859,039
Sector Breakdown as at 31 August 2019
% of Net Assets
Industrials 26.17Financials 20.38Healthcare 14.41Utilities 9.97Energy 6.43Materials 5.69Consumer Discretionary 5.50Consumer Staples 4.57Real Estate 2.20Communication Services 2.06Information Technology 2.03Investment Funds 1.97Other Net Liabilities (1.38)
100.00

Transferable Securities and Money Market Instruments Admitted to an Official Stock Exchange Listing or Dealt in on Another Regulated Market
Transferable Securities and Money Market Instruments Admitted to an Official Stock Exchange Listing or Dealt in on Another Regulated Market
Holding
Description
Market Value (USD)
% of Net
Assets
Holding
Description
Market Value (USD)
% of Net
Assets
~ Investment in connected party fund, see further information in Note 11.* All or a portion of this security represents a security on loan.** Security subject to a fair value adjustment as detailed in Note 2(j).
The notes on pages 728 to 741 form an integral part of these financial statements.
Annual Report and Audited Financial Statements [291]
FUNDS
Ireland 12,145 BlackRock ICS US Dollar Liquid
Environmentally Aware Fund~ 1,214,845 3.10Total Funds 1,214,845 3.10
COMMON / PREFERRED STOCKS (SHARES)
Bermuda 8,385 IHS Markit Ltd 551,398 1.41
Brazil 74,107 Banco Inter SA (Pref) 369,192 0.94
Canada 103,921 Element Fleet Management Corp 839,107 2.14
Cayman Islands 48,052 Futu Holdings Ltd ADR* 522,805 1.33 127,456 Qudian Inc ADR 1,026,021 2.62 1,548,826 3.95
China 100,000 Ping An Insurance Group Co
of China Ltd ‘H’* 1,146,703 2.93
Cyprus 49,661 TCS Group Holding Plc GDR 924,688 2.36
France 11,749 Ingenico Group SA* 1,171,162 2.99 6,721 Worldline SA/France 469,210 1.20 1,640,372 4.19
Germany 6,232 Wirecard AG 997,844 2.55
Italy 83,865 FinecoBank Banca Fineco SpA 880,819 2.25 75,306 Nexi SpA* 827,444 2.11 1,708,263 4.36
Jersey 125,846 Sanne Group Plc 807,035 2.06
Netherlands 647 Adyen NV 472,700 1.21
South Africa 28,573 Discovery Ltd 216,831 0.55
Switzerland 2,727 Temenos AG 459,847 1.18
United Kingdom 543,506 Finablr Plc 1,188,368 3.03 107,627 Network International Holdings Plc 799,315 2.04 1,987,683 5.07
United States 28,300 Assetmark Financial Holdings Inc 776,552 1.98 27,198 Axos Financial Inc 698,173 1.78 12,084 Black Knight Inc* 752,591 1.92 5,705 Broadridge Financial Solutions Inc 745,073 1.90 15,291 Capital One Financial Corp 1,328,482 3.39 23,210 Charles Schwab Corp/The 886,158 2.26 1,462 CME Group Inc 315,353 0.81 22,729 E*TRADE Financial Corp 952,345 2.43 12,524 Evo Payments Inc ‘A’ 371,712 0.95 14,211 Fidelity National Information
Services Inc 1,950,176 4.98 18,318 Fiserv Inc 1,971,017 5.03 20,481 Green Dot Corp ‘A’ 623,442 1.59 11,221 JPMorgan Chase & Co 1,235,769 3.15 5,391 Mastercard Inc 1,521,879 3.89 514 MercadoLibre Inc 307,989 0.79 3,758 Paychex Inc 309,095 0.79 10,633 PayPal Holdings Inc 1,167,610 2.98 12,363 Progressive Corp/The 940,330 2.40 17,478 SEI Investments Co 1,006,733 2.57 6,826 Square Inc 429,355 1.10 13,971 SS&C Technologies Holdings Inc 652,446 1.67 4,291 SVB Financial Group 843,997 2.15 7,666 Total System Services Inc 1,030,617 2.63 13,275 Tradeweb Markets Inc 580,648 1.48 8,247 Visa Inc ‘A’ 1,496,171 3.82 22,893,713 58.44Total Common / Preferred Stocks (Shares) 36,564,202 93.34Total Transferable Securities and Money Market Instruments Admitted to an Official Stock Exchange Listing or Dealt in on Another Regulated Market 37,779,047 96.44
Other Transferable Securities
COMMON STOCKS (SHARES)
Cayman Islands 100,000 Thunder Bridge Acquisition Ltd** 1,234,000 3.15Total Common Stocks (Shares) 1,234,000 3.15Total Other Transferable Securities 1,234,000 3.15Total Portfolio 39,013,047 99.59
Other Net Assets 162,474 0.41Total Net Assets (USD) 39,175,521 100.00
FinTech Fund(2)
Portfolio of Investments 31 August 2019
FinTech Fund(2)
(2) Fund launched during the year, see Note 1, for further details.

The notes on pages 728 to 741 form an integral part of these financial statements.
[292] BlackRock Global Funds (BGF)
FinTech Fund(2) continued
Open Forward Foreign Exchange Contracts as at 31 August 2019
Currency
Purchases Currency
Sales Counterparty
Maturity date
Unrealised appreciation/
(depreciation) USD
EUR Hedged Share Class
EUR 3,772,370 USD 4,231,269 BNY Mellon 12/9/2019 (61,241)USD 199,528 EUR 178,746 BNY Mellon 12/9/2019 1,940Net unrealised depreciation (59,301)
GBP Hedged Share Class
GBP 380,821 USD 461,077 BNY Mellon 12/9/2019 4,280USD 68,453 GBP 56,450 BNY Mellon 12/9/2019 (528)Net unrealised appreciation 3,752
SGD Hedged Share Class
SGD 377,252 USD 273,011 BNY Mellon 12/9/2019 (940)USD 61,053 SGD 84,689 BNY Mellon 12/9/2019 (24)Net unrealised depreciation (964)
Total net unrealised depreciation (USD underlying exposure - USD 5,231,655) (56,513)
Sector Breakdown as at 31 August 2019
% of Net Assets
Information Technology 47.97Financials 46.32Investment Funds 3.10Industrials 1.41Consumer Discretionary 0.79Other Net Assets 0.41
100.00
(2) Fund launched during the year, see Note 1, for further details.

Transferable Securities and Money Market Instruments Admitted to an Official Stock Exchange Listing or Dealt in on Another Regulated Market
Transferable Securities and Money Market Instruments Admitted to an Official Stock Exchange Listing or Dealt in on Another Regulated Market
Holding
Description
Market Value (USD)
% of Net
Assets
Holding
Description
Market Value (USD)
% of Net
Assets
* All or a portion of this security represents a security on loan.
The notes on pages 728 to 741 form an integral part of these financial statements.
Annual Report and Audited Financial Statements [293]
COMMON / PREFERRED STOCKS (SHARES) & WARRANTS
Bermuda 37,332 Marvell Technology Group Ltd 915,007 0.01
Canada 350,962 Largo Resources Ltd* 359,852 0.01 25,000 Lions Gate Entertainment Corp 232,750 0.00 5,883 Norbord Inc 146,663 0.00 99,749 Northern Graphite Corp (Unit) 7,144 0.00 746,409 0.01
Cayman Islands 147,094 Vantage Drilling Co 1,589 0.00
France 94,000 Engie SA 1,436,561 0.02 90,600 Orange SA 1,383,599 0.01 18,000 TOTAL SA 903,797 0.01 3,723,957 0.04
Germany 140,834 Daimler AG* 6,681,709 0.07
Italy 76 Enel SpA 556 0.00 272,389 Snam SpA 1,400,338 0.02 444,801 UniCredit SpA 4,972,367 0.05 6,373,261 0.07
Luxembourg 23,835 Intelsat SA* 503,157 0.00
Netherlands 89,000 ABN AMRO Bank NV 1,594,130 0.02 85,634 Altice Europe NV* 382,443 0.00 285,700 ING Groep NV 2,757,335 0.03 434,432 Koninklijke KPN NV 1,381,114 0.01 36,150 NXP Semiconductors NV 3,711,159 0.04 9,826,181 0.10
Spain 144,483 Iberdrola SA 1,499,285 0.02 175,538 Telefonica SA 1,222,180 0.01 2,721,465 0.03
Sweden 323,000 Telia Co AB 1,414,067 0.01
United Kingdom 122,517 AA Plc 84,031 0.00 232,000 BAE Systems Plc 1,544,464 0.02 24,759 Liberty Global Plc (Restricted) 660,818 0.01 132,000 National Grid Plc 1,389,106 0.01 31,000 Royal Dutch Shell Plc ‘A’ 863,964 0.01 4,542,383 0.05
United States 24,171 Advanced Micro Devices Inc 767,671 0.01 2,951 Alphabet Inc ‘A’ 3,536,951 0.04 267,413 Altice USA Inc* 7,744,280 0.08 5,560 Amgen Inc 1,155,368 0.01 6,587 Analog Devices Inc 726,744 0.01 94,781 Applied Materials Inc 4,521,054 0.05 119,707 Bank of America Corp 3,297,928 0.03 22,643 Beazer Homes USA Inc* 278,962 0.00
6,099 Broadcom Inc 1,737,666 0.02 390,093 Caesars Entertainment Corp 4,503,624 0.05 34,888 Centene Corp 1,636,247 0.02 72,800 Centennial Resource
Development Inc/DE ‘A’* 356,720 0.00 58,273 Century Communities Inc* 1,607,752 0.02 12,000 Cigna Corp 1,852,800 0.02 12,891 Cisco Systems Inc 608,326 0.01 34,025 Citigroup Inc 2,195,633 0.02 29,456 Corning Inc 825,357 0.01 110,676 Delta Air Lines Inc 6,478,973 0.07 25,983 Diamondback Energy Inc* 2,573,876 0.03 14,078 Everi Holdings Inc 126,702 0.00 87,600 Federal Home Loan Mortgage Corp 1,056,456 0.01 87,600 Federal National Mortgage
Association (Pref)* 1,063,464 0.01 42,321 Gaming and Leisure Properties
Inc (Reit) 1,653,481 0.02 10,972 Golden Entertainment Inc* 158,216 0.00 33,449 HCA Healthcare Inc 4,045,657 0.04 3,739 Humana Inc 1,055,482 0.01 7,242 Johnson & Johnson 927,555 0.01 57,100 JPMorgan Chase & Co 6,288,423 0.06 15,936 Lam Research Corp 3,376,201 0.03 9,583 Liberty Oilfield Services Inc ‘A’* 105,509 0.00 55,228 M/I Homes Inc 2,009,195 0.02 15,682 Microchip Technology Inc* 1,367,157 0.01 14,472 Microsoft Corp 2,003,070 0.02 8,248 Morgan Stanley (Pref) 235,810 0.00 19,561 NVIDIA Corp 3,330,456 0.03 144,238 PulteGroup Inc 4,846,397 0.05 19,951 Pure Acquisition Corp
(Wts 17/4/2023) 21,348 0.00 164,279 Rattler Midstream LP 3,026,019 0.03 29,854 Sciplay Corp 291,077 0.00 127,286 Sentinel Energy Services Inc
(Wts 22/12/2022) 53,460 0.00 202,208 Target Hospitality Corp* 1,184,939 0.01 6,913 Target Hospitality Corp
(Wts 15/3/2024) 6,083 0.00 136,121 Taylor Morrison Home Corp ‘A’ 3,192,037 0.03 39,556 Texas Instruments Inc 4,927,491 0.05 3,654 UnitedHealth Group Inc 855,401 0.01 22,243 VICI Properties Inc (Reit)* 493,127 0.01 21,358 Vistra Energy Corp 526,902 0.01 21,469 Walt Disney Co/The 2,966,157 0.03 77,224 William Lyon Homes ‘A’* 1,357,598 0.01 6,394 Xilinx Inc 667,534 0.01 99,624,336 1.02Total Common / Preferred Stocks (Shares) & Warrants 137,073,521 1.41
BONDS
Argentina ARS 31,967,000 Argentina Bonar Bonds FRN
1/3/2020 384,692 0.00 CHF 645,000 Argentine Republic Government
International Bond 3.375% 12/10/2020 341,931 0.00
USD 2,869,000 Argentine Republic Government International Bond 4.625% 11/1/2023 1,159,255 0.01
USD 21,763,000 Argentine Republic Government International Bond 5.875% 11/1/2028 8,378,755 0.09
USD 5,166,000 Argentine Republic Government International Bond 6.875% 22/4/2021* 2,292,412 0.02
Fixed Income Global Opportunities Fund
Portfolio of Investments 31 August 2019
Fixed Income Global Opportunities Fund

Transferable Securities and Money Market Instruments Admitted to an Official Stock Exchange Listing or Dealt in on Another Regulated Market
Transferable Securities and Money Market Instruments Admitted to an Official Stock Exchange Listing or Dealt in on Another Regulated Market
Holding
Description
Market Value (USD)
% of Net
Assets
Holding
Description
Market Value (USD)
% of Net
Assets
* All or a portion of this security represents a security on loan.
The notes on pages 728 to 741 form an integral part of these financial statements.
[294] BlackRock Global Funds (BGF)
USD 7,257,000 Argentine Republic Government International Bond 6.875% 11/1/2048 2,855,629 0.03
USD 4,409,000 Argentine Republic Government International Bond 7.125% 6/7/2036 1,741,555 0.02
USD 2,801,000 Argentine Republic Government International Bond 7.5% 22/4/2026 1,106,395 0.01
ARS 120,373,000 Banco Hipotecario SA ‘144A’ FRN 7/11/2022 1,224,146 0.01
ARS 48,553,000 Bonos de la Nacion Argentina con Ajuste por CER 4% 6/3/2020 741,867 0.01
USD 5,196,000 Generacion Mediterranea SA / Generacion Frias SA / Central Termica Roca SA ‘144A’ 9.625% 27/7/2023 3,013,680 0.03
USD 1,731,000 Rio Energy SA / UGEN SA / UENSA SA 6.875% 1/2/2025 804,915 0.01
USD 5,666,000 Tarjeta Naranja SA ‘144A’ FRN 11/4/2022 1,796,571 0.02
USD 2,476,000 Telecom Argentina SA ‘144A’ 8% 18/7/2026 1,999,757 0.02
USD 2,426,000 YPF SA 7% 15/12/2047 1,435,479 0.02 29,277,039 0.30
Australia AUD 5,300,000 Australia Government Bond
3% 21/3/2047 4,807,411 0.05 USD 187,500 Linc Energy Ltd (Defaulted)
10/4/2018 (Zero Coupon) 65,625 0.00 EUR 900,000 Origin Energy Finance Ltd FRN
16/9/2074 997,368 0.01 USD 3,640,000 Pacific National Finance Pty Ltd
4.75% 22/3/2028 3,853,522 0.04 USD 777,000 QBE Insurance Group Ltd FRN
17/6/2046 828,158 0.01 USD 922,000 Santos Finance Ltd 4.125%
14/9/2027 946,906 0.01 USD 4,100,000 Santos Finance Ltd 5.25%
13/3/2029 4,486,276 0.04 15,985,266 0.16
Austria EUR 2,400,000 BAWAG Group AG FRN 14/5/2025
(Perpetual) 2,697,507 0.03 EUR 4,400,000 BAWAG Group AG FRN 26/3/2029 5,058,068 0.05 USD 3,251,000 BRF GmbH ‘144A’ 4.35% 29/9/2026 3,179,884 0.03 USD 2,863,000 Eldorado Intl. Finance GmbH
‘144A’ 8.625% 16/6/2021 2,996,309 0.03 EUR 4,600,000 Erste Group Bank AG FRN
15/10/2021 (Perpetual)* 5,854,723 0.06 EUR 800,000 Erste Group Bank AG FRN
15/4/2024 (Perpetual) 1,011,965 0.01 EUR 4,400,000 Erste Group Bank AG FRN
15/10/2025 (Perpetual)* 5,218,825 0.05 USD 3,162,000 JBS Investments II GmbH ‘144A’
5.75% 15/1/2028 3,320,100 0.03 EUR 4,200,000 Raiffeisen Bank International AG
FRN 15/12/2022 (Perpetual) 4,900,416 0.05 EUR 600,000 Sappi Papier Holding GmbH 4%
1/4/2023 679,865 0.01 USD 1,640,000 Suzano Austria GmbH 5% 15/1/2030 1,685,100 0.02 USD 2,464,000 Suzano Austria GmbH 6%
15/1/2029* 2,744,280 0.03 USD 2,956,000 Suzano Austria GmbH ‘144A’ 7%
16/3/2047 3,443,740 0.04 42,790,782 0.44
Bahamas USD 1,021,000 Intercorp Peru Ltd ‘144A’ 3.875%
15/8/2029* 1,029,934 0.01 USD 4,076,000 Silversea Cruise Finance Ltd ‘144A’
7.25% 1/2/2025 4,381,700 0.05 5,411,634 0.06
Belgium EUR 630,000 House of Finance NV/The 4.375%
15/7/2026 722,529 0.01 EUR 3,000,000 KBC Group NV FRN 5/3/2024
(Perpetual)* 3,518,407 0.04 EUR 2,200,000 KBC Group NV FRN 24/10/2025
(Perpetual) 2,403,454 0.02 EUR 700,000 Solvay SA FRN 4/12/2023
(Perpetual) 855,008 0.01 7,499,398 0.08
Bermuda USD 200,000 China Singyes Solar Technologies
Holdings Ltd (Defaulted) 6.75% 17/10/2018 169,500 0.00
USD 519,000 China Singyes Solar Technologies Holdings Ltd (Defaulted) 7.95% 15/2/2019 439,853 0.00
USD 2,972,483 Digicel Group Two Ltd ‘144A’ 8.25% 30/9/2022* 564,772 0.01
USD 877,738 Digicel Group Two Ltd 9.125% 1/4/2024 83,659 0.00
USD 369,000 Digicel Ltd ‘144A’ 6.75% 1/3/2023 157,286 0.00 USD 1,571,000 Inkia Energy Ltd ‘144A’ 5.875%
9/11/2027 1,640,222 0.02 USD 4,600,000 Luye Pharma Group Ltd 1.5%
9/7/2024 4,891,847 0.05 USD 844,000 NCL Corp Ltd ‘144A’ 4.75%
15/12/2021 857,715 0.01 HKD 4,062,966 REXLot Holdings Ltd (Restricted)
(Defaulted) 4.5% 17/4/2019 440,508 0.01 HKD 348,254 REXLot Holdings Ltd (Defaulted)
6% 28/4/2017 15,825 0.00 9,261,187 0.10
Brazil USD 12,368,000 Brazilian Government International
Bond 4.5% 30/5/2029* 13,102,690 0.13 USD 3,769,000 Brazilian Government International
Bond 4.625% 13/1/2028 4,067,731 0.04 USD 1,578,000 Brazilian Government International
Bond 5.625% 21/2/2047 1,810,015 0.02 USD 2,238,000 Itau Unibanco Holding SA/Cayman
Island ‘144A’ FRN 12/12/2022 (Perpetual) 2,259,709 0.02
USD 1,554,000 Itau Unibanco Holding SA/Cayman Island ‘144A’ FRN 19/3/2023 (Perpetual) 1,587,265 0.02
USD 6,550,000 Oi SA 10% 27/7/2025 5,829,500 0.06 28,656,910 0.29
British Virgin Islands USD 1,454,000 Baoxin Auto Finance I Ltd FRN
30/10/2020 (Perpetual) 1,206,803 0.01 USD 915,000 Baoxin Auto Finance I Ltd 7.9%
9/2/2020 898,975 0.01 USD 2,435,000 Beijing Environment Bvi Co Ltd
5.3% 18/10/2021 2,510,713 0.03 USD 1,315,000 Bi Hai Co Ltd 6.25% 5/3/2022 1,352,189 0.01 USD 5,395,000 CCTI 2017 Ltd 3.625% 8/8/2022 5,348,637 0.05
Fixed Income Global Opportunities Fund continued
Portfolio of Investments 31 August 2019

Transferable Securities and Money Market Instruments Admitted to an Official Stock Exchange Listing or Dealt in on Another Regulated Market
Transferable Securities and Money Market Instruments Admitted to an Official Stock Exchange Listing or Dealt in on Another Regulated Market
Holding
Description
Market Value (USD)
% of Net
Assets
Holding
Description
Market Value (USD)
% of Net
Assets
* All or a portion of this security represents a security on loan.
The notes on pages 728 to 741 form an integral part of these financial statements.
Annual Report and Audited Financial Statements [295]
USD 2,540,000 Chalco Hong Kong Investment Co Ltd 4.875% 7/9/2021* 2,627,719 0.03
USD 2,130,000 China Cinda Finance 2017 I Ltd 4.75% 21/2/2029 2,399,717 0.02
HKD 15,000,000 China Conch Venture Holdings International Ltd 5/9/2023 (Zero Coupon) 1,947,258 0.02
USD 4,176,000 China Reinsurance Finance Corp Ltd 3.375% 9/3/2022 4,197,533 0.04
USD 3,450,000 Chinalco Capital Holdings Ltd 4.25% 21/4/2022* 3,460,643 0.04
USD 3,015,000 Coastal Emerald Ltd FRN 1/8/2024 (Perpetual) 3,017,977 0.03
USD 1,740,000 Coastal Emerald Ltd 3.95% 1/8/2022* 1,753,050 0.02
USD 1,591,000 Easy Tactic Ltd 8.125% 11/7/2024 1,504,371 0.02 USD 1,800,000 Easy Tactic Ltd 8.625% 27/2/2024* 1,750,500 0.02 USD 2,460,000 Franshion Brilliant Ltd 4.25%
23/7/2029 2,460,886 0.03 USD 1,735,000 Guojing Capital BVI Ltd 3.95%
11/12/2022 1,740,151 0.02 USD 4,600,000 Huarong Finance 2019 Co Ltd
4.5% 29/5/2029 4,890,964 0.05 USD 1,270,000 Joy Treasure Assets Holdings Inc
4.5% 20/3/2029* 1,381,954 0.01 USD 1,853,000 Knight Castle Investments Ltd
7.99% 23/1/2021 880,175 0.01 USD 2,500,000 Leader Goal International Ltd FRN
19/1/2023 (Perpetual) 2,542,709 0.03 USD 1,545,000 New Lion Bridge Co Ltd 9.75%
10/10/2020 1,400,519 0.01 USD 1,448,000 New Metro Global Ltd 6.5%
23/4/2021* 1,359,585 0.01 USD 3,200,000 NWD MTN Ltd 4.125% 18/7/2029* 3,204,653 0.03 USD 3,218,000 Prime Bloom Holdings Ltd 6.95%
5/7/2022 2,366,738 0.02 USD 1,959,000 Rock International Investment Inc
6.625% 27/3/2020 1,500,888 0.02 USD 5,365,000 Rongshi International Finance Ltd
3.75% 21/5/2029 5,819,781 0.06 USD 3,702,000 Scenery Journey Ltd 11% 6/11/2020 3,789,922 0.04 USD 657,000 Shandong Iron And Steel Xinheng
International Co Ltd 6.5% 14/6/2021 661,822 0.01
USD 263,000 Shanghai Port Group BVI Holding Co Ltd 9/8/2022 (Zero Coupon) 267,295 0.00
USD 1,925,000 Sino-Ocean Land Treasure IV Ltd 4.75% 5/8/2029* 1,856,216 0.02
USD 1,370,000 Sino-Ocean Land Treasure IV Ltd 5.25% 30/4/2022 1,407,233 0.01
USD 2,800,000 Studio City Finance Ltd 7.25% 11/2/2024* 2,943,500 0.03
74,451,076 0.76
Canada USD 520,000 1011778 BC ULC / New Red
Finance Inc ‘144A’ 4.25% 15/5/2024 538,075 0.01
USD 3,139,191 Air Canada 2015-2 Class B Pass Through Trust ‘144A’ 5% 15/12/2023 3,320,362 0.03
EUR 2,706,000 Bausch Health Cos Inc 4.5% 15/5/2023 3,035,640 0.03
USD 3,179,000 Bausch Health Cos Inc ‘144A’ 5.5% 1/11/2025 3,344,435 0.03
USD 500,000 Bausch Health Cos Inc ‘144A’ 5.875% 15/5/2023 508,125 0.01
USD 9,641,000 Bausch Health Cos Inc ‘144A’ 6.5% 15/3/2022 9,993,379 0.10
USD 7,107,000 Bausch Health Cos Inc ‘144A’ 7% 15/3/2024 7,540,527 0.08
USD 500,000 Bausch Health Cos Inc ‘144A’ 9% 15/12/2025 566,560 0.01
USD 965,000 Brookfield Residential Properties Inc ‘144A’ 6.5% 15/12/2020 967,412 0.01
USD 422,000 Brookfield Residential Properties Inc / Brookfield Residential US Corp ‘144A’ 6.125% 1/7/2022 428,330 0.01
USD 1,092,000 Cenovus Energy Inc 3.8% 15/9/2023 1,128,452 0.01 USD 2,975,000 Enbridge Inc 4% 1/10/2023 3,148,672 0.03 GBP 711,000 Entertainment One Ltd 4.625%
15/7/2026 949,325 0.01 USD 2,011,000 Frontera Energy Corp ‘144A’ 9.7%
25/6/2023 2,142,658 0.02 USD 110,000 Masonite International Corp ‘144A’
5.75% 15/9/2026 116,738 0.00 USD 4,250,000 NOVA Chemicals Corp ‘144A’
4.875% 1/6/2024 4,372,188 0.05 USD 6,147,000 NOVA Chemicals Corp ‘144A’
5.25% 1/8/2023 6,262,256 0.06 USD 242,000 Seven Generations Energy Ltd
‘144A’ 5.375% 30/9/2025 232,622 0.00 USD 6,669,189 Stoneway Capital Corp ‘144A’
10% 1/3/2027 4,164,242 0.04 USD 2,931,074 Stoneway Capital Corp 10%
1/3/2027 1,830,163 0.02 USD 1,356,000 Teck Resources Ltd 6.25%
15/7/2041 1,547,224 0.02 56,137,385 0.58
Cayman Islands USD 1,365,000 21Vianet Group Inc 7.875%
15/10/2021 1,381,664 0.01 USD 793,000 Agile Group Holdings Ltd FRN
7/3/2023 (Perpetual) 772,638 0.01 USD 3,767,037 Ambac LSNI LLC ‘144A’ FRN
12/2/2023 3,837,669 0.04 USD 1,624,000 Anton Oilfield Services Group/Hong
Kong 9.75% 5/12/2020 1,653,943 0.02 USD 773,000 Baozun Inc ‘144A’ 1.625% 1/5/2024 863,237 0.01 USD 2,000,000 Bizlink Holding Inc 1/2/2023
(Zero Coupon) 2,122,650 0.02 USD 515,000 Central China Real Estate Ltd
6.5% 5/3/2021 513,259 0.01 USD 1,605,000 Central China Real Estate Ltd
6.875% 23/10/2020 1,616,034 0.02 USD 1,295,000 Central China Real Estate Ltd
7.325% 27/1/2020* 1,297,266 0.01 USD 2,024,000 CFLD Cayman Investment Ltd
8.6% 8/4/2024 1,991,110 0.02 USD 1,797,000 CFLD Cayman Investment Ltd
8.625% 28/2/2021 1,837,433 0.02 USD 751,000 China Aoyuan Group Ltd 7.95%
7/9/2021 776,346 0.01 USD 5,002,000 China Aoyuan Group Ltd 7.95%
19/2/2023 5,085,548 0.05 USD 1,820,000 China Aoyuan Group Ltd 8.5%
23/1/2022* 1,899,625 0.02 HKD 22,000,000 China Education Group Holdings
Ltd 2% 28/3/2024 3,001,535 0.03 HKD 50,000,000 China Evergrande Group 4.25%
14/2/2023 5,699,035 0.06 USD 946,000 China Evergrande Group 6.25%
28/6/2021* 871,059 0.01 USD 2,464,000 China Evergrande Group 7.5%
28/6/2023* 2,137,135 0.02 USD 4,624,000 China Evergrande Group 8.75%
28/6/2025 3,819,135 0.04
Fixed Income Global Opportunities Fund continued
Portfolio of Investments 31 August 2019
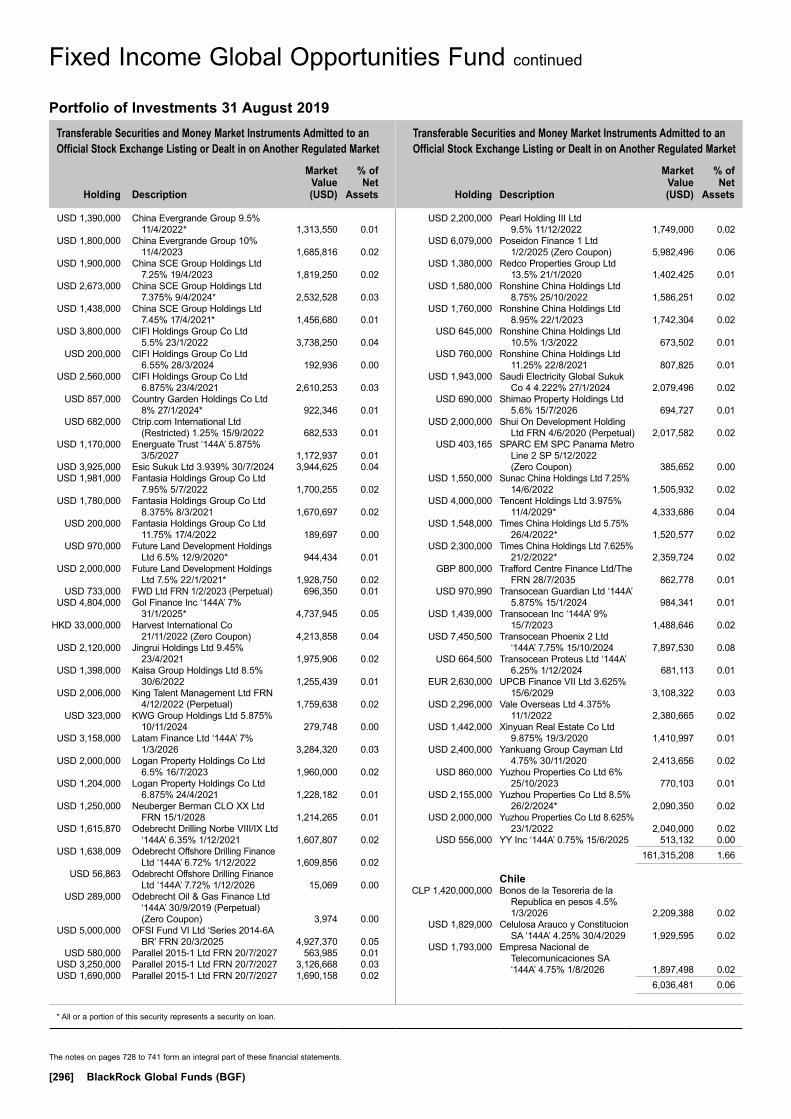
Transferable Securities and Money Market Instruments Admitted to an Official Stock Exchange Listing or Dealt in on Another Regulated Market
Transferable Securities and Money Market Instruments Admitted to an Official Stock Exchange Listing or Dealt in on Another Regulated Market
Holding
Description
Market Value (USD)
% of Net
Assets
Holding
Description
Market Value (USD)
% of Net
Assets
* All or a portion of this security represents a security on loan.
The notes on pages 728 to 741 form an integral part of these financial statements.
[296] BlackRock Global Funds (BGF)
USD 1,390,000 China Evergrande Group 9.5% 11/4/2022* 1,313,550 0.01
USD 1,800,000 China Evergrande Group 10% 11/4/2023 1,685,816 0.02
USD 1,900,000 China SCE Group Holdings Ltd 7.25% 19/4/2023 1,819,250 0.02
USD 2,673,000 China SCE Group Holdings Ltd 7.375% 9/4/2024* 2,532,528 0.03
USD 1,438,000 China SCE Group Holdings Ltd 7.45% 17/4/2021* 1,456,680 0.01
USD 3,800,000 CIFI Holdings Group Co Ltd 5.5% 23/1/2022 3,738,250 0.04
USD 200,000 CIFI Holdings Group Co Ltd 6.55% 28/3/2024 192,936 0.00
USD 2,560,000 CIFI Holdings Group Co Ltd 6.875% 23/4/2021 2,610,253 0.03
USD 857,000 Country Garden Holdings Co Ltd 8% 27/1/2024* 922,346 0.01
USD 682,000 Ctrip.com International Ltd (Restricted) 1.25% 15/9/2022 682,533 0.01
USD 1,170,000 Energuate Trust ‘144A’ 5.875% 3/5/2027 1,172,937 0.01
USD 3,925,000 Esic Sukuk Ltd 3.939% 30/7/2024 3,944,625 0.04 USD 1,981,000 Fantasia Holdings Group Co Ltd
7.95% 5/7/2022 1,700,255 0.02 USD 1,780,000 Fantasia Holdings Group Co Ltd
8.375% 8/3/2021 1,670,697 0.02 USD 200,000 Fantasia Holdings Group Co Ltd
11.75% 17/4/2022 189,697 0.00 USD 970,000 Future Land Development Holdings
Ltd 6.5% 12/9/2020* 944,434 0.01 USD 2,000,000 Future Land Development Holdings
Ltd 7.5% 22/1/2021* 1,928,750 0.02 USD 733,000 FWD Ltd FRN 1/2/2023 (Perpetual) 696,350 0.01 USD 4,804,000 Gol Finance Inc ‘144A’ 7%
31/1/2025* 4,737,945 0.05 HKD 33,000,000 Harvest International Co
21/11/2022 (Zero Coupon) 4,213,858 0.04 USD 2,120,000 Jingrui Holdings Ltd 9.45%
23/4/2021 1,975,906 0.02 USD 1,398,000 Kaisa Group Holdings Ltd 8.5%
30/6/2022 1,255,439 0.01 USD 2,006,000 King Talent Management Ltd FRN
4/12/2022 (Perpetual) 1,759,638 0.02 USD 323,000 KWG Group Holdings Ltd 5.875%
10/11/2024 279,748 0.00 USD 3,158,000 Latam Finance Ltd ‘144A’ 7%
1/3/2026 3,284,320 0.03 USD 2,000,000 Logan Property Holdings Co Ltd
6.5% 16/7/2023 1,960,000 0.02 USD 1,204,000 Logan Property Holdings Co Ltd
6.875% 24/4/2021 1,228,182 0.01 USD 1,250,000 Neuberger Berman CLO XX Ltd
FRN 15/1/2028 1,214,265 0.01 USD 1,615,870 Odebrecht Drilling Norbe VIII/IX Ltd
‘144A’ 6.35% 1/12/2021 1,607,807 0.02 USD 1,638,009 Odebrecht Offshore Drilling Finance
Ltd ‘144A’ 6.72% 1/12/2022 1,609,856 0.02 USD 56,863 Odebrecht Offshore Drilling Finance
Ltd ‘144A’ 7.72% 1/12/2026 15,069 0.00 USD 289,000 Odebrecht Oil & Gas Finance Ltd
‘144A’ 30/9/2019 (Perpetual) (Zero Coupon) 3,974 0.00
USD 5,000,000 OFSI Fund VI Ltd ‘Series 2014-6A BR’ FRN 20/3/2025 4,927,370 0.05
USD 580,000 Parallel 2015-1 Ltd FRN 20/7/2027 563,985 0.01 USD 3,250,000 Parallel 2015-1 Ltd FRN 20/7/2027 3,126,668 0.03 USD 1,690,000 Parallel 2015-1 Ltd FRN 20/7/2027 1,690,158 0.02
USD 2,200,000 Pearl Holding III Ltd 9.5% 11/12/2022 1,749,000 0.02
USD 6,079,000 Poseidon Finance 1 Ltd 1/2/2025 (Zero Coupon) 5,982,496 0.06
USD 1,380,000 Redco Properties Group Ltd 13.5% 21/1/2020 1,402,425 0.01
USD 1,580,000 Ronshine China Holdings Ltd 8.75% 25/10/2022 1,586,251 0.02
USD 1,760,000 Ronshine China Holdings Ltd 8.95% 22/1/2023 1,742,304 0.02
USD 645,000 Ronshine China Holdings Ltd 10.5% 1/3/2022 673,502 0.01
USD 760,000 Ronshine China Holdings Ltd 11.25% 22/8/2021 807,825 0.01
USD 1,943,000 Saudi Electricity Global Sukuk Co 4 4.222% 27/1/2024 2,079,496 0.02
USD 690,000 Shimao Property Holdings Ltd 5.6% 15/7/2026 694,727 0.01
USD 2,000,000 Shui On Development Holding Ltd FRN 4/6/2020 (Perpetual) 2,017,582 0.02
USD 403,165 SPARC EM SPC Panama Metro Line 2 SP 5/12/2022 (Zero Coupon) 385,652 0.00
USD 1,550,000 Sunac China Holdings Ltd 7.25% 14/6/2022 1,505,932 0.02
USD 4,000,000 Tencent Holdings Ltd 3.975% 11/4/2029* 4,333,686 0.04
USD 1,548,000 Times China Holdings Ltd 5.75% 26/4/2022* 1,520,577 0.02
USD 2,300,000 Times China Holdings Ltd 7.625% 21/2/2022* 2,359,724 0.02
GBP 800,000 Trafford Centre Finance Ltd/The FRN 28/7/2035 862,778 0.01
USD 970,990 Transocean Guardian Ltd ‘144A’ 5.875% 15/1/2024 984,341 0.01
USD 1,439,000 Transocean Inc ‘144A’ 9% 15/7/2023 1,488,646 0.02
USD 7,450,500 Transocean Phoenix 2 Ltd ‘144A’ 7.75% 15/10/2024 7,897,530 0.08
USD 664,500 Transocean Proteus Ltd ‘144A’ 6.25% 1/12/2024 681,113 0.01
EUR 2,630,000 UPCB Finance VII Ltd 3.625% 15/6/2029 3,108,322 0.03
USD 2,296,000 Vale Overseas Ltd 4.375% 11/1/2022 2,380,665 0.02
USD 1,442,000 Xinyuan Real Estate Co Ltd 9.875% 19/3/2020 1,410,997 0.01
USD 2,400,000 Yankuang Group Cayman Ltd 4.75% 30/11/2020 2,413,656 0.02
USD 860,000 Yuzhou Properties Co Ltd 6% 25/10/2023 770,103 0.01
USD 2,155,000 Yuzhou Properties Co Ltd 8.5% 26/2/2024* 2,090,350 0.02
USD 2,000,000 Yuzhou Properties Co Ltd 8.625% 23/1/2022 2,040,000 0.02
USD 556,000 YY Inc ‘144A’ 0.75% 15/6/2025 513,132 0.00 161,315,208 1.66
Chile CLP 1,420,000,000 Bonos de la Tesoreria de la
Republica en pesos 4.5% 1/3/2026 2,209,388 0.02
USD 1,829,000 Celulosa Arauco y Constitucion SA ‘144A’ 4.25% 30/4/2029 1,929,595 0.02
USD 1,793,000 Empresa Nacional de Telecomunicaciones SA ‘144A’ 4.75% 1/8/2026 1,897,498 0.02
6,036,481 0.06
Fixed Income Global Opportunities Fund continued
Portfolio of Investments 31 August 2019

Transferable Securities and Money Market Instruments Admitted to an Official Stock Exchange Listing or Dealt in on Another Regulated Market
Transferable Securities and Money Market Instruments Admitted to an Official Stock Exchange Listing or Dealt in on Another Regulated Market
Holding
Description
Market Value (USD)
% of Net
Assets
Holding
Description
Market Value (USD)
% of Net
Assets
* All or a portion of this security represents a security on loan.
The notes on pages 728 to 741 form an integral part of these financial statements.
Annual Report and Audited Financial Statements [297]
China CNY 30,000,000 Central Huijin Investment Ltd
3.83% 22/5/2024 4,247,278 0.04 EUR 2,600,000 Chengdu Xingcheng Investment
Group Co Ltd 2.5% 20/3/2021 2,841,537 0.03 USD 2,470,000 China Construction Bank Corp
FRN 27/2/2029 2,601,058 0.03 CNY 78,000,000 China Development Bank 3.3%
1/2/2024 10,907,220 0.11 CNY 46,700,000 China Development Bank 3.68%
26/2/2026 6,568,227 0.07 CNY 71,200,000 China Development Bank 4.04%
6/7/2028 10,270,344 0.11 CNY 385,500,000 China Government Bond 3.19%
11/4/2024 54,587,958 0.56 CNY 47,500,000 China Government Bond 3.22%
6/12/2025 6,715,099 0.07 CNY 127,700,000 China Government Bond 3.25%
22/11/2028 18,113,613 0.19 CNY 306,500,000 China Government Bond 3.29%
23/5/2029 43,809,078 0.45 CNH 10,000,000 China Government Bond 3.3%
4/7/2023 1,420,149 0.01 CNY 116,400,000 China Government Bond 3.54%
16/8/2028 16,885,617 0.17 CNY 129,200,000 China Government Bond 3.86%
22/7/2049 18,768,919 0.19 CNY 97,400,000 China Government Bond 4.08%
22/10/2048 14,600,671 0.15 USD 947,000 China Minmetals Corp FRN
13/11/2022 (Perpetual) 949,220 0.01 CNY 30,000,000 China National Petroleum Corp
4.16% 16/8/2025 4,294,314 0.04 CNY 15,000,000 China Railway Construction Corp
Ltd 1.5% 21/12/2021 2,062,547 0.02 CNY 30,000,000 China Southern Power Grid Co
Ltd 3.76% 14/1/2024 4,222,261 0.04 CNY 20,000,000 China State Railway Group Co Ltd
4.88% 17/10/2024 3,020,202 0.03 CNY 10,000,000 China State Railway Group Co Ltd
5.42% 27/5/2024 1,536,737 0.02 USD 2,000,000 Guangxi Financial Investment
Group Co Ltd 5.75% 23/1/2021 1,924,959 0.02 USD 2,062,000 Huachen Energy Co Ltd 6.625%
18/5/2020 1,185,856 0.01 USD 687,000 Inner Mongolia High-Grade
High Way Construction And Development Co Ltd 4.375% 4/12/2020 682,796 0.01
CNY 20,000,000 PetroChina Co Ltd 3.66% 22/2/2024 2,808,757 0.03
CNY 30,000,000 PetroChina Co Ltd 3.96% 23/4/2024 4,256,125 0.04
CNY 10,000,000 State Grid Corp of China 5.38% 19/8/2024 1,505,005 0.02
USD 1,157,000 Union Life Insurance Co Ltd 3% 19/9/2021 1,008,942 0.01
USD 1,720,000 Xi’an Municipal Infrastructure Construction Investment Group Corp Ltd 4% 24/6/2022 1,730,423 0.02
243,524,912 2.50
Colombia USD 11,647,000 Colombia Government International
Bond 4.375% 12/7/2021 12,131,078 0.12 USD 3,697,000 Colombia Government International
Bond 4.5% 15/3/2029 4,207,648 0.04
COP 31,349,000,000 Colombian TES 7% 30/6/2032 9,754,072 0.10 COP 14,176,700,000 Colombian TES 10% 24/7/2024 4,982,738 0.05 USD 2,596,000 Credivalores-Crediservicios SAS
‘144A’ 9.75% 27/7/2022 2,585,859 0.03 USD 1,967,000 Ecopetrol SA 5.875% 28/5/2045 2,324,134 0.02 USD 2,609,000 Ecopetrol SA 7.375% 18/9/2043 3,515,628 0.04 USD 3,637,000 Empresas Publicas de Medellin
ESP ‘144A’ 4.25% 18/7/2029* 3,827,943 0.04 43,329,100 0.44
Curacao USD 350,000 Teva Pharmaceutical Finance
IV BV 3.65% 10/11/2021 333,703 0.00
Czech Republic EUR 2,713,000 Residomo SRO 3.375%
15/10/2024 3,131,211 0.03
Denmark EUR 5,231,000 DKT Finance ApS 7% 17/6/2023 6,234,027 0.06 USD 800,000 DKT Finance ApS ‘144A’ 9.375%
17/6/2023 861,640 0.01 7,095,667 0.07
Dominican Republic USD 1,431,000 Aeropuertos Dominicanos Siglo
XXI SA ‘144A’ 6.75% 30/3/2029 1,508,140 0.02
USD 2,757,000 Dominican Republic International Bond 6% 19/7/2028* 3,036,146 0.03
4,544,286 0.05
Ecuador USD 2,353,000 Ecuador Government
International Bond 7.875% 23/1/2028 2,207,408 0.02
Egypt EGP 16,885,000 Egypt Government Bond 15.9%
2/7/2024 1,072,454 0.01 EGP 75,566,000 Egypt Government Bond 16.1%
7/5/2029 4,913,375 0.05 EUR 2,781,000 Egypt Government International
Bond ‘144A’ 4.75% 16/4/2026 3,170,376 0.03 EUR 3,981,000 Egypt Government International
Bond 5.625% 16/4/2030 4,456,624 0.05 EUR 3,538,000 Egypt Government International
Bond ‘144A’ 6.375% 11/4/2031 4,121,910 0.04 USD 4,601,000 Egypt Government International
Bond 6.875% 30/4/2040* 4,537,736 0.05 USD 1,499,000 Egypt Government International
Bond ‘144A’ 8.7% 1/3/2049* 1,642,810 0.02 EGP 102,425,000 Egypt Treasury Bills 10/9/2019
(Zero Coupon) 6,178,850 0.06 EGP 51,875,000 Egypt Treasury Bills 5/11/2019
(Zero Coupon) 3,046,626 0.03 33,140,761 0.34
Finland EUR 4,130,000 Fortum Oyj 2.125% 27/2/2029 5,135,262 0.05
France EUR 1,400,000 Altice France SA/France 5.875%
1/2/2027 1,713,750 0.02 USD 3,400,000 Altice France SA/France ‘144A’
8.125% 1/2/2027 3,749,214 0.04
Fixed Income Global Opportunities Fund continued
Portfolio of Investments 31 August 2019

Transferable Securities and Money Market Instruments Admitted to an Official Stock Exchange Listing or Dealt in on Another Regulated Market
Transferable Securities and Money Market Instruments Admitted to an Official Stock Exchange Listing or Dealt in on Another Regulated Market
Holding
Description
Market Value (USD)
% of Net
Assets
Holding
Description
Market Value (USD)
% of Net
Assets
* All or a portion of this security represents a security on loan.
The notes on pages 728 to 741 form an integral part of these financial statements.
[298] BlackRock Global Funds (BGF)
EUR 400,000 BNP Paribas SA FRN 17/6/2022 (Perpetual)* 491,560 0.01
USD 9,975,000 BNP Paribas SA FRN 25/3/2024 (Perpetual) 10,418,538 0.11
USD 1,500,000 BNP Paribas SA ‘144A’ FRN 25/3/2024 (Perpetual)* 1,566,698 0.02
USD 1,800,000 BNP Paribas SA FRN 19/8/2025 (Perpetual) 1,997,289 0.02
USD 3,165,000 BNP Paribas SA ‘144A’ FRN 1/3/2033* 3,373,310 0.04
EUR 400,000 Caisse Nationale de Reassurance Mutuelle Agricole Groupama FRN 28/5/2024 (Perpetual) 524,617 0.01
EUR 600,000 Caisse Nationale de Reassurance Mutuelle Agricole Groupama 6% 23/1/2027* 853,380 0.01
EUR 100,000 Casino Guichard Perrachon SA FRN 31/1/2024 (Perpetual) 64,789 0.00
EUR 200,000 CMA CGM SA 6.5% 15/7/2022 190,665 0.00 EUR 100,000 Credit Agricole Assurances SA
FRN 14/10/2025 (Perpetual) 126,744 0.00 EUR 1,627,000 Credit Agricole SA FRN 23/6/2021
(Perpetual) 1,945,505 0.02 USD 2,400,000 Credit Agricole SA ‘144A’ FRN
23/9/2024 (Perpetual) 2,548,716 0.03 USD 200,000 Credit Agricole SA FRN 23/12/2025
(Perpetual) 233,453 0.00 USD 5,666,000 Credit Agricole SA ‘144A’ FRN
10/1/2033* 5,924,933 0.06 EUR 1,400,000 Credit Mutuel Arkea SA 3.5%
9/2/2029 1,844,356 0.02 EUR 900,000 Crown European Holdings SA
2.25% 1/2/2023* 1,060,786 0.01 EUR 434,000 Crown European Holdings SA
‘144A’ 2.25% 1/2/2023 511,348 0.01 EUR 227,000 Crown European Holdings SA
3.375% 15/5/2025 280,643 0.00 EUR 400,000 Electricite de France SA FRN
4/7/2024 (Perpetual) 485,162 0.01 EUR 700,000 Electricite de France SA FRN
22/1/2026 (Perpetual) 883,610 0.01 GBP 900,000 Electricite de France SA FRN
29/1/2026 (Perpetual) 1,215,457 0.01 EUR 400,000 Engie SA FRN 2/6/2024 (Perpetual) 500,306 0.01 EUR 2,000,000 Engie SA FRN 28/11/2024
(Perpetual) 2,453,339 0.03 EUR 5,600,000 Engie SA 4/3/2027 (Zero Coupon) 6,176,279 0.06 EUR 731,000 Europcar Mobility Group 4%
30/4/2026 840,842 0.01 EUR 1,628,305 FCT Noria 2018-1 FRN 25/6/2038 1,807,882 0.02 EUR 1,724,088 FCT Noria 2018-1 FRN 25/6/2038 1,912,952 0.02 EUR 26,469,800 French Republic Government Bond
OAT ‘144A’ 1.5% 25/5/2050 38,429,263 0.39 EUR 1,168,000 Loxam SAS 3.25% 14/1/2025* 1,357,944 0.01 EUR 167,000 Loxam SAS 3.5% 15/4/2022 188,672 0.00 EUR 200,000 Loxam SAS 3.5% 3/5/2023 226,474 0.00 EUR 1,074,000 Loxam SAS 3.75% 15/7/2026* 1,251,623 0.01 EUR 1,900,000 Orange SA 4/9/2026 (Zero Coupon) 2,088,681 0.02 EUR 400,000 Orange SA 0.5% 4/9/2032 440,228 0.00 EUR 800,000 Orano SA 3.375% 23/4/2026 961,687 0.01 EUR 309,670 Parts Europe SA FRN 1/5/2022* 343,962 0.00 EUR 1,403,000 Parts Europe SA FRN 1/5/2022 1,552,183 0.02 EUR 1,310,000 Parts Europe SA 4.375% 1/5/2022* 1,457,571 0.02 EUR 200,000 Picard Groupe SAS FRN 30/11/2023 217,537 0.00 EUR 380,000 Rexel SA 2.625% 15/6/2024 431,739 0.00 USD 248,000 Societe Generale SA ‘144A’ FRN
13/9/2021 (Perpetual)* 261,020 0.00 USD 200,000 Societe Generale SA FRN
29/9/2025 (Perpetual) 223,421 0.00
EUR 2,000,000 Solvay Finance SA FRN 12/11/2023 (Perpetual)* 2,560,069 0.03
EUR 300,000 Solvay Finance SA FRN 3/6/2024 (Perpetual)* 395,079 0.00
EUR 300,000 SPIE SA 2.625% 18/6/2026 352,596 0.00 EUR 200,000 SPIE SA 3.125% 22/3/2024 243,807 0.00 EUR 100,000 TOTAL SA FRN 26/2/2021
(Perpetual) 113,988 0.00 EUR 160,000 TOTAL SA FRN 5/5/2023
(Perpetual) 190,758 0.00 108,984,425 1.12
Germany EUR 400,000 ADLER Real Estate AG 1.875%
27/4/2023 458,152 0.00 EUR 490,000 ADLER Real Estate AG 2.125%
6/2/2024 567,645 0.01 EUR 1,000,000 ADLER Real Estate AG 3%
27/4/2026 1,189,565 0.01 EUR 1,717,000 Consus Real Estate AG 9.625%
15/5/2024 1,822,462 0.02 EUR 12,472,000 Deutsche Bundesrepublik Inflation
Linked Bond 0.1% 15/4/2026* 16,272,640 0.17 EUR 2,400,000 Deutsche Pfandbriefbank AG FRN
28/4/2023 (Perpetual) 2,731,627 0.03 EUR 100,000 Deutsche Pfandbriefbank AG
4.6% 22/2/2027 122,833 0.00 EUR 1,821,000 IHO Verwaltungs GmbH 3.625%
15/5/2025* 2,058,068 0.02 EUR 555,000 IHO Verwaltungs GmbH 3.875%
15/5/2027 614,743 0.01 USD 1,100,000 IHO Verwaltungs GmbH ‘144A’
6% 15/5/2027 1,105,500 0.01 EUR 6,500,000 IKB Deutsche Industriebank AG
FRN 31/1/2028 7,022,062 0.07 EUR 3,400,000 Merck KGaA FRN 25/6/2079* 4,078,304 0.04 EUR 200,000 Nidda BondCo GmbH 5% 30/9/2025 226,721 0.00 EUR 599,000 Nidda BondCo GmbH 7.25%
30/9/2025 708,030 0.01 EUR 1,467,000 Platin 1426 GmbH 5.375%
15/6/2023* 1,601,249 0.02 EUR 1,450,000 RWE AG FRN 21/4/2075 1,636,527 0.02 EUR 400,000 Techem Verwaltungsgesellschaft
674 mbH 6% 30/7/2026 480,991 0.00 EUR 350,000 Tele Columbus AG 3.875% 2/5/2025 374,566 0.00 EUR 2,830,000 thyssenkrupp AG 2.875% 22/2/2024 3,233,532 0.03 EUR 1,700,000 Unitymedia GmbH 3.75% 15/1/2027 2,008,158 0.02 USD 1,400,000 Unitymedia GmbH ‘144A’ 6.125%
15/1/2025 1,465,450 0.02 EUR 182,000 Unitymedia Hessen GmbH & Co
KG / Unitymedia NRW GmbH 3.5% 15/1/2027 214,228 0.00
USD 6,009,000 Unitymedia Hessen GmbH & Co KG / Unitymedia NRW GmbH ‘144A’ 5% 15/1/2025* 6,227,547 0.06
EUR 856,800 Unitymedia Hessen GmbH & Co KG / Unitymedia NRW GmbH 6.25% 15/1/2029 1,056,737 0.01
EUR 400,000 Volkswagen Financial Services AG 2.25% 1/10/2027 487,301 0.01
57,764,638 0.59
Greece EUR 6,085,000 Hellenic Republic Government
Bond ‘144A’ 1.875% 23/7/2026 6,983,349 0.07 EUR 9,340,000 Hellenic Republic Government
Bond ‘144A’ 3.45% 2/4/2024 11,489,955 0.12
Fixed Income Global Opportunities Fund continued
Portfolio of Investments 31 August 2019
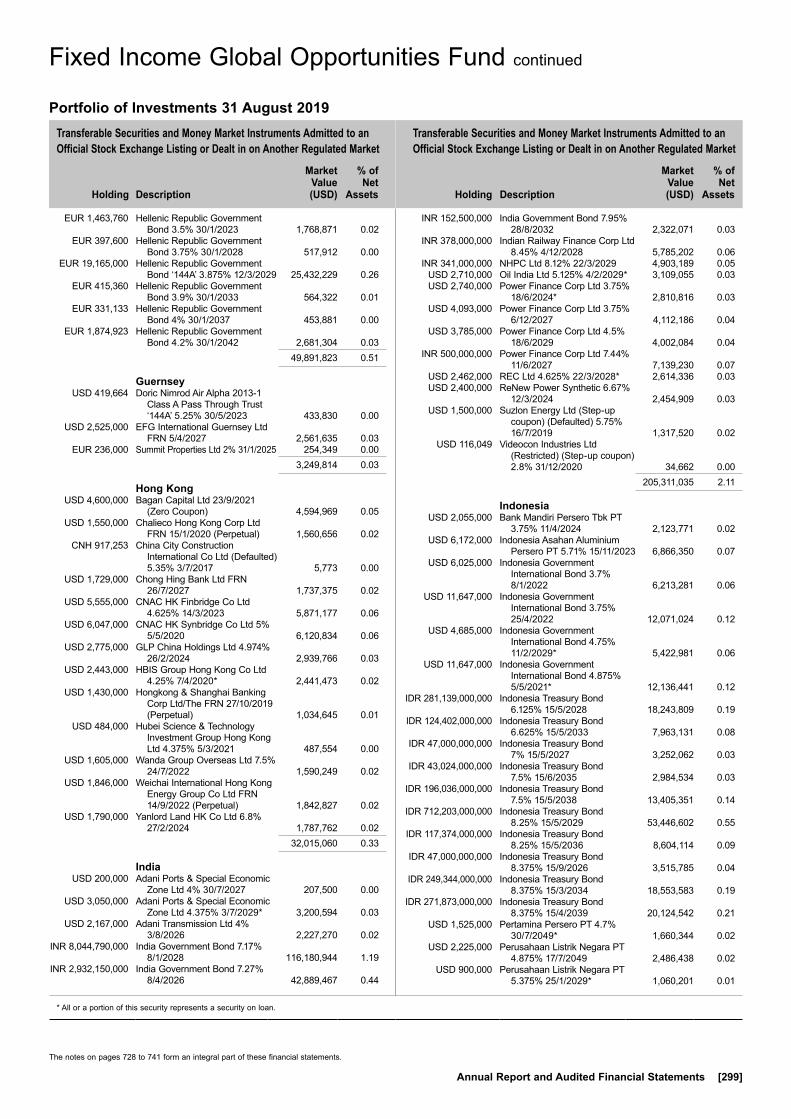
Transferable Securities and Money Market Instruments Admitted to an Official Stock Exchange Listing or Dealt in on Another Regulated Market
Transferable Securities and Money Market Instruments Admitted to an Official Stock Exchange Listing or Dealt in on Another Regulated Market
Holding
Description
Market Value (USD)
% of Net
Assets
Holding
Description
Market Value (USD)
% of Net
Assets
* All or a portion of this security represents a security on loan.
The notes on pages 728 to 741 form an integral part of these financial statements.
Annual Report and Audited Financial Statements [299]
EUR 1,463,760 Hellenic Republic Government Bond 3.5% 30/1/2023 1,768,871 0.02
EUR 397,600 Hellenic Republic Government Bond 3.75% 30/1/2028 517,912 0.00
EUR 19,165,000 Hellenic Republic Government Bond ‘144A’ 3.875% 12/3/2029 25,432,229 0.26
EUR 415,360 Hellenic Republic Government Bond 3.9% 30/1/2033 564,322 0.01
EUR 331,133 Hellenic Republic Government Bond 4% 30/1/2037 453,881 0.00
EUR 1,874,923 Hellenic Republic Government Bond 4.2% 30/1/2042 2,681,304 0.03
49,891,823 0.51
Guernsey USD 419,664 Doric Nimrod Air Alpha 2013-1
Class A Pass Through Trust ‘144A’ 5.25% 30/5/2023 433,830 0.00
USD 2,525,000 EFG International Guernsey Ltd FRN 5/4/2027 2,561,635 0.03
EUR 236,000 Summit Properties Ltd 2% 31/1/2025 254,349 0.00 3,249,814 0.03
Hong Kong USD 4,600,000 Bagan Capital Ltd 23/9/2021
(Zero Coupon) 4,594,969 0.05 USD 1,550,000 Chalieco Hong Kong Corp Ltd
FRN 15/1/2020 (Perpetual) 1,560,656 0.02 CNH 917,253 China City Construction
International Co Ltd (Defaulted) 5.35% 3/7/2017 5,773 0.00
USD 1,729,000 Chong Hing Bank Ltd FRN 26/7/2027 1,737,375 0.02
USD 5,555,000 CNAC HK Finbridge Co Ltd 4.625% 14/3/2023 5,871,177 0.06
USD 6,047,000 CNAC HK Synbridge Co Ltd 5% 5/5/2020 6,120,834 0.06
USD 2,775,000 GLP China Holdings Ltd 4.974% 26/2/2024 2,939,766 0.03
USD 2,443,000 HBIS Group Hong Kong Co Ltd 4.25% 7/4/2020* 2,441,473 0.02
USD 1,430,000 Hongkong & Shanghai Banking Corp Ltd/The FRN 27/10/2019 (Perpetual) 1,034,645 0.01
USD 484,000 Hubei Science & Technology Investment Group Hong Kong Ltd 4.375% 5/3/2021 487,554 0.00
USD 1,605,000 Wanda Group Overseas Ltd 7.5% 24/7/2022 1,590,249 0.02
USD 1,846,000 Weichai International Hong Kong Energy Group Co Ltd FRN 14/9/2022 (Perpetual) 1,842,827 0.02
USD 1,790,000 Yanlord Land HK Co Ltd 6.8% 27/2/2024 1,787,762 0.02
32,015,060 0.33
India USD 200,000 Adani Ports & Special Economic
Zone Ltd 4% 30/7/2027 207,500 0.00 USD 3,050,000 Adani Ports & Special Economic
Zone Ltd 4.375% 3/7/2029* 3,200,594 0.03 USD 2,167,000 Adani Transmission Ltd 4%
3/8/2026 2,227,270 0.02 INR 8,044,790,000 India Government Bond 7.17%
8/1/2028 116,180,944 1.19 INR 2,932,150,000 India Government Bond 7.27%
8/4/2026 42,889,467 0.44
INR 152,500,000 India Government Bond 7.95% 28/8/2032 2,322,071 0.03
INR 378,000,000 Indian Railway Finance Corp Ltd 8.45% 4/12/2028 5,785,202 0.06
INR 341,000,000 NHPC Ltd 8.12% 22/3/2029 4,903,189 0.05 USD 2,710,000 Oil India Ltd 5.125% 4/2/2029* 3,109,055 0.03 USD 2,740,000 Power Finance Corp Ltd 3.75%
18/6/2024* 2,810,816 0.03 USD 4,093,000 Power Finance Corp Ltd 3.75%
6/12/2027 4,112,186 0.04 USD 3,785,000 Power Finance Corp Ltd 4.5%
18/6/2029 4,002,084 0.04 INR 500,000,000 Power Finance Corp Ltd 7.44%
11/6/2027 7,139,230 0.07 USD 2,462,000 REC Ltd 4.625% 22/3/2028* 2,614,336 0.03 USD 2,400,000 ReNew Power Synthetic 6.67%
12/3/2024 2,454,909 0.03 USD 1,500,000 Suzlon Energy Ltd (Step-up
coupon) (Defaulted) 5.75% 16/7/2019 1,317,520 0.02
USD 116,049 Videocon Industries Ltd (Restricted) (Step-up coupon) 2.8% 31/12/2020 34,662 0.00
205,311,035 2.11
Indonesia USD 2,055,000 Bank Mandiri Persero Tbk PT
3.75% 11/4/2024 2,123,771 0.02 USD 6,172,000 Indonesia Asahan Aluminium
Persero PT 5.71% 15/11/2023 6,866,350 0.07 USD 6,025,000 Indonesia Government
International Bond 3.7% 8/1/2022 6,213,281 0.06
USD 11,647,000 Indonesia Government International Bond 3.75% 25/4/2022 12,071,024 0.12
USD 4,685,000 Indonesia Government International Bond 4.75% 11/2/2029* 5,422,981 0.06
USD 11,647,000 Indonesia Government International Bond 4.875% 5/5/2021* 12,136,441 0.12
IDR 281,139,000,000 Indonesia Treasury Bond 6.125% 15/5/2028 18,243,809 0.19
IDR 124,402,000,000 Indonesia Treasury Bond 6.625% 15/5/2033 7,963,131 0.08
IDR 47,000,000,000 Indonesia Treasury Bond 7% 15/5/2027 3,252,062 0.03
IDR 43,024,000,000 Indonesia Treasury Bond 7.5% 15/6/2035 2,984,534 0.03
IDR 196,036,000,000 Indonesia Treasury Bond 7.5% 15/5/2038 13,405,351 0.14
IDR 712,203,000,000 Indonesia Treasury Bond 8.25% 15/5/2029 53,446,602 0.55
IDR 117,374,000,000 Indonesia Treasury Bond 8.25% 15/5/2036 8,604,114 0.09
IDR 47,000,000,000 Indonesia Treasury Bond 8.375% 15/9/2026 3,515,785 0.04
IDR 249,344,000,000 Indonesia Treasury Bond 8.375% 15/3/2034 18,553,583 0.19
IDR 271,873,000,000 Indonesia Treasury Bond 8.375% 15/4/2039 20,124,542 0.21
USD 1,525,000 Pertamina Persero PT 4.7% 30/7/2049* 1,660,344 0.02
USD 2,225,000 Perusahaan Listrik Negara PT 4.875% 17/7/2049 2,486,438 0.02
USD 900,000 Perusahaan Listrik Negara PT 5.375% 25/1/2029* 1,060,201 0.01
Fixed Income Global Opportunities Fund continued
Portfolio of Investments 31 August 2019

Transferable Securities and Money Market Instruments Admitted to an Official Stock Exchange Listing or Dealt in on Another Regulated Market
Transferable Securities and Money Market Instruments Admitted to an Official Stock Exchange Listing or Dealt in on Another Regulated Market
Holding
Description
Market Value (USD)
% of Net
Assets
Holding
Description
Market Value (USD)
% of Net
Assets
* All or a portion of this security represents a security on loan.
The notes on pages 728 to 741 form an integral part of these financial statements.
[300] BlackRock Global Funds (BGF)
USD 900,000 Perusahaan Listrik Negara PT 5.45% 21/5/2028 1,056,656 0.01
USD 600,000 Perusahaan Listrik Negara PT 6.15% 21/5/2048 780,281 0.01
USD 1,425,000 Perusahaan Penerbit SBSN Indonesia III 4.4% 1/3/2028 1,575,738 0.02
IDR 28,140,000,000 Wijaya Karya Persero Tbk PT 7.7% 31/1/2021 1,923,171 0.02
205,470,190 2.11
Ireland EUR 3,752,000 Allied Irish Banks Plc FRN
3/12/2020 (Perpetual)* 4,433,242 0.05 EUR 743,000 Allied Irish Banks Plc FRN
26/11/2025 856,152 0.01 EUR 2,075,000 Ardagh Packaging Finance Plc /
Ardagh Holdings USA Inc 4.125% 15/5/2023* 2,350,785 0.02
USD 3,206,000 Ardagh Packaging Finance Plc / Ardagh Holdings USA Inc ‘144A’ 4.25% 15/9/2022 3,262,105 0.03
USD 6,911,000 Ardagh Packaging Finance Plc / Ardagh Holdings USA Inc ‘144A’ 4.625% 15/5/2023* 7,088,613 0.07
GBP 2,192,000 Ardagh Packaging Finance Plc / Ardagh Holdings USA Inc 4.75% 15/7/2027 2,724,104 0.03
USD 1,225,000 Ardagh Packaging Finance Plc / Ardagh Holdings USA Inc ‘144A’ 5.25% 15/8/2027 1,237,250 0.01
EUR 905,000 Ardagh Packaging Finance Plc / Ardagh Holdings USA Inc 6.75% 15/5/2024 1,059,262 0.01
EUR 150,000 Avoca CLO XIV Designated Activity Co FRN 12/1/2031 152,123 0.00
EUR 150,000 Avoca CLO XIV Designated Activity Co FRN 12/1/2031 159,754 0.00
EUR 550,000 Avoca CLO XIV Designated Activity Co FRN 12/1/2031 427,517 0.00
EUR 760,000 Avoca CLO XV DAC FRN 15/4/2031 781,730 0.01
EUR 1,400,000 Avoca CLO XVIII DAC FRN 15/4/2031 1,528,525 0.02
EUR 600,000 Avoca CLO XVIII DAC FRN 15/4/2031 628,632 0.01
EUR 2,350,000 Bank of Ireland FRN 18/6/2020 (Perpetual)* 2,720,665 0.03
USD 1,950,000 Bank of Ireland Group Plc FRN 19/9/2027* 1,913,047 0.02
GBP 200,000 Bank of Ireland Group Plc FRN 19/9/2027 240,855 0.00
USD 4,964,000 C&W Senior Financing DAC ‘144A’ 6.875% 15/9/2027 5,292,865 0.05
EUR 340,000 Cadogan Square CLO XI DAC FRN 15/2/2031 372,869 0.00
EUR 490,000 Carlyle Global Market Strategies Euro CLO 2014-2 Ltd FRN 17/11/2031 524,690 0.00
EUR 400,000 CIFC European Funding CLO I DAC FRN 15/7/2032 430,987 0.00
EUR 730,000 CVC Cordatus Loan Fund VI DAC FRN 15/4/2032 534,731 0.01
EUR 573,000 eircom Finance DAC 3.5% 15/5/2026 676,089 0.01
EUR 700,000 Halcyon Loan Advisors European Funding FRN 18/10/2031 767,491 0.01
EUR 1,350,000 Harvest CLO XVI DAC FRN 15/10/2031 1,483,102 0.01
EUR 500,000 Harvest CLO XXII DAC FRN 15/1/2032 546,601 0.01
EUR 710,000 Invesco Euro CLO I DAC FRN 15/7/2031 785,716 0.01
USD 2,956,000 Novolipetsk Steel Via Steel Funding DAC ‘144A’ 4.7% 30/5/2026 3,164,768 0.03
EUR 720,000 OZLME IV DAC FRN 27/7/2032 797,921 0.01 EUR 400,000 Providus Clo III DAC FRN 20/7/2032 428,729 0.00 EUR 1,420,000 Rockford Tower Europe CLO 2018-
1 DAC FRN 20/12/2031 1,569,124 0.02 EUR 560,562 Taurus 2016-2 DEU DAC ‘Series
2016-DE2 C’ FRN 3/1/2027 621,395 0.01 EUR 595,700 Taurus 2016-2 DEU DAC ‘Series
2016-DE2 D’ FRN 3/1/2027 661,028 0.01 EUR 500,000 Tikehau CLO V BV FRN 15/4/2032 531,603 0.01 GBP 693,000 Virgin Media Receivables
Financing Notes I DAC 5.5% 15/9/2024 871,911 0.01
GBP 1,340,000 Virgin Media Receivables Financing Notes II DAC 5.75% 15/4/2023 1,694,458 0.02
53,320,439 0.55
Italy GBP 100,000 Assicurazioni Generali SpA FRN
8/2/2022 (Perpetual) 129,865 0.00 EUR 900,000 Assicurazioni Generali SpA FRN
12/12/2042 1,223,650 0.01 EUR 403,000 Assicurazioni Generali SpA FRN
27/10/2047 537,303 0.01 EUR 700,000 Assicurazioni Generali SpA 4.125%
4/5/2026 916,564 0.01 EUR 1,700,000 Banca Carige SpA 0.75% 26/7/2020 1,886,096 0.02 EUR 830,000 Banco BPM SpA 1.75% 24/4/2023 932,218 0.01 EUR 1,100,000 Banco BPM SpA 2.5% 21/6/2024 1,254,505 0.01 EUR 225,000 Brignole Co 2019-1 SRL FRN
24/7/2034 248,542 0.00 EUR 1,200,000 Buzzi Unicem SpA 2.125%
28/4/2023* 1,403,923 0.01 EUR 691,000 Diocle Spa FRN 30/6/2026 778,413 0.01 EUR 4,000,000 Intesa Sanpaolo SpA FRN
19/1/2021 (Perpetual)* 4,694,678 0.05 EUR 200,000 Intesa Sanpaolo SpA FRN
16/5/2024 (Perpetual) 233,353 0.00 USD 300,000 Intesa Sanpaolo SpA ‘144A’ FRN
17/9/2025 (Perpetual)* 305,506 0.00 EUR 9,110,000 Intesa Sanpaolo SpA FRN
11/1/2027 (Perpetual) 11,698,447 0.12 EUR 150,000 Intesa Sanpaolo SpA 5.15%
16/7/2020 172,935 0.00 EUR 39,507,000 Italy Buoni Poliennali Del Tesoro
1.75% 1/7/2024 46,468,803 0.48 EUR 8,475,000 Italy Buoni Poliennali Del Tesoro
‘144A’ 2.7% 1/3/2047 11,106,561 0.11 EUR 16,886,000 Italy Buoni Poliennali Del Tesoro
2.8% 1/12/2028 21,906,559 0.23 EUR 7,350,000 Italy Buoni Poliennali Del Tesoro
‘144A’ 3.45% 1/3/2048 10,898,346 0.11 EUR 9,030,000 Italy Buoni Poliennali Del Tesoro
‘144A’ 3.85% 1/9/2049 14,219,934 0.15 EUR 7,935,000 Italy Buoni Poliennali Del Tesoro
‘144A’ 4.75% 1/9/2044 13,602,360 0.14 EUR 820,000 Nexi Capital SpA 4.125% 1/11/2023* 936,100 0.01 EUR 1,810,000 Sisal Group SpA 7% 31/7/2023* 2,079,176 0.02 EUR 5,468,915 Taurus 2018-1 IT SRL ‘Series
2018-IT1 A’ FRN 18/5/2030 6,025,542 0.06 EUR 2,500,000 Telecom Italia SpA/Milano 1.125%
26/3/2022 2,777,786 0.03 EUR 1,899,000 Telecom Italia SpA/Milano 2.75%
15/4/2025 2,201,896 0.02
Fixed Income Global Opportunities Fund continued
Portfolio of Investments 31 August 2019
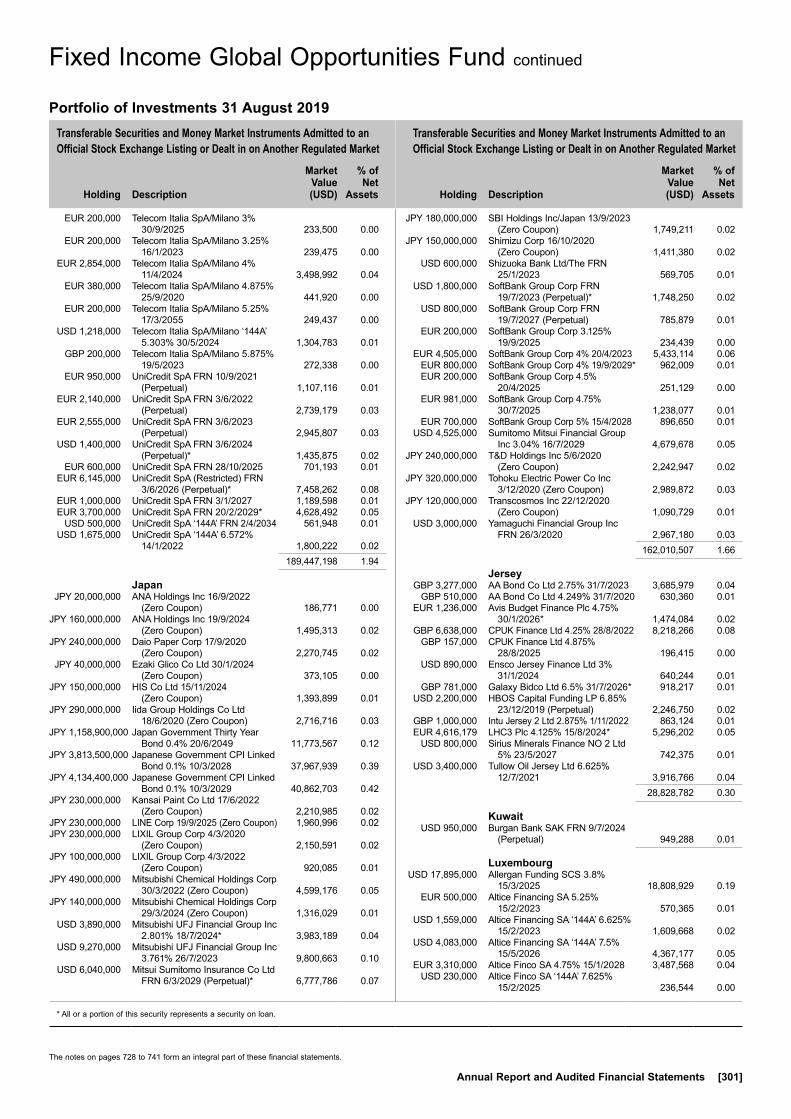
Transferable Securities and Money Market Instruments Admitted to an Official Stock Exchange Listing or Dealt in on Another Regulated Market
Transferable Securities and Money Market Instruments Admitted to an Official Stock Exchange Listing or Dealt in on Another Regulated Market
Holding
Description
Market Value (USD)
% of Net
Assets
Holding
Description
Market Value (USD)
% of Net
Assets
* All or a portion of this security represents a security on loan.
The notes on pages 728 to 741 form an integral part of these financial statements.
Annual Report and Audited Financial Statements [301]
EUR 200,000 Telecom Italia SpA/Milano 3% 30/9/2025 233,500 0.00
EUR 200,000 Telecom Italia SpA/Milano 3.25% 16/1/2023 239,475 0.00
EUR 2,854,000 Telecom Italia SpA/Milano 4% 11/4/2024 3,498,992 0.04
EUR 380,000 Telecom Italia SpA/Milano 4.875% 25/9/2020 441,920 0.00
EUR 200,000 Telecom Italia SpA/Milano 5.25% 17/3/2055 249,437 0.00
USD 1,218,000 Telecom Italia SpA/Milano ‘144A’ 5.303% 30/5/2024 1,304,783 0.01
GBP 200,000 Telecom Italia SpA/Milano 5.875% 19/5/2023 272,338 0.00
EUR 950,000 UniCredit SpA FRN 10/9/2021 (Perpetual) 1,107,116 0.01
EUR 2,140,000 UniCredit SpA FRN 3/6/2022 (Perpetual) 2,739,179 0.03
EUR 2,555,000 UniCredit SpA FRN 3/6/2023 (Perpetual) 2,945,807 0.03
USD 1,400,000 UniCredit SpA FRN 3/6/2024 (Perpetual)* 1,435,875 0.02
EUR 600,000 UniCredit SpA FRN 28/10/2025 701,193 0.01 EUR 6,145,000 UniCredit SpA (Restricted) FRN
3/6/2026 (Perpetual)* 7,458,262 0.08 EUR 1,000,000 UniCredit SpA FRN 3/1/2027 1,189,598 0.01 EUR 3,700,000 UniCredit SpA FRN 20/2/2029* 4,628,492 0.05 USD 500,000 UniCredit SpA ‘144A’ FRN 2/4/2034 561,948 0.01 USD 1,675,000 UniCredit SpA ‘144A’ 6.572%
14/1/2022 1,800,222 0.02 189,447,198 1.94
Japan JPY 20,000,000 ANA Holdings Inc 16/9/2022
(Zero Coupon) 186,771 0.00 JPY 160,000,000 ANA Holdings Inc 19/9/2024
(Zero Coupon) 1,495,313 0.02 JPY 240,000,000 Daio Paper Corp 17/9/2020
(Zero Coupon) 2,270,745 0.02 JPY 40,000,000 Ezaki Glico Co Ltd 30/1/2024
(Zero Coupon) 373,105 0.00 JPY 150,000,000 HIS Co Ltd 15/11/2024
(Zero Coupon) 1,393,899 0.01 JPY 290,000,000 Iida Group Holdings Co Ltd
18/6/2020 (Zero Coupon) 2,716,716 0.03 JPY 1,158,900,000 Japan Government Thirty Year
Bond 0.4% 20/6/2049 11,773,567 0.12 JPY 3,813,500,000 Japanese Government CPI Linked
Bond 0.1% 10/3/2028 37,967,939 0.39 JPY 4,134,400,000 Japanese Government CPI Linked
Bond 0.1% 10/3/2029 40,862,703 0.42 JPY 230,000,000 Kansai Paint Co Ltd 17/6/2022
(Zero Coupon) 2,210,985 0.02 JPY 230,000,000 LINE Corp 19/9/2025 (Zero Coupon) 1,960,996 0.02 JPY 230,000,000 LIXIL Group Corp 4/3/2020
(Zero Coupon) 2,150,591 0.02 JPY 100,000,000 LIXIL Group Corp 4/3/2022
(Zero Coupon) 920,085 0.01 JPY 490,000,000 Mitsubishi Chemical Holdings Corp
30/3/2022 (Zero Coupon) 4,599,176 0.05 JPY 140,000,000 Mitsubishi Chemical Holdings Corp
29/3/2024 (Zero Coupon) 1,316,029 0.01 USD 3,890,000 Mitsubishi UFJ Financial Group Inc
2.801% 18/7/2024* 3,983,189 0.04 USD 9,270,000 Mitsubishi UFJ Financial Group Inc
3.761% 26/7/2023 9,800,663 0.10 USD 6,040,000 Mitsui Sumitomo Insurance Co Ltd
FRN 6/3/2029 (Perpetual)* 6,777,786 0.07
JPY 180,000,000 SBI Holdings Inc/Japan 13/9/2023 (Zero Coupon) 1,749,211 0.02
JPY 150,000,000 Shimizu Corp 16/10/2020 (Zero Coupon) 1,411,380 0.02
USD 600,000 Shizuoka Bank Ltd/The FRN 25/1/2023 569,705 0.01
USD 1,800,000 SoftBank Group Corp FRN 19/7/2023 (Perpetual)* 1,748,250 0.02
USD 800,000 SoftBank Group Corp FRN 19/7/2027 (Perpetual) 785,879 0.01
EUR 200,000 SoftBank Group Corp 3.125% 19/9/2025 234,439 0.00
EUR 4,505,000 SoftBank Group Corp 4% 20/4/2023 5,433,114 0.06 EUR 800,000 SoftBank Group Corp 4% 19/9/2029* 962,009 0.01 EUR 200,000 SoftBank Group Corp 4.5%
20/4/2025 251,129 0.00 EUR 981,000 SoftBank Group Corp 4.75%
30/7/2025 1,238,077 0.01 EUR 700,000 SoftBank Group Corp 5% 15/4/2028 896,650 0.01 USD 4,525,000 Sumitomo Mitsui Financial Group
Inc 3.04% 16/7/2029 4,679,678 0.05 JPY 240,000,000 T&D Holdings Inc 5/6/2020
(Zero Coupon) 2,242,947 0.02 JPY 320,000,000 Tohoku Electric Power Co Inc
3/12/2020 (Zero Coupon) 2,989,872 0.03 JPY 120,000,000 Transcosmos Inc 22/12/2020
(Zero Coupon) 1,090,729 0.01 USD 3,000,000 Yamaguchi Financial Group Inc
FRN 26/3/2020 2,967,180 0.03 162,010,507 1.66
Jersey GBP 3,277,000 AA Bond Co Ltd 2.75% 31/7/2023 3,685,979 0.04 GBP 510,000 AA Bond Co Ltd 4.249% 31/7/2020 630,360 0.01 EUR 1,236,000 Avis Budget Finance Plc 4.75%
30/1/2026* 1,474,084 0.02 GBP 6,638,000 CPUK Finance Ltd 4.25% 28/8/2022 8,218,266 0.08 GBP 157,000 CPUK Finance Ltd 4.875%
28/8/2025 196,415 0.00 USD 890,000 Ensco Jersey Finance Ltd 3%
31/1/2024 640,244 0.01 GBP 781,000 Galaxy Bidco Ltd 6.5% 31/7/2026* 918,217 0.01 USD 2,200,000 HBOS Capital Funding LP 6.85%
23/12/2019 (Perpetual) 2,246,750 0.02 GBP 1,000,000 Intu Jersey 2 Ltd 2.875% 1/11/2022 863,124 0.01 EUR 4,616,179 LHC3 Plc 4.125% 15/8/2024* 5,296,202 0.05 USD 800,000 Sirius Minerals Finance NO 2 Ltd
5% 23/5/2027 742,375 0.01 USD 3,400,000 Tullow Oil Jersey Ltd 6.625%
12/7/2021 3,916,766 0.04 28,828,782 0.30
Kuwait USD 950,000 Burgan Bank SAK FRN 9/7/2024
(Perpetual) 949,288 0.01
Luxembourg USD 17,895,000 Allergan Funding SCS 3.8%
15/3/2025 18,808,929 0.19 EUR 500,000 Altice Financing SA 5.25%
15/2/2023 570,365 0.01 USD 1,559,000 Altice Financing SA ‘144A’ 6.625%
15/2/2023 1,609,668 0.02 USD 4,083,000 Altice Financing SA ‘144A’ 7.5%
15/5/2026 4,367,177 0.05 EUR 3,310,000 Altice Finco SA 4.75% 15/1/2028 3,487,568 0.04 USD 230,000 Altice Finco SA ‘144A’ 7.625%
15/2/2025 236,544 0.00
Fixed Income Global Opportunities Fund continued
Portfolio of Investments 31 August 2019
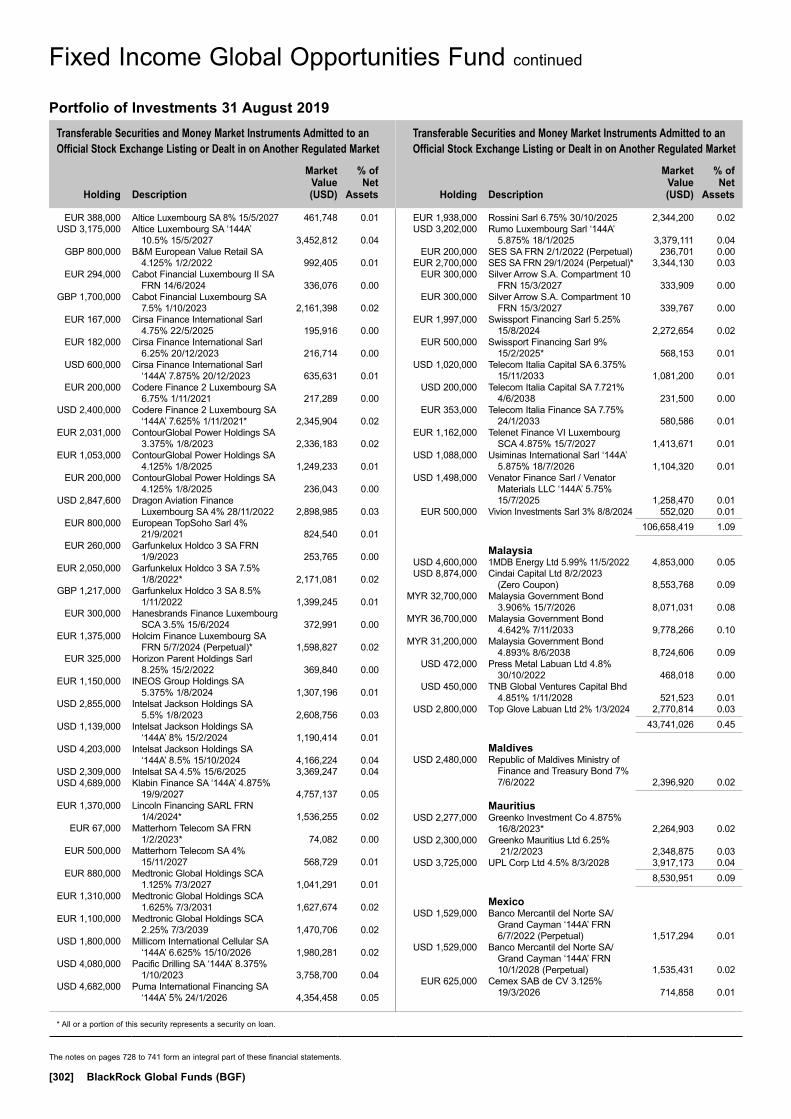
Transferable Securities and Money Market Instruments Admitted to an Official Stock Exchange Listing or Dealt in on Another Regulated Market
Transferable Securities and Money Market Instruments Admitted to an Official Stock Exchange Listing or Dealt in on Another Regulated Market
Holding
Description
Market Value (USD)
% of Net
Assets
Holding
Description
Market Value (USD)
% of Net
Assets
* All or a portion of this security represents a security on loan.
The notes on pages 728 to 741 form an integral part of these financial statements.
[302] BlackRock Global Funds (BGF)
EUR 388,000 Altice Luxembourg SA 8% 15/5/2027 461,748 0.01 USD 3,175,000 Altice Luxembourg SA ‘144A’
10.5% 15/5/2027 3,452,812 0.04 GBP 800,000 B&M European Value Retail SA
4.125% 1/2/2022 992,405 0.01 EUR 294,000 Cabot Financial Luxembourg II SA
FRN 14/6/2024 336,076 0.00 GBP 1,700,000 Cabot Financial Luxembourg SA
7.5% 1/10/2023 2,161,398 0.02 EUR 167,000 Cirsa Finance International Sarl
4.75% 22/5/2025 195,916 0.00 EUR 182,000 Cirsa Finance International Sarl
6.25% 20/12/2023 216,714 0.00 USD 600,000 Cirsa Finance International Sarl
‘144A’ 7.875% 20/12/2023 635,631 0.01 EUR 200,000 Codere Finance 2 Luxembourg SA
6.75% 1/11/2021 217,289 0.00 USD 2,400,000 Codere Finance 2 Luxembourg SA
‘144A’ 7.625% 1/11/2021* 2,345,904 0.02 EUR 2,031,000 ContourGlobal Power Holdings SA
3.375% 1/8/2023 2,336,183 0.02 EUR 1,053,000 ContourGlobal Power Holdings SA
4.125% 1/8/2025 1,249,233 0.01 EUR 200,000 ContourGlobal Power Holdings SA
4.125% 1/8/2025 236,043 0.00 USD 2,847,600 Dragon Aviation Finance
Luxembourg SA 4% 28/11/2022 2,898,985 0.03 EUR 800,000 European TopSoho Sarl 4%
21/9/2021 824,540 0.01 EUR 260,000 Garfunkelux Holdco 3 SA FRN
1/9/2023 253,765 0.00 EUR 2,050,000 Garfunkelux Holdco 3 SA 7.5%
1/8/2022* 2,171,081 0.02 GBP 1,217,000 Garfunkelux Holdco 3 SA 8.5%
1/11/2022 1,399,245 0.01 EUR 300,000 Hanesbrands Finance Luxembourg
SCA 3.5% 15/6/2024 372,991 0.00 EUR 1,375,000 Holcim Finance Luxembourg SA
FRN 5/7/2024 (Perpetual)* 1,598,827 0.02 EUR 325,000 Horizon Parent Holdings Sarl
8.25% 15/2/2022 369,840 0.00 EUR 1,150,000 INEOS Group Holdings SA
5.375% 1/8/2024 1,307,196 0.01 USD 2,855,000 Intelsat Jackson Holdings SA
5.5% 1/8/2023 2,608,756 0.03 USD 1,139,000 Intelsat Jackson Holdings SA
‘144A’ 8% 15/2/2024 1,190,414 0.01 USD 4,203,000 Intelsat Jackson Holdings SA
‘144A’ 8.5% 15/10/2024 4,166,224 0.04 USD 2,309,000 Intelsat SA 4.5% 15/6/2025 3,369,247 0.04 USD 4,689,000 Klabin Finance SA ‘144A’ 4.875%
19/9/2027 4,757,137 0.05 EUR 1,370,000 Lincoln Financing SARL FRN
1/4/2024* 1,536,255 0.02 EUR 67,000 Matterhorn Telecom SA FRN
1/2/2023* 74,082 0.00 EUR 500,000 Matterhorn Telecom SA 4%
15/11/2027 568,729 0.01 EUR 880,000 Medtronic Global Holdings SCA
1.125% 7/3/2027 1,041,291 0.01 EUR 1,310,000 Medtronic Global Holdings SCA
1.625% 7/3/2031 1,627,674 0.02 EUR 1,100,000 Medtronic Global Holdings SCA
2.25% 7/3/2039 1,470,706 0.02 USD 1,800,000 Millicom International Cellular SA
‘144A’ 6.625% 15/10/2026 1,980,281 0.02 USD 4,080,000 Pacific Drilling SA ‘144A’ 8.375%
1/10/2023 3,758,700 0.04 USD 4,682,000 Puma International Financing SA
‘144A’ 5% 24/1/2026 4,354,458 0.05
EUR 1,938,000 Rossini Sarl 6.75% 30/10/2025 2,344,200 0.02 USD 3,202,000 Rumo Luxembourg Sarl ‘144A’
5.875% 18/1/2025 3,379,111 0.04 EUR 200,000 SES SA FRN 2/1/2022 (Perpetual) 236,701 0.00 EUR 2,700,000 SES SA FRN 29/1/2024 (Perpetual)* 3,344,130 0.03 EUR 300,000 Silver Arrow S.A. Compartment 10
FRN 15/3/2027 333,909 0.00 EUR 300,000 Silver Arrow S.A. Compartment 10
FRN 15/3/2027 339,767 0.00 EUR 1,997,000 Swissport Financing Sarl 5.25%
15/8/2024 2,272,654 0.02 EUR 500,000 Swissport Financing Sarl 9%
15/2/2025* 568,153 0.01 USD 1,020,000 Telecom Italia Capital SA 6.375%
15/11/2033 1,081,200 0.01 USD 200,000 Telecom Italia Capital SA 7.721%
4/6/2038 231,500 0.00 EUR 353,000 Telecom Italia Finance SA 7.75%
24/1/2033 580,586 0.01 EUR 1,162,000 Telenet Finance VI Luxembourg
SCA 4.875% 15/7/2027 1,413,671 0.01 USD 1,088,000 Usiminas International Sarl ‘144A’
5.875% 18/7/2026 1,104,320 0.01 USD 1,498,000 Venator Finance Sarl / Venator
Materials LLC ‘144A’ 5.75% 15/7/2025 1,258,470 0.01
EUR 500,000 Vivion Investments Sarl 3% 8/8/2024 552,020 0.01 106,658,419 1.09
Malaysia USD 4,600,000 1MDB Energy Ltd 5.99% 11/5/2022 4,853,000 0.05 USD 8,874,000 Cindai Capital Ltd 8/2/2023
(Zero Coupon) 8,553,768 0.09 MYR 32,700,000 Malaysia Government Bond
3.906% 15/7/2026 8,071,031 0.08 MYR 36,700,000 Malaysia Government Bond
4.642% 7/11/2033 9,778,266 0.10 MYR 31,200,000 Malaysia Government Bond
4.893% 8/6/2038 8,724,606 0.09 USD 472,000 Press Metal Labuan Ltd 4.8%
30/10/2022 468,018 0.00 USD 450,000 TNB Global Ventures Capital Bhd
4.851% 1/11/2028 521,523 0.01 USD 2,800,000 Top Glove Labuan Ltd 2% 1/3/2024 2,770,814 0.03 43,741,026 0.45
Maldives USD 2,480,000 Republic of Maldives Ministry of
Finance and Treasury Bond 7% 7/6/2022 2,396,920 0.02
Mauritius USD 2,277,000 Greenko Investment Co 4.875%
16/8/2023* 2,264,903 0.02 USD 2,300,000 Greenko Mauritius Ltd 6.25%
21/2/2023 2,348,875 0.03 USD 3,725,000 UPL Corp Ltd 4.5% 8/3/2028 3,917,173 0.04 8,530,951 0.09
Mexico USD 1,529,000 Banco Mercantil del Norte SA/
Grand Cayman ‘144A’ FRN 6/7/2022 (Perpetual) 1,517,294 0.01
USD 1,529,000 Banco Mercantil del Norte SA/Grand Cayman ‘144A’ FRN 10/1/2028 (Perpetual) 1,535,431 0.02
EUR 625,000 Cemex SAB de CV 3.125% 19/3/2026 714,858 0.01
Fixed Income Global Opportunities Fund continued
Portfolio of Investments 31 August 2019
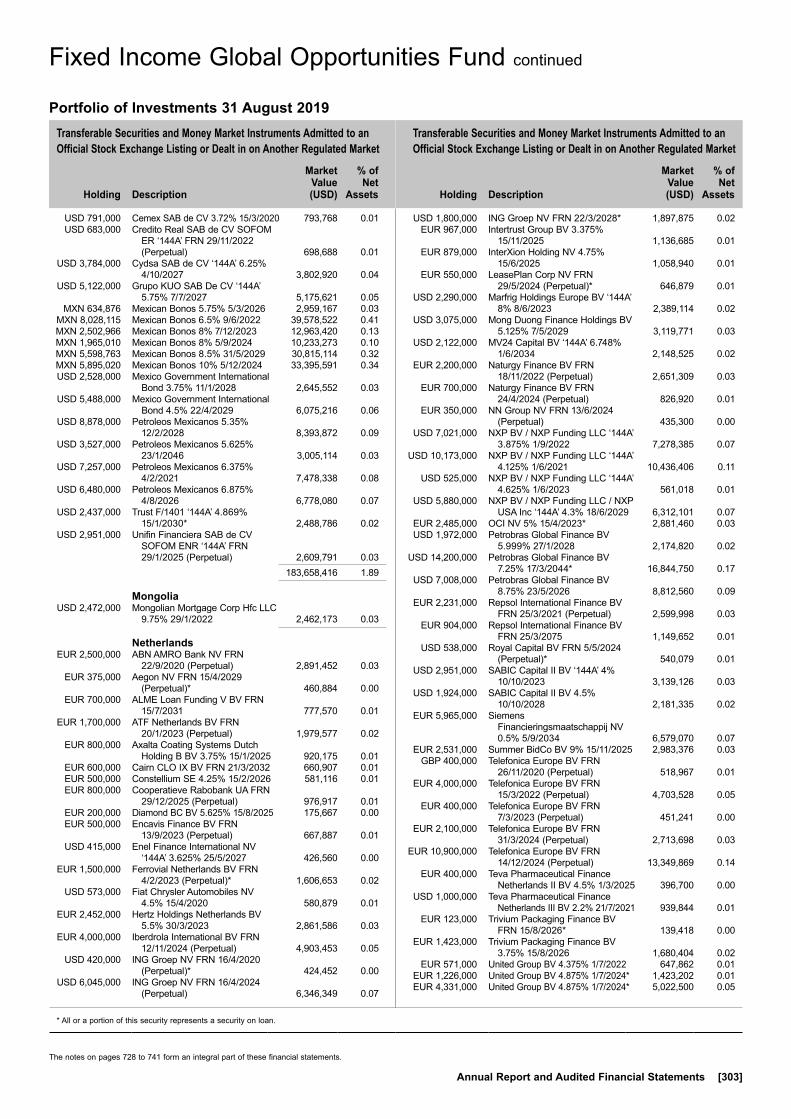
Transferable Securities and Money Market Instruments Admitted to an Official Stock Exchange Listing or Dealt in on Another Regulated Market
Transferable Securities and Money Market Instruments Admitted to an Official Stock Exchange Listing or Dealt in on Another Regulated Market
Holding
Description
Market Value (USD)
% of Net
Assets
Holding
Description
Market Value (USD)
% of Net
Assets
* All or a portion of this security represents a security on loan.
The notes on pages 728 to 741 form an integral part of these financial statements.
Annual Report and Audited Financial Statements [303]
USD 791,000 Cemex SAB de CV 3.72% 15/3/2020 793,768 0.01 USD 683,000 Credito Real SAB de CV SOFOM
ER ‘144A’ FRN 29/11/2022 (Perpetual) 698,688 0.01
USD 3,784,000 Cydsa SAB de CV ‘144A’ 6.25% 4/10/2027 3,802,920 0.04
USD 5,122,000 Grupo KUO SAB De CV ‘144A’ 5.75% 7/7/2027 5,175,621 0.05
MXN 634,876 Mexican Bonos 5.75% 5/3/2026 2,959,167 0.03 MXN 8,028,115 Mexican Bonos 6.5% 9/6/2022 39,578,522 0.41 MXN 2,502,966 Mexican Bonos 8% 7/12/2023 12,963,420 0.13 MXN 1,965,010 Mexican Bonos 8% 5/9/2024 10,233,273 0.10 MXN 5,598,763 Mexican Bonos 8.5% 31/5/2029 30,815,114 0.32 MXN 5,895,020 Mexican Bonos 10% 5/12/2024 33,395,591 0.34 USD 2,528,000 Mexico Government International
Bond 3.75% 11/1/2028 2,645,552 0.03 USD 5,488,000 Mexico Government International
Bond 4.5% 22/4/2029 6,075,216 0.06 USD 8,878,000 Petroleos Mexicanos 5.35%
12/2/2028 8,393,872 0.09 USD 3,527,000 Petroleos Mexicanos 5.625%
23/1/2046 3,005,114 0.03 USD 7,257,000 Petroleos Mexicanos 6.375%
4/2/2021 7,478,338 0.08 USD 6,480,000 Petroleos Mexicanos 6.875%
4/8/2026 6,778,080 0.07 USD 2,437,000 Trust F/1401 ‘144A’ 4.869%
15/1/2030* 2,488,786 0.02 USD 2,951,000 Unifin Financiera SAB de CV
SOFOM ENR ‘144A’ FRN 29/1/2025 (Perpetual) 2,609,791 0.03
183,658,416 1.89
Mongolia USD 2,472,000 Mongolian Mortgage Corp Hfc LLC
9.75% 29/1/2022 2,462,173 0.03
Netherlands EUR 2,500,000 ABN AMRO Bank NV FRN
22/9/2020 (Perpetual) 2,891,452 0.03 EUR 375,000 Aegon NV FRN 15/4/2029
(Perpetual)* 460,884 0.00 EUR 700,000 ALME Loan Funding V BV FRN
15/7/2031 777,570 0.01 EUR 1,700,000 ATF Netherlands BV FRN
20/1/2023 (Perpetual) 1,979,577 0.02 EUR 800,000 Axalta Coating Systems Dutch
Holding B BV 3.75% 15/1/2025 920,175 0.01 EUR 600,000 Cairn CLO IX BV FRN 21/3/2032 660,907 0.01 EUR 500,000 Constellium SE 4.25% 15/2/2026 581,116 0.01 EUR 800,000 Cooperatieve Rabobank UA FRN
29/12/2025 (Perpetual) 976,917 0.01 EUR 200,000 Diamond BC BV 5.625% 15/8/2025 175,667 0.00 EUR 500,000 Encavis Finance BV FRN
13/9/2023 (Perpetual) 667,887 0.01 USD 415,000 Enel Finance International NV
‘144A’ 3.625% 25/5/2027 426,560 0.00 EUR 1,500,000 Ferrovial Netherlands BV FRN
4/2/2023 (Perpetual)* 1,606,653 0.02 USD 573,000 Fiat Chrysler Automobiles NV
4.5% 15/4/2020 580,879 0.01 EUR 2,452,000 Hertz Holdings Netherlands BV
5.5% 30/3/2023 2,861,586 0.03 EUR 4,000,000 Iberdrola International BV FRN
12/11/2024 (Perpetual) 4,903,453 0.05 USD 420,000 ING Groep NV FRN 16/4/2020
(Perpetual)* 424,452 0.00 USD 6,045,000 ING Groep NV FRN 16/4/2024
(Perpetual) 6,346,349 0.07
USD 1,800,000 ING Groep NV FRN 22/3/2028* 1,897,875 0.02 EUR 967,000 Intertrust Group BV 3.375%
15/11/2025 1,136,685 0.01 EUR 879,000 InterXion Holding NV 4.75%
15/6/2025 1,058,940 0.01 EUR 550,000 LeasePlan Corp NV FRN
29/5/2024 (Perpetual)* 646,879 0.01 USD 2,290,000 Marfrig Holdings Europe BV ‘144A’
8% 8/6/2023 2,389,114 0.02 USD 3,075,000 Mong Duong Finance Holdings BV
5.125% 7/5/2029 3,119,771 0.03 USD 2,122,000 MV24 Capital BV ‘144A’ 6.748%
1/6/2034 2,148,525 0.02 EUR 2,200,000 Naturgy Finance BV FRN
18/11/2022 (Perpetual) 2,651,309 0.03 EUR 700,000 Naturgy Finance BV FRN
24/4/2024 (Perpetual) 826,920 0.01 EUR 350,000 NN Group NV FRN 13/6/2024
(Perpetual) 435,300 0.00 USD 7,021,000 NXP BV / NXP Funding LLC ‘144A’
3.875% 1/9/2022 7,278,385 0.07 USD 10,173,000 NXP BV / NXP Funding LLC ‘144A’
4.125% 1/6/2021 10,436,406 0.11 USD 525,000 NXP BV / NXP Funding LLC ‘144A’
4.625% 1/6/2023 561,018 0.01 USD 5,880,000 NXP BV / NXP Funding LLC / NXP
USA Inc ‘144A’ 4.3% 18/6/2029 6,312,101 0.07 EUR 2,485,000 OCI NV 5% 15/4/2023* 2,881,460 0.03 USD 1,972,000 Petrobras Global Finance BV
5.999% 27/1/2028 2,174,820 0.02 USD 14,200,000 Petrobras Global Finance BV
7.25% 17/3/2044* 16,844,750 0.17 USD 7,008,000 Petrobras Global Finance BV
8.75% 23/5/2026 8,812,560 0.09 EUR 2,231,000 Repsol International Finance BV
FRN 25/3/2021 (Perpetual) 2,599,998 0.03 EUR 904,000 Repsol International Finance BV
FRN 25/3/2075 1,149,652 0.01 USD 538,000 Royal Capital BV FRN 5/5/2024
(Perpetual)* 540,079 0.01 USD 2,951,000 SABIC Capital II BV ‘144A’ 4%
10/10/2023 3,139,126 0.03 USD 1,924,000 SABIC Capital II BV 4.5%
10/10/2028 2,181,335 0.02 EUR 5,965,000 Siemens
Financieringsmaatschappij NV 0.5% 5/9/2034 6,579,070 0.07
EUR 2,531,000 Summer BidCo BV 9% 15/11/2025 2,983,376 0.03 GBP 400,000 Telefonica Europe BV FRN
26/11/2020 (Perpetual) 518,967 0.01 EUR 4,000,000 Telefonica Europe BV FRN
15/3/2022 (Perpetual) 4,703,528 0.05 EUR 400,000 Telefonica Europe BV FRN
7/3/2023 (Perpetual) 451,241 0.00 EUR 2,100,000 Telefonica Europe BV FRN
31/3/2024 (Perpetual) 2,713,698 0.03 EUR 10,900,000 Telefonica Europe BV FRN
14/12/2024 (Perpetual) 13,349,869 0.14 EUR 400,000 Teva Pharmaceutical Finance
Netherlands II BV 4.5% 1/3/2025 396,700 0.00 USD 1,000,000 Teva Pharmaceutical Finance
Netherlands III BV 2.2% 21/7/2021 939,844 0.01 EUR 123,000 Trivium Packaging Finance BV
FRN 15/8/2026* 139,418 0.00 EUR 1,423,000 Trivium Packaging Finance BV
3.75% 15/8/2026 1,680,404 0.02 EUR 571,000 United Group BV 4.375% 1/7/2022 647,862 0.01 EUR 1,226,000 United Group BV 4.875% 1/7/2024* 1,423,202 0.01 EUR 4,331,000 United Group BV 4.875% 1/7/2024* 5,022,500 0.05
Fixed Income Global Opportunities Fund continued
Portfolio of Investments 31 August 2019

Transferable Securities and Money Market Instruments Admitted to an Official Stock Exchange Listing or Dealt in on Another Regulated Market
Transferable Securities and Money Market Instruments Admitted to an Official Stock Exchange Listing or Dealt in on Another Regulated Market
Holding
Description
Market Value (USD)
% of Net
Assets
Holding
Description
Market Value (USD)
% of Net
Assets
* All or a portion of this security represents a security on loan.
The notes on pages 728 to 741 form an integral part of these financial statements.
[304] BlackRock Global Funds (BGF)
EUR 2,766,000 UPC Holding BV 3.875% 15/6/2029* 3,242,062 0.03 USD 380,000 UPC Holding BV ‘144A’ 5.5%
15/1/2028 397,100 0.00 EUR 1,400,000 Volkswagen International Finance
NV FRN 14/12/2022 (Perpetual) 1,601,398 0.02 EUR 200,000 Volkswagen International Finance
NV FRN 27/6/2028 (Perpetual) 242,879 0.00 EUR 300,000 Ziggo Bond Co BV 4.625%
15/1/2025 344,134 0.00 USD 900,000 Ziggo Bond Co BV ‘144A’ 5.875%
15/1/2025 934,875 0.01 USD 1,621,000 Ziggo Bond Co BV ‘144A’ 6%
15/1/2027 1,697,998 0.02 EUR 2,000,000 Ziggo BV 4.25% 15/1/2027 2,408,425 0.02 USD 8,437,000 Ziggo BV ‘144A’ 5.5% 15/1/2027 8,943,220 0.09 169,826,862 1.74
Nigeria NGN 702,985,000 Nigeria Government Bond 13.98%
23/2/2028 1,938,299 0.02 NGN 401,706,000 Nigeria Government International
Bond 12/9/2019 (Zero Coupon) 1,104,353 0.01 NGN 200,853,000 Nigeria Government International
Bond 3/10/2019 (Zero Coupon) 546,158 0.01 NGN 401,706,000 Nigeria Government International
Bond 28/11/2019 (Zero Coupon) 1,075,275 0.01 NGN 401,706,000 Nigeria Government International
Bond 28/5/2020 (Zero Coupon) 1,000,868 0.01 NGN 200,855,000 Nigeria Government International
Bond 30/7/2020 (Zero Coupon) 489,377 0.00 USD 1,170,000 Nigeria Government International
Bond 7.143% 23/2/2030 1,179,872 0.01 USD 1,424,000 Nigeria Government International
Bond 8.747% 21/1/2031 1,567,290 0.02 USD 1,736,000 Nigeria Government International
Bond 9.248% 21/1/2049 1,917,195 0.02 NGN 401,706,000 Nigeria Treasury Bill 16/1/2020
(Zero Coupon) 1,059,539 0.01 NGN 702,984,000 Nigeria Treasury Bill 30/1/2020
(Zero Coupon) 1,835,615 0.02 13,713,841 0.14
Norway USD 400,000 DNB Bank ASA FRN 26/3/2020
(Perpetual) 403,014 0.00
Panama USD 624,000 AES Panama SRL ‘144A’ 6%
25/6/2022* 642,726 0.01 USD 499,000 Avianca Holdings SA / Avianca
Leasing LLC / Grupo Taca Holdings Ltd (Restricted) 8.375% 10/5/2020 394,522 0.00
1,037,248 0.01
Peru USD 2,863,000 Orazul Energy Egenor S en C por
A ‘144A’ 5.625% 28/4/2027 2,958,731 0.03 USD 5,844,000 Peruvian Government International
Bond 4.125% 25/8/2027 6,703,251 0.07 PEN 6,500,000 Telefonica del Peru SAA ‘144A’
7.375% 10/4/2027 2,036,901 0.02 11,698,883 0.12
Philippines USD 3,322,000 Philippine Government International
Bond 3.75% 14/1/2029* 3,774,623 0.04
Portugal EUR 200,000 Banco Espirito Santo SA
(Restricted) (Defaulted) 2.625% 8/5/2017 54,127 0.00
EUR 20,500,000 Banco Espirito Santo SA (Restricted) (Defaulted) 4% 21/1/2019 5,548,005 0.06
EUR 2,000,000 Banco Espirito Santo SA (Restricted) (Defaulted) 4.75% 15/1/2018 541,269 0.01
EUR 300,000 EDP - Energias de Portugal SA FRN 30/4/2079 370,327 0.00
EUR 500,000 SAGRES Socidade de Titularizacao de Creditos SA/Ulisses Finance No. 1 FRN 20/3/2033 551,979 0.01
EUR 900,000 SAGRES Socidade de Titularizacao de Creditos SA/Ulisses Finance No. 1 FRN 20/3/2033 1,019,339 0.01
EUR 5,217,982 TAGUS - Sociedade de Titularizacao de Creditos SA/Volta IV 2.423% 12/2/2021 5,851,477 0.06
EUR 8,153,039 TAGUS - Sociedade de Titularizacao de Creditos SA/Volta VII 0.7% 12/2/2024 9,008,344 0.09
EUR 11,767,875 TAGUS-Sociedade de Titularizacao de Creditos SA/Volta V 0.85% 12/2/2022 13,066,991 0.13
36,011,858 0.37
Qatar USD 1,861,000 Qatar Government International
Bond 4.5% 23/4/2028 2,186,675 0.02
Russian Federation RUB 720,117,000 Russian Federal Bond - OFZ
6.9% 23/5/2029 10,771,093 0.11 RUB 1,539,570,000 Russian Federal Bond - OFZ
7.05% 19/1/2028 23,352,567 0.24 RUB 955,850,000 Russian Federal Bond - OFZ
7.4% 17/7/2024 14,771,128 0.15 RUB 2,877,384,000 Russian Federal Bond - OFZ
8.5% 17/9/2031 48,147,870 0.49 USD 5,200,000 Russian Foreign Bond -
Eurobond 4.375% 21/3/2029 5,595,200 0.06 102,637,858 1.05
Saudi Arabia USD 1,918,000 Saudi Government International
Bond 5.25% 16/1/2050 2,480,847 0.02 USD 2,373,000 Saudi Telecom Co ‘144A’ 3.89%
13/5/2029 2,562,697 0.03 5,043,544 0.05
Singapore USD 1,235,000 Alam Synergy Pte Ltd 6.625%
24/4/2022 1,160,443 0.01 USD 1,301,000 Global Prime Capital Pte Ltd
7.25% 26/4/2021* 1,349,710 0.01 USD 2,164,000 Jubilant Pharma Ltd/SG 6%
5/3/2024* 2,237,035 0.02 USD 1,976,400 LLPL Capital Pte Ltd 6.875%
4/2/2039 2,353,650 0.03 USD 4,075,000 Medco Straits Services Pte Ltd
8.5% 17/8/2022 4,322,047 0.05
Fixed Income Global Opportunities Fund continued
Portfolio of Investments 31 August 2019
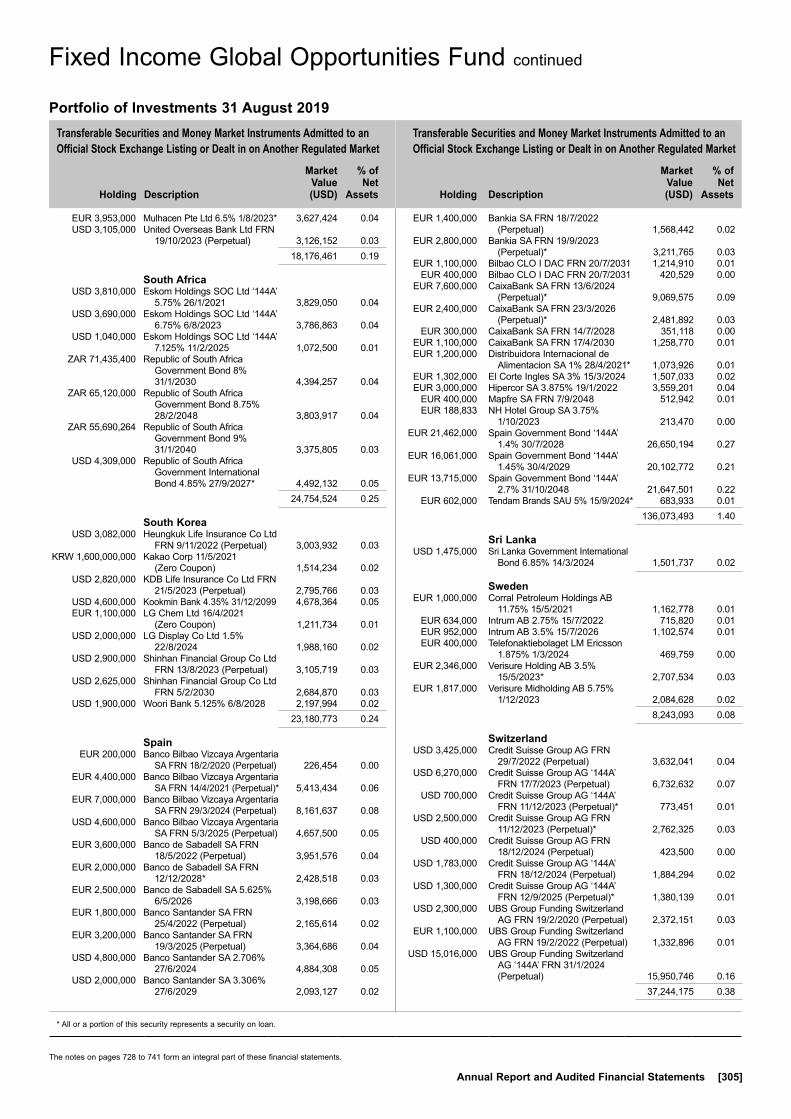
Transferable Securities and Money Market Instruments Admitted to an Official Stock Exchange Listing or Dealt in on Another Regulated Market
Transferable Securities and Money Market Instruments Admitted to an Official Stock Exchange Listing or Dealt in on Another Regulated Market
Holding
Description
Market Value (USD)
% of Net
Assets
Holding
Description
Market Value (USD)
% of Net
Assets
* All or a portion of this security represents a security on loan.
The notes on pages 728 to 741 form an integral part of these financial statements.
Annual Report and Audited Financial Statements [305]
EUR 3,953,000 Mulhacen Pte Ltd 6.5% 1/8/2023* 3,627,424 0.04 USD 3,105,000 United Overseas Bank Ltd FRN
19/10/2023 (Perpetual) 3,126,152 0.03 18,176,461 0.19
South Africa USD 3,810,000 Eskom Holdings SOC Ltd ‘144A’
5.75% 26/1/2021 3,829,050 0.04 USD 3,690,000 Eskom Holdings SOC Ltd ‘144A’
6.75% 6/8/2023 3,786,863 0.04 USD 1,040,000 Eskom Holdings SOC Ltd ‘144A’
7.125% 11/2/2025 1,072,500 0.01 ZAR 71,435,400 Republic of South Africa
Government Bond 8% 31/1/2030 4,394,257 0.04
ZAR 65,120,000 Republic of South Africa Government Bond 8.75% 28/2/2048 3,803,917 0.04
ZAR 55,690,264 Republic of South Africa Government Bond 9% 31/1/2040 3,375,805 0.03
USD 4,309,000 Republic of South Africa Government International Bond 4.85% 27/9/2027* 4,492,132 0.05
24,754,524 0.25
South Korea USD 3,082,000 Heungkuk Life Insurance Co Ltd
FRN 9/11/2022 (Perpetual) 3,003,932 0.03 KRW 1,600,000,000 Kakao Corp 11/5/2021
(Zero Coupon) 1,514,234 0.02 USD 2,820,000 KDB Life Insurance Co Ltd FRN
21/5/2023 (Perpetual) 2,795,766 0.03 USD 4,600,000 Kookmin Bank 4.35% 31/12/2099 4,678,364 0.05 EUR 1,100,000 LG Chem Ltd 16/4/2021
(Zero Coupon) 1,211,734 0.01 USD 2,000,000 LG Display Co Ltd 1.5%
22/8/2024 1,988,160 0.02 USD 2,900,000 Shinhan Financial Group Co Ltd
FRN 13/8/2023 (Perpetual) 3,105,719 0.03 USD 2,625,000 Shinhan Financial Group Co Ltd
FRN 5/2/2030 2,684,870 0.03 USD 1,900,000 Woori Bank 5.125% 6/8/2028 2,197,994 0.02 23,180,773 0.24
Spain EUR 200,000 Banco Bilbao Vizcaya Argentaria
SA FRN 18/2/2020 (Perpetual) 226,454 0.00 EUR 4,400,000 Banco Bilbao Vizcaya Argentaria
SA FRN 14/4/2021 (Perpetual)* 5,413,434 0.06 EUR 7,000,000 Banco Bilbao Vizcaya Argentaria
SA FRN 29/3/2024 (Perpetual) 8,161,637 0.08 USD 4,600,000 Banco Bilbao Vizcaya Argentaria
SA FRN 5/3/2025 (Perpetual) 4,657,500 0.05 EUR 3,600,000 Banco de Sabadell SA FRN
18/5/2022 (Perpetual) 3,951,576 0.04 EUR 2,000,000 Banco de Sabadell SA FRN
12/12/2028* 2,428,518 0.03 EUR 2,500,000 Banco de Sabadell SA 5.625%
6/5/2026 3,198,666 0.03 EUR 1,800,000 Banco Santander SA FRN
25/4/2022 (Perpetual) 2,165,614 0.02 EUR 3,200,000 Banco Santander SA FRN
19/3/2025 (Perpetual) 3,364,686 0.04 USD 4,800,000 Banco Santander SA 2.706%
27/6/2024 4,884,308 0.05 USD 2,000,000 Banco Santander SA 3.306%
27/6/2029 2,093,127 0.02
EUR 1,400,000 Bankia SA FRN 18/7/2022 (Perpetual) 1,568,442 0.02
EUR 2,800,000 Bankia SA FRN 19/9/2023 (Perpetual)* 3,211,765 0.03
EUR 1,100,000 Bilbao CLO I DAC FRN 20/7/2031 1,214,910 0.01 EUR 400,000 Bilbao CLO I DAC FRN 20/7/2031 420,529 0.00 EUR 7,600,000 CaixaBank SA FRN 13/6/2024
(Perpetual)* 9,069,575 0.09 EUR 2,400,000 CaixaBank SA FRN 23/3/2026
(Perpetual)* 2,481,892 0.03 EUR 300,000 CaixaBank SA FRN 14/7/2028 351,118 0.00 EUR 1,100,000 CaixaBank SA FRN 17/4/2030 1,258,770 0.01 EUR 1,200,000 Distribuidora Internacional de
Alimentacion SA 1% 28/4/2021* 1,073,926 0.01 EUR 1,302,000 El Corte Ingles SA 3% 15/3/2024 1,507,033 0.02 EUR 3,000,000 Hipercor SA 3.875% 19/1/2022 3,559,201 0.04 EUR 400,000 Mapfre SA FRN 7/9/2048 512,942 0.01 EUR 188,833 NH Hotel Group SA 3.75%
1/10/2023 213,470 0.00 EUR 21,462,000 Spain Government Bond ‘144A’
1.4% 30/7/2028 26,650,194 0.27 EUR 16,061,000 Spain Government Bond ‘144A’
1.45% 30/4/2029 20,102,772 0.21 EUR 13,715,000 Spain Government Bond ‘144A’
2.7% 31/10/2048 21,647,501 0.22 EUR 602,000 Tendam Brands SAU 5% 15/9/2024* 683,933 0.01 136,073,493 1.40
Sri Lanka USD 1,475,000 Sri Lanka Government International
Bond 6.85% 14/3/2024 1,501,737 0.02
Sweden EUR 1,000,000 Corral Petroleum Holdings AB
11.75% 15/5/2021 1,162,778 0.01 EUR 634,000 Intrum AB 2.75% 15/7/2022 715,820 0.01 EUR 952,000 Intrum AB 3.5% 15/7/2026 1,102,574 0.01 EUR 400,000 Telefonaktiebolaget LM Ericsson
1.875% 1/3/2024 469,759 0.00 EUR 2,346,000 Verisure Holding AB 3.5%
15/5/2023* 2,707,534 0.03 EUR 1,817,000 Verisure Midholding AB 5.75%
1/12/2023 2,084,628 0.02 8,243,093 0.08
Switzerland USD 3,425,000 Credit Suisse Group AG FRN
29/7/2022 (Perpetual) 3,632,041 0.04 USD 6,270,000 Credit Suisse Group AG ‘144A’
FRN 17/7/2023 (Perpetual) 6,732,632 0.07 USD 700,000 Credit Suisse Group AG ‘144A’
FRN 11/12/2023 (Perpetual)* 773,451 0.01 USD 2,500,000 Credit Suisse Group AG FRN
11/12/2023 (Perpetual)* 2,762,325 0.03 USD 400,000 Credit Suisse Group AG FRN
18/12/2024 (Perpetual) 423,500 0.00 USD 1,783,000 Credit Suisse Group AG ‘144A’
FRN 18/12/2024 (Perpetual) 1,884,294 0.02 USD 1,300,000 Credit Suisse Group AG ‘144A’
FRN 12/9/2025 (Perpetual)* 1,380,139 0.01 USD 2,300,000 UBS Group Funding Switzerland
AG FRN 19/2/2020 (Perpetual) 2,372,151 0.03 EUR 1,100,000 UBS Group Funding Switzerland
AG FRN 19/2/2022 (Perpetual) 1,332,896 0.01 USD 15,016,000 UBS Group Funding Switzerland
AG ‘144A’ FRN 31/1/2024 (Perpetual) 15,950,746 0.16
37,244,175 0.38
Fixed Income Global Opportunities Fund continued
Portfolio of Investments 31 August 2019
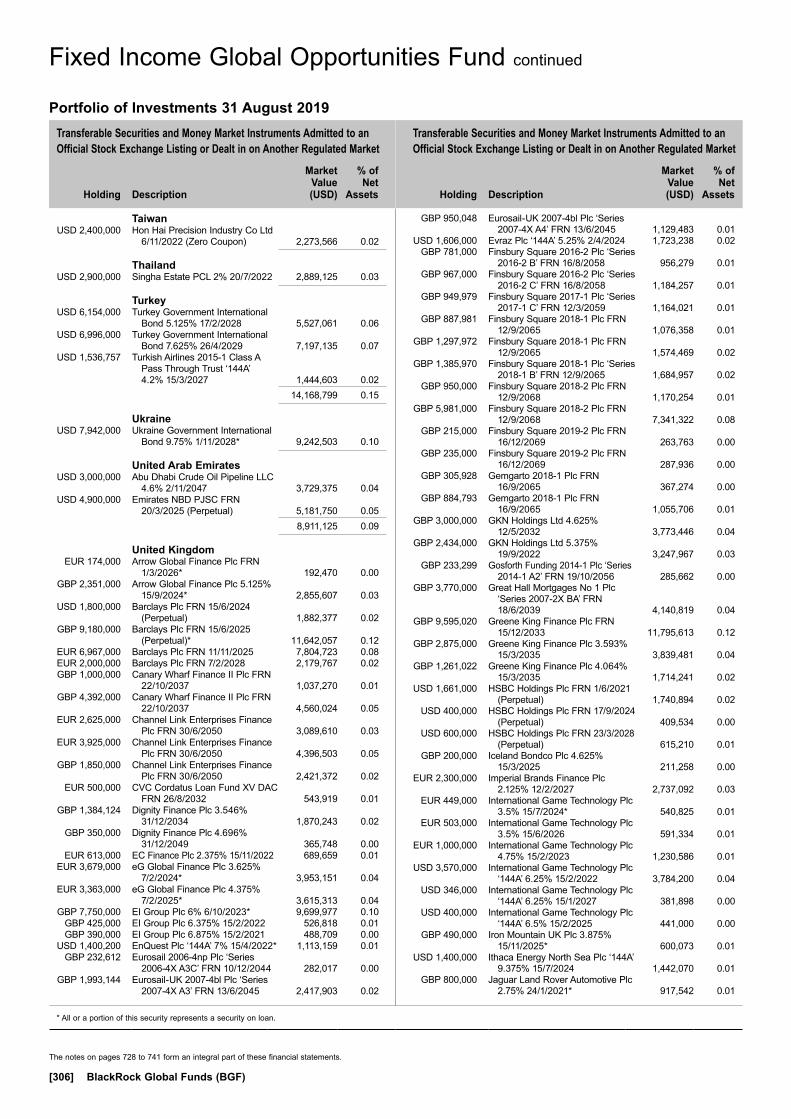
Transferable Securities and Money Market Instruments Admitted to an Official Stock Exchange Listing or Dealt in on Another Regulated Market
Transferable Securities and Money Market Instruments Admitted to an Official Stock Exchange Listing or Dealt in on Another Regulated Market
Holding
Description
Market Value (USD)
% of Net
Assets
Holding
Description
Market Value (USD)
% of Net
Assets
* All or a portion of this security represents a security on loan.
The notes on pages 728 to 741 form an integral part of these financial statements.
[306] BlackRock Global Funds (BGF)
Taiwan USD 2,400,000 Hon Hai Precision Industry Co Ltd
6/11/2022 (Zero Coupon) 2,273,566 0.02
Thailand USD 2,900,000 Singha Estate PCL 2% 20/7/2022 2,889,125 0.03
Turkey USD 6,154,000 Turkey Government International
Bond 5.125% 17/2/2028 5,527,061 0.06 USD 6,996,000 Turkey Government International
Bond 7.625% 26/4/2029 7,197,135 0.07 USD 1,536,757 Turkish Airlines 2015-1 Class A
Pass Through Trust ‘144A’ 4.2% 15/3/2027 1,444,603 0.02
14,168,799 0.15
Ukraine USD 7,942,000 Ukraine Government International
Bond 9.75% 1/11/2028* 9,242,503 0.10
United Arab Emirates USD 3,000,000 Abu Dhabi Crude Oil Pipeline LLC
4.6% 2/11/2047 3,729,375 0.04 USD 4,900,000 Emirates NBD PJSC FRN
20/3/2025 (Perpetual) 5,181,750 0.05 8,911,125 0.09
United Kingdom EUR 174,000 Arrow Global Finance Plc FRN
1/3/2026* 192,470 0.00 GBP 2,351,000 Arrow Global Finance Plc 5.125%
15/9/2024* 2,855,607 0.03 USD 1,800,000 Barclays Plc FRN 15/6/2024
(Perpetual) 1,882,377 0.02 GBP 9,180,000 Barclays Plc FRN 15/6/2025
(Perpetual)* 11,642,057 0.12 EUR 6,967,000 Barclays Plc FRN 11/11/2025 7,804,723 0.08 EUR 2,000,000 Barclays Plc FRN 7/2/2028 2,179,767 0.02 GBP 1,000,000 Canary Wharf Finance II Plc FRN
22/10/2037 1,037,270 0.01 GBP 4,392,000 Canary Wharf Finance II Plc FRN
22/10/2037 4,560,024 0.05 EUR 2,625,000 Channel Link Enterprises Finance
Plc FRN 30/6/2050 3,089,610 0.03 EUR 3,925,000 Channel Link Enterprises Finance
Plc FRN 30/6/2050 4,396,503 0.05 GBP 1,850,000 Channel Link Enterprises Finance
Plc FRN 30/6/2050 2,421,372 0.02 EUR 500,000 CVC Cordatus Loan Fund XV DAC
FRN 26/8/2032 543,919 0.01 GBP 1,384,124 Dignity Finance Plc 3.546%
31/12/2034 1,870,243 0.02 GBP 350,000 Dignity Finance Plc 4.696%
31/12/2049 365,748 0.00 EUR 613,000 EC Finance Plc 2.375% 15/11/2022 689,659 0.01 EUR 3,679,000 eG Global Finance Plc 3.625%
7/2/2024* 3,953,151 0.04 EUR 3,363,000 eG Global Finance Plc 4.375%
7/2/2025* 3,615,313 0.04 GBP 7,750,000 EI Group Plc 6% 6/10/2023* 9,699,977 0.10 GBP 425,000 EI Group Plc 6.375% 15/2/2022 526,818 0.01 GBP 390,000 EI Group Plc 6.875% 15/2/2021 488,709 0.00 USD 1,400,200 EnQuest Plc ‘144A’ 7% 15/4/2022* 1,113,159 0.01 GBP 232,612 Eurosail 2006-4np Plc ‘Series
2006-4X A3C’ FRN 10/12/2044 282,017 0.00 GBP 1,993,144 Eurosail-UK 2007-4bl Plc ‘Series
2007-4X A3’ FRN 13/6/2045 2,417,903 0.02
GBP 950,048 Eurosail-UK 2007-4bl Plc ‘Series 2007-4X A4’ FRN 13/6/2045 1,129,483 0.01
USD 1,606,000 Evraz Plc ‘144A’ 5.25% 2/4/2024 1,723,238 0.02 GBP 781,000 Finsbury Square 2016-2 Plc ‘Series
2016-2 B’ FRN 16/8/2058 956,279 0.01 GBP 967,000 Finsbury Square 2016-2 Plc ‘Series
2016-2 C’ FRN 16/8/2058 1,184,257 0.01 GBP 949,979 Finsbury Square 2017-1 Plc ‘Series
2017-1 C’ FRN 12/3/2059 1,164,021 0.01 GBP 887,981 Finsbury Square 2018-1 Plc FRN
12/9/2065 1,076,358 0.01 GBP 1,297,972 Finsbury Square 2018-1 Plc FRN
12/9/2065 1,574,469 0.02 GBP 1,385,970 Finsbury Square 2018-1 Plc ‘Series
2018-1 B’ FRN 12/9/2065 1,684,957 0.02 GBP 950,000 Finsbury Square 2018-2 Plc FRN
12/9/2068 1,170,254 0.01 GBP 5,981,000 Finsbury Square 2018-2 Plc FRN
12/9/2068 7,341,322 0.08 GBP 215,000 Finsbury Square 2019-2 Plc FRN
16/12/2069 263,763 0.00 GBP 235,000 Finsbury Square 2019-2 Plc FRN
16/12/2069 287,936 0.00 GBP 305,928 Gemgarto 2018-1 Plc FRN
16/9/2065 367,274 0.00 GBP 884,793 Gemgarto 2018-1 Plc FRN
16/9/2065 1,055,706 0.01 GBP 3,000,000 GKN Holdings Ltd 4.625%
12/5/2032 3,773,446 0.04 GBP 2,434,000 GKN Holdings Ltd 5.375%
19/9/2022 3,247,967 0.03 GBP 233,299 Gosforth Funding 2014-1 Plc ‘Series
2014-1 A2’ FRN 19/10/2056 285,662 0.00 GBP 3,770,000 Great Hall Mortgages No 1 Plc
‘Series 2007-2X BA’ FRN 18/6/2039 4,140,819 0.04
GBP 9,595,020 Greene King Finance Plc FRN 15/12/2033 11,795,613 0.12
GBP 2,875,000 Greene King Finance Plc 3.593% 15/3/2035 3,839,481 0.04
GBP 1,261,022 Greene King Finance Plc 4.064% 15/3/2035 1,714,241 0.02
USD 1,661,000 HSBC Holdings Plc FRN 1/6/2021 (Perpetual) 1,740,894 0.02
USD 400,000 HSBC Holdings Plc FRN 17/9/2024 (Perpetual) 409,534 0.00
USD 600,000 HSBC Holdings Plc FRN 23/3/2028 (Perpetual) 615,210 0.01
GBP 200,000 Iceland Bondco Plc 4.625% 15/3/2025 211,258 0.00
EUR 2,300,000 Imperial Brands Finance Plc 2.125% 12/2/2027 2,737,092 0.03
EUR 449,000 International Game Technology Plc 3.5% 15/7/2024* 540,825 0.01
EUR 503,000 International Game Technology Plc 3.5% 15/6/2026 591,334 0.01
EUR 1,000,000 International Game Technology Plc 4.75% 15/2/2023 1,230,586 0.01
USD 3,570,000 International Game Technology Plc ‘144A’ 6.25% 15/2/2022 3,784,200 0.04
USD 346,000 International Game Technology Plc ‘144A’ 6.25% 15/1/2027 381,898 0.00
USD 400,000 International Game Technology Plc ‘144A’ 6.5% 15/2/2025 441,000 0.00
GBP 490,000 Iron Mountain UK Plc 3.875% 15/11/2025* 600,073 0.01
USD 1,400,000 Ithaca Energy North Sea Plc ‘144A’ 9.375% 15/7/2024 1,442,070 0.01
GBP 800,000 Jaguar Land Rover Automotive Plc 2.75% 24/1/2021* 917,542 0.01
Fixed Income Global Opportunities Fund continued
Portfolio of Investments 31 August 2019
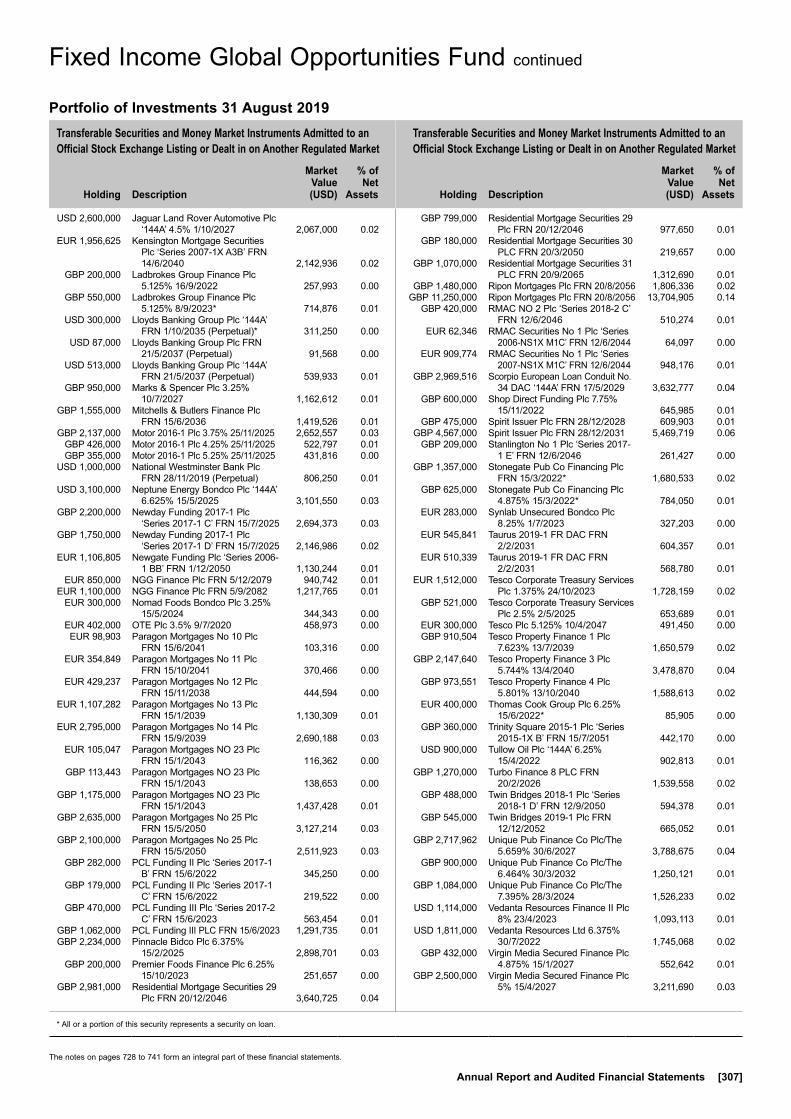
Transferable Securities and Money Market Instruments Admitted to an Official Stock Exchange Listing or Dealt in on Another Regulated Market
Transferable Securities and Money Market Instruments Admitted to an Official Stock Exchange Listing or Dealt in on Another Regulated Market
Holding
Description
Market Value (USD)
% of Net
Assets
Holding
Description
Market Value (USD)
% of Net
Assets
* All or a portion of this security represents a security on loan.
The notes on pages 728 to 741 form an integral part of these financial statements.
Annual Report and Audited Financial Statements [307]
USD 2,600,000 Jaguar Land Rover Automotive Plc ‘144A’ 4.5% 1/10/2027 2,067,000 0.02
EUR 1,956,625 Kensington Mortgage Securities Plc ‘Series 2007-1X A3B’ FRN 14/6/2040 2,142,936 0.02
GBP 200,000 Ladbrokes Group Finance Plc 5.125% 16/9/2022 257,993 0.00
GBP 550,000 Ladbrokes Group Finance Plc 5.125% 8/9/2023* 714,876 0.01
USD 300,000 Lloyds Banking Group Plc ‘144A’ FRN 1/10/2035 (Perpetual)* 311,250 0.00
USD 87,000 Lloyds Banking Group Plc FRN 21/5/2037 (Perpetual) 91,568 0.00
USD 513,000 Lloyds Banking Group Plc ‘144A’ FRN 21/5/2037 (Perpetual) 539,933 0.01
GBP 950,000 Marks & Spencer Plc 3.25% 10/7/2027 1,162,612 0.01
GBP 1,555,000 Mitchells & Butlers Finance Plc FRN 15/6/2036 1,419,526 0.01
GBP 2,137,000 Motor 2016-1 Plc 3.75% 25/11/2025 2,652,557 0.03 GBP 426,000 Motor 2016-1 Plc 4.25% 25/11/2025 522,797 0.01 GBP 355,000 Motor 2016-1 Plc 5.25% 25/11/2025 431,816 0.00 USD 1,000,000 National Westminster Bank Plc
FRN 28/11/2019 (Perpetual) 806,250 0.01 USD 3,100,000 Neptune Energy Bondco Plc ‘144A’
6.625% 15/5/2025 3,101,550 0.03 GBP 2,200,000 Newday Funding 2017-1 Plc
‘Series 2017-1 C’ FRN 15/7/2025 2,694,373 0.03 GBP 1,750,000 Newday Funding 2017-1 Plc
‘Series 2017-1 D’ FRN 15/7/2025 2,146,986 0.02 EUR 1,106,805 Newgate Funding Plc ‘Series 2006-
1 BB’ FRN 1/12/2050 1,130,244 0.01 EUR 850,000 NGG Finance Plc FRN 5/12/2079 940,742 0.01 EUR 1,100,000 NGG Finance Plc FRN 5/9/2082 1,217,765 0.01 EUR 300,000 Nomad Foods Bondco Plc 3.25%
15/5/2024 344,343 0.00 EUR 402,000 OTE Plc 3.5% 9/7/2020 458,973 0.00 EUR 98,903 Paragon Mortgages No 10 Plc
FRN 15/6/2041 103,316 0.00 EUR 354,849 Paragon Mortgages No 11 Plc
FRN 15/10/2041 370,466 0.00 EUR 429,237 Paragon Mortgages No 12 Plc
FRN 15/11/2038 444,594 0.00 EUR 1,107,282 Paragon Mortgages No 13 Plc
FRN 15/1/2039 1,130,309 0.01 EUR 2,795,000 Paragon Mortgages No 14 Plc
FRN 15/9/2039 2,690,188 0.03 EUR 105,047 Paragon Mortgages NO 23 Plc
FRN 15/1/2043 116,362 0.00 GBP 113,443 Paragon Mortgages NO 23 Plc
FRN 15/1/2043 138,653 0.00 GBP 1,175,000 Paragon Mortgages NO 23 Plc
FRN 15/1/2043 1,437,428 0.01 GBP 2,635,000 Paragon Mortgages No 25 Plc
FRN 15/5/2050 3,127,214 0.03 GBP 2,100,000 Paragon Mortgages No 25 Plc
FRN 15/5/2050 2,511,923 0.03 GBP 282,000 PCL Funding II Plc ‘Series 2017-1
B’ FRN 15/6/2022 345,250 0.00 GBP 179,000 PCL Funding II Plc ‘Series 2017-1
C’ FRN 15/6/2022 219,522 0.00 GBP 470,000 PCL Funding III Plc ‘Series 2017-2
C’ FRN 15/6/2023 563,454 0.01 GBP 1,062,000 PCL Funding III PLC FRN 15/6/2023 1,291,735 0.01 GBP 2,234,000 Pinnacle Bidco Plc 6.375%
15/2/2025 2,898,701 0.03 GBP 200,000 Premier Foods Finance Plc 6.25%
15/10/2023 251,657 0.00 GBP 2,981,000 Residential Mortgage Securities 29
Plc FRN 20/12/2046 3,640,725 0.04
GBP 799,000 Residential Mortgage Securities 29 Plc FRN 20/12/2046 977,650 0.01
GBP 180,000 Residential Mortgage Securities 30 PLC FRN 20/3/2050 219,657 0.00
GBP 1,070,000 Residential Mortgage Securities 31 PLC FRN 20/9/2065 1,312,690 0.01
GBP 1,480,000 Ripon Mortgages Plc FRN 20/8/2056 1,806,336 0.02 GBP 11,250,000 Ripon Mortgages Plc FRN 20/8/2056 13,704,905 0.14 GBP 420,000 RMAC NO 2 Plc ‘Series 2018-2 C’
FRN 12/6/2046 510,274 0.01 EUR 62,346 RMAC Securities No 1 Plc ‘Series
2006-NS1X M1C’ FRN 12/6/2044 64,097 0.00 EUR 909,774 RMAC Securities No 1 Plc ‘Series
2007-NS1X M1C’ FRN 12/6/2044 948,176 0.01 GBP 2,969,516 Scorpio European Loan Conduit No.
34 DAC ‘144A’ FRN 17/5/2029 3,632,777 0.04 GBP 600,000 Shop Direct Funding Plc 7.75%
15/11/2022 645,985 0.01 GBP 475,000 Spirit Issuer Plc FRN 28/12/2028 609,903 0.01 GBP 4,567,000 Spirit Issuer Plc FRN 28/12/2031 5,469,719 0.06 GBP 209,000 Stanlington No 1 Plc ‘Series 2017-
1 E’ FRN 12/6/2046 261,427 0.00 GBP 1,357,000 Stonegate Pub Co Financing Plc
FRN 15/3/2022* 1,680,533 0.02 GBP 625,000 Stonegate Pub Co Financing Plc
4.875% 15/3/2022* 784,050 0.01 EUR 283,000 Synlab Unsecured Bondco Plc
8.25% 1/7/2023 327,203 0.00 EUR 545,841 Taurus 2019-1 FR DAC FRN
2/2/2031 604,357 0.01 EUR 510,339 Taurus 2019-1 FR DAC FRN
2/2/2031 568,780 0.01 EUR 1,512,000 Tesco Corporate Treasury Services
Plc 1.375% 24/10/2023 1,728,159 0.02 GBP 521,000 Tesco Corporate Treasury Services
Plc 2.5% 2/5/2025 653,689 0.01 EUR 300,000 Tesco Plc 5.125% 10/4/2047 491,450 0.00 GBP 910,504 Tesco Property Finance 1 Plc
7.623% 13/7/2039 1,650,579 0.02 GBP 2,147,640 Tesco Property Finance 3 Plc
5.744% 13/4/2040 3,478,870 0.04 GBP 973,551 Tesco Property Finance 4 Plc
5.801% 13/10/2040 1,588,613 0.02 EUR 400,000 Thomas Cook Group Plc 6.25%
15/6/2022* 85,905 0.00 GBP 360,000 Trinity Square 2015-1 Plc ‘Series
2015-1X B’ FRN 15/7/2051 442,170 0.00 USD 900,000 Tullow Oil Plc ‘144A’ 6.25%
15/4/2022 902,813 0.01 GBP 1,270,000 Turbo Finance 8 PLC FRN
20/2/2026 1,539,558 0.02 GBP 488,000 Twin Bridges 2018-1 Plc ‘Series
2018-1 D’ FRN 12/9/2050 594,378 0.01 GBP 545,000 Twin Bridges 2019-1 Plc FRN
12/12/2052 665,052 0.01 GBP 2,717,962 Unique Pub Finance Co Plc/The
5.659% 30/6/2027 3,788,675 0.04 GBP 900,000 Unique Pub Finance Co Plc/The
6.464% 30/3/2032 1,250,121 0.01 GBP 1,084,000 Unique Pub Finance Co Plc/The
7.395% 28/3/2024 1,526,233 0.02 USD 1,114,000 Vedanta Resources Finance II Plc
8% 23/4/2023 1,093,113 0.01 USD 1,811,000 Vedanta Resources Ltd 6.375%
30/7/2022 1,745,068 0.02 GBP 432,000 Virgin Media Secured Finance Plc
4.875% 15/1/2027 552,642 0.01 GBP 2,500,000 Virgin Media Secured Finance Plc
5% 15/4/2027 3,211,690 0.03
Fixed Income Global Opportunities Fund continued
Portfolio of Investments 31 August 2019
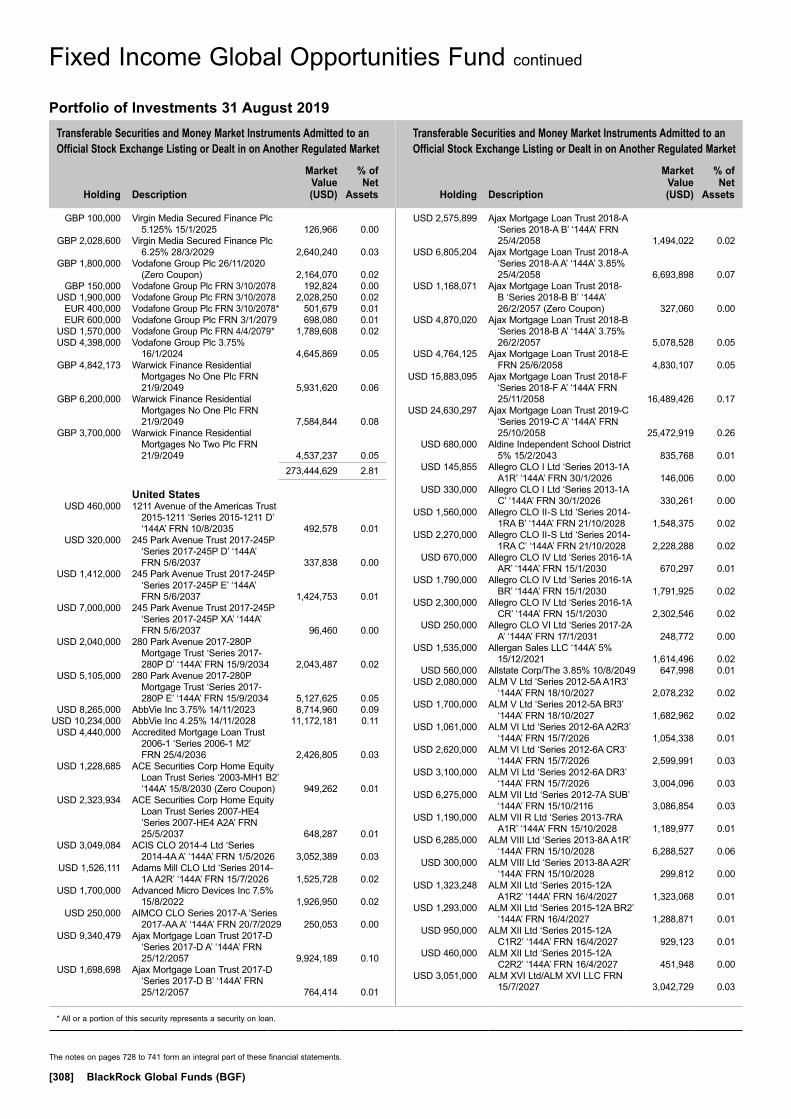
Transferable Securities and Money Market Instruments Admitted to an Official Stock Exchange Listing or Dealt in on Another Regulated Market
Transferable Securities and Money Market Instruments Admitted to an Official Stock Exchange Listing or Dealt in on Another Regulated Market
Holding
Description
Market Value (USD)
% of Net
Assets
Holding
Description
Market Value (USD)
% of Net
Assets
* All or a portion of this security represents a security on loan.
The notes on pages 728 to 741 form an integral part of these financial statements.
[308] BlackRock Global Funds (BGF)
GBP 100,000 Virgin Media Secured Finance Plc 5.125% 15/1/2025 126,966 0.00
GBP 2,028,600 Virgin Media Secured Finance Plc 6.25% 28/3/2029 2,640,240 0.03
GBP 1,800,000 Vodafone Group Plc 26/11/2020 (Zero Coupon) 2,164,070 0.02
GBP 150,000 Vodafone Group Plc FRN 3/10/2078 192,824 0.00 USD 1,900,000 Vodafone Group Plc FRN 3/10/2078 2,028,250 0.02 EUR 400,000 Vodafone Group Plc FRN 3/10/2078* 501,679 0.01 EUR 600,000 Vodafone Group Plc FRN 3/1/2079 698,080 0.01 USD 1,570,000 Vodafone Group Plc FRN 4/4/2079* 1,789,608 0.02 USD 4,398,000 Vodafone Group Plc 3.75%
16/1/2024 4,645,869 0.05 GBP 4,842,173 Warwick Finance Residential
Mortgages No One Plc FRN 21/9/2049 5,931,620 0.06
GBP 6,200,000 Warwick Finance Residential Mortgages No One Plc FRN 21/9/2049 7,584,844 0.08
GBP 3,700,000 Warwick Finance Residential Mortgages No Two Plc FRN 21/9/2049 4,537,237 0.05
273,444,629 2.81
United States USD 460,000 1211 Avenue of the Americas Trust
2015-1211 ‘Series 2015-1211 D’ ‘144A’ FRN 10/8/2035 492,578 0.01
USD 320,000 245 Park Avenue Trust 2017-245P ‘Series 2017-245P D’ ‘144A’ FRN 5/6/2037 337,838 0.00
USD 1,412,000 245 Park Avenue Trust 2017-245P ‘Series 2017-245P E’ ‘144A’ FRN 5/6/2037 1,424,753 0.01
USD 7,000,000 245 Park Avenue Trust 2017-245P ‘Series 2017-245P XA’ ‘144A’ FRN 5/6/2037 96,460 0.00
USD 2,040,000 280 Park Avenue 2017-280P Mortgage Trust ‘Series 2017-280P D’ ‘144A’ FRN 15/9/2034 2,043,487 0.02
USD 5,105,000 280 Park Avenue 2017-280P Mortgage Trust ‘Series 2017-280P E’ ‘144A’ FRN 15/9/2034 5,127,625 0.05
USD 8,265,000 AbbVie Inc 3.75% 14/11/2023 8,714,960 0.09 USD 10,234,000 AbbVie Inc 4.25% 14/11/2028 11,172,181 0.11 USD 4,440,000 Accredited Mortgage Loan Trust
2006-1 ‘Series 2006-1 M2’ FRN 25/4/2036 2,426,805 0.03
USD 1,228,685 ACE Securities Corp Home Equity Loan Trust Series ‘2003-MH1 B2’ ‘144A’ 15/8/2030 (Zero Coupon) 949,262 0.01
USD 2,323,934 ACE Securities Corp Home Equity Loan Trust Series 2007-HE4 ‘Series 2007-HE4 A2A’ FRN 25/5/2037 648,287 0.01
USD 3,049,084 ACIS CLO 2014-4 Ltd ‘Series 2014-4A A’ ‘144A’ FRN 1/5/2026 3,052,389 0.03
USD 1,526,111 Adams Mill CLO Ltd ‘Series 2014-1A A2R’ ‘144A’ FRN 15/7/2026 1,525,728 0.02
USD 1,700,000 Advanced Micro Devices Inc 7.5% 15/8/2022 1,926,950 0.02
USD 250,000 AIMCO CLO Series 2017-A ‘Series 2017-AA A’ ‘144A’ FRN 20/7/2029 250,053 0.00
USD 9,340,479 Ajax Mortgage Loan Trust 2017-D ‘Series 2017-D A’ ‘144A’ FRN 25/12/2057 9,924,189 0.10
USD 1,698,698 Ajax Mortgage Loan Trust 2017-D ‘Series 2017-D B’ ‘144A’ FRN 25/12/2057 764,414 0.01
USD 2,575,899 Ajax Mortgage Loan Trust 2018-A ‘Series 2018-A B’ ‘144A’ FRN 25/4/2058 1,494,022 0.02
USD 6,805,204 Ajax Mortgage Loan Trust 2018-A ‘Series 2018-A A’ ‘144A’ 3.85% 25/4/2058 6,693,898 0.07
USD 1,168,071 Ajax Mortgage Loan Trust 2018-B ‘Series 2018-B B’ ‘144A’ 26/2/2057 (Zero Coupon) 327,060 0.00
USD 4,870,020 Ajax Mortgage Loan Trust 2018-B ‘Series 2018-B A’ ‘144A’ 3.75% 26/2/2057 5,078,528 0.05
USD 4,764,125 Ajax Mortgage Loan Trust 2018-E FRN 25/6/2058 4,830,107 0.05
USD 15,883,095 Ajax Mortgage Loan Trust 2018-F ‘Series 2018-F A’ ‘144A’ FRN 25/11/2058 16,489,426 0.17
USD 24,630,297 Ajax Mortgage Loan Trust 2019-C ‘Series 2019-C A’ ‘144A’ FRN 25/10/2058 25,472,919 0.26
USD 680,000 Aldine Independent School District 5% 15/2/2043 835,768 0.01
USD 145,855 Allegro CLO I Ltd ‘Series 2013-1A A1R’ ‘144A’ FRN 30/1/2026 146,006 0.00
USD 330,000 Allegro CLO I Ltd ‘Series 2013-1A C’ ‘144A’ FRN 30/1/2026 330,261 0.00
USD 1,560,000 Allegro CLO II-S Ltd ‘Series 2014-1RA B’ ‘144A’ FRN 21/10/2028 1,548,375 0.02
USD 2,270,000 Allegro CLO II-S Ltd ‘Series 2014-1RA C’ ‘144A’ FRN 21/10/2028 2,228,288 0.02
USD 670,000 Allegro CLO IV Ltd ‘Series 2016-1A AR’ ‘144A’ FRN 15/1/2030 670,297 0.01
USD 1,790,000 Allegro CLO IV Ltd ‘Series 2016-1A BR’ ‘144A’ FRN 15/1/2030 1,791,925 0.02
USD 2,300,000 Allegro CLO IV Ltd ‘Series 2016-1A CR’ ‘144A’ FRN 15/1/2030 2,302,546 0.02
USD 250,000 Allegro CLO VI Ltd ‘Series 2017-2A A’ ‘144A’ FRN 17/1/2031 248,772 0.00
USD 1,535,000 Allergan Sales LLC ‘144A’ 5% 15/12/2021 1,614,496 0.02
USD 560,000 Allstate Corp/The 3.85% 10/8/2049 647,998 0.01 USD 2,080,000 ALM V Ltd ‘Series 2012-5A A1R3’
‘144A’ FRN 18/10/2027 2,078,232 0.02 USD 1,700,000 ALM V Ltd ‘Series 2012-5A BR3’
‘144A’ FRN 18/10/2027 1,682,962 0.02 USD 1,061,000 ALM VI Ltd ‘Series 2012-6A A2R3’
‘144A’ FRN 15/7/2026 1,054,338 0.01 USD 2,620,000 ALM VI Ltd ‘Series 2012-6A CR3’
‘144A’ FRN 15/7/2026 2,599,991 0.03 USD 3,100,000 ALM VI Ltd ‘Series 2012-6A DR3’
‘144A’ FRN 15/7/2026 3,004,096 0.03 USD 6,275,000 ALM VII Ltd ‘Series 2012-7A SUB’
‘144A’ FRN 15/10/2116 3,086,854 0.03 USD 1,190,000 ALM VII R Ltd ‘Series 2013-7RA
A1R’ ‘144A’ FRN 15/10/2028 1,189,977 0.01 USD 6,285,000 ALM VIII Ltd ‘Series 2013-8A A1R’
‘144A’ FRN 15/10/2028 6,288,527 0.06 USD 300,000 ALM VIII Ltd ‘Series 2013-8A A2R’
‘144A’ FRN 15/10/2028 299,812 0.00 USD 1,323,248 ALM XII Ltd ‘Series 2015-12A
A1R2’ ‘144A’ FRN 16/4/2027 1,323,068 0.01 USD 1,293,000 ALM XII Ltd ‘Series 2015-12A BR2’
‘144A’ FRN 16/4/2027 1,288,871 0.01 USD 950,000 ALM XII Ltd ‘Series 2015-12A
C1R2’ ‘144A’ FRN 16/4/2027 929,123 0.01 USD 460,000 ALM XII Ltd ‘Series 2015-12A
C2R2’ ‘144A’ FRN 16/4/2027 451,948 0.00 USD 3,051,000 ALM XVI Ltd/ALM XVI LLC FRN
15/7/2027 3,042,729 0.03
Fixed Income Global Opportunities Fund continued
Portfolio of Investments 31 August 2019
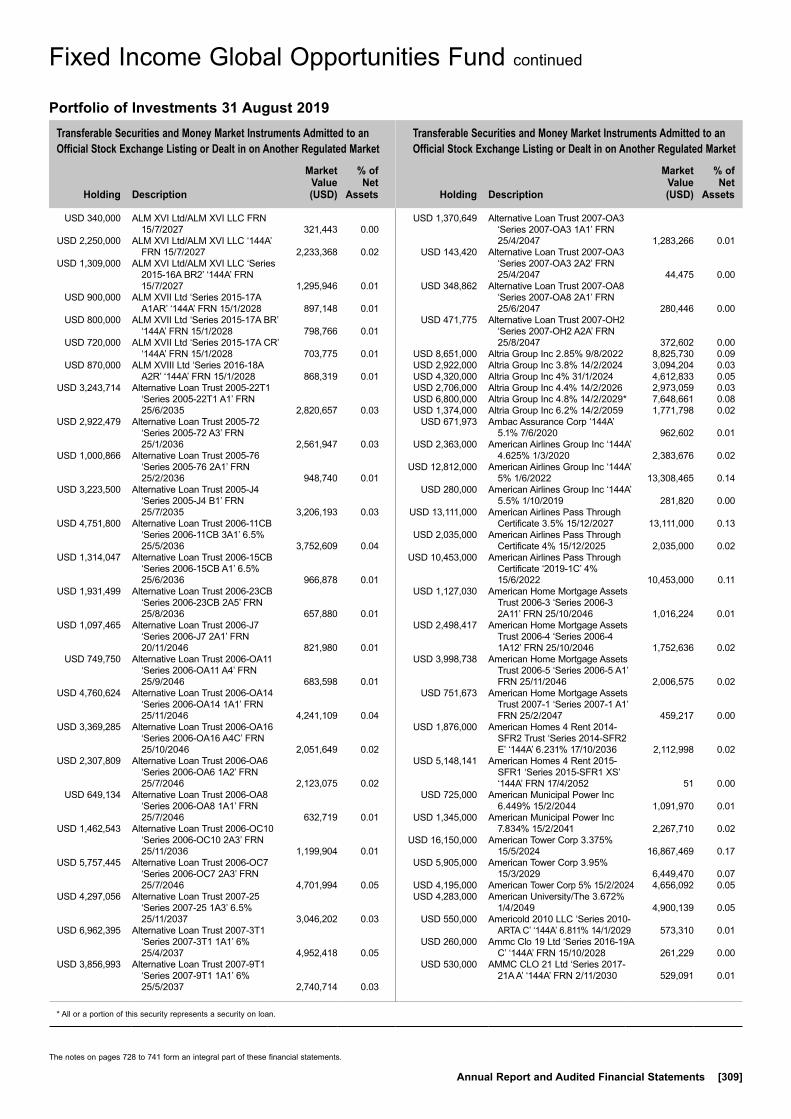
Transferable Securities and Money Market Instruments Admitted to an Official Stock Exchange Listing or Dealt in on Another Regulated Market
Transferable Securities and Money Market Instruments Admitted to an Official Stock Exchange Listing or Dealt in on Another Regulated Market
Holding
Description
Market Value (USD)
% of Net
Assets
Holding
Description
Market Value (USD)
% of Net
Assets
* All or a portion of this security represents a security on loan.
The notes on pages 728 to 741 form an integral part of these financial statements.
Annual Report and Audited Financial Statements [309]
USD 340,000 ALM XVI Ltd/ALM XVI LLC FRN 15/7/2027 321,443 0.00
USD 2,250,000 ALM XVI Ltd/ALM XVI LLC ‘144A’ FRN 15/7/2027 2,233,368 0.02
USD 1,309,000 ALM XVI Ltd/ALM XVI LLC ‘Series 2015-16A BR2’ ‘144A’ FRN 15/7/2027 1,295,946 0.01
USD 900,000 ALM XVII Ltd ‘Series 2015-17A A1AR’ ‘144A’ FRN 15/1/2028 897,148 0.01
USD 800,000 ALM XVII Ltd ‘Series 2015-17A BR’ ‘144A’ FRN 15/1/2028 798,766 0.01
USD 720,000 ALM XVII Ltd ‘Series 2015-17A CR’ ‘144A’ FRN 15/1/2028 703,775 0.01
USD 870,000 ALM XVIII Ltd ‘Series 2016-18A A2R’ ‘144A’ FRN 15/1/2028 868,319 0.01
USD 3,243,714 Alternative Loan Trust 2005-22T1 ‘Series 2005-22T1 A1’ FRN 25/6/2035 2,820,657 0.03
USD 2,922,479 Alternative Loan Trust 2005-72 ‘Series 2005-72 A3’ FRN 25/1/2036 2,561,947 0.03
USD 1,000,866 Alternative Loan Trust 2005-76 ‘Series 2005-76 2A1’ FRN 25/2/2036 948,740 0.01
USD 3,223,500 Alternative Loan Trust 2005-J4 ‘Series 2005-J4 B1’ FRN 25/7/2035 3,206,193 0.03
USD 4,751,800 Alternative Loan Trust 2006-11CB ‘Series 2006-11CB 3A1’ 6.5% 25/5/2036 3,752,609 0.04
USD 1,314,047 Alternative Loan Trust 2006-15CB ‘Series 2006-15CB A1’ 6.5% 25/6/2036 966,878 0.01
USD 1,931,499 Alternative Loan Trust 2006-23CB ‘Series 2006-23CB 2A5’ FRN 25/8/2036 657,880 0.01
USD 1,097,465 Alternative Loan Trust 2006-J7 ‘Series 2006-J7 2A1’ FRN 20/11/2046 821,980 0.01
USD 749,750 Alternative Loan Trust 2006-OA11 ‘Series 2006-OA11 A4’ FRN 25/9/2046 683,598 0.01
USD 4,760,624 Alternative Loan Trust 2006-OA14 ‘Series 2006-OA14 1A1’ FRN 25/11/2046 4,241,109 0.04
USD 3,369,285 Alternative Loan Trust 2006-OA16 ‘Series 2006-OA16 A4C’ FRN 25/10/2046 2,051,649 0.02
USD 2,307,809 Alternative Loan Trust 2006-OA6 ‘Series 2006-OA6 1A2’ FRN 25/7/2046 2,123,075 0.02
USD 649,134 Alternative Loan Trust 2006-OA8 ‘Series 2006-OA8 1A1’ FRN 25/7/2046 632,719 0.01
USD 1,462,543 Alternative Loan Trust 2006-OC10 ‘Series 2006-OC10 2A3’ FRN 25/11/2036 1,199,904 0.01
USD 5,757,445 Alternative Loan Trust 2006-OC7 ‘Series 2006-OC7 2A3’ FRN 25/7/2046 4,701,994 0.05
USD 4,297,056 Alternative Loan Trust 2007-25 ‘Series 2007-25 1A3’ 6.5% 25/11/2037 3,046,202 0.03
USD 6,962,395 Alternative Loan Trust 2007-3T1 ‘Series 2007-3T1 1A1’ 6% 25/4/2037 4,952,418 0.05
USD 3,856,993 Alternative Loan Trust 2007-9T1 ‘Series 2007-9T1 1A1’ 6% 25/5/2037 2,740,714 0.03
USD 1,370,649 Alternative Loan Trust 2007-OA3 ‘Series 2007-OA3 1A1’ FRN 25/4/2047 1,283,266 0.01
USD 143,420 Alternative Loan Trust 2007-OA3 ‘Series 2007-OA3 2A2’ FRN 25/4/2047 44,475 0.00
USD 348,862 Alternative Loan Trust 2007-OA8 ‘Series 2007-OA8 2A1’ FRN 25/6/2047 280,446 0.00
USD 471,775 Alternative Loan Trust 2007-OH2 ‘Series 2007-OH2 A2A’ FRN 25/8/2047 372,602 0.00
USD 8,651,000 Altria Group Inc 2.85% 9/8/2022 8,825,730 0.09 USD 2,922,000 Altria Group Inc 3.8% 14/2/2024 3,094,204 0.03 USD 4,320,000 Altria Group Inc 4% 31/1/2024 4,612,833 0.05 USD 2,706,000 Altria Group Inc 4.4% 14/2/2026 2,973,059 0.03 USD 6,800,000 Altria Group Inc 4.8% 14/2/2029* 7,648,661 0.08 USD 1,374,000 Altria Group Inc 6.2% 14/2/2059 1,771,798 0.02 USD 671,973 Ambac Assurance Corp ‘144A’
5.1% 7/6/2020 962,602 0.01 USD 2,363,000 American Airlines Group Inc ‘144A’
4.625% 1/3/2020 2,383,676 0.02 USD 12,812,000 American Airlines Group Inc ‘144A’
5% 1/6/2022 13,308,465 0.14 USD 280,000 American Airlines Group Inc ‘144A’
5.5% 1/10/2019 281,820 0.00 USD 13,111,000 American Airlines Pass Through
Certificate 3.5% 15/12/2027 13,111,000 0.13 USD 2,035,000 American Airlines Pass Through
Certificate 4% 15/12/2025 2,035,000 0.02 USD 10,453,000 American Airlines Pass Through
Certificate ‘2019-1C’ 4% 15/6/2022 10,453,000 0.11
USD 1,127,030 American Home Mortgage Assets Trust 2006-3 ‘Series 2006-3 2A11’ FRN 25/10/2046 1,016,224 0.01
USD 2,498,417 American Home Mortgage Assets Trust 2006-4 ‘Series 2006-4 1A12’ FRN 25/10/2046 1,752,636 0.02
USD 3,998,738 American Home Mortgage Assets Trust 2006-5 ‘Series 2006-5 A1’ FRN 25/11/2046 2,006,575 0.02
USD 751,673 American Home Mortgage Assets Trust 2007-1 ‘Series 2007-1 A1’ FRN 25/2/2047 459,217 0.00
USD 1,876,000 American Homes 4 Rent 2014-SFR2 Trust ‘Series 2014-SFR2 E’ ‘144A’ 6.231% 17/10/2036 2,112,998 0.02
USD 5,148,141 American Homes 4 Rent 2015-SFR1 ‘Series 2015-SFR1 XS’ ‘144A’ FRN 17/4/2052 51 0.00
USD 725,000 American Municipal Power Inc 6.449% 15/2/2044 1,091,970 0.01
USD 1,345,000 American Municipal Power Inc 7.834% 15/2/2041 2,267,710 0.02
USD 16,150,000 American Tower Corp 3.375% 15/5/2024 16,867,469 0.17
USD 5,905,000 American Tower Corp 3.95% 15/3/2029 6,449,470 0.07
USD 4,195,000 American Tower Corp 5% 15/2/2024 4,656,092 0.05 USD 4,283,000 American University/The 3.672%
1/4/2049 4,900,139 0.05 USD 550,000 Americold 2010 LLC ‘Series 2010-
ARTA C’ ‘144A’ 6.811% 14/1/2029 573,310 0.01 USD 260,000 Ammc Clo 19 Ltd ‘Series 2016-19A
C’ ‘144A’ FRN 15/10/2028 261,229 0.00 USD 530,000 AMMC CLO 21 Ltd ‘Series 2017-
21A A’ ‘144A’ FRN 2/11/2030 529,091 0.01
Fixed Income Global Opportunities Fund continued
Portfolio of Investments 31 August 2019
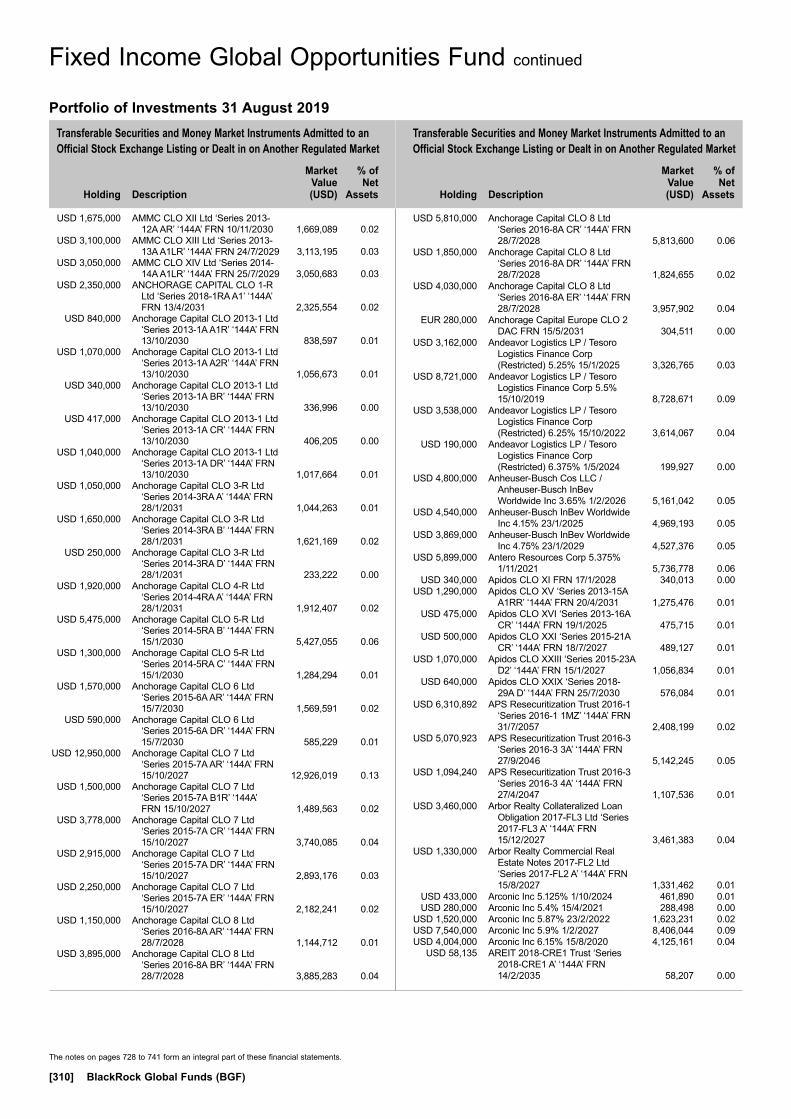
Transferable Securities and Money Market Instruments Admitted to an Official Stock Exchange Listing or Dealt in on Another Regulated Market
Transferable Securities and Money Market Instruments Admitted to an Official Stock Exchange Listing or Dealt in on Another Regulated Market
Holding
Description
Market Value (USD)
% of Net
Assets
Holding
Description
Market Value (USD)
% of Net
Assets
The notes on pages 728 to 741 form an integral part of these financial statements.
[310] BlackRock Global Funds (BGF)
USD 1,675,000 AMMC CLO XII Ltd ‘Series 2013-12A AR’ ‘144A’ FRN 10/11/2030 1,669,089 0.02
USD 3,100,000 AMMC CLO XIII Ltd ‘Series 2013-13A A1LR’ ‘144A’ FRN 24/7/2029 3,113,195 0.03
USD 3,050,000 AMMC CLO XIV Ltd ‘Series 2014-14A A1LR’ ‘144A’ FRN 25/7/2029 3,050,683 0.03
USD 2,350,000 ANCHORAGE CAPITAL CLO 1-R Ltd ‘Series 2018-1RA A1’ ‘144A’ FRN 13/4/2031 2,325,554 0.02
USD 840,000 Anchorage Capital CLO 2013-1 Ltd ‘Series 2013-1A A1R’ ‘144A’ FRN 13/10/2030 838,597 0.01
USD 1,070,000 Anchorage Capital CLO 2013-1 Ltd ‘Series 2013-1A A2R’ ‘144A’ FRN 13/10/2030 1,056,673 0.01
USD 340,000 Anchorage Capital CLO 2013-1 Ltd ‘Series 2013-1A BR’ ‘144A’ FRN 13/10/2030 336,996 0.00
USD 417,000 Anchorage Capital CLO 2013-1 Ltd ‘Series 2013-1A CR’ ‘144A’ FRN 13/10/2030 406,205 0.00
USD 1,040,000 Anchorage Capital CLO 2013-1 Ltd ‘Series 2013-1A DR’ ‘144A’ FRN 13/10/2030 1,017,664 0.01
USD 1,050,000 Anchorage Capital CLO 3-R Ltd ‘Series 2014-3RA A’ ‘144A’ FRN 28/1/2031 1,044,263 0.01
USD 1,650,000 Anchorage Capital CLO 3-R Ltd ‘Series 2014-3RA B’ ‘144A’ FRN 28/1/2031 1,621,169 0.02
USD 250,000 Anchorage Capital CLO 3-R Ltd ‘Series 2014-3RA D’ ‘144A’ FRN 28/1/2031 233,222 0.00
USD 1,920,000 Anchorage Capital CLO 4-R Ltd ‘Series 2014-4RA A’ ‘144A’ FRN 28/1/2031 1,912,407 0.02
USD 5,475,000 Anchorage Capital CLO 5-R Ltd ‘Series 2014-5RA B’ ‘144A’ FRN 15/1/2030 5,427,055 0.06
USD 1,300,000 Anchorage Capital CLO 5-R Ltd ‘Series 2014-5RA C’ ‘144A’ FRN 15/1/2030 1,284,294 0.01
USD 1,570,000 Anchorage Capital CLO 6 Ltd ‘Series 2015-6A AR’ ‘144A’ FRN 15/7/2030 1,569,591 0.02
USD 590,000 Anchorage Capital CLO 6 Ltd ‘Series 2015-6A DR’ ‘144A’ FRN 15/7/2030 585,229 0.01
USD 12,950,000 Anchorage Capital CLO 7 Ltd ‘Series 2015-7A AR’ ‘144A’ FRN 15/10/2027 12,926,019 0.13
USD 1,500,000 Anchorage Capital CLO 7 Ltd ‘Series 2015-7A B1R’ ‘144A’ FRN 15/10/2027 1,489,563 0.02
USD 3,778,000 Anchorage Capital CLO 7 Ltd ‘Series 2015-7A CR’ ‘144A’ FRN 15/10/2027 3,740,085 0.04
USD 2,915,000 Anchorage Capital CLO 7 Ltd ‘Series 2015-7A DR’ ‘144A’ FRN 15/10/2027 2,893,176 0.03
USD 2,250,000 Anchorage Capital CLO 7 Ltd ‘Series 2015-7A ER’ ‘144A’ FRN 15/10/2027 2,182,241 0.02
USD 1,150,000 Anchorage Capital CLO 8 Ltd ‘Series 2016-8A AR’ ‘144A’ FRN 28/7/2028 1,144,712 0.01
USD 3,895,000 Anchorage Capital CLO 8 Ltd ‘Series 2016-8A BR’ ‘144A’ FRN 28/7/2028 3,885,283 0.04
USD 5,810,000 Anchorage Capital CLO 8 Ltd ‘Series 2016-8A CR’ ‘144A’ FRN 28/7/2028 5,813,600 0.06
USD 1,850,000 Anchorage Capital CLO 8 Ltd ‘Series 2016-8A DR’ ‘144A’ FRN 28/7/2028 1,824,655 0.02
USD 4,030,000 Anchorage Capital CLO 8 Ltd ‘Series 2016-8A ER’ ‘144A’ FRN 28/7/2028 3,957,902 0.04
EUR 280,000 Anchorage Capital Europe CLO 2 DAC FRN 15/5/2031 304,511 0.00
USD 3,162,000 Andeavor Logistics LP / Tesoro Logistics Finance Corp (Restricted) 5.25% 15/1/2025 3,326,765 0.03
USD 8,721,000 Andeavor Logistics LP / Tesoro Logistics Finance Corp 5.5% 15/10/2019 8,728,671 0.09
USD 3,538,000 Andeavor Logistics LP / Tesoro Logistics Finance Corp (Restricted) 6.25% 15/10/2022 3,614,067 0.04
USD 190,000 Andeavor Logistics LP / Tesoro Logistics Finance Corp (Restricted) 6.375% 1/5/2024 199,927 0.00
USD 4,800,000 Anheuser-Busch Cos LLC / Anheuser-Busch InBev Worldwide Inc 3.65% 1/2/2026 5,161,042 0.05
USD 4,540,000 Anheuser-Busch InBev Worldwide Inc 4.15% 23/1/2025 4,969,193 0.05
USD 3,869,000 Anheuser-Busch InBev Worldwide Inc 4.75% 23/1/2029 4,527,376 0.05
USD 5,899,000 Antero Resources Corp 5.375% 1/11/2021 5,736,778 0.06
USD 340,000 Apidos CLO XI FRN 17/1/2028 340,013 0.00 USD 1,290,000 Apidos CLO XV ‘Series 2013-15A
A1RR’ ‘144A’ FRN 20/4/2031 1,275,476 0.01 USD 475,000 Apidos CLO XVI ‘Series 2013-16A
CR’ ‘144A’ FRN 19/1/2025 475,715 0.01 USD 500,000 Apidos CLO XXI ‘Series 2015-21A
CR’ ‘144A’ FRN 18/7/2027 489,127 0.01 USD 1,070,000 Apidos CLO XXIII ‘Series 2015-23A
D2’ ‘144A’ FRN 15/1/2027 1,056,834 0.01 USD 640,000 Apidos CLO XXIX ‘Series 2018-
29A D’ ‘144A’ FRN 25/7/2030 576,084 0.01 USD 6,310,892 APS Resecuritization Trust 2016-1
‘Series 2016-1 1MZ’ ‘144A’ FRN 31/7/2057 2,408,199 0.02
USD 5,070,923 APS Resecuritization Trust 2016-3 ‘Series 2016-3 3A’ ‘144A’ FRN 27/9/2046 5,142,245 0.05
USD 1,094,240 APS Resecuritization Trust 2016-3 ‘Series 2016-3 4A’ ‘144A’ FRN 27/4/2047 1,107,536 0.01
USD 3,460,000 Arbor Realty Collateralized Loan Obligation 2017-FL3 Ltd ‘Series 2017-FL3 A’ ‘144A’ FRN 15/12/2027 3,461,383 0.04
USD 1,330,000 Arbor Realty Commercial Real Estate Notes 2017-FL2 Ltd ‘Series 2017-FL2 A’ ‘144A’ FRN 15/8/2027 1,331,462 0.01
USD 433,000 Arconic Inc 5.125% 1/10/2024 461,890 0.01 USD 280,000 Arconic Inc 5.4% 15/4/2021 288,498 0.00 USD 1,520,000 Arconic Inc 5.87% 23/2/2022 1,623,231 0.02 USD 7,540,000 Arconic Inc 5.9% 1/2/2027 8,406,044 0.09 USD 4,004,000 Arconic Inc 6.15% 15/8/2020 4,125,161 0.04 USD 58,135 AREIT 2018-CRE1 Trust ‘Series
2018-CRE1 A’ ‘144A’ FRN 14/2/2035 58,207 0.00
Fixed Income Global Opportunities Fund continued
Portfolio of Investments 31 August 2019

Transferable Securities and Money Market Instruments Admitted to an Official Stock Exchange Listing or Dealt in on Another Regulated Market
Transferable Securities and Money Market Instruments Admitted to an Official Stock Exchange Listing or Dealt in on Another Regulated Market
Holding
Description
Market Value (USD)
% of Net
Assets
Holding
Description
Market Value (USD)
% of Net
Assets
* All or a portion of this security represents a security on loan.
The notes on pages 728 to 741 form an integral part of these financial statements.
Annual Report and Audited Financial Statements [311]
USD 400,000 Ares XLI Clo Ltd ‘Series 2016-41A D’ ‘144A’ FRN 15/1/2029 401,050 0.00
USD 200,000 ARES XLIV CLO Ltd ‘Series 2017-44A D’ ‘144A’ FRN 15/10/2029 192,598 0.00
USD 375,000 ARES XLV CLO Ltd ‘Series 2017-45A C’ ‘144A’ FRN 15/10/2030 367,988 0.00
USD 184,658 Ares XXIX CLO Ltd ‘Series 2014-1A A1R’ ‘144A’ FRN 17/4/2026 184,859 0.00
USD 250,000 Ares XXXIV CLO Ltd ‘Series 2015-2A BR’ ‘144A’ FRN 29/7/2026 249,944 0.00
USD 1,500,000 Ares XXXVII CLO Ltd ‘Series 2015-4A A1R’ ‘144A’ FRN 15/10/2030 1,498,308 0.02
USD 560,000 Ares XXXVII CLO Ltd ‘Series 2015-4A DR’ ‘144A’ FRN 15/10/2030 528,713 0.01
USD 4,683,982 Argent Mortgage Loan Trust 2005-W1 ‘Series 2005-W1 A2’ FRN 25/5/2035 4,470,254 0.05
USD 2,800,000 ARI Investments LLC 6/1/2025 (Zero Coupon) 2,800,000 0.03
USD 1,905,000 Arizona Health Facilities Authority FRN 1/1/2037 1,861,766 0.02
USD 1,060,000 Arizona State University 5% 1/7/2043 1,297,551 0.01 USD 5,085,000 Arrow Bidco LLC ‘144A’ 9.5%
15/3/2024 5,097,713 0.05 USD 1,667,000 Ashford Hospitality Trust 2018-
ASHF ‘Series 2018-ASHF D’ ‘144A’ FRN 15/4/2035 1,674,734 0.02
USD 896,000 Ashtead Capital Inc ‘144A’ 4.125% 15/8/2025 920,640 0.01
USD 250,000 Ashtead Capital Inc ‘144A’ 4.375% 15/8/2027 257,187 0.00
USD 300,000 Ashtead Capital Inc ‘144A’ 5.25% 1/8/2026 320,250 0.00
USD 1,788,000 Ashtead Capital Inc ‘144A’ 5.625% 1/10/2024 1,848,345 0.02
USD 822,000 Ashton Woods USA LLC / Ashton Woods Finance Co ‘144A’ 6.75% 1/8/2025 817,890 0.01
USD 5,505,000 Ashton Woods USA LLC / Ashton Woods Finance Co ‘144A’ 9.875% 1/4/2027 6,027,975 0.06
USD 53,371 Asset Securitization Corp ‘Series 1997-D5 B2’ 6.93% 14/2/2043 53,562 0.00
USD 1,040,000 ASSURANT CLO I Ltd ‘Series 2017-1A B’ ‘144A’ FRN 20/10/2029 1,037,293 0.01
USD 370,000 ASSURANT CLO III Ltd ‘Series 2018-2A C’ ‘144A’ FRN 20/10/2031 364,481 0.00
USD 8,351,000 AT&T Inc 3.4% 15/5/2025 8,756,603 0.09 USD 5,130,000 AT&T Inc 4.125% 17/2/2026 5,587,079 0.06 USD 6,180,000 AT&T Inc 4.35% 1/3/2029 6,897,533 0.07 USD 5,970,000 AT&T Inc 4.55% 9/3/2049 6,534,592 0.07 USD 4,410,000 Atrium Hotel Portfolio Trust 2017-
ATRM ‘Series 2017-ATRM D’ ‘144A’ FRN 15/12/2036 4,420,518 0.05
USD 824,447 Atrium Hotel Portfolio Trust 2017-ATRM ‘Series 2017-ATRM E’ ‘144A’ FRN 15/12/2036 828,590 0.01
USD 1,490,000 Atrium Hotel Portfolio Trust 2018-ATRM ‘Series 2018-ATRM E’ ‘144A’ FRN 15/6/2035 1,501,256 0.02
USD 985,000 Atrium XII ‘144A’ FRN 22/4/2027 984,540 0.01 USD 1,385,000 Atrium XII ‘144A’ FRN 22/4/2027 1,372,474 0.01 USD 9,978,000 AvalonBay Communities Inc 3.3%
1/6/2029 10,703,122 0.11 USD 1,092,000 Avantor Inc ‘144A’ 6% 1/10/2024 1,173,900 0.01 USD 5,000,000 Aventura Mall Trust 2013-AVM
‘Series 2013-AVM D’ ‘144A’ FRN 5/12/2032 5,068,702 0.05
USD 7,053,181 Avery Point IV CLO Ltd ‘Series 2014-1A AR’ ‘144A’ FRN 25/4/2026 7,056,484 0.07
USD 1,559,888 Avery Point V CLO Ltd ‘Series 2014-5A AR’ ‘144A’ FRN 17/7/2026 1,560,540 0.02
USD 520,000 Avery Point V CLO Ltd ‘Series 2014-5A BR’ ‘144A’ FRN 17/7/2026 517,629 0.01
USD 2,800,000 Avery Point VI CLO Ltd ‘Series 2015-6A AR’ ‘144A’ FRN 5/8/2027 2,797,208 0.03
USD 4,630,000 Avery Point VI CLO Ltd ‘Series 2015-6A BR’ ‘144A’ FRN 5/8/2027 4,599,895 0.05
USD 780,000 Aviation Capital Group LLC ‘144A’ 7.125% 15/10/2020 821,333 0.01
USD 389,000 Azul Investments LLP ‘144A’ 5.875% 26/10/2024* 388,271 0.00
USD 23,797 B2R Mortgage Trust 2015-1 ‘Series 2015-1 A1’ ‘144A’ 2.524% 15/5/2048 23,723 0.00
USD 7,452,975 B2R Mortgage Trust 2015-2 ‘Series 2015-2 XA’ ‘144A’ FRN 15/11/2048 151,444 0.00
USD 622,147 B2R Mortgage Trust 2015-2 ‘Series 2015-2 A’ ‘144A’ 3.336% 15/11/2048 623,118 0.01
USD 1,250,000 Babson CLO Ltd 2015-II ‘Series 2015-2A AR’ ‘144A’ FRN 20/10/2030 1,246,465 0.01
USD 4,000,000 Bain Capital Credit Clo 2016-2 Ltd ‘Series 2016-2A AR’ ‘144A’ FRN 15/1/2029 4,000,000 0.04
USD 2,650,000 Bain Capital Credit Clo 2016-2 Ltd ‘Series 2016-2A BR’ ‘144A’ FRN 15/1/2029 2,650,000 0.03
USD 1,790,000 Bain Capital Credit CLO 2018-2 ‘Series 2018-2A A1’ ‘144A’ FRN 19/7/2031 1,774,468 0.02
USD 1,147,000 BAMLL Commercial Mortgage Securities Trust 2015-200P ‘Series 2015-200P F’ ‘144A’ FRN 14/4/2033 1,168,409 0.01
USD 230,000 BAMLL Commercial Mortgage Securities Trust 2016-ISQ ‘Series 2016-ISQ C’ ‘144A’ FRN 14/8/2034 243,602 0.00
USD 5,000,000 BAMLL Commercial Mortgage Securities Trust 2016-ISQ ‘Series 2016-ISQ E’ ‘144A’ FRN 14/8/2034 5,035,706 0.05
USD 5,860,000 Bamll Commercial Mortgage Securities Trust 2016-SS1 ‘Series 2016-SS1 XA’ ‘144A’ FRN 15/12/2035 197,423 0.00
USD 3,820,000 BAMLL Commercial Mortgage Securities Trust 2017-SCH ‘Series 2017-SCH CL’ ‘144A’ FRN 15/11/2032 3,848,325 0.04
USD 1,780,000 BAMLL Commercial Mortgage Securities Trust 2017-SCH ‘Series 2017-SCH DL’ ‘144A’ FRN 15/11/2032 1,791,902 0.02
USD 1,430,000 BAMLL Commercial Mortgage Securities Trust 2017-SCH ‘Series 2017-SCH BF’ ‘144A’ FRN 15/11/2033 1,428,707 0.01
Fixed Income Global Opportunities Fund continued
Portfolio of Investments 31 August 2019

Transferable Securities and Money Market Instruments Admitted to an Official Stock Exchange Listing or Dealt in on Another Regulated Market
Transferable Securities and Money Market Instruments Admitted to an Official Stock Exchange Listing or Dealt in on Another Regulated Market
Holding
Description
Market Value (USD)
% of Net
Assets
Holding
Description
Market Value (USD)
% of Net
Assets
* All or a portion of this security represents a security on loan.
The notes on pages 728 to 741 form an integral part of these financial statements.
[312] BlackRock Global Funds (BGF)
USD 2,676,000 BAMLL Commercial Mortgage Securities Trust 2018-DSNY ‘Series 2018-DSNY D’ ‘144A’ FRN 15/9/2034 2,676,471 0.03
USD 299,815 Banc of America Commercial Mortgage Trust 2007-1 ‘Series 2007-1 AMFX’ FRN 15/1/2049 300,593 0.00
USD 2,030,000 Banc of America Commercial Mortgage Trust 2016-UBS10 ‘Series 2016-UB10 C’ FRN 15/7/2049 2,251,675 0.02
USD 9,780,000 Banc of America Commercial Mortgage Trust 2017-BNK3 ‘Series 2017-BNK3 XB’ FRN 15/2/2050 427,724 0.00
USD 4,000,000 Banc of America Commercial Mortgage Trust 2017-BNK3 ‘Series 2017-BNK3 XD’ ‘144A’ FRN 15/2/2050 332,760 0.00
USD 517,399 Banc of America Funding 2006-A Trust ‘Series 2006-A 3A2’ FRN 20/2/2036 500,956 0.01
USD 15,417,020 Banc of America Funding 2014-R2 Trust ‘Series 2014-R2 1C’ ‘144A’ FRN 26/11/2036 3,004,754 0.03
USD 1,542,087 Bancorp Commercial Mortgage 2018-CRE3 Trust/The ‘Series 2018-CR3 A’ ‘144A’ FRN 15/1/2033 1,538,026 0.02
EUR 970,000 Banff Merger Sub Inc 8.375% 1/9/2026* 966,271 0.01
USD 600,000 Banff Merger Sub Inc ‘144A’ 9.75% 1/9/2026 557,400 0.01
USD 2,810,000 Bank of America Corp FRN 5/3/2024 2,936,520 0.03 USD 5,800,000 Bank of America Corp FRN
5/9/2024 (Perpetual) 6,340,647 0.07 USD 2,927,000 Bank of America Corp FRN
23/10/2024 (Perpetual) 3,285,660 0.03 USD 3,693,000 Bank of America Corp FRN
15/3/2025 3,883,827 0.04 USD 748,000 Bank of America Corp FRN
10/3/2026 (Perpetual) 851,526 0.01 USD 2,450,000 Bank of America Corp FRN
23/4/2027 2,606,749 0.03 USD 2,165,000 Bank of America Corp FRN
24/4/2028 2,335,356 0.02 USD 575,000 Bank of America Corp FRN
21/7/2028 615,171 0.01 USD 910,000 Bank of America Corp FRN
20/12/2028 961,148 0.01 USD 6,255,000 Bank of America Corp FRN
5/3/2029 6,873,498 0.07 USD 18,764,000 Bank of America Corp FRN
23/7/2029 21,111,361 0.22 USD 7,847,000 Bank of America Corp FRN
23/7/2030 8,194,320 0.08 USD 4,325,000 Bank of America Corp FRN
15/3/2050 5,282,476 0.05 USD 10,870,000 Bank of America Corp 4.183%
25/11/2027 11,812,062 0.12 USD 2,160,000 Bank of America Corp 4.25%
22/10/2026 2,355,505 0.02 USD 11,135,000 Bank of America Corp 4.45%
3/3/2026 12,250,625 0.13 USD 690,000 Bank of America NA 6% 15/10/2036 963,993 0.01 USD 1,500,000 BankAmerica Manufactured
Housing Contract Trust ‘Series 1997-2 B1’ FRN 10/2/2022 1,172,705 0.01
USD 2,380,000 BankAmerica Manufactured Housing Contract Trust ‘Series 1998-2 B1’ FRN 10/12/2025 1,427,609 0.01
USD 790,000 Barings CLO Ltd 2018-III FRN 20/7/2031 785,680 0.01
USD 11,860,000 BAT Capital Corp 2.764% 15/8/2022 12,019,260 0.12 USD 1,250,000 BAT Capital Corp 3.222% 15/8/2024 1,285,169 0.01 USD 630,000 Battalion CLO VII Ltd ‘Series 2014-
7A A1RR’ ‘144A’ FRN 17/7/2028 628,312 0.01 USD 4,438,000 Battalion CLO VII Ltd ‘Series 2014-
7A BRR’ ‘144A’ FRN 17/7/2028 4,440,175 0.05 USD 1,080,000 Battalion CLO XI Ltd ‘Series 2017-
11A E’ ‘144A’ FRN 24/10/2029 1,047,618 0.01 USD 1,000,000 Bausch Health Americas Inc ‘144A’
8.5% 31/1/2027 1,111,250 0.01 USD 3,535,000 Bay Area Toll Authority 6.918%
1/4/2040 5,467,425 0.06 USD 6,550,000 Bay Area Toll Authority 7.043%
1/4/2050 11,367,001 0.12 USD 680,000 Bayer US Finance II LLC ‘144A’
3.5% 25/6/2021 694,136 0.01 USD 3,628,000 Bayer US Finance II LLC ‘144A’
4.25% 15/12/2025 3,908,446 0.04 USD 4,633,000 Bayer US Finance II LLC ‘144A’
4.875% 25/6/2048 5,207,939 0.05 USD 1,779,000 Bayer US Finance LLC ‘144A’
3.375% 8/10/2024 1,834,736 0.02 USD 1,780,000 Baylor Scott & White Holdings
4.185% 15/11/2045 2,173,487 0.02 USD 255,813 Bayview Commercial Asset Trust
2005-4 ‘Series 2005-4A A1’ ‘144A’ FRN 25/1/2036 248,011 0.00
USD 71,988 Bayview Commercial Asset Trust 2005-4 ‘Series 2005-4A A2’ ‘144A’ FRN 25/1/2036 70,100 0.00
USD 190,253 Bayview Commercial Asset Trust 2005-4 ‘Series 2005-4A M1’ ‘144A’ FRN 25/1/2036 184,274 0.00
USD 276,686 Bayview Commercial Asset Trust 2006-1 ‘Series 2006-1A A2’ ‘144A’ FRN 25/4/2036 268,293 0.00
USD 795,473 Bayview Commercial Asset Trust 2006-1 ‘Series 2006-1A M2’ ‘144A’ FRN 25/4/2036 765,287 0.01
USD 191,414 Bayview Commercial Asset Trust 2006-1 ‘Series 2006-1A M3’ ‘144A’ FRN 25/4/2036 184,012 0.00
USD 1,046,298 Bayview Commercial Asset Trust 2006-1 ‘Series 2006-1A M4’ ‘144A’ FRN 25/4/2036 1,009,288 0.01
USD 1,098,850 Bayview Commercial Asset Trust 2006-3 ‘Series 2006-3A A1’ ‘144A’ FRN 25/10/2036 1,056,628 0.01
USD 492,651 Bayview Commercial Asset Trust 2006-3 ‘Series 2006-3A A2’ ‘144A’ FRN 25/10/2036 474,685 0.01
USD 5,722,096 Bayview Commercial Asset Trust 2006-4 ‘Series 2006-4A A1’ ‘144A’ FRN 25/12/2036 5,540,051 0.06
USD 20,283,658 Bayview Commercial Asset Trust 2007-4 ‘Series 2007-4A A1’ ‘144A’ FRN 25/9/2037 19,375,060 0.20
USD 1,590,000 Bayview Commercial Asset Trust 2007-6 ‘Series 2007-6A A4A’ ‘144A’ FRN 25/12/2037 1,520,515 0.02
USD 6,789,376 Bayview Financial Revolving Asset Trust 2004-B ‘Series 2004-B A1’ ‘144A’ FRN 28/5/2039 6,236,320 0.06
USD 2,326,132 Bayview Financial Revolving Asset Trust 2004-B ‘Series 2004-B A2’ ‘144A’ FRN 28/5/2039 2,152,170 0.02
Fixed Income Global Opportunities Fund continued
Portfolio of Investments 31 August 2019
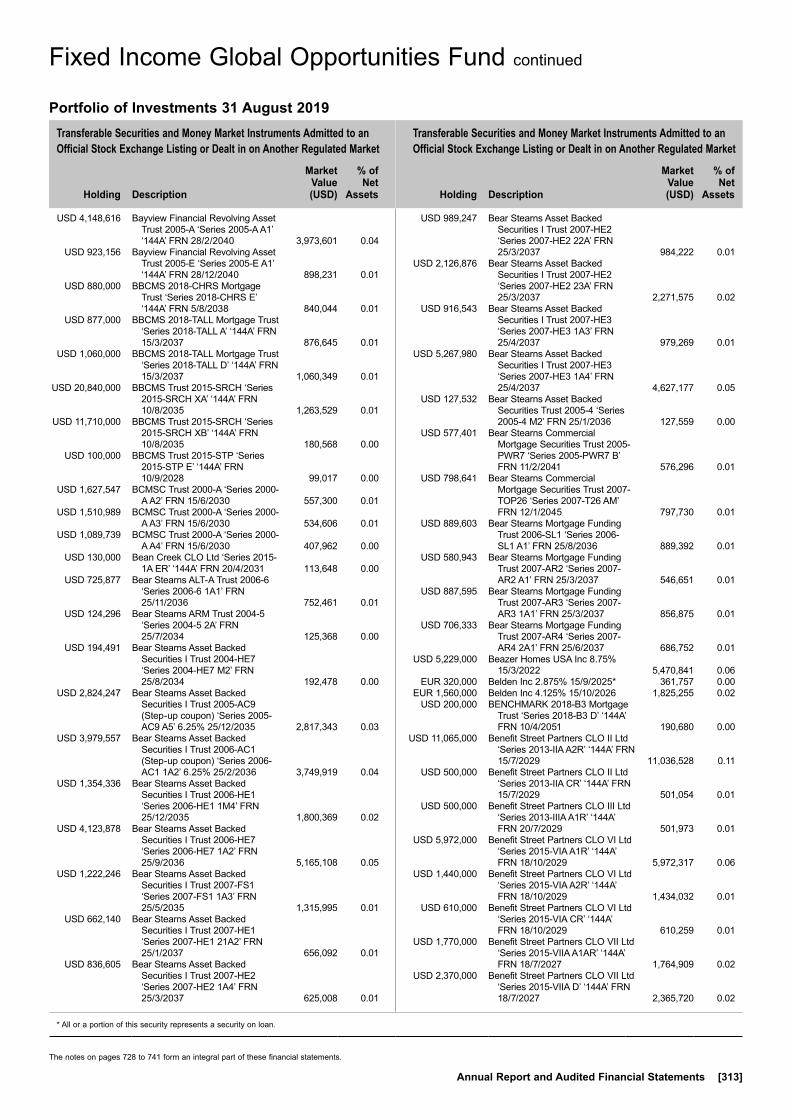
Transferable Securities and Money Market Instruments Admitted to an Official Stock Exchange Listing or Dealt in on Another Regulated Market
Transferable Securities and Money Market Instruments Admitted to an Official Stock Exchange Listing or Dealt in on Another Regulated Market
Holding
Description
Market Value (USD)
% of Net
Assets
Holding
Description
Market Value (USD)
% of Net
Assets
* All or a portion of this security represents a security on loan.
The notes on pages 728 to 741 form an integral part of these financial statements.
Annual Report and Audited Financial Statements [313]
USD 4,148,616 Bayview Financial Revolving Asset Trust 2005-A ‘Series 2005-A A1’ ‘144A’ FRN 28/2/2040 3,973,601 0.04
USD 923,156 Bayview Financial Revolving Asset Trust 2005-E ‘Series 2005-E A1’ ‘144A’ FRN 28/12/2040 898,231 0.01
USD 880,000 BBCMS 2018-CHRS Mortgage Trust ‘Series 2018-CHRS E’ ‘144A’ FRN 5/8/2038 840,044 0.01
USD 877,000 BBCMS 2018-TALL Mortgage Trust ‘Series 2018-TALL A’ ‘144A’ FRN 15/3/2037 876,645 0.01
USD 1,060,000 BBCMS 2018-TALL Mortgage Trust ‘Series 2018-TALL D’ ‘144A’ FRN 15/3/2037 1,060,349 0.01
USD 20,840,000 BBCMS Trust 2015-SRCH ‘Series 2015-SRCH XA’ ‘144A’ FRN 10/8/2035 1,263,529 0.01
USD 11,710,000 BBCMS Trust 2015-SRCH ‘Series 2015-SRCH XB’ ‘144A’ FRN 10/8/2035 180,568 0.00
USD 100,000 BBCMS Trust 2015-STP ‘Series 2015-STP E’ ‘144A’ FRN 10/9/2028 99,017 0.00
USD 1,627,547 BCMSC Trust 2000-A ‘Series 2000-A A2’ FRN 15/6/2030 557,300 0.01
USD 1,510,989 BCMSC Trust 2000-A ‘Series 2000-A A3’ FRN 15/6/2030 534,606 0.01
USD 1,089,739 BCMSC Trust 2000-A ‘Series 2000-A A4’ FRN 15/6/2030 407,962 0.00
USD 130,000 Bean Creek CLO Ltd ‘Series 2015-1A ER’ ‘144A’ FRN 20/4/2031 113,648 0.00
USD 725,877 Bear Stearns ALT-A Trust 2006-6 ‘Series 2006-6 1A1’ FRN 25/11/2036 752,461 0.01
USD 124,296 Bear Stearns ARM Trust 2004-5 ‘Series 2004-5 2A’ FRN 25/7/2034 125,368 0.00
USD 194,491 Bear Stearns Asset Backed Securities I Trust 2004-HE7 ‘Series 2004-HE7 M2’ FRN 25/8/2034 192,478 0.00
USD 2,824,247 Bear Stearns Asset Backed Securities I Trust 2005-AC9 (Step-up coupon) ‘Series 2005-AC9 A5’ 6.25% 25/12/2035 2,817,343 0.03
USD 3,979,557 Bear Stearns Asset Backed Securities I Trust 2006-AC1 (Step-up coupon) ‘Series 2006-AC1 1A2’ 6.25% 25/2/2036 3,749,919 0.04
USD 1,354,336 Bear Stearns Asset Backed Securities I Trust 2006-HE1 ‘Series 2006-HE1 1M4’ FRN 25/12/2035 1,800,369 0.02
USD 4,123,878 Bear Stearns Asset Backed Securities I Trust 2006-HE7 ‘Series 2006-HE7 1A2’ FRN 25/9/2036 5,165,108 0.05
USD 1,222,246 Bear Stearns Asset Backed Securities I Trust 2007-FS1 ‘Series 2007-FS1 1A3’ FRN 25/5/2035 1,315,995 0.01
USD 662,140 Bear Stearns Asset Backed Securities I Trust 2007-HE1 ‘Series 2007-HE1 21A2’ FRN 25/1/2037 656,092 0.01
USD 836,605 Bear Stearns Asset Backed Securities I Trust 2007-HE2 ‘Series 2007-HE2 1A4’ FRN 25/3/2037 625,008 0.01
USD 989,247 Bear Stearns Asset Backed Securities I Trust 2007-HE2 ‘Series 2007-HE2 22A’ FRN 25/3/2037 984,222 0.01
USD 2,126,876 Bear Stearns Asset Backed Securities I Trust 2007-HE2 ‘Series 2007-HE2 23A’ FRN 25/3/2037 2,271,575 0.02
USD 916,543 Bear Stearns Asset Backed Securities I Trust 2007-HE3 ‘Series 2007-HE3 1A3’ FRN 25/4/2037 979,269 0.01
USD 5,267,980 Bear Stearns Asset Backed Securities I Trust 2007-HE3 ‘Series 2007-HE3 1A4’ FRN 25/4/2037 4,627,177 0.05
USD 127,532 Bear Stearns Asset Backed Securities Trust 2005-4 ‘Series 2005-4 M2’ FRN 25/1/2036 127,559 0.00
USD 577,401 Bear Stearns Commercial Mortgage Securities Trust 2005-PWR7 ‘Series 2005-PWR7 B’ FRN 11/2/2041 576,296 0.01
USD 798,641 Bear Stearns Commercial Mortgage Securities Trust 2007-TOP26 ‘Series 2007-T26 AM’ FRN 12/1/2045 797,730 0.01
USD 889,603 Bear Stearns Mortgage Funding Trust 2006-SL1 ‘Series 2006-SL1 A1’ FRN 25/8/2036 889,392 0.01
USD 580,943 Bear Stearns Mortgage Funding Trust 2007-AR2 ‘Series 2007-AR2 A1’ FRN 25/3/2037 546,651 0.01
USD 887,595 Bear Stearns Mortgage Funding Trust 2007-AR3 ‘Series 2007-AR3 1A1’ FRN 25/3/2037 856,875 0.01
USD 706,333 Bear Stearns Mortgage Funding Trust 2007-AR4 ‘Series 2007-AR4 2A1’ FRN 25/6/2037 686,752 0.01
USD 5,229,000 Beazer Homes USA Inc 8.75% 15/3/2022 5,470,841 0.06
EUR 320,000 Belden Inc 2.875% 15/9/2025* 361,757 0.00 EUR 1,560,000 Belden Inc 4.125% 15/10/2026 1,825,255 0.02 USD 200,000 BENCHMARK 2018-B3 Mortgage
Trust ‘Series 2018-B3 D’ ‘144A’ FRN 10/4/2051 190,680 0.00
USD 11,065,000 Benefit Street Partners CLO II Ltd ‘Series 2013-IIA A2R’ ‘144A’ FRN 15/7/2029 11,036,528 0.11
USD 500,000 Benefit Street Partners CLO II Ltd ‘Series 2013-IIA CR’ ‘144A’ FRN 15/7/2029 501,054 0.01
USD 500,000 Benefit Street Partners CLO III Ltd ‘Series 2013-IIIA A1R’ ‘144A’ FRN 20/7/2029 501,973 0.01
USD 5,972,000 Benefit Street Partners CLO VI Ltd ‘Series 2015-VIA A1R’ ‘144A’ FRN 18/10/2029 5,972,317 0.06
USD 1,440,000 Benefit Street Partners CLO VI Ltd ‘Series 2015-VIA A2R’ ‘144A’ FRN 18/10/2029 1,434,032 0.01
USD 610,000 Benefit Street Partners CLO VI Ltd ‘Series 2015-VIA CR’ ‘144A’ FRN 18/10/2029 610,259 0.01
USD 1,770,000 Benefit Street Partners CLO VII Ltd ‘Series 2015-VIIA A1AR’ ‘144A’ FRN 18/7/2027 1,764,909 0.02
USD 2,370,000 Benefit Street Partners CLO VII Ltd ‘Series 2015-VIIA D’ ‘144A’ FRN 18/7/2027 2,365,720 0.02
Fixed Income Global Opportunities Fund continued
Portfolio of Investments 31 August 2019

Transferable Securities and Money Market Instruments Admitted to an Official Stock Exchange Listing or Dealt in on Another Regulated Market
Transferable Securities and Money Market Instruments Admitted to an Official Stock Exchange Listing or Dealt in on Another Regulated Market
Holding
Description
Market Value (USD)
% of Net
Assets
Holding
Description
Market Value (USD)
% of Net
Assets
* All or a portion of this security represents a security on loan.
The notes on pages 728 to 741 form an integral part of these financial statements.
[314] BlackRock Global Funds (BGF)
USD 1,110,000 Benefit Street Partners CLO VIII Ltd ‘Series 2015-8A A1AR’ ‘144A’ FRN 20/1/2031 1,102,949 0.01
USD 370,000 Benefit Street Partners Clo XII Ltd ‘Series 2017-12A D’ ‘144A’ FRN 15/10/2030 350,378 0.00
USD 1,630,000 Berks County Industrial Development Authority 5% 1/11/2047 1,915,861 0.02
USD 1,550,000 Berks County Industrial Development Authority 5% 1/11/2050 1,815,019 0.02
USD 1,730,000 Berkshire Hathaway Energy Co 6.125% 1/4/2036 2,446,587 0.03
USD 4,820,000 BHMS 2018-ATLS ‘Series 2018-ATLS A’ ‘144A’ FRN 15/7/2035 4,829,038 0.05
USD 4,000,000 Black Diamond CLO 2013-1 Ltd ‘Series 2013-1A A2R’ ‘144A’ FRN 6/2/2026 3,999,784 0.04
USD 441,391 Black Diamond CLO 2014-1 Ltd ‘Series 2014-1A A1R’ ‘144A’ FRN 17/10/2026 441,680 0.00
USD 2,970,000 BlueMountain CLO 2013-2 Ltd ‘Series 2013-2A A1R’ ‘144A’ FRN 22/10/2030 2,967,682 0.03
USD 480,000 BlueMountain CLO 2015-1 Ltd ‘Series 2015-1A C’ ‘144A’ FRN 13/4/2027 481,365 0.01
USD 889,000 BlueMountain CLO 2015-1 Ltd ‘Series 2015-1A D’ ‘144A’ FRN 13/4/2027 886,920 0.01
USD 530,000 BlueMountain CLO 2015-3 Ltd ‘Series 2015-3A A1R’ ‘144A’ FRN 20/4/2031 525,950 0.01
USD 250,000 BlueMountain CLO 2016-2 Ltd ‘Series 2016-2A D’ ‘144A’ FRN 20/8/2028 249,846 0.00
USD 2,370,000 Boeing Co/The 2.95% 1/2/2030 2,461,345 0.03 USD 3,866,000 Boston Properties LP 3.4%
21/6/2029 4,099,301 0.04 USD 1,717,000 Boyd Gaming Corp 6.875%
15/5/2023 1,787,449 0.02 USD 3,758,000 Brinker International Inc ‘144A’ 5%
1/10/2024 3,889,530 0.04 USD 750,000 Bristol Park CLO Ltd ‘Series 2016-
1A E’ ‘144A’ FRN 15/4/2029 742,416 0.01 USD 5,704,000 Bristow Group Inc (Restricted)
(Defaulted) ‘144A’ 8.75% 1/3/2023* 5,504,360 0.06
USD 3,680,000 Broadcom Corp / Broadcom Cayman Finance Ltd 2.2% 15/1/2021 3,663,930 0.04
USD 7,805,000 Broadcom Corp / Broadcom Cayman Finance Ltd 3.875% 15/1/2027 7,776,523 0.08
USD 6,245,000 Broadcom Inc ‘144A’ 3.125% 15/4/2021 6,292,682 0.06
USD 6,540,000 Broadcom Inc ‘144A’ 3.625% 15/10/2024 6,644,214 0.07
USD 4,440,000 Broadcom Inc ‘144A’ 4.75% 15/4/2029 4,682,741 0.05
USD 6,239,000 Bruin E&P Partners LLC ‘144A’ 8.875% 1/8/2023 4,484,281 0.05
USD 4,430,000 Buckeye Tobacco Settlement Financing Authority 5.875% 1/6/2047 4,452,172 0.05
USD 203,000 Builders FirstSource Inc ‘144A’ 5.625% 1/9/2024 212,643 0.00
USD 1,060,000 Burlington Northern Santa Fe LLC 3.55% 15/2/2050 1,165,163 0.01
USD 2,810,000 BWAY 2013-1515 Mortgage Trust ‘Series 2013-1515 A2’ ‘144A’ 3.454% 10/3/2033 3,009,686 0.03
USD 2,730,000 BWAY 2013-1515 Mortgage Trust ‘Series 2013-1515 D’ ‘144A’ 3.633% 10/3/2033 2,858,414 0.03
USD 14,000,000 BWAY 2013-1515 Mortgage Trust ‘Series 2013-1515 E’ ‘144A’ 3.717% 10/3/2033 14,602,696 0.15
USD 2,002,000 BWAY 2015-1740 Mortgage Trust ‘Series 2015-1740 E’ ‘144A’ FRN 10/1/2035 2,098,227 0.02
USD 1,110,000 BX Commercial Mortgage Trust 2018-BIOA ‘Series 2018-BIOA E’ ‘144A’ FRN 15/3/2037 1,112,552 0.01
USD 11,077,367 BX Commercial Mortgage Trust 2018-IND ‘Series 2018-IND H’ ‘144A’ FRN 15/11/2035 11,126,526 0.11
USD 600,000 BXP Trust 2017-CC ‘Series 2017-CC D’ ‘144A’ FRN 13/8/2037 613,566 0.01
USD 2,260,000 BXP Trust 2017-CC ‘Series 2017-CC E’ ‘144A’ FRN 13/8/2037 2,295,509 0.02
USD 470,000 BXP Trust 2017-GM ‘Series 2017-GM D’ ‘144A’ FRN 13/6/2039 494,505 0.01
USD 990,000 BXP Trust 2017-GM ‘Series 2017-GM E’ ‘144A’ FRN 13/6/2039 983,530 0.01
USD 1,689,000 Caesars Entertainment Corp 5% 1/10/2024 2,856,996 0.03
USD 1,005,000 California Health Facilities Financing Authority 5% 15/8/2033 1,252,697 0.01
USD 1,560,000 California Health Facilities Financing Authority 5% 15/8/2047 1,868,560 0.02
USD 1,120,000 California Health Facilities Financing Authority 5% 1/11/2047 1,762,824 0.02
USD 1,970,000 California Pollution Control Financing Authority ‘144A’ 5% 21/11/2045 2,114,263 0.02
USD 1,735,000 California State Public Works Board 8.361% 1/10/2034 2,832,943 0.03
USD 1,520,000 Calpine Corp 5.375% 15/1/2023 1,535,200 0.02 USD 1,930,000 Calpine Corp ‘144A’ 5.875%
15/1/2024 1,976,050 0.02 USD 1,540,000 Canaveral Port Authority 5%
1/6/2045 1,837,074 0.02 USD 1,540,000 Canaveral Port Authority 5%
1/6/2048 1,875,604 0.02 USD 1,859,000 Capital One Financial Corp FRN
1/6/2020 (Perpetual) 1,880,313 0.02 USD 11,623,000 Capital One Financial Corp 3.9%
29/1/2024 12,332,433 0.13 USD 1,515,000 Capitol Investment Merger Sub 2
LLC ‘144A’ 10% 1/8/2024 1,571,812 0.02 USD 2,959,000 Carlson Travel Inc ‘144A’ 6.75%
15/12/2023 3,010,782 0.03 USD 210,000 Carlson Travel Inc ‘144A’ 9.5%
15/12/2024 211,050 0.00 USD 2,260,000 Carlyle Global Market Strategies
CLO 2013-2 Ltd ‘Series 2013-2A AR’ ‘144A’ FRN 18/1/2029 2,251,598 0.02
USD 2,020,000 Carlyle Global Market Strategies CLO 2014-1 Ltd ‘Series 2014-1A A1R2’ ‘144A’ FRN 17/4/2031 1,999,800 0.02
USD 250,000 Carlyle Global Market Strategies CLO 2015-2 Ltd ‘Series 2015-2A CR’ ‘144A’ FRN 27/4/2027 246,545 0.00
USD 250,000 Carlyle Global Market Strategies CLO 2015-2 Ltd ‘Series 2015-2A DR’ ‘144A’ FRN 27/4/2027 239,391 0.00
USD 2,630,000 Carlyle Global Market Strategies CLO 2015-3 Ltd ‘Series 2015-3A A2R’ ‘144A’ FRN 28/7/2028 2,621,208 0.03
Fixed Income Global Opportunities Fund continued
Portfolio of Investments 31 August 2019
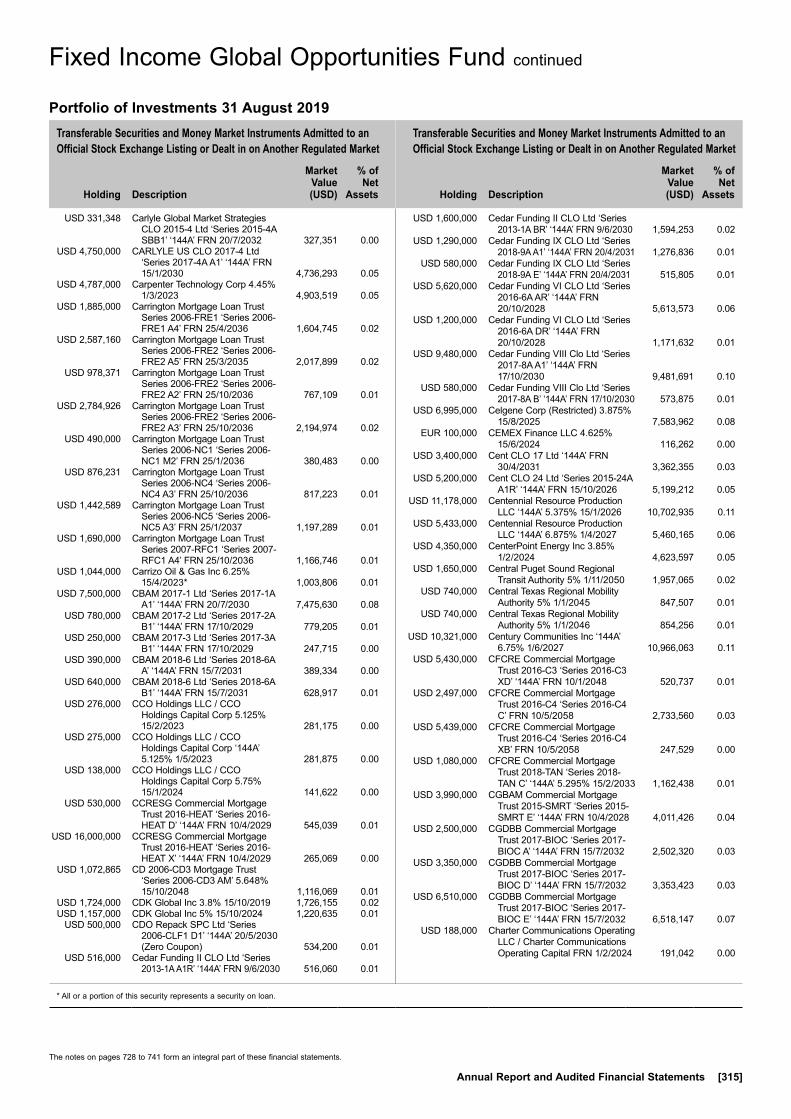
Transferable Securities and Money Market Instruments Admitted to an Official Stock Exchange Listing or Dealt in on Another Regulated Market
Transferable Securities and Money Market Instruments Admitted to an Official Stock Exchange Listing or Dealt in on Another Regulated Market
Holding
Description
Market Value (USD)
% of Net
Assets
Holding
Description
Market Value (USD)
% of Net
Assets
* All or a portion of this security represents a security on loan.
The notes on pages 728 to 741 form an integral part of these financial statements.
Annual Report and Audited Financial Statements [315]
USD 331,348 Carlyle Global Market Strategies CLO 2015-4 Ltd ‘Series 2015-4A SBB1’ ‘144A’ FRN 20/7/2032 327,351 0.00
USD 4,750,000 CARLYLE US CLO 2017-4 Ltd ‘Series 2017-4A A1’ ‘144A’ FRN 15/1/2030 4,736,293 0.05
USD 4,787,000 Carpenter Technology Corp 4.45% 1/3/2023 4,903,519 0.05
USD 1,885,000 Carrington Mortgage Loan Trust Series 2006-FRE1 ‘Series 2006-FRE1 A4’ FRN 25/4/2036 1,604,745 0.02
USD 2,587,160 Carrington Mortgage Loan Trust Series 2006-FRE2 ‘Series 2006-FRE2 A5’ FRN 25/3/2035 2,017,899 0.02
USD 978,371 Carrington Mortgage Loan Trust Series 2006-FRE2 ‘Series 2006-FRE2 A2’ FRN 25/10/2036 767,109 0.01
USD 2,784,926 Carrington Mortgage Loan Trust Series 2006-FRE2 ‘Series 2006-FRE2 A3’ FRN 25/10/2036 2,194,974 0.02
USD 490,000 Carrington Mortgage Loan Trust Series 2006-NC1 ‘Series 2006-NC1 M2’ FRN 25/1/2036 380,483 0.00
USD 876,231 Carrington Mortgage Loan Trust Series 2006-NC4 ‘Series 2006-NC4 A3’ FRN 25/10/2036 817,223 0.01
USD 1,442,589 Carrington Mortgage Loan Trust Series 2006-NC5 ‘Series 2006-NC5 A3’ FRN 25/1/2037 1,197,289 0.01
USD 1,690,000 Carrington Mortgage Loan Trust Series 2007-RFC1 ‘Series 2007-RFC1 A4’ FRN 25/10/2036 1,166,746 0.01
USD 1,044,000 Carrizo Oil & Gas Inc 6.25% 15/4/2023* 1,003,806 0.01
USD 7,500,000 CBAM 2017-1 Ltd ‘Series 2017-1A A1’ ‘144A’ FRN 20/7/2030 7,475,630 0.08
USD 780,000 CBAM 2017-2 Ltd ‘Series 2017-2A B1’ ‘144A’ FRN 17/10/2029 779,205 0.01
USD 250,000 CBAM 2017-3 Ltd ‘Series 2017-3A B1’ ‘144A’ FRN 17/10/2029 247,715 0.00
USD 390,000 CBAM 2018-6 Ltd ‘Series 2018-6A A’ ‘144A’ FRN 15/7/2031 389,334 0.00
USD 640,000 CBAM 2018-6 Ltd ‘Series 2018-6A B1’ ‘144A’ FRN 15/7/2031 628,917 0.01
USD 276,000 CCO Holdings LLC / CCO Holdings Capital Corp 5.125% 15/2/2023 281,175 0.00
USD 275,000 CCO Holdings LLC / CCO Holdings Capital Corp ‘144A’ 5.125% 1/5/2023 281,875 0.00
USD 138,000 CCO Holdings LLC / CCO Holdings Capital Corp 5.75% 15/1/2024 141,622 0.00
USD 530,000 CCRESG Commercial Mortgage Trust 2016-HEAT ‘Series 2016-HEAT D’ ‘144A’ FRN 10/4/2029 545,039 0.01
USD 16,000,000 CCRESG Commercial Mortgage Trust 2016-HEAT ‘Series 2016-HEAT X’ ‘144A’ FRN 10/4/2029 265,069 0.00
USD 1,072,865 CD 2006-CD3 Mortgage Trust ‘Series 2006-CD3 AM’ 5.648% 15/10/2048 1,116,069 0.01
USD 1,724,000 CDK Global Inc 3.8% 15/10/2019 1,726,155 0.02 USD 1,157,000 CDK Global Inc 5% 15/10/2024 1,220,635 0.01 USD 500,000 CDO Repack SPC Ltd ‘Series
2006-CLF1 D1’ ‘144A’ 20/5/2030 (Zero Coupon) 534,200 0.01
USD 516,000 Cedar Funding II CLO Ltd ‘Series 2013-1A A1R’ ‘144A’ FRN 9/6/2030 516,060 0.01
USD 1,600,000 Cedar Funding II CLO Ltd ‘Series 2013-1A BR’ ‘144A’ FRN 9/6/2030 1,594,253 0.02
USD 1,290,000 Cedar Funding IX CLO Ltd ‘Series 2018-9A A1’ ‘144A’ FRN 20/4/2031 1,276,836 0.01
USD 580,000 Cedar Funding IX CLO Ltd ‘Series 2018-9A E’ ‘144A’ FRN 20/4/2031 515,805 0.01
USD 5,620,000 Cedar Funding VI CLO Ltd ‘Series 2016-6A AR’ ‘144A’ FRN 20/10/2028 5,613,573 0.06
USD 1,200,000 Cedar Funding VI CLO Ltd ‘Series 2016-6A DR’ ‘144A’ FRN 20/10/2028 1,171,632 0.01
USD 9,480,000 Cedar Funding VIII Clo Ltd ‘Series 2017-8A A1’ ‘144A’ FRN 17/10/2030 9,481,691 0.10
USD 580,000 Cedar Funding VIII Clo Ltd ‘Series 2017-8A B’ ‘144A’ FRN 17/10/2030 573,875 0.01
USD 6,995,000 Celgene Corp (Restricted) 3.875% 15/8/2025 7,583,962 0.08
EUR 100,000 CEMEX Finance LLC 4.625% 15/6/2024 116,262 0.00
USD 3,400,000 Cent CLO 17 Ltd ‘144A’ FRN 30/4/2031 3,362,355 0.03
USD 5,200,000 Cent CLO 24 Ltd ‘Series 2015-24A A1R’ ‘144A’ FRN 15/10/2026 5,199,212 0.05
USD 11,178,000 Centennial Resource Production LLC ‘144A’ 5.375% 15/1/2026 10,702,935 0.11
USD 5,433,000 Centennial Resource Production LLC ‘144A’ 6.875% 1/4/2027 5,460,165 0.06
USD 4,350,000 CenterPoint Energy Inc 3.85% 1/2/2024 4,623,597 0.05
USD 1,650,000 Central Puget Sound Regional Transit Authority 5% 1/11/2050 1,957,065 0.02
USD 740,000 Central Texas Regional Mobility Authority 5% 1/1/2045 847,507 0.01
USD 740,000 Central Texas Regional Mobility Authority 5% 1/1/2046 854,256 0.01
USD 10,321,000 Century Communities Inc ‘144A’ 6.75% 1/6/2027 10,966,063 0.11
USD 5,430,000 CFCRE Commercial Mortgage Trust 2016-C3 ‘Series 2016-C3 XD’ ‘144A’ FRN 10/1/2048 520,737 0.01
USD 2,497,000 CFCRE Commercial Mortgage Trust 2016-C4 ‘Series 2016-C4 C’ FRN 10/5/2058 2,733,560 0.03
USD 5,439,000 CFCRE Commercial Mortgage Trust 2016-C4 ‘Series 2016-C4 XB’ FRN 10/5/2058 247,529 0.00
USD 1,080,000 CFCRE Commercial Mortgage Trust 2018-TAN ‘Series 2018-TAN C’ ‘144A’ 5.295% 15/2/2033 1,162,438 0.01
USD 3,990,000 CGBAM Commercial Mortgage Trust 2015-SMRT ‘Series 2015-SMRT E’ ‘144A’ FRN 10/4/2028 4,011,426 0.04
USD 2,500,000 CGDBB Commercial Mortgage Trust 2017-BIOC ‘Series 2017-BIOC A’ ‘144A’ FRN 15/7/2032 2,502,320 0.03
USD 3,350,000 CGDBB Commercial Mortgage Trust 2017-BIOC ‘Series 2017-BIOC D’ ‘144A’ FRN 15/7/2032 3,353,423 0.03
USD 6,510,000 CGDBB Commercial Mortgage Trust 2017-BIOC ‘Series 2017-BIOC E’ ‘144A’ FRN 15/7/2032 6,518,147 0.07
USD 188,000 Charter Communications Operating LLC / Charter Communications Operating Capital FRN 1/2/2024 191,042 0.00
Fixed Income Global Opportunities Fund continued
Portfolio of Investments 31 August 2019
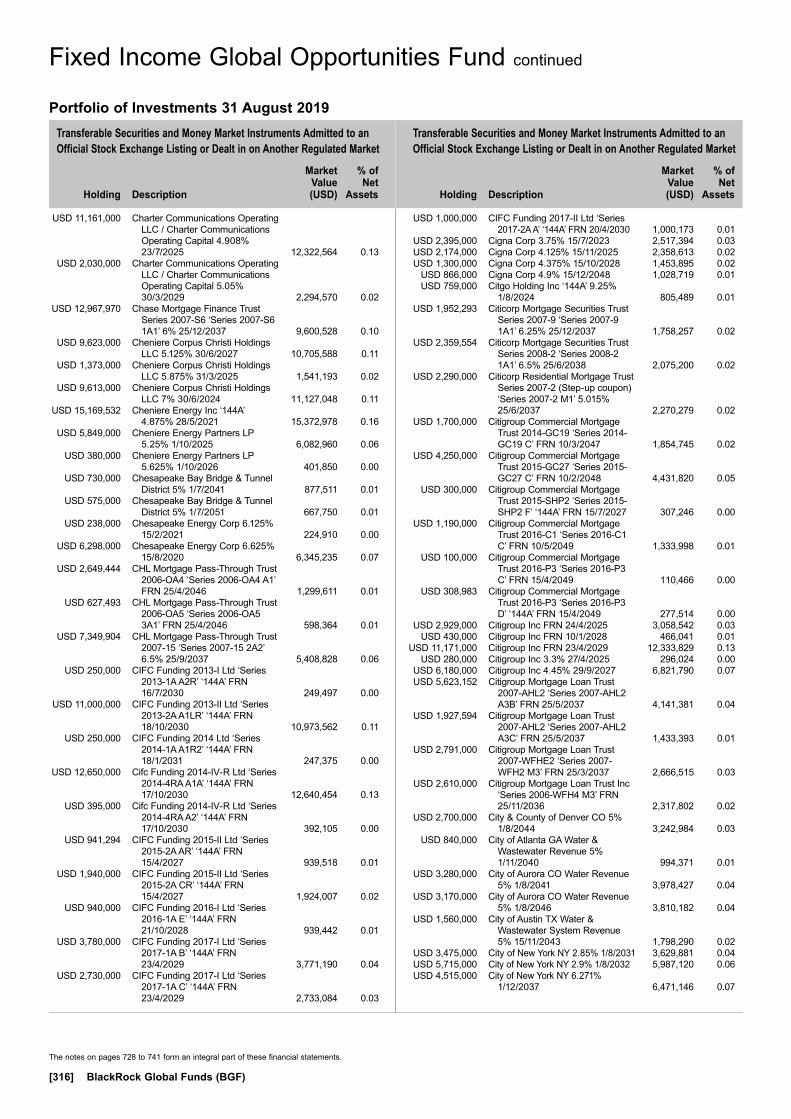
Transferable Securities and Money Market Instruments Admitted to an Official Stock Exchange Listing or Dealt in on Another Regulated Market
Transferable Securities and Money Market Instruments Admitted to an Official Stock Exchange Listing or Dealt in on Another Regulated Market
Holding
Description
Market Value (USD)
% of Net
Assets
Holding
Description
Market Value (USD)
% of Net
Assets
The notes on pages 728 to 741 form an integral part of these financial statements.
[316] BlackRock Global Funds (BGF)
USD 11,161,000 Charter Communications Operating LLC / Charter Communications Operating Capital 4.908% 23/7/2025 12,322,564 0.13
USD 2,030,000 Charter Communications Operating LLC / Charter Communications Operating Capital 5.05% 30/3/2029 2,294,570 0.02
USD 12,967,970 Chase Mortgage Finance Trust Series 2007-S6 ‘Series 2007-S6 1A1’ 6% 25/12/2037 9,600,528 0.10
USD 9,623,000 Cheniere Corpus Christi Holdings LLC 5.125% 30/6/2027 10,705,588 0.11
USD 1,373,000 Cheniere Corpus Christi Holdings LLC 5.875% 31/3/2025 1,541,193 0.02
USD 9,613,000 Cheniere Corpus Christi Holdings LLC 7% 30/6/2024 11,127,048 0.11
USD 15,169,532 Cheniere Energy Inc ‘144A’ 4.875% 28/5/2021 15,372,978 0.16
USD 5,849,000 Cheniere Energy Partners LP 5.25% 1/10/2025 6,082,960 0.06
USD 380,000 Cheniere Energy Partners LP 5.625% 1/10/2026 401,850 0.00
USD 730,000 Chesapeake Bay Bridge & Tunnel District 5% 1/7/2041 877,511 0.01
USD 575,000 Chesapeake Bay Bridge & Tunnel District 5% 1/7/2051 667,750 0.01
USD 238,000 Chesapeake Energy Corp 6.125% 15/2/2021 224,910 0.00
USD 6,298,000 Chesapeake Energy Corp 6.625% 15/8/2020 6,345,235 0.07
USD 2,649,444 CHL Mortgage Pass-Through Trust 2006-OA4 ‘Series 2006-OA4 A1’ FRN 25/4/2046 1,299,611 0.01
USD 627,493 CHL Mortgage Pass-Through Trust 2006-OA5 ‘Series 2006-OA5 3A1’ FRN 25/4/2046 598,364 0.01
USD 7,349,904 CHL Mortgage Pass-Through Trust 2007-15 ‘Series 2007-15 2A2’ 6.5% 25/9/2037 5,408,828 0.06
USD 250,000 CIFC Funding 2013-I Ltd ‘Series 2013-1A A2R’ ‘144A’ FRN 16/7/2030 249,497 0.00
USD 11,000,000 CIFC Funding 2013-II Ltd ‘Series 2013-2A A1LR’ ‘144A’ FRN 18/10/2030 10,973,562 0.11
USD 250,000 CIFC Funding 2014 Ltd ‘Series 2014-1A A1R2’ ‘144A’ FRN 18/1/2031 247,375 0.00
USD 12,650,000 Cifc Funding 2014-IV-R Ltd ‘Series 2014-4RA A1A’ ‘144A’ FRN 17/10/2030 12,640,454 0.13
USD 395,000 Cifc Funding 2014-IV-R Ltd ‘Series 2014-4RA A2’ ‘144A’ FRN 17/10/2030 392,105 0.00
USD 941,294 CIFC Funding 2015-II Ltd ‘Series 2015-2A AR’ ‘144A’ FRN 15/4/2027 939,518 0.01
USD 1,940,000 CIFC Funding 2015-II Ltd ‘Series 2015-2A CR’ ‘144A’ FRN 15/4/2027 1,924,007 0.02
USD 940,000 CIFC Funding 2016-I Ltd ‘Series 2016-1A E’ ‘144A’ FRN 21/10/2028 939,442 0.01
USD 3,780,000 CIFC Funding 2017-I Ltd ‘Series 2017-1A B’ ‘144A’ FRN 23/4/2029 3,771,190 0.04
USD 2,730,000 CIFC Funding 2017-I Ltd ‘Series 2017-1A C’ ‘144A’ FRN 23/4/2029 2,733,084 0.03
USD 1,000,000 CIFC Funding 2017-II Ltd ‘Series 2017-2A A’ ‘144A’ FRN 20/4/2030 1,000,173 0.01
USD 2,395,000 Cigna Corp 3.75% 15/7/2023 2,517,394 0.03 USD 2,174,000 Cigna Corp 4.125% 15/11/2025 2,358,613 0.02 USD 1,300,000 Cigna Corp 4.375% 15/10/2028 1,453,895 0.02 USD 866,000 Cigna Corp 4.9% 15/12/2048 1,028,719 0.01 USD 759,000 Citgo Holding Inc ‘144A’ 9.25%
1/8/2024 805,489 0.01 USD 1,952,293 Citicorp Mortgage Securities Trust
Series 2007-9 ‘Series 2007-9 1A1’ 6.25% 25/12/2037 1,758,257 0.02
USD 2,359,554 Citicorp Mortgage Securities Trust Series 2008-2 ‘Series 2008-2 1A1’ 6.5% 25/6/2038 2,075,200 0.02
USD 2,290,000 Citicorp Residential Mortgage Trust Series 2007-2 (Step-up coupon) ‘Series 2007-2 M1’ 5.015% 25/6/2037 2,270,279 0.02
USD 1,700,000 Citigroup Commercial Mortgage Trust 2014-GC19 ‘Series 2014-GC19 C’ FRN 10/3/2047 1,854,745 0.02
USD 4,250,000 Citigroup Commercial Mortgage Trust 2015-GC27 ‘Series 2015-GC27 C’ FRN 10/2/2048 4,431,820 0.05
USD 300,000 Citigroup Commercial Mortgage Trust 2015-SHP2 ‘Series 2015-SHP2 F’ ‘144A’ FRN 15/7/2027 307,246 0.00
USD 1,190,000 Citigroup Commercial Mortgage Trust 2016-C1 ‘Series 2016-C1 C’ FRN 10/5/2049 1,333,998 0.01
USD 100,000 Citigroup Commercial Mortgage Trust 2016-P3 ‘Series 2016-P3 C’ FRN 15/4/2049 110,466 0.00
USD 308,983 Citigroup Commercial Mortgage Trust 2016-P3 ‘Series 2016-P3 D’ ‘144A’ FRN 15/4/2049 277,514 0.00
USD 2,929,000 Citigroup Inc FRN 24/4/2025 3,058,542 0.03 USD 430,000 Citigroup Inc FRN 10/1/2028 466,041 0.01 USD 11,171,000 Citigroup Inc FRN 23/4/2029 12,333,829 0.13 USD 280,000 Citigroup Inc 3.3% 27/4/2025 296,024 0.00 USD 6,180,000 Citigroup Inc 4.45% 29/9/2027 6,821,790 0.07 USD 5,623,152 Citigroup Mortgage Loan Trust
2007-AHL2 ‘Series 2007-AHL2 A3B’ FRN 25/5/2037 4,141,381 0.04
USD 1,927,594 Citigroup Mortgage Loan Trust 2007-AHL2 ‘Series 2007-AHL2 A3C’ FRN 25/5/2037 1,433,393 0.01
USD 2,791,000 Citigroup Mortgage Loan Trust 2007-WFHE2 ‘Series 2007-WFH2 M3’ FRN 25/3/2037 2,666,515 0.03
USD 2,610,000 Citigroup Mortgage Loan Trust Inc ‘Series 2006-WFH4 M3’ FRN 25/11/2036 2,317,802 0.02
USD 2,700,000 City & County of Denver CO 5% 1/8/2044 3,242,984 0.03
USD 840,000 City of Atlanta GA Water & Wastewater Revenue 5% 1/11/2040 994,371 0.01
USD 3,280,000 City of Aurora CO Water Revenue 5% 1/8/2041 3,978,427 0.04
USD 3,170,000 City of Aurora CO Water Revenue 5% 1/8/2046 3,810,182 0.04
USD 1,560,000 City of Austin TX Water & Wastewater System Revenue 5% 15/11/2043 1,798,290 0.02
USD 3,475,000 City of New York NY 2.85% 1/8/2031 3,629,881 0.04 USD 5,715,000 City of New York NY 2.9% 1/8/2032 5,987,120 0.06 USD 4,515,000 City of New York NY 6.271%
1/12/2037 6,471,146 0.07
Fixed Income Global Opportunities Fund continued
Portfolio of Investments 31 August 2019
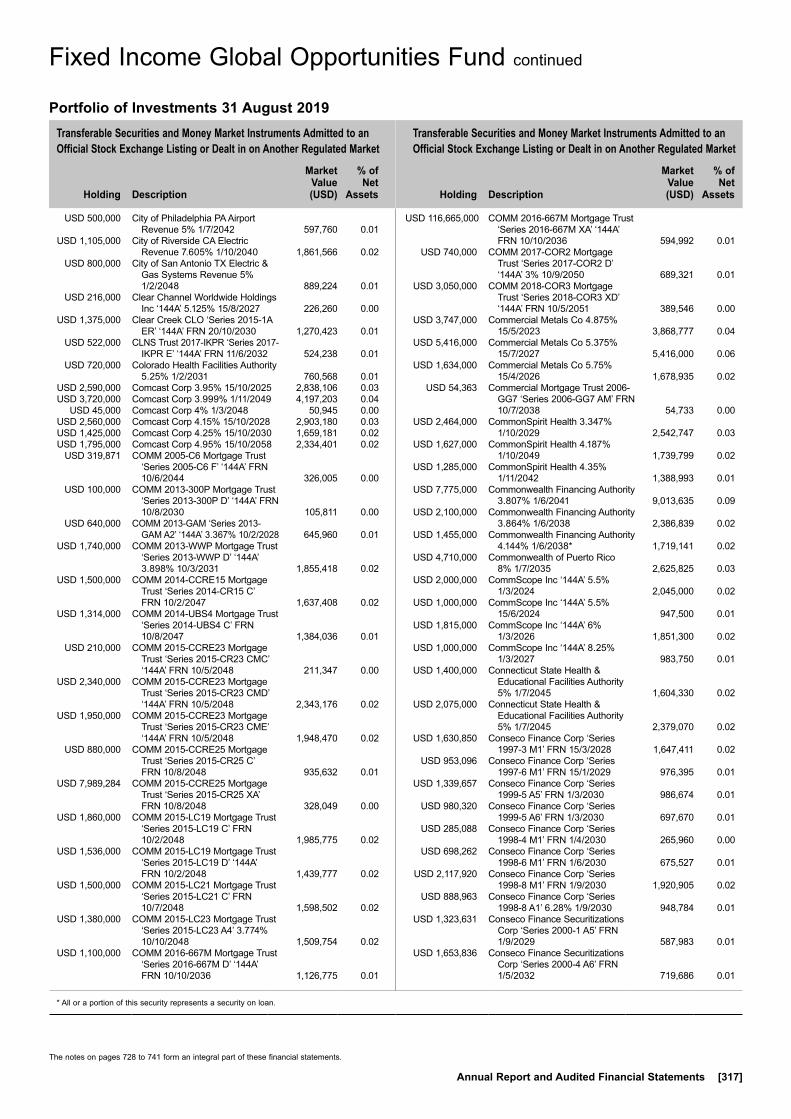
Transferable Securities and Money Market Instruments Admitted to an Official Stock Exchange Listing or Dealt in on Another Regulated Market
Transferable Securities and Money Market Instruments Admitted to an Official Stock Exchange Listing or Dealt in on Another Regulated Market
Holding
Description
Market Value (USD)
% of Net
Assets
Holding
Description
Market Value (USD)
% of Net
Assets
* All or a portion of this security represents a security on loan.
The notes on pages 728 to 741 form an integral part of these financial statements.
Annual Report and Audited Financial Statements [317]
USD 500,000 City of Philadelphia PA Airport Revenue 5% 1/7/2042 597,760 0.01
USD 1,105,000 City of Riverside CA Electric Revenue 7.605% 1/10/2040 1,861,566 0.02
USD 800,000 City of San Antonio TX Electric & Gas Systems Revenue 5% 1/2/2048 889,224 0.01
USD 216,000 Clear Channel Worldwide Holdings Inc ‘144A’ 5.125% 15/8/2027 226,260 0.00
USD 1,375,000 Clear Creek CLO ‘Series 2015-1A ER’ ‘144A’ FRN 20/10/2030 1,270,423 0.01
USD 522,000 CLNS Trust 2017-IKPR ‘Series 2017-IKPR E’ ‘144A’ FRN 11/6/2032 524,238 0.01
USD 720,000 Colorado Health Facilities Authority 5.25% 1/2/2031 760,568 0.01
USD 2,590,000 Comcast Corp 3.95% 15/10/2025 2,838,106 0.03 USD 3,720,000 Comcast Corp 3.999% 1/11/2049 4,197,203 0.04 USD 45,000 Comcast Corp 4% 1/3/2048 50,945 0.00 USD 2,560,000 Comcast Corp 4.15% 15/10/2028 2,903,180 0.03 USD 1,425,000 Comcast Corp 4.25% 15/10/2030 1,659,181 0.02 USD 1,795,000 Comcast Corp 4.95% 15/10/2058 2,334,401 0.02 USD 319,871 COMM 2005-C6 Mortgage Trust
‘Series 2005-C6 F’ ‘144A’ FRN 10/6/2044 326,005 0.00
USD 100,000 COMM 2013-300P Mortgage Trust ‘Series 2013-300P D’ ‘144A’ FRN 10/8/2030 105,811 0.00
USD 640,000 COMM 2013-GAM ‘Series 2013-GAM A2’ ‘144A’ 3.367% 10/2/2028 645,960 0.01
USD 1,740,000 COMM 2013-WWP Mortgage Trust ‘Series 2013-WWP D’ ‘144A’ 3.898% 10/3/2031 1,855,418 0.02
USD 1,500,000 COMM 2014-CCRE15 Mortgage Trust ‘Series 2014-CR15 C’ FRN 10/2/2047 1,637,408 0.02
USD 1,314,000 COMM 2014-UBS4 Mortgage Trust ‘Series 2014-UBS4 C’ FRN 10/8/2047 1,384,036 0.01
USD 210,000 COMM 2015-CCRE23 Mortgage Trust ‘Series 2015-CR23 CMC’ ‘144A’ FRN 10/5/2048 211,347 0.00
USD 2,340,000 COMM 2015-CCRE23 Mortgage Trust ‘Series 2015-CR23 CMD’ ‘144A’ FRN 10/5/2048 2,343,176 0.02
USD 1,950,000 COMM 2015-CCRE23 Mortgage Trust ‘Series 2015-CR23 CME’ ‘144A’ FRN 10/5/2048 1,948,470 0.02
USD 880,000 COMM 2015-CCRE25 Mortgage Trust ‘Series 2015-CR25 C’ FRN 10/8/2048 935,632 0.01
USD 7,989,284 COMM 2015-CCRE25 Mortgage Trust ‘Series 2015-CR25 XA’ FRN 10/8/2048 328,049 0.00
USD 1,860,000 COMM 2015-LC19 Mortgage Trust ‘Series 2015-LC19 C’ FRN 10/2/2048 1,985,775 0.02
USD 1,536,000 COMM 2015-LC19 Mortgage Trust ‘Series 2015-LC19 D’ ‘144A’ FRN 10/2/2048 1,439,777 0.02
USD 1,500,000 COMM 2015-LC21 Mortgage Trust ‘Series 2015-LC21 C’ FRN 10/7/2048 1,598,502 0.02
USD 1,380,000 COMM 2015-LC23 Mortgage Trust ‘Series 2015-LC23 A4’ 3.774% 10/10/2048 1,509,754 0.02
USD 1,100,000 COMM 2016-667M Mortgage Trust ‘Series 2016-667M D’ ‘144A’ FRN 10/10/2036 1,126,775 0.01
USD 116,665,000 COMM 2016-667M Mortgage Trust ‘Series 2016-667M XA’ ‘144A’ FRN 10/10/2036 594,992 0.01
USD 740,000 COMM 2017-COR2 Mortgage Trust ‘Series 2017-COR2 D’ ‘144A’ 3% 10/9/2050 689,321 0.01
USD 3,050,000 COMM 2018-COR3 Mortgage Trust ‘Series 2018-COR3 XD’ ‘144A’ FRN 10/5/2051 389,546 0.00
USD 3,747,000 Commercial Metals Co 4.875% 15/5/2023 3,868,777 0.04
USD 5,416,000 Commercial Metals Co 5.375% 15/7/2027 5,416,000 0.06
USD 1,634,000 Commercial Metals Co 5.75% 15/4/2026 1,678,935 0.02
USD 54,363 Commercial Mortgage Trust 2006-GG7 ‘Series 2006-GG7 AM’ FRN 10/7/2038 54,733 0.00
USD 2,464,000 CommonSpirit Health 3.347% 1/10/2029 2,542,747 0.03
USD 1,627,000 CommonSpirit Health 4.187% 1/10/2049 1,739,799 0.02
USD 1,285,000 CommonSpirit Health 4.35% 1/11/2042 1,388,993 0.01
USD 7,775,000 Commonwealth Financing Authority 3.807% 1/6/2041 9,013,635 0.09
USD 2,100,000 Commonwealth Financing Authority 3.864% 1/6/2038 2,386,839 0.02
USD 1,455,000 Commonwealth Financing Authority 4.144% 1/6/2038* 1,719,141 0.02
USD 4,710,000 Commonwealth of Puerto Rico 8% 1/7/2035 2,625,825 0.03
USD 2,000,000 CommScope Inc ‘144A’ 5.5% 1/3/2024 2,045,000 0.02
USD 1,000,000 CommScope Inc ‘144A’ 5.5% 15/6/2024 947,500 0.01
USD 1,815,000 CommScope Inc ‘144A’ 6% 1/3/2026 1,851,300 0.02
USD 1,000,000 CommScope Inc ‘144A’ 8.25% 1/3/2027 983,750 0.01
USD 1,400,000 Connecticut State Health & Educational Facilities Authority 5% 1/7/2045 1,604,330 0.02
USD 2,075,000 Connecticut State Health & Educational Facilities Authority 5% 1/7/2045 2,379,070 0.02
USD 1,630,850 Conseco Finance Corp ‘Series 1997-3 M1’ FRN 15/3/2028 1,647,411 0.02
USD 953,096 Conseco Finance Corp ‘Series 1997-6 M1’ FRN 15/1/2029 976,395 0.01
USD 1,339,657 Conseco Finance Corp ‘Series 1999-5 A5’ FRN 1/3/2030 986,674 0.01
USD 980,320 Conseco Finance Corp ‘Series 1999-5 A6’ FRN 1/3/2030 697,670 0.01
USD 285,088 Conseco Finance Corp ‘Series 1998-4 M1’ FRN 1/4/2030 265,960 0.00
USD 698,262 Conseco Finance Corp ‘Series 1998-6 M1’ FRN 1/6/2030 675,527 0.01
USD 2,117,920 Conseco Finance Corp ‘Series 1998-8 M1’ FRN 1/9/2030 1,920,905 0.02
USD 888,963 Conseco Finance Corp ‘Series 1998-8 A1’ 6.28% 1/9/2030 948,784 0.01
USD 1,323,631 Conseco Finance Securitizations Corp ‘Series 2000-1 A5’ FRN 1/9/2029 587,983 0.01
USD 1,653,836 Conseco Finance Securitizations Corp ‘Series 2000-4 A6’ FRN 1/5/2032 719,686 0.01
Fixed Income Global Opportunities Fund continued
Portfolio of Investments 31 August 2019

Transferable Securities and Money Market Instruments Admitted to an Official Stock Exchange Listing or Dealt in on Another Regulated Market
Transferable Securities and Money Market Instruments Admitted to an Official Stock Exchange Listing or Dealt in on Another Regulated Market
Holding
Description
Market Value (USD)
% of Net
Assets
Holding
Description
Market Value (USD)
% of Net
Assets
The notes on pages 728 to 741 form an integral part of these financial statements.
[318] BlackRock Global Funds (BGF)
USD 1,915,218 Conseco Finance Securitizations Corp ‘Series 2000-5 A6’ 7.96% 1/5/2031 1,062,786 0.01
USD 4,611,852 Conseco Finance Securitizations Corp ‘Series 2000-4 A5’ 7.97% 1/5/2032 1,925,531 0.02
USD 3,485,723 Conseco Finance Securitizations Corp ‘Series 2000-5 A7’ 8.2% 1/5/2031 1,988,803 0.02
USD 143 Continental Airlines 2000-1 Class B Pass Through Trust 8.388% 1/11/2020 149 0.00
USD 5,106,000 Continental Resources Inc/OK 5% 15/9/2022 5,147,404 0.05
USD 890,000 Contra Costa Community College District 6.504% 1/8/2034 1,240,949 0.01
USD 8,992,000 Core Industrial Trust 2015-CALW ‘Series 2015-CALW G’ ‘144A’ FRN 10/2/2034 9,090,328 0.09
USD 2,480,000 Core Industrial Trust 2015-TEXW ‘Series 2015-TEXW D’ ‘144A’ FRN 10/2/2034 2,574,530 0.03
USD 1,269,000 Core Industrial Trust 2015-TEXW ‘Series 2015-TEXW E’ ‘144A’ FRN 10/2/2034 1,310,685 0.01
USD 3,140,000 Core Industrial Trust 2015-TEXW ‘Series 2015-TEXW F’ ‘144A’ FRN 10/2/2034 3,226,031 0.03
USD 13,239,906 Core Industrial Trust 2015-TEXW ‘Series 2015-TEXW XA’ ‘144A’ FRN 10/2/2034 204,689 0.00
USD 424,000 Core Industrial Trust 2015-WEST ‘Series 2015-WEST E’ ‘144A’ FRN 10/2/2037 454,452 0.00
USD 27,146,221 Core Industrial Trust 2015-WEST ‘Series 2015-WEST XA’ ‘144A’ FRN 10/2/2037 1,259,313 0.01
EUR 200,000 Coty Inc 4% 15/4/2023 220,149 0.00 USD 4,800,000 Countrywide Asset-Backed
Certificates ‘Series 2006-BC4 M1’ FRN 25/11/2036 4,228,208 0.04
USD 1,331,769 Countrywide Asset-Backed Certificates (Step-up coupon) ‘Series 2006-S3 A4’ 6.634% 25/1/2029 1,440,715 0.02
USD 540,000 County of Clark Department of Aviation 5% 1/7/2032 708,844 0.01
USD 540,000 County of Clark Department of Aviation 5% 1/7/2033 707,022 0.01
USD 1,140,000 County of Clark Department of Aviation 5% 1/7/2035 1,481,327 0.02
USD 970,000 County of Clark Department of Aviation 5% 1/7/2041 1,235,693 0.01
USD 1,930,000 County of Clark Department of Aviation 5% 1/7/2042 2,456,012 0.03
USD 1,670,000 County of King WA Sewer Revenue 5% 1/7/2047 1,932,474 0.02
USD 3,560,000 County of Miami-Dade FL Aviation Revenue 2.529% 1/10/2030 3,596,846 0.04
USD 455,000 County of Miami-Dade FL Aviation Revenue 3.354% 1/10/2029 495,402 0.01
USD 835,000 County of Miami-Dade FL Aviation Revenue 3.454% 1/10/2030 913,252 0.01
USD 780,000 County of Miami-Dade FL Aviation Revenue 3.504% 1/10/2031 854,548 0.01
USD 1,545,000 County of Miami-Dade FL Aviation Revenue 4.062% 1/10/2031 1,770,176 0.02
USD 1,810,000 County of Miami-Dade FL Aviation Revenue 5% 1/10/2038 2,114,080 0.02
USD 1,560,000 County of Miami-Dade FL Aviation Revenue 5% 1/10/2040 1,888,045 0.02
USD 2,810,000 Cox Communications Inc ‘144A’ 3.25% 15/12/2022 2,887,581 0.03
USD 1,491,000 Cox Communications Inc ‘144A’ 3.5% 15/8/2027 1,568,209 0.02
USD 935,573 Credit Suisse ABS Repackaging Trust 2013-A ‘Series 2013-A B’ ‘144A’ 2.5% 25/1/2030 914,856 0.01
USD 31,016 Credit Suisse First Boston Mortgage Securities Corp ‘Series 2005-C3 C’ FRN 15/7/2037 30,909 0.00
USD 9,103 Credit Suisse First Boston Mortgage Securities Corp ‘Series 2005-C2 AMFX’ 4.877% 15/4/2037 9,118 0.00
USD 7,509,583 Credit Suisse Mortgage Capital Certificates ‘Series 2009-12R 3A1’ ‘144A’ 6.5% 27/10/2037 4,335,738 0.04
USD 2,161,359 Credit-Based Asset Servicing & Securitization LLC ‘Series 2007-CB6 A4’ ‘144A’ FRN 25/7/2037 1,485,242 0.02
USD 395,153 Credit-Based Asset Servicing & Securitization LLC (Step-up coupon) ‘Series 2006-CB2 AF4’ 3.43% 25/12/2036 364,479 0.00
USD 3,808,315 Credit-Based Asset Servicing & Securitization LLC (Step-up coupon) ‘Series 2006-SL1 A2’ ‘144A’ 6.056% 25/9/2036 555,162 0.01
USD 705,000 Credit-Based Asset Servicing & Securitization LLC (Step-up coupon) ‘Series 2006-MH1 B1’ ‘144A’ 6.25% 25/10/2036 735,489 0.01
USD 1,895,000 Crown Castle International Corp 3.1% 15/11/2029 1,937,183 0.02
USD 12,087,000 Crown Castle International Corp 3.65% 1/9/2027 12,880,860 0.13
USD 1,080,000 Crown Castle International Corp 4.3% 15/2/2029 1,210,117 0.01
USD 2,983,000 CrownRock LP / CrownRock Finance Inc ‘144A’ 5.625% 15/10/2025 2,949,441 0.03
USD 19,163,000 CSAIL 2017-CX10 Commercial Mortgage Trust FRN 15/11/2027 321,417 0.00
USD 830,000 CSAIL 2018-C14 Commercial Mortgage Trust ‘Series 2018-C14 C’ FRN 15/11/2051 948,213 0.01
USD 4,898,000 CSC Holdings LLC ‘144A’ 5.375% 15/7/2023 5,038,817 0.05
USD 329,000 CSC Holdings LLC ‘144A’ 5.375% 1/2/2028 350,796 0.00
USD 492,000 CSC Holdings LLC ‘144A’ 5.5% 15/5/2026 520,597 0.01
USD 553,000 CSC Holdings LLC ‘144A’ 5.5% 15/4/2027 593,093 0.01
USD 675,000 CSC Holdings LLC ‘144A’ 6.5% 1/2/2029 754,734 0.01
USD 5,781,000 CSC Holdings LLC ‘144A’ 6.625% 15/10/2025 6,212,899 0.06
USD 8,739,000 CSC Holdings LLC ‘144A’ 10.875% 15/10/2025 9,935,151 0.10
USD 1,051,781 CSFB Mortgage-Backed Pass-Through Certificates Series 2005-10 ‘Series 2005-10 10A1’ FRN 25/11/2035 328,809 0.00
USD 122,260,000 CSMC 2014-USA OA LLC ‘Series 2014-USA X2’ ‘144A’ FRN 15/9/2037 558,728 0.01
Fixed Income Global Opportunities Fund continued
Portfolio of Investments 31 August 2019
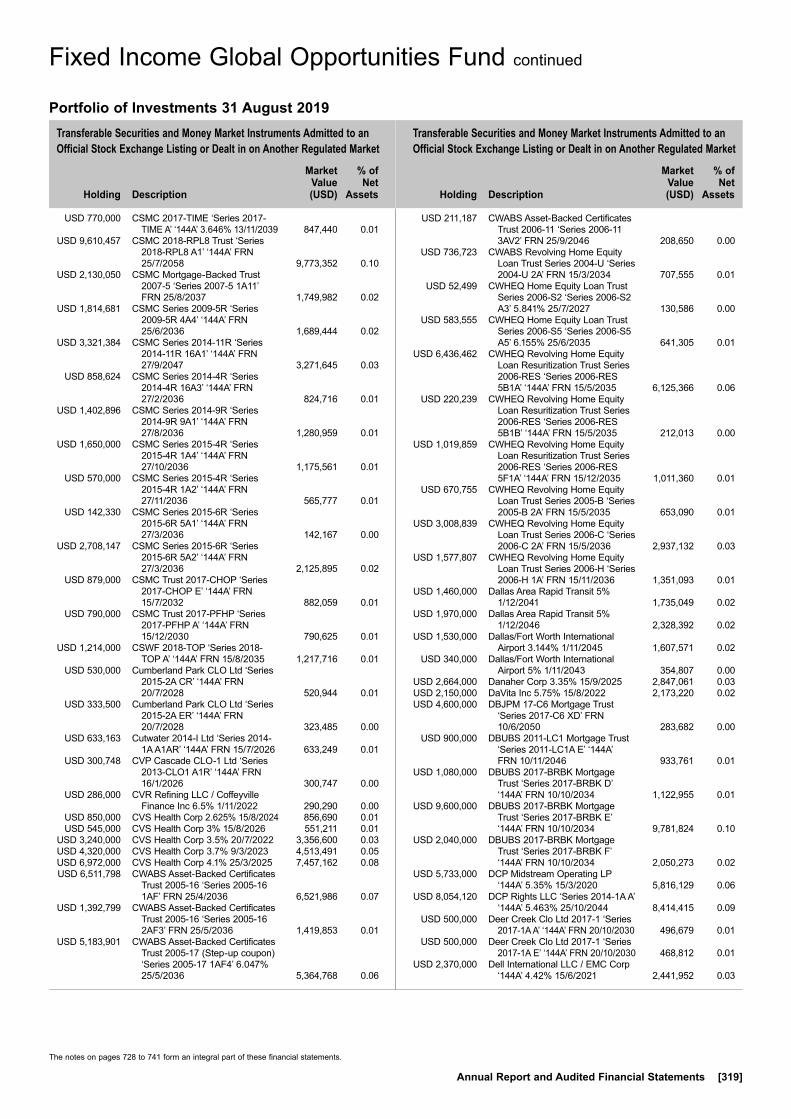
Transferable Securities and Money Market Instruments Admitted to an Official Stock Exchange Listing or Dealt in on Another Regulated Market
Transferable Securities and Money Market Instruments Admitted to an Official Stock Exchange Listing or Dealt in on Another Regulated Market
Holding
Description
Market Value (USD)
% of Net
Assets
Holding
Description
Market Value (USD)
% of Net
Assets
The notes on pages 728 to 741 form an integral part of these financial statements.
Annual Report and Audited Financial Statements [319]
USD 770,000 CSMC 2017-TIME ‘Series 2017-TIME A’ ‘144A’ 3.646% 13/11/2039 847,440 0.01
USD 9,610,457 CSMC 2018-RPL8 Trust ‘Series 2018-RPL8 A1’ ‘144A’ FRN 25/7/2058 9,773,352 0.10
USD 2,130,050 CSMC Mortgage-Backed Trust 2007-5 ‘Series 2007-5 1A11’ FRN 25/8/2037 1,749,982 0.02
USD 1,814,681 CSMC Series 2009-5R ‘Series 2009-5R 4A4’ ‘144A’ FRN 25/6/2036 1,689,444 0.02
USD 3,321,384 CSMC Series 2014-11R ‘Series 2014-11R 16A1’ ‘144A’ FRN 27/9/2047 3,271,645 0.03
USD 858,624 CSMC Series 2014-4R ‘Series 2014-4R 16A3’ ‘144A’ FRN 27/2/2036 824,716 0.01
USD 1,402,896 CSMC Series 2014-9R ‘Series 2014-9R 9A1’ ‘144A’ FRN 27/8/2036 1,280,959 0.01
USD 1,650,000 CSMC Series 2015-4R ‘Series 2015-4R 1A4’ ‘144A’ FRN 27/10/2036 1,175,561 0.01
USD 570,000 CSMC Series 2015-4R ‘Series 2015-4R 1A2’ ‘144A’ FRN 27/11/2036 565,777 0.01
USD 142,330 CSMC Series 2015-6R ‘Series 2015-6R 5A1’ ‘144A’ FRN 27/3/2036 142,167 0.00
USD 2,708,147 CSMC Series 2015-6R ‘Series 2015-6R 5A2’ ‘144A’ FRN 27/3/2036 2,125,895 0.02
USD 879,000 CSMC Trust 2017-CHOP ‘Series 2017-CHOP E’ ‘144A’ FRN 15/7/2032 882,059 0.01
USD 790,000 CSMC Trust 2017-PFHP ‘Series 2017-PFHP A’ ‘144A’ FRN 15/12/2030 790,625 0.01
USD 1,214,000 CSWF 2018-TOP ‘Series 2018-TOP A’ ‘144A’ FRN 15/8/2035 1,217,716 0.01
USD 530,000 Cumberland Park CLO Ltd ‘Series 2015-2A CR’ ‘144A’ FRN 20/7/2028 520,944 0.01
USD 333,500 Cumberland Park CLO Ltd ‘Series 2015-2A ER’ ‘144A’ FRN 20/7/2028 323,485 0.00
USD 633,163 Cutwater 2014-I Ltd ‘Series 2014-1A A1AR’ ‘144A’ FRN 15/7/2026 633,249 0.01
USD 300,748 CVP Cascade CLO-1 Ltd ‘Series 2013-CLO1 A1R’ ‘144A’ FRN 16/1/2026 300,747 0.00
USD 286,000 CVR Refining LLC / Coffeyville Finance Inc 6.5% 1/11/2022 290,290 0.00
USD 850,000 CVS Health Corp 2.625% 15/8/2024 856,690 0.01 USD 545,000 CVS Health Corp 3% 15/8/2026 551,211 0.01 USD 3,240,000 CVS Health Corp 3.5% 20/7/2022 3,356,600 0.03 USD 4,320,000 CVS Health Corp 3.7% 9/3/2023 4,513,491 0.05 USD 6,972,000 CVS Health Corp 4.1% 25/3/2025 7,457,162 0.08 USD 6,511,798 CWABS Asset-Backed Certificates
Trust 2005-16 ‘Series 2005-16 1AF’ FRN 25/4/2036 6,521,986 0.07
USD 1,392,799 CWABS Asset-Backed Certificates Trust 2005-16 ‘Series 2005-16 2AF3’ FRN 25/5/2036 1,419,853 0.01
USD 5,183,901 CWABS Asset-Backed Certificates Trust 2005-17 (Step-up coupon) ‘Series 2005-17 1AF4’ 6.047% 25/5/2036 5,364,768 0.06
USD 211,187 CWABS Asset-Backed Certificates Trust 2006-11 ‘Series 2006-11 3AV2’ FRN 25/9/2046 208,650 0.00
USD 736,723 CWABS Revolving Home Equity Loan Trust Series 2004-U ‘Series 2004-U 2A’ FRN 15/3/2034 707,555 0.01
USD 52,499 CWHEQ Home Equity Loan Trust Series 2006-S2 ‘Series 2006-S2 A3’ 5.841% 25/7/2027 130,586 0.00
USD 583,555 CWHEQ Home Equity Loan Trust Series 2006-S5 ‘Series 2006-S5 A5’ 6.155% 25/6/2035 641,305 0.01
USD 6,436,462 CWHEQ Revolving Home Equity Loan Resuritization Trust Series 2006-RES ‘Series 2006-RES 5B1A’ ‘144A’ FRN 15/5/2035 6,125,366 0.06
USD 220,239 CWHEQ Revolving Home Equity Loan Resuritization Trust Series 2006-RES ‘Series 2006-RES 5B1B’ ‘144A’ FRN 15/5/2035 212,013 0.00
USD 1,019,859 CWHEQ Revolving Home Equity Loan Resuritization Trust Series 2006-RES ‘Series 2006-RES 5F1A’ ‘144A’ FRN 15/12/2035 1,011,360 0.01
USD 670,755 CWHEQ Revolving Home Equity Loan Trust Series 2005-B ‘Series 2005-B 2A’ FRN 15/5/2035 653,090 0.01
USD 3,008,839 CWHEQ Revolving Home Equity Loan Trust Series 2006-C ‘Series 2006-C 2A’ FRN 15/5/2036 2,937,132 0.03
USD 1,577,807 CWHEQ Revolving Home Equity Loan Trust Series 2006-H ‘Series 2006-H 1A’ FRN 15/11/2036 1,351,093 0.01
USD 1,460,000 Dallas Area Rapid Transit 5% 1/12/2041 1,735,049 0.02
USD 1,970,000 Dallas Area Rapid Transit 5% 1/12/2046 2,328,392 0.02
USD 1,530,000 Dallas/Fort Worth International Airport 3.144% 1/11/2045 1,607,571 0.02
USD 340,000 Dallas/Fort Worth International Airport 5% 1/11/2043 354,807 0.00
USD 2,664,000 Danaher Corp 3.35% 15/9/2025 2,847,061 0.03 USD 2,150,000 DaVita Inc 5.75% 15/8/2022 2,173,220 0.02 USD 4,600,000 DBJPM 17-C6 Mortgage Trust
‘Series 2017-C6 XD’ FRN 10/6/2050 283,682 0.00
USD 900,000 DBUBS 2011-LC1 Mortgage Trust ‘Series 2011-LC1A E’ ‘144A’ FRN 10/11/2046 933,761 0.01
USD 1,080,000 DBUBS 2017-BRBK Mortgage Trust ‘Series 2017-BRBK D’ ‘144A’ FRN 10/10/2034 1,122,955 0.01
USD 9,600,000 DBUBS 2017-BRBK Mortgage Trust ‘Series 2017-BRBK E’ ‘144A’ FRN 10/10/2034 9,781,824 0.10
USD 2,040,000 DBUBS 2017-BRBK Mortgage Trust ‘Series 2017-BRBK F’ ‘144A’ FRN 10/10/2034 2,050,273 0.02
USD 5,733,000 DCP Midstream Operating LP ‘144A’ 5.35% 15/3/2020 5,816,129 0.06
USD 8,054,120 DCP Rights LLC ‘Series 2014-1A A’ ‘144A’ 5.463% 25/10/2044 8,414,415 0.09
USD 500,000 Deer Creek Clo Ltd 2017-1 ‘Series 2017-1A A’ ‘144A’ FRN 20/10/2030 496,679 0.01
USD 500,000 Deer Creek Clo Ltd 2017-1 ‘Series 2017-1A E’ ‘144A’ FRN 20/10/2030 468,812 0.01
USD 2,370,000 Dell International LLC / EMC Corp ‘144A’ 4.42% 15/6/2021 2,441,952 0.03
Fixed Income Global Opportunities Fund continued
Portfolio of Investments 31 August 2019
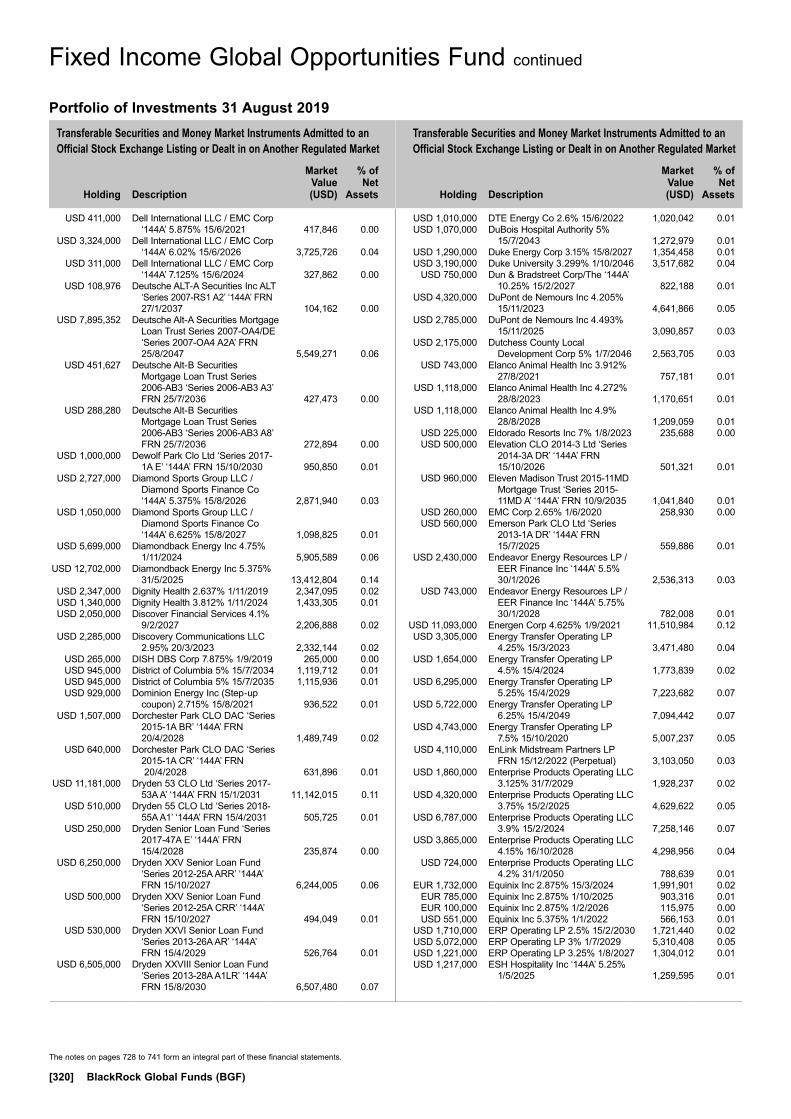
Transferable Securities and Money Market Instruments Admitted to an Official Stock Exchange Listing or Dealt in on Another Regulated Market
Transferable Securities and Money Market Instruments Admitted to an Official Stock Exchange Listing or Dealt in on Another Regulated Market
Holding
Description
Market Value (USD)
% of Net
Assets
Holding
Description
Market Value (USD)
% of Net
Assets
The notes on pages 728 to 741 form an integral part of these financial statements.
[320] BlackRock Global Funds (BGF)
USD 411,000 Dell International LLC / EMC Corp ‘144A’ 5.875% 15/6/2021 417,846 0.00
USD 3,324,000 Dell International LLC / EMC Corp ‘144A’ 6.02% 15/6/2026 3,725,726 0.04
USD 311,000 Dell International LLC / EMC Corp ‘144A’ 7.125% 15/6/2024 327,862 0.00
USD 108,976 Deutsche ALT-A Securities Inc ALT ‘Series 2007-RS1 A2’ ‘144A’ FRN 27/1/2037 104,162 0.00
USD 7,895,352 Deutsche Alt-A Securities Mortgage Loan Trust Series 2007-OA4/DE ‘Series 2007-OA4 A2A’ FRN 25/8/2047 5,549,271 0.06
USD 451,627 Deutsche Alt-B Securities Mortgage Loan Trust Series 2006-AB3 ‘Series 2006-AB3 A3’ FRN 25/7/2036 427,473 0.00
USD 288,280 Deutsche Alt-B Securities Mortgage Loan Trust Series 2006-AB3 ‘Series 2006-AB3 A8’ FRN 25/7/2036 272,894 0.00
USD 1,000,000 Dewolf Park Clo Ltd ‘Series 2017-1A E’ ‘144A’ FRN 15/10/2030 950,850 0.01
USD 2,727,000 Diamond Sports Group LLC / Diamond Sports Finance Co ‘144A’ 5.375% 15/8/2026 2,871,940 0.03
USD 1,050,000 Diamond Sports Group LLC / Diamond Sports Finance Co ‘144A’ 6.625% 15/8/2027 1,098,825 0.01
USD 5,699,000 Diamondback Energy Inc 4.75% 1/11/2024 5,905,589 0.06
USD 12,702,000 Diamondback Energy Inc 5.375% 31/5/2025 13,412,804 0.14
USD 2,347,000 Dignity Health 2.637% 1/11/2019 2,347,095 0.02 USD 1,340,000 Dignity Health 3.812% 1/11/2024 1,433,305 0.01 USD 2,050,000 Discover Financial Services 4.1%
9/2/2027 2,206,888 0.02 USD 2,285,000 Discovery Communications LLC
2.95% 20/3/2023 2,332,144 0.02 USD 265,000 DISH DBS Corp 7.875% 1/9/2019 265,000 0.00 USD 945,000 District of Columbia 5% 15/7/2034 1,119,712 0.01 USD 945,000 District of Columbia 5% 15/7/2035 1,115,936 0.01 USD 929,000 Dominion Energy Inc (Step-up
coupon) 2.715% 15/8/2021 936,522 0.01 USD 1,507,000 Dorchester Park CLO DAC ‘Series
2015-1A BR’ ‘144A’ FRN 20/4/2028 1,489,749 0.02
USD 640,000 Dorchester Park CLO DAC ‘Series 2015-1A CR’ ‘144A’ FRN 20/4/2028 631,896 0.01
USD 11,181,000 Dryden 53 CLO Ltd ‘Series 2017-53A A’ ‘144A’ FRN 15/1/2031 11,142,015 0.11
USD 510,000 Dryden 55 CLO Ltd ‘Series 2018-55A A1’ ‘144A’ FRN 15/4/2031 505,725 0.01
USD 250,000 Dryden Senior Loan Fund ‘Series 2017-47A E’ ‘144A’ FRN 15/4/2028 235,874 0.00
USD 6,250,000 Dryden XXV Senior Loan Fund ‘Series 2012-25A ARR’ ‘144A’ FRN 15/10/2027 6,244,005 0.06
USD 500,000 Dryden XXV Senior Loan Fund ‘Series 2012-25A CRR’ ‘144A’ FRN 15/10/2027 494,049 0.01
USD 530,000 Dryden XXVI Senior Loan Fund ‘Series 2013-26A AR’ ‘144A’ FRN 15/4/2029 526,764 0.01
USD 6,505,000 Dryden XXVIII Senior Loan Fund ‘Series 2013-28A A1LR’ ‘144A’ FRN 15/8/2030 6,507,480 0.07
USD 1,010,000 DTE Energy Co 2.6% 15/6/2022 1,020,042 0.01 USD 1,070,000 DuBois Hospital Authority 5%
15/7/2043 1,272,979 0.01 USD 1,290,000 Duke Energy Corp 3.15% 15/8/2027 1,354,458 0.01 USD 3,190,000 Duke University 3.299% 1/10/2046 3,517,682 0.04 USD 750,000 Dun & Bradstreet Corp/The ‘144A’
10.25% 15/2/2027 822,188 0.01 USD 4,320,000 DuPont de Nemours Inc 4.205%
15/11/2023 4,641,866 0.05 USD 2,785,000 DuPont de Nemours Inc 4.493%
15/11/2025 3,090,857 0.03 USD 2,175,000 Dutchess County Local
Development Corp 5% 1/7/2046 2,563,705 0.03 USD 743,000 Elanco Animal Health Inc 3.912%
27/8/2021 757,181 0.01 USD 1,118,000 Elanco Animal Health Inc 4.272%
28/8/2023 1,170,651 0.01 USD 1,118,000 Elanco Animal Health Inc 4.9%
28/8/2028 1,209,059 0.01 USD 225,000 Eldorado Resorts Inc 7% 1/8/2023 235,688 0.00 USD 500,000 Elevation CLO 2014-3 Ltd ‘Series
2014-3A DR’ ‘144A’ FRN 15/10/2026 501,321 0.01
USD 960,000 Eleven Madison Trust 2015-11MD Mortgage Trust ‘Series 2015-11MD A’ ‘144A’ FRN 10/9/2035 1,041,840 0.01
USD 260,000 EMC Corp 2.65% 1/6/2020 258,930 0.00 USD 560,000 Emerson Park CLO Ltd ‘Series
2013-1A DR’ ‘144A’ FRN 15/7/2025 559,886 0.01
USD 2,430,000 Endeavor Energy Resources LP / EER Finance Inc ‘144A’ 5.5% 30/1/2026 2,536,313 0.03
USD 743,000 Endeavor Energy Resources LP / EER Finance Inc ‘144A’ 5.75% 30/1/2028 782,008 0.01
USD 11,093,000 Energen Corp 4.625% 1/9/2021 11,510,984 0.12 USD 3,305,000 Energy Transfer Operating LP
4.25% 15/3/2023 3,471,480 0.04 USD 1,654,000 Energy Transfer Operating LP
4.5% 15/4/2024 1,773,839 0.02 USD 6,295,000 Energy Transfer Operating LP
5.25% 15/4/2029 7,223,682 0.07 USD 5,722,000 Energy Transfer Operating LP
6.25% 15/4/2049 7,094,442 0.07 USD 4,743,000 Energy Transfer Operating LP
7.5% 15/10/2020 5,007,237 0.05 USD 4,110,000 EnLink Midstream Partners LP
FRN 15/12/2022 (Perpetual) 3,103,050 0.03 USD 1,860,000 Enterprise Products Operating LLC
3.125% 31/7/2029 1,928,237 0.02 USD 4,320,000 Enterprise Products Operating LLC
3.75% 15/2/2025 4,629,622 0.05 USD 6,787,000 Enterprise Products Operating LLC
3.9% 15/2/2024 7,258,146 0.07 USD 3,865,000 Enterprise Products Operating LLC
4.15% 16/10/2028 4,298,956 0.04 USD 724,000 Enterprise Products Operating LLC
4.2% 31/1/2050 788,639 0.01 EUR 1,732,000 Equinix Inc 2.875% 15/3/2024 1,991,901 0.02 EUR 785,000 Equinix Inc 2.875% 1/10/2025 903,316 0.01 EUR 100,000 Equinix Inc 2.875% 1/2/2026 115,975 0.00 USD 551,000 Equinix Inc 5.375% 1/1/2022 566,153 0.01 USD 1,710,000 ERP Operating LP 2.5% 15/2/2030 1,721,440 0.02 USD 5,072,000 ERP Operating LP 3% 1/7/2029 5,310,408 0.05 USD 1,221,000 ERP Operating LP 3.25% 1/8/2027 1,304,012 0.01 USD 1,217,000 ESH Hospitality Inc ‘144A’ 5.25%
1/5/2025 1,259,595 0.01
Fixed Income Global Opportunities Fund continued
Portfolio of Investments 31 August 2019

Transferable Securities and Money Market Instruments Admitted to an Official Stock Exchange Listing or Dealt in on Another Regulated Market
Transferable Securities and Money Market Instruments Admitted to an Official Stock Exchange Listing or Dealt in on Another Regulated Market
Holding
Description
Market Value (USD)
% of Net
Assets
Holding
Description
Market Value (USD)
% of Net
Assets
The notes on pages 728 to 741 form an integral part of these financial statements.
Annual Report and Audited Financial Statements [321]
USD 3,543,335 Exantas Capital Corp 2018-RSO6 Ltd ‘Series 2018-RSO6 A’ ‘144A’ FRN 15/6/2035 3,549,839 0.04
USD 2,705,000 Extraction Oil & Gas Inc ‘144A’ 7.375% 15/5/2024 2,042,275 0.02
USD 1,861,380 Fannie Mae Pool ‘890694’ 4% 1/9/2045 2,011,202 0.02
USD 168,962 Fannie Mae Pool ‘890751’ 4% 1/9/2046 180,769 0.00
USD 1,446,386 Fannie Mae Pool ‘AB8742’ 4% 1/3/2043 1,575,879 0.02
USD 1,961,965 Fannie Mae Pool ‘AB9076’ 4% 1/4/2043 2,137,399 0.02
USD 3,786,252 Fannie Mae Pool ‘AE0625’ 4% 1/12/2040 4,106,614 0.04
USD 43,013 Fannie Mae Pool ‘AL5624’ 4.5% 1/8/2044 47,919 0.00
USD 91,456 Fannie Mae Pool ‘AL8195’ 4.5% 1/2/2046 101,874 0.00
USD 2,369,766 Fannie Mae Pool ‘AL9276’ 4% 1/9/2046 2,541,450 0.03
USD 107,359 Fannie Mae Pool ‘AL9281’ 4.5% 1/9/2046 115,552 0.00
USD 112,077 Fannie Mae Pool ‘AL9520’ 4% 1/2/2046 119,918 0.00
USD 325,544 Fannie Mae Pool ‘AL9980’ 4% 1/2/2046 348,293 0.00
USD 2,622,667 Fannie Mae Pool ‘AP6347’ 4% 1/9/2042 2,858,175 0.03
USD 947,782 Fannie Mae Pool ‘AS3707’ 4% 1/11/2044 1,011,056 0.01
USD 5,507,117 Fannie Mae Pool ‘AS4067’ 4% 1/12/2044 6,001,184 0.06
USD 43,880 Fannie Mae Pool ‘AS5848’ 4.5% 1/9/2045 48,889 0.00
USD 109,732 Fannie Mae Pool ‘AS6016’ 4% 1/10/2045 117,414 0.00
USD 63,722 Fannie Mae Pool ‘AS6220’ 4% 1/11/2045 68,184 0.00
USD 2,678,463 Fannie Mae Pool ‘AS6840’ 4% 1/3/2046 2,857,440 0.03
USD 3,847,170 Fannie Mae Pool ‘AS7940’ 4% 1/9/2046 4,104,702 0.04
USD 4,218,349 Fannie Mae Pool ‘AS8376’ 4% 1/11/2046 4,500,738 0.05
USD 6,307,265 Fannie Mae Pool ‘AS8377’ 4% 1/11/2046 6,729,493 0.07
USD 190,118 Fannie Mae Pool ‘AS9920’ 4% 1/7/2047 202,813 0.00
USD 1,601,918 Fannie Mae Pool ‘BC0170’ 4% 1/1/2046 1,708,961 0.02
USD 1,812,195 Fannie Mae Pool ‘BC0908’ 4% 1/5/2046 1,931,252 0.02
USD 3,912,495 Fannie Mae Pool ‘BC1222’ 4% 1/7/2046 4,227,385 0.04
USD 250,901 Fannie Mae Pool ‘BD6043’ 4% 1/8/2046 271,095 0.00
USD 7,619,886 Fannie Mae Pool ‘BD7085’ 4% 1/3/2047 8,232,056 0.08
USD 28,252 Fannie Mae Pool ‘BE5013’ 4% 1/2/2045 30,229 0.00
USD 1,408,292 Fannie Mae Pool ‘BE5047’ 4% 1/11/2046 1,521,620 0.02
USD 842,332 Fannie Mae Pool ‘BJ8745’ 3.5% 1/8/2049 881,898 0.01
USD 735,894 Fannie Mae Pool ‘BJ8749’ 3.5% 1/9/2049 773,616 0.01
USD 313,440 Fannie Mae Pool ‘BJ8759’ 3% 1/8/2034 322,136 0.00
USD 159,957 Fannie Mae Pool ‘BJ8784’ 4% 1/2/2048 174,179 0.00
USD 1,772,911 Fannie Mae Pool ‘BK4213’ 4% 1/7/2048 1,889,972 0.02
USD 477,472 Fannie Mae Pool ‘BM1068’ 3.5% 1/1/2032 499,356 0.01
USD 4,602,173 Fannie Mae Pool ‘BM1907’ 4% 1/11/2046 5,014,272 0.05
USD 14,144,347 Fannie Mae Pool ‘BM4299’ 3% 1/3/2030 14,542,833 0.15
USD 25,452,789 Fannie Mae Pool ‘BM4857’ 4% 1/3/2048 27,716,154 0.28
USD 5,317,045 Fannie Mae Pool ‘BM4858’ 4% 1/8/2048 5,789,890 0.06
USD 16,251,399 Fannie Mae Pool ‘BM4859’ 4% 1/4/2048 17,547,813 0.18
USD 44,420 Fannie Mae Pool ‘BM4888’ 4.5% 1/8/2048 49,440 0.00
USD 23,905 Fannie Mae Pool ‘BM4889’ 4.5% 1/1/2047 25,972 0.00
USD 5,868,242 Fannie Mae Pool ‘BM5757’ 4% 1/8/2048 6,335,426 0.07
USD 2,071,507 Fannie Mae Pool ‘BN7683’ 4% 1/8/2049 2,214,940 0.02
USD 1,065,472 Fannie Mae Pool ‘BN7715’ 3% 1/8/2034 1,095,690 0.01
USD 884,128 Fannie Mae Pool ‘BN7720’ 3% 1/8/2034 907,180 0.01
USD 278,013 Fannie Mae Pool ‘BO1822’ 3.5% 1/7/2034 288,621 0.00
USD 843,750 Fannie Mae Pool ‘BO1835’ 3.5% 1/7/2034 887,930 0.01
USD 662,918 Fannie Mae Pool ‘BO1837’ 3.5% 1/7/2034 698,041 0.01
USD 10,688,378 Fannie Mae Pool ‘BO1844’ 3.5% 1/8/2049 11,221,117 0.12
USD 868,981 Fannie Mae Pool ‘BO4492’ 3% 1/8/2034 893,091 0.01
USD 109,268 Fannie Mae Pool ‘CA1008’ 4% 1/1/2048 116,906 0.00
USD 27,262 Fannie Mae Pool ‘CA3344’ 4.5% 1/4/2049 30,257 0.00
USD 8,261,728 Fannie Mae Pool ‘CA3500’ 4% 1/5/2049 8,842,557 0.09
USD 6,466,642 Fannie Mae Pool ‘CA3668’ 4% 1/6/2049 6,841,641 0.07
USD 13,676,039 Fannie Mae Pool ‘CA3821’ 4% 1/7/2049 14,791,837 0.15
USD 10,177,682 Fannie Mae Pool ‘CA3826’ 4% 1/7/2049 10,882,702 0.11
USD 3,078,453 Fannie Mae Pool ‘CA3831’ 4% 1/7/2049 3,348,343 0.03
USD 7,861,168 Fannie Mae Pool ‘CA3832’ 4% 1/7/2049 8,550,367 0.09
USD 2,862,455 Fannie Mae Pool ‘CA3925’ 3.5% 1/7/2034 3,012,324 0.03
USD 5,742,980 Fannie Mae Pool ‘CA4084’ 3% 1/9/2034 5,901,612 0.06
USD 3,381,470 Fannie Mae Pool ‘CA4087’ 3.5% 1/8/2034 3,559,362 0.04
USD 2,859,740 Fannie Mae Pool ‘CA4088’ 3.5% 1/9/2034 3,003,117 0.03
USD 6,103,479 Fannie Mae Pool ‘CA4112’ 3.5% 1/9/2049 6,431,288 0.07
USD 7,315,643 Fannie Mae Pool ‘CA4119’ 4% 1/9/2049 7,703,085 0.08
USD 6,242,040 Fannie Mae Pool ‘CA4124’ 4% 1/9/2049 6,584,449 0.07
Fixed Income Global Opportunities Fund continued
Portfolio of Investments 31 August 2019
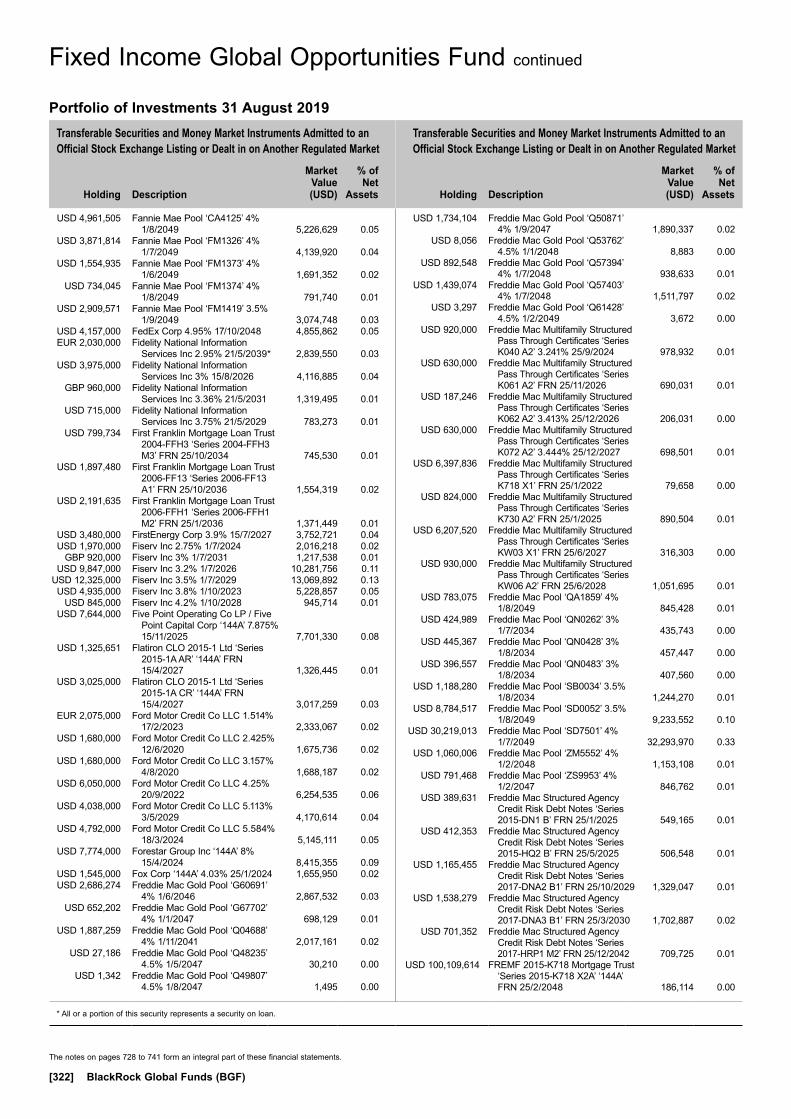
Transferable Securities and Money Market Instruments Admitted to an Official Stock Exchange Listing or Dealt in on Another Regulated Market
Transferable Securities and Money Market Instruments Admitted to an Official Stock Exchange Listing or Dealt in on Another Regulated Market
Holding
Description
Market Value (USD)
% of Net
Assets
Holding
Description
Market Value (USD)
% of Net
Assets
* All or a portion of this security represents a security on loan.
The notes on pages 728 to 741 form an integral part of these financial statements.
[322] BlackRock Global Funds (BGF)
USD 4,961,505 Fannie Mae Pool ‘CA4125’ 4% 1/8/2049 5,226,629 0.05
USD 3,871,814 Fannie Mae Pool ‘FM1326’ 4% 1/7/2049 4,139,920 0.04
USD 1,554,935 Fannie Mae Pool ‘FM1373’ 4% 1/6/2049 1,691,352 0.02
USD 734,045 Fannie Mae Pool ‘FM1374’ 4% 1/8/2049 791,740 0.01
USD 2,909,571 Fannie Mae Pool ‘FM1419’ 3.5% 1/9/2049 3,074,748 0.03
USD 4,157,000 FedEx Corp 4.95% 17/10/2048 4,855,862 0.05 EUR 2,030,000 Fidelity National Information
Services Inc 2.95% 21/5/2039* 2,839,550 0.03 USD 3,975,000 Fidelity National Information
Services Inc 3% 15/8/2026 4,116,885 0.04 GBP 960,000 Fidelity National Information
Services Inc 3.36% 21/5/2031 1,319,495 0.01 USD 715,000 Fidelity National Information
Services Inc 3.75% 21/5/2029 783,273 0.01 USD 799,734 First Franklin Mortgage Loan Trust
2004-FFH3 ‘Series 2004-FFH3 M3’ FRN 25/10/2034 745,530 0.01
USD 1,897,480 First Franklin Mortgage Loan Trust 2006-FF13 ‘Series 2006-FF13 A1’ FRN 25/10/2036 1,554,319 0.02
USD 2,191,635 First Franklin Mortgage Loan Trust 2006-FFH1 ‘Series 2006-FFH1 M2’ FRN 25/1/2036 1,371,449 0.01
USD 3,480,000 FirstEnergy Corp 3.9% 15/7/2027 3,752,721 0.04 USD 1,970,000 Fiserv Inc 2.75% 1/7/2024 2,016,218 0.02 GBP 920,000 Fiserv Inc 3% 1/7/2031 1,217,538 0.01 USD 9,847,000 Fiserv Inc 3.2% 1/7/2026 10,281,756 0.11 USD 12,325,000 Fiserv Inc 3.5% 1/7/2029 13,069,892 0.13 USD 4,935,000 Fiserv Inc 3.8% 1/10/2023 5,228,857 0.05 USD 845,000 Fiserv Inc 4.2% 1/10/2028 945,714 0.01 USD 7,644,000 Five Point Operating Co LP / Five
Point Capital Corp ‘144A’ 7.875% 15/11/2025 7,701,330 0.08
USD 1,325,651 Flatiron CLO 2015-1 Ltd ‘Series 2015-1A AR’ ‘144A’ FRN 15/4/2027 1,326,445 0.01
USD 3,025,000 Flatiron CLO 2015-1 Ltd ‘Series 2015-1A CR’ ‘144A’ FRN 15/4/2027 3,017,259 0.03
EUR 2,075,000 Ford Motor Credit Co LLC 1.514% 17/2/2023 2,333,067 0.02
USD 1,680,000 Ford Motor Credit Co LLC 2.425% 12/6/2020 1,675,736 0.02
USD 1,680,000 Ford Motor Credit Co LLC 3.157% 4/8/2020 1,688,187 0.02
USD 6,050,000 Ford Motor Credit Co LLC 4.25% 20/9/2022 6,254,535 0.06
USD 4,038,000 Ford Motor Credit Co LLC 5.113% 3/5/2029 4,170,614 0.04
USD 4,792,000 Ford Motor Credit Co LLC 5.584% 18/3/2024 5,145,111 0.05
USD 7,774,000 Forestar Group Inc ‘144A’ 8% 15/4/2024 8,415,355 0.09
USD 1,545,000 Fox Corp ‘144A’ 4.03% 25/1/2024 1,655,950 0.02 USD 2,686,274 Freddie Mac Gold Pool ‘G60691’
4% 1/6/2046 2,867,532 0.03 USD 652,202 Freddie Mac Gold Pool ‘G67702’
4% 1/1/2047 698,129 0.01 USD 1,887,259 Freddie Mac Gold Pool ‘Q04688’
4% 1/11/2041 2,017,161 0.02 USD 27,186 Freddie Mac Gold Pool ‘Q48235’
4.5% 1/5/2047 30,210 0.00 USD 1,342 Freddie Mac Gold Pool ‘Q49807’
4.5% 1/8/2047 1,495 0.00
USD 1,734,104 Freddie Mac Gold Pool ‘Q50871’ 4% 1/9/2047 1,890,337 0.02
USD 8,056 Freddie Mac Gold Pool ‘Q53762’ 4.5% 1/1/2048 8,883 0.00
USD 892,548 Freddie Mac Gold Pool ‘Q57394’ 4% 1/7/2048 938,633 0.01
USD 1,439,074 Freddie Mac Gold Pool ‘Q57403’ 4% 1/7/2048 1,511,797 0.02
USD 3,297 Freddie Mac Gold Pool ‘Q61428’ 4.5% 1/2/2049 3,672 0.00
USD 920,000 Freddie Mac Multifamily Structured Pass Through Certificates ‘Series K040 A2’ 3.241% 25/9/2024 978,932 0.01
USD 630,000 Freddie Mac Multifamily Structured Pass Through Certificates ‘Series K061 A2’ FRN 25/11/2026 690,031 0.01
USD 187,246 Freddie Mac Multifamily Structured Pass Through Certificates ‘Series K062 A2’ 3.413% 25/12/2026 206,031 0.00
USD 630,000 Freddie Mac Multifamily Structured Pass Through Certificates ‘Series K072 A2’ 3.444% 25/12/2027 698,501 0.01
USD 6,397,836 Freddie Mac Multifamily Structured Pass Through Certificates ‘Series K718 X1’ FRN 25/1/2022 79,658 0.00
USD 824,000 Freddie Mac Multifamily Structured Pass Through Certificates ‘Series K730 A2’ FRN 25/1/2025 890,504 0.01
USD 6,207,520 Freddie Mac Multifamily Structured Pass Through Certificates ‘Series KW03 X1’ FRN 25/6/2027 316,303 0.00
USD 930,000 Freddie Mac Multifamily Structured Pass Through Certificates ‘Series KW06 A2’ FRN 25/6/2028 1,051,695 0.01
USD 783,075 Freddie Mac Pool ‘QA1859’ 4% 1/8/2049 845,428 0.01
USD 424,989 Freddie Mac Pool ‘QN0262’ 3% 1/7/2034 435,743 0.00
USD 445,367 Freddie Mac Pool ‘QN0428’ 3% 1/8/2034 457,447 0.00
USD 396,557 Freddie Mac Pool ‘QN0483’ 3% 1/8/2034 407,560 0.00
USD 1,188,280 Freddie Mac Pool ‘SB0034’ 3.5% 1/8/2034 1,244,270 0.01
USD 8,784,517 Freddie Mac Pool ‘SD0052’ 3.5% 1/8/2049 9,233,552 0.10
USD 30,219,013 Freddie Mac Pool ‘SD7501’ 4% 1/7/2049 32,293,970 0.33
USD 1,060,006 Freddie Mac Pool ‘ZM5552’ 4% 1/2/2048 1,153,108 0.01
USD 791,468 Freddie Mac Pool ‘ZS9953’ 4% 1/2/2047 846,762 0.01
USD 389,631 Freddie Mac Structured Agency Credit Risk Debt Notes ‘Series 2015-DN1 B’ FRN 25/1/2025 549,165 0.01
USD 412,353 Freddie Mac Structured Agency Credit Risk Debt Notes ‘Series 2015-HQ2 B’ FRN 25/5/2025 506,548 0.01
USD 1,165,455 Freddie Mac Structured Agency Credit Risk Debt Notes ‘Series 2017-DNA2 B1’ FRN 25/10/2029 1,329,047 0.01
USD 1,538,279 Freddie Mac Structured Agency Credit Risk Debt Notes ‘Series 2017-DNA3 B1’ FRN 25/3/2030 1,702,887 0.02
USD 701,352 Freddie Mac Structured Agency Credit Risk Debt Notes ‘Series 2017-HRP1 M2’ FRN 25/12/2042 709,725 0.01
USD 100,109,614 FREMF 2015-K718 Mortgage Trust ‘Series 2015-K718 X2A’ ‘144A’ FRN 25/2/2048 186,114 0.00
Fixed Income Global Opportunities Fund continued
Portfolio of Investments 31 August 2019

Transferable Securities and Money Market Instruments Admitted to an Official Stock Exchange Listing or Dealt in on Another Regulated Market
Transferable Securities and Money Market Instruments Admitted to an Official Stock Exchange Listing or Dealt in on Another Regulated Market
Holding
Description
Market Value (USD)
% of Net
Assets
Holding
Description
Market Value (USD)
% of Net
Assets
The notes on pages 728 to 741 form an integral part of these financial statements.
Annual Report and Audited Financial Statements [323]
USD 1,150,000 FREMF 2016-K54 Mortgage Trust ‘Series 2016-K54 B’ ‘144A’ FRN 25/4/2048 1,234,249 0.01
USD 598,333 FREMF 2017-K64 Mortgage Trust ‘Series 2017-K64 B’ ‘144A’ FRN 25/5/2050 644,999 0.01
USD 820,000 FREMF 2017-KGS1 Mortgage Trust ‘Series 2017-KGX1 BFX’ ‘144A’ FRN 25/10/2027 826,835 0.01
USD 1,700,000 FREMF 2018-K732 Mortgage Trust FRN 25/5/2025 1,807,062 0.02
USD 390,000 FREMF 2018-K74 Mortgage Trust ‘Series 2018-K74 B’ ‘144A’ FRN 25/2/2051 423,354 0.00
USD 700,000 FREMF 2018-K77 Mortgage Trust ‘Series 2018-K77 B’ ‘144A’ FRN 25/5/2051 763,872 0.01
USD 9,725,971 Fremont Home Loan Trust 2006-3 ‘Series 2006-3 1A1’ FRN 25/2/2037 7,463,783 0.08
USD 2,198,668 FRESB 2018-SB52 Mortgage Trust ‘Series 2018-SB52 A10F’ FRN 25/6/2028 2,363,014 0.02
USD 1,326,654 FRESB 2018-SB53 Mortgage Trust ‘Series 2018-SB53 A10F’ FRN 25/6/2028 1,481,017 0.02
USD 1,572,000 Frontier Communications Corp ‘144A’ 8% 1/4/2027 1,642,740 0.02
USD 1,831,000 Frontier Communications Corp ‘144A’ 8.5% 1/4/2026 1,780,648 0.02
USD 2,198,000 Galaxy XXIII CLO Ltd ‘Series 2017-23A A’ ‘144A’ FRN 24/4/2029 2,198,612 0.02
USD 250,000 Galaxy XXIX CLO Ltd ‘Series 2018-29A B’ ‘144A’ FRN 15/11/2026 248,456 0.00
USD 850,000 Galaxy XXIX CLO Ltd ‘Series 2018-29A C’ ‘144A’ FRN 15/11/2026 843,277 0.01
USD 2,130,000 Galaxy XXIX CLO Ltd ‘Series 2018-29A D’ ‘144A’ FRN 15/11/2026 2,100,717 0.02
USD 5,056,341 GAM Resecuritization Trust 2018-B FRN 27/1/2027 4,947,415 0.05
USD 282,000 Gates Global LLC / Gates Global Co ‘144A’ 6% 15/7/2022 281,013 0.00
USD 1,230,000 General Electric Co 3.15% 7/9/2022 1,237,066 0.01 USD 1,105,000 General Mills Inc 4.2% 17/4/2028 1,245,015 0.01 USD 3,285,000 General Motors Co FRN 10/9/2021 3,287,672 0.03 USD 4,130,000 General Motors Financial Co Inc
3.15% 30/6/2022 4,185,370 0.04 USD 1,590,000 General Motors Financial Co Inc
3.55% 9/4/2021 1,616,296 0.02 USD 2,060,000 General Motors Financial Co Inc
4.2% 6/11/2021 2,135,453 0.02 USD 15,000 General Motors Financial Co Inc
4.35% 17/1/2027 15,554 0.00 USD 6,092,000 General Motors Financial Co Inc
5.1% 17/1/2024 6,586,189 0.07 USD 3,138,000 George Washington University/The
4.126% 15/9/2048 3,881,324 0.04 USD 313,768 GE-WMC Asset-Backed Pass-
Through Certificates Series 2005-2 ‘Series 2005-2 A2C’ FRN 25/12/2035 312,233 0.00
USD 3,933,673 GE-WMC Asset-Backed Pass-Through Certificates Series 2005-2 ‘Series 2005-2 M1’ FRN 25/12/2035 2,472,177 0.03
USD 1,500,000 Gilbert Park CLO Ltd ‘Series 2017-1A E’ ‘144A’ FRN 15/10/2030 1,435,795 0.02
USD 2,160,000 Gilead Sciences Inc 3.5% 1/2/2025 2,302,319 0.02 USD 9,305,000 Gilead Sciences Inc 3.65% 1/3/2026 10,004,491 0.10
USD 2,455,000 Gilead Sciences Inc 4.8% 1/4/2044 2,968,532 0.03 USD 40,850 GLG Ore Hill CLO 2013-1 Ltd ‘Series
2013-1A A’ ‘144A’ FRN 15/7/2025 40,844 0.00 USD 3,228,000 GLP Capital LP / GLP Financing II
Inc 3.35% 1/9/2024 3,260,183 0.03 USD 1,375,000 GLP Capital LP / GLP Financing II
Inc 4.375% 15/4/2021 1,406,322 0.01 USD 8,692,000 GLP Capital LP / GLP Financing II
Inc 4.875% 1/11/2020 8,903,216 0.09 USD 1,880,000 GLP Capital LP / GLP Financing II
Inc 5.25% 1/6/2025 2,052,152 0.02 USD 904,000 Golden Entertainment Inc ‘144A’
7.625% 15/4/2026 937,900 0.01 USD 720,000 GoldenTree Loan Opportunities IX
Ltd ‘Series 2014-9A AR2’ ‘144A’ FRN 29/10/2029 719,031 0.01
USD 349,000 Goldentree Loan Opportunities XI Ltd ‘Series 2015-11A AR2’ ‘144A’ FRN 18/1/2031 347,622 0.00
USD 2,080,000 Goldman Sachs Group Inc/The FRN 5/6/2023 2,116,076 0.02
USD 410,000 Goldman Sachs Group Inc/The FRN 24/7/2023 416,419 0.00
USD 5,365,000 Goldman Sachs Group Inc/The FRN 1/5/2029 5,940,317 0.06
USD 310,000 Goldman Sachs Group Inc/The 5.75% 24/1/2022 335,680 0.00
USD 2,471,412 Government National Mortgage Association ‘Series 2013-145 SI’ FRN 16/4/2040 156,786 0.00
USD 4,880,163 Government National Mortgage Association ‘Series 2015-48 IO’ FRN 16/2/2050 222,525 0.00
USD 15,768,335 Government National Mortgage Association ‘Series 2013-63 IO’ FRN 16/9/2051 850,594 0.01
USD 2,724,257 Government National Mortgage Association ‘Series 2012-23 IO’ FRN 16/6/2053 63,932 0.00
USD 11,473,639 Government National Mortgage Association ‘Series 2013-30 IO’ FRN 16/9/2053 471,127 0.01
USD 2,254,442 Government National Mortgage Association ‘Series 2013-191 IO’ FRN 16/11/2053 75,920 0.00
USD 12,842,523 Government National Mortgage Association ‘Series 2013-78 IO’ FRN 16/10/2054 539,613 0.01
USD 15,916,288 Government National Mortgage Association ‘Series 2015-22 IO’ FRN 16/3/2055 723,297 0.01
USD 5,748,010 Government National Mortgage Association ‘Series 2015-173 IO’ FRN 16/9/2055 373,567 0.00
USD 9,248,223 Government National Mortgage Association ‘Series 2016-97 IO’ FRN 16/7/2056 783,144 0.01
USD 12,555,437 Government National Mortgage Association ‘Series 2016-128 IO’ FRN 16/9/2056 955,751 0.01
USD 2,240,312 Government National Mortgage Association ‘Series 2015-37 IO’ FRN 16/10/2056 129,693 0.00
USD 4,534,871 Government National Mortgage Association ‘Series 2016-67 IO’ FRN 16/7/2057 368,442 0.00
USD 3,990,055 Government National Mortgage Association ‘Series 2016-36 IO’ FRN 16/8/2057 295,906 0.00
Fixed Income Global Opportunities Fund continued
Portfolio of Investments 31 August 2019
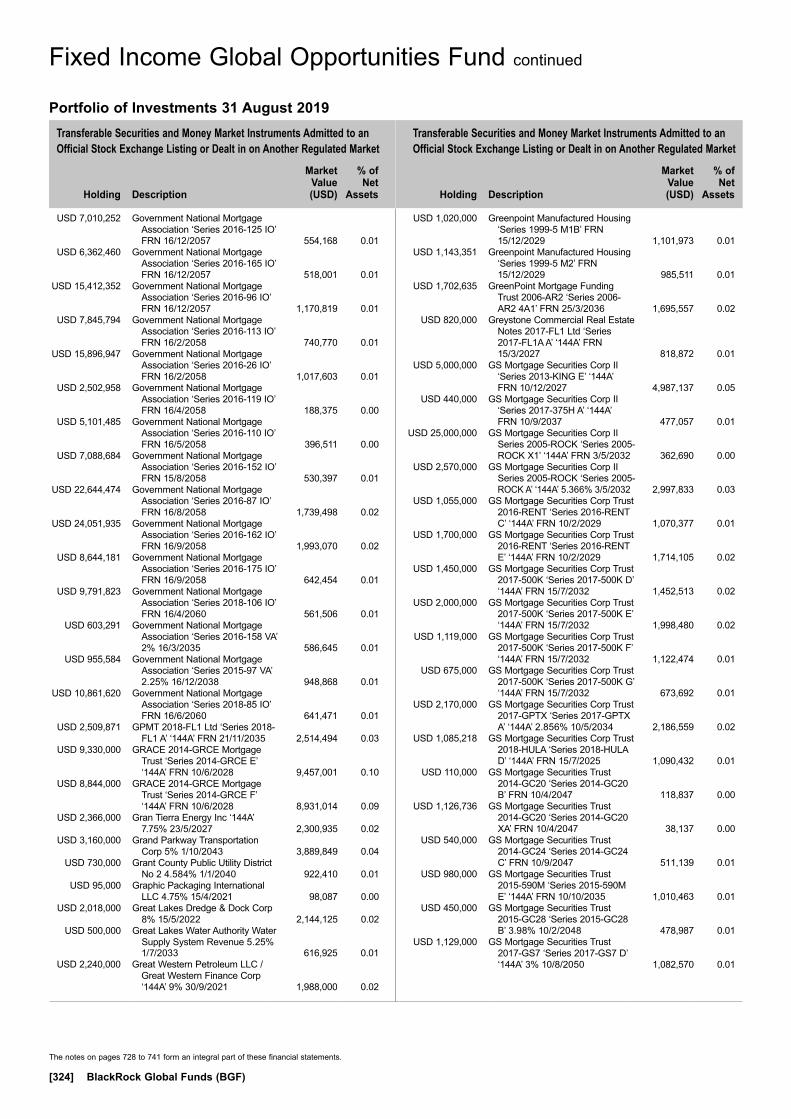
Transferable Securities and Money Market Instruments Admitted to an Official Stock Exchange Listing or Dealt in on Another Regulated Market
Transferable Securities and Money Market Instruments Admitted to an Official Stock Exchange Listing or Dealt in on Another Regulated Market
Holding
Description
Market Value (USD)
% of Net
Assets
Holding
Description
Market Value (USD)
% of Net
Assets
The notes on pages 728 to 741 form an integral part of these financial statements.
[324] BlackRock Global Funds (BGF)
USD 7,010,252 Government National Mortgage Association ‘Series 2016-125 IO’ FRN 16/12/2057 554,168 0.01
USD 6,362,460 Government National Mortgage Association ‘Series 2016-165 IO’ FRN 16/12/2057 518,001 0.01
USD 15,412,352 Government National Mortgage Association ‘Series 2016-96 IO’ FRN 16/12/2057 1,170,819 0.01
USD 7,845,794 Government National Mortgage Association ‘Series 2016-113 IO’ FRN 16/2/2058 740,770 0.01
USD 15,896,947 Government National Mortgage Association ‘Series 2016-26 IO’ FRN 16/2/2058 1,017,603 0.01
USD 2,502,958 Government National Mortgage Association ‘Series 2016-119 IO’ FRN 16/4/2058 188,375 0.00
USD 5,101,485 Government National Mortgage Association ‘Series 2016-110 IO’ FRN 16/5/2058 396,511 0.00
USD 7,088,684 Government National Mortgage Association ‘Series 2016-152 IO’ FRN 15/8/2058 530,397 0.01
USD 22,644,474 Government National Mortgage Association ‘Series 2016-87 IO’ FRN 16/8/2058 1,739,498 0.02
USD 24,051,935 Government National Mortgage Association ‘Series 2016-162 IO’ FRN 16/9/2058 1,993,070 0.02
USD 8,644,181 Government National Mortgage Association ‘Series 2016-175 IO’ FRN 16/9/2058 642,454 0.01
USD 9,791,823 Government National Mortgage Association ‘Series 2018-106 IO’ FRN 16/4/2060 561,506 0.01
USD 603,291 Government National Mortgage Association ‘Series 2016-158 VA’ 2% 16/3/2035 586,645 0.01
USD 955,584 Government National Mortgage Association ‘Series 2015-97 VA’ 2.25% 16/12/2038 948,868 0.01
USD 10,861,620 Government National Mortgage Association ‘Series 2018-85 IO’ FRN 16/6/2060 641,471 0.01
USD 2,509,871 GPMT 2018-FL1 Ltd ‘Series 2018-FL1 A’ ‘144A’ FRN 21/11/2035 2,514,494 0.03
USD 9,330,000 GRACE 2014-GRCE Mortgage Trust ‘Series 2014-GRCE E’ ‘144A’ FRN 10/6/2028 9,457,001 0.10
USD 8,844,000 GRACE 2014-GRCE Mortgage Trust ‘Series 2014-GRCE F’ ‘144A’ FRN 10/6/2028 8,931,014 0.09
USD 2,366,000 Gran Tierra Energy Inc ‘144A’ 7.75% 23/5/2027 2,300,935 0.02
USD 3,160,000 Grand Parkway Transportation Corp 5% 1/10/2043 3,889,849 0.04
USD 730,000 Grant County Public Utility District No 2 4.584% 1/1/2040 922,410 0.01
USD 95,000 Graphic Packaging International LLC 4.75% 15/4/2021 98,087 0.00
USD 2,018,000 Great Lakes Dredge & Dock Corp 8% 15/5/2022 2,144,125 0.02
USD 500,000 Great Lakes Water Authority Water Supply System Revenue 5.25% 1/7/2033 616,925 0.01
USD 2,240,000 Great Western Petroleum LLC / Great Western Finance Corp ‘144A’ 9% 30/9/2021 1,988,000 0.02
USD 1,020,000 Greenpoint Manufactured Housing ‘Series 1999-5 M1B’ FRN 15/12/2029 1,101,973 0.01
USD 1,143,351 Greenpoint Manufactured Housing ‘Series 1999-5 M2’ FRN 15/12/2029 985,511 0.01
USD 1,702,635 GreenPoint Mortgage Funding Trust 2006-AR2 ‘Series 2006-AR2 4A1’ FRN 25/3/2036 1,695,557 0.02
USD 820,000 Greystone Commercial Real Estate Notes 2017-FL1 Ltd ‘Series 2017-FL1A A’ ‘144A’ FRN 15/3/2027 818,872 0.01
USD 5,000,000 GS Mortgage Securities Corp II ‘Series 2013-KING E’ ‘144A’ FRN 10/12/2027 4,987,137 0.05
USD 440,000 GS Mortgage Securities Corp II ‘Series 2017-375H A’ ‘144A’ FRN 10/9/2037 477,057 0.01
USD 25,000,000 GS Mortgage Securities Corp II Series 2005-ROCK ‘Series 2005-ROCK X1’ ‘144A’ FRN 3/5/2032 362,690 0.00
USD 2,570,000 GS Mortgage Securities Corp II Series 2005-ROCK ‘Series 2005-ROCK A’ ‘144A’ 5.366% 3/5/2032 2,997,833 0.03
USD 1,055,000 GS Mortgage Securities Corp Trust 2016-RENT ‘Series 2016-RENT C’ ‘144A’ FRN 10/2/2029 1,070,377 0.01
USD 1,700,000 GS Mortgage Securities Corp Trust 2016-RENT ‘Series 2016-RENT E’ ‘144A’ FRN 10/2/2029 1,714,105 0.02
USD 1,450,000 GS Mortgage Securities Corp Trust 2017-500K ‘Series 2017-500K D’ ‘144A’ FRN 15/7/2032 1,452,513 0.02
USD 2,000,000 GS Mortgage Securities Corp Trust 2017-500K ‘Series 2017-500K E’ ‘144A’ FRN 15/7/2032 1,998,480 0.02
USD 1,119,000 GS Mortgage Securities Corp Trust 2017-500K ‘Series 2017-500K F’ ‘144A’ FRN 15/7/2032 1,122,474 0.01
USD 675,000 GS Mortgage Securities Corp Trust 2017-500K ‘Series 2017-500K G’ ‘144A’ FRN 15/7/2032 673,692 0.01
USD 2,170,000 GS Mortgage Securities Corp Trust 2017-GPTX ‘Series 2017-GPTX A’ ‘144A’ 2.856% 10/5/2034 2,186,559 0.02
USD 1,085,218 GS Mortgage Securities Corp Trust 2018-HULA ‘Series 2018-HULA D’ ‘144A’ FRN 15/7/2025 1,090,432 0.01
USD 110,000 GS Mortgage Securities Trust 2014-GC20 ‘Series 2014-GC20 B’ FRN 10/4/2047 118,837 0.00
USD 1,126,736 GS Mortgage Securities Trust 2014-GC20 ‘Series 2014-GC20 XA’ FRN 10/4/2047 38,137 0.00
USD 540,000 GS Mortgage Securities Trust 2014-GC24 ‘Series 2014-GC24 C’ FRN 10/9/2047 511,139 0.01
USD 980,000 GS Mortgage Securities Trust 2015-590M ‘Series 2015-590M E’ ‘144A’ FRN 10/10/2035 1,010,463 0.01
USD 450,000 GS Mortgage Securities Trust 2015-GC28 ‘Series 2015-GC28 B’ 3.98% 10/2/2048 478,987 0.01
USD 1,129,000 GS Mortgage Securities Trust 2017-GS7 ‘Series 2017-GS7 D’ ‘144A’ 3% 10/8/2050 1,082,570 0.01
Fixed Income Global Opportunities Fund continued
Portfolio of Investments 31 August 2019

Transferable Securities and Money Market Instruments Admitted to an Official Stock Exchange Listing or Dealt in on Another Regulated Market
Transferable Securities and Money Market Instruments Admitted to an Official Stock Exchange Listing or Dealt in on Another Regulated Market
Holding
Description
Market Value (USD)
% of Net
Assets
Holding
Description
Market Value (USD)
% of Net
Assets
The notes on pages 728 to 741 form an integral part of these financial statements.
Annual Report and Audited Financial Statements [325]
USD 780,000 GS Mortgage Securities Trust 2017-GS7 ‘Series 2017-GS7 E’ ‘144A’ 3% 10/8/2050 730,694 0.01
USD 2,052,325 GSAA Home Equity Trust 2006-4 ‘Series 2006-4 1A1’ FRN 25/3/2036 1,781,848 0.02
USD 12,961,603 GSAA Home Equity Trust 2006-5 ‘Series 2006-5 1A1’ FRN 25/3/2036 6,366,172 0.07
USD 478,667 GSAA Home Equity Trust 2007-2 ‘Series 2007-2 AF3’ FRN 25/3/2037 164,656 0.00
USD 3,819,467 GSAMP Trust 2006-FM3 ‘Series 2006-FM3 A1’ FRN 25/11/2036 2,257,350 0.02
USD 1,212,937 GSAMP Trust 2007-H1 ‘Series 2007-H1 A1B’ FRN 25/1/2047 747,387 0.01
USD 2,000,000 GSAMP Trust 2007-HSBC1 ‘Series 2007-HS1 M6’ FRN 25/2/2047 2,064,718 0.02
USD 1,244,753 GSMPS Mortgage Loan Trust 2005-RP1 ‘Series 2005-RP1 1AF’ ‘144A’ FRN 25/1/2035 1,146,394 0.01
USD 1,495,541 GSMPS Mortgage Loan Trust 2005-RP2 ‘Series 2005-RP2 1AF’ ‘144A’ FRN 25/3/2035 1,393,192 0.01
USD 1,152,181 GSMPS Mortgage Loan Trust 2006-RP1 ‘Series 2006-RP1 1AF1’ ‘144A’ FRN 25/1/2036 1,005,533 0.01
USD 13,020,709 GSR Mortgage Loan Trust 2006-OA1 ‘Series 2006-OA1 1A1’ FRN 25/8/2046 5,236,601 0.05
USD 2,373,032 GSR Mortgage Loan Trust 2007-1F ‘Series 2007-1F 2A4’ 5.5% 25/1/2037 2,646,180 0.03
USD 329,000 H&E Equipment Services Inc 5.625% 1/9/2025 347,088 0.00
USD 5,188 Halcyon Loan Advisors Funding 2013-2 Ltd ‘Series 2013-2A A’ ‘144A’ FRN 1/8/2025 5,187 0.00
USD 250,000 Halcyon Loan Advisors Funding 2013-2 Ltd ‘Series 2013-2A C’ ‘144A’ FRN 1/8/2025 250,411 0.00
USD 680,000 Halcyon Loan Advisors Funding 2014-3 Ltd ‘Series 2014-3A B1R’ ‘144A’ FRN 22/10/2025 680,265 0.01
USD 2,000,000 Halcyon Loan Advisors Funding 2015-2 Ltd ‘Series 2015-2A AR’ ‘144A’ FRN 25/7/2027 1,997,767 0.02
USD 1,083,000 Halliburton Co 3.8% 15/11/2025 1,147,647 0.01 USD 718,429 HarborView Mortgage Loan Trust
2007-4 ‘Series 2007-4 2A2’ FRN 19/7/2047 659,087 0.01
USD 685,000 HCA Healthcare Inc 6.25% 15/2/2021 721,237 0.01
USD 4,581,000 HCA Inc 4.125% 15/6/2029 4,871,705 0.05 USD 4,098,000 HCA Inc 4.75% 1/5/2023 4,401,115 0.05 USD 2,171,000 HCA Inc 5% 15/3/2024 2,377,616 0.02 USD 3,128,000 HCA Inc 5.25% 15/4/2025 3,492,489 0.04 USD 3,074,000 HCA Inc 5.25% 15/6/2026 3,461,139 0.04 USD 900,000 HCA Inc 5.375% 1/2/2025 997,803 0.01 USD 729,000 HCA Inc 5.375% 1/9/2026 812,835 0.01 USD 1,092,000 HCA Inc 5.625% 1/9/2028 1,247,610 0.01 USD 520,000 HCA Inc 5.875% 15/2/2026 595,400 0.01 USD 1,409,000 HCA Inc 5.875% 1/2/2029 1,625,634 0.02 USD 260,000 HD Supply Inc ‘144A’ 5.375%
15/10/2026 278,252 0.00 USD 3,895,000 Health & Educational Facilities
Authority of the State of Missouri 3.086% 15/9/2051 4,063,186 0.04
USD 550,000 Health & Educational Facilities Authority of the State of Missouri 3.651% 15/1/2046 633,421 0.01
USD 785,000 Health & Educational Facilities Authority of the State of Missouri 5% 15/11/2029 951,416 0.01
USD 320,000 Highbridge Loan Management 12-2018 Ltd ‘Series 12A-18 A1B’ ‘144A’ FRN 18/7/2031 319,110 0.00
USD 650,000 Highbridge Loan Management 12-2018 Ltd ‘Series 12A-18 D’ ‘144A’ FRN 18/7/2031 569,579 0.01
USD 250,000 Highbridge Loan Management 2013-2 Ltd ‘Series 2013-2A DR’ ‘144A’ FRN 20/10/2029 242,713 0.00
USD 2,830,000 Highbridge Loan Management 6-2015 Ltd ‘Series 6A-2015 A1R’ ‘144A’ FRN 5/2/2031 2,804,765 0.03
USD 330,000 Highbridge Loan Management 7-2015 Ltd ‘Series 7A-2015 CR’ ‘144A’ FRN 15/3/2027 325,215 0.00
USD 340,000 Highbridge Loan Management 7-2015 Ltd ‘Series 7A-2015 DR’ ‘144A’ FRN 15/3/2027 328,964 0.00
USD 260,000 Highbridge Loan Management 7-2015 Ltd ‘Series 7A-2015 ER’ ‘144A’ FRN 15/3/2027 239,783 0.00
USD 345,000 Hilton Domestic Operating Co Inc 4.25% 1/9/2024 352,763 0.00
USD 3,219,000 Hilton Worldwide Finance LLC / Hilton Worldwide Finance Corp 4.625% 1/4/2025 3,340,388 0.03
USD 207,000 Hilton Worldwide Finance LLC / Hilton Worldwide Finance Corp 4.875% 1/4/2027 218,644 0.00
USD 329,000 Hologic Inc ‘144A’ 4.375% 15/10/2025 338,459 0.00
USD 1,472,000 Home Depot Inc/The 2.95% 15/6/2029 1,557,118 0.02
USD 1,980,000 Home Equity Asset Trust 2007-1 ‘Series 2007-1 2A3’ FRN 25/5/2037 1,660,042 0.02
USD 9,353,330 Home Equity Mortgage Loan Asset-Backed Trust Series INABS 2006-E ‘Series 2006-E 2A3’ FRN 25/4/2037 6,371,341 0.07
USD 1,919,641 Home Equity Mortgage Loan Asset-Backed Trust Series INABS 2007-A ‘Series 2007-A 2A2’ FRN 25/4/2037 1,445,587 0.02
USD 9,388,338 Home Equity Mortgage Loan Asset-Backed Trust Series INABS 2007-A ‘Series 2007-A 2A3’ FRN 25/4/2037 7,121,871 0.07
USD 3,869,515 Home Equity Mortgage Loan Asset-Backed Trust Series INABS 2007-B ‘Series 2007-B 2A3’ FRN 25/7/2037 2,652,420 0.03
USD 543,469 Home Equity Mortgage Loan Asset-Backed Trust Series SPMD 2004-A ‘Series 2004-A M2’ FRN 25/7/2034 546,118 0.01
USD 3,008,405 Home Equity Mortgage Trust 2006-2 (Step-up coupon) ‘Series 2006-2 1A1’ 5.867% 25/7/2036 939,785 0.01
USD 1,167,715 Home Loan Mortgage Loan Trust 2005-1 ‘Series 2005-1 A3’ FRN 15/4/2036 1,091,450 0.01
Fixed Income Global Opportunities Fund continued
Portfolio of Investments 31 August 2019
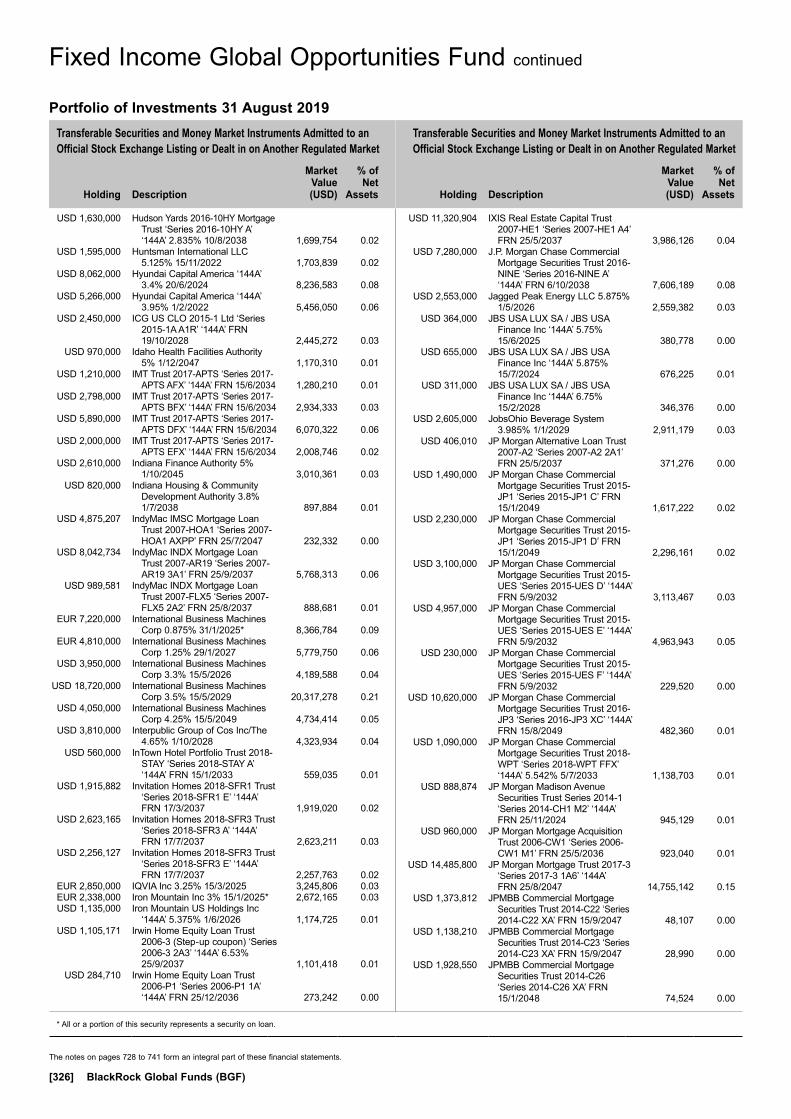
Transferable Securities and Money Market Instruments Admitted to an Official Stock Exchange Listing or Dealt in on Another Regulated Market
Transferable Securities and Money Market Instruments Admitted to an Official Stock Exchange Listing or Dealt in on Another Regulated Market
Holding
Description
Market Value (USD)
% of Net
Assets
Holding
Description
Market Value (USD)
% of Net
Assets
* All or a portion of this security represents a security on loan.
The notes on pages 728 to 741 form an integral part of these financial statements.
[326] BlackRock Global Funds (BGF)
USD 1,630,000 Hudson Yards 2016-10HY Mortgage Trust ‘Series 2016-10HY A’ ‘144A’ 2.835% 10/8/2038 1,699,754 0.02
USD 1,595,000 Huntsman International LLC 5.125% 15/11/2022 1,703,839 0.02
USD 8,062,000 Hyundai Capital America ‘144A’ 3.4% 20/6/2024 8,236,583 0.08
USD 5,266,000 Hyundai Capital America ‘144A’ 3.95% 1/2/2022 5,456,050 0.06
USD 2,450,000 ICG US CLO 2015-1 Ltd ‘Series 2015-1A A1R’ ‘144A’ FRN 19/10/2028 2,445,272 0.03
USD 970,000 Idaho Health Facilities Authority 5% 1/12/2047 1,170,310 0.01
USD 1,210,000 IMT Trust 2017-APTS ‘Series 2017-APTS AFX’ ‘144A’ FRN 15/6/2034 1,280,210 0.01
USD 2,798,000 IMT Trust 2017-APTS ‘Series 2017-APTS BFX’ ‘144A’ FRN 15/6/2034 2,934,333 0.03
USD 5,890,000 IMT Trust 2017-APTS ‘Series 2017-APTS DFX’ ‘144A’ FRN 15/6/2034 6,070,322 0.06
USD 2,000,000 IMT Trust 2017-APTS ‘Series 2017-APTS EFX’ ‘144A’ FRN 15/6/2034 2,008,746 0.02
USD 2,610,000 Indiana Finance Authority 5% 1/10/2045 3,010,361 0.03
USD 820,000 Indiana Housing & Community Development Authority 3.8% 1/7/2038 897,884 0.01
USD 4,875,207 IndyMac IMSC Mortgage Loan Trust 2007-HOA1 ‘Series 2007-HOA1 AXPP’ FRN 25/7/2047 232,332 0.00
USD 8,042,734 IndyMac INDX Mortgage Loan Trust 2007-AR19 ‘Series 2007-AR19 3A1’ FRN 25/9/2037 5,768,313 0.06
USD 989,581 IndyMac INDX Mortgage Loan Trust 2007-FLX5 ‘Series 2007-FLX5 2A2’ FRN 25/8/2037 888,681 0.01
EUR 7,220,000 International Business Machines Corp 0.875% 31/1/2025* 8,366,784 0.09
EUR 4,810,000 International Business Machines Corp 1.25% 29/1/2027 5,779,750 0.06
USD 3,950,000 International Business Machines Corp 3.3% 15/5/2026 4,189,588 0.04
USD 18,720,000 International Business Machines Corp 3.5% 15/5/2029 20,317,278 0.21
USD 4,050,000 International Business Machines Corp 4.25% 15/5/2049 4,734,414 0.05
USD 3,810,000 Interpublic Group of Cos Inc/The 4.65% 1/10/2028 4,323,934 0.04
USD 560,000 InTown Hotel Portfolio Trust 2018-STAY ‘Series 2018-STAY A’ ‘144A’ FRN 15/1/2033 559,035 0.01
USD 1,915,882 Invitation Homes 2018-SFR1 Trust ‘Series 2018-SFR1 E’ ‘144A’ FRN 17/3/2037 1,919,020 0.02
USD 2,623,165 Invitation Homes 2018-SFR3 Trust ‘Series 2018-SFR3 A’ ‘144A’ FRN 17/7/2037 2,623,211 0.03
USD 2,256,127 Invitation Homes 2018-SFR3 Trust ‘Series 2018-SFR3 E’ ‘144A’ FRN 17/7/2037 2,257,763 0.02
EUR 2,850,000 IQVIA Inc 3.25% 15/3/2025 3,245,806 0.03 EUR 2,338,000 Iron Mountain Inc 3% 15/1/2025* 2,672,165 0.03 USD 1,135,000 Iron Mountain US Holdings Inc
‘144A’ 5.375% 1/6/2026 1,174,725 0.01 USD 1,105,171 Irwin Home Equity Loan Trust
2006-3 (Step-up coupon) ‘Series 2006-3 2A3’ ‘144A’ 6.53% 25/9/2037 1,101,418 0.01
USD 284,710 Irwin Home Equity Loan Trust 2006-P1 ‘Series 2006-P1 1A’ ‘144A’ FRN 25/12/2036 273,242 0.00
USD 11,320,904 IXIS Real Estate Capital Trust 2007-HE1 ‘Series 2007-HE1 A4’ FRN 25/5/2037 3,986,126 0.04
USD 7,280,000 J.P. Morgan Chase Commercial Mortgage Securities Trust 2016-NINE ‘Series 2016-NINE A’ ‘144A’ FRN 6/10/2038 7,606,189 0.08
USD 2,553,000 Jagged Peak Energy LLC 5.875% 1/5/2026 2,559,382 0.03
USD 364,000 JBS USA LUX SA / JBS USA Finance Inc ‘144A’ 5.75% 15/6/2025 380,778 0.00
USD 655,000 JBS USA LUX SA / JBS USA Finance Inc ‘144A’ 5.875% 15/7/2024 676,225 0.01
USD 311,000 JBS USA LUX SA / JBS USA Finance Inc ‘144A’ 6.75% 15/2/2028 346,376 0.00
USD 2,605,000 JobsOhio Beverage System 3.985% 1/1/2029 2,911,179 0.03
USD 406,010 JP Morgan Alternative Loan Trust 2007-A2 ‘Series 2007-A2 2A1’ FRN 25/5/2037 371,276 0.00
USD 1,490,000 JP Morgan Chase Commercial Mortgage Securities Trust 2015-JP1 ‘Series 2015-JP1 C’ FRN 15/1/2049 1,617,222 0.02
USD 2,230,000 JP Morgan Chase Commercial Mortgage Securities Trust 2015-JP1 ‘Series 2015-JP1 D’ FRN 15/1/2049 2,296,161 0.02
USD 3,100,000 JP Morgan Chase Commercial Mortgage Securities Trust 2015-UES ‘Series 2015-UES D’ ‘144A’ FRN 5/9/2032 3,113,467 0.03
USD 4,957,000 JP Morgan Chase Commercial Mortgage Securities Trust 2015-UES ‘Series 2015-UES E’ ‘144A’ FRN 5/9/2032 4,963,943 0.05
USD 230,000 JP Morgan Chase Commercial Mortgage Securities Trust 2015-UES ‘Series 2015-UES F’ ‘144A’ FRN 5/9/2032 229,520 0.00
USD 10,620,000 JP Morgan Chase Commercial Mortgage Securities Trust 2016-JP3 ‘Series 2016-JP3 XC’ ‘144A’ FRN 15/8/2049 482,360 0.01
USD 1,090,000 JP Morgan Chase Commercial Mortgage Securities Trust 2018-WPT ‘Series 2018-WPT FFX’ ‘144A’ 5.542% 5/7/2033 1,138,703 0.01
USD 888,874 JP Morgan Madison Avenue Securities Trust Series 2014-1 ‘Series 2014-CH1 M2’ ‘144A’ FRN 25/11/2024 945,129 0.01
USD 960,000 JP Morgan Mortgage Acquisition Trust 2006-CW1 ‘Series 2006-CW1 M1’ FRN 25/5/2036 923,040 0.01
USD 14,485,800 JP Morgan Mortgage Trust 2017-3 ‘Series 2017-3 1A6’ ‘144A’ FRN 25/8/2047 14,755,142 0.15
USD 1,373,812 JPMBB Commercial Mortgage Securities Trust 2014-C22 ‘Series 2014-C22 XA’ FRN 15/9/2047 48,107 0.00
USD 1,138,210 JPMBB Commercial Mortgage Securities Trust 2014-C23 ‘Series 2014-C23 XA’ FRN 15/9/2047 28,990 0.00
USD 1,928,550 JPMBB Commercial Mortgage Securities Trust 2014-C26 ‘Series 2014-C26 XA’ FRN 15/1/2048 74,524 0.00
Fixed Income Global Opportunities Fund continued
Portfolio of Investments 31 August 2019

Transferable Securities and Money Market Instruments Admitted to an Official Stock Exchange Listing or Dealt in on Another Regulated Market
Transferable Securities and Money Market Instruments Admitted to an Official Stock Exchange Listing or Dealt in on Another Regulated Market
Holding
Description
Market Value (USD)
% of Net
Assets
Holding
Description
Market Value (USD)
% of Net
Assets
* All or a portion of this security represents a security on loan.
The notes on pages 728 to 741 form an integral part of these financial statements.
Annual Report and Audited Financial Statements [327]
USD 7,006,000 JPMBB Commercial Mortgage Securities Trust 2015-C27 ‘Series 2015-C27 XD’ ‘144A’ FRN 15/2/2048 164,361 0.00
USD 2,232,967 JPMBB Commercial Mortgage Securities Trust 2015-C29 ‘Series 2015-C29 XA’ FRN 15/5/2048 57,414 0.00
USD 1,480,000 JPMBB Commercial Mortgage Securities Trust 2015-C33 ‘Series 2015-C33 D1’ ‘144A’ FRN 15/12/2048 1,494,645 0.02
USD 930,000 JPMCC Commercial Mortgage Securities Trust 2017-JP5 ‘Series 2017-JP5 C’ FRN 15/3/2050 986,073 0.01
USD 1,340,000 JPMCC Commercial Mortgage Securities Trust 2017-JP5 ‘Series 2017-JP5 D’ ‘144A’ FRN 15/3/2050 1,432,440 0.01
USD 4,150,000 JPMDB Commercial Mortgage Securities Trust 2016-C4 ‘Series 2016-C4 XC’ ‘144A’ FRN 15/12/2049 195,258 0.00
USD 2,000,000 JPMDB Commercial Mortgage Securities Trust 2017-C5 ‘Series 2017-C5 C’ FRN 15/3/2050 2,183,697 0.02
USD 4,096,000 JPMorgan Chase & Co FRN 1/5/2020 (Perpetual) 4,158,321 0.04
USD 5,821,000 JPMorgan Chase & Co FRN 1/2/2024 (Perpetual) 6,487,301 0.07
USD 10,925,000 JPMorgan Chase & Co FRN 23/4/2024 11,469,576 0.12
USD 1,620,000 JPMorgan Chase & Co FRN 23/7/2024 1,720,450 0.02
USD 13,685,000 JPMorgan Chase & Co FRN 1/8/2024 (Perpetual) 14,187,924 0.15
USD 5,555,000 JPMorgan Chase & Co FRN 1/2/2028 6,036,808 0.06
USD 14,515,000 JPMorgan Chase & Co FRN 23/4/2029 16,136,096 0.17
USD 10,810,000 JPMorgan Chase & Co FRN 23/7/2029 12,191,756 0.13
USD 10,950,000 JPMorgan Chase & Co FRN 5/12/2029 12,584,322 0.13
USD 2,880,000 JPMorgan Chase & Co FRN 15/11/2048* 3,318,816 0.03
USD 4,884,000 Kaiser Aluminum Corp 5.875% 15/5/2024 5,079,360 0.05
USD 1,900,000 Kansas City Industrial Development Authority 5% 1/3/2049 2,336,250 0.02
USD 1,362,000 KB Home 7.625% 15/5/2023 1,535,655 0.02 USD 150,000 KB Home 8% 15/3/2020 154,687 0.00 USD 690,000 Kentucky Economic Development
Finance Authority 5.25% 1/6/2050 775,929 0.01 USD 1,100,000 Kentucky Turnpike Authority 5%
1/7/2020 1,134,491 0.01 USD 2,730,000 Keurig Dr Pepper Inc 4.057%
25/5/2023 2,899,020 0.03 USD 4,770,000 KFC Holding Co/Pizza Hut
Holdings LLC/Taco Bell of America LLC ‘144A’ 5% 1/6/2024 4,942,912 0.05
USD 364,000 KFC Holding Co/Pizza Hut Holdings LLC/Taco Bell of America LLC ‘144A’ 5.25% 1/6/2026 385,840 0.00
USD 2,165,000 Kinder Morgan Energy Partners LP 3.5% 1/3/2021 2,198,129 0.02
USD 1,080,000 Kinder Morgan Energy Partners LP 5.8% 1/3/2021 1,133,719 0.01
USD 594,000 Lamar Media Corp 5.375% 15/1/2024 613,305 0.01
USD 289,000 Lamb Weston Holdings Inc ‘144A’ 4.625% 1/11/2024 303,089 0.00
USD 289,000 Lamb Weston Holdings Inc ‘144A’ 4.875% 1/11/2026 303,089 0.00
USD 1,100,000 Las Vegas Sands Corp 3.2% 8/8/2024 1,121,201 0.01
USD 1,215,000 Las Vegas Sands Corp 3.5% 18/8/2026 1,240,099 0.01
USD 950,000 Las Vegas Valley Water District 5% 1/6/2046 1,135,744 0.01
USD 4,030,000 LCCM 2014-909 Mortgage Trust ‘Series 2014-909 E’ ‘144A’ FRN 15/5/2031 4,049,869 0.04
USD 4,770,000 LCM 26 Ltd ‘144A’ FRN 20/1/2031 4,743,858 0.05 USD 730,000 LCM XVIII LP ‘144A’ FRN 20/4/2031 397,797 0.00 USD 1,000,000 LCM XX LP ‘144A’ FRN 20/10/2027 999,472 0.01 USD 1,330,000 LCM XXI LP ‘144A’ FRN 20/4/2028 1,321,086 0.01 USD 400,000 LCM XXIV Ltd ‘144A’ FRN
20/3/2030 400,750 0.00 USD 355,687 Lehman ABS Manufactured Housing
Contract Trust 2002-A ‘Series 2002-A C’ 15/6/2033 (Zero Coupon) 306,390 0.00
USD 387,984 Lehman ABS Mortgage Loan Trust ‘Series 2007-1 2A1’ ‘144A’ FRN 25/6/2037 281,829 0.00
USD 530,000 Lehman Brothers Small Balance Commercial Mortgage Trust 2006-2 ‘Series 2006-2A M2’ ‘144A’ FRN 25/9/2036 517,558 0.01
USD 964,092 Lehman Brothers Small Balance Commercial Mortgage Trust 2007-1 ‘Series 2007-1A 1A’ ‘144A’ FRN 25/3/2037 906,338 0.01
USD 1,027,862 Lehman XS Trust Series 2007-20N ‘Series 2007-20N A1’ FRN 25/12/2037 972,703 0.01
USD 620,000 Lendmark Funding Trust 2017-2 ‘Series 2017-2A B’ ‘144A’ 3.38% 20/5/2026 623,504 0.01
USD 1,000,000 Lendmark Funding Trust 2017-2 ‘Series 2017-2A C’ ‘144A’ 4.33% 20/5/2026 1,010,274 0.01
USD 1,267,000 Lendmark Funding Trust 2018-1 ‘Series 2018-1A A’ ‘144A’ 3.81% 21/12/2026 1,299,294 0.01
USD 14,400,000 Lendmark Funding Trust 2018-2 ‘Series 2018-2A A’ ‘144A’ 4.23% 20/4/2027 15,012,449 0.15
USD 18,000 Lennar Corp 2.95% 29/11/2020 18,045 0.00 USD 895,000 Lennar Corp 4.125% 15/1/2022 925,206 0.01 USD 1,002,000 Lennar Corp 4.5% 15/11/2019 1,005,106 0.01 USD 225,000 Lennar Corp 4.5% 30/4/2024 239,625 0.00 USD 964,000 Lennar Corp 4.75% 1/4/2021 995,166 0.01 USD 10,973,000 Lennar Corp 4.75% 15/11/2022 11,590,231 0.12 USD 173,000 Lennar Corp 4.75% 30/5/2025 185,759 0.00 USD 311,000 Lennar Corp 4.75% 29/11/2027 339,767 0.00 USD 1,030,000 Lennar Corp 4.875% 15/12/2023 1,105,962 0.01 USD 60,000 Lennar Corp 5.25% 1/6/2026 65,325 0.00 USD 3,962,000 Lennar Corp 5.875% 15/11/2024 4,442,392 0.05 USD 5,843,000 Level 3 Financing Inc 5.125%
1/5/2023 5,959,918 0.06 USD 269,000 Level 3 Financing Inc 5.25%
15/3/2026 281,105 0.00 USD 2,561,000 Level 3 Financing Inc 5.375%
15/8/2022 2,581,232 0.03 USD 653,000 Level 3 Financing Inc 5.375%
15/1/2024 667,692 0.01 USD 459,000 Level 3 Financing Inc 5.375%
1/5/2025 479,081 0.01
Fixed Income Global Opportunities Fund continued
Portfolio of Investments 31 August 2019

Transferable Securities and Money Market Instruments Admitted to an Official Stock Exchange Listing or Dealt in on Another Regulated Market
Transferable Securities and Money Market Instruments Admitted to an Official Stock Exchange Listing or Dealt in on Another Regulated Market
Holding
Description
Market Value (USD)
% of Net
Assets
Holding
Description
Market Value (USD)
% of Net
Assets
The notes on pages 728 to 741 form an integral part of these financial statements.
[328] BlackRock Global Funds (BGF)
USD 2,393,000 Level 3 Financing Inc 5.625% 1/2/2023 2,435,595 0.03
USD 840,000 Lexington County Health Services District Inc 5% 1/11/2041 983,569 0.01
USD 3,410,719 LFRF ‘2015-1’ ‘144A’ 4% 30/10/2027 3,398,058 0.04 USD 822,000 LGI Homes Inc ‘144A’ 6.875%
15/7/2026 861,045 0.01 USD 1,223,869 Limerock CLO III LLC ‘Series 2014-
3A A1R’ ‘144A’ FRN 20/10/2026 1,223,684 0.01 USD 2,165,000 Limerock CLO III LLC ‘Series 2014-
3A C’ ‘144A’ FRN 20/10/2026 2,103,967 0.02 USD 7,140,000 LoanCore 2018-CRE1 Issuer Ltd
‘Series 2018-CRE1 A’ ‘144A’ FRN 15/5/2028 7,144,568 0.07
USD 354,164 Long Beach Mortgage Loan Trust 2006-10 ‘Series 2006-10 2A2’ FRN 25/11/2036 157,765 0.00
USD 3,642,622 Long Beach Mortgage Loan Trust 2006-10 ‘Series 2006-10 2A3’ FRN 25/11/2036 1,645,110 0.02
USD 1,295,818 Long Beach Mortgage Loan Trust 2006-10 ‘Series 2006-10 2A4’ FRN 25/11/2036 594,823 0.01
USD 5,512,396 Long Beach Mortgage Loan Trust 2006-2 ‘Series 2006-2 1A’ FRN 25/3/2046 4,539,896 0.05
USD 10,965,992 Long Beach Mortgage Loan Trust 2006-4 ‘Series 2006-4 2A3’ FRN 25/5/2036 4,820,809 0.05
USD 3,531,869 Long Beach Mortgage Loan Trust 2006-5 ‘Series 2006-5 2A3’ FRN 25/6/2036 1,949,489 0.02
USD 906,338 Long Beach Mortgage Loan Trust 2006-6 ‘Series 2006-6 2A3’ FRN 25/7/2036 466,615 0.01
USD 5,728,366 Long Beach Mortgage Loan Trust 2006-7 ‘Series 2006-7 2A3’ FRN 25/8/2036 2,969,425 0.03
USD 2,478,101 Long Beach Mortgage Loan Trust 2006-8 ‘Series 2006-8 2A3’ FRN 25/9/2036 1,036,026 0.01
USD 1,315,144 Long Beach Mortgage Loan Trust 2006-9 ‘Series 2006-9 2A2’ FRN 25/10/2036 560,477 0.01
USD 5,051,111 Long Beach Mortgage Loan Trust 2006-9 ‘Series 2006-9 2A3’ FRN 25/10/2036 2,181,914 0.02
USD 1,600,533 Long Beach Mortgage Loan Trust 2006-9 ‘Series 2006-9 2A4’ FRN 25/10/2036 704,269 0.01
USD 1,660,000 Los Angeles Community College District/CA 6.6% 1/8/2042 2,678,227 0.03
USD 5,000,000 Los Angeles Department of Water 5% 1/7/2043 5,532,275 0.06
USD 1,015,000 Los Angeles Department of Water & Power Power System Revenue 6.603% 1/7/2050 1,731,636 0.02
USD 1,030,000 Louisiana Public Facilities Authority 5% 1/7/2048 1,246,568 0.01
USD 11,880,000 Lowe’s Cos Inc 4.55% 5/4/2049 13,947,968 0.14 USD 3,000,000 LSTAR Commercial Mortgage
Trust 2015-3 ‘Series 2015-3 AS’ ‘144A’ FRN 20/4/2048 3,082,823 0.03
USD 2,660,196 LSTAR Commercial Mortgage Trust 2017-5 ‘Series 2017-5 X’ ‘144A’ FRN 10/3/2050 112,071 0.00
USD 4,200,000 MAD Mortgage Trust 2017-330M ‘Series 2017-330M D’ ‘144A’ FRN 15/8/2034 4,353,457 0.04
USD 6,600,000 MAD Mortgage Trust 2017-330M ‘Series 2017-330M E’ ‘144A’ FRN 15/8/2034 6,790,245 0.07
USD 1,309,087 Madison Avenue Manufactured Housing Contract Trust 2002-A ‘Series 2002-A B2’ FRN 25/3/2032 1,334,445 0.01
USD 6,600,000 Madison Avenue Trust 2013-650M ‘Series 2013-650M D’ ‘144A’ FRN 12/10/2032 6,667,041 0.07
USD 4,225,000 Madison Park Funding XI Ltd ‘Series 2013-11A AR’ ‘144A’ FRN 23/7/2029 4,225,045 0.04
USD 4,930,000 Madison Park Funding XIII Ltd ‘Series 2014-13A AR2’ ‘144A’ FRN 19/4/2030 4,923,148 0.05
USD 600,000 Madison Park Funding XIII Ltd ‘Series 2014-13A CR2’ ‘144A’ FRN 19/4/2030 589,132 0.01
USD 340,000 Madison Park Funding XV Ltd ‘Series 2014-15A CR’ ‘144A’ FRN 27/1/2026 340,824 0.00
USD 1,243,116 Madison Park Funding XVI Ltd ‘Series 2015-16A A1R’ ‘144A’ FRN 20/4/2026 1,243,523 0.01
USD 500,000 Madison Park Funding XVI Ltd ‘Series 2015-16A A2R’ ‘144A’ FRN 20/4/2026 500,360 0.01
USD 550,000 Madison Park Funding XVI Ltd ‘Series 2015-16A C’ ‘144A’ FRN 20/4/2026 551,837 0.01
USD 1,220,000 Madison Park Funding XVI Ltd ‘Series 2015-16A D’ ‘144A’ FRN 20/4/2026 1,221,942 0.01
USD 5,430,000 Madison Park Funding XVIII Ltd ‘Series 2015-18A A1R’ ‘144A’ FRN 21/10/2030 5,421,939 0.06
USD 1,510,000 Madison Park Funding XXI Ltd ‘Series 2016-21A A1’ ‘144A’ FRN 25/7/2029 1,511,145 0.02
USD 700,000 Madison Park Funding XXX Ltd ‘Series 2018-30A E’ ‘144A’ FRN 15/4/2029 652,423 0.01
USD 240,745 Marathon CLO VII Ltd ‘Series 2014-7A A1R’ ‘144A’ FRN 28/10/2025 240,825 0.00
USD 1,620,000 Marathon CRE 2018 FL1 Ltd FRN 15/6/2028 1,621,678 0.02
USD 4,000,000 Mariner CLO 2015-1 LLC ‘Series 2015-1A CR’ ‘144A’ FRN 20/4/2029 3,991,046 0.04
USD 690,000 Mariner CLO 2017-4 LLC ‘Series 2017-4A A’ ‘144A’ FRN 26/10/2029 688,083 0.01
USD 1,118,000 Marriott Ownership Resorts Inc / ILG LLC 6.5% 15/9/2026 1,209,542 0.01
USD 5,185,000 Marsh & McLennan Cos Inc 4.375% 15/3/2029 5,960,258 0.06
USD 835,000 Maryland Health & Higher Educational Facilities Authority 5.25% 1/7/2027 971,760 0.01
USD 1,500,000 Maryland Stadium Authority 5% 1/5/2041 1,792,388 0.02
USD 790,000 Massachusetts Bay Transportation Authority 5% 1/7/2039 974,414 0.01
USD 835,000 Massachusetts Bay Transportation Authority 5% 1/7/2040 1,027,701 0.01
USD 810,000 Massachusetts Development Finance Agency 5% 1/7/2043 987,815 0.01
USD 2,785,000 Massachusetts Development Finance Agency 5% 1/7/2044 3,283,292 0.03
Fixed Income Global Opportunities Fund continued
Portfolio of Investments 31 August 2019

Transferable Securities and Money Market Instruments Admitted to an Official Stock Exchange Listing or Dealt in on Another Regulated Market
Transferable Securities and Money Market Instruments Admitted to an Official Stock Exchange Listing or Dealt in on Another Regulated Market
Holding
Description
Market Value (USD)
% of Net
Assets
Holding
Description
Market Value (USD)
% of Net
Assets
* All or a portion of this security represents a security on loan.
The notes on pages 728 to 741 form an integral part of these financial statements.
Annual Report and Audited Financial Statements [329]
USD 1,040,000 Massachusetts Development Finance Agency 5% 1/7/2047 1,231,968 0.01
USD 2,600,000 Massachusetts Development Finance Agency 5% 1/7/2048 3,150,277 0.03
USD 500,000 Massachusetts Educational Financing Authority 5% 1/1/2022 542,515 0.01
USD 860,000 Massachusetts Housing Finance Agency 4.5% 1/12/2039 903,159 0.01
USD 1,060,000 Massachusetts Housing Finance Agency 4.5% 1/12/2048 1,149,422 0.01
USD 910,000 Massachusetts Housing Finance Agency 4.6% 1/12/2044 958,498 0.01
USD 1,500,000 Massachusetts Port Authority 5% 1/7/2043 1,776,945 0.02
USD 870,000 Massachusetts Water Resources Authority 5% 1/8/2040 1,055,471 0.01
USD 4,090,000 MassMutual Global Funding II ‘144A’ 3.4% 8/3/2026 4,366,077 0.05
USD 4,649,426 Mastr Asset Backed Securities Trust 2006-HE2 ‘Series 2006-HE2 A3’ FRN 25/6/2036 2,621,361 0.03
USD 1,401,845 Mastr Asset Backed Securities Trust 2007-HE1 ‘Series 2007-HE1 A4’ FRN 25/5/2037 1,101,659 0.01
USD 611,569 MASTR Resecuritization Trust 2008-3 ‘Series 2008-3 A1’ ‘144A’ FRN 25/8/2037 418,801 0.00
USD 536,360 Mastr Specialized Loan Trust ‘Series 2006-3 A’ ‘144A’ FRN 25/6/2046 512,425 0.01
USD 1,840,000 Matagorda County Navigation District No 1 2.6% 1/11/2029 1,915,192 0.02
USD 4,552,000 Mauser Packaging Solutions Holding Co ‘144A’ 5.5% 15/4/2024 4,717,010 0.05
USD 2,165,000 McDonald’s Corp 3.8% 1/4/2028 2,397,841 0.02 USD 475,000 McDonald’s Corp 4.7% 9/12/2035 573,775 0.01 USD 3,806,000 McDonald’s Corp 4.875% 9/12/2045 4,710,180 0.05 USD 9,768,475 MCM Capital_18-NPL2 4%
25/10/2028 9,768,215 0.10 USD 8,799,827 MCM Trust 2018-NPL1 ‘Series 2018-
NPL1 A’ ‘144A’ 4% 28/5/2058 8,839,925 0.09 USD 3,074,000 Meritor Inc 6.25% 15/2/2024 3,166,220 0.03 USD 2,202,998 Merrill Lynch Alternative Note Asset
Trust Series 2007-OAR2 ‘Series 2007-OAR2 A2’ FRN 25/4/2037 1,944,276 0.02
USD 6,026,619 Merrill Lynch First Franklin Mortgage Loan Trust Series 2007-2 ‘Series 2007-2 A2C’ FRN 25/5/2037 3,651,812 0.04
USD 911,167 Merrill Lynch Mortgage Investors Trust Series 2006-RM3 ‘Series 2006-RM3 A2B’ FRN 25/6/2037 273,890 0.00
USD 936,390 Merrill Lynch Mortgage Trust 2005-CIP1 ‘Series 2005-CIP1 D’ FRN 12/7/2038 952,669 0.01
USD 1,070,000 Merrill Lynch Mortgage Trust 2005-MKB2 ‘Series 2005-MKB2 F’ ‘144A’ FRN 12/9/2042 1,077,791 0.01
USD 1,380,000 Metropolitan Atlanta Rapid Transit Authority 5% 1/7/2041 1,638,619 0.02
USD 1,290,000 Metropolitan Atlanta Rapid Transit Authority 5% 1/7/2045 1,549,625 0.02
USD 770,000 Metropolitan Government Nashville & Davidson County Health & Educational Facs Bd 5% 1/7/2040 910,640 0.01
USD 1,400,000 Metropolitan Government Nashville & Davidson County Health & Educational Facs Bd 5% 1/7/2046 1,638,574 0.02
USD 2,100,000 Metropolitan St Louis Sewer District 5% 1/5/2047 2,554,934 0.03
USD 1,840,000 Metropolitan Transportation Authority 5% 15/5/2022 2,022,528 0.02
USD 1,860,000 Metropolitan Transportation Authority 5% 15/11/2040 2,340,652 0.02
USD 1,150,000 Metropolitan Transportation Authority 5% 15/11/2041 1,452,847 0.02
USD 2,230,000 Metropolitan Transportation Authority 5% 15/11/2042 2,795,495 0.03
USD 1,570,000 Metropolitan Transportation Authority 5% 15/11/2043 1,974,259 0.02
USD 1,360,000 Metropolitan Transportation Authority 6.687% 15/11/2040 2,052,879 0.02
USD 2,950,000 Metropolitan Washington Airports Authority 5% 1/10/2048 3,605,254 0.04
USD 1,000,000 Metropolitan Washington Airports Authority Dulles Toll Road Revenue 5% 1/10/2053 1,075,920 0.01
USD 1,280,000 Metropolitan Washington Airports Authority Dulles Toll Road Revenue 7.462% 1/10/2046 2,224,154 0.02
USD 173,000 MGM Growth Properties Operating Partnership LP / MGP Finance Co-Issuer Inc 4.5% 1/9/2026 181,650 0.00
USD 8,641,000 MGM Growth Properties Operating Partnership LP / MGP Finance Co-Issuer Inc 5.625% 1/5/2024 9,461,895 0.10
USD 260,000 MGM Growth Properties Operating Partnership LP / MGP Finance Co-Issuer Inc ‘144A’ 5.75% 1/2/2027 287,352 0.00
USD 143,000 MGM Resorts International 5.25% 31/3/2020 145,145 0.00
USD 640,000 Miami-Dade County Educational Facilities Authority 5% 1/4/2053 767,222 0.01
USD 880,000 Michigan Finance Authority 5% 1/6/2039 997,291 0.01
USD 700,000 Michigan Finance Authority 5% 15/11/2041 837,263 0.01
USD 100,000 Michigan Finance Authority 5% 1/12/2047 109,566 0.00
USD 1,000,000 Micron Technology Inc 4.185% 15/2/2027 1,031,631 0.01
USD 2,723,000 Micron Technology Inc 4.663% 15/2/2030 2,842,376 0.03
USD 3,197,000 Mid-America Apartments LP 3.95% 15/3/2029 3,529,809 0.04
USD 1,370,000 MidOcean Credit CLO III ‘Series 2014-3A A3A2’ ‘144A’ FRN 21/4/2031 1,348,183 0.01
USD 1,330,000 Mississippi Hospital Equipment & Facilities Authority 5% 1/9/2046 1,514,444 0.02
USD 3,095,000 Montefiore Obligated Group 5.246% 1/11/2048 3,713,494 0.04
USD 1,479,000 Morgan Stanley FRN 15/7/2020 (Perpetual) 1,503,034 0.02
USD 8,445,000 Morgan Stanley FRN 24/4/2024 8,883,909 0.09 USD 4,044,000 Morgan Stanley FRN 22/7/2025 4,124,774 0.04 USD 9,235,000 Morgan Stanley FRN 24/1/2029 9,984,687 0.10 USD 21,322,000 Morgan Stanley FRN 23/1/2030* 24,357,481 0.25 USD 2,380,000 Morgan Stanley 3.125% 23/1/2023 2,453,300 0.03 USD 3,159,114 Morgan Stanley ABS Capital I Inc
Trust 2005-HE5 ‘Series 2005-HE5 M4’ FRN 25/9/2035 1,788,219 0.02
USD 10,874,859 Morgan Stanley ABS Capital I Inc Trust 2007-NC1 ‘Series 2007-NC1 A1’ FRN 25/11/2036 6,693,004 0.07
USD 11,026,000 Morgan Stanley Bank of America Merrill Lynch Trust 2014 C19 ‘Series 2014-C19 XD’ ‘144A’ FRN 15/12/2047 636,110 0.01
Fixed Income Global Opportunities Fund continued
Portfolio of Investments 31 August 2019

Transferable Securities and Money Market Instruments Admitted to an Official Stock Exchange Listing or Dealt in on Another Regulated Market
Transferable Securities and Money Market Instruments Admitted to an Official Stock Exchange Listing or Dealt in on Another Regulated Market
Holding
Description
Market Value (USD)
% of Net
Assets
Holding
Description
Market Value (USD)
% of Net
Assets
The notes on pages 728 to 741 form an integral part of these financial statements.
[330] BlackRock Global Funds (BGF)
USD 3,830,000 Morgan Stanley Bank of America Merrill Lynch Trust 2014 C19 ‘Series 2014-C19 XF’ ‘144A’ FRN 15/12/2047 192,113 0.00
USD 3,510,000 Morgan Stanley Bank of America Merrill Lynch Trust 2015-C21 ‘Series 2015-C21 XB’ ‘144A’ FRN 15/3/2048 59,300 0.00
USD 1,704,000 Morgan Stanley Bank of America Merrill Lynch Trust 2015-C23 ‘Series 2015-C23 D’ ‘144A’ FRN 15/7/2050 1,718,814 0.02
USD 220,000 Morgan Stanley Bank of America Merrill Lynch Trust 2015-C25 ‘Series 2015-C25 C’ FRN 15/10/2048 239,905 0.00
USD 5,350,000 Morgan Stanley Bank of America Merrill Lynch Trust 2015-C26 ‘Series 2015-C26 XD’ ‘144A’ FRN 15/10/2048 399,003 0.00
USD 1,023,000 Morgan Stanley Bank of America Merrill Lynch Trust 2015-C26 ‘Series 2015-C26 D’ ‘144A’ 3.06% 15/10/2048 975,169 0.01
USD 2,164,328 Morgan Stanley Bank of America Merrill Lynch Trust 2016-C31 ‘Series 2016-C31 XA’ FRN 15/11/2049 163,472 0.00
USD 660,000 Morgan Stanley Bank of America Merrill Lynch Trust 2017-C33 ‘Series 2017-C33 C’ FRN 15/5/2050 722,953 0.01
USD 780,000 Morgan Stanley Capital Barclays Bank Trust 2016-MART ‘Series 2016-MART A’ ‘144A’ 2.2% 13/9/2031 781,997 0.01
USD 380,000 Morgan Stanley Capital I 2017-HR2 ‘Series 2017-HR2 D’ 2.73% 15/12/2050 349,249 0.00
USD 1,460,000 Morgan Stanley Capital I Trust 2006-IQ11 ‘Series 2006-IQ11 C’ FRN 15/10/2042 1,500,741 0.02
USD 464,022 Morgan Stanley Capital I Trust 2007-TOP27 ‘Series 2007-T27 AJ’ FRN 11/6/2042 495,019 0.01
USD 1,400,000 Morgan Stanley Capital I Trust 2014-150E ‘Series 2014-150E F’ ‘144A’ FRN 9/9/2032 1,457,823 0.02
USD 200,000 Morgan Stanley Capital I Trust 2014-CPT ‘Series 2014-CPT E’ ‘144A’ FRN 13/7/2029 201,831 0.00
USD 5,000,000 Morgan Stanley Capital I Trust 2014-CPT ‘Series 2014-CPT F’ ‘144A’ FRN 13/7/2029 5,048,478 0.05
USD 1,875,000 Morgan Stanley Capital I Trust 2014-CPT ‘Series 2014-CPT G’ ‘144A’ FRN 13/7/2029 1,880,746 0.02
USD 360,000 Morgan Stanley Capital I Trust 2015-MS1 ‘Series 2015-MS1 C’ FRN 15/5/2048 377,062 0.00
USD 250,000 Morgan Stanley Capital I Trust 2015-MS1 ‘Series 2015-MS1 D’ ‘144A’ FRN 15/5/2048 242,281 0.00
USD 5,480,000 Morgan Stanley Capital I Trust 2017-CLS ‘Series 2017-CLS F’ ‘144A’ FRN 15/11/2034 5,500,851 0.06
USD 1,560,000 Morgan Stanley Capital I Trust 2017-H1 ‘Series 2017-H1 C’ FRN 15/6/2050 1,689,321 0.02
USD 2,640,000 Morgan Stanley Capital I Trust 2017-H1 ‘Series 2017-H1 XD’ ‘144A’ FRN 15/6/2050 390,139 0.00
USD 920,000 Morgan Stanley Capital I Trust 2017-JWDR ‘Series 2017-JWDR D’ ‘144A’ FRN 15/11/2034 920,429 0.01
USD 1,097,000 Morgan Stanley Capital I Trust 2017-JWDR ‘Series 2017-JWDR E’ ‘144A’ FRN 15/11/2034 1,097,445 0.01
USD 1,280,000 Morgan Stanley Capital I Trust 2018-H3 ‘Series 2018-H3 C’ FRN 15/7/2051 1,433,412 0.01
USD 880,000 Morgan Stanley Capital I Trust 2018-H3 ‘Series 2018-H3 D’ ‘144A’ 3% 15/7/2051 812,585 0.01
USD 4,004,000 Morgan Stanley Capital I Trust 2018-MP ‘Series 2018-MP E’ ‘144A’ FRN 11/7/2040 4,121,741 0.04
USD 911,000 Morgan Stanley Capital I Trust 2018-SUN ‘Series 2018-SUN F’ ‘144A’ FRN 15/7/2035 916,389 0.01
USD 1,015,385 Morgan Stanley Mortgage Loan Trust 2007-9SL ‘Series 2007-9SL A’ FRN 25/7/2037 975,005 0.01
USD 7,557,977 Mortgage Loan Resecuritization Trust ‘Series 2009-RS1 A85’ ‘144A’ FRN 16/4/2036 6,561,005 0.07
USD 4,060,985 Mosaic Solar Loan Trust 2018-2-GS ‘Series 2018-2GS A’ ‘144A’ 4.2% 22/2/2044 4,240,687 0.04
USD 8,686,681 Mosaic Solar Loan Trust 2019-1 ‘Series 2019-1A A’ ‘144A’ 4.37% 21/12/2043 9,015,725 0.09
USD 6,195,000 Motorola Solutions Inc 4.6% 23/5/2029 6,795,216 0.07
USD 3,920,000 Mountain Hawk II CLO Ltd ‘Series 2013-2A BR’ ‘144A’ FRN 20/7/2024 3,919,319 0.04
USD 2,639,305 Mountain Hawk III CLO Ltd ‘Series 2014-3A AR’ ‘144A’ FRN 18/4/2025 2,643,055 0.03
USD 1,895,000 MP CLO VII Ltd ‘Series 2015-1A ARR’ ‘144A’ FRN 18/10/2028 1,884,320 0.02
EUR 950,000 MPT Operating Partnership LP / MPT Finance Corp 3.325% 24/3/2025 1,171,170 0.01
USD 649,102 Multi Security Asset Trust LP Commercial Mortgage-Backed Securities Pass-Through ‘Series 2005-RR4A N’ ‘144A’ FRN 28/11/2035 653,366 0.01
USD 1,305,000 National Retail Properties Inc 4.3% 15/10/2028 1,464,342 0.02
USD 3,545,000 National Retail Properties Inc 4.8% 15/10/2048 4,378,049 0.05
USD 146,263 Nationstar Home Equity Loan Trust 2007-C ‘Series 2007-C 2AV3’ FRN 25/6/2037 146,124 0.00
USD 691,598 Natixis Commercial Mortgage Securities Trust 2018-FL1 ‘Series 2018-FL1 A’ ‘144A’ FRN 15/6/2035 691,199 0.01
USD 1,195,978 Natixis Commercial Mortgage Securities Trust 2018-FL1 ‘Series 2018-FL1 MCR1’ ‘144A’ FRN 15/6/2035 1,191,264 0.01
USD 3,020,000 Navient Private Education Loan Trust 2014-A ‘Series 2014-AA B’ ‘144A’ 3.5% 15/8/2044 3,122,310 0.03
Fixed Income Global Opportunities Fund continued
Portfolio of Investments 31 August 2019
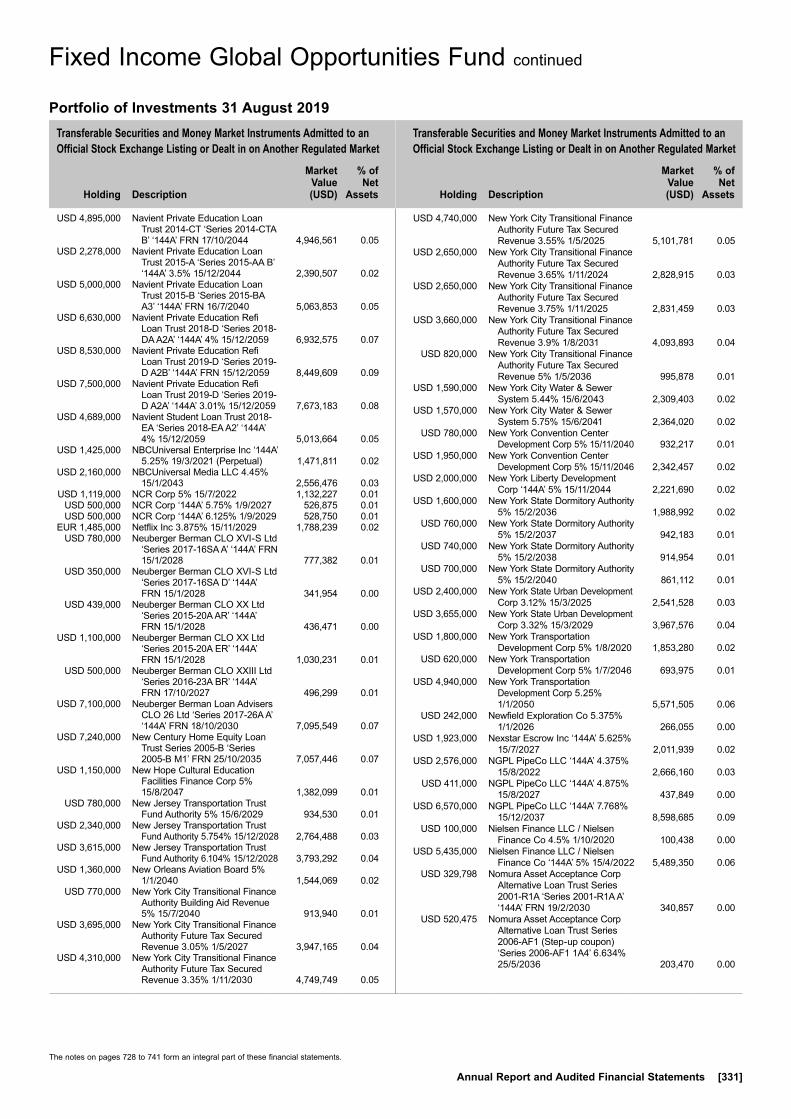
Transferable Securities and Money Market Instruments Admitted to an Official Stock Exchange Listing or Dealt in on Another Regulated Market
Transferable Securities and Money Market Instruments Admitted to an Official Stock Exchange Listing or Dealt in on Another Regulated Market
Holding
Description
Market Value (USD)
% of Net
Assets
Holding
Description
Market Value (USD)
% of Net
Assets
The notes on pages 728 to 741 form an integral part of these financial statements.
Annual Report and Audited Financial Statements [331]
USD 4,895,000 Navient Private Education Loan Trust 2014-CT ‘Series 2014-CTA B’ ‘144A’ FRN 17/10/2044 4,946,561 0.05
USD 2,278,000 Navient Private Education Loan Trust 2015-A ‘Series 2015-AA B’ ‘144A’ 3.5% 15/12/2044 2,390,507 0.02
USD 5,000,000 Navient Private Education Loan Trust 2015-B ‘Series 2015-BA A3’ ‘144A’ FRN 16/7/2040 5,063,853 0.05
USD 6,630,000 Navient Private Education Refi Loan Trust 2018-D ‘Series 2018-DA A2A’ ‘144A’ 4% 15/12/2059 6,932,575 0.07
USD 8,530,000 Navient Private Education Refi Loan Trust 2019-D ‘Series 2019-D A2B’ ‘144A’ FRN 15/12/2059 8,449,609 0.09
USD 7,500,000 Navient Private Education Refi Loan Trust 2019-D ‘Series 2019-D A2A’ ‘144A’ 3.01% 15/12/2059 7,673,183 0.08
USD 4,689,000 Navient Student Loan Trust 2018-EA ‘Series 2018-EA A2’ ‘144A’ 4% 15/12/2059 5,013,664 0.05
USD 1,425,000 NBCUniversal Enterprise Inc ‘144A’ 5.25% 19/3/2021 (Perpetual) 1,471,811 0.02
USD 2,160,000 NBCUniversal Media LLC 4.45% 15/1/2043 2,556,476 0.03
USD 1,119,000 NCR Corp 5% 15/7/2022 1,132,227 0.01 USD 500,000 NCR Corp ‘144A’ 5.75% 1/9/2027 526,875 0.01 USD 500,000 NCR Corp ‘144A’ 6.125% 1/9/2029 528,750 0.01 EUR 1,485,000 Netflix Inc 3.875% 15/11/2029 1,788,239 0.02 USD 780,000 Neuberger Berman CLO XVI-S Ltd
‘Series 2017-16SA A’ ‘144A’ FRN 15/1/2028 777,382 0.01
USD 350,000 Neuberger Berman CLO XVI-S Ltd ‘Series 2017-16SA D’ ‘144A’ FRN 15/1/2028 341,954 0.00
USD 439,000 Neuberger Berman CLO XX Ltd ‘Series 2015-20A AR’ ‘144A’ FRN 15/1/2028 436,471 0.00
USD 1,100,000 Neuberger Berman CLO XX Ltd ‘Series 2015-20A ER’ ‘144A’ FRN 15/1/2028 1,030,231 0.01
USD 500,000 Neuberger Berman CLO XXIII Ltd ‘Series 2016-23A BR’ ‘144A’ FRN 17/10/2027 496,299 0.01
USD 7,100,000 Neuberger Berman Loan Advisers CLO 26 Ltd ‘Series 2017-26A A’ ‘144A’ FRN 18/10/2030 7,095,549 0.07
USD 7,240,000 New Century Home Equity Loan Trust Series 2005-B ‘Series 2005-B M1’ FRN 25/10/2035 7,057,446 0.07
USD 1,150,000 New Hope Cultural Education Facilities Finance Corp 5% 15/8/2047 1,382,099 0.01
USD 780,000 New Jersey Transportation Trust Fund Authority 5% 15/6/2029 934,530 0.01
USD 2,340,000 New Jersey Transportation Trust Fund Authority 5.754% 15/12/2028 2,764,488 0.03
USD 3,615,000 New Jersey Transportation Trust Fund Authority 6.104% 15/12/2028 3,793,292 0.04
USD 1,360,000 New Orleans Aviation Board 5% 1/1/2040 1,544,069 0.02
USD 770,000 New York City Transitional Finance Authority Building Aid Revenue 5% 15/7/2040 913,940 0.01
USD 3,695,000 New York City Transitional Finance Authority Future Tax Secured Revenue 3.05% 1/5/2027 3,947,165 0.04
USD 4,310,000 New York City Transitional Finance Authority Future Tax Secured Revenue 3.35% 1/11/2030 4,749,749 0.05
USD 4,740,000 New York City Transitional Finance Authority Future Tax Secured Revenue 3.55% 1/5/2025 5,101,781 0.05
USD 2,650,000 New York City Transitional Finance Authority Future Tax Secured Revenue 3.65% 1/11/2024 2,828,915 0.03
USD 2,650,000 New York City Transitional Finance Authority Future Tax Secured Revenue 3.75% 1/11/2025 2,831,459 0.03
USD 3,660,000 New York City Transitional Finance Authority Future Tax Secured Revenue 3.9% 1/8/2031 4,093,893 0.04
USD 820,000 New York City Transitional Finance Authority Future Tax Secured Revenue 5% 1/5/2036 995,878 0.01
USD 1,590,000 New York City Water & Sewer System 5.44% 15/6/2043 2,309,403 0.02
USD 1,570,000 New York City Water & Sewer System 5.75% 15/6/2041 2,364,020 0.02
USD 780,000 New York Convention Center Development Corp 5% 15/11/2040 932,217 0.01
USD 1,950,000 New York Convention Center Development Corp 5% 15/11/2046 2,342,457 0.02
USD 2,000,000 New York Liberty Development Corp ‘144A’ 5% 15/11/2044 2,221,690 0.02
USD 1,600,000 New York State Dormitory Authority 5% 15/2/2036 1,988,992 0.02
USD 760,000 New York State Dormitory Authority 5% 15/2/2037 942,183 0.01
USD 740,000 New York State Dormitory Authority 5% 15/2/2038 914,954 0.01
USD 700,000 New York State Dormitory Authority 5% 15/2/2040 861,112 0.01
USD 2,400,000 New York State Urban Development Corp 3.12% 15/3/2025 2,541,528 0.03
USD 3,655,000 New York State Urban Development Corp 3.32% 15/3/2029 3,967,576 0.04
USD 1,800,000 New York Transportation Development Corp 5% 1/8/2020 1,853,280 0.02
USD 620,000 New York Transportation Development Corp 5% 1/7/2046 693,975 0.01
USD 4,940,000 New York Transportation Development Corp 5.25% 1/1/2050 5,571,505 0.06
USD 242,000 Newfield Exploration Co 5.375% 1/1/2026 266,055 0.00
USD 1,923,000 Nexstar Escrow Inc ‘144A’ 5.625% 15/7/2027 2,011,939 0.02
USD 2,576,000 NGPL PipeCo LLC ‘144A’ 4.375% 15/8/2022 2,666,160 0.03
USD 411,000 NGPL PipeCo LLC ‘144A’ 4.875% 15/8/2027 437,849 0.00
USD 6,570,000 NGPL PipeCo LLC ‘144A’ 7.768% 15/12/2037 8,598,685 0.09
USD 100,000 Nielsen Finance LLC / Nielsen Finance Co 4.5% 1/10/2020 100,438 0.00
USD 5,435,000 Nielsen Finance LLC / Nielsen Finance Co ‘144A’ 5% 15/4/2022 5,489,350 0.06
USD 329,798 Nomura Asset Acceptance Corp Alternative Loan Trust Series 2001-R1A ‘Series 2001-R1A A’ ‘144A’ FRN 19/2/2030 340,857 0.00
USD 520,475 Nomura Asset Acceptance Corp Alternative Loan Trust Series 2006-AF1 (Step-up coupon) ‘Series 2006-AF1 1A4’ 6.634% 25/5/2036 203,470 0.00
Fixed Income Global Opportunities Fund continued
Portfolio of Investments 31 August 2019

Transferable Securities and Money Market Instruments Admitted to an Official Stock Exchange Listing or Dealt in on Another Regulated Market
Transferable Securities and Money Market Instruments Admitted to an Official Stock Exchange Listing or Dealt in on Another Regulated Market
Holding
Description
Market Value (USD)
% of Net
Assets
Holding
Description
Market Value (USD)
% of Net
Assets
* All or a portion of this security represents a security on loan.
The notes on pages 728 to 741 form an integral part of these financial statements.
[332] BlackRock Global Funds (BGF)
USD 302,169 Nomura Asset Acceptance Corp Alternative Loan Trust Series 2006-S5 ‘Series 2006-S5 A1’ ‘144A’ FRN 25/10/2036 282,372 0.00
USD 2,260,231 Nomura Asset Acceptance Corp Alternative Loan Trust Series 2007-2 ‘Series 2007-2 A4’ FRN 25/6/2037 1,874,717 0.02
USD 1,070,000 North Carolina Turnpike Authority 5% 1/1/2035 1,346,905 0.01
USD 1,090,000 North Texas Tollway Authority 5% 1/1/2043 1,331,975 0.01
USD 1,360,778 Northern Oil and Gas Inc 8.5% 15/5/2023 1,406,704 0.01
USD 47,858 Northwest Airlines 2002-1 Class G-2 Pass Through Trust 6.264% 20/11/2021 49,660 0.00
USD 2,734,000 NRG Energy Inc 2.75% 1/6/2048 2,966,770 0.03 USD 285,000 NRG Energy Inc 5.75% 15/1/2028 307,800 0.00 USD 425,000 NRG Energy Inc 6.625% 15/1/2027 460,594 0.00 USD 347,000 NRG Energy Inc 7.25% 15/5/2026 380,832 0.00 USD 3,360,000 Oaktree CLO 2015-1 Ltd ‘Series
2015-1A A1R’ ‘144A’ FRN 20/10/2027 3,356,070 0.03
USD 2,000,000 Oaktree CLO 2015-1 Ltd ‘Series 2015-1A DR’ ‘144A’ FRN 20/10/2027 1,975,503 0.02
USD 699,897 Oakwood Mortgage Investors Inc (Defaulted) ‘Series 2001-D A2’ FRN 15/1/2019 495,159 0.01
USD 577,650 Oakwood Mortgage Investors Inc ‘Series 2001-D A4’ FRN 15/9/2031 481,254 0.01
USD 2,458,000 Occidental Petroleum Corp 2.6% 13/8/2021 2,473,526 0.03
USD 5,169,000 Occidental Petroleum Corp 2.7% 15/8/2022 5,213,614 0.05
USD 6,660,000 Occidental Petroleum Corp 2.9% 15/8/2024 6,706,815 0.07
USD 948,000 Ochsner Clinic Foundation 5.897% 15/5/2045 1,352,012 0.01
USD 460,000 OCP CLO 2014-5 Ltd ‘Series 2014-5A A1R’ ‘144A’ FRN 26/4/2031 456,101 0.00
USD 1,350,000 OCP CLO 2014-7 Ltd ‘Series 2014-7A A2RR’ ‘144A’ FRN 20/7/2029 1,339,243 0.01
USD 1,750,000 OCP CLO 2015-10 Ltd ‘Series 2015-10A BR’ ‘144A’ FRN 26/10/2027 1,740,389 0.02
USD 1,340,000 OCP CLO 2015-8 Ltd ‘Series 2015-8A BR’ ‘144A’ FRN 17/4/2027 1,337,943 0.01
USD 2,057,000 OCP CLO 2016-12 Ltd FRN 18/10/2028 2,055,027 0.02
USD 440,000 OCP CLO 2016-12 Ltd FRN 18/10/2028 431,589 0.00
USD 920,000 OCP CLO 2017-13 Ltd ‘Series 2017-13A D’ ‘144A’ FRN 15/7/2030 882,487 0.01
USD 5,200,000 Octagon Investment Partners 18-R Ltd ‘Series 2018-18A A1A’ ‘144A’ FRN 16/4/2031 5,142,539 0.05
USD 250,000 Octagon Investment Partners 30 Ltd ‘Series 2017-1A D’ ‘144A’ FRN 17/3/2030 241,812 0.00
USD 1,000,000 OCTAGON INVESTMENT PARTNERS 31 LLC ‘Series 2017-1A E’ ‘144A’ FRN 20/7/2030 960,122 0.01
USD 1,625,000 Octagon Investment Partners 33 Ltd ‘Series 2017-1A A1’ ‘144A’ FRN 20/1/2031 1,620,461 0.02
USD 4,335,000 Octagon Investment Partners XVII Ltd ‘Series 2013-1A A1R2’ ‘144A’ FRN 25/1/2031 4,290,742 0.04
USD 530,000 Octagon Investment Partners XXIII Ltd ‘144A’ FRN 15/7/2027 525,742 0.01
USD 1,120,000 Octagon Investment Partners XXIII Ltd FRN 15/7/2027 1,111,698 0.01
USD 7,105,000 OFSI Fund VI Ltd ‘144A’ FRN 20/3/2025 7,093,317 0.07
USD 670,000 OFSI Fund VI Ltd ‘Series 2014-6A CR’ ‘144A’ FRN 20/3/2025 667,143 0.01
USD 1,499,127 OFSI Fund VII Ltd ‘Series 2014-7A AR’ ‘144A’ FRN 18/10/2026 1,497,947 0.02
USD 180,523 OHA Credit Partners IX Ltd ‘Series 2013-9A A1R’ ‘144A’ FRN 20/10/2025 180,582 0.00
USD 730,000 OHA Credit Partners VII Ltd ‘Series 2012-7A DR’ ‘144A’ FRN 20/11/2027 732,240 0.01
USD 260,000 OHA Credit Partners XIII Ltd ‘Series 2016-13A E’ ‘144A’ FRN 21/1/2030 261,244 0.00
USD 1,360,000 OHA Loan Funding 2013-2 Ltd ‘Series 2013-2A AR’ ‘144A’ FRN 23/5/2031 1,347,338 0.01
USD 1,250,000 OHA Loan Funding 2015-1 Ltd ‘Series 2015-1A AR’ ‘144A’ FRN 15/8/2029 1,250,402 0.01
USD 1,658,000 OHA Loan Funding 2016-1 Ltd ‘Series 2016-1A B1’ ‘144A’ FRN 20/1/2028 1,658,903 0.02
USD 6,395,000 OHA Loan Funding 2016-1 Ltd ‘Series 2016-1A C’ ‘144A’ FRN 20/1/2028 6,409,052 0.07
USD 7,920,000 OHA Loan Funding 2016-1 Ltd ‘Series 2016-1A D’ ‘144A’ FRN 20/1/2028 7,926,148 0.08
USD 1,662,000 OHA Loan Funding 2016-1 Ltd ‘Series 2016-1A E’ ‘144A’ FRN 20/1/2028 1,640,007 0.02
USD 1,780,000 Ohio Turnpike & Infrastructure Commission 5% 15/2/2048 1,956,968 0.02
USD 1,000,000 Oklahoma Development Finance Authority 5.25% 15/8/2043 1,217,735 0.01
USD 500,000 Oklahoma Development Finance Authority 5.25% 15/8/2048 603,627 0.01
USD 4,480,000 Oklahoma Development Finance Authority 5.5% 15/8/2057 5,458,096 0.06
USD 2,340,000 Olympic Tower 2017-OT Mortgage Trust ‘Series 2017-OT E’ ‘144A’ FRN 10/5/2039 2,428,298 0.03
USD 29,500,000 Olympic Tower 2017-OT Mortgage Trust ‘Series 2017-OT XA’ ‘144A’ FRN 10/5/2039 848,715 0.01
USD 2,730,000 Oncor Electric Delivery Co LLC ‘144A’ 3.7% 15/11/2028 3,048,894 0.03
USD 2,830,000 Oncor Electric Delivery Co LLC ‘144A’ 3.8% 1/6/2049* 3,294,347 0.03
USD 43,880,000 One Market Plaza Trust 2017-1MKT ‘Series 2017-1MKT XCP’ ‘144A’ FRN 10/2/2032 154,019 0.00
USD 8,776,000 One Market Plaza Trust 2017-1MKT ‘Series 2017-1MKT XNCP’ ‘144A’ FRN 10/2/2032 88 0.00
USD 11,132,000 Onemain Financial Issuance Trust 2018-1 ‘Series 2018-1A A’ ‘144A’ 3.3% 14/3/2029 11,368,906 0.12
USD 6,900,000 Onemain Financial Issuance Trust 2018-1 ‘Series 2018-1A B’ ‘144A’ 3.61% 14/3/2029 7,031,074 0.07
USD 1,321,645 Option One Mortgage Loan Trust 2006-3 ‘Series 2006-3 1A1’ FRN 25/2/2037 963,714 0.01
Fixed Income Global Opportunities Fund continued
Portfolio of Investments 31 August 2019

Transferable Securities and Money Market Instruments Admitted to an Official Stock Exchange Listing or Dealt in on Another Regulated Market
Transferable Securities and Money Market Instruments Admitted to an Official Stock Exchange Listing or Dealt in on Another Regulated Market
Holding
Description
Market Value (USD)
% of Net
Assets
Holding
Description
Market Value (USD)
% of Net
Assets
The notes on pages 728 to 741 form an integral part of these financial statements.
Annual Report and Audited Financial Statements [333]
USD 1,950,000 Option One Mortgage Loan Trust 2007-CP1 ‘Series 2007-CP1 2A3’ FRN 25/3/2037 1,348,280 0.01
USD 2,635,619 Option One Mortgage Loan Trust 2007-FXD1 (Step-up coupon) ‘Series 2007-FXD1 1A1’ 5.866% 25/1/2037 2,580,795 0.03
USD 7,061,074 Option One Mortgage Loan Trust 2007-FXD1 (Step-up coupon) ‘Series 2007-FXD1 2A1’ 5.866% 25/1/2037 7,085,781 0.07
USD 10,003,279 Option One Mortgage Loan Trust 2007-FXD2 (Step-up coupon) ‘Series 2007-FXD2 1A1’ 5.82% 25/3/2037 10,326,584 0.11
USD 2,160,000 Oracle Corp 6.125% 8/7/2039 3,072,232 0.03 USD 3,255,000 Orange County Local
Transportation Authority 6.908% 15/2/2041 4,952,515 0.05
USD 4,395,000 Oregon School Boards Association 4.759% 30/6/2028 4,974,679 0.05
USD 5,005,000 Oregon School Boards Association 5.55% 30/6/2028 6,047,366 0.06
USD 3,575,000 Oregon School Boards Association 5.68% 30/6/2028 4,420,023 0.05
USD 679,856 Origen Manufactured Housing Contract Trust 2001-A ‘Series 2001-A M1’ FRN 15/3/2032 691,427 0.01
USD 1,811,720 Origen Manufactured Housing Contract Trust 2007-B ‘Series 2007-B A1’ ‘144A’ FRN 15/10/2037 1,739,696 0.02
USD 168,000 Outfront Media Capital LLC / Outfront Media Capital Corp 5.625% 15/2/2024 173,670 0.00
USD 1,590,000 Ownit Mortgage Loan Trust Series 2006-2 (Step-up coupon) ‘Series 2006-2 A2C’ 6% 25/1/2037 1,552,318 0.02
USD 5,030,000 OZLM Funding III Ltd ‘Series 2013-3A BR’ ‘144A’ FRN 22/1/2029 5,060,974 0.05
USD 2,850,000 OZLM Funding IV Ltd ‘Series 2013-4A A1R’ ‘144A’ FRN 22/10/2030 2,834,770 0.03
USD 290,000 OZLM Funding IV Ltd ‘Series 2013-4A A2R’ ‘144A’ FRN 22/10/2030 287,433 0.00
USD 250,000 OZLM Funding Ltd ‘Series 2012-1A A2R2’ ‘144A’ FRN 22/7/2029 250,162 0.00
USD 1,640,000 OZLM Funding Ltd ‘Series 2012-1X SUB’ FRN 22/7/2029 584,056 0.01
USD 3,200,000 OZLM VI Ltd ‘Series 2014-6A SUB’ ‘144A’ FRN 17/4/2031 1,285,293 0.01
USD 500,000 OZLM VII Ltd ‘Series 2014-7RA A2R’ ‘144A’ FRN 17/7/2029 493,892 0.01
USD 1,250,000 OZLM VIII Ltd ‘Series 2014-8A BRR’ ‘144A’ FRN 17/10/2029 1,222,884 0.01
USD 1,065,000 OZLM VIII Ltd ‘Series 2014-8A CRR’ ‘144A’ FRN 17/10/2029 1,015,311 0.01
USD 1,630,000 OZLM XIV Ltd ‘Series 2015-14A B1R’ ‘144A’ FRN 15/1/2029 1,618,092 0.02
USD 2,190,000 OZLM XIV Ltd ‘Series 2015-14A CR’ ‘144A’ FRN 15/1/2029 2,129,920 0.02
USD 2,250,000 OZLM XIX Ltd ‘Series 2017-19A A1’ ‘144A’ FRN 22/11/2030 2,240,353 0.02
USD 2,120,000 OZLM XV Ltd ‘Series 2016-15A A1’ ‘144A’ FRN 20/1/2029 2,121,322 0.02
USD 830,000 OZLM XV Ltd ‘Series 2016-15A A2A’ ‘144A’ FRN 20/1/2029 829,985 0.01
USD 440,000 OZLM XV Ltd ‘Series 2016-15A C’ ‘144A’ FRN 20/1/2029 440,732 0.00
USD 440,000 OZLM XV Ltd ‘Series 2016-15A D’ ‘144A’ FRN 20/1/2029 439,878 0.00
USD 580,000 Palmer Square CLO 2014-1 Ltd ‘Series 2014-1A A1R2’ ‘144A’ FRN 17/1/2031 577,103 0.01
USD 250,000 Palmer Square CLO 2015-2 Ltd ‘Series 2015-2A CR’ ‘144A’ FRN 20/7/2030 249,199 0.00
USD 630,000 Palmer Square CLO 2015-2 Ltd ‘Series 2015-2A DR’ ‘144A’ FRN 20/7/2030 610,294 0.01
USD 2,090,000 Palmer Square CLO 2018-1 Ltd ‘Series 2018-1A A1’ ‘144A’ FRN 18/4/2031 2,072,949 0.02
USD 3,502,000 Palmer Square CLO 2018-3 Ltd ‘Series 2018-3A A2’ ‘144A’ FRN 15/8/2026 3,483,671 0.04
USD 1,280,000 Palmer Square Loan Funding 2017-1 Ltd ‘Series 2017-1A A2’ ‘144A’ FRN 15/10/2025 1,275,832 0.01
USD 910,610 Palmer Square Loan Funding 2018-4 Ltd ‘Series 2018-4A A1’ ‘144A’ FRN 15/11/2026 910,106 0.01
USD 1,780,000 Palmer Square Loan Funding 2018-4 Ltd ‘Series 2018-4A B’ ‘144A’ FRN 15/11/2026 1,771,483 0.02
USD 1,550,000 Palmer Square Loan Funding 2018-4 Ltd ‘Series 2018-4A C’ ‘144A’ FRN 15/11/2026 1,478,581 0.02
USD 2,245,000 Palmer Square Loan Funding 2018-5 Ltd FRN 20/1/2027 2,239,098 0.02
USD 3,512,000 Palmer Square Loan Funding 2018-5 Ltd FRN 20/1/2027 3,498,994 0.04
USD 350,000 Palmer Square Loan Funding 2018-5 Ltd ‘Series 2018-5A D’ ‘144A’ FRN 20/1/2027 349,081 0.00
EUR 4,035,000 Panther BF Aggregator 2 LP / Panther Finance Co Inc 4.375% 15/5/2026 4,553,101 0.05
USD 96,276 Paragon Mortgages No 13 Plc FRN 15/1/2039 90,262 0.00
USD 1,560,000 Parallel 2017-1 Ltd ‘Series 2017-1A B’ ‘144A’ FRN 20/7/2029 1,546,574 0.02
USD 1,350,000 Park Avenue Institutional Advisers CLO Ltd 2016-1 ‘Series 2016-1A DR’ ‘144A’ FRN 23/8/2031 1,230,723 0.01
USD 2,525,000 Park Avenue Institutional Advisers CLO Ltd 2017-1 ‘Series 2017-1A A1’ ‘144A’ FRN 14/11/2029 2,517,246 0.03
USD 2,320,000 Park Avenue Institutional Advisers CLO Ltd 2017-1 ‘Series 2017-1A A2’ ‘144A’ FRN 14/11/2029 2,311,789 0.02
USD 3,100,000 Park Avenue Institutional Advisers CLO Ltd 2017-1 ‘Series 2017-1A B’ ‘144A’ FRN 14/11/2029 3,059,937 0.03
USD 2,830,000 Park Avenue Institutional Advisers CLO Ltd 2017-1 ‘Series 2017-1A D’ ‘144A’ FRN 14/11/2029 2,718,627 0.03
USD 1,230,000 Parsley Energy LLC / Parsley Finance Corp ‘144A’ 5.25% 15/8/2025 1,254,600 0.01
USD 6,070,000 Parsley Energy LLC / Parsley Finance Corp ‘144A’ 5.375% 15/1/2025 6,206,575 0.06
USD 1,044,000 Parsley Energy LLC / Parsley Finance Corp ‘144A’ 5.625% 15/10/2027 1,080,540 0.01
USD 4,860,000 Parsley Energy LLC / Parsley Finance Corp ‘144A’ 6.25% 1/6/2024 5,017,950 0.05
Fixed Income Global Opportunities Fund continued
Portfolio of Investments 31 August 2019
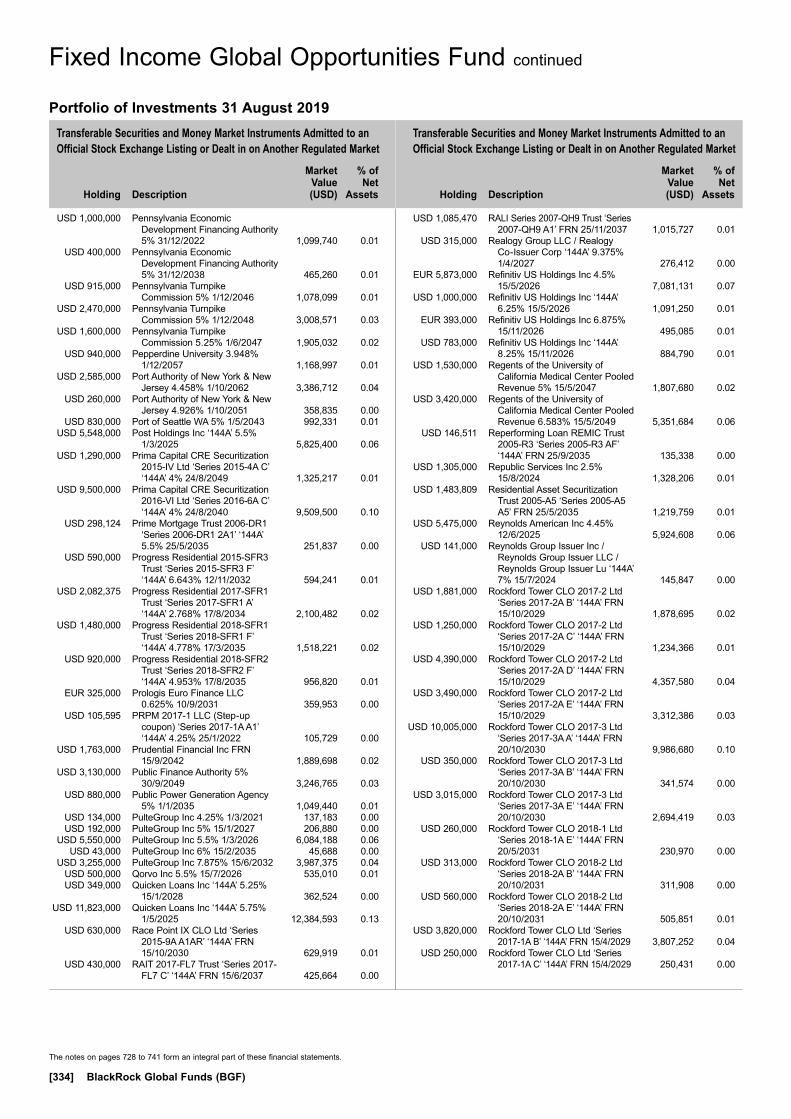
Transferable Securities and Money Market Instruments Admitted to an Official Stock Exchange Listing or Dealt in on Another Regulated Market
Transferable Securities and Money Market Instruments Admitted to an Official Stock Exchange Listing or Dealt in on Another Regulated Market
Holding
Description
Market Value (USD)
% of Net
Assets
Holding
Description
Market Value (USD)
% of Net
Assets
The notes on pages 728 to 741 form an integral part of these financial statements.
[334] BlackRock Global Funds (BGF)
USD 1,000,000 Pennsylvania Economic Development Financing Authority 5% 31/12/2022 1,099,740 0.01
USD 400,000 Pennsylvania Economic Development Financing Authority 5% 31/12/2038 465,260 0.01
USD 915,000 Pennsylvania Turnpike Commission 5% 1/12/2046 1,078,099 0.01
USD 2,470,000 Pennsylvania Turnpike Commission 5% 1/12/2048 3,008,571 0.03
USD 1,600,000 Pennsylvania Turnpike Commission 5.25% 1/6/2047 1,905,032 0.02
USD 940,000 Pepperdine University 3.948% 1/12/2057 1,168,997 0.01
USD 2,585,000 Port Authority of New York & New Jersey 4.458% 1/10/2062 3,386,712 0.04
USD 260,000 Port Authority of New York & New Jersey 4.926% 1/10/2051 358,835 0.00
USD 830,000 Port of Seattle WA 5% 1/5/2043 992,331 0.01 USD 5,548,000 Post Holdings Inc ‘144A’ 5.5%
1/3/2025 5,825,400 0.06 USD 1,290,000 Prima Capital CRE Securitization
2015-IV Ltd ‘Series 2015-4A C’ ‘144A’ 4% 24/8/2049 1,325,217 0.01
USD 9,500,000 Prima Capital CRE Securitization 2016-VI Ltd ‘Series 2016-6A C’ ‘144A’ 4% 24/8/2040 9,509,500 0.10
USD 298,124 Prime Mortgage Trust 2006-DR1 ‘Series 2006-DR1 2A1’ ‘144A’ 5.5% 25/5/2035 251,837 0.00
USD 590,000 Progress Residential 2015-SFR3 Trust ‘Series 2015-SFR3 F’ ‘144A’ 6.643% 12/11/2032 594,241 0.01
USD 2,082,375 Progress Residential 2017-SFR1 Trust ‘Series 2017-SFR1 A’ ‘144A’ 2.768% 17/8/2034 2,100,482 0.02
USD 1,480,000 Progress Residential 2018-SFR1 Trust ‘Series 2018-SFR1 F’ ‘144A’ 4.778% 17/3/2035 1,518,221 0.02
USD 920,000 Progress Residential 2018-SFR2 Trust ‘Series 2018-SFR2 F’ ‘144A’ 4.953% 17/8/2035 956,820 0.01
EUR 325,000 Prologis Euro Finance LLC 0.625% 10/9/2031 359,953 0.00
USD 105,595 PRPM 2017-1 LLC (Step-up coupon) ‘Series 2017-1A A1’ ‘144A’ 4.25% 25/1/2022 105,729 0.00
USD 1,763,000 Prudential Financial Inc FRN 15/9/2042 1,889,698 0.02
USD 3,130,000 Public Finance Authority 5% 30/9/2049 3,246,765 0.03
USD 880,000 Public Power Generation Agency 5% 1/1/2035 1,049,440 0.01
USD 134,000 PulteGroup Inc 4.25% 1/3/2021 137,183 0.00 USD 192,000 PulteGroup Inc 5% 15/1/2027 206,880 0.00 USD 5,550,000 PulteGroup Inc 5.5% 1/3/2026 6,084,188 0.06 USD 43,000 PulteGroup Inc 6% 15/2/2035 45,688 0.00 USD 3,255,000 PulteGroup Inc 7.875% 15/6/2032 3,987,375 0.04 USD 500,000 Qorvo Inc 5.5% 15/7/2026 535,010 0.01 USD 349,000 Quicken Loans Inc ‘144A’ 5.25%
15/1/2028 362,524 0.00 USD 11,823,000 Quicken Loans Inc ‘144A’ 5.75%
1/5/2025 12,384,593 0.13 USD 630,000 Race Point IX CLO Ltd ‘Series
2015-9A A1AR’ ‘144A’ FRN 15/10/2030 629,919 0.01
USD 430,000 RAIT 2017-FL7 Trust ‘Series 2017-FL7 C’ ‘144A’ FRN 15/6/2037 425,664 0.00
USD 1,085,470 RALI Series 2007-QH9 Trust ‘Series 2007-QH9 A1’ FRN 25/11/2037 1,015,727 0.01
USD 315,000 Realogy Group LLC / Realogy Co-Issuer Corp ‘144A’ 9.375% 1/4/2027 276,412 0.00
EUR 5,873,000 Refinitiv US Holdings Inc 4.5% 15/5/2026 7,081,131 0.07
USD 1,000,000 Refinitiv US Holdings Inc ‘144A’ 6.25% 15/5/2026 1,091,250 0.01
EUR 393,000 Refinitiv US Holdings Inc 6.875% 15/11/2026 495,085 0.01
USD 783,000 Refinitiv US Holdings Inc ‘144A’ 8.25% 15/11/2026 884,790 0.01
USD 1,530,000 Regents of the University of California Medical Center Pooled Revenue 5% 15/5/2047 1,807,680 0.02
USD 3,420,000 Regents of the University of California Medical Center Pooled Revenue 6.583% 15/5/2049 5,351,684 0.06
USD 146,511 Reperforming Loan REMIC Trust 2005-R3 ‘Series 2005-R3 AF’ ‘144A’ FRN 25/9/2035 135,338 0.00
USD 1,305,000 Republic Services Inc 2.5% 15/8/2024 1,328,206 0.01
USD 1,483,809 Residential Asset Securitization Trust 2005-A5 ‘Series 2005-A5 A5’ FRN 25/5/2035 1,219,759 0.01
USD 5,475,000 Reynolds American Inc 4.45% 12/6/2025 5,924,608 0.06
USD 141,000 Reynolds Group Issuer Inc / Reynolds Group Issuer LLC / Reynolds Group Issuer Lu ‘144A’ 7% 15/7/2024 145,847 0.00
USD 1,881,000 Rockford Tower CLO 2017-2 Ltd ‘Series 2017-2A B’ ‘144A’ FRN 15/10/2029 1,878,695 0.02
USD 1,250,000 Rockford Tower CLO 2017-2 Ltd ‘Series 2017-2A C’ ‘144A’ FRN 15/10/2029 1,234,366 0.01
USD 4,390,000 Rockford Tower CLO 2017-2 Ltd ‘Series 2017-2A D’ ‘144A’ FRN 15/10/2029 4,357,580 0.04
USD 3,490,000 Rockford Tower CLO 2017-2 Ltd ‘Series 2017-2A E’ ‘144A’ FRN 15/10/2029 3,312,386 0.03
USD 10,005,000 Rockford Tower CLO 2017-3 Ltd ‘Series 2017-3A A’ ‘144A’ FRN 20/10/2030 9,986,680 0.10
USD 350,000 Rockford Tower CLO 2017-3 Ltd ‘Series 2017-3A B’ ‘144A’ FRN 20/10/2030 341,574 0.00
USD 3,015,000 Rockford Tower CLO 2017-3 Ltd ‘Series 2017-3A E’ ‘144A’ FRN 20/10/2030 2,694,419 0.03
USD 260,000 Rockford Tower CLO 2018-1 Ltd ‘Series 2018-1A E’ ‘144A’ FRN 20/5/2031 230,970 0.00
USD 313,000 Rockford Tower CLO 2018-2 Ltd ‘Series 2018-2A B’ ‘144A’ FRN 20/10/2031 311,908 0.00
USD 560,000 Rockford Tower CLO 2018-2 Ltd ‘Series 2018-2A E’ ‘144A’ FRN 20/10/2031 505,851 0.01
USD 3,820,000 Rockford Tower CLO Ltd ‘Series 2017-1A B’ ‘144A’ FRN 15/4/2029 3,807,252 0.04
USD 250,000 Rockford Tower CLO Ltd ‘Series 2017-1A C’ ‘144A’ FRN 15/4/2029 250,431 0.00
Fixed Income Global Opportunities Fund continued
Portfolio of Investments 31 August 2019
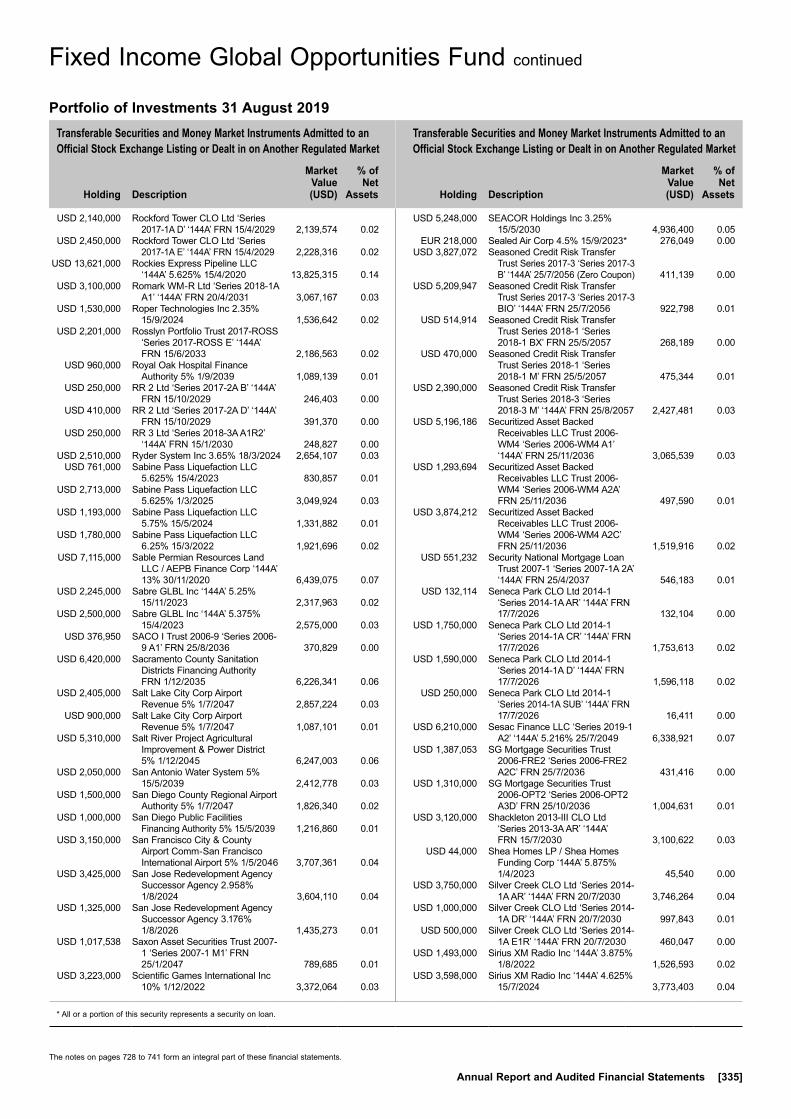
Transferable Securities and Money Market Instruments Admitted to an Official Stock Exchange Listing or Dealt in on Another Regulated Market
Transferable Securities and Money Market Instruments Admitted to an Official Stock Exchange Listing or Dealt in on Another Regulated Market
Holding
Description
Market Value (USD)
% of Net
Assets
Holding
Description
Market Value (USD)
% of Net
Assets
* All or a portion of this security represents a security on loan.
The notes on pages 728 to 741 form an integral part of these financial statements.
Annual Report and Audited Financial Statements [335]
USD 2,140,000 Rockford Tower CLO Ltd ‘Series 2017-1A D’ ‘144A’ FRN 15/4/2029 2,139,574 0.02
USD 2,450,000 Rockford Tower CLO Ltd ‘Series 2017-1A E’ ‘144A’ FRN 15/4/2029 2,228,316 0.02
USD 13,621,000 Rockies Express Pipeline LLC ‘144A’ 5.625% 15/4/2020 13,825,315 0.14
USD 3,100,000 Romark WM-R Ltd ‘Series 2018-1A A1’ ‘144A’ FRN 20/4/2031 3,067,167 0.03
USD 1,530,000 Roper Technologies Inc 2.35% 15/9/2024 1,536,642 0.02
USD 2,201,000 Rosslyn Portfolio Trust 2017-ROSS ‘Series 2017-ROSS E’ ‘144A’ FRN 15/6/2033 2,186,563 0.02
USD 960,000 Royal Oak Hospital Finance Authority 5% 1/9/2039 1,089,139 0.01
USD 250,000 RR 2 Ltd ‘Series 2017-2A B’ ‘144A’ FRN 15/10/2029 246,403 0.00
USD 410,000 RR 2 Ltd ‘Series 2017-2A D’ ‘144A’ FRN 15/10/2029 391,370 0.00
USD 250,000 RR 3 Ltd ‘Series 2018-3A A1R2’ ‘144A’ FRN 15/1/2030 248,827 0.00
USD 2,510,000 Ryder System Inc 3.65% 18/3/2024 2,654,107 0.03 USD 761,000 Sabine Pass Liquefaction LLC
5.625% 15/4/2023 830,857 0.01 USD 2,713,000 Sabine Pass Liquefaction LLC
5.625% 1/3/2025 3,049,924 0.03 USD 1,193,000 Sabine Pass Liquefaction LLC
5.75% 15/5/2024 1,331,882 0.01 USD 1,780,000 Sabine Pass Liquefaction LLC
6.25% 15/3/2022 1,921,696 0.02 USD 7,115,000 Sable Permian Resources Land
LLC / AEPB Finance Corp ‘144A’ 13% 30/11/2020 6,439,075 0.07
USD 2,245,000 Sabre GLBL Inc ‘144A’ 5.25% 15/11/2023 2,317,963 0.02
USD 2,500,000 Sabre GLBL Inc ‘144A’ 5.375% 15/4/2023 2,575,000 0.03
USD 376,950 SACO I Trust 2006-9 ‘Series 2006-9 A1’ FRN 25/8/2036 370,829 0.00
USD 6,420,000 Sacramento County Sanitation Districts Financing Authority FRN 1/12/2035 6,226,341 0.06
USD 2,405,000 Salt Lake City Corp Airport Revenue 5% 1/7/2047 2,857,224 0.03
USD 900,000 Salt Lake City Corp Airport Revenue 5% 1/7/2047 1,087,101 0.01
USD 5,310,000 Salt River Project Agricultural Improvement & Power District 5% 1/12/2045 6,247,003 0.06
USD 2,050,000 San Antonio Water System 5% 15/5/2039 2,412,778 0.03
USD 1,500,000 San Diego County Regional Airport Authority 5% 1/7/2047 1,826,340 0.02
USD 1,000,000 San Diego Public Facilities Financing Authority 5% 15/5/2039 1,216,860 0.01
USD 3,150,000 San Francisco City & County Airport Comm-San Francisco International Airport 5% 1/5/2046 3,707,361 0.04
USD 3,425,000 San Jose Redevelopment Agency Successor Agency 2.958% 1/8/2024 3,604,110 0.04
USD 1,325,000 San Jose Redevelopment Agency Successor Agency 3.176% 1/8/2026 1,435,273 0.01
USD 1,017,538 Saxon Asset Securities Trust 2007-1 ‘Series 2007-1 M1’ FRN 25/1/2047 789,685 0.01
USD 3,223,000 Scientific Games International Inc 10% 1/12/2022 3,372,064 0.03
USD 5,248,000 SEACOR Holdings Inc 3.25% 15/5/2030 4,936,400 0.05
EUR 218,000 Sealed Air Corp 4.5% 15/9/2023* 276,049 0.00 USD 3,827,072 Seasoned Credit Risk Transfer
Trust Series 2017-3 ‘Series 2017-3 B’ ‘144A’ 25/7/2056 (Zero Coupon) 411,139 0.00
USD 5,209,947 Seasoned Credit Risk Transfer Trust Series 2017-3 ‘Series 2017-3 BIO’ ‘144A’ FRN 25/7/2056 922,798 0.01
USD 514,914 Seasoned Credit Risk Transfer Trust Series 2018-1 ‘Series 2018-1 BX’ FRN 25/5/2057 268,189 0.00
USD 470,000 Seasoned Credit Risk Transfer Trust Series 2018-1 ‘Series 2018-1 M’ FRN 25/5/2057 475,344 0.01
USD 2,390,000 Seasoned Credit Risk Transfer Trust Series 2018-3 ‘Series 2018-3 M’ ‘144A’ FRN 25/8/2057 2,427,481 0.03
USD 5,196,186 Securitized Asset Backed Receivables LLC Trust 2006-WM4 ‘Series 2006-WM4 A1’ ‘144A’ FRN 25/11/2036 3,065,539 0.03
USD 1,293,694 Securitized Asset Backed Receivables LLC Trust 2006-WM4 ‘Series 2006-WM4 A2A’ FRN 25/11/2036 497,590 0.01
USD 3,874,212 Securitized Asset Backed Receivables LLC Trust 2006-WM4 ‘Series 2006-WM4 A2C’ FRN 25/11/2036 1,519,916 0.02
USD 551,232 Security National Mortgage Loan Trust 2007-1 ‘Series 2007-1A 2A’ ‘144A’ FRN 25/4/2037 546,183 0.01
USD 132,114 Seneca Park CLO Ltd 2014-1 ‘Series 2014-1A AR’ ‘144A’ FRN 17/7/2026 132,104 0.00
USD 1,750,000 Seneca Park CLO Ltd 2014-1 ‘Series 2014-1A CR’ ‘144A’ FRN 17/7/2026 1,753,613 0.02
USD 1,590,000 Seneca Park CLO Ltd 2014-1 ‘Series 2014-1A D’ ‘144A’ FRN 17/7/2026 1,596,118 0.02
USD 250,000 Seneca Park CLO Ltd 2014-1 ‘Series 2014-1A SUB’ ‘144A’ FRN 17/7/2026 16,411 0.00
USD 6,210,000 Sesac Finance LLC ‘Series 2019-1 A2’ ‘144A’ 5.216% 25/7/2049 6,338,921 0.07
USD 1,387,053 SG Mortgage Securities Trust 2006-FRE2 ‘Series 2006-FRE2 A2C’ FRN 25/7/2036 431,416 0.00
USD 1,310,000 SG Mortgage Securities Trust 2006-OPT2 ‘Series 2006-OPT2 A3D’ FRN 25/10/2036 1,004,631 0.01
USD 3,120,000 Shackleton 2013-III CLO Ltd ‘Series 2013-3A AR’ ‘144A’ FRN 15/7/2030 3,100,622 0.03
USD 44,000 Shea Homes LP / Shea Homes Funding Corp ‘144A’ 5.875% 1/4/2023 45,540 0.00
USD 3,750,000 Silver Creek CLO Ltd ‘Series 2014-1A AR’ ‘144A’ FRN 20/7/2030 3,746,264 0.04
USD 1,000,000 Silver Creek CLO Ltd ‘Series 2014-1A DR’ ‘144A’ FRN 20/7/2030 997,843 0.01
USD 500,000 Silver Creek CLO Ltd ‘Series 2014-1A E1R’ ‘144A’ FRN 20/7/2030 460,047 0.00
USD 1,493,000 Sirius XM Radio Inc ‘144A’ 3.875% 1/8/2022 1,526,593 0.02
USD 3,598,000 Sirius XM Radio Inc ‘144A’ 4.625% 15/7/2024 3,773,403 0.04
Fixed Income Global Opportunities Fund continued
Portfolio of Investments 31 August 2019
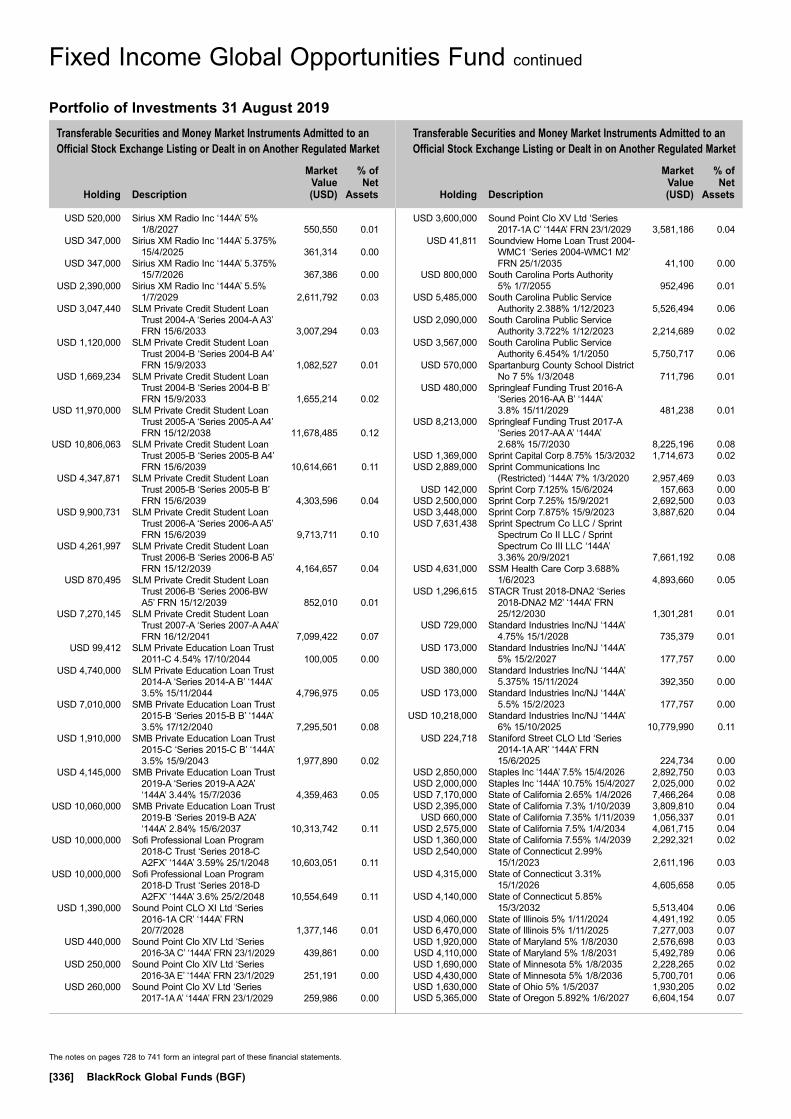
Transferable Securities and Money Market Instruments Admitted to an Official Stock Exchange Listing or Dealt in on Another Regulated Market
Transferable Securities and Money Market Instruments Admitted to an Official Stock Exchange Listing or Dealt in on Another Regulated Market
Holding
Description
Market Value (USD)
% of Net
Assets
Holding
Description
Market Value (USD)
% of Net
Assets
The notes on pages 728 to 741 form an integral part of these financial statements.
[336] BlackRock Global Funds (BGF)
USD 520,000 Sirius XM Radio Inc ‘144A’ 5% 1/8/2027 550,550 0.01
USD 347,000 Sirius XM Radio Inc ‘144A’ 5.375% 15/4/2025 361,314 0.00
USD 347,000 Sirius XM Radio Inc ‘144A’ 5.375% 15/7/2026 367,386 0.00
USD 2,390,000 Sirius XM Radio Inc ‘144A’ 5.5% 1/7/2029 2,611,792 0.03
USD 3,047,440 SLM Private Credit Student Loan Trust 2004-A ‘Series 2004-A A3’ FRN 15/6/2033 3,007,294 0.03
USD 1,120,000 SLM Private Credit Student Loan Trust 2004-B ‘Series 2004-B A4’ FRN 15/9/2033 1,082,527 0.01
USD 1,669,234 SLM Private Credit Student Loan Trust 2004-B ‘Series 2004-B B’ FRN 15/9/2033 1,655,214 0.02
USD 11,970,000 SLM Private Credit Student Loan Trust 2005-A ‘Series 2005-A A4’ FRN 15/12/2038 11,678,485 0.12
USD 10,806,063 SLM Private Credit Student Loan Trust 2005-B ‘Series 2005-B A4’ FRN 15/6/2039 10,614,661 0.11
USD 4,347,871 SLM Private Credit Student Loan Trust 2005-B ‘Series 2005-B B’ FRN 15/6/2039 4,303,596 0.04
USD 9,900,731 SLM Private Credit Student Loan Trust 2006-A ‘Series 2006-A A5’ FRN 15/6/2039 9,713,711 0.10
USD 4,261,997 SLM Private Credit Student Loan Trust 2006-B ‘Series 2006-B A5’ FRN 15/12/2039 4,164,657 0.04
USD 870,495 SLM Private Credit Student Loan Trust 2006-B ‘Series 2006-BW A5’ FRN 15/12/2039 852,010 0.01
USD 7,270,145 SLM Private Credit Student Loan Trust 2007-A ‘Series 2007-A A4A’ FRN 16/12/2041 7,099,422 0.07
USD 99,412 SLM Private Education Loan Trust 2011-C 4.54% 17/10/2044 100,005 0.00
USD 4,740,000 SLM Private Education Loan Trust 2014-A ‘Series 2014-A B’ ‘144A’ 3.5% 15/11/2044 4,796,975 0.05
USD 7,010,000 SMB Private Education Loan Trust 2015-B ‘Series 2015-B B’ ‘144A’ 3.5% 17/12/2040 7,295,501 0.08
USD 1,910,000 SMB Private Education Loan Trust 2015-C ‘Series 2015-C B’ ‘144A’ 3.5% 15/9/2043 1,977,890 0.02
USD 4,145,000 SMB Private Education Loan Trust 2019-A ‘Series 2019-A A2A’ ‘144A’ 3.44% 15/7/2036 4,359,463 0.05
USD 10,060,000 SMB Private Education Loan Trust 2019-B ‘Series 2019-B A2A’ ‘144A’ 2.84% 15/6/2037 10,313,742 0.11
USD 10,000,000 Sofi Professional Loan Program 2018-C Trust ‘Series 2018-C A2FX’ ‘144A’ 3.59% 25/1/2048 10,603,051 0.11
USD 10,000,000 Sofi Professional Loan Program 2018-D Trust ‘Series 2018-D A2FX’ ‘144A’ 3.6% 25/2/2048 10,554,649 0.11
USD 1,390,000 Sound Point CLO XI Ltd ‘Series 2016-1A CR’ ‘144A’ FRN 20/7/2028 1,377,146 0.01
USD 440,000 Sound Point Clo XIV Ltd ‘Series 2016-3A C’ ‘144A’ FRN 23/1/2029 439,861 0.00
USD 250,000 Sound Point Clo XIV Ltd ‘Series 2016-3A E’ ‘144A’ FRN 23/1/2029 251,191 0.00
USD 260,000 Sound Point Clo XV Ltd ‘Series 2017-1A A’ ‘144A’ FRN 23/1/2029 259,986 0.00
USD 3,600,000 Sound Point Clo XV Ltd ‘Series 2017-1A C’ ‘144A’ FRN 23/1/2029 3,581,186 0.04
USD 41,811 Soundview Home Loan Trust 2004-WMC1 ‘Series 2004-WMC1 M2’ FRN 25/1/2035 41,100 0.00
USD 800,000 South Carolina Ports Authority 5% 1/7/2055 952,496 0.01
USD 5,485,000 South Carolina Public Service Authority 2.388% 1/12/2023 5,526,494 0.06
USD 2,090,000 South Carolina Public Service Authority 3.722% 1/12/2023 2,214,689 0.02
USD 3,567,000 South Carolina Public Service Authority 6.454% 1/1/2050 5,750,717 0.06
USD 570,000 Spartanburg County School District No 7 5% 1/3/2048 711,796 0.01
USD 480,000 Springleaf Funding Trust 2016-A ‘Series 2016-AA B’ ‘144A’ 3.8% 15/11/2029 481,238 0.01
USD 8,213,000 Springleaf Funding Trust 2017-A ‘Series 2017-AA A’ ‘144A’ 2.68% 15/7/2030 8,225,196 0.08
USD 1,369,000 Sprint Capital Corp 8.75% 15/3/2032 1,714,673 0.02 USD 2,889,000 Sprint Communications Inc
(Restricted) ‘144A’ 7% 1/3/2020 2,957,469 0.03 USD 142,000 Sprint Corp 7.125% 15/6/2024 157,663 0.00 USD 2,500,000 Sprint Corp 7.25% 15/9/2021 2,692,500 0.03 USD 3,448,000 Sprint Corp 7.875% 15/9/2023 3,887,620 0.04 USD 7,631,438 Sprint Spectrum Co LLC / Sprint
Spectrum Co II LLC / Sprint Spectrum Co III LLC ‘144A’ 3.36% 20/9/2021 7,661,192 0.08
USD 4,631,000 SSM Health Care Corp 3.688% 1/6/2023 4,893,660 0.05
USD 1,296,615 STACR Trust 2018-DNA2 ‘Series 2018-DNA2 M2’ ‘144A’ FRN 25/12/2030 1,301,281 0.01
USD 729,000 Standard Industries Inc/NJ ‘144A’ 4.75% 15/1/2028 735,379 0.01
USD 173,000 Standard Industries Inc/NJ ‘144A’ 5% 15/2/2027 177,757 0.00
USD 380,000 Standard Industries Inc/NJ ‘144A’ 5.375% 15/11/2024 392,350 0.00
USD 173,000 Standard Industries Inc/NJ ‘144A’ 5.5% 15/2/2023 177,757 0.00
USD 10,218,000 Standard Industries Inc/NJ ‘144A’ 6% 15/10/2025 10,779,990 0.11
USD 224,718 Staniford Street CLO Ltd ‘Series 2014-1A AR’ ‘144A’ FRN 15/6/2025 224,734 0.00
USD 2,850,000 Staples Inc ‘144A’ 7.5% 15/4/2026 2,892,750 0.03 USD 2,000,000 Staples Inc ‘144A’ 10.75% 15/4/2027 2,025,000 0.02 USD 7,170,000 State of California 2.65% 1/4/2026 7,466,264 0.08 USD 2,395,000 State of California 7.3% 1/10/2039 3,809,810 0.04 USD 660,000 State of California 7.35% 1/11/2039 1,056,337 0.01 USD 2,575,000 State of California 7.5% 1/4/2034 4,061,715 0.04 USD 1,360,000 State of California 7.55% 1/4/2039 2,292,321 0.02 USD 2,540,000 State of Connecticut 2.99%
15/1/2023 2,611,196 0.03 USD 4,315,000 State of Connecticut 3.31%
15/1/2026 4,605,658 0.05 USD 4,140,000 State of Connecticut 5.85%
15/3/2032 5,513,404 0.06 USD 4,060,000 State of Illinois 5% 1/11/2024 4,491,192 0.05 USD 6,470,000 State of Illinois 5% 1/11/2025 7,277,003 0.07 USD 1,920,000 State of Maryland 5% 1/8/2030 2,576,698 0.03 USD 4,110,000 State of Maryland 5% 1/8/2031 5,492,789 0.06 USD 1,690,000 State of Minnesota 5% 1/8/2035 2,228,265 0.02 USD 4,430,000 State of Minnesota 5% 1/8/2036 5,700,701 0.06 USD 1,630,000 State of Ohio 5% 1/5/2037 1,930,205 0.02 USD 5,365,000 State of Oregon 5.892% 1/6/2027 6,604,154 0.07
Fixed Income Global Opportunities Fund continued
Portfolio of Investments 31 August 2019
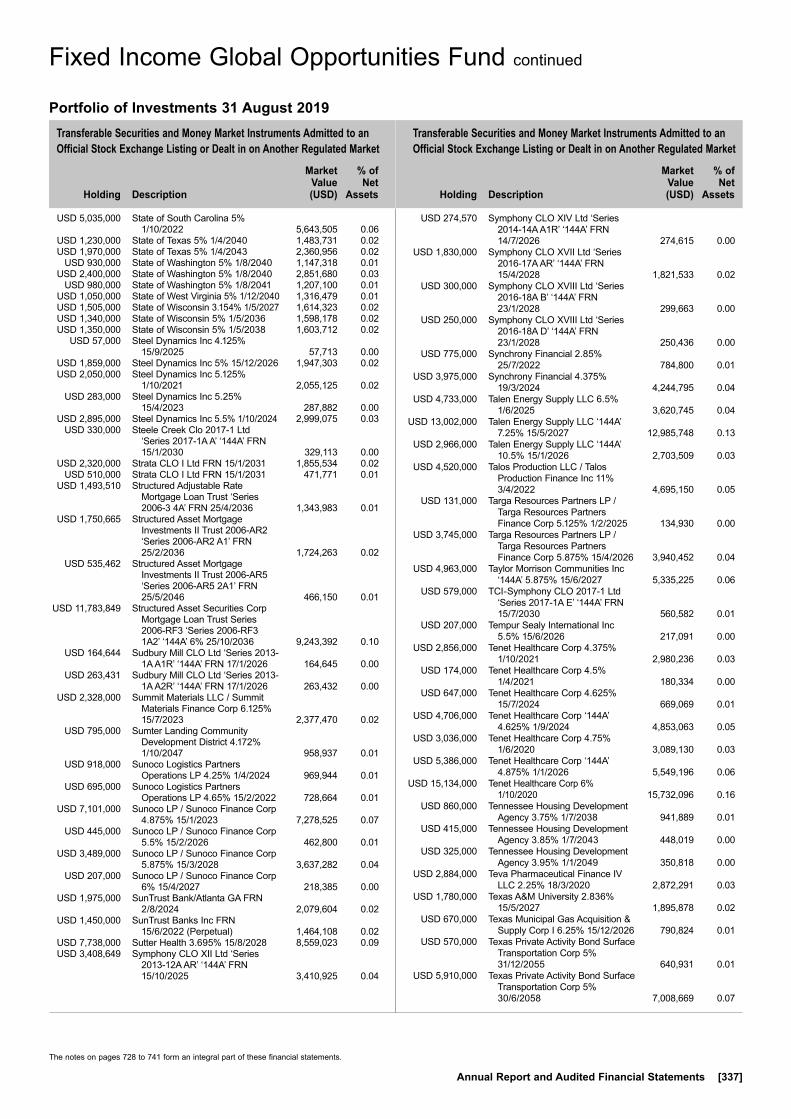
Transferable Securities and Money Market Instruments Admitted to an Official Stock Exchange Listing or Dealt in on Another Regulated Market
Transferable Securities and Money Market Instruments Admitted to an Official Stock Exchange Listing or Dealt in on Another Regulated Market
Holding
Description
Market Value (USD)
% of Net
Assets
Holding
Description
Market Value (USD)
% of Net
Assets
The notes on pages 728 to 741 form an integral part of these financial statements.
Annual Report and Audited Financial Statements [337]
USD 5,035,000 State of South Carolina 5% 1/10/2022 5,643,505 0.06
USD 1,230,000 State of Texas 5% 1/4/2040 1,483,731 0.02 USD 1,970,000 State of Texas 5% 1/4/2043 2,360,956 0.02 USD 930,000 State of Washington 5% 1/8/2040 1,147,318 0.01 USD 2,400,000 State of Washington 5% 1/8/2040 2,851,680 0.03 USD 980,000 State of Washington 5% 1/8/2041 1,207,100 0.01 USD 1,050,000 State of West Virginia 5% 1/12/2040 1,316,479 0.01 USD 1,505,000 State of Wisconsin 3.154% 1/5/2027 1,614,323 0.02 USD 1,340,000 State of Wisconsin 5% 1/5/2036 1,598,178 0.02 USD 1,350,000 State of Wisconsin 5% 1/5/2038 1,603,712 0.02 USD 57,000 Steel Dynamics Inc 4.125%
15/9/2025 57,713 0.00 USD 1,859,000 Steel Dynamics Inc 5% 15/12/2026 1,947,303 0.02 USD 2,050,000 Steel Dynamics Inc 5.125%
1/10/2021 2,055,125 0.02 USD 283,000 Steel Dynamics Inc 5.25%
15/4/2023 287,882 0.00 USD 2,895,000 Steel Dynamics Inc 5.5% 1/10/2024 2,999,075 0.03 USD 330,000 Steele Creek Clo 2017-1 Ltd
‘Series 2017-1A A’ ‘144A’ FRN 15/1/2030 329,113 0.00
USD 2,320,000 Strata CLO I Ltd FRN 15/1/2031 1,855,534 0.02 USD 510,000 Strata CLO I Ltd FRN 15/1/2031 471,771 0.01 USD 1,493,510 Structured Adjustable Rate
Mortgage Loan Trust ‘Series 2006-3 4A’ FRN 25/4/2036 1,343,983 0.01
USD 1,750,665 Structured Asset Mortgage Investments II Trust 2006-AR2 ‘Series 2006-AR2 A1’ FRN 25/2/2036 1,724,263 0.02
USD 535,462 Structured Asset Mortgage Investments II Trust 2006-AR5 ‘Series 2006-AR5 2A1’ FRN 25/5/2046 466,150 0.01
USD 11,783,849 Structured Asset Securities Corp Mortgage Loan Trust Series 2006-RF3 ‘Series 2006-RF3 1A2’ ‘144A’ 6% 25/10/2036 9,243,392 0.10
USD 164,644 Sudbury Mill CLO Ltd ‘Series 2013-1A A1R’ ‘144A’ FRN 17/1/2026 164,645 0.00
USD 263,431 Sudbury Mill CLO Ltd ‘Series 2013-1A A2R’ ‘144A’ FRN 17/1/2026 263,432 0.00
USD 2,328,000 Summit Materials LLC / Summit Materials Finance Corp 6.125% 15/7/2023 2,377,470 0.02
USD 795,000 Sumter Landing Community Development District 4.172% 1/10/2047 958,937 0.01
USD 918,000 Sunoco Logistics Partners Operations LP 4.25% 1/4/2024 969,944 0.01
USD 695,000 Sunoco Logistics Partners Operations LP 4.65% 15/2/2022 728,664 0.01
USD 7,101,000 Sunoco LP / Sunoco Finance Corp 4.875% 15/1/2023 7,278,525 0.07
USD 445,000 Sunoco LP / Sunoco Finance Corp 5.5% 15/2/2026 462,800 0.01
USD 3,489,000 Sunoco LP / Sunoco Finance Corp 5.875% 15/3/2028 3,637,282 0.04
USD 207,000 Sunoco LP / Sunoco Finance Corp 6% 15/4/2027 218,385 0.00
USD 1,975,000 SunTrust Bank/Atlanta GA FRN 2/8/2024 2,079,604 0.02
USD 1,450,000 SunTrust Banks Inc FRN 15/6/2022 (Perpetual) 1,464,108 0.02
USD 7,738,000 Sutter Health 3.695% 15/8/2028 8,559,023 0.09 USD 3,408,649 Symphony CLO XII Ltd ‘Series
2013-12A AR’ ‘144A’ FRN 15/10/2025 3,410,925 0.04
USD 274,570 Symphony CLO XIV Ltd ‘Series 2014-14A A1R’ ‘144A’ FRN 14/7/2026 274,615 0.00
USD 1,830,000 Symphony CLO XVII Ltd ‘Series 2016-17A AR’ ‘144A’ FRN 15/4/2028 1,821,533 0.02
USD 300,000 Symphony CLO XVIII Ltd ‘Series 2016-18A B’ ‘144A’ FRN 23/1/2028 299,663 0.00
USD 250,000 Symphony CLO XVIII Ltd ‘Series 2016-18A D’ ‘144A’ FRN 23/1/2028 250,436 0.00
USD 775,000 Synchrony Financial 2.85% 25/7/2022 784,800 0.01
USD 3,975,000 Synchrony Financial 4.375% 19/3/2024 4,244,795 0.04
USD 4,733,000 Talen Energy Supply LLC 6.5% 1/6/2025 3,620,745 0.04
USD 13,002,000 Talen Energy Supply LLC ‘144A’ 7.25% 15/5/2027 12,985,748 0.13
USD 2,966,000 Talen Energy Supply LLC ‘144A’ 10.5% 15/1/2026 2,703,509 0.03
USD 4,520,000 Talos Production LLC / Talos Production Finance Inc 11% 3/4/2022 4,695,150 0.05
USD 131,000 Targa Resources Partners LP / Targa Resources Partners Finance Corp 5.125% 1/2/2025 134,930 0.00
USD 3,745,000 Targa Resources Partners LP / Targa Resources Partners Finance Corp 5.875% 15/4/2026 3,940,452 0.04
USD 4,963,000 Taylor Morrison Communities Inc ‘144A’ 5.875% 15/6/2027 5,335,225 0.06
USD 579,000 TCI-Symphony CLO 2017-1 Ltd ‘Series 2017-1A E’ ‘144A’ FRN 15/7/2030 560,582 0.01
USD 207,000 Tempur Sealy International Inc 5.5% 15/6/2026 217,091 0.00
USD 2,856,000 Tenet Healthcare Corp 4.375% 1/10/2021 2,980,236 0.03
USD 174,000 Tenet Healthcare Corp 4.5% 1/4/2021 180,334 0.00
USD 647,000 Tenet Healthcare Corp 4.625% 15/7/2024 669,069 0.01
USD 4,706,000 Tenet Healthcare Corp ‘144A’ 4.625% 1/9/2024 4,853,063 0.05
USD 3,036,000 Tenet Healthcare Corp 4.75% 1/6/2020 3,089,130 0.03
USD 5,386,000 Tenet Healthcare Corp ‘144A’ 4.875% 1/1/2026 5,549,196 0.06
USD 15,134,000 Tenet Healthcare Corp 6% 1/10/2020 15,732,096 0.16
USD 860,000 Tennessee Housing Development Agency 3.75% 1/7/2038 941,889 0.01
USD 415,000 Tennessee Housing Development Agency 3.85% 1/7/2043 448,019 0.00
USD 325,000 Tennessee Housing Development Agency 3.95% 1/1/2049 350,818 0.00
USD 2,884,000 Teva Pharmaceutical Finance IV LLC 2.25% 18/3/2020 2,872,291 0.03
USD 1,780,000 Texas A&M University 2.836% 15/5/2027 1,895,878 0.02
USD 670,000 Texas Municipal Gas Acquisition & Supply Corp I 6.25% 15/12/2026 790,824 0.01
USD 570,000 Texas Private Activity Bond Surface Transportation Corp 5% 31/12/2055 640,931 0.01
USD 5,910,000 Texas Private Activity Bond Surface Transportation Corp 5% 30/6/2058 7,008,669 0.07
Fixed Income Global Opportunities Fund continued
Portfolio of Investments 31 August 2019
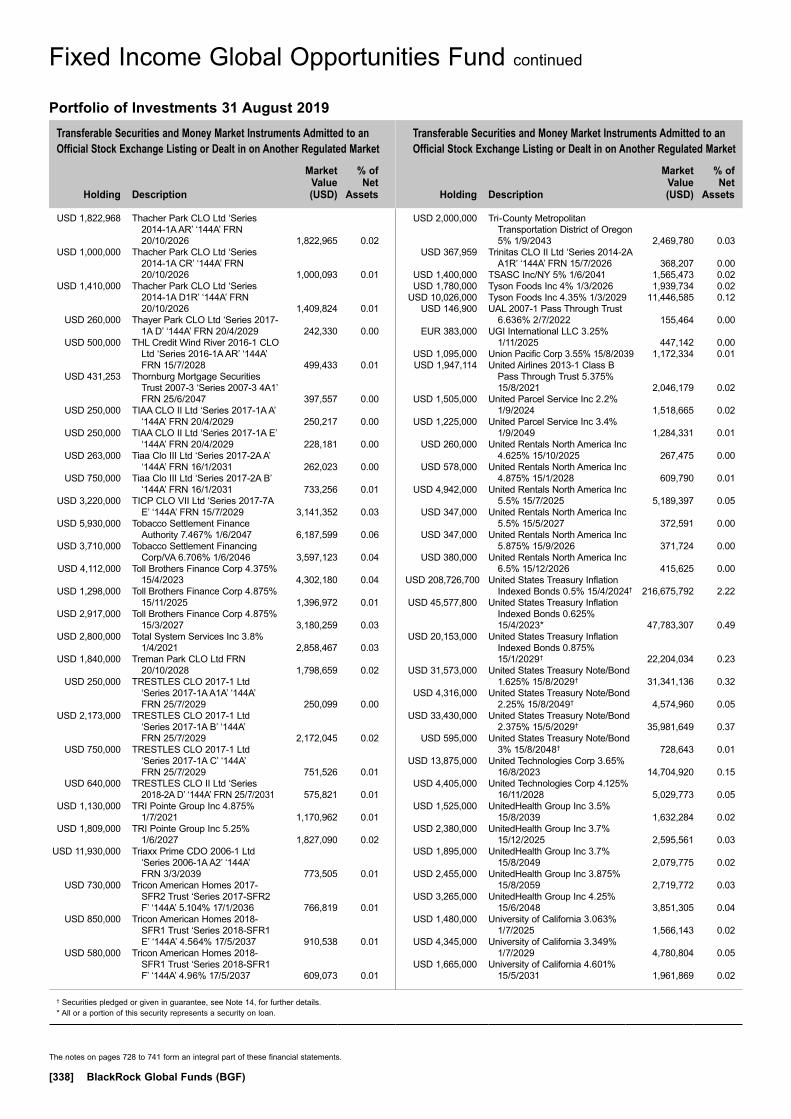
Transferable Securities and Money Market Instruments Admitted to an Official Stock Exchange Listing or Dealt in on Another Regulated Market
Transferable Securities and Money Market Instruments Admitted to an Official Stock Exchange Listing or Dealt in on Another Regulated Market
Holding
Description
Market Value (USD)
% of Net
Assets
Holding
Description
Market Value (USD)
% of Net
Assets
† Securities pledged or given in guarantee, see Note 14, for further details.* All or a portion of this security represents a security on loan.
The notes on pages 728 to 741 form an integral part of these financial statements.
[338] BlackRock Global Funds (BGF)
USD 1,822,968 Thacher Park CLO Ltd ‘Series 2014-1A AR’ ‘144A’ FRN 20/10/2026 1,822,965 0.02
USD 1,000,000 Thacher Park CLO Ltd ‘Series 2014-1A CR’ ‘144A’ FRN 20/10/2026 1,000,093 0.01
USD 1,410,000 Thacher Park CLO Ltd ‘Series 2014-1A D1R’ ‘144A’ FRN 20/10/2026 1,409,824 0.01
USD 260,000 Thayer Park CLO Ltd ‘Series 2017-1A D’ ‘144A’ FRN 20/4/2029 242,330 0.00
USD 500,000 THL Credit Wind River 2016-1 CLO Ltd ‘Series 2016-1A AR’ ‘144A’ FRN 15/7/2028 499,433 0.01
USD 431,253 Thornburg Mortgage Securities Trust 2007-3 ‘Series 2007-3 4A1’ FRN 25/6/2047 397,557 0.00
USD 250,000 TIAA CLO II Ltd ‘Series 2017-1A A’ ‘144A’ FRN 20/4/2029 250,217 0.00
USD 250,000 TIAA CLO II Ltd ‘Series 2017-1A E’ ‘144A’ FRN 20/4/2029 228,181 0.00
USD 263,000 Tiaa Clo III Ltd ‘Series 2017-2A A’ ‘144A’ FRN 16/1/2031 262,023 0.00
USD 750,000 Tiaa Clo III Ltd ‘Series 2017-2A B’ ‘144A’ FRN 16/1/2031 733,256 0.01
USD 3,220,000 TICP CLO VII Ltd ‘Series 2017-7A E’ ‘144A’ FRN 15/7/2029 3,141,352 0.03
USD 5,930,000 Tobacco Settlement Finance Authority 7.467% 1/6/2047 6,187,599 0.06
USD 3,710,000 Tobacco Settlement Financing Corp/VA 6.706% 1/6/2046 3,597,123 0.04
USD 4,112,000 Toll Brothers Finance Corp 4.375% 15/4/2023 4,302,180 0.04
USD 1,298,000 Toll Brothers Finance Corp 4.875% 15/11/2025 1,396,972 0.01
USD 2,917,000 Toll Brothers Finance Corp 4.875% 15/3/2027 3,180,259 0.03
USD 2,800,000 Total System Services Inc 3.8% 1/4/2021 2,858,467 0.03
USD 1,840,000 Treman Park CLO Ltd FRN 20/10/2028 1,798,659 0.02
USD 250,000 TRESTLES CLO 2017-1 Ltd ‘Series 2017-1A A1A’ ‘144A’ FRN 25/7/2029 250,099 0.00
USD 2,173,000 TRESTLES CLO 2017-1 Ltd ‘Series 2017-1A B’ ‘144A’ FRN 25/7/2029 2,172,045 0.02
USD 750,000 TRESTLES CLO 2017-1 Ltd ‘Series 2017-1A C’ ‘144A’ FRN 25/7/2029 751,526 0.01
USD 640,000 TRESTLES CLO II Ltd ‘Series 2018-2A D’ ‘144A’ FRN 25/7/2031 575,821 0.01
USD 1,130,000 TRI Pointe Group Inc 4.875% 1/7/2021 1,170,962 0.01
USD 1,809,000 TRI Pointe Group Inc 5.25% 1/6/2027 1,827,090 0.02
USD 11,930,000 Triaxx Prime CDO 2006-1 Ltd ‘Series 2006-1A A2’ ‘144A’ FRN 3/3/2039 773,505 0.01
USD 730,000 Tricon American Homes 2017-SFR2 Trust ‘Series 2017-SFR2 F’ ‘144A’ 5.104% 17/1/2036 766,819 0.01
USD 850,000 Tricon American Homes 2018-SFR1 Trust ‘Series 2018-SFR1 E’ ‘144A’ 4.564% 17/5/2037 910,538 0.01
USD 580,000 Tricon American Homes 2018-SFR1 Trust ‘Series 2018-SFR1 F’ ‘144A’ 4.96% 17/5/2037 609,073 0.01
USD 2,000,000 Tri-County Metropolitan Transportation District of Oregon 5% 1/9/2043 2,469,780 0.03
USD 367,959 Trinitas CLO II Ltd ‘Series 2014-2A A1R’ ‘144A’ FRN 15/7/2026 368,207 0.00
USD 1,400,000 TSASC Inc/NY 5% 1/6/2041 1,565,473 0.02 USD 1,780,000 Tyson Foods Inc 4% 1/3/2026 1,939,734 0.02 USD 10,026,000 Tyson Foods Inc 4.35% 1/3/2029 11,446,585 0.12 USD 146,900 UAL 2007-1 Pass Through Trust
6.636% 2/7/2022 155,464 0.00 EUR 383,000 UGI International LLC 3.25%
1/11/2025 447,142 0.00 USD 1,095,000 Union Pacific Corp 3.55% 15/8/2039 1,172,334 0.01 USD 1,947,114 United Airlines 2013-1 Class B
Pass Through Trust 5.375% 15/8/2021 2,046,179 0.02
USD 1,505,000 United Parcel Service Inc 2.2% 1/9/2024 1,518,665 0.02
USD 1,225,000 United Parcel Service Inc 3.4% 1/9/2049 1,284,331 0.01
USD 260,000 United Rentals North America Inc 4.625% 15/10/2025 267,475 0.00
USD 578,000 United Rentals North America Inc 4.875% 15/1/2028 609,790 0.01
USD 4,942,000 United Rentals North America Inc 5.5% 15/7/2025 5,189,397 0.05
USD 347,000 United Rentals North America Inc 5.5% 15/5/2027 372,591 0.00
USD 347,000 United Rentals North America Inc 5.875% 15/9/2026 371,724 0.00
USD 380,000 United Rentals North America Inc 6.5% 15/12/2026 415,625 0.00
USD 208,726,700 United States Treasury Inflation Indexed Bonds 0.5% 15/4/2024† 216,675,792 2.22
USD 45,577,800 United States Treasury Inflation Indexed Bonds 0.625% 15/4/2023* 47,783,307 0.49
USD 20,153,000 United States Treasury Inflation Indexed Bonds 0.875% 15/1/2029† 22,204,034 0.23
USD 31,573,000 United States Treasury Note/Bond 1.625% 15/8/2029† 31,341,136 0.32
USD 4,316,000 United States Treasury Note/Bond 2.25% 15/8/2049† 4,574,960 0.05
USD 33,430,000 United States Treasury Note/Bond 2.375% 15/5/2029† 35,981,649 0.37
USD 595,000 United States Treasury Note/Bond 3% 15/8/2048† 728,643 0.01
USD 13,875,000 United Technologies Corp 3.65% 16/8/2023 14,704,920 0.15
USD 4,405,000 United Technologies Corp 4.125% 16/11/2028 5,029,773 0.05
USD 1,525,000 UnitedHealth Group Inc 3.5% 15/8/2039 1,632,284 0.02
USD 2,380,000 UnitedHealth Group Inc 3.7% 15/12/2025 2,595,561 0.03
USD 1,895,000 UnitedHealth Group Inc 3.7% 15/8/2049 2,079,775 0.02
USD 2,455,000 UnitedHealth Group Inc 3.875% 15/8/2059 2,719,772 0.03
USD 3,265,000 UnitedHealth Group Inc 4.25% 15/6/2048 3,851,305 0.04
USD 1,480,000 University of California 3.063% 1/7/2025 1,566,143 0.02
USD 4,345,000 University of California 3.349% 1/7/2029 4,780,804 0.05
USD 1,665,000 University of California 4.601% 15/5/2031 1,961,869 0.02
Fixed Income Global Opportunities Fund continued
Portfolio of Investments 31 August 2019

Transferable Securities and Money Market Instruments Admitted to an Official Stock Exchange Listing or Dealt in on Another Regulated Market
Transferable Securities and Money Market Instruments Admitted to an Official Stock Exchange Listing or Dealt in on Another Regulated Market
Holding
Description
Market Value (USD)
% of Net
Assets
Holding
Description
Market Value (USD)
% of Net
Assets
The notes on pages 728 to 741 form an integral part of these financial statements.
Annual Report and Audited Financial Statements [339]
USD 2,595,000 University of California 5.77% 15/5/2043 3,702,416 0.04
USD 2,110,000 University of Houston 5% 15/2/2036 2,530,027 0.03 USD 2,500,000 University of Michigan 5% 1/4/2047 3,056,087 0.03 USD 2,296,000 University of Notre Dame du Lac
3.394% 15/2/2048 2,608,675 0.03 USD 1,220,000 University of Oregon 5% 1/4/2046 1,452,477 0.02 USD 256,000 University of Southern California
3.028% 1/10/2039 273,724 0.00 USD 2,075,000 University of Vermont & State
Agricultural College 5% 1/10/2043 2,535,474 0.03 USD 810,000 US 2018-USDC ‘Series 2018-
USDC E’ ‘144A’ FRN 13/5/2038 868,696 0.01 USD 1,300,000 US 2018-USDC ‘Series 2018-
USDC F’ ‘144A’ FRN 13/5/2038 1,347,408 0.01 USD 2,243,333 US Airways 2013-1 Class A Pass
Through Trust 3.95% 15/11/2025 2,381,297 0.02 USD 700,752 US Airways 2013-1 Class B Pass
Through Trust 5.375% 15/11/2021 732,334 0.01 USD 207,000 US Concrete Inc 6.375% 1/6/2024 217,868 0.00 USD 310,000 Velocity Commercial Capital Loan
Trust 2016-2 ‘Series 2016-2 M1’ FRN 25/10/2046 317,284 0.00
USD 170,000 Velocity Commercial Capital Loan Trust 2016-2 ‘Series 2016-2 M2’ FRN 25/10/2046 174,782 0.00
USD 710,000 Velocity Commercial Capital Loan Trust 2016-2 ‘Series 2016-2 M3’ FRN 25/10/2046 739,271 0.01
USD 310,000 Velocity Commercial Capital Loan Trust 2016-2 ‘Series 2016-2 M4’ FRN 25/10/2046 336,558 0.00
USD 330,000 Velocity Commercial Capital Loan Trust 2017-1 ‘Series 2017-1 M2’ ‘144A’ FRN 25/5/2047 336,368 0.00
USD 330,000 Velocity Commercial Capital Loan Trust 2017-1 ‘Series 2017-1 M3’ ‘144A’ FRN 25/5/2047 342,734 0.00
USD 1,924,779 Velocity Commercial Capital Loan Trust 2017-2 ‘Series 2017-2 M3’ ‘144A’ FRN 25/11/2047 1,970,747 0.02
USD 320,035 Velocity Commercial Capital Loan Trust 2017-2 ‘Series 2017-2 M4’ ‘144A’ FRN 25/11/2047 328,198 0.00
USD 328,068 Velocity Commercial Capital Loan Trust 2018-1 ‘Series 2018-1 M2’ ‘144A’ 4.26% 25/4/2048 342,855 0.00
USD 6,028,000 Ventas Realty LP 3.5% 15/4/2024 6,336,822 0.07 USD 2,282,000 Venture XXIV CLO Ltd ‘Series
2016-24A A1D’ ‘144A’ FRN 20/10/2028 2,283,138 0.02
USD 804,000 Venture XXIV CLO Ltd ‘Series 2016-24A E’ ‘144A’ FRN 20/10/2028 800,786 0.01
USD 16,296,000 VeriSign Inc 4.625% 1/5/2023 16,601,550 0.17 USD 3,535,000 Verizon Communications Inc
3.376% 15/2/2025 3,745,494 0.04 USD 1,025,000 Verizon Communications Inc
3.875% 8/2/2029 1,143,181 0.01 USD 5,315,000 Verizon Communications Inc
‘144A’ 4.016% 3/12/2029 6,002,076 0.06 USD 6,240,000 Verizon Communications Inc
4.125% 16/3/2027 6,947,490 0.07 USD 1,080,000 Verizon Communications Inc
4.272% 15/1/2036 1,239,942 0.01 USD 3,961,000 Verizon Communications Inc
4.672% 15/3/2055 4,877,650 0.05 USD 240,000 Verizon Communications Inc
5.012% 15/4/2049 308,210 0.00
USD 2,129,000 Viacom Inc FRN 28/2/2057 2,229,659 0.02 USD 435,000 Viacom Inc 4.25% 1/9/2023 464,122 0.01 USD 500,000 ViaSat Inc ‘144A’ 5.625% 15/4/2027 528,750 0.01 USD 830,000 Vibrant Clo V Ltd ‘Series 2016-5A
A’ ‘144A’ FRN 20/1/2029 830,608 0.01 USD 1,254,000 Vibrant Clo VII Ltd ‘Series 2017-7A
A1’ ‘144A’ FRN 15/9/2030 1,248,020 0.01 USD 2,270,000 Virginia Small Business Financing
Authority 5% 31/12/2052 2,627,309 0.03 USD 1,002,000 Vistra Energy Corp 5.875%
1/6/2023 1,025,798 0.01 USD 3,527,000 Vistra Energy Corp 7.625%
1/11/2024 3,736,962 0.04 USD 11,012,000 Vistra Operations Co LLC ‘144A’
3.55% 15/7/2024 11,135,234 0.11 USD 6,491,000 Vistra Operations Co LLC ‘144A’
5% 31/7/2027 6,718,185 0.07 USD 347,000 Vistra Operations Co LLC ‘144A’
5.5% 1/9/2026 365,218 0.00 USD 451,000 Vistra Operations Co LLC ‘144A’
5.625% 15/2/2027 477,496 0.01 USD 450,000 VNDO 2013-PENN Mortgage Trust
‘Series 2013-PENN D’ ‘144A’ FRN 13/12/2029 454,677 0.00
USD 885,000 VNDO 2013-PENN Mortgage Trust ‘Series 2013-PENN E’ ‘144A’ FRN 13/12/2029 879,892 0.01
USD 1,855,000 Voya CLO 2013-2 Ltd ‘Series 2013-2A A1R’ ‘144A’ FRN 25/4/2031 1,835,322 0.02
USD 750,000 Voya CLO 2015-2 Ltd ‘Series 2015-2A BR’ ‘144A’ FRN 23/7/2027 742,897 0.01
USD 3,500,000 Voya Clo 2017-4 Ltd ‘Series 2017-4A A1’ ‘144A’ FRN 15/10/2030 3,491,020 0.04
EUR 422,000 Voya Euro CLO I DAC FRN 15/10/2030 423,862 0.00
USD 16,376,592 Voyager OPTONE Delaware Trust ‘Series 2009-1 SAA7’ ‘144A’ FRN 25/2/2038 6,100,302 0.06
USD 2,013,670 Wachovia Asset Securitization Issuance II LLC 2007-HE2 Trust ‘Series 2007-HE2A A’ ‘144A’ FRN 25/7/2037 1,882,519 0.02
USD 8,352,500 WaMu Asset-Backed Certificates WaMu Series 2007-HE2 Trust ‘Series 2007-HE2 2A3’ FRN 25/4/2037 4,466,744 0.05
USD 894,911 WaMu Asset-Backed Certificates WaMu Series 2007-HE2 Trust ‘Series 2007-HE2 2A4’ FRN 25/4/2037 488,810 0.01
USD 548,313 WaMu Mortgage Pass-Through Certificates Series 2005-AR2 Trust ‘Series 2005-AR2 B1’ FRN 25/1/2045 423,274 0.00
USD 9,269,794 WaMu Mortgage Pass-Through Certificates Series 2006-AR3 Trust ‘Series 2006-AR3 A1B’ FRN 25/2/2046 8,948,441 0.09
USD 682,826 WaMu Mortgage Pass-Through Certificates Series 2007-OA5 Trust ‘Series 2007-OA5 1A’ FRN 25/6/2047 655,150 0.01
USD 870,000 Washington Metropolitan Area Transit Authority 5% 1/7/2036 1,077,473 0.01
USD 1,084,946 Washington Mutual Mortgage Pass-Through Certificates WMALT Series 2006-1 Trust ‘Series 2006-1 4CB’ 6.5% 25/2/2036 977,788 0.01
Fixed Income Global Opportunities Fund continued
Portfolio of Investments 31 August 2019

Transferable Securities and Money Market Instruments Admitted to an Official Stock Exchange Listing or Dealt in on Another Regulated Market
Transferable Securities and Money Market Instruments Admitted to an Official Stock Exchange Listing or Dealt in on Another Regulated Market
Holding
Description
Market Value (USD)
% of Net
Assets
Holding
Description
Market Value (USD)
% of Net
Assets
The notes on pages 728 to 741 form an integral part of these financial statements.
[340] BlackRock Global Funds (BGF)
USD 5,862,373 Washington Mutual Mortgage Pass-Through Certificates WMALT Series 2006-4 Trust ‘Series 2006-4 1A1’ 6% 25/4/2036 5,569,097 0.06
USD 372,519 Washington Mutual Mortgage Pass-Through Certificates WMALT Series 2006-4 Trust (Step-up coupon) ‘Series 2006-4 3A5’ 6.35% 25/5/2036 341,027 0.00
USD 1,629,618 Washington Mutual Mortgage Pass-Through Certificates WMALT Series 2006-4 Trust (Step-up coupon) ‘Series 2006-4 3A1’ 6.5% 25/5/2036 1,491,665 0.02
USD 4,990,267 Washington Mutual Mortgage Pass-Through Certificates WMALT Series 2006-9 Trust (Step-up coupon) ‘Series 2006-9 A7’ 4.649% 25/10/2036 2,617,484 0.03
USD 1,516,425 Washington Mutual Mortgage Pass-Through Certificates WMALT Series 2007-OA1 Trust ‘Series 2007-OA1 2A’ FRN 25/12/2046 1,353,921 0.01
USD 4,709,086 Washington Mutural Asset-Backed Certificates WMABS Series 2006-HE4 Trust ‘Series 2006-HE4 2A2’ FRN 25/9/2036 2,203,667 0.02
USD 3,857,261 Washington Mutural Asset-Backed Certificates WMABS Series 2006-HE5 Trust ‘Series 2006-HE5 1A’ FRN 25/10/2036 3,110,666 0.03
USD 3,499,335 Washington Mutural Asset-Backed Certificates WMABS Series 2006-HE5 Trust ‘Series 2006-HE5 2A2’ FRN 25/10/2036 1,823,675 0.02
USD 4,538,145 Washington Mutural Asset-Backed Certificates WMABS Series 2007-HE2 Trust ‘Series 2007-HE2 2A2’ FRN 25/2/2037 1,966,891 0.02
USD 1,530,000 Waste Management Inc 3.2% 15/6/2026 1,628,759 0.02
USD 3,557,000 Weekley Homes LLC / Weekley Finance Corp 6% 1/2/2023 3,557,000 0.04
USD 1,821,000 Weekley Homes LLC / Weekley Finance Corp 6.625% 15/8/2025 1,830,105 0.02
USD 2,900,000 Wells Fargo & Co FRN 15/6/2024 (Perpetual) 3,108,177 0.03
USD 4,726,000 Wells Fargo & Co FRN 15/6/2025 (Perpetual) 5,215,826 0.05
USD 13,777,000 Wells Fargo & Co FRN 17/6/2027 14,362,528 0.15 USD 3,900,000 Wells Fargo & Co 3% 22/4/2026 4,033,640 0.04 USD 9,530,000 Wells Fargo & Co 3.55% 29/9/2025 10,135,660 0.10 USD 24,745,000 Wells Fargo & Co 3.75% 24/1/2024 26,336,280 0.27 USD 6,446,000 Wells Fargo & Co 4.15% 24/1/2029 7,229,813 0.07 USD 1,329,000 Wells Fargo Commercial Mortgage
Trust 2015-C27 ‘Series 2015-C27 C’ 3.894% 15/2/2048 1,352,776 0.01
USD 3,400,000 Wells Fargo Commercial Mortgage Trust 2015-NXS1 ‘Series 2015-NXS1 XB’ FRN 15/5/2048 95,807 0.00
USD 600,000 Wells Fargo Commercial Mortgage Trust 2015-NXS4 ‘Series 2015-NXS4 B’ FRN 15/12/2048 647,024 0.01
USD 443,000 Wells Fargo Commercial Mortgage Trust 2015-NXS4 ‘Series 2015-NXS4 D’ FRN 15/12/2048 452,075 0.00
USD 480,000 Wells Fargo Commercial Mortgage Trust 2015-P2 ‘Series 2015-P2 D’ ‘144A’ 3.241% 15/12/2048 434,464 0.00
USD 2,760,000 Wells Fargo Commercial Mortgage Trust 2016-BNK1 ‘Series 2016-BNK1 XD’ ‘144A’ FRN 15/8/2049 200,514 0.00
USD 730,000 Wells Fargo Commercial Mortgage Trust 2016-C34 ‘Series 2016-C34 C’ FRN 15/6/2049 802,414 0.01
USD 800,000 Wells Fargo Commercial Mortgage Trust 2016-NXS5 ‘Series 2016-NXS5 C’ FRN 15/1/2059 878,993 0.01
USD 1,856,000 Wells Fargo Commercial Mortgage Trust 2017-C39 ‘Series 2017-C39 D’ ‘144A’ FRN 15/9/2050 1,902,759 0.02
USD 1,940,000 Wells Fargo Commercial Mortgage Trust 2017-C39 ‘Series 2017-C39 C’ 4.118% 15/9/2050 2,071,671 0.02
USD 1,356,000 Wells Fargo Commercial Mortgage Trust 2017-HSDB ‘Series 2017-HSDB A’ ‘144A’ FRN 13/12/2031 1,359,058 0.01
USD 9,624,522 Wells Fargo Commercial Mortgage Trust 2017-RC1 ‘Series 2017-RC1 XA’ FRN 15/1/2060 789,867 0.01
USD 850,000 Wells Fargo Commercial Mortgage Trust 2018-1745 ‘Series 2018-1745 A’ ‘144A’ FRN 15/6/2036 947,160 0.01
USD 798,379 Wells Fargo Commercial Mortgage Trust 2018-BXI ‘Series 2018-BXI E’ ‘144A’ FRN 15/12/2036 803,123 0.01
USD 21,622,054 Wells Fargo Commercial Mortgage Trust 2018-C44 ‘Series 2018-C44 XA’ FRN 15/5/2051 1,151,008 0.01
USD 1,050,000 Wells Fargo Commercial Mortgage Trust 2018-C44 ‘Series 2018-C44 D’ ‘144A’ 3% 15/5/2051 991,258 0.01
USD 490,000 Wells Fargo Commercial Mortgage Trust 2018-C45 ‘Series 2018-C45 C’ 4.727% 15/6/2051 537,386 0.01
USD 1,669,000 Welltower Inc 3.625% 15/3/2024 1,757,790 0.02 USD 3,087,000 Welltower Inc 4.125% 15/3/2029 3,404,360 0.04 USD 430,000 WESCO Distribution Inc 5.375%
15/12/2021 436,085 0.00 USD 1,173,000 Wesleyan University 4.781%
1/7/2116 1,487,000 0.02 USD 320,000 West CLO 2013-1 Ltd ‘Series
2013-1A C’ ‘144A’ FRN 7/11/2025 320,266 0.00 USD 895,000 West Virginia Hospital Finance
Authority 5% 1/6/2020 919,026 0.01 USD 890,000 West Virginia Hospital Finance
Authority 5% 1/6/2021 945,483 0.01 USD 975,000 West Virginia Hospital Finance
Authority 5% 1/6/2022 1,069,677 0.01 USD 810,000 West Virginia Hospital Finance
Authority 5% 1/6/2023 915,260 0.01 USD 860,000 West Virginia Hospital Finance
Authority 5% 1/6/2024 1,000,533 0.01 USD 2,350,000 Western Digital Corp 4.75%
15/2/2026 2,411,687 0.03 USD 40,598 WFRBS Commercial Mortgage
Trust 2011-C3 ‘Series 2011-C3 A3FL’ ‘144A’ FRN 15/3/2044 40,686 0.00
USD 360,000 WFRBS Commercial Mortgage Trust 2012-C8 ‘Series 2012-C8 C’ FRN 15/8/2045 379,131 0.00
USD 520,000 WFRBS Commercial Mortgage Trust 2014-C24 ‘Series 2014-C24 B’ FRN 15/11/2047 547,128 0.01
USD 937,000 Whiting Petroleum Corp 1.25% 1/4/2020 925,094 0.01
USD 2,522,000 William Lyon Homes Inc 6% 1/9/2023 2,610,270 0.03
Fixed Income Global Opportunities Fund continued
Portfolio of Investments 31 August 2019

Transferable Securities and Money Market Instruments Admitted to an Official Stock Exchange Listing or Dealt in on Another Regulated Market
Transferable Securities and Money Market Instruments Admitted to an Official Stock Exchange Listing or Dealt in on Another Regulated Market
Holding
Description
Market Value (USD)
% of Net
Assets
Holding
Description
Market Value (USD)
% of Net
Assets
** Security subject to a fair value adjustment as detailed in Note 2(j).
Open Forward Foreign Exchange Contracts as at 31 August 2019
Currency
Purchases Currency
Sales Counterparty
Maturity date
Unrealised appreciation/
(depreciation) USD
BRL 8,832,200 USD 2,187,000 RBS Plc 4/9/2019 (56,369)BRL 7,036,015 USD 1,745,000 Morgan Stanley 4/9/2019 (47,671)BRL 20,749,708 USD 5,197,000 Bank of America 4/9/2019 (191,454)BRL 111,333,649 USD 27,991,000 Citibank 4/9/2019 (1,133,484)BRL 7,527,469 USD 1,992,000 Toronto Dominion 4/9/2019 (176,115)BRL 12,623,636 USD 3,320,000 Goldman Sachs 4/9/2019 (274,744)BRL 88,925,652 USD 23,363,000 Barclays 4/9/2019 (1,911,066)
Open Forward Foreign Exchange Contracts as at 31 August 2019
Currency
Purchases Currency
Sales Counterparty
Maturity date
Unrealised appreciation/
(depreciation) USD
ARS 90,382,500 USD 1,950,000 Citibank 3/9/2019 (418,076)USD 1,950,000 ARS 88,920,000 BNP Paribas 3/9/2019 442,865 BRL 27,118,099 EUR 5,974,333 Deutsche Bank 4/9/2019 (58,119)BRL 17,877,189 EUR 3,982,000 Citibank 4/9/2019 (86,384)BRL 54,700,376 EUR 12,615,000 BNP Paribas 4/9/2019 (740,373)BRL 23,459,920 EUR 5,533,000 JP Morgan 4/9/2019 (453,051)BRL 14,612,902 USD 3,627,000 BNP Paribas 4/9/2019 (101,864)
The notes on pages 728 to 741 form an integral part of these financial statements.
Annual Report and Audited Financial Statements [341]
USD 537,000 William Lyon Homes Inc ‘144A’ 6.625% 15/7/2027 538,343 0.01
USD 753,000 Williams Cos Inc/The 3.75% 15/6/2027 785,237 0.01
USD 901,000 Williams Cos Inc/The 4% 15/9/2025 960,326 0.01 USD 650,000 Wisconsin Health & Educational
Facilities Authority 5% 15/12/2044 741,367 0.01 EUR 274,000 WMG Acquisition Corp 3.625%
15/10/2026 324,435 0.00 EUR 2,610,000 WMG Acquisition Corp 4.125%
1/11/2024 3,003,569 0.03 USD 225,000 WPX Energy Inc 5.25% 15/9/2024 229,739 0.00 USD 173,000 WPX Energy Inc 5.75% 1/6/2026 179,917 0.00 USD 173,000 WPX Energy Inc 8.25% 1/8/2023 193,328 0.00 USD 173,000 Wyndham Hotels & Resorts Inc
‘144A’ 5.375% 15/4/2026 182,515 0.00 USD 226,000 XPO Logistics Inc ‘144A’ 6.125%
1/9/2023 234,249 0.00 USD 90,000 XPO Logistics Inc ‘144A’ 6.5%
15/6/2022 92,199 0.00 USD 2,063,907 Yale Mortgage Loan Trust 2007-1
‘Series 2007-1 A’ ‘144A’ FRN 25/6/2037 871,037 0.01
USD 960,000 York Clo-3 Ltd ‘Series 2016-1A AR’ ‘144A’ FRN 20/10/2029 958,563 0.01
USD 5,995,000 York Clo-3 Ltd ‘Series 2016-1A BR’ ‘144A’ FRN 20/10/2029 5,959,299 0.06
USD 2,990,000 York Clo-3 Ltd ‘Series 2016-1A DR’ ‘144A’ FRN 20/10/2029 2,989,396 0.03
USD 1,520,000 York Clo-3 Ltd ‘Series 2016-1A ER’ ‘144A’ FRN 20/10/2029 1,473,055 0.02
USD 730,000 York Clo-3 Ltd ‘Series 2016-1A FR’ ‘144A’ FRN 20/10/2029 655,296 0.01
USD 2,740,000 York Clo-3 Ltd ‘Series 2016-1A SUB’ ‘144A’ FRN 20/10/2029 1,888,553 0.02
USD 550,000 York Clo-4 Ltd ‘Series 2016-2A A’ ‘144A’ FRN 20/1/2030 551,265 0.01
USD 610,000 York Clo-4 Ltd ‘Series 2016-2A D’ ‘144A’ FRN 20/1/2030 614,932 0.01
USD 1,820,000 York Clo-4 Ltd ‘Series 2016-2A E’ ‘144A’ FRN 20/1/2030 1,780,016 0.02
USD 2,010,000 York Clo-4 Ltd ‘Series 2016-2A SUB’ ‘144A’ FRN 20/1/2030 1,326,976 0.01
USD 3,115,000 Zayo Group LLC / Zayo Capital Inc 6% 1/4/2023 3,218,979 0.03
USD 1,085,000 Zayo Group LLC / Zayo Capital Inc 6.375% 15/5/2025 1,118,906 0.01
USD 172,000 Zekelman Industries Inc ‘144A’ 9.875% 15/6/2023 181,352 0.00
5,132,961,173 52.69
Uruguay USD 4,282,948 Uruguay Government International
Bond 4.375% 27/10/2027 4,755,411 0.05
Vietnam USD 5,200,000 No Va Land Investment Group
Corp 5.5% 27/4/2023 5,109,000 0.05 USD 3,000,000 Vinpearl JSC 3.5% 14/6/2023 3,330,778 0.04 8,439,778 0.09Total Bonds 8,276,550,551 84.95Total Transferable Securities and Money Market Instruments Admitted to an Official Stock Exchange Listing or Dealt in on Another Regulated Market 8,413,624,072 86.36
Other Transferable Securities
BONDS
United States USD 2,391 Lehman Brothers Holdings Inc
31/12/2049 (Zero Coupon)** 27 0.00 USD 2,391 Lehman Brothers Special Finance
31/12/2049 (Zero Coupon)** – 0.00 USD 3,780,000 Washington Mutual Bank Escrow
(Defaulted) 4/2/2018 (Zero Coupon) – 0.00
USD 7,220,000 Washington Mutual Bank Escrow (Defaulted) FRN 1/5/2018 (Zero Coupon) – 0.00
USD 3,399,000 Washington Mutual Bank Escrow 16/6/2018 (Zero Coupon) – 0.00
USD 630,000 Washington Mutual Bank Escrow (Defaulted) 16/6/2018 (Zero Coupon) – 0.00
USD 10,740,000 Washington Mutual Bank Escrow (Defaulted) 6/11/2018 (Zero Coupon) – 0.00
27 0.00Total Bonds 27 0.00Total Other Transferable Securities 27 0.00Total Portfolio 8,413,624,099 86.36
Other Net Assets 1,328,908,306 13.64Total Net Assets (USD) 9,742,532,405 100.00
Fixed Income Global Opportunities Fund continued
Portfolio of Investments 31 August 2019
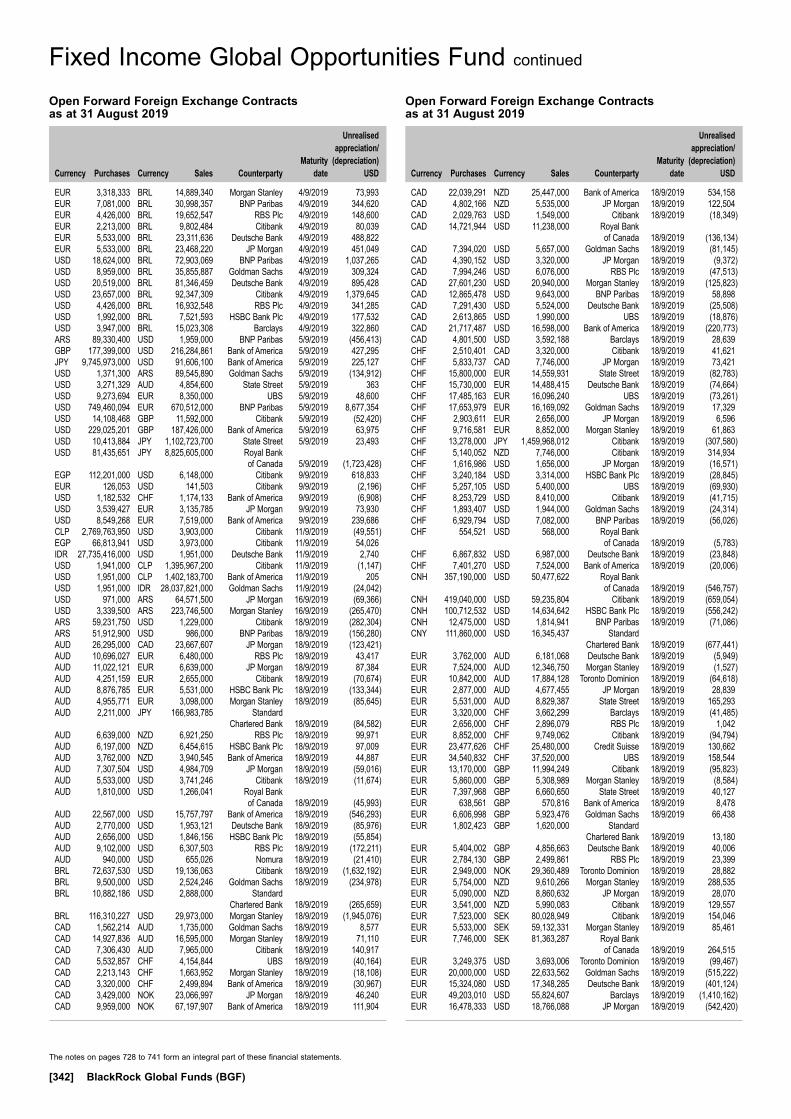
Open Forward Foreign Exchange Contracts as at 31 August 2019
Currency
Purchases Currency
Sales Counterparty
Maturity date
Unrealised appreciation/
(depreciation) USD
Open Forward Foreign Exchange Contracts as at 31 August 2019
Currency
Purchases Currency
Sales Counterparty
Maturity date
Unrealised appreciation/
(depreciation) USD
CAD 22,039,291 NZD 25,447,000 Bank of America 18/9/2019 534,158 CAD 4,802,166 NZD 5,535,000 JP Morgan 18/9/2019 122,504 CAD 2,029,763 USD 1,549,000 Citibank 18/9/2019 (18,349)CAD 14,721,944 USD 11,238,000 Royal Bank of Canada 18/9/2019 (136,134)CAD 7,394,020 USD 5,657,000 Goldman Sachs 18/9/2019 (81,145)CAD 4,390,152 USD 3,320,000 JP Morgan 18/9/2019 (9,372)CAD 7,994,246 USD 6,076,000 RBS Plc 18/9/2019 (47,513)CAD 27,601,230 USD 20,940,000 Morgan Stanley 18/9/2019 (125,823)CAD 12,865,478 USD 9,643,000 BNP Paribas 18/9/2019 58,898 CAD 7,291,430 USD 5,524,000 Deutsche Bank 18/9/2019 (25,508)CAD 2,613,865 USD 1,990,000 UBS 18/9/2019 (18,876)CAD 21,717,487 USD 16,598,000 Bank of America 18/9/2019 (220,773)CAD 4,801,500 USD 3,592,188 Barclays 18/9/2019 28,639 CHF 2,510,401 CAD 3,320,000 Citibank 18/9/2019 41,621 CHF 5,833,737 CAD 7,746,000 JP Morgan 18/9/2019 73,421 CHF 15,800,000 EUR 14,559,931 State Street 18/9/2019 (82,783)CHF 15,730,000 EUR 14,488,415 Deutsche Bank 18/9/2019 (74,664)CHF 17,485,163 EUR 16,096,240 UBS 18/9/2019 (73,261)CHF 17,653,979 EUR 16,169,092 Goldman Sachs 18/9/2019 17,329 CHF 2,903,611 EUR 2,656,000 JP Morgan 18/9/2019 6,596 CHF 9,716,581 EUR 8,852,000 Morgan Stanley 18/9/2019 61,863 CHF 13,278,000 JPY 1,459,968,012 Citibank 18/9/2019 (307,580)CHF 5,140,052 NZD 7,746,000 Citibank 18/9/2019 314,934 CHF 1,616,986 USD 1,656,000 JP Morgan 18/9/2019 (16,571)CHF 3,240,184 USD 3,314,000 HSBC Bank Plc 18/9/2019 (28,845)CHF 5,257,105 USD 5,400,000 UBS 18/9/2019 (69,930)CHF 8,253,729 USD 8,410,000 Citibank 18/9/2019 (41,715)CHF 1,893,407 USD 1,944,000 Goldman Sachs 18/9/2019 (24,314)CHF 6,929,794 USD 7,082,000 BNP Paribas 18/9/2019 (56,026)CHF 554,521 USD 568,000 Royal Bank of Canada 18/9/2019 (5,783)CHF 6,867,832 USD 6,987,000 Deutsche Bank 18/9/2019 (23,848)CHF 7,401,270 USD 7,524,000 Bank of America 18/9/2019 (20,006)CNH 357,190,000 USD 50,477,622 Royal Bank of Canada 18/9/2019 (546,757)CNH 419,040,000 USD 59,235,804 Citibank 18/9/2019 (659,054)CNH 100,712,532 USD 14,634,642 HSBC Bank Plc 18/9/2019 (556,242)CNH 12,475,000 USD 1,814,941 BNP Paribas 18/9/2019 (71,086)CNY 111,860,000 USD 16,345,437 Standard Chartered Bank 18/9/2019 (677,441)EUR 3,762,000 AUD 6,181,068 Deutsche Bank 18/9/2019 (5,949)EUR 7,524,000 AUD 12,346,750 Morgan Stanley 18/9/2019 (1,527)EUR 10,842,000 AUD 17,884,128 Toronto Dominion 18/9/2019 (64,618)EUR 2,877,000 AUD 4,677,455 JP Morgan 18/9/2019 28,839 EUR 5,531,000 AUD 8,829,387 State Street 18/9/2019 165,293 EUR 3,320,000 CHF 3,662,299 Barclays 18/9/2019 (41,485)EUR 2,656,000 CHF 2,896,079 RBS Plc 18/9/2019 1,042 EUR 8,852,000 CHF 9,749,062 Citibank 18/9/2019 (94,794)EUR 23,477,626 CHF 25,480,000 Credit Suisse 18/9/2019 130,662 EUR 34,540,832 CHF 37,520,000 UBS 18/9/2019 158,544 EUR 13,170,000 GBP 11,994,249 Citibank 18/9/2019 (95,823)EUR 5,860,000 GBP 5,308,989 Morgan Stanley 18/9/2019 (8,584)EUR 7,397,968 GBP 6,660,650 State Street 18/9/2019 40,127 EUR 638,561 GBP 570,816 Bank of America 18/9/2019 8,478 EUR 6,606,998 GBP 5,923,476 Goldman Sachs 18/9/2019 66,438 EUR 1,802,423 GBP 1,620,000 Standard Chartered Bank 18/9/2019 13,180 EUR 5,404,002 GBP 4,856,663 Deutsche Bank 18/9/2019 40,006 EUR 2,784,130 GBP 2,499,861 RBS Plc 18/9/2019 23,399 EUR 2,949,000 NOK 29,360,489 Toronto Dominion 18/9/2019 28,882 EUR 5,754,000 NZD 9,610,266 Morgan Stanley 18/9/2019 288,535 EUR 5,090,000 NZD 8,860,632 JP Morgan 18/9/2019 28,070 EUR 3,541,000 NZD 5,990,083 Citibank 18/9/2019 129,557 EUR 7,523,000 SEK 80,028,949 Citibank 18/9/2019 154,046 EUR 5,533,000 SEK 59,132,331 Morgan Stanley 18/9/2019 85,461 EUR 7,746,000 SEK 81,363,287 Royal Bank of Canada 18/9/2019 264,515 EUR 3,249,375 USD 3,693,006 Toronto Dominion 18/9/2019 (99,467)EUR 20,000,000 USD 22,633,562 Goldman Sachs 18/9/2019 (515,222)EUR 15,324,080 USD 17,348,285 Deutsche Bank 18/9/2019 (401,124)EUR 49,203,010 USD 55,824,607 Barclays 18/9/2019 (1,410,162)EUR 16,478,333 USD 18,766,088 JP Morgan 18/9/2019 (542,420)
EUR 3,318,333 BRL 14,889,340 Morgan Stanley 4/9/2019 73,993 EUR 7,081,000 BRL 30,998,357 BNP Paribas 4/9/2019 344,620 EUR 4,426,000 BRL 19,652,547 RBS Plc 4/9/2019 148,600 EUR 2,213,000 BRL 9,802,484 Citibank 4/9/2019 80,039 EUR 5,533,000 BRL 23,311,636 Deutsche Bank 4/9/2019 488,822 EUR 5,533,000 BRL 23,468,220 JP Morgan 4/9/2019 451,049 USD 18,624,000 BRL 72,903,069 BNP Paribas 4/9/2019 1,037,265 USD 8,959,000 BRL 35,855,887 Goldman Sachs 4/9/2019 309,324 USD 20,519,000 BRL 81,346,459 Deutsche Bank 4/9/2019 895,428 USD 23,657,000 BRL 92,347,309 Citibank 4/9/2019 1,379,645 USD 4,426,000 BRL 16,932,548 RBS Plc 4/9/2019 341,285 USD 1,992,000 BRL 7,521,593 HSBC Bank Plc 4/9/2019 177,532 USD 3,947,000 BRL 15,023,308 Barclays 4/9/2019 322,860 ARS 89,330,400 USD 1,959,000 BNP Paribas 5/9/2019 (456,413)GBP 177,399,000 USD 216,284,861 Bank of America 5/9/2019 427,295 JPY 9,745,973,000 USD 91,606,100 Bank of America 5/9/2019 225,127 USD 1,371,300 ARS 89,545,890 Goldman Sachs 5/9/2019 (134,912)USD 3,271,329 AUD 4,854,600 State Street 5/9/2019 363 USD 9,273,694 EUR 8,350,000 UBS 5/9/2019 48,600 USD 749,460,094 EUR 670,512,000 BNP Paribas 5/9/2019 8,677,354 USD 14,108,468 GBP 11,592,000 Citibank 5/9/2019 (52,420)USD 229,025,201 GBP 187,426,000 Bank of America 5/9/2019 63,975 USD 10,413,884 JPY 1,102,723,700 State Street 5/9/2019 23,493 USD 81,435,651 JPY 8,825,605,000 Royal Bank of Canada 5/9/2019 (1,723,428)EGP 112,201,000 USD 6,148,000 Citibank 9/9/2019 618,833 EUR 126,053 USD 141,503 Citibank 9/9/2019 (2,196)USD 1,182,532 CHF 1,174,133 Bank of America 9/9/2019 (6,908)USD 3,539,427 EUR 3,135,785 JP Morgan 9/9/2019 73,930 USD 8,549,268 EUR 7,519,000 Bank of America 9/9/2019 239,686 CLP 2,769,763,950 USD 3,903,000 Citibank 11/9/2019 (49,551)EGP 66,813,941 USD 3,973,000 Citibank 11/9/2019 54,026 IDR 27,735,416,000 USD 1,951,000 Deutsche Bank 11/9/2019 2,740 USD 1,941,000 CLP 1,395,967,200 Citibank 11/9/2019 (1,147)USD 1,951,000 CLP 1,402,183,700 Bank of America 11/9/2019 205 USD 1,951,000 IDR 28,037,821,000 Goldman Sachs 11/9/2019 (24,042)USD 971,000 ARS 64,571,500 JP Morgan 16/9/2019 (69,366)USD 3,339,500 ARS 223,746,500 Morgan Stanley 16/9/2019 (265,470)ARS 59,231,750 USD 1,229,000 Citibank 18/9/2019 (282,304)ARS 51,912,900 USD 986,000 BNP Paribas 18/9/2019 (156,280)AUD 26,295,000 CAD 23,667,607 JP Morgan 18/9/2019 (123,421)AUD 10,696,027 EUR 6,480,000 RBS Plc 18/9/2019 43,417 AUD 11,022,121 EUR 6,639,000 JP Morgan 18/9/2019 87,384 AUD 4,251,159 EUR 2,655,000 Citibank 18/9/2019 (70,674)AUD 8,876,785 EUR 5,531,000 HSBC Bank Plc 18/9/2019 (133,344)AUD 4,955,771 EUR 3,098,000 Morgan Stanley 18/9/2019 (85,645)AUD 2,211,000 JPY 166,983,785 Standard Chartered Bank 18/9/2019 (84,582)AUD 6,639,000 NZD 6,921,250 RBS Plc 18/9/2019 99,971 AUD 6,197,000 NZD 6,454,615 HSBC Bank Plc 18/9/2019 97,009 AUD 3,762,000 NZD 3,940,545 Bank of America 18/9/2019 44,887 AUD 7,307,504 USD 4,984,709 JP Morgan 18/9/2019 (59,016)AUD 5,533,000 USD 3,741,246 Citibank 18/9/2019 (11,674)AUD 1,810,000 USD 1,266,041 Royal Bank of Canada 18/9/2019 (45,993)AUD 22,567,000 USD 15,757,797 Bank of America 18/9/2019 (546,293)AUD 2,770,000 USD 1,953,121 Deutsche Bank 18/9/2019 (85,976)AUD 2,656,000 USD 1,846,156 HSBC Bank Plc 18/9/2019 (55,854)AUD 9,102,000 USD 6,307,503 RBS Plc 18/9/2019 (172,211)AUD 940,000 USD 655,026 Nomura 18/9/2019 (21,410)BRL 72,637,530 USD 19,136,063 Citibank 18/9/2019 (1,632,192)BRL 9,500,000 USD 2,524,246 Goldman Sachs 18/9/2019 (234,978)BRL 10,882,186 USD 2,888,000 Standard Chartered Bank 18/9/2019 (265,659)BRL 116,310,227 USD 29,973,000 Morgan Stanley 18/9/2019 (1,945,076)CAD 1,562,214 AUD 1,735,000 Goldman Sachs 18/9/2019 8,577 CAD 14,927,836 AUD 16,595,000 Morgan Stanley 18/9/2019 71,110 CAD 7,306,430 AUD 7,965,000 Citibank 18/9/2019 140,917 CAD 5,532,857 CHF 4,154,844 UBS 18/9/2019 (40,164)CAD 2,213,143 CHF 1,663,952 Morgan Stanley 18/9/2019 (18,108)CAD 3,320,000 CHF 2,499,894 Bank of America 18/9/2019 (30,967)CAD 3,429,000 NOK 23,066,997 JP Morgan 18/9/2019 46,240 CAD 9,959,000 NOK 67,197,907 Bank of America 18/9/2019 111,904
The notes on pages 728 to 741 form an integral part of these financial statements.
[342] BlackRock Global Funds (BGF)
Fixed Income Global Opportunities Fund continued

Open Forward Foreign Exchange Contracts as at 31 August 2019
Currency
Purchases Currency
Sales Counterparty
Maturity date
Unrealised appreciation/
(depreciation) USD
Open Forward Foreign Exchange Contracts as at 31 August 2019
Currency
Purchases Currency
Sales Counterparty
Maturity date
Unrealised appreciation/
(depreciation) USD
EUR 71,388,000 USD 79,998,209 HSBC Bank Plc 18/9/2019 (1,049,007)EUR 31,822,989 USD 35,844,082 RBS Plc 18/9/2019 (650,497)EUR 20,919,311 USD 23,357,361 State Street 18/9/2019 (222,340)EUR 8,046,792 USD 9,030,013 UBS 18/9/2019 (130,929)EUR 206,869,878 USD 232,463,869 Citibank 18/9/2019 (3,682,953)EUR 132,115,709 USD 149,638,257 Bank of America 18/9/2019 (3,529,250)EUR 12,649,065 USD 14,301,840 Standard Chartered Bank 18/9/2019 (313,024)EUR 18,725,000 USD 20,916,739 Morgan Stanley 18/9/2019 (208,444)EUR 5,540,000 USD 6,305,107 BNP Paribas 18/9/2019 (178,327)GBP 2,600,000 EUR 2,896,753 Barclays 18/9/2019 (25,550)GBP 5,200,000 EUR 5,840,367 Goldman Sachs 18/9/2019 (102,923)GBP 10,360,000 EUR 11,626,941 RBS Plc 18/9/2019 (195,249)GBP 2,709,043 USD 3,314,000 JP Morgan 18/9/2019 (2,696)GBP 4,111,609 USD 4,978,000 HSBC Bank Plc 18/9/2019 47,682 GBP 1,656,000 USD 2,074,985 Bank of America 18/9/2019 (50,831)GBP 1,910,000 USD 2,405,486 RBS Plc 18/9/2019 (70,865)GBP 680,000 USD 864,308 Nomura 18/9/2019 (33,134)GBP 1,656,000 USD 2,100,021 Morgan Stanley 18/9/2019 (75,868)GBP 2,600,000 USD 3,295,838 Deutsche Bank 18/9/2019 (117,819)IDR 14,056,482,000 USD 979,000 JP Morgan 18/9/2019 10,513 IDR 128,231,430,000 USD 9,087,982 BNY Mellon 18/9/2019 (61,062)IDR 45,520,000,000 USD 3,242,599 Deutsche Bank 18/9/2019 (38,194)IDR 9,313,800,000 USD 651,588 Citibank 18/9/2019 4,062 IDR 14,169,833,800 USD 990,216 UBS 18/9/2019 7,277 IDR 9,313,800,000 USD 650,314 Bank of America 18/9/2019 5,336 IDR 423,065,705,000 USD 29,206,398 BNP Paribas 18/9/2019 575,538 INR 333,890,710 USD 4,802,927 Deutsche Bank 18/9/2019 (144,364)INR 80,569,446 USD 1,167,000 JP Morgan 18/9/2019 (42,866)INR 72,670,000 USD 1,053,570 BNP Paribas 18/9/2019 (39,652)INR 1,900,404,000 USD 27,506,209 ANZ 18/9/2019 (991,088)JPY 167,498,859 AUD 2,211,000 JP Morgan 18/9/2019 89,440 JPY 489,431,727 CHF 4,426,000 Citibank 18/9/2019 128,706 JPY 970,175,632 CHF 8,852,000 HSBC Bank Plc 18/9/2019 175,472 JPY 1,140,827,212 USD 10,628,763 Standard Chartered Bank 18/9/2019 131,090 JPY 893,855,503 USD 8,410,000 State Street 18/9/2019 20,510 JPY 1,092,290,793 USD 10,297,302 UBS 18/9/2019 4,774 JPY 114,413,688 USD 1,080,000 Toronto Dominion 18/9/2019 (893)JPY 6,069,055,964 USD 56,901,872 Bank of America 18/9/2019 339,183 JPY 17,623,392,250 USD 164,362,374 Citibank 18/9/2019 1,854,836 JPY 310,322,925 USD 2,923,000 Royal Bank of Canada 18/9/2019 3,849 JPY 4,089,331,200 USD 38,451,154 HSBC Bank Plc 18/9/2019 117,880 JPY 717,603,905 USD 6,641,000 Morgan Stanley 18/9/2019 127,170 JPY 1,313,987,926 USD 12,172,000 JP Morgan 18/9/2019 221,040 JPY 305,260,000 USD 2,847,906 RBS Plc 18/9/2019 31,192 KRW 6,047,039,430 USD 5,101,000 BNP Paribas 18/9/2019 (100,330)KRW 3,901,862,925 USD 3,299,827 JP Morgan 18/9/2019 (73,136)KRW 4,287,303,490 USD 3,647,500 HSBC Bank Plc 18/9/2019 (102,064)KRW 3,608,210,000 USD 3,085,942 Bank of America 18/9/2019 (102,090)KRW 3,439,175,000 USD 2,924,704 Deutsche Bank 18/9/2019 (80,637)KRW 1,258,395,000 USD 1,076,195 Goldman Sachs 18/9/2019 (35,551)MXN 100,617,741 USD 4,981,000 State Street 18/9/2019 17,444 MXN 24,272,101 USD 1,213,500 Morgan Stanley 18/9/2019 (7,721)MXN 24,213,302 USD 1,213,500 HSBC Bank Plc 18/9/2019 (10,642)MXN 52,649,436 USD 2,656,000 Deutsche Bank 18/9/2019 (40,504)MXN 86,528,763 USD 4,381,000 UBS 18/9/2019 (82,462)MXN 55,422,667 USD 2,888,000 Bank of America 18/9/2019 (134,737)MXN 24,551,143 USD 1,231,000 Goldman Sachs 18/9/2019 (11,359)MXN 1,132,302,080 USD 58,240,000 JP Morgan 18/9/2019 (1,989,990)NOK 60,444,607 CAD 8,852,000 Morgan Stanley 18/9/2019 (20,622)NOK 146,315,656 CAD 21,575,000 JP Morgan 18/9/2019 (161,034)NOK 29,387,855 EUR 2,949,000 Deutsche Bank 18/9/2019 (25,869)NOK 48,688,000 SEK 52,167,975 BNP Paribas 18/9/2019 37,377 NOK 79,671,000 SEK 85,867,891 Citibank 18/9/2019 9,900 NOK 44,580,187 USD 4,952,000 Deutsche Bank 18/9/2019 (43,906)NOK 49,756,609 USD 5,533,000 Bank of America 18/9/2019 (55,004)NOK 27,723,899 USD 3,098,000 Barclays 18/9/2019 (45,714)NOK 27,477,547 USD 3,222,000 JP Morgan 18/9/2019 (196,837)NZD 17,311,325 AUD 16,598,000 Citibank 18/9/2019 (245,082)NZD 19,917,000 CAD 17,213,254 JP Morgan 18/9/2019 (390,492)NZD 11,065,000 CAD 9,627,225 Morgan Stanley 18/9/2019 (265,433)
NZD 7,746,000 CHF 5,130,369 Citibank 18/9/2019 (305,117)NZD 8,822,120 EUR 5,090,000 Toronto Dominion 18/9/2019 (52,414)NZD 15,505,772 EUR 9,295,000 Goldman Sachs 18/9/2019 (477,877)NZD 10,978,000 SEK 67,260,878 Bank of America 18/9/2019 76,518 NZD 8,243,500 USD 5,226,994 JP Morgan 18/9/2019 (16,053)NZD 6,171,310 USD 3,949,014 Standard Chartered Bank 18/9/2019 (47,960)NZD 2,582,902 USD 1,657,000 HSBC Bank Plc 18/9/2019 (24,277)NZD 3,776,934 USD 2,434,000 Toronto Dominion 18/9/2019 (46,497)NZD 21,024,000 USD 14,176,515 Morgan Stanley 18/9/2019 (886,671)NZD 495,000 USD 326,884 Citibank 18/9/2019 (13,981)PHP 116,300,000 USD 2,275,533 Goldman Sachs 18/9/2019 (42,800)PHP 28,102,500 USD 547,327 Standard Chartered Bank 18/9/2019 (7,814)PHP 28,095,000 USD 542,113 UBS 18/9/2019 (2,744)PHP 28,102,500 USD 542,519 BNP Paribas 18/9/2019 (3,006)RUB 66,398,427 USD 1,026,205 Bank of America 18/9/2019 (29,131)RUB 6,223,941 USD 98,000 Citibank 18/9/2019 (4,538)RUB 386,442,780 USD 6,059,614 Goldman Sachs 18/9/2019 (256,582)RUB 38,522,033 USD 602,798 Deutsche Bank 18/9/2019 (24,330)SEK 80,006,669 EUR 7,523,000 Morgan Stanley 18/9/2019 (156,319)SEK 58,402,752 EUR 5,533,000 Bank of America 18/9/2019 (159,903)SEK 24,943,055 EUR 2,360,686 JP Morgan 18/9/2019 (65,654)SEK 56,800,014 EUR 5,385,314 Citibank 18/9/2019 (160,111)SEK 137,652,478 NOK 128,359,000 JP Morgan 18/9/2019 (86,395)SEK 67,597,035 NZD 10,978,000 Bank of America 18/9/2019 (42,218)SEK 28,801 USD 3,000 Citibank 18/9/2019 (61)SEK 52,277,654 USD 5,535,000 Morgan Stanley 18/9/2019 (200,841)SEK 6,180,093 USD 663,000 UBS 18/9/2019 (32,413)SEK 37,233,866 USD 3,984,000 HSBC Bank Plc 18/9/2019 (184,836)SEK 61,025,524 USD 6,581,000 Bank of America 18/9/2019 (354,250)SEK 12,400,228 USD 1,317,000 RBS Plc 18/9/2019 (51,740)SGD 12,630,000 USD 9,107,835 UBS 18/9/2019 1,456 SGD 2,560,000 USD 1,843,185 Goldman Sachs 18/9/2019 3,195 SGD 4,008,388 USD 2,888,000 BNP Paribas 18/9/2019 3,020 TRY 5,946,804 USD 980,000 HSBC Bank Plc 18/9/2019 34,237 TRY 771,206 USD 124,000 Citibank 18/9/2019 7,531 TWD 117,217,504 USD 3,753,425 Deutsche Bank 18/9/2019 (10,518)TWD 67,600,000 USD 2,184,327 JP Morgan 18/9/2019 (25,771)TWD 13,400,000 USD 434,670 Citibank 18/9/2019 (6,790)TWD 13,400,000 USD 434,924 Bank of America 18/9/2019 (7,044)USD 3,339,500 ARS 215,564,725 Citibank 18/9/2019 (105,854)USD 7,173,133 AUD 10,598,000 Goldman Sachs 18/9/2019 29,449 USD 20,340,000 AUD 30,164,302 Bank of America 18/9/2019 7,461 USD 6,033,107 AUD 8,728,549 Standard Chartered Bank 18/9/2019 149,544 USD 3,000,200 AUD 4,426,000 Morgan Stanley 18/9/2019 16,812 USD 118,471 AUD 175,000 UBS 18/9/2019 511 USD 9,663,841 AUD 13,792,000 HSBC Bank Plc 18/9/2019 367,211 USD 3,620,518 AUD 5,201,000 RBS Plc 18/9/2019 114,733 USD 6,049,367 AUD 8,782,000 Citibank 18/9/2019 129,775 USD 2,888,000 BRL 11,953,432 Goldman Sachs 18/9/2019 7,515 USD 1,956,000 BRL 7,700,224 Standard Chartered Bank 18/9/2019 100,434 USD 9,760,000 BRL 40,558,656 Morgan Stanley 18/9/2019 (13,645)USD 4,880,000 BRL 20,387,640 UBS 18/9/2019 (32,923)USD 20,165,000 CAD 26,685,636 Bank of America 18/9/2019 41,275 USD 25,873,000 CAD 34,249,580 Morgan Stanley 18/9/2019 45,279 USD 14,976,000 CAD 19,605,681 JP Morgan 18/9/2019 191,292 USD 2,215,000 CAD 2,949,384 HSBC Bank Plc 18/9/2019 (9,140)USD 19,575,000 CAD 25,678,706 Citibank 18/9/2019 210,603 USD 3,311,000 CAD 4,402,875 RBS Plc 18/9/2019 (9,222)USD 5,533,000 CAD 7,303,754 Barclays 18/9/2019 25,216 USD 1,770,000 CAD 2,325,184 BNP Paribas 18/9/2019 16,572 USD 9,708,164 CAD 12,699,010 Royal Bank of Canada 18/9/2019 131,799 USD 6,715,000 CAD 8,854,735 Deutsche Bank 18/9/2019 37,616 USD 3,320,000 CHF 3,272,192 Citibank 18/9/2019 2,392 USD 12,740,000 CHF 12,473,538 Deutsche Bank 18/9/2019 93,339 USD 6,987,000 CHF 6,864,221 Bank of America 18/9/2019 27,509 USD 16,369,000 CHF 16,026,219 Morgan Stanley 18/9/2019 120,349 USD 6,914,000 CHF 6,732,514 JP Morgan 18/9/2019 88,044 USD 22,955,245 CNH 160,532,228 Citibank 18/9/2019 514,770
The notes on pages 728 to 741 form an integral part of these financial statements.
Annual Report and Audited Financial Statements [343]
Fixed Income Global Opportunities Fund continued
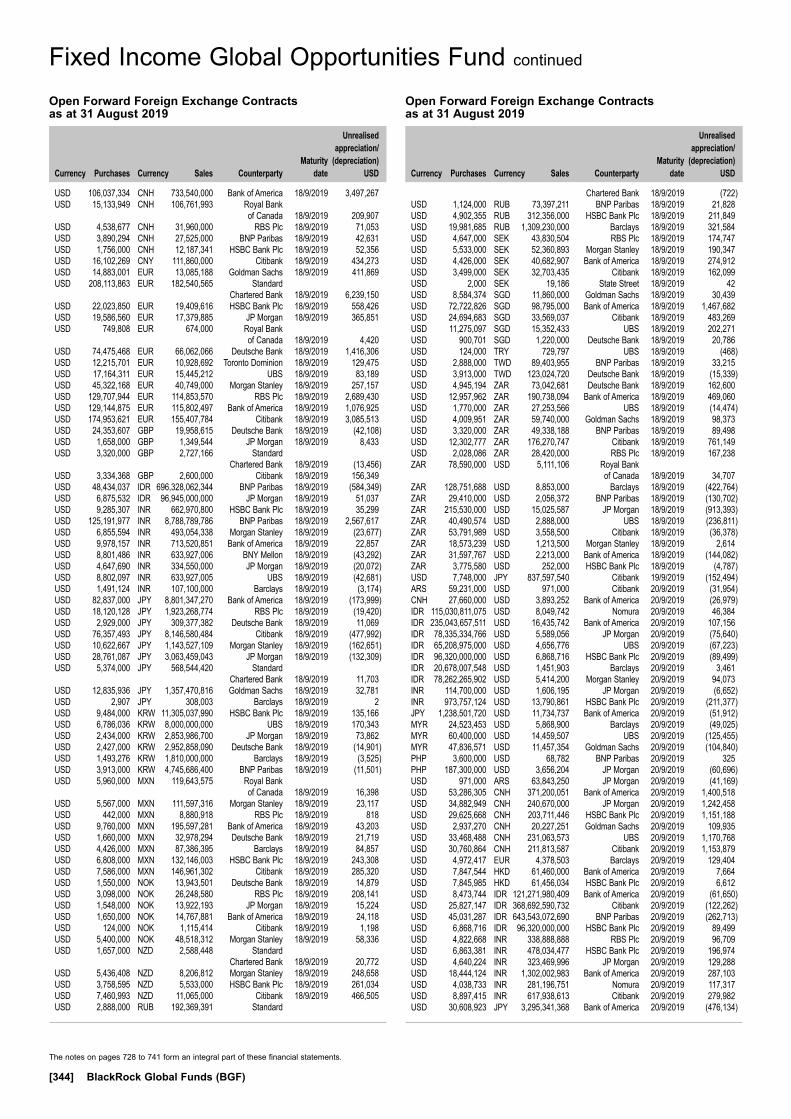
Open Forward Foreign Exchange Contracts as at 31 August 2019
Currency
Purchases Currency
Sales Counterparty
Maturity date
Unrealised appreciation/
(depreciation) USD
Open Forward Foreign Exchange Contracts as at 31 August 2019
Currency
Purchases Currency
Sales Counterparty
Maturity date
Unrealised appreciation/
(depreciation) USD
USD 106,037,334 CNH 733,540,000 Bank of America 18/9/2019 3,497,267 USD 15,133,949 CNH 106,761,993 Royal Bank of Canada 18/9/2019 209,907 USD 4,538,677 CNH 31,960,000 RBS Plc 18/9/2019 71,053 USD 3,890,294 CNH 27,525,000 BNP Paribas 18/9/2019 42,631 USD 1,756,000 CNH 12,187,341 HSBC Bank Plc 18/9/2019 52,356 USD 16,102,269 CNY 111,860,000 Citibank 18/9/2019 434,273 USD 14,883,001 EUR 13,085,188 Goldman Sachs 18/9/2019 411,869 USD 208,113,863 EUR 182,540,565 Standard Chartered Bank 18/9/2019 6,239,150 USD 22,023,850 EUR 19,409,616 HSBC Bank Plc 18/9/2019 558,426 USD 19,586,560 EUR 17,379,885 JP Morgan 18/9/2019 365,851 USD 749,808 EUR 674,000 Royal Bank of Canada 18/9/2019 4,420 USD 74,475,468 EUR 66,062,066 Deutsche Bank 18/9/2019 1,416,306 USD 12,215,701 EUR 10,928,692 Toronto Dominion 18/9/2019 129,475 USD 17,164,311 EUR 15,445,212 UBS 18/9/2019 83,189 USD 45,322,168 EUR 40,749,000 Morgan Stanley 18/9/2019 257,157 USD 129,707,944 EUR 114,853,570 RBS Plc 18/9/2019 2,689,430 USD 129,144,875 EUR 115,802,497 Bank of America 18/9/2019 1,076,925 USD 174,953,621 EUR 155,407,784 Citibank 18/9/2019 3,085,513 USD 24,353,607 GBP 19,958,615 Deutsche Bank 18/9/2019 (42,108)USD 1,658,000 GBP 1,349,544 JP Morgan 18/9/2019 8,433 USD 3,320,000 GBP 2,727,166 Standard Chartered Bank 18/9/2019 (13,456)USD 3,334,368 GBP 2,600,000 Citibank 18/9/2019 156,349 USD 48,434,037 IDR 696,328,062,344 BNP Paribas 18/9/2019 (584,349)USD 6,875,532 IDR 96,945,000,000 JP Morgan 18/9/2019 51,037 USD 9,285,307 INR 662,970,800 HSBC Bank Plc 18/9/2019 35,299 USD 125,191,977 INR 8,788,789,786 BNP Paribas 18/9/2019 2,567,617 USD 6,855,594 INR 493,054,338 Morgan Stanley 18/9/2019 (23,677)USD 9,978,157 INR 713,520,851 Bank of America 18/9/2019 22,857 USD 8,801,486 INR 633,927,006 BNY Mellon 18/9/2019 (43,292)USD 4,647,690 INR 334,550,000 JP Morgan 18/9/2019 (20,072)USD 8,802,097 INR 633,927,005 UBS 18/9/2019 (42,681)USD 1,491,124 INR 107,100,000 Barclays 18/9/2019 (3,174)USD 82,837,000 JPY 8,801,347,270 Bank of America 18/9/2019 (173,999)USD 18,120,128 JPY 1,923,268,774 RBS Plc 18/9/2019 (19,420)USD 2,929,000 JPY 309,377,382 Deutsche Bank 18/9/2019 11,069 USD 76,357,493 JPY 8,146,580,484 Citibank 18/9/2019 (477,992)USD 10,622,667 JPY 1,143,527,109 Morgan Stanley 18/9/2019 (162,651)USD 28,761,087 JPY 3,063,459,043 JP Morgan 18/9/2019 (132,309)USD 5,374,000 JPY 568,544,420 Standard Chartered Bank 18/9/2019 11,703 USD 12,835,936 JPY 1,357,470,816 Goldman Sachs 18/9/2019 32,781 USD 2,907 JPY 308,003 Barclays 18/9/2019 2 USD 9,484,000 KRW 11,305,037,990 HSBC Bank Plc 18/9/2019 135,166 USD 6,786,036 KRW 8,000,000,000 UBS 18/9/2019 170,343 USD 2,434,000 KRW 2,853,986,700 JP Morgan 18/9/2019 73,862 USD 2,427,000 KRW 2,952,858,090 Deutsche Bank 18/9/2019 (14,901)USD 1,493,276 KRW 1,810,000,000 Barclays 18/9/2019 (3,525)USD 3,913,000 KRW 4,745,686,400 BNP Paribas 18/9/2019 (11,501)USD 5,960,000 MXN 119,643,575 Royal Bank of Canada 18/9/2019 16,398 USD 5,567,000 MXN 111,597,316 Morgan Stanley 18/9/2019 23,117 USD 442,000 MXN 8,880,918 RBS Plc 18/9/2019 818 USD 9,760,000 MXN 195,597,281 Bank of America 18/9/2019 43,203 USD 1,660,000 MXN 32,978,294 Deutsche Bank 18/9/2019 21,719 USD 4,426,000 MXN 87,386,395 Barclays 18/9/2019 84,857 USD 6,808,000 MXN 132,146,003 HSBC Bank Plc 18/9/2019 243,308 USD 7,586,000 MXN 146,961,302 Citibank 18/9/2019 285,320 USD 1,550,000 NOK 13,943,501 Deutsche Bank 18/9/2019 14,879 USD 3,098,000 NOK 26,248,580 RBS Plc 18/9/2019 208,141 USD 1,548,000 NOK 13,922,193 JP Morgan 18/9/2019 15,224 USD 1,650,000 NOK 14,767,881 Bank of America 18/9/2019 24,118 USD 124,000 NOK 1,115,414 Citibank 18/9/2019 1,198 USD 5,400,000 NOK 48,518,312 Morgan Stanley 18/9/2019 58,336 USD 1,657,000 NZD 2,588,448 Standard Chartered Bank 18/9/2019 20,772 USD 5,436,408 NZD 8,206,812 Morgan Stanley 18/9/2019 248,658 USD 3,758,595 NZD 5,533,000 HSBC Bank Plc 18/9/2019 261,034 USD 7,460,993 NZD 11,065,000 Citibank 18/9/2019 466,505 USD 2,888,000 RUB 192,369,391 Standard
Chartered Bank 18/9/2019 (722)USD 1,124,000 RUB 73,397,211 BNP Paribas 18/9/2019 21,828 USD 4,902,355 RUB 312,356,000 HSBC Bank Plc 18/9/2019 211,849 USD 19,981,685 RUB 1,309,230,000 Barclays 18/9/2019 321,584 USD 4,647,000 SEK 43,830,504 RBS Plc 18/9/2019 174,747 USD 5,533,000 SEK 52,360,893 Morgan Stanley 18/9/2019 190,347 USD 4,426,000 SEK 40,682,907 Bank of America 18/9/2019 274,912 USD 3,499,000 SEK 32,703,435 Citibank 18/9/2019 162,099 USD 2,000 SEK 19,186 State Street 18/9/2019 42 USD 8,584,374 SGD 11,860,000 Goldman Sachs 18/9/2019 30,439 USD 72,722,826 SGD 98,795,000 Bank of America 18/9/2019 1,467,682 USD 24,694,683 SGD 33,569,037 Citibank 18/9/2019 483,269 USD 11,275,097 SGD 15,352,433 UBS 18/9/2019 202,271 USD 900,701 SGD 1,220,000 Deutsche Bank 18/9/2019 20,786 USD 124,000 TRY 729,797 UBS 18/9/2019 (468)USD 2,888,000 TWD 89,403,955 BNP Paribas 18/9/2019 33,215 USD 3,913,000 TWD 123,024,720 Deutsche Bank 18/9/2019 (15,339)USD 4,945,194 ZAR 73,042,681 Deutsche Bank 18/9/2019 162,600 USD 12,957,962 ZAR 190,738,094 Bank of America 18/9/2019 469,060 USD 1,770,000 ZAR 27,253,566 UBS 18/9/2019 (14,474)USD 4,009,951 ZAR 59,740,000 Goldman Sachs 18/9/2019 98,373 USD 3,320,000 ZAR 49,338,188 BNP Paribas 18/9/2019 89,498 USD 12,302,777 ZAR 176,270,747 Citibank 18/9/2019 761,149 USD 2,028,086 ZAR 28,420,000 RBS Plc 18/9/2019 167,238 ZAR 78,590,000 USD 5,111,106 Royal Bank of Canada 18/9/2019 34,707 ZAR 128,751,688 USD 8,853,000 Barclays 18/9/2019 (422,764)ZAR 29,410,000 USD 2,056,372 BNP Paribas 18/9/2019 (130,702)ZAR 215,530,000 USD 15,025,587 JP Morgan 18/9/2019 (913,393)ZAR 40,490,574 USD 2,888,000 UBS 18/9/2019 (236,811)ZAR 53,791,989 USD 3,558,500 Citibank 18/9/2019 (36,378)ZAR 18,573,239 USD 1,213,500 Morgan Stanley 18/9/2019 2,614 ZAR 31,597,767 USD 2,213,000 Bank of America 18/9/2019 (144,082)ZAR 3,775,580 USD 252,000 HSBC Bank Plc 18/9/2019 (4,787)USD 7,748,000 JPY 837,597,540 Citibank 19/9/2019 (152,494)ARS 59,231,000 USD 971,000 Citibank 20/9/2019 (31,954)CNH 27,660,000 USD 3,893,252 Bank of America 20/9/2019 (26,979)IDR 115,030,811,075 USD 8,049,742 Nomura 20/9/2019 46,384 IDR 235,043,657,511 USD 16,435,742 Bank of America 20/9/2019 107,156 IDR 78,335,334,766 USD 5,589,056 JP Morgan 20/9/2019 (75,640)IDR 65,208,975,000 USD 4,656,776 UBS 20/9/2019 (67,223)IDR 96,320,000,000 USD 6,868,716 HSBC Bank Plc 20/9/2019 (89,499)IDR 20,678,007,548 USD 1,451,903 Barclays 20/9/2019 3,461 IDR 78,262,265,902 USD 5,414,200 Morgan Stanley 20/9/2019 94,073 INR 114,700,000 USD 1,606,195 JP Morgan 20/9/2019 (6,652)INR 973,757,124 USD 13,790,861 HSBC Bank Plc 20/9/2019 (211,377)JPY 1,238,501,720 USD 11,734,737 Bank of America 20/9/2019 (51,912)MYR 24,523,453 USD 5,868,900 Barclays 20/9/2019 (49,025)MYR 60,400,000 USD 14,459,507 UBS 20/9/2019 (125,455)MYR 47,836,571 USD 11,457,354 Goldman Sachs 20/9/2019 (104,840)PHP 3,600,000 USD 68,782 BNP Paribas 20/9/2019 325 PHP 187,300,000 USD 3,656,204 JP Morgan 20/9/2019 (60,696)USD 971,000 ARS 63,843,250 JP Morgan 20/9/2019 (41,169)USD 53,286,305 CNH 371,200,051 Bank of America 20/9/2019 1,400,518 USD 34,882,949 CNH 240,670,000 JP Morgan 20/9/2019 1,242,458 USD 29,625,668 CNH 203,711,446 HSBC Bank Plc 20/9/2019 1,151,188 USD 2,937,270 CNH 20,227,251 Goldman Sachs 20/9/2019 109,935 USD 33,468,488 CNH 231,063,573 UBS 20/9/2019 1,170,768 USD 30,760,864 CNH 211,813,587 Citibank 20/9/2019 1,153,879 USD 4,972,417 EUR 4,378,503 Barclays 20/9/2019 129,404 USD 7,847,544 HKD 61,460,000 Bank of America 20/9/2019 7,664 USD 7,845,985 HKD 61,456,034 HSBC Bank Plc 20/9/2019 6,612 USD 8,473,744 IDR 121,271,980,409 Bank of America 20/9/2019 (61,650)USD 25,827,147 IDR 368,692,590,732 Citibank 20/9/2019 (122,262)USD 45,031,287 IDR 643,543,072,690 BNP Paribas 20/9/2019 (262,713)USD 6,868,716 IDR 96,320,000,000 HSBC Bank Plc 20/9/2019 89,499 USD 4,822,668 INR 338,888,888 RBS Plc 20/9/2019 96,709 USD 6,863,381 INR 478,034,477 HSBC Bank Plc 20/9/2019 196,974 USD 4,640,224 INR 323,469,996 JP Morgan 20/9/2019 129,288 USD 18,444,124 INR 1,302,002,983 Bank of America 20/9/2019 287,103 USD 4,038,733 INR 281,196,751 Nomura 20/9/2019 117,317 USD 8,897,415 INR 617,938,613 Citibank 20/9/2019 279,982 USD 30,608,923 JPY 3,295,341,368 Bank of America 20/9/2019 (476,134)
The notes on pages 728 to 741 form an integral part of these financial statements.
[344] BlackRock Global Funds (BGF)
Fixed Income Global Opportunities Fund continued

Open Forward Foreign Exchange Contracts as at 31 August 2019
Currency
Purchases Currency
Sales Counterparty
Maturity date
Unrealised appreciation/
(depreciation) USD
Open Forward Foreign Exchange Contracts as at 31 August 2019
Currency
Purchases Currency
Sales Counterparty
Maturity date
Unrealised appreciation/
(depreciation) USD
USD 1,376,089 KRW 1,619,932,156 Bank of America 20/9/2019 36,172 USD 12,128,740 MYR 50,255,747 Goldman Sachs 20/9/2019 202,110 USD 26,219,461 MYR 108,883,046 UBS 20/9/2019 379,474 USD 7,089,989 MYR 29,749,592 Barclays 20/9/2019 29,853 USD 13,355,998 MYR 55,000,000 Morgan Stanley 20/9/2019 303,467 USD 8,114,798 SGD 11,209,043 BNP Paribas 20/9/2019 30,173 USD 12,626,519 SGD 17,448,712 Bank of America 20/9/2019 41,477 USD 2,185,594 TWD 68,575,206 Goldman Sachs 20/9/2019 (4,964)USD 1,950,000 ZAR 29,913,975 Bank of America 20/9/2019 (8,152)ZAR 29,734,770 USD 1,950,000 BNP Paribas 20/9/2019 (3,579)USD 971,000 ARS 59,231,000 Morgan Stanley 23/9/2019 43,413 IDR 139,267,700,000 USD 9,739,000 Bank of America 25/9/2019 58,340 MXN 58,880,323 USD 2,928,000 Citibank 25/9/2019 (6,527)MXN 192,997,763 USD 9,739,000 Deutsche Bank 25/9/2019 (163,004)MXN 111,937,000 USD 5,661,671 UBS 25/9/2019 (107,677)USD 54,037,454 MXN 1,068,361,422 Citibank 25/9/2019 1,028,418 USD 1,953,000 MXN 39,045,382 HSBC Bank Plc 25/9/2019 15,680 USD 60,004,971 MXN 1,184,228,111 Royal Bank of Canada 25/9/2019 1,246,963 EUR 3,531,000 USD 3,926,128 BNP Paribas 26/9/2019 (18,709)COP 10,650,600,000 USD 3,050,000 RBS Plc 27/9/2019 65,738 USD 3,050,000 COP 10,415,750,000 UBS 27/9/2019 2,965 USD 3,912,000 ZAR 59,892,368 Deutsche Bank 30/9/2019 (3,348)USD 4,883,000 ZAR 71,335,747 Bank of America 30/9/2019 219,563 ZAR 70,601,820 USD 4,890,000 BNP Paribas 30/9/2019 (274,542)ZAR 51,505,561 USD 3,575,000 Bank of America 30/9/2019 (207,923)ZAR 4,864,703 USD 337,000 Morgan Stanley 30/9/2019 (18,979)USD 12,702,000 BRL 52,931,774 BNP Paribas 2/10/2019 (39,543)USD 1,328,000 BRL 5,521,691 Citibank 2/10/2019 (1,161)USD 1,950,000 BRL 8,123,505 Morgan Stanley 2/10/2019 (5,460)USD 216,555,749 GBP 177,399,000 Bank of America 3/10/2019 (426,290)USD 91,799,683 JPY 9,745,973,000 Bank of America 3/10/2019 (223,624)ARS 94,329,900 USD 1,953,000 BNP Paribas 7/10/2019 (553,628)USD 1,463,000 ARS 72,857,400 Citibank 7/10/2019 382,170 USD 2,725,000 INR 195,791,250 HSBC Bank Plc 7/10/2019 4,907 ARS 108,953,000 USD 2,210,000 JP Morgan 15/10/2019 (633,011)USD 885,000 ARS 61,065,000 BNP Paribas 15/10/2019 1,144 USD 2,655,000 ARS 184,080,000 Goldman Sachs 15/10/2019 (9,379)CNH 164,570,524 USD 23,984,633 HSBC Bank Plc 18/10/2019 (1,000,222)USD 9,987,222 CNH 69,170,000 Bank of America 18/10/2019 326,733 USD 14,184,581 CNH 95,400,524 JP Morgan 18/10/2019 860,659 CLP 1,882,990,060 USD 2,600,815 JP Morgan 23/10/2019 20,225 CLP 949,229,033 USD 1,310,185 UBS 23/10/2019 11,100 COP 9,948,002,750 USD 2,933,000 UBS 23/10/2019 (26,774)COP 16,662,735,000 USD 4,885,000 Barclays 23/10/2019 (17,121)USD 3,911,000 CLP 2,780,329,900 Citibank 23/10/2019 40,902 USD 3,900,000 COP 13,501,800,000 Morgan Stanley 23/10/2019 (44,438)USD 3,911,000 COP 13,254,379,000 RBS Plc 23/10/2019 38,844 USD 10,909,031 ZAR 168,639,544 HSBC Bank Plc 23/10/2019 (82,311)USD 3,911,000 TWD 122,218,750 BNP Paribas 30/10/2019 (9,455)USD 4,848,250 AUD 7,200,000 Goldman Sachs 31/10/2019 (11,238)USD 1,340,000 ARS 99,319,500 BNP Paribas 4/11/2019 (10,625)RUB 643,720,800 USD 9,760,000 JP Morgan 6/11/2019 (159,816)USD 7,344,088 IDR 105,806,277,447 Goldman Sachs 6/11/2019 (51,821)USD 28,425,530 IDR 408,815,971,450 Bank of America 6/11/2019 (150,902)USD 14,660,000 IDR 216,601,500,000 JP Morgan 6/11/2019 (480,549)USD 22,566,473 IDR 327,527,846,922 Citibank 6/11/2019 (327,880)USD 14,660,000 MXN 292,669,308 Citibank 6/11/2019 241,899 USD 45,616,145 RUB 3,007,860,149 Morgan Stanley 6/11/2019 758,172 USD 9,767,000 RUB 635,929,370 Bank of America 6/11/2019 283,014 ARS 113,557,250 USD 2,210,000 HSBC Bank Plc 13/11/2019 (697,713)RUB 118,273,170 USD 1,770,000 Bank of America 21/11/2019 (9,358)USD 1,770,000 RUB 119,368,800 Deutsche Bank 21/11/2019 (6,952)USD 895,000 ARS 66,453,750 Morgan Stanley 29/11/2019 43,282 USD 895,000 ARS 62,873,750 Goldman Sachs 29/11/2019 89,165 EUR 31,760,000 USD 38,858,995 JP Morgan 13/12/2019 (3,506,982)USD 41,192,720 EUR 31,760,000 Deutsche Bank 13/12/2019 5,840,707 USD 1,829,008 EUR 1,600,000 RBS Plc 15/1/2020 43,566 EUR 3,200,000 USD 3,622,179 RBS Plc 17/1/2020 (50,751)USD 1,828,045 EUR 1,600,000 Royal Bank of Canada 17/1/2020 42,331 USD 1,966,000 ARS 178,906,000 BNP Paribas 12/2/2020 17,313
EUR 31,760,000 USD 39,139,277 JP Morgan 25/2/2020 (3,587,361)USD 41,459,504 EUR 31,760,000 Deutsche Bank 25/2/2020 5,907,588 JPY 4,230,950,000 USD 39,204,503 JP Morgan 16/3/2020 1,208,882 USD 42,233,480 JPY 4,230,950,000 HSBC Bank Plc 16/3/2020 1,820,095 Net unrealised appreciation 27,375,997
AUD Hedged Share Class
AUD 117,727,432 USD 80,237,995 BNY Mellon 12/9/2019 (897,247)USD 299,331 AUD 442,820 BNY Mellon 12/9/2019 899 Net unrealised depreciation (896,348)
CAD Hedged Share Class
CAD 1,487,222,407 USD 1,125,273,466 BNY Mellon 12/9/2019 (3,863,125)Net unrealised depreciation (3,863,125)
CHF Hedged Share Class
CHF 237,563,662 USD 244,744,836 BNY Mellon 12/9/2019 (4,014,156)USD 3,126,716 CHF 3,056,478 BNY Mellon 12/9/2019 29,510 Net unrealised depreciation (3,984,646)
CNH Hedged Share Class
CNY 4,548,065 USD 641,752 BNY Mellon 12/9/2019 (5,860)Net unrealised depreciation (5,860)
EUR Hedged Share Class
EUR 1,670,276,318 USD 1,875,561,146 BNY Mellon 12/9/2019 (29,213,874)USD 20,656,804 EUR 18,563,603 BNY Mellon 12/9/2019 136,465 Net unrealised depreciation (29,077,409)
GBP Hedged Share Class
GBP 1,152,051,145 USD 1,394,631,141 BNY Mellon 12/9/2019 13,156,897 USD 45,643,669 GBP 37,663,923 BNY Mellon 12/9/2019 (381,062)Net unrealised appreciation 12,775,835
HKD Hedged Share Class
HKD 5,897,424 USD 752,672 BNY Mellon 12/9/2019 (413)Net unrealised depreciation (413)
JPY Hedged Share Class
JPY 46,373,256,652 USD 439,361,490 BNY Mellon 12/9/2019 (2,180,692)USD 236,799 JPY 25,000,002 BNY Mellon 12/9/2019 1,113 Net unrealised depreciation (2,179,579)
PLN Hedged Share Class
PLN 152,542,808 USD 39,596,801 BNY Mellon 12/9/2019 (1,169,603)USD 503,441 PLN 1,959,944 BNY Mellon 12/9/2019 9,710 Net unrealised depreciation (1,159,893)
SEK Hedged Share Class
SEK 1,224,415,735 USD 128,222,921 BNY Mellon 12/9/2019 (3,338,653)USD 280,254 SEK 2,711,300 BNY Mellon 12/9/2019 3,717 Net unrealised depreciation (3,334,936)
SGD Hedged Share Class
SGD 116,499,382 USD 84,314,898 BNY Mellon 12/9/2019 (296,421)USD 68,226 SGD 94,529 BNY Mellon 12/9/2019 53 Net unrealised depreciation (296,368)
Total net unrealised depreciation (USD underlying exposure - USD 13,641,353,586) (4,646,745)
The notes on pages 728 to 741 form an integral part of these financial statements.
Annual Report and Audited Financial Statements [345]
Fixed Income Global Opportunities Fund continued
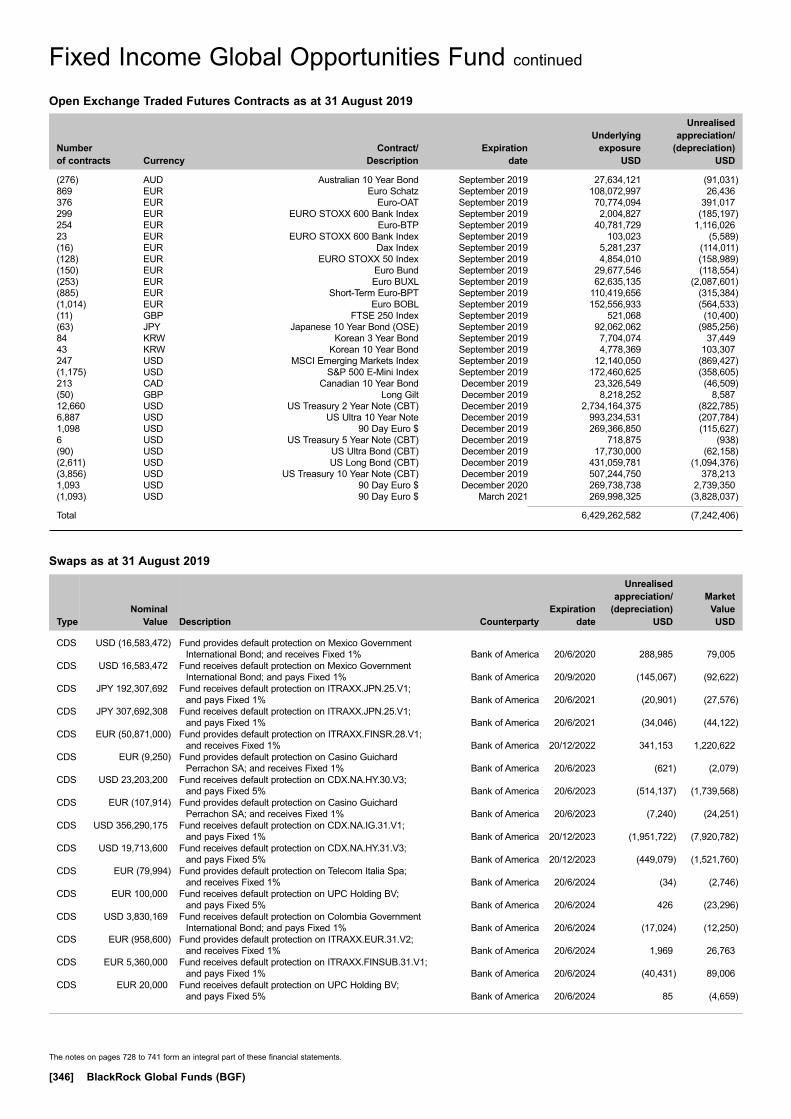
The notes on pages 728 to 741 form an integral part of these financial statements.
[346] BlackRock Global Funds (BGF)
Fixed Income Global Opportunities Fund continued
Swaps as at 31 August 2019
TypeNominal
Value Description Counterparty
Expiration date
Unrealised appreciation/
(depreciation) USD
Market Value USD
CDS USD (16,583,472) Fund provides default protection on Mexico Government International Bond; and receives Fixed 1% Bank of America 20/6/2020 288,985 79,005
CDS USD 16,583,472 Fund receives default protection on Mexico Government International Bond; and pays Fixed 1% Bank of America 20/9/2020 (145,067) (92,622)
CDS JPY 192,307,692 Fund receives default protection on ITRAXX.JPN.25.V1; and pays Fixed 1% Bank of America 20/6/2021 (20,901) (27,576)
CDS JPY 307,692,308 Fund receives default protection on ITRAXX.JPN.25.V1; and pays Fixed 1% Bank of America 20/6/2021 (34,046) (44,122)
CDS EUR (50,871,000) Fund provides default protection on ITRAXX.FINSR.28.V1; and receives Fixed 1% Bank of America 20/12/2022 341,153 1,220,622
CDS EUR (9,250) Fund provides default protection on Casino Guichard Perrachon SA; and receives Fixed 1% Bank of America 20/6/2023 (621) (2,079)
CDS USD 23,203,200 Fund receives default protection on CDX.NA.HY.30.V3; and pays Fixed 5% Bank of America 20/6/2023 (514,137) (1,739,568)
CDS EUR (107,914) Fund provides default protection on Casino Guichard Perrachon SA; and receives Fixed 1% Bank of America 20/6/2023 (7,240) (24,251)
CDS USD 356,290,175 Fund receives default protection on CDX.NA.IG.31.V1; and pays Fixed 1% Bank of America 20/12/2023 (1,951,722) (7,920,782)
CDS USD 19,713,600 Fund receives default protection on CDX.NA.HY.31.V3; and pays Fixed 5% Bank of America 20/12/2023 (449,079) (1,521,760)
CDS EUR (79,994) Fund provides default protection on Telecom Italia Spa; and receives Fixed 1% Bank of America 20/6/2024 (34) (2,746)
CDS EUR 100,000 Fund receives default protection on UPC Holding BV; and pays Fixed 5% Bank of America 20/6/2024 426 (23,296)
CDS USD 3,830,169 Fund receives default protection on Colombia Government International Bond; and pays Fixed 1% Bank of America 20/6/2024 (17,024) (12,250)
CDS EUR (958,600) Fund provides default protection on ITRAXX.EUR.31.V2; and receives Fixed 1% Bank of America 20/6/2024 1,969 26,763
CDS EUR 5,360,000 Fund receives default protection on ITRAXX.FINSUB.31.V1; and pays Fixed 1% Bank of America 20/6/2024 (40,431) 89,006
CDS EUR 20,000 Fund receives default protection on UPC Holding BV; and pays Fixed 5% Bank of America 20/6/2024 85 (4,659)
Open Exchange Traded Futures Contracts as at 31 August 2019
Number of contracts Currency
Contract/ Description
Expiration date
Underlying exposure
USD
Unrealised appreciation/
(depreciation) USD
(276) AUD Australian 10 Year Bond September 2019 27,634,121 (91,031)869 EUR Euro Schatz September 2019 108,072,997 26,436376 EUR Euro-OAT September 2019 70,774,094 391,017299 EUR EURO STOXX 600 Bank Index September 2019 2,004,827 (185,197)254 EUR Euro-BTP September 2019 40,781,729 1,116,02623 EUR EURO STOXX 600 Bank Index September 2019 103,023 (5,589)(16) EUR Dax Index September 2019 5,281,237 (114,011)(128) EUR EURO STOXX 50 Index September 2019 4,854,010 (158,989)(150) EUR Euro Bund September 2019 29,677,546 (118,554)(253) EUR Euro BUXL September 2019 62,635,135 (2,087,601)(885) EUR Short-Term Euro-BPT September 2019 110,419,656 (315,384)(1,014) EUR Euro BOBL September 2019 152,556,933 (564,533)(11) GBP FTSE 250 Index September 2019 521,068 (10,400)(63) JPY Japanese 10 Year Bond (OSE) September 2019 92,062,062 (985,256)84 KRW Korean 3 Year Bond September 2019 7,704,074 37,44943 KRW Korean 10 Year Bond September 2019 4,778,369 103,307247 USD MSCI Emerging Markets Index September 2019 12,140,050 (869,427)(1,175) USD S&P 500 E-Mini Index September 2019 172,460,625 (358,605)213 CAD Canadian 10 Year Bond December 2019 23,326,549 (46,509)(50) GBP Long Gilt December 2019 8,218,252 8,58712,660 USD US Treasury 2 Year Note (CBT) December 2019 2,734,164,375 (822,785)6,887 USD US Ultra 10 Year Note December 2019 993,234,531 (207,784)1,098 USD 90 Day Euro $ December 2019 269,366,850 (115,627)6 USD US Treasury 5 Year Note (CBT) December 2019 718,875 (938)(90) USD US Ultra Bond (CBT) December 2019 17,730,000 (62,158)(2,611) USD US Long Bond (CBT) December 2019 431,059,781 (1,094,376)(3,856) USD US Treasury 10 Year Note (CBT) December 2019 507,244,750 378,2131,093 USD 90 Day Euro $ December 2020 269,738,738 2,739,350(1,093) USD 90 Day Euro $ March 2021 269,998,325 (3,828,037)
Total 6,429,262,582 (7,242,406)

The notes on pages 728 to 741 form an integral part of these financial statements.
Annual Report and Audited Financial Statements [347]
Fixed Income Global Opportunities Fund continued
Swaps as at 31 August 2019
TypeNominal
Value Description Counterparty
Expiration date
Unrealised appreciation/
(depreciation) USD
Market Value USD
CDS EUR 260,000 Fund receives default protection on UPC Holding BV; and pays Fixed 5% Bank of America 20/6/2024 1,107 (60,569)
CDS EUR (620,000) Fund provides default protection on Telecom Italia SpA/Milano; and receives Fixed 1% Bank of America 20/6/2024 10,015 (21,285)
CDS EUR (424,968) Fund provides default protection on United Rentals Inc; and receives Fixed 5% Bank of America 20/6/2024 (181) (14,590)
CDS EUR (31,260,000) Fund provides default protection on ITRAXX.FINSR.31.V2; and receives Fixed 1% Bank of America 20/6/2024 217,101 662,115
CDS EUR (6,780,000) Fund provides default protection on Intesa Sanpaolo SpA; and receives Fixed 1% Bank of America 20/6/2024 346,680 (428,837)
CDS EUR 300,000 Fund receives default protection on Deutsche Bank AG; and pays Fixed 1% Bank of America 20/6/2024 1,926 36,212
CDS EUR (7,499) Fund provides default protection on Telecom Italia Spa; and receives Fixed 1% Bank of America 20/6/2024 (3) (257)
CDS USD (185,754,761) Fund provides default protection on CDX.NA.HY.32.V2; and receives Fixed 5% Bank of America 20/6/2024 394,773 12,767,027
CDS USD 411,224,500 Fund provides default protection on CDX.NA.IG.32.V1; and receives Fixed 1% Bank of America 20/6/2024 (893,656) (8,856,422)
CDS USD 1,980,000 Fund receives default protection on Beazer Homes USA Inc; and pays Fixed 5% Barclays 20/6/2020 (6,355) (72,858)
CDS USD (3,000,000) Fund provides default protection on China Government Bond; and receives Fixed 1% Barclays 20/9/2020 52,985 28,493
CDS JPY 74,812,967 Fund receives default protection on Sumitomo Corp; and pays Fixed 1% Barclays 20/12/2020 (9,114) (8,311)
CDS JPY 142,719,549 Fund receives default protection on Mitsubishi Corp; and pays Fixed 1% Barclays 20/12/2020 (11,202) (16,259)
CDS USD 475,000 Fund receives default protection on Frontier Communications Corp; and pays Fixed 5% Barclays 20/6/2021 94,739 207,276
CDS USD 1,113,000 Fund receives default protection on Frontier Communications Corp; and pays Fixed 5% Barclays 20/6/2021 221,989 485,681
CDS JPY 115,384,616 Fund receives default protection on ITRAXX.JPN.25.V1; and pays Fixed 1% Barclays 20/6/2021 (12,425) (16,546)
CDS EUR (3,633) Fund provides default protection on Casino Guichard Perrachon SA; and receives Fixed 1% Barclays 20/6/2023 (353) (816)
CDS EUR (36,367) Fund provides default protection on Casino Guichard Perrachon SA; and receives Fixed 1% Barclays 20/6/2023 (3,428) (8,173)
CDS EUR (412,016) Fund provides default protection on Casino Guichard Perrachon SA; and receives Fixed 1% Barclays 20/6/2023 (40,008) (92,591)
CDS USD (1,980,000) Fund provides default protection on Beazer Homes USA Inc; and receives Fixed 5% Barclays 20/6/2023 35,757 201,277
CDS EUR 100,000 Fund receives default protection on Smurfit Kappa Acquisitions ULC; and pays Fixed 5% Barclays 20/6/2023 95 (19,147)
CDS EUR (275,799) Fund provides default protection on Casino Guichard Perrachon SA; and receives Fixed 1% Barclays 20/6/2023 (25,611) (61,979)
CDS EUR (130,000) Fund provides default protection on Boparan Finance plc; and receives Fixed 5% Barclays 20/6/2023 (51,848) (64,040)
CDS EUR 730,000 Fund receives default protection on INEOS Group Holdings SA; and pays Fixed 5% Barclays 20/12/2023 (61,814) (109,939)
CDS EUR 3,524,615 Fund receives default protection on Akzo Nobel NV; and pays Fixed 1% Barclays 20/6/2024 (41,052) (135,125)CDS USD 2,387,000 Fund receives default protection on Colombia Government
International Bond; and pays Fixed 1% Barclays 20/6/2024 (7,354) (7,635)CDS USD 1,571,000 Fund receives default protection on Argentine Republic Government
International Bond; and pays Fixed 5% Barclays 20/6/2024 719,947 922,619CDS EUR 3,200,000 Fund receives default protection on Next Plc; and pays Fixed 1% Barclays 20/6/2024 (57,554) 5,773CDS EUR 1,870,000 Fund receives default protection on Bayerische Motoren Werke AG;
and pays Fixed 1% Barclays 20/6/2024 (17,938) (54,877)CDS EUR 1,346,000 Fund receives default protection on Valeo SA; and pays Fixed 1% Barclays 20/6/2024 (35,292) 7,441CDS EUR 1,870,000 Fund receives default protection on Daimler AG; and pays Fixed 1% Barclays 20/6/2024 (15,913) (44,973)CDS USD (500,000) Fund provides default protection on United Rentals Inc;
and receives Fixed 5% Barclays 20/6/2024 (821) 82,817CDS USD 856,000 Fund receives default protection on Beazer Homes USA Inc;
and pays Fixed 5% Barclays 20/6/2024 (28,890) (83,709)CDS USD 2,324,000 Fund receives default protection on Colombia Government
International Bond; and pays Fixed 1% Barclays 20/6/2024 (8,745) (7,433)CDS EUR 935,000 Fund receives default protection on British Telecommunications Plc;
and pays Fixed 1% Barclays 20/6/2024 (4,909) (10,170)CDS EUR 2,120,000 Fund receives default protection on CNH Industrial NV;
and pays Fixed 5% Barclays 20/6/2024 3,987 (464,038)CDS EUR 1,820,000 Fund receives default protection on Marks & Spencer Plc;
and pays Fixed 1% Barclays 20/6/2024 27,352 93,668CDS EUR 1,425,211 Fund receives default protection on Commerzbank AG;
and pays Fixed 1% Barclays 20/6/2024 (17,131) (25,321)

The notes on pages 728 to 741 form an integral part of these financial statements.
[348] BlackRock Global Funds (BGF)
Fixed Income Global Opportunities Fund continued
Swaps as at 31 August 2019
TypeNominal
Value Description Counterparty
Expiration date
Unrealised appreciation/
(depreciation) USD
Market Value USD
CDS EUR 1,345,000 Fund receives default protection on Valeo SA; and pays Fixed 1% Barclays 20/6/2024 (33,601) 7,435CDS EUR 1,909,000 Fund receives default protection on Valeo SA; and pays Fixed 1% Barclays 20/6/2024 (46,733) 10,553CDS EUR 2,270,000 Fund receives default protection on Renault SA; and pays Fixed 1% Barclays 20/6/2024 (46,475) (14,196)CDS EUR (340,000) Fund provides default protection on Casino Guichard Perrachon SA;
and receives Fixed 1% Barclays 20/6/2024 (16,658) (91,720)CDS USD 2,386,000 Fund receives default protection on Colombia Government
International Bond; and pays Fixed 1% Barclays 20/6/2024 (3,548) (7,631)CDS USD 500,000 Fund receives default protection on Tenet Healthcare Corp;
and pays Fixed 5% Barclays 20/6/2024 (4,426) (9,952)CDS USD 2,324,000 Fund receives default protection on Colombia Government
International Bond; and pays Fixed 1% Barclays 20/6/2024 (10,715) (7,433)CDS USD 500,000 Fund receives default protection on Beazer Homes USA Inc;
and pays Fixed 5% Barclays 20/6/2024 (18,409) (48,896)CDS USD 3,874,000 Fund receives default protection on Colombia Government
International Bond; and pays Fixed 1% Barclays 20/6/2024 (12,816) (12,391)CDS EUR (340,000) Fund provides default protection on Casino Guichard Perrachon SA;
and receives Fixed 1% Barclays 20/6/2024 (12,179) (91,720)CDS EUR 700,000 Fund receives default protection on Suedzucker AG;
and pays Fixed 1% Barclays 20/6/2024 (15,977) (2,146)CDS EUR 2,600,000 Fund receives default protection on WPP Finance 2005 Ltd;
and pays Fixed 1% Barclays 20/6/2024 (48,747) (74,694)CDS EUR (300,000) Fund provides default protection on Tesco Plc; and receives Fixed 1% Barclays 20/12/2025 869 (8,370)CDS USD (857,000) Fund provides default protection on CMBX.NA.9.BBB-;
and receives Fixed 3% Barclays 17/9/2058 47,252 (30,052)CDS EUR 2,460,000 Fund receives default protection on Standard Chartered Bank;
and pays Fixed 1% BNP Paribas 20/12/2020 (46,949) (31,049)CDS EUR 1,390,000 Fund receives default protection on Standard Chartered Bank;
and pays Fixed 1% BNP Paribas 20/12/2020 (26,776) (17,544)CDS USD 9,312,000 Fund receives default protection on CDX.NA.HY.29.V3;
and pays Fixed 5% BNP Paribas 20/12/2022 (207,946) (637,346)CDS EUR (70,000) Fund provides default protection on Casino Guichard Perrachon SA;
and receives Fixed 1% BNP Paribas 20/6/2023 (8,450) (15,731)CDS EUR (310,000) Fund provides default protection on Casino Guichard Perrachon SA;
and receives Fixed 1% BNP Paribas 20/6/2023 (22,249) (69,665)CDS EUR (70,000) Fund provides default protection on Casino Guichard Perrachon SA;
and receives Fixed 1% BNP Paribas 20/6/2023 (8,450) (15,731)CDS EUR (254,908) Fund provides default protection on Casino Guichard Perrachon SA;
and receives Fixed 1% BNP Paribas 20/6/2023 (18,850) (57,284)CDS EUR (759,000) Fund provides default protection on UniCredit SpA;
and receives Fixed 1% BNP Paribas 20/12/2023 35,832 4,445CDS EUR 210,000 Fund receives default protection on NXP BV / NXP Funding LLC;
and pays Fixed 5% BNP Paribas 20/12/2023 4,401 (37,353)CDS EUR 3,724,789 Fund receives default protection on Commerzbank AG;
and pays Fixed 1% BNP Paribas 20/6/2024 (54,764) (66,175)CDS EUR 282,000 Fund receives default protection on Jaguar Land Rover Automotive
Plc; and pays Fixed 5% BNP Paribas 20/6/2024 23,681 35,314CDS USD 3,857,000 Fund receives default protection on Colombia Government
International Bond; and pays Fixed 1% BNP Paribas 20/6/2024 (20,644) (12,336)CDS EUR 150,000 Fund receives default protection on Altice France SA/France;
and pays Fixed 5% BNP Paribas 20/6/2024 (13,207) (21,643)CDS EUR 1,900,000 Fund receives default protection on Banco Bilbao Vizcaya Argentaria
SA; and pays Fixed 1% BNP Paribas 20/6/2024 (10,648) 32,112CDS EUR 1,900,000 Fund receives default protection on Royal Bank of Scotland Group
Plc; and pays Fixed 1% BNP Paribas 20/6/2024 (11,722) (1,575)CDS EUR 130,000 Fund receives default protection on CMA CGM SA; and pays Fixed 5% BNP Paribas 20/6/2024 8,260 37,814CDS EUR 670,000 Fund receives default protection on ITV Plc; and pays Fixed 5% BNP Paribas 20/6/2024 (4,310) (133,670)CDS USD (625,000) Fund provides default protection on Freeport-Mcmoran Inc;
and receives Fixed 1% BNP Paribas 20/6/2024 2,071 (29,131)CDS EUR 1,400,000 Fund receives default protection on Lloyds Banking Group Plc;
and pays Fixed 1% BNP Paribas 20/6/2024 (9,676) 60,480CDS USD 750,000 Fund receives default protection on Beazer Homes USA Inc;
and pays Fixed 5% BNP Paribas 20/6/2024 (30,981) (73,343)CDS EUR 885,000 Fund receives default protection on CNH Industrial NV;
and pays Fixed 5% BNP Paribas 20/6/2024 3,528 (193,714)CDS USD 26,210,000 Fund receives default protection on Brazilian Government
International Bond; and pays Fixed 1% BNP Paribas 20/6/2024 (414,415) 399,962CDS EUR 9,010,000 Fund receives default protection on Banco Santander SA;
and pays Fixed 1% BNP Paribas 20/6/2024 (324,637) 17,173CDS EUR 600,000 Fund receives default protection on Deutsche Bank AG;
and pays Fixed 1% BNP Paribas 20/6/2024 (3,176) 72,424CDS EUR 3,552,000 Fund receives default protection on Akzo Nobel NV; and pays Fixed 1% BNP Paribas 20/6/2024 (39,069) (136,175)CDS EUR 274,000 Fund receives default protection on Ladbrokes Coral Group Ltd;
and pays Fixed 1% BNP Paribas 20/6/2024 (3,092) 5,338
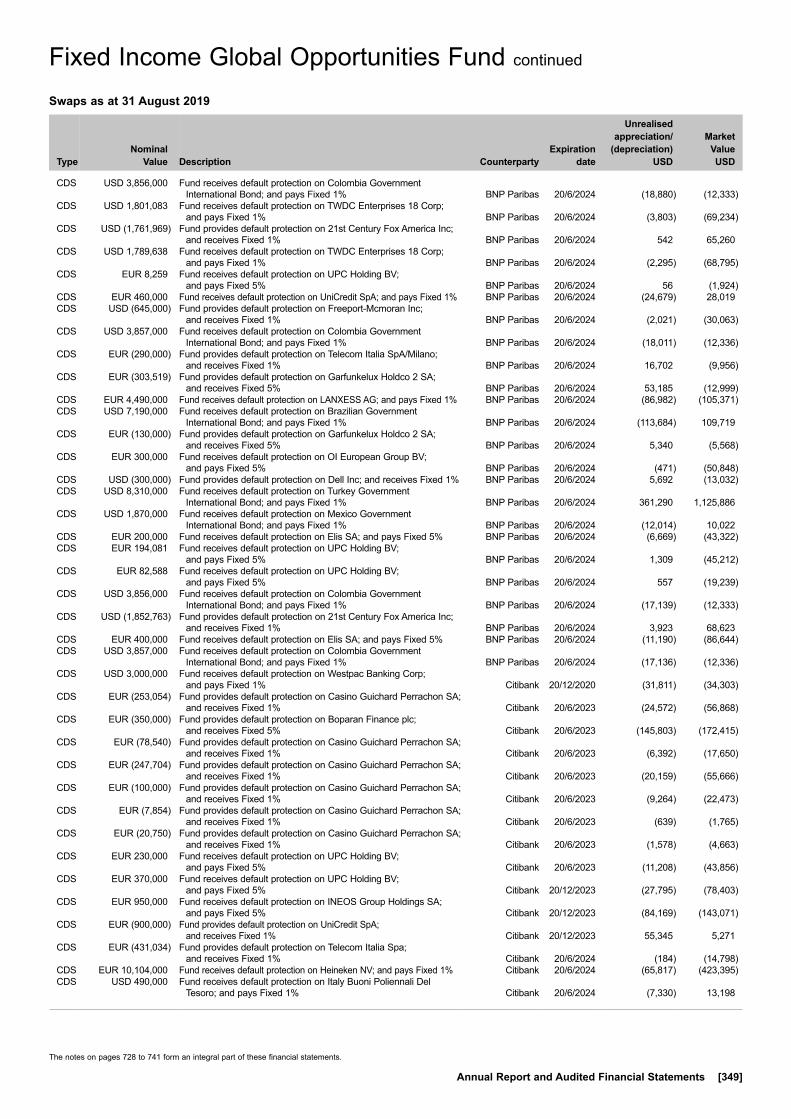
The notes on pages 728 to 741 form an integral part of these financial statements.
Annual Report and Audited Financial Statements [349]
Fixed Income Global Opportunities Fund continued
Swaps as at 31 August 2019
TypeNominal
Value Description Counterparty
Expiration date
Unrealised appreciation/
(depreciation) USD
Market Value USD
CDS USD 3,856,000 Fund receives default protection on Colombia Government International Bond; and pays Fixed 1% BNP Paribas 20/6/2024 (18,880) (12,333)
CDS USD 1,801,083 Fund receives default protection on TWDC Enterprises 18 Corp; and pays Fixed 1% BNP Paribas 20/6/2024 (3,803) (69,234)
CDS USD (1,761,969) Fund provides default protection on 21st Century Fox America Inc; and receives Fixed 1% BNP Paribas 20/6/2024 542 65,260
CDS USD 1,789,638 Fund receives default protection on TWDC Enterprises 18 Corp; and pays Fixed 1% BNP Paribas 20/6/2024 (2,295) (68,795)
CDS EUR 8,259 Fund receives default protection on UPC Holding BV; and pays Fixed 5% BNP Paribas 20/6/2024 56 (1,924)
CDS EUR 460,000 Fund receives default protection on UniCredit SpA; and pays Fixed 1% BNP Paribas 20/6/2024 (24,679) 28,019CDS USD (645,000) Fund provides default protection on Freeport-Mcmoran Inc;
and receives Fixed 1% BNP Paribas 20/6/2024 (2,021) (30,063)CDS USD 3,857,000 Fund receives default protection on Colombia Government
International Bond; and pays Fixed 1% BNP Paribas 20/6/2024 (18,011) (12,336)CDS EUR (290,000) Fund provides default protection on Telecom Italia SpA/Milano;
and receives Fixed 1% BNP Paribas 20/6/2024 16,702 (9,956)CDS EUR (303,519) Fund provides default protection on Garfunkelux Holdco 2 SA;
and receives Fixed 5% BNP Paribas 20/6/2024 53,185 (12,999)CDS EUR 4,490,000 Fund receives default protection on LANXESS AG; and pays Fixed 1% BNP Paribas 20/6/2024 (86,982) (105,371)CDS USD 7,190,000 Fund receives default protection on Brazilian Government
International Bond; and pays Fixed 1% BNP Paribas 20/6/2024 (113,684) 109,719CDS EUR (130,000) Fund provides default protection on Garfunkelux Holdco 2 SA;
and receives Fixed 5% BNP Paribas 20/6/2024 5,340 (5,568)CDS EUR 300,000 Fund receives default protection on OI European Group BV;
and pays Fixed 5% BNP Paribas 20/6/2024 (471) (50,848)CDS USD (300,000) Fund provides default protection on Dell Inc; and receives Fixed 1% BNP Paribas 20/6/2024 5,692 (13,032)CDS USD 8,310,000 Fund receives default protection on Turkey Government
International Bond; and pays Fixed 1% BNP Paribas 20/6/2024 361,290 1,125,886CDS USD 1,870,000 Fund receives default protection on Mexico Government
International Bond; and pays Fixed 1% BNP Paribas 20/6/2024 (12,014) 10,022CDS EUR 200,000 Fund receives default protection on Elis SA; and pays Fixed 5% BNP Paribas 20/6/2024 (6,669) (43,322)CDS EUR 194,081 Fund receives default protection on UPC Holding BV;
and pays Fixed 5% BNP Paribas 20/6/2024 1,309 (45,212)CDS EUR 82,588 Fund receives default protection on UPC Holding BV;
and pays Fixed 5% BNP Paribas 20/6/2024 557 (19,239)CDS USD 3,856,000 Fund receives default protection on Colombia Government
International Bond; and pays Fixed 1% BNP Paribas 20/6/2024 (17,139) (12,333)CDS USD (1,852,763) Fund provides default protection on 21st Century Fox America Inc;
and receives Fixed 1% BNP Paribas 20/6/2024 3,923 68,623CDS EUR 400,000 Fund receives default protection on Elis SA; and pays Fixed 5% BNP Paribas 20/6/2024 (11,190) (86,644)CDS USD 3,857,000 Fund receives default protection on Colombia Government
International Bond; and pays Fixed 1% BNP Paribas 20/6/2024 (17,136) (12,336)CDS USD 3,000,000 Fund receives default protection on Westpac Banking Corp;
and pays Fixed 1% Citibank 20/12/2020 (31,811) (34,303)CDS EUR (253,054) Fund provides default protection on Casino Guichard Perrachon SA;
and receives Fixed 1% Citibank 20/6/2023 (24,572) (56,868)CDS EUR (350,000) Fund provides default protection on Boparan Finance plc;
and receives Fixed 5% Citibank 20/6/2023 (145,803) (172,415)CDS EUR (78,540) Fund provides default protection on Casino Guichard Perrachon SA;
and receives Fixed 1% Citibank 20/6/2023 (6,392) (17,650)CDS EUR (247,704) Fund provides default protection on Casino Guichard Perrachon SA;
and receives Fixed 1% Citibank 20/6/2023 (20,159) (55,666)CDS EUR (100,000) Fund provides default protection on Casino Guichard Perrachon SA;
and receives Fixed 1% Citibank 20/6/2023 (9,264) (22,473)CDS EUR (7,854) Fund provides default protection on Casino Guichard Perrachon SA;
and receives Fixed 1% Citibank 20/6/2023 (639) (1,765)CDS EUR (20,750) Fund provides default protection on Casino Guichard Perrachon SA;
and receives Fixed 1% Citibank 20/6/2023 (1,578) (4,663)CDS EUR 230,000 Fund receives default protection on UPC Holding BV;
and pays Fixed 5% Citibank 20/6/2023 (11,208) (43,856)CDS EUR 370,000 Fund receives default protection on UPC Holding BV;
and pays Fixed 5% Citibank 20/12/2023 (27,795) (78,403)CDS EUR 950,000 Fund receives default protection on INEOS Group Holdings SA;
and pays Fixed 5% Citibank 20/12/2023 (84,169) (143,071)CDS EUR (900,000) Fund provides default protection on UniCredit SpA;
and receives Fixed 1% Citibank 20/12/2023 55,345 5,271CDS EUR (431,034) Fund provides default protection on Telecom Italia Spa;
and receives Fixed 1% Citibank 20/6/2024 (184) (14,798)CDS EUR 10,104,000 Fund receives default protection on Heineken NV; and pays Fixed 1% Citibank 20/6/2024 (65,817) (423,395)CDS USD 490,000 Fund receives default protection on Italy Buoni Poliennali Del
Tesoro; and pays Fixed 1% Citibank 20/6/2024 (7,330) 13,198

The notes on pages 728 to 741 form an integral part of these financial statements.
[350] BlackRock Global Funds (BGF)
Fixed Income Global Opportunities Fund continued
Swaps as at 31 August 2019
TypeNominal
Value Description Counterparty
Expiration date
Unrealised appreciation/
(depreciation) USD
Market Value USD
CDS USD 2,000,000 Fund receives default protection on Staples Inc; and pays Fixed 5% Citibank 20/6/2024 (27,191) 3,822CDS EUR 6,025,000 Fund receives default protection on Akzo Nobel NV; and pays Fixed 1% Citibank 20/6/2024 (75,496) (230,983)CDS EUR 710,000 Fund receives default protection on Suedzucker AG;
and pays Fixed 1% Citibank 20/6/2024 (16,177) (2,177)CDS EUR (430,595) Fund provides default protection on Telecom Italia Spa;
and receives Fixed 1% Citibank 20/6/2024 245 (14,783)CDS EUR 940,000 Fund receives default protection on Barclays Bank Plc;
and pays Fixed 1% Citibank 20/6/2024 (20,103) 44,424CDS EUR (7,607) Fund provides default protection on Telecom Italia Spa;
and receives Fixed 1% Citibank 20/6/2024 (3) (261)CDS EUR 3,015,000 Fund receives default protection on Akzo Nobel NV; and pays Fixed 1% Citibank 20/6/2024 (34,817) (115,587)CDS EUR (81,053) Fund provides default protection on Telecom Italia Spa;
and receives Fixed 1% Citibank 20/6/2024 46 (2,783)CDS EUR 282,000 Fund receives default protection on Altice Luxembourg SA;
and pays Fixed 5% Citibank 20/6/2024 (24,075) (17,812)CDS USD 30,346,000 Fund receives default protection on Philippine Government
International Bond; and pays Fixed 1% Citibank 20/6/2024 (279,647) (721,429)CDS USD 8,983,000 Fund receives default protection on Brazilian Government
International Bond; and pays Fixed 1% Citibank 20/6/2024 (145,099) 137,080CDS EUR 1,565,000 Fund receives default protection on Renault SA; and pays Fixed 1% Citibank 20/6/2024 (43,035) (9,787)CDS EUR 1,400,000 Fund receives default protection on UniCredit SpA; and pays Fixed 1% Citibank 20/6/2024 (87,937) 85,276CDS USD 950,000 Fund receives default protection on Ford Motor Credit Company
LLC; and pays Fixed 5% Citibank 20/6/2024 (11,226) (135,461)CDS EUR 3,125,000 Fund receives default protection on Renault SA; and pays Fixed 1% Citibank 20/6/2024 (85,932) (19,543)CDS USD (300,000) Fund provides default protection on Dell Inc; and receives Fixed 1% Citibank 20/6/2024 7,476 (13,032)CDS USD 22,948,675 Fund receives default protection on Mexico Government
International Bond; and pays Fixed 1% Citibank 20/6/2024 (248,366) 122,993CDS USD 7,356,375 Fund receives default protection on Mexico Government
International Bond; and pays Fixed 1% Citibank 20/6/2024 (79,616) 39,426CDS USD (300,000) Fund provides default protection on United Rentals Inc;
and receives Fixed 5% Citibank 20/6/2024 33 49,690CDS EUR (7,599) Fund provides default protection on Telecom Italia Spa;
and receives Fixed 1% Citibank 20/6/2024 4 (261)CDS EUR (81,136) Fund provides default protection on Telecom Italia Spa;
and receives Fixed 1% Citibank 20/6/2024 (35) (2,786)CDS EUR 260,000 Fund receives default protection on Elis SA; and pays Fixed 5% Citibank 20/6/2024 (7,290) (56,318)CDS USD 57,315,754 Fund receives default protection on Brazilian Government
International Bond; and pays Fixed 1% Citibank 20/6/2024 (784,724) 874,632CDS USD (200,000) Fund provides default protection on Dell Inc; and receives Fixed 1% Citibank 20/6/2024 4,601 (8,688)CDS EUR 100,000 Fund receives default protection on Hapag-Lloyd AG;
and pays Fixed 5% Citibank 20/6/2024 (10,399) (7,045)CDS USD 470,000 Fund receives default protection on Sprint Communications Inc;
and pays Fixed 5% Citibank 20/6/2024 (29,674) (65,942)CDS EUR 1,030,000 Fund receives default protection on GNK Holdings Ltd;
and pays Fixed 1% Citibank 20/6/2024 3,588 5,353CDS EUR 1,030,000 Fund receives default protection on Peugeot SA; and pays Fixed 5% Citibank 20/6/2024 1,465 (215,767)CDS EUR 900,000 Fund receives default protection on UPC Holding BV;
and pays Fixed 5% Citibank 20/6/2024 (28,453) (209,661)CDS USD 32,858,000 Fund receives default protection on Brazilian Government
International Bond; and pays Fixed 1% Citibank 20/6/2024 (530,741) 501,410CDS USD 39,774,331 Fund receives default protection on Colombia Government
International Bond; and pays Fixed 1% Citibank 20/6/2024 (488,476) (127,214)CDS EUR 2,600,000 Fund receives default protection on Standard Chartered Plc;
and pays Fixed 1% Citibank 20/6/2024 (11,504) 43,413CDS EUR 460,000 Fund receives default protection on UPC Holding BV;
and pays Fixed 5% Citibank 20/6/2024 (17,336) (107,160)CDS EUR 5,930,000 Fund receives default protection on HeidelbergCement AG;
and pays Fixed 5% Citibank 20/6/2024 (115,601) (1,389,201)CDS EUR (168,260) Fund provides default protection on Telecom Italia SpA/Milano;
and receives Fixed 1% Citibank 20/6/2026 9,751 (15,399)CDS EUR (499,681) Fund provides default protection on Telecom Italia SpA/Milano;
and receives Fixed 1% Citibank 20/6/2026 28,957 (45,731)CDS EUR (15,296) Fund provides default protection on Telecom Italia SpA/Milano;
and receives Fixed 1% Citibank 20/6/2026 886 (1,400)CDS EUR (700,000) Fund provides default protection on Ziggo Bond Co BV;
and receives Fixed 5% Citibank 20/12/2026 54,655 145,391CDS USD 1,440,000 Fund receives default protection on CMBX.NA.9.BBB-;
and pays Fixed 3% Citigroup 17/9/2058 (102) 50,495CDS EUR 160,000 Fund receives default protection on Boparan Finance plc;
and pays Fixed 5% Credit Suisse 20/6/2020 44,871 52,023CDS EUR 150,000 Fund receives default protection on Boparan Finance plc;
and pays Fixed 5% Credit Suisse 20/6/2021 27,898 65,678

The notes on pages 728 to 741 form an integral part of these financial statements.
Annual Report and Audited Financial Statements [351]
Fixed Income Global Opportunities Fund continued
Swaps as at 31 August 2019
TypeNominal
Value Description Counterparty
Expiration date
Unrealised appreciation/
(depreciation) USD
Market Value USD
CDS EUR (400,000) Fund provides default protection on CMA CGM SA; and receives Fixed 5% Credit Suisse 20/6/2021 (10,296) (76,431)
CDS EUR 490,000 Fund receives default protection on Garfunkelux Holdco 2 SA; and pays Fixed 5% Credit Suisse 20/6/2021 (19,338) (1,209)
CDS USD 12,641,820 Fund receives default protection on CDX.NA.IG.30.V1; and pays Fixed 1% Credit Suisse 20/6/2023 (124,960) (268,401)
CDS EUR (300,000) Fund provides default protection on Garfunkelux Holdco 2 SA; and receives Fixed 5% Credit Suisse 20/6/2023 (11,659) (7,891)
CDS EUR (200,000) Fund provides default protection on Garfunkelux Holdco 2 SA; and receives Fixed 5% Credit Suisse 20/6/2023 (4,550) (5,261)
CDS EUR 200,000 Fund receives default protection on UPC Holding BV; and pays Fixed 5% Credit Suisse 20/6/2023 (7,830) (38,136)
CDS EUR 400,000 Fund receives default protection on UPC Holding BV; and pays Fixed 5% Credit Suisse 20/6/2023 (20,585) (76,272)
CDS EUR (350,000) Fund provides default protection on Boparan Finance plc; and receives Fixed 5% Credit Suisse 20/6/2023 (142,089) (172,415)
CDS EUR 200,000 Fund receives default protection on Smurfit Kappa Acquisitions ULC; and pays Fixed 5% Credit Suisse 20/6/2023 (2,691) (38,294)
CDS EUR (57,836) Fund provides default protection on Garfunkelux Holdco 2 SA; and receives Fixed 5% Credit Suisse 20/12/2023 (3,133) (2,013)
CDS EUR (252,164) Fund provides default protection on Garfunkelux Holdco 2 SA; and receives Fixed 5% Credit Suisse 20/12/2023 (13,658) (8,778)
CDS EUR 201,724 Fund receives default protection on UPC Holding BV; and pays Fixed 5% Credit Suisse 20/12/2023 (5,489) (42,745)
CDS EUR 810,000 Fund receives default protection on UPC Holding BV; and pays Fixed 5% Credit Suisse 20/12/2023 (31,369) (171,639)
CDS EUR 950,000 Fund receives default protection on Jaguar Land Rover Automotive Plc; and pays Fixed 5% Credit Suisse 20/12/2023 29,276 99,621
CDS USD (675,180) Fund provides default protection on CDX.NA.HY.32.V2; and receives Fixed 5% Credit Suisse 20/6/2024 (2,803) 46,406
CDS EUR (940,000) Fund provides default protection on Telecom Italia SpA/Milano; and receives Fixed 1% Credit Suisse 20/6/2024 54,000 (32,272)
CDS EUR 940,000 Fund receives default protection on UPC Holding BV; and pays Fixed 5% Credit Suisse 20/6/2024 (6,720) (218,979)
CDS EUR 90,000 Fund receives default protection on Altice France SA/France; and pays Fixed 5% Credit Suisse 20/6/2024 (8,629) (12,986)
CDS EUR 1,400,000 Fund receives default protection on Royal Bank of Scotland Group Plc; and pays Fixed 1% Credit Suisse 20/6/2024 (24,414) (1,160)
CDS EUR 456,667 Fund receives default protection on TDC A/S; and pays Fixed 1% Credit Suisse 20/6/2024 1,320 9,040CDS EUR 500,000 Fund receives default protection on Altice Finco SA; and pays Fixed 5% Credit Suisse 20/6/2024 (26,097) (47,958)CDS EUR 940,000 Fund receives default protection on UPC Holding BV;
and pays Fixed 5% Credit Suisse 20/6/2024 (5,544) (218,979)CDS EUR 1,070,000 Fund receives default protection on Ardagh Packaging Finance plc;
and pays Fixed 5% Credit Suisse 20/6/2024 (3,684) (171,289)CDS EUR 1,235,000 Fund receives default protection on CNH Industrial NV;
and pays Fixed 5% Credit Suisse 20/6/2024 3,803 (270,324)CDS EUR (40,000) Fund provides default protection on Garfunkelux Holdco 2 SA;
and receives Fixed 5% Credit Suisse 20/6/2024 1,929 (1,713)CDS EUR 520,000 Fund receives default protection on Altice France SA/France;
and pays Fixed 5% Credit Suisse 20/6/2024 (13,897) (75,028)CDS EUR 840,000 Fund receives default protection on Hapag-Lloyd AG;
and pays Fixed 5% Credit Suisse 20/6/2024 (89,139) (59,176)CDS EUR (490,000) Fund provides default protection on Garfunkelux Holdco 2 SA;
and receives Fixed 5% Credit Suisse 20/6/2024 35,967 (20,986)CDS EUR (310,000) Fund provides default protection on Garfunkelux Holdco 2 SA;
and receives Fixed 5% Credit Suisse 20/6/2024 14,953 (13,277)CDS EUR (480,000) Fund provides default protection on Garfunkelux Holdco 2 SA;
and receives Fixed 5% Credit Suisse 20/6/2024 46,167 (20,558)CDS EUR 280,000 Fund receives default protection on Jaguar Land Rover Automotive
Plc; and pays Fixed 5% Credit Suisse 20/6/2024 20,103 35,064CDS EUR 860,000 Fund receives default protection on Jaguar Land Rover Automotive
Plc; and pays Fixed 5% Credit Suisse 20/6/2024 41,866 107,696CDS USD (1,146,420) Fund provides default protection on CDX.NA.HY.32.V2;
and receives Fixed 5% Credit Suisse 20/6/2024 (5,207) 78,794CDS EUR 310,000 Fund receives default protection on Jaguar Land Rover Automotive
Plc; and pays Fixed 5% Credit Suisse 20/6/2024 14,029 38,821CDS EUR (196,481) Fund provides default protection on Garfunkelux Holdco 2 SA;
and receives Fixed 5% Credit Suisse 20/6/2024 32,436 (8,415)CDS EUR 470,000 Fund receives default protection on TDC A/S; and pays Fixed 1% Credit Suisse 20/6/2024 736 9,304CDS EUR 188,000 Fund receives default protection on Jaguar Land Rover Automotive
Plc; and pays Fixed 5% Credit Suisse 20/6/2024 15,787 23,543CDS EUR (170,000) Fund provides default protection on Garfunkelux Holdco 2 SA;
and receives Fixed 5% Credit Suisse 20/6/2024 28,363 (7,281)

The notes on pages 728 to 741 form an integral part of these financial statements.
[352] BlackRock Global Funds (BGF)
Fixed Income Global Opportunities Fund continued
Swaps as at 31 August 2019
TypeNominal
Value Description Counterparty
Expiration date
Unrealised appreciation/
(depreciation) USD
Market Value USD
CDS EUR 960,000 Fund receives default protection on Ardagh Packaging Finance plc; and pays Fixed 5% Credit Suisse 20/6/2024 (12,954) (153,680)
CDS EUR 400,000 Fund receives default protection on CMA CGM SA; and pays Fixed 5% Credit Suisse 20/6/2024 8,584 116,352CDS EUR (290,000) Fund provides default protection on Garfunkelux Holdco 2 SA;
and receives Fixed 5% Credit Suisse 20/6/2024 18,674 (12,420)CDS EUR 1,585,000 Fund receives default protection on Lafargeholcim Ltd;
and pays Fixed 1% Credit Suisse 20/6/2024 (1,099) (34,418)CDS EUR (710,000) Fund provides default protection on Virgin Media Finance Plc;
and receives Fixed 5% Credit Suisse 20/6/2025 31,449 158,155CDS EUR (1,500,000) Fund provides default protection on Ziggo Bond Co BV;
and receives Fixed 5% Credit Suisse 20/6/2026 (8,357) 305,247CDS EUR (443,750) Fund provides default protection on Virgin Media Finance Plc;
and receives Fixed 5% Credit Suisse 20/6/2026 24,071 105,115CDS EUR (2,280,000) Fund provides default protection on Virgin Media Finance Plc;
and receives Fixed 5% Credit Suisse 20/6/2026 63,214 540,085CDS EUR (910,000) Fund provides default protection on Virgin Media Finance Plc;
and receives Fixed 5% Credit Suisse 20/6/2029 33,217 260,974CDS USD (645,000) Fund provides default protection on CMBX.NA.7.AA;
and receives Fixed 1.5% Credit Suisse 17/1/2047 72,038 17,543CDS USD 3,560,000 Fund receives default protection on CMBX.NA.9.AAA;
and pays Fixed 0.5% Credit Suisse 17/9/2058 (80,655) (39,078)CDS USD (670,000) Fund provides default protection on CMBX.NA.6.BBB-;
and receives Fixed 3% Credit Suisse 11/5/2063 (7,685) (64,629)CDS USD 2,812,800 Fund receives default protection on CDX.NA.HY.29.V3;
and pays Fixed 5% Deutsche Bank 20/12/2022 (62,338) (192,518)CDS USD 2,860,000 Fund receives default protection on CMBX.NA.9.AAA;
and pays Fixed 0.5% Deutsche Bank 17/9/2058 (65,276) (31,394)CDS USD (974,000) Fund provides default protection on CMBX.NA.9.BBB-;
and receives Fixed 3% Deutsche Bank 17/9/2058 72,926 (34,154)CDS USD 4,569,365 Fund receives default protection on CMBX.NA.6.AAA;
and pays Fixed 0.5% Deutsche Bank 11/5/2063 (36,907) (38,473)CDS USD 1,952,017 Fund receives default protection on CMBX.NA.6.AAA;
and pays Fixed 0.5% Deutsche Bank 11/5/2063 (16,805) (16,436)CDS USD (3,000,000) Fund provides default protection on China Government Bond;
and receives Fixed 1% Goldman Sachs 20/9/2020 54,406 28,493CDS JPY 87,976,540 Fund receives default protection on Mitsubishi Corp;
and pays Fixed 1% Goldman Sachs 20/12/2020 (7,290) (10,023)CDS JPY 87,976,540 Fund receives default protection on ITOCHU Corp; and pays Fixed 1% Goldman Sachs 20/12/2020 (8,457) (9,766)CDS JPY 87,976,540 Fund receives default protection on Mitsui & Co Ltd; and pays Fixed 1% Goldman Sachs 20/12/2020 (9,129) (9,907)CDS JPY 175,953,079 Fund receives default protection on Mitsui & Co Ltd; and pays Fixed 1% Goldman Sachs 20/12/2020 (17,666) (19,813)CDS USD (5,750,000) Fund provides default protection on ITRAXX.ASIA.XJ.IG.24.V1;
and receives Fixed 1% Goldman Sachs 20/12/2020 233,764 66,438CDS JPY 96,070,381 Fund receives default protection on ITOCHU Corp; and pays Fixed 1% Goldman Sachs 20/12/2020 (9,129) (10,664)CDS JPY 87,976,540 Fund receives default protection on ITOCHU Corp; and pays Fixed 1% Goldman Sachs 20/12/2020 (8,748) (9,766)CDS JPY 87,976,539 Fund receives default protection on ITOCHU Corp; and pays Fixed 1% Goldman Sachs 20/12/2020 (8,378) (9,766)CDS EUR 1,820,000 Fund receives default protection on Standard Chartered Bank;
and pays Fixed 1% Goldman Sachs 20/12/2020 (28,200) (22,971)CDS EUR 190,000 Fund receives default protection on Boparan Finance plc;
and pays Fixed 5% Goldman Sachs 20/12/2021 34,446 86,879CDS EUR 230,000 Fund receives default protection on Cable & Wireless Ltd;
and pays Fixed 5% Goldman Sachs 20/6/2023 (8,561) (41,840)CDS EUR (237,328) Fund provides default protection on Casino Guichard Perrachon SA;
and receives Fixed 1% Goldman Sachs 20/6/2023 (28,354) (53,334)CDS EUR 200,000 Fund receives default protection on Smurfit Kappa Acquisitions
ULC; and pays Fixed 5% Goldman Sachs 20/6/2023 (4,455) (38,294)CDS EUR (80,000) Fund provides default protection on Casino Guichard Perrachon SA;
and receives Fixed 1% Goldman Sachs 20/6/2023 (9,558) (17,978)CDS EUR 200,000 Fund receives default protection on Smurfit Kappa Acquisitions
ULC; and pays Fixed 5% Goldman Sachs 20/6/2023 (3,992) (38,294)CDS EUR 100,000 Fund receives default protection on UPC Holding BV;
and pays Fixed 5% Goldman Sachs 20/6/2023 (4,269) (19,068)CDS USD (938,301) Fund provides default protection on Beazer Homes USA Inc;
and receives Fixed 5% Goldman Sachs 20/6/2023 53,566 95,383CDS EUR 150,000 Fund receives default protection on UPC Holding BV;
and pays Fixed 5% Goldman Sachs 20/6/2023 (7,610) (28,602)CDS USD (562,981) Fund provides default protection on Beazer Homes USA Inc;
and receives Fixed 5% Goldman Sachs 20/6/2023 31,540 57,230CDS USD 1,650,305 Fund receives default protection on DISH DBS Corp;
and pays Fixed 5% Goldman Sachs 20/12/2023 (111,084) (36,735)CDS EUR 384,615 Fund receives default protection on Cable & Wireless Ltd;
and pays Fixed 5% Goldman Sachs 20/12/2023 (9,738) (76,159)CDS EUR 480,000 Fund receives default protection on Synlab Unsecured Bondco Plc;
and pays Fixed 5% Goldman Sachs 20/12/2023 5,876 (72,629)
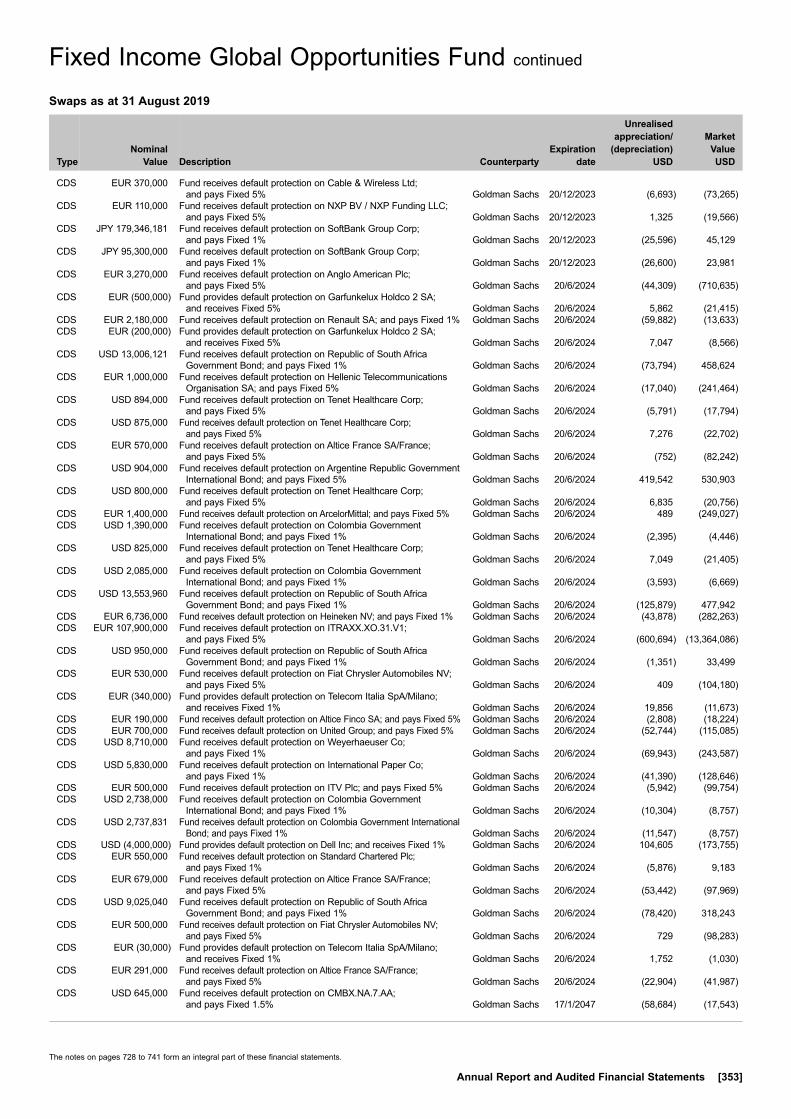
The notes on pages 728 to 741 form an integral part of these financial statements.
Annual Report and Audited Financial Statements [353]
Fixed Income Global Opportunities Fund continued
Swaps as at 31 August 2019
TypeNominal
Value Description Counterparty
Expiration date
Unrealised appreciation/
(depreciation) USD
Market Value USD
CDS EUR 370,000 Fund receives default protection on Cable & Wireless Ltd; and pays Fixed 5% Goldman Sachs 20/12/2023 (6,693) (73,265)
CDS EUR 110,000 Fund receives default protection on NXP BV / NXP Funding LLC; and pays Fixed 5% Goldman Sachs 20/12/2023 1,325 (19,566)
CDS JPY 179,346,181 Fund receives default protection on SoftBank Group Corp; and pays Fixed 1% Goldman Sachs 20/12/2023 (25,596) 45,129
CDS JPY 95,300,000 Fund receives default protection on SoftBank Group Corp; and pays Fixed 1% Goldman Sachs 20/12/2023 (26,600) 23,981
CDS EUR 3,270,000 Fund receives default protection on Anglo American Plc; and pays Fixed 5% Goldman Sachs 20/6/2024 (44,309) (710,635)
CDS EUR (500,000) Fund provides default protection on Garfunkelux Holdco 2 SA; and receives Fixed 5% Goldman Sachs 20/6/2024 5,862 (21,415)
CDS EUR 2,180,000 Fund receives default protection on Renault SA; and pays Fixed 1% Goldman Sachs 20/6/2024 (59,882) (13,633)CDS EUR (200,000) Fund provides default protection on Garfunkelux Holdco 2 SA;
and receives Fixed 5% Goldman Sachs 20/6/2024 7,047 (8,566)CDS USD 13,006,121 Fund receives default protection on Republic of South Africa
Government Bond; and pays Fixed 1% Goldman Sachs 20/6/2024 (73,794) 458,624CDS EUR 1,000,000 Fund receives default protection on Hellenic Telecommunications
Organisation SA; and pays Fixed 5% Goldman Sachs 20/6/2024 (17,040) (241,464)CDS USD 894,000 Fund receives default protection on Tenet Healthcare Corp;
and pays Fixed 5% Goldman Sachs 20/6/2024 (5,791) (17,794)CDS USD 875,000 Fund receives default protection on Tenet Healthcare Corp;
and pays Fixed 5% Goldman Sachs 20/6/2024 7,276 (22,702)CDS EUR 570,000 Fund receives default protection on Altice France SA/France;
and pays Fixed 5% Goldman Sachs 20/6/2024 (752) (82,242)CDS USD 904,000 Fund receives default protection on Argentine Republic Government
International Bond; and pays Fixed 5% Goldman Sachs 20/6/2024 419,542 530,903CDS USD 800,000 Fund receives default protection on Tenet Healthcare Corp;
and pays Fixed 5% Goldman Sachs 20/6/2024 6,835 (20,756)CDS EUR 1,400,000 Fund receives default protection on ArcelorMittal; and pays Fixed 5% Goldman Sachs 20/6/2024 489 (249,027)CDS USD 1,390,000 Fund receives default protection on Colombia Government
International Bond; and pays Fixed 1% Goldman Sachs 20/6/2024 (2,395) (4,446)CDS USD 825,000 Fund receives default protection on Tenet Healthcare Corp;
and pays Fixed 5% Goldman Sachs 20/6/2024 7,049 (21,405)CDS USD 2,085,000 Fund receives default protection on Colombia Government
International Bond; and pays Fixed 1% Goldman Sachs 20/6/2024 (3,593) (6,669)CDS USD 13,553,960 Fund receives default protection on Republic of South Africa
Government Bond; and pays Fixed 1% Goldman Sachs 20/6/2024 (125,879) 477,942CDS EUR 6,736,000 Fund receives default protection on Heineken NV; and pays Fixed 1% Goldman Sachs 20/6/2024 (43,878) (282,263)CDS EUR 107,900,000 Fund receives default protection on ITRAXX.XO.31.V1;
and pays Fixed 5% Goldman Sachs 20/6/2024 (600,694) (13,364,086)CDS USD 950,000 Fund receives default protection on Republic of South Africa
Government Bond; and pays Fixed 1% Goldman Sachs 20/6/2024 (1,351) 33,499CDS EUR 530,000 Fund receives default protection on Fiat Chrysler Automobiles NV;
and pays Fixed 5% Goldman Sachs 20/6/2024 409 (104,180)CDS EUR (340,000) Fund provides default protection on Telecom Italia SpA/Milano;
and receives Fixed 1% Goldman Sachs 20/6/2024 19,856 (11,673)CDS EUR 190,000 Fund receives default protection on Altice Finco SA; and pays Fixed 5% Goldman Sachs 20/6/2024 (2,808) (18,224)CDS EUR 700,000 Fund receives default protection on United Group; and pays Fixed 5% Goldman Sachs 20/6/2024 (52,744) (115,085)CDS USD 8,710,000 Fund receives default protection on Weyerhaeuser Co;
and pays Fixed 1% Goldman Sachs 20/6/2024 (69,943) (243,587)CDS USD 5,830,000 Fund receives default protection on International Paper Co;
and pays Fixed 1% Goldman Sachs 20/6/2024 (41,390) (128,646)CDS EUR 500,000 Fund receives default protection on ITV Plc; and pays Fixed 5% Goldman Sachs 20/6/2024 (5,942) (99,754)CDS USD 2,738,000 Fund receives default protection on Colombia Government
International Bond; and pays Fixed 1% Goldman Sachs 20/6/2024 (10,304) (8,757)CDS USD 2,737,831 Fund receives default protection on Colombia Government International
Bond; and pays Fixed 1% Goldman Sachs 20/6/2024 (11,547) (8,757)CDS USD (4,000,000) Fund provides default protection on Dell Inc; and receives Fixed 1% Goldman Sachs 20/6/2024 104,605 (173,755)CDS EUR 550,000 Fund receives default protection on Standard Chartered Plc;
and pays Fixed 1% Goldman Sachs 20/6/2024 (5,876) 9,183CDS EUR 679,000 Fund receives default protection on Altice France SA/France;
and pays Fixed 5% Goldman Sachs 20/6/2024 (53,442) (97,969)CDS USD 9,025,040 Fund receives default protection on Republic of South Africa
Government Bond; and pays Fixed 1% Goldman Sachs 20/6/2024 (78,420) 318,243CDS EUR 500,000 Fund receives default protection on Fiat Chrysler Automobiles NV;
and pays Fixed 5% Goldman Sachs 20/6/2024 729 (98,283)CDS EUR (30,000) Fund provides default protection on Telecom Italia SpA/Milano;
and receives Fixed 1% Goldman Sachs 20/6/2024 1,752 (1,030)CDS EUR 291,000 Fund receives default protection on Altice France SA/France;
and pays Fixed 5% Goldman Sachs 20/6/2024 (22,904) (41,987)CDS USD 645,000 Fund receives default protection on CMBX.NA.7.AA;
and pays Fixed 1.5% Goldman Sachs 17/1/2047 (58,684) (17,543)
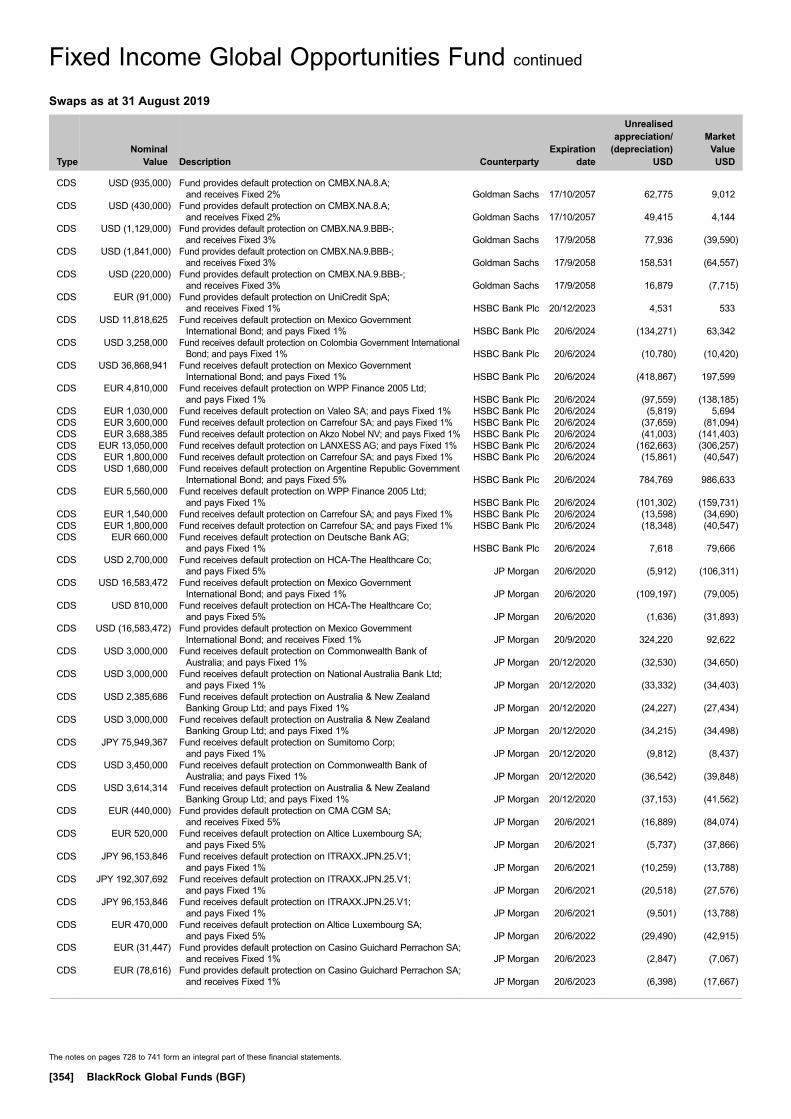
The notes on pages 728 to 741 form an integral part of these financial statements.
[354] BlackRock Global Funds (BGF)
Fixed Income Global Opportunities Fund continued
Swaps as at 31 August 2019
TypeNominal
Value Description Counterparty
Expiration date
Unrealised appreciation/
(depreciation) USD
Market Value USD
CDS USD (935,000) Fund provides default protection on CMBX.NA.8.A; and receives Fixed 2% Goldman Sachs 17/10/2057 62,775 9,012
CDS USD (430,000) Fund provides default protection on CMBX.NA.8.A; and receives Fixed 2% Goldman Sachs 17/10/2057 49,415 4,144
CDS USD (1,129,000) Fund provides default protection on CMBX.NA.9.BBB-; and receives Fixed 3% Goldman Sachs 17/9/2058 77,936 (39,590)
CDS USD (1,841,000) Fund provides default protection on CMBX.NA.9.BBB-; and receives Fixed 3% Goldman Sachs 17/9/2058 158,531 (64,557)
CDS USD (220,000) Fund provides default protection on CMBX.NA.9.BBB-; and receives Fixed 3% Goldman Sachs 17/9/2058 16,879 (7,715)
CDS EUR (91,000) Fund provides default protection on UniCredit SpA; and receives Fixed 1% HSBC Bank Plc 20/12/2023 4,531 533
CDS USD 11,818,625 Fund receives default protection on Mexico Government International Bond; and pays Fixed 1% HSBC Bank Plc 20/6/2024 (134,271) 63,342
CDS USD 3,258,000 Fund receives default protection on Colombia Government International Bond; and pays Fixed 1% HSBC Bank Plc 20/6/2024 (10,780) (10,420)
CDS USD 36,868,941 Fund receives default protection on Mexico Government International Bond; and pays Fixed 1% HSBC Bank Plc 20/6/2024 (418,867) 197,599
CDS EUR 4,810,000 Fund receives default protection on WPP Finance 2005 Ltd; and pays Fixed 1% HSBC Bank Plc 20/6/2024 (97,559) (138,185)
CDS EUR 1,030,000 Fund receives default protection on Valeo SA; and pays Fixed 1% HSBC Bank Plc 20/6/2024 (5,819) 5,694CDS EUR 3,600,000 Fund receives default protection on Carrefour SA; and pays Fixed 1% HSBC Bank Plc 20/6/2024 (37,659) (81,094)CDS EUR 3,688,385 Fund receives default protection on Akzo Nobel NV; and pays Fixed 1% HSBC Bank Plc 20/6/2024 (41,003) (141,403)CDS EUR 13,050,000 Fund receives default protection on LANXESS AG; and pays Fixed 1% HSBC Bank Plc 20/6/2024 (162,663) (306,257)CDS EUR 1,800,000 Fund receives default protection on Carrefour SA; and pays Fixed 1% HSBC Bank Plc 20/6/2024 (15,861) (40,547)CDS USD 1,680,000 Fund receives default protection on Argentine Republic Government
International Bond; and pays Fixed 5% HSBC Bank Plc 20/6/2024 784,769 986,633CDS EUR 5,560,000 Fund receives default protection on WPP Finance 2005 Ltd;
and pays Fixed 1% HSBC Bank Plc 20/6/2024 (101,302) (159,731)CDS EUR 1,540,000 Fund receives default protection on Carrefour SA; and pays Fixed 1% HSBC Bank Plc 20/6/2024 (13,598) (34,690)CDS EUR 1,800,000 Fund receives default protection on Carrefour SA; and pays Fixed 1% HSBC Bank Plc 20/6/2024 (18,348) (40,547)CDS EUR 660,000 Fund receives default protection on Deutsche Bank AG;
and pays Fixed 1% HSBC Bank Plc 20/6/2024 7,618 79,666CDS USD 2,700,000 Fund receives default protection on HCA-The Healthcare Co;
and pays Fixed 5% JP Morgan 20/6/2020 (5,912) (106,311)CDS USD 16,583,472 Fund receives default protection on Mexico Government
International Bond; and pays Fixed 1% JP Morgan 20/6/2020 (109,197) (79,005)CDS USD 810,000 Fund receives default protection on HCA-The Healthcare Co;
and pays Fixed 5% JP Morgan 20/6/2020 (1,636) (31,893)CDS USD (16,583,472) Fund provides default protection on Mexico Government
International Bond; and receives Fixed 1% JP Morgan 20/9/2020 324,220 92,622CDS USD 3,000,000 Fund receives default protection on Commonwealth Bank of
Australia; and pays Fixed 1% JP Morgan 20/12/2020 (32,530) (34,650)CDS USD 3,000,000 Fund receives default protection on National Australia Bank Ltd;
and pays Fixed 1% JP Morgan 20/12/2020 (33,332) (34,403)CDS USD 2,385,686 Fund receives default protection on Australia & New Zealand
Banking Group Ltd; and pays Fixed 1% JP Morgan 20/12/2020 (24,227) (27,434)CDS USD 3,000,000 Fund receives default protection on Australia & New Zealand
Banking Group Ltd; and pays Fixed 1% JP Morgan 20/12/2020 (34,215) (34,498)CDS JPY 75,949,367 Fund receives default protection on Sumitomo Corp;
and pays Fixed 1% JP Morgan 20/12/2020 (9,812) (8,437)CDS USD 3,450,000 Fund receives default protection on Commonwealth Bank of
Australia; and pays Fixed 1% JP Morgan 20/12/2020 (36,542) (39,848)CDS USD 3,614,314 Fund receives default protection on Australia & New Zealand
Banking Group Ltd; and pays Fixed 1% JP Morgan 20/12/2020 (37,153) (41,562)CDS EUR (440,000) Fund provides default protection on CMA CGM SA;
and receives Fixed 5% JP Morgan 20/6/2021 (16,889) (84,074)CDS EUR 520,000 Fund receives default protection on Altice Luxembourg SA;
and pays Fixed 5% JP Morgan 20/6/2021 (5,737) (37,866)CDS JPY 96,153,846 Fund receives default protection on ITRAXX.JPN.25.V1;
and pays Fixed 1% JP Morgan 20/6/2021 (10,259) (13,788)CDS JPY 192,307,692 Fund receives default protection on ITRAXX.JPN.25.V1;
and pays Fixed 1% JP Morgan 20/6/2021 (20,518) (27,576)CDS JPY 96,153,846 Fund receives default protection on ITRAXX.JPN.25.V1;
and pays Fixed 1% JP Morgan 20/6/2021 (9,501) (13,788)CDS EUR 470,000 Fund receives default protection on Altice Luxembourg SA;
and pays Fixed 5% JP Morgan 20/6/2022 (29,490) (42,915)CDS EUR (31,447) Fund provides default protection on Casino Guichard Perrachon SA;
and receives Fixed 1% JP Morgan 20/6/2023 (2,847) (7,067)CDS EUR (78,616) Fund provides default protection on Casino Guichard Perrachon SA;
and receives Fixed 1% JP Morgan 20/6/2023 (6,398) (17,667)

The notes on pages 728 to 741 form an integral part of these financial statements.
Annual Report and Audited Financial Statements [355]
Fixed Income Global Opportunities Fund continued
Swaps as at 31 August 2019
TypeNominal
Value Description Counterparty
Expiration date
Unrealised appreciation/
(depreciation) USD
Market Value USD
CDS USD (12,641,820) Fund provides default protection on CDX.NA.IG.30.V1; and receives Fixed 1% JP Morgan 20/6/2023 72,196 268,401
CDS EUR 100,000 Fund receives default protection on Smurfit Kappa Acquisitions ULC; and pays Fixed 5% JP Morgan 20/6/2023 (851) (19,147)
CDS EUR (4,717) Fund provides default protection on Casino Guichard Perrachon SA; and receives Fixed 1% JP Morgan 20/6/2023 (427) (1,060)
CDS EUR (47,170) Fund provides default protection on Casino Guichard Perrachon SA; and receives Fixed 1% JP Morgan 20/6/2023 (4,271) (10,600)
CDS EUR (3,144) Fund provides default protection on Casino Guichard Perrachon SA; and receives Fixed 1% JP Morgan 20/6/2023 (285) (707)
CDS EUR (247,944) Fund provides default protection on Casino Guichard Perrachon SA; and receives Fixed 1% JP Morgan 20/6/2023 (20,178) (55,719)
CDS EUR (360,000) Fund provides default protection on Casino Guichard Perrachon SA; and receives Fixed 1% JP Morgan 20/6/2023 (11,533) (80,901)
CDS EUR 1,000,000 Fund receives default protection on Smurfit Kappa Acquisitions ULC; and pays Fixed 5% JP Morgan 20/6/2023 (21,817) (191,472)
CDS EUR (7,862) Fund provides default protection on Casino Guichard Perrachon SA; and receives Fixed 1% JP Morgan 20/6/2023 (640) (1,767)
CDS EUR (210,000) Fund provides default protection on Casino Guichard Perrachon SA; and receives Fixed 1% JP Morgan 20/6/2023 (18,328) (47,192)
CDS EUR (80,000) Fund provides default protection on Casino Guichard Perrachon SA; and receives Fixed 1% JP Morgan 20/6/2023 (9,738) (17,978)
CDS USD 822,410 Fund receives default protection on Realogy Group LLC; and pays Fixed 5% JP Morgan 20/12/2023 119,654 113,087
CDS USD 820,000 Fund receives default protection on RR Donnelley & Sons Co; and pays Fixed 5% JP Morgan 20/12/2023 (2,104) 34,304
CDS USD 1,644,000 Fund receives default protection on KB Home; and pays Fixed 5% JP Morgan 20/12/2023 (138,056) (256,426)CDS EUR 160,000 Fund receives default protection on Cable & Wireless Ltd;
and pays Fixed 5% JP Morgan 20/12/2023 (2,573) (31,682)CDS EUR 180,000 Fund receives default protection on NXP BV / NXP Funding LLC;
and pays Fixed 5% JP Morgan 20/12/2023 1,997 (32,017)CDS EUR 490,000 Fund receives default protection on UPC Holding BV;
and pays Fixed 5% JP Morgan 20/6/2024 (2,906) (114,149)CDS USD 654,064 Fund receives default protection on Hess Corp; and pays Fixed 1% JP Morgan 20/6/2024 (8,561) 7,942CDS USD 654,064 Fund receives default protection on Hess Corp; and pays Fixed 1% JP Morgan 20/6/2024 (7,157) 7,942CDS USD 3,383,000 Fund receives default protection on Mexico Government
International Bond; and pays Fixed 1% JP Morgan 20/6/2024 (18,830) 18,131CDS USD 654,064 Fund receives default protection on Hess Corp; and pays Fixed 1% JP Morgan 20/6/2024 (7,952) 7,942CDS EUR 550,000 Fund receives default protection on Standard Chartered Plc;
and pays Fixed 1% JP Morgan 20/6/2024 (5,032) 9,183CDS USD 3,382,000 Fund receives default protection on Mexico Government
International Bond; and pays Fixed 1% JP Morgan 20/6/2024 (19,580) 18,126CDS USD 3,383,000 Fund receives default protection on Mexico Government
International Bond; and pays Fixed 1% JP Morgan 20/6/2024 (17,316) 18,131CDS USD 2,900,000 Fund receives default protection on Halliburton Co; and pays Fixed 1% JP Morgan 20/6/2024 14,474 (23,530)CDS USD 474,101 Fund receives default protection on Halliburton Co; and pays Fixed 1% JP Morgan 20/6/2024 (1,728) (3,847)CDS USD 4,604,000 Fund receives default protection on Mexico Government
International Bond; and pays Fixed 1% JP Morgan 20/6/2024 (27,684) 24,675CDS EUR 10,875,000 Fund receives default protection on Lafargeholcim Ltd;
and pays Fixed 1% JP Morgan 20/6/2024 (24,832) (236,147)CDS USD 3,782,000 Fund receives default protection on CDX.EM.31.V1;
and pays Fixed 1% JP Morgan 20/6/2024 19,223 192,709CDS USD 250,000 Fund receives default protection on Tenet Healthcare Corp;
and pays Fixed 5% JP Morgan 20/6/2024 (3,235) (6,486)CDS USD 6,312,000 Fund receives default protection on CDX.EM.31.V1; and pays Fixed 1% JP Morgan 20/6/2024 32,083 321,624CDS USD 576,923 Fund receives default protection on Apache Corp; and pays Fixed 1% JP Morgan 20/6/2024 (4,751) 14,981CDS USD 601,824 Fund receives default protection on Devon Energy Corp;
and pays Fixed 1% JP Morgan 20/6/2024 (4,659) 1,057CDS USD 601,824 Fund receives default protection on Devon Energy Corp;
and pays Fixed 1% JP Morgan 20/6/2024 (5,688) 1,057CDS EUR 2,670,000 Fund receives default protection on Lafargeholcim Ltd;
and pays Fixed 1% JP Morgan 20/6/2024 (5,068) (57,978)CDS USD 601,823 Fund receives default protection on Devon Energy Corp;
and pays Fixed 1% JP Morgan 20/6/2024 (2,544) 1,057CDS EUR 3,030,000 Fund receives default protection on Carrefour SA; and pays Fixed 1% JP Morgan 20/6/2024 (31,297) (68,254)CDS EUR 500,000 Fund receives default protection on CMA CGM SA; and pays Fixed 5% JP Morgan 20/6/2024 10,737 145,439CDS EUR 2,060,000 Fund receives default protection on Intesa Sanpaolo SpA; and pays
Fixed 1% JP Morgan 20/6/2024 (74,875) 130,295CDS USD 1,119,231 Fund receives default protection on Apache Corp; and pays Fixed 1% JP Morgan 20/6/2024 (5,062) 29,063CDS USD 237,050 Fund receives default protection on Halliburton Co; and pays Fixed 1% JP Morgan 20/6/2024 (646) (1,923)CDS USD 474,101 Fund receives default protection on Halliburton Co; and pays Fixed 1% JP Morgan 20/6/2024 (1,321) (3,847)

The notes on pages 728 to 741 form an integral part of these financial statements.
[356] BlackRock Global Funds (BGF)
Fixed Income Global Opportunities Fund continued
Swaps as at 31 August 2019
TypeNominal
Value Description Counterparty
Expiration date
Unrealised appreciation/
(depreciation) USD
Market Value USD
CDS USD 3,383,000 Fund receives default protection on Mexico Government International Bond; and pays Fixed 1% JP Morgan 20/6/2024 (15,044) 18,131
CDS USD 601,824 Fund receives default protection on Devon Energy Corp; and pays Fixed 1% JP Morgan 20/6/2024 (3,570) 1,057
CDS USD 576,923 Fund receives default protection on Apache Corp; and pays Fixed 1% JP Morgan 20/6/2024 (3,522) 14,981CDS USD 1,000,000 Fund receives default protection on General Electric Co;
and pays Fixed 1% JP Morgan 20/6/2024 3,095 22,277CDS USD (500,000) Fund provides default protection on United Rentals Inc;
and receives Fixed 5% JP Morgan 20/6/2024 8,721 82,817CDS EUR 935,000 Fund receives default protection on British Telecommunications Plc;
and pays Fixed 1% JP Morgan 20/6/2024 (2,887) (10,170)CDS USD (500,000) Fund provides default protection on United Rentals Inc;
and receives Fixed 5% JP Morgan 20/6/2024 1,632 82,817CDS USD 474,101 Fund receives default protection on Halliburton Co; and pays Fixed 1% JP Morgan 20/6/2024 (1,112) (3,847)CDS USD 3,383,000 Fund receives default protection on Mexico Government
International Bond; and pays Fixed 1% JP Morgan 20/6/2024 (16,559) 18,131CDS USD 237,050 Fund receives default protection on Halliburton Co; and pays Fixed 1% JP Morgan 20/6/2024 (644) (1,923)CDS USD 576,923 Fund receives default protection on Apache Corp; and pays Fixed 1% JP Morgan 20/6/2024 (5,197) 14,981CDS EUR 510,000 Fund receives default protection on Altice France SA/France;
and pays Fixed 5% JP Morgan 20/6/2024 (20,656) (73,585)CDS EUR 940,000 Fund receives default protection on Lloyds Banking Group Plc;
and pays Fixed 1% JP Morgan 20/6/2024 (14,257) 40,608CDS EUR 1,530,000 Fund receives default protection on Deutsche Lufthansa AG;
and pays Fixed 1% JP Morgan 20/6/2024 9,716 (24,926)CDS EUR 3,030,000 Fund receives default protection on CNH Industrial NV;
and pays Fixed 5% JP Morgan 20/6/2024 (654) (663,224)CDS EUR 3,030,000 Fund receives default protection on Carrefour SA; and pays Fixed 1% JP Morgan 20/6/2024 (31,440) (68,254)CDS EUR 1,700,000 Fund receives default protection on Intesa Sanpaolo SpA;
and pays Fixed 1% JP Morgan 20/6/2024 (89,798) 107,525CDS USD 654,064 Fund receives default protection on Hess Corp; and pays Fixed 1% JP Morgan 20/6/2024 (3,729) 7,942CDS EUR 470,000 Fund receives default protection on Jaguar Land Rover Automotive
Plc; and pays Fixed 5% JP Morgan 20/6/2024 38,135 58,857CDS EUR 3,864,000 Fund receives default protection on Anglo American Plc;
and pays Fixed 5% JP Morgan 20/6/2024 (85,862) (839,722)CDS USD (507,000) Fund provides default protection on CMBX.NA.9.BBB-;
and receives Fixed 3% JP Morgan 17/9/2058 37,803 (17,779)CDS USD (1,150,000) Fund provides default protection on CMBX.NA.9.BBB-;
and receives Fixed 3% JP Morgan 17/9/2058 106,835 (40,326)CDS USD (35,000) Fund provides default protection on CMBX.NA.10.BBB-;
and receives Fixed 3% JP Morgan 17/11/2059 1,994 (1,169)CDS USD 670,000 Fund receives default protection on CMBX.NA.6.BBB-;
and pays Fixed 3% JP Morgan 11/5/2063 477 64,629CDS EUR 720,000 Fund receives default protection on Standard Chartered Bank;
and pays Fixed 1% Morgan Stanley 20/12/2020 (13,965) (9,087)CDS USD 1,439,000 Fund receives default protection on Transocean Inc; and pays Fixed 1% Morgan Stanley 20/6/2022 19,083 150,326CDS EUR (330,000) Fund provides default protection on Garfunkelux Holdco 2 SA;
and receives Fixed 5% Morgan Stanley 20/6/2023 (5,420) (8,680)CDS EUR (630,000) Fund provides default protection on Casino Guichard Perrachon SA;
and receives Fixed 1% Morgan Stanley 20/6/2023 (48,732) (141,577)CDS EUR 1,340,000 Fund receives default protection on WPP Finance 2005 Ltd;
and pays Fixed 1% Morgan Stanley 20/6/2024 (28,780) (38,496)CDS USD (4,494,900) Fund provides default protection on Turkey Government
International Bond; and receives Fixed 1% Morgan Stanley 20/6/2024 (29,686) (608,994)CDS EUR 1,890,000 Fund receives default protection on Deutsche Bank AG;
and pays Fixed 1% Morgan Stanley 20/6/2024 5,867 (24,790)CDS EUR 3,480,000 Fund receives default protection on Enel SpA; and pays Fixed 1% Morgan Stanley 20/6/2024 (58,198) (82,055)CDS EUR 5,430,000 Fund receives default protection on Anglo American Plc;
and pays Fixed 5% Morgan Stanley 20/6/2024 (98,468) (1,180,045)CDS USD 2,900,000 Fund receives default protection on Mondelez International Inc;
and pays Fixed 1% Morgan Stanley 20/6/2024 (10,916) (86,521)CDS USD 3,475,000 Fund receives default protection on Colombia Government
International Bond; and pays Fixed 1% Morgan Stanley 20/6/2024 6,597 (11,114)CDS EUR 900,000 Fund receives default protection on Enel SpA; and pays Fixed 1% Morgan Stanley 20/6/2024 (17,538) (21,221)CDS EUR 2,700,000 Fund receives default protection on Carrefour SA; and pays Fixed 1% Morgan Stanley 20/6/2024 (27,998) (60,820)CDS EUR 980,000 Fund receives default protection on Enel SpA; and pays Fixed 1% Morgan Stanley 20/6/2024 (18,579) (23,108)CDS EUR (77,817) Fund provides default protection on Telecom Italia Spa;
and receives Fixed 1% Morgan Stanley 20/6/2024 122 (2,672)CDS EUR (413,403) Fund provides default protection on Telecom Italia Spa;
and receives Fixed 1% Morgan Stanley 20/6/2024 646 (14,193)CDS EUR 450,000 Fund receives default protection on Marks and Spencer Plc;
and pays Fixed 1% Morgan Stanley 20/6/2024 4,395 23,160CDS EUR (7,295) Fund provides default protection on Telecom Italia Spa;
and receives Fixed 1% Morgan Stanley 20/6/2024 11 (250)

The notes on pages 728 to 741 form an integral part of these financial statements.
Annual Report and Audited Financial Statements [357]
Fixed Income Global Opportunities Fund continued
Swaps as at 31 August 2019
TypeNominal
Value Description Counterparty
Expiration date
Unrealised appreciation/
(depreciation) USD
Market Value USD
CDS EUR 3,405,000 Fund receives default protection on Akzo Nobel NV; and pays Fixed 1% Morgan Stanley 20/6/2024 (37,452) (130,539)CDS USD 2,900,000 Fund receives default protection on ConocoPhillips; and pays Fixed 1% Morgan Stanley 20/6/2024 13,587 (55,922)CDS USD 3,475,000 Fund receives default protection on Colombia Government
International Bond; and pays Fixed 1% Morgan Stanley 20/6/2024 5,807 (11,114)CDS USD 9,669,600 Fund receives default protection on Turkey Government
International Bond; and pays Fixed 1% Morgan Stanley 20/6/2024 413,220 1,310,092CDS USD 5,894,000 Fund receives default protection on Qatar Government International
Bond; and pays Fixed 1% Morgan Stanley 20/6/2024 (57,722) (140,003)CDS USD 2,900,000 Fund receives default protection on American International Group Inc;
and pays Fixed 1% Morgan Stanley 20/6/2024 5,084 (39,727)CDS USD 2,900,000 Fund receives default protection on Kinder Morgan Inc/DE;
and pays Fixed 1% Morgan Stanley 20/6/2024 (2,280) (43,364)CDS USD 3,475,000 Fund receives default protection on Colombia Government
International Bond; and pays Fixed 1% Morgan Stanley 20/6/2024 7,417 (11,114)CDS USD 2,800,000 Fund receives default protection on Pfizer Inc; and pays Fixed 1% Morgan Stanley 20/6/2024 (4,622) (96,070)CDS USD 3,475,000 Fund receives default protection on Colombia Government
International Bond; and pays Fixed 1% Morgan Stanley 20/6/2024 8,165 (11,114)CDS USD 3,475,000 Fund receives default protection on Colombia Government
International Bond; and pays Fixed 1% Morgan Stanley 20/6/2024 8,218 (11,114)CDS USD 2,820,000 Fund receives default protection on Lowes Companies Inc;
and pays Fixed 1% Morgan Stanley 20/6/2024 (14,499) (90,792)CDS USD 3,475,000 Fund receives default protection on Colombia Government
International Bond; and pays Fixed 1% Morgan Stanley 20/6/2024 10,594 (11,114)CDS USD 2,785,000 Fund receives default protection on Allstate Corp/The; and pays
Fixed 1% Morgan Stanley 20/6/2024 (3,018) (103,363)CDS EUR 4,450,000 Fund receives default protection on Solvay SA; and pays Fixed 1% Morgan Stanley 20/6/2024 (46,620) (115,122)CDS EUR 200,000 Fund receives default protection on UPC Holding BV; and pays
Fixed 5% Morgan Stanley 20/6/2024 1,010 (46,591)CDS USD 2,820,000 Fund receives default protection on Boeing Co/The; and pays Fixed 1% Morgan Stanley 20/6/2024 (850) (77,143)CDS EUR (100,000) Fund provides default protection on Tesco Plc; and receives Fixed 1% Morgan Stanley 20/12/2028 2,604 (7,304)CDS EUR (1,010,000) Fund provides default protection on Tesco Plc; and receives Fixed 1% Morgan Stanley 20/12/2028 26,295 (73,769)CDS EUR (3,190,000) Fund provides default protection on Tesco Plc; and receives Fixed 1% Morgan Stanley 20/12/2028 83,051 (232,994)CDS USD 3,630,000 Fund receives default protection on CMBX.NA.9.AAA;
and pays Fixed 0.5% Morgan Stanley 17/9/2058 (82,242) (39,846)CDS USD 507,000 Fund receives default protection on CMBX.NA.9.BBB-;
and pays Fixed 3% Morgan Stanley 17/9/2058 (11,419) 17,779CDS USD 646,000 Fund receives default protection on CMBX.NA.9.BBB-;
and pays Fixed 3% Morgan Stanley 17/9/2058 (14,550) 22,653CDS USD 4,020,000 Fund receives default protection on CMBX.NA.9.AAA;
and pays Fixed 0.5% Morgan Stanley 17/9/2058 (96,157) (44,128)CDS USD 2,000,000 Fund receives default protection on CMBX.NA.9.AAA;
and pays Fixed 0.5% Morgan Stanley 17/9/2058 (45,311) (21,954)CDS EUR 1,800,000 Fund receives default protection on Lafargeholcim Ltd;
and pays Fixed 1% Societe Generale 20/6/2024 (4,348) (39,086)IFS EUR 26,620,000 Fund receives default protection on CPTFEMU + 0 bps;
and pays Fixed 1% Bank of America 16/7/2024 275,442 275,442IFS EUR 24,500,000 Fund provides default protection on CPTFEMU + 0 bps;
and receives Fixed 1.0153% Bank of America 16/7/2024 275,830 275,830IFS EUR 9,426,000 Fund provides default protection on CPTFEMU + 0 bps;
and receives Fixed 0.88% Bank of America 16/8/2024 18,796 18,796IFS EUR 7,840,000 Fund receives default protection on CPTFEMU + 0 bps;
and pays Fixed 1.2895% Bank of America 16/3/2029 (267,738) (267,738)IFS GBP 6,090,000 Fund provides default protection on UKRPI + 0 bps;
and receives Fixed 3.49% Bank of America 16/3/2029 (222,759) (222,759)IFS EUR 11,800,000 Fund provides default protection on CPTFEMU + 0 bps;
and receives Fixed 1.3225% Bank of America 18/3/2029 (453,750) (453,750)IFS EUR 26,620,000 Fund provides default protection on CPTFEMU + 0 bps;
and receives Fixed 1.16% Bank of America 16/7/2029 (500,944) (500,944)IFS EUR 24,500,000 Fund provides default protection on CPTFEMU + 0 bps;
and receives Fixed 1.2% Bank of America 16/7/2029 (587,424) (587,424)IFS GBP 1,947,000 Fund provides default protection on UKRPI + 0 bps;
and receives Fixed 3.725% Bank of America 15/8/2029 – –IFS EUR 9,426,000 Fund receives default protection on CPTFEMU + 0 bps;
and pays Fixed 1.0683% Bank of America 16/8/2029 (50,365) (50,365)IFS GBP 1,946,000 Fund provides default protection on UKRPI + 0 bps;
and receives Fixed 3.71% Bank of America 16/8/2029 (4,778) (4,778)IFS GBP 1,917,000 Fund provides default protection on UKRPI + 0 bps;
and receives Fixed 3.745% Bank of America 16/8/2029 6,285 6,285IFS GBP 2,000,000 Fund provides default protection on UKRPI + 0bps;
and receives Fixed 3.423% Bank of America 15/3/2048 145,078 145,078IFS GBP 3,395,000 Fund provides default protection on UKRPI + 0bps;
and receives Fixed 3.5325% Morgan Stanley 15/11/2046 411,778 411,778

The notes on pages 728 to 741 form an integral part of these financial statements.
[358] BlackRock Global Funds (BGF)
Fixed Income Global Opportunities Fund continued
Swaps as at 31 August 2019
TypeNominal
Value Description Counterparty
Expiration date
Unrealised appreciation/
(depreciation) USD
Market Value USD
IRS MXN 1,157,956,000 Fund receives Fixed 8.2062% and pays Floating MXN MXIBTIIE 1 Month Bank of America 7/10/2020 466,775 466,775
IRS MXN 1,750,000,000 Fund receives Fixed 8.505%; and pays Floating MXN MXIBTIIE 1 Month Bank of America 4/11/2020 1,108,140 1,108,140
IRS USD 95,500,000 Fund receives Fixed 1.528%; and pays Floating USD LIBOR 3 Month Bank of America 22/11/2020 (115,805) (115,805)IRS USD 328,694,000 Fund receives Floating USD LIBOR 3 Month; and pays Fixed 1.766% Bank of America 15/6/2021 (1,490,395) (1,490,395)IRS CAD 37,020,000 Fund receives Fixed 1.755%; and pays Floating CAD CDOR 6 Month Bank of America 26/6/2021 37,668 37,668IRS CAD 37,020,000 Fund receives Fixed 1.77%; and pays Floating CAD CDOR 6 Month Bank of America 26/6/2021 45,950 45,950IRS CAD 37,280,000 Fund receives Fixed 1.824%; and pays Floating CAD CDOR 6 Month Bank of America 5/7/2021 79,103 79,103IRS USD 166,495,000 Fund receives Fixed 2.098%; and pays Floating USD LIBOR 3 Month Bank of America 5/7/2021 1,105,085 1,614,604IRS CAD 23,215,000 Fund receives Fixed 1.905%; and pays Floating CAD CDOR 6 Month Bank of America 9/7/2021 78,296 78,296IRS CAD 299,555,000 Fund receives Fixed 1.9075%; and pays Floating CAD CDOR 6 Month Bank of America 9/7/2021 1,021,432 1,021,432IRS MXN 177,249,452 Fund receives Floating MXN MXIBTIIE 1 Month; and pays Fixed 6.86% Bank of America 23/7/2021 (23,311) (23,311)IRS MXN 247,396,167 Fund receives Floating MXN MXIBTIIE 1 Month; and pays Fixed 6.9% Bank of America 26/7/2021 (37,493) (37,493)IRS CAD 32,410,000 Fund receives Fixed 1.7925%; and pays Floating CAD CDOR 6 Month Bank of America 1/8/2021 63,648 63,648IRS USD 88,183,000 Fund receives Floating USD LIBOR 3 Month; and pays Fixed 1.75% Bank of America 4/8/2021 (505,620) (505,620)IRS MXN 782,700,671 Fund receives Floating MXN MXIBTIIE 1 Month; and pays Fixed 6.78% Bank of America 6/8/2021 (81,529) (81,529)IRS USD 12,500,000 Fund receives Fixed 1.529%; and pays Floating USD LIBOR 3 Month Bank of America 9/8/2021 (4,154) (4,154)IRS USD 12,500,000 Fund receives Fixed 1.5325%; and pays Floating USD LIBOR 3 Month Bank of America 9/8/2021 (3,319) (3,319)IRS USD 49,950,000 Fund receives Fixed 1.294%; and pays Floating USD LIBOR 3 Month Bank of America 18/8/2021 62,356 62,356IRS CZK 634,565,221 Fund receives Floating CZK Interbank 6 Month; and pays Fixed 1.64% Bank of America 19/8/2021 66,704 66,704IRS CZK 634,412,956 Fund receives Floating CZK Interbank 6 Month; and pays Fixed
1.6575% Bank of America 20/8/2021 55,680 55,680IRS CZK 318,758,750 Fund receives Floating CZK Interbank 6 Month; and pays Fixed 1.72% Bank of America 20/8/2021 11,226 11,226IRS HUF 7,901,580,591 Fund receives Fixed 0.295%; and pays Floating HUF BUBOR 6 Month Bank of America 21/8/2021 (48,327) (48,327)IRS HUF 7,903,477,046 Fund receives Fixed 0.305%; and pays Floating HUF BUBOR 6 Month Bank of America 21/8/2021 (43,139) (43,139)IRS HUF 3,976,245,000 Fund receives Fixed 0.3125%; and pays Floating HUF BUBOR 6 Month Bank of America 22/8/2021 (19,763) (19,763)IRS HUF 7,952,092,376 Fund receives Fixed 0.34%; and pays Floating HUF BUBOR 6 Month Bank of America 23/8/2021 (26,446) (26,446)IRS CZK 637,485,624 Fund receives Floating CZK Interbank 6 Month; and pays Fixed 1.775% Bank of America 23/8/2021 (6,733) (6,733)IRS HUF 4,423,661,034 Fund receives Fixed 0.375%; and pays Floating HUF BUBOR 6 Month Bank of America 26/8/2021 (4,669) (4,669)IRS CZK 354,626,202 Fund receives Floating CZK Interbank 6 Month; and pays Fixed 1.775% Bank of America 26/8/2021 (4,255) (4,255)IRS HUF 4,447,719,288 Fund receives Fixed 0.36%; and pays Floating HUF BUBOR 6 Month Bank of America 29/8/2021 (7,811) (7,811)IRS CZK 354,819,971 Fund receives Floating CZK Interbank 6 Month; and pays Fixed 1.74% Bank of America 29/8/2021 5,681 5,681IRS HUF 4,031,730,526 Fund receives Fixed 0.31%; and pays Floating HUF BUBOR 6 Month Bank of America 30/8/2021 (19,791) (19,791)IRS CZK 321,144,711 Fund receives Floating CZK Interbank 6 Month; and pays Fixed 1.715% Bank of America 30/8/2021 11,983 11,983IRS HUF 6,978,511,776 Fund receives Fixed 0.36%; and pays Floating HUF BUBOR 6 Month Bank of America 2/9/2021 (11,461) (11,461)IRS USD 25,010,000 Fund receives Fixed 1.2055%; and pays Floating USD LIBOR 3 Month Bank of America 2/9/2021 6,280 6,280IRS USD 50,010,000 Fund receives Fixed 1.22%; and pays Floating USD LIBOR 3 Month Bank of America 2/9/2021 19,645 19,645IRS USD 50,010,000 Fund receives Fixed 1.2285%; and pays Floating USD LIBOR 3 Month Bank of America 2/9/2021 23,800 23,800IRS CZK 563,234,742 Fund receives Floating CZK Interbank 6 Month; and pays Fixed 1.74% Bank of America 2/9/2021 7,253 7,253IRS USD 402,400,000 Fund receives Floating USD LIBOR 1 Day; and pays Fixed 1.1% Bank of America 15/9/2021 198,704 173,496IRS THB 367,260,000 Fund receives Fixed 1.165%; and pays Floating THB BKIBOR 6 Month Bank of America 18/9/2021 (17,615) (17,615)IRS THB 617,030,000 Fund receives Fixed 1.39%; and pays Floating THB BKIBOR 6 Month Bank of America 18/9/2021 60,107 60,107IRS SGD 22,420,000 Fund receives Fixed 1.555%; and pays Floating SGD SGDOW 6 Month Bank of America 18/9/2021 (5,415) (5,415)IRS SGD 11,810,000 Fund receives Fixed 1.622%; and pays Floating SGD SGDOW 6 Month Bank of America 18/9/2021 8,365 8,365IRS PLN 120,899,964 Fund receives Fixed 1.6886%; and pays Floating PLN WIBOR 6 Month Bank of America 18/9/2021 36,083 36,083IRS PLN 50,740,000 Fund receives Fixed 1.7%; and pays Floating PLN WIBOR 6 Month Bank of America 18/9/2021 17,991 17,991IRS PLN 63,420,000 Fund receives Fixed 1.716%; and pays Floating PLN WIBOR 6 Month Bank of America 18/9/2021 27,482 27,482IRS PLN 91,330,000 Fund receives Fixed 1.717%; and pays Floating PLN WIBOR 6 Month Bank of America 18/9/2021 40,026 40,026IRS PLN 63,420,000 Fund receives Fixed 1.721%; and pays Floating PLN WIBOR 6 Month Bank of America 18/9/2021 29,043 29,043IRS USD 275,700,000 Fund receives Fixed 2.222%; and pays Floating USD LIBOR 3 Month Bank of America 1/11/2021 4,230,167 4,230,167IRS CAD 13,047,000 Fund receives Floating CAD CDOR 6 Month; and pays Fixed 2.582% Bank of America 3/12/2021 (226,162) (226,162)IRS DKK 76,930,000 Fund receives Fixed 0.12%; and pays Floating DKK CIBOR 6 Month Bank of America 6/12/2021 147,951 149,466IRS SEK 107,005,000 Fund receives Fixed 0.166%; and pays Floating SEK STIBOR 3 Month Bank of America 6/12/2021 91,299 92,460IRS USD 9,883,000 Fund receives Floating USD LIBOR 3 Month; and pays Fixed 3% Bank of America 7/12/2021 (331,662) (333,366)IRS USD 86,935,000 Fund receives Fixed 2.521%; and pays Floating USD LIBOR 3 Month Bank of America 6/1/2022 2,052,473 2,052,473IRS USD 115,170,000 Fund receives Fixed 2.528%; and pays Floating USD LIBOR 3 Month Bank of America 6/1/2022 2,734,869 2,734,869IRS USD 130,250,000 Fund receives Fixed 2.34%; and pays Floating USD LIBOR 3 Month Bank of America 7/1/2022 2,617,267 2,617,267IRS USD 140,210,000 Fund receives Fixed 2.51%; and pays Floating USD LIBOR 3 Month Bank of America 13/2/2022 3,409,065 3,409,065IRS USD 162,060,000 Fund receives Fixed 2.0267%; and pays Floating USD LIBOR 3 Month Bank of America 30/3/2022 2,393,535 2,393,535IRS USD 186,210,000 Fund receives Fixed 2.2432%; and pays Floating USD LIBOR 3 Month Bank of America 27/4/2022 3,635,389 3,635,389IRS USD 45,756,000 Fund receives Fixed 1.742%; and pays Floating USD LIBOR 3 Month Bank of America 16/6/2022 458,947 458,947IRS EUR 8,000,000 Fund receives Fixed -0.3525%; and pays Floating EUR EURIBOR
6 Month Bank of America 3/7/2022 52,062 52,062IRS USD 319,810,000 Fund receives Fixed 1.7055%; and pays Floating USD LIBOR 3 Month Bank of America 13/7/2022 1,698,985 1,698,985IRS MXN 192,146,162 Fund receives Floating MXN MXIBTIIE 1 Month; and pays Fixed 7.23% Bank of America 18/7/2022 (95,419) (95,419)IRS MXN 96,087,025 Fund receives Floating MXN MXIBTIIE 1 Month; and pays Fixed 7.23% Bank of America 19/7/2022 (47,796) (47,796)IRS MXN 36,951,186 Fund receives Floating MXN MXIBTIIE 1 Month; and pays Fixed 7.22% Bank of America 20/7/2022 (17,932) (17,932)IRS MXN 51,731,659 Fund receives Floating MXN MXIBTIIE 1 Month; and pays Fixed 7.21% Bank of America 25/7/2022 (24,671) (24,671)IRS GBP 5,100,000 Fund receives Floating GBP LIBOR 6 Month; and pays Fixed 0.634% Bank of America 1/8/2022 (1,982) (1,982)IRS MXN 436,014,000 Fund receives Fixed 7%; and pays Floating MXN MXIBTIIE 1 Month Bank of America 11/8/2022 91,303 91,303IRS CAD 66,600,000 Fund receives Fixed 1.5775%; and pays Floating CAD CDOR 6 Month Bank of America 23/8/2022 66,824 66,824IRS USD 16,340,000 Fund receives Floating USD LIBOR 3 Month; and pays Fixed 2.4863% Bank of America 8/2/2023 (421,216) (421,216)
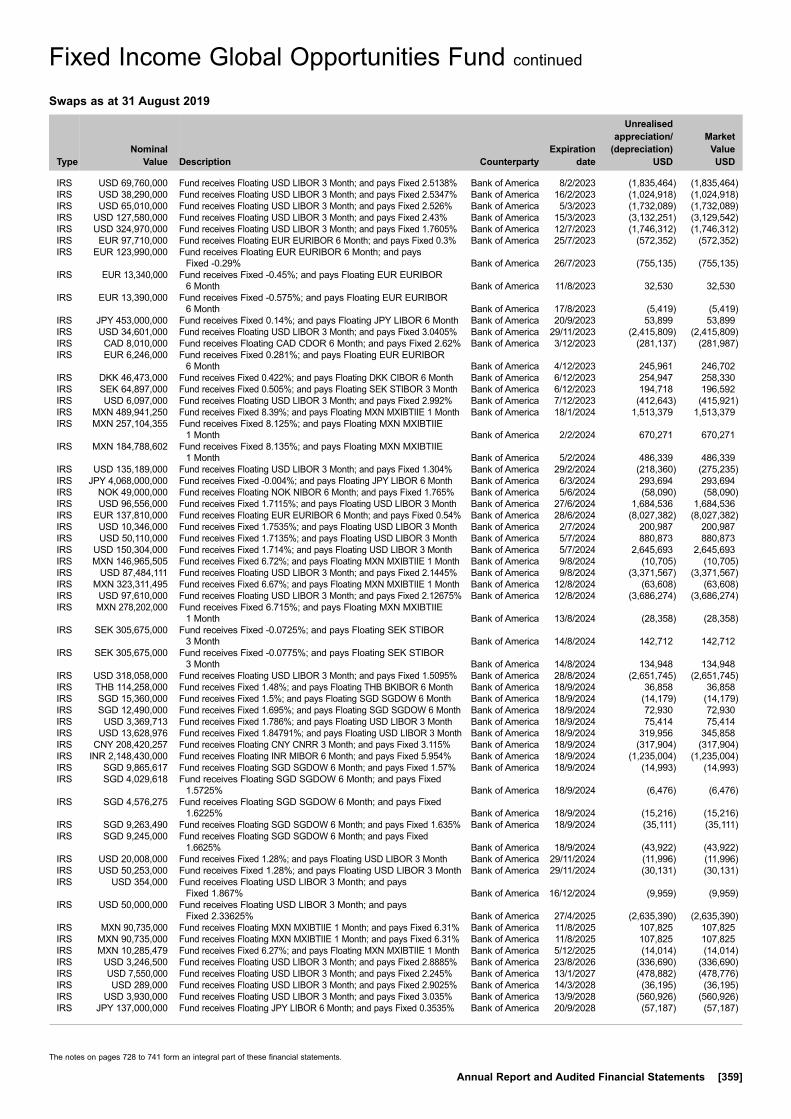
The notes on pages 728 to 741 form an integral part of these financial statements.
Annual Report and Audited Financial Statements [359]
Fixed Income Global Opportunities Fund continued
Swaps as at 31 August 2019
TypeNominal
Value Description Counterparty
Expiration date
Unrealised appreciation/
(depreciation) USD
Market Value USD
IRS USD 69,760,000 Fund receives Floating USD LIBOR 3 Month; and pays Fixed 2.5138% Bank of America 8/2/2023 (1,835,464) (1,835,464)IRS USD 38,290,000 Fund receives Floating USD LIBOR 3 Month; and pays Fixed 2.5347% Bank of America 16/2/2023 (1,024,918) (1,024,918)IRS USD 65,010,000 Fund receives Floating USD LIBOR 3 Month; and pays Fixed 2.526% Bank of America 5/3/2023 (1,732,089) (1,732,089)IRS USD 127,580,000 Fund receives Floating USD LIBOR 3 Month; and pays Fixed 2.43% Bank of America 15/3/2023 (3,132,251) (3,129,542)IRS USD 324,970,000 Fund receives Floating USD LIBOR 3 Month; and pays Fixed 1.7605% Bank of America 12/7/2023 (1,746,312) (1,746,312)IRS EUR 97,710,000 Fund receives Floating EUR EURIBOR 6 Month; and pays Fixed 0.3% Bank of America 25/7/2023 (572,352) (572,352)IRS EUR 123,990,000 Fund receives Floating EUR EURIBOR 6 Month; and pays
Fixed -0.29% Bank of America 26/7/2023 (755,135) (755,135)IRS EUR 13,340,000 Fund receives Fixed -0.45%; and pays Floating EUR EURIBOR
6 Month Bank of America 11/8/2023 32,530 32,530IRS EUR 13,390,000 Fund receives Fixed -0.575%; and pays Floating EUR EURIBOR
6 Month Bank of America 17/8/2023 (5,419) (5,419)IRS JPY 453,000,000 Fund receives Fixed 0.14%; and pays Floating JPY LIBOR 6 Month Bank of America 20/9/2023 53,899 53,899IRS USD 34,601,000 Fund receives Floating USD LIBOR 3 Month; and pays Fixed 3.0405% Bank of America 29/11/2023 (2,415,809) (2,415,809)IRS CAD 8,010,000 Fund receives Floating CAD CDOR 6 Month; and pays Fixed 2.62% Bank of America 3/12/2023 (281,137) (281,987)IRS EUR 6,246,000 Fund receives Fixed 0.281%; and pays Floating EUR EURIBOR
6 Month Bank of America 4/12/2023 245,961 246,702IRS DKK 46,473,000 Fund receives Fixed 0.422%; and pays Floating DKK CIBOR 6 Month Bank of America 6/12/2023 254,947 258,330IRS SEK 64,897,000 Fund receives Fixed 0.505%; and pays Floating SEK STIBOR 3 Month Bank of America 6/12/2023 194,718 196,592IRS USD 6,097,000 Fund receives Floating USD LIBOR 3 Month; and pays Fixed 2.992% Bank of America 7/12/2023 (412,643) (415,921)IRS MXN 489,941,250 Fund receives Fixed 8.39%; and pays Floating MXN MXIBTIIE 1 Month Bank of America 18/1/2024 1,513,379 1,513,379IRS MXN 257,104,355 Fund receives Fixed 8.125%; and pays Floating MXN MXIBTIIE
1 Month Bank of America 2/2/2024 670,271 670,271IRS MXN 184,788,602 Fund receives Fixed 8.135%; and pays Floating MXN MXIBTIIE
1 Month Bank of America 5/2/2024 486,339 486,339IRS USD 135,189,000 Fund receives Floating USD LIBOR 3 Month; and pays Fixed 1.304% Bank of America 29/2/2024 (218,360) (275,235)IRS JPY 4,068,000,000 Fund receives Fixed -0.004%; and pays Floating JPY LIBOR 6 Month Bank of America 6/3/2024 293,694 293,694IRS NOK 49,000,000 Fund receives Floating NOK NIBOR 6 Month; and pays Fixed 1.765% Bank of America 5/6/2024 (58,090) (58,090)IRS USD 96,556,000 Fund receives Fixed 1.7115%; and pays Floating USD LIBOR 3 Month Bank of America 27/6/2024 1,684,536 1,684,536IRS EUR 137,810,000 Fund receives Floating EUR EURIBOR 6 Month; and pays Fixed 0.54% Bank of America 28/6/2024 (8,027,382) (8,027,382)IRS USD 10,346,000 Fund receives Fixed 1.7535%; and pays Floating USD LIBOR 3 Month Bank of America 2/7/2024 200,987 200,987IRS USD 50,110,000 Fund receives Fixed 1.7135%; and pays Floating USD LIBOR 3 Month Bank of America 5/7/2024 880,873 880,873IRS USD 150,304,000 Fund receives Fixed 1.714%; and pays Floating USD LIBOR 3 Month Bank of America 5/7/2024 2,645,693 2,645,693IRS MXN 146,965,505 Fund receives Fixed 6.72%; and pays Floating MXN MXIBTIIE 1 Month Bank of America 9/8/2024 (10,705) (10,705)IRS USD 87,484,111 Fund receives Floating USD LIBOR 3 Month; and pays Fixed 2.1445% Bank of America 9/8/2024 (3,371,567) (3,371,567)IRS MXN 323,311,495 Fund receives Fixed 6.67%; and pays Floating MXN MXIBTIIE 1 Month Bank of America 12/8/2024 (63,608) (63,608)IRS USD 97,610,000 Fund receives Floating USD LIBOR 3 Month; and pays Fixed 2.12675% Bank of America 12/8/2024 (3,686,274) (3,686,274)IRS MXN 278,202,000 Fund receives Fixed 6.715%; and pays Floating MXN MXIBTIIE
1 Month Bank of America 13/8/2024 (28,358) (28,358)IRS SEK 305,675,000 Fund receives Fixed -0.0725%; and pays Floating SEK STIBOR
3 Month Bank of America 14/8/2024 142,712 142,712IRS SEK 305,675,000 Fund receives Fixed -0.0775%; and pays Floating SEK STIBOR
3 Month Bank of America 14/8/2024 134,948 134,948IRS USD 318,058,000 Fund receives Floating USD LIBOR 3 Month; and pays Fixed 1.5095% Bank of America 28/8/2024 (2,651,745) (2,651,745)IRS THB 114,258,000 Fund receives Fixed 1.48%; and pays Floating THB BKIBOR 6 Month Bank of America 18/9/2024 36,858 36,858IRS SGD 15,360,000 Fund receives Fixed 1.5%; and pays Floating SGD SGDOW 6 Month Bank of America 18/9/2024 (14,179) (14,179)IRS SGD 12,490,000 Fund receives Fixed 1.695%; and pays Floating SGD SGDOW 6 Month Bank of America 18/9/2024 72,930 72,930IRS USD 3,369,713 Fund receives Fixed 1.786%; and pays Floating USD LIBOR 3 Month Bank of America 18/9/2024 75,414 75,414IRS USD 13,628,976 Fund receives Fixed 1.84791%; and pays Floating USD LIBOR 3 Month Bank of America 18/9/2024 319,956 345,858IRS CNY 208,420,257 Fund receives Floating CNY CNRR 3 Month; and pays Fixed 3.115% Bank of America 18/9/2024 (317,904) (317,904)IRS INR 2,148,430,000 Fund receives Floating INR MIBOR 6 Month; and pays Fixed 5.954% Bank of America 18/9/2024 (1,235,004) (1,235,004)IRS SGD 9,865,617 Fund receives Floating SGD SGDOW 6 Month; and pays Fixed 1.57% Bank of America 18/9/2024 (14,993) (14,993)IRS SGD 4,029,618 Fund receives Floating SGD SGDOW 6 Month; and pays Fixed
1.5725% Bank of America 18/9/2024 (6,476) (6,476)IRS SGD 4,576,275 Fund receives Floating SGD SGDOW 6 Month; and pays Fixed
1.6225% Bank of America 18/9/2024 (15,216) (15,216)IRS SGD 9,263,490 Fund receives Floating SGD SGDOW 6 Month; and pays Fixed 1.635% Bank of America 18/9/2024 (35,111) (35,111)IRS SGD 9,245,000 Fund receives Floating SGD SGDOW 6 Month; and pays Fixed
1.6625% Bank of America 18/9/2024 (43,922) (43,922)IRS USD 20,008,000 Fund receives Fixed 1.28%; and pays Floating USD LIBOR 3 Month Bank of America 29/11/2024 (11,996) (11,996)IRS USD 50,253,000 Fund receives Fixed 1.28%; and pays Floating USD LIBOR 3 Month Bank of America 29/11/2024 (30,131) (30,131)IRS USD 354,000 Fund receives Floating USD LIBOR 3 Month; and pays
Fixed 1.867% Bank of America 16/12/2024 (9,959) (9,959)IRS USD 50,000,000 Fund receives Floating USD LIBOR 3 Month; and pays
Fixed 2.33625% Bank of America 27/4/2025 (2,635,390) (2,635,390)IRS MXN 90,735,000 Fund receives Floating MXN MXIBTIIE 1 Month; and pays Fixed 6.31% Bank of America 11/8/2025 107,825 107,825IRS MXN 90,735,000 Fund receives Floating MXN MXIBTIIE 1 Month; and pays Fixed 6.31% Bank of America 11/8/2025 107,825 107,825IRS MXN 10,285,479 Fund receives Fixed 6.27%; and pays Floating MXN MXIBTIIE 1 Month Bank of America 5/12/2025 (14,014) (14,014)IRS USD 3,246,500 Fund receives Floating USD LIBOR 3 Month; and pays Fixed 2.8885% Bank of America 23/8/2026 (336,690) (336,690)IRS USD 7,550,000 Fund receives Floating USD LIBOR 3 Month; and pays Fixed 2.245% Bank of America 13/1/2027 (478,882) (478,776)IRS USD 289,000 Fund receives Floating USD LIBOR 3 Month; and pays Fixed 2.9025% Bank of America 14/3/2028 (36,195) (36,195)IRS USD 3,930,000 Fund receives Floating USD LIBOR 3 Month; and pays Fixed 3.035% Bank of America 13/9/2028 (560,926) (560,926)IRS JPY 137,000,000 Fund receives Floating JPY LIBOR 6 Month; and pays Fixed 0.3535% Bank of America 20/9/2028 (57,187) (57,187)

The notes on pages 728 to 741 form an integral part of these financial statements.
[360] BlackRock Global Funds (BGF)
Fixed Income Global Opportunities Fund continued
Swaps as at 31 August 2019
TypeNominal
Value Description Counterparty
Expiration date
Unrealised appreciation/
(depreciation) USD
Market Value USD
IRS CAD 4,262,000 Fund receives Floating CAD CDOR 6 Month; and pays Fixed 2.75% Bank of America 3/12/2028 (345,468) (347,376)IRS EUR 3,229,000 Fund receives Fixed 0.884%; and pays Floating EUR EURIBOR
6 Month Bank of America 4/12/2028 409,678 410,153IRS DKK 23,964,000 Fund receives Fixed 1.026%; and pays Floating DKK CIBOR 6 Month Bank of America 6/12/2028 412,232 418,583IRS SEK 33,823,000 Fund receives Fixed 1.156%; and pays Floating SEK STIBOR 3 Month Bank of America 6/12/2028 331,106 336,658IRS USD 3,266,000 Fund receives Floating USD LIBOR 3 Month; and pays Fixed 3.06% Bank of America 7/12/2028 (481,828) (483,404)IRS JPY 863,940,000 Fund receives Floating JPY LIBOR 6 Month; and pays Fixed 0.1915% Bank of America 4/1/2029 (242,205) (242,205)IRS JPY 124,920,000 Fund receives Floating JPY LIBOR 6 Month; and pays Fixed 0.159% Bank of America 29/1/2029 (31,493) (31,493)IRS USD 82,192,193 Fund receives Fixed 1.5057%; and pays Floating USD LIBOR 3 Month Bank of America 15/2/2029 988,125 988,125IRS USD 67,625,000 Fund receives Floating USD LIBOR 3 Month; and pays Fixed 3.0035% Bank of America 16/2/2029 (9,824,018) (9,824,018)IRS JPY 2,018,000,000 Fund receives Floating JPY LIBOR 6 Month; and pays Fixed 0.176% Bank of America 6/3/2029 (542,032) (542,032)IRS USD 35,300,000 Fund receives Floating USD LIBOR 3 Month; and pays Fixed 1.4% Bank of America 15/5/2029 (177,482) (163,932)IRS MXN 290,620,000 Fund receives Fixed 7.9625%; and pays Floating MXN MXIBTIIE
1 Month Bank of America 24/5/2029 1,065,119 1,065,119IRS MXN 148,538,065 Fund receives Fixed 7.96%; and pays Floating MXN MXIBTIIE 1 Month Bank of America 24/5/2029 543,067 543,067IRS MXN 142,081,935 Fund receives Fixed 7.98%; and pays Floating MXN MXIBTIIE 1 Month Bank of America 24/5/2029 529,593 529,593IRS NOK 24,500,000 Fund receives Floating NOK NIBOR 6 Month; and pays Fixed 1.8595% Bank of America 5/6/2029 (79,686) (79,686)IRS USD 34,196,000 Fund receives Fixed 1.94%; and pays Floating USD LIBOR 3 Month Bank of America 27/6/2029 1,756,734 1,756,734IRS USD 21,310,000 Fund receives Fixed 1.975%; and pays Floating USD LIBOR 3 Month Bank of America 28/6/2029 1,163,297 1,163,297IRS USD 11,256,000 Fund receives Fixed 1.954%; and pays Floating USD LIBOR 3 Month Bank of America 2/7/2029 592,826 592,826IRS USD 12,695,000 Fund receives Fixed 1.9715%; and pays Floating USD LIBOR 3 Month Bank of America 5/8/2029 690,240 690,240IRS USD 5,415,000 Fund receives Fixed 1.5245%; and pays Floating USD LIBOR 3 Month Bank of America 9/8/2029 68,436 68,436IRS USD 2,707,500 Fund receives Fixed 1.531%; and pays Floating USD LIBOR 3 Month Bank of America 9/8/2029 35,869 35,869IRS USD 5,880,000 Fund receives Floating USD LIBOR 3 Month; and pays Fixed 1.545% Bank of America 9/8/2029 (85,618) (85,618)IRS USD 7,440,000 Fund receives Fixed 1.64%; and pays Floating USD LIBOR 3 Month Bank of America 12/8/2029 171,727 174,726IRS USD 10,710,000 Fund receives Fixed 1.406%; and pays Floating USD LIBOR 3 Month Bank of America 19/8/2029 16,992 16,992IRS USD 10,700,000 Fund receives Fixed 1.4265%; and pays Floating USD LIBOR 3 Month Bank of America 19/8/2029 37,609 37,609IRS USD 2,720,000 Fund receives Fixed 1.4215%; and pays Floating USD LIBOR 3 Month Bank of America 28/8/2029 8,197 8,197IRS USD 6,510,000 Fund receives Fixed 1.423%; and pays Floating USD LIBOR 3 Month Bank of America 28/8/2029 20,540 20,540IRS USD 3,240,000 Fund receives Floating USD LIBOR 3 Month; and pays Fixed
1.5585% Bank of America 28/8/2029 (51,629) (51,629)IRS SGD 8,880,000 Fund receives Fixed 1.615%; and pays Floating SGD SGDOW 6 Month Bank of America 18/9/2029 (24,250) (24,250)IRS SGD 6,970,000 Fund receives Fixed 1.952%; and pays Floating SGD SGDOW 6 Month Bank of America 18/9/2029 138,718 138,718IRS JPY 1,371,000,000 Fund receives Fixed -0.073%; and pays Floating JPY LIBOR 6 Month Bank of America 18/12/2029 43,820 43,820IRS USD 7,290,000 Fund receives Fixed 2.4205%; and pays Floating USD LIBOR 3 Month Bank of America 18/5/2031 696,408 696,408IRS USD 3,460,000 Fund receives Fixed 2.079%; and pays Floating USD LIBOR 3 Month Bank of America 22/6/2031 219,260 219,260IRS JPY 287,470,000 Fund receives Floating JPY LIBOR 6 Month; and pays Fixed 0.355% Bank of America 4/2/2034 (150,787) (150,787)IRS JPY 622,590,000 Fund receives Floating JPY LIBOR 6 Month; and pays Fixed 0.336% Bank of America 8/2/2034 (310,372) (310,372)IRS JPY 255,240,000 Fund receives Floating JPY LIBOR 6 Month; and pays Fixed 0.336% Bank of America 14/3/2034 (127,579) (127,579)IRS USD 2,490,000 Fund receives Floating USD LIBOR 3 Month; and pays Fixed 2.295% Bank of America 24/6/2034 (168,810) (168,810)IRS USD 10,350,000 Fund receives Floating USD LIBOR 3 Month; and pays Fixed 1.645% Bank of America 22/8/2034 (96,360) (96,360)IRS JPY 224,900,000 Fund receives Floating JPY LIBOR 6 Month; and pays Fixed 0.6165% Bank of America 14/12/2038 (240,246) (240,246)IRS JPY 340,690,000 Fund receives Floating JPY LIBOR 6 Month; and pays Fixed 0.409% Bank of America 3/4/2039 (235,550) (235,550)IRS JPY 249,520,000 Fund receives Floating JPY LIBOR 6 Month; and pays Fixed 0.3291% Bank of America 10/6/2039 (135,365) (135,365)IRS JPY 232,070,000 Fund receives Floating JPY LIBOR 6 Month; and pays Fixed 0.295% Bank of America 17/6/2039 (110,979) (110,979)IRS JPY 266,130,000 Fund receives Floating JPY LIBOR 6 Month; and pays Fixed 0.1665% Bank of America 8/8/2039 (62,477) (62,477)IRS JPY 163,330,000 Fund receives Floating JPY LIBOR 6 Month; and pays Fixed 0.715% Bank of America 21/3/2044 (180,445) (180,445)IRS JPY 150,180,000 Fund receives Floating JPY LIBOR 6 Month; and pays Fixed 0.2005% Bank of America 28/8/2044 (15,655) (15,655)IRS USD 7,090,000 Fund receives Fixed 1.625%; and pays Floating USD LIBOR 3 Month Bank of America 15/5/2045 151,189 155,725IRS USD 17,890,000 Fund receives Floating USD LIBOR 3 Month; and pays Fixed 3.30994% Bank of America 9/11/2048 (7,715,461) (7,715,461)IRS CAD 1,805,000 Fund receives Floating CAD CDOR 6 Month; and pays Fixed 2.91% Bank of America 3/12/2048 (384,493) (384,948)IRS EUR 1,266,000 Fund receives Fixed 1.46%; and pays Floating EUR EURIBOR 6 Month Bank of America 4/12/2048 578,086 578,112IRS GBP 946,000 Fund receives Floating GBP LIBOR 6 Month; and pays Fixed 1.732% Bank of America 4/12/2048 (350,451) (349,139)IRS DKK 9,291,000 Fund receives Fixed 1.5325%; and pays Floating DKK CIBOR 6 Month Bank of America 6/12/2048 551,982 552,503IRS SEK 13,474,000 Fund receives Fixed 1.681%; and pays Floating SEK STIBOR 3 Month Bank of America 6/12/2048 428,679 430,636IRS USD 1,414,000 Fund receives Floating USD LIBOR 3 Month; and pays Fixed 3.152% Bank of America 7/12/2048 (555,648) (556,968)IRS USD 2,948,000 Fund receives Floating USD LIBOR 3 Month; and pays Fixed 2.814% Bank of America 9/1/2049 (919,971) (919,971)IRS USD 4,960,000 Fund receives Floating USD LIBOR 3 Month; and pays Fixed 2.3375% Bank of America 5/7/2049 (268,710) (268,710)IRS USD 5,220,000 Fund receives Floating USD LIBOR 3 Month; and pays Fixed 1.891% Bank of America 8/8/2049 (458,489) (458,489)IRS USD 4,875,000 Fund receives Fixed 1.7215%; and pays Floating USD LIBOR 3 Month Bank of America 15/8/2049 223,163 223,163IRS USD 1,300,000 Fund receives Floating USD LIBOR 3 Month; and pays Fixed 1.636% Bank of America 16/8/2049 (31,831) (31,831)IRS USD 4,550,000 Fund receives Floating USD LIBOR 3 Month; and pays Fixed 1.705% Bank of America 16/8/2049 (39,722) (39,722)IRS USD 3,500,000 Fund receives Floating USD LIBOR 3 Month; and pays Fixed 1.6645% Bank of America 17/8/2049 (20,375) (20,375)IRS USD 4,080,000 Fund receives Floating USD LIBOR 3 Month; and pays Fixed 1.556% Bank of America 19/8/2049 (19,156) (19,156)IRS USD 4,060,000 Fund receives Floating USD LIBOR 3 Month; and pays Fixed 1.585% Bank of America 19/8/2049 (48,345) (48,345)IRS USD 1,250,000 Fund receives Floating USD LIBOR 3 Month; and pays Fixed 1.538% Bank of America 30/8/2049 (451) (451)IRS USD 2,970,000 Fund receives Fixed 1.86%; and pays Floating USD LIBOR 3 Month Bank of America 7/11/2049 241,982 241,982IRS USD 12,850,000 Fund receives Floating USD LIBOR 3 Month; and pays Fixed 2.3405% Bank of America 15/6/2050 (2,585,740) (2,585,740)IRS USD 3,430,000 Fund receives Fixed 3.0335%; and pays Floating USD LIBOR 3 Month Bank of America 20/2/2053 1,207,919 1,207,919IRS THB 459,570,000 Fund receives Fixed 1.403%; and pays Floating THB BKIBOR 6 Month BNP Paribas 18/9/2021 48,628 48,628IRS CNY 75,894,320 Fund receives Floating CNY CNRR 3 Month; and pays Fixed 3.11% BNP Paribas 18/9/2024 (113,293) (113,293)IRS MXN 279,950,277 Fund receives Floating MXN MXIBTIIE 1 Month; and pays Fixed 7.71% BNP Paribas 19/11/2026 (704,513) (704,513)
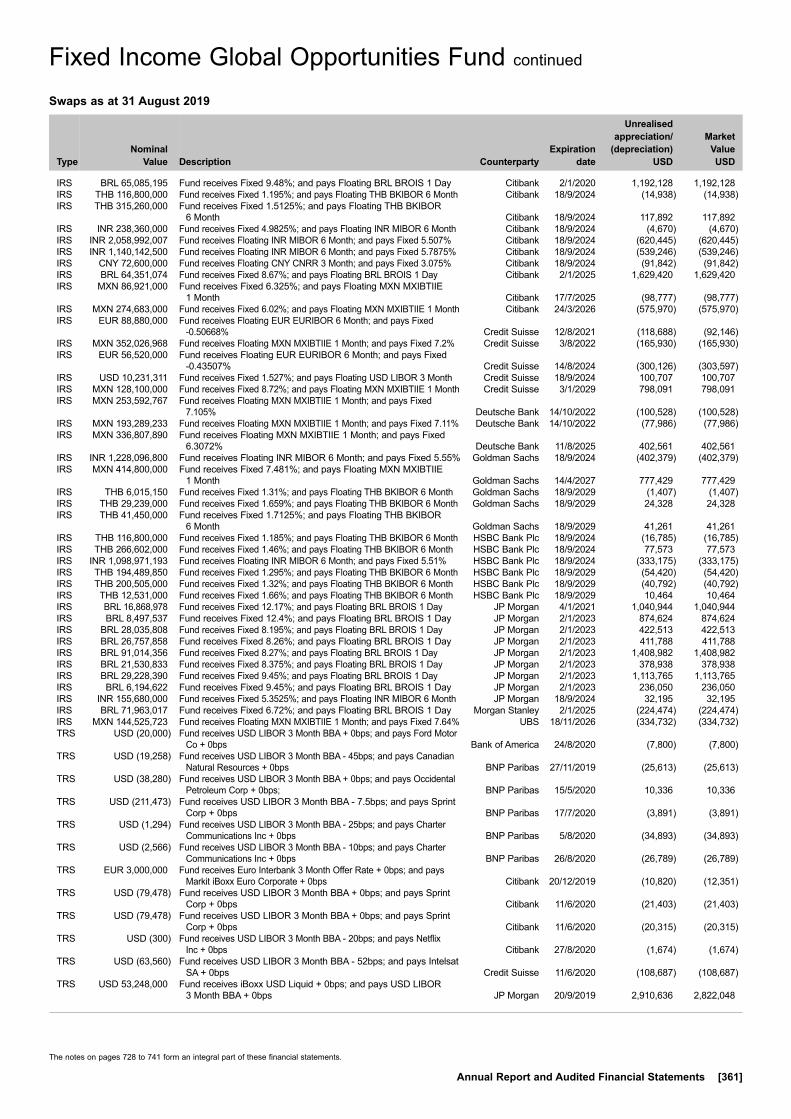
The notes on pages 728 to 741 form an integral part of these financial statements.
Annual Report and Audited Financial Statements [361]
Fixed Income Global Opportunities Fund continued
Swaps as at 31 August 2019
TypeNominal
Value Description Counterparty
Expiration date
Unrealised appreciation/
(depreciation) USD
Market Value USD
IRS BRL 65,085,195 Fund receives Fixed 9.48%; and pays Floating BRL BROIS 1 Day Citibank 2/1/2020 1,192,128 1,192,128IRS THB 116,800,000 Fund receives Fixed 1.195%; and pays Floating THB BKIBOR 6 Month Citibank 18/9/2024 (14,938) (14,938)IRS THB 315,260,000 Fund receives Fixed 1.5125%; and pays Floating THB BKIBOR
6 Month Citibank 18/9/2024 117,892 117,892IRS INR 238,360,000 Fund receives Fixed 4.9825%; and pays Floating INR MIBOR 6 Month Citibank 18/9/2024 (4,670) (4,670)IRS INR 2,058,992,007 Fund receives Floating INR MIBOR 6 Month; and pays Fixed 5.507% Citibank 18/9/2024 (620,445) (620,445)IRS INR 1,140,142,500 Fund receives Floating INR MIBOR 6 Month; and pays Fixed 5.7875% Citibank 18/9/2024 (539,246) (539,246)IRS CNY 72,600,000 Fund receives Floating CNY CNRR 3 Month; and pays Fixed 3.075% Citibank 18/9/2024 (91,842) (91,842)IRS BRL 64,351,074 Fund receives Fixed 8.67%; and pays Floating BRL BROIS 1 Day Citibank 2/1/2025 1,629,420 1,629,420IRS MXN 86,921,000 Fund receives Fixed 6.325%; and pays Floating MXN MXIBTIIE
1 Month Citibank 17/7/2025 (98,777) (98,777)IRS MXN 274,683,000 Fund receives Fixed 6.02%; and pays Floating MXN MXIBTIIE 1 Month Citibank 24/3/2026 (575,970) (575,970)IRS EUR 88,880,000 Fund receives Floating EUR EURIBOR 6 Month; and pays Fixed
-0.50668% Credit Suisse 12/8/2021 (118,688) (92,146)IRS MXN 352,026,968 Fund receives Floating MXN MXIBTIIE 1 Month; and pays Fixed 7.2% Credit Suisse 3/8/2022 (165,930) (165,930)IRS EUR 56,520,000 Fund receives Floating EUR EURIBOR 6 Month; and pays Fixed
-0.43507% Credit Suisse 14/8/2024 (300,126) (303,597)IRS USD 10,231,311 Fund receives Fixed 1.527%; and pays Floating USD LIBOR 3 Month Credit Suisse 18/9/2024 100,707 100,707IRS MXN 128,100,000 Fund receives Fixed 8.72%; and pays Floating MXN MXIBTIIE 1 Month Credit Suisse 3/1/2029 798,091 798,091IRS MXN 253,592,767 Fund receives Floating MXN MXIBTIIE 1 Month; and pays Fixed
7.105% Deutsche Bank 14/10/2022 (100,528) (100,528)IRS MXN 193,289,233 Fund receives Floating MXN MXIBTIIE 1 Month; and pays Fixed 7.11% Deutsche Bank 14/10/2022 (77,986) (77,986)IRS MXN 336,807,890 Fund receives Floating MXN MXIBTIIE 1 Month; and pays Fixed
6.3072% Deutsche Bank 11/8/2025 402,561 402,561IRS INR 1,228,096,800 Fund receives Floating INR MIBOR 6 Month; and pays Fixed 5.55% Goldman Sachs 18/9/2024 (402,379) (402,379)IRS MXN 414,800,000 Fund receives Fixed 7.481%; and pays Floating MXN MXIBTIIE
1 Month Goldman Sachs 14/4/2027 777,429 777,429IRS THB 6,015,150 Fund receives Fixed 1.31%; and pays Floating THB BKIBOR 6 Month Goldman Sachs 18/9/2029 (1,407) (1,407)IRS THB 29,239,000 Fund receives Fixed 1.659%; and pays Floating THB BKIBOR 6 Month Goldman Sachs 18/9/2029 24,328 24,328IRS THB 41,450,000 Fund receives Fixed 1.7125%; and pays Floating THB BKIBOR
6 Month Goldman Sachs 18/9/2029 41,261 41,261IRS THB 116,800,000 Fund receives Fixed 1.185%; and pays Floating THB BKIBOR 6 Month HSBC Bank Plc 18/9/2024 (16,785) (16,785)IRS THB 266,602,000 Fund receives Fixed 1.46%; and pays Floating THB BKIBOR 6 Month HSBC Bank Plc 18/9/2024 77,573 77,573IRS INR 1,098,971,193 Fund receives Floating INR MIBOR 6 Month; and pays Fixed 5.51% HSBC Bank Plc 18/9/2024 (333,175) (333,175)IRS THB 194,489,850 Fund receives Fixed 1.295%; and pays Floating THB BKIBOR 6 Month HSBC Bank Plc 18/9/2029 (54,420) (54,420)IRS THB 200,505,000 Fund receives Fixed 1.32%; and pays Floating THB BKIBOR 6 Month HSBC Bank Plc 18/9/2029 (40,792) (40,792)IRS THB 12,531,000 Fund receives Fixed 1.66%; and pays Floating THB BKIBOR 6 Month HSBC Bank Plc 18/9/2029 10,464 10,464IRS BRL 16,868,978 Fund receives Fixed 12.17%; and pays Floating BRL BROIS 1 Day JP Morgan 4/1/2021 1,040,944 1,040,944IRS BRL 8,497,537 Fund receives Fixed 12.4%; and pays Floating BRL BROIS 1 Day JP Morgan 2/1/2023 874,624 874,624IRS BRL 28,035,808 Fund receives Fixed 8.195%; and pays Floating BRL BROIS 1 Day JP Morgan 2/1/2023 422,513 422,513IRS BRL 26,757,858 Fund receives Fixed 8.26%; and pays Floating BRL BROIS 1 Day JP Morgan 2/1/2023 411,788 411,788IRS BRL 91,014,356 Fund receives Fixed 8.27%; and pays Floating BRL BROIS 1 Day JP Morgan 2/1/2023 1,408,982 1,408,982IRS BRL 21,530,833 Fund receives Fixed 8.375%; and pays Floating BRL BROIS 1 Day JP Morgan 2/1/2023 378,938 378,938IRS BRL 29,228,390 Fund receives Fixed 9.45%; and pays Floating BRL BROIS 1 Day JP Morgan 2/1/2023 1,113,765 1,113,765IRS BRL 6,194,622 Fund receives Fixed 9.45%; and pays Floating BRL BROIS 1 Day JP Morgan 2/1/2023 236,050 236,050IRS INR 155,680,000 Fund receives Fixed 5.3525%; and pays Floating INR MIBOR 6 Month JP Morgan 18/9/2024 32,195 32,195IRS BRL 71,963,017 Fund receives Fixed 6.72%; and pays Floating BRL BROIS 1 Day Morgan Stanley 2/1/2025 (224,474) (224,474)IRS MXN 144,525,723 Fund receives Floating MXN MXIBTIIE 1 Month; and pays Fixed 7.64% UBS 18/11/2026 (334,732) (334,732)TRS USD (20,000) Fund receives USD LIBOR 3 Month BBA + 0bps; and pays Ford Motor
Co + 0bps Bank of America 24/8/2020 (7,800) (7,800)TRS USD (19,258) Fund receives USD LIBOR 3 Month BBA - 45bps; and pays Canadian
Natural Resources + 0bps BNP Paribas 27/11/2019 (25,613) (25,613)TRS USD (38,280) Fund receives USD LIBOR 3 Month BBA + 0bps; and pays Occidental
Petroleum Corp + 0bps; BNP Paribas 15/5/2020 10,336 10,336TRS USD (211,473) Fund receives USD LIBOR 3 Month BBA - 7.5bps; and pays Sprint
Corp + 0bps BNP Paribas 17/7/2020 (3,891) (3,891)TRS USD (1,294) Fund receives USD LIBOR 3 Month BBA - 25bps; and pays Charter
Communications Inc + 0bps BNP Paribas 5/8/2020 (34,893) (34,893)TRS USD (2,566) Fund receives USD LIBOR 3 Month BBA - 10bps; and pays Charter
Communications Inc + 0bps BNP Paribas 26/8/2020 (26,789) (26,789)TRS EUR 3,000,000 Fund receives Euro Interbank 3 Month Offer Rate + 0bps; and pays
Markit iBoxx Euro Corporate + 0bps Citibank 20/12/2019 (10,820) (12,351)TRS USD (79,478) Fund receives USD LIBOR 3 Month BBA + 0bps; and pays Sprint
Corp + 0bps Citibank 11/6/2020 (21,403) (21,403)TRS USD (79,478) Fund receives USD LIBOR 3 Month BBA + 0bps; and pays Sprint
Corp + 0bps Citibank 11/6/2020 (20,315) (20,315)TRS USD (300) Fund receives USD LIBOR 3 Month BBA - 20bps; and pays Netflix
Inc + 0bps Citibank 27/8/2020 (1,674) (1,674)TRS USD (63,560) Fund receives USD LIBOR 3 Month BBA - 52bps; and pays Intelsat
SA + 0bps Credit Suisse 11/6/2020 (108,687) (108,687)TRS USD 53,248,000 Fund receives iBoxx USD Liquid + 0bps; and pays USD LIBOR
3 Month BBA + 0bps JP Morgan 20/9/2019 2,910,636 2,822,048

The notes on pages 728 to 741 form an integral part of these financial statements.
[362] BlackRock Global Funds (BGF)
Swaps as at 31 August 2019
TypeNominal
Value Description Counterparty
Expiration date
Unrealised appreciation/
(depreciation) USD
Market Value USD
TRS EUR 1,500,000 Fund receives Euro Interbank 3 Month Offer Rate + 0bps; and pays iBoxx EUR Liquid High Yield + 0bps JP Morgan 20/12/2019 (19,352) (20,100)
TRS USD (9,195) Fund receives USD LIBOR 3 Month BBA - 125bps; and pays Quorum Health Corp + 0bps JP Morgan 11/6/2020 5,265 5,265
TRS USD (4,767) Fund receives USD LIBOR 3 Month BBA - 125bps; and pays Quorum Health Corp + 0bps JP Morgan 11/6/2020 1,869 1,869
TRS USD (6,355) Fund receives USD LIBOR 3 Month BBA - 125bps; and pays Quorum Health Corp + 0bps JP Morgan 11/6/2020 2,023 2,023
TRS USD (21,927) Fund receives USD LIBOR 3 Month BBA - 125bps; and pays Quorum Health Corp + 0bps JP Morgan 11/6/2020 12,310 12,310
TRS USD (15,889) Fund receives USD LIBOR 3 Month BBA - 125bps; and pays Quorum Health Corp + 0bps JP Morgan 11/6/2020 5,661 5,661
TRS USD (11,917) Fund receives USD LIBOR 3 Month BBA - 125bps; and pays Quorum Health Corp + 0bps JP Morgan 11/6/2020 4,279 4,279
TRS USD (56,396) Fund receives USD LIBOR 3 Month BBA - 125bps; and pays Quorum Health Corp + 0bps JP Morgan 11/6/2020 20,799 20,799
TRS USD (5,243) Fund receives USD LIBOR 3 Month BBA - 125bps; and pays Quorum Health Corp + 0bps JP Morgan 11/6/2020 2,517 2,517
TRS USD (13,798) Fund receives USD LIBOR 3 Month BBA - 125bps; and pays Quorum Health Corp + 0bps JP Morgan 11/6/2020 4,306 4,306
TRS USD (8,290) Fund receives USD LIBOR 3 Month BBA - 125bps; and pays Quorum Health Corp + 0bps JP Morgan 11/6/2020 6,047 6,047
TRS USD (5,113) Fund receives USD LIBOR 3 Month BBA - 125bps; and pays Quorum Health Corp + 0bps JP Morgan 11/6/2020 3,451 3,451
TRS EUR 2,400,000 Fund receives Euro Interbank 3 Month Offer Rate + 0bps; and pays iBoxx EUR Liquid High Yield + 0bps Morgan Stanley 20/9/2019 (14,538) (14,695)
Total (USD underlying exposure - USD 10,413,422,099) (16,764,529) (35,484,519)
CDS: Credit Default Swaps IFS: Inflation SwapsIRS: Interest Rate SwapsTRS: Total Return Swaps
Fixed Income Global Opportunities Fund continued
Purchased Options as at 31 August 2019
Number of contracts
Call/ Put
Description Counterparty
Strike Price
Expiration date
Unrealised appreciation/
(depreciation) USD
Market Value USD
16,267,000 Put OTC EUR/USD Bank of America EUR 1.095 3/9/2019 (44,115) 2,911 11,065,000 Call OTC USD/CHF Bank of America USD 1 4/9/2019 (10,301) 1,760 7,330,000 Call OTC AUD/USD Bank of America AUD 0.685 5/9/2019 (27,523) 1,170 7,810,000 Call OTC USD/TWD Bank of America USD 31.75 5/9/2019 (32,343) 1,724 44,262,000 Call OTC EUR/USD Bank of America EUR 1.135 6/9/2019 (126,215) 11 5,230,000 Put OTC USD/KRW Bank of America USD 1,190 10/9/2019 (13,310) 4,529 5,230,000 Put OTC USD/MXN Bank of America USD 19.5 10/9/2019 (44,130) 2,307 14,664,000 Put OTC USD/JPY Bank of America USD 102.5 12/9/2019 (20,845) 5,301 7,332,000 Put OTC USD/JPY Bank of America USD 102.5 12/9/2019 (6,881) 2,651 33,196,000 Put OTC USD/CHF Bank of America USD 0.975 17/9/2019 (104,248) 72,654 332,000 Put OTC USD/CHF Bank of America USD 0.955 17/9/2019 (22,352) 7,860 115,053,000 Put OTC USD/JPY Bank of America USD 106 19/9/2019 (63,329) 831,209 22,132,000 Put OTC USD/CAD Bank of America USD 1.3 25/9/2019 3,204 16,705 114,773,000 Put OTC USD/JPY Bank of America USD 105.25 26/9/2019 (199,566) 681,431 143,687,000 Put OTC EUR/USD Bank of America EUR 1.1175 3/10/2019 1,313,474 1,986,736 16,598,250 Call OTC AUD/USD Bank of America AUD 0.715 11/10/2019 (50,581) 1,927 11,065,000 Put OTC EUR/AUD Bank of America EUR 1.6 11/10/2019 (121,246) 30,774 6,639,000 Call OTC EUR/AUD Bank of America EUR 1.64 11/10/2019 (52,965) 87,555 11,065,000 Put OTC USD/CAD Bank of America USD 1.3 25/10/2019 6,473 25,173 5,865,000 Put OTC USD/MXN Bank of America USD 20.15 30/10/2019 3,664 91,827 33,196,000 Call OTC AUD/CHF Bank of America AUD 0.71 5/11/2019 (11,581) 10,526 22,131,000 Put OTC USD/ZAR Bank of America USD 14.2 5/11/2019 (119,968) 76,334 22,131,000 Put OTC USD/BRL Bank of America USD 3.8 7/11/2019 (103,080) 33,003 2,400,000 Call OTC EUR/USD Bank of America EUR 1.135 8/11/2019 (4,335) 9,159 650,000 Call OTC EUR/USD Bank of America EUR 1.17 8/11/2019 (63,764) 20,659 664,000 Put OTC USD/BRL Bank of America USD 3.45 21/11/2019 (33,706) 822 780,000 Put OTC EUR/USD Bank of America EUR 1.09 27/11/2019 54,247 187,997 71,149,000 Put OTC EUR/GBP Bank of America EUR 0.87 20/12/2019 164,221 829,911 94,702,000 Put OTC EUR/USD Bank of America EUR 1.11 20/1/2020 703,018 1,310,730 6,471,000 Put OTC EUR/USD Bank of America EUR 1.095 27/1/2020 20,439 58,577 885,200 Put OTC USD/ZAR Bank of America USD 14 12/2/2020 15,704 122,813 870,000 Put OTC USD/TRY Bank of America USD 5.05 25/2/2020 29,891 108,138
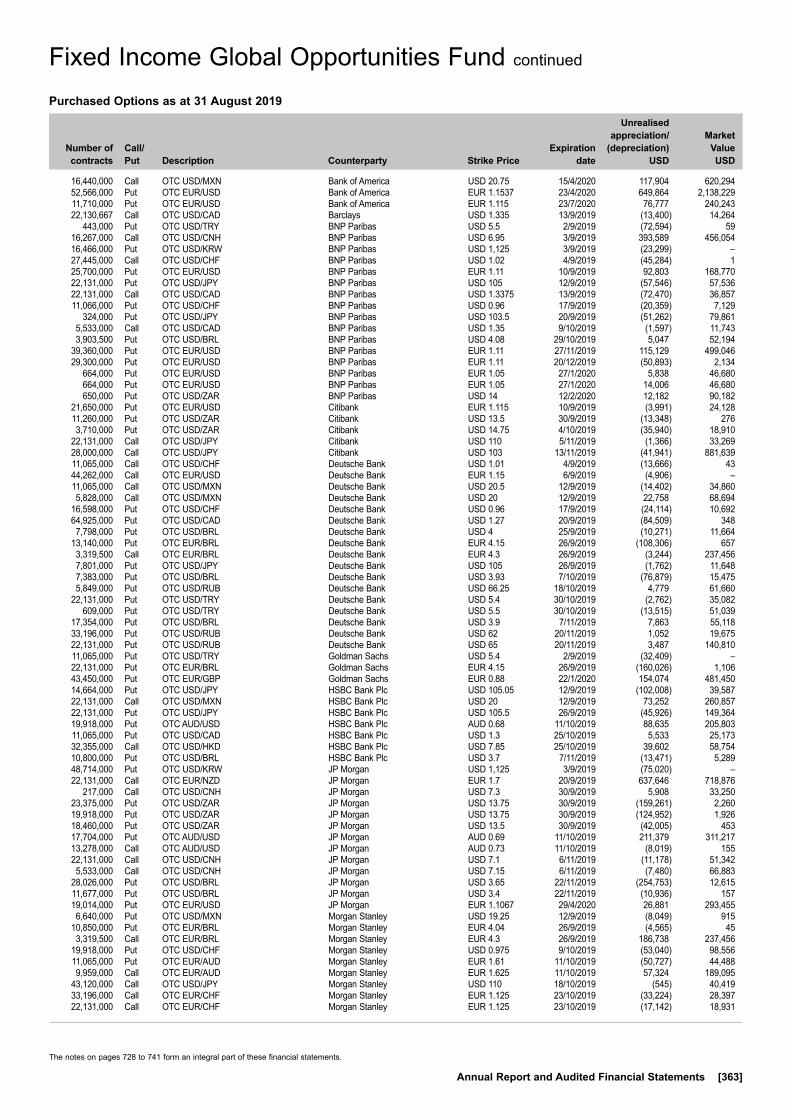
The notes on pages 728 to 741 form an integral part of these financial statements.
Annual Report and Audited Financial Statements [363]
Fixed Income Global Opportunities Fund continued
Purchased Options as at 31 August 2019
Number of contracts
Call/ Put
Description Counterparty
Strike Price
Expiration date
Unrealised appreciation/
(depreciation) USD
Market Value USD
16,440,000 Call OTC USD/MXN Bank of America USD 20.75 15/4/2020 117,904 620,294 52,566,000 Put OTC EUR/USD Bank of America EUR 1.1537 23/4/2020 649,864 2,138,229 11,710,000 Put OTC EUR/USD Bank of America EUR 1.115 23/7/2020 76,777 240,243 22,130,667 Call OTC USD/CAD Barclays USD 1.335 13/9/2019 (13,400) 14,264 443,000 Put OTC USD/TRY BNP Paribas USD 5.5 2/9/2019 (72,594) 59 16,267,000 Call OTC USD/CNH BNP Paribas USD 6.95 3/9/2019 393,589 456,054 16,466,000 Put OTC USD/KRW BNP Paribas USD 1,125 3/9/2019 (23,299) – 27,445,000 Call OTC USD/CHF BNP Paribas USD 1.02 4/9/2019 (45,284) 1 25,700,000 Put OTC EUR/USD BNP Paribas EUR 1.11 10/9/2019 92,803 168,770 22,131,000 Put OTC USD/JPY BNP Paribas USD 105 12/9/2019 (57,546) 57,536 22,131,000 Call OTC USD/CAD BNP Paribas USD 1.3375 13/9/2019 (72,470) 36,857 11,066,000 Put OTC USD/CHF BNP Paribas USD 0.96 17/9/2019 (20,359) 7,129 324,000 Put OTC USD/JPY BNP Paribas USD 103.5 20/9/2019 (51,262) 79,861 5,533,000 Call OTC USD/CAD BNP Paribas USD 1.35 9/10/2019 (1,597) 11,743 3,903,500 Put OTC USD/BRL BNP Paribas USD 4.08 29/10/2019 5,047 52,194 39,360,000 Put OTC EUR/USD BNP Paribas EUR 1.11 27/11/2019 115,129 499,046 29,300,000 Put OTC EUR/USD BNP Paribas EUR 1.11 20/12/2019 (50,893) 2,134 664,000 Put OTC EUR/USD BNP Paribas EUR 1.05 27/1/2020 5,838 46,680 664,000 Put OTC EUR/USD BNP Paribas EUR 1.05 27/1/2020 14,006 46,680 650,000 Put OTC USD/ZAR BNP Paribas USD 14 12/2/2020 12,182 90,182 21,650,000 Put OTC EUR/USD Citibank EUR 1.115 10/9/2019 (3,991) 24,128 11,260,000 Put OTC USD/ZAR Citibank USD 13.5 30/9/2019 (13,348) 276 3,710,000 Put OTC USD/ZAR Citibank USD 14.75 4/10/2019 (35,940) 18,910 22,131,000 Call OTC USD/JPY Citibank USD 110 5/11/2019 (1,366) 33,269 28,000,000 Call OTC USD/JPY Citibank USD 103 13/11/2019 (41,941) 881,639 11,065,000 Call OTC USD/CHF Deutsche Bank USD 1.01 4/9/2019 (13,666) 43 44,262,000 Call OTC EUR/USD Deutsche Bank EUR 1.15 6/9/2019 (4,906) – 11,065,000 Call OTC USD/MXN Deutsche Bank USD 20.5 12/9/2019 (14,402) 34,860 5,828,000 Call OTC USD/MXN Deutsche Bank USD 20 12/9/2019 22,758 68,694 16,598,000 Put OTC USD/CHF Deutsche Bank USD 0.96 17/9/2019 (24,114) 10,692 64,925,000 Put OTC USD/CAD Deutsche Bank USD 1.27 20/9/2019 (84,509) 348 7,798,000 Put OTC USD/BRL Deutsche Bank USD 4 25/9/2019 (10,271) 11,664 13,140,000 Put OTC EUR/BRL Deutsche Bank EUR 4.15 26/9/2019 (108,306) 657 3,319,500 Call OTC EUR/BRL Deutsche Bank EUR 4.3 26/9/2019 (3,244) 237,456 7,801,000 Put OTC USD/JPY Deutsche Bank USD 105 26/9/2019 (1,762) 11,648 7,383,000 Put OTC USD/BRL Deutsche Bank USD 3.93 7/10/2019 (76,879) 15,475 5,849,000 Put OTC USD/RUB Deutsche Bank USD 66.25 18/10/2019 4,779 61,660 22,131,000 Put OTC USD/TRY Deutsche Bank USD 5.4 30/10/2019 (2,762) 35,082 609,000 Put OTC USD/TRY Deutsche Bank USD 5.5 30/10/2019 (13,515) 51,039 17,354,000 Put OTC USD/BRL Deutsche Bank USD 3.9 7/11/2019 7,863 55,118 33,196,000 Put OTC USD/RUB Deutsche Bank USD 62 20/11/2019 1,052 19,675 22,131,000 Put OTC USD/RUB Deutsche Bank USD 65 20/11/2019 3,487 140,810 11,065,000 Put OTC USD/TRY Goldman Sachs USD 5.4 2/9/2019 (32,409) – 22,131,000 Put OTC EUR/BRL Goldman Sachs EUR 4.15 26/9/2019 (160,026) 1,106 43,450,000 Put OTC EUR/GBP Goldman Sachs EUR 0.88 22/1/2020 154,074 481,450 14,664,000 Put OTC USD/JPY HSBC Bank Plc USD 105.05 12/9/2019 (102,008) 39,587 22,131,000 Call OTC USD/MXN HSBC Bank Plc USD 20 12/9/2019 73,252 260,857 22,131,000 Put OTC USD/JPY HSBC Bank Plc USD 105.5 26/9/2019 (45,926) 149,364 19,918,000 Put OTC AUD/USD HSBC Bank Plc AUD 0.68 11/10/2019 88,635 205,803 11,065,000 Put OTC USD/CAD HSBC Bank Plc USD 1.3 25/10/2019 5,533 25,173 32,355,000 Call OTC USD/HKD HSBC Bank Plc USD 7.85 25/10/2019 39,602 58,754 10,800,000 Put OTC USD/BRL HSBC Bank Plc USD 3.7 7/11/2019 (13,471) 5,289 48,714,000 Put OTC USD/KRW JP Morgan USD 1,125 3/9/2019 (75,020) – 22,131,000 Call OTC EUR/NZD JP Morgan EUR 1.7 20/9/2019 637,646 718,876 217,000 Call OTC USD/CNH JP Morgan USD 7.3 30/9/2019 5,908 33,250 23,375,000 Put OTC USD/ZAR JP Morgan USD 13.75 30/9/2019 (159,261) 2,260 19,918,000 Put OTC USD/ZAR JP Morgan USD 13.75 30/9/2019 (124,952) 1,926 18,460,000 Put OTC USD/ZAR JP Morgan USD 13.5 30/9/2019 (42,005) 453 17,704,000 Put OTC AUD/USD JP Morgan AUD 0.69 11/10/2019 211,379 311,217 13,278,000 Call OTC AUD/USD JP Morgan AUD 0.73 11/10/2019 (8,019) 155 22,131,000 Call OTC USD/CNH JP Morgan USD 7.1 6/11/2019 (11,178) 51,342 5,533,000 Call OTC USD/CNH JP Morgan USD 7.15 6/11/2019 (7,480) 66,883 28,026,000 Put OTC USD/BRL JP Morgan USD 3.65 22/11/2019 (254,753) 12,615 11,677,000 Put OTC USD/BRL JP Morgan USD 3.4 22/11/2019 (10,936) 157 19,014,000 Put OTC EUR/USD JP Morgan EUR 1.1067 29/4/2020 26,881 293,455 6,640,000 Put OTC USD/MXN Morgan Stanley USD 19.25 12/9/2019 (8,049) 915 10,850,000 Put OTC EUR/BRL Morgan Stanley EUR 4.04 26/9/2019 (4,565) 45 3,319,500 Call OTC EUR/BRL Morgan Stanley EUR 4.3 26/9/2019 186,738 237,456 19,918,000 Put OTC USD/CHF Morgan Stanley USD 0.975 9/10/2019 (53,040) 98,556 11,065,000 Put OTC EUR/AUD Morgan Stanley EUR 1.61 11/10/2019 (50,727) 44,488 9,959,000 Call OTC EUR/AUD Morgan Stanley EUR 1.625 11/10/2019 57,324 189,095 43,120,000 Call OTC USD/JPY Morgan Stanley USD 110 18/10/2019 (545) 40,419 33,196,000 Call OTC EUR/CHF Morgan Stanley EUR 1.125 23/10/2019 (33,224) 28,397 22,131,000 Call OTC EUR/CHF Morgan Stanley EUR 1.125 23/10/2019 (17,142) 18,931

The notes on pages 728 to 741 form an integral part of these financial statements.
[364] BlackRock Global Funds (BGF)
Fixed Income Global Opportunities Fund continued
Purchased Options as at 31 August 2019
Number of contracts
Call/ Put
Description Counterparty
Strike Price
Expiration date
Unrealised appreciation/
(depreciation) USD
Market Value USD
3,903,500 Put OTC USD/BRL Morgan Stanley USD 4.08 29/10/2019 5,558 52,194 13,278,000 Put OTC USD/CHF Morgan Stanley USD 0.95 27/11/2019 (15,437) 57,539 6,471,000 Put OTC EUR/CAD Morgan Stanley EUR 1.4405 27/1/2020 6,897 47,170 4,900,000 Put OTC EUR/USD RBS Plc EUR 1.11 8/11/2019 21,787 58,175 22,131,000 Call OTC USD/CAD Royal Bank of Canada USD 1.35 13/9/2019 (9,786) 11,216 33,196,000 Call OTC USD/CAD UBS USD 1.35 25/9/2019 (58,467) 41,818 6,974,000 Put OTC EUR/USD UBS EUR 1.115 11/10/2019 37,787 87,590 22,318 Call S&P 500 Index Goldman Sachs USD 2,850 20/12/2019 (292,607) 672,055 1,748 Put 1 Year Eurodollar MIDCV Exchange Traded USD 97.5 13/12/2019 (144,874) 10,925 1,918 Put 3 Year Eurodollar MIDCV Exchange Traded USD 97.5 13/9/2019 (135,718) 11,987 1,460 Call Altice Europe NV Exchange Traded EUR 4.5 20/9/2019 (30,997) 8,064 1,095 Call Altice Europe NV Exchange Traded EUR 4.4 20/9/2019 (23,248) 7,862 365 Call Altice Europe NV Exchange Traded EUR 4.8 18/10/2019 (9,368) 3,226 730 Call American Airlines Group Inc Exchange Traded USD 35 20/12/2019 (145,355) 15,330 445 Call Apple Inc Exchange Traded USD 195 17/1/2020 634,717 1,046,862 2,575 Call Bank of America Corp Exchange Traded USD 28 18/10/2019 14,832 198,275 6,099 Call Caesars Entertainment Corp Exchange Traded USD 12 17/1/2020 (210,175) 121,980 329 Put Caesars Entertainment Corp Exchange Traded USD 10 17/1/2020 (3,685) 3,290 7,644 Call Caesars Entertainment Corp Exchange Traded USD 12 15/1/2021 (203,830) 707,070 357 Put Casino Guichard Perrachon SA Exchange Traded EUR 28 18/10/2019 (38,080) 27,210 289 Put CBOE SPX Volatility Index Exchange Traded USD 16 18/9/2019 5,433 18,063 55 Call CBOE SPX Volatility Index Exchange Traded USD 25 18/9/2019 (1,559) 3,025 1,438 Call Citigroup Inc Exchange Traded USD 67.5 18/10/2019 17,693 181,907 175 Put CommScope Holding Co Inc Exchange Traded USD 10 15/11/2019 640 13,125 981 Call Dax Index Exchange Traded EUR 12,000 20/9/2019 334,017 801,895 1,610 Call Dax Index Exchange Traded EUR 13,700 20/12/2019 (492,153) 42,238 144 Call Dax Index Exchange Traded EUR 13,300 20/12/2019 (58,834) 14,356 288 Call Dax Index Exchange Traded EUR 14,000 20/3/2020 (118,021) 20,758 107 Call Dax Index Exchange Traded EUR 13,600 20/3/2020 (42,780) 22,014 150 Put Dell Technologies Inc Exchange Traded USD 45 20/9/2019 (20,205) 3,375 580 Call Delta Air Lines Inc Exchange Traded USD 65 20/12/2019 (105,075) 58,580 1,323 Call Emerson Electric Co Exchange Traded USD 65 17/1/2020 (163,324) 198,450 731 Put Euro Bund Exchange Traded EUR 173 25/10/2019 (294,810) 246,283 1,812 Call EURO STOXX 50 Index Exchange Traded EUR 3,450 20/9/2019 322,975 764,607 211 Put EURO STOXX 50 Index Exchange Traded EUR 3,150 20/9/2019 (113,009) 10,721 164 Put EURO STOXX 50 Index Exchange Traded EUR 3,300 20/9/2019 (120,495) 28,080 144 Call EURO STOXX 50 Index Exchange Traded EUR 3,650 20/9/2019 (34,239) 477 712 Call EURO STOXX 50 Index Exchange Traded EUR 3,600 18/10/2019 (184,300) 72,358 5,623 Call EURO STOXX 50 Index Exchange Traded EUR 3,850 20/12/2019 (456,687) 136,649 242 Call EURO STOXX 50 Index Exchange Traded EUR 3,750 20/12/2019 (38,700) 21,920 100 Call EURO STOXX 50 Index Exchange Traded EUR 3,800 20/12/2019 (15,379) 4,860 575 Call EURO STOXX 50 Index Exchange Traded EUR 3,900 20/3/2020 (77,295) 44,144 259 Call EURO STOXX 50 Index Exchange Traded EUR 3,600 20/3/2020 (50,148) 183,676 214 Call EURO STOXX 50 Index Exchange Traded EUR 3,800 20/3/2020 (35,779) 38,768 1,261 Call EURO STOXX Banks Index Exchange Traded EUR 105 20/9/2019 (220,239) 3,482 536 Call EURO STOXX Banks Index Exchange Traded EUR 85 20/9/2019 (14,334) 18,503 500 Call EURO STOXX Banks Index Exchange Traded EUR 97.5 20/9/2019 (30,599) 1,381 2,900 Call Eurodollar IMM Exchange Traded USD 99 11/10/2019 (40,297) 18,125 1,557 Call Eurodollar IMM Exchange Traded USD 98.5 11/10/2019 (75,522) 63,253 3,421 Call Eurodollar IMM Exchange Traded USD 97.75 16/3/2020 5,318,697 5,901,225 250 Put Ford Motor Co Exchange Traded USD 9 27/9/2019 (3,200) 4,250 150 Put General Electric Co Exchange Traded USD 7 20/12/2019 (780) 5,700 256 Put Kellogg Co Exchange Traded USD 57.5 17/1/2020 (55,466) 37,760 200 Call Lions Gate Capital Holdings LLC Exchange Traded USD 15 20/3/2020 (14,940) 6,500 1,470 Call Lowe’s Cos Inc Exchange Traded USD 100 17/1/2020 1,458,191 2,296,875 817 Call Microsoft Corp Exchange Traded USD 150 18/10/2019 (59,386) 53,513 553 Call Microsoft Corp Exchange Traded USD 130 17/1/2020 430,123 757,610 75 Call Mylan NV Exchange Traded USD 20 20/9/2019 (446) 6,000 20 Call NASDAQ 100 Stock Index Exchange Traded USD 7,875 18/10/2019 56,261 280,100 30 Put Netflix Inc Exchange Traded USD 250 18/10/2019 (850) 11,775 607 Put Occidental Petroleum Corp Exchange Traded USD 37.5 20/9/2019 (6,798) 5,766 5,933 Call Pfizer Inc Exchange Traded USD 42 20/9/2019 (452,100) 5,933 125 Call QUALCOMM Inc Exchange Traded USD 80 20/9/2019 5,662 13,438 1,323 Call QUALCOMM Inc Exchange Traded USD 70 17/1/2020 608,646 1,336,230 89 Put S&P 500 Index Exchange Traded USD 2,900 20/9/2019 (161,255) 275,455 35 Put S&P 500 Index Exchange Traded USD 2,725 20/9/2019 (6,749) 23,800 135 Put SPDR S&P 500 ETF Trust Exchange Traded USD 278 6/9/2019 (1,714) 2,902 50 Put SPDR S&P 500 ETF Trust Exchange Traded USD 280 13/9/2019 (5,285) 3,825 50 Put SPDR S&P 500 ETF Trust Exchange Traded USD 277 16/9/2019 (7,372) 3,200 2,016 Call SPDR S&P 500 ETF Trust Exchange Traded USD 302 20/9/2019 56,263 144,144 1,008 Call SPDR S&P 500 ETF Trust Exchange Traded USD 296 20/9/2019 129,326 295,848 453 Call SPDR S&P 500 ETF Trust Exchange Traded USD 303 20/9/2019 (157,055) 24,235 3,401 Call SPDR S&P 500 ETF Trust Exchange Traded USD 300 20/12/2019 (1,623,410) 2,348,391 10 Call SPDR S&P 500 ETF Trust Exchange Traded USD 295 20/12/2019 2,808 9,750

The notes on pages 728 to 741 form an integral part of these financial statements.
Annual Report and Audited Financial Statements [365]
Fixed Income Global Opportunities Fund continued
Written Options as at 31 August 2019
Number of contracts
Call/ Put
Description Counterparty
Strike Price
Expiration date
Unrealised appreciation/
(depreciation) USD
Market Value USD
(32,534,000) Put OTC EUR/USD Bank of America EUR 1.084 3/9/2019 39,292 (75) (11,065,000) Call OTC USD/CHF Bank of America USD 1.01 4/9/2019 4,161 (43) (16,598,000) Put OTC EUR/USD Bank of America EUR 1.11 6/9/2019 (63,975) (100,158) (66,392,000) Call OTC EUR/USD Bank of America EUR 1.15 6/9/2019 54,637 – (25,700,000) Put OTC EUR/USD Bank of America EUR 1.11 10/9/2019 (35,116) (168,770) (14,664,000) Put OTC USD/JPY Bank of America USD 105.05 12/9/2019 54,820 (39,587) (27,664,000) Put OTC USD/CHF Bank of America USD 0.96 17/9/2019 53,608 (17,821) (115,053,000) Put OTC USD/JPY Bank of America USD 104.5 19/9/2019 (14,819) (354,225) (114,773,000) Put OTC USD/JPY Bank of America USD 103.75 26/9/2019 54,380 (306,582) (664,000) Put OTC AUD/USD Bank of America AUD 0.69 11/10/2019 (6,392) (11,672) (13,278,000) Call OTC AUD/USD Bank of America AUD 0.73 11/10/2019 13,508 (155) (9,959,000) Call OTC EUR/AUD Bank of America EUR 1.625 11/10/2019 91,623 (189,096) (11,065,000) Put OTC EUR/AUD Bank of America EUR 1.61 11/10/2019 155,224 (44,489) (8,797,000) Put OTC USD/MXN Bank of America USD 19.65 30/10/2019 (4,893) (56,663) (38,729,000) Put OTC USD/ZAR Bank of America USD 13.9 5/11/2019 118,229 (68,058) (27,664,000) Put OTC USD/BRL Bank of America USD 3.7 7/11/2019 52,958 (13,546) (32,480,000) Call OTC EUR/USD Bank of America EUR 1.17 8/11/2019 62,320 (23,505) (94,702,000) Call OTC EUR/USD Bank of America EUR 1.16 20/1/2020 481,820 (172,639) (6,471,000) Call OTC EUR/USD Bank of America EUR 1.155 27/1/2020 24,986 (13,731) (13,278,000) Put OTC USD/TRY BNP Paribas USD 5.4 2/9/2019 44,171 – (324,000) Put OTC USD/JPY BNP Paribas USD 103.5 3/9/2019 80,242 (3,998) (27,663,500) Put OTC USD/JPY BNP Paribas USD 104 12/9/2019 48,099 (33,608) (5,828,000) Call OTC USD/MXN BNP Paribas USD 20.2 12/9/2019 (9,166) (41,366) (13,280,000) Put OTC USD/CAD BNP Paribas USD 1.32 13/9/2019 15,420 (32,388) (33,196,000) Call OTC USD/CAD BNP Paribas USD 1.35 13/9/2019 62,847 (16,824) (332,000) Put OTC USD/CHF BNP Paribas USD 0.955 17/9/2019 44,596 (7,860) (14,272,000) Put OTC USD/CHF BNP Paribas USD 0.975 17/9/2019 125,316 (31,236) (18,924,000) Put OTC USD/CHF BNP Paribas USD 0.975 17/9/2019 73,017 (41,418) (33,196,000) Call OTC USD/CAD BNP Paribas USD 1.35 25/9/2019 8,806 (41,818) (1,952,000) Call OTC USD/BRL BNP Paribas USD 4.3 29/10/2019 3,825 (22,490) (3,903,500) Put OTC USD/BRL BNP Paribas USD 3.92 29/10/2019 (2,867) (14,497) (5,565,000) Put OTC USD/ZAR Citibank USD 14.4 4/10/2019 28,876 (10,614) (28,000,000) Call OTC USD/JPY Citibank USD 98 13/11/2019 39,609 (2,067,112) (11,065,000) Call OTC USD/CHF Deutsche Bank USD 1 4/9/2019 33,914 (1,760) (3,320,000) Call OTC USD/MXN Deutsche Bank USD 20 12/9/2019 5,146 (39,133) (2,924,000) Put OTC USD/RUB Deutsche Bank USD 66 20/9/2019 1,080 (15,903) (3,942,000) Call OTC EUR/BRL Deutsche Bank EUR 4.3 26/9/2019 (218,164) (281,985) (13,140,000) Put OTC EUR/BRL Deutsche Bank EUR 4.05 26/9/2019 36,917 (70) (14,646,000) Call OTC USD/JPY Deutsche Bank USD 106.25 26/9/2019 (20,526) (109,295) (3,692,000) Call OTC USD/BRL Deutsche Bank USD 4.2 7/10/2019 (25,655) (50,813) (7,383,000) Put OTC USD/BRL Deutsche Bank USD 3.8 7/10/2019 22,522 (2,580) (2,924,000) Call OTC USD/RUB Deutsche Bank USD 70 18/10/2019 5,461 (13,261) (22,131,000) Put OTC USD/TRY Deutsche Bank USD 5.5 30/10/2019 3,573 (66,693) (3,095,000) Call OTC USD/BRL Deutsche Bank USD 4.1 7/11/2019 (52,334) (98,140) (33,196,000) Put OTC USD/RUB Deutsche Bank USD 64 20/11/2019 (5,798) (107,212) (443,000) Put OTC USD/TRY Goldman Sachs USD 5.5 2/9/2019 154,205 (59) (6,639,000) Call OTC EUR/BRL Goldman Sachs EUR 4.3 26/9/2019 (363,702) (474,912)
Purchased Options as at 31 August 2019
Number of contracts
Call/ Put
Description Counterparty
Strike Price
Expiration date
Unrealised appreciation/
(depreciation) USD
Market Value USD
294 Call SPDR S&P 500 ETF Trust Exchange Traded USD 315 31/12/2019 (48,325) 51,597 2,160 Call SPDR S&P 500 ETF Trust Exchange Traded USD 325 30/6/2020 (247,456) 780,840 2,806 Call Taiwan Semiconductor
Manufacturing Co Ltd Exchange Traded USD 46 17/1/2020 (76,323) 392,840 500 Put Teva Pharmaceutical Industries Ltd Exchange Traded USD 6 18/10/2019 (5,350) 17,250 200 Put Teva Pharmaceutical Industries Ltd Exchange Traded USD 7 18/10/2019 460 15,100 218 Call Unicredit SpA Exchange Traded EUR 12 20/12/2019 (62,104) 23,358 387 Call United Airlines Holdings Inc Exchange Traded USD 100 20/12/2019 (128,991) 29,992 59 Put US Treasury 10 Year Note Exchange Traded USD 131.5 6/9/2019 4,981 19,820 59 Call US Treasury 10 Year Note Exchange Traded USD 132.5 6/9/2019 (11,152) 4,609 858 Put US Treasury 10 Year Note Exchange Traded USD 131 20/9/2019 45,618 341,860 57 Put US Treasury 10 Year Note Exchange Traded USD 130 20/9/2019 (20,571) 8,016 10 Put US Treasury 10 Year Note Exchange Traded USD 130 25/10/2019 (1,031) 3,984 218 Call US Treasury 10 Year Note Exchange Traded USD 132 22/11/2019 (36,097) 223,109 200 Call Walt Disney Co/The Exchange Traded USD 141 13/9/2019 (240) 20,300 65 Call Walt Disney Co/The Exchange Traded USD 141 20/9/2019 4,241 9,913
Total (USD underlying exposure - USD 1,878,850,020) 4,173,396 38,305,981

The notes on pages 728 to 741 form an integral part of these financial statements.
[366] BlackRock Global Funds (BGF)
Fixed Income Global Opportunities Fund continued
Written Options as at 31 August 2019
Number of contracts
Call/ Put
Description Counterparty
Strike Price
Expiration date
Unrealised appreciation/
(depreciation) USD
Market Value USD
(22,131,000) Put OTC EUR/BRL Goldman Sachs EUR 4.04 26/9/2019 47,078 (92) (16,267,000) Call OTC USD/CNH HSBC Bank Plc USD 6.95 3/9/2019 (335,679) (456,054) (21,996,000) Put OTC USD/JPY HSBC Bank Plc USD 102.5 12/9/2019 62,039 (7,952) (11,065,000) Put OTC USD/MXN HSBC Bank Plc USD 19.25 12/9/2019 34,437 (1,524) (33,196,000) Call OTC USD/MXN HSBC Bank Plc USD 20.5 12/9/2019 11,107 (104,581) (11,065,000) Call OTC USD/JPY HSBC Bank Plc USD 107 26/9/2019 1,717 (48,739) (27,664,000) Put OTC USD/JPY HSBC Bank Plc USD 104.5 26/9/2019 45,098 (111,574) (17,040,000) Put OTC AUD/USD HSBC Bank Plc AUD 0.69 11/10/2019 (118,685) (299,545) (4,900,000) Put OTC EUR/USD HSBC Bank Plc EUR 1.11 8/11/2019 (11,737) (58,175) (29,038,000) Put OTC USD/ZAR JP Morgan USD 13.5 30/9/2019 93,081 (712) (38,729,000) Put OTC USD/ZAR JP Morgan USD 13.5 30/9/2019 113,688 (950) (33,196,000) Put OTC AUD/USD JP Morgan AUD 0.68 11/10/2019 (239,667) (342,999) (8,852,000) Call OTC USD/CNH JP Morgan USD 7.1 6/11/2019 (37,306) (140,709) (8,758,000) Call OTC USD/BRL JP Morgan USD 3.95 22/11/2019 (406,328) (515,278) (35,032,000) Put OTC USD/BRL JP Morgan USD 3.5 22/11/2019 83,933 (2,246) (6,861,000) Call OTC EUR/NZD Morgan Stanley EUR 1.7 20/9/2019 (195,057) (222,864) (15,270,000) Call OTC EUR/NZD Morgan Stanley EUR 1.7 20/9/2019 (415,750) (496,012) (6,639,000) Put OTC EUR/BRL Morgan Stanley EUR 4.15 26/9/2019 52,917 (332) (38,729,000) Put OTC USD/CHF Morgan Stanley USD 0.965 9/10/2019 56,993 (109,425) (11,063,000) Call OTC EUR/AUD Morgan Stanley EUR 1.64 11/10/2019 (46,571) (145,898) (11,065,000) Put OTC EUR/AUD Morgan Stanley EUR 1.6 11/10/2019 37,491 (30,774) (11,065,000) Put OTC EUR/AUD Morgan Stanley EUR 1.625 11/10/2019 6,958 (75,950) (11,065,000) Call OTC EUR/AUD Morgan Stanley EUR 1.655 11/10/2019 (3,330) (97,998) (33,196,000) Call OTC EUR/CHF Morgan Stanley EUR 1.14 23/10/2019 12,378 (7,594) (1,952,000) Call OTC USD/BRL Morgan Stanley USD 4.3 29/10/2019 1,506 (22,490) (3,903,500) Put OTC USD/BRL Morgan Stanley USD 3.92 29/10/2019 (3,762) (14,497) (6,471,000) Call OTC EUR/CAD Morgan Stanley EUR 1.5295 27/1/2020 5,910 (30,961) (16,440,000) Call OTC USD/MXN Morgan Stanley USD 20.75 15/4/2020 (128,738) (620,294) (2,400,000) Call OTC EUR/USD RBS Plc EUR 1.135 8/11/2019 21,552 (9,159) (22,131,000) Call OTC USD/CAD Royal Bank of Canada USD 1.3375 13/9/2019 27,898 (36,857) (5,533,000) Put OTC USD/CAD Royal Bank of Canada USD 1.27 20/9/2019 8,104 (30) (5,533,000) Call OTC USD/CAD Royal Bank of Canada USD 1.35 9/10/2019 250 (11,743) (3,487,000) Call OTC EUR/USD UBS EUR 1.137 11/10/2019 16,954 (4,558) (5,230,000) Put OTC EUR/USD UBS EUR 1.095 11/10/2019 (7,732) (21,025) (1,279) Put 1 Year Eurodollar MIDCV Exchange Traded USD 97.625 13/9/2019 149,310 (7,994) (1,748) Put 1 Year Eurodollar MIDCV Exchange Traded USD 97.375 13/12/2019 51,776 (10,925) (9,357) Call 1 Year Eurodollar MIDCV Exchange Traded USD 98.375 13/12/2019 (6,690,466) (9,298,519) (23) Put Alphabet Inc Exchange Traded USD 1,040 18/10/2019 19,846 (10,235) (12) Put Amazon.com Inc Exchange Traded USD 1,550 18/10/2019 18,872 (10,620) (504) Put Apple Inc Exchange Traded USD 192.5 20/9/2019 68,598 (66,528) (1,008) Put Apple Inc Exchange Traded USD 197.5 20/9/2019 57,741 (202,608) (80) Put Apple Inc Exchange Traded USD 175 18/10/2019 19,220 (9,520) (445) Call Apple Inc Exchange Traded USD 220 17/1/2020 (290,491) (431,650) (232) Call BAE Systems Holdings Inc Exchange Traded GBP 5 20/9/2019 (97,880) (136,026) (2,725) Put Bank of America Corp Exchange Traded USD 25 20/9/2019 113,384 (28,613) (6,902) Put Bank of America Corp Exchange Traded USD 29 20/9/2019 (629,850) (1,187,144) (50) Call CBOE SPX Volatility Index Exchange Traded USD 30 18/9/2019 840 (1,500) (2,146) Put Citigroup Inc Exchange Traded USD 55 20/9/2019 115,216 (18,241) (4,014) Put Citigroup Inc Exchange Traded USD 67.5 20/9/2019 (820,387) (1,334,655) (108) Put Dax Index Exchange Traded EUR 11,100 20/9/2019 39,282 (12,467) (873) Call Dax Index Exchange Traded EUR 12,300 20/9/2019 (73,123) (160,322) (1,323) Call Emerson Electric Co Exchange Traded USD 75 17/1/2020 43,062 (19,845) (9,400) Call Engie SA Exchange Traded EUR 13.61 20/9/2019 (18,648) (40,496) (211) Put EURO STOXX 50 Index Exchange Traded EUR 3,000 20/9/2019 52,613 (3,962) (336) Put EURO STOXX 50 Index Exchange Traded EUR 3,200 20/9/2019 113,234 (24,868) (1,640) Call EURO STOXX 50 Index Exchange Traded EUR 3,550 20/9/2019 (37,376) (79,710) (2,878) Put Eurodollar IMM Exchange Traded USD 97.875 16/12/2019 497,865 (323,775) (3,421) Call Eurodollar IMM Exchange Traded USD 97.875 16/3/2020 (4,452,534) (4,917,687) (150) Put General Electric Co Exchange Traded USD 4 20/12/2019 45 (825) (1,412) Call Iberdrola SA Exchange Traded EUR 8.75 20/9/2019 (62,257) (102,943) (571) Put Intel Corp Exchange Traded USD 40 18/10/2019 15,889 (11,991) (2,896) Put JPMorgan Chase & Co Exchange Traded USD 110 20/9/2019 (109,598) (609,608) (4,344) Call Koninklijke Philips NV Exchange Traded EUR 2.8 20/9/2019 (21,268) (52,784) (1,470) Call Lowe’s Cos Inc Exchange Traded USD 115 17/1/2020 (662,243) (911,400) (150) Put Microsoft Corp Exchange Traded USD 120 18/10/2019 19,394 (9,675) (553) Put Microsoft Corp Exchange Traded USD 105 17/1/2020 149,195 (54,194) (553) Call Microsoft Corp Exchange Traded USD 140 17/1/2020 (258,365) (420,280) (132) Call National Grid Plc Exchange Traded GBP 8.5 20/9/2019 (4,174) (35,876) (30) Put Netflix Inc Exchange Traded USD 210 18/10/2019 463 (2,370) (906) Call Orange SA Exchange Traded EUR 14 20/9/2019 24,806 (12,009) (5,933) Call Pfizer Inc Exchange Traded USD 44 20/9/2019 182,539 (5,933) (125) Call QUALCOMM Inc Exchange Traded USD 85 20/9/2019 (712) (2,063) (190) Put QUALCOMM Inc Exchange Traded USD 60 18/10/2019 23,901 (4,370) (1,323) Call QUALCOMM Inc Exchange Traded USD 85 17/1/2020 (126,285) (341,995)

The notes on pages 728 to 741 form an integral part of these financial statements.
Annual Report and Audited Financial Statements [367]
Fixed Income Global Opportunities Fund continued
Written Options as at 31 August 2019
Number of contracts
Call/ Put
Description Counterparty
Strike Price
Expiration date
Unrealised appreciation/
(depreciation) USD
Market Value USD
(14) Put S&P 500 Index Exchange Traded USD 2,700 20/9/2019 34,567 (7,490) (35) Put S&P 500 Index Exchange Traded USD 2,825 20/9/2019 15,998 (57,575) (75) Put S&P 500 Index Exchange Traded USD 2,800 20/9/2019 88,532 (99,375) (272) Call Snam SpA Exchange Traded EUR 4.6 20/9/2019 2,212 (34,628) (135) Put SPDR S&P 500 ETF Trust Exchange Traded USD 268 6/9/2019 7,232 (742) (50) Put SPDR S&P 500 ETF Trust Exchange Traded USD 270 13/9/2019 1,606 (1,325) (407) Put SPDR S&P 500 ETF Trust Exchange Traded USD 281 13/9/2019 52,019 (35,002) (407) Call SPDR S&P 500 ETF Trust Exchange Traded USD 295 13/9/2019 (56,859) (110,500) (50) Put SPDR S&P 500 ETF Trust Exchange Traded USD 267 16/9/2019 2,707 (1,125) (2,160) Put SPDR S&P 500 ETF Trust Exchange Traded USD 250 30/6/2020 (265,228) (1,466,640) (2,806) Call Taiwan Semiconductor
Manufacturing Co Ltd Exchange Traded USD 50 17/1/2020 17,674 (147,315) (1,738) Call Telefonica SA Exchange Traded EUR 7.42 20/9/2019 24,781 (1,939) (3,230) Call Telia Co AB Exchange Traded SEK 42 20/9/2019 (15,517) (39,508) (144) Put Texas Instruments Inc Exchange Traded USD 105 18/10/2019 18,965 (7,848) (1,716) Put US Treasury 10 Year Note Exchange Traded USD 129.5 20/9/2019 (29,421) (134,063) (200) Call Walt Disney Co/The Exchange Traded USD 147 13/9/2019 1,460 (2,200) (65) Call Walt Disney Co/The Exchange Traded USD 147 20/9/2019 (627) (1,918) (1,872) Put Wells Fargo & Co Exchange Traded USD 45 20/9/2019 63,589 (80,496) (248) Put Western Digital Corp Exchange Traded USD 42.5 18/10/2019 19,170 (7,564)
Total (USD underlying exposure - USD 3,281,663,282) (12,529,158) (32,410,930)
Synthetic Cap Options as at 31 August 2019
Number of contracts
Call/ Put
Description Counterparty
Strike Price
Expiration date
Unrealised appreciation/
(depreciation) USD
Market Value USD
790,590,000 Put USD - 2 Year Constant Maturity Swap Citibank USD 0.50 13/3/2020 (181,203) 123,174 591,000,000 Put USD - 10 Year Constant Maturity Swap Goldman Sachs USD 0.40 31/3/2020 (302,114) 191,372 1,079,632,000 Call USD - 5 Year Constant Maturity Swap Goldman Sachs USD 0.21 29/5/2020 (535,174) 1,138,256 (1,079,632,000) Call USD - 5 Year Constant Maturity Swap Goldman Sachs USD 0.71 29/5/2020 368,943 (116,892)
Total (USD underlying exposure - USD 3,540,854,000) (649,548) 1,335,910
Holding
Description Counterparty
Unrealised appreciation/
(depreciation) USD
France 14,301 BNP Paribas SA Merrill Lynch 22,827 (10,730) Casino Guichard-
Perrachon SA Merrill Lynch (41,840) 16,423 Credit Agricole SA Merrill Lynch 9,071 (9,942)
Germany 114,728 Tele Columbus AG Merrill Lynch (9,252) (9,252)
Italy 1,648,821 Telecom Italia SpA/Milano Merrill Lynch 76,132 76,132
Luxembourg 38,578 SES SA Merrill Lynch 38,992 38,992
Netherlands 99,144 ALTICE EUROPE NV Merrill Lynch 10,185 10,185
Holding
Description Counterparty
Unrealised appreciation/
(depreciation) USD
Contracts For Difference as at 31 August 2019
Contracts For Difference as at 31 August 2019
Spain 266,445 Banco de Sabadell SA Merrill Lynch 15,481 59,305 CaixaBank SA Merrill Lynch 3,865 19,346
United Kingdom 60,038 AA Plc Merrill Lynch 697 256,123 Arrow Global Group Plc Merrill Lynch 13,140 32,066 International Game
Technology Plc Merrill Lynch 25,332 (262,866) Tullow Oil Plc Merrill Lynch (16,055) 23,114
United States 24,380 AMC Entertainment
Holdings Inc Merrill Lynch 8,289 8,289 Total (USD underlying exposure - USD 6,265,618) 156,864
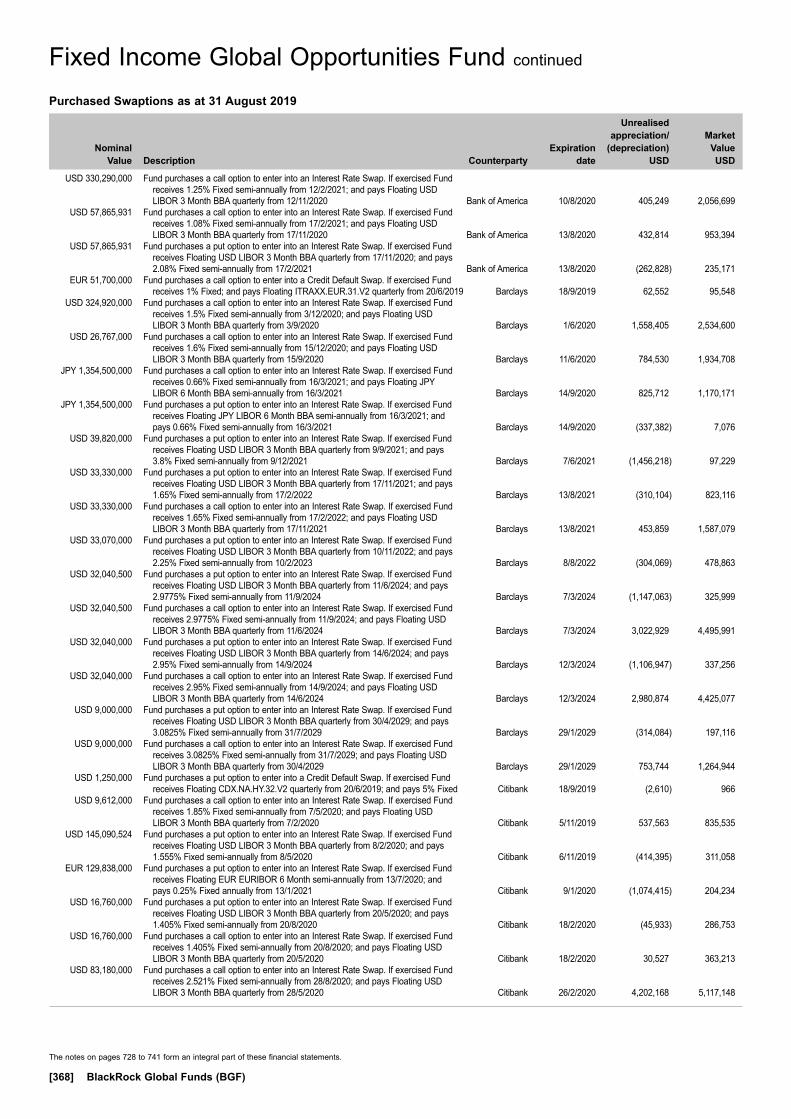
The notes on pages 728 to 741 form an integral part of these financial statements.
[368] BlackRock Global Funds (BGF)
Fixed Income Global Opportunities Fund continued
Purchased Swaptions as at 31 August 2019
Nominal Value
Description Counterparty
Expiration date
Unrealised appreciation/
(depreciation) USD
Market Value USD
USD 330,290,000 Fund purchases a call option to enter into an Interest Rate Swap. If exercised Fund receives 1.25% Fixed semi-annually from 12/2/2021; and pays Floating USD LIBOR 3 Month BBA quarterly from 12/11/2020 Bank of America 10/8/2020 405,249 2,056,699
USD 57,865,931 Fund purchases a call option to enter into an Interest Rate Swap. If exercised Fund receives 1.08% Fixed semi-annually from 17/2/2021; and pays Floating USD LIBOR 3 Month BBA quarterly from 17/11/2020 Bank of America 13/8/2020 432,814 953,394
USD 57,865,931 Fund purchases a put option to enter into an Interest Rate Swap. If exercised Fund receives Floating USD LIBOR 3 Month BBA quarterly from 17/11/2020; and pays 2.08% Fixed semi-annually from 17/2/2021 Bank of America 13/8/2020 (262,828) 235,171
EUR 51,700,000 Fund purchases a call option to enter into a Credit Default Swap. If exercised Fund receives 1% Fixed; and pays Floating ITRAXX.EUR.31.V2 quarterly from 20/6/2019 Barclays 18/9/2019 62,552 95,548
USD 324,920,000 Fund purchases a call option to enter into an Interest Rate Swap. If exercised Fund receives 1.5% Fixed semi-annually from 3/12/2020; and pays Floating USD LIBOR 3 Month BBA quarterly from 3/9/2020 Barclays 1/6/2020 1,558,405 2,534,600
USD 26,767,000 Fund purchases a call option to enter into an Interest Rate Swap. If exercised Fund receives 1.6% Fixed semi-annually from 15/12/2020; and pays Floating USD LIBOR 3 Month BBA quarterly from 15/9/2020 Barclays 11/6/2020 784,530 1,934,708
JPY 1,354,500,000 Fund purchases a call option to enter into an Interest Rate Swap. If exercised Fund receives 0.66% Fixed semi-annually from 16/3/2021; and pays Floating JPY LIBOR 6 Month BBA semi-annually from 16/3/2021 Barclays 14/9/2020 825,712 1,170,171
JPY 1,354,500,000 Fund purchases a put option to enter into an Interest Rate Swap. If exercised Fund receives Floating JPY LIBOR 6 Month BBA semi-annually from 16/3/2021; and pays 0.66% Fixed semi-annually from 16/3/2021 Barclays 14/9/2020 (337,382) 7,076
USD 39,820,000 Fund purchases a put option to enter into an Interest Rate Swap. If exercised Fund receives Floating USD LIBOR 3 Month BBA quarterly from 9/9/2021; and pays 3.8% Fixed semi-annually from 9/12/2021 Barclays 7/6/2021 (1,456,218) 97,229
USD 33,330,000 Fund purchases a put option to enter into an Interest Rate Swap. If exercised Fund receives Floating USD LIBOR 3 Month BBA quarterly from 17/11/2021; and pays 1.65% Fixed semi-annually from 17/2/2022 Barclays 13/8/2021 (310,104) 823,116
USD 33,330,000 Fund purchases a call option to enter into an Interest Rate Swap. If exercised Fund receives 1.65% Fixed semi-annually from 17/2/2022; and pays Floating USD LIBOR 3 Month BBA quarterly from 17/11/2021 Barclays 13/8/2021 453,859 1,587,079
USD 33,070,000 Fund purchases a put option to enter into an Interest Rate Swap. If exercised Fund receives Floating USD LIBOR 3 Month BBA quarterly from 10/11/2022; and pays 2.25% Fixed semi-annually from 10/2/2023 Barclays 8/8/2022 (304,069) 478,863
USD 32,040,500 Fund purchases a put option to enter into an Interest Rate Swap. If exercised Fund receives Floating USD LIBOR 3 Month BBA quarterly from 11/6/2024; and pays 2.9775% Fixed semi-annually from 11/9/2024 Barclays 7/3/2024 (1,147,063) 325,999
USD 32,040,500 Fund purchases a call option to enter into an Interest Rate Swap. If exercised Fund receives 2.9775% Fixed semi-annually from 11/9/2024; and pays Floating USD LIBOR 3 Month BBA quarterly from 11/6/2024 Barclays 7/3/2024 3,022,929 4,495,991
USD 32,040,000 Fund purchases a put option to enter into an Interest Rate Swap. If exercised Fund receives Floating USD LIBOR 3 Month BBA quarterly from 14/6/2024; and pays 2.95% Fixed semi-annually from 14/9/2024 Barclays 12/3/2024 (1,106,947) 337,256
USD 32,040,000 Fund purchases a call option to enter into an Interest Rate Swap. If exercised Fund receives 2.95% Fixed semi-annually from 14/9/2024; and pays Floating USD LIBOR 3 Month BBA quarterly from 14/6/2024 Barclays 12/3/2024 2,980,874 4,425,077
USD 9,000,000 Fund purchases a put option to enter into an Interest Rate Swap. If exercised Fund receives Floating USD LIBOR 3 Month BBA quarterly from 30/4/2029; and pays 3.0825% Fixed semi-annually from 31/7/2029 Barclays 29/1/2029 (314,084) 197,116
USD 9,000,000 Fund purchases a call option to enter into an Interest Rate Swap. If exercised Fund receives 3.0825% Fixed semi-annually from 31/7/2029; and pays Floating USD LIBOR 3 Month BBA quarterly from 30/4/2029 Barclays 29/1/2029 753,744 1,264,944
USD 1,250,000 Fund purchases a put option to enter into a Credit Default Swap. If exercised Fund receives Floating CDX.NA.HY.32.V2 quarterly from 20/6/2019; and pays 5% Fixed Citibank 18/9/2019 (2,610) 966
USD 9,612,000 Fund purchases a call option to enter into an Interest Rate Swap. If exercised Fund receives 1.85% Fixed semi-annually from 7/5/2020; and pays Floating USD LIBOR 3 Month BBA quarterly from 7/2/2020 Citibank 5/11/2019 537,563 835,535
USD 145,090,524 Fund purchases a put option to enter into an Interest Rate Swap. If exercised Fund receives Floating USD LIBOR 3 Month BBA quarterly from 8/2/2020; and pays 1.555% Fixed semi-annually from 8/5/2020 Citibank 6/11/2019 (414,395) 311,058
EUR 129,838,000 Fund purchases a put option to enter into an Interest Rate Swap. If exercised Fund receives Floating EUR EURIBOR 6 Month semi-annually from 13/7/2020; and pays 0.25% Fixed annually from 13/1/2021 Citibank 9/1/2020 (1,074,415) 204,234
USD 16,760,000 Fund purchases a put option to enter into an Interest Rate Swap. If exercised Fund receives Floating USD LIBOR 3 Month BBA quarterly from 20/5/2020; and pays 1.405% Fixed semi-annually from 20/8/2020 Citibank 18/2/2020 (45,933) 286,753
USD 16,760,000 Fund purchases a call option to enter into an Interest Rate Swap. If exercised Fund receives 1.405% Fixed semi-annually from 20/8/2020; and pays Floating USD LIBOR 3 Month BBA quarterly from 20/5/2020 Citibank 18/2/2020 30,527 363,213
USD 83,180,000 Fund purchases a call option to enter into an Interest Rate Swap. If exercised Fund receives 2.521% Fixed semi-annually from 28/8/2020; and pays Floating USD LIBOR 3 Month BBA quarterly from 28/5/2020 Citibank 26/2/2020 4,202,168 5,117,148

The notes on pages 728 to 741 form an integral part of these financial statements.
Annual Report and Audited Financial Statements [369]
Fixed Income Global Opportunities Fund continuedFixed Income Global Opportunities Fund continued
Purchased Swaptions as at 31 August 2019
Nominal Value
Description Counterparty
Expiration date
Unrealised appreciation/
(depreciation) USD
Market Value USD
USD 83,180,000 Fund purchases a put option to enter into an Interest Rate Swap. If exercised Fund receives Floating USD LIBOR 3 Month BBA quarterly from 28/5/2020; and pays 2.521% Fixed semi-annually from 28/8/2020 Citibank 26/2/2020 (909,232) 5,748
USD 33,510,000 Fund purchases a put option to enter into an Interest Rate Swap. If exercised Fund receives Floating USD LIBOR 3 Month BBA quarterly from 18/11/2021; and pays 1.46% Fixed semi-annually from 18/2/2022 Citibank 16/8/2021 (96,599) 1,102,640
USD 33,510,000 Fund purchases a call option to enter into an Interest Rate Swap. If exercised Fund receives 1.46% Fixed semi-annually from 18/2/2022; and pays Floating USD LIBOR 3 Month BBA quarterly from 18/11/2021 Citibank 16/8/2021 83,879 1,283,118
USD 20,387,000 Fund purchases a call option to enter into an Interest Rate Swap. If exercised Fund receives 3.05% Fixed semi-annually from 29/12/2028; and pays Floating USD LIBOR 3 Month BBA quarterly from 29/9/2028 Citibank 27/6/2028 1,673,911 2,825,895
EUR 41,300,000 Fund purchases a call option to enter into a Credit Default Swap. If exercised Fund receives 5% Fixed; and pays Floating ITRAXX.XO.31.V1 quarterly from 20/6/2019 Citigroup 18/9/2019 (29,903) 25,129
EUR 9,500,000 Fund purchases a call option to enter into a Credit Default Swap. If exercised Fund receives 5% Fixed; and pays Floating ITRAXX.XO.31.V1 quarterly from 20/6/2019 Citigroup 18/9/2019 (14,538) 16,961
EUR 10,800,000 Fund purchases a put option to enter into a Credit Default Swap. If exercised Fund receives Floating ITRAXX.XO.31.V1 quarterly from 20/6/2019; and pays 5% Fixed Citigroup 18/9/2019 (58,318) 12,129
EUR 45,310,000 Fund purchases a put option to enter into a Credit Default Swap. If exercised Fund receives Floating ITRAXX.EUR.31.V2 quarterly from 20/6/2019; and pays 1% Fixed Citigroup 18/9/2019 (25,692) 26,466
USD 18,200,000 Fund purchases a put option to enter into an Interest Rate Swap. If exercised Fund receives Floating USD LIBOR 3 Month BBA quarterly from 5/5/2020; and pays 4% Fixed semi-annually from 5/8/2020 Goldman Sachs 3/2/2020 (361,481) 34
USD 50,275,000 Fund purchases a call option to enter into an Interest Rate Swap. If exercised Fund receives 1.459% Fixed semi-annually from 25/8/2020; and pays Floating USD LIBOR 3 Month BBA quarterly from 25/5/2020 Goldman Sachs 21/2/2020 261,486 1,221,738
USD 50,275,000 Fund purchases a put option to enter into an Interest Rate Swap. If exercised Fund receives Floating USD LIBOR 3 Month BBA quarterly from 25/5/2020; and pays 1.459% Fixed semi-annually from 25/8/2020 Goldman Sachs 21/2/2020 (218,879) 741,373
USD 34,930,000 Fund purchases a put option to enter into an Interest Rate Swap. If exercised Fund receives Floating USD LIBOR 3 Month BBA quarterly from 5/8/2022; and pays 3.25% Fixed semi-annually from 5/11/2022 Goldman Sachs 3/5/2022 (1,659,515) 190,303
EUR 39,300,000 Fund purchases a put option to enter into a Credit Default Swap. If exercised Fund receives Floating ITRAXX.EUR.31.V2 quarterly from 20/6/2019; and pays 1% Fixed JP Morgan 18/9/2019 (182,243) 2,370
USD 162,480,000 Fund purchases a put option to enter into an Interest Rate Swap. If exercised Fund receives Floating USD LIBOR 3 Month BBA quarterly from 5/2/2020; and pays 2.1% Fixed semi-annually from 5/5/2020 JP Morgan 1/11/2019 (52,718) 22,835
USD 50,275,000 Fund purchases a call option to enter into an Interest Rate Swap. If exercised Fund receives 1.41% Fixed semi-annually from 2/9/2020; and pays Floating USD LIBOR 3 Month BBA quarterly from 2/6/2020 JP Morgan 27/2/2020 139,424 1,119,787
USD 50,275,000 Fund purchases a put option to enter into an Interest Rate Swap. If exercised Fund receives Floating USD LIBOR 3 Month BBA quarterly from 2/6/2020; and pays 1.41% Fixed semi-annually from 2/9/2020 JP Morgan 27/2/2020 (106,605) 873,758
JPY 1,184,200,000 Fund purchases a put option to enter into an Interest Rate Swap. If exercised Fund receives Floating JPY LIBOR 6 Month BBA semi-annually from 20/10/2021; and pays 0.78% Fixed semi-annually from 20/10/2021 JP Morgan 16/4/2021 (344,439) 25,848
JPY 1,184,200,000 Fund purchases a call option to enter into an Interest Rate Swap. If exercised Fund receives 0.78% Fixed semi-annually from 20/10/2021; and pays Floating JPY LIBOR 6 Month BBA semi-annually from 20/10/2021 JP Morgan 16/4/2021 1,096,819 1,466,950
USD 32,780,000 Fund purchases a put option to enter into an Interest Rate Swap. If exercised Fund receives Floating USD LIBOR 3 Month BBA quarterly from 4/11/2022; and pays 2.25% Fixed semi-annually from 4/2/2023 JP Morgan 2/8/2022 (413,465) 471,595
USD 28,838,000 Fund purchases a put option to enter into an Interest Rate Swap. If exercised Fund receives Floating USD LIBOR 3 Month BBA quarterly from 4/8/2028; and pays 3.1825% Fixed semi-annually from 4/11/2028 JP Morgan 2/5/2028 (1,031,821) 547,060
USD 28,838,000 Fund purchases a call option to enter into an Interest Rate Swap. If exercised Fund receives 3.1825% Fixed semi-annually from 4/11/2028; and pays Floating USD LIBOR 3 Month BBA quarterly from 4/8/2028 JP Morgan 2/5/2028 2,686,984 4,265,865
USD 2,255,000 Fund purchases a put option to enter into an Interest Rate Swap. If exercised Fund receives 2.985% Fixed semi-annually from 29/10/2038; and pays Floating USD LIBOR 3 Month BBA quarterly from 29/7/2038 JP Morgan 27/4/2038 (29,013) 76,972
USD 2,255,000 Fund purchases a call option to enter into an Interest Rate Swap. If exercised Fund receives Floating USD LIBOR 3 Month BBA quarterly from 29/7/2038; and pays 2.985% Fixed semi-annually from 29/10/2038 JP Morgan 27/4/2038 183,018 289,003
USD 8,077,500 Fund purchases a put option to enter into an Interest Rate Swap. If exercised Fund receives Floating USD LIBOR 3 Month BBA quarterly from 24/5/2039; and pays 2.86% Fixed semi-annually from 24/8/2039 JP Morgan 22/2/2039 (100,253) 299,382
USD 8,077,500 Fund purchases a call option to enter into an Interest Rate Swap. If exercised Fund receives 2.86% Fixed semi-annually from 24/8/2039; and pays Floating USD LIBOR 3 Month BBA quarterly from 24/5/2039 JP Morgan 22/2/2039 641,669 1,041,303
USD 147,902,000 Fund purchases a call option to enter into an Interest Rate Swap. If exercised Fund receives 2.26% Fixed semi-annually from 25/4/2020; and pays Floating USD LIBOR 3 Month BBA quarterly from 25/1/2020 Morgan Stanley 23/10/2019 6,090,696 6,808,021
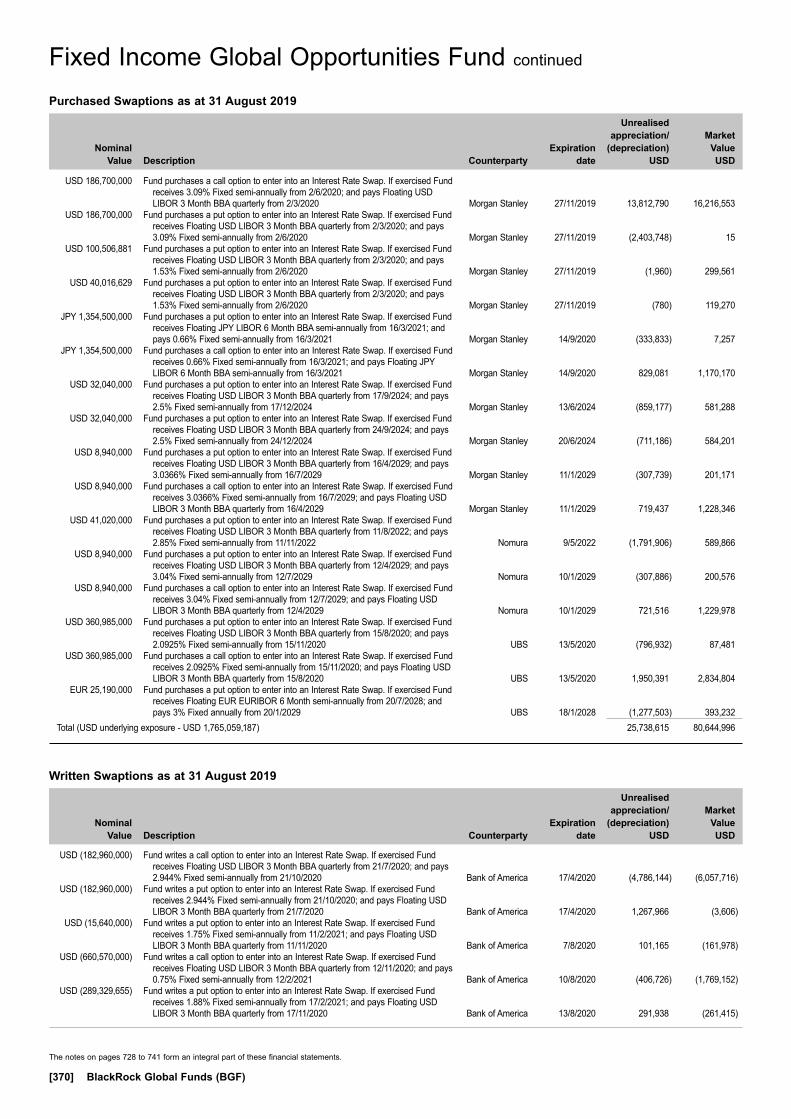
The notes on pages 728 to 741 form an integral part of these financial statements.
[370] BlackRock Global Funds (BGF)
Fixed Income Global Opportunities Fund continued
Purchased Swaptions as at 31 August 2019
Nominal Value
Description Counterparty
Expiration date
Unrealised appreciation/
(depreciation) USD
Market Value USD
USD 186,700,000 Fund purchases a call option to enter into an Interest Rate Swap. If exercised Fund receives 3.09% Fixed semi-annually from 2/6/2020; and pays Floating USD LIBOR 3 Month BBA quarterly from 2/3/2020 Morgan Stanley 27/11/2019 13,812,790 16,216,553
USD 186,700,000 Fund purchases a put option to enter into an Interest Rate Swap. If exercised Fund receives Floating USD LIBOR 3 Month BBA quarterly from 2/3/2020; and pays 3.09% Fixed semi-annually from 2/6/2020 Morgan Stanley 27/11/2019 (2,403,748) 15
USD 100,506,881 Fund purchases a put option to enter into an Interest Rate Swap. If exercised Fund receives Floating USD LIBOR 3 Month BBA quarterly from 2/3/2020; and pays 1.53% Fixed semi-annually from 2/6/2020 Morgan Stanley 27/11/2019 (1,960) 299,561
USD 40,016,629 Fund purchases a put option to enter into an Interest Rate Swap. If exercised Fund receives Floating USD LIBOR 3 Month BBA quarterly from 2/3/2020; and pays 1.53% Fixed semi-annually from 2/6/2020 Morgan Stanley 27/11/2019 (780) 119,270
JPY 1,354,500,000 Fund purchases a put option to enter into an Interest Rate Swap. If exercised Fund receives Floating JPY LIBOR 6 Month BBA semi-annually from 16/3/2021; and pays 0.66% Fixed semi-annually from 16/3/2021 Morgan Stanley 14/9/2020 (333,833) 7,257
JPY 1,354,500,000 Fund purchases a call option to enter into an Interest Rate Swap. If exercised Fund receives 0.66% Fixed semi-annually from 16/3/2021; and pays Floating JPY LIBOR 6 Month BBA semi-annually from 16/3/2021 Morgan Stanley 14/9/2020 829,081 1,170,170
USD 32,040,000 Fund purchases a put option to enter into an Interest Rate Swap. If exercised Fund receives Floating USD LIBOR 3 Month BBA quarterly from 17/9/2024; and pays 2.5% Fixed semi-annually from 17/12/2024 Morgan Stanley 13/6/2024 (859,177) 581,288
USD 32,040,000 Fund purchases a put option to enter into an Interest Rate Swap. If exercised Fund receives Floating USD LIBOR 3 Month BBA quarterly from 24/9/2024; and pays 2.5% Fixed semi-annually from 24/12/2024 Morgan Stanley 20/6/2024 (711,186) 584,201
USD 8,940,000 Fund purchases a put option to enter into an Interest Rate Swap. If exercised Fund receives Floating USD LIBOR 3 Month BBA quarterly from 16/4/2029; and pays 3.0366% Fixed semi-annually from 16/7/2029 Morgan Stanley 11/1/2029 (307,739) 201,171
USD 8,940,000 Fund purchases a call option to enter into an Interest Rate Swap. If exercised Fund receives 3.0366% Fixed semi-annually from 16/7/2029; and pays Floating USD LIBOR 3 Month BBA quarterly from 16/4/2029 Morgan Stanley 11/1/2029 719,437 1,228,346
USD 41,020,000 Fund purchases a put option to enter into an Interest Rate Swap. If exercised Fund receives Floating USD LIBOR 3 Month BBA quarterly from 11/8/2022; and pays 2.85% Fixed semi-annually from 11/11/2022 Nomura 9/5/2022 (1,791,906) 589,866
USD 8,940,000 Fund purchases a put option to enter into an Interest Rate Swap. If exercised Fund receives Floating USD LIBOR 3 Month BBA quarterly from 12/4/2029; and pays 3.04% Fixed semi-annually from 12/7/2029 Nomura 10/1/2029 (307,886) 200,576
USD 8,940,000 Fund purchases a call option to enter into an Interest Rate Swap. If exercised Fund receives 3.04% Fixed semi-annually from 12/7/2029; and pays Floating USD LIBOR 3 Month BBA quarterly from 12/4/2029 Nomura 10/1/2029 721,516 1,229,978
USD 360,985,000 Fund purchases a put option to enter into an Interest Rate Swap. If exercised Fund receives Floating USD LIBOR 3 Month BBA quarterly from 15/8/2020; and pays 2.0925% Fixed semi-annually from 15/11/2020 UBS 13/5/2020 (796,932) 87,481
USD 360,985,000 Fund purchases a call option to enter into an Interest Rate Swap. If exercised Fund receives 2.0925% Fixed semi-annually from 15/11/2020; and pays Floating USD LIBOR 3 Month BBA quarterly from 15/8/2020 UBS 13/5/2020 1,950,391 2,834,804
EUR 25,190,000 Fund purchases a put option to enter into an Interest Rate Swap. If exercised Fund receives Floating EUR EURIBOR 6 Month semi-annually from 20/7/2028; and pays 3% Fixed annually from 20/1/2029 UBS 18/1/2028 (1,277,503) 393,232
Total (USD underlying exposure - USD 1,765,059,187) 25,738,615 80,644,996
Written Swaptions as at 31 August 2019
Nominal Value
Description Counterparty
Expiration date
Unrealised appreciation/
(depreciation) USD
Market Value USD
USD (182,960,000) Fund writes a call option to enter into an Interest Rate Swap. If exercised Fund receives Floating USD LIBOR 3 Month BBA quarterly from 21/7/2020; and pays 2.944% Fixed semi-annually from 21/10/2020 Bank of America 17/4/2020 (4,786,144) (6,057,716)
USD (182,960,000) Fund writes a put option to enter into an Interest Rate Swap. If exercised Fund receives 2.944% Fixed semi-annually from 21/10/2020; and pays Floating USD LIBOR 3 Month BBA quarterly from 21/7/2020 Bank of America 17/4/2020 1,267,966 (3,606)
USD (15,640,000) Fund writes a put option to enter into an Interest Rate Swap. If exercised Fund receives 1.75% Fixed semi-annually from 11/2/2021; and pays Floating USD LIBOR 3 Month BBA quarterly from 11/11/2020 Bank of America 7/8/2020 101,165 (161,978)
USD (660,570,000) Fund writes a call option to enter into an Interest Rate Swap. If exercised Fund receives Floating USD LIBOR 3 Month BBA quarterly from 12/11/2020; and pays 0.75% Fixed semi-annually from 12/2/2021 Bank of America 10/8/2020 (406,726) (1,769,152)
USD (289,329,655) Fund writes a put option to enter into an Interest Rate Swap. If exercised Fund receives 1.88% Fixed semi-annually from 17/2/2021; and pays Floating USD LIBOR 3 Month BBA quarterly from 17/11/2020 Bank of America 13/8/2020 291,938 (261,415)
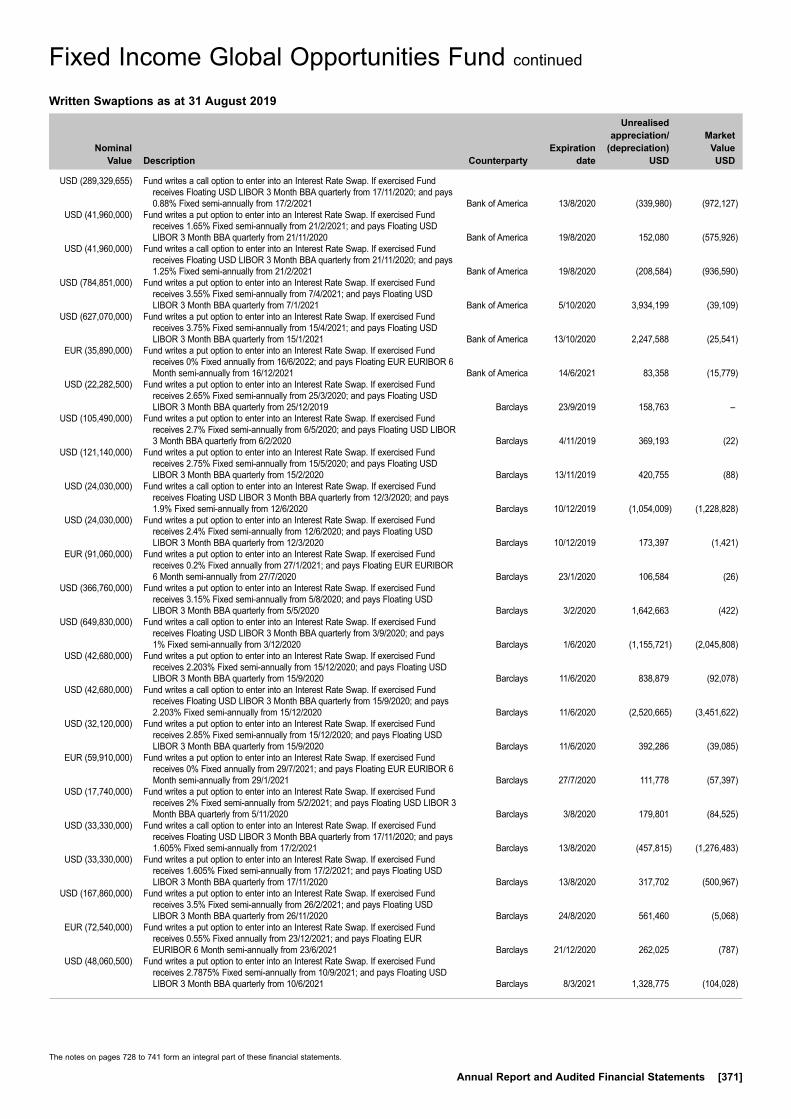
The notes on pages 728 to 741 form an integral part of these financial statements.
Annual Report and Audited Financial Statements [371]
Fixed Income Global Opportunities Fund continued
Written Swaptions as at 31 August 2019
Nominal Value
Description Counterparty
Expiration date
Unrealised appreciation/
(depreciation) USD
Market Value USD
USD (289,329,655) Fund writes a call option to enter into an Interest Rate Swap. If exercised Fund receives Floating USD LIBOR 3 Month BBA quarterly from 17/11/2020; and pays 0.88% Fixed semi-annually from 17/2/2021 Bank of America 13/8/2020 (339,980) (972,127)
USD (41,960,000) Fund writes a put option to enter into an Interest Rate Swap. If exercised Fund receives 1.65% Fixed semi-annually from 21/2/2021; and pays Floating USD LIBOR 3 Month BBA quarterly from 21/11/2020 Bank of America 19/8/2020 152,080 (575,926)
USD (41,960,000) Fund writes a call option to enter into an Interest Rate Swap. If exercised Fund receives Floating USD LIBOR 3 Month BBA quarterly from 21/11/2020; and pays 1.25% Fixed semi-annually from 21/2/2021 Bank of America 19/8/2020 (208,584) (936,590)
USD (784,851,000) Fund writes a put option to enter into an Interest Rate Swap. If exercised Fund receives 3.55% Fixed semi-annually from 7/4/2021; and pays Floating USD LIBOR 3 Month BBA quarterly from 7/1/2021 Bank of America 5/10/2020 3,934,199 (39,109)
USD (627,070,000) Fund writes a put option to enter into an Interest Rate Swap. If exercised Fund receives 3.75% Fixed semi-annually from 15/4/2021; and pays Floating USD LIBOR 3 Month BBA quarterly from 15/1/2021 Bank of America 13/10/2020 2,247,588 (25,541)
EUR (35,890,000) Fund writes a put option to enter into an Interest Rate Swap. If exercised Fund receives 0% Fixed annually from 16/6/2022; and pays Floating EUR EURIBOR 6 Month semi-annually from 16/12/2021 Bank of America 14/6/2021 83,358 (15,779)
USD (22,282,500) Fund writes a put option to enter into an Interest Rate Swap. If exercised Fund receives 2.65% Fixed semi-annually from 25/3/2020; and pays Floating USD LIBOR 3 Month BBA quarterly from 25/12/2019 Barclays 23/9/2019 158,763 –
USD (105,490,000) Fund writes a put option to enter into an Interest Rate Swap. If exercised Fund receives 2.7% Fixed semi-annually from 6/5/2020; and pays Floating USD LIBOR 3 Month BBA quarterly from 6/2/2020 Barclays 4/11/2019 369,193 (22)
USD (121,140,000) Fund writes a put option to enter into an Interest Rate Swap. If exercised Fund receives 2.75% Fixed semi-annually from 15/5/2020; and pays Floating USD LIBOR 3 Month BBA quarterly from 15/2/2020 Barclays 13/11/2019 420,755 (88)
USD (24,030,000) Fund writes a call option to enter into an Interest Rate Swap. If exercised Fund receives Floating USD LIBOR 3 Month BBA quarterly from 12/3/2020; and pays 1.9% Fixed semi-annually from 12/6/2020 Barclays 10/12/2019 (1,054,009) (1,228,828)
USD (24,030,000) Fund writes a put option to enter into an Interest Rate Swap. If exercised Fund receives 2.4% Fixed semi-annually from 12/6/2020; and pays Floating USD LIBOR 3 Month BBA quarterly from 12/3/2020 Barclays 10/12/2019 173,397 (1,421)
EUR (91,060,000) Fund writes a put option to enter into an Interest Rate Swap. If exercised Fund receives 0.2% Fixed annually from 27/1/2021; and pays Floating EUR EURIBOR 6 Month semi-annually from 27/7/2020 Barclays 23/1/2020 106,584 (26)
USD (366,760,000) Fund writes a put option to enter into an Interest Rate Swap. If exercised Fund receives 3.15% Fixed semi-annually from 5/8/2020; and pays Floating USD LIBOR 3 Month BBA quarterly from 5/5/2020 Barclays 3/2/2020 1,642,663 (422)
USD (649,830,000) Fund writes a call option to enter into an Interest Rate Swap. If exercised Fund receives Floating USD LIBOR 3 Month BBA quarterly from 3/9/2020; and pays 1% Fixed semi-annually from 3/12/2020 Barclays 1/6/2020 (1,155,721) (2,045,808)
USD (42,680,000) Fund writes a put option to enter into an Interest Rate Swap. If exercised Fund receives 2.203% Fixed semi-annually from 15/12/2020; and pays Floating USD LIBOR 3 Month BBA quarterly from 15/9/2020 Barclays 11/6/2020 838,879 (92,078)
USD (42,680,000) Fund writes a call option to enter into an Interest Rate Swap. If exercised Fund receives Floating USD LIBOR 3 Month BBA quarterly from 15/9/2020; and pays 2.203% Fixed semi-annually from 15/12/2020 Barclays 11/6/2020 (2,520,665) (3,451,622)
USD (32,120,000) Fund writes a put option to enter into an Interest Rate Swap. If exercised Fund receives 2.85% Fixed semi-annually from 15/12/2020; and pays Floating USD LIBOR 3 Month BBA quarterly from 15/9/2020 Barclays 11/6/2020 392,286 (39,085)
EUR (59,910,000) Fund writes a put option to enter into an Interest Rate Swap. If exercised Fund receives 0% Fixed annually from 29/7/2021; and pays Floating EUR EURIBOR 6 Month semi-annually from 29/1/2021 Barclays 27/7/2020 111,778 (57,397)
USD (17,740,000) Fund writes a put option to enter into an Interest Rate Swap. If exercised Fund receives 2% Fixed semi-annually from 5/2/2021; and pays Floating USD LIBOR 3 Month BBA quarterly from 5/11/2020 Barclays 3/8/2020 179,801 (84,525)
USD (33,330,000) Fund writes a call option to enter into an Interest Rate Swap. If exercised Fund receives Floating USD LIBOR 3 Month BBA quarterly from 17/11/2020; and pays 1.605% Fixed semi-annually from 17/2/2021 Barclays 13/8/2020 (457,815) (1,276,483)
USD (33,330,000) Fund writes a put option to enter into an Interest Rate Swap. If exercised Fund receives 1.605% Fixed semi-annually from 17/2/2021; and pays Floating USD LIBOR 3 Month BBA quarterly from 17/11/2020 Barclays 13/8/2020 317,702 (500,967)
USD (167,860,000) Fund writes a put option to enter into an Interest Rate Swap. If exercised Fund receives 3.5% Fixed semi-annually from 26/2/2021; and pays Floating USD LIBOR 3 Month BBA quarterly from 26/11/2020 Barclays 24/8/2020 561,460 (5,068)
EUR (72,540,000) Fund writes a put option to enter into an Interest Rate Swap. If exercised Fund receives 0.55% Fixed annually from 23/12/2021; and pays Floating EUR EURIBOR 6 Month semi-annually from 23/6/2021 Barclays 21/12/2020 262,025 (787)
USD (48,060,500) Fund writes a put option to enter into an Interest Rate Swap. If exercised Fund receives 2.7875% Fixed semi-annually from 10/9/2021; and pays Floating USD LIBOR 3 Month BBA quarterly from 10/6/2021 Barclays 8/3/2021 1,328,775 (104,028)

The notes on pages 728 to 741 form an integral part of these financial statements.
[372] BlackRock Global Funds (BGF)
Fixed Income Global Opportunities Fund continued
Written Swaptions as at 31 August 2019
Nominal Value
Description Counterparty
Expiration date
Unrealised appreciation/
(depreciation) USD
Market Value USD
USD (48,060,500) Fund writes a call option to enter into an Interest Rate Swap. If exercised Fund receives Floating USD LIBOR 3 Month BBA quarterly from 10/6/2021; and pays 2.7875% Fixed semi-annually from 10/9/2021 Barclays 8/3/2021 (4,952,582) (6,385,386)
EUR (155,850,000) Fund writes a put option to enter into an Interest Rate Swap. If exercised Fund receives 0.1% Fixed annually from 31/3/2022; and pays Floating EUR EURIBOR 6 Month semi-annually from 30/9/2021 Barclays 29/3/2021 512,725 (30,024)
EUR (241,430,000) Fund writes a put option to enter into an Interest Rate Swap. If exercised Fund receives 0.12% Fixed annually from 12/4/2022; and pays Floating EUR EURIBOR 6 Month semi-annually from 12/10/2021 Barclays 8/4/2021 873,420 (45,177)
EUR (28,200,000) Fund writes a put option to enter into an Interest Rate Swap. If exercised Fund receives 2% Fixed annually from 6/5/2022; and pays Floating EUR EURIBOR 6 Month semi-annually from 6/11/2021 Barclays 4/5/2021 692,026 (11,083)
EUR (79,776,000) Fund writes a put option to enter into an Interest Rate Swap. If exercised Fund receives 0.11% Fixed annually from 19/5/2022; and pays Floating EUR EURIBOR 6 Month semi-annually from 19/11/2021 Barclays 17/5/2021 244,896 (19,255)
USD (519,130,000) Fund writes a put option to enter into an Interest Rate Swap. If exercised Fund receives 2.15% Fixed semi-annually from 1/12/2021; and pays Floating USD LIBOR 3 Month BBA quarterly from 1/9/2021 Barclays 27/5/2021 1,153,938 (302,222)
USD (84,340,000) Fund writes a put option to enter into an Interest Rate Swap. If exercised Fund receives 3.87% Fixed semi-annually from 9/12/2021; and pays Floating USD LIBOR 3 Month BBA quarterly from 9/9/2021 Barclays 7/6/2021 1,576,817 (75,468)
EUR (79,370,000) Fund writes a put option to enter into an Interest Rate Swap. If exercised Fund receives 0.05% Fixed annually from 14/6/2022; and pays Floating EUR EURIBOR 6 Month semi-annually from 14/12/2021 Barclays 10/6/2021 171,733 (27,819)
EUR (34,980,000) Fund writes a put option to enter into an Interest Rate Swap. If exercised Fund receives 0% Fixed annually from 16/6/2022; and pays Floating EUR EURIBOR 6 Month semi-annually from 16/12/2021 Barclays 14/6/2021 80,023 (15,379)
EUR (41,760,000) Fund writes a put option to enter into an Interest Rate Swap. If exercised Fund receives 0% Fixed annually from 5/7/2022; and pays Floating EUR EURIBOR 6 Month semi-annually from 5/1/2022 Barclays 1/7/2021 66,829 (19,734)
EUR (40,830,000) Fund writes a put option to enter into an Interest Rate Swap. If exercised Fund receives -0.05% Fixed annually from 7/7/2022; and pays Floating EUR EURIBOR 6 Month semi-annually from 7/1/2022 Barclays 2/7/2021 62,454 (23,773)
EUR (42,580,000) Fund writes a put option to enter into an Interest Rate Swap. If exercised Fund receives 0% Fixed annually from 21/7/2022; and pays Floating EUR EURIBOR 6 Month semi-annually from 21/1/2022 Barclays 19/7/2021 56,253 (21,627)
EUR (95,440,000) Fund writes a put option to enter into an Interest Rate Swap. If exercised Fund receives -0.15% Fixed annually from 11/8/2022; and pays Floating EUR EURIBOR 6 Month semi-annually from 11/2/2022 Barclays 9/8/2021 38,382 (94,040)
EUR (53,810,000) Fund writes a put option to enter into an Interest Rate Swap. If exercised Fund receives -0.15% Fixed annually from 11/8/2022; and pays Floating EUR EURIBOR 6 Month semi-annually from 11/2/2022 Barclays 9/8/2021 19,857 (53,021)
USD (33,070,000) Fund writes a put option to enter into an Interest Rate Swap. If exercised Fund receives 2.75% Fixed semi-annually from 10/2/2023; and pays Floating USD LIBOR 3 Month BBA quarterly from 10/11/2022 Barclays 8/8/2022 150,032 (248,461)
USD (33,070,000) Fund writes a put option to enter into an Interest Rate Swap. If exercised Fund receives 3.25% Fixed semi-annually from 10/2/2023; and pays Floating USD LIBOR 3 Month BBA quarterly from 10/11/2022 Barclays 8/8/2022 48,563 (148,204)
USD (25,410,000) Fund writes a call option to enter into an Interest Rate Swap. If exercised Fund receives Floating USD LIBOR 3 Month BBA quarterly from 14/6/2029; and pays 3.05% Fixed semi-annually from 14/9/2029 Barclays 12/3/2029 (2,163,560) (3,511,560)
USD (25,410,000) Fund writes a put option to enter into an Interest Rate Swap. If exercised Fund receives 3.05% Fixed semi-annually from 14/9/2029; and pays Floating USD LIBOR 3 Month BBA quarterly from 14/6/2029 Barclays 12/3/2029 773,419 (574,581)
USD (39,209,000) Fund writes a call option to enter into an Interest Rate Swap. If exercised Fund receives Floating USD LIBOR 3 Month BBA quarterly from 6/12/2019; and pays 2.01% Fixed semi-annually from 6/3/2020 Citibank 4/9/2019 (1,970,810) (2,306,047)
USD (39,209,000) Fund writes a put option to enter into an Interest Rate Swap. If exercised Fund receives 2.21% Fixed semi-annually from 6/3/2020; and pays Floating USD LIBOR 3 Month BBA quarterly from 6/12/2019 Citibank 4/9/2019 347,000 –
USD (39,209,000) Fund writes a call option to enter into an Interest Rate Swap. If exercised Fund receives Floating USD LIBOR 3 Month BBA quarterly from 9/12/2019; and pays 2.015% Fixed semi-annually from 9/3/2020 Citibank 5/9/2019 (1,973,440) (2,326,321)
USD (39,209,000) Fund writes a put option to enter into an Interest Rate Swap. If exercised Fund receives 2.215% Fixed semi-annually from 9/3/2020; and pays Floating USD LIBOR 3 Month BBA quarterly from 9/12/2019 Citibank 5/9/2019 341,118 –
USD (40,207,000) Fund writes a call option to enter into an Interest Rate Swap. If exercised Fund receives Floating USD LIBOR 3 Month BBA quarterly from 2/1/2020; and pays 1.78% Fixed semi-annually from 2/4/2020 Citibank 30/9/2019 (1,285,619) (1,522,643)
USD (33,171,000) Fund writes a call option to enter into an Interest Rate Swap. If exercised Fund receives Floating USD LIBOR 3 Month BBA quarterly from 2/1/2020; and pays 1.54% Fixed semi-annually from 2/4/2020 Citibank 30/9/2019 (269,577) (393,246)

The notes on pages 728 to 741 form an integral part of these financial statements.
Annual Report and Audited Financial Statements [373]
Fixed Income Global Opportunities Fund continued
Written Swaptions as at 31 August 2019
Nominal Value
Description Counterparty
Expiration date
Unrealised appreciation/
(depreciation) USD
Market Value USD
USD (145,090,524) Fund writes a put option to enter into an Interest Rate Swap. If exercised Fund receives 1.655% Fixed semi-annually from 8/5/2020; and pays Floating USD LIBOR 3 Month BBA quarterly from 8/2/2020 Citibank 6/11/2019 284,698 (179,592)
USD (145,090,524) Fund writes a put option to enter into an Interest Rate Swap. If exercised Fund receives 1.755% Fixed semi-annually from 8/5/2020; and pays Floating USD LIBOR 3 Month BBA quarterly from 8/2/2020 Citibank 6/11/2019 208,871 (95,819)
USD (16,760,000) Fund writes a call option to enter into an Interest Rate Swap. If exercised Fund receives Floating USD LIBOR 3 Month BBA quarterly from 19/2/2020; and pays 1.41% Fixed semi-annually from 19/5/2020 Citibank 15/11/2019 (5,667) (258,743)
USD (16,760,000) Fund writes a put option to enter into an Interest Rate Swap. If exercised Fund receives 1.41% Fixed semi-annually from 19/5/2020; and pays Floating USD LIBOR 3 Month BBA quarterly from 19/2/2020 Citibank 15/11/2019 48,080 (204,996)
USD (37,392,000) Fund writes a call option to enter into an Interest Rate Swap. If exercised Fund receives Floating USD LIBOR 3 Month BBA quarterly from 2/4/2020; and pays 1.69% Fixed semi-annually from 2/7/2020 Citibank 30/12/2019 (1,063,693) (1,345,571)
USD (36,186,000) Fund writes a call option to enter into an Interest Rate Swap. If exercised Fund receives Floating USD LIBOR 3 Month BBA quarterly from 2/4/2020; and pays 1.45% Fixed semi-annually from 2/7/2020 Citibank 30/12/2019 (317,585) (493,222)
EUR (129,838,000) Fund writes a put option to enter into an Interest Rate Swap. If exercised Fund receives 0.5% Fixed annually from 13/1/2021; and pays Floating EUR EURIBOR 6 Month semi-annually from 13/7/2020 Citibank 9/1/2020 260,547 (74,121)
USD (200,940,000) Fund writes a call option to enter into an Interest Rate Swap. If exercised Fund receives Floating USD LIBOR 3 Month BBA quarterly from 28/5/2020; and pays 2.46% Fixed semi-annually from 28/8/2020 Citibank 26/2/2020 (3,808,862) (4,694,505)
USD (200,940,000) Fund writes a put option to enter into an Interest Rate Swap. If exercised Fund receives 2.46% Fixed semi-annually from 28/8/2020; and pays Floating USD LIBOR 3 Month BBA quarterly from 28/5/2020 Citibank 26/2/2020 877,619 (8,024)
USD (32,040,000) Fund writes a put option to enter into an Interest Rate Swap. If exercised Fund receives 2.3% Fixed semi-annually from 17/12/2020; and pays Floating USD LIBOR 3 Month BBA quarterly from 17/9/2020 Citibank 15/6/2020 435,490 (52,161)
USD (33,510,000) Fund writes a put option to enter into an Interest Rate Swap. If exercised Fund receives 1.42% Fixed semi-annually from 19/2/2021; and pays Floating USD LIBOR 3 Month BBA quarterly from 19/11/2020 Citibank 17/8/2020 102,521 (768,739)
USD (33,510,000) Fund writes a call option to enter into an Interest Rate Swap. If exercised Fund receives Floating USD LIBOR 3 Month BBA quarterly from 19/11/2020; and pays 1.42% Fixed semi-annually from 19/2/2021 Citibank 17/8/2020 (97,537) (968,797)
USD(126,680,000) Fund writes a put option to enter into an Interest Rate Swap. If exercised Fund receives 3.25% Fixed semi-annually from 30/6/2021; and pays Floating USD LIBOR 3 Month BBA quarterly from 31/3/2021 Citibank 29/12/2020 446,066 (16,316)
EUR (121,810,000) Fund writes a put option to enter into an Interest Rate Swap. If exercised Fund receives 0.1% Fixed annually from 14/4/2022; and pays Floating EUR EURIBOR 6 Month semi-annually from 14/10/2021 Citibank 12/4/2021 381,326 (25,391)
USD (386,970,000) Fund writes a put option to enter into an Interest Rate Swap. If exercised Fund receives 2.35% Fixed semi-annually from 19/11/2021; and pays Floating USD LIBOR 3 Month BBA quarterly from 19/8/2021 Citibank 17/5/2021 610,275 (156,893)
EUR (42,120,000) Fund writes a put option to enter into an Interest Rate Swap. If exercised Fund receives 0% Fixed annually from 23/6/2022; and pays Floating EUR EURIBOR 6 Month semi-annually from 23/12/2021 Citibank 21/6/2021 83,342 (19,071)
EUR (45,310,000) Fund writes a put option to enter into a Credit Default Swap. If exercised Fund receives 1% Fixed; and pays Floating ITRAXX.EUR.31.V2 quarterly from 20/6/2019 Citigroup 18/9/2019 7,296 (7,786)
EUR (10,800,000) Fund writes a put option to enter into a Credit Default Swap. If exercised Fund receives 5% Fixed; and pays Floating ITRAXX.XO.31.V1 quarterly from 20/6/2019 Citigroup 18/9/2019 35,833 (3,203)
USD (588,780,000) Fund writes a put option to enter into an Interest Rate Swap. If exercised Fund receives 3.35% Fixed semi-annually from 16/3/2020; and pays Floating USD LIBOR 3 Month BBA quarterly from 16/12/2019 Deutsche Bank 12/9/2019 1,606,033 –
USD (116,035,000) Fund writes a call option to enter into an Interest Rate Swap. If exercised Fund receives Floating USD LIBOR 3 Month BBA quarterly from 12/2/2020; and pays 3.295% Fixed semi-annually from 12/5/2020 Deutsche Bank 7/11/2019 (3,681,591) (4,254,514)
USD (116,035,000) Fund writes a put option to enter into an Interest Rate Swap. If exercised Fund receives 3.295% Fixed semi-annually from 12/5/2020; and pays Floating USD LIBOR 3 Month BBA quarterly from 12/2/2020 Deutsche Bank 7/11/2019 572,923 –
USD (111,070,000) Fund writes a put option to enter into an Interest Rate Swap. If exercised Fund receives 3.2% Fixed semi-annually from 11/8/2020; and pays Floating USD LIBOR 3 Month BBA quarterly from 11/5/2020 Deutsche Bank 7/2/2020 424,716 (127)
USD (112,110,000) Fund writes a put option to enter into an Interest Rate Swap. If exercised Fund receives 3.35% Fixed semi-annually from 19/8/2020; and pays Floating USD LIBOR 3 Month BBA quarterly from 19/5/2020 Deutsche Bank 14/2/2020 454,308 (104)
USD (401,095,000) Fund writes a call option to enter into an Interest Rate Swap. If exercised Fund receives Floating USD LIBOR 3 Month BBA quarterly from 8/7/2020; and pays 1.5% Fixed semi-annually from 8/10/2020 Deutsche Bank 6/4/2020 (581,510) (1,130,695)
USD (401,095,000) Fund writes a call option to enter into an Interest Rate Swap. If exercised Fund receives Floating USD LIBOR 3 Month BBA quarterly from 8/7/2020; and pays 1.5% Fixed semi-annually from 8/10/2020 Deutsche Bank 6/4/2020 (524,176) (1,130,695)

The notes on pages 728 to 741 form an integral part of these financial statements.
[374] BlackRock Global Funds (BGF)
Fixed Income Global Opportunities Fund continued
Written Swaptions as at 31 August 2019
Nominal Value
Description Counterparty
Expiration date
Unrealised appreciation/
(depreciation) USD
Market Value USD
USD (186,800,000) Fund writes a put option to enter into an Interest Rate Swap. If exercised Fund receives 2.8775% Fixed semi-annually from 16/10/2020; and pays Floating USD LIBOR 3 Month BBA quarterly from 16/7/2020 Deutsche Bank 14/4/2020 1,347,575 (4,390)
USD (186,800,000) Fund writes a call option to enter into an Interest Rate Swap. If exercised Fund receives Floating USD LIBOR 3 Month BBA quarterly from 16/7/2020; and pays 2.8775% Fixed semi-annually from 16/10/2020 Deutsche Bank 14/4/2020 (4,599,027) (5,950,992)
USD (97,150,000) Fund writes a put option to enter into an Interest Rate Swap. If exercised Fund receives 2.9% Fixed semi-annually from 2/12/2020; and pays Floating USD LIBOR 3 Month BBA quarterly from 2/9/2020 Deutsche Bank 29/5/2020 710,078 (3,974)
USD (125,270,000) Fund writes a put option to enter into an Interest Rate Swap. If exercised Fund receives 3.3% Fixed semi-annually from 10/3/2020; and pays Floating USD LIBOR 3 Month BBA quarterly from 10/12/2019 Goldman Sachs 6/9/2019 296,890 –
USD (86,498,000) Fund writes a call option to enter into an Interest Rate Swap. If exercised Fund receives Floating USD LIBOR 3 Month BBA quarterly from 27/12/2019; and pays 1.5% Fixed semi-annually from 27/3/2020 Goldman Sachs 25/9/2019 (517,947) (860,416)
USD (50,275,000) Fund writes a call option to enter into an Interest Rate Swap. If exercised Fund receives Floating USD LIBOR 3 Month BBA quarterly from 25/2/2020; and pays 1.463% Fixed semi-annually from 25/5/2020 Goldman Sachs 21/11/2019 (221,806) (933,197)
USD (50,275,000) Fund writes a put option to enter into an Interest Rate Swap. If exercised Fund receives 1.463% Fixed semi-annually from 25/5/2020; and pays Floating USD LIBOR 3 Month BBA quarterly from 25/2/2020 Goldman Sachs 21/11/2019 193,929 (517,462)
USD (72,417,000) Fund writes a call option to enter into an Interest Rate Swap. If exercised Fund receives Floating USD LIBOR 3 Month BBA quarterly from 31/3/2020; and pays 1.4% Fixed semi-annually from 30/6/2020 Goldman Sachs 27/12/2019 (521,788) (873,124)
USD (78,940,000) Fund writes a put option to enter into an Interest Rate Swap. If exercised Fund receives 2.8% Fixed semi-annually from 7/7/2020; and pays Floating USD LIBOR 3 Month BBA quarterly from 7/4/2020 Goldman Sachs 3/1/2020 183,763 (167)
USD (401,095,000) Fund writes a put option to enter into an Interest Rate Swap. If exercised Fund receives 2.35125% Fixed semi-annually from 8/10/2020; and pays Floating USD LIBOR 3 Month BBA quarterly from 8/7/2020 Goldman Sachs 6/4/2020 817,829 (36,504)
USD (401,095,000) Fund writes a put option to enter into an Interest Rate Swap. If exercised Fund receives 2.32% Fixed semi-annually from 8/10/2020; and pays Floating USD LIBOR 3 Month BBA quarterly from 8/7/2020 Goldman Sachs 6/4/2020 811,179 (41,148)
USD (250,597,000) Fund writes a call option to enter into an Interest Rate Swap. If exercised Fund receives Floating USD LIBOR 3 Month BBA quarterly from 29/7/2020; and pays 1.9% Fixed semi-annually from 29/10/2020 Goldman Sachs 27/4/2020 (2,713,943) (3,390,555)
USD (98,900,000) Fund writes a put option to enter into an Interest Rate Swap. If exercised Fund receives 3.15% Fixed semi-annually from 7/11/2020; and pays Floating USD LIBOR 3 Month BBA quarterly from 7/8/2020 Goldman Sachs 5/5/2020 544,932 (1,490)
USD (136,590,000) Fund writes a put option to enter into an Interest Rate Swap. If exercised Fund receives 3.35% Fixed semi-annually from 2/12/2020; and pays Floating USD LIBOR 3 Month BBA quarterly from 2/9/2020 Goldman Sachs 29/5/2020 494,800 (2,046)
USD (135,940,000) Fund writes a put option to enter into an Interest Rate Swap. If exercised Fund receives 3.45% Fixed semi-annually from 10/12/2020; and pays Floating USD LIBOR 3 Month BBA quarterly from 10/9/2020 Goldman Sachs 8/6/2020 560,780 (2,012)
USD (86,390,000) Fund writes a put option to enter into an Interest Rate Swap. If exercised Fund receives Floating USD LIBOR 3 Month BBA quarterly from 17/9/2020; and pays 3.35% Fixed semi-annually from 17/12/2020 Goldman Sachs 15/6/2020 422,416 (1,759)
USD (32,240,000) Fund writes a put option to enter into an Interest Rate Swap. If exercised Fund receives 2.3% Fixed semi-annually from 29/1/2021; and pays Floating USD LIBOR 3 Month BBA quarterly from 29/10/2020 Goldman Sachs 27/7/2020 329,750 (65,190)
EUR (121,810,000) Fund writes a put option to enter into an Interest Rate Swap. If exercised Fund receives 0.16% Fixed annually from 14/4/2022; and pays Floating EUR EURIBOR 6 Month semi-annually from 14/10/2021 Goldman Sachs 12/4/2021 391,281 (19,457)
EUR (36,120,000) Fund writes a put option to enter into an Interest Rate Swap. If exercised Fund receives 0% Fixed annually from 22/6/2022; and pays Floating EUR EURIBOR 6 Month semi-annually from 22/12/2021 Goldman Sachs 18/6/2021 67,550 (16,167)
USD (87,330,000) Fund writes a put option to enter into an Interest Rate Swap. If exercised Fund receives 3.25% Fixed semi-annually from 5/11/2022; and pays Floating USD LIBOR 3 Month BBA quarterly from 5/8/2022 Goldman Sachs 3/5/2022 1,665,890 (160,747)
EUR (39,300,000) Fund writes a put option to enter into a Credit Default Swap. If exercised Fund receives 1% Fixed; and pays Floating ITRAXX.EUR.31.V2 quarterly from 20/6/2019 JP Morgan 18/9/2019 110,069 (504)
USD (107,800,000) Fund writes a put option to enter into an Interest Rate Swap. If exercised Fund receives 2.6% Fixed semi-annually from 25/3/2020; and pays Floating USD LIBOR 3 Month BBA quarterly from 25/12/2019 JP Morgan 23/9/2019 78,155 –
USD (107,800,000) Fund writes a call option to enter into an Interest Rate Swap. If exercised Fund receives Floating USD LIBOR 3 Month BBA quarterly from 25/12/2019; and pays 2% Fixed semi-annually from 25/3/2020 JP Morgan 23/9/2019 (972,363) (1,085,552)
USD (32,789,000) Fund writes a call option to enter into an Interest Rate Swap. If exercised Fund receives Floating USD LIBOR 3 Month BBA quarterly from 27/12/2019; and pays 1.76% Fixed semi-annually from 27/3/2020 JP Morgan 25/9/2019 (966,211) (1,175,291)

The notes on pages 728 to 741 form an integral part of these financial statements.
Annual Report and Audited Financial Statements [375]
Fixed Income Global Opportunities Fund continued
Written Swaptions as at 31 August 2019
Nominal Value
Description Counterparty
Expiration date
Unrealised appreciation/
(depreciation) USD
Market Value USD
USD (20,104,000) Fund writes a call option to enter into an Interest Rate Swap. If exercised Fund receives Floating USD LIBOR 3 Month BBA quarterly from 31/12/2019; and pays 1.79% Fixed semi-annually from 31/3/2020 JP Morgan 26/9/2019 (662,646) (776,324)
USD (38,140,000) Fund writes a put option to enter into an Interest Rate Swap. If exercised Fund receives 2.55% Fixed semi-annually from 13/5/2020; and pays Floating USD LIBOR 3 Month BBA quarterly from 13/2/2020 JP Morgan 8/11/2019 418,491 (95)
USD (50,275,000) Fund writes a call option to enter into an Interest Rate Swap. If exercised Fund receives Floating USD LIBOR 3 Month BBA quarterly from 2/3/2020; and pays 1.416% Fixed semi-annually from 2/6/2020 JP Morgan 27/11/2019 (95,224) (841,808)
USD (50,275,000) Fund writes a put option to enter into an Interest Rate Swap. If exercised Fund receives 1.416% Fixed semi-annually from 2/6/2020; and pays Floating USD LIBOR 3 Month BBA quarterly from 2/3/2020 JP Morgan 27/11/2019 103,014 (643,570)
USD (74,400,000) Fund writes a put option to enter into an Interest Rate Swap. If exercised Fund receives 2.7% Fixed semi-annually from 18/6/2020; and pays Floating USD LIBOR 3 Month BBA quarterly from 18/3/2020 JP Morgan 16/12/2019 233,416 (227)
USD (15,279,000) Fund writes a call option to enter into an Interest Rate Swap. If exercised Fund receives Floating USD LIBOR 3 Month BBA quarterly from 31/3/2020; and pays 1.7% Fixed semi-annually from 30/6/2020 JP Morgan 27/12/2019 (446,363) (558,947)
USD (25,949,000) Fund writes a call option to enter into an Interest Rate Swap. If exercised Fund receives Floating USD LIBOR 3 Month BBA quarterly from 31/3/2020; and pays 1.66% Fixed semi-annually from 30/6/2020 JP Morgan 27/12/2019 (675,170) (874,807)
USD (186,800,000) Fund writes a put option to enter into an Interest Rate Swap. If exercised Fund receives 2.85% Fixed semi-annually from 23/7/2020; and pays Floating USD LIBOR 3 Month BBA quarterly from 23/4/2020 JP Morgan 21/1/2020 779,346 (544)
USD (32,820,000) Fund writes a call option to enter into an Interest Rate Swap. If exercised Fund receives Floating USD LIBOR 3 Month BBA quarterly from 7/11/2020; and pays 1.325% Fixed semi-annually from 7/2/2021 JP Morgan 5/8/2020 (15,105) (113,729)
USD (32,820,000) Fund writes a put option to enter into an Interest Rate Swap. If exercised Fund receives 1.325% Fixed semi-annually from 7/2/2021; and pays Floating USD LIBOR 3 Month BBA quarterly from 7/11/2020 JP Morgan 5/8/2020 38,495 (60,129)
USD (41,940,000) Fund writes a put option to enter into an Interest Rate Swap. If exercised Fund receives 1.6% Fixed semi-annually from 19/2/2021; and pays Floating USD LIBOR 3 Month BBA quarterly from 19/11/2020 JP Morgan 17/8/2020 137,543 (642,541)
USD (41,940,000) Fund writes a call option to enter into an Interest Rate Swap. If exercised Fund receives Floating USD LIBOR 3 Month BBA quarterly from 19/11/2020; and pays 1.2% Fixed semi-annually from 19/2/2021 JP Morgan 17/8/2020 (79,962) (860,046)
EUR (165,700,000) Fund writes a put option to enter into an Interest Rate Swap. If exercised Fund receives 0.6% Fixed annually from 16/12/2021; and pays Floating EUR EURIBOR 6 Month semi-annually from 16/6/2021 JP Morgan 14/12/2020 624,603 (1,338)
EUR (117,405,000) Fund writes a put option to enter into an Interest Rate Swap. If exercised Fund receives 0.3% Fixed anually from 10/3/2022; and pays Floating EUR EURIBOR 6 Month semi-annually from 10/9/2021 JP Morgan 8/3/2021 311,901 (7,876)
EUR (46,800,000) Fund writes a put option to enter into an Interest Rate Swap. If exercised Fund receives 2.15% Fixed semi-annually from 21/4/2022; and pays Floating EUR EURIBOR 6 Month semi-annually from 21/10/2021 JP Morgan 19/4/2021 989,155 (13,539)
USD (32,780,000) Fund writes a put option to enter into an Interest Rate Swap. If exercised Fund receives 3.25% Fixed semi-annually from 4/2/2023; and pays Floating USD LIBOR 3 Month BBA quarterly from 4/11/2022 JP Morgan 2/8/2022 69,181 (145,528)
USD (32,780,000) Fund writes a put option to enter into an Interest Rate Swap. If exercised Fund receives 2.75% Fixed semi-annually from 4/2/2023; and pays Floating USD LIBOR 3 Month BBA quarterly from 4/11/2022 JP Morgan 2/8/2022 204,798 (244,288)
USD (61,750,000) Fund writes a put option to enter into an Interest Rate Swap. If exercised Fund receives 2.55% Fixed semi-annually from 15/4/2020; and pays Floating USD LIBOR 3 Month BBA quarterly from 15/1/2020 Morgan Stanley 10/10/2019 67,306 (2)
USD (61,750,000) Fund writes a put option to enter into an Interest Rate Swap. If exercised Fund receives 2.55% Fixed semi-annually from 16/4/2020; and pays Floating USD LIBOR 3 Month BBA quarterly from 16/1/2020 Morgan Stanley 11/10/2019 68,231 (2)
USD (147,902,000) Fund writes a call option to enter into an Interest Rate Swap. If exercised Fund receives Floating USD LIBOR 3 Month BBA quarterly from 25/1/2020; and pays 2.34% Fixed semi-annually from 25/4/2020 Morgan Stanley 23/10/2019 (12,516,047) (13,376,174)
USD (22,300,000) Fund writes a call option to enter into an Interest Rate Swap. If exercised Fund receives Floating USD LIBOR 3 Month BBA quarterly from 5/2/2020; and pays 2.3% Fixed semi-annually from 5/5/2020 Morgan Stanley 1/11/2019 (1,806,815) (1,935,724)
USD (22,300,000) Fund writes a put option to enter into an Interest Rate Swap. If exercised Fund receives 2.8% Fixed semi-annually from 5/5/2020; and pays Floating USD LIBOR 3 Month BBA quarterly from 5/2/2020 Morgan Stanley 1/11/2019 110,367 (2)
USD (40,016,629) Fund writes a call option to enter into an Interest Rate Swap. If exercised Fund receives Floating USD LIBOR 3 Month BBA quarterly from 2/3/2020; and pays 1.03% Fixed semi-annually from 2/6/2020 Morgan Stanley 27/11/2019 21,310 (126,752)
USD (100,506,881) Fund writes a call option to enter into an Interest Rate Swap. If exercised Fund receives Floating USD LIBOR 3 Month BBA quarterly from 2/3/2020; and pays 1.03% Fixed semi-annually from 2/6/2020 Morgan Stanley 27/11/2019 53,522 (318,354)
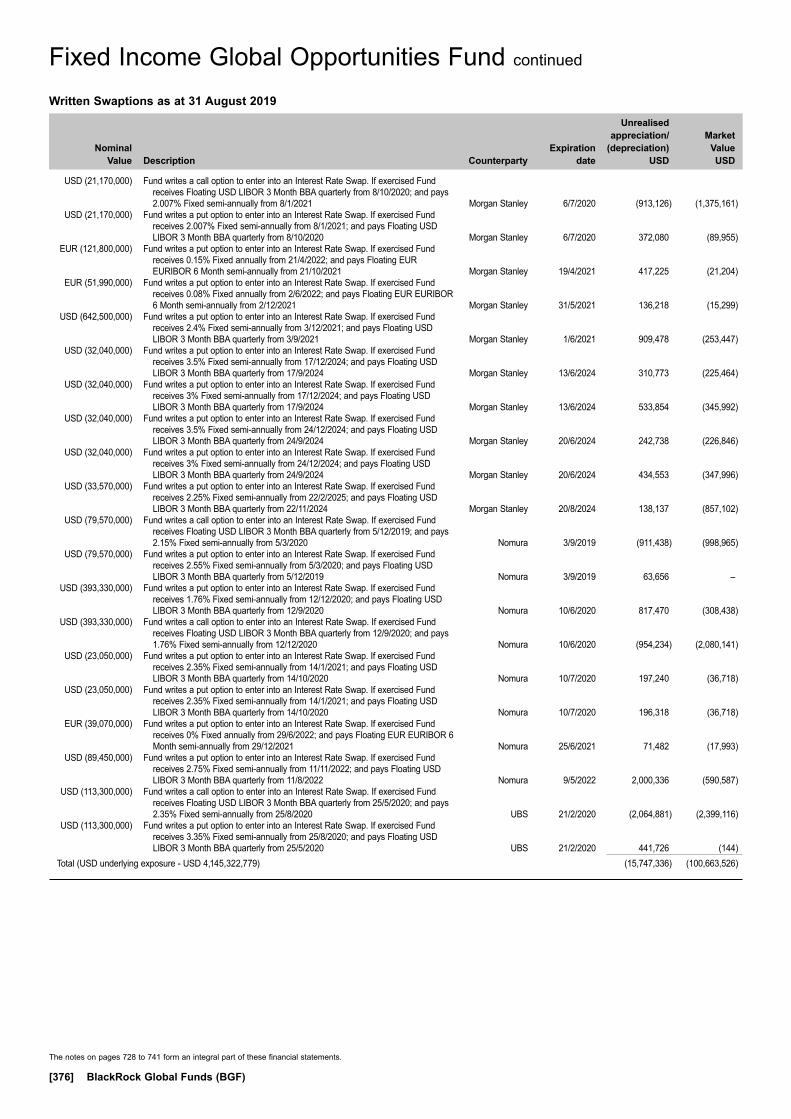
The notes on pages 728 to 741 form an integral part of these financial statements.
[376] BlackRock Global Funds (BGF)
Written Swaptions as at 31 August 2019
Nominal Value
Description Counterparty
Expiration date
Unrealised appreciation/
(depreciation) USD
Market Value USD
USD (21,170,000) Fund writes a call option to enter into an Interest Rate Swap. If exercised Fund receives Floating USD LIBOR 3 Month BBA quarterly from 8/10/2020; and pays 2.007% Fixed semi-annually from 8/1/2021 Morgan Stanley 6/7/2020 (913,126) (1,375,161)
USD (21,170,000) Fund writes a put option to enter into an Interest Rate Swap. If exercised Fund receives 2.007% Fixed semi-annually from 8/1/2021; and pays Floating USD LIBOR 3 Month BBA quarterly from 8/10/2020 Morgan Stanley 6/7/2020 372,080 (89,955)
EUR (121,800,000) Fund writes a put option to enter into an Interest Rate Swap. If exercised Fund receives 0.15% Fixed annually from 21/4/2022; and pays Floating EUR EURIBOR 6 Month semi-annually from 21/10/2021 Morgan Stanley 19/4/2021 417,225 (21,204)
EUR (51,990,000) Fund writes a put option to enter into an Interest Rate Swap. If exercised Fund receives 0.08% Fixed annually from 2/6/2022; and pays Floating EUR EURIBOR 6 Month semi-annually from 2/12/2021 Morgan Stanley 31/5/2021 136,218 (15,299)
USD (642,500,000) Fund writes a put option to enter into an Interest Rate Swap. If exercised Fund receives 2.4% Fixed semi-annually from 3/12/2021; and pays Floating USD LIBOR 3 Month BBA quarterly from 3/9/2021 Morgan Stanley 1/6/2021 909,478 (253,447)
USD (32,040,000) Fund writes a put option to enter into an Interest Rate Swap. If exercised Fund receives 3.5% Fixed semi-annually from 17/12/2024; and pays Floating USD LIBOR 3 Month BBA quarterly from 17/9/2024 Morgan Stanley 13/6/2024 310,773 (225,464)
USD (32,040,000) Fund writes a put option to enter into an Interest Rate Swap. If exercised Fund receives 3% Fixed semi-annually from 17/12/2024; and pays Floating USD LIBOR 3 Month BBA quarterly from 17/9/2024 Morgan Stanley 13/6/2024 533,854 (345,992)
USD (32,040,000) Fund writes a put option to enter into an Interest Rate Swap. If exercised Fund receives 3.5% Fixed semi-annually from 24/12/2024; and pays Floating USD LIBOR 3 Month BBA quarterly from 24/9/2024 Morgan Stanley 20/6/2024 242,738 (226,846)
USD (32,040,000) Fund writes a put option to enter into an Interest Rate Swap. If exercised Fund receives 3% Fixed semi-annually from 24/12/2024; and pays Floating USD LIBOR 3 Month BBA quarterly from 24/9/2024 Morgan Stanley 20/6/2024 434,553 (347,996)
USD (33,570,000) Fund writes a put option to enter into an Interest Rate Swap. If exercised Fund receives 2.25% Fixed semi-annually from 22/2/2025; and pays Floating USD LIBOR 3 Month BBA quarterly from 22/11/2024 Morgan Stanley 20/8/2024 138,137 (857,102)
USD (79,570,000) Fund writes a call option to enter into an Interest Rate Swap. If exercised Fund receives Floating USD LIBOR 3 Month BBA quarterly from 5/12/2019; and pays 2.15% Fixed semi-annually from 5/3/2020 Nomura 3/9/2019 (911,438) (998,965)
USD (79,570,000) Fund writes a put option to enter into an Interest Rate Swap. If exercised Fund receives 2.55% Fixed semi-annually from 5/3/2020; and pays Floating USD LIBOR 3 Month BBA quarterly from 5/12/2019 Nomura 3/9/2019 63,656 –
USD (393,330,000) Fund writes a put option to enter into an Interest Rate Swap. If exercised Fund receives 1.76% Fixed semi-annually from 12/12/2020; and pays Floating USD LIBOR 3 Month BBA quarterly from 12/9/2020 Nomura 10/6/2020 817,470 (308,438)
USD (393,330,000) Fund writes a call option to enter into an Interest Rate Swap. If exercised Fund receives Floating USD LIBOR 3 Month BBA quarterly from 12/9/2020; and pays 1.76% Fixed semi-annually from 12/12/2020 Nomura 10/6/2020 (954,234) (2,080,141)
USD (23,050,000) Fund writes a put option to enter into an Interest Rate Swap. If exercised Fund receives 2.35% Fixed semi-annually from 14/1/2021; and pays Floating USD LIBOR 3 Month BBA quarterly from 14/10/2020 Nomura 10/7/2020 197,240 (36,718)
USD (23,050,000) Fund writes a put option to enter into an Interest Rate Swap. If exercised Fund receives 2.35% Fixed semi-annually from 14/1/2021; and pays Floating USD LIBOR 3 Month BBA quarterly from 14/10/2020 Nomura 10/7/2020 196,318 (36,718)
EUR (39,070,000) Fund writes a put option to enter into an Interest Rate Swap. If exercised Fund receives 0% Fixed annually from 29/6/2022; and pays Floating EUR EURIBOR 6 Month semi-annually from 29/12/2021 Nomura 25/6/2021 71,482 (17,993)
USD (89,450,000) Fund writes a put option to enter into an Interest Rate Swap. If exercised Fund receives 2.75% Fixed semi-annually from 11/11/2022; and pays Floating USD LIBOR 3 Month BBA quarterly from 11/8/2022 Nomura 9/5/2022 2,000,336 (590,587)
USD (113,300,000) Fund writes a call option to enter into an Interest Rate Swap. If exercised Fund receives Floating USD LIBOR 3 Month BBA quarterly from 25/5/2020; and pays 2.35% Fixed semi-annually from 25/8/2020 UBS 21/2/2020 (2,064,881) (2,399,116)
USD (113,300,000) Fund writes a put option to enter into an Interest Rate Swap. If exercised Fund receives 3.35% Fixed semi-annually from 25/8/2020; and pays Floating USD LIBOR 3 Month BBA quarterly from 25/5/2020 UBS 21/2/2020 441,726 (144)
Total (USD underlying exposure - USD 4,145,322,779) (15,747,336) (100,663,526)
Fixed Income Global Opportunities Fund continued

The notes on pages 728 to 741 form an integral part of these financial statements.
Annual Report and Audited Financial Statements [377]
To Be Announced Securities Contracts as at 31 August 2019
Holding Description
Market Value (USD)
% of Net
Assets
TBA
United States USD (20,675,000) Fannie Mae or Freddie Mac
‘2.5 9/19’ 2.5% TBA (20,938,307) (0.22) USD (202,791,000) Fannie Mae or Freddie Mac
‘3 9/19’ 3% TBA (206,411,123) (2.12) USD (14,081,000) Fannie Mae or Freddie Mac
‘3 9/19’ 3% TBA (14,434,196) (0.15) USD 831,300,000 Fannie Mae or Freddie Mac
‘3.5 10/19’ 3.5% TBA 853,868,465 8.76 USD 172,896,000 Fannie Mae or Freddie Mac
‘3.5 9/19’ 3.5% TBA 177,522,308 1.82 USD 36,000 Fannie Mae or Freddie Mac
‘3.5 9/19’ 3.5% TBA 37,297 0.00 USD 607,800,000 Fannie Mae or Freddie Mac
‘4 10/19’ 4% TBA 630,853,641 6.48 USD 271,560,000 Fannie Mae or Freddie Mac
‘4 9/19’ 4% TBA 281,626,797 2.89 USD 143,300,000 Fannie Mae or Freddie Mac
‘4.5 10/19’ 4.5% TBA 150,784,093 1.55 USD 167,726,050 Fannie Mae or Freddie Mac
‘4.5 9/19’ 4.5% TBA 176,407,173 1.81 USD (94,877,000) Ginnie Mae ‘3.5 9/19’ 3.5% TBA (98,455,267) (1.01) USD (63,251,000) Ginnie Mae ‘3.5 10/19’ 3.5% TBA (65,582,141) (0.67) USD 146,520,000 Ginnie Mae ‘4.5 11/19’ 4.5% TBA 153,050,462 1.57 USD 99,468,000 Ginnie Mae ‘4.5 10/19’ 4.5% TBA 103,916,880 1.07 USD 105,423,000 Ginnie Mae ‘4.5 9/19’ 4.5% TBA 110,187,619 1.13
Total TBA (USD underlying exposure - USD 3,044,075,769) 2,232,433,701 22.91
To Be Announced (“TBA”) contracts are primarily classified by the country of incorporation of the issuer of the pass-through agency.
Fixed Income Global Opportunities Fund continued
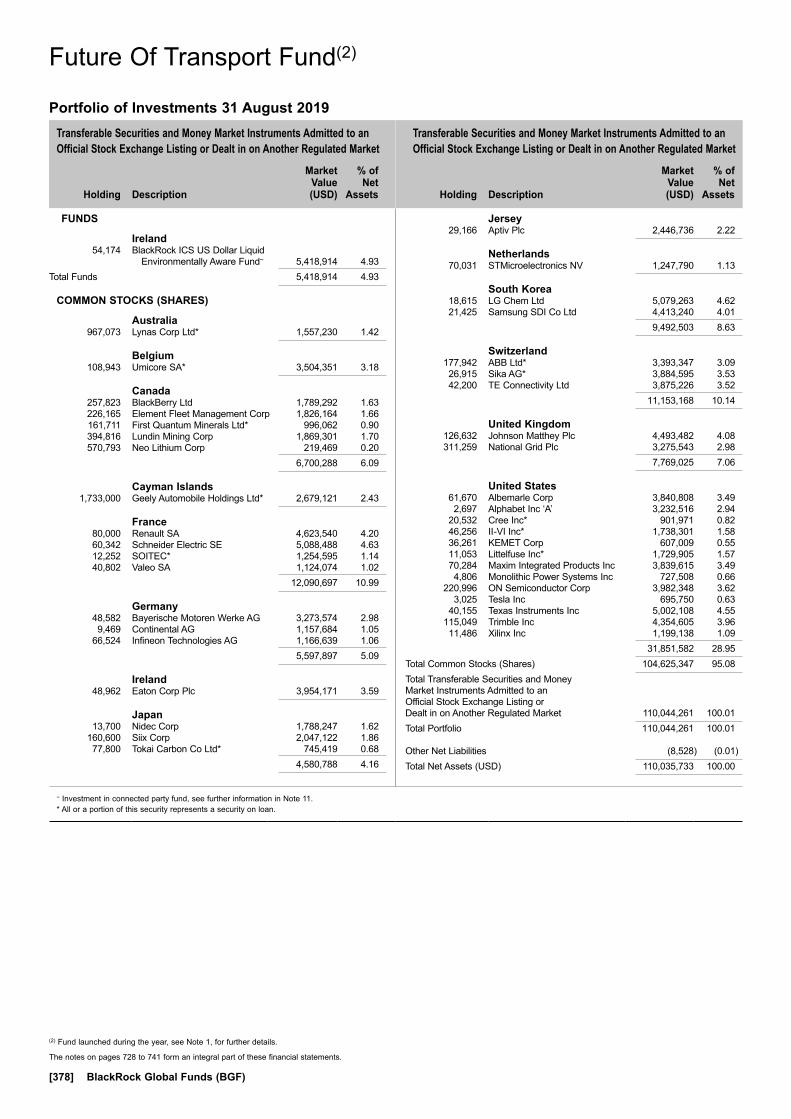
Transferable Securities and Money Market Instruments Admitted to an Official Stock Exchange Listing or Dealt in on Another Regulated Market
Transferable Securities and Money Market Instruments Admitted to an Official Stock Exchange Listing or Dealt in on Another Regulated Market
Holding
Description
Market Value (USD)
% of Net
Assets
Holding
Description
Market Value (USD)
% of Net
Assets
~ Investment in connected party fund, see further information in Note 11.* All or a portion of this security represents a security on loan.
(2) Fund launched during the year, see Note 1, for further details.
The notes on pages 728 to 741 form an integral part of these financial statements.
[378] BlackRock Global Funds (BGF)
FUNDS
Ireland 54,174 BlackRock ICS US Dollar Liquid
Environmentally Aware Fund~ 5,418,914 4.93Total Funds 5,418,914 4.93
COMMON STOCKS (SHARES)
Australia 967,073 Lynas Corp Ltd* 1,557,230 1.42
Belgium 108,943 Umicore SA* 3,504,351 3.18
Canada 257,823 BlackBerry Ltd 1,789,292 1.63 226,165 Element Fleet Management Corp 1,826,164 1.66 161,711 First Quantum Minerals Ltd* 996,062 0.90 394,816 Lundin Mining Corp 1,869,301 1.70 570,793 Neo Lithium Corp 219,469 0.20 6,700,288 6.09
Cayman Islands 1,733,000 Geely Automobile Holdings Ltd* 2,679,121 2.43
France 80,000 Renault SA 4,623,540 4.20 60,342 Schneider Electric SE 5,088,488 4.63 12,252 SOITEC* 1,254,595 1.14 40,802 Valeo SA 1,124,074 1.02 12,090,697 10.99
Germany 48,582 Bayerische Motoren Werke AG 3,273,574 2.98 9,469 Continental AG 1,157,684 1.05 66,524 Infineon Technologies AG 1,166,639 1.06 5,597,897 5.09
Ireland 48,962 Eaton Corp Plc 3,954,171 3.59
Japan 13,700 Nidec Corp 1,788,247 1.62 160,600 Siix Corp 2,047,122 1.86 77,800 Tokai Carbon Co Ltd* 745,419 0.68 4,580,788 4.16
Jersey 29,166 Aptiv Plc 2,446,736 2.22
Netherlands 70,031 STMicroelectronics NV 1,247,790 1.13
South Korea 18,615 LG Chem Ltd 5,079,263 4.62 21,425 Samsung SDI Co Ltd 4,413,240 4.01 9,492,503 8.63
Switzerland 177,942 ABB Ltd* 3,393,347 3.09 26,915 Sika AG* 3,884,595 3.53 42,200 TE Connectivity Ltd 3,875,226 3.52 11,153,168 10.14
United Kingdom 126,632 Johnson Matthey Plc 4,493,482 4.08 311,259 National Grid Plc 3,275,543 2.98 7,769,025 7.06
United States 61,670 Albemarle Corp 3,840,808 3.49 2,697 Alphabet Inc ‘A’ 3,232,516 2.94 20,532 Cree Inc* 901,971 0.82 46,256 II-VI Inc* 1,738,301 1.58 36,261 KEMET Corp 607,009 0.55 11,053 Littelfuse Inc* 1,729,905 1.57 70,284 Maxim Integrated Products Inc 3,839,615 3.49 4,806 Monolithic Power Systems Inc 727,508 0.66 220,996 ON Semiconductor Corp 3,982,348 3.62 3,025 Tesla Inc 695,750 0.63 40,155 Texas Instruments Inc 5,002,108 4.55 115,049 Trimble Inc 4,354,605 3.96 11,486 Xilinx Inc 1,199,138 1.09 31,851,582 28.95Total Common Stocks (Shares) 104,625,347 95.08Total Transferable Securities and Money Market Instruments Admitted to an Official Stock Exchange Listing or Dealt in on Another Regulated Market 110,044,261 100.01Total Portfolio 110,044,261 100.01
Other Net Liabilities (8,528) (0.01)Total Net Assets (USD) 110,035,733 100.00
Future Of Transport Fund(2)
Portfolio of Investments 31 August 2019
Future Of Transport Fund(2)
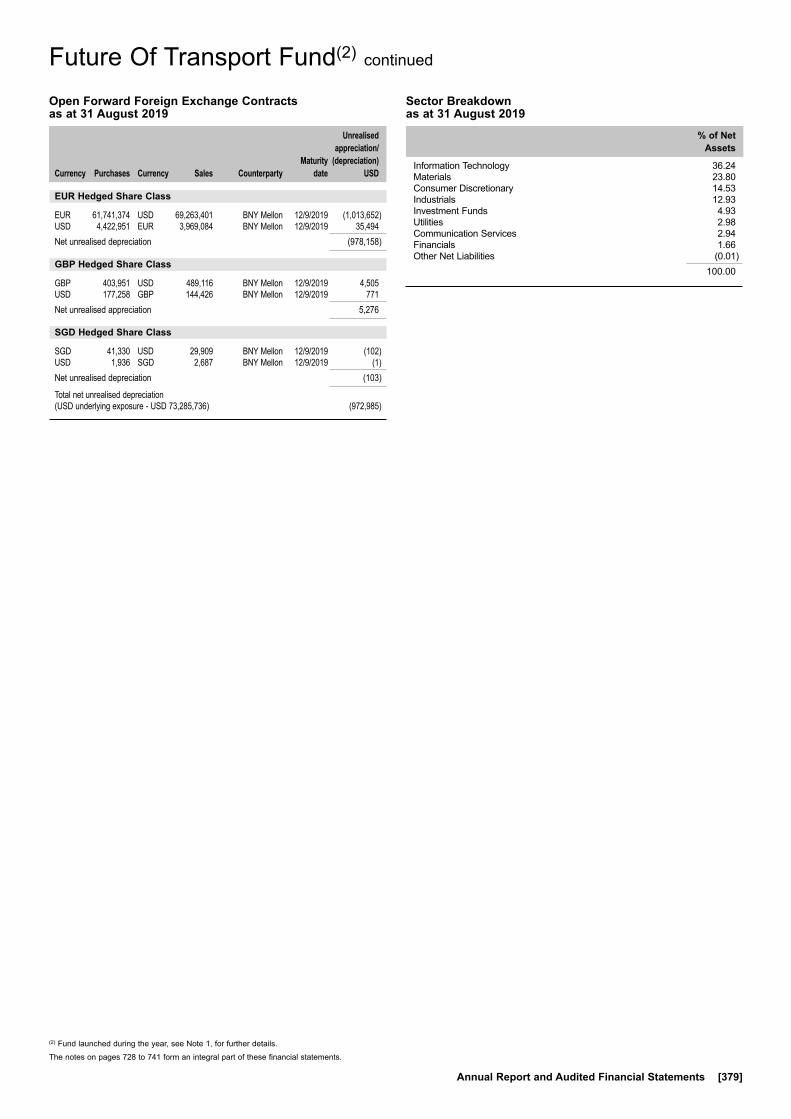
(2) Fund launched during the year, see Note 1, for further details.
The notes on pages 728 to 741 form an integral part of these financial statements.
Annual Report and Audited Financial Statements [379]
Future Of Transport Fund(2) continued
Open Forward Foreign Exchange Contracts as at 31 August 2019
Currency
Purchases Currency
Sales Counterparty
Maturity date
Unrealised appreciation/
(depreciation) USD
EUR Hedged Share Class
EUR 61,741,374 USD 69,263,401 BNY Mellon 12/9/2019 (1,013,652)USD 4,422,951 EUR 3,969,084 BNY Mellon 12/9/2019 35,494Net unrealised depreciation (978,158)
GBP Hedged Share Class
GBP 403,951 USD 489,116 BNY Mellon 12/9/2019 4,505USD 177,258 GBP 144,426 BNY Mellon 12/9/2019 771Net unrealised appreciation 5,276
SGD Hedged Share Class
SGD 41,330 USD 29,909 BNY Mellon 12/9/2019 (102)USD 1,936 SGD 2,687 BNY Mellon 12/9/2019 (1)Net unrealised depreciation (103)
Total net unrealised depreciation (USD underlying exposure - USD 73,285,736) (972,985)
Sector Breakdown as at 31 August 2019
% of Net Assets
Information Technology 36.24Materials 23.80Consumer Discretionary 14.53Industrials 12.93Investment Funds 4.93Utilities 2.98Communication Services 2.94Financials 1.66Other Net Liabilities (0.01)
100.00

Transferable Securities and Money Market Instruments Admitted to an Official Stock Exchange Listing or Dealt in on Another Regulated Market
Transferable Securities and Money Market Instruments Admitted to an Official Stock Exchange Listing or Dealt in on Another Regulated Market
Holding
Description
Market Value (USD)
% of Net
Assets
Holding
Description
Market Value (USD)
% of Net
Assets
~ Investment in connected party fund, see further information in Note 11.* All or a portion of this security represents a security on loan.
The notes on pages 728 to 741 form an integral part of these financial statements.
[380] BlackRock Global Funds (BGF)
FUNDS
Ireland 120,345 iShares USD Corp Bond
UCITS ETF*~ 14,895,101 0.10 131,727 iShares USD High Yield Corp Bond
UCITS ETF~ 13,661,407 0.10Total Funds 28,556,508 0.20
COMMON / PREFERRED STOCKS (SHARES)
Argentina 29,943 YPF SA ADR 262,900 0.00
Australia 132,669 AGL Energy Ltd 1,694,742 0.01 841,835 Newcrest Mining Ltd 20,985,744 0.15 4,833 Rio Tinto Ltd 285,179 0.00 213,913 South32 Ltd 380,484 0.00 23,346,149 0.16
Bermuda 714,500 CK Infrastructure Holdings Ltd* 4,816,576 0.04 294,200 Hongkong Land Holdings Ltd 1,606,332 0.01 138,200 Jardine Matheson Holdings Ltd 7,513,934 0.05 330,000 Kunlun Energy Co Ltd 287,492 0.00 368,620 Marvell Technology Group Ltd* 9,034,876 0.06 23,259,210 0.16
Brazil 57,542 Ambev SA 259,874 0.00 1,415,423 Azul SA ADR* 50,403,213 0.36 3,399 B3 SA - Brasil Bolsa Balcao 36,556 0.00 31,351 Banco do Brasil SA 345,048 0.00 24,114 Banco Santander Brasil SA (Unit) 246,956 0.00 9,473 Braskem SA (Pref) 66,436 0.00 23,923 Engie Brasil Energia SA 256,716 0.00 950,825 Itau Unibanco Holding SA (Pref) 7,815,296 0.06 55,335 JBS SA 406,900 0.00 2,746,058 Notre Dame Intermedica
Participacoes SA 35,867,461 0.25 171,516 Petrobras Distribuidora SA 1,193,777 0.01 96,898,233 0.68
Canada 354,473 Barrick Gold Corp* 6,758,601 0.05 13,276 Canadian National Railway Co 1,229,810 0.01 3,586 Canadian Pacific Railway Ltd 864,326 0.01 1,661,965 Enbridge Inc* 55,695,292 0.39 1,634 Fairfax Financial Holdings Ltd 732,737 0.01 21,276 Imperial Oil Ltd 522,435 0.00 16,678 Magna International Inc (Unit) 837,922 0.01 5,406 Nutrien Ltd 270,870 0.00 10,150 Rogers Communications Inc 504,974 0.00 852,521 TC Energy Corp 43,307,283 0.30 25,601 Thomson Reuters Corp 1,750,609 0.01 696,706 Wheaton Precious Metals Corp 20,185,745 0.14 132,660,604 0.93
Cayman Islands 388,000 Agile Group Holdings Ltd* 495,896 0.00 450,229 Alibaba Group Holding Ltd ADR 78,551,454 0.55 261,000 ANTA Sports Products Ltd 2,163,939 0.01 379,500 China Hongqiao Group Ltd 248,809 0.00 509,000 China Mengniu Dairy Co Ltd 2,019,154 0.01
1,172,000 China Resources Cement Holdings Ltd* 1,038,971 0.01
4,500 CK Asset Holdings Ltd 30,565 0.00 95,379 Country Garden Services Holdings
Co Ltd* 276,166 0.00 500,000 Dali Foods Group Co Ltd 332,914 0.00 1,420,000 Fullshare Holdings Ltd 37,855 0.00 341,000 Hengan International Group Co Ltd* 2,244,374 0.02 66,615 Huazhu Group Ltd ADR 2,252,919 0.02 43,229 JD.com Inc ADR 1,331,453 0.01 2,406,000 Kingdee International Software
Group Co Ltd* 2,178,940 0.01 738,500 Li Ning Co Ltd 2,180,684 0.02 18,000 Sands China Ltd* 81,736 0.00 61,747 TAL Education Group ADR 2,226,597 0.02 1,959,400 Tencent Holdings Ltd* 81,176,499 0.57 284,000 Tingyi Cayman Islands Holding Corp* 391,231 0.00 6,744,000 Want Want China Holdings Ltd* 5,255,935 0.04 566,000 Wharf Real Estate
Investment Co Ltd* 3,064,681 0.02 209,500 Wuxi Biologics Cayman Inc 2,207,269 0.02 189,788,041 1.33
Chile 133,110 Cia Cervecerias Unidas SA ADR* 2,967,022 0.02
China 691,000 Agricultural Bank of China Ltd ‘H’ 266,180 0.00 450,776 Aier Eye Hospital Group Co Ltd 2,129,662 0.02 104,000 Air China Ltd ‘H’ 90,073 0.00 68,700 Anhui Conch Cement Co Ltd 378,856 0.00 179,500 Anhui Conch Cement Co Ltd ‘H’* 1,010,849 0.01 139,530 Asymchem Laboratories
Tianjin Co Ltd 2,138,401 0.02 162,436 Autobio Diagnostics Co Ltd 1,967,844 0.01 130,000 Bank of China Ltd ‘H’ 49,580 0.00 774,000 Beijing Capital International
Airport Co Ltd ‘H’* 649,618 0.00 1,058,000 CGN Power Co Ltd ‘H’ 279,349 0.00 992,000 China CITIC Bank Corp Ltd ‘H’ 518,784 0.00 350,000 China Longyuan Power Group
Corp Ltd ‘H’ 192,414 0.00 2,064,000 China Petroleum & Chemical
Corp ‘H’ 1,208,408 0.01 365,500 China Shenhua Energy Co Ltd ‘H’ 714,229 0.01 70,000 CITIC Securities Co Ltd ‘H’* 125,359 0.00 50,900 Daqin Railway Co Ltd 55,100 0.00 142,266 Foshan Haitian Flavouring &
Food Co Ltd 2,281,609 0.02 20,200 GF Securities Co Ltd ‘H’ 20,741 0.00 429,092 Glodon Co Ltd 2,166,446 0.02 1,222,500 Great Wall Motor Co Ltd 1,396,887 0.01 184,600 Gree Electric Appliances Inc
of Zhuhai 1,432,897 0.01 890,280 Guangzhou Automobile
Group Co Ltd 1,460,545 0.01 91,200 Guotai Junan Securities Co Ltd ‘H’ 130,055 0.00 652,199 Haier Smart Home Co Ltd 1,451,244 0.01 278,800 Haitong Securities Co Ltd ‘H’ 265,647 0.00 489,300 Hangzhou Hikvision Digital
Technology Co Ltd 2,115,948 0.01 401,100 Hangzhou Robam Appliances
Co Ltd 1,402,996 0.01 251,879 Hangzhou Tigermed Consulting
Co Ltd 2,148,879 0.02 492,582 Han’s Laser Technology Industry
Group Co Ltd 2,135,652 0.02
Global Allocation Fund
Portfolio of Investments 31 August 2019
Global Allocation Fund

Transferable Securities and Money Market Instruments Admitted to an Official Stock Exchange Listing or Dealt in on Another Regulated Market
Transferable Securities and Money Market Instruments Admitted to an Official Stock Exchange Listing or Dealt in on Another Regulated Market
Holding
Description
Market Value (USD)
% of Net
Assets
Holding
Description
Market Value (USD)
% of Net
Assets
* All or a portion of this security represents a security on loan.
The notes on pages 728 to 741 form an integral part of these financial statements.
Annual Report and Audited Financial Statements [381]
203,292 Hundsun Technologies Inc 2,112,513 0.01 1,598,000 Industrial & Commercial Bank
of China Ltd ‘H’ 1,008,958 0.01 535,091 Inner Mongolia Yili Industrial
Group Co Ltd 2,144,087 0.02 601,400 Inspur Electronic Information
Industry Co Ltd 2,144,835 0.02 202,179 Jiangsu Hengrui Medicine Co Ltd 2,263,537 0.02 206,600 Laobaixing Pharmacy Chain JSC 2,180,695 0.02 172,200 Sany Heavy Industry Co Ltd 324,407 0.00 175,182 Shanghai International Airport
Co Ltd 2,059,290 0.01 443,300 Shanghai Jahwa United Co Ltd 2,110,462 0.01 84,000 Shenzhen Mindray Bio-Medical
Electronics Co Ltd 2,189,268 0.02 629,500 Sinopec Engineering Group
Co Ltd ‘H’ 411,109 0.00 2,472,000 Sinopec Shanghai
Petrochemical Co Ltd ‘H’ 712,604 0.01 50,400 Tsingtao Brewery Co Ltd 372,322 0.00 156,000 Tsingtao Brewery Co Ltd ‘H’* 1,053,614 0.01 513,007 Venustech Group Inc 2,118,019 0.01 198,000 Weichai Power Co Ltd ‘H’* 303,066 0.00 166,091 Wuhan Raycus Fiber Laser
Technologies Co Ltd 2,122,927 0.01 183,997 WuXi AppTec Co Ltd 2,231,105 0.02 426,000 Yanzhou Coal Mining Co Ltd ‘H’* 368,953 0.00 201,800 Yifeng Pharmacy Chain Co Ltd 2,161,923 0.02 464,593 Yonyou Network Technology Co Ltd 2,083,828 0.01 524,000 Zhejiang Expressway Co Ltd ‘H’ 438,456 0.00 1,694,000 Zijin Mining Group Co Ltd ‘H’ 633,100 0.00 63,733,330 0.45
Curacao 91,743 Schlumberger Ltd 3,028,436 0.02
Czech Republic 195,189 CEZ AS 4,305,802 0.03
Denmark 939 AP Moller - Maersk A/S ‘A’ 929,259 0.01 143 AP Moller - Maersk A/S ‘B’ 151,347 0.00 11,476 Carlsberg A/S 1,694,022 0.01 269,311 Novo Nordisk A/S 14,032,058 0.10 16,806,686 0.12
Finland 45,525 Nokia Oyj 226,297 0.00
France 186,667 Cie de Saint-Gobain 6,740,612 0.05 1,352,203 Danone SA* 121,795,008 0.85 14,811 Dassault Aviation SA 21,154,355 0.15 163 Dassault Systemes SE 23,218 0.00 48,208 Eiffage SA 5,032,315 0.03 12,790 Electricite de France SA 155,552 0.00 112,490 EssilorLuxottica SA 16,638,393 0.12 1,546 Kering SA 758,159 0.01 30,594 Orange SA* 467,217 0.00 35,643 Publicis Groupe SA 1,716,634 0.01 18,092 Renault SA 1,045,613 0.01 406,999 Safran SA 59,277,566 0.42 159,124 Sanofi* 13,766,554 0.10 482,140 Sodexo SA* 54,883,026 0.38 490,789 TOTAL SA 24,642,988 0.17 14,422 TOTAL SA ADR* 723,119 0.00 77,298 Unibail-Rodamco-Westfield (Reit)* 10,092,590 0.07 39,803 Vivendi SA 1,118,975 0.01 340,031,894 2.38
Germany 5,419 adidas AG 1,621,605 0.01 2,645 Allianz SE 585,664 0.00 467,898 Bayer AG* 34,903,166 0.25 1,634 Evonik Industries AG* 41,839 0.00 953,879 Fresenius SE & Co KGaA* 46,725,594 0.33 1,613 HeidelbergCement AG 111,931 0.00 428,356 Henkel AG & Co KGaA (Pref) 43,238,726 0.30 447,680 Knorr-Bremse AG 42,058,996 0.30 2,630 SAP SE 316,839 0.00 1,103,800 Siemens AG 110,540,898 0.78 119,075 Vonovia SE 5,966,375 0.04 1,286 Wirecard AG 205,909 0.00 286,317,542 2.01
Hong Kong 147,500 Beijing Enterprises Holdings Ltd 702,706 0.01 47,000 BYD Electronic International Co Ltd 56,533 0.00 162,500 China Mobile Ltd 1,346,244 0.01 76,000 China Resources Beer Holdings
Co Ltd 431,385 0.00 207,500 China Resources Pharmaceutical
Group Ltd 214,385 0.00 258,000 China Resources Power Holdings
Co Ltd 340,934 0.00 8,400 China Taiping Insurance Holdings
Co Ltd 18,922 0.00 96,000 China Unicom Hong Kong Ltd 95,634 0.00 305,000 CITIC Ltd 361,415 0.00 498,000 CLP Holdings Ltd 5,129,359 0.04 807,000 CNOOC Ltd 1,204,344 0.01 1,371,500 Fosun International Ltd* 1,763,387 0.01 2,743,000 Hang Lung Properties Ltd* 6,199,843 0.04 3,101,000 HKT Trust & HKT Ltd 4,849,349 0.03 529,000 Hysan Development Co Ltd 2,142,351 0.02 1,148,017 I-CABLE Communications Ltd 10,690 0.00 3,812,000 Lenovo Group Ltd* 2,508,960 0.02 409,500 Link REIT (Unit) (Reit) 4,596,505 0.03 300,500 Power Assets Holdings Ltd 2,000,812 0.01 906,000 Sino Land Co Ltd 1,294,307 0.01 265,500 Sun Art Retail Group Ltd 258,393 0.00 4,416,582 Sun Hung Kai Properties Ltd 62,588,069 0.44 381,000 Swire Pacific Ltd* 3,729,877 0.03 101,844,404 0.71
India 1,475,828 Coal India Ltd 3,818,356 0.03 135,643 Hero MotoCorp Ltd 4,885,770 0.03 66,276 Hindustan Petroleum Corp Ltd 241,455 0.00 1,268,707 Housing Development Finance
Corp Ltd 38,491,624 0.27 1,625,638 Oil & Natural Gas Corp Ltd 2,759,197 0.02 3,382,367 Reliance Industries Ltd 59,140,215 0.41 352,494 Vedanta Ltd 686,896 0.01 33,259 Wipro Ltd 118,490 0.00 110,142,003 0.77
Indonesia 2,792,900 Bank Central Asia Tbk PT 6,005,178 0.04
Ireland 70,052 Accenture Plc ‘A’ 13,983,080 0.10 5,817 Eaton Corp Plc 469,781 0.00 38,362 Medtronic Plc 4,139,643 0.03 18,592,504 0.13
Global Allocation Fund continued
Portfolio of Investments 31 August 2019
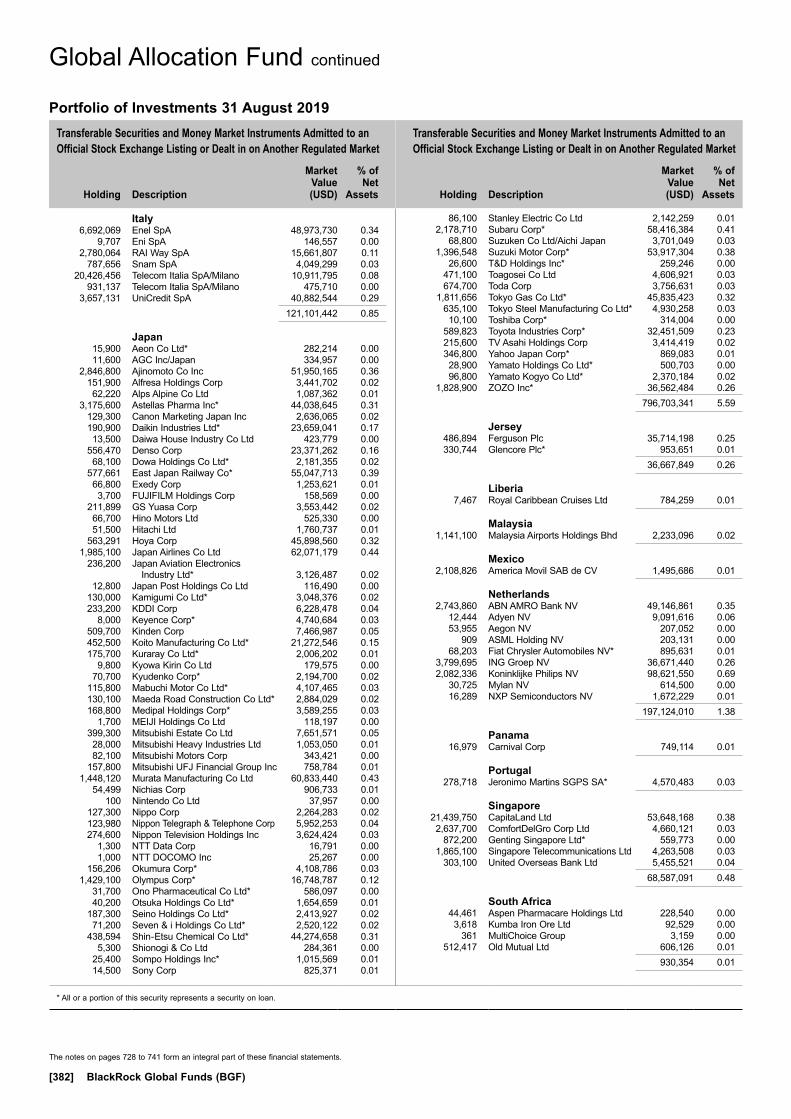
Transferable Securities and Money Market Instruments Admitted to an Official Stock Exchange Listing or Dealt in on Another Regulated Market
Transferable Securities and Money Market Instruments Admitted to an Official Stock Exchange Listing or Dealt in on Another Regulated Market
Holding
Description
Market Value (USD)
% of Net
Assets
Holding
Description
Market Value (USD)
% of Net
Assets
* All or a portion of this security represents a security on loan.
The notes on pages 728 to 741 form an integral part of these financial statements.
[382] BlackRock Global Funds (BGF)
Italy 6,692,069 Enel SpA 48,973,730 0.34 9,707 Eni SpA 146,557 0.00 2,780,064 RAI Way SpA 15,661,807 0.11 787,656 Snam SpA 4,049,299 0.03 20,426,456 Telecom Italia SpA/Milano 10,911,795 0.08 931,137 Telecom Italia SpA/Milano 475,710 0.00 3,657,131 UniCredit SpA 40,882,544 0.29 121,101,442 0.85
Japan 15,900 Aeon Co Ltd* 282,214 0.00 11,600 AGC Inc/Japan 334,957 0.00 2,846,800 Ajinomoto Co Inc 51,950,165 0.36 151,900 Alfresa Holdings Corp 3,441,702 0.02 62,220 Alps Alpine Co Ltd 1,087,362 0.01 3,175,600 Astellas Pharma Inc* 44,038,645 0.31 129,300 Canon Marketing Japan Inc 2,636,065 0.02 190,900 Daikin Industries Ltd* 23,659,041 0.17 13,500 Daiwa House Industry Co Ltd 423,779 0.00 556,470 Denso Corp 23,371,262 0.16 68,100 Dowa Holdings Co Ltd* 2,181,355 0.02 577,661 East Japan Railway Co* 55,047,713 0.39 66,800 Exedy Corp 1,253,621 0.01 3,700 FUJIFILM Holdings Corp 158,569 0.00 211,899 GS Yuasa Corp 3,553,442 0.02 66,700 Hino Motors Ltd 525,330 0.00 51,500 Hitachi Ltd 1,760,737 0.01 563,291 Hoya Corp 45,898,560 0.32 1,985,100 Japan Airlines Co Ltd 62,071,179 0.44 236,200 Japan Aviation Electronics
Industry Ltd* 3,126,487 0.02 12,800 Japan Post Holdings Co Ltd 116,490 0.00 130,000 Kamigumi Co Ltd* 3,048,376 0.02 233,200 KDDI Corp 6,228,478 0.04 8,000 Keyence Corp* 4,740,684 0.03 509,700 Kinden Corp 7,466,987 0.05 452,500 Koito Manufacturing Co Ltd* 21,272,546 0.15 175,700 Kuraray Co Ltd* 2,006,202 0.01 9,800 Kyowa Kirin Co Ltd 179,575 0.00 70,700 Kyudenko Corp* 2,194,700 0.02 115,800 Mabuchi Motor Co Ltd* 4,107,465 0.03 130,100 Maeda Road Construction Co Ltd* 2,884,029 0.02 168,800 Medipal Holdings Corp* 3,589,255 0.03 1,700 MEIJI Holdings Co Ltd 118,197 0.00 399,300 Mitsubishi Estate Co Ltd 7,651,571 0.05 28,000 Mitsubishi Heavy Industries Ltd 1,053,050 0.01 82,100 Mitsubishi Motors Corp 343,421 0.00 157,800 Mitsubishi UFJ Financial Group Inc 758,784 0.01 1,448,120 Murata Manufacturing Co Ltd 60,833,440 0.43 54,499 Nichias Corp 906,733 0.01 100 Nintendo Co Ltd 37,957 0.00 127,300 Nippo Corp 2,264,283 0.02 123,980 Nippon Telegraph & Telephone Corp 5,952,253 0.04 274,600 Nippon Television Holdings Inc 3,624,424 0.03 1,300 NTT Data Corp 16,791 0.00 1,000 NTT DOCOMO Inc 25,267 0.00 156,206 Okumura Corp* 4,108,786 0.03 1,429,100 Olympus Corp* 16,748,787 0.12 31,700 Ono Pharmaceutical Co Ltd* 586,097 0.00 40,200 Otsuka Holdings Co Ltd* 1,654,659 0.01 187,300 Seino Holdings Co Ltd* 2,413,927 0.02 71,200 Seven & i Holdings Co Ltd* 2,520,122 0.02 438,594 Shin-Etsu Chemical Co Ltd* 44,274,658 0.31 5,300 Shionogi & Co Ltd 284,361 0.00 25,400 Sompo Holdings Inc* 1,015,569 0.01 14,500 Sony Corp 825,371 0.01
86,100 Stanley Electric Co Ltd 2,142,259 0.01 2,178,710 Subaru Corp* 58,416,384 0.41 68,800 Suzuken Co Ltd/Aichi Japan 3,701,049 0.03 1,396,548 Suzuki Motor Corp* 53,917,304 0.38 26,600 T&D Holdings Inc* 259,246 0.00 471,100 Toagosei Co Ltd 4,606,921 0.03 674,700 Toda Corp 3,756,631 0.03 1,811,656 Tokyo Gas Co Ltd* 45,835,423 0.32 635,100 Tokyo Steel Manufacturing Co Ltd* 4,930,258 0.03 10,100 Toshiba Corp* 314,004 0.00 589,823 Toyota Industries Corp* 32,451,509 0.23 215,600 TV Asahi Holdings Corp 3,414,419 0.02 346,800 Yahoo Japan Corp* 869,083 0.01 28,900 Yamato Holdings Co Ltd* 500,703 0.00 96,800 Yamato Kogyo Co Ltd* 2,370,184 0.02 1,828,900 ZOZO Inc* 36,562,484 0.26 796,703,341 5.59
Jersey 486,894 Ferguson Plc 35,714,198 0.25 330,744 Glencore Plc* 953,651 0.01 36,667,849 0.26
Liberia 7,467 Royal Caribbean Cruises Ltd 784,259 0.01
Malaysia 1,141,100 Malaysia Airports Holdings Bhd 2,233,096 0.02
Mexico 2,108,826 America Movil SAB de CV 1,495,686 0.01
Netherlands 2,743,860 ABN AMRO Bank NV 49,146,861 0.35 12,444 Adyen NV 9,091,616 0.06 53,955 Aegon NV 207,052 0.00 909 ASML Holding NV 203,131 0.00 68,203 Fiat Chrysler Automobiles NV* 895,631 0.01 3,799,695 ING Groep NV 36,671,440 0.26 2,082,336 Koninklijke Philips NV 98,621,550 0.69 30,725 Mylan NV 614,500 0.00 16,289 NXP Semiconductors NV 1,672,229 0.01 197,124,010 1.38
Panama 16,979 Carnival Corp 749,114 0.01
Portugal 278,718 Jeronimo Martins SGPS SA* 4,570,483 0.03
Singapore 21,439,750 CapitaLand Ltd 53,648,168 0.38 2,637,700 ComfortDelGro Corp Ltd 4,660,121 0.03 872,200 Genting Singapore Ltd* 559,773 0.00 1,865,100 Singapore Telecommunications Ltd 4,263,508 0.03 303,100 United Overseas Bank Ltd 5,455,521 0.04 68,587,091 0.48
South Africa 44,461 Aspen Pharmacare Holdings Ltd 228,540 0.00 3,618 Kumba Iron Ore Ltd 92,529 0.00 361 MultiChoice Group 3,159 0.00 512,417 Old Mutual Ltd 606,126 0.01 930,354 0.01
Global Allocation Fund continued
Portfolio of Investments 31 August 2019

Transferable Securities and Money Market Instruments Admitted to an Official Stock Exchange Listing or Dealt in on Another Regulated Market
Transferable Securities and Money Market Instruments Admitted to an Official Stock Exchange Listing or Dealt in on Another Regulated Market
Holding
Description
Market Value (USD)
% of Net
Assets
Holding
Description
Market Value (USD)
% of Net
Assets
* All or a portion of this security represents a security on loan.
The notes on pages 728 to 741 form an integral part of these financial statements.
Annual Report and Audited Financial Statements [383]
South Korea 30,783 Hana Financial Group Inc 825,963 0.01 327 Hyundai Mobis Co Ltd 67,087 0.00 39,732 Industrial Bank of Korea 406,751 0.00 18,083 KB Financial Group Inc 592,689 0.01 3,567 Kia Motors Corp 128,692 0.00 375,863 KT&G Corp 31,651,620 0.22 17,691 LG Chem Ltd 4,827,142 0.04 33,895 LG Electronics Inc 1,715,388 0.01 42,086 LG Uplus Corp 458,646 0.00 11,575 NCSoft Corp 5,131,703 0.04 26,119 POSCO 4,549,935 0.03 102 Samsung SDI Co Ltd 21,011 0.00 43,965 Shinhan Financial Group Co Ltd 1,479,111 0.01 19,747 SK Telecom Co Ltd 3,904,567 0.03 36,859 S-Oil Corp 2,942,634 0.02 48,554 Woongjin Coway Co Ltd 3,375,229 0.02 62,078,168 0.44
Spain 179,943 CaixaBank SA 410,858 0.00 1,949,216 Cellnex Telecom SA* 78,655,034 0.55 44,169 Repsol SA 646,961 0.00 104,632 Telefonica SA 728,499 0.01 80,441,352 0.56
Sweden 25,826 Assa Abloy AB* 539,128 0.00 23,463 Atlas Copco AB 628,033 0.01 43,344 Sandvik AB 622,949 0.00 117,523 Telefonaktiebolaget LM Ericsson ‘B’ 917,366 0.01 2,707,476 0.02
Switzerland 336,539 Chubb Ltd 52,459,699 0.37 44,750 Cie Financiere Richemont SA* 3,505,951 0.02 30,962 LafargeHolcim Ltd 1,475,562 0.01 872,972 Nestle SA 98,303,131 0.69 155,744,343 1.09
Taiwan 3,504,000 Cathay Financial Holding Co Ltd 4,479,008 0.03 8,230,000 Chunghwa Telecom Co Ltd 28,560,024 0.20 5,002,000 Far EasTone Telecommunications
Co Ltd 11,657,005 0.08 1,209,000 Formosa Chemicals & Fibre Corp 3,391,052 0.02 940,000 Formosa Petrochemical Corp 2,908,884 0.02 1,257,000 Formosa Plastics Corp 3,765,799 0.03 4,244,000 Fubon Financial Holding Co Ltd 5,897,825 0.04 49,000 Globalwafers Co Ltd 449,284 0.00 2,396,600 Hon Hai Precision Industry Co Ltd 5,661,502 0.04 78,000 MediaTek Inc 912,608 0.01 1,600,000 Nan Ya Plastics Corp 3,504,618 0.02 3,821,000 Taiwan Mobile Co Ltd 13,624,711 0.10 11,528,000 Taiwan Semiconductor
Manufacturing Co Ltd 95,057,407 0.67 2,502,000 Uni-President Enterprises Corp 6,101,664 0.04 185,971,391 1.30
Thailand 959,900 Advanced Info Service PCL 7,284,221 0.05 2,886,600 Intouch Holdings PCL 6,042,766 0.04 2,603,500 PTT Global Chemical PCL 4,534,677 0.03 356,600 Siam Cement PCL/The 4,852,257 0.04 2,544,300 Thai Beverage PCL 1,651,264 0.01 1,598,200 Thai Oil PCL 3,541,682 0.03 27,906,867 0.20
Turkey 268,912 Eregli Demir ve Celik Fabrikalari TAS 295,766 0.00 4,818 Tupras Turkiye Petrol Rafinerileri AS 104,164 0.00 33,041 Turkcell Iletisim Hizmetleri AS 73,305 0.00 473,235 0.00
United Kingdom 9,573 AstraZeneca Plc 855,257 0.01 114,098 Berkeley Group Holdings Plc* 5,438,245 0.04 2,491 Coca-Cola European Partners Plc 139,496 0.00 28,384 Diageo Plc 1,219,381 0.01 10,748 GlaxoSmithKline Plc 224,868 0.00 5,612,723 HSBC Holdings Plc* 40,635,163 0.29 4,981,982 Kingfisher Plc* 11,848,451 0.08 1,065,299 Liberty Global Plc (Restricted) 28,432,830 0.20 696,662 NMC Health Plc* 21,231,767 0.15 25,163 RELX Plc 607,466 0.00 176,423 Rolls-Royce Holdings Plc* 1,662,372 0.01 2,266,175 Royal Dutch Shell Plc ‘A’ 63,157,885 0.44 26,374 Royal Dutch Shell Plc ‘A’ 735,166 0.01 623,764 Royal Dutch Shell Plc ADR* 34,737,417 0.24 13,383 Royal Dutch Shell Plc ‘B’ 371,330 0.00 45,633,950 Vodafone Group Plc 86,444,492 0.61 297,741,586 2.09
United States 90,311 Abbott Laboratories 7,686,369 0.05 576,661 AbbVie Inc* 38,099,992 0.27 85,643 Adobe Inc 24,543,571 0.17 64,828 AES Corp/VA 988,951 0.01 711,594 Agilent Technologies Inc* 50,693,957 0.36 441,697 Air Products & Chemicals Inc 99,209,563 0.70 951 Alexion Pharmaceuticals Inc 98,514 0.00 29,245 Ally Financial Inc 921,510 0.01 200,814 Alphabet Inc 240,372,350 1.69 2,038 Alphabet Inc ‘A’ 2,442,665 0.02 863,121 Altria Group Inc 38,193,104 0.27 67,044 Amazon.com Inc† 119,935,012 0.84 34,877 American Tower Corp (Reit) 8,028,337 0.06 23,103 Ameriprise Financial Inc 2,986,987 0.02 12,434 Amgen Inc 2,583,785 0.02 427,931 Anthem Inc 112,366,122 0.79 960,994 Apple Inc 201,184,094 1.41 428,130 Applied Materials Inc 20,421,801 0.14 12,441 Autodesk Inc 1,771,350 0.01 668 AutoZone Inc 744,860 0.01 2,531,305 Bank of America Corp 69,737,453 0.49 68,572 Baxter International Inc 6,011,707 0.04 287,469 Becton Dickinson and Co 73,364,963 0.51 71,692 Berkshire Hathaway Inc ‘B’* 14,600,793 0.10 91,146 Biogen Inc 19,895,349 0.14 2,166 Boeing Co/The* 789,074 0.01 519 Booking Holdings Inc 1,019,980 0.01 1,248 Boston Properties Inc (Reit) 159,719 0.00 41,241 Bristol-Myers Squibb Co 1,989,053 0.01 674 Broadcom Inc 192,029 0.00 10,907 Capital One Financial Corp 947,600 0.01 19,932 Cardinal Health Inc 849,502 0.01 23,125 Centene Corp 1,084,563 0.01 29,672 CenterPoint Energy Inc 828,591 0.01 87,937 CH Robinson Worldwide Inc 7,508,940 0.05 781,525 Charles Schwab Corp/The 29,838,624 0.21 221,499 Charter Communications Inc* 90,577,586 0.63 20,876 Chevron Corp 2,469,005 0.02 413,113 Cisco Systems Inc 19,494,802 0.14 469,464 Citigroup Capital XIII (Pref) 12,877,398 0.09 543,507 Citigroup Inc 35,072,507 0.25 148,421 Citrix Systems Inc* 13,877,364 0.10 1,046,637 Colgate-Palmolive Co 77,712,797 0.54
Global Allocation Fund continued
Portfolio of Investments 31 August 2019
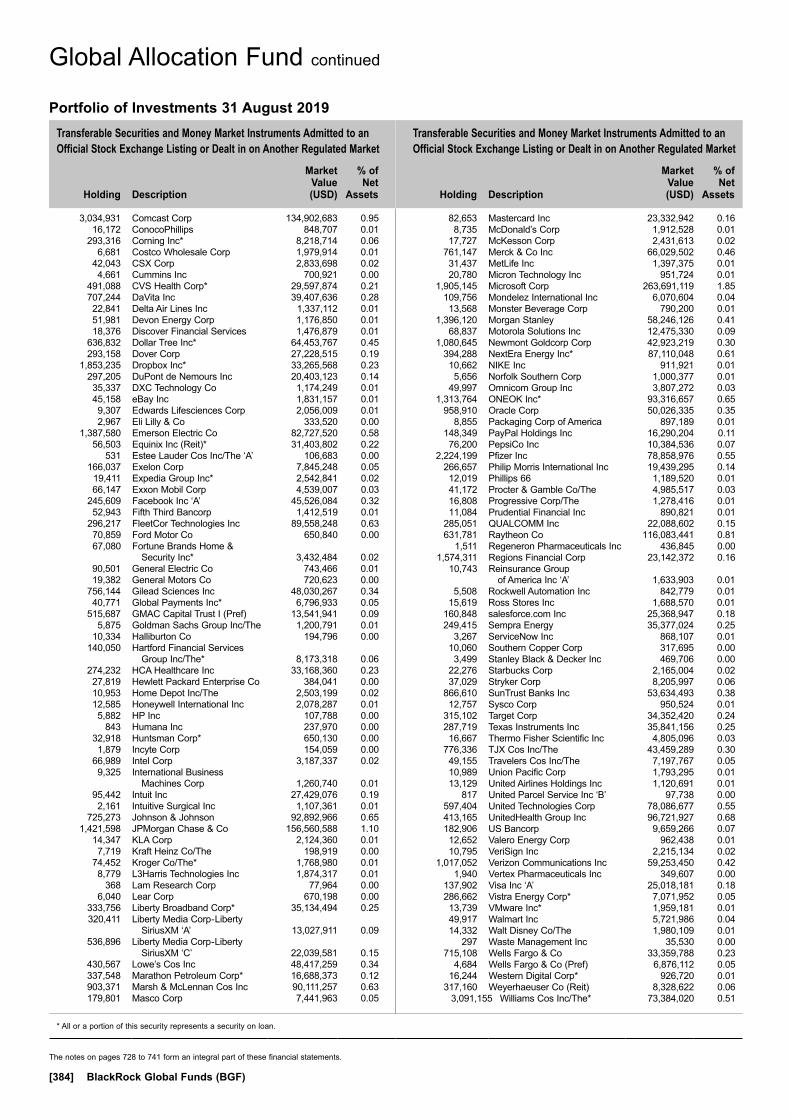
Transferable Securities and Money Market Instruments Admitted to an Official Stock Exchange Listing or Dealt in on Another Regulated Market
Transferable Securities and Money Market Instruments Admitted to an Official Stock Exchange Listing or Dealt in on Another Regulated Market
Holding
Description
Market Value (USD)
% of Net
Assets
Holding
Description
Market Value (USD)
% of Net
Assets
* All or a portion of this security represents a security on loan.
The notes on pages 728 to 741 form an integral part of these financial statements.
[384] BlackRock Global Funds (BGF)
3,034,931 Comcast Corp 134,902,683 0.95 16,172 ConocoPhillips 848,707 0.01 293,316 Corning Inc* 8,218,714 0.06 6,681 Costco Wholesale Corp 1,979,914 0.01 42,043 CSX Corp 2,833,698 0.02 4,661 Cummins Inc 700,921 0.00 491,088 CVS Health Corp* 29,597,874 0.21 707,244 DaVita Inc 39,407,636 0.28 22,841 Delta Air Lines Inc 1,337,112 0.01 51,981 Devon Energy Corp 1,176,850 0.01 18,376 Discover Financial Services 1,476,879 0.01 636,832 Dollar Tree Inc* 64,453,767 0.45 293,158 Dover Corp 27,228,515 0.19 1,853,235 Dropbox Inc* 33,265,568 0.23 297,205 DuPont de Nemours Inc 20,403,123 0.14 35,337 DXC Technology Co 1,174,249 0.01 45,158 eBay Inc 1,831,157 0.01 9,307 Edwards Lifesciences Corp 2,056,009 0.01 2,967 Eli Lilly & Co 333,520 0.00 1,387,580 Emerson Electric Co 82,727,520 0.58 56,503 Equinix Inc (Reit)* 31,403,802 0.22 531 Estee Lauder Cos Inc/The ‘A’ 106,683 0.00 166,037 Exelon Corp 7,845,248 0.05 19,411 Expedia Group Inc* 2,542,841 0.02 66,147 Exxon Mobil Corp 4,539,007 0.03 245,609 Facebook Inc ‘A’ 45,526,084 0.32 52,943 Fifth Third Bancorp 1,412,519 0.01 296,217 FleetCor Technologies Inc 89,558,248 0.63 70,859 Ford Motor Co 650,840 0.00 67,080 Fortune Brands Home &
Security Inc* 3,432,484 0.02 90,501 General Electric Co 743,466 0.01 19,382 General Motors Co 720,623 0.00 756,144 Gilead Sciences Inc 48,030,267 0.34 40,771 Global Payments Inc* 6,796,933 0.05 515,687 GMAC Capital Trust I (Pref) 13,541,941 0.09 5,875 Goldman Sachs Group Inc/The 1,200,791 0.01 10,334 Halliburton Co 194,796 0.00 140,050 Hartford Financial Services
Group Inc/The* 8,173,318 0.06 274,232 HCA Healthcare Inc 33,168,360 0.23 27,819 Hewlett Packard Enterprise Co 384,041 0.00 10,953 Home Depot Inc/The 2,503,199 0.02 12,585 Honeywell International Inc 2,078,287 0.01 5,882 HP Inc 107,788 0.00 843 Humana Inc 237,970 0.00 32,918 Huntsman Corp* 650,130 0.00 1,879 Incyte Corp 154,059 0.00 66,989 Intel Corp 3,187,337 0.02 9,325 International Business
Machines Corp 1,260,740 0.01 95,442 Intuit Inc 27,429,076 0.19 2,161 Intuitive Surgical Inc 1,107,361 0.01 725,273 Johnson & Johnson 92,892,966 0.65 1,421,598 JPMorgan Chase & Co 156,560,588 1.10 14,347 KLA Corp 2,124,360 0.01 7,719 Kraft Heinz Co/The 198,919 0.00 74,452 Kroger Co/The* 1,768,980 0.01 8,779 L3Harris Technologies Inc 1,874,317 0.01 368 Lam Research Corp 77,964 0.00 6,040 Lear Corp 670,198 0.00 333,756 Liberty Broadband Corp* 35,134,494 0.25 320,411 Liberty Media Corp-Liberty
SiriusXM ‘A’ 13,027,911 0.09 536,896 Liberty Media Corp-Liberty
SiriusXM ‘C’ 22,039,581 0.15 430,567 Lowe’s Cos Inc 48,417,259 0.34 337,548 Marathon Petroleum Corp* 16,688,373 0.12 903,371 Marsh & McLennan Cos Inc 90,111,257 0.63 179,801 Masco Corp 7,441,963 0.05
82,653 Mastercard Inc 23,332,942 0.16 8,735 McDonald’s Corp 1,912,528 0.01 17,727 McKesson Corp 2,431,613 0.02 761,147 Merck & Co Inc 66,029,502 0.46 31,437 MetLife Inc 1,397,375 0.01 20,780 Micron Technology Inc 951,724 0.01 1,905,145 Microsoft Corp 263,691,119 1.85 109,756 Mondelez International Inc 6,070,604 0.04 13,568 Monster Beverage Corp 790,200 0.01 1,396,120 Morgan Stanley 58,246,126 0.41 68,837 Motorola Solutions Inc 12,475,330 0.09 1,080,645 Newmont Goldcorp Corp 42,923,219 0.30 394,288 NextEra Energy Inc* 87,110,048 0.61 10,662 NIKE Inc 911,921 0.01 5,656 Norfolk Southern Corp 1,000,377 0.01 49,997 Omnicom Group Inc 3,807,272 0.03 1,313,764 ONEOK Inc* 93,316,657 0.65 958,910 Oracle Corp 50,026,335 0.35 8,855 Packaging Corp of America 897,189 0.01 148,349 PayPal Holdings Inc 16,290,204 0.11 76,200 PepsiCo Inc 10,384,536 0.07 2,224,199 Pfizer Inc 78,858,976 0.55 266,657 Philip Morris International Inc 19,439,295 0.14 12,019 Phillips 66 1,189,520 0.01 41,172 Procter & Gamble Co/The 4,985,517 0.03 16,808 Progressive Corp/The 1,278,416 0.01 11,084 Prudential Financial Inc 890,821 0.01 285,051 QUALCOMM Inc 22,088,602 0.15 631,781 Raytheon Co 116,083,441 0.81 1,511 Regeneron Pharmaceuticals Inc 436,845 0.00 1,574,311 Regions Financial Corp 23,142,372 0.16 10,743 Reinsurance Group
of America Inc ‘A’ 1,633,903 0.01 5,508 Rockwell Automation Inc 842,779 0.01 15,619 Ross Stores Inc 1,688,570 0.01 160,848 salesforce.com Inc 25,368,947 0.18 249,415 Sempra Energy 35,377,024 0.25 3,267 ServiceNow Inc 868,107 0.01 10,060 Southern Copper Corp 317,695 0.00 3,499 Stanley Black & Decker Inc 469,706 0.00 22,276 Starbucks Corp 2,165,004 0.02 37,029 Stryker Corp 8,205,997 0.06 866,610 SunTrust Banks Inc 53,634,493 0.38 12,757 Sysco Corp 950,524 0.01 315,102 Target Corp 34,352,420 0.24 287,719 Texas Instruments Inc 35,841,156 0.25 16,667 Thermo Fisher Scientific Inc 4,805,096 0.03 776,336 TJX Cos Inc/The 43,459,289 0.30 49,155 Travelers Cos Inc/The 7,197,767 0.05 10,989 Union Pacific Corp 1,793,295 0.01 13,129 United Airlines Holdings Inc 1,120,691 0.01 817 United Parcel Service Inc ‘B’ 97,738 0.00 597,404 United Technologies Corp 78,086,677 0.55 413,165 UnitedHealth Group Inc 96,721,927 0.68 182,906 US Bancorp 9,659,266 0.07 12,652 Valero Energy Corp 962,438 0.01 10,795 VeriSign Inc 2,215,134 0.02 1,017,052 Verizon Communications Inc 59,253,450 0.42 1,940 Vertex Pharmaceuticals Inc 349,607 0.00 137,902 Visa Inc ‘A’ 25,018,181 0.18 286,662 Vistra Energy Corp* 7,071,952 0.05 13,739 VMware Inc* 1,959,181 0.01 49,917 Walmart Inc 5,721,986 0.04 14,332 Walt Disney Co/The 1,980,109 0.01 297 Waste Management Inc 35,530 0.00 715,108 Wells Fargo & Co 33,359,788 0.23 4,684 Wells Fargo & Co (Pref) 6,876,112 0.05 16,244 Western Digital Corp* 926,720 0.01 317,160 Weyerhaeuser Co (Reit) 8,328,622 0.06 3,091,155 Williams Cos Inc/The* 73,384,020 0.51
Global Allocation Fund continued
Portfolio of Investments 31 August 2019

Transferable Securities and Money Market Instruments Admitted to an Official Stock Exchange Listing or Dealt in on Another Regulated Market
Transferable Securities and Money Market Instruments Admitted to an Official Stock Exchange Listing or Dealt in on Another Regulated Market
Holding
Description
Market Value (USD)
% of Net
Assets
Holding
Description
Market Value (USD)
% of Net
Assets
* All or a portion of this security represents a security on loan.
The notes on pages 728 to 741 form an integral part of these financial statements.
Annual Report and Audited Financial Statements [385]
24,608 Wyndham Destinations Inc* 1,092,349 0.01 14,076 Xcel Energy Inc 907,761 0.01 208,532 Xilinx Inc 21,770,741 0.15 124,168 Yum China Holdings Inc* 5,679,444 0.04 15,646 Yum! Brands Inc 1,832,772 0.01 11,878 Zoetis Inc 1,505,774 0.01 4,455,124,446 31.23Total Common / Preferred Stocks (Shares) 7,919,351,824 55.52
BONDS
Argentina EUR 7,819,000 Argentine Republic Government
International Bond 3.375% 15/1/2023 3,325,285 0.02
EUR 1,842,000 Argentine Republic Government International Bond 5.25% 15/1/2028 763,023 0.01
USD 23,209,000 Argentine Republic Government International Bond 5.875% 11/1/2028 8,935,465 0.06
USD 23,648,000 Argentine Republic Government International Bond 6.875% 26/1/2027 9,104,480 0.06
EUR 8,778,993 Argentine Republic Government International Bond 7.82% 31/12/2033 4,095,695 0.03
26,223,948 0.18
Australia AUD 42,061,000 Australia Government Bond
3% 21/3/2047 38,151,792 0.27
Canada CAD 33,034,000 Canadian Government Bond
0.75% 1/3/2021 24,657,663 0.17
Cayman Islands USD 7,809,000 Baidu Inc 4.375% 14/5/2024 8,410,215 0.06 USD 15,900,000 China Milk Products Group
Ltd (Restricted) (Defaulted) 5/1/2012 (Zero Coupon) 238,500 0.00
8,648,715 0.06
Chile USD 15,040,699 Inversiones Alsacia SA
(Defaulted) 8% 31/12/2018 582,827 0.00
France USD 10,733,000 Danone SA ‘144A’ 2.589%
2/11/2023 10,914,974 0.08
Germany EUR 81,610,417 Bundesrepublik Deutschland
Bundesanleihe 0.25% 15/8/2028 98,698,975 0.69
Indonesia IDR 466,317,000,000 Indonesia Treasury Bond
8.25% 15/5/2029 34,994,319 0.25
Italy EUR 105,096,000 Italy Buoni Poliennali Del Tesoro
3% 1/8/2029 137,729,010 0.97 EUR 41,847,000 Italy Buoni Poliennali Del Tesoro
‘144A’ 3.85% 1/9/2049 65,898,293 0.46 203,627,303 1.43
Japan JPY 14,236,900,000 Japan Treasury Discount Bill
21/10/2019 (Zero Coupon) 134,159,126 0.94 JPY 10,316,650,000 Japan Treasury Discount Bill
28/10/2019 (Zero Coupon) 97,220,297 0.68 JPY 10,316,650,000 Japan Treasury Discount Bill
5/11/2019 (Zero Coupon) 97,223,747 0.68 JPY 11,355,450,000 Japan Treasury Discount Bill
18/11/2019 (Zero Coupon) 107,020,957 0.75 USD 4,387,000 Mitsubishi UFJ Financial Group
Inc 3.777% 2/3/2025 4,721,934 0.04 USD 28,055,000 Sumitomo Mitsui Financial
Group Inc 3.936% 16/10/2023 29,952,257 0.21 470,298,318 3.30
Luxembourg USD 9,569,000 Allergan Funding SCS 3.45%
15/3/2022 9,826,772 0.07 USD 3,464,000 Intelsat Jackson Holdings SA
8% 15/2/2024 3,620,365 0.02 13,447,137 0.09
Mexico MXN 3,291,000 Mexican Bonos 8% 5/9/2024 17,138,691 0.12 MXN 3,095,000 Mexican Bonos 10% 5/12/2024 17,533,334 0.12 34,672,025 0.24
Netherlands USD 5,014,000 ING Groep NV FRN 16/4/2020
(Perpetual) 5,067,148 0.04 USD 14,485,000 ING Groep NV 4.1% 2/10/2023 15,476,992 0.11 USD 6,887,000 NXP BV / NXP Funding LLC
‘144A’ 4.625% 1/6/2023 7,359,481 0.05 27,903,621 0.20
Singapore SGD 12,500,000 CapitaLand Ltd 1.95% 17/10/2023 9,007,562 0.06
South Africa ZAR 536,471,000 Republic of South Africa
Government Bond 8% 31/1/2030 33,000,324 0.23
Spain EUR 93,924,000 Spain Government Bond ‘144A’
0.6% 31/10/2029 109,189,922 0.76 EUR 34,245,000 Spain Government Bond ‘144A’
2.7% 31/10/2048 54,051,672 0.38 163,241,594 1.14
Switzerland USD 6,575,000 UBS Group Funding Switzerland
AG 4.125% 24/9/2025 7,152,366 0.05
United Kingdom USD 10,061,000 HSBC Holdings Plc FRN
13/3/2023 10,271,430 0.07 USD 19,524,000 HSBC Holdings Plc FRN
17/9/2024 (Perpetual) 19,989,355 0.14 USD 5,746,000 HSBC Holdings Plc FRN
11/3/2025 5,997,786 0.04 GBP 10,455,000 Lloyds Bank Plc FRN 22/1/2029
(Perpetual)* 22,225,120 0.16 58,483,691 0.41
Global Allocation Fund continued
Portfolio of Investments 31 August 2019

Transferable Securities and Money Market Instruments Admitted to an Official Stock Exchange Listing or Dealt in on Another Regulated Market
Transferable Securities and Money Market Instruments Admitted to an Official Stock Exchange Listing or Dealt in on Another Regulated Market
Holding
Description
Market Value (USD)
% of Net
Assets
Holding
Description
Market Value (USD)
% of Net
Assets
† Securities pledged or given in guarantee, see Note 14, for further details.* All or a portion of this security represents a security on loan.
The notes on pages 728 to 741 form an integral part of these financial statements.
[386] BlackRock Global Funds (BGF)
United States USD 4,225,000 AbbVie Inc 3.6% 14/5/2025 4,413,957 0.03 USD 5,428,000 Allergan Sales LLC ‘144A’ 5%
15/12/2021 5,709,111 0.04 USD 16,410,000 Altria Group Inc 4.4% 14/2/2026 18,029,528 0.13 USD 6,873,000 American Express Co FRN
15/3/2020 (Perpetual) 6,883,447 0.05 USD 21,573,000 American Express Co 3.7%
3/8/2023 22,861,121 0.16 USD 2,494,000 Aon Corp 4.5% 15/12/2028 2,855,805 0.02 USD 16,915,000 Apple Inc 3.2% 11/5/2027 18,096,471 0.13 USD 17,602,000 Apple Inc 3.35% 9/2/2027 19,021,270 0.13 USD 2,093,000 AvalonBay Communities Inc
3.5% 15/11/2024 2,234,615 0.02 USD 10,078,000 Bank of America Corp 3.3%
11/1/2023 10,477,842 0.07 USD 5,387,000 Bank of America Corp 4%
22/1/2025 5,753,056 0.04 USD 22,331,000 Bank of America Corp 4.125%
22/1/2024 24,153,532 0.17 USD 13,871,000 Becton Dickinson and Co 2.894%
6/6/2022 14,089,538 0.10 USD 9,775,000 Becton Dickinson and Co 3.125%
8/11/2021 9,945,408 0.07 USD 4,921,000 Becton Dickinson and Co 3.363%
6/6/2024 5,134,307 0.04 USD 8,360,000 BP Capital Markets America Inc
3.79% 6/2/2024 8,923,399 0.06 USD 17,051,000 Broadcom Inc ‘144A’ 3.125%
15/4/2021 17,181,187 0.12 USD 7,252,000 Capital One Financial Corp 3.2%
30/1/2023 7,472,019 0.05 USD 9,296,000 Capital One Financial Corp 3.3%
30/10/2024 9,624,324 0.07 USD 13,670,000 Cigna Corp 3.4% 17/9/2021 13,989,935 0.10 USD 11,640,000 Cigna Corp 3.75% 15/7/2023 12,234,851 0.09 USD 22,657,000 Citigroup Inc FRN 27/3/2020
(Perpetual) 22,863,065 0.16 USD 9,181,000 Citigroup Inc FRN 15/8/2020
(Perpetual) 9,378,070 0.07 USD 17,344,000 Citigroup Inc FRN 24/4/2025 18,111,080 0.13 USD 19,962,000 Comcast Corp 3.7% 15/4/2024 21,373,812 0.15 USD 30,973,000 CVS Health Corp 3.7% 9/3/2023 32,360,265 0.23 USD 3,412,000 Energy Transfer Operating LP
4.05% 15/3/2025 3,593,754 0.03 USD 3,937,000 Energy Transfer Operating LP
5.875% 15/1/2024 4,404,819 0.03 USD 13,828,000 Enterprise Products Operating LLC
3.35% 15/3/2023 14,357,321 0.10 USD 3,354,000 Enterprise Products Operating LLC
3.75% 15/2/2025 3,594,387 0.03 USD 3,481,000 Enterprise Products Operating LLC
3.9% 15/2/2024 3,722,647 0.03 USD 35,567,000 Fiserv Inc 2.75% 1/7/2024 36,401,439 0.26 USD 10,085,000 Gilead Sciences Inc 3.25% 1/9/2022 10,462,423 0.07 USD 11,157,000 Gilead Sciences Inc 3.7% 1/4/2024 11,853,355 0.08 USD 10,703,000 Goldman Sachs Group Inc/The
FRN 10/5/2020 (Perpetual) 10,836,788 0.08 USD 10,081,000 Goldman Sachs Group Inc/The
FRN 5/6/2023 10,255,848 0.07 USD 11,751,000 Goldman Sachs Group Inc/The
3.625% 20/2/2024 12,389,671 0.09 USD 7,691,000 Home Depot Inc/The 2.95%
15/6/2029 8,135,731 0.06 USD 2,070,000 Hughes Satellite Systems Corp
7.625% 15/6/2021 2,240,775 0.02 USD 8,692,088 iHeartCommunications Inc 6.375%
1/5/2026 9,468,987 0.07
USD 3,037,789 iHeartCommunications Inc 8.375% 1/5/2027 3,299,798 0.02
USD 21,732,000 International Business Machines Corp 3% 15/5/2024 22,604,781 0.16
USD 11,815,000 JPMorgan Chase & Co FRN 1/8/2024 (Perpetual) 12,249,201 0.09
USD 13,444,000 JPMorgan Chase & Co FRN 5/12/2024 14,449,664 0.10
USD 2,698,000 Kinder Morgan Energy Partners LP 4.15% 1/2/2024 2,868,033 0.02
USD 2,602,000 Kinder Morgan Energy Partners LP 4.3% 1/5/2024 2,790,352 0.02
USD 5,775,000 Marsh & McLennan Cos Inc 3.875% 15/3/2024 6,206,595 0.04
USD 2,487,000 Marsh & McLennan Cos Inc 4.375% 15/3/2029 2,858,855 0.02
USD 6,248,000 McDonald’s Corp 3.35% 1/4/2023 6,539,933 0.05 USD 7,554,000 Morgan Stanley FRN 15/10/2019
(Perpetual) 7,582,328 0.05 USD 8,680,000 Morgan Stanley FRN 22/7/2025 8,853,372 0.06 USD 13,697,000 Morgan Stanley 3.875% 29/4/2024 14,695,256 0.10 USD 6,925,000 MPLX LP 4.125% 1/3/2027 7,281,756 0.05 USD 7,739,000 NBCUniversal Enterprise Inc ‘144A’
5.25% 19/3/2021 (Perpetual) 7,993,226 0.06 USD 9,338,000 NextEra Energy Capital Holdings
Inc 2.9% 1/4/2022 9,535,669 0.07 USD 3,065,000 Occidental Petroleum Corp 2.7%
15/8/2022 3,091,454 0.02 USD 7,885,000 ONEOK Inc 2.75% 1/9/2024 7,932,630 0.06 USD 5,755,000 Prudential Financial Inc FRN
15/9/2042 6,168,583 0.04 USD 3,823,000 Prudential Financial Inc FRN
15/6/2043 4,095,140 0.03 USD 5,077,000 QUALCOMM Inc 2.6% 30/1/2023 5,165,394 0.04 USD 13,130,000 QUALCOMM Inc 2.9% 20/5/2024 13,551,264 0.09 USD 10,104,000 Starbucks Corp 3.1% 1/3/2023 10,464,433 0.07 USD 4,257,000 SunTrust Banks Inc 4% 1/5/2025 4,637,046 0.03 USD 6,000,000 United States Treasury Bill
3/9/2019 (Zero Coupon) 5,998,670 0.04 USD 83,500,000 United States Treasury Bill
10/9/2019 (Zero Coupon) 83,448,568 0.58 USD 5,000,000 United States Treasury Bill
24/9/2019 (Zero Coupon) 4,992,969 0.04 USD 72,000,000 United States Treasury Bill
3/10/2019 (Zero Coupon) 71,866,256 0.50 USD 35,000,000 United States Treasury Bill
8/10/2019 (Zero Coupon) 34,925,424 0.24 USD 141,000,000 United States Treasury Bill
7/11/2019 (Zero Coupon) 140,474,972 0.98 USD 101,000,000 United States Treasury Bill
21/11/2019 (Zero Coupon) 100,548,793 0.70 USD 137,000,000 United States Treasury Bill
12/12/2019 (Zero Coupon) 136,250,000 0.96 USD 75,000,000 United States Treasury Bill
2/1/2020 (Zero Coupon) 74,516,276 0.52 USD 125,000,000 United States Treasury Bill
9/1/2020 (Zero Coupon) 124,148,645 0.87 USD 75,000,000 United States Treasury Bill
23/1/2020 (Zero Coupon) 74,439,573 0.52 USD 349,349,100 United States Treasury Inflation
Indexed Bonds 0.5% 15/4/2024 362,653,618 2.54 USD 63,129,700 United States Treasury Inflation
Indexed Bonds 0.625% 15/4/2023 66,184,542 0.46 USD 155,487,700 United States Treasury Note/Bond
1.625% 15/8/2029 154,345,837 1.08 USD 126,954,400 United States Treasury Note/Bond
1.75% 30/6/2024* 128,809,125 0.90 USD 652,635,400 United States Treasury Note/Bond
1.75% 31/7/2024*† 662,577,896 4.64
Global Allocation Fund continued
Portfolio of Investments 31 August 2019
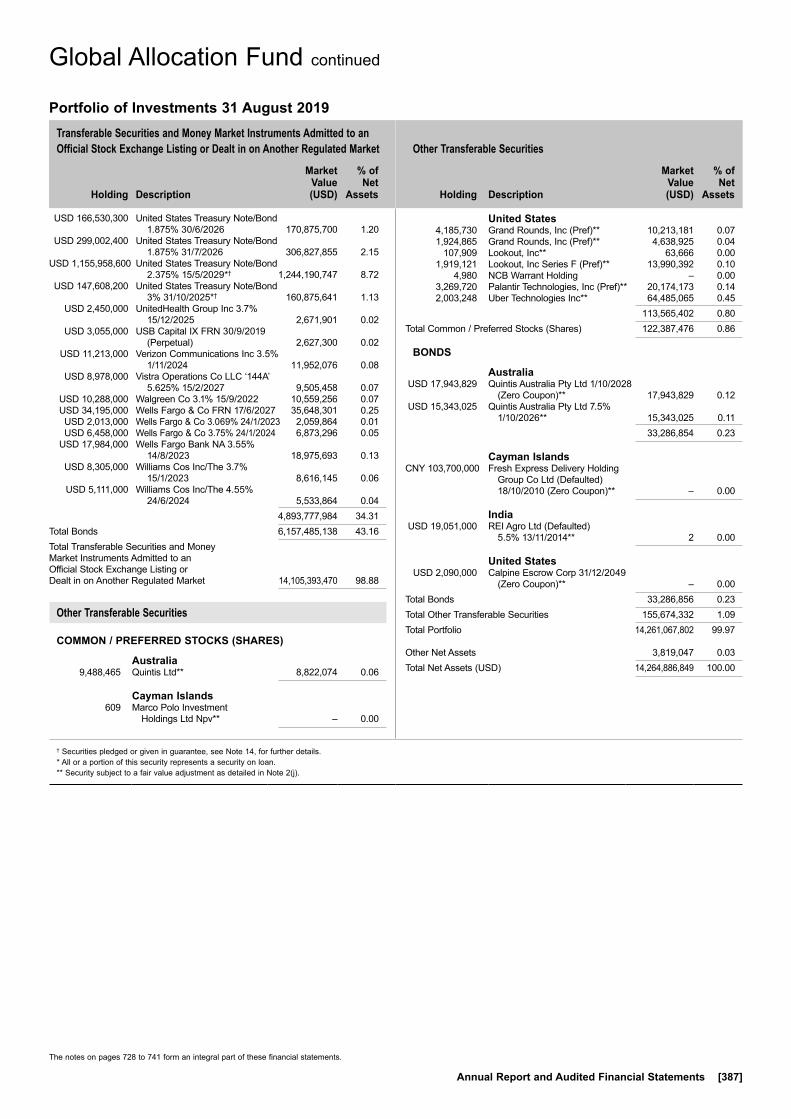
Transferable Securities and Money Market Instruments Admitted to an Official Stock Exchange Listing or Dealt in on Another Regulated Market Other Transferable Securities
Holding
Description
Market Value (USD)
% of Net
Assets
Holding
Description
Market Value (USD)
% of Net
Assets
w
† Securities pledged or given in guarantee, see Note 14, for further details.* All or a portion of this security represents a security on loan.** Security subject to a fair value adjustment as detailed in Note 2(j).
The notes on pages 728 to 741 form an integral part of these financial statements.
Annual Report and Audited Financial Statements [387]
USD 166,530,300 United States Treasury Note/Bond 1.875% 30/6/2026 170,875,700 1.20
USD 299,002,400 United States Treasury Note/Bond 1.875% 31/7/2026 306,827,855 2.15
USD 1,155,958,600 United States Treasury Note/Bond 2.375% 15/5/2029*† 1,244,190,747 8.72
USD 147,608,200 United States Treasury Note/Bond 3% 31/10/2025*† 160,875,641 1.13
USD 2,450,000 UnitedHealth Group Inc 3.7% 15/12/2025 2,671,901 0.02
USD 3,055,000 USB Capital IX FRN 30/9/2019 (Perpetual) 2,627,300 0.02
USD 11,213,000 Verizon Communications Inc 3.5% 1/11/2024 11,952,076 0.08
USD 8,978,000 Vistra Operations Co LLC ‘144A’ 5.625% 15/2/2027 9,505,458 0.07
USD 10,288,000 Walgreen Co 3.1% 15/9/2022 10,559,256 0.07 USD 34,195,000 Wells Fargo & Co FRN 17/6/2027 35,648,301 0.25 USD 2,013,000 Wells Fargo & Co 3.069% 24/1/2023 2,059,864 0.01 USD 6,458,000 Wells Fargo & Co 3.75% 24/1/2024 6,873,296 0.05 USD 17,984,000 Wells Fargo Bank NA 3.55%
14/8/2023 18,975,693 0.13 USD 8,305,000 Williams Cos Inc/The 3.7%
15/1/2023 8,616,145 0.06 USD 5,111,000 Williams Cos Inc/The 4.55%
24/6/2024 5,533,864 0.04 4,893,777,984 34.31Total Bonds 6,157,485,138 43.16Total Transferable Securities and Money Market Instruments Admitted to an Official Stock Exchange Listing or Dealt in on Another Regulated Market 14,105,393,470 98.88
Other Transferable Securities
COMMON / PREFERRED STOCKS (SHARES)
Australia 9,488,465 Quintis Ltd** 8,822,074 0.06
Cayman Islands 609 Marco Polo Investment
Holdings Ltd Npv** – 0.00
United States 4,185,730 Grand Rounds, Inc (Pref)** 10,213,181 0.07 1,924,865 Grand Rounds, Inc (Pref)** 4,638,925 0.04 107,909 Lookout, Inc** 63,666 0.00 1,919,121 Lookout, Inc Series F (Pref)** 13,990,392 0.10 4,980 NCB Warrant Holding – 0.00 3,269,720 Palantir Technologies, Inc (Pref)** 20,174,173 0.14 2,003,248 Uber Technologies Inc** 64,485,065 0.45 113,565,402 0.80Total Common / Preferred Stocks (Shares) 122,387,476 0.86
BONDS
Australia USD 17,943,829 Quintis Australia Pty Ltd 1/10/2028
(Zero Coupon)** 17,943,829 0.12 USD 15,343,025 Quintis Australia Pty Ltd 7.5%
1/10/2026** 15,343,025 0.11 33,286,854 0.23
Cayman Islands CNY 103,700,000 Fresh Express Delivery Holding
Group Co Ltd (Defaulted) 18/10/2010 (Zero Coupon)** – 0.00
India USD 19,051,000 REI Agro Ltd (Defaulted)
5.5% 13/11/2014** 2 0.00
United States USD 2,090,000 Calpine Escrow Corp 31/12/2049
(Zero Coupon)** – 0.00Total Bonds 33,286,856 0.23Total Other Transferable Securities 155,674,332 1.09Total Portfolio 14,261,067,802 99.97
Other Net Assets 3,819,047 0.03Total Net Assets (USD) 14,264,886,849 100.00
Global Allocation Fund continued
Portfolio of Investments 31 August 2019
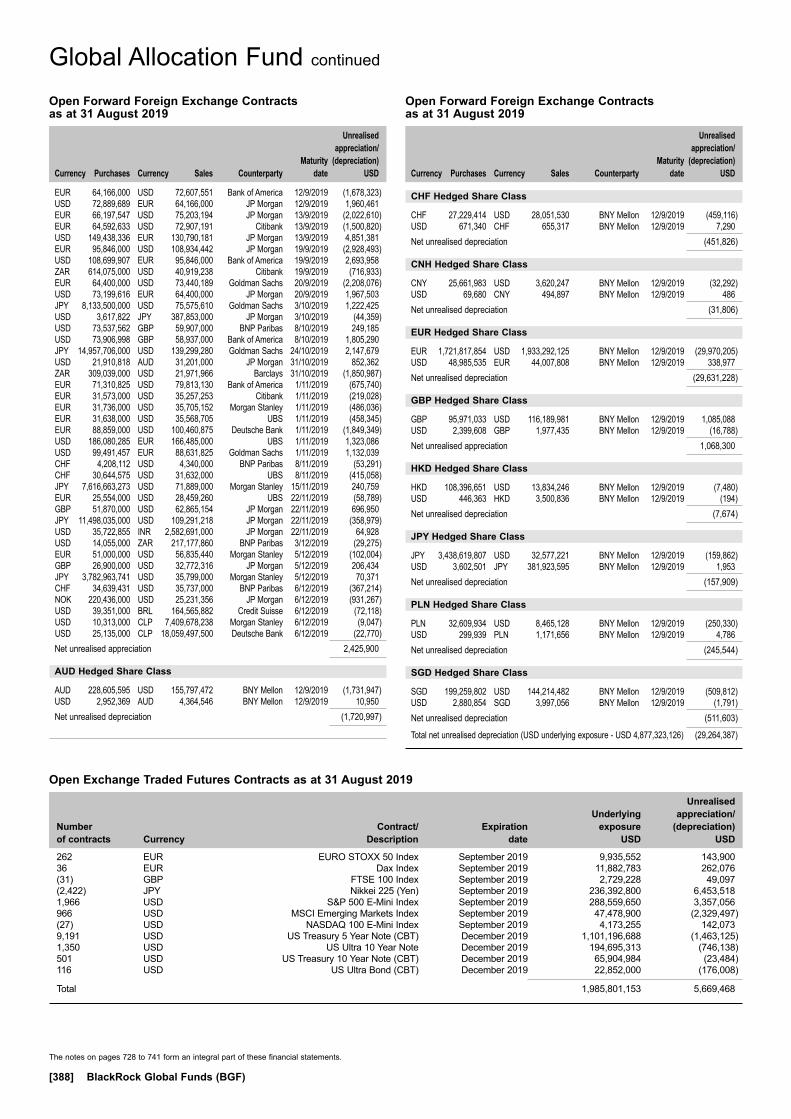
The notes on pages 728 to 741 form an integral part of these financial statements.
[388] BlackRock Global Funds (BGF)
Global Allocation Fund continued
CHF Hedged Share Class
CHF 27,229,414 USD 28,051,530 BNY Mellon 12/9/2019 (459,116)USD 671,340 CHF 655,317 BNY Mellon 12/9/2019 7,290 Net unrealised depreciation (451,826)
CNH Hedged Share Class
CNY 25,661,983 USD 3,620,247 BNY Mellon 12/9/2019 (32,292)USD 69,680 CNY 494,897 BNY Mellon 12/9/2019 486 Net unrealised depreciation (31,806)
EUR Hedged Share Class
EUR 1,721,817,854 USD 1,933,292,125 BNY Mellon 12/9/2019 (29,970,205)USD 48,985,535 EUR 44,007,808 BNY Mellon 12/9/2019 338,977 Net unrealised depreciation (29,631,228)
GBP Hedged Share Class
GBP 95,971,033 USD 116,189,981 BNY Mellon 12/9/2019 1,085,088 USD 2,399,608 GBP 1,977,435 BNY Mellon 12/9/2019 (16,788)Net unrealised appreciation 1,068,300
HKD Hedged Share Class
HKD 108,396,651 USD 13,834,246 BNY Mellon 12/9/2019 (7,480)USD 446,363 HKD 3,500,836 BNY Mellon 12/9/2019 (194)Net unrealised depreciation (7,674)
JPY Hedged Share Class
JPY 3,438,619,807 USD 32,577,221 BNY Mellon 12/9/2019 (159,862)USD 3,602,501 JPY 381,923,595 BNY Mellon 12/9/2019 1,953 Net unrealised depreciation (157,909)
PLN Hedged Share Class
PLN 32,609,934 USD 8,465,128 BNY Mellon 12/9/2019 (250,330)USD 299,939 PLN 1,171,656 BNY Mellon 12/9/2019 4,786 Net unrealised depreciation (245,544)
SGD Hedged Share Class
SGD 199,259,802 USD 144,214,482 BNY Mellon 12/9/2019 (509,812)USD 2,880,854 SGD 3,997,056 BNY Mellon 12/9/2019 (1,791)Net unrealised depreciation (511,603)
Total net unrealised depreciation (USD underlying exposure - USD 4,877,323,126) (29,264,387)
Open Forward Foreign Exchange Contracts as at 31 August 2019
Currency
Purchases Currency
Sales Counterparty
Maturity date
Unrealised appreciation/
(depreciation) USD
EUR 64,166,000 USD 72,607,551 Bank of America 12/9/2019 (1,678,323)USD 72,889,689 EUR 64,166,000 JP Morgan 12/9/2019 1,960,461 EUR 66,197,547 USD 75,203,194 JP Morgan 13/9/2019 (2,022,610)EUR 64,592,633 USD 72,907,191 Citibank 13/9/2019 (1,500,820)USD 149,438,336 EUR 130,790,181 JP Morgan 13/9/2019 4,851,381 EUR 95,846,000 USD 108,934,442 JP Morgan 19/9/2019 (2,928,493)USD 108,699,907 EUR 95,846,000 Bank of America 19/9/2019 2,693,958 ZAR 614,075,000 USD 40,919,238 Citibank 19/9/2019 (716,933)EUR 64,400,000 USD 73,440,189 Goldman Sachs 20/9/2019 (2,208,076)USD 73,199,616 EUR 64,400,000 JP Morgan 20/9/2019 1,967,503 JPY 8,133,500,000 USD 75,575,610 Goldman Sachs 3/10/2019 1,222,425 USD 3,617,822 JPY 387,853,000 JP Morgan 3/10/2019 (44,359)USD 73,537,562 GBP 59,907,000 BNP Paribas 8/10/2019 249,185 USD 73,906,998 GBP 58,937,000 Bank of America 8/10/2019 1,805,290 JPY 14,957,706,000 USD 139,299,280 Goldman Sachs 24/10/2019 2,147,679 USD 21,910,818 AUD 31,201,000 JP Morgan 31/10/2019 852,362 ZAR 309,039,000 USD 21,971,966 Barclays 31/10/2019 (1,850,987)EUR 71,310,825 USD 79,813,130 Bank of America 1/11/2019 (675,740)EUR 31,573,000 USD 35,257,253 Citibank 1/11/2019 (219,028)EUR 31,736,000 USD 35,705,152 Morgan Stanley 1/11/2019 (486,036)EUR 31,638,000 USD 35,568,705 UBS 1/11/2019 (458,345)EUR 88,859,000 USD 100,460,875 Deutsche Bank 1/11/2019 (1,849,349)USD 186,080,285 EUR 166,485,000 UBS 1/11/2019 1,323,086 USD 99,491,457 EUR 88,631,825 Goldman Sachs 1/11/2019 1,132,039 CHF 4,208,112 USD 4,340,000 BNP Paribas 8/11/2019 (53,291)CHF 30,644,575 USD 31,632,000 UBS 8/11/2019 (415,058)JPY 7,616,663,273 USD 71,889,000 Morgan Stanley 15/11/2019 240,759 EUR 25,554,000 USD 28,459,260 UBS 22/11/2019 (58,789)GBP 51,870,000 USD 62,865,154 JP Morgan 22/11/2019 696,950 JPY 11,498,035,000 USD 109,291,218 JP Morgan 22/11/2019 (358,979)USD 35,722,855 INR 2,582,691,000 JP Morgan 22/11/2019 64,928 USD 14,055,000 ZAR 217,177,860 BNP Paribas 3/12/2019 (29,275)EUR 51,000,000 USD 56,835,440 Morgan Stanley 5/12/2019 (102,004)GBP 26,900,000 USD 32,772,316 JP Morgan 5/12/2019 206,434 JPY 3,782,963,741 USD 35,799,000 Morgan Stanley 5/12/2019 70,371 CHF 34,639,431 USD 35,737,000 BNP Paribas 6/12/2019 (367,214)NOK 220,436,000 USD 25,231,356 JP Morgan 6/12/2019 (931,267)USD 39,351,000 BRL 164,565,882 Credit Suisse 6/12/2019 (72,118)USD 10,313,000 CLP 7,409,678,238 Morgan Stanley 6/12/2019 (9,047)USD 25,135,000 CLP 18,059,497,500 Deutsche Bank 6/12/2019 (22,770)Net unrealised appreciation 2,425,900
AUD Hedged Share Class
AUD 228,605,595 USD 155,797,472 BNY Mellon 12/9/2019 (1,731,947)USD 2,952,369 AUD 4,364,546 BNY Mellon 12/9/2019 10,950 Net unrealised depreciation (1,720,997)
Open Forward Foreign Exchange Contracts as at 31 August 2019
Currency
Purchases Currency
Sales Counterparty
Maturity date
Unrealised appreciation/
(depreciation) USD
Open Exchange Traded Futures Contracts as at 31 August 2019
Number of contracts Currency
Contract/ Description
Expiration date
Underlying exposure
USD
Unrealised appreciation/
(depreciation) USD
262 EUR EURO STOXX 50 Index September 2019 9,935,552 143,90036 EUR Dax Index September 2019 11,882,783 262,076(31) GBP FTSE 100 Index September 2019 2,729,228 49,097(2,422) JPY Nikkei 225 (Yen) September 2019 236,392,800 6,453,5181,966 USD S&P 500 E-Mini Index September 2019 288,559,650 3,357,056966 USD MSCI Emerging Markets Index September 2019 47,478,900 (2,329,497)(27) USD NASDAQ 100 E-Mini Index September 2019 4,173,255 142,0739,191 USD US Treasury 5 Year Note (CBT) December 2019 1,101,196,688 (1,463,125)1,350 USD US Ultra 10 Year Note December 2019 194,695,313 (746,138)501 USD US Treasury 10 Year Note (CBT) December 2019 65,904,984 (23,484)116 USD US Ultra Bond (CBT) December 2019 22,852,000 (176,008)
Total 1,985,801,153 5,669,468

The notes on pages 728 to 741 form an integral part of these financial statements.
Annual Report and Audited Financial Statements [389]
Global Allocation Fund continued
Swaps as at 31 August 2019
TypeNominal
Value Description Counterparty
Expiration date
Unrealised appreciation/
(depreciation) USD
Market Value USD
CDS USD (43,573,286) Fund provides default protection on CDX.NA.HY.32.V2; and receives Fixed 5% Goldman Sachs 20/6/2024 125,253 2,994,816
IRS CAD 36,230,000 Fund receives Fixed 1.905%; and pays Floating CAD CDOR 6 Month Goldman Sachs 9/7/2021 122,192 122,192
IRS CAD 456,209,599 Fund receives Fixed 1.9075%; and pays Floating CAD CDOR 6 Month Goldman Sachs 9/7/2021 1,555,598 1,555,598
IRS USD 73,038,000 Fund receives Fixed 1.28%; and pays Floating USD LIBOR 3 Month Goldman Sachs 29/11/2024 (43,792) (43,792)
IRS USD 29,080,000 Fund receives Fixed 1.28%; and pays Floating USD LIBOR 3 Month Goldman Sachs 29/11/2024 (17,436) (17,436)
TRS USD 88,500 Fund receives S&P 500 Annual Dividend Index December 21 + 0bps; and pays Fixed 0% BNP Paribas 17/12/2021 920,400 920,400
TRS USD 70,500 Fund receives S&P 500 Annual Dividend Index December 20 + 0bps; and pays Fixed 0% Goldman Sachs 18/12/2020 749,062 749,062
Total (USD underlying exposure - USD 527,357,609) 3,411,277 6,280,840
CDS: Credit Default SwapsIRS: Interest Rate SwapsTRS: Total Return Swaps
Purchased Options as at 31 August 2019
Number of contracts
Call/ Put
Description Counterparty
Strike Price
Expiration date
Unrealised appreciation/
(depreciation) USD
Market Value USD
20,811,000 Put OTC EUR/USD Bank of America EUR 1.115 23/7/2020 136,447 426,960 13,071,300 Put OTC GBP/USD Morgan Stanley GBP 1.25 8/10/2019 234,652 453,919 248,902,000 Call OTC GBP/USD UBS GBP 1.34 8/10/2019 (5,531,669) 86,452 72,827 Call S&P 500 Index Bank of America USD 3,050 6/9/2019 (2,163,523) 39,504 3,720 Call NASDAQ-100 Index Bank of America USD 7,900 18/10/2019 69,610 476,994 12,136,714 Call Tokyo Stock Exchange TOPIX Bank Index Bank of America JPY 191.28 13/12/2019 (1,532,272) 84 489,113 Call Emerson Electric Co Bank of America USD 65 20/12/2019 (1,083,942) 564,321 91,598 Call Alibaba Group Holding Inc Bank of America USD 162.5 17/1/2020 769,987 1,962,337 211,584 Call Johnson & Johnson Bank of America USD 155 17/1/2020 (773,516) 49,545 195,563 Call EURO STOXX Banks Index Barclays EUR 110 19/3/2021 (697,437) 179,806 16,191,686 Call Tokyo Stock Exchange TOPIX Bank Index BNP Paribas JPY 194.0398 13/3/2020 (2,459,026) 2,401 30,832 Call EURO STOXX 50 Index Citibank EUR 3,450 20/9/2019 753,391 1,463,379 97,893 Call FedEx Corp Citibank USD 170 18/10/2019 (638,251) 287,533 106,207 Call Alibaba Group Holding Inc Citibank USD 167 22/11/2019 429,861 1,666,206 37,063 Call S&P 500 Index Citibank USD 2,900 20/12/2019 (165,235) 1,306,723 581,323 Call Halliburton Co Citibank USD 50 17/1/2020 (2,490,247) 204 208,446 Call JP Morgan Citibank USD 114.5 17/1/2020 (971,185) 737,842 268,811 Call QUALCOMM Inc Citibank USD 71 17/1/2020 1,159,651 2,522,415 30,836 Call EURO STOXX 50 Index Credit Suisse EUR 3,575 20/9/2019 (1,247,897) 100,980 10,329 Call EURO STOXX 50 Index Credit Suisse EUR 3,600 18/10/2019 (244,570) 121,849 213,386 Call FedEx Corp Credit Suisse USD 162 17/1/2020 (674,529) 2,255,664 738,974 Call Taiwan Semiconductor Manfacturing Co Ltd Credit Suisse USD 46 17/1/2020 (591,429) 989,975 2,000 Call Dax Index Credit Suisse EUR 14,000 20/3/2020 (160,674) 31,496 9,051 Call EURO STOXX 50 Index Credit Suisse EUR 3,900 20/3/2020 (116,566) 72,841 4,108 Call EURO STOXX 50 Index Credit Suisse EUR 3,600 20/3/2020 (68,264) 297,857 6,530 Call Dax Index Goldman Sachs EUR 13,700 20/12/2019 (372,517) 33,091 1,885 Call Dax Index Goldman Sachs EUR 13,300 20/12/2019 (146,511) 44,334 41,500 Call EURO STOXX 50 Index Goldman Sachs EUR 3,850 20/12/2019 (352,912) 98,604 41,389 Call EURO STOXX 50 Index Goldman Sachs EUR 3,850 20/12/2019 (309,083) 98,340 7,625 Call EURO STOXX 50 Index Goldman Sachs EUR 3,750 20/12/2019 (116,784) 74,470 1,566 Call Dax Index Goldman Sachs EUR 13,600 20/3/2020 (119,872) 69,414 5,519 Call EURO STOXX 50 Index Goldman Sachs EUR 3,800 20/3/2020 (85,714) 105,430 208,222 Call CVS Health Corp JP Morgan USD 78.5 17/1/2020 (1,113,309) 15,338 28,631 Call Google Inc JP Morgan USD 1,315 17/1/2020 (575,029) 772,340 82,013 Call Apple Inc Morgan Stanley USD 212.5 20/9/2019 (140,921) 334,754 256,192 Call QUALCOMM Inc Morgan Stanley USD 70 18/10/2019 1,029,785 2,140,839 23,052,779 Call Tokyo Stock Exchange TOPIX Bank Index Morgan Stanley JPY 191.2806 13/12/2019 (3,363,659) 159 6,530 Call Dax Index Morgan Stanley EUR 13,700 20/12/2019 (424,498) 33,091 20,556 Call S&P 500 Index Morgan Stanley USD 2,915 20/12/2019 (16,864) 758,714 622,086 Call JP Morgan Morgan Stanley JPY 4,756.3349 13/3/2020 (1,928,435) 18,641 14,369,879 Call Tokyo Stock Exchange TOPIX Bank Index Morgan Stanley JPY 192.0414 10/4/2020 (2,184,483) 4,327 503,897 Call JP Morgan Morgan Stanley JPY 4,816.24 11/9/2020 (1,357,807) 65,754 502,454 Call JP Morgan Morgan Stanley JPY 4,894.869 11/12/2020 (1,660,052) 76,225

The notes on pages 728 to 741 form an integral part of these financial statements.
[390] BlackRock Global Funds (BGF)
Global Allocation Fund continued
246,203 Call Lowe’s Companies Inc Nomura USD 112 15/11/2019 441,633 1,300,882 209,135 Call Agilent Technologies Inc Nomura USD 71 17/1/2020 (69,682) 972,208 1,354,747 Call BP Plc Nomura USD 45 17/1/2020 (2,228,094) 88,524 488,783 Call Kroger Co Nomura USD 25 17/1/2020 (293,532) 688,164 171,043 Call Lowe’s Companies Inc Nomura USD 98 17/1/2020 1,872,029 2,972,930 29,968 Call S&P 500 Index Societe Generale USD 2,975 20/9/2019 (792,881) 792,426 653,135 Call SPDR Gold Trust Societe Generale USD 136 20/9/2019 3,480,010 5,452,478 542,054 Call SPDR Gold Trust Societe Generale USD 136 18/10/2019 3,349,341 4,782,098 577,817 Call SPDR Gold Trust Societe Generale USD 138 15/11/2019 2,398,885 4,507,917 122,418 Call Facebook Inc UBS USD 185 20/9/2019 (711,240) 591,471 1,057,809 Call Total SA UBS USD 70 20/9/2019 (2,820,679) – 245,218 Call Facebook Inc UBS USD 195 20/12/2019 (1,381,740) 2,081,817 481,086 Call Schlumberger Ltd UBS USD 70 17/1/2020 (1,810,097) 1,480 248,714 Call EURO STOXX Banks Index UBS EUR 110 18/6/2021 (855,273) 214,236 2,950 Call SPDR S&P 500 ETF Trust Exchange Traded USD 302 20/9/2019 82,217 210,925 1,475 Call SPDR S&P 500 ETF Trust Exchange Traded USD 296 20/9/2019 189,187 432,913
Total (USD underlying exposure - USD 830,707,946) (30,445,214) 45,931,621
Purchased Options as at 31 August 2019
Number of contracts
Call/ Put
Description Counterparty
Strike Price
Expiration date
Unrealised appreciation/
(depreciation) USD
Market Value USD
Written Options as at 31 August 2019
Number of contracts
Call/ Put
Description Counterparty
Strike Price
Expiration date
Unrealised appreciation/
(depreciation) USD
Market Value USD
(43,717,000) Call OTC USD/ZAR Bank of America USD 15.25 25/9/2019 (201,945) (758,025) (30,116,000) Call OTC USD/BRL Deutsche Bank USD 3.82 10/10/2019 (1,837,186) (2,443,873) (13,071,300) Call OTC GBP/USD Morgan Stanley GBP 1.34 8/10/2019 3,301 (4,540) (248,902,000) Put OTC GBP/USD UBS GBP 1.25 8/10/2019 (5,425,687) (8,643,471) (72,827) Put S&P 500 Index Bank of America USD 2,875 6/9/2019 689,853 (599,062) (12,136,714) Call Tokyo Stock Exchange TOPIX Bank Index Bank of America JPY 221.29 13/12/2019 606,374 (3) (12,136,714) Put Tokyo Stock Exchange TOPIX Bank Index Bank of America JPY 156.59 13/12/2019 (2,235,437) (3,169,753) (244,556) Put Emerson Electric Co Bank of America USD 55 20/12/2019 (36,934) (438,436) (489,113) Call Emerson Electric Co Bank of America USD 75 20/12/2019 246,721 (34,489) (61,074) Put Alibaba Group Holding Inc Bank of America USD 135 17/1/2020 307,857 (132,712) (91,598) Call Alibaba Group Holding Inc Bank of America USD 202.5 17/1/2020 (145,349) (419,722) (211,584) Put Johnson & Johnson Bank of America USD 109 17/1/2020 263,749 (318,107) (190,924) Put EURO STOXX Banks Index Barclays EUR 110.23 19/3/2021 (4,627,918) (7,652,595) (16,191,686) Put Tokyo Stock Exchange TOPIX Bank Index BNP Paribas JPY 155.7984 13/3/2020 (2,781,140) (4,209,276) (16,191,686) Call Tokyo Stock Exchange TOPIX Bank Index BNP Paribas JPY 237.4745 13/3/2020 783,987 (86) (30,836) Call EURO STOXX 50 Index Citibank EUR 3,575 20/9/2019 (66,674) (100,981) (457,595) Put Bank of America Corp Citibank USD 28.5 11/10/2019 (456,846) (702,804) (48,947) Put FedEx Corp Citibank USD 140 18/10/2019 70,200 (91,271) (97,893) Call FedEx Corp Citibank USD 195 18/10/2019 217,102 (16,040) (69,034) Put Alibaba Group Holding Inc Citibank USD 140 22/11/2019 254,869 (107,318) (106,207) Call Alibaba Group Holding Inc Citibank USD 195 22/11/2019 (22,605) (409,570) (523,037) Call Comcast Corp Citibank USD 37.5 17/1/2020 (2,427,334) (3,996,445) (208,446) Call JP Morgan Citibank USD 125.5 17/1/2020 787,891 (139,694) (134,405) Put QUALCOMM Inc Citibank USD 57 17/1/2020 371,984 (101,444) (268,811) Call QUALCOMM Inc Citibank USD 86 17/1/2020 (238,110) (639,982) (30,836) Put EURO STOXX 50 Index Credit Suisse EUR 3,275 20/9/2019 82,633 (472,482) (120,608) Put FedEx Corp Credit Suisse USD 130 17/1/2020 224,019 (363,925) (213,386) Call FedEx Corp Credit Suisse USD 190 17/1/2020 446,951 (486,001) (369,487) Put Taiwan Semiconductor Manfacturing Co Ltd Credit Suisse USD 39 17/1/2020 (68,928) (560,346) (738,974) Call Taiwan Semiconductor Manfacturing Co Ltd Credit Suisse USD 51 17/1/2020 238,414 (278,868) (259,997) Put Citigroup Inc JP Morgan USD 67 11/10/2019 (665,399) (925,397) (208,222) Put CVS Health Corp JP Morgan USD 56 17/1/2020 153,594 (439,838) (256,192) Call QUALCOMM Inc Morgan Stanley USD 85 18/10/2019 16,595 (207,214) (23,052,779) Call Tokyo Stock Exchange TOPIX Bank Index Morgan Stanley JPY 221.2854 13/12/2019 1,578,996 (5) (23,052,779) Put Tokyo Stock Exchange TOPIX Bank Index Morgan Stanley JPY 156.5876 13/12/2019 (4,057,315) (6,020,198) (622,086) Put JP Morgan Morgan Stanley JPY 3,832.7747 13/3/2020 (1,506,400) (2,890,402) (622,086) Call JP Morgan Morgan Stanley JPY 5,679.8951 13/3/2020 761,288 (1,754) (14,369,879) Call Tokyo Stock Exchange TOPIX Bank Index Morgan Stanley JPY 233.8722 10/4/2020 790,529 (222) (14,369,879) Put Tokyo Stock Exchange TOPIX Bank Index Morgan Stanley JPY 157.8162 10/4/2020 (2,765,570) (4,128,926) (335,931) Put JP Morgan Morgan Stanley JPY 3,820.96 11/9/2020 (1,054,303) (1,919,357) (334,969) Put JP Morgan Morgan Stanley JPY 3,786.5967 11/12/2020 (1,068,943) (2,100,366) (246,203) Call Lowe’s Companies Inc Nomura USD 125 15/11/2019 (62,690) (207,236) (182,071) Put Agilent Technologies Inc Nomura USD 61 17/1/2020 364,648 (246,091) (209,135) Call Agilent Technologies Inc Nomura USD 81 17/1/2020 140,528 (217,825) (1,354,747) Put BP Plc Nomura USD 36 17/1/2020 (622,943) (2,167,355)

The notes on pages 728 to 741 form an integral part of these financial statements.
Annual Report and Audited Financial Statements [391]
Global Allocation Fund continued
Synthetic Cap Options as at 31 August 2019
Number of contracts
Call/ Put
Description Counterparty
Strike Price
Expiration date
Unrealised depreciation
USD
Market Value USD
1,250,340,000 Put USD - 2 Year Constant Maturity Swap Goldman Sachs USD 0.50 27/2/2020 (1,189,348) 436,094 1,252,438,000 Put USD - 10 Year Constant Maturity Swap Goldman Sachs USD 0.50 27/8/2020 (1,779,552) 1,414,165
Total (USD underlying exposure - USD 2,502,778,000) (2,968,900) 1,850,259
Written Options as at 31 August 2019
Number of contracts
Call/ Put
Description Counterparty
Strike Price
Expiration date
Unrealised appreciation/
(depreciation) USD
Market Value USD
(244,413) Put Kroger Co Nomura USD 21 17/1/2020 107,657 (211,962) (171,043) Call Lowe’s Companies Inc Nomura USD 115 17/1/2020 (776,923) (1,064,617) (14,922) Put S&P 500 Index Societe Generale USD 2,645 20/9/2019 680,719 (21,958) (376,838) Call SPDR Gold Trust Societe Generale USD 150 15/11/2019 (345,021) (846,215) (502,449) Put SPDR Gold Trust Societe Generale USD 128 15/11/2019 439,885 (64,071) (245,218) Call Facebook Inc UBS USD 225 20/12/2019 744,514 (393,200) (194,662) Put EURO STOXX Banks Index UBS EUR 106.3798 18/6/2021 (4,600,441) (7,740,085) (248,714) Call EURO STOXX Banks Index UBS EUR 135 18/6/2021 229,033 (46,768) (41) Put Alphabet Inc Exchange Traded USD 1,040 18/10/2019 28,989 (18,245) (21) Put Amazon.com Inc Exchange Traded USD 1,550 18/10/2019 26,922 (18,585) (738) Put Apple Inc Exchange Traded USD 192.5 20/9/2019 100,419 (97,416) (1,475) Put Apple Inc Exchange Traded USD 197.5 20/9/2019 84,436 (296,475) (145) Put Apple Inc Exchange Traded USD 175 18/10/2019 30,704 (17,255) (5,891) Put Bank of America Corp Exchange Traded USD 29 20/9/2019 (401,451) (1,013,252) (3,366) Put Citigroup Inc Exchange Traded USD 67.5 20/9/2019 (634,774) (1,119,195) (1,999) Put JPMorgan Chase & Co Exchange Traded USD 110 20/9/2019 9,300 (420,790) (269) Put Microsoft Corp Exchange Traded USD 120 18/10/2019 30,735 (17,351) (341) Put QUALCOMM Inc Exchange Traded USD 60 18/10/2019 40,838 (7,843) (310) Put Texas Instruments Inc Exchange Traded USD 105 18/10/2019 35,792 (16,895) (5,996) Put Wells Fargo & Co Exchange Traded USD 45 20/9/2019 203,442 (257,828)
Total (USD underlying exposure - USD 473,221,989) (26,938,798) (72,453,513)
Holding
Description Counterparty
Unrealised appreciation/
(depreciation) USD
Bermuda (918,000) Brilliance China Automotive
Holdings Ltd JP Morgan (145,002) (110,400) China Gas Holdings Ltd JP Morgan (10,493) (155,495)
Brazil (1,389) Centrais Eletricas
Brasileiras SA JP Morgan (430) (83,938) Lojas Americanas SA (Pref) JP Morgan 7,310 (216,596) Suzano SA JP Morgan 190,755 (49,119) Ultrapar Participacoes SA JP Morgan 42,232 239,867
Canada (3,458) Pembina Pipeline Corp Citigroup (179) (2,046) Shopify Inc Citigroup 606 (98,296) Cenovus Energy Inc JP Morgan (46,113) (9,784) Saputo Inc JP Morgan 13,845 (31,841)
Cayman Islands (76,600) Meituan Dianping Citigroup (41,245) (10,761) Pinduoduo Inc ADR Citigroup (25,884) (805,000) Sino Biopharmaceutical Ltd Citigroup (112,165) (1,416,800) Xiaomi Corp Citigroup 62,015 (66,651) ZTO Express Cayman Inc Citigroup (45,323)
Holding
Description Counterparty
Unrealised appreciation/
(depreciation) USD
(128,500) AAC Technologies Holdings Inc JP Morgan 52,507 (15,770) Autohome Inc JP Morgan (141,724) (1,920,000) China State Construction
International Holdings Ltd JP Morgan (14,446) (2,626) Ctrip.com International Ltd JP Morgan 6,171 (172,000) Geely Automobile Holdings Ltd JP Morgan (16,909) (93,483) iQIYI Inc ADR JP Morgan (84,135) (39,800) Shenzhou International
Group Holdings Ltd JP Morgan (1,446) (4,982) SINA Corp JP Morgan (4,029) (51,200) Sunny Optical Technology
Group Co Ltd JP Morgan (167,348) (533,961)
China (41,000) Advantech Co Ltd Citigroup (2,242) (70,000) China International Capital
Group Ltd ‘H’ Citigroup 8,258 (708,000) China Molybdenum Co Ltd ‘H’ Citigroup 5,766 (9,300) China Vanke Co Ltd Citigroup 664 (46,000) Hotai Motor Co Ltd Citigroup (23,498) (37,500) Shanghai Fosun
Pharmaceutical Group Co Ltd Citigroup (1,935)
(106,400) ZTE Corp ‘H’ Citigroup 14,336 (1,534,000) China Southern Airlines
Co Ltd JP Morgan 16,147 17,496
Contracts For Difference as at 31 August 2019
Contracts For Difference as at 31 August 2019

The notes on pages 728 to 741 form an integral part of these financial statements.
[392] BlackRock Global Funds (BGF)
Global Allocation Fund continued
Holding
Description Counterparty
Unrealised appreciation/
(depreciation) USD
Holding
Description Counterparty
Unrealised appreciation/
(depreciation) USD
South Africa (4,349) Shoprite Holdings Ltd JP Morgan 456 456
South Korea (4,069) Hyundai Heavy Industries
Co Ltd Citigroup (7,277) (64,204) LG Display Co Ltd Citigroup (49,334) (13,724) Lotte Corp Citigroup (15,307) (4,010) Amorepacific Group JP Morgan (17,873) (246) Amorepacific Group JP Morgan (1,783) (4,853) Hyundai Steel Co Ltd JP Morgan (3,298) (36,964) LG Display Co Ltd JP Morgan (28,233) (2,875) Lotte Corp JP Morgan (3,297) (1,168) Lotte Shopping Co Ltd JP Morgan (10,860) (5,370) SK Hynix Inc JP Morgan (17,166) (154,428)
Spain (5,473) Ferrovial SA Citigroup (2,077) (2,077)
Switzerland (2,681) Kuehne + Nagel
International AG Citigroup (10,092) (10,092)
Turkey (24,762) Akbank T.A.S. JP Morgan 4,700 (34,819) BIM Birlesik Magazalar AS JP Morgan 25,565 30,265
United States (1,555) Boston Scientific Corp Citigroup (202) (492) Dow Inc Citigroup (330) (4,068) Fortive Corp Citigroup (5,166) (156,266) Freeport-McMoRan Inc Citigroup (9,376) (38,298) Hormel Foods Corp Citigroup 8,809 (3,124) Nucor Corp Citigroup (1,567) (42,167) Advanced Micro Devices Inc JP Morgan 86,841 (44,121) Conagra Foods Inc JP Morgan (20,737) (12,269) Concho Resources Inc JP Morgan 8,220 (4,595) Constellation Brands Inc JP Morgan (52,272) (531) Deere & Co JP Morgan (4,065) (163) Diamondback Energy Inc JP Morgan (688) (490) Fox Corp JP Morgan (703) (6,902) Fox Corp JP Morgan (4,541) (1,617) Hess Corp JP Morgan (3,687) (1,225) O’Reilly Automotive Inc JP Morgan (15,112) (1,715) PPL Corp JP Morgan 128 (10,761) Southwest Airlines Co JP Morgan (26,526) (13,584) Sprint Capital Corp JP Morgan 136 (40,838)
Total (USD underlying exposure - USD 46,336,335) (957,621)
Finland (6,963) Neste Oil Oyj JP Morgan 15,470 15,470
Germany (8,718) Continental AG Citigroup (13,673) (8,168) Infineon Technologies AG Citigroup (3,843) (9,253) Volkswagen AG Citigroup (38,796) (471) Volkswagen AG (Pref) Citigroup (2,036) (8,433) BASF SE JP Morgan (14,709) (73,057)
Hong Kong (696,000) China Everbright
International Ltd Citigroup 17,958 (175,000) Galaxy Entertainment Group Citigroup (703) (385,000) China Everbright
International Ltd JP Morgan 26,550 43,805
Ireland (3,806) Linde Plc Citigroup (3,768) (3,768)
Japan (11,800) LINE Corp Citigroup (13,933) (32,000) Sharp Corp/Japan Citigroup (2,621) (800) Daiichi Sankyo Co Ltd JP Morgan (196) (18,000) FamilyMart UNY Holdings
Co Ltd JP Morgan (31,290) (28,500) LINE Corp JP Morgan (73,806) (4,200) Makita Corp JP Morgan (1,117) (17,400) Nippon Paint Holdings Co Ltd JP Morgan (92,095) (87,800) Renesas Electronic Corp JP Morgan (26,187) (2,000) SMC Corp/Japan JP Morgan (53,876) (3,300) Softbank Group Corp JP Morgan (3,483) (2,300) Sony Financial Holdings Inc JP Morgan 199 (298,405)
Jersey (9,721) Delphi Automotive Plc Citigroup (3,597) (3,597)
Mexico (14,029) Industrias Penoles SAB de CV Citigroup (20,118) (20,118)
Poland (199,425) Polskie Górnictwo Naftowe
i Gazownictwo SA Citigroup 531 (211) mBank SA JP Morgan 677 (71,767) Pacific Gas and Electric Co JP Morgan 12,093 (1,810) Santander Bank Polska SA JP Morgan 9,396 22,697
Contracts For Difference as at 31 August 2019
Contracts For Difference as at 31 August 2019

The notes on pages 728 to 741 form an integral part of these financial statements.
Annual Report and Audited Financial Statements [393]
Written Swaptions as at 31 August 2019
Nominal Value
Description Counterparty
Expiration date
Unrealised appreciation/
(depreciation) USD
Market Value USD
USD (423,080,337) Fund writes a put option to enter into an Interest Rate Swap. If exercised Fund receives 1.88% Fixed semi-annually from 17/2/2021; and pays Floating USD LIBOR 3 Month BBA quarterly from 17/11/2020 Bank of America 13/8/2020 426,895 (382,262)
USD (423,080,337) Fund writes a call option to enter into an Interest Rate Swap. If exercised Fund receives Floating USD LIBOR 3 Month BBA quarterly from 17/11/2020; and pays 0.88% Fixed semi-annually from 17/2/2021 Bank of America 13/8/2020 (497,146) (1,421,520)
USD (206,679,965) Fund writes a put option to enter into an Interest Rate Swap. If exercised Fund receives 1.655% Fixed semi-annually from 8/5/2020; and pays Floating USD LIBOR 3 Month BBA quarterly from 8/2/2020 Citibank 6/11/2019 405,550 (255,826)
USD (206,679,965) Fund writes a put option to enter into an Interest Rate Swap. If exercised Fund receives 1.755% Fixed semi-annually from 8/5/2020; and pays Floating USD LIBOR 3 Month BBA quarterly from 8/2/2020 Citibank 6/11/2019 297,534 (136,493)
USD (181,795,676) Fund writes a call option to enter into an Interest Rate Swap. If exercised Fund receives Floating USD LIBOR 3 Month BBA quarterly from 27/12/2019; and pays 1.55% Fixed semi-annually from 27/3/2020 Goldman Sachs 25/9/2019 (1,267,826) (2,170,897)
USD (742,643,270) Fund writes a call option to enter into an Interest Rate Swap. If exercised Fund receives Floating USD LIBOR 3 Month BBA quarterly from 11/1/2020; and pays 1.2% Fixed semi-annually from 11/4/2020 Goldman Sachs 9/10/2019 (732,596) (2,349,040)
USD (120,841,431) Fund writes a call option to enter into an Interest Rate Swap. If exercised Fund receives Floating USD LIBOR 3 Month BBA quarterly from 31/3/2020; and pays 1.55% Fixed semi-annually from 30/6/2020 Goldman Sachs 27/12/2019 (1,129,309) (2,033,027)
USD (146,076,630) Fund writes a call option to enter into an Interest Rate Swap. If exercised Fund receives Floating USD LIBOR 3 Month BBA quarterly from 2/3/2020; and pays 1.03% Fixed semi-annually from 2/6/2020 Morgan Stanley 27/11/2019 77,789 (462,695)
USD (58,160,140) Fund writes a call option to enter into an Interest Rate Swap. If exercised Fund receives Floating USD LIBOR 3 Month BBA quarterly from 2/3/2020; and pays 1.03% Fixed semi-annually from 2/6/2020 Morgan Stanley 27/11/2019 30,972 (184,221)
Total (USD underlying exposure - USD 835,849,582) (2,388,137) (9,395,981)
Purchased Swaptions as at 31 August 2019
Nominal Value
Description Counterparty
Expiration date
Unrealised appreciation/
(depreciation) USD
Market Value USD
USD 84,616,067 Fund purchases a call option to enter into an Interest Rate Swap. If exercised Fund receives 1.08% Fixed semi-annually from 17/2/2021; and pays Floating USD LIBOR 3 Month BBA quarterly from 17/11/2020 Bank of America 13/8/2020 632,894 1,394,127
USD 84,616,067 Fund purchases a put option to enter into an Interest Rate Swap. If exercised Fund receives Floating USD LIBOR 3 Month BBA quarterly from 17/11/2020; and pays 2.08% Fixed semi-annually from 17/2/2021 Bank of America 13/8/2020 (384,328) 343,886
USD 206,679,965 Fund purchases a put option to enter into an Interest Rate Swap. If exercised Fund receives Floating USD LIBOR 3 Month BBA quarterly from 8/2/2020; and pays 1.555% Fixed semi-annually from 8/5/2020 Citibank 6/11/2019 (590,301) 443,099
USD 742,643,270 Fund purchases a call option to enter into an Interest Rate Swap. If exercised Fund receives 1.45% Fixed semi-annually from 11/4/2020; and pays Floating USD LIBOR 3 Month BBA quarterly from 11/1/2020 Goldman Sachs 9/10/2019 2,568,402 6,801,469
USD 58,160,140 Fund purchases a put option to enter into an Interest Rate Swap. If exercised Fund receives Floating USD LIBOR 3 Month BBA quarterly from 2/3/2020; and pays 1.53% Fixed semi-annually from 2/6/2020 Morgan Stanley 27/11/2019 (1,134) 173,346
USD 146,076,630 Fund purchases a put option to enter into an Interest Rate Swap. If exercised Fund receives Floating USD LIBOR 3 Month BBA quarterly from 2/3/2020; and pays 1.53% Fixed semi-annually from 2/6/2020 Morgan Stanley 27/11/2019 (2,849) 435,381
Total (USD underlying exposure - USD 670,662,467) 2,222,684 9,591,308
Global Allocation Fund continued
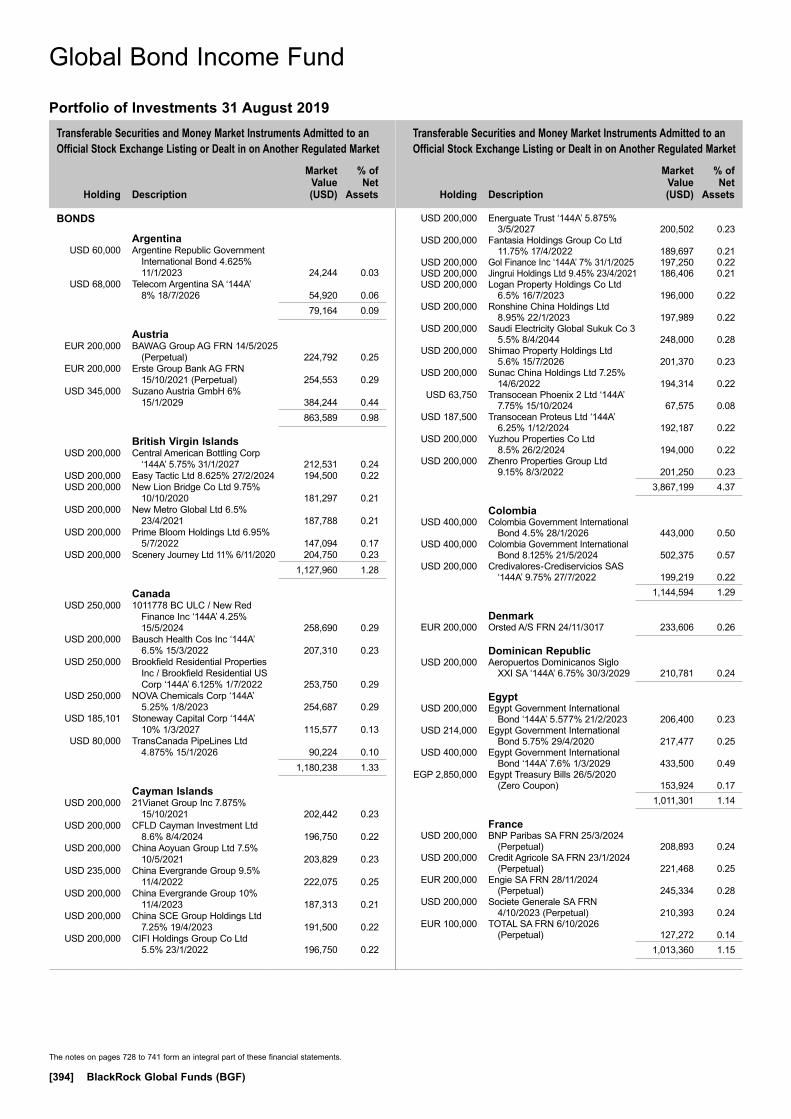
Transferable Securities and Money Market Instruments Admitted to an Official Stock Exchange Listing or Dealt in on Another Regulated Market
Transferable Securities and Money Market Instruments Admitted to an Official Stock Exchange Listing or Dealt in on Another Regulated Market
Holding
Description
Market Value (USD)
% of Net
Assets
Holding
Description
Market Value (USD)
% of Net
Assets
The notes on pages 728 to 741 form an integral part of these financial statements.
[394] BlackRock Global Funds (BGF)
BONDS
Argentina USD 60,000 Argentine Republic Government
International Bond 4.625% 11/1/2023 24,244 0.03
USD 68,000 Telecom Argentina SA ‘144A’ 8% 18/7/2026 54,920 0.06
79,164 0.09
Austria EUR 200,000 BAWAG Group AG FRN 14/5/2025
(Perpetual) 224,792 0.25 EUR 200,000 Erste Group Bank AG FRN
15/10/2021 (Perpetual) 254,553 0.29 USD 345,000 Suzano Austria GmbH 6%
15/1/2029 384,244 0.44 863,589 0.98
British Virgin Islands USD 200,000 Central American Bottling Corp
‘144A’ 5.75% 31/1/2027 212,531 0.24 USD 200,000 Easy Tactic Ltd 8.625% 27/2/2024 194,500 0.22 USD 200,000 New Lion Bridge Co Ltd 9.75%
10/10/2020 181,297 0.21 USD 200,000 New Metro Global Ltd 6.5%
23/4/2021 187,788 0.21 USD 200,000 Prime Bloom Holdings Ltd 6.95%
5/7/2022 147,094 0.17 USD 200,000 Scenery Journey Ltd 11% 6/11/2020 204,750 0.23 1,127,960 1.28
Canada USD 250,000 1011778 BC ULC / New Red
Finance Inc ‘144A’ 4.25% 15/5/2024 258,690 0.29
USD 200,000 Bausch Health Cos Inc ‘144A’ 6.5% 15/3/2022 207,310 0.23
USD 250,000 Brookfield Residential Properties Inc / Brookfield Residential US Corp ‘144A’ 6.125% 1/7/2022 253,750 0.29
USD 250,000 NOVA Chemicals Corp ‘144A’ 5.25% 1/8/2023 254,687 0.29
USD 185,101 Stoneway Capital Corp ‘144A’ 10% 1/3/2027 115,577 0.13
USD 80,000 TransCanada PipeLines Ltd 4.875% 15/1/2026 90,224 0.10
1,180,238 1.33
Cayman Islands USD 200,000 21Vianet Group Inc 7.875%
15/10/2021 202,442 0.23 USD 200,000 CFLD Cayman Investment Ltd
8.6% 8/4/2024 196,750 0.22 USD 200,000 China Aoyuan Group Ltd 7.5%
10/5/2021 203,829 0.23 USD 235,000 China Evergrande Group 9.5%
11/4/2022 222,075 0.25 USD 200,000 China Evergrande Group 10%
11/4/2023 187,313 0.21 USD 200,000 China SCE Group Holdings Ltd
7.25% 19/4/2023 191,500 0.22 USD 200,000 CIFI Holdings Group Co Ltd
5.5% 23/1/2022 196,750 0.22
USD 200,000 Energuate Trust ‘144A’ 5.875% 3/5/2027 200,502 0.23
USD 200,000 Fantasia Holdings Group Co Ltd 11.75% 17/4/2022 189,697 0.21
USD 200,000 Gol Finance Inc ‘144A’ 7% 31/1/2025 197,250 0.22 USD 200,000 Jingrui Holdings Ltd 9.45% 23/4/2021 186,406 0.21 USD 200,000 Logan Property Holdings Co Ltd
6.5% 16/7/2023 196,000 0.22 USD 200,000 Ronshine China Holdings Ltd
8.95% 22/1/2023 197,989 0.22 USD 200,000 Saudi Electricity Global Sukuk Co 3
5.5% 8/4/2044 248,000 0.28 USD 200,000 Shimao Property Holdings Ltd
5.6% 15/7/2026 201,370 0.23 USD 200,000 Sunac China Holdings Ltd 7.25%
14/6/2022 194,314 0.22 USD 63,750 Transocean Phoenix 2 Ltd ‘144A’
7.75% 15/10/2024 67,575 0.08 USD 187,500 Transocean Proteus Ltd ‘144A’
6.25% 1/12/2024 192,187 0.22 USD 200,000 Yuzhou Properties Co Ltd
8.5% 26/2/2024 194,000 0.22 USD 200,000 Zhenro Properties Group Ltd
9.15% 8/3/2022 201,250 0.23 3,867,199 4.37
Colombia USD 400,000 Colombia Government International
Bond 4.5% 28/1/2026 443,000 0.50 USD 400,000 Colombia Government International
Bond 8.125% 21/5/2024 502,375 0.57 USD 200,000 Credivalores-Crediservicios SAS
‘144A’ 9.75% 27/7/2022 199,219 0.22 1,144,594 1.29
Denmark EUR 200,000 Orsted A/S FRN 24/11/3017 233,606 0.26
Dominican Republic USD 200,000 Aeropuertos Dominicanos Siglo
XXI SA ‘144A’ 6.75% 30/3/2029 210,781 0.24
Egypt USD 200,000 Egypt Government International
Bond ‘144A’ 5.577% 21/2/2023 206,400 0.23 USD 214,000 Egypt Government International
Bond 5.75% 29/4/2020 217,477 0.25 USD 400,000 Egypt Government International
Bond ‘144A’ 7.6% 1/3/2029 433,500 0.49 EGP 2,850,000 Egypt Treasury Bills 26/5/2020
(Zero Coupon) 153,924 0.17 1,011,301 1.14
France USD 200,000 BNP Paribas SA FRN 25/3/2024
(Perpetual) 208,893 0.24 USD 200,000 Credit Agricole SA FRN 23/1/2024
(Perpetual) 221,468 0.25 EUR 200,000 Engie SA FRN 28/11/2024
(Perpetual) 245,334 0.28 USD 200,000 Societe Generale SA FRN
4/10/2023 (Perpetual) 210,393 0.24 EUR 100,000 TOTAL SA FRN 6/10/2026
(Perpetual) 127,272 0.14 1,013,360 1.15
Global Bond Income Fund
Portfolio of Investments 31 August 2019
Global Bond Income Fund

Transferable Securities and Money Market Instruments Admitted to an Official Stock Exchange Listing or Dealt in on Another Regulated Market
Transferable Securities and Money Market Instruments Admitted to an Official Stock Exchange Listing or Dealt in on Another Regulated Market
Holding
Description
Market Value (USD)
% of Net
Assets
Holding
Description
Market Value (USD)
% of Net
Assets
The notes on pages 728 to 741 form an integral part of these financial statements.
Annual Report and Audited Financial Statements [395]
Portfolio of Investments 31 August 2019
Global Bond Income Fund continued
Germany EUR 100,000 Bertelsmann SE & Co KGaA FRN
23/4/2075 122,376 0.14 EUR 100,000 IKB Deutsche Industriebank AG
FRN 31/1/2028 108,032 0.12 EUR 200,000 Merck KGaA FRN 25/6/2079 239,900 0.27 USD 250,000 Unitymedia GmbH ‘144A’ 6.125%
15/1/2025 261,688 0.30 731,996 0.83
Hong Kong USD 200,000 Yanlord Land HK Co Ltd 6.8%
27/2/2024 199,750 0.23
Indonesia USD 200,000 Indonesia Government International
Bond 4.1% 24/4/2028 218,441 0.25 USD 200,000 Indonesia Government International
Bond 4.75% 11/2/2029 231,504 0.26 IDR 1,486,000,000 Indonesia Treasury Bond 6.125%
15/5/2028 96,430 0.11 IDR 2,032,000,000 Indonesia Treasury Bond 8.375%
15/9/2026 152,002 0.17 698,377 0.79
Ireland USD 250,000 Ardagh Packaging Finance Plc /
Ardagh Holdings USA Inc ‘144A’ 4.625% 15/5/2023 256,425 0.29
EUR 110,000 Zurich Finance Ireland Designated Activity Co 1.625% 17/6/2039 141,557 0.16
397,982 0.45
Italy EUR 100,000 Assicurazioni Generali SpA FRN
8/6/2048 130,484 0.15 EUR 200,000 Intesa Sanpaolo SpA FRN
11/1/2027 (Perpetual) 256,827 0.29 USD 250,000 Telecom Italia SpA/Milano ‘144A’
5.303% 30/5/2024 267,813 0.30 EUR 200,000 UniCredit SpA (Restricted) FRN
3/6/2026 (Perpetual) 242,742 0.28 897,866 1.02
Luxembourg USD 100,000 Allergan Funding SCS 3.45%
15/3/2022 102,694 0.11 USD 23,000 Allergan Funding SCS 3.8%
15/3/2025 24,174 0.03 USD 249,000 Intelsat Jackson Holdings SA
5.5% 1/8/2023 227,524 0.26 USD 96,000 Intelsat Jackson Holdings SA
‘144A’ 8.5% 15/10/2024 95,160 0.11 USD 37,000 Intelsat SA 4.5% 15/6/2025 53,990 0.06 USD 200,000 Nexa Resources SA ‘144A’ 5.375%
4/5/2027 209,125 0.24 USD 250,000 Nielsen Co Luxembourg SARL/The
‘144A’ 5.5% 1/10/2021 251,717 0.28 USD 200,000 Rumo Luxembourg Sarl ‘144A’
7.375% 9/2/2024 214,750 0.24 1,179,134 1.33
Mauritius USD 200,000 Greenko Mauritius Ltd 6.25%
21/2/2023 204,250 0.23
Mexico USD 200,000 Axtel SAB de CV ‘144A’ 6.375%
14/11/2024 202,969 0.23 USD 200,000 Banco Mercantil del Norte SA/
Grand Cayman ‘144A’ FRN 27/9/2024 (Perpetual) 198,563 0.23
USD 200,000 Cydsa SAB de CV ‘144A’ 6.25% 4/10/2027 201,000 0.23
USD 200,000 Grupo Posadas SAB de CV ‘144A’ 7.875% 30/6/2022 200,000 0.23
USD 11,000 Petroleos Mexicanos 5.35% 12/2/2028 10,400 0.01
USD 200,000 Petroleos Mexicanos 6.375% 4/2/2021 206,100 0.23
USD 200,000 Petroleos Mexicanos 6.5% 13/3/2027 203,700 0.23
USD 200,000 Trust F/1401 6.95% 30/1/2044 232,687 0.26 1,455,419 1.65
Netherlands EUR 200,000 ABN AMRO Bank NV FRN
22/9/2027 (Perpetual) 231,531 0.26 USD 200,000 Argentum Netherlands BV for
Swiss Re Ltd FRN 15/8/2050 220,000 0.25 EUR 200,000 Cooperatieve Rabobank UA FRN
29/12/2025 (Perpetual) 244,229 0.28 EUR 100,000 Iberdrola International BV FRN
12/11/2024 (Perpetual) 122,586 0.14 USD 68,000 Petrobras Global Finance BV
5.299% 27/1/2025 73,525 0.08 USD 80,000 Petrobras Global Finance BV
7.25% 17/3/2044 94,900 0.11 EUR 200,000 Telefonica Europe BV FRN
22/6/2026 (Perpetual) 237,700 0.27 EUR 200,000 Volkswagen International Finance
NV FRN 14/6/2027 (Perpetual) 233,448 0.26 USD 250,000 Ziggo Bond Co BV ‘144A’ 5.875%
15/1/2025 259,688 0.29 1,717,607 1.94
Nigeria USD 200,000 Nigeria Government International
Bond 7.625% 21/11/2025 219,969 0.25
Panama USD 200,000 Promerica Financial Corp ‘144A’
9.7% 14/5/2024 214,002 0.24
Portugal EUR 100,000 EDP - Energias de Portugal SA
FRN 30/4/2079 123,442 0.14
Qatar USD 400,000 Qatar Government International
Bond ‘144A’ 4% 14/3/2029 458,313 0.52 USD 200,000 Qatar Government International
Bond 4.5% 23/4/2028 235,000 0.26 693,313 0.78
Russian Federation USD 200,000 Russian Foreign Bond - Eurobond
4.25% 23/6/2027 212,900 0.24
Saudi Arabia USD 225,000 Saudi Government International
Bond 4.5% 17/4/2030 263,363 0.30

Transferable Securities and Money Market Instruments Admitted to an Official Stock Exchange Listing or Dealt in on Another Regulated Market
Transferable Securities and Money Market Instruments Admitted to an Official Stock Exchange Listing or Dealt in on Another Regulated Market
Holding
Description
Market Value (USD)
% of Net
Assets
Holding
Description
Market Value (USD)
% of Net
Assets
The notes on pages 728 to 741 form an integral part of these financial statements.
[396] BlackRock Global Funds (BGF)
Global Bond Income Fund continued
Portfolio of Investments 31 August 2019
Singapore USD 200,000 Alam Synergy Pte Ltd 6.625%
24/4/2022 187,926 0.21 USD 200,000 Medco Straits Services Pte Ltd
8.5% 17/8/2022 212,125 0.24 400,051 0.45
Spain EUR 200,000 Banco Bilbao Vizcaya Argentaria
SA FRN 29/3/2024 (Perpetual) 233,190 0.26 USD 200,000 Banco Bilbao Vizcaya Argentaria
SA FRN 5/3/2025 (Perpetual) 202,500 0.23 EUR 100,000 Banco de Sabadell SA FRN
12/12/2028 121,426 0.14 EUR 200,000 CaixaBank SA FRN 13/6/2024
(Perpetual) 238,673 0.27 795,789 0.90
Switzerland USD 200,000 Credit Suisse Group AG ‘144A’
FRN 17/7/2023 (Perpetual) 214,757 0.24 USD 400,000 Credit Suisse Group AG ‘144A’
FRN 21/8/2026 (Perpetual) 413,500 0.47 USD 200,000 UBS Group Funding Switzerland
AG FRN 19/2/2025 (Perpetual) 219,188 0.25 847,445 0.96
Ukraine USD 100,000 Ukraine Government International
Bond 7.75% 1/9/2022 106,100 0.12
United Arab Emirates USD 200,000 Emirates NBD PJSC FRN
20/3/2025 (Perpetual) 211,500 0.24
United Kingdom USD 200,000 Barclays Plc FRN 15/3/2022
(Perpetual) 208,645 0.24 USD 200,000 HSBC Holdings Plc FRN
23/3/2023 (Perpetual) 203,893 0.23 USD 200,000 International Game Technology Plc
‘144A’ 6.25% 15/2/2022 212,000 0.24 USD 200,000 MARB BondCo Plc ‘144A’ 6.875%
19/1/2025 204,406 0.23 USD 200,000 Vedanta Resources Finance II Plc
8% 23/4/2023 196,250 0.22 1,025,194 1.16
United States USD 80,000 AbbVie Inc 3.6% 14/5/2025 83,578 0.09 USD 512,582 Ajax Mortgage Loan Trust 2018-G
‘Series 2018-G A’ ‘144A’ FRN 25/6/2057 530,471 0.60
USD 250,000 ALM VII R-2 Ltd ‘Series 2013-7R2A CR2’ ‘144A’ FRN 15/10/2027 243,066 0.28
USD 80,000 Altria Group Inc 4.4% 14/2/2026 87,895 0.10 USD 100,000 American Airlines 2011-1 Class B
4.87% 22/10/2023 100,000 0.11 USD 476,000 American Airlines Group Inc ‘144A’
5% 1/6/2022 494,445 0.56 USD 100,000 American Airlines Pass Through
Certificate 4% 15/12/2025 100,000 0.11 USD 80,000 American Express Co 3.4%
22/2/2024 84,358 0.10 USD 80,000 American Tower Corp 3.375%
15/5/2024 83,554 0.09
USD 148,000 Andeavor Logistics LP / Tesoro Logistics Finance Corp (Restricted) 5.25% 15/1/2025 155,712 0.18
USD 80,000 Anheuser-Busch InBev Worldwide Inc 4.75% 23/1/2029 93,613 0.11
USD 250,000 Antero Resources Corp 5.125% 1/12/2022 232,500 0.26
USD 120,000 Antero Resources Corp 5.375% 1/11/2021 116,700 0.13
USD 250,000 Arconic Inc 6.15% 15/8/2020 257,565 0.29 USD 108,000 Ashton Woods USA LLC / Ashton
Woods Finance Co ‘144A’ 9.875% 1/4/2027 118,260 0.13
USD 80,000 AT&T Inc 3.4% 15/5/2025 83,886 0.09 USD 35,000 AvalonBay Communities Inc 3.3%
1/6/2029 37,544 0.04 USD 15,000 Aviation Capital Group LLC ‘144A’
3.875% 1/5/2023 15,702 0.02 USD 80,000 Bank of America Corp 3.875%
1/8/2025 87,258 0.10 USD 570,000 BankAmerica Manufactured
Housing Contract Trust FRN 10/2/2022 445,628 0.50
USD 200,000 Bayer US Finance II LLC ‘144A’ 4.25% 15/12/2025 215,460 0.24
USD 559,085 Bayview Financial Revolving Asset Trust 2005-A ‘Series 2005-A A1’ ‘144A’ FRN 28/2/2040 535,500 0.61
USD 250,000 BBCMS 2017-DELC Mortgage Trust ‘Series 2017-DELC F’ ‘144A’ FRN 15/8/2036 251,140 0.28
USD 605,910 BCAP LLC 2012-RR3 Trust ‘Series 2012-RR3 1A5’ ‘144A’ FRN 26/12/2037 579,947 0.66
USD 250,000 Beazer Homes USA Inc 8.75% 15/3/2022 261,562 0.30
USD 21,000 Bruin E&P Partners LLC ‘144A’ 8.875% 1/8/2023 15,094 0.02
USD 406,062 BX Commercial Mortgage Trust 2018-IND ‘Series 2018-IND H’ ‘144A’ FRN 15/11/2035 407,864 0.46
USD 107,000 Caesars Entertainment Corp 5% 1/10/2024 180,994 0.20
USD 37,000 Capital One Financial Corp 3.9% 29/1/2024 39,258 0.04
USD 250,000 Carlyle US CLO 2016-4 Ltd ‘Series 2016-4A CR’ ‘144A’ FRN 20/10/2027 239,713 0.27
USD 250,000 CCO Holdings LLC / CCO Holdings Capital Corp ‘144A’ 4% 1/3/2023 254,350 0.29
USD 300,000 Cedar Funding VI CLO Ltd ‘Series 2016-6A DR’ ‘144A’ FRN 20/10/2028 292,908 0.33
USD 100,000 Celgene Corp (Restricted) 3.875% 15/8/2025 108,420 0.12
USD 195,000 Century Communities Inc ‘144A’ 6.75% 1/6/2027 207,187 0.23
USD 500,000 CFCRE Commercial Mortgage Trust 2016-C3 ‘Series 2016-C3 C’ FRN 10/1/2048 541,881 0.61
USD 80,000 Charter Communications Operating LLC / Charter Communications Operating Capital 4.908% 23/7/2025 88,326 0.10
USD 100,000 Charter Communications Operating LLC / Charter Communications Operating Capital 5.05% 30/3/2029 113,033 0.13
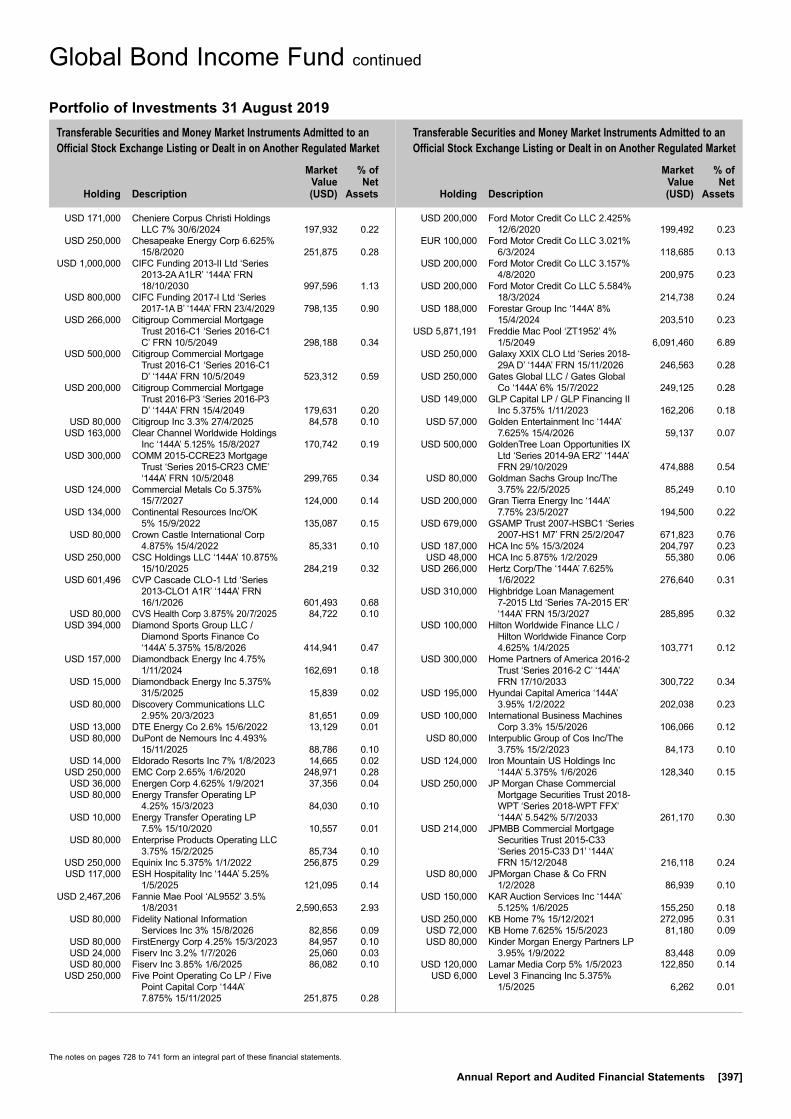
Transferable Securities and Money Market Instruments Admitted to an Official Stock Exchange Listing or Dealt in on Another Regulated Market
Transferable Securities and Money Market Instruments Admitted to an Official Stock Exchange Listing or Dealt in on Another Regulated Market
Holding
Description
Market Value (USD)
% of Net
Assets
Holding
Description
Market Value (USD)
% of Net
Assets
The notes on pages 728 to 741 form an integral part of these financial statements.
Annual Report and Audited Financial Statements [397]
Portfolio of Investments 31 August 2019
Global Bond Income Fund continued
USD 171,000 Cheniere Corpus Christi Holdings LLC 7% 30/6/2024 197,932 0.22
USD 250,000 Chesapeake Energy Corp 6.625% 15/8/2020 251,875 0.28
USD 1,000,000 CIFC Funding 2013-II Ltd ‘Series 2013-2A A1LR’ ‘144A’ FRN 18/10/2030 997,596 1.13
USD 800,000 CIFC Funding 2017-I Ltd ‘Series 2017-1A B’ ‘144A’ FRN 23/4/2029 798,135 0.90
USD 266,000 Citigroup Commercial Mortgage Trust 2016-C1 ‘Series 2016-C1 C’ FRN 10/5/2049 298,188 0.34
USD 500,000 Citigroup Commercial Mortgage Trust 2016-C1 ‘Series 2016-C1 D’ ‘144A’ FRN 10/5/2049 523,312 0.59
USD 200,000 Citigroup Commercial Mortgage Trust 2016-P3 ‘Series 2016-P3 D’ ‘144A’ FRN 15/4/2049 179,631 0.20
USD 80,000 Citigroup Inc 3.3% 27/4/2025 84,578 0.10 USD 163,000 Clear Channel Worldwide Holdings
Inc ‘144A’ 5.125% 15/8/2027 170,742 0.19 USD 300,000 COMM 2015-CCRE23 Mortgage
Trust ‘Series 2015-CR23 CME’ ‘144A’ FRN 10/5/2048 299,765 0.34
USD 124,000 Commercial Metals Co 5.375% 15/7/2027 124,000 0.14
USD 134,000 Continental Resources Inc/OK 5% 15/9/2022 135,087 0.15
USD 80,000 Crown Castle International Corp 4.875% 15/4/2022 85,331 0.10
USD 250,000 CSC Holdings LLC ‘144A’ 10.875% 15/10/2025 284,219 0.32
USD 601,496 CVP Cascade CLO-1 Ltd ‘Series 2013-CLO1 A1R’ ‘144A’ FRN 16/1/2026 601,493 0.68
USD 80,000 CVS Health Corp 3.875% 20/7/2025 84,722 0.10 USD 394,000 Diamond Sports Group LLC /
Diamond Sports Finance Co ‘144A’ 5.375% 15/8/2026 414,941 0.47
USD 157,000 Diamondback Energy Inc 4.75% 1/11/2024 162,691 0.18
USD 15,000 Diamondback Energy Inc 5.375% 31/5/2025 15,839 0.02
USD 80,000 Discovery Communications LLC 2.95% 20/3/2023 81,651 0.09
USD 13,000 DTE Energy Co 2.6% 15/6/2022 13,129 0.01 USD 80,000 DuPont de Nemours Inc 4.493%
15/11/2025 88,786 0.10 USD 14,000 Eldorado Resorts Inc 7% 1/8/2023 14,665 0.02 USD 250,000 EMC Corp 2.65% 1/6/2020 248,971 0.28 USD 36,000 Energen Corp 4.625% 1/9/2021 37,356 0.04 USD 80,000 Energy Transfer Operating LP
4.25% 15/3/2023 84,030 0.10 USD 10,000 Energy Transfer Operating LP
7.5% 15/10/2020 10,557 0.01 USD 80,000 Enterprise Products Operating LLC
3.75% 15/2/2025 85,734 0.10 USD 250,000 Equinix Inc 5.375% 1/1/2022 256,875 0.29 USD 117,000 ESH Hospitality Inc ‘144A’ 5.25%
1/5/2025 121,095 0.14 USD 2,467,206 Fannie Mae Pool ‘AL9552’ 3.5%
1/8/2031 2,590,653 2.93 USD 80,000 Fidelity National Information
Services Inc 3% 15/8/2026 82,856 0.09 USD 80,000 FirstEnergy Corp 4.25% 15/3/2023 84,957 0.10 USD 24,000 Fiserv Inc 3.2% 1/7/2026 25,060 0.03 USD 80,000 Fiserv Inc 3.85% 1/6/2025 86,082 0.10 USD 250,000 Five Point Operating Co LP / Five
Point Capital Corp ‘144A’ 7.875% 15/11/2025 251,875 0.28
USD 200,000 Ford Motor Credit Co LLC 2.425% 12/6/2020 199,492 0.23
EUR 100,000 Ford Motor Credit Co LLC 3.021% 6/3/2024 118,685 0.13
USD 200,000 Ford Motor Credit Co LLC 3.157% 4/8/2020 200,975 0.23
USD 200,000 Ford Motor Credit Co LLC 5.584% 18/3/2024 214,738 0.24
USD 188,000 Forestar Group Inc ‘144A’ 8% 15/4/2024 203,510 0.23
USD 5,871,191 Freddie Mac Pool ‘ZT1952’ 4% 1/5/2049 6,091,460 6.89
USD 250,000 Galaxy XXIX CLO Ltd ‘Series 2018-29A D’ ‘144A’ FRN 15/11/2026 246,563 0.28
USD 250,000 Gates Global LLC / Gates Global Co ‘144A’ 6% 15/7/2022 249,125 0.28
USD 149,000 GLP Capital LP / GLP Financing II Inc 5.375% 1/11/2023 162,206 0.18
USD 57,000 Golden Entertainment Inc ‘144A’ 7.625% 15/4/2026 59,137 0.07
USD 500,000 GoldenTree Loan Opportunities IX Ltd ‘Series 2014-9A ER2’ ‘144A’ FRN 29/10/2029 474,888 0.54
USD 80,000 Goldman Sachs Group Inc/The 3.75% 22/5/2025 85,249 0.10
USD 200,000 Gran Tierra Energy Inc ‘144A’ 7.75% 23/5/2027 194,500 0.22
USD 679,000 GSAMP Trust 2007-HSBC1 ‘Series 2007-HS1 M7’ FRN 25/2/2047 671,823 0.76
USD 187,000 HCA Inc 5% 15/3/2024 204,797 0.23 USD 48,000 HCA Inc 5.875% 1/2/2029 55,380 0.06 USD 266,000 Hertz Corp/The ‘144A’ 7.625%
1/6/2022 276,640 0.31 USD 310,000 Highbridge Loan Management
7-2015 Ltd ‘Series 7A-2015 ER’ ‘144A’ FRN 15/3/2027 285,895 0.32
USD 100,000 Hilton Worldwide Finance LLC / Hilton Worldwide Finance Corp 4.625% 1/4/2025 103,771 0.12
USD 300,000 Home Partners of America 2016-2 Trust ‘Series 2016-2 C’ ‘144A’ FRN 17/10/2033 300,722 0.34
USD 195,000 Hyundai Capital America ‘144A’ 3.95% 1/2/2022 202,038 0.23
USD 100,000 International Business Machines Corp 3.3% 15/5/2026 106,066 0.12
USD 80,000 Interpublic Group of Cos Inc/The 3.75% 15/2/2023 84,173 0.10
USD 124,000 Iron Mountain US Holdings Inc ‘144A’ 5.375% 1/6/2026 128,340 0.15
USD 250,000 JP Morgan Chase Commercial Mortgage Securities Trust 2018-WPT ‘Series 2018-WPT FFX’ ‘144A’ 5.542% 5/7/2033 261,170 0.30
USD 214,000 JPMBB Commercial Mortgage Securities Trust 2015-C33 ‘Series 2015-C33 D1’ ‘144A’ FRN 15/12/2048 216,118 0.24
USD 80,000 JPMorgan Chase & Co FRN 1/2/2028 86,939 0.10
USD 150,000 KAR Auction Services Inc ‘144A’ 5.125% 1/6/2025 155,250 0.18
USD 250,000 KB Home 7% 15/12/2021 272,095 0.31 USD 72,000 KB Home 7.625% 15/5/2023 81,180 0.09 USD 80,000 Kinder Morgan Energy Partners LP
3.95% 1/9/2022 83,448 0.09 USD 120,000 Lamar Media Corp 5% 1/5/2023 122,850 0.14 USD 6,000 Level 3 Financing Inc 5.375%
1/5/2025 6,262 0.01
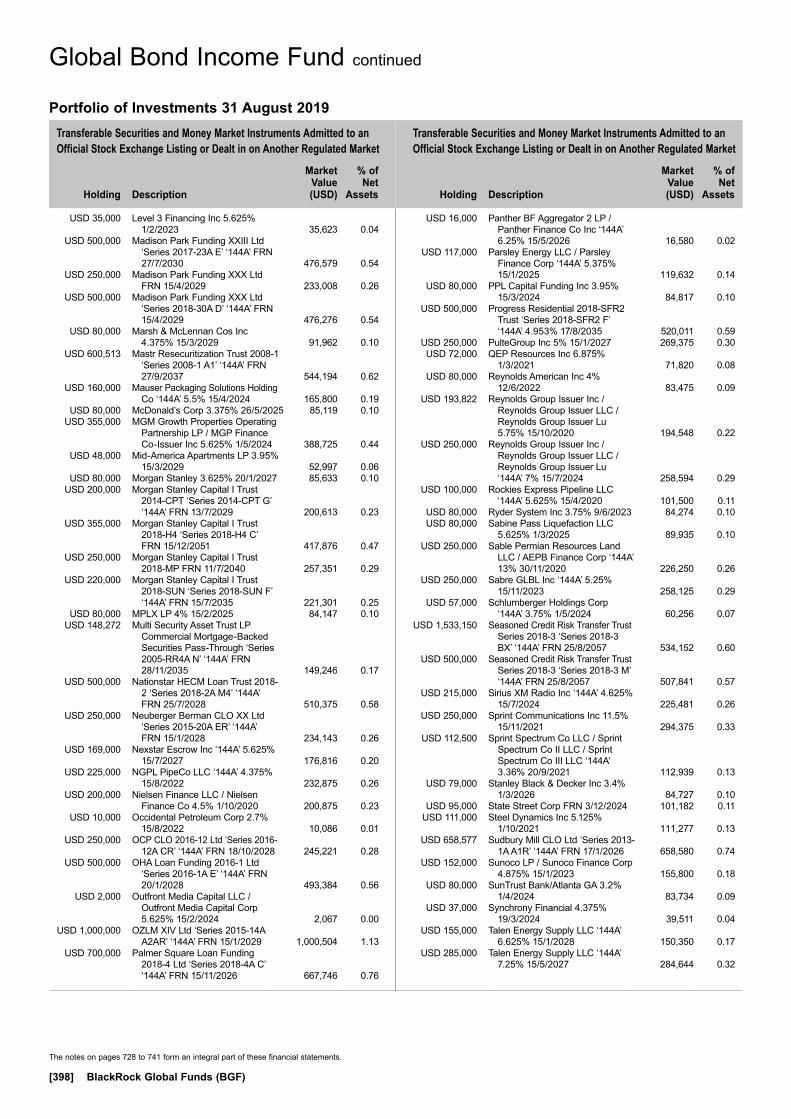
Transferable Securities and Money Market Instruments Admitted to an Official Stock Exchange Listing or Dealt in on Another Regulated Market
Transferable Securities and Money Market Instruments Admitted to an Official Stock Exchange Listing or Dealt in on Another Regulated Market
Holding
Description
Market Value (USD)
% of Net
Assets
Holding
Description
Market Value (USD)
% of Net
Assets
The notes on pages 728 to 741 form an integral part of these financial statements.
[398] BlackRock Global Funds (BGF)
USD 35,000 Level 3 Financing Inc 5.625% 1/2/2023 35,623 0.04
USD 500,000 Madison Park Funding XXIII Ltd ‘Series 2017-23A E’ ‘144A’ FRN 27/7/2030 476,579 0.54
USD 250,000 Madison Park Funding XXX Ltd FRN 15/4/2029 233,008 0.26
USD 500,000 Madison Park Funding XXX Ltd ‘Series 2018-30A D’ ‘144A’ FRN 15/4/2029 476,276 0.54
USD 80,000 Marsh & McLennan Cos Inc 4.375% 15/3/2029 91,962 0.10
USD 600,513 Mastr Resecuritization Trust 2008-1 ‘Series 2008-1 A1’ ‘144A’ FRN 27/9/2037 544,194 0.62
USD 160,000 Mauser Packaging Solutions Holding Co ‘144A’ 5.5% 15/4/2024 165,800 0.19
USD 80,000 McDonald’s Corp 3.375% 26/5/2025 85,119 0.10 USD 355,000 MGM Growth Properties Operating
Partnership LP / MGP Finance Co-Issuer Inc 5.625% 1/5/2024 388,725 0.44
USD 48,000 Mid-America Apartments LP 3.95% 15/3/2029 52,997 0.06
USD 80,000 Morgan Stanley 3.625% 20/1/2027 85,633 0.10 USD 200,000 Morgan Stanley Capital I Trust
2014-CPT ‘Series 2014-CPT G’ ‘144A’ FRN 13/7/2029 200,613 0.23
USD 355,000 Morgan Stanley Capital I Trust 2018-H4 ‘Series 2018-H4 C’ FRN 15/12/2051 417,876 0.47
USD 250,000 Morgan Stanley Capital I Trust 2018-MP FRN 11/7/2040 257,351 0.29
USD 220,000 Morgan Stanley Capital I Trust 2018-SUN ‘Series 2018-SUN F’ ‘144A’ FRN 15/7/2035 221,301 0.25
USD 80,000 MPLX LP 4% 15/2/2025 84,147 0.10 USD 148,272 Multi Security Asset Trust LP
Commercial Mortgage-Backed Securities Pass-Through ‘Series 2005-RR4A N’ ‘144A’ FRN 28/11/2035 149,246 0.17
USD 500,000 Nationstar HECM Loan Trust 2018-2 ‘Series 2018-2A M4’ ‘144A’ FRN 25/7/2028 510,375 0.58
USD 250,000 Neuberger Berman CLO XX Ltd ‘Series 2015-20A ER’ ‘144A’ FRN 15/1/2028 234,143 0.26
USD 169,000 Nexstar Escrow Inc ‘144A’ 5.625% 15/7/2027 176,816 0.20
USD 225,000 NGPL PipeCo LLC ‘144A’ 4.375% 15/8/2022 232,875 0.26
USD 200,000 Nielsen Finance LLC / Nielsen Finance Co 4.5% 1/10/2020 200,875 0.23
USD 10,000 Occidental Petroleum Corp 2.7% 15/8/2022 10,086 0.01
USD 250,000 OCP CLO 2016-12 Ltd ‘Series 2016-12A CR’ ‘144A’ FRN 18/10/2028 245,221 0.28
USD 500,000 OHA Loan Funding 2016-1 Ltd ‘Series 2016-1A E’ ‘144A’ FRN 20/1/2028 493,384 0.56
USD 2,000 Outfront Media Capital LLC / Outfront Media Capital Corp 5.625% 15/2/2024 2,067 0.00
USD 1,000,000 OZLM XIV Ltd ‘Series 2015-14A A2AR’ ‘144A’ FRN 15/1/2029 1,000,504 1.13
USD 700,000 Palmer Square Loan Funding 2018-4 Ltd ‘Series 2018-4A C’ ‘144A’ FRN 15/11/2026 667,746 0.76
USD 16,000 Panther BF Aggregator 2 LP / Panther Finance Co Inc ‘144A’ 6.25% 15/5/2026 16,580 0.02
USD 117,000 Parsley Energy LLC / Parsley Finance Corp ‘144A’ 5.375% 15/1/2025 119,632 0.14
USD 80,000 PPL Capital Funding Inc 3.95% 15/3/2024 84,817 0.10
USD 500,000 Progress Residential 2018-SFR2 Trust ‘Series 2018-SFR2 F’ ‘144A’ 4.953% 17/8/2035 520,011 0.59
USD 250,000 PulteGroup Inc 5% 15/1/2027 269,375 0.30 USD 72,000 QEP Resources Inc 6.875%
1/3/2021 71,820 0.08 USD 80,000 Reynolds American Inc 4%
12/6/2022 83,475 0.09 USD 193,822 Reynolds Group Issuer Inc /
Reynolds Group Issuer LLC / Reynolds Group Issuer Lu 5.75% 15/10/2020 194,548 0.22
USD 250,000 Reynolds Group Issuer Inc / Reynolds Group Issuer LLC / Reynolds Group Issuer Lu ‘144A’ 7% 15/7/2024 258,594 0.29
USD 100,000 Rockies Express Pipeline LLC ‘144A’ 5.625% 15/4/2020 101,500 0.11
USD 80,000 Ryder System Inc 3.75% 9/6/2023 84,274 0.10 USD 80,000 Sabine Pass Liquefaction LLC
5.625% 1/3/2025 89,935 0.10 USD 250,000 Sable Permian Resources Land
LLC / AEPB Finance Corp ‘144A’ 13% 30/11/2020 226,250 0.26
USD 250,000 Sabre GLBL Inc ‘144A’ 5.25% 15/11/2023 258,125 0.29
USD 57,000 Schlumberger Holdings Corp ‘144A’ 3.75% 1/5/2024 60,256 0.07
USD 1,533,150 Seasoned Credit Risk Transfer Trust Series 2018-3 ‘Series 2018-3 BX’ ‘144A’ FRN 25/8/2057 534,152 0.60
USD 500,000 Seasoned Credit Risk Transfer Trust Series 2018-3 ‘Series 2018-3 M’ ‘144A’ FRN 25/8/2057 507,841 0.57
USD 215,000 Sirius XM Radio Inc ‘144A’ 4.625% 15/7/2024 225,481 0.26
USD 250,000 Sprint Communications Inc 11.5% 15/11/2021 294,375 0.33
USD 112,500 Sprint Spectrum Co LLC / Sprint Spectrum Co II LLC / Sprint Spectrum Co III LLC ‘144A’ 3.36% 20/9/2021 112,939 0.13
USD 79,000 Stanley Black & Decker Inc 3.4% 1/3/2026 84,727 0.10
USD 95,000 State Street Corp FRN 3/12/2024 101,182 0.11 USD 111,000 Steel Dynamics Inc 5.125%
1/10/2021 111,277 0.13 USD 658,577 Sudbury Mill CLO Ltd ‘Series 2013-
1A A1R’ ‘144A’ FRN 17/1/2026 658,580 0.74 USD 152,000 Sunoco LP / Sunoco Finance Corp
4.875% 15/1/2023 155,800 0.18 USD 80,000 SunTrust Bank/Atlanta GA 3.2%
1/4/2024 83,734 0.09 USD 37,000 Synchrony Financial 4.375%
19/3/2024 39,511 0.04 USD 155,000 Talen Energy Supply LLC ‘144A’
6.625% 15/1/2028 150,350 0.17 USD 285,000 Talen Energy Supply LLC ‘144A’
7.25% 15/5/2027 284,644 0.32
Global Bond Income Fund continued
Portfolio of Investments 31 August 2019
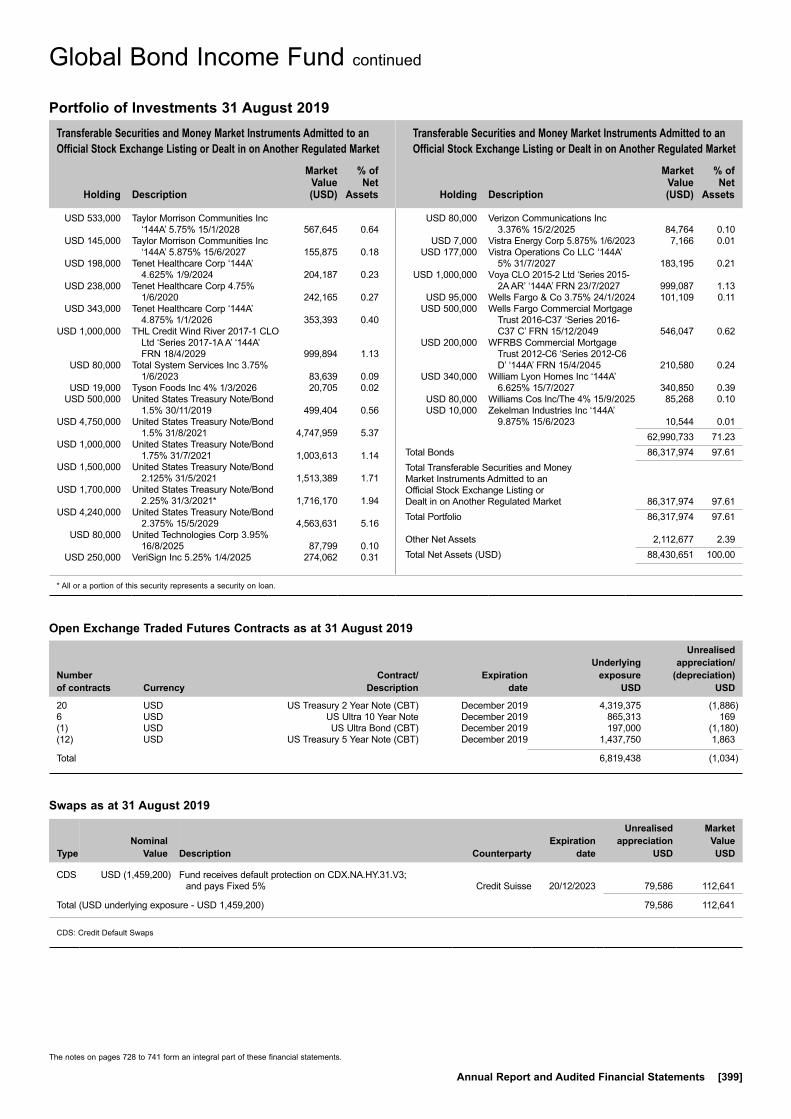
Transferable Securities and Money Market Instruments Admitted to an Official Stock Exchange Listing or Dealt in on Another Regulated Market
Transferable Securities and Money Market Instruments Admitted to an Official Stock Exchange Listing or Dealt in on Another Regulated Market
Holding
Description
Market Value (USD)
% of Net
Assets
Holding
Description
Market Value (USD)
% of Net
Assets
* All or a portion of this security represents a security on loan.
The notes on pages 728 to 741 form an integral part of these financial statements.
Annual Report and Audited Financial Statements [399]
Portfolio of Investments 31 August 2019
Global Bond Income Fund continued
USD 533,000 Taylor Morrison Communities Inc ‘144A’ 5.75% 15/1/2028 567,645 0.64
USD 145,000 Taylor Morrison Communities Inc ‘144A’ 5.875% 15/6/2027 155,875 0.18
USD 198,000 Tenet Healthcare Corp ‘144A’ 4.625% 1/9/2024 204,187 0.23
USD 238,000 Tenet Healthcare Corp 4.75% 1/6/2020 242,165 0.27
USD 343,000 Tenet Healthcare Corp ‘144A’ 4.875% 1/1/2026 353,393 0.40
USD 1,000,000 THL Credit Wind River 2017-1 CLO Ltd ‘Series 2017-1A A’ ‘144A’ FRN 18/4/2029 999,894 1.13
USD 80,000 Total System Services Inc 3.75% 1/6/2023 83,639 0.09
USD 19,000 Tyson Foods Inc 4% 1/3/2026 20,705 0.02 USD 500,000 United States Treasury Note/Bond
1.5% 30/11/2019 499,404 0.56 USD 4,750,000 United States Treasury Note/Bond
1.5% 31/8/2021 4,747,959 5.37 USD 1,000,000 United States Treasury Note/Bond
1.75% 31/7/2021 1,003,613 1.14 USD 1,500,000 United States Treasury Note/Bond
2.125% 31/5/2021 1,513,389 1.71 USD 1,700,000 United States Treasury Note/Bond
2.25% 31/3/2021* 1,716,170 1.94 USD 4,240,000 United States Treasury Note/Bond
2.375% 15/5/2029 4,563,631 5.16 USD 80,000 United Technologies Corp 3.95%
16/8/2025 87,799 0.10 USD 250,000 VeriSign Inc 5.25% 1/4/2025 274,062 0.31
USD 80,000 Verizon Communications Inc 3.376% 15/2/2025 84,764 0.10
USD 7,000 Vistra Energy Corp 5.875% 1/6/2023 7,166 0.01 USD 177,000 Vistra Operations Co LLC ‘144A’
5% 31/7/2027 183,195 0.21 USD 1,000,000 Voya CLO 2015-2 Ltd ‘Series 2015-
2A AR’ ‘144A’ FRN 23/7/2027 999,087 1.13 USD 95,000 Wells Fargo & Co 3.75% 24/1/2024 101,109 0.11 USD 500,000 Wells Fargo Commercial Mortgage
Trust 2016-C37 ‘Series 2016-C37 C’ FRN 15/12/2049 546,047 0.62
USD 200,000 WFRBS Commercial Mortgage Trust 2012-C6 ‘Series 2012-C6 D’ ‘144A’ FRN 15/4/2045 210,580 0.24
USD 340,000 William Lyon Homes Inc ‘144A’ 6.625% 15/7/2027 340,850 0.39
USD 80,000 Williams Cos Inc/The 4% 15/9/2025 85,268 0.10 USD 10,000 Zekelman Industries Inc ‘144A’
9.875% 15/6/2023 10,544 0.01 62,990,733 71.23Total Bonds 86,317,974 97.61Total Transferable Securities and Money Market Instruments Admitted to an Official Stock Exchange Listing or Dealt in on Another Regulated Market 86,317,974 97.61Total Portfolio 86,317,974 97.61
Other Net Assets 2,112,677 2.39Total Net Assets (USD) 88,430,651 100.00
Open Exchange Traded Futures Contracts as at 31 August 2019
Number of contracts Currency
Contract/ Description
Expiration date
Underlying exposure
USD
Unrealised appreciation/
(depreciation) USD
20 USD US Treasury 2 Year Note (CBT) December 2019 4,319,375 (1,886)6 USD US Ultra 10 Year Note December 2019 865,313 169(1) USD US Ultra Bond (CBT) December 2019 197,000 (1,180)(12) USD US Treasury 5 Year Note (CBT) December 2019 1,437,750 1,863
Total 6,819,438 (1,034)
Swaps as at 31 August 2019
TypeNominal
Value Description Counterparty
Expiration date
Unrealised appreciation
USD
Market Value USD
CDS USD (1,459,200) Fund receives default protection on CDX.NA.HY.31.V3; and pays Fixed 5% Credit Suisse 20/12/2023 79,586 112,641
Total (USD underlying exposure - USD 1,459,200) 79,586 112,641
CDS: Credit Default Swaps

The notes on pages 728 to 741 form an integral part of these financial statements.
[400] BlackRock Global Funds (BGF)
Global Bond Income Fund continued
Open Forward Foreign Exchange Contracts as at 31 August 2019
Currency
Purchases Currency
Sales Counterparty
Maturity date
Unrealised appreciation/
(depreciation) USD
USD 3,813,739 EUR 3,412,000 BNP Paribas 5/9/2019 44,156Net unrealised appreciation 44,156
AUD Hedged Share Class
AUD 7,293 USD 4,970 BNY Mellon 12/9/2019 (55)Net unrealised depreciation (55)
BRL Hedged Share Class
BRL 11,646,529 USD 2,803,866 BNY Mellon 12/9/2019 3,959Net unrealised appreciation 3,959
CAD Hedged Share Class
CAD 6,836 USD 5,173 BNY Mellon 12/9/2019 (18)Net unrealised depreciation (18)
CHF Hedged Share Class
CHF 531,552 USD 547,644 BNY Mellon 12/9/2019 (9,006)Net unrealised depreciation (9,006)
CNH Hedged Share Class
CNY 35,159 USD 4,961 BNY Mellon 12/9/2019 (45)Net unrealised depreciation (45)
EUR Hedged Share Class
EUR 1,324,320 USD 1,487,174 BNY Mellon 12/9/2019 (23,252)Net unrealised depreciation (23,252)
GBP Hedged Share Class
GBP 7,887 USD 9,548 BNY Mellon 12/9/2019 90Net unrealised appreciation 90
HKD Hedged Share Class
HKD 40,044 USD 5,111 BNY Mellon 12/9/2019 (3)Net unrealised depreciation (3)
NZD Hedged Share Class
NZD 7,723 USD 5,016 BNY Mellon 12/9/2019 (135)Net unrealised depreciation (135)
SGD Hedged Share Class
SGD 23,440 USD 16,941 BNY Mellon 12/9/2019 (37)USD 3,786 SGD 5,260 BNY Mellon 12/9/2019 (6)Net unrealised depreciation (43)
Total net unrealised appreciation (USD underlying exposure - USD 8,635,024) 15,648
Open Forward Foreign Exchange Contracts as at 31 August 2019
Currency
Purchases Currency
Sales Counterparty
Maturity date
Unrealised appreciation/
(depreciation) USD

Transferable Securities and Money Market Instruments Admitted to an Official Stock Exchange Listing or Dealt in on Another Regulated Market
Transferable Securities and Money Market Instruments Admitted to an Official Stock Exchange Listing or Dealt in on Another Regulated Market
Holding
Description
Market Value (EUR)
% of Net
Assets
Holding
Description
Market Value (EUR)
% of Net
Assets
~ Investment in connected party fund, see further information in Note 11.* All or a portion of this security represents a security on loan.
The notes on pages 728 to 741 form an integral part of these financial statements.
Annual Report and Audited Financial Statements [401]
FUNDS
Ireland 112,715 iShares Core S&P 500 UCITS ETF
USD Dist~ 2,992,809 1.29 10,243 iShares EUR High Yield Corp Bond
UCITS ETF~ 1,086,577 0.47 20,496 iShares USD Corp Bond
UCITS ETF~ 2,297,192 0.99 170,263 iShares USD High Yield Corp Bond
UCITS ETF~ 15,991,101 6.88Total Funds 22,367,679 9.63
COMMON / PREFERRED STOCKS (SHARES)
Bermuda 2,805 Hiscox Ltd 48,295 0.02
Denmark 3,492 DSV A/S 314,156 0.14 7,501 Novo Nordisk A/S 353,810 0.15 667,966 0.29
Finland 3,941 Kone Oyj ‘B’ 207,533 0.09 12,036 Sampo Oyj ‘A’ 435,101 0.19 642,634 0.28
France 16,413 Bouygues SA 569,039 0.24 33,914 Engie SA 469,200 0.20 759 LVMH Moet Hennessy
Louis Vuitton SE 276,238 0.12 2,065 Safran SA 272,270 0.12 6,860 Sanofi 537,275 0.23 14,863 SCOR SE 538,189 0.23 1,448 Thales SA 152,402 0.07 7,596 TOTAL SA* 345,276 0.15 5,169 Vinci SA 513,489 0.22 3,673,378 1.58
Germany 2,643 Allianz SE 529,789 0.23 2,133 Deutsche Boerse AG 286,462 0.12 4,688 LEG Immobilien AG 504,898 0.22 1,077 Muenchener Rueckversicherungs-
Gesellschaft AG in Muenchen 233,924 0.10 1,555,073 0.67
Italy 16,618 FinecoBank Banca Fineco SpA* 158,004 0.07 77,862 Telecom Italia SpA/Milano 37,654 0.01 195,658 0.08
Netherlands 1,463 ASML Holding NV 295,965 0.13 2,377 Koninklijke DSM NV 268,957 0.11 564,922 0.24
Spain 11,104 Cia de Distribucion Integral
Logista Holdings SA 199,095 0.09 46,972 Iberdrola SA 441,255 0.19 640,350 0.28
Sweden 5,215 Loomis AB ‘B’ 159,091 0.07 41,367 Tele2 AB 527,342 0.23 82,635 Telia Co AB 327,502 0.14 18,881 Volvo AB 237,034 0.10 1,250,969 0.54
Switzerland 1,558 Cembra Money Bank AG 144,088 0.06 737 Lonza Group AG* 236,498 0.10 3,352 Nestle SA 341,707 0.15 1,050 Roche Holding AG 260,426 0.11 2,052 Sika AG 268,109 0.12 1,674 Zurich Insurance Group AG 541,470 0.23 1,792,298 0.77
United Kingdom 22,167 Barratt Developments Plc* 155,359 0.07 29,325 GlaxoSmithKline Plc 555,420 0.24 2,567 International Game Technology Plc 28,258 0.01 37,120 Phoenix Group Holdings Plc 265,207 0.11 10,805 Prudential Plc 163,630 0.07 11,454 RELX Plc 250,322 0.11 157,668 Taylor Wimpey Plc 252,545 0.11 3,646 Unilever Plc 209,489 0.09 203,052 Vodafone Group Plc 348,209 0.15 2,228,439 0.96
United States 5,000 Allstate Corp/The (Pref) 118,365 0.05 7,000 Morgan Stanley (Pref) 171,352 0.08 2,000 US Bancorp (Pref) 49,917 0.02 339,634 0.15Total Common / Preferred Stocks (Shares) 13,599,616 5.86
COMMERCIAL PAPER
Canada USD 300,000 Bell Canada Inc 4/9/2019
(Zero Coupon) 271,476 0.12
United States USD 300,000 Boston Scientific Corp 9/9/2019
(Zero Coupon) 271,396 0.12 USD 300,000 VW Credit Inc 4/11/2019
(Zero Coupon) 270,409 0.11 541,805 0.23Total Commercial Paper 813,281 0.35
BONDS
Australia USD 250,000 Australia & New Zealand Banking
Group Ltd/New York NY 2.55% 23/11/2021 229,171 0.10
USD 200,000 Australia & New Zealand Banking Group Ltd/United Kingdom ‘144A’ FRN 15/6/2026 (Perpetual) 200,222 0.08
USD 25,000 BHP Billiton Finance USA Ltd 5% 30/9/2043 29,827 0.01
USD 80,000 Commonwealth Bank of Australia ‘144A’ 2.5% 18/9/2022 73,451 0.03
USD 200,000 Commonwealth Bank of Australia ‘144A’ 2.75% 10/3/2022 184,724 0.08
Global Conservative Income Fund(2)
Portfolio of Investments 31 August 2019
Global Conservative Income Fund(2)
(2) Fund launched during the year, see Note 1, for further details.

Transferable Securities and Money Market Instruments Admitted to an Official Stock Exchange Listing or Dealt in on Another Regulated Market
Transferable Securities and Money Market Instruments Admitted to an Official Stock Exchange Listing or Dealt in on Another Regulated Market
Holding
Description
Market Value (EUR)
% of Net
Assets
Holding
Description
Market Value (EUR)
% of Net
Assets
The notes on pages 728 to 741 form an integral part of these financial statements.
[402] BlackRock Global Funds (BGF)
USD 375,000 Macquarie Bank Ltd/London ‘144A’ FRN 8/3/2027 (Perpetual) 342,121 0.15
USD 500,000 National Australia Bank Ltd/New York 2.625% 14/1/2021 456,801 0.20
USD 250,000 Westpac Banking Corp 2.6% 23/11/2020 227,998 0.10
USD 500,000 Westpac Banking Corp/New Zealand FRN 21/9/2027 (Perpetual) 441,376 0.19
2,185,691 0.94
Austria EUR 200,000 Erste Group Bank AG FRN
15/10/2021 (Perpetual) 230,442 0.10 EUR 100,000 Sappi Papier Holding GmbH 4%
1/4/2023 102,578 0.04 333,020 0.14
Belgium EUR 100,000 House of Finance NV/The 4.375%
15/7/2026 103,824 0.05
Canada USD 40,798 Air Canada 2017-1 Class AA Pass
Through Trust ‘144A’ 3.3% 15/1/2030 38,667 0.02
USD 100,000 Alimentation Couche-Tard Inc ‘144A’ 2.7% 26/7/2022 91,515 0.04
USD 110,000 Bank of Nova Scotia/The 2.7% 7/3/2022 101,411 0.04
USD 25,000 Barrick Gold Corp 5.25% 1/4/2042 28,223 0.01 EUR 300,000 Bausch Health Cos Inc 4.5%
15/5/2023 304,668 0.13 USD 190,000 Canadian Natural Resources Ltd
3.85% 1/6/2027 182,534 0.08 USD 80,000 Cenovus Energy Inc 3% 15/8/2022 72,904 0.03 USD 55,000 Cenovus Energy Inc 4.25%
15/4/2027 51,920 0.02 USD 29,000 Cenovus Energy Inc 5.4%
15/6/2047 29,713 0.01 USD 325,000 Emera Inc FRN 15/6/2076 320,407 0.14 USD 400,000 Enbridge Inc FRN 15/1/2077 379,667 0.16 USD 225,000 Enbridge Inc FRN 1/3/2078 212,654 0.09 USD 100,000 Enbridge Inc 2.9% 15/7/2022 92,249 0.04 USD 40,000 Enbridge Inc 3.5% 10/6/2024 37,875 0.02 USD 120,000 Enbridge Inc 3.7% 15/7/2027 115,988 0.05 USD 80,000 Enbridge Inc 4.5% 10/6/2044 79,656 0.04 USD 225,000 Encana Corp 3.9% 15/11/2021 208,714 0.09 USD 25,000 Encana Corp 6.5% 1/2/2038 27,457 0.01 GBP 115,000 Entertainment One Ltd 4.625%
15/7/2026 139,004 0.06 USD 210,000 TransCanada PipeLines Ltd 2.5%
1/8/2022 191,694 0.08 USD 35,000 TransCanada PipeLines Ltd
4.875% 15/5/2048 37,678 0.02 USD 600,000 Transcanada Trust FRN 15/8/2076 573,868 0.25 3,318,466 1.43
Cayman Islands USD 200,000 Baidu Inc 3% 30/6/2020 182,009 0.08 GBP 49,641 Punch Taverns Finance B Ltd
7.369% 30/9/2021 58,928 0.03 USD 200,000 Tencent Holdings Ltd ‘144A’
3.975% 11/4/2029 196,160 0.08 EUR 100,000 UPCB Finance VII Ltd 3.625%
15/6/2029 106,993 0.05 USD 50,000 Vale Overseas Ltd 6.25%
10/8/2026 52,124 0.02 596,214 0.26
Czech Republic EUR 200,000 Residomo SRO 3.375%
15/10/2024 208,966 0.09
Denmark USD 200,000 Danske Bank A/S FRN
26/6/2025 (Perpetual) 188,471 0.08 USD 200,000 Danske Bank A/S ‘144A’ 5%
12/1/2022 190,872 0.08 EUR 100,000 DKT Finance ApS 7% 17/6/2023 107,887 0.05 USD 200,000 DKT Finance ApS ‘144A’ 9.375%
17/6/2023 195,006 0.09 GBP 150,000 TDC A/S 6.875% 23/2/2023 190,200 0.08 872,436 0.38
Finland USD 200,000 Nordea Bank Abp ‘144A’ FRN
26/3/2026 (Perpetual) 193,206 0.08
France EUR 300,000 Altice France SA/France 5.875%
1/2/2027 332,448 0.14 USD 200,000 BNP Paribas SA ‘144A’ FRN
19/8/2025 (Perpetual) 200,901 0.09 USD 400,000 BNP Paribas SA ‘144A’ 3.375%
9/1/2025 375,288 0.16 USD 250,000 BNP Paribas SA 5% 15/1/2021 235,005 0.10 EUR 100,000 Caisse Nationale de Reassurance
Mutuelle Agricole Groupama FRN 28/5/2024 (Perpetual) 118,731 0.05
EUR 200,000 CMA CGM SA 6.5% 15/7/2022 172,605 0.07 EUR 100,000 Credit Agricole Assurances SA
FRN 14/10/2025 (Perpetual) 114,739 0.05 EUR 100,000 Credit Agricole SA FRN 23/6/2021
(Perpetual) 108,250 0.05 USD 450,000 Credit Agricole SA ‘144A’ FRN
23/12/2025 (Perpetual) 475,516 0.20 EUR 100,000 Crown European Holdings SA
‘144A’ 2.25% 1/2/2023 106,662 0.05 EUR 100,000 Crown European Holdings SA
3.375% 15/5/2025 111,921 0.05 EUR 100,000 Electricite de France SA FRN
4/7/2024 (Perpetual) 109,802 0.05 GBP 200,000 Electricite de France SA FRN
29/1/2026 (Perpetual) 244,518 0.10 EUR 100,000 Europcar Mobility Group 4%
30/4/2026 104,131 0.04 EUR 168,000 Loxam SAS 3.25% 14/1/2025 176,820 0.08 EUR 100,000 Loxam SAS 3.5% 3/5/2023 102,511 0.04 EUR 100,000 Loxam SAS 3.75% 15/7/2026 105,500 0.05 EUR 100,000 Orano SA 3.375% 23/4/2026 108,824 0.05 EUR 86,019 Parts Europe SA FRN 1/5/2022 86,495 0.04 EUR 100,000 Parts Europe SA FRN 1/5/2022 100,154 0.04 USD 200,000 Societe Generale SA ‘144A’ FRN
13/9/2021 (Perpetual) 190,562 0.08 USD 200,000 Societe Generale SA ‘144A’ FRN
29/9/2025 (Perpetual) 202,259 0.09 EUR 100,000 Solvay Finance SA FRN 3/6/2024
(Perpetual) 119,219 0.05 4,002,861 1.72
Germany EUR 100,000 ADLER Real Estate AG 1.875%
27/4/2023 103,689 0.04 EUR 100,000 ADLER Real Estate AG 2.125%
6/2/2024 104,873 0.05 EUR 100,000 ADLER Real Estate AG 3%
27/4/2026 107,689 0.05
Global Conservative Income Fund(2) continued
Portfolio of Investments 31 August 2019
(2) Fund launched during the year, see Note 1, for further details.

Transferable Securities and Money Market Instruments Admitted to an Official Stock Exchange Listing or Dealt in on Another Regulated Market
Transferable Securities and Money Market Instruments Admitted to an Official Stock Exchange Listing or Dealt in on Another Regulated Market
Holding
Description
Market Value (EUR)
% of Net
Assets
Holding
Description
Market Value (EUR)
% of Net
Assets
The notes on pages 728 to 741 form an integral part of these financial statements.
Annual Report and Audited Financial Statements [403]
EUR 100,000 Consus Real Estate AG 9.625% 15/5/2024 96,089 0.04
USD 125,000 Deutsche Bank AG/New York NY 2.7% 13/7/2020 112,879 0.05
USD 195,000 Deutsche Bank AG/New York NY 4.25% 4/2/2021 178,510 0.08
EUR 113,000 IHO Verwaltungs GmbH 3.625% 15/5/2025 115,614 0.05
EUR 101,000 IHO Verwaltungs GmbH 3.875% 15/5/2027 101,276 0.04
EUR 100,000 Nidda BondCo GmbH 5% 30/9/2025 102,623 0.04 EUR 200,000 Nidda BondCo GmbH 7.25%
30/9/2025 214,012 0.09 EUR 100,000 Platin 1426 GmbH 5.375%
15/6/2023 98,812 0.04 EUR 100,000 RWE AG FRN 21/4/2075 102,173 0.04 EUR 100,000 RWE AG FRN 21/4/2075 108,135 0.05 EUR 100,000 Techem Verwaltungsgesellschaft
674 mbH 6% 30/7/2026 108,858 0.05 EUR 245,000 thyssenkrupp AG 2.875% 22/2/2024 253,419 0.11 EUR 300,000 Unitymedia GmbH 3.75% 15/1/2027 320,814 0.14 EUR 90,000 Unitymedia Hessen GmbH & Co
KG / Unitymedia NRW GmbH 6.25% 15/1/2029 100,488 0.04
2,329,953 1.00
Guernsey USD 250,000 Credit Suisse Group Funding
Guernsey Ltd 3.8% 15/9/2022 235,878 0.10 USD 600,000 Credit Suisse Group Funding
Guernsey Ltd 3.8% 9/6/2023 569,982 0.25 805,860 0.35
Ireland USD 150,000 AerCap Ireland Capital DAC /
AerCap Global Aviation Trust 3.65% 21/7/2027 139,290 0.06
USD 550,000 AerCap Ireland Capital DAC / AerCap Global Aviation Trust 4.5% 15/5/2021 513,591 0.22
USD 150,000 AerCap Ireland Capital DAC / AerCap Global Aviation Trust 4.875% 16/1/2024 147,451 0.06
EUR 200,000 Allied Irish Banks Plc FRN 3/12/2020 (Perpetual) 213,930 0.09
EUR 100,000 Allied Irish Banks Plc FRN 26/11/2025 104,315 0.05
GBP 100,000 Ardagh Packaging Finance Plc / Ardagh Holdings USA Inc 4.75% 15/7/2027 112,504 0.05
EUR 200,000 Ardagh Packaging Finance Plc / Ardagh Holdings USA Inc 6.75% 15/5/2024 211,918 0.09
EUR 100,000 Aurium CLO II DAC FRN 13/10/2029 100,167 0.04 EUR 100,000 Avoca CLO XV DAC FRN 15/4/2031 93,116 0.04 EUR 200,000 Bank of Ireland FRN 18/6/2020
(Perpetual) 209,614 0.09 EUR 150,000 Cadogan Square CLO VIII DAC
FRN 15/1/2030 150,648 0.07 EUR 150,000 Carlyle Global Market Strategies
Euro CLO 2014-2 Ltd FRN 17/11/2031 145,406 0.06
EUR 200,000 CIFC European Funding CLO I DAC FRN 15/7/2032 195,082 0.08
EUR 100,000 eircom Finance DAC 3.5% 15/5/2026 106,815 0.05
USD 500,000 GE Capital International Funding Co Unlimited Co 2.342% 15/11/2020 449,778 0.19
USD 400,000 GE Capital International Funding Co Unlimited Co 3.373% 15/11/2025 366,984 0.16
EUR 150,000 Harvest CLO XVI DAC FRN 15/10/2031 149,180 0.07
EUR 200,000 Providus Clo III DAC FRN 20/7/2032 194,060 0.08
USD 55,000 Shire Acquisitions Investments Ireland DAC 1.9% 23/9/2019 49,775 0.02
USD 95,000 Shire Acquisitions Investments Ireland DAC 2.4% 23/9/2021 86,269 0.04
USD 1,045,000 Shire Acquisitions Investments Ireland DAC 2.875% 23/9/2023 966,875 0.42
EUR 200,000 Tikehau CLO V BV FRN 15/4/2032 192,500 0.08 GBP 100,000 Virgin Media Receivables
Financing Notes I DAC 5.5% 15/9/2024 113,900 0.05
5,013,168 2.16
Italy EUR 200,000 Assicurazioni Generali SpA FRN
27/10/2047 241,394 0.10 EUR 100,000 Banco BPM SpA 1.75% 24/4/2023 101,677 0.04 EUR 200,000 Banco BPM SpA 2.5% 21/6/2024 206,487 0.09 EUR 100,000 Diocle Spa FRN 30/6/2026 101,980 0.04 EUR 200,000 Intesa Sanpaolo SpA FRN 11/1/2027
(Perpetual) 232,500 0.10 USD 400,000 Intesa Sanpaolo SpA ‘144A’ 3.125%
14/7/2022 363,502 0.16 EUR 100,000 Nexi Capital SpA 4.125% 1/11/2023 103,346 0.04 EUR 200,000 Sisal Group SpA 7% 31/7/2023 207,982 0.09 EUR 200,000 Telecom Italia SpA/Milano 1.125%
26/3/2022 201,174 0.09 EUR 170,000 Telecom Italia SpA/Milano 2.75%
15/4/2025 178,445 0.08 EUR 100,000 Telecom Italia SpA/Milano 2.875%
28/1/2026 104,439 0.05 EUR 100,000 Telecom Italia SpA/Milano 3%
30/9/2025 105,692 0.05 EUR 300,000 Telecom Italia SpA/Milano 4%
11/4/2024 332,961 0.14 GBP 100,000 Telecom Italia SpA/Milano 5.875%
19/5/2023 123,271 0.05 EUR 200,000 UniCredit SpA FRN 10/9/2021
(Perpetual) 211,000 0.09 EUR 200,000 UniCredit SpA FRN 3/6/2022
(Perpetual) 231,750 0.10 EUR 200,000 UniCredit SpA (Restricted) FRN
3/6/2026 (Perpetual) 219,750 0.10 3,267,350 1.41
Japan USD 200,000 Mitsubishi UFJ Financial Group Inc
2.623% 18/7/2022 183,164 0.08 USD 95,000 Mitsubishi UFJ Financial Group Inc
3.218% 7/3/2022 88,154 0.04 USD 100,000 Mitsubishi UFJ Financial Group Inc
3.455% 2/3/2023 94,262 0.04 USD 250,000 Mitsubishi UFJ Financial Group Inc
3.535% 26/7/2021 231,923 0.10 USD 225,000 Mitsubishi UFJ Financial Group Inc
3.761% 26/7/2023 215,348 0.09 USD 200,000 Panasonic Corp ‘144A’ 2.536%
19/7/2022 182,796 0.08 EUR 200,000 SoftBank Group Corp 4% 20/4/2023 218,357 0.09
Global Conservative Income Fund(2) continued
Portfolio of Investments 31 August 2019
(2) Fund launched during the year, see Note 1, for further details.

Transferable Securities and Money Market Instruments Admitted to an Official Stock Exchange Listing or Dealt in on Another Regulated Market
Transferable Securities and Money Market Instruments Admitted to an Official Stock Exchange Listing or Dealt in on Another Regulated Market
Holding
Description
Market Value (EUR)
% of Net
Assets
Holding
Description
Market Value (EUR)
% of Net
Assets
The notes on pages 728 to 741 form an integral part of these financial statements.
[404] BlackRock Global Funds (BGF)
EUR 100,000 SoftBank Group Corp 4% 19/9/2029 108,861 0.05
EUR 300,000 SoftBank Group Corp 4.75% 30/7/2025 342,754 0.15
EUR 300,000 SoftBank Group Corp 5% 15/4/2028 347,880 0.15 USD 450,000 Sumitomo Mitsui Financial Group
Inc 2.442% 19/10/2021 409,364 0.17 USD 150,000 Sumitomo Mitsui Financial Group
Inc 3.102% 17/1/2023 140,448 0.06 2,563,311 1.10
Jersey EUR 200,000 Avis Budget Finance Plc 4.75%
30/1/2026 215,932 0.09 GBP 100,000 CPUK Finance Ltd 4.25% 28/8/2022 112,080 0.05 GBP 100,000 Galaxy Bidco Ltd 6.5% 31/7/2026 106,433 0.05 USD 300,000 HBOS Capital Funding LP 6.85%
23/12/2019 (Perpetual) 277,355 0.12 EUR 200,000 LHC3 Plc 4.125% 15/8/2024 207,728 0.09 919,528 0.40
Luxembourg USD 660,000 Allergan Funding SCS 3.45%
15/3/2022 613,580 0.26 USD 50,000 Allergan Funding SCS 3.8%
15/3/2025 47,576 0.02 USD 70,000 Allergan Funding SCS 4.55%
15/3/2035 68,152 0.03 USD 200,000 Altice Financing SA ‘144A’ 6.625%
15/2/2023 186,940 0.08 USD 400,000 Altice Financing SA ‘144A’ 7.5%
15/5/2026 387,315 0.17 USD 200,000 Altice Finco SA ‘144A’ 7.625%
15/2/2025 186,207 0.08 USD 200,000 Altice Luxembourg SA ‘144A’ 10.5%
15/5/2027 196,898 0.08 GBP 100,000 B&M European Value Retail SA
4.125% 1/2/2022 112,301 0.05 GBP 300,000 Cabot Financial Luxembourg SA
7.5% 1/10/2023 345,295 0.15 USD 200,000 Cirsa Finance International Sarl
‘144A’ 7.875% 20/12/2023 191,808 0.08 EUR 100,000 Codere Finance 2 Luxembourg SA
6.75% 1/11/2021 98,354 0.04 EUR 100,000 ContourGlobal Power Holdings SA
3.375% 1/8/2023 104,131 0.05 EUR 100,000 ContourGlobal Power Holdings SA
4.125% 1/8/2025 106,843 0.05 EUR 100,000 ContourGlobal Power Holdings SA
4.125% 1/8/2025 107,399 0.05 EUR 100,000 European TopSoho Sarl 4%
21/9/2021 93,305 0.04 EUR 350,000 Garfunkelux Holdco 3 SA 7.5%
1/8/2022* 335,563 0.14 EUR 100,000 Holcim Finance Luxembourg SA
FRN 5/7/2024 (Perpetual) 105,265 0.05 EUR 100,000 INEOS Group Holdings SA 5.375%
1/8/2024 102,902 0.04 EUR 100,000 Matterhorn Telecom SA 3.875%
1/5/2022 101,455 0.04 EUR 100,000 Matterhorn Telecom SA 4%
15/11/2027 102,972 0.04 EUR 376,000 Rossini Sarl 6.75% 30/10/2025 411,729 0.18 EUR 100,000 SES SA FRN 2/1/2022 (Perpetual) 107,140 0.05 EUR 200,000 SES SA FRN 29/1/2024 (Perpetual) 224,250 0.10 EUR 184,000 Swissport Financing Sarl 5.25%
15/8/2024 189,564 0.08
EUR 140,000 Telenet Finance VI Luxembourg SCA 4.875% 15/7/2027 154,189 0.07
EUR 100,000 Vivion Investments Sarl 3% 8/8/2024 99,946 0.04 4,781,079 2.06
Mexico USD 825,000 America Movil SAB de CV 3.125%
16/7/2022 766,333 0.33 EUR 200,000 Cemex SAB de CV 3.125%
19/3/2026 207,087 0.09 973,420 0.42
Netherlands EUR 200,000 ABN AMRO Bank NV FRN
22/9/2020 (Perpetual) 209,406 0.09 EUR 100,000 Cairn CLO IV BV FRN 30/4/2031 100,249 0.04 EUR 100,000 Constellium SE 4.25% 15/2/2026 105,215 0.05 USD 250,000 Cooperatieve Rabobank UA/NY
2.5% 19/1/2021 227,848 0.10 EUR 100,000 Diamond BC BV 5.625% 15/8/2025 79,514 0.03 EUR 150,000 Dryden 32 Euro CLO 2014 B.V.
FRN 15/8/2031 145,565 0.06 EUR 100,000 Ferrovial Netherlands BV FRN
4/2/2023 (Perpetual) 96,965 0.04 EUR 200,000 Hertz Holdings Netherlands BV
5.5% 30/3/2023 211,300 0.09 USD 200,000 ING Groep NV FRN 16/4/2024
(Perpetual) 190,082 0.08 EUR 200,000 Intertrust Group BV 3.375%
15/11/2025 212,827 0.09 EUR 200,000 InterXion Holding NV 4.75%
15/6/2025 218,120 0.09 EUR 100,000 Naturgy Finance BV FRN
18/11/2022 (Perpetual) 109,099 0.05 EUR 100,000 Naturgy Finance BV FRN
24/4/2024 (Perpetual) 106,942 0.05 EUR 100,000 NN Group NV FRN 13/6/2024
(Perpetual) 112,591 0.05 USD 200,000 NXP BV / NXP Funding LLC ‘144A’
4.625% 15/6/2022 190,688 0.08 USD 225,000 NXP BV / NXP Funding LLC ‘144A’
4.875% 1/3/2024 220,910 0.09 USD 10,000 NXP BV / NXP Funding LLC ‘144A’
5.55% 1/12/2028 10,482 0.00 USD 75,000 NXP BV / NXP Funding LLC / NXP
USA Inc ‘144A’ 4.3% 18/6/2029 72,885 0.03 EUR 100,000 OCI NV 5% 15/4/2023 104,971 0.05 EUR 100,000 Repsol International Finance BV
FRN 25/3/2021 (Perpetual) 105,501 0.05 EUR 200,000 Repsol International Finance BV
FRN 25/3/2075 230,256 0.10 USD 100,000 Shell International Finance BV
2.25% 6/1/2023 91,776 0.04 USD 100,000 Shell International Finance BV
3.5% 13/11/2023 96,313 0.04 USD 20,000 Shell International Finance BV
3.625% 21/8/2042 19,941 0.01 EUR 100,000 Summer BidCo BV 9% 15/11/2025 106,709 0.05 EUR 100,000 Telefonica Europe BV FRN
15/3/2022 (Perpetual) 106,450 0.05 EUR 100,000 Telefonica Europe BV FRN 7/3/2023
(Perpetual) 102,125 0.04 EUR 300,000 Telefonica Europe BV FRN
31/3/2024 (Perpetual) 350,951 0.15 EUR 200,000 Telefonica Europe BV FRN
14/12/2024 (Perpetual) 221,750 0.10 EUR 100,000 Teva Pharmaceutical Finance
Netherlands II BV 4.5% 1/3/2025 89,781 0.04
Global Conservative Income Fund(2) continued
Portfolio of Investments 31 August 2019
(2) Fund launched during the year, see Note 1, for further details.
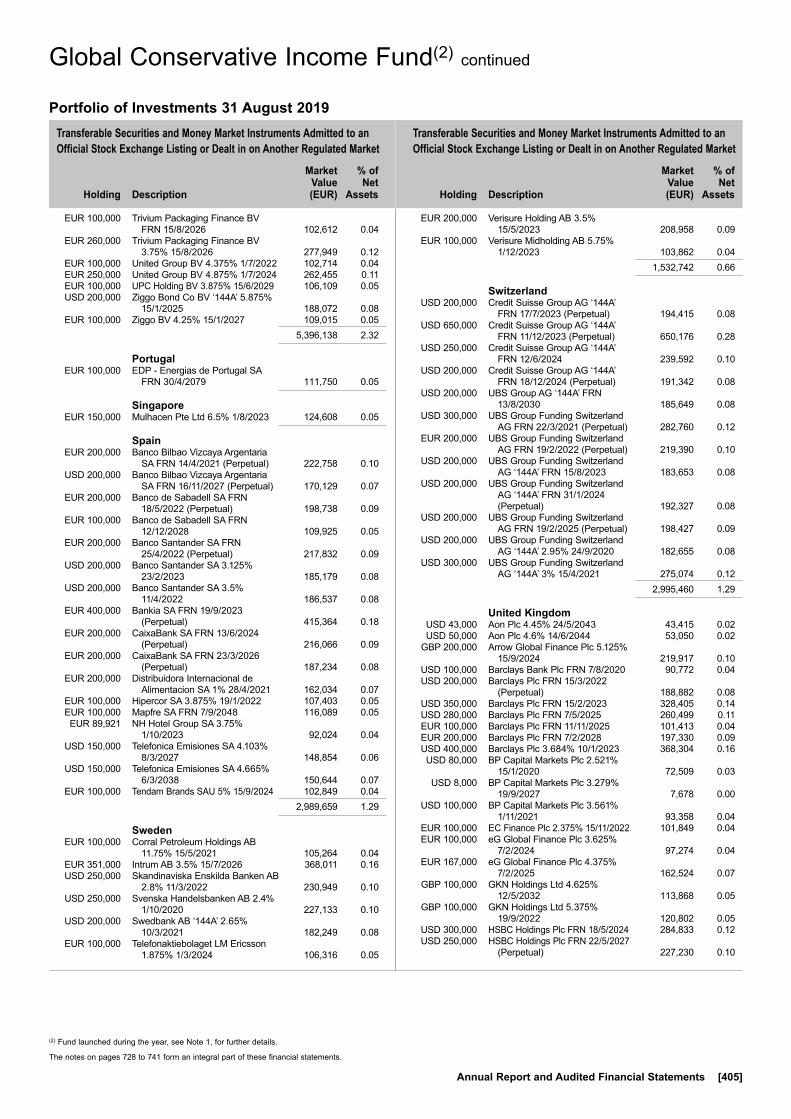
Transferable Securities and Money Market Instruments Admitted to an Official Stock Exchange Listing or Dealt in on Another Regulated Market
Transferable Securities and Money Market Instruments Admitted to an Official Stock Exchange Listing or Dealt in on Another Regulated Market
Holding
Description
Market Value (EUR)
% of Net
Assets
Holding
Description
Market Value (EUR)
% of Net
Assets
(2) Fund launched during the year, see Note 1, for further details.
The notes on pages 728 to 741 form an integral part of these financial statements.
Annual Report and Audited Financial Statements [405]
EUR 100,000 Trivium Packaging Finance BV FRN 15/8/2026 102,612 0.04
EUR 260,000 Trivium Packaging Finance BV 3.75% 15/8/2026 277,949 0.12
EUR 100,000 United Group BV 4.375% 1/7/2022 102,714 0.04 EUR 250,000 United Group BV 4.875% 1/7/2024 262,455 0.11 EUR 100,000 UPC Holding BV 3.875% 15/6/2029 106,109 0.05 USD 200,000 Ziggo Bond Co BV ‘144A’ 5.875%
15/1/2025 188,072 0.08 EUR 100,000 Ziggo BV 4.25% 15/1/2027 109,015 0.05 5,396,138 2.32
Portugal EUR 100,000 EDP - Energias de Portugal SA
FRN 30/4/2079 111,750 0.05
Singapore EUR 150,000 Mulhacen Pte Ltd 6.5% 1/8/2023 124,608 0.05
Spain EUR 200,000 Banco Bilbao Vizcaya Argentaria
SA FRN 14/4/2021 (Perpetual) 222,758 0.10 USD 200,000 Banco Bilbao Vizcaya Argentaria
SA FRN 16/11/2027 (Perpetual) 170,129 0.07 EUR 200,000 Banco de Sabadell SA FRN
18/5/2022 (Perpetual) 198,738 0.09 EUR 100,000 Banco de Sabadell SA FRN
12/12/2028 109,925 0.05 EUR 200,000 Banco Santander SA FRN
25/4/2022 (Perpetual) 217,832 0.09 USD 200,000 Banco Santander SA 3.125%
23/2/2023 185,179 0.08 USD 200,000 Banco Santander SA 3.5%
11/4/2022 186,537 0.08 EUR 400,000 Bankia SA FRN 19/9/2023
(Perpetual) 415,364 0.18 EUR 200,000 CaixaBank SA FRN 13/6/2024
(Perpetual) 216,066 0.09 EUR 200,000 CaixaBank SA FRN 23/3/2026
(Perpetual) 187,234 0.08 EUR 200,000 Distribuidora Internacional de
Alimentacion SA 1% 28/4/2021 162,034 0.07 EUR 100,000 Hipercor SA 3.875% 19/1/2022 107,403 0.05 EUR 100,000 Mapfre SA FRN 7/9/2048 116,089 0.05 EUR 89,921 NH Hotel Group SA 3.75%
1/10/2023 92,024 0.04 USD 150,000 Telefonica Emisiones SA 4.103%
8/3/2027 148,854 0.06 USD 150,000 Telefonica Emisiones SA 4.665%
6/3/2038 150,644 0.07 EUR 100,000 Tendam Brands SAU 5% 15/9/2024 102,849 0.04 2,989,659 1.29
Sweden EUR 100,000 Corral Petroleum Holdings AB
11.75% 15/5/2021 105,264 0.04 EUR 351,000 Intrum AB 3.5% 15/7/2026 368,011 0.16 USD 250,000 Skandinaviska Enskilda Banken AB
2.8% 11/3/2022 230,949 0.10 USD 250,000 Svenska Handelsbanken AB 2.4%
1/10/2020 227,133 0.10 USD 200,000 Swedbank AB ‘144A’ 2.65%
10/3/2021 182,249 0.08 EUR 100,000 Telefonaktiebolaget LM Ericsson
1.875% 1/3/2024 106,316 0.05
EUR 200,000 Verisure Holding AB 3.5% 15/5/2023 208,958 0.09
EUR 100,000 Verisure Midholding AB 5.75% 1/12/2023 103,862 0.04
1,532,742 0.66
Switzerland USD 200,000 Credit Suisse Group AG ‘144A’
FRN 17/7/2023 (Perpetual) 194,415 0.08 USD 650,000 Credit Suisse Group AG ‘144A’
FRN 11/12/2023 (Perpetual) 650,176 0.28 USD 250,000 Credit Suisse Group AG ‘144A’
FRN 12/6/2024 239,592 0.10 USD 200,000 Credit Suisse Group AG ‘144A’
FRN 18/12/2024 (Perpetual) 191,342 0.08 USD 200,000 UBS Group AG ‘144A’ FRN
13/8/2030 185,649 0.08 USD 300,000 UBS Group Funding Switzerland
AG FRN 22/3/2021 (Perpetual) 282,760 0.12 EUR 200,000 UBS Group Funding Switzerland
AG FRN 19/2/2022 (Perpetual) 219,390 0.10 USD 200,000 UBS Group Funding Switzerland
AG ‘144A’ FRN 15/8/2023 183,653 0.08 USD 200,000 UBS Group Funding Switzerland
AG ‘144A’ FRN 31/1/2024 (Perpetual) 192,327 0.08
USD 200,000 UBS Group Funding Switzerland AG FRN 19/2/2025 (Perpetual) 198,427 0.09
USD 200,000 UBS Group Funding Switzerland AG ‘144A’ 2.95% 24/9/2020 182,655 0.08
USD 300,000 UBS Group Funding Switzerland AG ‘144A’ 3% 15/4/2021 275,074 0.12
2,995,460 1.29
United Kingdom USD 43,000 Aon Plc 4.45% 24/5/2043 43,415 0.02 USD 50,000 Aon Plc 4.6% 14/6/2044 53,050 0.02 GBP 200,000 Arrow Global Finance Plc 5.125%
15/9/2024 219,917 0.10 USD 100,000 Barclays Bank Plc FRN 7/8/2020 90,772 0.04 USD 200,000 Barclays Plc FRN 15/3/2022
(Perpetual) 188,882 0.08 USD 350,000 Barclays Plc FRN 15/2/2023 328,405 0.14 USD 280,000 Barclays Plc FRN 7/5/2025 260,499 0.11 EUR 100,000 Barclays Plc FRN 11/11/2025 101,413 0.04 EUR 200,000 Barclays Plc FRN 7/2/2028 197,330 0.09 USD 400,000 Barclays Plc 3.684% 10/1/2023 368,304 0.16 USD 80,000 BP Capital Markets Plc 2.521%
15/1/2020 72,509 0.03 USD 8,000 BP Capital Markets Plc 3.279%
19/9/2027 7,678 0.00 USD 100,000 BP Capital Markets Plc 3.561%
1/11/2021 93,358 0.04 EUR 100,000 EC Finance Plc 2.375% 15/11/2022 101,849 0.04 EUR 100,000 eG Global Finance Plc 3.625%
7/2/2024 97,274 0.04 EUR 167,000 eG Global Finance Plc 4.375%
7/2/2025 162,524 0.07 GBP 100,000 GKN Holdings Ltd 4.625%
12/5/2032 113,868 0.05 GBP 100,000 GKN Holdings Ltd 5.375%
19/9/2022 120,802 0.05 USD 300,000 HSBC Holdings Plc FRN 18/5/2024 284,833 0.12 USD 250,000 HSBC Holdings Plc FRN 22/5/2027
(Perpetual) 227,230 0.10
Global Conservative Income Fund(2) continued
Portfolio of Investments 31 August 2019

Transferable Securities and Money Market Instruments Admitted to an Official Stock Exchange Listing or Dealt in on Another Regulated Market
Transferable Securities and Money Market Instruments Admitted to an Official Stock Exchange Listing or Dealt in on Another Regulated Market
Holding
Description
Market Value (EUR)
% of Net
Assets
Holding
Description
Market Value (EUR)
% of Net
Assets
* All or a portion of this security represents a security on loan.
The notes on pages 728 to 741 form an integral part of these financial statements.
[406] BlackRock Global Funds (BGF)
USD 225,000 HSBC Holdings Plc FRN 23/3/2028 (Perpetual) 208,852 0.09
USD 200,000 HSBC Holdings Plc FRN 19/6/2029 202,013 0.09 USD 250,000 HSBC Holdings Plc 2.65% 5/1/2022 228,687 0.10 USD 950,000 HSBC Holdings Plc 3.4% 8/3/2021 873,632 0.38 USD 200,000 HSBC Holdings Plc 4.25% 14/3/2024 191,002 0.08 GBP 100,000 Iceland Bondco Plc 4.625%
15/3/2025 95,624 0.04 EUR 161,000 International Game Technology Plc
3.5% 15/6/2026 171,346 0.07 GBP 100,000 Iron Mountain UK Plc 3.875%
15/11/2025 110,864 0.05 USD 200,000 Ithaca Energy North Sea Plc ‘144A’
9.375% 15/7/2024 186,497 0.08 USD 200,000 Lloyds Banking Group Plc FRN
27/9/2025 (Perpetual) 188,227 0.08 USD 250,000 Lloyds Banking Group Plc 3.1%
6/7/2021 229,723 0.10 USD 400,000 Lloyds Banking Group Plc 4.05%
16/8/2023 379,637 0.16 USD 100,000 National Westminster Bank Plc
FRN 28/11/2019 (Perpetual) 72,988 0.03 USD 400,000 Neptune Energy Bondco Plc ‘144A’
6.625% 15/5/2025 362,293 0.16 EUR 100,000 NGG Finance Plc FRN 5/12/2079 100,192 0.04 EUR 100,000 NGG Finance Plc FRN 5/9/2082 100,220 0.04 EUR 100,000 Nomad Foods Bondco Plc 3.25%
15/5/2024 103,909 0.05 GBP 100,000 Pinnacle Bidco Plc 6.375% 15/2/2025 117,464 0.05 GBP 100,000 Premier Foods Finance Plc 6.25%
15/10/2023 113,910 0.05 USD 200,000 Royal Bank of Scotland Group Plc
FRN 15/8/2021 (Perpetual) 192,146 0.08 USD 1,000,000 Royal Bank of Scotland Group Plc
3.875% 12/9/2023 932,557 0.40 USD 400,000 Santander UK Group Holdings Plc
2.875% 5/8/2021 363,954 0.16 USD 400,000 Santander UK Plc ‘144A’ 5%
7/11/2023 384,051 0.17 GBP 100,000 Shop Direct Funding Plc 7.75%
15/11/2022 97,466 0.04 USD 400,000 Standard Chartered Plc ‘144A’ FRN
2/4/2022 (Perpetual) 380,670 0.16 GBP 100,000 Stonegate Pub Co Financing Plc
FRN 15/3/2022 112,112 0.05 GBP 100,000 Stonegate Pub Co Financing Plc
4.875% 15/3/2022 113,566 0.05 GBP 103,000 Tesco Corporate Treasury Services
Plc 2.5% 2/5/2025 116,991 0.05 GBP 64,575 Unique Pub Finance Co Plc/The
5.659% 30/6/2027 81,488 0.04 GBP 100,000 Virgin Media Secured Finance Plc
4.875% 15/1/2027 115,809 0.05 GBP 200,000 Virgin Media Secured Finance Plc
5% 15/4/2027 232,598 0.10 GBP 180,000 Virgin Media Secured Finance Plc
6.25% 28/3/2029 212,081 0.09 GBP 100,000 Vodafone Group Plc 26/11/2020
(Zero Coupon) 108,838 0.05 EUR 200,000 Vodafone Group Plc FRN 3/10/2078* 227,080 0.10 EUR 200,000 Vodafone Group Plc FRN 3/1/2079 210,653 0.09 USD 195,000 Vodafone Group Plc FRN 4/4/2079 201,222 0.09 USD 120,000 Vodafone Group Plc 3.75%
16/1/2024 114,756 0.05 USD 115,000 Vodafone Group Plc 5.25%
30/5/2048 124,582 0.05 11,493,612 4.95
United States USD 150,000 Abbott Laboratories 2.9% 30/11/2021 138,441 0.06 USD 80,000 Abbott Laboratories 3.4% 30/11/2023 76,244 0.03 USD 121,000 Abbott Laboratories 3.75%
30/11/2026 120,516 0.05 USD 145,000 Abbott Laboratories 4.75%
30/11/2036 164,183 0.07 USD 445,000 AbbVie Inc 2.85% 14/5/2023 410,758 0.18 USD 215,000 AbbVie Inc 3.2% 6/11/2022 199,577 0.09 USD 45,000 AbbVie Inc 3.2% 14/5/2026 41,899 0.02 USD 60,000 AbbVie Inc 3.75% 14/11/2023 57,274 0.02 USD 30,000 AbbVie Inc 4.4% 6/11/2042 28,767 0.01 USD 25,000 AbbVie Inc 4.5% 14/5/2035 24,660 0.01 USD 180,000 AbbVie Inc 4.875% 14/11/2048 183,752 0.08 USD 100,000 Aetna Inc 2.8% 15/6/2023 92,188 0.04 USD 100,000 Aetna Inc 3.5% 15/11/2024 94,473 0.04 USD 500,000 AIMCO CLO Series 2018-A ‘Series
2018-AA A’ ‘144A’ FRN 17/4/2031 447,945 0.19 USD 850,000 AIMCO CLO Series 2018-B ‘Series
2018-BA B’ ‘144A’ FRN 15/1/2032 768,614 0.33 USD 485,000 Air Lease Corp 3.5% 15/1/2022 451,269 0.19 USD 60,000 Air Lease Corp 3.875% 3/7/2023 56,893 0.02 USD 50,000 Alabama Power Co 4.3% 15/7/2048 55,294 0.02 USD 100,000 Allergan Inc/United States 2.8%
15/3/2023 91,284 0.04 USD 10,000 Allstate Corp/The 3.85% 10/8/2049 10,475 0.00 USD 500,000 ALM VII R-2 Ltd ‘Series 2013-
7R2A A2R2’ ‘144A’ FRN 15/10/2027 450,414 0.19
USD 500,000 ALM VII R-2 Ltd ‘Series 2013-7R2A BR2’ ‘144A’ FRN 15/10/2027 444,765 0.19
USD 135,000 Altria Group Inc 2.85% 9/8/2022 124,681 0.05 USD 5,000 Altria Group Inc 3.49% 14/2/2022 4,681 0.00 USD 300,000 Altria Group Inc 3.8% 14/2/2024 287,590 0.12 USD 20,000 Altria Group Inc 4.5% 2/5/2043 19,416 0.01 USD 220,000 Altria Group Inc 4.8% 14/2/2029 224,018 0.10 USD 90,000 Altria Group Inc 5.375% 31/1/2044 97,044 0.04 USD 50,000 Altria Group Inc 5.8% 14/2/2039 56,222 0.02 USD 90,000 Altria Group Inc 5.95% 14/2/2049 104,961 0.05 USD 110,000 Amazon.com Inc 3.15% 22/8/2027 107,067 0.05 USD 165,000 Amazon.com Inc 3.875% 22/8/2037 173,894 0.08 USD 7,010 American Airlines 2017-1 Class AA
Pass Through Trust 3.65% 15/2/2029 6,844 0.00
USD 65,000 American Airlines 2019-1 Class B Pass Through Trust 3.85% 15/2/2028 59,610 0.03
USD 100,000 American Electric Power Co Inc 2.95% 15/12/2022 92,456 0.04
USD 500,000 American Express Co 3.4% 27/2/2023 472,827 0.20
USD 130,000 American Express Co 3.4% 22/2/2024 124,097 0.05
USD 140,000 American Honda Finance Corp 1.65% 12/7/2021 126,118 0.05
USD 250,000 American Tower Corp 2.25% 15/1/2022 227,153 0.10
USD 280,000 American Tower Corp 3.125% 15/1/2027 262,194 0.11
USD 250,000 American Tower Corp 3.45% 15/9/2021 231,813 0.10
USD 150,000 American Tower Corp 3.5% 31/1/2023 141,109 0.06
USD 30,000 American Tower Corp 3.95% 15/3/2029 29,663 0.01
USD 120,000 American Tower Corp 4.4% 15/2/2026 119,670 0.05
Global Conservative Income Fund(2) continued
Portfolio of Investments 31 August 2019
(2) Fund launched during the year, see Note 1, for further details.
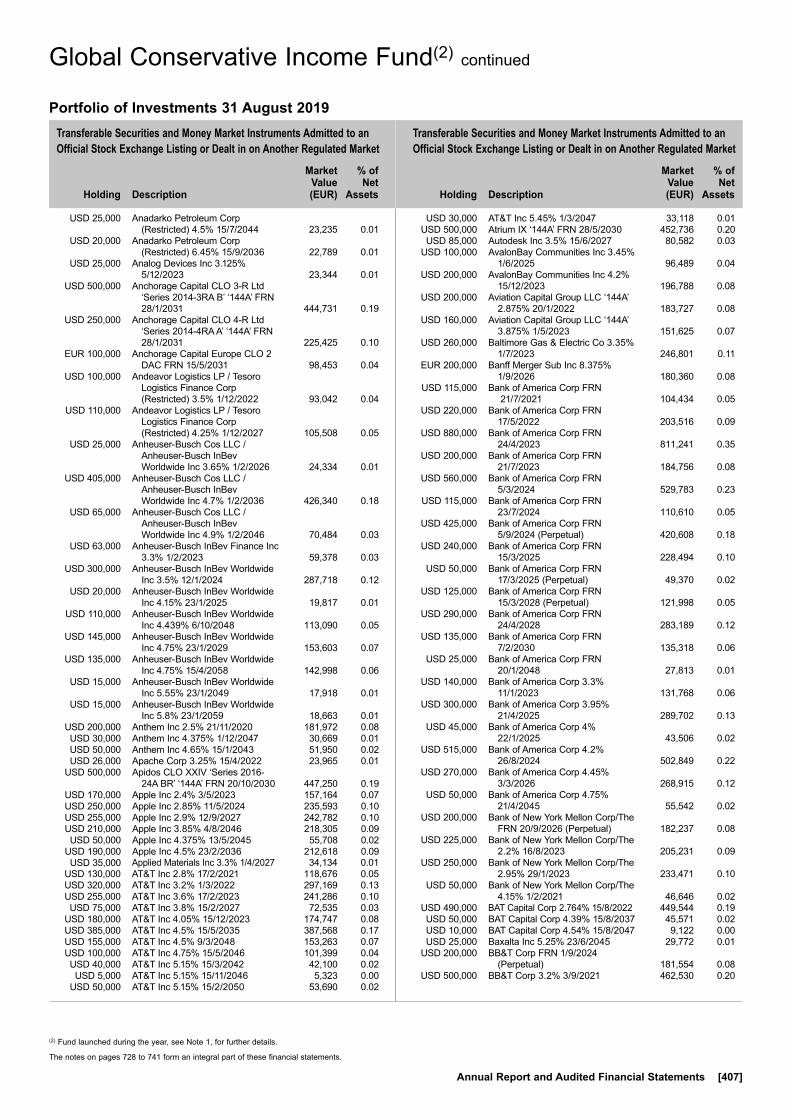
Transferable Securities and Money Market Instruments Admitted to an Official Stock Exchange Listing or Dealt in on Another Regulated Market
Transferable Securities and Money Market Instruments Admitted to an Official Stock Exchange Listing or Dealt in on Another Regulated Market
Holding
Description
Market Value (EUR)
% of Net
Assets
Holding
Description
Market Value (EUR)
% of Net
Assets
(2) Fund launched during the year, see Note 1, for further details.
The notes on pages 728 to 741 form an integral part of these financial statements.
Annual Report and Audited Financial Statements [407]
USD 25,000 Anadarko Petroleum Corp (Restricted) 4.5% 15/7/2044 23,235 0.01
USD 20,000 Anadarko Petroleum Corp (Restricted) 6.45% 15/9/2036 22,789 0.01
USD 25,000 Analog Devices Inc 3.125% 5/12/2023 23,344 0.01
USD 500,000 Anchorage Capital CLO 3-R Ltd ‘Series 2014-3RA B’ ‘144A’ FRN 28/1/2031 444,731 0.19
USD 250,000 Anchorage Capital CLO 4-R Ltd ‘Series 2014-4RA A’ ‘144A’ FRN 28/1/2031 225,425 0.10
EUR 100,000 Anchorage Capital Europe CLO 2 DAC FRN 15/5/2031 98,453 0.04
USD 100,000 Andeavor Logistics LP / Tesoro Logistics Finance Corp (Restricted) 3.5% 1/12/2022 93,042 0.04
USD 110,000 Andeavor Logistics LP / Tesoro Logistics Finance Corp (Restricted) 4.25% 1/12/2027 105,508 0.05
USD 25,000 Anheuser-Busch Cos LLC / Anheuser-Busch InBev Worldwide Inc 3.65% 1/2/2026 24,334 0.01
USD 405,000 Anheuser-Busch Cos LLC / Anheuser-Busch InBev Worldwide Inc 4.7% 1/2/2036 426,340 0.18
USD 65,000 Anheuser-Busch Cos LLC / Anheuser-Busch InBev Worldwide Inc 4.9% 1/2/2046 70,484 0.03
USD 63,000 Anheuser-Busch InBev Finance Inc 3.3% 1/2/2023 59,378 0.03
USD 300,000 Anheuser-Busch InBev Worldwide Inc 3.5% 12/1/2024 287,718 0.12
USD 20,000 Anheuser-Busch InBev Worldwide Inc 4.15% 23/1/2025 19,817 0.01
USD 110,000 Anheuser-Busch InBev Worldwide Inc 4.439% 6/10/2048 113,090 0.05
USD 145,000 Anheuser-Busch InBev Worldwide Inc 4.75% 23/1/2029 153,603 0.07
USD 135,000 Anheuser-Busch InBev Worldwide Inc 4.75% 15/4/2058 142,998 0.06
USD 15,000 Anheuser-Busch InBev Worldwide Inc 5.55% 23/1/2049 17,918 0.01
USD 15,000 Anheuser-Busch InBev Worldwide Inc 5.8% 23/1/2059 18,663 0.01
USD 200,000 Anthem Inc 2.5% 21/11/2020 181,972 0.08 USD 30,000 Anthem Inc 4.375% 1/12/2047 30,669 0.01 USD 50,000 Anthem Inc 4.65% 15/1/2043 51,950 0.02 USD 26,000 Apache Corp 3.25% 15/4/2022 23,965 0.01 USD 500,000 Apidos CLO XXIV ‘Series 2016-
24A BR’ ‘144A’ FRN 20/10/2030 447,250 0.19 USD 170,000 Apple Inc 2.4% 3/5/2023 157,164 0.07 USD 250,000 Apple Inc 2.85% 11/5/2024 235,593 0.10 USD 255,000 Apple Inc 2.9% 12/9/2027 242,782 0.10 USD 210,000 Apple Inc 3.85% 4/8/2046 218,305 0.09 USD 50,000 Apple Inc 4.375% 13/5/2045 55,708 0.02 USD 190,000 Apple Inc 4.5% 23/2/2036 212,618 0.09 USD 35,000 Applied Materials Inc 3.3% 1/4/2027 34,134 0.01 USD 130,000 AT&T Inc 2.8% 17/2/2021 118,676 0.05 USD 320,000 AT&T Inc 3.2% 1/3/2022 297,169 0.13 USD 255,000 AT&T Inc 3.6% 17/2/2023 241,286 0.10 USD 75,000 AT&T Inc 3.8% 15/2/2027 72,535 0.03 USD 180,000 AT&T Inc 4.05% 15/12/2023 174,747 0.08 USD 385,000 AT&T Inc 4.5% 15/5/2035 387,568 0.17 USD 155,000 AT&T Inc 4.5% 9/3/2048 153,263 0.07 USD 100,000 AT&T Inc 4.75% 15/5/2046 101,399 0.04 USD 40,000 AT&T Inc 5.15% 15/3/2042 42,100 0.02 USD 5,000 AT&T Inc 5.15% 15/11/2046 5,323 0.00 USD 50,000 AT&T Inc 5.15% 15/2/2050 53,690 0.02
USD 30,000 AT&T Inc 5.45% 1/3/2047 33,118 0.01 USD 500,000 Atrium IX ‘144A’ FRN 28/5/2030 452,736 0.20 USD 85,000 Autodesk Inc 3.5% 15/6/2027 80,582 0.03 USD 100,000 AvalonBay Communities Inc 3.45%
1/6/2025 96,489 0.04 USD 200,000 AvalonBay Communities Inc 4.2%
15/12/2023 196,788 0.08 USD 200,000 Aviation Capital Group LLC ‘144A’
2.875% 20/1/2022 183,727 0.08 USD 160,000 Aviation Capital Group LLC ‘144A’
3.875% 1/5/2023 151,625 0.07 USD 260,000 Baltimore Gas & Electric Co 3.35%
1/7/2023 246,801 0.11 EUR 200,000 Banff Merger Sub Inc 8.375%
1/9/2026 180,360 0.08 USD 115,000 Bank of America Corp FRN
21/7/2021 104,434 0.05 USD 220,000 Bank of America Corp FRN
17/5/2022 203,516 0.09 USD 880,000 Bank of America Corp FRN
24/4/2023 811,241 0.35 USD 200,000 Bank of America Corp FRN
21/7/2023 184,756 0.08 USD 560,000 Bank of America Corp FRN
5/3/2024 529,783 0.23 USD 115,000 Bank of America Corp FRN
23/7/2024 110,610 0.05 USD 425,000 Bank of America Corp FRN
5/9/2024 (Perpetual) 420,608 0.18 USD 240,000 Bank of America Corp FRN
15/3/2025 228,494 0.10 USD 50,000 Bank of America Corp FRN
17/3/2025 (Perpetual) 49,370 0.02 USD 125,000 Bank of America Corp FRN
15/3/2028 (Perpetual) 121,998 0.05 USD 290,000 Bank of America Corp FRN
24/4/2028 283,189 0.12 USD 135,000 Bank of America Corp FRN
7/2/2030 135,318 0.06 USD 25,000 Bank of America Corp FRN
20/1/2048 27,813 0.01 USD 140,000 Bank of America Corp 3.3%
11/1/2023 131,768 0.06 USD 300,000 Bank of America Corp 3.95%
21/4/2025 289,702 0.13 USD 45,000 Bank of America Corp 4%
22/1/2025 43,506 0.02 USD 515,000 Bank of America Corp 4.2%
26/8/2024 502,849 0.22 USD 270,000 Bank of America Corp 4.45%
3/3/2026 268,915 0.12 USD 50,000 Bank of America Corp 4.75%
21/4/2045 55,542 0.02 USD 200,000 Bank of New York Mellon Corp/The
FRN 20/9/2026 (Perpetual) 182,237 0.08 USD 225,000 Bank of New York Mellon Corp/The
2.2% 16/8/2023 205,231 0.09 USD 250,000 Bank of New York Mellon Corp/The
2.95% 29/1/2023 233,471 0.10 USD 50,000 Bank of New York Mellon Corp/The
4.15% 1/2/2021 46,646 0.02 USD 490,000 BAT Capital Corp 2.764% 15/8/2022 449,544 0.19 USD 50,000 BAT Capital Corp 4.39% 15/8/2037 45,571 0.02 USD 10,000 BAT Capital Corp 4.54% 15/8/2047 9,122 0.00 USD 25,000 Baxalta Inc 5.25% 23/6/2045 29,772 0.01 USD 200,000 BB&T Corp FRN 1/9/2024
(Perpetual) 181,554 0.08 USD 500,000 BB&T Corp 3.2% 3/9/2021 462,530 0.20
Global Conservative Income Fund(2) continued
Portfolio of Investments 31 August 2019
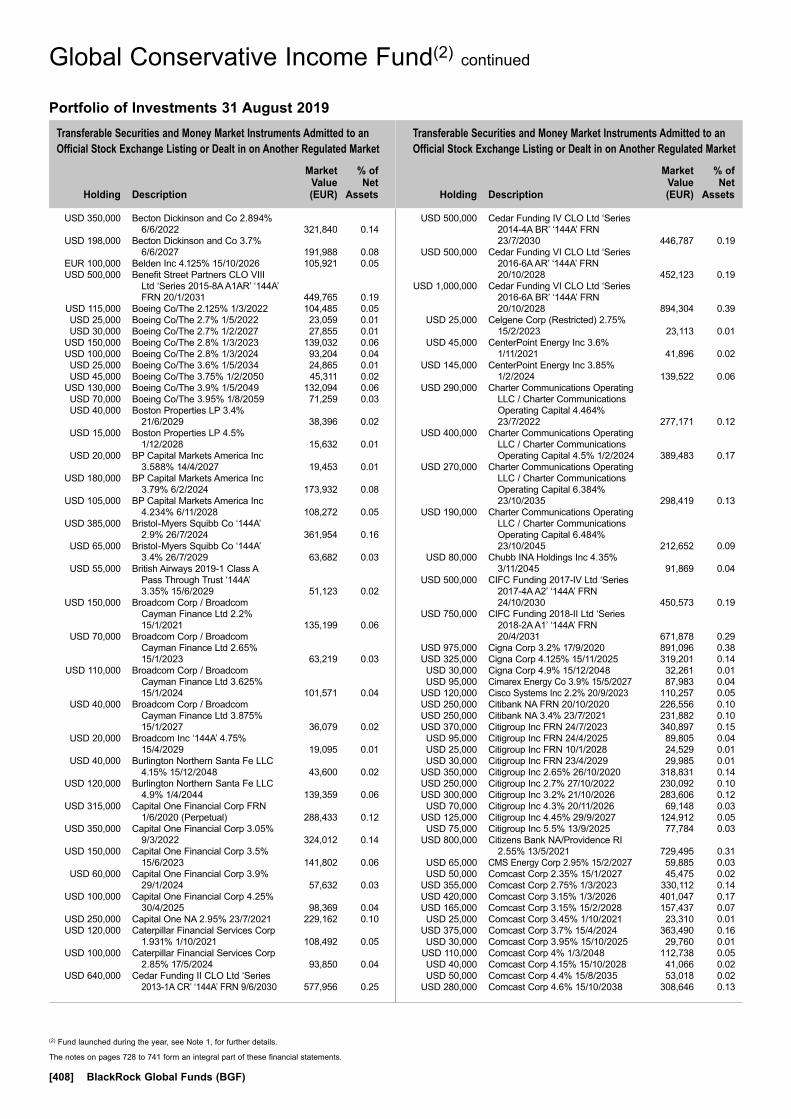
Transferable Securities and Money Market Instruments Admitted to an Official Stock Exchange Listing or Dealt in on Another Regulated Market
Transferable Securities and Money Market Instruments Admitted to an Official Stock Exchange Listing or Dealt in on Another Regulated Market
Holding
Description
Market Value (EUR)
% of Net
Assets
Holding
Description
Market Value (EUR)
% of Net
Assets
The notes on pages 728 to 741 form an integral part of these financial statements.
[408] BlackRock Global Funds (BGF)
USD 350,000 Becton Dickinson and Co 2.894% 6/6/2022 321,840 0.14
USD 198,000 Becton Dickinson and Co 3.7% 6/6/2027 191,988 0.08
EUR 100,000 Belden Inc 4.125% 15/10/2026 105,921 0.05 USD 500,000 Benefit Street Partners CLO VIII
Ltd ‘Series 2015-8A A1AR’ ‘144A’ FRN 20/1/2031 449,765 0.19
USD 115,000 Boeing Co/The 2.125% 1/3/2022 104,485 0.05 USD 25,000 Boeing Co/The 2.7% 1/5/2022 23,059 0.01 USD 30,000 Boeing Co/The 2.7% 1/2/2027 27,855 0.01 USD 150,000 Boeing Co/The 2.8% 1/3/2023 139,032 0.06 USD 100,000 Boeing Co/The 2.8% 1/3/2024 93,204 0.04 USD 25,000 Boeing Co/The 3.6% 1/5/2034 24,865 0.01 USD 45,000 Boeing Co/The 3.75% 1/2/2050 45,311 0.02 USD 130,000 Boeing Co/The 3.9% 1/5/2049 132,094 0.06 USD 70,000 Boeing Co/The 3.95% 1/8/2059 71,259 0.03 USD 40,000 Boston Properties LP 3.4%
21/6/2029 38,396 0.02 USD 15,000 Boston Properties LP 4.5%
1/12/2028 15,632 0.01 USD 20,000 BP Capital Markets America Inc
3.588% 14/4/2027 19,453 0.01 USD 180,000 BP Capital Markets America Inc
3.79% 6/2/2024 173,932 0.08 USD 105,000 BP Capital Markets America Inc
4.234% 6/11/2028 108,272 0.05 USD 385,000 Bristol-Myers Squibb Co ‘144A’
2.9% 26/7/2024 361,954 0.16 USD 65,000 Bristol-Myers Squibb Co ‘144A’
3.4% 26/7/2029 63,682 0.03 USD 55,000 British Airways 2019-1 Class A
Pass Through Trust ‘144A’ 3.35% 15/6/2029 51,123 0.02
USD 150,000 Broadcom Corp / Broadcom Cayman Finance Ltd 2.2% 15/1/2021 135,199 0.06
USD 70,000 Broadcom Corp / Broadcom Cayman Finance Ltd 2.65% 15/1/2023 63,219 0.03
USD 110,000 Broadcom Corp / Broadcom Cayman Finance Ltd 3.625% 15/1/2024 101,571 0.04
USD 40,000 Broadcom Corp / Broadcom Cayman Finance Ltd 3.875% 15/1/2027 36,079 0.02
USD 20,000 Broadcom Inc ‘144A’ 4.75% 15/4/2029 19,095 0.01
USD 40,000 Burlington Northern Santa Fe LLC 4.15% 15/12/2048 43,600 0.02
USD 120,000 Burlington Northern Santa Fe LLC 4.9% 1/4/2044 139,359 0.06
USD 315,000 Capital One Financial Corp FRN 1/6/2020 (Perpetual) 288,433 0.12
USD 350,000 Capital One Financial Corp 3.05% 9/3/2022 324,012 0.14
USD 150,000 Capital One Financial Corp 3.5% 15/6/2023 141,802 0.06
USD 60,000 Capital One Financial Corp 3.9% 29/1/2024 57,632 0.03
USD 100,000 Capital One Financial Corp 4.25% 30/4/2025 98,369 0.04
USD 250,000 Capital One NA 2.95% 23/7/2021 229,162 0.10 USD 120,000 Caterpillar Financial Services Corp
1.931% 1/10/2021 108,492 0.05 USD 100,000 Caterpillar Financial Services Corp
2.85% 17/5/2024 93,850 0.04 USD 640,000 Cedar Funding II CLO Ltd ‘Series
2013-1A CR’ ‘144A’ FRN 9/6/2030 577,956 0.25
USD 500,000 Cedar Funding IV CLO Ltd ‘Series 2014-4A BR’ ‘144A’ FRN 23/7/2030 446,787 0.19
USD 500,000 Cedar Funding VI CLO Ltd ‘Series 2016-6A AR’ ‘144A’ FRN 20/10/2028 452,123 0.19
USD 1,000,000 Cedar Funding VI CLO Ltd ‘Series 2016-6A BR’ ‘144A’ FRN 20/10/2028 894,304 0.39
USD 25,000 Celgene Corp (Restricted) 2.75% 15/2/2023 23,113 0.01
USD 45,000 CenterPoint Energy Inc 3.6% 1/11/2021 41,896 0.02
USD 145,000 CenterPoint Energy Inc 3.85% 1/2/2024 139,522 0.06
USD 290,000 Charter Communications Operating LLC / Charter Communications Operating Capital 4.464% 23/7/2022 277,171 0.12
USD 400,000 Charter Communications Operating LLC / Charter Communications Operating Capital 4.5% 1/2/2024 389,483 0.17
USD 270,000 Charter Communications Operating LLC / Charter Communications Operating Capital 6.384% 23/10/2035 298,419 0.13
USD 190,000 Charter Communications Operating LLC / Charter Communications Operating Capital 6.484% 23/10/2045 212,652 0.09
USD 80,000 Chubb INA Holdings Inc 4.35% 3/11/2045 91,869 0.04
USD 500,000 CIFC Funding 2017-IV Ltd ‘Series 2017-4A A2’ ‘144A’ FRN 24/10/2030 450,573 0.19
USD 750,000 CIFC Funding 2018-II Ltd ‘Series 2018-2A A1’ ‘144A’ FRN 20/4/2031 671,878 0.29
USD 975,000 Cigna Corp 3.2% 17/9/2020 891,096 0.38 USD 325,000 Cigna Corp 4.125% 15/11/2025 319,201 0.14 USD 30,000 Cigna Corp 4.9% 15/12/2048 32,261 0.01 USD 95,000 Cimarex Energy Co 3.9% 15/5/2027 87,983 0.04 USD 120,000 Cisco Systems Inc 2.2% 20/9/2023 110,257 0.05 USD 250,000 Citibank NA FRN 20/10/2020 226,556 0.10 USD 250,000 Citibank NA 3.4% 23/7/2021 231,882 0.10 USD 370,000 Citigroup Inc FRN 24/7/2023 340,897 0.15 USD 95,000 Citigroup Inc FRN 24/4/2025 89,805 0.04 USD 25,000 Citigroup Inc FRN 10/1/2028 24,529 0.01 USD 30,000 Citigroup Inc FRN 23/4/2029 29,985 0.01 USD 350,000 Citigroup Inc 2.65% 26/10/2020 318,831 0.14 USD 250,000 Citigroup Inc 2.7% 27/10/2022 230,092 0.10 USD 300,000 Citigroup Inc 3.2% 21/10/2026 283,606 0.12 USD 70,000 Citigroup Inc 4.3% 20/11/2026 69,148 0.03 USD 125,000 Citigroup Inc 4.45% 29/9/2027 124,912 0.05 USD 75,000 Citigroup Inc 5.5% 13/9/2025 77,784 0.03 USD 800,000 Citizens Bank NA/Providence RI
2.55% 13/5/2021 729,495 0.31 USD 65,000 CMS Energy Corp 2.95% 15/2/2027 59,885 0.03 USD 50,000 Comcast Corp 2.35% 15/1/2027 45,475 0.02 USD 355,000 Comcast Corp 2.75% 1/3/2023 330,112 0.14 USD 420,000 Comcast Corp 3.15% 1/3/2026 401,047 0.17 USD 165,000 Comcast Corp 3.15% 15/2/2028 157,437 0.07 USD 25,000 Comcast Corp 3.45% 1/10/2021 23,310 0.01 USD 375,000 Comcast Corp 3.7% 15/4/2024 363,490 0.16 USD 30,000 Comcast Corp 3.95% 15/10/2025 29,760 0.01 USD 110,000 Comcast Corp 4% 1/3/2048 112,738 0.05 USD 40,000 Comcast Corp 4.15% 15/10/2028 41,066 0.02 USD 50,000 Comcast Corp 4.4% 15/8/2035 53,018 0.02 USD 280,000 Comcast Corp 4.6% 15/10/2038 308,646 0.13
Global Conservative Income Fund(2) continued
Portfolio of Investments 31 August 2019
(2) Fund launched during the year, see Note 1, for further details.
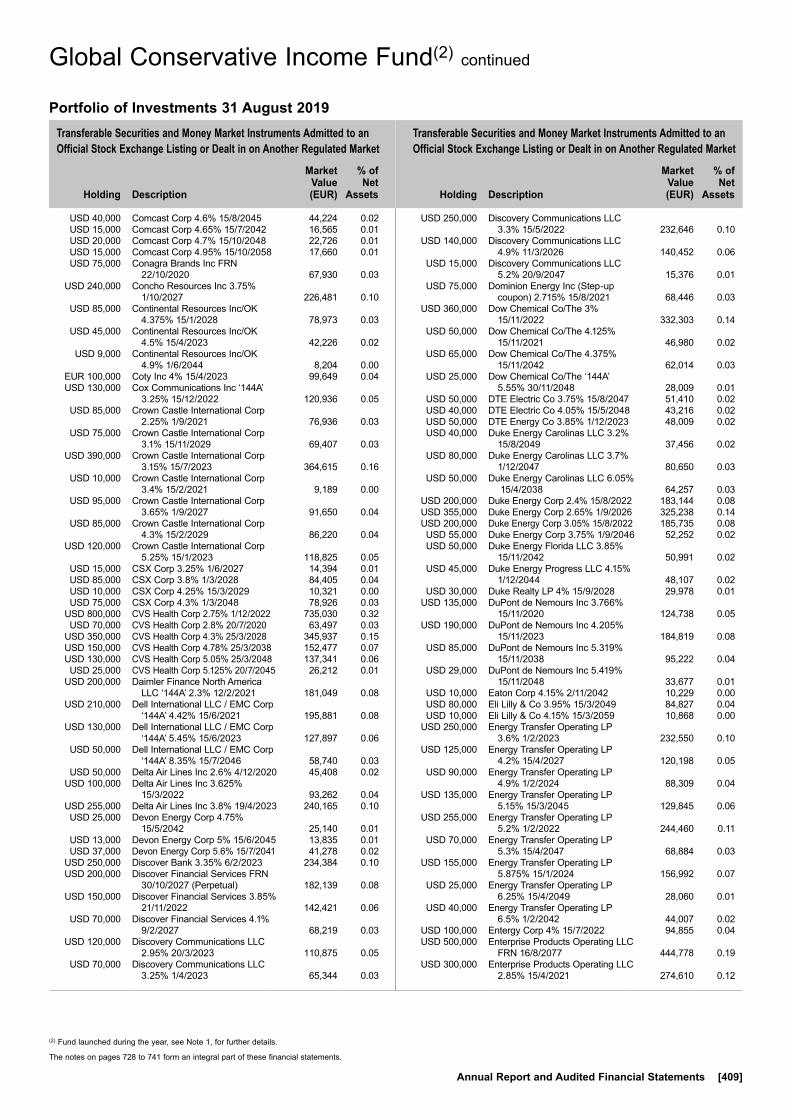
Transferable Securities and Money Market Instruments Admitted to an Official Stock Exchange Listing or Dealt in on Another Regulated Market
Transferable Securities and Money Market Instruments Admitted to an Official Stock Exchange Listing or Dealt in on Another Regulated Market
Holding
Description
Market Value (EUR)
% of Net
Assets
Holding
Description
Market Value (EUR)
% of Net
Assets
(2) Fund launched during the year, see Note 1, for further details.
The notes on pages 728 to 741 form an integral part of these financial statements.
Annual Report and Audited Financial Statements [409]
USD 40,000 Comcast Corp 4.6% 15/8/2045 44,224 0.02 USD 15,000 Comcast Corp 4.65% 15/7/2042 16,565 0.01 USD 20,000 Comcast Corp 4.7% 15/10/2048 22,726 0.01 USD 15,000 Comcast Corp 4.95% 15/10/2058 17,660 0.01 USD 75,000 Conagra Brands Inc FRN
22/10/2020 67,930 0.03 USD 240,000 Concho Resources Inc 3.75%
1/10/2027 226,481 0.10 USD 85,000 Continental Resources Inc/OK
4.375% 15/1/2028 78,973 0.03 USD 45,000 Continental Resources Inc/OK
4.5% 15/4/2023 42,226 0.02 USD 9,000 Continental Resources Inc/OK
4.9% 1/6/2044 8,204 0.00 EUR 100,000 Coty Inc 4% 15/4/2023 99,649 0.04 USD 130,000 Cox Communications Inc ‘144A’
3.25% 15/12/2022 120,936 0.05 USD 85,000 Crown Castle International Corp
2.25% 1/9/2021 76,936 0.03 USD 75,000 Crown Castle International Corp
3.1% 15/11/2029 69,407 0.03 USD 390,000 Crown Castle International Corp
3.15% 15/7/2023 364,615 0.16 USD 10,000 Crown Castle International Corp
3.4% 15/2/2021 9,189 0.00 USD 95,000 Crown Castle International Corp
3.65% 1/9/2027 91,650 0.04 USD 85,000 Crown Castle International Corp
4.3% 15/2/2029 86,220 0.04 USD 120,000 Crown Castle International Corp
5.25% 15/1/2023 118,825 0.05 USD 15,000 CSX Corp 3.25% 1/6/2027 14,394 0.01 USD 85,000 CSX Corp 3.8% 1/3/2028 84,405 0.04 USD 10,000 CSX Corp 4.25% 15/3/2029 10,321 0.00 USD 75,000 CSX Corp 4.3% 1/3/2048 78,926 0.03 USD 800,000 CVS Health Corp 2.75% 1/12/2022 735,030 0.32 USD 70,000 CVS Health Corp 2.8% 20/7/2020 63,497 0.03 USD 350,000 CVS Health Corp 4.3% 25/3/2028 345,937 0.15 USD 150,000 CVS Health Corp 4.78% 25/3/2038 152,477 0.07 USD 130,000 CVS Health Corp 5.05% 25/3/2048 137,341 0.06 USD 25,000 CVS Health Corp 5.125% 20/7/2045 26,212 0.01 USD 200,000 Daimler Finance North America
LLC ‘144A’ 2.3% 12/2/2021 181,049 0.08 USD 210,000 Dell International LLC / EMC Corp
‘144A’ 4.42% 15/6/2021 195,881 0.08 USD 130,000 Dell International LLC / EMC Corp
‘144A’ 5.45% 15/6/2023 127,897 0.06 USD 50,000 Dell International LLC / EMC Corp
‘144A’ 8.35% 15/7/2046 58,740 0.03 USD 50,000 Delta Air Lines Inc 2.6% 4/12/2020 45,408 0.02 USD 100,000 Delta Air Lines Inc 3.625%
15/3/2022 93,262 0.04 USD 255,000 Delta Air Lines Inc 3.8% 19/4/2023 240,165 0.10 USD 25,000 Devon Energy Corp 4.75%
15/5/2042 25,140 0.01 USD 13,000 Devon Energy Corp 5% 15/6/2045 13,835 0.01 USD 37,000 Devon Energy Corp 5.6% 15/7/2041 41,278 0.02 USD 250,000 Discover Bank 3.35% 6/2/2023 234,384 0.10 USD 200,000 Discover Financial Services FRN
30/10/2027 (Perpetual) 182,139 0.08 USD 150,000 Discover Financial Services 3.85%
21/11/2022 142,421 0.06 USD 70,000 Discover Financial Services 4.1%
9/2/2027 68,219 0.03 USD 120,000 Discovery Communications LLC
2.95% 20/3/2023 110,875 0.05 USD 70,000 Discovery Communications LLC
3.25% 1/4/2023 65,344 0.03
USD 250,000 Discovery Communications LLC 3.3% 15/5/2022 232,646 0.10
USD 140,000 Discovery Communications LLC 4.9% 11/3/2026 140,452 0.06
USD 15,000 Discovery Communications LLC 5.2% 20/9/2047 15,376 0.01
USD 75,000 Dominion Energy Inc (Step-up coupon) 2.715% 15/8/2021 68,446 0.03
USD 360,000 Dow Chemical Co/The 3% 15/11/2022 332,303 0.14
USD 50,000 Dow Chemical Co/The 4.125% 15/11/2021 46,980 0.02
USD 65,000 Dow Chemical Co/The 4.375% 15/11/2042 62,014 0.03
USD 25,000 Dow Chemical Co/The ‘144A’ 5.55% 30/11/2048 28,009 0.01
USD 50,000 DTE Electric Co 3.75% 15/8/2047 51,410 0.02 USD 40,000 DTE Electric Co 4.05% 15/5/2048 43,216 0.02 USD 50,000 DTE Energy Co 3.85% 1/12/2023 48,009 0.02 USD 40,000 Duke Energy Carolinas LLC 3.2%
15/8/2049 37,456 0.02 USD 80,000 Duke Energy Carolinas LLC 3.7%
1/12/2047 80,650 0.03 USD 50,000 Duke Energy Carolinas LLC 6.05%
15/4/2038 64,257 0.03 USD 200,000 Duke Energy Corp 2.4% 15/8/2022 183,144 0.08 USD 355,000 Duke Energy Corp 2.65% 1/9/2026 325,238 0.14 USD 200,000 Duke Energy Corp 3.05% 15/8/2022 185,735 0.08 USD 55,000 Duke Energy Corp 3.75% 1/9/2046 52,252 0.02 USD 50,000 Duke Energy Florida LLC 3.85%
15/11/2042 50,991 0.02 USD 45,000 Duke Energy Progress LLC 4.15%
1/12/2044 48,107 0.02 USD 30,000 Duke Realty LP 4% 15/9/2028 29,978 0.01 USD 135,000 DuPont de Nemours Inc 3.766%
15/11/2020 124,738 0.05 USD 190,000 DuPont de Nemours Inc 4.205%
15/11/2023 184,819 0.08 USD 85,000 DuPont de Nemours Inc 5.319%
15/11/2038 95,222 0.04 USD 29,000 DuPont de Nemours Inc 5.419%
15/11/2048 33,677 0.01 USD 10,000 Eaton Corp 4.15% 2/11/2042 10,229 0.00 USD 80,000 Eli Lilly & Co 3.95% 15/3/2049 84,827 0.04 USD 10,000 Eli Lilly & Co 4.15% 15/3/2059 10,868 0.00 USD 250,000 Energy Transfer Operating LP
3.6% 1/2/2023 232,550 0.10 USD 125,000 Energy Transfer Operating LP
4.2% 15/4/2027 120,198 0.05 USD 90,000 Energy Transfer Operating LP
4.9% 1/2/2024 88,309 0.04 USD 135,000 Energy Transfer Operating LP
5.15% 15/3/2045 129,845 0.06 USD 255,000 Energy Transfer Operating LP
5.2% 1/2/2022 244,460 0.11 USD 70,000 Energy Transfer Operating LP
5.3% 15/4/2047 68,884 0.03 USD 155,000 Energy Transfer Operating LP
5.875% 15/1/2024 156,992 0.07 USD 25,000 Energy Transfer Operating LP
6.25% 15/4/2049 28,060 0.01 USD 40,000 Energy Transfer Operating LP
6.5% 1/2/2042 44,007 0.02 USD 100,000 Entergy Corp 4% 15/7/2022 94,855 0.04 USD 500,000 Enterprise Products Operating LLC
FRN 16/8/2077 444,778 0.19 USD 300,000 Enterprise Products Operating LLC
2.85% 15/4/2021 274,610 0.12
Global Conservative Income Fund(2) continued
Portfolio of Investments 31 August 2019
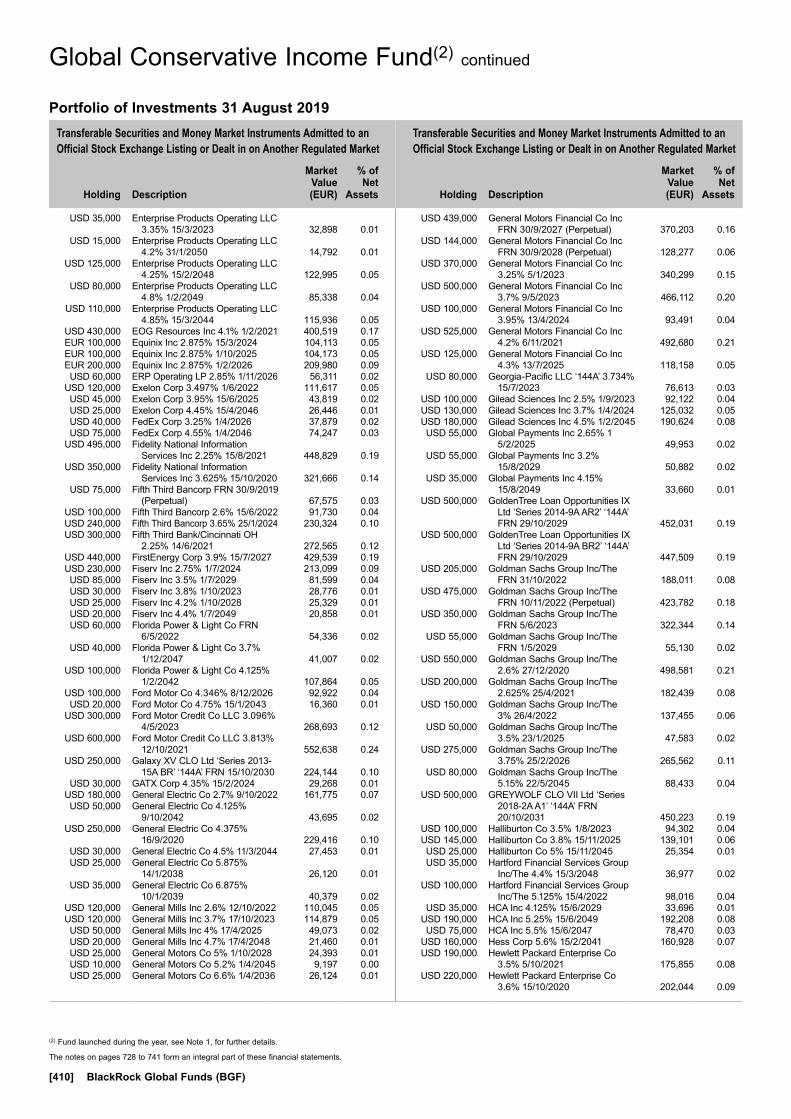
Transferable Securities and Money Market Instruments Admitted to an Official Stock Exchange Listing or Dealt in on Another Regulated Market
Transferable Securities and Money Market Instruments Admitted to an Official Stock Exchange Listing or Dealt in on Another Regulated Market
Holding
Description
Market Value (EUR)
% of Net
Assets
Holding
Description
Market Value (EUR)
% of Net
Assets
(2) Fund launched during the year, see Note 1, for further details.
The notes on pages 728 to 741 form an integral part of these financial statements.
[410] BlackRock Global Funds (BGF)
USD 35,000 Enterprise Products Operating LLC 3.35% 15/3/2023 32,898 0.01
USD 15,000 Enterprise Products Operating LLC 4.2% 31/1/2050 14,792 0.01
USD 125,000 Enterprise Products Operating LLC 4.25% 15/2/2048 122,995 0.05
USD 80,000 Enterprise Products Operating LLC 4.8% 1/2/2049 85,338 0.04
USD 110,000 Enterprise Products Operating LLC 4.85% 15/3/2044 115,936 0.05
USD 430,000 EOG Resources Inc 4.1% 1/2/2021 400,519 0.17 EUR 100,000 Equinix Inc 2.875% 15/3/2024 104,113 0.05 EUR 100,000 Equinix Inc 2.875% 1/10/2025 104,173 0.05 EUR 200,000 Equinix Inc 2.875% 1/2/2026 209,980 0.09 USD 60,000 ERP Operating LP 2.85% 1/11/2026 56,311 0.02 USD 120,000 Exelon Corp 3.497% 1/6/2022 111,617 0.05 USD 45,000 Exelon Corp 3.95% 15/6/2025 43,819 0.02 USD 25,000 Exelon Corp 4.45% 15/4/2046 26,446 0.01 USD 40,000 FedEx Corp 3.25% 1/4/2026 37,879 0.02 USD 75,000 FedEx Corp 4.55% 1/4/2046 74,247 0.03 USD 495,000 Fidelity National Information
Services Inc 2.25% 15/8/2021 448,829 0.19 USD 350,000 Fidelity National Information
Services Inc 3.625% 15/10/2020 321,666 0.14 USD 75,000 Fifth Third Bancorp FRN 30/9/2019
(Perpetual) 67,575 0.03 USD 100,000 Fifth Third Bancorp 2.6% 15/6/2022 91,730 0.04 USD 240,000 Fifth Third Bancorp 3.65% 25/1/2024 230,324 0.10 USD 300,000 Fifth Third Bank/Cincinnati OH
2.25% 14/6/2021 272,565 0.12 USD 440,000 FirstEnergy Corp 3.9% 15/7/2027 429,539 0.19 USD 230,000 Fiserv Inc 2.75% 1/7/2024 213,099 0.09 USD 85,000 Fiserv Inc 3.5% 1/7/2029 81,599 0.04 USD 30,000 Fiserv Inc 3.8% 1/10/2023 28,776 0.01 USD 25,000 Fiserv Inc 4.2% 1/10/2028 25,329 0.01 USD 20,000 Fiserv Inc 4.4% 1/7/2049 20,858 0.01 USD 60,000 Florida Power & Light Co FRN
6/5/2022 54,336 0.02 USD 40,000 Florida Power & Light Co 3.7%
1/12/2047 41,007 0.02 USD 100,000 Florida Power & Light Co 4.125%
1/2/2042 107,864 0.05 USD 100,000 Ford Motor Co 4.346% 8/12/2026 92,922 0.04 USD 20,000 Ford Motor Co 4.75% 15/1/2043 16,360 0.01 USD 300,000 Ford Motor Credit Co LLC 3.096%
4/5/2023 268,693 0.12 USD 600,000 Ford Motor Credit Co LLC 3.813%
12/10/2021 552,638 0.24 USD 250,000 Galaxy XV CLO Ltd ‘Series 2013-
15A BR’ ‘144A’ FRN 15/10/2030 224,144 0.10 USD 30,000 GATX Corp 4.35% 15/2/2024 29,268 0.01 USD 180,000 General Electric Co 2.7% 9/10/2022 161,775 0.07 USD 50,000 General Electric Co 4.125%
9/10/2042 43,695 0.02 USD 250,000 General Electric Co 4.375%
16/9/2020 229,416 0.10 USD 30,000 General Electric Co 4.5% 11/3/2044 27,453 0.01 USD 25,000 General Electric Co 5.875%
14/1/2038 26,120 0.01 USD 35,000 General Electric Co 6.875%
10/1/2039 40,379 0.02 USD 120,000 General Mills Inc 2.6% 12/10/2022 110,045 0.05 USD 120,000 General Mills Inc 3.7% 17/10/2023 114,879 0.05 USD 50,000 General Mills Inc 4% 17/4/2025 49,073 0.02 USD 20,000 General Mills Inc 4.7% 17/4/2048 21,460 0.01 USD 25,000 General Motors Co 5% 1/10/2028 24,393 0.01 USD 10,000 General Motors Co 5.2% 1/4/2045 9,197 0.00 USD 25,000 General Motors Co 6.6% 1/4/2036 26,124 0.01
USD 439,000 General Motors Financial Co Inc FRN 30/9/2027 (Perpetual) 370,203 0.16
USD 144,000 General Motors Financial Co Inc FRN 30/9/2028 (Perpetual) 128,277 0.06
USD 370,000 General Motors Financial Co Inc 3.25% 5/1/2023 340,299 0.15
USD 500,000 General Motors Financial Co Inc 3.7% 9/5/2023 466,112 0.20
USD 100,000 General Motors Financial Co Inc 3.95% 13/4/2024 93,491 0.04
USD 525,000 General Motors Financial Co Inc 4.2% 6/11/2021 492,680 0.21
USD 125,000 General Motors Financial Co Inc 4.3% 13/7/2025 118,158 0.05
USD 80,000 Georgia-Pacific LLC ‘144A’ 3.734% 15/7/2023 76,613 0.03
USD 100,000 Gilead Sciences Inc 2.5% 1/9/2023 92,122 0.04 USD 130,000 Gilead Sciences Inc 3.7% 1/4/2024 125,032 0.05 USD 180,000 Gilead Sciences Inc 4.5% 1/2/2045 190,624 0.08 USD 55,000 Global Payments Inc 2.65% 1
5/2/2025 49,953 0.02 USD 55,000 Global Payments Inc 3.2%
15/8/2029 50,882 0.02 USD 35,000 Global Payments Inc 4.15%
15/8/2049 33,660 0.01 USD 500,000 GoldenTree Loan Opportunities IX
Ltd ‘Series 2014-9A AR2’ ‘144A’ FRN 29/10/2029 452,031 0.19
USD 500,000 GoldenTree Loan Opportunities IX Ltd ‘Series 2014-9A BR2’ ‘144A’ FRN 29/10/2029 447,509 0.19
USD 205,000 Goldman Sachs Group Inc/The FRN 31/10/2022 188,011 0.08
USD 475,000 Goldman Sachs Group Inc/The FRN 10/11/2022 (Perpetual) 423,782 0.18
USD 350,000 Goldman Sachs Group Inc/The FRN 5/6/2023 322,344 0.14
USD 55,000 Goldman Sachs Group Inc/The FRN 1/5/2029 55,130 0.02
USD 550,000 Goldman Sachs Group Inc/The 2.6% 27/12/2020 498,581 0.21
USD 200,000 Goldman Sachs Group Inc/The 2.625% 25/4/2021 182,439 0.08
USD 150,000 Goldman Sachs Group Inc/The 3% 26/4/2022 137,455 0.06
USD 50,000 Goldman Sachs Group Inc/The 3.5% 23/1/2025 47,583 0.02
USD 275,000 Goldman Sachs Group Inc/The 3.75% 25/2/2026 265,562 0.11
USD 80,000 Goldman Sachs Group Inc/The 5.15% 22/5/2045 88,433 0.04
USD 500,000 GREYWOLF CLO VII Ltd ‘Series 2018-2A A1’ ‘144A’ FRN 20/10/2031 450,223 0.19
USD 100,000 Halliburton Co 3.5% 1/8/2023 94,302 0.04 USD 145,000 Halliburton Co 3.8% 15/11/2025 139,101 0.06 USD 25,000 Halliburton Co 5% 15/11/2045 25,354 0.01 USD 35,000 Hartford Financial Services Group
Inc/The 4.4% 15/3/2048 36,977 0.02 USD 100,000 Hartford Financial Services Group
Inc/The 5.125% 15/4/2022 98,016 0.04 USD 35,000 HCA Inc 4.125% 15/6/2029 33,696 0.01 USD 190,000 HCA Inc 5.25% 15/6/2049 192,208 0.08 USD 75,000 HCA Inc 5.5% 15/6/2047 78,470 0.03 USD 160,000 Hess Corp 5.6% 15/2/2041 160,928 0.07 USD 190,000 Hewlett Packard Enterprise Co
3.5% 5/10/2021 175,855 0.08 USD 220,000 Hewlett Packard Enterprise Co
3.6% 15/10/2020 202,044 0.09
Global Conservative Income Fund(2) continued
Portfolio of Investments 31 August 2019
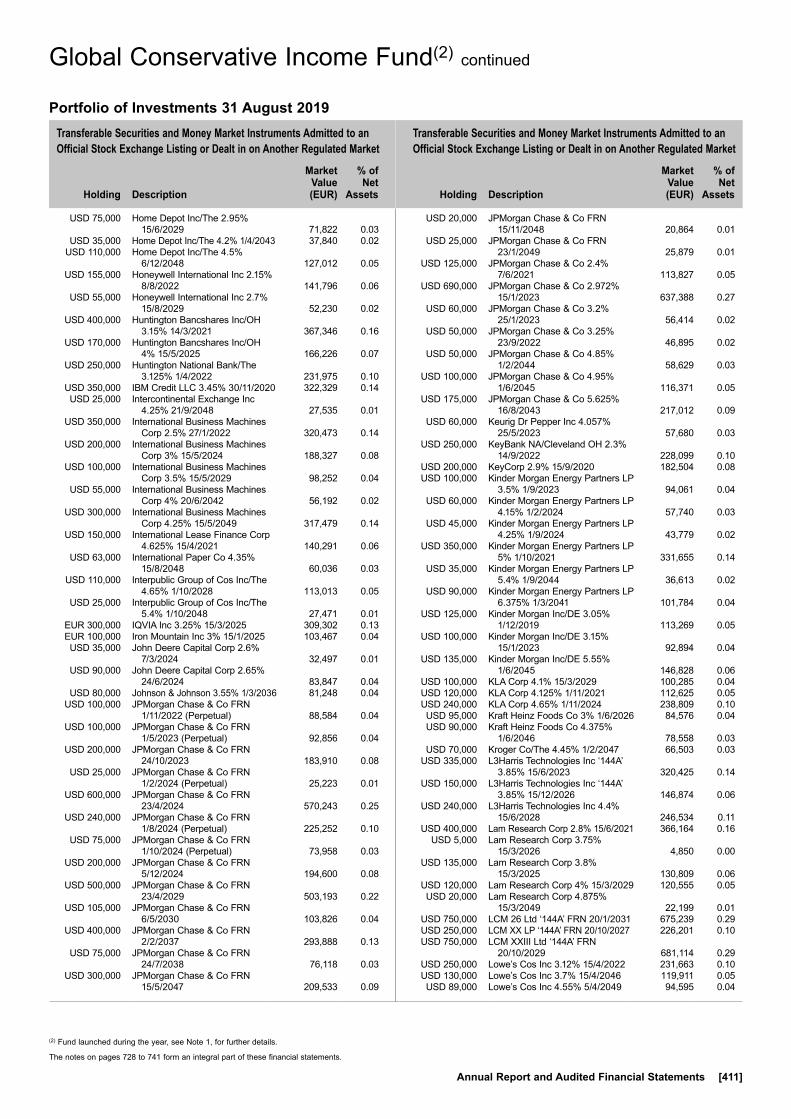
Transferable Securities and Money Market Instruments Admitted to an Official Stock Exchange Listing or Dealt in on Another Regulated Market
Transferable Securities and Money Market Instruments Admitted to an Official Stock Exchange Listing or Dealt in on Another Regulated Market
Holding
Description
Market Value (EUR)
% of Net
Assets
Holding
Description
Market Value (EUR)
% of Net
Assets
(2) Fund launched during the year, see Note 1, for further details.
The notes on pages 728 to 741 form an integral part of these financial statements.
Annual Report and Audited Financial Statements [411]
USD 75,000 Home Depot Inc/The 2.95% 15/6/2029 71,822 0.03
USD 35,000 Home Depot Inc/The 4.2% 1/4/2043 37,840 0.02 USD 110,000 Home Depot Inc/The 4.5%
6/12/2048 127,012 0.05 USD 155,000 Honeywell International Inc 2.15%
8/8/2022 141,796 0.06 USD 55,000 Honeywell International Inc 2.7%
15/8/2029 52,230 0.02 USD 400,000 Huntington Bancshares Inc/OH
3.15% 14/3/2021 367,346 0.16 USD 170,000 Huntington Bancshares Inc/OH
4% 15/5/2025 166,226 0.07 USD 250,000 Huntington National Bank/The
3.125% 1/4/2022 231,975 0.10 USD 350,000 IBM Credit LLC 3.45% 30/11/2020 322,329 0.14 USD 25,000 Intercontinental Exchange Inc
4.25% 21/9/2048 27,535 0.01 USD 350,000 International Business Machines
Corp 2.5% 27/1/2022 320,473 0.14 USD 200,000 International Business Machines
Corp 3% 15/5/2024 188,327 0.08 USD 100,000 International Business Machines
Corp 3.5% 15/5/2029 98,252 0.04 USD 55,000 International Business Machines
Corp 4% 20/6/2042 56,192 0.02 USD 300,000 International Business Machines
Corp 4.25% 15/5/2049 317,479 0.14 USD 150,000 International Lease Finance Corp
4.625% 15/4/2021 140,291 0.06 USD 63,000 International Paper Co 4.35%
15/8/2048 60,036 0.03 USD 110,000 Interpublic Group of Cos Inc/The
4.65% 1/10/2028 113,013 0.05 USD 25,000 Interpublic Group of Cos Inc/The
5.4% 1/10/2048 27,471 0.01 EUR 300,000 IQVIA Inc 3.25% 15/3/2025 309,302 0.13 EUR 100,000 Iron Mountain Inc 3% 15/1/2025 103,467 0.04 USD 35,000 John Deere Capital Corp 2.6%
7/3/2024 32,497 0.01 USD 90,000 John Deere Capital Corp 2.65%
24/6/2024 83,847 0.04 USD 80,000 Johnson & Johnson 3.55% 1/3/2036 81,248 0.04 USD 100,000 JPMorgan Chase & Co FRN
1/11/2022 (Perpetual) 88,584 0.04 USD 100,000 JPMorgan Chase & Co FRN
1/5/2023 (Perpetual) 92,856 0.04 USD 200,000 JPMorgan Chase & Co FRN
24/10/2023 183,910 0.08 USD 25,000 JPMorgan Chase & Co FRN
1/2/2024 (Perpetual) 25,223 0.01 USD 600,000 JPMorgan Chase & Co FRN
23/4/2024 570,243 0.25 USD 240,000 JPMorgan Chase & Co FRN
1/8/2024 (Perpetual) 225,252 0.10 USD 75,000 JPMorgan Chase & Co FRN
1/10/2024 (Perpetual) 73,958 0.03 USD 200,000 JPMorgan Chase & Co FRN
5/12/2024 194,600 0.08 USD 500,000 JPMorgan Chase & Co FRN
23/4/2029 503,193 0.22 USD 105,000 JPMorgan Chase & Co FRN
6/5/2030 103,826 0.04 USD 400,000 JPMorgan Chase & Co FRN
2/2/2037 293,888 0.13 USD 75,000 JPMorgan Chase & Co FRN
24/7/2038 76,118 0.03 USD 300,000 JPMorgan Chase & Co FRN
15/5/2047 209,533 0.09
USD 20,000 JPMorgan Chase & Co FRN 15/11/2048 20,864 0.01
USD 25,000 JPMorgan Chase & Co FRN 23/1/2049 25,879 0.01
USD 125,000 JPMorgan Chase & Co 2.4% 7/6/2021 113,827 0.05
USD 690,000 JPMorgan Chase & Co 2.972% 15/1/2023 637,388 0.27
USD 60,000 JPMorgan Chase & Co 3.2% 25/1/2023 56,414 0.02
USD 50,000 JPMorgan Chase & Co 3.25% 23/9/2022 46,895 0.02
USD 50,000 JPMorgan Chase & Co 4.85% 1/2/2044 58,629 0.03
USD 100,000 JPMorgan Chase & Co 4.95% 1/6/2045 116,371 0.05
USD 175,000 JPMorgan Chase & Co 5.625% 16/8/2043 217,012 0.09
USD 60,000 Keurig Dr Pepper Inc 4.057% 25/5/2023 57,680 0.03
USD 250,000 KeyBank NA/Cleveland OH 2.3% 14/9/2022 228,099 0.10
USD 200,000 KeyCorp 2.9% 15/9/2020 182,504 0.08 USD 100,000 Kinder Morgan Energy Partners LP
3.5% 1/9/2023 94,061 0.04 USD 60,000 Kinder Morgan Energy Partners LP
4.15% 1/2/2024 57,740 0.03 USD 45,000 Kinder Morgan Energy Partners LP
4.25% 1/9/2024 43,779 0.02 USD 350,000 Kinder Morgan Energy Partners LP
5% 1/10/2021 331,655 0.14 USD 35,000 Kinder Morgan Energy Partners LP
5.4% 1/9/2044 36,613 0.02 USD 90,000 Kinder Morgan Energy Partners LP
6.375% 1/3/2041 101,784 0.04 USD 125,000 Kinder Morgan Inc/DE 3.05%
1/12/2019 113,269 0.05 USD 100,000 Kinder Morgan Inc/DE 3.15%
15/1/2023 92,894 0.04 USD 135,000 Kinder Morgan Inc/DE 5.55%
1/6/2045 146,828 0.06 USD 100,000 KLA Corp 4.1% 15/3/2029 100,285 0.04 USD 120,000 KLA Corp 4.125% 1/11/2021 112,625 0.05 USD 240,000 KLA Corp 4.65% 1/11/2024 238,809 0.10 USD 95,000 Kraft Heinz Foods Co 3% 1/6/2026 84,576 0.04 USD 90,000 Kraft Heinz Foods Co 4.375%
1/6/2046 78,558 0.03 USD 70,000 Kroger Co/The 4.45% 1/2/2047 66,503 0.03 USD 335,000 L3Harris Technologies Inc ‘144A’
3.85% 15/6/2023 320,425 0.14 USD 150,000 L3Harris Technologies Inc ‘144A’
3.85% 15/12/2026 146,874 0.06 USD 240,000 L3Harris Technologies Inc 4.4%
15/6/2028 246,534 0.11 USD 400,000 Lam Research Corp 2.8% 15/6/2021 366,164 0.16 USD 5,000 Lam Research Corp 3.75%
15/3/2026 4,850 0.00 USD 135,000 Lam Research Corp 3.8%
15/3/2025 130,809 0.06 USD 120,000 Lam Research Corp 4% 15/3/2029 120,555 0.05 USD 20,000 Lam Research Corp 4.875%
15/3/2049 22,199 0.01 USD 750,000 LCM 26 Ltd ‘144A’ FRN 20/1/2031 675,239 0.29 USD 250,000 LCM XX LP ‘144A’ FRN 20/10/2027 226,201 0.10 USD 750,000 LCM XXIII Ltd ‘144A’ FRN
20/10/2029 681,114 0.29 USD 250,000 Lowe’s Cos Inc 3.12% 15/4/2022 231,663 0.10 USD 130,000 Lowe’s Cos Inc 3.7% 15/4/2046 119,911 0.05 USD 89,000 Lowe’s Cos Inc 4.55% 5/4/2049 94,595 0.04
Global Conservative Income Fund(2) continued
Portfolio of Investments 31 August 2019

Transferable Securities and Money Market Instruments Admitted to an Official Stock Exchange Listing or Dealt in on Another Regulated Market
Transferable Securities and Money Market Instruments Admitted to an Official Stock Exchange Listing or Dealt in on Another Regulated Market
Holding
Description
Market Value (EUR)
% of Net
Assets
Holding
Description
Market Value (EUR)
% of Net
Assets
The notes on pages 728 to 741 form an integral part of these financial statements.
[412] BlackRock Global Funds (BGF)
USD 75,000 M&T Bank Corp FRN 1/11/2026 (Perpetual) 71,182 0.03
USD 250,000 Madison Park Funding XXI Ltd ‘Series 2016-21A A2’ ‘144A’ FRN 25/7/2029 226,447 0.10
USD 74,000 Marathon Oil Corp 4.4% 15/7/2027 72,140 0.03 USD 85,000 Marathon Petroleum Corp 4.75%
15/9/2044 82,936 0.04 USD 100,000 Marriott International Inc/MD 2.3%
15/1/2022 90,479 0.04 USD 185,000 Marsh & McLennan Cos Inc 3.5%
29/12/2020 170,505 0.07 USD 50,000 Marsh & McLennan Cos Inc 3.5%
3/6/2024 47,782 0.02 USD 100,000 Marsh & McLennan Cos Inc 4.375%
15/3/2029 104,064 0.05 EUR 200,000 Mauser Packaging Solutions
Holding Co 4.75% 15/4/2024 207,091 0.09 USD 110,000 McDonald’s Corp 3.25% 10/6/2024 105,091 0.05 USD 30,000 McDonald’s Corp 4.45% 1/9/2048 32,260 0.01 USD 40,000 McDonald’s Corp 4.7% 9/12/2035 43,741 0.02 USD 159,000 McDonald’s Corp 4.875% 9/12/2045 178,135 0.08 USD 111,000 Medtronic Inc 4.375% 15/3/2035 121,623 0.05 USD 40,000 MetLife Inc 4.721% 15/12/2044 45,338 0.02 USD 250,000 Metropolitan Life Global Funding I
‘144A’ 2.4% 8/1/2021 227,631 0.10 USD 90,000 Microsoft Corp 2.4% 8/8/2026 84,233 0.04 USD 100,000 Microsoft Corp 3.45% 8/8/2036 101,697 0.04 USD 315,000 Microsoft Corp 3.7% 8/8/2046 335,066 0.14 USD 115,000 Microsoft Corp 4.1% 6/2/2037 125,891 0.05 USD 165,000 MidAmerican Energy Co 3.65%
15/4/2029 167,127 0.07 USD 200,000 Molson Coors Brewing Co 2.1%
15/7/2021 180,971 0.08 USD 450,000 Morgan Stanley FRN 15/10/2019
(Perpetual) 408,904 0.18 USD 200,000 Morgan Stanley FRN 24/4/2024 190,466 0.08 USD 130,000 Morgan Stanley FRN 22/7/2025 120,037 0.05 USD 275,000 Morgan Stanley FRN 22/7/2028 265,379 0.11 USD 110,000 Morgan Stanley FRN 23/1/2030 113,758 0.05 USD 550,000 Morgan Stanley 2.75% 19/5/2022 506,298 0.22 USD 175,000 Morgan Stanley 3.125% 23/1/2023 163,303 0.07 USD 100,000 Morgan Stanley 3.75% 25/2/2023 95,216 0.04 USD 100,000 Morgan Stanley 3.875% 29/4/2024 97,126 0.04 USD 125,000 Morgan Stanley 3.875% 27/1/2026 122,433 0.05 USD 105,000 Morgan Stanley 3.95% 23/4/2027 101,666 0.04 USD 180,000 Morgan Stanley 4.875% 1/11/2022 175,181 0.08 USD 140,000 Motorola Solutions Inc 4.6%
23/5/2029 139,019 0.06 USD 210,000 MPLX LP 4.125% 1/3/2027 199,903 0.09 USD 90,000 MPLX LP 4.7% 15/4/2048 83,876 0.04 USD 65,000 MPLX LP 4.875% 1/12/2024 64,578 0.03 USD 30,000 MPLX LP 4.875% 1/6/2025 29,998 0.01 USD 80,000 MPLX LP 5.5% 15/2/2049 82,714 0.04 USD 175,000 Nationwide Financial Services Inc
6.75% 15/5/2037 178,468 0.08 EUR 248,000 Netflix Inc 3.875% 15/11/2029 270,355 0.12 USD 500,000 Neuberger Berman CLO XXIII Ltd
‘Series 2016-23A CR’ ‘144A’ FRN 17/10/2027 445,182 0.19
USD 200,000 New York Life Global Funding ‘144A’ 2.25% 12/7/2022 182,381 0.08
USD 43,000 Newell Brands Inc 3.85% 1/4/2023 40,145 0.02 USD 207,000 Newfield Exploration Co 5.375%
1/1/2026 206,020 0.09 USD 240,000 Newfield Exploration Co 5.625%
1/7/2024 239,171 0.10
USD 20,000 Newmont Goldcorp Corp 4.875% 15/3/2042 21,731 0.01
USD 175,000 NextEra Energy Capital Holdings Inc FRN 1/5/2079 169,003 0.07
USD 140,000 NextEra Energy Capital Holdings Inc 2.403% 1/9/2021 127,473 0.06
USD 100,000 NextEra Energy Capital Holdings Inc 3.342% 1/9/2020 91,492 0.04
USD 20,000 NextEra Energy Capital Holdings Inc 3.55% 1/5/2027 19,353 0.01
USD 75,000 NiSource Inc 3.95% 30/3/2048 74,341 0.03 USD 25,000 NiSource Inc 4.8% 15/2/2044 27,138 0.01 USD 70,000 Nissan Motor Acceptance Corp
‘144A’ 2.65% 13/7/2022 63,726 0.03 USD 95,000 Noble Energy Inc 3.85% 15/1/2028 89,562 0.04 USD 3,000 Noble Energy Inc 5.05% 15/11/2044 3,018 0.00 USD 20,000 Noble Energy Inc 5.25% 15/11/2043 20,523 0.01 USD 145,000 Norfolk Southern Corp 2.9%
15/6/2026 135,758 0.06 USD 60,000 Norfolk Southern Corp 2.903%
15/2/2023 55,799 0.02 USD 55,000 Norfolk Southern Corp 4.15%
28/2/2048 58,342 0.03 USD 450,000 Northern Trust Corp FRN 1/10/2026
(Perpetual) 413,088 0.18 USD 75,000 NRG Energy Inc ‘144A’ 3.75%
15/6/2024 70,249 0.03 USD 185,000 NVIDIA Corp 3.2% 16/9/2026 175,961 0.08 USD 140,000 Occidental Petroleum Corp 2.7%
15/8/2022 127,833 0.06 USD 280,000 Occidental Petroleum Corp 2.9%
15/8/2024 255,260 0.11 USD 40,000 Occidental Petroleum Corp 4.2%
15/3/2048 36,375 0.02 USD 780,000 Octagon Investment Partners 30
Ltd ‘Series 2017-1A A1’ ‘144A’ FRN 17/3/2030 707,888 0.31
USD 525,000 Octagon Investment Partners XIV Ltd ‘Series 2012-1A A1AR’ ‘144A’ FRN 15/7/2029 475,516 0.21
USD 500,000 OHA Loan Funding 2015-1 Ltd ‘Series 2015-1A AR’ ‘144A’ FRN 15/8/2029 452,786 0.20
USD 50,000 Ohio Power Co 4% 1/6/2049 52,884 0.02 USD 105,000 Ohio Power Co 5.375% 1/10/2021 101,303 0.04 USD 25,000 Oncor Electric Delivery Co LLC
3.75% 1/4/2045 25,674 0.01 USD 105,000 Oncor Electric Delivery Co LLC
4.1% 15/11/2048 114,339 0.05 USD 80,000 Oracle Corp 2.4% 15/9/2023 73,562 0.03 USD 320,000 Oracle Corp 2.5% 15/10/2022 294,780 0.13 USD 145,000 Oracle Corp 3.4% 8/7/2024 138,983 0.06 USD 95,000 Oracle Corp 3.85% 15/7/2036 96,574 0.04 USD 170,000 Oracle Corp 4.125% 15/5/2045 177,518 0.08 USD 80,000 Oracle Corp 5.375% 15/7/2040 97,114 0.04 USD 75,000 PacifiCorp 4.1% 1/2/2042 78,891 0.03 USD 500,000 Palmer Square CLO 2018-1 Ltd
‘Series 2018-1A A1’ ‘144A’ FRN 18/4/2031 448,948 0.19
EUR 267,000 Panther BF Aggregator 2 LP / Panther Finance Co Inc 4.375% 15/5/2026 272,746 0.12
USD 500,000 Park Avenue Institutional Advisers CLO Ltd 2016-1 ‘Series 2016-1A A2R’ ‘144A’ FRN 23/8/2031 448,652 0.19
USD 220,000 Penske Truck Leasing Co Lp / PTL Finance Corp ‘144A’ 3.375% 1/2/2022 203,751 0.09
Global Conservative Income Fund(2) continued
Portfolio of Investments 31 August 2019
(2) Fund launched during the year, see Note 1, for further details.

Transferable Securities and Money Market Instruments Admitted to an Official Stock Exchange Listing or Dealt in on Another Regulated Market
Transferable Securities and Money Market Instruments Admitted to an Official Stock Exchange Listing or Dealt in on Another Regulated Market
Holding
Description
Market Value (EUR)
% of Net
Assets
Holding
Description
Market Value (EUR)
% of Net
Assets
(2) Fund launched during the year, see Note 1, for further details.
The notes on pages 728 to 741 form an integral part of these financial statements.
Annual Report and Audited Financial Statements [413]
Portfolio of Investments 31 August 2019
USD 295,000 Penske Truck Leasing Co Lp / PTL Finance Corp ‘144A’ 3.45% 1/7/2024 277,918 0.12
USD 100,000 Penske Truck Leasing Co Lp / PTL Finance Corp ‘144A’ 4.125% 1/8/2023 95,930 0.04
USD 80,000 Penske Truck Leasing Co Lp / PTL Finance Corp ‘144A’ 4.25% 17/1/2023 76,885 0.03
USD 85,000 Pfizer Inc 4.3% 15/6/2043 92,678 0.04 USD 100,000 Philip Morris International Inc
1.875% 1/11/2019 90,470 0.04 USD 120,000 Plains All American Pipeline LP /
PAA Finance Corp 2.6% 15/12/2019 108,549 0.05
USD 100,000 Plains All American Pipeline LP / PAA Finance Corp 3.65% 1/6/2022 93,019 0.04
USD 45,000 Plains All American Pipeline LP / PAA Finance Corp 4.9% 15/2/2045 41,824 0.02
USD 500,000 PNC Bank NA 2.45% 28/7/2022 458,365 0.20 USD 100,000 PPL Capital Funding Inc 3.1%
15/5/2026 92,957 0.04 USD 75,000 PPL Capital Funding Inc 5%
15/3/2044 82,251 0.04 USD 45,000 PPL Electric Utilities Corp 3.95%
1/6/2047 47,274 0.02 USD 5,000 Principal Financial Group Inc 3.7%
15/5/2029 4,919 0.00 USD 230,000 Progress Energy Inc 3.15% 1/4/2022 212,793 0.09 USD 30,000 Progress Energy Inc 6% 1/12/2039 36,854 0.02 USD 175,000 Progressive Corp/The FRN
15/3/2023 (Perpetual) 163,814 0.07 USD 50,000 Prologis LP 3.875% 15/9/2028 50,956 0.02 USD 110,000 Prudential Financial Inc 3.878%
27/3/2028 111,521 0.05 USD 15,000 Prudential Financial Inc 4.35%
25/2/2050 16,235 0.01 USD 50,000 Public Service Co of Colorado 4.3%
15/3/2044 54,819 0.02 USD 45,000 QUALCOMM Inc 2.6% 30/1/2023 41,447 0.02 USD 90,000 QUALCOMM Inc 2.9% 20/5/2024 84,089 0.04 USD 50,000 QUALCOMM Inc 4.3% 20/5/2047 51,454 0.02 USD 70,000 Realty Income Corp 3% 15/1/2027 65,952 0.03 EUR 400,000 Refinitiv US Holdings Inc 4.5%
15/5/2026 436,602 0.19 EUR 100,000 Refinitiv US Holdings Inc 6.875%
15/11/2026 114,044 0.05 USD 50,000 Refinitiv US Holdings Inc ‘144A’
8.25% 15/11/2026 51,148 0.02 USD 250,000 Regions Bank/Birmingham AL FRN
13/8/2021 228,619 0.10 USD 30,000 Republic Services Inc 3.95%
15/5/2028 30,445 0.01 USD 170,000 Reynolds American Inc 4%
12/6/2022 160,582 0.07 USD 230,000 Reynolds American Inc 4.45%
12/6/2025 225,313 0.10 USD 500,000 Rockford Tower CLO 2017-2 Ltd
‘Series 2017-2A B’ ‘144A’ FRN 15/10/2029 452,085 0.19
USD 500,000 Rockford Tower CLO 2018-2 Ltd ‘Series 2018-2A A’ ‘144A’ FRN 20/10/2031 450,857 0.19
USD 110,000 Rockwell Collins Inc 3.5% 15/3/2027 107,085 0.05 USD 75,000 Rockwell Collins Inc 4.35%
15/4/2047 80,412 0.03
USD 50,000 Roper Technologies Inc 3.65% 15/9/2023 47,673 0.02
USD 250,000 Ryder System Inc 2.25% 1/9/2021 226,453 0.10 USD 30,000 Ryder System Inc 2.5% 1/9/2024 27,371 0.01 USD 550,000 Ryder System Inc 2.875% 1/9/2020 500,248 0.22 USD 300,000 Ryder System Inc 3.5% 1/6/2021 278,726 0.12 USD 145,000 Ryder System Inc 3.875%
1/12/2023 139,517 0.06 USD 120,000 Sabine Pass Liquefaction LLC
5.625% 15/4/2023 118,606 0.05 USD 145,000 Sabine Pass Liquefaction LLC
5.75% 15/5/2024 146,547 0.06 USD 100,000 Sempra Energy FRN 15/3/2021 90,307 0.04 USD 93,000 Sherwin-Williams Co/The 2.75%
1/6/2022 85,468 0.04 USD 100,000 Sherwin-Williams Co/The 3.125%
1/6/2024 93,991 0.04 USD 90,000 Sherwin-Williams Co/The 4.2%
15/1/2022 84,846 0.04 USD 10,000 Sherwin-Williams Co/The 4.5%
1/6/2047 10,302 0.00 USD 29,000 Southern California Edison Co
4% 1/4/2047 28,968 0.01 USD 11,000 Southern California Edison Co
4.125% 1/3/2048 11,176 0.01 USD 60,000 Southern California Edison Co
4.875% 1/3/2049 67,530 0.03 USD 200,000 Southern Co/The FRN 15/3/2057 187,899 0.08 USD 55,000 Southern Copper Corp 5.875%
23/4/2045 61,600 0.03 USD 35,000 Spectra Energy Partners LP
3.375% 15/10/2026 33,115 0.01 USD 50,000 State Street Corp FRN 3/12/2024 48,209 0.02 USD 1,040,000 State Street Corp FRN 15/6/2047 724,189 0.31 USD 220,000 Sunoco Logistics Partners
Operations LP 4.25% 1/4/2024 210,431 0.09 USD 110,000 Sunoco Logistics Partners
Operations LP 5.4% 1/10/2047 111,048 0.05 USD 130,000 SunTrust Bank/Atlanta GA FRN
26/10/2021 119,453 0.05 USD 500,000 SunTrust Banks Inc FRN 15/6/2022
(Perpetual) 457,044 0.20 USD 340,000 SunTrust Banks Inc 2.7% 27/1/2022 311,805 0.13 USD 35,000 SunTrust Banks Inc 4% 1/5/2025 34,514 0.02 USD 90,000 Synchrony Financial 2.85%
25/7/2022 82,506 0.04 USD 20,000 Synchrony Financial 4.375%
19/3/2024 19,334 0.01 USD 50,000 Teachers Insurance & Annuity
Association of America ‘144A’ 4.27% 15/5/2047 52,941 0.02
USD 30,000 Teachers Insurance & Annuity Association of America ‘144A’ 4.9% 15/9/2044 34,166 0.01
USD 10,000 Texas Instruments Inc 2.25% 4/9/2029 9,091 0.00
USD 50,000 Thermo Fisher Scientific Inc 2.95% 19/9/2026 46,801 0.02
USD 60,000 Thermo Fisher Scientific Inc 3% 15/4/2023 55,869 0.02
USD 200,000 Thermo Fisher Scientific Inc 3.3% 15/2/2022 186,551 0.08
USD 485,000 THL Credit Wind River 2017-3 Clo Ltd ‘Series 2017-3A A’ ‘144A’ FRN 15/10/2030 438,428 0.19
USD 250,000 TICP CLO IX Ltd ‘Series 2017-9A A’ ‘144A’ FRN 20/1/2031 224,889 0.10
Global Conservative Income Fund(2) continued

The notes on pages 728 to 741 form an integral part of these financial statements.
[414] BlackRock Global Funds (BGF)
Transferable Securities and Money Market Instruments Admitted to an Official Stock Exchange Listing or Dealt in on Another Regulated Market
Transferable Securities and Money Market Instruments Admitted to an Official Stock Exchange Listing or Dealt in on Another Regulated Market
Holding
Description
Market Value (EUR)
% of Net
Assets
Holding
Description
Market Value (EUR)
% of Net
Assets
USD 1,000,000 TICP CLO IX Ltd ‘Series 2017-9A B’ ‘144A’ FRN 20/1/2031 895,298 0.39
USD 500,000 TICP CLO XI Ltd ‘Series 2018-11A C’ ‘144A’ FRN 20/10/2031 443,966 0.19
USD 155,000 Total System Services Inc 3.75% 1/6/2023 146,701 0.06
USD 30,000 Transcontinental Gas Pipe Line Co LLC 4% 15/3/2028 29,068 0.01
USD 25,000 Transcontinental Gas Pipe Line Co LLC 4.6% 15/3/2048 25,481 0.01
USD 25,000 Travelers Cos Inc/The 4.3% 25/8/2045 27,496 0.01
USD 40,000 Tyson Foods Inc 3.9% 28/9/2023 38,518 0.02 USD 75,000 Tyson Foods Inc 3.95% 15/8/2024 73,130 0.03 EUR 100,000 UGI International LLC 3.25%
1/11/2025 105,689 0.05 USD 130,000 Union Pacific Corp 2.75%
15/4/2023 120,621 0.05 USD 200,000 Union Pacific Corp 2.95%
15/1/2023 186,004 0.08 USD 15,000 Union Pacific Corp 3.55%
15/8/2039 14,538 0.01 USD 100,000 Union Pacific Corp 3.7%
1/3/2029 100,405 0.04 USD 40,000 Union Pacific Corp 3.95%
15/8/2059 39,878 0.02 USD 92,000 Union Pacific Corp 4.5%
10/9/2048 101,913 0.04 USD 50,000 Union Pacific Corp 4.8%
10/9/2058 56,641 0.02 USD 5,000 United Technologies Corp 2.3%
4/5/2022 4,564 0.00 USD 95,000 United Technologies Corp 2.8%
4/5/2024 88,597 0.04 USD 180,000 United Technologies Corp 3.1%
1/6/2022 168,231 0.07 USD 385,000 United Technologies Corp 3.35%
16/8/2021 357,351 0.15 USD 450,000 United Technologies Corp 3.65%
16/8/2023 431,743 0.19 USD 110,000 United Technologies Corp 4.125%
16/11/2028 113,705 0.05 USD 145,000 United Technologies Corp 4.5%
1/6/2042 159,332 0.07 USD 65,000 United Technologies Corp 6.7%
1/8/2028 77,801 0.03 USD 150,000 UnitedHealth Group Inc 3.35%
15/7/2022 140,928 0.06 USD 35,000 UnitedHealth Group Inc 3.5%
15/8/2039 33,914 0.01 USD 15,000 UnitedHealth Group Inc 3.7%
15/8/2049 14,903 0.01 USD 40,000 UnitedHealth Group Inc 3.875%
15/8/2059 40,117 0.02 USD 50,000 UnitedHealth Group Inc 4.25%
15/6/2048 53,392 0.02 USD 185,000 UnitedHealth Group Inc 4.375%
15/3/2042 196,636 0.08 USD 250,000 US Bank NA/Cincinnati OH 2.85%
23/1/2023 233,114 0.10 USD 750,000 US Bank NA/Cincinnati OH 3.15%
26/4/2021 691,075 0.30 USD 330,000 Verizon Communications Inc 2.946%
15/3/2022 306,255 0.13 USD 395,000 Verizon Communications Inc 3.125%
16/3/2022 368,619 0.16 USD 95,000 Verizon Communications Inc 3.85%
1/11/2042 93,233 0.04
USD 515,000 Verizon Communications Inc 4.272% 15/1/2036 535,264 0.23
USD 150,000 Verizon Communications Inc 4.522% 15/9/2048 163,513 0.07
USD 92,000 Verizon Communications Inc 4.672% 15/3/2055 102,560 0.04
USD 150,000 Verizon Communications Inc 5.15% 15/9/2023 152,426 0.07
USD 150,000 Viacom Inc FRN 28/2/2057 146,082 0.06 USD 150,000 Viacom Inc FRN 28/2/2057 142,212 0.06 USD 40,000 Viacom Inc 5.85% 1/9/2043 45,705 0.02 USD 450,000 Virginia Electric & Power Co 2.75%
15/3/2023 416,511 0.18 USD 220,000 Virginia Electric & Power Co 2.95%
15/1/2022 203,001 0.09 USD 155,000 Virginia Electric & Power Co 4.45%
15/2/2044 168,917 0.07 USD 170,000 Virginia Electric & Power Co 4.6%
1/12/2048 194,212 0.08 USD 105,000 Visa Inc 3.15% 14/12/2025 101,575 0.04 USD 500,000 Voya CLO 2018-3 Ltd ‘Series
2018-3A A1A’ ‘144A’ FRN 15/10/2031 451,341 0.19
USD 438,000 Voya Financial Inc FRN 15/9/2023 (Perpetual) 421,083 0.18
USD 15,000 Wachovia Capital Trust II FRN 15/1/2027 12,684 0.01
USD 135,000 Walgreens Boots Alliance Inc 3.3% 18/11/2021 125,079 0.05
USD 45,000 Walmart Inc 2.65% 15/12/2024 42,220 0.02 USD 100,000 Walmart Inc 3.05% 8/7/2026 96,819 0.04 USD 45,000 Walmart Inc 3.55% 26/6/2025 44,130 0.02 USD 195,000 Walmart Inc 4.05% 29/6/2048 219,788 0.09 USD 115,000 Walt Disney Co/The ‘144A’ 6.4%
15/12/2035 151,121 0.07 USD 50,000 Waste Management Inc 3.2%
15/6/2026 48,186 0.02 USD 40,000 Waste Management Inc 3.45%
15/6/2029 39,600 0.02 USD 400,000 WEC Energy Group Inc 3.375%
15/6/2021 370,039 0.16 USD 225,000 Wells Fargo & Co FRN 15/6/2024
(Perpetual) 218,310 0.09 USD 100,000 Wells Fargo & Co FRN 17/6/2027 94,376 0.04 USD 200,000 Wells Fargo & Co 3.069% 24/1/2023 185,271 0.08 USD 600,000 Wells Fargo & Co 3.5% 8/3/2022 562,103 0.24 USD 310,000 Wells Fargo & Co 3.75% 24/1/2024 298,684 0.13 USD 160,000 Wells Fargo & Co 4.15% 24/1/2029 162,458 0.07 USD 120,000 Wells Fargo & Co 4.4% 14/6/2046 126,628 0.05 USD 170,000 Wells Fargo & Co 4.65% 4/11/2044 183,819 0.08 USD 75,000 Wells Fargo & Co 5.606% 15/1/2044 91,093 0.04 USD 280,000 Williams Cos Inc/The 3.35%
15/8/2022 259,784 0.11 USD 280,000 Williams Cos Inc/The 3.6%
15/3/2022 260,887 0.11 USD 100,000 Williams Cos Inc/The 4% 15/11/2021 93,220 0.04 USD 100,000 Williams Cos Inc/The 4.3% 4/3/2024 96,762 0.04 USD 295,000 Williams Cos Inc/The 4.5%
15/11/2023 287,470 0.12 USD 100,000 Williams Cos Inc/The 4.55%
24/6/2024 98,018 0.04 USD 150,000 Williams Cos Inc/The 5.25%
15/3/2020 137,833 0.06 USD 140,000 Wisconsin Power & Light Co 3%
1/7/2029 133,403 0.06 USD 400,000 Wm Wrigley Jr Co ‘144A’ 3.375%
21/10/2020 367,240 0.16
Global Conservative Income Fund(2) continued
Portfolio of Investments 31 August 2019
(2) Fund launched during the year, see Note 1, for further details.

(2) Fund launched during the year, see Note 1, for further details.
The notes on pages 728 to 741 form an integral part of these financial statements.
Annual Report and Audited Financial Statements [415]
Transferable Securities and Money Market Instruments Admitted to an Official Stock Exchange Listing or Dealt in on Another Regulated Market
Transferable Securities and Money Market Instruments Admitted to an Official Stock Exchange Listing or Dealt in on Another Regulated Market
Holding
Description
Market Value (EUR)
% of Net
Assets
Holding
Description
Market Value (EUR)
% of Net
Assets
EUR 90,000 WMG Acquisition Corp 4.125% 1/11/2024 93,761 0.04
USD 85,000 WRKCo Inc 3.75% 15/3/2025 81,236 0.04 USD 500,000 York CLO-2 Ltd ‘Series 2015-1A
AR’ ‘144A’ FRN 22/1/2031 449,823 0.19 USD 525,000 York CLO-2 Ltd ‘Series 2015-1A
BR’ ‘144A’ FRN 22/1/2031 468,804 0.20 111,974,324 48.22Total Bonds 169,086,646 72.82
EQUITY LINKED NOTES
USD 5,488 BNP Paribas (Fund receives 10.26% Fixed; and receives/pays return on Oracle Corp) (10/9/2019) 259,211 0.11
USD 2,622 BNP Paribas (Fund receives 10.32% Fixed; and receives/pays return on Darden Restaurants Inc) (10/9/2019) 290,892 0.13
USD 2,006 BNP Paribas (Fund receives 10.95% Fixed; and receives/pays return on Walmart Inc) (4/10/2019) 207,595 0.09
USD 1,821 BNP Paribas (Fund receives 11.02% Fixed; and receives/pays return on Zoetis Inc) (28/10/2019) 206,253 0.09
USD 3,887 BNP Paribas (Fund receives 11.7% Fixed; and receives/pays return on Fifth Third Bancorp) (22/10/2019) 94,444 0.04
USD 3,887 BNP Paribas (Fund receives 11.75% Fixed; and receives/pays return on Fifth Third Bancorp) (21/10/2019) 94,475 0.04
USD 3,705 BNP Paribas (Fund receives 12.09% Fixed; and receives/pays return on Nike Inc) (17/9/2019) 288,059 0.12
USD 1,033 BNP Paribas (Fund receives 12.58% Fixed; and receives/pays return on McDonald’s Corp) (21/10/2019) 205,539 0.09
USD 1,683 BNP Paribas (Fund receives 13.48% Fixed; and receives/pays return on United Technologies Corp) (3/9/2019) 197,504 0.08
USD 127 BNP Paribas (Fund receives 13.95% Fixed; and receives/pays return on Amazon.com Inc) (21/10/2019) 206,323 0.09
USD 9,589 BNP Paribas (Fund receives 15.69% Fixed; and receives/pays return on Halliburton Co) (22/10/2019) 165,996 0.07
USD 1,727 BNP Paribas (Fund receives 16.94% Fixed; and receives/pays return on Johnson & Johnson) (10/10/2019) 202,282 0.09
USD 4,249 BNP Paribas (Fund receives 20.79% Fixed; and receives/pays return on Occidental Petroleum Corp) (19/9/2019) 167,261 0.07
USD 1,799 BNP Paribas (Fund receives 8.17% Fixed; and receives/pays return on Ingersoll-Rand Plc) (23/10/2019) 197,548 0.09
USD 931 BNP Paribas (Fund receives 8.6% Fixed; and receives/pays return on Biogen Inc) (22/10/2019) 186,158 0.08
USD 1,923 Citigroup (Fund receives 10.28% Fixed; and receives/pays return on Waste Management Inc) (12/9/2019) 206,842 0.09
USD 5,683 Citigroup (Fund receives 11.09% Fixed; and receives/pays return on eBay Inc) (6/9/2019) 208,431 0.09
USD 777 Citigroup (Fund receives 11.46% Fixed; and receives/pays return on Thermo Fisher Scientific Inc) (12/9/2019) 203,226 0.09
USD 3,144 Citigroup (Fund receives 11.97% Fixed; and receives/pays return on DuPont de Nemours Inc) (19/9/2019) 196,398 0.08
USD 3,424 Citigroup (Fund receives 14.89% Fixed; and receives/pays return on SunTrust Banks Inc ) (6/9/2019) 192,281 0.08
USD 1,574 Citigroup (Fund receives 8.64% Fixed; and receives/pays return on Danaher Corp) (3/9/2019) 201,980 0.09
USD 7,645 Citigroup (Fund receives 9.44% Fixed; and receives/pays return on Bank of America Corp) (3/9/2019) 189,263 0.08
USD 1,302 Citigroup (Fund receives 9.75% Fixed; and receives/pays return on Union Pacific Corp) (6/9/2019) 192,765 0.08
USD 2,372 Citigroup (Fund receives 9.96% Fixed; and receives/pays return on Starbucks Corp) (30/10/2019) 205,933 0.09
USD 1,678 Credit Suisse (Fund receives 12.6% Fixed; and receives/pays return on Microsoft Corp) (17/10/2019) 207,489 0.09
USD 5,081 Credit Suisse (Fund receives 13.8% Fixed; and receives/pays return on Morgan Stanley) (3/9/2019) 189,878 0.08
USD 1,179 Goldman Sachs (Fund receives 12.61% Fixed; and receives/pays return on Raytheon Co) (12/9/2019) 197,395 0.09
USD 1,771 Goldman Sachs (Fund receives 13.38% Fixed; and receives/pays return on Texas Instruments Inc) (12/9/2019) 200,646 0.09
USD 2,461 Goldman Sachs (Fund receives 14.11% Fixed; and receives/pays return on Discover Financial Services) (12/9/2019) 180,065 0.08
USD 5,057 Goldman Sachs (Fund receives 9.38% Fixed; and receives/pays return on Comcast Corp) (12/9/2019) 203,474 0.09
USD 4,034 Merrill Lynch (Fund receives 10.63% Fixed; and receives/pays return on Delta Air Lines Inc) (10/10/2019) 210,285 0.09
USD 3,177 Merrill Lynch (Fund receives 12.57% Fixed; and receives/pays return on Toll Brothers Inc) (2/12/2019) 103,233 0.04
Global Conservative Income Fund(2) continued
Portfolio of Investments 31 August 2019

The notes on pages 728 to 741 form an integral part of these financial statements.
[416] BlackRock Global Funds (BGF)
Transferable Securities and Money Market Instruments Admitted to an Official Stock Exchange Listing or Dealt in on Another Regulated Market
Transferable Securities and Money Market Instruments Admitted to an Official Stock Exchange Listing or Dealt in on Another Regulated Market
Holding
Description
Market Value (EUR)
% of Net
Assets
Holding
Description
Market Value (EUR)
% of Net
Assets
USD 3,177 Merrill Lynch (Fund receives 12.79% Fixed; and receives/pays return on Toll Brothers Inc) (29/11/2019) 103,350 0.05
USD 3,656 Merrill Lynch (Fund receives 18.1% Fixed; and receives/pays return on Citigroup Inc) (15/10/2019) 207,272 0.09
USD 2,136 Merrill Lynch (Fund receives 20.77% Fixed; and receives/pays return on JP Morgan Chase & Co) (15/10/2019) 206,928 0.09
USD 841 Nomura (Fund receives 12.1454% Fixed; and receives/pays return on Mastercard Inc) (17/10/2019) 211,058 0.09
USD 785 Nomura (Fund receives 13.2284% Fixed; and receives/pays return on Costco Wholesale Corp) (3/10/2019) 206,923 0.09
USD 3,380 Nomura (Fund receives 13.2353% Fixed; and receives/pays return on AbbVie Inc) (23/10/2019) 201,018 0.08
USD 990 Nomura (Fund receives 13.2629% Fixed; and receives/pays return on UnitedHealth Group) (16/10/2019) 203,875 0.09
USD 2,561 Nomura (Fund receives 13.3547% Fixed; and receives/pays return on Electronic Arts Inc) (28/10/2019) 213,169 0.09
USD 1,934 Nomura (Fund receives 13.7331% Fixed; and receives/pays return on Royal Caribbean Cruises Ltd) (23/10/2019) 185,586 0.08
USD 2,061 Nomura (Fund receives 8.7905% Fixed; and receives/pays return on Celanese Corp) (22/10/2019) 208,019 0.09
USD 611 Royal Bank of Canada (Fund receives 10% Fixed; and receives/pays return on Roper Technologies, Inc) (12/9/2019) 203,684 0.09
USD 1,139 Royal Bank of Canada (Fund receives 10.24% Fixed; and receives/pays return on Berkshire Hathaway Inc) (4/10/2019) 214,036 0.09
USD 1,244 Royal Bank of Canada (Fund receives 10.72% Fixed; and receives/pays return on ManpowerGroup Inc) (17/10/2019) 94,266 0.04
USD 1,217 Royal Bank of Canada (Fund receives 11.43% Fixed; and receives/pays return on Amgen Inc) (22/10/2019) 215,440 0.09
USD 767 Royal Bank of Canada (Fund receives 13.53% Fixed; and receives/pays return on Anthem Inc) (12/9/2019) 182,677 0.08
USD 1,069 Royal Bank of Canada (Fund receives 8.22% Fixed; and receives/pays return on American Tower Corp) (24/10/2019) 211,237 0.09
USD 5,308 Royal Bank of Canada (Fund receives 9.4% Fixed; and receives/pays return on Johnson Controls International Plc) (23/10/2019) 204,283 0.09
USD 1,802 Royal Bank of Canada (Fund receives 10.4% Fixed; and receives/pays return on Texas Instruments Inc) (18/10/2019) 203,945 0.09
USD 4,842 Societe Generale (Fund receives 11.24% Fixed; and receives/pays return on DR Horton Inc) (31/10/2019) 210,687 0.09
EUR 13,887 Societe Generale (Fund receives 11.41% Fixed; and receives/pays return on Repsol SA) (18/9/2019) 185,145 0.08
USD 2,636 Societe Generale (Fund receives 11.43% Fixed; and receives/pays return on Merck & Co Inc) (26/9/2019) 206,693 0.09
USD 1,051 Societe Generale (Fund receives 11.84% Fixed; and receives/pays return on Goldman Sachs Group Inc) (11/10/2019) 196,603 0.08
USD 5,423 Societe Generale (Fund receives 12.09% Fixed; and receives/pays return on Schwab (Charles) Corp) (11/10/2019) 189,766 0.08
USD 2,064 Societe Generale (Fund receives 13.33% Fixed; and receives/pays return on Eli Lilly & Co) (23/10/2019) 206,773 0.09
USD 1,082 UBS (Fund receives 10.7% Fixed; and receives/pays return on Adobe Inc) (10/9/2019) 280,720 0.12
USD 2,182 UBS (Fund receives 12.4% Fixed; and receives/pays return on Paypal Holdings Inc) (10/10/2019) 212,002 0.09
USD 2,041 UBS (Fund receives 13.1% Fixed; and receives/pays return on FedEx Corp) (10/9/2019) 293,351 0.13
USD 1,516 UBS (Fund receives 8.3% Fixed; and receives/pays return on Stanley Black & Decker Inc) (22/10/2019) 186,160 0.08
USD 2,364 Wells Fargo (Fund receives 10.24% Fixed; and receives/pays return on United Airlines Holdings Inc) (3/9/2019) 181,375 0.08
USD 1,302 Wells Fargo (Fund receives 10.41% Fixed; and receives/pays return on Honeywell International Inc) (3/9/2019) 192,963 0.08
USD 2,365 Wells Fargo (Fund receives 12.46% Fixed; and receives/pays return on E*TRADE Financial Corp) (16/10/2019) 91,062 0.04
USD 2,785 Wells Fargo (Fund receives 12.8% Fixed; and receives/pays return on The Progressive Corp) (3/9/2019) 191,255 0.08
USD 6,992 Wells Fargo (Fund receives 13.8% Fixed; and receives/pays return on Carnival Corp) (17/9/2019) 281,209 0.12
USD 285 Wells Fargo (Fund receives 9.05% Fixed; and receives/pays return on AutoZone Inc) (10/9/2019) 287,681 0.12
Total Equity Linked Notes 13,129,335 5.65Total Transferable Securities and Money Market Instruments Admitted to an Official Stock Exchange Listing or Dealt in on Another Regulated Market 218,996,557 94.31Total Portfolio 218,996,557 94.31
Other Net Assets 13,215,132 5.69Total Net Assets (EUR) 232,211,689 100.00
Global Conservative Income Fund(2) continued
Portfolio of Investments 31 August 2019
(2) Fund launched during the year, see Note 1, for further details.
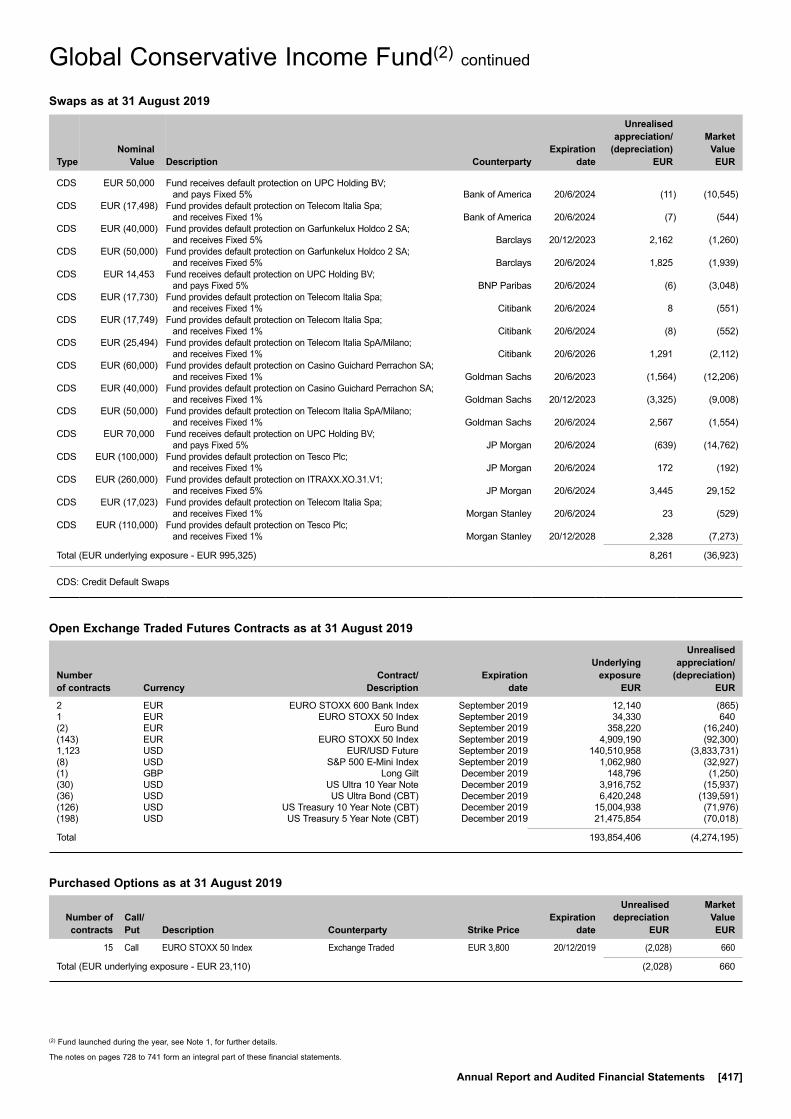
The notes on pages 728 to 741 form an integral part of these financial statements.
Annual Report and Audited Financial Statements [417]
Global Conservative Income Fund(2) continued
Swaps as at 31 August 2019
TypeNominal
Value Description Counterparty
Expiration date
Unrealised appreciation/
(depreciation) EUR
Market Value EUR
CDS EUR 50,000 Fund receives default protection on UPC Holding BV; and pays Fixed 5% Bank of America 20/6/2024 (11) (10,545)
CDS EUR (17,498) Fund provides default protection on Telecom Italia Spa; and receives Fixed 1% Bank of America 20/6/2024 (7) (544)
CDS EUR (40,000) Fund provides default protection on Garfunkelux Holdco 2 SA; and receives Fixed 5% Barclays 20/12/2023 2,162 (1,260)
CDS EUR (50,000) Fund provides default protection on Garfunkelux Holdco 2 SA; and receives Fixed 5% Barclays 20/6/2024 1,825 (1,939)
CDS EUR 14,453 Fund receives default protection on UPC Holding BV; and pays Fixed 5% BNP Paribas 20/6/2024 (6) (3,048)
CDS EUR (17,730) Fund provides default protection on Telecom Italia Spa; and receives Fixed 1% Citibank 20/6/2024 8 (551)
CDS EUR (17,749) Fund provides default protection on Telecom Italia Spa; and receives Fixed 1% Citibank 20/6/2024 (8) (552)
CDS EUR (25,494) Fund provides default protection on Telecom Italia SpA/Milano; and receives Fixed 1% Citibank 20/6/2026 1,291 (2,112)
CDS EUR (60,000) Fund provides default protection on Casino Guichard Perrachon SA; and receives Fixed 1% Goldman Sachs 20/6/2023 (1,564) (12,206)
CDS EUR (40,000) Fund provides default protection on Casino Guichard Perrachon SA; and receives Fixed 1% Goldman Sachs 20/12/2023 (3,325) (9,008)
CDS EUR (50,000) Fund provides default protection on Telecom Italia SpA/Milano; and receives Fixed 1% Goldman Sachs 20/6/2024 2,567 (1,554)
CDS EUR 70,000 Fund receives default protection on UPC Holding BV; and pays Fixed 5% JP Morgan 20/6/2024 (639) (14,762)
CDS EUR (100,000) Fund provides default protection on Tesco Plc; and receives Fixed 1% JP Morgan 20/6/2024 172 (192)
CDS EUR (260,000) Fund provides default protection on ITRAXX.XO.31.V1; and receives Fixed 5% JP Morgan 20/6/2024 3,445 29,152
CDS EUR (17,023) Fund provides default protection on Telecom Italia Spa; and receives Fixed 1% Morgan Stanley 20/6/2024 23 (529)
CDS EUR (110,000) Fund provides default protection on Tesco Plc; and receives Fixed 1% Morgan Stanley 20/12/2028 2,328 (7,273)
Total (EUR underlying exposure - EUR 995,325) 8,261 (36,923)
CDS: Credit Default Swaps
Open Exchange Traded Futures Contracts as at 31 August 2019
Number of contracts Currency
Contract/ Description
Expiration date
Underlying exposure
EUR
Unrealised appreciation/
(depreciation) EUR
2 EUR EURO STOXX 600 Bank Index September 2019 12,140 (865)1 EUR EURO STOXX 50 Index September 2019 34,330 640(2) EUR Euro Bund September 2019 358,220 (16,240)(143) EUR EURO STOXX 50 Index September 2019 4,909,190 (92,300)1,123 USD EUR/USD Future September 2019 140,510,958 (3,833,731)(8) USD S&P 500 E-Mini Index September 2019 1,062,980 (32,927)(1) GBP Long Gilt December 2019 148,796 (1,250)(30) USD US Ultra 10 Year Note December 2019 3,916,752 (15,937)(36) USD US Ultra Bond (CBT) December 2019 6,420,248 (139,591)(126) USD US Treasury 10 Year Note (CBT) December 2019 15,004,938 (71,976)(198) USD US Treasury 5 Year Note (CBT) December 2019 21,475,854 (70,018)
Total 193,854,406 (4,274,195)
Purchased Options as at 31 August 2019
Number of contracts
Call/ Put
Description Counterparty
Strike Price
Expiration date
Unrealised depreciation
EUR
Market Value EUR
15 Call EURO STOXX 50 Index Exchange Traded EUR 3,800 20/12/2019 (2,028) 660
Total (EUR underlying exposure - EUR 23,110) (2,028) 660
(2) Fund launched during the year, see Note 1, for further details.
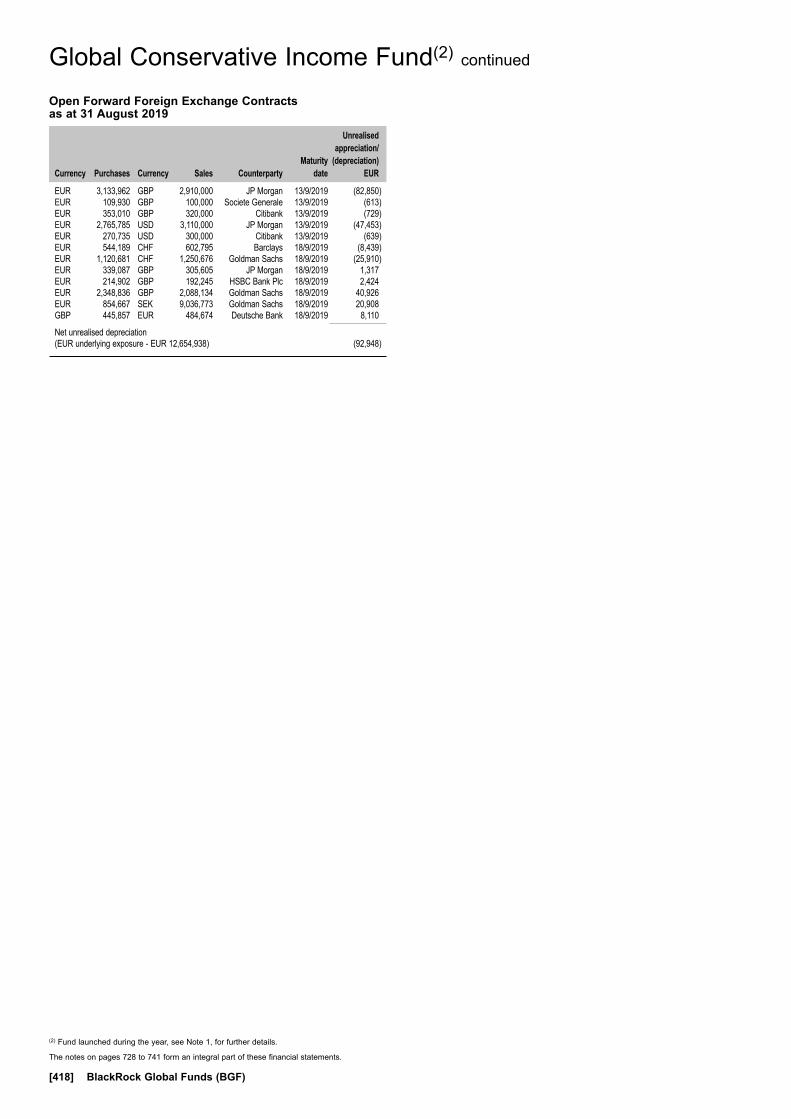
The notes on pages 728 to 741 form an integral part of these financial statements.
[418] BlackRock Global Funds (BGF)
Open Forward Foreign Exchange Contracts as at 31 August 2019
Currency
Purchases Currency
Sales Counterparty
Maturity date
Unrealised appreciation/
(depreciation) EUR
EUR 3,133,962 GBP 2,910,000 JP Morgan 13/9/2019 (82,850)EUR 109,930 GBP 100,000 Societe Generale 13/9/2019 (613)EUR 353,010 GBP 320,000 Citibank 13/9/2019 (729)EUR 2,765,785 USD 3,110,000 JP Morgan 13/9/2019 (47,453)EUR 270,735 USD 300,000 Citibank 13/9/2019 (639)EUR 544,189 CHF 602,795 Barclays 18/9/2019 (8,439)EUR 1,120,681 CHF 1,250,676 Goldman Sachs 18/9/2019 (25,910)EUR 339,087 GBP 305,605 JP Morgan 18/9/2019 1,317EUR 214,902 GBP 192,245 HSBC Bank Plc 18/9/2019 2,424EUR 2,348,836 GBP 2,088,134 Goldman Sachs 18/9/2019 40,926EUR 854,667 SEK 9,036,773 Goldman Sachs 18/9/2019 20,908GBP 445,857 EUR 484,674 Deutsche Bank 18/9/2019 8,110
Net unrealised depreciation (EUR underlying exposure - EUR 12,654,938) (92,948)
Global Conservative Income Fund(2) continued
(2) Fund launched during the year, see Note 1, for further details.
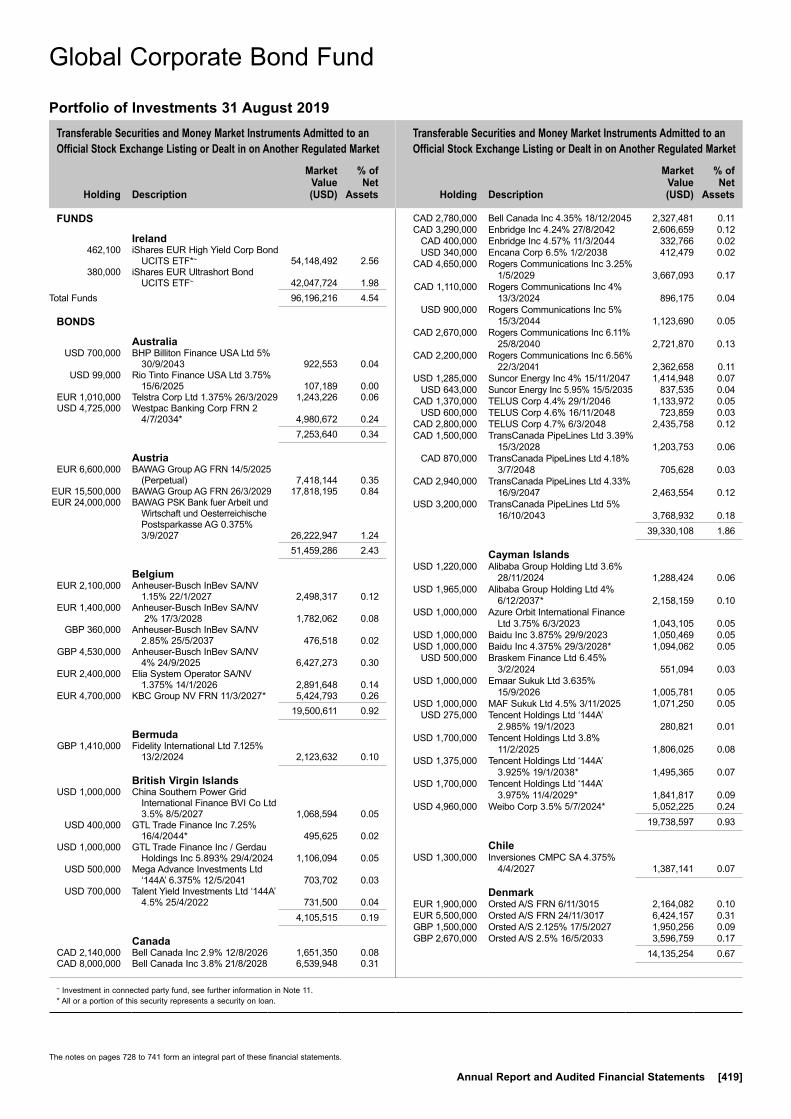
Transferable Securities and Money Market Instruments Admitted to an Official Stock Exchange Listing or Dealt in on Another Regulated Market
Transferable Securities and Money Market Instruments Admitted to an Official Stock Exchange Listing or Dealt in on Another Regulated Market
Holding
Description
Market Value (USD)
% of Net
Assets
Holding
Description
Market Value (USD)
% of Net
Assets
~ Investment in connected party fund, see further information in Note 11.* All or a portion of this security represents a security on loan.
The notes on pages 728 to 741 form an integral part of these financial statements.
Annual Report and Audited Financial Statements [419]
FUNDS
Ireland 462,100 iShares EUR High Yield Corp Bond
UCITS ETF*~ 54,148,492 2.56 380,000 iShares EUR Ultrashort Bond
UCITS ETF~ 42,047,724 1.98Total Funds 96,196,216 4.54
BONDS
Australia USD 700,000 BHP Billiton Finance USA Ltd 5%
30/9/2043 922,553 0.04 USD 99,000 Rio Tinto Finance USA Ltd 3.75%
15/6/2025 107,189 0.00 EUR 1,010,000 Telstra Corp Ltd 1.375% 26/3/2029 1,243,226 0.06 USD 4,725,000 Westpac Banking Corp FRN 2
4/7/2034* 4,980,672 0.24 7,253,640 0.34
Austria EUR 6,600,000 BAWAG Group AG FRN 14/5/2025
(Perpetual) 7,418,144 0.35 EUR 15,500,000 BAWAG Group AG FRN 26/3/2029 17,818,195 0.84 EUR 24,000,000 BAWAG PSK Bank fuer Arbeit und
Wirtschaft und Oesterreichische Postsparkasse AG 0.375% 3/9/2027 26,222,947 1.24
51,459,286 2.43
Belgium EUR 2,100,000 Anheuser-Busch InBev SA/NV
1.15% 22/1/2027 2,498,317 0.12 EUR 1,400,000 Anheuser-Busch InBev SA/NV
2% 17/3/2028 1,782,062 0.08 GBP 360,000 Anheuser-Busch InBev SA/NV
2.85% 25/5/2037 476,518 0.02 GBP 4,530,000 Anheuser-Busch InBev SA/NV
4% 24/9/2025 6,427,273 0.30 EUR 2,400,000 Elia System Operator SA/NV
1.375% 14/1/2026 2,891,648 0.14 EUR 4,700,000 KBC Group NV FRN 11/3/2027* 5,424,793 0.26 19,500,611 0.92
Bermuda GBP 1,410,000 Fidelity International Ltd 7.125%
13/2/2024 2,123,632 0.10
British Virgin Islands USD 1,000,000 China Southern Power Grid
International Finance BVI Co Ltd 3.5% 8/5/2027 1,068,594 0.05
USD 400,000 GTL Trade Finance Inc 7.25% 16/4/2044* 495,625 0.02
USD 1,000,000 GTL Trade Finance Inc / Gerdau Holdings Inc 5.893% 29/4/2024 1,106,094 0.05
USD 500,000 Mega Advance Investments Ltd ‘144A’ 6.375% 12/5/2041 703,702 0.03
USD 700,000 Talent Yield Investments Ltd ‘144A’ 4.5% 25/4/2022 731,500 0.04
4,105,515 0.19
Canada CAD 2,140,000 Bell Canada Inc 2.9% 12/8/2026 1,651,350 0.08 CAD 8,000,000 Bell Canada Inc 3.8% 21/8/2028 6,539,948 0.31
CAD 2,780,000 Bell Canada Inc 4.35% 18/12/2045 2,327,481 0.11 CAD 3,290,000 Enbridge Inc 4.24% 27/8/2042 2,606,659 0.12 CAD 400,000 Enbridge Inc 4.57% 11/3/2044 332,766 0.02 USD 340,000 Encana Corp 6.5% 1/2/2038 412,479 0.02 CAD 4,650,000 Rogers Communications Inc 3.25%
1/5/2029 3,667,093 0.17 CAD 1,110,000 Rogers Communications Inc 4%
13/3/2024 896,175 0.04 USD 900,000 Rogers Communications Inc 5%
15/3/2044 1,123,690 0.05 CAD 2,670,000 Rogers Communications Inc 6.11%
25/8/2040 2,721,870 0.13 CAD 2,200,000 Rogers Communications Inc 6.56%
22/3/2041 2,362,658 0.11 USD 1,285,000 Suncor Energy Inc 4% 15/11/2047 1,414,948 0.07 USD 643,000 Suncor Energy Inc 5.95% 15/5/2035 837,535 0.04 CAD 1,370,000 TELUS Corp 4.4% 29/1/2046 1,133,972 0.05 USD 600,000 TELUS Corp 4.6% 16/11/2048 723,859 0.03 CAD 2,800,000 TELUS Corp 4.7% 6/3/2048 2,435,758 0.12 CAD 1,500,000 TransCanada PipeLines Ltd 3.39%
15/3/2028 1,203,753 0.06 CAD 870,000 TransCanada PipeLines Ltd 4.18%
3/7/2048 705,628 0.03 CAD 2,940,000 TransCanada PipeLines Ltd 4.33%
16/9/2047 2,463,554 0.12 USD 3,200,000 TransCanada PipeLines Ltd 5%
16/10/2043 3,768,932 0.18 39,330,108 1.86
Cayman Islands USD 1,220,000 Alibaba Group Holding Ltd 3.6%
28/11/2024 1,288,424 0.06 USD 1,965,000 Alibaba Group Holding Ltd 4%
6/12/2037* 2,158,159 0.10 USD 1,000,000 Azure Orbit International Finance
Ltd 3.75% 6/3/2023 1,043,105 0.05 USD 1,000,000 Baidu Inc 3.875% 29/9/2023 1,050,469 0.05 USD 1,000,000 Baidu Inc 4.375% 29/3/2028* 1,094,062 0.05 USD 500,000 Braskem Finance Ltd 6.45%
3/2/2024 551,094 0.03 USD 1,000,000 Emaar Sukuk Ltd 3.635%
15/9/2026 1,005,781 0.05 USD 1,000,000 MAF Sukuk Ltd 4.5% 3/11/2025 1,071,250 0.05 USD 275,000 Tencent Holdings Ltd ‘144A’
2.985% 19/1/2023 280,821 0.01 USD 1,700,000 Tencent Holdings Ltd 3.8%
11/2/2025 1,806,025 0.08 USD 1,375,000 Tencent Holdings Ltd ‘144A’
3.925% 19/1/2038* 1,495,365 0.07 USD 1,700,000 Tencent Holdings Ltd ‘144A’
3.975% 11/4/2029* 1,841,817 0.09 USD 4,960,000 Weibo Corp 3.5% 5/7/2024* 5,052,225 0.24 19,738,597 0.93
Chile USD 1,300,000 Inversiones CMPC SA 4.375%
4/4/2027 1,387,141 0.07
Denmark EUR 1,900,000 Orsted A/S FRN 6/11/3015 2,164,082 0.10 EUR 5,500,000 Orsted A/S FRN 24/11/3017 6,424,157 0.31 GBP 1,500,000 Orsted A/S 2.125% 17/5/2027 1,950,256 0.09 GBP 2,670,000 Orsted A/S 2.5% 16/5/2033 3,596,759 0.17 14,135,254 0.67
Global Corporate Bond Fund
Portfolio of Investments 31 August 2019
Global Corporate Bond Fund

Transferable Securities and Money Market Instruments Admitted to an Official Stock Exchange Listing or Dealt in on Another Regulated Market
Transferable Securities and Money Market Instruments Admitted to an Official Stock Exchange Listing or Dealt in on Another Regulated Market
Holding
Description
Market Value (USD)
% of Net
Assets
Holding
Description
Market Value (USD)
% of Net
Assets
* All or a portion of this security represents a security on loan.
The notes on pages 728 to 741 form an integral part of these financial statements.
[420] BlackRock Global Funds (BGF)
Finland EUR 10,785,000 Fortum Oyj 1.625% 27/2/2026 12,830,353 0.60 EUR 3,880,000 Fortum Oyj 2.125% 27/2/2029 4,824,411 0.23 17,654,764 0.83
France EUR 4,000,000 Air Liquide Finance SA 0.625%
20/6/2030* 4,656,613 0.22 USD 3,440,000 Air Liquide Finance SA ‘144A’
3.5% 27/9/2046 3,727,523 0.18 USD 3,100,000 AXA SA FRN 17/1/2047 3,362,725 0.16 USD 1,755,000 BNP Paribas SA FRN 25/3/2024
(Perpetual) 1,833,036 0.09 EUR 4,700,000 BNP Paribas SA FRN 15/7/2025 5,278,750 0.25 USD 3,500,000 BNP Paribas SA ‘144A’ FRN
1/3/2033* 3,730,359 0.18 EUR 5,000,000 BNP Paribas SA 1.625% 2/7/2031* 5,773,653 0.27 EUR 1,700,000 BNP Paribas SA 2.75% 27/1/2026* 2,132,437 0.10 EUR 4,300,000 Coentreprise de Transport
d'Electricite SA 2.125% 29/7/2032 5,599,431 0.26 EUR 1,100,000 Credit Agricole SA/London 1%
3/7/2029 1,317,456 0.06 EUR 1,500,000 Credit Mutuel Arkea SA 3.5%
9/2/2029 1,976,096 0.09 USD 1,240,000 Danone SA ‘144A’ 2.947%
2/11/2026 1,284,852 0.06 EUR 4,300,000 Engie SA FRN 28/11/2024
(Perpetual) 5,274,680 0.25 EUR 12,400,000 Engie SA 4/3/2027 (Zero Coupon) 13,676,046 0.65 EUR 3,200,000 Engie SA 0.875% 27/3/2024 3,707,740 0.17 EUR 1,800,000 Engie SA 0.875% 19/9/2025 2,105,079 0.10 EUR 1,900,000 Engie SA 1.375% 21/6/2039 2,345,280 0.11 EUR 1,420,000 Engie SA 6.375% 18/1/2021 1,714,874 0.08 EUR 500,000 Legrand SA 0.625% 24/6/2028 573,223 0.03 EUR 3,900,000 Orange SA FRN 15/1/2025
(Perpetual)* 4,562,664 0.22 EUR 3,800,000 Orange SA 2% 15/1/2029 4,867,447 0.23 USD 497,000 Orange SA 9% 1/3/2031 786,090 0.04 EUR 1,100,000 RTE Reseau de Transport
d'Electricite SADIR 1.875% 23/10/2037* 1,490,742 0.07
EUR 2,500,000 Sanofi 1% 21/3/2026 2,986,519 0.14 EUR 3,550,000 Schneider Electric SE 3.625%
20/7/2020 4,058,550 0.19 EUR 7,900,000 Societe Generale SA 1.25%
15/2/2024 9,144,319 0.43 USD 1,600,000 Societe Generale SA ‘144A’
3.25% 12/1/2022 1,633,201 0.08 USD 4,891,000 Societe Generale SA ‘144A’
4% 12/1/2027 5,229,746 0.25 USD 4,085,000 Societe Generale SA ‘144A’
4.25% 14/4/2025 4,259,896 0.20 USD 1,500,000 Societe Generale SA ‘144A’
4.75% 24/11/2025 1,616,640 0.08 EUR 2,000,000 Thales SA 0.875% 19/4/2024 2,319,955 0.11 USD 9,500,000 Total Capital International SA
3.455% 19/2/2029 10,392,783 0.49 USD 1,455,000 Total Capital International SA
3.461% 12/7/2049 1,571,529 0.07 EUR 100,000 TOTAL SA FRN 26/2/2021
(Perpetual) 113,988 0.00 125,103,922 5.91
Germany EUR 2,000,000 Commerzbank AG 1% 4/3/2026 2,332,294 0.11 USD 1,500,000 Commerzbank AG ‘144A’ 8.125%
19/9/2023 1,742,741 0.08
USD 545,000 Commerzbank AG 8.125% 19/9/2023 633,196 0.03
EUR 1,700,000 Deutsche Bank AG 1.25% 8/9/2021 1,894,685 0.09 EUR 3,900,000 Deutsche Bank AG 1.5% 20/1/2022 4,364,924 0.21 EUR 600,000 Deutsche Bank AG 2.375%
11/1/2023 693,385 0.03 EUR 2,930,000 Fresenius SE & Co KGaA 1.875%
15/2/2025 3,545,218 0.17 EUR 4,895,000 Fresenius SE & Co KGaA 2.875%
15/2/2029 6,493,348 0.31 EUR 84,600,000 German Treasury Bill 16/10/2019
(Zero Coupon) 93,522,732 4.42 EUR 6,200,000 IKB Deutsche Industriebank AG
FRN 31/1/2028 6,697,967 0.32 EUR 6,500,000 Landesbank Baden-Wuerttemberg
2.2% 9/5/2029 7,815,211 0.37 EUR 10,300,000 Merck Financial Services GmbH
0.875% 5/7/2031* 11,955,711 0.56 EUR 1,544,000 Merck Financial Services GmbH
4.5% 24/3/2020 1,751,079 0.08 EUR 6,600,000 Merck KGaA FRN 25/6/2079 7,916,708 0.37 EUR 4,300,000 Muenchener Rueckversicherungs-
Gesellschaft AG in Muenchen FRN 26/5/2049* 5,771,829 0.27
EUR 12,000,000 SAP SE 0.25% 10/3/2022 13,463,409 0.64 EUR 4,300,000 SAP SE 0.75% 10/12/2024 4,996,145 0.24 EUR 1,800,000 SAP SE 1.25% 10/3/2028 2,201,225 0.10 EUR 7,400,000 SAP SE 1.625% 10/3/2031* 9,414,135 0.44 EUR 1,900,000 Volkswagen Leasing GmbH
1% 16/2/2023 2,155,979 0.10 189,361,921 8.94
Guernsey GBP 3,236,000 Credit Suisse Group Funding
Guernsey Ltd 2.75% 8/8/2025 4,161,322 0.20
India USD 1,500,000 Adani Ports & Special Economic
Zone Ltd 4% 30/7/2027* 1,556,250 0.07 USD 1,750,000 Reliance Industries Ltd 4.125%
28/1/2025 1,874,687 0.09 USD 700,000 Reliance Industries Ltd 4.875%
10/2/2045 866,877 0.04 4,297,814 0.20
Ireland EUR 2,540,000 Atlas Copco Finance DAC 0.125%
3/9/2029 2,794,313 0.13 EUR 125,000 Avoca CLO XIV Designated Activity
Co FRN 12/1/2031 97,163 0.01 GBP 2,284,000 Bank of Ireland Group Plc FRN
19/9/2027* 2,750,569 0.13 EUR 1,800,000 ESB Finance DAC 1.75% 7/2/2029* 2,284,232 0.11 EUR 1,300,000 ESB Finance DAC 2.125%
5/11/2033 1,736,061 0.08 EUR 840,000 Fresenius Finance Ireland Plc 3%
30/1/2032 1,127,992 0.06 USD 1,900,000 GE Capital International Funding
Co Unlimited Co 4.418% 15/11/2035 1,926,974 0.09
USD 405,000 Johnson Controls International plc 4.5% 15/2/2047 455,723 0.02
USD 235,000 Shire Acquisitions Investments Ireland DAC 3.2% 23/9/2026 244,229 0.01
EUR 1,500,000 Zurich Finance Ireland Designated Activity Co 1.625% 17/6/2039 1,930,316 0.09
15,347,572 0.73
Global Corporate Bond Fund continued
Portfolio of Investments 31 August 2019

Transferable Securities and Money Market Instruments Admitted to an Official Stock Exchange Listing or Dealt in on Another Regulated Market
Transferable Securities and Money Market Instruments Admitted to an Official Stock Exchange Listing or Dealt in on Another Regulated Market
Holding
Description
Market Value (USD)
% of Net
Assets
Holding
Description
Market Value (USD)
% of Net
Assets
* All or a portion of this security represents a security on loan.
The notes on pages 728 to 741 form an integral part of these financial statements.
Annual Report and Audited Financial Statements [421]
Italy EUR 1,465,000 A2A SpA 1% 16/7/2029 1,669,324 0.08 EUR 1,700,000 ACEA SpA 1.5% 8/6/2027 2,017,425 0.09 EUR 300,000 Assicurazioni Generali SpA FRN
12/12/2042 407,883 0.02 EUR 774,000 Assicurazioni Generali SpA FRN
8/6/2048 1,009,950 0.05 USD 1,000,000 Eni SpA ‘144A’ 4.25% 9/5/2029 1,097,325 0.05 USD 235,000 Eni SpA ‘144A’ 4.75% 12/9/2028 267,741 0.01 EUR 500,000 Hera SpA 0.875% 14/10/2026 582,587 0.03 EUR 1,655,000 Hera SpA 0.875% 5/7/2027 1,928,921 0.09 EUR 1,220,000 Intesa Sanpaolo SpA 1.75%
20/3/2028 1,433,514 0.07 EUR 10,800,000 Intesa Sanpaolo SpA 1.75%
4/7/2029 12,603,037 0.59 EUR 1,504,000 Snam SpA 0.875% 25/10/2026 1,754,093 0.08 EUR 2,400,000 Terna Rete Elettrica Nazionale SpA
0.875% 2/2/2022 2,719,502 0.13 EUR 2,180,000 Terna Rete Elettrica Nazionale SpA
1% 10/4/2026 2,557,191 0.12 EUR 4,330,000 UniCredit SpA FRN 20/2/2029* 5,416,587 0.26 35,465,080 1.67
Japan USD 1,845,000 Mizuho Financial Group Inc FRN
11/9/2024 1,953,340 0.09 EUR 3,610,000 Takeda Pharmaceutical Co Ltd
0.375% 21/11/2020 4,023,564 0.19 EUR 4,200,000 Takeda Pharmaceutical Co Ltd
1.125% 21/11/2022 4,819,040 0.23 EUR 925,000 Takeda Pharmaceutical Co Ltd
3% 21/11/2030 1,241,612 0.06 12,037,556 0.57
Jersey GBP 120,000 Glencore Finance Europe Ltd
3.125% 26/3/2026 150,523 0.01
Luxembourg USD 1,500,000 Allergan Funding SCS 4.55%
15/3/2035 1,613,190 0.08 EUR 907,000 CNH Industrial Finance Europe SA
1.75% 12/9/2025 1,069,938 0.05 EUR 1,016,000 GELF Bond Issuer I SA 0.875%
20/10/2022 1,154,526 0.06 EUR 1,740,000 Medtronic Global Holdings SCA
1.75% 2/7/2049 2,052,441 0.10 EUR 775,000 Nestle Finance International Ltd
0.375% 18/1/2024 884,421 0.04 EUR 3,200,000 Novartis Finance SA 1.375%
14/8/2030 3,985,278 0.19 EUR 1,125,000 Prologis International Funding II SA
0.875% 9/7/2029 1,279,251 0.06 EUR 2,470,000 Prologis International Funding II SA
1.75% 15/3/2028 3,021,007 0.14 EUR 3,744,000 SELP Finance Sarl 1.25%
25/10/2023 4,321,409 0.20 EUR 2,250,000 SELP Finance Sarl 1.5%
20/12/2026* 2,612,708 0.12 21,994,169 1.04
Mexico USD 2,480,000 America Movil SAB de CV 3.125%
16/7/2022 2,544,675 0.12 USD 2,500,000 America Movil SAB de CV 4.375%
16/7/2042* 2,907,031 0.14
USD 939,000 BBVA Bancomer SA/Texas 4.375% 10/4/2024 982,722 0.05
USD 500,000 Grupo Bimbo SAB de CV 4.7% 10/11/2047 557,578 0.02
USD 1,500,000 Grupo Televisa SAB 5% 13/5/2045 1,619,766 0.08 USD 500,000 Mexichem SAB de CV 5.875%
17/9/2044 535,860 0.02 USD 750,000 Sigma Alimentos SA de CV 4.125%
2/5/2026 774,750 0.04 9,922,382 0.47
Netherlands USD 6,400,000 ABN AMRO Bank NV FRN
27/3/2028* 6,666,208 0.32 EUR 1,330,000 Alliander NV 0.875% 24/6/2032 1,581,953 0.08 EUR 500,000 ASML Holding NV 1.375% 7/7/2026 605,997 0.03 EUR 1,640,000 ASR Nederland NV FRN 2/5/2049 1,988,224 0.09 EUR 1,900,000 Bayer Capital Corp BV 0.625%
15/12/2022 2,145,349 0.10 EUR 1,400,000 Bayer Capital Corp BV 2.125%
15/12/2029 1,733,653 0.08 EUR 1,800,000 BMW Finance NV 1.5% 6/2/2029 2,203,899 0.10 USD 1,000,000 Braskem Netherlands Finance BV
4.5% 10/1/2028* 1,000,700 0.05 GBP 2,435,000 Cooperatieve Rabobank UA
4.625% 23/5/2029 3,569,978 0.17 USD 380,000 Cooperatieve Rabobank UA 5.25%
24/5/2041 519,675 0.03 GBP 1,315,000 Deutsche Telekom International
Finance BV 2.25% 13/4/2029 1,682,057 0.08 USD 3,300,000 Deutsche Telekom International
Finance BV ‘144A’ 4.375% 21/6/2028 3,730,829 0.18
GBP 860,000 E.ON International Finance BV 6.375% 7/6/2032 1,561,619 0.07
USD 800,000 Embraer Netherlands Finance BV 5.05% 15/6/2025 877,125 0.04
USD 600,000 Embraer Netherlands Finance BV 5.4% 1/2/2027 679,594 0.03
USD 1,600,000 Enel Finance International NV ‘144A’ 3.625% 25/5/2027 1,644,567 0.08
USD 2,048,000 Enel Finance International NV ‘144A’ 4.625% 14/9/2025 2,236,829 0.11
GBP 3,690,000 Enel Finance International NV 5.625% 14/8/2024 5,379,470 0.25
EUR 2,700,000 Enexis Holding NV 0.75% 2/7/2031 3,139,321 0.15 EUR 5,800,000 Iberdrola International BV FRN
12/11/2024 (Perpetual) 7,110,007 0.34 EUR 600,000 ING Bank NV 0.375% 26/11/2021 673,237 0.03 USD 2,390,000 ING Bank NV ‘144A’ 5.8% 25/9/2023 2,652,146 0.13 USD 3,500,000 ING Groep NV FRN 22/3/2028* 3,690,312 0.17 EUR 1,800,000 Linde Finance BV 1.875% 22/5/2024 2,198,193 0.10 USD 2,000,000 Lukoil International Finance BV
4.75% 2/11/2026 2,177,500 0.10 EUR 1,515,000 Mylan NV 3.125% 22/11/2028 1,926,138 0.09 USD 620,000 NXP BV / NXP Funding LLC ‘144A’
4.875% 1/3/2024 672,422 0.03 USD 2,702,000 NXP BV / NXP Funding LLC / NXP
USA Inc ‘144A’ 4.3% 18/6/2029 2,900,561 0.14 EUR 4,175,000 RELX Finance BV 1% 22/3/2024 4,852,084 0.23 EUR 1,500,000 Repsol International Finance BV
0.25% 2/8/2027 1,678,635 0.08 USD 4,250,000 Shell International Finance BV
3.875% 13/11/2028 4,820,873 0.23 USD 1,290,000 Shell International Finance BV 4%
10/5/2046 1,510,233 0.07
Global Corporate Bond Fund continued
Portfolio of Investments 31 August 2019

Transferable Securities and Money Market Instruments Admitted to an Official Stock Exchange Listing or Dealt in on Another Regulated Market
Transferable Securities and Money Market Instruments Admitted to an Official Stock Exchange Listing or Dealt in on Another Regulated Market
Holding
Description
Market Value (USD)
% of Net
Assets
Holding
Description
Market Value (USD)
% of Net
Assets
* All or a portion of this security represents a security on loan.
The notes on pages 728 to 741 form an integral part of these financial statements.
[422] BlackRock Global Funds (BGF)
EUR 2,740,000 Siemens Financieringsmaatschappij NV 0.125% 5/9/2029 3,014,338 0.14
EUR 4,270,000 Siemens Financieringsmaatschappij NV 0.3% 28/2/2024 4,846,812 0.23
EUR 5,410,000 Siemens Financieringsmaatschappij NV 0.375% 6/9/2023 6,147,651 0.29
EUR 2,700,000 Siemens Financieringsmaatschappij NV 0.5% 5/9/2034 2,977,953 0.14
EUR 5,235,000 Siemens Financieringsmaatschappij NV 1.25% 28/2/2031* 6,430,319 0.30
USD 3,580,000 Siemens Financieringsmaatschappij NV ‘144A’ 2.35% 15/10/2026 3,605,236 0.17
USD 5,200,000 Siemens Financieringsmaatschappij NV ‘144A’ 3.125% 16/3/2024 5,411,732 0.26
USD 3,450,000 Siemens Financieringsmaatschappij NV 3.25% 27/5/2025 3,636,008 0.17
EUR 10,100,000 Telefonica Europe BV FRN 14/12/2024 (Perpetual) 12,370,062 0.58
EUR 3,505,000 TenneT Holding BV 1.5% 3/6/2039 4,450,726 0.21 GBP 2,396,000 Volkswagen Financial Services NV
2.25% 12/4/2025 3,008,121 0.14 EUR 2,000,000 Volkswagen International Finance
NV FRN 14/12/2022 (Perpetual)* 2,287,711 0.11 EUR 2,400,000 Volkswagen International Finance
NV FRN 14/6/2027 (Perpetual) 2,801,377 0.13 EUR 4,900,000 Volkswagen International Finance
NV 1.875% 30/3/2027 5,813,145 0.27 GBP 3,600,000 Volkswagen International Finance
NV 3.375% 16/11/2026 4,757,076 0.23 EUR 3,300,000 Volkswagen International Finance
NV 4.125% 16/11/2038 4,881,414 0.23 156,249,069 7.38
New Zealand EUR 5,723,000 Chorus Ltd 1.125% 18/10/2023 6,611,431 0.31
Norway EUR 1,382,000 Statnett SF 1.25% 26/4/2030 1,679,732 0.08 EUR 2,520,000 Telenor ASA 1.75% 31/5/2034* 3,222,218 0.15 4,901,950 0.23
Peru USD 900,000 Banco de Credito del Peru 4.25%
1/4/2023 949,359 0.05
South Korea USD 900,000 Shinhan Bank Co Ltd 2.875%
28/3/2022 915,891 0.04 USD 800,000 Woori Bank 2.625% 20/7/2021 807,250 0.04 1,723,141 0.08
Spain EUR 1,800,000 Amadeus Capital Markets SAU
1.625% 17/11/2021 2,061,735 0.10 USD 10,200,000 Banco Bilbao Vizcaya Argentaria
SA FRN 5/3/2025 (Perpetual) 10,327,500 0.49 EUR 3,500,000 Banco de Sabadell SA 1.625%
7/3/2024 4,087,758 0.19
EUR 1,500,000 Banco de Sabadell SA 1.75% 10/5/2024 1,704,450 0.08
EUR 800,000 CaixaBank SA FRN 13/6/2024 (Perpetual) 954,692 0.04
EUR 700,000 CaixaBank SA FRN 17/4/2030 801,036 0.04 EUR 1,900,000 Telefonica Emisiones SA 0.75%
13/4/2022 2,153,345 0.10 EUR 600,000 Telefonica Emisiones SA 1.93%
17/10/2031* 764,137 0.04 USD 463,000 Telefonica Emisiones SA 4.103%
8/3/2027 507,537 0.02 USD 1,540,000 Telefonica Emisiones SA 5.213%
8/3/2047 1,793,275 0.08 GBP 800,000 Telefonica Emisiones SA 5.375%
2/2/2026 1,194,353 0.06 26,349,818 1.24
Switzerland USD 5,435,000 Credit Suisse AG 6.5% 8/8/2023 6,056,628 0.29 USD 4,365,000 Credit Suisse Group AG ‘144A’
FRN 17/7/2023 (Perpetual) 4,687,071 0.22 USD 3,365,000 Credit Suisse Group AG ‘144A’
4.282% 9/1/2028 3,663,046 0.17 USD 6,325,000 UBS AG 5.125% 15/5/2024* 6,811,298 0.32 USD 2,100,000 UBS AG/Stamford CT 7.625%
17/8/2022 2,367,130 0.11 USD 5,000,000 UBS Group Funding Switzerland
AG FRN 31/1/2023 (Perpetual)* 4,670,000 0.22 USD 2,900,000 UBS Group Funding Switzerland
AG ‘144A’ 4.125% 24/9/2025 3,154,656 0.15 31,409,829 1.48
Thailand USD 1,200,000 Bangkok Bank PCL/Hong Kong
4.45% 19/9/2028 1,366,125 0.06
United Kingdom USD 2,700,000 Aon Plc 4.45% 24/5/2043 3,011,261 0.14 USD 935,000 Aon Plc 4.75% 15/5/2045 1,130,748 0.05 USD 9,360,000 AstraZeneca Plc 3.375%
16/11/2025 9,902,159 0.47 USD 875,000 AstraZeneca Plc 6.45% 15/9/2037 1,253,393 0.06 GBP 360,000 Aviva Plc FRN 3/6/2041 476,082 0.02 EUR 430,000 Aviva Plc FRN 5/7/2043 559,776 0.03 EUR 240,000 Barclays Bank Plc 6.625%
30/3/2022 305,256 0.01 EUR 1,810,000 Barclays Plc FRN 7/2/2028 1,972,689 0.09 GBP 5,780,000 Barclays Plc 3% 8/5/2026 7,210,795 0.34 EUR 800,000 BAT International Finance Plc
2.25% 16/1/2030 948,944 0.05 EUR 3,655,000 BP Capital Markets Plc 0.831%
8/11/2027 4,265,437 0.20 EUR 1,075,000 BP Capital Markets Plc 1.231%
8/5/2031 1,299,100 0.06 GBP 2,010,000 BP Capital Markets Plc 1.827%
8/9/2025 2,557,769 0.12 CAD 1,000,000 BP Capital Markets Plc 3.47%
15/5/2025 800,971 0.04 EUR 1,667,000 British Telecommunications Plc
1% 23/6/2024 1,921,060 0.09 GBP 755,000 British Telecommunications Plc
3.125% 21/11/2031 1,015,663 0.05 GBP 562,000 Centrica Plc 4.375% 13/3/2029 818,929 0.04 GBP 1,234,000 Channel Link Enterprises Finance
Plc FRN 30/6/2050 1,615,120 0.08 EUR 894,000 Channel Link Enterprises Finance
Plc FRN 30/6/2050 1,052,233 0.05
Global Corporate Bond Fund continued
Portfolio of Investments 31 August 2019
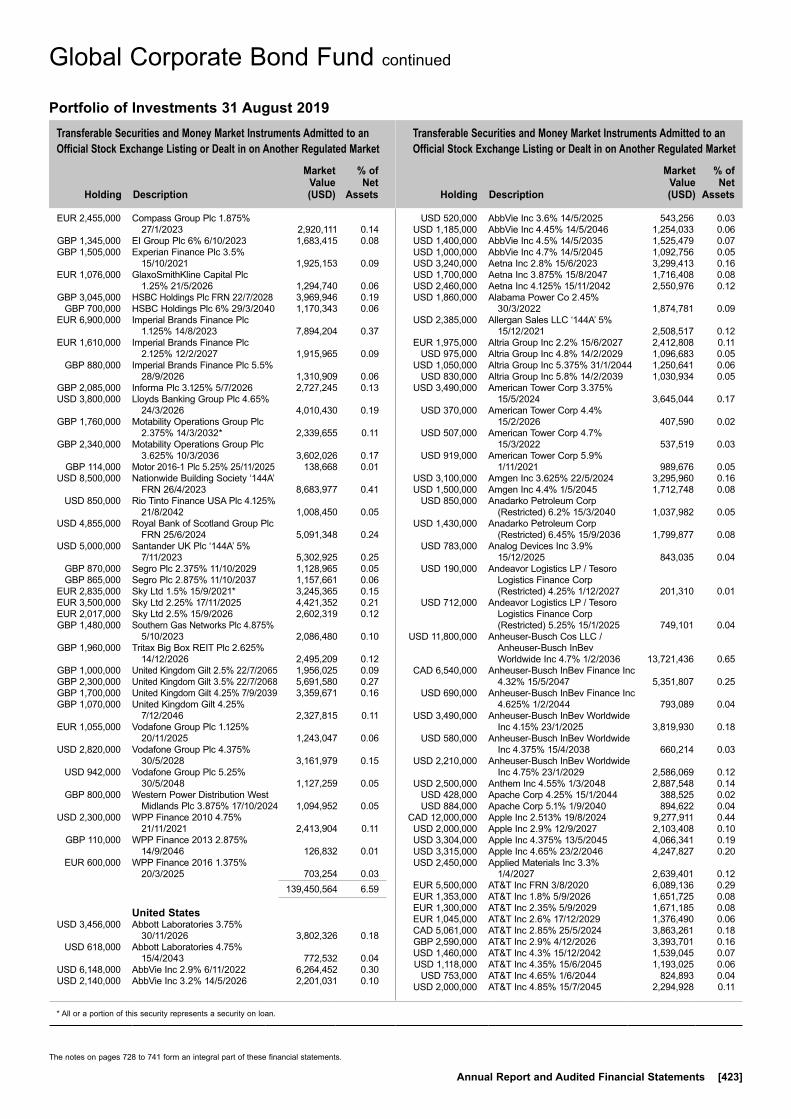
Transferable Securities and Money Market Instruments Admitted to an Official Stock Exchange Listing or Dealt in on Another Regulated Market
Transferable Securities and Money Market Instruments Admitted to an Official Stock Exchange Listing or Dealt in on Another Regulated Market
Holding
Description
Market Value (USD)
% of Net
Assets
Holding
Description
Market Value (USD)
% of Net
Assets
* All or a portion of this security represents a security on loan.
The notes on pages 728 to 741 form an integral part of these financial statements.
Annual Report and Audited Financial Statements [423]
EUR 2,455,000 Compass Group Plc 1.875% 27/1/2023 2,920,111 0.14
GBP 1,345,000 EI Group Plc 6% 6/10/2023 1,683,415 0.08 GBP 1,505,000 Experian Finance Plc 3.5%
15/10/2021 1,925,153 0.09 EUR 1,076,000 GlaxoSmithKline Capital Plc
1.25% 21/5/2026 1,294,740 0.06 GBP 3,045,000 HSBC Holdings Plc FRN 22/7/2028 3,969,946 0.19 GBP 700,000 HSBC Holdings Plc 6% 29/3/2040 1,170,343 0.06 EUR 6,900,000 Imperial Brands Finance Plc
1.125% 14/8/2023 7,894,204 0.37 EUR 1,610,000 Imperial Brands Finance Plc
2.125% 12/2/2027 1,915,965 0.09 GBP 880,000 Imperial Brands Finance Plc 5.5%
28/9/2026 1,310,909 0.06 GBP 2,085,000 Informa Plc 3.125% 5/7/2026 2,727,245 0.13 USD 3,800,000 Lloyds Banking Group Plc 4.65%
24/3/2026 4,010,430 0.19 GBP 1,760,000 Motability Operations Group Plc
2.375% 14/3/2032* 2,339,655 0.11 GBP 2,340,000 Motability Operations Group Plc
3.625% 10/3/2036 3,602,026 0.17 GBP 114,000 Motor 2016-1 Plc 5.25% 25/11/2025 138,668 0.01 USD 8,500,000 Nationwide Building Society ‘144A’
FRN 26/4/2023 8,683,977 0.41 USD 850,000 Rio Tinto Finance USA Plc 4.125%
21/8/2042 1,008,450 0.05 USD 4,855,000 Royal Bank of Scotland Group Plc
FRN 25/6/2024 5,091,348 0.24 USD 5,000,000 Santander UK Plc ‘144A’ 5%
7/11/2023 5,302,925 0.25 GBP 870,000 Segro Plc 2.375% 11/10/2029 1,128,965 0.05 GBP 865,000 Segro Plc 2.875% 11/10/2037 1,157,661 0.06 EUR 2,835,000 Sky Ltd 1.5% 15/9/2021* 3,245,365 0.15 EUR 3,500,000 Sky Ltd 2.25% 17/11/2025 4,421,352 0.21 EUR 2,017,000 Sky Ltd 2.5% 15/9/2026 2,602,319 0.12 GBP 1,480,000 Southern Gas Networks Plc 4.875%
5/10/2023 2,086,480 0.10 GBP 1,960,000 Tritax Big Box REIT Plc 2.625%
14/12/2026 2,495,209 0.12 GBP 1,000,000 United Kingdom Gilt 2.5% 22/7/2065 1,956,025 0.09 GBP 2,300,000 United Kingdom Gilt 3.5% 22/7/2068 5,691,580 0.27 GBP 1,700,000 United Kingdom Gilt 4.25% 7/9/2039 3,359,671 0.16 GBP 1,070,000 United Kingdom Gilt 4.25%
7/12/2046 2,327,815 0.11 EUR 1,055,000 Vodafone Group Plc 1.125%
20/11/2025 1,243,047 0.06 USD 2,820,000 Vodafone Group Plc 4.375%
30/5/2028 3,161,979 0.15 USD 942,000 Vodafone Group Plc 5.25%
30/5/2048 1,127,259 0.05 GBP 800,000 Western Power Distribution West
Midlands Plc 3.875% 17/10/2024 1,094,952 0.05 USD 2,300,000 WPP Finance 2010 4.75%
21/11/2021 2,413,904 0.11 GBP 110,000 WPP Finance 2013 2.875%
14/9/2046 126,832 0.01 EUR 600,000 WPP Finance 2016 1.375%
20/3/2025 703,254 0.03 139,450,564 6.59
United States USD 3,456,000 Abbott Laboratories 3.75%
30/11/2026 3,802,326 0.18 USD 618,000 Abbott Laboratories 4.75%
15/4/2043 772,532 0.04 USD 6,148,000 AbbVie Inc 2.9% 6/11/2022 6,264,452 0.30 USD 2,140,000 AbbVie Inc 3.2% 14/5/2026 2,201,031 0.10
USD 520,000 AbbVie Inc 3.6% 14/5/2025 543,256 0.03 USD 1,185,000 AbbVie Inc 4.45% 14/5/2046 1,254,033 0.06 USD 1,400,000 AbbVie Inc 4.5% 14/5/2035 1,525,479 0.07 USD 1,000,000 AbbVie Inc 4.7% 14/5/2045 1,092,756 0.05 USD 3,240,000 Aetna Inc 2.8% 15/6/2023 3,299,413 0.16 USD 1,700,000 Aetna Inc 3.875% 15/8/2047 1,716,408 0.08 USD 2,460,000 Aetna Inc 4.125% 15/11/2042 2,550,976 0.12 USD 1,860,000 Alabama Power Co 2.45%
30/3/2022 1,874,781 0.09 USD 2,385,000 Allergan Sales LLC ‘144A’ 5%
15/12/2021 2,508,517 0.12 EUR 1,975,000 Altria Group Inc 2.2% 15/6/2027 2,412,808 0.11 USD 975,000 Altria Group Inc 4.8% 14/2/2029 1,096,683 0.05 USD 1,050,000 Altria Group Inc 5.375% 31/1/2044 1,250,641 0.06 USD 830,000 Altria Group Inc 5.8% 14/2/2039 1,030,934 0.05 USD 3,490,000 American Tower Corp 3.375%
15/5/2024 3,645,044 0.17 USD 370,000 American Tower Corp 4.4%
15/2/2026 407,590 0.02 USD 507,000 American Tower Corp 4.7%
15/3/2022 537,519 0.03 USD 919,000 American Tower Corp 5.9%
1/11/2021 989,676 0.05 USD 3,100,000 Amgen Inc 3.625% 22/5/2024 3,295,960 0.16 USD 1,500,000 Amgen Inc 4.4% 1/5/2045 1,712,748 0.08 USD 850,000 Anadarko Petroleum Corp
(Restricted) 6.2% 15/3/2040 1,037,982 0.05 USD 1,430,000 Anadarko Petroleum Corp
(Restricted) 6.45% 15/9/2036 1,799,877 0.08 USD 783,000 Analog Devices Inc 3.9%
15/12/2025 843,035 0.04 USD 190,000 Andeavor Logistics LP / Tesoro
Logistics Finance Corp (Restricted) 4.25% 1/12/2027 201,310 0.01
USD 712,000 Andeavor Logistics LP / Tesoro Logistics Finance Corp (Restricted) 5.25% 15/1/2025 749,101 0.04
USD 11,800,000 Anheuser-Busch Cos LLC / Anheuser-Busch InBev Worldwide Inc 4.7% 1/2/2036 13,721,436 0.65
CAD 6,540,000 Anheuser-Busch InBev Finance Inc 4.32% 15/5/2047 5,351,807 0.25
USD 690,000 Anheuser-Busch InBev Finance Inc 4.625% 1/2/2044 793,089 0.04
USD 3,490,000 Anheuser-Busch InBev Worldwide Inc 4.15% 23/1/2025 3,819,930 0.18
USD 580,000 Anheuser-Busch InBev Worldwide Inc 4.375% 15/4/2038 660,214 0.03
USD 2,210,000 Anheuser-Busch InBev Worldwide Inc 4.75% 23/1/2029 2,586,069 0.12
USD 2,500,000 Anthem Inc 4.55% 1/3/2048 2,887,548 0.14 USD 428,000 Apache Corp 4.25% 15/1/2044 388,525 0.02 USD 884,000 Apache Corp 5.1% 1/9/2040 894,622 0.04 CAD 12,000,000 Apple Inc 2.513% 19/8/2024 9,277,911 0.44 USD 2,000,000 Apple Inc 2.9% 12/9/2027 2,103,408 0.10 USD 3,304,000 Apple Inc 4.375% 13/5/2045 4,066,341 0.19 USD 3,315,000 Apple Inc 4.65% 23/2/2046 4,247,827 0.20 USD 2,450,000 Applied Materials Inc 3.3%
1/4/2027 2,639,401 0.12 EUR 5,500,000 AT&T Inc FRN 3/8/2020 6,089,136 0.29 EUR 1,353,000 AT&T Inc 1.8% 5/9/2026 1,651,725 0.08 EUR 1,300,000 AT&T Inc 2.35% 5/9/2029 1,671,185 0.08 EUR 1,045,000 AT&T Inc 2.6% 17/12/2029 1,376,490 0.06 CAD 5,061,000 AT&T Inc 2.85% 25/5/2024 3,863,261 0.18 GBP 2,590,000 AT&T Inc 2.9% 4/12/2026 3,393,701 0.16 USD 1,460,000 AT&T Inc 4.3% 15/12/2042 1,539,045 0.07 USD 1,118,000 AT&T Inc 4.35% 15/6/2045 1,193,025 0.06 USD 753,000 AT&T Inc 4.65% 1/6/2044 824,893 0.04 USD 2,000,000 AT&T Inc 4.85% 15/7/2045 2,294,928 0.11
Global Corporate Bond Fund continued
Portfolio of Investments 31 August 2019
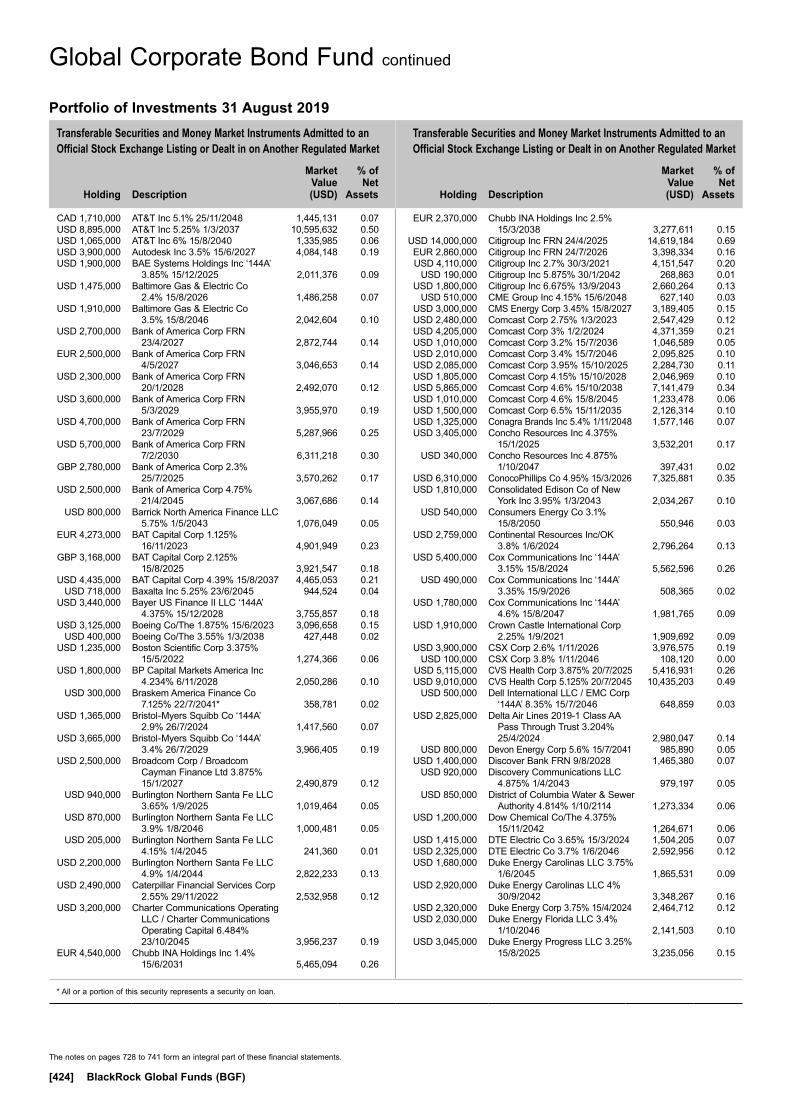
Transferable Securities and Money Market Instruments Admitted to an Official Stock Exchange Listing or Dealt in on Another Regulated Market
Transferable Securities and Money Market Instruments Admitted to an Official Stock Exchange Listing or Dealt in on Another Regulated Market
Holding
Description
Market Value (USD)
% of Net
Assets
Holding
Description
Market Value (USD)
% of Net
Assets
* All or a portion of this security represents a security on loan.
The notes on pages 728 to 741 form an integral part of these financial statements.
[424] BlackRock Global Funds (BGF)
CAD 1,710,000 AT&T Inc 5.1% 25/11/2048 1,445,131 0.07 USD 8,895,000 AT&T Inc 5.25% 1/3/2037 10,595,632 0.50 USD 1,065,000 AT&T Inc 6% 15/8/2040 1,335,985 0.06 USD 3,900,000 Autodesk Inc 3.5% 15/6/2027 4,084,148 0.19 USD 1,900,000 BAE Systems Holdings Inc ‘144A’
3.85% 15/12/2025 2,011,376 0.09 USD 1,475,000 Baltimore Gas & Electric Co
2.4% 15/8/2026 1,486,258 0.07 USD 1,910,000 Baltimore Gas & Electric Co
3.5% 15/8/2046 2,042,604 0.10 USD 2,700,000 Bank of America Corp FRN
23/4/2027 2,872,744 0.14 EUR 2,500,000 Bank of America Corp FRN
4/5/2027 3,046,653 0.14 USD 2,300,000 Bank of America Corp FRN
20/1/2028 2,492,070 0.12 USD 3,600,000 Bank of America Corp FRN
5/3/2029 3,955,970 0.19 USD 4,700,000 Bank of America Corp FRN
23/7/2029 5,287,966 0.25 USD 5,700,000 Bank of America Corp FRN
7/2/2030 6,311,218 0.30 GBP 2,780,000 Bank of America Corp 2.3%
25/7/2025 3,570,262 0.17 USD 2,500,000 Bank of America Corp 4.75%
21/4/2045 3,067,686 0.14 USD 800,000 Barrick North America Finance LLC
5.75% 1/5/2043 1,076,049 0.05 EUR 4,273,000 BAT Capital Corp 1.125%
16/11/2023 4,901,949 0.23 GBP 3,168,000 BAT Capital Corp 2.125%
15/8/2025 3,921,547 0.18 USD 4,435,000 BAT Capital Corp 4.39% 15/8/2037 4,465,053 0.21 USD 718,000 Baxalta Inc 5.25% 23/6/2045 944,524 0.04 USD 3,440,000 Bayer US Finance II LLC ‘144A’
4.375% 15/12/2028 3,755,857 0.18 USD 3,125,000 Boeing Co/The 1.875% 15/6/2023 3,096,658 0.15 USD 400,000 Boeing Co/The 3.55% 1/3/2038 427,448 0.02 USD 1,235,000 Boston Scientific Corp 3.375%
15/5/2022 1,274,366 0.06 USD 1,800,000 BP Capital Markets America Inc
4.234% 6/11/2028 2,050,286 0.10 USD 300,000 Braskem America Finance Co
7.125% 22/7/2041* 358,781 0.02 USD 1,365,000 Bristol-Myers Squibb Co ‘144A’
2.9% 26/7/2024 1,417,560 0.07 USD 3,665,000 Bristol-Myers Squibb Co ‘144A’
3.4% 26/7/2029 3,966,405 0.19 USD 2,500,000 Broadcom Corp / Broadcom
Cayman Finance Ltd 3.875% 15/1/2027 2,490,879 0.12
USD 940,000 Burlington Northern Santa Fe LLC 3.65% 1/9/2025 1,019,464 0.05
USD 870,000 Burlington Northern Santa Fe LLC 3.9% 1/8/2046 1,000,481 0.05
USD 205,000 Burlington Northern Santa Fe LLC 4.15% 1/4/2045 241,360 0.01
USD 2,200,000 Burlington Northern Santa Fe LLC 4.9% 1/4/2044 2,822,233 0.13
USD 2,490,000 Caterpillar Financial Services Corp 2.55% 29/11/2022 2,532,958 0.12
USD 3,200,000 Charter Communications Operating LLC / Charter Communications Operating Capital 6.484% 23/10/2045 3,956,237 0.19
EUR 4,540,000 Chubb INA Holdings Inc 1.4% 15/6/2031 5,465,094 0.26
EUR 2,370,000 Chubb INA Holdings Inc 2.5% 15/3/2038 3,277,611 0.15
USD 14,000,000 Citigroup Inc FRN 24/4/2025 14,619,184 0.69 EUR 2,860,000 Citigroup Inc FRN 24/7/2026 3,398,334 0.16 USD 4,110,000 Citigroup Inc 2.7% 30/3/2021 4,151,547 0.20 USD 190,000 Citigroup Inc 5.875% 30/1/2042 268,863 0.01 USD 1,800,000 Citigroup Inc 6.675% 13/9/2043 2,660,264 0.13 USD 510,000 CME Group Inc 4.15% 15/6/2048 627,140 0.03 USD 3,000,000 CMS Energy Corp 3.45% 15/8/2027 3,189,405 0.15 USD 2,480,000 Comcast Corp 2.75% 1/3/2023 2,547,429 0.12 USD 4,205,000 Comcast Corp 3% 1/2/2024 4,371,359 0.21 USD 1,010,000 Comcast Corp 3.2% 15/7/2036 1,046,589 0.05 USD 2,010,000 Comcast Corp 3.4% 15/7/2046 2,095,825 0.10 USD 2,085,000 Comcast Corp 3.95% 15/10/2025 2,284,730 0.11 USD 1,805,000 Comcast Corp 4.15% 15/10/2028 2,046,969 0.10 USD 5,865,000 Comcast Corp 4.6% 15/10/2038 7,141,479 0.34 USD 1,010,000 Comcast Corp 4.6% 15/8/2045 1,233,478 0.06 USD 1,500,000 Comcast Corp 6.5% 15/11/2035 2,126,314 0.10 USD 1,325,000 Conagra Brands Inc 5.4% 1/11/2048 1,577,146 0.07 USD 3,405,000 Concho Resources Inc 4.375%
15/1/2025 3,532,201 0.17 USD 340,000 Concho Resources Inc 4.875%
1/10/2047 397,431 0.02 USD 6,310,000 ConocoPhillips Co 4.95% 15/3/2026 7,325,881 0.35 USD 1,810,000 Consolidated Edison Co of New
York Inc 3.95% 1/3/2043 2,034,267 0.10 USD 540,000 Consumers Energy Co 3.1%
15/8/2050 550,946 0.03 USD 2,759,000 Continental Resources Inc/OK
3.8% 1/6/2024 2,796,264 0.13 USD 5,400,000 Cox Communications Inc ‘144A’
3.15% 15/8/2024 5,562,596 0.26 USD 490,000 Cox Communications Inc ‘144A’
3.35% 15/9/2026 508,365 0.02 USD 1,780,000 Cox Communications Inc ‘144A’
4.6% 15/8/2047 1,981,765 0.09 USD 1,910,000 Crown Castle International Corp
2.25% 1/9/2021 1,909,692 0.09 USD 3,900,000 CSX Corp 2.6% 1/11/2026 3,976,575 0.19 USD 100,000 CSX Corp 3.8% 1/11/2046 108,120 0.00 USD 5,115,000 CVS Health Corp 3.875% 20/7/2025 5,416,931 0.26 USD 9,010,000 CVS Health Corp 5.125% 20/7/2045 10,435,203 0.49 USD 500,000 Dell International LLC / EMC Corp
‘144A’ 8.35% 15/7/2046 648,859 0.03 USD 2,825,000 Delta Air Lines 2019-1 Class AA
Pass Through Trust 3.204% 25/4/2024 2,980,047 0.14
USD 800,000 Devon Energy Corp 5.6% 15/7/2041 985,890 0.05 USD 1,400,000 Discover Bank FRN 9/8/2028 1,465,380 0.07 USD 920,000 Discovery Communications LLC
4.875% 1/4/2043 979,197 0.05 USD 850,000 District of Columbia Water & Sewer
Authority 4.814% 1/10/2114 1,273,334 0.06 USD 1,200,000 Dow Chemical Co/The 4.375%
15/11/2042 1,264,671 0.06 USD 1,415,000 DTE Electric Co 3.65% 15/3/2024 1,504,205 0.07 USD 2,325,000 DTE Electric Co 3.7% 1/6/2046 2,592,956 0.12 USD 1,680,000 Duke Energy Carolinas LLC 3.75%
1/6/2045 1,865,531 0.09 USD 2,920,000 Duke Energy Carolinas LLC 4%
30/9/2042 3,348,267 0.16 USD 2,320,000 Duke Energy Corp 3.75% 15/4/2024 2,464,712 0.12 USD 2,030,000 Duke Energy Florida LLC 3.4%
1/10/2046 2,141,503 0.10 USD 3,045,000 Duke Energy Progress LLC 3.25%
15/8/2025 3,235,056 0.15
Global Corporate Bond Fund continued
Portfolio of Investments 31 August 2019

Transferable Securities and Money Market Instruments Admitted to an Official Stock Exchange Listing or Dealt in on Another Regulated Market
Transferable Securities and Money Market Instruments Admitted to an Official Stock Exchange Listing or Dealt in on Another Regulated Market
Holding
Description
Market Value (USD)
% of Net
Assets
Holding
Description
Market Value (USD)
% of Net
Assets
* All or a portion of this security represents a security on loan.
The notes on pages 728 to 741 form an integral part of these financial statements.
Annual Report and Audited Financial Statements [425]
USD 200,000 Duke Energy Progress LLC 3.45% 15/3/2029 218,097 0.01
USD 420,000 Duke Energy Progress LLC 4.1% 15/5/2042 490,668 0.02
USD 1,275,000 DuPont de Nemours Inc 5.419% 15/11/2048 1,635,565 0.08
USD 1,370,000 Eaton Corp 2.75% 2/11/2022 1,397,101 0.07 USD 1,165,000 Eli Lilly & Co 4.15% 15/3/2059 1,398,590 0.07 USD 1,470,000 Energy Transfer Operating LP
5.8% 15/6/2038 1,716,692 0.08 USD 840,000 Energy Transfer Operating LP
6.05% 1/6/2041 974,076 0.05 USD 2,000,000 Energy Transfer Operating LP
6.125% 15/12/2045 2,378,276 0.11 USD 4,997,000 Entergy Corp 2.95% 1/9/2026 5,098,820 0.24 USD 545,000 Entergy Corp 4% 15/7/2022 571,051 0.03 USD 4,000,000 Entergy Louisiana LLC 3.12%
1/9/2027 4,224,014 0.20 USD 3,627,000 Enterprise Products Operating LLC
3.75% 15/2/2025 3,886,953 0.18 USD 1,275,000 Enterprise Products Operating LLC
3.95% 15/2/2027 1,387,843 0.07 USD 1,210,000 Enterprise Products Operating LLC
4.45% 15/2/2043 1,329,934 0.06 USD 770,000 Enterprise Products Operating LLC
4.85% 15/8/2042 886,226 0.04 USD 200,000 Enterprise Products Operating LLC
4.9% 15/5/2046 236,533 0.01 USD 1,300,000 EOG Resources Inc 4.15% 15/1/2026 1,450,571 0.07 USD 1,870,000 Eversource Energy 2.75% 15/3/2022 1,899,310 0.09 USD 6,039,000 Exelon Corp 3.4% 15/4/2026 6,399,443 0.30 USD 3,345,000 Expedia Group Inc 3.8% 15/2/2028 3,543,240 0.17 USD 2,688,000 Expedia Group Inc 5.95% 15/8/2020 2,778,561 0.13 USD 3,570,000 Exxon Mobil Corp 2.44% 16/8/2029 3,650,418 0.17 USD 2,420,000 Exxon Mobil Corp 3.043% 1/3/2026 2,567,857 0.12 USD 4,302,000 Exxon Mobil Corp 3.095%
16/8/2049 4,453,536 0.21 USD 1,130,000 Exxon Mobil Corp 4.114% 1/3/2046 1,370,970 0.06 USD 1,600,000 FedEx Corp 5.1% 15/1/2044 1,867,972 0.09 GBP 997,000 Fidelity National Information
Services Inc 1.7% 30/6/2022 1,237,138 0.06 EUR 2,705,000 Fidelity National Information
Services Inc 2% 21/5/2030 3,401,164 0.16 EUR 3,655,000 Fidelity National Information
Services Inc 2.95% 21/5/2039* 5,112,589 0.24 GBP 1,900,000 Fidelity National Information
Services Inc 3.36% 21/5/2031 2,611,500 0.12 USD 2,025,000 Fidelity National Information
Services Inc 3.5% 15/4/2023 2,111,355 0.10 USD 627,000 Fidelity National Information
Services Inc 4.5% 15/10/2022 667,150 0.03 USD 4,040,000 FirstEnergy Corp 2.85% 15/7/2022 4,119,402 0.19 USD 6,190,000 FirstEnergy Corp 3.9% 15/7/2027 6,675,098 0.32 USD 1,250,000 FirstEnergy Transmission LLC
‘144A’ 4.55% 1/4/2049 1,499,148 0.07 EUR 3,500,000 Fiserv Inc 1.625% 1/7/2030 4,232,490 0.20 GBP 2,120,000 Fiserv Inc 2.25% 1/7/2025 2,682,255 0.13 GBP 1,170,000 Fiserv Inc 3% 1/7/2031 1,548,391 0.07 USD 4,074,000 Fiserv Inc 3.2% 1/7/2026 4,253,872 0.20 USD 3,738,000 Fiserv Inc 3.5% 1/7/2029 3,963,915 0.19 USD 2,390,000 Florida Power & Light Co 3.7%
1/12/2047 2,706,506 0.13 EUR 2,300,000 Ford Motor Credit Co LLC 1.514%
17/2/2023 2,586,051 0.12 EUR 2,645,000 Ford Motor Credit Co LLC 3.021%
6/3/2024* 3,139,227 0.15 USD 1,470,000 Ford Motor Credit Co LLC 3.813%
12/10/2021 1,495,628 0.07
USD 2,808,000 Ford Motor Credit Co LLC 4.389% 8/1/2026 2,855,794 0.13
USD 1,872,000 Ford Motor Credit Co LLC 4.542% 1/8/2026 1,909,853 0.09
USD 7,400,000 Fresenius Medical Care US Finance III Inc ‘144A’ 3.75% 15/6/2029 7,552,263 0.36
USD 1,190,000 GATX Corp 3.85% 30/3/2027 1,266,450 0.06 EUR 3,170,000 General Electric Co 0.875%
17/5/2025 3,447,487 0.16 EUR 4,200,000 General Electric Co 1.25%
26/5/2023 4,681,145 0.22 USD 2,725,000 General Electric Co 4.125%
9/10/2042 2,630,557 0.12 USD 1,400,000 General Electric Co 4.5% 11/3/2044 1,415,162 0.07 USD 2,645,000 General Motors Co 5% 1/4/2035 2,723,562 0.13 USD 15,000 General Motors Co 5.95% 1/4/2049 16,682 0.00 USD 300,000 General Motors Co 6.75% 1/4/2046 354,715 0.02 EUR 8,986,000 General Motors Financial Co Inc
2.2% 1/4/2024 10,595,382 0.50 USD 3,515,000 General Motors Financial Co Inc
3.55% 8/7/2022 3,602,204 0.17 USD 1,870,000 Georgia-Pacific LLC ‘144A’ 3.6%
1/3/2025 1,990,469 0.09 USD 930,000 Georgia-Pacific LLC ‘144A’ 3.734%
15/7/2023 983,818 0.05 USD 3,135,000 GlaxoSmithKline Capital Inc
3.625% 15/5/2025 3,370,577 0.16 USD 4,650,000 Goldman Sachs Group Inc/The
3.5% 23/1/2025 4,888,193 0.23 USD 500,000 Goldman Sachs Group Inc/The
5.25% 27/7/2021 528,874 0.02 USD 1,000,000 Goldman Sachs Group Inc/The
6.25% 1/2/2041 1,418,451 0.07 USD 2,355,000 Goldman Sachs Group Inc/The
6.75% 1/10/2037 3,225,351 0.15 USD 3,700,000 Goodman US Finance Four LLC
‘144A’ 4.5% 15/10/2037 4,121,717 0.19 USD 2,400,000 Goodman US Finance Three LLC
‘144A’ 3.7% 15/3/2028 2,517,735 0.12 USD 1,241,000 Halliburton Co 5% 15/11/2045 1,390,267 0.07 USD 2,325,000 Hartford Financial Services Group
Inc/The 3.6% 19/8/2049 2,438,588 0.11 USD 1,677,000 Hess Corp 4.3% 1/4/2027 1,749,059 0.08 USD 1,200,000 Home Depot Inc/The 4.2% 1/4/2043 1,433,096 0.07 USD 3,200,000 Home Depot Inc/The 4.25%
1/4/2046 3,891,920 0.18 EUR 6,400,000 Honeywell International Inc 1.3%
22/2/2023 7,463,971 0.35 USD 2,590,000 Honeywell International Inc 2.5%
1/11/2026 2,664,059 0.13 USD 2,100,000 Humana Inc 3.95% 15/3/2027 2,247,059 0.11 USD 500,000 Hyundai Capital America 2.45%
15/6/2021 499,531 0.02 USD 1,500,000 Hyundai Capital America 2.75%
27/9/2026 1,475,859 0.07 EUR 3,600,000 Illinois Tool Works Inc 1% 5/6/2031* 4,262,790 0.20 EUR 4,830,000 International Business Machines
Corp 0.875% 31/1/2025 5,597,170 0.26 EUR 3,235,000 International Business Machines
Corp 1.25% 29/1/2027 3,887,212 0.18 EUR 1,850,000 International Business Machines
Corp 1.75% 31/1/2031 2,339,770 0.11 USD 4,600,000 International Business Machines
Corp 3.45% 19/2/2026 4,937,855 0.23 USD 7,415,000 International Business Machines
Corp 3.5% 15/5/2029 8,047,683 0.38
Global Corporate Bond Fund continued
Portfolio of Investments 31 August 2019
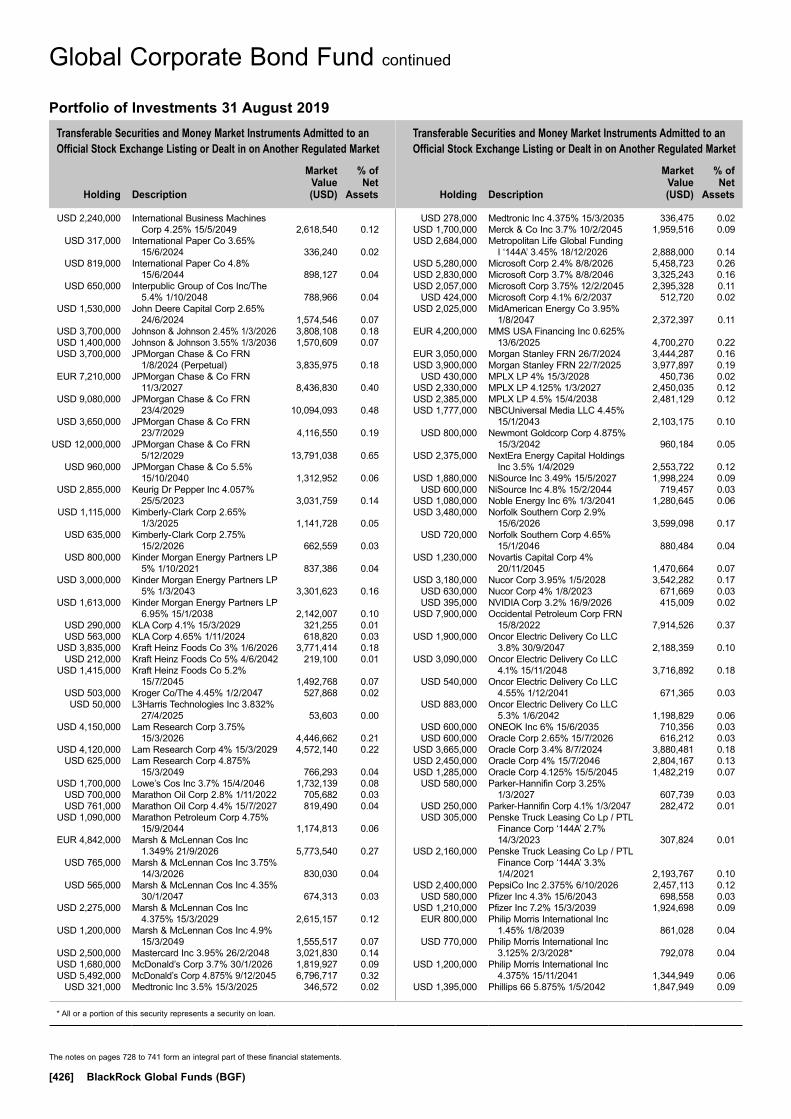
Transferable Securities and Money Market Instruments Admitted to an Official Stock Exchange Listing or Dealt in on Another Regulated Market
Transferable Securities and Money Market Instruments Admitted to an Official Stock Exchange Listing or Dealt in on Another Regulated Market
Holding
Description
Market Value (USD)
% of Net
Assets
Holding
Description
Market Value (USD)
% of Net
Assets
* All or a portion of this security represents a security on loan.
The notes on pages 728 to 741 form an integral part of these financial statements.
[426] BlackRock Global Funds (BGF)
USD 2,240,000 International Business Machines Corp 4.25% 15/5/2049 2,618,540 0.12
USD 317,000 International Paper Co 3.65% 15/6/2024 336,240 0.02
USD 819,000 International Paper Co 4.8% 15/6/2044 898,127 0.04
USD 650,000 Interpublic Group of Cos Inc/The 5.4% 1/10/2048 788,966 0.04
USD 1,530,000 John Deere Capital Corp 2.65% 24/6/2024 1,574,546 0.07
USD 3,700,000 Johnson & Johnson 2.45% 1/3/2026 3,808,108 0.18 USD 1,400,000 Johnson & Johnson 3.55% 1/3/2036 1,570,609 0.07 USD 3,700,000 JPMorgan Chase & Co FRN
1/8/2024 (Perpetual) 3,835,975 0.18 EUR 7,210,000 JPMorgan Chase & Co FRN
11/3/2027 8,436,830 0.40 USD 9,080,000 JPMorgan Chase & Co FRN
23/4/2029 10,094,093 0.48 USD 3,650,000 JPMorgan Chase & Co FRN
23/7/2029 4,116,550 0.19 USD 12,000,000 JPMorgan Chase & Co FRN
5/12/2029 13,791,038 0.65 USD 960,000 JPMorgan Chase & Co 5.5%
15/10/2040 1,312,952 0.06 USD 2,855,000 Keurig Dr Pepper Inc 4.057%
25/5/2023 3,031,759 0.14 USD 1,115,000 Kimberly-Clark Corp 2.65%
1/3/2025 1,141,728 0.05 USD 635,000 Kimberly-Clark Corp 2.75%
15/2/2026 662,559 0.03 USD 800,000 Kinder Morgan Energy Partners LP
5% 1/10/2021 837,386 0.04 USD 3,000,000 Kinder Morgan Energy Partners LP
5% 1/3/2043 3,301,623 0.16 USD 1,613,000 Kinder Morgan Energy Partners LP
6.95% 15/1/2038 2,142,007 0.10 USD 290,000 KLA Corp 4.1% 15/3/2029 321,255 0.01 USD 563,000 KLA Corp 4.65% 1/11/2024 618,820 0.03 USD 3,835,000 Kraft Heinz Foods Co 3% 1/6/2026 3,771,414 0.18 USD 212,000 Kraft Heinz Foods Co 5% 4/6/2042 219,100 0.01 USD 1,415,000 Kraft Heinz Foods Co 5.2%
15/7/2045 1,492,768 0.07 USD 503,000 Kroger Co/The 4.45% 1/2/2047 527,868 0.02 USD 50,000 L3Harris Technologies Inc 3.832%
27/4/2025 53,603 0.00 USD 4,150,000 Lam Research Corp 3.75%
15/3/2026 4,446,662 0.21 USD 4,120,000 Lam Research Corp 4% 15/3/2029 4,572,140 0.22 USD 625,000 Lam Research Corp 4.875%
15/3/2049 766,293 0.04 USD 1,700,000 Lowe’s Cos Inc 3.7% 15/4/2046 1,732,139 0.08 USD 700,000 Marathon Oil Corp 2.8% 1/11/2022 705,682 0.03 USD 761,000 Marathon Oil Corp 4.4% 15/7/2027 819,490 0.04 USD 1,090,000 Marathon Petroleum Corp 4.75%
15/9/2044 1,174,813 0.06 EUR 4,842,000 Marsh & McLennan Cos Inc
1.349% 21/9/2026 5,773,540 0.27 USD 765,000 Marsh & McLennan Cos Inc 3.75%
14/3/2026 830,030 0.04 USD 565,000 Marsh & McLennan Cos Inc 4.35%
30/1/2047 674,313 0.03 USD 2,275,000 Marsh & McLennan Cos Inc
4.375% 15/3/2029 2,615,157 0.12 USD 1,200,000 Marsh & McLennan Cos Inc 4.9%
15/3/2049 1,555,517 0.07 USD 2,500,000 Mastercard Inc 3.95% 26/2/2048 3,021,830 0.14 USD 1,680,000 McDonald’s Corp 3.7% 30/1/2026 1,819,927 0.09 USD 5,492,000 McDonald’s Corp 4.875% 9/12/2045 6,796,717 0.32 USD 321,000 Medtronic Inc 3.5% 15/3/2025 346,572 0.02
USD 278,000 Medtronic Inc 4.375% 15/3/2035 336,475 0.02 USD 1,700,000 Merck & Co Inc 3.7% 10/2/2045 1,959,516 0.09 USD 2,684,000 Metropolitan Life Global Funding
I ‘144A’ 3.45% 18/12/2026 2,888,000 0.14 USD 5,280,000 Microsoft Corp 2.4% 8/8/2026 5,458,723 0.26 USD 2,830,000 Microsoft Corp 3.7% 8/8/2046 3,325,243 0.16 USD 2,057,000 Microsoft Corp 3.75% 12/2/2045 2,395,328 0.11 USD 424,000 Microsoft Corp 4.1% 6/2/2037 512,720 0.02 USD 2,025,000 MidAmerican Energy Co 3.95%
1/8/2047 2,372,397 0.11 EUR 4,200,000 MMS USA Financing Inc 0.625%
13/6/2025 4,700,270 0.22 EUR 3,050,000 Morgan Stanley FRN 26/7/2024 3,444,287 0.16 USD 3,900,000 Morgan Stanley FRN 22/7/2025 3,977,897 0.19 USD 430,000 MPLX LP 4% 15/3/2028 450,736 0.02 USD 2,330,000 MPLX LP 4.125% 1/3/2027 2,450,035 0.12 USD 2,385,000 MPLX LP 4.5% 15/4/2038 2,481,129 0.12 USD 1,777,000 NBCUniversal Media LLC 4.45%
15/1/2043 2,103,175 0.10 USD 800,000 Newmont Goldcorp Corp 4.875%
15/3/2042 960,184 0.05 USD 2,375,000 NextEra Energy Capital Holdings
Inc 3.5% 1/4/2029 2,553,722 0.12 USD 1,880,000 NiSource Inc 3.49% 15/5/2027 1,998,224 0.09 USD 600,000 NiSource Inc 4.8% 15/2/2044 719,457 0.03 USD 1,080,000 Noble Energy Inc 6% 1/3/2041 1,280,645 0.06 USD 3,480,000 Norfolk Southern Corp 2.9%
15/6/2026 3,599,098 0.17 USD 720,000 Norfolk Southern Corp 4.65%
15/1/2046 880,484 0.04 USD 1,230,000 Novartis Capital Corp 4%
20/11/2045 1,470,664 0.07 USD 3,180,000 Nucor Corp 3.95% 1/5/2028 3,542,282 0.17 USD 630,000 Nucor Corp 4% 1/8/2023 671,669 0.03 USD 395,000 NVIDIA Corp 3.2% 16/9/2026 415,009 0.02 USD 7,900,000 Occidental Petroleum Corp FRN
15/8/2022 7,914,526 0.37 USD 1,900,000 Oncor Electric Delivery Co LLC
3.8% 30/9/2047 2,188,359 0.10 USD 3,090,000 Oncor Electric Delivery Co LLC
4.1% 15/11/2048 3,716,892 0.18 USD 540,000 Oncor Electric Delivery Co LLC
4.55% 1/12/2041 671,365 0.03 USD 883,000 Oncor Electric Delivery Co LLC
5.3% 1/6/2042 1,198,829 0.06 USD 600,000 ONEOK Inc 6% 15/6/2035 710,356 0.03 USD 600,000 Oracle Corp 2.65% 15/7/2026 616,212 0.03 USD 3,665,000 Oracle Corp 3.4% 8/7/2024 3,880,481 0.18 USD 2,450,000 Oracle Corp 4% 15/7/2046 2,804,167 0.13 USD 1,285,000 Oracle Corp 4.125% 15/5/2045 1,482,219 0.07 USD 580,000 Parker-Hannifin Corp 3.25%
1/3/2027 607,739 0.03 USD 250,000 Parker-Hannifin Corp 4.1% 1/3/2047 282,472 0.01 USD 305,000 Penske Truck Leasing Co Lp / PTL
Finance Corp ‘144A’ 2.7% 14/3/2023 307,824 0.01
USD 2,160,000 Penske Truck Leasing Co Lp / PTL Finance Corp ‘144A’ 3.3% 1/4/2021 2,193,767 0.10
USD 2,400,000 PepsiCo Inc 2.375% 6/10/2026 2,457,113 0.12 USD 580,000 Pfizer Inc 4.3% 15/6/2043 698,558 0.03 USD 1,210,000 Pfizer Inc 7.2% 15/3/2039 1,924,698 0.09 EUR 800,000 Philip Morris International Inc
1.45% 1/8/2039 861,028 0.04 USD 770,000 Philip Morris International Inc
3.125% 2/3/2028* 792,078 0.04 USD 1,200,000 Philip Morris International Inc
4.375% 15/11/2041 1,344,949 0.06 USD 1,395,000 Phillips 66 5.875% 1/5/2042 1,847,949 0.09
Global Corporate Bond Fund continued
Portfolio of Investments 31 August 2019
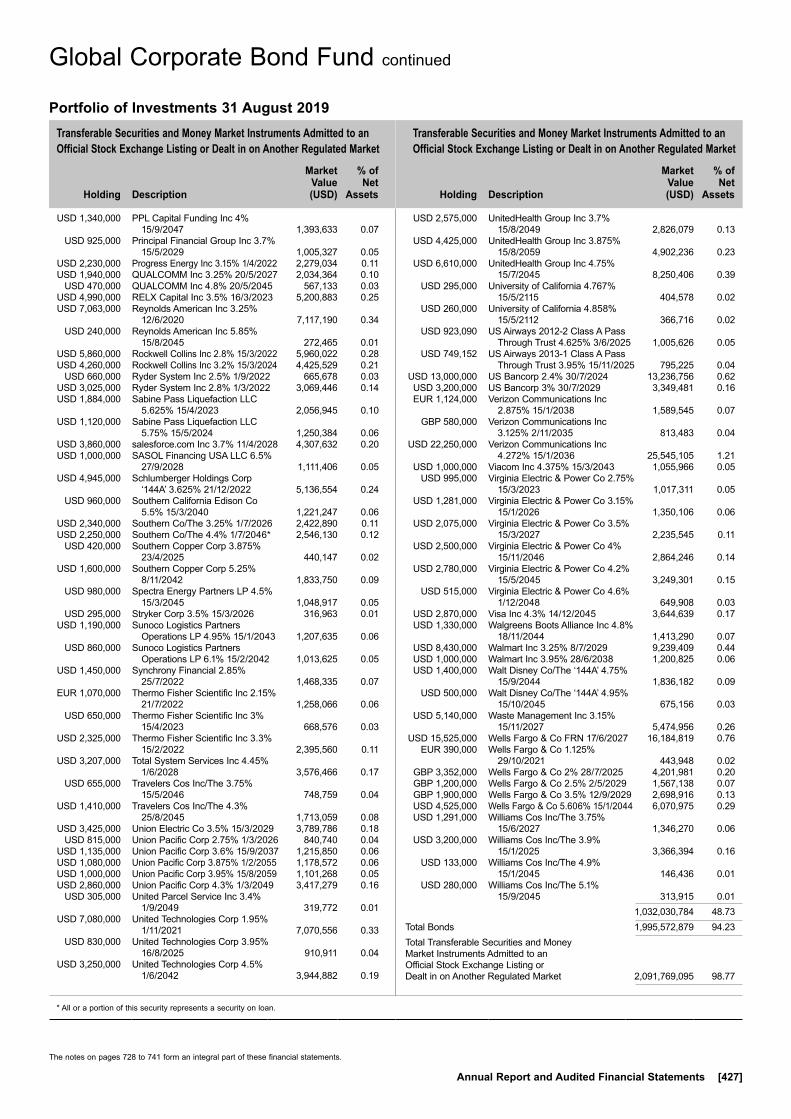
Transferable Securities and Money Market Instruments Admitted to an Official Stock Exchange Listing or Dealt in on Another Regulated Market
Transferable Securities and Money Market Instruments Admitted to an Official Stock Exchange Listing or Dealt in on Another Regulated Market
Holding
Description
Market Value (USD)
% of Net
Assets
Holding
Description
Market Value (USD)
% of Net
Assets
* All or a portion of this security represents a security on loan.
The notes on pages 728 to 741 form an integral part of these financial statements.
Annual Report and Audited Financial Statements [427]
USD 1,340,000 PPL Capital Funding Inc 4% 15/9/2047 1,393,633 0.07
USD 925,000 Principal Financial Group Inc 3.7% 15/5/2029 1,005,327 0.05
USD 2,230,000 Progress Energy Inc 3.15% 1/4/2022 2,279,034 0.11 USD 1,940,000 QUALCOMM Inc 3.25% 20/5/2027 2,034,364 0.10 USD 470,000 QUALCOMM Inc 4.8% 20/5/2045 567,133 0.03 USD 4,990,000 RELX Capital Inc 3.5% 16/3/2023 5,200,883 0.25 USD 7,063,000 Reynolds American Inc 3.25%
12/6/2020 7,117,190 0.34 USD 240,000 Reynolds American Inc 5.85%
15/8/2045 272,465 0.01 USD 5,860,000 Rockwell Collins Inc 2.8% 15/3/2022 5,960,022 0.28 USD 4,260,000 Rockwell Collins Inc 3.2% 15/3/2024 4,425,529 0.21 USD 660,000 Ryder System Inc 2.5% 1/9/2022 665,678 0.03 USD 3,025,000 Ryder System Inc 2.8% 1/3/2022 3,069,446 0.14 USD 1,884,000 Sabine Pass Liquefaction LLC
5.625% 15/4/2023 2,056,945 0.10 USD 1,120,000 Sabine Pass Liquefaction LLC
5.75% 15/5/2024 1,250,384 0.06 USD 3,860,000 salesforce.com Inc 3.7% 11/4/2028 4,307,632 0.20 USD 1,000,000 SASOL Financing USA LLC 6.5%
27/9/2028 1,111,406 0.05 USD 4,945,000 Schlumberger Holdings Corp
‘144A’ 3.625% 21/12/2022 5,136,554 0.24 USD 960,000 Southern California Edison Co
5.5% 15/3/2040 1,221,247 0.06 USD 2,340,000 Southern Co/The 3.25% 1/7/2026 2,422,890 0.11 USD 2,250,000 Southern Co/The 4.4% 1/7/2046* 2,546,130 0.12 USD 420,000 Southern Copper Corp 3.875%
23/4/2025 440,147 0.02 USD 1,600,000 Southern Copper Corp 5.25%
8/11/2042 1,833,750 0.09 USD 980,000 Spectra Energy Partners LP 4.5%
15/3/2045 1,048,917 0.05 USD 295,000 Stryker Corp 3.5% 15/3/2026 316,963 0.01 USD 1,190,000 Sunoco Logistics Partners
Operations LP 4.95% 15/1/2043 1,207,635 0.06 USD 860,000 Sunoco Logistics Partners
Operations LP 6.1% 15/2/2042 1,013,625 0.05 USD 1,450,000 Synchrony Financial 2.85%
25/7/2022 1,468,335 0.07 EUR 1,070,000 Thermo Fisher Scientific Inc 2.15%
21/7/2022 1,258,066 0.06 USD 650,000 Thermo Fisher Scientific Inc 3%
15/4/2023 668,576 0.03 USD 2,325,000 Thermo Fisher Scientific Inc 3.3%
15/2/2022 2,395,560 0.11 USD 3,207,000 Total System Services Inc 4.45%
1/6/2028 3,576,466 0.17 USD 655,000 Travelers Cos Inc/The 3.75%
15/5/2046 748,759 0.04 USD 1,410,000 Travelers Cos Inc/The 4.3%
25/8/2045 1,713,059 0.08 USD 3,425,000 Union Electric Co 3.5% 15/3/2029 3,789,786 0.18 USD 815,000 Union Pacific Corp 2.75% 1/3/2026 840,740 0.04 USD 1,135,000 Union Pacific Corp 3.6% 15/9/2037 1,215,850 0.06 USD 1,080,000 Union Pacific Corp 3.875% 1/2/2055 1,178,572 0.06 USD 1,000,000 Union Pacific Corp 3.95% 15/8/2059 1,101,268 0.05 USD 2,860,000 Union Pacific Corp 4.3% 1/3/2049 3,417,279 0.16 USD 305,000 United Parcel Service Inc 3.4%
1/9/2049 319,772 0.01 USD 7,080,000 United Technologies Corp 1.95%
1/11/2021 7,070,556 0.33 USD 830,000 United Technologies Corp 3.95%
16/8/2025 910,911 0.04 USD 3,250,000 United Technologies Corp 4.5%
1/6/2042 3,944,882 0.19
USD 2,575,000 UnitedHealth Group Inc 3.7% 15/8/2049 2,826,079 0.13
USD 4,425,000 UnitedHealth Group Inc 3.875% 15/8/2059 4,902,236 0.23
USD 6,610,000 UnitedHealth Group Inc 4.75% 15/7/2045 8,250,406 0.39
USD 295,000 University of California 4.767% 15/5/2115 404,578 0.02
USD 260,000 University of California 4.858% 15/5/2112 366,716 0.02
USD 923,090 US Airways 2012-2 Class A Pass Through Trust 4.625% 3/6/2025 1,005,626 0.05
USD 749,152 US Airways 2013-1 Class A Pass Through Trust 3.95% 15/11/2025 795,225 0.04
USD 13,000,000 US Bancorp 2.4% 30/7/2024 13,236,756 0.62 USD 3,200,000 US Bancorp 3% 30/7/2029 3,349,481 0.16 EUR 1,124,000 Verizon Communications Inc
2.875% 15/1/2038 1,589,545 0.07 GBP 580,000 Verizon Communications Inc
3.125% 2/11/2035 813,483 0.04 USD 22,250,000 Verizon Communications Inc
4.272% 15/1/2036 25,545,105 1.21 USD 1,000,000 Viacom Inc 4.375% 15/3/2043 1,055,966 0.05 USD 995,000 Virginia Electric & Power Co 2.75%
15/3/2023 1,017,311 0.05 USD 1,281,000 Virginia Electric & Power Co 3.15%
15/1/2026 1,350,106 0.06 USD 2,075,000 Virginia Electric & Power Co 3.5%
15/3/2027 2,235,545 0.11 USD 2,500,000 Virginia Electric & Power Co 4%
15/11/2046 2,864,246 0.14 USD 2,780,000 Virginia Electric & Power Co 4.2%
15/5/2045 3,249,301 0.15 USD 515,000 Virginia Electric & Power Co 4.6%
1/12/2048 649,908 0.03 USD 2,870,000 Visa Inc 4.3% 14/12/2045 3,644,639 0.17 USD 1,330,000 Walgreens Boots Alliance Inc 4.8%
18/11/2044 1,413,290 0.07 USD 8,430,000 Walmart Inc 3.25% 8/7/2029 9,239,409 0.44 USD 1,000,000 Walmart Inc 3.95% 28/6/2038 1,200,825 0.06 USD 1,400,000 Walt Disney Co/The ‘144A’ 4.75%
15/9/2044 1,836,182 0.09 USD 500,000 Walt Disney Co/The ‘144A’ 4.95%
15/10/2045 675,156 0.03 USD 5,140,000 Waste Management Inc 3.15%
15/11/2027 5,474,956 0.26 USD 15,525,000 Wells Fargo & Co FRN 17/6/2027 16,184,819 0.76 EUR 390,000 Wells Fargo & Co 1.125%
29/10/2021 443,948 0.02 GBP 3,352,000 Wells Fargo & Co 2% 28/7/2025 4,201,981 0.20 GBP 1,200,000 Wells Fargo & Co 2.5% 2/5/2029 1,567,138 0.07 GBP 1,900,000 Wells Fargo & Co 3.5% 12/9/2029 2,698,916 0.13 USD 4,525,000 Wells Fargo & Co 5.606% 15/1/2044 6,070,975 0.29 USD 1,291,000 Williams Cos Inc/The 3.75%
15/6/2027 1,346,270 0.06 USD 3,200,000 Williams Cos Inc/The 3.9%
15/1/2025 3,366,394 0.16 USD 133,000 Williams Cos Inc/The 4.9%
15/1/2045 146,436 0.01 USD 280,000 Williams Cos Inc/The 5.1%
15/9/2045 313,915 0.01 1,032,030,784 48.73Total Bonds 1,995,572,879 94.23Total Transferable Securities and Money Market Instruments Admitted to an Official Stock Exchange Listing or Dealt in on Another Regulated Market 2,091,769,095 98.77
Global Corporate Bond Fund continued
Portfolio of Investments 31 August 2019
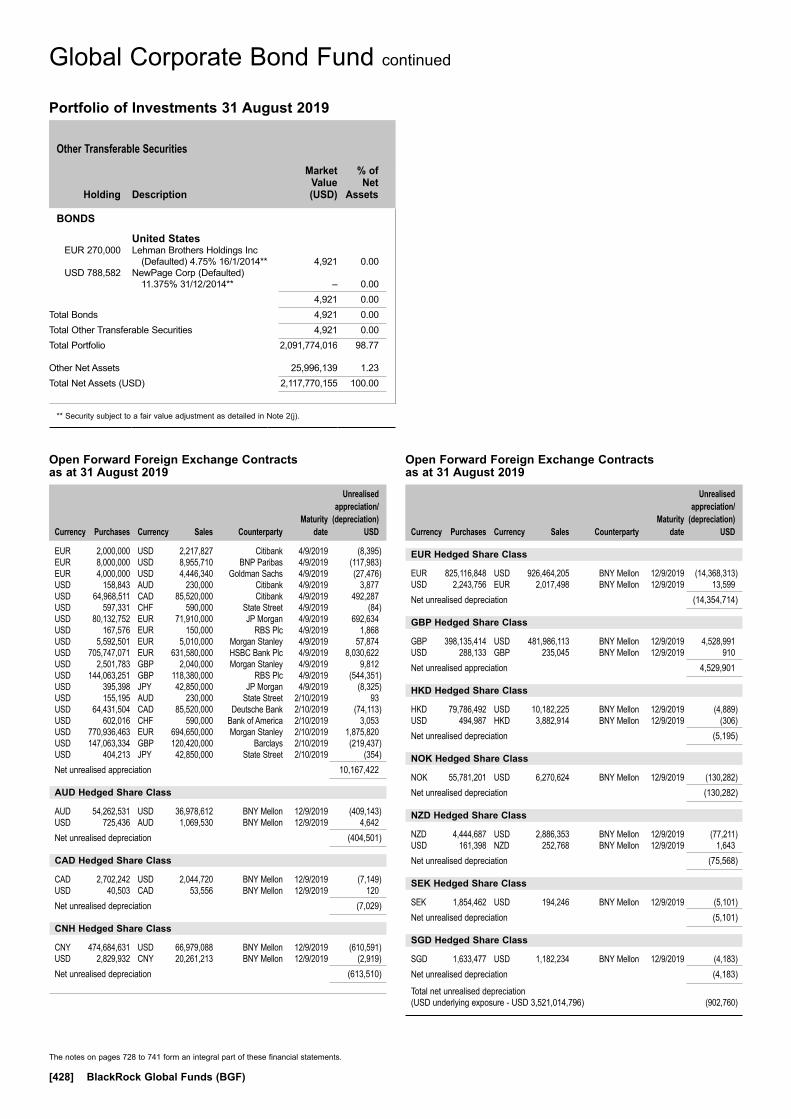
Other Transferable Securities
Holding
Description
Market Value (USD)
% of Net
Assets
** Security subject to a fair value adjustment as detailed in Note 2(j).
The notes on pages 728 to 741 form an integral part of these financial statements.
[428] BlackRock Global Funds (BGF)
Open Forward Foreign Exchange Contracts as at 31 August 2019
Currency
Purchases Currency
Sales Counterparty
Maturity date
Unrealised appreciation/
(depreciation) USD
EUR 2,000,000 USD 2,217,827 Citibank 4/9/2019 (8,395)EUR 8,000,000 USD 8,955,710 BNP Paribas 4/9/2019 (117,983)EUR 4,000,000 USD 4,446,340 Goldman Sachs 4/9/2019 (27,476)USD 158,843 AUD 230,000 Citibank 4/9/2019 3,877USD 64,968,511 CAD 85,520,000 Citibank 4/9/2019 492,287USD 597,331 CHF 590,000 State Street 4/9/2019 (84)USD 80,132,752 EUR 71,910,000 JP Morgan 4/9/2019 692,634USD 167,576 EUR 150,000 RBS Plc 4/9/2019 1,868USD 5,592,501 EUR 5,010,000 Morgan Stanley 4/9/2019 57,874USD 705,747,071 EUR 631,580,000 HSBC Bank Plc 4/9/2019 8,030,622USD 2,501,783 GBP 2,040,000 Morgan Stanley 4/9/2019 9,812USD 144,063,251 GBP 118,380,000 RBS Plc 4/9/2019 (544,351)USD 395,398 JPY 42,850,000 JP Morgan 4/9/2019 (8,325)USD 155,195 AUD 230,000 State Street 2/10/2019 93USD 64,431,504 CAD 85,520,000 Deutsche Bank 2/10/2019 (74,113)USD 602,016 CHF 590,000 Bank of America 2/10/2019 3,053USD 770,936,463 EUR 694,650,000 Morgan Stanley 2/10/2019 1,875,820USD 147,063,334 GBP 120,420,000 Barclays 2/10/2019 (219,437)USD 404,213 JPY 42,850,000 State Street 2/10/2019 (354)Net unrealised appreciation 10,167,422
AUD Hedged Share Class
AUD 54,262,531 USD 36,978,612 BNY Mellon 12/9/2019 (409,143)USD 725,436 AUD 1,069,530 BNY Mellon 12/9/2019 4,642Net unrealised depreciation (404,501)
CAD Hedged Share Class
CAD 2,702,242 USD 2,044,720 BNY Mellon 12/9/2019 (7,149)USD 40,503 CAD 53,556 BNY Mellon 12/9/2019 120Net unrealised depreciation (7,029)
CNH Hedged Share Class
CNY 474,684,631 USD 66,979,088 BNY Mellon 12/9/2019 (610,591)USD 2,829,932 CNY 20,261,213 BNY Mellon 12/9/2019 (2,919)Net unrealised depreciation (613,510)
Open Forward Foreign Exchange Contracts as at 31 August 2019
Currency
Purchases Currency
Sales Counterparty
Maturity date
Unrealised appreciation/
(depreciation) USD
EUR Hedged Share Class
EUR 825,116,848 USD 926,464,205 BNY Mellon 12/9/2019 (14,368,313)USD 2,243,756 EUR 2,017,498 BNY Mellon 12/9/2019 13,599Net unrealised depreciation (14,354,714)
GBP Hedged Share Class
GBP 398,135,414 USD 481,986,113 BNY Mellon 12/9/2019 4,528,991USD 288,133 GBP 235,045 BNY Mellon 12/9/2019 910Net unrealised appreciation 4,529,901
HKD Hedged Share Class
HKD 79,786,492 USD 10,182,225 BNY Mellon 12/9/2019 (4,889)USD 494,987 HKD 3,882,914 BNY Mellon 12/9/2019 (306)Net unrealised depreciation (5,195)
NOK Hedged Share Class
NOK 55,781,201 USD 6,270,624 BNY Mellon 12/9/2019 (130,282)Net unrealised depreciation (130,282)
NZD Hedged Share Class
NZD 4,444,687 USD 2,886,353 BNY Mellon 12/9/2019 (77,211)USD 161,398 NZD 252,768 BNY Mellon 12/9/2019 1,643Net unrealised depreciation (75,568)
SEK Hedged Share Class
SEK 1,854,462 USD 194,246 BNY Mellon 12/9/2019 (5,101)Net unrealised depreciation (5,101)
SGD Hedged Share Class
SGD 1,633,477 USD 1,182,234 BNY Mellon 12/9/2019 (4,183)Net unrealised depreciation (4,183)
Total net unrealised depreciation (USD underlying exposure - USD 3,521,014,796) (902,760)
Global Corporate Bond Fund continued
BONDS
United States EUR 270,000 Lehman Brothers Holdings Inc
(Defaulted) 4.75% 16/1/2014** 4,921 0.00 USD 788,582 NewPage Corp (Defaulted)
11.375% 31/12/2014** – 0.00 4,921 0.00Total Bonds 4,921 0.00Total Other Transferable Securities 4,921 0.00Total Portfolio 2,091,774,016 98.77
Other Net Assets 25,996,139 1.23Total Net Assets (USD) 2,117,770,155 100.00
Portfolio of Investments 31 August 2019

The notes on pages 728 to 741 form an integral part of these financial statements.
Annual Report and Audited Financial Statements [429]
Global Corporate Bond Fund continued
Open Exchange Traded Futures Contracts as at 31 August 2019
Number of contracts Currency
Contract/ Description
Expiration date
Underlying exposure
USD
Unrealised appreciation/
(depreciation) USD
32 AUD Australian 10 Year Bond September 2019 3,203,956 136,63320 AUD Australian 3 Year Bond September 2019 1,559,795 (1,747)421 EUR Euro Schatz September 2019 52,357,574 196,790(26) EUR Euro-BTP September 2019 4,174,508 (185,423)(63) EUR Euro BOBL September 2019 9,478,389 (75,491)(100) EUR Euro BUXL September 2019 24,756,971 (2,413,219)(610) EUR Euro Bund September 2019 120,688,685 (2,313,891)8 JPY Japanese 10 Year Bond (OSE) September 2019 11,690,421 124,35842 CAD Canadian 10 Year Bond December 2019 4,599,601 45,914(131) GBP Long Gilt December 2019 21,531,820 (243,237)692 USD US Treasury 5 Year Note (CBT) December 2019 82,910,250 (218,843)652 USD US Treasury 2 Year Note (CBT) December 2019 140,811,625 (71,313)154 USD US Long Bond (CBT) December 2019 25,424,438 (97,438)11 USD US Ultra Bond (CBT) December 2019 2,167,000 (9,711)(476) USD US Ultra 10 Year Note December 2019 68,648,125 382,718(532) USD US Treasury 10 Year Note (CBT) December 2019 69,982,937 251,773
Total 643,986,095 (4,492,127)
Swaps as at 31 August 2019
TypeNominal
Value Description Counterparty
Expiration date
Unrealised appreciation/
(depreciation) USD
Market Value USD
CDS EUR (6,580,000) Fund provides default protection on Intesa Sanpaolo SpA; and receives Fixed 1% Bank of America 20/6/2024 336,454 (416,187)
CDS EUR 2,105,000 Fund receives default protection on CNH Industrial NV; and pays Fixed 5% Barclays 20/6/2024 3,959 (460,755)
CDS EUR 2,110,000 Fund receives default protection on Renault SA; and pays Fixed 1% Barclays 20/6/2024 (43,199) (13,195)
CDS EUR 3,472,985 Fund receives default protection on Akzo Nobel NV; and pays Fixed 1% Barclays 20/6/2024 (40,450) (133,145)
CDS EUR 1,771,000 Fund receives default protection on Valeo SA; and pays Fixed 1% Barclays 20/6/2024 (43,354) 9,790
CDS EUR 2,570,000 Fund receives default protection on WPP Finance 2005 Ltd; and pays Fixed 1% Barclays 20/6/2024 (48,184) (73,833)
CDS EUR 1,250,000 Fund receives default protection on Valeo SA; and pays Fixed 1% Barclays 20/6/2024 (31,228) 6,910CDS EUR 1,249,000 Fund receives default protection on Valeo SA; and pays Fixed 1% Barclays 20/6/2024 (32,750) 6,904CDS EUR 5,300,000 Fund receives default protection on Pearson Plc;
and pays Fixed 1% Barclays 20/6/2024 (47,562) (170,565)CDS EUR 875,000 Fund receives default protection on CNH Industrial NV;
and pays Fixed 5% BNP Paribas 20/6/2024 3,488 (191,525)CDS EUR 4,170,000 Fund receives default protection on LANXESS AG;
and pays Fixed 1% BNP Paribas 20/6/2024 (80,783) (97,861)CDS EUR 3,503,000 Fund receives default protection on Akzo Nobel NV;
and pays Fixed 1% BNP Paribas 20/6/2024 (38,530) (134,296)CDS EUR 8,740,000 Fund receives default protection on Banco Santander SA;
and pays Fixed 1% BNP Paribas 20/6/2024 (314,910) 16,658CDS EUR 1,455,000 Fund receives default protection on Renault SA; and pays Fixed 1% Citibank 20/6/2024 (40,010) (9,099)CDS EUR 5,945,000 Fund receives default protection on Akzo Nobel NV;
and pays Fixed 1% Citibank 20/6/2024 (74,493) (227,916)CDS EUR 2,910,000 Fund receives default protection on Renault SA; and pays Fixed 1% Citibank 20/6/2024 (80,084) (18,198)CDS EUR 2,970,000 Fund receives default protection on Akzo Nobel NV;
and pays Fixed 1% Citibank 20/6/2024 (34,297) (113,862)CDS EUR 9,798,000 Fund receives default protection on Heineken NV;
and pays Fixed 1% Citibank 20/6/2024 (63,823) (410,572)CDS EUR 5,750,000 Fund receives default protection on HeidelbergCement AG;
and pays Fixed 5% Citibank 20/6/2024 (112,093) (1,347,033)CDS EUR 1,230,000 Fund receives default protection on CNH Industrial NV;
and pays Fixed 5% Credit Suisse 20/6/2024 3,788 (269,230)CDS EUR 1,670,000 Fund receives default protection on Lafargeholcim Ltd;
and pays Fixed 1% Credit Suisse 20/6/2024 (1,158) (36,263)CDS EUR 2,025,000 Fund receives default protection on Renault SA; and pays Fixed 1% Goldman Sachs 20/6/2024 (55,625) (12,664)CDS EUR 3,190,000 Fund receives default protection on Anglo American Plc;
and pays Fixed 5% Goldman Sachs 20/6/2024 (43,225) (693,249)CDS USD 8,460,000 Fund receives default protection on Weyerhaeuser Co;
and pays Fixed 1% Goldman Sachs 20/6/2024 (67,935) (236,595)CDS USD 5,660,000 Fund receives default protection on International Paper Co;
and pays Fixed 1% Goldman Sachs 20/6/2024 (40,183) (124,894)

The notes on pages 728 to 741 form an integral part of these financial statements.
[430] BlackRock Global Funds (BGF)
Global Corporate Bond Fund continued
Swaps as at 31 August 2019
TypeNominal
Value Description Counterparty
Expiration date
Unrealised appreciation/
(depreciation) USD
Market Value USD
CDS EUR 6,532,000 Fund receives default protection on Heineken NV; and pays Fixed 1% Goldman Sachs 20/6/2024 (42,549) (273,715)
CDS EUR 4,750,000 Fund receives default protection on WPP Finance 2005 Ltd; and pays Fixed 1% HSBC Bank Plc 20/6/2024 (96,343) (136,461)
CDS EUR 1,770,000 Fund receives default protection on Carrefour SA; and pays Fixed 1% HSBC Bank Plc 20/6/2024 (15,597) (39,871)
CDS EUR 13,190,000 Fund receives default protection on LANXESS AG; and pays Fixed 1% HSBC Bank Plc 20/6/2024 (164,407) (309,542)
CDS EUR 1,780,000 Fund receives default protection on Carrefour SA; and pays Fixed 1% HSBC Bank Plc 20/6/2024 (18,144) (40,096)
CDS EUR 3,550,000 Fund receives default protection on Carrefour SA; and pays Fixed 1% HSBC Bank Plc 20/6/2024 (37,136) (79,967)
CDS EUR 3,639,015 Fund receives default protection on Akzo Nobel NV; and pays Fixed 1% HSBC Bank Plc 20/6/2024 (40,454) (139,511)
CDS EUR 1,515,000 Fund receives default protection on Carrefour SA; and pays Fixed 1% HSBC Bank Plc 20/6/2024 (13,377) (34,127)
CDS EUR 5,470,000 Fund receives default protection on WPP Finance 2005 Ltd; and pays Fixed 1% HSBC Bank Plc 20/6/2024 (99,662) (157,146)
CDS EUR 2,990,000 Fund receives default protection on Carrefour SA; and pays Fixed 1% JP Morgan 20/6/2024 (30,884) (67,353)
CDS EUR 3,010,000 Fund receives default protection on CNH Industrial NV; and pays Fixed 5% JP Morgan 20/6/2024 (649) (658,847)
CDS EUR 11,440,000 Fund receives default protection on Lafargeholcim Ltd; and pays Fixed 1% JP Morgan 20/6/2024 (26,123) (248,415)
CDS EUR 2,985,000 Fund receives default protection on Carrefour SA; and pays Fixed 1% JP Morgan 20/6/2024 (30,973) (67,240)
CDS EUR 3,230,000 Fund receives default protection on Anglo American Plc; and pays Fixed 5% JP Morgan 20/6/2024 (71,774) (701,942)
CDS EUR 2,805,000 Fund receives default protection on Lafargeholcim Ltd; and pays Fixed 1% JP Morgan 20/6/2024 (5,324) (60,910)
CDS EUR 95,810,000 Fund provides default protection on ITRAXX.EUR.31.V2; and receives Fixed 1% Morgan Stanley 20/6/2024 (486,327) (2,674,881)
CDS EUR 3,360,000 Fund receives default protection on Akzo Nobel NV; and pays Fixed 1% Morgan Stanley 20/6/2024 (36,958) (128,814)
CDS EUR 4,130,000 Fund receives default protection on Solvay SA; and pays Fixed 1% Morgan Stanley 20/6/2024 (43,268) (106,844)CDS EUR 3,370,000 Fund receives default protection on Enel SpA; and pays Fixed 1% Morgan Stanley 20/6/2024 (56,358) (79,462)CDS EUR 2,670,000 Fund receives default protection on Carrefour SA;
and pays Fixed 1% Morgan Stanley 20/6/2024 (27,687) (60,144)CDS EUR 1,320,000 Fund receives default protection on WPP Finance 2005 Ltd;
and pays Fixed 1% Morgan Stanley 20/6/2024 (28,351) (37,922)CDS EUR 5,310,000 Fund receives default protection on Anglo American Plc;
and pays Fixed 5% Morgan Stanley 20/6/2024 (96,292) (1,153,966)CDS USD 229,985,000 Fund provides default protection on CDX.NA.IG.32.V1;
and receives Fixed 1% Morgan Stanley 20/6/2024 (718,643) (4,953,120)CDS EUR (79,005,000) Fund receives default protection on ITRAXX.XO.31.V1;
and pays Fixed 5% Morgan Stanley 20/6/2024 979,221 9,785,261CDS EUR 1,895,000 Fund receives default protection on Lafargeholcim Ltd;
and pays Fixed 1% Societe Generale 20/6/2024 (4,577) (41,149)IRS CHF 4,100,000 Fund receives Fixed 0.905%; and pays Floating CHF
LIBOR 6 Month Credit Suisse 12/8/2024 381,577 381,577IRS CAD 6,000,000 Fund receives Floating CAD CDOR 6 Month;
and pays Fixed 1.839% Morgan Stanley 9/8/2049 (113,008) (113,008)
Total (USD underlying exposure - USD 653,708,741) (1,930,254) (7,348,290)
CDS: Credit Default SwapsIRS: Interest Rate Swaps

Transferable Securities and Money Market Instruments Admitted to an Official Stock Exchange Listing or Dealt in on Another Regulated Market
Transferable Securities and Money Market Instruments Admitted to an Official Stock Exchange Listing or Dealt in on Another Regulated Market
Holding
Description
Market Value (USD)
% of Net
Assets
Holding
Description
Market Value (USD)
% of Net
Assets
* All or a portion of this security represents a security on loan.
The notes on pages 728 to 741 form an integral part of these financial statements.
Annual Report and Audited Financial Statements [431]
COMMON / PREFERRED STOCKS (SHARES)
Argentina 2,142 YPF SA ADR 18,807 0.00
Australia 46,168 Newcrest Mining Ltd 1,150,902 0.19
Bermuda 57,000 CK Infrastructure Holdings Ltd 384,247 0.06 11,300 Jardine Matheson Holdings Ltd* 614,381 0.10 29,901 Marvell Technology Group Ltd 732,874 0.12 1,731,502 0.28
Brazil 115,332 Azul SA ADR* 4,106,972 0.67 71,668 Itau Unibanco Holding SA (Pref) 589,074 0.10 223,754 Notre Dame Intermedica
Participacoes SA 2,922,549 0.47 7,618,595 1.24
Canada 135,735 Enbridge Inc* 4,548,712 0.74 69,239 TC Energy Corp 3,517,278 0.57 36,035 Wheaton Precious Metals Corp 1,044,046 0.17 9,110,036 1.48
Cayman Islands 36,755 Alibaba Group Holding Ltd ADR 6,412,645 1.04 21,000 ANTA Sports Products Ltd 174,110 0.03 41,000 China Mengniu Dairy Co Ltd* 162,643 0.02 28,000 Hengan International Group Co Ltd 184,289 0.03 5,427 Huazhu Group Ltd ADR 183,541 0.03 196,000 Kingdee International Software
Group Co Ltd 177,503 0.03 60,000 Li Ning Co Ltd 177,171 0.03 5,031 TAL Education Group ADR 181,418 0.03 159,700 Tencent Holdings Ltd 6,616,253 1.08 540,000 Want Want China Holdings Ltd* 420,849 0.07 47,000 Wharf Real Estate Investment Co Ltd 254,488 0.04 17,000 Wuxi Biologics Cayman Inc 179,110 0.03 15,124,020 2.46
Chile 10,806 Cia Cervecerias Unidas SA ADR 240,866 0.04
China 36,698 Aier Eye Hospital Group Co Ltd 173,377 0.03 11,393 Asymchem Laboratories Tianjin
Co Ltd 174,606 0.03 13,076 Autobio Diagnostics Co Ltd 158,410 0.02 11,600 Foshan Haitian Flavouring &
Food Co Ltd 186,037 0.03 34,999 Glodon Co Ltd 176,707 0.03 99,600 Great Wall Motor Co Ltd 113,808 0.02 15,000 Gree Electric Appliances Inc
of Zhuhai 116,433 0.02 72,499 Guangzhou Automobile Group
Co Ltd 118,938 0.02 53,100 Haier Smart Home Co Ltd 118,156 0.02 39,900 Hangzhou Hikvision Digital
Technology Co Ltd 172,545 0.03 32,700 Hangzhou Robam Appliances Co Ltd 114,380 0.02 20,498 Hangzhou Tigermed Consulting
Co Ltd 174,877 0.03 40,099 Han’s Laser Technology Industry
Group Co Ltd 173,854 0.03
16,600 Hundsun Technologies Inc 172,499 0.03 43,599 Inner Mongolia Yili Industrial Group
Co Ltd 174,699 0.03 49,000 Inspur Electronic Information
Industry Co Ltd 174,754 0.03 16,499 Jiangsu Hengrui Medicine Co Ltd 184,718 0.03 16,800 Laobaixing Pharmacy Chain JSC 177,327 0.03 14,299 Shanghai International Airport Co Ltd 168,087 0.02 36,100 Shanghai Jahwa United Co Ltd 171,865 0.02 6,799 Shenzhen Mindray Bio-Medical
Electronics Co Ltd 177,200 0.03 41,799 Venustech Group Inc 172,573 0.03 13,500 Wuhan Raycus Fiber Laser
Technologies Co Ltd 172,553 0.03 14,999 WuXi AppTec Co Ltd 181,874 0.03 16,400 Yifeng Pharmacy Chain Co Ltd 175,696 0.03 37,799 Yonyou Network Technology Co Ltd 169,539 0.02 4,245,512 0.69
Czech Republic 16,262 CEZ AS 358,734 0.06
Denmark 15,253 Novo Nordisk A/S 794,735 0.13
France 101,034 Danone SA* 9,100,288 1.48 1,207 Dassault Aviation SA 1,723,942 0.28 7,698 EssilorLuxottica SA* 1,138,611 0.18 33,239 Safran SA* 4,841,110 0.79 9,046 Sanofi 782,612 0.13 36,462 Sodexo SA* 4,150,547 0.68 39,623 TOTAL SA 1,989,509 0.32 6,291 Unibail-Rodamco-Westfield (Reit) 821,399 0.13 24,548,018 3.99
Germany 38,125 Bayer AG 2,843,960 0.46 77,569 Fresenius SE & Co KGaA* 3,799,704 0.62 34,903 Henkel AG & Co KGaA (Pref) 3,523,147 0.57 36,478 Knorr-Bremse AG* 3,427,064 0.56 89,707 Siemens AG 8,983,776 1.46 22,577,651 3.67
Hong Kong 40,000 CLP Holdings Ltd 411,997 0.07 219,000 Hang Lung Properties Ltd* 494,993 0.08 256,000 HKT Trust & HKT Ltd 400,333 0.06 42,000 Hysan Development Co Ltd 170,092 0.03 69,263 I-CABLE Communications Ltd 645 0.00 262,000 Lenovo Group Ltd 172,441 0.03 33,500 Link REIT (Unit) (Reit) 376,027 0.06 21,500 Power Assets Holdings Ltd 143,153 0.02 72,000 Sino Land Co Ltd 102,859 0.02 359,250 Sun Hung Kai Properties Ltd 5,090,987 0.83 31,000 Swire Pacific Ltd* 303,481 0.05 7,667,008 1.25
India 104,890 Coal India Ltd 271,378 0.05 10,753 Hero MotoCorp Ltd 387,316 0.06 103,166 Housing Development Finance
Corp Ltd 3,129,980 0.51 131,500 Oil & Natural Gas Corp Ltd 223,195 0.04 275,602 Reliance Industries Ltd 4,818,862 0.78 8,830,731 1.44
Global Dynamic Equity Fund
Portfolio of Investments 31 August 2019
Global Dynamic Equity Fund
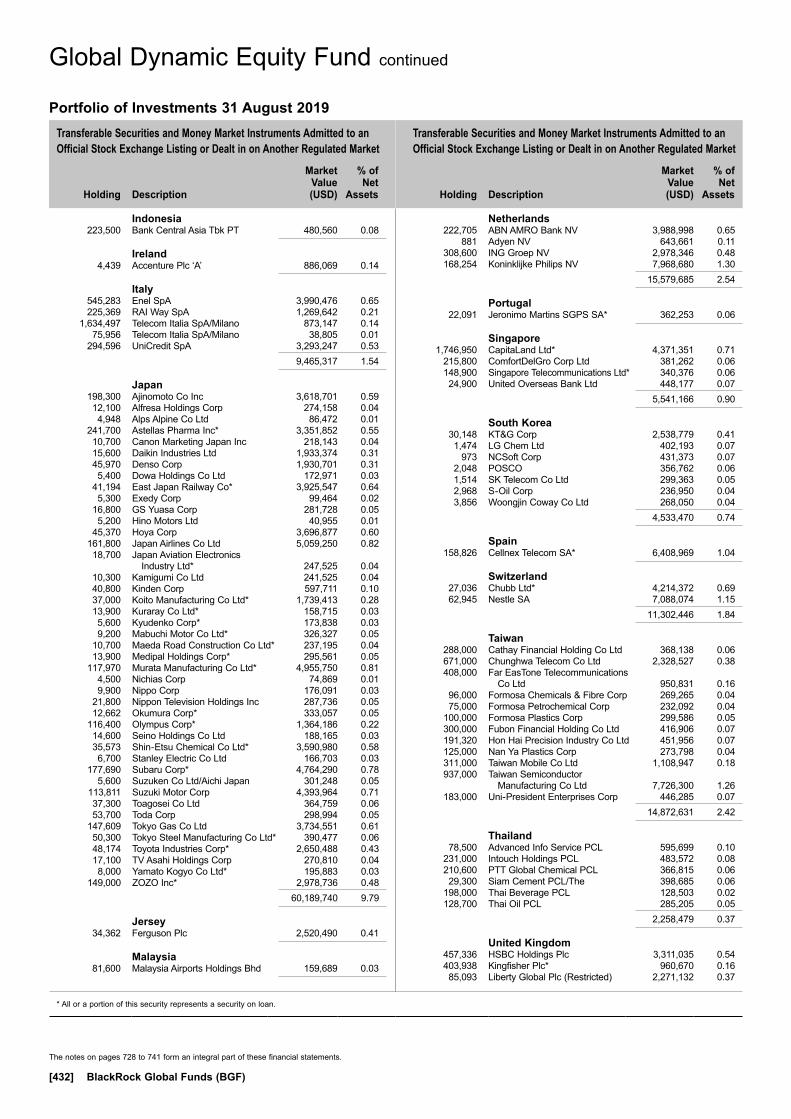
Transferable Securities and Money Market Instruments Admitted to an Official Stock Exchange Listing or Dealt in on Another Regulated Market
Transferable Securities and Money Market Instruments Admitted to an Official Stock Exchange Listing or Dealt in on Another Regulated Market
Holding
Description
Market Value (USD)
% of Net
Assets
Holding
Description
Market Value (USD)
% of Net
Assets
* All or a portion of this security represents a security on loan.
The notes on pages 728 to 741 form an integral part of these financial statements.
[432] BlackRock Global Funds (BGF)
Indonesia 223,500 Bank Central Asia Tbk PT 480,560 0.08
Ireland 4,439 Accenture Plc ‘A’ 886,069 0.14
Italy 545,283 Enel SpA 3,990,476 0.65 225,369 RAI Way SpA 1,269,642 0.21 1,634,497 Telecom Italia SpA/Milano 873,147 0.14 75,956 Telecom Italia SpA/Milano 38,805 0.01 294,596 UniCredit SpA 3,293,247 0.53 9,465,317 1.54
Japan 198,300 Ajinomoto Co Inc 3,618,701 0.59 12,100 Alfresa Holdings Corp 274,158 0.04 4,948 Alps Alpine Co Ltd 86,472 0.01 241,700 Astellas Pharma Inc* 3,351,852 0.55 10,700 Canon Marketing Japan Inc 218,143 0.04 15,600 Daikin Industries Ltd 1,933,374 0.31 45,970 Denso Corp 1,930,701 0.31 5,400 Dowa Holdings Co Ltd 172,971 0.03 41,194 East Japan Railway Co* 3,925,547 0.64 5,300 Exedy Corp 99,464 0.02 16,800 GS Yuasa Corp 281,728 0.05 5,200 Hino Motors Ltd 40,955 0.01 45,370 Hoya Corp 3,696,877 0.60 161,800 Japan Airlines Co Ltd 5,059,250 0.82 18,700 Japan Aviation Electronics
Industry Ltd* 247,525 0.04 10,300 Kamigumi Co Ltd 241,525 0.04 40,800 Kinden Corp 597,711 0.10 37,000 Koito Manufacturing Co Ltd* 1,739,413 0.28 13,900 Kuraray Co Ltd* 158,715 0.03 5,600 Kyudenko Corp* 173,838 0.03 9,200 Mabuchi Motor Co Ltd* 326,327 0.05 10,700 Maeda Road Construction Co Ltd* 237,195 0.04 13,900 Medipal Holdings Corp* 295,561 0.05 117,970 Murata Manufacturing Co Ltd* 4,955,750 0.81 4,500 Nichias Corp 74,869 0.01 9,900 Nippo Corp 176,091 0.03 21,800 Nippon Television Holdings Inc 287,736 0.05 12,662 Okumura Corp* 333,057 0.05 116,400 Olympus Corp* 1,364,186 0.22 14,600 Seino Holdings Co Ltd 188,165 0.03 35,573 Shin-Etsu Chemical Co Ltd* 3,590,980 0.58 6,700 Stanley Electric Co Ltd 166,703 0.03 177,690 Subaru Corp* 4,764,290 0.78 5,600 Suzuken Co Ltd/Aichi Japan 301,248 0.05 113,811 Suzuki Motor Corp 4,393,964 0.71 37,300 Toagosei Co Ltd 364,759 0.06 53,700 Toda Corp 298,994 0.05 147,609 Tokyo Gas Co Ltd 3,734,551 0.61 50,300 Tokyo Steel Manufacturing Co Ltd* 390,477 0.06 48,174 Toyota Industries Corp* 2,650,488 0.43 17,100 TV Asahi Holdings Corp 270,810 0.04 8,000 Yamato Kogyo Co Ltd* 195,883 0.03 149,000 ZOZO Inc* 2,978,736 0.48 60,189,740 9.79
Jersey 34,362 Ferguson Plc 2,520,490 0.41
Malaysia 81,600 Malaysia Airports Holdings Bhd 159,689 0.03
Netherlands 222,705 ABN AMRO Bank NV 3,988,998 0.65 881 Adyen NV 643,661 0.11 308,600 ING Groep NV 2,978,346 0.48 168,254 Koninklijke Philips NV 7,968,680 1.30 15,579,685 2.54
Portugal 22,091 Jeronimo Martins SGPS SA* 362,253 0.06
Singapore 1,746,950 CapitaLand Ltd* 4,371,351 0.71 215,800 ComfortDelGro Corp Ltd 381,262 0.06 148,900 Singapore Telecommunications Ltd* 340,376 0.06 24,900 United Overseas Bank Ltd 448,177 0.07 5,541,166 0.90
South Korea 30,148 KT&G Corp 2,538,779 0.41 1,474 LG Chem Ltd 402,193 0.07 973 NCSoft Corp 431,373 0.07 2,048 POSCO 356,762 0.06 1,514 SK Telecom Co Ltd 299,363 0.05 2,968 S-Oil Corp 236,950 0.04 3,856 Woongjin Coway Co Ltd 268,050 0.04 4,533,470 0.74
Spain 158,826 Cellnex Telecom SA* 6,408,969 1.04
Switzerland 27,036 Chubb Ltd* 4,214,372 0.69 62,945 Nestle SA 7,088,074 1.15 11,302,446 1.84
Taiwan 288,000 Cathay Financial Holding Co Ltd 368,138 0.06 671,000 Chunghwa Telecom Co Ltd 2,328,527 0.38 408,000 Far EasTone Telecommunications
Co Ltd 950,831 0.16 96,000 Formosa Chemicals & Fibre Corp 269,265 0.04 75,000 Formosa Petrochemical Corp 232,092 0.04 100,000 Formosa Plastics Corp 299,586 0.05 300,000 Fubon Financial Holding Co Ltd 416,906 0.07 191,320 Hon Hai Precision Industry Co Ltd 451,956 0.07 125,000 Nan Ya Plastics Corp 273,798 0.04 311,000 Taiwan Mobile Co Ltd 1,108,947 0.18 937,000 Taiwan Semiconductor
Manufacturing Co Ltd 7,726,300 1.26 183,000 Uni-President Enterprises Corp 446,285 0.07 14,872,631 2.42
Thailand 78,500 Advanced Info Service PCL 595,699 0.10 231,000 Intouch Holdings PCL 483,572 0.08 210,600 PTT Global Chemical PCL 366,815 0.06 29,300 Siam Cement PCL/The 398,685 0.06 198,000 Thai Beverage PCL 128,503 0.02 128,700 Thai Oil PCL 285,205 0.05 2,258,479 0.37
United Kingdom 457,336 HSBC Holdings Plc 3,311,035 0.54 403,938 Kingfisher Plc* 960,670 0.16 85,093 Liberty Global Plc (Restricted) 2,271,132 0.37
Global Dynamic Equity Fund continued
Portfolio of Investments 31 August 2019

Transferable Securities and Money Market Instruments Admitted to an Official Stock Exchange Listing or Dealt in on Another Regulated Market
Transferable Securities and Money Market Instruments Admitted to an Official Stock Exchange Listing or Dealt in on Another Regulated Market
Holding
Description
Market Value (USD)
% of Net
Assets
Holding
Description
Market Value (USD)
% of Net
Assets
* All or a portion of this security represents a security on loan.** Security subject to a fair value adjustment as detailed in Note 2(j).
The notes on pages 728 to 741 form an integral part of these financial statements.
Annual Report and Audited Financial Statements [433]
56,553 NMC Health Plc* 1,723,533 0.28 182,956 Royal Dutch Shell Plc ‘A’ 5,098,951 0.83 50,196 Royal Dutch Shell Plc ADR* 2,795,415 0.45 3,487,641 Vodafone Group Plc* 6,606,646 1.07 22,767,382 3.70
United States 45,941 AbbVie Inc* 3,035,322 0.49 6,140 Adobe Inc 1,759,601 0.29 57,864 Agilent Technologies Inc 4,122,231 0.67 33,417 Air Products & Chemicals Inc 7,505,792 1.22 15,622 Alphabet Inc 18,699,378 3.04 67,040 Altria Group Inc 2,966,520 0.48 5,178 Amazon.com Inc 9,262,924 1.51 34,213 Anthem Inc 8,983,650 1.46 74,431 Apple Inc 15,582,130 2.54 34,728 Applied Materials Inc 1,656,526 0.27 199,678 Bank of America Corp 5,501,129 0.90 23,383 Becton Dickinson and Co 5,967,575 0.97 7,185 Biogen Inc 1,568,342 0.26 63,959 Charles Schwab Corp/The 2,441,955 0.40 16,410 Charter Communications Inc* 6,710,541 1.09 27,989 Cisco Systems Inc 1,320,801 0.21 41,225 Citigroup Inc 2,660,249 0.43 12,027 Citrix Systems Inc* 1,124,525 0.18 77,109 Colgate-Palmolive Co 5,725,343 0.93 228,824 Comcast Corp 10,171,227 1.65 21,081 Corning Inc* 590,690 0.10 40,411 CVS Health Corp 2,435,571 0.40 57,526 DaVita Inc 3,205,349 0.52 45,705 Dollar Tree Inc* 4,625,803 0.75 23,816 Dover Corp 2,212,030 0.36 151,005 Dropbox Inc* 2,710,540 0.44 24,189 DuPont de Nemours Inc 1,660,575 0.27 113,063 Emerson Electric Co 6,740,816 1.10 4,590 Equinix Inc (Reit)* 2,551,076 0.42 17,560 Facebook Inc ‘A’ 3,254,922 0.53 24,136 FleetCor Technologies Inc 7,297,278 1.19 60,175 Gilead Sciences Inc 3,822,316 0.62 20,582 HCA Healthcare Inc 2,489,393 0.41 6,535 Intuit Inc 1,878,094 0.31 56,051 Johnson & Johnson 7,179,012 1.17 113,202 JPMorgan Chase & Co 12,466,936 2.03 22,982 Liberty Broadband Corp* 2,419,315 0.39 25,118 Liberty Media Corp-Liberty SiriusXM 1,021,298 0.17 42,089 Liberty Media Corp-Liberty SiriusXM 1,727,753 0.28 27,392 Lowe’s Cos Inc 3,080,230 0.50 25,919 Marathon Petroleum Corp 1,281,435 0.21 66,118 Marsh & McLennan Cos Inc 6,595,271 1.07 4,150 Mastercard Inc 1,171,545 0.19 55,251 Merck & Co Inc 4,793,024 0.78 142,631 Microsoft Corp 19,741,557 3.21 109,166 Morgan Stanley 4,554,406 0.74 5,584 Motorola Solutions Inc 1,011,988 0.16 74,396 Newmont Goldcorp Corp 2,955,009 0.48 28,811 NextEra Energy Inc 6,365,214 1.04 107,048 ONEOK Inc* 7,603,619 1.24 53,341 Oracle Corp 2,782,800 0.45 10,555 PayPal Holdings Inc 1,159,045 0.19 167,155 Pfizer Inc 5,926,481 0.96 15,456 Philip Morris International Inc 1,126,742 0.18 21,583 QUALCOMM Inc 1,672,467 0.27 48,745 Raytheon Co 8,956,406 1.46 128,210 Regions Financial Corp 1,884,687 0.31 13,034 salesforce.com Inc 2,055,723 0.33 20,323 Sempra Energy 2,882,614 0.47 70,627 SunTrust Banks Inc 4,371,105 0.71 24,756 Target Corp 2,698,899 0.44 19,816 Texas Instruments Inc 2,468,479 0.40
63,147 TJX Cos Inc/The* 3,534,969 0.58 48,678 United Technologies Corp 6,362,701 1.04 30,518 UnitedHealth Group Inc 7,144,264 1.16 71,518 Verizon Communications Inc 4,166,639 0.68 6,691 Visa Inc ‘A’ 1,213,881 0.20 49,191 Wells Fargo & Co 2,294,760 0.37 250,531 Williams Cos Inc/The 5,947,606 0.97 16,145 Xilinx Inc 1,685,538 0.27 9,019 Yum China Holdings Inc 412,529 0.07 316,956,161 51.58Total Common / Preferred Stocks (Shares) 578,301,624 94.10
BONDS
Cayman Islands USD 600,000 China Milk Products Group Ltd
(Restricted) (Defaulted) 5/1/2012 (Zero Coupon) 9,000 0.00
United States USD 1,000,000 United States Treasury Bill
8/10/2019 (Zero Coupon) 997,869 0.16 USD 18,000,000 United States Treasury Bill
21/11/2019 (Zero Coupon) 17,919,587 2.92 USD 4,000,000 United States Treasury Bill
5/12/2019 (Zero Coupon) 3,979,333 0.65 22,896,789 3.73Total Bonds 22,905,789 3.73Total Transferable Securities and Money Market Instruments Admitted to an Official Stock Exchange Listing or Dealt in on Another Regulated Market 601,207,413 97.83
Other Transferable Securities
COMMON / PREFERRED STOCKS (SHARES)
United States 107,482 Grand Rounds, Inc (Pref)** 259,032 0.04 282,700 Grand Rounds, Inc (Pref)** 689,788 0.11 14,725 Lookout, Inc** 8,688 0.00 119,463 Lookout, Inc Series F (Pref)** 870,885 0.14 241,868 Palantir Technologies, Inc (Pref)** 1,492,326 0.25 146,316 Uber Technologies Inc** 4,709,949 0.77 8,030,668 1.31Total Common / Preferred Stocks (Shares) 8,030,668 1.31
BONDS
Cayman Islands CNY 5,600,000 Fresh Express Delivery Holding
Group Co Ltd (Defaulted) 18/10/2010 (Zero Coupon)** – 0.00
India USD 1,215,000 REI Agro Ltd (Defaulted)
5.5% 13/11/2014** – 0.00Total Bonds – 0.00Total Other Transferable Securities 8,030,668 1.31Total Portfolio 609,238,081 99.14
Other Net Assets 5,314,830 0.86Total Net Assets (USD) 614,552,911 100.00
Global Dynamic Equity Fund continued
Portfolio of Investments 31 August 2019

The notes on pages 728 to 741 form an integral part of these financial statements.
[434] BlackRock Global Funds (BGF)
Global Dynamic Equity Fund continued
Purchased Options as at 31 August 2019
Number of contracts
Call/ Put
Description Counterparty
Strike Price
Expiration date
Unrealised appreciation/
(depreciation) USD
Market Value USD
38,692 Call Emerson Electric Co Bank of America USD 65 20/12/2019 (85,772) 44,642 7,354 Call Alibaba Group Holding Inc Bank of America USD 162.5 17/1/2020 61,819 157,547 13,774 Call Johnson & Johnson Bank of America USD 155 17/1/2020 (50,355) 3,225 7,752 Call FedEx Corp Citibank USD 170 18/10/2019 (50,542) 22,769 8,426 Call Alibaba Group Holding Inc Citibank USD 167 22/11/2019 34,103 132,190 39,977 Call Halliburton Co Citibank USD 50 17/1/2020 (171,252) 14 13,715 Call JP Morgan Citibank USD 114.5 17/1/2020 (63,901) 48,547 21,327 Call QUALCOMM Inc Citibank USD 71 17/1/2020 92,005 200,124 16,929 Call FedEx Corp Credit Suisse USD 162 17/1/2020 (53,514) 178,953 59,768 Call Taiwan Semiconductor Manfacturing Co Ltd Credit Suisse USD 46 17/1/2020 (47,835) 80,069 13,509 Call CVS Health Corp JP Morgan USD 78.5 17/1/2020 (72,229) 995 2,331 Call Google Inc JP Morgan USD 1,315 17/1/2020 (46,816) 62,880 6,635 Call Apple Inc Morgan Stanley USD 212.5 20/9/2019 (11,401) 27,082 20,387 Call QUALCOMM Inc Morgan Stanley USD 70 18/10/2019 81,947 170,362 19,922 Call Lowe’s Companies Inc Nomura USD 112 15/11/2019 35,736 105,263 8,988 Call Agilent Technologies Inc Nomura USD 71 17/1/2020 (2,995) 41,783 93,239 Call BP Plc Nomura USD 45 17/1/2020 (153,346) 6,092 39,484 Call Kroger Co Nomura USD 25 17/1/2020 (23,712) 55,590 13,643 Call Lowe’s Companies Inc Nomura USD 98 17/1/2020 149,320 237,132 9,703 Call Facebook Inc UBS USD 185 20/9/2019 (56,374) 46,881 70,611 Call Total SA UBS USD 70 20/9/2019 (188,286) – 19,827 Call Facebook Inc UBS USD 195 20/12/2019 (111,720) 168,325 32,102 Call Schlumberger Ltd UBS USD 70 17/1/2020 (120,784) 99
Total (USD underlying exposure - USD 15,418,139) (855,904) 1,790,564
Open Exchange Traded Futures Contracts as at 31 August 2019
Number of contracts Currency
Contract/ Description
Expiration date
Underlying exposure
USD
Unrealised appreciation/
(depreciation) USD
54 AUD KOSPI SPI 200 Index September 2019 5,980,331 (13,829)15 CAD S&P/TSX 60 Index September 2019 2,213,130 55,941(7) EUR Dax Index September 2019 2,310,541 (76,206)(13) EUR CAC 40 10 Euro September 2019 787,944 (35,613)90 GBP FTSE 100 Index September 2019 7,923,565 (99,265)(48) HKD Hang Seng China Enterprises Index September 2019 3,085,460 (37,648)(146) JPY Nikkei 225 (Yen) September 2019 14,249,938 317,530(64) SGD SGX MSCI Singapore Index September 2019 1,642,762 (24,186)183 USD S&P 500 E-Mini Index September 2019 26,859,825 183,019(4) USD NASDAQ 100 E-Mini Index September 2019 618,260 (4,430)(106) USD MSCI Taiwan Index September 2019 4,157,320 (108,560)
Total 69,829,076 156,753
Written Options as at 31 August 2019
Number of contracts
Call/ Put
Description Counterparty
Strike Price
Expiration date
Unrealised appreciation/
(depreciation) USD
Market Value USD
(19,346) Put Emerson Electric Co Bank of America USD 55 20/12/2019 (2,917) (34,683) (38,692) Call Emerson Electric Co Bank of America USD 75 20/12/2019 19,533 (2,728) (4,867) Put Alibaba Group Holding Inc Bank of America USD 135 17/1/2020 24,533 (10,576) (7,354) Call Alibaba Group Holding Inc Bank of America USD 202.5 17/1/2020 (11,670) (33,698) (13,774) Put Johnson & Johnson Bank of America USD 109 17/1/2020 17,170 (20,709) (3,876) Put FedEx Corp Citibank USD 140 18/10/2019 5,559 (7,228) (7,752) Call FedEx Corp Citibank USD 195 18/10/2019 17,192 (1,270) (5,477) Put Alibaba Group Holding Inc Citibank USD 140 22/11/2019 20,221 (8,514) (8,426) Call Alibaba Group Holding Inc Citibank USD 195 22/11/2019 (1,793) (32,493) (35,010) Call Comcast Corp Citibank USD 37.5 17/1/2020 (162,476) (267,506) (13,715) Call JP Morgan Citibank USD 125.5 17/1/2020 51,840 (9,191) (10,664) Put QUALCOMM Inc Citibank USD 57 17/1/2020 29,514 (8,049) (21,327) Call QUALCOMM Inc Citibank USD 86 17/1/2020 (18,891) (50,775) (9,565) Put FedEx Corp Credit Suisse USD 130 17/1/2020 17,766 (28,862) (16,929) Call FedEx Corp Credit Suisse USD 190 17/1/2020 35,459 (38,557) (29,885) Put Taiwan Semiconductor Manfacturing Co Ltd Credit Suisse USD 39 17/1/2020 (5,575) (45,322) (59,768) Call Taiwan Semiconductor Manfacturing Co Ltd Credit Suisse USD 51 17/1/2020 19,283 (22,555)
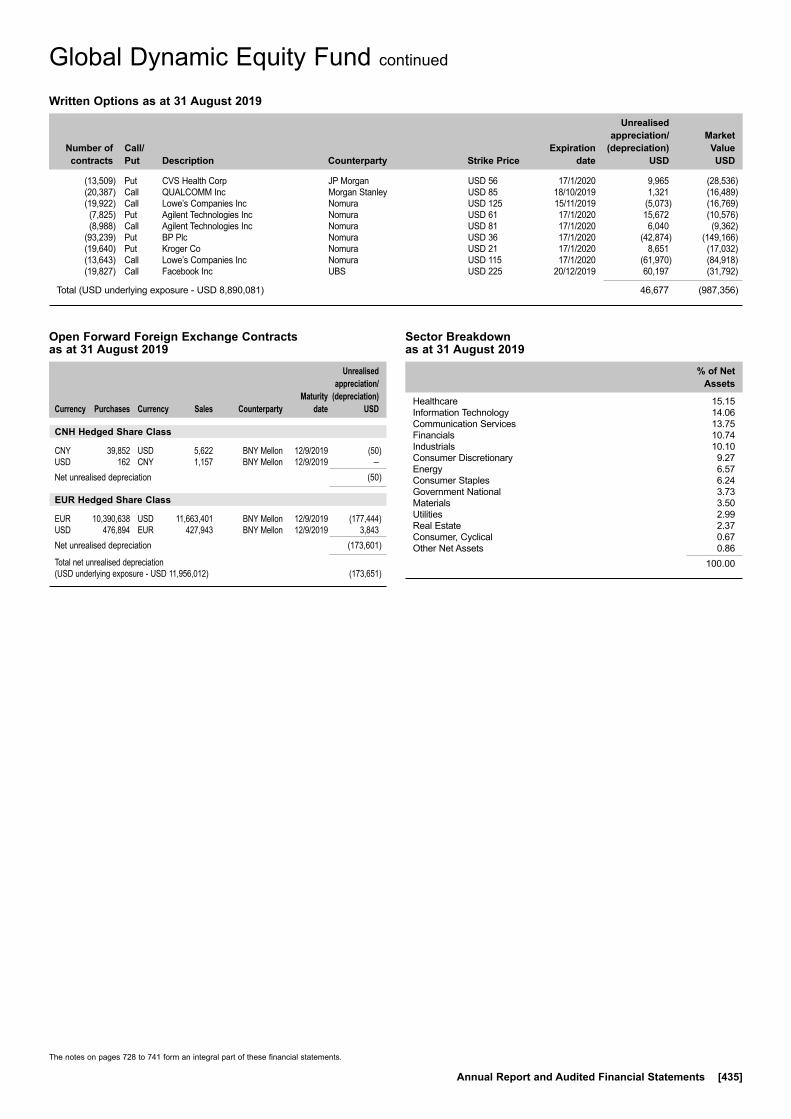
The notes on pages 728 to 741 form an integral part of these financial statements.
Annual Report and Audited Financial Statements [435]
Open Forward Foreign Exchange Contracts as at 31 August 2019
Currency
Purchases Currency
Sales Counterparty
Maturity date
Unrealised appreciation/
(depreciation) USD
CNH Hedged Share Class
CNY 39,852 USD 5,622 BNY Mellon 12/9/2019 (50)USD 162 CNY 1,157 BNY Mellon 12/9/2019 –Net unrealised depreciation (50)
EUR Hedged Share Class
EUR 10,390,638 USD 11,663,401 BNY Mellon 12/9/2019 (177,444)USD 476,894 EUR 427,943 BNY Mellon 12/9/2019 3,843Net unrealised depreciation (173,601)
Total net unrealised depreciation (USD underlying exposure - USD 11,956,012) (173,651)
Global Dynamic Equity Fund continued
(13,509) Put CVS Health Corp JP Morgan USD 56 17/1/2020 9,965 (28,536) (20,387) Call QUALCOMM Inc Morgan Stanley USD 85 18/10/2019 1,321 (16,489) (19,922) Call Lowe’s Companies Inc Nomura USD 125 15/11/2019 (5,073) (16,769) (7,825) Put Agilent Technologies Inc Nomura USD 61 17/1/2020 15,672 (10,576) (8,988) Call Agilent Technologies Inc Nomura USD 81 17/1/2020 6,040 (9,362) (93,239) Put BP Plc Nomura USD 36 17/1/2020 (42,874) (149,166) (19,640) Put Kroger Co Nomura USD 21 17/1/2020 8,651 (17,032) (13,643) Call Lowe’s Companies Inc Nomura USD 115 17/1/2020 (61,970) (84,918) (19,827) Call Facebook Inc UBS USD 225 20/12/2019 60,197 (31,792)
Total (USD underlying exposure - USD 8,890,081) 46,677 (987,356)
Written Options as at 31 August 2019
Number of contracts
Call/ Put
Description Counterparty
Strike Price
Expiration date
Unrealised appreciation/
(depreciation) USD
Market Value USD
Sector Breakdown as at 31 August 2019
% of Net Assets
Healthcare 15.15Information Technology 14.06Communication Services 13.75Financials 10.74Industrials 10.10Consumer Discretionary 9.27Energy 6.57Consumer Staples 6.24Government National 3.73Materials 3.50Utilities 2.99Real Estate 2.37Consumer, Cyclical 0.67Other Net Assets 0.86
100.00
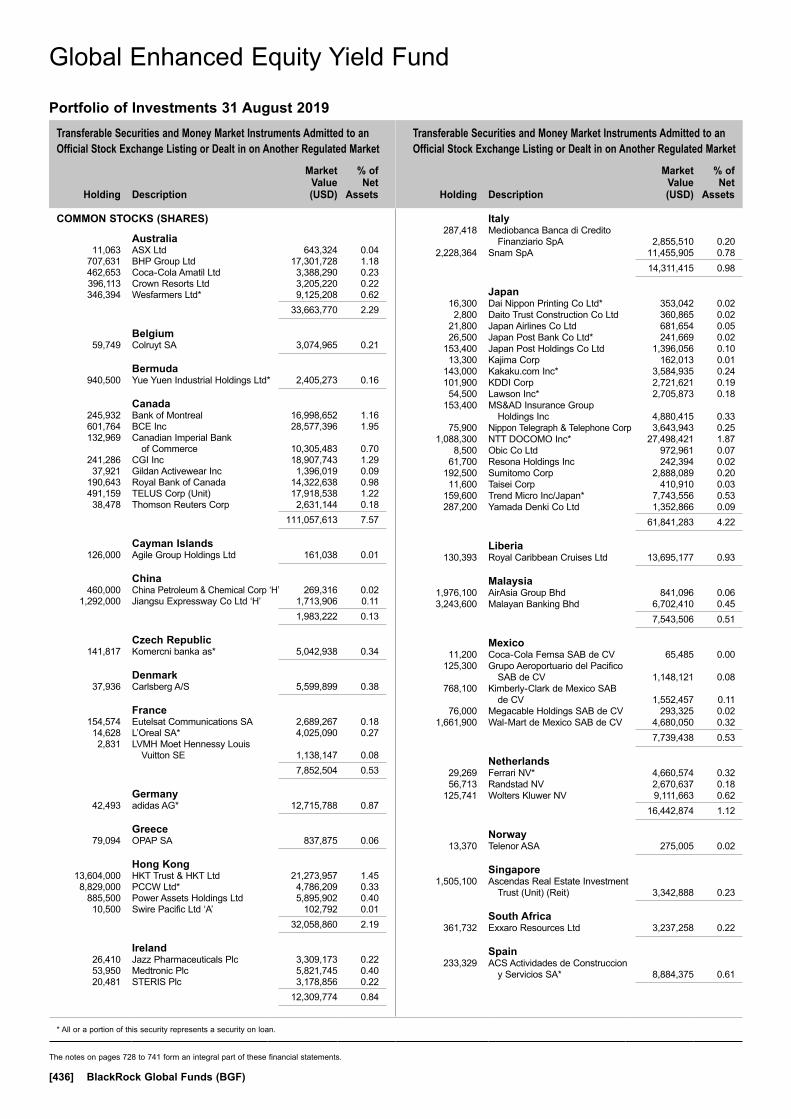
Transferable Securities and Money Market Instruments Admitted to an Official Stock Exchange Listing or Dealt in on Another Regulated Market
Transferable Securities and Money Market Instruments Admitted to an Official Stock Exchange Listing or Dealt in on Another Regulated Market
Holding
Description
Market Value (USD)
% of Net
Assets
Holding
Description
Market Value (USD)
% of Net
Assets
* All or a portion of this security represents a security on loan.
The notes on pages 728 to 741 form an integral part of these financial statements.
[436] BlackRock Global Funds (BGF)
COMMON STOCKS (SHARES)
Australia 11,063 ASX Ltd 643,324 0.04 707,631 BHP Group Ltd 17,301,728 1.18 462,653 Coca-Cola Amatil Ltd 3,388,290 0.23 396,113 Crown Resorts Ltd 3,205,220 0.22 346,394 Wesfarmers Ltd* 9,125,208 0.62 33,663,770 2.29
Belgium 59,749 Colruyt SA 3,074,965 0.21
Bermuda 940,500 Yue Yuen Industrial Holdings Ltd* 2,405,273 0.16
Canada 245,932 Bank of Montreal 16,998,652 1.16 601,764 BCE Inc 28,577,396 1.95 132,969 Canadian Imperial Bank
of Commerce 10,305,483 0.70 241,286 CGI Inc 18,907,743 1.29 37,921 Gildan Activewear Inc 1,396,019 0.09 190,643 Royal Bank of Canada 14,322,638 0.98 491,159 TELUS Corp (Unit) 17,918,538 1.22 38,478 Thomson Reuters Corp 2,631,144 0.18 111,057,613 7.57
Cayman Islands 126,000 Agile Group Holdings Ltd 161,038 0.01
China 460,000 China Petroleum & Chemical Corp ‘H’ 269,316 0.02 1,292,000 Jiangsu Expressway Co Ltd ‘H’ 1,713,906 0.11 1,983,222 0.13
Czech Republic 141,817 Komercni banka as* 5,042,938 0.34
Denmark 37,936 Carlsberg A/S 5,599,899 0.38
France 154,574 Eutelsat Communications SA 2,689,267 0.18 14,628 L’Oreal SA* 4,025,090 0.27 2,831 LVMH Moet Hennessy Louis
Vuitton SE 1,138,147 0.08 7,852,504 0.53
Germany 42,493 adidas AG* 12,715,788 0.87
Greece 79,094 OPAP SA 837,875 0.06
Hong Kong 13,604,000 HKT Trust & HKT Ltd 21,273,957 1.45 8,829,000 PCCW Ltd* 4,786,209 0.33 885,500 Power Assets Holdings Ltd 5,895,902 0.40 10,500 Swire Pacific Ltd ‘A’ 102,792 0.01 32,058,860 2.19
Ireland 26,410 Jazz Pharmaceuticals Plc 3,309,173 0.22 53,950 Medtronic Plc 5,821,745 0.40 20,481 STERIS Plc 3,178,856 0.22 12,309,774 0.84
Italy 287,418 Mediobanca Banca di Credito
Finanziario SpA 2,855,510 0.20 2,228,364 Snam SpA 11,455,905 0.78 14,311,415 0.98
Japan 16,300 Dai Nippon Printing Co Ltd* 353,042 0.02 2,800 Daito Trust Construction Co Ltd 360,865 0.02 21,800 Japan Airlines Co Ltd 681,654 0.05 26,500 Japan Post Bank Co Ltd* 241,669 0.02 153,400 Japan Post Holdings Co Ltd 1,396,056 0.10 13,300 Kajima Corp 162,013 0.01 143,000 Kakaku.com Inc* 3,584,935 0.24 101,900 KDDI Corp 2,721,621 0.19 54,500 Lawson Inc* 2,705,873 0.18 153,400 MS&AD Insurance Group
Holdings Inc 4,880,415 0.33 75,900 Nippon Telegraph & Telephone Corp 3,643,943 0.25 1,088,300 NTT DOCOMO Inc* 27,498,421 1.87 8,500 Obic Co Ltd 972,961 0.07 61,700 Resona Holdings Inc 242,394 0.02 192,500 Sumitomo Corp 2,888,089 0.20 11,600 Taisei Corp 410,910 0.03 159,600 Trend Micro Inc/Japan* 7,743,556 0.53 287,200 Yamada Denki Co Ltd 1,352,866 0.09 61,841,283 4.22
Liberia 130,393 Royal Caribbean Cruises Ltd 13,695,177 0.93
Malaysia 1,976,100 AirAsia Group Bhd 841,096 0.06 3,243,600 Malayan Banking Bhd 6,702,410 0.45 7,543,506 0.51
Mexico 11,200 Coca-Cola Femsa SAB de CV 65,485 0.00 125,300 Grupo Aeroportuario del Pacifico
SAB de CV 1,148,121 0.08 768,100 Kimberly-Clark de Mexico SAB
de CV 1,552,457 0.11 76,000 Megacable Holdings SAB de CV 293,325 0.02 1,661,900 Wal-Mart de Mexico SAB de CV 4,680,050 0.32 7,739,438 0.53
Netherlands 29,269 Ferrari NV* 4,660,574 0.32 56,713 Randstad NV 2,670,637 0.18 125,741 Wolters Kluwer NV 9,111,663 0.62 16,442,874 1.12
Norway 13,370 Telenor ASA 275,005 0.02
Singapore 1,505,100 Ascendas Real Estate Investment
Trust (Unit) (Reit) 3,342,888 0.23
South Africa 361,732 Exxaro Resources Ltd 3,237,258 0.22
Spain 233,329 ACS Actividades de Construccion
y Servicios SA* 8,884,375 0.61
Global Enhanced Equity Yield Fund
Portfolio of Investments 31 August 2019
Global Enhanced Equity Yield Fund

Transferable Securities and Money Market Instruments Admitted to an Official Stock Exchange Listing or Dealt in on Another Regulated Market
Transferable Securities and Money Market Instruments Admitted to an Official Stock Exchange Listing or Dealt in on Another Regulated Market
Holding
Description
Market Value (USD)
% of Net
Assets
Holding
Description
Market Value (USD)
% of Net
Assets
^ Securities pledged, see Note 14, for further details.* All or a portion of this security represents a security on loan.
The notes on pages 728 to 741 form an integral part of these financial statements.
Annual Report and Audited Financial Statements [437]
Sweden 90,739 Atlas Copco AB* 2,722,928 0.19 239,844 Industrivarden AB* 5,021,502 0.34 148,493 Tele2 AB 2,091,035 0.14 954,405 Telia Co AB 4,178,306 0.28 1,223,820 Volvo AB 16,971,508 1.16 30,985,279 2.11
Switzerland 31,585 Garmin Ltd 2,579,547 0.18 222,090 Novartis AG* 20,118,268 1.37 22,697,815 1.55
Taiwan 33,000 Advantech Co Ltd 280,516 0.02 321,389 Chicony Electronics Co Ltd 902,468 0.06 1,578,000 Eva Airways Corp 710,879 0.05 8,494,150 First Financial Holding Co Ltd 5,814,209 0.40 912,000 Highwealth Construction Corp 1,437,250 0.10 19,911 Hua Nan Financial Holdings Co Ltd 12,646 0.00 6,037,000 Lite-On Technology Corp 9,610,001 0.66 456,000 Mega Financial Holding Co Ltd 417,383 0.03 3,110,000 Powertech Technology Inc 7,435,883 0.51 1,083,000 Quanta Computer Inc 1,948,090 0.13 136,000 Realtek Semiconductor Corp 930,914 0.06 1,357,000 Synnex Technology
International Corp 1,598,504 0.11 1,201,000 Taiwan Semiconductor
Manufacturing Co Ltd 9,903,188 0.67 2,214,000 Wistron Corp 1,755,130 0.12 4,527,480 WPG Holdings Ltd 5,729,621 0.39 48,486,682 3.31
Thailand 10,399,600 Home Product Center PCL 6,122,916 0.42 888,900 Intouch Holdings PCL 1,860,810 0.13 4,057,900 Krung Thai Bank PCL 2,282,963 0.15 10,266,689 0.70
Turkey 41,430 Ford Otomotiv Sanayi AS 417,641 0.03
United Kingdom 234,051 Admiral Group Plc* 6,109,540 0.42 768,094 Auto Trader Group Plc* 5,000,749 0.34 2,154,649 Barratt Developments Plc* 16,681,006 1.14 41,374 BHP Group Plc 886,746 0.06 110,881 Carnival Plc 4,679,491 0.32 739,457 Diageo Plc 31,767,187 2.16 412,344 GlaxoSmithKline Plc 8,627,000 0.59 166,859 Halma Plc 4,008,086 0.27 9,606 Micro Focus International Plc 129,986 0.01 495,900 Rio Tinto Plc 25,023,196 1.71 8,750,197 Taylor Wimpey Plc 15,482,098 1.05 118,395,085 8.07
United States 164,927 AbbVie Inc* 10,896,727 0.74 28,676 Aflac Inc* 1,431,506 0.10 1,371 Agilent Technologies Inc 97,670 0.01 117,539 Akamai Technologies Inc 10,530,319 0.72 77,700 Allstate Corp/The 7,963,473 0.54 462,380 Altria Group Inc^ 20,460,315 1.39 6,456 Amazon.com Inc 11,549,138 0.79 34,546 American Financial Group Inc/OH 3,500,546 0.24 177,694 AmerisourceBergen Corp ‘A’ 14,551,362 0.99 61,541 AMETEK Inc 5,328,220 0.36
98,635 Amgen Inc 20,496,353 1.40 32,453 Analog Devices Inc 3,580,540 0.24 29,578 Apple Inc 6,192,154 0.42 6,989 Archer-Daniels-Midland Co* 267,120 0.02 158,235 Automatic Data Processing Inc* 26,982,232 1.84 9,278 AutoZone Inc* 10,345,527 0.71 171,514 Baxter International Inc 15,036,632 1.03 160,757 Best Buy Co Inc 10,241,829 0.70 13,148 Broadridge Financial Solutions Inc 1,717,129 0.12 2,384 Brown-Forman Corp 140,489 0.01 17,465 Cardinal Health Inc 744,358 0.05 39,934 CDW Corp/DE 4,598,999 0.31 21,745 Celgene Corp 2,109,917 0.14 27,362 Church & Dwight Co Inc 2,193,338 0.15 78,991 Cisco Systems Inc 3,727,585 0.25 5,528 Citrix Systems Inc 516,868 0.04 363,221 Comcast Corp* 16,145,173 1.10 195,565 Comerica Inc 12,171,966 0.83 121,389 Corning Inc 3,401,320 0.23 188,896 CSX Corp 12,731,590 0.87 29,324 Cummins Inc* 4,409,743 0.30 87,556 Dollar General Corp 13,828,595 0.94 5,748 DR Horton Inc 282,457 0.02 63,931 eBay Inc 2,592,402 0.18 216,872 Eli Lilly & Co 24,378,582 1.66 211,532 Evergy Inc 13,796,117 0.94 87,190 Expedia Group Inc* 11,421,890 0.78 101,985 Extra Space Storage Inc (Reit) 12,329,987 0.84 192,665 Fidelity National Information
Services Inc 26,439,418 1.80 5,117 FLIR Systems Inc 253,547 0.02 321,679 General Mills Inc 17,338,498 1.18 28,351 Genuine Parts Co 2,570,585 0.18 102,277 H&R Block Inc 2,468,967 0.17 14,073 Hilton Worldwide Holdings Inc 1,309,633 0.09 32,723 Hologic Inc 1,608,335 0.11 10,751 Hormel Foods Corp 459,283 0.03 12,405 Ingredion Inc 950,595 0.06 14,241 JM Smucker Co/The 1,497,299 0.10 260,102 Johnson & Johnson 33,313,864 2.27 122,830 Kimberly-Clark Corp 17,420,979 1.19 39,371 McDonald’s Corp 8,620,281 0.59 48,143 McKesson Corp 6,603,775 0.45 403,208 Merck & Co Inc^ 34,978,294 2.38 14,965 MetLife Inc 665,194 0.05 20,147 Microsoft Corp 2,788,546 0.19 157,474 Mondelez International Inc 8,709,887 0.59 136,594 NIKE Inc 11,682,885 0.80 86,600 Norfolk Southern Corp 15,316,942 1.04 140,378 OGE Energy Corp* 6,030,639 0.41 606,415 Oracle Corp*^ 31,636,671 2.16 44,970 PACCAR Inc 2,958,127 0.20 352,877 Paychex Inc 29,024,133 1.98 221,272 PepsiCo Inc 30,154,948 2.06 701,778 Pfizer Inc 24,881,539 1.70 78,816 Pinnacle West Capital Corp 7,521,411 0.51 49,224 Procter & Gamble Co/The 5,960,534 0.41 32,974 Quest Diagnostics Inc 3,382,143 0.23 101,136 Ralph Lauren Corp ‘A’ 9,002,115 0.61 8,669 Raytheon Co 1,592,842 0.11 3,516 Regency Centers Corp (Reit) 225,727 0.02 207,359 Republic Services Inc ‘A’ 18,614,617 1.27 36,558 salesforce.com Inc 5,765,928 0.39 121,312 Simon Property Group Inc (Reit) 18,057,291 1.23 2,045 SL Green Realty Corp (Reit) 163,048 0.01 8,796 Snap-on Inc 1,317,905 0.09 13,958 Stryker Corp 3,093,232 0.21 13,562 SunTrust Banks Inc 839,352 0.06 114,264 Target Corp 12,457,061 0.85
Global Enhanced Equity Yield Fund continued
Portfolio of Investments 31 August 2019

Transferable Securities and Money Market Instruments Admitted to an Official Stock Exchange Listing or Dealt in on Another Regulated Market Other Transferable Securities
Holding
Description
Market Value (USD)
% of Net
Assets
Holding
Description
Market Value (USD)
% of Net
Assets
* All or a portion of this security represents a security on loan.
The notes on pages 728 to 741 form an integral part of these financial statements.
[438] BlackRock Global Funds (BGF)
Portfolio of Investments 31 August 2019
45,172 Texas Instruments Inc 5,627,076 0.38 60,873 Union Pacific Corp 9,933,865 0.68 4,386 Vail Resorts Inc 1,040,447 0.07 17,957 Verizon Communications Inc 1,046,175 0.07 179,290 Waste Management Inc 21,448,463 1.46 3,209 Waters Corp 679,795 0.05 17,027 Whirlpool Corp* 2,377,650 0.16 15,430 WR Berkley Corp 1,102,165 0.08 247,108 Yum! Brands Inc 28,946,231 1.97 5,496 Zions Bancorp NA* 226,490 0.02 802,794,595 54.74Total Common Stocks (Shares) 1,400,120,524 95.46Total Transferable Securities and Money Market Instruments Admitted to an Official Stock Exchange Listing or Dealt in on Another Regulated Market 1,400,120,524 95.46
COMMON STOCKS (SHARES)
Taiwan 447,916 WPG Holdings Ltd (Right 17/9/2019) – 0.00Total Common Stocks (Shares) – 0.00Total Other Transferable Securities – 0.00Total Portfolio 1,400,120,524 95.46
Other Net Assets 66,550,381 4.54Total Net Assets (USD) 1,466,670,905 100.00
Global Enhanced Equity Yield Fund continued
Written Options as at 31 August 2019
Number of contracts
Call/ Put
Description Counterparty
Strike Price
Expiration date
Unrealised appreciation/
(depreciation) USD
Market Value USD
(384) Call EURO STOXX 50 Index Exchange Traded EUR 3,425 20/9/2019 (97,863) (223,966) (388) Call EURO STOXX 50 Index Exchange Traded EUR 3,400 20/9/2019 (164,085) (297,017) (368) Call FTSE 100 Index Exchange Traded GBP 7,275 20/9/2019 35,349 (256,222) (368) Call FTSE 100 Index Exchange Traded GBP 7,250 20/9/2019 (46,756) (307,915) (192) Call Nikkei 225 Index Exchange Traded JPY 20,750 13/9/2019 241,418 (416,035) (419) Call S&P 500 Index Exchange Traded USD 2,955 6/9/2019 720,255 (582,410) (386) Call S&P 500 Index Exchange Traded USD 2,950 13/9/2019 (186,867) (953,420) (314) Call S&P 500 Index Exchange Traded USD 2,910 20/9/2019 (857,518) (1,865,160)
Total (USD underlying exposure - USD 193,119,219) (356,067) (4,902,145)
Open Exchange Traded Futures Contracts as at 31 August 2019
Number of contracts Currency
Contract/ Description
Expiration date
Underlying exposure
USD
Unrealised appreciation/
(depreciation) USD
312 EUR EURO STOXX 50 Index September 2019 11,831,649 270,94493 GBP FTSE 100 Index September 2019 8,187,684 (34,598)96 JPY Nikkei 225 (Yen) September 2019 9,369,822 121,580602 USD S&P 500 E-Mini Index September 2019 88,358,550 (209,213)
Total 117,747,705 148,713
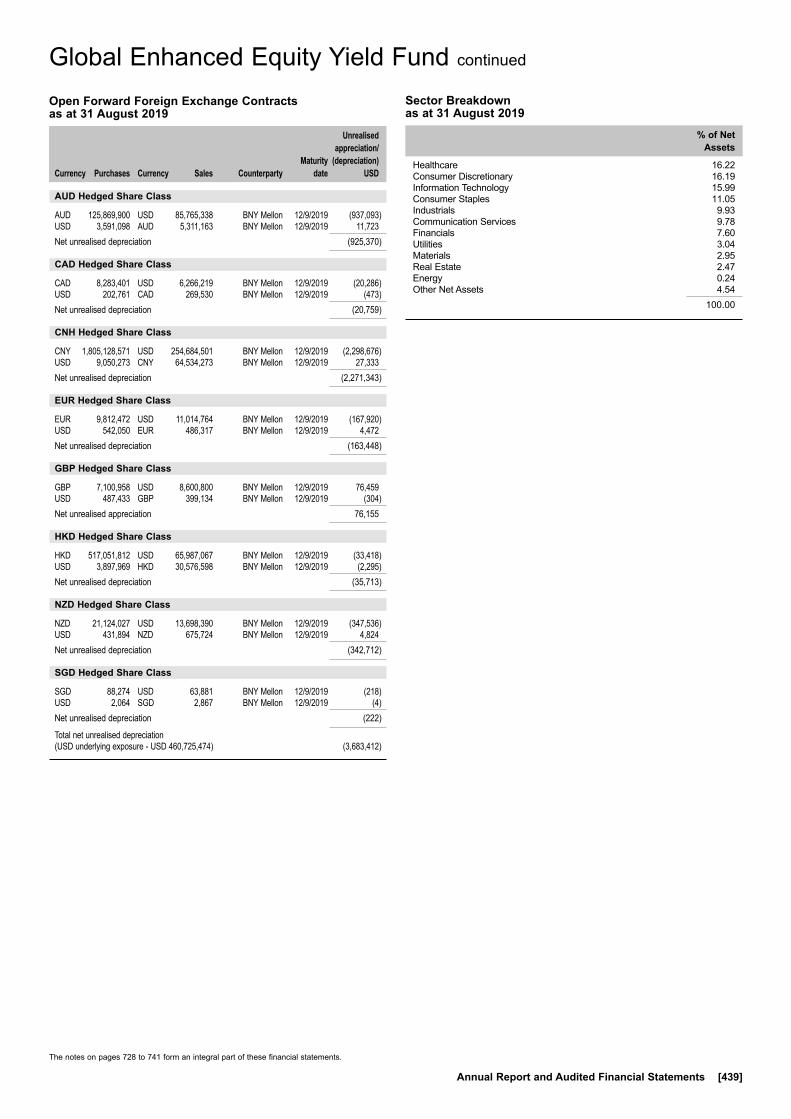
The notes on pages 728 to 741 form an integral part of these financial statements.
Annual Report and Audited Financial Statements [439]
Global Enhanced Equity Yield Fund continued
Open Forward Foreign Exchange Contracts as at 31 August 2019
Currency
Purchases Currency
Sales Counterparty
Maturity date
Unrealised appreciation/
(depreciation) USD
AUD Hedged Share Class
AUD 125,869,900 USD 85,765,338 BNY Mellon 12/9/2019 (937,093)USD 3,591,098 AUD 5,311,163 BNY Mellon 12/9/2019 11,723Net unrealised depreciation (925,370)
CAD Hedged Share Class
CAD 8,283,401 USD 6,266,219 BNY Mellon 12/9/2019 (20,286)USD 202,761 CAD 269,530 BNY Mellon 12/9/2019 (473)Net unrealised depreciation (20,759)
CNH Hedged Share Class
CNY 1,805,128,571 USD 254,684,501 BNY Mellon 12/9/2019 (2,298,676)USD 9,050,273 CNY 64,534,273 BNY Mellon 12/9/2019 27,333Net unrealised depreciation (2,271,343)
EUR Hedged Share Class
EUR 9,812,472 USD 11,014,764 BNY Mellon 12/9/2019 (167,920)USD 542,050 EUR 486,317 BNY Mellon 12/9/2019 4,472Net unrealised depreciation (163,448)
GBP Hedged Share Class
GBP 7,100,958 USD 8,600,800 BNY Mellon 12/9/2019 76,459USD 487,433 GBP 399,134 BNY Mellon 12/9/2019 (304)Net unrealised appreciation 76,155
HKD Hedged Share Class
HKD 517,051,812 USD 65,987,067 BNY Mellon 12/9/2019 (33,418)USD 3,897,969 HKD 30,576,598 BNY Mellon 12/9/2019 (2,295)Net unrealised depreciation (35,713)
NZD Hedged Share Class
NZD 21,124,027 USD 13,698,390 BNY Mellon 12/9/2019 (347,536)USD 431,894 NZD 675,724 BNY Mellon 12/9/2019 4,824Net unrealised depreciation (342,712)
SGD Hedged Share Class
SGD 88,274 USD 63,881 BNY Mellon 12/9/2019 (218)USD 2,064 SGD 2,867 BNY Mellon 12/9/2019 (4)Net unrealised depreciation (222)
Total net unrealised depreciation (USD underlying exposure - USD 460,725,474) (3,683,412)
Sector Breakdown as at 31 August 2019
% of Net Assets
Healthcare 16.22Consumer Discretionary 16.19Information Technology 15.99Consumer Staples 11.05Industrials 9.93Communication Services 9.78Financials 7.60Utilities 3.04Materials 2.95Real Estate 2.47Energy 0.24Other Net Assets 4.54
100.00
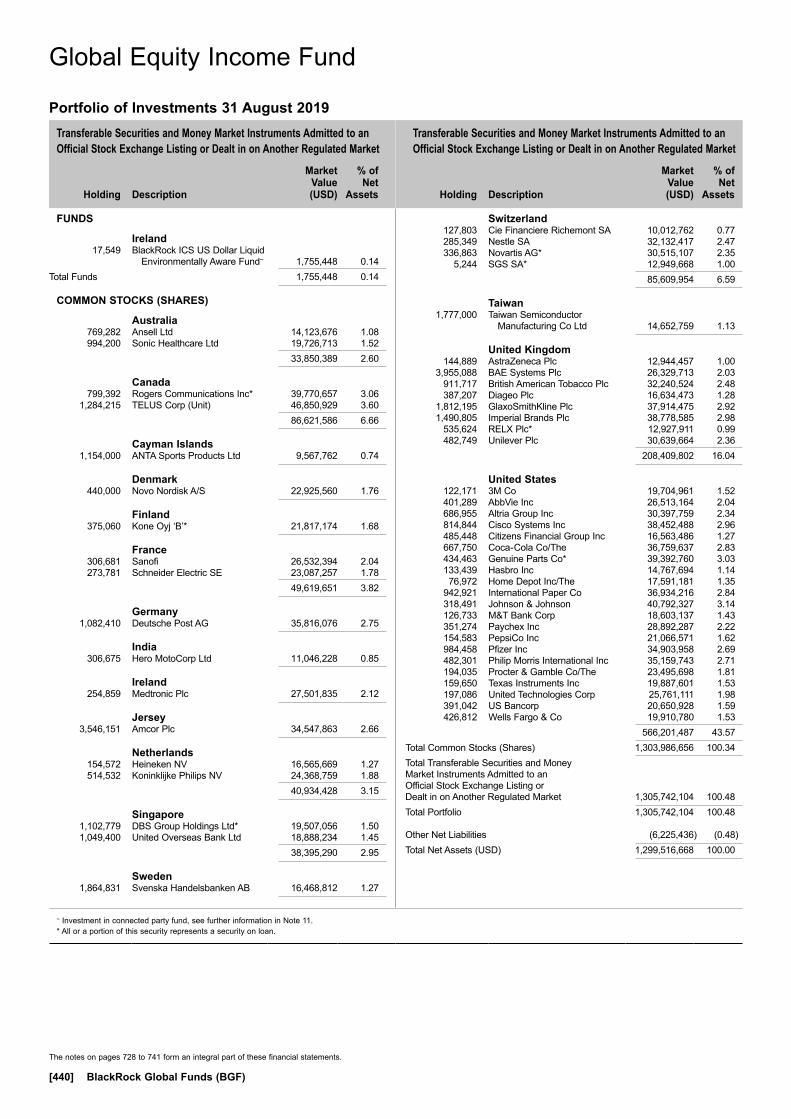
Transferable Securities and Money Market Instruments Admitted to an Official Stock Exchange Listing or Dealt in on Another Regulated Market
Transferable Securities and Money Market Instruments Admitted to an Official Stock Exchange Listing or Dealt in on Another Regulated Market
Holding
Description
Market Value (USD)
% of Net
Assets
Holding
Description
Market Value (USD)
% of Net
Assets
~ Investment in connected party fund, see further information in Note 11.* All or a portion of this security represents a security on loan.
The notes on pages 728 to 741 form an integral part of these financial statements.
[440] BlackRock Global Funds (BGF)
FUNDS
Ireland 17,549 BlackRock ICS US Dollar Liquid
Environmentally Aware Fund~ 1,755,448 0.14Total Funds 1,755,448 0.14
COMMON STOCKS (SHARES)
Australia 769,282 Ansell Ltd 14,123,676 1.08 994,200 Sonic Healthcare Ltd 19,726,713 1.52 33,850,389 2.60
Canada 799,392 Rogers Communications Inc* 39,770,657 3.06 1,284,215 TELUS Corp (Unit) 46,850,929 3.60 86,621,586 6.66
Cayman Islands 1,154,000 ANTA Sports Products Ltd 9,567,762 0.74
Denmark 440,000 Novo Nordisk A/S 22,925,560 1.76
Finland 375,060 Kone Oyj ‘B’* 21,817,174 1.68
France 306,681 Sanofi 26,532,394 2.04 273,781 Schneider Electric SE 23,087,257 1.78 49,619,651 3.82
Germany 1,082,410 Deutsche Post AG 35,816,076 2.75
India 306,675 Hero MotoCorp Ltd 11,046,228 0.85
Ireland 254,859 Medtronic Plc 27,501,835 2.12
Jersey 3,546,151 Amcor Plc 34,547,863 2.66
Netherlands 154,572 Heineken NV 16,565,669 1.27 514,532 Koninklijke Philips NV 24,368,759 1.88 40,934,428 3.15
Singapore 1,102,779 DBS Group Holdings Ltd* 19,507,056 1.50 1,049,400 United Overseas Bank Ltd 18,888,234 1.45 38,395,290 2.95
Sweden 1,864,831 Svenska Handelsbanken AB 16,468,812 1.27
Switzerland 127,803 Cie Financiere Richemont SA 10,012,762 0.77 285,349 Nestle SA 32,132,417 2.47 336,863 Novartis AG* 30,515,107 2.35 5,244 SGS SA* 12,949,668 1.00 85,609,954 6.59
Taiwan 1,777,000 Taiwan Semiconductor
Manufacturing Co Ltd 14,652,759 1.13
United Kingdom 144,889 AstraZeneca Plc 12,944,457 1.00 3,955,088 BAE Systems Plc 26,329,713 2.03 911,717 British American Tobacco Plc 32,240,524 2.48 387,207 Diageo Plc 16,634,473 1.28 1,812,195 GlaxoSmithKline Plc 37,914,475 2.92 1,490,805 Imperial Brands Plc 38,778,585 2.98 535,624 RELX Plc* 12,927,911 0.99 482,749 Unilever Plc 30,639,664 2.36 208,409,802 16.04
United States 122,171 3M Co 19,704,961 1.52 401,289 AbbVie Inc 26,513,164 2.04 686,955 Altria Group Inc 30,397,759 2.34 814,844 Cisco Systems Inc 38,452,488 2.96 485,448 Citizens Financial Group Inc 16,563,486 1.27 667,750 Coca-Cola Co/The 36,759,637 2.83 434,463 Genuine Parts Co* 39,392,760 3.03 133,439 Hasbro Inc 14,767,694 1.14 76,972 Home Depot Inc/The 17,591,181 1.35 942,921 International Paper Co 36,934,216 2.84 318,491 Johnson & Johnson 40,792,327 3.14 126,733 M&T Bank Corp 18,603,137 1.43 351,274 Paychex Inc 28,892,287 2.22 154,583 PepsiCo Inc 21,066,571 1.62 984,458 Pfizer Inc 34,903,958 2.69 482,301 Philip Morris International Inc 35,159,743 2.71 194,035 Procter & Gamble Co/The 23,495,698 1.81 159,650 Texas Instruments Inc 19,887,601 1.53 197,086 United Technologies Corp 25,761,111 1.98 391,042 US Bancorp 20,650,928 1.59 426,812 Wells Fargo & Co 19,910,780 1.53 566,201,487 43.57Total Common Stocks (Shares) 1,303,986,656 100.34Total Transferable Securities and Money Market Instruments Admitted to an Official Stock Exchange Listing or Dealt in on Another Regulated Market 1,305,742,104 100.48Total Portfolio 1,305,742,104 100.48
Other Net Liabilities (6,225,436) (0.48)Total Net Assets (USD) 1,299,516,668 100.00
Global Equity Income Fund
Portfolio of Investments 31 August 2019
Global Equity Income Fund
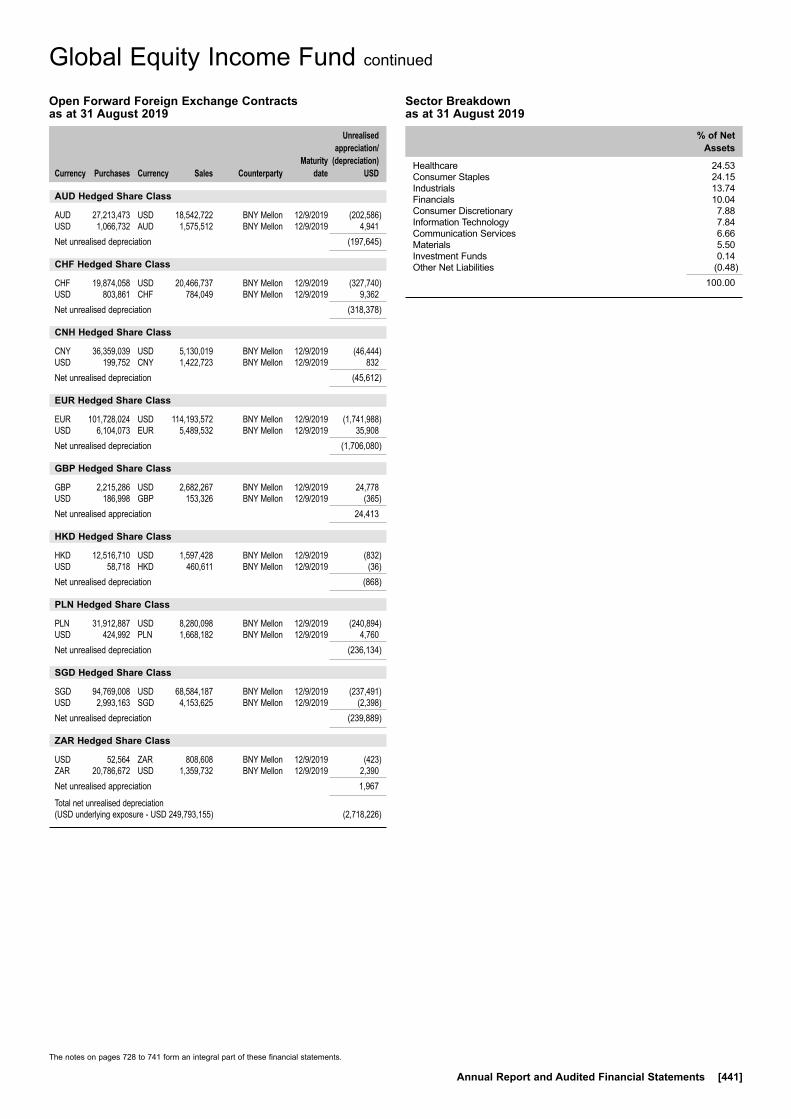
The notes on pages 728 to 741 form an integral part of these financial statements.
Annual Report and Audited Financial Statements [441]
Global Equity Income Fund continued
Open Forward Foreign Exchange Contracts as at 31 August 2019
Currency
Purchases Currency
Sales Counterparty
Maturity date
Unrealised appreciation/
(depreciation) USD
AUD Hedged Share Class
AUD 27,213,473 USD 18,542,722 BNY Mellon 12/9/2019 (202,586)USD 1,066,732 AUD 1,575,512 BNY Mellon 12/9/2019 4,941Net unrealised depreciation (197,645)
CHF Hedged Share Class
CHF 19,874,058 USD 20,466,737 BNY Mellon 12/9/2019 (327,740)USD 803,861 CHF 784,049 BNY Mellon 12/9/2019 9,362Net unrealised depreciation (318,378)
CNH Hedged Share Class
CNY 36,359,039 USD 5,130,019 BNY Mellon 12/9/2019 (46,444)USD 199,752 CNY 1,422,723 BNY Mellon 12/9/2019 832Net unrealised depreciation (45,612)
EUR Hedged Share Class
EUR 101,728,024 USD 114,193,572 BNY Mellon 12/9/2019 (1,741,988)USD 6,104,073 EUR 5,489,532 BNY Mellon 12/9/2019 35,908Net unrealised depreciation (1,706,080)
GBP Hedged Share Class
GBP 2,215,286 USD 2,682,267 BNY Mellon 12/9/2019 24,778USD 186,998 GBP 153,326 BNY Mellon 12/9/2019 (365)Net unrealised appreciation 24,413
HKD Hedged Share Class
HKD 12,516,710 USD 1,597,428 BNY Mellon 12/9/2019 (832)USD 58,718 HKD 460,611 BNY Mellon 12/9/2019 (36)Net unrealised depreciation (868)
PLN Hedged Share Class
PLN 31,912,887 USD 8,280,098 BNY Mellon 12/9/2019 (240,894)USD 424,992 PLN 1,668,182 BNY Mellon 12/9/2019 4,760Net unrealised depreciation (236,134)
SGD Hedged Share Class
SGD 94,769,008 USD 68,584,187 BNY Mellon 12/9/2019 (237,491)USD 2,993,163 SGD 4,153,625 BNY Mellon 12/9/2019 (2,398)Net unrealised depreciation (239,889)
ZAR Hedged Share Class
USD 52,564 ZAR 808,608 BNY Mellon 12/9/2019 (423)ZAR 20,786,672 USD 1,359,732 BNY Mellon 12/9/2019 2,390Net unrealised appreciation 1,967
Total net unrealised depreciation (USD underlying exposure - USD 249,793,155) (2,718,226)
Sector Breakdown as at 31 August 2019
% of Net Assets
Healthcare 24.53Consumer Staples 24.15Industrials 13.74Financials 10.04Consumer Discretionary 7.88Information Technology 7.84Communication Services 6.66Materials 5.50Investment Funds 0.14Other Net Liabilities (0.48)
100.00

Transferable Securities and Money Market Instruments Admitted to an Official Stock Exchange Listing or Dealt in on Another Regulated Market
Transferable Securities and Money Market Instruments Admitted to an Official Stock Exchange Listing or Dealt in on Another Regulated Market
Holding
Description
Market Value (USD)
% of Net
Assets
Holding
Description
Market Value (USD)
% of Net
Assets
~ Investment in connected party fund, see further information in Note 11.* All or a portion of this security represents a security on loan.
The notes on pages 728 to 741 form an integral part of these financial statements.
[442] BlackRock Global Funds (BGF)
FUNDS
Ireland 14,000 iShares Core EUR Corp Bond
UCITS ETF~ 2,100,185 0.29Total Funds 2,100,185 0.29
BONDS
Argentina CHF 40,000 Argentine Republic Government
International Bond 3.375% 12/10/2020 21,205 0.00
USD 1,365,000 Argentine Republic Government International Bond 5.875% 11/1/2028 525,525 0.07
USD 143,000 Argentine Republic Government International Bond 6.875% 11/1/2048 56,270 0.01
USD 311,000 Argentine Republic Government International Bond 7.125% 6/7/2036 122,845 0.01
USD 150,000 Argentine Republic Government International Bond 7.5% 22/4/2026 59,250 0.01
USD 246,000 Generacion Mediterranea SA / Generacion Frias SA / Central Termica Roca SA ‘144A’ 9.625% 27/7/2023 142,680 0.02
USD 176,000 Telecom Argentina SA ‘144A’ 8% 18/7/2026 142,148 0.02
1,069,923 0.14
Australia AUD 750,000 Australia Government Bond 2%
21/12/2021 520,170 0.07 AUD 2,410,000 Australia Government Bond 2.25%
21/11/2022 1,704,612 0.23 AUD 450,000 Australia Government Bond 2.5%
21/5/2030 351,988 0.05 AUD 930,000 Australia Government Bond 2.75%
21/4/2024 685,720 0.09 AUD 470,000 Australia Government Bond 2.75%
21/11/2029 373,542 0.05 AUD 450,000 Australia Government Bond 2.75%
21/5/2041 382,141 0.05 AUD 430,000 Australia Government Bond 3%
21/3/2047 390,035 0.05 AUD 690,000 Australia Government Bond 3.25%
21/6/2039 623,549 0.09 AUD 1,450,000 Australia Government Bond 5.75%
15/5/2021 1,059,393 0.14 AUD 860,000 Australia Government Bond 5.75%
15/7/2022 662,652 0.09 EUR 100,000 BHP Billiton Finance Ltd 3.125%
29/4/2033 146,530 0.02 EUR 900,000 Telstra Corp Ltd 3.5% 21/9/2022 1,110,121 0.15 USD 560,000 Westpac Banking Corp 3.65%
15/5/2023 592,911 0.08 8,603,364 1.16
Austria EUR 600,000 BAWAG PSK Bank fuer Arbeit und
Wirtschaft und Oesterreichische Postsparkasse AG 0.375% 3/9/2027 655,574 0.09
EUR 500,000 Republic of Austria Government Bond ‘144A’ 20/9/2022 (Zero Coupon) 566,324 0.08
EUR 560,000 Republic of Austria Government Bond ‘144A’ 15/7/2023 (Zero Coupon) 638,115 0.09
EUR 310,000 Republic of Austria Government Bond ‘144A’ 0.5% 20/2/2029 374,110 0.05
EUR 330,000 Republic of Austria Government Bond ‘144A’ 0.75% 20/10/2026 400,871 0.05
EUR 890,000 Republic of Austria Government Bond ‘144A’ 0.75% 20/2/2028 1,093,427 0.15
EUR 410,000 Republic of Austria Government Bond ‘144A’ 1.2% 20/10/2025 506,984 0.07
EUR 500,000 Republic of Austria Government Bond ‘144A’ 1.5% 20/2/2047* 753,485 0.10
EUR 280,000 Republic of Austria Government Bond ‘144A’ 3.15% 20/6/2044 544,934 0.07
EUR 1,500,000 Republic of Austria Government Bond ‘144A’ 3.65% 20/4/2022 1,855,163 0.25
EUR 270,000 Republic of Austria Government Bond ‘144A’ 3.8% 26/1/2062 711,433 0.10
EUR 620,000 Republic of Austria Government Bond ‘144A’ 4.15% 15/3/2037 1,199,663 0.16
9,300,083 1.26
Belgium EUR 685,000 Kingdom of Belgium Government
Bond ‘144A’ 0.2% 22/10/2023 787,321 0.11 EUR 410,000 Kingdom of Belgium Government
Bond ‘144A’ 0.5% 22/10/2024 479,891 0.06 EUR 490,000 Kingdom of Belgium Government
Bond ‘144A’ 0.8% 22/6/2027 597,804 0.08 EUR 745,000 Kingdom of Belgium Government
Bond ‘144A’ 0.8% 22/6/2028 913,217 0.12 EUR 650,000 Kingdom of Belgium Government
Bond ‘144A’ 0.9% 22/6/2029 808,515 0.11 EUR 2,230,000 Kingdom of Belgium Government
Bond ‘144A’ 1% 22/6/2026 2,732,690 0.37 EUR 1,685,000 Kingdom of Belgium Government
Bond ‘144A’ 1.45% 22/6/2037 2,304,664 0.31 EUR 260,000 Kingdom of Belgium Government
Bond ‘144A’ 1.6% 22/6/2047* 376,000 0.05 EUR 200,000 Kingdom of Belgium Government
Bond ‘144A’ 1.7% 22/6/2050 297,491 0.04 EUR 90,000 Kingdom of Belgium Government
Bond ‘144A’ 1.9% 22/6/2038 132,264 0.02 EUR 160,000 Kingdom of Belgium Government
Bond ‘144A’ 2.25% 22/6/2057 268,559 0.04 EUR 120,000 Kingdom of Belgium Government
Bond ‘144A’ 3% 22/6/2034 193,071 0.03 EUR 720,000 Kingdom of Belgium Government
Bond 3.75% 22/6/2045 1,467,782 0.20 EUR 2,800,000 Kingdom of Belgium Government
Bond 4% 28/3/2022 3,482,838 0.47 14,842,107 2.01
Brazil USD 797,000 Brazilian Government International
Bond 4.5% 30/5/2029 844,344 0.11 USD 230,000 Oi SA 10% 27/7/2025 204,700 0.03 1,049,044 0.14
Canada CAD 700,000 Canadian Government Bond 0.5%
1/3/2022 517,284 0.07 CAD 2,960,000 Canadian Government Bond 1.75%
1/5/2021 2,245,314 0.30 CAD 1,080,000 Canadian Government Bond 1.75%
1/3/2023 828,596 0.11 CAD 2,010,000 Canadian Government Bond 2%
1/9/2023* 1,560,422 0.21
Global Government Bond Fund
Portfolio of Investments 31 August 2019
Global Government Bond Fund
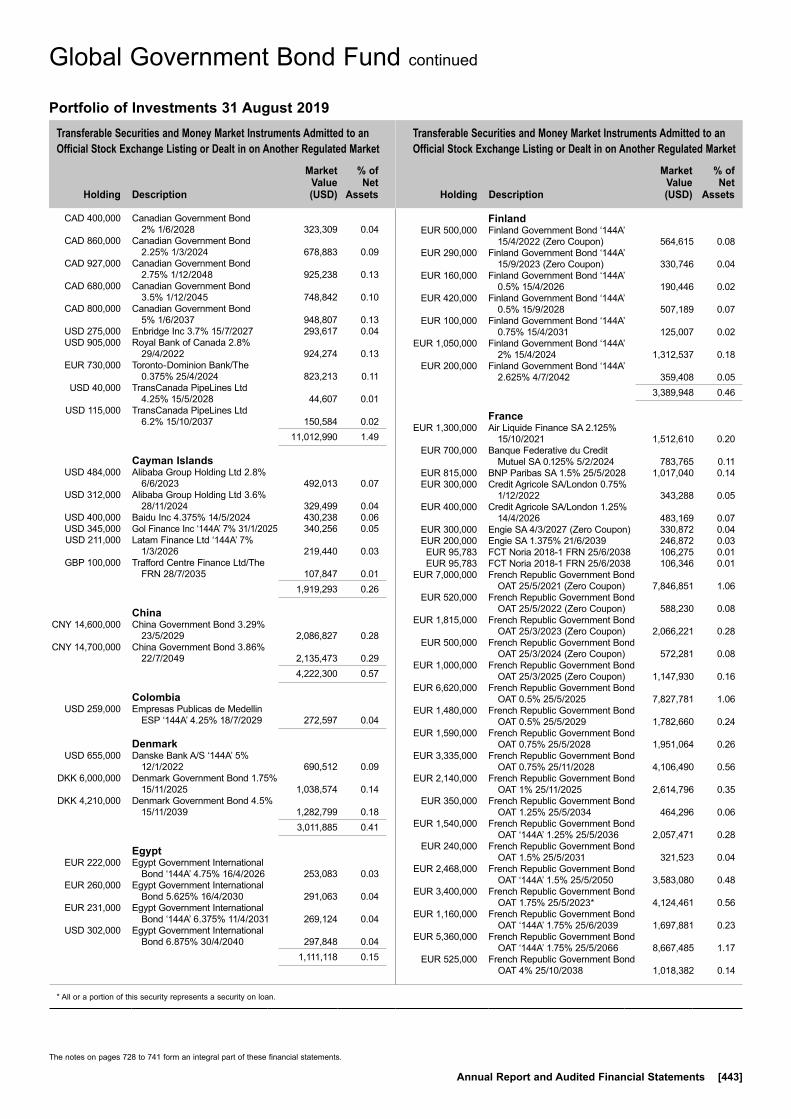
Transferable Securities and Money Market Instruments Admitted to an Official Stock Exchange Listing or Dealt in on Another Regulated Market
Transferable Securities and Money Market Instruments Admitted to an Official Stock Exchange Listing or Dealt in on Another Regulated Market
Holding
Description
Market Value (USD)
% of Net
Assets
Holding
Description
Market Value (USD)
% of Net
Assets
* All or a portion of this security represents a security on loan.
The notes on pages 728 to 741 form an integral part of these financial statements.
Annual Report and Audited Financial Statements [443]
CAD 400,000 Canadian Government Bond 2% 1/6/2028 323,309 0.04
CAD 860,000 Canadian Government Bond 2.25% 1/3/2024 678,883 0.09
CAD 927,000 Canadian Government Bond 2.75% 1/12/2048 925,238 0.13
CAD 680,000 Canadian Government Bond 3.5% 1/12/2045 748,842 0.10
CAD 800,000 Canadian Government Bond 5% 1/6/2037 948,807 0.13
USD 275,000 Enbridge Inc 3.7% 15/7/2027 293,617 0.04 USD 905,000 Royal Bank of Canada 2.8%
29/4/2022 924,274 0.13 EUR 730,000 Toronto-Dominion Bank/The
0.375% 25/4/2024 823,213 0.11 USD 40,000 TransCanada PipeLines Ltd
4.25% 15/5/2028 44,607 0.01 USD 115,000 TransCanada PipeLines Ltd
6.2% 15/10/2037 150,584 0.02 11,012,990 1.49
Cayman Islands USD 484,000 Alibaba Group Holding Ltd 2.8%
6/6/2023 492,013 0.07 USD 312,000 Alibaba Group Holding Ltd 3.6%
28/11/2024 329,499 0.04 USD 400,000 Baidu Inc 4.375% 14/5/2024 430,238 0.06 USD 345,000 Gol Finance Inc ‘144A’ 7% 31/1/2025 340,256 0.05 USD 211,000 Latam Finance Ltd ‘144A’ 7%
1/3/2026 219,440 0.03 GBP 100,000 Trafford Centre Finance Ltd/The
FRN 28/7/2035 107,847 0.01 1,919,293 0.26
China CNY 14,600,000 China Government Bond 3.29%
23/5/2029 2,086,827 0.28 CNY 14,700,000 China Government Bond 3.86%
22/7/2049 2,135,473 0.29 4,222,300 0.57
Colombia USD 259,000 Empresas Publicas de Medellin
ESP ‘144A’ 4.25% 18/7/2029 272,597 0.04
Denmark USD 655,000 Danske Bank A/S ‘144A’ 5%
12/1/2022 690,512 0.09 DKK 6,000,000 Denmark Government Bond 1.75%
15/11/2025 1,038,574 0.14 DKK 4,210,000 Denmark Government Bond 4.5%
15/11/2039 1,282,799 0.18 3,011,885 0.41
Egypt EUR 222,000 Egypt Government International
Bond ‘144A’ 4.75% 16/4/2026 253,083 0.03 EUR 260,000 Egypt Government International
Bond 5.625% 16/4/2030 291,063 0.04 EUR 231,000 Egypt Government International
Bond ‘144A’ 6.375% 11/4/2031 269,124 0.04 USD 302,000 Egypt Government International
Bond 6.875% 30/4/2040 297,848 0.04 1,111,118 0.15
Finland EUR 500,000 Finland Government Bond ‘144A’
15/4/2022 (Zero Coupon) 564,615 0.08 EUR 290,000 Finland Government Bond ‘144A’
15/9/2023 (Zero Coupon) 330,746 0.04 EUR 160,000 Finland Government Bond ‘144A’
0.5% 15/4/2026 190,446 0.02 EUR 420,000 Finland Government Bond ‘144A’
0.5% 15/9/2028 507,189 0.07 EUR 100,000 Finland Government Bond ‘144A’
0.75% 15/4/2031 125,007 0.02 EUR 1,050,000 Finland Government Bond ‘144A’
2% 15/4/2024 1,312,537 0.18 EUR 200,000 Finland Government Bond ‘144A’
2.625% 4/7/2042 359,408 0.05 3,389,948 0.46
France EUR 1,300,000 Air Liquide Finance SA 2.125%
15/10/2021 1,512,610 0.20 EUR 700,000 Banque Federative du Credit
Mutuel SA 0.125% 5/2/2024 783,765 0.11 EUR 815,000 BNP Paribas SA 1.5% 25/5/2028 1,017,040 0.14 EUR 300,000 Credit Agricole SA/London 0.75%
1/12/2022 343,288 0.05 EUR 400,000 Credit Agricole SA/London 1.25%
14/4/2026 483,169 0.07 EUR 300,000 Engie SA 4/3/2027 (Zero Coupon) 330,872 0.04 EUR 200,000 Engie SA 1.375% 21/6/2039 246,872 0.03 EUR 95,783 FCT Noria 2018-1 FRN 25/6/2038 106,275 0.01 EUR 95,783 FCT Noria 2018-1 FRN 25/6/2038 106,346 0.01 EUR 7,000,000 French Republic Government Bond
OAT 25/5/2021 (Zero Coupon) 7,846,851 1.06 EUR 520,000 French Republic Government Bond
OAT 25/5/2022 (Zero Coupon) 588,230 0.08 EUR 1,815,000 French Republic Government Bond
OAT 25/3/2023 (Zero Coupon) 2,066,221 0.28 EUR 500,000 French Republic Government Bond
OAT 25/3/2024 (Zero Coupon) 572,281 0.08 EUR 1,000,000 French Republic Government Bond
OAT 25/3/2025 (Zero Coupon) 1,147,930 0.16 EUR 6,620,000 French Republic Government Bond
OAT 0.5% 25/5/2025 7,827,781 1.06 EUR 1,480,000 French Republic Government Bond
OAT 0.5% 25/5/2029 1,782,660 0.24 EUR 1,590,000 French Republic Government Bond
OAT 0.75% 25/5/2028 1,951,064 0.26 EUR 3,335,000 French Republic Government Bond
OAT 0.75% 25/11/2028 4,106,490 0.56 EUR 2,140,000 French Republic Government Bond
OAT 1% 25/11/2025 2,614,796 0.35 EUR 350,000 French Republic Government Bond
OAT 1.25% 25/5/2034 464,296 0.06 EUR 1,540,000 French Republic Government Bond
OAT ‘144A’ 1.25% 25/5/2036 2,057,471 0.28 EUR 240,000 French Republic Government Bond
OAT 1.5% 25/5/2031 321,523 0.04 EUR 2,468,000 French Republic Government Bond
OAT ‘144A’ 1.5% 25/5/2050 3,583,080 0.48 EUR 3,400,000 French Republic Government Bond
OAT 1.75% 25/5/2023* 4,124,461 0.56 EUR 1,160,000 French Republic Government Bond
OAT ‘144A’ 1.75% 25/6/2039 1,697,881 0.23 EUR 5,360,000 French Republic Government Bond
OAT ‘144A’ 1.75% 25/5/2066 8,667,485 1.17 EUR 525,000 French Republic Government Bond
OAT 4% 25/10/2038 1,018,382 0.14
Global Government Bond Fund continued
Portfolio of Investments 31 August 2019
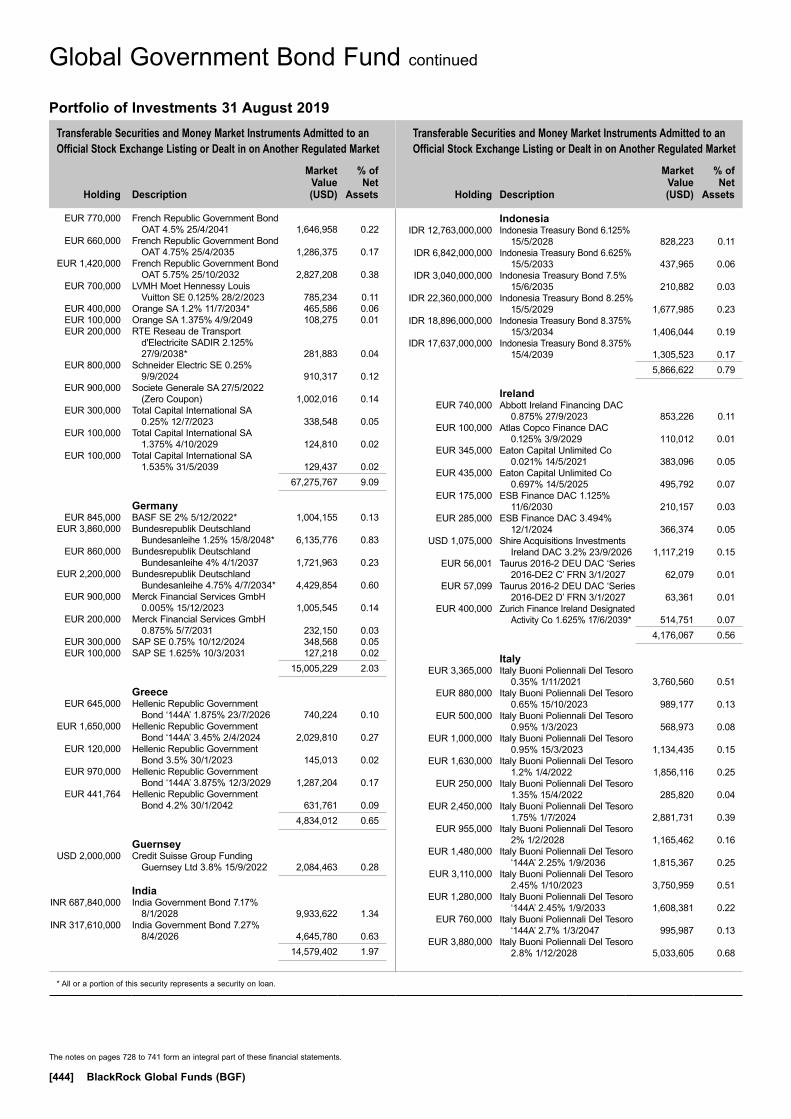
Transferable Securities and Money Market Instruments Admitted to an Official Stock Exchange Listing or Dealt in on Another Regulated Market
Transferable Securities and Money Market Instruments Admitted to an Official Stock Exchange Listing or Dealt in on Another Regulated Market
Holding
Description
Market Value (USD)
% of Net
Assets
Holding
Description
Market Value (USD)
% of Net
Assets
* All or a portion of this security represents a security on loan.
The notes on pages 728 to 741 form an integral part of these financial statements.
[444] BlackRock Global Funds (BGF)
EUR 770,000 French Republic Government Bond OAT 4.5% 25/4/2041 1,646,958 0.22
EUR 660,000 French Republic Government Bond OAT 4.75% 25/4/2035 1,286,375 0.17
EUR 1,420,000 French Republic Government Bond OAT 5.75% 25/10/2032 2,827,208 0.38
EUR 700,000 LVMH Moet Hennessy Louis Vuitton SE 0.125% 28/2/2023 785,234 0.11
EUR 400,000 Orange SA 1.2% 11/7/2034* 465,586 0.06 EUR 100,000 Orange SA 1.375% 4/9/2049 108,275 0.01 EUR 200,000 RTE Reseau de Transport
d'Electricite SADIR 2.125% 27/9/2038* 281,883 0.04
EUR 800,000 Schneider Electric SE 0.25% 9/9/2024 910,317 0.12
EUR 900,000 Societe Generale SA 27/5/2022 (Zero Coupon) 1,002,016 0.14
EUR 300,000 Total Capital International SA 0.25% 12/7/2023 338,548 0.05
EUR 100,000 Total Capital International SA 1.375% 4/10/2029 124,810 0.02
EUR 100,000 Total Capital International SA 1.535% 31/5/2039 129,437 0.02
67,275,767 9.09
Germany EUR 845,000 BASF SE 2% 5/12/2022* 1,004,155 0.13 EUR 3,860,000 Bundesrepublik Deutschland
Bundesanleihe 1.25% 15/8/2048* 6,135,776 0.83 EUR 860,000 Bundesrepublik Deutschland
Bundesanleihe 4% 4/1/2037 1,721,963 0.23 EUR 2,200,000 Bundesrepublik Deutschland
Bundesanleihe 4.75% 4/7/2034* 4,429,854 0.60 EUR 900,000 Merck Financial Services GmbH
0.005% 15/12/2023 1,005,545 0.14 EUR 200,000 Merck Financial Services GmbH
0.875% 5/7/2031 232,150 0.03 EUR 300,000 SAP SE 0.75% 10/12/2024 348,568 0.05 EUR 100,000 SAP SE 1.625% 10/3/2031 127,218 0.02 15,005,229 2.03
Greece EUR 645,000 Hellenic Republic Government
Bond ‘144A’ 1.875% 23/7/2026 740,224 0.10 EUR 1,650,000 Hellenic Republic Government
Bond ‘144A’ 3.45% 2/4/2024 2,029,810 0.27 EUR 120,000 Hellenic Republic Government
Bond 3.5% 30/1/2023 145,013 0.02 EUR 970,000 Hellenic Republic Government
Bond ‘144A’ 3.875% 12/3/2029 1,287,204 0.17 EUR 441,764 Hellenic Republic Government
Bond 4.2% 30/1/2042 631,761 0.09 4,834,012 0.65
Guernsey USD 2,000,000 Credit Suisse Group Funding
Guernsey Ltd 3.8% 15/9/2022 2,084,463 0.28
India INR 687,840,000 India Government Bond 7.17%
8/1/2028 9,933,622 1.34 INR 317,610,000 India Government Bond 7.27%
8/4/2026 4,645,780 0.63 14,579,402 1.97
Indonesia IDR 12,763,000,000 Indonesia Treasury Bond 6.125%
15/5/2028 828,223 0.11 IDR 6,842,000,000 Indonesia Treasury Bond 6.625%
15/5/2033 437,965 0.06 IDR 3,040,000,000 Indonesia Treasury Bond 7.5%
15/6/2035 210,882 0.03 IDR 22,360,000,000 Indonesia Treasury Bond 8.25%
15/5/2029 1,677,985 0.23 IDR 18,896,000,000 Indonesia Treasury Bond 8.375%
15/3/2034 1,406,044 0.19 IDR 17,637,000,000 Indonesia Treasury Bond 8.375%
15/4/2039 1,305,523 0.17 5,866,622 0.79
Ireland EUR 740,000 Abbott Ireland Financing DAC
0.875% 27/9/2023 853,226 0.11 EUR 100,000 Atlas Copco Finance DAC
0.125% 3/9/2029 110,012 0.01 EUR 345,000 Eaton Capital Unlimited Co
0.021% 14/5/2021 383,096 0.05 EUR 435,000 Eaton Capital Unlimited Co
0.697% 14/5/2025 495,792 0.07 EUR 175,000 ESB Finance DAC 1.125%
11/6/2030 210,157 0.03 EUR 285,000 ESB Finance DAC 3.494%
12/1/2024 366,374 0.05 USD 1,075,000 Shire Acquisitions Investments
Ireland DAC 3.2% 23/9/2026 1,117,219 0.15 EUR 56,001 Taurus 2016-2 DEU DAC ‘Series
2016-DE2 C’ FRN 3/1/2027 62,079 0.01 EUR 57,099 Taurus 2016-2 DEU DAC ‘Series
2016-DE2 D’ FRN 3/1/2027 63,361 0.01 EUR 400,000 Zurich Finance Ireland Designated
Activity Co 1.625% 17/6/2039* 514,751 0.07 4,176,067 0.56
Italy EUR 3,365,000 Italy Buoni Poliennali Del Tesoro
0.35% 1/11/2021 3,760,560 0.51 EUR 880,000 Italy Buoni Poliennali Del Tesoro
0.65% 15/10/2023 989,177 0.13 EUR 500,000 Italy Buoni Poliennali Del Tesoro
0.95% 1/3/2023 568,973 0.08 EUR 1,000,000 Italy Buoni Poliennali Del Tesoro
0.95% 15/3/2023 1,134,435 0.15 EUR 1,630,000 Italy Buoni Poliennali Del Tesoro
1.2% 1/4/2022 1,856,116 0.25 EUR 250,000 Italy Buoni Poliennali Del Tesoro
1.35% 15/4/2022 285,820 0.04 EUR 2,450,000 Italy Buoni Poliennali Del Tesoro
1.75% 1/7/2024 2,881,731 0.39 EUR 955,000 Italy Buoni Poliennali Del Tesoro
2% 1/2/2028 1,165,462 0.16 EUR 1,480,000 Italy Buoni Poliennali Del Tesoro
‘144A’ 2.25% 1/9/2036 1,815,367 0.25 EUR 3,110,000 Italy Buoni Poliennali Del Tesoro
2.45% 1/10/2023 3,750,959 0.51 EUR 1,280,000 Italy Buoni Poliennali Del Tesoro
‘144A’ 2.45% 1/9/2033 1,608,381 0.22 EUR 760,000 Italy Buoni Poliennali Del Tesoro
‘144A’ 2.7% 1/3/2047 995,987 0.13 EUR 3,880,000 Italy Buoni Poliennali Del Tesoro
2.8% 1/12/2028 5,033,605 0.68
Global Government Bond Fund continued
Portfolio of Investments 31 August 2019

Transferable Securities and Money Market Instruments Admitted to an Official Stock Exchange Listing or Dealt in on Another Regulated Market
Transferable Securities and Money Market Instruments Admitted to an Official Stock Exchange Listing or Dealt in on Another Regulated Market
Holding
Description
Market Value (USD)
% of Net
Assets
Holding
Description
Market Value (USD)
% of Net
Assets
The notes on pages 728 to 741 form an integral part of these financial statements.
Annual Report and Audited Financial Statements [445]
EUR 1,140,000 Italy Buoni Poliennali Del Tesoro ‘144A’ 2.95% 1/9/2038 1,533,660 0.21
EUR 640,000 Italy Buoni Poliennali Del Tesoro 3% 1/8/2029 838,724 0.11
EUR 290,000 Italy Buoni Poliennali Del Tesoro ‘144A’ 3.1% 1/3/2040 392,307 0.05
EUR 525,000 Italy Buoni Poliennali Del Tesoro ‘144A’ 3.25% 1/9/2046 743,414 0.10
EUR 1,195,000 Italy Buoni Poliennali Del Tesoro ‘144A’ 3.45% 1/3/2048 1,771,908 0.24
EUR 255,000 Italy Buoni Poliennali Del Tesoro ‘144A’ 3.85% 1/9/2049 401,560 0.05
EUR 1,140,000 Italy Buoni Poliennali Del Tesoro ‘144A’ 4% 1/2/2037 1,711,297 0.23
EUR 2,614,000 Italy Buoni Poliennali Del Tesoro 4.5% 1/3/2024 3,420,329 0.46
EUR 760,000 Italy Buoni Poliennali Del Tesoro ‘144A’ 5% 1/8/2034 1,234,429 0.17
EUR 98,539 Taurus 2018-1 IT SRL ‘Series 2018-IT1 A’ FRN 18/5/2030 108,568 0.02
38,002,769 5.14
Japan JPY 221,750,000 Japan Government Five Year Bond
0.1% 20/6/2021 2,104,227 0.28 JPY 84,000,000 Japan Government Five Year Bond
0.1% 20/12/2021 798,975 0.11 JPY 475,950,000 Japan Government Five Year Bond
0.1% 20/3/2022 4,532,207 0.61 JPY 35,800,000 Japan Government Five Year Bond
0.1% 20/6/2022 341,312 0.05 JPY 96,000,000 Japan Government Five Year Bond
0.1% 20/12/2022 917,822 0.12 JPY 214,450,000 Japan Government Five Year Bond
0.1% 20/3/2023 2,052,917 0.28 JPY 356,650,000 Japan Government Five Year Bond
0.1% 20/6/2023 3,420,103 0.46 JPY 941,800,000 Japan Government Five Year Bond
0.1% 20/9/2023 9,040,107 1.22 JPY 183,900,000 Japan Government Five Year Bond
0.1% 20/3/2024 1,768,711 0.24 JPY 140,200,000 Japan Government Five Year Bond
0.1% 20/6/2024 1,350,712 0.18 JPY 54,100,000 Japan Government Forty Year
Bond 0.5% 20/3/2059 577,536 0.08 JPY 36,950,000 Japan Government Ten Year Bond
0.1% 20/3/2028 362,134 0.05 JPY 457,600,000 Japan Government Ten Year Bond
0.1% 20/6/2028 4,484,927 0.61 JPY 773,100,000 Japan Government Ten Year Bond
0.1% 20/9/2028 7,577,208 1.02 JPY 284,250,000 Japan Government Ten Year Bond
0.1% 20/12/2028 2,786,062 0.38 JPY 177,600,000 Japan Government Ten Year Bond
0.1% 20/6/2029 1,738,805 0.23 JPY 142,100,000 Japan Government Ten Year Bond
0.5% 20/9/2024 1,398,328 0.19 JPY 110,000,000 Japan Government Ten Year Bond
0.6% 20/9/2023 1,076,714 0.15 JPY 43,000,000 Japan Government Ten Year Bond
0.6% 20/12/2023 421,906 0.06 JPY 1,045,400,000 Japan Government Ten Year Bond
1% 20/9/2021 10,114,953 1.37 JPY 444,000,000 Japan Government Thirty Year
Bond 0.4% 20/6/2049 4,510,712 0.61 JPY 55,200,000 Japan Government Thirty Year
Bond 0.5% 20/3/2049 575,701 0.08
JPY 135,500,000 Japan Government Thirty Year Bond 0.7% 20/6/2048 1,483,702 0.20
JPY 182,200,000 Japan Government Thirty Year Bond 0.7% 20/12/2048 1,997,024 0.27
JPY 917,750,000 Japan Government Thirty Year Bond 0.8% 20/3/2047 10,251,787 1.39
JPY 50,000,000 Japan Government Thirty Year Bond 0.8% 20/12/2047 559,779 0.08
JPY 35,450,000 Japan Government Thirty Year Bond 0.8% 20/3/2048 397,172 0.05
JPY 307,500,000 Japan Government Thirty Year Bond 0.9% 20/9/2048 3,531,158 0.48
JPY 314,950,000 Japan Government Twenty Year Bond 0.2% 20/6/2036 3,086,076 0.42
JPY 298,800,000 Japan Government Twenty Year Bond 0.4% 20/3/2039 3,020,794 0.41
JPY 132,950,000 Japan Government Twenty Year Bond 0.5% 20/9/2036 1,366,349 0.18
JPY 30,900,000 Japan Government Twenty Year Bond 0.5% 20/3/2038 318,209 0.04
JPY 260,000,000 Japan Government Twenty Year Bond 0.5% 20/6/2038 2,677,464 0.36
JPY 141,000,000 Japan Government Twenty Year Bond 0.5% 20/12/2038 1,451,671 0.20
JPY 102,000,000 Japan Government Twenty Year Bond 0.6% 20/12/2036 1,065,111 0.14
JPY 170,400,000 Japan Government Twenty Year Bond 0.7% 20/3/2037 1,807,978 0.24
JPY 477,000,000 Japan Government Twenty Year Bond 0.7% 20/9/2038 5,082,254 0.69
JPY 278,000,000 Japan Government Twenty Year Bond 1% 20/12/2035 3,071,003 0.41
JPY 165,000,000 Japan Government Twenty Year Bond 1.2% 20/12/2034 1,864,409 0.25
JPY 616,700,000 Japan Government Twenty Year Bond 1.4% 20/9/2034 7,133,197 0.96
JPY 176,900,000 Japan Government Twenty Year Bond 1.5% 20/6/2034 2,067,535 0.28
JPY 25,000,000 Japan Government Twenty Year Bond 1.8% 20/6/2023 254,958 0.03
JPY 881,650,000 Japan Government Twenty Year Bond 1.8% 20/9/2031 10,343,364 1.40
JPY 78,800,000 Japan Government Twenty Year Bond 2.1% 20/3/2030 930,140 0.13
JPY 277,850,000 Japan Government Twenty Year Bond 2.2% 20/6/2024 2,943,804 0.40
JPY 354,250,000 Japan Government Two Year Bond 0.1% 1/5/2021 3,359,976 0.45
JPY 399,600,000 Japanese Government CPI Linked Bond 0.1% 10/3/2028 3,978,494 0.54
JPY 433,300,000 Japanese Government CPI Linked Bond 0.1% 10/3/2029 4,282,558 0.58
EUR 685,000 Mitsubishi UFJ Financial Group Inc 0.339% 19/7/2024 769,066 0.10
USD 5,000 Mitsubishi UFJ Financial Group Inc 3.287% 25/7/2027 5,304 0.00
USD 270,000 Mitsubishi UFJ Financial Group Inc 3.677% 22/2/2027 292,577 0.04
USD 45,000 Mitsubishi UFJ Financial Group Inc 4.05% 11/9/2028 50,615 0.01
USD 995,000 Mizuho Financial Group Inc FRN 11/9/2024 1,053,427 0.14
USD 260,000 Mizuho Financial Group Inc 2.953% 28/2/2022 264,624 0.04
USD 630,000 Sumitomo Mitsui Financial Group Inc 3.102% 17/1/2023 651,599 0.09
EUR 110,000 Takeda Pharmaceutical Co Ltd 3% 21/11/2030 147,651 0.02
143,512,908 19.40
Global Government Bond Fund continued
Portfolio of Investments 31 August 2019
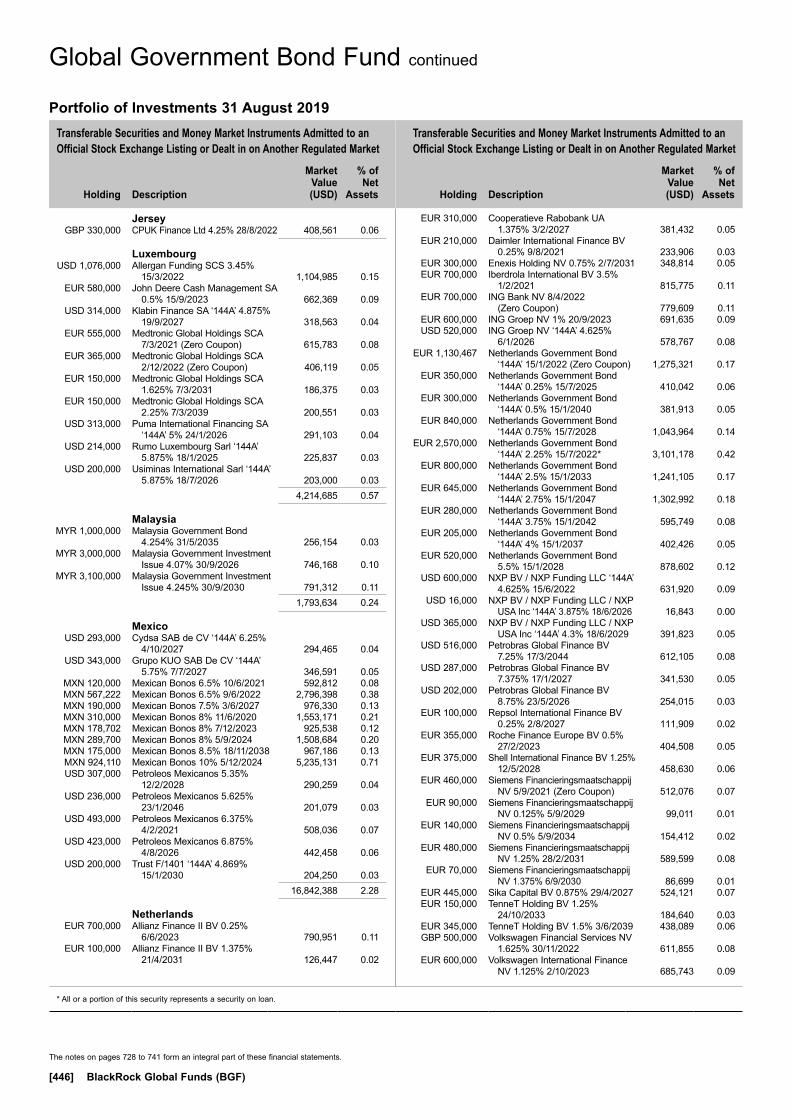
Transferable Securities and Money Market Instruments Admitted to an Official Stock Exchange Listing or Dealt in on Another Regulated Market
Transferable Securities and Money Market Instruments Admitted to an Official Stock Exchange Listing or Dealt in on Another Regulated Market
Holding
Description
Market Value (USD)
% of Net
Assets
Holding
Description
Market Value (USD)
% of Net
Assets
* All or a portion of this security represents a security on loan.
The notes on pages 728 to 741 form an integral part of these financial statements.
[446] BlackRock Global Funds (BGF)
Jersey GBP 330,000 CPUK Finance Ltd 4.25% 28/8/2022 408,561 0.06
Luxembourg USD 1,076,000 Allergan Funding SCS 3.45%
15/3/2022 1,104,985 0.15 EUR 580,000 John Deere Cash Management SA
0.5% 15/9/2023 662,369 0.09 USD 314,000 Klabin Finance SA ‘144A’ 4.875%
19/9/2027 318,563 0.04 EUR 555,000 Medtronic Global Holdings SCA
7/3/2021 (Zero Coupon) 615,783 0.08 EUR 365,000 Medtronic Global Holdings SCA
2/12/2022 (Zero Coupon) 406,119 0.05 EUR 150,000 Medtronic Global Holdings SCA
1.625% 7/3/2031 186,375 0.03 EUR 150,000 Medtronic Global Holdings SCA
2.25% 7/3/2039 200,551 0.03 USD 313,000 Puma International Financing SA
‘144A’ 5% 24/1/2026 291,103 0.04 USD 214,000 Rumo Luxembourg Sarl ‘144A’
5.875% 18/1/2025 225,837 0.03 USD 200,000 Usiminas International Sarl ‘144A’
5.875% 18/7/2026 203,000 0.03 4,214,685 0.57
Malaysia MYR 1,000,000 Malaysia Government Bond
4.254% 31/5/2035 256,154 0.03 MYR 3,000,000 Malaysia Government Investment
Issue 4.07% 30/9/2026 746,168 0.10 MYR 3,100,000 Malaysia Government Investment
Issue 4.245% 30/9/2030 791,312 0.11 1,793,634 0.24
Mexico USD 293,000 Cydsa SAB de CV ‘144A’ 6.25%
4/10/2027 294,465 0.04 USD 343,000 Grupo KUO SAB De CV ‘144A’
5.75% 7/7/2027 346,591 0.05 MXN 120,000 Mexican Bonos 6.5% 10/6/2021 592,812 0.08 MXN 567,222 Mexican Bonos 6.5% 9/6/2022 2,796,398 0.38 MXN 190,000 Mexican Bonos 7.5% 3/6/2027 976,330 0.13 MXN 310,000 Mexican Bonos 8% 11/6/2020 1,553,171 0.21 MXN 178,702 Mexican Bonos 8% 7/12/2023 925,538 0.12 MXN 289,700 Mexican Bonos 8% 5/9/2024 1,508,684 0.20 MXN 175,000 Mexican Bonos 8.5% 18/11/2038 967,186 0.13 MXN 924,110 Mexican Bonos 10% 5/12/2024 5,235,131 0.71 USD 307,000 Petroleos Mexicanos 5.35%
12/2/2028 290,259 0.04 USD 236,000 Petroleos Mexicanos 5.625%
23/1/2046 201,079 0.03 USD 493,000 Petroleos Mexicanos 6.375%
4/2/2021 508,036 0.07 USD 423,000 Petroleos Mexicanos 6.875%
4/8/2026 442,458 0.06 USD 200,000 Trust F/1401 ‘144A’ 4.869%
15/1/2030 204,250 0.03 16,842,388 2.28
Netherlands EUR 700,000 Allianz Finance II BV 0.25%
6/6/2023 790,951 0.11 EUR 100,000 Allianz Finance II BV 1.375%
21/4/2031 126,447 0.02
EUR 310,000 Cooperatieve Rabobank UA 1.375% 3/2/2027 381,432 0.05
EUR 210,000 Daimler International Finance BV 0.25% 9/8/2021 233,906 0.03
EUR 300,000 Enexis Holding NV 0.75% 2/7/2031 348,814 0.05 EUR 700,000 Iberdrola International BV 3.5%
1/2/2021 815,775 0.11 EUR 700,000 ING Bank NV 8/4/2022
(Zero Coupon) 779,609 0.11 EUR 600,000 ING Groep NV 1% 20/9/2023 691,635 0.09 USD 520,000 ING Groep NV ‘144A’ 4.625%
6/1/2026 578,767 0.08 EUR 1,130,467 Netherlands Government Bond
‘144A’ 15/1/2022 (Zero Coupon) 1,275,321 0.17 EUR 350,000 Netherlands Government Bond
‘144A’ 0.25% 15/7/2025 410,042 0.06 EUR 300,000 Netherlands Government Bond
‘144A’ 0.5% 15/1/2040 381,913 0.05 EUR 840,000 Netherlands Government Bond
‘144A’ 0.75% 15/7/2028 1,043,964 0.14 EUR 2,570,000 Netherlands Government Bond
‘144A’ 2.25% 15/7/2022* 3,101,178 0.42 EUR 800,000 Netherlands Government Bond
‘144A’ 2.5% 15/1/2033 1,241,105 0.17 EUR 645,000 Netherlands Government Bond
‘144A’ 2.75% 15/1/2047 1,302,992 0.18 EUR 280,000 Netherlands Government Bond
‘144A’ 3.75% 15/1/2042 595,749 0.08 EUR 205,000 Netherlands Government Bond
‘144A’ 4% 15/1/2037 402,426 0.05 EUR 520,000 Netherlands Government Bond
5.5% 15/1/2028 878,602 0.12 USD 600,000 NXP BV / NXP Funding LLC ‘144A’
4.625% 15/6/2022 631,920 0.09 USD 16,000 NXP BV / NXP Funding LLC / NXP
USA Inc ‘144A’ 3.875% 18/6/2026 16,843 0.00 USD 365,000 NXP BV / NXP Funding LLC / NXP
USA Inc ‘144A’ 4.3% 18/6/2029 391,823 0.05 USD 516,000 Petrobras Global Finance BV
7.25% 17/3/2044 612,105 0.08 USD 287,000 Petrobras Global Finance BV
7.375% 17/1/2027 341,530 0.05 USD 202,000 Petrobras Global Finance BV
8.75% 23/5/2026 254,015 0.03 EUR 100,000 Repsol International Finance BV
0.25% 2/8/2027 111,909 0.02 EUR 355,000 Roche Finance Europe BV 0.5%
27/2/2023 404,508 0.05 EUR 375,000 Shell International Finance BV 1.25%
12/5/2028 458,630 0.06 EUR 460,000 Siemens Financieringsmaatschappij
NV 5/9/2021 (Zero Coupon) 512,076 0.07 EUR 90,000 Siemens Financieringsmaatschappij
NV 0.125% 5/9/2029 99,011 0.01 EUR 140,000 Siemens Financieringsmaatschappij
NV 0.5% 5/9/2034 154,412 0.02 EUR 480,000 Siemens Financieringsmaatschappij
NV 1.25% 28/2/2031 589,599 0.08 EUR 70,000 Siemens Financieringsmaatschappij
NV 1.375% 6/9/2030 86,699 0.01 EUR 445,000 Sika Capital BV 0.875% 29/4/2027 524,121 0.07 EUR 150,000 TenneT Holding BV 1.25%
24/10/2033 184,640 0.03 EUR 345,000 TenneT Holding BV 1.5% 3/6/2039 438,089 0.06 GBP 500,000 Volkswagen Financial Services NV
1.625% 30/11/2022 611,855 0.08 EUR 600,000 Volkswagen International Finance
NV 1.125% 2/10/2023 685,743 0.09
Global Government Bond Fund continued
Portfolio of Investments 31 August 2019
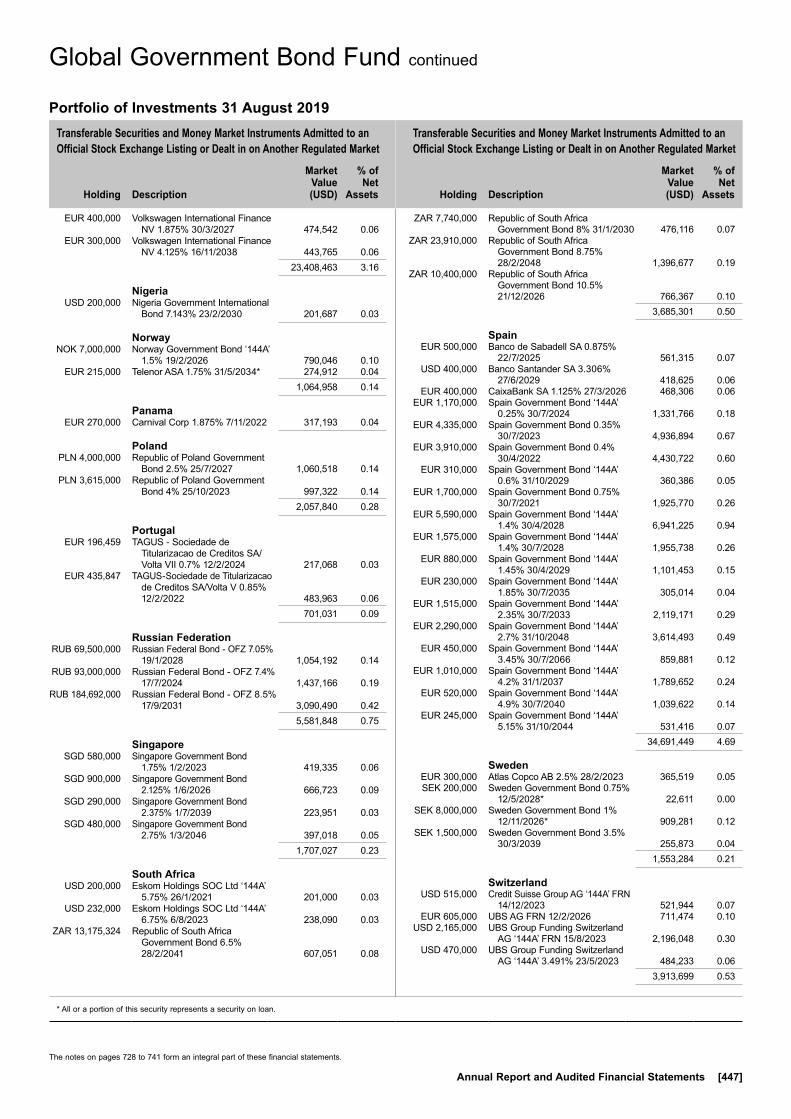
Transferable Securities and Money Market Instruments Admitted to an Official Stock Exchange Listing or Dealt in on Another Regulated Market
Transferable Securities and Money Market Instruments Admitted to an Official Stock Exchange Listing or Dealt in on Another Regulated Market
Holding
Description
Market Value (USD)
% of Net
Assets
Holding
Description
Market Value (USD)
% of Net
Assets
* All or a portion of this security represents a security on loan.
The notes on pages 728 to 741 form an integral part of these financial statements.
Annual Report and Audited Financial Statements [447]
EUR 400,000 Volkswagen International Finance NV 1.875% 30/3/2027 474,542 0.06
EUR 300,000 Volkswagen International Finance NV 4.125% 16/11/2038 443,765 0.06
23,408,463 3.16
Nigeria USD 200,000 Nigeria Government International
Bond 7.143% 23/2/2030 201,687 0.03
Norway NOK 7,000,000 Norway Government Bond ‘144A’
1.5% 19/2/2026 790,046 0.10 EUR 215,000 Telenor ASA 1.75% 31/5/2034* 274,912 0.04 1,064,958 0.14
Panama EUR 270,000 Carnival Corp 1.875% 7/11/2022 317,193 0.04
Poland PLN 4,000,000 Republic of Poland Government
Bond 2.5% 25/7/2027 1,060,518 0.14 PLN 3,615,000 Republic of Poland Government
Bond 4% 25/10/2023 997,322 0.14 2,057,840 0.28
Portugal EUR 196,459 TAGUS - Sociedade de
Titularizacao de Creditos SA/Volta VII 0.7% 12/2/2024 217,068 0.03
EUR 435,847 TAGUS-Sociedade de Titularizacao de Creditos SA/Volta V 0.85% 12/2/2022 483,963 0.06
701,031 0.09
Russian Federation RUB 69,500,000 Russian Federal Bond - OFZ 7.05%
19/1/2028 1,054,192 0.14 RUB 93,000,000 Russian Federal Bond - OFZ 7.4%
17/7/2024 1,437,166 0.19 RUB 184,692,000 Russian Federal Bond - OFZ 8.5%
17/9/2031 3,090,490 0.42 5,581,848 0.75
Singapore SGD 580,000 Singapore Government Bond
1.75% 1/2/2023 419,335 0.06 SGD 900,000 Singapore Government Bond
2.125% 1/6/2026 666,723 0.09 SGD 290,000 Singapore Government Bond
2.375% 1/7/2039 223,951 0.03 SGD 480,000 Singapore Government Bond
2.75% 1/3/2046 397,018 0.05 1,707,027 0.23
South Africa USD 200,000 Eskom Holdings SOC Ltd ‘144A’
5.75% 26/1/2021 201,000 0.03 USD 232,000 Eskom Holdings SOC Ltd ‘144A’
6.75% 6/8/2023 238,090 0.03 ZAR 13,175,324 Republic of South Africa
Government Bond 6.5% 28/2/2041 607,051 0.08
ZAR 7,740,000 Republic of South Africa Government Bond 8% 31/1/2030 476,116 0.07
ZAR 23,910,000 Republic of South Africa Government Bond 8.75% 28/2/2048 1,396,677 0.19
ZAR 10,400,000 Republic of South Africa Government Bond 10.5% 21/12/2026 766,367 0.10
3,685,301 0.50
Spain EUR 500,000 Banco de Sabadell SA 0.875%
22/7/2025 561,315 0.07 USD 400,000 Banco Santander SA 3.306%
27/6/2029 418,625 0.06 EUR 400,000 CaixaBank SA 1.125% 27/3/2026 468,306 0.06 EUR 1,170,000 Spain Government Bond ‘144A’
0.25% 30/7/2024 1,331,766 0.18 EUR 4,335,000 Spain Government Bond 0.35%
30/7/2023 4,936,894 0.67 EUR 3,910,000 Spain Government Bond 0.4%
30/4/2022 4,430,722 0.60 EUR 310,000 Spain Government Bond ‘144A’
0.6% 31/10/2029 360,386 0.05 EUR 1,700,000 Spain Government Bond 0.75%
30/7/2021 1,925,770 0.26 EUR 5,590,000 Spain Government Bond ‘144A’
1.4% 30/4/2028 6,941,225 0.94 EUR 1,575,000 Spain Government Bond ‘144A’
1.4% 30/7/2028 1,955,738 0.26 EUR 880,000 Spain Government Bond ‘144A’
1.45% 30/4/2029 1,101,453 0.15 EUR 230,000 Spain Government Bond ‘144A’
1.85% 30/7/2035 305,014 0.04 EUR 1,515,000 Spain Government Bond ‘144A’
2.35% 30/7/2033 2,119,171 0.29 EUR 2,290,000 Spain Government Bond ‘144A’
2.7% 31/10/2048 3,614,493 0.49 EUR 450,000 Spain Government Bond ‘144A’
3.45% 30/7/2066 859,881 0.12 EUR 1,010,000 Spain Government Bond ‘144A’
4.2% 31/1/2037 1,789,652 0.24 EUR 520,000 Spain Government Bond ‘144A’
4.9% 30/7/2040 1,039,622 0.14 EUR 245,000 Spain Government Bond ‘144A’
5.15% 31/10/2044 531,416 0.07 34,691,449 4.69
Sweden EUR 300,000 Atlas Copco AB 2.5% 28/2/2023 365,519 0.05 SEK 200,000 Sweden Government Bond 0.75%
12/5/2028* 22,611 0.00 SEK 8,000,000 Sweden Government Bond 1%
12/11/2026* 909,281 0.12 SEK 1,500,000 Sweden Government Bond 3.5%
30/3/2039 255,873 0.04 1,553,284 0.21
Switzerland USD 515,000 Credit Suisse Group AG ‘144A’ FRN
14/12/2023 521,944 0.07 EUR 605,000 UBS AG FRN 12/2/2026 711,474 0.10 USD 2,165,000 UBS Group Funding Switzerland
AG ‘144A’ FRN 15/8/2023 2,196,048 0.30 USD 470,000 UBS Group Funding Switzerland
AG ‘144A’ 3.491% 23/5/2023 484,233 0.06 3,913,699 0.53
Global Government Bond Fund continued
Portfolio of Investments 31 August 2019

Transferable Securities and Money Market Instruments Admitted to an Official Stock Exchange Listing or Dealt in on Another Regulated Market
Transferable Securities and Money Market Instruments Admitted to an Official Stock Exchange Listing or Dealt in on Another Regulated Market
Holding
Description
Market Value (USD)
% of Net
Assets
Holding
Description
Market Value (USD)
% of Net
Assets
* All or a portion of this security represents a security on loan.
The notes on pages 728 to 741 form an integral part of these financial statements.
[448] BlackRock Global Funds (BGF)
Global Government Bond Fund continued
Turkey USD 430,000 Turkey Government International
Bond 7.625% 26/4/2029 442,363 0.06
Ukraine USD 653,000 Ukraine Government International
Bond 9.75% 1/11/2028 759,929 0.10
United Kingdom USD 200,000 Anglo American Capital Plc ‘144A’
4.75% 10/4/2027 216,524 0.03 USD 200,000 Anglo American Capital Plc ‘144A’
4.875% 14/5/2025 217,273 0.03 USD 460,000 Aon Plc 3.5% 14/6/2024 486,463 0.06 EUR 400,000 BAT International Finance Plc
3.125% 6/3/2029 517,116 0.07 EUR 1,055,000 BP Capital Markets Plc 1.526%
26/9/2022 1,229,526 0.17 USD 81,000 BP Capital Markets Plc 3.814%
10/2/2024 86,696 0.01 EUR 275,000 Channel Link Enterprises Finance
Plc FRN 30/6/2050 308,035 0.04 EUR 200,000 Channel Link Enterprises Finance
Plc FRN 30/6/2050 235,399 0.03 EUR 320,000 Coca-Cola European Partners Plc
1.875% 18/3/2030* 404,882 0.05 GBP 111,000 Finsbury Square 2016-2 Plc ‘Series
2016-2 C’ FRN 16/8/2058 135,938 0.02 GBP 99,998 Finsbury Square 2017-1 Plc ‘Series
2017-1 C’ FRN 12/3/2059 122,528 0.02 GBP 100,998 Finsbury Square 2018-1 Plc FRN
12/9/2065 122,513 0.02 GBP 102,998 Finsbury Square 2018-1 Plc ‘Series
2018-1 B’ FRN 12/9/2065 125,217 0.02 GBP 205,000 Finsbury Square 2018-2 Plc FRN
12/9/2068 250,102 0.03 GBP 161,000 Finsbury Square 2018-2 Plc FRN
12/9/2068 197,618 0.03 GBP 100,000 Finsbury Square 2018-2 Plc FRN
12/9/2068 123,185 0.02 GBP 99,977 Gemgarto 2018-1 Plc FRN
16/9/2065 119,617 0.02 GBP 167,355 Greene King Finance Plc FRN
15/12/2033 205,737 0.03 GBP 108,709 Greene King Finance Plc 4.064%
15/3/2035* 147,779 0.02 USD 720,000 HSBC Holdings Plc FRN 13/3/2028* 767,381 0.10 GBP 146,000 Motor 2016-1 Plc 3.75% 25/11/2025 181,223 0.02 GBP 102,000 Motor 2016-1 Plc 4.25% 25/11/2025 125,177 0.02 EUR 37,353 Paragon Mortgages No 11 Plc FRN
15/10/2041 38,996 0.00 EUR 45,183 Paragon Mortgages No 12 Plc FRN
15/11/2038 46,799 0.01 EUR 142,568 Paragon Mortgages No 13 Plc FRN
15/1/2039 145,533 0.02 EUR 300,000 Paragon Mortgages No 14 Plc FRN
15/9/2039 288,750 0.04 GBP 100,000 Paragon Mortgages NO 23 Plc FRN
15/1/2043 122,334 0.02 GBP 100,000 Paragon Mortgages No 25 Plc FRN
15/5/2050 118,680 0.01 GBP 100,000 Paragon Mortgages No 25 Plc FRN
15/5/2050 119,615 0.02 GBP 43,565 Tesco Property Finance 1 Plc
7.623% 13/7/2039 78,975 0.01
GBP 48,370 Tesco Property Finance 3 Plc 5.744% 13/4/2040 78,353 0.01
GBP 97,550 Tesco Property Finance 4 Plc 5.801% 13/10/2040 159,180 0.02
GBP 100,000 Twin Bridges 2019-1 Plc FRN 12/12/2052 122,028 0.02
GBP 368,078 Unique Pub Finance Co Plc/The 5.659% 30/6/2027 513,078 0.07
GBP 1,230,000 United Kingdom Gilt 0.75% 22/7/2023 1,527,198 0.21
GBP 160,000 United Kingdom Gilt 1.25% 22/7/2027 209,649 0.03
GBP 2,040,000 United Kingdom Gilt 1.5% 22/1/2021 2,528,789 0.34 GBP 1,630,000 United Kingdom Gilt 1.5% 22/7/2047 2,242,156 0.30 GBP 420,000 United Kingdom Gilt 1.625%
22/10/2028 570,312 0.08 GBP 320,000 United Kingdom Gilt 1.625%
22/10/2071 512,696 0.07 GBP 760,000 United Kingdom Gilt 1.75% 7/9/2022 967,660 0.13 GBP 2,350,000 United Kingdom Gilt 1.75% 7/9/2037 3,300,386 0.45 GBP 3,645,000 United Kingdom Gilt 1.75%
22/1/2049 5,345,512 0.72 GBP 180,000 United Kingdom Gilt 1.75%
22/7/2057 278,694 0.04 GBP 680,000 United Kingdom Gilt 2% 7/9/2025* 917,304 0.12 GBP 390,000 United Kingdom Gilt 2.25% 7/9/2023 513,076 0.07 GBP 1,560,000 United Kingdom Gilt 2.75% 7/9/2024 2,137,816 0.29 GBP 2,035,000 United Kingdom Gilt 3.25%
22/1/2044 3,706,394 0.50 GBP 1,696,500 United Kingdom Gilt 3.5%
22/1/2045* 3,245,027 0.44 GBP 200,000 United Kingdom Gilt 3.5% 22/7/2068 494,920 0.07 GBP 1,950,000 United Kingdom Gilt 3.75% 7/9/2021* 2,543,551 0.34 GBP 1,115,000 United Kingdom Gilt 4.25%
7/12/2040 2,238,375 0.30 GBP 130,000 United Kingdom Gilt 4.25%
7/12/2055 320,898 0.04 GBP 185,000 United Kingdom Gilt 4.5% 7/12/2042 393,619 0.05 GBP 300,000 Warwick Finance Residential
Mortgages No Two Plc FRN 21/9/2049 367,884 0.05
42,520,166 5.75
United States USD 330,000 1211 Avenue of the Americas Trust
2015-1211 ‘Series 2015-1211 D’ ‘144A’ FRN 10/8/2035 353,371 0.05
USD 415,000 245 Park Avenue Trust 2017-245P ‘Series 2017-245P C’ ‘144A’ FRN 5/6/2037 447,630 0.06
USD 330,000 245 Park Avenue Trust 2017-245P ‘Series 2017-245P D’ ‘144A’ FRN 5/6/2037 348,396 0.05
USD 330,000 245 Park Avenue Trust 2017-245P ‘Series 2017-245P E’ ‘144A’ FRN 5/6/2037 332,981 0.04
USD 360,000 280 Park Avenue 2017-280P Mortgage Trust ‘Series 2017-280P D’ ‘144A’ FRN 15/9/2034 360,615 0.05
USD 280,000 Abbott Laboratories 3.75% 30/11/2026 308,059 0.04
USD 495,000 Abbott Laboratories 3.875% 15/9/2025 540,133 0.07
USD 195,000 AbbVie Inc 4.5% 14/5/2035 212,477 0.03 USD 216,493 ACIS CLO 2014-4 Ltd ‘Series
2014-4A A’ ‘144A’ FRN 1/5/2026 216,727 0.03 USD 23,000 Allergan Finance LLC 4.625%
1/10/2042 24,391 0.00 USD 37,000 Allergan Sales LLC ‘144A’ 4.875%
15/2/2021 38,101 0.01 USD 175,000 Allergan Sales LLC ‘144A’ 5%
15/12/2021 184,063 0.02 USD 500,000 ALM VII R Ltd ‘Series 2013-7RA
A1R’ ‘144A’ FRN 15/10/2028 499,990 0.07
Portfolio of Investments 31 August 2019
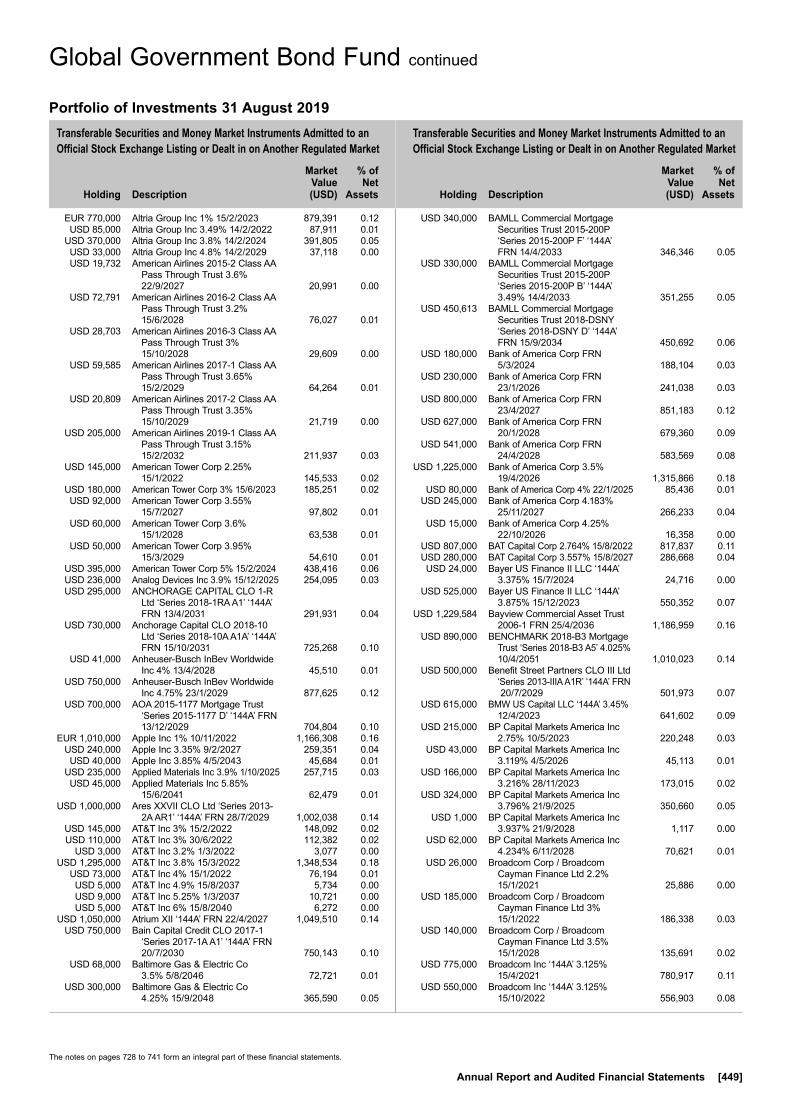
Transferable Securities and Money Market Instruments Admitted to an Official Stock Exchange Listing or Dealt in on Another Regulated Market
Transferable Securities and Money Market Instruments Admitted to an Official Stock Exchange Listing or Dealt in on Another Regulated Market
Holding
Description
Market Value (USD)
% of Net
Assets
Holding
Description
Market Value (USD)
% of Net
Assets
The notes on pages 728 to 741 form an integral part of these financial statements.
Annual Report and Audited Financial Statements [449]
EUR 770,000 Altria Group Inc 1% 15/2/2023 879,391 0.12 USD 85,000 Altria Group Inc 3.49% 14/2/2022 87,911 0.01 USD 370,000 Altria Group Inc 3.8% 14/2/2024 391,805 0.05 USD 33,000 Altria Group Inc 4.8% 14/2/2029 37,118 0.00 USD 19,732 American Airlines 2015-2 Class AA
Pass Through Trust 3.6% 22/9/2027 20,991 0.00
USD 72,791 American Airlines 2016-2 Class AA Pass Through Trust 3.2% 15/6/2028 76,027 0.01
USD 28,703 American Airlines 2016-3 Class AA Pass Through Trust 3% 15/10/2028 29,609 0.00
USD 59,585 American Airlines 2017-1 Class AA Pass Through Trust 3.65% 15/2/2029 64,264 0.01
USD 20,809 American Airlines 2017-2 Class AA Pass Through Trust 3.35% 15/10/2029 21,719 0.00
USD 205,000 American Airlines 2019-1 Class AA Pass Through Trust 3.15% 15/2/2032 211,937 0.03
USD 145,000 American Tower Corp 2.25% 15/1/2022 145,533 0.02
USD 180,000 American Tower Corp 3% 15/6/2023 185,251 0.02 USD 92,000 American Tower Corp 3.55%
15/7/2027 97,802 0.01 USD 60,000 American Tower Corp 3.6%
15/1/2028 63,538 0.01 USD 50,000 American Tower Corp 3.95%
15/3/2029 54,610 0.01 USD 395,000 American Tower Corp 5% 15/2/2024 438,416 0.06 USD 236,000 Analog Devices Inc 3.9% 15/12/2025 254,095 0.03 USD 295,000 ANCHORAGE CAPITAL CLO 1-R
Ltd ‘Series 2018-1RA A1’ ‘144A’ FRN 13/4/2031 291,931 0.04
USD 730,000 Anchorage Capital CLO 2018-10 Ltd ‘Series 2018-10A A1A’ ‘144A’ FRN 15/10/2031 725,268 0.10
USD 41,000 Anheuser-Busch InBev Worldwide Inc 4% 13/4/2028 45,510 0.01
USD 750,000 Anheuser-Busch InBev Worldwide Inc 4.75% 23/1/2029 877,625 0.12
USD 700,000 AOA 2015-1177 Mortgage Trust ‘Series 2015-1177 D’ ‘144A’ FRN 13/12/2029 704,804 0.10
EUR 1,010,000 Apple Inc 1% 10/11/2022 1,166,308 0.16 USD 240,000 Apple Inc 3.35% 9/2/2027 259,351 0.04 USD 40,000 Apple Inc 3.85% 4/5/2043 45,684 0.01 USD 235,000 Applied Materials Inc 3.9% 1/10/2025 257,715 0.03 USD 45,000 Applied Materials Inc 5.85%
15/6/2041 62,479 0.01 USD 1,000,000 Ares XXVII CLO Ltd ‘Series 2013-
2A AR1’ ‘144A’ FRN 28/7/2029 1,002,038 0.14 USD 145,000 AT&T Inc 3% 15/2/2022 148,092 0.02 USD 110,000 AT&T Inc 3% 30/6/2022 112,382 0.02 USD 3,000 AT&T Inc 3.2% 1/3/2022 3,077 0.00 USD 1,295,000 AT&T Inc 3.8% 15/3/2022 1,348,534 0.18 USD 73,000 AT&T Inc 4% 15/1/2022 76,194 0.01 USD 5,000 AT&T Inc 4.9% 15/8/2037 5,734 0.00 USD 9,000 AT&T Inc 5.25% 1/3/2037 10,721 0.00 USD 5,000 AT&T Inc 6% 15/8/2040 6,272 0.00 USD 1,050,000 Atrium XII ‘144A’ FRN 22/4/2027 1,049,510 0.14 USD 750,000 Bain Capital Credit CLO 2017-1
‘Series 2017-1A A1’ ‘144A’ FRN 20/7/2030 750,143 0.10
USD 68,000 Baltimore Gas & Electric Co 3.5% 5/8/2046 72,721 0.01
USD 300,000 Baltimore Gas & Electric Co 4.25% 15/9/2048 365,590 0.05
USD 340,000 BAMLL Commercial Mortgage Securities Trust 2015-200P ‘Series 2015-200P F’ ‘144A’ FRN 14/4/2033 346,346 0.05
USD 330,000 BAMLL Commercial Mortgage Securities Trust 2015-200P ‘Series 2015-200P B’ ‘144A’ 3.49% 14/4/2033 351,255 0.05
USD 450,613 BAMLL Commercial Mortgage Securities Trust 2018-DSNY ‘Series 2018-DSNY D’ ‘144A’ FRN 15/9/2034 450,692 0.06
USD 180,000 Bank of America Corp FRN 5/3/2024 188,104 0.03
USD 230,000 Bank of America Corp FRN 23/1/2026 241,038 0.03
USD 800,000 Bank of America Corp FRN 23/4/2027 851,183 0.12
USD 627,000 Bank of America Corp FRN 20/1/2028 679,360 0.09
USD 541,000 Bank of America Corp FRN 24/4/2028 583,569 0.08
USD 1,225,000 Bank of America Corp 3.5% 19/4/2026 1,315,866 0.18
USD 80,000 Bank of America Corp 4% 22/1/2025 85,436 0.01 USD 245,000 Bank of America Corp 4.183%
25/11/2027 266,233 0.04 USD 15,000 Bank of America Corp 4.25%
22/10/2026 16,358 0.00 USD 807,000 BAT Capital Corp 2.764% 15/8/2022 817,837 0.11 USD 280,000 BAT Capital Corp 3.557% 15/8/2027 286,668 0.04 USD 24,000 Bayer US Finance II LLC ‘144A’
3.375% 15/7/2024 24,716 0.00 USD 525,000 Bayer US Finance II LLC ‘144A’
3.875% 15/12/2023 550,352 0.07 USD 1,229,584 Bayview Commercial Asset Trust
2006-1 FRN 25/4/2036 1,186,959 0.16 USD 890,000 BENCHMARK 2018-B3 Mortgage
Trust ‘Series 2018-B3 A5’ 4.025% 10/4/2051 1,010,023 0.14
USD 500,000 Benefit Street Partners CLO III Ltd ‘Series 2013-IIIA A1R’ ‘144A’ FRN 20/7/2029 501,973 0.07
USD 615,000 BMW US Capital LLC ‘144A’ 3.45% 12/4/2023 641,602 0.09
USD 215,000 BP Capital Markets America Inc 2.75% 10/5/2023 220,248 0.03
USD 43,000 BP Capital Markets America Inc 3.119% 4/5/2026 45,113 0.01
USD 166,000 BP Capital Markets America Inc 3.216% 28/11/2023 173,015 0.02
USD 324,000 BP Capital Markets America Inc 3.796% 21/9/2025 350,660 0.05
USD 1,000 BP Capital Markets America Inc 3.937% 21/9/2028 1,117 0.00
USD 62,000 BP Capital Markets America Inc 4.234% 6/11/2028 70,621 0.01
USD 26,000 Broadcom Corp / Broadcom Cayman Finance Ltd 2.2% 15/1/2021 25,886 0.00
USD 185,000 Broadcom Corp / Broadcom Cayman Finance Ltd 3% 15/1/2022 186,338 0.03
USD 140,000 Broadcom Corp / Broadcom Cayman Finance Ltd 3.5% 15/1/2028 135,691 0.02
USD 775,000 Broadcom Inc ‘144A’ 3.125% 15/4/2021 780,917 0.11
USD 550,000 Broadcom Inc ‘144A’ 3.125% 15/10/2022 556,903 0.08
Global Government Bond Fund continued
Portfolio of Investments 31 August 2019
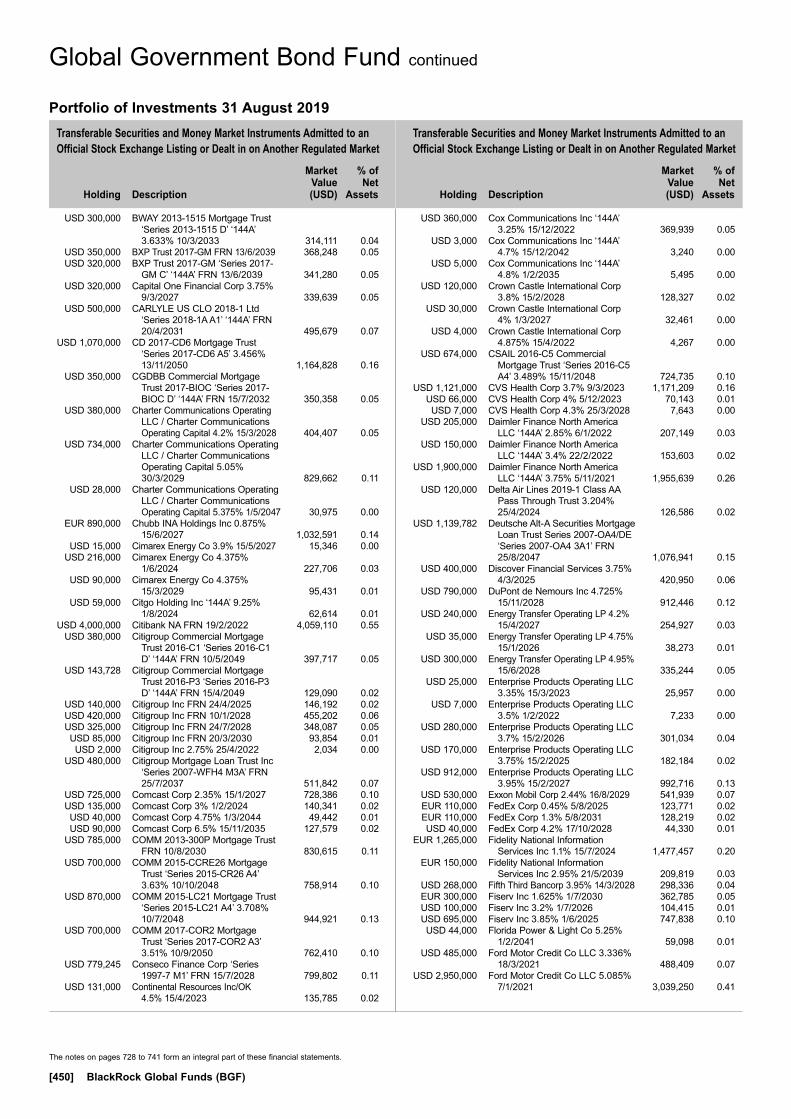
Transferable Securities and Money Market Instruments Admitted to an Official Stock Exchange Listing or Dealt in on Another Regulated Market
Transferable Securities and Money Market Instruments Admitted to an Official Stock Exchange Listing or Dealt in on Another Regulated Market
Holding
Description
Market Value (USD)
% of Net
Assets
Holding
Description
Market Value (USD)
% of Net
Assets
The notes on pages 728 to 741 form an integral part of these financial statements.
[450] BlackRock Global Funds (BGF)
Global Government Bond Fund continued
USD 300,000 BWAY 2013-1515 Mortgage Trust ‘Series 2013-1515 D’ ‘144A’ 3.633% 10/3/2033 314,111 0.04
USD 350,000 BXP Trust 2017-GM FRN 13/6/2039 368,248 0.05 USD 320,000 BXP Trust 2017-GM ‘Series 2017-
GM C’ ‘144A’ FRN 13/6/2039 341,280 0.05 USD 320,000 Capital One Financial Corp 3.75%
9/3/2027 339,639 0.05 USD 500,000 CARLYLE US CLO 2018-1 Ltd
‘Series 2018-1A A1’ ‘144A’ FRN 20/4/2031 495,679 0.07
USD 1,070,000 CD 2017-CD6 Mortgage Trust ‘Series 2017-CD6 A5’ 3.456% 13/11/2050 1,164,828 0.16
USD 350,000 CGDBB Commercial Mortgage Trust 2017-BIOC ‘Series 2017-BIOC D’ ‘144A’ FRN 15/7/2032 350,358 0.05
USD 380,000 Charter Communications Operating LLC / Charter Communications Operating Capital 4.2% 15/3/2028 404,407 0.05
USD 734,000 Charter Communications Operating LLC / Charter Communications Operating Capital 5.05% 30/3/2029 829,662 0.11
USD 28,000 Charter Communications Operating LLC / Charter Communications Operating Capital 5.375% 1/5/2047 30,975 0.00
EUR 890,000 Chubb INA Holdings Inc 0.875% 15/6/2027 1,032,591 0.14
USD 15,000 Cimarex Energy Co 3.9% 15/5/2027 15,346 0.00 USD 216,000 Cimarex Energy Co 4.375%
1/6/2024 227,706 0.03 USD 90,000 Cimarex Energy Co 4.375%
15/3/2029 95,431 0.01 USD 59,000 Citgo Holding Inc ‘144A’ 9.25%
1/8/2024 62,614 0.01 USD 4,000,000 Citibank NA FRN 19/2/2022 4,059,110 0.55 USD 380,000 Citigroup Commercial Mortgage
Trust 2016-C1 ‘Series 2016-C1 D’ ‘144A’ FRN 10/5/2049 397,717 0.05
USD 143,728 Citigroup Commercial Mortgage Trust 2016-P3 ‘Series 2016-P3 D’ ‘144A’ FRN 15/4/2049 129,090 0.02
USD 140,000 Citigroup Inc FRN 24/4/2025 146,192 0.02 USD 420,000 Citigroup Inc FRN 10/1/2028 455,202 0.06 USD 325,000 Citigroup Inc FRN 24/7/2028 348,087 0.05 USD 85,000 Citigroup Inc FRN 20/3/2030 93,854 0.01 USD 2,000 Citigroup Inc 2.75% 25/4/2022 2,034 0.00 USD 480,000 Citigroup Mortgage Loan Trust Inc
‘Series 2007-WFH4 M3A’ FRN 25/7/2037 511,842 0.07
USD 725,000 Comcast Corp 2.35% 15/1/2027 728,386 0.10 USD 135,000 Comcast Corp 3% 1/2/2024 140,341 0.02 USD 40,000 Comcast Corp 4.75% 1/3/2044 49,442 0.01 USD 90,000 Comcast Corp 6.5% 15/11/2035 127,579 0.02 USD 785,000 COMM 2013-300P Mortgage Trust
FRN 10/8/2030 830,615 0.11 USD 700,000 COMM 2015-CCRE26 Mortgage
Trust ‘Series 2015-CR26 A4’ 3.63% 10/10/2048 758,914 0.10
USD 870,000 COMM 2015-LC21 Mortgage Trust ‘Series 2015-LC21 A4’ 3.708% 10/7/2048 944,921 0.13
USD 700,000 COMM 2017-COR2 Mortgage Trust ‘Series 2017-COR2 A3’ 3.51% 10/9/2050 762,410 0.10
USD 779,245 Conseco Finance Corp ‘Series 1997-7 M1’ FRN 15/7/2028 799,802 0.11
USD 131,000 Continental Resources Inc/OK 4.5% 15/4/2023 135,785 0.02
USD 360,000 Cox Communications Inc ‘144A’ 3.25% 15/12/2022 369,939 0.05
USD 3,000 Cox Communications Inc ‘144A’ 4.7% 15/12/2042 3,240 0.00
USD 5,000 Cox Communications Inc ‘144A’ 4.8% 1/2/2035 5,495 0.00
USD 120,000 Crown Castle International Corp 3.8% 15/2/2028 128,327 0.02
USD 30,000 Crown Castle International Corp 4% 1/3/2027 32,461 0.00
USD 4,000 Crown Castle International Corp 4.875% 15/4/2022 4,267 0.00
USD 674,000 CSAIL 2016-C5 Commercial Mortgage Trust ‘Series 2016-C5 A4’ 3.489% 15/11/2048 724,735 0.10
USD 1,121,000 CVS Health Corp 3.7% 9/3/2023 1,171,209 0.16 USD 66,000 CVS Health Corp 4% 5/12/2023 70,143 0.01 USD 7,000 CVS Health Corp 4.3% 25/3/2028 7,643 0.00 USD 205,000 Daimler Finance North America
LLC ‘144A’ 2.85% 6/1/2022 207,149 0.03 USD 150,000 Daimler Finance North America
LLC ‘144A’ 3.4% 22/2/2022 153,603 0.02 USD 1,900,000 Daimler Finance North America
LLC ‘144A’ 3.75% 5/11/2021 1,955,639 0.26 USD 120,000 Delta Air Lines 2019-1 Class AA
Pass Through Trust 3.204% 25/4/2024 126,586 0.02
USD 1,139,782 Deutsche Alt-A Securities Mortgage Loan Trust Series 2007-OA4/DE ‘Series 2007-OA4 3A1’ FRN 25/8/2047 1,076,941 0.15
USD 400,000 Discover Financial Services 3.75% 4/3/2025 420,950 0.06
USD 790,000 DuPont de Nemours Inc 4.725% 15/11/2028 912,446 0.12
USD 240,000 Energy Transfer Operating LP 4.2% 15/4/2027 254,927 0.03
USD 35,000 Energy Transfer Operating LP 4.75% 15/1/2026 38,273 0.01
USD 300,000 Energy Transfer Operating LP 4.95% 15/6/2028 335,244 0.05
USD 25,000 Enterprise Products Operating LLC 3.35% 15/3/2023 25,957 0.00
USD 7,000 Enterprise Products Operating LLC 3.5% 1/2/2022 7,233 0.00
USD 280,000 Enterprise Products Operating LLC 3.7% 15/2/2026 301,034 0.04
USD 170,000 Enterprise Products Operating LLC 3.75% 15/2/2025 182,184 0.02
USD 912,000 Enterprise Products Operating LLC 3.95% 15/2/2027 992,716 0.13
USD 530,000 Exxon Mobil Corp 2.44% 16/8/2029 541,939 0.07 EUR 110,000 FedEx Corp 0.45% 5/8/2025 123,771 0.02 EUR 110,000 FedEx Corp 1.3% 5/8/2031 128,219 0.02 USD 40,000 FedEx Corp 4.2% 17/10/2028 44,330 0.01 EUR 1,265,000 Fidelity National Information
Services Inc 1.1% 15/7/2024 1,477,457 0.20 EUR 150,000 Fidelity National Information
Services Inc 2.95% 21/5/2039 209,819 0.03 USD 268,000 Fifth Third Bancorp 3.95% 14/3/2028 298,336 0.04 EUR 300,000 Fiserv Inc 1.625% 1/7/2030 362,785 0.05 USD 100,000 Fiserv Inc 3.2% 1/7/2026 104,415 0.01 USD 695,000 Fiserv Inc 3.85% 1/6/2025 747,838 0.10 USD 44,000 Florida Power & Light Co 5.25%
1/2/2041 59,098 0.01 USD 485,000 Ford Motor Credit Co LLC 3.336%
18/3/2021 488,409 0.07 USD 2,950,000 Ford Motor Credit Co LLC 5.085%
7/1/2021 3,039,250 0.41
Portfolio of Investments 31 August 2019

Transferable Securities and Money Market Instruments Admitted to an Official Stock Exchange Listing or Dealt in on Another Regulated Market
Transferable Securities and Money Market Instruments Admitted to an Official Stock Exchange Listing or Dealt in on Another Regulated Market
Holding
Description
Market Value (USD)
% of Net
Assets
Holding
Description
Market Value (USD)
% of Net
Assets
* All or a portion of this security represents a security on loan.
The notes on pages 728 to 741 form an integral part of these financial statements.
Annual Report and Audited Financial Statements [451]
USD 589,000 Freddie Mac Multifamily Structured Pass Through Certificates ‘Series K089 A2’ 3.563% 25/1/2029 663,903 0.09
USD 221,000 Freddie Mac Multifamily Structured Pass Through Certificates ‘Series KL4F A2AS’ FRN 25/10/2025 239,895 0.03
USD 9,000 Gilead Sciences Inc 2.55% 1/9/2020 9,047 0.00 USD 53,000 Gilead Sciences Inc 2.95% 1/3/2027 55,034 0.01 USD 6,000 Gilead Sciences Inc 3.25% 1/9/2022 6,225 0.00 USD 1,150,000 Gilead Sciences Inc 3.5% 1/2/2025 1,225,772 0.17 USD 195,000 Gilead Sciences Inc 3.65% 1/3/2026 209,659 0.03 USD 490,000 Gilead Sciences Inc 3.7% 1/4/2024 520,583 0.07 USD 25,000 Gilead Sciences Inc 4.5% 1/2/2045 29,246 0.00 USD 19,639 GLG Ore Hill CLO 2013-1 Ltd
‘Series 2013-1A A’ ‘144A’ FRN 15/7/2025 19,637 0.00
USD 290,000 Global Payments Inc 3.2% 15/8/2029 296,356 0.04 USD 10,000 Goldman Sachs Group Inc/The
FRN 24/7/2023 10,157 0.00 USD 14,000 Goldman Sachs Group Inc/The
FRN 29/9/2025 14,547 0.00 USD 480,000 Goldman Sachs Group Inc/The
FRN 5/6/2028 510,539 0.07 USD 70,000 Goldman Sachs Group Inc/The
3.5% 16/11/2026 73,406 0.01 USD 477,000 Goldman Sachs Group Inc/The
3.85% 26/1/2027 508,780 0.07 USD 4,000 Goldman Sachs Group Inc/The
5.25% 27/7/2021 4,231 0.00 USD 1,390,000 GS Mortgage Securities Trust
‘2015-GC34’ 3.506% 10/10/2048 1,500,554 0.20 USD 625,000 GS Mortgage Securities Trust
2017-GS7 ‘Series 2017-GS7 E’ ‘144A’ 3% 10/8/2050 585,492 0.08
USD 1,260,000 GS Mortgage Securities Trust 2017-GS7 ‘Series 2017-GS7 A4’ 3.43% 10/8/2050 1,369,661 0.19
USD 597,257 GSMPS Mortgage Loan Trust 2005-RP1 ‘Series 2005-RP1 2A1’ ‘144A’ FRN 25/1/2035 598,857 0.08
USD 450,340 GSMPS Mortgage Loan Trust 2005-RP3 ‘Series 2005-RP3 2A1’ ‘144A’ FRN 25/9/2035 443,924 0.06
USD 813 Halcyon Loan Advisors Funding 2013-2 Ltd ‘Series 2013-2A A’ ‘144A’ FRN 1/8/2025 812 0.00
USD 257,792 Halcyon Loan Advisors Funding 2014-1 Ltd ‘Series 2014-1A A1R’ ‘144A’ FRN 18/4/2026 257,779 0.03
USD 250,000 Halcyon Loan Advisors Funding 2015-2 Ltd ‘Series 2015-2A AR’ ‘144A’ FRN 25/7/2027 249,721 0.03
USD 90,000 Halliburton Co 3.5% 1/8/2023 93,752 0.01 USD 715,000 Halliburton Co 3.8% 15/11/2025 757,680 0.10 USD 9,000 HCA Inc 4.5% 15/2/2027 9,759 0.00 USD 45,000 HCA Inc 5% 15/3/2024 49,283 0.01 USD 330,000 HCA Inc 5.25% 15/4/2025 368,453 0.05 USD 50,000 HCA Inc 5.25% 15/6/2026 56,297 0.01 USD 460,000 HMH Trust 2017-NSS ‘Series
2017-NSS A’ ‘144A’ 3.062% 5/7/2031 469,243 0.06
EUR 1,155,000 Honeywell International Inc 1.3% 22/2/2023 1,347,013 0.18
USD 854,000 Hyundai Capital America ‘144A’ 3.95% 1/2/2022 884,821 0.12
EUR 420,000 Illinois Tool Works Inc 0.625% 5/12/2027* 484,708 0.07
USD 6,000 Intercontinental Exchange Inc 2.75% 1/12/2020 6,051 0.00
USD 119,000 Intercontinental Exchange Inc 3.1% 15/9/2027 126,016 0.02
USD 144,000 Intercontinental Exchange Inc 3.75% 1/12/2025 156,217 0.02
USD 330,000 Intercontinental Exchange Inc 3.75% 21/9/2028 367,257 0.05
USD 5,000 Intercontinental Exchange Inc 4% 15/10/2023 5,386 0.00
EUR 700,000 International Business Machines Corp 0.95% 23/5/2025 817,347 0.11
USD 330,000 International Business Machines Corp 3.3% 15/5/2026 350,016 0.05
USD 312,000 JP Morgan Chase Commercial Mortgage Securities Trust 2015-UES ‘Series 2015-UES F’ ‘144A’ FRN 5/9/2032 311,349 0.04
USD 600,000 JPMBB Commercial Mortgage Securities Trust 2016-C1 ‘Series 2016-C1 A5’ 3.576% 15/3/2049 652,221 0.09
USD 975,000 JPMorgan Chase & Co FRN 25/4/2023 989,865 0.13
USD 70,000 JPMorgan Chase & Co FRN 23/4/2024 73,489 0.01
USD 370,000 JPMorgan Chase & Co FRN 23/7/2024 392,942 0.05
USD 373,000 JPMorgan Chase & Co FRN 29/1/2027 406,157 0.05
USD 435,000 JPMorgan Chase & Co FRN 1/2/2028 472,729 0.06
USD 1,167,000 JPMorgan Chase & Co FRN 1/5/2028 1,247,851 0.17
USD 105,000 JPMorgan Chase & Co FRN 23/1/2029 112,347 0.02
USD 14,000 JPMorgan Chase & Co FRN 23/4/2029 15,564 0.00
USD 153,000 JPMorgan Chase & Co FRN 23/7/2029 172,557 0.02
USD 183,000 JPMorgan Chase & Co FRN 5/12/2029 210,313 0.03
USD 170,000 JPMorgan Chase & Co FRN 6/5/2030 185,687 0.03
USD 17,000 JPMorgan Chase & Co 3.25% 23/9/2022 17,613 0.00
USD 150,000 Kinder Morgan Energy Partners LP 3.45% 15/2/2023 155,423 0.02
USD 170,000 Kinder Morgan Inc/DE 5.55% 1/6/2045 204,240 0.03
USD 537,000 KLA Corp 4.1% 15/3/2029 594,875 0.08 USD 355,000 Lam Research Corp 3.75%
15/3/2026 380,377 0.05 USD 500,000 LCM XXV Ltd FRN 20/7/2030 499,433 0.07 USD 1,480,000 Lendmark Funding Trust 2018-2
‘Series 2018-2A A’ ‘144A’ 4.23% 20/4/2027 1,542,946 0.21
USD 600,000 Madison Park Funding XI Ltd ‘Series 2013-11A AR’ ‘144A’ FRN 23/7/2029 600,006 0.08
USD 600,000 Madison Park Funding XIII Ltd ‘Series 2014-13A AR2’ ‘144A’ FRN 19/4/2030 599,166 0.08
USD 500,000 Mariner CLO 5 Ltd FRN 25/4/2031 497,507 0.07 EUR 405,000 Marsh & McLennan Cos Inc
1.349% 21/9/2026 482,917 0.07 USD 3,000 Marsh & McLennan Cos Inc
3.3% 14/3/2023 3,116 0.00 USD 1,500,000 Marsh & McLennan Cos Inc
3.5% 10/3/2025 1,596,458 0.22
Global Government Bond Fund continued
Portfolio of Investments 31 August 2019

Transferable Securities and Money Market Instruments Admitted to an Official Stock Exchange Listing or Dealt in on Another Regulated Market
Transferable Securities and Money Market Instruments Admitted to an Official Stock Exchange Listing or Dealt in on Another Regulated Market
Holding
Description
Market Value (USD)
% of Net
Assets
Holding
Description
Market Value (USD)
% of Net
Assets
The notes on pages 728 to 741 form an integral part of these financial statements.
[452] BlackRock Global Funds (BGF)
Global Government Bond Fund continued
USD 103,000 Marsh & McLennan Cos Inc 3.75% 14/3/2026 111,756 0.02
USD 315,000 Marsh & McLennan Cos Inc 4.375% 15/3/2029 362,099 0.05
EUR 600,000 Mastercard Inc 1.1% 1/12/2022 692,151 0.09 USD 24,000 Mastercard Inc 2.95% 21/11/2026 25,421 0.00 USD 245,000 Mastercard Inc 2.95% 1/6/2029 262,101 0.04 USD 295,000 McDonald’s Corp 3.625% 1/5/2043 307,486 0.04 USD 28,000 McDonald’s Corp 3.7% 30/1/2026 30,332 0.00 EUR 300,000 Metropolitan Life Global Funding I
0.375% 9/4/2024 339,657 0.05 EUR 165,000 Metropolitan Life Global Funding I
2.375% 11/1/2023 198,348 0.03 EUR 500,000 MMS USA Financing Inc 0.625%
13/6/2025 559,556 0.08 USD 1,465,000 Morgan Stanley 3.625% 20/1/2027 1,568,158 0.21 USD 27,000 Morgan Stanley 4% 23/7/2025 29,266 0.00 USD 630,000 Morgan Stanley Bank of America
Merrill Lynch Trust 2016-C28 ‘Series 2016-C28 A4’ 3.544% 15/1/2049 681,728 0.09
USD 440,000 Morgan Stanley Capital I Trust 2018-H3 ‘Series 2018-H3 A5’ 4.177% 15/7/2051 505,811 0.07
USD 475,000 Morgan Stanley Capital I Trust 2018-H4 ‘Series 2018-H4 A4’ 4.31% 15/12/2051 552,954 0.07
USD 1,080,000 Morgan Stanley Capital I Trust 2018-L1 ‘Series 2018-L1 A3’ 4.139% 15/10/2051 1,235,745 0.17
USD 350,000 Morgan Stanley Capital I Trust 2018-MP ‘Series 2018-MP E’ ‘144A’ FRN 11/7/2040 360,292 0.05
USD 160,000 MPLX LP 4.5% 15/4/2038 166,449 0.02 USD 690,000 MSSG Trust 2017-237P ‘Series
2017-237P A’ ‘144A’ 3.397% 13/9/2039 744,676 0.10
USD 560,000 Navient Private Education Refi Loan Trust 2019-D ‘Series 2019-D A2B’ ‘144A’ FRN 15/12/2059 554,722 0.07
USD 3,000 NBCUniversal Media LLC 6.4% 30/4/2040 4,349 0.00
USD 655,000 Nestle Holdings Inc ‘144A’ 3.625% 24/9/2028 731,604 0.10
USD 550,000 New Century Home Equity Loan Trust Series 2005-B ‘Series 2005-B M1’ FRN 25/10/2035 536,132 0.07
USD 117,000 Norfolk Southern Corp 4.1% 15/5/2049 134,940 0.02
USD 13,000 Norfolk Southern Corp 4.45% 15/6/2045 15,505 0.00
USD 26,000 NRG Energy Inc ‘144A’ 3.75% 15/6/2024 26,901 0.00
USD 85,000 NRG Energy Inc ‘144A’ 4.45% 15/6/2029 89,353 0.01
USD 367,000 NVIDIA Corp 3.2% 16/9/2026 385,591 0.05 USD 300,000 Occidental Petroleum Corp 2.6%
13/8/2021 301,895 0.04 USD 360,901 OFSI Fund VII Ltd ‘Series 2014-7A
AR’ ‘144A’ FRN 18/10/2026 360,617 0.05 USD 1,000,000 OHA Loan Funding 2015-1 Ltd
‘Series 2015-1A AR’ ‘144A’ FRN 15/8/2029 1,000,321 0.14
USD 204,433 OneMain Financial Issuance Trust 2016-2 ‘Series 2016-2A B’ ‘144A’ 5.94% 20/3/2028 205,089 0.03
USD 1,230,000 Onemain Financial Issuance Trust 2018-1 ‘Series 2018-1A A’ ‘144A’ 3.3% 14/3/2029 1,256,176 0.17
USD 250,000 OZLM Funding IV Ltd ‘Series 2013-4A A1R’ ‘144A’ FRN 22/10/2030 248,664 0.03
USD 500,000 Palmer Square CLO 2018-2 Ltd ‘Series 2018-2A A1A’ ‘144A’ FRN 16/7/2031 496,783 0.07
USD 425,000 Penske Truck Leasing Co Lp / PTL Finance Corp ‘144A’ 3.45% 1/7/2024 442,284 0.06
EUR 160,000 Philip Morris International Inc 1.45% 1/8/2039 172,206 0.02
USD 180,000 Philip Morris International Inc 2.125% 10/5/2023 179,690 0.02
EUR 100,000 Prologis Euro Finance LLC 1.5% 10/9/2049 107,414 0.01
USD 14,000 QUALCOMM Inc 3.25% 20/5/2027 14,681 0.00 USD 395,000 QUALCOMM Inc 3.45% 20/5/2025 419,632 0.06 EUR 530,000 RELX Capital Inc 1.3% 12/5/2025 629,315 0.09 USD 290,000 Republic Services Inc 2.9% 1/7/2026 300,643 0.04 USD 125,000 Reynolds American Inc 4%
12/6/2022 130,429 0.02 USD 160,000 Sabine Pass Liquefaction LLC
5.625% 15/4/2023 174,688 0.02 USD 790,000 Sabine Pass Liquefaction LLC
5.75% 15/5/2024 881,967 0.12 USD 84,000 Schlumberger Holdings Corp
‘144A’ 3.9% 17/5/2028 89,335 0.01 USD 240,000 Sesac Finance LLC ‘Series 2019-1
A2’ ‘144A’ 5.216% 25/7/2049 244,982 0.03 USD 414,137 SLM Private Credit Student Loan
Trust 2004-A ‘Series 2004-A A3’ FRN 15/6/2033 408,681 0.06
USD 991,763 SLM Private Credit Student Loan Trust 2004-B ‘Series 2004-B A3’ FRN 15/3/2024 987,105 0.13
USD 919,214 SLM Private Credit Student Loan Trust 2007-A FRN 16/12/2041 897,628 0.12
USD 375,358 SLM Student Loan Trust 2012-2 ‘Series 2012-2 A’ FRN 25/1/2029 367,235 0.05
USD 345,000 SMB Private Education Loan Trust 2015-C ‘Series 2015-C B’ ‘144A’ 3.5% 15/9/2043 357,263 0.05
USD 720,000 SMB Private Education Loan Trust 2018-C ‘Series 2018-C A2A’ ‘144A’ 3.63% 15/11/2035 770,775 0.10
USD 260,000 SMB Private Education Loan Trust 2019-A ‘Series 2019-A A2A’ ‘144A’ 3.44% 15/7/2036 273,452 0.04
USD 410,000 Sofi Professional Loan Program 2018-B Trust ‘Series 2018-B A2FX’ ‘144A’ 3.34% 25/8/2047 425,457 0.06
USD 680,000 Sofi Professional Loan Program 2018-C Trust ‘Series 2018-C A2FX’ ‘144A’ 3.59% 25/1/2048 721,007 0.10
USD 39,000 Spectra Energy Partners LP 3.375% 15/10/2026 40,761 0.01
USD 1,365,000 Springleaf Funding Trust 2015-B ‘Series 2015-BA A’ ‘144A’ 3.48% 15/5/2028 1,382,608 0.19
USD 1,300,000 Springleaf Funding Trust 2017-A ‘Series 2017-AA A’ ‘144A’ 2.68% 15/7/2030 1,301,930 0.18
USD 255,000 State Street Corp FRN 3/12/2029 293,742 0.04 EUR 365,000 Stryker Corp 2.125% 30/11/2027 466,112 0.06 USD 50,000 Sunoco Logistics Partners
Operations LP 4% 1/10/2027 52,480 0.01 USD 1,111,000 Thermo Fisher Scientific Inc 3%
15/4/2023 1,142,751 0.15 USD 95,000 Thermo Fisher Scientific Inc 4.15%
1/2/2024 102,330 0.01 USD 361,000 Union Pacific Corp 3.799%
1/10/2051 395,363 0.05 USD 10,000 Union Pacific Corp 4.5% 10/9/2048 12,237 0.00 USD 25,000 Union Pacific Corp 4.75% 15/9/2041 30,151 0.00
Portfolio of Investments 31 August 2019
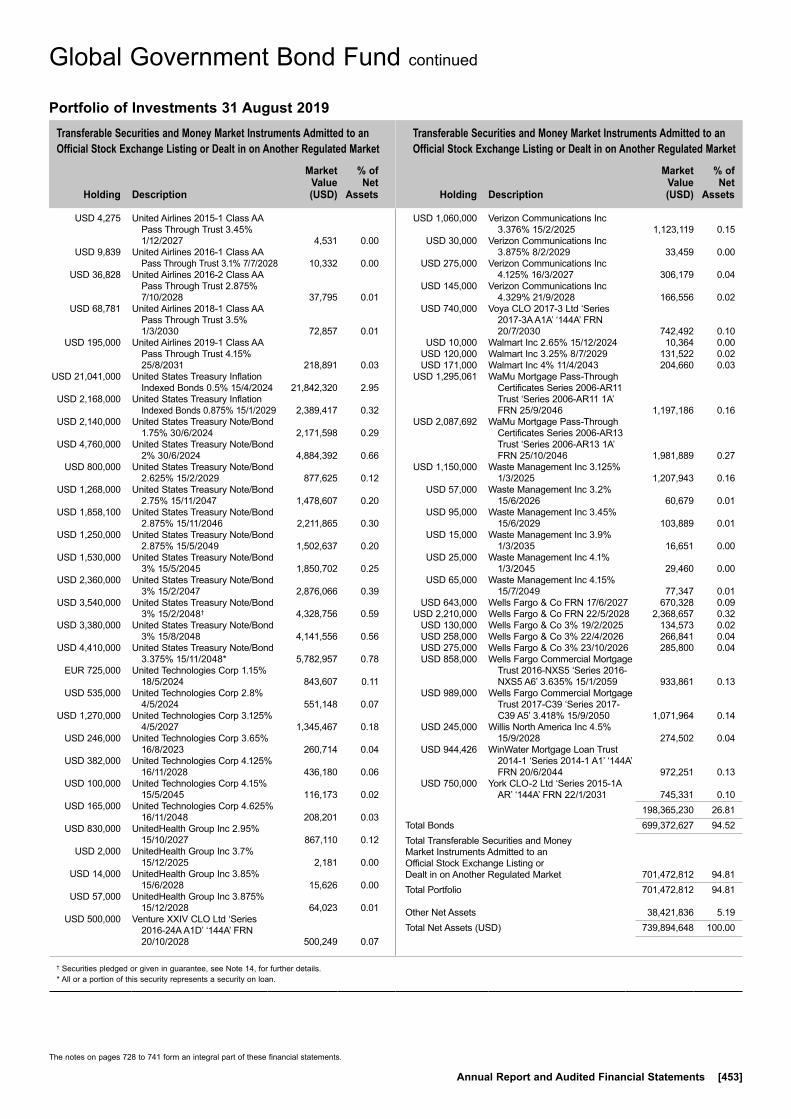
Transferable Securities and Money Market Instruments Admitted to an Official Stock Exchange Listing or Dealt in on Another Regulated Market
Transferable Securities and Money Market Instruments Admitted to an Official Stock Exchange Listing or Dealt in on Another Regulated Market
Holding
Description
Market Value (USD)
% of Net
Assets
Holding
Description
Market Value (USD)
% of Net
Assets
† Securities pledged or given in guarantee, see Note 14, for further details.* All or a portion of this security represents a security on loan.
The notes on pages 728 to 741 form an integral part of these financial statements.
Annual Report and Audited Financial Statements [453]
USD 4,275 United Airlines 2015-1 Class AA Pass Through Trust 3.45% 1/12/2027 4,531 0.00
USD 9,839 United Airlines 2016-1 Class AA Pass Through Trust 3.1% 7/7/2028 10,332 0.00
USD 36,828 United Airlines 2016-2 Class AA Pass Through Trust 2.875% 7/10/2028 37,795 0.01
USD 68,781 United Airlines 2018-1 Class AA Pass Through Trust 3.5% 1/3/2030 72,857 0.01
USD 195,000 United Airlines 2019-1 Class AA Pass Through Trust 4.15% 25/8/2031 218,891 0.03
USD 21,041,000 United States Treasury Inflation Indexed Bonds 0.5% 15/4/2024 21,842,320 2.95
USD 2,168,000 United States Treasury Inflation Indexed Bonds 0.875% 15/1/2029 2,389,417 0.32
USD 2,140,000 United States Treasury Note/Bond 1.75% 30/6/2024 2,171,598 0.29
USD 4,760,000 United States Treasury Note/Bond 2% 30/6/2024 4,884,392 0.66
USD 800,000 United States Treasury Note/Bond 2.625% 15/2/2029 877,625 0.12
USD 1,268,000 United States Treasury Note/Bond 2.75% 15/11/2047 1,478,607 0.20
USD 1,858,100 United States Treasury Note/Bond 2.875% 15/11/2046 2,211,865 0.30
USD 1,250,000 United States Treasury Note/Bond 2.875% 15/5/2049 1,502,637 0.20
USD 1,530,000 United States Treasury Note/Bond 3% 15/5/2045 1,850,702 0.25
USD 2,360,000 United States Treasury Note/Bond 3% 15/2/2047 2,876,066 0.39
USD 3,540,000 United States Treasury Note/Bond 3% 15/2/2048† 4,328,756 0.59
USD 3,380,000 United States Treasury Note/Bond 3% 15/8/2048 4,141,556 0.56
USD 4,410,000 United States Treasury Note/Bond 3.375% 15/11/2048* 5,782,957 0.78
EUR 725,000 United Technologies Corp 1.15% 18/5/2024 843,607 0.11
USD 535,000 United Technologies Corp 2.8% 4/5/2024 551,148 0.07
USD 1,270,000 United Technologies Corp 3.125% 4/5/2027 1,345,467 0.18
USD 246,000 United Technologies Corp 3.65% 16/8/2023 260,714 0.04
USD 382,000 United Technologies Corp 4.125% 16/11/2028 436,180 0.06
USD 100,000 United Technologies Corp 4.15% 15/5/2045 116,173 0.02
USD 165,000 United Technologies Corp 4.625% 16/11/2048 208,201 0.03
USD 830,000 UnitedHealth Group Inc 2.95% 15/10/2027 867,110 0.12
USD 2,000 UnitedHealth Group Inc 3.7% 15/12/2025 2,181 0.00
USD 14,000 UnitedHealth Group Inc 3.85% 15/6/2028 15,626 0.00
USD 57,000 UnitedHealth Group Inc 3.875% 15/12/2028 64,023 0.01
USD 500,000 Venture XXIV CLO Ltd ‘Series 2016-24A A1D’ ‘144A’ FRN 20/10/2028 500,249 0.07
USD 1,060,000 Verizon Communications Inc 3.376% 15/2/2025 1,123,119 0.15
USD 30,000 Verizon Communications Inc 3.875% 8/2/2029 33,459 0.00
USD 275,000 Verizon Communications Inc 4.125% 16/3/2027 306,179 0.04
USD 145,000 Verizon Communications Inc 4.329% 21/9/2028 166,556 0.02
USD 740,000 Voya CLO 2017-3 Ltd ‘Series 2017-3A A1A’ ‘144A’ FRN 20/7/2030 742,492 0.10
USD 10,000 Walmart Inc 2.65% 15/12/2024 10,364 0.00 USD 120,000 Walmart Inc 3.25% 8/7/2029 131,522 0.02 USD 171,000 Walmart Inc 4% 11/4/2043 204,660 0.03 USD 1,295,061 WaMu Mortgage Pass-Through
Certificates Series 2006-AR11 Trust ‘Series 2006-AR11 1A’ FRN 25/9/2046 1,197,186 0.16
USD 2,087,692 WaMu Mortgage Pass-Through Certificates Series 2006-AR13 Trust ‘Series 2006-AR13 1A’ FRN 25/10/2046 1,981,889 0.27
USD 1,150,000 Waste Management Inc 3.125% 1/3/2025 1,207,943 0.16
USD 57,000 Waste Management Inc 3.2% 15/6/2026 60,679 0.01
USD 95,000 Waste Management Inc 3.45% 15/6/2029 103,889 0.01
USD 15,000 Waste Management Inc 3.9% 1/3/2035 16,651 0.00
USD 25,000 Waste Management Inc 4.1% 1/3/2045 29,460 0.00
USD 65,000 Waste Management Inc 4.15% 15/7/2049 77,347 0.01
USD 643,000 Wells Fargo & Co FRN 17/6/2027 670,328 0.09 USD 2,210,000 Wells Fargo & Co FRN 22/5/2028 2,368,657 0.32 USD 130,000 Wells Fargo & Co 3% 19/2/2025 134,573 0.02 USD 258,000 Wells Fargo & Co 3% 22/4/2026 266,841 0.04 USD 275,000 Wells Fargo & Co 3% 23/10/2026 285,800 0.04 USD 858,000 Wells Fargo Commercial Mortgage
Trust 2016-NXS5 ‘Series 2016-NXS5 A6’ 3.635% 15/1/2059 933,861 0.13
USD 989,000 Wells Fargo Commercial Mortgage Trust 2017-C39 ‘Series 2017-C39 A5’ 3.418% 15/9/2050 1,071,964 0.14
USD 245,000 Willis North America Inc 4.5% 15/9/2028 274,502 0.04
USD 944,426 WinWater Mortgage Loan Trust 2014-1 ‘Series 2014-1 A1’ ‘144A’ FRN 20/6/2044 972,251 0.13
USD 750,000 York CLO-2 Ltd ‘Series 2015-1A AR’ ‘144A’ FRN 22/1/2031 745,331 0.10
198,365,230 26.81Total Bonds 699,372,627 94.52Total Transferable Securities and Money Market Instruments Admitted to an Official Stock Exchange Listing or Dealt in on Another Regulated Market 701,472,812 94.81Total Portfolio 701,472,812 94.81
Other Net Assets 38,421,836 5.19Total Net Assets (USD) 739,894,648 100.00
Global Government Bond Fund continued
Portfolio of Investments 31 August 2019
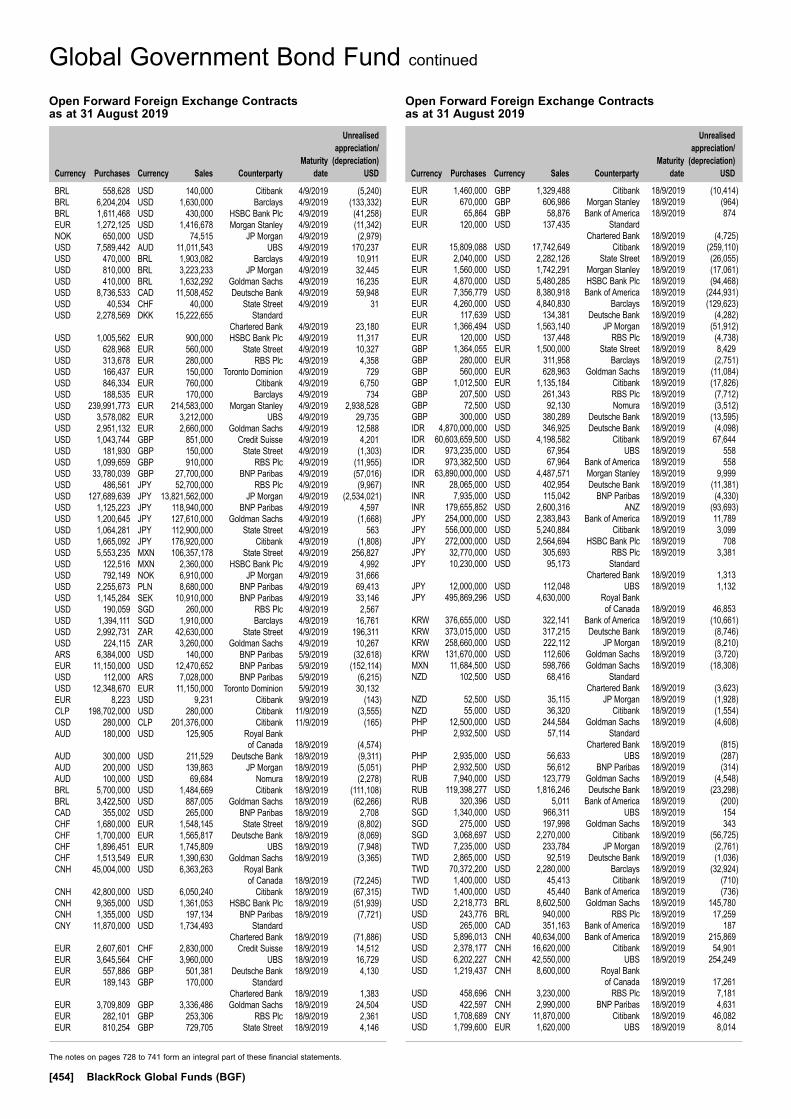
The notes on pages 728 to 741 form an integral part of these financial statements.
[454] BlackRock Global Funds (BGF)
Global Government Bond Fund continued
Open Forward Foreign Exchange Contracts as at 31 August 2019
Currency
Purchases Currency
Sales Counterparty
Maturity date
Unrealised appreciation/
(depreciation) USD
BRL 558,628 USD 140,000 Citibank 4/9/2019 (5,240)BRL 6,204,204 USD 1,630,000 Barclays 4/9/2019 (133,332)BRL 1,611,468 USD 430,000 HSBC Bank Plc 4/9/2019 (41,258)EUR 1,272,125 USD 1,416,678 Morgan Stanley 4/9/2019 (11,342)NOK 650,000 USD 74,515 JP Morgan 4/9/2019 (2,979)USD 7,589,442 AUD 11,011,543 UBS 4/9/2019 170,237USD 470,000 BRL 1,903,082 Barclays 4/9/2019 10,911USD 810,000 BRL 3,223,233 JP Morgan 4/9/2019 32,445USD 410,000 BRL 1,632,292 Goldman Sachs 4/9/2019 16,235USD 8,736,533 CAD 11,508,452 Deutsche Bank 4/9/2019 59,948USD 40,534 CHF 40,000 State Street 4/9/2019 31USD 2,278,569 DKK 15,222,655 Standard Chartered Bank 4/9/2019 23,180USD 1,005,562 EUR 900,000 HSBC Bank Plc 4/9/2019 11,317USD 628,968 EUR 560,000 State Street 4/9/2019 10,327USD 313,678 EUR 280,000 RBS Plc 4/9/2019 4,358USD 166,437 EUR 150,000 Toronto Dominion 4/9/2019 729USD 846,334 EUR 760,000 Citibank 4/9/2019 6,750USD 188,535 EUR 170,000 Barclays 4/9/2019 734USD 239,991,773 EUR 214,583,000 Morgan Stanley 4/9/2019 2,938,528USD 3,578,082 EUR 3,212,000 UBS 4/9/2019 29,735USD 2,951,132 EUR 2,660,000 Goldman Sachs 4/9/2019 12,588USD 1,043,744 GBP 851,000 Credit Suisse 4/9/2019 4,201USD 181,930 GBP 150,000 State Street 4/9/2019 (1,303)USD 1,099,659 GBP 910,000 RBS Plc 4/9/2019 (11,955)USD 33,780,039 GBP 27,700,000 BNP Paribas 4/9/2019 (57,016)USD 486,561 JPY 52,700,000 RBS Plc 4/9/2019 (9,967)USD 127,689,639 JPY 13,821,562,000 JP Morgan 4/9/2019 (2,534,021)USD 1,125,223 JPY 118,940,000 BNP Paribas 4/9/2019 4,597USD 1,200,645 JPY 127,610,000 Goldman Sachs 4/9/2019 (1,668)USD 1,064,281 JPY 112,900,000 State Street 4/9/2019 563USD 1,665,092 JPY 176,920,000 Citibank 4/9/2019 (1,808)USD 5,553,235 MXN 106,357,178 State Street 4/9/2019 256,827USD 122,516 MXN 2,360,000 HSBC Bank Plc 4/9/2019 4,992USD 792,149 NOK 6,910,000 JP Morgan 4/9/2019 31,666USD 2,255,673 PLN 8,680,000 BNP Paribas 4/9/2019 69,413USD 1,145,284 SEK 10,910,000 BNP Paribas 4/9/2019 33,146USD 190,059 SGD 260,000 RBS Plc 4/9/2019 2,567USD 1,394,111 SGD 1,910,000 Barclays 4/9/2019 16,761USD 2,992,731 ZAR 42,630,000 State Street 4/9/2019 196,311USD 224,115 ZAR 3,260,000 Goldman Sachs 4/9/2019 10,267ARS 6,384,000 USD 140,000 BNP Paribas 5/9/2019 (32,618)EUR 11,150,000 USD 12,470,652 BNP Paribas 5/9/2019 (152,114)USD 112,000 ARS 7,028,000 BNP Paribas 5/9/2019 (6,215)USD 12,348,670 EUR 11,150,000 Toronto Dominion 5/9/2019 30,132EUR 8,223 USD 9,231 Citibank 9/9/2019 (143)CLP 198,702,000 USD 280,000 Citibank 11/9/2019 (3,555)USD 280,000 CLP 201,376,000 Citibank 11/9/2019 (165)AUD 180,000 USD 125,905 Royal Bank of Canada 18/9/2019 (4,574)AUD 300,000 USD 211,529 Deutsche Bank 18/9/2019 (9,311)AUD 200,000 USD 139,863 JP Morgan 18/9/2019 (5,051)AUD 100,000 USD 69,684 Nomura 18/9/2019 (2,278)BRL 5,700,000 USD 1,484,669 Citibank 18/9/2019 (111,108)BRL 3,422,500 USD 887,005 Goldman Sachs 18/9/2019 (62,266)CAD 355,002 USD 265,000 BNP Paribas 18/9/2019 2,708CHF 1,680,000 EUR 1,548,145 State Street 18/9/2019 (8,802)CHF 1,700,000 EUR 1,565,817 Deutsche Bank 18/9/2019 (8,069)CHF 1,896,451 EUR 1,745,809 UBS 18/9/2019 (7,948)CHF 1,513,549 EUR 1,390,630 Goldman Sachs 18/9/2019 (3,365)CNH 45,004,000 USD 6,363,263 Royal Bank of Canada 18/9/2019 (72,245)CNH 42,800,000 USD 6,050,240 Citibank 18/9/2019 (67,315)CNH 9,365,000 USD 1,361,053 HSBC Bank Plc 18/9/2019 (51,939)CNH 1,355,000 USD 197,134 BNP Paribas 18/9/2019 (7,721)CNY 11,870,000 USD 1,734,493 Standard Chartered Bank 18/9/2019 (71,886)EUR 2,607,601 CHF 2,830,000 Credit Suisse 18/9/2019 14,512EUR 3,645,564 CHF 3,960,000 UBS 18/9/2019 16,729EUR 557,886 GBP 501,381 Deutsche Bank 18/9/2019 4,130EUR 189,143 GBP 170,000 Standard Chartered Bank 18/9/2019 1,383EUR 3,709,809 GBP 3,336,486 Goldman Sachs 18/9/2019 24,504EUR 282,101 GBP 253,306 RBS Plc 18/9/2019 2,361EUR 810,254 GBP 729,705 State Street 18/9/2019 4,146
EUR 1,460,000 GBP 1,329,488 Citibank 18/9/2019 (10,414)EUR 670,000 GBP 606,986 Morgan Stanley 18/9/2019 (964)EUR 65,864 GBP 58,876 Bank of America 18/9/2019 874EUR 120,000 USD 137,435 Standard Chartered Bank 18/9/2019 (4,725)EUR 15,809,088 USD 17,742,649 Citibank 18/9/2019 (259,110)EUR 2,040,000 USD 2,282,126 State Street 18/9/2019 (26,055)EUR 1,560,000 USD 1,742,291 Morgan Stanley 18/9/2019 (17,061)EUR 4,870,000 USD 5,480,285 HSBC Bank Plc 18/9/2019 (94,468)EUR 7,356,779 USD 8,380,918 Bank of America 18/9/2019 (244,931)EUR 4,260,000 USD 4,840,830 Barclays 18/9/2019 (129,623)EUR 117,639 USD 134,381 Deutsche Bank 18/9/2019 (4,282)EUR 1,366,494 USD 1,563,140 JP Morgan 18/9/2019 (51,912)EUR 120,000 USD 137,448 RBS Plc 18/9/2019 (4,738)GBP 1,364,055 EUR 1,500,000 State Street 18/9/2019 8,429GBP 280,000 EUR 311,958 Barclays 18/9/2019 (2,751)GBP 560,000 EUR 628,963 Goldman Sachs 18/9/2019 (11,084)GBP 1,012,500 EUR 1,135,184 Citibank 18/9/2019 (17,826)GBP 207,500 USD 261,343 RBS Plc 18/9/2019 (7,712)GBP 72,500 USD 92,130 Nomura 18/9/2019 (3,512)GBP 300,000 USD 380,289 Deutsche Bank 18/9/2019 (13,595)IDR 4,870,000,000 USD 346,925 Deutsche Bank 18/9/2019 (4,098)IDR 60,603,659,500 USD 4,198,582 Citibank 18/9/2019 67,644IDR 973,235,000 USD 67,954 UBS 18/9/2019 558IDR 973,382,500 USD 67,964 Bank of America 18/9/2019 558IDR 63,890,000,000 USD 4,487,571 Morgan Stanley 18/9/2019 9,999INR 28,065,000 USD 402,954 Deutsche Bank 18/9/2019 (11,381)INR 7,935,000 USD 115,042 BNP Paribas 18/9/2019 (4,330)INR 179,655,852 USD 2,600,316 ANZ 18/9/2019 (93,693)JPY 254,000,000 USD 2,383,843 Bank of America 18/9/2019 11,789JPY 556,000,000 USD 5,240,884 Citibank 18/9/2019 3,099JPY 272,000,000 USD 2,564,694 HSBC Bank Plc 18/9/2019 708JPY 32,770,000 USD 305,693 RBS Plc 18/9/2019 3,381JPY 10,230,000 USD 95,173 Standard Chartered Bank 18/9/2019 1,313JPY 12,000,000 USD 112,048 UBS 18/9/2019 1,132JPY 495,869,296 USD 4,630,000 Royal Bank of Canada 18/9/2019 46,853KRW 376,655,000 USD 322,141 Bank of America 18/9/2019 (10,661)KRW 373,015,000 USD 317,215 Deutsche Bank 18/9/2019 (8,746)KRW 258,660,000 USD 222,112 JP Morgan 18/9/2019 (8,210)KRW 131,670,000 USD 112,606 Goldman Sachs 18/9/2019 (3,720)MXN 11,684,500 USD 598,766 Goldman Sachs 18/9/2019 (18,308)NZD 102,500 USD 68,416 Standard Chartered Bank 18/9/2019 (3,623)NZD 52,500 USD 35,115 JP Morgan 18/9/2019 (1,928)NZD 55,000 USD 36,320 Citibank 18/9/2019 (1,554)PHP 12,500,000 USD 244,584 Goldman Sachs 18/9/2019 (4,608)PHP 2,932,500 USD 57,114 Standard Chartered Bank 18/9/2019 (815)PHP 2,935,000 USD 56,633 UBS 18/9/2019 (287)PHP 2,932,500 USD 56,612 BNP Paribas 18/9/2019 (314)RUB 7,940,000 USD 123,779 Goldman Sachs 18/9/2019 (4,548)RUB 119,398,277 USD 1,816,246 Deutsche Bank 18/9/2019 (23,298)RUB 320,396 USD 5,011 Bank of America 18/9/2019 (200)SGD 1,340,000 USD 966,311 UBS 18/9/2019 154SGD 275,000 USD 197,998 Goldman Sachs 18/9/2019 343SGD 3,068,697 USD 2,270,000 Citibank 18/9/2019 (56,725)TWD 7,235,000 USD 233,784 JP Morgan 18/9/2019 (2,761)TWD 2,865,000 USD 92,519 Deutsche Bank 18/9/2019 (1,036)TWD 70,372,200 USD 2,280,000 Barclays 18/9/2019 (32,924)TWD 1,400,000 USD 45,413 Citibank 18/9/2019 (710)TWD 1,400,000 USD 45,440 Bank of America 18/9/2019 (736)USD 2,218,773 BRL 8,602,500 Goldman Sachs 18/9/2019 145,780USD 243,776 BRL 940,000 RBS Plc 18/9/2019 17,259USD 265,000 CAD 351,163 Bank of America 18/9/2019 187USD 5,896,013 CNH 40,634,000 Bank of America 18/9/2019 215,869USD 2,378,177 CNH 16,620,000 Citibank 18/9/2019 54,901USD 6,202,227 CNH 42,550,000 UBS 18/9/2019 254,249USD 1,219,437 CNH 8,600,000 Royal Bank of Canada 18/9/2019 17,261USD 458,696 CNH 3,230,000 RBS Plc 18/9/2019 7,181USD 422,597 CNH 2,990,000 BNP Paribas 18/9/2019 4,631USD 1,708,689 CNY 11,870,000 Citibank 18/9/2019 46,082USD 1,799,600 EUR 1,620,000 UBS 18/9/2019 8,014
Open Forward Foreign Exchange Contracts as at 31 August 2019
Currency
Purchases Currency
Sales Counterparty
Maturity date
Unrealised appreciation/
(depreciation) USD
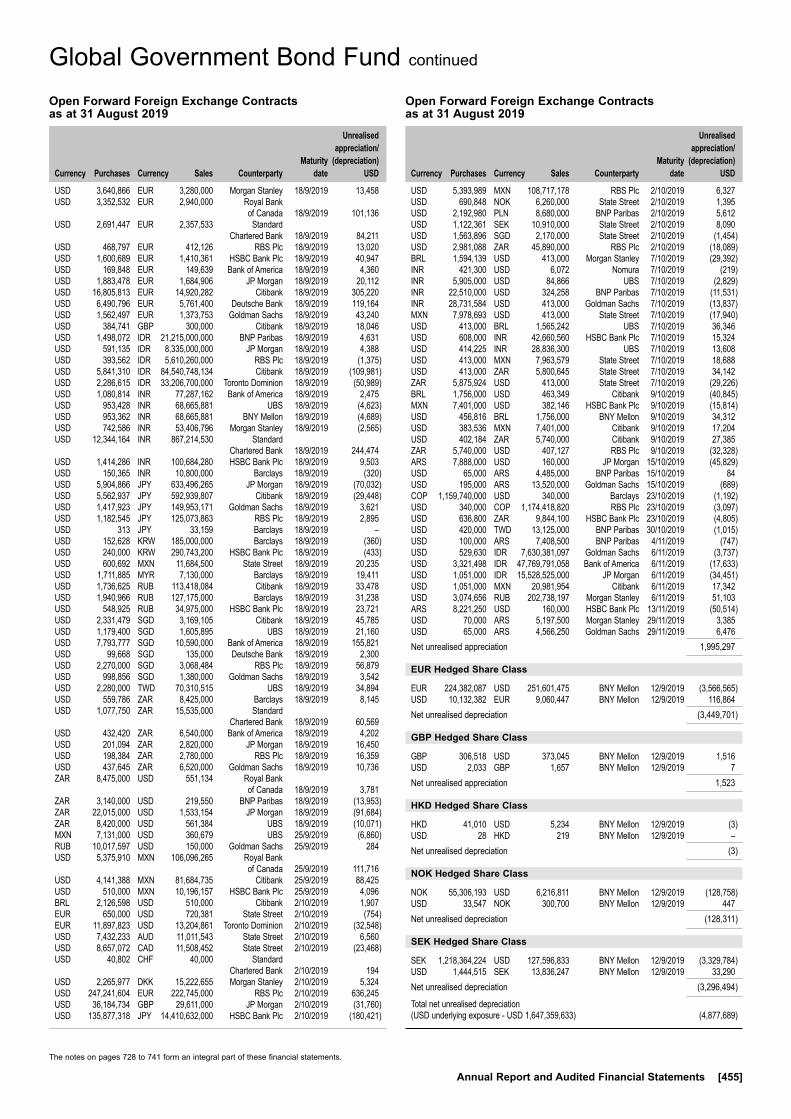
The notes on pages 728 to 741 form an integral part of these financial statements.
Annual Report and Audited Financial Statements [455]
Global Government Bond Fund continued
USD 3,640,866 EUR 3,280,000 Morgan Stanley 18/9/2019 13,458USD 3,352,532 EUR 2,940,000 Royal Bank of Canada 18/9/2019 101,136USD 2,691,447 EUR 2,357,533 Standard Chartered Bank 18/9/2019 84,211USD 468,797 EUR 412,126 RBS Plc 18/9/2019 13,020USD 1,600,689 EUR 1,410,361 HSBC Bank Plc 18/9/2019 40,947USD 169,848 EUR 149,639 Bank of America 18/9/2019 4,360USD 1,883,478 EUR 1,684,906 JP Morgan 18/9/2019 20,112USD 16,805,813 EUR 14,920,282 Citibank 18/9/2019 305,220USD 6,490,796 EUR 5,761,400 Deutsche Bank 18/9/2019 119,164USD 1,562,497 EUR 1,373,753 Goldman Sachs 18/9/2019 43,240USD 384,741 GBP 300,000 Citibank 18/9/2019 18,046USD 1,498,072 IDR 21,215,000,000 BNP Paribas 18/9/2019 4,631USD 591,135 IDR 8,335,000,000 JP Morgan 18/9/2019 4,388USD 393,562 IDR 5,610,260,000 RBS Plc 18/9/2019 (1,375)USD 5,841,310 IDR 84,540,748,134 Citibank 18/9/2019 (109,981)USD 2,286,615 IDR 33,206,700,000 Toronto Dominion 18/9/2019 (50,989)USD 1,080,814 INR 77,287,162 Bank of America 18/9/2019 2,475USD 953,428 INR 68,665,881 UBS 18/9/2019 (4,623)USD 953,362 INR 68,665,881 BNY Mellon 18/9/2019 (4,689)USD 742,586 INR 53,406,796 Morgan Stanley 18/9/2019 (2,565)USD 12,344,164 INR 867,214,530 Standard Chartered Bank 18/9/2019 244,474USD 1,414,286 INR 100,684,280 HSBC Bank Plc 18/9/2019 9,503USD 150,365 INR 10,800,000 Barclays 18/9/2019 (320)USD 5,904,866 JPY 633,496,265 JP Morgan 18/9/2019 (70,032)USD 5,562,937 JPY 592,939,807 Citibank 18/9/2019 (29,448)USD 1,417,923 JPY 149,953,171 Goldman Sachs 18/9/2019 3,621USD 1,182,545 JPY 125,073,863 RBS Plc 18/9/2019 2,895USD 313 JPY 33,159 Barclays 18/9/2019 –USD 152,628 KRW 185,000,000 Barclays 18/9/2019 (360)USD 240,000 KRW 290,743,200 HSBC Bank Plc 18/9/2019 (433)USD 600,692 MXN 11,684,500 State Street 18/9/2019 20,235USD 1,711,885 MYR 7,130,000 Barclays 18/9/2019 19,411USD 1,736,625 RUB 113,418,084 Citibank 18/9/2019 33,478USD 1,940,966 RUB 127,175,000 Barclays 18/9/2019 31,238USD 548,925 RUB 34,975,000 HSBC Bank Plc 18/9/2019 23,721USD 2,331,479 SGD 3,169,105 Citibank 18/9/2019 45,785USD 1,179,400 SGD 1,605,895 UBS 18/9/2019 21,160USD 7,793,777 SGD 10,590,000 Bank of America 18/9/2019 155,821USD 99,668 SGD 135,000 Deutsche Bank 18/9/2019 2,300USD 2,270,000 SGD 3,068,484 RBS Plc 18/9/2019 56,879USD 998,856 SGD 1,380,000 Goldman Sachs 18/9/2019 3,542USD 2,280,000 TWD 70,310,515 UBS 18/9/2019 34,894USD 559,786 ZAR 8,425,000 Barclays 18/9/2019 8,145USD 1,077,750 ZAR 15,535,000 Standard Chartered Bank 18/9/2019 60,569USD 432,420 ZAR 6,540,000 Bank of America 18/9/2019 4,202USD 201,094 ZAR 2,820,000 JP Morgan 18/9/2019 16,450USD 198,384 ZAR 2,780,000 RBS Plc 18/9/2019 16,359USD 437,645 ZAR 6,520,000 Goldman Sachs 18/9/2019 10,736ZAR 8,475,000 USD 551,134 Royal Bank of Canada 18/9/2019 3,781ZAR 3,140,000 USD 219,550 BNP Paribas 18/9/2019 (13,953)ZAR 22,015,000 USD 1,533,154 JP Morgan 18/9/2019 (91,684)ZAR 8,420,000 USD 561,384 UBS 18/9/2019 (10,071)MXN 7,131,000 USD 360,679 UBS 25/9/2019 (6,860)RUB 10,017,597 USD 150,000 Goldman Sachs 25/9/2019 284USD 5,375,910 MXN 106,096,265 Royal Bank of Canada 25/9/2019 111,716USD 4,141,388 MXN 81,684,735 Citibank 25/9/2019 88,425USD 510,000 MXN 10,196,157 HSBC Bank Plc 25/9/2019 4,096BRL 2,126,598 USD 510,000 Citibank 2/10/2019 1,907EUR 650,000 USD 720,381 State Street 2/10/2019 (754)EUR 11,897,823 USD 13,204,861 Toronto Dominion 2/10/2019 (32,548)USD 7,432,233 AUD 11,011,543 State Street 2/10/2019 6,560USD 8,657,072 CAD 11,508,452 State Street 2/10/2019 (23,468)USD 40,802 CHF 40,000 Standard Chartered Bank 2/10/2019 194USD 2,265,977 DKK 15,222,655 Morgan Stanley 2/10/2019 5,324USD 247,241,604 EUR 222,745,000 RBS Plc 2/10/2019 636,245USD 36,184,734 GBP 29,611,000 JP Morgan 2/10/2019 (31,760)USD 135,877,318 JPY 14,410,632,000 HSBC Bank Plc 2/10/2019 (180,421)
USD 5,393,989 MXN 108,717,178 RBS Plc 2/10/2019 6,327USD 690,848 NOK 6,260,000 State Street 2/10/2019 1,395USD 2,192,980 PLN 8,680,000 BNP Paribas 2/10/2019 5,612USD 1,122,361 SEK 10,910,000 State Street 2/10/2019 8,090USD 1,563,896 SGD 2,170,000 State Street 2/10/2019 (1,454)USD 2,981,088 ZAR 45,890,000 RBS Plc 2/10/2019 (18,089)BRL 1,594,139 USD 413,000 Morgan Stanley 7/10/2019 (29,392)INR 421,300 USD 6,072 Nomura 7/10/2019 (219)INR 5,905,000 USD 84,866 UBS 7/10/2019 (2,829)INR 22,510,000 USD 324,258 BNP Paribas 7/10/2019 (11,531)INR 28,731,584 USD 413,000 Goldman Sachs 7/10/2019 (13,837)MXN 7,978,693 USD 413,000 State Street 7/10/2019 (17,940)USD 413,000 BRL 1,565,242 UBS 7/10/2019 36,346USD 608,000 INR 42,660,560 HSBC Bank Plc 7/10/2019 15,324USD 414,225 INR 28,836,300 UBS 7/10/2019 13,608USD 413,000 MXN 7,963,579 State Street 7/10/2019 18,688USD 413,000 ZAR 5,800,645 State Street 7/10/2019 34,142ZAR 5,875,924 USD 413,000 State Street 7/10/2019 (29,226)BRL 1,756,000 USD 463,349 Citibank 9/10/2019 (40,845)MXN 7,401,000 USD 382,146 HSBC Bank Plc 9/10/2019 (15,814)USD 456,816 BRL 1,756,000 BNY Mellon 9/10/2019 34,312USD 383,536 MXN 7,401,000 Citibank 9/10/2019 17,204USD 402,184 ZAR 5,740,000 Citibank 9/10/2019 27,385ZAR 5,740,000 USD 407,127 RBS Plc 9/10/2019 (32,328)ARS 7,888,000 USD 160,000 JP Morgan 15/10/2019 (45,829)USD 65,000 ARS 4,485,000 BNP Paribas 15/10/2019 84USD 195,000 ARS 13,520,000 Goldman Sachs 15/10/2019 (689)COP 1,159,740,000 USD 340,000 Barclays 23/10/2019 (1,192)USD 340,000 COP 1,174,418,820 RBS Plc 23/10/2019 (3,097)USD 636,800 ZAR 9,844,100 HSBC Bank Plc 23/10/2019 (4,805)USD 420,000 TWD 13,125,000 BNP Paribas 30/10/2019 (1,015)USD 100,000 ARS 7,408,500 BNP Paribas 4/11/2019 (747)USD 529,630 IDR 7,630,381,097 Goldman Sachs 6/11/2019 (3,737)USD 3,321,498 IDR 47,769,791,058 Bank of America 6/11/2019 (17,633)USD 1,051,000 IDR 15,528,525,000 JP Morgan 6/11/2019 (34,451)USD 1,051,000 MXN 20,981,954 Citibank 6/11/2019 17,342USD 3,074,656 RUB 202,738,197 Morgan Stanley 6/11/2019 51,103ARS 8,221,250 USD 160,000 HSBC Bank Plc 13/11/2019 (50,514)USD 70,000 ARS 5,197,500 Morgan Stanley 29/11/2019 3,385USD 65,000 ARS 4,566,250 Goldman Sachs 29/11/2019 6,476Net unrealised appreciation 1,995,297
EUR Hedged Share Class
EUR 224,382,087 USD 251,601,475 BNY Mellon 12/9/2019 (3,566,565)USD 10,132,382 EUR 9,060,447 BNY Mellon 12/9/2019 116,864Net unrealised depreciation (3,449,701)
GBP Hedged Share Class
GBP 306,518 USD 373,045 BNY Mellon 12/9/2019 1,516USD 2,033 GBP 1,657 BNY Mellon 12/9/2019 7Net unrealised appreciation 1,523
HKD Hedged Share Class
HKD 41,010 USD 5,234 BNY Mellon 12/9/2019 (3)USD 28 HKD 219 BNY Mellon 12/9/2019 –Net unrealised depreciation (3)
NOK Hedged Share Class
NOK 55,306,193 USD 6,216,811 BNY Mellon 12/9/2019 (128,758)USD 33,547 NOK 300,700 BNY Mellon 12/9/2019 447Net unrealised depreciation (128,311)
SEK Hedged Share Class
SEK 1,218,364,224 USD 127,596,833 BNY Mellon 12/9/2019 (3,329,784)USD 1,444,515 SEK 13,836,247 BNY Mellon 12/9/2019 33,290Net unrealised depreciation (3,296,494)
Total net unrealised depreciation (USD underlying exposure - USD 1,647,359,633) (4,877,689)
Open Forward Foreign Exchange Contracts as at 31 August 2019
Currency
Purchases Currency
Sales Counterparty
Maturity date
Unrealised appreciation/
(depreciation) USD
Open Forward Foreign Exchange Contracts as at 31 August 2019
Currency
Purchases Currency
Sales Counterparty
Maturity date
Unrealised appreciation/
(depreciation) USD
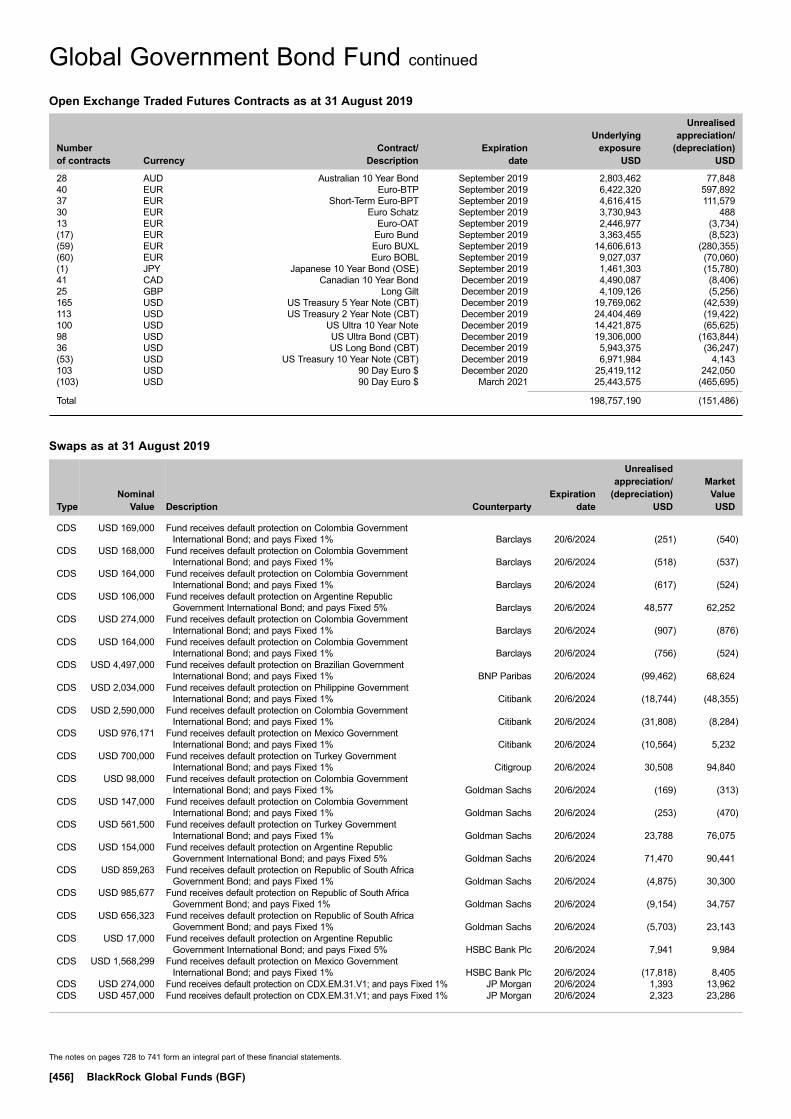
The notes on pages 728 to 741 form an integral part of these financial statements.
[456] BlackRock Global Funds (BGF)
Global Government Bond Fund continued
Swaps as at 31 August 2019
TypeNominal
Value Description Counterparty
Expiration date
Unrealised appreciation/
(depreciation) USD
Market Value USD
CDS USD 169,000 Fund receives default protection on Colombia Government International Bond; and pays Fixed 1% Barclays 20/6/2024 (251) (540)
CDS USD 168,000 Fund receives default protection on Colombia Government International Bond; and pays Fixed 1% Barclays 20/6/2024 (518) (537)
CDS USD 164,000 Fund receives default protection on Colombia Government International Bond; and pays Fixed 1% Barclays 20/6/2024 (617) (524)
CDS USD 106,000 Fund receives default protection on Argentine Republic Government International Bond; and pays Fixed 5% Barclays 20/6/2024 48,577 62,252
CDS USD 274,000 Fund receives default protection on Colombia Government International Bond; and pays Fixed 1% Barclays 20/6/2024 (907) (876)
CDS USD 164,000 Fund receives default protection on Colombia Government International Bond; and pays Fixed 1% Barclays 20/6/2024 (756) (524)
CDS USD 4,497,000 Fund receives default protection on Brazilian Government International Bond; and pays Fixed 1% BNP Paribas 20/6/2024 (99,462) 68,624
CDS USD 2,034,000 Fund receives default protection on Philippine Government International Bond; and pays Fixed 1% Citibank 20/6/2024 (18,744) (48,355)
CDS USD 2,590,000 Fund receives default protection on Colombia Government International Bond; and pays Fixed 1% Citibank 20/6/2024 (31,808) (8,284)
CDS USD 976,171 Fund receives default protection on Mexico Government International Bond; and pays Fixed 1% Citibank 20/6/2024 (10,564) 5,232
CDS USD 700,000 Fund receives default protection on Turkey Government International Bond; and pays Fixed 1% Citigroup 20/6/2024 30,508 94,840
CDS USD 98,000 Fund receives default protection on Colombia Government International Bond; and pays Fixed 1% Goldman Sachs 20/6/2024 (169) (313)
CDS USD 147,000 Fund receives default protection on Colombia Government International Bond; and pays Fixed 1% Goldman Sachs 20/6/2024 (253) (470)
CDS USD 561,500 Fund receives default protection on Turkey Government International Bond; and pays Fixed 1% Goldman Sachs 20/6/2024 23,788 76,075
CDS USD 154,000 Fund receives default protection on Argentine Republic Government International Bond; and pays Fixed 5% Goldman Sachs 20/6/2024 71,470 90,441
CDS USD 859,263 Fund receives default protection on Republic of South Africa Government Bond; and pays Fixed 1% Goldman Sachs 20/6/2024 (4,875) 30,300
CDS USD 985,677 Fund receives default protection on Republic of South Africa Government Bond; and pays Fixed 1% Goldman Sachs 20/6/2024 (9,154) 34,757
CDS USD 656,323 Fund receives default protection on Republic of South Africa Government Bond; and pays Fixed 1% Goldman Sachs 20/6/2024 (5,703) 23,143
CDS USD 17,000 Fund receives default protection on Argentine Republic Government International Bond; and pays Fixed 5% HSBC Bank Plc 20/6/2024 7,941 9,984
CDS USD 1,568,299 Fund receives default protection on Mexico Government International Bond; and pays Fixed 1% HSBC Bank Plc 20/6/2024 (17,818) 8,405
CDS USD 274,000 Fund receives default protection on CDX.EM.31.V1; and pays Fixed 1% JP Morgan 20/6/2024 1,393 13,962CDS USD 457,000 Fund receives default protection on CDX.EM.31.V1; and pays Fixed 1% JP Morgan 20/6/2024 2,323 23,286
Open Exchange Traded Futures Contracts as at 31 August 2019
Number of contracts Currency
Contract/ Description
Expiration date
Underlying exposure
USD
Unrealised appreciation/
(depreciation) USD
28 AUD Australian 10 Year Bond September 2019 2,803,462 77,84840 EUR Euro-BTP September 2019 6,422,320 597,89237 EUR Short-Term Euro-BPT September 2019 4,616,415 111,57930 EUR Euro Schatz September 2019 3,730,943 48813 EUR Euro-OAT September 2019 2,446,977 (3,734)(17) EUR Euro Bund September 2019 3,363,455 (8,523)(59) EUR Euro BUXL September 2019 14,606,613 (280,355)(60) EUR Euro BOBL September 2019 9,027,037 (70,060)(1) JPY Japanese 10 Year Bond (OSE) September 2019 1,461,303 (15,780)41 CAD Canadian 10 Year Bond December 2019 4,490,087 (8,406)25 GBP Long Gilt December 2019 4,109,126 (5,256)165 USD US Treasury 5 Year Note (CBT) December 2019 19,769,062 (42,539)113 USD US Treasury 2 Year Note (CBT) December 2019 24,404,469 (19,422)100 USD US Ultra 10 Year Note December 2019 14,421,875 (65,625)98 USD US Ultra Bond (CBT) December 2019 19,306,000 (163,844)36 USD US Long Bond (CBT) December 2019 5,943,375 (36,247)(53) USD US Treasury 10 Year Note (CBT) December 2019 6,971,984 4,143103 USD 90 Day Euro $ December 2020 25,419,112 242,050(103) USD 90 Day Euro $ March 2021 25,443,575 (465,695)
Total 198,757,190 (151,486)

The notes on pages 728 to 741 form an integral part of these financial statements.
Annual Report and Audited Financial Statements [457]
Global Government Bond Fund continued
Swaps as at 31 August 2019
TypeNominal
Value Description Counterparty
Expiration date
Unrealised appreciation/
(depreciation) USD
Market Value USD
CDS USD 246,000 Fund receives default protection on Mexico Government International Bond; and pays Fixed 1% JP Morgan 20/6/2024 (1,204) 1,318
CDS USD 246,000 Fund receives default protection on Mexico Government International Bond; and pays Fixed 1% JP Morgan 20/6/2024 (1,094) 1,318
CDS USD 246,000 Fund receives default protection on Mexico Government International Bond; and pays Fixed 1% JP Morgan 20/6/2024 (1,424) 1,318
CDS USD 335,000 Fund receives default protection on Mexico Government International Bond; and pays Fixed 1% JP Morgan 20/6/2024 (2,014) 1,795
CDS USD 246,000 Fund receives default protection on Mexico Government International Bond; and pays Fixed 1% JP Morgan 20/6/2024 (1,369) 1,319
CDS USD 246,000 Fund receives default protection on Mexico Government International Bond; and pays Fixed 1% JP Morgan 20/6/2024 (1,259) 1,318
CDS USD 2,647,000 Fund receives default protection on Brazilian Government International Bond; and pays Fixed 1% Morgan Stanley 20/6/2024 (47,534) 40,393
CDS USD 383,000 Fund receives default protection on Qatar Government International Bond; and pays Fixed 1% Morgan Stanley 20/6/2024 (3,751) (9,098)
CDS USD 246,000 Fund receives default protection on Colombia Government International Bond; and pays Fixed 1% Morgan Stanley 20/6/2024 582 (787)
CDS USD 246,000 Fund receives default protection on Colombia Government International Bond; and pays Fixed 1% Morgan Stanley 20/6/2024 411 (787)
CDS USD 245,000 Fund receives default protection on Colombia Government International Bond; and pays Fixed 1% Morgan Stanley 20/6/2024 465 (784)
CDS USD 246,000 Fund receives default protection on Colombia Government International Bond; and pays Fixed 1% Morgan Stanley 20/6/2024 525 (787)
CDS USD 245,000 Fund receives default protection on Colombia Government International Bond; and pays Fixed 1% Morgan Stanley 20/6/2024 576 (784)
CDS USD 245,000 Fund receives default protection on Colombia Government International Bond; and pays Fixed 1% Morgan Stanley 20/6/2024 747 (784)
IFS EUR 2,595,000 Fund provides default protection on CPTFEMU + 0 bps; and receives Fixed 1.0153% Credit Suisse 16/7/2024 29,215 29,215
IFS EUR 2,900,000 Fund provides default protection on CPTFEMU + 0 bps; and receives Fixed 1% Credit Suisse 16/7/2024 30,007 30,007
IFS EUR 5,250,000 Fund provides default protection on CPTFEMU + 0 bps; and receives Fixed 0.82% Credit Suisse 16/8/2024 (4,348) (4,348)
IFS EUR 1,020,000 Fund provides default protection on CPTFEMU + 0 bps; and receives Fixed 0.88% Credit Suisse 16/8/2024 2,034 2,034
IFS EUR 2,595,000 Fund receives default protection on CPTFEMU + 0 bps; and pays Fixed 1.2% Credit Suisse 16/7/2029 (62,219) (62,219)
IFS EUR 2,900,000 Fund provides default protection on CPTFEMU + 0 bps; and receives Fixed 1.16% Credit Suisse 16/7/2029 (54,573) (54,573)
IFS EUR 5,250,000 Fund receives default protection on CPTFEMU + 0 bps; and pays Fixed 1.00375% Credit Suisse 16/8/2029 15,093 15,093
IFS EUR 1,020,000 Fund receives default protection on CPTFEMU + 0 bps; and pays Fixed 1.0683% Credit Suisse 16/8/2029 (5,450) (5,450)
IRS MXN 17,548,717 Fund receives Floating MXN MXIBTIIE 1 Month; and pays Fixed 6.9% Bank of America 26/7/2021 (2,660) (2,660)IRS MXN 3,656,203 Fund receives Floating MXN MXIBTIIE 1 Month; and pays Fixed 7.21% Bank of America 25/7/2022 (1,744) (1,744)IRS USD 1,446,484 Fund receives Fixed 1.84791%; and pays Floating USD LIBOR 3 Month Bank of America 18/9/2024 33,958 36,707IRS INR 207,250,000 Fund receives Floating INR MIBOR 6 Month; and pays Fixed 5.954% Bank of America 18/9/2024 (119,136) (119,136)IRS INR 201,812,256 Fund receives Floating INR MIBOR 6 Month; and pays Fixed 5.507% Citibank 18/9/2024 (60,813) (60,813)IRS INR 110,440,000 Fund receives Floating INR MIBOR 6 Month; and pays Fixed 5.7875% Citibank 18/9/2024 (52,234) (52,234)IRS MXN 12,572,954 Fund receives Floating MXN MXIBTIIE 1 Month; and pays Fixed 6.86% Credit Suisse 23/7/2021 (1,654) (1,654)IRS MXN 55,519,828 Fund receives Floating MXN MXIBTIIE 1 Month; and pays Fixed 6.78% Credit Suisse 6/8/2021 (5,783) (5,783)IRS EUR 10,090,000 Fund receives Floating EUR EURIBOR 6 Month; and pays Fixed
-0.50668% Credit Suisse 12/8/2021 (13,474) (10,461)IRS CZK 68,648,727 Fund receives Floating CZK Interbank 6 Month; and pays Fixed 1.64% Credit Suisse 19/8/2021 7,216 7,216IRS CZK 68,632,255 Fund receives Floating CZK Interbank 6 Month;
and pays Fixed 1.6575% Credit Suisse 20/8/2021 6,024 6,024IRS CZK 34,622,500 Fund receives Floating CZK Interbank 6 Month; and pays Fixed 1.72% Credit Suisse 20/8/2021 1,219 1,219IRS HUF 854,804,140 Fund receives Fixed 0.295%; and pays Floating HUF BUBOR 6 Month Credit Suisse 21/8/2021 (5,228) (5,228)IRS HUF 855,009,301 Fund receives Fixed 0.305%; and pays Floating HUF BUBOR 6 Month Credit Suisse 21/8/2021 (4,667) (4,667)IRS HUF 431,888,750 Fund receives Fixed 0.3125%; and pays Floating HUF BUBOR 6 Month Credit Suisse 22/8/2021 (2,147) (2,147)IRS HUF 863,734,311 Fund receives Fixed 0.34%; and pays Floating HUF BUBOR 6 Month Credit Suisse 23/8/2021 (2,872) (2,872)IRS CZK 69,241,538 Fund receives Floating CZK Interbank 6 Month; and pays Fixed 1.775% Credit Suisse 23/8/2021 (731) (731)IRS HUF 480,485,844 Fund receives Fixed 0.375%; and pays Floating HUF BUBOR 6 Month Credit Suisse 26/8/2021 (507) (507)IRS CZK 38,518,302 Fund receives Floating CZK Interbank 6 Month; and pays Fixed 1.775% Credit Suisse 26/8/2021 (462) (462)IRS HUF 483,098,985 Fund receives Fixed 0.36%; and pays Floating HUF BUBOR 6 Month Credit Suisse 29/8/2021 (848) (848)IRS CZK 38,539,348 Fund receives Floating CZK Interbank 6 Month; and pays Fixed 1.74% Credit Suisse 29/8/2021 617 617IRS HUF 437,915,435 Fund receives Fixed 0.31%; and pays Floating HUF BUBOR 6 Month Credit Suisse 30/8/2021 (2,150) (2,150)IRS CZK 34,881,655 Fund receives Floating CZK Interbank 6 Month; and pays Fixed 1.715% Credit Suisse 30/8/2021 1,301 1,301IRS HUF 757,986,675 Fund receives Fixed 0.36%; and pays Floating HUF BUBOR 6 Month Credit Suisse 2/9/2021 (1,245) (1,245)IRS CZK 61,176,657 Fund receives Floating CZK Interbank 6 Month; and pays Fixed 1.74% Credit Suisse 2/9/2021 788 788

The notes on pages 728 to 741 form an integral part of these financial statements.
[458] BlackRock Global Funds (BGF)
Swaps as at 31 August 2019
TypeNominal
Value Description Counterparty
Expiration date
Unrealised appreciation/
(depreciation) USD
Market Value USD
IRS PLN 15,729,418 Fund receives Fixed 1.6886%; and pays Floating PLN WIBOR 6 Month Credit Suisse 18/9/2021 4,695 4,695IRS PLN 5,390,000 Fund receives Fixed 1.7%; and pays Floating PLN WIBOR 6 Month Credit Suisse 18/9/2021 1,911 1,911IRS PLN 6,730,000 Fund receives Fixed 1.716%; and pays Floating PLN WIBOR 6 Month Credit Suisse 18/9/2021 2,916 2,916IRS PLN 9,690,000 Fund receives Fixed 1.717%; and pays Floating PLN WIBOR 6 Month Credit Suisse 18/9/2021 4,247 4,247IRS PLN 6,730,000 Fund receives Fixed 1.721%; and pays Floating PLN WIBOR 6 Month Credit Suisse 18/9/2021 3,082 3,082IRS MXN 13,580,181 Fund receives Floating MXN MXIBTIIE 1 Month; and pays Fixed 7.23% Credit Suisse 18/7/2022 (6,744) (6,744)IRS MXN 6,791,077 Fund receives Floating MXN MXIBTIIE 1 Month; and pays Fixed 7.23% Credit Suisse 19/7/2022 (3,378) (3,378)IRS MXN 2,611,573 Fund receives Floating MXN MXIBTIIE 1 Month; and pays Fixed 7.22% Credit Suisse 20/7/2022 (1,267) (1,267)IRS MXN 24,879,966 Fund receives Floating MXN MXIBTIIE 1 Month; and pays Fixed 7.2% Credit Suisse 3/8/2022 (11,727) (11,727)IRS GBP 30,110,000 Fund receives Fixed 0.545%; and pays Floating GBP LIBOR 6 Month Credit Suisse 6/8/2022 (5,512) (5,512)IRS MXN 31,704,000 Fund receives Fixed 7%; and pays Floating MXN MXIBTIIE 1 Month Credit Suisse 11/8/2022 6,639 6,639IRS GBP 30,740,000 Fund receives Fixed 0.585%; and pays Floating GBP LIBOR 6 Month Credit Suisse 16/8/2022 9,299 9,299IRS JPY 524,000,000 Fund receives Fixed 0.14%; and pays Floating JPY LIBOR 6 Month Credit Suisse 20/9/2023 62,347 62,347IRS MXN 10,599,034 Fund receives Fixed 6.73%; and pays Floating MXN MXIBTIIE 1 Month Credit Suisse 9/8/2024 (772) (772)IRS MXN 23,316,966 Fund receives Fixed 6.67%; and pays Floating MXN MXIBTIIE 1 Month Credit Suisse 12/8/2024 (4,587) (4,587)IRS MXN 20,064,000 Fund receives Fixed 6.715%; and pays Floating MXN MXIBTIIE
1 Month Credit Suisse 13/8/2024 (2,045) (2,045)IRS SEK 32,860,000 Fund receives Fixed -0.0725%; and pays Floating SEK STIBOR
3 Month Credit Suisse 14/8/2024 15,341 15,341IRS SEK 32,860,000 Fund receives Fixed -0.0775%; and pays Floating SEK STIBOR
3 Month Credit Suisse 14/8/2024 14,507 14,507IRS EUR 6,080,000 Fund receives Floating EUR EURIBOR 6 Month; and pays Fixed
-0.43507% Credit Suisse 14/8/2024 (32,286) (32,659)IRS USD 1,085,878 Fund receives Fixed 1.527%; and pays Floating USD LIBOR 3 Month Credit Suisse 18/9/2024 10,688 10,688IRS USD 357,638 Fund receives Fixed 1.786%; and pays Floating USD LIBOR 3 Month Credit Suisse 18/9/2024 8,004 8,004IRS SGD 1,045,787 Fund receives Floating SGD SGDOW 6 Month; and pays Fixed 1.57% Credit Suisse 18/9/2024 (1,589) (1,589)IRS SGD 427,153 Fund receives Floating SGD SGDOW 6 Month; and pays Fixed
1.5725% Credit Suisse 18/9/2024 (686) (686)IRS SGD 485,100 Fund receives Floating SGD SGDOW 6 Month; and pays Fixed
1.6225% Credit Suisse 18/9/2024 (1,627) (1,627)IRS SGD 981,960 Fund receives Floating SGD SGDOW 6 Month; and pays Fixed
1.635% Credit Suisse 18/9/2024 (3,722) (3,722)IRS SGD 980,000 Fund receives Floating SGD SGDOW 6 Month; and pays Fixed
1.6625% Credit Suisse 18/9/2024 (4,656) (4,656)IRS JPY 237,000,000 Fund receives Floating JPY LIBOR 6 Month; and pays Fixed 0.3535% Credit Suisse 20/9/2028 (98,929) (98,929)IRS JPY 154,000,000 Fund receives Fixed -0.073%; and pays Floating JPY LIBOR 6 Month Credit Suisse 18/12/2029 4,922 4,922IRS BRL 5,601,736 Fund receives Fixed 8.345%; and pays Floating BRL BROIS 1 Day Goldman Sachs 2/1/2023 90,566 90,566IRS INR 120,372,000 Fund receives Floating INR MIBOR 6 Month; and pays Fixed 5.55% Goldman Sachs 18/9/2024 (39,439) (39,439)IRS INR 107,715,744 Fund receives Floating INR MIBOR 6 Month; and pays Fixed 5.51% HSBC Bank Plc 18/9/2024 (32,656) (32,656)IRS BRL 2,615,880 Fund receives Fixed 8.26%; and pays Floating BRL BROIS 1 Day JP Morgan 2/1/2023 40,257 40,257IRS BRL 5,878,444 Fund receives Fixed 8.27%; and pays Floating BRL BROIS 1 Day JP Morgan 2/1/2023 91,003 91,003
Total (USD underlying exposure - USD 240,027,835) (230,613) 362,564
CDS: Credit Default Swaps IFS: Inflation SwapsIRS: Interest Rate Swaps
Global Government Bond Fund continued
Purchased Options as at 31 August 2019
Number of contracts
Call/ Put
Description Counterparty
Strike Price
Expiration date
Unrealised appreciation/
(depreciation) USD
Market Value USD
15,237,000 Put OTC EUR/USD Bank of America EUR 1.1175 3/10/2019 139,285 210,679 7,525,000 Put OTC EUR/GBP Bank of America EUR 0.87 20/12/2019 17,369 87,775 4,620,000 Put OTC EUR/GBP Goldman Sachs EUR 0.88 22/1/2020 16,382 51,192 82 Put Euro Bund Exchange Traded EUR 173 25/10/2019 (33,070) 27,627
Total (USD underlying exposure - USD 17,940,713) 139,966 377,273

The notes on pages 728 to 741 form an integral part of these financial statements.
Annual Report and Audited Financial Statements [459]
Global Government Bond Fund continued
To Be Announced Securities Contracts as at 31 August 2019
Holding Description
Market Value (USD)
% of Net
Assets
TBA
United States USD 16,623,000 Fannie Mae or Freddie Mac
‘3 9/19’ 3% TBA 16,919,745 2.29 USD 16,623,000 Fannie Mae or Freddie Mac
‘3.5 10/19’ 3.5% TBA 17,074,288 2.31 USD 3,100,000 Fannie Mae or Freddie Mac
‘4 9/19’ 4% TBA 3,214,918 0.43 USD 13,500,000 Fannie Mae or Freddie Mac
‘4 10/19’ 4% TBA 14,012,050 1.89 USD 2,800,000 Fannie Mae or Freddie Mac
‘4.5 9/19’ 4.5% TBA 2,944,922 0.40 USD 2,400,000 Fannie Mae or Freddie Mac
‘4.5 10/19’ 4.5% TBA 2,525,344 0.34
Total TBA (USD underlying exposure - USD 56,691,267) 56,691,267 7.66
To Be Announced (“TBA”) contracts are primarily classified by the country of incorporation of the issuer of the pass-through agency.

Transferable Securities and Money Market Instruments Admitted to an Official Stock Exchange Listing or Dealt in on Another Regulated Market
Transferable Securities and Money Market Instruments Admitted to an Official Stock Exchange Listing or Dealt in on Another Regulated Market
Holding
Description
Market Value (USD)
% of Net
Assets
Holding
Description
Market Value (USD)
% of Net
Assets
* All or a portion of this security represents a security on loan.
The notes on pages 728 to 741 form an integral part of these financial statements.
[460] BlackRock Global Funds (BGF)
COMMON / PREFERRED STOCKS (SHARES)
Canada 86,025 Stars Group Inc/The 1,322,412 0.11
Italy 713,922 Telecom Italia SpA/Milano 381,377 0.03
Netherlands 175,830 Constellium SE ‘A’ 2,101,168 0.17
United Kingdom 19,739 International Game Technology Plc 240,026 0.02
United States 261,029 Clear Channel Outdoor Holdings Inc* 696,947 0.06 12,884 Crown Holdings Inc* 851,761 0.07 373,987 Element Solutions Inc 3,459,380 0.28 233,495 GMAC Capital Trust I (Pref) 6,131,579 0.50 128,786 UCI International Inc 2,929,882 0.24 14,069,549 1.15Total Common / Preferred Stocks (Shares) 18,114,532 1.48
BONDS
Argentina USD 1,760,000 Argentine Republic Government
International Bond 6.875% 11/1/2048 692,560 0.06
USD 911,000 YPF SA 7% 15/12/2047 539,045 0.04 USD 2,441,000 YPF SA ‘144A’ 8.5% 28/7/2025 1,599,587 0.13 2,831,192 0.23
Austria EUR 400,000 Erste Group Bank AG FRN
15/10/2021 (Perpetual)* 509,106 0.04 EUR 800,000 Erste Group Bank AG FRN
15/4/2024 (Perpetual) 1,011,965 0.08 USD 1,600,000 Klabin Austria GmbH ‘144A’ 5.75%
3/4/2029* 1,686,250 0.14 EUR 300,000 Sappi Papier Holding GmbH 4%
1/4/2023 339,933 0.03 USD 740,000 Suzano Austria GmbH 5% 15/1/2030 760,350 0.06 USD 1,200,000 Suzano Austria GmbH 6% 15/1/2029 1,336,500 0.11 5,644,104 0.46
Azerbaijan USD 2,151,000 State Oil Co of the Azerbaijan
Republic 4.75% 13/3/2023 2,258,214 0.18
Bahamas USD 2,389,000 Intercorp Peru Ltd 3.875%
15/8/2029* 2,409,904 0.20
Belgium EUR 828,000 House of Finance NV/The
4.375% 15/7/2026 949,609 0.08 EUR 200,000 Solvay SA FRN 4/12/2023
(Perpetual) 244,288 0.02 1,193,897 0.10
Bermuda USD 775,000 China Singyes Solar Technologies
Holdings Ltd (Defaulted) 7.95% 15/2/2019 656,812 0.06
USD 236,000 Digicel Group One Ltd 8.25% 30/12/2022 130,980 0.01
USD 3,037,375 Digicel Group Two Ltd 8.25% 30/9/2022 622,662 0.05
USD 1,000,000 GCL New Energy Holdings Ltd 7.1% 30/1/2021 955,469 0.08
USD 1,000,000 Hopson Development Holdings Ltd 7.5% 27/6/2022 991,250 0.08
USD 2,258,000 Inkia Energy Ltd 5.875% 9/11/2027 2,357,493 0.19 USD 2,620,000 Viking Cruises Ltd ‘144A’ 5.875%
15/9/2027 2,737,140 0.22 8,451,806 0.69
Brazil USD 3,072,000 Banco Bradesco SA/Cayman
Islands ‘144A’ 5.9% 16/1/2021 3,181,920 0.26 USD 3,839,000 Banco do Brasil SA/Cayman FRN
15/4/2024 (Perpetual) 3,723,830 0.30 USD 500,000 Banco do Brasil SA/Cayman 3.875%
10/10/2022 508,100 0.04 USD 3,155,000 Banco do Brasil SA/Cayman 4.75%
20/3/2024* 3,308,313 0.27 USD 2,818,000 Globo Comunicacao e
Participacoes SA (Step-up coupon) 4.843% 8/6/2025 2,934,243 0.24
USD 2,239,000 Itau Unibanco Holding SA/Cayman Island FRN 19/3/2023 (Perpetual)* 2,295,199 0.19
USD 750,000 Itau Unibanco Holding SA/Cayman Island ‘144A’ 5.125% 13/5/2023 781,172 0.07
USD 4,544,000 Itau Unibanco Holding SA/Cayman Island 5.75% 22/1/2021 4,697,360 0.38
21,430,137 1.75
British Virgin Islands USD 1,556,000 Central American Bottling Corp
5.75% 31/1/2027 1,653,493 0.13 USD 600,000 Easy Tactic Ltd 8.125% 27/2/2023 579,000 0.05 USD 335,000 Easy Tactic Ltd 8.125% 11/7/2024 316,759 0.02 USD 600,000 Easy Tactic Ltd 8.625% 27/2/2024* 583,500 0.05 USD 365,000 Easy Tactic Ltd 9.125% 28/7/2022 377,572 0.03 USD 600,000 ENN Clean Energy International
Investment Ltd 7.5% 27/2/2021* 610,500 0.05 USD 400,000 Greenland Global Investment Ltd
FRN 26/9/2021* 405,450 0.03 USD 420,000 Knight Castle Investments Ltd
7.99% 23/1/2021 199,500 0.02 USD 815,000 New Lion Bridge Co Ltd 9.75%
10/10/2020 738,785 0.06 USD 400,000 New Metro Global Ltd 7.125%
23/5/2021* 378,126 0.03 USD 400,000 Nuoxi Capital Ltd 7.45% 16/10/2022 355,001 0.03 USD 400,000 Nuoxi Capital Ltd 7.5% 28/1/2022 363,875 0.03 USD 400,000 Nuoxi Capital Ltd 7.875% 24/6/2021 370,000 0.03 USD 362,000 Prime Bloom Holdings Ltd 6.95%
5/7/2022 266,240 0.02 USD 500,000 Prime Bloom Holdings Ltd 7.5%
19/12/2019* 461,250 0.04 USD 400,000 RKPF Overseas 2019 A Ltd 7.875%
1/2/2023* 419,020 0.03 USD 600,000 Rock International Investment Inc
6.625% 27/3/2020* 459,690 0.04 USD 1,600,000 Scenery Journey Ltd 13% 6/11/2022 1,606,750 0.13 USD 450,000 Studio City Finance Ltd 7.25%
11/2/2024* 473,063 0.04 USD 600,000 Tsinghua Unic Ltd 4.75% 31/1/2021 580,293 0.05 USD 465,000 Tuspark Forward Ltd 7.9% 7/3/2021 467,301 0.04 11,665,168 0.95
Global High Yield Bond Fund
Portfolio of Investments 31 August 2019
Global High Yield Bond Fund

Transferable Securities and Money Market Instruments Admitted to an Official Stock Exchange Listing or Dealt in on Another Regulated Market
Transferable Securities and Money Market Instruments Admitted to an Official Stock Exchange Listing or Dealt in on Another Regulated Market
Holding
Description
Market Value (USD)
% of Net
Assets
Holding
Description
Market Value (USD)
% of Net
Assets
* All or a portion of this security represents a security on loan.
The notes on pages 728 to 741 form an integral part of these financial statements.
Annual Report and Audited Financial Statements [461]
Canada USD 1,186,000 1011778 BC ULC / New Red
Finance Inc ‘144A’ 4.25% 15/5/2024 1,227,225 0.10
USD 5,878,000 1011778 BC ULC / New Red Finance Inc ‘144A’ 5% 15/10/2025* 6,076,382 0.50
EUR 4,311,000 Bausch Health Cos Inc 4.5% 15/5/2023 4,836,158 0.39
USD 1,937,000 Bausch Health Cos Inc ‘144A’ 5.5% 1/3/2023 1,963,634 0.16
USD 1,546,000 Bausch Health Cos Inc ‘144A’ 5.5% 1/11/2025 1,626,454 0.13
USD 359,000 Bausch Health Cos Inc ‘144A’ 5.75% 15/8/2027 385,028 0.03
USD 1,248,000 Bausch Health Cos Inc ‘144A’ 5.875% 15/5/2023* 1,268,280 0.10
USD 5,000 Bausch Health Cos Inc ‘144A’ 6.125% 15/4/2025 5,192 0.00
USD 3,009,000 Bausch Health Cos Inc ‘144A’ 7% 15/3/2024 3,192,549 0.26
USD 1,119,000 Bausch Health Cos Inc ‘144A’ 7% 15/1/2028 1,177,747 0.10
USD 2,023,000 Bausch Health Cos Inc ‘144A’ 7.25% 30/5/2029 2,139,323 0.17
USD 1,925,000 Bausch Health Cos Inc ‘144A’ 9% 15/12/2025 2,181,256 0.18
USD 360,000 Bombardier Inc ‘144A’ 5.75% 15/3/2022 364,500 0.03
USD 950,000 Bombardier Inc ‘144A’ 6.125% 15/1/2023 947,625 0.08
USD 1,263,000 Bombardier Inc ‘144A’ 7.5% 1/12/2024 1,259,842 0.10
USD 2,815,000 Bombardier Inc ‘144A’ 7.5% 15/3/2025 2,755,181 0.23
USD 5,958,000 Bombardier Inc ‘144A’ 7.875% 15/4/2027 5,794,155 0.47
USD 599,000 Bombardier Inc ‘144A’ 8.75% 1/12/2021 651,976 0.05
USD 1,766,000 Canacol Energy Ltd 7.25% 3/5/2025 1,861,750 0.15
GBP 916,000 Entertainment One Ltd 4.625% 15/7/2026 1,223,041 0.10
USD 249,000 Fairstone Financial Inc ‘144A’ 7.875% 15/7/2024 260,361 0.02
USD 290,000 First Quantum Minerals Ltd ‘144A’ 6.5% 1/3/2024 262,178 0.02
USD 863,000 First Quantum Minerals Ltd ‘144A’ 7.25% 15/5/2022 844,122 0.07
USD 1,040,000 GFL Environmental Inc ‘144A’ 7% 1/6/2026 1,073,800 0.09
USD 1,290,000 GFL Environmental Inc ‘144A’ 8.5% 1/5/2027 1,415,775 0.12
USD 449,000 Intertape Polymer Group Inc ‘144A’ 7% 15/10/2026 468,082 0.04
USD 388,000 Masonite International Corp ‘144A’ 5.375% 1/2/2028 410,310 0.03
USD 55,000 Masonite International Corp ‘144A’ 5.75% 15/9/2026 58,369 0.01
USD 259,000 Mattamy Group Corp ‘144A’ 6.875% 15/12/2023 270,979 0.02
USD 562,000 MDC Partners Inc ‘144A’ 6.5% 1/5/2024 514,230 0.04
USD 442,000 MEG Energy Corp ‘144A’ 6.375% 30/1/2023 419,348 0.03
USD 2,096,000 MEG Energy Corp ‘144A’ 6.5% 15/1/2025 2,114,340 0.17
USD 140,000 MEG Energy Corp ‘144A’ 7% 31/3/2024 133,875 0.01
USD 1,265,000 New Gold Inc ‘144A’ 6.25% 15/11/2022 1,239,700 0.10
USD 72,000 NOVA Chemicals Corp ‘144A’ 4.875% 1/6/2024 74,070 0.01
USD 550,000 Parkland Fuel Corp ‘144A’ 5.875% 15/7/2027 580,938 0.05
USD 897,000 Superior Plus LP / Superior General Partner Inc ‘144A’ 7% 15/7/2026 950,820 0.08
USD 306,000 Telesat Canada / Telesat LLC ‘144A’ 8.875% 15/11/2024 331,817 0.03
USD 764,000 Tervita Corp ‘144A’ 7.625% 1/12/2021 779,280 0.06 USD 443,000 Videotron Ltd ‘144A’ 5.125%
15/4/2027 469,580 0.04 USD 1,225,618 Xplornet Communications Inc
‘144A’ 9.625% 1/6/2022 1,247,066 0.10 54,856,338 4.47
Cayman Islands USD 805,000 21Vianet Group Inc 7.875%
15/10/2021 814,828 0.07 USD 400,000 Anton Oilfield Services Group/Hong
Kong 9.75% 5/12/2020 407,375 0.03 USD 400,000 CAR Inc 8.875% 10/5/2022 391,186 0.03 USD 1,200,000 Central China Real Estate Ltd
7.25% 24/4/2023* 1,164,010 0.10 USD 1,000,000 CFLD Cayman Investment Ltd
8.6% 8/4/2024* 983,750 0.08 USD 1,000,000 CFLD Cayman Investment Ltd
9% 31/7/2021 1,029,531 0.08 USD 400,000 China Aoyuan Group Ltd 5.375%
13/9/2022 385,976 0.03 USD 800,000 China Aoyuan Group Ltd 7.95%
7/9/2021 827,000 0.07 USD 600,000 China Aoyuan Group Ltd 7.95%
19/2/2023 610,022 0.05 HKD 4,000,000 China Evergrande Group 4.25%
14/2/2023 455,923 0.04 USD 248,000 China Evergrande Group 7.5%
28/6/2023* 215,101 0.02 USD 1,000,000 China Evergrande Group 8.25%
23/3/2022 921,563 0.08 USD 390,000 China Evergrande Group 9.5%
11/4/2022* 368,550 0.03 USD 400,000 China SCE Group Holdings Ltd
5.875% 10/3/2022 387,286 0.03 USD 1,000,000 China SCE Group Holdings Ltd
7.25% 19/4/2023 957,500 0.08 USD 400,000 China SCE Group Holdings Ltd
7.375% 9/4/2024 378,979 0.03 USD 400,000 China SCE Group Holdings Ltd
7.45% 17/4/2021 405,196 0.03 USD 400,000 CIFI Holdings Group Co Ltd 5.5%
23/1/2022 393,500 0.03 USD 600,000 CIFI Holdings Group Co Ltd 6.55%
28/3/2024* 578,809 0.05 USD 500,000 Esic Sukuk Ltd 3.939% 30/7/2024 502,500 0.04 USD 202,000 Fantasia Holdings Group Co Ltd
7.375% 4/10/2021 181,232 0.02 USD 420,000 Fantasia Holdings Group Co Ltd
8.375% 8/3/2021 394,209 0.03 USD 1,000,000 Fantasia Holdings Group Co Ltd
15% 18/12/2021* 1,029,687 0.09 USD 1,600,000 GEMS MENASA Cayman Ltd /
GEMS Education Delaware LLC 7.125% 31/7/2026 1,632,000 0.13
USD 1,401,000 Global Aircraft Leasing Co Ltd ‘144A’ 6.5% 15/9/2024 1,390,492 0.11
Global High Yield Bond Fund continued
Portfolio of Investments 31 August 2019
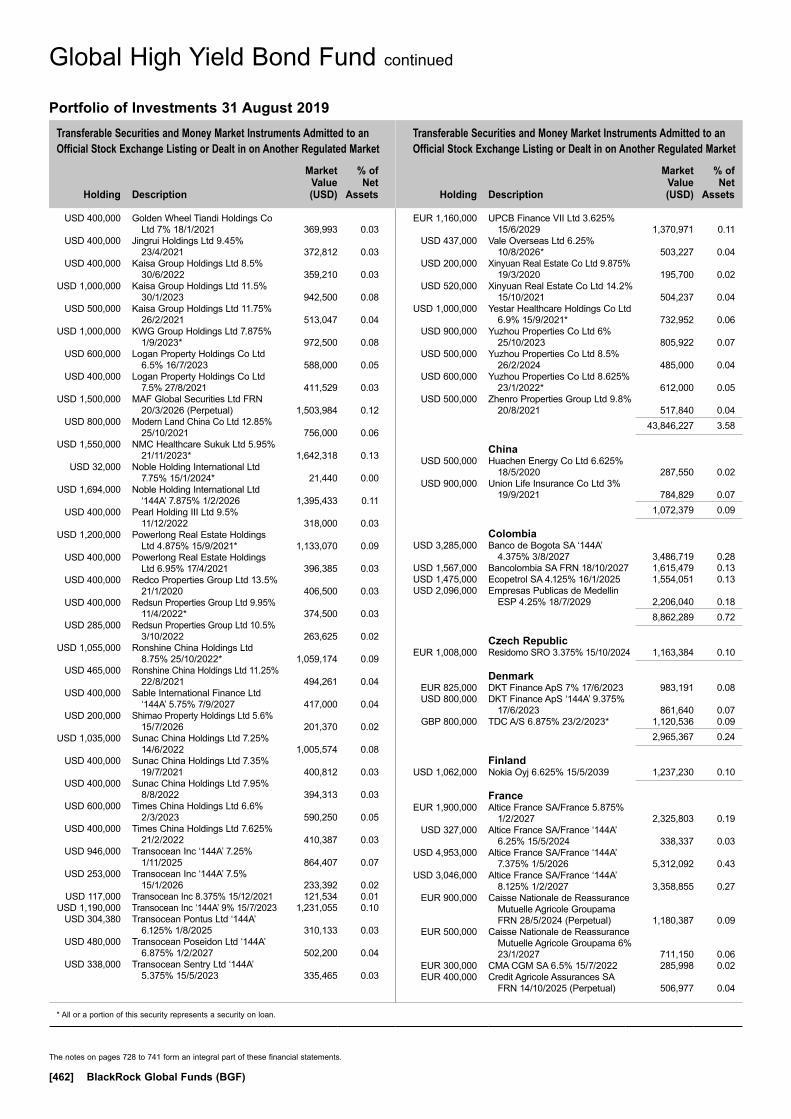
Transferable Securities and Money Market Instruments Admitted to an Official Stock Exchange Listing or Dealt in on Another Regulated Market
Transferable Securities and Money Market Instruments Admitted to an Official Stock Exchange Listing or Dealt in on Another Regulated Market
Holding
Description
Market Value (USD)
% of Net
Assets
Holding
Description
Market Value (USD)
% of Net
Assets
* All or a portion of this security represents a security on loan.
The notes on pages 728 to 741 form an integral part of these financial statements.
[462] BlackRock Global Funds (BGF)
USD 400,000 Golden Wheel Tiandi Holdings Co Ltd 7% 18/1/2021 369,993 0.03
USD 400,000 Jingrui Holdings Ltd 9.45% 23/4/2021 372,812 0.03
USD 400,000 Kaisa Group Holdings Ltd 8.5% 30/6/2022 359,210 0.03
USD 1,000,000 Kaisa Group Holdings Ltd 11.5% 30/1/2023 942,500 0.08
USD 500,000 Kaisa Group Holdings Ltd 11.75% 26/2/2021 513,047 0.04
USD 1,000,000 KWG Group Holdings Ltd 7.875% 1/9/2023* 972,500 0.08
USD 600,000 Logan Property Holdings Co Ltd 6.5% 16/7/2023 588,000 0.05
USD 400,000 Logan Property Holdings Co Ltd 7.5% 27/8/2021 411,529 0.03
USD 1,500,000 MAF Global Securities Ltd FRN 20/3/2026 (Perpetual) 1,503,984 0.12
USD 800,000 Modern Land China Co Ltd 12.85% 25/10/2021 756,000 0.06
USD 1,550,000 NMC Healthcare Sukuk Ltd 5.95% 21/11/2023* 1,642,318 0.13
USD 32,000 Noble Holding International Ltd 7.75% 15/1/2024* 21,440 0.00
USD 1,694,000 Noble Holding International Ltd ‘144A’ 7.875% 1/2/2026 1,395,433 0.11
USD 400,000 Pearl Holding III Ltd 9.5% 11/12/2022 318,000 0.03
USD 1,200,000 Powerlong Real Estate Holdings Ltd 4.875% 15/9/2021* 1,133,070 0.09
USD 400,000 Powerlong Real Estate Holdings Ltd 6.95% 17/4/2021 396,385 0.03
USD 400,000 Redco Properties Group Ltd 13.5% 21/1/2020 406,500 0.03
USD 400,000 Redsun Properties Group Ltd 9.95% 11/4/2022* 374,500 0.03
USD 285,000 Redsun Properties Group Ltd 10.5% 3/10/2022 263,625 0.02
USD 1,055,000 Ronshine China Holdings Ltd 8.75% 25/10/2022* 1,059,174 0.09
USD 465,000 Ronshine China Holdings Ltd 11.25% 22/8/2021 494,261 0.04
USD 400,000 Sable International Finance Ltd ‘144A’ 5.75% 7/9/2027 417,000 0.04
USD 200,000 Shimao Property Holdings Ltd 5.6% 15/7/2026 201,370 0.02
USD 1,035,000 Sunac China Holdings Ltd 7.25% 14/6/2022 1,005,574 0.08
USD 400,000 Sunac China Holdings Ltd 7.35% 19/7/2021 400,812 0.03
USD 400,000 Sunac China Holdings Ltd 7.95% 8/8/2022 394,313 0.03
USD 600,000 Times China Holdings Ltd 6.6% 2/3/2023 590,250 0.05
USD 400,000 Times China Holdings Ltd 7.625% 21/2/2022 410,387 0.03
USD 946,000 Transocean Inc ‘144A’ 7.25% 1/11/2025 864,407 0.07
USD 253,000 Transocean Inc ‘144A’ 7.5% 15/1/2026 233,392 0.02
USD 117,000 Transocean Inc 8.375% 15/12/2021 121,534 0.01 USD 1,190,000 Transocean Inc ‘144A’ 9% 15/7/2023 1,231,055 0.10 USD 304,380 Transocean Pontus Ltd ‘144A’
6.125% 1/8/2025 310,133 0.03 USD 480,000 Transocean Poseidon Ltd ‘144A’
6.875% 1/2/2027 502,200 0.04 USD 338,000 Transocean Sentry Ltd ‘144A’
5.375% 15/5/2023 335,465 0.03
EUR 1,160,000 UPCB Finance VII Ltd 3.625% 15/6/2029 1,370,971 0.11
USD 437,000 Vale Overseas Ltd 6.25% 10/8/2026* 503,227 0.04
USD 200,000 Xinyuan Real Estate Co Ltd 9.875% 19/3/2020 195,700 0.02
USD 520,000 Xinyuan Real Estate Co Ltd 14.2% 15/10/2021 504,237 0.04
USD 1,000,000 Yestar Healthcare Holdings Co Ltd 6.9% 15/9/2021* 732,952 0.06
USD 900,000 Yuzhou Properties Co Ltd 6% 25/10/2023 805,922 0.07
USD 500,000 Yuzhou Properties Co Ltd 8.5% 26/2/2024 485,000 0.04
USD 600,000 Yuzhou Properties Co Ltd 8.625% 23/1/2022* 612,000 0.05
USD 500,000 Zhenro Properties Group Ltd 9.8% 20/8/2021 517,840 0.04
43,846,227 3.58
China USD 500,000 Huachen Energy Co Ltd 6.625%
18/5/2020 287,550 0.02 USD 900,000 Union Life Insurance Co Ltd 3%
19/9/2021 784,829 0.07 1,072,379 0.09
Colombia USD 3,285,000 Banco de Bogota SA ‘144A’
4.375% 3/8/2027 3,486,719 0.28 USD 1,567,000 Bancolombia SA FRN 18/10/2027 1,615,479 0.13 USD 1,475,000 Ecopetrol SA 4.125% 16/1/2025 1,554,051 0.13 USD 2,096,000 Empresas Publicas de Medellin
ESP 4.25% 18/7/2029 2,206,040 0.18 8,862,289 0.72
Czech Republic EUR 1,008,000 Residomo SRO 3.375% 15/10/2024 1,163,384 0.10
Denmark EUR 825,000 DKT Finance ApS 7% 17/6/2023 983,191 0.08 USD 800,000 DKT Finance ApS ‘144A’ 9.375%
17/6/2023 861,640 0.07 GBP 800,000 TDC A/S 6.875% 23/2/2023* 1,120,536 0.09 2,965,367 0.24
Finland USD 1,062,000 Nokia Oyj 6.625% 15/5/2039 1,237,230 0.10
France EUR 1,900,000 Altice France SA/France 5.875%
1/2/2027 2,325,803 0.19 USD 327,000 Altice France SA/France ‘144A’
6.25% 15/5/2024 338,337 0.03 USD 4,953,000 Altice France SA/France ‘144A’
7.375% 1/5/2026 5,312,092 0.43 USD 3,046,000 Altice France SA/France ‘144A’
8.125% 1/2/2027 3,358,855 0.27 EUR 900,000 Caisse Nationale de Reassurance
Mutuelle Agricole Groupama FRN 28/5/2024 (Perpetual) 1,180,387 0.09
EUR 500,000 Caisse Nationale de Reassurance Mutuelle Agricole Groupama 6% 23/1/2027 711,150 0.06
EUR 300,000 CMA CGM SA 6.5% 15/7/2022 285,998 0.02 EUR 400,000 Credit Agricole Assurances SA
FRN 14/10/2025 (Perpetual) 506,977 0.04
Global High Yield Bond Fund continued
Portfolio of Investments 31 August 2019

Transferable Securities and Money Market Instruments Admitted to an Official Stock Exchange Listing or Dealt in on Another Regulated Market
Transferable Securities and Money Market Instruments Admitted to an Official Stock Exchange Listing or Dealt in on Another Regulated Market
Holding
Description
Market Value (USD)
% of Net
Assets
Holding
Description
Market Value (USD)
% of Net
Assets
* All or a portion of this security represents a security on loan.
The notes on pages 728 to 741 form an integral part of these financial statements.
Annual Report and Audited Financial Statements [463]
EUR 1,311,000 Credit Agricole SA FRN 23/6/2021 (Perpetual) 1,567,644 0.13
USD 200,000 Credit Agricole SA FRN 23/12/2025 (Perpetual) 233,453 0.02
EUR 412,000 Crown European Holdings SA ‘144A’ 2.25% 1/2/2023 485,427 0.04
EUR 539,000 Crown European Holdings SA 3.375% 15/5/2025 666,373 0.05
EUR 600,000 Electricite de France SA FRN 4/7/2024 (Perpetual) 727,744 0.06
GBP 700,000 Electricite de France SA FRN 29/1/2026 (Perpetual) 945,355 0.08
EUR 971,000 Europcar Mobility Group 4% 30/4/2026 1,116,905 0.09
EUR 708,000 Loxam SAS 3.25% 14/1/2025 823,137 0.07 EUR 573,000 Loxam SAS 3.75% 15/7/2026 667,765 0.05 EUR 1,000,000 Orano SA 3.375% 23/4/2026 1,202,108 0.10 EUR 669,000 Parts Europe SA FRN 1/5/2022 740,136 0.06 EUR 516,117 Parts Europe SA FRN 1/5/2022 573,271 0.05 EUR 400,000 Parts Europe SA 4.375% 1/5/2022* 445,060 0.04 EUR 300,000 Picard Groupe SAS FRN 30/11/2023 326,305 0.03 USD 200,000 Societe Generale SA FRN 29/9/2025
(Perpetual) 223,421 0.02 EUR 632,000 Solvay Finance SA FRN 12/11/2023
(Perpetual) 808,982 0.06 EUR 400,000 SPIE SA 2.625% 18/6/2026 470,128 0.04 EUR 500,000 SPIE SA 3.125% 22/3/2024 609,518 0.05 26,652,331 2.17
Germany EUR 700,000 ADLER Real Estate AG 1.875%
27/4/2023 801,766 0.06 EUR 911,000 ADLER Real Estate AG 2.125%
6/2/2024 1,055,356 0.09 EUR 900,000 ADLER Real Estate AG 3%
27/4/2026 1,070,609 0.09 EUR 1,010,000 Consus Real Estate AG 9.625%
15/5/2024 1,072,037 0.09 EUR 300,000 Deutsche Pfandbriefbank AG 4.6%
22/2/2027 368,498 0.03 EUR 735,000 IHO Verwaltungs GmbH 3.625%
15/5/2025 830,686 0.07 EUR 406,000 IHO Verwaltungs GmbH 3.875%
15/5/2027 449,704 0.04 EUR 900,000 Nidda BondCo GmbH 5%
30/9/2025* 1,020,243 0.08 EUR 882,000 Nidda BondCo GmbH 7.25%
30/9/2025 1,042,542 0.08 EUR 1,000,000 Platin 1426 GmbH 5.375%
15/6/2023 1,091,513 0.09 EUR 843,000 RWE AG FRN 21/4/2075 951,443 0.08 EUR 331,000 RWE AG FRN 21/4/2075 395,377 0.03 EUR 600,000 Techem Verwaltungsgesellschaft
674 mbH 6% 30/7/2026* 721,487 0.06 EUR 200,000 Tele Columbus AG 3.875% 2/5/2025 214,038 0.02 EUR 2,247,000 thyssenkrupp AG 2.875% 22/2/2024 2,567,401 0.21 EUR 2,513,000 Unitymedia GmbH 3.75% 15/1/2027 2,968,530 0.24 EUR 417,000 Unitymedia Hessen GmbH & Co
KG / Unitymedia NRW GmbH 3.5% 15/1/2027 490,840 0.04
EUR 844,200 Unitymedia Hessen GmbH & Co KG / Unitymedia NRW GmbH 6.25% 15/1/2029 1,041,196 0.08
18,153,266 1.48
Guernsey USD 2,600,000 Pershing Square Holdings Ltd
‘144A’ 5.5% 15/7/2022 2,723,999 0.22 EUR 509,000 Summit Properties Ltd 2%
31/1/2025 548,574 0.05 3,272,573 0.27
Hong Kong USD 805,000 Wanda Group Overseas Ltd
7.5% 24/7/2022 797,601 0.07 USD 510,000 Yanlord Land HK Co Ltd 6.8%
27/2/2024 509,363 0.04 1,306,964 0.11
India USD 600,000 Adani Green Energy UP Ltd /
Prayatna Developers Pvt Ltd / Parampujya Solar Energ 6.25% 10/12/2024* 617,268 0.05
USD 350,000 Delhi International Airport Ltd 6.45% 4/6/2029* 369,320 0.03
USD 1,000,000 ReNew Power Synthetic 6.67% 12/3/2024* 1,022,879 0.08
USD 386,831 Videocon Industries Ltd (Restricted) (Step-up coupon) 2.8% 31/12/2020 115,539 0.01
2,125,006 0.17
Indonesia USD 200,000 Delta Merlin Dunia Tekstil PT
8.625% 12/3/2024 64,995 0.01
Ireland EUR 1,920,000 Allied Irish Banks Plc FRN
3/12/2020 (Perpetual)* 2,268,610 0.19 EUR 600,000 Allied Irish Banks Plc FRN
26/11/2025 691,375 0.06 EUR 359,000 Aqueduct European CLO 2-2017
DAC FRN 15/10/2030 371,448 0.03 EUR 883,000 Ardagh Packaging Finance Plc /
Ardagh Holdings USA Inc 4.125% 15/5/2023* 1,000,358 0.08
USD 622,000 Ardagh Packaging Finance Plc / Ardagh Holdings USA Inc ‘144A’ 4.125% 15/8/2026 629,775 0.05
USD 3,366,000 Ardagh Packaging Finance Plc / Ardagh Holdings USA Inc ‘144A’ 4.625% 15/5/2023 3,452,506 0.28
GBP 684,000 Ardagh Packaging Finance Plc / Ardagh Holdings USA Inc 4.75% 15/7/2027 850,040 0.07
GBP 355,000 Ardagh Packaging Finance Plc / Ardagh Holdings USA Inc ‘144A’ 4.75% 15/7/2027 439,933 0.04
EUR 1,393,000 Ardagh Packaging Finance Plc / Ardagh Holdings USA Inc 6.75% 15/5/2024 1,630,444 0.13
EUR 3,400,000 Aurium CLO II DAC FRN 13/10/2029 3,761,869 0.31
EUR 3,920,000 Aurium CLO II DAC FRN 13/10/2029 4,341,267 0.35
EUR 800,000 Avoca Capital CLO X Ltd FRN 15/1/2030 891,383 0.07
EUR 1,050,000 Avoca CLO XV DAC FRN 15/4/2031 1,080,021 0.09
Global High Yield Bond Fund continued
Portfolio of Investments 31 August 2019

Transferable Securities and Money Market Instruments Admitted to an Official Stock Exchange Listing or Dealt in on Another Regulated Market
Transferable Securities and Money Market Instruments Admitted to an Official Stock Exchange Listing or Dealt in on Another Regulated Market
Holding
Description
Market Value (USD)
% of Net
Assets
Holding
Description
Market Value (USD)
% of Net
Assets
* All or a portion of this security represents a security on loan.
The notes on pages 728 to 741 form an integral part of these financial statements.
[464] BlackRock Global Funds (BGF)
EUR 600,000 Avoca CLO XVIII DAC FRN 15/4/2031 628,632 0.05
GBP 300,000 Bank of Ireland Group Plc FRN 19/9/2027* 361,283 0.03
EUR 263,000 Cadogan Square CLO IX DAC FRN 15/7/2030 282,874 0.02
EUR 730,000 Cadogan Square CLO VIII DAC FRN 15/1/2030 809,866 0.07
EUR 4,000,000 Cadogan Square CLO XI DAC FRN 15/2/2031 4,301,923 0.35
EUR 1,880,000 Cadogan Square CLO XI DAC FRN 15/2/2031 2,061,746 0.17
EUR 1,280,000 Contego Clo V DAC FRN 15/1/2031 1,401,225 0.11 EUR 663,000 eircom Finance DAC 3.5%
15/5/2026 782,281 0.06 EUR 1,680,000 Harvest CLO XVI DAC FRN
15/10/2031 1,845,638 0.15 USD 202,000 James Hardie International Finance
DAC ‘144A’ 4.75% 15/1/2025 208,060 0.02 USD 750,000 MMC Norilsk Nickel OJSC Via
MMC Finance DAC 4.1% 11/4/2023 775,781 0.06
USD 1,620,000 Novolipetsk Steel Via Steel Funding DAC 4% 21/9/2024 1,674,675 0.14
USD 750,000 Novolipetsk Steel Via Steel Funding DAC 4.7% 30/5/2026 802,969 0.07
EUR 400,000 OCP Euro CLO 2017-2 DAC FRN 15/1/2032 414,090 0.03
EUR 597,000 OCP Euro CLO 2017-2 DAC FRN 15/1/2032 655,759 0.05
EUR 312,000 Ozlme II DAC FRN 15/10/2030 338,465 0.03 EUR 500,000 OZLME III DAC FRN 24/8/2030 515,663 0.04 USD 1,600,000 Phosagro OAO Via Phosagro Bond
Funding DAC 3.949% 24/4/2023 1,638,000 0.13 USD 910,000 Rusal Capital DAC 4.85% 1/2/2023 921,147 0.08 USD 800,000 Rusal Capital DAC 5.125% 2/2/2022 819,800 0.07 GBP 617,000 Virgin Media Receivables
Financing Notes I DAC 5.5% 15/9/2024 776,290 0.06
43,425,196 3.54
Italy EUR 913,000 Assicurazioni Generali SpA FRN
27/10/2047 1,217,264 0.10 EUR 800,000 Banca Carige SpA 0.75% 26/7/2020 887,575 0.07 EUR 694,000 Banco BPM SpA 1.75% 24/4/2023 779,469 0.06 EUR 1,500,000 Banco BPM SpA 2.5% 21/6/2024 1,710,688 0.14 EUR 545,000 Diocle Spa FRN 30/6/2026* 613,944 0.05 USD 527,000 F-Brasile SpA / F-Brasile US LLC
‘144A’ 7.375% 15/8/2026 537,540 0.04 EUR 2,055,000 Intesa Sanpaolo SpA FRN
11/1/2027 (Perpetual) 2,638,892 0.22 EUR 1,022,000 Sisal Group SpA 7% 31/7/2023 1,173,988 0.10 EUR 1,500,000 Telecom Italia SpA/Milano 1.125%
26/3/2022 1,666,671 0.14 EUR 1,991,000 Telecom Italia SpA/Milano 2.75%
15/4/2025 2,308,570 0.19 EUR 300,000 Telecom Italia SpA/Milano 3%
30/9/2025 350,250 0.03 EUR 2,549,000 Telecom Italia SpA/Milano 4%
11/4/2024 3,125,063 0.26 USD 1,303,000 Telecom Italia SpA/Milano ‘144A’
5.303% 30/5/2024 1,395,839 0.11 GBP 1,000,000 Telecom Italia SpA/Milano 5.875%
19/5/2023 1,361,692 0.11 EUR 400,000 UniCredit SpA FRN 10/9/2021
(Perpetual) 466,154 0.04
EUR 982,000 UniCredit SpA FRN 3/6/2022 (Perpetual) 1,256,950 0.10
EUR 750,000 UniCredit SpA (Restricted) FRN 3/6/2026 (Perpetual) 910,284 0.07
22,400,833 1.83
Japan USD 1,800,000 Asahi Mutual Life Insurance Co
FRN 5/9/2023 (Perpetual)* 1,888,947 0.15 EUR 300,000 SoftBank Group Corp 3.125%
19/9/2025 351,659 0.03 EUR 2,543,000 SoftBank Group Corp 4% 20/4/2023 3,066,905 0.25 EUR 500,000 SoftBank Group Corp 4% 19/9/2029 601,256 0.05 EUR 200,000 SoftBank Group Corp 4.5%
20/4/2025 251,129 0.02 USD 3,300,000 SoftBank Group Corp 4.75%
19/9/2024* 3,374,250 0.28 EUR 1,631,000 SoftBank Group Corp 4.75%
30/7/2025 2,058,414 0.17 EUR 998,000 SoftBank Group Corp 5%
15/4/2028* 1,278,367 0.10 USD 1,650,000 SoftBank Group Corp 5.125%
19/9/2027* 1,701,563 0.14 14,572,490 1.19
Jersey GBP 100,000 AA Bond Co Ltd 4.249% 31/7/2020 123,600 0.01 EUR 1,402,000 Avis Budget Finance Plc 4.75%
30/1/2026* 1,672,060 0.14 GBP 685,000 CPUK Finance Ltd 4.25% 28/8/2022 848,073 0.07 GBP 365,000 CPUK Finance Ltd 4.875%
28/8/2025 456,632 0.04 GBP 367,000 Galaxy Bidco Ltd 6.5% 31/7/2026* 431,480 0.03 USD 2,260,000 HBOS Capital Funding LP 6.85%
23/12/2019 (Perpetual) 2,308,025 0.19 EUR 1,849,651 LHC3 Plc 4.125% 15/8/2024 2,122,129 0.17 7,961,999 0.65
Kuwait USD 1,200,000 Burgan Bank SAK FRN 9/7/2024
(Perpetual) 1,199,100 0.10
Luxembourg USD 1,735,000 Altice Financing SA ‘144A’ 6.625%
15/2/2023 1,791,388 0.15 USD 3,494,000 Altice Financing SA ‘144A’ 7.5%
15/5/2026 3,737,182 0.30 EUR 200,000 Altice Finco SA 4.75% 15/1/2028 210,729 0.02 USD 450,000 Altice Finco SA ‘144A’ 7.625%
15/2/2025 462,803 0.04 USD 2,824,000 Altice Luxembourg SA ‘144A’
7.625% 15/2/2025 2,922,840 0.24 USD 501,000 Altice Luxembourg SA ‘144A’ 7.75%
15/5/2022 515,028 0.04 EUR 655,000 Altice Luxembourg SA 8%
15/5/2027 779,498 0.06 USD 2,858,000 Altice Luxembourg SA ‘144A’ 10.5%
15/5/2027 3,108,075 0.25 GBP 325,000 B&M European Value Retail SA
4.125% 1/2/2022 403,165 0.03 GBP 2,400,000 Cabot Financial Luxembourg SA
7.5% 1/10/2023 3,051,385 0.25 EUR 234,000 Cirsa Finance International Sarl
4.75% 22/5/2025 274,517 0.02 EUR 302,000 Cirsa Finance International Sarl
6.25% 20/12/2023 359,602 0.03
Global High Yield Bond Fund continued
Portfolio of Investments 31 August 2019
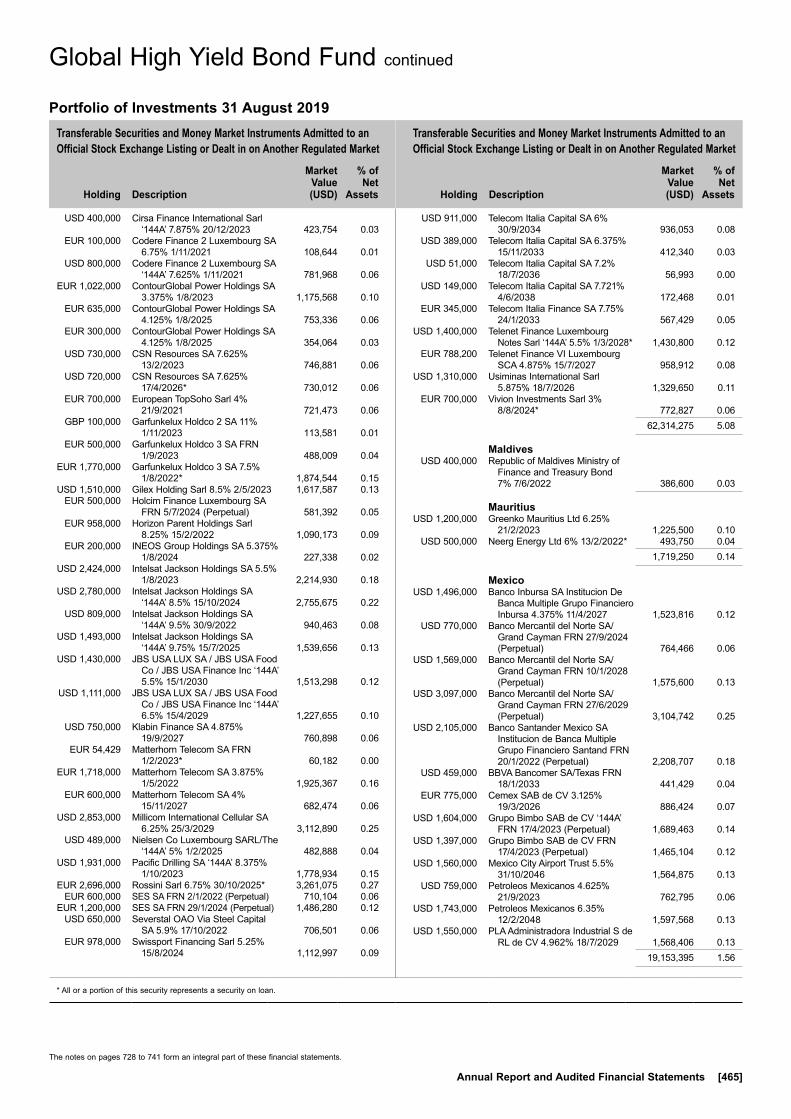
Transferable Securities and Money Market Instruments Admitted to an Official Stock Exchange Listing or Dealt in on Another Regulated Market
Transferable Securities and Money Market Instruments Admitted to an Official Stock Exchange Listing or Dealt in on Another Regulated Market
Holding
Description
Market Value (USD)
% of Net
Assets
Holding
Description
Market Value (USD)
% of Net
Assets
* All or a portion of this security represents a security on loan.
The notes on pages 728 to 741 form an integral part of these financial statements.
Annual Report and Audited Financial Statements [465]
USD 400,000 Cirsa Finance International Sarl ‘144A’ 7.875% 20/12/2023 423,754 0.03
EUR 100,000 Codere Finance 2 Luxembourg SA 6.75% 1/11/2021 108,644 0.01
USD 800,000 Codere Finance 2 Luxembourg SA ‘144A’ 7.625% 1/11/2021 781,968 0.06
EUR 1,022,000 ContourGlobal Power Holdings SA 3.375% 1/8/2023 1,175,568 0.10
EUR 635,000 ContourGlobal Power Holdings SA 4.125% 1/8/2025 753,336 0.06
EUR 300,000 ContourGlobal Power Holdings SA 4.125% 1/8/2025 354,064 0.03
USD 730,000 CSN Resources SA 7.625% 13/2/2023 746,881 0.06
USD 720,000 CSN Resources SA 7.625% 17/4/2026* 730,012 0.06
EUR 700,000 European TopSoho Sarl 4% 21/9/2021 721,473 0.06
GBP 100,000 Garfunkelux Holdco 2 SA 11% 1/11/2023 113,581 0.01
EUR 500,000 Garfunkelux Holdco 3 SA FRN 1/9/2023 488,009 0.04
EUR 1,770,000 Garfunkelux Holdco 3 SA 7.5% 1/8/2022* 1,874,544 0.15
USD 1,510,000 Gilex Holding Sarl 8.5% 2/5/2023 1,617,587 0.13 EUR 500,000 Holcim Finance Luxembourg SA
FRN 5/7/2024 (Perpetual) 581,392 0.05 EUR 958,000 Horizon Parent Holdings Sarl
8.25% 15/2/2022 1,090,173 0.09 EUR 200,000 INEOS Group Holdings SA 5.375%
1/8/2024 227,338 0.02 USD 2,424,000 Intelsat Jackson Holdings SA 5.5%
1/8/2023 2,214,930 0.18 USD 2,780,000 Intelsat Jackson Holdings SA
‘144A’ 8.5% 15/10/2024 2,755,675 0.22 USD 809,000 Intelsat Jackson Holdings SA
‘144A’ 9.5% 30/9/2022 940,463 0.08 USD 1,493,000 Intelsat Jackson Holdings SA
‘144A’ 9.75% 15/7/2025 1,539,656 0.13 USD 1,430,000 JBS USA LUX SA / JBS USA Food
Co / JBS USA Finance Inc ‘144A’ 5.5% 15/1/2030 1,513,298 0.12
USD 1,111,000 JBS USA LUX SA / JBS USA Food Co / JBS USA Finance Inc ‘144A’ 6.5% 15/4/2029 1,227,655 0.10
USD 750,000 Klabin Finance SA 4.875% 19/9/2027 760,898 0.06
EUR 54,429 Matterhorn Telecom SA FRN 1/2/2023* 60,182 0.00
EUR 1,718,000 Matterhorn Telecom SA 3.875% 1/5/2022 1,925,367 0.16
EUR 600,000 Matterhorn Telecom SA 4% 15/11/2027 682,474 0.06
USD 2,853,000 Millicom International Cellular SA 6.25% 25/3/2029 3,112,890 0.25
USD 489,000 Nielsen Co Luxembourg SARL/The ‘144A’ 5% 1/2/2025 482,888 0.04
USD 1,931,000 Pacific Drilling SA ‘144A’ 8.375% 1/10/2023 1,778,934 0.15
EUR 2,696,000 Rossini Sarl 6.75% 30/10/2025* 3,261,075 0.27 EUR 600,000 SES SA FRN 2/1/2022 (Perpetual) 710,104 0.06 EUR 1,200,000 SES SA FRN 29/1/2024 (Perpetual) 1,486,280 0.12 USD 650,000 Severstal OAO Via Steel Capital
SA 5.9% 17/10/2022 706,501 0.06 EUR 978,000 Swissport Financing Sarl 5.25%
15/8/2024 1,112,997 0.09
USD 911,000 Telecom Italia Capital SA 6% 30/9/2034 936,053 0.08
USD 389,000 Telecom Italia Capital SA 6.375% 15/11/2033 412,340 0.03
USD 51,000 Telecom Italia Capital SA 7.2% 18/7/2036 56,993 0.00
USD 149,000 Telecom Italia Capital SA 7.721% 4/6/2038 172,468 0.01
EUR 345,000 Telecom Italia Finance SA 7.75% 24/1/2033 567,429 0.05
USD 1,400,000 Telenet Finance Luxembourg Notes Sarl ‘144A’ 5.5% 1/3/2028* 1,430,800 0.12
EUR 788,200 Telenet Finance VI Luxembourg SCA 4.875% 15/7/2027 958,912 0.08
USD 1,310,000 Usiminas International Sarl 5.875% 18/7/2026 1,329,650 0.11
EUR 700,000 Vivion Investments Sarl 3% 8/8/2024* 772,827 0.06
62,314,275 5.08
Maldives USD 400,000 Republic of Maldives Ministry of
Finance and Treasury Bond 7% 7/6/2022 386,600 0.03
Mauritius USD 1,200,000 Greenko Mauritius Ltd 6.25%
21/2/2023 1,225,500 0.10 USD 500,000 Neerg Energy Ltd 6% 13/2/2022* 493,750 0.04 1,719,250 0.14
Mexico USD 1,496,000 Banco Inbursa SA Institucion De
Banca Multiple Grupo Financiero Inbursa 4.375% 11/4/2027 1,523,816 0.12
USD 770,000 Banco Mercantil del Norte SA/Grand Cayman FRN 27/9/2024 (Perpetual) 764,466 0.06
USD 1,569,000 Banco Mercantil del Norte SA/Grand Cayman FRN 10/1/2028 (Perpetual) 1,575,600 0.13
USD 3,097,000 Banco Mercantil del Norte SA/Grand Cayman FRN 27/6/2029 (Perpetual) 3,104,742 0.25
USD 2,105,000 Banco Santander Mexico SA Institucion de Banca Multiple Grupo Financiero Santand FRN 20/1/2022 (Perpetual) 2,208,707 0.18
USD 459,000 BBVA Bancomer SA/Texas FRN 18/1/2033 441,429 0.04
EUR 775,000 Cemex SAB de CV 3.125% 19/3/2026 886,424 0.07
USD 1,604,000 Grupo Bimbo SAB de CV ‘144A’ FRN 17/4/2023 (Perpetual) 1,689,463 0.14
USD 1,397,000 Grupo Bimbo SAB de CV FRN 17/4/2023 (Perpetual) 1,465,104 0.12
USD 1,560,000 Mexico City Airport Trust 5.5% 31/10/2046 1,564,875 0.13
USD 759,000 Petroleos Mexicanos 4.625% 21/9/2023 762,795 0.06
USD 1,743,000 Petroleos Mexicanos 6.35% 12/2/2048 1,597,568 0.13
USD 1,550,000 PLA Administradora Industrial S de RL de CV 4.962% 18/7/2029 1,568,406 0.13
19,153,395 1.56
Global High Yield Bond Fund continued
Portfolio of Investments 31 August 2019

Transferable Securities and Money Market Instruments Admitted to an Official Stock Exchange Listing or Dealt in on Another Regulated Market
Transferable Securities and Money Market Instruments Admitted to an Official Stock Exchange Listing or Dealt in on Another Regulated Market
Holding
Description
Market Value (USD)
% of Net
Assets
Holding
Description
Market Value (USD)
% of Net
Assets
* All or a portion of this security represents a security on loan.
The notes on pages 728 to 741 form an integral part of these financial statements.
[466] BlackRock Global Funds (BGF)
Mongolia USD 600,000 Mongolian Mining Corp/Energy
Resources LLC 9.25% 15/4/2024 570,000 0.05 USD 1,300,000 Mongolian Mortgage Corp Hfc LLC
9.75% 29/1/2022 1,294,832 0.10 1,864,832 0.15
Netherlands EUR 1,400,000 ABN AMRO Bank NV FRN
22/9/2020 (Perpetual) 1,619,213 0.13 EUR 350,000 Aegon NV FRN 15/4/2029
(Perpetual) 430,158 0.03 USD 1,068,000 Alpha 2 BV ‘144A’ 8.75% 1/6/2023 1,037,295 0.08 USD 3,255,000 Alpha 3 BV / Alpha US Bidco Inc
‘144A’ 6.25% 1/2/2025 3,246,863 0.26 EUR 400,000 Barings Euro CLO 2018-3 BV FRN
27/7/2031 434,673 0.03 USD 1,550,000 Braskem Netherlands Finance BV
4.5% 10/1/2028* 1,551,085 0.13 EUR 300,000 Cairn CLO IV BV FRN 30/4/2031 332,216 0.03 EUR 2,000,000 Cairn CLO IV BV FRN 30/4/2031 2,222,181 0.18 EUR 2,940,000 Cairn CLO VI BV FRN 25/7/2029 3,257,799 0.27 EUR 800,000 Constellium SE 4.25% 15/2/2026 929,786 0.08 USD 3,345,000 Constellium SE ‘144A’ 5.75%
15/5/2024 3,453,713 0.28 USD 2,502,000 Constellium SE ‘144A’ 5.875%
15/2/2026 2,602,080 0.21 USD 792,000 Constellium SE ‘144A’ 6.625%
1/3/2025* 827,640 0.07 EUR 1,800,000 Contego Clo V DAC FRN 15/1/2031 1,953,550 0.16 EUR 300,000 Diamond BC BV 5.625% 15/8/2025 263,500 0.02 EUR 730,000 Dryden 32 Euro CLO 2014 B.V.
FRN 15/8/2031 782,540 0.06 EUR 500,000 Encavis Finance BV FRN
13/9/2023 (Perpetual) 667,887 0.05 EUR 885,000 Energizer Gamma Acquisition BV
4.625% 15/7/2026 1,029,968 0.08 EUR 800,000 Ferrovial Netherlands BV FRN
4/2/2023 (Perpetual) 856,881 0.07 EUR 2,875,000 Hertz Holdings Netherlands BV
5.5% 30/3/2023 3,355,245 0.27 USD 1,394,000 ING Groep NV FRN 16/4/2024
(Perpetual) 1,463,492 0.12 EUR 1,405,000 Intertrust Group BV 3.375%
15/11/2025 1,651,543 0.13 EUR 916,000 InterXion Holding NV 4.75%
15/6/2025 1,103,514 0.09 EUR 950,000 LeasePlan Corp NV FRN
29/5/2024 (Perpetual) 1,117,337 0.09 USD 1,550,000 Lukoil International Finance BV
4.75% 2/11/2026 1,687,562 0.14 USD 925,000 Mong Duong Finance Holdings BV
5.125% 7/5/2029* 938,468 0.08 EUR 1,400,000 Naturgy Finance BV FRN
18/11/2022 (Perpetual) 1,687,197 0.14 EUR 900,000 Naturgy Finance BV FRN
24/4/2024 (Perpetual)* 1,063,182 0.09 EUR 503,000 NN Group NV FRN 13/6/2024
(Perpetual) 625,588 0.05 EUR 383,000 OCI NV 5% 15/4/2023 444,104 0.04 USD 4,741,000 Petrobras Global Finance BV
5.299% 27/1/2025 5,126,206 0.42 USD 4,739,000 Petrobras Global Finance BV
5.75% 1/2/2029 5,129,968 0.42 USD 2,210,000 Petrobras Global Finance BV
5.999% 27/1/2028 2,437,299 0.20 USD 1,478,000 Petrobras Global Finance BV
6.125% 17/1/2022* 1,588,388 0.13 USD 7,313,000 Petrobras Global Finance BV
6.85% 5/6/2115 8,155,092 0.66
USD 838,000 Petrobras Global Finance BV 6.9% 19/3/2049 954,241 0.08
EUR 903,000 Repsol International Finance BV FRN 25/3/2021 (Perpetual) 1,052,352 0.09
EUR 1,173,000 Repsol International Finance BV FRN 25/3/2075 1,491,749 0.12
USD 775,000 Sensata Technologies BV ‘144A’ 5% 1/10/2025 825,375 0.07
USD 193,000 Sensata Technologies BV ‘144A’ 5.625% 1/11/2024 210,370 0.02
EUR 523,000 Summer BidCo BV 9% 15/11/2025 616,478 0.05 GBP 700,000 Telefonica Europe BV FRN
26/11/2020 (Perpetual) 908,191 0.07 EUR 500,000 Telefonica Europe BV FRN
15/3/2022 (Perpetual) 587,941 0.05 EUR 700,000 Telefonica Europe BV FRN 7/3/2023
(Perpetual) 789,672 0.06 EUR 1,600,000 Telefonica Europe BV FRN
31/3/2024 (Perpetual) 2,067,579 0.17 EUR 2,200,000 Telefonica Europe BV FRN
14/12/2024 (Perpetual) 2,694,469 0.22 EUR 500,000 Teva Pharmaceutical Finance
Netherlands II BV 4.5% 1/3/2025 495,875 0.04 USD 1,381,000 Teva Pharmaceutical Finance
Netherlands III BV 2.2% 21/7/2021 1,297,924 0.11 USD 5,300,000 Teva Pharmaceutical Finance
Netherlands III BV 2.8% 21/7/2023* 4,482,641 0.37
USD 627,000 Teva Pharmaceutical Finance Netherlands III BV 3.15% 1/10/2026 473,013 0.04
EUR 197,000 Trivium Packaging Finance BV FRN 15/8/2026 223,296 0.02
EUR 2,198,000 Trivium Packaging Finance BV 3.75% 15/8/2026* 2,595,592 0.21
USD 2,378,000 Trivium Packaging Finance BV ‘144A’ 5.5% 15/8/2026 2,520,680 0.21
USD 2,333,000 Trivium Packaging Finance BV ‘144A’ 8.5% 15/8/2027 2,513,808 0.20
EUR 1,195,000 United Group BV 4.375% 1/7/2022 1,355,859 0.11 EUR 699,000 United Group BV 4.875% 1/7/2024 810,604 0.07 EUR 491,000 United Group BV 4.875% 1/7/2024 569,977 0.05 EUR 400,000 UPC Holding BV 3.875% 15/6/2029 468,845 0.04 EUR 437,000 Ziggo Bond Co BV 4.625%
15/1/2025 501,289 0.04 USD 1,865,000 Ziggo Bond Co BV ‘144A’ 5.875%
15/1/2025 1,937,269 0.16 USD 495,000 Ziggo Bond Co BV ‘144A’ 6%
15/1/2027 518,513 0.04 EUR 1,462,000 Ziggo BV 4.25% 15/1/2027 1,760,559 0.14 USD 1,613,000 Ziggo BV ‘144A’ 5.5% 15/1/2027 1,709,780 0.14 101,507,154 8.28
Norway USD 693,000 Aker BP ASA ‘144A’ 4.75%
15/6/2024 708,592 0.06
Paraguay USD 1,295,000 Telefonica Celular del Paraguay SA
5.875% 15/4/2027 1,380,187 0.11
Portugal EUR 3,000,000 Banco Espirito Santo SA
(Restricted) (Defaulted) 2.625% 8/5/2017 811,903 0.07
EUR 3,400,000 Banco Espirito Santo SA (Restricted) (Defaulted) 4% 21/1/2019 920,157 0.07
Global High Yield Bond Fund continued
Portfolio of Investments 31 August 2019
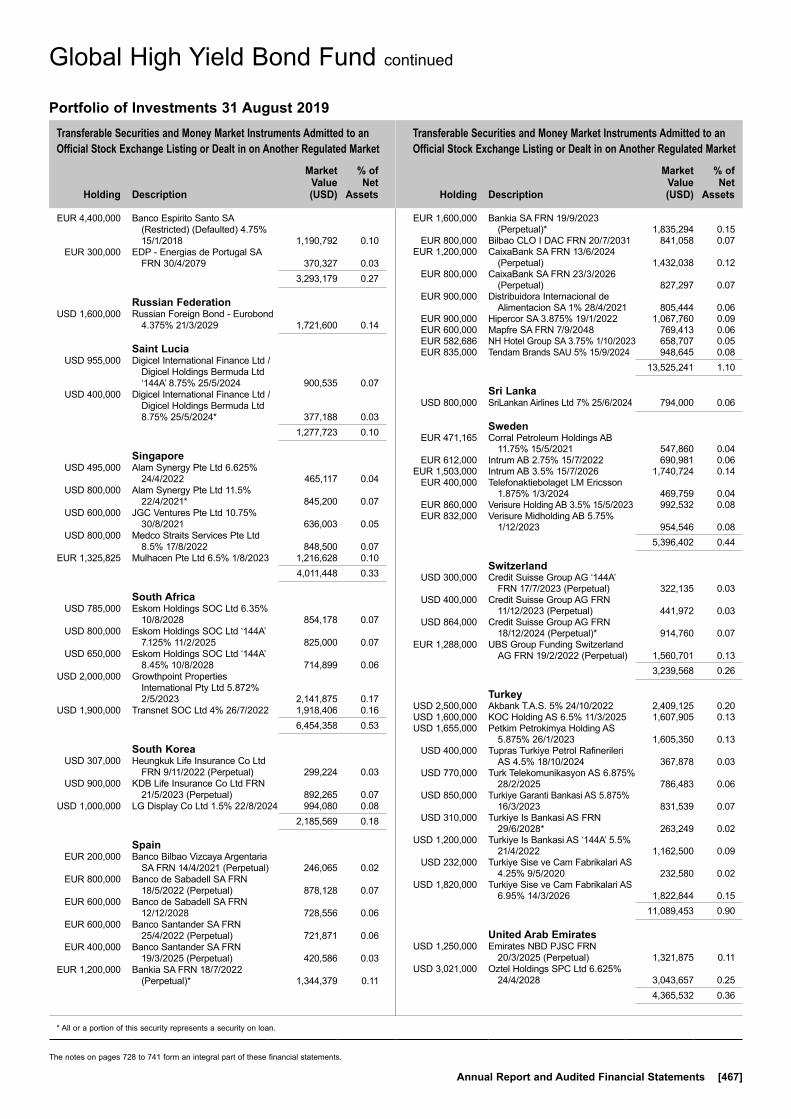
Transferable Securities and Money Market Instruments Admitted to an Official Stock Exchange Listing or Dealt in on Another Regulated Market
Transferable Securities and Money Market Instruments Admitted to an Official Stock Exchange Listing or Dealt in on Another Regulated Market
Holding
Description
Market Value (USD)
% of Net
Assets
Holding
Description
Market Value (USD)
% of Net
Assets
* All or a portion of this security represents a security on loan.
The notes on pages 728 to 741 form an integral part of these financial statements.
Annual Report and Audited Financial Statements [467]
EUR 4,400,000 Banco Espirito Santo SA (Restricted) (Defaulted) 4.75% 15/1/2018 1,190,792 0.10
EUR 300,000 EDP - Energias de Portugal SA FRN 30/4/2079 370,327 0.03
3,293,179 0.27
Russian Federation USD 1,600,000 Russian Foreign Bond - Eurobond
4.375% 21/3/2029 1,721,600 0.14
Saint Lucia USD 955,000 Digicel International Finance Ltd /
Digicel Holdings Bermuda Ltd ‘144A’ 8.75% 25/5/2024 900,535 0.07
USD 400,000 Digicel International Finance Ltd / Digicel Holdings Bermuda Ltd 8.75% 25/5/2024* 377,188 0.03
1,277,723 0.10
Singapore USD 495,000 Alam Synergy Pte Ltd 6.625%
24/4/2022 465,117 0.04 USD 800,000 Alam Synergy Pte Ltd 11.5%
22/4/2021* 845,200 0.07 USD 600,000 JGC Ventures Pte Ltd 10.75%
30/8/2021 636,003 0.05 USD 800,000 Medco Straits Services Pte Ltd
8.5% 17/8/2022 848,500 0.07 EUR 1,325,825 Mulhacen Pte Ltd 6.5% 1/8/2023 1,216,628 0.10 4,011,448 0.33
South Africa USD 785,000 Eskom Holdings SOC Ltd 6.35%
10/8/2028 854,178 0.07 USD 800,000 Eskom Holdings SOC Ltd ‘144A’
7.125% 11/2/2025 825,000 0.07 USD 650,000 Eskom Holdings SOC Ltd ‘144A’
8.45% 10/8/2028 714,899 0.06 USD 2,000,000 Growthpoint Properties
International Pty Ltd 5.872% 2/5/2023 2,141,875 0.17
USD 1,900,000 Transnet SOC Ltd 4% 26/7/2022 1,918,406 0.16 6,454,358 0.53
South Korea USD 307,000 Heungkuk Life Insurance Co Ltd
FRN 9/11/2022 (Perpetual) 299,224 0.03 USD 900,000 KDB Life Insurance Co Ltd FRN
21/5/2023 (Perpetual) 892,265 0.07 USD 1,000,000 LG Display Co Ltd 1.5% 22/8/2024 994,080 0.08 2,185,569 0.18
Spain EUR 200,000 Banco Bilbao Vizcaya Argentaria
SA FRN 14/4/2021 (Perpetual) 246,065 0.02 EUR 800,000 Banco de Sabadell SA FRN
18/5/2022 (Perpetual) 878,128 0.07 EUR 600,000 Banco de Sabadell SA FRN
12/12/2028 728,556 0.06 EUR 600,000 Banco Santander SA FRN
25/4/2022 (Perpetual) 721,871 0.06 EUR 400,000 Banco Santander SA FRN
19/3/2025 (Perpetual) 420,586 0.03 EUR 1,200,000 Bankia SA FRN 18/7/2022
(Perpetual)* 1,344,379 0.11
EUR 1,600,000 Bankia SA FRN 19/9/2023 (Perpetual)* 1,835,294 0.15
EUR 800,000 Bilbao CLO I DAC FRN 20/7/2031 841,058 0.07 EUR 1,200,000 CaixaBank SA FRN 13/6/2024
(Perpetual) 1,432,038 0.12 EUR 800,000 CaixaBank SA FRN 23/3/2026
(Perpetual) 827,297 0.07 EUR 900,000 Distribuidora Internacional de
Alimentacion SA 1% 28/4/2021 805,444 0.06 EUR 900,000 Hipercor SA 3.875% 19/1/2022 1,067,760 0.09 EUR 600,000 Mapfre SA FRN 7/9/2048 769,413 0.06 EUR 582,686 NH Hotel Group SA 3.75% 1/10/2023 658,707 0.05 EUR 835,000 Tendam Brands SAU 5% 15/9/2024 948,645 0.08 13,525,241 1.10
Sri Lanka USD 800,000 SriLankan Airlines Ltd 7% 25/6/2024 794,000 0.06
Sweden EUR 471,165 Corral Petroleum Holdings AB
11.75% 15/5/2021 547,860 0.04 EUR 612,000 Intrum AB 2.75% 15/7/2022 690,981 0.06 EUR 1,503,000 Intrum AB 3.5% 15/7/2026 1,740,724 0.14 EUR 400,000 Telefonaktiebolaget LM Ericsson
1.875% 1/3/2024 469,759 0.04 EUR 860,000 Verisure Holding AB 3.5% 15/5/2023 992,532 0.08 EUR 832,000 Verisure Midholding AB 5.75%
1/12/2023 954,546 0.08 5,396,402 0.44
Switzerland USD 300,000 Credit Suisse Group AG ‘144A’
FRN 17/7/2023 (Perpetual) 322,135 0.03 USD 400,000 Credit Suisse Group AG FRN
11/12/2023 (Perpetual) 441,972 0.03 USD 864,000 Credit Suisse Group AG FRN
18/12/2024 (Perpetual)* 914,760 0.07 EUR 1,288,000 UBS Group Funding Switzerland
AG FRN 19/2/2022 (Perpetual) 1,560,701 0.13 3,239,568 0.26
Turkey USD 2,500,000 Akbank T.A.S. 5% 24/10/2022 2,409,125 0.20 USD 1,600,000 KOC Holding AS 6.5% 11/3/2025 1,607,905 0.13 USD 1,655,000 Petkim Petrokimya Holding AS
5.875% 26/1/2023 1,605,350 0.13 USD 400,000 Tupras Turkiye Petrol Rafinerileri
AS 4.5% 18/10/2024 367,878 0.03 USD 770,000 Turk Telekomunikasyon AS 6.875%
28/2/2025 786,483 0.06 USD 850,000 Turkiye Garanti Bankasi AS 5.875%
16/3/2023 831,539 0.07 USD 310,000 Turkiye Is Bankasi AS FRN
29/6/2028* 263,249 0.02 USD 1,200,000 Turkiye Is Bankasi AS ‘144A’ 5.5%
21/4/2022 1,162,500 0.09 USD 232,000 Turkiye Sise ve Cam Fabrikalari AS
4.25% 9/5/2020 232,580 0.02 USD 1,820,000 Turkiye Sise ve Cam Fabrikalari AS
6.95% 14/3/2026 1,822,844 0.15 11,089,453 0.90
United Arab Emirates USD 1,250,000 Emirates NBD PJSC FRN
20/3/2025 (Perpetual) 1,321,875 0.11 USD 3,021,000 Oztel Holdings SPC Ltd 6.625%
24/4/2028 3,043,657 0.25 4,365,532 0.36
Global High Yield Bond Fund continued
Portfolio of Investments 31 August 2019

Transferable Securities and Money Market Instruments Admitted to an Official Stock Exchange Listing or Dealt in on Another Regulated Market
Transferable Securities and Money Market Instruments Admitted to an Official Stock Exchange Listing or Dealt in on Another Regulated Market
Holding
Description
Market Value (USD)
% of Net
Assets
Holding
Description
Market Value (USD)
% of Net
Assets
* All or a portion of this security represents a security on loan.
The notes on pages 728 to 741 form an integral part of these financial statements.
[468] BlackRock Global Funds (BGF)
United Kingdom EUR 300,000 Algeco Global Finance Plc 6.5%
15/2/2023 344,363 0.03 USD 490,000 Algeco Global Finance Plc ‘144A’
8% 15/2/2023 492,818 0.04 USD 428,000 Ardonagh Midco 3 Plc ‘144A’
8.625% 15/7/2023 416,230 0.03 EUR 207,000 Arrow Global Finance Plc FRN
1/3/2026* 228,973 0.02 GBP 808,000 Arrow Global Finance Plc 5.125%
15/9/2024 981,425 0.08 USD 286,000 Avon International Capital Plc
‘144A’ 6.5% 15/8/2022 295,295 0.02 EUR 1,178,000 Barclays Plc FRN 11/11/2025 1,319,645 0.11 EUR 1,022,000 Barclays Plc FRN 7/2/2028 1,113,861 0.09 USD 1,620,000 Barclays Plc 4.375% 11/9/2024* 1,666,183 0.14 USD 400,000 Barclays Plc 5.2% 12/5/2026 425,738 0.03 GBP 273,000 Boparan Finance Plc 5.5% 15/7/2021 167,925 0.01 EUR 722,000 EC Finance Plc 2.375% 15/11/2022 812,290 0.07 EUR 873,000 eG Global Finance Plc 3.625%
7/2/2024 938,054 0.08 EUR 1,464,000 eG Global Finance Plc 4.375%
7/2/2025* 1,573,838 0.13 USD 1,031,000 eG Global Finance Plc ‘144A’
6.75% 7/2/2025 998,781 0.08 USD 735,000 Evraz Plc 5.25% 2/4/2024 788,655 0.06 USD 1,550,000 Evraz Plc 5.375% 20/3/2023 1,658,500 0.13 GBP 1,100,000 GKN Holdings Ltd 4.625%
12/5/2032 1,383,597 0.11 GBP 698,000 Iceland Bondco Plc 4.625%
15/3/2025* 737,292 0.06 EUR 732,000 International Game Technology Plc
3.5% 15/6/2026 860,549 0.07 GBP 777,000 Iron Mountain UK Plc 3.875%
15/11/2025* 951,545 0.08 USD 450,000 Ithaca Energy North Sea Plc ‘144A’
9.375% 15/7/2024 463,522 0.04 USD 510,000 National Westminster Bank Plc
FRN 28/11/2019 (Perpetual) 411,187 0.03 USD 1,183,000 Neptune Energy Bondco Plc ‘144A’
6.625% 15/5/2025 1,183,592 0.10 EUR 450,000 NGG Finance Plc FRN 5/12/2079 498,040 0.04 EUR 600,000 NGG Finance Plc FRN 5/9/2082 664,236 0.05 EUR 471,000 Nomad Foods Bondco Plc 3.25%
15/5/2024 540,618 0.04 GBP 372,000 Pinnacle Bidco Plc 6.375%
15/2/2025 482,684 0.04 USD 800,000 Polyus Finance Plc 4.7% 29/1/2024 838,000 0.07 GBP 400,000 Premier Foods Finance Plc 6.25%
15/10/2023 503,314 0.04 USD 562,000 Royal Bank of Scotland Group Plc
FRN 15/8/2021 (Perpetual) 596,423 0.05 USD 200,000 Sensata Technologies UK
Financing Co Plc ‘144A’ 6.25% 15/2/2026 213,500 0.02
GBP 315,000 Shop Direct Funding Plc 7.75% 15/11/2022 339,142 0.03
GBP 583,000 Stonegate Pub Co Financing Plc FRN 15/3/2022* 721,998 0.06
GBP 432,000 Stonegate Pub Co Financing Plc FRN 15/3/2022* 532,485 0.04
GBP 352,000 Stonegate Pub Co Financing Plc 4.875% 15/3/2022 441,577 0.04
EUR 542,000 Synlab Unsecured Bondco Plc 8.25% 1/7/2023 626,657 0.05
GBP 654,000 Tesco Corporate Treasury Services Plc 2.5% 2/5/2025 820,562 0.07
USD 1,570,000 Ukraine Railways Via Rail Capital Markets Plc 8.25% 9/7/2024* 1,607,295 0.13
GBP 1,200,000 Unique Pub Finance Co Plc/The 6.464% 30/3/2032 1,666,828 0.14
USD 1,000,000 Vedanta Resources Finance II Plc 8% 23/4/2023 981,250 0.08
USD 600,000 Vedanta Resources Ltd 6.375% 30/7/2022 578,156 0.05
USD 400,000 Vedanta Resources Ltd 7.125% 31/5/2023* 385,125 0.03
USD 3,105,000 Virgin Media Finance Plc ‘144A’ 5.75% 15/1/2025 3,233,081 0.26
GBP 1,036,000 Virgin Media Secured Finance Plc 4.875% 15/1/2027* 1,325,318 0.11
GBP 600,000 Virgin Media Secured Finance Plc 5% 15/4/2027 770,806 0.06
GBP 691,000 Virgin Media Secured Finance Plc 5.125% 15/1/2025 877,338 0.07
USD 203,000 Virgin Media Secured Finance Plc ‘144A’ 5.25% 15/1/2026 208,836 0.02
USD 218,000 Virgin Media Secured Finance Plc ‘144A’ 5.5% 15/8/2026 228,835 0.02
USD 800,000 Virgin Media Secured Finance Plc ‘144A’ 5.5% 15/5/2029 838,000 0.07
GBP 630,000 Virgin Media Secured Finance Plc 6.25% 28/3/2029 819,950 0.07
GBP 300,000 Vodafone Group Plc 26/11/2020 (Zero Coupon) 360,678 0.03
EUR 900,000 Vodafone Group Plc FRN 3/10/2078* 1,128,777 0.09
EUR 1,500,000 Vodafone Group Plc FRN 3/1/2079 1,745,201 0.14 44,788,568 3.65
United States USD 38,000 Acadia Healthcare Co Inc 5.125%
1/7/2022 38,380 0.00 USD 1,441,000 ACI Worldwide Inc ‘144A’ 5.75%
15/8/2026 1,516,652 0.12 USD 376,000 Acrisure LLC / Acrisure Finance Inc
‘144A’ 8.125% 15/2/2024 405,845 0.03 USD 203,000 ADT Security Corp/The 4.125%
15/6/2023 206,299 0.02 USD 1,686,000 ADT Security Corp/The ‘144A’
4.875% 15/7/2032 1,477,357 0.12 USD 191,000 Advanced Disposal Services Inc
‘144A’ 5.625% 15/11/2024 201,028 0.02 USD 514,000 Advanced Micro Devices Inc 7.5%
15/8/2022 582,619 0.05 USD 50,000 AES Corp/VA 6% 15/5/2026 53,799 0.00 USD 126,000 AHP Health Partners Inc ‘144A’
9.75% 15/7/2026 135,970 0.01 USD 896,000 Albertsons Cos LLC / Safeway Inc /
New Albertsons LP / Albertson’s LLC ‘144A’ 5.875% 15/2/2028 947,520 0.08
USD 250,000 Allegro CLO VIII Ltd ‘Series 2018-2A C’ ‘144A’ FRN 15/7/2031 244,070 0.02
USD 4,848,000 Alliant Holdings Intermediate LLC / Alliant Holdings Co-Issuer ‘144A’ 8.25% 1/8/2023 4,963,140 0.40
USD 2,839,000 Allied Universal Holdco LLC / Allied Universal Finance Corp ‘144A’ 6.625% 15/7/2026 3,016,437 0.25
USD 928,000 Allison Transmission Inc ‘144A’ 5.875% 1/6/2029 997,600 0.08
USD 536,000 Ally Financial Inc 3.875% 21/5/2024 566,820 0.05 USD 180,000 Ally Financial Inc 5.75% 20/11/2025 208,125 0.02 USD 6,363,000 Ally Financial Inc 8% 1/11/2031 8,924,107 0.73 USD 1,000,000 ALM XVI Ltd/ALM XVI LLC ‘Series
2015-16A BR2’ ‘144A’ FRN 15/7/2027 990,028 0.08
Global High Yield Bond Fund continued
Portfolio of Investments 31 August 2019
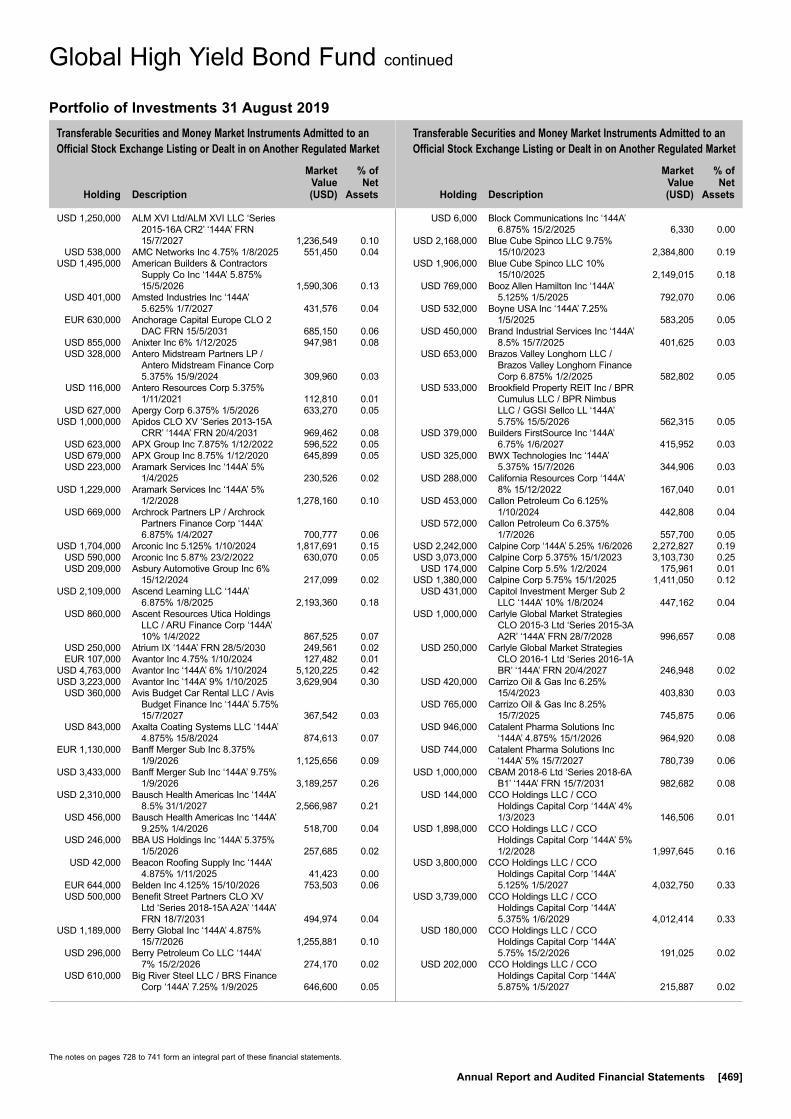
Transferable Securities and Money Market Instruments Admitted to an Official Stock Exchange Listing or Dealt in on Another Regulated Market
Transferable Securities and Money Market Instruments Admitted to an Official Stock Exchange Listing or Dealt in on Another Regulated Market
Holding
Description
Market Value (USD)
% of Net
Assets
Holding
Description
Market Value (USD)
% of Net
Assets
The notes on pages 728 to 741 form an integral part of these financial statements.
Annual Report and Audited Financial Statements [469]
USD 1,250,000 ALM XVI Ltd/ALM XVI LLC ‘Series 2015-16A CR2’ ‘144A’ FRN 15/7/2027 1,236,549 0.10
USD 538,000 AMC Networks Inc 4.75% 1/8/2025 551,450 0.04 USD 1,495,000 American Builders & Contractors
Supply Co Inc ‘144A’ 5.875% 15/5/2026 1,590,306 0.13
USD 401,000 Amsted Industries Inc ‘144A’ 5.625% 1/7/2027 431,576 0.04
EUR 630,000 Anchorage Capital Europe CLO 2 DAC FRN 15/5/2031 685,150 0.06
USD 855,000 Anixter Inc 6% 1/12/2025 947,981 0.08 USD 328,000 Antero Midstream Partners LP /
Antero Midstream Finance Corp 5.375% 15/9/2024 309,960 0.03
USD 116,000 Antero Resources Corp 5.375% 1/11/2021 112,810 0.01
USD 627,000 Apergy Corp 6.375% 1/5/2026 633,270 0.05 USD 1,000,000 Apidos CLO XV ‘Series 2013-15A
CRR’ ‘144A’ FRN 20/4/2031 969,462 0.08 USD 623,000 APX Group Inc 7.875% 1/12/2022 596,522 0.05 USD 679,000 APX Group Inc 8.75% 1/12/2020 645,899 0.05 USD 223,000 Aramark Services Inc ‘144A’ 5%
1/4/2025 230,526 0.02 USD 1,229,000 Aramark Services Inc ‘144A’ 5%
1/2/2028 1,278,160 0.10 USD 669,000 Archrock Partners LP / Archrock
Partners Finance Corp ‘144A’ 6.875% 1/4/2027 700,777 0.06
USD 1,704,000 Arconic Inc 5.125% 1/10/2024 1,817,691 0.15 USD 590,000 Arconic Inc 5.87% 23/2/2022 630,070 0.05 USD 209,000 Asbury Automotive Group Inc 6%
15/12/2024 217,099 0.02 USD 2,109,000 Ascend Learning LLC ‘144A’
6.875% 1/8/2025 2,193,360 0.18 USD 860,000 Ascent Resources Utica Holdings
LLC / ARU Finance Corp ‘144A’ 10% 1/4/2022 867,525 0.07
USD 250,000 Atrium IX ‘144A’ FRN 28/5/2030 249,561 0.02 EUR 107,000 Avantor Inc 4.75% 1/10/2024 127,482 0.01 USD 4,763,000 Avantor Inc ‘144A’ 6% 1/10/2024 5,120,225 0.42 USD 3,223,000 Avantor Inc ‘144A’ 9% 1/10/2025 3,629,904 0.30 USD 360,000 Avis Budget Car Rental LLC / Avis
Budget Finance Inc ‘144A’ 5.75% 15/7/2027 367,542 0.03
USD 843,000 Axalta Coating Systems LLC ‘144A’ 4.875% 15/8/2024 874,613 0.07
EUR 1,130,000 Banff Merger Sub Inc 8.375% 1/9/2026 1,125,656 0.09
USD 3,433,000 Banff Merger Sub Inc ‘144A’ 9.75% 1/9/2026 3,189,257 0.26
USD 2,310,000 Bausch Health Americas Inc ‘144A’ 8.5% 31/1/2027 2,566,987 0.21
USD 456,000 Bausch Health Americas Inc ‘144A’ 9.25% 1/4/2026 518,700 0.04
USD 246,000 BBA US Holdings Inc ‘144A’ 5.375% 1/5/2026 257,685 0.02
USD 42,000 Beacon Roofing Supply Inc ‘144A’ 4.875% 1/11/2025 41,423 0.00
EUR 644,000 Belden Inc 4.125% 15/10/2026 753,503 0.06 USD 500,000 Benefit Street Partners CLO XV
Ltd ‘Series 2018-15A A2A’ ‘144A’ FRN 18/7/2031 494,974 0.04
USD 1,189,000 Berry Global Inc ‘144A’ 4.875% 15/7/2026 1,255,881 0.10
USD 296,000 Berry Petroleum Co LLC ‘144A’ 7% 15/2/2026 274,170 0.02
USD 610,000 Big River Steel LLC / BRS Finance Corp ‘144A’ 7.25% 1/9/2025 646,600 0.05
USD 6,000 Block Communications Inc ‘144A’ 6.875% 15/2/2025 6,330 0.00
USD 2,168,000 Blue Cube Spinco LLC 9.75% 15/10/2023 2,384,800 0.19
USD 1,906,000 Blue Cube Spinco LLC 10% 15/10/2025 2,149,015 0.18
USD 769,000 Booz Allen Hamilton Inc ‘144A’ 5.125% 1/5/2025 792,070 0.06
USD 532,000 Boyne USA Inc ‘144A’ 7.25% 1/5/2025 583,205 0.05
USD 450,000 Brand Industrial Services Inc ‘144A’ 8.5% 15/7/2025 401,625 0.03
USD 653,000 Brazos Valley Longhorn LLC / Brazos Valley Longhorn Finance Corp 6.875% 1/2/2025 582,802 0.05
USD 533,000 Brookfield Property REIT Inc / BPR Cumulus LLC / BPR Nimbus LLC / GGSI Sellco LL ‘144A’ 5.75% 15/5/2026 562,315 0.05
USD 379,000 Builders FirstSource Inc ‘144A’ 6.75% 1/6/2027 415,952 0.03
USD 325,000 BWX Technologies Inc ‘144A’ 5.375% 15/7/2026 344,906 0.03
USD 288,000 California Resources Corp ‘144A’ 8% 15/12/2022 167,040 0.01
USD 453,000 Callon Petroleum Co 6.125% 1/10/2024 442,808 0.04
USD 572,000 Callon Petroleum Co 6.375% 1/7/2026 557,700 0.05
USD 2,242,000 Calpine Corp ‘144A’ 5.25% 1/6/2026 2,272,827 0.19 USD 3,073,000 Calpine Corp 5.375% 15/1/2023 3,103,730 0.25 USD 174,000 Calpine Corp 5.5% 1/2/2024 175,961 0.01 USD 1,380,000 Calpine Corp 5.75% 15/1/2025 1,411,050 0.12 USD 431,000 Capitol Investment Merger Sub 2
LLC ‘144A’ 10% 1/8/2024 447,162 0.04 USD 1,000,000 Carlyle Global Market Strategies
CLO 2015-3 Ltd ‘Series 2015-3A A2R’ ‘144A’ FRN 28/7/2028 996,657 0.08
USD 250,000 Carlyle Global Market Strategies CLO 2016-1 Ltd ‘Series 2016-1A BR’ ‘144A’ FRN 20/4/2027 246,948 0.02
USD 420,000 Carrizo Oil & Gas Inc 6.25% 15/4/2023 403,830 0.03
USD 765,000 Carrizo Oil & Gas Inc 8.25% 15/7/2025 745,875 0.06
USD 946,000 Catalent Pharma Solutions Inc ‘144A’ 4.875% 15/1/2026 964,920 0.08
USD 744,000 Catalent Pharma Solutions Inc ‘144A’ 5% 15/7/2027 780,739 0.06
USD 1,000,000 CBAM 2018-6 Ltd ‘Series 2018-6A B1’ ‘144A’ FRN 15/7/2031 982,682 0.08
USD 144,000 CCO Holdings LLC / CCO Holdings Capital Corp ‘144A’ 4% 1/3/2023 146,506 0.01
USD 1,898,000 CCO Holdings LLC / CCO Holdings Capital Corp ‘144A’ 5% 1/2/2028 1,997,645 0.16
USD 3,800,000 CCO Holdings LLC / CCO Holdings Capital Corp ‘144A’ 5.125% 1/5/2027 4,032,750 0.33
USD 3,739,000 CCO Holdings LLC / CCO Holdings Capital Corp ‘144A’ 5.375% 1/6/2029 4,012,414 0.33
USD 180,000 CCO Holdings LLC / CCO Holdings Capital Corp ‘144A’ 5.75% 15/2/2026 191,025 0.02
USD 202,000 CCO Holdings LLC / CCO Holdings Capital Corp ‘144A’ 5.875% 1/5/2027 215,887 0.02
Global High Yield Bond Fund continued
Portfolio of Investments 31 August 2019
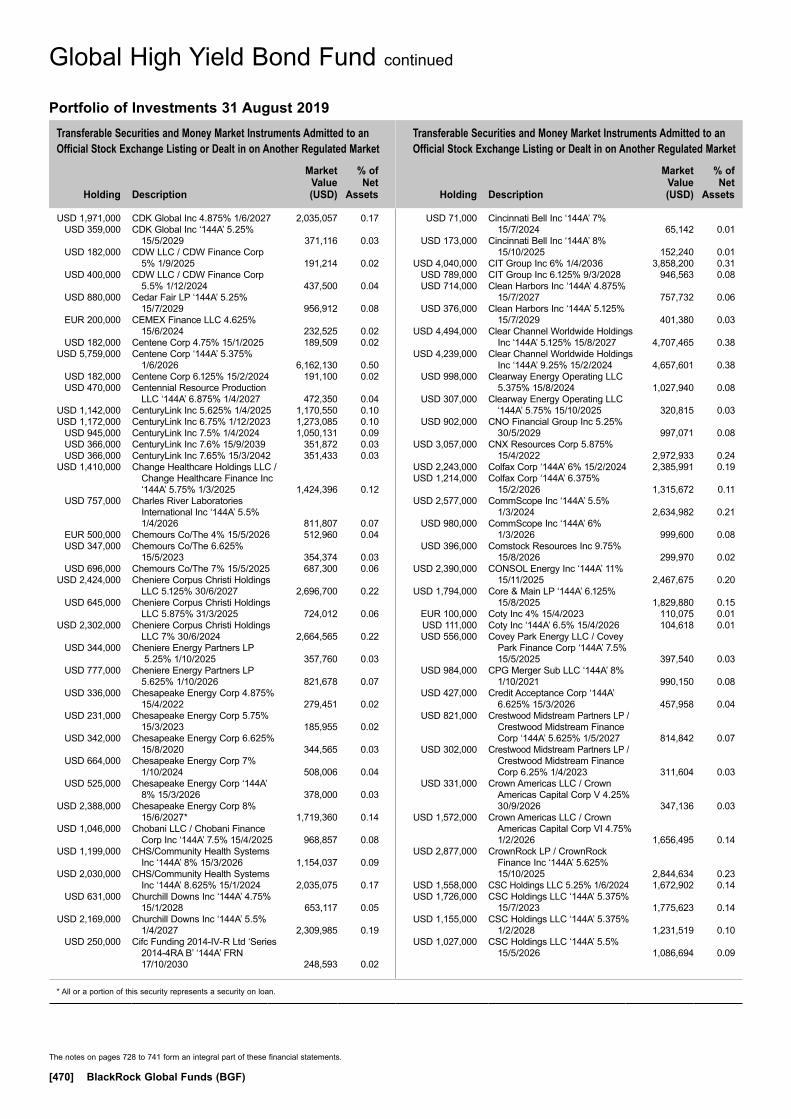
Transferable Securities and Money Market Instruments Admitted to an Official Stock Exchange Listing or Dealt in on Another Regulated Market
Transferable Securities and Money Market Instruments Admitted to an Official Stock Exchange Listing or Dealt in on Another Regulated Market
Holding
Description
Market Value (USD)
% of Net
Assets
Holding
Description
Market Value (USD)
% of Net
Assets
* All or a portion of this security represents a security on loan.
The notes on pages 728 to 741 form an integral part of these financial statements.
[470] BlackRock Global Funds (BGF)
USD 1,971,000 CDK Global Inc 4.875% 1/6/2027 2,035,057 0.17 USD 359,000 CDK Global Inc ‘144A’ 5.25%
15/5/2029 371,116 0.03 USD 182,000 CDW LLC / CDW Finance Corp
5% 1/9/2025 191,214 0.02 USD 400,000 CDW LLC / CDW Finance Corp
5.5% 1/12/2024 437,500 0.04 USD 880,000 Cedar Fair LP ‘144A’ 5.25%
15/7/2029 956,912 0.08 EUR 200,000 CEMEX Finance LLC 4.625%
15/6/2024 232,525 0.02 USD 182,000 Centene Corp 4.75% 15/1/2025 189,509 0.02 USD 5,759,000 Centene Corp ‘144A’ 5.375%
1/6/2026 6,162,130 0.50 USD 182,000 Centene Corp 6.125% 15/2/2024 191,100 0.02 USD 470,000 Centennial Resource Production
LLC ‘144A’ 6.875% 1/4/2027 472,350 0.04 USD 1,142,000 CenturyLink Inc 5.625% 1/4/2025 1,170,550 0.10 USD 1,172,000 CenturyLink Inc 6.75% 1/12/2023 1,273,085 0.10 USD 945,000 CenturyLink Inc 7.5% 1/4/2024 1,050,131 0.09 USD 366,000 CenturyLink Inc 7.6% 15/9/2039 351,872 0.03 USD 366,000 CenturyLink Inc 7.65% 15/3/2042 351,433 0.03 USD 1,410,000 Change Healthcare Holdings LLC /
Change Healthcare Finance Inc ‘144A’ 5.75% 1/3/2025 1,424,396 0.12
USD 757,000 Charles River Laboratories International Inc ‘144A’ 5.5% 1/4/2026 811,807 0.07
EUR 500,000 Chemours Co/The 4% 15/5/2026 512,960 0.04 USD 347,000 Chemours Co/The 6.625%
15/5/2023 354,374 0.03 USD 696,000 Chemours Co/The 7% 15/5/2025 687,300 0.06 USD 2,424,000 Cheniere Corpus Christi Holdings
LLC 5.125% 30/6/2027 2,696,700 0.22 USD 645,000 Cheniere Corpus Christi Holdings
LLC 5.875% 31/3/2025 724,012 0.06 USD 2,302,000 Cheniere Corpus Christi Holdings
LLC 7% 30/6/2024 2,664,565 0.22 USD 344,000 Cheniere Energy Partners LP
5.25% 1/10/2025 357,760 0.03 USD 777,000 Cheniere Energy Partners LP
5.625% 1/10/2026 821,678 0.07 USD 336,000 Chesapeake Energy Corp 4.875%
15/4/2022 279,451 0.02 USD 231,000 Chesapeake Energy Corp 5.75%
15/3/2023 185,955 0.02 USD 342,000 Chesapeake Energy Corp 6.625%
15/8/2020 344,565 0.03 USD 664,000 Chesapeake Energy Corp 7%
1/10/2024 508,006 0.04 USD 525,000 Chesapeake Energy Corp ‘144A’
8% 15/3/2026 378,000 0.03 USD 2,388,000 Chesapeake Energy Corp 8%
15/6/2027* 1,719,360 0.14 USD 1,046,000 Chobani LLC / Chobani Finance
Corp Inc ‘144A’ 7.5% 15/4/2025 968,857 0.08 USD 1,199,000 CHS/Community Health Systems
Inc ‘144A’ 8% 15/3/2026 1,154,037 0.09 USD 2,030,000 CHS/Community Health Systems
Inc ‘144A’ 8.625% 15/1/2024 2,035,075 0.17 USD 631,000 Churchill Downs Inc ‘144A’ 4.75%
15/1/2028 653,117 0.05 USD 2,169,000 Churchill Downs Inc ‘144A’ 5.5%
1/4/2027 2,309,985 0.19 USD 250,000 Cifc Funding 2014-IV-R Ltd ‘Series
2014-4RA B’ ‘144A’ FRN 17/10/2030 248,593 0.02
USD 71,000 Cincinnati Bell Inc ‘144A’ 7% 15/7/2024 65,142 0.01
USD 173,000 Cincinnati Bell Inc ‘144A’ 8% 15/10/2025 152,240 0.01
USD 4,040,000 CIT Group Inc 6% 1/4/2036 3,858,200 0.31 USD 789,000 CIT Group Inc 6.125% 9/3/2028 946,563 0.08 USD 714,000 Clean Harbors Inc ‘144A’ 4.875%
15/7/2027 757,732 0.06 USD 376,000 Clean Harbors Inc ‘144A’ 5.125%
15/7/2029 401,380 0.03 USD 4,494,000 Clear Channel Worldwide Holdings
Inc ‘144A’ 5.125% 15/8/2027 4,707,465 0.38 USD 4,239,000 Clear Channel Worldwide Holdings
Inc ‘144A’ 9.25% 15/2/2024 4,657,601 0.38 USD 998,000 Clearway Energy Operating LLC
5.375% 15/8/2024 1,027,940 0.08 USD 307,000 Clearway Energy Operating LLC
‘144A’ 5.75% 15/10/2025 320,815 0.03 USD 902,000 CNO Financial Group Inc 5.25%
30/5/2029 997,071 0.08 USD 3,057,000 CNX Resources Corp 5.875%
15/4/2022 2,972,933 0.24 USD 2,243,000 Colfax Corp ‘144A’ 6% 15/2/2024 2,385,991 0.19 USD 1,214,000 Colfax Corp ‘144A’ 6.375%
15/2/2026 1,315,672 0.11 USD 2,577,000 CommScope Inc ‘144A’ 5.5%
1/3/2024 2,634,982 0.21 USD 980,000 CommScope Inc ‘144A’ 6%
1/3/2026 999,600 0.08 USD 396,000 Comstock Resources Inc 9.75%
15/8/2026 299,970 0.02 USD 2,390,000 CONSOL Energy Inc ‘144A’ 11%
15/11/2025 2,467,675 0.20 USD 1,794,000 Core & Main LP ‘144A’ 6.125%
15/8/2025 1,829,880 0.15 EUR 100,000 Coty Inc 4% 15/4/2023 110,075 0.01 USD 111,000 Coty Inc ‘144A’ 6.5% 15/4/2026 104,618 0.01 USD 556,000 Covey Park Energy LLC / Covey
Park Finance Corp ‘144A’ 7.5% 15/5/2025 397,540 0.03
USD 984,000 CPG Merger Sub LLC ‘144A’ 8% 1/10/2021 990,150 0.08
USD 427,000 Credit Acceptance Corp ‘144A’ 6.625% 15/3/2026 457,958 0.04
USD 821,000 Crestwood Midstream Partners LP / Crestwood Midstream Finance Corp ‘144A’ 5.625% 1/5/2027 814,842 0.07
USD 302,000 Crestwood Midstream Partners LP / Crestwood Midstream Finance Corp 6.25% 1/4/2023 311,604 0.03
USD 331,000 Crown Americas LLC / Crown Americas Capital Corp V 4.25% 30/9/2026 347,136 0.03
USD 1,572,000 Crown Americas LLC / Crown Americas Capital Corp VI 4.75% 1/2/2026 1,656,495 0.14
USD 2,877,000 CrownRock LP / CrownRock Finance Inc ‘144A’ 5.625% 15/10/2025 2,844,634 0.23
USD 1,558,000 CSC Holdings LLC 5.25% 1/6/2024 1,672,902 0.14 USD 1,726,000 CSC Holdings LLC ‘144A’ 5.375%
15/7/2023 1,775,623 0.14 USD 1,155,000 CSC Holdings LLC ‘144A’ 5.375%
1/2/2028 1,231,519 0.10 USD 1,027,000 CSC Holdings LLC ‘144A’ 5.5%
15/5/2026 1,086,694 0.09
Global High Yield Bond Fund continued
Portfolio of Investments 31 August 2019

Transferable Securities and Money Market Instruments Admitted to an Official Stock Exchange Listing or Dealt in on Another Regulated Market
Transferable Securities and Money Market Instruments Admitted to an Official Stock Exchange Listing or Dealt in on Another Regulated Market
Holding
Description
Market Value (USD)
% of Net
Assets
Holding
Description
Market Value (USD)
% of Net
Assets
* All or a portion of this security represents a security on loan.
The notes on pages 728 to 741 form an integral part of these financial statements.
Annual Report and Audited Financial Statements [471]
USD 1,461,000 CSC Holdings LLC ‘144A’ 5.75% 15/1/2030 1,524,919 0.12
USD 1,559,000 CSC Holdings LLC ‘144A’ 6.5% 1/2/2029 1,743,157 0.14
USD 332,000 CSC Holdings LLC ‘144A’ 6.625% 15/10/2025 356,804 0.03
USD 1,204,000 CSC Holdings LLC 7.75% 15/7/2025 1,298,815 0.11 USD 2,133,000 CSC Holdings LLC ‘144A’ 10.875%
15/10/2025 2,424,954 0.20 USD 208,000 CyrusOne LP / CyrusOne Finance
Corp 5.375% 15/3/2027 221,780 0.02 USD 907,000 Darling Ingredients Inc ‘144A’
5.25% 15/4/2027 969,356 0.08 USD 409,000 DCP Midstream Operating LP
5.125% 15/5/2029 419,757 0.03 USD 520,000 DCP Midstream Operating LP
5.375% 15/7/2025 551,200 0.04 USD 702,000 DCP Midstream Operating LP
‘144A’ 6.45% 3/11/2036 738,855 0.06 USD 902,000 DCP Midstream Operating LP
‘144A’ 6.75% 15/9/2037 951,610 0.08 USD 1,626,000 Dell International LLC / EMC Corp
‘144A’ 7.125% 15/6/2024* 1,714,160 0.14 USD 222,000 Denbury Resources Inc ‘144A’
9% 15/5/2021 204,240 0.02 USD 911,000 Denbury Resources Inc ‘144A’
9.25% 31/3/2022 772,072 0.06 USD 2,378,000 Diamond Sports Group LLC /
Diamond Sports Finance Co ‘144A’ 5.375% 15/8/2026 2,504,391 0.20
USD 3,872,000 DISH DBS Corp 5.875% 15/7/2022 4,031,720 0.33 USD 1,262,000 DISH DBS Corp 6.75% 1/6/2021 1,332,988 0.11 USD 3,197,000 Dun & Bradstreet Corp/The ‘144A’
6.875% 15/8/2026 3,470,743 0.28 USD 520,000 Dun & Bradstreet Corp/The ‘144A’
10.25% 15/2/2027 570,050 0.05 USD 410,000 Eagle Holding Co II LLC ‘144A’
7.625% 15/5/2022 415,125 0.03 USD 884,000 Eagle Holding Co II LLC ‘144A’
7.75% 15/5/2022 896,155 0.07 USD 95,000 Edison International 5.75%
15/6/2027 108,216 0.01 USD 642,000 Elanco Animal Health Inc 4.9%
28/8/2028 694,290 0.06 USD 9,000 Eldorado Resorts Inc 6% 1/4/2025 9,585 0.00 USD 29,000 Eldorado Resorts Inc 6% 15/9/2026 31,864 0.00 USD 5,089,000 Element Solutions Inc ‘144A’
5.875% 1/12/2025 5,318,005 0.43 USD 1,138,000 Embarq Corp 7.995% 1/6/2036 1,120,930 0.09 USD 1,422,000 Endeavor Energy Resources LP /
EER Finance Inc ‘144A’ 5.5% 30/1/2026 1,484,212 0.12
USD 1,152,000 Endeavor Energy Resources LP / EER Finance Inc ‘144A’ 5.75% 30/1/2028 1,212,480 0.10
USD 991,000 Energizer Holdings Inc ‘144A’ 7.75% 15/1/2027 1,086,384 0.09
USD 36,000 EnLink Midstream LLC 5.375% 1/6/2029 35,381 0.00
USD 88,000 EnLink Midstream Partners LP 4.15% 1/6/2025 84,810 0.01
USD 1,040,000 EnLink Midstream Partners LP 4.4% 1/4/2024 1,032,200 0.08
USD 190,000 EnLink Midstream Partners LP 4.85% 15/7/2026 187,862 0.02
USD 558,000 EnLink Midstream Partners LP 5.05% 1/4/2045 463,140 0.04
USD 319,000 EnLink Midstream Partners LP 5.45% 1/6/2047 271,150 0.02
USD 226,000 EnLink Midstream Partners LP 5.6% 1/4/2044 193,230 0.02
USD 529,000 EnPro Industries Inc 5.75% 15/10/2026 556,773 0.05
USD 216,000 Entegris Inc ‘144A’ 4.625% 10/2/2026 223,560 0.02
USD 444,000 Entercom Media Corp ‘144A’ 6.5% 1/5/2027 459,722 0.04
USD 890,000 Envision Healthcare Corp ‘144A’ 8.75% 15/10/2026 489,500 0.04
EUR 962,000 Equinix Inc 2.875% 15/3/2024 1,106,356 0.09 EUR 181,000 Equinix Inc 2.875% 1/10/2025 208,280 0.02 EUR 1,000,000 Equinix Inc 2.875% 1/2/2026 1,159,751 0.09 USD 1,521,000 Extraction Oil & Gas Inc ‘144A’
5.625% 1/2/2026 1,011,465 0.08 USD 1,214,000 Extraction Oil & Gas Inc ‘144A’
7.375% 15/5/2024 916,570 0.07 USD 500,000 Fillmore Park CLO Ltd 2018-1A
‘Series 2018-1A D’ ‘144A’ FRN 15/7/2030 474,609 0.04
USD 303,000 Five Point Operating Co LP / Five Point Capital Corp ‘144A’ 7.875% 15/11/2025 305,272 0.02
USD 572,000 Flexi-Van Leasing Inc ‘144A’ 10% 15/2/2023 561,990 0.05
USD 3,000 Fortress Transportation & Infrastructure Investors LLC ‘144A’ 6.5% 1/10/2025 3,094 0.00
USD 191,000 Fortress Transportation & Infrastructure Investors LLC ‘144A’ 6.75% 15/3/2022 199,117 0.02
USD 717,000 Freeport-McMoRan Inc 3.55% 1/3/2022 722,378 0.06
USD 1,799,000 Freeport-McMoRan Inc 3.875% 15/3/2023 1,816,990 0.15
USD 289,000 Freeport-McMoRan Inc 5% 1/9/2027 287,194 0.02
USD 518,000 Freeport-McMoRan Inc 5.25% 1/9/2029 511,525 0.04
USD 6,080,000 Freeport-McMoRan Inc 5.45% 15/3/2043 5,532,800 0.45
USD 693,000 frontdoor Inc ‘144A’ 6.75% 15/8/2026 753,638 0.06
USD 4,045,000 Frontier Communications Corp ‘144A’ 8% 1/4/2027 4,227,025 0.34
USD 407,000 Frontier Communications Corp ‘144A’ 8.5% 1/4/2026 395,808 0.03
USD 129,000 FS Energy & Power Fund ‘144A’ 7.5% 15/8/2023 128,355 0.01
USD 250,000 Galaxy XXVI CLO Ltd ‘Series 2018-26A B’ ‘144A’ FRN 22/11/2031 248,874 0.02
USD 11,000 Gartner Inc ‘144A’ 5.125% 1/4/2025 11,564 0.00 USD 806,000 Gates Global LLC / Gates Global
Co ‘144A’ 6% 15/7/2022 803,179 0.07 USD 390,000 GCI LLC ‘144A’ 6.625% 15/6/2024 417,300 0.03 USD 536,000 GCP Applied Technologies Inc
‘144A’ 5.5% 15/4/2026 550,740 0.04 USD 114,000 Genesis Energy LP / Genesis
Energy Finance Corp 5.625% 15/6/2024 109,440 0.01
USD 211,000 Genesis Energy LP / Genesis Energy Finance Corp 6% 15/5/2023 210,472 0.02
USD 302,000 Genesis Energy LP / Genesis Energy Finance Corp 6.25% 15/5/2026 290,038 0.02
Global High Yield Bond Fund continued
Portfolio of Investments 31 August 2019
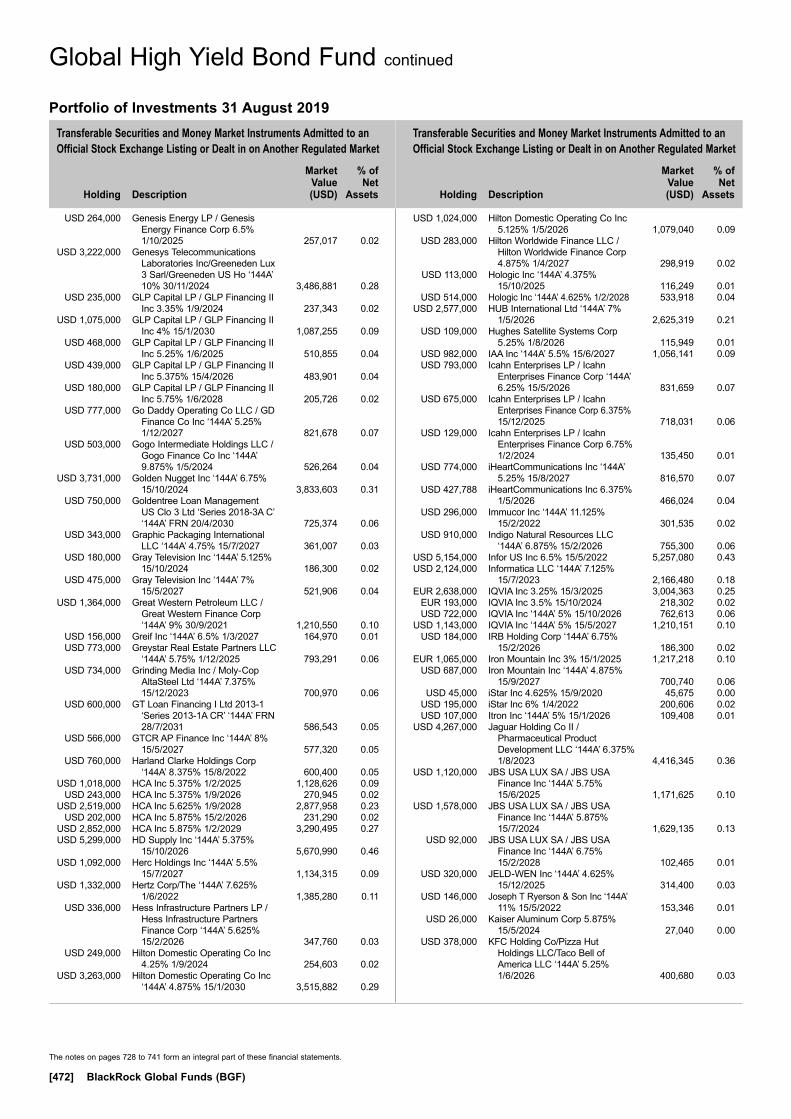
Transferable Securities and Money Market Instruments Admitted to an Official Stock Exchange Listing or Dealt in on Another Regulated Market
Transferable Securities and Money Market Instruments Admitted to an Official Stock Exchange Listing or Dealt in on Another Regulated Market
Holding
Description
Market Value (USD)
% of Net
Assets
Holding
Description
Market Value (USD)
% of Net
Assets
The notes on pages 728 to 741 form an integral part of these financial statements.
[472] BlackRock Global Funds (BGF)
USD 264,000 Genesis Energy LP / Genesis Energy Finance Corp 6.5% 1/10/2025 257,017 0.02
USD 3,222,000 Genesys Telecommunications Laboratories Inc/Greeneden Lux 3 Sarl/Greeneden US Ho ‘144A’ 10% 30/11/2024 3,486,881 0.28
USD 235,000 GLP Capital LP / GLP Financing II Inc 3.35% 1/9/2024 237,343 0.02
USD 1,075,000 GLP Capital LP / GLP Financing II Inc 4% 15/1/2030 1,087,255 0.09
USD 468,000 GLP Capital LP / GLP Financing II Inc 5.25% 1/6/2025 510,855 0.04
USD 439,000 GLP Capital LP / GLP Financing II Inc 5.375% 15/4/2026 483,901 0.04
USD 180,000 GLP Capital LP / GLP Financing II Inc 5.75% 1/6/2028 205,726 0.02
USD 777,000 Go Daddy Operating Co LLC / GD Finance Co Inc ‘144A’ 5.25% 1/12/2027 821,678 0.07
USD 503,000 Gogo Intermediate Holdings LLC / Gogo Finance Co Inc ‘144A’ 9.875% 1/5/2024 526,264 0.04
USD 3,731,000 Golden Nugget Inc ‘144A’ 6.75% 15/10/2024 3,833,603 0.31
USD 750,000 Goldentree Loan Management US Clo 3 Ltd ‘Series 2018-3A C’ ‘144A’ FRN 20/4/2030 725,374 0.06
USD 343,000 Graphic Packaging International LLC ‘144A’ 4.75% 15/7/2027 361,007 0.03
USD 180,000 Gray Television Inc ‘144A’ 5.125% 15/10/2024 186,300 0.02
USD 475,000 Gray Television Inc ‘144A’ 7% 15/5/2027 521,906 0.04
USD 1,364,000 Great Western Petroleum LLC / Great Western Finance Corp ‘144A’ 9% 30/9/2021 1,210,550 0.10
USD 156,000 Greif Inc ‘144A’ 6.5% 1/3/2027 164,970 0.01 USD 773,000 Greystar Real Estate Partners LLC
‘144A’ 5.75% 1/12/2025 793,291 0.06 USD 734,000 Grinding Media Inc / Moly-Cop
AltaSteel Ltd ‘144A’ 7.375% 15/12/2023 700,970 0.06
USD 600,000 GT Loan Financing I Ltd 2013-1 ‘Series 2013-1A CR’ ‘144A’ FRN 28/7/2031 586,543 0.05
USD 566,000 GTCR AP Finance Inc ‘144A’ 8% 15/5/2027 577,320 0.05
USD 760,000 Harland Clarke Holdings Corp ‘144A’ 8.375% 15/8/2022 600,400 0.05
USD 1,018,000 HCA Inc 5.375% 1/2/2025 1,128,626 0.09 USD 243,000 HCA Inc 5.375% 1/9/2026 270,945 0.02 USD 2,519,000 HCA Inc 5.625% 1/9/2028 2,877,958 0.23 USD 202,000 HCA Inc 5.875% 15/2/2026 231,290 0.02 USD 2,852,000 HCA Inc 5.875% 1/2/2029 3,290,495 0.27 USD 5,299,000 HD Supply Inc ‘144A’ 5.375%
15/10/2026 5,670,990 0.46 USD 1,092,000 Herc Holdings Inc ‘144A’ 5.5%
15/7/2027 1,134,315 0.09 USD 1,332,000 Hertz Corp/The ‘144A’ 7.625%
1/6/2022 1,385,280 0.11 USD 336,000 Hess Infrastructure Partners LP /
Hess Infrastructure Partners Finance Corp ‘144A’ 5.625% 15/2/2026 347,760 0.03
USD 249,000 Hilton Domestic Operating Co Inc 4.25% 1/9/2024 254,603 0.02
USD 3,263,000 Hilton Domestic Operating Co Inc ‘144A’ 4.875% 15/1/2030 3,515,882 0.29
USD 1,024,000 Hilton Domestic Operating Co Inc 5.125% 1/5/2026 1,079,040 0.09
USD 283,000 Hilton Worldwide Finance LLC / Hilton Worldwide Finance Corp 4.875% 1/4/2027 298,919 0.02
USD 113,000 Hologic Inc ‘144A’ 4.375% 15/10/2025 116,249 0.01
USD 514,000 Hologic Inc ‘144A’ 4.625% 1/2/2028 533,918 0.04 USD 2,577,000 HUB International Ltd ‘144A’ 7%
1/5/2026 2,625,319 0.21 USD 109,000 Hughes Satellite Systems Corp
5.25% 1/8/2026 115,949 0.01 USD 982,000 IAA Inc ‘144A’ 5.5% 15/6/2027 1,056,141 0.09 USD 793,000 Icahn Enterprises LP / Icahn
Enterprises Finance Corp ‘144A’ 6.25% 15/5/2026 831,659 0.07
USD 675,000 Icahn Enterprises LP / Icahn Enterprises Finance Corp 6.375% 15/12/2025 718,031 0.06
USD 129,000 Icahn Enterprises LP / Icahn Enterprises Finance Corp 6.75% 1/2/2024 135,450 0.01
USD 774,000 iHeartCommunications Inc ‘144A’ 5.25% 15/8/2027 816,570 0.07
USD 427,788 iHeartCommunications Inc 6.375% 1/5/2026 466,024 0.04
USD 296,000 Immucor Inc ‘144A’ 11.125% 15/2/2022 301,535 0.02
USD 910,000 Indigo Natural Resources LLC ‘144A’ 6.875% 15/2/2026 755,300 0.06
USD 5,154,000 Infor US Inc 6.5% 15/5/2022 5,257,080 0.43 USD 2,124,000 Informatica LLC ‘144A’ 7.125%
15/7/2023 2,166,480 0.18 EUR 2,638,000 IQVIA Inc 3.25% 15/3/2025 3,004,363 0.25 EUR 193,000 IQVIA Inc 3.5% 15/10/2024 218,302 0.02 USD 722,000 IQVIA Inc ‘144A’ 5% 15/10/2026 762,613 0.06 USD 1,143,000 IQVIA Inc ‘144A’ 5% 15/5/2027 1,210,151 0.10 USD 184,000 IRB Holding Corp ‘144A’ 6.75%
15/2/2026 186,300 0.02 EUR 1,065,000 Iron Mountain Inc 3% 15/1/2025 1,217,218 0.10 USD 687,000 Iron Mountain Inc ‘144A’ 4.875%
15/9/2027 700,740 0.06 USD 45,000 iStar Inc 4.625% 15/9/2020 45,675 0.00 USD 195,000 iStar Inc 6% 1/4/2022 200,606 0.02 USD 107,000 Itron Inc ‘144A’ 5% 15/1/2026 109,408 0.01 USD 4,267,000 Jaguar Holding Co II /
Pharmaceutical Product Development LLC ‘144A’ 6.375% 1/8/2023 4,416,345 0.36
USD 1,120,000 JBS USA LUX SA / JBS USA Finance Inc ‘144A’ 5.75% 15/6/2025 1,171,625 0.10
USD 1,578,000 JBS USA LUX SA / JBS USA Finance Inc ‘144A’ 5.875% 15/7/2024 1,629,135 0.13
USD 92,000 JBS USA LUX SA / JBS USA Finance Inc ‘144A’ 6.75% 15/2/2028 102,465 0.01
USD 320,000 JELD-WEN Inc ‘144A’ 4.625% 15/12/2025 314,400 0.03
USD 146,000 Joseph T Ryerson & Son Inc ‘144A’ 11% 15/5/2022 153,346 0.01
USD 26,000 Kaiser Aluminum Corp 5.875% 15/5/2024 27,040 0.00
USD 378,000 KFC Holding Co/Pizza Hut Holdings LLC/Taco Bell of America LLC ‘144A’ 5.25% 1/6/2026 400,680 0.03
Global High Yield Bond Fund continued
Portfolio of Investments 31 August 2019
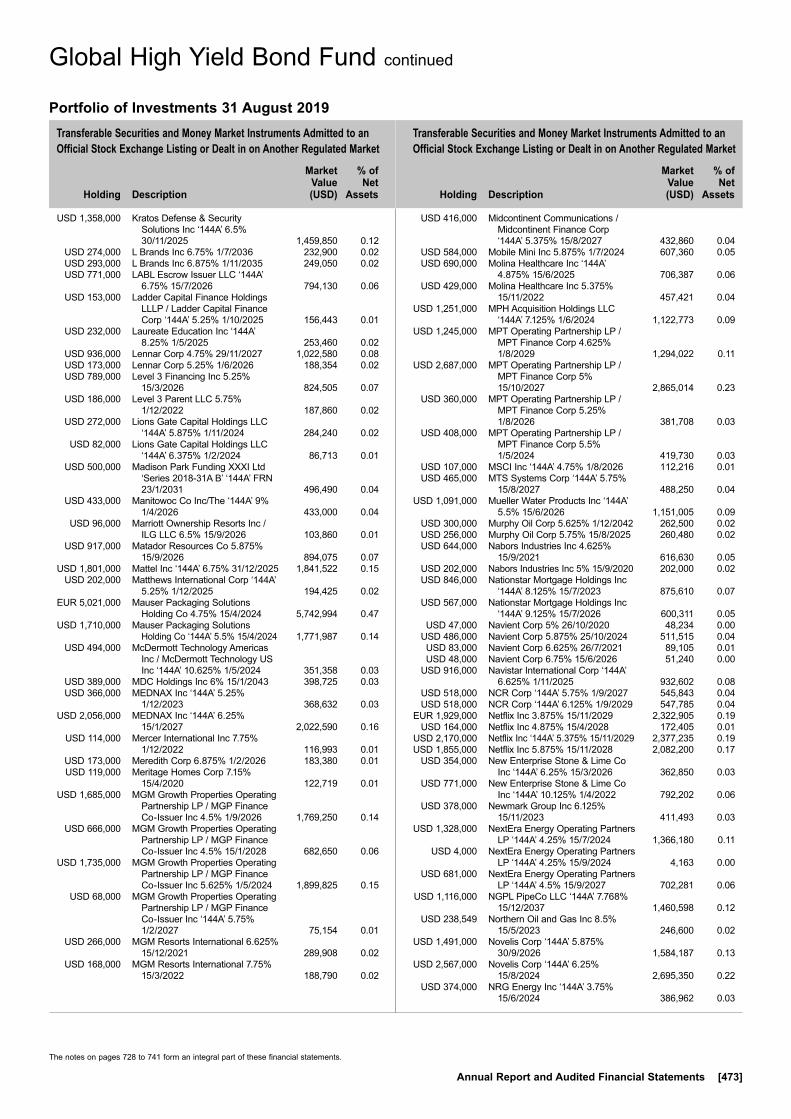
Transferable Securities and Money Market Instruments Admitted to an Official Stock Exchange Listing or Dealt in on Another Regulated Market
Transferable Securities and Money Market Instruments Admitted to an Official Stock Exchange Listing or Dealt in on Another Regulated Market
Holding
Description
Market Value (USD)
% of Net
Assets
Holding
Description
Market Value (USD)
% of Net
Assets
The notes on pages 728 to 741 form an integral part of these financial statements.
Annual Report and Audited Financial Statements [473]
USD 1,358,000 Kratos Defense & Security Solutions Inc ‘144A’ 6.5% 30/11/2025 1,459,850 0.12
USD 274,000 L Brands Inc 6.75% 1/7/2036 232,900 0.02 USD 293,000 L Brands Inc 6.875% 1/11/2035 249,050 0.02 USD 771,000 LABL Escrow Issuer LLC ‘144A’
6.75% 15/7/2026 794,130 0.06 USD 153,000 Ladder Capital Finance Holdings
LLLP / Ladder Capital Finance Corp ‘144A’ 5.25% 1/10/2025 156,443 0.01
USD 232,000 Laureate Education Inc ‘144A’ 8.25% 1/5/2025 253,460 0.02
USD 936,000 Lennar Corp 4.75% 29/11/2027 1,022,580 0.08 USD 173,000 Lennar Corp 5.25% 1/6/2026 188,354 0.02 USD 789,000 Level 3 Financing Inc 5.25%
15/3/2026 824,505 0.07 USD 186,000 Level 3 Parent LLC 5.75%
1/12/2022 187,860 0.02 USD 272,000 Lions Gate Capital Holdings LLC
‘144A’ 5.875% 1/11/2024 284,240 0.02 USD 82,000 Lions Gate Capital Holdings LLC
‘144A’ 6.375% 1/2/2024 86,713 0.01 USD 500,000 Madison Park Funding XXXI Ltd
‘Series 2018-31A B’ ‘144A’ FRN 23/1/2031 496,490 0.04
USD 433,000 Manitowoc Co Inc/The ‘144A’ 9% 1/4/2026 433,000 0.04
USD 96,000 Marriott Ownership Resorts Inc / ILG LLC 6.5% 15/9/2026 103,860 0.01
USD 917,000 Matador Resources Co 5.875% 15/9/2026 894,075 0.07
USD 1,801,000 Mattel Inc ‘144A’ 6.75% 31/12/2025 1,841,522 0.15 USD 202,000 Matthews International Corp ‘144A’
5.25% 1/12/2025 194,425 0.02 EUR 5,021,000 Mauser Packaging Solutions
Holding Co 4.75% 15/4/2024 5,742,994 0.47 USD 1,710,000 Mauser Packaging Solutions
Holding Co ‘144A’ 5.5% 15/4/2024 1,771,987 0.14 USD 494,000 McDermott Technology Americas
Inc / McDermott Technology US Inc ‘144A’ 10.625% 1/5/2024 351,358 0.03
USD 389,000 MDC Holdings Inc 6% 15/1/2043 398,725 0.03 USD 366,000 MEDNAX Inc ‘144A’ 5.25%
1/12/2023 368,632 0.03 USD 2,056,000 MEDNAX Inc ‘144A’ 6.25%
15/1/2027 2,022,590 0.16 USD 114,000 Mercer International Inc 7.75%
1/12/2022 116,993 0.01 USD 173,000 Meredith Corp 6.875% 1/2/2026 183,380 0.01 USD 119,000 Meritage Homes Corp 7.15%
15/4/2020 122,719 0.01 USD 1,685,000 MGM Growth Properties Operating
Partnership LP / MGP Finance Co-Issuer Inc 4.5% 1/9/2026 1,769,250 0.14
USD 666,000 MGM Growth Properties Operating Partnership LP / MGP Finance Co-Issuer Inc 4.5% 15/1/2028 682,650 0.06
USD 1,735,000 MGM Growth Properties Operating Partnership LP / MGP Finance Co-Issuer Inc 5.625% 1/5/2024 1,899,825 0.15
USD 68,000 MGM Growth Properties Operating Partnership LP / MGP Finance Co-Issuer Inc ‘144A’ 5.75% 1/2/2027 75,154 0.01
USD 266,000 MGM Resorts International 6.625% 15/12/2021 289,908 0.02
USD 168,000 MGM Resorts International 7.75% 15/3/2022 188,790 0.02
USD 416,000 Midcontinent Communications / Midcontinent Finance Corp ‘144A’ 5.375% 15/8/2027 432,860 0.04
USD 584,000 Mobile Mini Inc 5.875% 1/7/2024 607,360 0.05 USD 690,000 Molina Healthcare Inc ‘144A’
4.875% 15/6/2025 706,387 0.06 USD 429,000 Molina Healthcare Inc 5.375%
15/11/2022 457,421 0.04 USD 1,251,000 MPH Acquisition Holdings LLC
‘144A’ 7.125% 1/6/2024 1,122,773 0.09 USD 1,245,000 MPT Operating Partnership LP /
MPT Finance Corp 4.625% 1/8/2029 1,294,022 0.11
USD 2,687,000 MPT Operating Partnership LP / MPT Finance Corp 5% 15/10/2027 2,865,014 0.23
USD 360,000 MPT Operating Partnership LP / MPT Finance Corp 5.25% 1/8/2026 381,708 0.03
USD 408,000 MPT Operating Partnership LP / MPT Finance Corp 5.5% 1/5/2024 419,730 0.03
USD 107,000 MSCI Inc ‘144A’ 4.75% 1/8/2026 112,216 0.01 USD 465,000 MTS Systems Corp ‘144A’ 5.75%
15/8/2027 488,250 0.04 USD 1,091,000 Mueller Water Products Inc ‘144A’
5.5% 15/6/2026 1,151,005 0.09 USD 300,000 Murphy Oil Corp 5.625% 1/12/2042 262,500 0.02 USD 256,000 Murphy Oil Corp 5.75% 15/8/2025 260,480 0.02 USD 644,000 Nabors Industries Inc 4.625%
15/9/2021 616,630 0.05 USD 202,000 Nabors Industries Inc 5% 15/9/2020 202,000 0.02 USD 846,000 Nationstar Mortgage Holdings Inc
‘144A’ 8.125% 15/7/2023 875,610 0.07 USD 567,000 Nationstar Mortgage Holdings Inc
‘144A’ 9.125% 15/7/2026 600,311 0.05 USD 47,000 Navient Corp 5% 26/10/2020 48,234 0.00 USD 486,000 Navient Corp 5.875% 25/10/2024 511,515 0.04 USD 83,000 Navient Corp 6.625% 26/7/2021 89,105 0.01 USD 48,000 Navient Corp 6.75% 15/6/2026 51,240 0.00 USD 916,000 Navistar International Corp ‘144A’
6.625% 1/11/2025 932,602 0.08 USD 518,000 NCR Corp ‘144A’ 5.75% 1/9/2027 545,843 0.04 USD 518,000 NCR Corp ‘144A’ 6.125% 1/9/2029 547,785 0.04 EUR 1,929,000 Netflix Inc 3.875% 15/11/2029 2,322,905 0.19 USD 164,000 Netflix Inc 4.875% 15/4/2028 172,405 0.01 USD 2,170,000 Netflix Inc ‘144A’ 5.375% 15/11/2029 2,377,235 0.19 USD 1,855,000 Netflix Inc 5.875% 15/11/2028 2,082,200 0.17 USD 354,000 New Enterprise Stone & Lime Co
Inc ‘144A’ 6.25% 15/3/2026 362,850 0.03 USD 771,000 New Enterprise Stone & Lime Co
Inc ‘144A’ 10.125% 1/4/2022 792,202 0.06 USD 378,000 Newmark Group Inc 6.125%
15/11/2023 411,493 0.03 USD 1,328,000 NextEra Energy Operating Partners
LP ‘144A’ 4.25% 15/7/2024 1,366,180 0.11 USD 4,000 NextEra Energy Operating Partners
LP ‘144A’ 4.25% 15/9/2024 4,163 0.00 USD 681,000 NextEra Energy Operating Partners
LP ‘144A’ 4.5% 15/9/2027 702,281 0.06 USD 1,116,000 NGPL PipeCo LLC ‘144A’ 7.768%
15/12/2037 1,460,598 0.12 USD 238,549 Northern Oil and Gas Inc 8.5%
15/5/2023 246,600 0.02 USD 1,491,000 Novelis Corp ‘144A’ 5.875%
30/9/2026 1,584,187 0.13 USD 2,567,000 Novelis Corp ‘144A’ 6.25%
15/8/2024 2,695,350 0.22 USD 374,000 NRG Energy Inc ‘144A’ 3.75%
15/6/2024 386,962 0.03
Global High Yield Bond Fund continued
Portfolio of Investments 31 August 2019

Transferable Securities and Money Market Instruments Admitted to an Official Stock Exchange Listing or Dealt in on Another Regulated Market
Transferable Securities and Money Market Instruments Admitted to an Official Stock Exchange Listing or Dealt in on Another Regulated Market
Holding
Description
Market Value (USD)
% of Net
Assets
Holding
Description
Market Value (USD)
% of Net
Assets
* All or a portion of this security represents a security on loan.
The notes on pages 728 to 741 form an integral part of these financial statements.
[474] BlackRock Global Funds (BGF)
USD 1,180,000 NRG Energy Inc ‘144A’ 4.45% 15/6/2029 1,240,435 0.10
USD 1,687,000 NRG Energy Inc ‘144A’ 5.25% 15/6/2029 1,805,090 0.15
USD 1,504,000 NRG Energy Inc 5.75% 15/1/2028 1,624,320 0.13 USD 576,000 NRG Energy Inc 6.625% 15/1/2027 624,240 0.05 USD 316,000 Nuance Communications Inc
5.625% 15/12/2026 333,775 0.03 USD 29,000 Nuance Communications Inc 6%
1/7/2024 30,269 0.00 USD 424,000 NuStar Logistics LP 6% 1/6/2026 455,800 0.04 USD 515,000 NVA Holdings Inc/United States
‘144A’ 6.875% 1/4/2026 552,492 0.05 USD 508,000 Oak Hill Credit Partners X-R Ltd
‘Series 2014-10RA C’ ‘144A’ FRN 12/12/2030 496,550 0.04
USD 500,000 Octagon Investment Partners XXIII Ltd ‘Series 2015-1A CR’ ‘144A’ FRN 15/7/2027 495,666 0.04
USD 5,166,000 Ortho-Clinical Diagnostics Inc / Ortho-Clinical Diagnostics SA ‘144A’ 6.625% 15/5/2022* 5,011,020 0.41
USD 1,891,000 Outfront Media Capital LLC / Outfront Media Capital Corp ‘144A’ 5% 15/8/2027 1,959,549 0.16
USD 608,000 Owl Rock Capital Corp 5.25% 15/4/2024 638,796 0.05
EUR 2,634,000 Panther BF Aggregator 2 LP / Panther Finance Co Inc 4.375% 15/5/2026 2,972,210 0.24
USD 3,269,000 Panther BF Aggregator 2 LP / Panther Finance Co Inc ‘144A’ 6.25% 15/5/2026 3,387,501 0.28
USD 3,290,000 Panther BF Aggregator 2 LP / Panther Finance Co Inc ‘144A’ 8.5% 15/5/2027 3,207,750 0.26
USD 2,001,000 Par Pharmaceutical Inc ‘144A’ 7.5% 1/4/2027 1,870,935 0.15
USD 69,000 Parsley Energy LLC / Parsley Finance Corp ‘144A’ 5.25% 15/8/2025 70,380 0.01
USD 486,000 Parsley Energy LLC / Parsley Finance Corp ‘144A’ 5.375% 15/1/2025 496,935 0.04
USD 1,266,000 Parsley Energy LLC / Parsley Finance Corp ‘144A’ 5.625% 15/10/2027 1,310,310 0.11
USD 563,000 Parsley Energy LLC / Parsley Finance Corp ‘144A’ 6.25% 1/6/2024 581,298 0.05
USD 153,000 Pattern Energy Group Inc ‘144A’ 5.875% 1/2/2024 159,120 0.01
USD 549,000 PBF Holding Co LLC / PBF Finance Corp 7.25% 15/6/2025 567,529 0.05
USD 24,000 PDC Energy Inc 1.125% 15/9/2021 22,244 0.00 USD 414,000 PDC Energy Inc 5.75% 15/5/2026 405,679 0.03 USD 77,000 PDC Energy Inc 6.125% 15/9/2024 76,807 0.01 USD 1,903,000 PetSmart Inc ‘144A’ 5.875%
1/6/2025 1,874,455 0.15 USD 418,000 PetSmart Inc ‘144A’ 7.125%
15/3/2023 388,740 0.03 USD 38,000 PGT Escrow Issuer Inc ‘144A’
6.75% 1/8/2026 41,040 0.00 USD 1,994,333 Polaris Intermediate Corp ‘144A’
8.5% 1/12/2022 1,675,439 0.14 USD 131,000 Post Holdings Inc ‘144A’ 5.5%
1/3/2025 137,550 0.01 USD 636,000 Post Holdings Inc ‘144A’ 5.5%
15/12/2029 674,160 0.06
USD 174,000 Post Holdings Inc ‘144A’ 5.625% 15/1/2028 184,222 0.02
USD 47,000 Post Holdings Inc ‘144A’ 5.75% 1/3/2027 50,172 0.00
USD 992,000 PQ Corp ‘144A’ 5.75% 15/12/2025 1,021,760 0.08 USD 658,000 Prime Security Services Borrower
LLC / Prime Finance Inc ‘144A’ 5.25% 15/4/2024 677,740 0.06
USD 700,000 Prime Security Services Borrower LLC / Prime Finance Inc ‘144A’ 5.75% 15/4/2026 734,125 0.06
USD 9,000 PTC Inc 6% 15/5/2024 9,450 0.00 USD 835,000 PulteGroup Inc 6% 15/2/2035 887,188 0.07 USD 406,000 QEP Resources Inc 5.25% 1/5/2023 355,250 0.03 USD 539,000 QEP Resources Inc 5.375%
1/10/2022 487,121 0.04 USD 559,000 QEP Resources Inc 5.625%
1/3/2026 455,585 0.04 USD 242,000 QEP Resources Inc 6.875%
1/3/2021 241,395 0.02 USD 419,000 Qorvo Inc 5.5% 15/7/2026 448,338 0.04 USD 526,000 Qualitytech LP / QTS Finance Corp
‘144A’ 4.75% 15/11/2025 536,520 0.04 USD 540,000 Rackspace Hosting Inc ‘144A’
8.625% 15/11/2024* 494,775 0.04 USD 436,000 Radiate Holdco LLC / Radiate
Finance Inc ‘144A’ 6.625% 15/2/2025 434,910 0.04
USD 45,000 Radiate Holdco LLC / Radiate Finance Inc ‘144A’ 6.875% 15/2/2023 46,125 0.00
USD 153,000 Range Resources Corp 4.875% 15/5/2025* 127,755 0.01
USD 221,000 Range Resources Corp 5% 15/8/2022 208,845 0.02
USD 878,000 Range Resources Corp 5.75% 1/6/2021 875,805 0.07
USD 27,000 Range Resources Corp 5.875% 1/7/2022 26,055 0.00
USD 973,000 RBS Global Inc / Rexnord LLC ‘144A’ 4.875% 15/12/2025 1,004,623 0.08
EUR 3,711,000 Refinitiv US Holdings Inc 4.5% 15/5/2026 4,474,387 0.36
USD 2,810,000 Refinitiv US Holdings Inc ‘144A’ 6.25% 15/5/2026 3,066,413 0.25
EUR 785,000 Refinitiv US Holdings Inc 6.875% 15/11/2026 988,911 0.08
USD 2,543,000 Refinitiv US Holdings Inc ‘144A’ 8.25% 15/11/2026 2,873,590 0.23
USD 250,000 Regatta VII Funding Ltd ‘Series 2016-1A CR’ ‘144A’ FRN 20/12/2028 246,164 0.02
USD 500,000 Regatta VII Funding Ltd ‘Series 2016-1A DR’ ‘144A’ FRN 20/12/2028 484,404 0.04
USD 1,666,000 RegionalCare Hospital Partners Holdings Inc ‘144A’ 8.25% 1/5/2023 1,782,079 0.15
USD 275,000 Reynolds Group Issuer Inc / Reynolds Group Issuer LLC / Reynolds Group Issuer Lu ‘144A’ 5.125% 15/7/2023 282,906 0.02
USD 1,319,000 Reynolds Group Issuer Inc / Reynolds Group Issuer LLC / Reynolds Group Issuer Lu ‘144A’ 7% 15/7/2024 1,364,341 0.11
USD 1,442,000 Rowan Cos Inc 4.875% 1/6/2022 1,188,208 0.10 USD 1,688,000 RP Crown Parent LLC ‘144A’
7.375% 15/10/2024 1,763,470 0.14
Global High Yield Bond Fund continued
Portfolio of Investments 31 August 2019
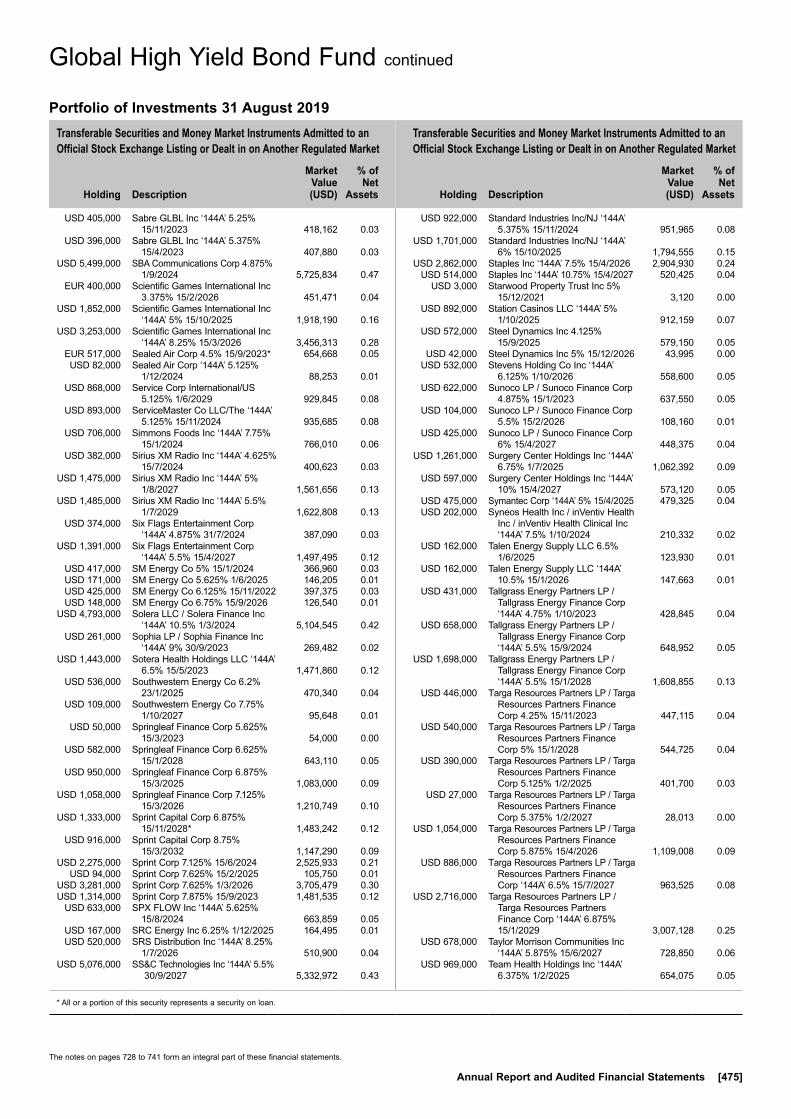
Transferable Securities and Money Market Instruments Admitted to an Official Stock Exchange Listing or Dealt in on Another Regulated Market
Transferable Securities and Money Market Instruments Admitted to an Official Stock Exchange Listing or Dealt in on Another Regulated Market
Holding
Description
Market Value (USD)
% of Net
Assets
Holding
Description
Market Value (USD)
% of Net
Assets
* All or a portion of this security represents a security on loan.
The notes on pages 728 to 741 form an integral part of these financial statements.
Annual Report and Audited Financial Statements [475]
USD 405,000 Sabre GLBL Inc ‘144A’ 5.25% 15/11/2023 418,162 0.03
USD 396,000 Sabre GLBL Inc ‘144A’ 5.375% 15/4/2023 407,880 0.03
USD 5,499,000 SBA Communications Corp 4.875% 1/9/2024 5,725,834 0.47
EUR 400,000 Scientific Games International Inc 3.375% 15/2/2026 451,471 0.04
USD 1,852,000 Scientific Games International Inc ‘144A’ 5% 15/10/2025 1,918,190 0.16
USD 3,253,000 Scientific Games International Inc ‘144A’ 8.25% 15/3/2026 3,456,313 0.28
EUR 517,000 Sealed Air Corp 4.5% 15/9/2023* 654,668 0.05 USD 82,000 Sealed Air Corp ‘144A’ 5.125%
1/12/2024 88,253 0.01 USD 868,000 Service Corp International/US
5.125% 1/6/2029 929,845 0.08 USD 893,000 ServiceMaster Co LLC/The ‘144A’
5.125% 15/11/2024 935,685 0.08 USD 706,000 Simmons Foods Inc ‘144A’ 7.75%
15/1/2024 766,010 0.06 USD 382,000 Sirius XM Radio Inc ‘144A’ 4.625%
15/7/2024 400,623 0.03 USD 1,475,000 Sirius XM Radio Inc ‘144A’ 5%
1/8/2027 1,561,656 0.13 USD 1,485,000 Sirius XM Radio Inc ‘144A’ 5.5%
1/7/2029 1,622,808 0.13 USD 374,000 Six Flags Entertainment Corp
‘144A’ 4.875% 31/7/2024 387,090 0.03 USD 1,391,000 Six Flags Entertainment Corp
‘144A’ 5.5% 15/4/2027 1,497,495 0.12 USD 417,000 SM Energy Co 5% 15/1/2024 366,960 0.03 USD 171,000 SM Energy Co 5.625% 1/6/2025 146,205 0.01 USD 425,000 SM Energy Co 6.125% 15/11/2022 397,375 0.03 USD 148,000 SM Energy Co 6.75% 15/9/2026 126,540 0.01 USD 4,793,000 Solera LLC / Solera Finance Inc
‘144A’ 10.5% 1/3/2024 5,104,545 0.42 USD 261,000 Sophia LP / Sophia Finance Inc
‘144A’ 9% 30/9/2023 269,482 0.02 USD 1,443,000 Sotera Health Holdings LLC ‘144A’
6.5% 15/5/2023 1,471,860 0.12 USD 536,000 Southwestern Energy Co 6.2%
23/1/2025 470,340 0.04 USD 109,000 Southwestern Energy Co 7.75%
1/10/2027 95,648 0.01 USD 50,000 Springleaf Finance Corp 5.625%
15/3/2023 54,000 0.00 USD 582,000 Springleaf Finance Corp 6.625%
15/1/2028 643,110 0.05 USD 950,000 Springleaf Finance Corp 6.875%
15/3/2025 1,083,000 0.09 USD 1,058,000 Springleaf Finance Corp 7.125%
15/3/2026 1,210,749 0.10 USD 1,333,000 Sprint Capital Corp 6.875%
15/11/2028* 1,483,242 0.12 USD 916,000 Sprint Capital Corp 8.75%
15/3/2032 1,147,290 0.09 USD 2,275,000 Sprint Corp 7.125% 15/6/2024 2,525,933 0.21 USD 94,000 Sprint Corp 7.625% 15/2/2025 105,750 0.01 USD 3,281,000 Sprint Corp 7.625% 1/3/2026 3,705,479 0.30 USD 1,314,000 Sprint Corp 7.875% 15/9/2023 1,481,535 0.12 USD 633,000 SPX FLOW Inc ‘144A’ 5.625%
15/8/2024 663,859 0.05 USD 167,000 SRC Energy Inc 6.25% 1/12/2025 164,495 0.01 USD 520,000 SRS Distribution Inc ‘144A’ 8.25%
1/7/2026 510,900 0.04 USD 5,076,000 SS&C Technologies Inc ‘144A’ 5.5%
30/9/2027 5,332,972 0.43
USD 922,000 Standard Industries Inc/NJ ‘144A’ 5.375% 15/11/2024 951,965 0.08
USD 1,701,000 Standard Industries Inc/NJ ‘144A’ 6% 15/10/2025 1,794,555 0.15
USD 2,862,000 Staples Inc ‘144A’ 7.5% 15/4/2026 2,904,930 0.24 USD 514,000 Staples Inc ‘144A’ 10.75% 15/4/2027 520,425 0.04 USD 3,000 Starwood Property Trust Inc 5%
15/12/2021 3,120 0.00 USD 892,000 Station Casinos LLC ‘144A’ 5%
1/10/2025 912,159 0.07 USD 572,000 Steel Dynamics Inc 4.125%
15/9/2025 579,150 0.05 USD 42,000 Steel Dynamics Inc 5% 15/12/2026 43,995 0.00 USD 532,000 Stevens Holding Co Inc ‘144A’
6.125% 1/10/2026 558,600 0.05 USD 622,000 Sunoco LP / Sunoco Finance Corp
4.875% 15/1/2023 637,550 0.05 USD 104,000 Sunoco LP / Sunoco Finance Corp
5.5% 15/2/2026 108,160 0.01 USD 425,000 Sunoco LP / Sunoco Finance Corp
6% 15/4/2027 448,375 0.04 USD 1,261,000 Surgery Center Holdings Inc ‘144A’
6.75% 1/7/2025 1,062,392 0.09 USD 597,000 Surgery Center Holdings Inc ‘144A’
10% 15/4/2027 573,120 0.05 USD 475,000 Symantec Corp ‘144A’ 5% 15/4/2025 479,325 0.04 USD 202,000 Syneos Health Inc / inVentiv Health
Inc / inVentiv Health Clinical Inc ‘144A’ 7.5% 1/10/2024 210,332 0.02
USD 162,000 Talen Energy Supply LLC 6.5% 1/6/2025 123,930 0.01
USD 162,000 Talen Energy Supply LLC ‘144A’ 10.5% 15/1/2026 147,663 0.01
USD 431,000 Tallgrass Energy Partners LP / Tallgrass Energy Finance Corp ‘144A’ 4.75% 1/10/2023 428,845 0.04
USD 658,000 Tallgrass Energy Partners LP / Tallgrass Energy Finance Corp ‘144A’ 5.5% 15/9/2024 648,952 0.05
USD 1,698,000 Tallgrass Energy Partners LP / Tallgrass Energy Finance Corp ‘144A’ 5.5% 15/1/2028 1,608,855 0.13
USD 446,000 Targa Resources Partners LP / Targa Resources Partners Finance Corp 4.25% 15/11/2023 447,115 0.04
USD 540,000 Targa Resources Partners LP / Targa Resources Partners Finance Corp 5% 15/1/2028 544,725 0.04
USD 390,000 Targa Resources Partners LP / Targa Resources Partners Finance Corp 5.125% 1/2/2025 401,700 0.03
USD 27,000 Targa Resources Partners LP / Targa Resources Partners Finance Corp 5.375% 1/2/2027 28,013 0.00
USD 1,054,000 Targa Resources Partners LP / Targa Resources Partners Finance Corp 5.875% 15/4/2026 1,109,008 0.09
USD 886,000 Targa Resources Partners LP / Targa Resources Partners Finance Corp ‘144A’ 6.5% 15/7/2027 963,525 0.08
USD 2,716,000 Targa Resources Partners LP / Targa Resources Partners Finance Corp ‘144A’ 6.875% 15/1/2029 3,007,128 0.25
USD 678,000 Taylor Morrison Communities Inc ‘144A’ 5.875% 15/6/2027 728,850 0.06
USD 969,000 Team Health Holdings Inc ‘144A’ 6.375% 1/2/2025 654,075 0.05
Global High Yield Bond Fund continued
Portfolio of Investments 31 August 2019

Transferable Securities and Money Market Instruments Admitted to an Official Stock Exchange Listing or Dealt in on Another Regulated Market
Transferable Securities and Money Market Instruments Admitted to an Official Stock Exchange Listing or Dealt in on Another Regulated Market
Holding
Description
Market Value (USD)
% of Net
Assets
Holding
Description
Market Value (USD)
% of Net
Assets
* All or a portion of this security represents a security on loan.
The notes on pages 728 to 741 form an integral part of these financial statements.
[476] BlackRock Global Funds (BGF)
USD 47,000 Teleflex Inc 4.625% 15/11/2027 49,873 0.00 USD 216,000 Teleflex Inc 4.875% 1/6/2026 228,627 0.02 USD 1,818,000 Tempo Acquisition LLC / Tempo
Acquisition Finance Corp ‘144A’ 6.75% 1/6/2025 1,875,958 0.15
USD 752,000 Tenet Healthcare Corp 4.625% 15/7/2024 777,651 0.06
USD 883,000 Tenet Healthcare Corp ‘144A’ 4.625% 1/9/2024 910,594 0.07
USD 3,587,000 Tenet Healthcare Corp ‘144A’ 4.875% 1/1/2026 3,695,686 0.30
USD 2,343,000 Tenet Healthcare Corp ‘144A’ 5.125% 1/11/2027 2,427,934 0.20
USD 349,000 Tenet Healthcare Corp 6% 1/10/2020 362,792 0.03 USD 1,707,000 Tenet Healthcare Corp ‘144A’
6.25% 1/2/2027 1,779,548 0.15 USD 3,137,000 Tenet Healthcare Corp 8.125%
1/4/2022 3,391,881 0.28 USD 118,000 Terex Corp ‘144A’ 5.625% 1/2/2025 120,360 0.01 USD 590,000 TerraForm Power Operating LLC
‘144A’ 4.25% 31/1/2023 605,924 0.05 USD 1,028,000 TerraForm Power Operating LLC
‘144A’ 5% 31/1/2028 1,069,120 0.09 USD 738,000 Tesla Inc ‘144A’ 5.3% 15/8/2025* 656,820 0.05 USD 2,097,000 TIBCO Software Inc ‘144A’ 11.375%
1/12/2021 2,203,161 0.18 USD 1,355,000 Titan Acquisition Ltd / Titan
Co-Borrower LLC ‘144A’ 7.75% 15/4/2026 1,229,663 0.10
USD 713,000 T-Mobile USA Inc 4.5% 1/2/2026 741,520 0.06 USD 1,754,000 T-Mobile USA Inc 4.75% 1/2/2028 1,847,208 0.15 USD 374,000 T-Mobile USA Inc 6.5% 15/1/2026 402,050 0.03 USD 815,000 TPC Group Inc ‘144A’ 10.5%
1/8/2024 859,825 0.07 USD 250,000 Treman Park CLO Ltd ‘Series
2015-1A C3RR’ ‘144A’ FRN 20/10/2028 247,693 0.02
USD 750,000 TRESTLES CLO II Ltd ‘Series 2018-2A B’ ‘144A’ FRN 25/7/2031 720,224 0.06
USD 37,000 TRI Pointe Group Inc 5.25% 1/6/2027 37,370 0.00
USD 723,000 Uber Technologies Inc ‘144A’ 7.5% 1/11/2023 757,343 0.06
USD 57,000 Uber Technologies Inc ‘144A’ 8% 1/11/2026 59,992 0.00
EUR 544,000 UGI International LLC 3.25% 1/11/2025 635,105 0.05
USD 141,000 United Rentals North America Inc 4.625% 15/7/2023 144,613 0.01
USD 279,000 United Rentals North America Inc 4.625% 15/10/2025 287,021 0.02
USD 494,000 United Rentals North America Inc 5.25% 15/1/2030 530,284 0.04
USD 650,000 United Rentals North America Inc 5.875% 15/9/2026 696,313 0.06
USD 2,195,000 United Rentals North America Inc 6.5% 15/12/2026 2,400,781 0.20
USD 117,000 Univision Communications Inc ‘144A’ 5.125% 15/2/2025 113,783 0.01
USD 153,000 Univision Communications Inc ‘144A’ 6.75% 15/9/2022 155,678 0.01
USD 1,025,000 USA Compression Partners LP / USA Compression Finance Corp 6.875% 1/4/2026 1,055,750 0.09
USD 887,000 USA Compression Partners LP / USA Compression Finance Corp ‘144A’ 6.875% 1/9/2027 916,785 0.07
USD 637,000 Veritas US Inc / Veritas Bermuda Ltd ‘144A’ 7.5% 1/2/2023 633,815 0.05
USD 3,738,000 Verscend Escrow Corp ‘144A’ 9.75% 15/8/2026 4,023,396 0.33
USD 454,000 Versum Materials Inc ‘144A’ 5.5% 30/9/2024 486,915 0.04
USD 1,820,000 Vertiv Group Corp ‘144A’ 9.25% 15/10/2024 1,738,100 0.14
USD 1,701,000 ViaSat Inc ‘144A’ 5.625% 15/4/2027 1,798,808 0.15 USD 9,667 VICI Properties 1 LLC / VICI FC
Inc 8% 15/10/2023 10,610 0.00 USD 480,000 Vistra Operations Co LLC ‘144A’
3.55% 15/7/2024 485,372 0.04 USD 1,486,000 Vistra Operations Co LLC ‘144A’
4.3% 15/7/2029 1,519,002 0.12 USD 557,000 Vistra Operations Co LLC ‘144A’
5% 31/7/2027 576,495 0.05 USD 16,000 Vistra Operations Co LLC ‘144A’
5.5% 1/9/2026 16,840 0.00 USD 317,000 Vistra Operations Co LLC ‘144A’
5.625% 15/2/2027 335,624 0.03 USD 616,000 Vizient Inc ‘144A’ 6.25% 15/5/2027 663,740 0.05 USD 644,000 Wabash National Corp ‘144A’ 5.5%
1/10/2025 633,535 0.05 USD 693,000 Waste Pro USA Inc ‘144A’ 5.5%
15/2/2026 724,185 0.06 USD 769,000 WellCare Health Plans Inc 5.25%
1/4/2025 809,988 0.07 USD 1,040,000 WellCare Health Plans Inc ‘144A’
5.375% 15/8/2026 1,111,500 0.09 USD 1,410,000 Western Digital Corp 4.75%
15/2/2026 1,447,012 0.12 USD 540,000 WeWork Cos Inc ‘144A’ 7.875%
1/5/2025 554,850 0.05 USD 436,000 William Carter Co/The ‘144A’
5.625% 15/3/2027 463,250 0.04 USD 699,000 Williams Scotsman International
Inc ‘144A’ 6.875% 15/8/2023 733,950 0.06 USD 358,000 Williams Scotsman International
Inc ‘144A’ 7.875% 15/12/2022 377,135 0.03 EUR 411,000 WMG Acquisition Corp 3.625%
15/10/2026 486,653 0.04 EUR 1,192,500 WMG Acquisition Corp 4.125%
1/11/2024 1,372,320 0.11 USD 202,000 WMG Acquisition Corp ‘144A’ 5.5%
15/4/2026 212,100 0.02 USD 253,000 WPX Energy Inc 5.75% 1/6/2026 263,115 0.02 USD 87,000 WPX Energy Inc 6% 15/1/2022 90,263 0.01 USD 410,000 WPX Energy Inc 8.25% 1/8/2023 458,175 0.04 USD 330,000 WR Grace & Co-Conn ‘144A’
5.625% 1/10/2024 358,050 0.03 USD 212,000 Wyndham Destinations Inc 5.75%
1/4/2027 226,575 0.02 USD 182,000 Wyndham Hotels & Resorts Inc
‘144A’ 5.375% 15/4/2026 192,010 0.02 USD 888,000 Xerox Corp 4.8% 1/3/2035 774,780 0.06 USD 213,000 Xerox Corp 6.75% 15/12/2039 214,065 0.02 USD 62,000 XPO Logistics Inc ‘144A’ 6.75%
15/8/2024 67,115 0.01 USD 500,000 York CLO 1 Ltd ‘Series 2014-1A
CRR’ ‘144A’ FRN 22/10/2029 490,899 0.04 USD 72,000 Yum! Brands Inc 5.35% 1/11/2043 68,760 0.01 USD 3,607,000 Zayo Group LLC / Zayo Capital Inc
‘144A’ 5.75% 15/1/2027 3,711,242 0.30 USD 882,000 Zayo Group LLC / Zayo Capital Inc
6% 1/4/2023 911,441 0.07 USD 1,989,000 Zayo Group LLC / Zayo Capital Inc
6.375% 15/5/2025 2,051,156 0.17 575,035,200 46.90
Global High Yield Bond Fund continued
Portfolio of Investments 31 August 2019
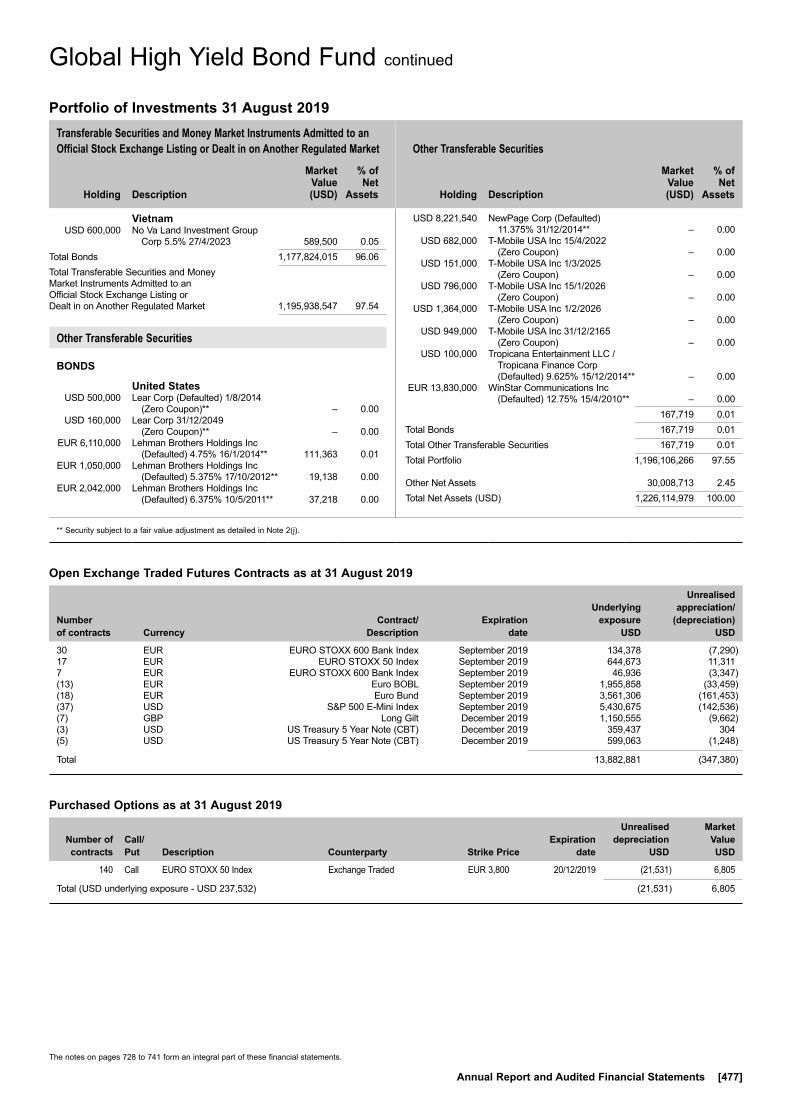
Transferable Securities and Money Market Instruments Admitted to an Official Stock Exchange Listing or Dealt in on Another Regulated Market Other Transferable Securities
Holding
Description
Market Value (USD)
% of Net
Assets
Holding
Description
Market Value (USD)
% of Net
Assets
** Security subject to a fair value adjustment as detailed in Note 2(j).
The notes on pages 728 to 741 form an integral part of these financial statements.
Annual Report and Audited Financial Statements [477]
Purchased Options as at 31 August 2019
Number of contracts
Call/ Put
Description Counterparty
Strike Price
Expiration date
Unrealised depreciation
USD
Market Value USD
140 Call EURO STOXX 50 Index Exchange Traded EUR 3,800 20/12/2019 (21,531) 6,805
Total (USD underlying exposure - USD 237,532) (21,531) 6,805
Vietnam USD 600,000 No Va Land Investment Group
Corp 5.5% 27/4/2023 589,500 0.05Total Bonds 1,177,824,015 96.06Total Transferable Securities and Money Market Instruments Admitted to an Official Stock Exchange Listing or Dealt in on Another Regulated Market 1,195,938,547 97.54
Other Transferable Securities
BONDS
United States USD 500,000 Lear Corp (Defaulted) 1/8/2014
(Zero Coupon)** – 0.00 USD 160,000 Lear Corp 31/12/2049
(Zero Coupon)** – 0.00 EUR 6,110,000 Lehman Brothers Holdings Inc
(Defaulted) 4.75% 16/1/2014** 111,363 0.01 EUR 1,050,000 Lehman Brothers Holdings Inc
(Defaulted) 5.375% 17/10/2012** 19,138 0.00 EUR 2,042,000 Lehman Brothers Holdings Inc
(Defaulted) 6.375% 10/5/2011** 37,218 0.00
USD 8,221,540 NewPage Corp (Defaulted) 11.375% 31/12/2014** – 0.00
USD 682,000 T-Mobile USA Inc 15/4/2022 (Zero Coupon) – 0.00
USD 151,000 T-Mobile USA Inc 1/3/2025 (Zero Coupon) – 0.00
USD 796,000 T-Mobile USA Inc 15/1/2026 (Zero Coupon) – 0.00
USD 1,364,000 T-Mobile USA Inc 1/2/2026 (Zero Coupon) – 0.00
USD 949,000 T-Mobile USA Inc 31/12/2165 (Zero Coupon) – 0.00
USD 100,000 Tropicana Entertainment LLC / Tropicana Finance Corp (Defaulted) 9.625% 15/12/2014** – 0.00
EUR 13,830,000 WinStar Communications Inc (Defaulted) 12.75% 15/4/2010** – 0.00
167,719 0.01Total Bonds 167,719 0.01Total Other Transferable Securities 167,719 0.01Total Portfolio 1,196,106,266 97.55
Other Net Assets 30,008,713 2.45Total Net Assets (USD) 1,226,114,979 100.00
Global High Yield Bond Fund continued
Portfolio of Investments 31 August 2019
Open Exchange Traded Futures Contracts as at 31 August 2019
Number of contracts Currency
Contract/ Description
Expiration date
Underlying exposure
USD
Unrealised appreciation/
(depreciation) USD
30 EUR EURO STOXX 600 Bank Index September 2019 134,378 (7,290)17 EUR EURO STOXX 50 Index September 2019 644,673 11,3117 EUR EURO STOXX 600 Bank Index September 2019 46,936 (3,347)(13) EUR Euro BOBL September 2019 1,955,858 (33,459)(18) EUR Euro Bund September 2019 3,561,306 (161,453)(37) USD S&P 500 E-Mini Index September 2019 5,430,675 (142,536)(7) GBP Long Gilt December 2019 1,150,555 (9,662)(3) USD US Treasury 5 Year Note (CBT) December 2019 359,437 304(5) USD US Treasury 5 Year Note (CBT) December 2019 599,063 (1,248)
Total 13,882,881 (347,380)
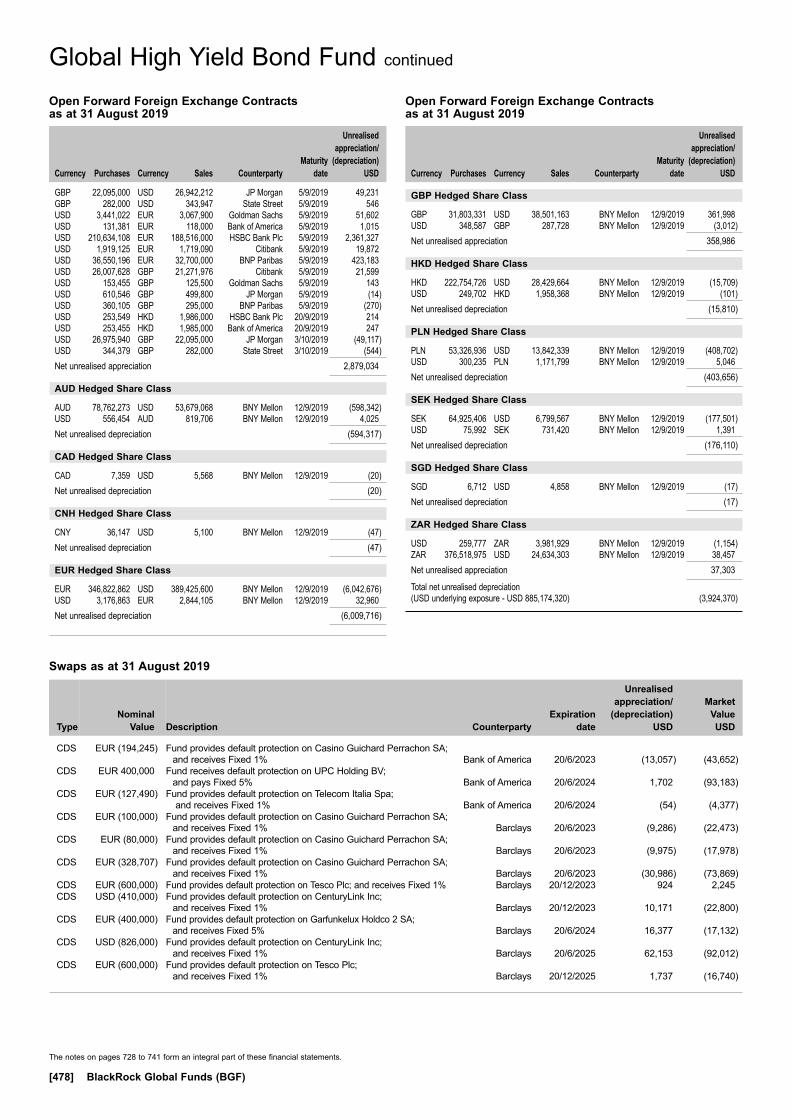
The notes on pages 728 to 741 form an integral part of these financial statements.
[478] BlackRock Global Funds (BGF)
Global High Yield Bond Fund continued
GBP Hedged Share Class
GBP 31,803,331 USD 38,501,163 BNY Mellon 12/9/2019 361,998USD 348,587 GBP 287,728 BNY Mellon 12/9/2019 (3,012)Net unrealised appreciation 358,986
HKD Hedged Share Class
HKD 222,754,726 USD 28,429,664 BNY Mellon 12/9/2019 (15,709)USD 249,702 HKD 1,958,368 BNY Mellon 12/9/2019 (101)Net unrealised depreciation (15,810)
PLN Hedged Share Class
PLN 53,326,936 USD 13,842,339 BNY Mellon 12/9/2019 (408,702)USD 300,235 PLN 1,171,799 BNY Mellon 12/9/2019 5,046Net unrealised depreciation (403,656)
SEK Hedged Share Class
SEK 64,925,406 USD 6,799,567 BNY Mellon 12/9/2019 (177,501)USD 75,992 SEK 731,420 BNY Mellon 12/9/2019 1,391Net unrealised depreciation (176,110)
SGD Hedged Share Class
SGD 6,712 USD 4,858 BNY Mellon 12/9/2019 (17)Net unrealised depreciation (17)
ZAR Hedged Share Class
USD 259,777 ZAR 3,981,929 BNY Mellon 12/9/2019 (1,154)ZAR 376,518,975 USD 24,634,303 BNY Mellon 12/9/2019 38,457Net unrealised appreciation 37,303
Total net unrealised depreciation (USD underlying exposure - USD 885,174,320) (3,924,370)
Open Forward Foreign Exchange Contracts as at 31 August 2019
Currency
Purchases Currency
Sales Counterparty
Maturity date
Unrealised appreciation/
(depreciation) USD
Open Forward Foreign Exchange Contracts as at 31 August 2019
Currency
Purchases Currency
Sales Counterparty
Maturity date
Unrealised appreciation/
(depreciation) USD
GBP 22,095,000 USD 26,942,212 JP Morgan 5/9/2019 49,231GBP 282,000 USD 343,947 State Street 5/9/2019 546USD 3,441,022 EUR 3,067,900 Goldman Sachs 5/9/2019 51,602USD 131,381 EUR 118,000 Bank of America 5/9/2019 1,015USD 210,634,108 EUR 188,516,000 HSBC Bank Plc 5/9/2019 2,361,327USD 1,919,125 EUR 1,719,090 Citibank 5/9/2019 19,872USD 36,550,196 EUR 32,700,000 BNP Paribas 5/9/2019 423,183USD 26,007,628 GBP 21,271,976 Citibank 5/9/2019 21,599USD 153,455 GBP 125,500 Goldman Sachs 5/9/2019 143USD 610,546 GBP 499,800 JP Morgan 5/9/2019 (14)USD 360,105 GBP 295,000 BNP Paribas 5/9/2019 (270)USD 253,549 HKD 1,986,000 HSBC Bank Plc 20/9/2019 214USD 253,455 HKD 1,985,000 Bank of America 20/9/2019 247USD 26,975,940 GBP 22,095,000 JP Morgan 3/10/2019 (49,117)USD 344,379 GBP 282,000 State Street 3/10/2019 (544)Net unrealised appreciation 2,879,034
AUD Hedged Share Class
AUD 78,762,273 USD 53,679,068 BNY Mellon 12/9/2019 (598,342)USD 556,454 AUD 819,706 BNY Mellon 12/9/2019 4,025Net unrealised depreciation (594,317)
CAD Hedged Share Class
CAD 7,359 USD 5,568 BNY Mellon 12/9/2019 (20)Net unrealised depreciation (20)
CNH Hedged Share Class
CNY 36,147 USD 5,100 BNY Mellon 12/9/2019 (47)Net unrealised depreciation (47)
EUR Hedged Share Class
EUR 346,822,862 USD 389,425,600 BNY Mellon 12/9/2019 (6,042,676)USD 3,176,863 EUR 2,844,105 BNY Mellon 12/9/2019 32,960Net unrealised depreciation (6,009,716)
Swaps as at 31 August 2019
TypeNominal
Value Description Counterparty
Expiration date
Unrealised appreciation/
(depreciation) USD
Market Value USD
CDS EUR (194,245) Fund provides default protection on Casino Guichard Perrachon SA; and receives Fixed 1% Bank of America 20/6/2023 (13,057) (43,652)
CDS EUR 400,000 Fund receives default protection on UPC Holding BV; and pays Fixed 5% Bank of America 20/6/2024 1,702 (93,183)
CDS EUR (127,490) Fund provides default protection on Telecom Italia Spa; and receives Fixed 1% Bank of America 20/6/2024 (54) (4,377)
CDS EUR (100,000) Fund provides default protection on Casino Guichard Perrachon SA; and receives Fixed 1% Barclays 20/6/2023 (9,286) (22,473)
CDS EUR (80,000) Fund provides default protection on Casino Guichard Perrachon SA; and receives Fixed 1% Barclays 20/6/2023 (9,975) (17,978)
CDS EUR (328,707) Fund provides default protection on Casino Guichard Perrachon SA; and receives Fixed 1% Barclays 20/6/2023 (30,986) (73,869)
CDS EUR (600,000) Fund provides default protection on Tesco Plc; and receives Fixed 1% Barclays 20/12/2023 924 2,245CDS USD (410,000) Fund provides default protection on CenturyLink Inc;
and receives Fixed 1% Barclays 20/12/2023 10,171 (22,800)CDS EUR (400,000) Fund provides default protection on Garfunkelux Holdco 2 SA;
and receives Fixed 5% Barclays 20/6/2024 16,377 (17,132)CDS USD (826,000) Fund provides default protection on CenturyLink Inc;
and receives Fixed 1% Barclays 20/6/2025 62,153 (92,012)CDS EUR (600,000) Fund provides default protection on Tesco Plc;
and receives Fixed 1% Barclays 20/12/2025 1,737 (16,740)

The notes on pages 728 to 741 form an integral part of these financial statements.
Annual Report and Audited Financial Statements [479]
Global High Yield Bond Fund continued
Swaps as at 31 August 2019
TypeNominal
Value Description Counterparty
Expiration date
Unrealised appreciation/
(depreciation) USD
Market Value USD
CDS EUR (435,755) Fund provides default protection on Casino Guichard Perrachon SA; and receives Fixed 1% Citibank 20/6/2023 (33,203) (97,925)
CDS EUR (129,179) Fund provides default protection on Telecom Italia Spa; and receives Fixed 1% Citibank 20/6/2024 74 (4,435)
CDS EUR (129,310) Fund provides default protection on Telecom Italia Spa; and receives Fixed 1% Citibank 20/6/2024 (55) (4,439)
CDS EUR (254,939) Fund provides default protection on Telecom Italia SpA/Milano; and receives Fixed 1% Citibank 20/6/2026 14,774 (23,332)
CDS USD (11,972,533) Fund provides default protection on CDX.NA.HY.32.V2; and receives Fixed 5% Goldman Sachs 20/6/2024 146,340 822,879
CDS EUR (510,000) Fund provides default protection on Telecom Italia SpA/Milano; and receives Fixed 1% Goldman Sachs 20/6/2024 29,785 (17,509)
CDS EUR (66,522) Fund provides default protection on Casino Guichard Perrachon SA; and receives Fixed 1% JP Morgan 20/6/2023 (6,023) (14,949)
CDS EUR (166,304) Fund provides default protection on Casino Guichard Perrachon SA; and receives Fixed 1% JP Morgan 20/6/2023 (13,534) (37,373)
CDS EUR (199,829) Fund provides default protection on Garfunkelux Holdco 2 SA; and receives Fixed 5% JP Morgan 20/12/2023 (5,324) (6,956)
CDS EUR 690,000 Fund receives default protection on UPC Holding BV; and pays Fixed 5% JP Morgan 20/6/2024 (4,092) (160,740)
CDS EUR (2,050,000) Fund provides default protection on ITRAXX.XO.31.V1; and receives Fixed 5% JP Morgan 20/6/2024 27,242 253,905
TRS USD 20,193,000 Fund receives iBoxx US Dollar Liquid High Yield + 0bps; and pays USD LIBOR 3 Month BBA + 0bps Goldman Sachs 20/9/2019 296,227 262,279
Total (USD underlying exposure - USD 42,342,751) 481,917 569,434
CDS: Credit Default SwapsTRS: Total Return Swaps

Transferable Securities and Money Market Instruments Admitted to an Official Stock Exchange Listing or Dealt in on Another Regulated Market
Transferable Securities and Money Market Instruments Admitted to an Official Stock Exchange Listing or Dealt in on Another Regulated Market
Holding
Description
Market Value (USD)
% of Net
Assets
Holding
Description
Market Value (USD)
% of Net
Assets
~ Investment in connected party fund, see further information in Note 11.
The notes on pages 728 to 741 form an integral part of these financial statements.
[480] BlackRock Global Funds (BGF)
FUNDS
Ireland 1,160,509 BlackRock ICS US Dollar
Liquidity Fund~ 1,160,509 0.88Total Funds 1,160,509 0.88
BONDS
Australia AUD 300,000 Australia Government Bond
0.75% 21/11/2027 226,868 0.17 AUD 55,000 Australia Government Bond
1.25% 21/8/2040 49,451 0.04 AUD 295,000 Australia Government Bond
1.437% 21/2/2022 272,960 0.21 AUD 195,000 Australia Government Bond
2% 21/8/2035 195,235 0.15 AUD 230,000 Australia Government Bond
2.5% 20/9/2030 243,509 0.18 AUD 470,000 Australia Government Bond
3% 20/9/2025 470,723 0.36 1,458,746 1.11
Austria EUR 159,000 Republic of Austria Government
Bond ‘144A’ 2.1% 20/9/2117 353,011 0.27
Canada CAD 25,000 Canadian Government Real Return
Bond 1.25% 1/12/2047 27,130 0.02 CAD 267,000 Canadian Government Real Return
Bond 3% 1/12/2036 397,520 0.30 CAD 372,000 Canadian Government Real Return
Bond 4% 1/12/2031 621,874 0.47 CAD 351,000 Canadian Government Real Return
Bond 4.25% 1/12/2021 472,749 0.36 CAD 270,000 Canadian Government Real Return
Bond 4.25% 1/12/2026 414,497 0.32 1,933,770 1.47
Denmark DKK 3,165,000 Denmark I/L Government Bond
0.1% 15/11/2023 539,681 0.41
France EUR 600,000 French Republic Government Bond
OAT 0.1% 1/3/2025 744,595 0.57 EUR 570,000 French Republic Government Bond
OAT 0.1% 1/3/2028 731,646 0.56 EUR 195,000 French Republic Government Bond
OAT 0.1% 1/3/2029 248,848 0.19 EUR 250,000 French Republic Government Bond
OAT ‘144A’ 0.1% 25/7/2036 348,831 0.26 EUR 40,000 French Republic Government Bond
OAT ‘144A’ 0.1% 25/7/2047 61,651 0.05 EUR 932,000 French Republic Government Bond
OAT 0.25% 25/7/2024 1,193,743 0.91 EUR 750,000 French Republic Government Bond
OAT ‘144A’ 0.7% 25/7/2030 1,076,316 0.82 EUR 1,450,000 French Republic Government Bond
OAT 1.1% 25/7/2022 1,959,825 1.49 EUR 1,645,000 French Republic Government Bond
OAT 1.85% 25/7/2027 2,594,459 1.97 EUR 825,000 French Republic Government Bond
OAT ‘144A’ 2% 25/5/2048 1,322,188 1.01 EUR 1,195,000 French Republic Government Bond
OAT 2.1% 25/7/2023 1,716,268 1.31
EUR 625,000 French Republic Government Bond OAT 3.15% 25/7/2032 1,451,868 1.10
EUR 553,000 French Republic Government Bond OAT 3.4% 25/7/2029 1,190,758 0.91
14,640,996 11.15
Germany EUR 140,000 Deutsche Bundesrepublik Inflation
Linked Bond 0.1% 15/4/2026 182,663 0.14
Italy EUR 895,000 Italy Buoni Poliennali Del Tesoro
‘144A’ 0.1% 15/5/2022 1,055,809 0.80 EUR 120,000 Italy Buoni Poliennali Del Tesoro
0.1% 15/5/2023 138,226 0.11 EUR 240,000 Italy Buoni Poliennali Del Tesoro
‘144A’ 0.45% 22/5/2023 268,315 0.20 EUR 945,000 Italy Buoni Poliennali Del Tesoro
‘144A’ 1.25% 15/9/2032 1,196,718 0.91 EUR 5,988,000 Italy Buoni Poliennali Del Tesoro
‘144A’ 1.3% 15/5/2028 7,553,603 5.75 EUR 615,000 Italy Buoni Poliennali Del Tesoro
‘144A’ 2.1% 15/9/2021 814,300 0.62 EUR 790,000 Italy Buoni Poliennali Del Tesoro
‘144A’ 2.35% 15/9/2024 1,035,446 0.79 EUR 730,000 Italy Buoni Poliennali Del Tesoro
‘144A’ 2.35% 15/9/2035 1,308,975 1.00 EUR 1,019,000 Italy Buoni Poliennali Del Tesoro
‘144A’ 2.6% 15/9/2023 1,503,680 1.15 EUR 715,000 Italy Buoni Poliennali Del Tesoro
‘144A’ 3.1% 15/9/2026 1,068,891 0.81 15,943,963 12.14
Japan JPY 48,300,000 Japanese Government CPI Linked
Bond 0.1% 10/3/2024 484,229 0.37 JPY 70,500,000 Japanese Government CPI Linked
Bond 0.1% 10/9/2024 690,186 0.52 JPY 128,000,000 Japanese Government CPI Linked
Bond 0.1% 10/3/2025 1,259,081 0.96 JPY 95,300,000 Japanese Government CPI Linked
Bond 0.1% 10/3/2026 942,854 0.72 JPY 251,700,000 Japanese Government CPI Linked
Bond 0.1% 10/3/2027 2,518,560 1.92 JPY 317,300,000 Japanese Government CPI Linked
Bond 0.1% 10/3/2028 3,159,100 2.41 JPY 309,800,000 Japanese Government CPI Linked
Bond 0.1% 10/3/2029 3,061,935 2.33 12,115,945 9.23
New Zealand NZD 375,000 New Zealand Government Inflation
Linked Bond 2.165% 20/9/2025 289,322 0.22 NZD 586,000 New Zealand Government Inflation
Linked Bond 2.614% 20/9/2040 549,194 0.42 NZD 4,260,000 New Zealand Government Inflation
Linked Bond 3% 20/9/2030 3,808,227 2.90 4,646,743 3.54
Spain EUR 1,235,000 Spain Government Bond ‘144A’
0.25% 30/7/2024 1,405,753 1.07 EUR 720,000 Spain Government Bond ‘144A’
0.6% 31/10/2029 837,025 0.64 EUR 580,000 Spain Government Bond ‘144A’
1.45% 31/10/2027 719,945 0.55
Global Inflation Linked Bond Fund
Portfolio of Investments 31 August 2019
Global Inflation Linked Bond Fund

Transferable Securities and Money Market Instruments Admitted to an Official Stock Exchange Listing or Dealt in on Another Regulated Market
Transferable Securities and Money Market Instruments Admitted to an Official Stock Exchange Listing or Dealt in on Another Regulated Market
Holding
Description
Market Value (USD)
% of Net
Assets
Holding
Description
Market Value (USD)
% of Net
Assets
* All or a portion of this security represents a security on loan.
The notes on pages 728 to 741 form an integral part of these financial statements.
Annual Report and Audited Financial Statements [481]
EUR 295,000 Spain Government Inflation Linked Bond 0.15% 30/11/2023 352,907 0.27
EUR 371,000 Spain Government Inflation Linked Bond ‘144A’ 0.7% 30/11/2033 508,234 0.38
EUR 813,000 Spain Government Inflation Linked Bond ‘144A’ 1.8% 30/11/2024 1,090,480 0.83
4,914,344 3.74
Sweden SEK 2,755,000 Sweden Inflation Linked Bond
0.125% 1/6/2026 352,619 0.27 SEK 585,000 Sweden Inflation Linked Bond
0.125% 1/12/2027 76,199 0.06 SEK 55,000 Sweden Inflation Linked Bond
‘144A’ 0.125% 1/6/2032 7,912 0.01 SEK 220,000 Sweden Inflation Linked Bond
‘144A’ 0.25% 1/6/2022 25,908 0.02 SEK 2,060,000 Sweden Inflation Linked Bond
‘144A’ 1% 1/6/2025 269,690 0.20 SEK 2,710,000 Sweden Inflation Linked Bond
‘144A’ 3.5% 1/12/2028 573,960 0.44 1,306,288 1.00
United Kingdom GBP 900,000 United Kingdom Gilt Inflation
Linked 0.125% 22/3/2024 1,515,007 1.15 GBP 10,000 United Kingdom Gilt Inflation
Linked 0.125% 22/3/2026 16,832 0.01 GBP 1,230,000 United Kingdom Gilt Inflation
Linked 0.125% 22/3/2029 2,452,940 1.87 GBP 585,000 United Kingdom Gilt Inflation
Linked 0.125% 22/11/2036 1,275,375 0.97 GBP 50,000 United Kingdom Gilt Inflation
Linked 0.125% 10/8/2041 109,987 0.08 GBP 95,000 United Kingdom Gilt Inflation
Linked 0.125% 10/8/2048 240,333 0.18 GBP 155,000 United Kingdom Gilt Inflation
Linked 0.625% 22/3/2040 463,198 0.35 GBP 75,000 United Kingdom Gilt Inflation
Linked 0.625% 22/11/2042 243,362 0.19 GBP 852,481 United Kingdom Gilt Inflation
Linked 0.75% 22/3/2034 2,110,126 1.61 GBP 84,350 United Kingdom Gilt Inflation
Linked 0.75% 22/11/2047 315,421 0.24 GBP 739,456 United Kingdom Gilt Inflation
Linked 1.125% 22/11/2037 2,427,201 1.85 GBP 10,000 United Kingdom Gilt Inflation
Linked 1.25% 22/11/2027 25,562 0.02 GBP 355,000 United Kingdom Gilt Inflation
Linked 1.25% 22/11/2032 959,573 0.73 GBP 470,000 United Kingdom Gilt Inflation
Linked 1.875% 22/11/2022 945,639 0.72 GBP 403,109 United Kingdom Gilt Inflation
Linked 2% 26/1/2035 1,529,311 1.17 GBP 299,372 United Kingdom Gilt Inflation
Linked 2.5% 17/7/2024 1,376,633 1.05 GBP 98,616 United Kingdom Gilt Inflation
Linked 4.125% 22/7/2030 483,853 0.37 16,490,353 12.56
United States USD 89,000 United States Treasury Inflation
Indexed Bonds 0.125% 15/1/2022 100,166 0.08 USD 2,090,000 United States Treasury Inflation
Indexed Bonds 0.125% 15/4/2022 2,189,041 1.67 USD 4,025,000 United States Treasury Inflation
Indexed Bonds 0.125% 15/7/2022 4,483,516 3.42 USD 335,000 United States Treasury Inflation
Indexed Bonds 0.125% 15/1/2023 371,496 0.28 USD 2,555,000 United States Treasury Inflation
Indexed Bonds 0.125% 15/7/2026 2,770,749 2.11 USD 2,930,100 United States Treasury Inflation
Indexed Bonds 0.25% 15/1/2025 3,213,599 2.45 USD 2,175,000 United States Treasury Inflation
Indexed Bonds 0.25% 15/7/2029 2,249,485 1.71 USD 2,595,000 United States Treasury Inflation
Indexed Bonds 0.375% 15/7/2025* 2,877,748 2.19 USD 1,291,100 United States Treasury Inflation
Indexed Bonds 0.375% 15/1/2027 1,409,460 1.07 USD 3,660,000 United States Treasury Inflation
Indexed Bonds 0.375% 15/7/2027* 3,966,819 3.02 USD 4,018,300 United States Treasury Inflation
Indexed Bonds 0.5% 15/1/2028 4,358,130 3.32 USD 2,371,800 United States Treasury Inflation
Indexed Bonds 0.625% 15/4/2023 2,486,093 1.89 USD 3,705,000 United States Treasury Inflation
Indexed Bonds 0.625% 15/1/2026 4,158,821 3.17 USD 2,620,000 United States Treasury Inflation
Indexed Bonds 0.75% 15/7/2028 2,869,285 2.19 USD 8,654,400 United States Treasury Inflation
Indexed Bonds 0.875% 15/1/2029 9,538,272 7.27 USD 365,000 United States Treasury Inflation
Indexed Bonds 1% 15/2/2048 447,872 0.34 USD 650,000 United States Treasury Inflation
Indexed Bonds 1% 15/2/2049 788,767 0.60 USD 550,000 United States Treasury Inflation
Indexed Bonds 1.75% 15/1/2028 771,481 0.59 USD 1,130,000 United States Treasury Inflation
Indexed Bonds 2% 15/1/2026* 1,644,732 1.25 USD 1,170,000 United States Treasury Inflation
Indexed Bonds 2.375% 15/1/2027 1,747,330 1.33 USD 803,000 United States Treasury Inflation
Indexed Bonds 2.5% 15/1/2029 1,183,787 0.90 USD 230,000 United States Treasury Inflation
Indexed Bonds 3.375% 15/4/2032 471,284 0.36 USD 177,100 United States Treasury Inflation
Indexed Bonds 3.625% 15/4/2028 367,836 0.28 USD 325,000 United States Treasury Inflation
Indexed Bonds 3.875% 15/4/2029 694,788 0.53 55,160,557 42.02Total Bonds 129,687,060 98.78Total Transferable Securities and Money Market Instruments Admitted to an Official Stock Exchange Listing or Dealt in on Another Regulated Market 130,847,569 99.66Total Portfolio 130,847,569 99.66
Other Net Assets 440,943 0.34Total Net Assets (USD) 131,288,512 100.00
Global Inflation Linked Bond Fund continued
Portfolio of Investments 31 August 2019
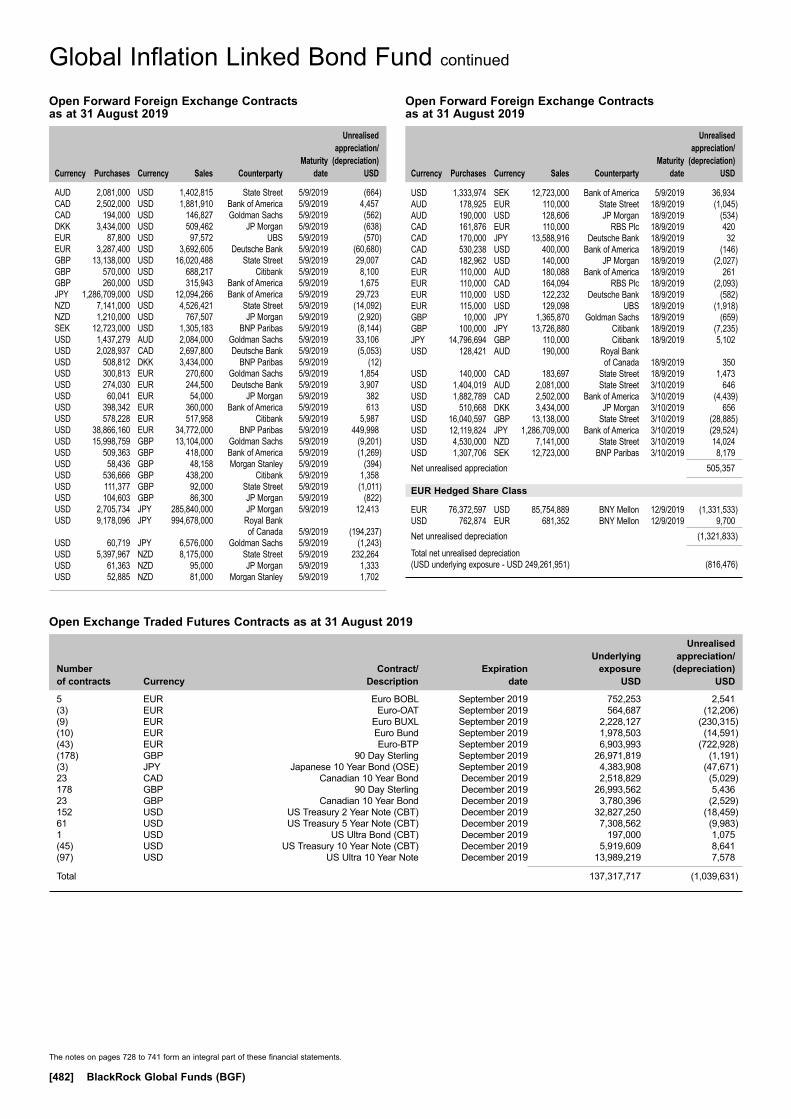
The notes on pages 728 to 741 form an integral part of these financial statements.
[482] BlackRock Global Funds (BGF)
Global Inflation Linked Bond Fund continued
Open Exchange Traded Futures Contracts as at 31 August 2019
Number of contracts Currency
Contract/ Description
Expiration date
Underlying exposure
USD
Unrealised appreciation/
(depreciation) USD
5 EUR Euro BOBL September 2019 752,253 2,541(3) EUR Euro-OAT September 2019 564,687 (12,206)(9) EUR Euro BUXL September 2019 2,228,127 (230,315)(10) EUR Euro Bund September 2019 1,978,503 (14,591)(43) EUR Euro-BTP September 2019 6,903,993 (722,928)(178) GBP 90 Day Sterling September 2019 26,971,819 (1,191)(3) JPY Japanese 10 Year Bond (OSE) September 2019 4,383,908 (47,671)23 CAD Canadian 10 Year Bond December 2019 2,518,829 (5,029)178 GBP 90 Day Sterling December 2019 26,993,562 5,43623 GBP Canadian 10 Year Bond December 2019 3,780,396 (2,529)152 USD US Treasury 2 Year Note (CBT) December 2019 32,827,250 (18,459)61 USD US Treasury 5 Year Note (CBT) December 2019 7,308,562 (9,983)1 USD US Ultra Bond (CBT) December 2019 197,000 1,075(45) USD US Treasury 10 Year Note (CBT) December 2019 5,919,609 8,641(97) USD US Ultra 10 Year Note December 2019 13,989,219 7,578
Total 137,317,717 (1,039,631)
Open Forward Foreign Exchange Contracts as at 31 August 2019
Currency
Purchases Currency
Sales Counterparty
Maturity date
Unrealised appreciation/
(depreciation) USD
AUD 2,081,000 USD 1,402,815 State Street 5/9/2019 (664)CAD 2,502,000 USD 1,881,910 Bank of America 5/9/2019 4,457CAD 194,000 USD 146,827 Goldman Sachs 5/9/2019 (562)DKK 3,434,000 USD 509,462 JP Morgan 5/9/2019 (638)EUR 87,800 USD 97,572 UBS 5/9/2019 (570)EUR 3,287,400 USD 3,692,605 Deutsche Bank 5/9/2019 (60,680)GBP 13,138,000 USD 16,020,488 State Street 5/9/2019 29,007GBP 570,000 USD 688,217 Citibank 5/9/2019 8,100GBP 260,000 USD 315,943 Bank of America 5/9/2019 1,675JPY 1,286,709,000 USD 12,094,266 Bank of America 5/9/2019 29,723NZD 7,141,000 USD 4,526,421 State Street 5/9/2019 (14,092)NZD 1,210,000 USD 767,507 JP Morgan 5/9/2019 (2,920)SEK 12,723,000 USD 1,305,183 BNP Paribas 5/9/2019 (8,144)USD 1,437,279 AUD 2,084,000 Goldman Sachs 5/9/2019 33,106USD 2,028,937 CAD 2,697,800 Deutsche Bank 5/9/2019 (5,053)USD 508,812 DKK 3,434,000 BNP Paribas 5/9/2019 (12)USD 300,813 EUR 270,600 Goldman Sachs 5/9/2019 1,854USD 274,030 EUR 244,500 Deutsche Bank 5/9/2019 3,907USD 60,041 EUR 54,000 JP Morgan 5/9/2019 382USD 398,342 EUR 360,000 Bank of America 5/9/2019 613USD 578,228 EUR 517,958 Citibank 5/9/2019 5,987USD 38,866,160 EUR 34,772,000 BNP Paribas 5/9/2019 449,998USD 15,998,759 GBP 13,104,000 Goldman Sachs 5/9/2019 (9,201)USD 509,363 GBP 418,000 Bank of America 5/9/2019 (1,269)USD 58,436 GBP 48,158 Morgan Stanley 5/9/2019 (394)USD 536,666 GBP 438,200 Citibank 5/9/2019 1,358USD 111,377 GBP 92,000 State Street 5/9/2019 (1,011)USD 104,603 GBP 86,300 JP Morgan 5/9/2019 (822)USD 2,705,734 JPY 285,840,000 JP Morgan 5/9/2019 12,413USD 9,178,096 JPY 994,678,000 Royal Bank of Canada 5/9/2019 (194,237)USD 60,719 JPY 6,576,000 Goldman Sachs 5/9/2019 (1,243)USD 5,397,967 NZD 8,175,000 State Street 5/9/2019 232,264USD 61,363 NZD 95,000 JP Morgan 5/9/2019 1,333USD 52,885 NZD 81,000 Morgan Stanley 5/9/2019 1,702
Open Forward Foreign Exchange Contracts as at 31 August 2019
Currency
Purchases Currency
Sales Counterparty
Maturity date
Unrealised appreciation/
(depreciation) USD
USD 1,333,974 SEK 12,723,000 Bank of America 5/9/2019 36,934AUD 178,925 EUR 110,000 State Street 18/9/2019 (1,045)AUD 190,000 USD 128,606 JP Morgan 18/9/2019 (534)CAD 161,876 EUR 110,000 RBS Plc 18/9/2019 420CAD 170,000 JPY 13,588,916 Deutsche Bank 18/9/2019 32CAD 530,238 USD 400,000 Bank of America 18/9/2019 (146)CAD 182,962 USD 140,000 JP Morgan 18/9/2019 (2,027)EUR 110,000 AUD 180,088 Bank of America 18/9/2019 261EUR 110,000 CAD 164,094 RBS Plc 18/9/2019 (2,093)EUR 110,000 USD 122,232 Deutsche Bank 18/9/2019 (582)EUR 115,000 USD 129,098 UBS 18/9/2019 (1,918)GBP 10,000 JPY 1,365,870 Goldman Sachs 18/9/2019 (659)GBP 100,000 JPY 13,726,880 Citibank 18/9/2019 (7,235)JPY 14,796,694 GBP 110,000 Citibank 18/9/2019 5,102USD 128,421 AUD 190,000 Royal Bank of Canada 18/9/2019 350USD 140,000 CAD 183,697 State Street 18/9/2019 1,473USD 1,404,019 AUD 2,081,000 State Street 3/10/2019 646USD 1,882,789 CAD 2,502,000 Bank of America 3/10/2019 (4,439)USD 510,668 DKK 3,434,000 JP Morgan 3/10/2019 656USD 16,040,597 GBP 13,138,000 State Street 3/10/2019 (28,885)USD 12,119,824 JPY 1,286,709,000 Bank of America 3/10/2019 (29,524)USD 4,530,000 NZD 7,141,000 State Street 3/10/2019 14,024USD 1,307,706 SEK 12,723,000 BNP Paribas 3/10/2019 8,179Net unrealised appreciation 505,357
EUR Hedged Share Class
EUR 76,372,597 USD 85,754,889 BNY Mellon 12/9/2019 (1,331,533)USD 762,874 EUR 681,352 BNY Mellon 12/9/2019 9,700Net unrealised depreciation (1,321,833)
Total net unrealised depreciation (USD underlying exposure - USD 249,261,951) (816,476)
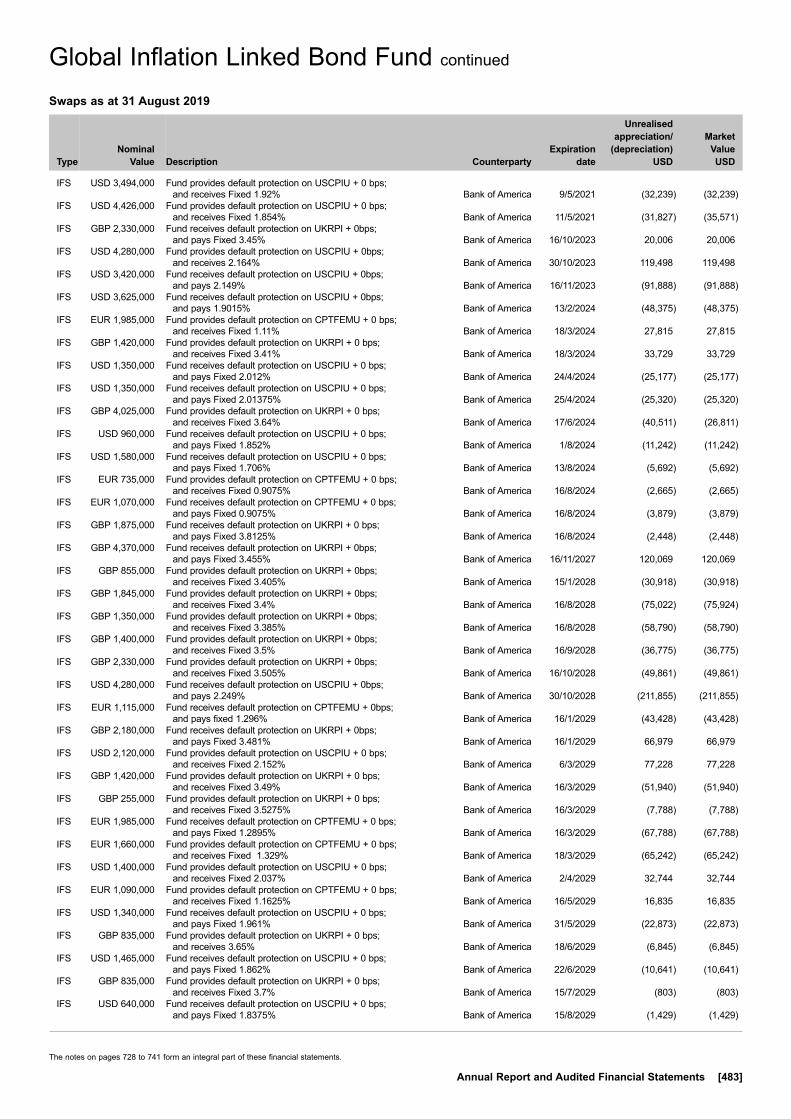
The notes on pages 728 to 741 form an integral part of these financial statements.
Annual Report and Audited Financial Statements [483]
Global Inflation Linked Bond Fund continued
Swaps as at 31 August 2019
TypeNominal
Value Description Counterparty
Expiration date
Unrealised appreciation/
(depreciation) USD
Market Value USD
IFS USD 3,494,000 Fund provides default protection on USCPIU + 0 bps; and receives Fixed 1.92% Bank of America 9/5/2021 (32,239) (32,239)
IFS USD 4,426,000 Fund provides default protection on USCPIU + 0 bps; and receives Fixed 1.854% Bank of America 11/5/2021 (31,827) (35,571)
IFS GBP 2,330,000 Fund receives default protection on UKRPI + 0bps; and pays Fixed 3.45% Bank of America 16/10/2023 20,006 20,006
IFS USD 4,280,000 Fund provides default protection on USCPIU + 0bps; and receives 2.164% Bank of America 30/10/2023 119,498 119,498
IFS USD 3,420,000 Fund receives default protection on USCPIU + 0bps; and pays 2.149% Bank of America 16/11/2023 (91,888) (91,888)
IFS USD 3,625,000 Fund receives default protection on USCPIU + 0bps; and pays 1.9015% Bank of America 13/2/2024 (48,375) (48,375)
IFS EUR 1,985,000 Fund provides default protection on CPTFEMU + 0 bps; and receives Fixed 1.11% Bank of America 18/3/2024 27,815 27,815
IFS GBP 1,420,000 Fund provides default protection on UKRPI + 0 bps; and receives Fixed 3.41% Bank of America 18/3/2024 33,729 33,729
IFS USD 1,350,000 Fund receives default protection on USCPIU + 0 bps; and pays Fixed 2.012% Bank of America 24/4/2024 (25,177) (25,177)
IFS USD 1,350,000 Fund receives default protection on USCPIU + 0 bps; and pays Fixed 2.01375% Bank of America 25/4/2024 (25,320) (25,320)
IFS GBP 4,025,000 Fund provides default protection on UKRPI + 0 bps; and receives Fixed 3.64% Bank of America 17/6/2024 (40,511) (26,811)
IFS USD 960,000 Fund receives default protection on USCPIU + 0 bps; and pays Fixed 1.852% Bank of America 1/8/2024 (11,242) (11,242)
IFS USD 1,580,000 Fund receives default protection on USCPIU + 0 bps; and pays Fixed 1.706% Bank of America 13/8/2024 (5,692) (5,692)
IFS EUR 735,000 Fund provides default protection on CPTFEMU + 0 bps; and receives Fixed 0.9075% Bank of America 16/8/2024 (2,665) (2,665)
IFS EUR 1,070,000 Fund receives default protection on CPTFEMU + 0 bps; and pays Fixed 0.9075% Bank of America 16/8/2024 (3,879) (3,879)
IFS GBP 1,875,000 Fund receives default protection on UKRPI + 0 bps; and pays Fixed 3.8125% Bank of America 16/8/2024 (2,448) (2,448)
IFS GBP 4,370,000 Fund receives default protection on UKRPI + 0bps; and pays Fixed 3.455% Bank of America 16/11/2027 120,069 120,069
IFS GBP 855,000 Fund provides default protection on UKRPI + 0bps; and receives Fixed 3.405% Bank of America 15/1/2028 (30,918) (30,918)
IFS GBP 1,845,000 Fund provides default protection on UKRPI + 0bps; and receives Fixed 3.4% Bank of America 16/8/2028 (75,022) (75,924)
IFS GBP 1,350,000 Fund provides default protection on UKRPI + 0bps; and receives Fixed 3.385% Bank of America 16/8/2028 (58,790) (58,790)
IFS GBP 1,400,000 Fund provides default protection on UKRPI + 0bps; and receives Fixed 3.5% Bank of America 16/9/2028 (36,775) (36,775)
IFS GBP 2,330,000 Fund provides default protection on UKRPI + 0bps; and receives Fixed 3.505% Bank of America 16/10/2028 (49,861) (49,861)
IFS USD 4,280,000 Fund receives default protection on USCPIU + 0bps; and pays 2.249% Bank of America 30/10/2028 (211,855) (211,855)
IFS EUR 1,115,000 Fund receives default protection on CPTFEMU + 0bps; and pays fixed 1.296% Bank of America 16/1/2029 (43,428) (43,428)
IFS GBP 2,180,000 Fund receives default protection on UKRPI + 0bps; and pays Fixed 3.481% Bank of America 16/1/2029 66,979 66,979
IFS USD 2,120,000 Fund provides default protection on USCPIU + 0 bps; and receives Fixed 2.152% Bank of America 6/3/2029 77,228 77,228
IFS GBP 1,420,000 Fund provides default protection on UKRPI + 0 bps; and receives Fixed 3.49% Bank of America 16/3/2029 (51,940) (51,940)
IFS GBP 255,000 Fund provides default protection on UKRPI + 0 bps; and receives Fixed 3.5275% Bank of America 16/3/2029 (7,788) (7,788)
IFS EUR 1,985,000 Fund receives default protection on CPTFEMU + 0 bps; and pays Fixed 1.2895% Bank of America 16/3/2029 (67,788) (67,788)
IFS EUR 1,660,000 Fund provides default protection on CPTFEMU + 0 bps; and receives Fixed 1.329% Bank of America 18/3/2029 (65,242) (65,242)
IFS USD 1,400,000 Fund provides default protection on USCPIU + 0 bps; and receives Fixed 2.037% Bank of America 2/4/2029 32,744 32,744
IFS EUR 1,090,000 Fund provides default protection on CPTFEMU + 0 bps; and receives Fixed 1.1625% Bank of America 16/5/2029 16,835 16,835
IFS USD 1,340,000 Fund receives default protection on USCPIU + 0 bps; and pays Fixed 1.961% Bank of America 31/5/2029 (22,873) (22,873)
IFS GBP 835,000 Fund provides default protection on UKRPI + 0 bps; and receives 3.65% Bank of America 18/6/2029 (6,845) (6,845)
IFS USD 1,465,000 Fund receives default protection on USCPIU + 0 bps; and pays Fixed 1.862% Bank of America 22/6/2029 (10,641) (10,641)
IFS GBP 835,000 Fund provides default protection on UKRPI + 0 bps; and receives Fixed 3.7% Bank of America 15/7/2029 (803) (803)
IFS USD 640,000 Fund receives default protection on USCPIU + 0 bps; and pays Fixed 1.8375% Bank of America 15/8/2029 (1,429) (1,429)

The notes on pages 728 to 741 form an integral part of these financial statements.
[484] BlackRock Global Funds (BGF)
Global Inflation Linked Bond Fund continued
Swaps as at 31 August 2019
TypeNominal
Value Description Counterparty
Expiration date
Unrealised appreciation/
(depreciation) USD
Market Value USD
IFS GBP 1,605,000 Fund provides default protection on UKRPI + 0 bps; and receives Fixed 3.77% Bank of America 16/8/2029 11,853 11,853
IFS EUR 655,000 Fund receives default protection on CPTFEMU + 0 bps; and pays Fixed 1.0075% Bank of America 16/8/2029 1,571 1,571
IFS EUR 1,080,000 Fund provides default protection on CPTFEMU + 0 bps; and receives Fixed 1.0925% Bank of America 16/8/2029 (9,111) (9,111)
IFS EUR 515,000 Fund provides default protection on CPTFEMU + 0 bps; and receives Fixed 1.085% Bank of America 16/8/2029 3,851 3,851
IFS EUR 445,000 Fund receives default protection on CPTFEMU + 0 bps; and pays Fixed 1.0575% Bank of America 16/8/2029 (1,765) (1,765)
IFS EUR 1,040,000 Fund receives default protection on CPTFEMU + 0 bps; and pays Fixed 1.0525% Bank of America 16/8/2029 (3,460) (3,460)
IFS GBP 805,000 Fund receives default protection on UKRPI + 0 bps; and pays Fixed 3.662% Bank of America 16/8/2029 8,284 8,284
IFS GBP 795,000 Fund receives default protection on UKRPI + 0 bps; and pays Fixed 3.734% Bank of America 16/8/2029 (1,172) (1,172)
IFS USD 1,270,000 Fund provides default protection on USCPIU + 0 bps; and receives Fixed 1.75% Bank of America 23/8/2029 (9,528) (9,528)
IFS GBP 4,370,000 Fund provides default protection on UKRPI + 0bps; and receives Fixed 3.5475% Bank of America 16/11/2032 (65,463) (65,463)
IFS GBP 2,520,000 Fund provides default protection on UKRPI + 0bps; and receives Fixed 3.6% Bank of America 16/11/2042 212,774 212,774
IFS GBP 2,520,000 Fund receives default protection on UKRPI + 0bps; and pays Fixed 3.55% Bank of America 16/11/2047 (430,901) (430,901)
IFS GBP 260,000 Fund receives default protection on UKRPI + 0bps; and pays Fixed 3.41% Bank of America 15/3/2048 (15,930) (15,930)
IFS GBP 295,000 Fund provides default protection on UKRPI + 0bps; and receives Fixed 3.44% Bank of America 15/8/2048 25,303 25,303
IFS EUR 295,000 Fund provides default protection on CPTFEMU + 0 bps; and receives Fixed 1.39% Bank of America 16/6/2049 343 (847)
IFS GBP 190,000 Fund receives default protection on UKRPI + 0 bps; and pays Fixed 3.42% Bank of America 16/6/2049 (14,695) (14,695)
IFS GBP 755,000 Fund receives default protection on UKRPI + 0 bps; and pays Fixed 3.36% Bank of America 16/8/2049 (17,548) (17,548)
IFS EUR 265,000 Fund provides default protection on CPTFEMU + 0 bps; and receives Fixed 1.403% Bank of America 16/8/2049 1,834 1,834
IFS GBP 160,000 Fund receives default protection on UKRPI + 0 bps; and pays Fixed 3.4% Bank of America 16/8/2049 (9,180) (9,180)
IFS EUR 265,000 Fund provides default protection on CPTFEMU + 0 bps; and receives Fixed 1.395% Bank of America 16/8/2049 760 760
IFS USD 400,000 Fund receives default protection on USCPIU + 0 bps; and pays Fixed 1.78625% Bank of America 23/8/2049 14,207 14,207
IFS USD 400,000 Fund receives default protection on USCPIU + 0 bps; and pays Fixed 1.7775% Bank of America 24/8/2049 15,419 15,419
IRS USD 740,000 Fund receives Floating USD LIBOR 3 Month; and pays Fixed 2.273% Bank of America 27/4/2021 (6,754) (6,761)
IRS USD 450,000 Fund receives Fixed 1.745%; and pays Floating USD LIBOR 3 Month Bank of America 12/6/2021 1,960 1,960
IRS USD 2,502,000 Fund receives Floating USD LIBOR 3 Month; and pays Fixed 2.1485% Bank of America 10/7/2021 (26,799) (26,799)
IRS GBP 7,300,000 Fund receives Fixed 0.68%; and pays Floating GBP LIBOR 6 Month Bank of America 15/8/2021 3,934 4,952
IRS GBP 7,300,000 Fund receives Fixed 0.718%; and pays Floating GBP LIBOR 6 Month Bank of America 16/8/2021 11,333 11,230
IRS EUR 8,025,000 Fund receives Floating EUR EURIBOR 6 Month; and pays Fixed -0.56% Bank of America 16/8/2021 688 504
IRS EUR 7,960,000 Fund receives Floating EUR EURIBOR 6 Month; and pays Fixed -0.565% Bank of America 20/8/2021 511 511
IRS USD 340,000 Fund receives Fixed 1.2055%; and pays Floating USD LIBOR 3 Month Bank of America 2/9/2021 85 85
IRS USD 680,000 Fund receives Fixed 1.22%; and pays Floating USD LIBOR 3 Month Bank of America 2/9/2021 267 267
IRS USD 680,000 Fund receives Fixed 1.2285%; and pays Floating USD LIBOR 3 Month Bank of America 2/9/2021 324 324
IRS USD 5,500,000 Fund receives Floating USD LIBOR 1 Day; and pays Fixed 1.1% Bank of America 15/9/2021 2,716 2,371
IRS USD 1,340,000 Fund receives Floating USD LIBOR 3 Month; and pays Fixed 2.313% Bank of America 25/10/2021 (22,886) (22,717)
IRS USD 430,000 Fund receives Fixed 2.2605%; and pays Floating USD LIBOR 3 Month Bank of America 5/11/2021 6,966 6,966
IRS USD 430,000 Fund receives Fixed 2.2675%; and pays Floating USD LIBOR 3 Month Bank of America 5/11/2021 7,025 7,025

The notes on pages 728 to 741 form an integral part of these financial statements.
Annual Report and Audited Financial Statements [485]
Global Inflation Linked Bond Fund continued
Swaps as at 31 August 2019
TypeNominal
Value Description Counterparty
Expiration date
Unrealised appreciation/
(depreciation) USD
Market Value USD
IRS USD 430,000 Fund receives Fixed 2.2845%; and pays Floating USD LIBOR 3 Month Bank of America 5/11/2021 7,168 7,168
IRS USD 1,080,000 Fund receives Floating USD LIBOR 3 Month; and pays Fixed 2.293% Bank of America 12/11/2021 (18,375) (18,375)
IRS USD 340,000 Fund receives Floating USD LIBOR 3 Month; and pays Fixed 2.1785% Bank of America 25/11/2021 (5,143) (5,143)
IRS USD 1,140,000 Fund receives Fixed 2.174%; and pays Floating USD LIBOR 3 Month Bank of America 26/11/2021 17,140 17,140
IRS USD 5,000,000 Fund receives Floating USD LIBOR 3 Month; and pays Fixed 2.7355% Bank of America 14/12/2021 (75,764) (75,764)
IRS USD 290,000 Fund receives Fixed 2.474%; and pays Floating USD LIBOR 3 Month Bank of America 11/2/2022 6,838 6,838
IRS USD 290,000 Fund receives Fixed 2.499%; and pays Floating USD LIBOR 3 Month Bank of America 11/2/2022 6,979 6,979
IRS USD 675,000 Fund receives Floating USD LIBOR 3 Month; and pays Fixed 2.55% Bank of America 14/2/2022 (16,913) (16,913)
IRS USD 545,000 Fund receives Fixed 2.4225%; and pays Floating USD LIBOR 3 Month Bank of America 23/3/2022 12,203 12,203
IRS USD 545,000 Fund receives Fixed 2.428%; and pays Floating USD LIBOR 3 Month Bank of America 23/3/2022 12,261 12,261
IRS USD 1,620,000 Fund receives Fixed 2.1795%; and pays Floating USD LIBOR 3 Month Bank of America 31/3/2022 28,790 28,790
IRS USD 350,000 Fund receives Fixed 2.247%; and pays Floating USD LIBOR 3 Month Bank of America 7/4/2022 6,723 6,723
IRS USD 650,000 Fund receives Fixed 2.955%; and pays Floating USD LIBOR 3 Month Bank of America 19/7/2022 22,417 22,417
IRS USD 381,100 Fund receives Fixed 2.8261%; and pays Floating USD LIBOR 3 Month Bank of America 17/12/2022 12,238 12,238
IRS USD 1,020,000 Fund receives Fixed 2.5205%; and pays Floating USD LIBOR 3 Month Bank of America 9/2/2023 27,180 26,976
IRS USD 2,240,000 Fund receives Floating USD LIBOR 3 Month; and pays Fixed 2.43% Bank of America 15/3/2023 (54,995) (54,947)
IRS EUR 330,000 Fund receives Floating EUR EURIBOR 6 Month; and pays Fixed 0.04% Bank of America 30/3/2023 (4,639) (4,639)
IRS USD 940,000 Fund receives Fixed 2.178%; and pays Floating USD LIBOR 3 Month Bank of America 29/3/2024 34,874 34,874
IRS USD 177,000 Fund receives Fixed 3.1341%; and pays Floating USD LIBOR 3 Month Bank of America 4/10/2024 15,568 15,561
IRS NZD 6,559,440 Fund receives Floating NZD BBR FRA 3 Month; and pays Fixed 2.8% Bank of America 20/3/2029 (608,776) (611,631)
IRS USD 375,000 Fund receives Fixed 2.577%; and pays Floating USD LIBOR 3 Month Bank of America 26/3/2029 40,601 40,601
IRS USD 480,000 Fund receives Floating USD LIBOR 3 Month; and pays Fixed 1.4% Bank of America 15/5/2029 (2,413) (2,229)
IRS NZD 3,430,000 Fund receives Fixed 1.2725%; and pays Floating NZD BBR FRA 3 Month Bank of America 15/8/2029 17,112 17,112
IRS USD 70,000 Fund receives Fixed 1.4215%; and pays Floating USD LIBOR 3 Month Bank of America 28/8/2029 211 211
IRS USD 90,000 Fund receives Fixed 1.423%; and pays Floating USD LIBOR 3 Month Bank of America 28/8/2029 284 284
IRS USD 100,000 Fund receives Floating USD LIBOR 3 Month; and pays Fixed 1.4395% Bank of America 28/8/2029 (471) (471)
IRS USD 480,000 Fund receives Floating USD LIBOR 3 Month; and pays Fixed 2.3297% Bank of America 29/3/2030 (43,548) (43,548)
IRS JPY 5,050,000 Fund receives Floating JPY LIBOR 6 Month; and pays Fixed 0.336% Bank of America 8/2/2034 (2,517) (2,517)
IRS JPY 3,260,000 Fund receives Floating JPY LIBOR 6 Month; and pays Fixed 0.295% Bank of America 17/6/2039 (1,559) (1,559)
IRS JPY 2,350,000 Fund receives Floating JPY LIBOR 6 Month; and pays Fixed 0.1665% Bank of America 8/8/2039 (552) (552)
IRS JPY 1,600,000 Fund receives Floating JPY LIBOR 6 Month; and pays Fixed 0.715% Bank of America 21/3/2044 (1,768) (1,768)
IRS JPY 1,270,000 Fund receives Floating JPY LIBOR 6 Month; and pays Fixed 0.2005% Bank of America 28/8/2044 (132) (132)
IRS USD 20,000 Fund receives Floating USD LIBOR 3 Month; and pays Fixed 1.538% Bank of America 30/8/2049 (7) (7)
IRS USD 50,000 Fund receives Floating USD LIBOR 3 Month; and pays Fixed 1.568% Bank of America 3/9/2049 (387) (387)
Total (USD underlying exposure - USD 105,248,489) (1,420,914) (1,415,336)
IFS: Inflation SwapsIRS: Interest Rate Swaps
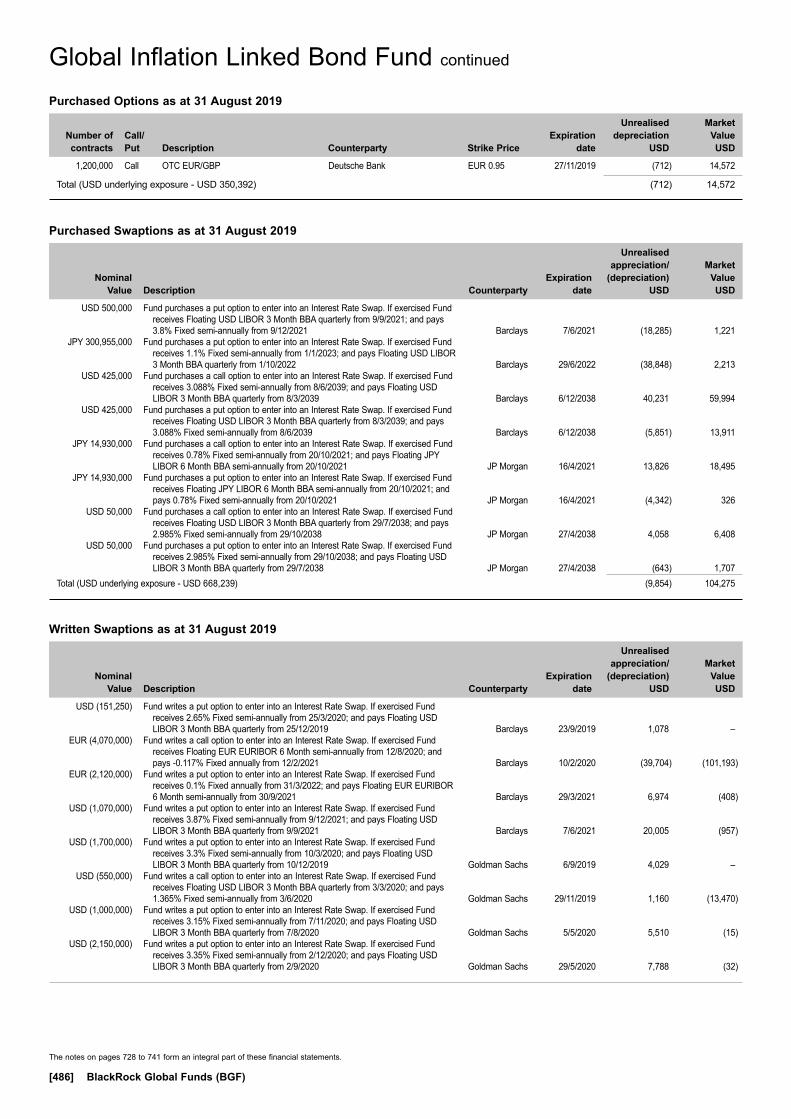
The notes on pages 728 to 741 form an integral part of these financial statements.
[486] BlackRock Global Funds (BGF)
Global Inflation Linked Bond Fund continued
Purchased Swaptions as at 31 August 2019
Nominal Value
Description Counterparty
Expiration date
Unrealised appreciation/
(depreciation) USD
Market Value USD
USD 500,000 Fund purchases a put option to enter into an Interest Rate Swap. If exercised Fund receives Floating USD LIBOR 3 Month BBA quarterly from 9/9/2021; and pays 3.8% Fixed semi-annually from 9/12/2021 Barclays 7/6/2021 (18,285) 1,221
JPY 300,955,000 Fund purchases a put option to enter into an Interest Rate Swap. If exercised Fund receives 1.1% Fixed semi-annually from 1/1/2023; and pays Floating USD LIBOR 3 Month BBA quarterly from 1/10/2022 Barclays 29/6/2022 (38,848) 2,213
USD 425,000 Fund purchases a call option to enter into an Interest Rate Swap. If exercised Fund receives 3.088% Fixed semi-annually from 8/6/2039; and pays Floating USD LIBOR 3 Month BBA quarterly from 8/3/2039 Barclays 6/12/2038 40,231 59,994
USD 425,000 Fund purchases a put option to enter into an Interest Rate Swap. If exercised Fund receives Floating USD LIBOR 3 Month BBA quarterly from 8/3/2039; and pays 3.088% Fixed semi-annually from 8/6/2039 Barclays 6/12/2038 (5,851) 13,911
JPY 14,930,000 Fund purchases a call option to enter into an Interest Rate Swap. If exercised Fund receives 0.78% Fixed semi-annually from 20/10/2021; and pays Floating JPY LIBOR 6 Month BBA semi-annually from 20/10/2021 JP Morgan 16/4/2021 13,826 18,495
JPY 14,930,000 Fund purchases a put option to enter into an Interest Rate Swap. If exercised Fund receives Floating JPY LIBOR 6 Month BBA semi-annually from 20/10/2021; and pays 0.78% Fixed semi-annually from 20/10/2021 JP Morgan 16/4/2021 (4,342) 326
USD 50,000 Fund purchases a call option to enter into an Interest Rate Swap. If exercised Fund receives Floating USD LIBOR 3 Month BBA quarterly from 29/7/2038; and pays 2.985% Fixed semi-annually from 29/10/2038 JP Morgan 27/4/2038 4,058 6,408
USD 50,000 Fund purchases a put option to enter into an Interest Rate Swap. If exercised Fund receives 2.985% Fixed semi-annually from 29/10/2038; and pays Floating USD LIBOR 3 Month BBA quarterly from 29/7/2038 JP Morgan 27/4/2038 (643) 1,707
Total (USD underlying exposure - USD 668,239) (9,854) 104,275
Written Swaptions as at 31 August 2019
Nominal Value
Description Counterparty
Expiration date
Unrealised appreciation/
(depreciation) USD
Market Value USD
USD (151,250) Fund writes a put option to enter into an Interest Rate Swap. If exercised Fund receives 2.65% Fixed semi-annually from 25/3/2020; and pays Floating USD LIBOR 3 Month BBA quarterly from 25/12/2019 Barclays 23/9/2019 1,078 –
EUR (4,070,000) Fund writes a call option to enter into an Interest Rate Swap. If exercised Fund receives Floating EUR EURIBOR 6 Month semi-annually from 12/8/2020; and pays -0.117% Fixed annually from 12/2/2021 Barclays 10/2/2020 (39,704) (101,193)
EUR (2,120,000) Fund writes a put option to enter into an Interest Rate Swap. If exercised Fund receives 0.1% Fixed annually from 31/3/2022; and pays Floating EUR EURIBOR 6 Month semi-annually from 30/9/2021 Barclays 29/3/2021 6,974 (408)
USD (1,070,000) Fund writes a put option to enter into an Interest Rate Swap. If exercised Fund receives 3.87% Fixed semi-annually from 9/12/2021; and pays Floating USD LIBOR 3 Month BBA quarterly from 9/9/2021 Barclays 7/6/2021 20,005 (957)
USD (1,700,000) Fund writes a put option to enter into an Interest Rate Swap. If exercised Fund receives 3.3% Fixed semi-annually from 10/3/2020; and pays Floating USD LIBOR 3 Month BBA quarterly from 10/12/2019 Goldman Sachs 6/9/2019 4,029 –
USD (550,000) Fund writes a call option to enter into an Interest Rate Swap. If exercised Fund receives Floating USD LIBOR 3 Month BBA quarterly from 3/3/2020; and pays 1.365% Fixed semi-annually from 3/6/2020 Goldman Sachs 29/11/2019 1,160 (13,470)
USD (1,000,000) Fund writes a put option to enter into an Interest Rate Swap. If exercised Fund receives 3.15% Fixed semi-annually from 7/11/2020; and pays Floating USD LIBOR 3 Month BBA quarterly from 7/8/2020 Goldman Sachs 5/5/2020 5,510 (15)
USD (2,150,000) Fund writes a put option to enter into an Interest Rate Swap. If exercised Fund receives 3.35% Fixed semi-annually from 2/12/2020; and pays Floating USD LIBOR 3 Month BBA quarterly from 2/9/2020 Goldman Sachs 29/5/2020 7,788 (32)
Purchased Options as at 31 August 2019
Number of contracts
Call/ Put
Description Counterparty
Strike Price
Expiration date
Unrealised depreciation
USD
Market Value USD
1,200,000 Call OTC EUR/GBP Deutsche Bank EUR 0.95 27/11/2019 (712) 14,572
Total (USD underlying exposure - USD 350,392) (712) 14,572

The notes on pages 728 to 741 form an integral part of these financial statements.
Annual Report and Audited Financial Statements [487]
Global Inflation Linked Bond Fund continued
Written Swaptions as at 31 August 2019
Nominal Value
Description Counterparty
Expiration date
Unrealised appreciation/
(depreciation) USD
Market Value USD
USD (2,130,000) Fund writes a put option to enter into an Interest Rate Swap. If exercised Fund receives 3.45% Fixed semi-annually from 10/12/2020; and pays Floating USD LIBOR 3 Month BBA quarterly from 10/9/2020 Goldman Sachs 8/6/2020 8,787 (32)
USD (1,500,000) Fund writes a put option to enter into an Interest Rate Swap. If exercised Fund receives 2.6% Fixed semi-annually from 25/3/2020; and pays Floating USD LIBOR 3 Month BBA quarterly from 25/12/2019 JP Morgan 23/9/2019 1,087 –
USD (1,500,000) Fund writes a call option to enter into an Interest Rate Swap. If exercised Fund receives Floating USD LIBOR 3 Month BBA quarterly from 25/12/2019; and pays 2% Fixed semi-annually from 25/3/2020 JP Morgan 23/9/2019 (13,530) (15,105)
Total (USD underlying exposure - USD 4,728,795) 3,184 (131,212)
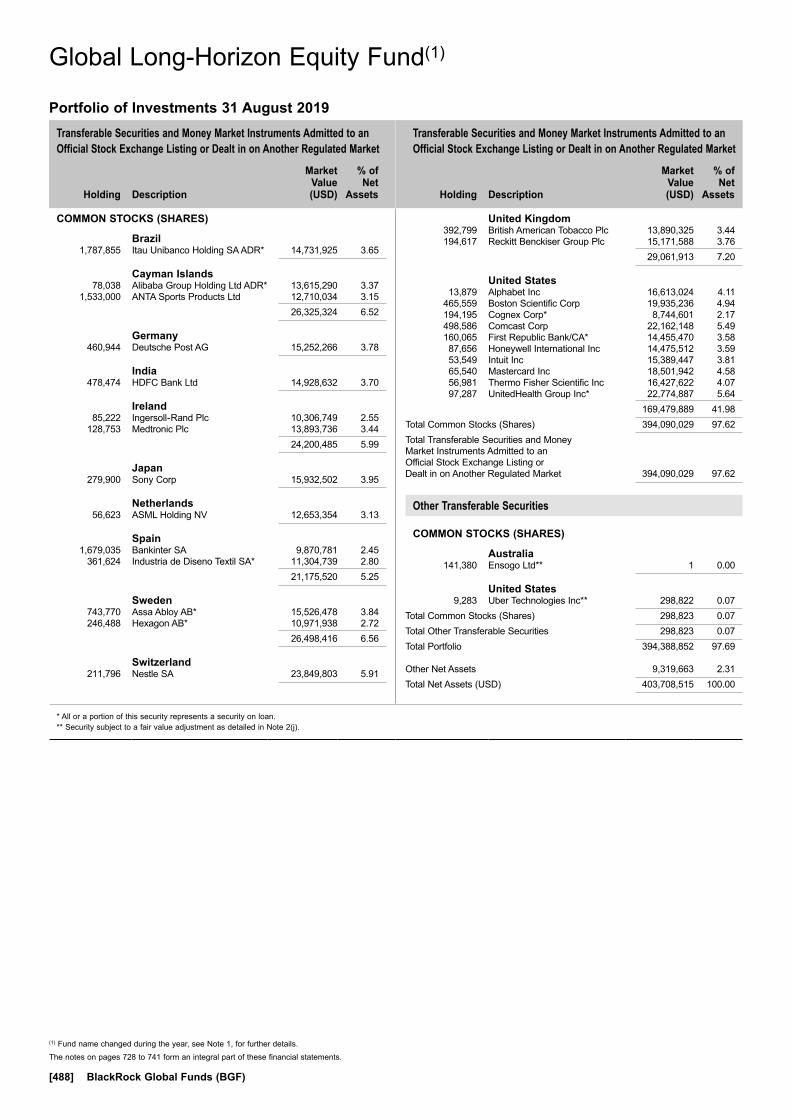
Transferable Securities and Money Market Instruments Admitted to an Official Stock Exchange Listing or Dealt in on Another Regulated Market
Transferable Securities and Money Market Instruments Admitted to an Official Stock Exchange Listing or Dealt in on Another Regulated Market
Holding
Description
Market Value (USD)
% of Net
Assets
Holding
Description
Market Value (USD)
% of Net
Assets
* All or a portion of this security represents a security on loan.** Security subject to a fair value adjustment as detailed in Note 2(j).
The notes on pages 728 to 741 form an integral part of these financial statements.
[488] BlackRock Global Funds (BGF)
COMMON STOCKS (SHARES)
Brazil 1,787,855 Itau Unibanco Holding SA ADR* 14,731,925 3.65
Cayman Islands 78,038 Alibaba Group Holding Ltd ADR* 13,615,290 3.37 1,533,000 ANTA Sports Products Ltd 12,710,034 3.15 26,325,324 6.52
Germany 460,944 Deutsche Post AG 15,252,266 3.78
India 478,474 HDFC Bank Ltd 14,928,632 3.70
Ireland 85,222 Ingersoll-Rand Plc 10,306,749 2.55 128,753 Medtronic Plc 13,893,736 3.44 24,200,485 5.99
Japan 279,900 Sony Corp 15,932,502 3.95
Netherlands 56,623 ASML Holding NV 12,653,354 3.13
Spain 1,679,035 Bankinter SA 9,870,781 2.45 361,624 Industria de Diseno Textil SA* 11,304,739 2.80 21,175,520 5.25
Sweden 743,770 Assa Abloy AB* 15,526,478 3.84 246,488 Hexagon AB* 10,971,938 2.72 26,498,416 6.56
Switzerland 211,796 Nestle SA 23,849,803 5.91
United Kingdom 392,799 British American Tobacco Plc 13,890,325 3.44 194,617 Reckitt Benckiser Group Plc 15,171,588 3.76 29,061,913 7.20
United States 13,879 Alphabet Inc 16,613,024 4.11 465,559 Boston Scientific Corp 19,935,236 4.94 194,195 Cognex Corp* 8,744,601 2.17 498,586 Comcast Corp 22,162,148 5.49 160,065 First Republic Bank/CA* 14,455,470 3.58 87,656 Honeywell International Inc 14,475,512 3.59 53,549 Intuit Inc 15,389,447 3.81 65,540 Mastercard Inc 18,501,942 4.58 56,981 Thermo Fisher Scientific Inc 16,427,622 4.07 97,287 UnitedHealth Group Inc* 22,774,887 5.64 169,479,889 41.98Total Common Stocks (Shares) 394,090,029 97.62Total Transferable Securities and Money Market Instruments Admitted to an Official Stock Exchange Listing or Dealt in on Another Regulated Market 394,090,029 97.62
Other Transferable Securities
COMMON STOCKS (SHARES)
Australia 141,380 Ensogo Ltd** 1 0.00
United States 9,283 Uber Technologies Inc** 298,822 0.07Total Common Stocks (Shares) 298,823 0.07Total Other Transferable Securities 298,823 0.07Total Portfolio 394,388,852 97.69
Other Net Assets 9,319,663 2.31Total Net Assets (USD) 403,708,515 100.00
Global Long-Horizon Equity Fund(1)
Portfolio of Investments 31 August 2019
Global Long-Horizon Equity Fund(1)
(1) Fund name changed during the year, see Note 1, for further details.

The notes on pages 728 to 741 form an integral part of these financial statements.
Annual Report and Audited Financial Statements [489]
Global Long-Horizon Equity Fund(1) continued
Open Forward Foreign Exchange Contracts as at 31 August 2019
Currency
Purchases Currency
Sales Counterparty
Maturity date
Unrealised depreciation
USD
SGD Hedged Share Class
SGD 68,495 USD 49,569 BNY Mellon 12/9/2019 (171)USD 1,676 SGD 2,329 BNY Mellon 12/9/2019 (3)
Net unrealised depreciation (USD underlying exposure - USD 51,073) (174)
Sector Breakdown as at 31 August 2019
% of Net Assets
Healthcare 18.09Information Technology 16.48Industrials 13.76Financials 13.38Consumer Discretionary 13.27Consumer Staples 13.11Communication Services 9.60Other Net Assets 2.31
100.00
(1) Fund name changed during the year, see Note 1, for further details.

Transferable Securities and Money Market Instruments Admitted to an Official Stock Exchange Listing or Dealt in on Another Regulated Market
Transferable Securities and Money Market Instruments Admitted to an Official Stock Exchange Listing or Dealt in on Another Regulated Market
Holding
Description
Market Value (USD)
% of Net
Assets
Holding
Description
Market Value (USD)
% of Net
Assets
∞ Cross umbrella holding and investment in connected party fund, see further information in Note 11. ~ Investment in connected party fund, see further information in Note 11.* All or a portion of this security represents a security on loan.
The notes on pages 728 to 741 form an integral part of these financial statements.
[490] BlackRock Global Funds (BGF)
FUNDS
Ireland 173,249 BlackRock ICS US Dollar Liquid
Environmentally Aware Fund~ 17,329,883 0.22 1,151,564 iShares USD High Yield Corp Bond
UCITS ETF*~ 119,428,703 1.54 136,758,586 1.76
Luxembourg 6,738,127 BlackRock Global Funds - US
Dollar High Yield Bond Fund∞ 73,243,442 0.94Total Funds 210,002,028 2.70
COMMON / PREFERRED STOCKS (SHARES)
Argentina 2,637 Banco Macro SA ADR 64,976 0.00
Australia 155,606 Ansell Ltd 2,856,857 0.04 2,998 ASX Ltd 174,337 0.00 130,570 BHP Group Ltd* 3,192,464 0.04 93,087 Coca-Cola Amatil Ltd 681,733 0.01 76,854 Crown Resorts Ltd 621,878 0.01 834,879 Dexus (Unit) (Reit) 7,256,194 0.09 5,411 Medibank Pvt Ltd 13,270 0.00 3,719,333 National Storage REIT (Unit) (Reit) 4,598,295 0.06 1,686,365 Scentre Group (Reit) 4,590,168 0.06 249,774 Sonic Healthcare Ltd 4,955,965 0.06 64,743 Wesfarmers Ltd* 1,705,553 0.02 30,646,714 0.39
Austria 81,277 Erste Group Bank AG 2,630,584 0.03
Belgium 12,437 Colruyt SA 640,067 0.01
Bermuda 84,000 China Resources Gas Group Ltd* 415,185 0.01 5,801 Credicorp Ltd 1,183,346 0.01 413 Everest Re Group Ltd 96,293 0.00 1,530,000 Haier Electronics Group Co Ltd 3,981,189 0.05 44,311 Hiscox Ltd 842,740 0.01 3,363 IHS Markit Ltd* 221,151 0.00 4,183 Invesco Ltd 65,799 0.00 830,000 Kunlun Energy Co Ltd 723,086 0.01 2,183 Norwegian Cruise Line Holdings Ltd 110,394 0.00 172,500 Yue Yuen Industrial Holdings Ltd* 441,159 0.01 8,080,342 0.10
Brazil 604,256 Ambev SA 2,728,975 0.04 341,972 BB Seguridade Participacoes SA 2,701,108 0.04 60,832 Cia Brasileira de Distribuicao (Pref) 1,269,466 0.02 30,619 Cia Brasileira de Distribuicao ADR* 638,712 0.01 8,046 Hypera SA 62,349 0.00 19,700 Iguatemi Empresa de Shopping
Centers SA 218,053 0.00 139,000 JBS SA 1,022,121 0.01 3,900 Multiplan Empreendimentos
Imobiliarios SA 24,971 0.00 509,059 Neoenergia SA 2,563,086 0.03 244,288 Notre Dame Intermedica
Participacoes SA 3,190,752 0.04
242,101 Petroleo Brasileiro SA 1,647,678 0.02 121,000 Petroleo Brasileiro SA ADR 1,646,810 0.02 3,500 Telefonica Brasil SA (Pref) 44,617 0.00 17,758,698 0.23
British Virgin Islands 1,528 Capri Holdings Ltd 41,103 0.00
Canada 44,685 Bank of Montreal 3,088,597 0.04 110,756 BCE Inc 5,259,733 0.07 23,382 Canadian Imperial Bank
of Commerce 1,812,173 0.02 43,876 CGI Inc 3,438,227 0.04 6,796 Gildan Activewear Inc 250,187 0.00 574,245 RioCan Real Estate Investment
Trust (Reit) 11,407,821 0.15 180,949 Rogers Communications Inc 9,002,418 0.12 34,617 Royal Bank of Canada 2,600,708 0.03 48,099 Stars Group Inc/The 739,398 0.01 387,918 TELUS Corp (Unit) 14,152,084 0.18 5,429 Thomson Reuters Corp 371,237 0.01 52,122,583 0.67
Cayman Islands 66,000 Agile Group Holdings Ltd 84,353 0.00 313,000 ANTA Sports Products Ltd 2,595,069 0.03 82,000 Bosideng International Holdings Ltd 28,136 0.00 390,400 ENN Energy Holdings Ltd* 4,456,809 0.06 17,000 Hengan International Group Co Ltd 111,890 0.00 1,149,500 Li Ning Co Ltd 3,394,307 0.04 10,673 NetEase Inc ADR 2,721,615 0.04 152,000 Shui On Land Ltd 31,603 0.00 252,000 Tingyi Cayman Islands Holding Corp 347,149 0.00 638,000 Want Want China Holdings Ltd* 497,225 0.01 1,416,800 Wynn Macau Ltd 2,833,647 0.04 17,101,803 0.22
Chile 218,621 Aguas Andinas SA 117,975 0.00 440,525 Banco de Chile 62,320 0.00 1 Banco de Credito e Inversiones SA 61 0.00 773,896 Banco Santander Chile 54,121 0.00 6,738 Cia Cervecerias Unidas SA 75,355 0.00 40,958 Embotelladora Andina SA (Pref) 124,095 0.00 3,878 Empresa Nacional de
Telecomunicaciones SA 32,369 0.00 24,794 SACI Falabella 141,070 0.01 607,366 0.01
China 243,900 Agricultural Bank of China Ltd 115,979 0.00 538,500 Anhui Conch Cement Co Ltd ‘H’ 3,032,547 0.04 44,000 Anhui Expressway Co Ltd ‘H’ 24,863 0.00 106,897 Asymchem Laboratories Tianjin
Co Ltd 1,638,276 0.02 159,900 Bank of Beijing Co Ltd 117,408 0.00 141,300 Bank of China Ltd 69,760 0.00 8,944,000 Bank of China Ltd ‘H’ 3,411,098 0.04 628,500 Bank of Communications Co Ltd 475,546 0.01 954,000 Bank of Communications Co Ltd ‘H’ 624,248 0.01 1,787,000 CGN Power Co Ltd ‘H’ 471,831 0.01 95,000 China Coal Energy Co Ltd ‘H’ 37,686 0.00 158,000 China Communications Services
Corp Ltd ‘H’ 88,473 0.00 465,500 China Minsheng Banking Corp Ltd 378,256 0.01
Global Multi-Asset Income Fund
Portfolio of Investments 31 August 2019
Global Multi-Asset Income Fund
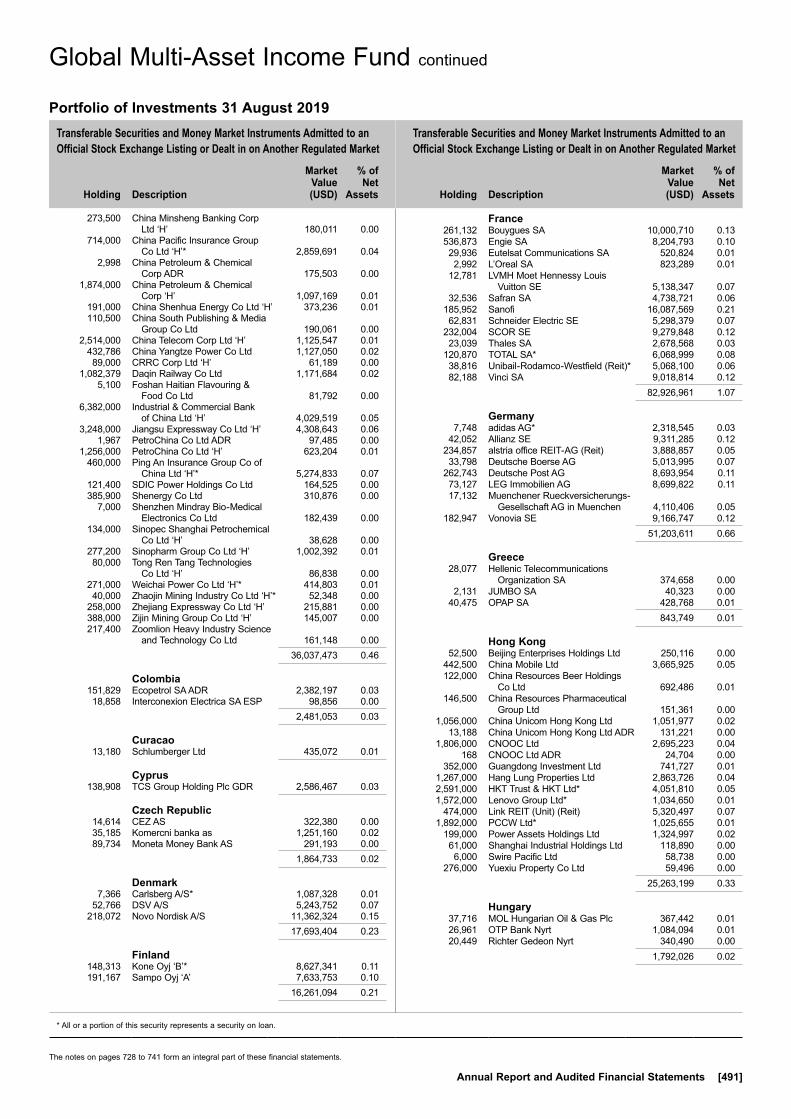
Transferable Securities and Money Market Instruments Admitted to an Official Stock Exchange Listing or Dealt in on Another Regulated Market
Transferable Securities and Money Market Instruments Admitted to an Official Stock Exchange Listing or Dealt in on Another Regulated Market
Holding
Description
Market Value (USD)
% of Net
Assets
Holding
Description
Market Value (USD)
% of Net
Assets
* All or a portion of this security represents a security on loan.
The notes on pages 728 to 741 form an integral part of these financial statements.
Annual Report and Audited Financial Statements [491]
273,500 China Minsheng Banking Corp Ltd ‘H’ 180,011 0.00
714,000 China Pacific Insurance Group Co Ltd ‘H’* 2,859,691 0.04
2,998 China Petroleum & Chemical Corp ADR 175,503 0.00
1,874,000 China Petroleum & Chemical Corp ‘H’ 1,097,169 0.01
191,000 China Shenhua Energy Co Ltd ‘H’ 373,236 0.01 110,500 China South Publishing & Media
Group Co Ltd 190,061 0.00 2,514,000 China Telecom Corp Ltd ‘H’ 1,125,547 0.01 432,786 China Yangtze Power Co Ltd 1,127,050 0.02 89,000 CRRC Corp Ltd ‘H’ 61,189 0.00 1,082,379 Daqin Railway Co Ltd 1,171,684 0.02 5,100 Foshan Haitian Flavouring &
Food Co Ltd 81,792 0.00 6,382,000 Industrial & Commercial Bank
of China Ltd ‘H’ 4,029,519 0.05 3,248,000 Jiangsu Expressway Co Ltd ‘H’ 4,308,643 0.06 1,967 PetroChina Co Ltd ADR 97,485 0.00 1,256,000 PetroChina Co Ltd ‘H’ 623,204 0.01 460,000 Ping An Insurance Group Co of
China Ltd ‘H’* 5,274,833 0.07 121,400 SDIC Power Holdings Co Ltd 164,525 0.00 385,900 Shenergy Co Ltd 310,876 0.00 7,000 Shenzhen Mindray Bio-Medical
Electronics Co Ltd 182,439 0.00 134,000 Sinopec Shanghai Petrochemical
Co Ltd ‘H’ 38,628 0.00 277,200 Sinopharm Group Co Ltd ‘H’ 1,002,392 0.01 80,000 Tong Ren Tang Technologies
Co Ltd ‘H’ 86,838 0.00 271,000 Weichai Power Co Ltd ‘H’* 414,803 0.01 40,000 Zhaojin Mining Industry Co Ltd ‘H’* 52,348 0.00 258,000 Zhejiang Expressway Co Ltd ‘H’ 215,881 0.00 388,000 Zijin Mining Group Co Ltd ‘H’ 145,007 0.00 217,400 Zoomlion Heavy Industry Science
and Technology Co Ltd 161,148 0.00 36,037,473 0.46
Colombia 151,829 Ecopetrol SA ADR 2,382,197 0.03 18,858 Interconexion Electrica SA ESP 98,856 0.00 2,481,053 0.03
Curacao 13,180 Schlumberger Ltd 435,072 0.01
Cyprus 138,908 TCS Group Holding Plc GDR 2,586,467 0.03
Czech Republic 14,614 CEZ AS 322,380 0.00 35,185 Komercni banka as 1,251,160 0.02 89,734 Moneta Money Bank AS 291,193 0.00 1,864,733 0.02
Denmark 7,366 Carlsberg A/S* 1,087,328 0.01 52,766 DSV A/S 5,243,752 0.07 218,072 Novo Nordisk A/S 11,362,324 0.15 17,693,404 0.23
Finland 148,313 Kone Oyj ‘B’* 8,627,341 0.11 191,167 Sampo Oyj ‘A’ 7,633,753 0.10 16,261,094 0.21
France 261,132 Bouygues SA 10,000,710 0.13 536,873 Engie SA 8,204,793 0.10 29,936 Eutelsat Communications SA 520,824 0.01 2,992 L’Oreal SA 823,289 0.01 12,781 LVMH Moet Hennessy Louis
Vuitton SE 5,138,347 0.07 32,536 Safran SA 4,738,721 0.06 185,952 Sanofi 16,087,569 0.21 62,831 Schneider Electric SE 5,298,379 0.07 232,004 SCOR SE 9,279,848 0.12 23,039 Thales SA 2,678,568 0.03 120,870 TOTAL SA* 6,068,999 0.08 38,816 Unibail-Rodamco-Westfield (Reit)* 5,068,100 0.06 82,188 Vinci SA 9,018,814 0.12 82,926,961 1.07
Germany 7,748 adidas AG* 2,318,545 0.03 42,052 Allianz SE 9,311,285 0.12 234,857 alstria office REIT-AG (Reit) 3,888,857 0.05 33,798 Deutsche Boerse AG 5,013,995 0.07 262,743 Deutsche Post AG 8,693,954 0.11 73,127 LEG Immobilien AG 8,699,822 0.11 17,132 Muenchener Rueckversicherungs-
Gesellschaft AG in Muenchen 4,110,406 0.05 182,947 Vonovia SE 9,166,747 0.12 51,203,611 0.66
Greece 28,077 Hellenic Telecommunications
Organization SA 374,658 0.00 2,131 JUMBO SA 40,323 0.00 40,475 OPAP SA 428,768 0.01 843,749 0.01
Hong Kong 52,500 Beijing Enterprises Holdings Ltd 250,116 0.00 442,500 China Mobile Ltd 3,665,925 0.05 122,000 China Resources Beer Holdings
Co Ltd 692,486 0.01 146,500 China Resources Pharmaceutical
Group Ltd 151,361 0.00 1,056,000 China Unicom Hong Kong Ltd 1,051,977 0.02 13,188 China Unicom Hong Kong Ltd ADR 131,221 0.00 1,806,000 CNOOC Ltd 2,695,223 0.04 168 CNOOC Ltd ADR 24,704 0.00 352,000 Guangdong Investment Ltd 741,727 0.01 1,267,000 Hang Lung Properties Ltd 2,863,726 0.04 2,591,000 HKT Trust & HKT Ltd* 4,051,810 0.05 1,572,000 Lenovo Group Ltd* 1,034,650 0.01 474,000 Link REIT (Unit) (Reit) 5,320,497 0.07 1,892,000 PCCW Ltd* 1,025,655 0.01 199,000 Power Assets Holdings Ltd 1,324,997 0.02 61,000 Shanghai Industrial Holdings Ltd 118,890 0.00 6,000 Swire Pacific Ltd 58,738 0.00 276,000 Yuexiu Property Co Ltd 59,496 0.00 25,263,199 0.33
Hungary 37,716 MOL Hungarian Oil & Gas Plc 367,442 0.01 26,961 OTP Bank Nyrt 1,084,094 0.01 20,449 Richter Gedeon Nyrt 340,490 0.00 1,792,026 0.02
Global Multi-Asset Income Fund continued
Portfolio of Investments 31 August 2019

Transferable Securities and Money Market Instruments Admitted to an Official Stock Exchange Listing or Dealt in on Another Regulated Market
Transferable Securities and Money Market Instruments Admitted to an Official Stock Exchange Listing or Dealt in on Another Regulated Market
Holding
Description
Market Value (USD)
% of Net
Assets
Holding
Description
Market Value (USD)
% of Net
Assets
* All or a portion of this security represents a security on loan.
The notes on pages 728 to 741 form an integral part of these financial statements.
[492] BlackRock Global Funds (BGF)
India 937 Atul Ltd 46,547 0.00 23,579 Bharti Infratel Ltd 82,699 0.00 208,895 Biocon Ltd 689,223 0.01 22,075 Castrol India Ltd 37,978 0.00 23,175 Colgate-Palmolive India Ltd 413,650 0.01 23,108 Dr Reddy’s Laboratories Ltd 827,626 0.01 10,193 Dr Reddy’s Laboratories Ltd ADR* 358,590 0.00 71,044 GAIL India Ltd 129,139 0.00 88,175 HDFC Bank Ltd 2,751,105 0.04 61,238 Hero MotoCorp Ltd 2,205,752 0.03 45,461 Hindustan Unilever Ltd 1,198,096 0.02 38,141 Housing Development Finance
Corp Ltd 1,157,170 0.02 24,205 Infosys Ltd 276,227 0.00 2,009 Ipca Laboratories Ltd 26,982 0.00 1,883 L&T Technology Services Ltd 42,751 0.00 137,023 Larsen & Toubro Ltd 2,548,763 0.03 5,820 LIC Housing Finance Ltd 34,672 0.00 97,884 Marico Ltd 536,112 0.01 28,378 Maruti Suzuki India Ltd 2,433,635 0.03 17,555 Mphasis Ltd 239,893 0.00 3,879 Nestle India Ltd 699,407 0.01 1,107,402 Petronet LNG Ltd 4,138,365 0.05 11,371 Pidilite Industries Ltd 219,386 0.00 37,477 Tata Consultancy Services Ltd 1,185,912 0.02 22,279,680 0.29
Indonesia 6,012,800 Astra International Tbk PT 2,829,428 0.04 558,100 Bank Central Asia Tbk PT 1,200,003 0.02 9,687,500 Bank Mandiri Persero Tbk PT 4,951,313 0.06 245,000 Bank Tabungan Pensiunan
Nasional Syariah Tbk PT 55,615 0.00 901,200 Hanjaya Mandala Sampoerna
Tbk PT 170,901 0.00 131,300 Indofood CBP Sukses Makmur
Tbk PT 111,538 0.00 25,700 Unilever Indonesia Tbk PT 88,505 0.00 9,407,303 0.12
Ireland 6,086 Accenture Plc ‘A’ 1,214,826 0.02 938 Allegion Plc 90,198 0.00 2,932 Allergan Plc 468,768 0.01 4,604 Eaton Corp Plc 371,819 0.01 2,458 Ingersoll-Rand Plc 297,271 0.00 4,472 Jazz Pharmaceuticals Plc 560,342 0.01 7,941 Johnson Controls International plc 341,304 0.00 5,081 Linde Plc 955,838 0.01 86,346 Medtronic Plc 9,317,597 0.12 1,825 Pentair Plc 65,955 0.00 1,163 Perrigo Co Plc 54,661 0.00 2,537 Seagate Technology Plc 127,763 0.00 3,812 STERIS Plc 591,661 0.01 1,209 Willis Towers Watson Plc 238,064 0.00 14,696,067 0.19
Italy 334,084 FinecoBank Banca Fineco SpA* 3,508,825 0.04 53,484 Mediobanca Banca di Credito
Finanziario SpA 531,366 0.01 404,700 Snam SpA 2,080,542 0.03 316,506 Telecom Italia SpA/Milano 169,077 0.00 6,289,810 0.08
Japan 2,700 Dai Nippon Printing Co Ltd 58,479 0.00 6,280 Japan Rental Housing
Investments Inc (Reit) 5,815,854 0.07 18,300 Kakaku.com Inc* 458,771 0.01 12,100 KDDI Corp 323,176 0.00 1,484 Kenedix Office Investment Corp
(Reit)* 11,366,449 0.15 2,000 Lawson Inc 99,298 0.00 833 Mitsui Fudosan Logistics Park
Inc (Reit) 3,464,783 0.04 13,400 MS&AD Insurance Group
Holdings Inc 426,321 0.01 8,400 Nippon Telegraph & Telephone Corp 403,282 0.01 189,900 NTT DOCOMO Inc* 4,798,264 0.06 900 Obic Co Ltd 103,019 0.00 3,500 Sumitomo Corp 52,511 0.00 24,500 Trend Micro Inc/Japan 1,188,704 0.02 29,800 Yamada Denki Co Ltd 140,374 0.00 28,699,285 0.37
Jersey 15,427 Amcor Plc 151,030 0.00 829,898 Amcor Plc 8,085,161 0.11 2,304 Aptiv Plc 193,283 0.00 8,429,474 0.11
Liberia 26,070 Royal Caribbean Cruises Ltd 2,738,132 0.04
Luxembourg 363 Millicom International Cellular SA 18,556 0.00
Malaysia 382,200 AirAsia Group Bhd 162,678 0.00 266,300 CIMB Group Holdings Bhd 320,410 0.01 215,600 DiGi.Com Bhd 257,357 0.00 16,100 Fraser & Neave Holdings Bhd 135,140 0.00 232,500 Genting Bhd 331,710 0.01 522,400 Genting Malaysia Bhd 390,047 0.01 54,800 Hong Leong Bank Bhd 216,308 0.00 18,900 Hong Leong Financial Group Bhd 75,771 0.00 276,300 IHH Healthcare Bhd 380,403 0.01 1,120,400 Malayan Banking Bhd 2,315,137 0.03 32,900 Malaysia Airports Holdings Bhd 64,384 0.00 98,500 Maxis Bhd 130,459 0.00 83,800 MISC Bhd 144,665 0.00 4,300 Nestle Malaysia Bhd 150,815 0.00 25,000 Petronas Chemicals Group Bhd 41,196 0.00 41,900 Petronas Gas Bhd 160,208 0.00 15,500 PPB Group Bhd 68,774 0.00 225,600 Public Bank Bhd 1,090,051 0.02 27,000 QL Resources Bhd 44,556 0.00 166,000 RHB Bank Bhd 224,992 0.00 287,700 Tenaga Nasional Bhd 955,013 0.01 57,100 Westports Holdings Bhd 57,026 0.00 7,717,100 0.10
Mexico 377,482 America Movil SAB de CV 267,729 0.01 43,847 Coca-Cola Femsa SAB de CV 256,366 0.00 4,230 Coca-Cola Femsa SAB de CV ADR 248,513 0.00 109,759 Fomento Economico Mexicano
SAB de CV 982,595 0.01 10,844 Fomento Economico Mexicano
SAB de CV ADR 968,586 0.01
Global Multi-Asset Income Fund continued
Portfolio of Investments 31 August 2019

Transferable Securities and Money Market Instruments Admitted to an Official Stock Exchange Listing or Dealt in on Another Regulated Market
Transferable Securities and Money Market Instruments Admitted to an Official Stock Exchange Listing or Dealt in on Another Regulated Market
Holding
Description
Market Value (USD)
% of Net
Assets
Holding
Description
Market Value (USD)
% of Net
Assets
* All or a portion of this security represents a security on loan.
The notes on pages 728 to 741 form an integral part of these financial statements.
Annual Report and Audited Financial Statements [493]
11,490 Gruma SAB de CV 104,957 0.00 50,100 Grupo Aeroportuario del Centro
Norte SAB de CV ‘B’ 287,711 0.01 341,180 Grupo Aeroportuario del Pacifico
SAB de CV 3,126,226 0.04 766 Grupo Aeroportuario del Pacifico
SAB de CV ADR 70,166 0.00 872,057 Grupo Financiero Banorte SAB
de CV 4,605,792 0.06 104,600 Kimberly-Clark de Mexico SAB
de CV 211,414 0.00 11,800 Megacable Holdings SAB de CV 45,543 0.00 371,200 Wal-Mart de Mexico SAB de CV 1,045,330 0.02 12,220,928 0.16
Netherlands 22,994 ASML Holding NV 5,138,393 0.07 5,274 Ferrari NV 839,792 0.01 39,239 Heineken NV 4,205,291 0.05 37,805 Koninklijke DSM NV 4,725,205 0.06 121,966 Koninklijke Philips NV 5,776,434 0.08 2,497 LyondellBasell Industries NV 191,994 0.00 4,926 Mylan NV 98,520 0.00 12,992 Randstad NV 611,798 0.01 23,794 Wolters Kluwer NV 1,724,202 0.02 1,245 X5 Retail Group NV GDR 42,928 0.00 23,354,557 0.30
Norway 374,073 Entra ASA 5,615,269 0.07
Panama 3,917 Carnival Corp 172,818 0.00 29,402 Copa Holdings SA 3,033,404 0.04 3,206,222 0.04
Peru 65,976 Cia de Minas Buenaventura
SAA ADR 991,619 0.01
Philippines 3,320 Ayala Corp 58,992 0.00 216,200 Ayala Land Inc 196,442 0.01 1,845,950 Bank of the Philippine Islands 3,118,691 0.04 67,910 BDO Unibank Inc 194,373 0.00 67,520 International Container Terminal
Services Inc 176,136 0.00 37,240 Jollibee Foods Corp 170,113 0.00 13,400 Manila Electric Co 93,954 0.00 750,100 Megaworld Corp 73,919 0.00 1,334,000 Metro Pacific Investments Corp 126,846 0.00 11,980 SM Investments Corp 236,114 0.01 4,445,580 0.06
Poland 52,645 Bank Polska Kasa Opieki SA 1,282,736 0.02 26,915 Cyfrowy Polsat SA 194,966 0.00 29,806 Powszechna Kasa Oszczednosci
Bank Polski SA 294,132 0.00 67,007 Powszechny Zaklad
Ubezpieczen SA 629,173 0.01 2,401,007 0.03
Qatar 66,120 Barwa Real Estate Co 61,731 0.00 83,450 Commercial Bank PSQC/The 109,074 0.00 79,400 Industries Qatar QSC 237,213 0.00
186,690 Masraf Al Rayan QSC 186,088 0.00 42,190 Ooredoo QPSC 81,096 0.00 20,780 Qatar Electricity & Water Co QSC 86,161 0.00 4,425,550 Qatar Gas Transport Co Ltd 2,892,237 0.04 55,820 Qatar Islamic Bank SAQ 242,179 0.01 3,895,779 0.05
Russian Federation 318,265 Alrosa PJSC 352,867 0.01 13,587 LUKOIL PJSC 1,094,444 0.02 1,715 LUKOIL PJSC ADR 137,989 0.00 12,968 PhosAgro PJSC GDR 166,379 0.00 245,779 Sberbank of Russia PJSC ADR 3,381,919 0.04 5,133,598 0.07
Saudi Arabia 46,584 Al Rajhi Bank 751,453 0.01 2,447 Almarai Co JSC 32,329 0.00 5,007 Bank AlBilad 34,977 0.00 7,346 Bank Al-Jazira 26,442 0.00 6,547 Co for Cooperative Insurance/The 115,561 0.00 62,151 Etihad Etisalat Co 411,963 0.01 30,054 Fawaz Abdulaziz Al Hokair & Co 172,286 0.00 6,583 Jarir Marketing Co 272,762 0.00 121,028 Mobile Telecommunications
Co Saudi Arabia 378,201 0.01 10 National Commercial Bank 127 0.00 26,031 Riyad Bank 177,681 0.00 5,565 Saudi Airlines Catering Co 129,832 0.00 27,848 Saudi Telecom Co 735,087 0.01 28,919 Savola Group/The 240,959 0.00 3,479,660 0.04
Singapore 3,853,644 Ascendas Real Estate Investment
Trust (Unit) (Reit) 8,559,098 0.11 242,000 DBS Group Holdings Ltd 4,280,738 0.06 3,517,600 Genting Singapore Ltd 2,257,575 0.03 1,686,500 Sabana Shari’ah Compliant
Industrial Real Estate Investment Trust (Unit) (Reit) 547,273 0.01
232,500 United Overseas Bank Ltd* 4,184,786 0.05 19,829,470 0.26
South Africa 60,818 Exxaro Resources Ltd 544,280 0.01 4,730 MultiChoice Group 41,390 0.00 250,052 Old Mutual Ltd 295,781 0.00 846,238 Old Mutual Ltd Npv 1,000,395 0.01 1,881,846 0.02
South Korea 13,109 Cheil Worldwide Inc 285,719 0.00 1,543 DB Insurance Co Ltd 61,019 0.00 1,402 Fila Korea Ltd 66,208 0.00 1,689 Hyundai Glovis Co Ltd 223,108 0.00 2,522 Hyundai Marine & Fire Insurance
Co Ltd 49,763 0.00 536 Hyundai Mobis Co Ltd 109,966 0.00 17,723 Kia Motors Corp 639,418 0.01 43,229 KT Corp ADR 481,571 0.01 2,233 LG Electronics Inc 113,010 0.00 8,118 NCSoft Corp 3,599,064 0.05 516 NongShim Co Ltd 102,241 0.00 5,697 Partron Co Ltd 54,795 0.00 35,138 S-1 Corp 2,929,980 0.04 379,459 Samsung Electronics Co Ltd (Pref) 11,544,325 0.15
Global Multi-Asset Income Fund continued
Portfolio of Investments 31 August 2019
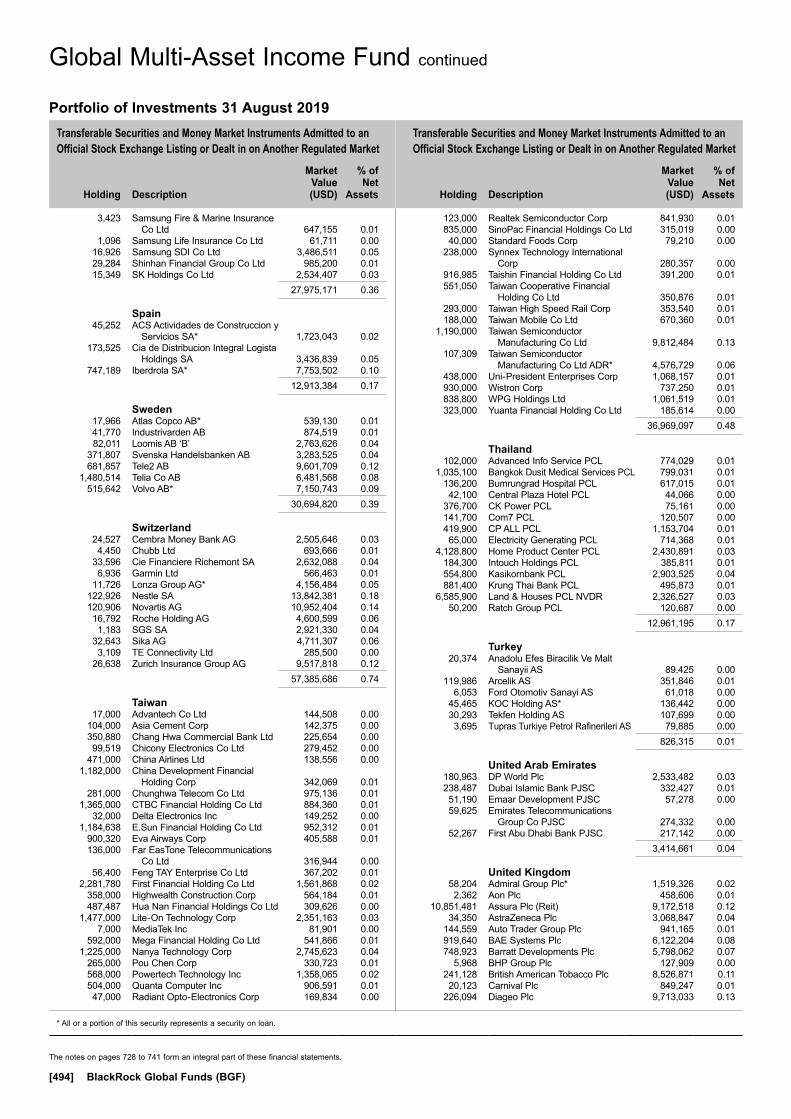
Transferable Securities and Money Market Instruments Admitted to an Official Stock Exchange Listing or Dealt in on Another Regulated Market
Transferable Securities and Money Market Instruments Admitted to an Official Stock Exchange Listing or Dealt in on Another Regulated Market
Holding
Description
Market Value (USD)
% of Net
Assets
Holding
Description
Market Value (USD)
% of Net
Assets
* All or a portion of this security represents a security on loan.
The notes on pages 728 to 741 form an integral part of these financial statements.
[494] BlackRock Global Funds (BGF)
3,423 Samsung Fire & Marine Insurance Co Ltd 647,155 0.01
1,096 Samsung Life Insurance Co Ltd 61,711 0.00 16,926 Samsung SDI Co Ltd 3,486,511 0.05 29,284 Shinhan Financial Group Co Ltd 985,200 0.01 15,349 SK Holdings Co Ltd 2,534,407 0.03 27,975,171 0.36
Spain 45,252 ACS Actividades de Construccion y
Servicios SA* 1,723,043 0.02 173,525 Cia de Distribucion Integral Logista
Holdings SA 3,436,839 0.05 747,189 Iberdrola SA* 7,753,502 0.10 12,913,384 0.17
Sweden 17,966 Atlas Copco AB* 539,130 0.01 41,770 Industrivarden AB 874,519 0.01 82,011 Loomis AB ‘B’ 2,763,626 0.04 371,807 Svenska Handelsbanken AB 3,283,525 0.04 681,857 Tele2 AB 9,601,709 0.12 1,480,514 Telia Co AB 6,481,568 0.08 515,642 Volvo AB* 7,150,743 0.09 30,694,820 0.39
Switzerland 24,527 Cembra Money Bank AG 2,505,646 0.03 4,450 Chubb Ltd 693,666 0.01 33,596 Cie Financiere Richemont SA 2,632,088 0.04 6,936 Garmin Ltd 566,463 0.01 11,726 Lonza Group AG* 4,156,484 0.05 122,926 Nestle SA 13,842,381 0.18 120,906 Novartis AG 10,952,404 0.14 16,792 Roche Holding AG 4,600,599 0.06 1,183 SGS SA 2,921,330 0.04 32,643 Sika AG 4,711,307 0.06 3,109 TE Connectivity Ltd 285,500 0.00 26,638 Zurich Insurance Group AG 9,517,818 0.12 57,385,686 0.74
Taiwan 17,000 Advantech Co Ltd 144,508 0.00 104,000 Asia Cement Corp 142,375 0.00 350,880 Chang Hwa Commercial Bank Ltd 225,654 0.00 99,519 Chicony Electronics Co Ltd 279,452 0.00 471,000 China Airlines Ltd 138,556 0.00 1,182,000 China Development Financial
Holding Corp 342,069 0.01 281,000 Chunghwa Telecom Co Ltd 975,136 0.01 1,365,000 CTBC Financial Holding Co Ltd 884,360 0.01 32,000 Delta Electronics Inc 149,252 0.00 1,184,638 E.Sun Financial Holding Co Ltd 952,312 0.01 900,320 Eva Airways Corp 405,588 0.01 136,000 Far EasTone Telecommunications
Co Ltd 316,944 0.00 56,400 Feng TAY Enterprise Co Ltd 367,202 0.01 2,281,780 First Financial Holding Co Ltd 1,561,868 0.02 358,000 Highwealth Construction Corp 564,184 0.01 487,487 Hua Nan Financial Holdings Co Ltd 309,626 0.00 1,477,000 Lite-On Technology Corp 2,351,163 0.03 7,000 MediaTek Inc 81,901 0.00 592,000 Mega Financial Holding Co Ltd 541,866 0.01 1,225,000 Nanya Technology Corp 2,745,623 0.04 265,000 Pou Chen Corp 330,723 0.01 568,000 Powertech Technology Inc 1,358,065 0.02 504,000 Quanta Computer Inc 906,591 0.01 47,000 Radiant Opto-Electronics Corp 169,834 0.00
123,000 Realtek Semiconductor Corp 841,930 0.01 835,000 SinoPac Financial Holdings Co Ltd 315,019 0.00 40,000 Standard Foods Corp 79,210 0.00 238,000 Synnex Technology International
Corp 280,357 0.00 916,985 Taishin Financial Holding Co Ltd 391,200 0.01 551,050 Taiwan Cooperative Financial
Holding Co Ltd 350,876 0.01 293,000 Taiwan High Speed Rail Corp 353,540 0.01 188,000 Taiwan Mobile Co Ltd 670,360 0.01 1,190,000 Taiwan Semiconductor
Manufacturing Co Ltd 9,812,484 0.13 107,309 Taiwan Semiconductor
Manufacturing Co Ltd ADR* 4,576,729 0.06 438,000 Uni-President Enterprises Corp 1,068,157 0.01 930,000 Wistron Corp 737,250 0.01 838,800 WPG Holdings Ltd 1,061,519 0.01 323,000 Yuanta Financial Holding Co Ltd 185,614 0.00 36,969,097 0.48
Thailand 102,000 Advanced Info Service PCL 774,029 0.01 1,035,100 Bangkok Dusit Medical Services PCL 799,031 0.01 136,200 Bumrungrad Hospital PCL 617,015 0.01 42,100 Central Plaza Hotel PCL 44,066 0.00 376,700 CK Power PCL 75,161 0.00 141,700 Com7 PCL 120,507 0.00 419,900 CP ALL PCL 1,153,704 0.01 65,000 Electricity Generating PCL 714,368 0.01 4,128,800 Home Product Center PCL 2,430,891 0.03 184,300 Intouch Holdings PCL 385,811 0.01 554,800 Kasikornbank PCL 2,903,525 0.04 881,400 Krung Thai Bank PCL 495,873 0.01 6,585,900 Land & Houses PCL NVDR 2,326,527 0.03 50,200 Ratch Group PCL 120,687 0.00 12,961,195 0.17
Turkey 20,374 Anadolu Efes Biracilik Ve Malt
Sanayii AS 89,425 0.00 119,986 Arcelik AS 351,846 0.01 6,053 Ford Otomotiv Sanayi AS 61,018 0.00 45,465 KOC Holding AS* 136,442 0.00 30,293 Tekfen Holding AS 107,699 0.00 3,695 Tupras Turkiye Petrol Rafinerileri AS 79,885 0.00 826,315 0.01
United Arab Emirates 180,963 DP World Plc 2,533,482 0.03 238,487 Dubai Islamic Bank PJSC 332,427 0.01 51,190 Emaar Development PJSC 57,278 0.00 59,625 Emirates Telecommunications
Group Co PJSC 274,332 0.00 52,267 First Abu Dhabi Bank PJSC 217,142 0.00 3,414,661 0.04
United Kingdom 58,204 Admiral Group Plc* 1,519,326 0.02 2,362 Aon Plc 458,606 0.01 10,851,481 Assura Plc (Reit) 9,172,518 0.12 34,350 AstraZeneca Plc 3,068,847 0.04 144,559 Auto Trader Group Plc 941,165 0.01 919,640 BAE Systems Plc 6,122,204 0.08 748,923 Barratt Developments Plc 5,798,062 0.07 5,968 BHP Group Plc 127,909 0.00 241,128 British American Tobacco Plc 8,526,871 0.11 20,123 Carnival Plc 849,247 0.01 226,094 Diageo Plc 9,713,033 0.13
Global Multi-Asset Income Fund continued
Portfolio of Investments 31 August 2019
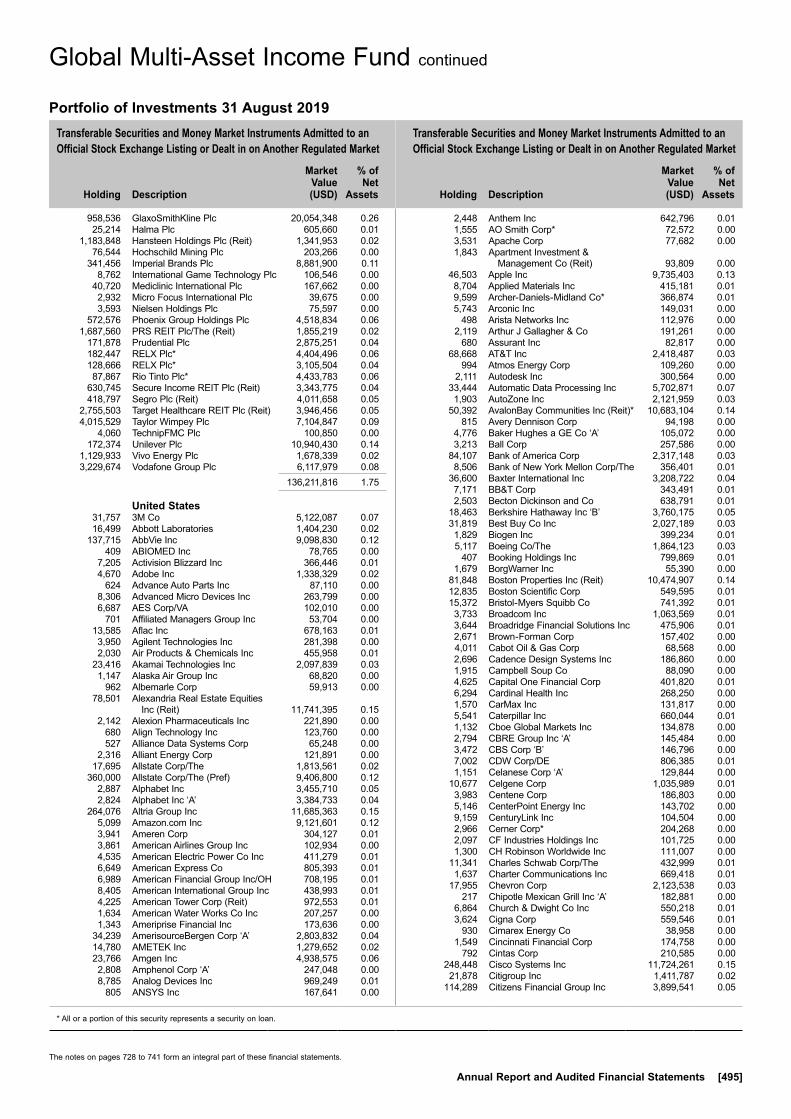
Transferable Securities and Money Market Instruments Admitted to an Official Stock Exchange Listing or Dealt in on Another Regulated Market
Transferable Securities and Money Market Instruments Admitted to an Official Stock Exchange Listing or Dealt in on Another Regulated Market
Holding
Description
Market Value (USD)
% of Net
Assets
Holding
Description
Market Value (USD)
% of Net
Assets
* All or a portion of this security represents a security on loan.
The notes on pages 728 to 741 form an integral part of these financial statements.
Annual Report and Audited Financial Statements [495]
958,536 GlaxoSmithKline Plc 20,054,348 0.26 25,214 Halma Plc 605,660 0.01 1,183,848 Hansteen Holdings Plc (Reit) 1,341,953 0.02 76,544 Hochschild Mining Plc 203,266 0.00 341,456 Imperial Brands Plc 8,881,900 0.11 8,762 International Game Technology Plc 106,546 0.00 40,720 Mediclinic International Plc 167,662 0.00 2,932 Micro Focus International Plc 39,675 0.00 3,593 Nielsen Holdings Plc 75,597 0.00 572,576 Phoenix Group Holdings Plc 4,518,834 0.06 1,687,560 PRS REIT Plc/The (Reit) 1,855,219 0.02 171,878 Prudential Plc 2,875,251 0.04 182,447 RELX Plc* 4,404,496 0.06 128,666 RELX Plc* 3,105,504 0.04 87,867 Rio Tinto Plc* 4,433,783 0.06 630,745 Secure Income REIT Plc (Reit) 3,343,775 0.04 418,797 Segro Plc (Reit) 4,011,658 0.05 2,755,503 Target Healthcare REIT Plc (Reit) 3,946,456 0.05 4,015,529 Taylor Wimpey Plc 7,104,847 0.09 4,060 TechnipFMC Plc 100,850 0.00 172,374 Unilever Plc 10,940,430 0.14 1,129,933 Vivo Energy Plc 1,678,339 0.02 3,229,674 Vodafone Group Plc 6,117,979 0.08 136,211,816 1.75
United States 31,757 3M Co 5,122,087 0.07 16,499 Abbott Laboratories 1,404,230 0.02 137,715 AbbVie Inc 9,098,830 0.12 409 ABIOMED Inc 78,765 0.00 7,205 Activision Blizzard Inc 366,446 0.01 4,670 Adobe Inc 1,338,329 0.02 624 Advance Auto Parts Inc 87,110 0.00 8,306 Advanced Micro Devices Inc 263,799 0.00 6,687 AES Corp/VA 102,010 0.00 701 Affiliated Managers Group Inc 53,704 0.00 13,585 Aflac Inc 678,163 0.01 3,950 Agilent Technologies Inc 281,398 0.00 2,030 Air Products & Chemicals Inc 455,958 0.01 23,416 Akamai Technologies Inc 2,097,839 0.03 1,147 Alaska Air Group Inc 68,820 0.00 962 Albemarle Corp 59,913 0.00 78,501 Alexandria Real Estate Equities
Inc (Reit) 11,741,395 0.15 2,142 Alexion Pharmaceuticals Inc 221,890 0.00 680 Align Technology Inc 123,760 0.00 527 Alliance Data Systems Corp 65,248 0.00 2,316 Alliant Energy Corp 121,891 0.00 17,695 Allstate Corp/The 1,813,561 0.02 360,000 Allstate Corp/The (Pref) 9,406,800 0.12 2,887 Alphabet Inc 3,455,710 0.05 2,824 Alphabet Inc ‘A’ 3,384,733 0.04 264,076 Altria Group Inc 11,685,363 0.15 5,099 Amazon.com Inc 9,121,601 0.12 3,941 Ameren Corp 304,127 0.01 3,861 American Airlines Group Inc 102,934 0.00 4,535 American Electric Power Co Inc 411,279 0.01 6,649 American Express Co 805,393 0.01 6,989 American Financial Group Inc/OH 708,195 0.01 8,405 American International Group Inc 438,993 0.01 4,225 American Tower Corp (Reit) 972,553 0.01 1,634 American Water Works Co Inc 207,257 0.00 1,343 Ameriprise Financial Inc 173,636 0.00 34,239 AmerisourceBergen Corp ‘A’ 2,803,832 0.04 14,780 AMETEK Inc 1,279,652 0.02 23,766 Amgen Inc 4,938,575 0.06 2,808 Amphenol Corp ‘A’ 247,048 0.00 8,785 Analog Devices Inc 969,249 0.01 805 ANSYS Inc 167,641 0.00
2,448 Anthem Inc 642,796 0.01 1,555 AO Smith Corp* 72,572 0.00 3,531 Apache Corp 77,682 0.00 1,843 Apartment Investment &
Management Co (Reit) 93,809 0.00 46,503 Apple Inc 9,735,403 0.13 8,704 Applied Materials Inc 415,181 0.01 9,599 Archer-Daniels-Midland Co* 366,874 0.01 5,743 Arconic Inc 149,031 0.00 498 Arista Networks Inc 112,976 0.00 2,119 Arthur J Gallagher & Co 191,261 0.00 680 Assurant Inc 82,817 0.00 68,668 AT&T Inc 2,418,487 0.03 994 Atmos Energy Corp 109,260 0.00 2,111 Autodesk Inc 300,564 0.00 33,444 Automatic Data Processing Inc 5,702,871 0.07 1,903 AutoZone Inc 2,121,959 0.03 50,392 AvalonBay Communities Inc (Reit)* 10,683,104 0.14 815 Avery Dennison Corp 94,198 0.00 4,776 Baker Hughes a GE Co ‘A’ 105,072 0.00 3,213 Ball Corp 257,586 0.00 84,107 Bank of America Corp 2,317,148 0.03 8,506 Bank of New York Mellon Corp/The 356,401 0.01 36,600 Baxter International Inc 3,208,722 0.04 7,171 BB&T Corp 343,491 0.01 2,503 Becton Dickinson and Co 638,791 0.01 18,463 Berkshire Hathaway Inc ‘B’ 3,760,175 0.05 31,819 Best Buy Co Inc 2,027,189 0.03 1,829 Biogen Inc 399,234 0.01 5,117 Boeing Co/The 1,864,123 0.03 407 Booking Holdings Inc 799,869 0.01 1,679 BorgWarner Inc 55,390 0.00 81,848 Boston Properties Inc (Reit) 10,474,907 0.14 12,835 Boston Scientific Corp 549,595 0.01 15,372 Bristol-Myers Squibb Co 741,392 0.01 3,733 Broadcom Inc 1,063,569 0.01 3,644 Broadridge Financial Solutions Inc 475,906 0.01 2,671 Brown-Forman Corp 157,402 0.00 4,011 Cabot Oil & Gas Corp 68,568 0.00 2,696 Cadence Design Systems Inc 186,860 0.00 1,915 Campbell Soup Co 88,090 0.00 4,625 Capital One Financial Corp 401,820 0.01 6,294 Cardinal Health Inc 268,250 0.00 1,570 CarMax Inc 131,817 0.00 5,541 Caterpillar Inc 660,044 0.01 1,132 Cboe Global Markets Inc 134,878 0.00 2,794 CBRE Group Inc ‘A’ 145,484 0.00 3,472 CBS Corp ‘B’ 146,796 0.00 7,002 CDW Corp/DE 806,385 0.01 1,151 Celanese Corp ‘A’ 129,844 0.00 10,677 Celgene Corp 1,035,989 0.01 3,983 Centene Corp 186,803 0.00 5,146 CenterPoint Energy Inc 143,702 0.00 9,159 CenturyLink Inc 104,504 0.00 2,966 Cerner Corp* 204,268 0.00 2,097 CF Industries Holdings Inc 101,725 0.00 1,300 CH Robinson Worldwide Inc 111,007 0.00 11,341 Charles Schwab Corp/The 432,999 0.01 1,637 Charter Communications Inc 669,418 0.01 17,955 Chevron Corp 2,123,538 0.03 217 Chipotle Mexican Grill Inc ‘A’ 182,881 0.00 6,864 Church & Dwight Co Inc 550,218 0.01 3,624 Cigna Corp 559,546 0.01 930 Cimarex Energy Co 38,958 0.00 1,549 Cincinnati Financial Corp 174,758 0.00 792 Cintas Corp 210,585 0.00 248,448 Cisco Systems Inc 11,724,261 0.15 21,878 Citigroup Inc 1,411,787 0.02 114,289 Citizens Financial Group Inc 3,899,541 0.05
Global Multi-Asset Income Fund continued
Portfolio of Investments 31 August 2019
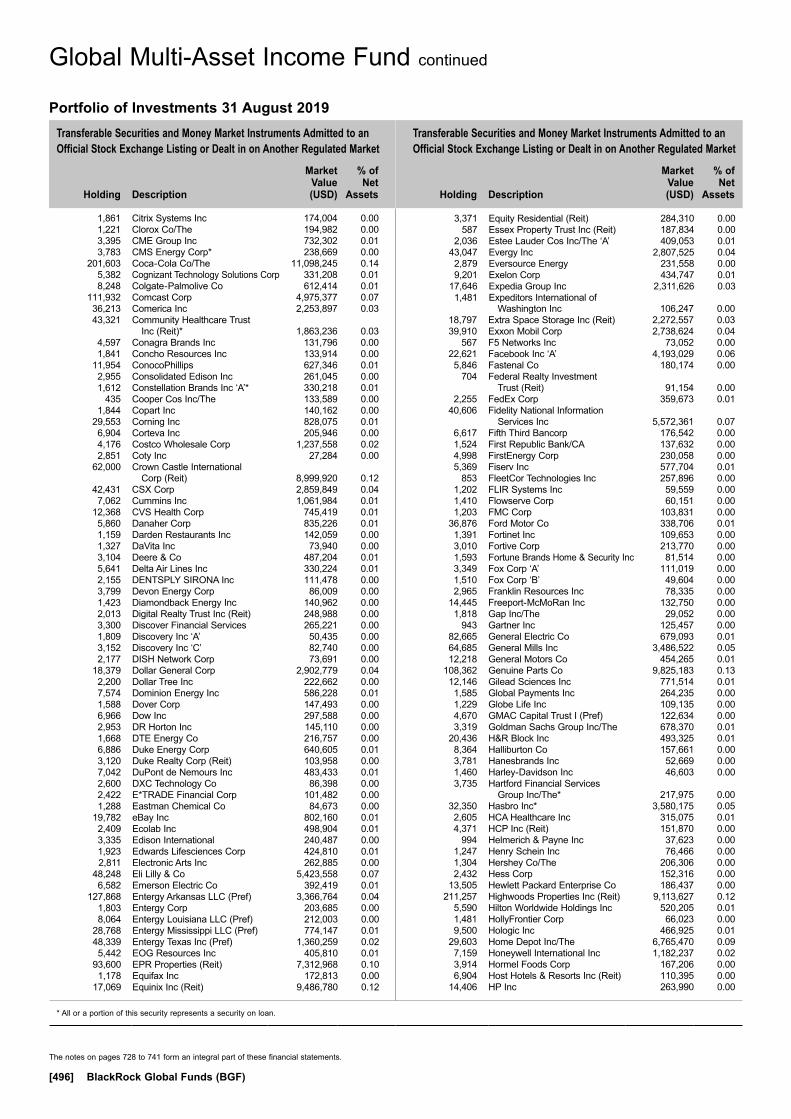
Transferable Securities and Money Market Instruments Admitted to an Official Stock Exchange Listing or Dealt in on Another Regulated Market
Transferable Securities and Money Market Instruments Admitted to an Official Stock Exchange Listing or Dealt in on Another Regulated Market
Holding
Description
Market Value (USD)
% of Net
Assets
Holding
Description
Market Value (USD)
% of Net
Assets
* All or a portion of this security represents a security on loan.
The notes on pages 728 to 741 form an integral part of these financial statements.
[496] BlackRock Global Funds (BGF)
1,861 Citrix Systems Inc 174,004 0.00 1,221 Clorox Co/The 194,982 0.00 3,395 CME Group Inc 732,302 0.01 3,783 CMS Energy Corp* 238,669 0.00 201,603 Coca-Cola Co/The 11,098,245 0.14 5,382 Cognizant Technology Solutions Corp 331,208 0.01 8,248 Colgate-Palmolive Co 612,414 0.01 111,932 Comcast Corp 4,975,377 0.07 36,213 Comerica Inc 2,253,897 0.03 43,321 Community Healthcare Trust
Inc (Reit)* 1,863,236 0.03 4,597 Conagra Brands Inc 131,796 0.00 1,841 Concho Resources Inc 133,914 0.00 11,954 ConocoPhillips 627,346 0.01 2,955 Consolidated Edison Inc 261,045 0.00 1,612 Constellation Brands Inc ‘A’* 330,218 0.01 435 Cooper Cos Inc/The 133,589 0.00 1,844 Copart Inc 140,162 0.00 29,553 Corning Inc 828,075 0.01 6,904 Corteva Inc 205,946 0.00 4,176 Costco Wholesale Corp 1,237,558 0.02 2,851 Coty Inc 27,284 0.00 62,000 Crown Castle International
Corp (Reit) 8,999,920 0.12 42,431 CSX Corp 2,859,849 0.04 7,062 Cummins Inc 1,061,984 0.01 12,368 CVS Health Corp 745,419 0.01 5,860 Danaher Corp 835,226 0.01 1,159 Darden Restaurants Inc 142,059 0.00 1,327 DaVita Inc 73,940 0.00 3,104 Deere & Co 487,204 0.01 5,641 Delta Air Lines Inc 330,224 0.01 2,155 DENTSPLY SIRONA Inc 111,478 0.00 3,799 Devon Energy Corp 86,009 0.00 1,423 Diamondback Energy Inc 140,962 0.00 2,013 Digital Realty Trust Inc (Reit) 248,988 0.00 3,300 Discover Financial Services 265,221 0.00 1,809 Discovery Inc ‘A’ 50,435 0.00 3,152 Discovery Inc ‘C’ 82,740 0.00 2,177 DISH Network Corp 73,691 0.00 18,379 Dollar General Corp 2,902,779 0.04 2,200 Dollar Tree Inc 222,662 0.00 7,574 Dominion Energy Inc 586,228 0.01 1,588 Dover Corp 147,493 0.00 6,966 Dow Inc 297,588 0.00 2,953 DR Horton Inc 145,110 0.00 1,668 DTE Energy Co 216,757 0.00 6,886 Duke Energy Corp 640,605 0.01 3,120 Duke Realty Corp (Reit) 103,958 0.00 7,042 DuPont de Nemours Inc 483,433 0.01 2,600 DXC Technology Co 86,398 0.00 2,422 E*TRADE Financial Corp 101,482 0.00 1,288 Eastman Chemical Co 84,673 0.00 19,782 eBay Inc 802,160 0.01 2,409 Ecolab Inc 498,904 0.01 3,335 Edison International 240,487 0.00 1,923 Edwards Lifesciences Corp 424,810 0.01 2,811 Electronic Arts Inc 262,885 0.00 48,248 Eli Lilly & Co 5,423,558 0.07 6,582 Emerson Electric Co 392,419 0.01 127,868 Entergy Arkansas LLC (Pref) 3,366,764 0.04 1,803 Entergy Corp 203,685 0.00 8,064 Entergy Louisiana LLC (Pref) 212,003 0.00 28,768 Entergy Mississippi LLC (Pref) 774,147 0.01 48,339 Entergy Texas Inc (Pref) 1,360,259 0.02 5,442 EOG Resources Inc 405,810 0.01 93,600 EPR Properties (Reit) 7,312,968 0.10 1,178 Equifax Inc 172,813 0.00 17,069 Equinix Inc (Reit) 9,486,780 0.12
3,371 Equity Residential (Reit) 284,310 0.00 587 Essex Property Trust Inc (Reit) 187,834 0.00 2,036 Estee Lauder Cos Inc/The ‘A’ 409,053 0.01 43,047 Evergy Inc 2,807,525 0.04 2,879 Eversource Energy 231,558 0.00 9,201 Exelon Corp 434,747 0.01 17,646 Expedia Group Inc 2,311,626 0.03 1,481 Expeditors International of
Washington Inc 106,247 0.00 18,797 Extra Space Storage Inc (Reit) 2,272,557 0.03 39,910 Exxon Mobil Corp 2,738,624 0.04 567 F5 Networks Inc 73,052 0.00 22,621 Facebook Inc ‘A’ 4,193,029 0.06 5,846 Fastenal Co 180,174 0.00 704 Federal Realty Investment
Trust (Reit) 91,154 0.00 2,255 FedEx Corp 359,673 0.01 40,606 Fidelity National Information
Services Inc 5,572,361 0.07 6,617 Fifth Third Bancorp 176,542 0.00 1,524 First Republic Bank/CA 137,632 0.00 4,998 FirstEnergy Corp 230,058 0.00 5,369 Fiserv Inc 577,704 0.01 853 FleetCor Technologies Inc 257,896 0.00 1,202 FLIR Systems Inc 59,559 0.00 1,410 Flowserve Corp 60,151 0.00 1,203 FMC Corp 103,831 0.00 36,876 Ford Motor Co 338,706 0.01 1,391 Fortinet Inc 109,653 0.00 3,010 Fortive Corp 213,770 0.00 1,593 Fortune Brands Home & Security Inc 81,514 0.00 3,349 Fox Corp ‘A’ 111,019 0.00 1,510 Fox Corp ‘B’ 49,604 0.00 2,965 Franklin Resources Inc 78,335 0.00 14,445 Freeport-McMoRan Inc 132,750 0.00 1,818 Gap Inc/The 29,052 0.00 943 Gartner Inc 125,457 0.00 82,665 General Electric Co 679,093 0.01 64,685 General Mills Inc 3,486,522 0.05 12,218 General Motors Co 454,265 0.01 108,362 Genuine Parts Co 9,825,183 0.13 12,146 Gilead Sciences Inc 771,514 0.01 1,585 Global Payments Inc 264,235 0.00 1,229 Globe Life Inc 109,135 0.00 4,670 GMAC Capital Trust I (Pref) 122,634 0.00 3,319 Goldman Sachs Group Inc/The 678,370 0.01 20,436 H&R Block Inc 493,325 0.01 8,364 Halliburton Co 157,661 0.00 3,781 Hanesbrands Inc 52,669 0.00 1,460 Harley-Davidson Inc 46,603 0.00 3,735 Hartford Financial Services
Group Inc/The* 217,975 0.00 32,350 Hasbro Inc* 3,580,175 0.05 2,605 HCA Healthcare Inc 315,075 0.01 4,371 HCP Inc (Reit) 151,870 0.00 994 Helmerich & Payne Inc 37,623 0.00 1,247 Henry Schein Inc 76,466 0.00 1,304 Hershey Co/The 206,306 0.00 2,432 Hess Corp 152,316 0.00 13,505 Hewlett Packard Enterprise Co 186,437 0.00 211,257 Highwoods Properties Inc (Reit) 9,113,627 0.12 5,590 Hilton Worldwide Holdings Inc 520,205 0.01 1,481 HollyFrontier Corp 66,023 0.00 9,500 Hologic Inc 466,925 0.01 29,603 Home Depot Inc/The 6,765,470 0.09 7,159 Honeywell International Inc 1,182,237 0.02 3,914 Hormel Foods Corp 167,206 0.00 6,904 Host Hotels & Resorts Inc (Reit) 110,395 0.00 14,406 HP Inc 263,990 0.00
Global Multi-Asset Income Fund continued
Portfolio of Investments 31 August 2019

Transferable Securities and Money Market Instruments Admitted to an Official Stock Exchange Listing or Dealt in on Another Regulated Market
Transferable Securities and Money Market Instruments Admitted to an Official Stock Exchange Listing or Dealt in on Another Regulated Market
Holding
Description
Market Value (USD)
% of Net
Assets
Holding
Description
Market Value (USD)
% of Net
Assets
* All or a portion of this security represents a security on loan.
The notes on pages 728 to 741 form an integral part of these financial statements.
Annual Report and Audited Financial Statements [497]
142,236 Hudson Pacific Properties Inc (Reit) 4,827,490 0.06 1,317 Humana Inc 371,776 0.01 9,673 Huntington Bancshares Inc/OH 128,844 0.00 603 Huntington Ingalls Industries Inc 125,756 0.00 712 IDEX Corp 118,135 0.00 790 IDEXX Laboratories Inc 228,278 0.00 3,227 Illinois Tool Works Inc 484,018 0.01 1,392 Illumina Inc* 396,149 0.01 1,686 Incyte Corp 138,235 0.00 2,472 Ingredion Inc 189,429 0.00 42,119 Intel Corp 2,004,022 0.03 5,527 Intercontinental Exchange Inc 513,900 0.01 8,465 International Business
Machines Corp 1,144,468 0.02 936 International Flavors &
Fragrances Inc 103,026 0.00 226,886 International Paper Co* 8,887,125 0.12 3,765 Interpublic Group of Cos Inc/The 75,262 0.00 2,475 Intuit Inc 711,290 0.01 1,067 Intuitive Surgical Inc 546,763 0.01 317 IPG Photonics Corp 38,829 0.00 1,638 IQVIA Holdings Inc 254,856 0.00 2,892 Iron Mountain Inc (Reit) 92,342 0.00 763 Jack Henry & Associates Inc 110,917 0.00 1,210 Jacobs Engineering Group Inc 107,291 0.00 774 JB Hunt Transport Services Inc 83,770 0.00 3,687 Jefferies Financial Group Inc 69,058 0.00 3,374 JM Smucker Co/The 354,742 0.01 151,881 Johnson & Johnson 19,452,918 0.25 30,705 JPMorgan Chase & Co 3,381,542 0.04 3,324 Juniper Networks Inc 77,250 0.00 925 Kansas City Southern 115,940 0.00 2,417 Kellogg Co 153,286 0.00 9,306 KeyCorp 155,038 0.00 160,000 KeyCorp (Pref) 4,564,800 0.06 1,747 Keysight Technologies Inc 169,634 0.00 26,049 Kimberly-Clark Corp* 3,694,530 0.05 3,920 Kimco Realty Corp (Reit) 72,442 0.00 19,321 Kinder Morgan Inc/DE 394,148 0.01 1,493 KLA Corp 221,069 0.00 1,447 Kohl’s Corp 69,239 0.00 5,857 Kraft Heinz Co/The 150,935 0.00 7,815 Kroger Co/The 185,684 0.00 2,124 L Brands Inc 36,172 0.00 2,325 L3Harris Technologies Inc 496,388 0.01 938 Laboratory Corp of America Holdings 158,006 0.00 1,394 Lam Research Corp 295,333 0.00 1,402 Lamb Weston Holdings Inc 98,659 0.00 1,551 Leggett & Platt Inc 58,240 0.00 1,357 Leidos Holdings Inc 118,914 0.00 2,484 Lennar Corp* 126,138 0.00 2,085 Lincoln National Corp 111,110 0.00 2,824 LKQ Corp* 74,977 0.00 3,159 Loews Corp 152,043 0.00 7,380 Lowe’s Cos Inc 829,881 0.01 29,728 M&T Bank Corp 4,363,773 0.06 1,067 Macerich Co/The (Reit) 30,196 0.00 2,687 Macy’s Inc 40,654 0.00 7,734 Marathon Oil Corp 94,123 0.00 6,286 Marathon Petroleum Corp 310,780 0.01 355 MarketAxess Holdings Inc 139,888 0.00 2,819 Marriott International Inc/MD 358,633 0.01 5,117 Marsh & McLennan Cos Inc 510,421 0.01 583 Martin Marietta Materials Inc 147,936 0.00 3,475 Masco Corp 143,830 0.00 8,707 Mastercard Inc 2,457,986 0.03 2,568 Maxim Integrated Products Inc 140,290 0.00 1,133 McCormick & Co Inc/MD 184,872 0.00 14,309 McDonald’s Corp 3,132,956 0.04
10,579 McKesson Corp 1,451,121 0.02 139,182 Medical Properties Trust Inc (Reit) 2,588,785 0.03 98,404 Merck & Co Inc 8,536,547 0.11 15,133 MetLife Inc 672,662 0.01 239 Mettler-Toledo International Inc 156,672 0.00 5,223 MGM Resorts International 148,020 0.00 2,260 Microchip Technology Inc* 197,027 0.00 10,300 Micron Technology Inc 471,740 0.01 76,154 Microsoft Corp 10,540,475 0.14 1,073 Mid-America Apartment
Communities Inc (Reit) 135,960 0.00 587 Mohawk Industries Inc 69,906 0.00 1,907 Molson Coors Brewing Co ‘B’ 97,600 0.00 44,819 Mondelez International Inc 2,478,939 0.03 3,704 Monster Beverage Corp 215,721 0.00 1,783 Moody’s Corp 386,768 0.01 12,748 Morgan Stanley 531,847 0.01 1,040,387 Morgan Stanley (Pref) 28,132,064 0.36 3,296 Mosaic Co/The 60,679 0.00 1,623 Motorola Solutions Inc 294,136 0.00 955 MSCI Inc ‘A’ 224,501 0.00 1,200 Nasdaq Inc 119,928 0.00 3,698 National Oilwell Varco Inc 75,476 0.00 1,675 Nektar Therapeutics ‘A’ 29,078 0.00 2,370 NetApp Inc 115,301 0.00 4,119 Netflix Inc 1,214,693 0.02 3,794 Newell Brands Inc 62,905 0.00 7,886 Newmont Goldcorp Corp 313,232 0.01 3,584 News Corp ‘A’ 49,531 0.00 1,873 News Corp ‘B’ 26,728 0.00 4,461 NextEra Energy Inc 985,569 0.01 37,588 NIKE Inc 3,214,902 0.04 3,652 NiSource Inc 107,551 0.00 4,648 Noble Energy Inc 105,928 0.00 921 Nordstrom Inc 27,216 0.00 18,467 Norfolk Southern Corp 3,266,258 0.04 2,202 Northern Trust Corp 194,194 0.00 2,565 NRG Energy Inc 92,289 0.00 3,468 Nucor Corp 170,834 0.00 5,724 NVIDIA Corp 974,568 0.01 8,428 Occidental Petroleum Corp 368,219 0.01 29,920 OGE Energy Corp* 1,285,363 0.02 100,899 Omega Healthcare Investors
Inc (Reit)* 4,094,481 0.05 2,085 Omnicom Group Inc 158,773 0.00 4,086 ONEOK Inc 290,229 0.00 134,961 Oracle Corp 7,040,915 0.09 733 O'Reilly Automotive Inc* 283,561 0.00 12,247 PACCAR Inc 805,608 0.01 847 Packaging Corp of America* 85,818 0.00 1,322 Parker-Hannifin Corp 220,457 0.00 150,334 Paychex Inc 12,364,972 0.16 11,106 PayPal Holdings Inc 1,219,550 0.02 4,031 People’s United Financial Inc 58,288 0.00 90,663 PepsiCo Inc 12,355,554 0.16 1,105 PerkinElmer Inc 91,759 0.00 413,416 Pfizer Inc 14,657,664 0.19 131,641 Philip Morris International Inc 9,596,629 0.12 3,954 Phillips 66 391,327 0.01 15,781 Pinnacle West Capital Corp 1,505,981 0.02 1,557 Pioneer Natural Resources Co 192,959 0.00 83,556 Plymouth Industrial REIT Inc (Reit) 1,566,675 0.02 4,293 PNC Financial Services Group
Inc/The 555,901 0.01 2,203 PPG Industries Inc 244,026 0.00 6,947 PPL Corp 204,242 0.00 2,596 Principal Financial Group Inc 138,626 0.00 77,619 Procter & Gamble Co/The 9,398,885 0.12 5,574 Progressive Corp/The 423,958 0.01
Global Multi-Asset Income Fund continued
Portfolio of Investments 31 August 2019

Transferable Securities and Money Market Instruments Admitted to an Official Stock Exchange Listing or Dealt in on Another Regulated Market
Transferable Securities and Money Market Instruments Admitted to an Official Stock Exchange Listing or Dealt in on Another Regulated Market
Holding
Description
Market Value (USD)
% of Net
Assets
Holding
Description
Market Value (USD)
% of Net
Assets
* All or a portion of this security represents a security on loan.
The notes on pages 728 to 741 form an integral part of these financial statements.
[498] BlackRock Global Funds (BGF)
145,523 Prologis Inc (Reit) 12,172,999 0.16 4,146 Prudential Financial Inc 333,214 0.01 4,623 Public Service Enterprise Group Inc 279,229 0.00 1,374 Public Storage (Reit) 360,593 0.01 2,057 PulteGroup Inc 69,115 0.00 734 PVH Corp 57,597 0.00 1,097 Qorvo Inc 78,315 0.00 11,474 QUALCOMM Inc 889,120 0.01 1,638 Quanta Services Inc 55,545 0.00 7,753 Quest Diagnostics Inc 795,225 0.01 18,871 Ralph Lauren Corp ‘A’ 1,679,708 0.02 1,235 Raymond James Financial Inc 97,417 0.00 4,599 Raytheon Co 845,020 0.01 2,848 Realty Income Corp (Reit) 209,613 0.00 73,764 Regency Centers Corp (Reit)* 4,735,649 0.06 746 Regeneron Pharmaceuticals Inc 215,676 0.00 9,772 Regions Financial Corp 143,648 0.00 40,482 Republic Services Inc ‘A’ 3,634,069 0.05 1,306 ResMed Inc 181,181 0.00 1,038 Robert Half International Inc 55,855 0.00 1,314 Rockwell Automation Inc 201,055 0.00 1,298 Rollins Inc 42,510 0.00 1,094 Roper Technologies Inc 402,931 0.01 3,364 Ross Stores Inc 363,682 0.01 2,513 S&P Global Inc 656,245 0.01 14,735 salesforce.com Inc 2,324,004 0.03 1,079 SBA Communications Corp (Reit) ‘A’ 283,604 0.00 1,703 Sealed Air Corp 68,018 0.00 2,583 Sempra Energy 366,373 0.01 785 Sherwin-Williams Co/The* 414,056 0.01 59,745 Simon Property Group Inc (Reit) 8,893,043 0.12 1,541 Skyworks Solutions Inc 116,007 0.00 754 SL Green Realty Corp (Reit) 60,116 0.00 43,000 SLM Corp (Pref) 2,491,850 0.03 2,150 Snap-on Inc 322,135 0.01 9,853 Southern Co/The (Unit) 571,671 0.01 4,611 Southwest Airlines Co 243,645 0.00 235,541 Spirit Realty Capital Inc (Reit) 11,258,860 0.15 84,760 STAG Industrial Inc (Reit) 2,463,126 0.03 1,503 Stanley Black & Decker Inc 201,763 0.00 11,418 Starbucks Corp 1,109,715 0.02 3,623 State Street Corp 187,237 0.00 5,829 Stryker Corp* 1,291,765 0.02 52,051 Sun Communities Inc (Reit) 7,685,330 0.10 6,570 SunTrust Banks Inc 406,617 0.01 477 SVB Financial Group 93,821 0.00 5,951 Symantec Corp 138,956 0.00 6,176 Synchrony Financial 199,423 0.00 1,425 Synopsys Inc 202,250 0.00 4,718 Sysco Corp 351,538 0.01 2,343 T Rowe Price Group Inc 260,354 0.00 1,059 Take-Two Interactive Software Inc 139,322 0.00 2,821 Tapestry Inc 59,015 0.00 25,735 Target Corp 2,805,630 0.04 408 Teleflex Inc 148,377 0.00 58,963 Texas Instruments Inc 7,345,021 0.10 3,739 Thermo Fisher Scientific Inc 1,077,954 0.01 936 Tiffany & Co 81,404 0.00 11,223 TJX Cos Inc/The 628,264 0.01 2,980 T-Mobile US Inc 232,678 0.00 1,569 Total System Services Inc 210,936 0.00 1,137 Tractor Supply Co 118,168 0.00 2,591 Travelers Cos Inc/The 379,400 0.01 953 TripAdvisor Inc 36,614 0.00 6,844 Twitter Inc 290,870 0.00 2,726 Tyson Foods Inc ‘A’ 252,455 0.00 2,596 UDR Inc (Reit) 124,920 0.00 502 Ulta Beauty Inc 121,755 0.00 1,790 Under Armour Inc 30,697 0.00
1,835 Under Armour Inc ‘A’ 34,590 0.00 18,274 Union Pacific Corp 2,982,134 0.04 2,145 United Airlines Holdings Inc 183,097 0.00 6,679 United Parcel Service Inc ‘B’ 799,009 0.01 755 United Rentals Inc 85,632 0.00 56,776 United Technologies Corp 7,421,191 0.10 9,141 UnitedHealth Group Inc 2,139,908 0.03 798 Universal Health Services Inc 115,423 0.00 2,233 Unum Group 57,120 0.00 102,119 US Bancorp 5,392,904 0.07 219,000 US Bancorp (Pref) 6,037,830 0.08 790 Vail Resorts Inc* 187,404 0.00 3,949 Valero Energy Corp 300,400 0.00 773 Varian Medical Systems Inc 82,456 0.00 3,454 Ventas Inc (Reit) 254,249 0.00 440,046 VEREIT Inc (Reit) 4,277,247 0.06 1,080 VeriSign Inc 221,616 0.00 1,552 Verisk Analytics Inc ‘A’ 250,291 0.00 43,590 Verizon Communications Inc 2,539,553 0.03 2,451 Vertex Pharmaceuticals Inc 441,695 0.01 3,160 VF Corp 262,564 0.00 3,432 Viacom Inc ‘B’ 86,212 0.00 314,570 VICI Properties Inc (Reit)* 6,974,017 0.09 16,746 Visa Inc ‘A’ 3,038,059 0.04 1,739 Vornado Realty Trust (Reit) 105,053 0.00 1,228 Vulcan Materials Co 173,676 0.00 1,611 Wabtec Corp 111,062 0.00 7,378 Walgreens Boots Alliance Inc 374,138 0.01 13,322 Walmart Inc 1,527,101 0.02 16,456 Walt Disney Co/The 2,273,561 0.03 36,954 Waste Management Inc 4,420,807 0.06 1,439 Waters Corp* 304,838 0.01 2,849 WEC Energy Group Inc* 273,618 0.00 478 WellCare Health Plans Inc 129,983 0.00 139,271 Wells Fargo & Co 6,496,992 0.08 3,796 Welltower Inc (Reit) 339,286 0.01 2,843 Western Digital Corp* 162,193 0.00 5,006 Western Union Co/The 111,283 0.00 2,395 Westrock Co 82,843 0.00 6,911 Weyerhaeuser Co (Reit) 181,483 0.00 3,755 Whirlpool Corp 524,348 0.01 11,926 Williams Cos Inc/The 283,123 0.00 3,480 WR Berkley Corp 248,576 0.00 447 WW Grainger Inc 123,283 0.00 823 Wynn Resorts Ltd 89,510 0.00 4,811 Xcel Energy Inc 310,261 0.01 1,928 Xerox Holdings Corp 56,086 0.00 2,370 Xilinx Inc 247,428 0.00 1,989 Xylem Inc/NY 153,690 0.00 24,613 Yum China Holdings Inc 1,125,799 0.02 48,274 Yum! Brands Inc* 5,654,816 0.07 1,881 Zimmer Biomet Holdings Inc 261,252 0.00 1,518 Zions Bancorp NA 62,557 0.00 4,648 Zoetis Inc 589,227 0.01 696,887,007 8.97Total Common / Preferred Stocks (Shares) 1,572,053,172 20.23
BONDS
Argentina USD 5,151,000 Arcor SAIC ‘144A’ 6% 6/7/2023 4,401,530 0.06 USD 161,850 Argentina Bonar Bonds 8.75%
7/5/2024 48,794 0.00 USD 4,604,000 Argentine Republic Government
International Bond 4.625% 11/1/2023 1,860,304 0.02
USD 1,004,000 Argentine Republic Government International Bond 6.875% 22/4/2021 445,525 0.01
Global Multi-Asset Income Fund continued
Portfolio of Investments 31 August 2019

Transferable Securities and Money Market Instruments Admitted to an Official Stock Exchange Listing or Dealt in on Another Regulated Market
Transferable Securities and Money Market Instruments Admitted to an Official Stock Exchange Listing or Dealt in on Another Regulated Market
Holding
Description
Market Value (USD)
% of Net
Assets
Holding
Description
Market Value (USD)
% of Net
Assets
* All or a portion of this security represents a security on loan.
The notes on pages 728 to 741 form an integral part of these financial statements.
Annual Report and Audited Financial Statements [499]
USD 3,514,000 Pampa Energia SA ‘144A’ 7.375% 21/7/2023 2,480,115 0.03
USD 2,344,000 Tarjeta Naranja SA ‘144A’ FRN 11/4/2022 743,234 0.01
USD 4,239,000 Telecom Argentina SA ‘144A’ 6.5% 15/6/2021 3,815,100 0.05
USD 159,000 YPF SA 8.75% 4/4/2024 107,738 0.00 USD 2,898,000 YPF SA ‘144A’ 8.75% 4/4/2024 2,021,239 0.03 15,923,579 0.21
Australia USD 1,831,000 Australia & New Zealand Banking
Group Ltd/United Kingdom FRN 15/6/2026 (Perpetual)* 2,024,821 0.03
USD 6,000,000 Australia & New Zealand Banking Group Ltd/United Kingdom ‘144A’ FRN 15/6/2026 (Perpetual) 6,635,130 0.09
USD 750,000 CNOOC Finance 2015 Australia Pty Ltd 2.625% 5/5/2020 751,684 0.01
USD 145,000 FMG Resources August 2006 Pty Ltd ‘144A’ 4.75% 15/5/2022 150,082 0.00
USD 210,000 FMG Resources August 2006 Pty Ltd ‘144A’ 5.125% 15/3/2023 218,925 0.00
USD 360,000 FMG Resources August 2006 Pty Ltd ‘144A’ 5.125% 15/5/2024 376,650 0.01
USD 1,060,000 Macquarie Bank Ltd/London FRN 8/3/2027 (Perpetual)* 1,068,247 0.01
USD 19,545,000 Macquarie Bank Ltd/London ‘144A’ FRN 8/3/2027 (Perpetual)* 19,697,060 0.25
USD 305,000 Mineral Resources Ltd ‘144A’ 8.125% 1/5/2027 312,625 0.00
USD 3,400,000 Pacific National Finance Pty Ltd 4.75% 22/3/2028 3,599,444 0.05
USD 378,000 QBE Insurance Group Ltd FRN 17/6/2046 402,888 0.01
USD 592,000 Santos Finance Ltd 4.125% 14/9/2027 607,991 0.01
USD 2,200,000 Santos Finance Ltd 5.25% 13/3/2029 2,407,270 0.03
USD 20,180,000 Westpac Banking Corp/New Zealand FRN 21/9/2027 (Perpetual)* 19,677,808 0.25
57,930,625 0.75
Austria USD 1,004,000 BRF GmbH 4.35% 29/9/2026* 982,037 0.01 EUR 1,800,000 Erste Group Bank AG FRN
15/10/2021 (Perpetual)* 2,290,979 0.03 EUR 1,200,000 Erste Group Bank AG FRN
15/4/2024 (Perpetual) 1,517,947 0.02 USD 200,000 JBS Investments II GmbH ‘144A’
7% 15/1/2026 215,500 0.00 EUR 200,000 Sappi Papier Holding GmbH 4%
1/4/2023 226,622 0.00 USD 1,004,000 Suzano Austria GmbH 5.75%
14/7/2026 1,120,715 0.02 6,353,800 0.08
Bahamas USD 162,000 Silversea Cruise Finance Ltd ‘144A’
7.25% 1/2/2025 174,150 0.00
Belgium EUR 364,000 House of Finance NV/The 4.375%
15/7/2026 417,461 0.01 EUR 1,400,000 KBC Group NV FRN 5/3/2024
(Perpetual) 1,641,923 0.02 EUR 100,000 Solvay SA FRN 4/12/2023
(Perpetual) 122,144 0.00 2,181,528 0.03
Bermuda USD 549,000 China Singyes Solar Technologies
Holdings Ltd (Defaulted) 7.95% 15/2/2019 465,277 0.01
USD 456,946 Digicel Group Two Ltd 9.125% 1/4/2024 43,553 0.00
USD 235,000 IHS Markit Ltd ‘144A’ 4% 1/3/2026 250,440 0.00 USD 390,000 IHS Markit Ltd ‘144A’ 4.75%
15/2/2025 426,621 0.01 USD 200,000 IHS Markit Ltd ‘144A’ 5% 1/11/2022 213,636 0.00 USD 5,854,000 Viking Cruises Ltd ‘144A’ 5.875%
15/9/2027 6,115,732 0.08 USD 400,000 VOC Escrow Ltd ‘144A’ 5%
15/2/2028 412,000 0.00 7,927,259 0.10
Brazil USD 7,056,000 Brazilian Government International
Bond 4.875% 22/1/2021 7,353,675 0.09
British Virgin Islands USD 852,000 Baoxin Auto Finance I Ltd FRN
30/10/2020 (Perpetual) 707,150 0.01 USD 745,000 Baoxin Auto Finance I Ltd 7.9%
9/2/2020* 731,952 0.01 USD 3,640,000 CCTI 2017 Ltd 3.625% 8/8/2022 3,608,719 0.05 USD 4,119,000 Central American Bottling Corp
‘144A’ 5.75% 31/1/2027 4,377,081 0.06 USD 2,500,000 Chalco Hong Kong Investment Co
Ltd 4.875% 7/9/2021* 2,586,337 0.03 USD 2,603,000 China Reinsurance Finance Corp
Ltd 3.375% 9/3/2022 2,616,422 0.03 USD 3,105,000 Chinalco Capital Holdings Ltd
4.25% 21/4/2022 3,114,579 0.04 USD 250,000 CNOOC Finance 2012 Ltd 5%
2/5/2042 324,648 0.00 USD 600,000 Easy Tactic Ltd 7% 25/4/2021* 597,885 0.01 USD 1,995,000 Easy Tactic Ltd 8.125% 11/7/2024 1,886,374 0.02 USD 2,885,000 Easy Tactic Ltd 8.625% 27/2/2024* 2,805,662 0.04 USD 3,300,000 Excel Capital Global Ltd FRN
17/5/2021 (Perpetual)* 3,374,250 0.04 USD 1,070,000 Fortune Star BVI Ltd 6.75% 2/7/2023 1,092,403 0.01 USD 2,535,000 Gold Fields Orogen Holdings BVI
Ltd ‘144A’ 5.125% 15/5/2024 2,715,619 0.04 USD 3,030,000 Greenland Global Investment Ltd
FRN 26/9/2021 3,071,284 0.04 USD 2,097,000 Guojing Capital BVI Ltd 3.95%
11/12/2022 2,103,225 0.03 USD 665,000 Huayi Finance I Ltd 4% 2/12/2019 665,046 0.01 USD 420,000 Knight Castle Investments Ltd
7.99% 23/1/2021 199,500 0.00 USD 1,900,000 Leader Goal International Ltd FRN
19/1/2023 (Perpetual) 1,932,459 0.03 USD 1,200,000 Minmetals Bounteous Finance BVI
Ltd 4.2% 27/7/2026* 1,287,562 0.02 USD 1,350,000 Minmetals Bounteous Finance BVI
Ltd 4.75% 30/7/2025 1,485,844 0.02 USD 1,030,000 New Lion Bridge Co Ltd 9.75%
10/10/2020 933,679 0.01 USD 1,809,000 New Metro Global Ltd 6.5%
23/4/2021 1,698,542 0.02 USD 1,700,000 Nuoxi Capital Ltd 7.45% 16/10/2022 1,508,753 0.02 USD 539,000 Nuoxi Capital Ltd 7.5% 28/1/2022 490,322 0.01 USD 1,600,000 Poly Real Estate Finance Ltd
4.75% 17/9/2023 1,699,901 0.02 USD 2,700,000 Prime Bloom Holdings Ltd 6.95%
5/7/2022 1,985,766 0.03 USD 1,200,000 Rock International Investment Inc
6.625% 27/3/2020 919,380 0.01
Global Multi-Asset Income Fund continued
Portfolio of Investments 31 August 2019
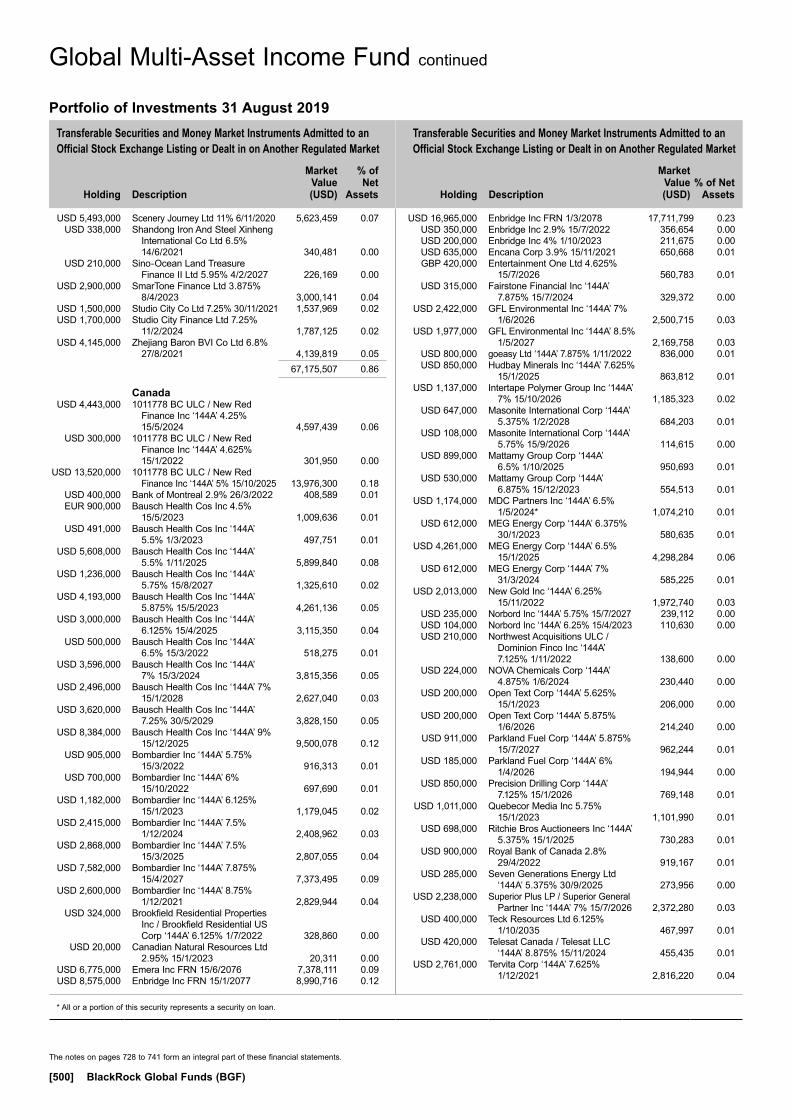
Transferable Securities and Money Market Instruments Admitted to an Official Stock Exchange Listing or Dealt in on Another Regulated Market
Transferable Securities and Money Market Instruments Admitted to an Official Stock Exchange Listing or Dealt in on Another Regulated Market
Holding
Description
Market Value (USD)
% of Net
Assets
Holding
Description
Market Value (USD)
% of Net Assets
* All or a portion of this security represents a security on loan.
The notes on pages 728 to 741 form an integral part of these financial statements.
[500] BlackRock Global Funds (BGF)
USD 5,493,000 Scenery Journey Ltd 11% 6/11/2020 5,623,459 0.07 USD 338,000 Shandong Iron And Steel Xinheng
International Co Ltd 6.5% 14/6/2021 340,481 0.00
USD 210,000 Sino-Ocean Land Treasure Finance II Ltd 5.95% 4/2/2027 226,169 0.00
USD 2,900,000 SmarTone Finance Ltd 3.875% 8/4/2023 3,000,141 0.04
USD 1,500,000 Studio City Co Ltd 7.25% 30/11/2021 1,537,969 0.02 USD 1,700,000 Studio City Finance Ltd 7.25%
11/2/2024 1,787,125 0.02 USD 4,145,000 Zhejiang Baron BVI Co Ltd 6.8%
27/8/2021 4,139,819 0.05 67,175,507 0.86
Canada USD 4,443,000 1011778 BC ULC / New Red
Finance Inc ‘144A’ 4.25% 15/5/2024 4,597,439 0.06
USD 300,000 1011778 BC ULC / New Red Finance Inc ‘144A’ 4.625% 15/1/2022 301,950 0.00
USD 13,520,000 1011778 BC ULC / New Red Finance Inc ‘144A’ 5% 15/10/2025 13,976,300 0.18
USD 400,000 Bank of Montreal 2.9% 26/3/2022 408,589 0.01 EUR 900,000 Bausch Health Cos Inc 4.5%
15/5/2023 1,009,636 0.01 USD 491,000 Bausch Health Cos Inc ‘144A’
5.5% 1/3/2023 497,751 0.01 USD 5,608,000 Bausch Health Cos Inc ‘144A’
5.5% 1/11/2025 5,899,840 0.08 USD 1,236,000 Bausch Health Cos Inc ‘144A’
5.75% 15/8/2027 1,325,610 0.02 USD 4,193,000 Bausch Health Cos Inc ‘144A’
5.875% 15/5/2023 4,261,136 0.05 USD 3,000,000 Bausch Health Cos Inc ‘144A’
6.125% 15/4/2025 3,115,350 0.04 USD 500,000 Bausch Health Cos Inc ‘144A’
6.5% 15/3/2022 518,275 0.01 USD 3,596,000 Bausch Health Cos Inc ‘144A’
7% 15/3/2024 3,815,356 0.05 USD 2,496,000 Bausch Health Cos Inc ‘144A’ 7%
15/1/2028 2,627,040 0.03 USD 3,620,000 Bausch Health Cos Inc ‘144A’
7.25% 30/5/2029 3,828,150 0.05 USD 8,384,000 Bausch Health Cos Inc ‘144A’ 9%
15/12/2025 9,500,078 0.12 USD 905,000 Bombardier Inc ‘144A’ 5.75%
15/3/2022 916,313 0.01 USD 700,000 Bombardier Inc ‘144A’ 6%
15/10/2022 697,690 0.01 USD 1,182,000 Bombardier Inc ‘144A’ 6.125%
15/1/2023 1,179,045 0.02 USD 2,415,000 Bombardier Inc ‘144A’ 7.5%
1/12/2024 2,408,962 0.03 USD 2,868,000 Bombardier Inc ‘144A’ 7.5%
15/3/2025 2,807,055 0.04 USD 7,582,000 Bombardier Inc ‘144A’ 7.875%
15/4/2027 7,373,495 0.09 USD 2,600,000 Bombardier Inc ‘144A’ 8.75%
1/12/2021 2,829,944 0.04 USD 324,000 Brookfield Residential Properties
Inc / Brookfield Residential US Corp ‘144A’ 6.125% 1/7/2022 328,860 0.00
USD 20,000 Canadian Natural Resources Ltd 2.95% 15/1/2023 20,311 0.00
USD 6,775,000 Emera Inc FRN 15/6/2076 7,378,111 0.09 USD 8,575,000 Enbridge Inc FRN 15/1/2077 8,990,716 0.12
USD 16,965,000 Enbridge Inc FRN 1/3/2078 17,711,799 0.23 USD 350,000 Enbridge Inc 2.9% 15/7/2022 356,654 0.00 USD 200,000 Enbridge Inc 4% 1/10/2023 211,675 0.00 USD 635,000 Encana Corp 3.9% 15/11/2021 650,668 0.01 GBP 420,000 Entertainment One Ltd 4.625%
15/7/2026 560,783 0.01 USD 315,000 Fairstone Financial Inc ‘144A’
7.875% 15/7/2024 329,372 0.00 USD 2,422,000 GFL Environmental Inc ‘144A’ 7%
1/6/2026 2,500,715 0.03 USD 1,977,000 GFL Environmental Inc ‘144A’ 8.5%
1/5/2027 2,169,758 0.03 USD 800,000 goeasy Ltd ‘144A’ 7.875% 1/11/2022 836,000 0.01 USD 850,000 Hudbay Minerals Inc ‘144A’ 7.625%
15/1/2025 863,812 0.01 USD 1,137,000 Intertape Polymer Group Inc ‘144A’
7% 15/10/2026 1,185,323 0.02 USD 647,000 Masonite International Corp ‘144A’
5.375% 1/2/2028 684,203 0.01 USD 108,000 Masonite International Corp ‘144A’
5.75% 15/9/2026 114,615 0.00 USD 899,000 Mattamy Group Corp ‘144A’
6.5% 1/10/2025 950,693 0.01 USD 530,000 Mattamy Group Corp ‘144A’
6.875% 15/12/2023 554,513 0.01 USD 1,174,000 MDC Partners Inc ‘144A’ 6.5%
1/5/2024* 1,074,210 0.01 USD 612,000 MEG Energy Corp ‘144A’ 6.375%
30/1/2023 580,635 0.01 USD 4,261,000 MEG Energy Corp ‘144A’ 6.5%
15/1/2025 4,298,284 0.06 USD 612,000 MEG Energy Corp ‘144A’ 7%
31/3/2024 585,225 0.01 USD 2,013,000 New Gold Inc ‘144A’ 6.25%
15/11/2022 1,972,740 0.03 USD 235,000 Norbord Inc ‘144A’ 5.75% 15/7/2027 239,112 0.00 USD 104,000 Norbord Inc ‘144A’ 6.25% 15/4/2023 110,630 0.00 USD 210,000 Northwest Acquisitions ULC /
Dominion Finco Inc ‘144A’ 7.125% 1/11/2022 138,600 0.00
USD 224,000 NOVA Chemicals Corp ‘144A’ 4.875% 1/6/2024 230,440 0.00
USD 200,000 Open Text Corp ‘144A’ 5.625% 15/1/2023 206,000 0.00
USD 200,000 Open Text Corp ‘144A’ 5.875% 1/6/2026 214,240 0.00
USD 911,000 Parkland Fuel Corp ‘144A’ 5.875% 15/7/2027 962,244 0.01
USD 185,000 Parkland Fuel Corp ‘144A’ 6% 1/4/2026 194,944 0.00
USD 850,000 Precision Drilling Corp ‘144A’ 7.125% 15/1/2026 769,148 0.01
USD 1,011,000 Quebecor Media Inc 5.75% 15/1/2023 1,101,990 0.01
USD 698,000 Ritchie Bros Auctioneers Inc ‘144A’ 5.375% 15/1/2025 730,283 0.01
USD 900,000 Royal Bank of Canada 2.8% 29/4/2022 919,167 0.01
USD 285,000 Seven Generations Energy Ltd ‘144A’ 5.375% 30/9/2025 273,956 0.00
USD 2,238,000 Superior Plus LP / Superior General Partner Inc ‘144A’ 7% 15/7/2026 2,372,280 0.03
USD 400,000 Teck Resources Ltd 6.125% 1/10/2035 467,997 0.01
USD 420,000 Telesat Canada / Telesat LLC ‘144A’ 8.875% 15/11/2024 455,435 0.01
USD 2,761,000 Tervita Corp ‘144A’ 7.625% 1/12/2021 2,816,220 0.04
Global Multi-Asset Income Fund continued
Portfolio of Investments 31 August 2019
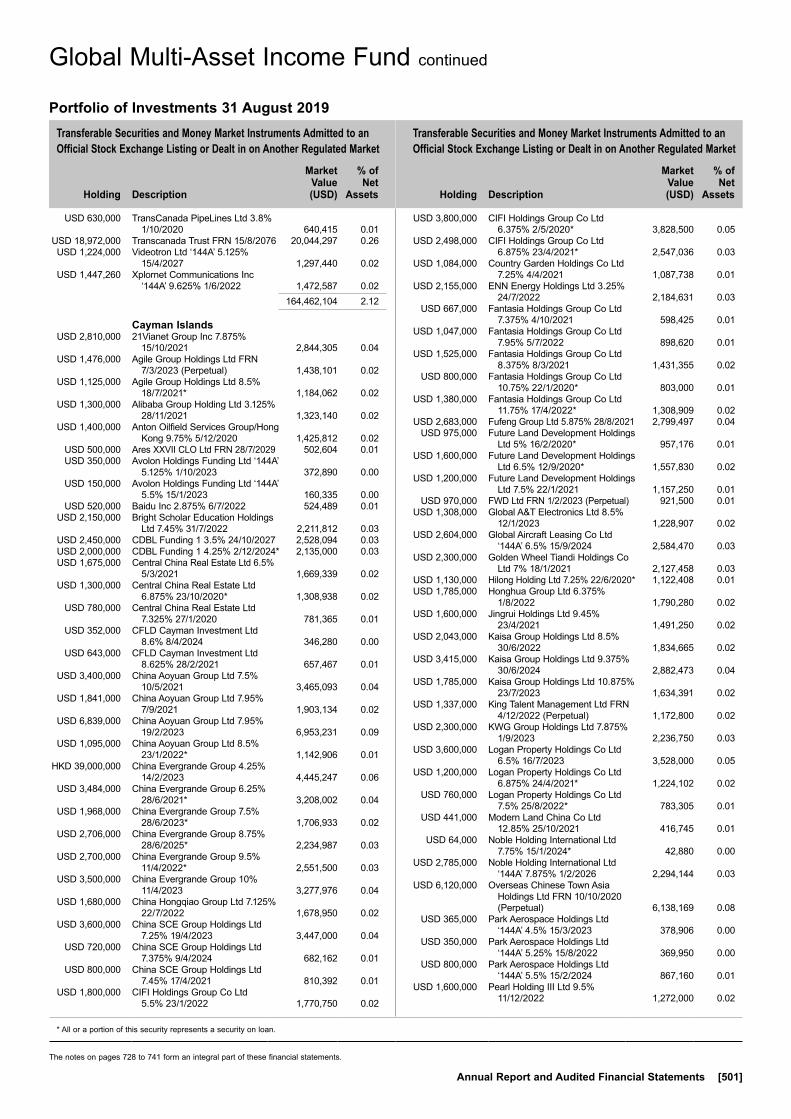
Transferable Securities and Money Market Instruments Admitted to an Official Stock Exchange Listing or Dealt in on Another Regulated Market
Transferable Securities and Money Market Instruments Admitted to an Official Stock Exchange Listing or Dealt in on Another Regulated Market
Holding
Description
Market Value (USD)
% of Net
Assets
Holding
Description
Market Value (USD)
% of Net
Assets
* All or a portion of this security represents a security on loan.
The notes on pages 728 to 741 form an integral part of these financial statements.
Annual Report and Audited Financial Statements [501]
USD 630,000 TransCanada PipeLines Ltd 3.8% 1/10/2020 640,415 0.01
USD 18,972,000 Transcanada Trust FRN 15/8/2076 20,044,297 0.26 USD 1,224,000 Videotron Ltd ‘144A’ 5.125%
15/4/2027 1,297,440 0.02 USD 1,447,260 Xplornet Communications Inc
‘144A’ 9.625% 1/6/2022 1,472,587 0.02 164,462,104 2.12
Cayman Islands USD 2,810,000 21Vianet Group Inc 7.875%
15/10/2021 2,844,305 0.04 USD 1,476,000 Agile Group Holdings Ltd FRN
7/3/2023 (Perpetual) 1,438,101 0.02 USD 1,125,000 Agile Group Holdings Ltd 8.5%
18/7/2021* 1,184,062 0.02 USD 1,300,000 Alibaba Group Holding Ltd 3.125%
28/11/2021 1,323,140 0.02 USD 1,400,000 Anton Oilfield Services Group/Hong
Kong 9.75% 5/12/2020 1,425,812 0.02 USD 500,000 Ares XXVII CLO Ltd FRN 28/7/2029 502,604 0.01 USD 350,000 Avolon Holdings Funding Ltd ‘144A’
5.125% 1/10/2023 372,890 0.00 USD 150,000 Avolon Holdings Funding Ltd ‘144A’
5.5% 15/1/2023 160,335 0.00 USD 520,000 Baidu Inc 2.875% 6/7/2022 524,489 0.01 USD 2,150,000 Bright Scholar Education Holdings
Ltd 7.45% 31/7/2022 2,211,812 0.03 USD 2,450,000 CDBL Funding 1 3.5% 24/10/2027 2,528,094 0.03 USD 2,000,000 CDBL Funding 1 4.25% 2/12/2024* 2,135,000 0.03 USD 1,675,000 Central China Real Estate Ltd 6.5%
5/3/2021 1,669,339 0.02 USD 1,300,000 Central China Real Estate Ltd
6.875% 23/10/2020* 1,308,938 0.02 USD 780,000 Central China Real Estate Ltd
7.325% 27/1/2020 781,365 0.01 USD 352,000 CFLD Cayman Investment Ltd
8.6% 8/4/2024 346,280 0.00 USD 643,000 CFLD Cayman Investment Ltd
8.625% 28/2/2021 657,467 0.01 USD 3,400,000 China Aoyuan Group Ltd 7.5%
10/5/2021 3,465,093 0.04 USD 1,841,000 China Aoyuan Group Ltd 7.95%
7/9/2021 1,903,134 0.02 USD 6,839,000 China Aoyuan Group Ltd 7.95%
19/2/2023 6,953,231 0.09 USD 1,095,000 China Aoyuan Group Ltd 8.5%
23/1/2022* 1,142,906 0.01 HKD 39,000,000 China Evergrande Group 4.25%
14/2/2023 4,445,247 0.06 USD 3,484,000 China Evergrande Group 6.25%
28/6/2021* 3,208,002 0.04 USD 1,968,000 China Evergrande Group 7.5%
28/6/2023* 1,706,933 0.02 USD 2,706,000 China Evergrande Group 8.75%
28/6/2025* 2,234,987 0.03 USD 2,700,000 China Evergrande Group 9.5%
11/4/2022* 2,551,500 0.03 USD 3,500,000 China Evergrande Group 10%
11/4/2023 3,277,976 0.04 USD 1,680,000 China Hongqiao Group Ltd 7.125%
22/7/2022 1,678,950 0.02 USD 3,600,000 China SCE Group Holdings Ltd
7.25% 19/4/2023 3,447,000 0.04 USD 720,000 China SCE Group Holdings Ltd
7.375% 9/4/2024 682,162 0.01 USD 800,000 China SCE Group Holdings Ltd
7.45% 17/4/2021 810,392 0.01 USD 1,800,000 CIFI Holdings Group Co Ltd
5.5% 23/1/2022 1,770,750 0.02
USD 3,800,000 CIFI Holdings Group Co Ltd 6.375% 2/5/2020* 3,828,500 0.05
USD 2,498,000 CIFI Holdings Group Co Ltd 6.875% 23/4/2021* 2,547,036 0.03
USD 1,084,000 Country Garden Holdings Co Ltd 7.25% 4/4/2021 1,087,738 0.01
USD 2,155,000 ENN Energy Holdings Ltd 3.25% 24/7/2022 2,184,631 0.03
USD 667,000 Fantasia Holdings Group Co Ltd 7.375% 4/10/2021 598,425 0.01
USD 1,047,000 Fantasia Holdings Group Co Ltd 7.95% 5/7/2022 898,620 0.01
USD 1,525,000 Fantasia Holdings Group Co Ltd 8.375% 8/3/2021 1,431,355 0.02
USD 800,000 Fantasia Holdings Group Co Ltd 10.75% 22/1/2020* 803,000 0.01
USD 1,380,000 Fantasia Holdings Group Co Ltd 11.75% 17/4/2022* 1,308,909 0.02
USD 2,683,000 Fufeng Group Ltd 5.875% 28/8/2021 2,799,497 0.04 USD 975,000 Future Land Development Holdings
Ltd 5% 16/2/2020* 957,176 0.01 USD 1,600,000 Future Land Development Holdings
Ltd 6.5% 12/9/2020* 1,557,830 0.02 USD 1,200,000 Future Land Development Holdings
Ltd 7.5% 22/1/2021 1,157,250 0.01 USD 970,000 FWD Ltd FRN 1/2/2023 (Perpetual) 921,500 0.01 USD 1,308,000 Global A&T Electronics Ltd 8.5%
12/1/2023 1,228,907 0.02 USD 2,604,000 Global Aircraft Leasing Co Ltd
‘144A’ 6.5% 15/9/2024 2,584,470 0.03 USD 2,300,000 Golden Wheel Tiandi Holdings Co
Ltd 7% 18/1/2021 2,127,458 0.03 USD 1,130,000 Hilong Holding Ltd 7.25% 22/6/2020* 1,122,408 0.01 USD 1,785,000 Honghua Group Ltd 6.375%
1/8/2022 1,790,280 0.02 USD 1,600,000 Jingrui Holdings Ltd 9.45%
23/4/2021 1,491,250 0.02 USD 2,043,000 Kaisa Group Holdings Ltd 8.5%
30/6/2022 1,834,665 0.02 USD 3,415,000 Kaisa Group Holdings Ltd 9.375%
30/6/2024 2,882,473 0.04 USD 1,785,000 Kaisa Group Holdings Ltd 10.875%
23/7/2023 1,634,391 0.02 USD 1,337,000 King Talent Management Ltd FRN
4/12/2022 (Perpetual) 1,172,800 0.02 USD 2,300,000 KWG Group Holdings Ltd 7.875%
1/9/2023 2,236,750 0.03 USD 3,600,000 Logan Property Holdings Co Ltd
6.5% 16/7/2023 3,528,000 0.05 USD 1,200,000 Logan Property Holdings Co Ltd
6.875% 24/4/2021* 1,224,102 0.02 USD 760,000 Logan Property Holdings Co Ltd
7.5% 25/8/2022* 783,305 0.01 USD 441,000 Modern Land China Co Ltd
12.85% 25/10/2021 416,745 0.01 USD 64,000 Noble Holding International Ltd
7.75% 15/1/2024* 42,880 0.00 USD 2,785,000 Noble Holding International Ltd
‘144A’ 7.875% 1/2/2026 2,294,144 0.03 USD 6,120,000 Overseas Chinese Town Asia
Holdings Ltd FRN 10/10/2020 (Perpetual) 6,138,169 0.08
USD 365,000 Park Aerospace Holdings Ltd ‘144A’ 4.5% 15/3/2023 378,906 0.00
USD 350,000 Park Aerospace Holdings Ltd ‘144A’ 5.25% 15/8/2022 369,950 0.00
USD 800,000 Park Aerospace Holdings Ltd ‘144A’ 5.5% 15/2/2024 867,160 0.01
USD 1,600,000 Pearl Holding III Ltd 9.5% 11/12/2022 1,272,000 0.02
Global Multi-Asset Income Fund continued
Portfolio of Investments 31 August 2019

Transferable Securities and Money Market Instruments Admitted to an Official Stock Exchange Listing or Dealt in on Another Regulated Market
Transferable Securities and Money Market Instruments Admitted to an Official Stock Exchange Listing or Dealt in on Another Regulated Market
Holding
Description
Market Value (USD)
% of Net
Assets
Holding
Description
Market Value (USD)
% of Net
Assets
* All or a portion of this security represents a security on loan.
The notes on pages 728 to 741 form an integral part of these financial statements.
[502] BlackRock Global Funds (BGF)
USD 4,314,000 Powerlong Real Estate Holdings Ltd 5.95% 19/7/2020 4,300,066 0.06
USD 800,000 Powerlong Real Estate Holdings Ltd 6.95% 17/4/2021 792,770 0.01
USD 2,675,000 Redco Properties Group Ltd 13.5% 21/1/2020 2,718,469 0.04
USD 3,065,000 Ronshine China Holdings Ltd 8.75% 25/10/2022 3,077,127 0.04
USD 3,170,000 Ronshine China Holdings Ltd 8.95% 22/1/2023 3,138,126 0.04
USD 425,000 Ronshine China Holdings Ltd 10.5% 1/3/2022 443,781 0.01
USD 595,000 Ronshine China Holdings Ltd 11.25% 22/8/2021 632,442 0.01
USD 1,174,000 Sable International Finance Ltd ‘144A’ 5.75% 7/9/2027 1,223,895 0.02
USD 1,200,000 Shimao Property Holdings Ltd 6.375% 15/10/2021 1,255,500 0.02
USD 925,000 Sunac China Holdings Ltd 6.875% 8/8/2020* 930,781 0.01
USD 3,010,000 Sunac China Holdings Ltd 7.25% 14/6/2022* 2,924,422 0.04
USD 389,000 Times China Holdings Ltd 5.75% 26/4/2022* 382,109 0.00
USD 1,257,000 Times China Holdings Ltd 6.25% 23/1/2020 1,262,696 0.02
USD 2,500,000 Times China Holdings Ltd 6.75% 16/7/2023 2,444,531 0.03
USD 1,800,000 Times China Holdings Ltd 7.625% 21/2/2022 1,846,741 0.02
USD 111,250 Transocean Guardian Ltd ‘144A’ 5.875% 15/1/2024 112,780 0.00
USD 85,000 Transocean Inc 6.5% 15/11/2020 87,444 0.00 USD 821,000 Transocean Inc ‘144A’ 7.25%
1/11/2025 750,189 0.01 USD 413,000 Transocean Inc ‘144A’ 7.5%
15/1/2026 380,992 0.00 USD 138,000 Transocean Inc 8.375% 15/12/2021 143,348 0.00 USD 2,355,000 Transocean Inc ‘144A’ 9% 15/7/2023 2,436,247 0.03 USD 410,670 Transocean Pontus Ltd ‘144A’
6.125% 1/8/2025 418,432 0.01 USD 778,000 Transocean Poseidon Ltd ‘144A’
6.875% 1/2/2027 813,982 0.01 USD 300,000 Transocean Proteus Ltd ‘144A’
6.25% 1/12/2024 307,500 0.00 USD 426,000 Transocean Sentry Ltd ‘144A’
5.375% 15/5/2023 422,805 0.01 USD 350,000 UPCB Finance IV Ltd ‘144A’
5.375% 15/1/2025 361,816 0.00 EUR 300,000 UPCB Finance VII Ltd 3.625%
15/6/2029 354,561 0.00 USD 500,000 Vale Overseas Ltd 4.375% 11/1/2022 518,437 0.01 USD 930,000 VLL International Inc 5.75%
28/11/2024* 963,131 0.01 USD 1,000,000 VLL International Inc 7.375%
18/6/2022 1,090,180 0.01 USD 250,000 WTT Investment Ltd/Hong Kong
‘144A’ 5.5% 21/11/2022* 257,266 0.00 USD 1,200,000 Xinyuan Real Estate Co Ltd
9.875% 19/3/2020* 1,174,200 0.02 USD 1,845,000 Yankuang Group Cayman Ltd
4.75% 30/11/2020 1,855,498 0.02 USD 1,580,000 Yuzhou Properties Co Ltd 6%
25/10/2023 1,414,841 0.02 USD 1,106,000 Yuzhou Properties Co Ltd 6.375%
6/3/2021* 1,102,804 0.01 USD 2,179,000 Yuzhou Properties Co Ltd 7.9%
11/5/2021 2,222,580 0.03 USD 2,000,000 Yuzhou Properties Co Ltd 8.5%
26/2/2024 1,940,000 0.03
USD 1,200,000 Yuzhou Properties Co Ltd 8.625% 23/1/2022 1,224,000 0.02
USD 580,000 Zhenro Properties Group Ltd 9.15% 8/3/2022 583,625 0.01
USD 1,300,000 Zhenro Properties Group Ltd 12.5% 2/1/2021 1,379,219 0.02
169,884,309 2.19
Chile USD 1,750,000 Chile Government International
Bond 2.25% 30/10/2022* 1,763,580 0.02 USD 8,020,000 Chile Government International
Bond 3.125% 27/3/2025* 8,524,258 0.11 USD 2,800,000 Chile Government International
Bond 3.125% 21/1/2026 3,002,562 0.04 USD 9,640,000 Chile Government International
Bond 3.24% 6/2/2028* 10,557,306 0.14 USD 4,199,000 Empresa de Transporte de
Pasajeros Metro SA ‘144A’ 5% 25/1/2047 4,904,957 0.06
USD 4,376,000 Enel Americas SA 4% 25/10/2026 4,559,929 0.06 USD 6,272,000 GNL Quintero SA 4.634% 31/7/2029 6,749,260 0.09 40,061,852 0.52
China EUR 2,400,000 Chengdu Xingcheng Investment
Group Co Ltd 2.5% 20/3/2021 2,622,957 0.03 USD 1,205,000 China Construction Bank Corp
FRN 16/12/2020 (Perpetual) 1,223,452 0.01 USD 575,000 China Minmetals Corp FRN
13/11/2022 (Perpetual) 576,348 0.01 USD 1,500,000 Guangxi Financial Investment
Group Co Ltd 5.75% 23/1/2021 1,443,719 0.02 USD 2,500,000 Huachen Energy Co Ltd 6.625%
18/5/2020 1,437,750 0.02 USD 3,000,000 Industrial & Commercial Bank of
China Ltd/New York NY 3.538% 8/11/2027 3,183,281 0.04
USD 601,000 Inner Mongolia High-Grade High Way Construction And Development Co Ltd 4.375% 4/12/2020 597,322 0.01
USD 1,405,000 Postal Savings Bank of China Co Ltd FRN 27/9/2022 (Perpetual) 1,409,391 0.02
USD 206,000 Union Life Insurance Co Ltd 3% 19/9/2021 179,639 0.00
12,673,859 0.16
Colombia USD 5,256,000 Colombia Government International
Bond 3.875% 25/4/2027 5,693,726 0.07 USD 9,780,000 Colombia Government International
Bond 4% 26/2/2024* 10,443,206 0.14 USD 7,875,000 Colombia Government International
Bond 4.5% 28/1/2026 8,721,563 0.11 USD 2,602,000 Colombia Government International
Bond 4.5% 15/3/2029 2,961,401 0.04 USD 6,200,000 Colombia Government International
Bond 8.125% 21/5/2024* 7,786,813 0.10 USD 5,359,000 SURA Asset Management SA
‘144A’ 4.875% 17/4/2024 5,775,160 0.07 41,381,869 0.53
Croatia USD 4,504,000 Croatia Government International
Bond 6.625% 14/7/2020 4,679,431 0.06
Global Multi-Asset Income Fund continued
Portfolio of Investments 31 August 2019
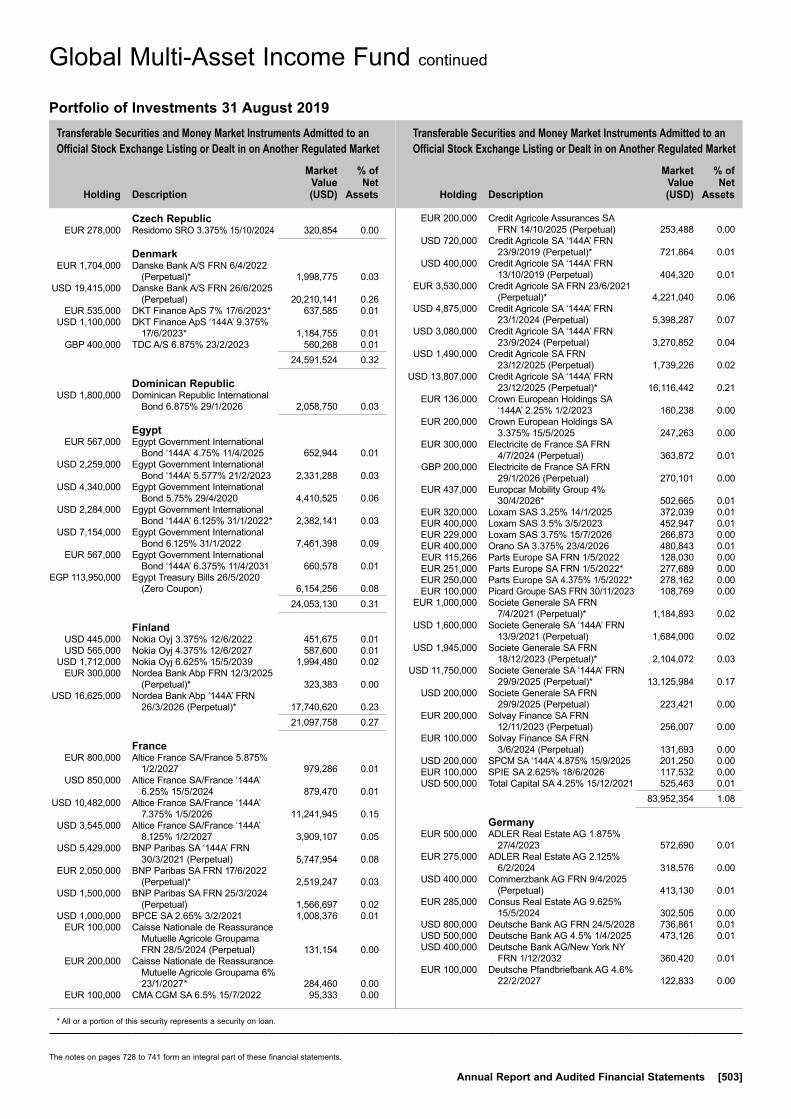
Transferable Securities and Money Market Instruments Admitted to an Official Stock Exchange Listing or Dealt in on Another Regulated Market
Transferable Securities and Money Market Instruments Admitted to an Official Stock Exchange Listing or Dealt in on Another Regulated Market
Holding
Description
Market Value (USD)
% of Net
Assets
Holding
Description
Market Value (USD)
% of Net
Assets
* All or a portion of this security represents a security on loan.
The notes on pages 728 to 741 form an integral part of these financial statements.
Annual Report and Audited Financial Statements [503]
Czech Republic EUR 278,000 Residomo SRO 3.375% 15/10/2024 320,854 0.00
Denmark EUR 1,704,000 Danske Bank A/S FRN 6/4/2022
(Perpetual)* 1,998,775 0.03 USD 19,415,000 Danske Bank A/S FRN 26/6/2025
(Perpetual) 20,210,141 0.26 EUR 535,000 DKT Finance ApS 7% 17/6/2023* 637,585 0.01 USD 1,100,000 DKT Finance ApS ‘144A’ 9.375%
17/6/2023* 1,184,755 0.01 GBP 400,000 TDC A/S 6.875% 23/2/2023 560,268 0.01 24,591,524 0.32
Dominican Republic USD 1,800,000 Dominican Republic International
Bond 6.875% 29/1/2026 2,058,750 0.03
Egypt EUR 567,000 Egypt Government International
Bond ‘144A’ 4.75% 11/4/2025 652,944 0.01 USD 2,259,000 Egypt Government International
Bond ‘144A’ 5.577% 21/2/2023 2,331,288 0.03 USD 4,340,000 Egypt Government International
Bond 5.75% 29/4/2020 4,410,525 0.06 USD 2,284,000 Egypt Government International
Bond ‘144A’ 6.125% 31/1/2022* 2,382,141 0.03 USD 7,154,000 Egypt Government International
Bond 6.125% 31/1/2022 7,461,398 0.09 EUR 567,000 Egypt Government International
Bond ‘144A’ 6.375% 11/4/2031 660,578 0.01 EGP 113,950,000 Egypt Treasury Bills 26/5/2020
(Zero Coupon) 6,154,256 0.08 24,053,130 0.31
Finland USD 445,000 Nokia Oyj 3.375% 12/6/2022 451,675 0.01 USD 565,000 Nokia Oyj 4.375% 12/6/2027 587,600 0.01 USD 1,712,000 Nokia Oyj 6.625% 15/5/2039 1,994,480 0.02 EUR 300,000 Nordea Bank Abp FRN 12/3/2025
(Perpetual)* 323,383 0.00 USD 16,625,000 Nordea Bank Abp ‘144A’ FRN
26/3/2026 (Perpetual)* 17,740,620 0.23 21,097,758 0.27
France EUR 800,000 Altice France SA/France 5.875%
1/2/2027 979,286 0.01 USD 850,000 Altice France SA/France ‘144A’
6.25% 15/5/2024 879,470 0.01 USD 10,482,000 Altice France SA/France ‘144A’
7.375% 1/5/2026 11,241,945 0.15 USD 3,545,000 Altice France SA/France ‘144A’
8.125% 1/2/2027 3,909,107 0.05 USD 5,429,000 BNP Paribas SA ‘144A’ FRN
30/3/2021 (Perpetual) 5,747,954 0.08 EUR 2,050,000 BNP Paribas SA FRN 17/6/2022
(Perpetual)* 2,519,247 0.03 USD 1,500,000 BNP Paribas SA FRN 25/3/2024
(Perpetual) 1,566,697 0.02 USD 1,000,000 BPCE SA 2.65% 3/2/2021 1,008,376 0.01 EUR 100,000 Caisse Nationale de Reassurance
Mutuelle Agricole Groupama FRN 28/5/2024 (Perpetual) 131,154 0.00
EUR 200,000 Caisse Nationale de Reassurance Mutuelle Agricole Groupama 6% 23/1/2027* 284,460 0.00
EUR 100,000 CMA CGM SA 6.5% 15/7/2022 95,333 0.00
EUR 200,000 Credit Agricole Assurances SA FRN 14/10/2025 (Perpetual) 253,488 0.00
USD 720,000 Credit Agricole SA ‘144A’ FRN 23/9/2019 (Perpetual)* 721,864 0.01
USD 400,000 Credit Agricole SA ‘144A’ FRN 13/10/2019 (Perpetual) 404,320 0.01
EUR 3,530,000 Credit Agricole SA FRN 23/6/2021 (Perpetual)* 4,221,040 0.06
USD 4,875,000 Credit Agricole SA ‘144A’ FRN 23/1/2024 (Perpetual) 5,398,287 0.07
USD 3,080,000 Credit Agricole SA ‘144A’ FRN 23/9/2024 (Perpetual) 3,270,852 0.04
USD 1,490,000 Credit Agricole SA FRN 23/12/2025 (Perpetual) 1,739,226 0.02
USD 13,807,000 Credit Agricole SA ‘144A’ FRN 23/12/2025 (Perpetual)* 16,116,442 0.21
EUR 136,000 Crown European Holdings SA ‘144A’ 2.25% 1/2/2023 160,238 0.00
EUR 200,000 Crown European Holdings SA 3.375% 15/5/2025 247,263 0.00
EUR 300,000 Electricite de France SA FRN 4/7/2024 (Perpetual) 363,872 0.01
GBP 200,000 Electricite de France SA FRN 29/1/2026 (Perpetual) 270,101 0.00
EUR 437,000 Europcar Mobility Group 4% 30/4/2026* 502,665 0.01
EUR 320,000 Loxam SAS 3.25% 14/1/2025 372,039 0.01 EUR 400,000 Loxam SAS 3.5% 3/5/2023 452,947 0.01 EUR 229,000 Loxam SAS 3.75% 15/7/2026 266,873 0.00 EUR 400,000 Orano SA 3.375% 23/4/2026 480,843 0.01 EUR 115,266 Parts Europe SA FRN 1/5/2022 128,030 0.00 EUR 251,000 Parts Europe SA FRN 1/5/2022* 277,689 0.00 EUR 250,000 Parts Europe SA 4.375% 1/5/2022* 278,162 0.00 EUR 100,000 Picard Groupe SAS FRN 30/11/2023 108,769 0.00 EUR 1,000,000 Societe Generale SA FRN
7/4/2021 (Perpetual)* 1,184,893 0.02 USD 1,600,000 Societe Generale SA ‘144A’ FRN
13/9/2021 (Perpetual) 1,684,000 0.02 USD 1,945,000 Societe Generale SA FRN
18/12/2023 (Perpetual)* 2,104,072 0.03 USD 11,750,000 Societe Generale SA ‘144A’ FRN
29/9/2025 (Perpetual)* 13,125,984 0.17 USD 200,000 Societe Generale SA FRN
29/9/2025 (Perpetual) 223,421 0.00 EUR 200,000 Solvay Finance SA FRN
12/11/2023 (Perpetual) 256,007 0.00 EUR 100,000 Solvay Finance SA FRN
3/6/2024 (Perpetual) 131,693 0.00 USD 200,000 SPCM SA ‘144A’ 4.875% 15/9/2025 201,250 0.00 EUR 100,000 SPIE SA 2.625% 18/6/2026 117,532 0.00 USD 500,000 Total Capital SA 4.25% 15/12/2021 525,463 0.01 83,952,354 1.08
Germany EUR 500,000 ADLER Real Estate AG 1.875%
27/4/2023 572,690 0.01 EUR 275,000 ADLER Real Estate AG 2.125%
6/2/2024 318,576 0.00 USD 400,000 Commerzbank AG FRN 9/4/2025
(Perpetual) 413,130 0.01 EUR 285,000 Consus Real Estate AG 9.625%
15/5/2024 302,505 0.00 USD 800,000 Deutsche Bank AG FRN 24/5/2028 736,861 0.01 USD 500,000 Deutsche Bank AG 4.5% 1/4/2025 473,126 0.01 USD 400,000 Deutsche Bank AG/New York NY
FRN 1/12/2032 360,420 0.01 EUR 100,000 Deutsche Pfandbriefbank AG 4.6%
22/2/2027 122,833 0.00
Global Multi-Asset Income Fund continued
Portfolio of Investments 31 August 2019

Transferable Securities and Money Market Instruments Admitted to an Official Stock Exchange Listing or Dealt in on Another Regulated Market
Transferable Securities and Money Market Instruments Admitted to an Official Stock Exchange Listing or Dealt in on Another Regulated Market
Holding
Description
Market Value (USD)
% of Net
Assets
Holding
Description
Market Value (USD)
% of Net
Assets
* All or a portion of this security represents a security on loan.
The notes on pages 728 to 741 form an integral part of these financial statements.
[504] BlackRock Global Funds (BGF)
EUR 461,000 IHO Verwaltungs GmbH 3.625% 15/5/2025 521,016 0.01
EUR 253,000 IHO Verwaltungs GmbH 3.875% 15/5/2027 280,234 0.00
USD 300,000 IHO Verwaltungs GmbH ‘144A’ 4.75% 15/9/2026 290,250 0.00
EUR 300,000 Nidda BondCo GmbH 5% 30/9/2025 340,081 0.00 EUR 350,000 Nidda BondCo GmbH 7.25%
30/9/2025 413,707 0.01 EUR 658,000 Platin 1426 GmbH 5.375%
15/6/2023* 718,215 0.01 EUR 380,000 RWE AG FRN 21/4/2075 428,883 0.01 EUR 47,000 RWE AG FRN 21/4/2075 56,141 0.00 EUR 224,000 Techem Verwaltungsgesellschaft
674 mbH 6% 30/7/2026 269,355 0.00 EUR 100,000 Tele Columbus AG 3.875% 2/5/2025 107,019 0.00 EUR 906,000 thyssenkrupp AG 2.875% 22/2/2024 1,035,187 0.01 EUR 600,000 Unitymedia GmbH 3.75% 15/1/2027 708,762 0.01 USD 300,000 Unitymedia GmbH ‘144A’ 6.125%
15/1/2025 314,025 0.00 EUR 400,000 Unitymedia Hessen GmbH & Co
KG / Unitymedia NRW GmbH 3.5% 15/1/2027 470,830 0.01
EUR 720,000 Unitymedia Hessen GmbH & Co KG / Unitymedia NRW GmbH 6.25% 15/1/2029 888,014 0.01
10,141,860 0.13
Guernsey USD 350,000 Credit Suisse Group Funding
Guernsey Ltd 3.8% 9/6/2023 367,279 0.00 USD 1,100,000 Pershing Square Holdings Ltd
‘144A’ 5.5% 15/7/2022 1,152,461 0.02 EUR 123,000 Summit Properties Ltd 2%
31/1/2025 132,563 0.00 1,652,303 0.02
Hong Kong USD 1,229,000 Chalieco Hong Kong Corp Ltd FRN
15/1/2020 (Perpetual) 1,237,450 0.02 USD 1,075,000 Chong Hing Bank Ltd FRN
26/7/2027 1,080,207 0.01 USD 1,540,000 CITIC Ltd 4% 11/1/2028 1,649,966 0.02 USD 750,000 CITIC Ltd 6.8% 17/1/2023 847,852 0.01 USD 8,944,000 CNAC HK Synbridge Co Ltd 5%
5/5/2020 9,053,206 0.12 USD 1,126,000 HBIS Group Hong Kong Co Ltd
4.25% 7/4/2020 1,125,296 0.01 USD 400,000 Hongkong & Shanghai Banking
Corp Ltd/The FRN 27/10/2019 (Perpetual) 289,411 0.00
USD 515,000 Hubei Science & Technology Investment Group Hong Kong Ltd 4.375% 5/3/2021 518,782 0.01
USD 1,550,000 Industrial & Commercial Bank of China Asia Ltd FRN 21/7/2021 (Perpetual) 1,555,328 0.02
USD 2,885,000 Wanda Group Overseas Ltd 7.5% 24/7/2022 2,858,485 0.04
USD 1,610,000 Yancoal International Resources Development Co Ltd FRN 13/4/2020 (Perpetual) 1,624,667 0.02
USD 5,600,000 Yanlord Land HK Co Ltd 6.75% 23/4/2023* 5,747,000 0.07
USD 2,215,000 Yanlord Land HK Co Ltd 6.8% 27/2/2024 2,212,231 0.03
29,799,881 0.38
India USD 1,150,000 Adani Ports & Special Economic
Zone Ltd ‘144A’ 3.95% 19/1/2022 1,180,906 0.02
USD 1,027,000 Adani Ports & Special Economic Zone Ltd 4% 30/7/2027* 1,065,512 0.02
USD 1,880,000 Adani Transmission Ltd 4% 3/8/2026 1,932,288 0.03
USD 2,375,000 Delhi International Airport Ltd 6.45% 4/6/2029 2,506,100 0.03
USD 230,000 NTPC Ltd 5.625% 14/7/2021 242,578 0.00 USD 3,200,000 Power Finance Corp Ltd 3.75%
6/12/2027 3,215,000 0.04 USD 4,468,000 REC Ltd 4.625% 22/3/2028 4,744,458 0.06 USD 3,300,000 ReNew Power Synthetic 6.67%
12/3/2024* 3,375,500 0.04 18,262,342 0.24
Indonesia USD 3,425,000 Indonesia Government
International Bond 3.5% 11/1/2028* 3,599,996 0.05
USD 2,378,000 Indonesia Government International Bond 3.75% 25/4/2022 2,464,574 0.03
USD 2,492,000 Indonesia Government International Bond 4.1% 24/4/2028 2,721,773 0.04
USD 4,249,000 Indonesia Government International Bond 4.75% 8/1/2026 4,746,266 0.06
USD 790,000 Indonesia Government International Bond 4.75% 11/2/2029 914,441 0.01
USD 11,980,000 Indonesia Government International Bond 5.875% 13/3/2020 12,247,678 0.16
IDR 178,526,000,000 Indonesia Treasury Bond 6.125% 15/5/2028 11,584,996 0.15
USD 1,500,000 Perusahaan Listrik Negara PT 4.875% 17/7/2049* 1,676,250 0.02
USD 2,500,000 Perusahaan Listrik Negara PT 6.15% 21/5/2048 3,251,172 0.04
43,207,146 0.56
Ireland USD 200,000 AerCap Ireland Capital DAC /
AerCap Global Aviation Trust 2.875% 14/8/2024 200,211 0.00
USD 460,000 AerCap Ireland Capital DAC / AerCap Global Aviation Trust 3.5% 26/5/2022 472,425 0.01
USD 600,000 AerCap Ireland Capital DAC / AerCap Global Aviation Trust 4.5% 15/5/2021 618,904 0.01
EUR 3,615,000 Allied Irish Banks Plc FRN 3/12/2020 (Perpetual)* 4,271,367 0.06
EUR 900,000 Allied Irish Banks Plc FRN 26/11/2025 1,037,062 0.01
EUR 113,000 Aqueduct European CLO 2-2017 DAC FRN 15/10/2030 116,918 0.00
EUR 128,000 Arbour CLO IV DAC FRN 15/1/2030 142,141 0.00
USD 1,604,000 Ardagh Packaging Finance Plc / Ardagh Holdings USA Inc ‘144A’ 4.125% 15/8/2026 1,624,050 0.02
Global Multi-Asset Income Fund continued
Portfolio of Investments 31 August 2019
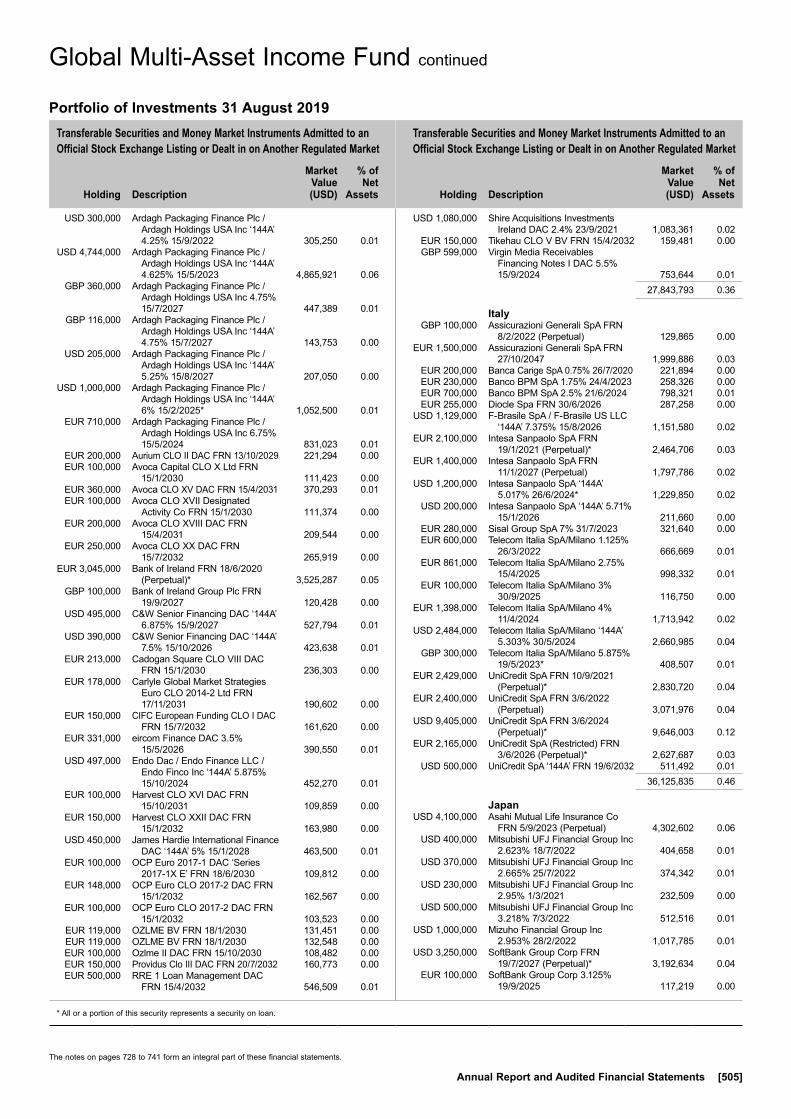
Transferable Securities and Money Market Instruments Admitted to an Official Stock Exchange Listing or Dealt in on Another Regulated Market
Transferable Securities and Money Market Instruments Admitted to an Official Stock Exchange Listing or Dealt in on Another Regulated Market
Holding
Description
Market Value (USD)
% of Net
Assets
Holding
Description
Market Value (USD)
% of Net
Assets
* All or a portion of this security represents a security on loan.
The notes on pages 728 to 741 form an integral part of these financial statements.
Annual Report and Audited Financial Statements [505]
USD 300,000 Ardagh Packaging Finance Plc / Ardagh Holdings USA Inc ‘144A’ 4.25% 15/9/2022 305,250 0.01
USD 4,744,000 Ardagh Packaging Finance Plc / Ardagh Holdings USA Inc ‘144A’ 4.625% 15/5/2023 4,865,921 0.06
GBP 360,000 Ardagh Packaging Finance Plc / Ardagh Holdings USA Inc 4.75% 15/7/2027 447,389 0.01
GBP 116,000 Ardagh Packaging Finance Plc / Ardagh Holdings USA Inc ‘144A’ 4.75% 15/7/2027 143,753 0.00
USD 205,000 Ardagh Packaging Finance Plc / Ardagh Holdings USA Inc ‘144A’ 5.25% 15/8/2027 207,050 0.00
USD 1,000,000 Ardagh Packaging Finance Plc / Ardagh Holdings USA Inc ‘144A’ 6% 15/2/2025* 1,052,500 0.01
EUR 710,000 Ardagh Packaging Finance Plc / Ardagh Holdings USA Inc 6.75% 15/5/2024 831,023 0.01
EUR 200,000 Aurium CLO II DAC FRN 13/10/2029 221,294 0.00 EUR 100,000 Avoca Capital CLO X Ltd FRN
15/1/2030 111,423 0.00 EUR 360,000 Avoca CLO XV DAC FRN 15/4/2031 370,293 0.01 EUR 100,000 Avoca CLO XVII Designated
Activity Co FRN 15/1/2030 111,374 0.00 EUR 200,000 Avoca CLO XVIII DAC FRN
15/4/2031 209,544 0.00 EUR 250,000 Avoca CLO XX DAC FRN
15/7/2032 265,919 0.00 EUR 3,045,000 Bank of Ireland FRN 18/6/2020
(Perpetual)* 3,525,287 0.05 GBP 100,000 Bank of Ireland Group Plc FRN
19/9/2027 120,428 0.00 USD 495,000 C&W Senior Financing DAC ‘144A’
6.875% 15/9/2027 527,794 0.01 USD 390,000 C&W Senior Financing DAC ‘144A’
7.5% 15/10/2026 423,638 0.01 EUR 213,000 Cadogan Square CLO VIII DAC
FRN 15/1/2030 236,303 0.00 EUR 178,000 Carlyle Global Market Strategies
Euro CLO 2014-2 Ltd FRN 17/11/2031 190,602 0.00
EUR 150,000 CIFC European Funding CLO I DAC FRN 15/7/2032 161,620 0.00
EUR 331,000 eircom Finance DAC 3.5% 15/5/2026 390,550 0.01
USD 497,000 Endo Dac / Endo Finance LLC / Endo Finco Inc ‘144A’ 5.875% 15/10/2024 452,270 0.01
EUR 100,000 Harvest CLO XVI DAC FRN 15/10/2031 109,859 0.00
EUR 150,000 Harvest CLO XXII DAC FRN 15/1/2032 163,980 0.00
USD 450,000 James Hardie International Finance DAC ‘144A’ 5% 15/1/2028 463,500 0.01
EUR 100,000 OCP Euro 2017-1 DAC ‘Series 2017-1X E’ FRN 18/6/2030 109,812 0.00
EUR 148,000 OCP Euro CLO 2017-2 DAC FRN 15/1/2032 162,567 0.00
EUR 100,000 OCP Euro CLO 2017-2 DAC FRN 15/1/2032 103,523 0.00
EUR 119,000 OZLME BV FRN 18/1/2030 131,451 0.00 EUR 119,000 OZLME BV FRN 18/1/2030 132,548 0.00 EUR 100,000 Ozlme II DAC FRN 15/10/2030 108,482 0.00 EUR 150,000 Providus Clo III DAC FRN 20/7/2032 160,773 0.00 EUR 500,000 RRE 1 Loan Management DAC
FRN 15/4/2032 546,509 0.01
USD 1,080,000 Shire Acquisitions Investments Ireland DAC 2.4% 23/9/2021 1,083,361 0.02
EUR 150,000 Tikehau CLO V BV FRN 15/4/2032 159,481 0.00 GBP 599,000 Virgin Media Receivables
Financing Notes I DAC 5.5% 15/9/2024 753,644 0.01
27,843,793 0.36
Italy GBP 100,000 Assicurazioni Generali SpA FRN
8/2/2022 (Perpetual) 129,865 0.00 EUR 1,500,000 Assicurazioni Generali SpA FRN
27/10/2047 1,999,886 0.03 EUR 200,000 Banca Carige SpA 0.75% 26/7/2020 221,894 0.00 EUR 230,000 Banco BPM SpA 1.75% 24/4/2023 258,326 0.00 EUR 700,000 Banco BPM SpA 2.5% 21/6/2024 798,321 0.01 EUR 255,000 Diocle Spa FRN 30/6/2026 287,258 0.00 USD 1,129,000 F-Brasile SpA / F-Brasile US LLC
‘144A’ 7.375% 15/8/2026 1,151,580 0.02 EUR 2,100,000 Intesa Sanpaolo SpA FRN
19/1/2021 (Perpetual)* 2,464,706 0.03 EUR 1,400,000 Intesa Sanpaolo SpA FRN
11/1/2027 (Perpetual) 1,797,786 0.02 USD 1,200,000 Intesa Sanpaolo SpA ‘144A’
5.017% 26/6/2024* 1,229,850 0.02 USD 200,000 Intesa Sanpaolo SpA ‘144A’ 5.71%
15/1/2026 211,660 0.00 EUR 280,000 Sisal Group SpA 7% 31/7/2023 321,640 0.00 EUR 600,000 Telecom Italia SpA/Milano 1.125%
26/3/2022 666,669 0.01 EUR 861,000 Telecom Italia SpA/Milano 2.75%
15/4/2025 998,332 0.01 EUR 100,000 Telecom Italia SpA/Milano 3%
30/9/2025 116,750 0.00 EUR 1,398,000 Telecom Italia SpA/Milano 4%
11/4/2024 1,713,942 0.02 USD 2,484,000 Telecom Italia SpA/Milano ‘144A’
5.303% 30/5/2024 2,660,985 0.04 GBP 300,000 Telecom Italia SpA/Milano 5.875%
19/5/2023* 408,507 0.01 EUR 2,429,000 UniCredit SpA FRN 10/9/2021
(Perpetual)* 2,830,720 0.04 EUR 2,400,000 UniCredit SpA FRN 3/6/2022
(Perpetual) 3,071,976 0.04 USD 9,405,000 UniCredit SpA FRN 3/6/2024
(Perpetual)* 9,646,003 0.12 EUR 2,165,000 UniCredit SpA (Restricted) FRN
3/6/2026 (Perpetual)* 2,627,687 0.03 USD 500,000 UniCredit SpA ‘144A’ FRN 19/6/2032 511,492 0.01 36,125,835 0.46
Japan USD 4,100,000 Asahi Mutual Life Insurance Co
FRN 5/9/2023 (Perpetual) 4,302,602 0.06 USD 400,000 Mitsubishi UFJ Financial Group Inc
2.623% 18/7/2022 404,658 0.01 USD 370,000 Mitsubishi UFJ Financial Group Inc
2.665% 25/7/2022 374,342 0.01 USD 230,000 Mitsubishi UFJ Financial Group Inc
2.95% 1/3/2021 232,509 0.00 USD 500,000 Mitsubishi UFJ Financial Group Inc
3.218% 7/3/2022 512,516 0.01 USD 1,000,000 Mizuho Financial Group Inc
2.953% 28/2/2022 1,017,785 0.01 USD 3,250,000 SoftBank Group Corp FRN
19/7/2027 (Perpetual)* 3,192,634 0.04 EUR 100,000 SoftBank Group Corp 3.125%
19/9/2025 117,219 0.00
Global Multi-Asset Income Fund continued
Portfolio of Investments 31 August 2019

Transferable Securities and Money Market Instruments Admitted to an Official Stock Exchange Listing or Dealt in on Another Regulated Market
Transferable Securities and Money Market Instruments Admitted to an Official Stock Exchange Listing or Dealt in on Another Regulated Market
Holding
Description
Market Value (USD)
% of Net
Assets
Holding
Description
Market Value (USD)
% of Net
Assets
* All or a portion of this security represents a security on loan.
The notes on pages 728 to 741 form an integral part of these financial statements.
[506] BlackRock Global Funds (BGF)
EUR 1,187,000 SoftBank Group Corp 4% 20/4/2023 1,431,544 0.02 EUR 200,000 SoftBank Group Corp 4% 19/9/2029 240,502 0.00 EUR 200,000 SoftBank Group Corp 4.5%
20/4/2025 251,129 0.00 USD 2,004,000 SoftBank Group Corp 4.75%
19/9/2024 2,049,090 0.03 EUR 565,000 SoftBank Group Corp 4.75%
30/7/2025 713,062 0.01 EUR 400,000 SoftBank Group Corp 5%
15/4/2028 512,372 0.01 USD 971,000 SoftBank Group Corp 5.125%
19/9/2027* 1,001,344 0.01 USD 250,000 Sumitomo Mitsui Financial Group
Inc 2.442% 19/10/2021 251,220 0.00 USD 150,000 Sumitomo Mitsui Financial Group
Inc 2.778% 18/10/2022 152,803 0.00 USD 1,000,000 Sumitomo Mitsui Financial Group
Inc 2.934% 9/3/2021 1,010,336 0.01 17,767,667 0.23
Jersey GBP 100,000 AA Bond Co Ltd 4.249% 31/7/2020 123,600 0.00 EUR 707,000 Avis Budget Finance Plc 4.75%
30/1/2026 843,186 0.01 GBP 250,000 CPUK Finance Ltd 4.25% 28/8/2022 309,516 0.01 GBP 120,000 CPUK Finance Ltd 4.875%
28/8/2025 150,126 0.00 GBP 158,000 Galaxy Bidco Ltd 6.5% 31/7/2026* 185,759 0.00 USD 3,062,000 HBOS Capital Funding LP 6.85%
23/12/2019 (Perpetual) 3,127,067 0.04 EUR 750,000 LHC3 Plc 4.125% 15/8/2024 860,485 0.01 5,599,739 0.07
Kuwait USD 1,725,000 Burgan Bank SAK FRN 9/7/2024
(Perpetual) 1,723,706 0.02
Luxembourg USD 248,000 Allergan Funding SCS 3.45%
15/3/2022 254,681 0.00 USD 3,043,000 Altice Financing SA ‘144A’ 6.625%
15/2/2023 3,141,898 0.04 USD 5,370,000 Altice Financing SA ‘144A’ 7.5%
15/5/2026 5,743,752 0.08 EUR 100,000 Altice Finco SA 4.75% 15/1/2028 105,365 0.00 USD 220,000 Altice Finco SA ‘144A’ 7.625%
15/2/2025 226,259 0.00 USD 4,583,000 Altice Luxembourg SA ‘144A’
7.625% 15/2/2025 4,743,405 0.06 USD 876,000 Altice Luxembourg SA ‘144A’
7.75% 15/5/2022 900,528 0.01 EUR 200,000 Altice Luxembourg SA 8% 15/5/2027 238,015 0.00 USD 2,983,000 Altice Luxembourg SA ‘144A’
10.5% 15/5/2027 3,244,012 0.04 USD 215,000 Avation Capital SA ‘144A’ 6.5%
15/5/2021 222,256 0.00 GBP 250,000 B&M European Value Retail SA
4.125% 1/2/2022 310,127 0.01 GBP 1,000,000 Cabot Financial Luxembourg SA
7.5% 1/10/2023 1,271,410 0.02 EUR 100,000 Cirsa Finance International Sarl
4.75% 22/5/2025 117,315 0.00 USD 613,000 Cirsa Finance International Sarl
‘144A’ 7.875% 20/12/2023 649,403 0.01 EUR 100,000 Codere Finance 2 Luxembourg SA
6.75% 1/11/2021 108,644 0.00 USD 600,000 Codere Finance 2 Luxembourg SA
‘144A’ 7.625% 1/11/2021 586,476 0.01
USD 200,000 Consolidated Energy Finance SA ‘144A’ 6.875% 15/6/2025 205,500 0.00
EUR 371,000 ContourGlobal Power Holdings SA 3.375% 1/8/2023 426,747 0.01
EUR 254,000 ContourGlobal Power Holdings SA 4.125% 1/8/2025 301,334 0.01
EUR 100,000 ContourGlobal Power Holdings SA 4.125% 1/8/2025 118,021 0.00
EUR 200,000 European TopSoho Sarl 4% 21/9/2021 206,135 0.00
GBP 100,000 Garfunkelux Holdco 2 SA 11% 1/11/2023 113,581 0.00
EUR 810,000 Garfunkelux Holdco 3 SA 7.5% 1/8/2022* 857,842 0.01
EUR 200,000 Holcim Finance Luxembourg SA FRN 5/7/2024 (Perpetual) 232,557 0.00
EUR 150,000 Horizon Parent Holdings Sarl 8.25% 15/2/2022 170,695 0.00
EUR 200,000 INEOS Group Holdings SA 5.375% 1/8/2024 227,338 0.00
USD 200,000 INEOS Group Holdings SA ‘144A’ 5.625% 1/8/2024 203,500 0.00
USD 4,913,000 Intelsat Jackson Holdings SA 5.5% 1/8/2023 4,489,254 0.06
USD 400,000 Intelsat Jackson Holdings SA ‘144A’ 8% 15/2/2024 418,056 0.01
USD 2,178,000 Intelsat Jackson Holdings SA ‘144A’ 8.5% 15/10/2024 2,158,942 0.03
USD 3,731,000 Intelsat Jackson Holdings SA ‘144A’ 9.75% 15/7/2025 3,847,594 0.05
USD 2,761,000 JBS USA LUX SA / JBS USA Food Co / JBS USA Finance Inc ‘144A’ 5.5% 15/1/2030 2,921,828 0.04
USD 3,459,000 JBS USA LUX SA / JBS USA Food Co / JBS USA Finance Inc ‘144A’ 6.5% 15/4/2029 3,822,195 0.05
USD 450,000 Mallinckrodt International Finance SA / Mallinckrodt CB LLC ‘144A’ 5.5% 15/4/2025 213,750 0.00
USD 525,000 Mallinckrodt International Finance SA / Mallinckrodt CB LLC ‘144A’ 5.625% 15/10/2023* 270,375 0.00
USD 1,750,000 Mallinckrodt International Finance SA / Mallinckrodt CB LLC ‘144A’ 5.75% 1/8/2022* 1,023,750 0.01
EUR 14,286 Matterhorn Telecom SA FRN 1/2/2023 15,796 0.00
EUR 700,000 Matterhorn Telecom SA 3.875% 1/5/2022 784,492 0.01
EUR 300,000 Matterhorn Telecom SA 4% 15/11/2027 341,237 0.01
USD 247,000 Nielsen Co Luxembourg SARL/The ‘144A’ 5% 1/2/2025 243,912 0.00
USD 3,075,000 Pacific Drilling SA ‘144A’ 8.375% 1/10/2023 2,832,844 0.04
USD 250,000 Puma International Financing SA ‘144A’ 5% 24/1/2026 232,511 0.00
USD 250,000 Puma International Financing SA ‘144A’ 5.125% 6/10/2024 234,128 0.00
EUR 1,199,000 Rossini Sarl 6.75% 30/10/2025* 1,450,308 0.02 EUR 200,000 SES SA FRN 2/1/2022 (Perpetual) 236,701 0.00 EUR 600,000 SES SA FRN 29/1/2024 (Perpetual) 743,140 0.01 EUR 444,000 Swissport Financing Sarl 5.25%
15/8/2024 505,287 0.01 USD 1,353,000 Telecom Italia Capital SA 6%
30/9/2034 1,390,208 0.02 USD 583,000 Telecom Italia Capital SA 6.375%
15/11/2033 617,980 0.01
Global Multi-Asset Income Fund continued
Portfolio of Investments 31 August 2019
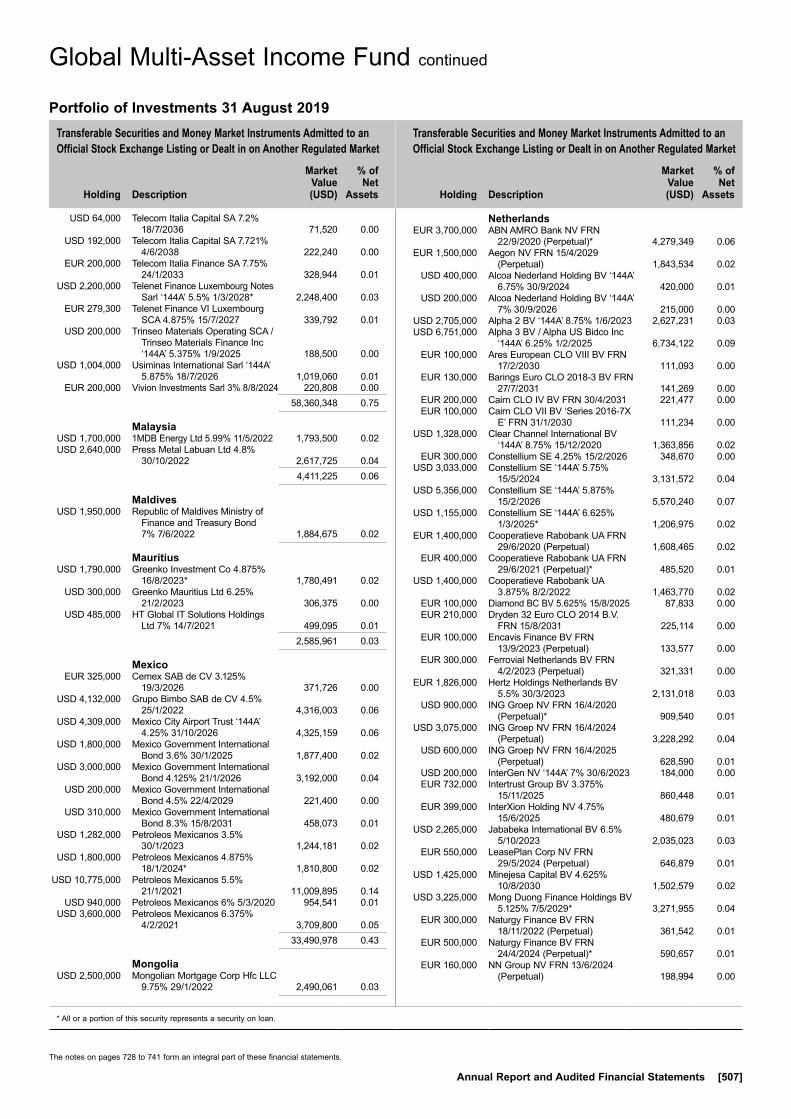
Transferable Securities and Money Market Instruments Admitted to an Official Stock Exchange Listing or Dealt in on Another Regulated Market
Transferable Securities and Money Market Instruments Admitted to an Official Stock Exchange Listing or Dealt in on Another Regulated Market
Holding
Description
Market Value (USD)
% of Net
Assets
Holding
Description
Market Value (USD)
% of Net
Assets
* All or a portion of this security represents a security on loan.
The notes on pages 728 to 741 form an integral part of these financial statements.
Annual Report and Audited Financial Statements [507]
USD 64,000 Telecom Italia Capital SA 7.2% 18/7/2036 71,520 0.00
USD 192,000 Telecom Italia Capital SA 7.721% 4/6/2038 222,240 0.00
EUR 200,000 Telecom Italia Finance SA 7.75% 24/1/2033 328,944 0.01
USD 2,200,000 Telenet Finance Luxembourg Notes Sarl ‘144A’ 5.5% 1/3/2028* 2,248,400 0.03
EUR 279,300 Telenet Finance VI Luxembourg SCA 4.875% 15/7/2027 339,792 0.01
USD 200,000 Trinseo Materials Operating SCA / Trinseo Materials Finance Inc ‘144A’ 5.375% 1/9/2025 188,500 0.00
USD 1,004,000 Usiminas International Sarl ‘144A’ 5.875% 18/7/2026 1,019,060 0.01
EUR 200,000 Vivion Investments Sarl 3% 8/8/2024 220,808 0.00 58,360,348 0.75
Malaysia USD 1,700,000 1MDB Energy Ltd 5.99% 11/5/2022 1,793,500 0.02 USD 2,640,000 Press Metal Labuan Ltd 4.8%
30/10/2022 2,617,725 0.04 4,411,225 0.06
Maldives USD 1,950,000 Republic of Maldives Ministry of
Finance and Treasury Bond 7% 7/6/2022 1,884,675 0.02
Mauritius USD 1,790,000 Greenko Investment Co 4.875%
16/8/2023* 1,780,491 0.02 USD 300,000 Greenko Mauritius Ltd 6.25%
21/2/2023 306,375 0.00 USD 485,000 HT Global IT Solutions Holdings
Ltd 7% 14/7/2021 499,095 0.01 2,585,961 0.03
Mexico EUR 325,000 Cemex SAB de CV 3.125%
19/3/2026 371,726 0.00 USD 4,132,000 Grupo Bimbo SAB de CV 4.5%
25/1/2022 4,316,003 0.06 USD 4,309,000 Mexico City Airport Trust ‘144A’
4.25% 31/10/2026 4,325,159 0.06 USD 1,800,000 Mexico Government International
Bond 3.6% 30/1/2025 1,877,400 0.02 USD 3,000,000 Mexico Government International
Bond 4.125% 21/1/2026 3,192,000 0.04 USD 200,000 Mexico Government International
Bond 4.5% 22/4/2029 221,400 0.00 USD 310,000 Mexico Government International
Bond 8.3% 15/8/2031 458,073 0.01 USD 1,282,000 Petroleos Mexicanos 3.5%
30/1/2023 1,244,181 0.02 USD 1,800,000 Petroleos Mexicanos 4.875%
18/1/2024* 1,810,800 0.02 USD 10,775,000 Petroleos Mexicanos 5.5%
21/1/2021 11,009,895 0.14 USD 940,000 Petroleos Mexicanos 6% 5/3/2020 954,541 0.01 USD 3,600,000 Petroleos Mexicanos 6.375%
4/2/2021 3,709,800 0.05 33,490,978 0.43
Mongolia USD 2,500,000 Mongolian Mortgage Corp Hfc LLC
9.75% 29/1/2022 2,490,061 0.03
Netherlands EUR 3,700,000 ABN AMRO Bank NV FRN
22/9/2020 (Perpetual)* 4,279,349 0.06 EUR 1,500,000 Aegon NV FRN 15/4/2029
(Perpetual) 1,843,534 0.02 USD 400,000 Alcoa Nederland Holding BV ‘144A’
6.75% 30/9/2024 420,000 0.01 USD 200,000 Alcoa Nederland Holding BV ‘144A’
7% 30/9/2026 215,000 0.00 USD 2,705,000 Alpha 2 BV ‘144A’ 8.75% 1/6/2023 2,627,231 0.03 USD 6,751,000 Alpha 3 BV / Alpha US Bidco Inc
‘144A’ 6.25% 1/2/2025 6,734,122 0.09 EUR 100,000 Ares European CLO VIII BV FRN
17/2/2030 111,093 0.00 EUR 130,000 Barings Euro CLO 2018-3 BV FRN
27/7/2031 141,269 0.00 EUR 200,000 Cairn CLO IV BV FRN 30/4/2031 221,477 0.00 EUR 100,000 Cairn CLO VII BV ‘Series 2016-7X
E’ FRN 31/1/2030 111,234 0.00 USD 1,328,000 Clear Channel International BV
‘144A’ 8.75% 15/12/2020 1,363,856 0.02 EUR 300,000 Constellium SE 4.25% 15/2/2026 348,670 0.00 USD 3,033,000 Constellium SE ‘144A’ 5.75%
15/5/2024 3,131,572 0.04 USD 5,356,000 Constellium SE ‘144A’ 5.875%
15/2/2026 5,570,240 0.07 USD 1,155,000 Constellium SE ‘144A’ 6.625%
1/3/2025* 1,206,975 0.02 EUR 1,400,000 Cooperatieve Rabobank UA FRN
29/6/2020 (Perpetual) 1,608,465 0.02 EUR 400,000 Cooperatieve Rabobank UA FRN
29/6/2021 (Perpetual)* 485,520 0.01 USD 1,400,000 Cooperatieve Rabobank UA
3.875% 8/2/2022 1,463,770 0.02 EUR 100,000 Diamond BC BV 5.625% 15/8/2025 87,833 0.00 EUR 210,000 Dryden 32 Euro CLO 2014 B.V.
FRN 15/8/2031 225,114 0.00 EUR 100,000 Encavis Finance BV FRN
13/9/2023 (Perpetual) 133,577 0.00 EUR 300,000 Ferrovial Netherlands BV FRN
4/2/2023 (Perpetual) 321,331 0.00 EUR 1,826,000 Hertz Holdings Netherlands BV
5.5% 30/3/2023 2,131,018 0.03 USD 900,000 ING Groep NV FRN 16/4/2020
(Perpetual)* 909,540 0.01 USD 3,075,000 ING Groep NV FRN 16/4/2024
(Perpetual) 3,228,292 0.04 USD 600,000 ING Groep NV FRN 16/4/2025
(Perpetual) 628,590 0.01 USD 200,000 InterGen NV ‘144A’ 7% 30/6/2023 184,000 0.00 EUR 732,000 Intertrust Group BV 3.375%
15/11/2025 860,448 0.01 EUR 399,000 InterXion Holding NV 4.75%
15/6/2025 480,679 0.01 USD 2,265,000 Jababeka International BV 6.5%
5/10/2023 2,035,023 0.03 EUR 550,000 LeasePlan Corp NV FRN
29/5/2024 (Perpetual) 646,879 0.01 USD 1,425,000 Minejesa Capital BV 4.625%
10/8/2030 1,502,579 0.02 USD 3,225,000 Mong Duong Finance Holdings BV
5.125% 7/5/2029* 3,271,955 0.04 EUR 300,000 Naturgy Finance BV FRN
18/11/2022 (Perpetual) 361,542 0.01 EUR 500,000 Naturgy Finance BV FRN
24/4/2024 (Perpetual)* 590,657 0.01 EUR 160,000 NN Group NV FRN 13/6/2024
(Perpetual) 198,994 0.00
Global Multi-Asset Income Fund continued
Portfolio of Investments 31 August 2019
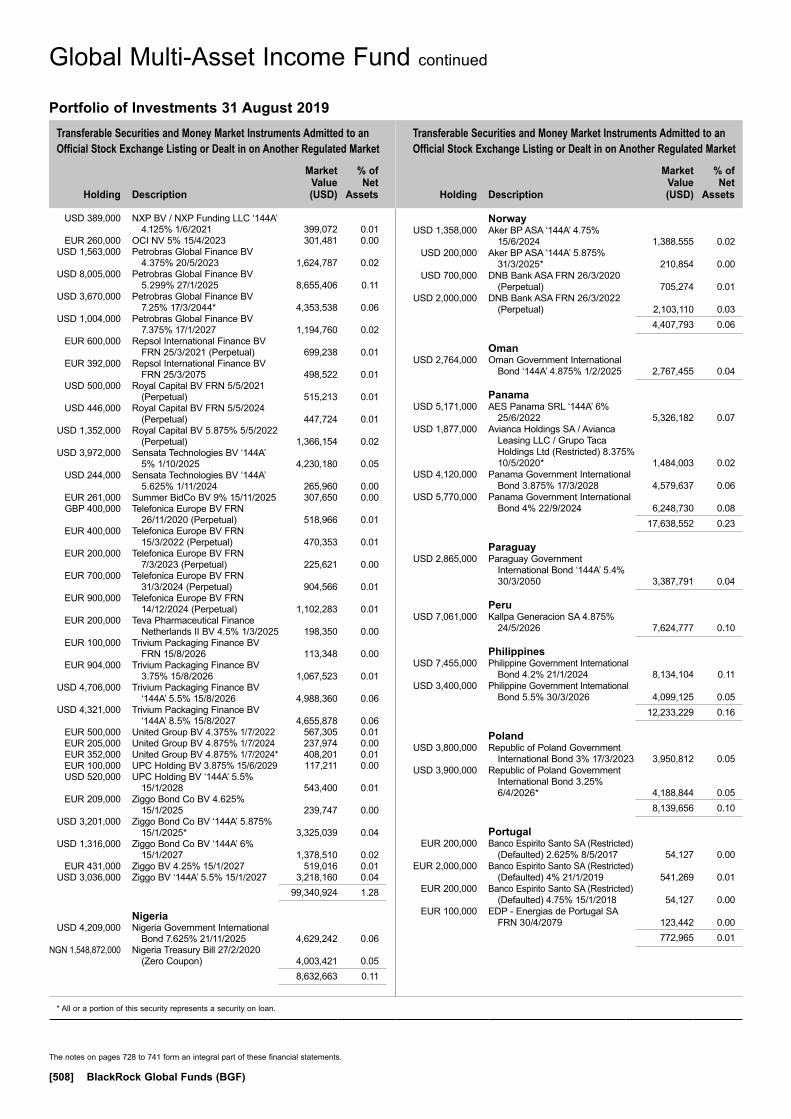
Transferable Securities and Money Market Instruments Admitted to an Official Stock Exchange Listing or Dealt in on Another Regulated Market
Transferable Securities and Money Market Instruments Admitted to an Official Stock Exchange Listing or Dealt in on Another Regulated Market
Holding
Description
Market Value (USD)
% of Net
Assets
Holding
Description
Market Value (USD)
% of Net
Assets
* All or a portion of this security represents a security on loan.
The notes on pages 728 to 741 form an integral part of these financial statements.
[508] BlackRock Global Funds (BGF)
USD 389,000 NXP BV / NXP Funding LLC ‘144A’ 4.125% 1/6/2021 399,072 0.01
EUR 260,000 OCI NV 5% 15/4/2023 301,481 0.00 USD 1,563,000 Petrobras Global Finance BV
4.375% 20/5/2023 1,624,787 0.02 USD 8,005,000 Petrobras Global Finance BV
5.299% 27/1/2025 8,655,406 0.11 USD 3,670,000 Petrobras Global Finance BV
7.25% 17/3/2044* 4,353,538 0.06 USD 1,004,000 Petrobras Global Finance BV
7.375% 17/1/2027 1,194,760 0.02 EUR 600,000 Repsol International Finance BV
FRN 25/3/2021 (Perpetual) 699,238 0.01 EUR 392,000 Repsol International Finance BV
FRN 25/3/2075 498,522 0.01 USD 500,000 Royal Capital BV FRN 5/5/2021
(Perpetual) 515,213 0.01 USD 446,000 Royal Capital BV FRN 5/5/2024
(Perpetual) 447,724 0.01 USD 1,352,000 Royal Capital BV 5.875% 5/5/2022
(Perpetual) 1,366,154 0.02 USD 3,972,000 Sensata Technologies BV ‘144A’
5% 1/10/2025 4,230,180 0.05 USD 244,000 Sensata Technologies BV ‘144A’
5.625% 1/11/2024 265,960 0.00 EUR 261,000 Summer BidCo BV 9% 15/11/2025 307,650 0.00 GBP 400,000 Telefonica Europe BV FRN
26/11/2020 (Perpetual) 518,966 0.01 EUR 400,000 Telefonica Europe BV FRN
15/3/2022 (Perpetual) 470,353 0.01 EUR 200,000 Telefonica Europe BV FRN
7/3/2023 (Perpetual) 225,621 0.00 EUR 700,000 Telefonica Europe BV FRN
31/3/2024 (Perpetual) 904,566 0.01 EUR 900,000 Telefonica Europe BV FRN
14/12/2024 (Perpetual) 1,102,283 0.01 EUR 200,000 Teva Pharmaceutical Finance
Netherlands II BV 4.5% 1/3/2025 198,350 0.00 EUR 100,000 Trivium Packaging Finance BV
FRN 15/8/2026 113,348 0.00 EUR 904,000 Trivium Packaging Finance BV
3.75% 15/8/2026 1,067,523 0.01 USD 4,706,000 Trivium Packaging Finance BV
‘144A’ 5.5% 15/8/2026 4,988,360 0.06 USD 4,321,000 Trivium Packaging Finance BV
‘144A’ 8.5% 15/8/2027 4,655,878 0.06 EUR 500,000 United Group BV 4.375% 1/7/2022 567,305 0.01 EUR 205,000 United Group BV 4.875% 1/7/2024 237,974 0.00 EUR 352,000 United Group BV 4.875% 1/7/2024* 408,201 0.01 EUR 100,000 UPC Holding BV 3.875% 15/6/2029 117,211 0.00 USD 520,000 UPC Holding BV ‘144A’ 5.5%
15/1/2028 543,400 0.01 EUR 209,000 Ziggo Bond Co BV 4.625%
15/1/2025 239,747 0.00 USD 3,201,000 Ziggo Bond Co BV ‘144A’ 5.875%
15/1/2025* 3,325,039 0.04 USD 1,316,000 Ziggo Bond Co BV ‘144A’ 6%
15/1/2027 1,378,510 0.02 EUR 431,000 Ziggo BV 4.25% 15/1/2027 519,016 0.01 USD 3,036,000 Ziggo BV ‘144A’ 5.5% 15/1/2027 3,218,160 0.04 99,340,924 1.28
Nigeria USD 4,209,000 Nigeria Government International
Bond 7.625% 21/11/2025 4,629,242 0.06 NGN 1,548,872,000 Nigeria Treasury Bill 27/2/2020
(Zero Coupon) 4,003,421 0.05 8,632,663 0.11
Norway USD 1,358,000 Aker BP ASA ‘144A’ 4.75%
15/6/2024 1,388,555 0.02 USD 200,000 Aker BP ASA ‘144A’ 5.875%
31/3/2025* 210,854 0.00 USD 700,000 DNB Bank ASA FRN 26/3/2020
(Perpetual) 705,274 0.01 USD 2,000,000 DNB Bank ASA FRN 26/3/2022
(Perpetual) 2,103,110 0.03 4,407,793 0.06
Oman USD 2,764,000 Oman Government International
Bond ‘144A’ 4.875% 1/2/2025 2,767,455 0.04
Panama USD 5,171,000 AES Panama SRL ‘144A’ 6%
25/6/2022 5,326,182 0.07 USD 1,877,000 Avianca Holdings SA / Avianca
Leasing LLC / Grupo Taca Holdings Ltd (Restricted) 8.375% 10/5/2020* 1,484,003 0.02
USD 4,120,000 Panama Government International Bond 3.875% 17/3/2028 4,579,637 0.06
USD 5,770,000 Panama Government International Bond 4% 22/9/2024 6,248,730 0.08
17,638,552 0.23
Paraguay USD 2,865,000 Paraguay Government
International Bond ‘144A’ 5.4% 30/3/2050 3,387,791 0.04
Peru USD 7,061,000 Kallpa Generacion SA 4.875%
24/5/2026 7,624,777 0.10
Philippines USD 7,455,000 Philippine Government International
Bond 4.2% 21/1/2024 8,134,104 0.11 USD 3,400,000 Philippine Government International
Bond 5.5% 30/3/2026 4,099,125 0.05 12,233,229 0.16
Poland USD 3,800,000 Republic of Poland Government
International Bond 3% 17/3/2023 3,950,812 0.05 USD 3,900,000 Republic of Poland Government
International Bond 3.25% 6/4/2026* 4,188,844 0.05
8,139,656 0.10
Portugal EUR 200,000 Banco Espirito Santo SA (Restricted)
(Defaulted) 2.625% 8/5/2017 54,127 0.00 EUR 2,000,000 Banco Espirito Santo SA (Restricted)
(Defaulted) 4% 21/1/2019 541,269 0.01 EUR 200,000 Banco Espirito Santo SA (Restricted)
(Defaulted) 4.75% 15/1/2018 54,127 0.00 EUR 100,000 EDP - Energias de Portugal SA
FRN 30/4/2079 123,442 0.00 772,965 0.01
Global Multi-Asset Income Fund continued
Portfolio of Investments 31 August 2019

Transferable Securities and Money Market Instruments Admitted to an Official Stock Exchange Listing or Dealt in on Another Regulated Market
Transferable Securities and Money Market Instruments Admitted to an Official Stock Exchange Listing or Dealt in on Another Regulated Market
Holding
Description
Market Value (USD)
% of Net
Assets
Holding
Description
Market Value (USD)
% of Net
Assets
* All or a portion of this security represents a security on loan.
The notes on pages 728 to 741 form an integral part of these financial statements.
Annual Report and Audited Financial Statements [509]
Qatar USD 7,230,000 Qatar Government International
Bond ‘144A’ 4% 14/3/2029 8,283,998 0.11 USD 10,980,000 Qatar Government International
Bond 4.5% 23/4/2028 12,901,500 0.16 21,185,498 0.27
Russian Federation USD 4,400,000 Russian Foreign Bond - Eurobond
4.25% 23/6/2027 4,683,800 0.06 USD 7,000,000 Russian Foreign Bond - Eurobond
4.75% 27/5/2026 7,644,219 0.10 12,328,019 0.16
Saint Lucia USD 954,000 Digicel International Finance Ltd /
Digicel Holdings Bermuda Ltd ‘144A’ 8.75% 25/5/2024 899,592 0.01
Saudi Arabia USD 520,000 Saudi Arabian Oil Co ‘144A’
2.875% 16/4/2024 534,040 0.01 USD 1,805,000 Saudi Arabian Oil Co ‘144A’
3.5% 16/4/2029* 1,930,447 0.02 USD 8,000,000 Saudi Government International
Bond 3.25% 26/10/2026 8,472,000 0.11 USD 4,000,000 Saudi Government International
Bond 4% 17/4/2025 4,362,000 0.06 USD 4,087,000 Saudi Government International
Bond ‘144A’ 4.375% 16/4/2029 4,716,398 0.06 USD 5,300,000 Saudi Government International
Bond 4.5% 17/4/2030* 6,203,650 0.08 26,218,535 0.34
Singapore USD 2,310,000 Alam Synergy Pte Ltd 6.625%
24/4/2022 2,170,545 0.03 USD 790,000 Alam Synergy Pte Ltd 11.5%
22/4/2021 834,635 0.01 USD 928,000 BPRL International Singapore Pte
Ltd 4.375% 18/1/2027* 998,343 0.01 USD 1,880,000 Global Prime Capital Pte Ltd 7.25%
26/4/2021* 1,950,387 0.03 USD 3,500,000 JGC Ventures Pte Ltd 10.75%
30/8/2021 3,710,018 0.05 USD 1,100,000 Jubilant Pharma Ltd/SG 6%
5/3/2024* 1,137,125 0.01 USD 3,737,000 Medco Straits Services Pte Ltd
8.5% 17/8/2022* 3,963,556 0.05 USD 1,496,000 Modernland Overseas Pte Ltd
6.95% 13/4/2024* 1,368,481 0.02 EUR 1,451,000 Mulhacen Pte Ltd 6.5% 1/8/2023* 1,331,493 0.02 USD 326,000 Oil India International Pte Ltd 4%
21/4/2027 343,675 0.00 USD 1,994,000 United Overseas Bank Ltd FRN
19/10/2023 (Perpetual) 2,007,584 0.03 19,815,842 0.26
South Africa USD 3,820,000 Eskom Holdings SOC Ltd ‘144A’
6.35% 10/8/2028 4,156,638 0.05 USD 7,352,000 Republic of South Africa
Government International Bond 5.5% 9/3/2020* 7,454,928 0.10
11,611,566 0.15
South Korea USD 1,452,000 Heungkuk Life Insurance Co Ltd
FRN 9/11/2022 (Perpetual) 1,415,221 0.02 USD 2,300,000 KDB Life Insurance Co Ltd FRN
21/5/2023 (Perpetual) 2,280,234 0.03 USD 4,400,000 Shinhan Financial Group Co Ltd
FRN 13/8/2023 (Perpetual) 4,712,125 0.06 USD 2,100,000 Woori Bank 5.125% 6/8/2028 2,429,362 0.03 10,836,942 0.14
Spain EUR 1,800,000 Banco Bilbao Vizcaya Argentaria
SA FRN 18/2/2020 (Perpetual)* 2,038,082 0.03 EUR 1,800,000 Banco Bilbao Vizcaya Argentaria
SA FRN 14/4/2021 (Perpetual) 2,214,587 0.03 USD 9,400,000 Banco Bilbao Vizcaya Argentaria
SA FRN 16/11/2027 (Perpetual) 8,832,710 0.11 EUR 4,200,000 Banco de Sabadell SA FRN
18/5/2022 (Perpetual) 4,610,172 0.06 EUR 400,000 Banco de Sabadell SA FRN
23/11/2022 (Perpetual)* 433,567 0.01 EUR 200,000 Banco de Sabadell SA FRN
12/12/2028 242,852 0.00 EUR 3,600,000 Banco Santander SA FRN
25/4/2022 (Perpetual) 4,331,228 0.06 EUR 200,000 Banco Santander SA FRN
19/3/2025 (Perpetual) 210,293 0.00 EUR 4,000,000 Bankia SA FRN 18/7/2022
(Perpetual) 4,481,263 0.06 EUR 1,200,000 Bankia SA FRN 19/9/2023
(Perpetual) 1,376,471 0.02 EUR 250,000 Bilbao CLO I DAC FRN 20/7/2031 262,831 0.00 EUR 3,600,000 CaixaBank SA FRN 13/6/2024
(Perpetual) 4,296,114 0.06 EUR 2,400,000 CaixaBank SA FRN 23/3/2026
(Perpetual) 2,481,892 0.03 EUR 400,000 Distribuidora Internacional de
Alimentacion SA 1% 28/4/2021 357,975 0.01 EUR 300,000 Hipercor SA 3.875% 19/1/2022 355,920 0.00 EUR 200,000 Mapfre SA FRN 7/9/2048 256,471 0.00 EUR 143,873 NH Hotel Group SA 3.75%
1/10/2023 162,644 0.00 EUR 300,000 Tendam Brands SAU 5% 15/9/2024* 340,830 0.00 37,285,902 0.48
Sri Lanka USD 1,150,000 Sri Lanka Government International
Bond 5.75% 18/1/2022 1,152,336 0.01 USD 2,579,000 Sri Lanka Government International
Bond 6.25% 4/10/2020* 2,621,714 0.03 USD 444,000 Sri Lanka Government International
Bond 6.25% 27/7/2021 451,354 0.01 USD 1,050,000 Sri Lanka Government International
Bond 6.85% 14/3/2024 1,069,033 0.01 USD 2,713,000 Sri Lanka Government International
Bond 7.85% 14/3/2029 2,747,155 0.04 8,041,592 0.10
Sweden EUR 200,000 Corral Petroleum Holdings AB
11.75% 15/5/2021 232,556 0.00 EUR 404,000 Intrum AB 2.75% 15/7/2022 456,138 0.01 EUR 651,000 Intrum AB 3.5% 15/7/2026 753,966 0.01 USD 2,000,000 Skandinaviska Enskilda Banken AB
FRN 13/5/2020 (Perpetual) 2,016,310 0.03
Global Multi-Asset Income Fund continued
Portfolio of Investments 31 August 2019
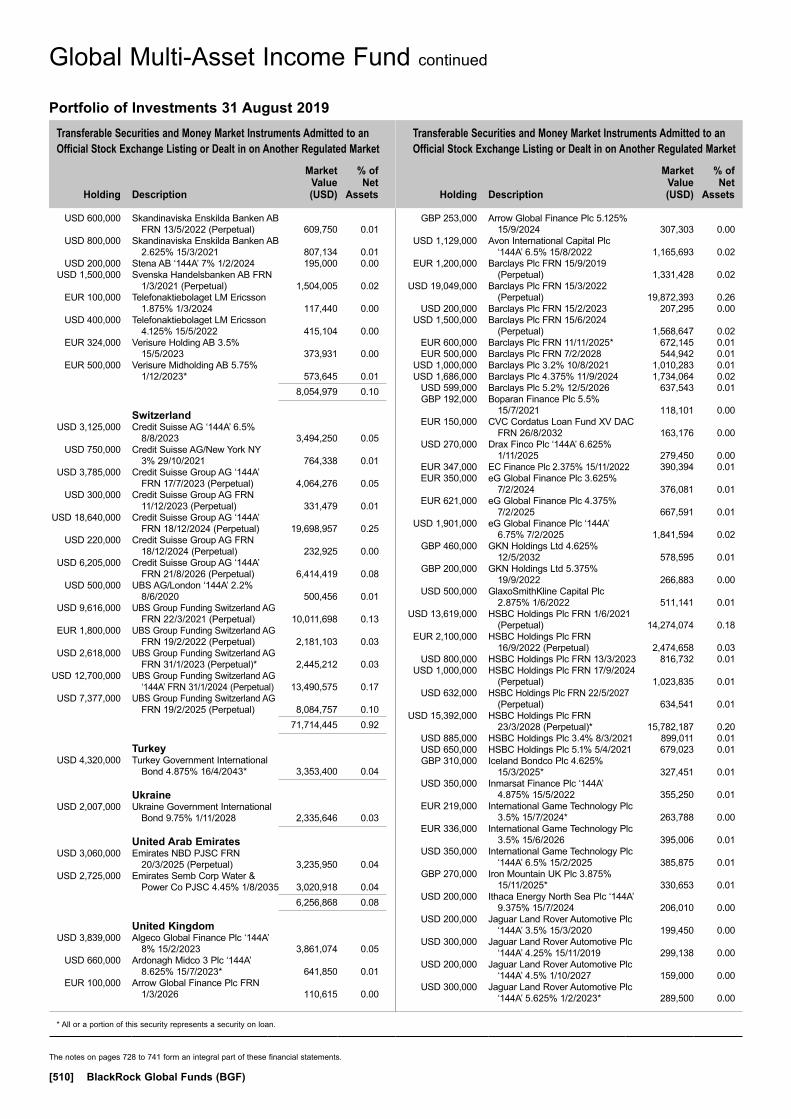
Transferable Securities and Money Market Instruments Admitted to an Official Stock Exchange Listing or Dealt in on Another Regulated Market
Transferable Securities and Money Market Instruments Admitted to an Official Stock Exchange Listing or Dealt in on Another Regulated Market
Holding
Description
Market Value (USD)
% of Net
Assets
Holding
Description
Market Value (USD)
% of Net
Assets
* All or a portion of this security represents a security on loan.
The notes on pages 728 to 741 form an integral part of these financial statements.
[510] BlackRock Global Funds (BGF)
USD 600,000 Skandinaviska Enskilda Banken AB FRN 13/5/2022 (Perpetual) 609,750 0.01
USD 800,000 Skandinaviska Enskilda Banken AB 2.625% 15/3/2021 807,134 0.01
USD 200,000 Stena AB ‘144A’ 7% 1/2/2024 195,000 0.00 USD 1,500,000 Svenska Handelsbanken AB FRN
1/3/2021 (Perpetual) 1,504,005 0.02 EUR 100,000 Telefonaktiebolaget LM Ericsson
1.875% 1/3/2024 117,440 0.00 USD 400,000 Telefonaktiebolaget LM Ericsson
4.125% 15/5/2022 415,104 0.00 EUR 324,000 Verisure Holding AB 3.5%
15/5/2023 373,931 0.00 EUR 500,000 Verisure Midholding AB 5.75%
1/12/2023* 573,645 0.01 8,054,979 0.10
Switzerland USD 3,125,000 Credit Suisse AG ‘144A’ 6.5%
8/8/2023 3,494,250 0.05 USD 750,000 Credit Suisse AG/New York NY
3% 29/10/2021 764,338 0.01 USD 3,785,000 Credit Suisse Group AG ‘144A’
FRN 17/7/2023 (Perpetual) 4,064,276 0.05 USD 300,000 Credit Suisse Group AG FRN
11/12/2023 (Perpetual) 331,479 0.01 USD 18,640,000 Credit Suisse Group AG ‘144A’
FRN 18/12/2024 (Perpetual) 19,698,957 0.25 USD 220,000 Credit Suisse Group AG FRN
18/12/2024 (Perpetual) 232,925 0.00 USD 6,205,000 Credit Suisse Group AG ‘144A’
FRN 21/8/2026 (Perpetual) 6,414,419 0.08 USD 500,000 UBS AG/London ‘144A’ 2.2%
8/6/2020 500,456 0.01 USD 9,616,000 UBS Group Funding Switzerland AG
FRN 22/3/2021 (Perpetual) 10,011,698 0.13 EUR 1,800,000 UBS Group Funding Switzerland AG
FRN 19/2/2022 (Perpetual) 2,181,103 0.03 USD 2,618,000 UBS Group Funding Switzerland AG
FRN 31/1/2023 (Perpetual)* 2,445,212 0.03 USD 12,700,000 UBS Group Funding Switzerland AG
‘144A’ FRN 31/1/2024 (Perpetual) 13,490,575 0.17 USD 7,377,000 UBS Group Funding Switzerland AG
FRN 19/2/2025 (Perpetual) 8,084,757 0.10 71,714,445 0.92
Turkey USD 4,320,000 Turkey Government International
Bond 4.875% 16/4/2043* 3,353,400 0.04
Ukraine USD 2,007,000 Ukraine Government International
Bond 9.75% 1/11/2028 2,335,646 0.03
United Arab Emirates USD 3,060,000 Emirates NBD PJSC FRN
20/3/2025 (Perpetual) 3,235,950 0.04 USD 2,725,000 Emirates Semb Corp Water &
Power Co PJSC 4.45% 1/8/2035 3,020,918 0.04 6,256,868 0.08
United Kingdom USD 3,839,000 Algeco Global Finance Plc ‘144A’
8% 15/2/2023 3,861,074 0.05 USD 660,000 Ardonagh Midco 3 Plc ‘144A’
8.625% 15/7/2023* 641,850 0.01 EUR 100,000 Arrow Global Finance Plc FRN
1/3/2026 110,615 0.00
GBP 253,000 Arrow Global Finance Plc 5.125% 15/9/2024 307,303 0.00
USD 1,129,000 Avon International Capital Plc ‘144A’ 6.5% 15/8/2022 1,165,693 0.02
EUR 1,200,000 Barclays Plc FRN 15/9/2019 (Perpetual) 1,331,428 0.02
USD 19,049,000 Barclays Plc FRN 15/3/2022 (Perpetual) 19,872,393 0.26
USD 200,000 Barclays Plc FRN 15/2/2023 207,295 0.00 USD 1,500,000 Barclays Plc FRN 15/6/2024
(Perpetual) 1,568,647 0.02 EUR 600,000 Barclays Plc FRN 11/11/2025* 672,145 0.01 EUR 500,000 Barclays Plc FRN 7/2/2028 544,942 0.01 USD 1,000,000 Barclays Plc 3.2% 10/8/2021 1,010,283 0.01 USD 1,686,000 Barclays Plc 4.375% 11/9/2024 1,734,064 0.02 USD 599,000 Barclays Plc 5.2% 12/5/2026 637,543 0.01 GBP 192,000 Boparan Finance Plc 5.5%
15/7/2021 118,101 0.00 EUR 150,000 CVC Cordatus Loan Fund XV DAC
FRN 26/8/2032 163,176 0.00 USD 270,000 Drax Finco Plc ‘144A’ 6.625%
1/11/2025 279,450 0.00 EUR 347,000 EC Finance Plc 2.375% 15/11/2022 390,394 0.01 EUR 350,000 eG Global Finance Plc 3.625%
7/2/2024 376,081 0.01 EUR 621,000 eG Global Finance Plc 4.375%
7/2/2025 667,591 0.01 USD 1,901,000 eG Global Finance Plc ‘144A’
6.75% 7/2/2025 1,841,594 0.02 GBP 460,000 GKN Holdings Ltd 4.625%
12/5/2032 578,595 0.01 GBP 200,000 GKN Holdings Ltd 5.375%
19/9/2022 266,883 0.00 USD 500,000 GlaxoSmithKline Capital Plc
2.875% 1/6/2022 511,141 0.01 USD 13,619,000 HSBC Holdings Plc FRN 1/6/2021
(Perpetual) 14,274,074 0.18 EUR 2,100,000 HSBC Holdings Plc FRN
16/9/2022 (Perpetual) 2,474,658 0.03 USD 800,000 HSBC Holdings Plc FRN 13/3/2023 816,732 0.01 USD 1,000,000 HSBC Holdings Plc FRN 17/9/2024
(Perpetual) 1,023,835 0.01 USD 632,000 HSBC Holdings Plc FRN 22/5/2027
(Perpetual) 634,541 0.01 USD 15,392,000 HSBC Holdings Plc FRN
23/3/2028 (Perpetual)* 15,782,187 0.20 USD 885,000 HSBC Holdings Plc 3.4% 8/3/2021 899,011 0.01 USD 650,000 HSBC Holdings Plc 5.1% 5/4/2021 679,023 0.01 GBP 310,000 Iceland Bondco Plc 4.625%
15/3/2025* 327,451 0.01 USD 350,000 Inmarsat Finance Plc ‘144A’
4.875% 15/5/2022 355,250 0.01 EUR 219,000 International Game Technology Plc
3.5% 15/7/2024* 263,788 0.00 EUR 336,000 International Game Technology Plc
3.5% 15/6/2026 395,006 0.01 USD 350,000 International Game Technology Plc
‘144A’ 6.5% 15/2/2025 385,875 0.01 GBP 270,000 Iron Mountain UK Plc 3.875%
15/11/2025* 330,653 0.01 USD 200,000 Ithaca Energy North Sea Plc ‘144A’
9.375% 15/7/2024 206,010 0.00 USD 200,000 Jaguar Land Rover Automotive Plc
‘144A’ 3.5% 15/3/2020 199,450 0.00 USD 300,000 Jaguar Land Rover Automotive Plc
‘144A’ 4.25% 15/11/2019 299,138 0.00 USD 200,000 Jaguar Land Rover Automotive Plc
‘144A’ 4.5% 1/10/2027 159,000 0.00 USD 300,000 Jaguar Land Rover Automotive Plc
‘144A’ 5.625% 1/2/2023* 289,500 0.00
Global Multi-Asset Income Fund continued
Portfolio of Investments 31 August 2019

Transferable Securities and Money Market Instruments Admitted to an Official Stock Exchange Listing or Dealt in on Another Regulated Market
Transferable Securities and Money Market Instruments Admitted to an Official Stock Exchange Listing or Dealt in on Another Regulated Market
Holding
Description
Market Value (USD)
% of Net
Assets
Holding
Description
Market Value (USD)
% of Net
Assets
* All or a portion of this security represents a security on loan.
The notes on pages 728 to 741 form an integral part of these financial statements.
Annual Report and Audited Financial Statements [511]
USD 800,000 Lloyds Bank Plc 2.25% 14/8/2022 801,646 0.01 USD 3,595,000 Lloyds Banking Group Plc FRN
27/6/2026 (Perpetual) 3,648,925 0.05 USD 900,000 National Westminster Bank Plc
FRN 28/11/2019 (Perpetual) 725,625 0.01 USD 600,000 Neptune Energy Bondco Plc ‘144A’
6.625% 15/5/2025 600,300 0.01 EUR 225,000 NGG Finance Plc FRN 5/12/2079 249,020 0.00 EUR 275,000 NGG Finance Plc FRN 5/9/2082 304,441 0.00 EUR 200,000 Nomad Foods Bondco Plc 3.25%
15/5/2024 229,562 0.00 EUR 330,000 OTE Plc 3.5% 9/7/2020 376,769 0.01 GBP 216,000 Pinnacle Bidco Plc 6.375%
15/2/2025 280,268 0.00 GBP 200,000 Premier Foods Finance Plc 6.25%
15/10/2023 251,657 0.00 USD 3,775,000 Royal Bank of Scotland Group Plc
FRN 10/8/2020 (Perpetual) 3,844,460 0.05 USD 15,544,000 Royal Bank of Scotland Group Plc
FRN 15/8/2021 (Perpetual) 16,496,070 0.21 USD 260,000 Royal Bank of Scotland Group Plc
3.875% 12/9/2023 267,834 0.00 USD 650,000 Royal Bank of Scotland Group Plc
6.125% 15/12/2022 703,103 0.01 GBP 1,600,000 Santander UK Group Holdings Plc
FRN 24/6/2024 (Perpetual) 2,030,172 0.03 USD 200,000 Santander UK Group Holdings Plc
3.571% 10/1/2023 203,675 0.00 USD 295,000 Santander UK Plc 2.5% 5/1/2021 296,074 0.00 USD 1,000,000 Santander UK Plc 3.4% 1/6/2021 1,020,607 0.01 USD 200,000 Santander UK Plc 3.75% 15/11/2021 206,146 0.00 USD 300,000 Santander UK Plc 4% 13/3/2024 319,185 0.01 USD 3,175,000 Santander UK Plc ‘144A’ 5%
7/11/2023 3,367,357 0.04 USD 200,000 Sensata Technologies UK Financing
Co Plc ‘144A’ 6.25% 15/2/2026 213,500 0.00 GBP 140,000 Shop Direct Funding Plc 7.75%
15/11/2022 150,730 0.00 USD 18,675,000 Standard Chartered Plc ‘144A’ FRN
2/4/2022 (Perpetual)* 19,632,094 0.25 GBP 248,000 Stonegate Pub Co Financing Plc
FRN 15/3/2022 307,128 0.00 GBP 200,000 Stonegate Pub Co Financing Plc
FRN 15/3/2022 246,521 0.00 GBP 159,000 Stonegate Pub Co Financing Plc
4.875% 15/3/2022 199,462 0.00 EUR 300,000 Synlab Unsecured Bondco Plc
8.25% 1/7/2023 346,858 0.01 GBP 281,000 Tesco Corporate Treasury Services
Plc 2.5% 2/5/2025 352,566 0.01 USD 100,000 Tesco Plc ‘144A’ 6.15% 15/11/2037 118,150 0.00 GBP 322,875 Unique Pub Finance Co Plc/The
5.659% 30/6/2027 450,068 0.01 GBP 100,000 Unique Pub Finance Co Plc/The
6.464% 30/3/2032 138,902 0.00 USD 953,000 Vedanta Resources Finance II Plc
8% 23/4/2023 935,131 0.01 USD 4,725,000 Vedanta Resources Ltd 7.125%
31/5/2023* 4,549,289 0.06 USD 322,000 Vedanta Resources Ltd 8.25%
7/6/2021* 334,679 0.01 USD 5,709,000 Virgin Media Finance Plc ‘144A’
5.75% 15/1/2025 5,944,496 0.08 USD 200,000 Virgin Media Finance Plc ‘144A’
6% 15/10/2024 207,250 0.00 GBP 109,000 Virgin Media Secured Finance Plc
4.875% 15/1/2027* 139,440 0.00 GBP 200,000 Virgin Media Secured Finance Plc
5% 15/4/2027 256,935 0.00
GBP 200,000 Virgin Media Secured Finance Plc 5.125% 15/1/2025 253,933 0.00
USD 966,000 Virgin Media Secured Finance Plc ‘144A’ 5.25% 15/1/2026 993,773 0.01
USD 400,000 Virgin Media Secured Finance Plc ‘144A’ 5.5% 15/8/2026* 419,880 0.01
USD 2,047,000 Virgin Media Secured Finance Plc ‘144A’ 5.5% 15/5/2029 2,144,232 0.03
GBP 540,000 Virgin Media Secured Finance Plc 6.25% 28/3/2029 702,814 0.01
GBP 100,000 Vodafone Group Plc 26/11/2020 (Zero Coupon) 120,226 0.00
EUR 400,000 Vodafone Group Plc FRN 3/10/2078 501,679 0.01 EUR 600,000 Vodafone Group Plc FRN 3/1/2079 698,080 0.01 USD 10,520,000 Vodafone Group Plc FRN 4/4/2079* 11,991,513 0.16 167,225,688 2.15
United States USD 2,391,000 245 Park Avenue Trust 2017-245P
‘Series 2017-245P E’ ‘144A’ FRN 5/6/2037 2,412,596 0.03
USD 425,000 280 Park Avenue 2017-280P Mortgage Trust ‘Series 2017-280P A’ ‘144A’ FRN 15/9/2034 425,565 0.01
USD 11,370,000 280 Park Avenue 2017-280P Mortgage Trust ‘Series 2017-280P E’ ‘144A’ FRN 15/9/2034 11,420,390 0.15
USD 575,000 AbbVie Inc 3.375% 14/11/2021 589,652 0.01 USD 299,000 AbbVie Inc 3.75% 14/11/2023 315,278 0.00 USD 291,000 Acadia Healthcare Co Inc 5.125%
1/7/2022 293,910 0.00 USD 399,159 Accredited Mortgage Loan Trust
2004-4 ‘Series 2004-4 M2’ FRN 25/1/2035 392,483 0.01
USD 4,155,000 ACI Worldwide Inc ‘144A’ 5.75% 15/8/2026 4,373,138 0.06
USD 658,000 Acrisure LLC / Acrisure Finance Inc ‘144A’ 8.125% 15/2/2024 710,229 0.01
USD 1,060,000 Adient US LLC ‘144A’ 7% 15/5/2026 1,081,200 0.01 USD 590,920 Adjustable Rate Mortgage Trust
2005-8 ‘Series 2005-8 2A1’ FRN 25/11/2035 551,426 0.01
USD 334,889 Adjustable Rate Mortgage Trust 2005-8 ‘Series 2005-8 7A2’ FRN 25/11/2035 333,952 0.00
USD 479,000 ADT Security Corp/The 3.5% 15/7/2022 483,790 0.01
USD 819,000 ADT Security Corp/The 4.125% 15/6/2023 832,309 0.01
USD 3,117,000 ADT Security Corp/The ‘144A’ 4.875% 15/7/2032 2,731,271 0.04
USD 350,000 ADT Security Corp/The 6.25% 15/10/2021 373,188 0.01
USD 300,000 Advance Auto Parts Inc 4.5% 1/12/2023 322,998 0.00
USD 106,000 Advanced Micro Devices Inc 7.5% 15/8/2022 120,151 0.00
USD 800,000 AECOM 5.125% 15/3/2027 834,000 0.01 USD 1,032,000 AECOM 5.875% 15/10/2024 1,115,850 0.01 USD 195,000 AES Corp/VA 4% 15/3/2021 198,904 0.00 USD 245,000 AES Corp/VA 4.5% 15/3/2023 252,448 0.00 USD 510,000 AES Corp/VA 4.875% 15/5/2023 518,288 0.01 USD 190,000 AES Corp/VA 5.125% 1/9/2027 202,943 0.00 USD 321,000 AES Corp/VA 5.5% 15/4/2025 335,244 0.00 USD 486,000 AES Corp/VA 6% 15/5/2026 522,931 0.01 USD 1,317,000 AHP Health Partners Inc ‘144A’
9.75% 15/7/2026 1,421,208 0.02 USD 800,000 AIMCO CLO Series 2018-A ‘Series
2018-AA A’ ‘144A’ FRN 17/4/2031 791,701 0.01
Global Multi-Asset Income Fund continued
Portfolio of Investments 31 August 2019
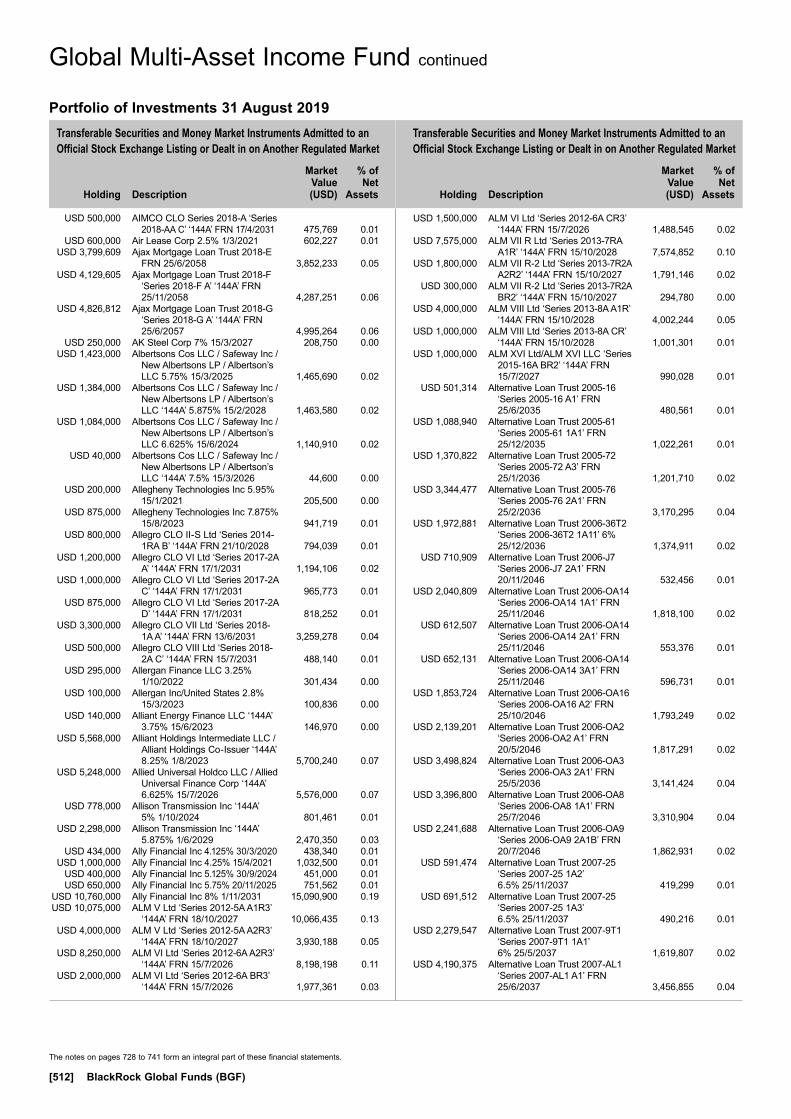
Transferable Securities and Money Market Instruments Admitted to an Official Stock Exchange Listing or Dealt in on Another Regulated Market
Transferable Securities and Money Market Instruments Admitted to an Official Stock Exchange Listing or Dealt in on Another Regulated Market
Holding
Description
Market Value (USD)
% of Net
Assets
Holding
Description
Market Value (USD)
% of Net
Assets
The notes on pages 728 to 741 form an integral part of these financial statements.
[512] BlackRock Global Funds (BGF)
USD 500,000 AIMCO CLO Series 2018-A ‘Series 2018-AA C’ ‘144A’ FRN 17/4/2031 475,769 0.01
USD 600,000 Air Lease Corp 2.5% 1/3/2021 602,227 0.01 USD 3,799,609 Ajax Mortgage Loan Trust 2018-E
FRN 25/6/2058 3,852,233 0.05 USD 4,129,605 Ajax Mortgage Loan Trust 2018-F
‘Series 2018-F A’ ‘144A’ FRN 25/11/2058 4,287,251 0.06
USD 4,826,812 Ajax Mortgage Loan Trust 2018-G ‘Series 2018-G A’ ‘144A’ FRN 25/6/2057 4,995,264 0.06
USD 250,000 AK Steel Corp 7% 15/3/2027 208,750 0.00 USD 1,423,000 Albertsons Cos LLC / Safeway Inc /
New Albertsons LP / Albertson’s LLC 5.75% 15/3/2025 1,465,690 0.02
USD 1,384,000 Albertsons Cos LLC / Safeway Inc / New Albertsons LP / Albertson’s LLC ‘144A’ 5.875% 15/2/2028 1,463,580 0.02
USD 1,084,000 Albertsons Cos LLC / Safeway Inc / New Albertsons LP / Albertson’s LLC 6.625% 15/6/2024 1,140,910 0.02
USD 40,000 Albertsons Cos LLC / Safeway Inc / New Albertsons LP / Albertson’s LLC ‘144A’ 7.5% 15/3/2026 44,600 0.00
USD 200,000 Allegheny Technologies Inc 5.95% 15/1/2021 205,500 0.00
USD 875,000 Allegheny Technologies Inc 7.875% 15/8/2023 941,719 0.01
USD 800,000 Allegro CLO II-S Ltd ‘Series 2014-1RA B’ ‘144A’ FRN 21/10/2028 794,039 0.01
USD 1,200,000 Allegro CLO VI Ltd ‘Series 2017-2A A’ ‘144A’ FRN 17/1/2031 1,194,106 0.02
USD 1,000,000 Allegro CLO VI Ltd ‘Series 2017-2A C’ ‘144A’ FRN 17/1/2031 965,773 0.01
USD 875,000 Allegro CLO VI Ltd ‘Series 2017-2A D’ ‘144A’ FRN 17/1/2031 818,252 0.01
USD 3,300,000 Allegro CLO VII Ltd ‘Series 2018-1A A’ ‘144A’ FRN 13/6/2031 3,259,278 0.04
USD 500,000 Allegro CLO VIII Ltd ‘Series 2018-2A C’ ‘144A’ FRN 15/7/2031 488,140 0.01
USD 295,000 Allergan Finance LLC 3.25% 1/10/2022 301,434 0.00
USD 100,000 Allergan Inc/United States 2.8% 15/3/2023 100,836 0.00
USD 140,000 Alliant Energy Finance LLC ‘144A’ 3.75% 15/6/2023 146,970 0.00
USD 5,568,000 Alliant Holdings Intermediate LLC / Alliant Holdings Co-Issuer ‘144A’ 8.25% 1/8/2023 5,700,240 0.07
USD 5,248,000 Allied Universal Holdco LLC / Allied Universal Finance Corp ‘144A’ 6.625% 15/7/2026 5,576,000 0.07
USD 778,000 Allison Transmission Inc ‘144A’ 5% 1/10/2024 801,461 0.01
USD 2,298,000 Allison Transmission Inc ‘144A’ 5.875% 1/6/2029 2,470,350 0.03
USD 434,000 Ally Financial Inc 4.125% 30/3/2020 438,340 0.01 USD 1,000,000 Ally Financial Inc 4.25% 15/4/2021 1,032,500 0.01 USD 400,000 Ally Financial Inc 5.125% 30/9/2024 451,000 0.01 USD 650,000 Ally Financial Inc 5.75% 20/11/2025 751,562 0.01 USD 10,760,000 Ally Financial Inc 8% 1/11/2031 15,090,900 0.19 USD 10,075,000 ALM V Ltd ‘Series 2012-5A A1R3’
‘144A’ FRN 18/10/2027 10,066,435 0.13 USD 4,000,000 ALM V Ltd ‘Series 2012-5A A2R3’
‘144A’ FRN 18/10/2027 3,930,188 0.05 USD 8,250,000 ALM VI Ltd ‘Series 2012-6A A2R3’
‘144A’ FRN 15/7/2026 8,198,198 0.11 USD 2,000,000 ALM VI Ltd ‘Series 2012-6A BR3’
‘144A’ FRN 15/7/2026 1,977,361 0.03
USD 1,500,000 ALM VI Ltd ‘Series 2012-6A CR3’ ‘144A’ FRN 15/7/2026 1,488,545 0.02
USD 7,575,000 ALM VII R Ltd ‘Series 2013-7RA A1R’ ‘144A’ FRN 15/10/2028 7,574,852 0.10
USD 1,800,000 ALM VII R-2 Ltd ‘Series 2013-7R2A A2R2’ ‘144A’ FRN 15/10/2027 1,791,146 0.02
USD 300,000 ALM VII R-2 Ltd ‘Series 2013-7R2A BR2’ ‘144A’ FRN 15/10/2027 294,780 0.00
USD 4,000,000 ALM VIII Ltd ‘Series 2013-8A A1R’ ‘144A’ FRN 15/10/2028 4,002,244 0.05
USD 1,000,000 ALM VIII Ltd ‘Series 2013-8A CR’ ‘144A’ FRN 15/10/2028 1,001,301 0.01
USD 1,000,000 ALM XVI Ltd/ALM XVI LLC ‘Series 2015-16A BR2’ ‘144A’ FRN 15/7/2027 990,028 0.01
USD 501,314 Alternative Loan Trust 2005-16 ‘Series 2005-16 A1’ FRN 25/6/2035 480,561 0.01
USD 1,088,940 Alternative Loan Trust 2005-61 ‘Series 2005-61 1A1’ FRN 25/12/2035 1,022,261 0.01
USD 1,370,822 Alternative Loan Trust 2005-72 ‘Series 2005-72 A3’ FRN 25/1/2036 1,201,710 0.02
USD 3,344,477 Alternative Loan Trust 2005-76 ‘Series 2005-76 2A1’ FRN 25/2/2036 3,170,295 0.04
USD 1,972,881 Alternative Loan Trust 2006-36T2 ‘Series 2006-36T2 1A11’ 6% 25/12/2036 1,374,911 0.02
USD 710,909 Alternative Loan Trust 2006-J7 ‘Series 2006-J7 2A1’ FRN 20/11/2046 532,456 0.01
USD 2,040,809 Alternative Loan Trust 2006-OA14 ‘Series 2006-OA14 1A1’ FRN 25/11/2046 1,818,100 0.02
USD 612,507 Alternative Loan Trust 2006-OA14 ‘Series 2006-OA14 2A1’ FRN 25/11/2046 553,376 0.01
USD 652,131 Alternative Loan Trust 2006-OA14 ‘Series 2006-OA14 3A1’ FRN 25/11/2046 596,731 0.01
USD 1,853,724 Alternative Loan Trust 2006-OA16 ‘Series 2006-OA16 A2’ FRN 25/10/2046 1,793,249 0.02
USD 2,139,201 Alternative Loan Trust 2006-OA2 ‘Series 2006-OA2 A1’ FRN 20/5/2046 1,817,291 0.02
USD 3,498,824 Alternative Loan Trust 2006-OA3 ‘Series 2006-OA3 2A1’ FRN 25/5/2036 3,141,424 0.04
USD 3,396,800 Alternative Loan Trust 2006-OA8 ‘Series 2006-OA8 1A1’ FRN 25/7/2046 3,310,904 0.04
USD 2,241,688 Alternative Loan Trust 2006-OA9 ‘Series 2006-OA9 2A1B’ FRN 20/7/2046 1,862,931 0.02
USD 591,474 Alternative Loan Trust 2007-25 ‘Series 2007-25 1A2’ 6.5% 25/11/2037 419,299 0.01
USD 691,512 Alternative Loan Trust 2007-25 ‘Series 2007-25 1A3’ 6.5% 25/11/2037 490,216 0.01
USD 2,279,547 Alternative Loan Trust 2007-9T1 ‘Series 2007-9T1 1A1’ 6% 25/5/2037 1,619,807 0.02
USD 4,190,375 Alternative Loan Trust 2007-AL1 ‘Series 2007-AL1 A1’ FRN 25/6/2037 3,456,855 0.04
Global Multi-Asset Income Fund continued
Portfolio of Investments 31 August 2019
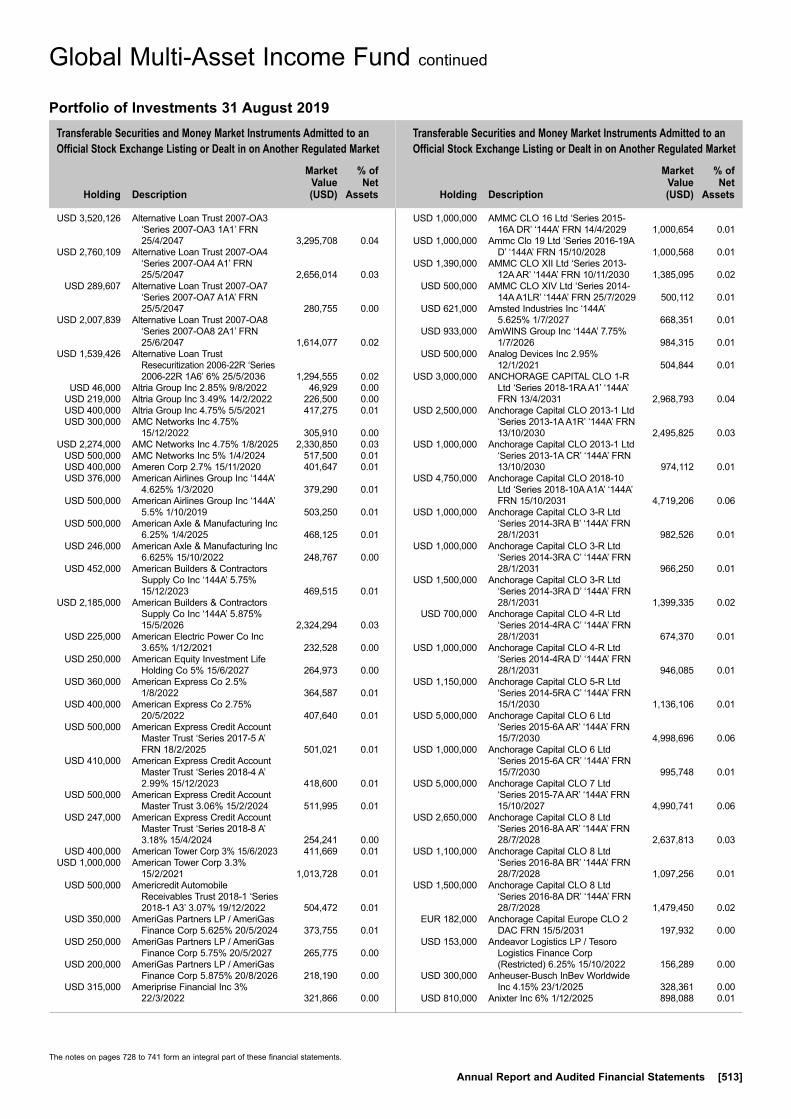
Transferable Securities and Money Market Instruments Admitted to an Official Stock Exchange Listing or Dealt in on Another Regulated Market
Transferable Securities and Money Market Instruments Admitted to an Official Stock Exchange Listing or Dealt in on Another Regulated Market
Holding
Description
Market Value (USD)
% of Net
Assets
Holding
Description
Market Value (USD)
% of Net
Assets
The notes on pages 728 to 741 form an integral part of these financial statements.
Annual Report and Audited Financial Statements [513]
USD 3,520,126 Alternative Loan Trust 2007-OA3 ‘Series 2007-OA3 1A1’ FRN 25/4/2047 3,295,708 0.04
USD 2,760,109 Alternative Loan Trust 2007-OA4 ‘Series 2007-OA4 A1’ FRN 25/5/2047 2,656,014 0.03
USD 289,607 Alternative Loan Trust 2007-OA7 ‘Series 2007-OA7 A1A’ FRN 25/5/2047 280,755 0.00
USD 2,007,839 Alternative Loan Trust 2007-OA8 ‘Series 2007-OA8 2A1’ FRN 25/6/2047 1,614,077 0.02
USD 1,539,426 Alternative Loan Trust Resecuritization 2006-22R ‘Series 2006-22R 1A6’ 6% 25/5/2036 1,294,555 0.02
USD 46,000 Altria Group Inc 2.85% 9/8/2022 46,929 0.00 USD 219,000 Altria Group Inc 3.49% 14/2/2022 226,500 0.00 USD 400,000 Altria Group Inc 4.75% 5/5/2021 417,275 0.01 USD 300,000 AMC Networks Inc 4.75%
15/12/2022 305,910 0.00 USD 2,274,000 AMC Networks Inc 4.75% 1/8/2025 2,330,850 0.03 USD 500,000 AMC Networks Inc 5% 1/4/2024 517,500 0.01 USD 400,000 Ameren Corp 2.7% 15/11/2020 401,647 0.01 USD 376,000 American Airlines Group Inc ‘144A’
4.625% 1/3/2020 379,290 0.01 USD 500,000 American Airlines Group Inc ‘144A’
5.5% 1/10/2019 503,250 0.01 USD 500,000 American Axle & Manufacturing Inc
6.25% 1/4/2025 468,125 0.01 USD 246,000 American Axle & Manufacturing Inc
6.625% 15/10/2022 248,767 0.00 USD 452,000 American Builders & Contractors
Supply Co Inc ‘144A’ 5.75% 15/12/2023 469,515 0.01
USD 2,185,000 American Builders & Contractors Supply Co Inc ‘144A’ 5.875% 15/5/2026 2,324,294 0.03
USD 225,000 American Electric Power Co Inc 3.65% 1/12/2021 232,528 0.00
USD 250,000 American Equity Investment Life Holding Co 5% 15/6/2027 264,973 0.00
USD 360,000 American Express Co 2.5% 1/8/2022 364,587 0.01
USD 400,000 American Express Co 2.75% 20/5/2022 407,640 0.01
USD 500,000 American Express Credit Account Master Trust ‘Series 2017-5 A’ FRN 18/2/2025 501,021 0.01
USD 410,000 American Express Credit Account Master Trust ‘Series 2018-4 A’ 2.99% 15/12/2023 418,600 0.01
USD 500,000 American Express Credit Account Master Trust 3.06% 15/2/2024 511,995 0.01
USD 247,000 American Express Credit Account Master Trust ‘Series 2018-8 A’ 3.18% 15/4/2024 254,241 0.00
USD 400,000 American Tower Corp 3% 15/6/2023 411,669 0.01 USD 1,000,000 American Tower Corp 3.3%
15/2/2021 1,013,728 0.01 USD 500,000 Americredit Automobile
Receivables Trust 2018-1 ‘Series 2018-1 A3’ 3.07% 19/12/2022 504,472 0.01
USD 350,000 AmeriGas Partners LP / AmeriGas Finance Corp 5.625% 20/5/2024 373,755 0.01
USD 250,000 AmeriGas Partners LP / AmeriGas Finance Corp 5.75% 20/5/2027 265,775 0.00
USD 200,000 AmeriGas Partners LP / AmeriGas Finance Corp 5.875% 20/8/2026 218,190 0.00
USD 315,000 Ameriprise Financial Inc 3% 22/3/2022 321,866 0.00
USD 1,000,000 AMMC CLO 16 Ltd ‘Series 2015-16A DR’ ‘144A’ FRN 14/4/2029 1,000,654 0.01
USD 1,000,000 Ammc Clo 19 Ltd ‘Series 2016-19A D’ ‘144A’ FRN 15/10/2028 1,000,568 0.01
USD 1,390,000 AMMC CLO XII Ltd ‘Series 2013-12A AR’ ‘144A’ FRN 10/11/2030 1,385,095 0.02
USD 500,000 AMMC CLO XIV Ltd ‘Series 2014-14A A1LR’ ‘144A’ FRN 25/7/2029 500,112 0.01
USD 621,000 Amsted Industries Inc ‘144A’ 5.625% 1/7/2027 668,351 0.01
USD 933,000 AmWINS Group Inc ‘144A’ 7.75% 1/7/2026 984,315 0.01
USD 500,000 Analog Devices Inc 2.95% 12/1/2021 504,844 0.01
USD 3,000,000 ANCHORAGE CAPITAL CLO 1-R Ltd ‘Series 2018-1RA A1’ ‘144A’ FRN 13/4/2031 2,968,793 0.04
USD 2,500,000 Anchorage Capital CLO 2013-1 Ltd ‘Series 2013-1A A1R’ ‘144A’ FRN 13/10/2030 2,495,825 0.03
USD 1,000,000 Anchorage Capital CLO 2013-1 Ltd ‘Series 2013-1A CR’ ‘144A’ FRN 13/10/2030 974,112 0.01
USD 4,750,000 Anchorage Capital CLO 2018-10 Ltd ‘Series 2018-10A A1A’ ‘144A’ FRN 15/10/2031 4,719,206 0.06
USD 1,000,000 Anchorage Capital CLO 3-R Ltd ‘Series 2014-3RA B’ ‘144A’ FRN 28/1/2031 982,526 0.01
USD 1,000,000 Anchorage Capital CLO 3-R Ltd ‘Series 2014-3RA C’ ‘144A’ FRN 28/1/2031 966,250 0.01
USD 1,500,000 Anchorage Capital CLO 3-R Ltd ‘Series 2014-3RA D’ ‘144A’ FRN 28/1/2031 1,399,335 0.02
USD 700,000 Anchorage Capital CLO 4-R Ltd ‘Series 2014-4RA C’ ‘144A’ FRN 28/1/2031 674,370 0.01
USD 1,000,000 Anchorage Capital CLO 4-R Ltd ‘Series 2014-4RA D’ ‘144A’ FRN 28/1/2031 946,085 0.01
USD 1,150,000 Anchorage Capital CLO 5-R Ltd ‘Series 2014-5RA C’ ‘144A’ FRN 15/1/2030 1,136,106 0.01
USD 5,000,000 Anchorage Capital CLO 6 Ltd ‘Series 2015-6A AR’ ‘144A’ FRN 15/7/2030 4,998,696 0.06
USD 1,000,000 Anchorage Capital CLO 6 Ltd ‘Series 2015-6A CR’ ‘144A’ FRN 15/7/2030 995,748 0.01
USD 5,000,000 Anchorage Capital CLO 7 Ltd ‘Series 2015-7A AR’ ‘144A’ FRN 15/10/2027 4,990,741 0.06
USD 2,650,000 Anchorage Capital CLO 8 Ltd ‘Series 2016-8A AR’ ‘144A’ FRN 28/7/2028 2,637,813 0.03
USD 1,100,000 Anchorage Capital CLO 8 Ltd ‘Series 2016-8A BR’ ‘144A’ FRN 28/7/2028 1,097,256 0.01
USD 1,500,000 Anchorage Capital CLO 8 Ltd ‘Series 2016-8A DR’ ‘144A’ FRN 28/7/2028 1,479,450 0.02
EUR 182,000 Anchorage Capital Europe CLO 2 DAC FRN 15/5/2031 197,932 0.00
USD 153,000 Andeavor Logistics LP / Tesoro Logistics Finance Corp (Restricted) 6.25% 15/10/2022 156,289 0.00
USD 300,000 Anheuser-Busch InBev Worldwide Inc 4.15% 23/1/2025 328,361 0.00
USD 810,000 Anixter Inc 6% 1/12/2025 898,088 0.01
Global Multi-Asset Income Fund continued
Portfolio of Investments 31 August 2019
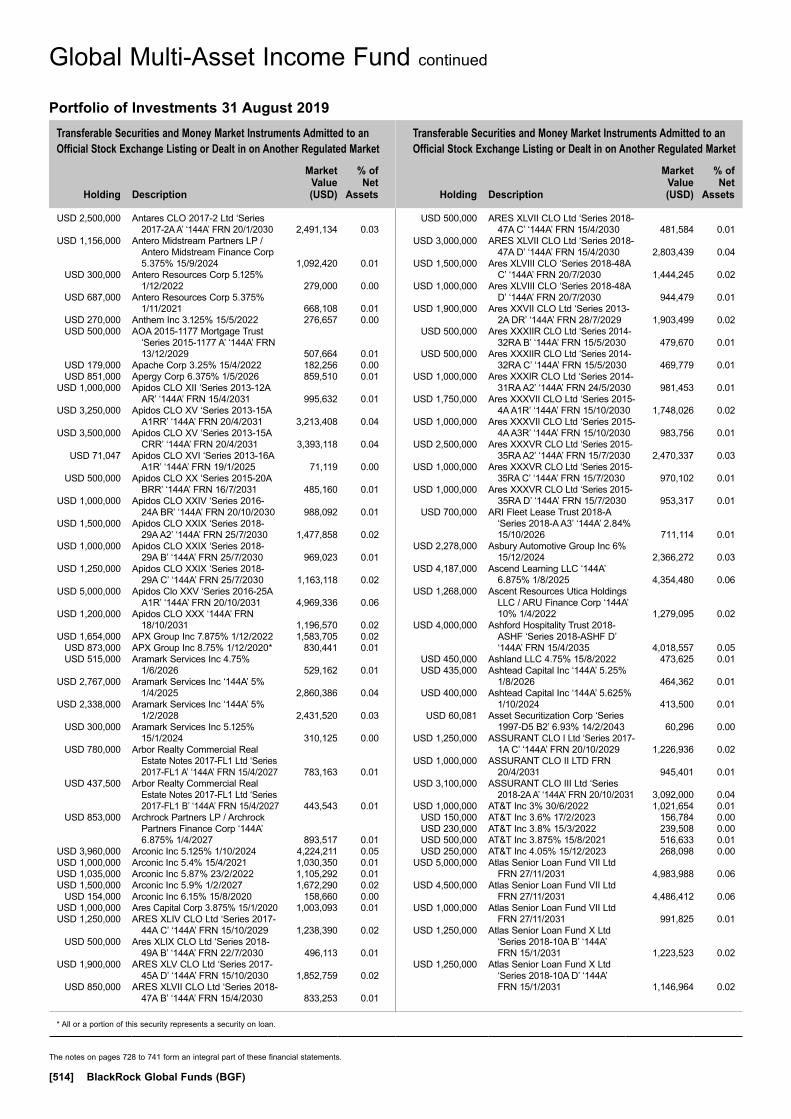
Transferable Securities and Money Market Instruments Admitted to an Official Stock Exchange Listing or Dealt in on Another Regulated Market
Transferable Securities and Money Market Instruments Admitted to an Official Stock Exchange Listing or Dealt in on Another Regulated Market
Holding
Description
Market Value (USD)
% of Net
Assets
Holding
Description
Market Value (USD)
% of Net
Assets
* All or a portion of this security represents a security on loan.
The notes on pages 728 to 741 form an integral part of these financial statements.
[514] BlackRock Global Funds (BGF)
USD 2,500,000 Antares CLO 2017-2 Ltd ‘Series 2017-2A A’ ‘144A’ FRN 20/1/2030 2,491,134 0.03
USD 1,156,000 Antero Midstream Partners LP / Antero Midstream Finance Corp 5.375% 15/9/2024 1,092,420 0.01
USD 300,000 Antero Resources Corp 5.125% 1/12/2022 279,000 0.00
USD 687,000 Antero Resources Corp 5.375% 1/11/2021 668,108 0.01
USD 270,000 Anthem Inc 3.125% 15/5/2022 276,657 0.00 USD 500,000 AOA 2015-1177 Mortgage Trust
‘Series 2015-1177 A’ ‘144A’ FRN 13/12/2029 507,664 0.01
USD 179,000 Apache Corp 3.25% 15/4/2022 182,256 0.00 USD 851,000 Apergy Corp 6.375% 1/5/2026 859,510 0.01 USD 1,000,000 Apidos CLO XII ‘Series 2013-12A
AR’ ‘144A’ FRN 15/4/2031 995,632 0.01 USD 3,250,000 Apidos CLO XV ‘Series 2013-15A
A1RR’ ‘144A’ FRN 20/4/2031 3,213,408 0.04 USD 3,500,000 Apidos CLO XV ‘Series 2013-15A
CRR’ ‘144A’ FRN 20/4/2031 3,393,118 0.04 USD 71,047 Apidos CLO XVI ‘Series 2013-16A
A1R’ ‘144A’ FRN 19/1/2025 71,119 0.00 USD 500,000 Apidos CLO XX ‘Series 2015-20A
BRR’ ‘144A’ FRN 16/7/2031 485,160 0.01 USD 1,000,000 Apidos CLO XXIV ‘Series 2016-
24A BR’ ‘144A’ FRN 20/10/2030 988,092 0.01 USD 1,500,000 Apidos CLO XXIX ‘Series 2018-
29A A2’ ‘144A’ FRN 25/7/2030 1,477,858 0.02 USD 1,000,000 Apidos CLO XXIX ‘Series 2018-
29A B’ ‘144A’ FRN 25/7/2030 969,023 0.01 USD 1,250,000 Apidos CLO XXIX ‘Series 2018-
29A C’ ‘144A’ FRN 25/7/2030 1,163,118 0.02 USD 5,000,000 Apidos Clo XXV ‘Series 2016-25A
A1R’ ‘144A’ FRN 20/10/2031 4,969,336 0.06 USD 1,200,000 Apidos CLO XXX ‘144A’ FRN
18/10/2031 1,196,570 0.02 USD 1,654,000 APX Group Inc 7.875% 1/12/2022 1,583,705 0.02 USD 873,000 APX Group Inc 8.75% 1/12/2020* 830,441 0.01 USD 515,000 Aramark Services Inc 4.75%
1/6/2026 529,162 0.01 USD 2,767,000 Aramark Services Inc ‘144A’ 5%
1/4/2025 2,860,386 0.04 USD 2,338,000 Aramark Services Inc ‘144A’ 5%
1/2/2028 2,431,520 0.03 USD 300,000 Aramark Services Inc 5.125%
15/1/2024 310,125 0.00 USD 780,000 Arbor Realty Commercial Real
Estate Notes 2017-FL1 Ltd ‘Series 2017-FL1 A’ ‘144A’ FRN 15/4/2027 783,163 0.01
USD 437,500 Arbor Realty Commercial Real Estate Notes 2017-FL1 Ltd ‘Series 2017-FL1 B’ ‘144A’ FRN 15/4/2027 443,543 0.01
USD 853,000 Archrock Partners LP / Archrock Partners Finance Corp ‘144A’ 6.875% 1/4/2027 893,517 0.01
USD 3,960,000 Arconic Inc 5.125% 1/10/2024 4,224,211 0.05 USD 1,000,000 Arconic Inc 5.4% 15/4/2021 1,030,350 0.01 USD 1,035,000 Arconic Inc 5.87% 23/2/2022 1,105,292 0.01 USD 1,500,000 Arconic Inc 5.9% 1/2/2027 1,672,290 0.02 USD 154,000 Arconic Inc 6.15% 15/8/2020 158,660 0.00 USD 1,000,000 Ares Capital Corp 3.875% 15/1/2020 1,003,093 0.01 USD 1,250,000 ARES XLIV CLO Ltd ‘Series 2017-
44A C’ ‘144A’ FRN 15/10/2029 1,238,390 0.02 USD 500,000 Ares XLIX CLO Ltd ‘Series 2018-
49A B’ ‘144A’ FRN 22/7/2030 496,113 0.01 USD 1,900,000 ARES XLV CLO Ltd ‘Series 2017-
45A D’ ‘144A’ FRN 15/10/2030 1,852,759 0.02 USD 850,000 ARES XLVII CLO Ltd ‘Series 2018-
47A B’ ‘144A’ FRN 15/4/2030 833,253 0.01
USD 500,000 ARES XLVII CLO Ltd ‘Series 2018-47A C’ ‘144A’ FRN 15/4/2030 481,584 0.01
USD 3,000,000 ARES XLVII CLO Ltd ‘Series 2018-47A D’ ‘144A’ FRN 15/4/2030 2,803,439 0.04
USD 1,500,000 Ares XLVIII CLO ‘Series 2018-48A C’ ‘144A’ FRN 20/7/2030 1,444,245 0.02
USD 1,000,000 Ares XLVIII CLO ‘Series 2018-48A D’ ‘144A’ FRN 20/7/2030 944,479 0.01
USD 1,900,000 Ares XXVII CLO Ltd ‘Series 2013-2A DR’ ‘144A’ FRN 28/7/2029 1,903,499 0.02
USD 500,000 Ares XXXIIR CLO Ltd ‘Series 2014-32RA B’ ‘144A’ FRN 15/5/2030 479,670 0.01
USD 500,000 Ares XXXIIR CLO Ltd ‘Series 2014-32RA C’ ‘144A’ FRN 15/5/2030 469,779 0.01
USD 1,000,000 Ares XXXIR CLO Ltd ‘Series 2014-31RA A2’ ‘144A’ FRN 24/5/2030 981,453 0.01
USD 1,750,000 Ares XXXVII CLO Ltd ‘Series 2015-4A A1R’ ‘144A’ FRN 15/10/2030 1,748,026 0.02
USD 1,000,000 Ares XXXVII CLO Ltd ‘Series 2015-4A A3R’ ‘144A’ FRN 15/10/2030 983,756 0.01
USD 2,500,000 Ares XXXVR CLO Ltd ‘Series 2015-35RA A2’ ‘144A’ FRN 15/7/2030 2,470,337 0.03
USD 1,000,000 Ares XXXVR CLO Ltd ‘Series 2015-35RA C’ ‘144A’ FRN 15/7/2030 970,102 0.01
USD 1,000,000 Ares XXXVR CLO Ltd ‘Series 2015-35RA D’ ‘144A’ FRN 15/7/2030 953,317 0.01
USD 700,000 ARI Fleet Lease Trust 2018-A ‘Series 2018-A A3’ ‘144A’ 2.84% 15/10/2026 711,114 0.01
USD 2,278,000 Asbury Automotive Group Inc 6% 15/12/2024 2,366,272 0.03
USD 4,187,000 Ascend Learning LLC ‘144A’ 6.875% 1/8/2025 4,354,480 0.06
USD 1,268,000 Ascent Resources Utica Holdings LLC / ARU Finance Corp ‘144A’ 10% 1/4/2022 1,279,095 0.02
USD 4,000,000 Ashford Hospitality Trust 2018-ASHF ‘Series 2018-ASHF D’ ‘144A’ FRN 15/4/2035 4,018,557 0.05
USD 450,000 Ashland LLC 4.75% 15/8/2022 473,625 0.01 USD 435,000 Ashtead Capital Inc ‘144A’ 5.25%
1/8/2026 464,362 0.01 USD 400,000 Ashtead Capital Inc ‘144A’ 5.625%
1/10/2024 413,500 0.01 USD 60,081 Asset Securitization Corp ‘Series
1997-D5 B2’ 6.93% 14/2/2043 60,296 0.00 USD 1,250,000 ASSURANT CLO I Ltd ‘Series 2017-
1A C’ ‘144A’ FRN 20/10/2029 1,226,936 0.02 USD 1,000,000 ASSURANT CLO II LTD FRN
20/4/2031 945,401 0.01 USD 3,100,000 ASSURANT CLO III Ltd ‘Series
2018-2A A’ ‘144A’ FRN 20/10/2031 3,092,000 0.04 USD 1,000,000 AT&T Inc 3% 30/6/2022 1,021,654 0.01 USD 150,000 AT&T Inc 3.6% 17/2/2023 156,784 0.00 USD 230,000 AT&T Inc 3.8% 15/3/2022 239,508 0.00 USD 500,000 AT&T Inc 3.875% 15/8/2021 516,633 0.01 USD 250,000 AT&T Inc 4.05% 15/12/2023 268,098 0.00 USD 5,000,000 Atlas Senior Loan Fund VII Ltd
FRN 27/11/2031 4,983,988 0.06 USD 4,500,000 Atlas Senior Loan Fund VII Ltd
FRN 27/11/2031 4,486,412 0.06 USD 1,000,000 Atlas Senior Loan Fund VII Ltd
FRN 27/11/2031 991,825 0.01 USD 1,250,000 Atlas Senior Loan Fund X Ltd
‘Series 2018-10A B’ ‘144A’ FRN 15/1/2031 1,223,523 0.02
USD 1,250,000 Atlas Senior Loan Fund X Ltd ‘Series 2018-10A D’ ‘144A’ FRN 15/1/2031 1,146,964 0.02
Global Multi-Asset Income Fund continued
Portfolio of Investments 31 August 2019
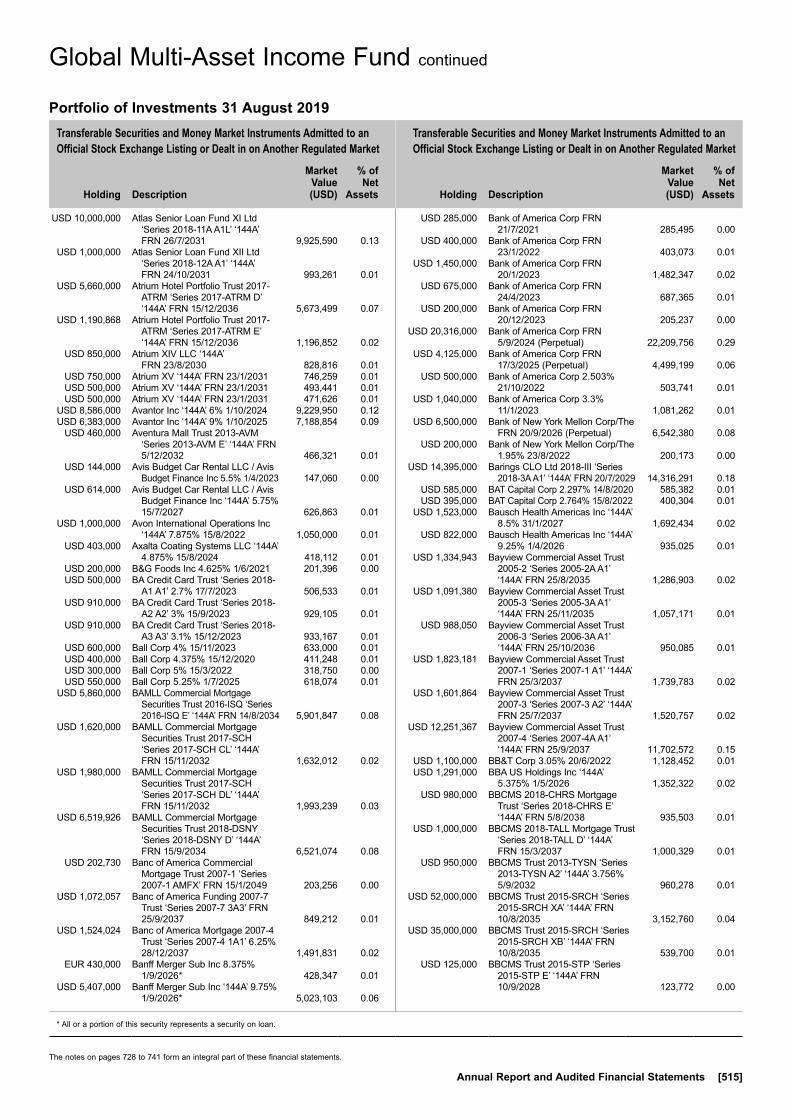
Transferable Securities and Money Market Instruments Admitted to an Official Stock Exchange Listing or Dealt in on Another Regulated Market
Transferable Securities and Money Market Instruments Admitted to an Official Stock Exchange Listing or Dealt in on Another Regulated Market
Holding
Description
Market Value (USD)
% of Net
Assets
Holding
Description
Market Value (USD)
% of Net
Assets
* All or a portion of this security represents a security on loan.
The notes on pages 728 to 741 form an integral part of these financial statements.
Annual Report and Audited Financial Statements [515]
USD 10,000,000 Atlas Senior Loan Fund XI Ltd ‘Series 2018-11A A1L’ ‘144A’ FRN 26/7/2031 9,925,590 0.13
USD 1,000,000 Atlas Senior Loan Fund XII Ltd ‘Series 2018-12A A1’ ‘144A’ FRN 24/10/2031 993,261 0.01
USD 5,660,000 Atrium Hotel Portfolio Trust 2017-ATRM ‘Series 2017-ATRM D’ ‘144A’ FRN 15/12/2036 5,673,499 0.07
USD 1,190,868 Atrium Hotel Portfolio Trust 2017-ATRM ‘Series 2017-ATRM E’ ‘144A’ FRN 15/12/2036 1,196,852 0.02
USD 850,000 Atrium XIV LLC ‘144A’ FRN 23/8/2030 828,816 0.01
USD 750,000 Atrium XV ‘144A’ FRN 23/1/2031 746,259 0.01 USD 500,000 Atrium XV ‘144A’ FRN 23/1/2031 493,441 0.01 USD 500,000 Atrium XV ‘144A’ FRN 23/1/2031 471,626 0.01 USD 8,586,000 Avantor Inc ‘144A’ 6% 1/10/2024 9,229,950 0.12 USD 6,383,000 Avantor Inc ‘144A’ 9% 1/10/2025 7,188,854 0.09 USD 460,000 Aventura Mall Trust 2013-AVM
‘Series 2013-AVM E’ ‘144A’ FRN 5/12/2032 466,321 0.01
USD 144,000 Avis Budget Car Rental LLC / Avis Budget Finance Inc 5.5% 1/4/2023 147,060 0.00
USD 614,000 Avis Budget Car Rental LLC / Avis Budget Finance Inc ‘144A’ 5.75% 15/7/2027 626,863 0.01
USD 1,000,000 Avon International Operations Inc ‘144A’ 7.875% 15/8/2022 1,050,000 0.01
USD 403,000 Axalta Coating Systems LLC ‘144A’ 4.875% 15/8/2024 418,112 0.01
USD 200,000 B&G Foods Inc 4.625% 1/6/2021 201,396 0.00 USD 500,000 BA Credit Card Trust ‘Series 2018-
A1 A1’ 2.7% 17/7/2023 506,533 0.01 USD 910,000 BA Credit Card Trust ‘Series 2018-
A2 A2’ 3% 15/9/2023 929,105 0.01 USD 910,000 BA Credit Card Trust ‘Series 2018-
A3 A3’ 3.1% 15/12/2023 933,167 0.01 USD 600,000 Ball Corp 4% 15/11/2023 633,000 0.01 USD 400,000 Ball Corp 4.375% 15/12/2020 411,248 0.01 USD 300,000 Ball Corp 5% 15/3/2022 318,750 0.00 USD 550,000 Ball Corp 5.25% 1/7/2025 618,074 0.01 USD 5,860,000 BAMLL Commercial Mortgage
Securities Trust 2016-ISQ ‘Series 2016-ISQ E’ ‘144A’ FRN 14/8/2034 5,901,847 0.08
USD 1,620,000 BAMLL Commercial Mortgage Securities Trust 2017-SCH ‘Series 2017-SCH CL’ ‘144A’ FRN 15/11/2032 1,632,012 0.02
USD 1,980,000 BAMLL Commercial Mortgage Securities Trust 2017-SCH ‘Series 2017-SCH DL’ ‘144A’ FRN 15/11/2032 1,993,239 0.03
USD 6,519,926 BAMLL Commercial Mortgage Securities Trust 2018-DSNY ‘Series 2018-DSNY D’ ‘144A’ FRN 15/9/2034 6,521,074 0.08
USD 202,730 Banc of America Commercial Mortgage Trust 2007-1 ‘Series 2007-1 AMFX’ FRN 15/1/2049 203,256 0.00
USD 1,072,057 Banc of America Funding 2007-7 Trust ‘Series 2007-7 3A3’ FRN 25/9/2037 849,212 0.01
USD 1,524,024 Banc of America Mortgage 2007-4 Trust ‘Series 2007-4 1A1’ 6.25% 28/12/2037 1,491,831 0.02
EUR 430,000 Banff Merger Sub Inc 8.375% 1/9/2026* 428,347 0.01
USD 5,407,000 Banff Merger Sub Inc ‘144A’ 9.75% 1/9/2026* 5,023,103 0.06
USD 285,000 Bank of America Corp FRN 21/7/2021 285,495 0.00
USD 400,000 Bank of America Corp FRN 23/1/2022 403,073 0.01
USD 1,450,000 Bank of America Corp FRN 20/1/2023 1,482,347 0.02
USD 675,000 Bank of America Corp FRN 24/4/2023 687,365 0.01
USD 200,000 Bank of America Corp FRN 20/12/2023 205,237 0.00
USD 20,316,000 Bank of America Corp FRN 5/9/2024 (Perpetual) 22,209,756 0.29
USD 4,125,000 Bank of America Corp FRN 17/3/2025 (Perpetual) 4,499,199 0.06
USD 500,000 Bank of America Corp 2.503% 21/10/2022 503,741 0.01
USD 1,040,000 Bank of America Corp 3.3% 11/1/2023 1,081,262 0.01
USD 6,500,000 Bank of New York Mellon Corp/The FRN 20/9/2026 (Perpetual) 6,542,380 0.08
USD 200,000 Bank of New York Mellon Corp/The 1.95% 23/8/2022 200,173 0.00
USD 14,395,000 Barings CLO Ltd 2018-III ‘Series 2018-3A A1’ ‘144A’ FRN 20/7/2029 14,316,291 0.18
USD 585,000 BAT Capital Corp 2.297% 14/8/2020 585,382 0.01 USD 395,000 BAT Capital Corp 2.764% 15/8/2022 400,304 0.01 USD 1,523,000 Bausch Health Americas Inc ‘144A’
8.5% 31/1/2027 1,692,434 0.02 USD 822,000 Bausch Health Americas Inc ‘144A’
9.25% 1/4/2026 935,025 0.01 USD 1,334,943 Bayview Commercial Asset Trust
2005-2 ‘Series 2005-2A A1’ ‘144A’ FRN 25/8/2035 1,286,903 0.02
USD 1,091,380 Bayview Commercial Asset Trust 2005-3 ‘Series 2005-3A A1’ ‘144A’ FRN 25/11/2035 1,057,171 0.01
USD 988,050 Bayview Commercial Asset Trust 2006-3 ‘Series 2006-3A A1’ ‘144A’ FRN 25/10/2036 950,085 0.01
USD 1,823,181 Bayview Commercial Asset Trust 2007-1 ‘Series 2007-1 A1’ ‘144A’ FRN 25/3/2037 1,739,783 0.02
USD 1,601,864 Bayview Commercial Asset Trust 2007-3 ‘Series 2007-3 A2’ ‘144A’ FRN 25/7/2037 1,520,757 0.02
USD 12,251,367 Bayview Commercial Asset Trust 2007-4 ‘Series 2007-4A A1’ ‘144A’ FRN 25/9/2037 11,702,572 0.15
USD 1,100,000 BB&T Corp 3.05% 20/6/2022 1,128,452 0.01 USD 1,291,000 BBA US Holdings Inc ‘144A’
5.375% 1/5/2026 1,352,322 0.02 USD 980,000 BBCMS 2018-CHRS Mortgage
Trust ‘Series 2018-CHRS E’ ‘144A’ FRN 5/8/2038 935,503 0.01
USD 1,000,000 BBCMS 2018-TALL Mortgage Trust ‘Series 2018-TALL D’ ‘144A’ FRN 15/3/2037 1,000,329 0.01
USD 950,000 BBCMS Trust 2013-TYSN ‘Series 2013-TYSN A2’ ‘144A’ 3.756% 5/9/2032 960,278 0.01
USD 52,000,000 BBCMS Trust 2015-SRCH ‘Series 2015-SRCH XA’ ‘144A’ FRN 10/8/2035 3,152,760 0.04
USD 35,000,000 BBCMS Trust 2015-SRCH ‘Series 2015-SRCH XB’ ‘144A’ FRN 10/8/2035 539,700 0.01
USD 125,000 BBCMS Trust 2015-STP ‘Series 2015-STP E’ ‘144A’ FRN 10/9/2028 123,772 0.00
Global Multi-Asset Income Fund continued
Portfolio of Investments 31 August 2019
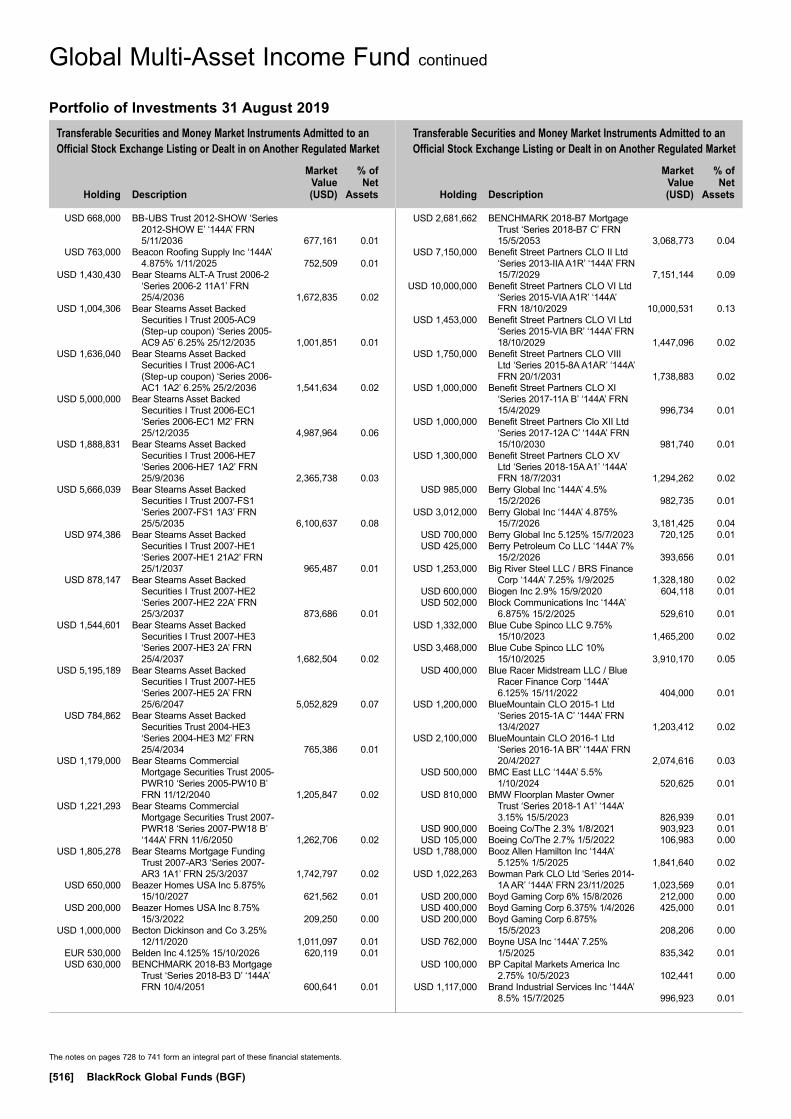
Transferable Securities and Money Market Instruments Admitted to an Official Stock Exchange Listing or Dealt in on Another Regulated Market
Transferable Securities and Money Market Instruments Admitted to an Official Stock Exchange Listing or Dealt in on Another Regulated Market
Holding
Description
Market Value (USD)
% of Net
Assets
Holding
Description
Market Value (USD)
% of Net
Assets
The notes on pages 728 to 741 form an integral part of these financial statements.
[516] BlackRock Global Funds (BGF)
USD 668,000 BB-UBS Trust 2012-SHOW ‘Series 2012-SHOW E’ ‘144A’ FRN 5/11/2036 677,161 0.01
USD 763,000 Beacon Roofing Supply Inc ‘144A’ 4.875% 1/11/2025 752,509 0.01
USD 1,430,430 Bear Stearns ALT-A Trust 2006-2 ‘Series 2006-2 11A1’ FRN 25/4/2036 1,672,835 0.02
USD 1,004,306 Bear Stearns Asset Backed Securities I Trust 2005-AC9 (Step-up coupon) ‘Series 2005-AC9 A5’ 6.25% 25/12/2035 1,001,851 0.01
USD 1,636,040 Bear Stearns Asset Backed Securities I Trust 2006-AC1 (Step-up coupon) ‘Series 2006-AC1 1A2’ 6.25% 25/2/2036 1,541,634 0.02
USD 5,000,000 Bear Stearns Asset Backed Securities I Trust 2006-EC1 ‘Series 2006-EC1 M2’ FRN 25/12/2035 4,987,964 0.06
USD 1,888,831 Bear Stearns Asset Backed Securities I Trust 2006-HE7 ‘Series 2006-HE7 1A2’ FRN 25/9/2036 2,365,738 0.03
USD 5,666,039 Bear Stearns Asset Backed Securities I Trust 2007-FS1 ‘Series 2007-FS1 1A3’ FRN 25/5/2035 6,100,637 0.08
USD 974,386 Bear Stearns Asset Backed Securities I Trust 2007-HE1 ‘Series 2007-HE1 21A2’ FRN 25/1/2037 965,487 0.01
USD 878,147 Bear Stearns Asset Backed Securities I Trust 2007-HE2 ‘Series 2007-HE2 22A’ FRN 25/3/2037 873,686 0.01
USD 1,544,601 Bear Stearns Asset Backed Securities I Trust 2007-HE3 ‘Series 2007-HE3 2A’ FRN 25/4/2037 1,682,504 0.02
USD 5,195,189 Bear Stearns Asset Backed Securities I Trust 2007-HE5 ‘Series 2007-HE5 2A’ FRN 25/6/2047 5,052,829 0.07
USD 784,862 Bear Stearns Asset Backed Securities Trust 2004-HE3 ‘Series 2004-HE3 M2’ FRN 25/4/2034 765,386 0.01
USD 1,179,000 Bear Stearns Commercial Mortgage Securities Trust 2005-PWR10 ‘Series 2005-PW10 B’ FRN 11/12/2040 1,205,847 0.02
USD 1,221,293 Bear Stearns Commercial Mortgage Securities Trust 2007-PWR18 ‘Series 2007-PW18 B’ ‘144A’ FRN 11/6/2050 1,262,706 0.02
USD 1,805,278 Bear Stearns Mortgage Funding Trust 2007-AR3 ‘Series 2007-AR3 1A1’ FRN 25/3/2037 1,742,797 0.02
USD 650,000 Beazer Homes USA Inc 5.875% 15/10/2027 621,562 0.01
USD 200,000 Beazer Homes USA Inc 8.75% 15/3/2022 209,250 0.00
USD 1,000,000 Becton Dickinson and Co 3.25% 12/11/2020 1,011,097 0.01
EUR 530,000 Belden Inc 4.125% 15/10/2026 620,119 0.01 USD 630,000 BENCHMARK 2018-B3 Mortgage
Trust ‘Series 2018-B3 D’ ‘144A’ FRN 10/4/2051 600,641 0.01
USD 2,681,662 BENCHMARK 2018-B7 Mortgage Trust ‘Series 2018-B7 C’ FRN 15/5/2053 3,068,773 0.04
USD 7,150,000 Benefit Street Partners CLO II Ltd ‘Series 2013-IIA A1R’ ‘144A’ FRN 15/7/2029 7,151,144 0.09
USD 10,000,000 Benefit Street Partners CLO VI Ltd ‘Series 2015-VIA A1R’ ‘144A’ FRN 18/10/2029 10,000,531 0.13
USD 1,453,000 Benefit Street Partners CLO VI Ltd ‘Series 2015-VIA BR’ ‘144A’ FRN 18/10/2029 1,447,096 0.02
USD 1,750,000 Benefit Street Partners CLO VIII Ltd ‘Series 2015-8A A1AR’ ‘144A’ FRN 20/1/2031 1,738,883 0.02
USD 1,000,000 Benefit Street Partners CLO XI ‘Series 2017-11A B’ ‘144A’ FRN 15/4/2029 996,734 0.01
USD 1,000,000 Benefit Street Partners Clo XII Ltd ‘Series 2017-12A C’ ‘144A’ FRN 15/10/2030 981,740 0.01
USD 1,300,000 Benefit Street Partners CLO XV Ltd ‘Series 2018-15A A1’ ‘144A’ FRN 18/7/2031 1,294,262 0.02
USD 985,000 Berry Global Inc ‘144A’ 4.5% 15/2/2026 982,735 0.01
USD 3,012,000 Berry Global Inc ‘144A’ 4.875% 15/7/2026 3,181,425 0.04
USD 700,000 Berry Global Inc 5.125% 15/7/2023 720,125 0.01 USD 425,000 Berry Petroleum Co LLC ‘144A’ 7%
15/2/2026 393,656 0.01 USD 1,253,000 Big River Steel LLC / BRS Finance
Corp ‘144A’ 7.25% 1/9/2025 1,328,180 0.02 USD 600,000 Biogen Inc 2.9% 15/9/2020 604,118 0.01 USD 502,000 Block Communications Inc ‘144A’
6.875% 15/2/2025 529,610 0.01 USD 1,332,000 Blue Cube Spinco LLC 9.75%
15/10/2023 1,465,200 0.02 USD 3,468,000 Blue Cube Spinco LLC 10%
15/10/2025 3,910,170 0.05 USD 400,000 Blue Racer Midstream LLC / Blue
Racer Finance Corp ‘144A’ 6.125% 15/11/2022 404,000 0.01
USD 1,200,000 BlueMountain CLO 2015-1 Ltd ‘Series 2015-1A C’ ‘144A’ FRN 13/4/2027 1,203,412 0.02
USD 2,100,000 BlueMountain CLO 2016-1 Ltd ‘Series 2016-1A BR’ ‘144A’ FRN 20/4/2027 2,074,616 0.03
USD 500,000 BMC East LLC ‘144A’ 5.5% 1/10/2024 520,625 0.01
USD 810,000 BMW Floorplan Master Owner Trust ‘Series 2018-1 A1’ ‘144A’ 3.15% 15/5/2023 826,939 0.01
USD 900,000 Boeing Co/The 2.3% 1/8/2021 903,923 0.01 USD 105,000 Boeing Co/The 2.7% 1/5/2022 106,983 0.00 USD 1,788,000 Booz Allen Hamilton Inc ‘144A’
5.125% 1/5/2025 1,841,640 0.02 USD 1,022,263 Bowman Park CLO Ltd ‘Series 2014-
1A AR’ ‘144A’ FRN 23/11/2025 1,023,569 0.01 USD 200,000 Boyd Gaming Corp 6% 15/8/2026 212,000 0.00 USD 400,000 Boyd Gaming Corp 6.375% 1/4/2026 425,000 0.01 USD 200,000 Boyd Gaming Corp 6.875%
15/5/2023 208,206 0.00 USD 762,000 Boyne USA Inc ‘144A’ 7.25%
1/5/2025 835,342 0.01 USD 100,000 BP Capital Markets America Inc
2.75% 10/5/2023 102,441 0.00 USD 1,117,000 Brand Industrial Services Inc ‘144A’
8.5% 15/7/2025 996,923 0.01
Global Multi-Asset Income Fund continued
Portfolio of Investments 31 August 2019

Transferable Securities and Money Market Instruments Admitted to an Official Stock Exchange Listing or Dealt in on Another Regulated Market
Transferable Securities and Money Market Instruments Admitted to an Official Stock Exchange Listing or Dealt in on Another Regulated Market
Holding
Description
Market Value (USD)
% of Net
Assets
Holding
Description
Market Value (USD)
% of Net
Assets
* All or a portion of this security represents a security on loan.
The notes on pages 728 to 741 form an integral part of these financial statements.
Annual Report and Audited Financial Statements [517]
USD 484,000 Brazos Valley Longhorn LLC / Brazos Valley Longhorn Finance Corp 6.875% 1/2/2025 431,970 0.01
USD 587,000 Brink’s Co/The ‘144A’ 4.625% 15/10/2027 598,740 0.01
USD 310,000 Bristol-Myers Squibb Co ‘144A’ 2.9% 26/7/2024 321,937 0.00
USD 1,000,000 Broadcom Corp / Broadcom Cayman Finance Ltd 3% 15/1/2022 1,007,230 0.01
USD 300,000 Broadcom Inc ‘144A’ 3.125% 15/10/2022 303,765 0.00
USD 1,699,000 Brookfield Property REIT Inc / BPR Cumulus LLC / BPR Nimbus LLC / GGSI Sellco LL ‘144A’ 5.75% 15/5/2026 1,792,445 0.02
USD 1,880,000 Buckeye Partners LP FRN 22/1/2078 1,424,100 0.02 USD 1,235,000 Builders FirstSource Inc ‘144A’
6.75% 1/6/2027 1,355,412 0.02 USD 3,500,000 Burnham Park Clo Ltd ‘Series 2016-
1A A’ ‘144A’ FRN 20/10/2029 3,501,821 0.05 USD 900,000 BWAY 2013-1515 Mortgage Trust
‘Series 2013-1515 D’ ‘144A’ 3.633% 10/3/2033 942,334 0.01
USD 500,000 BWAY 2013-1515 Mortgage Trust ‘Series 2013-1515 E’ ‘144A’ 3.717% 10/3/2033 521,525 0.01
USD 500,000 BWAY 2015-1740 Mortgage Trust ‘Series 2015-1740 E’ ‘144A’ FRN 10/1/2035 524,033 0.01
USD 2,256,000 BWX Technologies Inc ‘144A’ 5.375% 15/7/2026 2,394,180 0.03
USD 812,124 BX Commercial Mortgage Trust 2018-IND ‘Series 2018-IND A’ ‘144A’ FRN 15/11/2035 813,249 0.01
USD 7,309,113 BX Commercial Mortgage Trust 2018-IND ‘Series 2018-IND G’ ‘144A’ FRN 15/11/2035 7,338,131 0.09
USD 7,309,113 BX Commercial Mortgage Trust 2018-IND ‘Series 2018-IND H’ ‘144A’ FRN 15/11/2035 7,341,549 0.09
USD 2,270,000 BXP Trust 2017-CC ‘Series 2017-CC D’ ‘144A’ FRN 13/8/2037 2,321,326 0.03
USD 2,975,000 BXP Trust 2017-CC ‘Series 2017-CC E’ ‘144A’ FRN 13/8/2037 3,021,744 0.04
USD 200,000 Cablevision Systems Corp 5.875% 15/9/2022 214,000 0.00
USD 500,000 Cablevision Systems Corp 8% 15/4/2020 515,625 0.01
USD 466,000 California Resources Corp ‘144A’ 8% 15/12/2022 270,280 0.00
USD 883,000 Callon Petroleum Co 6.125% 1/10/2024 863,133 0.01
USD 2,091,000 Callon Petroleum Co 6.375% 1/7/2026 2,038,725 0.03
USD 3,968,000 Calpine Corp ‘144A’ 5.25% 1/6/2026 4,022,560 0.05
USD 5,675,000 Calpine Corp 5.375% 15/1/2023 5,731,750 0.07 USD 616,000 Calpine Corp 5.5% 1/2/2024 622,942 0.01 USD 3,577,000 Calpine Corp 5.75% 15/1/2025 3,657,483 0.05 USD 962,000 Calpine Corp ‘144A’ 5.875%
15/1/2024 984,953 0.01 USD 300,000 Campbell Soup Co 3.3% 15/3/2021 304,203 0.00 USD 12,002,000 Capital One Financial Corp FRN
1/6/2020 (Perpetual) 12,139,603 0.16 USD 1,500,000 Capital One Financial Corp 3.45%
30/4/2021 1,531,563 0.02 USD 760,000 Capital One Multi-Asset Execution
Trust ‘Series 2017-A3 A3’ 2.43% 15/1/2025 774,127 0.01
USD 980,000 Capital One Multi-Asset Execution Trust ‘Series 2018-A1 A1’ 3.01% 15/2/2024 1,000,574 0.01
USD 901,000 Capitol Investment Merger Sub 2 LLC ‘144A’ 10% 1/8/2024 934,788 0.01
USD 1,972,000 Carbone Clo Ltd ‘Series 2017-1A A1’ ‘144A’ FRN 20/1/2031 1,964,248 0.03
USD 1,000,000 Carlyle Global Market Strategies CLO 2013-1 Ltd ‘Series 2013-1A CR’ ‘144A’ FRN 14/8/2030 962,897 0.01
USD 4,000,000 Carlyle Global Market Strategies CLO 2014-2R Ltd ‘Series 2014-2RA A1’ ‘144A’ FRN 15/5/2031 3,969,112 0.05
USD 6,750,000 Carlyle Global Market Strategies CLO 2014-5 Ltd ‘Series 2014-5A A1RR’ ‘144A’ FRN 15/7/2031 6,735,438 0.09
USD 1,100,000 Carlyle Global Market Strategies CLO 2015-2 Ltd ‘Series 2015-2A CR’ ‘144A’ FRN 27/4/2027 1,084,799 0.01
USD 3,200,000 Carlyle Global Market Strategies CLO 2015-3 Ltd ‘Series 2015-3A A2R’ ‘144A’ FRN 28/7/2028 3,189,302 0.04
USD 400,000 Carlyle Global Market Strategies CLO 2016-1 Ltd ‘Series 2016-1A BR’ ‘144A’ FRN 20/4/2027 395,117 0.01
USD 1,000,000 Carlyle Global Market Strategies CLO 2016-3 Ltd ‘Series 2016-3A C’ ‘144A’ FRN 20/10/2029 1,001,469 0.01
USD 250,000 Carlyle US CLO 2016-4 Ltd ‘Series 2016-4A BR’ ‘144A’ FRN 20/10/2027 248,674 0.00
USD 750,000 Carlyle US Clo 2017-2 Ltd ‘Series 2017-2A B’ ‘144A’ FRN 20/7/2031 743,655 0.01
USD 1,000,000 Carlyle US Clo 2017-2 Ltd ‘Series 2017-2A C’ ‘144A’ FRN 20/7/2031 986,026 0.01
USD 1,000,000 CarMax Auto Owner Trust 2018-1 ‘Series 2018-1 A3’ 2.48% 15/11/2022 1,005,879 0.01
USD 1,000,000 Carmax Auto Owner Trust 2018-4 ‘Series 2018-4 A3’ 3.36% 15/9/2023 1,026,065 0.01
USD 2,643,337 Carrington Mortgage Loan Trust Series 2006-FRE1 ‘Series 2006-FRE1 A4’ FRN 25/4/2036 2,250,335 0.03
USD 2,259,681 Carrington Mortgage Loan Trust Series 2006-NC5 ‘Series 2006-NC5 A3’ FRN 25/1/2037 1,875,441 0.02
USD 2,215,000 Carrington Mortgage Loan Trust Series 2007-FRE1 ‘Series 2007-FRE1 A3’ FRN 25/2/2037 2,075,056 0.03
USD 4,817,031 Carrington Mortgage Loan Trust Series 2007-RFC1 ‘Series 2007-RFC1 A3’ FRN 25/12/2036 4,585,550 0.06
USD 2,023,000 Carrizo Oil & Gas Inc 6.25% 15/4/2023* 1,945,115 0.03
USD 192,000 Carrizo Oil & Gas Inc 8.25% 15/7/2025 187,200 0.00
USD 1,395,000 Catalent Pharma Solutions Inc ‘144A’ 4.875% 15/1/2026 1,422,900 0.02
USD 2,359,000 Catalent Pharma Solutions Inc ‘144A’ 5% 15/7/2027 2,475,487 0.03
USD 750,000 Catskill Park CLO Ltd ‘Series 2017-1A C’ ‘144A’ FRN 20/4/2029 749,848 0.01
USD 1,000,000 CBAM 2017-2 Ltd ‘Series 2017-2A C1’ ‘144A’ FRN 17/10/2029 993,430 0.01
USD 5,000,000 CBAM 2017-3 Ltd ‘Series 2017-3A A’ ‘144A’ FRN 17/10/2029 5,000,717 0.06
USD 4,000,000 CBAM 2018-5 Ltd ‘Series 2018-5A A’ ‘144A’ FRN 17/4/2031 3,960,562 0.05
Global Multi-Asset Income Fund continued
Portfolio of Investments 31 August 2019
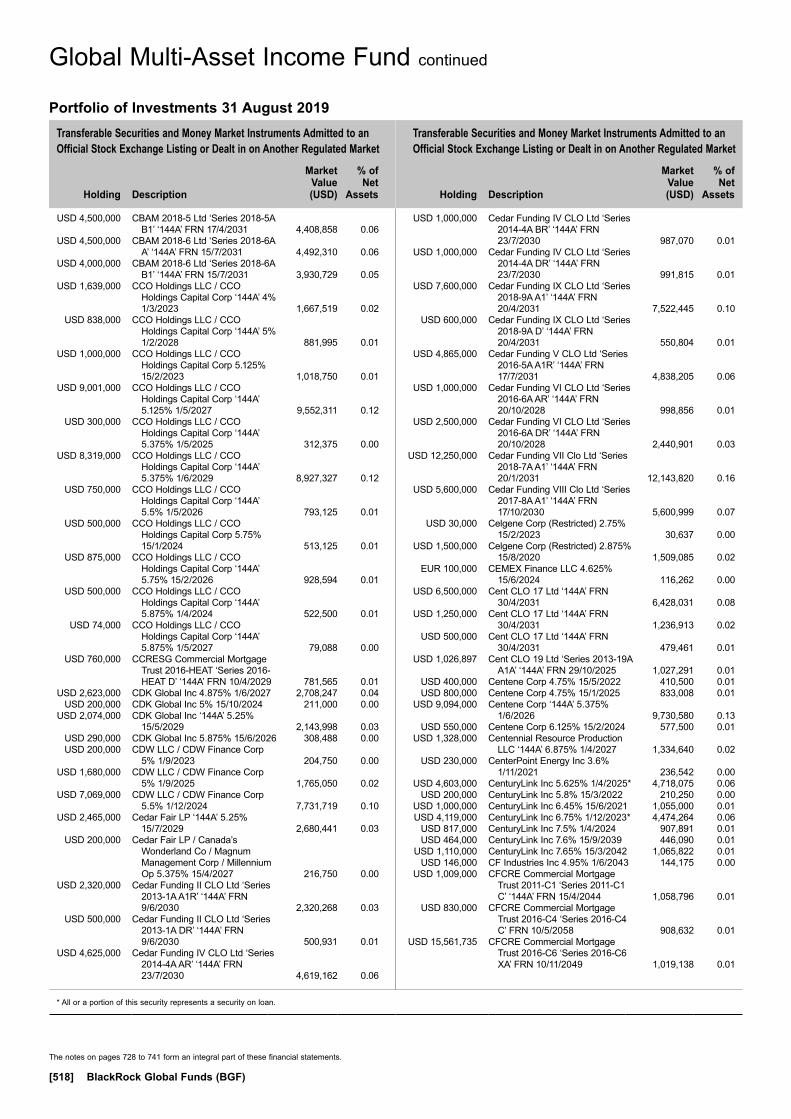
Transferable Securities and Money Market Instruments Admitted to an Official Stock Exchange Listing or Dealt in on Another Regulated Market
Transferable Securities and Money Market Instruments Admitted to an Official Stock Exchange Listing or Dealt in on Another Regulated Market
Holding
Description
Market Value (USD)
% of Net
Assets
Holding
Description
Market Value (USD)
% of Net
Assets
* All or a portion of this security represents a security on loan.
The notes on pages 728 to 741 form an integral part of these financial statements.
[518] BlackRock Global Funds (BGF)
USD 4,500,000 CBAM 2018-5 Ltd ‘Series 2018-5A B1’ ‘144A’ FRN 17/4/2031 4,408,858 0.06
USD 4,500,000 CBAM 2018-6 Ltd ‘Series 2018-6A A’ ‘144A’ FRN 15/7/2031 4,492,310 0.06
USD 4,000,000 CBAM 2018-6 Ltd ‘Series 2018-6A B1’ ‘144A’ FRN 15/7/2031 3,930,729 0.05
USD 1,639,000 CCO Holdings LLC / CCO Holdings Capital Corp ‘144A’ 4% 1/3/2023 1,667,519 0.02
USD 838,000 CCO Holdings LLC / CCO Holdings Capital Corp ‘144A’ 5% 1/2/2028 881,995 0.01
USD 1,000,000 CCO Holdings LLC / CCO Holdings Capital Corp 5.125% 15/2/2023 1,018,750 0.01
USD 9,001,000 CCO Holdings LLC / CCO Holdings Capital Corp ‘144A’ 5.125% 1/5/2027 9,552,311 0.12
USD 300,000 CCO Holdings LLC / CCO Holdings Capital Corp ‘144A’ 5.375% 1/5/2025 312,375 0.00
USD 8,319,000 CCO Holdings LLC / CCO Holdings Capital Corp ‘144A’ 5.375% 1/6/2029 8,927,327 0.12
USD 750,000 CCO Holdings LLC / CCO Holdings Capital Corp ‘144A’ 5.5% 1/5/2026 793,125 0.01
USD 500,000 CCO Holdings LLC / CCO Holdings Capital Corp 5.75% 15/1/2024 513,125 0.01
USD 875,000 CCO Holdings LLC / CCO Holdings Capital Corp ‘144A’ 5.75% 15/2/2026 928,594 0.01
USD 500,000 CCO Holdings LLC / CCO Holdings Capital Corp ‘144A’ 5.875% 1/4/2024 522,500 0.01
USD 74,000 CCO Holdings LLC / CCO Holdings Capital Corp ‘144A’ 5.875% 1/5/2027 79,088 0.00
USD 760,000 CCRESG Commercial Mortgage Trust 2016-HEAT ‘Series 2016-HEAT D’ ‘144A’ FRN 10/4/2029 781,565 0.01
USD 2,623,000 CDK Global Inc 4.875% 1/6/2027 2,708,247 0.04 USD 200,000 CDK Global Inc 5% 15/10/2024 211,000 0.00 USD 2,074,000 CDK Global Inc ‘144A’ 5.25%
15/5/2029 2,143,998 0.03 USD 290,000 CDK Global Inc 5.875% 15/6/2026 308,488 0.00 USD 200,000 CDW LLC / CDW Finance Corp
5% 1/9/2023 204,750 0.00 USD 1,680,000 CDW LLC / CDW Finance Corp
5% 1/9/2025 1,765,050 0.02 USD 7,069,000 CDW LLC / CDW Finance Corp
5.5% 1/12/2024 7,731,719 0.10 USD 2,465,000 Cedar Fair LP ‘144A’ 5.25%
15/7/2029 2,680,441 0.03 USD 200,000 Cedar Fair LP / Canada’s
Wonderland Co / Magnum Management Corp / Millennium Op 5.375% 15/4/2027 216,750 0.00
USD 2,320,000 Cedar Funding II CLO Ltd ‘Series 2013-1A A1R’ ‘144A’ FRN 9/6/2030 2,320,268 0.03
USD 500,000 Cedar Funding II CLO Ltd ‘Series 2013-1A DR’ ‘144A’ FRN 9/6/2030 500,931 0.01
USD 4,625,000 Cedar Funding IV CLO Ltd ‘Series 2014-4A AR’ ‘144A’ FRN 23/7/2030 4,619,162 0.06
USD 1,000,000 Cedar Funding IV CLO Ltd ‘Series 2014-4A BR’ ‘144A’ FRN 23/7/2030 987,070 0.01
USD 1,000,000 Cedar Funding IV CLO Ltd ‘Series 2014-4A DR’ ‘144A’ FRN 23/7/2030 991,815 0.01
USD 7,600,000 Cedar Funding IX CLO Ltd ‘Series 2018-9A A1’ ‘144A’ FRN 20/4/2031 7,522,445 0.10
USD 600,000 Cedar Funding IX CLO Ltd ‘Series 2018-9A D’ ‘144A’ FRN 20/4/2031 550,804 0.01
USD 4,865,000 Cedar Funding V CLO Ltd ‘Series 2016-5A A1R’ ‘144A’ FRN 17/7/2031 4,838,205 0.06
USD 1,000,000 Cedar Funding VI CLO Ltd ‘Series 2016-6A AR’ ‘144A’ FRN 20/10/2028 998,856 0.01
USD 2,500,000 Cedar Funding VI CLO Ltd ‘Series 2016-6A DR’ ‘144A’ FRN 20/10/2028 2,440,901 0.03
USD 12,250,000 Cedar Funding VII Clo Ltd ‘Series 2018-7A A1’ ‘144A’ FRN 20/1/2031 12,143,820 0.16
USD 5,600,000 Cedar Funding VIII Clo Ltd ‘Series 2017-8A A1’ ‘144A’ FRN 17/10/2030 5,600,999 0.07
USD 30,000 Celgene Corp (Restricted) 2.75% 15/2/2023 30,637 0.00
USD 1,500,000 Celgene Corp (Restricted) 2.875% 15/8/2020 1,509,085 0.02
EUR 100,000 CEMEX Finance LLC 4.625% 15/6/2024 116,262 0.00
USD 6,500,000 Cent CLO 17 Ltd ‘144A’ FRN 30/4/2031 6,428,031 0.08
USD 1,250,000 Cent CLO 17 Ltd ‘144A’ FRN 30/4/2031 1,236,913 0.02
USD 500,000 Cent CLO 17 Ltd ‘144A’ FRN 30/4/2031 479,461 0.01
USD 1,026,897 Cent CLO 19 Ltd ‘Series 2013-19A A1A’ ‘144A’ FRN 29/10/2025 1,027,291 0.01
USD 400,000 Centene Corp 4.75% 15/5/2022 410,500 0.01 USD 800,000 Centene Corp 4.75% 15/1/2025 833,008 0.01 USD 9,094,000 Centene Corp ‘144A’ 5.375%
1/6/2026 9,730,580 0.13 USD 550,000 Centene Corp 6.125% 15/2/2024 577,500 0.01 USD 1,328,000 Centennial Resource Production
LLC ‘144A’ 6.875% 1/4/2027 1,334,640 0.02 USD 230,000 CenterPoint Energy Inc 3.6%
1/11/2021 236,542 0.00 USD 4,603,000 CenturyLink Inc 5.625% 1/4/2025* 4,718,075 0.06 USD 200,000 CenturyLink Inc 5.8% 15/3/2022 210,250 0.00 USD 1,000,000 CenturyLink Inc 6.45% 15/6/2021 1,055,000 0.01 USD 4,119,000 CenturyLink Inc 6.75% 1/12/2023* 4,474,264 0.06 USD 817,000 CenturyLink Inc 7.5% 1/4/2024 907,891 0.01 USD 464,000 CenturyLink Inc 7.6% 15/9/2039 446,090 0.01 USD 1,110,000 CenturyLink Inc 7.65% 15/3/2042 1,065,822 0.01 USD 146,000 CF Industries Inc 4.95% 1/6/2043 144,175 0.00 USD 1,009,000 CFCRE Commercial Mortgage
Trust 2011-C1 ‘Series 2011-C1 C’ ‘144A’ FRN 15/4/2044 1,058,796 0.01
USD 830,000 CFCRE Commercial Mortgage Trust 2016-C4 ‘Series 2016-C4 C’ FRN 10/5/2058 908,632 0.01
USD 15,561,735 CFCRE Commercial Mortgage Trust 2016-C6 ‘Series 2016-C6 XA’ FRN 10/11/2049 1,019,138 0.01
Global Multi-Asset Income Fund continued
Portfolio of Investments 31 August 2019
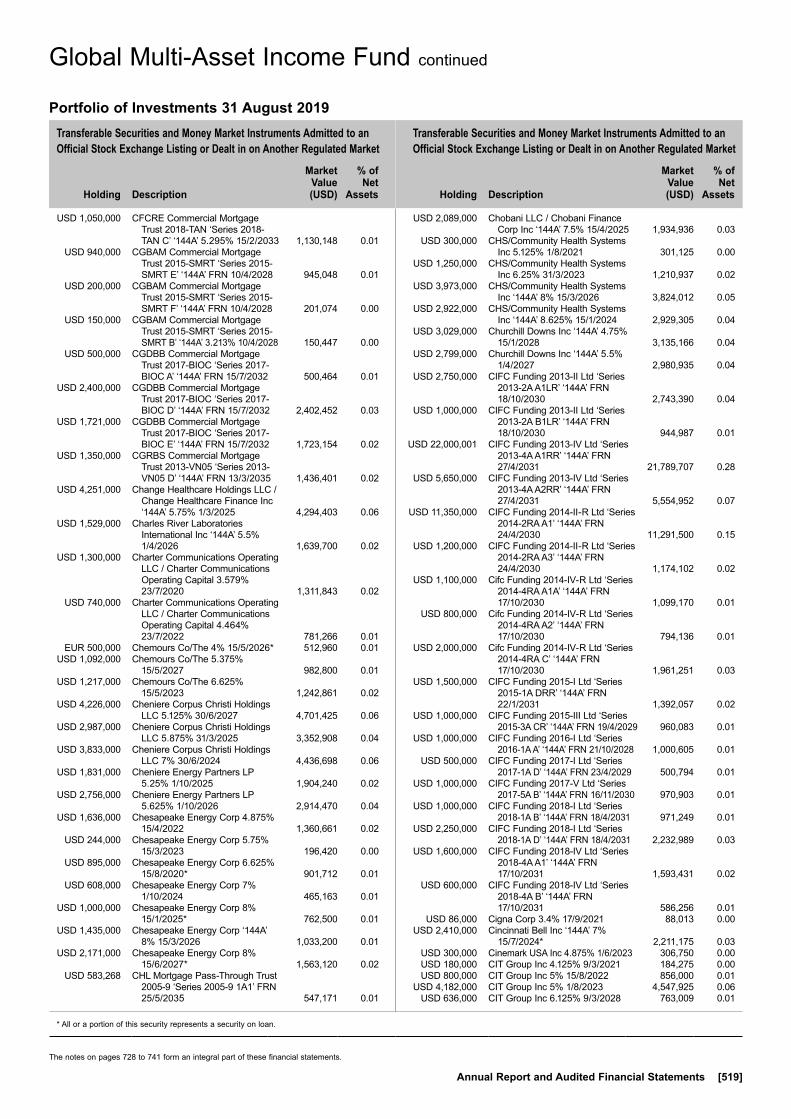
Transferable Securities and Money Market Instruments Admitted to an Official Stock Exchange Listing or Dealt in on Another Regulated Market
Transferable Securities and Money Market Instruments Admitted to an Official Stock Exchange Listing or Dealt in on Another Regulated Market
Holding
Description
Market Value (USD)
% of Net
Assets
Holding
Description
Market Value (USD)
% of Net
Assets
* All or a portion of this security represents a security on loan.
The notes on pages 728 to 741 form an integral part of these financial statements.
Annual Report and Audited Financial Statements [519]
USD 1,050,000 CFCRE Commercial Mortgage Trust 2018-TAN ‘Series 2018-TAN C’ ‘144A’ 5.295% 15/2/2033 1,130,148 0.01
USD 940,000 CGBAM Commercial Mortgage Trust 2015-SMRT ‘Series 2015-SMRT E’ ‘144A’ FRN 10/4/2028 945,048 0.01
USD 200,000 CGBAM Commercial Mortgage Trust 2015-SMRT ‘Series 2015-SMRT F’ ‘144A’ FRN 10/4/2028 201,074 0.00
USD 150,000 CGBAM Commercial Mortgage Trust 2015-SMRT ‘Series 2015-SMRT B’ ‘144A’ 3.213% 10/4/2028 150,447 0.00
USD 500,000 CGDBB Commercial Mortgage Trust 2017-BIOC ‘Series 2017-BIOC A’ ‘144A’ FRN 15/7/2032 500,464 0.01
USD 2,400,000 CGDBB Commercial Mortgage Trust 2017-BIOC ‘Series 2017-BIOC D’ ‘144A’ FRN 15/7/2032 2,402,452 0.03
USD 1,721,000 CGDBB Commercial Mortgage Trust 2017-BIOC ‘Series 2017-BIOC E’ ‘144A’ FRN 15/7/2032 1,723,154 0.02
USD 1,350,000 CGRBS Commercial Mortgage Trust 2013-VN05 ‘Series 2013-VN05 D’ ‘144A’ FRN 13/3/2035 1,436,401 0.02
USD 4,251,000 Change Healthcare Holdings LLC / Change Healthcare Finance Inc ‘144A’ 5.75% 1/3/2025 4,294,403 0.06
USD 1,529,000 Charles River Laboratories International Inc ‘144A’ 5.5% 1/4/2026 1,639,700 0.02
USD 1,300,000 Charter Communications Operating LLC / Charter Communications Operating Capital 3.579% 23/7/2020 1,311,843 0.02
USD 740,000 Charter Communications Operating LLC / Charter Communications Operating Capital 4.464% 23/7/2022 781,266 0.01
EUR 500,000 Chemours Co/The 4% 15/5/2026* 512,960 0.01 USD 1,092,000 Chemours Co/The 5.375%
15/5/2027 982,800 0.01 USD 1,217,000 Chemours Co/The 6.625%
15/5/2023 1,242,861 0.02 USD 4,226,000 Cheniere Corpus Christi Holdings
LLC 5.125% 30/6/2027 4,701,425 0.06 USD 2,987,000 Cheniere Corpus Christi Holdings
LLC 5.875% 31/3/2025 3,352,908 0.04 USD 3,833,000 Cheniere Corpus Christi Holdings
LLC 7% 30/6/2024 4,436,698 0.06 USD 1,831,000 Cheniere Energy Partners LP
5.25% 1/10/2025 1,904,240 0.02 USD 2,756,000 Cheniere Energy Partners LP
5.625% 1/10/2026 2,914,470 0.04 USD 1,636,000 Chesapeake Energy Corp 4.875%
15/4/2022 1,360,661 0.02 USD 244,000 Chesapeake Energy Corp 5.75%
15/3/2023 196,420 0.00 USD 895,000 Chesapeake Energy Corp 6.625%
15/8/2020* 901,712 0.01 USD 608,000 Chesapeake Energy Corp 7%
1/10/2024 465,163 0.01 USD 1,000,000 Chesapeake Energy Corp 8%
15/1/2025* 762,500 0.01 USD 1,435,000 Chesapeake Energy Corp ‘144A’
8% 15/3/2026 1,033,200 0.01 USD 2,171,000 Chesapeake Energy Corp 8%
15/6/2027* 1,563,120 0.02 USD 583,268 CHL Mortgage Pass-Through Trust
2005-9 ‘Series 2005-9 1A1’ FRN 25/5/2035 547,171 0.01
USD 2,089,000 Chobani LLC / Chobani Finance Corp Inc ‘144A’ 7.5% 15/4/2025 1,934,936 0.03
USD 300,000 CHS/Community Health Systems Inc 5.125% 1/8/2021 301,125 0.00
USD 1,250,000 CHS/Community Health Systems Inc 6.25% 31/3/2023 1,210,937 0.02
USD 3,973,000 CHS/Community Health Systems Inc ‘144A’ 8% 15/3/2026 3,824,012 0.05
USD 2,922,000 CHS/Community Health Systems Inc ‘144A’ 8.625% 15/1/2024 2,929,305 0.04
USD 3,029,000 Churchill Downs Inc ‘144A’ 4.75% 15/1/2028 3,135,166 0.04
USD 2,799,000 Churchill Downs Inc ‘144A’ 5.5% 1/4/2027 2,980,935 0.04
USD 2,750,000 CIFC Funding 2013-II Ltd ‘Series 2013-2A A1LR’ ‘144A’ FRN 18/10/2030 2,743,390 0.04
USD 1,000,000 CIFC Funding 2013-II Ltd ‘Series 2013-2A B1LR’ ‘144A’ FRN 18/10/2030 944,987 0.01
USD 22,000,001 CIFC Funding 2013-IV Ltd ‘Series 2013-4A A1RR’ ‘144A’ FRN 27/4/2031 21,789,707 0.28
USD 5,650,000 CIFC Funding 2013-IV Ltd ‘Series 2013-4A A2RR’ ‘144A’ FRN 27/4/2031 5,554,952 0.07
USD 11,350,000 CIFC Funding 2014-II-R Ltd ‘Series 2014-2RA A1’ ‘144A’ FRN 24/4/2030 11,291,500 0.15
USD 1,200,000 CIFC Funding 2014-II-R Ltd ‘Series 2014-2RA A3’ ‘144A’ FRN 24/4/2030 1,174,102 0.02
USD 1,100,000 Cifc Funding 2014-IV-R Ltd ‘Series 2014-4RA A1A’ ‘144A’ FRN 17/10/2030 1,099,170 0.01
USD 800,000 Cifc Funding 2014-IV-R Ltd ‘Series 2014-4RA A2’ ‘144A’ FRN 17/10/2030 794,136 0.01
USD 2,000,000 Cifc Funding 2014-IV-R Ltd ‘Series 2014-4RA C’ ‘144A’ FRN 17/10/2030 1,961,251 0.03
USD 1,500,000 CIFC Funding 2015-I Ltd ‘Series 2015-1A DRR’ ‘144A’ FRN 22/1/2031 1,392,057 0.02
USD 1,000,000 CIFC Funding 2015-III Ltd ‘Series 2015-3A CR’ ‘144A’ FRN 19/4/2029 960,083 0.01
USD 1,000,000 CIFC Funding 2016-I Ltd ‘Series 2016-1A A’ ‘144A’ FRN 21/10/2028 1,000,605 0.01
USD 500,000 CIFC Funding 2017-I Ltd ‘Series 2017-1A D’ ‘144A’ FRN 23/4/2029 500,794 0.01
USD 1,000,000 CIFC Funding 2017-V Ltd ‘Series 2017-5A B’ ‘144A’ FRN 16/11/2030 970,903 0.01
USD 1,000,000 CIFC Funding 2018-I Ltd ‘Series 2018-1A B’ ‘144A’ FRN 18/4/2031 971,249 0.01
USD 2,250,000 CIFC Funding 2018-I Ltd ‘Series 2018-1A D’ ‘144A’ FRN 18/4/2031 2,232,989 0.03
USD 1,600,000 CIFC Funding 2018-IV Ltd ‘Series 2018-4A A1’ ‘144A’ FRN 17/10/2031 1,593,431 0.02
USD 600,000 CIFC Funding 2018-IV Ltd ‘Series 2018-4A B’ ‘144A’ FRN 17/10/2031 586,256 0.01
USD 86,000 Cigna Corp 3.4% 17/9/2021 88,013 0.00 USD 2,410,000 Cincinnati Bell Inc ‘144A’ 7%
15/7/2024* 2,211,175 0.03 USD 300,000 Cinemark USA Inc 4.875% 1/6/2023 306,750 0.00 USD 180,000 CIT Group Inc 4.125% 9/3/2021 184,275 0.00 USD 800,000 CIT Group Inc 5% 15/8/2022 856,000 0.01 USD 4,182,000 CIT Group Inc 5% 1/8/2023 4,547,925 0.06 USD 636,000 CIT Group Inc 6.125% 9/3/2028 763,009 0.01
Global Multi-Asset Income Fund continued
Portfolio of Investments 31 August 2019

Transferable Securities and Money Market Instruments Admitted to an Official Stock Exchange Listing or Dealt in on Another Regulated Market
Transferable Securities and Money Market Instruments Admitted to an Official Stock Exchange Listing or Dealt in on Another Regulated Market
Holding
Description
Market Value (USD)
% of Net
Assets
Holding
Description
Market Value (USD)
% of Net
Assets
The notes on pages 728 to 741 form an integral part of these financial statements.
[520] BlackRock Global Funds (BGF)
USD 1,000,000 Citibank Credit Card Issuance Trust ‘Series 2017-A7 A7’ FRN 8/8/2024 1,004,005 0.01
USD 1,000,000 Citibank Credit Card Issuance Trust ‘Series 2018-A1 A1’ 2.49% 20/1/2023 1,009,566 0.01
USD 400,000 Citibank Credit Card Issuance Trust ‘Series 2018-A6 A6’ 3.21% 7/12/2024 419,950 0.01
USD 1,500,000 Citibank NA FRN 19/2/2022 1,522,166 0.02 USD 400,000 Citibank NA FRN 20/5/2022 404,272 0.01 USD 1,139,000 Citigroup Commercial Mortgage
Trust 2014-GC19 ‘Series 2014-GC19 C’ FRN 10/3/2047 1,242,679 0.02
USD 1,000,000 Citigroup Commercial Mortgage Trust 2015-GC27 ‘Series 2015-GC27 C’ FRN 10/2/2048 1,042,781 0.01
USD 300,000 Citigroup Commercial Mortgage Trust 2015-SHP2 ‘Series 2015-SHP2 A’ ‘144A’ FRN 15/7/2027 299,964 0.00
USD 720,000 Citigroup Commercial Mortgage Trust 2016-C1 ‘Series 2016-C1 C’ FRN 10/5/2049 807,125 0.01
USD 540,000 Citigroup Commercial Mortgage Trust 2016-C1 ‘Series 2016-C1 D’ ‘144A’ FRN 10/5/2049 565,177 0.01
USD 405,000 Citigroup Commercial Mortgage Trust 2016-C2 ‘Series 2016-C2 AAB’ 2.71% 10/8/2049 416,207 0.01
USD 660,000 Citigroup Commercial Mortgage Trust 2016-GC37 ‘Series 2016-GC37 C’ FRN 10/4/2049 724,824 0.01
USD 1,044,000 Citigroup Commercial Mortgage Trust 2016-GC37 ‘Series 2016-GC37 D’ ‘144A’ 2.788% 10/4/2049 895,571 0.01
USD 318,000 Citigroup Commercial Mortgage Trust 2016-P3 ‘Series 2016-P3 C’ FRN 15/4/2049 351,281 0.00
USD 795,000 Citigroup Commercial Mortgage Trust 2016-P5 ‘Series 2016-P5 AAB’ 2.841% 10/10/2049 819,597 0.01
USD 600,000 Citigroup Commercial Mortgage Trust 2016-P6 ‘Series 2016-P6 C’ FRN 10/12/2049 653,193 0.01
USD 2,169,000 Citigroup COmmercial Mortgage Trust 2018-C6 ‘Series 2018-C6 C’ FRN 10/11/2051 2,527,072 0.03
USD 850,000 Citigroup Inc FRN 24/1/2023 868,839 0.01 USD 135,000 Citigroup Inc 2.75% 25/4/2022 137,288 0.00 USD 500,000 Citizens Bank NA/Providence RI
2.55% 13/5/2021 503,639 0.01 USD 750,000 Citizens Bank NA/Providence RI
3.25% 14/2/2022 769,847 0.01 USD 908,000 Clean Harbors Inc ‘144A’ 4.875%
15/7/2027 963,615 0.01 USD 1,828,000 Clean Harbors Inc ‘144A’ 5.125%
15/7/2029 1,951,390 0.03 USD 7,225,000 Clear Channel Worldwide Holdings
Inc ‘144A’ 5.125% 15/8/2027 7,568,187 0.10 USD 9,116,000 Clear Channel Worldwide Holdings
Inc 6.5% 15/11/2022 9,323,389 0.12 USD 7,315,000 Clear Channel Worldwide Holdings
Inc ‘144A’ 9.25% 15/2/2024 8,037,356 0.10 USD 4,500,000 Clear Creek CLO ‘Series 2015-1A
AR’ ‘144A’ FRN 20/10/2030 4,473,755 0.06 USD 1,705,000 Clearway Energy Operating LLC
5.375% 15/8/2024 1,756,150 0.02 USD 1,793,000 Clearway Energy Operating LLC
‘144A’ 5.75% 15/10/2025 1,873,685 0.02 USD 482,000 Cleveland-Cliffs Inc 5.75% 1/3/2025 483,205 0.01
USD 1,300,000 Cleveland-Cliffs Inc ‘144A’ 5.875% 1/6/2027 1,267,500 0.02
USD 577,000 CLNS Trust 2017-IKPR ‘Series 2017-IKPR E’ ‘144A’ FRN 11/6/2032 579,474 0.01
USD 400,000 Clorox Co/The 3.05% 15/9/2022 411,057 0.01 USD 200,000 Cloud Crane LLC ‘144A’ 10.125%
1/8/2024 215,442 0.00 USD 200,000 CNO Financial Group Inc 5.25%
30/5/2025 218,186 0.00 USD 1,461,000 CNO Financial Group Inc 5.25%
30/5/2029 1,614,989 0.02 USD 5,466,000 CNX Resources Corp 5.875%
15/4/2022 5,315,685 0.07 USD 370,000 Cogent Communications Group Inc
‘144A’ 5.375% 1/3/2022 386,650 0.01 USD 2,027,000 Colfax Corp ‘144A’ 6% 15/2/2024 2,156,221 0.03 USD 1,894,000 Colfax Corp ‘144A’ 6.375%
15/2/2026 2,052,623 0.03 USD 735,000 Comcast Corp 3.7% 15/4/2024 786,983 0.01 USD 711,099 COMM 2005-C6 Mortgage Trust
‘Series 2005-C6 F’ ‘144A’ FRN 10/6/2044 724,733 0.01
USD 568,724 COMM 2012-LC4 Mortgage Trust ‘Series 2012-LC4 A4’ 3.288% 10/12/2044 581,949 0.01
USD 370,000 COMM 2013-300P Mortgage Trust ‘Series 2013-300P A1’ ‘144A’ 4.353% 10/8/2030 399,730 0.01
USD 415,000 COMM 2013-CCRE12 Mortgage Trust ‘Series 2013-CR12 A4’ 4.046% 10/10/2046 446,423 0.01
USD 681,090 COMM 2013-CCRE7 Mortgage Trust ‘Series 2013-CR7 ASB’ 2.739% 10/3/2046 689,062 0.01
USD 525,213 COMM 2013-LC6 Mortgage Trust ‘Series 2013-LC6 A3’ 2.666% 10/1/2046 535,652 0.01
USD 930,000 COMM 2014-CCRE15 Mortgage Trust ‘Series 2014-CR15 C’ FRN 10/2/2047 1,015,193 0.01
USD 236,007 COMM 2014-CCRE15 Mortgage Trust ‘Series 2014-CR15 A2’ 2.928% 10/2/2047 235,935 0.00
USD 440,000 COMM 2014-CCRE17 Mortgage Trust ‘Series 2014-CR17 A5’ 3.977% 10/5/2047 478,153 0.01
USD 186,074 COMM 2014-CR14 Mortgage Trust ‘Series 2014-CR14 ASB’ 3.743% 10/2/2047 192,814 0.00
USD 2,250,000 COMM 2014-UBS4 Mortgage Trust ‘Series 2014-UBS4 C’ FRN 10/8/2047 2,369,925 0.03
USD 12,675,000 COMM 2014-UBS5 Mortgage Trust ‘Series 2014-UBS5 XB2’ ‘144A’ FRN 10/9/2047 444,259 0.01
USD 871,000 COMM 2014-UBS6 Mortgage Trust ‘Series 2014-UBS6 ASB’ 3.387% 10/12/2047 903,409 0.01
USD 2,380,000 COMM 2015-CCRE23 Mortgage Trust ‘Series 2015-CR23 B’ FRN 10/5/2048 2,557,492 0.03
USD 2,562,000 COMM 2015-CCRE23 Mortgage Trust ‘Series 2015-CR23 CMC’ ‘144A’ FRN 10/5/2048 2,578,435 0.03
USD 5,545,000 COMM 2015-CCRE23 Mortgage Trust ‘Series 2015-CR23 CMD’ ‘144A’ FRN 10/5/2048 5,552,526 0.07
Global Multi-Asset Income Fund continued
Portfolio of Investments 31 August 2019

Transferable Securities and Money Market Instruments Admitted to an Official Stock Exchange Listing or Dealt in on Another Regulated Market
Transferable Securities and Money Market Instruments Admitted to an Official Stock Exchange Listing or Dealt in on Another Regulated Market
Holding
Description
Market Value (USD)
% of Net
Assets
Holding
Description
Market Value (USD)
% of Net
Assets
The notes on pages 728 to 741 form an integral part of these financial statements.
Annual Report and Audited Financial Statements [521]
USD 1,820,000 COMM 2015-CCRE23 Mortgage Trust ‘Series 2015-CR23 CME’ ‘144A’ FRN 10/5/2048 1,818,572 0.02
USD 282,000 COMM 2015-CCRE25 Mortgage Trust ‘Series 2015-CR25 C’ FRN 10/8/2048 299,828 0.00
USD 7,476,378 COMM 2015-CCRE25 Mortgage Trust ‘Series 2015-CR25 XA’ FRN 10/8/2048 306,989 0.00
USD 340,000 COMM 2015-CCRE25 Mortgage Trust ‘Series 2015-CR25 ASB’ 3.537% 10/8/2048 356,541 0.00
USD 2,417,400 COMM 2015-LC19 Mortgage Trust ‘Series 2015-LC19 C’ FRN 10/2/2048 2,580,867 0.03
USD 1,793,000 COMM 2015-LC19 Mortgage Trust ‘Series 2015-LC19 D’ ‘144A’ FRN 10/2/2048 1,680,678 0.02
USD 2,000,000 COMM 2015-LC21 Mortgage Trust ‘Series 2015-LC21 C’ FRN 10/7/2048 2,131,336 0.03
USD 455,000 COMM 2015-LC21 Mortgage Trust ‘Series 2015-LC21 ASB’ 3.421% 10/7/2048 474,920 0.01
USD 400,000 COMM 2015-PC1 Mortgage Trust ‘Series 2015-PC1 ASB’ 3.608% 10/7/2050 418,595 0.01
USD 800,000 COMM 2016-667M Mortgage Trust ‘Series 2016-667M D’ ‘144A’ FRN 10/10/2036 819,473 0.01
USD 500,000 COMM 2016-CR28 Mortgage Trust ‘Series 2016-CR28 A3’ 3.495% 10/2/2049 540,161 0.01
USD 1,462,000 COMM 2017-COR2 Mortgage Trust ‘Series 2017-COR2 D’ ‘144A’ 3% 10/9/2050 1,361,875 0.02
USD 35,000 Commercial Metals Co 4.875% 15/5/2023 36,138 0.00
USD 6,240,000 CommScope Inc ‘144A’ 5.5% 1/3/2024 6,380,400 0.08
USD 300,000 CommScope Inc ‘144A’ 5.5% 15/6/2024 284,250 0.00
USD 1,213,000 CommScope Inc ‘144A’ 6% 1/3/2026 1,237,260 0.02 USD 500,000 CommScope Inc ‘144A’ 8.25%
1/3/2027 491,875 0.01 USD 1,596,000 Comstock Resources Inc 9.75%
15/8/2026 1,208,970 0.02 USD 295,000 Conagra Brands Inc FRN
22/10/2020 295,147 0.00 USD 1,206,795 Conseco Finance Corp ‘Series
1997-7 M1’ FRN 15/7/2028 1,238,631 0.02 USD 2,562,429 Conseco Finance Corp ‘Series
1998-6 M1’ FRN 1/6/2030 2,478,997 0.03 USD 1,574,257 Conseco Finance Corp ‘Series
1998-8 A1’ 6.28% 1/9/2030 1,680,192 0.02 USD 2,873,000 Conseco Finance Securitizations
Corp ‘Series 2001-4 M1’ FRN 1/9/2033 2,900,128 0.04
USD 2,337,000 CONSOL Energy Inc ‘144A’ 11% 15/11/2025 2,412,953 0.03
USD 1,200,000 Constellation Brands Inc 2.25% 6/11/2020 1,201,462 0.02
USD 800,000 Continental Resources Inc/OK 5% 15/9/2022 806,487 0.01
USD 4,946,000 Core & Main LP ‘144A’ 6.125% 15/8/2025 5,044,920 0.07
USD 2,700,000 Core Industrial Trust 2015-CALW ‘Series 2015-CALW G’ ‘144A’ FRN 10/2/2034 2,729,524 0.04
USD 570,000 Core Industrial Trust 2015-TEXW ‘Series 2015-TEXW D’ ‘144A’ FRN 10/2/2034 591,727 0.01
USD 2,930,000 Core Industrial Trust 2015-TEXW ‘Series 2015-TEXW E’ ‘144A’ FRN 10/2/2034 3,026,248 0.04
USD 1,600,000 Core Industrial Trust 2015-WEST ‘Series 2015-WEST E’ ‘144A’ FRN 10/2/2037 1,714,913 0.02
USD 1,100,000 CoreCivic Inc 4.75% 15/10/2027 963,875 0.01 USD 350,000 Cott Holdings Inc ‘144A’ 5.5%
1/4/2025 366,187 0.01 EUR 100,000 Coty Inc 4% 15/4/2023 110,075 0.00 USD 438,000 Coty Inc ‘144A’ 6.5% 15/4/2026 412,815 0.01 USD 2,245,559 Countrywide Asset-Backed
Certificates ‘Series 2006-5 2A3’ FRN 25/8/2036 2,243,572 0.03
USD 930,000 Covey Park Energy LLC / Covey Park Finance Corp ‘144A’ 7.5% 15/5/2025 664,950 0.01
USD 285,000 Cox Communications Inc ‘144A’ 3.25% 15/12/2022 292,869 0.00
USD 1,260,000 CPG Merger Sub LLC ‘144A’ 8% 1/10/2021 1,267,875 0.02
USD 470,000 Credit Acceptance Auto Loan Trust 2018-3 ‘Series 2018-3A A’ ‘144A’ 3.55% 15/8/2027 480,452 0.01
USD 2,301,000 Credit Acceptance Corp ‘144A’ 6.625% 15/3/2026 2,467,822 0.03
USD 7,487 Credit Suisse First Boston Mortgage Securities Corp ‘Series 2005-C3 C’ FRN 15/7/2037 7,461 0.00
USD 549,867 Credit-Based Asset Servicing & Securitization LLC ‘Series 2007-CB6 A4’ ‘144A’ FRN 25/7/2037 377,857 0.01
USD 2,207,000 Crestwood Midstream Partners LP / Crestwood Midstream Finance Corp ‘144A’ 5.625% 1/5/2027 2,190,448 0.03
USD 150,000 Crestwood Midstream Partners LP / Crestwood Midstream Finance Corp 5.75% 1/4/2025 152,625 0.00
USD 447,000 Crestwood Midstream Partners LP / Crestwood Midstream Finance Corp 6.25% 1/4/2023 461,215 0.01
USD 400,000 Crown Americas LLC / Crown Americas Capital Corp IV 4.5% 15/1/2023 421,500 0.01
USD 3,023,000 Crown Americas LLC / Crown Americas Capital Corp VI 4.75% 1/2/2026 3,185,486 0.04
USD 265,000 Crown Castle International Corp 3.2% 1/9/2024 274,141 0.00
USD 1,200,000 Crown Castle International Corp 3.4% 15/2/2021 1,218,030 0.02
USD 5,733,000 CrownRock LP / CrownRock Finance Inc ‘144A’ 5.625% 15/10/2025 5,668,504 0.07
USD 1,060,000 CSAIL 2016-C6 Commercial Mortgage Trust ‘Series 2016-C6 C’ FRN 15/1/2049 1,174,114 0.02
USD 2,744,000 CSAIL 2018-C14 Commercial Mortgage Trust FRN 15/11/2051 2,928,716 0.04
USD 422,000 CSC Holdings LLC ‘144A’ 5.125% 15/12/2021 423,582 0.01
USD 3,701,000 CSC Holdings LLC 5.25% 1/6/2024 3,973,949 0.05 USD 4,130,000 CSC Holdings LLC ‘144A’ 5.375%
15/7/2023 4,248,738 0.06 USD 800,000 CSC Holdings LLC ‘144A’ 5.375%
1/2/2028 853,000 0.01
Global Multi-Asset Income Fund continued
Portfolio of Investments 31 August 2019

Transferable Securities and Money Market Instruments Admitted to an Official Stock Exchange Listing or Dealt in on Another Regulated Market
Transferable Securities and Money Market Instruments Admitted to an Official Stock Exchange Listing or Dealt in on Another Regulated Market
Holding
Description
Market Value (USD)
% of Net
Assets
Holding
Description
Market Value (USD)
% of Net
Assets
* All or a portion of this security represents a security on loan.
The notes on pages 728 to 741 form an integral part of these financial statements.
[522] BlackRock Global Funds (BGF)
USD 1,695,000 CSC Holdings LLC ‘144A’ 5.5% 15/5/2026 1,793,522 0.02
USD 600,000 CSC Holdings LLC ‘144A’ 5.5% 15/4/2027 643,500 0.01
USD 2,989,000 CSC Holdings LLC ‘144A’ 5.75% 15/1/2030 3,119,769 0.04
USD 1,577,000 CSC Holdings LLC ‘144A’ 6.5% 1/2/2029 1,763,283 0.02
USD 1,839,000 CSC Holdings LLC ‘144A’ 6.625% 15/10/2025 1,976,392 0.03
USD 300,000 CSC Holdings LLC 6.75% 15/11/2021 326,220 0.00
USD 1,138,000 CSC Holdings LLC ‘144A’ 7.75% 15/7/2025* 1,227,617 0.02
USD 9,356,000 CSC Holdings LLC ‘144A’ 10.875% 15/10/2025 10,636,602 0.14
USD 600,000 CSI Compressco LP / CSI Compressco Finance Inc ‘144A’ 7.5% 1/4/2025 589,500 0.01
USD 6,504,280 CSMC 2018-RPL8 Trust ‘Series 2018-RPL8 A1’ ‘144A’ FRN 25/7/2058 6,614,527 0.09
USD 113,631 CSMC Series 2008-2R ‘Series 2008-2R 1A1’ ‘144A’ 6% 25/7/2037 108,714 0.00
USD 489,391 CSMC Trust 2015-GLPB ‘Series 2015-GLPB A’ ‘144A’ 3.639% 15/11/2034 519,800 0.01
USD 170,000 CSWF 2018-TOP ‘Series 2018-TOP A’ ‘144A’ FRN 15/8/2035 170,520 0.00
USD 650,000 Curo Group Holdings Corp ‘144A’ 8.25% 1/9/2025 568,750 0.01
USD 150,000 CVR Partners LP / CVR Nitrogen Finance Corp ‘144A’ 9.25% 15/6/2023 156,563 0.00
USD 200,000 CVR Refining LLC / Coffeyville Finance Inc 6.5% 1/11/2022 203,000 0.00
USD 140,000 CVS Health Corp 3.7% 9/3/2023 146,271 0.00 USD 320,000 CVS Health Corp 4.3% 25/3/2028 349,378 0.00 USD 843,537 CWHEQ Revolving Home Equity
Loan Trust Series 2006-G ‘Series 2006-G 2A’ FRN 15/10/2036 806,350 0.01
USD 200,000 CyrusOne LP / CyrusOne Finance Corp 5% 15/3/2024 207,000 0.00
USD 613,000 CyrusOne LP / CyrusOne Finance Corp 5.375% 15/3/2027 653,611 0.01
USD 1,474,000 Darling Ingredients Inc ‘144A’ 5.25% 15/4/2027 1,575,337 0.02
USD 650,000 DaVita Inc 5.125% 15/7/2024 663,819 0.01 USD 2,184,000 DBJPM 16-C3 Mortgage Trust
‘Series 2016-C3 D’ ‘144A’ FRN 10/8/2049 2,101,499 0.03
USD 5,211,000 DBUBS 2017-BRBK Mortgage Trust ‘Series 2017-BRBK E’ ‘144A’ FRN 10/10/2034 5,309,696 0.07
USD 1,850,000 DBUBS 2017-BRBK Mortgage Trust ‘Series 2017-BRBK F’ ‘144A’ FRN 10/10/2034 1,859,316 0.02
USD 150,000 DCP Midstream Operating LP ‘144A’ FRN 21/5/2043 139,500 0.00
USD 200,000 DCP Midstream Operating LP 3.875% 15/3/2023 201,500 0.00
USD 600,000 DCP Midstream Operating LP ‘144A’ 4.75% 30/9/2021 616,500 0.01
USD 941,000 DCP Midstream Operating LP 5.125% 15/5/2029 965,748 0.01
USD 785,000 DCP Midstream Operating LP 5.375% 15/7/2025 832,100 0.01
USD 286,000 DCP Midstream Operating LP ‘144A’ 6.45% 3/11/2036 301,015 0.00
USD 2,087,000 DCP Midstream Operating LP ‘144A’ 6.75% 15/9/2037 2,201,785 0.03
USD 1,200,000 Dell International LLC / EMC Corp ‘144A’ 4.42% 15/6/2021 1,236,432 0.02
USD 365,000 Dell International LLC / EMC Corp ‘144A’ 5.45% 15/6/2023 396,669 0.01
USD 1,000,000 Dell International LLC / EMC Corp ‘144A’ 5.875% 15/6/2021 1,016,656 0.01
USD 3,392,000 Dell International LLC / EMC Corp ‘144A’ 7.125% 15/6/2024* 3,575,910 0.05
USD 1,000,000 Delta Air Lines Inc 3.4% 19/4/2021 1,013,773 0.01 USD 345,000 Delta Air Lines Inc 3.625%
15/3/2022 355,418 0.00 USD 250,000 Denbury Resources Inc ‘144A’
9% 15/5/2021 230,000 0.00 USD 1,021,000 Denbury Resources Inc ‘144A’
9.25% 31/3/2022 865,298 0.01 USD 4,109,213 Deutsche Alt-A Securities Mortgage
Loan Trust Series 2007-OA4/DE ‘Series 2007-OA4 3A1’ FRN 25/8/2047 3,882,655 0.05
USD 1,750,000 Dewolf Park Clo Ltd ‘Series 2017-1A A’ ‘144A’ FRN 15/10/2030 1,746,559 0.02
USD 1,000,000 Dewolf Park Clo Ltd ‘Series 2017-1A C’ ‘144A’ FRN 15/10/2030 987,675 0.01
USD 300,000 Diamond Offshore Drilling Inc 5.7% 15/10/2039 187,500 0.00
USD 200,000 Diamond Resorts International Inc ‘144A’ 7.75% 1/9/2023 202,346 0.00
USD 4,648,000 Diamond Sports Group LLC / Diamond Sports Finance Co ‘144A’ 5.375% 15/8/2026 4,895,041 0.06
USD 769,000 Diamond Sports Group LLC / Diamond Sports Finance Co ‘144A’ 6.625% 15/8/2027 804,759 0.01
USD 300,000 Diamondback Energy Inc 5.375% 31/5/2025 316,788 0.00
USD 1,000,000 Discover Bank 3.1% 4/6/2020 1,004,642 0.01 USD 260,000 Discover Bank 3.35% 6/2/2023 269,264 0.00 USD 750,000 Discover Card Execution Note
Trust ‘Series 2017-A5 A5’ FRN 15/12/2026 755,038 0.01
USD 270,000 Discover Card Execution Note Trust ‘Series 2018-A5 A5’ 3.32% 15/3/2024 278,942 0.00
USD 6,575,000 Discover Financial Services FRN 30/10/2027 (Perpetual) 6,614,319 0.09
USD 532,000 DISH DBS Corp 5% 15/3/2023 524,020 0.01 USD 7,630,000 DISH DBS Corp 5.875% 15/7/2022 7,944,737 0.10 USD 2,809,000 DISH DBS Corp 5.875% 15/11/2024 2,682,595 0.03 USD 3,064,000 DISH DBS Corp 6.75% 1/6/2021 3,236,350 0.04 USD 1,050,000 DISH DBS Corp 7.75% 1/7/2026 1,036,875 0.01 USD 1,400,000 DISH DBS Corp 7.875% 1/9/2019 1,400,000 0.02 USD 1,000,000 Dominion Energy Inc 2.579%
1/7/2020 1,002,294 0.01 USD 194,000 DPL Inc 7.25% 15/10/2021 208,792 0.00 USD 400,000 DR Horton Inc 2.55% 1/12/2020 401,079 0.01 USD 250,000 Dresdner Funding Trust I ‘144A’
8.151% 30/6/2031 340,000 0.00 USD 1,000,000 Dryden 49 Senior Loan Fund ‘Series
2017-49A C’ ‘144A’ FRN 18/7/2030 990,670 0.01 USD 1,500,000 Dryden 50 Senior Loan Fund ‘Series
2017-50A C’ ‘144A’ FRN 15/7/2030 1,500,657 0.02 USD 500,000 Dryden 70 CLO Ltd ‘Series 2018-
70A D’ ‘144A’ FRN 16/1/2032 499,914 0.01 USD 1,000,000 Dryden XXVIII Senior Loan Fund
‘Series 2013-28A B1LR’ ‘144A’ FRN 15/8/2030 967,075 0.01
USD 75,000 DTE Energy Co 2.6% 15/6/2022 75,746 0.00 USD 315,000 DTE Energy Co 3.7% 1/8/2023 332,285 0.00
Global Multi-Asset Income Fund continued
Portfolio of Investments 31 August 2019

Transferable Securities and Money Market Instruments Admitted to an Official Stock Exchange Listing or Dealt in on Another Regulated Market
Transferable Securities and Money Market Instruments Admitted to an Official Stock Exchange Listing or Dealt in on Another Regulated Market
Holding
Description
Market Value (USD)
% of Net
Assets
Holding
Description
Market Value (USD)
% of Net
Assets
* All or a portion of this security represents a security on loan.
The notes on pages 728 to 741 form an integral part of these financial statements.
Annual Report and Audited Financial Statements [523]
USD 160,000 Duke Energy Corp 3.95% 15/10/2023 170,544 0.00
USD 5,054,000 Dun & Bradstreet Corp/The ‘144A’ 6.875% 15/8/2026 5,486,749 0.07
USD 845,000 Dun & Bradstreet Corp/The ‘144A’ 10.25% 15/2/2027 926,331 0.01
USD 169,000 Eagle Holding Co II LLC ‘144A’ 7.625% 15/5/2022 171,113 0.00
USD 1,246,000 Eagle Holding Co II LLC ‘144A’ 7.75% 15/5/2022 1,263,132 0.02
USD 100,000 Ecolab Inc 2.375% 10/8/2022 100,998 0.00 USD 165,000 Edison International 5.75%
15/6/2027 187,954 0.00 USD 556,000 Elanco Animal Health Inc 4.9%
28/8/2028 601,285 0.01 USD 582,000 Eldorado Resorts Inc 6% 1/4/2025 619,830 0.01 USD 770,000 Eldorado Resorts Inc 6% 15/9/2026 846,037 0.01 USD 800,000 Electronic Arts Inc 3.7% 1/3/2021 816,086 0.01 USD 7,793,000 Element Solutions Inc ‘144A’
5.875% 1/12/2025 8,143,685 0.11 USD 2,252,000 Embarq Corp 7.995% 1/6/2036 2,218,220 0.03 USD 300,000 EMC Corp 3.375% 1/6/2023 297,386 0.00 USD 1,138,000 Encompass Health Corp 5.75%
1/11/2024 1,156,492 0.02 USD 2,443,000 Endeavor Energy Resources LP /
EER Finance Inc ‘144A’ 5.5% 30/1/2026 2,549,881 0.03
USD 1,521,000 Endeavor Energy Resources LP / EER Finance Inc ‘144A’ 5.75% 30/1/2028 1,600,852 0.02
USD 415,000 Energizer Holdings Inc ‘144A’ 6.375% 15/7/2026 437,825 0.01
USD 2,360,000 Energizer Holdings Inc ‘144A’ 7.75% 15/1/2027 2,587,150 0.03
USD 240,000 Energy Transfer Operating LP 3.6% 1/2/2023 246,607 0.00
USD 1,000,000 Energy Transfer Operating LP 5.2% 1/2/2022 1,058,973 0.01
USD 200,000 Energy Transfer Operating LP 5.5% 1/6/2027 230,009 0.00
USD 550,000 Energy Transfer Operating LP 5.875% 15/1/2024 615,354 0.01
USD 352,000 EnLink Midstream LLC 5.375% 1/6/2029 345,946 0.00
USD 3,997,000 EnLink Midstream Partners LP FRN 15/12/2022 (Perpetual) 3,017,735 0.04
USD 683,000 EnLink Midstream Partners LP 4.15% 1/6/2025 658,241 0.01
USD 801,000 EnLink Midstream Partners LP 4.4% 1/4/2024 794,992 0.01
USD 118,000 EnLink Midstream Partners LP 4.85% 15/7/2026 116,672 0.00
USD 705,000 EnLink Midstream Partners LP 5.05% 1/4/2045 585,150 0.01
USD 376,000 EnLink Midstream Partners LP 5.45% 1/6/2047 319,600 0.00
USD 567,000 EnLink Midstream Partners LP 5.6% 1/4/2044 484,785 0.01
USD 2,240,000 EnPro Industries Inc 5.75% 15/10/2026 2,357,600 0.03
USD 1,101,000 Entegris Inc ‘144A’ 4.625% 10/2/2026 1,139,535 0.02
USD 1,285,000 Entercom Media Corp ‘144A’ 6.5% 1/5/2027 1,330,502 0.02
USD 87,013 Enterprise Fleet Financing LLC ‘Series 2017-1 A2’ ‘144A’ 2.13% 20/7/2022 86,979 0.00
USD 320,000 Enterprise Fleet Financing LLC ‘Series 2017-2 A3’ ‘144A’ 2.22% 20/1/2023 320,279 0.00
USD 250,000 Enterprise Fleet Financing LLC ‘Series 2017-3 A3’ ‘144A’ 2.36% 20/5/2023 251,144 0.00
USD 6,192,000 Enterprise Products Operating LLC FRN 16/8/2077 6,084,445 0.08
USD 600,000 Enterprise Products Operating LLC 3.5% 1/2/2022 619,975 0.01
USD 1,058,000 Envision Healthcare Corp ‘144A’ 8.75% 15/10/2026 581,900 0.01
EUR 486,000 Equinix Inc 2.875% 15/3/2024* 558,928 0.01 EUR 560,000 Equinix Inc 2.875% 1/10/2025 644,404 0.01 EUR 300,000 Equinix Inc 2.875% 1/2/2026 347,925 0.00 USD 1,000,000 Equinix Inc 5.375% 1/4/2023 1,023,750 0.01 USD 500,000 Equinix Inc 5.375% 15/5/2027 540,625 0.01 USD 400,000 Equinix Inc 5.875% 15/1/2026 427,000 0.01 USD 1,930,000 ESH Hospitality Inc ‘144A’ 5.25%
1/5/2025 1,997,550 0.03 USD 550,000 Eversource Energy 2.5% 15/3/2021 552,331 0.01 USD 400,000 EW Scripps Co/The ‘144A’ 5.125%
15/5/2025 404,000 0.01 USD 500,000 Exelon Generation Co LLC 2.95%
15/1/2020 501,046 0.01 USD 650,000 Exelon Generation Co LLC 3.4%
15/3/2022 668,160 0.01 USD 1,000,000 Express Scripts Holding Co 3.9%
15/2/2022 1,041,987 0.01 USD 1,260,000 Extraction Oil & Gas Inc ‘144A’
5.625% 1/2/2026 837,900 0.01 USD 709,000 Extraction Oil & Gas Inc ‘144A’
7.375% 15/5/2024 535,295 0.01 USD 270,000 Exxon Mobil Corp 1.902%
16/8/2022 271,732 0.00 USD 135,000 Fair Isaac Corp ‘144A’ 5.25%
15/5/2026 144,450 0.00 USD 279,402 Fannie Mae Connecticut Avenue
Securities ‘Series 2017-C02 2M1’ FRN 25/9/2029 279,936 0.00
USD 164,014 Fannie Mae Pool ‘AH5702’ 4.5% 1/2/2026 172,881 0.00
USD 794,859 Fannie Mae Pool ‘AM4780’ 1.94% 1/11/2022 797,832 0.01
USD 225,636 Fannie Mae Pool ‘AS8399’ 3% 1/11/2031 232,401 0.00
USD 190,265 Fannie Mae Pool ‘AS8980’ 4.5% 1/3/2047 203,462 0.00
USD 208,011 Fannie Mae Pool ‘AU6963’ 3.5% 1/10/2028 217,858 0.00
USD 1,180,321 Fannie Mae Pool ‘AZ2960’ 3% 1/9/2030 1,215,664 0.02
USD 142,932 Fannie Mae Pool ‘BH3727’ 3% 1/5/2032 146,526 0.00
USD 7,096 Fannie Mae Pool ‘BN5357’ 4% 1/3/2034 7,412 0.00
USD 45,953 Fannie Mae Pool ‘BN5360’ 4% 1/3/2034 48,837 0.00
USD 3,920,312 Fannie Mae Pool ‘CA1126’ 4.5% 1/2/2048 4,217,594 0.05
USD 189,001 Fannie Mae Pool ‘CA1937’ 4% 1/6/2033 201,191 0.00
USD 55,162 Fannie Mae Pool ‘CA3287’ 4% 1/3/2034 58,026 0.00
USD 500,262 Fannie Mae Pool ‘CA3840’ 4.5% 1/7/2049 538,161 0.01
USD 9,625,837 Fannie Mae Pool ‘FM1245’ 4% 1/9/2033 10,095,888 0.13
Global Multi-Asset Income Fund continued
Portfolio of Investments 31 August 2019
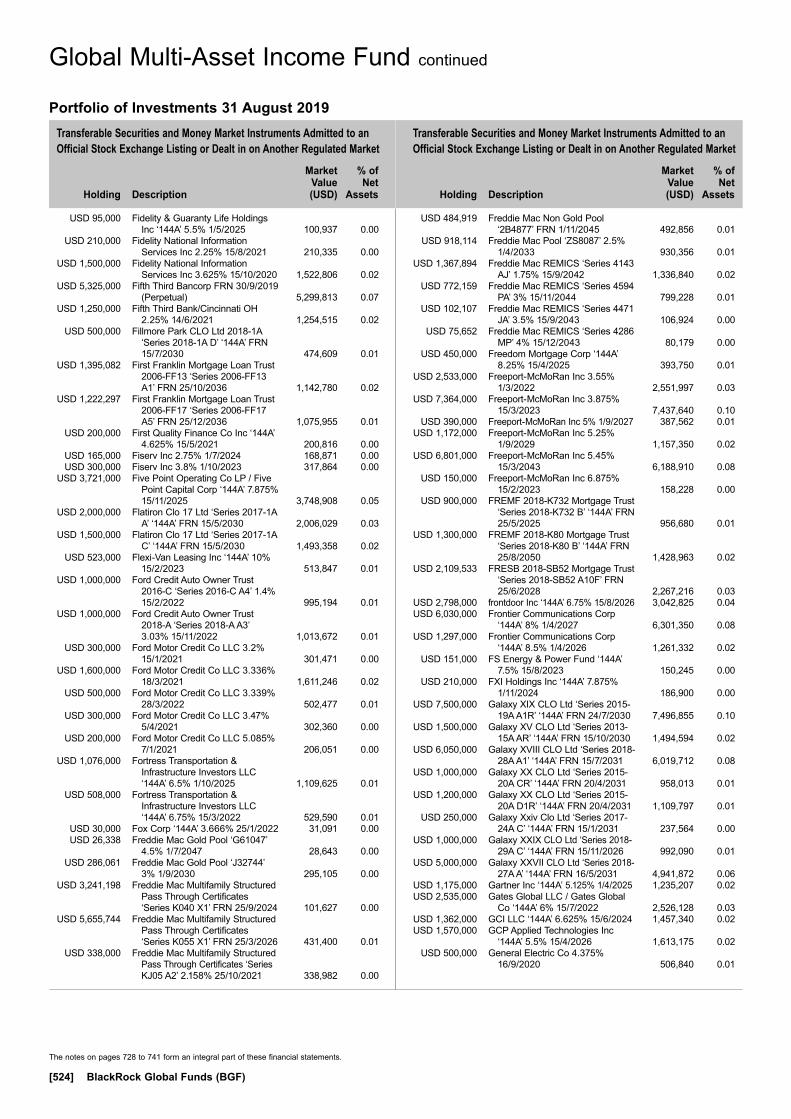
Transferable Securities and Money Market Instruments Admitted to an Official Stock Exchange Listing or Dealt in on Another Regulated Market
Transferable Securities and Money Market Instruments Admitted to an Official Stock Exchange Listing or Dealt in on Another Regulated Market
Holding
Description
Market Value (USD)
% of Net
Assets
Holding
Description
Market Value (USD)
% of Net
Assets
The notes on pages 728 to 741 form an integral part of these financial statements.
[524] BlackRock Global Funds (BGF)
USD 95,000 Fidelity & Guaranty Life Holdings Inc ‘144A’ 5.5% 1/5/2025 100,937 0.00
USD 210,000 Fidelity National Information Services Inc 2.25% 15/8/2021 210,335 0.00
USD 1,500,000 Fidelity National Information Services Inc 3.625% 15/10/2020 1,522,806 0.02
USD 5,325,000 Fifth Third Bancorp FRN 30/9/2019 (Perpetual) 5,299,813 0.07
USD 1,250,000 Fifth Third Bank/Cincinnati OH 2.25% 14/6/2021 1,254,515 0.02
USD 500,000 Fillmore Park CLO Ltd 2018-1A ‘Series 2018-1A D’ ‘144A’ FRN 15/7/2030 474,609 0.01
USD 1,395,082 First Franklin Mortgage Loan Trust 2006-FF13 ‘Series 2006-FF13 A1’ FRN 25/10/2036 1,142,780 0.02
USD 1,222,297 First Franklin Mortgage Loan Trust 2006-FF17 ‘Series 2006-FF17 A5’ FRN 25/12/2036 1,075,955 0.01
USD 200,000 First Quality Finance Co Inc ‘144A’ 4.625% 15/5/2021 200,816 0.00
USD 165,000 Fiserv Inc 2.75% 1/7/2024 168,871 0.00 USD 300,000 Fiserv Inc 3.8% 1/10/2023 317,864 0.00 USD 3,721,000 Five Point Operating Co LP / Five
Point Capital Corp ‘144A’ 7.875% 15/11/2025 3,748,908 0.05
USD 2,000,000 Flatiron Clo 17 Ltd ‘Series 2017-1A A’ ‘144A’ FRN 15/5/2030 2,006,029 0.03
USD 1,500,000 Flatiron Clo 17 Ltd ‘Series 2017-1A C’ ‘144A’ FRN 15/5/2030 1,493,358 0.02
USD 523,000 Flexi-Van Leasing Inc ‘144A’ 10% 15/2/2023 513,847 0.01
USD 1,000,000 Ford Credit Auto Owner Trust 2016-C ‘Series 2016-C A4’ 1.4% 15/2/2022 995,194 0.01
USD 1,000,000 Ford Credit Auto Owner Trust 2018-A ‘Series 2018-A A3’ 3.03% 15/11/2022 1,013,672 0.01
USD 300,000 Ford Motor Credit Co LLC 3.2% 15/1/2021 301,471 0.00
USD 1,600,000 Ford Motor Credit Co LLC 3.336% 18/3/2021 1,611,246 0.02
USD 500,000 Ford Motor Credit Co LLC 3.339% 28/3/2022 502,477 0.01
USD 300,000 Ford Motor Credit Co LLC 3.47% 5/4/2021 302,360 0.00
USD 200,000 Ford Motor Credit Co LLC 5.085% 7/1/2021 206,051 0.00
USD 1,076,000 Fortress Transportation & Infrastructure Investors LLC ‘144A’ 6.5% 1/10/2025 1,109,625 0.01
USD 508,000 Fortress Transportation & Infrastructure Investors LLC ‘144A’ 6.75% 15/3/2022 529,590 0.01
USD 30,000 Fox Corp ‘144A’ 3.666% 25/1/2022 31,091 0.00 USD 26,338 Freddie Mac Gold Pool ‘G61047’
4.5% 1/7/2047 28,643 0.00 USD 286,061 Freddie Mac Gold Pool ‘J32744’
3% 1/9/2030 295,105 0.00 USD 3,241,198 Freddie Mac Multifamily Structured
Pass Through Certificates ‘Series K040 X1’ FRN 25/9/2024 101,627 0.00
USD 5,655,744 Freddie Mac Multifamily Structured Pass Through Certificates ‘Series K055 X1’ FRN 25/3/2026 431,400 0.01
USD 338,000 Freddie Mac Multifamily Structured Pass Through Certificates ‘Series KJ05 A2’ 2.158% 25/10/2021 338,982 0.00
USD 484,919 Freddie Mac Non Gold Pool ‘2B4877’ FRN 1/11/2045 492,856 0.01
USD 918,114 Freddie Mac Pool ‘ZS8087’ 2.5% 1/4/2033 930,356 0.01
USD 1,367,894 Freddie Mac REMICS ‘Series 4143 AJ’ 1.75% 15/9/2042 1,336,840 0.02
USD 772,159 Freddie Mac REMICS ‘Series 4594 PA’ 3% 15/11/2044 799,228 0.01
USD 102,107 Freddie Mac REMICS ‘Series 4471 JA’ 3.5% 15/9/2043 106,924 0.00
USD 75,652 Freddie Mac REMICS ‘Series 4286 MP’ 4% 15/12/2043 80,179 0.00
USD 450,000 Freedom Mortgage Corp ‘144A’ 8.25% 15/4/2025 393,750 0.01
USD 2,533,000 Freeport-McMoRan Inc 3.55% 1/3/2022 2,551,997 0.03
USD 7,364,000 Freeport-McMoRan Inc 3.875% 15/3/2023 7,437,640 0.10
USD 390,000 Freeport-McMoRan Inc 5% 1/9/2027 387,562 0.01 USD 1,172,000 Freeport-McMoRan Inc 5.25%
1/9/2029 1,157,350 0.02 USD 6,801,000 Freeport-McMoRan Inc 5.45%
15/3/2043 6,188,910 0.08 USD 150,000 Freeport-McMoRan Inc 6.875%
15/2/2023 158,228 0.00 USD 900,000 FREMF 2018-K732 Mortgage Trust
‘Series 2018-K732 B’ ‘144A’ FRN 25/5/2025 956,680 0.01
USD 1,300,000 FREMF 2018-K80 Mortgage Trust ‘Series 2018-K80 B’ ‘144A’ FRN 25/8/2050 1,428,963 0.02
USD 2,109,533 FRESB 2018-SB52 Mortgage Trust ‘Series 2018-SB52 A10F’ FRN 25/6/2028 2,267,216 0.03
USD 2,798,000 frontdoor Inc ‘144A’ 6.75% 15/8/2026 3,042,825 0.04 USD 6,030,000 Frontier Communications Corp
‘144A’ 8% 1/4/2027 6,301,350 0.08 USD 1,297,000 Frontier Communications Corp
‘144A’ 8.5% 1/4/2026 1,261,332 0.02 USD 151,000 FS Energy & Power Fund ‘144A’
7.5% 15/8/2023 150,245 0.00 USD 210,000 FXI Holdings Inc ‘144A’ 7.875%
1/11/2024 186,900 0.00 USD 7,500,000 Galaxy XIX CLO Ltd ‘Series 2015-
19A A1R’ ‘144A’ FRN 24/7/2030 7,496,855 0.10 USD 1,500,000 Galaxy XV CLO Ltd ‘Series 2013-
15A AR’ ‘144A’ FRN 15/10/2030 1,494,594 0.02 USD 6,050,000 Galaxy XVIII CLO Ltd ‘Series 2018-
28A A1’ ‘144A’ FRN 15/7/2031 6,019,712 0.08 USD 1,000,000 Galaxy XX CLO Ltd ‘Series 2015-
20A CR’ ‘144A’ FRN 20/4/2031 958,013 0.01 USD 1,200,000 Galaxy XX CLO Ltd ‘Series 2015-
20A D1R’ ‘144A’ FRN 20/4/2031 1,109,797 0.01 USD 250,000 Galaxy Xxiv Clo Ltd ‘Series 2017-
24A C’ ‘144A’ FRN 15/1/2031 237,564 0.00 USD 1,000,000 Galaxy XXIX CLO Ltd ‘Series 2018-
29A C’ ‘144A’ FRN 15/11/2026 992,090 0.01 USD 5,000,000 Galaxy XXVII CLO Ltd ‘Series 2018-
27A A’ ‘144A’ FRN 16/5/2031 4,941,872 0.06 USD 1,175,000 Gartner Inc ‘144A’ 5.125% 1/4/2025 1,235,207 0.02 USD 2,535,000 Gates Global LLC / Gates Global
Co ‘144A’ 6% 15/7/2022 2,526,128 0.03 USD 1,362,000 GCI LLC ‘144A’ 6.625% 15/6/2024 1,457,340 0.02 USD 1,570,000 GCP Applied Technologies Inc
‘144A’ 5.5% 15/4/2026 1,613,175 0.02 USD 500,000 General Electric Co 4.375%
16/9/2020 506,840 0.01
Global Multi-Asset Income Fund continued
Portfolio of Investments 31 August 2019
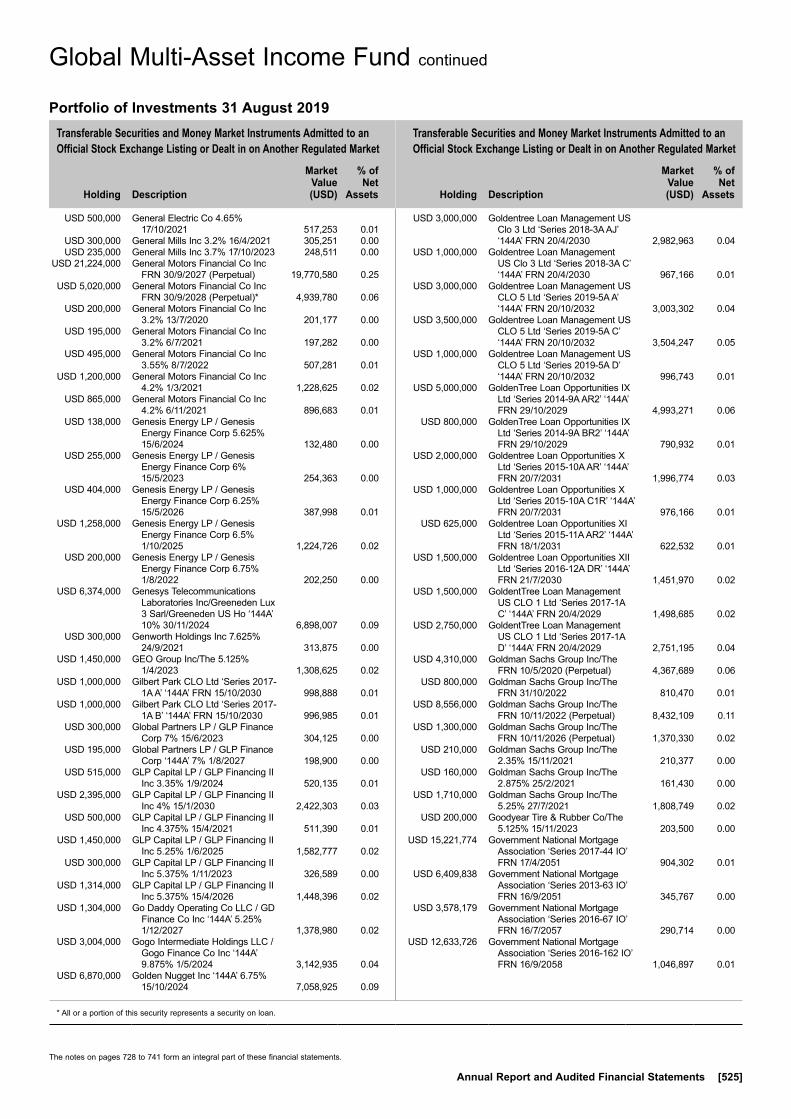
Transferable Securities and Money Market Instruments Admitted to an Official Stock Exchange Listing or Dealt in on Another Regulated Market
Transferable Securities and Money Market Instruments Admitted to an Official Stock Exchange Listing or Dealt in on Another Regulated Market
Holding
Description
Market Value (USD)
% of Net
Assets
Holding
Description
Market Value (USD)
% of Net
Assets
* All or a portion of this security represents a security on loan.
The notes on pages 728 to 741 form an integral part of these financial statements.
Annual Report and Audited Financial Statements [525]
USD 500,000 General Electric Co 4.65% 17/10/2021 517,253 0.01
USD 300,000 General Mills Inc 3.2% 16/4/2021 305,251 0.00 USD 235,000 General Mills Inc 3.7% 17/10/2023 248,511 0.00 USD 21,224,000 General Motors Financial Co Inc
FRN 30/9/2027 (Perpetual) 19,770,580 0.25 USD 5,020,000 General Motors Financial Co Inc
FRN 30/9/2028 (Perpetual)* 4,939,780 0.06 USD 200,000 General Motors Financial Co Inc
3.2% 13/7/2020 201,177 0.00 USD 195,000 General Motors Financial Co Inc
3.2% 6/7/2021 197,282 0.00 USD 495,000 General Motors Financial Co Inc
3.55% 8/7/2022 507,281 0.01 USD 1,200,000 General Motors Financial Co Inc
4.2% 1/3/2021 1,228,625 0.02 USD 865,000 General Motors Financial Co Inc
4.2% 6/11/2021 896,683 0.01 USD 138,000 Genesis Energy LP / Genesis
Energy Finance Corp 5.625% 15/6/2024 132,480 0.00
USD 255,000 Genesis Energy LP / Genesis Energy Finance Corp 6% 15/5/2023 254,363 0.00
USD 404,000 Genesis Energy LP / Genesis Energy Finance Corp 6.25% 15/5/2026 387,998 0.01
USD 1,258,000 Genesis Energy LP / Genesis Energy Finance Corp 6.5% 1/10/2025 1,224,726 0.02
USD 200,000 Genesis Energy LP / Genesis Energy Finance Corp 6.75% 1/8/2022 202,250 0.00
USD 6,374,000 Genesys Telecommunications Laboratories Inc/Greeneden Lux 3 Sarl/Greeneden US Ho ‘144A’ 10% 30/11/2024 6,898,007 0.09
USD 300,000 Genworth Holdings Inc 7.625% 24/9/2021 313,875 0.00
USD 1,450,000 GEO Group Inc/The 5.125% 1/4/2023 1,308,625 0.02
USD 1,000,000 Gilbert Park CLO Ltd ‘Series 2017-1A A’ ‘144A’ FRN 15/10/2030 998,888 0.01
USD 1,000,000 Gilbert Park CLO Ltd ‘Series 2017-1A B’ ‘144A’ FRN 15/10/2030 996,985 0.01
USD 300,000 Global Partners LP / GLP Finance Corp 7% 15/6/2023 304,125 0.00
USD 195,000 Global Partners LP / GLP Finance Corp ‘144A’ 7% 1/8/2027 198,900 0.00
USD 515,000 GLP Capital LP / GLP Financing II Inc 3.35% 1/9/2024 520,135 0.01
USD 2,395,000 GLP Capital LP / GLP Financing II Inc 4% 15/1/2030 2,422,303 0.03
USD 500,000 GLP Capital LP / GLP Financing II Inc 4.375% 15/4/2021 511,390 0.01
USD 1,450,000 GLP Capital LP / GLP Financing II Inc 5.25% 1/6/2025 1,582,777 0.02
USD 300,000 GLP Capital LP / GLP Financing II Inc 5.375% 1/11/2023 326,589 0.00
USD 1,314,000 GLP Capital LP / GLP Financing II Inc 5.375% 15/4/2026 1,448,396 0.02
USD 1,304,000 Go Daddy Operating Co LLC / GD Finance Co Inc ‘144A’ 5.25% 1/12/2027 1,378,980 0.02
USD 3,004,000 Gogo Intermediate Holdings LLC / Gogo Finance Co Inc ‘144A’ 9.875% 1/5/2024 3,142,935 0.04
USD 6,870,000 Golden Nugget Inc ‘144A’ 6.75% 15/10/2024 7,058,925 0.09
USD 3,000,000 Goldentree Loan Management US Clo 3 Ltd ‘Series 2018-3A AJ’ ‘144A’ FRN 20/4/2030 2,982,963 0.04
USD 1,000,000 Goldentree Loan Management US Clo 3 Ltd ‘Series 2018-3A C’ ‘144A’ FRN 20/4/2030 967,166 0.01
USD 3,000,000 Goldentree Loan Management US CLO 5 Ltd ‘Series 2019-5A A’ ‘144A’ FRN 20/10/2032 3,003,302 0.04
USD 3,500,000 Goldentree Loan Management US CLO 5 Ltd ‘Series 2019-5A C’ ‘144A’ FRN 20/10/2032 3,504,247 0.05
USD 1,000,000 Goldentree Loan Management US CLO 5 Ltd ‘Series 2019-5A D’ ‘144A’ FRN 20/10/2032 996,743 0.01
USD 5,000,000 GoldenTree Loan Opportunities IX Ltd ‘Series 2014-9A AR2’ ‘144A’ FRN 29/10/2029 4,993,271 0.06
USD 800,000 GoldenTree Loan Opportunities IX Ltd ‘Series 2014-9A BR2’ ‘144A’ FRN 29/10/2029 790,932 0.01
USD 2,000,000 Goldentree Loan Opportunities X Ltd ‘Series 2015-10A AR’ ‘144A’ FRN 20/7/2031 1,996,774 0.03
USD 1,000,000 Goldentree Loan Opportunities X Ltd ‘Series 2015-10A C1R’ ‘144A’ FRN 20/7/2031 976,166 0.01
USD 625,000 Goldentree Loan Opportunities XI Ltd ‘Series 2015-11A AR2’ ‘144A’ FRN 18/1/2031 622,532 0.01
USD 1,500,000 Goldentree Loan Opportunities XII Ltd ‘Series 2016-12A DR’ ‘144A’ FRN 21/7/2030 1,451,970 0.02
USD 1,500,000 GoldentTree Loan Management US CLO 1 Ltd ‘Series 2017-1A C’ ‘144A’ FRN 20/4/2029 1,498,685 0.02
USD 2,750,000 GoldentTree Loan Management US CLO 1 Ltd ‘Series 2017-1A D’ ‘144A’ FRN 20/4/2029 2,751,195 0.04
USD 4,310,000 Goldman Sachs Group Inc/The FRN 10/5/2020 (Perpetual) 4,367,689 0.06
USD 800,000 Goldman Sachs Group Inc/The FRN 31/10/2022 810,470 0.01
USD 8,556,000 Goldman Sachs Group Inc/The FRN 10/11/2022 (Perpetual) 8,432,109 0.11
USD 1,300,000 Goldman Sachs Group Inc/The FRN 10/11/2026 (Perpetual) 1,370,330 0.02
USD 210,000 Goldman Sachs Group Inc/The 2.35% 15/11/2021 210,377 0.00
USD 160,000 Goldman Sachs Group Inc/The 2.875% 25/2/2021 161,430 0.00
USD 1,710,000 Goldman Sachs Group Inc/The 5.25% 27/7/2021 1,808,749 0.02
USD 200,000 Goodyear Tire & Rubber Co/The 5.125% 15/11/2023 203,500 0.00
USD 15,221,774 Government National Mortgage Association ‘Series 2017-44 IO’ FRN 17/4/2051 904,302 0.01
USD 6,409,838 Government National Mortgage Association ‘Series 2013-63 IO’ FRN 16/9/2051 345,767 0.00
USD 3,578,179 Government National Mortgage Association ‘Series 2016-67 IO’ FRN 16/7/2057 290,714 0.00
USD 12,633,726 Government National Mortgage Association ‘Series 2016-162 IO’ FRN 16/9/2058 1,046,897 0.01
Global Multi-Asset Income Fund continued
Portfolio of Investments 31 August 2019
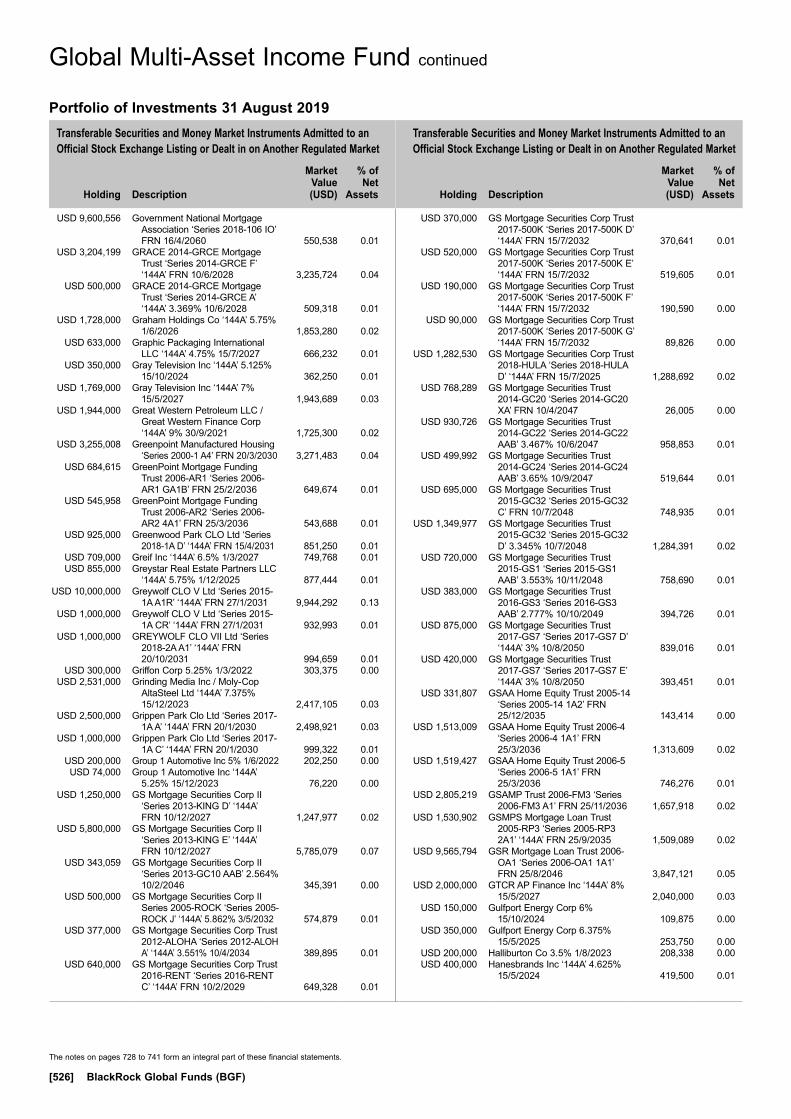
Transferable Securities and Money Market Instruments Admitted to an Official Stock Exchange Listing or Dealt in on Another Regulated Market
Transferable Securities and Money Market Instruments Admitted to an Official Stock Exchange Listing or Dealt in on Another Regulated Market
Holding
Description
Market Value (USD)
% of Net
Assets
Holding
Description
Market Value (USD)
% of Net
Assets
The notes on pages 728 to 741 form an integral part of these financial statements.
[526] BlackRock Global Funds (BGF)
USD 9,600,556 Government National Mortgage Association ‘Series 2018-106 IO’ FRN 16/4/2060 550,538 0.01
USD 3,204,199 GRACE 2014-GRCE Mortgage Trust ‘Series 2014-GRCE F’ ‘144A’ FRN 10/6/2028 3,235,724 0.04
USD 500,000 GRACE 2014-GRCE Mortgage Trust ‘Series 2014-GRCE A’ ‘144A’ 3.369% 10/6/2028 509,318 0.01
USD 1,728,000 Graham Holdings Co ‘144A’ 5.75% 1/6/2026 1,853,280 0.02
USD 633,000 Graphic Packaging International LLC ‘144A’ 4.75% 15/7/2027 666,232 0.01
USD 350,000 Gray Television Inc ‘144A’ 5.125% 15/10/2024 362,250 0.01
USD 1,769,000 Gray Television Inc ‘144A’ 7% 15/5/2027 1,943,689 0.03
USD 1,944,000 Great Western Petroleum LLC / Great Western Finance Corp ‘144A’ 9% 30/9/2021 1,725,300 0.02
USD 3,255,008 Greenpoint Manufactured Housing ‘Series 2000-1 A4’ FRN 20/3/2030 3,271,483 0.04
USD 684,615 GreenPoint Mortgage Funding Trust 2006-AR1 ‘Series 2006-AR1 GA1B’ FRN 25/2/2036 649,674 0.01
USD 545,958 GreenPoint Mortgage Funding Trust 2006-AR2 ‘Series 2006-AR2 4A1’ FRN 25/3/2036 543,688 0.01
USD 925,000 Greenwood Park CLO Ltd ‘Series 2018-1A D’ ‘144A’ FRN 15/4/2031 851,250 0.01
USD 709,000 Greif Inc ‘144A’ 6.5% 1/3/2027 749,768 0.01 USD 855,000 Greystar Real Estate Partners LLC
‘144A’ 5.75% 1/12/2025 877,444 0.01 USD 10,000,000 Greywolf CLO V Ltd ‘Series 2015-
1A A1R’ ‘144A’ FRN 27/1/2031 9,944,292 0.13 USD 1,000,000 Greywolf CLO V Ltd ‘Series 2015-
1A CR’ ‘144A’ FRN 27/1/2031 932,993 0.01 USD 1,000,000 GREYWOLF CLO VII Ltd ‘Series
2018-2A A1’ ‘144A’ FRN 20/10/2031 994,659 0.01
USD 300,000 Griffon Corp 5.25% 1/3/2022 303,375 0.00 USD 2,531,000 Grinding Media Inc / Moly-Cop
AltaSteel Ltd ‘144A’ 7.375% 15/12/2023 2,417,105 0.03
USD 2,500,000 Grippen Park Clo Ltd ‘Series 2017-1A A’ ‘144A’ FRN 20/1/2030 2,498,921 0.03
USD 1,000,000 Grippen Park Clo Ltd ‘Series 2017-1A C’ ‘144A’ FRN 20/1/2030 999,322 0.01
USD 200,000 Group 1 Automotive Inc 5% 1/6/2022 202,250 0.00 USD 74,000 Group 1 Automotive Inc ‘144A’
5.25% 15/12/2023 76,220 0.00 USD 1,250,000 GS Mortgage Securities Corp II
‘Series 2013-KING D’ ‘144A’ FRN 10/12/2027 1,247,977 0.02
USD 5,800,000 GS Mortgage Securities Corp II ‘Series 2013-KING E’ ‘144A’ FRN 10/12/2027 5,785,079 0.07
USD 343,059 GS Mortgage Securities Corp II ‘Series 2013-GC10 AAB’ 2.564% 10/2/2046 345,391 0.00
USD 500,000 GS Mortgage Securities Corp II Series 2005-ROCK ‘Series 2005-ROCK J’ ‘144A’ 5.862% 3/5/2032 574,879 0.01
USD 377,000 GS Mortgage Securities Corp Trust 2012-ALOHA ‘Series 2012-ALOH A’ ‘144A’ 3.551% 10/4/2034 389,895 0.01
USD 640,000 GS Mortgage Securities Corp Trust 2016-RENT ‘Series 2016-RENT C’ ‘144A’ FRN 10/2/2029 649,328 0.01
USD 370,000 GS Mortgage Securities Corp Trust 2017-500K ‘Series 2017-500K D’ ‘144A’ FRN 15/7/2032 370,641 0.01
USD 520,000 GS Mortgage Securities Corp Trust 2017-500K ‘Series 2017-500K E’ ‘144A’ FRN 15/7/2032 519,605 0.01
USD 190,000 GS Mortgage Securities Corp Trust 2017-500K ‘Series 2017-500K F’ ‘144A’ FRN 15/7/2032 190,590 0.00
USD 90,000 GS Mortgage Securities Corp Trust 2017-500K ‘Series 2017-500K G’ ‘144A’ FRN 15/7/2032 89,826 0.00
USD 1,282,530 GS Mortgage Securities Corp Trust 2018-HULA ‘Series 2018-HULA D’ ‘144A’ FRN 15/7/2025 1,288,692 0.02
USD 768,289 GS Mortgage Securities Trust 2014-GC20 ‘Series 2014-GC20 XA’ FRN 10/4/2047 26,005 0.00
USD 930,726 GS Mortgage Securities Trust 2014-GC22 ‘Series 2014-GC22 AAB’ 3.467% 10/6/2047 958,853 0.01
USD 499,992 GS Mortgage Securities Trust 2014-GC24 ‘Series 2014-GC24 AAB’ 3.65% 10/9/2047 519,644 0.01
USD 695,000 GS Mortgage Securities Trust 2015-GC32 ‘Series 2015-GC32 C’ FRN 10/7/2048 748,935 0.01
USD 1,349,977 GS Mortgage Securities Trust 2015-GC32 ‘Series 2015-GC32 D’ 3.345% 10/7/2048 1,284,391 0.02
USD 720,000 GS Mortgage Securities Trust 2015-GS1 ‘Series 2015-GS1 AAB’ 3.553% 10/11/2048 758,690 0.01
USD 383,000 GS Mortgage Securities Trust 2016-GS3 ‘Series 2016-GS3 AAB’ 2.777% 10/10/2049 394,726 0.01
USD 875,000 GS Mortgage Securities Trust 2017-GS7 ‘Series 2017-GS7 D’ ‘144A’ 3% 10/8/2050 839,016 0.01
USD 420,000 GS Mortgage Securities Trust 2017-GS7 ‘Series 2017-GS7 E’ ‘144A’ 3% 10/8/2050 393,451 0.01
USD 331,807 GSAA Home Equity Trust 2005-14 ‘Series 2005-14 1A2’ FRN 25/12/2035 143,414 0.00
USD 1,513,009 GSAA Home Equity Trust 2006-4 ‘Series 2006-4 1A1’ FRN 25/3/2036 1,313,609 0.02
USD 1,519,427 GSAA Home Equity Trust 2006-5 ‘Series 2006-5 1A1’ FRN 25/3/2036 746,276 0.01
USD 2,805,219 GSAMP Trust 2006-FM3 ‘Series 2006-FM3 A1’ FRN 25/11/2036 1,657,918 0.02
USD 1,530,902 GSMPS Mortgage Loan Trust 2005-RP3 ‘Series 2005-RP3 2A1’ ‘144A’ FRN 25/9/2035 1,509,089 0.02
USD 9,565,794 GSR Mortgage Loan Trust 2006-OA1 ‘Series 2006-OA1 1A1’ FRN 25/8/2046 3,847,121 0.05
USD 2,000,000 GTCR AP Finance Inc ‘144A’ 8% 15/5/2027 2,040,000 0.03
USD 150,000 Gulfport Energy Corp 6% 15/10/2024 109,875 0.00
USD 350,000 Gulfport Energy Corp 6.375% 15/5/2025 253,750 0.00
USD 200,000 Halliburton Co 3.5% 1/8/2023 208,338 0.00 USD 400,000 Hanesbrands Inc ‘144A’ 4.625%
15/5/2024 419,500 0.01
Global Multi-Asset Income Fund continued
Portfolio of Investments 31 August 2019
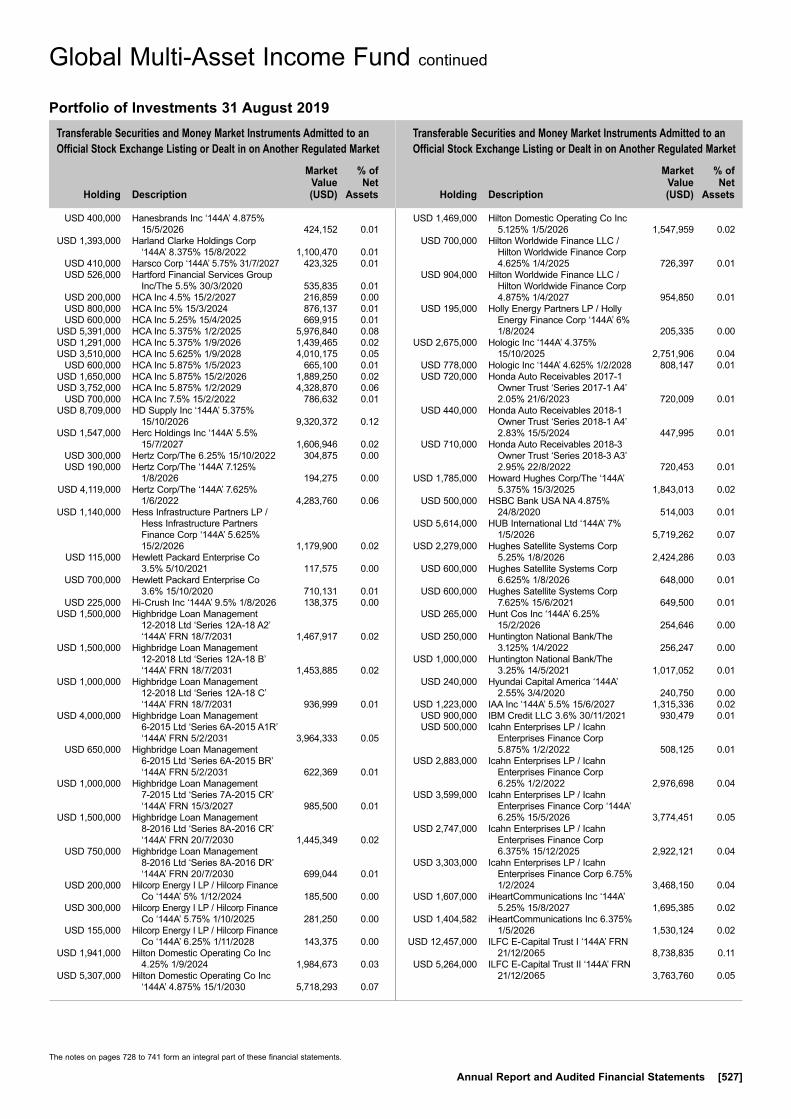
Transferable Securities and Money Market Instruments Admitted to an Official Stock Exchange Listing or Dealt in on Another Regulated Market
Transferable Securities and Money Market Instruments Admitted to an Official Stock Exchange Listing or Dealt in on Another Regulated Market
Holding
Description
Market Value (USD)
% of Net
Assets
Holding
Description
Market Value (USD)
% of Net
Assets
The notes on pages 728 to 741 form an integral part of these financial statements.
Annual Report and Audited Financial Statements [527]
USD 400,000 Hanesbrands Inc ‘144A’ 4.875% 15/5/2026 424,152 0.01
USD 1,393,000 Harland Clarke Holdings Corp ‘144A’ 8.375% 15/8/2022 1,100,470 0.01
USD 410,000 Harsco Corp ‘144A’ 5.75% 31/7/2027 423,325 0.01 USD 526,000 Hartford Financial Services Group
Inc/The 5.5% 30/3/2020 535,835 0.01 USD 200,000 HCA Inc 4.5% 15/2/2027 216,859 0.00 USD 800,000 HCA Inc 5% 15/3/2024 876,137 0.01 USD 600,000 HCA Inc 5.25% 15/4/2025 669,915 0.01 USD 5,391,000 HCA Inc 5.375% 1/2/2025 5,976,840 0.08 USD 1,291,000 HCA Inc 5.375% 1/9/2026 1,439,465 0.02 USD 3,510,000 HCA Inc 5.625% 1/9/2028 4,010,175 0.05 USD 600,000 HCA Inc 5.875% 1/5/2023 665,100 0.01 USD 1,650,000 HCA Inc 5.875% 15/2/2026 1,889,250 0.02 USD 3,752,000 HCA Inc 5.875% 1/2/2029 4,328,870 0.06 USD 700,000 HCA Inc 7.5% 15/2/2022 786,632 0.01 USD 8,709,000 HD Supply Inc ‘144A’ 5.375%
15/10/2026 9,320,372 0.12 USD 1,547,000 Herc Holdings Inc ‘144A’ 5.5%
15/7/2027 1,606,946 0.02 USD 300,000 Hertz Corp/The 6.25% 15/10/2022 304,875 0.00 USD 190,000 Hertz Corp/The ‘144A’ 7.125%
1/8/2026 194,275 0.00 USD 4,119,000 Hertz Corp/The ‘144A’ 7.625%
1/6/2022 4,283,760 0.06 USD 1,140,000 Hess Infrastructure Partners LP /
Hess Infrastructure Partners Finance Corp ‘144A’ 5.625% 15/2/2026 1,179,900 0.02
USD 115,000 Hewlett Packard Enterprise Co 3.5% 5/10/2021 117,575 0.00
USD 700,000 Hewlett Packard Enterprise Co 3.6% 15/10/2020 710,131 0.01
USD 225,000 Hi-Crush Inc ‘144A’ 9.5% 1/8/2026 138,375 0.00 USD 1,500,000 Highbridge Loan Management
12-2018 Ltd ‘Series 12A-18 A2’ ‘144A’ FRN 18/7/2031 1,467,917 0.02
USD 1,500,000 Highbridge Loan Management 12-2018 Ltd ‘Series 12A-18 B’ ‘144A’ FRN 18/7/2031 1,453,885 0.02
USD 1,000,000 Highbridge Loan Management 12-2018 Ltd ‘Series 12A-18 C’ ‘144A’ FRN 18/7/2031 936,999 0.01
USD 4,000,000 Highbridge Loan Management 6-2015 Ltd ‘Series 6A-2015 A1R’ ‘144A’ FRN 5/2/2031 3,964,333 0.05
USD 650,000 Highbridge Loan Management 6-2015 Ltd ‘Series 6A-2015 BR’ ‘144A’ FRN 5/2/2031 622,369 0.01
USD 1,000,000 Highbridge Loan Management 7-2015 Ltd ‘Series 7A-2015 CR’ ‘144A’ FRN 15/3/2027 985,500 0.01
USD 1,500,000 Highbridge Loan Management 8-2016 Ltd ‘Series 8A-2016 CR’ ‘144A’ FRN 20/7/2030 1,445,349 0.02
USD 750,000 Highbridge Loan Management 8-2016 Ltd ‘Series 8A-2016 DR’ ‘144A’ FRN 20/7/2030 699,044 0.01
USD 200,000 Hilcorp Energy I LP / Hilcorp Finance Co ‘144A’ 5% 1/12/2024 185,500 0.00
USD 300,000 Hilcorp Energy I LP / Hilcorp Finance Co ‘144A’ 5.75% 1/10/2025 281,250 0.00
USD 155,000 Hilcorp Energy I LP / Hilcorp Finance Co ‘144A’ 6.25% 1/11/2028 143,375 0.00
USD 1,941,000 Hilton Domestic Operating Co Inc 4.25% 1/9/2024 1,984,673 0.03
USD 5,307,000 Hilton Domestic Operating Co Inc ‘144A’ 4.875% 15/1/2030 5,718,293 0.07
USD 1,469,000 Hilton Domestic Operating Co Inc 5.125% 1/5/2026 1,547,959 0.02
USD 700,000 Hilton Worldwide Finance LLC / Hilton Worldwide Finance Corp 4.625% 1/4/2025 726,397 0.01
USD 904,000 Hilton Worldwide Finance LLC / Hilton Worldwide Finance Corp 4.875% 1/4/2027 954,850 0.01
USD 195,000 Holly Energy Partners LP / Holly Energy Finance Corp ‘144A’ 6% 1/8/2024 205,335 0.00
USD 2,675,000 Hologic Inc ‘144A’ 4.375% 15/10/2025 2,751,906 0.04
USD 778,000 Hologic Inc ‘144A’ 4.625% 1/2/2028 808,147 0.01 USD 720,000 Honda Auto Receivables 2017-1
Owner Trust ‘Series 2017-1 A4’ 2.05% 21/6/2023 720,009 0.01
USD 440,000 Honda Auto Receivables 2018-1 Owner Trust ‘Series 2018-1 A4’ 2.83% 15/5/2024 447,995 0.01
USD 710,000 Honda Auto Receivables 2018-3 Owner Trust ‘Series 2018-3 A3’ 2.95% 22/8/2022 720,453 0.01
USD 1,785,000 Howard Hughes Corp/The ‘144A’ 5.375% 15/3/2025 1,843,013 0.02
USD 500,000 HSBC Bank USA NA 4.875% 24/8/2020 514,003 0.01
USD 5,614,000 HUB International Ltd ‘144A’ 7% 1/5/2026 5,719,262 0.07
USD 2,279,000 Hughes Satellite Systems Corp 5.25% 1/8/2026 2,424,286 0.03
USD 600,000 Hughes Satellite Systems Corp 6.625% 1/8/2026 648,000 0.01
USD 600,000 Hughes Satellite Systems Corp 7.625% 15/6/2021 649,500 0.01
USD 265,000 Hunt Cos Inc ‘144A’ 6.25% 15/2/2026 254,646 0.00
USD 250,000 Huntington National Bank/The 3.125% 1/4/2022 256,247 0.00
USD 1,000,000 Huntington National Bank/The 3.25% 14/5/2021 1,017,052 0.01
USD 240,000 Hyundai Capital America ‘144A’ 2.55% 3/4/2020 240,750 0.00
USD 1,223,000 IAA Inc ‘144A’ 5.5% 15/6/2027 1,315,336 0.02 USD 900,000 IBM Credit LLC 3.6% 30/11/2021 930,479 0.01 USD 500,000 Icahn Enterprises LP / Icahn
Enterprises Finance Corp 5.875% 1/2/2022 508,125 0.01
USD 2,883,000 Icahn Enterprises LP / Icahn Enterprises Finance Corp 6.25% 1/2/2022 2,976,698 0.04
USD 3,599,000 Icahn Enterprises LP / Icahn Enterprises Finance Corp ‘144A’ 6.25% 15/5/2026 3,774,451 0.05
USD 2,747,000 Icahn Enterprises LP / Icahn Enterprises Finance Corp 6.375% 15/12/2025 2,922,121 0.04
USD 3,303,000 Icahn Enterprises LP / Icahn Enterprises Finance Corp 6.75% 1/2/2024 3,468,150 0.04
USD 1,607,000 iHeartCommunications Inc ‘144A’ 5.25% 15/8/2027 1,695,385 0.02
USD 1,404,582 iHeartCommunications Inc 6.375% 1/5/2026 1,530,124 0.02
USD 12,457,000 ILFC E-Capital Trust I ‘144A’ FRN 21/12/2065 8,738,835 0.11
USD 5,264,000 ILFC E-Capital Trust II ‘144A’ FRN 21/12/2065 3,763,760 0.05
Global Multi-Asset Income Fund continued
Portfolio of Investments 31 August 2019

Transferable Securities and Money Market Instruments Admitted to an Official Stock Exchange Listing or Dealt in on Another Regulated Market
Transferable Securities and Money Market Instruments Admitted to an Official Stock Exchange Listing or Dealt in on Another Regulated Market
Holding
Description
Market Value (USD)
% of Net
Assets
Holding
Description
Market Value (USD)
% of Net
Assets
* All or a portion of this security represents a security on loan.
The notes on pages 728 to 741 form an integral part of these financial statements.
[528] BlackRock Global Funds (BGF)
USD 325,000 Immucor Inc ‘144A’ 11.125% 15/2/2022 331,077 0.00
USD 2,537,833 Impac CMB Trust Series 2005-6 ‘Series 2005-6 1A1’ FRN 25/10/2035 2,486,618 0.03
USD 1,467,000 Indigo Natural Resources LLC ‘144A’ 6.875% 15/2/2026 1,217,610 0.02
USD 1,362,876 IndyMac INDX Mortgage Loan Trust 2007-FLX5 ‘Series 2007-FLX5 2A1’ FRN 25/8/2037 1,337,600 0.02
USD 10,091,000 Infor US Inc 6.5% 15/5/2022 10,292,820 0.13 USD 3,694,000 Informatica LLC ‘144A’ 7.125%
15/7/2023 3,767,880 0.05 USD 250,000 Ingles Markets Inc 5.75% 15/6/2023 256,150 0.00 USD 150,000 Ingram Micro Inc 5.45% 15/12/2024 154,721 0.00 USD 500,000 International Business Machines
Corp 2.85% 13/5/2022 511,535 0.01 USD 585,000 International Business Machines
Corp 3% 15/5/2024 608,494 0.01 USD 350,000 International Flavors & Fragrances
Inc 3.4% 25/9/2020 354,615 0.00 USD 205,000 Interpublic Group of Cos Inc/The
3.75% 1/10/2021 210,581 0.00 USD 3,335,000 Invitation Homes 2018-SFR2 Trust
‘Series 2018-SFR2 E’ ‘144A’ FRN 17/6/2037 3,340,783 0.04
USD 5,990,000 Invitation Homes 2018-SFR2 Trust ‘Series 2018-SFR2 F’ ‘144A’ FRN 17/6/2037 5,972,557 0.08
USD 3,194,260 Invitation Homes 2018-SFR3 Trust ‘Series 2018-SFR3 A’ ‘144A’ FRN 17/7/2037 3,194,316 0.04
USD 5,339,388 Invitation Homes 2018-SFR3 Trust ‘Series 2018-SFR3 E’ ‘144A’ FRN 17/7/2037 5,343,259 0.07
USD 5,990,000 Invitation Homes 2018-SFR3 Trust ‘Series 2018-SFR3 F’ ‘144A’ FRN 17/7/2037 5,994,001 0.08
USD 1,659,622 Invitation Homes 2018-SFR4 Trust ‘Series 2018-SFR4 A’ ‘144A’ FRN 17/1/2038 1,666,759 0.02
USD 2,275,555 Invitation Homes 2018-SFR4 Trust ‘Series 2018-SFR4 C’ ‘144A’ FRN 17/1/2038 2,275,909 0.03
EUR 810,000 IQVIA Inc 3.25% 15/3/2025 922,492 0.01 EUR 100,000 IQVIA Inc 3.5% 15/10/2024 113,110 0.00 USD 1,436,000 IQVIA Inc ‘144A’ 5% 15/10/2026 1,516,775 0.02 USD 2,936,000 IQVIA Inc ‘144A’ 5% 15/5/2027 3,108,490 0.04 USD 1,140,000 IRB Holding Corp ‘144A’ 6.75%
15/2/2026 1,154,250 0.02 EUR 450,000 Iron Mountain Inc 3% 15/1/2025* 514,317 0.01 USD 1,354,000 Iron Mountain Inc ‘144A’ 4.875%
15/9/2027 1,381,080 0.02 USD 645,000 Iron Mountain Inc ‘144A’ 5.25%
15/3/2028 668,381 0.01 USD 600,000 Iron Mountain Inc 5.75% 15/8/2024 607,752 0.01 USD 900,000 Iron Mountain Inc 6% 15/8/2023 922,500 0.01 USD 115,000 iStar Inc 5.25% 15/9/2022 118,704 0.00 USD 74,000 Itron Inc ‘144A’ 5% 15/1/2026 75,665 0.00 USD 545,000 J.P. Morgan Chase Commercial
Mortgage Securities Trust 2018-BCON ‘Series 2018-BCON A’ ‘144A’ 3.735% 5/1/2031 574,683 0.01
USD 230,000 j2 Cloud Services LLC / j2 Global Co-Obligor Inc ‘144A’ 6% 15/7/2025 242,914 0.00
USD 200,000 Jack Ohio Finance LLC / Jack Ohio Finance 1 Corp ‘144A’ 6.75% 15/11/2021 205,000 0.00
USD 20,000 Jacobs Entertainment Inc ‘144A’ 7.875% 1/2/2024 21,324 0.00
USD 70,000 Jagged Peak Energy LLC 5.875% 1/5/2026 70,175 0.00
USD 4,932,000 Jaguar Holding Co II / Pharmaceutical Product Development LLC ‘144A’ 6.375% 1/8/2023 5,104,620 0.07
USD 1,000,000 Jay Park CLO Ltd ‘Series 2016-1A CR’ ‘144A’ FRN 20/10/2027 954,413 0.01
USD 4,424,000 JBS USA LUX SA / JBS USA Finance Inc ‘144A’ 5.75% 15/6/2025 4,627,919 0.06
USD 2,327,000 JBS USA LUX SA / JBS USA Finance Inc ‘144A’ 5.875% 15/7/2024 2,402,406 0.03
USD 1,854,000 JBS USA LUX SA / JBS USA Finance Inc ‘144A’ 6.75% 15/2/2028 2,064,893 0.03
USD 1,024,000 JELD-WEN Inc ‘144A’ 4.625% 15/12/2025 1,006,080 0.01
USD 59,000 JELD-WEN Inc ‘144A’ 4.875% 15/12/2027 57,230 0.00
USD 500,000 JM Smucker Co/The 2.5% 15/3/2020 500,850 0.01
USD 135,000 John Deere Capital Corp 2.6% 7/3/2024 138,459 0.00
USD 365,000 John Deere Capital Corp 2.95% 1/4/2022 373,553 0.01
USD 138,000 Joseph T Ryerson & Son Inc ‘144A’ 11% 15/5/2022 144,943 0.00
USD 600,000 JP Morgan Chase Commercial Mortgage Securities Trust 2009-IWST ‘Series 2009-IWST C’ ‘144A’ FRN 5/12/2027 602,269 0.01
USD 813,312 JP Morgan Chase Commercial Mortgage Securities Trust 2012-C6 ‘Series 2012-C6 A3’ 3.507% 15/5/2045 843,222 0.01
USD 467,643 JP Morgan Chase Commercial Mortgage Securities Trust 2013-C13 ‘Series 2013-C13 ASB’ 3.414% 15/1/2046 479,384 0.01
USD 483,651 JP Morgan Chase Commercial Mortgage Securities Trust 2013-C16 ‘Series 2013-C16 ASB’ 3.674% 15/12/2046 498,812 0.01
USD 724,903 JP Morgan Chase Commercial Mortgage Securities Trust 2013-LC11 ‘Series 2013-LC11 ASB’ 2.554% 15/4/2046 731,896 0.01
USD 5,750,000 JP Morgan Chase Commercial Mortgage Securities Trust 2015-JP1 ‘Series 2015-JP1 D’ FRN 15/1/2049 5,920,595 0.08
USD 1,310,000 JP Morgan Chase Commercial Mortgage Securities Trust 2015-UES ‘Series 2015-UES D’ ‘144A’ FRN 5/9/2032 1,315,691 0.02
USD 3,750,000 JP Morgan Chase Commercial Mortgage Securities Trust 2015-UES ‘Series 2015-UES E’ ‘144A’ FRN 5/9/2032 3,755,252 0.05
USD 750,000 JP Morgan Chase Commercial Mortgage Securities Trust 2016-JP2 ‘Series 2016-JP2 ASB’ 2.713% 15/8/2049 769,374 0.01
Global Multi-Asset Income Fund continued
Portfolio of Investments 31 August 2019
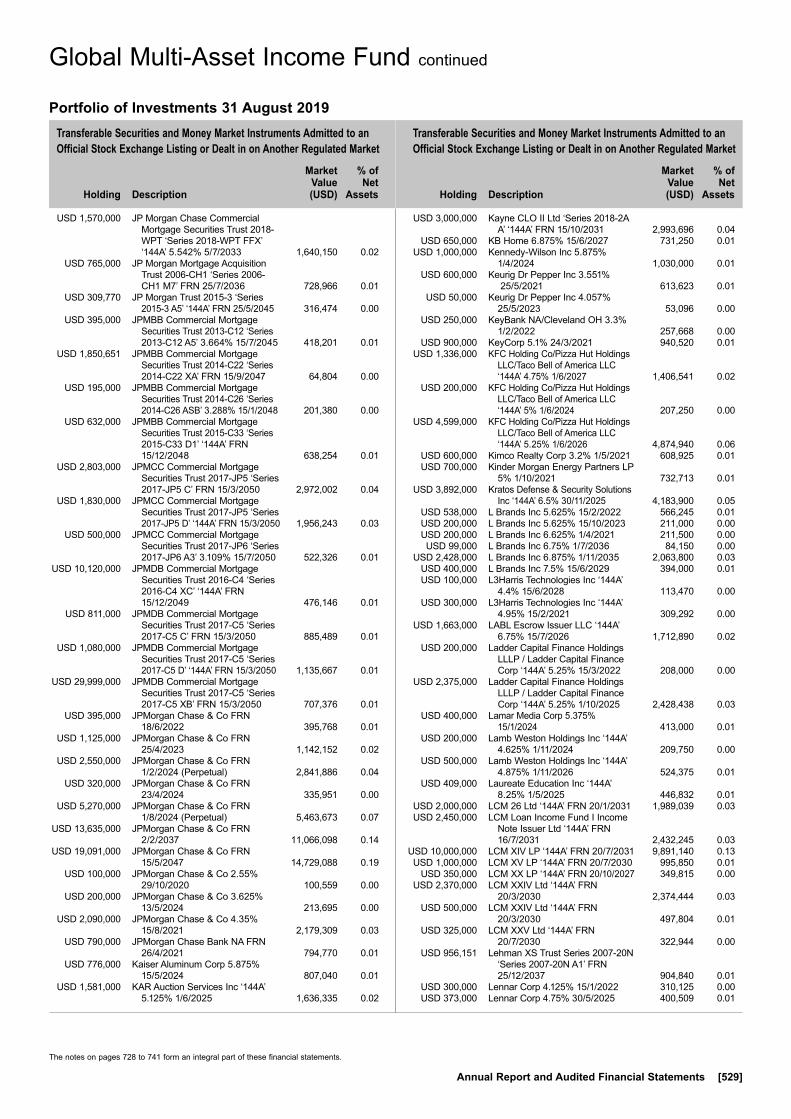
Transferable Securities and Money Market Instruments Admitted to an Official Stock Exchange Listing or Dealt in on Another Regulated Market
Transferable Securities and Money Market Instruments Admitted to an Official Stock Exchange Listing or Dealt in on Another Regulated Market
Holding
Description
Market Value (USD)
% of Net
Assets
Holding
Description
Market Value (USD)
% of Net
Assets
The notes on pages 728 to 741 form an integral part of these financial statements.
Annual Report and Audited Financial Statements [529]
USD 1,570,000 JP Morgan Chase Commercial Mortgage Securities Trust 2018-WPT ‘Series 2018-WPT FFX’ ‘144A’ 5.542% 5/7/2033 1,640,150 0.02
USD 765,000 JP Morgan Mortgage Acquisition Trust 2006-CH1 ‘Series 2006-CH1 M7’ FRN 25/7/2036 728,966 0.01
USD 309,770 JP Morgan Trust 2015-3 ‘Series 2015-3 A5’ ‘144A’ FRN 25/5/2045 316,474 0.00
USD 395,000 JPMBB Commercial Mortgage Securities Trust 2013-C12 ‘Series 2013-C12 A5’ 3.664% 15/7/2045 418,201 0.01
USD 1,850,651 JPMBB Commercial Mortgage Securities Trust 2014-C22 ‘Series 2014-C22 XA’ FRN 15/9/2047 64,804 0.00
USD 195,000 JPMBB Commercial Mortgage Securities Trust 2014-C26 ‘Series 2014-C26 ASB’ 3.288% 15/1/2048 201,380 0.00
USD 632,000 JPMBB Commercial Mortgage Securities Trust 2015-C33 ‘Series 2015-C33 D1’ ‘144A’ FRN 15/12/2048 638,254 0.01
USD 2,803,000 JPMCC Commercial Mortgage Securities Trust 2017-JP5 ‘Series 2017-JP5 C’ FRN 15/3/2050 2,972,002 0.04
USD 1,830,000 JPMCC Commercial Mortgage Securities Trust 2017-JP5 ‘Series 2017-JP5 D’ ‘144A’ FRN 15/3/2050 1,956,243 0.03
USD 500,000 JPMCC Commercial Mortgage Securities Trust 2017-JP6 ‘Series 2017-JP6 A3’ 3.109% 15/7/2050 522,326 0.01
USD 10,120,000 JPMDB Commercial Mortgage Securities Trust 2016-C4 ‘Series 2016-C4 XC’ ‘144A’ FRN 15/12/2049 476,146 0.01
USD 811,000 JPMDB Commercial Mortgage Securities Trust 2017-C5 ‘Series 2017-C5 C’ FRN 15/3/2050 885,489 0.01
USD 1,080,000 JPMDB Commercial Mortgage Securities Trust 2017-C5 ‘Series 2017-C5 D’ ‘144A’ FRN 15/3/2050 1,135,667 0.01
USD 29,999,000 JPMDB Commercial Mortgage Securities Trust 2017-C5 ‘Series 2017-C5 XB’ FRN 15/3/2050 707,376 0.01
USD 395,000 JPMorgan Chase & Co FRN 18/6/2022 395,768 0.01
USD 1,125,000 JPMorgan Chase & Co FRN 25/4/2023 1,142,152 0.02
USD 2,550,000 JPMorgan Chase & Co FRN 1/2/2024 (Perpetual) 2,841,886 0.04
USD 320,000 JPMorgan Chase & Co FRN 23/4/2024 335,951 0.00
USD 5,270,000 JPMorgan Chase & Co FRN 1/8/2024 (Perpetual) 5,463,673 0.07
USD 13,635,000 JPMorgan Chase & Co FRN 2/2/2037 11,066,098 0.14
USD 19,091,000 JPMorgan Chase & Co FRN 15/5/2047 14,729,088 0.19
USD 100,000 JPMorgan Chase & Co 2.55% 29/10/2020 100,559 0.00
USD 200,000 JPMorgan Chase & Co 3.625% 13/5/2024 213,695 0.00
USD 2,090,000 JPMorgan Chase & Co 4.35% 15/8/2021 2,179,309 0.03
USD 790,000 JPMorgan Chase Bank NA FRN 26/4/2021 794,770 0.01
USD 776,000 Kaiser Aluminum Corp 5.875% 15/5/2024 807,040 0.01
USD 1,581,000 KAR Auction Services Inc ‘144A’ 5.125% 1/6/2025 1,636,335 0.02
USD 3,000,000 Kayne CLO II Ltd ‘Series 2018-2A A’ ‘144A’ FRN 15/10/2031 2,993,696 0.04
USD 650,000 KB Home 6.875% 15/6/2027 731,250 0.01 USD 1,000,000 Kennedy-Wilson Inc 5.875%
1/4/2024 1,030,000 0.01 USD 600,000 Keurig Dr Pepper Inc 3.551%
25/5/2021 613,623 0.01 USD 50,000 Keurig Dr Pepper Inc 4.057%
25/5/2023 53,096 0.00 USD 250,000 KeyBank NA/Cleveland OH 3.3%
1/2/2022 257,668 0.00 USD 900,000 KeyCorp 5.1% 24/3/2021 940,520 0.01 USD 1,336,000 KFC Holding Co/Pizza Hut Holdings
LLC/Taco Bell of America LLC ‘144A’ 4.75% 1/6/2027 1,406,541 0.02
USD 200,000 KFC Holding Co/Pizza Hut Holdings LLC/Taco Bell of America LLC ‘144A’ 5% 1/6/2024 207,250 0.00
USD 4,599,000 KFC Holding Co/Pizza Hut Holdings LLC/Taco Bell of America LLC ‘144A’ 5.25% 1/6/2026 4,874,940 0.06
USD 600,000 Kimco Realty Corp 3.2% 1/5/2021 608,925 0.01 USD 700,000 Kinder Morgan Energy Partners LP
5% 1/10/2021 732,713 0.01 USD 3,892,000 Kratos Defense & Security Solutions
Inc ‘144A’ 6.5% 30/11/2025 4,183,900 0.05 USD 538,000 L Brands Inc 5.625% 15/2/2022 566,245 0.01 USD 200,000 L Brands Inc 5.625% 15/10/2023 211,000 0.00 USD 200,000 L Brands Inc 6.625% 1/4/2021 211,500 0.00 USD 99,000 L Brands Inc 6.75% 1/7/2036 84,150 0.00 USD 2,428,000 L Brands Inc 6.875% 1/11/2035 2,063,800 0.03 USD 400,000 L Brands Inc 7.5% 15/6/2029 394,000 0.01 USD 100,000 L3Harris Technologies Inc ‘144A’
4.4% 15/6/2028 113,470 0.00 USD 300,000 L3Harris Technologies Inc ‘144A’
4.95% 15/2/2021 309,292 0.00 USD 1,663,000 LABL Escrow Issuer LLC ‘144A’
6.75% 15/7/2026 1,712,890 0.02 USD 200,000 Ladder Capital Finance Holdings
LLLP / Ladder Capital Finance Corp ‘144A’ 5.25% 15/3/2022 208,000 0.00
USD 2,375,000 Ladder Capital Finance Holdings LLLP / Ladder Capital Finance Corp ‘144A’ 5.25% 1/10/2025 2,428,438 0.03
USD 400,000 Lamar Media Corp 5.375% 15/1/2024 413,000 0.01
USD 200,000 Lamb Weston Holdings Inc ‘144A’ 4.625% 1/11/2024 209,750 0.00
USD 500,000 Lamb Weston Holdings Inc ‘144A’ 4.875% 1/11/2026 524,375 0.01
USD 409,000 Laureate Education Inc ‘144A’ 8.25% 1/5/2025 446,832 0.01
USD 2,000,000 LCM 26 Ltd ‘144A’ FRN 20/1/2031 1,989,039 0.03 USD 2,450,000 LCM Loan Income Fund I Income
Note Issuer Ltd ‘144A’ FRN 16/7/2031 2,432,245 0.03
USD 10,000,000 LCM XIV LP ‘144A’ FRN 20/7/2031 9,891,140 0.13 USD 1,000,000 LCM XV LP ‘144A’ FRN 20/7/2030 995,850 0.01 USD 350,000 LCM XX LP ‘144A’ FRN 20/10/2027 349,815 0.00 USD 2,370,000 LCM XXIV Ltd ‘144A’ FRN
20/3/2030 2,374,444 0.03 USD 500,000 LCM XXIV Ltd ‘144A’ FRN
20/3/2030 497,804 0.01 USD 325,000 LCM XXV Ltd ‘144A’ FRN
20/7/2030 322,944 0.00 USD 956,151 Lehman XS Trust Series 2007-20N
‘Series 2007-20N A1’ FRN 25/12/2037 904,840 0.01
USD 300,000 Lennar Corp 4.125% 15/1/2022 310,125 0.00 USD 373,000 Lennar Corp 4.75% 30/5/2025 400,509 0.01
Global Multi-Asset Income Fund continued
Portfolio of Investments 31 August 2019
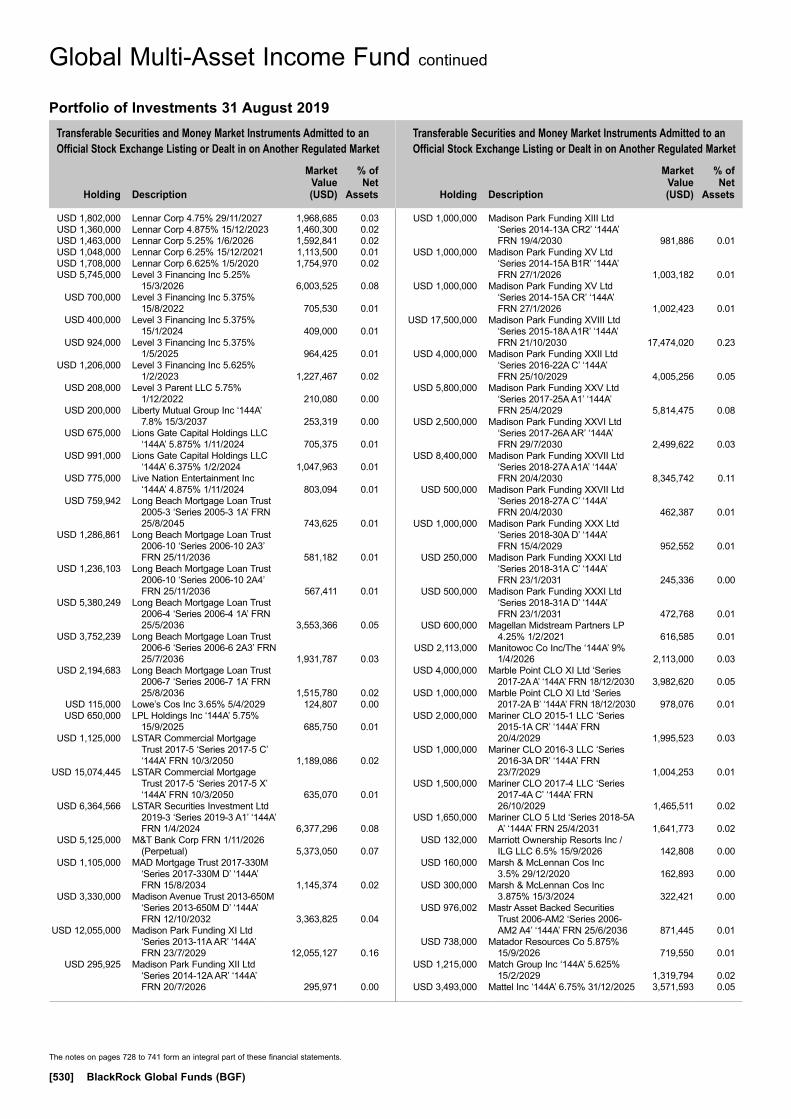
Transferable Securities and Money Market Instruments Admitted to an Official Stock Exchange Listing or Dealt in on Another Regulated Market
Transferable Securities and Money Market Instruments Admitted to an Official Stock Exchange Listing or Dealt in on Another Regulated Market
Holding
Description
Market Value (USD)
% of Net
Assets
Holding
Description
Market Value (USD)
% of Net
Assets
The notes on pages 728 to 741 form an integral part of these financial statements.
[530] BlackRock Global Funds (BGF)
USD 1,802,000 Lennar Corp 4.75% 29/11/2027 1,968,685 0.03 USD 1,360,000 Lennar Corp 4.875% 15/12/2023 1,460,300 0.02 USD 1,463,000 Lennar Corp 5.25% 1/6/2026 1,592,841 0.02 USD 1,048,000 Lennar Corp 6.25% 15/12/2021 1,113,500 0.01 USD 1,708,000 Lennar Corp 6.625% 1/5/2020 1,754,970 0.02 USD 5,745,000 Level 3 Financing Inc 5.25%
15/3/2026 6,003,525 0.08 USD 700,000 Level 3 Financing Inc 5.375%
15/8/2022 705,530 0.01 USD 400,000 Level 3 Financing Inc 5.375%
15/1/2024 409,000 0.01 USD 924,000 Level 3 Financing Inc 5.375%
1/5/2025 964,425 0.01 USD 1,206,000 Level 3 Financing Inc 5.625%
1/2/2023 1,227,467 0.02 USD 208,000 Level 3 Parent LLC 5.75%
1/12/2022 210,080 0.00 USD 200,000 Liberty Mutual Group Inc ‘144A’
7.8% 15/3/2037 253,319 0.00 USD 675,000 Lions Gate Capital Holdings LLC
‘144A’ 5.875% 1/11/2024 705,375 0.01 USD 991,000 Lions Gate Capital Holdings LLC
‘144A’ 6.375% 1/2/2024 1,047,963 0.01 USD 775,000 Live Nation Entertainment Inc
‘144A’ 4.875% 1/11/2024 803,094 0.01 USD 759,942 Long Beach Mortgage Loan Trust
2005-3 ‘Series 2005-3 1A’ FRN 25/8/2045 743,625 0.01
USD 1,286,861 Long Beach Mortgage Loan Trust 2006-10 ‘Series 2006-10 2A3’ FRN 25/11/2036 581,182 0.01
USD 1,236,103 Long Beach Mortgage Loan Trust 2006-10 ‘Series 2006-10 2A4’ FRN 25/11/2036 567,411 0.01
USD 5,380,249 Long Beach Mortgage Loan Trust 2006-4 ‘Series 2006-4 1A’ FRN 25/5/2036 3,553,366 0.05
USD 3,752,239 Long Beach Mortgage Loan Trust 2006-6 ‘Series 2006-6 2A3’ FRN 25/7/2036 1,931,787 0.03
USD 2,194,683 Long Beach Mortgage Loan Trust 2006-7 ‘Series 2006-7 1A’ FRN 25/8/2036 1,515,780 0.02
USD 115,000 Lowe’s Cos Inc 3.65% 5/4/2029 124,807 0.00 USD 650,000 LPL Holdings Inc ‘144A’ 5.75%
15/9/2025 685,750 0.01 USD 1,125,000 LSTAR Commercial Mortgage
Trust 2017-5 ‘Series 2017-5 C’ ‘144A’ FRN 10/3/2050 1,189,086 0.02
USD 15,074,445 LSTAR Commercial Mortgage Trust 2017-5 ‘Series 2017-5 X’ ‘144A’ FRN 10/3/2050 635,070 0.01
USD 6,364,566 LSTAR Securities Investment Ltd 2019-3 ‘Series 2019-3 A1’ ‘144A’ FRN 1/4/2024 6,377,296 0.08
USD 5,125,000 M&T Bank Corp FRN 1/11/2026 (Perpetual) 5,373,050 0.07
USD 1,105,000 MAD Mortgage Trust 2017-330M ‘Series 2017-330M D’ ‘144A’ FRN 15/8/2034 1,145,374 0.02
USD 3,330,000 Madison Avenue Trust 2013-650M ‘Series 2013-650M D’ ‘144A’ FRN 12/10/2032 3,363,825 0.04
USD 12,055,000 Madison Park Funding XI Ltd ‘Series 2013-11A AR’ ‘144A’ FRN 23/7/2029 12,055,127 0.16
USD 295,925 Madison Park Funding XII Ltd ‘Series 2014-12A AR’ ‘144A’ FRN 20/7/2026 295,971 0.00
USD 1,000,000 Madison Park Funding XIII Ltd ‘Series 2014-13A CR2’ ‘144A’ FRN 19/4/2030 981,886 0.01
USD 1,000,000 Madison Park Funding XV Ltd ‘Series 2014-15A B1R’ ‘144A’ FRN 27/1/2026 1,003,182 0.01
USD 1,000,000 Madison Park Funding XV Ltd ‘Series 2014-15A CR’ ‘144A’ FRN 27/1/2026 1,002,423 0.01
USD 17,500,000 Madison Park Funding XVIII Ltd ‘Series 2015-18A A1R’ ‘144A’ FRN 21/10/2030 17,474,020 0.23
USD 4,000,000 Madison Park Funding XXII Ltd ‘Series 2016-22A C’ ‘144A’ FRN 25/10/2029 4,005,256 0.05
USD 5,800,000 Madison Park Funding XXV Ltd ‘Series 2017-25A A1’ ‘144A’ FRN 25/4/2029 5,814,475 0.08
USD 2,500,000 Madison Park Funding XXVI Ltd ‘Series 2017-26A AR’ ‘144A’ FRN 29/7/2030 2,499,622 0.03
USD 8,400,000 Madison Park Funding XXVII Ltd ‘Series 2018-27A A1A’ ‘144A’ FRN 20/4/2030 8,345,742 0.11
USD 500,000 Madison Park Funding XXVII Ltd ‘Series 2018-27A C’ ‘144A’ FRN 20/4/2030 462,387 0.01
USD 1,000,000 Madison Park Funding XXX Ltd ‘Series 2018-30A D’ ‘144A’ FRN 15/4/2029 952,552 0.01
USD 250,000 Madison Park Funding XXXI Ltd ‘Series 2018-31A C’ ‘144A’ FRN 23/1/2031 245,336 0.00
USD 500,000 Madison Park Funding XXXI Ltd ‘Series 2018-31A D’ ‘144A’ FRN 23/1/2031 472,768 0.01
USD 600,000 Magellan Midstream Partners LP 4.25% 1/2/2021 616,585 0.01
USD 2,113,000 Manitowoc Co Inc/The ‘144A’ 9% 1/4/2026 2,113,000 0.03
USD 4,000,000 Marble Point CLO XI Ltd ‘Series 2017-2A A’ ‘144A’ FRN 18/12/2030 3,982,620 0.05
USD 1,000,000 Marble Point CLO XI Ltd ‘Series 2017-2A B’ ‘144A’ FRN 18/12/2030 978,076 0.01
USD 2,000,000 Mariner CLO 2015-1 LLC ‘Series 2015-1A CR’ ‘144A’ FRN 20/4/2029 1,995,523 0.03
USD 1,000,000 Mariner CLO 2016-3 LLC ‘Series 2016-3A DR’ ‘144A’ FRN 23/7/2029 1,004,253 0.01
USD 1,500,000 Mariner CLO 2017-4 LLC ‘Series 2017-4A C’ ‘144A’ FRN 26/10/2029 1,465,511 0.02
USD 1,650,000 Mariner CLO 5 Ltd ‘Series 2018-5A A’ ‘144A’ FRN 25/4/2031 1,641,773 0.02
USD 132,000 Marriott Ownership Resorts Inc / ILG LLC 6.5% 15/9/2026 142,808 0.00
USD 160,000 Marsh & McLennan Cos Inc 3.5% 29/12/2020 162,893 0.00
USD 300,000 Marsh & McLennan Cos Inc 3.875% 15/3/2024 322,421 0.00
USD 976,002 Mastr Asset Backed Securities Trust 2006-AM2 ‘Series 2006-AM2 A4’ ‘144A’ FRN 25/6/2036 871,445 0.01
USD 738,000 Matador Resources Co 5.875% 15/9/2026 719,550 0.01
USD 1,215,000 Match Group Inc ‘144A’ 5.625% 15/2/2029 1,319,794 0.02
USD 3,493,000 Mattel Inc ‘144A’ 6.75% 31/12/2025 3,571,593 0.05
Global Multi-Asset Income Fund continued
Portfolio of Investments 31 August 2019

Transferable Securities and Money Market Instruments Admitted to an Official Stock Exchange Listing or Dealt in on Another Regulated Market
Transferable Securities and Money Market Instruments Admitted to an Official Stock Exchange Listing or Dealt in on Another Regulated Market
Holding
Description
Market Value (USD)
% of Net
Assets
Holding
Description
Market Value (USD)
% of Net
Assets
The notes on pages 728 to 741 form an integral part of these financial statements.
Annual Report and Audited Financial Statements [531]
USD 2,032,000 Matthews International Corp ‘144A’ 5.25% 1/12/2025 1,955,800 0.03
EUR 4,716,000 Mauser Packaging Solutions Holding Co 4.75% 15/4/2024 5,394,136 0.07
USD 5,190,000 Mauser Packaging Solutions Holding Co ‘144A’ 5.5% 15/4/2024 5,378,138 0.07
USD 632,000 McDermott Technology Americas Inc / McDermott Technology US Inc ‘144A’ 10.625% 1/5/2024 449,510 0.01
USD 300,000 McKesson Corp 3.65% 30/11/2020 305,139 0.00 USD 624,000 MDC Holdings Inc 6% 15/1/2043 639,600 0.01 USD 894,000 MEDNAX Inc ‘144A’ 5.25%
1/12/2023 900,428 0.01 USD 2,757,000 MEDNAX Inc ‘144A’ 6.25%
15/1/2027 2,712,199 0.04 USD 1,000,000 Mercedes-Benz Master Owner
Trust 2018-BA ‘Series 2018-BA A’ ‘144A’ FRN 15/5/2023 1,000,476 0.01
USD 300,000 Mercer International Inc 7.375% 15/1/2025 309,000 0.00
USD 2,555,000 Meredith Corp 6.875% 1/2/2026 2,708,300 0.04 USD 1,695,000 Meritage Homes Corp 5.125%
6/6/2027 1,783,987 0.02 USD 797,394 Merrill Lynch Mortgage Trust 2005-
CIP1 ‘Series 2005-CIP1 D’ FRN 12/7/2038 811,257 0.01
USD 3,726,000 MGM Growth Properties Operating Partnership LP / MGP Finance Co-Issuer Inc 4.5% 1/9/2026 3,912,300 0.05
USD 4,147,000 MGM Growth Properties Operating Partnership LP / MGP Finance Co-Issuer Inc 4.5% 15/1/2028 4,250,675 0.06
USD 5,826,000 MGM Growth Properties Operating Partnership LP / MGP Finance Co-Issuer Inc 5.625% 1/5/2024 6,379,470 0.08
USD 1,282,000 MGM Growth Properties Operating Partnership LP / MGP Finance Co-Issuer Inc ‘144A’ 5.75% 1/2/2027 1,416,866 0.02
USD 200,000 MGM Resorts International 4.625% 1/9/2026 208,000 0.00
USD 500,000 MGM Resorts International 6% 15/3/2023 551,250 0.01
USD 4,265,000 MGM Resorts International 6.625% 15/12/2021 4,648,338 0.06
USD 2,112,000 MGM Resorts International 7.75% 15/3/2022 2,373,360 0.03
USD 620,000 Michaels Stores Inc ‘144A’ 8% 15/7/2027 593,836 0.01
USD 943,000 Midcontinent Communications / Midcontinent Finance Corp ‘144A’ 5.375% 15/8/2027 981,220 0.01
USD 393,689 Mill City Mortgage Loan Trust 2016-1 ‘Series 2016-1 A1’ ‘144A’ FRN 25/4/2057 394,422 0.01
USD 2,207,000 Mobile Mini Inc 5.875% 1/7/2024 2,295,280 0.03 USD 2,451,000 Molina Healthcare Inc ‘144A’
4.875% 15/6/2025 2,509,211 0.03 USD 851,000 Molina Healthcare Inc 5.375%
15/11/2022 907,379 0.01 USD 300,000 Mondelez International Inc 3%
7/5/2020 301,481 0.00 USD 60,000 Moody’s Corp 2.75% 15/12/2021 60,791 0.00 USD 209,000 Moog Inc ‘144A’ 5.25% 1/12/2022 213,180 0.00 USD 1,314,000 Morgan Stanley FRN 15/10/2019
(Perpetual) 1,318,928 0.02 USD 2,050,000 Morgan Stanley 2.625% 17/11/2021 2,071,044 0.03 USD 795,000 Morgan Stanley 2.75% 19/5/2022 808,402 0.01 USD 500,000 Morgan Stanley 5.5% 24/7/2020 514,571 0.01 USD 350,000 Morgan Stanley 5.75% 25/1/2021 367,321 0.01
USD 605,000 Morgan Stanley Bank of America Merrill Lynch Trust 2013-C12 ‘Series 2013-C12 A4’ FRN 15/10/2046 654,838 0.01
USD 456,980 Morgan Stanley Bank of America Merrill Lynch Trust 2014 C19 ‘Series 2014-C19 A2’ 3.101% 15/12/2047 456,878 0.01
USD 230,000 Morgan Stanley Bank of America Merrill Lynch Trust 2014-C15 ‘Series 2014-C15 A4’ 4.051% 15/4/2047 249,320 0.00
USD 1,700,000 Morgan Stanley Bank of America Merrill Lynch Trust 2015-C23 ‘Series 2015-C23 D’ ‘144A’ FRN 15/7/2050 1,714,779 0.02
USD 3,393,000 Morgan Stanley Bank of America Merrill Lynch Trust 2015-C25 ‘Series 2015-C25 D’ 3.068% 15/10/2048 3,300,900 0.04
USD 12,675,000 Morgan Stanley Bank of America Merrill Lynch Trust 2015-C26 ‘Series 2015-C26 XD’ ‘144A’ FRN 15/10/2048 945,302 0.01
USD 1,483,000 Morgan Stanley Bank of America Merrill Lynch Trust 2015-C26 ‘Series 2015-C26 D’ ‘144A’ 3.06% 15/10/2048 1,413,661 0.02
USD 12,560,833 Morgan Stanley Bank of America Merrill Lynch Trust 2016-C31 ‘Series 2016-C31 XA’ FRN 15/11/2049 948,720 0.01
USD 10,727,269 Morgan Stanley Bank of America Merrill Lynch Trust 2016-C32 ‘Series 2016-C32 XA’ FRN 15/12/2049 460,093 0.01
USD 1,054,000 Morgan Stanley Bank of America Merrill Lynch Trust 2017-C33 ‘Series 2017-C33 C’ FRN 15/5/2050 1,154,533 0.02
USD 780,000 Morgan Stanley Capital I 2017-HR2 ‘Series 2017-HR2 D’ 2.73% 15/12/2050 716,879 0.01
USD 1,330,000 Morgan Stanley Capital I Trust 2006-IQ11 ‘Series 2006-IQ11 C’ FRN 15/10/2042 1,367,113 0.02
USD 2,460,723 Morgan Stanley Capital I Trust 2007-TOP27 ‘Series 2007-T27 AJ’ FRN 11/6/2042 2,625,100 0.03
USD 320,000 Morgan Stanley Capital I Trust 2014-CPT ‘Series 2014-CPT E’ ‘144A’ FRN 13/7/2029 322,930 0.00
USD 1,875,000 Morgan Stanley Capital I Trust 2014-CPT ‘Series 2014-CPT F’ ‘144A’ FRN 13/7/2029 1,893,179 0.02
USD 848,000 Morgan Stanley Capital I Trust 2014-CPT ‘Series 2014-CPT G’ ‘144A’ FRN 13/7/2029 850,599 0.01
USD 2,575,000 Morgan Stanley Capital I Trust 2015-MS1 ‘Series 2015-MS1 D’ ‘144A’ FRN 15/5/2048 2,495,499 0.03
USD 3,400,000 Morgan Stanley Capital I Trust 2016-UBS9 ‘Series 2016-UBS9 XD’ ‘144A’ FRN 15/3/2049 313,038 0.00
USD 500,000 Morgan Stanley Capital I Trust 2017-CLS ‘Series 2017-CLS A’ ‘144A’ FRN 15/11/2034 500,074 0.01
USD 2,635,000 Morgan Stanley Capital I Trust 2017-CLS ‘Series 2017-CLS F’ ‘144A’ FRN 15/11/2034 2,645,026 0.03
Global Multi-Asset Income Fund continued
Portfolio of Investments 31 August 2019

Transferable Securities and Money Market Instruments Admitted to an Official Stock Exchange Listing or Dealt in on Another Regulated Market
Transferable Securities and Money Market Instruments Admitted to an Official Stock Exchange Listing or Dealt in on Another Regulated Market
Holding
Description
Market Value (USD)
% of Net
Assets
Holding
Description
Market Value (USD)
% of Net
Assets
The notes on pages 728 to 741 form an integral part of these financial statements.
[532] BlackRock Global Funds (BGF)
USD 2,370,000 Morgan Stanley Capital I Trust 2017-H1 ‘Series 2017-H1 D’ ‘144A’ 2.546% 15/6/2050 2,168,609 0.03
USD 1,140,000 Morgan Stanley Capital I Trust 2017-JWDR ‘Series 2017-JWDR D’ ‘144A’ FRN 15/11/2034 1,140,531 0.02
USD 1,078,000 Morgan Stanley Capital I Trust 2017-JWDR ‘Series 2017-JWDR E’ ‘144A’ FRN 15/11/2034 1,078,437 0.01
USD 1,590,000 Morgan Stanley Capital I Trust 2018-H3 ‘Series 2018-H3 C’ FRN 15/7/2051 1,780,566 0.02
USD 1,630,000 Morgan Stanley Capital I Trust 2018-MP ‘Series 2018-MP E’ ‘144A’ FRN 11/7/2040 1,677,931 0.02
USD 2,240,000 Morgan Stanley Capital I Trust 2018-SUN ‘Series 2018-SUN F’ ‘144A’ FRN 15/7/2035 2,253,250 0.03
USD 250,000 Moss Creek Resources Holdings Inc ‘144A’ 7.5% 15/1/2026 175,625 0.00
USD 14,500,000 MP CLO III Ltd ‘Series 2013-1A AR’ ‘144A’ FRN 20/10/2030 14,445,136 0.19
USD 2,578,000 MPH Acquisition Holdings LLC ‘144A’ 7.125% 1/6/2024 2,313,755 0.03
USD 20,995,000 MPLX LP FRN 15/2/2023 (Perpetual) 20,995,000 0.27
USD 1,579,000 MPT Operating Partnership LP / MPT Finance Corp 4.625% 1/8/2029 1,641,173 0.02
USD 5,559,000 MPT Operating Partnership LP / MPT Finance Corp 5% 15/10/2027 5,927,284 0.08
USD 1,100,000 MPT Operating Partnership LP / MPT Finance Corp 5.25% 1/8/2026 1,166,330 0.02
USD 2,000 MPT Operating Partnership LP / MPT Finance Corp 5.5% 1/5/2024 2,058 0.00
USD 335,000 MSCI Inc ‘144A’ 4.75% 1/8/2026 351,331 0.00 USD 357,000 MSCI Inc ‘144A’ 5.25% 15/11/2024 372,422 0.01 USD 1,475,000 MSCI Inc ‘144A’ 5.375% 15/5/2027 1,590,050 0.02 USD 600,000 MSCI Inc ‘144A’ 5.75% 15/8/2025 633,000 0.01 USD 966,000 MTS Systems Corp ‘144A’ 5.75%
15/8/2027 1,014,300 0.01 USD 1,614,000 Mueller Water Products Inc ‘144A’
5.5% 15/6/2026 1,702,770 0.02 USD 290,000 MUFG Union Bank NA 3.15%
1/4/2022 297,765 0.00 USD 200,000 Murphy Oil Corp 4% 1/6/2022 201,000 0.00 USD 362,000 Murphy Oil Corp 5.625% 1/12/2042 316,750 0.00 USD 691,000 Murphy Oil Corp 5.75% 15/8/2025 703,092 0.01 USD 400,000 Murphy Oil Corp 6.875% 15/8/2024 421,120 0.01 USD 675,000 Nabors Industries Inc 4.625%
15/9/2021 646,312 0.01 USD 58,000 Nabors Industries Inc 5% 15/9/2020 58,000 0.00 USD 300,000 Nabors Industries Inc 5.75%
1/2/2025 240,750 0.00 USD 2,635,000 Nationstar Mortgage Holdings Inc
‘144A’ 8.125% 15/7/2023 2,727,225 0.04 USD 1,030,000 Nationstar Mortgage Holdings Inc
‘144A’ 9.125% 15/7/2026 1,090,512 0.01 USD 200,000 Nationstar Mortgage LLC /
Nationstar Capital Corp 6.5% 1/7/2021 200,750 0.00
USD 1,345,000 Nationwide Financial Services Inc 6.75% 15/5/2037 1,515,169 0.02
USD 13,537,000 Natixis Commercial Mortgage Securities Trust 2017-75B ‘Series 2017-75B XA’ ‘144A’ FRN 9/4/2037 228,911 0.00
USD 8,875,000 Natixis Commercial Mortgage Securities Trust 2017-75B ‘Series 2017-75B XB’ ‘144A’ FRN 9/4/2037 38,074 0.00
USD 821,000 Navient Corp 5% 26/10/2020 842,551 0.01 USD 2,464,000 Navient Corp 5.5% 25/1/2023 2,590,280 0.03 USD 567,000 Navient Corp 5.875% 25/10/2024 596,767 0.01 USD 1,437,000 Navient Corp 6.125% 25/3/2024 1,540,751 0.02 USD 445,000 Navient Corp 6.5% 15/6/2022 482,269 0.01 USD 272,000 Navient Corp 6.625% 26/7/2021 292,008 0.00 USD 409,000 Navient Corp 6.75% 25/6/2025 439,655 0.01 USD 500,000 Navient Corp 6.75% 15/6/2026 533,750 0.01 USD 433,000 Navient Corp 7.25% 25/9/2023 482,254 0.01 USD 800,000 Navient Corp 8% 25/3/2020 825,000 0.01 USD 500,000 Navient Private Education Loan
Trust 2014-CT ‘Series 2014-CTA B’ ‘144A’ FRN 17/10/2044 505,267 0.01
USD 377,209 Navient Private Education Loan Trust 2015-A ‘Series 2015-AA A2B’ ‘144A’ FRN 15/12/2028 380,747 0.01
USD 1,953,000 Navistar International Corp ‘144A’ 6.625% 1/11/2025 1,988,398 0.03
USD 300,000 NCR Corp 5% 15/7/2022 303,546 0.00 USD 1,440,000 NCR Corp ‘144A’ 5.75% 1/9/2027 1,517,400 0.02 USD 885,000 NCR Corp ‘144A’ 6.125% 1/9/2029 935,888 0.01 USD 300,000 NCR Corp 6.375% 15/12/2023 310,104 0.00 EUR 891,000 Netflix Inc 3.875% 15/11/2029 1,072,944 0.01 USD 1,907,000 Netflix Inc 4.875% 15/4/2028 2,004,734 0.03 USD 200,000 Netflix Inc 5.375% 1/2/2021 207,500 0.00 USD 4,312,000 Netflix Inc ‘144A’ 5.375% 15/11/2029 4,723,796 0.06 USD 300,000 Netflix Inc 5.5% 15/2/2022 319,782 0.00 USD 794,000 Netflix Inc 5.875% 15/2/2025 880,467 0.01 USD 3,146,000 Netflix Inc 5.875% 15/11/2028 3,531,322 0.05 USD 750,000 Neuberger Berman CLO XVII Ltd
‘Series 2014-17A DR’ ‘144A’ FRN 22/4/2029 735,300 0.01
USD 500,000 Neuberger Berman CLO XVIII Ltd ‘Series 2014-18A BR2’ ‘144A’ FRN 21/10/2030 489,847 0.01
USD 1,000,000 Neuberger Berman CLO XXI Ltd ‘Series 2016-21A CR’ ‘144A’ FRN 20/4/2027 967,144 0.01
USD 600,000 Neuberger Berman CLO XXII Ltd ‘Series 2016-22A BR’ ‘144A’ FRN 17/10/2030 594,890 0.01
USD 500,000 Neuberger Berman CLO XXII Ltd ‘Series 2016-22A CR’ ‘144A’ FRN 17/10/2030 493,692 0.01
USD 1,500,000 Neuberger Berman CLO XXII Ltd ‘Series 2016-22A DR’ ‘144A’ FRN 17/10/2030 1,391,909 0.02
USD 400,000 Neuberger Berman CLO XXIII Ltd ‘Series 2016-23A CR’ ‘144A’ FRN 17/10/2027 393,410 0.01
USD 300,000 Neuberger Berman CLO XXIII Ltd ‘Series 2016-23A DR’ ‘144A’ FRN 17/10/2027 293,998 0.00
USD 1,000,000 Neuberger Berman Loan Advisers CLO 25 Ltd ‘Series 2017-25A D’ ‘144A’ FRN 18/10/2029 982,578 0.01
USD 6,750,000 Neuberger Berman Loan Advisers CLO 26 Ltd ‘Series 2017-26A A’ ‘144A’ FRN 18/10/2030 6,745,768 0.09
USD 1,000,000 Neuberger Berman Loan Advisers CLO 27 Ltd ‘Series 2018-27A D’ ‘144A’ FRN 15/1/2030 923,884 0.01
USD 228,000 New Enterprise Stone & Lime Co Inc ‘144A’ 6.25% 15/3/2026 233,700 0.00
Global Multi-Asset Income Fund continued
Portfolio of Investments 31 August 2019
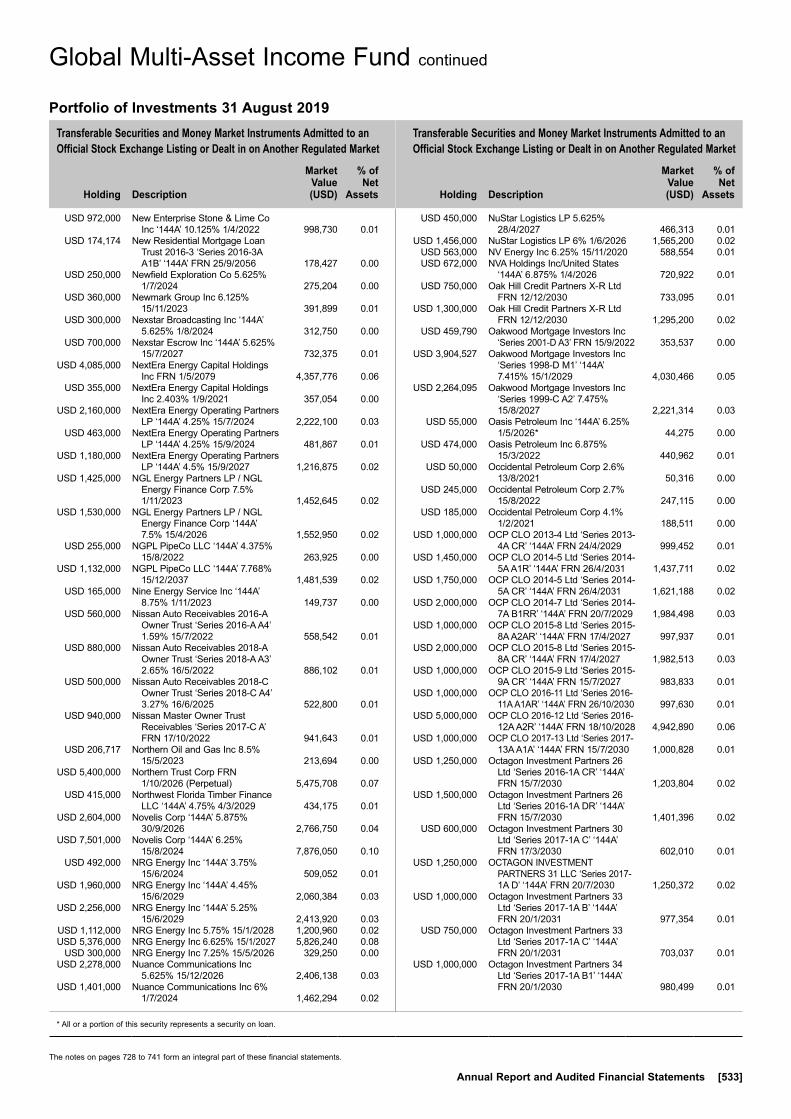
Transferable Securities and Money Market Instruments Admitted to an Official Stock Exchange Listing or Dealt in on Another Regulated Market
Transferable Securities and Money Market Instruments Admitted to an Official Stock Exchange Listing or Dealt in on Another Regulated Market
Holding
Description
Market Value (USD)
% of Net
Assets
Holding
Description
Market Value (USD)
% of Net
Assets
* All or a portion of this security represents a security on loan.
The notes on pages 728 to 741 form an integral part of these financial statements.
Annual Report and Audited Financial Statements [533]
USD 972,000 New Enterprise Stone & Lime Co Inc ‘144A’ 10.125% 1/4/2022 998,730 0.01
USD 174,174 New Residential Mortgage Loan Trust 2016-3 ‘Series 2016-3A A1B’ ‘144A’ FRN 25/9/2056 178,427 0.00
USD 250,000 Newfield Exploration Co 5.625% 1/7/2024 275,204 0.00
USD 360,000 Newmark Group Inc 6.125% 15/11/2023 391,899 0.01
USD 300,000 Nexstar Broadcasting Inc ‘144A’ 5.625% 1/8/2024 312,750 0.00
USD 700,000 Nexstar Escrow Inc ‘144A’ 5.625% 15/7/2027 732,375 0.01
USD 4,085,000 NextEra Energy Capital Holdings Inc FRN 1/5/2079 4,357,776 0.06
USD 355,000 NextEra Energy Capital Holdings Inc 2.403% 1/9/2021 357,054 0.00
USD 2,160,000 NextEra Energy Operating Partners LP ‘144A’ 4.25% 15/7/2024 2,222,100 0.03
USD 463,000 NextEra Energy Operating Partners LP ‘144A’ 4.25% 15/9/2024 481,867 0.01
USD 1,180,000 NextEra Energy Operating Partners LP ‘144A’ 4.5% 15/9/2027 1,216,875 0.02
USD 1,425,000 NGL Energy Partners LP / NGL Energy Finance Corp 7.5% 1/11/2023 1,452,645 0.02
USD 1,530,000 NGL Energy Partners LP / NGL Energy Finance Corp ‘144A’ 7.5% 15/4/2026 1,552,950 0.02
USD 255,000 NGPL PipeCo LLC ‘144A’ 4.375% 15/8/2022 263,925 0.00
USD 1,132,000 NGPL PipeCo LLC ‘144A’ 7.768% 15/12/2037 1,481,539 0.02
USD 165,000 Nine Energy Service Inc ‘144A’ 8.75% 1/11/2023 149,737 0.00
USD 560,000 Nissan Auto Receivables 2016-A Owner Trust ‘Series 2016-A A4’ 1.59% 15/7/2022 558,542 0.01
USD 880,000 Nissan Auto Receivables 2018-A Owner Trust ‘Series 2018-A A3’ 2.65% 16/5/2022 886,102 0.01
USD 500,000 Nissan Auto Receivables 2018-C Owner Trust ‘Series 2018-C A4’ 3.27% 16/6/2025 522,800 0.01
USD 940,000 Nissan Master Owner Trust Receivables ‘Series 2017-C A’ FRN 17/10/2022 941,643 0.01
USD 206,717 Northern Oil and Gas Inc 8.5% 15/5/2023 213,694 0.00
USD 5,400,000 Northern Trust Corp FRN 1/10/2026 (Perpetual) 5,475,708 0.07
USD 415,000 Northwest Florida Timber Finance LLC ‘144A’ 4.75% 4/3/2029 434,175 0.01
USD 2,604,000 Novelis Corp ‘144A’ 5.875% 30/9/2026 2,766,750 0.04
USD 7,501,000 Novelis Corp ‘144A’ 6.25% 15/8/2024 7,876,050 0.10
USD 492,000 NRG Energy Inc ‘144A’ 3.75% 15/6/2024 509,052 0.01
USD 1,960,000 NRG Energy Inc ‘144A’ 4.45% 15/6/2029 2,060,384 0.03
USD 2,256,000 NRG Energy Inc ‘144A’ 5.25% 15/6/2029 2,413,920 0.03
USD 1,112,000 NRG Energy Inc 5.75% 15/1/2028 1,200,960 0.02 USD 5,376,000 NRG Energy Inc 6.625% 15/1/2027 5,826,240 0.08 USD 300,000 NRG Energy Inc 7.25% 15/5/2026 329,250 0.00 USD 2,278,000 Nuance Communications Inc
5.625% 15/12/2026 2,406,138 0.03 USD 1,401,000 Nuance Communications Inc 6%
1/7/2024 1,462,294 0.02
USD 450,000 NuStar Logistics LP 5.625% 28/4/2027 466,313 0.01
USD 1,456,000 NuStar Logistics LP 6% 1/6/2026 1,565,200 0.02 USD 563,000 NV Energy Inc 6.25% 15/11/2020 588,554 0.01 USD 672,000 NVA Holdings Inc/United States
‘144A’ 6.875% 1/4/2026 720,922 0.01 USD 750,000 Oak Hill Credit Partners X-R Ltd
FRN 12/12/2030 733,095 0.01 USD 1,300,000 Oak Hill Credit Partners X-R Ltd
FRN 12/12/2030 1,295,200 0.02 USD 459,790 Oakwood Mortgage Investors Inc
‘Series 2001-D A3’ FRN 15/9/2022 353,537 0.00 USD 3,904,527 Oakwood Mortgage Investors Inc
‘Series 1998-D M1’ ‘144A’ 7.415% 15/1/2029 4,030,466 0.05
USD 2,264,095 Oakwood Mortgage Investors Inc ‘Series 1999-C A2’ 7.475% 15/8/2027 2,221,314 0.03
USD 55,000 Oasis Petroleum Inc ‘144A’ 6.25% 1/5/2026* 44,275 0.00
USD 474,000 Oasis Petroleum Inc 6.875% 15/3/2022 440,962 0.01
USD 50,000 Occidental Petroleum Corp 2.6% 13/8/2021 50,316 0.00
USD 245,000 Occidental Petroleum Corp 2.7% 15/8/2022 247,115 0.00
USD 185,000 Occidental Petroleum Corp 4.1% 1/2/2021 188,511 0.00
USD 1,000,000 OCP CLO 2013-4 Ltd ‘Series 2013-4A CR’ ‘144A’ FRN 24/4/2029 999,452 0.01
USD 1,450,000 OCP CLO 2014-5 Ltd ‘Series 2014-5A A1R’ ‘144A’ FRN 26/4/2031 1,437,711 0.02
USD 1,750,000 OCP CLO 2014-5 Ltd ‘Series 2014-5A CR’ ‘144A’ FRN 26/4/2031 1,621,188 0.02
USD 2,000,000 OCP CLO 2014-7 Ltd ‘Series 2014-7A B1RR’ ‘144A’ FRN 20/7/2029 1,984,498 0.03
USD 1,000,000 OCP CLO 2015-8 Ltd ‘Series 2015-8A A2AR’ ‘144A’ FRN 17/4/2027 997,937 0.01
USD 2,000,000 OCP CLO 2015-8 Ltd ‘Series 2015-8A CR’ ‘144A’ FRN 17/4/2027 1,982,513 0.03
USD 1,000,000 OCP CLO 2015-9 Ltd ‘Series 2015-9A CR’ ‘144A’ FRN 15/7/2027 983,833 0.01
USD 1,000,000 OCP CLO 2016-11 Ltd ‘Series 2016-11A A1AR’ ‘144A’ FRN 26/10/2030 997,630 0.01
USD 5,000,000 OCP CLO 2016-12 Ltd ‘Series 2016-12A A2R’ ‘144A’ FRN 18/10/2028 4,942,890 0.06
USD 1,000,000 OCP CLO 2017-13 Ltd ‘Series 2017-13A A1A’ ‘144A’ FRN 15/7/2030 1,000,828 0.01
USD 1,250,000 Octagon Investment Partners 26 Ltd ‘Series 2016-1A CR’ ‘144A’ FRN 15/7/2030 1,203,804 0.02
USD 1,500,000 Octagon Investment Partners 26 Ltd ‘Series 2016-1A DR’ ‘144A’ FRN 15/7/2030 1,401,396 0.02
USD 600,000 Octagon Investment Partners 30 Ltd ‘Series 2017-1A C’ ‘144A’ FRN 17/3/2030 602,010 0.01
USD 1,250,000 OCTAGON INVESTMENT PARTNERS 31 LLC ‘Series 2017-1A D’ ‘144A’ FRN 20/7/2030 1,250,372 0.02
USD 1,000,000 Octagon Investment Partners 33 Ltd ‘Series 2017-1A B’ ‘144A’ FRN 20/1/2031 977,354 0.01
USD 750,000 Octagon Investment Partners 33 Ltd ‘Series 2017-1A C’ ‘144A’ FRN 20/1/2031 703,037 0.01
USD 1,000,000 Octagon Investment Partners 34 Ltd ‘Series 2017-1A B1’ ‘144A’ FRN 20/1/2030 980,499 0.01
Global Multi-Asset Income Fund continued
Portfolio of Investments 31 August 2019

Transferable Securities and Money Market Instruments Admitted to an Official Stock Exchange Listing or Dealt in on Another Regulated Market
Transferable Securities and Money Market Instruments Admitted to an Official Stock Exchange Listing or Dealt in on Another Regulated Market
Holding
Description
Market Value (USD)
% of Net
Assets
Holding
Description
Market Value (USD)
% of Net
Assets
The notes on pages 728 to 741 form an integral part of these financial statements.
[534] BlackRock Global Funds (BGF)
USD 1,500,000 Octagon Investment Partners 37 Ltd ‘Series 2018-2A B’ ‘144A’ FRN 25/7/2030 1,441,382 0.02
USD 1,250,000 Octagon Investment Partners XIV Ltd ‘Series 2012-1A A1AR’ ‘144A’ FRN 15/7/2029 1,250,640 0.02
USD 1,000,000 Octagon Investment Partners XVI Ltd ‘Series 2013-1A CR’ ‘144A’ FRN 17/7/2030 961,706 0.01
USD 1,000,000 Octagon Investment Partners XVII Ltd ‘Series 2013-1A A1R2’ ‘144A’ FRN 25/1/2031 989,791 0.01
USD 1,000,000 Octagon Investment Partners XVII Ltd ‘Series 2013-1A CR2’ ‘144A’ FRN 25/1/2031 946,376 0.01
USD 1,000,000 Octagon Investment Partners XXII Ltd ‘Series 2014-1A DRR’ ‘144A’ FRN 22/1/2030 934,648 0.01
USD 5,500,000 Octagon Loan Funding Ltd ‘Series 2014-1A ARR’ ‘144A’ FRN 18/11/2031 5,483,248 0.07
USD 1,000,000 Octagon Loan Funding Ltd ‘Series 2014-1A BRR’ ‘144A’ FRN 18/11/2031 992,177 0.01
USD 250,000 Octagon Loan Funding Ltd ‘Series 2014-1A DRR’ ‘144A’ FRN 18/11/2031 235,528 0.00
USD 300,000 OHA Credit Partners XI Ltd ‘Series 2015-11A DR’ ‘144A’ FRN 20/1/2032 282,138 0.00
USD 2,250,000 OHA Credit Partners XII Ltd ‘Series 2015-12A DR’ ‘144A’ FRN 23/7/2030 2,099,993 0.03
USD 1,000,000 OHA Credit Partners XIV Ltd ‘Series 2017-14A B’ ‘144A’ FRN 21/1/2030 978,551 0.01
USD 1,000,000 OHA Credit Partners XIV Ltd ‘Series 2017-14A C’ ‘144A’ FRN 21/1/2030 964,414 0.01
USD 750,000 OHA Loan Funding 2013-1 Ltd ‘Series 2013-1A DR2’ ‘144A’ FRN 23/7/2031 712,458 0.01
USD 3,625,000 OHA Loan Funding 2015-1 Ltd ‘Series 2015-1A AR’ ‘144A’ FRN 15/8/2029 3,626,165 0.05
USD 2,761,000 Olympic Tower 2017-OT Mortgage Trust ‘Series 2017-OT E’ ‘144A’ FRN 10/5/2039 2,865,184 0.04
USD 480,000 Omnicom Group Inc / Omnicom Capital Inc 4.45% 15/8/2020 489,941 0.01
USD 10,069,000 Ortho-Clinical Diagnostics Inc / Ortho-Clinical Diagnostics SA ‘144A’ 6.625% 15/5/2022 9,766,930 0.13
USD 3,618,000 Outfront Media Capital LLC / Outfront Media Capital Corp ‘144A’ 5% 15/8/2027 3,749,152 0.05
USD 300,000 Outfront Media Capital LLC / Outfront Media Capital Corp 5.625% 15/2/2024 310,125 0.00
USD 200,000 Owens-Brockway Glass Container Inc ‘144A’ 5% 15/1/2022 205,500 0.00
USD 300,000 Owens-Brockway Glass Container Inc ‘144A’ 5.875% 15/8/2023 320,625 0.00
USD 624,000 Owl Rock Capital Corp 5.25% 15/4/2024 655,607 0.01
USD 1,000,000 OZLM Funding IV Ltd ‘Series 2013-4A BR’ ‘144A’ FRN 22/10/2030 974,906 0.01
USD 1,000,000 OZLM Funding Ltd ‘Series 2012-1A CR2’ ‘144A’ FRN 22/7/2029 998,047 0.01
USD 1,000,000 OZLM VI Ltd ‘Series 2014-6A A2AS’ ‘144A’ FRN 17/4/2031 992,615 0.01
USD 1,000,000 OZLM VI Ltd ‘Series 2014-6A B1S’ ‘144A’ FRN 17/4/2031 968,378 0.01
USD 3,000,000 OZLM XI Ltd ‘Series 2015-11A A1R’ ‘144A’ FRN 30/10/2030 2,997,234 0.04
USD 5,750,000 OZLM XIX Ltd ‘Series 2017-19A A1’ ‘144A’ FRN 22/11/2030 5,725,347 0.07
USD 1,000,000 OZLM XX Ltd ‘Series 2018-20A B’ ‘144A’ FRN 20/4/2031 973,628 0.01
USD 1,000,000 OZLM XX Ltd ‘Series 2018-20A C’ ‘144A’ FRN 20/4/2031 944,508 0.01
USD 1,065,000 Packaging Corp of America 2.45% 15/12/2020 1,066,285 0.01
USD 1,150,000 Palmer Square CLO 2013-2 Ltd ‘Series 2013-2A A2RR’ ‘144A’ FRN 17/10/2031 1,139,057 0.02
USD 1,500,000 Palmer Square CLO 2013-2 Ltd ‘Series 2013-2A BRR’ ‘144A’ FRN 17/10/2031 1,447,239 0.02
USD 450,000 Palmer Square CLO 2013-2 Ltd ‘Series 2013-2A CRR’ ‘144A’ FRN 17/10/2031 433,818 0.01
USD 500,000 Palmer Square CLO 2015-2 Ltd ‘Series 2015-2A A1AR’ ‘144A’ FRN 20/7/2030 499,927 0.01
USD 8,000,000 Palmer Square CLO 2018-1 Ltd ‘Series 2018-1A A1’ ‘144A’ FRN 18/4/2031 7,934,735 0.10
USD 4,000,000 Palmer Square CLO 2018-1 Ltd ‘Series 2018-1A A2’ ‘144A’ FRN 18/4/2031 3,907,101 0.05
USD 1,000,000 Palmer Square CLO 2018-1 Ltd ‘Series 2018-1A B’ ‘144A’ FRN 18/4/2031 956,211 0.01
USD 5,000,000 Palmer Square CLO 2018-2 Ltd ‘Series 2018-2A A1A’ ‘144A’ FRN 16/7/2031 4,967,832 0.06
USD 1,000,000 Palmer Square CLO 2018-2 Ltd ‘Series 2018-2A A2’ ‘144A’ FRN 16/7/2031 987,273 0.01
EUR 1,234,000 Panther BF Aggregator 2 LP / Panther Finance Co Inc 4.375% 15/5/2026 1,392,448 0.02
USD 5,189,000 Panther BF Aggregator 2 LP / Panther Finance Co Inc ‘144A’ 6.25% 15/5/2026 5,377,101 0.07
USD 5,672,000 Panther BF Aggregator 2 LP / Panther Finance Co Inc ‘144A’ 8.5% 15/5/2027 5,530,200 0.07
USD 3,939,000 Par Pharmaceutical Inc ‘144A’ 7.5% 1/4/2027 3,682,965 0.05
USD 2,100,000 Park Avenue Institutional Advisers CLO Ltd 2016-1 ‘Series 2016-1A A2R’ ‘144A’ FRN 23/8/2031 2,081,499 0.03
USD 900,000 Park Avenue Institutional Advisers CLO Ltd 2017-1 ‘Series 2017-1A B’ ‘144A’ FRN 14/11/2029 888,369 0.01
USD 148,000 Parsley Energy LLC / Parsley Finance Corp ‘144A’ 5.25% 15/8/2025 150,960 0.00
USD 2,064,000 Parsley Energy LLC / Parsley Finance Corp ‘144A’ 5.375% 15/1/2025 2,110,440 0.03
USD 1,046,000 Parsley Energy LLC / Parsley Finance Corp ‘144A’ 5.625% 15/10/2027 1,082,610 0.01
Global Multi-Asset Income Fund continued
Portfolio of Investments 31 August 2019

Transferable Securities and Money Market Instruments Admitted to an Official Stock Exchange Listing or Dealt in on Another Regulated Market
Transferable Securities and Money Market Instruments Admitted to an Official Stock Exchange Listing or Dealt in on Another Regulated Market
Holding
Description
Market Value (USD)
% of Net
Assets
Holding
Description
Market Value (USD)
% of Net
Assets
* All or a portion of this security represents a security on loan.
The notes on pages 728 to 741 form an integral part of these financial statements.
Annual Report and Audited Financial Statements [535]
USD 257,000 Parsley Energy LLC / Parsley Finance Corp ‘144A’ 6.25% 1/6/2024 265,352 0.00
USD 1,248,000 Pattern Energy Group Inc ‘144A’ 5.875% 1/2/2024 1,297,920 0.02
USD 1,893,000 PBF Holding Co LLC / PBF Finance Corp 7.25% 15/6/2025 1,956,889 0.03
USD 942,000 PDC Energy Inc 5.75% 15/5/2026 923,066 0.01 USD 670,000 PDC Energy Inc 6.125% 15/9/2024 668,325 0.01 USD 300,000 Peabody Energy Corp ‘144A’
6.375% 31/3/2025 313,875 0.00 USD 1,115,000 Penske Automotive Group Inc
5.5% 15/5/2026 1,170,750 0.02 USD 200,000 Penske Automotive Group Inc
5.75% 1/10/2022 203,120 0.00 USD 455,000 Penske Truck Leasing Co Lp / PTL
Finance Corp ‘144A’ 2.7% 14/3/2023 459,214 0.01
USD 200,000 Penske Truck Leasing Co Lp / PTL Finance Corp ‘144A’ 3.45% 1/7/2024 208,134 0.00
USD 215,000 Penske Truck Leasing Co Lp / PTL Finance Corp ‘144A’ 4.25% 17/1/2023 228,247 0.00
USD 3,523,000 PetSmart Inc ‘144A’ 5.875% 1/6/2025 3,470,155 0.05
USD 577,000 PetSmart Inc ‘144A’ 7.125% 15/3/2023 536,610 0.01
USD 300,000 PFS Financing Corp ‘Series 2016-BA A’ ‘144A’ 1.87% 15/10/2021 300,201 0.00
USD 1,000,000 PFS Financing Corp ‘Series 2018-D A’ ‘144A’ 3.19% 17/4/2023 1,017,796 0.01
USD 523,000 PGT Escrow Issuer Inc ‘144A’ 6.75% 1/8/2026 564,840 0.01
USD 1,980,000 Pilgrim’s Pride Corp ‘144A’ 5.75% 15/3/2025 2,064,150 0.03
USD 500,000 Pilgrim’s Pride Corp ‘144A’ 5.875% 30/9/2027 540,000 0.01
USD 500,000 Pioneer Natural Resources Co 3.45% 15/1/2021 507,337 0.01
USD 30,000 Pioneer Natural Resources Co 7.5% 15/1/2020 30,544 0.00
USD 500,000 Pitney Bowes Inc 4.95% 1/4/2023 477,500 0.01 USD 16,425,000 Plains All American Pipeline LP
FRN 15/11/2022 (Perpetual) 15,628,716 0.20 USD 190,000 Plastipak Holdings Inc ‘144A’
6.25% 15/10/2025 170,050 0.00 USD 2,802,000 Polaris Intermediate Corp ‘144A’
8.5% 1/12/2022 2,353,960 0.03 USD 200,000 PolyOne Corp 5.25% 15/3/2023 215,000 0.00 USD 4,319,000 Post Holdings Inc ‘144A’ 5%
15/8/2026 4,513,355 0.06 USD 1,515,000 Post Holdings Inc ‘144A’ 5.5%
1/3/2025 1,590,750 0.02 USD 807,000 Post Holdings Inc ‘144A’ 5.5%
15/12/2029 855,420 0.01 USD 1,036,000 Post Holdings Inc ‘144A’ 5.625%
15/1/2028 1,096,865 0.01 USD 1,500,000 Post Holdings Inc ‘144A’ 5.75%
1/3/2027 1,601,250 0.02 USD 2,258,000 PQ Corp ‘144A’ 5.75% 15/12/2025 2,325,740 0.03 USD 500,000 Prestige Auto Receivables Trust
2016-2 ‘Series 2016-2A C’ ‘144A’ 2.88% 15/11/2022 500,686 0.01
USD 8,022,547 Pretium Mortgage Credit Partners I 2019-NPL1 LLC (Step-up coupon) ‘Series 2019-NPL1 A1’ ‘144A’ 4.213% 25/7/2060 8,108,900 0.10
USD 3,800,288 Pretium Mortgage Credit Partners I 2019-NPL2 LLC (Step-up coupon) ‘Series 2019-NPL2 A1’ ‘144A’ 3.844% 25/12/2058 3,821,599 0.05
USD 1,790,000 Prima Capital CRE Securitization 2015-IV Ltd ‘Series 2015-4A C’ ‘144A’ 4% 24/8/2049 1,838,867 0.02
USD 8,000,000 Prima Capital CRE Securitization 2016-VI Ltd ‘Series 2016-6A C’ ‘144A’ 4% 24/8/2040 8,008,000 0.10
USD 2,982,000 Prime Security Services Borrower LLC / Prime Finance Inc ‘144A’ 5.25% 15/4/2024 3,071,460 0.04
USD 1,074,000 Prime Security Services Borrower LLC / Prime Finance Inc ‘144A’ 5.75% 15/4/2026 1,122,330 0.01
USD 374,000 Prime Security Services Borrower LLC / Prime Finance Inc ‘144A’ 9.25% 15/5/2023 393,401 0.01
USD 500,000 Progress Energy Inc 3.15% 1/4/2022 510,994 0.01 USD 1,500,000 Progress Energy Inc 4.4% 15/1/2021 1,538,504 0.02 USD 1,625,000 Progress Residential 2015-SFR3
Trust ‘Series 2015-SFR3 F’ ‘144A’ 6.643% 12/11/2032 1,636,680 0.02
USD 4,140,000 Progress Residential 2017-SFR1 Trust ‘Series 2017-SFR1 E’ ‘144A’ 4.261% 17/8/2034 4,275,864 0.06
USD 834,000 Progress Residential 2017-SFR2 Trust ‘Series 2017-SFR2 D’ ‘144A’ 3.595% 17/12/2034 846,226 0.01
USD 11,585,000 Progress Residential 2018-SFR3 Trust ‘Series 2018-SFR3 F’ ‘144A’ 5.368% 17/10/2035 12,204,855 0.16
USD 4,465,000 Progress Residential 2019-SFR2 Trust ‘Series 2019-SFR2 E’ ‘144A’ 4.142% 17/5/2036 4,627,646 0.06
USD 1,845,000 Progress Residential 2019-SFR2 Trust ‘Series 2019-SFR2 F’ ‘144A’ 4.837% 17/5/2036 1,927,374 0.03
USD 4,500,000 Progressive Corp/The FRN 15/3/2023 (Perpetual) 4,653,090 0.06
USD 181,000 PTC Inc 6% 15/5/2024 190,050 0.00 USD 850,000 PulteGroup Inc 5% 15/1/2027 915,875 0.01 USD 1,500,000 PulteGroup Inc 5.5% 1/3/2026 1,644,375 0.02 USD 1,921,000 PulteGroup Inc 6.375% 15/5/2033 2,098,693 0.03 USD 359,000 QEP Resources Inc 5.25%
1/5/2023 314,125 0.00 USD 1,246,000 QEP Resources Inc 5.375%
1/10/2022 1,126,073 0.01 USD 697,000 QEP Resources Inc 5.625%
1/3/2026 568,055 0.01 USD 591,000 QEP Resources Inc 6.875%
1/3/2021 589,523 0.01 USD 3,202,000 Qorvo Inc 5.5% 15/7/2026 3,426,204 0.04 USD 2,452,000 Qualitytech LP / QTS Finance Corp
‘144A’ 4.75% 15/11/2025 2,501,040 0.03 USD 600,000 Quicken Loans Inc ‘144A’ 5.75%
1/5/2025 628,500 0.01 USD 506,000 Qwest Corp 6.75% 1/12/2021 546,047 0.01 USD 3,700,000 Qwest Corp 6.875% 15/9/2033 3,719,382 0.05 USD 1,000,000 Race Point VIII CLO Ltd ‘Series
2013-8A DR’ ‘144A’ FRN 20/2/2030 1,000,728 0.01
USD 1,237,000 Rackspace Hosting Inc ‘144A’ 8.625% 15/11/2024* 1,133,401 0.01
USD 350,000 Radian Group Inc 4.5% 1/10/2024 363,125 0.01 USD 1,010,000 Radian Group Inc 4.875% 15/3/2027 1,033,988 0.01
Global Multi-Asset Income Fund continued
Portfolio of Investments 31 August 2019

Transferable Securities and Money Market Instruments Admitted to an Official Stock Exchange Listing or Dealt in on Another Regulated Market
Transferable Securities and Money Market Instruments Admitted to an Official Stock Exchange Listing or Dealt in on Another Regulated Market
Holding
Description
Market Value (USD)
% of Net
Assets
Holding
Description
Market Value (USD)
% of Net
Assets
* All or a portion of this security represents a security on loan.
The notes on pages 728 to 741 form an integral part of these financial statements.
[536] BlackRock Global Funds (BGF)
USD 1,014,000 Radiate Holdco LLC / Radiate Finance Inc ‘144A’ 6.625% 15/2/2025 1,011,465 0.01
USD 182,000 Radiate Holdco LLC / Radiate Finance Inc ‘144A’ 6.875% 15/2/2023 186,550 0.00
USD 150,000 Rain CII Carbon LLC / CII Carbon Corp ‘144A’ 7.25% 1/4/2025 141,750 0.00
USD 64,323 RAIT 2017-FL7 Trust ‘Series 2017-FL7 A’ ‘144A’ FRN 15/6/2037 64,282 0.00
USD 330,000 RAIT 2017-FL7 Trust ‘Series 2017-FL7 C’ ‘144A’ FRN 15/6/2037 326,672 0.00
USD 254,000 Range Resources Corp 4.875% 15/5/2025* 212,090 0.00
USD 552,000 Range Resources Corp 5% 15/8/2022 521,640 0.01
USD 600,000 Range Resources Corp 5% 15/3/2023 528,000 0.01
USD 828,000 Range Resources Corp 5.75% 1/6/2021 825,930 0.01
USD 208,000 Range Resources Corp 5.875% 1/7/2022 200,720 0.00
USD 3,752,000 RBS Global Inc / Rexnord LLC ‘144A’ 4.875% 15/12/2025 3,873,940 0.05
USD 300,000 Realogy Group LLC / Realogy Co-Issuer Corp ‘144A’ 4.875% 1/6/2023* 261,750 0.00
EUR 2,359,000 Refinitiv US Holdings Inc 4.5% 15/5/2026 2,844,268 0.04
USD 7,886,000 Refinitiv US Holdings Inc ‘144A’ 6.25% 15/5/2026 8,605,597 0.11
EUR 300,000 Refinitiv US Holdings Inc 6.875% 15/11/2026 377,928 0.01
USD 5,548,000 Refinitiv US Holdings Inc ‘144A’ 8.25% 15/11/2026 6,269,240 0.08
USD 4,000,000 Regatta IX Funding Ltd ‘Series 2017-1A B’ ‘144A’ FRN 17/4/2030 3,982,723 0.05
USD 500,000 Regatta IX Funding Ltd ‘Series 2017-1A D’ ‘144A’ FRN 17/4/2030 503,258 0.01
USD 1,000,000 Regatta VI Funding Ltd ‘Series 2016-1A CR’ ‘144A’ FRN 20/7/2028 980,314 0.01
USD 500,000 Regatta VII Funding Ltd FRN 20/12/2028 484,404 0.01
USD 500,000 Regatta VII Funding Ltd FRN 20/12/2028 492,328 0.01
USD 1,000,000 Regatta X Funding Ltd ‘Series 2017-3A C’ ‘144A’ FRN 17/1/2031 970,263 0.01
USD 750,000 Regatta X Funding Ltd ‘Series 2017-3A D’ ‘144A’ FRN 17/1/2031 700,135 0.01
USD 1,957,000 RegionalCare Hospital Partners Holdings Inc ‘144A’ 8.25% 1/5/2023 2,093,354 0.03
USD 500,000 Regions Bank/Birmingham AL FRN 13/8/2021 505,079 0.01
USD 600,000 Regions Financial Corp 3.2% 8/2/2021 608,143 0.01
USD 993,184 Renaissance Home Equity Loan Trust 2005-1 ‘Series 2005-1 AV3’ FRN 25/5/2035 965,878 0.01
USD 3,996,845 Renaissance Home Equity Loan Trust 2005-3 (Step-up coupon) ‘Series 2005-3 AF4’ 5.14% 25/11/2035 4,238,024 0.05
USD 200,000 Resolute Forest Products Inc 5.875% 15/5/2023* 201,000 0.00
USD 1,535,000 Reynolds Group Issuer Inc / Reynolds Group Issuer LLC / Reynolds Group Issuer Lu ‘144A’ FRN 15/7/2021 1,536,919 0.02
USD 2,732,000 Reynolds Group Issuer Inc / Reynolds Group Issuer LLC / Reynolds Group Issuer Lu ‘144A’ 5.125% 15/7/2023 2,810,545 0.04
USD 4,369,000 Reynolds Group Issuer Inc / Reynolds Group Issuer LLC / Reynolds Group Issuer Lu ‘144A’ 7% 15/7/2024 4,519,184 0.06
USD 3,000 RHP Hotel Properties LP / RHP Finance Corp 5% 15/4/2021 3,011 0.00
USD 500,000 Rockford Tower CLO 2017-2 Ltd ‘Series 2017-2A C’ ‘144A’ FRN 15/10/2029 493,747 0.01
USD 17,500,000 Rockford Tower CLO 2017-3 Ltd ‘Series 2017-3A A’ ‘144A’ FRN 20/10/2030 17,467,956 0.23
USD 11,000,000 Rockford Tower CLO 2018-1 Ltd ‘Series 2018-1A A’ ‘144A’ FRN 20/5/2031 10,867,298 0.14
USD 2,900,000 Rockford Tower CLO 2018-1 Ltd ‘Series 2018-1A B’ ‘144A’ FRN 20/5/2031 2,878,430 0.04
USD 2,100,000 Rockford Tower CLO 2018-2 Ltd ‘Series 2018-2A A’ ‘144A’ FRN 20/10/2031 2,091,727 0.03
USD 400,000 Rockford Tower CLO 2018-2 Ltd ‘Series 2018-2A C’ ‘144A’ FRN 20/10/2031 396,266 0.01
USD 300,000 Rockies Express Pipeline LLC ‘144A’ 5.625% 15/4/2020 304,500 0.00
USD 800,000 Roper Technologies Inc 3% 15/12/2020 807,929 0.01
USD 1,929,000 Rowan Cos Inc 4.875% 1/6/2022 1,589,496 0.02 USD 2,701,000 RP Crown Parent LLC ‘144A’
7.375% 15/10/2024 2,821,762 0.04 USD 3,000,000 RR 3 Ltd ‘Series 2018-3A A1R2’
‘144A’ FRN 15/1/2030 2,985,929 0.04 USD 700,000 RR 5 Ltd ‘Series 2018-5A B’ ‘144A’
FRN 15/10/2031 687,392 0.01 USD 165,000 Ryder System Inc 2.875% 1/6/2022 168,328 0.00 USD 420,000 Ryder System Inc 3.75% 9/6/2023 442,441 0.01 USD 800,000 Sabine Pass Liquefaction LLC
5.625% 1/2/2021 827,762 0.01 USD 100,000 Sabine Pass Liquefaction LLC
5.75% 15/5/2024 111,641 0.00 USD 200,000 Sable Permian Resources Land
LLC / AEPB Finance Corp ‘144A’ 13% 30/11/2020 181,000 0.00
USD 1,523,000 Sabre GLBL Inc ‘144A’ 5.25% 15/11/2023 1,572,497 0.02
USD 600,000 Sally Holdings LLC / Sally Capital Inc 5.625% 1/12/2025 602,364 0.01
USD 89,287 San Diego Gas & Electric Co 1.914% 1/2/2022 87,597 0.00
USD 10,000 Santander Holdings USA Inc 3.7% 28/3/2022 10,303 0.00
USD 400,000 Santander Holdings USA Inc 4.45% 3/12/2021 417,274 0.01
USD 225,000 SBA Communications Corp 4% 1/10/2022 230,625 0.00
USD 200,000 SBA Communications Corp 4.875% 15/7/2022 203,250 0.00
USD 7,011,000 SBA Communications Corp 4.875% 1/9/2024 7,300,204 0.09
USD 6,540,000 Scientific Games International Inc ‘144A’ 5% 15/10/2025 6,773,740 0.09
USD 3,902,000 Scientific Games International Inc ‘144A’ 8.25% 15/3/2026 4,145,875 0.05
EUR 300,000 Sealed Air Corp 4.5% 15/9/2023* 379,885 0.01
Global Multi-Asset Income Fund continued
Portfolio of Investments 31 August 2019

Transferable Securities and Money Market Instruments Admitted to an Official Stock Exchange Listing or Dealt in on Another Regulated Market
Transferable Securities and Money Market Instruments Admitted to an Official Stock Exchange Listing or Dealt in on Another Regulated Market
Holding
Description
Market Value (USD)
% of Net
Assets
Holding
Description
Market Value (USD)
% of Net
Assets
* All or a portion of this security represents a security on loan.
The notes on pages 728 to 741 form an integral part of these financial statements.
Annual Report and Audited Financial Statements [537]
USD 114,000 Sealed Air Corp ‘144A’ 6.875% 15/7/2033 133,950 0.00
USD 135,000 Select Medical Corp ‘144A’ 6.25% 15/8/2026 140,413 0.00
USD 1,000,000 Sempra Energy 2.4% 1/2/2020 998,728 0.01 USD 367,639 Sequoia Mortgage Trust 2017-CH2
‘Series 2017-CH2 A10’ ‘144A’ FRN 25/12/2047 371,683 0.01
USD 948,000 Service Corp International/US 4.625% 15/12/2027 994,499 0.01
USD 1,669,000 Service Corp International/US 5.125% 1/6/2029 1,787,916 0.02
USD 4,580,000 ServiceMaster Co LLC/The ‘144A’ 5.125% 15/11/2024 4,798,924 0.06
USD 350,000 SESI LLC 7.125% 15/12/2021 247,625 0.00 USD 145,000 SESI LLC 7.75% 15/9/2024 87,725 0.00 USD 215,000 Simmons Foods Inc ‘144A’ 5.75%
1/11/2024 204,788 0.00 USD 1,290,000 Simmons Foods Inc ‘144A’ 7.75%
15/1/2024 1,399,650 0.02 USD 400,000 Sinclair Television Group Inc ‘144A’
5.625% 1/8/2024 413,000 0.01 USD 555,000 Sirius XM Radio Inc ‘144A’ 3.875%
1/8/2022 567,488 0.01 USD 1,000,000 Sirius XM Radio Inc ‘144A’ 4.625%
15/5/2023 1,018,750 0.01 USD 497,000 Sirius XM Radio Inc ‘144A’ 4.625%
15/7/2024 521,229 0.01 USD 3,124,000 Sirius XM Radio Inc ‘144A’ 5%
1/8/2027 3,307,535 0.04 USD 500,000 Sirius XM Radio Inc ‘144A’ 5.375%
15/4/2025 520,625 0.01 USD 2,894,000 Sirius XM Radio Inc ‘144A’ 5.5%
1/7/2029 3,162,563 0.04 USD 3,621,000 Six Flags Entertainment Corp
‘144A’ 4.875% 31/7/2024 3,747,735 0.05 USD 4,468,000 Six Flags Entertainment Corp
‘144A’ 5.5% 15/4/2027 4,810,070 0.06 USD 256,933 SLM Private Credit Student Loan
Trust 2004-B ‘Series 2004-B A3’ FRN 15/3/2024 255,727 0.00
USD 26,503 SLM Private Education Loan Trust 2013-B ‘Series 2013-B A2A’ ‘144A’ 1.85% 17/6/2030 26,492 0.00
USD 1,109,000 SM Energy Co 5% 15/1/2024* 975,920 0.01 USD 250,000 SM Energy Co 5.625% 1/6/2025 213,750 0.00 USD 286,000 SM Energy Co 6.125% 15/11/2022 267,410 0.00 USD 120,000 SM Energy Co 6.625% 15/1/2027 102,600 0.00 USD 367,000 SM Energy Co 6.75% 15/9/2026* 313,785 0.00 USD 151,392 SMB Private Education Loan Trust
2016-A ‘Series 2016-A A2A’ ‘144A’ 2.7% 15/5/2031 153,235 0.00
USD 212,680 SMB Private Education Loan Trust 2016-B ‘Series 2016-B A2A’ ‘144A’ 2.43% 17/2/2032 213,354 0.00
USD 632,623 SMB Private Education Loan Trust 2017-A ‘Series 2017-A A2B’ ‘144A’ FRN 15/9/2034 634,807 0.01
USD 398,444 SMB Private Education Loan Trust 2017-B ‘Series 2017-B A2B’ ‘144A’ FRN 15/10/2035 396,528 0.01
USD 600,000 SMB Private Education Loan Trust 2018-A ‘Series 2018-A A2A’ ‘144A’ 3.5% 15/2/2036 633,463 0.01
USD 770,000 SMB Private Education Loan Trust 2018-B ‘Series 2018-B A2B’ ‘144A’ FRN 15/1/2037 767,172 0.01
USD 190,000 SMB Private Education Loan Trust 2019-A ‘Series 2019-A A2A’ ‘144A’ 3.44% 15/7/2036 199,831 0.00
USD 51,593 SoFi Professional Loan Program 2015-A LLC ‘Series 2015-A A1’ ‘144A’ FRN 25/3/2033 51,876 0.00
USD 342,554 SoFi Professional Loan Program 2015-B LLC ‘Series 2015-B A1’ ‘144A’ FRN 25/4/2035 345,325 0.00
USD 254,003 SoFi Professional Loan Program 2015-B LLC ‘Series 2015-B A2’ ‘144A’ 2.51% 27/9/2032 255,074 0.00
USD 169,791 SoFi Professional Loan Program 2015-d LLC ‘Series 2015-D A2’ ‘144A’ 2.72% 27/10/2036 171,582 0.00
USD 226,901 Sofi Professional Loan Program 2016-A LLC ‘Series 2016-A A1’ ‘144A’ FRN 25/8/2036 231,428 0.00
USD 89,672 SoFi Professional Loan Program 2016-C LLC ‘Series 2016-C A2B’ ‘144A’ 2.36% 27/12/2032 90,233 0.00
USD 169,800 SoFi Professional Loan Program 2016-D LLC ‘Series 2016-D A2B’ ‘144A’ 2.34% 25/4/2033 170,741 0.00
USD 800,000 Sofi Professional Loan Program 2018-A LLC ‘Series 2018-A A2B’ ‘144A’ 2.95% 25/2/2042 819,764 0.01
USD 164,000 Sofi Professional Loan Program 2018-C Trust ‘Series 2018-C A2FX’ ‘144A’ 3.59% 25/1/2048 173,890 0.00
USD 161,000 Sofi Professional Loan Program 2018-D Trust ‘Series 2018-D A2FX’ ‘144A’ 3.6% 25/2/2048 169,930 0.00
USD 10,390,000 Solera LLC / Solera Finance Inc ‘144A’ 10.5% 1/3/2024 11,065,350 0.14
USD 187,000 Sophia LP / Sophia Finance Inc ‘144A’ 9% 30/9/2023 193,078 0.00
USD 2,625,000 Sotera Health Holdings LLC ‘144A’ 6.5% 15/5/2023 2,677,500 0.03
USD 1,000,000 Sound Point CLO II Ltd ‘Series 2013-1A A1R’ ‘144A’ FRN 26/1/2031 992,482 0.01
USD 1,500,000 SOUND POINT CLO VII-R Ltd ‘Series 2014-3RA A1’ ‘144A’ FRN 23/10/2031 1,494,457 0.02
USD 4,250,000 Sound Point Clo XXI Ltd ‘Series 2018-3A A1A’ ‘144A’ FRN 26/10/2031 4,217,271 0.05
USD 13,500,000 Sounds Point CLO IV-R Ltd ‘Series 2013-3RA A’ ‘144A’ FRN 18/4/2031 13,408,393 0.17
USD 300,000 Southern California Edison Co 2.9% 1/3/2021 302,822 0.00
USD 1,400,000 Southern Co/The FRN 15/3/2057 1,452,913 0.02 USD 9,295,000 Southern Copper Corp 5.375%
16/4/2020 9,491,066 0.12 USD 1,350,000 Southwestern Energy Co 6.2%
23/1/2025 1,184,625 0.02 USD 550,000 Southwestern Energy Co 7.5%
1/4/2026 483,890 0.01 USD 547,000 Southwestern Energy Co 7.75%
1/10/2027 479,993 0.01 USD 1,547,000 Spectrum Brands Inc 5.75%
15/7/2025 1,620,947 0.02 USD 635,000 Springleaf Finance Corp 5.625%
15/3/2023 685,800 0.01 USD 350,000 Springleaf Finance Corp 6.125%
15/5/2022 379,750 0.01 USD 1,070,000 Springleaf Finance Corp 6.125%
15/3/2024 1,171,329 0.02 USD 1,481,000 Springleaf Finance Corp 6.625%
15/1/2028 1,636,505 0.02 USD 1,833,000 Springleaf Finance Corp 6.875%
15/3/2025 2,089,620 0.03
Global Multi-Asset Income Fund continued
Portfolio of Investments 31 August 2019

Transferable Securities and Money Market Instruments Admitted to an Official Stock Exchange Listing or Dealt in on Another Regulated Market
Transferable Securities and Money Market Instruments Admitted to an Official Stock Exchange Listing or Dealt in on Another Regulated Market
Holding
Description
Market Value (USD)
% of Net
Assets
Holding
Description
Market Value (USD)
% of Net
Assets
The notes on pages 728 to 741 form an integral part of these financial statements.
[538] BlackRock Global Funds (BGF)
USD 2,716,000 Springleaf Finance Corp 7.125% 15/3/2026 3,108,122 0.04
USD 500,000 Springleaf Finance Corp 7.75% 1/10/2021 549,375 0.01
USD 300,000 Springleaf Finance Corp 8.25% 15/12/2020 321,000 0.00
USD 1,970,000 Sprint Capital Corp 6.875% 15/11/2028 2,192,039 0.03
USD 1,560,000 Sprint Capital Corp 8.75% 15/3/2032 1,953,900 0.03
USD 900,000 Sprint Communications Inc 6% 15/11/2022 960,489 0.01
USD 5,313,000 Sprint Corp 7.125% 15/6/2024 5,899,024 0.08 USD 700,000 Sprint Corp 7.25% 15/9/2021 753,900 0.01 USD 861,000 Sprint Corp 7.625% 15/2/2025 968,625 0.01 USD 2,627,000 Sprint Corp 7.625% 1/3/2026 2,966,868 0.04 USD 4,235,000 Sprint Corp 7.875% 15/9/2023 4,774,963 0.06 USD 200,000 Sprint Spectrum Co LLC / Sprint
Spectrum Co II LLC / Sprint Spectrum Co III LLC ‘144A’ 4.738% 20/3/2025 212,250 0.00
USD 976,000 SPX FLOW Inc ‘144A’ 5.625% 15/8/2024 1,023,580 0.01
USD 590,000 SPX FLOW Inc ‘144A’ 5.875% 15/8/2026 625,400 0.01
USD 290,000 SRC Energy Inc 6.25% 1/12/2025 285,650 0.00 USD 1,242,000 SRS Distribution Inc ‘144A’ 8.25%
1/7/2026 1,220,265 0.02 USD 9,685,000 SS&C Technologies Inc ‘144A’
5.5% 30/9/2027 10,175,303 0.13 USD 340,000 Standard Industries Inc/NJ ‘144A’
4.75% 15/1/2028 342,975 0.00 USD 200,000 Standard Industries Inc/NJ ‘144A’
5% 15/2/2027 205,500 0.00 USD 3,630,000 Standard Industries Inc/NJ ‘144A’
5.375% 15/11/2024 3,747,975 0.05 USD 1,752,000 Standard Industries Inc/NJ ‘144A’
6% 15/10/2025 1,848,360 0.02 USD 6,238,000 Staples Inc ‘144A’ 7.5% 15/4/2026 6,331,570 0.08 USD 633,000 Staples Inc ‘144A’ 10.75% 15/4/2027 640,913 0.01 USD 200,000 Starwood Property Trust Inc
3.625% 1/2/2021 202,000 0.00 USD 190,000 Starwood Property Trust Inc
4.75% 15/3/2025 194,875 0.00 USD 300,000 Starwood Property Trust Inc
5% 15/12/2021 312,000 0.00 USD 38,242,000 State Street Corp FRN 15/6/2047 29,415,493 0.38 USD 1,640,000 Station Casinos LLC ‘144A’ 5%
1/10/2025 1,677,064 0.02 USD 133,000 Steel Dynamics Inc 4.125%
15/9/2025 134,663 0.00 USD 3,588,000 Steel Dynamics Inc 5%
15/12/2026 3,758,430 0.05 USD 568,000 Steel Dynamics Inc 5.5% 1/10/2024 588,420 0.01 USD 654,000 Stevens Holding Co Inc ‘144A’
6.125% 1/10/2026 686,700 0.01 USD 1,000,000 Stewart Park CLO Ltd ‘Series 2015-
1A DR’ ‘144A’ FRN 15/1/2030 922,278 0.01 USD 875,333 Structured Asset Mortgage
Investments II Trust 2006-AR2 ‘Series 2006-AR2 A1’ FRN 25/2/2036 862,131 0.01
USD 1,082,191 Structured Asset Mortgage Investments II Trust 2006-AR4 ‘Series 2006-AR4 3A1’ FRN 25/6/2036 1,053,046 0.01
USD 2,769,919 Structured Asset Mortgage Investments II Trust 2006-AR6 ‘Series 2006-AR6 2A1’ FRN 25/7/2046 2,403,378 0.03
USD 2,155,944 Structured Asset Mortgage Investments II Trust 2007-AR4 ‘Series 2007-AR4 GA4B’ FRN 25/9/2047 2,077,882 0.03
USD 1,000,000 Stryker Corp 2.625% 15/3/2021 1,007,929 0.01 USD 950,000 Suburban Propane Partners LP/
Suburban Energy Finance Corp 5.5% 1/6/2024 969,000 0.01
USD 200,000 Summit Materials LLC / Summit Materials Finance Corp 6.125% 15/7/2023 204,250 0.00
USD 255,000 Summit Materials LLC / Summit Materials Finance Corp ‘144A’ 6.5% 15/3/2027 274,125 0.00
USD 200,000 Summit Midstream Holdings LLC / Summit Midstream Finance Corp 5.75% 15/4/2025 172,540 0.00
USD 600,000 SunCoke Energy Partners LP / SunCoke Energy Partners Finance Corp ‘144A’ 7.5% 15/6/2025 575,250 0.01
USD 1,242,000 Sunoco LP / Sunoco Finance Corp 4.875% 15/1/2023 1,273,050 0.02
USD 2,862,000 Sunoco LP / Sunoco Finance Corp 5.5% 15/2/2026 2,976,480 0.04
USD 151,000 Sunoco LP / Sunoco Finance Corp 5.875% 15/3/2028 157,417 0.00
USD 1,079,000 Sunoco LP / Sunoco Finance Corp 6% 15/4/2027 1,138,345 0.02
USD 300,000 SunTrust Bank/Atlanta GA 2.45% 1/8/2022 303,228 0.00
USD 700,000 SunTrust Bank/Atlanta GA 2.8% 17/5/2022 712,873 0.01
USD 16,360,000 SunTrust Banks Inc FRN 15/6/2022 (Perpetual) 16,519,183 0.21
USD 3,525,000 SunTrust Banks Inc FRN 15/12/2027 (Perpetual) 3,497,399 0.05
USD 1,927,000 Surgery Center Holdings Inc ‘144A’ 6.75% 1/7/2025 1,623,498 0.02
USD 1,017,000 Surgery Center Holdings Inc ‘144A’ 10% 15/4/2027 976,320 0.01
USD 700,000 Symantec Corp ‘144A’ 5% 15/4/2025 706,373 0.01 USD 600,000 Synchrony Bank 3.65% 24/5/2021 612,179 0.01 USD 265,000 Synchrony Financial 2.85%
25/7/2022 268,351 0.00 USD 518,000 Syneos Health Inc / inVentiv Health
Inc / inVentiv Health Clinical Inc ‘144A’ 7.5% 1/10/2024 539,367 0.01
USD 166,000 Talen Energy Supply LLC 6.5% 1/6/2025 126,990 0.00
USD 365,000 Talen Energy Supply LLC ‘144A’ 6.625% 15/1/2028 354,050 0.00
USD 80,000 Talen Energy Supply LLC ‘144A’ 7.25% 15/5/2027 79,900 0.00
USD 426,000 Talen Energy Supply LLC ‘144A’ 10.5% 15/1/2026 388,299 0.01
USD 87,000 Tallgrass Energy Partners LP / Tallgrass Energy Finance Corp ‘144A’ 4.75% 1/10/2023 86,565 0.00
USD 1,164,000 Tallgrass Energy Partners LP / Tallgrass Energy Finance Corp ‘144A’ 5.5% 15/9/2024 1,147,995 0.02
USD 4,355,000 Tallgrass Energy Partners LP / Tallgrass Energy Finance Corp ‘144A’ 5.5% 15/1/2028 4,126,363 0.05
USD 176,000 Targa Resources Partners LP / Targa Resources Partners Finance Corp 4.25% 15/11/2023 176,440 0.00
USD 2,663,000 Targa Resources Partners LP / Targa Resources Partners Finance Corp 5% 15/1/2028 2,686,301 0.03
Global Multi-Asset Income Fund continued
Portfolio of Investments 31 August 2019
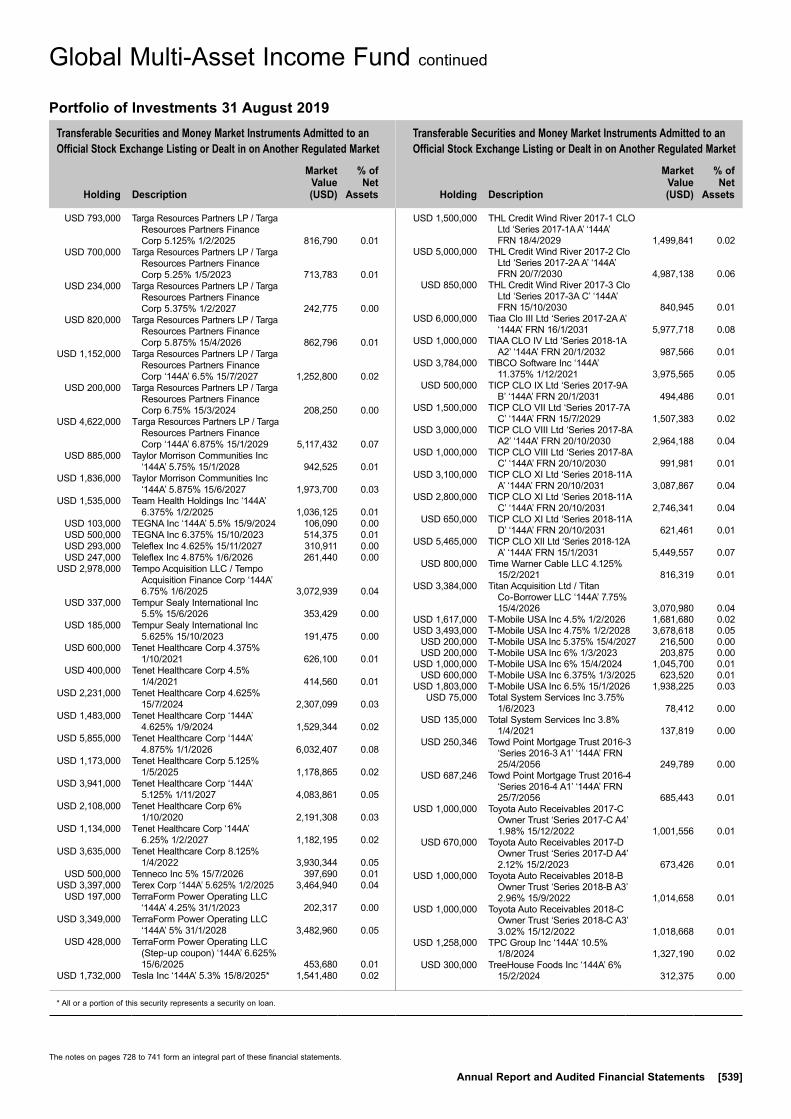
Transferable Securities and Money Market Instruments Admitted to an Official Stock Exchange Listing or Dealt in on Another Regulated Market
Transferable Securities and Money Market Instruments Admitted to an Official Stock Exchange Listing or Dealt in on Another Regulated Market
Holding
Description
Market Value (USD)
% of Net
Assets
Holding
Description
Market Value (USD)
% of Net
Assets
* All or a portion of this security represents a security on loan.
The notes on pages 728 to 741 form an integral part of these financial statements.
Annual Report and Audited Financial Statements [539]
USD 793,000 Targa Resources Partners LP / Targa Resources Partners Finance Corp 5.125% 1/2/2025 816,790 0.01
USD 700,000 Targa Resources Partners LP / Targa Resources Partners Finance Corp 5.25% 1/5/2023 713,783 0.01
USD 234,000 Targa Resources Partners LP / Targa Resources Partners Finance Corp 5.375% 1/2/2027 242,775 0.00
USD 820,000 Targa Resources Partners LP / Targa Resources Partners Finance Corp 5.875% 15/4/2026 862,796 0.01
USD 1,152,000 Targa Resources Partners LP / Targa Resources Partners Finance Corp ‘144A’ 6.5% 15/7/2027 1,252,800 0.02
USD 200,000 Targa Resources Partners LP / Targa Resources Partners Finance Corp 6.75% 15/3/2024 208,250 0.00
USD 4,622,000 Targa Resources Partners LP / Targa Resources Partners Finance Corp ‘144A’ 6.875% 15/1/2029 5,117,432 0.07
USD 885,000 Taylor Morrison Communities Inc ‘144A’ 5.75% 15/1/2028 942,525 0.01
USD 1,836,000 Taylor Morrison Communities Inc ‘144A’ 5.875% 15/6/2027 1,973,700 0.03
USD 1,535,000 Team Health Holdings Inc ‘144A’ 6.375% 1/2/2025 1,036,125 0.01
USD 103,000 TEGNA Inc ‘144A’ 5.5% 15/9/2024 106,090 0.00 USD 500,000 TEGNA Inc 6.375% 15/10/2023 514,375 0.01 USD 293,000 Teleflex Inc 4.625% 15/11/2027 310,911 0.00 USD 247,000 Teleflex Inc 4.875% 1/6/2026 261,440 0.00 USD 2,978,000 Tempo Acquisition LLC / Tempo
Acquisition Finance Corp ‘144A’ 6.75% 1/6/2025 3,072,939 0.04
USD 337,000 Tempur Sealy International Inc 5.5% 15/6/2026 353,429 0.00
USD 185,000 Tempur Sealy International Inc 5.625% 15/10/2023 191,475 0.00
USD 600,000 Tenet Healthcare Corp 4.375% 1/10/2021 626,100 0.01
USD 400,000 Tenet Healthcare Corp 4.5% 1/4/2021 414,560 0.01
USD 2,231,000 Tenet Healthcare Corp 4.625% 15/7/2024 2,307,099 0.03
USD 1,483,000 Tenet Healthcare Corp ‘144A’ 4.625% 1/9/2024 1,529,344 0.02
USD 5,855,000 Tenet Healthcare Corp ‘144A’ 4.875% 1/1/2026 6,032,407 0.08
USD 1,173,000 Tenet Healthcare Corp 5.125% 1/5/2025 1,178,865 0.02
USD 3,941,000 Tenet Healthcare Corp ‘144A’ 5.125% 1/11/2027 4,083,861 0.05
USD 2,108,000 Tenet Healthcare Corp 6% 1/10/2020 2,191,308 0.03
USD 1,134,000 Tenet Healthcare Corp ‘144A’ 6.25% 1/2/2027 1,182,195 0.02
USD 3,635,000 Tenet Healthcare Corp 8.125% 1/4/2022 3,930,344 0.05
USD 500,000 Tenneco Inc 5% 15/7/2026 397,690 0.01 USD 3,397,000 Terex Corp ‘144A’ 5.625% 1/2/2025 3,464,940 0.04 USD 197,000 TerraForm Power Operating LLC
‘144A’ 4.25% 31/1/2023 202,317 0.00 USD 3,349,000 TerraForm Power Operating LLC
‘144A’ 5% 31/1/2028 3,482,960 0.05 USD 428,000 TerraForm Power Operating LLC
(Step-up coupon) ‘144A’ 6.625% 15/6/2025 453,680 0.01
USD 1,732,000 Tesla Inc ‘144A’ 5.3% 15/8/2025* 1,541,480 0.02
USD 1,500,000 THL Credit Wind River 2017-1 CLO Ltd ‘Series 2017-1A A’ ‘144A’ FRN 18/4/2029 1,499,841 0.02
USD 5,000,000 THL Credit Wind River 2017-2 Clo Ltd ‘Series 2017-2A A’ ‘144A’ FRN 20/7/2030 4,987,138 0.06
USD 850,000 THL Credit Wind River 2017-3 Clo Ltd ‘Series 2017-3A C’ ‘144A’ FRN 15/10/2030 840,945 0.01
USD 6,000,000 Tiaa Clo III Ltd ‘Series 2017-2A A’ ‘144A’ FRN 16/1/2031 5,977,718 0.08
USD 1,000,000 TIAA CLO IV Ltd ‘Series 2018-1A A2’ ‘144A’ FRN 20/1/2032 987,566 0.01
USD 3,784,000 TIBCO Software Inc ‘144A’ 11.375% 1/12/2021 3,975,565 0.05
USD 500,000 TICP CLO IX Ltd ‘Series 2017-9A B’ ‘144A’ FRN 20/1/2031 494,486 0.01
USD 1,500,000 TICP CLO VII Ltd ‘Series 2017-7A C’ ‘144A’ FRN 15/7/2029 1,507,383 0.02
USD 3,000,000 TICP CLO VIII Ltd ‘Series 2017-8A A2’ ‘144A’ FRN 20/10/2030 2,964,188 0.04
USD 1,000,000 TICP CLO VIII Ltd ‘Series 2017-8A C’ ‘144A’ FRN 20/10/2030 991,981 0.01
USD 3,100,000 TICP CLO XI Ltd ‘Series 2018-11A A’ ‘144A’ FRN 20/10/2031 3,087,867 0.04
USD 2,800,000 TICP CLO XI Ltd ‘Series 2018-11A C’ ‘144A’ FRN 20/10/2031 2,746,341 0.04
USD 650,000 TICP CLO XI Ltd ‘Series 2018-11A D’ ‘144A’ FRN 20/10/2031 621,461 0.01
USD 5,465,000 TICP CLO XII Ltd ‘Series 2018-12A A’ ‘144A’ FRN 15/1/2031 5,449,557 0.07
USD 800,000 Time Warner Cable LLC 4.125% 15/2/2021 816,319 0.01
USD 3,384,000 Titan Acquisition Ltd / Titan Co-Borrower LLC ‘144A’ 7.75% 15/4/2026 3,070,980 0.04
USD 1,617,000 T-Mobile USA Inc 4.5% 1/2/2026 1,681,680 0.02 USD 3,493,000 T-Mobile USA Inc 4.75% 1/2/2028 3,678,618 0.05 USD 200,000 T-Mobile USA Inc 5.375% 15/4/2027 216,500 0.00 USD 200,000 T-Mobile USA Inc 6% 1/3/2023 203,875 0.00 USD 1,000,000 T-Mobile USA Inc 6% 15/4/2024 1,045,700 0.01 USD 600,000 T-Mobile USA Inc 6.375% 1/3/2025 623,520 0.01 USD 1,803,000 T-Mobile USA Inc 6.5% 15/1/2026 1,938,225 0.03 USD 75,000 Total System Services Inc 3.75%
1/6/2023 78,412 0.00 USD 135,000 Total System Services Inc 3.8%
1/4/2021 137,819 0.00 USD 250,346 Towd Point Mortgage Trust 2016-3
‘Series 2016-3 A1’ ‘144A’ FRN 25/4/2056 249,789 0.00
USD 687,246 Towd Point Mortgage Trust 2016-4 ‘Series 2016-4 A1’ ‘144A’ FRN 25/7/2056 685,443 0.01
USD 1,000,000 Toyota Auto Receivables 2017-C Owner Trust ‘Series 2017-C A4’ 1.98% 15/12/2022 1,001,556 0.01
USD 670,000 Toyota Auto Receivables 2017-D Owner Trust ‘Series 2017-D A4’ 2.12% 15/2/2023 673,426 0.01
USD 1,000,000 Toyota Auto Receivables 2018-B Owner Trust ‘Series 2018-B A3’ 2.96% 15/9/2022 1,014,658 0.01
USD 1,000,000 Toyota Auto Receivables 2018-C Owner Trust ‘Series 2018-C A3’ 3.02% 15/12/2022 1,018,668 0.01
USD 1,258,000 TPC Group Inc ‘144A’ 10.5% 1/8/2024 1,327,190 0.02
USD 300,000 TreeHouse Foods Inc ‘144A’ 6% 15/2/2024 312,375 0.00
Global Multi-Asset Income Fund continued
Portfolio of Investments 31 August 2019
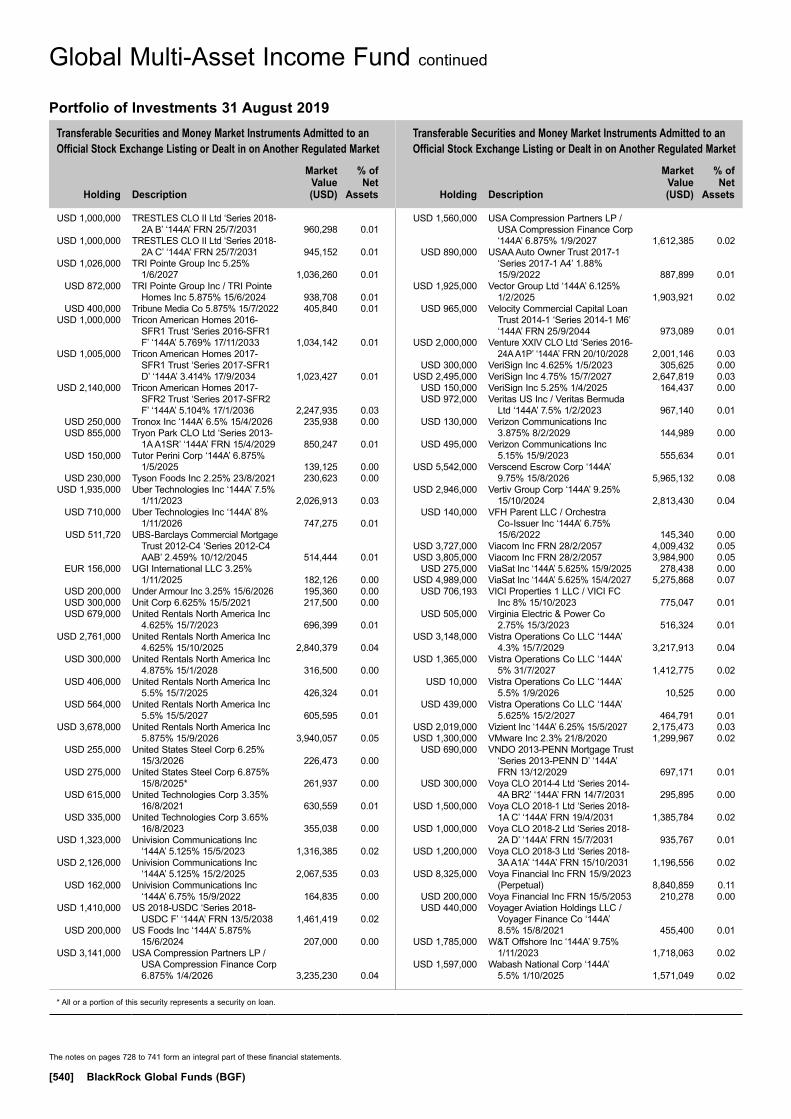
Transferable Securities and Money Market Instruments Admitted to an Official Stock Exchange Listing or Dealt in on Another Regulated Market
Transferable Securities and Money Market Instruments Admitted to an Official Stock Exchange Listing or Dealt in on Another Regulated Market
Holding
Description
Market Value (USD)
% of Net
Assets
Holding
Description
Market Value (USD)
% of Net
Assets
* All or a portion of this security represents a security on loan.
The notes on pages 728 to 741 form an integral part of these financial statements.
[540] BlackRock Global Funds (BGF)
USD 1,000,000 TRESTLES CLO II Ltd ‘Series 2018-2A B’ ‘144A’ FRN 25/7/2031 960,298 0.01
USD 1,000,000 TRESTLES CLO II Ltd ‘Series 2018-2A C’ ‘144A’ FRN 25/7/2031 945,152 0.01
USD 1,026,000 TRI Pointe Group Inc 5.25% 1/6/2027 1,036,260 0.01
USD 872,000 TRI Pointe Group Inc / TRI Pointe Homes Inc 5.875% 15/6/2024 938,708 0.01
USD 400,000 Tribune Media Co 5.875% 15/7/2022 405,840 0.01 USD 1,000,000 Tricon American Homes 2016-
SFR1 Trust ‘Series 2016-SFR1 F’ ‘144A’ 5.769% 17/11/2033 1,034,142 0.01
USD 1,005,000 Tricon American Homes 2017-SFR1 Trust ‘Series 2017-SFR1 D’ ‘144A’ 3.414% 17/9/2034 1,023,427 0.01
USD 2,140,000 Tricon American Homes 2017-SFR2 Trust ‘Series 2017-SFR2 F’ ‘144A’ 5.104% 17/1/2036 2,247,935 0.03
USD 250,000 Tronox Inc ‘144A’ 6.5% 15/4/2026 235,938 0.00 USD 855,000 Tryon Park CLO Ltd ‘Series 2013-
1A A1SR’ ‘144A’ FRN 15/4/2029 850,247 0.01 USD 150,000 Tutor Perini Corp ‘144A’ 6.875%
1/5/2025 139,125 0.00 USD 230,000 Tyson Foods Inc 2.25% 23/8/2021 230,623 0.00 USD 1,935,000 Uber Technologies Inc ‘144A’ 7.5%
1/11/2023 2,026,913 0.03 USD 710,000 Uber Technologies Inc ‘144A’ 8%
1/11/2026 747,275 0.01 USD 511,720 UBS-Barclays Commercial Mortgage
Trust 2012-C4 ‘Series 2012-C4 AAB’ 2.459% 10/12/2045 514,444 0.01
EUR 156,000 UGI International LLC 3.25% 1/11/2025 182,126 0.00
USD 200,000 Under Armour Inc 3.25% 15/6/2026 195,360 0.00 USD 300,000 Unit Corp 6.625% 15/5/2021 217,500 0.00 USD 679,000 United Rentals North America Inc
4.625% 15/7/2023 696,399 0.01 USD 2,761,000 United Rentals North America Inc
4.625% 15/10/2025 2,840,379 0.04 USD 300,000 United Rentals North America Inc
4.875% 15/1/2028 316,500 0.00 USD 406,000 United Rentals North America Inc
5.5% 15/7/2025 426,324 0.01 USD 564,000 United Rentals North America Inc
5.5% 15/5/2027 605,595 0.01 USD 3,678,000 United Rentals North America Inc
5.875% 15/9/2026 3,940,057 0.05 USD 255,000 United States Steel Corp 6.25%
15/3/2026 226,473 0.00 USD 275,000 United States Steel Corp 6.875%
15/8/2025* 261,937 0.00 USD 615,000 United Technologies Corp 3.35%
16/8/2021 630,559 0.01 USD 335,000 United Technologies Corp 3.65%
16/8/2023 355,038 0.00 USD 1,323,000 Univision Communications Inc
‘144A’ 5.125% 15/5/2023 1,316,385 0.02 USD 2,126,000 Univision Communications Inc
‘144A’ 5.125% 15/2/2025 2,067,535 0.03 USD 162,000 Univision Communications Inc
‘144A’ 6.75% 15/9/2022 164,835 0.00 USD 1,410,000 US 2018-USDC ‘Series 2018-
USDC F’ ‘144A’ FRN 13/5/2038 1,461,419 0.02 USD 200,000 US Foods Inc ‘144A’ 5.875%
15/6/2024 207,000 0.00 USD 3,141,000 USA Compression Partners LP /
USA Compression Finance Corp 6.875% 1/4/2026 3,235,230 0.04
USD 1,560,000 USA Compression Partners LP / USA Compression Finance Corp ‘144A’ 6.875% 1/9/2027 1,612,385 0.02
USD 890,000 USAA Auto Owner Trust 2017-1 ‘Series 2017-1 A4’ 1.88% 15/9/2022 887,899 0.01
USD 1,925,000 Vector Group Ltd ‘144A’ 6.125% 1/2/2025 1,903,921 0.02
USD 965,000 Velocity Commercial Capital Loan Trust 2014-1 ‘Series 2014-1 M6’ ‘144A’ FRN 25/9/2044 973,089 0.01
USD 2,000,000 Venture XXIV CLO Ltd ‘Series 2016-24A A1P’ ‘144A’ FRN 20/10/2028 2,001,146 0.03
USD 300,000 VeriSign Inc 4.625% 1/5/2023 305,625 0.00 USD 2,495,000 VeriSign Inc 4.75% 15/7/2027 2,647,819 0.03 USD 150,000 VeriSign Inc 5.25% 1/4/2025 164,437 0.00 USD 972,000 Veritas US Inc / Veritas Bermuda
Ltd ‘144A’ 7.5% 1/2/2023 967,140 0.01 USD 130,000 Verizon Communications Inc
3.875% 8/2/2029 144,989 0.00 USD 495,000 Verizon Communications Inc
5.15% 15/9/2023 555,634 0.01 USD 5,542,000 Verscend Escrow Corp ‘144A’
9.75% 15/8/2026 5,965,132 0.08 USD 2,946,000 Vertiv Group Corp ‘144A’ 9.25%
15/10/2024 2,813,430 0.04 USD 140,000 VFH Parent LLC / Orchestra
Co-Issuer Inc ‘144A’ 6.75% 15/6/2022 145,340 0.00
USD 3,727,000 Viacom Inc FRN 28/2/2057 4,009,432 0.05 USD 3,805,000 Viacom Inc FRN 28/2/2057 3,984,900 0.05 USD 275,000 ViaSat Inc ‘144A’ 5.625% 15/9/2025 278,438 0.00 USD 4,989,000 ViaSat Inc ‘144A’ 5.625% 15/4/2027 5,275,868 0.07 USD 706,193 VICI Properties 1 LLC / VICI FC
Inc 8% 15/10/2023 775,047 0.01 USD 505,000 Virginia Electric & Power Co
2.75% 15/3/2023 516,324 0.01 USD 3,148,000 Vistra Operations Co LLC ‘144A’
4.3% 15/7/2029 3,217,913 0.04 USD 1,365,000 Vistra Operations Co LLC ‘144A’
5% 31/7/2027 1,412,775 0.02 USD 10,000 Vistra Operations Co LLC ‘144A’
5.5% 1/9/2026 10,525 0.00 USD 439,000 Vistra Operations Co LLC ‘144A’
5.625% 15/2/2027 464,791 0.01 USD 2,019,000 Vizient Inc ‘144A’ 6.25% 15/5/2027 2,175,473 0.03 USD 1,300,000 VMware Inc 2.3% 21/8/2020 1,299,967 0.02 USD 690,000 VNDO 2013-PENN Mortgage Trust
‘Series 2013-PENN D’ ‘144A’ FRN 13/12/2029 697,171 0.01
USD 300,000 Voya CLO 2014-4 Ltd ‘Series 2014-4A BR2’ ‘144A’ FRN 14/7/2031 295,895 0.00
USD 1,500,000 Voya CLO 2018-1 Ltd ‘Series 2018-1A C’ ‘144A’ FRN 19/4/2031 1,385,784 0.02
USD 1,000,000 Voya CLO 2018-2 Ltd ‘Series 2018-2A D’ ‘144A’ FRN 15/7/2031 935,767 0.01
USD 1,200,000 Voya CLO 2018-3 Ltd ‘Series 2018-3A A1A’ ‘144A’ FRN 15/10/2031 1,196,556 0.02
USD 8,325,000 Voya Financial Inc FRN 15/9/2023 (Perpetual) 8,840,859 0.11
USD 200,000 Voya Financial Inc FRN 15/5/2053 210,278 0.00 USD 440,000 Voyager Aviation Holdings LLC /
Voyager Finance Co ‘144A’ 8.5% 15/8/2021 455,400 0.01
USD 1,785,000 W&T Offshore Inc ‘144A’ 9.75% 1/11/2023 1,718,063 0.02
USD 1,597,000 Wabash National Corp ‘144A’ 5.5% 1/10/2025 1,571,049 0.02
Global Multi-Asset Income Fund continued
Portfolio of Investments 31 August 2019
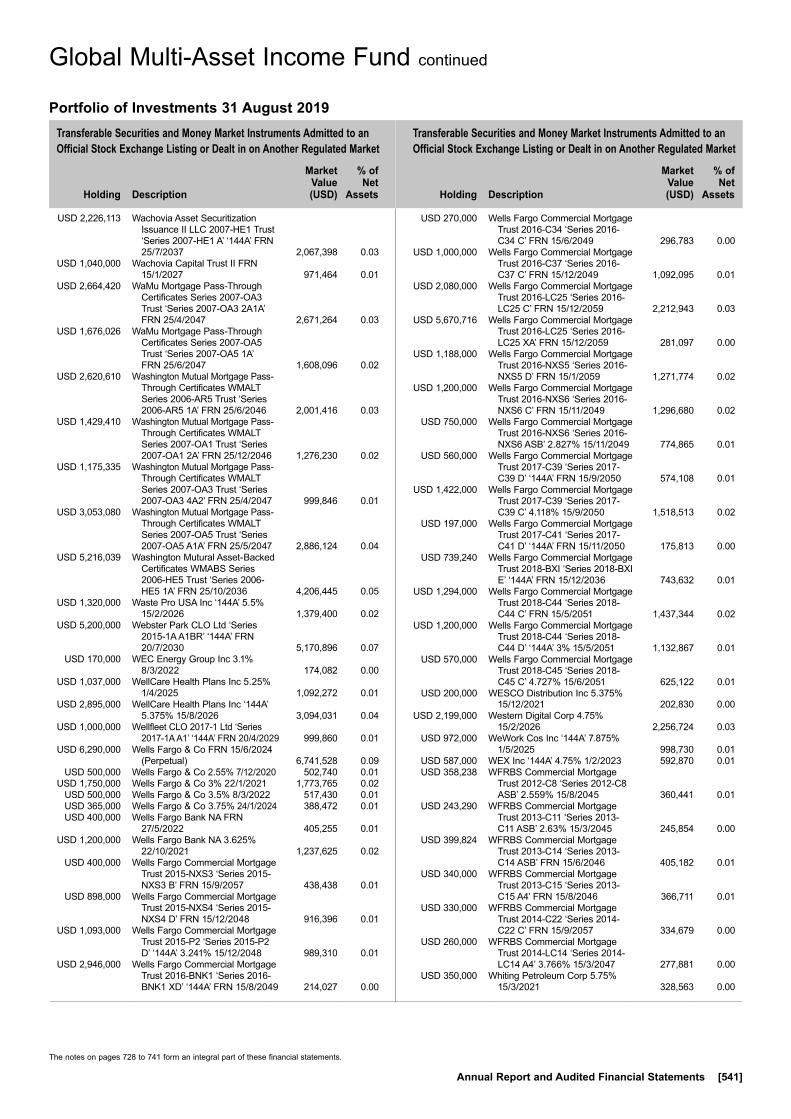
Transferable Securities and Money Market Instruments Admitted to an Official Stock Exchange Listing or Dealt in on Another Regulated Market
Transferable Securities and Money Market Instruments Admitted to an Official Stock Exchange Listing or Dealt in on Another Regulated Market
Holding
Description
Market Value (USD)
% of Net
Assets
Holding
Description
Market Value (USD)
% of Net
Assets
The notes on pages 728 to 741 form an integral part of these financial statements.
Annual Report and Audited Financial Statements [541]
USD 2,226,113 Wachovia Asset Securitization Issuance II LLC 2007-HE1 Trust ‘Series 2007-HE1 A’ ‘144A’ FRN 25/7/2037 2,067,398 0.03
USD 1,040,000 Wachovia Capital Trust II FRN 15/1/2027 971,464 0.01
USD 2,664,420 WaMu Mortgage Pass-Through Certificates Series 2007-OA3 Trust ‘Series 2007-OA3 2A1A’ FRN 25/4/2047 2,671,264 0.03
USD 1,676,026 WaMu Mortgage Pass-Through Certificates Series 2007-OA5 Trust ‘Series 2007-OA5 1A’ FRN 25/6/2047 1,608,096 0.02
USD 2,620,610 Washington Mutual Mortgage Pass-Through Certificates WMALT Series 2006-AR5 Trust ‘Series 2006-AR5 1A’ FRN 25/6/2046 2,001,416 0.03
USD 1,429,410 Washington Mutual Mortgage Pass-Through Certificates WMALT Series 2007-OA1 Trust ‘Series 2007-OA1 2A’ FRN 25/12/2046 1,276,230 0.02
USD 1,175,335 Washington Mutual Mortgage Pass-Through Certificates WMALT Series 2007-OA3 Trust ‘Series 2007-OA3 4A2’ FRN 25/4/2047 999,846 0.01
USD 3,053,080 Washington Mutual Mortgage Pass-Through Certificates WMALT Series 2007-OA5 Trust ‘Series 2007-OA5 A1A’ FRN 25/5/2047 2,886,124 0.04
USD 5,216,039 Washington Mutural Asset-Backed Certificates WMABS Series 2006-HE5 Trust ‘Series 2006-HE5 1A’ FRN 25/10/2036 4,206,445 0.05
USD 1,320,000 Waste Pro USA Inc ‘144A’ 5.5% 15/2/2026 1,379,400 0.02
USD 5,200,000 Webster Park CLO Ltd ‘Series 2015-1A A1BR’ ‘144A’ FRN 20/7/2030 5,170,896 0.07
USD 170,000 WEC Energy Group Inc 3.1% 8/3/2022 174,082 0.00
USD 1,037,000 WellCare Health Plans Inc 5.25% 1/4/2025 1,092,272 0.01
USD 2,895,000 WellCare Health Plans Inc ‘144A’ 5.375% 15/8/2026 3,094,031 0.04
USD 1,000,000 Wellfleet CLO 2017-1 Ltd ‘Series 2017-1A A1’ ‘144A’ FRN 20/4/2029 999,860 0.01
USD 6,290,000 Wells Fargo & Co FRN 15/6/2024 (Perpetual) 6,741,528 0.09
USD 500,000 Wells Fargo & Co 2.55% 7/12/2020 502,740 0.01 USD 1,750,000 Wells Fargo & Co 3% 22/1/2021 1,773,765 0.02 USD 500,000 Wells Fargo & Co 3.5% 8/3/2022 517,430 0.01 USD 365,000 Wells Fargo & Co 3.75% 24/1/2024 388,472 0.01 USD 400,000 Wells Fargo Bank NA FRN
27/5/2022 405,255 0.01 USD 1,200,000 Wells Fargo Bank NA 3.625%
22/10/2021 1,237,625 0.02 USD 400,000 Wells Fargo Commercial Mortgage
Trust 2015-NXS3 ‘Series 2015-NXS3 B’ FRN 15/9/2057 438,438 0.01
USD 898,000 Wells Fargo Commercial Mortgage Trust 2015-NXS4 ‘Series 2015-NXS4 D’ FRN 15/12/2048 916,396 0.01
USD 1,093,000 Wells Fargo Commercial Mortgage Trust 2015-P2 ‘Series 2015-P2 D’ ‘144A’ 3.241% 15/12/2048 989,310 0.01
USD 2,946,000 Wells Fargo Commercial Mortgage Trust 2016-BNK1 ‘Series 2016-BNK1 XD’ ‘144A’ FRN 15/8/2049 214,027 0.00
USD 270,000 Wells Fargo Commercial Mortgage Trust 2016-C34 ‘Series 2016-C34 C’ FRN 15/6/2049 296,783 0.00
USD 1,000,000 Wells Fargo Commercial Mortgage Trust 2016-C37 ‘Series 2016-C37 C’ FRN 15/12/2049 1,092,095 0.01
USD 2,080,000 Wells Fargo Commercial Mortgage Trust 2016-LC25 ‘Series 2016-LC25 C’ FRN 15/12/2059 2,212,943 0.03
USD 5,670,716 Wells Fargo Commercial Mortgage Trust 2016-LC25 ‘Series 2016-LC25 XA’ FRN 15/12/2059 281,097 0.00
USD 1,188,000 Wells Fargo Commercial Mortgage Trust 2016-NXS5 ‘Series 2016-NXS5 D’ FRN 15/1/2059 1,271,774 0.02
USD 1,200,000 Wells Fargo Commercial Mortgage Trust 2016-NXS6 ‘Series 2016-NXS6 C’ FRN 15/11/2049 1,296,680 0.02
USD 750,000 Wells Fargo Commercial Mortgage Trust 2016-NXS6 ‘Series 2016-NXS6 ASB’ 2.827% 15/11/2049 774,865 0.01
USD 560,000 Wells Fargo Commercial Mortgage Trust 2017-C39 ‘Series 2017-C39 D’ ‘144A’ FRN 15/9/2050 574,108 0.01
USD 1,422,000 Wells Fargo Commercial Mortgage Trust 2017-C39 ‘Series 2017-C39 C’ 4.118% 15/9/2050 1,518,513 0.02
USD 197,000 Wells Fargo Commercial Mortgage Trust 2017-C41 ‘Series 2017-C41 D’ ‘144A’ FRN 15/11/2050 175,813 0.00
USD 739,240 Wells Fargo Commercial Mortgage Trust 2018-BXI ‘Series 2018-BXI E’ ‘144A’ FRN 15/12/2036 743,632 0.01
USD 1,294,000 Wells Fargo Commercial Mortgage Trust 2018-C44 ‘Series 2018-C44 C’ FRN 15/5/2051 1,437,344 0.02
USD 1,200,000 Wells Fargo Commercial Mortgage Trust 2018-C44 ‘Series 2018-C44 D’ ‘144A’ 3% 15/5/2051 1,132,867 0.01
USD 570,000 Wells Fargo Commercial Mortgage Trust 2018-C45 ‘Series 2018-C45 C’ 4.727% 15/6/2051 625,122 0.01
USD 200,000 WESCO Distribution Inc 5.375% 15/12/2021 202,830 0.00
USD 2,199,000 Western Digital Corp 4.75% 15/2/2026 2,256,724 0.03
USD 972,000 WeWork Cos Inc ‘144A’ 7.875% 1/5/2025 998,730 0.01
USD 587,000 WEX Inc ‘144A’ 4.75% 1/2/2023 592,870 0.01 USD 358,238 WFRBS Commercial Mortgage
Trust 2012-C8 ‘Series 2012-C8 ASB’ 2.559% 15/8/2045 360,441 0.01
USD 243,290 WFRBS Commercial Mortgage Trust 2013-C11 ‘Series 2013-C11 ASB’ 2.63% 15/3/2045 245,854 0.00
USD 399,824 WFRBS Commercial Mortgage Trust 2013-C14 ‘Series 2013-C14 ASB’ FRN 15/6/2046 405,182 0.01
USD 340,000 WFRBS Commercial Mortgage Trust 2013-C15 ‘Series 2013-C15 A4’ FRN 15/8/2046 366,711 0.01
USD 330,000 WFRBS Commercial Mortgage Trust 2014-C22 ‘Series 2014-C22 C’ FRN 15/9/2057 334,679 0.00
USD 260,000 WFRBS Commercial Mortgage Trust 2014-LC14 ‘Series 2014-LC14 A4’ 3.766% 15/3/2047 277,881 0.00
USD 350,000 Whiting Petroleum Corp 5.75% 15/3/2021 328,563 0.00
Global Multi-Asset Income Fund continued
Portfolio of Investments 31 August 2019

Transferable Securities and Money Market Instruments Admitted to an Official Stock Exchange Listing or Dealt in on Another Regulated Market
Transferable Securities and Money Market Instruments Admitted to an Official Stock Exchange Listing or Dealt in on Another Regulated Market
Holding
Description
Market Value (USD)
% of Net
Assets
Holding
Description
Market Value (USD)
% of Net
Assets
The notes on pages 728 to 741 form an integral part of these financial statements.
[542] BlackRock Global Funds (BGF)
USD 430,000 Whiting Petroleum Corp 6.625% 15/1/2026 318,738 0.00
USD 1,384,000 William Carter Co/The ‘144A’ 5.625% 15/3/2027 1,470,500 0.02
USD 365,000 Williams Cos Inc/The 3.6% 15/3/2022 375,668 0.01
USD 500,000 Williams Cos Inc/The 3.7% 15/1/2023 518,732 0.01
USD 5,000 Williams Cos Inc/The 7.875% 1/9/2021 5,521 0.00
USD 2,748,000 Williams Scotsman International Inc ‘144A’ 6.875% 15/8/2023 2,885,400 0.04
USD 323,000 Williams Scotsman International Inc ‘144A’ 7.875% 15/12/2022 340,264 0.00
USD 100,000 Wisconsin Electric Power Co 2.95% 15/9/2021 101,476 0.00
EUR 183,000 WMG Acquisition Corp 3.625% 15/10/2026 216,685 0.00
EUR 504,000 WMG Acquisition Corp 4.125% 1/11/2024 579,999 0.01
USD 348,000 WMG Acquisition Corp ‘144A’ 5.5% 15/4/2026 365,400 0.01
USD 250,000 WPX Energy Inc 5.25% 15/9/2024 255,265 0.00 USD 541,000 WPX Energy Inc 5.75% 1/6/2026 562,629 0.01 USD 187,000 WPX Energy Inc 6% 15/1/2022 194,012 0.00 USD 2,220,000 WPX Energy Inc 8.25% 1/8/2023 2,480,850 0.03 USD 1,652,000 WR Grace & Co-Conn ‘144A’
5.625% 1/10/2024 1,792,420 0.02 USD 165,000 WRKCo Inc 3.75% 15/3/2025 174,193 0.00 USD 40,000 Wyndham Destinations Inc 5.4%
1/4/2024 42,150 0.00 USD 1,529,000 Wyndham Destinations Inc 5.75%
1/4/2027 1,634,119 0.02 USD 505,000 Wyndham Hotels & Resorts Inc
‘144A’ 5.375% 15/4/2026 532,775 0.01 USD 200,000 Wynn Las Vegas LLC / Wynn Las
Vegas Capital Corp ‘144A’ 4.25% 30/5/2023 204,750 0.00
USD 800,000 Wynn Las Vegas LLC / Wynn Las Vegas Capital Corp ‘144A’ 5.5% 1/3/2025 845,000 0.01
USD 650,000 Xcel Energy Inc 2.4% 15/3/2021 653,041 0.01 USD 775,000 Xerox Corp 3.5% 20/8/2020 779,844 0.01 USD 1,393,000 Xerox Corp 4.8% 1/3/2035 1,215,392 0.02 USD 15,000 Xerox Corp 6.75% 15/12/2039 15,075 0.00 USD 500,000 Xilinx Inc 3% 15/3/2021 505,461 0.01 USD 558,000 XPO Logistics Inc ‘144A’ 6.5%
15/6/2022 571,632 0.01 USD 725,000 XPO Logistics Inc ‘144A’ 6.75%
15/8/2024 784,812 0.01 USD 4,300,000 York CLO 1 Ltd ‘Series 2014-1A
ARR’ ‘144A’ FRN 22/10/2029 4,274,583 0.06 USD 1,900,000 York CLO 1 Ltd ‘Series 2014-1A
BRR’ ‘144A’ FRN 22/10/2029 1,885,934 0.02 USD 1,850,000 York CLO 1 Ltd ‘Series 2014-1A
CRR’ ‘144A’ FRN 22/10/2029 1,816,325 0.02 USD 1,000,000 York CLO 1 Ltd ‘Series 2014-1A
DRR’ ‘144A’ FRN 22/10/2029 994,270 0.01 USD 9,500,000 York CLO-2 Ltd ‘Series 2015-1A
AR’ ‘144A’ FRN 22/1/2031 9,440,863 0.12 USD 2,500,000 York CLO-2 Ltd ‘Series 2015-1A
BR’ ‘144A’ FRN 22/1/2031 2,465,978 0.03 USD 1,750,000 York Clo-3 Ltd ‘Series 2016-1A DR’
‘144A’ FRN 20/10/2029 1,749,647 0.02 USD 500,000 York Clo-4 Ltd ‘Series 2016-2A D’
‘144A’ FRN 20/1/2030 504,043 0.01 USD 722,000 Yum! Brands Inc 5.35% 1/11/2043 689,510 0.01
USD 9,456,000 Zayo Group LLC / Zayo Capital Inc ‘144A’ 5.75% 15/1/2027 9,729,278 0.13
USD 3,574,000 Zayo Group LLC / Zayo Capital Inc 6% 1/4/2023 3,693,300 0.05
USD 882,000 Zayo Group LLC / Zayo Capital Inc 6.375% 15/5/2025 909,562 0.01
USD 1,000,000 Zimmer Biomet Holdings Inc 2.7% 1/4/2020 1,002,014 0.01
USD 455,000 Zions Bancorp NA 3.5% 27/8/2021 465,462 0.01 USD 955,000 Zoetis Inc 3.25% 20/8/2021 973,479 0.01 3,213,253,534 41.34Total Bonds 4,834,949,290 62.20
EQUITY LINKED NOTES
USD 371,482 BNP Paribas (Fund receives 10.26% Fixed; and receives/pays return on Oracle Corp) (10/9/2019) 19,381,792 0.25
USD 28,236 BNP Paribas (Fund receives 10.32% Fixed; and receives/pays return on Darden Restaurants Inc) (10/9/2019) 3,460,339 0.04
USD 142,627 BNP Paribas (Fund receives 10.95% Fixed; and receives/pays return on Walmart Inc) (4/10/2019) 16,304,376 0.21
USD 28,327 BNP Paribas (Fund receives 11.02% Fixed; and receives/pays return on Zoetis Inc) (28/10/2019) 3,544,119 0.05
USD 155,466 BNP Paribas (Fund receives 11.7% Fixed; and receives/pays return on Fifth Third Bancorp) (22/10/2019) 4,172,661 0.05
USD 155,466 BNP Paribas (Fund receives 11.75% Fixed; and receives/pays return on Fifth Third Bancorp) (21/10/2019) 4,174,025 0.05
USD 182,383 BNP Paribas (Fund receives 12.09% Fixed; and receives/pays return on Nike Inc) (17/9/2019) 15,663,714 0.20
USD 101,025 BNP Paribas (Fund receives 12.58% Fixed; and receives/pays return on McDonald’s Corp) (21/10/2019) 22,204,440 0.29
USD 164,591 BNP Paribas (Fund receives 13.48% Fixed; and receives/pays return on United Technologies Corp) (3/9/2019) 21,336,061 0.27
USD 12,381 BNP Paribas (Fund receives 13.95% Fixed; and receives/pays return on Amazon.com Inc) (21/10/2019) 22,218,629 0.29
USD 937,566 BNP Paribas (Fund receives 15.69% Fixed; and receives/pays return on Halliburton Co) (22/10/2019) 17,928,449 0.23
USD 168,889 BNP Paribas (Fund receives 16.94% Fixed; and receives/pays return on Johnson & Johnson) (10/10/2019) 21,851,591 0.28
USD 169,966 BNP Paribas (Fund receives 20.79% Fixed; and receives/pays return on Occidental Petroleum Corp) (19/9/2019) 7,390,733 0.10
USD 127,950 BNP Paribas (Fund receives 8.17% Fixed; and receives/pays return on Ingersoll-Rand Plc) (23/10/2019) 15,520,260 0.20
USD 91,002 BNP Paribas (Fund receives 8.6% Fixed; and receives/pays return on Biogen Inc) (22/10/2019) 20,100,105 0.26
Global Multi-Asset Income Fund continued
Portfolio of Investments 31 August 2019

Transferable Securities and Money Market Instruments Admitted to an Official Stock Exchange Listing or Dealt in on Another Regulated Market
Transferable Securities and Money Market Instruments Admitted to an Official Stock Exchange Listing or Dealt in on Another Regulated Market
Holding
Description
Market Value (USD)
% of Net
Assets
Holding
Description
Market Value (USD)
% of Net
Assets
The notes on pages 728 to 741 form an integral part of these financial statements.
Annual Report and Audited Financial Statements [543]
USD 51,293 Citigroup (Fund receives 10.28% Fixed; and receives/pays return on Waste Management Inc) (12/9/2019) 6,094,455 0.08
USD 328,365 Citigroup (Fund receives 11.09% Fixed; and receives/pays return on eBay Inc) (6/9/2019) 13,303,297 0.17
USD 51,772 Citigroup (Fund receives 11.46% Fixed; and receives/pays return on Thermo Fisher Scientific Inc) (12/9/2019) 14,957,916 0.19
USD 48,913 Citigroup (Fund receives 11.97% Fixed; and receives/pays return on DuPont de Nemours Inc) (19/9/2019) 3,375,163 0.04
USD 53,264 Citigroup (Fund receives 14.89% Fixed; and receives/pays return on SunTrust Banks Inc ) (6/9/2019) 3,304,109 0.04
USD 90,965 Citigroup (Fund receives 8.64% Fixed; and receives/pays return on Danaher Corp) (3/9/2019) 12,894,231 0.17
USD 883,435 Citigroup (Fund receives 9.44% Fixed; and receives/pays return on Bank of America Corp) (3/9/2019) 24,159,035 0.31
USD 115,696 Citigroup (Fund receives 9.75% Fixed; and receives/pays return on Union Pacific Corp) (6/9/2019) 18,921,341 0.24
USD 36,892 Citigroup (Fund receives 9.96% Fixed; and receives/pays return on Starbucks Corp) (30/10/2019) 3,538,023 0.05
USD 164,026 Credit Suisse (Fund receives 12.6% Fixed; and receives/pays return on Microsoft Corp) (17/10/2019) 22,404,335 0.29
USD 293,576 Credit Suisse (Fund receives 13.8% Fixed; and receives/pays return on Morgan Stanley) (3/9/2019) 12,118,899 0.15
USD 78,582 Goldman Sachs (Fund receives 12.61% Fixed; and receives/pays return on Raytheon Co) (12/9/2019) 14,533,224 0.19
USD 118,041 Goldman Sachs (Fund receives 13.38% Fixed; and receives/pays return on Texas Instruments Inc) (12/9/2019) 14,772,773 0.19
USD 65,634 Goldman Sachs (Fund receives 14.11% Fixed; and receives/pays return on Discover Financial Services) (12/9/2019) 5,304,725 0.07
USD 606,838 Goldman Sachs (Fund receives 9.38% Fixed; and receives/pays return on Comcast Corp) (12/9/2019) 26,971,488 0.35
USD 286,868 Merrill Lynch (Fund receives 10.63% Fixed; and receives/pays return on Delta Air Lines Inc) (10/10/2019) 16,518,537 0.21
USD 35,303 Merrill Lynch (Fund receives 12.57% Fixed; and receives/pays return on Toll Brothers Inc) (2/12/2019) 1,267,155 0.01
USD 35,303 Merrill Lynch (Fund receives 12.79% Fixed; and receives/pays return on Toll Brothers Inc) (29/11/2019) 1,268,591 0.02
USD 357,486 Merrill Lynch (Fund receives 18.1% Fixed; and receives/pays return on Citigroup Inc) (15/10/2019) 22,387,812 0.29
USD 208,891 Merrill Lynch (Fund receives 20.77% Fixed; and receives/pays return on JP Morgan Chase & Co) (15/10/2019) 22,353,954 0.29
USD 82,203 Nomura (Fund receives 12.1454% Fixed; and receives/pays return on Mastercard Inc) (17/10/2019) 22,788,253 0.29
USD 76,727 Nomura (Fund receives 13.2284% Fixed; and receives/pays return on Costco Wholesale Corp) (3/10/2019) 22,341,038 0.29
USD 135,195 Nomura (Fund receives 13.2353% Fixed; and receives/pays return on AbbVie Inc) (23/10/2019) 8,881,717 0.11
USD 96,844 Nomura (Fund receives 13.2629% Fixed; and receives/pays return on UnitedHealth Group) (16/10/2019) 22,030,218 0.28
USD 39,830 Nomura (Fund receives 13.3547% Fixed; and receives/pays return on Electronic Arts Inc) (28/10/2019) 3,662,192 0.05
USD 77,344 Nomura (Fund receives 13.7331% Fixed; and receives/pays return on Royal Caribbean Cruises Ltd) (23/10/2019) 8,198,444 0.11
USD 10,508 Nomura (Fund receives 15.974% Fixed; and receives/pays return on IAC/InterActiveCorp) (3/10/2019) 2,622,024 0.03
USD 32,055 Nomura (Fund receives 8.7905% Fixed; and receives/pays return on Celanese Corp) (22/10/2019) 3,573,871 0.05
USD 16,293 Royal Bank of Canada (Fund receives 10% Fixed; and receives/pays return on Roper Technologies, Inc) (12/9/2019) 5,999,749 0.08
USD 111,404 Royal Bank of Canada (Fund receives 10.24% Fixed; and receives/pays return on Berkshire Hathaway Inc) (4/10/2019) 23,125,007 0.30
USD 13,823 Royal Bank of Canada (Fund receives 10.72% Fixed; and receives/pays return on ManpowerGroup Inc) (17/10/2019) 1,157,051 0.01
USD 118,953 Royal Bank of Canada (Fund receives 11.43% Fixed; and receives/pays return on Amgen Inc) (22/10/2019) 23,260,982 0.30
USD 51,101 Royal Bank of Canada (Fund receives 13.53% Fixed; and receives/pays return on Anthem Inc) (12/9/2019) 13,444,172 0.17
USD 104,486 Royal Bank of Canada (Fund receives 8.22% Fixed; and receives/pays return on American Tower Corp) (24/10/2019) 22,806,920 0.29
USD 212,322 Royal Bank of Canada (Fund receives 9.4% Fixed; and receives/pays return on Johnson Controls International Plc) (23/10/2019) 9,026,379 0.12
USD 72,087 Royal Bank of Canada (Fund receives 10.4% Fixed; and receives/pays return on Texas Instruments Inc) (18/10/2019) 9,012,230 0.12
Global Multi-Asset Income Fund continued
Portfolio of Investments 31 August 2019
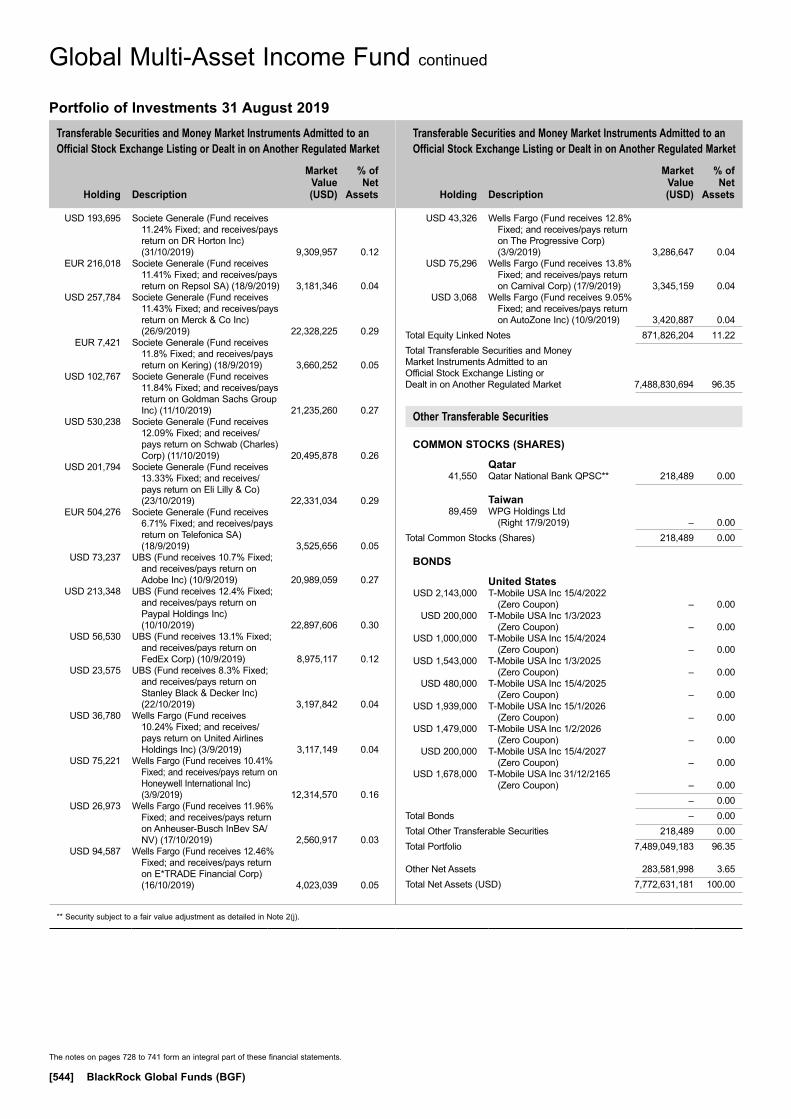
Transferable Securities and Money Market Instruments Admitted to an Official Stock Exchange Listing or Dealt in on Another Regulated Market
Transferable Securities and Money Market Instruments Admitted to an Official Stock Exchange Listing or Dealt in on Another Regulated Market
Holding
Description
Market Value (USD)
% of Net
Assets
Holding
Description
Market Value (USD)
% of Net
Assets
** Security subject to a fair value adjustment as detailed in Note 2(j).
The notes on pages 728 to 741 form an integral part of these financial statements.
[544] BlackRock Global Funds (BGF)
USD 193,695 Societe Generale (Fund receives 11.24% Fixed; and receives/pays return on DR Horton Inc) (31/10/2019) 9,309,957 0.12
EUR 216,018 Societe Generale (Fund receives 11.41% Fixed; and receives/pays return on Repsol SA) (18/9/2019) 3,181,346 0.04
USD 257,784 Societe Generale (Fund receives 11.43% Fixed; and receives/pays return on Merck & Co Inc) (26/9/2019) 22,328,225 0.29
EUR 7,421 Societe Generale (Fund receives 11.8% Fixed; and receives/pays return on Kering) (18/9/2019) 3,660,252 0.05
USD 102,767 Societe Generale (Fund receives 11.84% Fixed; and receives/pays return on Goldman Sachs Group Inc) (11/10/2019) 21,235,260 0.27
USD 530,238 Societe Generale (Fund receives 12.09% Fixed; and receives/pays return on Schwab (Charles) Corp) (11/10/2019) 20,495,878 0.26
USD 201,794 Societe Generale (Fund receives 13.33% Fixed; and receives/pays return on Eli Lilly & Co) (23/10/2019) 22,331,034 0.29
EUR 504,276 Societe Generale (Fund receives 6.71% Fixed; and receives/pays return on Telefonica SA) (18/9/2019) 3,525,656 0.05
USD 73,237 UBS (Fund receives 10.7% Fixed; and receives/pays return on Adobe Inc) (10/9/2019) 20,989,059 0.27
USD 213,348 UBS (Fund receives 12.4% Fixed; and receives/pays return on Paypal Holdings Inc) (10/10/2019) 22,897,606 0.30
USD 56,530 UBS (Fund receives 13.1% Fixed; and receives/pays return on FedEx Corp) (10/9/2019) 8,975,117 0.12
USD 23,575 UBS (Fund receives 8.3% Fixed; and receives/pays return on Stanley Black & Decker Inc) (22/10/2019) 3,197,842 0.04
USD 36,780 Wells Fargo (Fund receives 10.24% Fixed; and receives/pays return on United Airlines Holdings Inc) (3/9/2019) 3,117,149 0.04
USD 75,221 Wells Fargo (Fund receives 10.41% Fixed; and receives/pays return on Honeywell International Inc) (3/9/2019) 12,314,570 0.16
USD 26,973 Wells Fargo (Fund receives 11.96% Fixed; and receives/pays return on Anheuser-Busch InBev SA/NV) (17/10/2019) 2,560,917 0.03
USD 94,587 Wells Fargo (Fund receives 12.46% Fixed; and receives/pays return on E*TRADE Financial Corp) (16/10/2019) 4,023,039 0.05
USD 43,326 Wells Fargo (Fund receives 12.8% Fixed; and receives/pays return on The Progressive Corp) (3/9/2019) 3,286,647 0.04
USD 75,296 Wells Fargo (Fund receives 13.8% Fixed; and receives/pays return on Carnival Corp) (17/9/2019) 3,345,159 0.04
USD 3,068 Wells Fargo (Fund receives 9.05% Fixed; and receives/pays return on AutoZone Inc) (10/9/2019) 3,420,887 0.04
Total Equity Linked Notes 871,826,204 11.22Total Transferable Securities and Money Market Instruments Admitted to an Official Stock Exchange Listing or Dealt in on Another Regulated Market 7,488,830,694 96.35
Other Transferable Securities
COMMON STOCKS (SHARES)
Qatar 41,550 Qatar National Bank QPSC** 218,489 0.00
Taiwan 89,459 WPG Holdings Ltd
(Right 17/9/2019) – 0.00Total Common Stocks (Shares) 218,489 0.00
BONDS
United States USD 2,143,000 T-Mobile USA Inc 15/4/2022
(Zero Coupon) – 0.00 USD 200,000 T-Mobile USA Inc 1/3/2023
(Zero Coupon) – 0.00 USD 1,000,000 T-Mobile USA Inc 15/4/2024
(Zero Coupon) – 0.00 USD 1,543,000 T-Mobile USA Inc 1/3/2025
(Zero Coupon) – 0.00 USD 480,000 T-Mobile USA Inc 15/4/2025
(Zero Coupon) – 0.00 USD 1,939,000 T-Mobile USA Inc 15/1/2026
(Zero Coupon) – 0.00 USD 1,479,000 T-Mobile USA Inc 1/2/2026
(Zero Coupon) – 0.00 USD 200,000 T-Mobile USA Inc 15/4/2027
(Zero Coupon) – 0.00 USD 1,678,000 T-Mobile USA Inc 31/12/2165
(Zero Coupon) – 0.00 – 0.00Total Bonds – 0.00Total Other Transferable Securities 218,489 0.00Total Portfolio 7,489,049,183 96.35
Other Net Assets 283,581,998 3.65Total Net Assets (USD) 7,772,631,181 100.00
Global Multi-Asset Income Fund continued
Portfolio of Investments 31 August 2019
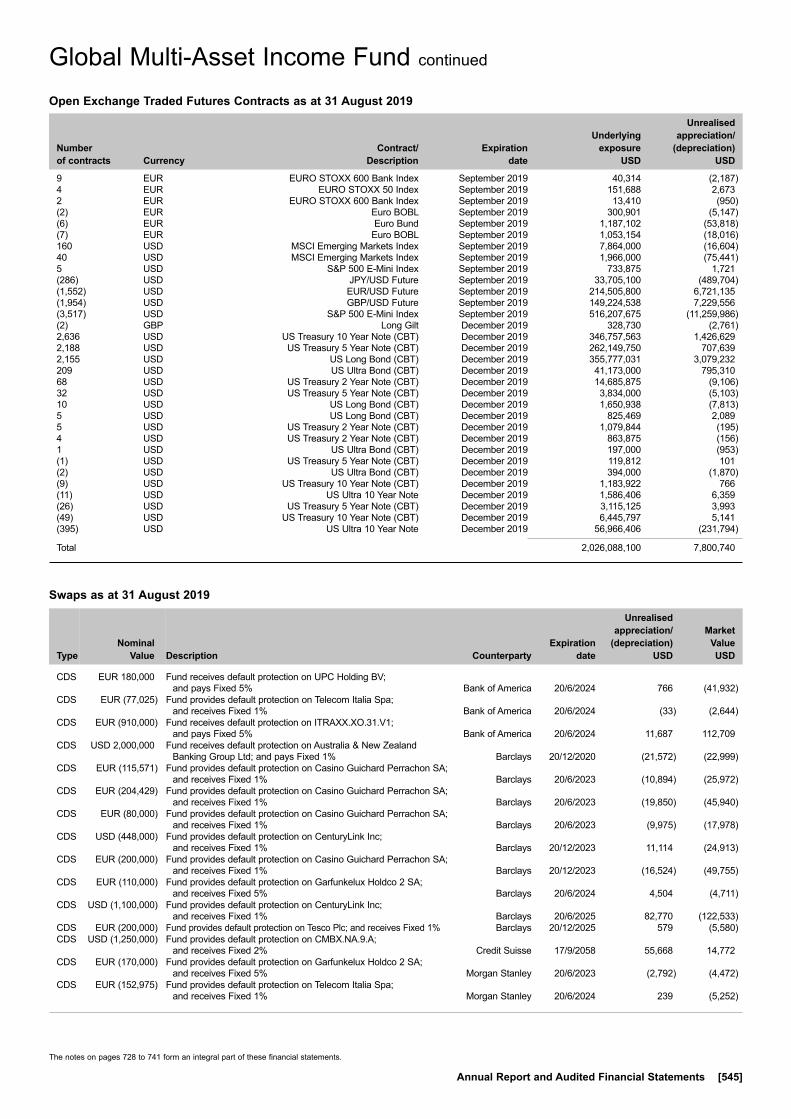
The notes on pages 728 to 741 form an integral part of these financial statements.
Annual Report and Audited Financial Statements [545]
Global Multi-Asset Income Fund continued
Open Exchange Traded Futures Contracts as at 31 August 2019
Number of contracts Currency
Contract/ Description
Expiration date
Underlying exposure
USD
Unrealised appreciation/
(depreciation) USD
9 EUR EURO STOXX 600 Bank Index September 2019 40,314 (2,187)4 EUR EURO STOXX 50 Index September 2019 151,688 2,6732 EUR EURO STOXX 600 Bank Index September 2019 13,410 (950)(2) EUR Euro BOBL September 2019 300,901 (5,147)(6) EUR Euro Bund September 2019 1,187,102 (53,818)(7) EUR Euro BOBL September 2019 1,053,154 (18,016)160 USD MSCI Emerging Markets Index September 2019 7,864,000 (16,604)40 USD MSCI Emerging Markets Index September 2019 1,966,000 (75,441)5 USD S&P 500 E-Mini Index September 2019 733,875 1,721(286) USD JPY/USD Future September 2019 33,705,100 (489,704)(1,552) USD EUR/USD Future September 2019 214,505,800 6,721,135(1,954) USD GBP/USD Future September 2019 149,224,538 7,229,556(3,517) USD S&P 500 E-Mini Index September 2019 516,207,675 (11,259,986)(2) GBP Long Gilt December 2019 328,730 (2,761)2,636 USD US Treasury 10 Year Note (CBT) December 2019 346,757,563 1,426,6292,188 USD US Treasury 5 Year Note (CBT) December 2019 262,149,750 707,6392,155 USD US Long Bond (CBT) December 2019 355,777,031 3,079,232209 USD US Ultra Bond (CBT) December 2019 41,173,000 795,31068 USD US Treasury 2 Year Note (CBT) December 2019 14,685,875 (9,106)32 USD US Treasury 5 Year Note (CBT) December 2019 3,834,000 (5,103)10 USD US Long Bond (CBT) December 2019 1,650,938 (7,813)5 USD US Long Bond (CBT) December 2019 825,469 2,0895 USD US Treasury 2 Year Note (CBT) December 2019 1,079,844 (195)4 USD US Treasury 2 Year Note (CBT) December 2019 863,875 (156)1 USD US Ultra Bond (CBT) December 2019 197,000 (953)(1) USD US Treasury 5 Year Note (CBT) December 2019 119,812 101(2) USD US Ultra Bond (CBT) December 2019 394,000 (1,870)(9) USD US Treasury 10 Year Note (CBT) December 2019 1,183,922 766(11) USD US Ultra 10 Year Note December 2019 1,586,406 6,359(26) USD US Treasury 5 Year Note (CBT) December 2019 3,115,125 3,993(49) USD US Treasury 10 Year Note (CBT) December 2019 6,445,797 5,141(395) USD US Ultra 10 Year Note December 2019 56,966,406 (231,794)
Total 2,026,088,100 7,800,740
Swaps as at 31 August 2019
TypeNominal
Value Description Counterparty
Expiration date
Unrealised appreciation/
(depreciation) USD
Market Value USD
CDS EUR 180,000 Fund receives default protection on UPC Holding BV; and pays Fixed 5% Bank of America 20/6/2024 766 (41,932)
CDS EUR (77,025) Fund provides default protection on Telecom Italia Spa; and receives Fixed 1% Bank of America 20/6/2024 (33) (2,644)
CDS EUR (910,000) Fund receives default protection on ITRAXX.XO.31.V1; and pays Fixed 5% Bank of America 20/6/2024 11,687 112,709
CDS USD 2,000,000 Fund receives default protection on Australia & New Zealand Banking Group Ltd; and pays Fixed 1% Barclays 20/12/2020 (21,572) (22,999)
CDS EUR (115,571) Fund provides default protection on Casino Guichard Perrachon SA; and receives Fixed 1% Barclays 20/6/2023 (10,894) (25,972)
CDS EUR (204,429) Fund provides default protection on Casino Guichard Perrachon SA; and receives Fixed 1% Barclays 20/6/2023 (19,850) (45,940)
CDS EUR (80,000) Fund provides default protection on Casino Guichard Perrachon SA; and receives Fixed 1% Barclays 20/6/2023 (9,975) (17,978)
CDS USD (448,000) Fund provides default protection on CenturyLink Inc; and receives Fixed 1% Barclays 20/12/2023 11,114 (24,913)
CDS EUR (200,000) Fund provides default protection on Casino Guichard Perrachon SA; and receives Fixed 1% Barclays 20/12/2023 (16,524) (49,755)
CDS EUR (110,000) Fund provides default protection on Garfunkelux Holdco 2 SA; and receives Fixed 5% Barclays 20/6/2024 4,504 (4,711)
CDS USD (1,100,000) Fund provides default protection on CenturyLink Inc; and receives Fixed 1% Barclays 20/6/2025 82,770 (122,533)
CDS EUR (200,000) Fund provides default protection on Tesco Plc; and receives Fixed 1% Barclays 20/12/2025 579 (5,580)CDS USD (1,250,000) Fund provides default protection on CMBX.NA.9.A;
and receives Fixed 2% Credit Suisse 17/9/2058 55,668 14,772CDS EUR (170,000) Fund provides default protection on Garfunkelux Holdco 2 SA;
and receives Fixed 5% Morgan Stanley 20/6/2023 (2,792) (4,472)CDS EUR (152,975) Fund provides default protection on Telecom Italia Spa;
and receives Fixed 1% Morgan Stanley 20/6/2024 239 (5,252)
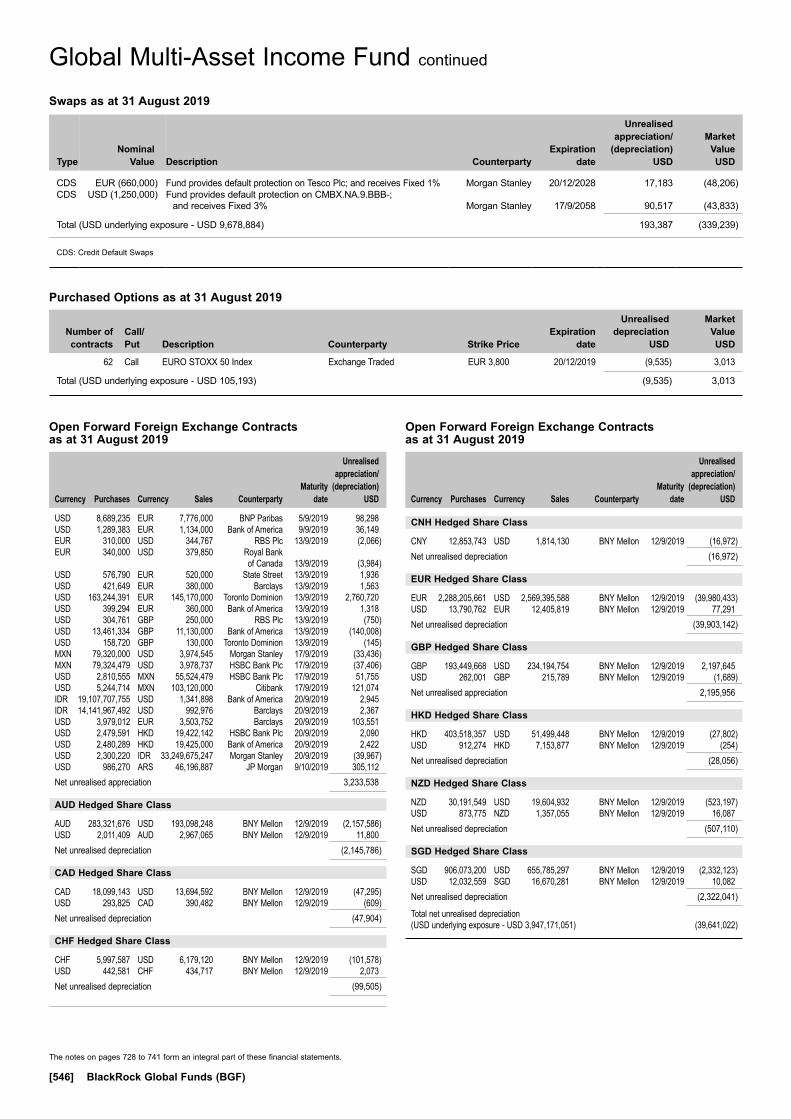
The notes on pages 728 to 741 form an integral part of these financial statements.
[546] BlackRock Global Funds (BGF)
Global Multi-Asset Income Fund continued
CNH Hedged Share Class
CNY 12,853,743 USD 1,814,130 BNY Mellon 12/9/2019 (16,972)Net unrealised depreciation (16,972)
EUR Hedged Share Class
EUR 2,288,205,661 USD 2,569,395,588 BNY Mellon 12/9/2019 (39,980,433)USD 13,790,762 EUR 12,405,819 BNY Mellon 12/9/2019 77,291Net unrealised depreciation (39,903,142)
GBP Hedged Share Class
GBP 193,449,668 USD 234,194,754 BNY Mellon 12/9/2019 2,197,645USD 262,001 GBP 215,789 BNY Mellon 12/9/2019 (1,689)Net unrealised appreciation 2,195,956
HKD Hedged Share Class
HKD 403,518,357 USD 51,499,448 BNY Mellon 12/9/2019 (27,802)USD 912,274 HKD 7,153,877 BNY Mellon 12/9/2019 (254)Net unrealised depreciation (28,056)
NZD Hedged Share Class
NZD 30,191,549 USD 19,604,932 BNY Mellon 12/9/2019 (523,197)USD 873,775 NZD 1,357,055 BNY Mellon 12/9/2019 16,087Net unrealised depreciation (507,110)
SGD Hedged Share Class
SGD 906,073,200 USD 655,785,297 BNY Mellon 12/9/2019 (2,332,123)USD 12,032,559 SGD 16,670,281 BNY Mellon 12/9/2019 10,082Net unrealised depreciation (2,322,041)
Total net unrealised depreciation (USD underlying exposure - USD 3,947,171,051) (39,641,022)
Open Forward Foreign Exchange Contracts as at 31 August 2019
Currency
Purchases Currency
Sales Counterparty
Maturity date
Unrealised appreciation/
(depreciation) USD
Open Forward Foreign Exchange Contracts as at 31 August 2019
Currency
Purchases Currency
Sales Counterparty
Maturity date
Unrealised appreciation/
(depreciation) USD
USD 8,689,235 EUR 7,776,000 BNP Paribas 5/9/2019 98,298USD 1,289,383 EUR 1,134,000 Bank of America 9/9/2019 36,149EUR 310,000 USD 344,767 RBS Plc 13/9/2019 (2,066)EUR 340,000 USD 379,850 Royal Bank of Canada 13/9/2019 (3,984)USD 576,790 EUR 520,000 State Street 13/9/2019 1,936USD 421,649 EUR 380,000 Barclays 13/9/2019 1,563USD 163,244,391 EUR 145,170,000 Toronto Dominion 13/9/2019 2,760,720USD 399,294 EUR 360,000 Bank of America 13/9/2019 1,318USD 304,761 GBP 250,000 RBS Plc 13/9/2019 (750)USD 13,461,334 GBP 11,130,000 Bank of America 13/9/2019 (140,008)USD 158,720 GBP 130,000 Toronto Dominion 13/9/2019 (145)MXN 79,320,000 USD 3,974,545 Morgan Stanley 17/9/2019 (33,436)MXN 79,324,479 USD 3,978,737 HSBC Bank Plc 17/9/2019 (37,406)USD 2,810,555 MXN 55,524,479 HSBC Bank Plc 17/9/2019 51,755USD 5,244,714 MXN 103,120,000 Citibank 17/9/2019 121,074IDR 19,107,707,755 USD 1,341,898 Bank of America 20/9/2019 2,945IDR 14,141,967,492 USD 992,976 Barclays 20/9/2019 2,367USD 3,979,012 EUR 3,503,752 Barclays 20/9/2019 103,551USD 2,479,591 HKD 19,422,142 HSBC Bank Plc 20/9/2019 2,090USD 2,480,289 HKD 19,425,000 Bank of America 20/9/2019 2,422USD 2,300,220 IDR 33,249,675,247 Morgan Stanley 20/9/2019 (39,967)USD 986,270 ARS 46,196,887 JP Morgan 9/10/2019 305,112Net unrealised appreciation 3,233,538
AUD Hedged Share Class
AUD 283,321,676 USD 193,098,248 BNY Mellon 12/9/2019 (2,157,586)USD 2,011,409 AUD 2,967,065 BNY Mellon 12/9/2019 11,800Net unrealised depreciation (2,145,786)
CAD Hedged Share Class
CAD 18,099,143 USD 13,694,592 BNY Mellon 12/9/2019 (47,295)USD 293,825 CAD 390,482 BNY Mellon 12/9/2019 (609)Net unrealised depreciation (47,904)
CHF Hedged Share Class
CHF 5,997,587 USD 6,179,120 BNY Mellon 12/9/2019 (101,578)USD 442,581 CHF 434,717 BNY Mellon 12/9/2019 2,073Net unrealised depreciation (99,505)
Swaps as at 31 August 2019
TypeNominal
Value Description Counterparty
Expiration date
Unrealised appreciation/
(depreciation) USD
Market Value USD
CDS EUR (660,000) Fund provides default protection on Tesco Plc; and receives Fixed 1% Morgan Stanley 20/12/2028 17,183 (48,206)CDS USD (1,250,000) Fund provides default protection on CMBX.NA.9.BBB-;
and receives Fixed 3% Morgan Stanley 17/9/2058 90,517 (43,833)
Total (USD underlying exposure - USD 9,678,884) 193,387 (339,239)
CDS: Credit Default Swaps
Purchased Options as at 31 August 2019
Number of contracts
Call/ Put
Description Counterparty
Strike Price
Expiration date
Unrealised depreciation
USD
Market Value USD
62 Call EURO STOXX 50 Index Exchange Traded EUR 3,800 20/12/2019 (9,535) 3,013
Total (USD underlying exposure - USD 105,193) (9,535) 3,013

Contracts For Difference as at 31 August 2019
Holding
Description Counterparty
Unrealised appreciation/
(depreciation) USD
Egypt 462,344 Commercial International
Bank Egypt SAE HSBC Bank Plc 148,852 161,483 Commercial International
Bank Egypt SAE JP Morgan 51,775 200,627
Russia 197,052 Severstal PAO JP Morgan (43,351) (43,351)
United Kingdom 10,253 Mediclinic International Plc HSBC Bank Plc 2,167 175,117 Prudential Plc JP Morgan (323,603) (321,436)
Total (USD underlying exposure - USD 11,633,410) (164,160)
The notes on pages 728 to 741 form an integral part of these financial statements.
Annual Report and Audited Financial Statements [547]
Global Multi-Asset Income Fund continued
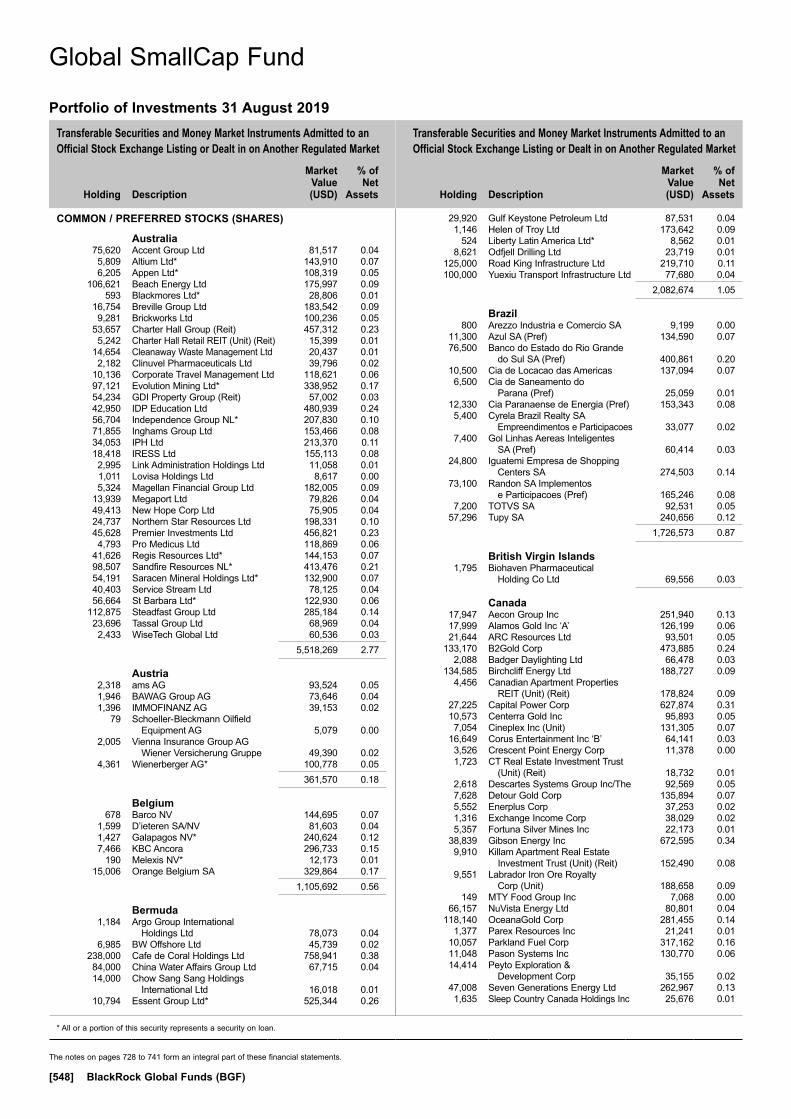
Transferable Securities and Money Market Instruments Admitted to an Official Stock Exchange Listing or Dealt in on Another Regulated Market
Transferable Securities and Money Market Instruments Admitted to an Official Stock Exchange Listing or Dealt in on Another Regulated Market
Holding
Description
Market Value (USD)
% of Net
Assets
Holding
Description
Market Value (USD)
% of Net
Assets
* All or a portion of this security represents a security on loan.
The notes on pages 728 to 741 form an integral part of these financial statements.
[548] BlackRock Global Funds (BGF)
COMMON / PREFERRED STOCKS (SHARES)
Australia 75,620 Accent Group Ltd 81,517 0.04 5,809 Altium Ltd* 143,910 0.07 6,205 Appen Ltd* 108,319 0.05 106,621 Beach Energy Ltd 175,997 0.09 593 Blackmores Ltd* 28,806 0.01 16,754 Breville Group Ltd 183,542 0.09 9,281 Brickworks Ltd 100,236 0.05 53,657 Charter Hall Group (Reit) 457,312 0.23 5,242 Charter Hall Retail REIT (Unit) (Reit) 15,399 0.01 14,654 Cleanaway Waste Management Ltd 20,437 0.01 2,182 Clinuvel Pharmaceuticals Ltd 39,796 0.02 10,136 Corporate Travel Management Ltd 118,621 0.06 97,121 Evolution Mining Ltd* 338,952 0.17 54,234 GDI Property Group (Reit) 57,002 0.03 42,950 IDP Education Ltd 480,939 0.24 56,704 Independence Group NL* 207,830 0.10 71,855 Inghams Group Ltd 153,466 0.08 34,053 IPH Ltd 213,370 0.11 18,418 IRESS Ltd 155,113 0.08 2,995 Link Administration Holdings Ltd 11,058 0.01 1,011 Lovisa Holdings Ltd 8,617 0.00 5,324 Magellan Financial Group Ltd 182,005 0.09 13,939 Megaport Ltd 79,826 0.04 49,413 New Hope Corp Ltd 75,905 0.04 24,737 Northern Star Resources Ltd 198,331 0.10 45,628 Premier Investments Ltd 456,821 0.23 4,793 Pro Medicus Ltd 118,869 0.06 41,626 Regis Resources Ltd* 144,153 0.07 98,507 Sandfire Resources NL* 413,476 0.21 54,191 Saracen Mineral Holdings Ltd* 132,900 0.07 40,403 Service Stream Ltd 78,125 0.04 56,664 St Barbara Ltd* 122,930 0.06 112,875 Steadfast Group Ltd 285,184 0.14 23,696 Tassal Group Ltd 68,969 0.04 2,433 WiseTech Global Ltd 60,536 0.03 5,518,269 2.77
Austria 2,318 ams AG 93,524 0.05 1,946 BAWAG Group AG 73,646 0.04 1,396 IMMOFINANZ AG 39,153 0.02 79 Schoeller-Bleckmann Oilfield
Equipment AG 5,079 0.00 2,005 Vienna Insurance Group AG
Wiener Versicherung Gruppe 49,390 0.02 4,361 Wienerberger AG* 100,778 0.05 361,570 0.18
Belgium 678 Barco NV 144,695 0.07 1,599 D’ieteren SA/NV 81,603 0.04 1,427 Galapagos NV* 240,624 0.12 7,466 KBC Ancora 296,733 0.15 190 Melexis NV* 12,173 0.01 15,006 Orange Belgium SA 329,864 0.17 1,105,692 0.56
Bermuda 1,184 Argo Group International
Holdings Ltd 78,073 0.04 6,985 BW Offshore Ltd 45,739 0.02 238,000 Cafe de Coral Holdings Ltd 758,941 0.38 84,000 China Water Affairs Group Ltd 67,715 0.04 14,000 Chow Sang Sang Holdings
International Ltd 16,018 0.01 10,794 Essent Group Ltd* 525,344 0.26
29,920 Gulf Keystone Petroleum Ltd 87,531 0.04 1,146 Helen of Troy Ltd 173,642 0.09 524 Liberty Latin America Ltd* 8,562 0.01 8,621 Odfjell Drilling Ltd 23,719 0.01 125,000 Road King Infrastructure Ltd 219,710 0.11 100,000 Yuexiu Transport Infrastructure Ltd 77,680 0.04 2,082,674 1.05
Brazil 800 Arezzo Industria e Comercio SA 9,199 0.00 11,300 Azul SA (Pref) 134,590 0.07 76,500 Banco do Estado do Rio Grande
do Sul SA (Pref) 400,861 0.20 10,500 Cia de Locacao das Americas 137,094 0.07 6,500 Cia de Saneamento do
Parana (Pref) 25,059 0.01 12,330 Cia Paranaense de Energia (Pref) 153,343 0.08 5,400 Cyrela Brazil Realty SA
Empreendimentos e Participacoes 33,077 0.02 7,400 Gol Linhas Aereas Inteligentes
SA (Pref) 60,414 0.03 24,800 Iguatemi Empresa de Shopping
Centers SA 274,503 0.14 73,100 Randon SA Implementos
e Participacoes (Pref) 165,246 0.08 7,200 TOTVS SA 92,531 0.05 57,296 Tupy SA 240,656 0.12 1,726,573 0.87
British Virgin Islands 1,795 Biohaven Pharmaceutical
Holding Co Ltd 69,556 0.03
Canada 17,947 Aecon Group Inc 251,940 0.13 17,999 Alamos Gold Inc ‘A’ 126,199 0.06 21,644 ARC Resources Ltd 93,501 0.05 133,170 B2Gold Corp 473,885 0.24 2,088 Badger Daylighting Ltd 66,478 0.03 134,585 Birchcliff Energy Ltd 188,727 0.09 4,456 Canadian Apartment Properties
REIT (Unit) (Reit) 178,824 0.09 27,225 Capital Power Corp 627,874 0.31 10,573 Centerra Gold Inc 95,893 0.05 7,054 Cineplex Inc (Unit) 131,305 0.07 16,649 Corus Entertainment Inc ‘B’ 64,141 0.03 3,526 Crescent Point Energy Corp 11,378 0.00 1,723 CT Real Estate Investment Trust
(Unit) (Reit) 18,732 0.01 2,618 Descartes Systems Group Inc/The 92,569 0.05 7,628 Detour Gold Corp 135,894 0.07 5,552 Enerplus Corp 37,253 0.02 1,316 Exchange Income Corp 38,029 0.02 5,357 Fortuna Silver Mines Inc 22,173 0.01 38,839 Gibson Energy Inc 672,595 0.34 9,910 Killam Apartment Real Estate
Investment Trust (Unit) (Reit) 152,490 0.08 9,551 Labrador Iron Ore Royalty
Corp (Unit) 188,658 0.09 149 MTY Food Group Inc 7,068 0.00 66,157 NuVista Energy Ltd 80,801 0.04 118,140 OceanaGold Corp 281,455 0.14 1,377 Parex Resources Inc 21,241 0.01 10,057 Parkland Fuel Corp 317,162 0.16 11,048 Pason Systems Inc 130,770 0.06 14,414 Peyto Exploration &
Development Corp 35,155 0.02 47,008 Seven Generations Energy Ltd 262,967 0.13 1,635 Sleep Country Canada Holdings Inc 25,676 0.01
Global SmallCap Fund
Portfolio of Investments 31 August 2019
Global SmallCap FundUSD
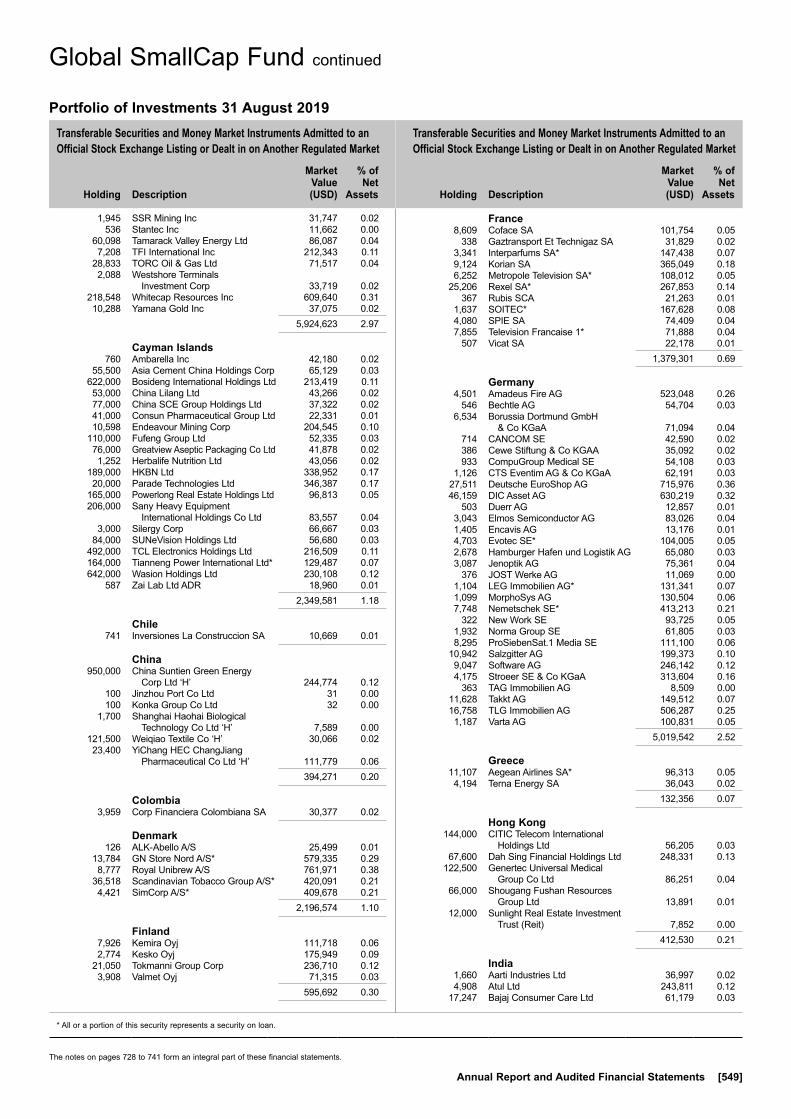
Transferable Securities and Money Market Instruments Admitted to an Official Stock Exchange Listing or Dealt in on Another Regulated Market
Transferable Securities and Money Market Instruments Admitted to an Official Stock Exchange Listing or Dealt in on Another Regulated Market
Holding
Description
Market Value (USD)
% of Net
Assets
Holding
Description
Market Value (USD)
% of Net
Assets
* All or a portion of this security represents a security on loan.
The notes on pages 728 to 741 form an integral part of these financial statements.
Annual Report and Audited Financial Statements [549]
1,945 SSR Mining Inc 31,747 0.02 536 Stantec Inc 11,662 0.00 60,098 Tamarack Valley Energy Ltd 86,087 0.04 7,208 TFI International Inc 212,343 0.11 28,833 TORC Oil & Gas Ltd 71,517 0.04 2,088 Westshore Terminals
Investment Corp 33,719 0.02 218,548 Whitecap Resources Inc 609,640 0.31 10,288 Yamana Gold Inc 37,075 0.02 5,924,623 2.97
Cayman Islands 760 Ambarella Inc 42,180 0.02 55,500 Asia Cement China Holdings Corp 65,129 0.03 622,000 Bosideng International Holdings Ltd 213,419 0.11 53,000 China Lilang Ltd 43,266 0.02 77,000 China SCE Group Holdings Ltd 37,322 0.02 41,000 Consun Pharmaceutical Group Ltd 22,331 0.01 10,598 Endeavour Mining Corp 204,545 0.10 110,000 Fufeng Group Ltd 52,335 0.03 76,000 Greatview Aseptic Packaging Co Ltd 41,878 0.02 1,252 Herbalife Nutrition Ltd 43,056 0.02 189,000 HKBN Ltd 338,952 0.17 20,000 Parade Technologies Ltd 346,387 0.17 165,000 Powerlong Real Estate Holdings Ltd 96,813 0.05 206,000 Sany Heavy Equipment
International Holdings Co Ltd 83,557 0.04 3,000 Silergy Corp 66,667 0.03 84,000 SUNeVision Holdings Ltd 56,680 0.03 492,000 TCL Electronics Holdings Ltd 216,509 0.11 164,000 Tianneng Power International Ltd* 129,487 0.07 642,000 Wasion Holdings Ltd 230,108 0.12 587 Zai Lab Ltd ADR 18,960 0.01 2,349,581 1.18
Chile 741 Inversiones La Construccion SA 10,669 0.01
China 950,000 China Suntien Green Energy
Corp Ltd ‘H’ 244,774 0.12 100 Jinzhou Port Co Ltd 31 0.00 100 Konka Group Co Ltd 32 0.00 1,700 Shanghai Haohai Biological
Technology Co Ltd ‘H’ 7,589 0.00 121,500 Weiqiao Textile Co ‘H’ 30,066 0.02 23,400 YiChang HEC ChangJiang
Pharmaceutical Co Ltd ‘H’ 111,779 0.06 394,271 0.20
Colombia 3,959 Corp Financiera Colombiana SA 30,377 0.02
Denmark 126 ALK-Abello A/S 25,499 0.01 13,784 GN Store Nord A/S* 579,335 0.29 8,777 Royal Unibrew A/S 761,971 0.38 36,518 Scandinavian Tobacco Group A/S* 420,091 0.21 4,421 SimCorp A/S* 409,678 0.21 2,196,574 1.10
Finland 7,926 Kemira Oyj 111,718 0.06 2,774 Kesko Oyj 175,949 0.09 21,050 Tokmanni Group Corp 236,710 0.12 3,908 Valmet Oyj 71,315 0.03 595,692 0.30
France 8,609 Coface SA 101,754 0.05 338 Gaztransport Et Technigaz SA 31,829 0.02 3,341 Interparfums SA* 147,438 0.07 9,124 Korian SA 365,049 0.18 6,252 Metropole Television SA* 108,012 0.05 25,206 Rexel SA* 267,853 0.14 367 Rubis SCA 21,263 0.01 1,637 SOITEC* 167,628 0.08 4,080 SPIE SA 74,409 0.04 7,855 Television Francaise 1* 71,888 0.04 507 Vicat SA 22,178 0.01 1,379,301 0.69
Germany 4,501 Amadeus Fire AG 523,048 0.26 546 Bechtle AG 54,704 0.03 6,534 Borussia Dortmund GmbH
& Co KGaA 71,094 0.04 714 CANCOM SE 42,590 0.02 386 Cewe Stiftung & Co KGAA 35,092 0.02 933 CompuGroup Medical SE 54,108 0.03 1,126 CTS Eventim AG & Co KGaA 62,191 0.03 27,511 Deutsche EuroShop AG 715,976 0.36 46,159 DIC Asset AG 630,219 0.32 503 Duerr AG 12,857 0.01 3,043 Elmos Semiconductor AG 83,026 0.04 1,405 Encavis AG 13,176 0.01 4,703 Evotec SE* 104,005 0.05 2,678 Hamburger Hafen und Logistik AG 65,080 0.03 3,087 Jenoptik AG 75,361 0.04 376 JOST Werke AG 11,069 0.00 1,104 LEG Immobilien AG* 131,341 0.07 1,099 MorphoSys AG 130,504 0.06 7,748 Nemetschek SE* 413,213 0.21 322 New Work SE 93,725 0.05 1,932 Norma Group SE 61,805 0.03 8,295 ProSiebenSat.1 Media SE 111,100 0.06 10,942 Salzgitter AG 199,373 0.10 9,047 Software AG 246,142 0.12 4,175 Stroeer SE & Co KGaA 313,604 0.16 363 TAG Immobilien AG 8,509 0.00 11,628 Takkt AG 149,512 0.07 16,758 TLG Immobilien AG 506,287 0.25 1,187 Varta AG 100,831 0.05 5,019,542 2.52
Greece 11,107 Aegean Airlines SA* 96,313 0.05 4,194 Terna Energy SA 36,043 0.02 132,356 0.07
Hong Kong 144,000 CITIC Telecom International
Holdings Ltd 56,205 0.03 67,600 Dah Sing Financial Holdings Ltd 248,331 0.13 122,500 Genertec Universal Medical
Group Co Ltd 86,251 0.04 66,000 Shougang Fushan Resources
Group Ltd 13,891 0.01 12,000 Sunlight Real Estate Investment
Trust (Reit) 7,852 0.00 412,530 0.21
India 1,660 Aarti Industries Ltd 36,997 0.02 4,908 Atul Ltd 243,811 0.12 17,247 Bajaj Consumer Care Ltd 61,179 0.03
Global SmallCap Fund continued
Portfolio of Investments 31 August 2019
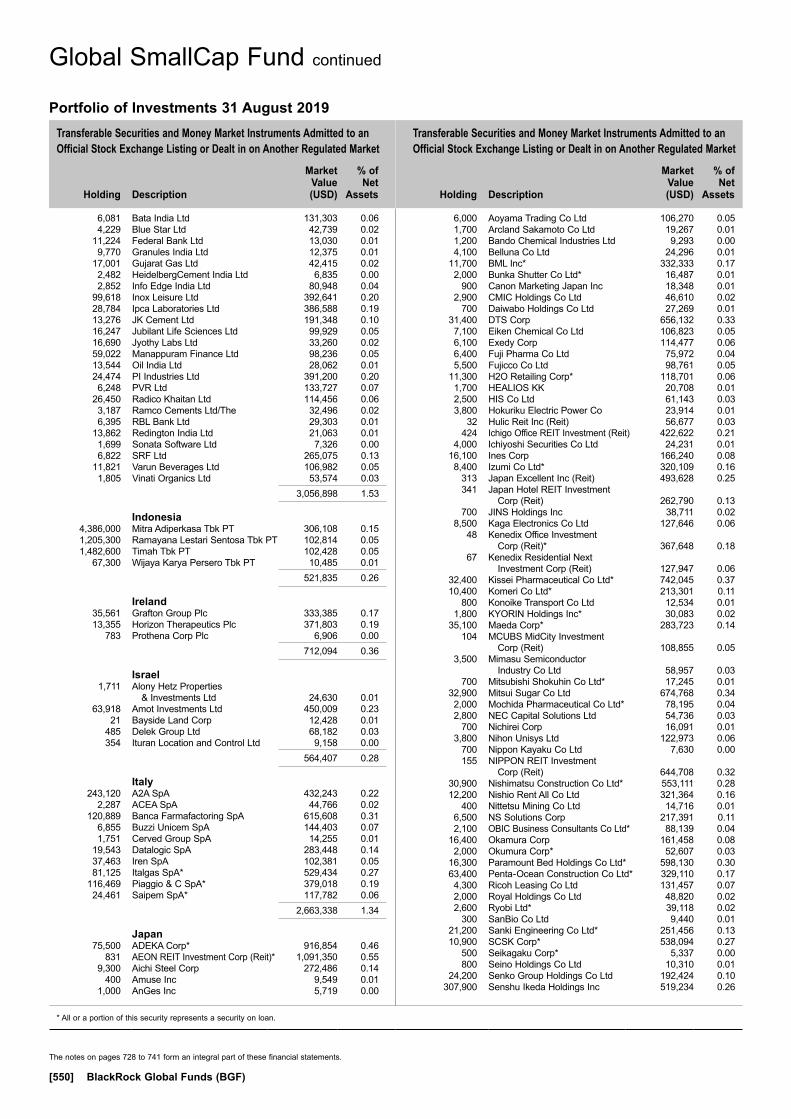
Transferable Securities and Money Market Instruments Admitted to an Official Stock Exchange Listing or Dealt in on Another Regulated Market
Transferable Securities and Money Market Instruments Admitted to an Official Stock Exchange Listing or Dealt in on Another Regulated Market
Holding
Description
Market Value (USD)
% of Net
Assets
Holding
Description
Market Value (USD)
% of Net
Assets
* All or a portion of this security represents a security on loan.
The notes on pages 728 to 741 form an integral part of these financial statements.
[550] BlackRock Global Funds (BGF)
6,081 Bata India Ltd 131,303 0.06 4,229 Blue Star Ltd 42,739 0.02 11,224 Federal Bank Ltd 13,030 0.01 9,770 Granules India Ltd 12,375 0.01 17,001 Gujarat Gas Ltd 42,415 0.02 2,482 HeidelbergCement India Ltd 6,835 0.00 2,852 Info Edge India Ltd 80,948 0.04 99,618 Inox Leisure Ltd 392,641 0.20 28,784 Ipca Laboratories Ltd 386,588 0.19 13,276 JK Cement Ltd 191,348 0.10 16,247 Jubilant Life Sciences Ltd 99,929 0.05 16,690 Jyothy Labs Ltd 33,260 0.02 59,022 Manappuram Finance Ltd 98,236 0.05 13,544 Oil India Ltd 28,062 0.01 24,474 PI Industries Ltd 391,200 0.20 6,248 PVR Ltd 133,727 0.07 26,450 Radico Khaitan Ltd 114,456 0.06 3,187 Ramco Cements Ltd/The 32,496 0.02 6,395 RBL Bank Ltd 29,303 0.01 13,862 Redington India Ltd 21,063 0.01 1,699 Sonata Software Ltd 7,326 0.00 6,822 SRF Ltd 265,075 0.13 11,821 Varun Beverages Ltd 106,982 0.05 1,805 Vinati Organics Ltd 53,574 0.03 3,056,898 1.53
Indonesia 4,386,000 Mitra Adiperkasa Tbk PT 306,108 0.15 1,205,300 Ramayana Lestari Sentosa Tbk PT 102,814 0.05 1,482,600 Timah Tbk PT 102,428 0.05 67,300 Wijaya Karya Persero Tbk PT 10,485 0.01 521,835 0.26
Ireland 35,561 Grafton Group Plc 333,385 0.17 13,355 Horizon Therapeutics Plc 371,803 0.19 783 Prothena Corp Plc 6,906 0.00 712,094 0.36
Israel 1,711 Alony Hetz Properties
& Investments Ltd 24,630 0.01 63,918 Amot Investments Ltd 450,009 0.23 21 Bayside Land Corp 12,428 0.01 485 Delek Group Ltd 68,182 0.03 354 Ituran Location and Control Ltd 9,158 0.00 564,407 0.28
Italy 243,120 A2A SpA 432,243 0.22 2,287 ACEA SpA 44,766 0.02 120,889 Banca Farmafactoring SpA 615,608 0.31 6,855 Buzzi Unicem SpA 144,403 0.07 1,751 Cerved Group SpA 14,255 0.01 19,543 Datalogic SpA 283,448 0.14 37,463 Iren SpA 102,381 0.05 81,125 Italgas SpA* 529,434 0.27 116,469 Piaggio & C SpA* 379,018 0.19 24,461 Saipem SpA* 117,782 0.06 2,663,338 1.34
Japan 75,500 ADEKA Corp* 916,854 0.46 831 AEON REIT Investment Corp (Reit)* 1,091,350 0.55 9,300 Aichi Steel Corp 272,486 0.14 400 Amuse Inc 9,549 0.01 1,000 AnGes Inc 5,719 0.00
6,000 Aoyama Trading Co Ltd 106,270 0.05 1,700 Arcland Sakamoto Co Ltd 19,267 0.01 1,200 Bando Chemical Industries Ltd 9,293 0.00 4,100 Belluna Co Ltd 24,296 0.01 11,700 BML Inc* 332,333 0.17 2,000 Bunka Shutter Co Ltd* 16,487 0.01 900 Canon Marketing Japan Inc 18,348 0.01 2,900 CMIC Holdings Co Ltd 46,610 0.02 700 Daiwabo Holdings Co Ltd 27,269 0.01 31,400 DTS Corp 656,132 0.33 7,100 Eiken Chemical Co Ltd 106,823 0.05 6,100 Exedy Corp 114,477 0.06 6,400 Fuji Pharma Co Ltd 75,972 0.04 5,500 Fujicco Co Ltd 98,761 0.05 11,300 H2O Retailing Corp* 118,701 0.06 1,700 HEALIOS KK 20,708 0.01 2,500 HIS Co Ltd 61,143 0.03 3,800 Hokuriku Electric Power Co 23,914 0.01 32 Hulic Reit Inc (Reit) 56,677 0.03 424 Ichigo Office REIT Investment (Reit) 422,622 0.21 4,000 Ichiyoshi Securities Co Ltd 24,231 0.01 16,100 Ines Corp 166,240 0.08 8,400 Izumi Co Ltd* 320,109 0.16 313 Japan Excellent Inc (Reit) 493,628 0.25 341 Japan Hotel REIT Investment
Corp (Reit) 262,790 0.13 700 JINS Holdings Inc 38,711 0.02 8,500 Kaga Electronics Co Ltd 127,646 0.06 48 Kenedix Office Investment
Corp (Reit)* 367,648 0.18 67 Kenedix Residential Next
Investment Corp (Reit) 127,947 0.06 32,400 Kissei Pharmaceutical Co Ltd* 742,045 0.37 10,400 Komeri Co Ltd* 213,301 0.11 800 Konoike Transport Co Ltd 12,534 0.01 1,800 KYORIN Holdings Inc* 30,083 0.02 35,100 Maeda Corp* 283,723 0.14 104 MCUBS MidCity Investment
Corp (Reit) 108,855 0.05 3,500 Mimasu Semiconductor
Industry Co Ltd 58,957 0.03 700 Mitsubishi Shokuhin Co Ltd* 17,245 0.01 32,900 Mitsui Sugar Co Ltd 674,768 0.34 2,000 Mochida Pharmaceutical Co Ltd* 78,195 0.04 2,800 NEC Capital Solutions Ltd 54,736 0.03 700 Nichirei Corp 16,091 0.01 3,800 Nihon Unisys Ltd 122,973 0.06 700 Nippon Kayaku Co Ltd 7,630 0.00 155 NIPPON REIT Investment
Corp (Reit) 644,708 0.32 30,900 Nishimatsu Construction Co Ltd* 553,111 0.28 12,200 Nishio Rent All Co Ltd 321,364 0.16 400 Nittetsu Mining Co Ltd 14,716 0.01 6,500 NS Solutions Corp 217,391 0.11 2,100 OBIC Business Consultants Co Ltd* 88,139 0.04 16,400 Okamura Corp 161,458 0.08 2,000 Okumura Corp* 52,607 0.03 16,300 Paramount Bed Holdings Co Ltd* 598,130 0.30 63,400 Penta-Ocean Construction Co Ltd* 329,110 0.17 4,300 Ricoh Leasing Co Ltd 131,457 0.07 2,000 Royal Holdings Co Ltd 48,820 0.02 2,600 Ryobi Ltd* 39,118 0.02 300 SanBio Co Ltd 9,440 0.01 21,200 Sanki Engineering Co Ltd* 251,456 0.13 10,900 SCSK Corp* 538,094 0.27 500 Seikagaku Corp* 5,337 0.00 800 Seino Holdings Co Ltd 10,310 0.01 24,200 Senko Group Holdings Co Ltd 192,424 0.10 307,900 Senshu Ikeda Holdings Inc 519,234 0.26
Global SmallCap Fund continued
Portfolio of Investments 31 August 2019
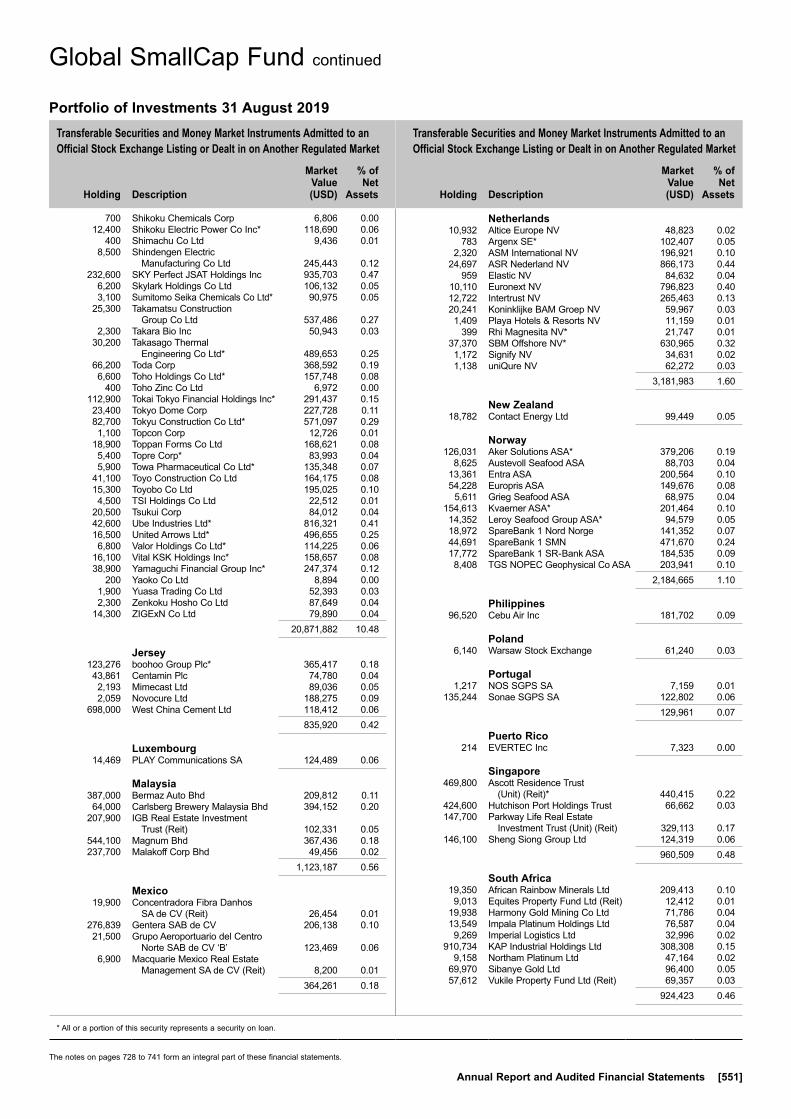
Transferable Securities and Money Market Instruments Admitted to an Official Stock Exchange Listing or Dealt in on Another Regulated Market
Transferable Securities and Money Market Instruments Admitted to an Official Stock Exchange Listing or Dealt in on Another Regulated Market
Holding
Description
Market Value (USD)
% of Net
Assets
Holding
Description
Market Value (USD)
% of Net
Assets
* All or a portion of this security represents a security on loan.
The notes on pages 728 to 741 form an integral part of these financial statements.
Annual Report and Audited Financial Statements [551]
700 Shikoku Chemicals Corp 6,806 0.00 12,400 Shikoku Electric Power Co Inc* 118,690 0.06 400 Shimachu Co Ltd 9,436 0.01 8,500 Shindengen Electric
Manufacturing Co Ltd 245,443 0.12 232,600 SKY Perfect JSAT Holdings Inc 935,703 0.47 6,200 Skylark Holdings Co Ltd 106,132 0.05 3,100 Sumitomo Seika Chemicals Co Ltd* 90,975 0.05 25,300 Takamatsu Construction
Group Co Ltd 537,486 0.27 2,300 Takara Bio Inc 50,943 0.03 30,200 Takasago Thermal
Engineering Co Ltd* 489,653 0.25 66,200 Toda Corp 368,592 0.19 6,600 Toho Holdings Co Ltd* 157,748 0.08 400 Toho Zinc Co Ltd 6,972 0.00 112,900 Tokai Tokyo Financial Holdings Inc* 291,437 0.15 23,400 Tokyo Dome Corp 227,728 0.11 82,700 Tokyu Construction Co Ltd* 571,097 0.29 1,100 Topcon Corp 12,726 0.01 18,900 Toppan Forms Co Ltd 168,621 0.08 5,400 Topre Corp* 83,993 0.04 5,900 Towa Pharmaceutical Co Ltd* 135,348 0.07 41,100 Toyo Construction Co Ltd 164,175 0.08 15,300 Toyobo Co Ltd 195,025 0.10 4,500 TSI Holdings Co Ltd 22,512 0.01 20,500 Tsukui Corp 84,012 0.04 42,600 Ube Industries Ltd* 816,321 0.41 16,500 United Arrows Ltd* 496,655 0.25 6,800 Valor Holdings Co Ltd* 114,225 0.06 16,100 Vital KSK Holdings Inc* 158,657 0.08 38,900 Yamaguchi Financial Group Inc* 247,374 0.12 200 Yaoko Co Ltd 8,894 0.00 1,900 Yuasa Trading Co Ltd 52,393 0.03 2,300 Zenkoku Hosho Co Ltd 87,649 0.04 14,300 ZIGExN Co Ltd 79,890 0.04 20,871,882 10.48
Jersey 123,276 boohoo Group Plc* 365,417 0.18 43,861 Centamin Plc 74,780 0.04 2,193 Mimecast Ltd 89,036 0.05 2,059 Novocure Ltd 188,275 0.09 698,000 West China Cement Ltd 118,412 0.06 835,920 0.42
Luxembourg 14,469 PLAY Communications SA 124,489 0.06
Malaysia 387,000 Bermaz Auto Bhd 209,812 0.11 64,000 Carlsberg Brewery Malaysia Bhd 394,152 0.20 207,900 IGB Real Estate Investment
Trust (Reit) 102,331 0.05 544,100 Magnum Bhd 367,436 0.18 237,700 Malakoff Corp Bhd 49,456 0.02 1,123,187 0.56
Mexico 19,900 Concentradora Fibra Danhos
SA de CV (Reit) 26,454 0.01 276,839 Gentera SAB de CV 206,138 0.10 21,500 Grupo Aeroportuario del Centro
Norte SAB de CV ‘B’ 123,469 0.06 6,900 Macquarie Mexico Real Estate
Management SA de CV (Reit) 8,200 0.01 364,261 0.18
Netherlands 10,932 Altice Europe NV 48,823 0.02 783 Argenx SE* 102,407 0.05 2,320 ASM International NV 196,921 0.10 24,697 ASR Nederland NV 866,173 0.44 959 Elastic NV 84,632 0.04 10,110 Euronext NV 796,823 0.40 12,722 Intertrust NV 265,463 0.13 20,241 Koninklijke BAM Groep NV 59,967 0.03 1,409 Playa Hotels & Resorts NV 11,159 0.01 399 Rhi Magnesita NV* 21,747 0.01 37,370 SBM Offshore NV* 630,965 0.32 1,172 Signify NV 34,631 0.02 1,138 uniQure NV 62,272 0.03 3,181,983 1.60
New Zealand 18,782 Contact Energy Ltd 99,449 0.05
Norway 126,031 Aker Solutions ASA* 379,206 0.19 8,625 Austevoll Seafood ASA 88,703 0.04 13,361 Entra ASA 200,564 0.10 54,228 Europris ASA 149,676 0.08 5,611 Grieg Seafood ASA 68,975 0.04 154,613 Kvaerner ASA* 201,464 0.10 14,352 Leroy Seafood Group ASA* 94,579 0.05 18,972 SpareBank 1 Nord Norge 141,352 0.07 44,691 SpareBank 1 SMN 471,670 0.24 17,772 SpareBank 1 SR-Bank ASA 184,535 0.09 8,408 TGS NOPEC Geophysical Co ASA 203,941 0.10 2,184,665 1.10
Philippines 96,520 Cebu Air Inc 181,702 0.09
Poland 6,140 Warsaw Stock Exchange 61,240 0.03
Portugal 1,217 NOS SGPS SA 7,159 0.01 135,244 Sonae SGPS SA 122,802 0.06 129,961 0.07
Puerto Rico 214 EVERTEC Inc 7,323 0.00
Singapore 469,800 Ascott Residence Trust
(Unit) (Reit)* 440,415 0.22 424,600 Hutchison Port Holdings Trust 66,662 0.03 147,700 Parkway Life Real Estate
Investment Trust (Unit) (Reit) 329,113 0.17 146,100 Sheng Siong Group Ltd 124,319 0.06 960,509 0.48
South Africa 19,350 African Rainbow Minerals Ltd 209,413 0.10 9,013 Equites Property Fund Ltd (Reit) 12,412 0.01 19,938 Harmony Gold Mining Co Ltd 71,786 0.04 13,549 Impala Platinum Holdings Ltd 76,587 0.04 9,269 Imperial Logistics Ltd 32,996 0.02 910,734 KAP Industrial Holdings Ltd 308,308 0.15 9,158 Northam Platinum Ltd 47,164 0.02 69,970 Sibanye Gold Ltd 96,400 0.05 57,612 Vukile Property Fund Ltd (Reit) 69,357 0.03 924,423 0.46
Global SmallCap Fund continued
Portfolio of Investments 31 August 2019
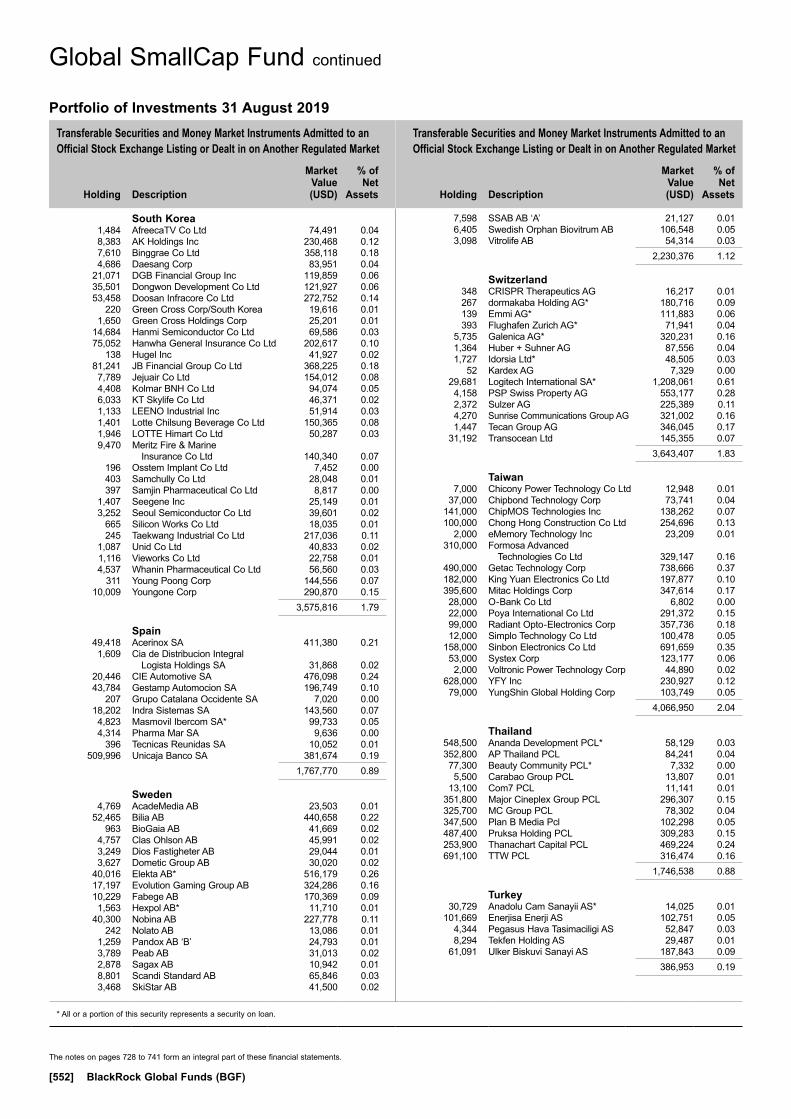
Transferable Securities and Money Market Instruments Admitted to an Official Stock Exchange Listing or Dealt in on Another Regulated Market
Transferable Securities and Money Market Instruments Admitted to an Official Stock Exchange Listing or Dealt in on Another Regulated Market
Holding
Description
Market Value (USD)
% of Net
Assets
Holding
Description
Market Value (USD)
% of Net
Assets
* All or a portion of this security represents a security on loan.
The notes on pages 728 to 741 form an integral part of these financial statements.
[552] BlackRock Global Funds (BGF)
South Korea 1,484 AfreecaTV Co Ltd 74,491 0.04 8,383 AK Holdings Inc 230,468 0.12 7,610 Binggrae Co Ltd 358,118 0.18 4,686 Daesang Corp 83,951 0.04 21,071 DGB Financial Group Inc 119,859 0.06 35,501 Dongwon Development Co Ltd 121,927 0.06 53,458 Doosan Infracore Co Ltd 272,752 0.14 220 Green Cross Corp/South Korea 19,616 0.01 1,650 Green Cross Holdings Corp 25,201 0.01 14,684 Hanmi Semiconductor Co Ltd 69,586 0.03 75,052 Hanwha General Insurance Co Ltd 202,617 0.10 138 Hugel Inc 41,927 0.02 81,241 JB Financial Group Co Ltd 368,225 0.18 7,789 Jejuair Co Ltd 154,012 0.08 4,408 Kolmar BNH Co Ltd 94,074 0.05 6,033 KT Skylife Co Ltd 46,371 0.02 1,133 LEENO Industrial Inc 51,914 0.03 1,401 Lotte Chilsung Beverage Co Ltd 150,365 0.08 1,946 LOTTE Himart Co Ltd 50,287 0.03 9,470 Meritz Fire & Marine
Insurance Co Ltd 140,340 0.07 196 Osstem Implant Co Ltd 7,452 0.00 403 Samchully Co Ltd 28,048 0.01 397 Samjin Pharmaceutical Co Ltd 8,817 0.00 1,407 Seegene Inc 25,149 0.01 3,252 Seoul Semiconductor Co Ltd 39,601 0.02 665 Silicon Works Co Ltd 18,035 0.01 245 Taekwang Industrial Co Ltd 217,036 0.11 1,087 Unid Co Ltd 40,833 0.02 1,116 Vieworks Co Ltd 22,758 0.01 4,537 Whanin Pharmaceutical Co Ltd 56,560 0.03 311 Young Poong Corp 144,556 0.07 10,009 Youngone Corp 290,870 0.15 3,575,816 1.79
Spain 49,418 Acerinox SA 411,380 0.21 1,609 Cia de Distribucion Integral
Logista Holdings SA 31,868 0.02 20,446 CIE Automotive SA 476,098 0.24 43,784 Gestamp Automocion SA 196,749 0.10 207 Grupo Catalana Occidente SA 7,020 0.00 18,202 Indra Sistemas SA 143,560 0.07 4,823 Masmovil Ibercom SA* 99,733 0.05 4,314 Pharma Mar SA 9,636 0.00 396 Tecnicas Reunidas SA 10,052 0.01 509,996 Unicaja Banco SA 381,674 0.19 1,767,770 0.89
Sweden 4,769 AcadeMedia AB 23,503 0.01 52,465 Bilia AB 440,658 0.22 963 BioGaia AB 41,669 0.02 4,757 Clas Ohlson AB 45,991 0.02 3,249 Dios Fastigheter AB 29,044 0.01 3,627 Dometic Group AB 30,020 0.02 40,016 Elekta AB* 516,179 0.26 17,197 Evolution Gaming Group AB 324,286 0.16 10,229 Fabege AB 170,369 0.09 1,563 Hexpol AB* 11,710 0.01 40,300 Nobina AB 227,778 0.11 242 Nolato AB 13,086 0.01 1,259 Pandox AB ‘B’ 24,793 0.01 3,789 Peab AB 31,013 0.02 2,878 Sagax AB 10,942 0.01 8,801 Scandi Standard AB 65,846 0.03 3,468 SkiStar AB 41,500 0.02
7,598 SSAB AB ‘A’ 21,127 0.01 6,405 Swedish Orphan Biovitrum AB 106,548 0.05 3,098 Vitrolife AB 54,314 0.03 2,230,376 1.12
Switzerland 348 CRISPR Therapeutics AG 16,217 0.01 267 dormakaba Holding AG* 180,716 0.09 139 Emmi AG* 111,883 0.06 393 Flughafen Zurich AG* 71,941 0.04 5,735 Galenica AG* 320,231 0.16 1,364 Huber + Suhner AG 87,556 0.04 1,727 Idorsia Ltd* 48,505 0.03 52 Kardex AG 7,329 0.00 29,681 Logitech International SA* 1,208,061 0.61 4,158 PSP Swiss Property AG 553,177 0.28 2,372 Sulzer AG 225,389 0.11 4,270 Sunrise Communications Group AG 321,002 0.16 1,447 Tecan Group AG 346,045 0.17 31,192 Transocean Ltd 145,355 0.07 3,643,407 1.83
Taiwan 7,000 Chicony Power Technology Co Ltd 12,948 0.01 37,000 Chipbond Technology Corp 73,741 0.04 141,000 ChipMOS Technologies Inc 138,262 0.07 100,000 Chong Hong Construction Co Ltd 254,696 0.13 2,000 eMemory Technology Inc 23,209 0.01 310,000 Formosa Advanced
Technologies Co Ltd 329,147 0.16 490,000 Getac Technology Corp 738,666 0.37 182,000 King Yuan Electronics Co Ltd 197,877 0.10 395,600 Mitac Holdings Corp 347,614 0.17 28,000 O-Bank Co Ltd 6,802 0.00 22,000 Poya International Co Ltd 291,372 0.15 99,000 Radiant Opto-Electronics Corp 357,736 0.18 12,000 Simplo Technology Co Ltd 100,478 0.05 158,000 Sinbon Electronics Co Ltd 691,659 0.35 53,000 Systex Corp 123,177 0.06 2,000 Voltronic Power Technology Corp 44,890 0.02 628,000 YFY Inc 230,927 0.12 79,000 YungShin Global Holding Corp 103,749 0.05 4,066,950 2.04
Thailand 548,500 Ananda Development PCL* 58,129 0.03 352,800 AP Thailand PCL 84,241 0.04 77,300 Beauty Community PCL* 7,332 0.00 5,500 Carabao Group PCL 13,807 0.01 13,100 Com7 PCL 11,141 0.01 351,800 Major Cineplex Group PCL 296,307 0.15 325,700 MC Group PCL 78,302 0.04 347,500 Plan B Media Pcl 102,298 0.05 487,400 Pruksa Holding PCL 309,283 0.15 253,900 Thanachart Capital PCL 469,224 0.24 691,100 TTW PCL 316,474 0.16 1,746,538 0.88
Turkey 30,729 Anadolu Cam Sanayii AS* 14,025 0.01 101,669 Enerjisa Enerji AS 102,751 0.05 4,344 Pegasus Hava Tasimaciligi AS 52,847 0.03 8,294 Tekfen Holding AS 29,487 0.01 61,091 Ulker Biskuvi Sanayi AS 187,843 0.09 386,953 0.19
Global SmallCap Fund continued
Portfolio of Investments 31 August 2019
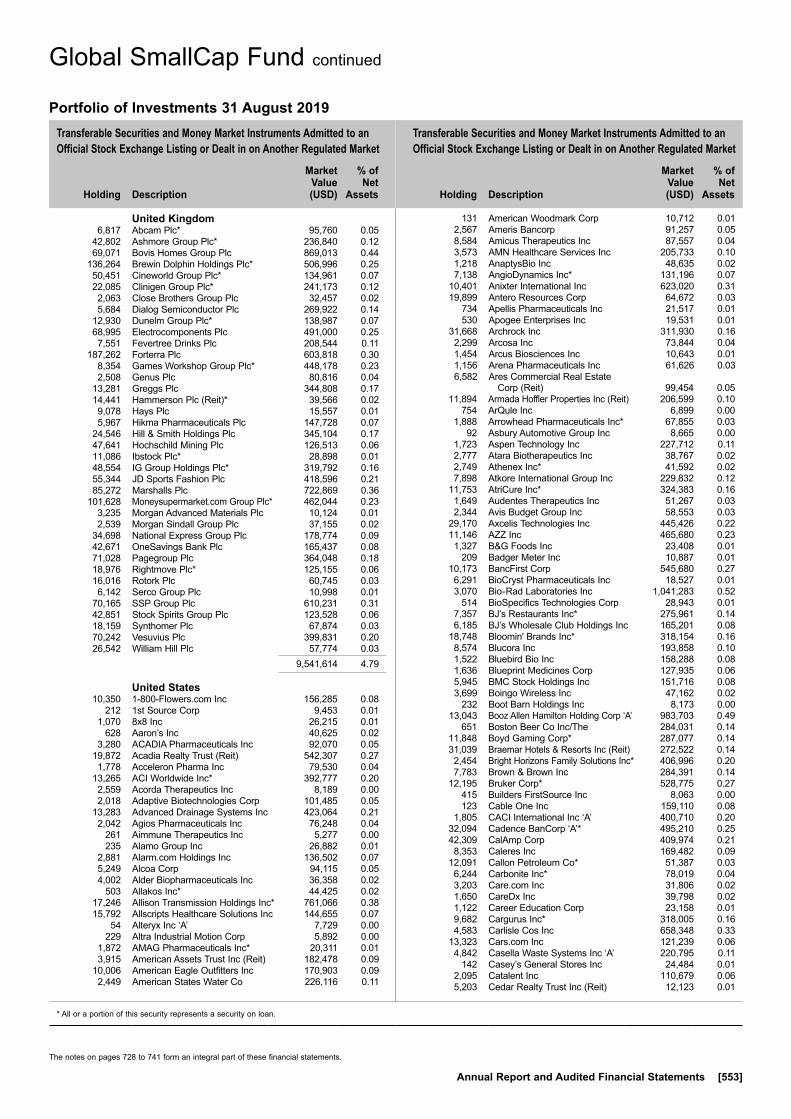
Transferable Securities and Money Market Instruments Admitted to an Official Stock Exchange Listing or Dealt in on Another Regulated Market
Transferable Securities and Money Market Instruments Admitted to an Official Stock Exchange Listing or Dealt in on Another Regulated Market
Holding
Description
Market Value (USD)
% of Net
Assets
Holding
Description
Market Value (USD)
% of Net
Assets
* All or a portion of this security represents a security on loan.
The notes on pages 728 to 741 form an integral part of these financial statements.
Annual Report and Audited Financial Statements [553]
United Kingdom 6,817 Abcam Plc* 95,760 0.05 42,802 Ashmore Group Plc* 236,840 0.12 69,071 Bovis Homes Group Plc 869,013 0.44 136,264 Brewin Dolphin Holdings Plc* 506,996 0.25 50,451 Cineworld Group Plc* 134,961 0.07 22,085 Clinigen Group Plc* 241,173 0.12 2,063 Close Brothers Group Plc 32,457 0.02 5,684 Dialog Semiconductor Plc 269,922 0.14 12,930 Dunelm Group Plc* 138,987 0.07 68,995 Electrocomponents Plc 491,000 0.25 7,551 Fevertree Drinks Plc 208,544 0.11 187,262 Forterra Plc 603,818 0.30 8,354 Games Workshop Group Plc* 448,178 0.23 2,508 Genus Plc 80,816 0.04 13,281 Greggs Plc 344,808 0.17 14,441 Hammerson Plc (Reit)* 39,566 0.02 9,078 Hays Plc 15,557 0.01 5,967 Hikma Pharmaceuticals Plc 147,728 0.07 24,546 Hill & Smith Holdings Plc 345,104 0.17 47,641 Hochschild Mining Plc 126,513 0.06 11,086 Ibstock Plc* 28,898 0.01 48,554 IG Group Holdings Plc* 319,792 0.16 55,344 JD Sports Fashion Plc 418,596 0.21 85,272 Marshalls Plc 722,869 0.36 101,628 Moneysupermarket.com Group Plc* 462,044 0.23 3,235 Morgan Advanced Materials Plc 10,124 0.01 2,539 Morgan Sindall Group Plc 37,155 0.02 34,698 National Express Group Plc 178,774 0.09 42,671 OneSavings Bank Plc 165,437 0.08 71,028 Pagegroup Plc 364,048 0.18 18,976 Rightmove Plc* 125,155 0.06 16,016 Rotork Plc 60,745 0.03 6,142 Serco Group Plc 10,998 0.01 70,165 SSP Group Plc 610,231 0.31 42,851 Stock Spirits Group Plc 123,528 0.06 18,159 Synthomer Plc 67,874 0.03 70,242 Vesuvius Plc 399,831 0.20 26,542 William Hill Plc 57,774 0.03 9,541,614 4.79
United States 10,350 1-800-Flowers.com Inc 156,285 0.08 212 1st Source Corp 9,453 0.01 1,070 8x8 Inc 26,215 0.01 628 Aaron’s Inc 40,625 0.02 3,280 ACADIA Pharmaceuticals Inc 92,070 0.05 19,872 Acadia Realty Trust (Reit) 542,307 0.27 1,778 Acceleron Pharma Inc 79,530 0.04 13,265 ACI Worldwide Inc* 392,777 0.20 2,559 Acorda Therapeutics Inc 8,189 0.00 2,018 Adaptive Biotechnologies Corp 101,485 0.05 13,283 Advanced Drainage Systems Inc 423,064 0.21 2,042 Agios Pharmaceuticals Inc 76,248 0.04 261 Aimmune Therapeutics Inc 5,277 0.00 235 Alamo Group Inc 26,882 0.01 2,881 Alarm.com Holdings Inc 136,502 0.07 5,249 Alcoa Corp 94,115 0.05 4,002 Alder Biopharmaceuticals Inc 36,358 0.02 503 Allakos Inc* 44,425 0.02 17,246 Allison Transmission Holdings Inc* 761,066 0.38 15,792 Allscripts Healthcare Solutions Inc 144,655 0.07 54 Alteryx Inc ‘A’ 7,729 0.00 229 Altra Industrial Motion Corp 5,892 0.00 1,872 AMAG Pharmaceuticals Inc* 20,311 0.01 3,915 American Assets Trust Inc (Reit) 182,478 0.09 10,006 American Eagle Outfitters Inc 170,903 0.09 2,449 American States Water Co 226,116 0.11
131 American Woodmark Corp 10,712 0.01 2,567 Ameris Bancorp 91,257 0.05 8,584 Amicus Therapeutics Inc 87,557 0.04 3,573 AMN Healthcare Services Inc 205,733 0.10 1,218 AnaptysBio Inc 48,635 0.02 7,138 AngioDynamics Inc* 131,196 0.07 10,401 Anixter International Inc 623,020 0.31 19,899 Antero Resources Corp 64,672 0.03 734 Apellis Pharmaceuticals Inc 21,517 0.01 530 Apogee Enterprises Inc 19,531 0.01 31,668 Archrock Inc 311,930 0.16 2,299 Arcosa Inc 73,844 0.04 1,454 Arcus Biosciences Inc 10,643 0.01 1,156 Arena Pharmaceuticals Inc 61,626 0.03 6,582 Ares Commercial Real Estate
Corp (Reit) 99,454 0.05 11,894 Armada Hoffler Properties Inc (Reit) 206,599 0.10 754 ArQule Inc 6,899 0.00 1,888 Arrowhead Pharmaceuticals Inc* 67,855 0.03 92 Asbury Automotive Group Inc 8,665 0.00 1,723 Aspen Technology Inc 227,712 0.11 2,777 Atara Biotherapeutics Inc 38,767 0.02 2,749 Athenex Inc* 41,592 0.02 7,898 Atkore International Group Inc 229,832 0.12 11,753 AtriCure Inc* 324,383 0.16 1,649 Audentes Therapeutics Inc 51,267 0.03 2,344 Avis Budget Group Inc 58,553 0.03 29,170 Axcelis Technologies Inc 445,426 0.22 11,146 AZZ Inc 465,680 0.23 1,327 B&G Foods Inc 23,408 0.01 209 Badger Meter Inc 10,887 0.01 10,173 BancFirst Corp 545,680 0.27 6,291 BioCryst Pharmaceuticals Inc 18,527 0.01 3,070 Bio-Rad Laboratories Inc 1,041,283 0.52 514 BioSpecifics Technologies Corp 28,943 0.01 7,357 BJ’s Restaurants Inc* 275,961 0.14 6,185 BJ’s Wholesale Club Holdings Inc 165,201 0.08 18,748 Bloomin' Brands Inc* 318,154 0.16 8,574 Blucora Inc 193,858 0.10 1,522 Bluebird Bio Inc 158,288 0.08 1,636 Blueprint Medicines Corp 127,935 0.06 5,945 BMC Stock Holdings Inc 151,716 0.08 3,699 Boingo Wireless Inc 47,162 0.02 232 Boot Barn Holdings Inc 8,173 0.00 13,043 Booz Allen Hamilton Holding Corp ‘A’ 983,703 0.49 651 Boston Beer Co Inc/The 284,031 0.14 11,848 Boyd Gaming Corp* 287,077 0.14 31,039 Braemar Hotels & Resorts Inc (Reit) 272,522 0.14 2,454 Bright Horizons Family Solutions Inc* 406,996 0.20 7,783 Brown & Brown Inc 284,391 0.14 12,195 Bruker Corp* 528,775 0.27 415 Builders FirstSource Inc 8,063 0.00 123 Cable One Inc 159,110 0.08 1,805 CACI International Inc ‘A’ 400,710 0.20 32,094 Cadence BanCorp ‘A’* 495,210 0.25 42,309 CalAmp Corp 409,974 0.21 8,353 Caleres Inc 169,482 0.09 12,091 Callon Petroleum Co* 51,387 0.03 6,244 Carbonite Inc* 78,019 0.04 3,203 Care.com Inc 31,806 0.02 1,650 CareDx Inc 39,798 0.02 1,122 Career Education Corp 23,158 0.01 9,682 Cargurus Inc* 318,005 0.16 4,583 Carlisle Cos Inc 658,348 0.33 13,323 Cars.com Inc 121,239 0.06 4,842 Casella Waste Systems Inc ‘A’ 220,795 0.11 142 Casey’s General Stores Inc 24,484 0.01 2,095 Catalent Inc 110,679 0.06 5,203 Cedar Realty Trust Inc (Reit) 12,123 0.01
Global SmallCap Fund continued
Portfolio of Investments 31 August 2019

Transferable Securities and Money Market Instruments Admitted to an Official Stock Exchange Listing or Dealt in on Another Regulated Market
Transferable Securities and Money Market Instruments Admitted to an Official Stock Exchange Listing or Dealt in on Another Regulated Market
Holding
Description
Market Value (USD)
% of Net
Assets
Holding
Description
Market Value (USD)
% of Net
Assets
* All or a portion of this security represents a security on loan.
The notes on pages 728 to 741 form an integral part of these financial statements.
[554] BlackRock Global Funds (BGF)
5,626 Central Garden & Pet Co 137,499 0.07 1,062 Central Garden & Pet Co ‘A’ 28,472 0.01 601 Century Bancorp Inc/MA 49,589 0.03 5,402 Charles River Laboratories
International Inc 708,094 0.36 845 Chart Industries Inc* 53,860 0.03 10,962 Cheesecake Factory Inc/The* 421,379 0.21 2,155 Chegg Inc 85,855 0.04 2,469 Chemed Corp 1,058,929 0.53 3,544 ChemoCentryx Inc 23,993 0.01 1,695 Choice Hotels International Inc* 154,262 0.08 17,071 Ciena Corp* 704,691 0.35 6,426 Cinemark Holdings Inc 245,923 0.12 1,373 Cirrus Logic Inc 73,304 0.04 321 Clean Harbors Inc 23,821 0.01 2,551 Coherus Biosciences Inc* 56,556 0.03 31,889 Cohu Inc 379,479 0.19 6,675 Columbia Sportswear Co 633,725 0.32 2,684 Columbus McKinnon Corp/NY 86,264 0.04 12,808 Comfort Systems USA Inc 491,571 0.25 1,871 Comtech Telecommunications Corp 50,087 0.03 2,331 CONMED Corp* 234,755 0.12 4,134 CoreCivic Inc (Reit) 70,567 0.04 4,946 Core-Mark Holding Co Inc 163,267 0.08 7,907 Cornerstone OnDemand Inc 412,034 0.21 1,845 CorVel Corp 158,633 0.08 1,448 Coupa Software Inc 202,821 0.10 404 Covetrus Inc 5,361 0.00 60 Cracker Barrel Old Country Store Inc 9,969 0.01 13,453 Crane Co 1,023,908 0.51 3,072 Crocs Inc 69,980 0.04 1,081 CSW Industrials Inc 73,184 0.04 2,989 Curtiss-Wright Corp 369,411 0.19 1,270 Deciphera Pharmaceuticals Inc 47,625 0.02 1,210 Deckers Outdoor Corp 177,580 0.09 989 Denali Therapeutics Inc 18,148 0.01 13,147 Denny’s Corp 308,034 0.15 23,322 Designer Brands Inc* 379,449 0.19 31,627 DiamondRock Hospitality Co (Reit) 297,926 0.15 1,357 Dicerna Pharmaceuticals Inc 18,876 0.01 149 Dine Brands Global Inc* 10,834 0.01 342 Diodes Inc 12,613 0.01 8,911 Domtar Corp 294,776 0.15 4,994 Douglas Dynamics Inc 209,598 0.11 26,460 Douglas Emmett Inc (Reit) 1,111,055 0.56 299 Dril-Quip Inc 14,200 0.01 2,055 Ducommun Inc 84,029 0.04 6,961 Dunkin' Brands Group Inc* 574,561 0.29 986 Eagle Bancorp Inc 40,012 0.02 706 Eagle Pharmaceuticals Inc/DE 39,889 0.02 16,636 EastGroup Properties Inc (Reit) 2,056,709 1.03 436 Editas Medicine Inc 10,961 0.01 10,095 EMCOR Group Inc 870,593 0.44 1,162 Emerald Expositions Events Inc 11,132 0.01 1,827 Emergent BioSolutions Inc 80,096 0.04 691 Enanta Pharmaceuticals Inc 49,234 0.02 1,190 Encompass Health Corp 72,531 0.04 1,644 Enova International Inc 39,538 0.02 847 EnPro Industries Inc 52,675 0.03 13,698 Enterprise Financial Services Corp* 541,482 0.27 2,486 Epizyme Inc 33,412 0.02 4,028 ePlus Inc 330,779 0.17 416 EPR Properties (Reit) 32,502 0.02 9,886 EQT Corp 104,792 0.05 3,297 Equitrans Midstream Corp* 44,378 0.02 1,193 Esperion Therapeutics Inc 43,807 0.02 3,658 Etsy Inc 195,758 0.10 3,854 Euronet Worldwide Inc 593,863 0.30 8,579 Evercore Inc ‘A’* 683,103 0.34
6,784 Everi Holdings Inc 61,056 0.03 2,088 EW Scripps Co/The ‘A’ 26,267 0.01 117,565 Exantas Capital Corp (Reit) 1,322,606 0.66 9,906 Exelixis Inc 192,375 0.10 1,638 Exponent Inc 115,315 0.06 14,145 Extended Stay America Inc 201,354 0.10 7,253 Exterran Corp 75,794 0.04 2,576 Fate Therapeutics Inc 43,431 0.02 1,483 Federal Agricultural Mortgage Corp 122,763 0.06 6,909 Federal Signal Corp 204,506 0.10 8,235 Federated Investors Inc 263,767 0.13 2,753 FibroGen Inc 125,647 0.06 14,606 First Industrial Realty Trust Inc (Reit) 570,218 0.29 3,658 Five Prime Therapeutics Inc 20,521 0.01 1,396 Five9 Inc 88,548 0.04 4,954 Forrester Research Inc 171,755 0.09 3,120 Forty Seven Inc 22,901 0.01 18,758 Forum Energy Technologies Inc 28,512 0.01 1,526 Fox Factory Holding Corp* 111,352 0.06 3,210 frontdoor Inc 163,871 0.08 1,664 FTI Consulting Inc 178,813 0.09 281 G1 Therapeutics Inc 10,265 0.01 6,360 Generac Holdings Inc 491,119 0.25 1,141 Genomic Health Inc 85,735 0.04 12,111 Gentex Corp 323,000 0.16 2,509 G-III Apparel Group Ltd 52,639 0.03 1,121 Glaukos Corp 73,941 0.04 2,092 Global Blood Therapeutics Inc 98,052 0.05 2,173 GMS Inc 62,104 0.03 5,034 Goodyear Tire & Rubber Co/The 58,344 0.03 531 Gossamer Bio Inc 10,540 0.01 202,867 Gran Tierra Energy Inc* 290,100 0.15 1,752 Grand Canyon Education Inc* 222,767 0.11 4,342 Granite Construction Inc* 122,401 0.06 763 Gray Television Inc 11,689 0.01 885 Great Southern Bancorp Inc 50,082 0.03 1,505 Green Dot Corp ‘A’ 45,812 0.02 864 Green Plains Inc 7,042 0.00 1,036 Group 1 Automotive Inc 78,705 0.04 5,045 H&E Equipment Services Inc 122,240 0.06 1,318 Haemonetics Corp 175,294 0.09 5,186 Halozyme Therapeutics Inc 85,828 0.04 16,764 Hancock Whitney Corp 589,590 0.30 1,889 Health Catalyst Inc 76,032 0.04 4,201 Healthcare Services Group Inc* 93,178 0.05 4,667 HealthEquity Inc* 277,780 0.14 261 Herc Holdings Inc 10,881 0.01 29,392 Heritage Commerce Corp* 343,299 0.17 5,893 Herman Miller Inc 248,508 0.12 1,123 Heron Therapeutics Inc 20,978 0.01 846 Hertz Global Holdings Inc 10,440 0.01 4,355 Hexcel Corp* 366,168 0.18 38,336 Hillenbrand Inc 1,057,307 0.53 3,030 Hill-Rom Holdings Inc 325,422 0.16 1,482 Hilltop Holdings Inc 34,634 0.02 6,282 HMS Holdings Corp 230,361 0.12 1,238 Hooker Furniture Corp 22,197 0.01 8,352 Hostess Brands Inc ‘A’ 117,012 0.06 2,501 Hub Group Inc ‘A’ 108,443 0.05 2,200 HubSpot Inc* 443,014 0.22 7,078 IAA Inc 344,840 0.17 5,767 IBERIABANK Corp* 399,884 0.20 3,240 Immunomedics Inc* 42,930 0.02 4,125 Ingevity Corp 316,429 0.16 3,960 Inphi Corp* 242,431 0.12 3,378 Insight Enterprises Inc 163,495 0.08 3,351 Insmed Inc 55,694 0.03 2,565 Insperity Inc 258,501 0.13 1,000 Installed Building Products Inc 56,800 0.03
Portfolio of Investments 31 August 2019
Global SmallCap Fund continued
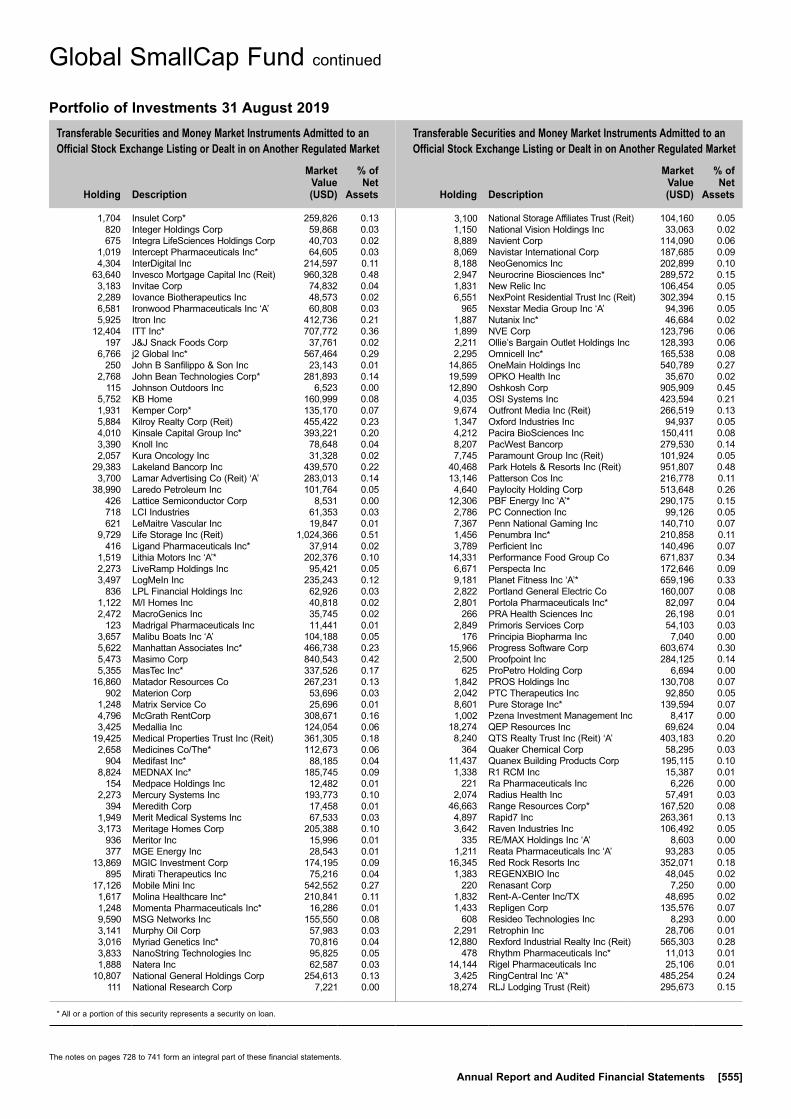
Transferable Securities and Money Market Instruments Admitted to an Official Stock Exchange Listing or Dealt in on Another Regulated Market
Transferable Securities and Money Market Instruments Admitted to an Official Stock Exchange Listing or Dealt in on Another Regulated Market
Holding
Description
Market Value (USD)
% of Net
Assets
Holding
Description
Market Value (USD)
% of Net
Assets
* All or a portion of this security represents a security on loan.
The notes on pages 728 to 741 form an integral part of these financial statements.
Annual Report and Audited Financial Statements [555]
1,704 Insulet Corp* 259,826 0.13 820 Integer Holdings Corp 59,868 0.03 675 Integra LifeSciences Holdings Corp 40,703 0.02 1,019 Intercept Pharmaceuticals Inc* 64,605 0.03 4,304 InterDigital Inc 214,597 0.11 63,640 Invesco Mortgage Capital Inc (Reit) 960,328 0.48 3,183 Invitae Corp 74,832 0.04 2,289 Iovance Biotherapeutics Inc 48,573 0.02 6,581 Ironwood Pharmaceuticals Inc ‘A’ 60,808 0.03 5,925 Itron Inc 412,736 0.21 12,404 ITT Inc* 707,772 0.36 197 J&J Snack Foods Corp 37,761 0.02 6,766 j2 Global Inc* 567,464 0.29 250 John B Sanfilippo & Son Inc 23,143 0.01 2,768 John Bean Technologies Corp* 281,893 0.14 115 Johnson Outdoors Inc 6,523 0.00 5,752 KB Home 160,999 0.08 1,931 Kemper Corp* 135,170 0.07 5,884 Kilroy Realty Corp (Reit) 455,422 0.23 4,010 Kinsale Capital Group Inc* 393,221 0.20 3,390 Knoll Inc 78,648 0.04 2,057 Kura Oncology Inc 31,328 0.02 29,383 Lakeland Bancorp Inc 439,570 0.22 3,700 Lamar Advertising Co (Reit) ‘A’ 283,013 0.14 38,990 Laredo Petroleum Inc 101,764 0.05 426 Lattice Semiconductor Corp 8,531 0.00 718 LCI Industries 61,353 0.03 621 LeMaitre Vascular Inc 19,847 0.01 9,729 Life Storage Inc (Reit) 1,024,366 0.51 416 Ligand Pharmaceuticals Inc* 37,914 0.02 1,519 Lithia Motors Inc ‘A’* 202,376 0.10 2,273 LiveRamp Holdings Inc 95,421 0.05 3,497 LogMeIn Inc 235,243 0.12 836 LPL Financial Holdings Inc 62,926 0.03 1,122 M/I Homes Inc 40,818 0.02 2,472 MacroGenics Inc 35,745 0.02 123 Madrigal Pharmaceuticals Inc 11,441 0.01 3,657 Malibu Boats Inc ‘A’ 104,188 0.05 5,622 Manhattan Associates Inc* 466,738 0.23 5,473 Masimo Corp 840,543 0.42 5,355 MasTec Inc* 337,526 0.17 16,860 Matador Resources Co 267,231 0.13 902 Materion Corp 53,696 0.03 1,248 Matrix Service Co 25,696 0.01 4,796 McGrath RentCorp 308,671 0.16 3,425 Medallia Inc 124,054 0.06 19,425 Medical Properties Trust Inc (Reit) 361,305 0.18 2,658 Medicines Co/The* 112,673 0.06 904 Medifast Inc* 88,185 0.04 8,824 MEDNAX Inc* 185,745 0.09 154 Medpace Holdings Inc 12,482 0.01 2,273 Mercury Systems Inc 193,773 0.10 394 Meredith Corp 17,458 0.01 1,949 Merit Medical Systems Inc 67,533 0.03 3,173 Meritage Homes Corp 205,388 0.10 936 Meritor Inc 15,996 0.01 377 MGE Energy Inc 28,543 0.01 13,869 MGIC Investment Corp 174,195 0.09 895 Mirati Therapeutics Inc 75,216 0.04 17,126 Mobile Mini Inc 542,552 0.27 1,617 Molina Healthcare Inc* 210,841 0.11 1,248 Momenta Pharmaceuticals Inc* 16,286 0.01 9,590 MSG Networks Inc 155,550 0.08 3,141 Murphy Oil Corp 57,983 0.03 3,016 Myriad Genetics Inc* 70,816 0.04 3,833 NanoString Technologies Inc 95,825 0.05 1,888 Natera Inc 62,587 0.03 10,807 National General Holdings Corp 254,613 0.13 111 National Research Corp 7,221 0.00
3,100 National Storage Affiliates Trust (Reit) 104,160 0.05 1,150 National Vision Holdings Inc 33,063 0.02 8,889 Navient Corp 114,090 0.06 8,069 Navistar International Corp 187,685 0.09 8,188 NeoGenomics Inc 202,899 0.10 2,947 Neurocrine Biosciences Inc* 289,572 0.15 1,831 New Relic Inc 106,454 0.05 6,551 NexPoint Residential Trust Inc (Reit) 302,394 0.15 965 Nexstar Media Group Inc ‘A’ 94,396 0.05 1,887 Nutanix Inc* 46,684 0.02 1,899 NVE Corp 123,796 0.06 2,211 Ollie’s Bargain Outlet Holdings Inc 128,393 0.06 2,295 Omnicell Inc* 165,538 0.08 14,865 OneMain Holdings Inc 540,789 0.27 19,599 OPKO Health Inc 35,670 0.02 12,890 Oshkosh Corp 905,909 0.45 4,035 OSI Systems Inc 423,594 0.21 9,674 Outfront Media Inc (Reit) 266,519 0.13 1,347 Oxford Industries Inc 94,937 0.05 4,212 Pacira BioSciences Inc 150,411 0.08 8,207 PacWest Bancorp 279,530 0.14 7,745 Paramount Group Inc (Reit) 101,924 0.05 40,468 Park Hotels & Resorts Inc (Reit) 951,807 0.48 13,146 Patterson Cos Inc 216,778 0.11 4,640 Paylocity Holding Corp 513,648 0.26 12,306 PBF Energy Inc ‘A’* 290,175 0.15 2,786 PC Connection Inc 99,126 0.05 7,367 Penn National Gaming Inc 140,710 0.07 1,456 Penumbra Inc* 210,858 0.11 3,789 Perficient Inc 140,496 0.07 14,331 Performance Food Group Co 671,837 0.34 6,671 Perspecta Inc 172,646 0.09 9,181 Planet Fitness Inc ‘A’* 659,196 0.33 2,822 Portland General Electric Co 160,007 0.08 2,801 Portola Pharmaceuticals Inc* 82,097 0.04 266 PRA Health Sciences Inc 26,198 0.01 2,849 Primoris Services Corp 54,103 0.03 176 Principia Biopharma Inc 7,040 0.00 15,966 Progress Software Corp 603,674 0.30 2,500 Proofpoint Inc 284,125 0.14 625 ProPetro Holding Corp 6,694 0.00 1,842 PROS Holdings Inc 130,708 0.07 2,042 PTC Therapeutics Inc 92,850 0.05 8,601 Pure Storage Inc* 139,594 0.07 1,002 Pzena Investment Management Inc 8,417 0.00 18,274 QEP Resources Inc 69,624 0.04 8,240 QTS Realty Trust Inc (Reit) ‘A’ 403,183 0.20 364 Quaker Chemical Corp 58,295 0.03 11,437 Quanex Building Products Corp 195,115 0.10 1,338 R1 RCM Inc 15,387 0.01 221 Ra Pharmaceuticals Inc 6,226 0.00 2,074 Radius Health Inc 57,491 0.03 46,663 Range Resources Corp* 167,520 0.08 4,897 Rapid7 Inc 263,361 0.13 3,642 Raven Industries Inc 106,492 0.05 335 RE/MAX Holdings Inc ‘A’ 8,603 0.00 1,211 Reata Pharmaceuticals Inc ‘A’ 93,283 0.05 16,345 Red Rock Resorts Inc 352,071 0.18 1,383 REGENXBIO Inc 48,045 0.02 220 Renasant Corp 7,250 0.00 1,832 Rent-A-Center Inc/TX 48,695 0.02 1,433 Repligen Corp 135,576 0.07 608 Resideo Technologies Inc 8,293 0.00 2,291 Retrophin Inc 28,706 0.01 12,880 Rexford Industrial Realty Inc (Reit) 565,303 0.28 478 Rhythm Pharmaceuticals Inc* 11,013 0.01 14,144 Rigel Pharmaceuticals Inc 25,106 0.01 3,425 RingCentral Inc ‘A’* 485,254 0.24 18,274 RLJ Lodging Trust (Reit) 295,673 0.15
Global SmallCap Fund continued
Portfolio of Investments 31 August 2019

Transferable Securities and Money Market Instruments Admitted to an Official Stock Exchange Listing or Dealt in on Another Regulated Market
Transferable Securities and Money Market Instruments Admitted to an Official Stock Exchange Listing or Dealt in on Another Regulated Market
Holding
Description
Market Value (USD)
% of Net
Assets
Holding
Description
Market Value (USD)
% of Net
Assets
* All or a portion of this security represents a security on loan.** Security subject to a fair value adjustment as detailed in Note 2(j).
The notes on pages 728 to 741 form an integral part of these financial statements.
[556] BlackRock Global Funds (BGF)
2,464 Rocket Pharmaceuticals Inc* 27,326 0.01 4,209 RPM International Inc* 285,034 0.14 2,892 Rubius Therapeutics Inc 26,751 0.01 11,518 Rush Enterprises Inc ‘A’ 410,386 0.21 17,850 Ruth’s Hospitality Group Inc* 353,787 0.18 4,062 Ryder System Inc* 197,535 0.10 1,427 Sage Therapeutics Inc* 245,986 0.12 1,626 Sangamo Therapeutics Inc 18,081 0.01 9,493 Sanmina Corp 277,196 0.14 204 Sarepta Therapeutics Inc* 18,360 0.01 3,058 Saul Centers Inc (Reit) 154,093 0.08 3,736 ScanSource Inc 107,111 0.05 1,787 Scholar Rock Holding Corp* 19,550 0.01 4,412 Science Applications
International Corp* 384,859 0.19 2,785 Scotts Miracle-Gro Co/The 297,187 0.15 807 Semtech Corp 33,926 0.02 274 Shake Shack Inc ‘A’ 27,247 0.01 9,704 Shenandoah Telecommunications Co 308,102 0.15 1,358 Simply Good Foods Co/The 40,618 0.02 3,167 Sinclair Broadcast Group Inc ‘A’ 142,578 0.07 1,265 Six Flags Entertainment Corp 73,876 0.04 1,386 Skechers U.S.A. Inc 43,811 0.02 8,433 SkyWest Inc 486,415 0.24 1,573 Sleep Number Corp 66,506 0.03 1,827 SM Energy Co 17,594 0.01 3,956 Smartsheet Inc ‘A’ 196,851 0.10 2,592 Southwest Gas Holdings Inc 234,446 0.12 14,967 SP Plus Corp 520,103 0.26 2,614 SpartanNash Co 28,806 0.01 3,576 Spectrum Pharmaceuticals Inc 27,178 0.01 11,693 SPS Commerce Inc 592,017 0.30 23,544 STAG Industrial Inc (Reit) 684,189 0.34 6,327 Standex International Corp 434,981 0.22 31,821 Steelcase Inc 497,680 0.25 2,721 Stemline Therapeutics Inc 33,577 0.02 1,051 Steven Madden Ltd 35,219 0.02 6,450 Stifel Financial Corp* 348,236 0.18 664 Strategic Education Inc 113,783 0.06 2,521 Summit Hotel Properties Inc (Reit) 27,807 0.01 8,430 Sunstone Hotel Investors Inc (Reit) 110,686 0.06 1,756 Surgery Partners Inc* 11,230 0.01 459 SVMK Inc 7,757 0.00 2,369 Syneos Health Inc 124,207 0.06 10,182 SYNNEX Corp 860,888 0.43 419 Tactile Systems Technology Inc 20,875 0.01 8,112 Talos Energy Inc* 157,941 0.08 910 Tandem Diabetes Care Inc 67,103 0.03 24,401 TCF Financial Corp 943,343 0.47 4,912 TEGNA Inc 70,536 0.04 2,828 Teledyne Technologies Inc 882,336 0.44 13,847 Telephone & Data Systems Inc 350,329 0.18 4,352 Tempur Sealy International Inc 337,933 0.17 6,861 Teradyne Inc 363,907 0.18 11,551 Terreno Realty Corp (Reit) 582,401 0.29 3,656 Tetra Tech Inc 296,831 0.15 904 Texas Roadhouse Inc ‘A’ 46,222 0.02 30,066 Thermon Group Holdings Inc 653,635 0.33 10,685 Thor Industries Inc* 494,929 0.25 1,318 TopBuild Corp 121,296 0.06 111 Trade Desk Inc/The ‘A’ 27,902 0.01 859 TriNet Group Inc 58,627 0.03 9,272 TriState Capital Holdings Inc 183,678 0.09 1,301 Ultragenyx Pharmaceutical Inc 70,839 0.04 773 Umpqua Holdings Corp 12,105 0.01 759 United Community Financial
Corp/OH 7,294 0.00 4,854 United States Cellular Corp* 175,909 0.09 1,545 United Therapeutics Corp 129,208 0.07
1,551 Unitil Corp 93,618 0.05 5,664 Universal Forest Products Inc 221,916 0.11 2,699 Universal Insurance Holdings Inc 64,101 0.03 13,831 Universal Logistics Holdings Inc 288,515 0.15 632 Upland Software Inc 24,831 0.01 1,076 US Ecology Inc 64,560 0.03 9,784 US Foods Holding Corp 396,643 0.20 1,044 US Physical Therapy Inc* 139,959 0.07 2,679 Vanda Pharmaceuticals Inc 37,854 0.02 385 Varex Imaging Corp 10,210 0.01 1,858 Veracyte Inc 50,909 0.03 2,322 Vericel Corp* 38,359 0.02 491 Verint Systems Inc 26,161 0.01 7,556 ViaSat Inc 599,871 0.30 627 Viavi Solutions Inc 8,628 0.00 29,033 VICI Properties Inc (Reit)* 643,662 0.32 2,636 Vocera Communications Inc 60,997 0.03 17,075 Vonage Holdings Corp 225,988 0.11 1,644 Voyager Therapeutics Inc 30,389 0.02 12,325 Webster Financial Corp 547,970 0.28 3,656 Weingarten Realty Investors (Reit) 96,445 0.05 7,205 WesBanco Inc 248,861 0.13 4,706 West Pharmaceutical Services Inc* 689,617 0.35 9,355 Western Alliance Bancorp* 408,439 0.21 25,551 Western Asset Mortgage Capital
Corp (Reit) 240,690 0.12 57 WEX Inc 11,728 0.01 359 Williams-Sonoma Inc* 23,235 0.01 1,240 Wingstop Inc* 127,100 0.06 5,990 Wintrust Financial Corp 378,388 0.19 1,944 Woodward Inc 208,144 0.10 6,213 Workiva Inc ‘A’ 295,925 0.15 2,764 Worthington Industries Inc 96,519 0.05 2,361 WR Grace & Co* 158,754 0.08 2,938 Wyndham Hotels & Resorts Inc 151,630 0.08 961 Xencor Inc* 35,831 0.02 7,801 Xperi Corp 144,006 0.07 12,458 Yelp Inc ‘A’ 418,838 0.21 3,215 Zendesk Inc* 260,865 0.13 1,243 ZIOPHARM Oncology Inc* 6,215 0.00 1,115 Zscaler Inc 78,150 0.04 80,059 Zynga Inc ‘A’ 461,140 0.23 98,152,496 49.26Total Common / Preferred Stocks (Shares) 192,991,336 96.87Total Transferable Securities and Money Market Instruments Admitted to an Official Stock Exchange Listing or Dealt in on Another Regulated Market 192,991,336 96.87
Other Transferable Securities
COMMON STOCKS (SHARES)
Brazil 316 Gol Linhas Aéreas Inteligentes
(Right 4/10/2019) – 0.00
Canada 1,272,764 Diagnocure Inc** – 0.00Total Common Stocks (Shares) – 0.00Total Other Transferable Securities – 0.00Total Portfolio 192,991,336 96.87
Other Net Assets 6,242,884 3.13Total Net Assets (USD) 199,234,220 100.00
Global SmallCap Fund continued
Portfolio of Investments 31 August 2019
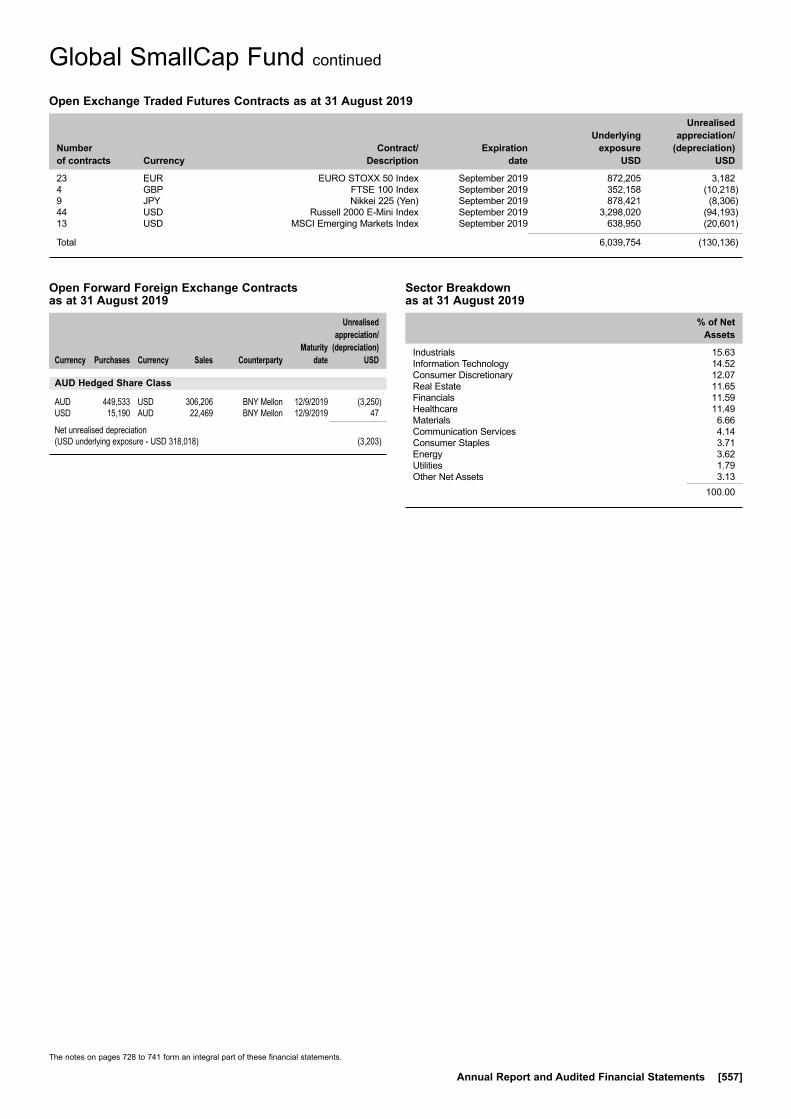
The notes on pages 728 to 741 form an integral part of these financial statements.
Annual Report and Audited Financial Statements [557]
Global SmallCap Fund continued
Open Forward Foreign Exchange Contracts as at 31 August 2019
Currency
Purchases Currency
Sales Counterparty
Maturity date
Unrealised appreciation/
(depreciation) USD
AUD Hedged Share Class
AUD 449,533 USD 306,206 BNY Mellon 12/9/2019 (3,250)USD 15,190 AUD 22,469 BNY Mellon 12/9/2019 47
Net unrealised depreciation (USD underlying exposure - USD 318,018) (3,203)
Sector Breakdown as at 31 August 2019
% of Net Assets
Industrials 15.63Information Technology 14.52Consumer Discretionary 12.07Real Estate 11.65Financials 11.59Healthcare 11.49Materials 6.66Communication Services 4.14Consumer Staples 3.71Energy 3.62Utilities 1.79Other Net Assets 3.13
100.00
Open Exchange Traded Futures Contracts as at 31 August 2019
Number of contracts Currency
Contract/ Description
Expiration date
Underlying exposure
USD
Unrealised appreciation/
(depreciation) USD
23 EUR EURO STOXX 50 Index September 2019 872,205 3,1824 GBP FTSE 100 Index September 2019 352,158 (10,218)9 JPY Nikkei 225 (Yen) September 2019 878,421 (8,306)44 USD Russell 2000 E-Mini Index September 2019 3,298,020 (94,193)13 USD MSCI Emerging Markets Index September 2019 638,950 (20,601)
Total 6,039,754 (130,136)

Transferable Securities and Money Market Instruments Admitted to an Official Stock Exchange Listing or Dealt in on Another Regulated Market
Transferable Securities and Money Market Instruments Admitted to an Official Stock Exchange Listing or Dealt in on Another Regulated Market
Holding
Description
Market Value (USD)
% of Net
Assets
Holding
Description
Market Value (USD)
% of Net
Assets
The notes on pages 728 to 741 form an integral part of these financial statements.
[558] BlackRock Global Funds (BGF)
COMMON STOCKS (SHARES)
India 4,672,714 Ashok Leyland Ltd 4,217,435 0.97 445,378 Asian Paints Ltd 10,080,454 2.31 348,881 AU Small Finance Bank Ltd 3,291,547 0.76 2,489,481 Axis Bank Ltd 23,145,561 5.31 316,328 Bajaj Finance Ltd 14,762,640 3.39 1,505,783 Bharat Petroleum Corp Ltd 7,491,223 1.72 2,407,855 Bharti Airtel Ltd 11,694,069 2.68 887,354 Chalet Hotels Ltd 3,642,243 0.84 104,230 Dalmia Bharat Ltd 1,313,905 0.30 9,385 Eicher Motors Ltd 2,136,828 0.49 2,636,923 Fortis Healthcare Ltd 4,584,589 1.05 3,310,058 GAIL India Ltd 6,016,813 1.38 730,151 Godrej Industries Ltd 4,295,067 0.99 646,037 Havells India Ltd 6,143,493 1.41 1,307,891 HDFC Bank Ltd 40,806,864 9.37 944,966 HDFC Life Insurance Co Ltd 7,373,005 1.69 108,157 Hero MotoCorp Ltd 3,895,743 0.89 660,412 Housing Development
Finance Corp Ltd 20,036,407 4.60 4,493,331 ICICI Bank Ltd 25,777,310 5.92 147,394 ICICI Lombard General
Insurance Co Ltd 2,596,257 0.60 406,329 ICICI Prudential Life
Insurance Co Ltd 2,416,095 0.55 489,133 IndusInd Bank Ltd 9,560,725 2.19 3,579,455 Infosys Ltd 40,848,626 9.38 3,817,563 ITC Ltd 13,132,857 3.01 2,896,228 Jindal Steel & Power Ltd 3,918,015 0.90 752,527 Kotak Mahindra Bank Ltd 15,085,319 3.46 264,930 L&T Technology Services Ltd 6,014,838 1.38 744,506 Larsen & Toubro Ltd 13,848,548 3.18
1,437,453 Mahindra & Mahindra Financial Services Ltd 6,440,684 1.48
154,961 Maruti Suzuki India Ltd 13,289,116 3.05 16,566 Nestle India Ltd 2,986,949 0.69 683,008 Oberoi Realty Ltd 5,432,405 1.25 2,150,942 Petronet LNG Ltd 8,038,077 1.85 395,428 Quess Corp Ltd 2,630,649 0.60 1,976,828 Reliance Industries Ltd 34,564,561 7.93 24,364 Shree Cement Ltd 6,337,319 1.45 102,832 SRF Ltd 3,995,627 0.92 321,273 Sterling & Wilson Solar Ltd 2,743,807 0.63 123,966 Supreme Industries Ltd 1,919,015 0.44 550,271 Tata Steel Ltd 2,657,823 0.61 1,059,370 Tech Mahindra Ltd 10,290,685 2.36 386,926 Titan Co Ltd 5,988,054 1.37 110,615 UltraTech Cement Ltd 6,277,207 1.44 946,363 UPL Ltd 7,464,086 1.71 429,182,540 98.50
United States 84,708 Cognizant Technology
Solutions Corp 5,212,930 1.20Total Common Stocks (Shares) 434,395,470 99.70Total Transferable Securities and Money Market Instruments Admitted to an Official Stock Exchange Listing or Dealt in on Another Regulated Market 434,395,470 99.70Total Portfolio 434,395,470 99.70
Other Net Assets 1,320,873 0.30Total Net Assets (USD) 435,716,343 100.00
India Fund
Portfolio of Investments 31 August 2019
India Fund
The above investments are those held by BlackRock India Equities (Mauritius) Limited, which is a wholly owned subsidiary of the Company.
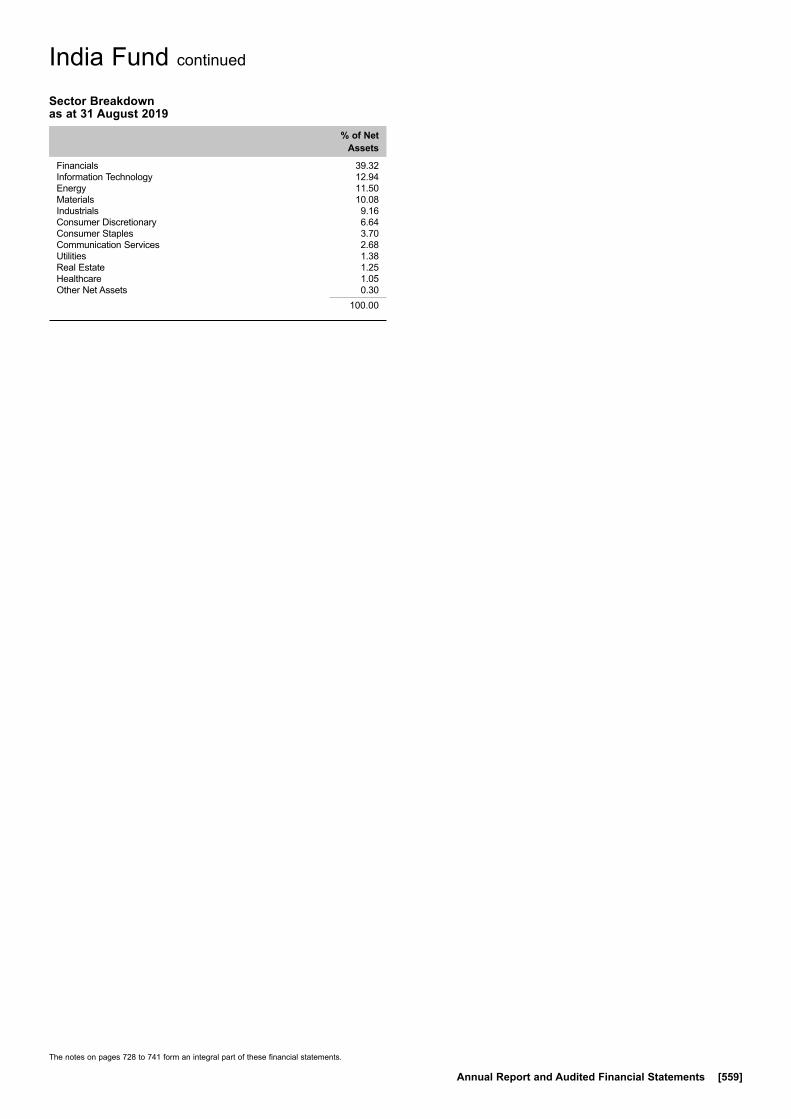
The notes on pages 728 to 741 form an integral part of these financial statements.
Annual Report and Audited Financial Statements [559]
India Fund continued
Sector Breakdown as at 31 August 2019
% of Net Assets
Financials 39.32Information Technology 12.94Energy 11.50Materials 10.08Industrials 9.16Consumer Discretionary 6.64Consumer Staples 3.70Communication Services 2.68Utilities 1.38Real Estate 1.25Healthcare 1.05Other Net Assets 0.30
100.00
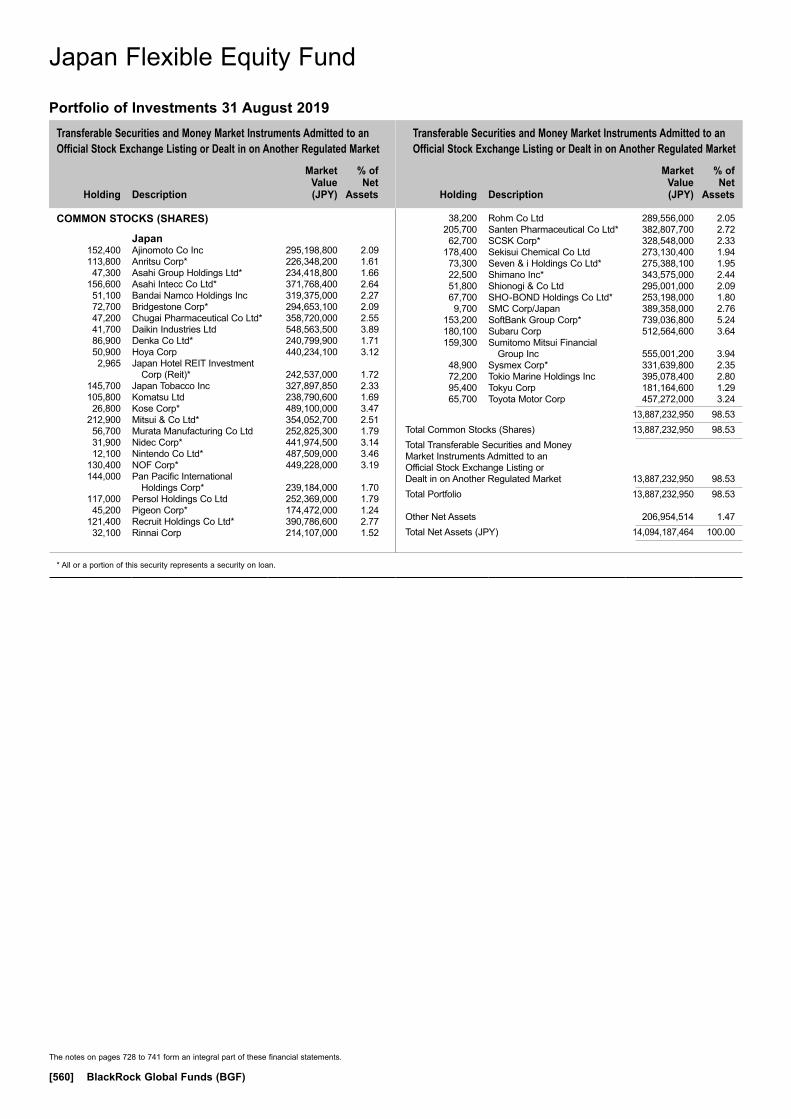
Transferable Securities and Money Market Instruments Admitted to an Official Stock Exchange Listing or Dealt in on Another Regulated Market
Transferable Securities and Money Market Instruments Admitted to an Official Stock Exchange Listing or Dealt in on Another Regulated Market
Holding
Description
Market Value (JPY)
% of Net
Assets
Holding
Description
Market Value (JPY)
% of Net
Assets
* All or a portion of this security represents a security on loan.
The notes on pages 728 to 741 form an integral part of these financial statements.
[560] BlackRock Global Funds (BGF)
COMMON STOCKS (SHARES)
Japan 152,400 Ajinomoto Co Inc 295,198,800 2.09 113,800 Anritsu Corp* 226,348,200 1.61 47,300 Asahi Group Holdings Ltd* 234,418,800 1.66 156,600 Asahi Intecc Co Ltd* 371,768,400 2.64 51,100 Bandai Namco Holdings Inc 319,375,000 2.27 72,700 Bridgestone Corp* 294,653,100 2.09 47,200 Chugai Pharmaceutical Co Ltd* 358,720,000 2.55 41,700 Daikin Industries Ltd 548,563,500 3.89 86,900 Denka Co Ltd* 240,799,900 1.71 50,900 Hoya Corp 440,234,100 3.12 2,965 Japan Hotel REIT Investment
Corp (Reit)* 242,537,000 1.72 145,700 Japan Tobacco Inc 327,897,850 2.33 105,800 Komatsu Ltd 238,790,600 1.69 26,800 Kose Corp* 489,100,000 3.47 212,900 Mitsui & Co Ltd* 354,052,700 2.51 56,700 Murata Manufacturing Co Ltd 252,825,300 1.79 31,900 Nidec Corp* 441,974,500 3.14 12,100 Nintendo Co Ltd* 487,509,000 3.46 130,400 NOF Corp* 449,228,000 3.19 144,000 Pan Pacific International
Holdings Corp* 239,184,000 1.70 117,000 Persol Holdings Co Ltd 252,369,000 1.79 45,200 Pigeon Corp* 174,472,000 1.24 121,400 Recruit Holdings Co Ltd* 390,786,600 2.77 32,100 Rinnai Corp 214,107,000 1.52
38,200 Rohm Co Ltd 289,556,000 2.05 205,700 Santen Pharmaceutical Co Ltd* 382,807,700 2.72 62,700 SCSK Corp* 328,548,000 2.33 178,400 Sekisui Chemical Co Ltd 273,130,400 1.94 73,300 Seven & i Holdings Co Ltd* 275,388,100 1.95 22,500 Shimano Inc* 343,575,000 2.44 51,800 Shionogi & Co Ltd 295,001,000 2.09 67,700 SHO-BOND Holdings Co Ltd* 253,198,000 1.80 9,700 SMC Corp/Japan 389,358,000 2.76 153,200 SoftBank Group Corp* 739,036,800 5.24 180,100 Subaru Corp 512,564,600 3.64 159,300 Sumitomo Mitsui Financial
Group Inc 555,001,200 3.94 48,900 Sysmex Corp* 331,639,800 2.35 72,200 Tokio Marine Holdings Inc 395,078,400 2.80 95,400 Tokyu Corp 181,164,600 1.29 65,700 Toyota Motor Corp 457,272,000 3.24 13,887,232,950 98.53Total Common Stocks (Shares) 13,887,232,950 98.53Total Transferable Securities and Money Market Instruments Admitted to an Official Stock Exchange Listing or Dealt in on Another Regulated Market 13,887,232,950 98.53Total Portfolio 13,887,232,950 98.53
Other Net Assets 206,954,514 1.47Total Net Assets (JPY) 14,094,187,464 100.00
Japan Flexible Equity Fund
Portfolio of Investments 31 August 2019
Japan Flexible Equity Fund
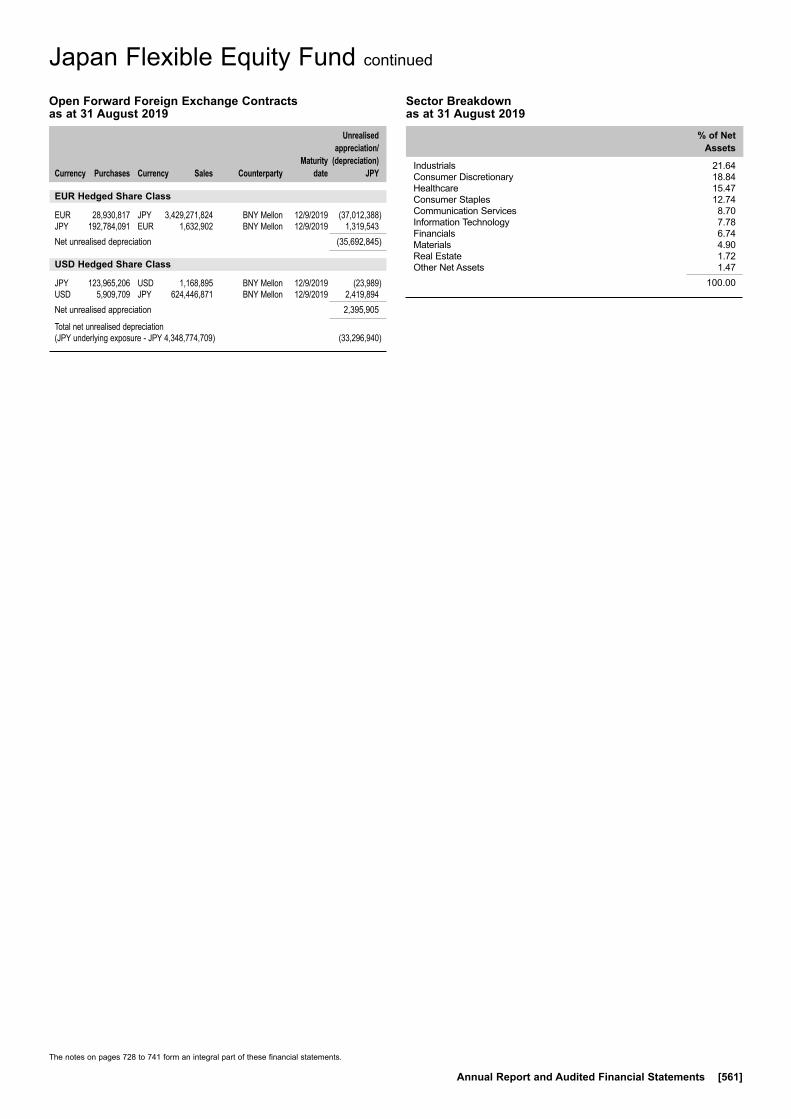
The notes on pages 728 to 741 form an integral part of these financial statements.
Annual Report and Audited Financial Statements [561]
Japan Flexible Equity Fund continued
Open Forward Foreign Exchange Contracts as at 31 August 2019
Currency
Purchases Currency
Sales Counterparty
Maturity date
Unrealised appreciation/
(depreciation) JPY
EUR Hedged Share Class
EUR 28,930,817 JPY 3,429,271,824 BNY Mellon 12/9/2019 (37,012,388)JPY 192,784,091 EUR 1,632,902 BNY Mellon 12/9/2019 1,319,543Net unrealised depreciation (35,692,845)
USD Hedged Share Class
JPY 123,965,206 USD 1,168,895 BNY Mellon 12/9/2019 (23,989)USD 5,909,709 JPY 624,446,871 BNY Mellon 12/9/2019 2,419,894Net unrealised appreciation 2,395,905
Total net unrealised depreciation (JPY underlying exposure - JPY 4,348,774,709) (33,296,940)
Sector Breakdown as at 31 August 2019
% of Net Assets
Industrials 21.64Consumer Discretionary 18.84Healthcare 15.47Consumer Staples 12.74Communication Services 8.70Information Technology 7.78Financials 6.74Materials 4.90Real Estate 1.72Other Net Assets 1.47
100.00
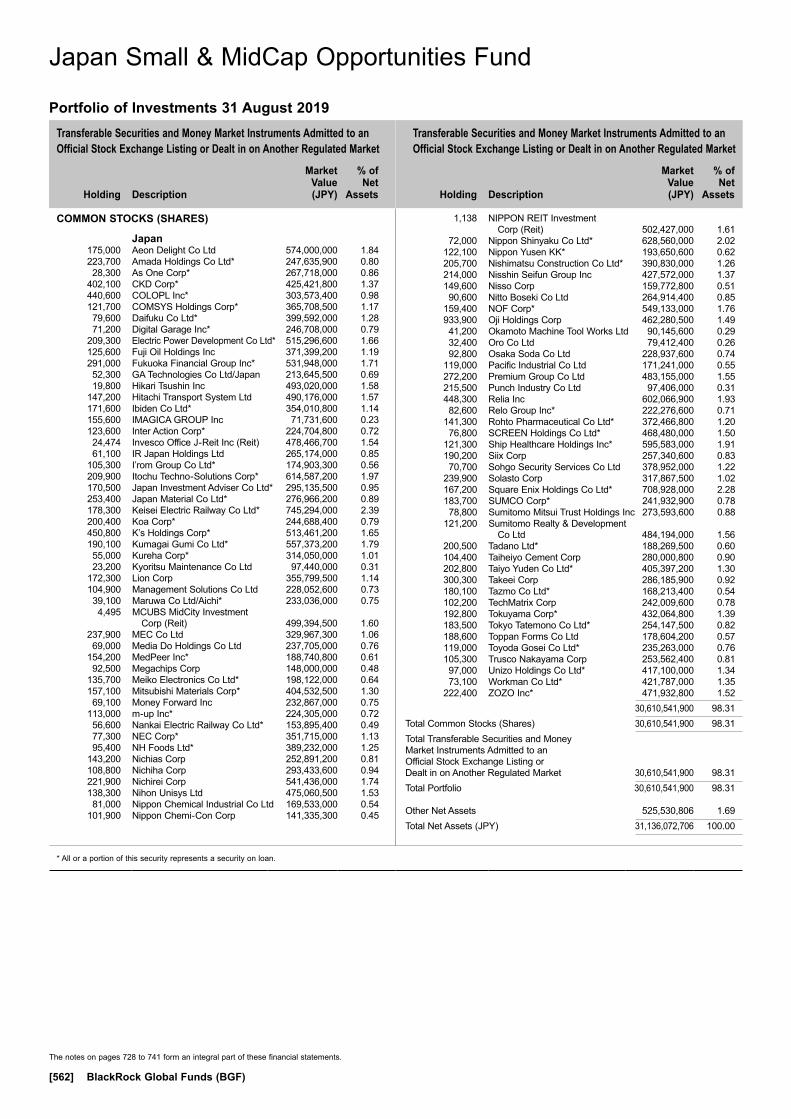
Transferable Securities and Money Market Instruments Admitted to an Official Stock Exchange Listing or Dealt in on Another Regulated Market
Transferable Securities and Money Market Instruments Admitted to an Official Stock Exchange Listing or Dealt in on Another Regulated Market
Holding
Description
Market Value (JPY)
% of Net
Assets
Holding
Description
Market Value (JPY)
% of Net
Assets
* All or a portion of this security represents a security on loan.
The notes on pages 728 to 741 form an integral part of these financial statements.
[562] BlackRock Global Funds (BGF)
COMMON STOCKS (SHARES)
Japan 175,000 Aeon Delight Co Ltd 574,000,000 1.84 223,700 Amada Holdings Co Ltd* 247,635,900 0.80 28,300 As One Corp* 267,718,000 0.86 402,100 CKD Corp* 425,421,800 1.37 440,600 COLOPL Inc* 303,573,400 0.98 121,700 COMSYS Holdings Corp* 365,708,500 1.17 79,600 Daifuku Co Ltd* 399,592,000 1.28 71,200 Digital Garage Inc* 246,708,000 0.79 209,300 Electric Power Development Co Ltd* 515,296,600 1.66 125,600 Fuji Oil Holdings Inc 371,399,200 1.19 291,000 Fukuoka Financial Group Inc* 531,948,000 1.71 52,300 GA Technologies Co Ltd/Japan 213,645,500 0.69 19,800 Hikari Tsushin Inc 493,020,000 1.58 147,200 Hitachi Transport System Ltd 490,176,000 1.57 171,600 Ibiden Co Ltd* 354,010,800 1.14 155,600 IMAGICA GROUP Inc 71,731,600 0.23 123,600 Inter Action Corp* 224,704,800 0.72 24,474 Invesco Office J-Reit Inc (Reit) 478,466,700 1.54 61,100 IR Japan Holdings Ltd 265,174,000 0.85 105,300 I’rom Group Co Ltd* 174,903,300 0.56 209,900 Itochu Techno-Solutions Corp* 614,587,200 1.97 170,500 Japan Investment Adviser Co Ltd* 295,135,500 0.95 253,400 Japan Material Co Ltd* 276,966,200 0.89 178,300 Keisei Electric Railway Co Ltd* 745,294,000 2.39 200,400 Koa Corp* 244,688,400 0.79 450,800 K’s Holdings Corp* 513,461,200 1.65 190,100 Kumagai Gumi Co Ltd* 557,373,200 1.79 55,000 Kureha Corp* 314,050,000 1.01 23,200 Kyoritsu Maintenance Co Ltd 97,440,000 0.31 172,300 Lion Corp 355,799,500 1.14 104,900 Management Solutions Co Ltd 228,052,600 0.73 39,100 Maruwa Co Ltd/Aichi* 233,036,000 0.75 4,495 MCUBS MidCity Investment
Corp (Reit) 499,394,500 1.60 237,900 MEC Co Ltd 329,967,300 1.06 69,000 Media Do Holdings Co Ltd 237,705,000 0.76 154,200 MedPeer Inc* 188,740,800 0.61 92,500 Megachips Corp 148,000,000 0.48 135,700 Meiko Electronics Co Ltd* 198,122,000 0.64 157,100 Mitsubishi Materials Corp* 404,532,500 1.30 69,100 Money Forward Inc 232,867,000 0.75 113,000 m-up Inc* 224,305,000 0.72 56,600 Nankai Electric Railway Co Ltd* 153,895,400 0.49 77,300 NEC Corp* 351,715,000 1.13 95,400 NH Foods Ltd* 389,232,000 1.25 143,200 Nichias Corp 252,891,200 0.81 108,800 Nichiha Corp 293,433,600 0.94 221,900 Nichirei Corp 541,436,000 1.74 138,300 Nihon Unisys Ltd 475,060,500 1.53 81,000 Nippon Chemical Industrial Co Ltd 169,533,000 0.54 101,900 Nippon Chemi-Con Corp 141,335,300 0.45
1,138 NIPPON REIT Investment Corp (Reit) 502,427,000 1.61
72,000 Nippon Shinyaku Co Ltd* 628,560,000 2.02 122,100 Nippon Yusen KK* 193,650,600 0.62 205,700 Nishimatsu Construction Co Ltd* 390,830,000 1.26 214,000 Nisshin Seifun Group Inc 427,572,000 1.37 149,600 Nisso Corp 159,772,800 0.51 90,600 Nitto Boseki Co Ltd 264,914,400 0.85 159,400 NOF Corp* 549,133,000 1.76 933,900 Oji Holdings Corp 462,280,500 1.49 41,200 Okamoto Machine Tool Works Ltd 90,145,600 0.29 32,400 Oro Co Ltd 79,412,400 0.26 92,800 Osaka Soda Co Ltd 228,937,600 0.74 119,000 Pacific Industrial Co Ltd 171,241,000 0.55 272,200 Premium Group Co Ltd 483,155,000 1.55 215,500 Punch Industry Co Ltd 97,406,000 0.31 448,300 Relia Inc 602,066,900 1.93 82,600 Relo Group Inc* 222,276,600 0.71 141,300 Rohto Pharmaceutical Co Ltd* 372,466,800 1.20 76,800 SCREEN Holdings Co Ltd* 468,480,000 1.50 121,300 Ship Healthcare Holdings Inc* 595,583,000 1.91 190,200 Siix Corp 257,340,600 0.83 70,700 Sohgo Security Services Co Ltd 378,952,000 1.22 239,900 Solasto Corp 317,867,500 1.02 167,200 Square Enix Holdings Co Ltd* 708,928,000 2.28 183,700 SUMCO Corp* 241,932,900 0.78 78,800 Sumitomo Mitsui Trust Holdings Inc 273,593,600 0.88 121,200 Sumitomo Realty & Development
Co Ltd 484,194,000 1.56 200,500 Tadano Ltd* 188,269,500 0.60 104,400 Taiheiyo Cement Corp 280,000,800 0.90 202,800 Taiyo Yuden Co Ltd* 405,397,200 1.30 300,300 Takeei Corp 286,185,900 0.92 180,100 Tazmo Co Ltd* 168,213,400 0.54 102,200 TechMatrix Corp 242,009,600 0.78 192,800 Tokuyama Corp* 432,064,800 1.39 183,500 Tokyo Tatemono Co Ltd* 254,147,500 0.82 188,600 Toppan Forms Co Ltd 178,604,200 0.57 119,000 Toyoda Gosei Co Ltd* 235,263,000 0.76 105,300 Trusco Nakayama Corp 253,562,400 0.81 97,000 Unizo Holdings Co Ltd* 417,100,000 1.34 73,100 Workman Co Ltd* 421,787,000 1.35 222,400 ZOZO Inc* 471,932,800 1.52 30,610,541,900 98.31Total Common Stocks (Shares) 30,610,541,900 98.31Total Transferable Securities and Money Market Instruments Admitted to an Official Stock Exchange Listing or Dealt in on Another Regulated Market 30,610,541,900 98.31Total Portfolio 30,610,541,900 98.31
Other Net Assets 525,530,806 1.69Total Net Assets (JPY) 31,136,072,706 100.00
Japan Small & MidCap Opportunities Fund
Portfolio of Investments 31 August 2019
Japan Small & MidCap Opportunities Fund
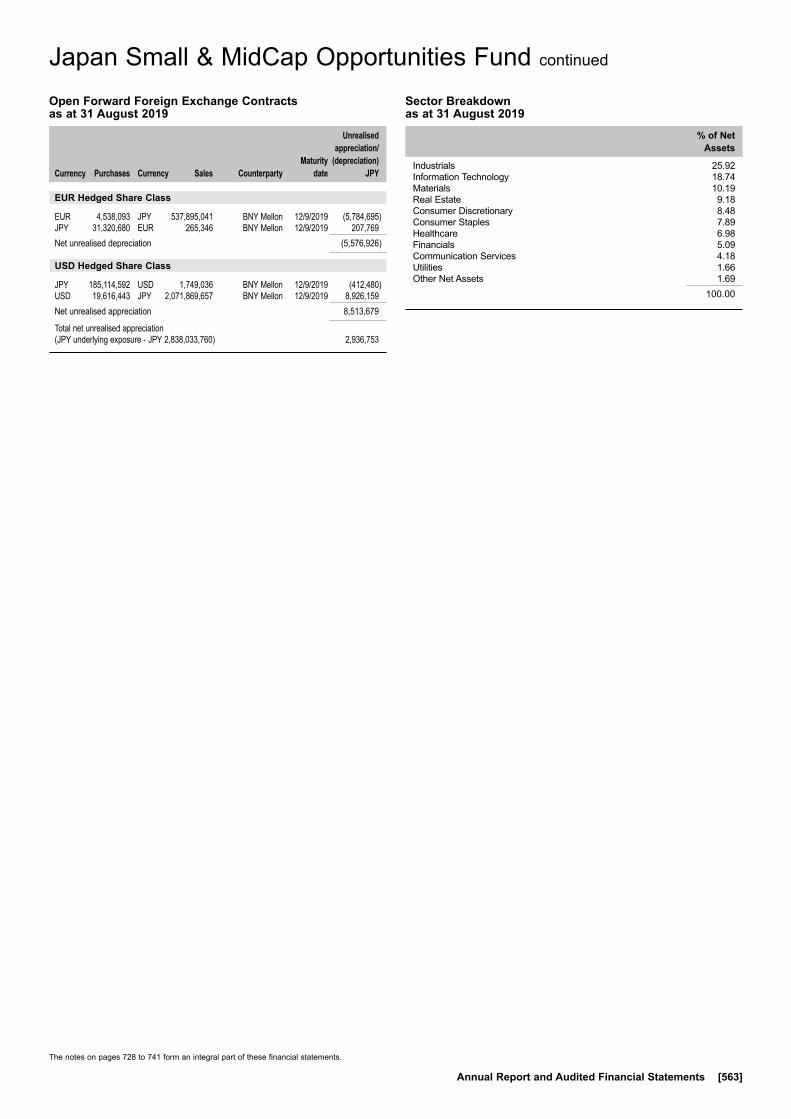
The notes on pages 728 to 741 form an integral part of these financial statements.
Annual Report and Audited Financial Statements [563]
Japan Small & MidCap Opportunities Fund continued
Open Forward Foreign Exchange Contracts as at 31 August 2019
Currency
Purchases Currency
Sales Counterparty
Maturity date
Unrealised appreciation/
(depreciation) JPY
EUR Hedged Share Class
EUR 4,538,093 JPY 537,895,041 BNY Mellon 12/9/2019 (5,784,695)JPY 31,320,680 EUR 265,346 BNY Mellon 12/9/2019 207,769Net unrealised depreciation (5,576,926)
USD Hedged Share Class
JPY 185,114,592 USD 1,749,036 BNY Mellon 12/9/2019 (412,480)USD 19,616,443 JPY 2,071,869,657 BNY Mellon 12/9/2019 8,926,159Net unrealised appreciation 8,513,679
Total net unrealised appreciation (JPY underlying exposure - JPY 2,838,033,760) 2,936,753
Sector Breakdown as at 31 August 2019
% of Net Assets
Industrials 25.92 Information Technology 18.74 Materials 10.19 Real Estate 9.18 Consumer Discretionary 8.48 Consumer Staples 7.89 Healthcare 6.98 Financials 5.09 Communication Services 4.18 Utilities 1.66 Other Net Assets 1.69
100.00
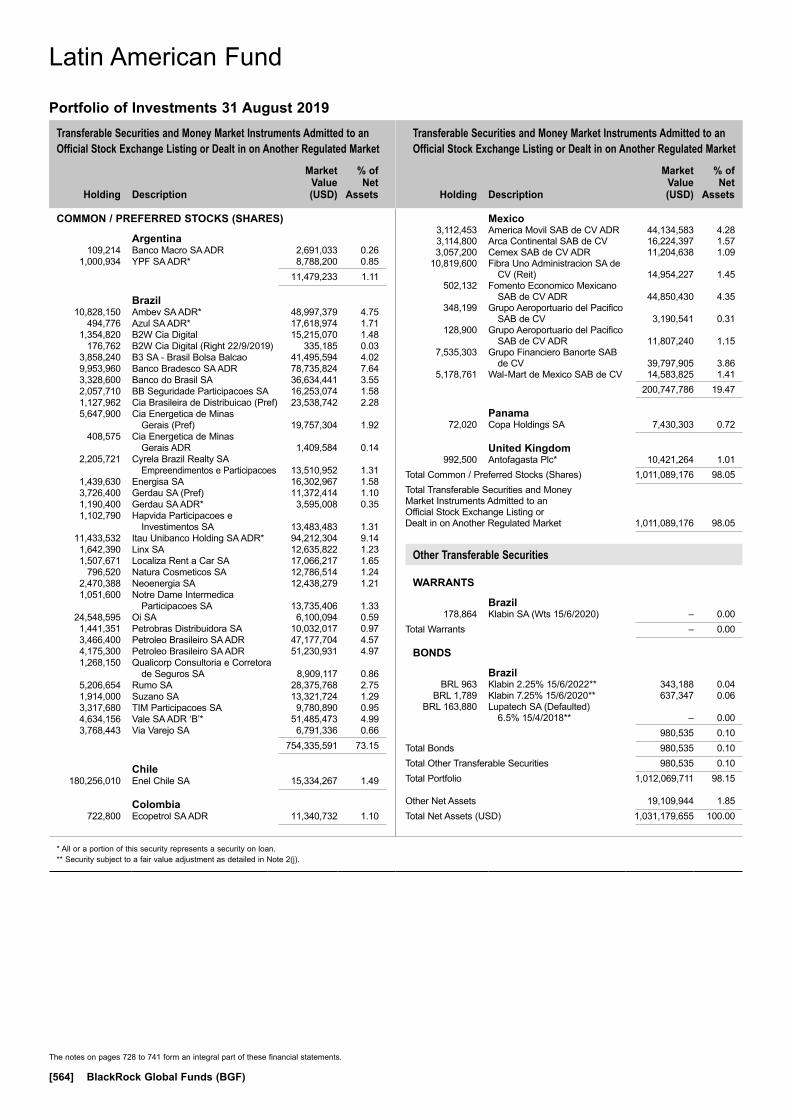
Transferable Securities and Money Market Instruments Admitted to an Official Stock Exchange Listing or Dealt in on Another Regulated Market
Transferable Securities and Money Market Instruments Admitted to an Official Stock Exchange Listing or Dealt in on Another Regulated Market
Holding
Description
Market Value (USD)
% of Net
Assets
Holding
Description
Market Value (USD)
% of Net
Assets
* All or a portion of this security represents a security on loan.** Security subject to a fair value adjustment as detailed in Note 2(j).
The notes on pages 728 to 741 form an integral part of these financial statements.
[564] BlackRock Global Funds (BGF)
COMMON / PREFERRED STOCKS (SHARES)
Argentina 109,214 Banco Macro SA ADR 2,691,033 0.26 1,000,934 YPF SA ADR* 8,788,200 0.85 11,479,233 1.11
Brazil 10,828,150 Ambev SA ADR* 48,997,379 4.75 494,776 Azul SA ADR* 17,618,974 1.71 1,354,820 B2W Cia Digital 15,215,070 1.48 176,762 B2W Cia Digital (Right 22/9/2019) 335,185 0.03 3,858,240 B3 SA - Brasil Bolsa Balcao 41,495,594 4.02 9,953,960 Banco Bradesco SA ADR 78,735,824 7.64 3,328,600 Banco do Brasil SA 36,634,441 3.55 2,057,710 BB Seguridade Participacoes SA 16,253,074 1.58 1,127,962 Cia Brasileira de Distribuicao (Pref) 23,538,742 2.28 5,647,900 Cia Energetica de Minas
Gerais (Pref) 19,757,304 1.92 408,575 Cia Energetica de Minas
Gerais ADR 1,409,584 0.14 2,205,721 Cyrela Brazil Realty SA
Empreendimentos e Participacoes 13,510,952 1.31 1,439,630 Energisa SA 16,302,967 1.58 3,726,400 Gerdau SA (Pref) 11,372,414 1.10 1,190,400 Gerdau SA ADR* 3,595,008 0.35 1,102,790 Hapvida Participacoes e
Investimentos SA 13,483,483 1.31 11,433,532 Itau Unibanco Holding SA ADR* 94,212,304 9.14 1,642,390 Linx SA 12,635,822 1.23 1,507,671 Localiza Rent a Car SA 17,066,217 1.65 796,520 Natura Cosmeticos SA 12,786,514 1.24 2,470,388 Neoenergia SA 12,438,279 1.21 1,051,600 Notre Dame Intermedica
Participacoes SA 13,735,406 1.33 24,548,595 Oi SA 6,100,094 0.59 1,441,351 Petrobras Distribuidora SA 10,032,017 0.97 3,466,400 Petroleo Brasileiro SA ADR 47,177,704 4.57 4,175,300 Petroleo Brasileiro SA ADR 51,230,931 4.97 1,268,150 Qualicorp Consultoria e Corretora
de Seguros SA 8,909,117 0.86 5,206,654 Rumo SA 28,375,768 2.75 1,914,000 Suzano SA 13,321,724 1.29 3,317,680 TIM Participacoes SA 9,780,890 0.95 4,634,156 Vale SA ADR ‘B’* 51,485,473 4.99 3,768,443 Via Varejo SA 6,791,336 0.66 754,335,591 73.15
Chile 180,256,010 Enel Chile SA 15,334,267 1.49
Colombia 722,800 Ecopetrol SA ADR 11,340,732 1.10
Mexico 3,112,453 America Movil SAB de CV ADR 44,134,583 4.28 3,114,800 Arca Continental SAB de CV 16,224,397 1.57 3,057,200 Cemex SAB de CV ADR 11,204,638 1.09 10,819,600 Fibra Uno Administracion SA de
CV (Reit) 14,954,227 1.45 502,132 Fomento Economico Mexicano
SAB de CV ADR 44,850,430 4.35 348,199 Grupo Aeroportuario del Pacifico
SAB de CV 3,190,541 0.31 128,900 Grupo Aeroportuario del Pacifico
SAB de CV ADR 11,807,240 1.15 7,535,303 Grupo Financiero Banorte SAB
de CV 39,797,905 3.86 5,178,761 Wal-Mart de Mexico SAB de CV 14,583,825 1.41 200,747,786 19.47
Panama 72,020 Copa Holdings SA 7,430,303 0.72
United Kingdom 992,500 Antofagasta Plc* 10,421,264 1.01Total Common / Preferred Stocks (Shares) 1,011,089,176 98.05Total Transferable Securities and Money Market Instruments Admitted to an Official Stock Exchange Listing or Dealt in on Another Regulated Market 1,011,089,176 98.05
Other Transferable Securities
WARRANTS
Brazil 178,864 Klabin SA (Wts 15/6/2020) – 0.00Total Warrants – 0.00
BONDS
Brazil BRL 963 Klabin 2.25% 15/6/2022** 343,188 0.04 BRL 1,789 Klabin 7.25% 15/6/2020** 637,347 0.06 BRL 163,880 Lupatech SA (Defaulted)
6.5% 15/4/2018** – 0.00 980,535 0.10Total Bonds 980,535 0.10Total Other Transferable Securities 980,535 0.10Total Portfolio 1,012,069,711 98.15
Other Net Assets 19,109,944 1.85Total Net Assets (USD) 1,031,179,655 100.00
Latin American Fund
Portfolio of Investments 31 August 2019
Latin American Fund
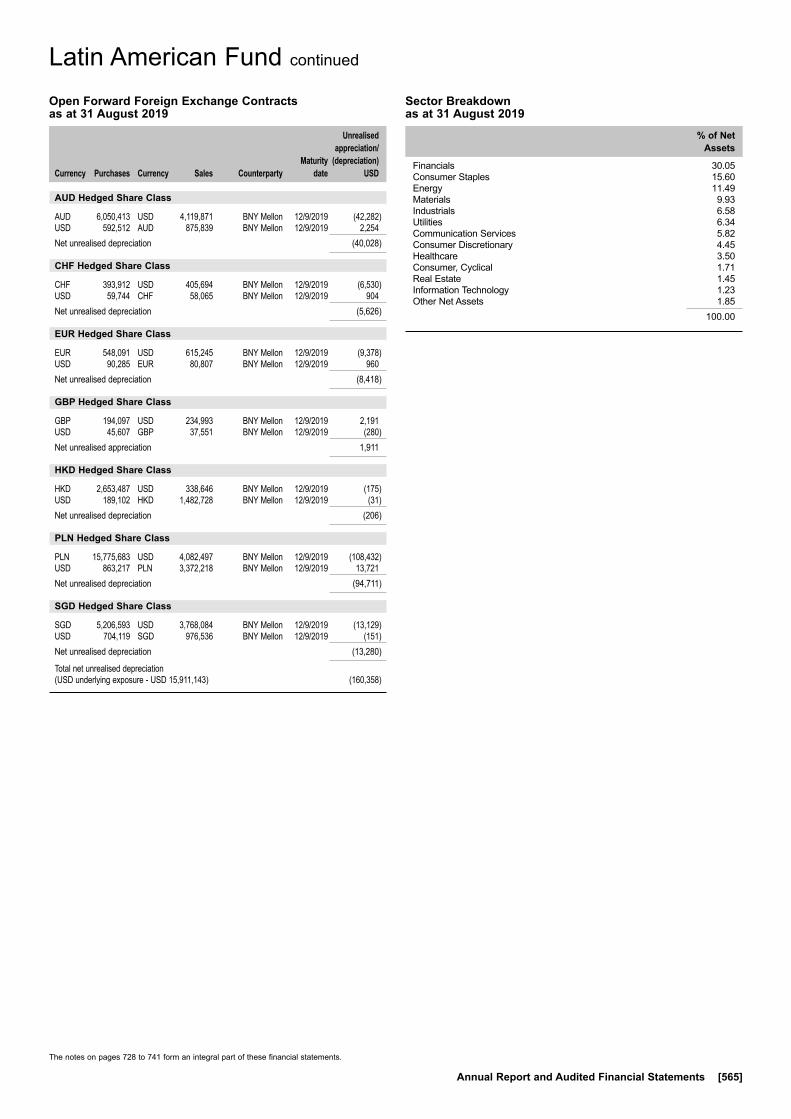
The notes on pages 728 to 741 form an integral part of these financial statements.
Annual Report and Audited Financial Statements [565]
Latin American Fund continued
Open Forward Foreign Exchange Contracts as at 31 August 2019
Currency
Purchases Currency
Sales Counterparty
Maturity date
Unrealised appreciation/
(depreciation) USD
AUD Hedged Share Class
AUD 6,050,413 USD 4,119,871 BNY Mellon 12/9/2019 (42,282)USD 592,512 AUD 875,839 BNY Mellon 12/9/2019 2,254Net unrealised depreciation (40,028)
CHF Hedged Share Class
CHF 393,912 USD 405,694 BNY Mellon 12/9/2019 (6,530)USD 59,744 CHF 58,065 BNY Mellon 12/9/2019 904Net unrealised depreciation (5,626)
EUR Hedged Share Class
EUR 548,091 USD 615,245 BNY Mellon 12/9/2019 (9,378)USD 90,285 EUR 80,807 BNY Mellon 12/9/2019 960Net unrealised depreciation (8,418)
GBP Hedged Share Class
GBP 194,097 USD 234,993 BNY Mellon 12/9/2019 2,191USD 45,607 GBP 37,551 BNY Mellon 12/9/2019 (280)Net unrealised appreciation 1,911
HKD Hedged Share Class
HKD 2,653,487 USD 338,646 BNY Mellon 12/9/2019 (175)USD 189,102 HKD 1,482,728 BNY Mellon 12/9/2019 (31)Net unrealised depreciation (206)
PLN Hedged Share Class
PLN 15,775,683 USD 4,082,497 BNY Mellon 12/9/2019 (108,432)USD 863,217 PLN 3,372,218 BNY Mellon 12/9/2019 13,721Net unrealised depreciation (94,711)
SGD Hedged Share Class
SGD 5,206,593 USD 3,768,084 BNY Mellon 12/9/2019 (13,129)USD 704,119 SGD 976,536 BNY Mellon 12/9/2019 (151)Net unrealised depreciation (13,280)
Total net unrealised depreciation (USD underlying exposure - USD 15,911,143) (160,358)
Sector Breakdown as at 31 August 2019
% of Net Assets
Financials 30.05Consumer Staples 15.60Energy 11.49Materials 9.93Industrials 6.58Utilities 6.34Communication Services 5.82Consumer Discretionary 4.45Healthcare 3.50Consumer, Cyclical 1.71Real Estate 1.45Information Technology 1.23Other Net Assets 1.85
100.00
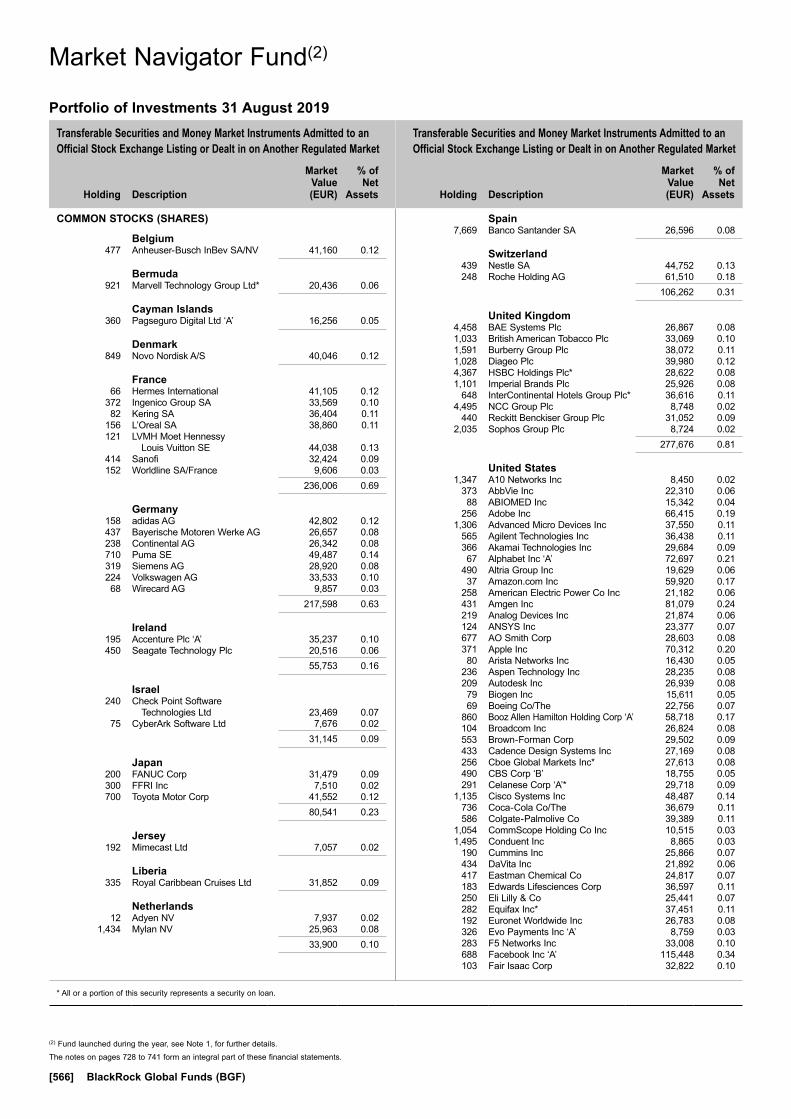
Transferable Securities and Money Market Instruments Admitted to an Official Stock Exchange Listing or Dealt in on Another Regulated Market
Transferable Securities and Money Market Instruments Admitted to an Official Stock Exchange Listing or Dealt in on Another Regulated Market
Holding
Description
Market Value (EUR)
% of Net
Assets
Holding
Description
Market Value (EUR)
% of Net
Assets
* All or a portion of this security represents a security on loan.
The notes on pages 728 to 741 form an integral part of these financial statements.
[566] BlackRock Global Funds (BGF)
COMMON STOCKS (SHARES)
Belgium 477 Anheuser-Busch InBev SA/NV 41,160 0.12
Bermuda 921 Marvell Technology Group Ltd* 20,436 0.06
Cayman Islands 360 Pagseguro Digital Ltd ‘A’ 16,256 0.05
Denmark 849 Novo Nordisk A/S 40,046 0.12
France 66 Hermes International 41,105 0.12 372 Ingenico Group SA 33,569 0.10 82 Kering SA 36,404 0.11 156 L’Oreal SA 38,860 0.11 121 LVMH Moet Hennessy
Louis Vuitton SE 44,038 0.13 414 Sanofi 32,424 0.09 152 Worldline SA/France 9,606 0.03 236,006 0.69
Germany 158 adidas AG 42,802 0.12 437 Bayerische Motoren Werke AG 26,657 0.08 238 Continental AG 26,342 0.08 710 Puma SE 49,487 0.14 319 Siemens AG 28,920 0.08 224 Volkswagen AG 33,533 0.10 68 Wirecard AG 9,857 0.03 217,598 0.63
Ireland 195 Accenture Plc ‘A’ 35,237 0.10 450 Seagate Technology Plc 20,516 0.06 55,753 0.16
Israel 240 Check Point Software
Technologies Ltd 23,469 0.07 75 CyberArk Software Ltd 7,676 0.02 31,145 0.09
Japan 200 FANUC Corp 31,479 0.09 300 FFRI Inc 7,510 0.02 700 Toyota Motor Corp 41,552 0.12 80,541 0.23
Jersey 192 Mimecast Ltd 7,057 0.02
Liberia 335 Royal Caribbean Cruises Ltd 31,852 0.09
Netherlands 12 Adyen NV 7,937 0.02 1,434 Mylan NV 25,963 0.08 33,900 0.10
Spain 7,669 Banco Santander SA 26,596 0.08
Switzerland 439 Nestle SA 44,752 0.13 248 Roche Holding AG 61,510 0.18 106,262 0.31
United Kingdom 4,458 BAE Systems Plc 26,867 0.08 1,033 British American Tobacco Plc 33,069 0.10 1,591 Burberry Group Plc 38,072 0.11 1,028 Diageo Plc 39,980 0.12 4,367 HSBC Holdings Plc* 28,622 0.08 1,101 Imperial Brands Plc 25,926 0.08 648 InterContinental Hotels Group Plc* 36,616 0.11 4,495 NCC Group Plc 8,748 0.02 440 Reckitt Benckiser Group Plc 31,052 0.09 2,035 Sophos Group Plc 8,724 0.02 277,676 0.81
United States 1,347 A10 Networks Inc 8,450 0.02 373 AbbVie Inc 22,310 0.06 88 ABIOMED Inc 15,342 0.04 256 Adobe Inc 66,415 0.19 1,306 Advanced Micro Devices Inc 37,550 0.11 565 Agilent Technologies Inc 36,438 0.11 366 Akamai Technologies Inc 29,684 0.09 67 Alphabet Inc ‘A’ 72,697 0.21 490 Altria Group Inc 19,629 0.06 37 Amazon.com Inc 59,920 0.17 258 American Electric Power Co Inc 21,182 0.06 431 Amgen Inc 81,079 0.24 219 Analog Devices Inc 21,874 0.06 124 ANSYS Inc 23,377 0.07 677 AO Smith Corp 28,603 0.08 371 Apple Inc 70,312 0.20 80 Arista Networks Inc 16,430 0.05 236 Aspen Technology Inc 28,235 0.08 209 Autodesk Inc 26,939 0.08 79 Biogen Inc 15,611 0.05 69 Boeing Co/The 22,756 0.07 860 Booz Allen Hamilton Holding Corp ‘A’ 58,718 0.17 104 Broadcom Inc 26,824 0.08 553 Brown-Forman Corp 29,502 0.09 433 Cadence Design Systems Inc 27,169 0.08 256 Cboe Global Markets Inc* 27,613 0.08 490 CBS Corp ‘B’ 18,755 0.05 291 Celanese Corp ‘A’* 29,718 0.09 1,135 Cisco Systems Inc 48,487 0.14 736 Coca-Cola Co/The 36,679 0.11 586 Colgate-Palmolive Co 39,389 0.11 1,054 CommScope Holding Co Inc 10,515 0.03 1,495 Conduent Inc 8,865 0.03 190 Cummins Inc 25,866 0.07 434 DaVita Inc 21,892 0.06 417 Eastman Chemical Co 24,817 0.07 183 Edwards Lifesciences Corp 36,597 0.11 250 Eli Lilly & Co 25,441 0.07 282 Equifax Inc* 37,451 0.11 192 Euronet Worldwide Inc 26,783 0.08 326 Evo Payments Inc ‘A’ 8,759 0.03 283 F5 Networks Inc 33,008 0.10 688 Facebook Inc ‘A’ 115,448 0.34 103 Fair Isaac Corp 32,822 0.10
Market Navigator Fund(2)
Portfolio of Investments 31 August 2019
Market Navigator Fund(2)
(2) Fund launched during the year, see Note 1, for further details.

Transferable Securities and Money Market Instruments Admitted to an Official Stock Exchange Listing or Dealt in on Another Regulated Market
Transferable Securities and Money Market Instruments Admitted to an Official Stock Exchange Listing or Dealt in on Another Regulated Market
Holding
Description
Market Value (EUR)
% of Net
Assets
Holding
Description
Market Value (EUR)
% of Net
Assets
* All or a portion of this security represents a security on loan.
The notes on pages 728 to 741 form an integral part of these financial statements.
Annual Report and Audited Financial Statements [567]
282 FedEx Corp* 40,719 0.12 485 Fidelity National Information
Services Inc 60,252 0.18 1,802 FireEye Inc* 22,047 0.06 771 Fiserv Inc 75,102 0.22 590 FLIR Systems Inc 26,465 0.08 598 Fluor Corp 9,582 0.03 239 ForeScout Technologies Inc 7,720 0.02 580 Fortinet Inc 41,391 0.12 1,282 Gap Inc/The* 18,546 0.05 198 Global Payments Inc* 29,882 0.09 179 Goldman Sachs Group Inc/The 33,120 0.10 996 H&R Block Inc 21,766 0.06 131 Huntington Ingalls Industries Inc 24,732 0.07 1,377 Intel Corp 59,312 0.17 202 International Business Machines Corp 24,724 0.07 654 International Paper Co* 23,191 0.07 282 Intuit Inc 73,368 0.21 253 Johnson & Johnson 29,335 0.09 333 JPMorgan Chase & Co 33,200 0.10 1,003 Juniper Networks Inc 21,102 0.06 86 L3Harris Technologies Inc 16,622 0.05 179 Laboratory Corp of America Holdings 27,296 0.08 734 Leidos Holdings Inc 58,228 0.17 164 ManTech International Corp/VA ‘A’ 10,461 0.03 56 MarketAxess Holdings Inc 19,977 0.06 265 Mastercard Inc 67,724 0.20 200 McDonald’s Corp 39,642 0.12 506 Microsoft Corp 63,402 0.18 1,657 MobileIron Inc 10,140 0.03 217 Motorola Solutions Inc 35,602 0.10 735 Nektar Therapeutics ‘A’ 11,551 0.03 287 NetApp Inc 12,640 0.04 492 NIKE Inc 38,095 0.11 146 NVIDIA Corp 22,503 0.07 94 Okta Inc 10,801 0.03 1,076 ON Semiconductor Corp 17,553 0.05 539 OneSpan Inc 6,699 0.02 488 Oracle Corp 23,047 0.07 232 Palo Alto Networks Inc 42,528 0.12 89 PayPal Holdings Inc 8,847 0.03 312 PepsiCo Inc 38,492 0.11 390 Procter & Gamble Co/The 42,752 0.12 75 Proofpoint Inc 7,716 0.02 221 PTC Inc* 13,116 0.04 507 QUALCOMM Inc 35,566 0.10 111 Qualys Inc 8,185 0.02 179 Rapid7 Inc 8,715 0.02 192 Raytheon Co 31,937 0.09 155 S&P Global Inc 36,643 0.11 797 Sabre Corp 17,020 0.05 186 salesforce.com Inc 26,557 0.08 128 Science Applications
International Corp 10,108 0.03 504 SecureWorks Corp 5,534 0.02 265 Splunk Inc 27,161 0.08 131 Square Inc 7,459 0.02 541 Starbucks Corp 47,599 0.14 2,021 Symantec Corp 42,720 0.12 499 Total System Services Inc 60,731 0.18 444 TripAdvisor Inc* 15,443 0.04 793 Twitter Inc 30,510 0.09 256 United Parcel Service Inc ‘B’ 27,724 0.08 240 Varian Medical Systems Inc 23,176 0.07 148 Varonis Systems Inc 9,179 0.03 462 Verint Systems Inc* 22,284 0.06 357 VeriSign Inc 66,318 0.19 168 Vertex Pharmaceuticals Inc 27,408 0.08 641 Visa Inc ‘A’ 105,275 0.31 125 VMware Inc 16,137 0.05 312 Walt Disney Co/The 39,023 0.11
113 WellCare Health Plans Inc 27,818 0.08 1,261 Weyerhaeuser Co (Reit) 29,977 0.09 1,102 Xerox Holdings Corp 29,021 0.08 316 Yum! Brands Inc 33,510 0.10 110 Zebra Technologies Corp 20,521 0.06 3,880 Zix Corp 26,063 0.08 145 Zscaler Inc 9,200 0.03 3,721,463 10.84Total Common Stocks (Shares) 4,943,747 14.40
BONDS
Australia AUD 327,000 Australia Government Bond
0.75% 21/11/2027 223,864 0.65 AUD 267,000 Australia Government Bond
1% 21/2/2050 204,881 0.60 AUD 469,000 Australia Government Bond
1.25% 21/2/2022 341,643 1.00 AUD 253,000 Australia Government Bond
1.25% 21/8/2040 205,928 0.60 AUD 281,000 Australia Government Bond
2% 21/8/2035 254,690 0.74 AUD 341,000 Australia Government Bond
2.5% 20/9/2030 326,831 0.95 AUD 540,000 Australia Government Bond
3% 20/9/2025 489,604 1.43 AUD 147,000 Australia Government Bond
4% 20/8/2020 161,533 0.47 2,208,974 6.44
Canada CAD 172,000 Canadian Government Real Return
Bond 0.5% 1/12/2050 136,397 0.40 CAD 259,000 Canadian Government Real Return
Bond 1.25% 1/12/2047 254,445 0.74 CAD 259,000 Canadian Government Real Return
Bond 1.5% 1/12/2044 276,505 0.80 CAD 220,000 Canadian Government Real Return
Bond 2% 1/12/2041 257,183 0.75 CAD 197,000 Canadian Government Real Return
Bond 3% 1/12/2036 265,520 0.77 CAD 195,000 Canadian Government Real Return
Bond 4% 1/12/2031 295,105 0.86 CAD 169,000 Canadian Government Real Return
Bond 4.25% 1/12/2021 206,060 0.60 CAD 177,000 Canadian Government Real Return
Bond 4.25% 1/12/2026 245,988 0.72 1,937,203 5.64
France EUR 1,740,000 France Treasury Bill BTF 11/9/2019
(Zero Coupon) 1,740,218 5.07 EUR 1,400,000 France Treasury Bill BTF
29/1/2020 (Zero Coupon) 1,404,354 4.09 EUR 1,390,000 France Treasury Bill BTF
22/4/2020 (Zero Coupon) 1,396,804 4.07 EUR 30,000 French Republic Government Bond
OAT 0.1% 1/3/2021 32,080 0.09 EUR 30,000 French Republic Government Bond
OAT 0.1% 25/7/2021 32,300 0.09 EUR 38,100 French Republic Government Bond
OAT 0.1% 1/3/2025 42,803 0.13 EUR 36,300 French Republic Government Bond
OAT 0.1% 1/3/2028 42,181 0.12 EUR 14,000 French Republic Government Bond
OAT 0.1% 1/3/2029 16,174 0.05 EUR 19,200 French Republic Government Bond
OAT ‘144A’ 0.1% 25/7/2036 24,253 0.07
Market Navigator Fund(2) continued
Portfolio of Investments 31 August 2019
(2) Fund launched during the year, see Note 1, for further details.
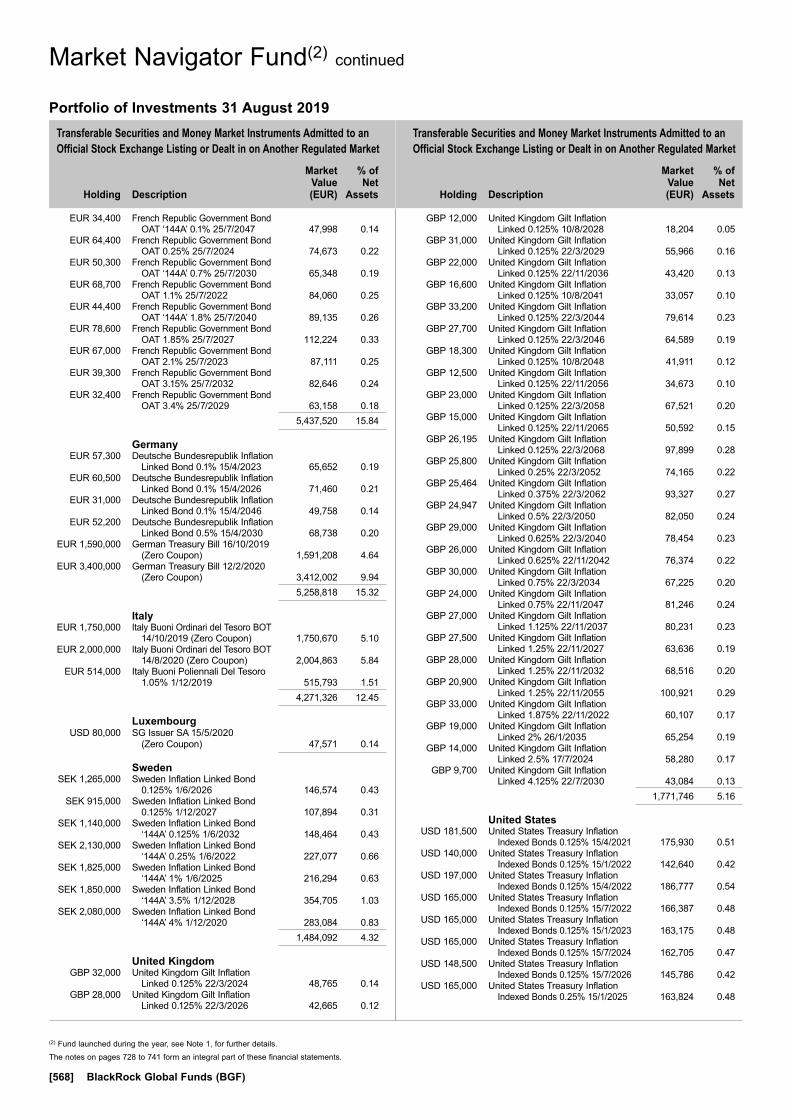
The notes on pages 728 to 741 form an integral part of these financial statements.
[568] BlackRock Global Funds (BGF)
Transferable Securities and Money Market Instruments Admitted to an Official Stock Exchange Listing or Dealt in on Another Regulated Market
Transferable Securities and Money Market Instruments Admitted to an Official Stock Exchange Listing or Dealt in on Another Regulated Market
Holding
Description
Market Value (EUR)
% of Net
Assets
Holding
Description
Market Value (EUR)
% of Net
Assets
EUR 34,400 French Republic Government Bond OAT ‘144A’ 0.1% 25/7/2047 47,998 0.14
EUR 64,400 French Republic Government Bond OAT 0.25% 25/7/2024 74,673 0.22
EUR 50,300 French Republic Government Bond OAT ‘144A’ 0.7% 25/7/2030 65,348 0.19
EUR 68,700 French Republic Government Bond OAT 1.1% 25/7/2022 84,060 0.25
EUR 44,400 French Republic Government Bond OAT ‘144A’ 1.8% 25/7/2040 89,135 0.26
EUR 78,600 French Republic Government Bond OAT 1.85% 25/7/2027 112,224 0.33
EUR 67,000 French Republic Government Bond OAT 2.1% 25/7/2023 87,111 0.25
EUR 39,300 French Republic Government Bond OAT 3.15% 25/7/2032 82,646 0.24
EUR 32,400 French Republic Government Bond OAT 3.4% 25/7/2029 63,158 0.18
5,437,520 15.84
Germany EUR 57,300 Deutsche Bundesrepublik Inflation
Linked Bond 0.1% 15/4/2023 65,652 0.19 EUR 60,500 Deutsche Bundesrepublik Inflation
Linked Bond 0.1% 15/4/2026 71,460 0.21 EUR 31,000 Deutsche Bundesrepublik Inflation
Linked Bond 0.1% 15/4/2046 49,758 0.14 EUR 52,200 Deutsche Bundesrepublik Inflation
Linked Bond 0.5% 15/4/2030 68,738 0.20 EUR 1,590,000 German Treasury Bill 16/10/2019
(Zero Coupon) 1,591,208 4.64 EUR 3,400,000 German Treasury Bill 12/2/2020
(Zero Coupon) 3,412,002 9.94 5,258,818 15.32
Italy EUR 1,750,000 Italy Buoni Ordinari del Tesoro BOT
14/10/2019 (Zero Coupon) 1,750,670 5.10 EUR 2,000,000 Italy Buoni Ordinari del Tesoro BOT
14/8/2020 (Zero Coupon) 2,004,863 5.84 EUR 514,000 Italy Buoni Poliennali Del Tesoro
1.05% 1/12/2019 515,793 1.51 4,271,326 12.45
Luxembourg USD 80,000 SG Issuer SA 15/5/2020
(Zero Coupon) 47,571 0.14
Sweden SEK 1,265,000 Sweden Inflation Linked Bond
0.125% 1/6/2026 146,574 0.43 SEK 915,000 Sweden Inflation Linked Bond
0.125% 1/12/2027 107,894 0.31 SEK 1,140,000 Sweden Inflation Linked Bond
‘144A’ 0.125% 1/6/2032 148,464 0.43 SEK 2,130,000 Sweden Inflation Linked Bond
‘144A’ 0.25% 1/6/2022 227,077 0.66 SEK 1,825,000 Sweden Inflation Linked Bond
‘144A’ 1% 1/6/2025 216,294 0.63 SEK 1,850,000 Sweden Inflation Linked Bond
‘144A’ 3.5% 1/12/2028 354,705 1.03 SEK 2,080,000 Sweden Inflation Linked Bond
‘144A’ 4% 1/12/2020 283,084 0.83 1,484,092 4.32
United Kingdom GBP 32,000 United Kingdom Gilt Inflation
Linked 0.125% 22/3/2024 48,765 0.14 GBP 28,000 United Kingdom Gilt Inflation
Linked 0.125% 22/3/2026 42,665 0.12
GBP 12,000 United Kingdom Gilt Inflation Linked 0.125% 10/8/2028 18,204 0.05
GBP 31,000 United Kingdom Gilt Inflation Linked 0.125% 22/3/2029 55,966 0.16
GBP 22,000 United Kingdom Gilt Inflation Linked 0.125% 22/11/2036 43,420 0.13
GBP 16,600 United Kingdom Gilt Inflation Linked 0.125% 10/8/2041 33,057 0.10
GBP 33,200 United Kingdom Gilt Inflation Linked 0.125% 22/3/2044 79,614 0.23
GBP 27,700 United Kingdom Gilt Inflation Linked 0.125% 22/3/2046 64,589 0.19
GBP 18,300 United Kingdom Gilt Inflation Linked 0.125% 10/8/2048 41,911 0.12
GBP 12,500 United Kingdom Gilt Inflation Linked 0.125% 22/11/2056 34,673 0.10
GBP 23,000 United Kingdom Gilt Inflation Linked 0.125% 22/3/2058 67,521 0.20
GBP 15,000 United Kingdom Gilt Inflation Linked 0.125% 22/11/2065 50,592 0.15
GBP 26,195 United Kingdom Gilt Inflation Linked 0.125% 22/3/2068 97,899 0.28
GBP 25,800 United Kingdom Gilt Inflation Linked 0.25% 22/3/2052 74,165 0.22
GBP 25,464 United Kingdom Gilt Inflation Linked 0.375% 22/3/2062 93,327 0.27
GBP 24,947 United Kingdom Gilt Inflation Linked 0.5% 22/3/2050 82,050 0.24
GBP 29,000 United Kingdom Gilt Inflation Linked 0.625% 22/3/2040 78,454 0.23
GBP 26,000 United Kingdom Gilt Inflation Linked 0.625% 22/11/2042 76,374 0.22
GBP 30,000 United Kingdom Gilt Inflation Linked 0.75% 22/3/2034 67,225 0.20
GBP 24,000 United Kingdom Gilt Inflation Linked 0.75% 22/11/2047 81,246 0.24
GBP 27,000 United Kingdom Gilt Inflation Linked 1.125% 22/11/2037 80,231 0.23
GBP 27,500 United Kingdom Gilt Inflation Linked 1.25% 22/11/2027 63,636 0.19
GBP 28,000 United Kingdom Gilt Inflation Linked 1.25% 22/11/2032 68,516 0.20
GBP 20,900 United Kingdom Gilt Inflation Linked 1.25% 22/11/2055 100,921 0.29
GBP 33,000 United Kingdom Gilt Inflation Linked 1.875% 22/11/2022 60,107 0.17
GBP 19,000 United Kingdom Gilt Inflation Linked 2% 26/1/2035 65,254 0.19
GBP 14,000 United Kingdom Gilt Inflation Linked 2.5% 17/7/2024 58,280 0.17
GBP 9,700 United Kingdom Gilt Inflation Linked 4.125% 22/7/2030 43,084 0.13
1,771,746 5.16
United States USD 181,500 United States Treasury Inflation
Indexed Bonds 0.125% 15/4/2021 175,930 0.51 USD 140,000 United States Treasury Inflation
Indexed Bonds 0.125% 15/1/2022 142,640 0.42 USD 197,000 United States Treasury Inflation
Indexed Bonds 0.125% 15/4/2022 186,777 0.54 USD 165,000 United States Treasury Inflation
Indexed Bonds 0.125% 15/7/2022 166,387 0.48 USD 165,000 United States Treasury Inflation
Indexed Bonds 0.125% 15/1/2023 163,175 0.48 USD 165,000 United States Treasury Inflation
Indexed Bonds 0.125% 15/7/2024 162,705 0.47 USD 148,500 United States Treasury Inflation
Indexed Bonds 0.125% 15/7/2026 145,786 0.42 USD 165,000 United States Treasury Inflation
Indexed Bonds 0.25% 15/1/2025 163,824 0.48
Market Navigator Fund(2) continued
Portfolio of Investments 31 August 2019
(2) Fund launched during the year, see Note 1, for further details.
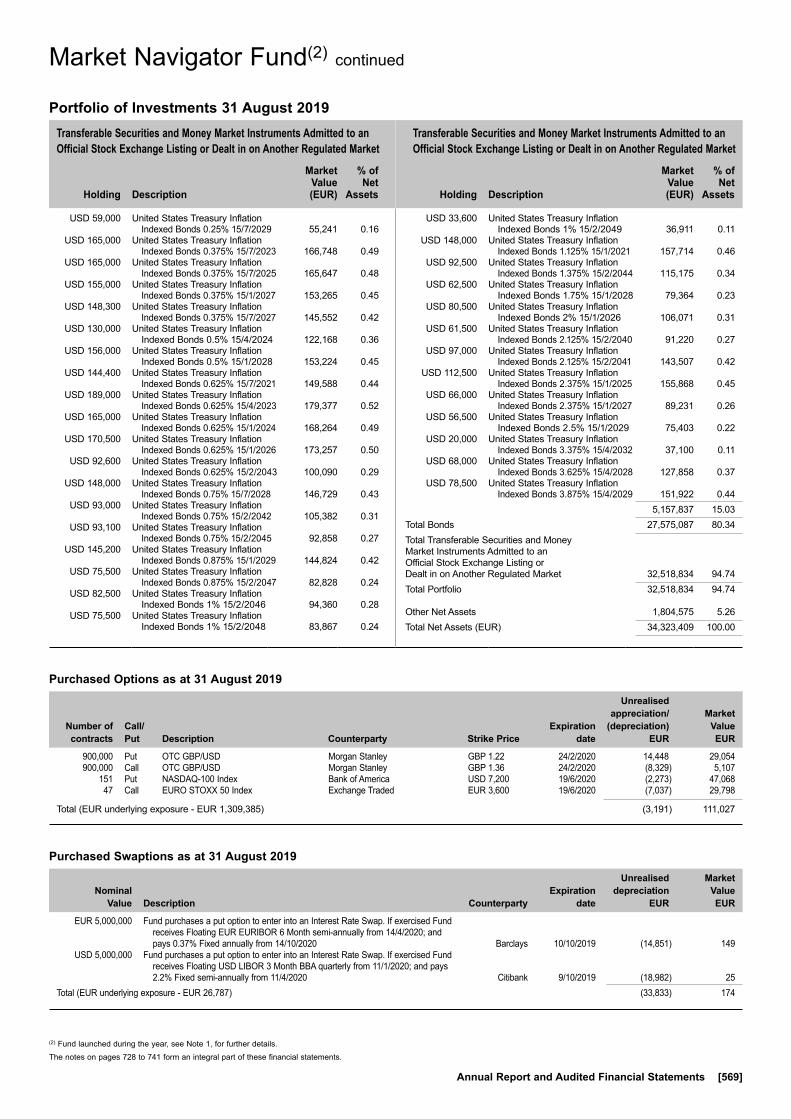
The notes on pages 728 to 741 form an integral part of these financial statements.
Annual Report and Audited Financial Statements [569]
Transferable Securities and Money Market Instruments Admitted to an Official Stock Exchange Listing or Dealt in on Another Regulated Market
Transferable Securities and Money Market Instruments Admitted to an Official Stock Exchange Listing or Dealt in on Another Regulated Market
Holding
Description
Market Value (EUR)
% of Net
Assets
Holding
Description
Market Value (EUR)
% of Net
Assets
USD 59,000 United States Treasury Inflation Indexed Bonds 0.25% 15/7/2029 55,241 0.16
USD 165,000 United States Treasury Inflation Indexed Bonds 0.375% 15/7/2023 166,748 0.49
USD 165,000 United States Treasury Inflation Indexed Bonds 0.375% 15/7/2025 165,647 0.48
USD 155,000 United States Treasury Inflation Indexed Bonds 0.375% 15/1/2027 153,265 0.45
USD 148,300 United States Treasury Inflation Indexed Bonds 0.375% 15/7/2027 145,552 0.42
USD 130,000 United States Treasury Inflation Indexed Bonds 0.5% 15/4/2024 122,168 0.36
USD 156,000 United States Treasury Inflation Indexed Bonds 0.5% 15/1/2028 153,224 0.45
USD 144,400 United States Treasury Inflation Indexed Bonds 0.625% 15/7/2021 149,588 0.44
USD 189,000 United States Treasury Inflation Indexed Bonds 0.625% 15/4/2023 179,377 0.52
USD 165,000 United States Treasury Inflation Indexed Bonds 0.625% 15/1/2024 168,264 0.49
USD 170,500 United States Treasury Inflation Indexed Bonds 0.625% 15/1/2026 173,257 0.50
USD 92,600 United States Treasury Inflation Indexed Bonds 0.625% 15/2/2043 100,090 0.29
USD 148,000 United States Treasury Inflation Indexed Bonds 0.75% 15/7/2028 146,729 0.43
USD 93,000 United States Treasury Inflation Indexed Bonds 0.75% 15/2/2042 105,382 0.31
USD 93,100 United States Treasury Inflation Indexed Bonds 0.75% 15/2/2045 92,858 0.27
USD 145,200 United States Treasury Inflation Indexed Bonds 0.875% 15/1/2029 144,824 0.42
USD 75,500 United States Treasury Inflation Indexed Bonds 0.875% 15/2/2047 82,828 0.24
USD 82,500 United States Treasury Inflation Indexed Bonds 1% 15/2/2046 94,360 0.28
USD 75,500 United States Treasury Inflation Indexed Bonds 1% 15/2/2048 83,867 0.24
USD 33,600 United States Treasury Inflation Indexed Bonds 1% 15/2/2049 36,911 0.11
USD 148,000 United States Treasury Inflation Indexed Bonds 1.125% 15/1/2021 157,714 0.46
USD 92,500 United States Treasury Inflation Indexed Bonds 1.375% 15/2/2044 115,175 0.34
USD 62,500 United States Treasury Inflation Indexed Bonds 1.75% 15/1/2028 79,364 0.23
USD 80,500 United States Treasury Inflation Indexed Bonds 2% 15/1/2026 106,071 0.31
USD 61,500 United States Treasury Inflation Indexed Bonds 2.125% 15/2/2040 91,220 0.27
USD 97,000 United States Treasury Inflation Indexed Bonds 2.125% 15/2/2041 143,507 0.42
USD 112,500 United States Treasury Inflation Indexed Bonds 2.375% 15/1/2025 155,868 0.45
USD 66,000 United States Treasury Inflation Indexed Bonds 2.375% 15/1/2027 89,231 0.26
USD 56,500 United States Treasury Inflation Indexed Bonds 2.5% 15/1/2029 75,403 0.22
USD 20,000 United States Treasury Inflation Indexed Bonds 3.375% 15/4/2032 37,100 0.11
USD 68,000 United States Treasury Inflation Indexed Bonds 3.625% 15/4/2028 127,858 0.37
USD 78,500 United States Treasury Inflation Indexed Bonds 3.875% 15/4/2029 151,922 0.44
5,157,837 15.03Total Bonds 27,575,087 80.34Total Transferable Securities and Money Market Instruments Admitted to an Official Stock Exchange Listing or Dealt in on Another Regulated Market 32,518,834 94.74Total Portfolio 32,518,834 94.74
Other Net Assets 1,804,575 5.26Total Net Assets (EUR) 34,323,409 100.00
Market Navigator Fund(2) continued
Portfolio of Investments 31 August 2019
(2) Fund launched during the year, see Note 1, for further details.
Purchased Options as at 31 August 2019
Number of contracts
Call/ Put
Description Counterparty
Strike Price
Expiration date
Unrealised appreciation/
(depreciation) EUR
Market Value EUR
900,000 Put OTC GBP/USD Morgan Stanley GBP 1.22 24/2/2020 14,448 29,054 900,000 Call OTC GBP/USD Morgan Stanley GBP 1.36 24/2/2020 (8,329) 5,107 151 Put NASDAQ-100 Index Bank of America USD 7,200 19/6/2020 (2,273) 47,068 47 Call EURO STOXX 50 Index Exchange Traded EUR 3,600 19/6/2020 (7,037) 29,798
Total (EUR underlying exposure - EUR 1,309,385) (3,191) 111,027
Purchased Swaptions as at 31 August 2019
Nominal Value
Description Counterparty
Expiration date
Unrealised depreciation
EUR
Market Value EUR
EUR 5,000,000 Fund purchases a put option to enter into an Interest Rate Swap. If exercised Fund receives Floating EUR EURIBOR 6 Month semi-annually from 14/4/2020; and pays 0.37% Fixed annually from 14/10/2020 Barclays 10/10/2019 (14,851) 149
USD 5,000,000 Fund purchases a put option to enter into an Interest Rate Swap. If exercised Fund receives Floating USD LIBOR 3 Month BBA quarterly from 11/1/2020; and pays 2.2% Fixed semi-annually from 11/4/2020 Citibank 9/10/2019 (18,982) 25
Total (EUR underlying exposure - EUR 26,787) (33,833) 174
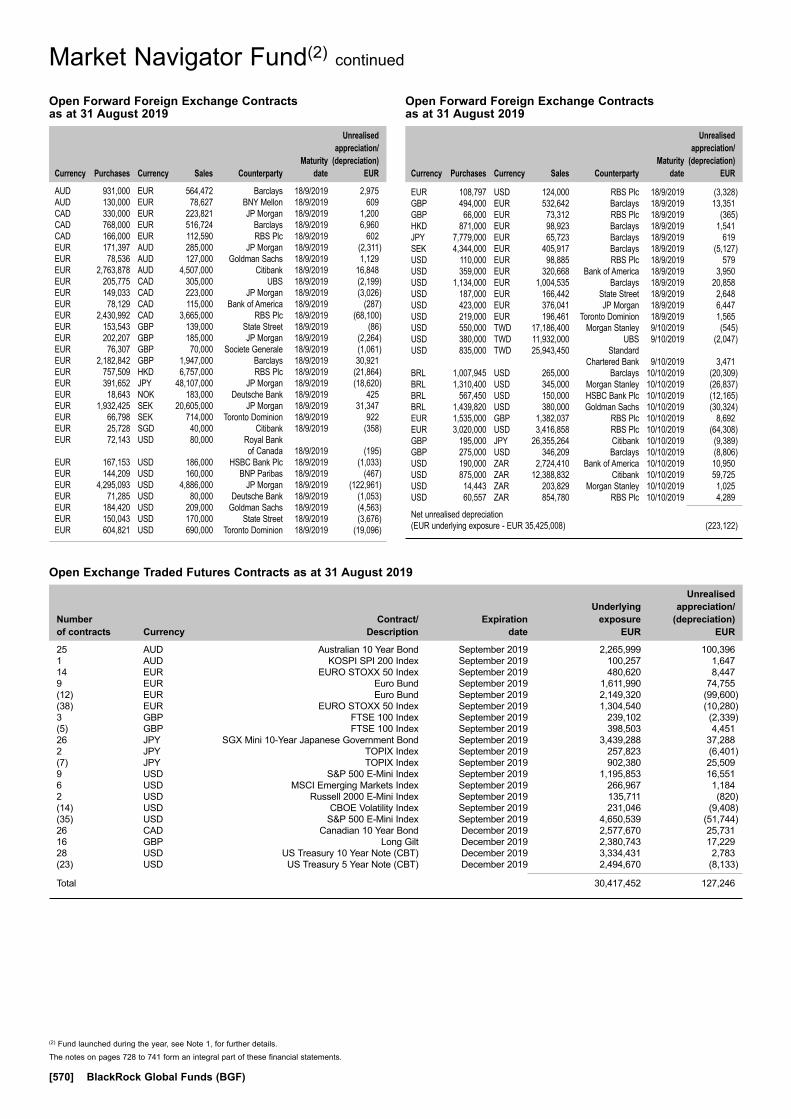
The notes on pages 728 to 741 form an integral part of these financial statements.
[570] BlackRock Global Funds (BGF)
Market Navigator Fund(2) continued
(2) Fund launched during the year, see Note 1, for further details.
Open Exchange Traded Futures Contracts as at 31 August 2019
Number of contracts Currency
Contract/ Description
Expiration date
Underlying exposure
EUR
Unrealised appreciation/
(depreciation) EUR
25 AUD Australian 10 Year Bond September 2019 2,265,999 100,3961 AUD KOSPI SPI 200 Index September 2019 100,257 1,64714 EUR EURO STOXX 50 Index September 2019 480,620 8,4479 EUR Euro Bund September 2019 1,611,990 74,755(12) EUR Euro Bund September 2019 2,149,320 (99,600)(38) EUR EURO STOXX 50 Index September 2019 1,304,540 (10,280)3 GBP FTSE 100 Index September 2019 239,102 (2,339)(5) GBP FTSE 100 Index September 2019 398,503 4,45126 JPY SGX Mini 10-Year Japanese Government Bond September 2019 3,439,288 37,2882 JPY TOPIX Index September 2019 257,823 (6,401)(7) JPY TOPIX Index September 2019 902,380 25,5099 USD S&P 500 E-Mini Index September 2019 1,195,853 16,5516 USD MSCI Emerging Markets Index September 2019 266,967 1,1842 USD Russell 2000 E-Mini Index September 2019 135,711 (820)(14) USD CBOE Volatility Index September 2019 231,046 (9,408)(35) USD S&P 500 E-Mini Index September 2019 4,650,539 (51,744)26 CAD Canadian 10 Year Bond December 2019 2,577,670 25,73116 GBP Long Gilt December 2019 2,380,743 17,22928 USD US Treasury 10 Year Note (CBT) December 2019 3,334,431 2,783(23) USD US Treasury 5 Year Note (CBT) December 2019 2,494,670 (8,133)
Total 30,417,452 127,246
Open Forward Foreign Exchange Contracts as at 31 August 2019
Currency
Purchases Currency
Sales Counterparty
Maturity date
Unrealised appreciation/
(depreciation) EUR
AUD 931,000 EUR 564,472 Barclays 18/9/2019 2,975AUD 130,000 EUR 78,627 BNY Mellon 18/9/2019 609CAD 330,000 EUR 223,821 JP Morgan 18/9/2019 1,200CAD 768,000 EUR 516,724 Barclays 18/9/2019 6,960CAD 166,000 EUR 112,590 RBS Plc 18/9/2019 602EUR 171,397 AUD 285,000 JP Morgan 18/9/2019 (2,311)EUR 78,536 AUD 127,000 Goldman Sachs 18/9/2019 1,129EUR 2,763,878 AUD 4,507,000 Citibank 18/9/2019 16,848EUR 205,775 CAD 305,000 UBS 18/9/2019 (2,199)EUR 149,033 CAD 223,000 JP Morgan 18/9/2019 (3,026)EUR 78,129 CAD 115,000 Bank of America 18/9/2019 (287)EUR 2,430,992 CAD 3,665,000 RBS Plc 18/9/2019 (68,100)EUR 153,543 GBP 139,000 State Street 18/9/2019 (86)EUR 202,207 GBP 185,000 JP Morgan 18/9/2019 (2,264)EUR 76,307 GBP 70,000 Societe Generale 18/9/2019 (1,061)EUR 2,182,842 GBP 1,947,000 Barclays 18/9/2019 30,921EUR 757,509 HKD 6,757,000 RBS Plc 18/9/2019 (21,864)EUR 391,652 JPY 48,107,000 JP Morgan 18/9/2019 (18,620)EUR 18,643 NOK 183,000 Deutsche Bank 18/9/2019 425EUR 1,932,425 SEK 20,605,000 JP Morgan 18/9/2019 31,347EUR 66,798 SEK 714,000 Toronto Dominion 18/9/2019 922EUR 25,728 SGD 40,000 Citibank 18/9/2019 (358)EUR 72,143 USD 80,000 Royal Bank of Canada 18/9/2019 (195)EUR 167,153 USD 186,000 HSBC Bank Plc 18/9/2019 (1,033)EUR 144,209 USD 160,000 BNP Paribas 18/9/2019 (467)EUR 4,295,093 USD 4,886,000 JP Morgan 18/9/2019 (122,961)EUR 71,285 USD 80,000 Deutsche Bank 18/9/2019 (1,053)EUR 184,420 USD 209,000 Goldman Sachs 18/9/2019 (4,563)EUR 150,043 USD 170,000 State Street 18/9/2019 (3,676)EUR 604,821 USD 690,000 Toronto Dominion 18/9/2019 (19,096)
EUR 108,797 USD 124,000 RBS Plc 18/9/2019 (3,328)GBP 494,000 EUR 532,642 Barclays 18/9/2019 13,351GBP 66,000 EUR 73,312 RBS Plc 18/9/2019 (365)HKD 871,000 EUR 98,923 Barclays 18/9/2019 1,541JPY 7,779,000 EUR 65,723 Barclays 18/9/2019 619SEK 4,344,000 EUR 405,917 Barclays 18/9/2019 (5,127)USD 110,000 EUR 98,885 RBS Plc 18/9/2019 579USD 359,000 EUR 320,668 Bank of America 18/9/2019 3,950USD 1,134,000 EUR 1,004,535 Barclays 18/9/2019 20,858USD 187,000 EUR 166,442 State Street 18/9/2019 2,648USD 423,000 EUR 376,041 JP Morgan 18/9/2019 6,447USD 219,000 EUR 196,461 Toronto Dominion 18/9/2019 1,565USD 550,000 TWD 17,186,400 Morgan Stanley 9/10/2019 (545)USD 380,000 TWD 11,932,000 UBS 9/10/2019 (2,047)USD 835,000 TWD 25,943,450 Standard Chartered Bank 9/10/2019 3,471BRL 1,007,945 USD 265,000 Barclays 10/10/2019 (20,309)BRL 1,310,400 USD 345,000 Morgan Stanley 10/10/2019 (26,837)BRL 567,450 USD 150,000 HSBC Bank Plc 10/10/2019 (12,165)BRL 1,439,820 USD 380,000 Goldman Sachs 10/10/2019 (30,324)EUR 1,535,000 GBP 1,382,037 RBS Plc 10/10/2019 8,692EUR 3,020,000 USD 3,416,858 RBS Plc 10/10/2019 (64,308)GBP 195,000 JPY 26,355,264 Citibank 10/10/2019 (9,389)GBP 275,000 USD 346,209 Barclays 10/10/2019 (8,806)USD 190,000 ZAR 2,724,410 Bank of America 10/10/2019 10,950USD 875,000 ZAR 12,388,832 Citibank 10/10/2019 59,725USD 14,443 ZAR 203,829 Morgan Stanley 10/10/2019 1,025USD 60,557 ZAR 854,780 RBS Plc 10/10/2019 4,289
Net unrealised depreciation (EUR underlying exposure - EUR 35,425,008) (223,122)
Open Forward Foreign Exchange Contracts as at 31 August 2019
Currency
Purchases Currency
Sales Counterparty
Maturity date
Unrealised appreciation/
(depreciation) EUR

The notes on pages 728 to 741 form an integral part of these financial statements.
Annual Report and Audited Financial Statements [571]
Market Navigator Fund(2) continued
(2) Fund launched during the year, see Note 1, for further details.
Swaps as at 31 August 2019
TypeNominal
Value Description Counterparty
Expiration date
Unrealised appreciation/
(depreciation) EUR
Market Value EUR
CDS USD (529,000) Fund provides default protection on CDX.EM.31.V1; and receives Fixed 1% Citibank 20/6/2024 (8,944) (24,402)
CDS USD (1,631,047) Fund provides default protection on CDX.EM.31.V1; and receives Fixed 1% Citibank 20/6/2024 (30,751) (75,237)
CDS EUR (5,500,000) Fund provides default protection on ITRAXX.EUR.31.V2; and receives Fixed 1% Credit Suisse 20/6/2024 31,499 139,008
CDS USD (6,500,000) Fund provides default protection on CDX.NA.IG.32.V1; and receives Fixed 1% Credit Suisse 20/6/2024 30,364 126,729
CDS USD (2,970,000) Fund provides default protection on CDX.NA.HY.32.V2; and receives Fixed 5% Credit Suisse 20/6/2024 16,924 184,795
CDS EUR (1,000,000) Fund receives default protection on ITRAXX.XO.31.V1; and pays Fixed 5% Credit Suisse 20/6/2024 (1,682) 112,125
CDS USD (2,559,180) Fund provides default protection on CDX.EM.31.V1; and receives Fixed 1% Goldman Sachs 20/6/2024 (44,791) (118,050)
IFS USD 1,900,000 Fund provides default protection on USCPIU + 0 bps; and receives Fixed 1.7598% Credit Suisse 7/8/2024 11,552 11,552
IFS USD 1,900,000 Fund receives default protection on USCPIU + 0 bps; and pays Fixed 1.885% Credit Suisse 7/8/2029 (13,443) (13,443)
IRS KRW 215,756,650 Fund receives Fixed 1.74%; and pays Floating KRW KORIBOR 3 Month Bank of America 18/9/2024 5,127 5,127
IRS KRW 698,500,000 Fund receives Fixed 1.778%; and pays Floating KRW KORIBOR 3 Month Bank of America 18/9/2024 17,560 17,560
IRS CNY 1,350,000 Fund receives Fixed 3.115%; and pays Floating CNY CNRR 3 Month Bank of America 18/9/2024 1,864 1,864
IRS INR 58,000,000 Fund receives Fixed 5.85%; and pays Floating INR MIBOR 6 Month Bank of America 18/9/2024 26,841 26,841IRS INR 18,459,696 Fund receives Fixed 5.85%; and pays Floating INR MIBOR 6 Month Bank of America 18/9/2024 8,543 8,543IRS KRW 633,740,000 Fund receives Fixed 1.776%; and pays Floating KRW
KORIBOR 3 Month BNP Paribas 18/9/2024 15,886 15,886IRS THB 8,500,000 Fund receives Fixed 2.04%; and pays Floating THB
BKIBOR 6 Month BNP Paribas 18/9/2024 9,294 9,294IRS CNY 1,150,000 Fund receives Fixed 3.09%; and pays Floating CNY CNRR 3 Month BNP Paribas 18/9/2024 1,419 1,419IRS THB 7,000,000 Fund receives Fixed 2.04%; and pays Floating THB
BKIBOR 6 Month Citibank 18/9/2024 7,653 7,653IRS CNY 4,500,000 Fund receives Fixed 3.12%; and pays Floating CNY CNRR 3 Month Citibank 18/9/2024 6,346 6,346IRS MXN 20,000,000 Fund receives Fixed 8.0275%; and pays Floating MXN
MXIBTIIE 1 Month Credit Suisse 11/9/2024 49,051 49,051IRS PLN 4,178,531 Fund receives Fixed 2.025%; and pays Floating PLN
WIBOR 6 Month Credit Suisse 18/9/2024 22,387 22,387IRS PLN 1,000,000 Fund receives Fixed 2.0825%; and pays Floating PLN
WIBOR 6 Month Credit Suisse 18/9/2024 5,983 5,983IRS SGD 2,043,170 Fund receives Fixed 2.1645%; and pays Floating SGD
SGDOW 6 Month Credit Suisse 18/9/2024 41,223 41,223IRS HKD 9,739,053 Fund receives Fixed 2.35%; and pays Floating HKD
HIBOR 3 Month Credit Suisse 18/9/2024 41,002 41,002IRS ZAR 3,521,408 Fund receives Fixed 7.52%; and pays Floating ZAR JIBAR 3 Month Credit Suisse 18/9/2024 5,671 5,671IRS ZAR 8,000,000 Fund receives Fixed 7.534%; and pays Floating ZAR
JIBAR 3 Month Credit Suisse 18/9/2024 13,163 13,163IRS ZAR 2,000,000 Fund receives Fixed 7.57%; and pays Floating ZAR JIBAR 3 Month Credit Suisse 18/9/2024 3,471 3,471IRS ZAR 1,507,309 Fund receives Fixed 7.61%; and pays Floating ZAR JIBAR 3 Month Credit Suisse 18/9/2024 2,766 2,766IRS KRW 204,000,000 Fund receives Fixed 1.755%; and pays Floating KRW
KORIBOR 3 Month Deutsche Bank 18/9/2024 4,958 4,958IRS KRW 534,020,000 Fund receives Fixed 1.7765%; and pays Floating KRW
KORIBOR 3 Month Goldman Sachs 18/9/2024 13,396 13,396IRS THB 4,000,000 Fund receives Fixed 2.03%; and pays Floating THB
BKIBOR 6 Month Goldman Sachs 18/9/2024 4,316 4,316IRS THB 25,673,716 Fund receives Fixed 1.998%; and pays Floating THB
BKIBOR 6 Month HSBC Bank Plc 18/9/2024 26,527 26,527IRS INR 6,287,350 Fund receives Fixed 6.01%; and pays Floating INR MIBOR 6 Month HSBC Bank Plc 18/9/2024 3,467 3,467IRS CNY 1,500,000 Fund receives Fixed 3.125%; and pays Floating CNY
CNRR 3 Month JP Morgan 18/9/2024 2,160 2,160TRS USD 162,485 Fund receives BofA Merrill Lynch Commodity + 0bps;
and pays Fixed 0% Bank of America 19/12/2019 (1,158) (1,158)TRS USD 344,426 Fund receives BofA Merill Lynch Commodity + 0bps;
and pays Fixed 0% Bank of America 19/12/2019 (2,455) (2,455)TRS USD 405,160 Fund receives BofA Merill Lynch Commodity + 0bps;
and pays Fixed 0% Bank of America 19/12/2019 (2,888) (2,888)TRS USD 470 Fund receives MSCI Emerging Markets Net Returns + 0bps;
and pays USD LIBOR 3 Month BBA +24bps Bank of America 28/1/2020 (13,116) (14,655)TRS USD 97 Fund receives MSCI Emerging Markets + 0bps; and pays USD
LIBOR 3 Month BBA + 19bps Bank of America 25/3/2020 (1,472) (2,777)
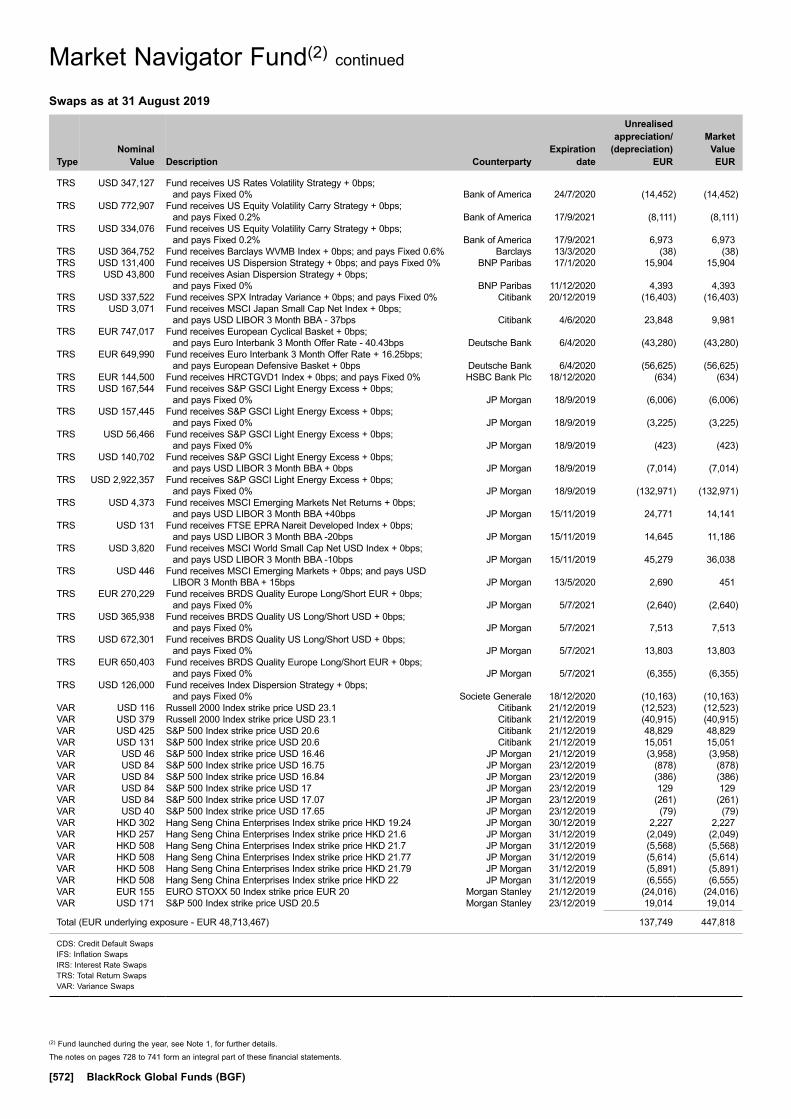
The notes on pages 728 to 741 form an integral part of these financial statements.
[572] BlackRock Global Funds (BGF)
Market Navigator Fund(2) continued
(2) Fund launched during the year, see Note 1, for further details.
Swaps as at 31 August 2019
TypeNominal
Value Description Counterparty
Expiration date
Unrealised appreciation/
(depreciation) EUR
Market Value EUR
TRS USD 347,127 Fund receives US Rates Volatility Strategy + 0bps; and pays Fixed 0% Bank of America 24/7/2020 (14,452) (14,452)
TRS USD 772,907 Fund receives US Equity Volatility Carry Strategy + 0bps; and pays Fixed 0.2% Bank of America 17/9/2021 (8,111) (8,111)
TRS USD 334,076 Fund receives US Equity Volatility Carry Strategy + 0bps; and pays Fixed 0.2% Bank of America 17/9/2021 6,973 6,973
TRS USD 364,752 Fund receives Barclays WVMB Index + 0bps; and pays Fixed 0.6% Barclays 13/3/2020 (38) (38)TRS USD 131,400 Fund receives US Dispersion Strategy + 0bps; and pays Fixed 0% BNP Paribas 17/1/2020 15,904 15,904TRS USD 43,800 Fund receives Asian Dispersion Strategy + 0bps;
and pays Fixed 0% BNP Paribas 11/12/2020 4,393 4,393TRS USD 337,522 Fund receives SPX Intraday Variance + 0bps; and pays Fixed 0% Citibank 20/12/2019 (16,403) (16,403)TRS USD 3,071 Fund receives MSCI Japan Small Cap Net Index + 0bps;
and pays USD LIBOR 3 Month BBA - 37bps Citibank 4/6/2020 23,848 9,981TRS EUR 747,017 Fund receives European Cyclical Basket + 0bps;
and pays Euro Interbank 3 Month Offer Rate - 40.43bps Deutsche Bank 6/4/2020 (43,280) (43,280)TRS EUR 649,990 Fund receives Euro Interbank 3 Month Offer Rate + 16.25bps;
and pays European Defensive Basket + 0bps Deutsche Bank 6/4/2020 (56,625) (56,625)TRS EUR 144,500 Fund receives HRCTGVD1 Index + 0bps; and pays Fixed 0% HSBC Bank Plc 18/12/2020 (634) (634)TRS USD 167,544 Fund receives S&P GSCI Light Energy Excess + 0bps;
and pays Fixed 0% JP Morgan 18/9/2019 (6,006) (6,006)TRS USD 157,445 Fund receives S&P GSCI Light Energy Excess + 0bps;
and pays Fixed 0% JP Morgan 18/9/2019 (3,225) (3,225)TRS USD 56,466 Fund receives S&P GSCI Light Energy Excess + 0bps;
and pays Fixed 0% JP Morgan 18/9/2019 (423) (423)TRS USD 140,702 Fund receives S&P GSCI Light Energy Excess + 0bps;
and pays USD LIBOR 3 Month BBA + 0bps JP Morgan 18/9/2019 (7,014) (7,014)TRS USD 2,922,357 Fund receives S&P GSCI Light Energy Excess + 0bps;
and pays Fixed 0% JP Morgan 18/9/2019 (132,971) (132,971)TRS USD 4,373 Fund receives MSCI Emerging Markets Net Returns + 0bps;
and pays USD LIBOR 3 Month BBA +40bps JP Morgan 15/11/2019 24,771 14,141TRS USD 131 Fund receives FTSE EPRA Nareit Developed Index + 0bps;
and pays USD LIBOR 3 Month BBA -20bps JP Morgan 15/11/2019 14,645 11,186TRS USD 3,820 Fund receives MSCI World Small Cap Net USD Index + 0bps;
and pays USD LIBOR 3 Month BBA -10bps JP Morgan 15/11/2019 45,279 36,038TRS USD 446 Fund receives MSCI Emerging Markets + 0bps; and pays USD
LIBOR 3 Month BBA + 15bps JP Morgan 13/5/2020 2,690 451TRS EUR 270,229 Fund receives BRDS Quality Europe Long/Short EUR + 0bps;
and pays Fixed 0% JP Morgan 5/7/2021 (2,640) (2,640)TRS USD 365,938 Fund receives BRDS Quality US Long/Short USD + 0bps;
and pays Fixed 0% JP Morgan 5/7/2021 7,513 7,513TRS USD 672,301 Fund receives BRDS Quality US Long/Short USD + 0bps;
and pays Fixed 0% JP Morgan 5/7/2021 13,803 13,803TRS EUR 650,403 Fund receives BRDS Quality Europe Long/Short EUR + 0bps;
and pays Fixed 0% JP Morgan 5/7/2021 (6,355) (6,355)TRS USD 126,000 Fund receives Index Dispersion Strategy + 0bps;
and pays Fixed 0% Societe Generale 18/12/2020 (10,163) (10,163)VAR USD 116 Russell 2000 Index strike price USD 23.1 Citibank 21/12/2019 (12,523) (12,523)VAR USD 379 Russell 2000 Index strike price USD 23.1 Citibank 21/12/2019 (40,915) (40,915)VAR USD 425 S&P 500 Index strike price USD 20.6 Citibank 21/12/2019 48,829 48,829VAR USD 131 S&P 500 Index strike price USD 20.6 Citibank 21/12/2019 15,051 15,051VAR USD 46 S&P 500 Index strike price USD 16.46 JP Morgan 21/12/2019 (3,958) (3,958)VAR USD 84 S&P 500 Index strike price USD 16.75 JP Morgan 23/12/2019 (878) (878)VAR USD 84 S&P 500 Index strike price USD 16.84 JP Morgan 23/12/2019 (386) (386)VAR USD 84 S&P 500 Index strike price USD 17 JP Morgan 23/12/2019 129 129VAR USD 84 S&P 500 Index strike price USD 17.07 JP Morgan 23/12/2019 (261) (261)VAR USD 40 S&P 500 Index strike price USD 17.65 JP Morgan 23/12/2019 (79) (79)VAR HKD 302 Hang Seng China Enterprises Index strike price HKD 19.24 JP Morgan 30/12/2019 2,227 2,227VAR HKD 257 Hang Seng China Enterprises Index strike price HKD 21.6 JP Morgan 31/12/2019 (2,049) (2,049)VAR HKD 508 Hang Seng China Enterprises Index strike price HKD 21.7 JP Morgan 31/12/2019 (5,568) (5,568)VAR HKD 508 Hang Seng China Enterprises Index strike price HKD 21.77 JP Morgan 31/12/2019 (5,614) (5,614)VAR HKD 508 Hang Seng China Enterprises Index strike price HKD 21.79 JP Morgan 31/12/2019 (5,891) (5,891)VAR HKD 508 Hang Seng China Enterprises Index strike price HKD 22 JP Morgan 31/12/2019 (6,555) (6,555)VAR EUR 155 EURO STOXX 50 Index strike price EUR 20 Morgan Stanley 21/12/2019 (24,016) (24,016)VAR USD 171 S&P 500 Index strike price USD 20.5 Morgan Stanley 23/12/2019 19,014 19,014
Total (EUR underlying exposure - EUR 48,713,467) 137,749 447,818
CDS: Credit Default SwapsIFS: Inflation SwapsIRS: Interest Rate SwapsTRS: Total Return SwapsVAR: Variance Swaps
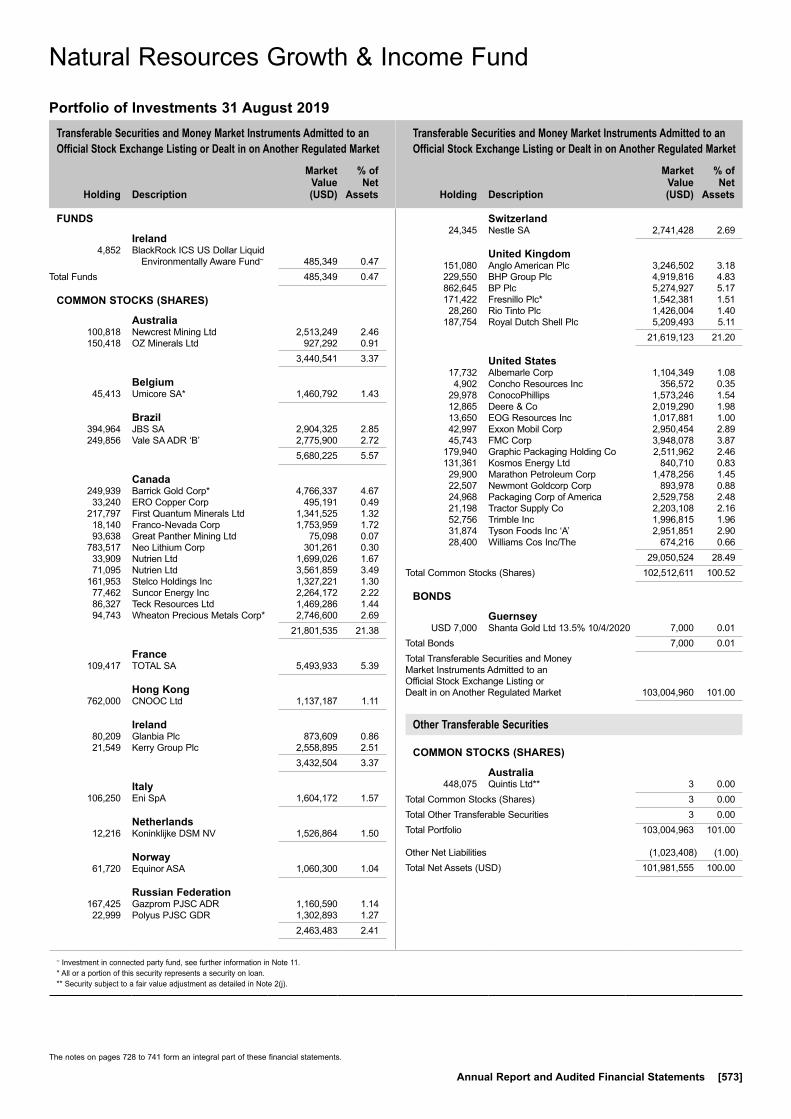
Transferable Securities and Money Market Instruments Admitted to an Official Stock Exchange Listing or Dealt in on Another Regulated Market
Transferable Securities and Money Market Instruments Admitted to an Official Stock Exchange Listing or Dealt in on Another Regulated Market
Holding
Description
Market Value (USD)
% of Net
Assets
Holding
Description
Market Value (USD)
% of Net
Assets
~ Investment in connected party fund, see further information in Note 11.* All or a portion of this security represents a security on loan.** Security subject to a fair value adjustment as detailed in Note 2(j).
The notes on pages 728 to 741 form an integral part of these financial statements.
Annual Report and Audited Financial Statements [573]
FUNDS
Ireland 4,852 BlackRock ICS US Dollar Liquid
Environmentally Aware Fund~ 485,349 0.47Total Funds 485,349 0.47
COMMON STOCKS (SHARES)
Australia 100,818 Newcrest Mining Ltd 2,513,249 2.46 150,418 OZ Minerals Ltd 927,292 0.91 3,440,541 3.37
Belgium 45,413 Umicore SA* 1,460,792 1.43
Brazil 394,964 JBS SA 2,904,325 2.85 249,856 Vale SA ADR ‘B’ 2,775,900 2.72 5,680,225 5.57
Canada 249,939 Barrick Gold Corp* 4,766,337 4.67 33,240 ERO Copper Corp 495,191 0.49 217,797 First Quantum Minerals Ltd 1,341,525 1.32 18,140 Franco-Nevada Corp 1,753,959 1.72 93,638 Great Panther Mining Ltd 75,098 0.07 783,517 Neo Lithium Corp 301,261 0.30 33,909 Nutrien Ltd 1,699,026 1.67 71,095 Nutrien Ltd 3,561,859 3.49 161,953 Stelco Holdings Inc 1,327,221 1.30 77,462 Suncor Energy Inc 2,264,172 2.22 86,327 Teck Resources Ltd 1,469,286 1.44 94,743 Wheaton Precious Metals Corp* 2,746,600 2.69 21,801,535 21.38
France 109,417 TOTAL SA 5,493,933 5.39
Hong Kong 762,000 CNOOC Ltd 1,137,187 1.11
Ireland 80,209 Glanbia Plc 873,609 0.86 21,549 Kerry Group Plc 2,558,895 2.51 3,432,504 3.37
Italy 106,250 Eni SpA 1,604,172 1.57
Netherlands 12,216 Koninklijke DSM NV 1,526,864 1.50
Norway 61,720 Equinor ASA 1,060,300 1.04
Russian Federation 167,425 Gazprom PJSC ADR 1,160,590 1.14 22,999 Polyus PJSC GDR 1,302,893 1.27 2,463,483 2.41
Switzerland 24,345 Nestle SA 2,741,428 2.69
United Kingdom 151,080 Anglo American Plc 3,246,502 3.18 229,550 BHP Group Plc 4,919,816 4.83 862,645 BP Plc 5,274,927 5.17 171,422 Fresnillo Plc* 1,542,381 1.51 28,260 Rio Tinto Plc 1,426,004 1.40 187,754 Royal Dutch Shell Plc 5,209,493 5.11 21,619,123 21.20
United States 17,732 Albemarle Corp 1,104,349 1.08 4,902 Concho Resources Inc 356,572 0.35 29,978 ConocoPhillips 1,573,246 1.54 12,865 Deere & Co 2,019,290 1.98 13,650 EOG Resources Inc 1,017,881 1.00 42,997 Exxon Mobil Corp 2,950,454 2.89 45,743 FMC Corp 3,948,078 3.87 179,940 Graphic Packaging Holding Co 2,511,962 2.46 131,361 Kosmos Energy Ltd 840,710 0.83 29,900 Marathon Petroleum Corp 1,478,256 1.45 22,507 Newmont Goldcorp Corp 893,978 0.88 24,968 Packaging Corp of America 2,529,758 2.48 21,198 Tractor Supply Co 2,203,108 2.16 52,756 Trimble Inc 1,996,815 1.96 31,874 Tyson Foods Inc ‘A’ 2,951,851 2.90 28,400 Williams Cos Inc/The 674,216 0.66 29,050,524 28.49Total Common Stocks (Shares) 102,512,611 100.52
BONDS
Guernsey USD 7,000 Shanta Gold Ltd 13.5% 10/4/2020 7,000 0.01Total Bonds 7,000 0.01Total Transferable Securities and Money Market Instruments Admitted to an Official Stock Exchange Listing or Dealt in on Another Regulated Market 103,004,960 101.00
Other Transferable Securities
COMMON STOCKS (SHARES)
Australia 448,075 Quintis Ltd** 3 0.00Total Common Stocks (Shares) 3 0.00Total Other Transferable Securities 3 0.00Total Portfolio 103,004,963 101.00
Other Net Liabilities (1,023,408) (1.00)Total Net Assets (USD) 101,981,555 100.00
Natural Resources Growth & Income Fund
Portfolio of Investments 31 August 2019
Natural Resources Growth & Income Fund

The notes on pages 728 to 741 form an integral part of these financial statements.
[574] BlackRock Global Funds (BGF)
Natural Resources Growth & Income Fund continued
Open Forward Foreign Exchange Contracts as at 31 August 2019
Currency
Purchases Currency
Sales Counterparty
Maturity date
Unrealised appreciation/
(depreciation) USD
EUR Hedged Share Class
EUR 2,759,827 USD 3,097,228 BNY Mellon 12/9/2019 (46,477)USD 201,871 EUR 180,618 BNY Mellon 12/9/2019 2,214
Net unrealised depreciation (USD underlying exposure - USD 3,248,034) (44,263)
Sector Breakdown as at 31 August 2019
% of Net Assets
Materials 51.13Energy 31.48Consumer Staples 11.81Consumer Discretionary 2.16Industrials 1.98Information Technology 1.96Investment Funds 0.47Basic Materials 0.01Other Net Liabilities (1.00)
100.00
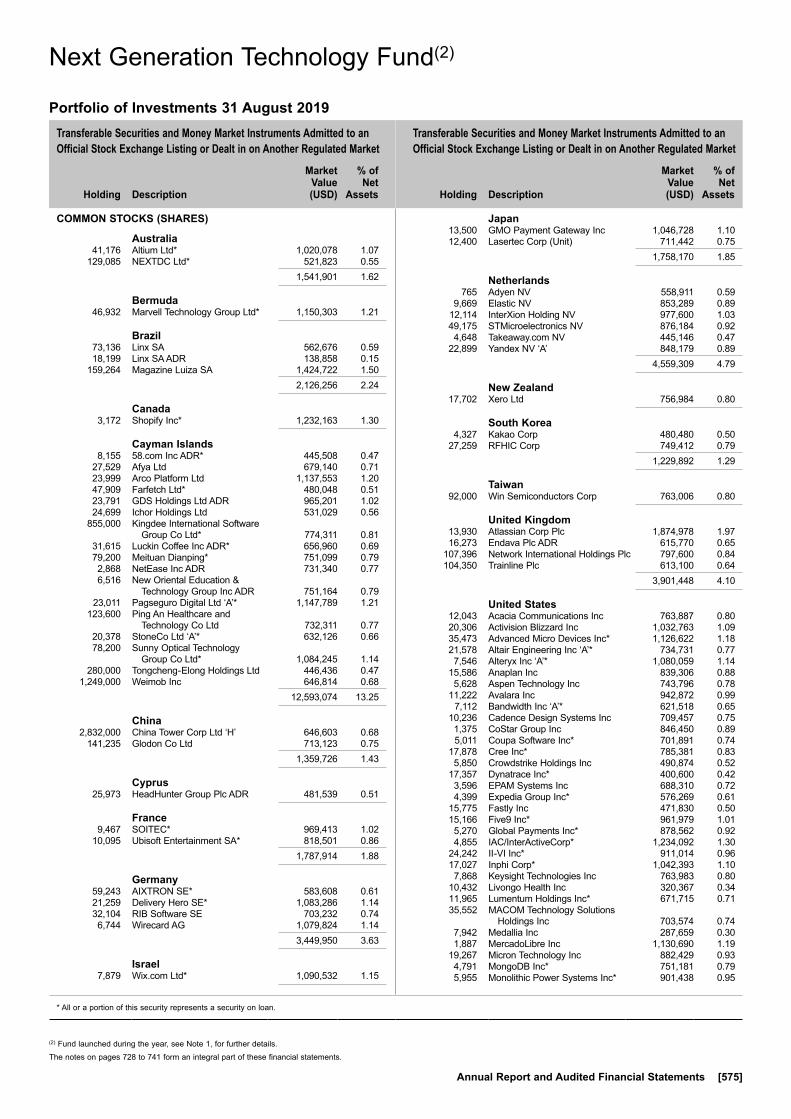
Transferable Securities and Money Market Instruments Admitted to an Official Stock Exchange Listing or Dealt in on Another Regulated Market
Transferable Securities and Money Market Instruments Admitted to an Official Stock Exchange Listing or Dealt in on Another Regulated Market
Holding
Description
Market Value (USD)
% of Net
Assets
Holding
Description
Market Value (USD)
% of Net
Assets
* All or a portion of this security represents a security on loan.
The notes on pages 728 to 741 form an integral part of these financial statements.
Annual Report and Audited Financial Statements [575]
COMMON STOCKS (SHARES)
Australia 41,176 Altium Ltd* 1,020,078 1.07 129,085 NEXTDC Ltd* 521,823 0.55 1,541,901 1.62
Bermuda 46,932 Marvell Technology Group Ltd* 1,150,303 1.21
Brazil 73,136 Linx SA 562,676 0.59 18,199 Linx SA ADR 138,858 0.15 159,264 Magazine Luiza SA 1,424,722 1.50 2,126,256 2.24
Canada 3,172 Shopify Inc* 1,232,163 1.30
Cayman Islands 8,155 58.com Inc ADR* 445,508 0.47 27,529 Afya Ltd 679,140 0.71 23,999 Arco Platform Ltd 1,137,553 1.20 47,909 Farfetch Ltd* 480,048 0.51 23,791 GDS Holdings Ltd ADR 965,201 1.02 24,699 Ichor Holdings Ltd 531,029 0.56 855,000 Kingdee International Software
Group Co Ltd* 774,311 0.81 31,615 Luckin Coffee Inc ADR* 656,960 0.69 79,200 Meituan Dianping* 751,099 0.79 2,868 NetEase Inc ADR 731,340 0.77 6,516 New Oriental Education &
Technology Group Inc ADR 751,164 0.79 23,011 Pagseguro Digital Ltd ‘A’* 1,147,789 1.21 123,600 Ping An Healthcare and
Technology Co Ltd 732,311 0.77 20,378 StoneCo Ltd ‘A’* 632,126 0.66 78,200 Sunny Optical Technology
Group Co Ltd* 1,084,245 1.14 280,000 Tongcheng-Elong Holdings Ltd 446,436 0.47 1,249,000 Weimob Inc 646,814 0.68 12,593,074 13.25
China 2,832,000 China Tower Corp Ltd ‘H’ 646,603 0.68 141,235 Glodon Co Ltd 713,123 0.75 1,359,726 1.43
Cyprus 25,973 HeadHunter Group Plc ADR 481,539 0.51
France 9,467 SOITEC* 969,413 1.02 10,095 Ubisoft Entertainment SA* 818,501 0.86 1,787,914 1.88
Germany 59,243 AIXTRON SE* 583,608 0.61 21,259 Delivery Hero SE* 1,083,286 1.14 32,104 RIB Software SE 703,232 0.74 6,744 Wirecard AG 1,079,824 1.14 3,449,950 3.63
Israel 7,879 Wix.com Ltd* 1,090,532 1.15
Japan 13,500 GMO Payment Gateway Inc 1,046,728 1.10 12,400 Lasertec Corp (Unit) 711,442 0.75 1,758,170 1.85
Netherlands 765 Adyen NV 558,911 0.59 9,669 Elastic NV 853,289 0.89 12,114 InterXion Holding NV 977,600 1.03 49,175 STMicroelectronics NV 876,184 0.92 4,648 Takeaway.com NV 445,146 0.47 22,899 Yandex NV ‘A’ 848,179 0.89 4,559,309 4.79
New Zealand 17,702 Xero Ltd 756,984 0.80
South Korea 4,327 Kakao Corp 480,480 0.50 27,259 RFHIC Corp 749,412 0.79 1,229,892 1.29
Taiwan 92,000 Win Semiconductors Corp 763,006 0.80
United Kingdom 13,930 Atlassian Corp Plc 1,874,978 1.97 16,273 Endava Plc ADR 615,770 0.65 107,396 Network International Holdings Plc 797,600 0.84 104,350 Trainline Plc 613,100 0.64 3,901,448 4.10
United States 12,043 Acacia Communications Inc 763,887 0.80 20,306 Activision Blizzard Inc 1,032,763 1.09 35,473 Advanced Micro Devices Inc* 1,126,622 1.18 21,578 Altair Engineering Inc ‘A’* 734,731 0.77 7,546 Alteryx Inc ‘A’* 1,080,059 1.14 15,586 Anaplan Inc 839,306 0.88 5,628 Aspen Technology Inc 743,796 0.78 11,222 Avalara Inc 942,872 0.99 7,112 Bandwidth Inc ‘A’* 621,518 0.65 10,236 Cadence Design Systems Inc 709,457 0.75 1,375 CoStar Group Inc 846,450 0.89 5,011 Coupa Software Inc* 701,891 0.74 17,878 Cree Inc* 785,381 0.83 5,850 Crowdstrike Holdings Inc 490,874 0.52 17,357 Dynatrace Inc* 400,600 0.42 3,596 EPAM Systems Inc 688,310 0.72 4,399 Expedia Group Inc* 576,269 0.61 15,775 Fastly Inc 471,830 0.50 15,166 Five9 Inc* 961,979 1.01 5,270 Global Payments Inc* 878,562 0.92 4,855 IAC/InterActiveCorp* 1,234,092 1.30 24,242 II-VI Inc* 911,014 0.96 17,027 Inphi Corp* 1,042,393 1.10 7,868 Keysight Technologies Inc 763,983 0.80 10,432 Livongo Health Inc 320,367 0.34 11,965 Lumentum Holdings Inc* 671,715 0.71 35,552 MACOM Technology Solutions
Holdings Inc 703,574 0.74 7,942 Medallia Inc 287,659 0.30 1,887 MercadoLibre Inc 1,130,690 1.19 19,267 Micron Technology Inc 882,429 0.93 4,791 MongoDB Inc* 751,181 0.79 5,955 Monolithic Power Systems Inc* 901,438 0.95
Next Generation Technology Fund(2)
Portfolio of Investments 31 August 2019
Next Generation Technology Fund(2)
(2) Fund launched during the year, see Note 1, for further details.
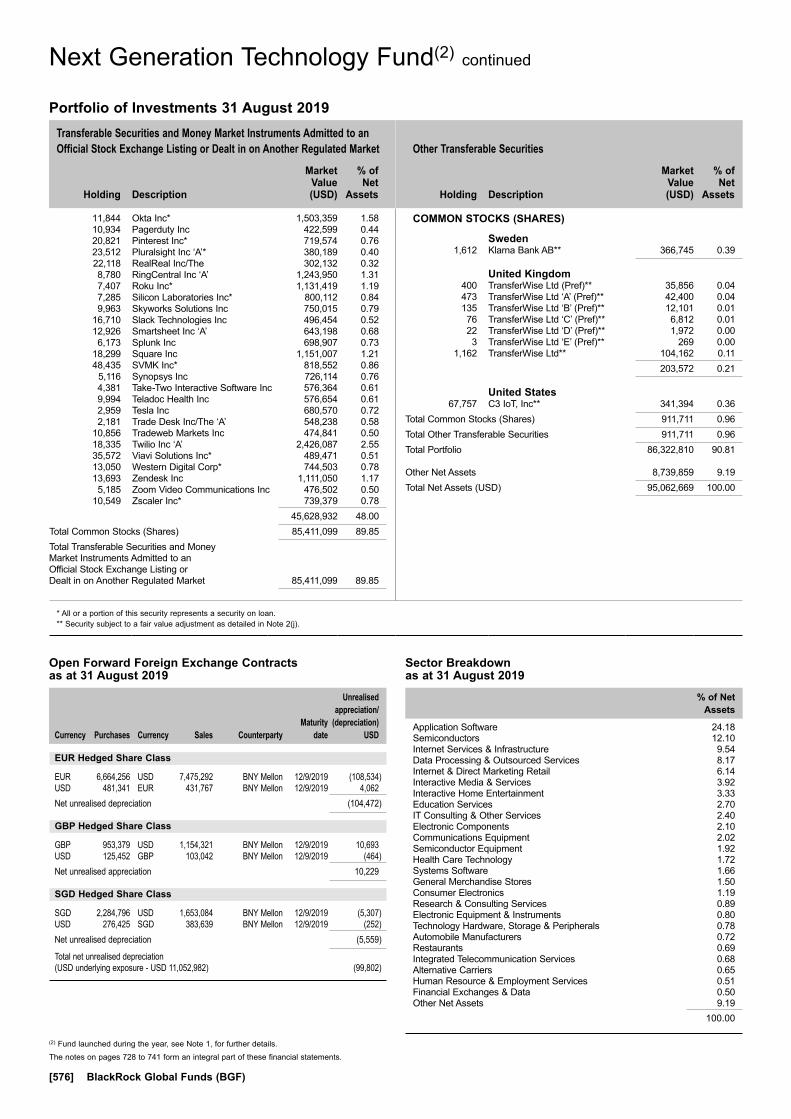
Transferable Securities and Money Market Instruments Admitted to an Official Stock Exchange Listing or Dealt in on Another Regulated Market Other Transferable Securities
Holding
Description
Market Value (USD)
% of Net
Assets
Holding
Description
Market Value (USD)
% of Net
Assets
* All or a portion of this security represents a security on loan.** Security subject to a fair value adjustment as detailed in Note 2(j).
The notes on pages 728 to 741 form an integral part of these financial statements.
[576] BlackRock Global Funds (BGF)
Next Generation Technology Fund(2) continued
Sector Breakdown as at 31 August 2019
% of Net Assets
Application Software 24.18Semiconductors 12.10Internet Services & Infrastructure 9.54Data Processing & Outsourced Services 8.17Internet & Direct Marketing Retail 6.14Interactive Media & Services 3.92Interactive Home Entertainment 3.33Education Services 2.70IT Consulting & Other Services 2.40Electronic Components 2.10Communications Equipment 2.02Semiconductor Equipment 1.92Health Care Technology 1.72Systems Software 1.66General Merchandise Stores 1.50Consumer Electronics 1.19Research & Consulting Services 0.89Electronic Equipment & Instruments 0.80Technology Hardware, Storage & Peripherals 0.78Automobile Manufacturers 0.72Restaurants 0.69Integrated Telecommunication Services 0.68Alternative Carriers 0.65Human Resource & Employment Services 0.51Financial Exchanges & Data 0.50Other Net Assets 9.19
100.00
Open Forward Foreign Exchange Contracts as at 31 August 2019
Currency
Purchases Currency
Sales Counterparty
Maturity date
Unrealised appreciation/
(depreciation) USD
EUR Hedged Share Class
EUR 6,664,256 USD 7,475,292 BNY Mellon 12/9/2019 (108,534)USD 481,341 EUR 431,767 BNY Mellon 12/9/2019 4,062Net unrealised depreciation (104,472)
GBP Hedged Share Class
GBP 953,379 USD 1,154,321 BNY Mellon 12/9/2019 10,693USD 125,452 GBP 103,042 BNY Mellon 12/9/2019 (464)Net unrealised appreciation 10,229
SGD Hedged Share Class
SGD 2,284,796 USD 1,653,084 BNY Mellon 12/9/2019 (5,307)USD 276,425 SGD 383,639 BNY Mellon 12/9/2019 (252)Net unrealised depreciation (5,559)
Total net unrealised depreciation (USD underlying exposure - USD 11,052,982) (99,802)
11,844 Okta Inc* 1,503,359 1.58 10,934 Pagerduty Inc 422,599 0.44 20,821 Pinterest Inc* 719,574 0.76 23,512 Pluralsight Inc ‘A’* 380,189 0.40 22,118 RealReal Inc/The 302,132 0.32 8,780 RingCentral Inc ‘A’ 1,243,950 1.31 7,407 Roku Inc* 1,131,419 1.19 7,285 Silicon Laboratories Inc* 800,112 0.84 9,963 Skyworks Solutions Inc 750,015 0.79 16,710 Slack Technologies Inc 496,454 0.52 12,926 Smartsheet Inc ‘A’ 643,198 0.68 6,173 Splunk Inc 698,907 0.73 18,299 Square Inc 1,151,007 1.21 48,435 SVMK Inc* 818,552 0.86 5,116 Synopsys Inc 726,114 0.76 4,381 Take-Two Interactive Software Inc 576,364 0.61 9,994 Teladoc Health Inc 576,654 0.61 2,959 Tesla Inc 680,570 0.72 2,181 Trade Desk Inc/The ‘A’ 548,238 0.58 10,856 Tradeweb Markets Inc 474,841 0.50 18,335 Twilio Inc ‘A’ 2,426,087 2.55 35,572 Viavi Solutions Inc* 489,471 0.51 13,050 Western Digital Corp* 744,503 0.78 13,693 Zendesk Inc 1,111,050 1.17 5,185 Zoom Video Communications Inc 476,502 0.50 10,549 Zscaler Inc* 739,379 0.78 45,628,932 48.00Total Common Stocks (Shares) 85,411,099 89.85Total Transferable Securities and Money Market Instruments Admitted to an Official Stock Exchange Listing or Dealt in on Another Regulated Market 85,411,099 89.85
COMMON STOCKS (SHARES)
Sweden 1,612 Klarna Bank AB** 366,745 0.39
United Kingdom 400 TransferWise Ltd (Pref)** 35,856 0.04 473 TransferWise Ltd ‘A’ (Pref)** 42,400 0.04 135 TransferWise Ltd ‘B’ (Pref)** 12,101 0.01 76 TransferWise Ltd ‘C’ (Pref)** 6,812 0.01 22 TransferWise Ltd ‘D’ (Pref)** 1,972 0.00 3 TransferWise Ltd ‘E’ (Pref)** 269 0.00 1,162 TransferWise Ltd** 104,162 0.11 203,572 0.21
United States 67,757 C3 IoT, Inc** 341,394 0.36Total Common Stocks (Shares) 911,711 0.96Total Other Transferable Securities 911,711 0.96Total Portfolio 86,322,810 90.81
Other Net Assets 8,739,859 9.19Total Net Assets (USD) 95,062,669 100.00
Portfolio of Investments 31 August 2019
(2) Fund launched during the year, see Note 1, for further details.

Transferable Securities and Money Market Instruments Admitted to an Official Stock Exchange Listing or Dealt in on Another Regulated Market
Transferable Securities and Money Market Instruments Admitted to an Official Stock Exchange Listing or Dealt in on Another Regulated Market
Holding
Description
Market Value (USD)
% of Net
Assets
Holding
Description
Market Value (USD)
% of Net
Assets
* All or a portion of this security represents a security on loan.
The notes on pages 728 to 741 form an integral part of these financial statements.
Annual Report and Audited Financial Statements [577]
COMMON STOCKS (SHARES)
Bermuda 4,630 Marvell Technology Group Ltd* 113,481 0.13
Canada 5,053 BCE Inc* 239,967 0.26 484 Constellation Software Inc/Canada 474,238 0.52 714,205 0.78
Denmark 8,235 Novo Nordisk A/S ADR* 428,714 0.47
Germany 15,137 Bayer AG* 1,129,155 1.23
Ireland 15,037 Johnson Controls International plc 646,290 0.71 25,472 Medtronic Plc 2,748,683 3.00 16,197 Pentair Plc 585,360 0.64 3,980,333 4.35
Japan 25,900 Sony Corp 1,474,283 1.61
Jersey 6,980 Ferguson Plc 511,991 0.56
Netherlands 34,488 Koninklijke Philips NV 1,633,387 1.79 8,993 Unilever NV (NY Shares)* 558,825 0.61 2,192,212 2.40
Norway 15,820 Equinor ASA 271,775 0.30
South Korea 545 Samsung Electronics Co Ltd GDR 497,040 0.54
Switzerland 1,483 Alcon Inc 90,315 0.10 9,057 Nestle SA 1,019,885 1.11 1,110,200 1.21
United Kingdom 13,425 AstraZeneca Plc 1,199,396 1.31 220,280 BP Plc 1,346,975 1.47 2,546,371 2.78
United States 31,565 Altria Group Inc 1,396,751 1.53 34,691 American International Group Inc 1,811,911 1.98 6,507 Anthem Inc 1,708,608 1.87 24,699 Arthur J Gallagher & Co 2,229,332 2.44 35,221 AXA Equitable Holdings Inc* 732,597 0.80 26,325 Baker Hughes a GE Co ‘A’ 579,150 0.63 85,810 Bank of America Corp 2,364,066 2.58 22,080 Bristol-Myers Squibb Co 1,064,918 1.16 14,684 Charles Schwab Corp/The 560,635 0.61 6,596 Chevron Corp 780,109 0.85 9,560 Cisco Systems Inc 451,136 0.49
44,036 Citigroup Inc 2,841,643 3.10 33,715 Cognizant Technology Solutions Corp 2,074,821 2.27 38,203 Comcast Corp* 1,698,123 1.85 25,697 Conagra Brands Inc 736,733 0.80 5,230 ConocoPhillips 274,470 0.30 3,931 Constellation Brands Inc ‘A’ 805,265 0.88 17,926 Corteva Inc* 534,733 0.58 18,249 CVS Health Corp 1,099,867 1.20 10,472 Dollar General Corp 1,653,948 1.81 6,702 Dow Inc 286,309 0.31 8,526 DuPont de Nemours Inc 585,310 0.64 8,168 FedEx Corp* 1,302,796 1.42 31,340 FirstEnergy Corp 1,442,580 1.58 178,014 General Electric Co 1,462,385 1.60 28,648 General Motors Co 1,065,133 1.16 3,409 Goldman Sachs Group Inc/The 696,766 0.76 4,420 Humana Inc 1,247,722 1.36 4,463 International Paper Co 174,816 0.19 29,493 JPMorgan Chase & Co 3,248,064 3.55 7,905 Kellogg Co* 501,335 0.55 7,386 Lowe’s Cos Inc* 830,556 0.91 47,342 Marathon Oil Corp* 576,152 0.63 31,401 Marathon Petroleum Corp 1,552,465 1.70 3,228 Marsh & McLennan Cos Inc 321,993 0.35 15,185 Mattel Inc* 145,624 0.16 3,020 McKesson Corp 414,253 0.45 33,913 MetLife Inc 1,507,433 1.65 17,504 Micron Technology Inc 801,683 0.88 10,224 Microsoft Corp 1,415,104 1.55 5,816 Mondelez International Inc 321,683 0.35 30,361 Morgan Stanley 1,266,661 1.38 5,636 Motorola Solutions Inc 1,021,412 1.12 44,546 Newell Brands Inc* 738,573 0.81 3,178 NextEra Energy Inc* 702,116 0.77 2,370 NVIDIA Corp 403,516 0.44 7,475 ONEOK Inc* 530,949 0.58 12,237 Oracle Corp 638,404 0.70 7,982 PepsiCo Inc 1,087,787 1.19 57,157 Pfizer Inc 2,026,501 2.21 3,346 Procter & Gamble Co/The 405,167 0.44 4,911 Public Service Enterprise Group Inc 296,624 0.32 6,274 QUALCOMM Inc 486,172 0.53 4,090 Quest Diagnostics Inc* 419,511 0.46 11,597 Raytheon Co 2,130,833 2.33 14,282 State Street Corp 738,094 0.81 6,695 Travelers Cos Inc/The* 980,349 1.07 2,472 Union Pacific Corp 403,406 0.44 1,717 UnitedHealth Group Inc 401,950 0.44 65,175 Verizon Communications Inc 3,797,096 4.15 66,673 Wells Fargo & Co 3,110,296 3.40 94,748 Williams Cos Inc/The* 2,249,318 2.46 69,133,713 75.53Total Common Stocks (Shares) 84,103,473 91.89Total Transferable Securities and Money Market Instruments Admitted to an Official Stock Exchange Listing or Dealt in on Another Regulated Market 84,103,473 91.89Total Portfolio 84,103,473 91.89
Other Net Assets 7,423,647 8.11Total Net Assets (USD) 91,527,120 100.00
North American Equity Income Fund
Portfolio of Investments 31 August 2019
North American Equity Income Fund
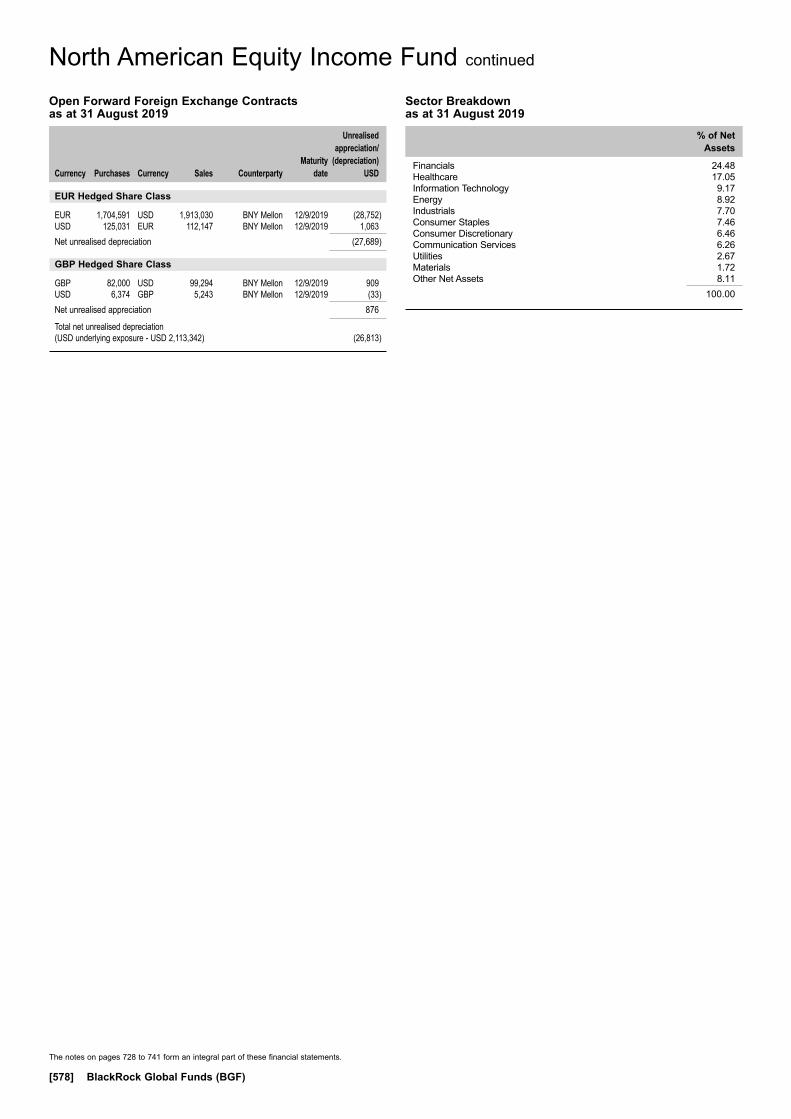
The notes on pages 728 to 741 form an integral part of these financial statements.
[578] BlackRock Global Funds (BGF)
North American Equity Income Fund continued
Open Forward Foreign Exchange Contracts as at 31 August 2019
Currency
Purchases Currency
Sales Counterparty
Maturity date
Unrealised appreciation/
(depreciation) USD
EUR Hedged Share Class
EUR 1,704,591 USD 1,913,030 BNY Mellon 12/9/2019 (28,752)USD 125,031 EUR 112,147 BNY Mellon 12/9/2019 1,063Net unrealised depreciation (27,689)
GBP Hedged Share Class
GBP 82,000 USD 99,294 BNY Mellon 12/9/2019 909USD 6,374 GBP 5,243 BNY Mellon 12/9/2019 (33)Net unrealised appreciation 876
Total net unrealised depreciation (USD underlying exposure - USD 2,113,342) (26,813)
Sector Breakdown as at 31 August 2019
% of Net Assets
Financials 24.48Healthcare 17.05Information Technology 9.17Energy 8.92Industrials 7.70Consumer Staples 7.46Consumer Discretionary 6.46Communication Services 6.26Utilities 2.67Materials 1.72Other Net Assets 8.11
100.00
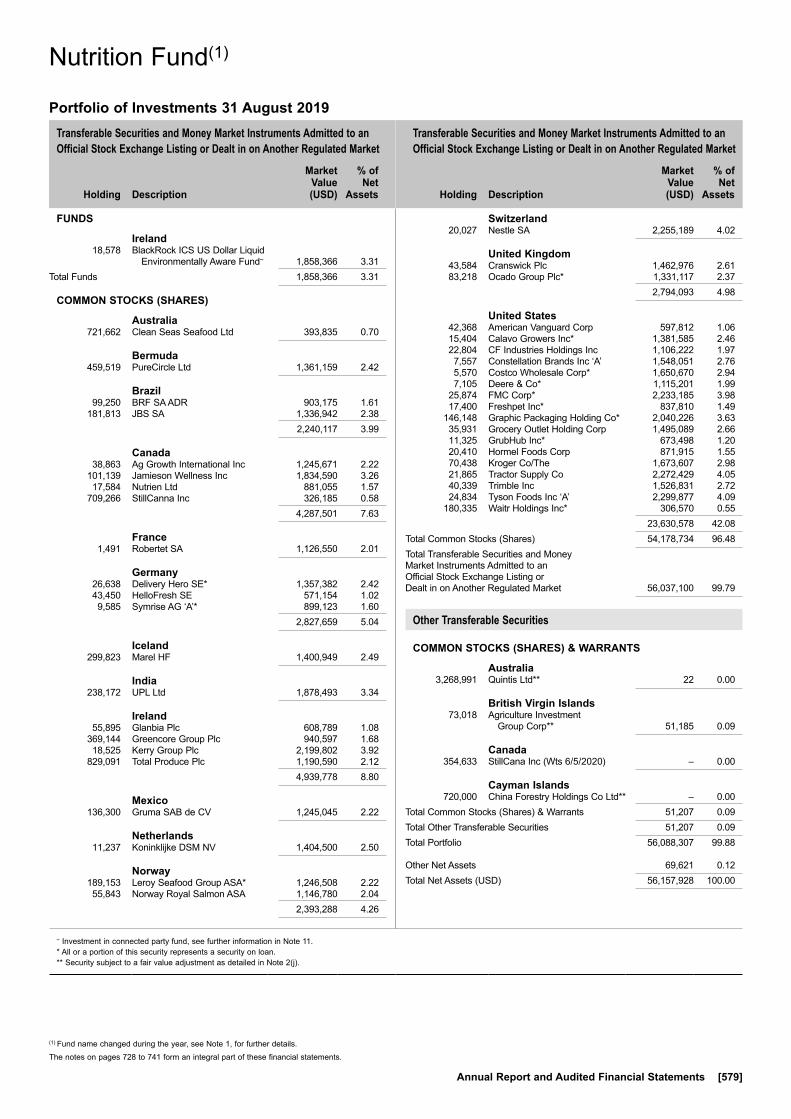
Transferable Securities and Money Market Instruments Admitted to an Official Stock Exchange Listing or Dealt in on Another Regulated Market
Transferable Securities and Money Market Instruments Admitted to an Official Stock Exchange Listing or Dealt in on Another Regulated Market
Holding
Description
Market Value (USD)
% of Net
Assets
Holding
Description
Market Value (USD)
% of Net
Assets
~ Investment in connected party fund, see further information in Note 11.* All or a portion of this security represents a security on loan.** Security subject to a fair value adjustment as detailed in Note 2(j).
The notes on pages 728 to 741 form an integral part of these financial statements.
Annual Report and Audited Financial Statements [579]
FUNDS
Ireland 18,578 BlackRock ICS US Dollar Liquid
Environmentally Aware Fund~ 1,858,366 3.31Total Funds 1,858,366 3.31
COMMON STOCKS (SHARES)
Australia 721,662 Clean Seas Seafood Ltd 393,835 0.70
Bermuda 459,519 PureCircle Ltd 1,361,159 2.42
Brazil 99,250 BRF SA ADR 903,175 1.61 181,813 JBS SA 1,336,942 2.38 2,240,117 3.99
Canada 38,863 Ag Growth International Inc 1,245,671 2.22 101,139 Jamieson Wellness Inc 1,834,590 3.26 17,584 Nutrien Ltd 881,055 1.57 709,266 StillCanna Inc 326,185 0.58 4,287,501 7.63
France 1,491 Robertet SA 1,126,550 2.01
Germany 26,638 Delivery Hero SE* 1,357,382 2.42 43,450 HelloFresh SE 571,154 1.02 9,585 Symrise AG ‘A’* 899,123 1.60 2,827,659 5.04
Iceland 299,823 Marel HF 1,400,949 2.49
India 238,172 UPL Ltd 1,878,493 3.34
Ireland 55,895 Glanbia Plc 608,789 1.08 369,144 Greencore Group Plc 940,597 1.68 18,525 Kerry Group Plc 2,199,802 3.92 829,091 Total Produce Plc 1,190,590 2.12 4,939,778 8.80
Mexico 136,300 Gruma SAB de CV 1,245,045 2.22
Netherlands 11,237 Koninklijke DSM NV 1,404,500 2.50
Norway 189,153 Leroy Seafood Group ASA* 1,246,508 2.22 55,843 Norway Royal Salmon ASA 1,146,780 2.04 2,393,288 4.26
Switzerland 20,027 Nestle SA 2,255,189 4.02
United Kingdom 43,584 Cranswick Plc 1,462,976 2.61 83,218 Ocado Group Plc* 1,331,117 2.37 2,794,093 4.98
United States 42,368 American Vanguard Corp 597,812 1.06 15,404 Calavo Growers Inc* 1,381,585 2.46 22,804 CF Industries Holdings Inc 1,106,222 1.97 7,557 Constellation Brands Inc ‘A’ 1,548,051 2.76 5,570 Costco Wholesale Corp* 1,650,670 2.94 7,105 Deere & Co* 1,115,201 1.99 25,874 FMC Corp* 2,233,185 3.98 17,400 Freshpet Inc* 837,810 1.49 146,148 Graphic Packaging Holding Co* 2,040,226 3.63 35,931 Grocery Outlet Holding Corp 1,495,089 2.66 11,325 GrubHub Inc* 673,498 1.20 20,410 Hormel Foods Corp 871,915 1.55 70,438 Kroger Co/The 1,673,607 2.98 21,865 Tractor Supply Co 2,272,429 4.05 40,339 Trimble Inc 1,526,831 2.72 24,834 Tyson Foods Inc ‘A’ 2,299,877 4.09 180,335 Waitr Holdings Inc* 306,570 0.55 23,630,578 42.08Total Common Stocks (Shares) 54,178,734 96.48Total Transferable Securities and Money Market Instruments Admitted to an Official Stock Exchange Listing or Dealt in on Another Regulated Market 56,037,100 99.79
Other Transferable Securities
COMMON STOCKS (SHARES) & WARRANTS
Australia 3,268,991 Quintis Ltd** 22 0.00
British Virgin Islands 73,018 Agriculture Investment
Group Corp** 51,185 0.09
Canada 354,633 StillCana Inc (Wts 6/5/2020) – 0.00
Cayman Islands 720,000 China Forestry Holdings Co Ltd** – 0.00Total Common Stocks (Shares) & Warrants 51,207 0.09Total Other Transferable Securities 51,207 0.09Total Portfolio 56,088,307 99.88
Other Net Assets 69,621 0.12Total Net Assets (USD) 56,157,928 100.00
Nutrition Fund(1)
Portfolio of Investments 31 August 2019
Nutrition Fund(1)
(1) Fund name changed during the year, see Note 1, for further details.
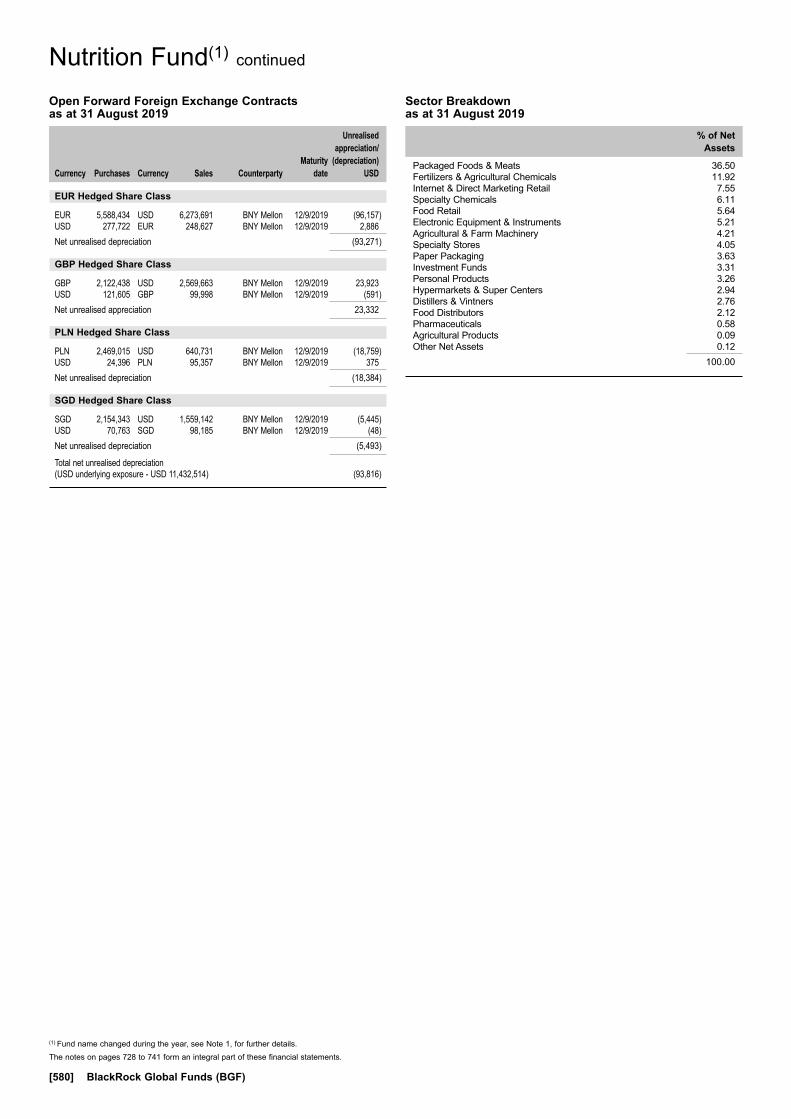
The notes on pages 728 to 741 form an integral part of these financial statements.
[580] BlackRock Global Funds (BGF)
Nutrition Fund(1) continued
Open Forward Foreign Exchange Contracts as at 31 August 2019
Currency
Purchases Currency
Sales Counterparty
Maturity date
Unrealised appreciation/
(depreciation) USD
EUR Hedged Share Class
EUR 5,588,434 USD 6,273,691 BNY Mellon 12/9/2019 (96,157)USD 277,722 EUR 248,627 BNY Mellon 12/9/2019 2,886Net unrealised depreciation (93,271)
GBP Hedged Share Class
GBP 2,122,438 USD 2,569,663 BNY Mellon 12/9/2019 23,923USD 121,605 GBP 99,998 BNY Mellon 12/9/2019 (591)Net unrealised appreciation 23,332
PLN Hedged Share Class
PLN 2,469,015 USD 640,731 BNY Mellon 12/9/2019 (18,759)USD 24,396 PLN 95,357 BNY Mellon 12/9/2019 375Net unrealised depreciation (18,384)
SGD Hedged Share Class
SGD 2,154,343 USD 1,559,142 BNY Mellon 12/9/2019 (5,445)USD 70,763 SGD 98,185 BNY Mellon 12/9/2019 (48)Net unrealised depreciation (5,493)
Total net unrealised depreciation (USD underlying exposure - USD 11,432,514) (93,816)
Sector Breakdown as at 31 August 2019
% of Net Assets
Packaged Foods & Meats 36.50Fertilizers & Agricultural Chemicals 11.92Internet & Direct Marketing Retail 7.55Specialty Chemicals 6.11Food Retail 5.64Electronic Equipment & Instruments 5.21Agricultural & Farm Machinery 4.21Specialty Stores 4.05Paper Packaging 3.63Investment Funds 3.31Personal Products 3.26Hypermarkets & Super Centers 2.94Distillers & Vintners 2.76Food Distributors 2.12Pharmaceuticals 0.58Agricultural Products 0.09Other Net Assets 0.12
100.00
(1) Fund name changed during the year, see Note 1, for further details.
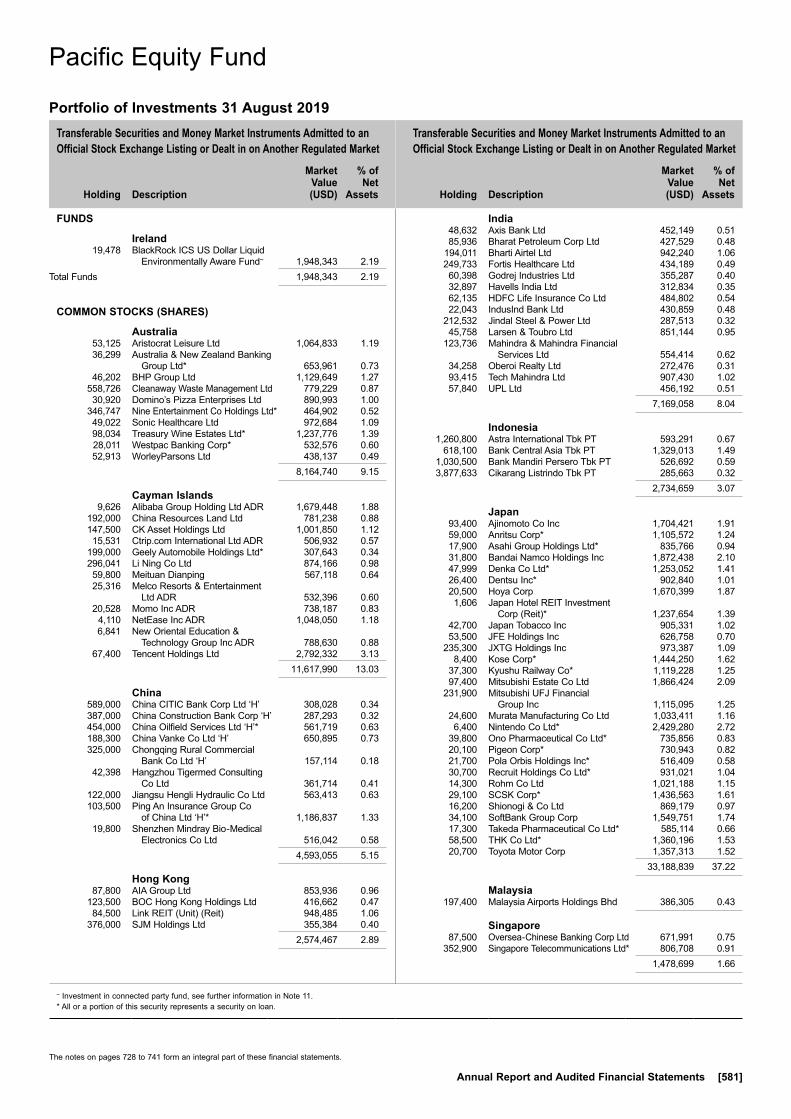
Transferable Securities and Money Market Instruments Admitted to an Official Stock Exchange Listing or Dealt in on Another Regulated Market
Transferable Securities and Money Market Instruments Admitted to an Official Stock Exchange Listing or Dealt in on Another Regulated Market
Holding
Description
Market Value (USD)
% of Net
Assets
Holding
Description
Market Value (USD)
% of Net
Assets
~ Investment in connected party fund, see further information in Note 11.* All or a portion of this security represents a security on loan.
The notes on pages 728 to 741 form an integral part of these financial statements.
Annual Report and Audited Financial Statements [581]
FUNDS
Ireland 19,478 BlackRock ICS US Dollar Liquid
Environmentally Aware Fund~ 1,948,343 2.19Total Funds 1,948,343 2.19
COMMON STOCKS (SHARES)
Australia 53,125 Aristocrat Leisure Ltd 1,064,833 1.19 36,299 Australia & New Zealand Banking
Group Ltd* 653,961 0.73 46,202 BHP Group Ltd 1,129,649 1.27 558,726 Cleanaway Waste Management Ltd 779,229 0.87 30,920 Domino’s Pizza Enterprises Ltd 890,993 1.00 346,747 Nine Entertainment Co Holdings Ltd* 464,902 0.52 49,022 Sonic Healthcare Ltd 972,684 1.09 98,034 Treasury Wine Estates Ltd* 1,237,776 1.39 28,011 Westpac Banking Corp* 532,576 0.60 52,913 WorleyParsons Ltd 438,137 0.49 8,164,740 9.15
Cayman Islands 9,626 Alibaba Group Holding Ltd ADR 1,679,448 1.88 192,000 China Resources Land Ltd 781,238 0.88 147,500 CK Asset Holdings Ltd 1,001,850 1.12 15,531 Ctrip.com International Ltd ADR 506,932 0.57 199,000 Geely Automobile Holdings Ltd* 307,643 0.34 296,041 Li Ning Co Ltd 874,166 0.98 59,800 Meituan Dianping 567,118 0.64 25,316 Melco Resorts & Entertainment
Ltd ADR 532,396 0.60 20,528 Momo Inc ADR 738,187 0.83 4,110 NetEase Inc ADR 1,048,050 1.18 6,841 New Oriental Education &
Technology Group Inc ADR 788,630 0.88 67,400 Tencent Holdings Ltd 2,792,332 3.13 11,617,990 13.03
China 589,000 China CITIC Bank Corp Ltd ‘H’ 308,028 0.34 387,000 China Construction Bank Corp ‘H’ 287,293 0.32 454,000 China Oilfield Services Ltd ‘H’* 561,719 0.63 188,300 China Vanke Co Ltd ‘H’ 650,895 0.73 325,000 Chongqing Rural Commercial
Bank Co Ltd ‘H’ 157,114 0.18 42,398 Hangzhou Tigermed Consulting
Co Ltd 361,714 0.41 122,000 Jiangsu Hengli Hydraulic Co Ltd 563,413 0.63 103,500 Ping An Insurance Group Co
of China Ltd ‘H’* 1,186,837 1.33 19,800 Shenzhen Mindray Bio-Medical
Electronics Co Ltd 516,042 0.58 4,593,055 5.15
Hong Kong 87,800 AIA Group Ltd 853,936 0.96 123,500 BOC Hong Kong Holdings Ltd 416,662 0.47 84,500 Link REIT (Unit) (Reit) 948,485 1.06 376,000 SJM Holdings Ltd 355,384 0.40 2,574,467 2.89
India 48,632 Axis Bank Ltd 452,149 0.51 85,936 Bharat Petroleum Corp Ltd 427,529 0.48 194,011 Bharti Airtel Ltd 942,240 1.06 249,733 Fortis Healthcare Ltd 434,189 0.49 60,398 Godrej Industries Ltd 355,287 0.40 32,897 Havells India Ltd 312,834 0.35 62,135 HDFC Life Insurance Co Ltd 484,802 0.54 22,043 IndusInd Bank Ltd 430,859 0.48 212,532 Jindal Steel & Power Ltd 287,513 0.32 45,758 Larsen & Toubro Ltd 851,144 0.95 123,736 Mahindra & Mahindra Financial
Services Ltd 554,414 0.62 34,258 Oberoi Realty Ltd 272,476 0.31 93,415 Tech Mahindra Ltd 907,430 1.02 57,840 UPL Ltd 456,192 0.51 7,169,058 8.04
Indonesia 1,260,800 Astra International Tbk PT 593,291 0.67 618,100 Bank Central Asia Tbk PT 1,329,013 1.49 1,030,500 Bank Mandiri Persero Tbk PT 526,692 0.59 3,877,633 Cikarang Listrindo Tbk PT 285,663 0.32 2,734,659 3.07
Japan 93,400 Ajinomoto Co Inc 1,704,421 1.91 59,000 Anritsu Corp* 1,105,572 1.24 17,900 Asahi Group Holdings Ltd* 835,766 0.94 31,800 Bandai Namco Holdings Inc 1,872,438 2.10 47,999 Denka Co Ltd* 1,253,052 1.41 26,400 Dentsu Inc* 902,840 1.01 20,500 Hoya Corp 1,670,399 1.87 1,606 Japan Hotel REIT Investment
Corp (Reit)* 1,237,654 1.39 42,700 Japan Tobacco Inc 905,331 1.02 53,500 JFE Holdings Inc 626,758 0.70 235,300 JXTG Holdings Inc 973,387 1.09 8,400 Kose Corp* 1,444,250 1.62 37,300 Kyushu Railway Co* 1,119,228 1.25 97,400 Mitsubishi Estate Co Ltd 1,866,424 2.09 231,900 Mitsubishi UFJ Financial
Group Inc 1,115,095 1.25 24,600 Murata Manufacturing Co Ltd 1,033,411 1.16 6,400 Nintendo Co Ltd* 2,429,280 2.72 39,800 Ono Pharmaceutical Co Ltd* 735,856 0.83 20,100 Pigeon Corp* 730,943 0.82 21,700 Pola Orbis Holdings Inc* 516,409 0.58 30,700 Recruit Holdings Co Ltd* 931,021 1.04 14,300 Rohm Co Ltd 1,021,188 1.15 29,100 SCSK Corp* 1,436,563 1.61 16,200 Shionogi & Co Ltd 869,179 0.97 34,100 SoftBank Group Corp 1,549,751 1.74 17,300 Takeda Pharmaceutical Co Ltd* 585,114 0.66 58,500 THK Co Ltd* 1,360,196 1.53 20,700 Toyota Motor Corp 1,357,313 1.52 33,188,839 37.22
Malaysia 197,400 Malaysia Airports Holdings Bhd 386,305 0.43
Singapore 87,500 Oversea-Chinese Banking Corp Ltd 671,991 0.75 352,900 Singapore Telecommunications Ltd* 806,708 0.91 1,478,699 1.66
Pacific Equity Fund
Portfolio of Investments 31 August 2019
Pacific Equity Fund
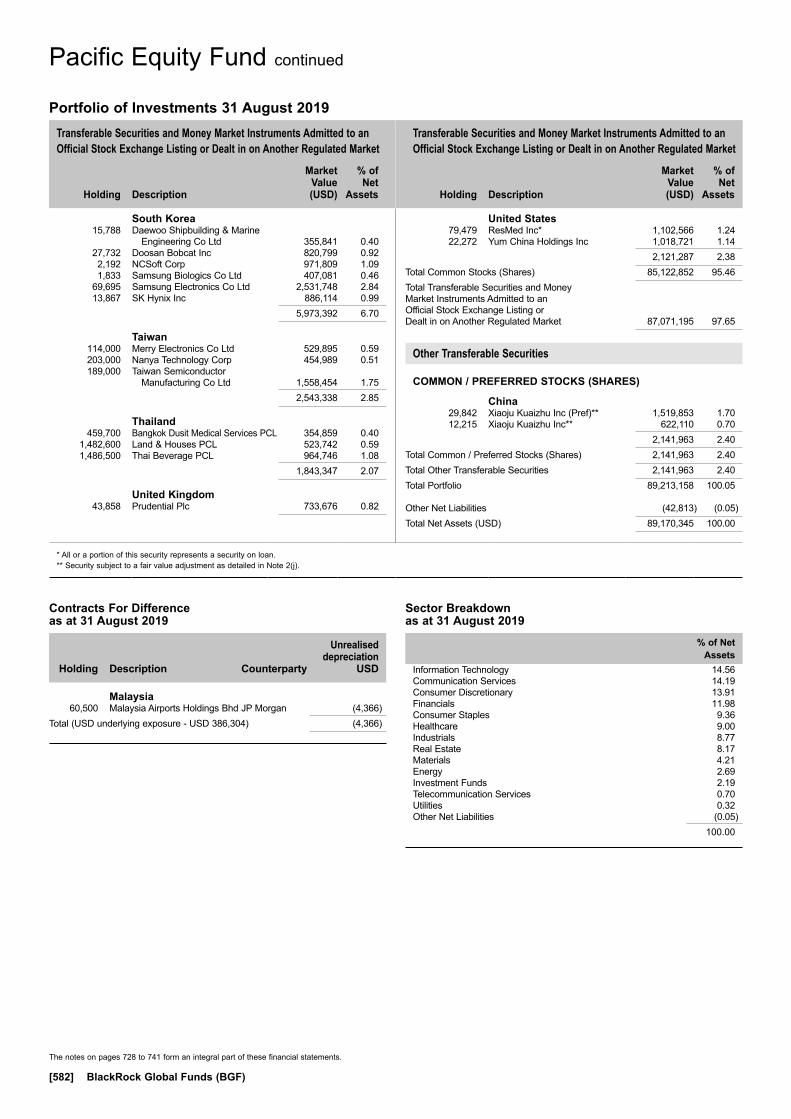
Transferable Securities and Money Market Instruments Admitted to an Official Stock Exchange Listing or Dealt in on Another Regulated Market
Transferable Securities and Money Market Instruments Admitted to an Official Stock Exchange Listing or Dealt in on Another Regulated Market
Holding
Description
Market Value (USD)
% of Net
Assets
Holding
Description
Market Value (USD)
% of Net
Assets
* All or a portion of this security represents a security on loan.** Security subject to a fair value adjustment as detailed in Note 2(j).
The notes on pages 728 to 741 form an integral part of these financial statements.
[582] BlackRock Global Funds (BGF)
South Korea 15,788 Daewoo Shipbuilding & Marine
Engineering Co Ltd 355,841 0.40 27,732 Doosan Bobcat Inc 820,799 0.92 2,192 NCSoft Corp 971,809 1.09 1,833 Samsung Biologics Co Ltd 407,081 0.46 69,695 Samsung Electronics Co Ltd 2,531,748 2.84 13,867 SK Hynix Inc 886,114 0.99 5,973,392 6.70
Taiwan 114,000 Merry Electronics Co Ltd 529,895 0.59 203,000 Nanya Technology Corp 454,989 0.51 189,000 Taiwan Semiconductor
Manufacturing Co Ltd 1,558,454 1.75 2,543,338 2.85
Thailand 459,700 Bangkok Dusit Medical Services PCL 354,859 0.40 1,482,600 Land & Houses PCL 523,742 0.59 1,486,500 Thai Beverage PCL 964,746 1.08 1,843,347 2.07
United Kingdom 43,858 Prudential Plc 733,676 0.82
United States 79,479 ResMed Inc* 1,102,566 1.24 22,272 Yum China Holdings Inc 1,018,721 1.14 2,121,287 2.38Total Common Stocks (Shares) 85,122,852 95.46Total Transferable Securities and Money Market Instruments Admitted to an Official Stock Exchange Listing or Dealt in on Another Regulated Market 87,071,195 97.65
Other Transferable Securities
COMMON / PREFERRED STOCKS (SHARES)
China 29,842 Xiaoju Kuaizhu Inc (Pref)** 1,519,853 1.70 12,215 Xiaoju Kuaizhu Inc** 622,110 0.70 2,141,963 2.40Total Common / Preferred Stocks (Shares) 2,141,963 2.40Total Other Transferable Securities 2,141,963 2.40Total Portfolio 89,213,158 100.05
Other Net Liabilities (42,813) (0.05)Total Net Assets (USD) 89,170,345 100.00
Pacific Equity Fund continued
Portfolio of Investments 31 August 2019
Sector Breakdown as at 31 August 2019
% of Net Assets
Information Technology 14.56Communication Services 14.19Consumer Discretionary 13.91Financials 11.98Consumer Staples 9.36Healthcare 9.00Industrials 8.77Real Estate 8.17Materials 4.21Energy 2.69Investment Funds 2.19Telecommunication Services 0.70Utilities 0.32Other Net Liabilities (0.05)
100.00
Contracts For Difference as at 31 August 2019
Holding
Description Counterparty
Unrealised depreciation
USD
Malaysia 60,500 Malaysia Airports Holdings Bhd JP Morgan (4,366) Total (USD underlying exposure - USD 386,304) (4,366)
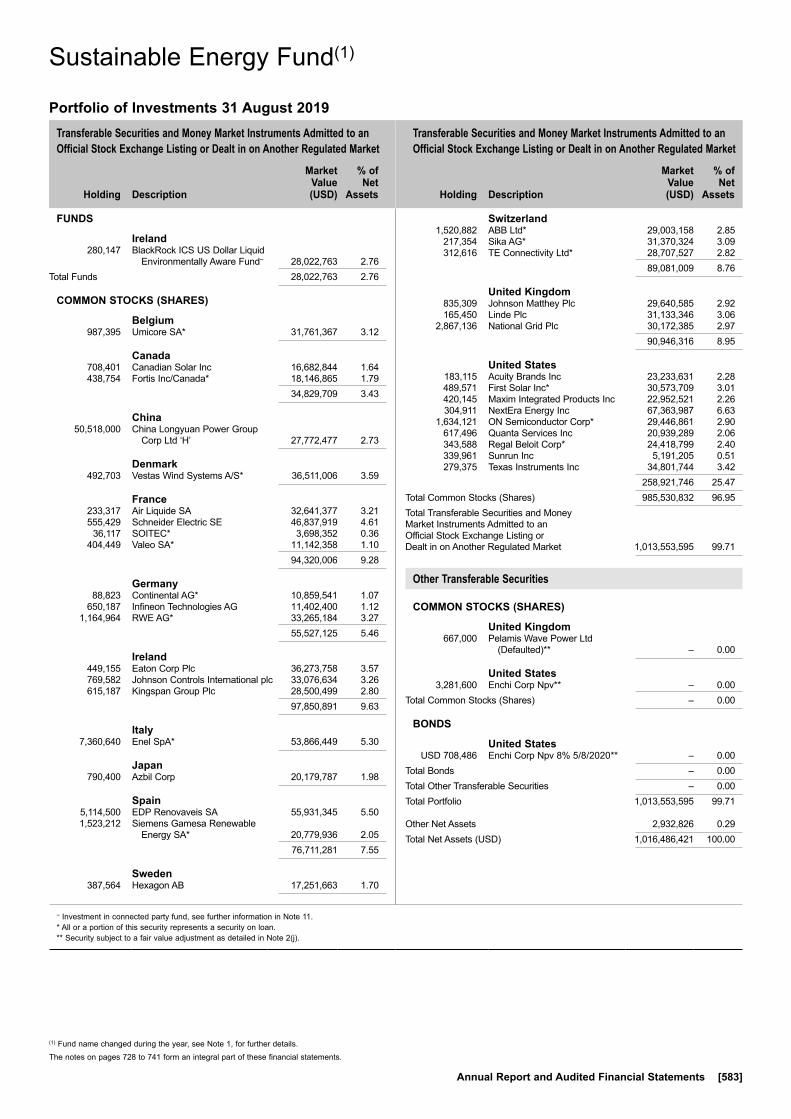
Transferable Securities and Money Market Instruments Admitted to an Official Stock Exchange Listing or Dealt in on Another Regulated Market
Transferable Securities and Money Market Instruments Admitted to an Official Stock Exchange Listing or Dealt in on Another Regulated Market
Holding
Description
Market Value (USD)
% of Net
Assets
Holding
Description
Market Value (USD)
% of Net
Assets
~ Investment in connected party fund, see further information in Note 11.* All or a portion of this security represents a security on loan.** Security subject to a fair value adjustment as detailed in Note 2(j).
The notes on pages 728 to 741 form an integral part of these financial statements.
Annual Report and Audited Financial Statements [583]
FUNDS
Ireland 280,147 BlackRock ICS US Dollar Liquid
Environmentally Aware Fund~ 28,022,763 2.76Total Funds 28,022,763 2.76
COMMON STOCKS (SHARES)
Belgium 987,395 Umicore SA* 31,761,367 3.12
Canada 708,401 Canadian Solar Inc 16,682,844 1.64 438,754 Fortis Inc/Canada* 18,146,865 1.79 34,829,709 3.43
China 50,518,000 China Longyuan Power Group
Corp Ltd ‘H’ 27,772,477 2.73
Denmark 492,703 Vestas Wind Systems A/S* 36,511,006 3.59
France 233,317 Air Liquide SA 32,641,377 3.21 555,429 Schneider Electric SE 46,837,919 4.61 36,117 SOITEC* 3,698,352 0.36 404,449 Valeo SA* 11,142,358 1.10 94,320,006 9.28
Germany 88,823 Continental AG* 10,859,541 1.07 650,187 Infineon Technologies AG 11,402,400 1.12 1,164,964 RWE AG* 33,265,184 3.27 55,527,125 5.46
Ireland 449,155 Eaton Corp Plc 36,273,758 3.57 769,582 Johnson Controls International plc 33,076,634 3.26 615,187 Kingspan Group Plc 28,500,499 2.80 97,850,891 9.63
Italy 7,360,640 Enel SpA* 53,866,449 5.30
Japan 790,400 Azbil Corp 20,179,787 1.98
Spain 5,114,500 EDP Renovaveis SA 55,931,345 5.50 1,523,212 Siemens Gamesa Renewable
Energy SA* 20,779,936 2.05 76,711,281 7.55
Sweden 387,564 Hexagon AB 17,251,663 1.70
Switzerland 1,520,882 ABB Ltd* 29,003,158 2.85 217,354 Sika AG* 31,370,324 3.09 312,616 TE Connectivity Ltd* 28,707,527 2.82 89,081,009 8.76
United Kingdom 835,309 Johnson Matthey Plc 29,640,585 2.92 165,450 Linde Plc 31,133,346 3.06 2,867,136 National Grid Plc 30,172,385 2.97 90,946,316 8.95
United States 183,115 Acuity Brands Inc 23,233,631 2.28 489,571 First Solar Inc* 30,573,709 3.01 420,145 Maxim Integrated Products Inc 22,952,521 2.26 304,911 NextEra Energy Inc 67,363,987 6.63 1,634,121 ON Semiconductor Corp* 29,446,861 2.90 617,496 Quanta Services Inc 20,939,289 2.06 343,588 Regal Beloit Corp* 24,418,799 2.40 339,961 Sunrun Inc 5,191,205 0.51 279,375 Texas Instruments Inc 34,801,744 3.42 258,921,746 25.47Total Common Stocks (Shares) 985,530,832 96.95Total Transferable Securities and Money Market Instruments Admitted to an Official Stock Exchange Listing or Dealt in on Another Regulated Market 1,013,553,595 99.71
Other Transferable Securities
COMMON STOCKS (SHARES)
United Kingdom 667,000 Pelamis Wave Power Ltd
(Defaulted)** – 0.00
United States 3,281,600 Enchi Corp Npv** – 0.00Total Common Stocks (Shares) – 0.00
BONDS
United States USD 708,486 Enchi Corp Npv 8% 5/8/2020** – 0.00Total Bonds – 0.00Total Other Transferable Securities – 0.00Total Portfolio 1,013,553,595 99.71
Other Net Assets 2,932,826 0.29Total Net Assets (USD) 1,016,486,421 100.00
Sustainable Energy Fund(1)
Portfolio of Investments 31 August 2019
Sustainable Energy Fund(1)
(1) Fund name changed during the year, see Note 1, for further details.
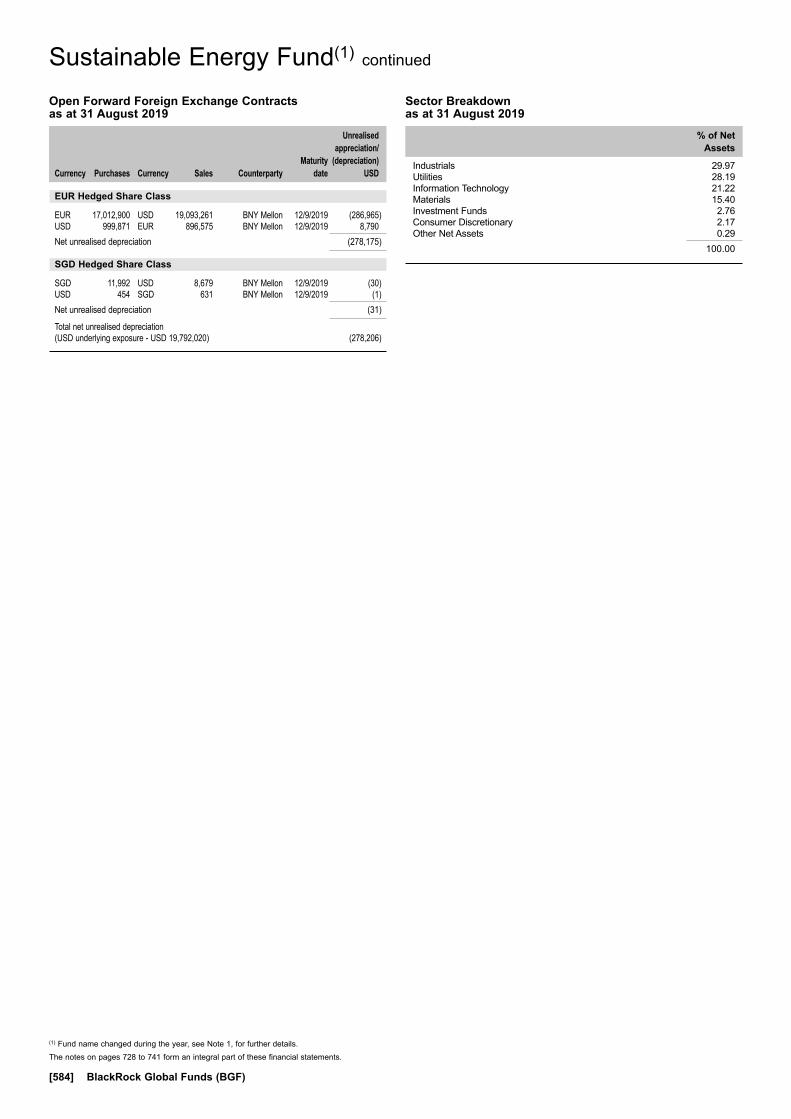
The notes on pages 728 to 741 form an integral part of these financial statements.
[584] BlackRock Global Funds (BGF)
Sustainable Energy Fund(1) continued
Sector Breakdown as at 31 August 2019
% of Net Assets
Industrials 29.97Utilities 28.19Information Technology 21.22Materials 15.40Investment Funds 2.76Consumer Discretionary 2.17Other Net Assets 0.29
100.00
Open Forward Foreign Exchange Contracts as at 31 August 2019
Currency
Purchases Currency
Sales Counterparty
Maturity date
Unrealised appreciation/
(depreciation) USD
EUR Hedged Share Class
EUR 17,012,900 USD 19,093,261 BNY Mellon 12/9/2019 (286,965)USD 999,871 EUR 896,575 BNY Mellon 12/9/2019 8,790Net unrealised depreciation (278,175)
SGD Hedged Share Class
SGD 11,992 USD 8,679 BNY Mellon 12/9/2019 (30)USD 454 SGD 631 BNY Mellon 12/9/2019 (1)Net unrealised depreciation (31)
Total net unrealised depreciation (USD underlying exposure - USD 19,792,020) (278,206)
(1) Fund name changed during the year, see Note 1, for further details.

Transferable Securities and Money Market Instruments Admitted to an Official Stock Exchange Listing or Dealt in on Another Regulated Market
Transferable Securities and Money Market Instruments Admitted to an Official Stock Exchange Listing or Dealt in on Another Regulated Market
Holding
Description
Market Value (CHF)
% of Net
Assets
Holding
Description
Market Value (CHF)
% of Net
Assets
* All or a portion of this security represents a security on loan.
(3) Fund closed to subscriptions, see Note 1, for further details.The notes on pages 728 to 741 form an integral part of these financial statements.
Annual Report and Audited Financial Statements [585]
COMMON STOCKS (SHARES)
Denmark 185,057 DSV A/S 18,163,910 2.11
Switzerland 28,181 ALSO Holding AG 3,973,521 0.46 259,100 Baloise Holding AG 43,736,080 5.09 9,515 Barry Callebaut AG* 19,182,240 2.23 6,618 Belimo Holding AG* 33,222,360 3.86 31,485 Bossard Holding AG 4,281,960 0.50 26,601 Burckhardt Compression Holding AG 6,264,535 0.73 275,669 Cembra Money Bank AG* 27,815,002 3.24 3,977 Chocoladefabriken Lindt
& Spruengli AG* 28,992,330 3.37 149,264 Daetwyler Holding AG 23,195,626 2.70 22,891 Forbo Holding AG* 33,054,604 3.84 425,687 Galenica AG* 23,476,638 2.73 200,555 Helvetia Holding AG* 25,771,317 3.00 351 Interroll Holding AG 644,436 0.07 182,699 Klingelnberg AG 5,517,510 0.64 306,245 LafargeHolcim Ltd 14,414,952 1.68 1,194,349 Logitech International SA* 48,012,830 5.58 89,819 Lonza Group AG* 31,445,632 3.66 195,919 Medacta Group SA 15,928,215 1.85 87,308 Medartis Holding AG 3,841,552 0.45 780,126 OC Oerlikon Corp AG* 7,204,464 0.84 99,813 Partners Group Holding AG 80,069,989 9.31
4,490 Roche Holding AG 1,206,912 0.14 65,715 Roche Holding AG-Genusschein 17,782,479 2.07 110,383 Schindler Holding AG 24,924,481 2.90 162,242 Schindler Holding AG REG* 36,244,863 4.22 1,370 Schweiter Technologies AG 1,276,840 0.15 241,725 Sika AG* 34,457,899 4.01 80,112 Sonova Holding AG* 18,369,682 2.14 146,931 Stadler Rail AG* 6,406,192 0.74 66,625 Straumann Holding AG* 51,834,250 6.03 212,050 Sulzer AG* 19,900,892 2.31 123,066 Tecan Group AG 29,068,189 3.38 275,399 Temenos AG 45,867,703 5.33 34,225 VAT Group AG* 4,088,176 0.48 46,772 VZ Holding AG* 13,634,038 1.59 37,211 Zurich Insurance Group AG 13,131,762 1.53 798,240,151 92.85Total Common Stocks (Shares) 816,404,061 94.96Total Transferable Securities and Money Market Instruments Admitted to an Official Stock Exchange Listing or Dealt in on Another Regulated Market 816,404,061 94.96Total Portfolio 816,404,061 94.96
Other Net Assets 43,300,675 5.04Total Net Assets (CHF) 859,704,736 100.00
Swiss Small & MidCap Opportunities Fund(3)
Portfolio of Investments 31 August 2019
Swiss Small & MidCap Opportunities Fund(3)
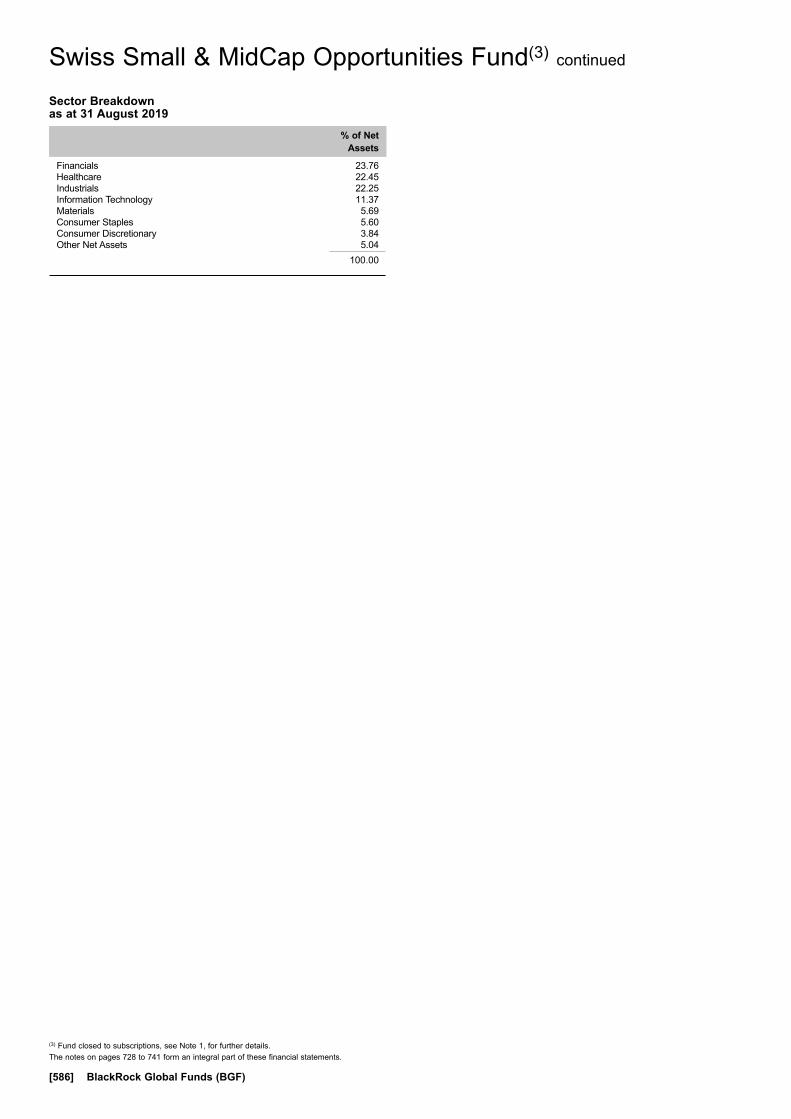
(3) Fund closed to subscriptions, see Note 1, for further details.The notes on pages 728 to 741 form an integral part of these financial statements.
[586] BlackRock Global Funds (BGF)
Swiss Small & MidCap Opportunities Fund(3) continued
Sector Breakdown as at 31 August 2019
% of Net Assets
Financials 23.76Healthcare 22.45Industrials 22.25Information Technology 11.37Materials 5.69Consumer Staples 5.60Consumer Discretionary 3.84Other Net Assets 5.04
100.00
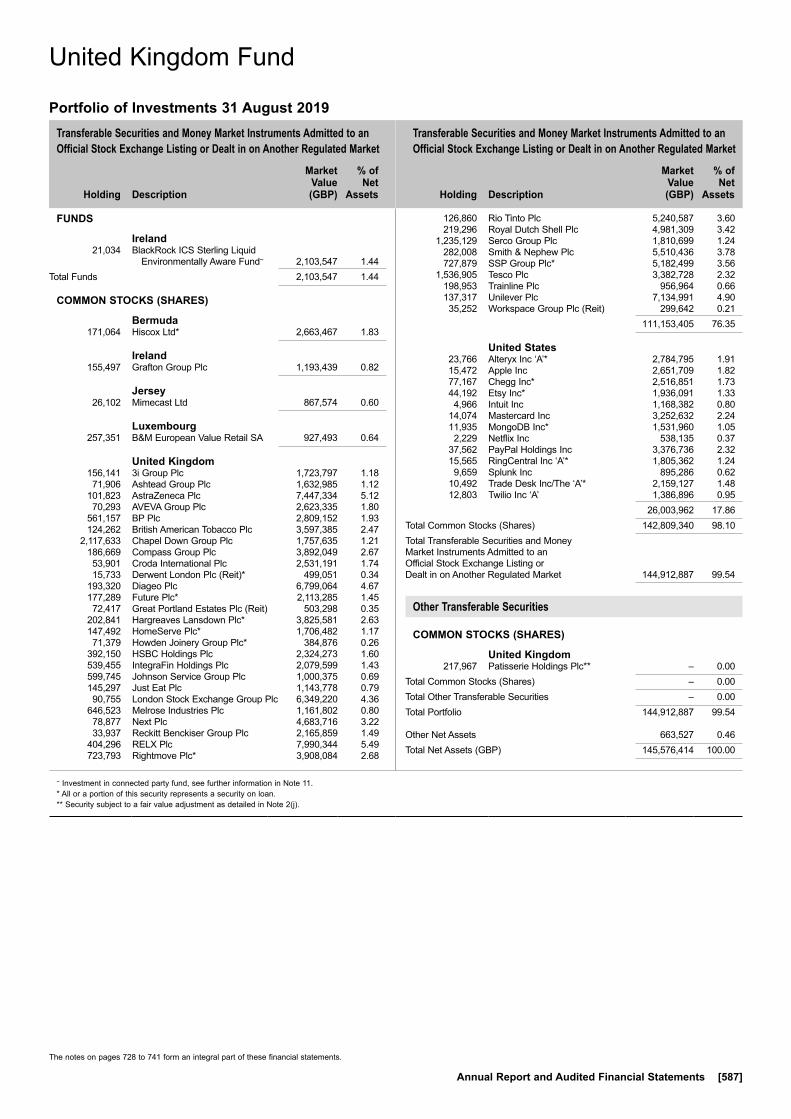
Transferable Securities and Money Market Instruments Admitted to an Official Stock Exchange Listing or Dealt in on Another Regulated Market
Transferable Securities and Money Market Instruments Admitted to an Official Stock Exchange Listing or Dealt in on Another Regulated Market
Holding
Description
Market Value (GBP)
% of Net
Assets
Holding
Description
Market Value (GBP)
% of Net
Assets
~ Investment in connected party fund, see further information in Note 11.* All or a portion of this security represents a security on loan.** Security subject to a fair value adjustment as detailed in Note 2(j).
The notes on pages 728 to 741 form an integral part of these financial statements.
Annual Report and Audited Financial Statements [587]
FUNDS
Ireland 21,034 BlackRock ICS Sterling Liquid
Environmentally Aware Fund~ 2,103,547 1.44Total Funds 2,103,547 1.44
COMMON STOCKS (SHARES)
Bermuda 171,064 Hiscox Ltd* 2,663,467 1.83
Ireland 155,497 Grafton Group Plc 1,193,439 0.82
Jersey 26,102 Mimecast Ltd 867,574 0.60
Luxembourg 257,351 B&M European Value Retail SA 927,493 0.64
United Kingdom 156,141 3i Group Plc 1,723,797 1.18 71,906 Ashtead Group Plc 1,632,985 1.12 101,823 AstraZeneca Plc 7,447,334 5.12 70,293 AVEVA Group Plc 2,623,335 1.80 561,157 BP Plc 2,809,152 1.93 124,262 British American Tobacco Plc 3,597,385 2.47 2,117,633 Chapel Down Group Plc 1,757,635 1.21 186,669 Compass Group Plc 3,892,049 2.67 53,901 Croda International Plc 2,531,191 1.74 15,733 Derwent London Plc (Reit)* 499,051 0.34 193,320 Diageo Plc 6,799,064 4.67 177,289 Future Plc* 2,113,285 1.45 72,417 Great Portland Estates Plc (Reit) 503,298 0.35 202,841 Hargreaves Lansdown Plc* 3,825,581 2.63 147,492 HomeServe Plc* 1,706,482 1.17 71,379 Howden Joinery Group Plc* 384,876 0.26 392,150 HSBC Holdings Plc 2,324,273 1.60 539,455 IntegraFin Holdings Plc 2,079,599 1.43 599,745 Johnson Service Group Plc 1,000,375 0.69 145,297 Just Eat Plc 1,143,778 0.79 90,755 London Stock Exchange Group Plc 6,349,220 4.36 646,523 Melrose Industries Plc 1,161,802 0.80 78,877 Next Plc 4,683,716 3.22 33,937 Reckitt Benckiser Group Plc 2,165,859 1.49 404,296 RELX Plc 7,990,344 5.49 723,793 Rightmove Plc* 3,908,084 2.68
126,860 Rio Tinto Plc 5,240,587 3.60 219,296 Royal Dutch Shell Plc 4,981,309 3.42 1,235,129 Serco Group Plc 1,810,699 1.24 282,008 Smith & Nephew Plc 5,510,436 3.78 727,879 SSP Group Plc* 5,182,499 3.56 1,536,905 Tesco Plc 3,382,728 2.32 198,953 Trainline Plc 956,964 0.66 137,317 Unilever Plc 7,134,991 4.90 35,252 Workspace Group Plc (Reit) 299,642 0.21 111,153,405 76.35
United States 23,766 Alteryx Inc ‘A’* 2,784,795 1.91 15,472 Apple Inc 2,651,709 1.82 77,167 Chegg Inc* 2,516,851 1.73 44,192 Etsy Inc* 1,936,091 1.33 4,966 Intuit Inc 1,168,382 0.80 14,074 Mastercard Inc 3,252,632 2.24 11,935 MongoDB Inc* 1,531,960 1.05 2,229 Netflix Inc 538,135 0.37 37,562 PayPal Holdings Inc 3,376,736 2.32 15,565 RingCentral Inc ‘A’* 1,805,362 1.24 9,659 Splunk Inc 895,286 0.62 10,492 Trade Desk Inc/The ‘A’* 2,159,127 1.48 12,803 Twilio Inc ‘A’ 1,386,896 0.95 26,003,962 17.86Total Common Stocks (Shares) 142,809,340 98.10Total Transferable Securities and Money Market Instruments Admitted to an Official Stock Exchange Listing or Dealt in on Another Regulated Market 144,912,887 99.54
Other Transferable Securities
COMMON STOCKS (SHARES)
United Kingdom 217,967 Patisserie Holdings Plc** – 0.00Total Common Stocks (Shares) – 0.00Total Other Transferable Securities – 0.00Total Portfolio 144,912,887 99.54
Other Net Assets 663,527 0.46Total Net Assets (GBP) 145,576,414 100.00
United Kingdom Fund
Portfolio of Investments 31 August 2019
United Kingdom Fund
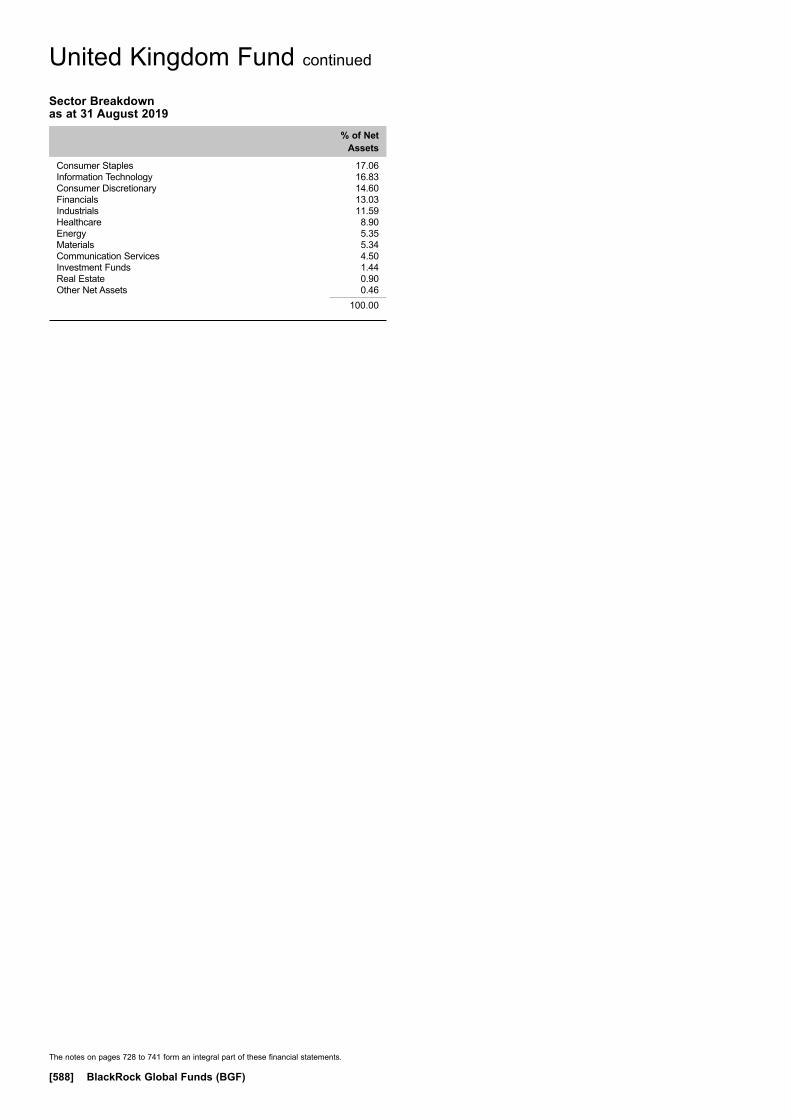
The notes on pages 728 to 741 form an integral part of these financial statements.
[588] BlackRock Global Funds (BGF)
United Kingdom Fund continued
Sector Breakdown as at 31 August 2019
% of Net Assets
Consumer Staples 17.06Information Technology 16.83Consumer Discretionary 14.60Financials 13.03Industrials 11.59Healthcare 8.90Energy 5.35Materials 5.34Communication Services 4.50Investment Funds 1.44Real Estate 0.90Other Net Assets 0.46
100.00
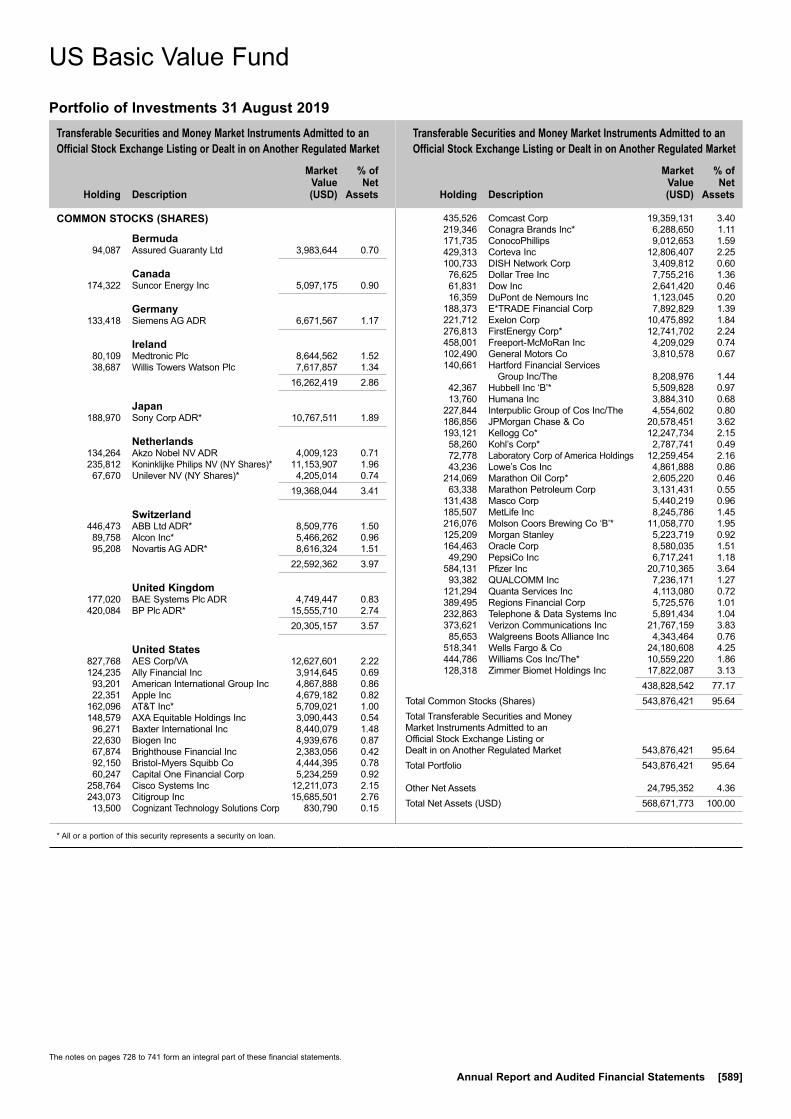
Transferable Securities and Money Market Instruments Admitted to an Official Stock Exchange Listing or Dealt in on Another Regulated Market
Transferable Securities and Money Market Instruments Admitted to an Official Stock Exchange Listing or Dealt in on Another Regulated Market
Holding
Description
Market Value (USD)
% of Net
Assets
Holding
Description
Market Value (USD)
% of Net
Assets
* All or a portion of this security represents a security on loan.
The notes on pages 728 to 741 form an integral part of these financial statements.
Annual Report and Audited Financial Statements [589]
COMMON STOCKS (SHARES)
Bermuda 94,087 Assured Guaranty Ltd 3,983,644 0.70
Canada 174,322 Suncor Energy Inc 5,097,175 0.90
Germany 133,418 Siemens AG ADR 6,671,567 1.17
Ireland 80,109 Medtronic Plc 8,644,562 1.52 38,687 Willis Towers Watson Plc 7,617,857 1.34 16,262,419 2.86
Japan 188,970 Sony Corp ADR* 10,767,511 1.89
Netherlands 134,264 Akzo Nobel NV ADR 4,009,123 0.71 235,812 Koninklijke Philips NV (NY Shares)* 11,153,907 1.96 67,670 Unilever NV (NY Shares)* 4,205,014 0.74 19,368,044 3.41
Switzerland 446,473 ABB Ltd ADR* 8,509,776 1.50 89,758 Alcon Inc* 5,466,262 0.96 95,208 Novartis AG ADR* 8,616,324 1.51 22,592,362 3.97
United Kingdom 177,020 BAE Systems Plc ADR 4,749,447 0.83 420,084 BP Plc ADR* 15,555,710 2.74 20,305,157 3.57
United States 827,768 AES Corp/VA 12,627,601 2.22 124,235 Ally Financial Inc 3,914,645 0.69 93,201 American International Group Inc 4,867,888 0.86 22,351 Apple Inc 4,679,182 0.82 162,096 AT&T Inc* 5,709,021 1.00 148,579 AXA Equitable Holdings Inc 3,090,443 0.54 96,271 Baxter International Inc 8,440,079 1.48 22,630 Biogen Inc 4,939,676 0.87 67,874 Brighthouse Financial Inc 2,383,056 0.42 92,150 Bristol-Myers Squibb Co 4,444,395 0.78 60,247 Capital One Financial Corp 5,234,259 0.92 258,764 Cisco Systems Inc 12,211,073 2.15 243,073 Citigroup Inc 15,685,501 2.76 13,500 Cognizant Technology Solutions Corp 830,790 0.15
435,526 Comcast Corp 19,359,131 3.40 219,346 Conagra Brands Inc* 6,288,650 1.11 171,735 ConocoPhillips 9,012,653 1.59 429,313 Corteva Inc 12,806,407 2.25 100,733 DISH Network Corp 3,409,812 0.60 76,625 Dollar Tree Inc 7,755,216 1.36 61,831 Dow Inc 2,641,420 0.46 16,359 DuPont de Nemours Inc 1,123,045 0.20 188,373 E*TRADE Financial Corp 7,892,829 1.39 221,712 Exelon Corp 10,475,892 1.84 276,813 FirstEnergy Corp* 12,741,702 2.24 458,001 Freeport-McMoRan Inc 4,209,029 0.74 102,490 General Motors Co 3,810,578 0.67 140,661 Hartford Financial Services
Group Inc/The 8,208,976 1.44 42,367 Hubbell Inc ‘B’* 5,509,828 0.97 13,760 Humana Inc 3,884,310 0.68 227,844 Interpublic Group of Cos Inc/The 4,554,602 0.80 186,856 JPMorgan Chase & Co 20,578,451 3.62 193,121 Kellogg Co* 12,247,734 2.15 58,260 Kohl’s Corp* 2,787,741 0.49 72,778 Laboratory Corp of America Holdings 12,259,454 2.16 43,236 Lowe’s Cos Inc 4,861,888 0.86 214,069 Marathon Oil Corp* 2,605,220 0.46 63,338 Marathon Petroleum Corp 3,131,431 0.55 131,438 Masco Corp 5,440,219 0.96 185,507 MetLife Inc 8,245,786 1.45 216,076 Molson Coors Brewing Co ‘B’* 11,058,770 1.95 125,209 Morgan Stanley 5,223,719 0.92 164,463 Oracle Corp 8,580,035 1.51 49,290 PepsiCo Inc 6,717,241 1.18 584,131 Pfizer Inc 20,710,365 3.64 93,382 QUALCOMM Inc 7,236,171 1.27 121,294 Quanta Services Inc 4,113,080 0.72 389,495 Regions Financial Corp 5,725,576 1.01 232,863 Telephone & Data Systems Inc 5,891,434 1.04 373,621 Verizon Communications Inc 21,767,159 3.83 85,653 Walgreens Boots Alliance Inc 4,343,464 0.76 518,341 Wells Fargo & Co 24,180,608 4.25 444,786 Williams Cos Inc/The* 10,559,220 1.86 128,318 Zimmer Biomet Holdings Inc 17,822,087 3.13 438,828,542 77.17Total Common Stocks (Shares) 543,876,421 95.64Total Transferable Securities and Money Market Instruments Admitted to an Official Stock Exchange Listing or Dealt in on Another Regulated Market 543,876,421 95.64Total Portfolio 543,876,421 95.64
Other Net Assets 24,795,352 4.36Total Net Assets (USD) 568,671,773 100.00
US Basic Value Fund
Portfolio of Investments 31 August 2019
US Basic Value Fund
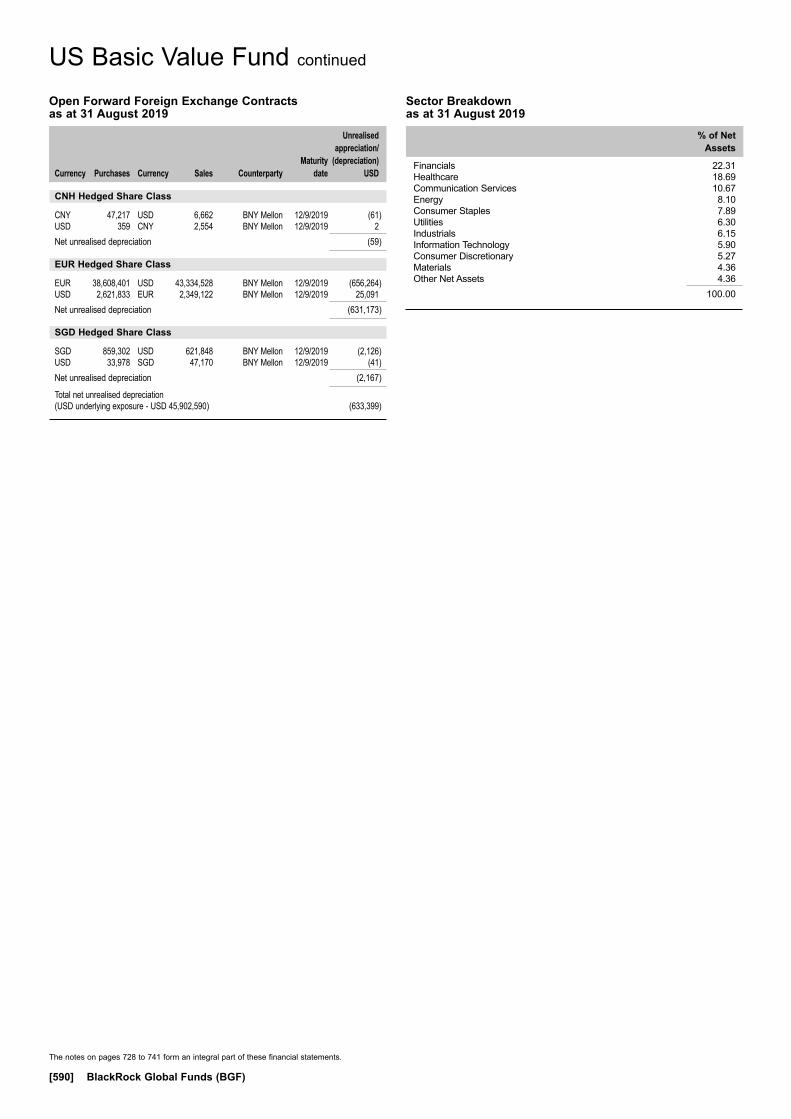
The notes on pages 728 to 741 form an integral part of these financial statements.
[590] BlackRock Global Funds (BGF)
US Basic Value Fund continued
Open Forward Foreign Exchange Contracts as at 31 August 2019
Currency
Purchases Currency
Sales Counterparty
Maturity date
Unrealised appreciation/
(depreciation) USD
CNH Hedged Share Class
CNY 47,217 USD 6,662 BNY Mellon 12/9/2019 (61)USD 359 CNY 2,554 BNY Mellon 12/9/2019 2Net unrealised depreciation (59)
EUR Hedged Share Class
EUR 38,608,401 USD 43,334,528 BNY Mellon 12/9/2019 (656,264)USD 2,621,833 EUR 2,349,122 BNY Mellon 12/9/2019 25,091Net unrealised depreciation (631,173)
SGD Hedged Share Class
SGD 859,302 USD 621,848 BNY Mellon 12/9/2019 (2,126)USD 33,978 SGD 47,170 BNY Mellon 12/9/2019 (41)Net unrealised depreciation (2,167)
Total net unrealised depreciation (USD underlying exposure - USD 45,902,590) (633,399)
Sector Breakdown as at 31 August 2019
% of Net Assets
Financials 22.31Healthcare 18.69Communication Services 10.67Energy 8.10Consumer Staples 7.89Utilities 6.30Industrials 6.15Information Technology 5.90Consumer Discretionary 5.27Materials 4.36Other Net Assets 4.36
100.00

Transferable Securities and Money Market Instruments Admitted to an Official Stock Exchange Listing or Dealt in on Another Regulated Market
Transferable Securities and Money Market Instruments Admitted to an Official Stock Exchange Listing or Dealt in on Another Regulated Market
Holding
Description
Market Value (USD)
% of Net
Assets
Holding
Description
Market Value (USD)
% of Net
Assets
* All or a portion of this security represents a security on loan.
The notes on pages 728 to 741 form an integral part of these financial statements.
Annual Report and Audited Financial Statements [591]
BONDS
Argentina USD 579,000 Argentine Republic Government
International Bond 5.875% 11/1/2028 222,915 0.03
USD 235,000 Argentine Republic Government International Bond 6.875% 11/1/2048 92,473 0.01
USD 150,000 Argentine Republic Government International Bond 7.125% 6/7/2036 59,250 0.01
USD 150,000 Argentine Republic Government International Bond 7.5% 22/4/2026 59,250 0.01
ARS 1,772,000 Bonos de la Nacion Argentina con Ajuste por CER 4% 6/3/2020 27,075 0.00
USD 150,000 Tarjeta Naranja SA ‘144A’ FRN 11/4/2022 47,562 0.01
USD 81,000 Telecom Argentina SA ‘144A’ 8% 18/7/2026 65,420 0.01
573,945 0.08
Australia USD 250,000 Australia & New Zealand Banking
Group Ltd/New York NY 2.625% 9/11/2022 255,187 0.04
USD 19,000 Barrick PD Australia Finance Pty Ltd 5.95% 15/10/2039 25,256 0.00
EUR 100,000 BHP Billiton Finance Ltd 3.125% 29/4/2033 146,530 0.02
USD 68,000 BHP Billiton Finance USA Ltd 4.125% 24/2/2042 80,663 0.01
USD 52,000 BHP Billiton Finance USA Ltd 5% 30/9/2043 68,532 0.01
USD 42,000 Woodside Finance Ltd ‘144A’ 3.65% 5/3/2025 43,621 0.01
619,789 0.09
Austria EUR 300,000 BAWAG PSK Bank fuer Arbeit und
Wirtschaft und Oesterreichische Postsparkasse AG 0.375% 3/9/2027 327,787 0.05
Brazil USD 339,000 Brazilian Government International
Bond 4.5% 30/5/2029 359,137 0.05
Canada USD 64,800 Air Canada 2015-2 Class B Pass
Through Trust ‘144A’ 5% 15/12/2023 68,540 0.01
USD 81,597 Air Canada 2017-1 Class AA Pass Through Trust ‘144A’ 3.3% 15/1/2030 85,426 0.01
USD 450,000 Alimentation Couche-Tard Inc ‘144A’ 3.55% 26/7/2027 473,857 0.07
USD 10,000 Bank of Montreal 1.9% 27/8/2021 10,009 0.00 USD 8,000 Bank of Montreal 2.35% 11/9/2022 8,114 0.00 USD 61,000 Bank of Montreal 2.5% 28/6/2024 61,821 0.01 USD 78,000 Bank of Montreal 2.9% 26/3/2022 79,675 0.01 USD 8,000 Bank of Montreal 3.1% 13/7/2020 8,075 0.00 USD 55,000 Bank of Montreal 3.1% 13/4/2021 56,009 0.01 USD 17,000 Bank of Montreal 3.3% 5/2/2024 17,816 0.00 USD 82,000 Barrick Gold Corp 5.25% 1/4/2042 102,257 0.01 USD 1,040,000 Enbridge Inc FRN 15/7/2077 1,044,545 0.15 USD 75,000 Enbridge Inc 2.9% 15/7/2022 76,426 0.01 USD 195,000 Enbridge Inc 3.7% 15/7/2027 208,201 0.03
USD 138,826 Stoneway Capital Corp ‘144A’ 10% 1/3/2027 86,683 0.01
USD 138,826 Stoneway Capital Corp 10% 1/3/2027 86,683 0.01
USD 69,000 Suncor Energy Inc 3.6% 1/12/2024 72,710 0.01 USD 121,000 Suncor Energy Inc 4% 15/11/2047 133,236 0.02 USD 21,000 Teck Resources Ltd 6.125%
1/10/2035 24,570 0.00 USD 56,000 Teck Resources Ltd 6.25%
15/7/2041 63,897 0.01 EUR 300,000 Toronto-Dominion Bank/The
0.375% 25/4/2024 338,307 0.05 USD 108,000 Toronto-Dominion Bank/The
1.8% 13/7/2021 107,728 0.02 USD 166,000 Toronto-Dominion Bank/The
3.25% 11/3/2024 174,608 0.03 USD 155,000 TransCanada PipeLines Ltd
4.25% 15/5/2028 172,853 0.03 USD 18,000 TransCanada PipeLines Ltd
4.625% 1/3/2034 20,584 0.00 USD 14,000 TransCanada PipeLines Ltd
4.75% 15/5/2038 16,054 0.00 USD 390,000 TransCanada PipeLines Ltd
4.875% 15/1/2026 439,841 0.06 USD 36,000 TransCanada PipeLines Ltd
5.85% 15/3/2036 45,726 0.01 USD 201,000 TransCanada PipeLines Ltd
6.1% 1/6/2040 266,618 0.04 USD 30,000 TransCanada PipeLines Ltd
6.2% 15/10/2037 39,283 0.01 4,390,152 0.63
Cayman Islands USD 200,000 Alibaba Group Holding Ltd 3.6%
28/11/2024 211,217 0.03 USD 239,950 Ambac LSNI LLC ‘144A’ FRN
12/2/2023 244,450 0.04 USD 136,000 Gol Finance Inc ‘144A’ 7%
31/1/2025 134,130 0.02 USD 45,908 Odebrecht Drilling Norbe VIII/IX Ltd
‘144A’ 6.35% 1/12/2021 45,679 0.01 USD 33,956 Odebrecht Offshore Drilling
Finance Ltd ‘144A’ 6.72% 1/12/2022 33,372 0.00
USD 76,000 Seagate HDD Cayman 4.25% 1/3/2022 78,679 0.01
747,527 0.11
Colombia USD 1,410,000 Colombia Government International
Bond 3.875% 25/4/2027* 1,527,427 0.22 USD 200,000 Empresas Publicas de Medellin
ESP ‘144A’ 4.25% 18/7/2029 210,500 0.03 1,737,927 0.25
Denmark USD 570,000 Danske Bank A/S ‘144A’ 5%
12/1/2022 600,904 0.09 USD 400,000 Danske Bank A/S ‘144A’ 5.375%
12/1/2024 441,043 0.06 1,041,947 0.15
Egypt EGP 585,000 Egypt Government Bond 15.9%
2/7/2024 37,156 0.01 EGP 2,612,000 Egypt Government Bond 16.1%
7/5/2029 169,835 0.02
US Dollar Bond Fund
Portfolio of Investments 31 August 2019
US Dollar Bond Fund

Transferable Securities and Money Market Instruments Admitted to an Official Stock Exchange Listing or Dealt in on Another Regulated Market
Transferable Securities and Money Market Instruments Admitted to an Official Stock Exchange Listing or Dealt in on Another Regulated Market
Holding
Description
Market Value (USD)
% of Net
Assets
Holding
Description
Market Value (USD)
% of Net
Assets
* All or a portion of this security represents a security on loan.
The notes on pages 728 to 741 form an integral part of these financial statements.
[592] BlackRock Global Funds (BGF)
EUR 116,000 Egypt Government International Bond 5.625% 16/4/2030 129,859 0.02
EUR 132,000 Egypt Government International Bond ‘144A’ 6.375% 11/4/2031 153,785 0.02
EGP 2,850,000 Egypt Treasury Bills 10/9/2019 (Zero Coupon) 171,928 0.03
EGP 1,375,000 Egypt Treasury Bills 5/11/2019 (Zero Coupon) 80,754 0.01
743,317 0.11
Finland USD 500,000 Nordea Bank Abp ‘144A’ FRN
26/3/2026 (Perpetual) 533,552 0.07 USD 395,000 Nordea Bank Abp ‘144A’ 2.125%
29/5/2020 395,416 0.06 928,968 0.13
France EUR 300,000 Air Liquide Finance SA 0.375%
18/4/2022 337,674 0.05 EUR 400,000 Banque Federative du Credit
Mutuel SA 0.125% 5/2/2024 447,866 0.07 EUR 100,000 Banque Federative du Credit
Mutuel SA 2.625% 18/3/2024 124,838 0.02 USD 455,000 BNP Paribas SA ‘144A’ FRN
30/3/2021 (Perpetual) 481,731 0.07 USD 460,000 BNP Paribas SA ‘144A’ FRN
10/1/2025 497,925 0.07 USD 400,000 BNP Paribas SA ‘144A’ FRN
19/8/2025 (Perpetual) 443,842 0.06 USD 400,000 BNP Paribas SA ‘144A’ FRN
16/8/2028 (Perpetual) 433,860 0.06 EUR 580,000 BNP Paribas SA 1.5% 25/5/2028 723,783 0.10 USD 200,000 BNP Paribas SA ‘144A’ 3.5%
1/3/2023 207,486 0.03 USD 450,000 Credit Agricole SA ‘144A’ FRN
23/12/2025 (Perpetual)* 525,270 0.08 EUR 200,000 Credit Agricole SA/London 1.25%
14/4/2026 241,585 0.04 EUR 500,000 Engie SA 4/3/2027 (Zero Coupon) 551,453 0.08 EUR 100,000 Engie SA 1.375% 21/6/2039 123,436 0.02 EUR 2,530,000 French Republic Government Bond
OAT ‘144A’ 1.75% 25/5/2066 4,091,182 0.59 EUR 300,000 LVMH Moet Hennessy Louis
Vuitton SE 0.125% 28/2/2023 336,529 0.05 EUR 200,000 Orange SA 1.2% 11/7/2034 232,793 0.03 EUR 100,000 Orange SA 1.375% 4/9/2049 108,276 0.02 EUR 200,000 RTE Reseau de Transport
d’Electricite SADIR 2.125% 27/9/2038 281,883 0.04
EUR 500,000 Schneider Electric SE 0.25% 9/9/2024 568,948 0.08
EUR 200,000 Societe Generale SA 0.75% 26/5/2023 229,166 0.03
EUR 300,000 Total Capital International SA 1.375% 4/10/2029 374,431 0.05
USD 80,000 Total Capital International SA 2.434% 10/1/2025 81,592 0.01
EUR 100,000 Veolia Environnement SA 0.672% 30/3/2022 112,814 0.02
11,558,363 1.67
Germany EUR 330,000 BASF SE 2% 5/12/2022 392,155 0.06 USD 150,000 Deutsche Bank AG 4.25%
14/10/2021 152,460 0.02 USD 459,000 Deutsche Bank AG/New York NY
2.7% 13/7/2020 457,858 0.06
USD 100,000 Deutsche Bank AG/New York NY 2.95% 20/8/2020 99,904 0.01
USD 150,000 Deutsche Bank AG/New York NY 4.25% 4/2/2021 151,682 0.02
EUR 600,000 Merck Financial Services GmbH 0.005% 15/12/2023 670,364 0.10
EUR 100,000 Merck Financial Services GmbH 0.875% 5/7/2031 116,075 0.02
EUR 200,000 SAP SE 0.75% 10/12/2024 232,379 0.03 EUR 100,000 SAP SE 1.625% 10/3/2031 127,218 0.02 EUR 800,000 Volkswagen Bank GmbH
0.375% 5/7/2022 889,917 0.13 EUR 100,000 Volkswagen Leasing GmbH
1% 16/2/2023 113,473 0.02 3,403,485 0.49
Guernsey USD 250,000 Credit Suisse Group Funding
Guernsey Ltd 3.8% 15/9/2022 260,558 0.04 USD 250,000 Credit Suisse Group Funding
Guernsey Ltd 3.8% 9/6/2023 262,342 0.04 USD 250,000 Credit Suisse Group Funding
Guernsey Ltd 4.55% 17/4/2026 276,725 0.04 799,625 0.12
Hungary USD 450,000 Hungary Government
International Bond 5.375% 25/3/2024 510,469 0.07
Indonesia USD 260,000 Indonesia Government
International Bond 4.1% 24/4/2028 283,973 0.04
IDR 1,109,000,000 Indonesia Treasury Bond 6.625% 15/5/2033 70,989 0.01
IDR 1,417,000,000 Indonesia Treasury Bond 7.5% 15/6/2035 98,296 0.01
IDR 19,819,000,000 Indonesia Treasury Bond 8.25% 15/5/2029 1,487,298 0.22
IDR 4,436,000,000 Indonesia Treasury Bond 8.375% 15/3/2034 330,081 0.05
IDR 7,658,000,000 Indonesia Treasury Bond 8.375% 15/4/2039 566,859 0.08
2,837,496 0.41
Ireland EUR 110,000 Atlas Copco Finance DAC
0.125% 3/9/2029 121,014 0.02 EUR 315,000 Eaton Capital Unlimited Co
0.021% 14/5/2021 349,784 0.05 EUR 225,000 Eaton Capital Unlimited Co
0.697% 14/5/2025 256,444 0.04 EUR 125,000 ESB Finance DAC 3.494%
12/1/2024 160,691 0.02 USD 300,000 GE Capital International Funding
Co Unlimited Co 4.418% 15/11/2035 304,259 0.04
USD 85,000 Johnson Controls International plc 4.625% 2/7/2044 94,783 0.01
USD 7,000 Johnson Controls International plc 5.125% 14/9/2045 8,361 0.00
USD 1,495,000 Shire Acquisitions Investments Ireland DAC 1.9% 23/9/2019 1,494,547 0.22
USD 220,000 Shire Acquisitions Investments Ireland DAC 2.875% 23/9/2023 224,850 0.03
US Dollar Bond Fund continued
Portfolio of Investments 31 August 2019
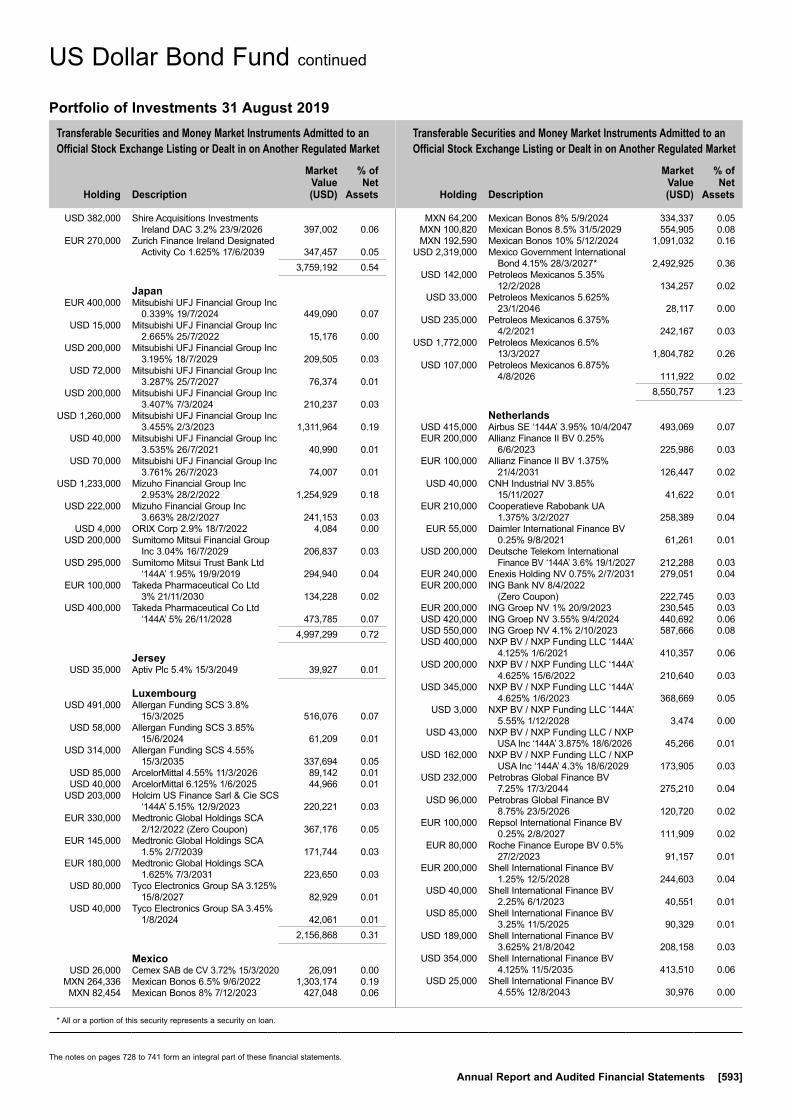
Transferable Securities and Money Market Instruments Admitted to an Official Stock Exchange Listing or Dealt in on Another Regulated Market
Transferable Securities and Money Market Instruments Admitted to an Official Stock Exchange Listing or Dealt in on Another Regulated Market
Holding
Description
Market Value (USD)
% of Net
Assets
Holding
Description
Market Value (USD)
% of Net
Assets
* All or a portion of this security represents a security on loan.
The notes on pages 728 to 741 form an integral part of these financial statements.
Annual Report and Audited Financial Statements [593]
USD 382,000 Shire Acquisitions Investments Ireland DAC 3.2% 23/9/2026 397,002 0.06
EUR 270,000 Zurich Finance Ireland Designated Activity Co 1.625% 17/6/2039 347,457 0.05
3,759,192 0.54
Japan EUR 400,000 Mitsubishi UFJ Financial Group Inc
0.339% 19/7/2024 449,090 0.07 USD 15,000 Mitsubishi UFJ Financial Group Inc
2.665% 25/7/2022 15,176 0.00 USD 200,000 Mitsubishi UFJ Financial Group Inc
3.195% 18/7/2029 209,505 0.03 USD 72,000 Mitsubishi UFJ Financial Group Inc
3.287% 25/7/2027 76,374 0.01 USD 200,000 Mitsubishi UFJ Financial Group Inc
3.407% 7/3/2024 210,237 0.03 USD 1,260,000 Mitsubishi UFJ Financial Group Inc
3.455% 2/3/2023 1,311,964 0.19 USD 40,000 Mitsubishi UFJ Financial Group Inc
3.535% 26/7/2021 40,990 0.01 USD 70,000 Mitsubishi UFJ Financial Group Inc
3.761% 26/7/2023 74,007 0.01 USD 1,233,000 Mizuho Financial Group Inc
2.953% 28/2/2022 1,254,929 0.18 USD 222,000 Mizuho Financial Group Inc
3.663% 28/2/2027 241,153 0.03 USD 4,000 ORIX Corp 2.9% 18/7/2022 4,084 0.00 USD 200,000 Sumitomo Mitsui Financial Group
Inc 3.04% 16/7/2029 206,837 0.03 USD 295,000 Sumitomo Mitsui Trust Bank Ltd
‘144A’ 1.95% 19/9/2019 294,940 0.04 EUR 100,000 Takeda Pharmaceutical Co Ltd
3% 21/11/2030 134,228 0.02 USD 400,000 Takeda Pharmaceutical Co Ltd
‘144A’ 5% 26/11/2028 473,785 0.07 4,997,299 0.72
Jersey USD 35,000 Aptiv Plc 5.4% 15/3/2049 39,927 0.01
Luxembourg USD 491,000 Allergan Funding SCS 3.8%
15/3/2025 516,076 0.07 USD 58,000 Allergan Funding SCS 3.85%
15/6/2024 61,209 0.01 USD 314,000 Allergan Funding SCS 4.55%
15/3/2035 337,694 0.05 USD 85,000 ArcelorMittal 4.55% 11/3/2026 89,142 0.01 USD 40,000 ArcelorMittal 6.125% 1/6/2025 44,966 0.01 USD 203,000 Holcim US Finance Sarl & Cie SCS
‘144A’ 5.15% 12/9/2023 220,221 0.03 EUR 330,000 Medtronic Global Holdings SCA
2/12/2022 (Zero Coupon) 367,176 0.05 EUR 145,000 Medtronic Global Holdings SCA
1.5% 2/7/2039 171,744 0.03 EUR 180,000 Medtronic Global Holdings SCA
1.625% 7/3/2031 223,650 0.03 USD 80,000 Tyco Electronics Group SA 3.125%
15/8/2027 82,929 0.01 USD 40,000 Tyco Electronics Group SA 3.45%
1/8/2024 42,061 0.01 2,156,868 0.31
Mexico USD 26,000 Cemex SAB de CV 3.72% 15/3/2020 26,091 0.00 MXN 264,336 Mexican Bonos 6.5% 9/6/2022 1,303,174 0.19 MXN 82,454 Mexican Bonos 8% 7/12/2023 427,048 0.06
MXN 64,200 Mexican Bonos 8% 5/9/2024 334,337 0.05 MXN 100,820 Mexican Bonos 8.5% 31/5/2029 554,905 0.08 MXN 192,590 Mexican Bonos 10% 5/12/2024 1,091,032 0.16 USD 2,319,000 Mexico Government International
Bond 4.15% 28/3/2027* 2,492,925 0.36 USD 142,000 Petroleos Mexicanos 5.35%
12/2/2028 134,257 0.02 USD 33,000 Petroleos Mexicanos 5.625%
23/1/2046 28,117 0.00 USD 235,000 Petroleos Mexicanos 6.375%
4/2/2021 242,167 0.03 USD 1,772,000 Petroleos Mexicanos 6.5%
13/3/2027 1,804,782 0.26 USD 107,000 Petroleos Mexicanos 6.875%
4/8/2026 111,922 0.02 8,550,757 1.23
Netherlands USD 415,000 Airbus SE ‘144A’ 3.95% 10/4/2047 493,069 0.07 EUR 200,000 Allianz Finance II BV 0.25%
6/6/2023 225,986 0.03 EUR 100,000 Allianz Finance II BV 1.375%
21/4/2031 126,447 0.02 USD 40,000 CNH Industrial NV 3.85%
15/11/2027 41,622 0.01 EUR 210,000 Cooperatieve Rabobank UA
1.375% 3/2/2027 258,389 0.04 EUR 55,000 Daimler International Finance BV
0.25% 9/8/2021 61,261 0.01 USD 200,000 Deutsche Telekom International
Finance BV ‘144A’ 3.6% 19/1/2027 212,288 0.03 EUR 240,000 Enexis Holding NV 0.75% 2/7/2031 279,051 0.04 EUR 200,000 ING Bank NV 8/4/2022
(Zero Coupon) 222,745 0.03 EUR 200,000 ING Groep NV 1% 20/9/2023 230,545 0.03 USD 420,000 ING Groep NV 3.55% 9/4/2024 440,692 0.06 USD 550,000 ING Groep NV 4.1% 2/10/2023 587,666 0.08 USD 400,000 NXP BV / NXP Funding LLC ‘144A’
4.125% 1/6/2021 410,357 0.06 USD 200,000 NXP BV / NXP Funding LLC ‘144A’
4.625% 15/6/2022 210,640 0.03 USD 345,000 NXP BV / NXP Funding LLC ‘144A’
4.625% 1/6/2023 368,669 0.05 USD 3,000 NXP BV / NXP Funding LLC ‘144A’
5.55% 1/12/2028 3,474 0.00 USD 43,000 NXP BV / NXP Funding LLC / NXP
USA Inc ‘144A’ 3.875% 18/6/2026 45,266 0.01 USD 162,000 NXP BV / NXP Funding LLC / NXP
USA Inc ‘144A’ 4.3% 18/6/2029 173,905 0.03 USD 232,000 Petrobras Global Finance BV
7.25% 17/3/2044 275,210 0.04 USD 96,000 Petrobras Global Finance BV
8.75% 23/5/2026 120,720 0.02 EUR 100,000 Repsol International Finance BV
0.25% 2/8/2027 111,909 0.02 EUR 80,000 Roche Finance Europe BV 0.5%
27/2/2023 91,157 0.01 EUR 200,000 Shell International Finance BV
1.25% 12/5/2028 244,603 0.04 USD 40,000 Shell International Finance BV
2.25% 6/1/2023 40,551 0.01 USD 85,000 Shell International Finance BV
3.25% 11/5/2025 90,329 0.01 USD 189,000 Shell International Finance BV
3.625% 21/8/2042 208,158 0.03 USD 354,000 Shell International Finance BV
4.125% 11/5/2035 413,510 0.06 USD 25,000 Shell International Finance BV
4.55% 12/8/2043 30,976 0.00
US Dollar Bond Fund continued
Portfolio of Investments 31 August 2019

Transferable Securities and Money Market Instruments Admitted to an Official Stock Exchange Listing or Dealt in on Another Regulated Market
Transferable Securities and Money Market Instruments Admitted to an Official Stock Exchange Listing or Dealt in on Another Regulated Market
Holding
Description
Market Value (USD)
% of Net
Assets
Holding
Description
Market Value (USD)
% of Net
Assets
The notes on pages 728 to 741 form an integral part of these financial statements.
[594] BlackRock Global Funds (BGF)
EUR 230,000 Siemens Financieringsmaatschappij NV 5/9/2021 (Zero Coupon) 256,038 0.04
EUR 60,000 Siemens Financieringsmaatschappij NV 0.125% 5/9/2029 66,007 0.01
EUR 50,000 Siemens Financieringsmaatschappij NV 0.5% 5/9/2034 55,147 0.01
EUR 200,000 Siemens Financieringsmaatschappij NV 1.25% 28/2/2031 245,666 0.04
EUR 80,000 Siemens Financieringsmaatschappij NV 1.375% 6/9/2030 99,085 0.01
EUR 235,000 Sika Capital BV 0.875% 29/4/2027 276,783 0.04 EUR 100,000 Sika Capital BV 1.5% 29/4/2031 123,409 0.02 EUR 125,000 TenneT Holding BV 1.5% 3/6/2039 158,728 0.02 EUR 200,000 Volkswagen International Finance
NV 1.875% 30/3/2027 237,271 0.03 EUR 100,000 Volkswagen International Finance
NV 4.125% 16/11/2038 147,922 0.02 7,685,251 1.11
Norway EUR 200,000 Telenor ASA 1.75% 31/5/2034 255,732 0.04
Panama EUR 160,000 Carnival Corp 1.875% 7/11/2022 187,966 0.03 USD 570,000 Panama Government International
Bond 3.875% 17/3/2028 633,591 0.09 821,557 0.12
Peru USD 614,000 Peruvian Government International
Bond 4.125% 25/8/2027 704,277 0.10
Philippines USD 1,010,000 Philippine Government
International Bond 3% 1/2/2028 1,075,221 0.16
Russian Federation RUB 64,646,000 Russian Federal Bond - OFZ 6.9%
23/5/2029 966,937 0.14 RUB 83,902,000 Russian Federal Bond - OFZ 8.5%
17/9/2031 1,403,950 0.20 2,370,887 0.34
South Africa USD 200,000 Eskom Holdings SOC Ltd ‘144A’
6.75% 6/8/2023 205,250 0.03 ZAR 14,732,000 Republic of South Africa
Government Bond 6.25% 31/3/2036 700,078 0.10
905,328 0.13
South Korea USD 460,000 Hyundai Capital Services Inc ‘144A’
3% 29/8/2022 465,103 0.07
Spain EUR 300,000 Banco de Sabadell SA 0.875%
22/7/2025 336,789 0.05 USD 200,000 Banco Santander SA 2.706%
27/6/2024 203,513 0.03 USD 400,000 Banco Santander SA 3.306%
27/6/2029 418,625 0.06 USD 400,000 Banco Santander SA 3.848%
12/4/2023 417,958 0.06 EUR 100,000 CaixaBank SA 1.125% 27/3/2026 117,076 0.02 1,493,961 0.22
Sweden EUR 150,000 Atlas Copco AB 2.5% 28/2/2023 182,759 0.03
Switzerland USD 600,000 Credit Suisse Group AG ‘144A’
FRN 17/7/2023 (Perpetual) 644,271 0.09 USD 650,000 Credit Suisse Group AG ‘144A’
FRN 14/12/2023 658,765 0.10 USD 550,000 Credit Suisse Group AG ‘144A’
FRN 12/9/2025 (Perpetual) 583,905 0.08 EUR 560,000 UBS AG FRN 12/2/2026 658,554 0.10 USD 645,000 UBS Group Funding Switzerland
AG ‘144A’ FRN 15/8/2023 654,250 0.09 USD 450,000 UBS Group Funding Switzerland
AG ‘144A’ FRN 31/1/2024 (Perpetual) 478,012 0.07
USD 200,000 UBS Group Funding Switzerland AG ‘144A’ 2.95% 24/9/2020 201,767 0.03
USD 400,000 UBS Group Funding Switzerland AG ‘144A’ 4.125% 15/4/2026 437,873 0.06
4,317,397 0.62
Turkey USD 200,000 Turkey Government International
Bond 7.625% 26/4/2029 205,750 0.03 USD 104,440 Turkish Airlines 2015-1 Class A
Pass Through Trust ‘144A’ 4.2% 15/3/2027 98,177 0.01
303,927 0.04
United Kingdom USD 200,000 Anglo American Capital Plc ‘144A’
4.875% 14/5/2025 217,273 0.03 USD 4,000 Aon Plc 4% 27/11/2023 4,276 0.00 USD 64,000 Aon Plc 4.75% 15/5/2045 77,399 0.01 USD 480,000 Barclays Plc FRN 16/5/2029 527,337 0.08 USD 200,000 Barclays Plc 4.95% 10/1/2047 219,561 0.03 EUR 200,000 BAT International Finance Plc
3.125% 6/3/2029 258,558 0.04 EUR 100,000 BP Capital Markets Plc 1.109%
16/2/2023 115,605 0.02 EUR 100,000 BP Capital Markets Plc 1.526%
26/9/2022 116,543 0.02 USD 320,000 BP Capital Markets Plc 2.315%
13/2/2020 320,410 0.05 USD 70,000 BP Capital Markets Plc 3.279%
19/9/2027 74,213 0.01 EUR 170,000 Coca-Cola European Partners Plc
1.875% 18/3/2030 215,094 0.03 USD 45,000 GlaxoSmithKline Capital Plc 3.375%
1/6/2029 49,014 0.01 USD 495,000 HSBC Holdings Plc FRN 22/5/2027
(Perpetual) 496,990 0.07 USD 615,000 HSBC Holdings Plc FRN 13/3/2028 655,471 0.09 USD 200,000 HSBC Holdings Plc FRN 23/3/2028
(Perpetual) 205,070 0.03 USD 204,000 HSBC Holdings Plc FRN 19/6/2029 227,612 0.03 USD 435,000 Lloyds Banking Group Plc 3.75%
11/1/2027 453,951 0.07 USD 200,000 Royal Bank of Scotland Group Plc
FRN 15/5/2023 202,375 0.03 USD 600,000 Santander UK Group Holdings Plc
2.875% 5/8/2021 603,052 0.09 USD 780,000 Santander UK Plc ‘144A’ 5%
7/11/2023 827,256 0.12 GBP 184,970 Scorpio European Loan Conduit
No. 34 DAC ‘144A’ FRN 17/5/2029 226,284 0.03 EUR 100,000 Sky Ltd 1.5% 15/9/2021 114,475 0.02
US Dollar Bond Fund continued
Portfolio of Investments 31 August 2019
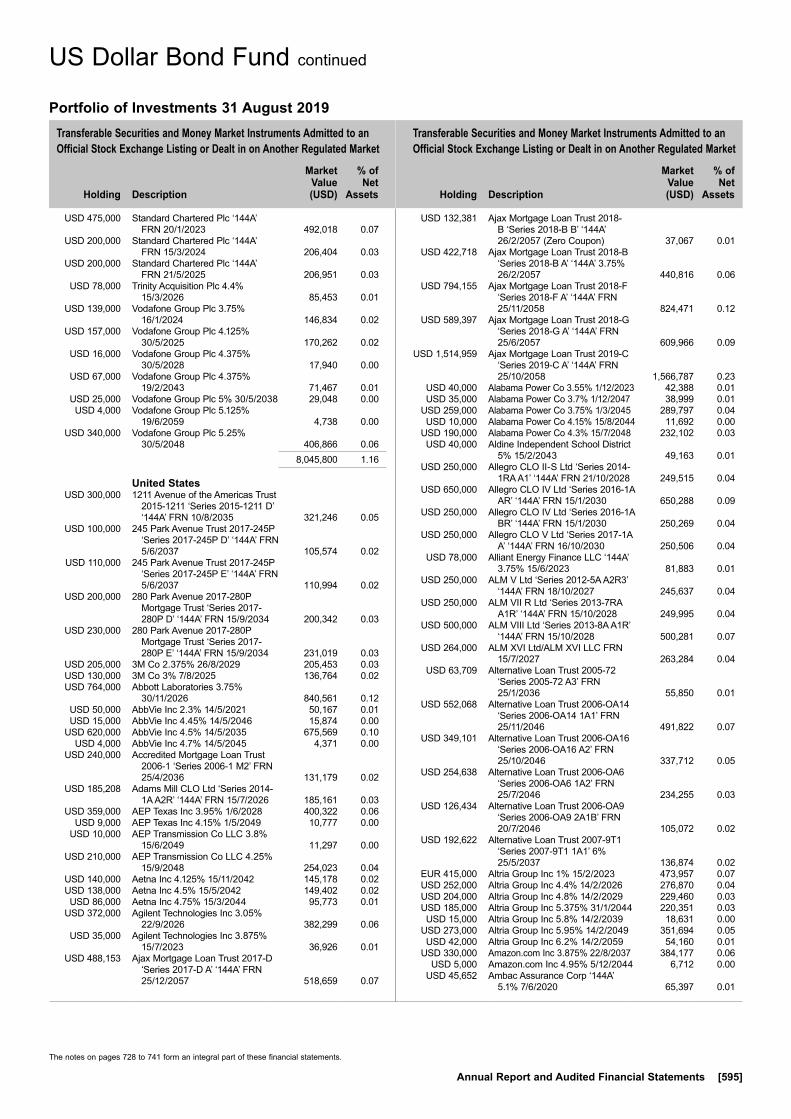
Transferable Securities and Money Market Instruments Admitted to an Official Stock Exchange Listing or Dealt in on Another Regulated Market
Transferable Securities and Money Market Instruments Admitted to an Official Stock Exchange Listing or Dealt in on Another Regulated Market
Holding
Description
Market Value (USD)
% of Net
Assets
Holding
Description
Market Value (USD)
% of Net
Assets
The notes on pages 728 to 741 form an integral part of these financial statements.
Annual Report and Audited Financial Statements [595]
USD 475,000 Standard Chartered Plc ‘144A’ FRN 20/1/2023 492,018 0.07
USD 200,000 Standard Chartered Plc ‘144A’ FRN 15/3/2024 206,404 0.03
USD 200,000 Standard Chartered Plc ‘144A’ FRN 21/5/2025 206,951 0.03
USD 78,000 Trinity Acquisition Plc 4.4% 15/3/2026 85,453 0.01
USD 139,000 Vodafone Group Plc 3.75% 16/1/2024 146,834 0.02
USD 157,000 Vodafone Group Plc 4.125% 30/5/2025 170,262 0.02
USD 16,000 Vodafone Group Plc 4.375% 30/5/2028 17,940 0.00
USD 67,000 Vodafone Group Plc 4.375% 19/2/2043 71,467 0.01
USD 25,000 Vodafone Group Plc 5% 30/5/2038 29,048 0.00 USD 4,000 Vodafone Group Plc 5.125%
19/6/2059 4,738 0.00 USD 340,000 Vodafone Group Plc 5.25%
30/5/2048 406,866 0.06 8,045,800 1.16
United States USD 300,000 1211 Avenue of the Americas Trust
2015-1211 ‘Series 2015-1211 D’ ‘144A’ FRN 10/8/2035 321,246 0.05
USD 100,000 245 Park Avenue Trust 2017-245P ‘Series 2017-245P D’ ‘144A’ FRN 5/6/2037 105,574 0.02
USD 110,000 245 Park Avenue Trust 2017-245P ‘Series 2017-245P E’ ‘144A’ FRN 5/6/2037 110,994 0.02
USD 200,000 280 Park Avenue 2017-280P Mortgage Trust ‘Series 2017-280P D’ ‘144A’ FRN 15/9/2034 200,342 0.03
USD 230,000 280 Park Avenue 2017-280P Mortgage Trust ‘Series 2017-280P E’ ‘144A’ FRN 15/9/2034 231,019 0.03
USD 205,000 3M Co 2.375% 26/8/2029 205,453 0.03 USD 130,000 3M Co 3% 7/8/2025 136,764 0.02 USD 764,000 Abbott Laboratories 3.75%
30/11/2026 840,561 0.12 USD 50,000 AbbVie Inc 2.3% 14/5/2021 50,167 0.01 USD 15,000 AbbVie Inc 4.45% 14/5/2046 15,874 0.00 USD 620,000 AbbVie Inc 4.5% 14/5/2035 675,569 0.10 USD 4,000 AbbVie Inc 4.7% 14/5/2045 4,371 0.00 USD 240,000 Accredited Mortgage Loan Trust
2006-1 ‘Series 2006-1 M2’ FRN 25/4/2036 131,179 0.02
USD 185,208 Adams Mill CLO Ltd ‘Series 2014-1A A2R’ ‘144A’ FRN 15/7/2026 185,161 0.03
USD 359,000 AEP Texas Inc 3.95% 1/6/2028 400,322 0.06 USD 9,000 AEP Texas Inc 4.15% 1/5/2049 10,777 0.00 USD 10,000 AEP Transmission Co LLC 3.8%
15/6/2049 11,297 0.00 USD 210,000 AEP Transmission Co LLC 4.25%
15/9/2048 254,023 0.04 USD 140,000 Aetna Inc 4.125% 15/11/2042 145,178 0.02 USD 138,000 Aetna Inc 4.5% 15/5/2042 149,402 0.02 USD 86,000 Aetna Inc 4.75% 15/3/2044 95,773 0.01 USD 372,000 Agilent Technologies Inc 3.05%
22/9/2026 382,299 0.06 USD 35,000 Agilent Technologies Inc 3.875%
15/7/2023 36,926 0.01 USD 488,153 Ajax Mortgage Loan Trust 2017-D
‘Series 2017-D A’ ‘144A’ FRN 25/12/2057 518,659 0.07
USD 132,381 Ajax Mortgage Loan Trust 2018-B ‘Series 2018-B B’ ‘144A’ 26/2/2057 (Zero Coupon) 37,067 0.01
USD 422,718 Ajax Mortgage Loan Trust 2018-B ‘Series 2018-B A’ ‘144A’ 3.75% 26/2/2057 440,816 0.06
USD 794,155 Ajax Mortgage Loan Trust 2018-F ‘Series 2018-F A’ ‘144A’ FRN 25/11/2058 824,471 0.12
USD 589,397 Ajax Mortgage Loan Trust 2018-G ‘Series 2018-G A’ ‘144A’ FRN 25/6/2057 609,966 0.09
USD 1,514,959 Ajax Mortgage Loan Trust 2019-C ‘Series 2019-C A’ ‘144A’ FRN 25/10/2058 1,566,787 0.23
USD 40,000 Alabama Power Co 3.55% 1/12/2023 42,388 0.01 USD 35,000 Alabama Power Co 3.7% 1/12/2047 38,999 0.01 USD 259,000 Alabama Power Co 3.75% 1/3/2045 289,797 0.04 USD 10,000 Alabama Power Co 4.15% 15/8/2044 11,692 0.00 USD 190,000 Alabama Power Co 4.3% 15/7/2048 232,102 0.03 USD 40,000 Aldine Independent School District
5% 15/2/2043 49,163 0.01 USD 250,000 Allegro CLO II-S Ltd ‘Series 2014-
1RA A1’ ‘144A’ FRN 21/10/2028 249,515 0.04 USD 650,000 Allegro CLO IV Ltd ‘Series 2016-1A
AR’ ‘144A’ FRN 15/1/2030 650,288 0.09 USD 250,000 Allegro CLO IV Ltd ‘Series 2016-1A
BR’ ‘144A’ FRN 15/1/2030 250,269 0.04 USD 250,000 Allegro CLO V Ltd ‘Series 2017-1A
A’ ‘144A’ FRN 16/10/2030 250,506 0.04 USD 78,000 Alliant Energy Finance LLC ‘144A’
3.75% 15/6/2023 81,883 0.01 USD 250,000 ALM V Ltd ‘Series 2012-5A A2R3’
‘144A’ FRN 18/10/2027 245,637 0.04 USD 250,000 ALM VII R Ltd ‘Series 2013-7RA
A1R’ ‘144A’ FRN 15/10/2028 249,995 0.04 USD 500,000 ALM VIII Ltd ‘Series 2013-8A A1R’
‘144A’ FRN 15/10/2028 500,281 0.07 USD 264,000 ALM XVI Ltd/ALM XVI LLC FRN
15/7/2027 263,284 0.04 USD 63,709 Alternative Loan Trust 2005-72
‘Series 2005-72 A3’ FRN 25/1/2036 55,850 0.01
USD 552,068 Alternative Loan Trust 2006-OA14 ‘Series 2006-OA14 1A1’ FRN 25/11/2046 491,822 0.07
USD 349,101 Alternative Loan Trust 2006-OA16 ‘Series 2006-OA16 A2’ FRN 25/10/2046 337,712 0.05
USD 254,638 Alternative Loan Trust 2006-OA6 ‘Series 2006-OA6 1A2’ FRN 25/7/2046 234,255 0.03
USD 126,434 Alternative Loan Trust 2006-OA9 ‘Series 2006-OA9 2A1B’ FRN 20/7/2046 105,072 0.02
USD 192,622 Alternative Loan Trust 2007-9T1 ‘Series 2007-9T1 1A1’ 6% 25/5/2037 136,874 0.02
EUR 415,000 Altria Group Inc 1% 15/2/2023 473,957 0.07 USD 252,000 Altria Group Inc 4.4% 14/2/2026 276,870 0.04 USD 204,000 Altria Group Inc 4.8% 14/2/2029 229,460 0.03 USD 185,000 Altria Group Inc 5.375% 31/1/2044 220,351 0.03 USD 15,000 Altria Group Inc 5.8% 14/2/2039 18,631 0.00 USD 273,000 Altria Group Inc 5.95% 14/2/2049 351,694 0.05 USD 42,000 Altria Group Inc 6.2% 14/2/2059 54,160 0.01 USD 330,000 Amazon.com Inc 3.875% 22/8/2037 384,177 0.06 USD 5,000 Amazon.com Inc 4.95% 5/12/2044 6,712 0.00 USD 45,652 Ambac Assurance Corp ‘144A’
5.1% 7/6/2020 65,397 0.01
US Dollar Bond Fund continued
Portfolio of Investments 31 August 2019

Transferable Securities and Money Market Instruments Admitted to an Official Stock Exchange Listing or Dealt in on Another Regulated Market
Transferable Securities and Money Market Instruments Admitted to an Official Stock Exchange Listing or Dealt in on Another Regulated Market
Holding
Description
Market Value (USD)
% of Net
Assets
Holding
Description
Market Value (USD)
% of Net
Assets
The notes on pages 728 to 741 form an integral part of these financial statements.
[596] BlackRock Global Funds (BGF)
USD 157,000 Ameren Illinois Co 3.8% 15/5/2028 174,742 0.03 USD 2,429 American Airlines 2014-1 Class B
Pass Through Trust 4.375% 1/10/2022 2,492 0.00
USD 178,990 American Airlines 2015-1 Class B Pass Through Trust 3.7% 1/5/2023 181,603 0.03
USD 45,470 American Airlines 2015-2 Class AA Pass Through Trust 3.6% 22/9/2027 48,371 0.01
USD 278,057 American Airlines 2015-2 Class B Pass Through Trust 4.4% 22/9/2023 289,638 0.04
USD 168,407 American Airlines 2016-1 Class B Pass Through Trust 5.25% 15/1/2024 180,513 0.03
USD 81,561 American Airlines 2016-2 Class AA Pass Through Trust 3.2% 15/6/2028 85,186 0.01
USD 181,190 American Airlines 2016-3 Class AA Pass Through Trust 3% 15/10/2028 186,905 0.03
USD 2,602 American Airlines 2016-3 Class B Pass Through Trust 3.75% 15/10/2025 2,680 0.00
USD 64,843 American Airlines 2017-1 Class AA Pass Through Trust 3.65% 15/2/2029 69,935 0.01
USD 48,007 American Airlines 2017-1 Class B Pass Through Trust 4.95% 15/2/2025 51,130 0.01
USD 79,454 American Airlines 2017-2 Class AA Pass Through Trust 3.35% 15/10/2029 82,928 0.01
USD 62,923 American Airlines 2017-2 Class B Pass Through Trust 3.7% 15/10/2025 63,670 0.01
USD 221,000 American Airlines Group Inc ‘144A’ 4.625% 1/3/2020 222,934 0.03
USD 94,000 American Express Co 2.5% 1/8/2022 95,198 0.01
USD 14,000 American Express Co 2.75% 20/5/2022 14,267 0.00
USD 585,000 American Express Co 3.125% 20/5/2026 614,365 0.09
USD 105,000 American Express Co 3.4% 22/2/2024 110,720 0.02
USD 165,000 American Express Co 3.7% 3/8/2023 174,852 0.03 USD 110,000 American Express Co 4.2%
6/11/2025 122,124 0.02 USD 148,000 American Express Credit Corp
2.25% 5/5/2021 148,650 0.02 USD 2,000 American Express Credit Corp
2.6% 14/9/2020 2,012 0.00 USD 10,000 American Express Credit Corp
2.7% 3/3/2022 10,195 0.00 USD 48,766 American Home Mortgage Assets
Trust 2007-1 ‘Series 2007-1 A1’ FRN 25/2/2047 29,793 0.00
USD 40,000 American Municipal Power Inc 6.449% 15/2/2044 60,247 0.01
USD 65,000 American Municipal Power Inc 7.834% 15/2/2041 109,592 0.02
USD 525,000 American Tower Corp 2.95% 15/1/2025 537,465 0.08
USD 33,000 American Tower Corp 3.125% 15/1/2027 34,135 0.01
USD 23,000 American Tower Corp 3.375% 15/10/2026 24,075 0.00
USD 193,000 American Tower Corp 3.5% 31/1/2023 200,557 0.03
USD 53,000 American Tower Corp 3.8% 15/8/2029 57,045 0.01
USD 12,000 American Tower Corp 3.95% 15/3/2029 13,106 0.00
USD 3,000 American Tower Corp 4.4% 15/2/2026 3,305 0.00
USD 14,000 American Tower Corp 5% 15/2/2024 15,539 0.00
USD 278,000 American University/The 3.672% 1/4/2049 318,057 0.05
USD 100,000 Americold 2010 LLC ‘Series 2010-ARTA C’ ‘144A’ 6.811% 14/1/2029 104,238 0.02
USD 389,000 Amgen Inc 4.4% 1/5/2045 444,173 0.06 USD 5,000 Amgen Inc 4.95% 1/10/2041 6,033 0.00 USD 250,000 AMMC CLO 21 Ltd ‘Series 2017-
21A A’ ‘144A’ FRN 2/11/2030 249,571 0.04 USD 1,000,000 Anadarko Petroleum Corp
(Restricted) 10/10/2036 (Zero Coupon) 497,474 0.07
USD 15,000 Analog Devices Inc 3.5% 5/12/2026 15,845 0.00 USD 33,000 Analog Devices Inc 3.9% 15/12/2025 35,530 0.01 USD 250,000 Anchorage Capital CLO 2013-1 Ltd
‘Series 2013-1A A1R’ ‘144A’ FRN 13/10/2030 249,583 0.04
USD 250,000 Anchorage Capital CLO 2013-1 Ltd ‘Series 2013-1A A2R’ ‘144A’ FRN 13/10/2030 246,886 0.04
USD 250,000 Anchorage Capital CLO 3-R Ltd ‘Series 2014-3RA B’ ‘144A’ FRN 28/1/2031 245,632 0.04
USD 250,000 Anchorage Capital CLO 4-R Ltd ‘Series 2014-4RA A’ ‘144A’ FRN 28/1/2031 249,011 0.04
USD 600,000 Anchorage Capital CLO 5-R Ltd ‘Series 2014-5RA B’ ‘144A’ FRN 15/1/2030 594,746 0.09
USD 250,000 Anchorage Capital CLO 5-R Ltd ‘Series 2014-5RA C’ ‘144A’ FRN 15/1/2030 246,980 0.04
USD 500,000 Anchorage Capital CLO 6 Ltd ‘Series 2015-6A AR’ ‘144A’ FRN 15/7/2030 499,870 0.07
USD 250,000 Anchorage Capital CLO 7 Ltd ‘Series 2015-7A B1R’ ‘144A’ FRN 15/10/2027 248,260 0.04
USD 902,000 Andeavor Logistics LP / Tesoro Logistics Finance Corp (Restricted) 4.25% 1/12/2027 955,691 0.14
USD 2,000 Andeavor Logistics LP / Tesoro Logistics Finance Corp (Restricted) 5.2% 1/12/2047 2,170 0.00
USD 280,000 Andeavor Logistics LP / Tesoro Logistics Finance Corp 5.5% 15/10/2019 280,246 0.04
USD 1,264,000 Anheuser-Busch Cos LLC / Anheuser-Busch InBev Worldwide Inc 4.7% 1/2/2036 1,469,822 0.21
USD 332,000 Anheuser-Busch Cos LLC / Anheuser-Busch InBev Worldwide Inc 4.9% 1/2/2046 397,679 0.06
USD 5,000 Anheuser-Busch InBev Worldwide Inc 4.375% 15/4/2038 5,691 0.00
USD 1,146,000 Anheuser-Busch InBev Worldwide Inc 4.75% 23/1/2029 1,341,011 0.19
USD 35,000 Anheuser-Busch InBev Worldwide Inc 4.9% 23/1/2031 41,891 0.01
USD 20,000 Anthem Inc 3.5% 15/8/2024 20,965 0.00
US Dollar Bond Fund continued
Portfolio of Investments 31 August 2019

Transferable Securities and Money Market Instruments Admitted to an Official Stock Exchange Listing or Dealt in on Another Regulated Market
Transferable Securities and Money Market Instruments Admitted to an Official Stock Exchange Listing or Dealt in on Another Regulated Market
Holding
Description
Market Value (USD)
% of Net
Assets
Holding
Description
Market Value (USD)
% of Net
Assets
The notes on pages 728 to 741 form an integral part of these financial statements.
Annual Report and Audited Financial Statements [597]
USD 145,000 Anthem Inc 4.101% 1/3/2028 158,077 0.02 USD 100,000 AOA 2015-1177 Mortgage Trust
‘Series 2015-1177 C’ ‘144A’ FRN 13/12/2029 100,906 0.01
USD 185,000 Aon Corp 3.75% 2/5/2029 200,651 0.03 USD 600,000 Aon Corp 4.5% 15/12/2028 687,042 0.10 EUR 500,000 Apple Inc 1% 10/11/2022 577,380 0.08 USD 232,000 Apple Inc 3% 9/2/2024 242,786 0.04 USD 53,000 Apple Inc 3.25% 23/2/2026 56,749 0.01 USD 28,000 Apple Inc 3.35% 9/2/2027 30,258 0.00 USD 41,000 Apple Inc 3.45% 9/2/2045 44,253 0.01 USD 1,082,000 Apple Inc 3.85% 4/5/2043 1,235,745 0.18 USD 285,000 Applied Materials Inc 3.3% 1/4/2027 307,032 0.04 USD 55,000 Applied Materials Inc 3.9% 1/10/2025 60,316 0.01 USD 320,000 Applied Materials Inc 4.35% 1/4/2047 392,139 0.06 USD 170,000 Applied Materials Inc 5.1% 1/10/2035 216,791 0.03 USD 20,000 Applied Materials Inc 5.85%
15/6/2041 27,768 0.00 USD 1,702,360 APS Resecuritization Trust 2016-1
‘Series 2016-1 1MZ’ ‘144A’ FRN 31/7/2057 649,611 0.09
USD 327,970 APS Resecuritization Trust 2016-3 ‘Series 2016-3 3A’ ‘144A’ FRN 27/9/2046 332,583 0.05
USD 71,461 APS Resecuritization Trust 2016-3 ‘Series 2016-3 4A’ ‘144A’ FRN 27/4/2047 72,329 0.01
USD 500,000 Arbor Realty Collateralized Loan Obligation 2017-FL3 Ltd ‘Series 2017-FL3 A’ ‘144A’ FRN 15/12/2027 500,200 0.07
USD 250,000 Arbor Realty Commercial Real Estate Notes 2017-FL2 Ltd ‘Series 2017-FL2 A’ ‘144A’ FRN 15/8/2027 250,275 0.04
USD 210,335 Argent Mortgage Loan Trust 2005-W1 ‘Series 2005-W1 A2’ FRN 25/5/2035 200,738 0.03
USD 1,000,000 ARI Investments LLC 6/1/2025 (Zero Coupon) 1,000,000 0.14
USD 100,000 Arizona Health Facilities Authority FRN 1/1/2037 97,730 0.01
USD 50,000 Arizona State University 5% 1/7/2043 61,205 0.01
USD 1,000,000 AT&T Inc ‘144A’ 27/11/2022 (Zero Coupon) 920,318 0.13
USD 145,000 AT&T Inc 3.6% 15/7/2025 152,887 0.02 USD 80,000 AT&T Inc 3.8% 15/2/2027 85,466 0.01 USD 215,000 AT&T Inc 4.1% 15/2/2028 234,908 0.03 USD 899,000 AT&T Inc 4.3% 15/2/2030 999,053 0.14 USD 34,000 AT&T Inc 4.3% 15/12/2042 35,841 0.01 USD 113,000 AT&T Inc 4.35% 1/3/2029 126,120 0.02 USD 441,000 AT&T Inc 4.35% 15/6/2045 470,594 0.07 USD 321,000 AT&T Inc 4.5% 15/5/2035 356,951 0.05 USD 24,000 AT&T Inc 4.65% 1/6/2044 26,291 0.00 USD 51,000 AT&T Inc 4.75% 15/5/2046 57,124 0.01 USD 248,000 AT&T Inc 4.8% 15/6/2044 277,926 0.04 USD 236,000 AT&T Inc 4.85% 15/7/2045 270,802 0.04 USD 10,000 AT&T Inc 4.9% 15/8/2037 11,468 0.00 USD 63,000 AT&T Inc 5.15% 15/3/2042 73,245 0.01 USD 71,000 AT&T Inc 5.15% 15/11/2046 83,501 0.01 USD 2,000 AT&T Inc 5.15% 15/2/2050 2,372 0.00 USD 15,000 AT&T Inc 5.35% 1/9/2040 17,885 0.00 USD 25,000 AT&T Inc 5.45% 1/3/2047 30,486 0.00 USD 249,000 AT&T Inc 6% 15/8/2040 312,357 0.05 USD 45,000 AT&T Inc 6.35% 15/3/2040 58,841 0.01 USD 22,000 AT&T Inc 6.375% 1/3/2041 28,761 0.00 USD 75,000 Atmos Energy Corp 4.125%
15/3/2049 90,450 0.01
USD 750,000 Atrium XII ‘144A’ FRN 22/4/2027 743,217 0.11 USD 475,000 Autodesk Inc 3.5% 15/6/2027 497,428 0.07 USD 835,531 Avery Point IV CLO Ltd ‘Series
2014-1A AR’ ‘144A’ FRN 25/4/2026 835,922 0.12
USD 180,543 Avery Point V CLO Ltd ‘Series 2014-5A AR’ ‘144A’ FRN 17/7/2026 180,618 0.03
USD 250,000 Avery Point V CLO Ltd ‘Series 2014-5A BR’ ‘144A’ FRN 17/7/2026 248,860 0.04
USD 250,000 Avery Point VI CLO Ltd ‘Series 2015-6A AR’ ‘144A’ FRN 5/8/2027 249,751 0.04
USD 70,000 AXA Equitable Holdings Inc 3.9% 20/4/2023 73,573 0.01
USD 60,000 AXA Equitable Holdings Inc 5% 20/4/2048 65,126 0.01
USD 2,224 B2R Mortgage Trust 2015-1 ‘Series 2015-1 A1’ ‘144A’ 2.524% 15/5/2048 2,217 0.00
USD 42,613 B2R Mortgage Trust 2015-2 ‘Series 2015-2 A’ ‘144A’ 3.336% 15/11/2048 42,679 0.01
USD 304,000 BAE Systems Holdings Inc ‘144A’ 2.85% 15/12/2020 305,832 0.04
USD 795,000 BAE Systems Holdings Inc ‘144A’ 3.85% 15/12/2025 841,602 0.12
USD 18,000 BAE Systems Holdings Inc ‘144A’ 4.75% 7/10/2044 21,523 0.00
USD 750,000 Bain Capital Credit Clo 2016-2 Ltd ‘Series 2016-2A AR’ ‘144A’ FRN 15/1/2029 750,000 0.11
USD 500,000 Bain Capital Credit Clo 2016-2 Ltd ‘Series 2016-2A BR’ ‘144A’ FRN 15/1/2029 500,000 0.07
USD 195,000 Baltimore Gas & Electric Co 3.5% 15/8/2046 208,538 0.03
USD 103,000 Baltimore Gas & Electric Co 3.75% 15/8/2047 115,617 0.02
USD 120,000 Baltimore Gas & Electric Co 4.25% 15/9/2048 146,236 0.02
USD 250,000 BAMLL Commercial Mortgage Securities Trust 2015-200P ‘Series 2015-200P F’ ‘144A’ FRN 14/4/2033 254,666 0.04
USD 300,000 BAMLL Commercial Mortgage Securities Trust 2016-ISQ ‘Series 2016-ISQ C’ ‘144A’ FRN 14/8/2034 317,741 0.05
USD 100,000 BAMLL Commercial Mortgage Securities Trust 2017-SCH ‘Series 2017-SCH CL’ ‘144A’ FRN 15/11/2032 100,741 0.01
USD 300,000 BAMLL Commercial Mortgage Securities Trust 2017-SCH ‘Series 2017-SCH DL’ ‘144A’ FRN 15/11/2032 302,006 0.04
USD 100,000 BAMLL Commercial Mortgage Securities Trust 2017-SCH ‘Series 2017-SCH BF’ ‘144A’ FRN 15/11/2033 99,910 0.01
USD 410,000 BAMLL Commercial Mortgage Securities Trust 2018-DSNY ‘Series 2018-DSNY D’ ‘144A’ FRN 15/9/2034 410,072 0.06
USD 14,642 Banc of America Commercial Mortgage Trust 2007-1 ‘Series 2007-1 AMFX’ FRN 15/1/2049 14,680 0.00
US Dollar Bond Fund continued
Portfolio of Investments 31 August 2019

Transferable Securities and Money Market Instruments Admitted to an Official Stock Exchange Listing or Dealt in on Another Regulated Market
Transferable Securities and Money Market Instruments Admitted to an Official Stock Exchange Listing or Dealt in on Another Regulated Market
Holding
Description
Market Value (USD)
% of Net
Assets
Holding
Description
Market Value (USD)
% of Net
Assets
The notes on pages 728 to 741 form an integral part of these financial statements.
[598] BlackRock Global Funds (BGF)
USD 1,000,000 Banc of America Commercial Mortgage Trust 2017-BNK3 ‘Series 2017-BNK3 XB’ FRN 15/2/2050 43,735 0.01
USD 1,000,000 Banc of America Commercial Mortgage Trust 2017-BNK3 ‘Series 2017-BNK3 XD’ ‘144A’ FRN 15/2/2050 83,190 0.01
USD 75,057 Bancorp Commercial Mortgage 2018-CRE3 Trust/The ‘Series 2018-CR3 A’ ‘144A’ FRN 15/1/2033 74,860 0.01
USD 1,879,000 Bank of America Corp FRN 1/10/2021 1,882,464 0.27
USD 347,000 Bank of America Corp FRN 17/5/2022 354,587 0.05
USD 6,000 Bank of America Corp FRN 20/1/2023 6,134 0.00
USD 405,000 Bank of America Corp FRN 21/7/2023 413,277 0.06
USD 6,000 Bank of America Corp FRN 5/3/2024 6,270 0.00
USD 235,000 Bank of America Corp FRN 15/3/2025 247,143 0.04
USD 80,000 Bank of America Corp FRN 23/1/2026 83,839 0.01
USD 85,000 Bank of America Corp FRN 23/4/2027 90,438 0.01
USD 723,000 Bank of America Corp FRN 20/1/2028 783,377 0.11
USD 570,000 Bank of America Corp FRN 15/3/2028 (Perpetual) 614,517 0.09
USD 1,007,000 Bank of America Corp FRN 24/4/2028 1,086,237 0.16
USD 11,000 Bank of America Corp FRN 21/7/2028 11,768 0.00
USD 1,368,000 Bank of America Corp FRN 20/12/2028 1,444,891 0.21
USD 407,000 Bank of America Corp FRN 5/3/2029 447,244 0.06
USD 104,000 Bank of America Corp FRN 23/7/2029 117,010 0.02
USD 260,000 Bank of America Corp FRN 7/2/2030 287,880 0.04
USD 90,000 Bank of America Corp FRN 23/7/2030 93,984 0.01
USD 470,000 Bank of America Corp 2.625% 19/10/2020 473,378 0.07
USD 105,000 Bank of America Corp 3.3% 11/1/2023 109,166 0.02
USD 219,000 Bank of America Corp 3.5% 19/4/2026 235,245 0.03
USD 205,000 Bank of America Corp 3.95% 21/4/2025 218,676 0.03
USD 40,000 Bank of America Corp 4% 22/1/2025 42,718 0.01
USD 50,000 Bank of America Corp 4.125% 22/1/2024 54,081 0.01
USD 50,000 Bank of America Corp 4.2% 26/8/2024 53,928 0.01
USD 3,000 Bank of America Corp 4.25% 22/10/2026 3,272 0.00
USD 524,000 Bank of America Corp 4.45% 3/3/2026 576,500 0.08
USD 3,000 Bank of America Corp 4.75% 21/4/2045 3,681 0.00
USD 190,000 Bank of New York Mellon Corp/The FRN 20/6/2020 (Perpetual) 192,181 0.03
USD 325,000 Bank of New York Mellon Corp/The FRN 20/9/2026 (Perpetual) 327,119 0.05
USD 307,000 Bank of New York Mellon Corp/The FRN 7/2/2028 329,640 0.05
USD 600,000 BankAmerica Manufactured Housing Contract Trust ‘Series 1998-2 B1’ FRN 10/12/2025 359,901 0.05
USD 25,000 BAT Capital Corp 3.557% 15/8/2027 25,595 0.00 USD 45,000 Baxalta Inc 5.25% 23/6/2045 59,197 0.01 USD 20,000 Baxter International Inc 1.7%
15/8/2021 19,886 0.00 USD 220,000 Bay Area Toll Authority 6.918%
1/4/2040 340,264 0.05 USD 520,000 Bay Area Toll Authority 7.043%
1/4/2050 902,418 0.13 USD 300,000 Bayer US Finance II LLC ‘144A’
2.85% 15/4/2025 289,820 0.04 USD 35,000 Bayer US Finance II LLC ‘144A’
3.95% 15/4/2045 33,958 0.00 USD 238,000 Bayer US Finance LLC ‘144A’
3.375% 8/10/2024 245,456 0.04 USD 105,000 Baylor Scott & White Holdings
4.185% 15/11/2045 128,211 0.02 USD 15,426 Bayview Commercial Asset Trust
2005-4 ‘Series 2005-4A A1’ ‘144A’ FRN 25/1/2036 14,955 0.00
USD 12,855 Bayview Commercial Asset Trust 2005-4 ‘Series 2005-4A M1’ ‘144A’ FRN 25/1/2036 12,451 0.00
USD 25,640 Bayview Commercial Asset Trust 2006-3 ‘Series 2006-3A A1’ ‘144A’ FRN 25/10/2036 24,655 0.00
USD 616,691 Bayview Commercial Asset Trust 2006-4 ‘Series 2006-4A A1’ ‘144A’ FRN 25/12/2036 597,072 0.09
USD 100,000 Bayview Commercial Asset Trust 2007-6 ‘Series 2007-6A A4A’ ‘144A’ FRN 25/12/2037 95,630 0.01
USD 716,452 Bayview Financial Revolving Asset Trust 2004-B ‘Series 2004-B A1’ ‘144A’ FRN 28/5/2039 658,090 0.10
USD 116,307 Bayview Financial Revolving Asset Trust 2004-B ‘Series 2004-B A2’ ‘144A’ FRN 28/5/2039 107,608 0.02
USD 66,414 Bayview Financial Revolving Asset Trust 2005-E ‘Series 2005-E A1’ ‘144A’ FRN 28/12/2040 64,621 0.01
USD 158,000 BBCMS Trust 2015-SRCH ‘Series 2015-SRCH A1’ ‘144A’ 3.312% 10/8/2035 166,480 0.02
USD 100,000 BBCMS Trust 2015-STP ‘Series 2015-STP E’ ‘144A’ FRN 10/9/2028 99,017 0.01
USD 118,927 BCMSC Trust 2000-A ‘Series 2000-A A2’ FRN 15/6/2030 40,723 0.01
USD 110,398 BCMSC Trust 2000-A ‘Series 2000-A A3’ FRN 15/6/2030 39,060 0.01
USD 79,834 BCMSC Trust 2000-A ‘Series 2000-A A4’ FRN 15/6/2030 29,887 0.00
USD 52,642 Bear Stearns ALT-A Trust 2006-6 ‘Series 2006-6 1A1’ FRN 25/11/2036 54,570 0.01
USD 132,521 Bear Stearns Asset Backed Securities I Trust 2005-AC9 (Step-up coupon) ‘Series 2005-AC9 A5’ 6.25% 25/12/2035 132,197 0.02
US Dollar Bond Fund continued
Portfolio of Investments 31 August 2019
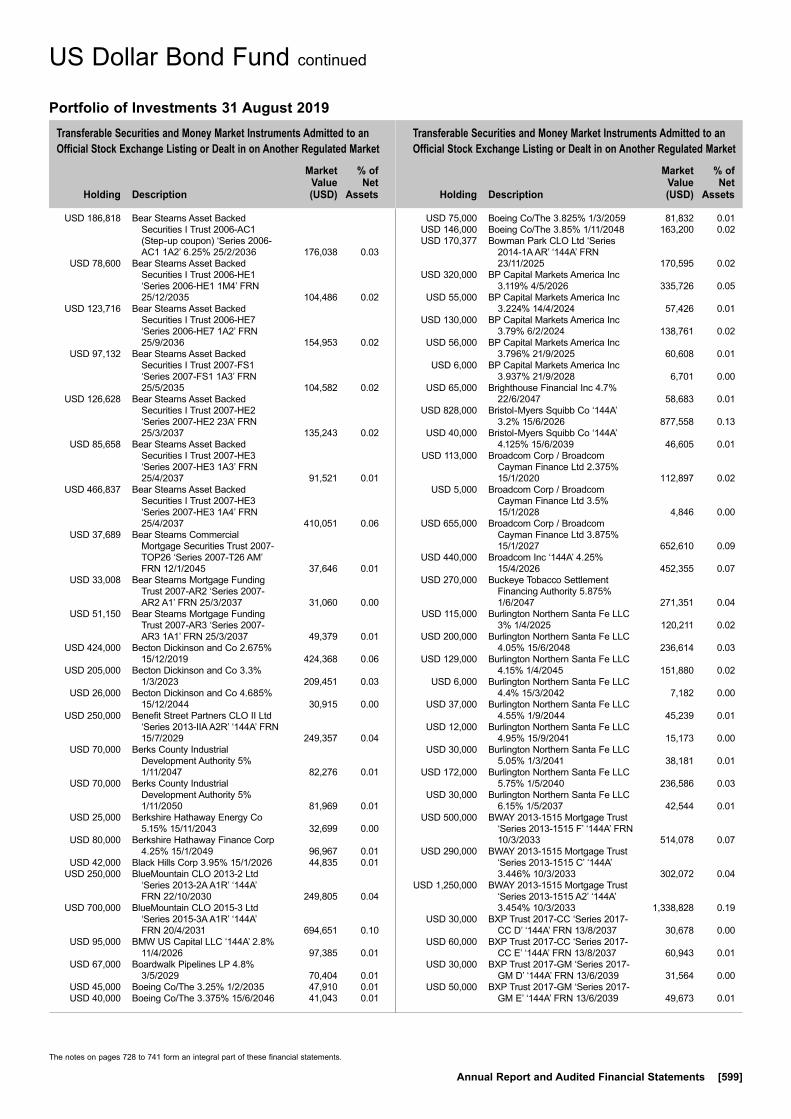
Transferable Securities and Money Market Instruments Admitted to an Official Stock Exchange Listing or Dealt in on Another Regulated Market
Transferable Securities and Money Market Instruments Admitted to an Official Stock Exchange Listing or Dealt in on Another Regulated Market
Holding
Description
Market Value (USD)
% of Net
Assets
Holding
Description
Market Value (USD)
% of Net
Assets
The notes on pages 728 to 741 form an integral part of these financial statements.
Annual Report and Audited Financial Statements [599]
USD 186,818 Bear Stearns Asset Backed Securities I Trust 2006-AC1 (Step-up coupon) ‘Series 2006-AC1 1A2’ 6.25% 25/2/2036 176,038 0.03
USD 78,600 Bear Stearns Asset Backed Securities I Trust 2006-HE1 ‘Series 2006-HE1 1M4’ FRN 25/12/2035 104,486 0.02
USD 123,716 Bear Stearns Asset Backed Securities I Trust 2006-HE7 ‘Series 2006-HE7 1A2’ FRN 25/9/2036 154,953 0.02
USD 97,132 Bear Stearns Asset Backed Securities I Trust 2007-FS1 ‘Series 2007-FS1 1A3’ FRN 25/5/2035 104,582 0.02
USD 126,628 Bear Stearns Asset Backed Securities I Trust 2007-HE2 ‘Series 2007-HE2 23A’ FRN 25/3/2037 135,243 0.02
USD 85,658 Bear Stearns Asset Backed Securities I Trust 2007-HE3 ‘Series 2007-HE3 1A3’ FRN 25/4/2037 91,521 0.01
USD 466,837 Bear Stearns Asset Backed Securities I Trust 2007-HE3 ‘Series 2007-HE3 1A4’ FRN 25/4/2037 410,051 0.06
USD 37,689 Bear Stearns Commercial Mortgage Securities Trust 2007-TOP26 ‘Series 2007-T26 AM’ FRN 12/1/2045 37,646 0.01
USD 33,008 Bear Stearns Mortgage Funding Trust 2007-AR2 ‘Series 2007-AR2 A1’ FRN 25/3/2037 31,060 0.00
USD 51,150 Bear Stearns Mortgage Funding Trust 2007-AR3 ‘Series 2007-AR3 1A1’ FRN 25/3/2037 49,379 0.01
USD 424,000 Becton Dickinson and Co 2.675% 15/12/2019 424,368 0.06
USD 205,000 Becton Dickinson and Co 3.3% 1/3/2023 209,451 0.03
USD 26,000 Becton Dickinson and Co 4.685% 15/12/2044 30,915 0.00
USD 250,000 Benefit Street Partners CLO II Ltd ‘Series 2013-IIA A2R’ ‘144A’ FRN 15/7/2029 249,357 0.04
USD 70,000 Berks County Industrial Development Authority 5% 1/11/2047 82,276 0.01
USD 70,000 Berks County Industrial Development Authority 5% 1/11/2050 81,969 0.01
USD 25,000 Berkshire Hathaway Energy Co 5.15% 15/11/2043 32,699 0.00
USD 80,000 Berkshire Hathaway Finance Corp 4.25% 15/1/2049 96,967 0.01
USD 42,000 Black Hills Corp 3.95% 15/1/2026 44,835 0.01 USD 250,000 BlueMountain CLO 2013-2 Ltd
‘Series 2013-2A A1R’ ‘144A’ FRN 22/10/2030 249,805 0.04
USD 700,000 BlueMountain CLO 2015-3 Ltd ‘Series 2015-3A A1R’ ‘144A’ FRN 20/4/2031 694,651 0.10
USD 95,000 BMW US Capital LLC ‘144A’ 2.8% 11/4/2026 97,385 0.01
USD 67,000 Boardwalk Pipelines LP 4.8% 3/5/2029 70,404 0.01
USD 45,000 Boeing Co/The 3.25% 1/2/2035 47,910 0.01 USD 40,000 Boeing Co/The 3.375% 15/6/2046 41,043 0.01
USD 75,000 Boeing Co/The 3.825% 1/3/2059 81,832 0.01 USD 146,000 Boeing Co/The 3.85% 1/11/2048 163,200 0.02 USD 170,377 Bowman Park CLO Ltd ‘Series
2014-1A AR’ ‘144A’ FRN 23/11/2025 170,595 0.02
USD 320,000 BP Capital Markets America Inc 3.119% 4/5/2026 335,726 0.05
USD 55,000 BP Capital Markets America Inc 3.224% 14/4/2024 57,426 0.01
USD 130,000 BP Capital Markets America Inc 3.79% 6/2/2024 138,761 0.02
USD 56,000 BP Capital Markets America Inc 3.796% 21/9/2025 60,608 0.01
USD 6,000 BP Capital Markets America Inc 3.937% 21/9/2028 6,701 0.00
USD 65,000 Brighthouse Financial Inc 4.7% 22/6/2047 58,683 0.01
USD 828,000 Bristol-Myers Squibb Co ‘144A’ 3.2% 15/6/2026 877,558 0.13
USD 40,000 Bristol-Myers Squibb Co ‘144A’ 4.125% 15/6/2039 46,605 0.01
USD 113,000 Broadcom Corp / Broadcom Cayman Finance Ltd 2.375% 15/1/2020 112,897 0.02
USD 5,000 Broadcom Corp / Broadcom Cayman Finance Ltd 3.5% 15/1/2028 4,846 0.00
USD 655,000 Broadcom Corp / Broadcom Cayman Finance Ltd 3.875% 15/1/2027 652,610 0.09
USD 440,000 Broadcom Inc ‘144A’ 4.25% 15/4/2026 452,355 0.07
USD 270,000 Buckeye Tobacco Settlement Financing Authority 5.875% 1/6/2047 271,351 0.04
USD 115,000 Burlington Northern Santa Fe LLC 3% 1/4/2025 120,211 0.02
USD 200,000 Burlington Northern Santa Fe LLC 4.05% 15/6/2048 236,614 0.03
USD 129,000 Burlington Northern Santa Fe LLC 4.15% 1/4/2045 151,880 0.02
USD 6,000 Burlington Northern Santa Fe LLC 4.4% 15/3/2042 7,182 0.00
USD 37,000 Burlington Northern Santa Fe LLC 4.55% 1/9/2044 45,239 0.01
USD 12,000 Burlington Northern Santa Fe LLC 4.95% 15/9/2041 15,173 0.00
USD 30,000 Burlington Northern Santa Fe LLC 5.05% 1/3/2041 38,181 0.01
USD 172,000 Burlington Northern Santa Fe LLC 5.75% 1/5/2040 236,586 0.03
USD 30,000 Burlington Northern Santa Fe LLC 6.15% 1/5/2037 42,544 0.01
USD 500,000 BWAY 2013-1515 Mortgage Trust ‘Series 2013-1515 F’ ‘144A’ FRN 10/3/2033 514,078 0.07
USD 290,000 BWAY 2013-1515 Mortgage Trust ‘Series 2013-1515 C’ ‘144A’ 3.446% 10/3/2033 302,072 0.04
USD 1,250,000 BWAY 2013-1515 Mortgage Trust ‘Series 2013-1515 A2’ ‘144A’ 3.454% 10/3/2033 1,338,828 0.19
USD 30,000 BXP Trust 2017-CC ‘Series 2017-CC D’ ‘144A’ FRN 13/8/2037 30,678 0.00
USD 60,000 BXP Trust 2017-CC ‘Series 2017-CC E’ ‘144A’ FRN 13/8/2037 60,943 0.01
USD 30,000 BXP Trust 2017-GM ‘Series 2017-GM D’ ‘144A’ FRN 13/6/2039 31,564 0.00
USD 50,000 BXP Trust 2017-GM ‘Series 2017-GM E’ ‘144A’ FRN 13/6/2039 49,673 0.01
US Dollar Bond Fund continued
Portfolio of Investments 31 August 2019
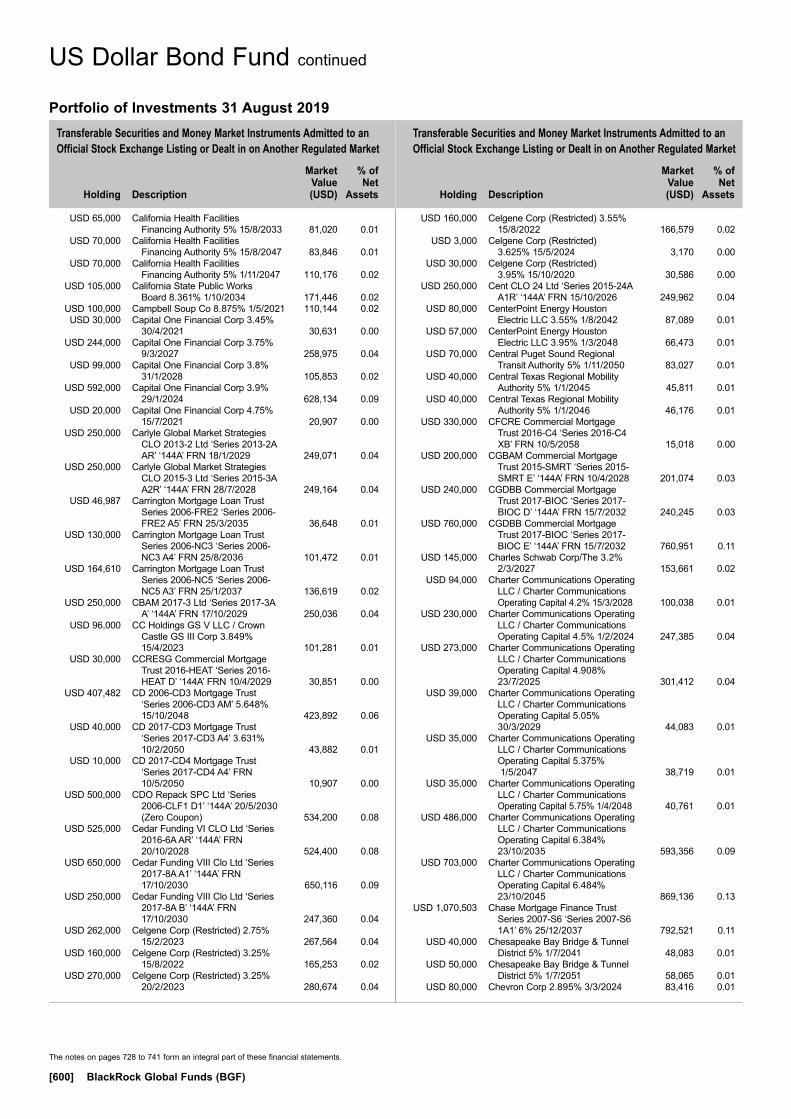
Transferable Securities and Money Market Instruments Admitted to an Official Stock Exchange Listing or Dealt in on Another Regulated Market
Transferable Securities and Money Market Instruments Admitted to an Official Stock Exchange Listing or Dealt in on Another Regulated Market
Holding
Description
Market Value (USD)
% of Net
Assets
Holding
Description
Market Value (USD)
% of Net
Assets
The notes on pages 728 to 741 form an integral part of these financial statements.
[600] BlackRock Global Funds (BGF)
USD 65,000 California Health Facilities Financing Authority 5% 15/8/2033 81,020 0.01
USD 70,000 California Health Facilities Financing Authority 5% 15/8/2047 83,846 0.01
USD 70,000 California Health Facilities Financing Authority 5% 1/11/2047 110,176 0.02
USD 105,000 California State Public Works Board 8.361% 1/10/2034 171,446 0.02
USD 100,000 Campbell Soup Co 8.875% 1/5/2021 110,144 0.02 USD 30,000 Capital One Financial Corp 3.45%
30/4/2021 30,631 0.00 USD 244,000 Capital One Financial Corp 3.75%
9/3/2027 258,975 0.04 USD 99,000 Capital One Financial Corp 3.8%
31/1/2028 105,853 0.02 USD 592,000 Capital One Financial Corp 3.9%
29/1/2024 628,134 0.09 USD 20,000 Capital One Financial Corp 4.75%
15/7/2021 20,907 0.00 USD 250,000 Carlyle Global Market Strategies
CLO 2013-2 Ltd ‘Series 2013-2A AR’ ‘144A’ FRN 18/1/2029 249,071 0.04
USD 250,000 Carlyle Global Market Strategies CLO 2015-3 Ltd ‘Series 2015-3A A2R’ ‘144A’ FRN 28/7/2028 249,164 0.04
USD 46,987 Carrington Mortgage Loan Trust Series 2006-FRE2 ‘Series 2006-FRE2 A5’ FRN 25/3/2035 36,648 0.01
USD 130,000 Carrington Mortgage Loan Trust Series 2006-NC3 ‘Series 2006-NC3 A4’ FRN 25/8/2036 101,472 0.01
USD 164,610 Carrington Mortgage Loan Trust Series 2006-NC5 ‘Series 2006-NC5 A3’ FRN 25/1/2037 136,619 0.02
USD 250,000 CBAM 2017-3 Ltd ‘Series 2017-3A A’ ‘144A’ FRN 17/10/2029 250,036 0.04
USD 96,000 CC Holdings GS V LLC / Crown Castle GS III Corp 3.849% 15/4/2023 101,281 0.01
USD 30,000 CCRESG Commercial Mortgage Trust 2016-HEAT ‘Series 2016-HEAT D’ ‘144A’ FRN 10/4/2029 30,851 0.00
USD 407,482 CD 2006-CD3 Mortgage Trust ‘Series 2006-CD3 AM’ 5.648% 15/10/2048 423,892 0.06
USD 40,000 CD 2017-CD3 Mortgage Trust ‘Series 2017-CD3 A4’ 3.631% 10/2/2050 43,882 0.01
USD 10,000 CD 2017-CD4 Mortgage Trust ‘Series 2017-CD4 A4’ FRN 10/5/2050 10,907 0.00
USD 500,000 CDO Repack SPC Ltd ‘Series 2006-CLF1 D1’ ‘144A’ 20/5/2030 (Zero Coupon) 534,200 0.08
USD 525,000 Cedar Funding VI CLO Ltd ‘Series 2016-6A AR’ ‘144A’ FRN 20/10/2028 524,400 0.08
USD 650,000 Cedar Funding VIII Clo Ltd ‘Series 2017-8A A1’ ‘144A’ FRN 17/10/2030 650,116 0.09
USD 250,000 Cedar Funding VIII Clo Ltd ‘Series 2017-8A B’ ‘144A’ FRN 17/10/2030 247,360 0.04
USD 262,000 Celgene Corp (Restricted) 2.75% 15/2/2023 267,564 0.04
USD 160,000 Celgene Corp (Restricted) 3.25% 15/8/2022 165,253 0.02
USD 270,000 Celgene Corp (Restricted) 3.25% 20/2/2023 280,674 0.04
USD 160,000 Celgene Corp (Restricted) 3.55% 15/8/2022 166,579 0.02
USD 3,000 Celgene Corp (Restricted) 3.625% 15/5/2024 3,170 0.00
USD 30,000 Celgene Corp (Restricted) 3.95% 15/10/2020 30,586 0.00
USD 250,000 Cent CLO 24 Ltd ‘Series 2015-24A A1R’ ‘144A’ FRN 15/10/2026 249,962 0.04
USD 80,000 CenterPoint Energy Houston Electric LLC 3.55% 1/8/2042 87,089 0.01
USD 57,000 CenterPoint Energy Houston Electric LLC 3.95% 1/3/2048 66,473 0.01
USD 70,000 Central Puget Sound Regional Transit Authority 5% 1/11/2050 83,027 0.01
USD 40,000 Central Texas Regional Mobility Authority 5% 1/1/2045 45,811 0.01
USD 40,000 Central Texas Regional Mobility Authority 5% 1/1/2046 46,176 0.01
USD 330,000 CFCRE Commercial Mortgage Trust 2016-C4 ‘Series 2016-C4 XB’ FRN 10/5/2058 15,018 0.00
USD 200,000 CGBAM Commercial Mortgage Trust 2015-SMRT ‘Series 2015-SMRT E’ ‘144A’ FRN 10/4/2028 201,074 0.03
USD 240,000 CGDBB Commercial Mortgage Trust 2017-BIOC ‘Series 2017-BIOC D’ ‘144A’ FRN 15/7/2032 240,245 0.03
USD 760,000 CGDBB Commercial Mortgage Trust 2017-BIOC ‘Series 2017-BIOC E’ ‘144A’ FRN 15/7/2032 760,951 0.11
USD 145,000 Charles Schwab Corp/The 3.2% 2/3/2027 153,661 0.02
USD 94,000 Charter Communications Operating LLC / Charter Communications Operating Capital 4.2% 15/3/2028 100,038 0.01
USD 230,000 Charter Communications Operating LLC / Charter Communications Operating Capital 4.5% 1/2/2024 247,385 0.04
USD 273,000 Charter Communications Operating LLC / Charter Communications Operating Capital 4.908% 23/7/2025 301,412 0.04
USD 39,000 Charter Communications Operating LLC / Charter Communications Operating Capital 5.05% 30/3/2029 44,083 0.01
USD 35,000 Charter Communications Operating LLC / Charter Communications Operating Capital 5.375% 1/5/2047 38,719 0.01
USD 35,000 Charter Communications Operating LLC / Charter Communications Operating Capital 5.75% 1/4/2048 40,761 0.01
USD 486,000 Charter Communications Operating LLC / Charter Communications Operating Capital 6.384% 23/10/2035 593,356 0.09
USD 703,000 Charter Communications Operating LLC / Charter Communications Operating Capital 6.484% 23/10/2045 869,136 0.13
USD 1,070,503 Chase Mortgage Finance Trust Series 2007-S6 ‘Series 2007-S6 1A1’ 6% 25/12/2037 792,521 0.11
USD 40,000 Chesapeake Bay Bridge & Tunnel District 5% 1/7/2041 48,083 0.01
USD 50,000 Chesapeake Bay Bridge & Tunnel District 5% 1/7/2051 58,065 0.01
USD 80,000 Chevron Corp 2.895% 3/3/2024 83,416 0.01
US Dollar Bond Fund continued
Portfolio of Investments 31 August 2019
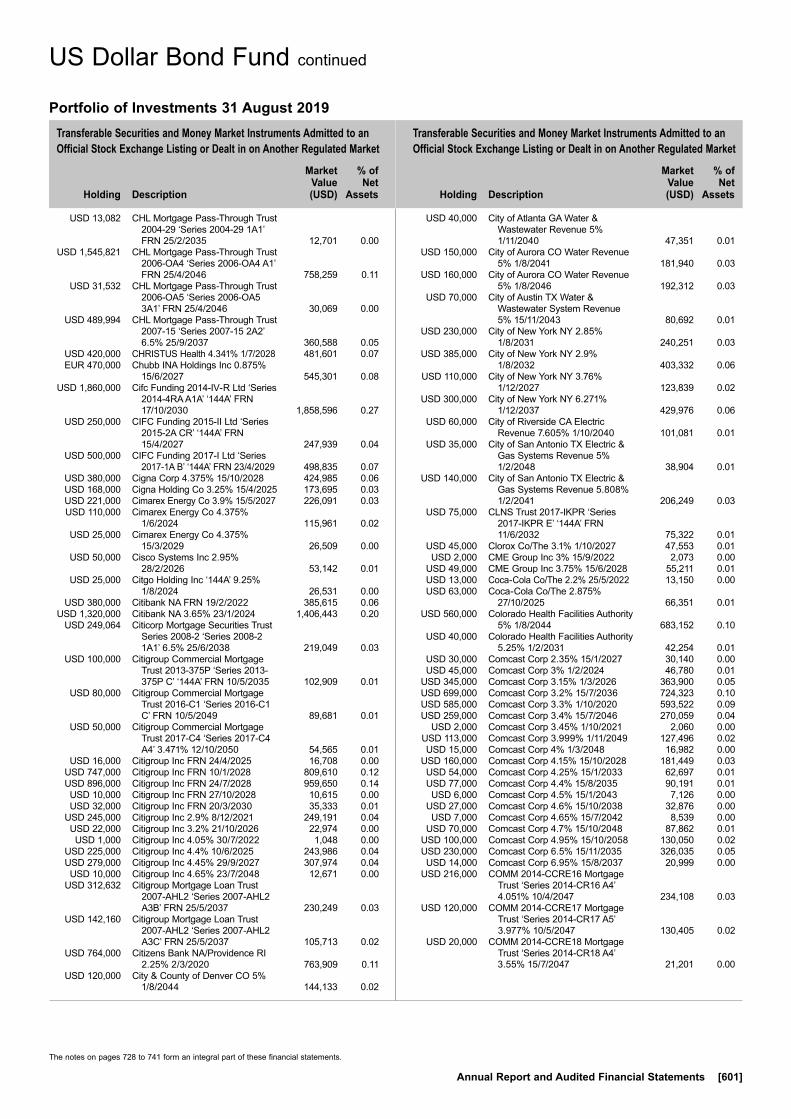
Transferable Securities and Money Market Instruments Admitted to an Official Stock Exchange Listing or Dealt in on Another Regulated Market
Transferable Securities and Money Market Instruments Admitted to an Official Stock Exchange Listing or Dealt in on Another Regulated Market
Holding
Description
Market Value (USD)
% of Net
Assets
Holding
Description
Market Value (USD)
% of Net
Assets
The notes on pages 728 to 741 form an integral part of these financial statements.
Annual Report and Audited Financial Statements [601]
USD 13,082 CHL Mortgage Pass-Through Trust 2004-29 ‘Series 2004-29 1A1’ FRN 25/2/2035 12,701 0.00
USD 1,545,821 CHL Mortgage Pass-Through Trust 2006-OA4 ‘Series 2006-OA4 A1’ FRN 25/4/2046 758,259 0.11
USD 31,532 CHL Mortgage Pass-Through Trust 2006-OA5 ‘Series 2006-OA5 3A1’ FRN 25/4/2046 30,069 0.00
USD 489,994 CHL Mortgage Pass-Through Trust 2007-15 ‘Series 2007-15 2A2’ 6.5% 25/9/2037 360,588 0.05
USD 420,000 CHRISTUS Health 4.341% 1/7/2028 481,601 0.07 EUR 470,000 Chubb INA Holdings Inc 0.875%
15/6/2027 545,301 0.08 USD 1,860,000 Cifc Funding 2014-IV-R Ltd ‘Series
2014-4RA A1A’ ‘144A’ FRN 17/10/2030 1,858,596 0.27
USD 250,000 CIFC Funding 2015-II Ltd ‘Series 2015-2A CR’ ‘144A’ FRN 15/4/2027 247,939 0.04
USD 500,000 CIFC Funding 2017-I Ltd ‘Series 2017-1A B’ ‘144A’ FRN 23/4/2029 498,835 0.07
USD 380,000 Cigna Corp 4.375% 15/10/2028 424,985 0.06 USD 168,000 Cigna Holding Co 3.25% 15/4/2025 173,695 0.03 USD 221,000 Cimarex Energy Co 3.9% 15/5/2027 226,091 0.03 USD 110,000 Cimarex Energy Co 4.375%
1/6/2024 115,961 0.02 USD 25,000 Cimarex Energy Co 4.375%
15/3/2029 26,509 0.00 USD 50,000 Cisco Systems Inc 2.95%
28/2/2026 53,142 0.01 USD 25,000 Citgo Holding Inc ‘144A’ 9.25%
1/8/2024 26,531 0.00 USD 380,000 Citibank NA FRN 19/2/2022 385,615 0.06 USD 1,320,000 Citibank NA 3.65% 23/1/2024 1,406,443 0.20 USD 249,064 Citicorp Mortgage Securities Trust
Series 2008-2 ‘Series 2008-2 1A1’ 6.5% 25/6/2038 219,049 0.03
USD 100,000 Citigroup Commercial Mortgage Trust 2013-375P ‘Series 2013-375P C’ ‘144A’ FRN 10/5/2035 102,909 0.01
USD 80,000 Citigroup Commercial Mortgage Trust 2016-C1 ‘Series 2016-C1 C’ FRN 10/5/2049 89,681 0.01
USD 50,000 Citigroup Commercial Mortgage Trust 2017-C4 ‘Series 2017-C4 A4’ 3.471% 12/10/2050 54,565 0.01
USD 16,000 Citigroup Inc FRN 24/4/2025 16,708 0.00 USD 747,000 Citigroup Inc FRN 10/1/2028 809,610 0.12 USD 896,000 Citigroup Inc FRN 24/7/2028 959,650 0.14 USD 10,000 Citigroup Inc FRN 27/10/2028 10,615 0.00 USD 32,000 Citigroup Inc FRN 20/3/2030 35,333 0.01 USD 245,000 Citigroup Inc 2.9% 8/12/2021 249,191 0.04 USD 22,000 Citigroup Inc 3.2% 21/10/2026 22,974 0.00 USD 1,000 Citigroup Inc 4.05% 30/7/2022 1,048 0.00 USD 225,000 Citigroup Inc 4.4% 10/6/2025 243,986 0.04 USD 279,000 Citigroup Inc 4.45% 29/9/2027 307,974 0.04 USD 10,000 Citigroup Inc 4.65% 23/7/2048 12,671 0.00 USD 312,632 Citigroup Mortgage Loan Trust
2007-AHL2 ‘Series 2007-AHL2 A3B’ FRN 25/5/2037 230,249 0.03
USD 142,160 Citigroup Mortgage Loan Trust 2007-AHL2 ‘Series 2007-AHL2 A3C’ FRN 25/5/2037 105,713 0.02
USD 764,000 Citizens Bank NA/Providence RI 2.25% 2/3/2020 763,909 0.11
USD 120,000 City & County of Denver CO 5% 1/8/2044 144,133 0.02
USD 40,000 City of Atlanta GA Water & Wastewater Revenue 5% 1/11/2040 47,351 0.01
USD 150,000 City of Aurora CO Water Revenue 5% 1/8/2041 181,940 0.03
USD 160,000 City of Aurora CO Water Revenue 5% 1/8/2046 192,312 0.03
USD 70,000 City of Austin TX Water & Wastewater System Revenue 5% 15/11/2043 80,692 0.01
USD 230,000 City of New York NY 2.85% 1/8/2031 240,251 0.03
USD 385,000 City of New York NY 2.9% 1/8/2032 403,332 0.06
USD 110,000 City of New York NY 3.76% 1/12/2027 123,839 0.02
USD 300,000 City of New York NY 6.271% 1/12/2037 429,976 0.06
USD 60,000 City of Riverside CA Electric Revenue 7.605% 1/10/2040 101,081 0.01
USD 35,000 City of San Antonio TX Electric & Gas Systems Revenue 5% 1/2/2048 38,904 0.01
USD 140,000 City of San Antonio TX Electric & Gas Systems Revenue 5.808% 1/2/2041 206,249 0.03
USD 75,000 CLNS Trust 2017-IKPR ‘Series 2017-IKPR E’ ‘144A’ FRN 11/6/2032 75,322 0.01
USD 45,000 Clorox Co/The 3.1% 1/10/2027 47,553 0.01 USD 2,000 CME Group Inc 3% 15/9/2022 2,073 0.00 USD 49,000 CME Group Inc 3.75% 15/6/2028 55,211 0.01 USD 13,000 Coca-Cola Co/The 2.2% 25/5/2022 13,150 0.00 USD 63,000 Coca-Cola Co/The 2.875%
27/10/2025 66,351 0.01 USD 560,000 Colorado Health Facilities Authority
5% 1/8/2044 683,152 0.10 USD 40,000 Colorado Health Facilities Authority
5.25% 1/2/2031 42,254 0.01 USD 30,000 Comcast Corp 2.35% 15/1/2027 30,140 0.00 USD 45,000 Comcast Corp 3% 1/2/2024 46,780 0.01 USD 345,000 Comcast Corp 3.15% 1/3/2026 363,900 0.05 USD 699,000 Comcast Corp 3.2% 15/7/2036 724,323 0.10 USD 585,000 Comcast Corp 3.3% 1/10/2020 593,522 0.09 USD 259,000 Comcast Corp 3.4% 15/7/2046 270,059 0.04 USD 2,000 Comcast Corp 3.45% 1/10/2021 2,060 0.00 USD 113,000 Comcast Corp 3.999% 1/11/2049 127,496 0.02 USD 15,000 Comcast Corp 4% 1/3/2048 16,982 0.00 USD 160,000 Comcast Corp 4.15% 15/10/2028 181,449 0.03 USD 54,000 Comcast Corp 4.25% 15/1/2033 62,697 0.01 USD 77,000 Comcast Corp 4.4% 15/8/2035 90,191 0.01 USD 6,000 Comcast Corp 4.5% 15/1/2043 7,126 0.00 USD 27,000 Comcast Corp 4.6% 15/10/2038 32,876 0.00 USD 7,000 Comcast Corp 4.65% 15/7/2042 8,539 0.00 USD 70,000 Comcast Corp 4.7% 15/10/2048 87,862 0.01 USD 100,000 Comcast Corp 4.95% 15/10/2058 130,050 0.02 USD 230,000 Comcast Corp 6.5% 15/11/2035 326,035 0.05 USD 14,000 Comcast Corp 6.95% 15/8/2037 20,999 0.00 USD 216,000 COMM 2014-CCRE16 Mortgage
Trust ‘Series 2014-CR16 A4’ 4.051% 10/4/2047 234,108 0.03
USD 120,000 COMM 2014-CCRE17 Mortgage Trust ‘Series 2014-CR17 A5’ 3.977% 10/5/2047 130,405 0.02
USD 20,000 COMM 2014-CCRE18 Mortgage Trust ‘Series 2014-CR18 A4’ 3.55% 15/7/2047 21,201 0.00
US Dollar Bond Fund continued
Portfolio of Investments 31 August 2019

Transferable Securities and Money Market Instruments Admitted to an Official Stock Exchange Listing or Dealt in on Another Regulated Market
Transferable Securities and Money Market Instruments Admitted to an Official Stock Exchange Listing or Dealt in on Another Regulated Market
Holding
Description
Market Value (USD)
% of Net
Assets
Holding
Description
Market Value (USD)
% of Net
Assets
The notes on pages 728 to 741 form an integral part of these financial statements.
[602] BlackRock Global Funds (BGF)
USD 70,000 COMM 2014-CCRE19 Mortgage Trust ‘Series 2014-CR19 A5’ 3.796% 10/8/2047 75,742 0.01
USD 10,000,000 COMM 2015-3BP Mortgage Trust ‘Series 2015-3BP XA’ ‘144A’ FRN 10/2/2035 51,950 0.01
USD 500,000 COMM 2015-CCRE23 Mortgage Trust ‘Series 2015-CR23 CMD’ ‘144A’ FRN 10/5/2048 500,679 0.07
USD 100,000 COMM 2015-CCRE23 Mortgage Trust ‘Series 2015-CR23 A4’ 3.497% 10/5/2048 107,445 0.02
USD 60,000 COMM 2015-CCRE24 Mortgage Trust ‘Series 2015-CR24 A5’ 3.696% 10/8/2048 65,272 0.01
USD 120,000 COMM 2015-CCRE25 Mortgage Trust ‘Series 2015-CR25 C’ FRN 10/8/2048 127,586 0.02
USD 2,380,805 COMM 2015-CCRE25 Mortgage Trust ‘Series 2015-CR25 XA’ FRN 10/8/2048 97,759 0.01
USD 624,000 COMM 2015-CCRE25 Mortgage Trust ‘Series 2015-CR25 A4’ 3.759% 10/8/2048 680,415 0.10
USD 60,000 COMM 2015-LC19 Mortgage Trust ‘Series 2015-LC19 D’ ‘144A’ FRN 10/2/2048 56,241 0.01
USD 74,000 COMM 2015-LC19 Mortgage Trust ‘Series 2015-LC19 A4’ 3.183% 10/2/2048 78,318 0.01
USD 250,000 COMM 2015-LC21 Mortgage Trust ‘Series 2015-LC21 C’ FRN 10/7/2048 266,417 0.04
USD 130,000 COMM 2015-LC23 Mortgage Trust ‘Series 2015-LC23 A4’ 3.774% 10/10/2048 142,223 0.02
USD 100,000 COMM 2017-COR2 Mortgage Trust ‘Series 2017-COR2 D’ ‘144A’ 3% 10/9/2050 93,151 0.01
USD 50,000 COMM 2017-COR2 Mortgage Trust ‘Series 2017-COR2 A3’ 3.51% 10/9/2050 54,458 0.01
USD 166,000 CommonSpirit Health 3.347% 1/10/2029 171,305 0.02
USD 109,000 CommonSpirit Health 4.187% 1/10/2049 116,557 0.02
USD 75,000 CommonSpirit Health 4.35% 1/11/2042 81,070 0.01
USD 36,000 Commonwealth Edison Co 2.95% 15/8/2027 37,615 0.01
USD 25,000 Commonwealth Edison Co 4.6% 15/8/2043 31,280 0.00
USD 460,000 Commonwealth Financing Authority 3.807% 1/6/2041 533,283 0.08
USD 105,000 Commonwealth Financing Authority 3.864% 1/6/2038 119,342 0.02
USD 90,000 Commonwealth Financing Authority 4.144% 1/6/2038 106,339 0.02
USD 195,000 Commonwealth of Puerto Rico 8% 1/7/2035 108,712 0.02
USD 155,000 Concho Resources Inc 3.75% 1/10/2027 161,573 0.02
USD 80,000 Connecticut State Health & Educational Facilities Authority 5% 1/7/2045 91,676 0.01
USD 120,000 Connecticut State Health & Educational Facilities Authority 5% 1/7/2045 137,585 0.02
USD 99,594 Conseco Finance Corp ‘Series 1997-3 M1’ FRN 15/3/2028 100,605 0.01
USD 88,668 Conseco Finance Corp ‘Series 1999-5 A5’ FRN 1/3/2030 65,305 0.01
USD 64,445 Conseco Finance Corp ‘Series 1999-5 A6’ FRN 1/3/2030 45,864 0.01
USD 97,956 Conseco Finance Corp/Old ‘Series 2001-D B1’ FRN 15/11/2032 95,782 0.01
USD 109,044 Conseco Finance Securitizations Corp ‘Series 2000-4 A6’ FRN 1/5/2032 47,452 0.01
USD 95,000 Consumers Energy Co 3.1% 15/8/2050 96,926 0.01
USD 2,000 Consumers Energy Co 3.375% 15/8/2023 2,105 0.00
USD 146,000 Consumers Energy Co 3.75% 15/2/2050 168,543 0.02
USD 17,000 Consumers Energy Co 3.8% 15/11/2028 19,167 0.00
USD 20,000 Consumers Energy Co 3.95% 15/5/2043 23,264 0.00
USD 30,000 Consumers Energy Co 3.95% 15/7/2047 35,176 0.01
USD 55,000 Consumers Energy Co 4.05% 15/5/2048 65,532 0.01
USD 213,000 Continental Resources Inc/OK 3.8% 1/6/2024 215,877 0.03
USD 114,000 Continental Resources Inc/OK 4.5% 15/4/2023 118,164 0.02
USD 50,000 Contra Costa Community College District 6.504% 1/8/2034 69,716 0.01
USD 117,000 Core Industrial Trust 2015-CALW ‘Series 2015-CALW G’ ‘144A’ FRN 10/2/2034 118,279 0.02
USD 1,022,272 Core Industrial Trust 2015-TEXW ‘Series 2015-TEXW XA’ ‘144A’ FRN 10/2/2034 15,804 0.00
USD 30,000 Corning Inc 3.7% 15/11/2023 31,646 0.00 USD 75,000 Corning Inc 4.375% 15/11/2057 78,318 0.01 USD 16,036 Countrywide Asset-Backed
Certificates ‘Series 2006-SPS1 A’ FRN 25/12/2025 18,039 0.00
USD 31,044 Countrywide Asset-Backed Certificates ‘Series 2003-BC3 A2’ FRN 25/9/2033 30,651 0.00
USD 205,892 Countrywide Asset-Backed Certificates ‘Series 2006-8 2A3’ FRN 25/12/2035 203,997 0.03
USD 118,330 Countrywide Asset-Backed Certificates ‘Series 2006-S10 A3’ FRN 25/10/2036 114,390 0.02
USD 34,246 Countrywide Asset-Backed Certificates (Step-up coupon) ‘Series 2006-S3 A4’ 6.634% 25/1/2029 37,047 0.01
USD 40,000 County of Clark Department of Aviation 5% 1/7/2032 52,507 0.01
USD 40,000 County of Clark Department of Aviation 5% 1/7/2033 52,372 0.01
USD 70,000 County of Clark Department of Aviation 5% 1/7/2035 90,959 0.01
USD 100,000 County of Clark Department of Aviation 5% 1/7/2041 127,391 0.02
USD 120,000 County of Clark Department of Aviation 5% 1/7/2042 152,705 0.02
USD 70,000 County of King WA Sewer Revenue 5% 1/7/2047 81,002 0.01
US Dollar Bond Fund continued
Portfolio of Investments 31 August 2019
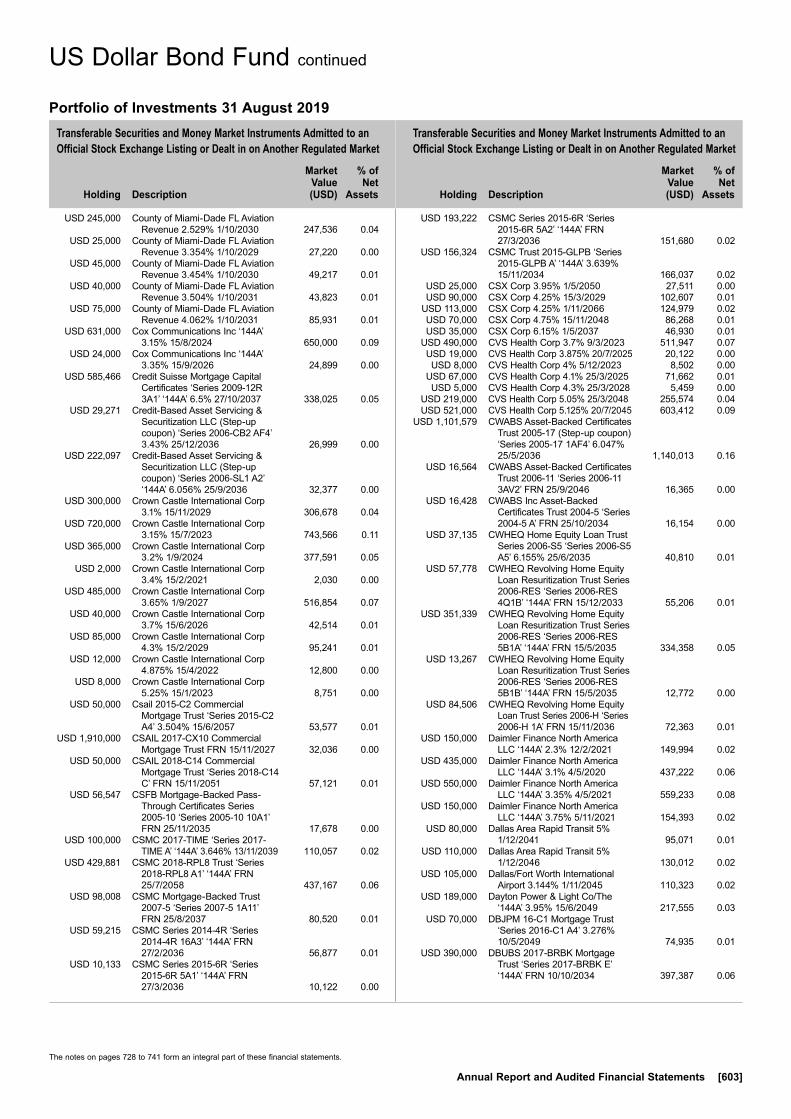
Transferable Securities and Money Market Instruments Admitted to an Official Stock Exchange Listing or Dealt in on Another Regulated Market
Transferable Securities and Money Market Instruments Admitted to an Official Stock Exchange Listing or Dealt in on Another Regulated Market
Holding
Description
Market Value (USD)
% of Net
Assets
Holding
Description
Market Value (USD)
% of Net
Assets
The notes on pages 728 to 741 form an integral part of these financial statements.
Annual Report and Audited Financial Statements [603]
USD 245,000 County of Miami-Dade FL Aviation Revenue 2.529% 1/10/2030 247,536 0.04
USD 25,000 County of Miami-Dade FL Aviation Revenue 3.354% 1/10/2029 27,220 0.00
USD 45,000 County of Miami-Dade FL Aviation Revenue 3.454% 1/10/2030 49,217 0.01
USD 40,000 County of Miami-Dade FL Aviation Revenue 3.504% 1/10/2031 43,823 0.01
USD 75,000 County of Miami-Dade FL Aviation Revenue 4.062% 1/10/2031 85,931 0.01
USD 631,000 Cox Communications Inc ‘144A’ 3.15% 15/8/2024 650,000 0.09
USD 24,000 Cox Communications Inc ‘144A’ 3.35% 15/9/2026 24,899 0.00
USD 585,466 Credit Suisse Mortgage Capital Certificates ‘Series 2009-12R 3A1’ ‘144A’ 6.5% 27/10/2037 338,025 0.05
USD 29,271 Credit-Based Asset Servicing & Securitization LLC (Step-up coupon) ‘Series 2006-CB2 AF4’ 3.43% 25/12/2036 26,999 0.00
USD 222,097 Credit-Based Asset Servicing & Securitization LLC (Step-up coupon) ‘Series 2006-SL1 A2’ ‘144A’ 6.056% 25/9/2036 32,377 0.00
USD 300,000 Crown Castle International Corp 3.1% 15/11/2029 306,678 0.04
USD 720,000 Crown Castle International Corp 3.15% 15/7/2023 743,566 0.11
USD 365,000 Crown Castle International Corp 3.2% 1/9/2024 377,591 0.05
USD 2,000 Crown Castle International Corp 3.4% 15/2/2021 2,030 0.00
USD 485,000 Crown Castle International Corp 3.65% 1/9/2027 516,854 0.07
USD 40,000 Crown Castle International Corp 3.7% 15/6/2026 42,514 0.01
USD 85,000 Crown Castle International Corp 4.3% 15/2/2029 95,241 0.01
USD 12,000 Crown Castle International Corp 4.875% 15/4/2022 12,800 0.00
USD 8,000 Crown Castle International Corp 5.25% 15/1/2023 8,751 0.00
USD 50,000 Csail 2015-C2 Commercial Mortgage Trust ‘Series 2015-C2 A4’ 3.504% 15/6/2057 53,577 0.01
USD 1,910,000 CSAIL 2017-CX10 Commercial Mortgage Trust FRN 15/11/2027 32,036 0.00
USD 50,000 CSAIL 2018-C14 Commercial Mortgage Trust ‘Series 2018-C14 C’ FRN 15/11/2051 57,121 0.01
USD 56,547 CSFB Mortgage-Backed Pass-Through Certificates Series 2005-10 ‘Series 2005-10 10A1’ FRN 25/11/2035 17,678 0.00
USD 100,000 CSMC 2017-TIME ‘Series 2017-TIME A’ ‘144A’ 3.646% 13/11/2039 110,057 0.02
USD 429,881 CSMC 2018-RPL8 Trust ‘Series 2018-RPL8 A1’ ‘144A’ FRN 25/7/2058 437,167 0.06
USD 98,008 CSMC Mortgage-Backed Trust 2007-5 ‘Series 2007-5 1A11’ FRN 25/8/2037 80,520 0.01
USD 59,215 CSMC Series 2014-4R ‘Series 2014-4R 16A3’ ‘144A’ FRN 27/2/2036 56,877 0.01
USD 10,133 CSMC Series 2015-6R ‘Series 2015-6R 5A1’ ‘144A’ FRN 27/3/2036 10,122 0.00
USD 193,222 CSMC Series 2015-6R ‘Series 2015-6R 5A2’ ‘144A’ FRN 27/3/2036 151,680 0.02
USD 156,324 CSMC Trust 2015-GLPB ‘Series 2015-GLPB A’ ‘144A’ 3.639% 15/11/2034 166,037 0.02
USD 25,000 CSX Corp 3.95% 1/5/2050 27,511 0.00 USD 90,000 CSX Corp 4.25% 15/3/2029 102,607 0.01 USD 113,000 CSX Corp 4.25% 1/11/2066 124,979 0.02 USD 70,000 CSX Corp 4.75% 15/11/2048 86,268 0.01 USD 35,000 CSX Corp 6.15% 1/5/2037 46,930 0.01 USD 490,000 CVS Health Corp 3.7% 9/3/2023 511,947 0.07 USD 19,000 CVS Health Corp 3.875% 20/7/2025 20,122 0.00 USD 8,000 CVS Health Corp 4% 5/12/2023 8,502 0.00 USD 67,000 CVS Health Corp 4.1% 25/3/2025 71,662 0.01 USD 5,000 CVS Health Corp 4.3% 25/3/2028 5,459 0.00 USD 219,000 CVS Health Corp 5.05% 25/3/2048 255,574 0.04 USD 521,000 CVS Health Corp 5.125% 20/7/2045 603,412 0.09 USD 1,101,579 CWABS Asset-Backed Certificates
Trust 2005-17 (Step-up coupon) ‘Series 2005-17 1AF4’ 6.047% 25/5/2036 1,140,013 0.16
USD 16,564 CWABS Asset-Backed Certificates Trust 2006-11 ‘Series 2006-11 3AV2’ FRN 25/9/2046 16,365 0.00
USD 16,428 CWABS Inc Asset-Backed Certificates Trust 2004-5 ‘Series 2004-5 A’ FRN 25/10/2034 16,154 0.00
USD 37,135 CWHEQ Home Equity Loan Trust Series 2006-S5 ‘Series 2006-S5 A5’ 6.155% 25/6/2035 40,810 0.01
USD 57,778 CWHEQ Revolving Home Equity Loan Resuritization Trust Series 2006-RES ‘Series 2006-RES 4Q1B’ ‘144A’ FRN 15/12/2033 55,206 0.01
USD 351,339 CWHEQ Revolving Home Equity Loan Resuritization Trust Series 2006-RES ‘Series 2006-RES 5B1A’ ‘144A’ FRN 15/5/2035 334,358 0.05
USD 13,267 CWHEQ Revolving Home Equity Loan Resuritization Trust Series 2006-RES ‘Series 2006-RES 5B1B’ ‘144A’ FRN 15/5/2035 12,772 0.00
USD 84,506 CWHEQ Revolving Home Equity Loan Trust Series 2006-H ‘Series 2006-H 1A’ FRN 15/11/2036 72,363 0.01
USD 150,000 Daimler Finance North America LLC ‘144A’ 2.3% 12/2/2021 149,994 0.02
USD 435,000 Daimler Finance North America LLC ‘144A’ 3.1% 4/5/2020 437,222 0.06
USD 550,000 Daimler Finance North America LLC ‘144A’ 3.35% 4/5/2021 559,233 0.08
USD 150,000 Daimler Finance North America LLC ‘144A’ 3.75% 5/11/2021 154,393 0.02
USD 80,000 Dallas Area Rapid Transit 5% 1/12/2041 95,071 0.01
USD 110,000 Dallas Area Rapid Transit 5% 1/12/2046 130,012 0.02
USD 105,000 Dallas/Fort Worth International Airport 3.144% 1/11/2045 110,323 0.02
USD 189,000 Dayton Power & Light Co/The ‘144A’ 3.95% 15/6/2049 217,555 0.03
USD 70,000 DBJPM 16-C1 Mortgage Trust ‘Series 2016-C1 A4’ 3.276% 10/5/2049 74,935 0.01
USD 390,000 DBUBS 2017-BRBK Mortgage Trust ‘Series 2017-BRBK E’ ‘144A’ FRN 10/10/2034 397,387 0.06
US Dollar Bond Fund continued
Portfolio of Investments 31 August 2019

Transferable Securities and Money Market Instruments Admitted to an Official Stock Exchange Listing or Dealt in on Another Regulated Market
Transferable Securities and Money Market Instruments Admitted to an Official Stock Exchange Listing or Dealt in on Another Regulated Market
Holding
Description
Market Value (USD)
% of Net
Assets
Holding
Description
Market Value (USD)
% of Net
Assets
The notes on pages 728 to 741 form an integral part of these financial statements.
[604] BlackRock Global Funds (BGF)
USD 100,000 DBUBS 2017-BRBK Mortgage Trust ‘Series 2017-BRBK F’ ‘144A’ FRN 10/10/2034 100,504 0.01
USD 110,000 DBUBS 2017-BRBK Mortgage Trust ‘Series 2017-BRBK A’ ‘144A’ 3.452% 10/10/2034 116,907 0.02
USD 518,243 DCP Rights LLC ‘Series 2014-1A A’ ‘144A’ 5.463% 25/10/2044 541,426 0.08
USD 45,000 Dell International LLC / EMC Corp ‘144A’ 8.35% 15/7/2046 58,397 0.01
USD 195,000 Delta Air Lines 2019-1 Class AA Pass Through Trust 3.204% 25/4/2024 205,702 0.03
USD 1,085,000 Delta Air Lines Inc 2.875% 13/3/2020 1,085,303 0.16
USD 10,000 Delta Air Lines Inc 3.4% 19/4/2021 10,138 0.00 USD 14,776 Deutsche ALT-A Securities Inc ALT
‘Series 2007-RS1 A2’ ‘144A’ FRN 27/1/2037 14,123 0.00
USD 792,693 Deutsche Alt-A Securities Mortgage Loan Trust Series 2007-OA4/DE ‘Series 2007-OA4 A2A’ FRN 25/8/2047 557,147 0.08
USD 165,000 Devon Energy Corp 5.85% 15/12/2025 197,559 0.03
USD 114,000 Dignity Health 2.637% 1/11/2019 114,005 0.02 USD 90,000 Dignity Health 3.812% 1/11/2024 96,267 0.01 USD 55,000 Discover Financial Services 4.1%
9/2/2027 59,209 0.01 USD 85,000 Discovery Communications LLC
5% 20/9/2037 93,999 0.01 USD 150,000 Discovery Communications LLC
5.2% 20/9/2047 169,847 0.02 USD 50,000 Dollar General Corp 3.875%
15/4/2027 53,989 0.01 USD 175,000 Dominion Energy Gas Holdings
LLC 4.6% 15/12/2044 211,741 0.03 USD 48,000 Dominion Energy Gas Holdings
LLC 4.8% 1/11/2043 59,417 0.01 USD 398,000 Dow Chemical Co/The ‘144A’
3.625% 15/5/2026 418,498 0.06 USD 288,000 Dow Chemical Co/The 4.375%
15/11/2042 303,521 0.04 USD 4,000 Dow Chemical Co/The ‘144A’
4.55% 30/11/2025 4,409 0.00 USD 155,000 Dow Chemical Co/The 9% 1/4/2021 170,274 0.02 USD 1,450,000 Dryden 53 CLO Ltd ‘Series 2017-
53A A’ ‘144A’ FRN 15/1/2031 1,444,944 0.21 USD 820,000 Dryden XXV Senior Loan Fund
‘Series 2012-25A ARR’ ‘144A’ FRN 15/10/2027 819,213 0.12
USD 250,000 Dryden XXVI Senior Loan Fund ‘Series 2013-26A AR’ ‘144A’ FRN 15/4/2029 248,474 0.04
USD 275,000 DTE Electric Co 4.05% 15/5/2048 328,195 0.05 USD 120,000 DTE Energy Co 3.7% 1/8/2023 126,585 0.02 USD 50,000 DuBois Hospital Authority 5%
15/7/2043 59,485 0.01 USD 235,000 Duke Energy Carolinas LLC
2.45% 15/8/2029 237,648 0.03 USD 45,000 Duke Energy Carolinas LLC
3.05% 15/3/2023 46,550 0.01 USD 120,000 Duke Energy Carolinas LLC
3.2% 15/8/2049 124,124 0.02 USD 145,000 Duke Energy Carolinas LLC
3.7% 1/12/2047 161,473 0.02 USD 135,000 Duke Energy Carolinas LLC
3.95% 15/11/2028 152,710 0.02 USD 60,000 Duke Energy Carolinas LLC
3.95% 15/3/2048 69,743 0.01
USD 65,000 Duke Energy Carolinas LLC 4% 30/9/2042 74,533 0.01
USD 20,000 Duke Energy Carolinas LLC 4.25% 15/12/2041 23,676 0.00
USD 44,000 Duke Energy Carolinas LLC 5.3% 15/2/2040 58,575 0.01
USD 40,000 Duke Energy Florida LLC 3.4% 1/10/2046 42,197 0.01
USD 144,000 Duke Energy Florida LLC 3.8% 15/7/2028 160,720 0.02
USD 105,000 Duke Energy Florida LLC 3.85% 15/11/2042 118,286 0.02
USD 60,000 Duke Energy Florida LLC 6.35% 15/9/2037 87,393 0.01
USD 425,000 Duke Energy Ohio Inc 3.65% 1/2/2029 470,905 0.07
USD 70,000 Duke Energy Progress LLC 3% 15/9/2021 71,380 0.01
USD 175,000 Duke Energy Progress LLC 3.25% 15/8/2025 185,923 0.03
USD 80,000 Duke Energy Progress LLC 3.45% 15/3/2029 87,239 0.01
USD 425,000 Duke Energy Progress LLC 3.7% 1/9/2028 472,167 0.07
USD 110,000 Duke Energy Progress LLC 4.1% 15/5/2042 128,508 0.02
USD 105,000 Duke Energy Progress LLC 4.1% 15/3/2043 121,946 0.02
USD 20,000 Duke Energy Progress LLC 4.2% 15/8/2045 23,600 0.00
USD 760,000 DuPont de Nemours Inc 4.493% 15/11/2025 843,466 0.12
USD 345,000 DuPont de Nemours Inc 5.419% 15/11/2048 442,565 0.06
USD 64,000 Edwards Lifesciences Corp 4.3% 15/6/2028 72,688 0.01
USD 100,000 Eleven Madison Trust 2015-11MD Mortgage Trust ‘Series 2015-11MD A’ ‘144A’ FRN 10/9/2035 108,525 0.02
USD 155,000 Eli Lilly & Co 4.15% 15/3/2059 186,079 0.03 USD 21,000 Energy Transfer Operating LP
4.2% 15/4/2027 22,306 0.00 USD 41,000 Energy Transfer Operating LP
5.15% 15/3/2045 43,560 0.01 USD 164,000 Energy Transfer Operating LP
5.5% 1/6/2027 188,607 0.03 USD 166,000 Energy Transfer Operating LP
5.875% 15/1/2024 185,725 0.03 USD 175,000 Energy Transfer Operating LP
6.125% 15/12/2045 208,099 0.03 USD 580,000 Energy Transfer Operating LP
6.5% 1/2/2042 704,873 0.10 USD 4,000 Entergy Arkansas LLC 4.2%
1/4/2049 4,825 0.00 USD 235,000 Entergy Louisiana LLC 4.2%
1/9/2048 284,850 0.04 USD 55,000 Entergy Louisiana LLC 5.4%
1/11/2024 63,817 0.01 USD 30,000 Enterprise Products Operating LLC
3.75% 15/2/2025 32,150 0.00 USD 35,000 Enterprise Products Operating LLC
4.15% 16/10/2028 38,930 0.01 USD 316,000 Enterprise Products Operating LLC
4.45% 15/2/2043 347,322 0.05 USD 20,000 Enterprise Products Operating LLC
4.8% 1/2/2049 23,567 0.00 USD 8,000 Enterprise Products Operating LLC
4.85% 15/3/2044 9,314 0.00 USD 89,000 Enterprise Products Operating LLC
5.1% 15/2/2045 106,537 0.02
US Dollar Bond Fund continued
Portfolio of Investments 31 August 2019

Transferable Securities and Money Market Instruments Admitted to an Official Stock Exchange Listing or Dealt in on Another Regulated Market
Transferable Securities and Money Market Instruments Admitted to an Official Stock Exchange Listing or Dealt in on Another Regulated Market
Holding
Description
Market Value (USD)
% of Net
Assets
Holding
Description
Market Value (USD)
% of Net
Assets
The notes on pages 728 to 741 form an integral part of these financial statements.
Annual Report and Audited Financial Statements [605]
USD 55,000 Enterprise Products Operating LLC 5.95% 1/2/2041 71,160 0.01
USD 85,000 Enterprise Products Operating LLC 6.65% 15/10/2034 118,107 0.02
USD 5,000 Enterprise Products Operating LLC 6.875% 1/3/2033 6,961 0.00
USD 51,000 EOG Resources Inc 3.9% 1/4/2035 57,337 0.01 USD 26,000 EOG Resources Inc 4.15% 15/1/2026 29,011 0.00 USD 165,000 Equifax Inc 3.6% 15/8/2021 168,610 0.02 USD 165,000 Eversource Energy 2.8% 1/5/2023 168,036 0.02 USD 50,000 Exelon Corp 4.45% 15/4/2046 58,426 0.01 USD 47,000 Exelon Corp 4.95% 15/6/2035 55,484 0.01 USD 105,000 Express Scripts Holding Co 4.75%
15/11/2021 110,742 0.02 USD 262,000 Exxon Mobil Corp 2.709% 6/3/2025 271,652 0.04 USD 10,000 Exxon Mobil Corp 2.726% 1/3/2023 10,296 0.00 USD 142,000 Exxon Mobil Corp 3.095%
16/8/2049 147,002 0.02 USD 383,287 Fannie Mae Pool ‘735226’ 5%
1/2/2035 426,414 0.06 USD 658 Fannie Mae Pool ‘794412’ 6%
1/9/2019 657 0.00 USD 3,276 Fannie Mae Pool ‘804967’ 6%
1/1/2020 3,275 0.00 USD 229 Fannie Mae Pool ‘821570’ 6%
1/5/2020 229 0.00 USD 236 Fannie Mae Pool ‘821758’ 6%
1/6/2020 236 0.00 USD 392 Fannie Mae Pool ‘845490’ 6%
1/6/2021 398 0.00 USD 358,177 Fannie Mae Pool ‘888649’ 5.5%
1/9/2036 401,491 0.06 USD 56,863 Fannie Mae Pool ‘889218’ 6%
1/2/2038 64,981 0.01 USD 56,978 Fannie Mae Pool ‘889466’ 6%
1/5/2038 65,310 0.01 USD 17,693 Fannie Mae Pool ‘889529’ 6%
1/3/2038 20,285 0.00 USD 22,210 Fannie Mae Pool ‘889974’ 5%
1/9/2035 24,721 0.00 USD 12,865 Fannie Mae Pool ‘889983’ 6%
1/10/2038 14,738 0.00 USD 17,420 Fannie Mae Pool ‘890097’ 6%
1/10/2038 19,971 0.00 USD 21,021 Fannie Mae Pool ‘890102’ 6%
1/12/2038 24,101 0.00 USD 114,632 Fannie Mae Pool ‘890629’ 4%
1/8/2044 124,916 0.02 USD 11,915 Fannie Mae Pool ‘890720’ 4.5%
1/7/2044 12,899 0.00 USD 600,410 Fannie Mae Pool ‘890824’ 4%
1/3/2047 640,336 0.09 USD 257,521 Fannie Mae Pool ‘931983’ 5.5%
1/9/2039 289,170 0.04 USD 188,356 Fannie Mae Pool ‘995066’ 5.5%
1/8/2037 213,151 0.03 USD 41,797 Fannie Mae Pool ‘AA7236’ 4%
1/6/2039 44,619 0.01 USD 160,521 Fannie Mae Pool ‘AB0686’ 4%
1/1/2036 169,403 0.02 USD 48,510 Fannie Mae Pool ‘AB1226’ 4.5%
1/7/2040 52,507 0.01 USD 589,877 Fannie Mae Pool ‘AB1614’ 4%
1/10/2040 629,988 0.09 USD 26,375 Fannie Mae Pool ‘AB3314’ 4.5%
1/7/2041 28,548 0.00 USD 105,123 Fannie Mae Pool ‘AB4054’ 4%
1/12/2041 114,570 0.02 USD 148,192 Fannie Mae Pool ‘AB4307’ 4%
1/1/2042 158,277 0.02
USD 130,658 Fannie Mae Pool ‘AB4530’ 4% 1/2/2042 139,573 0.02
USD 693,806 Fannie Mae Pool ‘AB5919’ 3% 1/8/2042 718,113 0.10
USD 59,678 Fannie Mae Pool ‘AB6194’ 2.5% 1/9/2027 60,624 0.01
USD 104,301 Fannie Mae Pool ‘AB6512’ 3.5% 1/10/2042 109,338 0.02
USD 60,653 Fannie Mae Pool ‘AB6768’ 3% 1/10/2042 62,647 0.01
USD 47,617 Fannie Mae Pool ‘AB7271’ 3% 1/12/2042 49,241 0.01
USD 39,995 Fannie Mae Pool ‘AB7425’ 3% 1/12/2042 41,351 0.01
USD 303,933 Fannie Mae Pool ‘AB7458’ 3% 1/1/2043 313,906 0.05
USD 294,659 Fannie Mae Pool ‘AB7497’ 3% 1/1/2043 304,345 0.04
USD 667,068 Fannie Mae Pool ‘AB7565’ 3% 1/1/2043 690,430 0.10
USD 350,604 Fannie Mae Pool ‘AB7567’ 3% 1/1/2043 362,128 0.05
USD 108,998 Fannie Mae Pool ‘AB7755’ 3% 1/1/2043 112,716 0.02
USD 44,395 Fannie Mae Pool ‘AB7762’ 3% 1/2/2043 45,948 0.01
USD 137,440 Fannie Mae Pool ‘AB7846’ 3% 1/2/2043 142,033 0.02
USD 14,909 Fannie Mae Pool ‘AB8446’ 2.5% 1/2/2028 15,135 0.00
USD 43,857 Fannie Mae Pool ‘AB8558’ 3% 1/2/2043 45,389 0.01
USD 29,524 Fannie Mae Pool ‘AB8870’ 2.5% 1/4/2028 30,037 0.00
USD 327,875 Fannie Mae Pool ‘AB9241’ 3% 1/5/2043 338,450 0.05
USD 34,424 Fannie Mae Pool ‘AB9255’ 3.5% 1/5/2043 36,204 0.01
USD 17,835 Fannie Mae Pool ‘AB9567’ 3.5% 1/6/2043 18,757 0.00
USD 5,939,542 Fannie Mae Pool ‘AB9940’ 3% 1/7/2043 6,147,668 0.89
USD 38,986 Fannie Mae Pool ‘AC9312’ 4% 1/10/2041 41,641 0.01
USD 37,213 Fannie Mae Pool ‘AD0207’ 6% 1/10/2038 42,642 0.01
USD 208,809 Fannie Mae Pool ‘AD0495’ 5.5% 1/2/2035 234,449 0.03
USD 35,500 Fannie Mae Pool ‘AD1612’ 4.5% 1/2/2025 36,911 0.01
USD 6,106 Fannie Mae Pool ‘AD2907’ 4.5% 1/4/2025 6,435 0.00
USD 65,000 Fannie Mae Pool ‘AD7992’ 4.5% 1/7/2040 70,366 0.01
USD 29,120 Fannie Mae Pool ‘AD9100’ 4.5% 1/7/2025 30,682 0.00
USD 3,558 Fannie Mae Pool ‘AD9136’ 4% 1/8/2040 3,799 0.00
USD 129,338 Fannie Mae Pool ‘AE0113’ 4% 1/7/2040 138,055 0.02
USD 229,053 Fannie Mae Pool ‘AE0216’ 4% 1/8/2040 244,627 0.04
USD 11,093 Fannie Mae Pool ‘AE0823’ 6% 1/9/2040 12,710 0.00
USD 11,580 Fannie Mae Pool ‘AE7535’ 4% 1/10/2040 12,369 0.00
USD 45,139 Fannie Mae Pool ‘AE8407’ 4% 1/11/2040 48,206 0.01
USD 31,533 Fannie Mae Pool ‘AH0006’ 4% 1/12/2040 33,686 0.00
US Dollar Bond Fund continued
Portfolio of Investments 31 August 2019

Transferable Securities and Money Market Instruments Admitted to an Official Stock Exchange Listing or Dealt in on Another Regulated Market
Transferable Securities and Money Market Instruments Admitted to an Official Stock Exchange Listing or Dealt in on Another Regulated Market
Holding
Description
Market Value (USD)
% of Net
Assets
Holding
Description
Market Value (USD)
% of Net
Assets
The notes on pages 728 to 741 form an integral part of these financial statements.
[606] BlackRock Global Funds (BGF)
USD 187,468 Fannie Mae Pool ‘AH0946’ 4% 1/12/2040 200,206 0.03
USD 18,602 Fannie Mae Pool ‘AH4236’ 5.5% 1/4/2041 20,944 0.00
USD 46,122 Fannie Mae Pool ‘AH7036’ 4.5% 1/3/2041 49,928 0.01
USD 18,861 Fannie Mae Pool ‘AI1186’ 4% 1/4/2041 20,144 0.00
USD 77,687 Fannie Mae Pool ‘AJ0756’ 4.5% 1/9/2041 84,118 0.01
USD 423,575 Fannie Mae Pool ‘AJ0784’ 4% 1/9/2041 452,373 0.07
USD 465,963 Fannie Mae Pool ‘AJ1541’ 4% 1/9/2041 497,687 0.07
USD 33,942 Fannie Mae Pool ‘AJ7684’ 4% 1/12/2041 36,948 0.01
USD 13,643 Fannie Mae Pool ‘AK7510’ 3.5% 1/4/2042 14,289 0.00
USD 9,373 Fannie Mae Pool ‘AK9225’ 3.5% 1/6/2042 9,817 0.00
USD 153,307 Fannie Mae Pool ‘AL1704’ 6.5% 1/5/2040 180,883 0.03
USD 82,460 Fannie Mae Pool ‘AL1867’ 4.5% 1/6/2026 86,900 0.01
USD 72,088 Fannie Mae Pool ‘AL2003’ 4% 1/6/2042 76,931 0.01
USD 12,107 Fannie Mae Pool ‘AL2168’ 3.5% 1/6/2042 12,800 0.00
USD 36,218 Fannie Mae Pool ‘AL2242’ 4% 1/8/2042 38,679 0.01
USD 135,773 Fannie Mae Pool ‘AL2482’ 4.5% 1/9/2042 146,821 0.02
USD 52,066 Fannie Mae Pool ‘AL2607’ 4% 1/7/2042 55,622 0.01
USD 66,038 Fannie Mae Pool ‘AL2901’ 4% 1/9/2042 70,548 0.01
USD 46,285 Fannie Mae Pool ‘AL2935’ 3.5% 1/2/2043 48,775 0.01
USD 25,469 Fannie Mae Pool ‘AL3300’ 4% 1/3/2043 27,253 0.00
USD 112,212 Fannie Mae Pool ‘AL4010’ 3.5% 1/7/2043 118,272 0.02
USD 90,433 Fannie Mae Pool ‘AL4141’ 6% 1/4/2040 103,626 0.02
USD 20,761 Fannie Mae Pool ‘AL4142’ 6% 1/6/2041 23,770 0.00
USD 295,566 Fannie Mae Pool ‘AL4244’ 4% 1/7/2042 321,961 0.05
USD 3,309 Fannie Mae Pool ‘AL5097’ 4.5% 1/9/2043 3,578 0.00
USD 4,016 Fannie Mae Pool ‘AL5231’ 4.5% 1/9/2042 4,347 0.00
USD 654,718 Fannie Mae Pool ‘AL5241’ 3.5% 1/4/2029 685,632 0.10
USD 915,691 Fannie Mae Pool ‘AL5597’ 4.5% 1/6/2044 995,220 0.14
USD 1,164,360 Fannie Mae Pool ‘AL5601’ 4% 1/8/2044 1,268,809 0.18
USD 138,524 Fannie Mae Pool ‘AL5778’ 3% 1/7/2043 142,988 0.02
USD 158,470 Fannie Mae Pool ‘AL6055’ 4% 1/12/2042 172,677 0.03
USD 542,282 Fannie Mae Pool ‘AL6144’ 3% 1/1/2030 558,466 0.08
USD 5,950 Fannie Mae Pool ‘AL6302’ 4.5% 1/10/2041 6,441 0.00
USD 109,446 Fannie Mae Pool ‘AL6583’ 3% 1/3/2030 112,846 0.02
USD 90,415 Fannie Mae Pool ‘AL6584’ 3% 1/4/2030 93,111 0.01
USD 85,459 Fannie Mae Pool ‘AL6626’ 4% 1/12/2042 91,260 0.01
USD 52,477 Fannie Mae Pool ‘AL6761’ 3% 1/5/2030 54,106 0.01
USD 14,866 Fannie Mae Pool ‘AL6887’ 4.5% 1/4/2044 16,094 0.00
USD 72,524 Fannie Mae Pool ‘AL7139’ 3% 1/7/2030 74,689 0.01
USD 54,045 Fannie Mae Pool ‘AL7167’ 4% 1/1/2041 57,332 0.01
USD 145,143 Fannie Mae Pool ‘AL7225’ 3% 1/8/2030 149,481 0.02
USD 128,275 Fannie Mae Pool ‘AL7227’ 3% 1/8/2030 132,106 0.02
USD 121,967 Fannie Mae Pool ‘AL7369’ 4% 1/1/2043 130,266 0.02
USD 76,409 Fannie Mae Pool ‘AL7442’ 4% 1/10/2045 83,265 0.01
USD 107,388 Fannie Mae Pool ‘AL7443’ 4% 1/10/2045 116,032 0.02
USD 472,225 Fannie Mae Pool ‘AL7524’ 5% 1/7/2041 518,089 0.07
USD 184,495 Fannie Mae Pool ‘AL7567’ 3.5% 1/7/2029 192,844 0.03
USD 88,603 Fannie Mae Pool ‘AL7577’ 4% 1/10/2043 94,606 0.01
USD 718,824 Fannie Mae Pool ‘AL7777’ 5% 1/12/2043 789,658 0.11
USD 6,479 Fannie Mae Pool ‘AL7800’ 2.5% 1/11/2030 6,577 0.00
USD 75,290 Fannie Mae Pool ‘AL7936’ 4.5% 1/9/2045 83,033 0.01
USD 116,730 Fannie Mae Pool ‘AL8045’ 3.5% 1/12/2042 121,996 0.02
USD 54,968 Fannie Mae Pool ‘AL8153’ 3% 1/3/2031 56,608 0.01
USD 73,675 Fannie Mae Pool ‘AL8521’ 3.5% 1/4/2046 77,887 0.01
USD 83,029 Fannie Mae Pool ‘AL8570’ 3.5% 1/5/2046 86,952 0.01
USD 6,000 Fannie Mae Pool ‘AL8637’ 4% 1/6/2046 6,436 0.00
USD 173,403 Fannie Mae Pool ‘AL8952’ 3.5% 1/8/2046 181,605 0.03
USD 398,190 Fannie Mae Pool ‘AL9093’ 4% 1/6/2046 421,482 0.06
USD 13,169 Fannie Mae Pool ‘AL9227’ 3% 1/10/2036 13,585 0.00
USD 549,916 Fannie Mae Pool ‘AL9376’ 3% 1/8/2031 565,297 0.08
USD 107,096 Fannie Mae Pool ‘AL9378’ 3% 1/9/2031 110,298 0.02
USD 1,176,350 Fannie Mae Pool ‘AL9405’ 3.5% 1/6/2044 1,229,143 0.18
USD 346,274 Fannie Mae Pool ‘AL9475’ 4.5% 1/11/2045 376,461 0.05
USD 63,581 Fannie Mae Pool ‘AL9481’ 3% 1/11/2046 65,809 0.01
USD 44,351 Fannie Mae Pool ‘AL9501’ 4.5% 1/11/2045 48,891 0.01
USD 180,405 Fannie Mae Pool ‘AL9511’ 3.5% 1/9/2046 189,718 0.03
USD 40,110 Fannie Mae Pool ‘AL9593’ 3.5% 1/12/2046 42,181 0.01
USD 139,812 Fannie Mae Pool ‘AL9635’ 3.5% 1/12/2045 148,109 0.02
USD 523,064 Fannie Mae Pool ‘AL9725’ 3.5% 1/1/2047 555,206 0.08
USD 286,887 Fannie Mae Pool ‘AL9745’ 3.5% 1/11/2043 299,761 0.04
US Dollar Bond Fund continued
Portfolio of Investments 31 August 2019
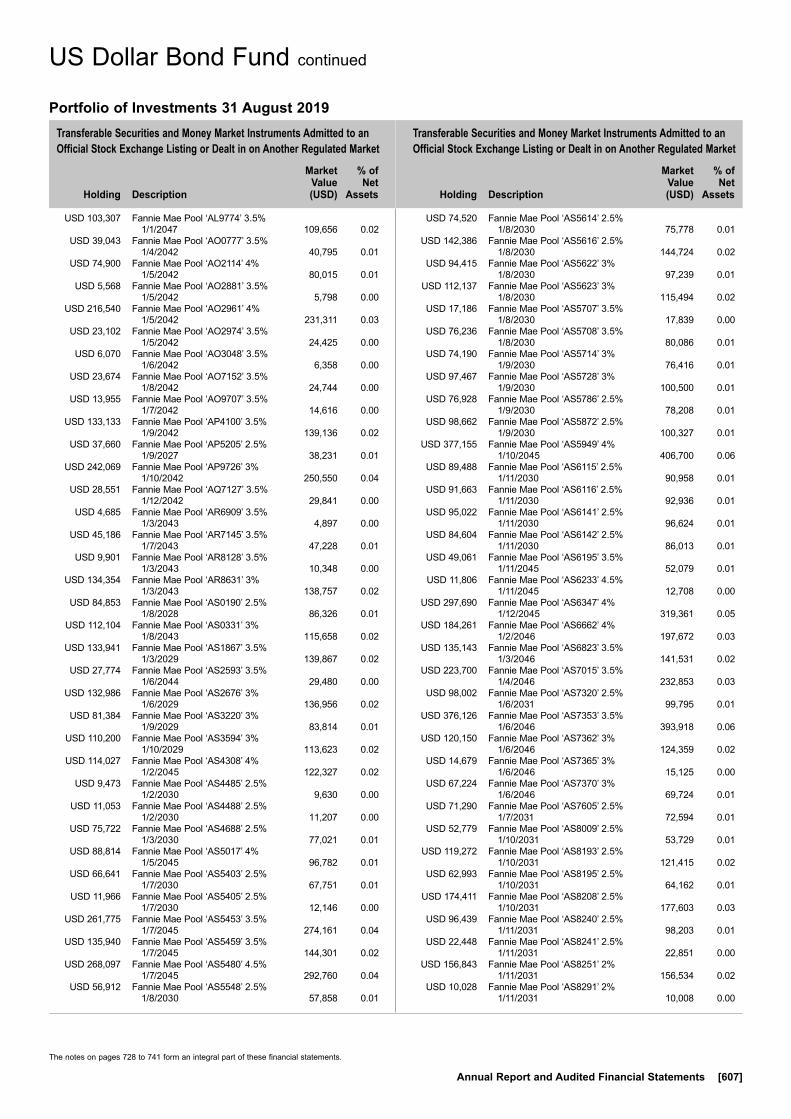
Transferable Securities and Money Market Instruments Admitted to an Official Stock Exchange Listing or Dealt in on Another Regulated Market
Transferable Securities and Money Market Instruments Admitted to an Official Stock Exchange Listing or Dealt in on Another Regulated Market
Holding
Description
Market Value (USD)
% of Net
Assets
Holding
Description
Market Value (USD)
% of Net
Assets
The notes on pages 728 to 741 form an integral part of these financial statements.
Annual Report and Audited Financial Statements [607]
USD 103,307 Fannie Mae Pool ‘AL9774’ 3.5% 1/1/2047 109,656 0.02
USD 39,043 Fannie Mae Pool ‘AO0777’ 3.5% 1/4/2042 40,795 0.01
USD 74,900 Fannie Mae Pool ‘AO2114’ 4% 1/5/2042 80,015 0.01
USD 5,568 Fannie Mae Pool ‘AO2881’ 3.5% 1/5/2042 5,798 0.00
USD 216,540 Fannie Mae Pool ‘AO2961’ 4% 1/5/2042 231,311 0.03
USD 23,102 Fannie Mae Pool ‘AO2974’ 3.5% 1/5/2042 24,425 0.00
USD 6,070 Fannie Mae Pool ‘AO3048’ 3.5% 1/6/2042 6,358 0.00
USD 23,674 Fannie Mae Pool ‘AO7152’ 3.5% 1/8/2042 24,744 0.00
USD 13,955 Fannie Mae Pool ‘AO9707’ 3.5% 1/7/2042 14,616 0.00
USD 133,133 Fannie Mae Pool ‘AP4100’ 3.5% 1/9/2042 139,136 0.02
USD 37,660 Fannie Mae Pool ‘AP5205’ 2.5% 1/9/2027 38,231 0.01
USD 242,069 Fannie Mae Pool ‘AP9726’ 3% 1/10/2042 250,550 0.04
USD 28,551 Fannie Mae Pool ‘AQ7127’ 3.5% 1/12/2042 29,841 0.00
USD 4,685 Fannie Mae Pool ‘AR6909’ 3.5% 1/3/2043 4,897 0.00
USD 45,186 Fannie Mae Pool ‘AR7145’ 3.5% 1/7/2043 47,228 0.01
USD 9,901 Fannie Mae Pool ‘AR8128’ 3.5% 1/3/2043 10,348 0.00
USD 134,354 Fannie Mae Pool ‘AR8631’ 3% 1/3/2043 138,757 0.02
USD 84,853 Fannie Mae Pool ‘AS0190’ 2.5% 1/8/2028 86,326 0.01
USD 112,104 Fannie Mae Pool ‘AS0331’ 3% 1/8/2043 115,658 0.02
USD 133,941 Fannie Mae Pool ‘AS1867’ 3.5% 1/3/2029 139,867 0.02
USD 27,774 Fannie Mae Pool ‘AS2593’ 3.5% 1/6/2044 29,480 0.00
USD 132,986 Fannie Mae Pool ‘AS2676’ 3% 1/6/2029 136,956 0.02
USD 81,384 Fannie Mae Pool ‘AS3220’ 3% 1/9/2029 83,814 0.01
USD 110,200 Fannie Mae Pool ‘AS3594’ 3% 1/10/2029 113,623 0.02
USD 114,027 Fannie Mae Pool ‘AS4308’ 4% 1/2/2045 122,327 0.02
USD 9,473 Fannie Mae Pool ‘AS4485’ 2.5% 1/2/2030 9,630 0.00
USD 11,053 Fannie Mae Pool ‘AS4488’ 2.5% 1/2/2030 11,207 0.00
USD 75,722 Fannie Mae Pool ‘AS4688’ 2.5% 1/3/2030 77,021 0.01
USD 88,814 Fannie Mae Pool ‘AS5017’ 4% 1/5/2045 96,782 0.01
USD 66,641 Fannie Mae Pool ‘AS5403’ 2.5% 1/7/2030 67,751 0.01
USD 11,966 Fannie Mae Pool ‘AS5405’ 2.5% 1/7/2030 12,146 0.00
USD 261,775 Fannie Mae Pool ‘AS5453’ 3.5% 1/7/2045 274,161 0.04
USD 135,940 Fannie Mae Pool ‘AS5459’ 3.5% 1/7/2045 144,301 0.02
USD 268,097 Fannie Mae Pool ‘AS5480’ 4.5% 1/7/2045 292,760 0.04
USD 56,912 Fannie Mae Pool ‘AS5548’ 2.5% 1/8/2030 57,858 0.01
USD 74,520 Fannie Mae Pool ‘AS5614’ 2.5% 1/8/2030 75,778 0.01
USD 142,386 Fannie Mae Pool ‘AS5616’ 2.5% 1/8/2030 144,724 0.02
USD 94,415 Fannie Mae Pool ‘AS5622’ 3% 1/8/2030 97,239 0.01
USD 112,137 Fannie Mae Pool ‘AS5623’ 3% 1/8/2030 115,494 0.02
USD 17,186 Fannie Mae Pool ‘AS5707’ 3.5% 1/8/2030 17,839 0.00
USD 76,236 Fannie Mae Pool ‘AS5708’ 3.5% 1/8/2030 80,086 0.01
USD 74,190 Fannie Mae Pool ‘AS5714’ 3% 1/9/2030 76,416 0.01
USD 97,467 Fannie Mae Pool ‘AS5728’ 3% 1/9/2030 100,500 0.01
USD 76,928 Fannie Mae Pool ‘AS5786’ 2.5% 1/9/2030 78,208 0.01
USD 98,662 Fannie Mae Pool ‘AS5872’ 2.5% 1/9/2030 100,327 0.01
USD 377,155 Fannie Mae Pool ‘AS5949’ 4% 1/10/2045 406,700 0.06
USD 89,488 Fannie Mae Pool ‘AS6115’ 2.5% 1/11/2030 90,958 0.01
USD 91,663 Fannie Mae Pool ‘AS6116’ 2.5% 1/11/2030 92,936 0.01
USD 95,022 Fannie Mae Pool ‘AS6141’ 2.5% 1/11/2030 96,624 0.01
USD 84,604 Fannie Mae Pool ‘AS6142’ 2.5% 1/11/2030 86,013 0.01
USD 49,061 Fannie Mae Pool ‘AS6195’ 3.5% 1/11/2045 52,079 0.01
USD 11,806 Fannie Mae Pool ‘AS6233’ 4.5% 1/11/2045 12,708 0.00
USD 297,690 Fannie Mae Pool ‘AS6347’ 4% 1/12/2045 319,361 0.05
USD 184,261 Fannie Mae Pool ‘AS6662’ 4% 1/2/2046 197,672 0.03
USD 135,143 Fannie Mae Pool ‘AS6823’ 3.5% 1/3/2046 141,531 0.02
USD 223,700 Fannie Mae Pool ‘AS7015’ 3.5% 1/4/2046 232,853 0.03
USD 98,002 Fannie Mae Pool ‘AS7320’ 2.5% 1/6/2031 99,795 0.01
USD 376,126 Fannie Mae Pool ‘AS7353’ 3.5% 1/6/2046 393,918 0.06
USD 120,150 Fannie Mae Pool ‘AS7362’ 3% 1/6/2046 124,359 0.02
USD 14,679 Fannie Mae Pool ‘AS7365’ 3% 1/6/2046 15,125 0.00
USD 67,224 Fannie Mae Pool ‘AS7370’ 3% 1/6/2046 69,724 0.01
USD 71,290 Fannie Mae Pool ‘AS7605’ 2.5% 1/7/2031 72,594 0.01
USD 52,779 Fannie Mae Pool ‘AS8009’ 2.5% 1/10/2031 53,729 0.01
USD 119,272 Fannie Mae Pool ‘AS8193’ 2.5% 1/10/2031 121,415 0.02
USD 62,993 Fannie Mae Pool ‘AS8195’ 2.5% 1/10/2031 64,162 0.01
USD 174,411 Fannie Mae Pool ‘AS8208’ 2.5% 1/10/2031 177,603 0.03
USD 96,439 Fannie Mae Pool ‘AS8240’ 2.5% 1/11/2031 98,203 0.01
USD 22,448 Fannie Mae Pool ‘AS8241’ 2.5% 1/11/2031 22,851 0.00
USD 156,843 Fannie Mae Pool ‘AS8251’ 2% 1/11/2031 156,534 0.02
USD 10,028 Fannie Mae Pool ‘AS8291’ 2% 1/11/2031 10,008 0.00
US Dollar Bond Fund continued
Portfolio of Investments 31 August 2019
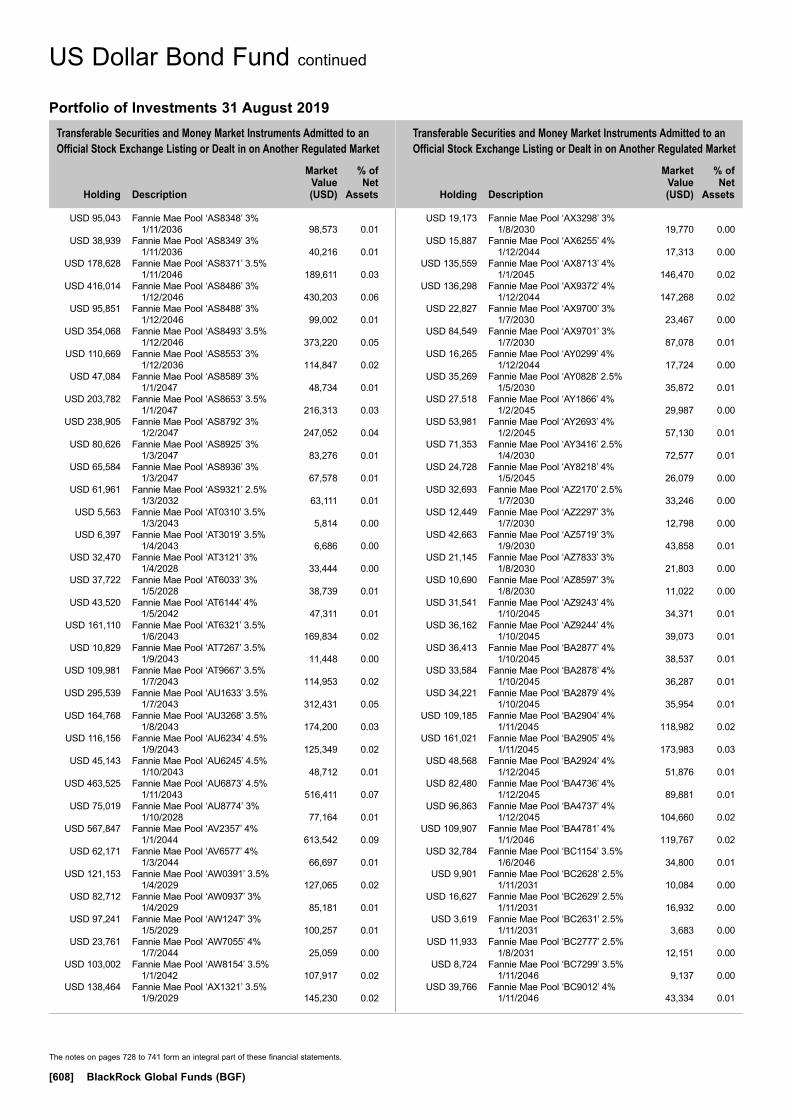
Transferable Securities and Money Market Instruments Admitted to an Official Stock Exchange Listing or Dealt in on Another Regulated Market
Transferable Securities and Money Market Instruments Admitted to an Official Stock Exchange Listing or Dealt in on Another Regulated Market
Holding
Description
Market Value (USD)
% of Net
Assets
Holding
Description
Market Value (USD)
% of Net
Assets
The notes on pages 728 to 741 form an integral part of these financial statements.
[608] BlackRock Global Funds (BGF)
USD 95,043 Fannie Mae Pool ‘AS8348’ 3% 1/11/2036 98,573 0.01
USD 38,939 Fannie Mae Pool ‘AS8349’ 3% 1/11/2036 40,216 0.01
USD 178,628 Fannie Mae Pool ‘AS8371’ 3.5% 1/11/2046 189,611 0.03
USD 416,014 Fannie Mae Pool ‘AS8486’ 3% 1/12/2046 430,203 0.06
USD 95,851 Fannie Mae Pool ‘AS8488’ 3% 1/12/2046 99,002 0.01
USD 354,068 Fannie Mae Pool ‘AS8493’ 3.5% 1/12/2046 373,220 0.05
USD 110,669 Fannie Mae Pool ‘AS8553’ 3% 1/12/2036 114,847 0.02
USD 47,084 Fannie Mae Pool ‘AS8589’ 3% 1/1/2047 48,734 0.01
USD 203,782 Fannie Mae Pool ‘AS8653’ 3.5% 1/1/2047 216,313 0.03
USD 238,905 Fannie Mae Pool ‘AS8792’ 3% 1/2/2047 247,052 0.04
USD 80,626 Fannie Mae Pool ‘AS8925’ 3% 1/3/2047 83,276 0.01
USD 65,584 Fannie Mae Pool ‘AS8936’ 3% 1/3/2047 67,578 0.01
USD 61,961 Fannie Mae Pool ‘AS9321’ 2.5% 1/3/2032 63,111 0.01
USD 5,563 Fannie Mae Pool ‘AT0310’ 3.5% 1/3/2043 5,814 0.00
USD 6,397 Fannie Mae Pool ‘AT3019’ 3.5% 1/4/2043 6,686 0.00
USD 32,470 Fannie Mae Pool ‘AT3121’ 3% 1/4/2028 33,444 0.00
USD 37,722 Fannie Mae Pool ‘AT6033’ 3% 1/5/2028 38,739 0.01
USD 43,520 Fannie Mae Pool ‘AT6144’ 4% 1/5/2042 47,311 0.01
USD 161,110 Fannie Mae Pool ‘AT6321’ 3.5% 1/6/2043 169,834 0.02
USD 10,829 Fannie Mae Pool ‘AT7267’ 3.5% 1/9/2043 11,448 0.00
USD 109,981 Fannie Mae Pool ‘AT9667’ 3.5% 1/7/2043 114,953 0.02
USD 295,539 Fannie Mae Pool ‘AU1633’ 3.5% 1/7/2043 312,431 0.05
USD 164,768 Fannie Mae Pool ‘AU3268’ 3.5% 1/8/2043 174,200 0.03
USD 116,156 Fannie Mae Pool ‘AU6234’ 4.5% 1/9/2043 125,349 0.02
USD 45,143 Fannie Mae Pool ‘AU6245’ 4.5% 1/10/2043 48,712 0.01
USD 463,525 Fannie Mae Pool ‘AU6873’ 4.5% 1/11/2043 516,411 0.07
USD 75,019 Fannie Mae Pool ‘AU8774’ 3% 1/10/2028 77,164 0.01
USD 567,847 Fannie Mae Pool ‘AV2357’ 4% 1/1/2044 613,542 0.09
USD 62,171 Fannie Mae Pool ‘AV6577’ 4% 1/3/2044 66,697 0.01
USD 121,153 Fannie Mae Pool ‘AW0391’ 3.5% 1/4/2029 127,065 0.02
USD 82,712 Fannie Mae Pool ‘AW0937’ 3% 1/4/2029 85,181 0.01
USD 97,241 Fannie Mae Pool ‘AW1247’ 3% 1/5/2029 100,257 0.01
USD 23,761 Fannie Mae Pool ‘AW7055’ 4% 1/7/2044 25,059 0.00
USD 103,002 Fannie Mae Pool ‘AW8154’ 3.5% 1/1/2042 107,917 0.02
USD 138,464 Fannie Mae Pool ‘AX1321’ 3.5% 1/9/2029 145,230 0.02
USD 19,173 Fannie Mae Pool ‘AX3298’ 3% 1/8/2030 19,770 0.00
USD 15,887 Fannie Mae Pool ‘AX6255’ 4% 1/12/2044 17,313 0.00
USD 135,559 Fannie Mae Pool ‘AX8713’ 4% 1/1/2045 146,470 0.02
USD 136,298 Fannie Mae Pool ‘AX9372’ 4% 1/12/2044 147,268 0.02
USD 22,827 Fannie Mae Pool ‘AX9700’ 3% 1/7/2030 23,467 0.00
USD 84,549 Fannie Mae Pool ‘AX9701’ 3% 1/7/2030 87,078 0.01
USD 16,265 Fannie Mae Pool ‘AY0299’ 4% 1/12/2044 17,724 0.00
USD 35,269 Fannie Mae Pool ‘AY0828’ 2.5% 1/5/2030 35,872 0.01
USD 27,518 Fannie Mae Pool ‘AY1866’ 4% 1/2/2045 29,987 0.00
USD 53,981 Fannie Mae Pool ‘AY2693’ 4% 1/2/2045 57,130 0.01
USD 71,353 Fannie Mae Pool ‘AY3416’ 2.5% 1/4/2030 72,577 0.01
USD 24,728 Fannie Mae Pool ‘AY8218’ 4% 1/5/2045 26,079 0.00
USD 32,693 Fannie Mae Pool ‘AZ2170’ 2.5% 1/7/2030 33,246 0.00
USD 12,449 Fannie Mae Pool ‘AZ2297’ 3% 1/7/2030 12,798 0.00
USD 42,663 Fannie Mae Pool ‘AZ5719’ 3% 1/9/2030 43,858 0.01
USD 21,145 Fannie Mae Pool ‘AZ7833’ 3% 1/8/2030 21,803 0.00
USD 10,690 Fannie Mae Pool ‘AZ8597’ 3% 1/8/2030 11,022 0.00
USD 31,541 Fannie Mae Pool ‘AZ9243’ 4% 1/10/2045 34,371 0.01
USD 36,162 Fannie Mae Pool ‘AZ9244’ 4% 1/10/2045 39,073 0.01
USD 36,413 Fannie Mae Pool ‘BA2877’ 4% 1/10/2045 38,537 0.01
USD 33,584 Fannie Mae Pool ‘BA2878’ 4% 1/10/2045 36,287 0.01
USD 34,221 Fannie Mae Pool ‘BA2879’ 4% 1/10/2045 35,954 0.01
USD 109,185 Fannie Mae Pool ‘BA2904’ 4% 1/11/2045 118,982 0.02
USD 161,021 Fannie Mae Pool ‘BA2905’ 4% 1/11/2045 173,983 0.03
USD 48,568 Fannie Mae Pool ‘BA2924’ 4% 1/12/2045 51,876 0.01
USD 82,480 Fannie Mae Pool ‘BA4736’ 4% 1/12/2045 89,881 0.01
USD 96,863 Fannie Mae Pool ‘BA4737’ 4% 1/12/2045 104,660 0.02
USD 109,907 Fannie Mae Pool ‘BA4781’ 4% 1/1/2046 119,767 0.02
USD 32,784 Fannie Mae Pool ‘BC1154’ 3.5% 1/6/2046 34,800 0.01
USD 9,901 Fannie Mae Pool ‘BC2628’ 2.5% 1/11/2031 10,084 0.00
USD 16,627 Fannie Mae Pool ‘BC2629’ 2.5% 1/11/2031 16,932 0.00
USD 3,619 Fannie Mae Pool ‘BC2631’ 2.5% 1/11/2031 3,683 0.00
USD 11,933 Fannie Mae Pool ‘BC2777’ 2.5% 1/8/2031 12,151 0.00
USD 8,724 Fannie Mae Pool ‘BC7299’ 3.5% 1/11/2046 9,137 0.00
USD 39,766 Fannie Mae Pool ‘BC9012’ 4% 1/11/2046 43,334 0.01
US Dollar Bond Fund continued
Portfolio of Investments 31 August 2019

Transferable Securities and Money Market Instruments Admitted to an Official Stock Exchange Listing or Dealt in on Another Regulated Market
Transferable Securities and Money Market Instruments Admitted to an Official Stock Exchange Listing or Dealt in on Another Regulated Market
Holding
Description
Market Value (USD)
% of Net
Assets
Holding
Description
Market Value (USD)
% of Net
Assets
The notes on pages 728 to 741 form an integral part of these financial statements.
Annual Report and Audited Financial Statements [609]
USD 53,681 Fannie Mae Pool ‘BC9040’ 2% 1/11/2031 53,575 0.01
USD 84,452 Fannie Mae Pool ‘BC9084’ 3.5% 1/12/2046 89,281 0.01
USD 57,287 Fannie Mae Pool ‘BD2439’ 4% 1/1/2047 62,418 0.01
USD 86,495 Fannie Mae Pool ‘BD5049’ 3% 1/2/2047 89,338 0.01
USD 23,071 Fannie Mae Pool ‘BD5056’ 3% 1/2/2047 23,879 0.00
USD 25,363 Fannie Mae Pool ‘BD8477’ 3.5% 1/11/2046 26,563 0.00
USD 62,361 Fannie Mae Pool ‘BD8531’ 3.5% 1/1/2047 65,578 0.01
USD 23,513 Fannie Mae Pool ‘BD8962’ 3% 1/11/2046 24,216 0.00
USD 16,686 Fannie Mae Pool ‘BD8963’ 3% 1/11/2046 17,175 0.00
USD 5,656 Fannie Mae Pool ‘BE0547’ 3.5% 1/9/2046 5,912 0.00
USD 87,092 Fannie Mae Pool ‘BE1896’ 3% 1/12/2036 89,842 0.01
USD 12,537 Fannie Mae Pool ‘BE1932’ 3.5% 1/11/2046 13,130 0.00
USD 58,326 Fannie Mae Pool ‘BE2735’ 4.5% 1/10/2047 63,399 0.01
USD 239,887 Fannie Mae Pool ‘BE2930’ 3.5% 1/12/2046 253,603 0.04
USD 97,659 Fannie Mae Pool ‘BE3188’ 3.5% 1/2/2047 103,239 0.01
USD 44,057 Fannie Mae Pool ‘BE4467’ 3.5% 1/11/2046 45,641 0.01
USD 32,551 Fannie Mae Pool ‘BE4913’ 3.5% 1/1/2047 34,054 0.01
USD 379,930 Fannie Mae Pool ‘BF0056’ 6% 1/7/2039 427,114 0.06
USD 243,107 Fannie Mae Pool ‘BH5764’ 4.5% 1/11/2047 261,641 0.04
USD 1,253,330 Fannie Mae Pool ‘BH7060’ 3.5% 1/12/2047 1,317,997 0.19
USD 51,002 Fannie Mae Pool ‘BJ2054’ 3.5% 1/11/2032 53,582 0.01
USD 33,566 Fannie Mae Pool ‘BJ2096’ 3.5% 1/1/2033 35,325 0.01
USD 97,111 Fannie Mae Pool ‘BJ5879’ 3.5% 1/1/2048 102,652 0.01
USD 48,026 Fannie Mae Pool ‘BJ8120’ 3.5% 1/1/2048 50,973 0.01
USD 28,042 Fannie Mae Pool ‘BJ8126’ 3.5% 1/1/2048 29,556 0.00
USD 18,354 Fannie Mae Pool ‘BJ8650’ 3.5% 1/1/2048 19,401 0.00
USD 1,190,417 Fannie Mae Pool ‘BJ9172’ 4.5% 1/5/2048 1,293,394 0.19
USD 412,438 Fannie Mae Pool ‘BK4237’ 4% 1/8/2048 439,608 0.06
USD 748,773 Fannie Mae Pool ‘BK4241’ 4% 1/8/2048 790,633 0.11
USD 105,324 Fannie Mae Pool ‘BK4243’ 4% 1/8/2048 112,923 0.02
USD 208,205 Fannie Mae Pool ‘BK4244’ 4% 1/8/2048 222,656 0.03
USD 52,018 Fannie Mae Pool ‘BK4251’ 4% 1/8/2048 55,625 0.01
USD 127,906 Fannie Mae Pool ‘BK4252’ 4% 1/8/2048 136,297 0.02
USD 80,203 Fannie Mae Pool ‘BK4254’ 4% 1/8/2048 84,662 0.01
USD 76,694 Fannie Mae Pool ‘BK4689’ 4.5% 1/7/2048 85,363 0.01
USD 17,221 Fannie Mae Pool ‘BM1036’ 2.5% 1/2/2032 17,525 0.00
USD 128,127 Fannie Mae Pool ‘BM1100’ 3.5% 1/2/2045 134,181 0.02
USD 561,196 Fannie Mae Pool ‘BM1124’ 3.5% 1/11/2045 593,256 0.09
USD 373,965 Fannie Mae Pool ‘BM1155’ 4% 1/3/2047 400,099 0.06
USD 194,299 Fannie Mae Pool ‘BM1174’ 3.5% 1/5/2047 204,324 0.03
USD 168,489 Fannie Mae Pool ‘BM1502’ 4% 1/10/2043 179,814 0.03
USD 147,771 Fannie Mae Pool ‘BM1571’ 3.5% 1/7/2047 155,759 0.02
USD 60,461 Fannie Mae Pool ‘BM1595’ 2.5% 1/3/2031 61,340 0.01
USD 154,814 Fannie Mae Pool ‘BM1619’ 4% 1/8/2047 165,157 0.02
USD 146,616 Fannie Mae Pool ‘BM1756’ 4.5% 1/12/2045 157,790 0.02
USD 87,673 Fannie Mae Pool ‘BM1822’ 3.5% 1/9/2047 92,683 0.01
USD 9,577 Fannie Mae Pool ‘BM1896’ 2.5% 1/11/2031 9,752 0.00
USD 212,048 Fannie Mae Pool ‘BM1902’ 3.5% 1/6/2047 223,305 0.03
USD 647,807 Fannie Mae Pool ‘BM1922’ 4.5% 1/7/2046 721,380 0.10
USD 68,728 Fannie Mae Pool ‘BM1937’ 3.5% 1/5/2047 72,951 0.01
USD 186,904 Fannie Mae Pool ‘BM1938’ 3.5% 1/11/2046 197,583 0.03
USD 80,412 Fannie Mae Pool ‘BM1952’ 3.5% 1/10/2047 84,908 0.01
USD 577,476 Fannie Mae Pool ‘BM3031’ 3% 1/7/2043 598,941 0.09
USD 197,671 Fannie Mae Pool ‘BM3054’ 2% 1/11/2031 197,281 0.03
USD 267,887 Fannie Mae Pool ‘BM3061’ 2% 1/3/2032 267,358 0.04
USD 471,782 Fannie Mae Pool ‘BM3208’ 4.5% 1/11/2047 507,734 0.07
USD 202,785 Fannie Mae Pool ‘BM3240’ 3% 1/9/2032 209,318 0.03
USD 280,962 Fannie Mae Pool ‘BM3282’ 3.5% 1/12/2047 298,229 0.04
USD 251,816 Fannie Mae Pool ‘BM3326’ 3.5% 1/12/2047 267,293 0.04
USD 17,566 Fannie Mae Pool ‘BM3327’ 3.5% 1/12/2047 18,570 0.00
USD 37,281 Fannie Mae Pool ‘BM3403’ 2.5% 1/2/2030 37,881 0.01
USD 107,147 Fannie Mae Pool ‘BM3552’ 2.5% 1/8/2030 108,894 0.02
USD 416,655 Fannie Mae Pool ‘BM3578’ 2.5% 1/8/2032 424,114 0.06
USD 66,240 Fannie Mae Pool ‘BM3762’ 4% 1/4/2048 72,131 0.01
USD 70,756 Fannie Mae Pool ‘BM3763’ 4% 1/4/2048 76,401 0.01
USD 752,005 Fannie Mae Pool ‘BM3793’ 2.5% 1/2/2033 763,305 0.11
USD 170,886 Fannie Mae Pool ‘BM3846’ 4.5% 1/4/2048 187,901 0.03
USD 453,846 Fannie Mae Pool ‘BM4351’ 4.5% 1/8/2048 493,106 0.07
USD 1,064,542 Fannie Mae Pool ‘BM5002’ 3.5% 1/5/2044 1,129,821 0.16
USD 2,962,384 Fannie Mae Pool ‘BM5003’ 4% 1/3/2047 3,198,657 0.46
US Dollar Bond Fund continued
Portfolio of Investments 31 August 2019

Transferable Securities and Money Market Instruments Admitted to an Official Stock Exchange Listing or Dealt in on Another Regulated Market
Transferable Securities and Money Market Instruments Admitted to an Official Stock Exchange Listing or Dealt in on Another Regulated Market
Holding
Description
Market Value (USD)
% of Net
Assets
Holding
Description
Market Value (USD)
% of Net
Assets
The notes on pages 728 to 741 form an integral part of these financial statements.
[610] BlackRock Global Funds (BGF)
USD 638,513 Fannie Mae Pool ‘BM5024’ 3% 1/11/2048 653,362 0.09
USD 1,379,501 Fannie Mae Pool ‘BM5862’ 4.5% 1/2/2049 1,498,704 0.22
USD 618,502 Fannie Mae Pool ‘BM5896’ 4.5% 1/5/2048 671,907 0.10
USD 401,017 Fannie Mae Pool ‘BN1623’ 4.5% 1/11/2048 431,383 0.06
USD 37,195 Fannie Mae Pool ‘CA0681’ 3.5% 1/11/2047 39,321 0.01
USD 204,530 Fannie Mae Pool ‘CA0689’ 3.5% 1/11/2047 217,100 0.03
USD 465,631 Fannie Mae Pool ‘CA0993’ 3.5% 1/1/2048 490,286 0.07
USD 625,095 Fannie Mae Pool ‘CA1021’ 4.5% 1/1/2048 672,750 0.10
USD 515,157 Fannie Mae Pool ‘CA1058’ 3.5% 1/1/2048 546,768 0.08
USD 636,616 Fannie Mae Pool ‘CA1372’ 4% 1/3/2048 693,229 0.10
USD 256,453 Fannie Mae Pool ‘CA1549’ 4% 1/4/2048 279,259 0.04
USD 2,511,480 Fannie Mae Pool ‘CA1704’ 4.5% 1/5/2048 2,728,728 0.39
USD 220,889 Fannie Mae Pool ‘CA2404’ 4% 1/10/2033 233,454 0.03
USD 167,033 Fannie Mae Pool ‘CA2406’ 4% 1/10/2033 176,440 0.03
USD 145,181 Fannie Mae Pool ‘CA2527’ 4% 1/10/2033 154,540 0.02
USD 148,278 Fannie Mae Pool ‘CA2528’ 4% 1/10/2033 157,520 0.02
USD 894,202 Fannie Mae Pool ‘CA2557’ 4% 1/11/2033 949,947 0.14
USD 2,283,375 Fannie Mae Pool ‘CA3094’ 4.5% 1/2/2049 2,541,170 0.37
USD 1,842,386 Fannie Mae Pool ‘CA3516’ 4.5% 1/5/2049 2,050,398 0.30
USD 9,905 Fannie Mae Pool ‘MA1440’ 3.5% 1/5/2043 10,353 0.00
USD 279,710 Fannie Mae Pool ‘MA2414’ 3.5% 1/10/2045 293,210 0.04
USD 34,295 Fannie Mae Pool ‘MA2774’ 2% 1/10/2031 34,228 0.01
USD 44,570 Fannie Mae Pool ‘MA2845’ 2% 1/12/2031 44,482 0.01
USD 3,908,942 Fannie Mae-Aces ‘Series 2013-M5 X2’ FRN 25/1/2022 93,966 0.01
USD 2,212,159 Fannie Mae-Aces ‘Series 2015-M4 X2’ FRN 25/7/2022 17,310 0.00
EUR 110,000 FedEx Corp 0.45% 5/8/2025 123,771 0.02 EUR 100,000 FedEx Corp 1.3% 5/8/2031 116,563 0.02 USD 52,000 FedEx Corp 3.4% 14/1/2022 53,637 0.01 USD 135,000 FedEx Corp 3.875% 1/8/2042 133,864 0.02 USD 113,000 FedEx Corp 3.9% 1/2/2035 118,514 0.02 USD 124,000 FedEx Corp 4.1% 1/2/2045 127,501 0.02 EUR 510,000 Fidelity National Information
Services Inc 1.1% 15/7/2024 595,655 0.09 USD 93,000 Fidelity National Information
Services Inc 2.25% 15/8/2021 93,148 0.01 EUR 150,000 Fidelity National Information
Services Inc 2.95% 21/5/2039 209,819 0.03 USD 640,000 Fidelity National Information
Services Inc 3% 15/8/2026 662,844 0.10 USD 21,000 Fidelity National Information
Services Inc 3.625% 15/10/2020 21,319 0.00 USD 62,000 Fidelity National Information
Services Inc 4.5% 15/8/2046 72,834 0.01
USD 140,000 Fidelity National Information Services Inc 4.75% 15/5/2048 172,308 0.02
USD 100,000 Fifth Third Bancorp 3.65% 25/1/2024 106,009 0.02 USD 41,847 First Franklin Mortgage Loan Trust
2004-FFH3 ‘Series 2004-FFH3 M3’ FRN 25/10/2034 39,010 0.01
USD 112,111 First Franklin Mortgage Loan Trust 2006-FF13 ‘Series 2006-FF13 A1’ FRN 25/10/2036 91,836 0.01
USD 628,596 First Franklin Mortgage Loan Trust 2006-FF16 ‘Series 2006-FF16 2A3’ FRN 25/12/2036 362,624 0.05
USD 361,270 First Franklin Mortgage Loan Trust 2006-FF17 ‘Series 2006-FF17 A5’ FRN 25/12/2036 318,016 0.05
USD 121,206 First Franklin Mortgage Loan Trust 2006-FFH1 ‘Series 2006-FFH1 M2’ FRN 25/1/2036 75,846 0.01
USD 578,000 FirstEnergy Transmission LLC ‘144A’ 4.35% 15/1/2025 628,350 0.09
USD 185,000 FirstEnergy Transmission LLC ‘144A’ 4.55% 1/4/2049 221,874 0.03
EUR 270,000 Fiserv Inc 1.625% 1/7/2030 326,506 0.05 USD 785,000 Fiserv Inc 3.2% 1/7/2026 819,659 0.12 USD 90,000 Fiserv Inc 3.5% 1/7/2029 95,439 0.01 USD 35,000 Fiserv Inc 3.85% 1/6/2025 37,661 0.01 USD 390,000 Fiserv Inc 4.2% 1/10/2028 436,483 0.06 USD 1,090,000 Florida Power & Light Co FRN
6/5/2022 1,090,376 0.16 USD 85,000 Florida Power & Light Co 3.7%
1/12/2047 96,256 0.01 USD 152,000 Florida Power & Light Co 3.95%
1/3/2048 179,481 0.03 USD 20,000 Florida Power & Light Co 3.99%
1/3/2049 23,866 0.00 USD 25,000 Florida Power & Light Co 4.05%
1/6/2042 29,444 0.00 USD 190,000 Florida Power & Light Co 4.125%
1/6/2048 230,704 0.03 USD 200,000 Ford Motor Credit Co LLC 3.157%
4/8/2020 200,975 0.03 USD 1,270,000 Ford Motor Credit Co LLC 3.219%
9/1/2022 1,272,883 0.18 USD 320,000 Ford Motor Credit Co LLC 3.336%
18/3/2021 322,249 0.05 USD 200,000 Ford Motor Credit Co LLC 4.389%
8/1/2026 203,404 0.03 USD 495,000 Ford Motor Credit Co LLC 5.75%
1/2/2021 514,011 0.07 USD 95,000 Fox Corp ‘144A’ 4.03% 25/1/2024 101,822 0.01 USD 185,000 Fox Corp ‘144A’ 4.709% 25/1/2029 214,061 0.03 USD 20 Freddie Mac Gold Pool ‘A20431’ 6%
1/1/2034 22 0.00 USD 49,986 Freddie Mac Gold Pool ‘A35615’ 6%
1/6/2035 55,193 0.01 USD 31,777 Freddie Mac Gold Pool ‘A90196’ 4.5%
1/12/2039 34,412 0.01 USD 34,313 Freddie Mac Gold Pool ‘A93534’ 4%
1/8/2040 36,657 0.01 USD 313,136 Freddie Mac Gold Pool ‘A93786’ 4%
1/9/2040 334,554 0.05 USD 49,272 Freddie Mac Gold Pool ‘A93851’ 4%
1/9/2040 52,625 0.01 USD 137,214 Freddie Mac Gold Pool ‘C03608’
3.5% 1/12/2040 143,469 0.02 USD 99,689 Freddie Mac Gold Pool ‘C03811’ 3.5%
1/4/2042 105,450 0.02 USD 246,765 Freddie Mac Gold Pool ‘G04471’ 5.5%
1/7/2038 278,186 0.04
US Dollar Bond Fund continued
Portfolio of Investments 31 August 2019

Transferable Securities and Money Market Instruments Admitted to an Official Stock Exchange Listing or Dealt in on Another Regulated Market
Transferable Securities and Money Market Instruments Admitted to an Official Stock Exchange Listing or Dealt in on Another Regulated Market
Holding
Description
Market Value (USD)
% of Net
Assets
Holding
Description
Market Value (USD)
% of Net
Assets
The notes on pages 728 to 741 form an integral part of these financial statements.
Annual Report and Audited Financial Statements [611]
USD 66,205 Freddie Mac Gold Pool ‘G05175’ 4.5% 1/2/2039 71,547 0.01
USD 331,938 Freddie Mac Gold Pool ‘G07550’ 3% 1/8/2043 341,823 0.05
USD 154,818 Freddie Mac Gold Pool ‘G07553’ 5.5% 1/6/2041 174,438 0.03
USD 31,006 Freddie Mac Gold Pool ‘G07642’ 5% 1/10/2041 34,116 0.01
USD 369,023 Freddie Mac Gold Pool ‘G07848’ 3.5% 1/4/2044 390,304 0.06
USD 1,912,501 Freddie Mac Gold Pool ‘G07922’ 3.5% 1/1/2044 2,016,970 0.29
USD 493,184 Freddie Mac Gold Pool ‘G07962’ 5% 1/11/2041 538,650 0.08
USD 777,756 Freddie Mac Gold Pool ‘G08528’ 3% 1/4/2043 803,223 0.12
USD 7,279 Freddie Mac Gold Pool ‘G08741’ 3% 1/1/2047 7,472 0.00
USD 9,832 Freddie Mac Gold Pool ‘G08747’ 3% 1/2/2047 10,082 0.00
USD 148,206 Freddie Mac Gold Pool ‘G15520’ 3% 1/7/2030 152,711 0.02
USD 106,537 Freddie Mac Gold Pool ‘G15601’ 2.5% 1/1/2029 108,437 0.02
USD 246,824 Freddie Mac Gold Pool ‘G15815’ 3.5% 1/4/2031 259,110 0.04
USD 179,726 Freddie Mac Gold Pool ‘G15870’ 3.5% 1/9/2030 188,205 0.03
USD 268,337 Freddie Mac Gold Pool ‘G16186’ 2.5% 1/4/2031 272,857 0.04
USD 610,048 Freddie Mac Gold Pool ‘G16292’ 3.5% 1/4/2032 640,609 0.09
USD 228,941 Freddie Mac Gold Pool ‘G60018’ 4.5% 1/12/2043 248,709 0.04
USD 1,154,817 Freddie Mac Gold Pool ‘G60138’ 3.5% 1/8/2045 1,221,479 0.18
USD 656,305 Freddie Mac Gold Pool ‘G60270’ 3.5% 1/12/2043 690,531 0.10
USD 989,643 Freddie Mac Gold Pool ‘G60271’ 3.5% 1/1/2044 1,041,262 0.15
USD 126,762 Freddie Mac Gold Pool ‘G60393’ 3.5% 1/1/2046 132,820 0.02
USD 104,511 Freddie Mac Gold Pool ‘G60561’ 3.5% 1/5/2046 109,505 0.02
USD 1,392,567 Freddie Mac Gold Pool ‘G60658’ 3.5% 1/7/2046 1,470,574 0.21
USD 3,980 Freddie Mac Gold Pool ‘G60729’ 4% 1/9/2046 4,241 0.00
USD 682,240 Freddie Mac Gold Pool ‘G60888’ 3.5% 1/12/2044 713,303 0.10
USD 74,815 Freddie Mac Gold Pool ‘G60901’ 4% 1/7/2044 79,416 0.01
USD 268,515 Freddie Mac Gold Pool ‘G60968’ 3.5% 1/3/2047 284,004 0.04
USD 177,022 Freddie Mac Gold Pool ‘G60972’ 4.5% 1/5/2047 192,512 0.03
USD 363,668 Freddie Mac Gold Pool ‘G61047’ 4.5% 1/7/2047 395,489 0.06
USD 225,894 Freddie Mac Gold Pool ‘G61079’ 4.5% 1/7/2047 242,588 0.04
USD 320,891 Freddie Mac Gold Pool ‘G61177’ 3% 1/8/2043 332,267 0.05
USD 250,519 Freddie Mac Gold Pool ‘G61178’ 3.5% 1/10/2047 266,051 0.04
USD 300,963 Freddie Mac Gold Pool ‘G61208’ 3.5% 1/12/2047 319,623 0.05
USD 460,521 Freddie Mac Gold Pool ‘G61677’ 4.5% 1/4/2047 494,963 0.07
USD 900,736 Freddie Mac Gold Pool ‘G67702’ 4% 1/1/2047 964,164 0.14
USD 359,229 Freddie Mac Gold Pool ‘G67704’ 4% 1/8/2047 388,279 0.06
USD 2,380,257 Freddie Mac Gold Pool ‘G67715’ 4.5% 1/8/2048 2,587,302 0.37
USD 416,480 Freddie Mac Gold Pool ‘G67721’ 4.5% 1/4/2049 448,221 0.06
USD 76,338 Freddie Mac Gold Pool ‘J31418’ 2.5% 1/5/2030 77,659 0.01
USD 155,480 Freddie Mac Gold Pool ‘J31689’ 3% 1/5/2030 160,394 0.02
USD 18,234 Freddie Mac Gold Pool ‘J32181’ 3% 1/7/2030 18,811 0.00
USD 29,332 Freddie Mac Gold Pool ‘J32204’ 2.5% 1/7/2030 29,833 0.00
USD 27,008 Freddie Mac Gold Pool ‘J32209’ 2.5% 1/7/2030 27,475 0.00
USD 20,926 Freddie Mac Gold Pool ‘J32436’ 3% 1/8/2030 21,561 0.00
USD 8,202 Freddie Mac Gold Pool ‘J32491’ 2.5% 1/7/2030 8,341 0.00
USD 31,290 Freddie Mac Gold Pool ‘J33633’ 3.5% 1/2/2031 32,763 0.00
USD 4,796 Freddie Mac Gold Pool ‘J33763’ 2.5% 1/2/2031 4,861 0.00
USD 14,875 Freddie Mac Gold Pool ‘J34223’ 3.5% 1/4/2031 15,438 0.00
USD 2,202 Freddie Mac Gold Pool ‘Q00093’ 4% 1/4/2041 2,353 0.00
USD 93,639 Freddie Mac Gold Pool ‘Q00804’ 4.5% 1/5/2041 101,418 0.01
USD 103,919 Freddie Mac Gold Pool ‘Q00959’ 4.5% 1/5/2041 112,538 0.02
USD 4,698 Freddie Mac Gold Pool ‘Q07896’ 3.5% 1/5/2042 4,913 0.00
USD 10,881 Freddie Mac Gold Pool ‘Q08239’ 3.5% 1/5/2042 11,378 0.00
USD 3,363 Freddie Mac Gold Pool ‘Q08306’ 3.5% 1/5/2042 3,524 0.00
USD 47,707 Freddie Mac Gold Pool ‘Q09810’ 3.5% 1/8/2042 50,671 0.01
USD 112,394 Freddie Mac Gold Pool ‘Q10724’ 3.5% 1/8/2042 117,498 0.02
USD 42,522 Freddie Mac Gold Pool ‘Q11750’ 3.5% 1/10/2042 44,468 0.01
USD 17,055 Freddie Mac Gold Pool ‘Q11909’ 3.5% 1/10/2042 17,819 0.00
USD 28,571 Freddie Mac Gold Pool ‘Q12162’ 3.5% 1/8/2042 29,993 0.00
USD 127,389 Freddie Mac Gold Pool ‘Q13134’ 3.5% 1/11/2042 133,219 0.02
USD 56,123 Freddie Mac Gold Pool ‘Q14866’ 3% 1/1/2043 57,960 0.01
USD 52,818 Freddie Mac Gold Pool ‘Q16403’ 3% 1/3/2043 54,550 0.01
USD 134,341 Freddie Mac Gold Pool ‘Q16673’ 3% 1/3/2043 138,744 0.02
USD 36,363 Freddie Mac Gold Pool ‘Q18718’ 3.5% 1/6/2043 38,186 0.01
USD 44,239 Freddie Mac Gold Pool ‘Q19129’ 3.5% 1/6/2043 46,987 0.01
USD 22,845 Freddie Mac Gold Pool ‘Q20176’ 3.5% 1/7/2043 23,987 0.00
USD 38,024 Freddie Mac Gold Pool ‘Q22848’ 4.5% 1/11/2043 40,329 0.01
USD 20,261 Freddie Mac Gold Pool ‘Q24367’ 3.5% 1/1/2044 21,517 0.00
USD 49,151 Freddie Mac Gold Pool ‘Q25643’ 4% 1/4/2044 52,754 0.01
USD 47,646 Freddie Mac Gold Pool ‘Q27843’ 3.5% 1/8/2044 50,394 0.01
US Dollar Bond Fund continued
Portfolio of Investments 31 August 2019

Transferable Securities and Money Market Instruments Admitted to an Official Stock Exchange Listing or Dealt in on Another Regulated Market
Transferable Securities and Money Market Instruments Admitted to an Official Stock Exchange Listing or Dealt in on Another Regulated Market
Holding
Description
Market Value (USD)
% of Net
Assets
Holding
Description
Market Value (USD)
% of Net
Assets
The notes on pages 728 to 741 form an integral part of these financial statements.
[612] BlackRock Global Funds (BGF)
USD 22,074 Freddie Mac Gold Pool ‘Q28604’ 3.5% 1/9/2044 23,443 0.00
USD 56,449 Freddie Mac Gold Pool ‘Q28605’ 3.5% 1/9/2044 59,706 0.01
USD 12,023 Freddie Mac Gold Pool ‘Q28763’ 3.5% 1/9/2044 12,597 0.00
USD 3,092 Freddie Mac Gold Pool ‘Q29697’ 3.5% 1/11/2044 3,240 0.00
USD 523 Freddie Mac Gold Pool ‘Q29911’ 3.5% 1/11/2044 548 0.00
USD 17,368 Freddie Mac Gold Pool ‘Q30876’ 3.5% 1/1/2045 18,197 0.00
USD 14,593 Freddie Mac Gold Pool ‘Q31122’ 3.5% 1/1/2045 15,236 0.00
USD 4,980 Freddie Mac Gold Pool ‘Q33131’ 3.5% 1/5/2045 5,212 0.00
USD 38,246 Freddie Mac Gold Pool ‘Q33606’ 3.5% 1/5/2045 40,075 0.01
USD 38,508 Freddie Mac Gold Pool ‘Q34176’ 3.5% 1/6/2045 40,351 0.01
USD 609 Freddie Mac Gold Pool ‘Q34960’ 3.5% 1/7/2045 638 0.00
USD 129,435 Freddie Mac Gold Pool ‘Q35609’ 4% 1/9/2045 137,054 0.02
USD 22,553 Freddie Mac Gold Pool ‘Q36302’ 3.5% 1/9/2045 23,952 0.00
USD 224,390 Freddie Mac Gold Pool ‘Q36972’ 4% 1/10/2045 239,495 0.03
USD 27,571 Freddie Mac Gold Pool ‘Q37955’ 4% 1/12/2045 29,194 0.00
USD 34,088 Freddie Mac Gold Pool ‘Q37957’ 4% 1/12/2045 35,968 0.01
USD 87,058 Freddie Mac Gold Pool ‘Q39250’ 3.5% 1/3/2046 91,212 0.01
USD 43,974 Freddie Mac Gold Pool ‘Q44665’ 3% 1/11/2046 45,166 0.01
USD 136,139 Freddie Mac Gold Pool ‘Q44853’ 3% 1/12/2046 140,685 0.02
USD 129,466 Freddie Mac Gold Pool ‘Q45064’ 3% 1/12/2046 133,469 0.02
USD 53,612 Freddie Mac Gold Pool ‘Q45079’ 3% 1/12/2046 55,518 0.01
USD 64,961 Freddie Mac Gold Pool ‘Q45080’ 3% 1/12/2046 67,211 0.01
USD 32,153 Freddie Mac Gold Pool ‘Q45083’ 3% 1/12/2046 33,367 0.00
USD 8,988 Freddie Mac Gold Pool ‘Q45094’ 3% 1/12/2046 9,227 0.00
USD 61,101 Freddie Mac Gold Pool ‘Q53113’ 3.5% 1/7/2047 64,625 0.01
USD 34,334 Freddie Mac Gold Pool ‘Q53630’ 3.5% 1/1/2048 36,459 0.01
USD 65,602 Freddie Mac Gold Pool ‘Q53648’ 3.5% 1/1/2048 69,179 0.01
USD 580,227 Freddie Mac Gold Pool ‘Q57853’ 4.5% 1/8/2048 630,735 0.09
USD 1,386,143 Freddie Mac Gold Pool ‘Q59918’ 4.5% 1/7/2048 1,506,791 0.22
USD 75,051 Freddie Mac Gold Pool ‘U70060’ 3% 1/9/2027 76,965 0.01
USD 37,897 Freddie Mac Gold Pool ‘U79018’ 3% 1/7/2028 38,863 0.01
USD 35,179 Freddie Mac Gold Pool ‘V60696’ 3% 1/1/2030 36,247 0.01
USD 47,593 Freddie Mac Gold Pool ‘V60724’ 3% 1/1/2030 49,039 0.01
USD 67,747 Freddie Mac Gold Pool ‘V60770’ 2.5% 1/3/2030 68,954 0.01
USD 128,284 Freddie Mac Gold Pool ‘V60796’ 2.5% 1/5/2030 130,448 0.02
USD 293,415 Freddie Mac Gold Pool ‘V60840’ 3% 1/6/2030 302,333 0.04
USD 141,882 Freddie Mac Gold Pool ‘V60886’ 2.5% 1/8/2030 144,338 0.02
USD 111,446 Freddie Mac Gold Pool ‘V60902’ 2.5% 1/8/2030 113,374 0.02
USD 107,225 Freddie Mac Gold Pool ‘V60903’ 2.5% 1/9/2030 109,056 0.02
USD 215,171 Freddie Mac Gold Pool ‘V60904’ 2.5% 1/9/2030 218,793 0.03
USD 10,229 Freddie Mac Gold Pool ‘V60905’ 2.5% 1/7/2030 10,401 0.00
USD 34,313 Freddie Mac Gold Pool ‘V60909’ 3% 1/8/2030 35,357 0.01
USD 509,307 Freddie Mac Gold Pool ‘V80169’ 3% 1/7/2043 526,307 0.08
USD 3,843 Freddie Mac Gold Pool ‘V81932’ 3.5% 1/10/2045 4,026 0.00
USD 16,848 Freddie Mac Gold Pool ‘V82209’ 3.5% 1/2/2046 17,653 0.00
USD 51,384 Freddie Mac Gold Pool ‘V82528’ 4% 1/7/2046 54,847 0.01
USD 28,677 Freddie Mac Gold Pool ‘V82553’ 4% 1/8/2046 30,610 0.00
USD 8,350 Freddie Mac Gold Pool ‘V82661’ 4% 1/10/2046 8,898 0.00
USD 517,997 Freddie Mac Gold Pool ‘V82848’ 3% 1/12/2046 535,938 0.08
USD 82,105 Freddie Mac Gold Pool ‘V82929’ 4% 1/2/2047 87,635 0.01
USD 50,000 Freddie Mac Multifamily Structured Pass Through Certificates ‘Series K040 A2’ 3.241% 25/9/2024 53,203 0.01
USD 60,000 Freddie Mac Multifamily Structured Pass Through Certificates ‘Series K061 A2’ FRN 25/11/2026 65,717 0.01
USD 9,855 Freddie Mac Multifamily Structured Pass Through Certificates ‘Series K062 A2’ 3.413% 25/12/2026 10,844 0.00
USD 30,000 Freddie Mac Multifamily Structured Pass Through Certificates ‘Series K072 A2’ 3.444% 25/12/2027 33,262 0.00
USD 326,451 Freddie Mac Multifamily Structured Pass Through Certificates ‘Series KW03 X1’ FRN 25/6/2027 16,634 0.00
USD 250,000 Freddie Mac Structured Agency Credit Risk Debt Notes ‘Series 2017-DNA3 B1’ FRN 25/3/2030 276,752 0.04
USD 233,784 Freddie Mac Structured Agency Credit Risk Debt Notes ‘Series 2017-HRP1 M2’ FRN 25/12/2042 236,575 0.03
USD 50,000 FREMF 2016-K54 Mortgage Trust ‘Series 2016-K54 B’ ‘144A’ FRN 25/4/2048 53,663 0.01
USD 20,000 FREMF 2017-K64 Mortgage Trust ‘Series 2017-K64 B’ ‘144A’ FRN 25/5/2050 21,560 0.00
USD 100,000 FREMF 2017-KGS1 Mortgage Trust ‘Series 2017-KGX1 BFX’ ‘144A’ FRN 25/10/2027 100,833 0.01
USD 400,000 Galaxy XV CLO Ltd ‘Series 2013-15A AR’ ‘144A’ FRN 15/10/2030 398,558 0.06
USD 1,000,000 Galaxy XXIII CLO Ltd ‘Series 2017-23A A’ ‘144A’ FRN 24/4/2029 1,000,279 0.14
US Dollar Bond Fund continued
Portfolio of Investments 31 August 2019

Transferable Securities and Money Market Instruments Admitted to an Official Stock Exchange Listing or Dealt in on Another Regulated Market
Transferable Securities and Money Market Instruments Admitted to an Official Stock Exchange Listing or Dealt in on Another Regulated Market
Holding
Description
Market Value (USD)
% of Net
Assets
Holding
Description
Market Value (USD)
% of Net
Assets
The notes on pages 728 to 741 form an integral part of these financial statements.
Annual Report and Audited Financial Statements [613]
USD 187,000 GATX Corp 2.6% 30/3/2020 187,189 0.03 USD 377,000 General Electric Co 4.125%
9/10/2042 363,934 0.05 USD 43,000 General Electric Co 5.875%
14/1/2038 49,628 0.01 USD 16,000 General Electric Co 6.875%
10/1/2039 20,390 0.00 USD 7,000 General Motors Co 5% 1/4/2035 7,208 0.00 USD 21,000 General Motors Co 5.4% 1/4/2048 21,737 0.00 USD 30,000 General Motors Co 6.25% 2/10/2043 33,665 0.00 USD 170,000 General Motors Co 6.6% 1/4/2036 196,226 0.03 USD 70,000 General Motors Co 6.75% 1/4/2046 82,767 0.01 USD 25,000 General Motors Financial Co Inc
FRN 30/9/2027 (Perpetual) 23,288 0.00 USD 18,000 General Motors Financial Co Inc
3.95% 13/4/2024 18,589 0.00 USD 417,000 General Motors Financial Co Inc
4% 15/1/2025 429,673 0.06 USD 104,000 General Motors Financial Co Inc
4% 6/10/2026 106,482 0.02 USD 95,000 General Motors Financial Co Inc
4.15% 19/6/2023 99,254 0.01 USD 10,000 General Motors Financial Co Inc
4.2% 6/11/2021 10,366 0.00 USD 6,000 General Motors Financial Co Inc
4.35% 9/4/2025 6,269 0.00 USD 144,000 George Washington University/The
4.126% 15/9/2048 178,110 0.03 USD 50,000 Georgia-Pacific LLC ‘144A’ 3.6%
1/3/2025 53,221 0.01 USD 168,000 Georgia-Pacific LLC ‘144A’ 3.734%
15/7/2023 177,722 0.03 USD 172,000 Georgia-Pacific LLC ‘144A’ 5.4%
1/11/2020 178,345 0.03 USD 223,000 Georgia-Pacific LLC 7.375%
1/12/2025 286,192 0.04 USD 50,000 Georgia-Pacific LLC 7.75%
15/11/2029 72,972 0.01 USD 12,000 Georgia-Pacific LLC 8.875%
15/5/2031 19,373 0.00 USD 24,798 GE-WMC Asset-Backed Pass-
Through Certificates Series 2005-2 ‘Series 2005-2 A2C’ FRN 25/12/2035 24,677 0.00
USD 220,351 GE-WMC Asset-Backed Pass-Through Certificates Series 2005-2 ‘Series 2005-2 M1’ FRN 25/12/2035 138,483 0.02
USD 357,000 Gilead Sciences Inc 3.5% 1/2/2025 380,522 0.06 USD 41,000 Gilead Sciences Inc 3.65% 1/3/2026 44,082 0.01 USD 85,000 Gilead Sciences Inc 4.5% 1/2/2045 99,435 0.01 USD 251,000 Gilead Sciences Inc 4.6% 1/9/2035 302,398 0.04 USD 35,000 Gilead Sciences Inc 4.75% 1/3/2046 42,407 0.01 USD 7,000 Gilead Sciences Inc 4.8% 1/4/2044 8,464 0.00 USD 48,920 Ginnie Mae I Pool ‘553461’ 3.5%
15/1/2042 51,485 0.01 USD 46,481 Ginnie Mae I Pool ‘710692’ 5%
15/7/2039 51,464 0.01 USD 67,929 Ginnie Mae I Pool ‘720199’ 5%
15/7/2039 75,962 0.01 USD 90,883 Ginnie Mae I Pool ‘762838’ 4%
15/3/2041 96,825 0.01 USD 39,105 Ginnie Mae I Pool ‘782487’ 5%
15/12/2038 43,766 0.01 USD 89,036 Ginnie Mae I Pool ‘783314’ 5%
15/12/2040 99,577 0.01 USD 178,664 Ginnie Mae I Pool ‘784439’ 3%
15/2/2045 184,256 0.03
USD 54,396 Ginnie Mae I Pool ‘794929’ 3.5% 15/5/2042 57,868 0.01
USD 56,538 Ginnie Mae I Pool ‘AA1920’ 3.5% 15/12/2042 60,135 0.01
USD 36,955 Ginnie Mae I Pool ‘AB9456’ 3.5% 15/11/2042 38,853 0.01
USD 44,612 Ginnie Mae I Pool ‘AC3738’ 3.5% 15/12/2042 47,450 0.01
USD 48,980 Ginnie Mae I Pool ‘AC3934’ 3.5% 15/1/2043 50,990 0.01
USD 46,260 Ginnie Mae I Pool ‘AD2222’ 3.5% 15/2/2043 48,634 0.01
USD 83,374 Ginnie Mae I Pool ‘AD2334’ 3.5% 15/4/2043 87,207 0.01
USD 83,002 Ginnie Mae I Pool ‘AD2409’ 3.5% 15/5/2043 87,263 0.01
USD 31,464 Ginnie Mae I Pool ‘AD2410’ 3.5% 15/5/2043 32,757 0.00
USD 55,360 Ginnie Mae I Pool ‘AD3519’ 3.5% 15/4/2043 58,881 0.01
USD 43,423 Ginnie Mae I Pool ‘AD3543’ 3.5% 15/5/2043 46,183 0.01
USD 51,608 Ginnie Mae I Pool ‘AD7474’ 3.5% 15/4/2043 54,892 0.01
USD 57,053 Ginnie Mae I Pool ‘AE9889’ 3.5% 15/5/2043 60,682 0.01
USD 44,120 Ginnie Mae I Pool ‘AF0130’ 3.5% 15/6/2043 46,926 0.01
USD 160,517 Ginnie Mae I Pool ‘AF1072’ 3.5% 15/7/2043 170,721 0.02
USD 51,190 Ginnie Mae I Pool ‘AF1077’ 3.5% 15/7/2043 54,444 0.01
USD 49,548 Ginnie Mae I Pool ‘AZ8560’ 4.5% 15/3/2047 54,161 0.01
USD 74,447 Ginnie Mae I Pool ‘AZ8596’ 4.5% 15/4/2047 81,417 0.01
USD 51,949 Ginnie Mae I Pool ‘AZ8597’ 4.5% 15/4/2047 56,790 0.01
USD 46,315 Ginnie Mae I Pool ‘BA7888’ 4.5% 15/5/2047 50,659 0.01
USD 5,755 Ginnie Mae II Pool ‘4422’ 4% 20/4/2039 6,135 0.00
USD 14,929 Ginnie Mae II Pool ‘4494’ 4% 20/7/2039 15,916 0.00
USD 20,798 Ginnie Mae II Pool ‘4559’ 5% 20/10/2039 22,898 0.00
USD 9,624 Ginnie Mae II Pool ‘4598’ 4.5% 20/12/2039 10,386 0.00
USD 12,023 Ginnie Mae II Pool ‘4617’ 4.5% 20/1/2040 12,979 0.00
USD 9,429 Ginnie Mae II Pool ‘4636’ 4.5% 20/2/2040 10,182 0.00
USD 674 Ginnie Mae II Pool ‘4696’ 4.5% 20/5/2040 729 0.00
USD 3,802 Ginnie Mae II Pool ‘4746’ 4.5% 20/7/2040 4,109 0.00
USD 4,552 Ginnie Mae II Pool ‘4800’ 4% 20/9/2040 4,855 0.00
USD 107,857 Ginnie Mae II Pool ‘4833’ 4% 20/10/2040 115,043 0.02
USD 6,550 Ginnie Mae II Pool ‘4834’ 4.5% 20/10/2040 7,080 0.00
USD 436,224 Ginnie Mae II Pool ‘4853’ 4% 20/11/2040 465,316 0.07
USD 96,340 Ginnie Mae II Pool ‘4882’ 4% 20/12/2040 102,767 0.01
USD 81,828 Ginnie Mae II Pool ‘4922’ 4% 20/1/2041 87,302 0.01
US Dollar Bond Fund continued
Portfolio of Investments 31 August 2019
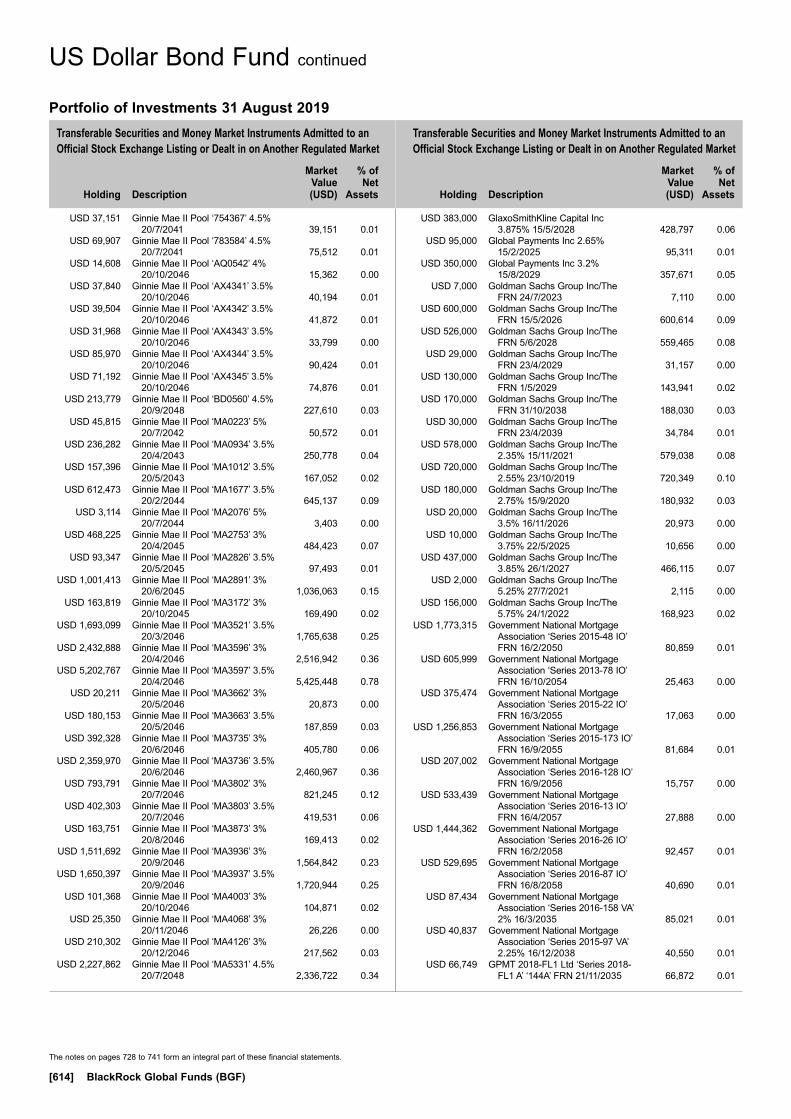
Transferable Securities and Money Market Instruments Admitted to an Official Stock Exchange Listing or Dealt in on Another Regulated Market
Transferable Securities and Money Market Instruments Admitted to an Official Stock Exchange Listing or Dealt in on Another Regulated Market
Holding
Description
Market Value (USD)
% of Net
Assets
Holding
Description
Market Value (USD)
% of Net
Assets
The notes on pages 728 to 741 form an integral part of these financial statements.
[614] BlackRock Global Funds (BGF)
USD 37,151 Ginnie Mae II Pool ‘754367’ 4.5% 20/7/2041 39,151 0.01
USD 69,907 Ginnie Mae II Pool ‘783584’ 4.5% 20/7/2041 75,512 0.01
USD 14,608 Ginnie Mae II Pool ‘AQ0542’ 4% 20/10/2046 15,362 0.00
USD 37,840 Ginnie Mae II Pool ‘AX4341’ 3.5% 20/10/2046 40,194 0.01
USD 39,504 Ginnie Mae II Pool ‘AX4342’ 3.5% 20/10/2046 41,872 0.01
USD 31,968 Ginnie Mae II Pool ‘AX4343’ 3.5% 20/10/2046 33,799 0.00
USD 85,970 Ginnie Mae II Pool ‘AX4344’ 3.5% 20/10/2046 90,424 0.01
USD 71,192 Ginnie Mae II Pool ‘AX4345’ 3.5% 20/10/2046 74,876 0.01
USD 213,779 Ginnie Mae II Pool ‘BD0560’ 4.5% 20/9/2048 227,610 0.03
USD 45,815 Ginnie Mae II Pool ‘MA0223’ 5% 20/7/2042 50,572 0.01
USD 236,282 Ginnie Mae II Pool ‘MA0934’ 3.5% 20/4/2043 250,778 0.04
USD 157,396 Ginnie Mae II Pool ‘MA1012’ 3.5% 20/5/2043 167,052 0.02
USD 612,473 Ginnie Mae II Pool ‘MA1677’ 3.5% 20/2/2044 645,137 0.09
USD 3,114 Ginnie Mae II Pool ‘MA2076’ 5% 20/7/2044 3,403 0.00
USD 468,225 Ginnie Mae II Pool ‘MA2753’ 3% 20/4/2045 484,423 0.07
USD 93,347 Ginnie Mae II Pool ‘MA2826’ 3.5% 20/5/2045 97,493 0.01
USD 1,001,413 Ginnie Mae II Pool ‘MA2891’ 3% 20/6/2045 1,036,063 0.15
USD 163,819 Ginnie Mae II Pool ‘MA3172’ 3% 20/10/2045 169,490 0.02
USD 1,693,099 Ginnie Mae II Pool ‘MA3521’ 3.5% 20/3/2046 1,765,638 0.25
USD 2,432,888 Ginnie Mae II Pool ‘MA3596’ 3% 20/4/2046 2,516,942 0.36
USD 5,202,767 Ginnie Mae II Pool ‘MA3597’ 3.5% 20/4/2046 5,425,448 0.78
USD 20,211 Ginnie Mae II Pool ‘MA3662’ 3% 20/5/2046 20,873 0.00
USD 180,153 Ginnie Mae II Pool ‘MA3663’ 3.5% 20/5/2046 187,859 0.03
USD 392,328 Ginnie Mae II Pool ‘MA3735’ 3% 20/6/2046 405,780 0.06
USD 2,359,970 Ginnie Mae II Pool ‘MA3736’ 3.5% 20/6/2046 2,460,967 0.36
USD 793,791 Ginnie Mae II Pool ‘MA3802’ 3% 20/7/2046 821,245 0.12
USD 402,303 Ginnie Mae II Pool ‘MA3803’ 3.5% 20/7/2046 419,531 0.06
USD 163,751 Ginnie Mae II Pool ‘MA3873’ 3% 20/8/2046 169,413 0.02
USD 1,511,692 Ginnie Mae II Pool ‘MA3936’ 3% 20/9/2046 1,564,842 0.23
USD 1,650,397 Ginnie Mae II Pool ‘MA3937’ 3.5% 20/9/2046 1,720,944 0.25
USD 101,368 Ginnie Mae II Pool ‘MA4003’ 3% 20/10/2046 104,871 0.02
USD 25,350 Ginnie Mae II Pool ‘MA4068’ 3% 20/11/2046 26,226 0.00
USD 210,302 Ginnie Mae II Pool ‘MA4126’ 3% 20/12/2046 217,562 0.03
USD 2,227,862 Ginnie Mae II Pool ‘MA5331’ 4.5% 20/7/2048 2,336,722 0.34
USD 383,000 GlaxoSmithKline Capital Inc 3.875% 15/5/2028 428,797 0.06
USD 95,000 Global Payments Inc 2.65% 15/2/2025 95,311 0.01
USD 350,000 Global Payments Inc 3.2% 15/8/2029 357,671 0.05
USD 7,000 Goldman Sachs Group Inc/The FRN 24/7/2023 7,110 0.00
USD 600,000 Goldman Sachs Group Inc/The FRN 15/5/2026 600,614 0.09
USD 526,000 Goldman Sachs Group Inc/The FRN 5/6/2028 559,465 0.08
USD 29,000 Goldman Sachs Group Inc/The FRN 23/4/2029 31,157 0.00
USD 130,000 Goldman Sachs Group Inc/The FRN 1/5/2029 143,941 0.02
USD 170,000 Goldman Sachs Group Inc/The FRN 31/10/2038 188,030 0.03
USD 30,000 Goldman Sachs Group Inc/The FRN 23/4/2039 34,784 0.01
USD 578,000 Goldman Sachs Group Inc/The 2.35% 15/11/2021 579,038 0.08
USD 720,000 Goldman Sachs Group Inc/The 2.55% 23/10/2019 720,349 0.10
USD 180,000 Goldman Sachs Group Inc/The 2.75% 15/9/2020 180,932 0.03
USD 20,000 Goldman Sachs Group Inc/The 3.5% 16/11/2026 20,973 0.00
USD 10,000 Goldman Sachs Group Inc/The 3.75% 22/5/2025 10,656 0.00
USD 437,000 Goldman Sachs Group Inc/The 3.85% 26/1/2027 466,115 0.07
USD 2,000 Goldman Sachs Group Inc/The 5.25% 27/7/2021 2,115 0.00
USD 156,000 Goldman Sachs Group Inc/The 5.75% 24/1/2022 168,923 0.02
USD 1,773,315 Government National Mortgage Association ‘Series 2015-48 IO’ FRN 16/2/2050 80,859 0.01
USD 605,999 Government National Mortgage Association ‘Series 2013-78 IO’ FRN 16/10/2054 25,463 0.00
USD 375,474 Government National Mortgage Association ‘Series 2015-22 IO’ FRN 16/3/2055 17,063 0.00
USD 1,256,853 Government National Mortgage Association ‘Series 2015-173 IO’ FRN 16/9/2055 81,684 0.01
USD 207,002 Government National Mortgage Association ‘Series 2016-128 IO’ FRN 16/9/2056 15,757 0.00
USD 533,439 Government National Mortgage Association ‘Series 2016-13 IO’ FRN 16/4/2057 27,888 0.00
USD 1,444,362 Government National Mortgage Association ‘Series 2016-26 IO’ FRN 16/2/2058 92,457 0.01
USD 529,695 Government National Mortgage Association ‘Series 2016-87 IO’ FRN 16/8/2058 40,690 0.01
USD 87,434 Government National Mortgage Association ‘Series 2016-158 VA’ 2% 16/3/2035 85,021 0.01
USD 40,837 Government National Mortgage Association ‘Series 2015-97 VA’ 2.25% 16/12/2038 40,550 0.01
USD 66,749 GPMT 2018-FL1 Ltd ‘Series 2018-FL1 A’ ‘144A’ FRN 21/11/2035 66,872 0.01
US Dollar Bond Fund continued
Portfolio of Investments 31 August 2019

Transferable Securities and Money Market Instruments Admitted to an Official Stock Exchange Listing or Dealt in on Another Regulated Market
Transferable Securities and Money Market Instruments Admitted to an Official Stock Exchange Listing or Dealt in on Another Regulated Market
Holding
Description
Market Value (USD)
% of Net
Assets
Holding
Description
Market Value (USD)
% of Net
Assets
The notes on pages 728 to 741 form an integral part of these financial statements.
Annual Report and Audited Financial Statements [615]
USD 250,000 GRACE 2014-GRCE Mortgage Trust ‘Series 2014-GRCE E’ ‘144A’ FRN 10/6/2028 253,403 0.04
USD 140,000 Grand Parkway Transportation Corp 5% 1/10/2043 172,335 0.02
USD 45,000 Grant County Public Utility District No 2 4.584% 1/1/2040 56,861 0.01
USD 60,000 Great Lakes Water Authority Water Supply System Revenue 5.25% 1/7/2033 74,031 0.01
USD 70,000 Greenpoint Manufactured Housing ‘Series 1999-5 M1B’ FRN 15/12/2029 75,626 0.01
USD 26,405 Greenpoint Manufactured Housing ‘Series 1999-5 M2’ FRN 15/12/2029 22,760 0.00
USD 27,526 GreenPoint Mortgage Funding Trust 2006-AR2 ‘Series 2006-AR2 4A1’ FRN 25/3/2036 27,412 0.00
USD 5,000,000 GS Mortgage Securities Corp II Series 2005-ROCK ‘Series 2005-ROCK X1’ ‘144A’ FRN 3/5/2032 72,538 0.01
USD 10,000 GS Mortgage Securities Corp Trust 2017-500K ‘Series 2017-500K D’ ‘144A’ FRN 15/7/2032 10,017 0.00
USD 20,000 GS Mortgage Securities Corp Trust 2017-500K ‘Series 2017-500K E’ ‘144A’ FRN 15/7/2032 19,985 0.00
USD 10,000 GS Mortgage Securities Corp Trust 2017-500K ‘Series 2017-500K F’ ‘144A’ FRN 15/7/2032 10,031 0.00
USD 110,000 GS Mortgage Securities Corp Trust 2017-GPTX ‘Series 2017-GPTX A’ ‘144A’ 2.856% 10/5/2034 110,839 0.02
USD 26,668 GS Mortgage Securities Trust 2010-C1 ‘Series 2010-C1 A1’ ‘144A’ 3.679% 10/8/2043 26,694 0.00
USD 100,000 GS Mortgage Securities Trust 2015-590M ‘Series 2015-590M E’ ‘144A’ FRN 10/10/2035 103,108 0.01
USD 30,000 GS Mortgage Securities Trust 2015-GC28 ‘Series 2015-GC28 B’ 3.98% 10/2/2048 31,932 0.00
USD 40,000 GS Mortgage Securities Trust 2015-GC32 ‘Series 2015-GC32 C’ FRN 10/7/2048 43,104 0.01
USD 180,000 GS Mortgage Securities Trust 2017-GS6 ‘Series 2017-GS6 A3’ 3.433% 10/5/2050 194,972 0.03
USD 20,000 GS Mortgage Securities Trust 2017-GS7 3% 12/8/2050 19,178 0.00
USD 70,000 GS Mortgage Securities Trust 2017-GS7 ‘Series 2017-GS7 A4’ 3.43% 10/8/2050 76,092 0.01
USD 122,142 GSAA Home Equity Trust 2006-4 ‘Series 2006-4 1A1’ FRN 25/3/2036 106,045 0.02
USD 779,719 GSAA Home Equity Trust 2006-5 ‘Series 2006-5 1A1’ FRN 25/3/2036 382,964 0.06
USD 33,788 GSAA Home Equity Trust 2007-2 ‘Series 2007-2 AF3’ FRN 25/3/2037 11,623 0.00
USD 226,602 GSAMP Trust 2006-FM3 ‘Series 2006-FM3 A1’ FRN 25/11/2036 133,924 0.02
USD 50,000 GSAMP Trust 2007-HSBC1 ‘Series 2007-HS1 M6’ FRN 25/2/2047 51,618 0.01
USD 771,186 GSR Mortgage Loan Trust 2006-OA1 ‘Series 2006-OA1 1A1’ FRN 25/8/2046 310,152 0.04
USD 189,843 GSR Mortgage Loan Trust 2007-1F ‘Series 2007-1F 2A4’ 5.5% 25/1/2037 211,694 0.03
USD 64,448 Halcyon Loan Advisors Funding 2014-1 Ltd ‘Series 2014-1A A1R’ ‘144A’ FRN 18/4/2026 64,445 0.01
USD 1,500,000 Halcyon Loan Advisors Funding 2015-2 Ltd ‘Series 2015-2A AR’ ‘144A’ FRN 25/7/2027 1,498,325 0.22
USD 11,000 Halliburton Co 7.45% 15/9/2039 15,539 0.00 USD 45,000 Hartford Financial Services Group
Inc/The 4.3% 15/4/2043 50,744 0.01 USD 435,000 HCA Inc 4.125% 15/6/2029 462,605 0.07 USD 15,000 HCA Inc 4.5% 15/2/2027 16,264 0.00 USD 328,000 HCA Inc 4.75% 1/5/2023 352,261 0.05 USD 276,000 HCA Inc 5% 15/3/2024 302,267 0.04 USD 565,000 HCA Inc 5.25% 15/4/2025 630,836 0.09 USD 140,000 HCA Inc 5.25% 15/6/2026 157,632 0.02 USD 165,000 Health & Educational Facilities
Authority of the State of Missouri 3.086% 15/9/2051 172,125 0.02
USD 430,000 Health & Educational Facilities Authority of the State of Missouri 3.651% 15/1/2046 495,220 0.07
USD 50,000 Health & Educational Facilities Authority of the State of Missouri 5% 15/11/2029 60,600 0.01
USD 64,000 Hess Corp 6% 15/1/2040 72,753 0.01 USD 2,000 Hewlett Packard Enterprise Co
3.6% 15/10/2020 2,029 0.00 USD 20,000 Hewlett Packard Enterprise Co
4.4% 15/10/2022 21,187 0.00 USD 59,000 Home Depot Inc/The 2.8%
14/9/2027 61,814 0.01 USD 104,000 Home Depot Inc/The 2.95%
15/6/2029 110,014 0.02 USD 80,000 Home Depot Inc/The 3.5%
15/9/2056 87,455 0.01 USD 75,000 Home Depot Inc/The 3.9%
6/12/2028 85,471 0.01 USD 25,000 Home Depot Inc/The 4.2%
1/4/2043 29,856 0.00 USD 60,000 Home Depot Inc/The 4.25%
1/4/2046 72,973 0.01 USD 42,000 Home Depot Inc/The 5.4%
15/9/2040 56,677 0.01 USD 78,000 Home Depot Inc/The 5.875%
16/12/2036 110,557 0.02 USD 73,000 Home Depot Inc/The 5.95%
1/4/2041 105,717 0.02 USD 110,000 Home Equity Asset Trust 2007-1
‘Series 2007-1 2A3’ FRN 25/5/2037 92,225 0.01
USD 604,770 Home Equity Mortgage Loan Asset-Backed Trust Series INABS 2007-A ‘Series 2007-A 2A3’ FRN 25/4/2037 458,771 0.07
USD 35,554 Home Equity Mortgage Loan Asset-Backed Trust Series SPMD 2004-A ‘Series 2004-A M2’ FRN 25/7/2034 35,727 0.01
USD 80,802 Home Loan Mortgage Loan Trust 2005-1 ‘Series 2005-1 A3’ FRN 15/4/2036 75,525 0.01
US Dollar Bond Fund continued
Portfolio of Investments 31 August 2019

Transferable Securities and Money Market Instruments Admitted to an Official Stock Exchange Listing or Dealt in on Another Regulated Market
Transferable Securities and Money Market Instruments Admitted to an Official Stock Exchange Listing or Dealt in on Another Regulated Market
Holding
Description
Market Value (USD)
% of Net
Assets
Holding
Description
Market Value (USD)
% of Net
Assets
The notes on pages 728 to 741 form an integral part of these financial statements.
[616] BlackRock Global Funds (BGF)
EUR 1,120,000 Honeywell International Inc 1.3% 22/2/2023 1,306,195 0.19
USD 75,000 Honeywell International Inc 3.812% 21/11/2047 88,365 0.01
USD 2,000 HP Inc 3.75% 1/12/2020 2,037 0.00 USD 50,000 HP Inc 6% 15/9/2041 56,060 0.01 USD 875,000 Hyundai Capital America ‘144A’
2.55% 3/4/2020 877,734 0.13 USD 10,000 Hyundai Capital America ‘144A’
3.95% 1/2/2022 10,361 0.00 USD 190,000 IBM Credit LLC 3.45% 30/11/2020 193,286 0.03 USD 250,000 ICG US CLO 2015-1 Ltd ‘Series
2015-1A A1R’ ‘144A’ FRN 19/10/2028 249,518 0.04
USD 50,000 Idaho Health Facilities Authority 5% 1/12/2047 60,325 0.01
EUR 350,000 Illinois Tool Works Inc 0.625% 5/12/2027 403,924 0.06
USD 100,000 IMT Trust 2017-APTS ‘Series 2017-APTS DFX’ ‘144A’ FRN 15/6/2034 103,061 0.01
USD 120,000 Indiana Finance Authority 5% 1/10/2045 138,407 0.02
USD 40,000 Indiana Housing & Community Development Authority 3.8% 1/7/2038 43,799 0.01
USD 65,000 Indiana Michigan Power Co 3.75% 1/7/2047 71,755 0.01
USD 125,000 Intel Corp 4.8% 1/10/2041 159,687 0.02 USD 2,000 Intercontinental Exchange Inc
2.35% 15/9/2022 2,020 0.00 USD 13,000 Intercontinental Exchange Inc
2.75% 1/12/2020 13,112 0.00 USD 86,000 Intercontinental Exchange Inc
3.1% 15/9/2027 91,071 0.01 USD 248,000 Intercontinental Exchange Inc
3.75% 1/12/2025 269,041 0.04 USD 195,000 Intercontinental Exchange Inc
3.75% 21/9/2028 217,740 0.03 USD 10,000 Intercontinental Exchange Inc
4% 15/10/2023 10,771 0.00 USD 40,000 Intercontinental Exchange Inc
4.25% 21/9/2048 48,665 0.01 EUR 200,000 International Business Machines
Corp 0.375% 31/1/2023 225,271 0.03 EUR 100,000 International Business Machines
Corp 0.95% 23/5/2025 116,764 0.02 EUR 100,000 International Business Machines
Corp 1.25% 29/1/2027 120,161 0.02 USD 300,000 International Business Machines
Corp 3% 15/5/2024 312,048 0.05 USD 795,000 International Business Machines
Corp 3.3% 15/5/2026 843,221 0.12 USD 100,000 International Business Machines
Corp 4.7% 19/2/2046 123,614 0.02 USD 31,000 International Paper Co 3%
15/2/2027 31,749 0.00 USD 200,000 International Paper Co 6%
15/11/2041 251,315 0.04 USD 3,000 Interstate Power & Light Co
3.6% 1/4/2029 3,257 0.00 USD 120,000 Invitation Homes 2018-SFR3 Trust
‘Series 2018-SFR3 E’ ‘144A’ FRN 17/7/2037 120,087 0.02
USD 966,419 IXIS Real Estate Capital Trust 2007-HE1 ‘Series 2007-HE1 A4’ FRN 25/5/2037 340,279 0.05
USD 200,000 J.P. Morgan Chase Commercial Mortgage Securities Trust 2016-NINE ‘Series 2016-NINE A’ ‘144A’ FRN 6/10/2038 208,961 0.03
USD 350,000 JobsOhio Beverage System 3.985% 1/1/2029 391,137 0.06
USD 70,000 Johnson & Johnson 2.45% 1/3/2026 72,045 0.01 USD 270,335 JP Morgan Alternative Loan Trust
2007-A1 ‘Series 2007-A1 1A4’ FRN 25/3/2037 258,904 0.04
USD 50,499 JP Morgan Alternative Loan Trust 2007-A2 ‘Series 2007-A2 2A1’ FRN 25/5/2037 46,179 0.01
USD 1,030,000 JP Morgan Chase Commercial Mortgage Securities Trust 2013-LC11 ‘Series 2013-LC11 XB’ FRN 15/4/2046 19,180 0.00
USD 100,000 JP Morgan Chase Commercial Mortgage Securities Trust 2015-JP1 ‘Series 2015-JP1 C’ FRN 15/1/2049 108,538 0.02
USD 65,000 JP Morgan Chase Commercial Mortgage Securities Trust 2015-JP1 ‘Series 2015-JP1 A5’ 3.914% 15/1/2049 71,829 0.01
USD 140,000 JP Morgan Chase Commercial Mortgage Securities Trust 2015-UES ‘Series 2015-UES C’ ‘144A’ FRN 5/9/2032 140,815 0.02
USD 165,000 JP Morgan Chase Commercial Mortgage Securities Trust 2015-UES ‘Series 2015-UES D’ ‘144A’ FRN 5/9/2032 165,717 0.02
USD 280,000 JP Morgan Chase Commercial Mortgage Securities Trust 2015-UES ‘Series 2015-UES E’ ‘144A’ FRN 5/9/2032 280,392 0.04
USD 100,000 JP Morgan Chase Commercial Mortgage Securities Trust 2015-UES ‘Series 2015-UES F’ ‘144A’ FRN 5/9/2032 99,791 0.01
USD 775,910 JP Morgan Mortgage Trust 2017-3 ‘Series 2017-3 1A6’ ‘144A’ FRN 25/8/2047 790,337 0.11
USD 70,000 JPMBB Commercial Mortgage Securities Trust 2014-C21 ‘Series 2014-C21 A5’ 3.775% 15/8/2047 75,459 0.01
USD 100,000 JPMBB Commercial Mortgage Securities Trust 2015-C33 ‘Series 2015-C33 D1’ ‘144A’ FRN 15/12/2048 100,989 0.01
USD 50,000 JPMCC Commercial Mortgage Securities Trust 2017-JP6 ‘Series 2017-JP6 A5’ 3.49% 15/7/2050 54,542 0.01
USD 20,000 JPMCC Commercial Mortgage Securities Trust 2017-JP7 ‘Series 2017-JP7 B’ 4.05% 15/9/2050 21,809 0.00
USD 1,800,000 JPMDB Commercial Mortgage Securities Trust 2016-C4 ‘Series 2016-C4 XC’ ‘144A’ FRN 15/12/2049 84,690 0.01
USD 500,000 JPMDB Commercial Mortgage Securities Trust 2017-C5 ‘Series 2017-C5 C’ FRN 15/3/2050 545,924 0.08
USD 80,000 JPMDB Commercial Mortgage Securities Trust 2017-C5 ‘Series 2017-C5 A5’ 3.694% 15/3/2050 88,221 0.01
US Dollar Bond Fund continued
Portfolio of Investments 31 August 2019
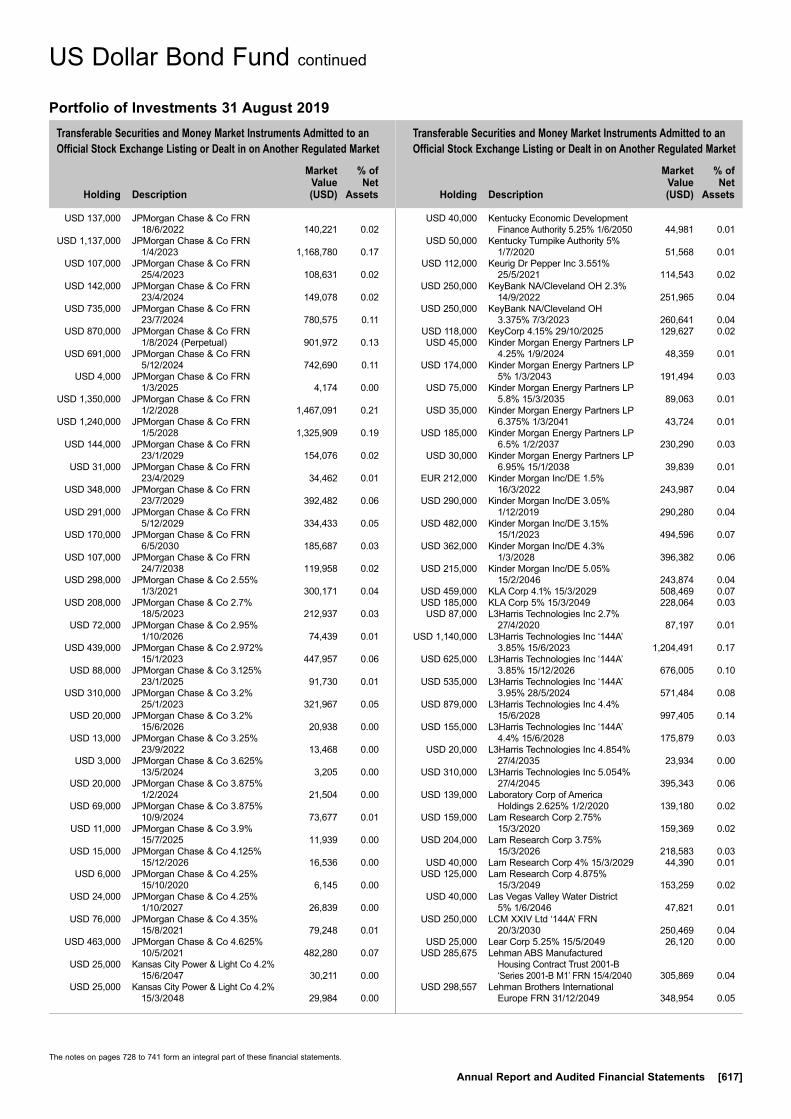
Transferable Securities and Money Market Instruments Admitted to an Official Stock Exchange Listing or Dealt in on Another Regulated Market
Transferable Securities and Money Market Instruments Admitted to an Official Stock Exchange Listing or Dealt in on Another Regulated Market
Holding
Description
Market Value (USD)
% of Net
Assets
Holding
Description
Market Value (USD)
% of Net
Assets
The notes on pages 728 to 741 form an integral part of these financial statements.
Annual Report and Audited Financial Statements [617]
USD 137,000 JPMorgan Chase & Co FRN 18/6/2022 140,221 0.02
USD 1,137,000 JPMorgan Chase & Co FRN 1/4/2023 1,168,780 0.17
USD 107,000 JPMorgan Chase & Co FRN 25/4/2023 108,631 0.02
USD 142,000 JPMorgan Chase & Co FRN 23/4/2024 149,078 0.02
USD 735,000 JPMorgan Chase & Co FRN 23/7/2024 780,575 0.11
USD 870,000 JPMorgan Chase & Co FRN 1/8/2024 (Perpetual) 901,972 0.13
USD 691,000 JPMorgan Chase & Co FRN 5/12/2024 742,690 0.11
USD 4,000 JPMorgan Chase & Co FRN 1/3/2025 4,174 0.00
USD 1,350,000 JPMorgan Chase & Co FRN 1/2/2028 1,467,091 0.21
USD 1,240,000 JPMorgan Chase & Co FRN 1/5/2028 1,325,909 0.19
USD 144,000 JPMorgan Chase & Co FRN 23/1/2029 154,076 0.02
USD 31,000 JPMorgan Chase & Co FRN 23/4/2029 34,462 0.01
USD 348,000 JPMorgan Chase & Co FRN 23/7/2029 392,482 0.06
USD 291,000 JPMorgan Chase & Co FRN 5/12/2029 334,433 0.05
USD 170,000 JPMorgan Chase & Co FRN 6/5/2030 185,687 0.03
USD 107,000 JPMorgan Chase & Co FRN 24/7/2038 119,958 0.02
USD 298,000 JPMorgan Chase & Co 2.55% 1/3/2021 300,171 0.04
USD 208,000 JPMorgan Chase & Co 2.7% 18/5/2023 212,937 0.03
USD 72,000 JPMorgan Chase & Co 2.95% 1/10/2026 74,439 0.01
USD 439,000 JPMorgan Chase & Co 2.972% 15/1/2023 447,957 0.06
USD 88,000 JPMorgan Chase & Co 3.125% 23/1/2025 91,730 0.01
USD 310,000 JPMorgan Chase & Co 3.2% 25/1/2023 321,967 0.05
USD 20,000 JPMorgan Chase & Co 3.2% 15/6/2026 20,938 0.00
USD 13,000 JPMorgan Chase & Co 3.25% 23/9/2022 13,468 0.00
USD 3,000 JPMorgan Chase & Co 3.625% 13/5/2024 3,205 0.00
USD 20,000 JPMorgan Chase & Co 3.875% 1/2/2024 21,504 0.00
USD 69,000 JPMorgan Chase & Co 3.875% 10/9/2024 73,677 0.01
USD 11,000 JPMorgan Chase & Co 3.9% 15/7/2025 11,939 0.00
USD 15,000 JPMorgan Chase & Co 4.125% 15/12/2026 16,536 0.00
USD 6,000 JPMorgan Chase & Co 4.25% 15/10/2020 6,145 0.00
USD 24,000 JPMorgan Chase & Co 4.25% 1/10/2027 26,839 0.00
USD 76,000 JPMorgan Chase & Co 4.35% 15/8/2021 79,248 0.01
USD 463,000 JPMorgan Chase & Co 4.625% 10/5/2021 482,280 0.07
USD 25,000 Kansas City Power & Light Co 4.2% 15/6/2047 30,211 0.00
USD 25,000 Kansas City Power & Light Co 4.2% 15/3/2048 29,984 0.00
USD 40,000 Kentucky Economic Development Finance Authority 5.25% 1/6/2050 44,981 0.01
USD 50,000 Kentucky Turnpike Authority 5% 1/7/2020 51,568 0.01
USD 112,000 Keurig Dr Pepper Inc 3.551% 25/5/2021 114,543 0.02
USD 250,000 KeyBank NA/Cleveland OH 2.3% 14/9/2022 251,965 0.04
USD 250,000 KeyBank NA/Cleveland OH 3.375% 7/3/2023 260,641 0.04
USD 118,000 KeyCorp 4.15% 29/10/2025 129,627 0.02 USD 45,000 Kinder Morgan Energy Partners LP
4.25% 1/9/2024 48,359 0.01 USD 174,000 Kinder Morgan Energy Partners LP
5% 1/3/2043 191,494 0.03 USD 75,000 Kinder Morgan Energy Partners LP
5.8% 15/3/2035 89,063 0.01 USD 35,000 Kinder Morgan Energy Partners LP
6.375% 1/3/2041 43,724 0.01 USD 185,000 Kinder Morgan Energy Partners LP
6.5% 1/2/2037 230,290 0.03 USD 30,000 Kinder Morgan Energy Partners LP
6.95% 15/1/2038 39,839 0.01 EUR 212,000 Kinder Morgan Inc/DE 1.5%
16/3/2022 243,987 0.04 USD 290,000 Kinder Morgan Inc/DE 3.05%
1/12/2019 290,280 0.04 USD 482,000 Kinder Morgan Inc/DE 3.15%
15/1/2023 494,596 0.07 USD 362,000 Kinder Morgan Inc/DE 4.3%
1/3/2028 396,382 0.06 USD 215,000 Kinder Morgan Inc/DE 5.05%
15/2/2046 243,874 0.04 USD 459,000 KLA Corp 4.1% 15/3/2029 508,469 0.07 USD 185,000 KLA Corp 5% 15/3/2049 228,064 0.03 USD 87,000 L3Harris Technologies Inc 2.7%
27/4/2020 87,197 0.01 USD 1,140,000 L3Harris Technologies Inc ‘144A’
3.85% 15/6/2023 1,204,491 0.17 USD 625,000 L3Harris Technologies Inc ‘144A’
3.85% 15/12/2026 676,005 0.10 USD 535,000 L3Harris Technologies Inc ‘144A’
3.95% 28/5/2024 571,484 0.08 USD 879,000 L3Harris Technologies Inc 4.4%
15/6/2028 997,405 0.14 USD 155,000 L3Harris Technologies Inc ‘144A’
4.4% 15/6/2028 175,879 0.03 USD 20,000 L3Harris Technologies Inc 4.854%
27/4/2035 23,934 0.00 USD 310,000 L3Harris Technologies Inc 5.054%
27/4/2045 395,343 0.06 USD 139,000 Laboratory Corp of America
Holdings 2.625% 1/2/2020 139,180 0.02 USD 159,000 Lam Research Corp 2.75%
15/3/2020 159,369 0.02 USD 204,000 Lam Research Corp 3.75%
15/3/2026 218,583 0.03 USD 40,000 Lam Research Corp 4% 15/3/2029 44,390 0.01 USD 125,000 Lam Research Corp 4.875%
15/3/2049 153,259 0.02 USD 40,000 Las Vegas Valley Water District
5% 1/6/2046 47,821 0.01 USD 250,000 LCM XXIV Ltd ‘144A’ FRN
20/3/2030 250,469 0.04 USD 25,000 Lear Corp 5.25% 15/5/2049 26,120 0.00 USD 285,675 Lehman ABS Manufactured
Housing Contract Trust 2001-B ‘Series 2001-B M1’ FRN 15/4/2040 305,869 0.04
USD 298,557 Lehman Brothers International Europe FRN 31/12/2049 348,954 0.05
US Dollar Bond Fund continued
Portfolio of Investments 31 August 2019
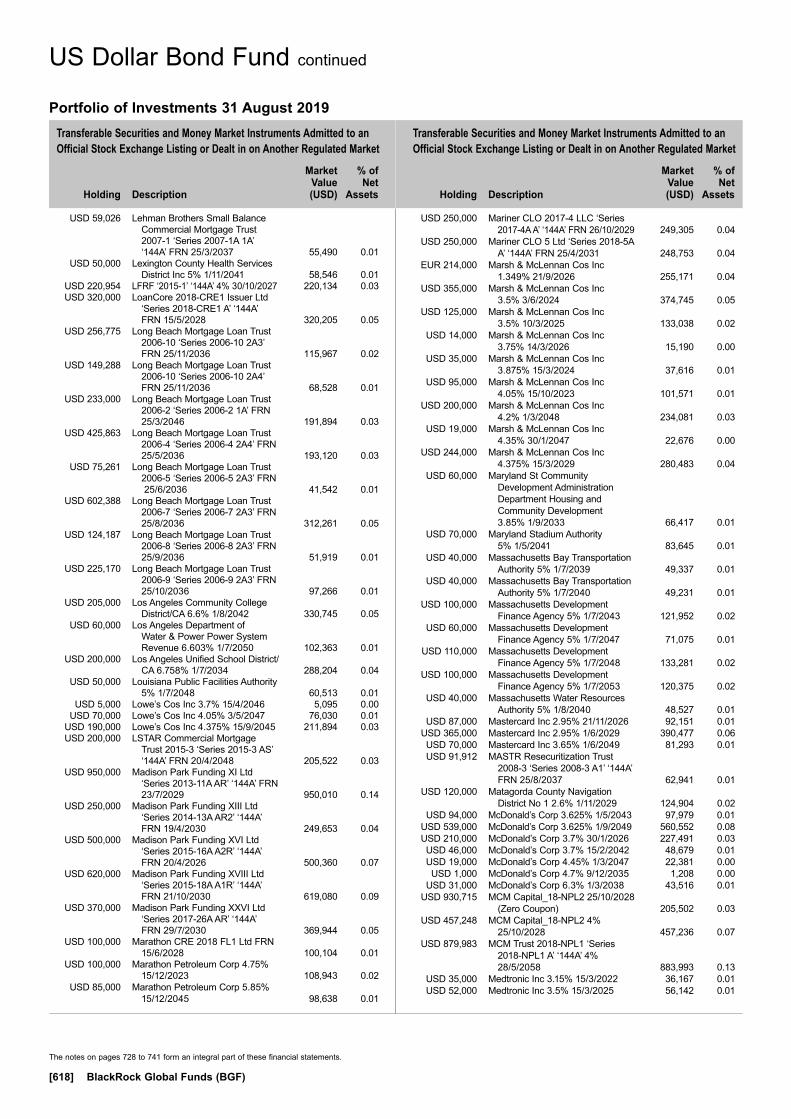
Transferable Securities and Money Market Instruments Admitted to an Official Stock Exchange Listing or Dealt in on Another Regulated Market
Transferable Securities and Money Market Instruments Admitted to an Official Stock Exchange Listing or Dealt in on Another Regulated Market
Holding
Description
Market Value (USD)
% of Net
Assets
Holding
Description
Market Value (USD)
% of Net
Assets
The notes on pages 728 to 741 form an integral part of these financial statements.
[618] BlackRock Global Funds (BGF)
USD 59,026 Lehman Brothers Small Balance Commercial Mortgage Trust 2007-1 ‘Series 2007-1A 1A’ ‘144A’ FRN 25/3/2037 55,490 0.01
USD 50,000 Lexington County Health Services District Inc 5% 1/11/2041 58,546 0.01
USD 220,954 LFRF ‘2015-1’ ‘144A’ 4% 30/10/2027 220,134 0.03 USD 320,000 LoanCore 2018-CRE1 Issuer Ltd
‘Series 2018-CRE1 A’ ‘144A’ FRN 15/5/2028 320,205 0.05
USD 256,775 Long Beach Mortgage Loan Trust 2006-10 ‘Series 2006-10 2A3’ FRN 25/11/2036 115,967 0.02
USD 149,288 Long Beach Mortgage Loan Trust 2006-10 ‘Series 2006-10 2A4’ FRN 25/11/2036 68,528 0.01
USD 233,000 Long Beach Mortgage Loan Trust 2006-2 ‘Series 2006-2 1A’ FRN 25/3/2046 191,894 0.03
USD 425,863 Long Beach Mortgage Loan Trust 2006-4 ‘Series 2006-4 2A4’ FRN 25/5/2036 193,120 0.03
USD 75,261 Long Beach Mortgage Loan Trust 2006-5 ‘Series 2006-5 2A3’ FRN 25/6/2036 41,542 0.01
USD 602,388 Long Beach Mortgage Loan Trust 2006-7 ‘Series 2006-7 2A3’ FRN 25/8/2036 312,261 0.05
USD 124,187 Long Beach Mortgage Loan Trust 2006-8 ‘Series 2006-8 2A3’ FRN 25/9/2036 51,919 0.01
USD 225,170 Long Beach Mortgage Loan Trust 2006-9 ‘Series 2006-9 2A3’ FRN 25/10/2036 97,266 0.01
USD 205,000 Los Angeles Community College District/CA 6.6% 1/8/2042 330,745 0.05
USD 60,000 Los Angeles Department of Water & Power Power System Revenue 6.603% 1/7/2050 102,363 0.01
USD 200,000 Los Angeles Unified School District/CA 6.758% 1/7/2034 288,204 0.04
USD 50,000 Louisiana Public Facilities Authority 5% 1/7/2048 60,513 0.01
USD 5,000 Lowe’s Cos Inc 3.7% 15/4/2046 5,095 0.00 USD 70,000 Lowe’s Cos Inc 4.05% 3/5/2047 76,030 0.01 USD 190,000 Lowe’s Cos Inc 4.375% 15/9/2045 211,894 0.03 USD 200,000 LSTAR Commercial Mortgage
Trust 2015-3 ‘Series 2015-3 AS’ ‘144A’ FRN 20/4/2048 205,522 0.03
USD 950,000 Madison Park Funding XI Ltd ‘Series 2013-11A AR’ ‘144A’ FRN 23/7/2029 950,010 0.14
USD 250,000 Madison Park Funding XIII Ltd ‘Series 2014-13A AR2’ ‘144A’ FRN 19/4/2030 249,653 0.04
USD 500,000 Madison Park Funding XVI Ltd ‘Series 2015-16A A2R’ ‘144A’ FRN 20/4/2026 500,360 0.07
USD 620,000 Madison Park Funding XVIII Ltd ‘Series 2015-18A A1R’ ‘144A’ FRN 21/10/2030 619,080 0.09
USD 370,000 Madison Park Funding XXVI Ltd ‘Series 2017-26A AR’ ‘144A’ FRN 29/7/2030 369,944 0.05
USD 100,000 Marathon CRE 2018 FL1 Ltd FRN 15/6/2028 100,104 0.01
USD 100,000 Marathon Petroleum Corp 4.75% 15/12/2023 108,943 0.02
USD 85,000 Marathon Petroleum Corp 5.85% 15/12/2045 98,638 0.01
USD 250,000 Mariner CLO 2017-4 LLC ‘Series 2017-4A A’ ‘144A’ FRN 26/10/2029 249,305 0.04
USD 250,000 Mariner CLO 5 Ltd ‘Series 2018-5A A’ ‘144A’ FRN 25/4/2031 248,753 0.04
EUR 214,000 Marsh & McLennan Cos Inc 1.349% 21/9/2026 255,171 0.04
USD 355,000 Marsh & McLennan Cos Inc 3.5% 3/6/2024 374,745 0.05
USD 125,000 Marsh & McLennan Cos Inc 3.5% 10/3/2025 133,038 0.02
USD 14,000 Marsh & McLennan Cos Inc 3.75% 14/3/2026 15,190 0.00
USD 35,000 Marsh & McLennan Cos Inc 3.875% 15/3/2024 37,616 0.01
USD 95,000 Marsh & McLennan Cos Inc 4.05% 15/10/2023 101,571 0.01
USD 200,000 Marsh & McLennan Cos Inc 4.2% 1/3/2048 234,081 0.03
USD 19,000 Marsh & McLennan Cos Inc 4.35% 30/1/2047 22,676 0.00
USD 244,000 Marsh & McLennan Cos Inc 4.375% 15/3/2029 280,483 0.04
USD 60,000 Maryland St Community Development Administration Department Housing and Community Development 3.85% 1/9/2033 66,417 0.01
USD 70,000 Maryland Stadium Authority 5% 1/5/2041 83,645 0.01
USD 40,000 Massachusetts Bay Transportation Authority 5% 1/7/2039 49,337 0.01
USD 40,000 Massachusetts Bay Transportation Authority 5% 1/7/2040 49,231 0.01
USD 100,000 Massachusetts Development Finance Agency 5% 1/7/2043 121,952 0.02
USD 60,000 Massachusetts Development Finance Agency 5% 1/7/2047 71,075 0.01
USD 110,000 Massachusetts Development Finance Agency 5% 1/7/2048 133,281 0.02
USD 100,000 Massachusetts Development Finance Agency 5% 1/7/2053 120,375 0.02
USD 40,000 Massachusetts Water Resources Authority 5% 1/8/2040 48,527 0.01
USD 87,000 Mastercard Inc 2.95% 21/11/2026 92,151 0.01 USD 365,000 Mastercard Inc 2.95% 1/6/2029 390,477 0.06 USD 70,000 Mastercard Inc 3.65% 1/6/2049 81,293 0.01 USD 91,912 MASTR Resecuritization Trust
2008-3 ‘Series 2008-3 A1’ ‘144A’ FRN 25/8/2037 62,941 0.01
USD 120,000 Matagorda County Navigation District No 1 2.6% 1/11/2029 124,904 0.02
USD 94,000 McDonald’s Corp 3.625% 1/5/2043 97,979 0.01 USD 539,000 McDonald’s Corp 3.625% 1/9/2049 560,552 0.08 USD 210,000 McDonald’s Corp 3.7% 30/1/2026 227,491 0.03 USD 46,000 McDonald’s Corp 3.7% 15/2/2042 48,679 0.01 USD 19,000 McDonald’s Corp 4.45% 1/3/2047 22,381 0.00 USD 1,000 McDonald’s Corp 4.7% 9/12/2035 1,208 0.00 USD 31,000 McDonald’s Corp 6.3% 1/3/2038 43,516 0.01 USD 930,715 MCM Capital_18-NPL2 25/10/2028
(Zero Coupon) 205,502 0.03 USD 457,248 MCM Capital_18-NPL2 4%
25/10/2028 457,236 0.07 USD 879,983 MCM Trust 2018-NPL1 ‘Series
2018-NPL1 A’ ‘144A’ 4% 28/5/2058 883,993 0.13
USD 35,000 Medtronic Inc 3.15% 15/3/2022 36,167 0.01 USD 52,000 Medtronic Inc 3.5% 15/3/2025 56,142 0.01
US Dollar Bond Fund continued
Portfolio of Investments 31 August 2019

Transferable Securities and Money Market Instruments Admitted to an Official Stock Exchange Listing or Dealt in on Another Regulated Market
Transferable Securities and Money Market Instruments Admitted to an Official Stock Exchange Listing or Dealt in on Another Regulated Market
Holding
Description
Market Value (USD)
% of Net
Assets
Holding
Description
Market Value (USD)
% of Net
Assets
The notes on pages 728 to 741 form an integral part of these financial statements.
Annual Report and Audited Financial Statements [619]
USD 449,000 Medtronic Inc 4.375% 15/3/2035 543,443 0.08 USD 40,000 Merck & Co Inc 3.6% 15/9/2042 45,065 0.01 USD 70,000 Merck & Co Inc 3.7% 10/2/2045 80,686 0.01 USD 65,832 Merrill Lynch First Franklin
Mortgage Loan Trust Series 2007-2 ‘Series 2007-2 A2C’ FRN 25/5/2037 39,891 0.01
USD 272,385 Merrill Lynch Mortgage Investors Trust Series 2006-A3 ‘Series 2006-A3 6A1’ FRN 25/5/2036 258,640 0.04
USD 25,000 MetLife Inc 4.125% 13/8/2042 28,682 0.00 USD 60,000 Metropolitan Atlanta Rapid Transit
Authority 4% 1/7/2025 70,023 0.01 USD 110,000 Metropolitan Atlanta Rapid Transit
Authority 5% 1/7/2041 130,615 0.02 USD 60,000 Metropolitan Atlanta Rapid Transit
Authority 5% 1/7/2045 72,076 0.01 USD 40,000 Metropolitan Government Nashville
& Davidson County Health & Educational Facs Bd 5% 1/7/2040 47,306 0.01
EUR 155,000 Metropolitan Life Global Funding I 2.375% 11/1/2023 186,327 0.03
USD 100,000 Metropolitan St Louis Sewer District 5% 1/5/2042 122,511 0.02
USD 90,000 Metropolitan St Louis Sewer District 5% 1/5/2047 109,497 0.02
USD 220,000 Metropolitan Transportation Authority 5% 15/5/2022 241,824 0.03
USD 130,000 Metropolitan Transportation Authority 5% 15/11/2040 163,594 0.02
USD 80,000 Metropolitan Transportation Authority 5% 15/11/2041 101,068 0.01
USD 160,000 Metropolitan Transportation Authority 5% 15/11/2042 200,574 0.03
USD 110,000 Metropolitan Transportation Authority 5% 15/11/2043 138,324 0.02
USD 40,000 Metropolitan Transportation Authority 5.871% 15/11/2039 55,658 0.01
USD 40,000 Metropolitan Transportation Authority 6.668% 15/11/2039 60,020 0.01
USD 80,000 Metropolitan Transportation Authority 6.687% 15/11/2040 120,758 0.02
USD 50,000 Metropolitan Transportation Authority 6.814% 15/11/2040 76,212 0.01
USD 75,000 Metropolitan Washington Airports Authority Dulles Toll Road Revenue 7.462% 1/10/2046 130,321 0.02
USD 40,000 Miami-Dade County Educational Facilities Authority 5% 1/4/2053 47,951 0.01
USD 40,000 Michigan Finance Authority 5% 15/11/2041 47,844 0.01
USD 260,000 Michigan Finance Authority 5% 1/12/2047 284,872 0.04
USD 40,000 Michigan State Housing Development Authority 3.55% 1/10/2033 43,429 0.01
USD 40,000 Michigan State Housing Development Authority 4% 1/10/2043 43,751 0.01
USD 20,000 Michigan State Housing Development Authority 4.05% 1/10/2048 21,785 0.00
USD 100,000 Michigan State Housing Development Authority 4.15% 1/10/2053 108,458 0.02
USD 446,000 Microsoft Corp 3.45% 8/8/2036 501,027 0.07 USD 510,000 Microsoft Corp 3.5% 12/2/2035 575,026 0.08 USD 30,000 Microsoft Corp 3.5% 15/11/2042 33,849 0.00 USD 555,000 Microsoft Corp 3.7% 8/8/2046 652,124 0.09
USD 15,000 Microsoft Corp 3.75% 12/2/2045 17,467 0.00 USD 25,000 Microsoft Corp 4.1% 6/2/2037 30,231 0.00 USD 49,000 Microsoft Corp 4.2% 3/11/2035 59,004 0.01 USD 20,000 Microsoft Corp 4.45% 3/11/2045 25,874 0.00 USD 55,000 Microsoft Corp 4.5% 1/10/2040 69,928 0.01 USD 160,000 MidAmerican Energy Co 4.4%
15/10/2044 197,107 0.03 USD 70,000 Mississippi Hospital Equipment &
Facilities Authority 5% 1/9/2046 79,708 0.01 EUR 300,000 MMS USA Financing Inc 0.625%
13/6/2025 335,734 0.05 USD 65,000 Molson Coors Brewing Co 4.2%
15/7/2046 66,292 0.01 USD 147,000 Montefiore Obligated Group
5.246% 1/11/2048 176,376 0.03 USD 9,000 Moody’s Corp 2.75% 15/12/2021 9,119 0.00 USD 19,000 Moody’s Corp 4.875% 15/2/2024 21,045 0.00 USD 1,078,000 Morgan Stanley FRN 22/7/2028 1,149,130 0.17 USD 436,000 Morgan Stanley FRN 24/1/2029 471,394 0.07 USD 212,000 Morgan Stanley FRN 23/1/2030 242,181 0.04 USD 572,000 Morgan Stanley 2.75% 19/5/2022 581,643 0.08 USD 954,000 Morgan Stanley 3.625% 20/1/2027 1,021,176 0.15 USD 125,000 Morgan Stanley 3.7% 23/10/2024 133,365 0.02 USD 26,000 Morgan Stanley 4% 23/7/2025 28,182 0.00 USD 110,000 Morgan Stanley 6.25% 9/8/2026 134,448 0.02 USD 24,414 Morgan Stanley ABS Capital I Inc
Trust 2005-HE1 ‘Series 2005-HE1 A2MZ’ FRN 25/12/2034 24,304 0.00
USD 174,124 Morgan Stanley ABS Capital I Inc Trust 2005-HE5 ‘Series 2005-HE5 M4’ FRN 25/9/2035 98,563 0.01
USD 580,667 Morgan Stanley ABS Capital I Inc Trust 2007-NC1 ‘Series 2007-NC1 A1’ FRN 25/11/2036 357,376 0.05
USD 260,000 Morgan Stanley Bank of America Merrill Lynch Trust 2014 C19 ‘Series 2014-C19 XF’ ‘144A’ FRN 15/12/2047 13,042 0.00
USD 180,000 Morgan Stanley Bank of America Merrill Lynch Trust 2014-C16 ‘Series 2014-C16 A5’ 3.892% 15/6/2047 194,028 0.03
USD 1,435,000 Morgan Stanley Bank of America Merrill Lynch Trust 2015-C25 ‘Series 2015-C25 A5’ 3.635% 15/10/2048 1,558,320 0.22
USD 74,000 Morgan Stanley Bank of America Merrill Lynch Trust 2015-C26 ‘Series 2015-C26 D’ ‘144A’ 3.06% 15/10/2048 70,540 0.01
USD 14,000 Morgan Stanley Bank of America Merrill Lynch Trust 2015-C26 ‘Series 2015-C26 A5’ 3.531% 15/10/2048 15,098 0.00
USD 20,000 Morgan Stanley Capital I 2017-HR2 ‘Series 2017-HR2 D’ 2.73% 15/12/2050 18,381 0.00
USD 750,000 Morgan Stanley Capital I Trust 2006-IQ11 ‘Series 2006-IQ11 C’ FRN 15/10/2042 770,929 0.11
USD 100,000 Morgan Stanley Capital I Trust 2014-CPT ‘Series 2014-CPT E’ ‘144A’ FRN 13/7/2029 100,916 0.01
USD 200,000 Morgan Stanley Capital I Trust 2014-CPT ‘Series 2014-CPT F’ ‘144A’ FRN 13/7/2029 201,939 0.03
USD 100,000 Morgan Stanley Capital I Trust 2015-MS1 ‘Series 2015-MS1 A4’ FRN 15/5/2048 108,842 0.02
US Dollar Bond Fund continued
Portfolio of Investments 31 August 2019

Transferable Securities and Money Market Instruments Admitted to an Official Stock Exchange Listing or Dealt in on Another Regulated Market
Transferable Securities and Money Market Instruments Admitted to an Official Stock Exchange Listing or Dealt in on Another Regulated Market
Holding
Description
Market Value (USD)
% of Net
Assets
Holding
Description
Market Value (USD)
% of Net
Assets
The notes on pages 728 to 741 form an integral part of these financial statements.
[620] BlackRock Global Funds (BGF)
USD 20,000 Morgan Stanley Capital I Trust 2015-MS1 ‘Series 2015-MS1 C’ FRN 15/5/2048 20,948 0.00
USD 590,000 Morgan Stanley Capital I Trust 2017-CLS ‘Series 2017-CLS F’ ‘144A’ FRN 15/11/2034 592,245 0.09
USD 100,000 Morgan Stanley Capital I Trust 2017-H1 ‘Series 2017-H1 C’ FRN 15/6/2050 108,290 0.02
USD 260,000 Morgan Stanley Capital I Trust 2017-JWDR ‘Series 2017-JWDR D’ ‘144A’ FRN 15/11/2034 260,121 0.04
USD 295,000 Morgan Stanley Capital I Trust 2017-JWDR ‘Series 2017-JWDR E’ ‘144A’ FRN 15/11/2034 295,120 0.04
USD 542,414 Morgan Stanley Capital I Trust 2018-H4 ‘Series 2018-H4 XA’ FRN 15/12/2051 36,035 0.01
USD 147,000 Morgan Stanley Capital I Trust 2018-MP ‘Series 2018-MP E’ ‘144A’ FRN 11/7/2040 151,323 0.02
USD 45,000 Morgan Stanley Capital I Trust 2018-SUN ‘Series 2018-SUN F’ ‘144A’ FRN 15/7/2035 45,266 0.01
USD 532,468 Mortgage Loan Resecuritization Trust ‘Series 2009-RS1 A85’ ‘144A’ FRN 16/4/2036 462,230 0.07
USD 321,635 MortgageIT Trust 2004-1 ‘Series 2004-1 A1’ FRN 25/11/2034 323,383 0.05
USD 10,000 Motorola Solutions Inc 4.6% 23/2/2028 10,839 0.00
USD 440,000 Motorola Solutions Inc 4.6% 23/5/2029 482,630 0.07
USD 250,000 Mountain Hawk II CLO Ltd ‘Series 2013-2A BR’ ‘144A’ FRN 20/7/2024 249,957 0.04
USD 250,000 MP CLO III Ltd ‘Series 2013-1A AR’ ‘144A’ FRN 20/10/2030 249,054 0.04
USD 250,000 MP CLO VIII Ltd ‘Series 2015-2A BR’ ‘144A’ FRN 28/10/2027 248,804 0.04
USD 165,000 MPLX LP 4% 15/2/2025 173,552 0.03 USD 9,000 MPLX LP 4% 15/3/2028 9,434 0.00 USD 830,000 MPLX LP 4.125% 1/3/2027 872,759 0.13 USD 106,000 MPLX LP 4.5% 15/7/2023 113,095 0.02 USD 332,000 MPLX LP 4.875% 1/12/2024 364,355 0.05 USD 104,000 Municipal Electric Authority of
Georgia 6.637% 1/4/2057 137,838 0.02 USD 77,000 Mylan Inc 5.2% 15/4/2048 84,053 0.01 USD 48,000 Mylan Inc 5.4% 29/11/2043 52,559 0.01 USD 85,244 Natixis Commercial Mortgage
Securities Trust 2018-FL1 ‘Series 2018-FL1 MCR1’ ‘144A’ FRN 15/6/2035 84,908 0.01
USD 1,125,000 Navient Private Education Loan Trust 2014-CT ‘Series 2014-CTA B’ ‘144A’ FRN 17/10/2044 1,136,850 0.16
USD 129,000 NBCUniversal Media LLC 4.45% 15/1/2043 152,678 0.02
USD 160,000 NBCUniversal Media LLC 5.95% 1/4/2041 222,729 0.03
USD 2,000 NBCUniversal Media LLC 6.4% 30/4/2040 2,899 0.00
USD 550,000 Neuberger Berman CLO XVI-S Ltd ‘Series 2017-16SA A’ ‘144A’ FRN 15/1/2028 548,154 0.08
USD 250,000 Neuberger Berman Loan Advisers CLO 26 Ltd ‘Series 2017-26A A’ ‘144A’ FRN 18/10/2030 249,843 0.04
USD 50,000 New Hope Cultural Education Facilities Finance Corp 5% 15/8/2047 60,091 0.01
USD 50,000 New Jersey Transportation Trust Fund Authority 5% 15/6/2029 59,906 0.01
USD 140,000 New Jersey Transportation Trust Fund Authority 5.754% 15/12/2028 165,397 0.02
USD 149,000 New Jersey Turnpike Authority 7.414% 1/1/2040 245,376 0.04
USD 50,000 New York City Housing Development Corp 3.7% 1/11/2038 53,759 0.01
USD 140,000 New York City Housing Development Corp 3.85% 1/11/2043 150,007 0.02
USD 140,000 New York City Housing Development Corp 4% 1/11/2053 150,445 0.02
USD 40,000 New York City Transitional Finance Authority Building Aid Revenue 5% 15/7/2040 47,477 0.01
USD 205,000 New York City Transitional Finance Authority Future Tax Secured Revenue 3.05% 1/5/2027 218,990 0.03
USD 260,000 New York City Transitional Finance Authority Future Tax Secured Revenue 3.35% 1/11/2030 286,528 0.04
USD 215,000 New York City Transitional Finance Authority Future Tax Secured Revenue 3.55% 1/5/2025 231,410 0.03
USD 175,000 New York City Transitional Finance Authority Future Tax Secured Revenue 3.65% 1/11/2024 186,815 0.03
USD 175,000 New York City Transitional Finance Authority Future Tax Secured Revenue 3.75% 1/11/2025 186,983 0.03
USD 205,000 New York City Water & Sewer System 5.375% 15/6/2043 216,458 0.03
USD 105,000 New York City Water & Sewer System 5.375% 15/6/2043 110,602 0.02
USD 75,000 New York City Water & Sewer System 5.44% 15/6/2043 108,934 0.02
USD 370,000 New York City Water & Sewer System 5.5% 15/6/2043 391,269 0.06
USD 85,000 New York City Water & Sewer System 5.75% 15/6/2041 127,988 0.02
USD 80,000 New York City Water & Sewer System 5.882% 15/6/2044 122,364 0.02
USD 130,000 New York City Water & Sewer System 6.011% 15/6/2042 201,742 0.03
USD 50,000 New York Convention Center Development Corp 5% 15/11/2040 59,757 0.01
USD 110,000 New York Convention Center Development Corp 5% 15/11/2046 132,139 0.02
USD 80,000 New York State Dormitory Authority 5% 15/2/2036 99,450 0.01
USD 40,000 New York State Dormitory Authority 5% 15/2/2037 49,589 0.01
USD 40,000 New York State Dormitory Authority 5% 15/2/2038 49,457 0.01
USD 30,000 New York State Dormitory Authority 5% 15/2/2040 36,905 0.01
USD 100,000 New York State Dormitory Authority 5.389% 15/3/2040 136,572 0.02
USD 120,000 New York State Urban Development Corp 3.12% 15/3/2025 127,076 0.02
USD 90,000 New York State Urban Development Corp 3.25% 15/3/2025 95,966 0.01
US Dollar Bond Fund continued
Portfolio of Investments 31 August 2019
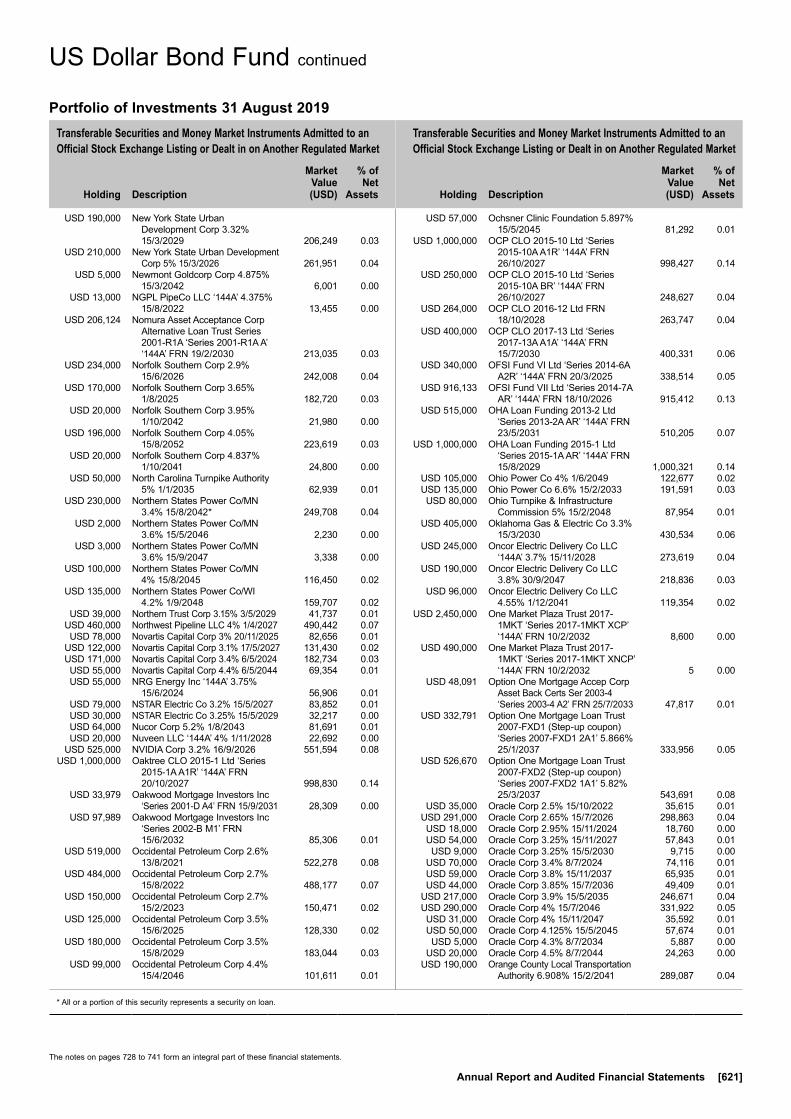
Transferable Securities and Money Market Instruments Admitted to an Official Stock Exchange Listing or Dealt in on Another Regulated Market
Transferable Securities and Money Market Instruments Admitted to an Official Stock Exchange Listing or Dealt in on Another Regulated Market
Holding
Description
Market Value (USD)
% of Net
Assets
Holding
Description
Market Value (USD)
% of Net
Assets
* All or a portion of this security represents a security on loan.
The notes on pages 728 to 741 form an integral part of these financial statements.
Annual Report and Audited Financial Statements [621]
USD 190,000 New York State Urban Development Corp 3.32% 15/3/2029 206,249 0.03
USD 210,000 New York State Urban Development Corp 5% 15/3/2026 261,951 0.04
USD 5,000 Newmont Goldcorp Corp 4.875% 15/3/2042 6,001 0.00
USD 13,000 NGPL PipeCo LLC ‘144A’ 4.375% 15/8/2022 13,455 0.00
USD 206,124 Nomura Asset Acceptance Corp Alternative Loan Trust Series 2001-R1A ‘Series 2001-R1A A’ ‘144A’ FRN 19/2/2030 213,035 0.03
USD 234,000 Norfolk Southern Corp 2.9% 15/6/2026 242,008 0.04
USD 170,000 Norfolk Southern Corp 3.65% 1/8/2025 182,720 0.03
USD 20,000 Norfolk Southern Corp 3.95% 1/10/2042 21,980 0.00
USD 196,000 Norfolk Southern Corp 4.05% 15/8/2052 223,619 0.03
USD 20,000 Norfolk Southern Corp 4.837% 1/10/2041 24,800 0.00
USD 50,000 North Carolina Turnpike Authority 5% 1/1/2035 62,939 0.01
USD 230,000 Northern States Power Co/MN 3.4% 15/8/2042* 249,708 0.04
USD 2,000 Northern States Power Co/MN 3.6% 15/5/2046 2,230 0.00
USD 3,000 Northern States Power Co/MN 3.6% 15/9/2047 3,338 0.00
USD 100,000 Northern States Power Co/MN 4% 15/8/2045 116,450 0.02
USD 135,000 Northern States Power Co/WI 4.2% 1/9/2048 159,707 0.02
USD 39,000 Northern Trust Corp 3.15% 3/5/2029 41,737 0.01 USD 460,000 Northwest Pipeline LLC 4% 1/4/2027 490,442 0.07 USD 78,000 Novartis Capital Corp 3% 20/11/2025 82,656 0.01 USD 122,000 Novartis Capital Corp 3.1% 17/5/2027 131,430 0.02 USD 171,000 Novartis Capital Corp 3.4% 6/5/2024 182,734 0.03 USD 55,000 Novartis Capital Corp 4.4% 6/5/2044 69,354 0.01 USD 55,000 NRG Energy Inc ‘144A’ 3.75%
15/6/2024 56,906 0.01 USD 79,000 NSTAR Electric Co 3.2% 15/5/2027 83,852 0.01 USD 30,000 NSTAR Electric Co 3.25% 15/5/2029 32,217 0.00 USD 64,000 Nucor Corp 5.2% 1/8/2043 81,691 0.01 USD 20,000 Nuveen LLC ‘144A’ 4% 1/11/2028 22,692 0.00 USD 525,000 NVIDIA Corp 3.2% 16/9/2026 551,594 0.08 USD 1,000,000 Oaktree CLO 2015-1 Ltd ‘Series
2015-1A A1R’ ‘144A’ FRN 20/10/2027 998,830 0.14
USD 33,979 Oakwood Mortgage Investors Inc ‘Series 2001-D A4’ FRN 15/9/2031 28,309 0.00
USD 97,989 Oakwood Mortgage Investors Inc ‘Series 2002-B M1’ FRN 15/6/2032 85,306 0.01
USD 519,000 Occidental Petroleum Corp 2.6% 13/8/2021 522,278 0.08
USD 484,000 Occidental Petroleum Corp 2.7% 15/8/2022 488,177 0.07
USD 150,000 Occidental Petroleum Corp 2.7% 15/2/2023 150,471 0.02
USD 125,000 Occidental Petroleum Corp 3.5% 15/6/2025 128,330 0.02
USD 180,000 Occidental Petroleum Corp 3.5% 15/8/2029 183,044 0.03
USD 99,000 Occidental Petroleum Corp 4.4% 15/4/2046 101,611 0.01
USD 57,000 Ochsner Clinic Foundation 5.897% 15/5/2045 81,292 0.01
USD 1,000,000 OCP CLO 2015-10 Ltd ‘Series 2015-10A A1R’ ‘144A’ FRN 26/10/2027 998,427 0.14
USD 250,000 OCP CLO 2015-10 Ltd ‘Series 2015-10A BR’ ‘144A’ FRN 26/10/2027 248,627 0.04
USD 264,000 OCP CLO 2016-12 Ltd FRN 18/10/2028 263,747 0.04
USD 400,000 OCP CLO 2017-13 Ltd ‘Series 2017-13A A1A’ ‘144A’ FRN 15/7/2030 400,331 0.06
USD 340,000 OFSI Fund VI Ltd ‘Series 2014-6A A2R’ ‘144A’ FRN 20/3/2025 338,514 0.05
USD 916,133 OFSI Fund VII Ltd ‘Series 2014-7A AR’ ‘144A’ FRN 18/10/2026 915,412 0.13
USD 515,000 OHA Loan Funding 2013-2 Ltd ‘Series 2013-2A AR’ ‘144A’ FRN 23/5/2031 510,205 0.07
USD 1,000,000 OHA Loan Funding 2015-1 Ltd ‘Series 2015-1A AR’ ‘144A’ FRN 15/8/2029 1,000,321 0.14
USD 105,000 Ohio Power Co 4% 1/6/2049 122,677 0.02 USD 135,000 Ohio Power Co 6.6% 15/2/2033 191,591 0.03 USD 80,000 Ohio Turnpike & Infrastructure
Commission 5% 15/2/2048 87,954 0.01 USD 405,000 Oklahoma Gas & Electric Co 3.3%
15/3/2030 430,534 0.06 USD 245,000 Oncor Electric Delivery Co LLC
‘144A’ 3.7% 15/11/2028 273,619 0.04 USD 190,000 Oncor Electric Delivery Co LLC
3.8% 30/9/2047 218,836 0.03 USD 96,000 Oncor Electric Delivery Co LLC
4.55% 1/12/2041 119,354 0.02 USD 2,450,000 One Market Plaza Trust 2017-
1MKT ‘Series 2017-1MKT XCP’ ‘144A’ FRN 10/2/2032 8,600 0.00
USD 490,000 One Market Plaza Trust 2017-1MKT ‘Series 2017-1MKT XNCP’ ‘144A’ FRN 10/2/2032 5 0.00
USD 48,091 Option One Mortgage Accep Corp Asset Back Certs Ser 2003-4 ‘Series 2003-4 A2’ FRN 25/7/2033 47,817 0.01
USD 332,791 Option One Mortgage Loan Trust 2007-FXD1 (Step-up coupon) ‘Series 2007-FXD1 2A1’ 5.866% 25/1/2037 333,956 0.05
USD 526,670 Option One Mortgage Loan Trust 2007-FXD2 (Step-up coupon) ‘Series 2007-FXD2 1A1’ 5.82% 25/3/2037 543,691 0.08
USD 35,000 Oracle Corp 2.5% 15/10/2022 35,615 0.01 USD 291,000 Oracle Corp 2.65% 15/7/2026 298,863 0.04 USD 18,000 Oracle Corp 2.95% 15/11/2024 18,760 0.00 USD 54,000 Oracle Corp 3.25% 15/11/2027 57,843 0.01 USD 9,000 Oracle Corp 3.25% 15/5/2030 9,715 0.00 USD 70,000 Oracle Corp 3.4% 8/7/2024 74,116 0.01 USD 59,000 Oracle Corp 3.8% 15/11/2037 65,935 0.01 USD 44,000 Oracle Corp 3.85% 15/7/2036 49,409 0.01 USD 217,000 Oracle Corp 3.9% 15/5/2035 246,671 0.04 USD 290,000 Oracle Corp 4% 15/7/2046 331,922 0.05 USD 31,000 Oracle Corp 4% 15/11/2047 35,592 0.01 USD 50,000 Oracle Corp 4.125% 15/5/2045 57,674 0.01 USD 5,000 Oracle Corp 4.3% 8/7/2034 5,887 0.00 USD 20,000 Oracle Corp 4.5% 8/7/2044 24,263 0.00 USD 190,000 Orange County Local Transportation
Authority 6.908% 15/2/2041 289,087 0.04
US Dollar Bond Fund continued
Portfolio of Investments 31 August 2019
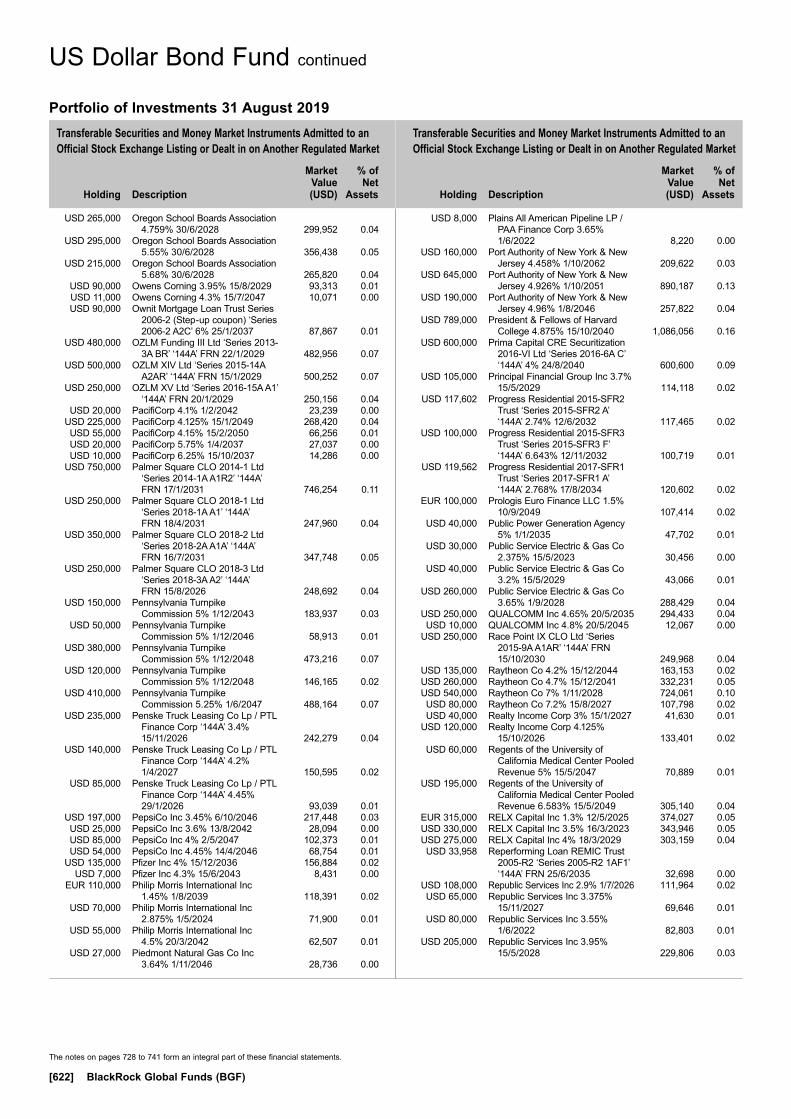
Transferable Securities and Money Market Instruments Admitted to an Official Stock Exchange Listing or Dealt in on Another Regulated Market
Transferable Securities and Money Market Instruments Admitted to an Official Stock Exchange Listing or Dealt in on Another Regulated Market
Holding
Description
Market Value (USD)
% of Net
Assets
Holding
Description
Market Value (USD)
% of Net
Assets
The notes on pages 728 to 741 form an integral part of these financial statements.
[622] BlackRock Global Funds (BGF)
USD 265,000 Oregon School Boards Association 4.759% 30/6/2028 299,952 0.04
USD 295,000 Oregon School Boards Association 5.55% 30/6/2028 356,438 0.05
USD 215,000 Oregon School Boards Association 5.68% 30/6/2028 265,820 0.04
USD 90,000 Owens Corning 3.95% 15/8/2029 93,313 0.01 USD 11,000 Owens Corning 4.3% 15/7/2047 10,071 0.00 USD 90,000 Ownit Mortgage Loan Trust Series
2006-2 (Step-up coupon) ‘Series 2006-2 A2C’ 6% 25/1/2037 87,867 0.01
USD 480,000 OZLM Funding III Ltd ‘Series 2013-3A BR’ ‘144A’ FRN 22/1/2029 482,956 0.07
USD 500,000 OZLM XIV Ltd ‘Series 2015-14A A2AR’ ‘144A’ FRN 15/1/2029 500,252 0.07
USD 250,000 OZLM XV Ltd ‘Series 2016-15A A1’ ‘144A’ FRN 20/1/2029 250,156 0.04
USD 20,000 PacifiCorp 4.1% 1/2/2042 23,239 0.00 USD 225,000 PacifiCorp 4.125% 15/1/2049 268,420 0.04 USD 55,000 PacifiCorp 4.15% 15/2/2050 66,256 0.01 USD 20,000 PacifiCorp 5.75% 1/4/2037 27,037 0.00 USD 10,000 PacifiCorp 6.25% 15/10/2037 14,286 0.00 USD 750,000 Palmer Square CLO 2014-1 Ltd
‘Series 2014-1A A1R2’ ‘144A’ FRN 17/1/2031 746,254 0.11
USD 250,000 Palmer Square CLO 2018-1 Ltd ‘Series 2018-1A A1’ ‘144A’ FRN 18/4/2031 247,960 0.04
USD 350,000 Palmer Square CLO 2018-2 Ltd ‘Series 2018-2A A1A’ ‘144A’ FRN 16/7/2031 347,748 0.05
USD 250,000 Palmer Square CLO 2018-3 Ltd ‘Series 2018-3A A2’ ‘144A’ FRN 15/8/2026 248,692 0.04
USD 150,000 Pennsylvania Turnpike Commission 5% 1/12/2043 183,937 0.03
USD 50,000 Pennsylvania Turnpike Commission 5% 1/12/2046 58,913 0.01
USD 380,000 Pennsylvania Turnpike Commission 5% 1/12/2048 473,216 0.07
USD 120,000 Pennsylvania Turnpike Commission 5% 1/12/2048 146,165 0.02
USD 410,000 Pennsylvania Turnpike Commission 5.25% 1/6/2047 488,164 0.07
USD 235,000 Penske Truck Leasing Co Lp / PTL Finance Corp ‘144A’ 3.4% 15/11/2026 242,279 0.04
USD 140,000 Penske Truck Leasing Co Lp / PTL Finance Corp ‘144A’ 4.2% 1/4/2027 150,595 0.02
USD 85,000 Penske Truck Leasing Co Lp / PTL Finance Corp ‘144A’ 4.45% 29/1/2026 93,039 0.01
USD 197,000 PepsiCo Inc 3.45% 6/10/2046 217,448 0.03 USD 25,000 PepsiCo Inc 3.6% 13/8/2042 28,094 0.00 USD 85,000 PepsiCo Inc 4% 2/5/2047 102,373 0.01 USD 54,000 PepsiCo Inc 4.45% 14/4/2046 68,754 0.01 USD 135,000 Pfizer Inc 4% 15/12/2036 156,884 0.02 USD 7,000 Pfizer Inc 4.3% 15/6/2043 8,431 0.00 EUR 110,000 Philip Morris International Inc
1.45% 1/8/2039 118,391 0.02 USD 70,000 Philip Morris International Inc
2.875% 1/5/2024 71,900 0.01 USD 55,000 Philip Morris International Inc
4.5% 20/3/2042 62,507 0.01 USD 27,000 Piedmont Natural Gas Co Inc
3.64% 1/11/2046 28,736 0.00
USD 8,000 Plains All American Pipeline LP / PAA Finance Corp 3.65% 1/6/2022 8,220 0.00
USD 160,000 Port Authority of New York & New Jersey 4.458% 1/10/2062 209,622 0.03
USD 645,000 Port Authority of New York & New Jersey 4.926% 1/10/2051 890,187 0.13
USD 190,000 Port Authority of New York & New Jersey 4.96% 1/8/2046 257,822 0.04
USD 789,000 President & Fellows of Harvard College 4.875% 15/10/2040 1,086,056 0.16
USD 600,000 Prima Capital CRE Securitization 2016-VI Ltd ‘Series 2016-6A C’ ‘144A’ 4% 24/8/2040 600,600 0.09
USD 105,000 Principal Financial Group Inc 3.7% 15/5/2029 114,118 0.02
USD 117,602 Progress Residential 2015-SFR2 Trust ‘Series 2015-SFR2 A’ ‘144A’ 2.74% 12/6/2032 117,465 0.02
USD 100,000 Progress Residential 2015-SFR3 Trust ‘Series 2015-SFR3 F’ ‘144A’ 6.643% 12/11/2032 100,719 0.01
USD 119,562 Progress Residential 2017-SFR1 Trust ‘Series 2017-SFR1 A’ ‘144A’ 2.768% 17/8/2034 120,602 0.02
EUR 100,000 Prologis Euro Finance LLC 1.5% 10/9/2049 107,414 0.02
USD 40,000 Public Power Generation Agency 5% 1/1/2035 47,702 0.01
USD 30,000 Public Service Electric & Gas Co 2.375% 15/5/2023 30,456 0.00
USD 40,000 Public Service Electric & Gas Co 3.2% 15/5/2029 43,066 0.01
USD 260,000 Public Service Electric & Gas Co 3.65% 1/9/2028 288,429 0.04
USD 250,000 QUALCOMM Inc 4.65% 20/5/2035 294,433 0.04 USD 10,000 QUALCOMM Inc 4.8% 20/5/2045 12,067 0.00 USD 250,000 Race Point IX CLO Ltd ‘Series
2015-9A A1AR’ ‘144A’ FRN 15/10/2030 249,968 0.04
USD 135,000 Raytheon Co 4.2% 15/12/2044 163,153 0.02 USD 260,000 Raytheon Co 4.7% 15/12/2041 332,231 0.05 USD 540,000 Raytheon Co 7% 1/11/2028 724,061 0.10 USD 80,000 Raytheon Co 7.2% 15/8/2027 107,798 0.02 USD 40,000 Realty Income Corp 3% 15/1/2027 41,630 0.01 USD 120,000 Realty Income Corp 4.125%
15/10/2026 133,401 0.02 USD 60,000 Regents of the University of
California Medical Center Pooled Revenue 5% 15/5/2047 70,889 0.01
USD 195,000 Regents of the University of California Medical Center Pooled Revenue 6.583% 15/5/2049 305,140 0.04
EUR 315,000 RELX Capital Inc 1.3% 12/5/2025 374,027 0.05 USD 330,000 RELX Capital Inc 3.5% 16/3/2023 343,946 0.05 USD 275,000 RELX Capital Inc 4% 18/3/2029 303,159 0.04 USD 33,958 Reperforming Loan REMIC Trust
2005-R2 ‘Series 2005-R2 1AF1’ ‘144A’ FRN 25/6/2035 32,698 0.00
USD 108,000 Republic Services Inc 2.9% 1/7/2026 111,964 0.02 USD 65,000 Republic Services Inc 3.375%
15/11/2027 69,646 0.01 USD 80,000 Republic Services Inc 3.55%
1/6/2022 82,803 0.01 USD 205,000 Republic Services Inc 3.95%
15/5/2028 229,806 0.03
US Dollar Bond Fund continued
Portfolio of Investments 31 August 2019

Transferable Securities and Money Market Instruments Admitted to an Official Stock Exchange Listing or Dealt in on Another Regulated Market
Transferable Securities and Money Market Instruments Admitted to an Official Stock Exchange Listing or Dealt in on Another Regulated Market
Holding
Description
Market Value (USD)
% of Net
Assets
Holding
Description
Market Value (USD)
% of Net
Assets
* All or a portion of this security represents a security on loan.
The notes on pages 728 to 741 form an integral part of these financial statements.
Annual Report and Audited Financial Statements [623]
Portfolio of Investments 31 August 2019
USD 275,000 Republic Services Inc 4.75% 15/5/2023 298,995 0.04
USD 1,435,000 Reynolds American Inc 4.45% 12/6/2025 1,552,842 0.22
USD 271,350 Reynolds Group Issuer Inc / Reynolds Group Issuer LLC / Reynolds Group Issuer Lu 5.75% 15/10/2020 272,368 0.04
USD 1,250,000 Rockford Tower CLO 2017-3 Ltd ‘Series 2017-3A A’ ‘144A’ FRN 20/10/2030 1,247,711 0.18
USD 250,000 Rockford Tower CLO Ltd ‘Series 2017-1A B’ ‘144A’ FRN 15/4/2029 249,166 0.04
USD 60,000 Royal Oak Hospital Finance Authority 5% 1/9/2039 68,071 0.01
USD 30,000 RPM International Inc 4.25% 15/1/2048 29,696 0.00
USD 9,000 Ryder System Inc 2.8% 1/3/2022 9,132 0.00 USD 23,000 Ryder System Inc 3.75% 9/6/2023 24,229 0.00 USD 213,000 Sabine Pass Liquefaction LLC
5.625% 15/4/2023 232,553 0.03 USD 615,000 Sabine Pass Liquefaction LLC
5.625% 1/3/2025 691,376 0.10 USD 550,000 Sabine Pass Liquefaction LLC
5.75% 15/5/2024 614,028 0.09 USD 255,000 Sabine Pass Liquefaction LLC
5.875% 30/6/2026 293,550 0.04 USD 27,828 SACO I Trust 2006-9 ‘Series 2006-
9 A1’ FRN 25/8/2036 27,376 0.00 USD 350,000 Sacramento County Sanitation
Districts Financing Authority FRN 1/12/2035 339,442 0.05
USD 50,000 Salt Lake City Corp Airport Revenue 5% 1/7/2047 60,395 0.01
USD 230,000 Salt River Project Agricultural Improvement & Power District 5% 1/12/2045 270,586 0.04
USD 70,000 San Antonio Water System 5% 15/5/2039 82,388 0.01
USD 70,000 San Diego County Regional Airport Authority 5% 1/7/2047 85,229 0.01
USD 50,000 San Diego Public Facilities Financing Authority 5% 15/5/2039 60,843 0.01
USD 345,000 San Jose Redevelopment Agency Successor Agency 2.958% 1/8/2024 363,042 0.05
USD 200,000 San Jose Redevelopment Agency Successor Agency 3.125% 1/8/2028 216,561 0.03
USD 85,000 San Jose Redevelopment Agency Successor Agency 3.176% 1/8/2026 92,074 0.01
USD 170,000 San Jose Redevelopment Agency Successor Agency 3.25% 1/8/2029 184,972 0.03
USD 161,000 Schlumberger Holdings Corp ‘144A’ 3.9% 17/5/2028 171,226 0.02
USD 137,735 Seasoned Credit Risk Transfer Trust Series 2017-3 ‘Series 2017-3 B’ ‘144A’ 25/7/2056 (Zero Coupon) 14,797 0.00
USD 100,000 Seasoned Credit Risk Transfer Trust Series 2017-3 ‘Series 2017-3 M2’ ‘144A’ FRN 25/7/2056 101,474 0.01
USD 122,110 Securitized Asset Backed Receivables LLC Trust 2006-WM4 ‘Series 2006-WM4 A1’ ‘144A’ FRN 25/11/2036 72,040 0.01
USD 62,732 Securitized Asset Backed Receivables LLC Trust 2006-WM4 ‘Series 2006-WM4 A2A’ FRN 25/11/2036 24,128 0.00
USD 189,242 Securitized Asset Backed Receivables LLC Trust 2006-WM4 ‘Series 2006-WM4 A2C’ FRN 25/11/2036 74,243 0.01
USD 29,330 Security National Mortgage Loan Trust 2007-1 ‘Series 2007-1A 2A’ ‘144A’ FRN 25/4/2037 29,061 0.00
USD 528,454 Seneca Park CLO Ltd 2014-1 ‘Series 2014-1A AR’ ‘144A’ FRN 17/7/2026 528,417 0.08
USD 41,612 SG Mortgage Securities Trust 2006-FRE2 ‘Series 2006-FRE2 A2C’ FRN 25/7/2036 12,942 0.00
USD 90,000 Sherwin-Williams Co/The 4.5% 1/6/2047 102,416 0.01
USD 436,787 SLM Private Credit Student Loan Trust 2004-B ‘Series 2004-B A3’ FRN 15/3/2024 434,735 0.06
USD 77,483 SLM Private Credit Student Loan Trust 2005-A ‘Series 2005-A A3’ FRN 15/6/2023 77,323 0.01
USD 226,192 SLM Private Credit Student Loan Trust 2006-B ‘Series 2006-B A5’ FRN 15/12/2039 221,026 0.03
USD 275,401 SMB Private Education Loan Trust 2014-A ‘Series 2014-A A2A’ ‘144A’ 3.05% 15/5/2026 277,399 0.04
USD 250,000 Sound Point Clo XIV Ltd ‘Series 2016-3A C’ ‘144A’ FRN 23/1/2029 249,921 0.04
USD 339,000 South Carolina Public Service Authority 2.388% 1/12/2023 341,565 0.05
USD 190,000 South Carolina Public Service Authority 6.454% 1/1/2050 306,318 0.04
USD 25,000 Southwestern Public Service Co 3.4% 15/8/2046 26,622 0.00
USD 3,000 Southwestern Public Service Co 3.75% 15/6/2049 3,395 0.00
USD 30,000 Spartanburg County School District No 7 5% 1/3/2048 37,463 0.01
USD 305,000 Spectra Energy Partners LP 4.5% 15/3/2045 326,449 0.05
USD 604,688 Sprint Spectrum Co LLC / Sprint Spectrum Co II LLC / Sprint Spectrum Co III LLC ‘144A’ 3.36% 20/9/2021 607,045 0.09
USD 440,000 State of California 2.65% 1/4/2026 458,181 0.07 USD 550,000 State of California 4.6% 1/4/2038 621,376 0.09 USD 150,000 State of California 5% 1/10/2025 184,988 0.03 USD 120,000 State of California 7.3% 1/10/2039 190,888 0.03 USD 40,000 State of California 7.35% 1/11/2039 64,020 0.01 USD 150,000 State of California 7.5% 1/4/2034 236,605 0.03 USD 335,000 State of California 7.55% 1/4/2039 564,653 0.08 USD 155,000 State of Connecticut 2.99%
15/1/2023 159,345 0.02 USD 210,000 State of Connecticut 3.31%
15/1/2026 224,146 0.03 USD 250,000 State of Connecticut 5.85%
15/3/2032 332,935 0.05 USD 180,000 State of Illinois 5% 1/11/2024 199,117 0.03 USD 190,000 State of Illinois 5% 1/11/2025 213,699 0.03 USD 535,000 State of Illinois 5.1% 1/6/2033* 573,598 0.08 USD 140,000 State of Maryland 5% 1/8/2030 187,884 0.03 USD 290,000 State of Maryland 5% 1/8/2031 387,569 0.06 USD 120,000 State of Minnesota 5% 1/8/2035 158,220 0.02
US Dollar Bond Fund continued
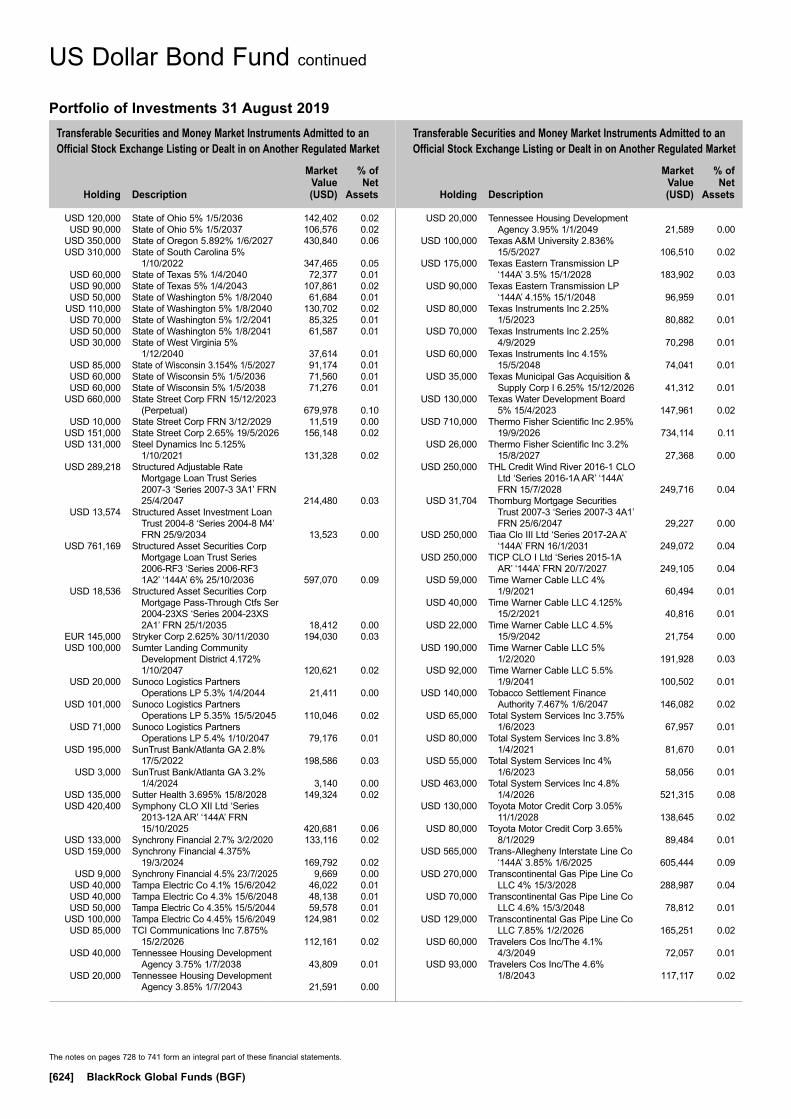
The notes on pages 728 to 741 form an integral part of these financial statements.
[624] BlackRock Global Funds (BGF)
Transferable Securities and Money Market Instruments Admitted to an Official Stock Exchange Listing or Dealt in on Another Regulated Market
Transferable Securities and Money Market Instruments Admitted to an Official Stock Exchange Listing or Dealt in on Another Regulated Market
Holding
Description
Market Value (USD)
% of Net
Assets
Holding
Description
Market Value (USD)
% of Net
Assets
USD 120,000 State of Ohio 5% 1/5/2036 142,402 0.02 USD 90,000 State of Ohio 5% 1/5/2037 106,576 0.02 USD 350,000 State of Oregon 5.892% 1/6/2027 430,840 0.06 USD 310,000 State of South Carolina 5%
1/10/2022 347,465 0.05 USD 60,000 State of Texas 5% 1/4/2040 72,377 0.01 USD 90,000 State of Texas 5% 1/4/2043 107,861 0.02 USD 50,000 State of Washington 5% 1/8/2040 61,684 0.01 USD 110,000 State of Washington 5% 1/8/2040 130,702 0.02 USD 70,000 State of Washington 5% 1/2/2041 85,325 0.01 USD 50,000 State of Washington 5% 1/8/2041 61,587 0.01 USD 30,000 State of West Virginia 5%
1/12/2040 37,614 0.01 USD 85,000 State of Wisconsin 3.154% 1/5/2027 91,174 0.01 USD 60,000 State of Wisconsin 5% 1/5/2036 71,560 0.01 USD 60,000 State of Wisconsin 5% 1/5/2038 71,276 0.01 USD 660,000 State Street Corp FRN 15/12/2023
(Perpetual) 679,978 0.10 USD 10,000 State Street Corp FRN 3/12/2029 11,519 0.00 USD 151,000 State Street Corp 2.65% 19/5/2026 156,148 0.02 USD 131,000 Steel Dynamics Inc 5.125%
1/10/2021 131,328 0.02 USD 289,218 Structured Adjustable Rate
Mortgage Loan Trust Series 2007-3 ‘Series 2007-3 3A1’ FRN 25/4/2047 214,480 0.03
USD 13,574 Structured Asset Investment Loan Trust 2004-8 ‘Series 2004-8 M4’ FRN 25/9/2034 13,523 0.00
USD 761,169 Structured Asset Securities Corp Mortgage Loan Trust Series 2006-RF3 ‘Series 2006-RF3 1A2’ ‘144A’ 6% 25/10/2036 597,070 0.09
USD 18,536 Structured Asset Securities Corp Mortgage Pass-Through Ctfs Ser 2004-23XS ‘Series 2004-23XS 2A1’ FRN 25/1/2035 18,412 0.00
EUR 145,000 Stryker Corp 2.625% 30/11/2030 194,030 0.03 USD 100,000 Sumter Landing Community
Development District 4.172% 1/10/2047 120,621 0.02
USD 20,000 Sunoco Logistics Partners Operations LP 5.3% 1/4/2044 21,411 0.00
USD 101,000 Sunoco Logistics Partners Operations LP 5.35% 15/5/2045 110,046 0.02
USD 71,000 Sunoco Logistics Partners Operations LP 5.4% 1/10/2047 79,176 0.01
USD 195,000 SunTrust Bank/Atlanta GA 2.8% 17/5/2022 198,586 0.03
USD 3,000 SunTrust Bank/Atlanta GA 3.2% 1/4/2024 3,140 0.00
USD 135,000 Sutter Health 3.695% 15/8/2028 149,324 0.02 USD 420,400 Symphony CLO XII Ltd ‘Series
2013-12A AR’ ‘144A’ FRN 15/10/2025 420,681 0.06
USD 133,000 Synchrony Financial 2.7% 3/2/2020 133,116 0.02 USD 159,000 Synchrony Financial 4.375%
19/3/2024 169,792 0.02 USD 9,000 Synchrony Financial 4.5% 23/7/2025 9,669 0.00 USD 40,000 Tampa Electric Co 4.1% 15/6/2042 46,022 0.01 USD 40,000 Tampa Electric Co 4.3% 15/6/2048 48,138 0.01 USD 50,000 Tampa Electric Co 4.35% 15/5/2044 59,578 0.01 USD 100,000 Tampa Electric Co 4.45% 15/6/2049 124,981 0.02 USD 85,000 TCI Communications Inc 7.875%
15/2/2026 112,161 0.02 USD 40,000 Tennessee Housing Development
Agency 3.75% 1/7/2038 43,809 0.01 USD 20,000 Tennessee Housing Development
Agency 3.85% 1/7/2043 21,591 0.00
USD 20,000 Tennessee Housing Development Agency 3.95% 1/1/2049 21,589 0.00
USD 100,000 Texas A&M University 2.836% 15/5/2027 106,510 0.02
USD 175,000 Texas Eastern Transmission LP ‘144A’ 3.5% 15/1/2028 183,902 0.03
USD 90,000 Texas Eastern Transmission LP ‘144A’ 4.15% 15/1/2048 96,959 0.01
USD 80,000 Texas Instruments Inc 2.25% 1/5/2023 80,882 0.01
USD 70,000 Texas Instruments Inc 2.25% 4/9/2029 70,298 0.01
USD 60,000 Texas Instruments Inc 4.15% 15/5/2048 74,041 0.01
USD 35,000 Texas Municipal Gas Acquisition & Supply Corp I 6.25% 15/12/2026 41,312 0.01
USD 130,000 Texas Water Development Board 5% 15/4/2023 147,961 0.02
USD 710,000 Thermo Fisher Scientific Inc 2.95% 19/9/2026 734,114 0.11
USD 26,000 Thermo Fisher Scientific Inc 3.2% 15/8/2027 27,368 0.00
USD 250,000 THL Credit Wind River 2016-1 CLO Ltd ‘Series 2016-1A AR’ ‘144A’ FRN 15/7/2028 249,716 0.04
USD 31,704 Thornburg Mortgage Securities Trust 2007-3 ‘Series 2007-3 4A1’ FRN 25/6/2047 29,227 0.00
USD 250,000 Tiaa Clo III Ltd ‘Series 2017-2A A’ ‘144A’ FRN 16/1/2031 249,072 0.04
USD 250,000 TICP CLO I Ltd ‘Series 2015-1A AR’ ‘144A’ FRN 20/7/2027 249,105 0.04
USD 59,000 Time Warner Cable LLC 4% 1/9/2021 60,494 0.01
USD 40,000 Time Warner Cable LLC 4.125% 15/2/2021 40,816 0.01
USD 22,000 Time Warner Cable LLC 4.5% 15/9/2042 21,754 0.00
USD 190,000 Time Warner Cable LLC 5% 1/2/2020 191,928 0.03
USD 92,000 Time Warner Cable LLC 5.5% 1/9/2041 100,502 0.01
USD 140,000 Tobacco Settlement Finance Authority 7.467% 1/6/2047 146,082 0.02
USD 65,000 Total System Services Inc 3.75% 1/6/2023 67,957 0.01
USD 80,000 Total System Services Inc 3.8% 1/4/2021 81,670 0.01
USD 55,000 Total System Services Inc 4% 1/6/2023 58,056 0.01
USD 463,000 Total System Services Inc 4.8% 1/4/2026 521,315 0.08
USD 130,000 Toyota Motor Credit Corp 3.05% 11/1/2028 138,645 0.02
USD 80,000 Toyota Motor Credit Corp 3.65% 8/1/2029 89,484 0.01
USD 565,000 Trans-Allegheny Interstate Line Co ‘144A’ 3.85% 1/6/2025 605,444 0.09
USD 270,000 Transcontinental Gas Pipe Line Co LLC 4% 15/3/2028 288,987 0.04
USD 70,000 Transcontinental Gas Pipe Line Co LLC 4.6% 15/3/2048 78,812 0.01
USD 129,000 Transcontinental Gas Pipe Line Co LLC 7.85% 1/2/2026 165,251 0.02
USD 60,000 Travelers Cos Inc/The 4.1% 4/3/2049 72,057 0.01
USD 93,000 Travelers Cos Inc/The 4.6% 1/8/2043 117,117 0.02
US Dollar Bond Fund continued
Portfolio of Investments 31 August 2019

The notes on pages 728 to 741 form an integral part of these financial statements.
Annual Report and Audited Financial Statements [625]
Transferable Securities and Money Market Instruments Admitted to an Official Stock Exchange Listing or Dealt in on Another Regulated Market
Transferable Securities and Money Market Instruments Admitted to an Official Stock Exchange Listing or Dealt in on Another Regulated Market
Holding
Description
Market Value (USD)
% of Net
Assets
Holding
Description
Market Value (USD)
% of Net
Assets
* All or a portion of this security represents a security on loan.
USD 2,000 Travelers Cos Inc/The 6.25% 15/6/2037 2,899 0.00
USD 35,000 Travelers Cos Inc/The 6.75% 20/6/2036 52,469 0.01
USD 100,000 Tricon American Homes 2017-SFR2 Trust ‘Series 2017-SFR2 F’ ‘144A’ 5.104% 17/1/2036 105,044 0.02
USD 80,000 TSASC Inc/NY 5% 1/6/2041 89,456 0.01 USD 201,000 Tyson Foods Inc 3.55% 2/6/2027 215,716 0.03 USD 5,000 Tyson Foods Inc 4% 1/3/2026 5,449 0.00 USD 31,000 Tyson Foods Inc 4.55% 2/6/2047 35,769 0.01 USD 20,000 Tyson Foods Inc 5.1% 28/9/2048 24,903 0.00 USD 20,000 Tyson Foods Inc 5.15% 15/8/2044 24,393 0.00 USD 1,155,787 UBS_18-C14 15/12/2051
(Zero Coupon) 87,774 0.01 USD 155,000 Union Electric Co 3.5% 15/3/2029 171,509 0.02 USD 200,000 Union Pacific Corp 2.75% 1/3/2026 206,317 0.03 USD 170,000 Union Pacific Corp 3.15% 1/3/2024 177,716 0.03 USD 321,000 Union Pacific Corp 3.375% 1/2/2035 332,876 0.05 USD 30,000 Union Pacific Corp 3.55% 15/8/2039 32,119 0.00 USD 236,000 Union Pacific Corp 3.6% 15/9/2037 252,811 0.04 USD 50,000 Union Pacific Corp 3.799% 1/10/2051 54,759 0.01 USD 177,000 Union Pacific Corp 3.875% 1/2/2055 193,155 0.03 USD 60,000 Union Pacific Corp 3.95% 15/8/2059 66,076 0.01 USD 1,000 Union Pacific Corp 4.3% 1/3/2049 1,195 0.00 USD 45,000 Union Pacific Corp 4.75% 15/9/2041 54,271 0.01 USD 132,480 Union Pacific Railroad Co 2014-1
Pass Through Trust 3.227% 14/5/2026 140,045 0.02
USD 20,943 United Airlines 2014-1 Class B Pass Through Trust 4.75% 11/4/2022 21,599 0.00
USD 19,504 United Airlines 2014-2 Class B Pass Through Trust 4.625% 3/9/2022 20,204 0.00
USD 39,327 United Airlines 2015-1 Class AA Pass Through Trust 3.45% 1/12/2027 41,683 0.01
USD 12,523 United Airlines 2016-1 Class AA Pass Through Trust 3.1% 7/7/2028 13,150 0.00
USD 10,458 United Airlines 2016-1 Class B Pass Through Trust 3.65% 7/1/2026 10,702 0.00
USD 78,260 United Airlines 2016-2 Class AA Pass Through Trust 2.875% 7/10/2028 80,314 0.01
USD 13,073 United Airlines 2016-2 Class B Pass Through Trust 3.65% 7/10/2025 13,302 0.00
USD 39,304 United Airlines 2018-1 Class AA Pass Through Trust 3.5% 1/3/2030 41,633 0.01
USD 91,818 United Airlines 2018-1 Class B Pass Through Trust 4.6% 1/3/2026 97,031 0.01
USD 115,000 United Airlines 2019-1 Class AA Pass Through Trust 4.15% 25/8/2031 129,089 0.02
USD 17,000 United Parcel Service Inc 2.5% 1/4/2023 17,293 0.00
USD 115,000 United Parcel Service Inc 2.5% 1/9/2029 116,302 0.02
USD 169,000 United Parcel Service Inc 3.4% 15/3/2029 183,941 0.03
USD 10,000 United Parcel Service Inc 3.4% 1/9/2049 10,484 0.00
USD 19,000 United Parcel Service Inc 6.2% 15/1/2038 26,598 0.00
USD 19,985,200 United States Treasury Inflation Indexed Bonds 0.5% 15/4/2024 20,746,311 2.99
USD 6,848,000 United States Treasury Note/Bond 1.125% 31/7/2021 6,790,621 0.98
USD 6,085,000 United States Treasury Note/Bond 1.5% 31/1/2022 6,086,426 0.88
USD 4,412,000 United States Treasury Note/Bond 1.5% 15/8/2026 4,420,617 0.64
USD 915,000 United States Treasury Note/Bond 1.625% 15/8/2029 908,280 0.13
USD 3,700,000 United States Treasury Note/Bond 1.75% 31/7/2021* 3,713,369 0.54
USD 5,782,000 United States Treasury Note/Bond 1.75% 30/4/2022 5,824,462 0.84
USD 5,890,000 United States Treasury Note/Bond 1.75% 31/7/2024* 5,979,731 0.86
USD 6,085,000 United States Treasury Note/Bond 2% 31/7/2020 6,095,696 0.88
USD 3,806,000 United States Treasury Note/Bond 2% 15/2/2025 3,916,612 0.57
USD 3,050,000 United States Treasury Note/Bond 2.125% 31/12/2022 3,116,719 0.45
USD 3,050,000 United States Treasury Note/Bond 2.125% 31/7/2024 3,148,648 0.45
USD 3,344,000 United States Treasury Note/Bond 2.125% 15/5/2025 3,466,657 0.50
USD 3,050,000 United States Treasury Note/Bond 2.25% 15/8/2027 3,224,422 0.47
USD 1,722,000 United States Treasury Note/Bond 2.25% 15/8/2049 1,825,320 0.26
USD 4,563,000 United States Treasury Note/Bond 2.5% 31/12/2020 4,610,858 0.67
USD 3,050,000 United States Treasury Note/Bond 2.75% 31/5/2023 3,192,850 0.46
USD 916,000 United States Treasury Note/Bond 2.875% 15/8/2028 1,020,195 0.15
USD 1,586,000 United States Treasury Note/Bond 2.875% 15/5/2043 1,867,515 0.27
USD 1,522,000 United States Treasury Note/Bond 2.875% 15/11/2046 1,811,775 0.26
USD 1,522,000 United States Treasury Note/Bond 3% 15/2/2048 1,861,121 0.27
USD 916,000 United States Treasury Note/Bond 3.125% 15/11/2028 1,042,022 0.15
USD 1,586,000 United States Treasury Note/Bond 3.125% 15/2/2043 1,941,487 0.28
USD 1,586,000 United States Treasury Note/Bond 3.625% 15/8/2043 2,099,591 0.30
USD 1,586,000 United States Treasury Note/Bond 3.75% 15/11/2043 2,141,472 0.31
USD 412,000 United States Treasury Note/Bond 4.25% 15/5/2039 579,922 0.08
USD 412,000 United States Treasury Note/Bond 4.375% 15/11/2039 590,641 0.09
USD 412,000 United States Treasury Note/Bond 4.5% 15/8/2039 598,816 0.09
EUR 385,000 United Technologies Corp 1.15% 18/5/2024 447,984 0.06
USD 550,000 United Technologies Corp 1.95% 1/11/2021 549,266 0.08
USD 25,000 United Technologies Corp 2.3% 4/5/2022 25,210 0.00
USD 598,000 United Technologies Corp 4.125% 16/11/2028 682,816 0.10
USD 422,000 United Technologies Corp 4.5% 1/6/2042 512,228 0.07
USD 90,000 United Technologies Corp 5.4% 1/5/2035 116,037 0.02
US Dollar Bond Fund continued
Portfolio of Investments 31 August 2019

The notes on pages 728 to 741 form an integral part of these financial statements.
[626] BlackRock Global Funds (BGF)
Transferable Securities and Money Market Instruments Admitted to an Official Stock Exchange Listing or Dealt in on Another Regulated Market
Transferable Securities and Money Market Instruments Admitted to an Official Stock Exchange Listing or Dealt in on Another Regulated Market
Holding
Description
Market Value (USD)
% of Net
Assets
Holding
Description
Market Value (USD)
% of Net
Assets
USD 220,000 United Technologies Corp 6.125% 15/7/2038 309,384 0.04
USD 35,000 UnitedHealth Group Inc 2.875% 15/8/2029 36,581 0.01
USD 115,000 UnitedHealth Group Inc 3.1% 15/3/2026 121,527 0.02
USD 34,000 UnitedHealth Group Inc 3.375% 15/4/2027 36,676 0.01
USD 120,000 UnitedHealth Group Inc 3.5% 15/8/2039 128,442 0.02
USD 70,000 UnitedHealth Group Inc 3.7% 15/12/2025 76,340 0.01
USD 795,000 UnitedHealth Group Inc 3.75% 15/7/2025 865,708 0.13
USD 83,000 UnitedHealth Group Inc 3.75% 15/10/2047 90,941 0.01
USD 135,000 UnitedHealth Group Inc 3.85% 15/6/2028 150,680 0.02
USD 35,000 UnitedHealth Group Inc 3.95% 15/10/2042 39,018 0.01
USD 71,000 UnitedHealth Group Inc 4.45% 15/12/2048 86,592 0.01
USD 207,000 UnitedHealth Group Inc 4.625% 15/11/2041 251,672 0.04
USD 60,000 UnitedHealth Group Inc 4.75% 15/7/2045 74,890 0.01
USD 515,000 University of California 3.063% 1/7/2025 544,976 0.08
USD 260,000 University of California 3.349% 1/7/2029 286,078 0.04
USD 160,000 University of California 4.601% 15/5/2031 188,528 0.03
USD 85,000 University of California 4.858% 15/5/2112 119,888 0.02
USD 170,000 University of California 5.77% 15/5/2043 242,548 0.04
USD 120,000 University of Houston 5% 15/2/2036 143,888 0.02
USD 117,000 University of Notre Dame du Lac 3.394% 15/2/2048 132,933 0.02
USD 60,000 University of Oregon 5% 1/4/2046 71,433 0.01 USD 13,000 University of Southern California
3.028% 1/10/2039 13,900 0.00 USD 125,000 University of Vermont & State
Agricultural College 5% 1/10/2043 152,739 0.02 USD 50,000 US 2018-USDC ‘Series 2018-
USDC E’ ‘144A’ FRN 13/5/2038 53,623 0.01 USD 6,983 US Airways 2012-2 Class B Pass
Through Trust 6.75% 3/6/2021 7,383 0.00 USD 18,637 US Airways 2013-1 Class B Pass
Through Trust 5.375% 15/11/2021 19,477 0.00 USD 324,000 US Bancorp 2.4% 30/7/2024 329,901 0.05 USD 244,000 US Bancorp 2.95% 15/7/2022 250,281 0.04 USD 8,000 US Bancorp 3.15% 27/4/2027 8,572 0.00 USD 161,000 Valero Energy Corp 3.4% 15/9/2026 166,332 0.02 USD 186,000 Valero Energy Corp 3.65%
15/3/2025 196,154 0.03 USD 2,000 Valero Energy Corp 4% 1/4/2029 2,129 0.00 USD 33,000 Valero Energy Corp 4.35% 1/6/2028 35,915 0.01 USD 100,000 Velocity Commercial Capital Loan
Trust 2016-2 ‘Series 2016-2 M1’ FRN 25/10/2046 102,350 0.01
USD 132,000 Venture XXIV CLO Ltd ‘Series 2016-24A A1D’ ‘144A’ FRN 20/10/2028 132,066 0.02
USD 35,000 Verizon Communications Inc FRN 22/5/2020 35,083 0.01
USD 135,000 Verizon Communications Inc 3.85% 1/11/2042 146,351 0.02
USD 1,892,000 Verizon Communications Inc 4.125% 16/3/2027 2,106,515 0.30
USD 31,000 Verizon Communications Inc 4.125% 15/8/2046 35,224 0.01
USD 1,328,000 Verizon Communications Inc 4.272% 15/1/2036 1,524,670 0.22
USD 195,000 Verizon Communications Inc 4.4% 1/11/2034 226,318 0.03
USD 428,000 Verizon Communications Inc 4.5% 10/8/2033 505,115 0.07
USD 46,000 Verizon Communications Inc 4.812% 15/3/2039 56,539 0.01
USD 30,000 Viacom Inc 4.375% 15/3/2043 31,679 0.00 USD 130,000 Viacom Inc 6.875% 30/4/2036 173,491 0.03 USD 260,000 Virginia Electric & Power Co
2.75% 15/3/2023 265,830 0.04 USD 297,000 Virginia Electric & Power Co
3.5% 15/3/2027 319,979 0.05 USD 277,000 Virginia Electric & Power Co
4% 15/11/2046 317,358 0.05 USD 144,000 Virginia Electric & Power Co
4.2% 15/5/2045 168,309 0.02 USD 50,000 Virginia Electric & Power Co
4.45% 15/2/2044 60,191 0.01 USD 170,000 Visa Inc 4.15% 14/12/2035 206,979 0.03 USD 100,000 Visa Inc 4.3% 14/12/2045 126,991 0.02 USD 352,000 Vistra Operations Co LLC ‘144A’
4.3% 15/7/2029 359,817 0.05 USD 100,000 VNDO 2013-PENN Mortgage Trust
‘Series 2013-PENN D’ ‘144A’ FRN 13/12/2029 101,039 0.01
USD 500,000 Voya Clo 2017-4 Ltd ‘Series 2017-4A A1’ ‘144A’ FRN 15/10/2030 498,717 0.07
USD 1,053,511 Voyager OPTONE Delaware Trust ‘Series 2009-1 SAA7’ ‘144A’ FRN 25/2/2038 392,434 0.06
USD 2,000 Walgreen Co 4.4% 15/9/2042 2,045 0.00 USD 795,000 Walgreens Boots Alliance Inc
3.45% 1/6/2026 826,172 0.12 USD 9,000 Walgreens Boots Alliance Inc
4.8% 18/11/2044 9,564 0.00 USD 329,000 Walmart Inc 3.25% 8/7/2029 360,589 0.05 USD 200,000 Walmart Inc 3.55% 26/6/2025 216,653 0.03 USD 20,000 Walmart Inc 3.7% 26/6/2028 22,469 0.00 USD 270,000 Walmart Inc 3.95% 28/6/2038 324,223 0.05 USD 95,000 Walmart Inc 4% 11/4/2043 113,700 0.02 USD 208,000 Walt Disney Co/The ‘144A’ 6.15%
1/3/2037 298,239 0.04 USD 44,000 Walt Disney Co/The ‘144A’ 6.15%
15/2/2041 64,957 0.01 USD 37,000 Walt Disney Co/The ‘144A’ 6.2%
15/12/2034 52,401 0.01 USD 161,000 Walt Disney Co/The ‘144A’ 6.4%
15/12/2035 233,706 0.03 USD 37,000 Walt Disney Co/The ‘144A’ 6.65%
15/11/2037 56,163 0.01 USD 18,000 Walt Disney Co/The ‘144A’ 6.9%
15/8/2039 28,173 0.00 USD 598,779 WaMu Mortgage Pass-Through
Certificates Series 2006-AR3 Trust ‘Series 2006-AR3 A1B’ FRN 25/2/2046 578,022 0.08
USD 55,000 Warner Media LLC 7.625% 15/4/2031 76,631 0.01
USD 40,000 Washington Metropolitan Area Transit Authority 5% 1/7/2036 49,539 0.01
US Dollar Bond Fund continued
Portfolio of Investments 31 August 2019
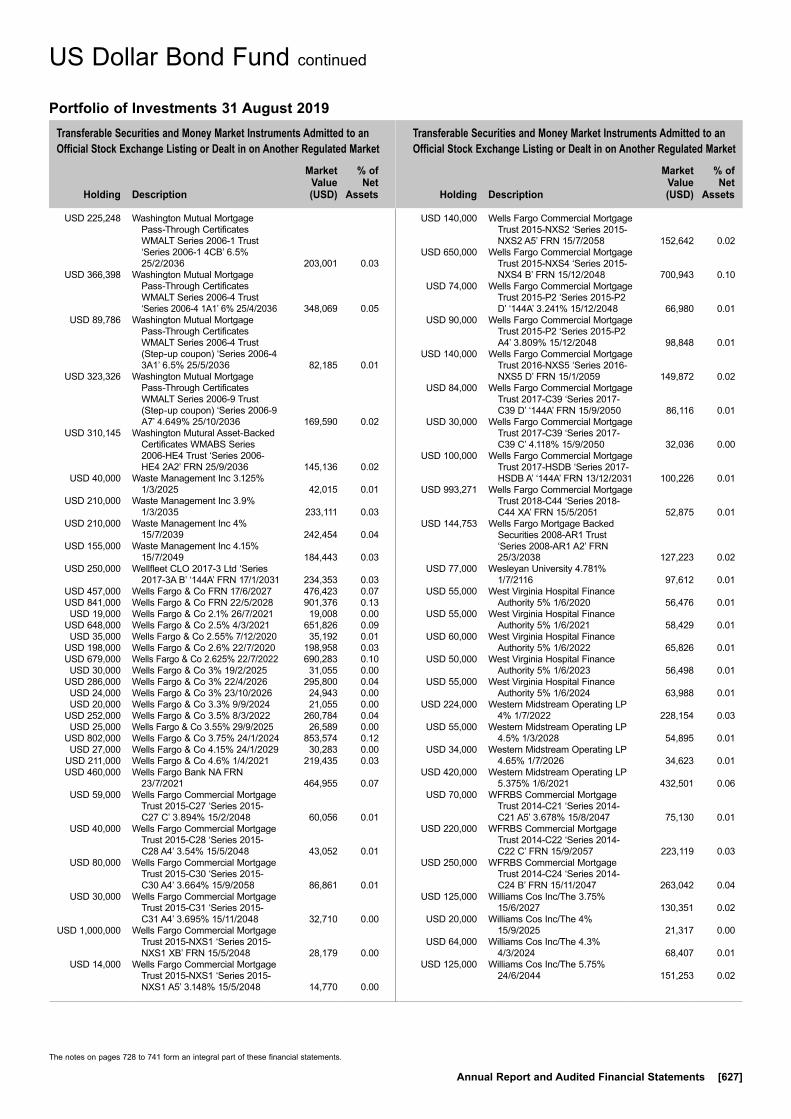
The notes on pages 728 to 741 form an integral part of these financial statements.
Annual Report and Audited Financial Statements [627]
Transferable Securities and Money Market Instruments Admitted to an Official Stock Exchange Listing or Dealt in on Another Regulated Market
Transferable Securities and Money Market Instruments Admitted to an Official Stock Exchange Listing or Dealt in on Another Regulated Market
Holding
Description
Market Value (USD)
% of Net
Assets
Holding
Description
Market Value (USD)
% of Net
Assets
USD 225,248 Washington Mutual Mortgage Pass-Through Certificates WMALT Series 2006-1 Trust ‘Series 2006-1 4CB’ 6.5% 25/2/2036 203,001 0.03
USD 366,398 Washington Mutual Mortgage Pass-Through Certificates WMALT Series 2006-4 Trust ‘Series 2006-4 1A1’ 6% 25/4/2036 348,069 0.05
USD 89,786 Washington Mutual Mortgage Pass-Through Certificates WMALT Series 2006-4 Trust (Step-up coupon) ‘Series 2006-4 3A1’ 6.5% 25/5/2036 82,185 0.01
USD 323,326 Washington Mutual Mortgage Pass-Through Certificates WMALT Series 2006-9 Trust (Step-up coupon) ‘Series 2006-9 A7’ 4.649% 25/10/2036 169,590 0.02
USD 310,145 Washington Mutural Asset-Backed Certificates WMABS Series 2006-HE4 Trust ‘Series 2006-HE4 2A2’ FRN 25/9/2036 145,136 0.02
USD 40,000 Waste Management Inc 3.125% 1/3/2025 42,015 0.01
USD 210,000 Waste Management Inc 3.9% 1/3/2035 233,111 0.03
USD 210,000 Waste Management Inc 4% 15/7/2039 242,454 0.04
USD 155,000 Waste Management Inc 4.15% 15/7/2049 184,443 0.03
USD 250,000 Wellfleet CLO 2017-3 Ltd ‘Series 2017-3A B’ ‘144A’ FRN 17/1/2031 234,353 0.03
USD 457,000 Wells Fargo & Co FRN 17/6/2027 476,423 0.07 USD 841,000 Wells Fargo & Co FRN 22/5/2028 901,376 0.13 USD 19,000 Wells Fargo & Co 2.1% 26/7/2021 19,008 0.00 USD 648,000 Wells Fargo & Co 2.5% 4/3/2021 651,826 0.09 USD 35,000 Wells Fargo & Co 2.55% 7/12/2020 35,192 0.01 USD 198,000 Wells Fargo & Co 2.6% 22/7/2020 198,958 0.03 USD 679,000 Wells Fargo & Co 2.625% 22/7/2022 690,283 0.10 USD 30,000 Wells Fargo & Co 3% 19/2/2025 31,055 0.00 USD 286,000 Wells Fargo & Co 3% 22/4/2026 295,800 0.04 USD 24,000 Wells Fargo & Co 3% 23/10/2026 24,943 0.00 USD 20,000 Wells Fargo & Co 3.3% 9/9/2024 21,055 0.00 USD 252,000 Wells Fargo & Co 3.5% 8/3/2022 260,784 0.04 USD 25,000 Wells Fargo & Co 3.55% 29/9/2025 26,589 0.00 USD 802,000 Wells Fargo & Co 3.75% 24/1/2024 853,574 0.12 USD 27,000 Wells Fargo & Co 4.15% 24/1/2029 30,283 0.00 USD 211,000 Wells Fargo & Co 4.6% 1/4/2021 219,435 0.03 USD 460,000 Wells Fargo Bank NA FRN
23/7/2021 464,955 0.07 USD 59,000 Wells Fargo Commercial Mortgage
Trust 2015-C27 ‘Series 2015-C27 C’ 3.894% 15/2/2048 60,056 0.01
USD 40,000 Wells Fargo Commercial Mortgage Trust 2015-C28 ‘Series 2015-C28 A4’ 3.54% 15/5/2048 43,052 0.01
USD 80,000 Wells Fargo Commercial Mortgage Trust 2015-C30 ‘Series 2015-C30 A4’ 3.664% 15/9/2058 86,861 0.01
USD 30,000 Wells Fargo Commercial Mortgage Trust 2015-C31 ‘Series 2015-C31 A4’ 3.695% 15/11/2048 32,710 0.00
USD 1,000,000 Wells Fargo Commercial Mortgage Trust 2015-NXS1 ‘Series 2015-NXS1 XB’ FRN 15/5/2048 28,179 0.00
USD 14,000 Wells Fargo Commercial Mortgage Trust 2015-NXS1 ‘Series 2015-NXS1 A5’ 3.148% 15/5/2048 14,770 0.00
USD 140,000 Wells Fargo Commercial Mortgage Trust 2015-NXS2 ‘Series 2015-NXS2 A5’ FRN 15/7/2058 152,642 0.02
USD 650,000 Wells Fargo Commercial Mortgage Trust 2015-NXS4 ‘Series 2015-NXS4 B’ FRN 15/12/2048 700,943 0.10
USD 74,000 Wells Fargo Commercial Mortgage Trust 2015-P2 ‘Series 2015-P2 D’ ‘144A’ 3.241% 15/12/2048 66,980 0.01
USD 90,000 Wells Fargo Commercial Mortgage Trust 2015-P2 ‘Series 2015-P2 A4’ 3.809% 15/12/2048 98,848 0.01
USD 140,000 Wells Fargo Commercial Mortgage Trust 2016-NXS5 ‘Series 2016-NXS5 D’ FRN 15/1/2059 149,872 0.02
USD 84,000 Wells Fargo Commercial Mortgage Trust 2017-C39 ‘Series 2017-C39 D’ ‘144A’ FRN 15/9/2050 86,116 0.01
USD 30,000 Wells Fargo Commercial Mortgage Trust 2017-C39 ‘Series 2017-C39 C’ 4.118% 15/9/2050 32,036 0.00
USD 100,000 Wells Fargo Commercial Mortgage Trust 2017-HSDB ‘Series 2017-HSDB A’ ‘144A’ FRN 13/12/2031 100,226 0.01
USD 993,271 Wells Fargo Commercial Mortgage Trust 2018-C44 ‘Series 2018-C44 XA’ FRN 15/5/2051 52,875 0.01
USD 144,753 Wells Fargo Mortgage Backed Securities 2008-AR1 Trust ‘Series 2008-AR1 A2’ FRN 25/3/2038 127,223 0.02
USD 77,000 Wesleyan University 4.781% 1/7/2116 97,612 0.01
USD 55,000 West Virginia Hospital Finance Authority 5% 1/6/2020 56,476 0.01
USD 55,000 West Virginia Hospital Finance Authority 5% 1/6/2021 58,429 0.01
USD 60,000 West Virginia Hospital Finance Authority 5% 1/6/2022 65,826 0.01
USD 50,000 West Virginia Hospital Finance Authority 5% 1/6/2023 56,498 0.01
USD 55,000 West Virginia Hospital Finance Authority 5% 1/6/2024 63,988 0.01
USD 224,000 Western Midstream Operating LP 4% 1/7/2022 228,154 0.03
USD 55,000 Western Midstream Operating LP 4.5% 1/3/2028 54,895 0.01
USD 34,000 Western Midstream Operating LP 4.65% 1/7/2026 34,623 0.01
USD 420,000 Western Midstream Operating LP 5.375% 1/6/2021 432,501 0.06
USD 70,000 WFRBS Commercial Mortgage Trust 2014-C21 ‘Series 2014-C21 A5’ 3.678% 15/8/2047 75,130 0.01
USD 220,000 WFRBS Commercial Mortgage Trust 2014-C22 ‘Series 2014-C22 C’ FRN 15/9/2057 223,119 0.03
USD 250,000 WFRBS Commercial Mortgage Trust 2014-C24 ‘Series 2014-C24 B’ FRN 15/11/2047 263,042 0.04
USD 125,000 Williams Cos Inc/The 3.75% 15/6/2027 130,351 0.02
USD 20,000 Williams Cos Inc/The 4% 15/9/2025 21,317 0.00
USD 64,000 Williams Cos Inc/The 4.3% 4/3/2024 68,407 0.01
USD 125,000 Williams Cos Inc/The 5.75% 24/6/2044 151,253 0.02
US Dollar Bond Fund continued
Portfolio of Investments 31 August 2019

To Be Announced Securities Contracts as at 31 August 2019
Holding Description
Market Value
(USD)
% of Net
Assets
TBA
United States USD (1,309,500) Fannie Mae or Freddie Mac
‘2.5 9/19’ 2.5% TBA (1,326,177) (0.19) USD 2,930,000 Fannie Mae or Freddie Mac
‘3 10/19’ 3% TBA 3,002,799 0.43 USD (9,963,823) Fannie Mae or Freddie Mac
‘3 9/19’ 3% TBA (10,141,692) (1.46) USD 280,000 Fannie Mae or Freddie Mac
‘3.5 10/19’ 3.5% TBA 290,119 0.04 USD 36,286,031 Fannie Mae or Freddie Mac
‘3.5 10/19’ 3.5% TBA 37,271,139 5.38 USD 3,371,000 Fannie Mae or Freddie Mac
‘3.5 9/19’ 3.5% TBA 3,461,200 0.50 USD (450,000) Fannie Mae or Freddie Mac
‘4 9/19’ 4% TBA (468,382) (0.07) USD 7,187,000 Fannie Mae or Freddie Mac
‘4 9/19’ 4% TBA 7,453,424 1.07 USD 19,200,000 Fannie Mae or Freddie Mac
‘4 10/19’ 4% TBA 19,928,249 2.88 USD 4,400,000 Fannie Mae or Freddie Mac
‘4.5 10/19’ 4.5% TBA 4,629,798 0.67
To Be Announced Securities Contracts as at 31 August 2019
Holding Description
Market Value
(USD)
% of Net
Assets
USD 5,089,000 Fannie Mae or Freddie Mac ‘4.5 9/19’ 4.5% TBA 5,352,395 0.77
USD 921,000 Fannie Mae or Freddie Mac ‘5 10/19’ 5% TBA 984,463 0.14
USD 127,000 Fannie Mae or Freddie Mac ‘5.5 10/19’ 5.5% TBA 137,224 0.02
USD 6,450,000 Ginnie Mae ‘3 9/19’ 3% TBA 6,640,728 0.96 USD 3,986,181 Ginnie Mae ‘3.5 10/19’ 3.5% TBA 4,133,093 0.60 USD 81,000 Ginnie Mae ‘3.5 9/19’ 3.5% TBA 84,055 0.01 USD 7,787,500 Ginnie Mae ‘4 9/19’ 4% TBA 8,105,996 1.17 USD 2,600,000 Ginnie Mae ‘4 10/19’ 4% TBA 2,704,914 0.39 USD 1,000,000 Ginnie Mae ‘4.5 9/19’ 4.5% TBA 1,058,945 0.15 USD 1,101,000 Ginnie Mae ‘4.5 11/19’ 4.5% TBA 1,150,072 0.17 USD 665,500 Ginnie Mae ‘4.5 10/19’ 4.5% TBA 695,266 0.10 USD 1,758,000 Ginnie Mae ‘5 10/19’ 5% TBA 1,845,557 0.27
Total TBA (USD underlying exposure - USD 120,865,687) 96,993,185 14.00
To Be Announced (“TBA”) contracts are primarily classified by the country of incorporation of the issuer of the pass-through agency.
The notes on pages 728 to 741 form an integral part of these financial statements.
[628] BlackRock Global Funds (BGF)
Transferable Securities and Money Market Instruments Admitted to an Official Stock Exchange Listing or Dealt in on Another Regulated Market Other Transferable Securities
Holding
Description
Market Value (USD)
% of Net
Assets
Holding
Description
Market Value (USD)
% of Net
Assets
** Security subject to a fair value adjustment as detailed in Note 2(j).
USD 95,000 Williams Cos Inc/The 7.5% 15/1/2031 126,435 0.02
USD 488,000 Willis North America Inc 3.6% 15/5/2024 508,491 0.07
USD 40,000 Wisconsin Health & Educational Facilities Authority 5% 15/12/2044 45,623 0.01
USD 38,000 Wisconsin Power & Light Co 3% 1/7/2029 39,998 0.01
USD 238,000 Wyeth LLC 5.95% 1/4/2037 331,938 0.05 USD 5,000 Wyeth LLC 6% 15/2/2036 7,023 0.00 USD 40,000 Wyeth LLC 6.45% 1/2/2024 47,418 0.01 USD 115,950 Yale Mortgage Loan Trust 2007-1
‘Series 2007-1 A’ ‘144A’ FRN 25/6/2037 48,935 0.01
USD 250,000 York Clo-4 Ltd ‘Series 2016-2A A’ ‘144A’ FRN 20/1/2030 250,575 0.04
559,602,552 80.75
Uruguay USD 587,000 Uruguay Government International
Bond 4.375% 27/10/2027 651,753 0.09Total Bonds 638,965,482 92.20Total Transferable Securities and Money Market Instruments Admitted to an Official Stock Exchange Listing or Dealt in on Another Regulated Market 638,965,482 92.20
BONDS
United States USD 20,000 Lehman Brothers Holdings Capital
Trust VII (Defaulted) 30/11/2056 (Perpetual) (Zero Coupon)** – 0.00
USD 475,000 Lehman Brothers Holdings Inc (Defaulted) 19/7/2017 (Perpetual) (Zero Coupon)** – 0.00
USD 298,557 Lehman Brothers International Europe FRN 31/12/2049 (Zero Coupon)** – 0.00
USD 250,000 Washington Mutual Bank Escrow (Defaulted) 4/2/2018 (Zero Coupon) – 0.00
USD 1,360,000 Washington Mutual Bank Escrow (Defaulted) FRN 1/5/2018 (Zero Coupon) – 0.00
USD 250,000 Washington Mutual Bank Escrow (Defaulted) 16/6/2018 (Zero Coupon) – 0.00
USD 560,000 Washington Mutual Bank Escrow (Defaulted) 6/11/2018 (Zero Coupon) – 0.00
– 0.00Total Bonds – 0.00Total Other Transferable Securities – 0.00Total Portfolio 638,965,482 92.20
Other Net Assets 54,052,929 7.80Total Net Assets (USD) 693,018,411 100.00
US Dollar Bond Fund continued
Portfolio of Investments 31 August 2019
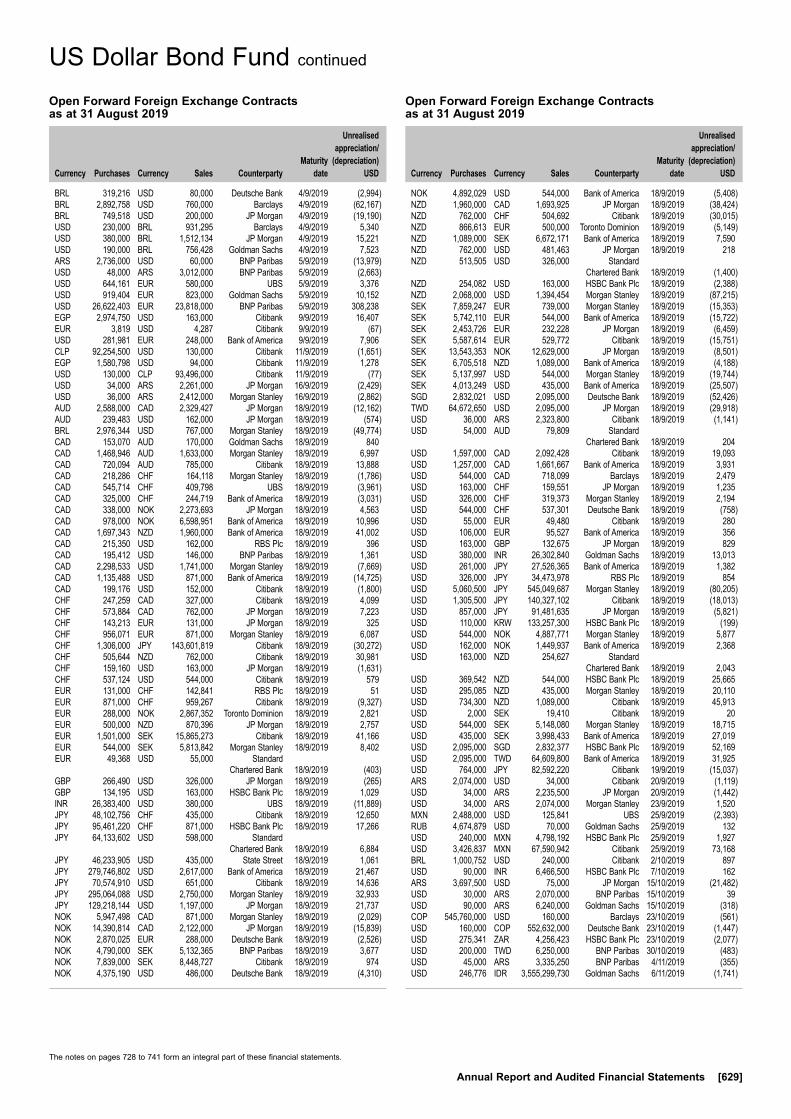
The notes on pages 728 to 741 form an integral part of these financial statements.
Annual Report and Audited Financial Statements [629]
US Dollar Bond Fund continued
Open Forward Foreign Exchange Contracts as at 31 August 2019
Currency
Purchases Currency
Sales Counterparty
Maturity date
Unrealised appreciation/
(depreciation) USD
Open Forward Foreign Exchange Contracts as at 31 August 2019
Currency
Purchases Currency
Sales Counterparty
Maturity date
Unrealised appreciation/
(depreciation) USD
BRL 319,216 USD 80,000 Deutsche Bank 4/9/2019 (2,994)BRL 2,892,758 USD 760,000 Barclays 4/9/2019 (62,167)BRL 749,518 USD 200,000 JP Morgan 4/9/2019 (19,190)USD 230,000 BRL 931,295 Barclays 4/9/2019 5,340USD 380,000 BRL 1,512,134 JP Morgan 4/9/2019 15,221USD 190,000 BRL 756,428 Goldman Sachs 4/9/2019 7,523ARS 2,736,000 USD 60,000 BNP Paribas 5/9/2019 (13,979)USD 48,000 ARS 3,012,000 BNP Paribas 5/9/2019 (2,663)USD 644,161 EUR 580,000 UBS 5/9/2019 3,376USD 919,404 EUR 823,000 Goldman Sachs 5/9/2019 10,152USD 26,622,403 EUR 23,818,000 BNP Paribas 5/9/2019 308,238EGP 2,974,750 USD 163,000 Citibank 9/9/2019 16,407EUR 3,819 USD 4,287 Citibank 9/9/2019 (67)USD 281,981 EUR 248,000 Bank of America 9/9/2019 7,906CLP 92,254,500 USD 130,000 Citibank 11/9/2019 (1,651)EGP 1,580,798 USD 94,000 Citibank 11/9/2019 1,278USD 130,000 CLP 93,496,000 Citibank 11/9/2019 (77)USD 34,000 ARS 2,261,000 JP Morgan 16/9/2019 (2,429)USD 36,000 ARS 2,412,000 Morgan Stanley 16/9/2019 (2,862)AUD 2,588,000 CAD 2,329,427 JP Morgan 18/9/2019 (12,162)AUD 239,483 USD 162,000 JP Morgan 18/9/2019 (574)BRL 2,976,344 USD 767,000 Morgan Stanley 18/9/2019 (49,774)CAD 153,070 AUD 170,000 Goldman Sachs 18/9/2019 840CAD 1,468,946 AUD 1,633,000 Morgan Stanley 18/9/2019 6,997CAD 720,094 AUD 785,000 Citibank 18/9/2019 13,888CAD 218,286 CHF 164,118 Morgan Stanley 18/9/2019 (1,786)CAD 545,714 CHF 409,798 UBS 18/9/2019 (3,961)CAD 325,000 CHF 244,719 Bank of America 18/9/2019 (3,031)CAD 338,000 NOK 2,273,693 JP Morgan 18/9/2019 4,563CAD 978,000 NOK 6,598,951 Bank of America 18/9/2019 10,996CAD 1,697,343 NZD 1,960,000 Bank of America 18/9/2019 41,002CAD 215,350 USD 162,000 RBS Plc 18/9/2019 396CAD 195,412 USD 146,000 BNP Paribas 18/9/2019 1,361CAD 2,298,533 USD 1,741,000 Morgan Stanley 18/9/2019 (7,669)CAD 1,135,488 USD 871,000 Bank of America 18/9/2019 (14,725)CAD 199,176 USD 152,000 Citibank 18/9/2019 (1,800)CHF 247,259 CAD 327,000 Citibank 18/9/2019 4,099CHF 573,884 CAD 762,000 JP Morgan 18/9/2019 7,223CHF 143,213 EUR 131,000 JP Morgan 18/9/2019 325CHF 956,071 EUR 871,000 Morgan Stanley 18/9/2019 6,087CHF 1,306,000 JPY 143,601,819 Citibank 18/9/2019 (30,272)CHF 505,644 NZD 762,000 Citibank 18/9/2019 30,981CHF 159,160 USD 163,000 JP Morgan 18/9/2019 (1,631)CHF 537,124 USD 544,000 Citibank 18/9/2019 579EUR 131,000 CHF 142,841 RBS Plc 18/9/2019 51EUR 871,000 CHF 959,267 Citibank 18/9/2019 (9,327)EUR 288,000 NOK 2,867,352 Toronto Dominion 18/9/2019 2,821EUR 500,000 NZD 870,396 JP Morgan 18/9/2019 2,757EUR 1,501,000 SEK 15,865,273 Citibank 18/9/2019 41,166EUR 544,000 SEK 5,813,842 Morgan Stanley 18/9/2019 8,402EUR 49,368 USD 55,000 Standard Chartered Bank 18/9/2019 (403)GBP 266,490 USD 326,000 JP Morgan 18/9/2019 (265)GBP 134,195 USD 163,000 HSBC Bank Plc 18/9/2019 1,029INR 26,383,400 USD 380,000 UBS 18/9/2019 (11,889)JPY 48,102,756 CHF 435,000 Citibank 18/9/2019 12,650JPY 95,461,220 CHF 871,000 HSBC Bank Plc 18/9/2019 17,266JPY 64,133,602 USD 598,000 Standard Chartered Bank 18/9/2019 6,884JPY 46,233,905 USD 435,000 State Street 18/9/2019 1,061JPY 279,746,802 USD 2,617,000 Bank of America 18/9/2019 21,467JPY 70,574,910 USD 651,000 Citibank 18/9/2019 14,636JPY 295,064,088 USD 2,750,000 Morgan Stanley 18/9/2019 32,933JPY 129,218,144 USD 1,197,000 JP Morgan 18/9/2019 21,737NOK 5,947,498 CAD 871,000 Morgan Stanley 18/9/2019 (2,029)NOK 14,390,814 CAD 2,122,000 JP Morgan 18/9/2019 (15,839)NOK 2,870,025 EUR 288,000 Deutsche Bank 18/9/2019 (2,526)NOK 4,790,000 SEK 5,132,365 BNP Paribas 18/9/2019 3,677NOK 7,839,000 SEK 8,448,727 Citibank 18/9/2019 974NOK 4,375,190 USD 486,000 Deutsche Bank 18/9/2019 (4,310)
NOK 4,892,029 USD 544,000 Bank of America 18/9/2019 (5,408)NZD 1,960,000 CAD 1,693,925 JP Morgan 18/9/2019 (38,424)NZD 762,000 CHF 504,692 Citibank 18/9/2019 (30,015)NZD 866,613 EUR 500,000 Toronto Dominion 18/9/2019 (5,149)NZD 1,089,000 SEK 6,672,171 Bank of America 18/9/2019 7,590NZD 762,000 USD 481,463 JP Morgan 18/9/2019 218NZD 513,505 USD 326,000 Standard Chartered Bank 18/9/2019 (1,400)NZD 254,082 USD 163,000 HSBC Bank Plc 18/9/2019 (2,388)NZD 2,068,000 USD 1,394,454 Morgan Stanley 18/9/2019 (87,215)SEK 7,859,247 EUR 739,000 Morgan Stanley 18/9/2019 (15,353)SEK 5,742,110 EUR 544,000 Bank of America 18/9/2019 (15,722)SEK 2,453,726 EUR 232,228 JP Morgan 18/9/2019 (6,459)SEK 5,587,614 EUR 529,772 Citibank 18/9/2019 (15,751)SEK 13,543,353 NOK 12,629,000 JP Morgan 18/9/2019 (8,501)SEK 6,705,518 NZD 1,089,000 Bank of America 18/9/2019 (4,188)SEK 5,137,997 USD 544,000 Morgan Stanley 18/9/2019 (19,744)SEK 4,013,249 USD 435,000 Bank of America 18/9/2019 (25,507)SGD 2,832,021 USD 2,095,000 Deutsche Bank 18/9/2019 (52,426)TWD 64,672,650 USD 2,095,000 JP Morgan 18/9/2019 (29,918)USD 36,000 ARS 2,323,800 Citibank 18/9/2019 (1,141)USD 54,000 AUD 79,809 Standard Chartered Bank 18/9/2019 204USD 1,597,000 CAD 2,092,428 Citibank 18/9/2019 19,093USD 1,257,000 CAD 1,661,667 Bank of America 18/9/2019 3,931USD 544,000 CAD 718,099 Barclays 18/9/2019 2,479USD 163,000 CHF 159,551 JP Morgan 18/9/2019 1,235USD 326,000 CHF 319,373 Morgan Stanley 18/9/2019 2,194USD 544,000 CHF 537,301 Deutsche Bank 18/9/2019 (758)USD 55,000 EUR 49,480 Citibank 18/9/2019 280USD 106,000 EUR 95,527 Bank of America 18/9/2019 356USD 163,000 GBP 132,675 JP Morgan 18/9/2019 829USD 380,000 INR 26,302,840 Goldman Sachs 18/9/2019 13,013USD 261,000 JPY 27,526,365 Bank of America 18/9/2019 1,382USD 326,000 JPY 34,473,978 RBS Plc 18/9/2019 854USD 5,060,500 JPY 545,049,687 Morgan Stanley 18/9/2019 (80,205)USD 1,305,500 JPY 140,327,102 Citibank 18/9/2019 (18,013)USD 857,000 JPY 91,481,635 JP Morgan 18/9/2019 (5,821)USD 110,000 KRW 133,257,300 HSBC Bank Plc 18/9/2019 (199)USD 544,000 NOK 4,887,771 Morgan Stanley 18/9/2019 5,877USD 162,000 NOK 1,449,937 Bank of America 18/9/2019 2,368USD 163,000 NZD 254,627 Standard Chartered Bank 18/9/2019 2,043USD 369,542 NZD 544,000 HSBC Bank Plc 18/9/2019 25,665USD 295,085 NZD 435,000 Morgan Stanley 18/9/2019 20,110USD 734,300 NZD 1,089,000 Citibank 18/9/2019 45,913USD 2,000 SEK 19,410 Citibank 18/9/2019 20USD 544,000 SEK 5,148,080 Morgan Stanley 18/9/2019 18,715USD 435,000 SEK 3,998,433 Bank of America 18/9/2019 27,019USD 2,095,000 SGD 2,832,377 HSBC Bank Plc 18/9/2019 52,169USD 2,095,000 TWD 64,609,800 Bank of America 18/9/2019 31,925USD 764,000 JPY 82,592,220 Citibank 19/9/2019 (15,037)ARS 2,074,000 USD 34,000 Citibank 20/9/2019 (1,119)USD 34,000 ARS 2,235,500 JP Morgan 20/9/2019 (1,442)USD 34,000 ARS 2,074,000 Morgan Stanley 23/9/2019 1,520MXN 2,488,000 USD 125,841 UBS 25/9/2019 (2,393)RUB 4,674,879 USD 70,000 Goldman Sachs 25/9/2019 132USD 240,000 MXN 4,798,192 HSBC Bank Plc 25/9/2019 1,927USD 3,426,837 MXN 67,590,942 Citibank 25/9/2019 73,168BRL 1,000,752 USD 240,000 Citibank 2/10/2019 897USD 90,000 INR 6,466,500 HSBC Bank Plc 7/10/2019 162ARS 3,697,500 USD 75,000 JP Morgan 15/10/2019 (21,482)USD 30,000 ARS 2,070,000 BNP Paribas 15/10/2019 39USD 90,000 ARS 6,240,000 Goldman Sachs 15/10/2019 (318)COP 545,760,000 USD 160,000 Barclays 23/10/2019 (561)USD 160,000 COP 552,632,000 Deutsche Bank 23/10/2019 (1,447)USD 275,341 ZAR 4,256,423 HSBC Bank Plc 23/10/2019 (2,077)USD 200,000 TWD 6,250,000 BNP Paribas 30/10/2019 (483)USD 45,000 ARS 3,335,250 BNP Paribas 4/11/2019 (355)USD 246,776 IDR 3,555,299,730 Goldman Sachs 6/11/2019 (1,741)

The notes on pages 728 to 741 form an integral part of these financial statements.
[630] BlackRock Global Funds (BGF)
US Dollar Bond Fund continued
Open Exchange Traded Futures Contracts as at 31 August 2019
Number of contracts Currency
Contract/ Description
Expiration date
Underlying exposure
USD
Unrealised appreciation/
(depreciation) USD
(17) EUR Euro Schatz September 2019 2,114,201 (3,800)(36) EUR Euro Bund September 2019 7,122,611 (184,749)(38) EUR Euro BUXL September 2019 9,407,649 (295,687)(67) EUR Euro BOBL September 2019 10,080,192 (113,424)229 USD US Treasury 5 Year Note (CBT) December 2019 27,437,063 (37,571)179 USD US Ultra Bond (CBT) December 2019 35,263,000 342,789173 USD US Treasury 2 Year Note (CBT) December 2019 37,362,594 (24,063)114 USD US Ultra 10 Year Note December 2019 16,440,938 2,5409 USD US Long Bond (CBT) December 2019 1,485,844 (7,687)(178) USD US Treasury 10 Year Note (CBT) December 2019 23,415,344 21,735
Total 170,129,436 (299,917)
Open Forward Foreign Exchange Contracts as at 31 August 2019
Currency
Purchases Currency
Sales Counterparty
Maturity date
Unrealised appreciation/
(depreciation) USD
Open Forward Foreign Exchange Contracts as at 31 August 2019
Currency
Purchases Currency
Sales Counterparty
Maturity date
Unrealised appreciation/
(depreciation) USD
USD 837,594 IDR 12,046,270,362 Bank of America 6/11/2019 (4,446)USD 489,000 IDR 7,224,975,000 JP Morgan 6/11/2019 (16,029)USD 651,456 IDR 9,455,162,949 Citibank 6/11/2019 (9,464)USD 489,000 MXN 9,762,298 Citibank 6/11/2019 8,069USD 1,330,084 RUB 87,703,766 Morgan Stanley 6/11/2019 22,107ARS 3,853,750 USD 75,000 HSBC Bank Plc 13/11/2019 (23,678)USD 30,000 ARS 2,107,500 Goldman Sachs 29/11/2019 2,989USD 30,000 ARS 2,227,500 Morgan Stanley 29/11/2019 1,451EUR 1,510,000 USD 1,847,515 JP Morgan 13/12/2019 (166,736)USD 1,958,470 EUR 1,510,000 Deutsche Bank 13/12/2019 277,691EUR 1,510,000 USD 1,860,841 JP Morgan 25/2/2020 (170,558)USD 1,971,154 EUR 1,510,000 Deutsche Bank 25/2/2020 280,871JPY 201,550,000 USD 1,867,587 JP Morgan 16/3/2020 57,587USD 2,011,879 JPY 201,550,000 HSBC Bank Plc 16/3/2020 86,704Net unrealised appreciation 603,962
EUR Hedged Share Class
EUR 40,507,716 USD 45,485,539 BNY Mellon 12/9/2019 (707,733)USD 645,203 EUR 581,656 BNY Mellon 12/9/2019 2,238Net unrealised depreciation (705,495)
GBP Hedged Share Class
GBP 484,145 USD 586,119 BNY Mellon 12/9/2019 5,498Net unrealised appreciation 5,498
HKD Hedged Share Class
HKD 37,544 USD 4,792 BNY Mellon 12/9/2019 (3)Net unrealised depreciation (3)
Total net unrealised depreciation (USD underlying exposure - USD 194,209,168) (96,038)
Swaps as at 31 August 2019
TypeNominal
Value Description Counterparty
Expiration date
Unrealised appreciation/
(depreciation) USD
Market Value USD
CDS USD (476,601) Fund provides default protection on Mexico Government International Bond; and receives Fixed 1% Bank of America 20/6/2020 8,305 2,271
CDS USD 476,601 Fund receives default protection on Mexico Government International Bond; and pays Fixed 1% Bank of America 20/9/2020 (4,169) (2,662)
CDS USD 133,543 Fund receives default protection on Colombia Government International Bond; and pays Fixed 1% Bank of America 20/6/2024 (594) (427)
CDS USD 4,044,000 Fund provides default protection on CDX.NA.IG.32.V1; and receives Fixed 1% Bank of America 20/6/2024 (2,448) (87,094)
CDS USD 43,000 Fund receives default protection on Argentine Republic Government International Bond; and pays Fixed 5% Barclays 20/6/2024 19,706 25,253
CDS USD 135,000 Fund receives default protection on Colombia Government International Bond; and pays Fixed 1% BNP Paribas 20/6/2024 (600) (432)
CDS USD 135,000 Fund receives default protection on Colombia Government International Bond; and pays Fixed 1% BNP Paribas 20/6/2024 (661) (432)
CDS USD 135,000 Fund receives default protection on Colombia Government International Bond; and pays Fixed 1% BNP Paribas 20/6/2024 (722) (432)
CDS USD 135,000 Fund receives default protection on Colombia Government International Bond; and pays Fixed 1% BNP Paribas 20/6/2024 (600) (432)
CDS USD 190,000 Fund receives default protection on Brazilian Government International Bond; and pays Fixed 1% BNP Paribas 20/6/2024 (3,004) 2,899
CDS USD 215,000 Fund receives default protection on Turkey Government International Bond; and pays Fixed 1% BNP Paribas 20/6/2024 9,348 29,129

The notes on pages 728 to 741 form an integral part of these financial statements.
Annual Report and Audited Financial Statements [631]
US Dollar Bond Fund continued
Swaps as at 31 August 2019
TypeNominal
Value Description Counterparty
Expiration date
Unrealised appreciation/
(depreciation) USD
Market Value USD
CDS USD 650,000 Fund receives default protection on Brazilian Government International Bond; and pays Fixed 1% BNP Paribas 20/6/2024 (10,278) 9,919
CDS USD 135,000 Fund receives default protection on Colombia Government International Bond; and pays Fixed 1% BNP Paribas 20/6/2024 (630) (432)
CDS USD 1,435,827 Fund receives default protection on Brazilian Government International Bond; and pays Fixed 1% Citibank 20/6/2024 (19,658) 21,911
CDS USD 820,000 Fund receives default protection on Brazilian Government International Bond; and pays Fixed 1% Citibank 20/6/2024 (13,245) 12,513
CDS USD 228,000 Fund receives default protection on Brazilian Government International Bond; and pays Fixed 1% Citibank 20/6/2024 (3,683) 3,479
CDS USD 587,041 Fund receives default protection on Mexico Government International Bond; and pays Fixed 1% Citibank 20/6/2024 (6,353) 3,146
CDS USD 754,000 Fund receives default protection on Philippine Government International Bond; and pays Fixed 1% Citibank 20/6/2024 (6,948) (17,925)
CDS USD 59,000 Fund receives default protection on Colombia Government International Bond; and pays Fixed 1% Citibank 20/6/2024 (724) (189)
CDS USD 168,036 Fund receives default protection on Mexico Government International Bond; and pays Fixed 1% Citibank 20/6/2024 (1,818) 901
CDS USD 210,000 Fund receives default protection on CMBX.NA.9.AAA; and pays Fixed 0.5% Credit Suisse 17/9/2058 (4,758) (2,305)
CDS USD (40,000) Fund provides default protection on CMBX.NA.6.BBB-; and receives Fixed 3% Credit Suisse 11/5/2063 (459) (3,858)
CDS USD 160,000 Fund receives default protection on CMBX.NA.9.AAA; and pays Fixed 0.5% Deutsche Bank 17/9/2058 (3,653) (1,756)
CDS USD (29,000) Fund provides default protection on CMBX.NA.9.BBB-; and receives Fixed 3% Deutsche Bank 17/9/2058 2,552 (1,017)
CDS USD (160,000) Fund provides default protection on CMBX.NA.10.A; and receives Fixed 2% Deutsche Bank 17/11/2059 7,000 (349)
CDS USD (80,000) Fund provides default protection on CMBX.NA.10.A; and receives Fixed 2% Deutsche Bank 17/11/2059 3,561 (174)
CDS USD 277,221 Fund receives default protection on CMBX.NA.6.AAA; and pays Fixed 0.5% Deutsche Bank 11/5/2063 (2,241) (2,334)
CDS USD 119,492 Fund receives default protection on CMBX.NA.6.AAA; and pays Fixed 0.5% Deutsche Bank 11/5/2063 (1,029) (1,006)
CDS USD 315,371 Fund receives default protection on Republic of South Africa Government Bond; and pays Fixed 1% Goldman Sachs 20/6/2024 (2,740) 11,121
CDS USD 95,000 Fund receives default protection on Colombia Government International Bond; and pays Fixed 1% Goldman Sachs 20/6/2024 (358) (304)
CDS USD 95,457 Fund receives default protection on Colombia Government International Bond; and pays Fixed 1% Goldman Sachs 20/6/2024 (403) (305)
CDS USD 473,629 Fund receives default protection on Republic of South Africa Government Bond; and pays Fixed 1% Goldman Sachs 20/6/2024 (4,399) 16,701
CDS USD 26,000 Fund receives default protection on Argentine Republic Government International Bond; and pays Fixed 5% Goldman Sachs 20/6/2024 12,066 15,269
CDS USD (130,000) Fund provides default protection on CMBX.NA.8.A; and receives Fixed 2% Goldman Sachs 17/10/2057 14,939 1,253
CDS USD (55,000) Fund provides default protection on CMBX.NA.8.A; and receives Fixed 2% Goldman Sachs 17/10/2057 3,693 530
CDS USD 114,000 Fund receives default protection on Colombia Government International Bond; and pays Fixed 1% HSBC Bank Plc 20/6/2024 (377) (365)
CDS USD 943,130 Fund receives default protection on Mexico Government International Bond; and pays Fixed 1% HSBC Bank Plc 20/6/2024 (10,715) 5,055
CDS USD 269,964 Fund receives default protection on Mexico Government International Bond; and pays Fixed 1% HSBC Bank Plc 20/6/2024 (3,067) 1,447
CDS USD 40,000 Fund receives default protection on Argentine Republic Government International Bond; and pays Fixed 5% HSBC Bank Plc 20/6/2024 18,685 23,491
CDS USD 476,601 Fund receives default protection on Mexico Government International Bond; and pays Fixed 1% JP Morgan 20/6/2020 (3,139) (2,271)
CDS USD (476,601) Fund provides default protection on Mexico Government International Bond; and receives Fixed 1% JP Morgan 20/9/2020 9,318 2,662
CDS USD 118,000 Fund receives default protection on Mexico Government International Bond; and pays Fixed 1% JP Morgan 20/6/2024 (604) 632
CDS USD 221,000 Fund receives default protection on CDX.EM.31.V1; and pays Fixed 1% JP Morgan 20/6/2024 1,123 11,261
CDS USD 132,000 Fund receives default protection on CDX.EM.31.V1; and pays Fixed 1% JP Morgan 20/6/2024 671 6,726
CDS USD 161,000 Fund receives default protection on Mexico Government International Bond; and pays Fixed 1% JP Morgan 20/6/2024 (968) 863
CDS USD 118,000 Fund receives default protection on Mexico Government International Bond; and pays Fixed 1% JP Morgan 20/6/2024 (525) 632
CDS USD 119,000 Fund receives default protection on Mexico Government International Bond; and pays Fixed 1% JP Morgan 20/6/2024 (662) 638

The notes on pages 728 to 741 form an integral part of these financial statements.
[632] BlackRock Global Funds (BGF)
US Dollar Bond Fund continued
Swaps as at 31 August 2019
TypeNominal
Value Description Counterparty
Expiration date
Unrealised appreciation/
(depreciation) USD
Market Value USD
CDS USD 118,000 Fund receives default protection on Mexico Government International Bond; and pays Fixed 1% JP Morgan 20/6/2024 (578) 632
CDS USD 118,000 Fund receives default protection on Mexico Government International Bond; and pays Fixed 1% JP Morgan 20/6/2024 (683) 632
CDS USD 40,000 Fund receives default protection on CMBX.NA.6.BBB-; and pays Fixed 3% JP Morgan 11/5/2063 29 3,858
CDS USD (115,150) Fund provides default protection on Turkey Government International Bond; and receives Fixed 1% Morgan Stanley 20/6/2024 (760) (15,601)
CDS USD 170,000 Fund receives default protection on Qatar Government International Bond; and pays Fixed 1% Morgan Stanley 20/6/2024 (1,665) (4,038)
CDS USD 245,600 Fund receives default protection on Turkey Government International Bond; and pays Fixed 1% Morgan Stanley 20/6/2024 10,495 33,275
CDS USD 330,000 Fund receives default protection on CMBX.NA.9.AAA; and pays Fixed 0.5% Morgan Stanley 17/9/2058 (7,893) (3,622)
CDS USD 110,000 Fund receives default protection on CMBX.NA.9.AAA; and pays Fixed 0.5% Morgan Stanley 17/9/2058 (2,492) (1,207)
CDS USD 7,000 Fund receives default protection on CMBX.NA.9.BBB-; and pays Fixed 3% Morgan Stanley 17/9/2058 (158) 245
CDS USD (5,000) Fund provides default protection on CMBX.NA.9.BBB-; and receives Fixed 3% Morgan Stanley 17/9/2058 129 (175)
CDS USD (50,000) Fund provides default protection on CMBX.NA.9.BBB-; and receives Fixed 3% Morgan Stanley 17/9/2058 791 (1,753)
IFS EUR 4,030,000 Fund provides default protection on CPTFEMU + 0 bps; and receives Fixed 0.82% Bank of America 16/8/2024 (6,283) (6,283)
IFS EUR 4,030,000 Fund receives default protection on CPTFEMU + 0 bps; and pays Fixed 1.00375% Bank of America 16/8/2029 11,586 11,586
IRS MXN 26,086,000 Fund receives Fixed 8.2062% and pays Floating MXN MXIBTIIE 1 Month Bank of America 7/10/2020 10,515 10,515
IRS MXN 5,850,407 Fund receives Floating MXN MXIBTIIE 1 Month; and pays Fixed 6.86% Bank of America 23/7/2021 (769) (769)
IRS MXN 8,165,714 Fund receives Floating MXN MXIBTIIE 1 Month; and pays Fixed 6.9% Bank of America 26/7/2021 (1,238) (1,238)
IRS MXN 25,834,313 Fund receives Floating MXN MXIBTIIE 1 Month; and pays Fixed 6.78% Bank of America 6/8/2021 (2,691) (2,691)
IRS MXN 6,335,784 Fund receives Floating MXN MXIBTIIE 1 Month; and pays Fixed 7.23% Bank of America 18/7/2022 (3,146) (3,146)
IRS MXN 3,168,351 Fund receives Floating MXN MXIBTIIE 1 Month; and pays Fixed 7.23% Bank of America 19/7/2022 (1,576) (1,576)
IRS MXN 1,218,420 Fund receives Floating MXN MXIBTIIE 1 Month; and pays Fixed 7.22% Bank of America 20/7/2022 (591) (591)
IRS MXN 1,705,788 Fund receives Floating MXN MXIBTIIE 1 Month; and pays Fixed 7.21% Bank of America 25/7/2022 (814) (814)
IRS GBP 2,756,000 Fund receives Fixed 0.5245%; and pays Floating GBP LIBOR 6 Month Bank of America 30/7/2022 (1,185) (1,185)
IRS GBP 54,000,000 Fund receives Fixed 0.535%; and pays Floating GBP LIBOR 6 Month Bank of America 2/8/2022 (16,398) (16,398)
IRS MXN 15,238,000 Fund receives Fixed 7%; and pays Floating MXN MXIBTIIE 1 Month Bank of America 11/8/2022 3,191 3,191
IRS MXN 6,790,392 Fund receives Fixed 8.125%; and pays Floating MXN MXIBTIIE 1 Month Bank of America 2/2/2024 17,702 17,702
IRS MXN 4,880,458 Fund receives Fixed 8.135%; and pays Floating MXN MXIBTIIE 1 Month Bank of America 5/2/2024 12,845 12,845
IRS MXN 5,141,075 Fund receives Fixed 6.72%; and pays Floating MXN MXIBTIIE 1 Month Bank of America 9/8/2024 (374) (374)
IRS MXN 11,309,925 Fund receives Fixed 6.67%; and pays Floating MXN MXIBTIIE 1 Month Bank of America 12/8/2024 (2,225) (2,225)
IRS MXN 9,732,000 Fund receives Fixed 6.715%; and pays Floating MXN MXIBTIIE 1 Month Bank of America 13/8/2024 (992) (992)
IRS MXN 1,644,000 Fund receives Floating MXN MXIBTIIE 1 Month; and pays Fixed 5.725% Bank of America 3/1/2025 3,888 3,888
IRS MXN 1,913,500 Fund receives Fixed 6.425%; and pays Floating MXN MXIBTIIE 1 Month Bank of America 6/6/2025 (1,670) (1,670)
IRS MXN 2,491,500 Fund receives Floating MXN MXIBTIIE 1 Month; and pays Fixed 6.31% Bank of America 11/8/2025 2,961 2,961
IRS MXN 2,491,500 Fund receives Floating MXN MXIBTIIE 1 Month; and pays Fixed 6.31% Bank of America 11/8/2025 2,961 2,961
IRS MXN 282,854 Fund receives Fixed 6.27%; and pays Floating MXN MXIBTIIE 1 Month Bank of America 5/12/2025 (385) (385)
IRS USD 160,000 Fund receives Fixed 2.128%; and pays Floating USD LIBOR 3 Month Barclays 25/8/2025 7,323 7,323IRS USD 239,445 Fund receives Fixed 2.13%; and pays Floating USD LIBOR 3 Month Barclays 25/8/2025 10,987 10,987IRS BRL 2,444,969 Fund receives Fixed 8.49%; and pays Floating BRL BROIS 1 Day Citibank 2/1/2025 54,926 54,926

The notes on pages 728 to 741 form an integral part of these financial statements.
Annual Report and Audited Financial Statements [633]
US Dollar Bond Fund continued
Swaps as at 31 August 2019
TypeNominal
Value Description Counterparty
Expiration date
Unrealised appreciation/
(depreciation) USD
Market Value USD
IRS MXN 2,270,000 Fund receives Fixed 6.325%; and pays Floating MXN MXIBTIIE 1 Month Citibank 17/7/2025 (2,580) (2,580)
IRS MXN 11,607,657 Fund receives Floating MXN MXIBTIIE 1 Month; and pays Fixed 7.2% Credit Suisse 3/8/2022 (5,471) (5,471)
IRS USD 540,000 Fund receives Floating USD LIBOR 3 Month; and pays Fixed 3.267% Deutsche Bank 16/5/2021 (15,138) (15,138)
IRS MXN 5,893,758 Fund receives Floating MXN MXIBTIIE 1 Month; and pays Fixed 7.105% Deutsche Bank 14/10/2022 (2,336) (2,336)
IRS MXN 4,492,242 Fund receives Floating MXN MXIBTIIE 1 Month; and pays Fixed 7.11% Deutsche Bank 14/10/2022 (1,813) (1,813)
IRS MXN 9,249,638 Fund receives Floating MXN MXIBTIIE 1 Month; and pays Fixed 6.3072% Deutsche Bank 11/8/2025 11,055 11,055
IRS USD 82,400 Fund receives Floating USD LIBOR 3 Month; and pays Fixed 2.255% Deutsche Bank 20/8/2025 (4,364) (4,364)
IRS MXN 6,799,000 Fund receives Fixed 6.321%; and pays Floating MXN MXIBTIIE 1 Month Goldman Sachs 6/8/2025 (7,892) (7,892)
IRS USD 180,000 Fund receives Floating USD LIBOR 3 Month; and pays Fixed 2.231% Goldman Sachs 13/1/2027 (11,237) (11,237)
IRS USD 80,000 Fund receives Floating USD LIBOR 3 Month; and pays Fixed 2.238% Goldman Sachs 13/1/2027 (5,033) (5,033)
IRS USD 230,000 Fund receives Floating USD LIBOR 3 Month; and pays Fixed 2.245% Goldman Sachs 13/1/2027 (14,585) (14,585)
IRS USD 30,000 Fund receives Floating USD LIBOR 3 Month; and pays Fixed 2.251% Goldman Sachs 13/1/2027 (1,915) (1,915)
IRS BRL 275,269 Fund receives Fixed 8.505%; and pays Floating BRL BROIS 1 Day HSBC Bank Plc 2/1/2025 5,953 5,953IRS BRL 2,508,425 Fund receives Fixed 8.27%; and pays Floating BRL BROIS 1 Day JP Morgan 2/1/2023 38,833 38,833IRS MXN 4,556,000 Fund receives Fixed 6.32%; and pays Floating MXN
MXIBTIIE 1 Month Morgan Stanley 17/7/2025 (5,233) (5,233)
Total (USD underlying exposure - USD 109,854,037) 68,742 172,239
CDS: Credit Default SwapsIFS: Inflation SwapsIRS: Interest Rate Swaps
Purchased Options as at 31 August 2019
Number of contracts
Call/ Put
Description Counterparty
Strike Price
Expiration date
Unrealised depreciation
USD
Market Value USD
244,500 Call OTC AUD/USD Bank of America AUD 0.685 5/9/2019 (918) 39 1,089,000 Call OTC EUR/CHF Morgan Stanley EUR 1.125 23/10/2019 (844) 932
Total (USD underlying exposure - USD 77,057) (1,762) 971
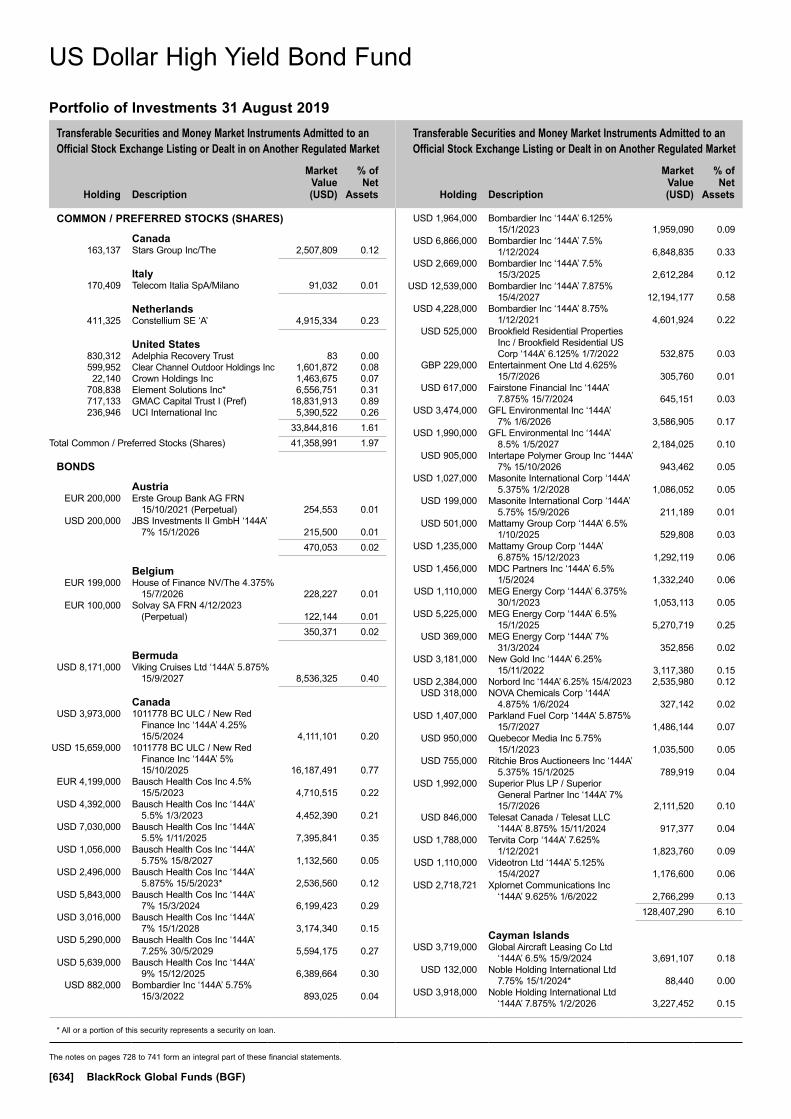
Transferable Securities and Money Market Instruments Admitted to an Official Stock Exchange Listing or Dealt in on Another Regulated Market
Transferable Securities and Money Market Instruments Admitted to an Official Stock Exchange Listing or Dealt in on Another Regulated Market
Holding
Description
Market Value (USD)
% of Net
Assets
Holding
Description
Market Value (USD)
% of Net
Assets
* All or a portion of this security represents a security on loan.
The notes on pages 728 to 741 form an integral part of these financial statements.
[634] BlackRock Global Funds (BGF)
COMMON / PREFERRED STOCKS (SHARES)
Canada 163,137 Stars Group Inc/The 2,507,809 0.12
Italy 170,409 Telecom Italia SpA/Milano 91,032 0.01
Netherlands 411,325 Constellium SE ‘A’ 4,915,334 0.23
United States 830,312 Adelphia Recovery Trust 83 0.00 599,952 Clear Channel Outdoor Holdings Inc 1,601,872 0.08 22,140 Crown Holdings Inc 1,463,675 0.07 708,838 Element Solutions Inc* 6,556,751 0.31 717,133 GMAC Capital Trust I (Pref) 18,831,913 0.89 236,946 UCI International Inc 5,390,522 0.26 33,844,816 1.61Total Common / Preferred Stocks (Shares) 41,358,991 1.97
BONDS
Austria EUR 200,000 Erste Group Bank AG FRN
15/10/2021 (Perpetual) 254,553 0.01 USD 200,000 JBS Investments II GmbH ‘144A’
7% 15/1/2026 215,500 0.01 470,053 0.02
Belgium EUR 199,000 House of Finance NV/The 4.375%
15/7/2026 228,227 0.01 EUR 100,000 Solvay SA FRN 4/12/2023
(Perpetual) 122,144 0.01 350,371 0.02
Bermuda USD 8,171,000 Viking Cruises Ltd ‘144A’ 5.875%
15/9/2027 8,536,325 0.40
Canada USD 3,973,000 1011778 BC ULC / New Red
Finance Inc ‘144A’ 4.25% 15/5/2024 4,111,101 0.20
USD 15,659,000 1011778 BC ULC / New Red Finance Inc ‘144A’ 5% 15/10/2025 16,187,491 0.77
EUR 4,199,000 Bausch Health Cos Inc 4.5% 15/5/2023 4,710,515 0.22
USD 4,392,000 Bausch Health Cos Inc ‘144A’ 5.5% 1/3/2023 4,452,390 0.21
USD 7,030,000 Bausch Health Cos Inc ‘144A’ 5.5% 1/11/2025 7,395,841 0.35
USD 1,056,000 Bausch Health Cos Inc ‘144A’ 5.75% 15/8/2027 1,132,560 0.05
USD 2,496,000 Bausch Health Cos Inc ‘144A’ 5.875% 15/5/2023* 2,536,560 0.12
USD 5,843,000 Bausch Health Cos Inc ‘144A’ 7% 15/3/2024 6,199,423 0.29
USD 3,016,000 Bausch Health Cos Inc ‘144A’ 7% 15/1/2028 3,174,340 0.15
USD 5,290,000 Bausch Health Cos Inc ‘144A’ 7.25% 30/5/2029 5,594,175 0.27
USD 5,639,000 Bausch Health Cos Inc ‘144A’ 9% 15/12/2025 6,389,664 0.30
USD 882,000 Bombardier Inc ‘144A’ 5.75% 15/3/2022 893,025 0.04
USD 1,964,000 Bombardier Inc ‘144A’ 6.125% 15/1/2023 1,959,090 0.09
USD 6,866,000 Bombardier Inc ‘144A’ 7.5% 1/12/2024 6,848,835 0.33
USD 2,669,000 Bombardier Inc ‘144A’ 7.5% 15/3/2025 2,612,284 0.12
USD 12,539,000 Bombardier Inc ‘144A’ 7.875% 15/4/2027 12,194,177 0.58
USD 4,228,000 Bombardier Inc ‘144A’ 8.75% 1/12/2021 4,601,924 0.22
USD 525,000 Brookfield Residential Properties Inc / Brookfield Residential US Corp ‘144A’ 6.125% 1/7/2022 532,875 0.03
GBP 229,000 Entertainment One Ltd 4.625% 15/7/2026 305,760 0.01
USD 617,000 Fairstone Financial Inc ‘144A’ 7.875% 15/7/2024 645,151 0.03
USD 3,474,000 GFL Environmental Inc ‘144A’ 7% 1/6/2026 3,586,905 0.17
USD 1,990,000 GFL Environmental Inc ‘144A’ 8.5% 1/5/2027 2,184,025 0.10
USD 905,000 Intertape Polymer Group Inc ‘144A’ 7% 15/10/2026 943,462 0.05
USD 1,027,000 Masonite International Corp ‘144A’ 5.375% 1/2/2028 1,086,052 0.05
USD 199,000 Masonite International Corp ‘144A’ 5.75% 15/9/2026 211,189 0.01
USD 501,000 Mattamy Group Corp ‘144A’ 6.5% 1/10/2025 529,808 0.03
USD 1,235,000 Mattamy Group Corp ‘144A’ 6.875% 15/12/2023 1,292,119 0.06
USD 1,456,000 MDC Partners Inc ‘144A’ 6.5% 1/5/2024 1,332,240 0.06
USD 1,110,000 MEG Energy Corp ‘144A’ 6.375% 30/1/2023 1,053,113 0.05
USD 5,225,000 MEG Energy Corp ‘144A’ 6.5% 15/1/2025 5,270,719 0.25
USD 369,000 MEG Energy Corp ‘144A’ 7% 31/3/2024 352,856 0.02
USD 3,181,000 New Gold Inc ‘144A’ 6.25% 15/11/2022 3,117,380 0.15
USD 2,384,000 Norbord Inc ‘144A’ 6.25% 15/4/2023 2,535,980 0.12 USD 318,000 NOVA Chemicals Corp ‘144A’
4.875% 1/6/2024 327,142 0.02 USD 1,407,000 Parkland Fuel Corp ‘144A’ 5.875%
15/7/2027 1,486,144 0.07 USD 950,000 Quebecor Media Inc 5.75%
15/1/2023 1,035,500 0.05 USD 755,000 Ritchie Bros Auctioneers Inc ‘144A’
5.375% 15/1/2025 789,919 0.04 USD 1,992,000 Superior Plus LP / Superior
General Partner Inc ‘144A’ 7% 15/7/2026 2,111,520 0.10
USD 846,000 Telesat Canada / Telesat LLC ‘144A’ 8.875% 15/11/2024 917,377 0.04
USD 1,788,000 Tervita Corp ‘144A’ 7.625% 1/12/2021 1,823,760 0.09
USD 1,110,000 Videotron Ltd ‘144A’ 5.125% 15/4/2027 1,176,600 0.06
USD 2,718,721 Xplornet Communications Inc ‘144A’ 9.625% 1/6/2022 2,766,299 0.13
128,407,290 6.10
Cayman Islands USD 3,719,000 Global Aircraft Leasing Co Ltd
‘144A’ 6.5% 15/9/2024 3,691,107 0.18 USD 132,000 Noble Holding International Ltd
7.75% 15/1/2024* 88,440 0.00 USD 3,918,000 Noble Holding International Ltd
‘144A’ 7.875% 1/2/2026 3,227,452 0.15
US Dollar High Yield Bond Fund
Portfolio of Investments 31 August 2019
US Dollar High Yield Bond Fund
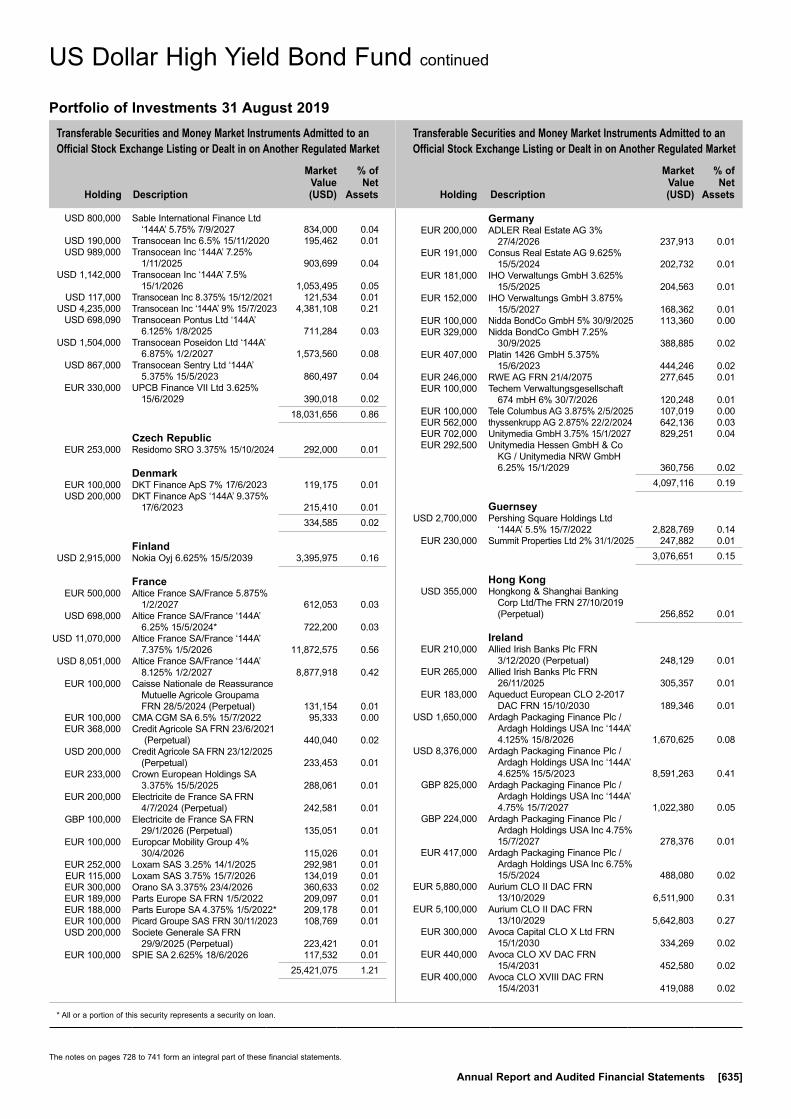
Transferable Securities and Money Market Instruments Admitted to an Official Stock Exchange Listing or Dealt in on Another Regulated Market
Transferable Securities and Money Market Instruments Admitted to an Official Stock Exchange Listing or Dealt in on Another Regulated Market
Holding
Description
Market Value (USD)
% of Net
Assets
Holding
Description
Market Value (USD)
% of Net
Assets
* All or a portion of this security represents a security on loan.
The notes on pages 728 to 741 form an integral part of these financial statements.
Annual Report and Audited Financial Statements [635]
USD 800,000 Sable International Finance Ltd ‘144A’ 5.75% 7/9/2027 834,000 0.04
USD 190,000 Transocean Inc 6.5% 15/11/2020 195,462 0.01 USD 989,000 Transocean Inc ‘144A’ 7.25%
1/11/2025 903,699 0.04 USD 1,142,000 Transocean Inc ‘144A’ 7.5%
15/1/2026 1,053,495 0.05 USD 117,000 Transocean Inc 8.375% 15/12/2021 121,534 0.01 USD 4,235,000 Transocean Inc ‘144A’ 9% 15/7/2023 4,381,108 0.21 USD 698,090 Transocean Pontus Ltd ‘144A’
6.125% 1/8/2025 711,284 0.03 USD 1,504,000 Transocean Poseidon Ltd ‘144A’
6.875% 1/2/2027 1,573,560 0.08 USD 867,000 Transocean Sentry Ltd ‘144A’
5.375% 15/5/2023 860,497 0.04 EUR 330,000 UPCB Finance VII Ltd 3.625%
15/6/2029 390,018 0.02 18,031,656 0.86
Czech Republic EUR 253,000 Residomo SRO 3.375% 15/10/2024 292,000 0.01
Denmark EUR 100,000 DKT Finance ApS 7% 17/6/2023 119,175 0.01 USD 200,000 DKT Finance ApS ‘144A’ 9.375%
17/6/2023 215,410 0.01 334,585 0.02
Finland USD 2,915,000 Nokia Oyj 6.625% 15/5/2039 3,395,975 0.16
France EUR 500,000 Altice France SA/France 5.875%
1/2/2027 612,053 0.03 USD 698,000 Altice France SA/France ‘144A’
6.25% 15/5/2024* 722,200 0.03 USD 11,070,000 Altice France SA/France ‘144A’
7.375% 1/5/2026 11,872,575 0.56 USD 8,051,000 Altice France SA/France ‘144A’
8.125% 1/2/2027 8,877,918 0.42 EUR 100,000 Caisse Nationale de Reassurance
Mutuelle Agricole Groupama FRN 28/5/2024 (Perpetual) 131,154 0.01
EUR 100,000 CMA CGM SA 6.5% 15/7/2022 95,333 0.00 EUR 368,000 Credit Agricole SA FRN 23/6/2021
(Perpetual) 440,040 0.02 USD 200,000 Credit Agricole SA FRN 23/12/2025
(Perpetual) 233,453 0.01 EUR 233,000 Crown European Holdings SA
3.375% 15/5/2025 288,061 0.01 EUR 200,000 Electricite de France SA FRN
4/7/2024 (Perpetual) 242,581 0.01 GBP 100,000 Electricite de France SA FRN
29/1/2026 (Perpetual) 135,051 0.01 EUR 100,000 Europcar Mobility Group 4%
30/4/2026 115,026 0.01 EUR 252,000 Loxam SAS 3.25% 14/1/2025 292,981 0.01 EUR 115,000 Loxam SAS 3.75% 15/7/2026 134,019 0.01 EUR 300,000 Orano SA 3.375% 23/4/2026 360,633 0.02 EUR 189,000 Parts Europe SA FRN 1/5/2022 209,097 0.01 EUR 188,000 Parts Europe SA 4.375% 1/5/2022* 209,178 0.01 EUR 100,000 Picard Groupe SAS FRN 30/11/2023 108,769 0.01 USD 200,000 Societe Generale SA FRN
29/9/2025 (Perpetual) 223,421 0.01 EUR 100,000 SPIE SA 2.625% 18/6/2026 117,532 0.01 25,421,075 1.21
Germany EUR 200,000 ADLER Real Estate AG 3%
27/4/2026 237,913 0.01 EUR 191,000 Consus Real Estate AG 9.625%
15/5/2024 202,732 0.01 EUR 181,000 IHO Verwaltungs GmbH 3.625%
15/5/2025 204,563 0.01 EUR 152,000 IHO Verwaltungs GmbH 3.875%
15/5/2027 168,362 0.01 EUR 100,000 Nidda BondCo GmbH 5% 30/9/2025 113,360 0.00 EUR 329,000 Nidda BondCo GmbH 7.25%
30/9/2025 388,885 0.02 EUR 407,000 Platin 1426 GmbH 5.375%
15/6/2023 444,246 0.02 EUR 246,000 RWE AG FRN 21/4/2075 277,645 0.01 EUR 100,000 Techem Verwaltungsgesellschaft
674 mbH 6% 30/7/2026 120,248 0.01 EUR 100,000 Tele Columbus AG 3.875% 2/5/2025 107,019 0.00 EUR 562,000 thyssenkrupp AG 2.875% 22/2/2024 642,136 0.03 EUR 702,000 Unitymedia GmbH 3.75% 15/1/2027 829,251 0.04 EUR 292,500 Unitymedia Hessen GmbH & Co
KG / Unitymedia NRW GmbH 6.25% 15/1/2029 360,756 0.02
4,097,116 0.19
Guernsey USD 2,700,000 Pershing Square Holdings Ltd
‘144A’ 5.5% 15/7/2022 2,828,769 0.14 EUR 230,000 Summit Properties Ltd 2% 31/1/2025 247,882 0.01 3,076,651 0.15
Hong Kong USD 355,000 Hongkong & Shanghai Banking
Corp Ltd/The FRN 27/10/2019 (Perpetual) 256,852 0.01
Ireland EUR 210,000 Allied Irish Banks Plc FRN
3/12/2020 (Perpetual) 248,129 0.01 EUR 265,000 Allied Irish Banks Plc FRN
26/11/2025 305,357 0.01 EUR 183,000 Aqueduct European CLO 2-2017
DAC FRN 15/10/2030 189,346 0.01 USD 1,650,000 Ardagh Packaging Finance Plc /
Ardagh Holdings USA Inc ‘144A’ 4.125% 15/8/2026 1,670,625 0.08
USD 8,376,000 Ardagh Packaging Finance Plc / Ardagh Holdings USA Inc ‘144A’ 4.625% 15/5/2023 8,591,263 0.41
GBP 825,000 Ardagh Packaging Finance Plc / Ardagh Holdings USA Inc ‘144A’ 4.75% 15/7/2027 1,022,380 0.05
GBP 224,000 Ardagh Packaging Finance Plc / Ardagh Holdings USA Inc 4.75% 15/7/2027 278,376 0.01
EUR 417,000 Ardagh Packaging Finance Plc / Ardagh Holdings USA Inc 6.75% 15/5/2024 488,080 0.02
EUR 5,880,000 Aurium CLO II DAC FRN 13/10/2029 6,511,900 0.31
EUR 5,100,000 Aurium CLO II DAC FRN 13/10/2029 5,642,803 0.27
EUR 300,000 Avoca Capital CLO X Ltd FRN 15/1/2030 334,269 0.02
EUR 440,000 Avoca CLO XV DAC FRN 15/4/2031 452,580 0.02
EUR 400,000 Avoca CLO XVIII DAC FRN 15/4/2031 419,088 0.02
US Dollar High Yield Bond Fund continued
Portfolio of Investments 31 August 2019
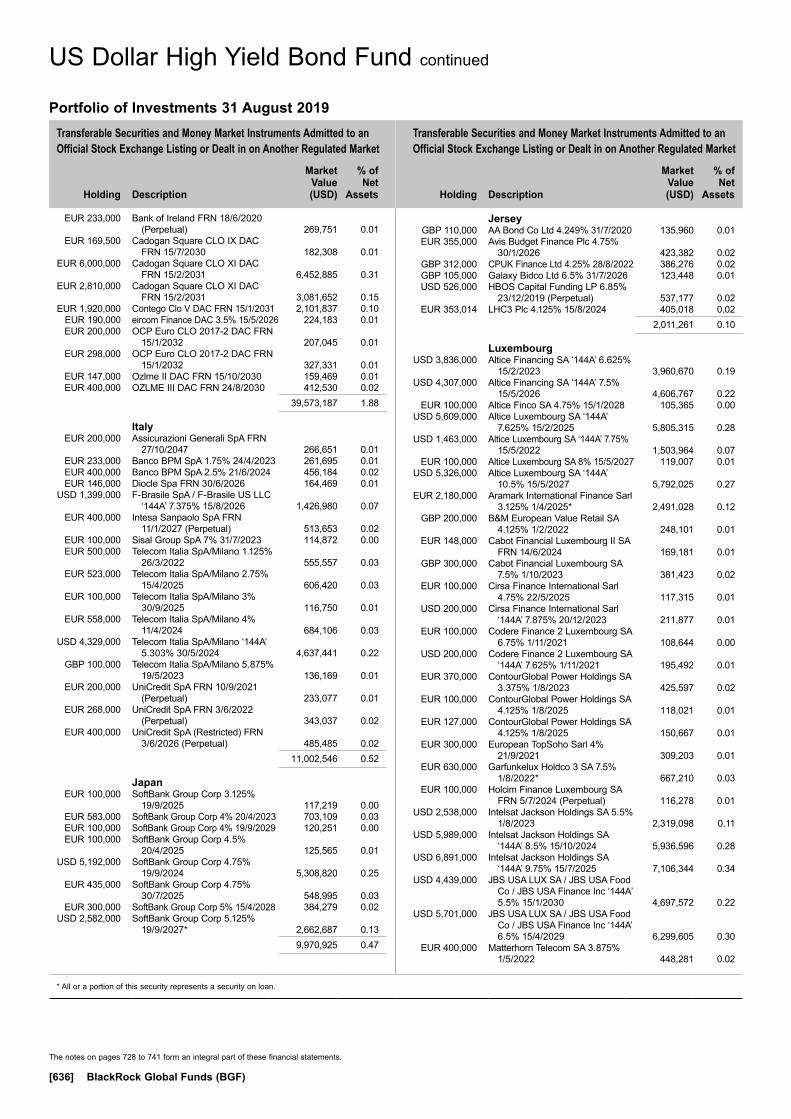
Transferable Securities and Money Market Instruments Admitted to an Official Stock Exchange Listing or Dealt in on Another Regulated Market
Transferable Securities and Money Market Instruments Admitted to an Official Stock Exchange Listing or Dealt in on Another Regulated Market
Holding
Description
Market Value (USD)
% of Net
Assets
Holding
Description
Market Value (USD)
% of Net
Assets
* All or a portion of this security represents a security on loan.
The notes on pages 728 to 741 form an integral part of these financial statements.
[636] BlackRock Global Funds (BGF)
EUR 233,000 Bank of Ireland FRN 18/6/2020 (Perpetual) 269,751 0.01
EUR 169,500 Cadogan Square CLO IX DAC FRN 15/7/2030 182,308 0.01
EUR 6,000,000 Cadogan Square CLO XI DAC FRN 15/2/2031 6,452,885 0.31
EUR 2,810,000 Cadogan Square CLO XI DAC FRN 15/2/2031 3,081,652 0.15
EUR 1,920,000 Contego Clo V DAC FRN 15/1/2031 2,101,837 0.10 EUR 190,000 eircom Finance DAC 3.5% 15/5/2026 224,183 0.01 EUR 200,000 OCP Euro CLO 2017-2 DAC FRN
15/1/2032 207,045 0.01 EUR 298,000 OCP Euro CLO 2017-2 DAC FRN
15/1/2032 327,331 0.01 EUR 147,000 Ozlme II DAC FRN 15/10/2030 159,469 0.01 EUR 400,000 OZLME III DAC FRN 24/8/2030 412,530 0.02 39,573,187 1.88
Italy EUR 200,000 Assicurazioni Generali SpA FRN
27/10/2047 266,651 0.01 EUR 233,000 Banco BPM SpA 1.75% 24/4/2023 261,695 0.01 EUR 400,000 Banco BPM SpA 2.5% 21/6/2024 456,184 0.02 EUR 146,000 Diocle Spa FRN 30/6/2026 164,469 0.01 USD 1,399,000 F-Brasile SpA / F-Brasile US LLC
‘144A’ 7.375% 15/8/2026 1,426,980 0.07 EUR 400,000 Intesa Sanpaolo SpA FRN
11/1/2027 (Perpetual) 513,653 0.02 EUR 100,000 Sisal Group SpA 7% 31/7/2023 114,872 0.00 EUR 500,000 Telecom Italia SpA/Milano 1.125%
26/3/2022 555,557 0.03 EUR 523,000 Telecom Italia SpA/Milano 2.75%
15/4/2025 606,420 0.03 EUR 100,000 Telecom Italia SpA/Milano 3%
30/9/2025 116,750 0.01 EUR 558,000 Telecom Italia SpA/Milano 4%
11/4/2024 684,106 0.03 USD 4,329,000 Telecom Italia SpA/Milano ‘144A’
5.303% 30/5/2024 4,637,441 0.22 GBP 100,000 Telecom Italia SpA/Milano 5.875%
19/5/2023 136,169 0.01 EUR 200,000 UniCredit SpA FRN 10/9/2021
(Perpetual) 233,077 0.01 EUR 268,000 UniCredit SpA FRN 3/6/2022
(Perpetual) 343,037 0.02 EUR 400,000 UniCredit SpA (Restricted) FRN
3/6/2026 (Perpetual) 485,485 0.02 11,002,546 0.52
Japan EUR 100,000 SoftBank Group Corp 3.125%
19/9/2025 117,219 0.00 EUR 583,000 SoftBank Group Corp 4% 20/4/2023 703,109 0.03 EUR 100,000 SoftBank Group Corp 4% 19/9/2029 120,251 0.00 EUR 100,000 SoftBank Group Corp 4.5%
20/4/2025 125,565 0.01 USD 5,192,000 SoftBank Group Corp 4.75%
19/9/2024 5,308,820 0.25 EUR 435,000 SoftBank Group Corp 4.75%
30/7/2025 548,995 0.03 EUR 300,000 SoftBank Group Corp 5% 15/4/2028 384,279 0.02 USD 2,582,000 SoftBank Group Corp 5.125%
19/9/2027* 2,662,687 0.13 9,970,925 0.47
Jersey GBP 110,000 AA Bond Co Ltd 4.249% 31/7/2020 135,960 0.01 EUR 355,000 Avis Budget Finance Plc 4.75%
30/1/2026 423,382 0.02 GBP 312,000 CPUK Finance Ltd 4.25% 28/8/2022 386,276 0.02 GBP 105,000 Galaxy Bidco Ltd 6.5% 31/7/2026 123,448 0.01 USD 526,000 HBOS Capital Funding LP 6.85%
23/12/2019 (Perpetual) 537,177 0.02 EUR 353,014 LHC3 Plc 4.125% 15/8/2024 405,018 0.02 2,011,261 0.10
Luxembourg USD 3,836,000 Altice Financing SA ‘144A’ 6.625%
15/2/2023 3,960,670 0.19 USD 4,307,000 Altice Financing SA ‘144A’ 7.5%
15/5/2026 4,606,767 0.22 EUR 100,000 Altice Finco SA 4.75% 15/1/2028 105,365 0.00 USD 5,609,000 Altice Luxembourg SA ‘144A’
7.625% 15/2/2025 5,805,315 0.28 USD 1,463,000 Altice Luxembourg SA ‘144A’ 7.75%
15/5/2022 1,503,964 0.07 EUR 100,000 Altice Luxembourg SA 8% 15/5/2027 119,007 0.01 USD 5,326,000 Altice Luxembourg SA ‘144A’
10.5% 15/5/2027 5,792,025 0.27 EUR 2,180,000 Aramark International Finance Sarl
3.125% 1/4/2025* 2,491,028 0.12 GBP 200,000 B&M European Value Retail SA
4.125% 1/2/2022 248,101 0.01 EUR 148,000 Cabot Financial Luxembourg II SA
FRN 14/6/2024 169,181 0.01 GBP 300,000 Cabot Financial Luxembourg SA
7.5% 1/10/2023 381,423 0.02 EUR 100,000 Cirsa Finance International Sarl
4.75% 22/5/2025 117,315 0.01 USD 200,000 Cirsa Finance International Sarl
‘144A’ 7.875% 20/12/2023 211,877 0.01 EUR 100,000 Codere Finance 2 Luxembourg SA
6.75% 1/11/2021 108,644 0.00 USD 200,000 Codere Finance 2 Luxembourg SA
‘144A’ 7.625% 1/11/2021 195,492 0.01 EUR 370,000 ContourGlobal Power Holdings SA
3.375% 1/8/2023 425,597 0.02 EUR 100,000 ContourGlobal Power Holdings SA
4.125% 1/8/2025 118,021 0.01 EUR 127,000 ContourGlobal Power Holdings SA
4.125% 1/8/2025 150,667 0.01 EUR 300,000 European TopSoho Sarl 4%
21/9/2021 309,203 0.01 EUR 630,000 Garfunkelux Holdco 3 SA 7.5%
1/8/2022* 667,210 0.03 EUR 100,000 Holcim Finance Luxembourg SA
FRN 5/7/2024 (Perpetual) 116,278 0.01 USD 2,538,000 Intelsat Jackson Holdings SA 5.5%
1/8/2023 2,319,098 0.11 USD 5,989,000 Intelsat Jackson Holdings SA
‘144A’ 8.5% 15/10/2024 5,936,596 0.28 USD 6,891,000 Intelsat Jackson Holdings SA
‘144A’ 9.75% 15/7/2025 7,106,344 0.34 USD 4,439,000 JBS USA LUX SA / JBS USA Food
Co / JBS USA Finance Inc ‘144A’ 5.5% 15/1/2030 4,697,572 0.22
USD 5,701,000 JBS USA LUX SA / JBS USA Food Co / JBS USA Finance Inc ‘144A’ 6.5% 15/4/2029 6,299,605 0.30
EUR 400,000 Matterhorn Telecom SA 3.875% 1/5/2022 448,281 0.02
US Dollar High Yield Bond Fund continued
Portfolio of Investments 31 August 2019
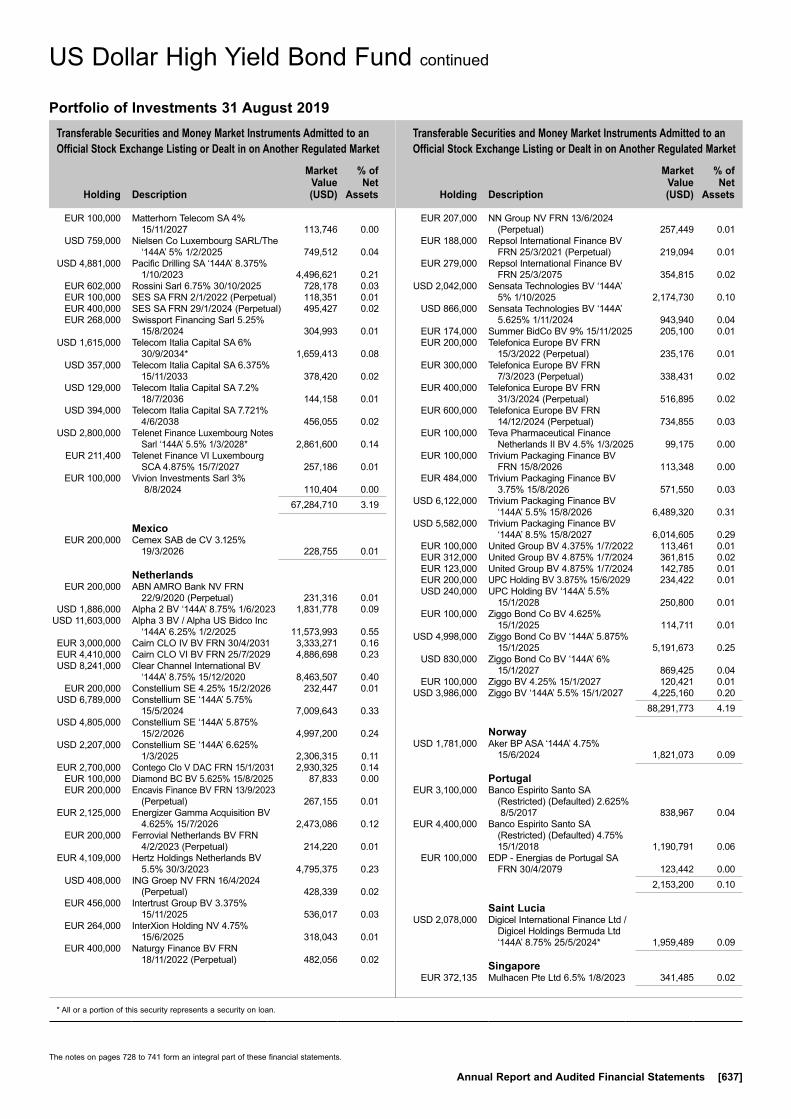
Transferable Securities and Money Market Instruments Admitted to an Official Stock Exchange Listing or Dealt in on Another Regulated Market
Transferable Securities and Money Market Instruments Admitted to an Official Stock Exchange Listing or Dealt in on Another Regulated Market
Holding
Description
Market Value (USD)
% of Net
Assets
Holding
Description
Market Value (USD)
% of Net
Assets
* All or a portion of this security represents a security on loan.
The notes on pages 728 to 741 form an integral part of these financial statements.
Annual Report and Audited Financial Statements [637]
EUR 100,000 Matterhorn Telecom SA 4% 15/11/2027 113,746 0.00
USD 759,000 Nielsen Co Luxembourg SARL/The ‘144A’ 5% 1/2/2025 749,512 0.04
USD 4,881,000 Pacific Drilling SA ‘144A’ 8.375% 1/10/2023 4,496,621 0.21
EUR 602,000 Rossini Sarl 6.75% 30/10/2025 728,178 0.03 EUR 100,000 SES SA FRN 2/1/2022 (Perpetual) 118,351 0.01 EUR 400,000 SES SA FRN 29/1/2024 (Perpetual) 495,427 0.02 EUR 268,000 Swissport Financing Sarl 5.25%
15/8/2024 304,993 0.01 USD 1,615,000 Telecom Italia Capital SA 6%
30/9/2034* 1,659,413 0.08 USD 357,000 Telecom Italia Capital SA 6.375%
15/11/2033 378,420 0.02 USD 129,000 Telecom Italia Capital SA 7.2%
18/7/2036 144,158 0.01 USD 394,000 Telecom Italia Capital SA 7.721%
4/6/2038 456,055 0.02 USD 2,800,000 Telenet Finance Luxembourg Notes
Sarl ‘144A’ 5.5% 1/3/2028* 2,861,600 0.14 EUR 211,400 Telenet Finance VI Luxembourg
SCA 4.875% 15/7/2027 257,186 0.01 EUR 100,000 Vivion Investments Sarl 3%
8/8/2024 110,404 0.00 67,284,710 3.19
Mexico EUR 200,000 Cemex SAB de CV 3.125%
19/3/2026 228,755 0.01
Netherlands EUR 200,000 ABN AMRO Bank NV FRN
22/9/2020 (Perpetual) 231,316 0.01 USD 1,886,000 Alpha 2 BV ‘144A’ 8.75% 1/6/2023 1,831,778 0.09 USD 11,603,000 Alpha 3 BV / Alpha US Bidco Inc
‘144A’ 6.25% 1/2/2025 11,573,993 0.55 EUR 3,000,000 Cairn CLO IV BV FRN 30/4/2031 3,333,271 0.16 EUR 4,410,000 Cairn CLO VI BV FRN 25/7/2029 4,886,698 0.23 USD 8,241,000 Clear Channel International BV
‘144A’ 8.75% 15/12/2020 8,463,507 0.40 EUR 200,000 Constellium SE 4.25% 15/2/2026 232,447 0.01 USD 6,789,000 Constellium SE ‘144A’ 5.75%
15/5/2024 7,009,643 0.33 USD 4,805,000 Constellium SE ‘144A’ 5.875%
15/2/2026 4,997,200 0.24 USD 2,207,000 Constellium SE ‘144A’ 6.625%
1/3/2025 2,306,315 0.11 EUR 2,700,000 Contego Clo V DAC FRN 15/1/2031 2,930,325 0.14 EUR 100,000 Diamond BC BV 5.625% 15/8/2025 87,833 0.00 EUR 200,000 Encavis Finance BV FRN 13/9/2023
(Perpetual) 267,155 0.01 EUR 2,125,000 Energizer Gamma Acquisition BV
4.625% 15/7/2026 2,473,086 0.12 EUR 200,000 Ferrovial Netherlands BV FRN
4/2/2023 (Perpetual) 214,220 0.01 EUR 4,109,000 Hertz Holdings Netherlands BV
5.5% 30/3/2023 4,795,375 0.23 USD 408,000 ING Groep NV FRN 16/4/2024
(Perpetual) 428,339 0.02 EUR 456,000 Intertrust Group BV 3.375%
15/11/2025 536,017 0.03 EUR 264,000 InterXion Holding NV 4.75%
15/6/2025 318,043 0.01 EUR 400,000 Naturgy Finance BV FRN
18/11/2022 (Perpetual) 482,056 0.02
EUR 207,000 NN Group NV FRN 13/6/2024 (Perpetual) 257,449 0.01
EUR 188,000 Repsol International Finance BV FRN 25/3/2021 (Perpetual) 219,094 0.01
EUR 279,000 Repsol International Finance BV FRN 25/3/2075 354,815 0.02
USD 2,042,000 Sensata Technologies BV ‘144A’ 5% 1/10/2025 2,174,730 0.10
USD 866,000 Sensata Technologies BV ‘144A’ 5.625% 1/11/2024 943,940 0.04
EUR 174,000 Summer BidCo BV 9% 15/11/2025 205,100 0.01 EUR 200,000 Telefonica Europe BV FRN
15/3/2022 (Perpetual) 235,176 0.01 EUR 300,000 Telefonica Europe BV FRN
7/3/2023 (Perpetual) 338,431 0.02 EUR 400,000 Telefonica Europe BV FRN
31/3/2024 (Perpetual) 516,895 0.02 EUR 600,000 Telefonica Europe BV FRN
14/12/2024 (Perpetual) 734,855 0.03 EUR 100,000 Teva Pharmaceutical Finance
Netherlands II BV 4.5% 1/3/2025 99,175 0.00 EUR 100,000 Trivium Packaging Finance BV
FRN 15/8/2026 113,348 0.00 EUR 484,000 Trivium Packaging Finance BV
3.75% 15/8/2026 571,550 0.03 USD 6,122,000 Trivium Packaging Finance BV
‘144A’ 5.5% 15/8/2026 6,489,320 0.31 USD 5,582,000 Trivium Packaging Finance BV
‘144A’ 8.5% 15/8/2027 6,014,605 0.29 EUR 100,000 United Group BV 4.375% 1/7/2022 113,461 0.01 EUR 312,000 United Group BV 4.875% 1/7/2024 361,815 0.02 EUR 123,000 United Group BV 4.875% 1/7/2024 142,785 0.01 EUR 200,000 UPC Holding BV 3.875% 15/6/2029 234,422 0.01 USD 240,000 UPC Holding BV ‘144A’ 5.5%
15/1/2028 250,800 0.01 EUR 100,000 Ziggo Bond Co BV 4.625%
15/1/2025 114,711 0.01 USD 4,998,000 Ziggo Bond Co BV ‘144A’ 5.875%
15/1/2025 5,191,673 0.25 USD 830,000 Ziggo Bond Co BV ‘144A’ 6%
15/1/2027 869,425 0.04 EUR 100,000 Ziggo BV 4.25% 15/1/2027 120,421 0.01 USD 3,986,000 Ziggo BV ‘144A’ 5.5% 15/1/2027 4,225,160 0.20 88,291,773 4.19
Norway USD 1,781,000 Aker BP ASA ‘144A’ 4.75%
15/6/2024 1,821,073 0.09
Portugal EUR 3,100,000 Banco Espirito Santo SA
(Restricted) (Defaulted) 2.625% 8/5/2017 838,967 0.04
EUR 4,400,000 Banco Espirito Santo SA (Restricted) (Defaulted) 4.75% 15/1/2018 1,190,791 0.06
EUR 100,000 EDP - Energias de Portugal SA FRN 30/4/2079 123,442 0.00
2,153,200 0.10
Saint Lucia USD 2,078,000 Digicel International Finance Ltd /
Digicel Holdings Bermuda Ltd ‘144A’ 8.75% 25/5/2024* 1,959,489 0.09
Singapore EUR 372,135 Mulhacen Pte Ltd 6.5% 1/8/2023 341,485 0.02
US Dollar High Yield Bond Fund continued
Portfolio of Investments 31 August 2019
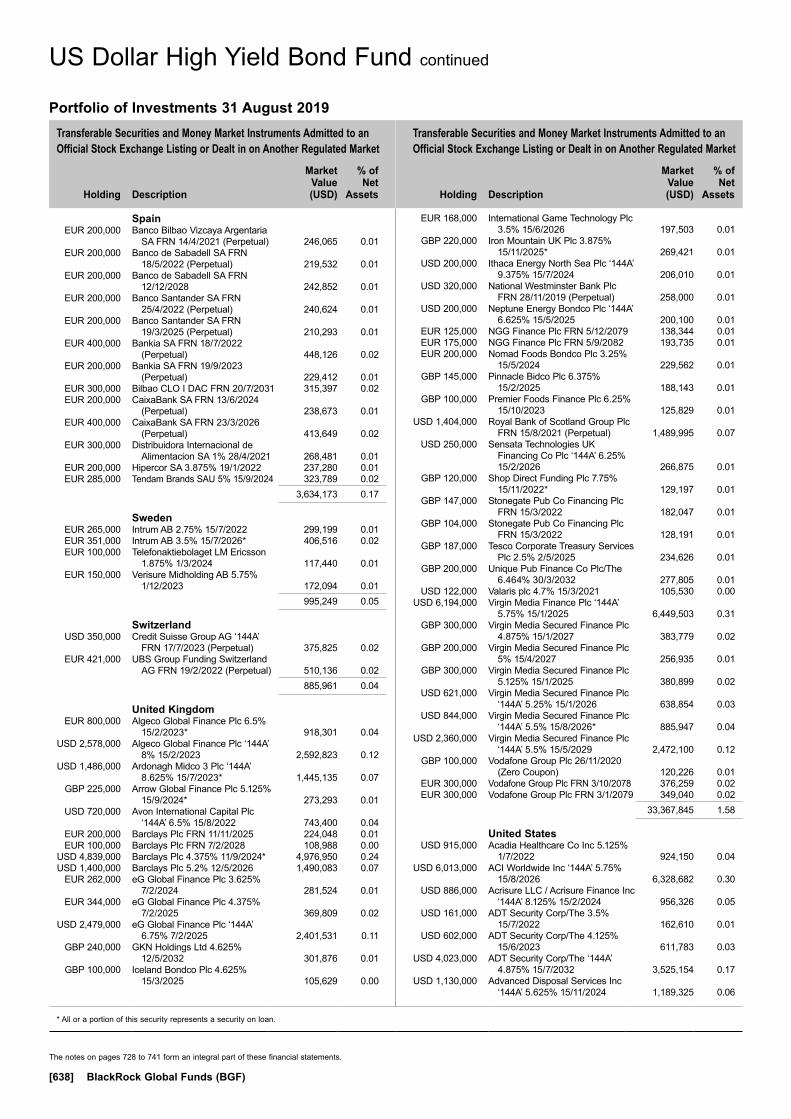
Transferable Securities and Money Market Instruments Admitted to an Official Stock Exchange Listing or Dealt in on Another Regulated Market
Transferable Securities and Money Market Instruments Admitted to an Official Stock Exchange Listing or Dealt in on Another Regulated Market
Holding
Description
Market Value (USD)
% of Net
Assets
Holding
Description
Market Value (USD)
% of Net
Assets
* All or a portion of this security represents a security on loan.
The notes on pages 728 to 741 form an integral part of these financial statements.
[638] BlackRock Global Funds (BGF)
Spain EUR 200,000 Banco Bilbao Vizcaya Argentaria
SA FRN 14/4/2021 (Perpetual) 246,065 0.01 EUR 200,000 Banco de Sabadell SA FRN
18/5/2022 (Perpetual) 219,532 0.01 EUR 200,000 Banco de Sabadell SA FRN
12/12/2028 242,852 0.01 EUR 200,000 Banco Santander SA FRN
25/4/2022 (Perpetual) 240,624 0.01 EUR 200,000 Banco Santander SA FRN
19/3/2025 (Perpetual) 210,293 0.01 EUR 400,000 Bankia SA FRN 18/7/2022
(Perpetual) 448,126 0.02 EUR 200,000 Bankia SA FRN 19/9/2023
(Perpetual) 229,412 0.01 EUR 300,000 Bilbao CLO I DAC FRN 20/7/2031 315,397 0.02 EUR 200,000 CaixaBank SA FRN 13/6/2024
(Perpetual) 238,673 0.01 EUR 400,000 CaixaBank SA FRN 23/3/2026
(Perpetual) 413,649 0.02 EUR 300,000 Distribuidora Internacional de
Alimentacion SA 1% 28/4/2021 268,481 0.01 EUR 200,000 Hipercor SA 3.875% 19/1/2022 237,280 0.01 EUR 285,000 Tendam Brands SAU 5% 15/9/2024 323,789 0.02 3,634,173 0.17
Sweden EUR 265,000 Intrum AB 2.75% 15/7/2022 299,199 0.01 EUR 351,000 Intrum AB 3.5% 15/7/2026* 406,516 0.02 EUR 100,000 Telefonaktiebolaget LM Ericsson
1.875% 1/3/2024 117,440 0.01 EUR 150,000 Verisure Midholding AB 5.75%
1/12/2023 172,094 0.01 995,249 0.05
Switzerland USD 350,000 Credit Suisse Group AG ‘144A’
FRN 17/7/2023 (Perpetual) 375,825 0.02 EUR 421,000 UBS Group Funding Switzerland
AG FRN 19/2/2022 (Perpetual) 510,136 0.02 885,961 0.04
United Kingdom EUR 800,000 Algeco Global Finance Plc 6.5%
15/2/2023* 918,301 0.04 USD 2,578,000 Algeco Global Finance Plc ‘144A’
8% 15/2/2023 2,592,823 0.12 USD 1,486,000 Ardonagh Midco 3 Plc ‘144A’
8.625% 15/7/2023* 1,445,135 0.07 GBP 225,000 Arrow Global Finance Plc 5.125%
15/9/2024* 273,293 0.01 USD 720,000 Avon International Capital Plc
‘144A’ 6.5% 15/8/2022 743,400 0.04 EUR 200,000 Barclays Plc FRN 11/11/2025 224,048 0.01 EUR 100,000 Barclays Plc FRN 7/2/2028 108,988 0.00 USD 4,839,000 Barclays Plc 4.375% 11/9/2024* 4,976,950 0.24 USD 1,400,000 Barclays Plc 5.2% 12/5/2026 1,490,083 0.07 EUR 262,000 eG Global Finance Plc 3.625%
7/2/2024 281,524 0.01 EUR 344,000 eG Global Finance Plc 4.375%
7/2/2025 369,809 0.02 USD 2,479,000 eG Global Finance Plc ‘144A’
6.75% 7/2/2025 2,401,531 0.11 GBP 240,000 GKN Holdings Ltd 4.625%
12/5/2032 301,876 0.01 GBP 100,000 Iceland Bondco Plc 4.625%
15/3/2025 105,629 0.00
EUR 168,000 International Game Technology Plc 3.5% 15/6/2026 197,503 0.01
GBP 220,000 Iron Mountain UK Plc 3.875% 15/11/2025* 269,421 0.01
USD 200,000 Ithaca Energy North Sea Plc ‘144A’ 9.375% 15/7/2024 206,010 0.01
USD 320,000 National Westminster Bank Plc FRN 28/11/2019 (Perpetual) 258,000 0.01
USD 200,000 Neptune Energy Bondco Plc ‘144A’ 6.625% 15/5/2025 200,100 0.01
EUR 125,000 NGG Finance Plc FRN 5/12/2079 138,344 0.01 EUR 175,000 NGG Finance Plc FRN 5/9/2082 193,735 0.01 EUR 200,000 Nomad Foods Bondco Plc 3.25%
15/5/2024 229,562 0.01 GBP 145,000 Pinnacle Bidco Plc 6.375%
15/2/2025 188,143 0.01 GBP 100,000 Premier Foods Finance Plc 6.25%
15/10/2023 125,829 0.01 USD 1,404,000 Royal Bank of Scotland Group Plc
FRN 15/8/2021 (Perpetual) 1,489,995 0.07 USD 250,000 Sensata Technologies UK
Financing Co Plc ‘144A’ 6.25% 15/2/2026 266,875 0.01
GBP 120,000 Shop Direct Funding Plc 7.75% 15/11/2022* 129,197 0.01
GBP 147,000 Stonegate Pub Co Financing Plc FRN 15/3/2022 182,047 0.01
GBP 104,000 Stonegate Pub Co Financing Plc FRN 15/3/2022 128,191 0.01
GBP 187,000 Tesco Corporate Treasury Services Plc 2.5% 2/5/2025 234,626 0.01
GBP 200,000 Unique Pub Finance Co Plc/The 6.464% 30/3/2032 277,805 0.01
USD 122,000 Valaris plc 4.7% 15/3/2021 105,530 0.00 USD 6,194,000 Virgin Media Finance Plc ‘144A’
5.75% 15/1/2025 6,449,503 0.31 GBP 300,000 Virgin Media Secured Finance Plc
4.875% 15/1/2027 383,779 0.02 GBP 200,000 Virgin Media Secured Finance Plc
5% 15/4/2027 256,935 0.01 GBP 300,000 Virgin Media Secured Finance Plc
5.125% 15/1/2025 380,899 0.02 USD 621,000 Virgin Media Secured Finance Plc
‘144A’ 5.25% 15/1/2026 638,854 0.03 USD 844,000 Virgin Media Secured Finance Plc
‘144A’ 5.5% 15/8/2026* 885,947 0.04 USD 2,360,000 Virgin Media Secured Finance Plc
‘144A’ 5.5% 15/5/2029 2,472,100 0.12 GBP 100,000 Vodafone Group Plc 26/11/2020
(Zero Coupon) 120,226 0.01 EUR 300,000 Vodafone Group Plc FRN 3/10/2078 376,259 0.02 EUR 300,000 Vodafone Group Plc FRN 3/1/2079 349,040 0.02 33,367,845 1.58
United States USD 915,000 Acadia Healthcare Co Inc 5.125%
1/7/2022 924,150 0.04 USD 6,013,000 ACI Worldwide Inc ‘144A’ 5.75%
15/8/2026 6,328,682 0.30 USD 886,000 Acrisure LLC / Acrisure Finance Inc
‘144A’ 8.125% 15/2/2024 956,326 0.05 USD 161,000 ADT Security Corp/The 3.5%
15/7/2022 162,610 0.01 USD 602,000 ADT Security Corp/The 4.125%
15/6/2023 611,783 0.03 USD 4,023,000 ADT Security Corp/The ‘144A’
4.875% 15/7/2032 3,525,154 0.17 USD 1,130,000 Advanced Disposal Services Inc
‘144A’ 5.625% 15/11/2024 1,189,325 0.06
US Dollar High Yield Bond Fund continued
Portfolio of Investments 31 August 2019
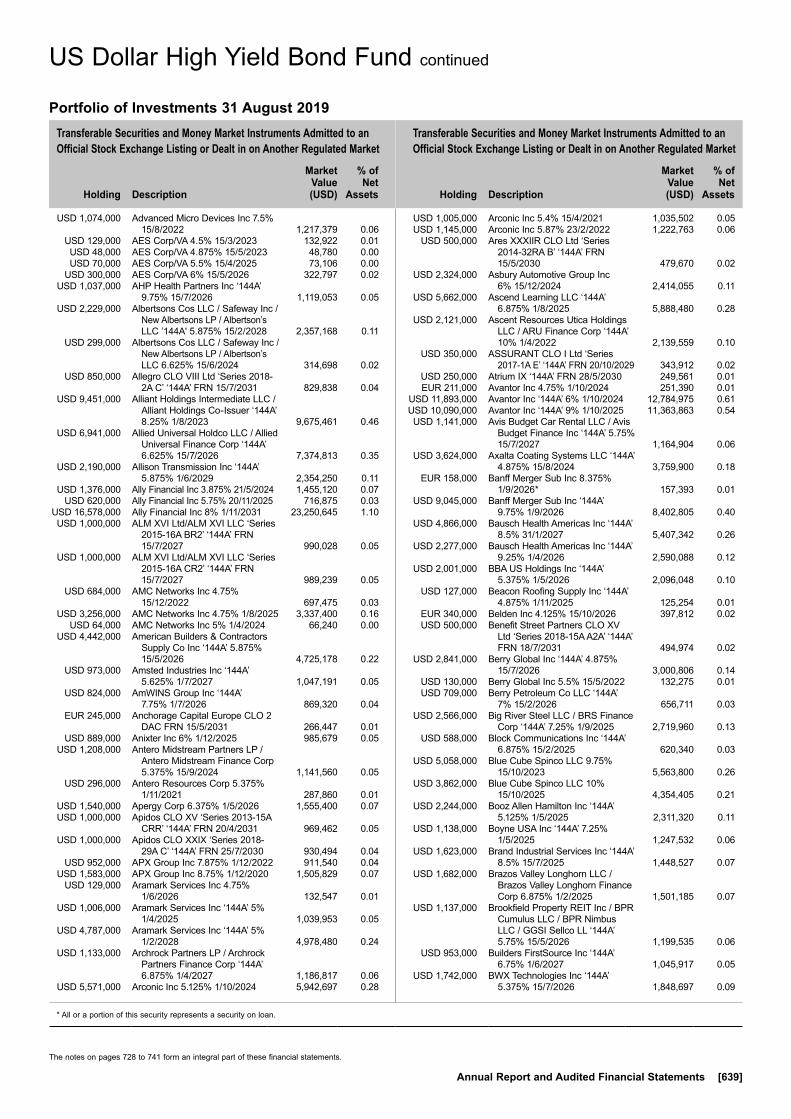
Transferable Securities and Money Market Instruments Admitted to an Official Stock Exchange Listing or Dealt in on Another Regulated Market
Transferable Securities and Money Market Instruments Admitted to an Official Stock Exchange Listing or Dealt in on Another Regulated Market
Holding
Description
Market Value (USD)
% of Net
Assets
Holding
Description
Market Value (USD)
% of Net
Assets
* All or a portion of this security represents a security on loan.
The notes on pages 728 to 741 form an integral part of these financial statements.
Annual Report and Audited Financial Statements [639]
USD 1,074,000 Advanced Micro Devices Inc 7.5% 15/8/2022 1,217,379 0.06
USD 129,000 AES Corp/VA 4.5% 15/3/2023 132,922 0.01 USD 48,000 AES Corp/VA 4.875% 15/5/2023 48,780 0.00 USD 70,000 AES Corp/VA 5.5% 15/4/2025 73,106 0.00 USD 300,000 AES Corp/VA 6% 15/5/2026 322,797 0.02 USD 1,037,000 AHP Health Partners Inc ‘144A’
9.75% 15/7/2026 1,119,053 0.05 USD 2,229,000 Albertsons Cos LLC / Safeway Inc /
New Albertsons LP / Albertson’s LLC ’144A' 5.875% 15/2/2028 2,357,168 0.11
USD 299,000 Albertsons Cos LLC / Safeway Inc / New Albertsons LP / Albertson’s LLC 6.625% 15/6/2024 314,698 0.02
USD 850,000 Allegro CLO VIII Ltd ‘Series 2018-2A C’ ‘144A’ FRN 15/7/2031 829,838 0.04
USD 9,451,000 Alliant Holdings Intermediate LLC / Alliant Holdings Co-Issuer ‘144A’ 8.25% 1/8/2023 9,675,461 0.46
USD 6,941,000 Allied Universal Holdco LLC / Allied Universal Finance Corp ‘144A’ 6.625% 15/7/2026 7,374,813 0.35
USD 2,190,000 Allison Transmission Inc ‘144A’ 5.875% 1/6/2029 2,354,250 0.11
USD 1,376,000 Ally Financial Inc 3.875% 21/5/2024 1,455,120 0.07 USD 620,000 Ally Financial Inc 5.75% 20/11/2025 716,875 0.03 USD 16,578,000 Ally Financial Inc 8% 1/11/2031 23,250,645 1.10 USD 1,000,000 ALM XVI Ltd/ALM XVI LLC ‘Series
2015-16A BR2’ ‘144A’ FRN 15/7/2027 990,028 0.05
USD 1,000,000 ALM XVI Ltd/ALM XVI LLC ‘Series 2015-16A CR2’ ‘144A’ FRN 15/7/2027 989,239 0.05
USD 684,000 AMC Networks Inc 4.75% 15/12/2022 697,475 0.03
USD 3,256,000 AMC Networks Inc 4.75% 1/8/2025 3,337,400 0.16 USD 64,000 AMC Networks Inc 5% 1/4/2024 66,240 0.00 USD 4,442,000 American Builders & Contractors
Supply Co Inc ‘144A’ 5.875% 15/5/2026 4,725,178 0.22
USD 973,000 Amsted Industries Inc ‘144A’ 5.625% 1/7/2027 1,047,191 0.05
USD 824,000 AmWINS Group Inc ‘144A’ 7.75% 1/7/2026 869,320 0.04
EUR 245,000 Anchorage Capital Europe CLO 2 DAC FRN 15/5/2031 266,447 0.01
USD 889,000 Anixter Inc 6% 1/12/2025 985,679 0.05 USD 1,208,000 Antero Midstream Partners LP /
Antero Midstream Finance Corp 5.375% 15/9/2024 1,141,560 0.05
USD 296,000 Antero Resources Corp 5.375% 1/11/2021 287,860 0.01
USD 1,540,000 Apergy Corp 6.375% 1/5/2026 1,555,400 0.07 USD 1,000,000 Apidos CLO XV ‘Series 2013-15A
CRR’ ‘144A’ FRN 20/4/2031 969,462 0.05 USD 1,000,000 Apidos CLO XXIX ‘Series 2018-
29A C’ ‘144A’ FRN 25/7/2030 930,494 0.04 USD 952,000 APX Group Inc 7.875% 1/12/2022 911,540 0.04 USD 1,583,000 APX Group Inc 8.75% 1/12/2020 1,505,829 0.07 USD 129,000 Aramark Services Inc 4.75%
1/6/2026 132,547 0.01 USD 1,006,000 Aramark Services Inc ‘144A’ 5%
1/4/2025 1,039,953 0.05 USD 4,787,000 Aramark Services Inc ‘144A’ 5%
1/2/2028 4,978,480 0.24 USD 1,133,000 Archrock Partners LP / Archrock
Partners Finance Corp ‘144A’ 6.875% 1/4/2027 1,186,817 0.06
USD 5,571,000 Arconic Inc 5.125% 1/10/2024 5,942,697 0.28
USD 1,005,000 Arconic Inc 5.4% 15/4/2021 1,035,502 0.05 USD 1,145,000 Arconic Inc 5.87% 23/2/2022 1,222,763 0.06 USD 500,000 Ares XXXIIR CLO Ltd ‘Series
2014-32RA B’ ‘144A’ FRN 15/5/2030 479,670 0.02
USD 2,324,000 Asbury Automotive Group Inc 6% 15/12/2024 2,414,055 0.11
USD 5,662,000 Ascend Learning LLC ‘144A’ 6.875% 1/8/2025 5,888,480 0.28
USD 2,121,000 Ascent Resources Utica Holdings LLC / ARU Finance Corp ‘144A’ 10% 1/4/2022 2,139,559 0.10
USD 350,000 ASSURANT CLO I Ltd ‘Series 2017-1A E’ ‘144A’ FRN 20/10/2029 343,912 0.02
USD 250,000 Atrium IX ‘144A’ FRN 28/5/2030 249,561 0.01 EUR 211,000 Avantor Inc 4.75% 1/10/2024 251,390 0.01 USD 11,893,000 Avantor Inc ‘144A’ 6% 1/10/2024 12,784,975 0.61 USD 10,090,000 Avantor Inc ‘144A’ 9% 1/10/2025 11,363,863 0.54 USD 1,141,000 Avis Budget Car Rental LLC / Avis
Budget Finance Inc ‘144A’ 5.75% 15/7/2027 1,164,904 0.06
USD 3,624,000 Axalta Coating Systems LLC ‘144A’ 4.875% 15/8/2024 3,759,900 0.18
EUR 158,000 Banff Merger Sub Inc 8.375% 1/9/2026* 157,393 0.01
USD 9,045,000 Banff Merger Sub Inc ‘144A’ 9.75% 1/9/2026 8,402,805 0.40
USD 4,866,000 Bausch Health Americas Inc ‘144A’ 8.5% 31/1/2027 5,407,342 0.26
USD 2,277,000 Bausch Health Americas Inc ‘144A’ 9.25% 1/4/2026 2,590,088 0.12
USD 2,001,000 BBA US Holdings Inc ‘144A’ 5.375% 1/5/2026 2,096,048 0.10
USD 127,000 Beacon Roofing Supply Inc ‘144A’ 4.875% 1/11/2025 125,254 0.01
EUR 340,000 Belden Inc 4.125% 15/10/2026 397,812 0.02 USD 500,000 Benefit Street Partners CLO XV
Ltd ‘Series 2018-15A A2A’ ‘144A’ FRN 18/7/2031 494,974 0.02
USD 2,841,000 Berry Global Inc ‘144A’ 4.875% 15/7/2026 3,000,806 0.14
USD 130,000 Berry Global Inc 5.5% 15/5/2022 132,275 0.01 USD 709,000 Berry Petroleum Co LLC ‘144A’
7% 15/2/2026 656,711 0.03 USD 2,566,000 Big River Steel LLC / BRS Finance
Corp ‘144A’ 7.25% 1/9/2025 2,719,960 0.13 USD 588,000 Block Communications Inc ‘144A’
6.875% 15/2/2025 620,340 0.03 USD 5,058,000 Blue Cube Spinco LLC 9.75%
15/10/2023 5,563,800 0.26 USD 3,862,000 Blue Cube Spinco LLC 10%
15/10/2025 4,354,405 0.21 USD 2,244,000 Booz Allen Hamilton Inc ‘144A’
5.125% 1/5/2025 2,311,320 0.11 USD 1,138,000 Boyne USA Inc ‘144A’ 7.25%
1/5/2025 1,247,532 0.06 USD 1,623,000 Brand Industrial Services Inc ‘144A’
8.5% 15/7/2025 1,448,527 0.07 USD 1,682,000 Brazos Valley Longhorn LLC /
Brazos Valley Longhorn Finance Corp 6.875% 1/2/2025 1,501,185 0.07
USD 1,137,000 Brookfield Property REIT Inc / BPR Cumulus LLC / BPR Nimbus LLC / GGSI Sellco LL ‘144A’ 5.75% 15/5/2026 1,199,535 0.06
USD 953,000 Builders FirstSource Inc ‘144A’ 6.75% 1/6/2027 1,045,917 0.05
USD 1,742,000 BWX Technologies Inc ‘144A’ 5.375% 15/7/2026 1,848,697 0.09
US Dollar High Yield Bond Fund continued
Portfolio of Investments 31 August 2019

Transferable Securities and Money Market Instruments Admitted to an Official Stock Exchange Listing or Dealt in on Another Regulated Market
Transferable Securities and Money Market Instruments Admitted to an Official Stock Exchange Listing or Dealt in on Another Regulated Market
Holding
Description
Market Value (USD)
% of Net
Assets
Holding
Description
Market Value (USD)
% of Net
Assets
* All or a portion of this security represents a security on loan.
The notes on pages 728 to 741 form an integral part of these financial statements.
[640] BlackRock Global Funds (BGF)
USD 738,000 California Resources Corp ‘144A’ 8% 15/12/2022 428,040 0.02
USD 1,474,000 Callon Petroleum Co 6.125% 1/10/2024 1,440,835 0.07
USD 1,380,000 Callon Petroleum Co 6.375% 1/7/2026 1,345,500 0.06
USD 4,317,000 Calpine Corp ‘144A’ 5.25% 1/6/2026 4,376,359 0.21 USD 7,648,000 Calpine Corp 5.375% 15/1/2023 7,724,480 0.37 USD 4,290,000 Calpine Corp 5.75% 15/1/2025 4,386,525 0.21 USD 2,067,000 Calpine Corp ‘144A’ 5.875%
15/1/2024 2,116,319 0.10 USD 1,143,000 Capitol Investment Merger Sub 2
LLC ‘144A’ 10% 1/8/2024 1,185,863 0.06 USD 750,000 Carlyle Global Market Strategies
CLO 2015-3 Ltd ‘Series 2015-3A A2R’ ‘144A’ FRN 28/7/2028 747,493 0.04
USD 250,000 Carlyle Global Market Strategies CLO 2016-1 Ltd ‘Series 2016-1A BR’ ‘144A’ FRN 20/4/2027 246,948 0.01
USD 1,168,000 Carrizo Oil & Gas Inc 6.25% 15/4/2023 1,123,032 0.05
USD 1,783,000 Carrizo Oil & Gas Inc 8.25% 15/7/2025 1,738,425 0.08
USD 1,807,000 Catalent Pharma Solutions Inc ‘144A’ 4.875% 15/1/2026 1,843,140 0.09
USD 1,778,000 Catalent Pharma Solutions Inc ‘144A’ 5% 15/7/2027 1,865,798 0.09
USD 2,014,000 CCO Holdings LLC / CCO Holdings Capital Corp ‘144A’ 4% 1/3/2023 2,049,044 0.10
USD 4,514,000 CCO Holdings LLC / CCO Holdings Capital Corp ‘144A’ 5% 1/2/2028 4,750,985 0.23
USD 6,489,000 CCO Holdings LLC / CCO Holdings Capital Corp ‘144A’ 5.125% 1/5/2027 6,886,451 0.33
USD 129,000 CCO Holdings LLC / CCO Holdings Capital Corp ‘144A’ 5.375% 1/5/2025 134,321 0.01
USD 10,200,000 CCO Holdings LLC / CCO Holdings Capital Corp ‘144A’ 5.375% 1/6/2029 10,945,875 0.52
USD 2,433,000 CCO Holdings LLC / CCO Holdings Capital Corp ‘144A’ 5.75% 15/2/2026 2,582,021 0.12
USD 718,000 CCO Holdings LLC / CCO Holdings Capital Corp ‘144A’ 5.875% 1/5/2027 767,363 0.04
USD 5,318,000 CDK Global Inc 4.875% 1/6/2027 5,490,835 0.26 USD 932,000 CDK Global Inc ‘144A’ 5.25%
15/5/2029 963,455 0.05 USD 1,256,000 CDW LLC / CDW Finance Corp
5% 1/9/2025 1,319,585 0.06 USD 12,000 CDW LLC / CDW Finance Corp
5.5% 1/12/2024 13,125 0.00 USD 2,027,000 Cedar Fair LP ‘144A’ 5.25%
15/7/2029 2,204,160 0.10 USD 1,000,000 Cedar Funding IX CLO Ltd ‘Series
2018-9A C’ FRN 20/4/2031 953,161 0.05 USD 1,000,000 Cent CLO 17 Ltd ‘144A’ FRN
30/4/2031 989,530 0.05 USD 13,557,000 Centene Corp ‘144A’ 5.375%
1/6/2026 14,505,990 0.69 USD 964,000 Centennial Resource Production
LLC ‘144A’ 6.875% 1/4/2027 968,820 0.05 USD 2,117,000 CenturyLink Inc 5.625% 1/4/2025 2,169,925 0.10 USD 3,758,000 CenturyLink Inc 6.75% 1/12/2023 4,082,128 0.19 USD 1,619,000 CenturyLink Inc 7.5% 1/4/2024 1,799,114 0.09 USD 912,000 CenturyLink Inc 7.6% 15/9/2039 876,797 0.04
USD 912,000 CenturyLink Inc 7.65% 15/3/2042 875,702 0.04 USD 4,683,000 Change Healthcare Holdings LLC /
Change Healthcare Finance Inc ‘144A’ 5.75% 1/3/2025 4,730,813 0.22
USD 3,221,000 Charles River Laboratories International Inc ‘144A’ 5.5% 1/4/2026 3,454,200 0.16
EUR 1,100,000 Chemours Co/The 4% 15/5/2026 1,128,512 0.05 USD 7,000 Chemours Co/The 5.375%
15/5/2027 6,300 0.00 USD 879,000 Chemours Co/The 6.625%
15/5/2023 897,679 0.04 USD 1,938,000 Chemours Co/The 7% 15/5/2025 1,913,775 0.09 USD 4,458,000 Cheniere Corpus Christi Holdings
LLC 5.125% 30/6/2027 4,959,525 0.24 USD 4,176,000 Cheniere Corpus Christi Holdings
LLC 5.875% 31/3/2025 4,687,560 0.22 USD 5,469,000 Cheniere Corpus Christi Holdings
LLC 7% 30/6/2024 6,330,367 0.30 USD 634,000 Cheniere Energy Partners LP 5.25%
1/10/2025 659,360 0.03 USD 1,267,000 Cheniere Energy Partners LP
5.625% 1/10/2026 1,339,853 0.06 USD 1,998,000 Chesapeake Energy Corp 4.875%
15/4/2022 1,661,737 0.08 USD 709,000 Chesapeake Energy Corp 5.75%
15/3/2023 570,745 0.03 USD 2,864,000 Chesapeake Energy Corp 6.625%
15/8/2020 2,885,480 0.14 USD 1,368,000 Chesapeake Energy Corp 7%
1/10/2024 1,046,616 0.05 USD 1,109,000 Chesapeake Energy Corp ‘144A’
8% 15/3/2026 798,480 0.04 USD 3,015,000 Chesapeake Energy Corp 8%
15/6/2027* 2,170,800 0.10 USD 2,728,000 Chobani LLC / Chobani Finance
Corp Inc ‘144A’ 7.5% 15/4/2025 2,526,810 0.12 USD 3,754,000 CHS/Community Health Systems
Inc ‘144A’ 8% 15/3/2026 3,613,225 0.17 USD 4,242,000 CHS/Community Health Systems
Inc ‘144A’ 8.625% 15/1/2024 4,252,605 0.20 USD 1,788,000 Churchill Downs Inc ‘144A’ 4.75%
15/1/2028 1,850,669 0.09 USD 5,242,000 Churchill Downs Inc ‘144A’ 5.5%
1/4/2027 5,582,730 0.27 USD 250,000 Cifc Funding 2014-IV-R Ltd ‘Series
2014-4RA B’ ‘144A’ FRN 17/10/2030 248,593 0.01
USD 392,000 Cifc Funding 2014-IV-R Ltd ‘Series 2014-4RA C’ ‘144A’ FRN 17/10/2030 384,405 0.02
USD 645,000 Cincinnati Bell Inc ‘144A’ 7% 15/7/2024 591,787 0.03
USD 2,602,000 Cincinnati Bell Inc ‘144A’ 8% 15/10/2025 2,289,760 0.11
USD 353,000 CIT Group Inc 5% 1/8/2023 383,888 0.02 USD 715,000 CIT Group Inc 5.25% 7/3/2025 802,587 0.04 USD 5,998,000 CIT Group Inc 6% 1/4/2036 5,728,090 0.27 USD 929,000 CIT Group Inc 6.125% 9/3/2028 1,114,521 0.05 USD 1,769,000 Clean Harbors Inc ‘144A’ 4.875%
15/7/2027 1,877,351 0.09 USD 932,000 Clean Harbors Inc ‘144A’ 5.125%
15/7/2029 994,910 0.05 USD 11,343,000 Clear Channel Worldwide Holdings
Inc ‘144A’ 5.125% 15/8/2027 11,881,793 0.56 USD 11,078,000 Clear Channel Worldwide Holdings
Inc 6.5% 15/11/2022 11,330,025 0.54 USD 6,916,000 Clear Channel Worldwide Holdings
Inc 6.5% 15/11/2022 7,080,255 0.34
US Dollar High Yield Bond Fund continued
Portfolio of Investments 31 August 2019
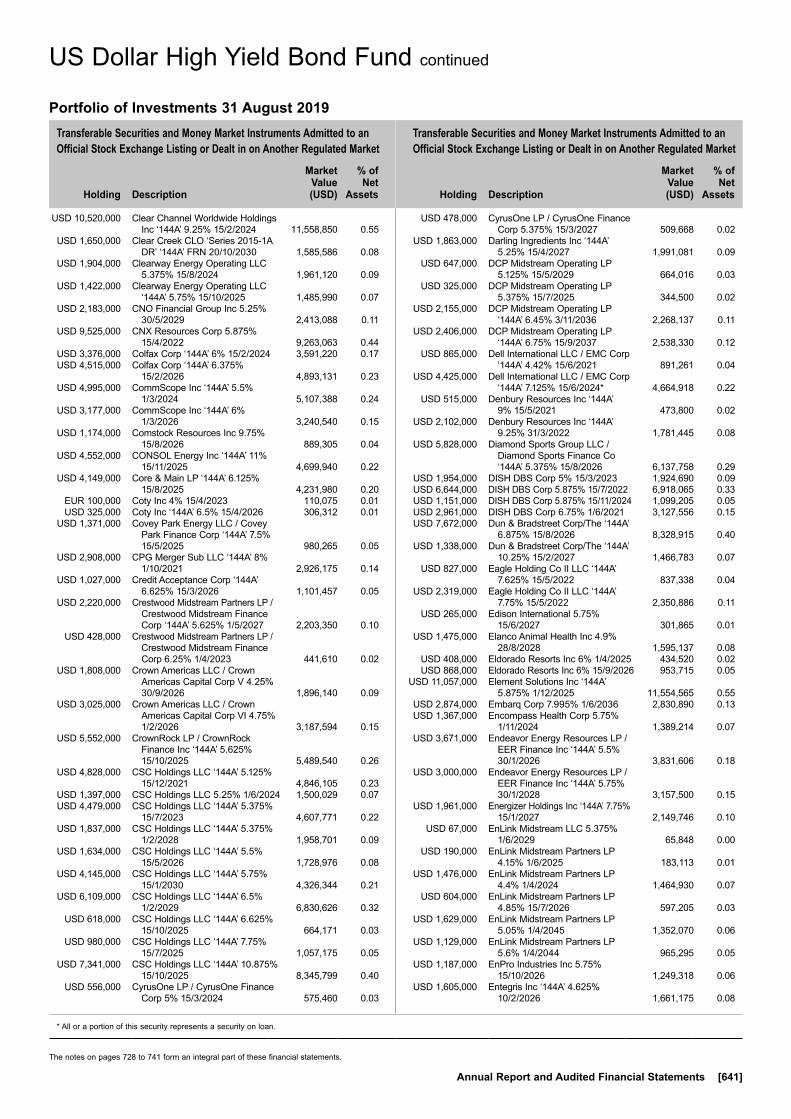
Transferable Securities and Money Market Instruments Admitted to an Official Stock Exchange Listing or Dealt in on Another Regulated Market
Transferable Securities and Money Market Instruments Admitted to an Official Stock Exchange Listing or Dealt in on Another Regulated Market
Holding
Description
Market Value (USD)
% of Net
Assets
Holding
Description
Market Value (USD)
% of Net
Assets
* All or a portion of this security represents a security on loan.
The notes on pages 728 to 741 form an integral part of these financial statements.
Annual Report and Audited Financial Statements [641]
USD 10,520,000 Clear Channel Worldwide Holdings Inc ‘144A’ 9.25% 15/2/2024 11,558,850 0.55
USD 1,650,000 Clear Creek CLO ‘Series 2015-1A DR’ ‘144A’ FRN 20/10/2030 1,585,586 0.08
USD 1,904,000 Clearway Energy Operating LLC 5.375% 15/8/2024 1,961,120 0.09
USD 1,422,000 Clearway Energy Operating LLC ‘144A’ 5.75% 15/10/2025 1,485,990 0.07
USD 2,183,000 CNO Financial Group Inc 5.25% 30/5/2029 2,413,088 0.11
USD 9,525,000 CNX Resources Corp 5.875% 15/4/2022 9,263,063 0.44
USD 3,376,000 Colfax Corp ‘144A’ 6% 15/2/2024 3,591,220 0.17 USD 4,515,000 Colfax Corp ‘144A’ 6.375%
15/2/2026 4,893,131 0.23 USD 4,995,000 CommScope Inc ‘144A’ 5.5%
1/3/2024 5,107,388 0.24 USD 3,177,000 CommScope Inc ‘144A’ 6%
1/3/2026 3,240,540 0.15 USD 1,174,000 Comstock Resources Inc 9.75%
15/8/2026 889,305 0.04 USD 4,552,000 CONSOL Energy Inc ‘144A’ 11%
15/11/2025 4,699,940 0.22 USD 4,149,000 Core & Main LP ‘144A’ 6.125%
15/8/2025 4,231,980 0.20 EUR 100,000 Coty Inc 4% 15/4/2023 110,075 0.01 USD 325,000 Coty Inc ‘144A’ 6.5% 15/4/2026 306,312 0.01 USD 1,371,000 Covey Park Energy LLC / Covey
Park Finance Corp ‘144A’ 7.5% 15/5/2025 980,265 0.05
USD 2,908,000 CPG Merger Sub LLC ‘144A’ 8% 1/10/2021 2,926,175 0.14
USD 1,027,000 Credit Acceptance Corp ‘144A’ 6.625% 15/3/2026 1,101,457 0.05
USD 2,220,000 Crestwood Midstream Partners LP / Crestwood Midstream Finance Corp ‘144A’ 5.625% 1/5/2027 2,203,350 0.10
USD 428,000 Crestwood Midstream Partners LP / Crestwood Midstream Finance Corp 6.25% 1/4/2023 441,610 0.02
USD 1,808,000 Crown Americas LLC / Crown Americas Capital Corp V 4.25% 30/9/2026 1,896,140 0.09
USD 3,025,000 Crown Americas LLC / Crown Americas Capital Corp VI 4.75% 1/2/2026 3,187,594 0.15
USD 5,552,000 CrownRock LP / CrownRock Finance Inc ‘144A’ 5.625% 15/10/2025 5,489,540 0.26
USD 4,828,000 CSC Holdings LLC ‘144A’ 5.125% 15/12/2021 4,846,105 0.23
USD 1,397,000 CSC Holdings LLC 5.25% 1/6/2024 1,500,029 0.07 USD 4,479,000 CSC Holdings LLC ‘144A’ 5.375%
15/7/2023 4,607,771 0.22 USD 1,837,000 CSC Holdings LLC ‘144A’ 5.375%
1/2/2028 1,958,701 0.09 USD 1,634,000 CSC Holdings LLC ‘144A’ 5.5%
15/5/2026 1,728,976 0.08 USD 4,145,000 CSC Holdings LLC ‘144A’ 5.75%
15/1/2030 4,326,344 0.21 USD 6,109,000 CSC Holdings LLC ‘144A’ 6.5%
1/2/2029 6,830,626 0.32 USD 618,000 CSC Holdings LLC ‘144A’ 6.625%
15/10/2025 664,171 0.03 USD 980,000 CSC Holdings LLC ‘144A’ 7.75%
15/7/2025 1,057,175 0.05 USD 7,341,000 CSC Holdings LLC ‘144A’ 10.875%
15/10/2025 8,345,799 0.40 USD 556,000 CyrusOne LP / CyrusOne Finance
Corp 5% 15/3/2024 575,460 0.03
USD 478,000 CyrusOne LP / CyrusOne Finance Corp 5.375% 15/3/2027 509,668 0.02
USD 1,863,000 Darling Ingredients Inc ‘144A’ 5.25% 15/4/2027 1,991,081 0.09
USD 647,000 DCP Midstream Operating LP 5.125% 15/5/2029 664,016 0.03
USD 325,000 DCP Midstream Operating LP 5.375% 15/7/2025 344,500 0.02
USD 2,155,000 DCP Midstream Operating LP ‘144A’ 6.45% 3/11/2036 2,268,137 0.11
USD 2,406,000 DCP Midstream Operating LP ‘144A’ 6.75% 15/9/2037 2,538,330 0.12
USD 865,000 Dell International LLC / EMC Corp ‘144A’ 4.42% 15/6/2021 891,261 0.04
USD 4,425,000 Dell International LLC / EMC Corp ‘144A’ 7.125% 15/6/2024* 4,664,918 0.22
USD 515,000 Denbury Resources Inc ‘144A’ 9% 15/5/2021 473,800 0.02
USD 2,102,000 Denbury Resources Inc ‘144A’ 9.25% 31/3/2022 1,781,445 0.08
USD 5,828,000 Diamond Sports Group LLC / Diamond Sports Finance Co ‘144A’ 5.375% 15/8/2026 6,137,758 0.29
USD 1,954,000 DISH DBS Corp 5% 15/3/2023 1,924,690 0.09 USD 6,644,000 DISH DBS Corp 5.875% 15/7/2022 6,918,065 0.33 USD 1,151,000 DISH DBS Corp 5.875% 15/11/2024 1,099,205 0.05 USD 2,961,000 DISH DBS Corp 6.75% 1/6/2021 3,127,556 0.15 USD 7,672,000 Dun & Bradstreet Corp/The ‘144A’
6.875% 15/8/2026 8,328,915 0.40 USD 1,338,000 Dun & Bradstreet Corp/The ‘144A’
10.25% 15/2/2027 1,466,783 0.07 USD 827,000 Eagle Holding Co II LLC ‘144A’
7.625% 15/5/2022 837,338 0.04 USD 2,319,000 Eagle Holding Co II LLC ‘144A’
7.75% 15/5/2022 2,350,886 0.11 USD 265,000 Edison International 5.75%
15/6/2027 301,865 0.01 USD 1,475,000 Elanco Animal Health Inc 4.9%
28/8/2028 1,595,137 0.08 USD 408,000 Eldorado Resorts Inc 6% 1/4/2025 434,520 0.02 USD 868,000 Eldorado Resorts Inc 6% 15/9/2026 953,715 0.05 USD 11,057,000 Element Solutions Inc ‘144A’
5.875% 1/12/2025 11,554,565 0.55 USD 2,874,000 Embarq Corp 7.995% 1/6/2036 2,830,890 0.13 USD 1,367,000 Encompass Health Corp 5.75%
1/11/2024 1,389,214 0.07 USD 3,671,000 Endeavor Energy Resources LP /
EER Finance Inc ‘144A’ 5.5% 30/1/2026 3,831,606 0.18
USD 3,000,000 Endeavor Energy Resources LP / EER Finance Inc ‘144A’ 5.75% 30/1/2028 3,157,500 0.15
USD 1,961,000 Energizer Holdings Inc ‘144A’ 7.75% 15/1/2027 2,149,746 0.10
USD 67,000 EnLink Midstream LLC 5.375% 1/6/2029 65,848 0.00
USD 190,000 EnLink Midstream Partners LP 4.15% 1/6/2025 183,113 0.01
USD 1,476,000 EnLink Midstream Partners LP 4.4% 1/4/2024 1,464,930 0.07
USD 604,000 EnLink Midstream Partners LP 4.85% 15/7/2026 597,205 0.03
USD 1,629,000 EnLink Midstream Partners LP 5.05% 1/4/2045 1,352,070 0.06
USD 1,129,000 EnLink Midstream Partners LP 5.6% 1/4/2044 965,295 0.05
USD 1,187,000 EnPro Industries Inc 5.75% 15/10/2026 1,249,318 0.06
USD 1,605,000 Entegris Inc ‘144A’ 4.625% 10/2/2026 1,661,175 0.08
US Dollar High Yield Bond Fund continued
Portfolio of Investments 31 August 2019

Transferable Securities and Money Market Instruments Admitted to an Official Stock Exchange Listing or Dealt in on Another Regulated Market
Transferable Securities and Money Market Instruments Admitted to an Official Stock Exchange Listing or Dealt in on Another Regulated Market
Holding
Description
Market Value (USD)
% of Net
Assets
Holding
Description
Market Value (USD)
% of Net
Assets
The notes on pages 728 to 741 form an integral part of these financial statements.
[642] BlackRock Global Funds (BGF)
USD 917,000 Entercom Media Corp ‘144A’ 6.5% 1/5/2027 949,471 0.05
USD 2,080,000 Envision Healthcare Corp ‘144A’ 8.75% 15/10/2026 1,144,000 0.05
EUR 200,000 Equinix Inc 2.875% 15/3/2024 230,012 0.01 EUR 175,000 Equinix Inc 2.875% 1/10/2025 201,376 0.01 EUR 100,000 Equinix Inc 2.875% 1/2/2026 115,975 0.01 USD 850,000 Erscrew Adelphia 31/12/2049
(Zero Coupon) 38 0.00 USD 1,322,000 ESH Hospitality Inc ‘144A’ 5.25%
1/5/2025 1,368,270 0.07 USD 1,924,000 Extraction Oil & Gas Inc ‘144A’
5.625% 1/2/2026 1,279,460 0.06 USD 3,298,000 Extraction Oil & Gas Inc ‘144A’
7.375% 15/5/2024 2,489,990 0.12 USD 1,461,000 Five Point Operating Co LP / Five
Point Capital Corp ‘144A’ 7.875% 15/11/2025 1,471,958 0.07
USD 556,000 Flexi-Van Leasing Inc ‘144A’ 10% 15/2/2023 546,270 0.03
USD 572,000 Fortress Transportation & Infrastructure Investors LLC ‘144A’ 6.5% 1/10/2025 589,875 0.03
USD 539,000 Fortress Transportation & Infrastructure Investors LLC ‘144A’ 6.75% 15/3/2022 561,908 0.03
USD 2,509,000 Freeport-McMoRan Inc 3.55% 1/3/2022 2,527,818 0.12
USD 5,292,000 Freeport-McMoRan Inc 3.875% 15/3/2023 5,344,920 0.25
USD 834,000 Freeport-McMoRan Inc 5% 1/9/2027 828,788 0.04 USD 1,368,000 Freeport-McMoRan Inc 5.25%
1/9/2029 1,350,900 0.06 USD 13,935,000 Freeport-McMoRan Inc 5.45%
15/3/2043 12,680,850 0.60 USD 2,990,000 frontdoor Inc ‘144A’ 6.75%
15/8/2026 3,251,625 0.15 USD 10,958,000 Frontier Communications Corp
‘144A’ 8% 1/4/2027 11,451,110 0.54 USD 592,000 Frontier Communications Corp
‘144A’ 8.5% 1/4/2026 575,720 0.03 USD 339,000 FS Energy & Power Fund ‘144A’
7.5% 15/8/2023 337,305 0.02 USD 250,000 Galaxy XXVI CLO Ltd ‘Series
2018-26A B’ ‘144A’ FRN 22/11/2031 248,874 0.01
USD 960,000 Gartner Inc ‘144A’ 5.125% 1/4/2025 1,009,190 0.05 USD 2,183,000 Gates Global LLC / Gates Global
Co ‘144A’ 6% 15/7/2022 2,175,360 0.10 USD 993,000 GCI LLC ‘144A’ 6.625% 15/6/2024 1,062,510 0.05 USD 1,037,000 GCP Applied Technologies Inc
‘144A’ 5.5% 15/4/2026 1,065,517 0.05 USD 108,000 Genesis Energy LP / Genesis
Energy Finance Corp 5.625% 15/6/2024 103,680 0.00
USD 200,000 Genesis Energy LP / Genesis Energy Finance Corp 6% 15/5/2023 199,500 0.01
USD 978,000 Genesis Energy LP / Genesis Energy Finance Corp 6.25% 15/5/2026 939,261 0.04
USD 779,000 Genesis Energy LP / Genesis Energy Finance Corp 6.5% 1/10/2025 758,395 0.04
USD 8,075,000 Genesys Telecommunications Laboratories Inc/Greeneden Lux 3 Sarl/Greeneden US Ho ‘144A’ 10% 30/11/2024 8,738,846 0.41
USD 590,000 GLP Capital LP / GLP Financing II Inc 3.35% 1/9/2024 595,882 0.03
USD 2,745,000 GLP Capital LP / GLP Financing II Inc 4% 15/1/2030 2,776,293 0.13
USD 174,000 GLP Capital LP / GLP Financing II Inc 5.25% 1/6/2025 189,933 0.01
USD 343,000 GLP Capital LP / GLP Financing II Inc 5.375% 15/4/2026 378,082 0.02
USD 620,000 GLP Capital LP / GLP Financing II Inc 5.75% 1/6/2028 708,610 0.03
USD 1,981,000 Go Daddy Operating Co LLC / GD Finance Co Inc ‘144A’ 5.25% 1/12/2027 2,094,908 0.10
USD 1,509,000 Gogo Intermediate Holdings LLC / Gogo Finance Co Inc ‘144A’ 9.875% 1/5/2024 1,578,791 0.08
USD 10,070,000 Golden Nugget Inc ‘144A’ 6.75% 15/10/2024 10,346,925 0.49
USD 1,000,000 Goldentree Loan Management US Clo 3 Ltd ‘Series 2018-3A C’ FRN 20/4/2030 974,081 0.05
USD 1,200,000 GoldentTree Loan Management US CLO 1 Ltd ‘Series 2017-1A D’ ‘144A’ FRN 20/4/2029 1,200,521 0.06
USD 692,000 Graham Holdings Co ‘144A’ 5.75% 1/6/2026 742,170 0.04
USD 866,000 Graphic Packaging International LLC ‘144A’ 4.75% 15/7/2027 911,465 0.04
USD 709,000 Gray Television Inc ‘144A’ 5.125% 15/10/2024 733,815 0.03
USD 1,416,000 Gray Television Inc ‘144A’ 7% 15/5/2027 1,555,830 0.07
USD 3,150,000 Great Western Petroleum LLC / Great Western Finance Corp ‘144A’ 9% 30/9/2021 2,795,625 0.13
USD 350,000 Greif Inc ‘144A’ 6.5% 1/3/2027 370,125 0.02 USD 1,305,000 Greystar Real Estate Partners LLC
‘144A’ 5.75% 1/12/2025 1,339,256 0.06 USD 1,727,000 Grinding Media Inc / Moly-Cop
AltaSteel Ltd ‘144A’ 7.375% 15/12/2023 1,649,285 0.08
USD 495,000 Group 1 Automotive Inc ‘144A’ 5.25% 15/12/2023 509,850 0.02
USD 1,391,000 GTCR AP Finance Inc ‘144A’ 8% 15/5/2027 1,418,820 0.07
USD 1,503,000 Harland Clarke Holdings Corp ‘144A’ 8.375% 15/8/2022 1,187,370 0.06
USD 5,106,000 HCA Inc 5.375% 1/2/2025 5,660,869 0.27 USD 902,000 HCA Inc 5.375% 1/9/2026 1,005,730 0.05 USD 6,021,000 HCA Inc 5.625% 1/9/2028 6,878,993 0.33 USD 129,000 HCA Inc 5.875% 15/2/2026 147,705 0.01 USD 6,149,000 HCA Inc 5.875% 1/2/2029 7,094,409 0.34 USD 12,687,000 HD Supply Inc ‘144A’ 5.375%
15/10/2026 13,577,627 0.64 USD 2,751,000 Herc Holdings Inc ‘144A’ 5.5%
15/7/2027 2,857,601 0.14 USD 3,224,000 Hertz Corp/The ‘144A’ 7.625%
1/6/2022 3,352,960 0.16 USD 1,336,000 Hess Infrastructure Partners LP /
Hess Infrastructure Partners Finance Corp ‘144A’ 5.625% 15/2/2026 1,382,760 0.07
USD 1,566,000 Hilton Domestic Operating Co Inc 4.25% 1/9/2024 1,601,235 0.08
USD 8,033,000 Hilton Domestic Operating Co Inc ‘144A’ 4.875% 15/1/2030 8,655,557 0.41
USD 2,658,000 Hilton Domestic Operating Co Inc 5.125% 1/5/2026 2,800,868 0.13
US Dollar High Yield Bond Fund continued
Portfolio of Investments 31 August 2019

Transferable Securities and Money Market Instruments Admitted to an Official Stock Exchange Listing or Dealt in on Another Regulated Market
Transferable Securities and Money Market Instruments Admitted to an Official Stock Exchange Listing or Dealt in on Another Regulated Market
Holding
Description
Market Value (USD)
% of Net
Assets
Holding
Description
Market Value (USD)
% of Net
Assets
The notes on pages 728 to 741 form an integral part of these financial statements.
Annual Report and Audited Financial Statements [643]
USD 838,000 Hilton Worldwide Finance LLC / Hilton Worldwide Finance Corp 4.625% 1/4/2025 869,601 0.04
USD 623,000 Hilton Worldwide Finance LLC / Hilton Worldwide Finance Corp 4.875% 1/4/2027 658,044 0.03
USD 321,000 Hologic Inc ‘144A’ 4.375% 15/10/2025 330,229 0.02
USD 1,403,000 Hologic Inc ‘144A’ 4.625% 1/2/2028 1,457,366 0.07 USD 907,000 Howard Hughes Corp/The ‘144A’
5.375% 15/3/2025 936,478 0.04 USD 8,619,000 HUB International Ltd ‘144A’ 7%
1/5/2026 8,780,606 0.42 USD 1,137,000 Hughes Satellite Systems Corp
5.25% 1/8/2026 1,209,484 0.06 USD 2,338,000 IAA Inc ‘144A’ 5.5% 15/6/2027 2,514,519 0.12 USD 3,459,000 Icahn Enterprises LP / Icahn
Enterprises Finance Corp ‘144A’ 6.25% 15/5/2026 3,627,626 0.17
USD 3,796,000 Icahn Enterprises LP / Icahn Enterprises Finance Corp 6.375% 15/12/2025 4,037,995 0.19
USD 557,000 Icahn Enterprises LP / Icahn Enterprises Finance Corp 6.75% 1/2/2024 584,850 0.03
USD 2,053,000 iHeartCommunications Inc ‘144A’ 5.25% 15/8/2027 2,165,915 0.10
USD 1,085,876 iHeartCommunications Inc 6.375% 1/5/2026 1,182,932 0.06
USD 728,000 Immucor Inc ‘144A’ 11.125% 15/2/2022 741,614 0.04
USD 2,235,000 Indigo Natural Resources LLC ‘144A’ 6.875% 15/2/2026 1,855,050 0.09
USD 18,545,000 Infor US Inc 6.5% 15/5/2022 18,915,900 0.90 USD 5,357,000 Informatica LLC ‘144A’ 7.125%
15/7/2023 5,464,140 0.26 EUR 1,700,000 IQVIA Inc 3.25% 15/3/2025 1,936,095 0.09 USD 3,054,000 IQVIA Inc ‘144A’ 5% 15/10/2026 3,225,787 0.15 USD 3,533,000 IQVIA Inc ‘144A’ 5% 15/5/2027 3,740,564 0.18 USD 408,000 IRB Holding Corp ‘144A’ 6.75%
15/2/2026 413,100 0.02 EUR 149,000 Iron Mountain Inc 3% 15/1/2025 170,296 0.01 USD 1,642,000 Iron Mountain Inc ‘144A’ 4.875%
15/9/2027 1,674,840 0.08 USD 267,000 iStar Inc 4.625% 15/9/2020 271,005 0.01 USD 106,000 iStar Inc 5.25% 15/9/2022 109,414 0.01 USD 463,000 iStar Inc 6% 1/4/2022 476,311 0.02 USD 234,000 Itron Inc ‘144A’ 5% 15/1/2026 239,265 0.01 USD 10,682,000 Jaguar Holding Co II /
Pharmaceutical Product Development LLC ‘144A’ 6.375% 1/8/2023 11,055,870 0.52
USD 4,308,000 JBS USA LUX SA / JBS USA Finance Inc ‘144A’ 5.75% 15/6/2025 4,506,572 0.21
USD 3,807,000 JBS USA LUX SA / JBS USA Finance Inc ‘144A’ 5.875% 15/7/2024 3,930,366 0.19
USD 1,073,000 JBS USA LUX SA / JBS USA Finance Inc ‘144A’ 6.75% 15/2/2028 1,195,054 0.06
USD 1,272,000 JELD-WEN Inc ‘144A’ 4.625% 15/12/2025 1,249,740 0.06
USD 1,198,000 Joseph T Ryerson & Son Inc ‘144A’ 11% 15/5/2022 1,258,274 0.06
USD 861,000 Kaiser Aluminum Corp 5.875% 15/5/2024 895,440 0.04
USD 250,000 KAR Auction Services Inc ‘144A’ 5.125% 1/6/2025 258,750 0.01
USD 95,000 KFC Holding Co/Pizza Hut Holdings LLC/Taco Bell of America LLC ‘144A’ 4.75% 1/6/2027 100,016 0.00
USD 2,372,000 KFC Holding Co/Pizza Hut Holdings LLC/Taco Bell of America LLC ‘144A’ 5.25% 1/6/2026 2,514,320 0.12
USD 5,376,000 Kratos Defense & Security Solutions Inc ‘144A’ 6.5% 30/11/2025 5,779,200 0.27
USD 269,000 L Brands Inc 6.75% 1/7/2036 228,650 0.01 USD 2,391,000 L Brands Inc 6.875% 1/11/2035 2,032,350 0.10 USD 2,204,000 LABL Escrow Issuer LLC ‘144A’
6.75% 15/7/2026 2,270,120 0.11 USD 46,000 Ladder Capital Finance Holdings
LLLP / Ladder Capital Finance Corp ‘144A’ 5.25% 15/3/2022 47,840 0.00
USD 1,791,000 Ladder Capital Finance Holdings LLLP / Ladder Capital Finance Corp ‘144A’ 5.25% 1/10/2025 1,831,298 0.09
USD 846,000 Laureate Education Inc ‘144A’ 8.25% 1/5/2025 924,255 0.04
USD 561,000 Lennar Corp 4.75% 30/5/2025 602,374 0.03 USD 2,304,000 Lennar Corp 4.75% 29/11/2027 2,517,120 0.12 USD 282,000 Lennar Corp 5.25% 1/6/2026 307,027 0.01 USD 862,000 Lennar Corp 6.25% 15/12/2021 915,875 0.04 USD 796,000 Lennar Corp 8.375% 15/1/2021 859,680 0.04 USD 4,331,000 Level 3 Financing Inc 5.25%
15/3/2026 4,525,895 0.21 USD 239,000 Level 3 Financing Inc 5.375%
1/5/2025 249,456 0.01 USD 442,000 Level 3 Financing Inc 5.625%
1/2/2023 449,868 0.02 USD 1,726,000 Level 3 Parent LLC 5.75%
1/12/2022 1,743,260 0.08 USD 1,335,000 Lions Gate Capital Holdings LLC
‘144A’ 5.875% 1/11/2024 1,395,075 0.07 USD 180,000 Lions Gate Capital Holdings LLC
‘144A’ 6.375% 1/2/2024 190,346 0.01 USD 319,000 Live Nation Entertainment Inc
‘144A’ 4.875% 1/11/2024 330,564 0.02 USD 1,000,000 Madison Park Funding XXXI Ltd
‘Series 2018-31A B’ ‘144A’ FRN 23/1/2031 992,980 0.05
USD 905,000 Manitowoc Co Inc/The ‘144A’ 9% 1/4/2026 905,000 0.04
USD 287,000 Marriott Ownership Resorts Inc / ILG LLC 6.5% 15/9/2026 310,500 0.01
USD 1,859,000 Matador Resources Co 5.875% 15/9/2026 1,812,525 0.09
USD 5,155,000 Mattel Inc ‘144A’ 6.75% 31/12/2025 5,270,987 0.25 USD 425,000 Matthews International Corp ‘144A’
5.25% 1/12/2025 409,063 0.02 EUR 312,000 Mauser Packaging Solutions
Holding Co 4.75% 15/4/2024 356,864 0.02 USD 10,439,000 Mauser Packaging Solutions
Holding Co ‘144A’ 5.5% 15/4/2024 10,817,414 0.51 USD 1,375,000 McDermott Technology Americas
Inc / McDermott Technology US Inc ‘144A’ 10.625% 1/5/2024 977,969 0.05
USD 878,000 MDC Holdings Inc 6% 15/1/2043 899,950 0.04 USD 1,255,000 MEDNAX Inc ‘144A’ 5.25%
1/12/2023 1,264,023 0.06 USD 5,726,000 MEDNAX Inc ‘144A’ 6.25%
15/1/2027 5,632,953 0.27 USD 257,000 Mercer International Inc 7.75%
1/12/2022 263,746 0.01 USD 1,922,000 Meredith Corp 6.875% 1/2/2026 2,037,320 0.10 USD 140,000 Meritage Homes Corp 7.15%
15/4/2020 144,375 0.01
US Dollar High Yield Bond Fund continued
Portfolio of Investments 31 August 2019

Transferable Securities and Money Market Instruments Admitted to an Official Stock Exchange Listing or Dealt in on Another Regulated Market
Transferable Securities and Money Market Instruments Admitted to an Official Stock Exchange Listing or Dealt in on Another Regulated Market
Holding
Description
Market Value (USD)
% of Net
Assets
Holding
Description
Market Value (USD)
% of Net
Assets
The notes on pages 728 to 741 form an integral part of these financial statements.
[644] BlackRock Global Funds (BGF)
USD 4,200,000 MGM Growth Properties Operating Partnership LP / MGP Finance Co-Issuer Inc 4.5% 1/9/2026 4,410,000 0.21
USD 3,433,000 MGM Growth Properties Operating Partnership LP / MGP Finance Co-Issuer Inc 4.5% 15/1/2028 3,518,825 0.17
USD 5,610,000 MGM Growth Properties Operating Partnership LP / MGP Finance Co-Issuer Inc 5.625% 1/5/2024 6,142,950 0.29
USD 170,000 MGM Growth Properties Operating Partnership LP / MGP Finance Co-Issuer Inc ‘144A’ 5.75% 1/2/2027 187,884 0.01
USD 2,245,000 MGM Resorts International 6.625% 15/12/2021 2,446,781 0.12
USD 1,126,000 MGM Resorts International 7.75% 15/3/2022 1,265,343 0.06
USD 1,104,000 Midcontinent Communications / Midcontinent Finance Corp ‘144A’ 5.375% 15/8/2027 1,148,745 0.05
USD 3,971,000 Mobile Mini Inc 5.875% 1/7/2024 4,129,840 0.20 USD 1,438,000 Molina Healthcare Inc ‘144A’
4.875% 15/6/2025 1,472,152 0.07 USD 1,275,000 Molina Healthcare Inc 5.375%
15/11/2022 1,359,469 0.06 USD 3,082,000 MPH Acquisition Holdings LLC
‘144A’ 7.125% 1/6/2024 2,766,095 0.13 USD 3,263,000 MPT Operating Partnership LP /
MPT Finance Corp 4.625% 1/8/2029 3,391,481 0.16
USD 6,794,000 MPT Operating Partnership LP / MPT Finance Corp 5% 15/10/2027 7,244,102 0.34
USD 1,650,000 MPT Operating Partnership LP / MPT Finance Corp 5.25% 1/8/2026 1,749,495 0.08
USD 805,000 MPT Operating Partnership LP / MPT Finance Corp 5.5% 1/5/2024 828,144 0.04
USD 265,000 MSCI Inc ‘144A’ 4.75% 1/8/2026 277,919 0.01 USD 851,000 MSCI Inc ‘144A’ 5.25% 15/11/2024 887,763 0.04 USD 1,218,000 MTS Systems Corp ‘144A’ 5.75%
15/8/2027 1,278,900 0.06 USD 2,578,000 Mueller Water Products Inc ‘144A’
5.5% 15/6/2026 2,719,790 0.13 USD 707,000 Murphy Oil Corp 5.625% 1/12/2042 618,625 0.03 USD 542,000 Murphy Oil Corp 5.75% 15/8/2025 551,485 0.03 USD 1,412,000 Nabors Industries Inc 4.625%
15/9/2021 1,351,990 0.06 USD 2,589,000 Nationstar Mortgage Holdings Inc
‘144A’ 8.125% 15/7/2023 2,679,615 0.13 USD 2,243,000 Nationstar Mortgage Holdings Inc
‘144A’ 9.125% 15/7/2026 2,374,776 0.11 USD 233,000 Navient Corp 5% 26/10/2020 239,116 0.01 USD 498,000 Navient Corp 5.5% 25/1/2023 523,523 0.02 USD 906,000 Navient Corp 5.875% 25/10/2024 953,565 0.05 USD 179,000 Navient Corp 6.125% 25/3/2024 191,924 0.01 USD 168,000 Navient Corp 6.5% 15/6/2022 182,070 0.01 USD 1,557,000 Navient Corp 6.625% 26/7/2021 1,671,533 0.08 USD 293,000 Navient Corp 6.75% 25/6/2025 314,960 0.02 USD 361,000 Navient Corp 6.75% 15/6/2026 385,367 0.02 USD 880,000 Navient Corp 7.25% 25/9/2023 980,100 0.05 USD 2,686,000 Navistar International Corp ‘144A’
6.625% 1/11/2025 2,734,684 0.13 USD 1,292,000 NBCUniversal Enterprise Inc ‘144A’
5.25% 19/3/2021 (Perpetual) 1,334,442 0.06 USD 1,362,000 NCR Corp ‘144A’ 5.75% 1/9/2027 1,435,208 0.07 USD 1,362,000 NCR Corp ‘144A’ 6.125% 1/9/2029 1,440,315 0.07 EUR 445,000 Netflix Inc 3.875% 15/11/2029 535,870 0.03 USD 791,000 Netflix Inc 4.875% 15/4/2028 831,539 0.04 USD 4,531,000 Netflix Inc ‘144A’ 5.375% 15/11/2029 4,963,710 0.24 USD 5,314,000 Netflix Inc 5.875% 15/11/2028 5,964,859 0.28
USD 1,000,000 Neuberger Berman CLO XV ‘Series 2013-15A CR’ ‘144A’ FRN 15/10/2029 976,576 0.05
USD 623,000 New Enterprise Stone & Lime Co Inc ‘144A’ 6.25% 15/3/2026 638,575 0.03
USD 972,000 New Enterprise Stone & Lime Co Inc ‘144A’ 10.125% 1/4/2022 998,730 0.05
USD 787,000 Newmark Group Inc 6.125% 15/11/2023 856,734 0.04
USD 3,819,000 NextEra Energy Operating Partners LP ‘144A’ 4.25% 15/7/2024 3,928,796 0.19
USD 616,000 NextEra Energy Operating Partners LP ‘144A’ 4.25% 15/9/2024 641,102 0.03
USD 1,010,000 NextEra Energy Operating Partners LP ‘144A’ 4.5% 15/9/2027 1,041,562 0.05
USD 2,258,000 NGPL PipeCo LLC ‘144A’ 7.768% 15/12/2037 2,955,225 0.14
USD 341,222 Northern Oil and Gas Inc 8.5% 15/5/2023 352,738 0.02
USD 3,139,000 Novelis Corp ‘144A’ 5.875% 30/9/2026 3,335,187 0.16
USD 10,027,000 Novelis Corp ‘144A’ 6.25% 15/8/2024 10,528,350 0.50
USD 900,000 NRG Energy Inc ‘144A’ 3.75% 15/6/2024 931,193 0.04
USD 3,006,000 NRG Energy Inc ‘144A’ 4.45% 15/6/2029 3,159,956 0.15
USD 3,324,000 NRG Energy Inc ‘144A’ 5.25% 15/6/2029 3,556,680 0.17
USD 3,961,000 NRG Energy Inc 5.75% 15/1/2028 4,277,880 0.20 USD 931,000 NRG Energy Inc 6.625% 15/1/2027 1,008,971 0.05 USD 2,191,000 Nuance Communications Inc
5.625% 15/12/2026 2,314,244 0.11 USD 417,000 Nuance Communications Inc 6%
1/7/2024 435,244 0.02 USD 1,031,000 NuStar Logistics LP 6% 1/6/2026 1,108,325 0.05 USD 918,000 NVA Holdings Inc/United States
‘144A’ 6.875% 1/4/2026 984,830 0.05 USD 508,000 Oak Hill Credit Partners X-R Ltd
‘Series 2014-10RA C’ ‘144A’ FRN 12/12/2030 496,550 0.02
USD 470,000 Octagon Investment Partners XXII Ltd ‘Series 2014-1A CRR’ ‘144A’ FRN 22/1/2030 457,572 0.02
USD 500,000 Octagon Investment Partners XXIII Ltd ‘Series 2015-1A CR’ ‘144A’ FRN 15/7/2027 495,666 0.02
USD 11,630,000 Ortho-Clinical Diagnostics Inc / Ortho-Clinical Diagnostics SA ‘144A’ 6.625% 15/5/2022 11,281,100 0.54
USD 4,891,000 Outfront Media Capital LLC / Outfront Media Capital Corp ‘144A’ 5% 15/8/2027 5,068,299 0.24
USD 1,209,000 Owl Rock Capital Corp 5.25% 15/4/2024 1,270,238 0.06
EUR 534,000 Panther BF Aggregator 2 LP / Panther Finance Co Inc 4.375% 15/5/2026 602,567 0.03
USD 8,177,000 Panther BF Aggregator 2 LP / Panther Finance Co Inc ‘144A’ 6.25% 15/5/2026 8,473,416 0.40
USD 8,858,000 Panther BF Aggregator 2 LP / Panther Finance Co Inc ‘144A’ 8.5% 15/5/2027 8,636,550 0.41
USD 4,907,000 Par Pharmaceutical Inc ‘144A’ 7.5% 1/4/2027 4,588,045 0.22
USD 1,013,000 Parsley Energy LLC / Parsley Finance Corp ‘144A’ 5.25% 15/8/2025 1,033,260 0.05
US Dollar High Yield Bond Fund continued
Portfolio of Investments 31 August 2019
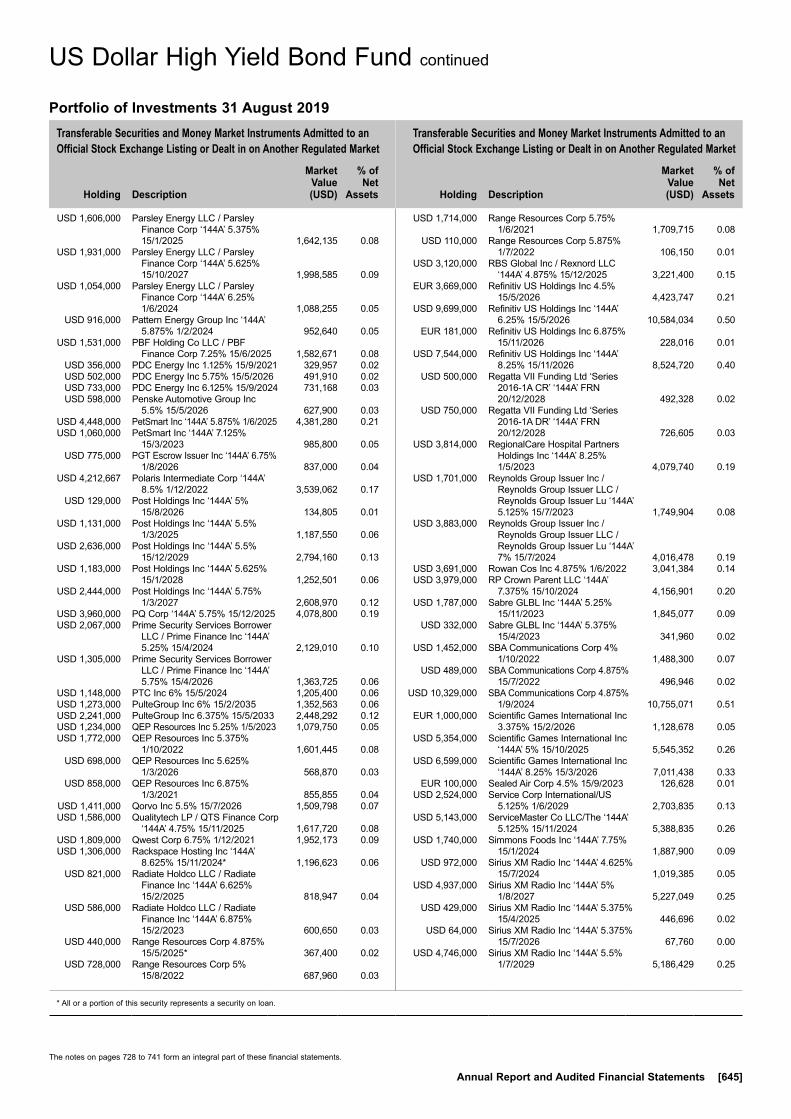
Transferable Securities and Money Market Instruments Admitted to an Official Stock Exchange Listing or Dealt in on Another Regulated Market
Transferable Securities and Money Market Instruments Admitted to an Official Stock Exchange Listing or Dealt in on Another Regulated Market
Holding
Description
Market Value (USD)
% of Net
Assets
Holding
Description
Market Value (USD)
% of Net
Assets
* All or a portion of this security represents a security on loan.
The notes on pages 728 to 741 form an integral part of these financial statements.
Annual Report and Audited Financial Statements [645]
USD 1,606,000 Parsley Energy LLC / Parsley Finance Corp ‘144A’ 5.375% 15/1/2025 1,642,135 0.08
USD 1,931,000 Parsley Energy LLC / Parsley Finance Corp ‘144A’ 5.625% 15/10/2027 1,998,585 0.09
USD 1,054,000 Parsley Energy LLC / Parsley Finance Corp ‘144A’ 6.25% 1/6/2024 1,088,255 0.05
USD 916,000 Pattern Energy Group Inc ‘144A’ 5.875% 1/2/2024 952,640 0.05
USD 1,531,000 PBF Holding Co LLC / PBF Finance Corp 7.25% 15/6/2025 1,582,671 0.08
USD 356,000 PDC Energy Inc 1.125% 15/9/2021 329,957 0.02 USD 502,000 PDC Energy Inc 5.75% 15/5/2026 491,910 0.02 USD 733,000 PDC Energy Inc 6.125% 15/9/2024 731,168 0.03 USD 598,000 Penske Automotive Group Inc
5.5% 15/5/2026 627,900 0.03 USD 4,448,000 PetSmart Inc ‘144A’ 5.875% 1/6/2025 4,381,280 0.21 USD 1,060,000 PetSmart Inc ‘144A’ 7.125%
15/3/2023 985,800 0.05 USD 775,000 PGT Escrow Issuer Inc ‘144A’ 6.75%
1/8/2026 837,000 0.04 USD 4,212,667 Polaris Intermediate Corp ‘144A’
8.5% 1/12/2022 3,539,062 0.17 USD 129,000 Post Holdings Inc ‘144A’ 5%
15/8/2026 134,805 0.01 USD 1,131,000 Post Holdings Inc ‘144A’ 5.5%
1/3/2025 1,187,550 0.06 USD 2,636,000 Post Holdings Inc ‘144A’ 5.5%
15/12/2029 2,794,160 0.13 USD 1,183,000 Post Holdings Inc ‘144A’ 5.625%
15/1/2028 1,252,501 0.06 USD 2,444,000 Post Holdings Inc ‘144A’ 5.75%
1/3/2027 2,608,970 0.12 USD 3,960,000 PQ Corp ‘144A’ 5.75% 15/12/2025 4,078,800 0.19 USD 2,067,000 Prime Security Services Borrower
LLC / Prime Finance Inc ‘144A’ 5.25% 15/4/2024 2,129,010 0.10
USD 1,305,000 Prime Security Services Borrower LLC / Prime Finance Inc ‘144A’ 5.75% 15/4/2026 1,363,725 0.06
USD 1,148,000 PTC Inc 6% 15/5/2024 1,205,400 0.06 USD 1,273,000 PulteGroup Inc 6% 15/2/2035 1,352,563 0.06 USD 2,241,000 PulteGroup Inc 6.375% 15/5/2033 2,448,292 0.12 USD 1,234,000 QEP Resources Inc 5.25% 1/5/2023 1,079,750 0.05 USD 1,772,000 QEP Resources Inc 5.375%
1/10/2022 1,601,445 0.08 USD 698,000 QEP Resources Inc 5.625%
1/3/2026 568,870 0.03 USD 858,000 QEP Resources Inc 6.875%
1/3/2021 855,855 0.04 USD 1,411,000 Qorvo Inc 5.5% 15/7/2026 1,509,798 0.07 USD 1,586,000 Qualitytech LP / QTS Finance Corp
‘144A’ 4.75% 15/11/2025 1,617,720 0.08 USD 1,809,000 Qwest Corp 6.75% 1/12/2021 1,952,173 0.09 USD 1,306,000 Rackspace Hosting Inc ‘144A’
8.625% 15/11/2024* 1,196,623 0.06 USD 821,000 Radiate Holdco LLC / Radiate
Finance Inc ‘144A’ 6.625% 15/2/2025 818,947 0.04
USD 586,000 Radiate Holdco LLC / Radiate Finance Inc ‘144A’ 6.875% 15/2/2023 600,650 0.03
USD 440,000 Range Resources Corp 4.875% 15/5/2025* 367,400 0.02
USD 728,000 Range Resources Corp 5% 15/8/2022 687,960 0.03
USD 1,714,000 Range Resources Corp 5.75% 1/6/2021 1,709,715 0.08
USD 110,000 Range Resources Corp 5.875% 1/7/2022 106,150 0.01
USD 3,120,000 RBS Global Inc / Rexnord LLC ‘144A’ 4.875% 15/12/2025 3,221,400 0.15
EUR 3,669,000 Refinitiv US Holdings Inc 4.5% 15/5/2026 4,423,747 0.21
USD 9,699,000 Refinitiv US Holdings Inc ‘144A’ 6.25% 15/5/2026 10,584,034 0.50
EUR 181,000 Refinitiv US Holdings Inc 6.875% 15/11/2026 228,016 0.01
USD 7,544,000 Refinitiv US Holdings Inc ‘144A’ 8.25% 15/11/2026 8,524,720 0.40
USD 500,000 Regatta VII Funding Ltd ‘Series 2016-1A CR’ ‘144A’ FRN 20/12/2028 492,328 0.02
USD 750,000 Regatta VII Funding Ltd ‘Series 2016-1A DR’ ‘144A’ FRN 20/12/2028 726,605 0.03
USD 3,814,000 RegionalCare Hospital Partners Holdings Inc ‘144A’ 8.25% 1/5/2023 4,079,740 0.19
USD 1,701,000 Reynolds Group Issuer Inc / Reynolds Group Issuer LLC / Reynolds Group Issuer Lu ‘144A’ 5.125% 15/7/2023 1,749,904 0.08
USD 3,883,000 Reynolds Group Issuer Inc / Reynolds Group Issuer LLC / Reynolds Group Issuer Lu ‘144A’ 7% 15/7/2024 4,016,478 0.19
USD 3,691,000 Rowan Cos Inc 4.875% 1/6/2022 3,041,384 0.14 USD 3,979,000 RP Crown Parent LLC ‘144A’
7.375% 15/10/2024 4,156,901 0.20 USD 1,787,000 Sabre GLBL Inc ‘144A’ 5.25%
15/11/2023 1,845,077 0.09 USD 332,000 Sabre GLBL Inc ‘144A’ 5.375%
15/4/2023 341,960 0.02 USD 1,452,000 SBA Communications Corp 4%
1/10/2022 1,488,300 0.07 USD 489,000 SBA Communications Corp 4.875%
15/7/2022 496,946 0.02 USD 10,329,000 SBA Communications Corp 4.875%
1/9/2024 10,755,071 0.51 EUR 1,000,000 Scientific Games International Inc
3.375% 15/2/2026 1,128,678 0.05 USD 5,354,000 Scientific Games International Inc
‘144A’ 5% 15/10/2025 5,545,352 0.26 USD 6,599,000 Scientific Games International Inc
‘144A’ 8.25% 15/3/2026 7,011,438 0.33 EUR 100,000 Sealed Air Corp 4.5% 15/9/2023 126,628 0.01 USD 2,524,000 Service Corp International/US
5.125% 1/6/2029 2,703,835 0.13 USD 5,143,000 ServiceMaster Co LLC/The ‘144A’
5.125% 15/11/2024 5,388,835 0.26 USD 1,740,000 Simmons Foods Inc ‘144A’ 7.75%
15/1/2024 1,887,900 0.09 USD 972,000 Sirius XM Radio Inc ‘144A’ 4.625%
15/7/2024 1,019,385 0.05 USD 4,937,000 Sirius XM Radio Inc ‘144A’ 5%
1/8/2027 5,227,049 0.25 USD 429,000 Sirius XM Radio Inc ‘144A’ 5.375%
15/4/2025 446,696 0.02 USD 64,000 Sirius XM Radio Inc ‘144A’ 5.375%
15/7/2026 67,760 0.00 USD 4,746,000 Sirius XM Radio Inc ‘144A’ 5.5%
1/7/2029 5,186,429 0.25
US Dollar High Yield Bond Fund continued
Portfolio of Investments 31 August 2019
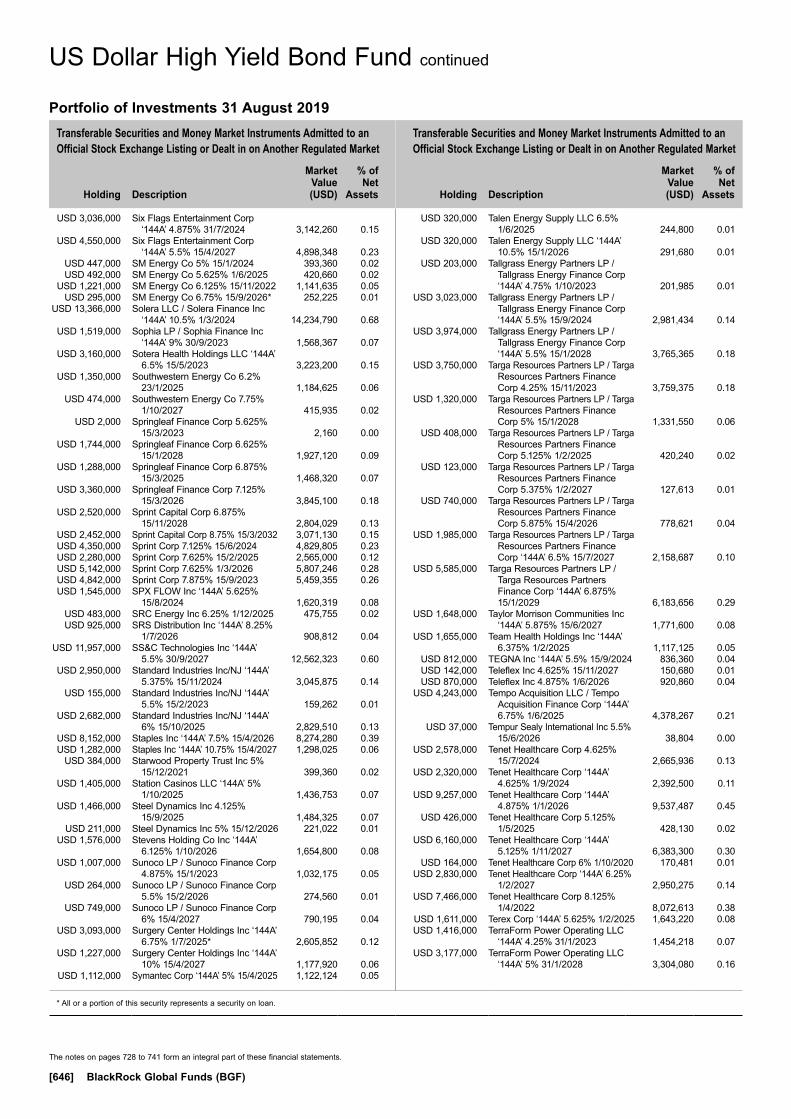
Transferable Securities and Money Market Instruments Admitted to an Official Stock Exchange Listing or Dealt in on Another Regulated Market
Transferable Securities and Money Market Instruments Admitted to an Official Stock Exchange Listing or Dealt in on Another Regulated Market
Holding
Description
Market Value (USD)
% of Net
Assets
Holding
Description
Market Value (USD)
% of Net
Assets
* All or a portion of this security represents a security on loan.
The notes on pages 728 to 741 form an integral part of these financial statements.
[646] BlackRock Global Funds (BGF)
USD 3,036,000 Six Flags Entertainment Corp ‘144A’ 4.875% 31/7/2024 3,142,260 0.15
USD 4,550,000 Six Flags Entertainment Corp ‘144A’ 5.5% 15/4/2027 4,898,348 0.23
USD 447,000 SM Energy Co 5% 15/1/2024 393,360 0.02 USD 492,000 SM Energy Co 5.625% 1/6/2025 420,660 0.02 USD 1,221,000 SM Energy Co 6.125% 15/11/2022 1,141,635 0.05 USD 295,000 SM Energy Co 6.75% 15/9/2026* 252,225 0.01 USD 13,366,000 Solera LLC / Solera Finance Inc
‘144A’ 10.5% 1/3/2024 14,234,790 0.68 USD 1,519,000 Sophia LP / Sophia Finance Inc
‘144A’ 9% 30/9/2023 1,568,367 0.07 USD 3,160,000 Sotera Health Holdings LLC ‘144A’
6.5% 15/5/2023 3,223,200 0.15 USD 1,350,000 Southwestern Energy Co 6.2%
23/1/2025 1,184,625 0.06 USD 474,000 Southwestern Energy Co 7.75%
1/10/2027 415,935 0.02 USD 2,000 Springleaf Finance Corp 5.625%
15/3/2023 2,160 0.00 USD 1,744,000 Springleaf Finance Corp 6.625%
15/1/2028 1,927,120 0.09 USD 1,288,000 Springleaf Finance Corp 6.875%
15/3/2025 1,468,320 0.07 USD 3,360,000 Springleaf Finance Corp 7.125%
15/3/2026 3,845,100 0.18 USD 2,520,000 Sprint Capital Corp 6.875%
15/11/2028 2,804,029 0.13 USD 2,452,000 Sprint Capital Corp 8.75% 15/3/2032 3,071,130 0.15 USD 4,350,000 Sprint Corp 7.125% 15/6/2024 4,829,805 0.23 USD 2,280,000 Sprint Corp 7.625% 15/2/2025 2,565,000 0.12 USD 5,142,000 Sprint Corp 7.625% 1/3/2026 5,807,246 0.28 USD 4,842,000 Sprint Corp 7.875% 15/9/2023 5,459,355 0.26 USD 1,545,000 SPX FLOW Inc ‘144A’ 5.625%
15/8/2024 1,620,319 0.08 USD 483,000 SRC Energy Inc 6.25% 1/12/2025 475,755 0.02 USD 925,000 SRS Distribution Inc ‘144A’ 8.25%
1/7/2026 908,812 0.04 USD 11,957,000 SS&C Technologies Inc ‘144A’
5.5% 30/9/2027 12,562,323 0.60 USD 2,950,000 Standard Industries Inc/NJ ‘144A’
5.375% 15/11/2024 3,045,875 0.14 USD 155,000 Standard Industries Inc/NJ ‘144A’
5.5% 15/2/2023 159,262 0.01 USD 2,682,000 Standard Industries Inc/NJ ‘144A’
6% 15/10/2025 2,829,510 0.13 USD 8,152,000 Staples Inc ‘144A’ 7.5% 15/4/2026 8,274,280 0.39 USD 1,282,000 Staples Inc ‘144A’ 10.75% 15/4/2027 1,298,025 0.06 USD 384,000 Starwood Property Trust Inc 5%
15/12/2021 399,360 0.02 USD 1,405,000 Station Casinos LLC ‘144A’ 5%
1/10/2025 1,436,753 0.07 USD 1,466,000 Steel Dynamics Inc 4.125%
15/9/2025 1,484,325 0.07 USD 211,000 Steel Dynamics Inc 5% 15/12/2026 221,022 0.01 USD 1,576,000 Stevens Holding Co Inc ‘144A’
6.125% 1/10/2026 1,654,800 0.08 USD 1,007,000 Sunoco LP / Sunoco Finance Corp
4.875% 15/1/2023 1,032,175 0.05 USD 264,000 Sunoco LP / Sunoco Finance Corp
5.5% 15/2/2026 274,560 0.01 USD 749,000 Sunoco LP / Sunoco Finance Corp
6% 15/4/2027 790,195 0.04 USD 3,093,000 Surgery Center Holdings Inc ‘144A’
6.75% 1/7/2025* 2,605,852 0.12 USD 1,227,000 Surgery Center Holdings Inc ‘144A’
10% 15/4/2027 1,177,920 0.06 USD 1,112,000 Symantec Corp ‘144A’ 5% 15/4/2025 1,122,124 0.05
USD 320,000 Talen Energy Supply LLC 6.5% 1/6/2025 244,800 0.01
USD 320,000 Talen Energy Supply LLC ‘144A’ 10.5% 15/1/2026 291,680 0.01
USD 203,000 Tallgrass Energy Partners LP / Tallgrass Energy Finance Corp ‘144A’ 4.75% 1/10/2023 201,985 0.01
USD 3,023,000 Tallgrass Energy Partners LP / Tallgrass Energy Finance Corp ‘144A’ 5.5% 15/9/2024 2,981,434 0.14
USD 3,974,000 Tallgrass Energy Partners LP / Tallgrass Energy Finance Corp ‘144A’ 5.5% 15/1/2028 3,765,365 0.18
USD 3,750,000 Targa Resources Partners LP / Targa Resources Partners Finance Corp 4.25% 15/11/2023 3,759,375 0.18
USD 1,320,000 Targa Resources Partners LP / Targa Resources Partners Finance Corp 5% 15/1/2028 1,331,550 0.06
USD 408,000 Targa Resources Partners LP / Targa Resources Partners Finance Corp 5.125% 1/2/2025 420,240 0.02
USD 123,000 Targa Resources Partners LP / Targa Resources Partners Finance Corp 5.375% 1/2/2027 127,613 0.01
USD 740,000 Targa Resources Partners LP / Targa Resources Partners Finance Corp 5.875% 15/4/2026 778,621 0.04
USD 1,985,000 Targa Resources Partners LP / Targa Resources Partners Finance Corp ‘144A’ 6.5% 15/7/2027 2,158,687 0.10
USD 5,585,000 Targa Resources Partners LP / Targa Resources Partners Finance Corp ‘144A’ 6.875% 15/1/2029 6,183,656 0.29
USD 1,648,000 Taylor Morrison Communities Inc ‘144A’ 5.875% 15/6/2027 1,771,600 0.08
USD 1,655,000 Team Health Holdings Inc ‘144A’ 6.375% 1/2/2025 1,117,125 0.05
USD 812,000 TEGNA Inc ‘144A’ 5.5% 15/9/2024 836,360 0.04 USD 142,000 Teleflex Inc 4.625% 15/11/2027 150,680 0.01 USD 870,000 Teleflex Inc 4.875% 1/6/2026 920,860 0.04 USD 4,243,000 Tempo Acquisition LLC / Tempo
Acquisition Finance Corp ‘144A’ 6.75% 1/6/2025 4,378,267 0.21
USD 37,000 Tempur Sealy International Inc 5.5% 15/6/2026 38,804 0.00
USD 2,578,000 Tenet Healthcare Corp 4.625% 15/7/2024 2,665,936 0.13
USD 2,320,000 Tenet Healthcare Corp ‘144A’ 4.625% 1/9/2024 2,392,500 0.11
USD 9,257,000 Tenet Healthcare Corp ‘144A’ 4.875% 1/1/2026 9,537,487 0.45
USD 426,000 Tenet Healthcare Corp 5.125% 1/5/2025 428,130 0.02
USD 6,160,000 Tenet Healthcare Corp ‘144A’ 5.125% 1/11/2027 6,383,300 0.30
USD 164,000 Tenet Healthcare Corp 6% 1/10/2020 170,481 0.01 USD 2,830,000 Tenet Healthcare Corp ‘144A’ 6.25%
1/2/2027 2,950,275 0.14 USD 7,466,000 Tenet Healthcare Corp 8.125%
1/4/2022 8,072,613 0.38 USD 1,611,000 Terex Corp ‘144A’ 5.625% 1/2/2025 1,643,220 0.08 USD 1,416,000 TerraForm Power Operating LLC
‘144A’ 4.25% 31/1/2023 1,454,218 0.07 USD 3,177,000 TerraForm Power Operating LLC
‘144A’ 5% 31/1/2028 3,304,080 0.16
US Dollar High Yield Bond Fund continued
Portfolio of Investments 31 August 2019
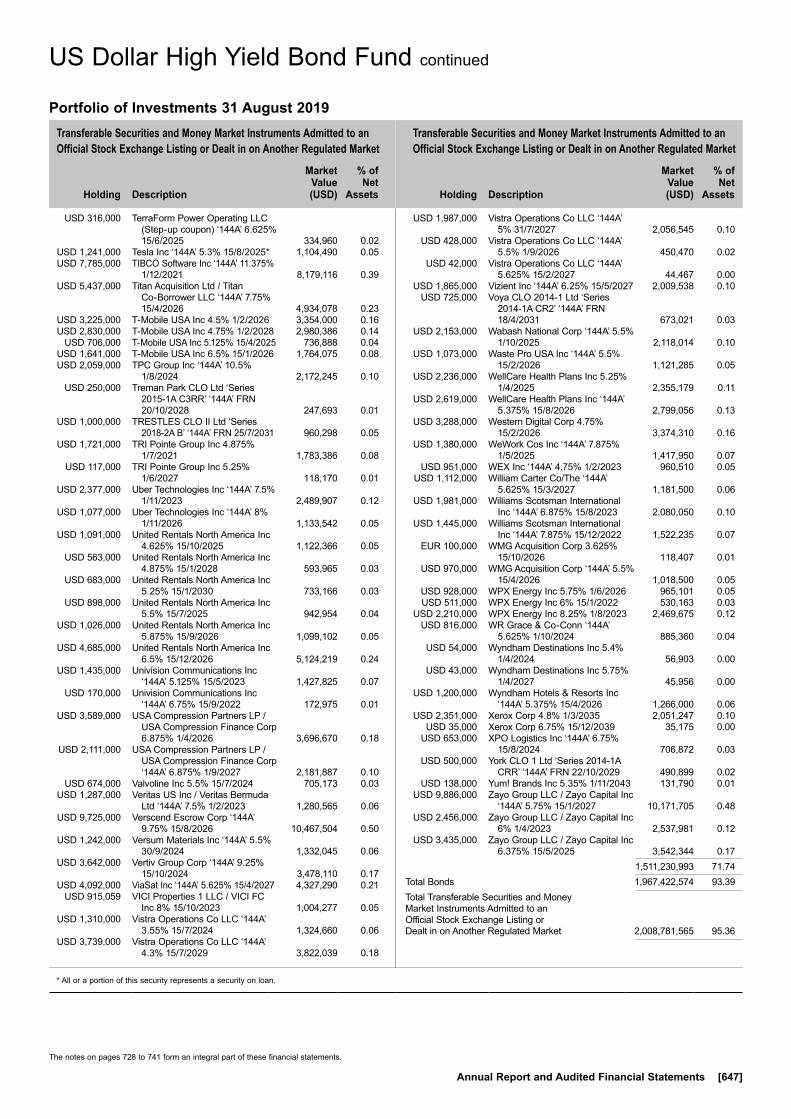
Transferable Securities and Money Market Instruments Admitted to an Official Stock Exchange Listing or Dealt in on Another Regulated Market
Transferable Securities and Money Market Instruments Admitted to an Official Stock Exchange Listing or Dealt in on Another Regulated Market
Holding
Description
Market Value (USD)
% of Net
Assets
Holding
Description
Market Value (USD)
% of Net
Assets
* All or a portion of this security represents a security on loan.
The notes on pages 728 to 741 form an integral part of these financial statements.
Annual Report and Audited Financial Statements [647]
USD 316,000 TerraForm Power Operating LLC (Step-up coupon) ‘144A’ 6.625% 15/6/2025 334,960 0.02
USD 1,241,000 Tesla Inc ‘144A’ 5.3% 15/8/2025* 1,104,490 0.05 USD 7,785,000 TIBCO Software Inc ‘144A’ 11.375%
1/12/2021 8,179,116 0.39 USD 5,437,000 Titan Acquisition Ltd / Titan
Co-Borrower LLC ‘144A’ 7.75% 15/4/2026 4,934,078 0.23
USD 3,225,000 T-Mobile USA Inc 4.5% 1/2/2026 3,354,000 0.16 USD 2,830,000 T-Mobile USA Inc 4.75% 1/2/2028 2,980,386 0.14 USD 706,000 T-Mobile USA Inc 5.125% 15/4/2025 736,888 0.04 USD 1,641,000 T-Mobile USA Inc 6.5% 15/1/2026 1,764,075 0.08 USD 2,059,000 TPC Group Inc ‘144A’ 10.5%
1/8/2024 2,172,245 0.10 USD 250,000 Treman Park CLO Ltd ‘Series
2015-1A C3RR’ ‘144A’ FRN 20/10/2028 247,693 0.01
USD 1,000,000 TRESTLES CLO II Ltd ‘Series 2018-2A B’ ‘144A’ FRN 25/7/2031 960,298 0.05
USD 1,721,000 TRI Pointe Group Inc 4.875% 1/7/2021 1,783,386 0.08
USD 117,000 TRI Pointe Group Inc 5.25% 1/6/2027 118,170 0.01
USD 2,377,000 Uber Technologies Inc ‘144A’ 7.5% 1/11/2023 2,489,907 0.12
USD 1,077,000 Uber Technologies Inc ‘144A’ 8% 1/11/2026 1,133,542 0.05
USD 1,091,000 United Rentals North America Inc 4.625% 15/10/2025 1,122,366 0.05
USD 563,000 United Rentals North America Inc 4.875% 15/1/2028 593,965 0.03
USD 683,000 United Rentals North America Inc 5.25% 15/1/2030 733,166 0.03
USD 898,000 United Rentals North America Inc 5.5% 15/7/2025 942,954 0.04
USD 1,026,000 United Rentals North America Inc 5.875% 15/9/2026 1,099,102 0.05
USD 4,685,000 United Rentals North America Inc 6.5% 15/12/2026 5,124,219 0.24
USD 1,435,000 Univision Communications Inc ‘144A’ 5.125% 15/5/2023 1,427,825 0.07
USD 170,000 Univision Communications Inc ‘144A’ 6.75% 15/9/2022 172,975 0.01
USD 3,589,000 USA Compression Partners LP / USA Compression Finance Corp 6.875% 1/4/2026 3,696,670 0.18
USD 2,111,000 USA Compression Partners LP / USA Compression Finance Corp ‘144A’ 6.875% 1/9/2027 2,181,887 0.10
USD 674,000 Valvoline Inc 5.5% 15/7/2024 705,173 0.03 USD 1,287,000 Veritas US Inc / Veritas Bermuda
Ltd ‘144A’ 7.5% 1/2/2023 1,280,565 0.06 USD 9,725,000 Verscend Escrow Corp ‘144A’
9.75% 15/8/2026 10,467,504 0.50 USD 1,242,000 Versum Materials Inc ‘144A’ 5.5%
30/9/2024 1,332,045 0.06 USD 3,642,000 Vertiv Group Corp ‘144A’ 9.25%
15/10/2024 3,478,110 0.17 USD 4,092,000 ViaSat Inc ‘144A’ 5.625% 15/4/2027 4,327,290 0.21 USD 915,059 VICI Properties 1 LLC / VICI FC
Inc 8% 15/10/2023 1,004,277 0.05 USD 1,310,000 Vistra Operations Co LLC ‘144A’
3.55% 15/7/2024 1,324,660 0.06 USD 3,739,000 Vistra Operations Co LLC ‘144A’
4.3% 15/7/2029 3,822,039 0.18
USD 1,987,000 Vistra Operations Co LLC ‘144A’ 5% 31/7/2027 2,056,545 0.10
USD 428,000 Vistra Operations Co LLC ‘144A’ 5.5% 1/9/2026 450,470 0.02
USD 42,000 Vistra Operations Co LLC ‘144A’ 5.625% 15/2/2027 44,467 0.00
USD 1,865,000 Vizient Inc ‘144A’ 6.25% 15/5/2027 2,009,538 0.10 USD 725,000 Voya CLO 2014-1 Ltd ‘Series
2014-1A CR2’ ‘144A’ FRN 18/4/2031 673,021 0.03
USD 2,153,000 Wabash National Corp ‘144A’ 5.5% 1/10/2025 2,118,014 0.10
USD 1,073,000 Waste Pro USA Inc ‘144A’ 5.5% 15/2/2026 1,121,285 0.05
USD 2,236,000 WellCare Health Plans Inc 5.25% 1/4/2025 2,355,179 0.11
USD 2,619,000 WellCare Health Plans Inc ‘144A’ 5.375% 15/8/2026 2,799,056 0.13
USD 3,288,000 Western Digital Corp 4.75% 15/2/2026 3,374,310 0.16
USD 1,380,000 WeWork Cos Inc ‘144A’ 7.875% 1/5/2025 1,417,950 0.07
USD 951,000 WEX Inc ‘144A’ 4.75% 1/2/2023 960,510 0.05 USD 1,112,000 William Carter Co/The ‘144A’
5.625% 15/3/2027 1,181,500 0.06 USD 1,981,000 Williams Scotsman International
Inc ‘144A’ 6.875% 15/8/2023 2,080,050 0.10 USD 1,445,000 Williams Scotsman International
Inc ‘144A’ 7.875% 15/12/2022 1,522,235 0.07 EUR 100,000 WMG Acquisition Corp 3.625%
15/10/2026 118,407 0.01 USD 970,000 WMG Acquisition Corp ‘144A’ 5.5%
15/4/2026 1,018,500 0.05 USD 928,000 WPX Energy Inc 5.75% 1/6/2026 965,101 0.05 USD 511,000 WPX Energy Inc 6% 15/1/2022 530,163 0.03 USD 2,210,000 WPX Energy Inc 8.25% 1/8/2023 2,469,675 0.12 USD 816,000 WR Grace & Co-Conn ‘144A’
5.625% 1/10/2024 885,360 0.04 USD 54,000 Wyndham Destinations Inc 5.4%
1/4/2024 56,903 0.00 USD 43,000 Wyndham Destinations Inc 5.75%
1/4/2027 45,956 0.00 USD 1,200,000 Wyndham Hotels & Resorts Inc
‘144A’ 5.375% 15/4/2026 1,266,000 0.06 USD 2,351,000 Xerox Corp 4.8% 1/3/2035 2,051,247 0.10 USD 35,000 Xerox Corp 6.75% 15/12/2039 35,175 0.00 USD 653,000 XPO Logistics Inc ‘144A’ 6.75%
15/8/2024 706,872 0.03 USD 500,000 York CLO 1 Ltd ‘Series 2014-1A
CRR’ ‘144A’ FRN 22/10/2029 490,899 0.02 USD 138,000 Yum! Brands Inc 5.35% 1/11/2043 131,790 0.01 USD 9,886,000 Zayo Group LLC / Zayo Capital Inc
‘144A’ 5.75% 15/1/2027 10,171,705 0.48 USD 2,456,000 Zayo Group LLC / Zayo Capital Inc
6% 1/4/2023 2,537,981 0.12 USD 3,435,000 Zayo Group LLC / Zayo Capital Inc
6.375% 15/5/2025 3,542,344 0.17 1,511,230,993 71.74Total Bonds 1,967,422,574 93.39Total Transferable Securities and Money Market Instruments Admitted to an Official Stock Exchange Listing or Dealt in on Another Regulated Market 2,008,781,565 95.36
US Dollar High Yield Bond Fund continued
Portfolio of Investments 31 August 2019
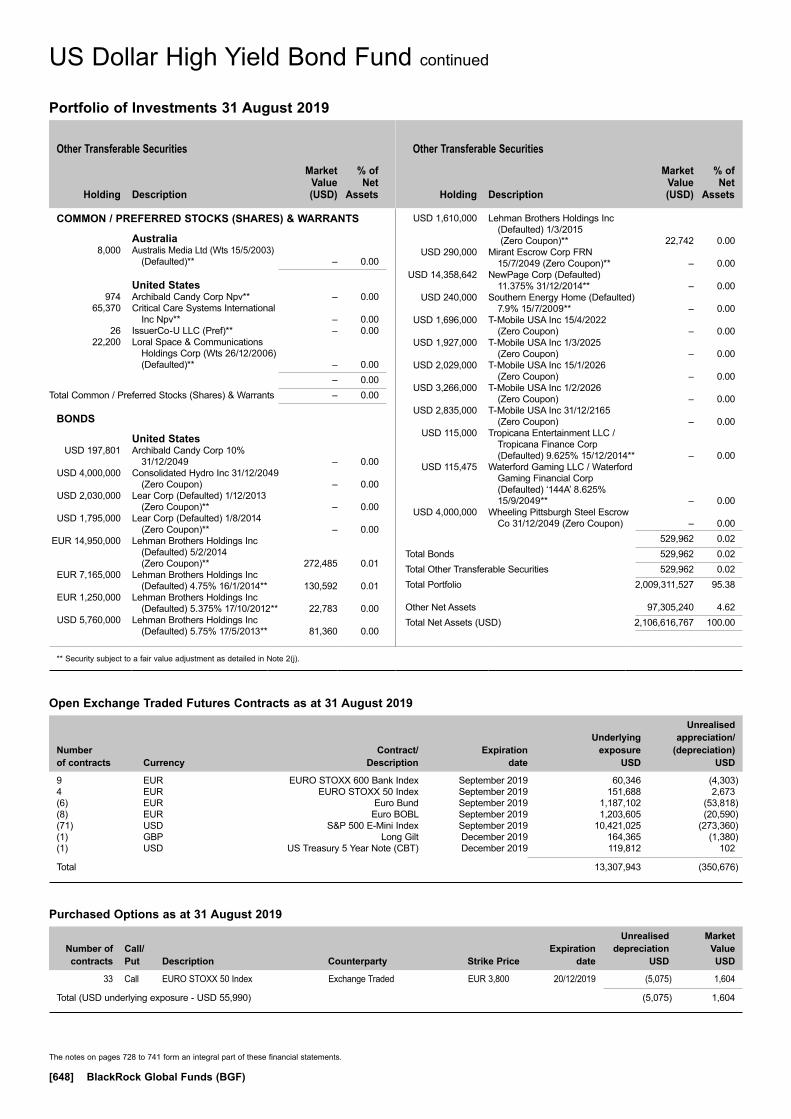
Other Transferable Securities Other Transferable Securities
Holding
Description
Market Value (USD)
% of Net
Assets
Holding
Description
Market Value (USD)
% of Net
Assets
** Security subject to a fair value adjustment as detailed in Note 2(j).
The notes on pages 728 to 741 form an integral part of these financial statements.
[648] BlackRock Global Funds (BGF)
COMMON / PREFERRED STOCKS (SHARES) & WARRANTS
Australia 8,000 Australis Media Ltd (Wts 15/5/2003)
(Defaulted)** – 0.00
United States 974 Archibald Candy Corp Npv** – 0.00 65,370 Critical Care Systems International
Inc Npv** – 0.00 26 IssuerCo-U LLC (Pref)** – 0.00 22,200 Loral Space & Communications
Holdings Corp (Wts 26/12/2006) (Defaulted)** – 0.00
– 0.00Total Common / Preferred Stocks (Shares) & Warrants – 0.00
BONDS
United States USD 197,801 Archibald Candy Corp 10%
31/12/2049 – 0.00 USD 4,000,000 Consolidated Hydro Inc 31/12/2049
(Zero Coupon) – 0.00 USD 2,030,000 Lear Corp (Defaulted) 1/12/2013
(Zero Coupon)** – 0.00 USD 1,795,000 Lear Corp (Defaulted) 1/8/2014
(Zero Coupon)** – 0.00 EUR 14,950,000 Lehman Brothers Holdings Inc
(Defaulted) 5/2/2014 (Zero Coupon)** 272,485 0.01
EUR 7,165,000 Lehman Brothers Holdings Inc (Defaulted) 4.75% 16/1/2014** 130,592 0.01
EUR 1,250,000 Lehman Brothers Holdings Inc (Defaulted) 5.375% 17/10/2012** 22,783 0.00
USD 5,760,000 Lehman Brothers Holdings Inc (Defaulted) 5.75% 17/5/2013** 81,360 0.00
USD 1,610,000 Lehman Brothers Holdings Inc (Defaulted) 1/3/2015 (Zero Coupon)** 22,742 0.00
USD 290,000 Mirant Escrow Corp FRN 15/7/2049 (Zero Coupon)** – 0.00
USD 14,358,642 NewPage Corp (Defaulted) 11.375% 31/12/2014** – 0.00
USD 240,000 Southern Energy Home (Defaulted) 7.9% 15/7/2009** – 0.00
USD 1,696,000 T-Mobile USA Inc 15/4/2022 (Zero Coupon) – 0.00
USD 1,927,000 T-Mobile USA Inc 1/3/2025 (Zero Coupon) – 0.00
USD 2,029,000 T-Mobile USA Inc 15/1/2026 (Zero Coupon) – 0.00
USD 3,266,000 T-Mobile USA Inc 1/2/2026 (Zero Coupon) – 0.00
USD 2,835,000 T-Mobile USA Inc 31/12/2165 (Zero Coupon) – 0.00
USD 115,000 Tropicana Entertainment LLC / Tropicana Finance Corp (Defaulted) 9.625% 15/12/2014** – 0.00
USD 115,475 Waterford Gaming LLC / Waterford Gaming Financial Corp (Defaulted) ‘144A’ 8.625% 15/9/2049** – 0.00
USD 4,000,000 Wheeling Pittsburgh Steel Escrow Co 31/12/2049 (Zero Coupon) – 0.00
529,962 0.02Total Bonds 529,962 0.02Total Other Transferable Securities 529,962 0.02Total Portfolio 2,009,311,527 95.38
Other Net Assets 97,305,240 4.62Total Net Assets (USD) 2,106,616,767 100.00
US Dollar High Yield Bond Fund continued
Portfolio of Investments 31 August 2019
Open Exchange Traded Futures Contracts as at 31 August 2019
Number of contracts Currency
Contract/ Description
Expiration date
Underlying exposure
USD
Unrealised appreciation/
(depreciation) USD
9 EUR EURO STOXX 600 Bank Index September 2019 60,346 (4,303)4 EUR EURO STOXX 50 Index September 2019 151,688 2,673(6) EUR Euro Bund September 2019 1,187,102 (53,818)(8) EUR Euro BOBL September 2019 1,203,605 (20,590)(71) USD S&P 500 E-Mini Index September 2019 10,421,025 (273,360)(1) GBP Long Gilt December 2019 164,365 (1,380)(1) USD US Treasury 5 Year Note (CBT) December 2019 119,812 102
Total 13,307,943 (350,676)
Purchased Options as at 31 August 2019
Number of contracts
Call/ Put
Description Counterparty
Strike Price
Expiration date
Unrealised depreciation
USD
Market Value USD
33 Call EURO STOXX 50 Index Exchange Traded EUR 3,800 20/12/2019 (5,075) 1,604
Total (USD underlying exposure - USD 55,990) (5,075) 1,604
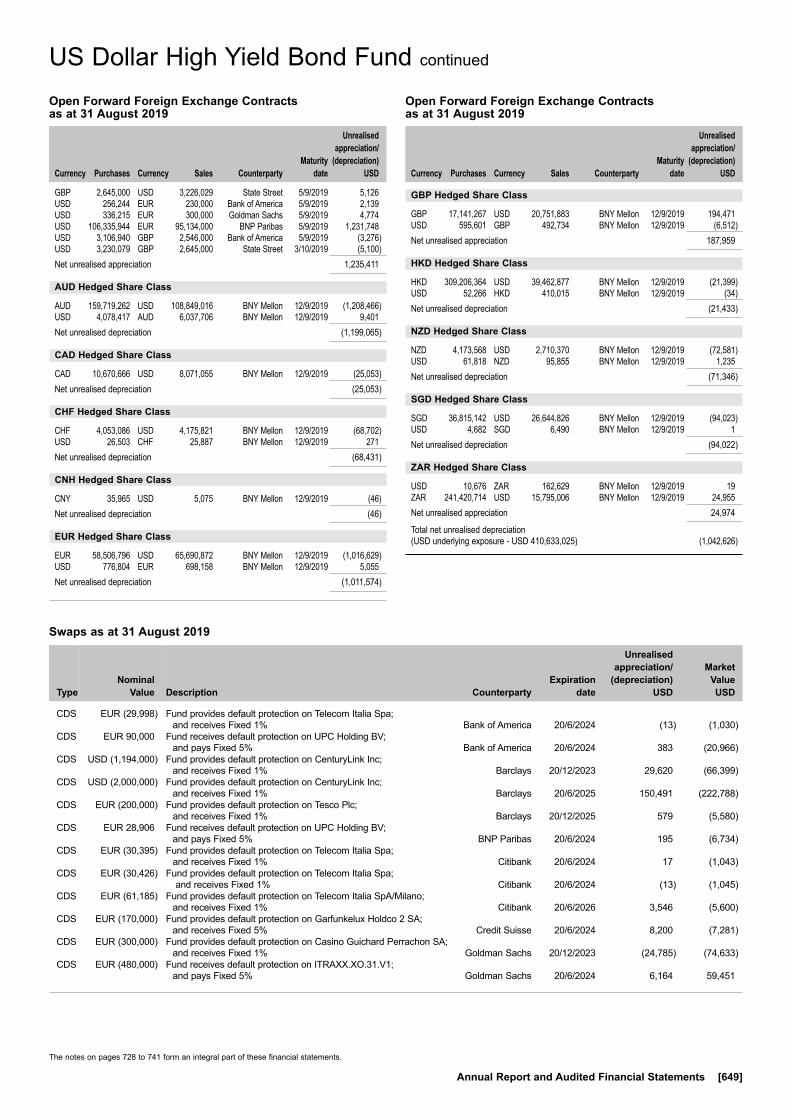
The notes on pages 728 to 741 form an integral part of these financial statements.
Annual Report and Audited Financial Statements [649]
US Dollar High Yield Bond Fund continued
Open Forward Foreign Exchange Contracts as at 31 August 2019
Currency
Purchases Currency
Sales Counterparty
Maturity date
Unrealised appreciation/
(depreciation) USD
GBP 2,645,000 USD 3,226,029 State Street 5/9/2019 5,126USD 256,244 EUR 230,000 Bank of America 5/9/2019 2,139USD 336,215 EUR 300,000 Goldman Sachs 5/9/2019 4,774USD 106,335,944 EUR 95,134,000 BNP Paribas 5/9/2019 1,231,748USD 3,106,940 GBP 2,546,000 Bank of America 5/9/2019 (3,276)USD 3,230,079 GBP 2,645,000 State Street 3/10/2019 (5,100)Net unrealised appreciation 1,235,411
AUD Hedged Share Class
AUD 159,719,262 USD 108,849,016 BNY Mellon 12/9/2019 (1,208,466)USD 4,078,417 AUD 6,037,706 BNY Mellon 12/9/2019 9,401Net unrealised depreciation (1,199,065)
CAD Hedged Share Class
CAD 10,670,666 USD 8,071,055 BNY Mellon 12/9/2019 (25,053)Net unrealised depreciation (25,053)
CHF Hedged Share Class
CHF 4,053,086 USD 4,175,821 BNY Mellon 12/9/2019 (68,702)USD 26,503 CHF 25,887 BNY Mellon 12/9/2019 271Net unrealised depreciation (68,431)
CNH Hedged Share Class
CNY 35,965 USD 5,075 BNY Mellon 12/9/2019 (46)Net unrealised depreciation (46)
EUR Hedged Share Class
EUR 58,506,796 USD 65,690,872 BNY Mellon 12/9/2019 (1,016,629)USD 776,804 EUR 698,158 BNY Mellon 12/9/2019 5,055Net unrealised depreciation (1,011,574)
Open Forward Foreign Exchange Contracts as at 31 August 2019
Currency
Purchases Currency
Sales Counterparty
Maturity date
Unrealised appreciation/
(depreciation) USD
GBP Hedged Share Class
GBP 17,141,267 USD 20,751,883 BNY Mellon 12/9/2019 194,471USD 595,601 GBP 492,734 BNY Mellon 12/9/2019 (6,512)Net unrealised appreciation 187,959
HKD Hedged Share Class
HKD 309,206,364 USD 39,462,877 BNY Mellon 12/9/2019 (21,399)USD 52,266 HKD 410,015 BNY Mellon 12/9/2019 (34)Net unrealised depreciation (21,433)
NZD Hedged Share Class
NZD 4,173,568 USD 2,710,370 BNY Mellon 12/9/2019 (72,581)USD 61,818 NZD 95,855 BNY Mellon 12/9/2019 1,235Net unrealised depreciation (71,346)
SGD Hedged Share Class
SGD 36,815,142 USD 26,644,826 BNY Mellon 12/9/2019 (94,023)USD 4,682 SGD 6,490 BNY Mellon 12/9/2019 1Net unrealised depreciation (94,022)
ZAR Hedged Share Class
USD 10,676 ZAR 162,629 BNY Mellon 12/9/2019 19ZAR 241,420,714 USD 15,795,006 BNY Mellon 12/9/2019 24,955Net unrealised appreciation 24,974
Total net unrealised depreciation (USD underlying exposure - USD 410,633,025) (1,042,626)
Swaps as at 31 August 2019
TypeNominal
Value Description Counterparty
Expiration date
Unrealised appreciation/
(depreciation) USD
Market Value USD
CDS EUR (29,998) Fund provides default protection on Telecom Italia Spa; and receives Fixed 1% Bank of America 20/6/2024 (13) (1,030)
CDS EUR 90,000 Fund receives default protection on UPC Holding BV; and pays Fixed 5% Bank of America 20/6/2024 383 (20,966)
CDS USD (1,194,000) Fund provides default protection on CenturyLink Inc; and receives Fixed 1% Barclays 20/12/2023 29,620 (66,399)
CDS USD (2,000,000) Fund provides default protection on CenturyLink Inc; and receives Fixed 1% Barclays 20/6/2025 150,491 (222,788)
CDS EUR (200,000) Fund provides default protection on Tesco Plc; and receives Fixed 1% Barclays 20/12/2025 579 (5,580)
CDS EUR 28,906 Fund receives default protection on UPC Holding BV; and pays Fixed 5% BNP Paribas 20/6/2024 195 (6,734)
CDS EUR (30,395) Fund provides default protection on Telecom Italia Spa; and receives Fixed 1% Citibank 20/6/2024 17 (1,043)
CDS EUR (30,426) Fund provides default protection on Telecom Italia Spa; and receives Fixed 1% Citibank 20/6/2024 (13) (1,045)
CDS EUR (61,185) Fund provides default protection on Telecom Italia SpA/Milano; and receives Fixed 1% Citibank 20/6/2026 3,546 (5,600)
CDS EUR (170,000) Fund provides default protection on Garfunkelux Holdco 2 SA; and receives Fixed 5% Credit Suisse 20/6/2024 8,200 (7,281)
CDS EUR (300,000) Fund provides default protection on Casino Guichard Perrachon SA; and receives Fixed 1% Goldman Sachs 20/12/2023 (24,785) (74,633)
CDS EUR (480,000) Fund receives default protection on ITRAXX.XO.31.V1; and pays Fixed 5% Goldman Sachs 20/6/2024 6,164 59,451

The notes on pages 728 to 741 form an integral part of these financial statements.
[650] BlackRock Global Funds (BGF)
US Dollar High Yield Bond Fund continued
Swaps as at 31 August 2019
TypeNominal
Value Description Counterparty
Expiration date
Unrealised appreciation/
(depreciation) USD
Market Value USD
CDS EUR (120,000) Fund provides default protection on Telecom Italia SpA/Milano; and receives Fixed 1% Goldman Sachs 20/6/2024 7,008 (4,120)
CDS USD (27,806,683) Fund provides default protection on CDX.NA.HY.32.V2; and receives Fixed 5% Goldman Sachs 20/6/2024 368,069 1,911,169
CDS EUR (10,000) Fund provides default protection on Casino Guichard Perrachon SA; and receives Fixed 1% JP Morgan 20/6/2023 (1,217) (2,247)
CDS EUR 160,000 Fund receives default protection on UPC Holding BV; and pays Fixed 5% JP Morgan 20/6/2024 (949) (37,273)
CDS EUR (29,181) Fund provides default protection on Telecom Italia Spa; and receives Fixed 1% Morgan Stanley 20/6/2024 46 (1,002)
CDS EUR (370,000) Fund provides default protection on Tesco Plc; and receives Fixed 1% Morgan Stanley 20/12/2028 9,633 (27,024)TRS USD 43,691,467 Fund receives iBoxx US Dollar Liquid High Yield + 0bps;
and pays USD LIBOR 3 Month BBA + 0bps Goldman Sachs 20/9/2019 640,945 567,492
Total (USD underlying exposure - USD 77,955,937) 1,197,919 2,053,347
CDS: Credit Default SwapsTRS: Total Return Swaps

Transferable Securities and Money Market Instruments Admitted to an Official Stock Exchange Listing or Dealt in on Another Regulated Market
Transferable Securities and Money Market Instruments Admitted to an Official Stock Exchange Listing or Dealt in on Another Regulated Market
Holding
Description
Market Value (USD)
% of Net
Assets
Holding
Description
Market Value (USD)
% of Net
Assets
The notes on pages 728 to 741 form an integral part of these financial statements.
Annual Report and Audited Financial Statements [651]
COMMERCIAL PAPER
Australia USD 4,000,000 Australia & New Zealand Banking
Group Ltd FRN 10/1/2020 4,005,010 0.69 USD 3,000,000 Macquarie Bank Ltd FRN 7/5/2020 3,000,709 0.52 USD 3,500,000 Macquarie Bank Ltd FRN 7/7/2020 3,500,473 0.60 USD 5,000,000 Oesterreichische Kontrollbank AG
13/3/2020 (Zero Coupon) 4,947,603 0.85 USD 6,000,000 Suncorp Group Ltd 14/11/2019
(Zero Coupon) 5,970,689 1.03 USD 6,000,000 Suncorp Group Ltd 16/12/2019
(Zero Coupon) 5,958,780 1.03 27,383,264 4.72
Canada USD 10,000,000 Canada Pension Plan Investment
Board Capital 7/11/2019 (Zero Coupon) 9,958,817 1.72
USD 7,000,000 Canada Pension Plan Investment Board Capital 9/3/2020 (Zero Coupon) 6,924,456 1.19
USD 6,000,000 CDP Financial Inc 28/10/2019 (Zero Coupon) 5,979,150 1.03
USD 5,000,000 CDP Financial Inc 5/11/2019 (Zero Coupon) 4,980,356 0.86
USD 6,000,000 Federation des Caisses FRN 10/12/2019 6,005,140 1.03
USD 6,000,000 National Bank of Canada FRN 11/12/2019 6,001,028 1.03
USD 6,150,000 Ontario Teachers' Finance Trust 30/10/2019 (Zero Coupon) 6,128,139 1.06
USD 6,000,000 Ontario Teachers' Finance Trust 2/1/2020 (Zero Coupon) 5,958,819 1.03
USD 5,000,000 Ontario Teachers' Finance Trust 23/3/2020 (Zero Coupon) 4,944,484 0.85
USD 3,000,000 Province of Alberta Canada 14/11/2019 (Zero Coupon) 2,986,628 0.51
USD 7,000,000 Province of Alberta Canada 21/2/2020 (Zero Coupon) 6,931,624 1.19
66,798,641 11.50
Germany USD 7,000,000 Erste Abwicklungsanstalt
18/9/2019 (Zero Coupon) 6,991,942 1.20
International USD 4,000,000 European Investment Bank
30/3/2020 (Zero Coupon) 3,953,871 0.68
Netherlands USD 3,786,000 Nederlandse Waterschapsbank NV
2/10/2019 (Zero Coupon) 3,778,362 0.65 USD 2,000,000 Shell International Finance BV
30/6/2020 (Zero Coupon) 1,967,445 0.34 5,745,807 0.99
Singapore USD 10,000,000 DBS Bank Ltd Singapore
10/9/2019 (Zero Coupon) 9,992,763 1.72 USD 2,000,000 DBS Bank Ltd Singapore
20/2/2020 (Zero Coupon) 1,980,536 0.34 USD 10,000,000 Oversea-Chinese Banking Corp
Ltd 23/9/2019 (Zero Coupon) 9,985,014 1.72 21,958,313 3.78
Switzerland USD 3,000,000 UBS AG 24/4/2020 (Zero Coupon) 2,961,899 0.51 USD 3,000,000 UBS AG (London Branch) FRN
19/12/2019 3,002,583 0.52 5,964,482 1.03
United States USD 6,000,000 ABN AMRO Funding USA LLC
20/12/2019 (Zero Coupon) 5,957,813 1.03 USD 12,000,000 Atlantic Asset Securitization
27/9/2019 (Zero Coupon) 11,979,797 2.06 USD 10,000,000 Autobahn Funding Co LLC
9/9/2019 (Zero Coupon) 9,993,369 1.72 USD 13,000,000 Bennington Stark Capital Co LLC
3/9/2019 (Zero Coupon) 12,996,055 2.24 USD 3,500,000 Caterpillar Financial Services Corp
5/9/2019 (Zero Coupon) 3,498,425 0.60 USD 4,000,000 Crown Point Capital Co LLC
2.3% 3/2/2020 4,002,895 0.69 USD 7,000,000 Crown Point Capital Co LLC
2.35% 8/1/2020 7,005,298 1.21 USD 4,000,000 ING US Funding LLC FRN
20/8/2020 3,999,746 0.69 USD 3,000,000 Kells Funding LLC 19/2/2020
(Zero Coupon) 2,970,899 0.51 USD 2,000,000 Kells Funding LLC 19/2/2020
(Zero Coupon) 1,980,599 0.34 USD 5,000,000 Liberty Street Funding LLC
6/9/2019 (Zero Coupon) 4,997,584 0.86 USD 9,000,000 MetLife Short Term Funding LLC
9/9/2019 (Zero Coupon) 8,994,088 1.55 USD 4,500,000 MetLife Short Term Funding LLC
2/12/2019 (Zero Coupon) 4,475,953 0.77 USD 4,000,000 Mont Blanc Capital Corp 4/10/2019
(Zero Coupon) 3,991,444 0.69 USD 6,125,000 Nestle Holdings Inc 3/9/2019
(Zero Coupon) 6,123,259 1.05 USD 4,000,000 Ridgfield Funding Co LLC
25/10/2019 (Zero Coupon) 3,986,586 0.69 USD 4,000,000 Toyota Motor Credit Corp FRN
7/1/2020 4,000,328 0.69 USD 7,000,000 Victory Receivables Corp 4/9/2019
(Zero Coupon) 6,997,498 1.20 USD 4,000,000 Westpac Banking Corp FRN
1/11/2019 4,001,245 0.69 USD 3,000,000 Westpac Banking Corp FRN
8/11/2019 3,001,679 0.52 USD 7,000,000 Westpac Banking Corp FRN
3/2/2020 7,001,009 1.20 121,955,569 21.00Total Commercial Paper 260,751,889 44.90
CERTIFICATES OF DEPOSIT
Canada USD 3,000,000 Bank of Montreal (Chicago Branch)
FRN 10/12/2019 3,002,827 0.52 USD 2,500,000 Bank of Montreal (Chicago Branch)
FRN 17/1/2020 2,502,835 0.43 USD 6,700,000 Bank of Nova Scotia FRN 20/9/2019 6,700,679 1.15 USD 3,000,000 Canadian Imperial Bank of
Commerce (New York Branch) FRN 6/12/2019 3,002,200 0.52
USD 7,000,000 Toronto Dominion Bank (New York Branch) FRN 10/6/2020 6,999,030 1.21
USD 4,500,000 Toronto Dominion Bank (New York Branch) FRN 16/7/2020 4,500,557 0.77
USD 8,000,000 Toronto Dominion Bank (New York Branch) 2.54% 5/9/2019 8,000,639 1.38
34,708,767 5.98
US Dollar Reserve Fund
Portfolio of Investments 31 August 2019
US Dollar Reserve Fund
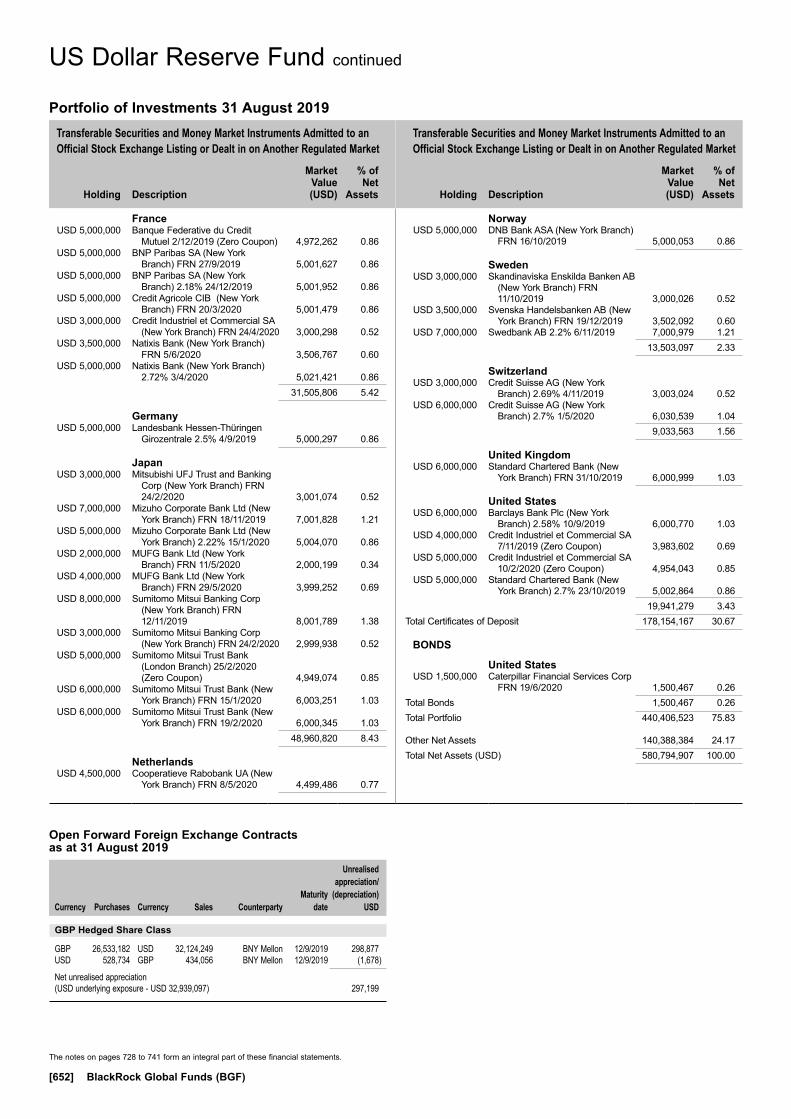
Transferable Securities and Money Market Instruments Admitted to an Official Stock Exchange Listing or Dealt in on Another Regulated Market
Transferable Securities and Money Market Instruments Admitted to an Official Stock Exchange Listing or Dealt in on Another Regulated Market
Holding
Description
Market Value (USD)
% of Net
Assets
Holding
Description
Market Value (USD)
% of Net
Assets
The notes on pages 728 to 741 form an integral part of these financial statements.
[652] BlackRock Global Funds (BGF)
France USD 5,000,000 Banque Federative du Credit
Mutuel 2/12/2019 (Zero Coupon) 4,972,262 0.86 USD 5,000,000 BNP Paribas SA (New York
Branch) FRN 27/9/2019 5,001,627 0.86 USD 5,000,000 BNP Paribas SA (New York
Branch) 2.18% 24/12/2019 5,001,952 0.86 USD 5,000,000 Credit Agricole CIB (New York
Branch) FRN 20/3/2020 5,001,479 0.86 USD 3,000,000 Credit Industriel et Commercial SA
(New York Branch) FRN 24/4/2020 3,000,298 0.52 USD 3,500,000 Natixis Bank (New York Branch)
FRN 5/6/2020 3,506,767 0.60 USD 5,000,000 Natixis Bank (New York Branch)
2.72% 3/4/2020 5,021,421 0.86 31,505,806 5.42
Germany USD 5,000,000 Landesbank Hessen-Thüringen
Girozentrale 2.5% 4/9/2019 5,000,297 0.86
Japan USD 3,000,000 Mitsubishi UFJ Trust and Banking
Corp (New York Branch) FRN 24/2/2020 3,001,074 0.52
USD 7,000,000 Mizuho Corporate Bank Ltd (New York Branch) FRN 18/11/2019 7,001,828 1.21
USD 5,000,000 Mizuho Corporate Bank Ltd (New York Branch) 2.22% 15/1/2020 5,004,070 0.86
USD 2,000,000 MUFG Bank Ltd (New York Branch) FRN 11/5/2020 2,000,199 0.34
USD 4,000,000 MUFG Bank Ltd (New York Branch) FRN 29/5/2020 3,999,252 0.69
USD 8,000,000 Sumitomo Mitsui Banking Corp (New York Branch) FRN 12/11/2019 8,001,789 1.38
USD 3,000,000 Sumitomo Mitsui Banking Corp (New York Branch) FRN 24/2/2020 2,999,938 0.52
USD 5,000,000 Sumitomo Mitsui Trust Bank (London Branch) 25/2/2020 (Zero Coupon) 4,949,074 0.85
USD 6,000,000 Sumitomo Mitsui Trust Bank (New York Branch) FRN 15/1/2020 6,003,251 1.03
USD 6,000,000 Sumitomo Mitsui Trust Bank (New York Branch) FRN 19/2/2020 6,000,345 1.03
48,960,820 8.43
Netherlands USD 4,500,000 Cooperatieve Rabobank UA (New
York Branch) FRN 8/5/2020 4,499,486 0.77
Norway USD 5,000,000 DNB Bank ASA (New York Branch)
FRN 16/10/2019 5,000,053 0.86
Sweden USD 3,000,000 Skandinaviska Enskilda Banken AB
(New York Branch) FRN 11/10/2019 3,000,026 0.52
USD 3,500,000 Svenska Handelsbanken AB (New York Branch) FRN 19/12/2019 3,502,092 0.60
USD 7,000,000 Swedbank AB 2.2% 6/11/2019 7,000,979 1.21 13,503,097 2.33
Switzerland USD 3,000,000 Credit Suisse AG (New York
Branch) 2.69% 4/11/2019 3,003,024 0.52 USD 6,000,000 Credit Suisse AG (New York
Branch) 2.7% 1/5/2020 6,030,539 1.04 9,033,563 1.56
United Kingdom USD 6,000,000 Standard Chartered Bank (New
York Branch) FRN 31/10/2019 6,000,999 1.03
United States USD 6,000,000 Barclays Bank Plc (New York
Branch) 2.58% 10/9/2019 6,000,770 1.03 USD 4,000,000 Credit Industriel et Commercial SA
7/11/2019 (Zero Coupon) 3,983,602 0.69 USD 5,000,000 Credit Industriel et Commercial SA
10/2/2020 (Zero Coupon) 4,954,043 0.85 USD 5,000,000 Standard Chartered Bank (New
York Branch) 2.7% 23/10/2019 5,002,864 0.86 19,941,279 3.43Total Certificates of Deposit 178,154,167 30.67
BONDS
United States USD 1,500,000 Caterpillar Financial Services Corp
FRN 19/6/2020 1,500,467 0.26Total Bonds 1,500,467 0.26Total Portfolio 440,406,523 75.83
Other Net Assets 140,388,384 24.17Total Net Assets (USD) 580,794,907 100.00
US Dollar Reserve Fund continued
Portfolio of Investments 31 August 2019
Open Forward Foreign Exchange Contracts as at 31 August 2019
Currency
Purchases Currency
Sales Counterparty
Maturity date
Unrealised appreciation/
(depreciation) USD
GBP Hedged Share Class
GBP 26,533,182 USD 32,124,249 BNY Mellon 12/9/2019 298,877USD 528,734 GBP 434,056 BNY Mellon 12/9/2019 (1,678)
Net unrealised appreciation (USD underlying exposure - USD 32,939,097) 297,199

Transferable Securities and Money Market Instruments Admitted to an Official Stock Exchange Listing or Dealt in on Another Regulated Market
Transferable Securities and Money Market Instruments Admitted to an Official Stock Exchange Listing or Dealt in on Another Regulated Market
Holding
Description
Market Value (USD)
% of Net
Assets
Holding
Description
Market Value (USD)
% of Net
Assets
* All or a portion of this security represents a security on loan.
The notes on pages 728 to 741 form an integral part of these financial statements.
Annual Report and Audited Financial Statements [653]
COMMERCIAL PAPER
United States USD 6,000,000 VW Credit Inc 25/10/2019
(Zero Coupon) 5,977,932 0.34 USD 6,000,000 VW Credit Inc 6/11/2019
(Zero Coupon) 5,973,262 0.34 11,951,194 0.68Total Commercial Paper 11,951,194 0.68
BONDS
Australia AUD 4,953 Apollo Series 2009-1 Trust ‘Series
2009-1 A3’ FRN 3/10/2040 3,340 0.00 USD 1,705,000 Commonwealth Bank of Australia
‘144A’ 2.05% 18/9/2020 1,706,226 0.10 AUD 174,583 National Rmbs Trust 2012-2 ‘Series
2012-2 A1’ FRN 20/6/2044 118,146 0.00 EUR 1,100,000 Telstra Corp Ltd 3.5% 21/9/2022 1,356,815 0.08 AUD 1,063,040 TORRENS Series 2013-1 Trust
‘Series 2013-1 A’ FRN 12/4/2044 715,735 0.04 USD 8,450,000 Westpac Banking Corp ‘144A’
3.15% 16/1/2024 8,919,430 0.51 12,819,692 0.73
Brazil USD 3,600,000 Centrais Eletricas Brasileiras SA
‘144A’ 5.75% 27/10/2021 3,773,250 0.21
Canada USD 1,443,651 Air Canada 2013-1 Class B Pass
Through Trust ‘144A’ 5.375% 15/5/2021 1,475,139 0.08
CAD 26,975,000 Canada Housing Trust No 1 ‘144A’ 2.65% 15/12/2028 22,213,668 1.26
USD 175,000 Enbridge Inc 2.9% 15/7/2022 178,327 0.01 USD 2,175,000 Encana Corp 3.9% 15/11/2021 2,228,665 0.13 EUR 810,000 Toronto-Dominion Bank/The
0.375% 25/4/2024 913,429 0.05 USD 475,000 TransCanada PipeLines Ltd
3.75% 16/10/2023 500,305 0.03 27,509,533 1.56
Cayman Islands USD 2,780,000 Baidu Inc 2.875% 6/7/2022* 2,803,998 0.16
Chile USD 2,000,000 Empresa Nacional del Petroleo
‘144A’ 5.25% 10/8/2020 2,057,188 0.12
Colombia USD 3,635,000 Bancolombia SA 5.95% 3/6/2021 3,846,230 0.22
Cyprus EUR 1,996,000 Cyprus Government International
Bond ‘144A’ 4.625% 3/2/2020 2,249,556 0.13
France EUR 600,000 Air Liquide Finance SA 0.375%
18/4/2022 675,348 0.04 EUR 500,000 Autoroutes du Sud de la France SA
2.95% 17/1/2024 628,367 0.03 EUR 800,000 Banque Federative du Credit
Mutuel SA 0.125% 5/2/2024 895,731 0.05 EUR 100,000 Banque Federative du Credit
Mutuel SA 2.625% 18/3/2024 124,838 0.01
EUR 1,200,000 Credit Agricole SA/London 0.875% 19/1/2022 1,364,160 0.08
EUR 900,000 Engie SA 0.375% 28/2/2023 1,015,086 0.06 EUR 1,600,000 LVMH Moet Hennessy Louis
Vuitton SE 28/2/2021 (Zero Coupon) 1,778,958 0.10
EUR 800,000 Orange SA 0.5% 15/1/2022 899,911 0.05 EUR 2,000,000 Orange SA 0.75% 11/9/2023 2,295,577 0.13 EUR 300,000 RTE Reseau de Transport
d’Electricite SADIR 1.625% 8/10/2024 361,431 0.02
EUR 300,000 Sanofi 13/9/2022 (Zero Coupon) 334,600 0.02 EUR 500,000 Societe Generale SA 27/5/2022
(Zero Coupon) 556,676 0.03 EUR 600,000 Total Capital International SA
2.125% 15/3/2023 720,203 0.04 EUR 1,200,000 Veolia Environnement SA 0.672%
30/3/2022 1,353,768 0.08 13,004,654 0.74
Germany EUR 1,105,000 BASF SE 2% 5/12/2022 1,313,126 0.08 USD 3,695,000 Deutsche Bank AG/New York NY
4.25% 4/2/2021 3,736,443 0.21 EUR 2,100,000 Merck Financial Services GmbH
0.005% 15/12/2023 2,346,273 0.13 EUR 1,000,000 SAP SE 0.25% 10/3/2022 1,121,951 0.06 EUR 1,900,000 Volkswagen Leasing GmbH FRN
2/8/2021 2,099,773 0.12 EUR 2,455,000 Volkswagen Leasing GmbH 1%
16/2/2023 2,785,752 0.16 13,403,318 0.76
Guernsey USD 2,065,000 Credit Suisse Group Funding
Guernsey Ltd 3.125% 10/12/2020 2,088,160 0.12
Ireland EUR 375,000 Abbott Ireland Financing DAC
0.875% 27/9/2023 432,378 0.02 USD 1,000,000 AerCap Ireland Capital DAC /
AerCap Global Aviation Trust 2.875% 14/8/2024 1,001,054 0.06
USD 1,160,000 AerCap Ireland Capital DAC / AerCap Global Aviation Trust 3.3% 23/1/2023 1,188,876 0.07
USD 1,150,000 AerCap Ireland Capital DAC / AerCap Global Aviation Trust 3.5% 26/5/2022 1,181,063 0.07
USD 3,000,000 AerCap Ireland Capital DAC / AerCap Global Aviation Trust 3.95% 1/2/2022 3,109,065 0.18
USD 1,010,000 AerCap Ireland Capital DAC / AerCap Global Aviation Trust 4.25% 1/7/2020 1,024,184 0.06
USD 2,889,000 AerCap Ireland Capital DAC / AerCap Global Aviation Trust 4.5% 15/5/2021 2,980,022 0.17
USD 325,000 AerCap Ireland Capital DAC / AerCap Global Aviation Trust 4.625% 1/7/2022 342,428 0.02
USD 790,000 AIB Group Plc ‘144A’ FRN 10/4/2025 825,189 0.05
EUR 1,590,000 Eaton Capital Unlimited Co 0.021% 14/5/2021 1,765,574 0.10
EUR 325,000 ESB Finance DAC 3.494% 12/1/2024 417,795 0.02
US Dollar Short Duration Bond Fund
Portfolio of Investments 31 August 2019
US Dollar Short Duration Bond Fund
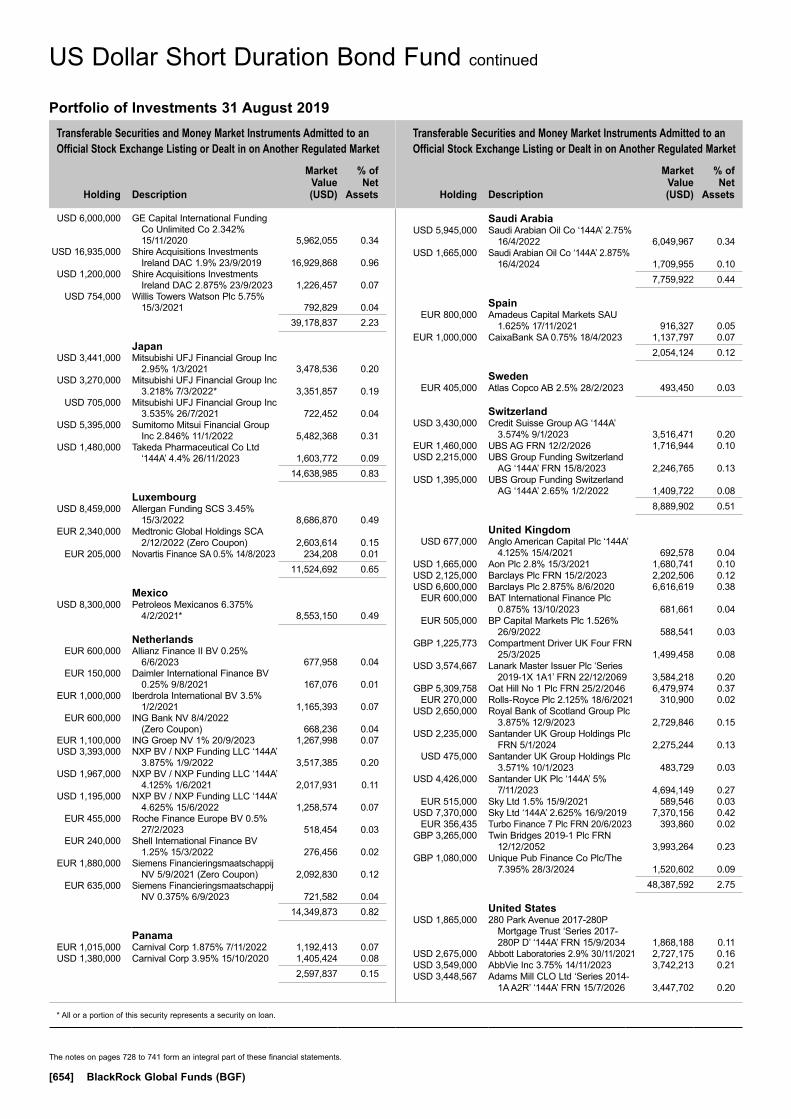
Transferable Securities and Money Market Instruments Admitted to an Official Stock Exchange Listing or Dealt in on Another Regulated Market
Transferable Securities and Money Market Instruments Admitted to an Official Stock Exchange Listing or Dealt in on Another Regulated Market
Holding
Description
Market Value (USD)
% of Net
Assets
Holding
Description
Market Value (USD)
% of Net
Assets
* All or a portion of this security represents a security on loan.
The notes on pages 728 to 741 form an integral part of these financial statements.
[654] BlackRock Global Funds (BGF)
USD 6,000,000 GE Capital International Funding Co Unlimited Co 2.342% 15/11/2020 5,962,055 0.34
USD 16,935,000 Shire Acquisitions Investments Ireland DAC 1.9% 23/9/2019 16,929,868 0.96
USD 1,200,000 Shire Acquisitions Investments Ireland DAC 2.875% 23/9/2023 1,226,457 0.07
USD 754,000 Willis Towers Watson Plc 5.75% 15/3/2021 792,829 0.04
39,178,837 2.23
Japan USD 3,441,000 Mitsubishi UFJ Financial Group Inc
2.95% 1/3/2021 3,478,536 0.20 USD 3,270,000 Mitsubishi UFJ Financial Group Inc
3.218% 7/3/2022* 3,351,857 0.19 USD 705,000 Mitsubishi UFJ Financial Group Inc
3.535% 26/7/2021 722,452 0.04 USD 5,395,000 Sumitomo Mitsui Financial Group
Inc 2.846% 11/1/2022 5,482,368 0.31 USD 1,480,000 Takeda Pharmaceutical Co Ltd
‘144A’ 4.4% 26/11/2023 1,603,772 0.09 14,638,985 0.83
Luxembourg USD 8,459,000 Allergan Funding SCS 3.45%
15/3/2022 8,686,870 0.49 EUR 2,340,000 Medtronic Global Holdings SCA
2/12/2022 (Zero Coupon) 2,603,614 0.15 EUR 205,000 Novartis Finance SA 0.5% 14/8/2023 234,208 0.01 11,524,692 0.65
Mexico USD 8,300,000 Petroleos Mexicanos 6.375%
4/2/2021* 8,553,150 0.49
Netherlands EUR 600,000 Allianz Finance II BV 0.25%
6/6/2023 677,958 0.04 EUR 150,000 Daimler International Finance BV
0.25% 9/8/2021 167,076 0.01 EUR 1,000,000 Iberdrola International BV 3.5%
1/2/2021 1,165,393 0.07 EUR 600,000 ING Bank NV 8/4/2022
(Zero Coupon) 668,236 0.04 EUR 1,100,000 ING Groep NV 1% 20/9/2023 1,267,998 0.07 USD 3,393,000 NXP BV / NXP Funding LLC ‘144A’
3.875% 1/9/2022 3,517,385 0.20 USD 1,967,000 NXP BV / NXP Funding LLC ‘144A’
4.125% 1/6/2021 2,017,931 0.11 USD 1,195,000 NXP BV / NXP Funding LLC ‘144A’
4.625% 15/6/2022 1,258,574 0.07 EUR 455,000 Roche Finance Europe BV 0.5%
27/2/2023 518,454 0.03 EUR 240,000 Shell International Finance BV
1.25% 15/3/2022 276,456 0.02 EUR 1,880,000 Siemens Financieringsmaatschappij
NV 5/9/2021 (Zero Coupon) 2,092,830 0.12 EUR 635,000 Siemens Financieringsmaatschappij
NV 0.375% 6/9/2023 721,582 0.04 14,349,873 0.82
Panama EUR 1,015,000 Carnival Corp 1.875% 7/11/2022 1,192,413 0.07 USD 1,380,000 Carnival Corp 3.95% 15/10/2020 1,405,424 0.08 2,597,837 0.15
Saudi Arabia USD 5,945,000 Saudi Arabian Oil Co ‘144A’ 2.75%
16/4/2022 6,049,967 0.34 USD 1,665,000 Saudi Arabian Oil Co ‘144A’ 2.875%
16/4/2024 1,709,955 0.10 7,759,922 0.44
Spain EUR 800,000 Amadeus Capital Markets SAU
1.625% 17/11/2021 916,327 0.05 EUR 1,000,000 CaixaBank SA 0.75% 18/4/2023 1,137,797 0.07 2,054,124 0.12
Sweden EUR 405,000 Atlas Copco AB 2.5% 28/2/2023 493,450 0.03
Switzerland USD 3,430,000 Credit Suisse Group AG ‘144A’
3.574% 9/1/2023 3,516,471 0.20 EUR 1,460,000 UBS AG FRN 12/2/2026 1,716,944 0.10 USD 2,215,000 UBS Group Funding Switzerland
AG ‘144A’ FRN 15/8/2023 2,246,765 0.13 USD 1,395,000 UBS Group Funding Switzerland
AG ‘144A’ 2.65% 1/2/2022 1,409,722 0.08 8,889,902 0.51
United Kingdom USD 677,000 Anglo American Capital Plc ‘144A’
4.125% 15/4/2021 692,578 0.04 USD 1,665,000 Aon Plc 2.8% 15/3/2021 1,680,741 0.10 USD 2,125,000 Barclays Plc FRN 15/2/2023 2,202,506 0.12 USD 6,600,000 Barclays Plc 2.875% 8/6/2020 6,616,619 0.38 EUR 600,000 BAT International Finance Plc
0.875% 13/10/2023 681,661 0.04 EUR 505,000 BP Capital Markets Plc 1.526%
26/9/2022 588,541 0.03 GBP 1,225,773 Compartment Driver UK Four FRN
25/3/2025 1,499,458 0.08 USD 3,574,667 Lanark Master Issuer Plc ‘Series
2019-1X 1A1’ FRN 22/12/2069 3,584,218 0.20 GBP 5,309,758 Oat Hill No 1 Plc FRN 25/2/2046 6,479,974 0.37 EUR 270,000 Rolls-Royce Plc 2.125% 18/6/2021 310,900 0.02 USD 2,650,000 Royal Bank of Scotland Group Plc
3.875% 12/9/2023 2,729,846 0.15 USD 2,235,000 Santander UK Group Holdings Plc
FRN 5/1/2024 2,275,244 0.13 USD 475,000 Santander UK Group Holdings Plc
3.571% 10/1/2023 483,729 0.03 USD 4,426,000 Santander UK Plc ‘144A’ 5%
7/11/2023 4,694,149 0.27 EUR 515,000 Sky Ltd 1.5% 15/9/2021 589,546 0.03 USD 7,370,000 Sky Ltd ‘144A’ 2.625% 16/9/2019 7,370,156 0.42 EUR 356,435 Turbo Finance 7 Plc FRN 20/6/2023 393,860 0.02 GBP 3,265,000 Twin Bridges 2019-1 Plc FRN
12/12/2052 3,993,264 0.23 GBP 1,080,000 Unique Pub Finance Co Plc/The
7.395% 28/3/2024 1,520,602 0.09 48,387,592 2.75
United States USD 1,865,000 280 Park Avenue 2017-280P
Mortgage Trust ‘Series 2017-280P D’ ‘144A’ FRN 15/9/2034 1,868,188 0.11
USD 2,675,000 Abbott Laboratories 2.9% 30/11/2021 2,727,175 0.16 USD 3,549,000 AbbVie Inc 3.75% 14/11/2023 3,742,213 0.21 USD 3,448,567 Adams Mill CLO Ltd ‘Series 2014-
1A A2R’ ‘144A’ FRN 15/7/2026 3,447,702 0.20
US Dollar Short Duration Bond Fund continued
Portfolio of Investments 31 August 2019
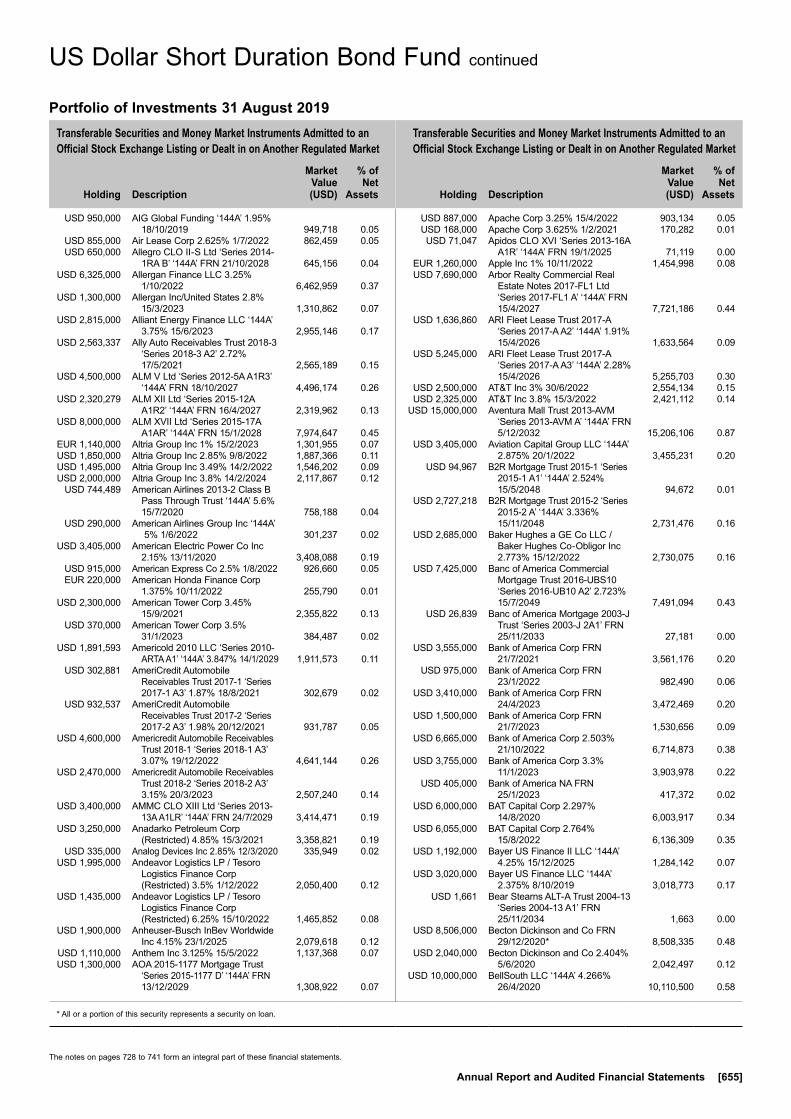
Transferable Securities and Money Market Instruments Admitted to an Official Stock Exchange Listing or Dealt in on Another Regulated Market
Transferable Securities and Money Market Instruments Admitted to an Official Stock Exchange Listing or Dealt in on Another Regulated Market
Holding
Description
Market Value (USD)
% of Net
Assets
Holding
Description
Market Value (USD)
% of Net
Assets
* All or a portion of this security represents a security on loan.
The notes on pages 728 to 741 form an integral part of these financial statements.
Annual Report and Audited Financial Statements [655]
USD 950,000 AIG Global Funding ‘144A’ 1.95% 18/10/2019 949,718 0.05
USD 855,000 Air Lease Corp 2.625% 1/7/2022 862,459 0.05 USD 650,000 Allegro CLO II-S Ltd ‘Series 2014-
1RA B’ ‘144A’ FRN 21/10/2028 645,156 0.04 USD 6,325,000 Allergan Finance LLC 3.25%
1/10/2022 6,462,959 0.37 USD 1,300,000 Allergan Inc/United States 2.8%
15/3/2023 1,310,862 0.07 USD 2,815,000 Alliant Energy Finance LLC ‘144A’
3.75% 15/6/2023 2,955,146 0.17 USD 2,563,337 Ally Auto Receivables Trust 2018-3
‘Series 2018-3 A2’ 2.72% 17/5/2021 2,565,189 0.15
USD 4,500,000 ALM V Ltd ‘Series 2012-5A A1R3’ ‘144A’ FRN 18/10/2027 4,496,174 0.26
USD 2,320,279 ALM XII Ltd ‘Series 2015-12A A1R2’ ‘144A’ FRN 16/4/2027 2,319,962 0.13
USD 8,000,000 ALM XVII Ltd ‘Series 2015-17A A1AR’ ‘144A’ FRN 15/1/2028 7,974,647 0.45
EUR 1,140,000 Altria Group Inc 1% 15/2/2023 1,301,955 0.07 USD 1,850,000 Altria Group Inc 2.85% 9/8/2022 1,887,366 0.11 USD 1,495,000 Altria Group Inc 3.49% 14/2/2022 1,546,202 0.09 USD 2,000,000 Altria Group Inc 3.8% 14/2/2024 2,117,867 0.12 USD 744,489 American Airlines 2013-2 Class B
Pass Through Trust ‘144A’ 5.6% 15/7/2020 758,188 0.04
USD 290,000 American Airlines Group Inc ‘144A’ 5% 1/6/2022 301,237 0.02
USD 3,405,000 American Electric Power Co Inc 2.15% 13/11/2020 3,408,088 0.19
USD 915,000 American Express Co 2.5% 1/8/2022 926,660 0.05 EUR 220,000 American Honda Finance Corp
1.375% 10/11/2022 255,790 0.01 USD 2,300,000 American Tower Corp 3.45%
15/9/2021 2,355,822 0.13 USD 370,000 American Tower Corp 3.5%
31/1/2023 384,487 0.02 USD 1,891,593 Americold 2010 LLC ‘Series 2010-
ARTA A1’ ‘144A’ 3.847% 14/1/2029 1,911,573 0.11 USD 302,881 AmeriCredit Automobile
Receivables Trust 2017-1 ‘Series 2017-1 A3’ 1.87% 18/8/2021 302,679 0.02
USD 932,537 AmeriCredit Automobile Receivables Trust 2017-2 ‘Series 2017-2 A3’ 1.98% 20/12/2021 931,787 0.05
USD 4,600,000 Americredit Automobile Receivables Trust 2018-1 ‘Series 2018-1 A3’ 3.07% 19/12/2022 4,641,144 0.26
USD 2,470,000 Americredit Automobile Receivables Trust 2018-2 ‘Series 2018-2 A3’ 3.15% 20/3/2023 2,507,240 0.14
USD 3,400,000 AMMC CLO XIII Ltd ‘Series 2013-13A A1LR’ ‘144A’ FRN 24/7/2029 3,414,471 0.19
USD 3,250,000 Anadarko Petroleum Corp (Restricted) 4.85% 15/3/2021 3,358,821 0.19
USD 335,000 Analog Devices Inc 2.85% 12/3/2020 335,949 0.02 USD 1,995,000 Andeavor Logistics LP / Tesoro
Logistics Finance Corp (Restricted) 3.5% 1/12/2022 2,050,400 0.12
USD 1,435,000 Andeavor Logistics LP / Tesoro Logistics Finance Corp (Restricted) 6.25% 15/10/2022 1,465,852 0.08
USD 1,900,000 Anheuser-Busch InBev Worldwide Inc 4.15% 23/1/2025 2,079,618 0.12
USD 1,110,000 Anthem Inc 3.125% 15/5/2022 1,137,368 0.07 USD 1,300,000 AOA 2015-1177 Mortgage Trust
‘Series 2015-1177 D’ ‘144A’ FRN 13/12/2029 1,308,922 0.07
USD 887,000 Apache Corp 3.25% 15/4/2022 903,134 0.05 USD 168,000 Apache Corp 3.625% 1/2/2021 170,282 0.01 USD 71,047 Apidos CLO XVI ‘Series 2013-16A
A1R’ ‘144A’ FRN 19/1/2025 71,119 0.00 EUR 1,260,000 Apple Inc 1% 10/11/2022 1,454,998 0.08 USD 7,690,000 Arbor Realty Commercial Real
Estate Notes 2017-FL1 Ltd ‘Series 2017-FL1 A’ ‘144A’ FRN 15/4/2027 7,721,186 0.44
USD 1,636,860 ARI Fleet Lease Trust 2017-A ‘Series 2017-A A2’ ‘144A’ 1.91% 15/4/2026 1,633,564 0.09
USD 5,245,000 ARI Fleet Lease Trust 2017-A ‘Series 2017-A A3’ ‘144A’ 2.28% 15/4/2026 5,255,703 0.30
USD 2,500,000 AT&T Inc 3% 30/6/2022 2,554,134 0.15 USD 2,325,000 AT&T Inc 3.8% 15/3/2022 2,421,112 0.14 USD 15,000,000 Aventura Mall Trust 2013-AVM
‘Series 2013-AVM A’ ‘144A’ FRN 5/12/2032 15,206,106 0.87
USD 3,405,000 Aviation Capital Group LLC ‘144A’ 2.875% 20/1/2022 3,455,231 0.20
USD 94,967 B2R Mortgage Trust 2015-1 ‘Series 2015-1 A1’ ‘144A’ 2.524% 15/5/2048 94,672 0.01
USD 2,727,218 B2R Mortgage Trust 2015-2 ‘Series 2015-2 A’ ‘144A’ 3.336% 15/11/2048 2,731,476 0.16
USD 2,685,000 Baker Hughes a GE Co LLC / Baker Hughes Co-Obligor Inc 2.773% 15/12/2022 2,730,075 0.16
USD 7,425,000 Banc of America Commercial Mortgage Trust 2016-UBS10 ‘Series 2016-UB10 A2’ 2.723% 15/7/2049 7,491,094 0.43
USD 26,839 Banc of America Mortgage 2003-J Trust ‘Series 2003-J 2A1’ FRN 25/11/2033 27,181 0.00
USD 3,555,000 Bank of America Corp FRN 21/7/2021 3,561,176 0.20
USD 975,000 Bank of America Corp FRN 23/1/2022 982,490 0.06
USD 3,410,000 Bank of America Corp FRN 24/4/2023 3,472,469 0.20
USD 1,500,000 Bank of America Corp FRN 21/7/2023 1,530,656 0.09
USD 6,665,000 Bank of America Corp 2.503% 21/10/2022 6,714,873 0.38
USD 3,755,000 Bank of America Corp 3.3% 11/1/2023 3,903,978 0.22
USD 405,000 Bank of America NA FRN 25/1/2023 417,372 0.02
USD 6,000,000 BAT Capital Corp 2.297% 14/8/2020 6,003,917 0.34
USD 6,055,000 BAT Capital Corp 2.764% 15/8/2022 6,136,309 0.35
USD 1,192,000 Bayer US Finance II LLC ‘144A’ 4.25% 15/12/2025 1,284,142 0.07
USD 3,020,000 Bayer US Finance LLC ‘144A’ 2.375% 8/10/2019 3,018,773 0.17
USD 1,661 Bear Stearns ALT-A Trust 2004-13 ‘Series 2004-13 A1’ FRN 25/11/2034 1,663 0.00
USD 8,506,000 Becton Dickinson and Co FRN 29/12/2020* 8,508,335 0.48
USD 2,040,000 Becton Dickinson and Co 2.404% 5/6/2020 2,042,497 0.12
USD 10,000,000 BellSouth LLC ‘144A’ 4.266% 26/4/2020 10,110,500 0.58
US Dollar Short Duration Bond Fund continued
Portfolio of Investments 31 August 2019

Transferable Securities and Money Market Instruments Admitted to an Official Stock Exchange Listing or Dealt in on Another Regulated Market
Transferable Securities and Money Market Instruments Admitted to an Official Stock Exchange Listing or Dealt in on Another Regulated Market
Holding
Description
Market Value (USD)
% of Net
Assets
Holding
Description
Market Value (USD)
% of Net
Assets
The notes on pages 728 to 741 form an integral part of these financial statements.
[656] BlackRock Global Funds (BGF)
USD 2,000,000 Benefit Street Partners CLO II Ltd ‘Series 2013-IIA A2R’ ‘144A’ FRN 15/7/2029 1,994,854 0.11
USD 870,000 Black Diamond CLO 2013-1 Ltd ‘Series 2013-1A A2R’ ‘144A’ FRN 6/2/2026 869,953 0.05
USD 1,240,000 Boeing Co/The 2.7% 1/5/2022 1,263,420 0.07 USD 4,890,000 Broadcom Corp / Broadcom
Cayman Finance Ltd 2.375% 15/1/2020 4,885,555 0.28
USD 564,000 Broadcom Corp / Broadcom Cayman Finance Ltd 3% 15/1/2022 568,078 0.03
USD 9,195,000 Broadcom Inc ‘144A’ 3.625% 15/10/2024 9,341,521 0.53
USD 3,086,070 BX Commercial Mortgage Trust 2018-IND ‘Series 2018-IND A’ ‘144A’ FRN 15/11/2035 3,090,346 0.18
USD 3,659,000 Caesars Palace Las Vegas Trust 2017-VICI ‘Series 2017-VICI A’ ‘144A’ 3.531% 15/10/2034 3,821,039 0.22
USD 1,485,000 Capital One Financial Corp 2.4% 30/10/2020 1,489,638 0.09
USD 955,000 Capital One Financial Corp 3.05% 9/3/2022 976,594 0.06
USD 1,410,000 Capital One NA 1.85% 13/9/2019 1,409,807 0.08 USD 1,710,453 Catamaran CLO 2015-1 Ltd ‘Series
2015-1A AR’ ‘144A’ FRN 22/4/2027 1,705,174 0.10
USD 1,095,000 CCRESG Commercial Mortgage Trust 2016-HEAT ‘Series 2016-HEAT A’ ‘144A’ 3.357% 10/4/2029 1,106,743 0.06
USD 6,580,000 Cedar Funding VI CLO Ltd ‘Series 2016-6A AR’ ‘144A’ FRN 20/10/2028 6,572,475 0.37
USD 765,000 Celgene Corp (Restricted) 2.75% 15/2/2023 781,246 0.04
USD 1,820,000 CenterPoint Energy Inc 2.5% 1/9/2022 1,834,031 0.10
USD 3,150,000 CGDBB Commercial Mortgage Trust 2017-BIOC ‘Series 2017-BIOC A’ ‘144A’ FRN 15/7/2032 3,152,923 0.18
USD 3,568,000 Charter Communications Operating LLC / Charter Communications Operating Capital 4.464% 23/7/2022 3,766,971 0.21
USD 633,000 Charter Communications Operating LLC / Charter Communications Operating Capital 4.5% 1/2/2024 680,846 0.04
USD 3,707,412 Chesapeake Funding II LLC ‘Series 2017-2A A2’ ‘144A’ FRN 15/5/2029 3,704,835 0.21
USD 1,519,187 Chesapeake Funding II LLC ‘Series 2017-3A A2’ ‘144A’ FRN 15/8/2029 1,519,124 0.09
USD 230,471 CHL Mortgage Pass-Through Trust 2005-HYB8 ‘Series 2005-HYB8 2A1’ FRN 20/12/2035 206,055 0.01
USD 1,975,000 Cifc Funding 2014-IV-R Ltd ‘Series 2014-4RA A1A’ ‘144A’ FRN 17/10/2030 1,973,510 0.11
USD 7,282,642 CIFC Funding 2015-II Ltd ‘Series 2015-2A AR’ ‘144A’ FRN 15/4/2027 7,268,900 0.41
USD 4,735,000 Citigroup Commercial Mortgage Trust 2013-375P ‘Series 2013-375P A’ ‘144A’ 3.251% 10/5/2035 4,926,466 0.28
USD 4,293,282 Citigroup Commercial Mortgage Trust 2013-GC11 ‘Series 2013-GC11 A3’ 2.815% 10/4/2046 4,418,180 0.25
USD 6,455,829 Citigroup Commercial Mortgage Trust 2014-GC19 ‘Series 2014-GC19 AAB’ 3.552% 10/3/2047 6,701,068 0.38
USD 115,000 Citigroup Inc FRN 24/1/2023 117,549 0.01 USD 850,000 Citigroup Inc 2.75% 25/4/2022 864,407 0.05 USD 1,615,000 Citizens Bank NA/Providence RI
2.25% 2/3/2020 1,614,807 0.09 USD 6,640,000 Citizens Bank NA/Providence RI
2.25% 30/10/2020 6,647,812 0.38 USD 4,776,000 Citizens Bank NA/Providence RI
2.55% 13/5/2021 4,810,757 0.27 USD 1,515,000 Citizens Bank NA/Providence RI
3.25% 14/2/2022 1,555,090 0.09 USD 6,510,000 CLNS Trust 2017-IKPR ‘Series
2017-IKPR A’ ‘144A’ FRN 11/6/2032 6,501,470 0.37
EUR 600,000 Coca-Cola Co/The 1.125% 22/9/2022 692,842 0.04
USD 400,000 Comcast Corp 3.45% 1/10/2021 411,991 0.02 USD 2,050,000 Comcast Corp 3.7% 15/4/2024 2,194,986 0.13 USD 2,471,211 COMM 2005-C6 Mortgage Trust
‘Series 2005-C6 F’ ‘144A’ FRN 10/6/2044 2,518,594 0.14
USD 4,185,300 COMM 2013-CCRE7 Mortgage Trust ‘Series 2013-CR7 ASB’ 2.739% 10/3/2046 4,234,284 0.24
USD 602,814 COMM 2013-GAM ‘Series 2013-GAM A1’ ‘144A’ 1.705% 10/2/2028 598,716 0.03
USD 1,111,598 COMM 2013-LC6 Mortgage Trust ‘Series 2013-LC6 ASB’ 2.478% 10/1/2046 1,120,371 0.06
USD 671,559 COMM 2013-SFS Mortgage Trust ‘Series 2013-SFS A1’ ‘144A’ 1.873% 12/4/2035 669,865 0.04
USD 7,051,129 COMM 2014-UBS3 Mortgage Trust ‘Series 2014-UBS3 ASB’ 3.367% 10/6/2047 7,259,641 0.41
USD 2,770,000 COMM 2014-UBS5 Mortgage Trust ‘Series 2014-UBS5 ASB’ 3.548% 10/9/2047 2,862,473 0.16
USD 5,293,323 COMM 2015-CCRE22 Mortgage Trust ‘Series 2015-CR22 A2’ 2.856% 10/3/2048 5,293,352 0.30
USD 10,630,492 COMM 2015-CCRE23 Mortgage Trust ‘Series 2015-CR23 XA’ FRN 10/5/2048 379,175 0.02
USD 2,655,000 COMM 2015-CCRE24 Mortgage Trust ‘Series 2015-CR24 ASB’ 3.445% 10/8/2048 2,766,793 0.16
USD 10,036,198 COMM 2015-LC21 Mortgage Trust ‘Series 2015-LC21 A2’ 2.976% 10/7/2048 10,059,908 0.57
USD 4,100,000 COMM 2015-LC21 Mortgage Trust ‘Series 2015-LC21 ASB’ 3.421% 10/7/2048 4,279,495 0.24
USD 3,935,000 Conagra Brands Inc FRN 22/10/2020 3,936,961 0.22 USD 3,220,000 Concho Resources Inc 4.375%
15/1/2025 3,340,290 0.19 USD 258 Continental Airlines 2000-1 Class B
Pass Through Trust 8.388% 1/11/2020 269 0.00
USD 2,680,000 Continental Resources Inc/OK 3.8% 1/6/2024 2,716,197 0.15
USD 8,149,087 Core Industrial Trust 2015-CALW ‘Series 2015-CALW A’ ‘144A’ 3.04% 10/2/2034 8,360,932 0.48
US Dollar Short Duration Bond Fund continued
Portfolio of Investments 31 August 2019
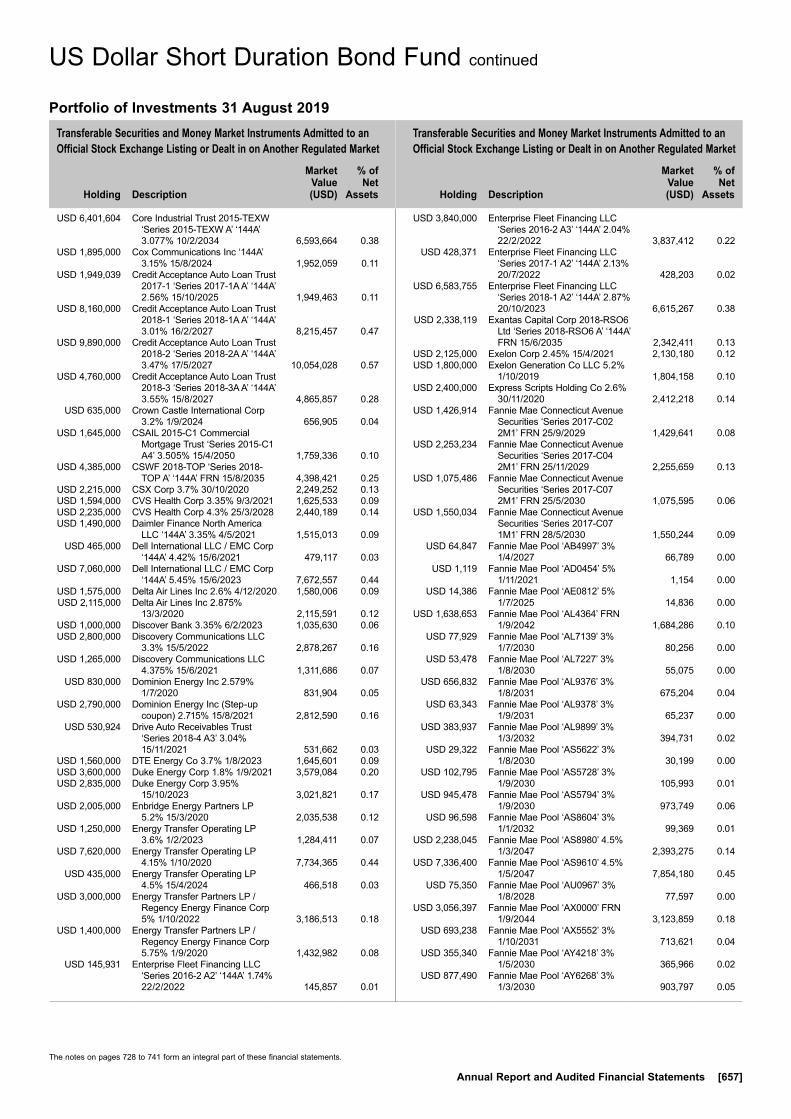
Transferable Securities and Money Market Instruments Admitted to an Official Stock Exchange Listing or Dealt in on Another Regulated Market
Transferable Securities and Money Market Instruments Admitted to an Official Stock Exchange Listing or Dealt in on Another Regulated Market
Holding
Description
Market Value (USD)
% of Net
Assets
Holding
Description
Market Value (USD)
% of Net
Assets
The notes on pages 728 to 741 form an integral part of these financial statements.
Annual Report and Audited Financial Statements [657]
USD 6,401,604 Core Industrial Trust 2015-TEXW ‘Series 2015-TEXW A’ ‘144A’ 3.077% 10/2/2034 6,593,664 0.38
USD 1,895,000 Cox Communications Inc ‘144A’ 3.15% 15/8/2024 1,952,059 0.11
USD 1,949,039 Credit Acceptance Auto Loan Trust 2017-1 ‘Series 2017-1A A’ ‘144A’ 2.56% 15/10/2025 1,949,463 0.11
USD 8,160,000 Credit Acceptance Auto Loan Trust 2018-1 ‘Series 2018-1A A’ ‘144A’ 3.01% 16/2/2027 8,215,457 0.47
USD 9,890,000 Credit Acceptance Auto Loan Trust 2018-2 ‘Series 2018-2A A’ ‘144A’ 3.47% 17/5/2027 10,054,028 0.57
USD 4,760,000 Credit Acceptance Auto Loan Trust 2018-3 ‘Series 2018-3A A’ ‘144A’ 3.55% 15/8/2027 4,865,857 0.28
USD 635,000 Crown Castle International Corp 3.2% 1/9/2024 656,905 0.04
USD 1,645,000 CSAIL 2015-C1 Commercial Mortgage Trust ‘Series 2015-C1 A4’ 3.505% 15/4/2050 1,759,336 0.10
USD 4,385,000 CSWF 2018-TOP ‘Series 2018-TOP A’ ‘144A’ FRN 15/8/2035 4,398,421 0.25
USD 2,215,000 CSX Corp 3.7% 30/10/2020 2,249,252 0.13 USD 1,594,000 CVS Health Corp 3.35% 9/3/2021 1,625,533 0.09 USD 2,235,000 CVS Health Corp 4.3% 25/3/2028 2,440,189 0.14 USD 1,490,000 Daimler Finance North America
LLC ‘144A’ 3.35% 4/5/2021 1,515,013 0.09 USD 465,000 Dell International LLC / EMC Corp
‘144A’ 4.42% 15/6/2021 479,117 0.03 USD 7,060,000 Dell International LLC / EMC Corp
‘144A’ 5.45% 15/6/2023 7,672,557 0.44 USD 1,575,000 Delta Air Lines Inc 2.6% 4/12/2020 1,580,006 0.09 USD 2,115,000 Delta Air Lines Inc 2.875%
13/3/2020 2,115,591 0.12 USD 1,000,000 Discover Bank 3.35% 6/2/2023 1,035,630 0.06 USD 2,800,000 Discovery Communications LLC
3.3% 15/5/2022 2,878,267 0.16 USD 1,265,000 Discovery Communications LLC
4.375% 15/6/2021 1,311,686 0.07 USD 830,000 Dominion Energy Inc 2.579%
1/7/2020 831,904 0.05 USD 2,790,000 Dominion Energy Inc (Step-up
coupon) 2.715% 15/8/2021 2,812,590 0.16 USD 530,924 Drive Auto Receivables Trust
‘Series 2018-4 A3’ 3.04% 15/11/2021 531,662 0.03
USD 1,560,000 DTE Energy Co 3.7% 1/8/2023 1,645,601 0.09 USD 3,600,000 Duke Energy Corp 1.8% 1/9/2021 3,579,084 0.20 USD 2,835,000 Duke Energy Corp 3.95%
15/10/2023 3,021,821 0.17 USD 2,005,000 Enbridge Energy Partners LP
5.2% 15/3/2020 2,035,538 0.12 USD 1,250,000 Energy Transfer Operating LP
3.6% 1/2/2023 1,284,411 0.07 USD 7,620,000 Energy Transfer Operating LP
4.15% 1/10/2020 7,734,365 0.44 USD 435,000 Energy Transfer Operating LP
4.5% 15/4/2024 466,518 0.03 USD 3,000,000 Energy Transfer Partners LP /
Regency Energy Finance Corp 5% 1/10/2022 3,186,513 0.18
USD 1,400,000 Energy Transfer Partners LP / Regency Energy Finance Corp 5.75% 1/9/2020 1,432,982 0.08
USD 145,931 Enterprise Fleet Financing LLC ‘Series 2016-2 A2’ ‘144A’ 1.74% 22/2/2022 145,857 0.01
USD 3,840,000 Enterprise Fleet Financing LLC ‘Series 2016-2 A3’ ‘144A’ 2.04% 22/2/2022 3,837,412 0.22
USD 428,371 Enterprise Fleet Financing LLC ‘Series 2017-1 A2’ ‘144A’ 2.13% 20/7/2022 428,203 0.02
USD 6,583,755 Enterprise Fleet Financing LLC ‘Series 2018-1 A2’ ‘144A’ 2.87% 20/10/2023 6,615,267 0.38
USD 2,338,119 Exantas Capital Corp 2018-RSO6 Ltd ‘Series 2018-RSO6 A’ ‘144A’ FRN 15/6/2035 2,342,411 0.13
USD 2,125,000 Exelon Corp 2.45% 15/4/2021 2,130,180 0.12 USD 1,800,000 Exelon Generation Co LLC 5.2%
1/10/2019 1,804,158 0.10 USD 2,400,000 Express Scripts Holding Co 2.6%
30/11/2020 2,412,218 0.14 USD 1,426,914 Fannie Mae Connecticut Avenue
Securities ‘Series 2017-C02 2M1’ FRN 25/9/2029 1,429,641 0.08
USD 2,253,234 Fannie Mae Connecticut Avenue Securities ‘Series 2017-C04 2M1’ FRN 25/11/2029 2,255,659 0.13
USD 1,075,486 Fannie Mae Connecticut Avenue Securities ‘Series 2017-C07 2M1’ FRN 25/5/2030 1,075,595 0.06
USD 1,550,034 Fannie Mae Connecticut Avenue Securities ‘Series 2017-C07 1M1’ FRN 28/5/2030 1,550,244 0.09
USD 64,847 Fannie Mae Pool ‘AB4997’ 3% 1/4/2027 66,789 0.00
USD 1,119 Fannie Mae Pool ‘AD0454’ 5% 1/11/2021 1,154 0.00
USD 14,386 Fannie Mae Pool ‘AE0812’ 5% 1/7/2025 14,836 0.00
USD 1,638,653 Fannie Mae Pool ‘AL4364’ FRN 1/9/2042 1,684,286 0.10
USD 77,929 Fannie Mae Pool ‘AL7139’ 3% 1/7/2030 80,256 0.00
USD 53,478 Fannie Mae Pool ‘AL7227’ 3% 1/8/2030 55,075 0.00
USD 656,832 Fannie Mae Pool ‘AL9376’ 3% 1/8/2031 675,204 0.04
USD 63,343 Fannie Mae Pool ‘AL9378’ 3% 1/9/2031 65,237 0.00
USD 383,937 Fannie Mae Pool ‘AL9899’ 3% 1/3/2032 394,731 0.02
USD 29,322 Fannie Mae Pool ‘AS5622’ 3% 1/8/2030 30,199 0.00
USD 102,795 Fannie Mae Pool ‘AS5728’ 3% 1/9/2030 105,993 0.01
USD 945,478 Fannie Mae Pool ‘AS5794’ 3% 1/9/2030 973,749 0.06
USD 96,598 Fannie Mae Pool ‘AS8604’ 3% 1/1/2032 99,369 0.01
USD 2,238,045 Fannie Mae Pool ‘AS8980’ 4.5% 1/3/2047 2,393,275 0.14
USD 7,336,400 Fannie Mae Pool ‘AS9610’ 4.5% 1/5/2047 7,854,180 0.45
USD 75,350 Fannie Mae Pool ‘AU0967’ 3% 1/8/2028 77,597 0.00
USD 3,056,397 Fannie Mae Pool ‘AX0000’ FRN 1/9/2044 3,123,859 0.18
USD 693,238 Fannie Mae Pool ‘AX5552’ 3% 1/10/2031 713,621 0.04
USD 355,340 Fannie Mae Pool ‘AY4218’ 3% 1/5/2030 365,966 0.02
USD 877,490 Fannie Mae Pool ‘AY6268’ 3% 1/3/2030 903,797 0.05
US Dollar Short Duration Bond Fund continued
Portfolio of Investments 31 August 2019
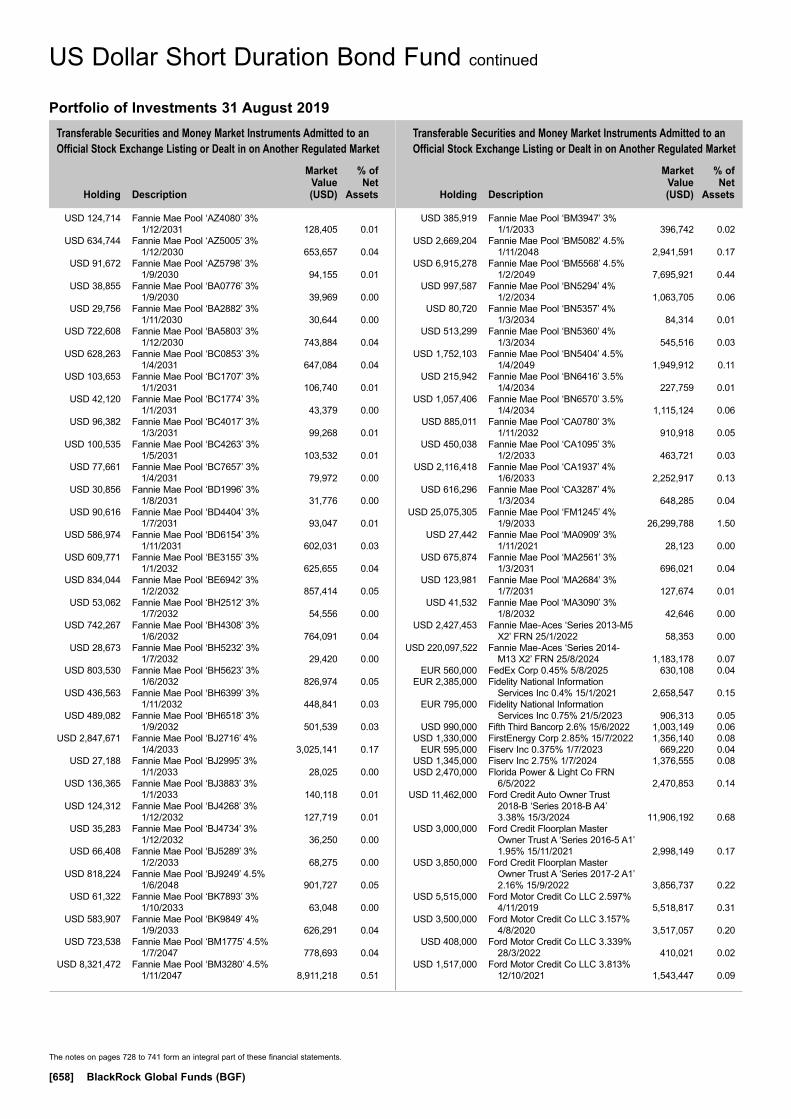
Transferable Securities and Money Market Instruments Admitted to an Official Stock Exchange Listing or Dealt in on Another Regulated Market
Transferable Securities and Money Market Instruments Admitted to an Official Stock Exchange Listing or Dealt in on Another Regulated Market
Holding
Description
Market Value (USD)
% of Net
Assets
Holding
Description
Market Value (USD)
% of Net
Assets
The notes on pages 728 to 741 form an integral part of these financial statements.
[658] BlackRock Global Funds (BGF)
USD 124,714 Fannie Mae Pool ‘AZ4080’ 3% 1/12/2031 128,405 0.01
USD 634,744 Fannie Mae Pool ‘AZ5005’ 3% 1/12/2030 653,657 0.04
USD 91,672 Fannie Mae Pool ‘AZ5798’ 3% 1/9/2030 94,155 0.01
USD 38,855 Fannie Mae Pool ‘BA0776’ 3% 1/9/2030 39,969 0.00
USD 29,756 Fannie Mae Pool ‘BA2882’ 3% 1/11/2030 30,644 0.00
USD 722,608 Fannie Mae Pool ‘BA5803’ 3% 1/12/2030 743,884 0.04
USD 628,263 Fannie Mae Pool ‘BC0853’ 3% 1/4/2031 647,084 0.04
USD 103,653 Fannie Mae Pool ‘BC1707’ 3% 1/1/2031 106,740 0.01
USD 42,120 Fannie Mae Pool ‘BC1774’ 3% 1/1/2031 43,379 0.00
USD 96,382 Fannie Mae Pool ‘BC4017’ 3% 1/3/2031 99,268 0.01
USD 100,535 Fannie Mae Pool ‘BC4263’ 3% 1/5/2031 103,532 0.01
USD 77,661 Fannie Mae Pool ‘BC7657’ 3% 1/4/2031 79,972 0.00
USD 30,856 Fannie Mae Pool ‘BD1996’ 3% 1/8/2031 31,776 0.00
USD 90,616 Fannie Mae Pool ‘BD4404’ 3% 1/7/2031 93,047 0.01
USD 586,974 Fannie Mae Pool ‘BD6154’ 3% 1/11/2031 602,031 0.03
USD 609,771 Fannie Mae Pool ‘BE3155’ 3% 1/1/2032 625,655 0.04
USD 834,044 Fannie Mae Pool ‘BE6942’ 3% 1/2/2032 857,414 0.05
USD 53,062 Fannie Mae Pool ‘BH2512’ 3% 1/7/2032 54,556 0.00
USD 742,267 Fannie Mae Pool ‘BH4308’ 3% 1/6/2032 764,091 0.04
USD 28,673 Fannie Mae Pool ‘BH5232’ 3% 1/7/2032 29,420 0.00
USD 803,530 Fannie Mae Pool ‘BH5623’ 3% 1/6/2032 826,974 0.05
USD 436,563 Fannie Mae Pool ‘BH6399’ 3% 1/11/2032 448,841 0.03
USD 489,082 Fannie Mae Pool ‘BH6518’ 3% 1/9/2032 501,539 0.03
USD 2,847,671 Fannie Mae Pool ‘BJ2716’ 4% 1/4/2033 3,025,141 0.17
USD 27,188 Fannie Mae Pool ‘BJ2995’ 3% 1/1/2033 28,025 0.00
USD 136,365 Fannie Mae Pool ‘BJ3883’ 3% 1/1/2033 140,118 0.01
USD 124,312 Fannie Mae Pool ‘BJ4268’ 3% 1/12/2032 127,719 0.01
USD 35,283 Fannie Mae Pool ‘BJ4734’ 3% 1/12/2032 36,250 0.00
USD 66,408 Fannie Mae Pool ‘BJ5289’ 3% 1/2/2033 68,275 0.00
USD 818,224 Fannie Mae Pool ‘BJ9249’ 4.5% 1/6/2048 901,727 0.05
USD 61,322 Fannie Mae Pool ‘BK7893’ 3% 1/10/2033 63,048 0.00
USD 583,907 Fannie Mae Pool ‘BK9849’ 4% 1/9/2033 626,291 0.04
USD 723,538 Fannie Mae Pool ‘BM1775’ 4.5% 1/7/2047 778,693 0.04
USD 8,321,472 Fannie Mae Pool ‘BM3280’ 4.5% 1/11/2047 8,911,218 0.51
USD 385,919 Fannie Mae Pool ‘BM3947’ 3% 1/1/2033 396,742 0.02
USD 2,669,204 Fannie Mae Pool ‘BM5082’ 4.5% 1/11/2048 2,941,591 0.17
USD 6,915,278 Fannie Mae Pool ‘BM5568’ 4.5% 1/2/2049 7,695,921 0.44
USD 997,587 Fannie Mae Pool ‘BN5294’ 4% 1/2/2034 1,063,705 0.06
USD 80,720 Fannie Mae Pool ‘BN5357’ 4% 1/3/2034 84,314 0.01
USD 513,299 Fannie Mae Pool ‘BN5360’ 4% 1/3/2034 545,516 0.03
USD 1,752,103 Fannie Mae Pool ‘BN5404’ 4.5% 1/4/2049 1,949,912 0.11
USD 215,942 Fannie Mae Pool ‘BN6416’ 3.5% 1/4/2034 227,759 0.01
USD 1,057,406 Fannie Mae Pool ‘BN6570’ 3.5% 1/4/2034 1,115,124 0.06
USD 885,011 Fannie Mae Pool ‘CA0780’ 3% 1/11/2032 910,918 0.05
USD 450,038 Fannie Mae Pool ‘CA1095’ 3% 1/2/2033 463,721 0.03
USD 2,116,418 Fannie Mae Pool ‘CA1937’ 4% 1/6/2033 2,252,917 0.13
USD 616,296 Fannie Mae Pool ‘CA3287’ 4% 1/3/2034 648,285 0.04
USD 25,075,305 Fannie Mae Pool ‘FM1245’ 4% 1/9/2033 26,299,788 1.50
USD 27,442 Fannie Mae Pool ‘MA0909’ 3% 1/11/2021 28,123 0.00
USD 675,874 Fannie Mae Pool ‘MA2561’ 3% 1/3/2031 696,021 0.04
USD 123,981 Fannie Mae Pool ‘MA2684’ 3% 1/7/2031 127,674 0.01
USD 41,532 Fannie Mae Pool ‘MA3090’ 3% 1/8/2032 42,646 0.00
USD 2,427,453 Fannie Mae-Aces ‘Series 2013-M5 X2’ FRN 25/1/2022 58,353 0.00
USD 220,097,522 Fannie Mae-Aces ‘Series 2014-M13 X2’ FRN 25/8/2024 1,183,178 0.07
EUR 560,000 FedEx Corp 0.45% 5/8/2025 630,108 0.04 EUR 2,385,000 Fidelity National Information
Services Inc 0.4% 15/1/2021 2,658,547 0.15 EUR 795,000 Fidelity National Information
Services Inc 0.75% 21/5/2023 906,313 0.05 USD 990,000 Fifth Third Bancorp 2.6% 15/6/2022 1,003,149 0.06 USD 1,330,000 FirstEnergy Corp 2.85% 15/7/2022 1,356,140 0.08 EUR 595,000 Fiserv Inc 0.375% 1/7/2023 669,220 0.04 USD 1,345,000 Fiserv Inc 2.75% 1/7/2024 1,376,555 0.08 USD 2,470,000 Florida Power & Light Co FRN
6/5/2022 2,470,853 0.14 USD 11,462,000 Ford Credit Auto Owner Trust
2018-B ‘Series 2018-B A4’ 3.38% 15/3/2024 11,906,192 0.68
USD 3,000,000 Ford Credit Floorplan Master Owner Trust A ‘Series 2016-5 A1’ 1.95% 15/11/2021 2,998,149 0.17
USD 3,850,000 Ford Credit Floorplan Master Owner Trust A ‘Series 2017-2 A1’ 2.16% 15/9/2022 3,856,737 0.22
USD 5,515,000 Ford Motor Credit Co LLC 2.597% 4/11/2019 5,518,817 0.31
USD 3,500,000 Ford Motor Credit Co LLC 3.157% 4/8/2020 3,517,057 0.20
USD 408,000 Ford Motor Credit Co LLC 3.339% 28/3/2022 410,021 0.02
USD 1,517,000 Ford Motor Credit Co LLC 3.813% 12/10/2021 1,543,447 0.09
US Dollar Short Duration Bond Fund continued
Portfolio of Investments 31 August 2019
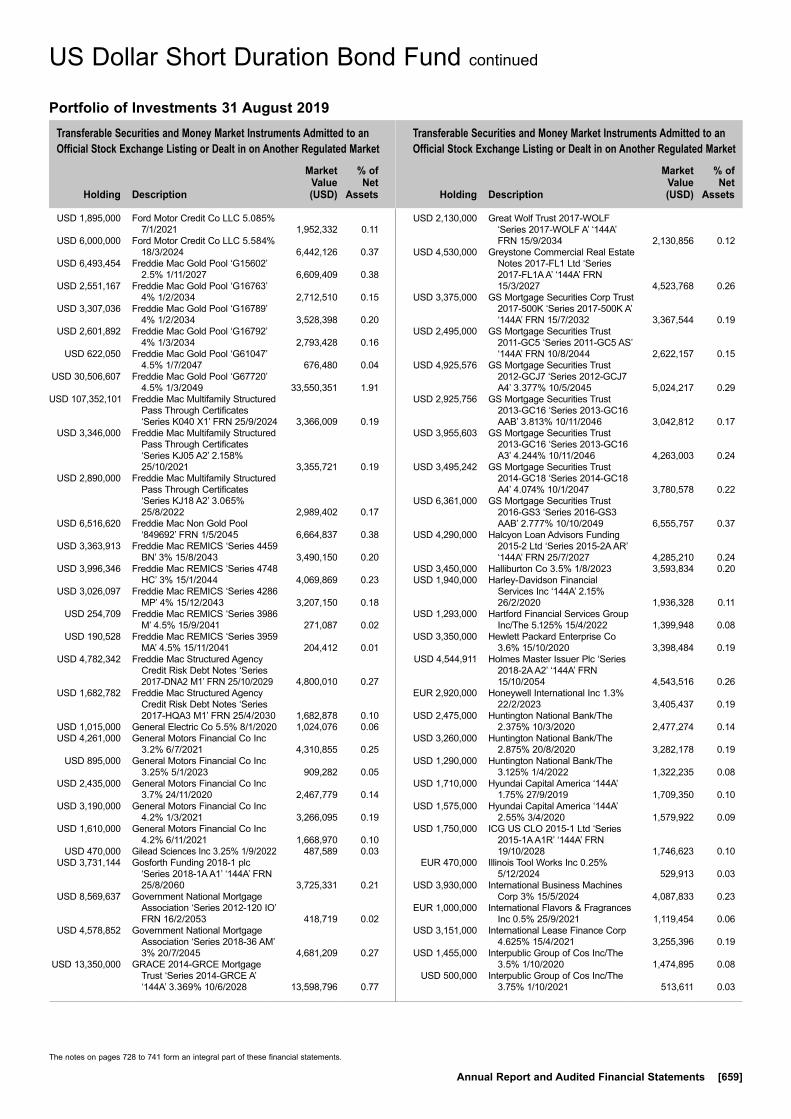
Transferable Securities and Money Market Instruments Admitted to an Official Stock Exchange Listing or Dealt in on Another Regulated Market
Transferable Securities and Money Market Instruments Admitted to an Official Stock Exchange Listing or Dealt in on Another Regulated Market
Holding
Description
Market Value (USD)
% of Net
Assets
Holding
Description
Market Value (USD)
% of Net
Assets
The notes on pages 728 to 741 form an integral part of these financial statements.
Annual Report and Audited Financial Statements [659]
USD 1,895,000 Ford Motor Credit Co LLC 5.085% 7/1/2021 1,952,332 0.11
USD 6,000,000 Ford Motor Credit Co LLC 5.584% 18/3/2024 6,442,126 0.37
USD 6,493,454 Freddie Mac Gold Pool ‘G15602’ 2.5% 1/11/2027 6,609,409 0.38
USD 2,551,167 Freddie Mac Gold Pool ‘G16763’ 4% 1/2/2034 2,712,510 0.15
USD 3,307,036 Freddie Mac Gold Pool ‘G16789’ 4% 1/2/2034 3,528,398 0.20
USD 2,601,892 Freddie Mac Gold Pool ‘G16792’ 4% 1/3/2034 2,793,428 0.16
USD 622,050 Freddie Mac Gold Pool ‘G61047’ 4.5% 1/7/2047 676,480 0.04
USD 30,506,607 Freddie Mac Gold Pool ‘G67720’ 4.5% 1/3/2049 33,550,351 1.91
USD 107,352,101 Freddie Mac Multifamily Structured Pass Through Certificates ‘Series K040 X1’ FRN 25/9/2024 3,366,009 0.19
USD 3,346,000 Freddie Mac Multifamily Structured Pass Through Certificates ‘Series KJ05 A2’ 2.158% 25/10/2021 3,355,721 0.19
USD 2,890,000 Freddie Mac Multifamily Structured Pass Through Certificates ‘Series KJ18 A2’ 3.065% 25/8/2022 2,989,402 0.17
USD 6,516,620 Freddie Mac Non Gold Pool ‘849692’ FRN 1/5/2045 6,664,837 0.38
USD 3,363,913 Freddie Mac REMICS ‘Series 4459 BN’ 3% 15/8/2043 3,490,150 0.20
USD 3,996,346 Freddie Mac REMICS ‘Series 4748 HC’ 3% 15/1/2044 4,069,869 0.23
USD 3,026,097 Freddie Mac REMICS ‘Series 4286 MP’ 4% 15/12/2043 3,207,150 0.18
USD 254,709 Freddie Mac REMICS ‘Series 3986 M’ 4.5% 15/9/2041 271,087 0.02
USD 190,528 Freddie Mac REMICS ‘Series 3959 MA’ 4.5% 15/11/2041 204,412 0.01
USD 4,782,342 Freddie Mac Structured Agency Credit Risk Debt Notes ‘Series 2017-DNA2 M1’ FRN 25/10/2029 4,800,010 0.27
USD 1,682,782 Freddie Mac Structured Agency Credit Risk Debt Notes ‘Series 2017-HQA3 M1’ FRN 25/4/2030 1,682,878 0.10
USD 1,015,000 General Electric Co 5.5% 8/1/2020 1,024,076 0.06 USD 4,261,000 General Motors Financial Co Inc
3.2% 6/7/2021 4,310,855 0.25 USD 895,000 General Motors Financial Co Inc
3.25% 5/1/2023 909,282 0.05 USD 2,435,000 General Motors Financial Co Inc
3.7% 24/11/2020 2,467,779 0.14 USD 3,190,000 General Motors Financial Co Inc
4.2% 1/3/2021 3,266,095 0.19 USD 1,610,000 General Motors Financial Co Inc
4.2% 6/11/2021 1,668,970 0.10 USD 470,000 Gilead Sciences Inc 3.25% 1/9/2022 487,589 0.03 USD 3,731,144 Gosforth Funding 2018-1 plc
‘Series 2018-1A A1’ ‘144A’ FRN 25/8/2060 3,725,331 0.21
USD 8,569,637 Government National Mortgage Association ‘Series 2012-120 IO’ FRN 16/2/2053 418,719 0.02
USD 4,578,852 Government National Mortgage Association ‘Series 2018-36 AM’ 3% 20/7/2045 4,681,209 0.27
USD 13,350,000 GRACE 2014-GRCE Mortgage Trust ‘Series 2014-GRCE A’ ‘144A’ 3.369% 10/6/2028 13,598,796 0.77
USD 2,130,000 Great Wolf Trust 2017-WOLF ‘Series 2017-WOLF A’ ‘144A’ FRN 15/9/2034 2,130,856 0.12
USD 4,530,000 Greystone Commercial Real Estate Notes 2017-FL1 Ltd ‘Series 2017-FL1A A’ ‘144A’ FRN 15/3/2027 4,523,768 0.26
USD 3,375,000 GS Mortgage Securities Corp Trust 2017-500K ‘Series 2017-500K A’ ‘144A’ FRN 15/7/2032 3,367,544 0.19
USD 2,495,000 GS Mortgage Securities Trust 2011-GC5 ‘Series 2011-GC5 AS’ ‘144A’ FRN 10/8/2044 2,622,157 0.15
USD 4,925,576 GS Mortgage Securities Trust 2012-GCJ7 ‘Series 2012-GCJ7 A4’ 3.377% 10/5/2045 5,024,217 0.29
USD 2,925,756 GS Mortgage Securities Trust 2013-GC16 ‘Series 2013-GC16 AAB’ 3.813% 10/11/2046 3,042,812 0.17
USD 3,955,603 GS Mortgage Securities Trust 2013-GC16 ‘Series 2013-GC16 A3’ 4.244% 10/11/2046 4,263,003 0.24
USD 3,495,242 GS Mortgage Securities Trust 2014-GC18 ‘Series 2014-GC18 A4’ 4.074% 10/1/2047 3,780,578 0.22
USD 6,361,000 GS Mortgage Securities Trust 2016-GS3 ‘Series 2016-GS3 AAB’ 2.777% 10/10/2049 6,555,757 0.37
USD 4,290,000 Halcyon Loan Advisors Funding 2015-2 Ltd ‘Series 2015-2A AR’ ‘144A’ FRN 25/7/2027 4,285,210 0.24
USD 3,450,000 Halliburton Co 3.5% 1/8/2023 3,593,834 0.20 USD 1,940,000 Harley-Davidson Financial
Services Inc ‘144A’ 2.15% 26/2/2020 1,936,328 0.11
USD 1,293,000 Hartford Financial Services Group Inc/The 5.125% 15/4/2022 1,399,948 0.08
USD 3,350,000 Hewlett Packard Enterprise Co 3.6% 15/10/2020 3,398,484 0.19
USD 4,544,911 Holmes Master Issuer Plc ‘Series 2018-2A A2’ ‘144A’ FRN 15/10/2054 4,543,516 0.26
EUR 2,920,000 Honeywell International Inc 1.3% 22/2/2023 3,405,437 0.19
USD 2,475,000 Huntington National Bank/The 2.375% 10/3/2020 2,477,274 0.14
USD 3,260,000 Huntington National Bank/The 2.875% 20/8/2020 3,282,178 0.19
USD 1,290,000 Huntington National Bank/The 3.125% 1/4/2022 1,322,235 0.08
USD 1,710,000 Hyundai Capital America ‘144A’ 1.75% 27/9/2019 1,709,350 0.10
USD 1,575,000 Hyundai Capital America ‘144A’ 2.55% 3/4/2020 1,579,922 0.09
USD 1,750,000 ICG US CLO 2015-1 Ltd ‘Series 2015-1A A1R’ ‘144A’ FRN 19/10/2028 1,746,623 0.10
EUR 470,000 Illinois Tool Works Inc 0.25% 5/12/2024 529,913 0.03
USD 3,930,000 International Business Machines Corp 3% 15/5/2024 4,087,833 0.23
EUR 1,000,000 International Flavors & Fragrances Inc 0.5% 25/9/2021 1,119,454 0.06
USD 3,151,000 International Lease Finance Corp 4.625% 15/4/2021 3,255,396 0.19
USD 1,455,000 Interpublic Group of Cos Inc/The 3.5% 1/10/2020 1,474,895 0.08
USD 500,000 Interpublic Group of Cos Inc/The 3.75% 1/10/2021 513,611 0.03
US Dollar Short Duration Bond Fund continued
Portfolio of Investments 31 August 2019

Transferable Securities and Money Market Instruments Admitted to an Official Stock Exchange Listing or Dealt in on Another Regulated Market
Transferable Securities and Money Market Instruments Admitted to an Official Stock Exchange Listing or Dealt in on Another Regulated Market
Holding
Description
Market Value (USD)
% of Net
Assets
Holding
Description
Market Value (USD)
% of Net
Assets
The notes on pages 728 to 741 form an integral part of these financial statements.
[660] BlackRock Global Funds (BGF)
USD 900,000 ITC Holdings Corp 2.7% 15/11/2022 913,441 0.05 USD 3,780,000 J.P. Morgan Chase Commercial
Mortgage Securities Trust 2018-BCON ‘Series 2018-BCON A’ ‘144A’ 3.735% 5/1/2031 3,985,878 0.23
USD 620,000 John Deere Capital Corp 2.6% 7/3/2024 635,888 0.04
USD 4,647,997 John Deere Owner Trust 2017-B ‘Series 2017-B A3’ 1.82% 15/10/2021 4,640,277 0.26
USD 4,892,468 JP Morgan Chase Commercial Mortgage Securities Trust 2012-CIBX ‘Series 2012-CBX A4’ 3.483% 15/6/2045 5,018,996 0.29
USD 3,499,359 JP Morgan Chase Commercial Mortgage Securities Trust 2013-C16 ‘Series 2013-C16 ASB’ 3.674% 15/12/2046 3,609,050 0.21
USD 5,320,789 JP Morgan Chase Commercial Mortgage Securities Trust 2013-LC11 ‘Series 2013-LC11 ASB’ 2.554% 15/4/2046 5,372,118 0.31
USD 646,174 JP Morgan Chase Commercial Mortgage Securities Trust 2014-C20 ‘Series 2014-C20 A2’ 2.872% 15/7/2047 645,551 0.04
USD 3,889,000 JP Morgan Chase Commercial Mortgage Securities Trust 2016-JP2 ‘Series 2016-JP2 ASB’ 2.713% 15/8/2049 3,989,458 0.23
USD 3,931,694 JP Morgan Mortgage Trust 2016-2 ‘Series 2016-2 A1’ ‘144A’ FRN 25/6/2046 3,942,655 0.22
USD 4,531,122 JP Morgan Mortgage Trust 2017-1 ‘Series 2017-1 A4’ ‘144A’ FRN 25/1/2047 4,679,331 0.27
USD 11,619,420 JP Morgan Mortgage Trust 2017-3 ‘Series 2017-3 1A6’ ‘144A’ FRN 25/8/2047 11,835,466 0.67
USD 7,292,224 JPMBB Commercial Mortgage Securities Trust 2013-C17 ‘Series 2013-C17 ASB’ 3.705% 15/1/2047 7,572,920 0.43
USD 3,829,957 JPMBB Commercial Mortgage Securities Trust 2014-C23 ‘Series 2014-C23 ASB’ 3.657% 15/9/2047 3,982,067 0.23
USD 1,055,000 JPMBB Commercial Mortgage Securities Trust 2014-C26 ‘Series 2014-C26 ASB’ 3.288% 15/1/2048 1,089,517 0.06
USD 3,380,000 JPMorgan Chase & Co FRN 18/6/2022 3,386,572 0.19
USD 6,115,000 JPMorgan Chase & Co FRN 25/4/2023 6,208,229 0.35
USD 2,305,000 JPMorgan Chase & Co FRN 23/4/2024 2,419,897 0.14
USD 1,800,000 JPMorgan Chase & Co FRN 23/7/2024 1,911,611 0.11
USD 2,800,000 JPMorgan Chase & Co 3.25% 23/9/2022 2,900,904 0.17
USD 1,410,000 JPMorgan Chase Bank NA FRN 1/2/2021 1,412,681 0.08
USD 7,100,000 JPMorgan Chase Bank NA FRN 26/4/2021 7,142,867 0.41
USD 900,000 Keurig Dr Pepper Inc 4.057% 25/5/2023 955,721 0.05
USD 3,000,000 KeyBank NA/Cleveland OH 2.25% 16/3/2020 3,002,775 0.17
USD 2,715,000 Kinder Morgan Inc/DE ‘144A’ 5% 15/2/2021 2,811,606 0.16
USD 1,745,000 Kraft Heinz Foods Co 3.5% 6/6/2022 1,784,532 0.10 USD 1,690,000 Kraft Heinz Foods Co ‘144A’
4.875% 15/2/2025 1,747,749 0.10 USD 2,205,000 L3Harris Technologies Inc ‘144A’
4.4% 15/6/2028 2,502,023 0.14 USD 6,790,000 Lendmark Funding Trust 2018-1
‘Series 2018-1A A’ ‘144A’ 3.81% 21/12/2026 6,963,069 0.40
USD 2,043,479 LFRF ‘2015-1’ ‘144A’ 4% 30/10/2027 2,035,894 0.12 USD 2,075,000 Lowe’s Cos Inc 3.65% 5/4/2029 2,251,957 0.13 USD 1,385,000 Madison Avenue Trust 2013-650M
‘Series 2013-650M A’ ‘144A’ 3.843% 12/10/2032 1,402,564 0.08
EUR 970,000 Mastercard Inc 1.1% 1/12/2022 1,118,978 0.06 USD 9,820,000 Mercedes-Benz Master Owner
Trust 2017-B ‘Series 2017-BA A’ ‘144A’ FRN 16/5/2022 9,833,441 0.56
USD 4,595,000 Mercedes-Benz Master Owner Trust 2018-BA ‘Series 2018-BA A’ ‘144A’ FRN 15/5/2023 4,597,186 0.26
EUR 700,000 Metropolitan Life Global Funding I 0.375% 9/4/2024 792,533 0.05
EUR 310,000 Metropolitan Life Global Funding I 2.375% 11/1/2023 372,654 0.02
USD 3,851,490 Mill City Mortgage Loan Trust 2016-1 ‘Series 2016-1 A1’ ‘144A’ FRN 25/4/2057 3,858,654 0.22
USD 1,540,436 Morgan Stanley Bank of America Merrill Lynch Trust 2013-C10 ‘Series 2013-C10 ASB’ FRN 15/7/2046 1,587,555 0.09
USD 3,480,000 Morgan Stanley Bank of America Merrill Lynch Trust 2013-C13 ‘Series 2013-C13 A4’ 4.039% 15/11/2046 3,752,089 0.21
USD 3,691,287 Morgan Stanley Bank of America Merrill Lynch Trust 2013-C9 ‘Series 2013-C9 AAB’ 2.657% 15/5/2046 3,727,865 0.21
USD 572,540 Morgan Stanley Bank of America Merrill Lynch Trust 2014 C19 ‘Series 2014-C19 A2’ 3.101% 15/12/2047 572,412 0.03
USD 3,740,000 Morgan Stanley Bank of America Merrill Lynch Trust 2014-C18 ‘Series 2014-C18 ASB’ 3.621% 15/10/2047 3,880,007 0.22
USD 5,385,000 Morgan Stanley Bank of America Merrill Lynch Trust 2015-C25 ‘Series 2015-C25 ASB’ 3.383% 15/10/2048 5,612,536 0.32
USD 1,687,353 Morgan Stanley Capital I Trust 2007-TOP27 ‘Series 2007-T27 AJ’ FRN 11/6/2042 1,800,069 0.10
USD 4,940,000 Morgan Stanley Capital I Trust 2014-MP ‘Series 2014-MP A’ ‘144A’ 3.469% 11/8/2033 5,074,156 0.29
USD 888,400 Navient Private Education Loan Trust 2014-A ‘Series 2014-AA A2B’ ‘144A’ FRN 15/2/2029 899,583 0.05
USD 1,434,766 Navient Private Education Loan Trust 2014-A ‘Series 2014-AA A2A’ ‘144A’ 2.74% 15/2/2029 1,448,457 0.08
USD 71,376 Navient Private Education Loan Trust 2014-CT ‘Series 2014-CTA A’ ‘144A’ FRN 16/9/2024 71,426 0.00
US Dollar Short Duration Bond Fund continued
Portfolio of Investments 31 August 2019
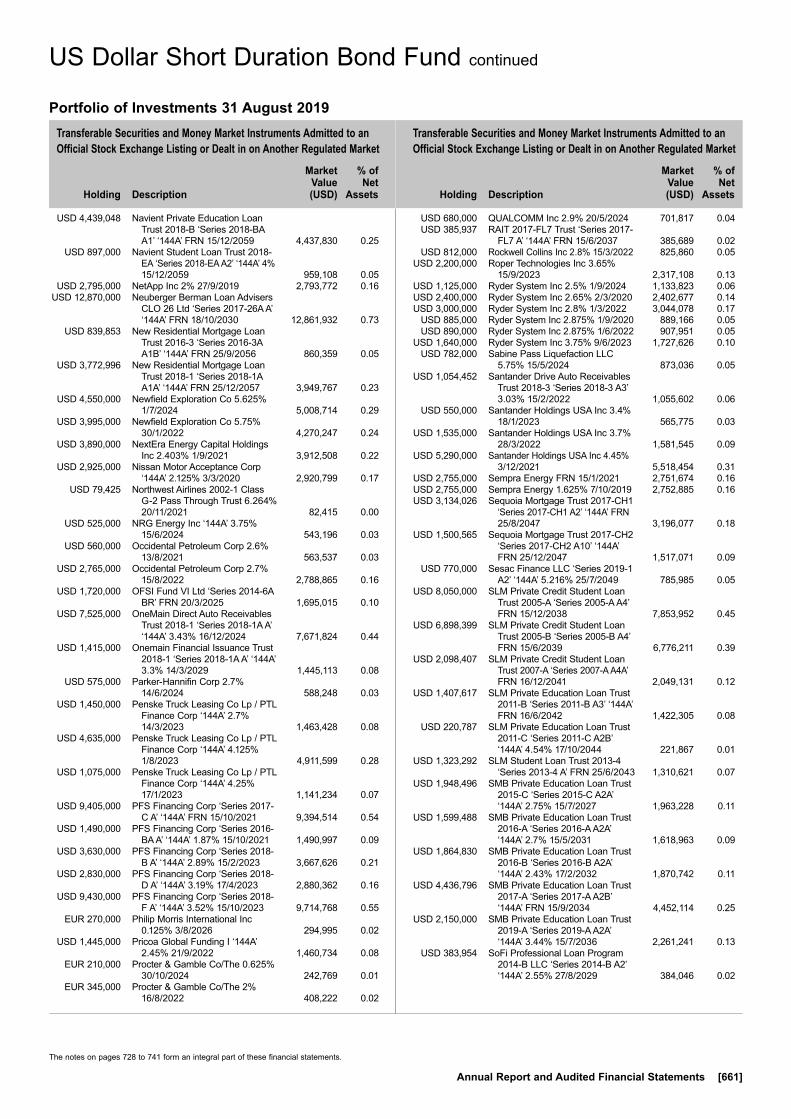
Transferable Securities and Money Market Instruments Admitted to an Official Stock Exchange Listing or Dealt in on Another Regulated Market
Transferable Securities and Money Market Instruments Admitted to an Official Stock Exchange Listing or Dealt in on Another Regulated Market
Holding
Description
Market Value (USD)
% of Net
Assets
Holding
Description
Market Value (USD)
% of Net
Assets
The notes on pages 728 to 741 form an integral part of these financial statements.
Annual Report and Audited Financial Statements [661]
USD 4,439,048 Navient Private Education Loan Trust 2018-B ‘Series 2018-BA A1’ ‘144A’ FRN 15/12/2059 4,437,830 0.25
USD 897,000 Navient Student Loan Trust 2018-EA ‘Series 2018-EA A2’ ‘144A’ 4% 15/12/2059 959,108 0.05
USD 2,795,000 NetApp Inc 2% 27/9/2019 2,793,772 0.16 USD 12,870,000 Neuberger Berman Loan Advisers
CLO 26 Ltd ‘Series 2017-26A A’ ‘144A’ FRN 18/10/2030 12,861,932 0.73
USD 839,853 New Residential Mortgage Loan Trust 2016-3 ‘Series 2016-3A A1B’ ‘144A’ FRN 25/9/2056 860,359 0.05
USD 3,772,996 New Residential Mortgage Loan Trust 2018-1 ‘Series 2018-1A A1A’ ‘144A’ FRN 25/12/2057 3,949,767 0.23
USD 4,550,000 Newfield Exploration Co 5.625% 1/7/2024 5,008,714 0.29
USD 3,995,000 Newfield Exploration Co 5.75% 30/1/2022 4,270,247 0.24
USD 3,890,000 NextEra Energy Capital Holdings Inc 2.403% 1/9/2021 3,912,508 0.22
USD 2,925,000 Nissan Motor Acceptance Corp ‘144A’ 2.125% 3/3/2020 2,920,799 0.17
USD 79,425 Northwest Airlines 2002-1 Class G-2 Pass Through Trust 6.264% 20/11/2021 82,415 0.00
USD 525,000 NRG Energy Inc ‘144A’ 3.75% 15/6/2024 543,196 0.03
USD 560,000 Occidental Petroleum Corp 2.6% 13/8/2021 563,537 0.03
USD 2,765,000 Occidental Petroleum Corp 2.7% 15/8/2022 2,788,865 0.16
USD 1,720,000 OFSI Fund VI Ltd ‘Series 2014-6A BR’ FRN 20/3/2025 1,695,015 0.10
USD 7,525,000 OneMain Direct Auto Receivables Trust 2018-1 ‘Series 2018-1A A’ ‘144A’ 3.43% 16/12/2024 7,671,824 0.44
USD 1,415,000 Onemain Financial Issuance Trust 2018-1 ‘Series 2018-1A A’ ‘144A’ 3.3% 14/3/2029 1,445,113 0.08
USD 575,000 Parker-Hannifin Corp 2.7% 14/6/2024 588,248 0.03
USD 1,450,000 Penske Truck Leasing Co Lp / PTL Finance Corp ‘144A’ 2.7% 14/3/2023 1,463,428 0.08
USD 4,635,000 Penske Truck Leasing Co Lp / PTL Finance Corp ‘144A’ 4.125% 1/8/2023 4,911,599 0.28
USD 1,075,000 Penske Truck Leasing Co Lp / PTL Finance Corp ‘144A’ 4.25% 17/1/2023 1,141,234 0.07
USD 9,405,000 PFS Financing Corp ‘Series 2017-C A’ ‘144A’ FRN 15/10/2021 9,394,514 0.54
USD 1,490,000 PFS Financing Corp ‘Series 2016-BA A’ ‘144A’ 1.87% 15/10/2021 1,490,997 0.09
USD 3,630,000 PFS Financing Corp ‘Series 2018-B A’ ‘144A’ 2.89% 15/2/2023 3,667,626 0.21
USD 2,830,000 PFS Financing Corp ‘Series 2018-D A’ ‘144A’ 3.19% 17/4/2023 2,880,362 0.16
USD 9,430,000 PFS Financing Corp ‘Series 2018-F A’ ‘144A’ 3.52% 15/10/2023 9,714,768 0.55
EUR 270,000 Philip Morris International Inc 0.125% 3/8/2026 294,995 0.02
USD 1,445,000 Pricoa Global Funding I ‘144A’ 2.45% 21/9/2022 1,460,734 0.08
EUR 210,000 Procter & Gamble Co/The 0.625% 30/10/2024 242,769 0.01
EUR 345,000 Procter & Gamble Co/The 2% 16/8/2022 408,222 0.02
USD 680,000 QUALCOMM Inc 2.9% 20/5/2024 701,817 0.04 USD 385,937 RAIT 2017-FL7 Trust ‘Series 2017-
FL7 A’ ‘144A’ FRN 15/6/2037 385,689 0.02 USD 812,000 Rockwell Collins Inc 2.8% 15/3/2022 825,860 0.05 USD 2,200,000 Roper Technologies Inc 3.65%
15/9/2023 2,317,108 0.13 USD 1,125,000 Ryder System Inc 2.5% 1/9/2024 1,133,823 0.06 USD 2,400,000 Ryder System Inc 2.65% 2/3/2020 2,402,677 0.14 USD 3,000,000 Ryder System Inc 2.8% 1/3/2022 3,044,078 0.17 USD 885,000 Ryder System Inc 2.875% 1/9/2020 889,166 0.05 USD 890,000 Ryder System Inc 2.875% 1/6/2022 907,951 0.05 USD 1,640,000 Ryder System Inc 3.75% 9/6/2023 1,727,626 0.10 USD 782,000 Sabine Pass Liquefaction LLC
5.75% 15/5/2024 873,036 0.05 USD 1,054,452 Santander Drive Auto Receivables
Trust 2018-3 ‘Series 2018-3 A3’ 3.03% 15/2/2022 1,055,602 0.06
USD 550,000 Santander Holdings USA Inc 3.4% 18/1/2023 565,775 0.03
USD 1,535,000 Santander Holdings USA Inc 3.7% 28/3/2022 1,581,545 0.09
USD 5,290,000 Santander Holdings USA Inc 4.45% 3/12/2021 5,518,454 0.31
USD 2,755,000 Sempra Energy FRN 15/1/2021 2,751,674 0.16 USD 2,755,000 Sempra Energy 1.625% 7/10/2019 2,752,885 0.16 USD 3,134,026 Sequoia Mortgage Trust 2017-CH1
‘Series 2017-CH1 A2’ ‘144A’ FRN 25/8/2047 3,196,077 0.18
USD 1,500,565 Sequoia Mortgage Trust 2017-CH2 ‘Series 2017-CH2 A10’ ‘144A’ FRN 25/12/2047 1,517,071 0.09
USD 770,000 Sesac Finance LLC ‘Series 2019-1 A2’ ‘144A’ 5.216% 25/7/2049 785,985 0.05
USD 8,050,000 SLM Private Credit Student Loan Trust 2005-A ‘Series 2005-A A4’ FRN 15/12/2038 7,853,952 0.45
USD 6,898,399 SLM Private Credit Student Loan Trust 2005-B ‘Series 2005-B A4’ FRN 15/6/2039 6,776,211 0.39
USD 2,098,407 SLM Private Credit Student Loan Trust 2007-A ‘Series 2007-A A4A’ FRN 16/12/2041 2,049,131 0.12
USD 1,407,617 SLM Private Education Loan Trust 2011-B ‘Series 2011-B A3’ ‘144A’ FRN 16/6/2042 1,422,305 0.08
USD 220,787 SLM Private Education Loan Trust 2011-C ‘Series 2011-C A2B’ ‘144A’ 4.54% 17/10/2044 221,867 0.01
USD 1,323,292 SLM Student Loan Trust 2013-4 ‘Series 2013-4 A’ FRN 25/6/2043 1,310,621 0.07
USD 1,948,496 SMB Private Education Loan Trust 2015-C ‘Series 2015-C A2A’ ‘144A’ 2.75% 15/7/2027 1,963,228 0.11
USD 1,599,488 SMB Private Education Loan Trust 2016-A ‘Series 2016-A A2A’ ‘144A’ 2.7% 15/5/2031 1,618,963 0.09
USD 1,864,830 SMB Private Education Loan Trust 2016-B ‘Series 2016-B A2A’ ‘144A’ 2.43% 17/2/2032 1,870,742 0.11
USD 4,436,796 SMB Private Education Loan Trust 2017-A ‘Series 2017-A A2B’ ‘144A’ FRN 15/9/2034 4,452,114 0.25
USD 2,150,000 SMB Private Education Loan Trust 2019-A ‘Series 2019-A A2A’ ‘144A’ 3.44% 15/7/2036 2,261,241 0.13
USD 383,954 SoFi Professional Loan Program 2014-B LLC ‘Series 2014-B A2’ ‘144A’ 2.55% 27/8/2029 384,046 0.02
US Dollar Short Duration Bond Fund continued
Portfolio of Investments 31 August 2019
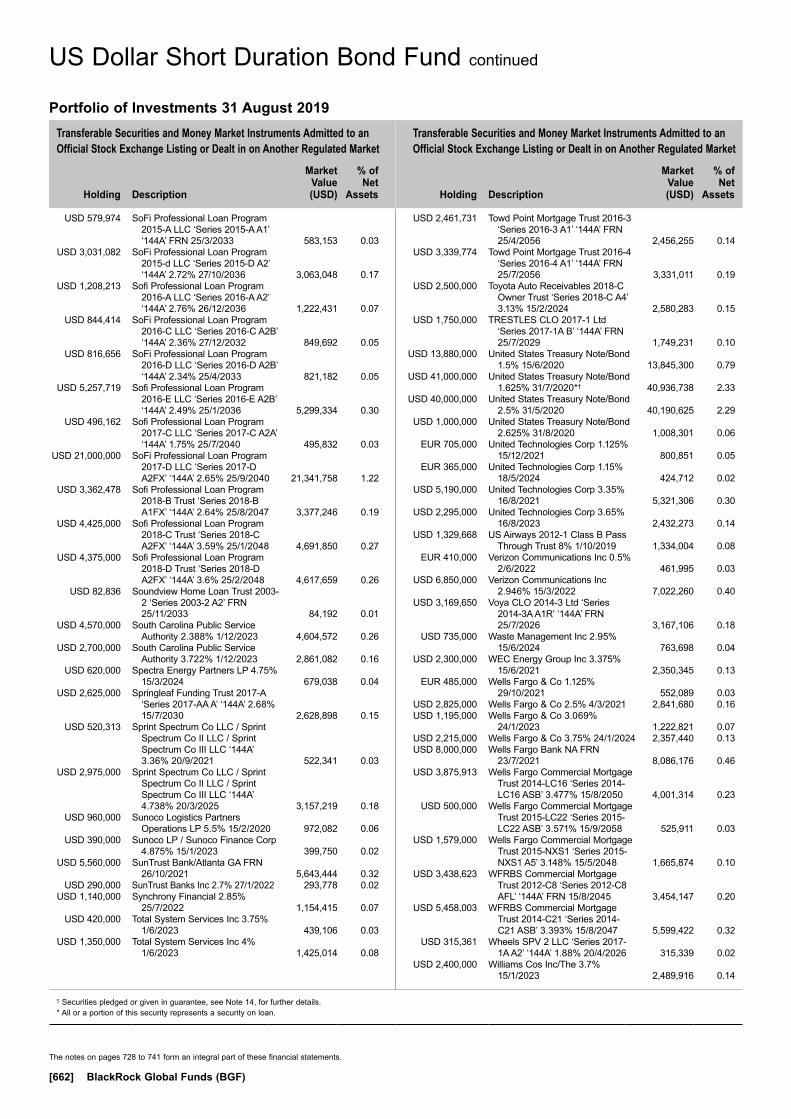
Transferable Securities and Money Market Instruments Admitted to an Official Stock Exchange Listing or Dealt in on Another Regulated Market
Transferable Securities and Money Market Instruments Admitted to an Official Stock Exchange Listing or Dealt in on Another Regulated Market
Holding
Description
Market Value (USD)
% of Net
Assets
Holding
Description
Market Value (USD)
% of Net
Assets
† Securities pledged or given in guarantee, see Note 14, for further details.* All or a portion of this security represents a security on loan.
The notes on pages 728 to 741 form an integral part of these financial statements.
[662] BlackRock Global Funds (BGF)
USD 579,974 SoFi Professional Loan Program 2015-A LLC ‘Series 2015-A A1’ ‘144A’ FRN 25/3/2033 583,153 0.03
USD 3,031,082 SoFi Professional Loan Program 2015-d LLC ‘Series 2015-D A2’ ‘144A’ 2.72% 27/10/2036 3,063,048 0.17
USD 1,208,213 Sofi Professional Loan Program 2016-A LLC ‘Series 2016-A A2’ ‘144A’ 2.76% 26/12/2036 1,222,431 0.07
USD 844,414 SoFi Professional Loan Program 2016-C LLC ‘Series 2016-C A2B’ ‘144A’ 2.36% 27/12/2032 849,692 0.05
USD 816,656 SoFi Professional Loan Program 2016-D LLC ‘Series 2016-D A2B’ ‘144A’ 2.34% 25/4/2033 821,182 0.05
USD 5,257,719 Sofi Professional Loan Program 2016-E LLC ‘Series 2016-E A2B’ ‘144A’ 2.49% 25/1/2036 5,299,334 0.30
USD 496,162 Sofi Professional Loan Program 2017-C LLC ‘Series 2017-C A2A’ ‘144A’ 1.75% 25/7/2040 495,832 0.03
USD 21,000,000 SoFi Professional Loan Program 2017-D LLC ‘Series 2017-D A2FX’ ‘144A’ 2.65% 25/9/2040 21,341,758 1.22
USD 3,362,478 Sofi Professional Loan Program 2018-B Trust ‘Series 2018-B A1FX’ ‘144A’ 2.64% 25/8/2047 3,377,246 0.19
USD 4,425,000 Sofi Professional Loan Program 2018-C Trust ‘Series 2018-C A2FX’ ‘144A’ 3.59% 25/1/2048 4,691,850 0.27
USD 4,375,000 Sofi Professional Loan Program 2018-D Trust ‘Series 2018-D A2FX’ ‘144A’ 3.6% 25/2/2048 4,617,659 0.26
USD 82,836 Soundview Home Loan Trust 2003-2 ‘Series 2003-2 A2’ FRN 25/11/2033 84,192 0.01
USD 4,570,000 South Carolina Public Service Authority 2.388% 1/12/2023 4,604,572 0.26
USD 2,700,000 South Carolina Public Service Authority 3.722% 1/12/2023 2,861,082 0.16
USD 620,000 Spectra Energy Partners LP 4.75% 15/3/2024 679,038 0.04
USD 2,625,000 Springleaf Funding Trust 2017-A ‘Series 2017-AA A’ ‘144A’ 2.68% 15/7/2030 2,628,898 0.15
USD 520,313 Sprint Spectrum Co LLC / Sprint Spectrum Co II LLC / Sprint Spectrum Co III LLC ‘144A’ 3.36% 20/9/2021 522,341 0.03
USD 2,975,000 Sprint Spectrum Co LLC / Sprint Spectrum Co II LLC / Sprint Spectrum Co III LLC ‘144A’ 4.738% 20/3/2025 3,157,219 0.18
USD 960,000 Sunoco Logistics Partners Operations LP 5.5% 15/2/2020 972,082 0.06
USD 390,000 Sunoco LP / Sunoco Finance Corp 4.875% 15/1/2023 399,750 0.02
USD 5,560,000 SunTrust Bank/Atlanta GA FRN 26/10/2021 5,643,444 0.32
USD 290,000 SunTrust Banks Inc 2.7% 27/1/2022 293,778 0.02 USD 1,140,000 Synchrony Financial 2.85%
25/7/2022 1,154,415 0.07 USD 420,000 Total System Services Inc 3.75%
1/6/2023 439,106 0.03 USD 1,350,000 Total System Services Inc 4%
1/6/2023 1,425,014 0.08
USD 2,461,731 Towd Point Mortgage Trust 2016-3 ‘Series 2016-3 A1’ ‘144A’ FRN 25/4/2056 2,456,255 0.14
USD 3,339,774 Towd Point Mortgage Trust 2016-4 ‘Series 2016-4 A1’ ‘144A’ FRN 25/7/2056 3,331,011 0.19
USD 2,500,000 Toyota Auto Receivables 2018-C Owner Trust ‘Series 2018-C A4’ 3.13% 15/2/2024 2,580,283 0.15
USD 1,750,000 TRESTLES CLO 2017-1 Ltd ‘Series 2017-1A B’ ‘144A’ FRN 25/7/2029 1,749,231 0.10
USD 13,880,000 United States Treasury Note/Bond 1.5% 15/6/2020 13,845,300 0.79
USD 41,000,000 United States Treasury Note/Bond 1.625% 31/7/2020*† 40,936,738 2.33
USD 40,000,000 United States Treasury Note/Bond 2.5% 31/5/2020 40,190,625 2.29
USD 1,000,000 United States Treasury Note/Bond 2.625% 31/8/2020 1,008,301 0.06
EUR 705,000 United Technologies Corp 1.125% 15/12/2021 800,851 0.05
EUR 365,000 United Technologies Corp 1.15% 18/5/2024 424,712 0.02
USD 5,190,000 United Technologies Corp 3.35% 16/8/2021 5,321,306 0.30
USD 2,295,000 United Technologies Corp 3.65% 16/8/2023 2,432,273 0.14
USD 1,329,668 US Airways 2012-1 Class B Pass Through Trust 8% 1/10/2019 1,334,004 0.08
EUR 410,000 Verizon Communications Inc 0.5% 2/6/2022 461,995 0.03
USD 6,850,000 Verizon Communications Inc 2.946% 15/3/2022 7,022,260 0.40
USD 3,169,650 Voya CLO 2014-3 Ltd ‘Series 2014-3A A1R’ ‘144A’ FRN 25/7/2026 3,167,106 0.18
USD 735,000 Waste Management Inc 2.95% 15/6/2024 763,698 0.04
USD 2,300,000 WEC Energy Group Inc 3.375% 15/6/2021 2,350,345 0.13
EUR 485,000 Wells Fargo & Co 1.125% 29/10/2021 552,089 0.03
USD 2,825,000 Wells Fargo & Co 2.5% 4/3/2021 2,841,680 0.16 USD 1,195,000 Wells Fargo & Co 3.069%
24/1/2023 1,222,821 0.07 USD 2,215,000 Wells Fargo & Co 3.75% 24/1/2024 2,357,440 0.13 USD 8,000,000 Wells Fargo Bank NA FRN
23/7/2021 8,086,176 0.46 USD 3,875,913 Wells Fargo Commercial Mortgage
Trust 2014-LC16 ‘Series 2014-LC16 ASB’ 3.477% 15/8/2050 4,001,314 0.23
USD 500,000 Wells Fargo Commercial Mortgage Trust 2015-LC22 ‘Series 2015-LC22 ASB’ 3.571% 15/9/2058 525,911 0.03
USD 1,579,000 Wells Fargo Commercial Mortgage Trust 2015-NXS1 ‘Series 2015-NXS1 A5’ 3.148% 15/5/2048 1,665,874 0.10
USD 3,438,623 WFRBS Commercial Mortgage Trust 2012-C8 ‘Series 2012-C8 AFL’ ‘144A’ FRN 15/8/2045 3,454,147 0.20
USD 5,458,003 WFRBS Commercial Mortgage Trust 2014-C21 ‘Series 2014-C21 ASB’ 3.393% 15/8/2047 5,599,422 0.32
USD 315,361 Wheels SPV 2 LLC ‘Series 2017-1A A2’ ‘144A’ 1.88% 20/4/2026 315,339 0.02
USD 2,400,000 Williams Cos Inc/The 3.7% 15/1/2023 2,489,916 0.14
US Dollar Short Duration Bond Fund continued
Portfolio of Investments 31 August 2019

Transferable Securities and Money Market Instruments Admitted to an Official Stock Exchange Listing or Dealt in on Another Regulated Market Other Transferable Securities
Holding
Description
Market Value (USD)
% of Net
Assets
Holding
Description
Market Value (USD)
% of Net
Assets
The notes on pages 728 to 741 form an integral part of these financial statements.
Annual Report and Audited Financial Statements [663]
USD 1,765,000 Williams Cos Inc/The 4% 15/11/2021 1,817,493 0.10 USD 2,000,000 WRKCo Inc 3.75% 15/3/2025 2,111,436 0.12 USD 3,205,000 Xerox Corp 3.5% 20/8/2020 3,225,031 0.18 USD 719,000 ZF North America Capital Inc
‘144A’ 4.5% 29/4/2022 742,628 0.04 1,387,554,923 78.99Total Bonds 1,629,538,866 92.76Total Transferable Securities and Money Market Instruments Admitted to an Official Stock Exchange Listing or Dealt in on Another Regulated Market 1,641,490,060 93.44
BONDS
United States USD 350,000 Structured Asset Receivables Trust
‘Series 2003-2A CTFS’ 0.649% 31/12/2049 – 0.00
Total Bonds – 0.00Total Other Transferable Securities – 0.00Total Portfolio 1,641,490,060 93.44
Other Net Assets 115,211,514 6.56Total Net Assets (USD) 1,756,701,574 100.00
US Dollar Short Duration Bond Fund continued
Open Exchange Traded Futures Contracts as at 31 August 2019
Number of contracts Currency
Contract/ Description
Expiration date
Underlying exposure
USD
Unrealised appreciation/
(depreciation) USD
(1) EUR Euro Bund September 2019 197,850 (571)(148) EUR Euro Schatz September 2019 18,405,988 (39,921)(221) EUR Euro BOBL September 2019 33,249,588 (407,233)(109) CAD Canadian 10 Year Bond December 2019 11,937,060 23,0093,002 USD US Treasury 2 Year Note (CBT) December 2019 648,338,187 (211,899)12 USD US Ultra Bond (CBT) December 2019 2,364,000 13,525(24) USD US Long Bond (CBT) December 2019 3,962,250 (8,907)(45) USD US Ultra 10 Year Note December 2019 6,489,844 2,622(175) USD US Treasury 10 Year Note (CBT) December 2019 23,020,703 21,111(961) USD US Treasury 5 Year Note (CBT) December 2019 115,139,813 28,801
Total 863,105,283 (579,463)
Open Forward Foreign Exchange Contracts as at 31 August 2019
Currency
Purchases Currency
Sales Counterparty
Maturity date
Unrealised appreciation/
(depreciation) USD
AUD 1,229,000 USD 828,440 JP Morgan 5/9/2019 (356)CAD 27,554,000 USD 20,725,085 Bank of America 5/9/2019 49,083GBP 10,302,000 USD 12,562,267 State Street 5/9/2019 22,745USD 872,436 AUD 1,265,000 Goldman Sachs 5/9/2019 20,096USD 20,975,912 CAD 27,557,000 RBS Plc 5/9/2019 199,483USD 455,921 EUR 410,000 ANZ 5/9/2019 2,953USD 691,151 EUR 616,000 Bank of America 5/9/2019 10,594USD 6,723,266 EUR 6,027,000 Goldman Sachs 5/9/2019 64,627USD 232,094 EUR 207,000 State Street 5/9/2019 3,400USD 852,234 EUR 762,000 Citibank 5/9/2019 10,374USD 54,754,876 EUR 48,987,000 BNP Paribas 5/9/2019 633,960USD 1,716,716 EUR 1,540,000 HSBC Bank Plc 5/9/2019 15,321USD 13,069,804 GBP 10,705,000 Goldman Sachs 5/9/2019 (7,517)CAD 5,772,274 EUR 3,920,000 Deutsche Bank 18/9/2019 17,696EUR 3,920,000 CAD 5,762,286 Morgan Stanley 18/9/2019 (10,164)JPY 466,234,560 USD 4,400,000 Toronto Dominion 18/9/2019 (2,651)JPY 476,418,984 USD 4,460,000 Bank of America 18/9/2019 33,405JPY 481,379,529 USD 4,470,000 State Street 18/9/2019 70,191SEK 83,237,480 USD 8,930,000 JP Morgan 18/9/2019 (436,849)USD 4,460,000 JPY 475,607,710 Bank of America 18/9/2019 (25,753)USD 4,470,000 JPY 480,743,583 Royal Bank of Canada 18/9/2019 (64,193)
Open Forward Foreign Exchange Contracts as at 31 August 2019
Currency
Purchases Currency
Sales Counterparty
Maturity date
Unrealised appreciation/
(depreciation) USD
USD 4,460,000 SEK 41,753,735 JP Morgan 18/9/2019 199,650USD 4,470,000 SEK 42,069,119 State Street 18/9/2019 177,470USD 829,152 AUD 1,229,000 JP Morgan 3/10/2019 346USD 20,734,754 CAD 27,554,000 Bank of America 3/10/2019 (48,884)USD 12,578,035 GBP 10,302,000 State Street 3/10/2019 (22,650)Net unrealised appreciation 912,377
EUR Hedged Share Class
EUR 147,251,208 USD 165,315,764 BNY Mellon 12/9/2019 (2,542,201)USD 1,229,846 EUR 1,105,921 BNY Mellon 12/9/2019 7,354Net unrealised depreciation (2,534,847)
SGD Hedged Share Class
SGD 556,105 USD 402,499 BNY Mellon 12/9/2019 (1,441)Net unrealised depreciation (1,441)
Total net unrealised depreciation (USD underlying exposure - USD 388,834,994) (1,623,911)
Portfolio of Investments 31 August 2019

The notes on pages 728 to 741 form an integral part of these financial statements.
[664] BlackRock Global Funds (BGF)
US Dollar Short Duration Bond Fund continued
Swaps as at 31 August 2019
TypeNominal
Value Description Counterparty
Expiration date
Unrealised appreciation/
(depreciation) USD
Market Value USD
CDS USD (575,434) Fund provides default protection on Mexico Government International Bond; and receives Fixed 1% Bank of America 20/6/2020 10,028 2,741
CDS USD 575,434 Fund receives default protection on Mexico Government International Bond; and pays Fixed 1% Bank of America 20/9/2020 (5,035) (3,214)
CDS USD 18,619,200 Fund receives default protection on CDX.NA.HY.29.V3; and pays Fixed 5% Bank of America 20/12/2022 (120,453) (1,274,363)
CDS USD (19,700,000) Fund provides default protection on CDX.NA.IG.32.V1; and receives Fixed 1% Bank of America 20/6/2024 22,171 424,273
CDS USD (750,000) Fund provides default protection on Conagra Brands Inc; and receives Fixed 1% Barclays 20/6/2024 1,040 10,294
CDS USD (1,358,000) Fund provides default protection on Conagra Brands Inc; and receives Fixed 1% Barclays 20/6/2024 1,860 18,638
CDS USD (1,500,000) Fund provides default protection on Conagra Brands Inc; and receives Fixed 1% Barclays 20/6/2024 4,235 20,587
CDS USD 207,000 Fund receives default protection on Kraft Heinz Foods Co; and pays Fixed 1% BNP Paribas 20/6/2024 (2,314) 1,063
CDS USD 1,032,000 Fund receives default protection on Kraft Heinz Foods Co; and pays Fixed 1% BNP Paribas 20/6/2024 (12,474) 5,302
CDS USD (788,869) Fund provides default protection on 21st Century Fox America Inc; and receives Fixed 1% BNP Paribas 20/6/2024 243 29,218
CDS USD 844,970 Fund receives default protection on TWDC Enterprises 18 Corp; and pays Fixed 1% BNP Paribas 20/6/2024 (1,784) (32,481)
CDS USD (898,113) Fund provides default protection on 21st Century Fox America Inc; and receives Fixed 1% BNP Paribas 20/6/2024 1,902 33,264
CDS USD 842,012 Fund receives default protection on TWDC Enterprises 18 Corp; and pays Fixed 1% BNP Paribas 20/6/2024 (1,080) (32,367)
CDS USD (144,000) Fund provides default protection on CDX.NA.HY.29.V3; and receives Fixed 5% Citibank 20/12/2022 (602) 9,856
CDS USD (8,640,000) Fund provides default protection on CDX.NA.HY.29.V3; and receives Fixed 5% Credit Suisse 20/12/2022 (90,537) 591,352
CDS USD (9,835,200) Fund provides default protection on CDX.NA.HY.29.V3; and receives Fixed 5% Deutsche Bank 20/12/2022 88,507 673,155
CDS USD (1,129,000) Fund provides default protection on Kroger Co/The; and receives Fixed 1% Goldman Sachs 20/6/2024 7,914 14,786
CDS USD (2,500,000) Fund provides default protection on Kroger Co/The; and receives Fixed 1% Goldman Sachs 20/6/2024 21,115 32,741
CDS USD (15,097,500) Fund provides default protection on CDX.NA.HY.32.V2; and receives Fixed 5% Goldman Sachs 20/6/2024 266,979 1,037,659
CDS USD 2,800,000 Fund receives default protection on CBS Corp; and pays Fixed 1% Goldman Sachs 20/6/2024 (30,725) (50,148)CDS USD 575,434 Fund receives default protection on Mexico Government
International Bond; and pays Fixed 1% JP Morgan 20/6/2020 (3,789) (2,741)CDS USD (575,434) Fund provides default protection on Mexico Government
International Bond; and receives Fixed 1% JP Morgan 20/9/2020 11,250 3,214CDS EUR 993,000 Fund receives default protection on British American Tobacco Plc;
and pays Fixed 1% JP Morgan 20/12/2023 (16,829) (20,042)CDS EUR 1,489,000 Fund receives default protection on British American Tobacco Plc;
and pays Fixed 1% JP Morgan 20/12/2023 (31,417) (32,041)CDS EUR 993,000 Fund receives default protection on British American Tobacco Plc;
and pays Fixed 1% JP Morgan 20/12/2023 (20,951) (21,368)CDS USD 433,463 Fund receives default protection on Halliburton Co;
and pays Fixed 1% JP Morgan 20/6/2024 (1,178) (3,517)CDS USD 770,010 Fund receives default protection on Devon Energy Corp;
and pays Fixed 1% JP Morgan 20/6/2024 (4,568) 1,353CDS USD 809,717 Fund receives default protection on Apache Corp;
and pays Fixed 1% JP Morgan 20/6/2024 (4,944) 21,026CDS USD 809,717 Fund receives default protection on Apache Corp;
and pays Fixed 1% JP Morgan 20/6/2024 (6,668) 21,026CDS USD 770,010 Fund receives default protection on Devon Energy Corp;
and pays Fixed 1% JP Morgan 20/6/2024 (5,961) 1,353CDS USD 770,010 Fund receives default protection on Devon Energy Corp;
and pays Fixed 1% JP Morgan 20/6/2024 (3,256) 1,353CDS USD 866,927 Fund receives default protection on Halliburton Co;
and pays Fixed 1% JP Morgan 20/6/2024 (2,033) (7,034)CDS USD 1,750,000 Fund receives default protection on Halliburton Co;
and pays Fixed 1% JP Morgan 20/6/2024 8,734 (14,199)CDS USD (3,627,000) Fund provides default protection on Campbell Soup Co;
and receives Fixed 1% JP Morgan 20/6/2024 37,794 66,839CDS USD 1,570,850 Fund receives default protection on Apache Corp;
and pays Fixed 1% JP Morgan 20/6/2024 (7,105) 40,790CDS USD 809,716 Fund receives default protection on Apache Corp;
and pays Fixed 1% JP Morgan 20/6/2024 (7,294) 21,026CDS USD 770,010 Fund receives default protection on Devon Energy Corp;
and pays Fixed 1% JP Morgan 20/6/2024 (7,278) 1,353CDS USD 866,927 Fund receives default protection on Halliburton Co;
and pays Fixed 1% JP Morgan 20/6/2024 (2,416) (7,034)CDS USD 604,915 Fund receives default protection on Hess Corp; and pays Fixed 1% JP Morgan 20/6/2024 (3,449) 7,346CDS USD 604,915 Fund receives default protection on Hess Corp; and pays Fixed 1% JP Morgan 20/6/2024 (7,354) 7,346
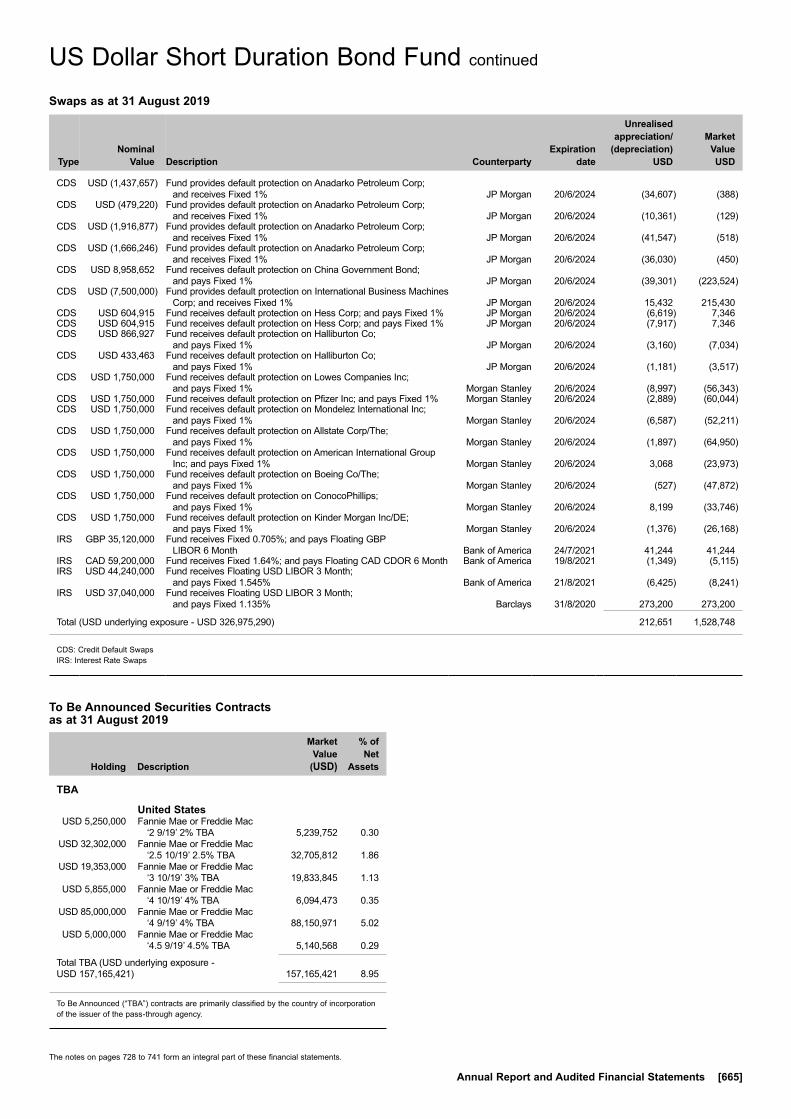
The notes on pages 728 to 741 form an integral part of these financial statements.
Annual Report and Audited Financial Statements [665]
To Be Announced Securities Contracts as at 31 August 2019
Holding Description
Market Value
(USD)
% of Net
Assets
TBA
United States USD 5,250,000 Fannie Mae or Freddie Mac
‘2 9/19’ 2% TBA 5,239,752 0.30 USD 32,302,000 Fannie Mae or Freddie Mac
‘2.5 10/19’ 2.5% TBA 32,705,812 1.86 USD 19,353,000 Fannie Mae or Freddie Mac
‘3 10/19’ 3% TBA 19,833,845 1.13 USD 5,855,000 Fannie Mae or Freddie Mac
‘4 10/19’ 4% TBA 6,094,473 0.35 USD 85,000,000 Fannie Mae or Freddie Mac
‘4 9/19’ 4% TBA 88,150,971 5.02 USD 5,000,000 Fannie Mae or Freddie Mac
‘4.5 9/19’ 4.5% TBA 5,140,568 0.29
Total TBA (USD underlying exposure - USD 157,165,421) 157,165,421 8.95
To Be Announced (“TBA”) contracts are primarily classified by the country of incorporation of the issuer of the pass-through agency.
US Dollar Short Duration Bond Fund continued
Swaps as at 31 August 2019
TypeNominal
Value Description Counterparty
Expiration date
Unrealised appreciation/
(depreciation) USD
Market Value USD
CDS USD (1,437,657) Fund provides default protection on Anadarko Petroleum Corp; and receives Fixed 1% JP Morgan 20/6/2024 (34,607) (388)
CDS USD (479,220) Fund provides default protection on Anadarko Petroleum Corp; and receives Fixed 1% JP Morgan 20/6/2024 (10,361) (129)
CDS USD (1,916,877) Fund provides default protection on Anadarko Petroleum Corp; and receives Fixed 1% JP Morgan 20/6/2024 (41,547) (518)
CDS USD (1,666,246) Fund provides default protection on Anadarko Petroleum Corp; and receives Fixed 1% JP Morgan 20/6/2024 (36,030) (450)
CDS USD 8,958,652 Fund receives default protection on China Government Bond; and pays Fixed 1% JP Morgan 20/6/2024 (39,301) (223,524)
CDS USD (7,500,000) Fund provides default protection on International Business Machines Corp; and receives Fixed 1% JP Morgan 20/6/2024 15,432 215,430
CDS USD 604,915 Fund receives default protection on Hess Corp; and pays Fixed 1% JP Morgan 20/6/2024 (6,619) 7,346CDS USD 604,915 Fund receives default protection on Hess Corp; and pays Fixed 1% JP Morgan 20/6/2024 (7,917) 7,346CDS USD 866,927 Fund receives default protection on Halliburton Co;
and pays Fixed 1% JP Morgan 20/6/2024 (3,160) (7,034)CDS USD 433,463 Fund receives default protection on Halliburton Co;
and pays Fixed 1% JP Morgan 20/6/2024 (1,181) (3,517)CDS USD 1,750,000 Fund receives default protection on Lowes Companies Inc;
and pays Fixed 1% Morgan Stanley 20/6/2024 (8,997) (56,343)CDS USD 1,750,000 Fund receives default protection on Pfizer Inc; and pays Fixed 1% Morgan Stanley 20/6/2024 (2,889) (60,044)CDS USD 1,750,000 Fund receives default protection on Mondelez International Inc;
and pays Fixed 1% Morgan Stanley 20/6/2024 (6,587) (52,211)CDS USD 1,750,000 Fund receives default protection on Allstate Corp/The;
and pays Fixed 1% Morgan Stanley 20/6/2024 (1,897) (64,950)CDS USD 1,750,000 Fund receives default protection on American International Group
Inc; and pays Fixed 1% Morgan Stanley 20/6/2024 3,068 (23,973)CDS USD 1,750,000 Fund receives default protection on Boeing Co/The;
and pays Fixed 1% Morgan Stanley 20/6/2024 (527) (47,872)CDS USD 1,750,000 Fund receives default protection on ConocoPhillips;
and pays Fixed 1% Morgan Stanley 20/6/2024 8,199 (33,746)CDS USD 1,750,000 Fund receives default protection on Kinder Morgan Inc/DE;
and pays Fixed 1% Morgan Stanley 20/6/2024 (1,376) (26,168)IRS GBP 35,120,000 Fund receives Fixed 0.705%; and pays Floating GBP
LIBOR 6 Month Bank of America 24/7/2021 41,244 41,244IRS CAD 59,200,000 Fund receives Fixed 1.64%; and pays Floating CAD CDOR 6 Month Bank of America 19/8/2021 (1,349) (5,115)IRS USD 44,240,000 Fund receives Floating USD LIBOR 3 Month;
and pays Fixed 1.545% Bank of America 21/8/2021 (6,425) (8,241)IRS USD 37,040,000 Fund receives Floating USD LIBOR 3 Month;
and pays Fixed 1.135% Barclays 31/8/2020 273,200 273,200
Total (USD underlying exposure - USD 326,975,290) 212,651 1,528,748
CDS: Credit Default SwapsIRS: Interest Rate Swaps
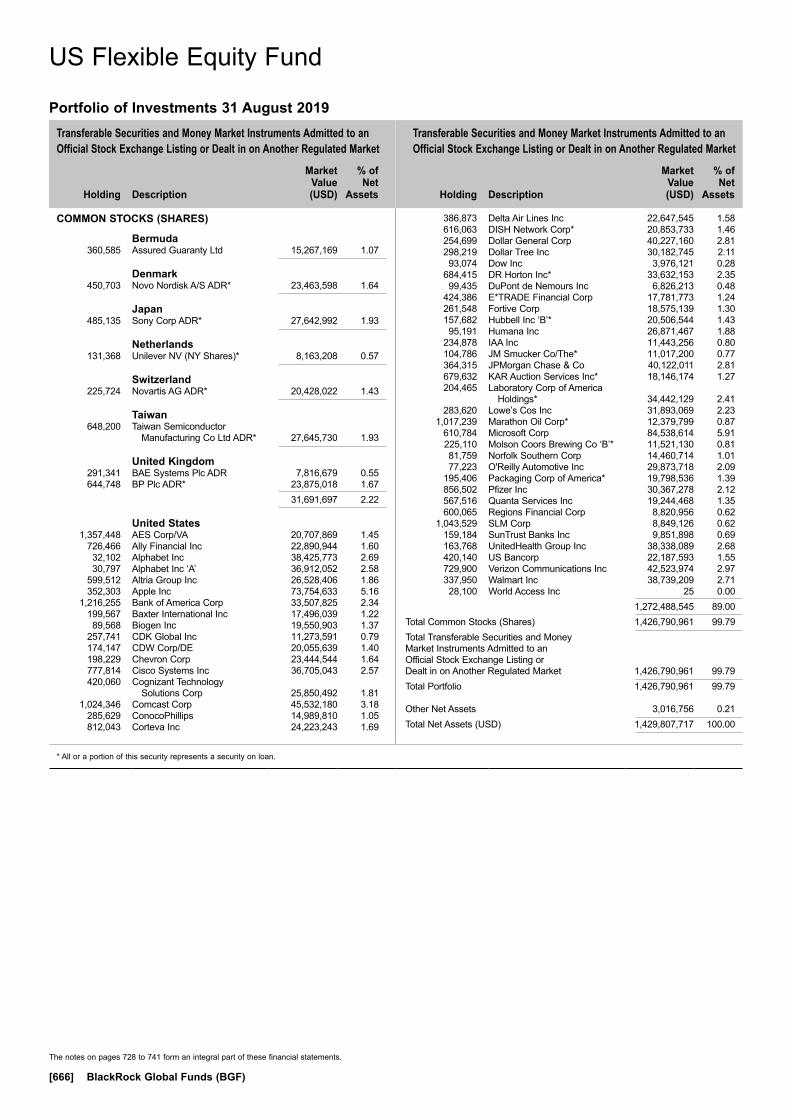
Transferable Securities and Money Market Instruments Admitted to an Official Stock Exchange Listing or Dealt in on Another Regulated Market
Transferable Securities and Money Market Instruments Admitted to an Official Stock Exchange Listing or Dealt in on Another Regulated Market
Holding
Description
Market Value (USD)
% of Net
Assets
Holding
Description
Market Value (USD)
% of Net
Assets
* All or a portion of this security represents a security on loan.
The notes on pages 728 to 741 form an integral part of these financial statements.
[666] BlackRock Global Funds (BGF)
COMMON STOCKS (SHARES)
Bermuda 360,585 Assured Guaranty Ltd 15,267,169 1.07
Denmark 450,703 Novo Nordisk A/S ADR* 23,463,598 1.64
Japan 485,135 Sony Corp ADR* 27,642,992 1.93
Netherlands 131,368 Unilever NV (NY Shares)* 8,163,208 0.57
Switzerland 225,724 Novartis AG ADR* 20,428,022 1.43
Taiwan 648,200 Taiwan Semiconductor
Manufacturing Co Ltd ADR* 27,645,730 1.93
United Kingdom 291,341 BAE Systems Plc ADR 7,816,679 0.55 644,748 BP Plc ADR* 23,875,018 1.67 31,691,697 2.22
United States 1,357,448 AES Corp/VA 20,707,869 1.45 726,466 Ally Financial Inc 22,890,944 1.60 32,102 Alphabet Inc 38,425,773 2.69 30,797 Alphabet Inc ‘A’ 36,912,052 2.58 599,512 Altria Group Inc 26,528,406 1.86 352,303 Apple Inc 73,754,633 5.16 1,216,255 Bank of America Corp 33,507,825 2.34 199,567 Baxter International Inc 17,496,039 1.22 89,568 Biogen Inc 19,550,903 1.37 257,741 CDK Global Inc 11,273,591 0.79 174,147 CDW Corp/DE 20,055,639 1.40 198,229 Chevron Corp 23,444,544 1.64 777,814 Cisco Systems Inc 36,705,043 2.57 420,060 Cognizant Technology
Solutions Corp 25,850,492 1.81 1,024,346 Comcast Corp 45,532,180 3.18 285,629 ConocoPhillips 14,989,810 1.05 812,043 Corteva Inc 24,223,243 1.69
386,873 Delta Air Lines Inc 22,647,545 1.58 616,063 DISH Network Corp* 20,853,733 1.46 254,699 Dollar General Corp 40,227,160 2.81 298,219 Dollar Tree Inc 30,182,745 2.11 93,074 Dow Inc 3,976,121 0.28 684,415 DR Horton Inc* 33,632,153 2.35 99,435 DuPont de Nemours Inc 6,826,213 0.48 424,386 E*TRADE Financial Corp 17,781,773 1.24 261,548 Fortive Corp 18,575,139 1.30 157,682 Hubbell Inc ‘B’* 20,506,544 1.43 95,191 Humana Inc 26,871,467 1.88 234,878 IAA Inc 11,443,256 0.80 104,786 JM Smucker Co/The* 11,017,200 0.77 364,315 JPMorgan Chase & Co 40,122,011 2.81 679,632 KAR Auction Services Inc* 18,146,174 1.27 204,465 Laboratory Corp of America
Holdings* 34,442,129 2.41 283,620 Lowe’s Cos Inc 31,893,069 2.23 1,017,239 Marathon Oil Corp* 12,379,799 0.87 610,784 Microsoft Corp 84,538,614 5.91 225,110 Molson Coors Brewing Co ‘B’* 11,521,130 0.81 81,759 Norfolk Southern Corp 14,460,714 1.01 77,223 O'Reilly Automotive Inc 29,873,718 2.09 195,406 Packaging Corp of America* 19,798,536 1.39 856,502 Pfizer Inc 30,367,278 2.12 567,516 Quanta Services Inc 19,244,468 1.35 600,065 Regions Financial Corp 8,820,956 0.62 1,043,529 SLM Corp 8,849,126 0.62 159,184 SunTrust Banks Inc 9,851,898 0.69 163,768 UnitedHealth Group Inc 38,338,089 2.68 420,140 US Bancorp 22,187,593 1.55 729,900 Verizon Communications Inc 42,523,974 2.97 337,950 Walmart Inc 38,739,209 2.71 28,100 World Access Inc 25 0.00 1,272,488,545 89.00Total Common Stocks (Shares) 1,426,790,961 99.79Total Transferable Securities and Money Market Instruments Admitted to an Official Stock Exchange Listing or Dealt in on Another Regulated Market 1,426,790,961 99.79Total Portfolio 1,426,790,961 99.79
Other Net Assets 3,016,756 0.21Total Net Assets (USD) 1,429,807,717 100.00
US Flexible Equity Fund
Portfolio of Investments 31 August 2019
US Flexible Equity Fund
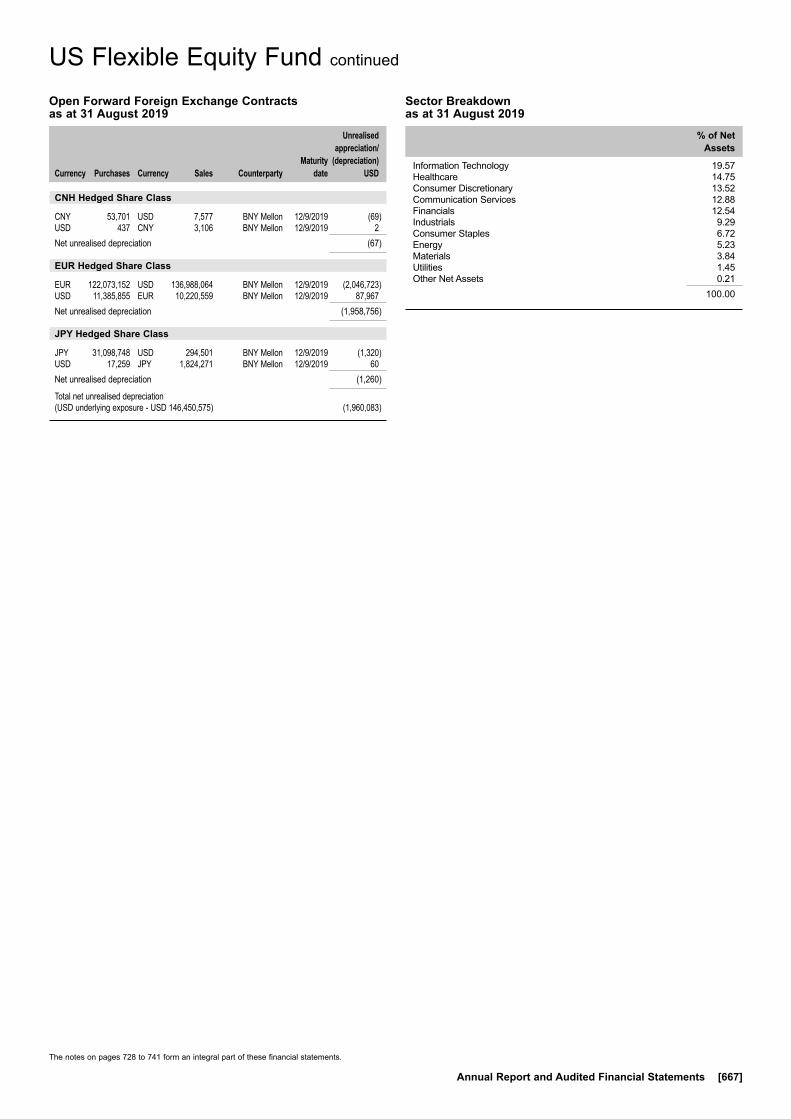
The notes on pages 728 to 741 form an integral part of these financial statements.
Annual Report and Audited Financial Statements [667]
US Flexible Equity Fund continued
Open Forward Foreign Exchange Contracts as at 31 August 2019
Currency
Purchases Currency
Sales Counterparty
Maturity date
Unrealised appreciation/
(depreciation) USD
CNH Hedged Share Class
CNY 53,701 USD 7,577 BNY Mellon 12/9/2019 (69)USD 437 CNY 3,106 BNY Mellon 12/9/2019 2Net unrealised depreciation (67)
EUR Hedged Share Class
EUR 122,073,152 USD 136,988,064 BNY Mellon 12/9/2019 (2,046,723)USD 11,385,855 EUR 10,220,559 BNY Mellon 12/9/2019 87,967Net unrealised depreciation (1,958,756)
JPY Hedged Share Class
JPY 31,098,748 USD 294,501 BNY Mellon 12/9/2019 (1,320)USD 17,259 JPY 1,824,271 BNY Mellon 12/9/2019 60Net unrealised depreciation (1,260)
Total net unrealised depreciation (USD underlying exposure - USD 146,450,575) (1,960,083)
Sector Breakdown as at 31 August 2019
% of Net Assets
Information Technology 19.57Healthcare 14.75Consumer Discretionary 13.52Communication Services 12.88Financials 12.54Industrials 9.29Consumer Staples 6.72Energy 5.23Materials 3.84Utilities 1.45Other Net Assets 0.21
100.00
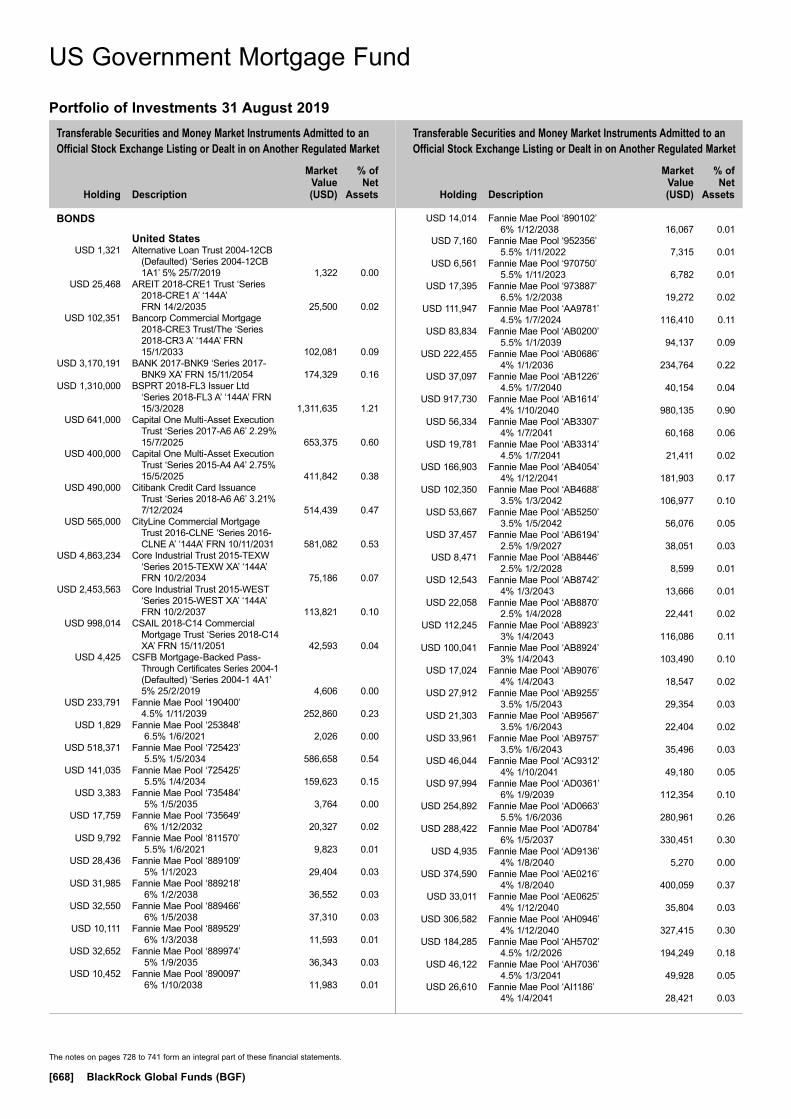
Transferable Securities and Money Market Instruments Admitted to an Official Stock Exchange Listing or Dealt in on Another Regulated Market
Transferable Securities and Money Market Instruments Admitted to an Official Stock Exchange Listing or Dealt in on Another Regulated Market
Holding
Description
Market Value (USD)
% of Net
Assets
Holding
Description
Market Value (USD)
% of Net
Assets
The notes on pages 728 to 741 form an integral part of these financial statements.
[668] BlackRock Global Funds (BGF)
BONDS
United States USD 1,321 Alternative Loan Trust 2004-12CB
(Defaulted) ‘Series 2004-12CB 1A1’ 5% 25/7/2019 1,322 0.00
USD 25,468 AREIT 2018-CRE1 Trust ‘Series 2018-CRE1 A’ ‘144A’ FRN 14/2/2035 25,500 0.02
USD 102,351 Bancorp Commercial Mortgage 2018-CRE3 Trust/The ‘Series 2018-CR3 A’ ‘144A’ FRN 15/1/2033 102,081 0.09
USD 3,170,191 BANK 2017-BNK9 ‘Series 2017-BNK9 XA’ FRN 15/11/2054 174,329 0.16
USD 1,310,000 BSPRT 2018-FL3 Issuer Ltd ‘Series 2018-FL3 A’ ‘144A’ FRN 15/3/2028 1,311,635 1.21
USD 641,000 Capital One Multi-Asset Execution Trust ‘Series 2017-A6 A6’ 2.29% 15/7/2025 653,375 0.60
USD 400,000 Capital One Multi-Asset Execution Trust ‘Series 2015-A4 A4’ 2.75% 15/5/2025 411,842 0.38
USD 490,000 Citibank Credit Card Issuance Trust ‘Series 2018-A6 A6’ 3.21% 7/12/2024 514,439 0.47
USD 565,000 CityLine Commercial Mortgage Trust 2016-CLNE ‘Series 2016-CLNE A’ ‘144A’ FRN 10/11/2031 581,082 0.53
USD 4,863,234 Core Industrial Trust 2015-TEXW ‘Series 2015-TEXW XA’ ‘144A’ FRN 10/2/2034 75,186 0.07
USD 2,453,563 Core Industrial Trust 2015-WEST ‘Series 2015-WEST XA’ ‘144A’ FRN 10/2/2037 113,821 0.10
USD 998,014 CSAIL 2018-C14 Commercial Mortgage Trust ‘Series 2018-C14 XA’ FRN 15/11/2051 42,593 0.04
USD 4,425 CSFB Mortgage-Backed Pass-Through Certificates Series 2004-1 (Defaulted) ‘Series 2004-1 4A1’ 5% 25/2/2019 4,606 0.00
USD 233,791 Fannie Mae Pool ‘190400’ 4.5% 1/11/2039 252,860 0.23
USD 1,829 Fannie Mae Pool ‘253848’ 6.5% 1/6/2021 2,026 0.00
USD 518,371 Fannie Mae Pool ‘725423’ 5.5% 1/5/2034 586,658 0.54
USD 141,035 Fannie Mae Pool ‘725425’ 5.5% 1/4/2034 159,623 0.15
USD 3,383 Fannie Mae Pool ‘735484’ 5% 1/5/2035 3,764 0.00
USD 17,759 Fannie Mae Pool ‘735649’ 6% 1/12/2032 20,327 0.02
USD 9,792 Fannie Mae Pool ‘811570’ 5.5% 1/6/2021 9,823 0.01
USD 28,436 Fannie Mae Pool ‘889109’ 5% 1/1/2023 29,404 0.03
USD 31,985 Fannie Mae Pool ‘889218’ 6% 1/2/2038 36,552 0.03
USD 32,550 Fannie Mae Pool ‘889466’ 6% 1/5/2038 37,310 0.03
USD 10,111 Fannie Mae Pool ‘889529’ 6% 1/3/2038 11,593 0.01
USD 32,652 Fannie Mae Pool ‘889974’ 5% 1/9/2035 36,343 0.03
USD 10,452 Fannie Mae Pool ‘890097’ 6% 1/10/2038 11,983 0.01
USD 14,014 Fannie Mae Pool ‘890102’ 6% 1/12/2038 16,067 0.01
USD 7,160 Fannie Mae Pool ‘952356’ 5.5% 1/11/2022 7,315 0.01
USD 6,561 Fannie Mae Pool ‘970750’ 5.5% 1/11/2023 6,782 0.01
USD 17,395 Fannie Mae Pool ‘973887’ 6.5% 1/2/2038 19,272 0.02
USD 111,947 Fannie Mae Pool ‘AA9781’ 4.5% 1/7/2024 116,410 0.11
USD 83,834 Fannie Mae Pool ‘AB0200’ 5.5% 1/1/2039 94,137 0.09
USD 222,455 Fannie Mae Pool ‘AB0686’ 4% 1/1/2036 234,764 0.22
USD 37,097 Fannie Mae Pool ‘AB1226’ 4.5% 1/7/2040 40,154 0.04
USD 917,730 Fannie Mae Pool ‘AB1614’ 4% 1/10/2040 980,135 0.90
USD 56,334 Fannie Mae Pool ‘AB3307’ 4% 1/7/2041 60,168 0.06
USD 19,781 Fannie Mae Pool ‘AB3314’ 4.5% 1/7/2041 21,411 0.02
USD 166,903 Fannie Mae Pool ‘AB4054’ 4% 1/12/2041 181,903 0.17
USD 102,350 Fannie Mae Pool ‘AB4688’ 3.5% 1/3/2042 106,977 0.10
USD 53,667 Fannie Mae Pool ‘AB5250’ 3.5% 1/5/2042 56,076 0.05
USD 37,457 Fannie Mae Pool ‘AB6194’ 2.5% 1/9/2027 38,051 0.03
USD 8,471 Fannie Mae Pool ‘AB8446’ 2.5% 1/2/2028 8,599 0.01
USD 12,543 Fannie Mae Pool ‘AB8742’ 4% 1/3/2043 13,666 0.01
USD 22,058 Fannie Mae Pool ‘AB8870’ 2.5% 1/4/2028 22,441 0.02
USD 112,245 Fannie Mae Pool ‘AB8923’ 3% 1/4/2043 116,086 0.11
USD 100,041 Fannie Mae Pool ‘AB8924’ 3% 1/4/2043 103,490 0.10
USD 17,024 Fannie Mae Pool ‘AB9076’ 4% 1/4/2043 18,547 0.02
USD 27,912 Fannie Mae Pool ‘AB9255’ 3.5% 1/5/2043 29,354 0.03
USD 21,303 Fannie Mae Pool ‘AB9567’ 3.5% 1/6/2043 22,404 0.02
USD 33,961 Fannie Mae Pool ‘AB9757’ 3.5% 1/6/2043 35,496 0.03
USD 46,044 Fannie Mae Pool ‘AC9312’ 4% 1/10/2041 49,180 0.05
USD 97,994 Fannie Mae Pool ‘AD0361’ 6% 1/9/2039 112,354 0.10
USD 254,892 Fannie Mae Pool ‘AD0663’ 5.5% 1/6/2036 280,961 0.26
USD 288,422 Fannie Mae Pool ‘AD0784’ 6% 1/5/2037 330,451 0.30
USD 4,935 Fannie Mae Pool ‘AD9136’ 4% 1/8/2040 5,270 0.00
USD 374,590 Fannie Mae Pool ‘AE0216’ 4% 1/8/2040 400,059 0.37
USD 33,011 Fannie Mae Pool ‘AE0625’ 4% 1/12/2040 35,804 0.03
USD 306,582 Fannie Mae Pool ‘AH0946’ 4% 1/12/2040 327,415 0.30
USD 184,285 Fannie Mae Pool ‘AH5702’ 4.5% 1/2/2026 194,249 0.18
USD 46,122 Fannie Mae Pool ‘AH7036’ 4.5% 1/3/2041 49,928 0.05
USD 26,610 Fannie Mae Pool ‘AI1186’ 4% 1/4/2041 28,421 0.03
US Government Mortgage Fund
Portfolio of Investments 31 August 2019
US Government Mortgage Fund

Transferable Securities and Money Market Instruments Admitted to an Official Stock Exchange Listing or Dealt in on Another Regulated Market
Transferable Securities and Money Market Instruments Admitted to an Official Stock Exchange Listing or Dealt in on Another Regulated Market
Holding
Description
Market Value (USD)
% of Net
Assets
Holding
Description
Market Value (USD)
% of Net
Assets
The notes on pages 728 to 741 form an integral part of these financial statements.
Annual Report and Audited Financial Statements [669]
USD 54,680 Fannie Mae Pool ‘AI4140’ 4.5% 1/6/2041 59,206 0.05
USD 202,888 Fannie Mae Pool ‘AI4891’ 4.5% 1/6/2041 219,643 0.20
USD 60,128 Fannie Mae Pool ‘AI5228’ 4% 1/9/2041 64,218 0.06
USD 291,953 Fannie Mae Pool ‘AJ0784’ 4% 1/9/2041 311,802 0.29
USD 27,699 Fannie Mae Pool ‘AJ3120’ 4.5% 1/10/2041 30,101 0.03
USD 53,890 Fannie Mae Pool ‘AJ7684’ 4% 1/12/2041 58,662 0.05
USD 22,351 Fannie Mae Pool ‘AK7510’ 3.5% 1/4/2042 23,410 0.02
USD 15,355 Fannie Mae Pool ‘AK9225’ 3.5% 1/6/2042 16,083 0.01
USD 53,134 Fannie Mae Pool ‘AL0603’ 6.5% 1/10/2039 60,292 0.06
USD 154,226 Fannie Mae Pool ‘AL0808’ 6.5% 1/5/2040 179,265 0.16
USD 17,832 Fannie Mae Pool ‘AL1064’ 6.5% 1/10/2039 21,260 0.02
USD 127,103 Fannie Mae Pool ‘AL1319’ 4.5% 1/10/2041 137,605 0.13
USD 230,956 Fannie Mae Pool ‘AL1730’ 3.5% 1/4/2042 243,465 0.22
USD 213,783 Fannie Mae Pool ‘AL1899’ 5% 1/6/2026 221,857 0.20
USD 12,107 Fannie Mae Pool ‘AL2168’ 3.5% 1/6/2042 12,800 0.01
USD 51,098 Fannie Mae Pool ‘AL2242’ 4% 1/8/2042 54,569 0.05
USD 121,744 Fannie Mae Pool ‘AL2629’ 5% 1/6/2039 135,486 0.12
USD 92,569 Fannie Mae Pool ‘AL2935’ 3.5% 1/2/2043 97,549 0.09
USD 502,198 Fannie Mae Pool ‘AL4244’ 4% 1/7/2042 547,046 0.50
USD 16,949 Fannie Mae Pool ‘AL5304’ 5.5% 1/3/2040 19,106 0.02
USD 541 Fannie Mae Pool ‘AL5624’ 4.5% 1/8/2044 603 0.00
USD 8,975 Fannie Mae Pool ‘AL5943’ 4.5% 1/6/2042 9,713 0.01
USD 41,053 Fannie Mae Pool ‘AL6761’ 3% 1/5/2030 42,328 0.04
USD 56,533 Fannie Mae Pool ‘AL7139’ 3% 1/7/2030 58,220 0.05
USD 76,989 Fannie Mae Pool ‘AL7167’ 4% 1/1/2041 81,671 0.08
USD 1,253,346 Fannie Mae Pool ‘AL9078’ 3.5% 1/6/2046 1,325,002 1.22
USD 21,675 Fannie Mae Pool ‘AL9227’ 3% 1/10/2036 22,359 0.02
USD 21,376 Fannie Mae Pool ‘AL9276’ 4% 1/9/2046 22,924 0.02
USD 1,944,936 Fannie Mae Pool ‘AL9405’ 3.5% 1/6/2044 2,032,222 1.87
USD 188,446 Fannie Mae Pool ‘AL9600’ 3.5% 1/1/2044 198,163 0.18
USD 49,354 Fannie Mae Pool ‘AO0292’ 3.5% 1/4/2042 52,027 0.05
USD 69,054 Fannie Mae Pool ‘AO0763’ 4% 1/4/2042 73,766 0.07
USD 9,122 Fannie Mae Pool ‘AO2881’ 3.5% 1/5/2042 9,499 0.01
USD 78,961 Fannie Mae Pool ‘AO2974’ 3.5% 1/5/2042 83,481 0.08
USD 9,945 Fannie Mae Pool ‘AO3048’ 3.5% 1/6/2042 10,416 0.01
USD 31,015 Fannie Mae Pool ‘AO7152’ 3.5% 1/8/2042 32,417 0.03
USD 22,863 Fannie Mae Pool ‘AO9707’ 3.5% 1/7/2042 23,945 0.02
USD 22,475 Fannie Mae Pool ‘AP5205’ 2.5% 1/9/2027 22,815 0.02
USD 22,539 Fannie Mae Pool ‘AP6347’ 4% 1/9/2042 24,563 0.02
USD 37,398 Fannie Mae Pool ‘AQ7127’ 3.5% 1/12/2042 39,089 0.04
USD 11,300 Fannie Mae Pool ‘AQ7965’ 3.5% 1/11/2027 11,707 0.01
USD 60,323 Fannie Mae Pool ‘AR7568’ 3% 1/3/2043 62,214 0.06
USD 102,711 Fannie Mae Pool ‘AR7576’ 3% 1/3/2043 106,200 0.10
USD 102,385 Fannie Mae Pool ‘AR8630’ 3% 1/4/2043 105,889 0.10
USD 131,881 Fannie Mae Pool ‘AR9218’ 3% 1/3/2043 136,393 0.13
USD 53,893 Fannie Mae Pool ‘AS0190’ 2.5% 1/8/2028 54,829 0.05
USD 513,786 Fannie Mae Pool ‘AS0496’ 3% 1/9/2028 529,141 0.49
USD 83,484 Fannie Mae Pool ‘AS1767’ 4% 1/2/2044 89,326 0.08
USD 108,240 Fannie Mae Pool ‘AS1867’ 3.5% 1/3/2029 113,029 0.10
USD 11,292 Fannie Mae Pool ‘AS2591’ 3.5% 1/6/2044 11,852 0.01
USD 8,298 Fannie Mae Pool ‘AS3707’ 4% 1/11/2044 8,852 0.01
USD 48,536 Fannie Mae Pool ‘AS4067’ 4% 1/12/2044 52,890 0.05
USD 6,315 Fannie Mae Pool ‘AS4485’ 2.5% 1/2/2030 6,420 0.01
USD 6,448 Fannie Mae Pool ‘AS4488’ 2.5% 1/2/2030 6,538 0.01
USD 75,722 Fannie Mae Pool ‘AS4688’ 2.5% 1/3/2030 77,021 0.07
USD 47,473 Fannie Mae Pool ‘AS5548’ 2.5% 1/8/2030 48,262 0.04
USD 58,090 Fannie Mae Pool ‘AS5614’ 2.5% 1/8/2030 59,071 0.05
USD 23,924 Fannie Mae Pool ‘AS5622’ 3% 1/8/2030 24,640 0.02
USD 97,887 Fannie Mae Pool ‘AS5786’ 2.5% 1/9/2030 99,515 0.09
USD 1,085 Fannie Mae Pool ‘AS6016’ 4% 1/10/2045 1,161 0.00
USD 630 Fannie Mae Pool ‘AS6220’ 4% 1/11/2045 674 0.00
USD 16,316 Fannie Mae Pool ‘AS6233’ 4.5% 1/11/2045 17,563 0.02
USD 23,418 Fannie Mae Pool ‘AS6840’ 4% 1/3/2046 24,983 0.02
USD 8,042 Fannie Mae Pool ‘AS7320’ 2.5% 1/6/2031 8,189 0.01
USD 53,625 Fannie Mae Pool ‘AS7605’ 2.5% 1/7/2031 54,606 0.05
USD 35,568 Fannie Mae Pool ‘AS7940’ 4% 1/9/2046 37,949 0.03
USD 19,445 Fannie Mae Pool ‘AS8009’ 2.5% 1/10/2031 19,795 0.02
USD 88,948 Fannie Mae Pool ‘AS8193’ 2.5% 1/10/2031 90,547 0.08
USD 47,414 Fannie Mae Pool ‘AS8195’ 2.5% 1/10/2031 48,294 0.04
USD 130,973 Fannie Mae Pool ‘AS8208’ 2.5% 1/10/2031 133,370 0.12
US Government Mortgage Fund continued
Portfolio of Investments 31 August 2019

Transferable Securities and Money Market Instruments Admitted to an Official Stock Exchange Listing or Dealt in on Another Regulated Market
Transferable Securities and Money Market Instruments Admitted to an Official Stock Exchange Listing or Dealt in on Another Regulated Market
Holding
Description
Market Value (USD)
% of Net
Assets
Holding
Description
Market Value (USD)
% of Net
Assets
The notes on pages 728 to 741 form an integral part of these financial statements.
[670] BlackRock Global Funds (BGF)
USD 51,297 Fannie Mae Pool ‘AS8240’ 2.5% 1/11/2031 52,236 0.05
USD 16,326 Fannie Mae Pool ‘AS8241’ 2.5% 1/11/2031 16,619 0.02
USD 161,200 Fannie Mae Pool ‘AS8251’ 2% 1/11/2031 160,882 0.15
USD 10,744 Fannie Mae Pool ‘AS8291’ 2% 1/11/2031 10,723 0.01
USD 156,440 Fannie Mae Pool ‘AS8348’ 3% 1/11/2036 162,249 0.15
USD 64,092 Fannie Mae Pool ‘AS8349’ 3% 1/11/2036 66,195 0.06
USD 39,098 Fannie Mae Pool ‘AS8376’ 4% 1/11/2046 41,715 0.04
USD 63,842 Fannie Mae Pool ‘AS8377’ 4% 1/11/2046 68,116 0.06
USD 184,761 Fannie Mae Pool ‘AS8553’ 3% 1/12/2036 191,737 0.18
USD 46,284 Fannie Mae Pool ‘AS9321’ 2.5% 1/3/2032 47,143 0.04
USD 45,600 Fannie Mae Pool ‘AT2037’ 3% 1/4/2043 47,067 0.04
USD 143,006 Fannie Mae Pool ‘AT2040’ 3% 1/4/2043 147,973 0.14
USD 54,359 Fannie Mae Pool ‘AT2043’ 3% 1/4/2043 56,247 0.05
USD 43,520 Fannie Mae Pool ‘AT6144’ 4% 1/5/2042 47,311 0.04
USD 454,374 Fannie Mae Pool ‘AV1821’ 3.5% 1/12/2028 476,421 0.44
USD 45,388 Fannie Mae Pool ‘AV2859’ 3.5% 1/12/2028 47,590 0.04
USD 41,486 Fannie Mae Pool ‘AV2869’ 3.5% 1/12/2028 43,009 0.04
USD 287,264 Fannie Mae Pool ‘AV5420’ 5% 1/1/2044 311,367 0.29
USD 62,171 Fannie Mae Pool ‘AV6577’ 4% 1/3/2044 66,697 0.06
USD 63,733 Fannie Mae Pool ‘AV8736’ 5% 1/3/2044 69,853 0.06
USD 127,528 Fannie Mae Pool ‘AV9273’ 3.5% 1/2/2029 133,460 0.12
USD 129,055 Fannie Mae Pool ‘AW1141’ 3% 1/2/2029 132,674 0.12
USD 44,757 Fannie Mae Pool ‘AW1310’ 3.5% 1/7/2044 47,177 0.04
USD 18,084 Fannie Mae Pool ‘AW3139’ 4% 1/5/2039 19,238 0.02
USD 106,681 Fannie Mae Pool ‘AW8154’ 3.5% 1/1/2042 111,771 0.10
USD 17,692 Fannie Mae Pool ‘AX3298’ 3% 1/8/2030 18,242 0.02
USD 1,858 Fannie Mae Pool ‘AX9372’ 4% 1/12/2044 2,007 0.00
USD 17,858 Fannie Mae Pool ‘AX9700’ 3% 1/7/2030 18,358 0.02
USD 29,646 Fannie Mae Pool ‘AY0828’ 2.5% 1/5/2030 30,153 0.03
USD 59,461 Fannie Mae Pool ‘AY3416’ 2.5% 1/4/2030 60,481 0.06
USD 24,468 Fannie Mae Pool ‘AY4688’ 4% 1/8/2031 25,935 0.02
USD 30,678 Fannie Mae Pool ‘AY4707’ 4% 1/8/2031 32,701 0.03
USD 27,504 Fannie Mae Pool ‘AZ2170’ 2.5% 1/7/2030 27,968 0.03
USD 11,590 Fannie Mae Pool ‘AZ2297’ 3% 1/7/2030 11,915 0.01
USD 84 Fannie Mae Pool ‘AZ3353’ 4% 1/7/2045 89 0.00
USD 19,511 Fannie Mae Pool ‘AZ7833’ 3% 1/8/2030 20,118 0.02
USD 42,724 Fannie Mae Pool ‘AZ9243’ 4% 1/10/2045 46,558 0.04
USD 65,874 Fannie Mae Pool ‘BA2924’ 4% 1/12/2045 70,361 0.06
USD 14,171 Fannie Mae Pool ‘BC0170’ 4% 1/1/2046 15,118 0.01
USD 15,916 Fannie Mae Pool ‘BC0908’ 4% 1/5/2046 16,962 0.02
USD 34,028 Fannie Mae Pool ‘BC1222’ 4% 1/7/2046 36,767 0.03
USD 7,616 Fannie Mae Pool ‘BC2628’ 2.5% 1/11/2031 7,757 0.01
USD 1,372 Fannie Mae Pool ‘BC2629’ 2.5% 1/11/2031 1,397 0.00
USD 2,171 Fannie Mae Pool ‘BC2631’ 2.5% 1/11/2031 2,210 0.00
USD 8,950 Fannie Mae Pool ‘BC2777’ 2.5% 1/8/2031 9,113 0.01
USD 71,546 Fannie Mae Pool ‘BC2837’ 4.5% 1/9/2046 79,698 0.07
USD 55,058 Fannie Mae Pool ‘BC9040’ 2% 1/11/2031 54,949 0.05
USD 51,162 Fannie Mae Pool ‘BD3933’ 4% 1/8/2046 55,672 0.05
USD 2,397 Fannie Mae Pool ‘BD6043’ 4% 1/8/2046 2,590 0.00
USD 280,652 Fannie Mae Pool ‘BE1896’ 3% 1/12/2036 289,514 0.27
USD 45,355 Fannie Mae Pool ‘BE4913’ 3.5% 1/1/2047 47,450 0.04
USD 251 Fannie Mae Pool ‘BE5013’ 4% 1/2/2045 269 0.00
USD 673,746 Fannie Mae Pool ‘BF0154’ 3.5% 1/11/2046 699,251 0.64
USD 43,525 Fannie Mae Pool ‘BH7993’ 4.5% 1/9/2047 46,167 0.04
USD 35,277 Fannie Mae Pool ‘BH8026’ 4.5% 1/10/2047 38,345 0.04
USD 74,850 Fannie Mae Pool ‘BH8027’ 4.5% 1/10/2047 79,363 0.07
USD 28,140 Fannie Mae Pool ‘BJ3177’ 4.5% 1/11/2047 30,027 0.03
USD 31,482 Fannie Mae Pool ‘BJ3218’ 4.5% 1/12/2047 33,582 0.03
USD 64,428 Fannie Mae Pool ‘BJ6316’ 4.5% 1/2/2048 68,293 0.06
USD 294,819 Fannie Mae Pool ‘BJ8417’ 3.5% 1/8/2049 307,049 0.28
USD 30,243 Fannie Mae Pool ‘BJ8745’ 3.5% 1/8/2049 31,664 0.03
USD 26,422 Fannie Mae Pool ‘BJ8749’ 3.5% 1/9/2049 27,776 0.03
USD 11,037 Fannie Mae Pool ‘BJ8759’ 3% 1/8/2034 11,343 0.01
USD 51,390 Fannie Mae Pool ‘BJ9437’ 4.5% 1/3/2048 54,473 0.05
USD 65,302 Fannie Mae Pool ‘BJ9480’ 4.5% 1/3/2048 69,657 0.06
USD 56,876 Fannie Mae Pool ‘BK3988’ 4.5% 1/5/2048 60,288 0.06
USD 25,049 Fannie Mae Pool ‘BK4213’ 4% 1/7/2048 26,703 0.02
USD 43,526 Fannie Mae Pool ‘BK4471’ 4.5% 1/7/2048 47,291 0.04
USD 39,330 Fannie Mae Pool ‘BK6737’ 4.5% 1/7/2048 41,689 0.04
USD 39,431 Fannie Mae Pool ‘BM1595’ 2.5% 1/3/2031 40,004 0.04
US Government Mortgage Fund continued
Portfolio of Investments 31 August 2019

Transferable Securities and Money Market Instruments Admitted to an Official Stock Exchange Listing or Dealt in on Another Regulated Market
Transferable Securities and Money Market Instruments Admitted to an Official Stock Exchange Listing or Dealt in on Another Regulated Market
Holding
Description
Market Value (USD)
% of Net
Assets
Holding
Description
Market Value (USD)
% of Net
Assets
The notes on pages 728 to 741 form an integral part of these financial statements.
Annual Report and Audited Financial Statements [671]
USD 24,837 Fannie Mae Pool ‘BM1619’ 4% 1/8/2047 26,496 0.02
USD 56,865 Fannie Mae Pool ‘BM1907’ 4% 1/11/2046 61,957 0.06
USD 165,109 Fannie Mae Pool ‘BM3031’ 3% 1/7/2043 171,247 0.16
USD 233,052 Fannie Mae Pool ‘BM3054’ 2% 1/11/2031 232,593 0.21
USD 22,661 Fannie Mae Pool ‘BM3403’ 2.5% 1/2/2030 23,026 0.02
USD 17,968 Fannie Mae Pool ‘BM3501’ 3% 1/4/2032 18,534 0.02
USD 69,419 Fannie Mae Pool ‘BM3552’ 2.5% 1/8/2030 70,551 0.06
USD 82,138 Fannie Mae Pool ‘BM3762’ 4% 1/4/2048 89,442 0.08
USD 518,055 Fannie Mae Pool ‘BM3846’ 4.5% 1/4/2048 569,637 0.52
USD 1,540,880 Fannie Mae Pool ‘BM3987’ 2.5% 1/6/2032 1,562,123 1.44
USD 310,527 Fannie Mae Pool ‘BM4163’ 3.155% 1/3/2027 332,703 0.31
USD 210,842 Fannie Mae Pool ‘BM4164’ 3.125% 1/9/2027 227,193 0.21
USD 500,392 Fannie Mae Pool ‘BM4299’ 3% 1/3/2030 514,490 0.47
USD 358,694 Fannie Mae Pool ‘BM4857’ 4% 1/3/2048 390,591 0.36
USD 132,066 Fannie Mae Pool ‘BM4858’ 4% 1/8/2048 143,811 0.13
USD 327,180 Fannie Mae Pool ‘BM4859’ 4% 1/4/2048 353,280 0.32
USD 4,372,160 Fannie Mae Pool ‘BM5024’ 3% 1/11/2048 4,473,834 4.12
USD 392,153 Fannie Mae Pool ‘BM5757’ 4% 1/8/2048 423,373 0.39
USD 37,981 Fannie Mae Pool ‘BN7715’ 3% 1/8/2034 39,058 0.04
USD 10,001 Fannie Mae Pool ‘BO1822’ 3.5% 1/7/2034 10,382 0.01
USD 30,999 Fannie Mae Pool ‘BO4492’ 3% 1/8/2034 31,859 0.03
USD 167,876 Fannie Mae Pool ‘CA2404’ 4% 1/10/2033 177,425 0.16
USD 114,285 Fannie Mae Pool ‘CA2406’ 4% 1/10/2033 120,722 0.11
USD 168,804 Fannie Mae Pool ‘CA2408’ 4% 1/10/2033 179,661 0.17
USD 361,740 Fannie Mae Pool ‘CA3826’ 4% 1/7/2049 386,798 0.36
USD 107,952 Fannie Mae Pool ‘CA3831’ 4% 1/7/2049 117,416 0.11
USD 275,666 Fannie Mae Pool ‘CA3832’ 4% 1/7/2049 299,834 0.28
USD 6,980,261 Fannie Mae Pool ‘CA3942’ 3.5% 1/8/2049 7,308,126 6.73
USD 4,412,775 Fannie Mae Pool ‘CA3944’ 4% 1/8/2049 4,705,027 4.33
USD 1,647,251 Fannie Mae Pool ‘CA3972’ 4% 1/8/2049 1,778,414 1.64
USD 1,042,484 Fannie Mae Pool ‘CA4023’ 3.5% 1/8/2049 1,106,133 1.02
USD 176,405 Fannie Mae Pool ‘CA4125’ 4% 1/8/2049 185,831 0.17
USD 103,515 Fannie Mae Pool ‘FM1419’ 3.5% 1/9/2049 109,392 0.10
USD 34,995 Fannie Mae Pool ‘MA2774’ 2% 1/10/2031 34,926 0.03
USD 46,031 Fannie Mae Pool ‘MA2845’ 2% 1/12/2031 45,941 0.04
USD 6,746,398 Fannie Mae Pool ‘MA3663’ 3.5% 1/5/2049 6,928,619 6.38
USD 55,844 Fannie Mae REMICS ‘Series 2016-78 CS’ FRN 25/5/2039 10,049 0.01
USD 17,725 Fannie Mae REMICS ‘Series 2011-100 S’ FRN 25/10/2041 2,783 0.00
USD 1,899,407 Fannie Mae REMICS ‘Series 2015-66 AS’ FRN 25/9/2045 334,585 0.31
USD 279,148 Fannie Mae REMICS ‘Series 2016-60 SD’ FRN 25/9/2046 49,473 0.05
USD 2,106,041 Fannie Mae REMICS ‘Series 2016-81 CS’ FRN 25/11/2046 357,744 0.33
USD 1,064,159 Fannie Mae REMICS ‘Series 2019-25 SA’ FRN 25/6/2049 219,419 0.20
USD 987,583 Fannie Mae REMICS ‘Series 2019-35 SA’ FRN 25/7/2049 150,132 0.14
USD 497,876 Fannie Mae REMICS ‘Series 2019-39 LF’ FRN 25/8/2049 497,622 0.46
USD 741,019 Fannie Mae REMICS ‘Series 2013-10 PI’ 3% 25/2/2043 62,116 0.06
USD 186,433 Fannie Mae REMICS ‘Series 2018-63 IO’ 3% 25/9/2048 21,068 0.02
USD 450,000 Fannie Mae REMICS ‘Series 2017-76 PB’ 3% 25/10/2057 476,010 0.44
USD 200,000 Fannie Mae REMICS ‘Series 2013-81 YK’ 4% 25/8/2043 237,931 0.22
USD 3,990 Fannie Mae REMICS ‘Series 2010-134 KZ’ 4.5% 25/12/2040 4,528 0.00
USD 80,088 Fannie Mae REMICS ‘Series 2011-131 LZ’ 4.5% 25/12/2041 90,043 0.08
USD 423,189 Fannie Mae REMICS ‘Series 2017-68 IE’ 4.5% 25/9/2047 72,522 0.07
USD 11,986 Freddie Mac Gold Pool ‘A49323’ 6% 1/6/2036 13,726 0.01
USD 42,108 Freddie Mac Gold Pool ‘A56155’ 6% 1/12/2036 48,151 0.04
USD 21,158 Freddie Mac Gold Pool ‘A58057’ 6% 1/3/2037 23,468 0.02
USD 37,307 Freddie Mac Gold Pool ‘A61985’ 6% 1/6/2037 42,660 0.04
USD 7,963 Freddie Mac Gold Pool ‘A66777’ 6% 1/10/2037 9,109 0.01
USD 15,237 Freddie Mac Gold Pool ‘A67449’ 6% 1/11/2037 17,109 0.02
USD 78,755 Freddie Mac Gold Pool ‘A76211’ 6% 1/4/2038 88,346 0.08
USD 5,784 Freddie Mac Gold Pool ‘A79025’ 6% 1/7/2038 6,625 0.01
USD 8,866 Freddie Mac Gold Pool ‘A84162’ 6% 1/1/2039 10,006 0.01
USD 39,146 Freddie Mac Gold Pool ‘A90196’ 4.5% 1/12/2039 42,391 0.04
USD 44,246 Freddie Mac Gold Pool ‘A93534’ 4% 1/8/2040 47,268 0.04
USD 24,921 Freddie Mac Gold Pool ‘C03466’ 5.5% 1/3/2040 28,029 0.03
USD 226,758 Freddie Mac Gold Pool ‘C03608’ 3.5% 1/12/2040 237,095 0.22
USD 99,689 Freddie Mac Gold Pool ‘C03811’ 3.5% 1/4/2042 105,450 0.10
USD 194,226 Freddie Mac Gold Pool ‘C03815’ 3.5% 1/3/2042 203,478 0.19
USD 1,260,454 Freddie Mac Gold Pool ‘C04320’ 3% 1/12/2042 1,302,508 1.20
USD 2,416 Freddie Mac Gold Pool ‘C91195’ 5.5% 1/7/2028 2,609 0.00
USD 27,147 Freddie Mac Gold Pool ‘C91239’ 4.5% 1/3/2029 28,915 0.03
USD 98,576 Freddie Mac Gold Pool ‘C91324’ 4.5% 1/8/2030 105,639 0.10
US Government Mortgage Fund continued
Portfolio of Investments 31 August 2019
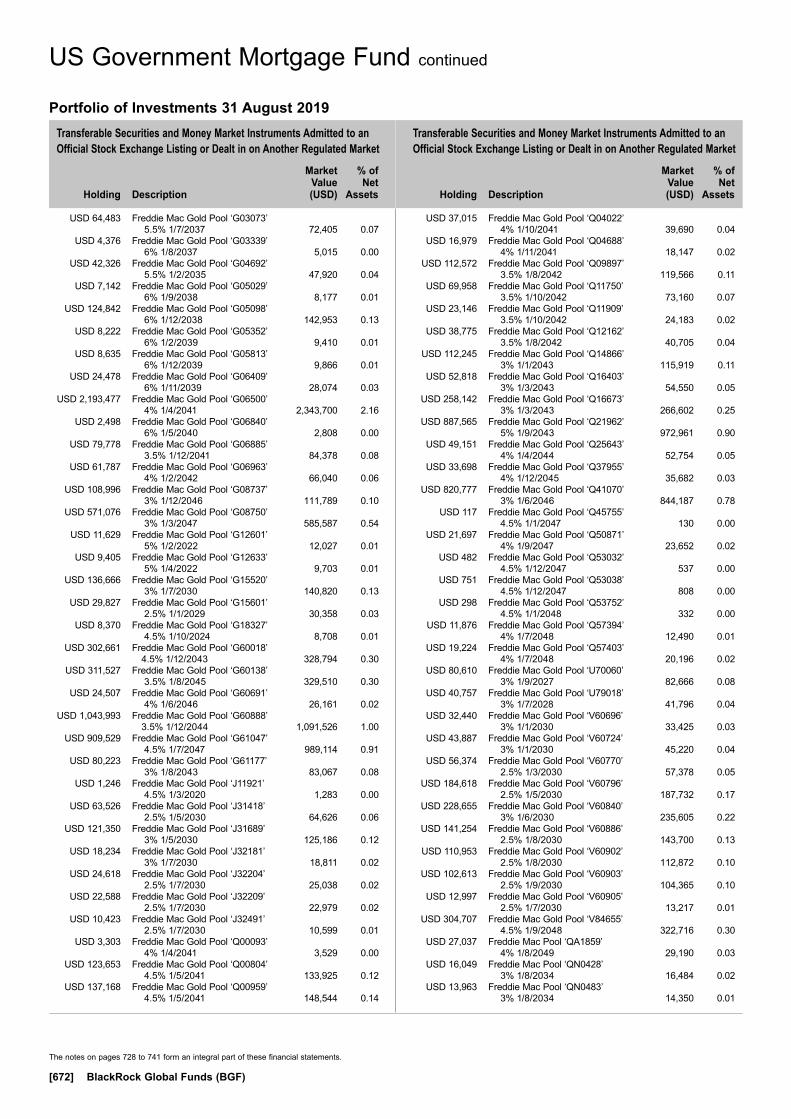
Transferable Securities and Money Market Instruments Admitted to an Official Stock Exchange Listing or Dealt in on Another Regulated Market
Transferable Securities and Money Market Instruments Admitted to an Official Stock Exchange Listing or Dealt in on Another Regulated Market
Holding
Description
Market Value (USD)
% of Net
Assets
Holding
Description
Market Value (USD)
% of Net
Assets
The notes on pages 728 to 741 form an integral part of these financial statements.
[672] BlackRock Global Funds (BGF)
USD 64,483 Freddie Mac Gold Pool ‘G03073’ 5.5% 1/7/2037 72,405 0.07
USD 4,376 Freddie Mac Gold Pool ‘G03339’ 6% 1/8/2037 5,015 0.00
USD 42,326 Freddie Mac Gold Pool ‘G04692’ 5.5% 1/2/2035 47,920 0.04
USD 7,142 Freddie Mac Gold Pool ‘G05029’ 6% 1/9/2038 8,177 0.01
USD 124,842 Freddie Mac Gold Pool ‘G05098’ 6% 1/12/2038 142,953 0.13
USD 8,222 Freddie Mac Gold Pool ‘G05352’ 6% 1/2/2039 9,410 0.01
USD 8,635 Freddie Mac Gold Pool ‘G05813’ 6% 1/12/2039 9,866 0.01
USD 24,478 Freddie Mac Gold Pool ‘G06409’ 6% 1/11/2039 28,074 0.03
USD 2,193,477 Freddie Mac Gold Pool ‘G06500’ 4% 1/4/2041 2,343,700 2.16
USD 2,498 Freddie Mac Gold Pool ‘G06840’ 6% 1/5/2040 2,808 0.00
USD 79,778 Freddie Mac Gold Pool ‘G06885’ 3.5% 1/12/2041 84,378 0.08
USD 61,787 Freddie Mac Gold Pool ‘G06963’ 4% 1/2/2042 66,040 0.06
USD 108,996 Freddie Mac Gold Pool ‘G08737’ 3% 1/12/2046 111,789 0.10
USD 571,076 Freddie Mac Gold Pool ‘G08750’ 3% 1/3/2047 585,587 0.54
USD 11,629 Freddie Mac Gold Pool ‘G12601’ 5% 1/2/2022 12,027 0.01
USD 9,405 Freddie Mac Gold Pool ‘G12633’ 5% 1/4/2022 9,703 0.01
USD 136,666 Freddie Mac Gold Pool ‘G15520’ 3% 1/7/2030 140,820 0.13
USD 29,827 Freddie Mac Gold Pool ‘G15601’ 2.5% 1/1/2029 30,358 0.03
USD 8,370 Freddie Mac Gold Pool ‘G18327’ 4.5% 1/10/2024 8,708 0.01
USD 302,661 Freddie Mac Gold Pool ‘G60018’ 4.5% 1/12/2043 328,794 0.30
USD 311,527 Freddie Mac Gold Pool ‘G60138’ 3.5% 1/8/2045 329,510 0.30
USD 24,507 Freddie Mac Gold Pool ‘G60691’ 4% 1/6/2046 26,161 0.02
USD 1,043,993 Freddie Mac Gold Pool ‘G60888’ 3.5% 1/12/2044 1,091,526 1.00
USD 909,529 Freddie Mac Gold Pool ‘G61047’ 4.5% 1/7/2047 989,114 0.91
USD 80,223 Freddie Mac Gold Pool ‘G61177’ 3% 1/8/2043 83,067 0.08
USD 1,246 Freddie Mac Gold Pool ‘J11921’ 4.5% 1/3/2020 1,283 0.00
USD 63,526 Freddie Mac Gold Pool ‘J31418’ 2.5% 1/5/2030 64,626 0.06
USD 121,350 Freddie Mac Gold Pool ‘J31689’ 3% 1/5/2030 125,186 0.12
USD 18,234 Freddie Mac Gold Pool ‘J32181’ 3% 1/7/2030 18,811 0.02
USD 24,618 Freddie Mac Gold Pool ‘J32204’ 2.5% 1/7/2030 25,038 0.02
USD 22,588 Freddie Mac Gold Pool ‘J32209’ 2.5% 1/7/2030 22,979 0.02
USD 10,423 Freddie Mac Gold Pool ‘J32491’ 2.5% 1/7/2030 10,599 0.01
USD 3,303 Freddie Mac Gold Pool ‘Q00093’ 4% 1/4/2041 3,529 0.00
USD 123,653 Freddie Mac Gold Pool ‘Q00804’ 4.5% 1/5/2041 133,925 0.12
USD 137,168 Freddie Mac Gold Pool ‘Q00959’ 4.5% 1/5/2041 148,544 0.14
USD 37,015 Freddie Mac Gold Pool ‘Q04022’ 4% 1/10/2041 39,690 0.04
USD 16,979 Freddie Mac Gold Pool ‘Q04688’ 4% 1/11/2041 18,147 0.02
USD 112,572 Freddie Mac Gold Pool ‘Q09897’ 3.5% 1/8/2042 119,566 0.11
USD 69,958 Freddie Mac Gold Pool ‘Q11750’ 3.5% 1/10/2042 73,160 0.07
USD 23,146 Freddie Mac Gold Pool ‘Q11909’ 3.5% 1/10/2042 24,183 0.02
USD 38,775 Freddie Mac Gold Pool ‘Q12162’ 3.5% 1/8/2042 40,705 0.04
USD 112,245 Freddie Mac Gold Pool ‘Q14866’ 3% 1/1/2043 115,919 0.11
USD 52,818 Freddie Mac Gold Pool ‘Q16403’ 3% 1/3/2043 54,550 0.05
USD 258,142 Freddie Mac Gold Pool ‘Q16673’ 3% 1/3/2043 266,602 0.25
USD 887,565 Freddie Mac Gold Pool ‘Q21962’ 5% 1/9/2043 972,961 0.90
USD 49,151 Freddie Mac Gold Pool ‘Q25643’ 4% 1/4/2044 52,754 0.05
USD 33,698 Freddie Mac Gold Pool ‘Q37955’ 4% 1/12/2045 35,682 0.03
USD 820,777 Freddie Mac Gold Pool ‘Q41070’ 3% 1/6/2046 844,187 0.78
USD 117 Freddie Mac Gold Pool ‘Q45755’ 4.5% 1/1/2047 130 0.00
USD 21,697 Freddie Mac Gold Pool ‘Q50871’ 4% 1/9/2047 23,652 0.02
USD 482 Freddie Mac Gold Pool ‘Q53032’ 4.5% 1/12/2047 537 0.00
USD 751 Freddie Mac Gold Pool ‘Q53038’ 4.5% 1/12/2047 808 0.00
USD 298 Freddie Mac Gold Pool ‘Q53752’ 4.5% 1/1/2048 332 0.00
USD 11,876 Freddie Mac Gold Pool ‘Q57394’ 4% 1/7/2048 12,490 0.01
USD 19,224 Freddie Mac Gold Pool ‘Q57403’ 4% 1/7/2048 20,196 0.02
USD 80,610 Freddie Mac Gold Pool ‘U70060’ 3% 1/9/2027 82,666 0.08
USD 40,757 Freddie Mac Gold Pool ‘U79018’ 3% 1/7/2028 41,796 0.04
USD 32,440 Freddie Mac Gold Pool ‘V60696’ 3% 1/1/2030 33,425 0.03
USD 43,887 Freddie Mac Gold Pool ‘V60724’ 3% 1/1/2030 45,220 0.04
USD 56,374 Freddie Mac Gold Pool ‘V60770’ 2.5% 1/3/2030 57,378 0.05
USD 184,618 Freddie Mac Gold Pool ‘V60796’ 2.5% 1/5/2030 187,732 0.17
USD 228,655 Freddie Mac Gold Pool ‘V60840’ 3% 1/6/2030 235,605 0.22
USD 141,254 Freddie Mac Gold Pool ‘V60886’ 2.5% 1/8/2030 143,700 0.13
USD 110,953 Freddie Mac Gold Pool ‘V60902’ 2.5% 1/8/2030 112,872 0.10
USD 102,613 Freddie Mac Gold Pool ‘V60903’ 2.5% 1/9/2030 104,365 0.10
USD 12,997 Freddie Mac Gold Pool ‘V60905’ 2.5% 1/7/2030 13,217 0.01
USD 304,707 Freddie Mac Gold Pool ‘V84655’ 4.5% 1/9/2048 322,716 0.30
USD 27,037 Freddie Mac Pool ‘QA1859’ 4% 1/8/2049 29,190 0.03
USD 16,049 Freddie Mac Pool ‘QN0428’ 3% 1/8/2034 16,484 0.02
USD 13,963 Freddie Mac Pool ‘QN0483’ 3% 1/8/2034 14,350 0.01
US Government Mortgage Fund continued
Portfolio of Investments 31 August 2019
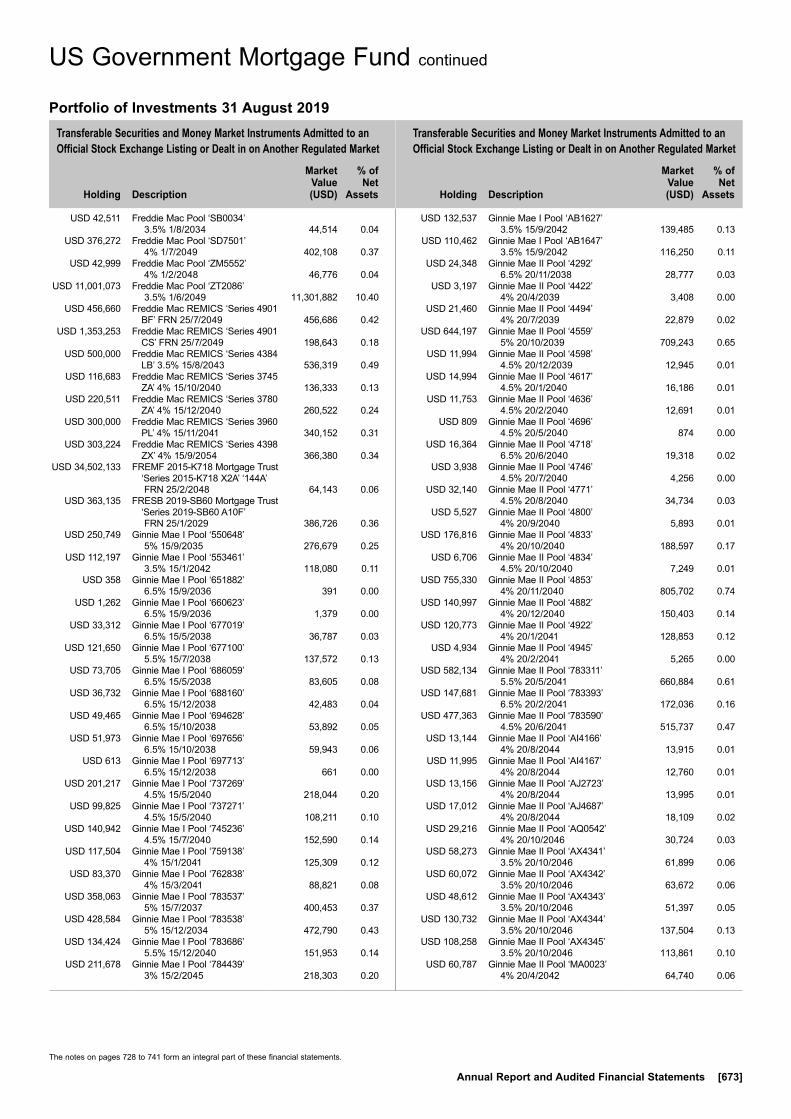
Transferable Securities and Money Market Instruments Admitted to an Official Stock Exchange Listing or Dealt in on Another Regulated Market
Transferable Securities and Money Market Instruments Admitted to an Official Stock Exchange Listing or Dealt in on Another Regulated Market
Holding
Description
Market Value (USD)
% of Net
Assets
Holding
Description
Market Value (USD)
% of Net
Assets
The notes on pages 728 to 741 form an integral part of these financial statements.
Annual Report and Audited Financial Statements [673]
USD 42,511 Freddie Mac Pool ‘SB0034’ 3.5% 1/8/2034 44,514 0.04
USD 376,272 Freddie Mac Pool ‘SD7501’ 4% 1/7/2049 402,108 0.37
USD 42,999 Freddie Mac Pool ‘ZM5552’ 4% 1/2/2048 46,776 0.04
USD 11,001,073 Freddie Mac Pool ‘ZT2086’ 3.5% 1/6/2049 11,301,882 10.40
USD 456,660 Freddie Mac REMICS ‘Series 4901 BF’ FRN 25/7/2049 456,686 0.42
USD 1,353,253 Freddie Mac REMICS ‘Series 4901 CS’ FRN 25/7/2049 198,643 0.18
USD 500,000 Freddie Mac REMICS ‘Series 4384 LB’ 3.5% 15/8/2043 536,319 0.49
USD 116,683 Freddie Mac REMICS ‘Series 3745 ZA’ 4% 15/10/2040 136,333 0.13
USD 220,511 Freddie Mac REMICS ‘Series 3780 ZA’ 4% 15/12/2040 260,522 0.24
USD 300,000 Freddie Mac REMICS ‘Series 3960 PL’ 4% 15/11/2041 340,152 0.31
USD 303,224 Freddie Mac REMICS ‘Series 4398 ZX’ 4% 15/9/2054 366,380 0.34
USD 34,502,133 FREMF 2015-K718 Mortgage Trust ‘Series 2015-K718 X2A’ ‘144A’ FRN 25/2/2048 64,143 0.06
USD 363,135 FRESB 2019-SB60 Mortgage Trust ‘Series 2019-SB60 A10F’ FRN 25/1/2029 386,726 0.36
USD 250,749 Ginnie Mae I Pool ‘550648’ 5% 15/9/2035 276,679 0.25
USD 112,197 Ginnie Mae I Pool ‘553461’ 3.5% 15/1/2042 118,080 0.11
USD 358 Ginnie Mae I Pool ‘651882’ 6.5% 15/9/2036 391 0.00
USD 1,262 Ginnie Mae I Pool ‘660623’ 6.5% 15/9/2036 1,379 0.00
USD 33,312 Ginnie Mae I Pool ‘677019’ 6.5% 15/5/2038 36,787 0.03
USD 121,650 Ginnie Mae I Pool ‘677100’ 5.5% 15/7/2038 137,572 0.13
USD 73,705 Ginnie Mae I Pool ‘686059’ 6.5% 15/5/2038 83,605 0.08
USD 36,732 Ginnie Mae I Pool ‘688160’ 6.5% 15/12/2038 42,483 0.04
USD 49,465 Ginnie Mae I Pool ‘694628’ 6.5% 15/10/2038 53,892 0.05
USD 51,973 Ginnie Mae I Pool ‘697656’ 6.5% 15/10/2038 59,943 0.06
USD 613 Ginnie Mae I Pool ‘697713’ 6.5% 15/12/2038 661 0.00
USD 201,217 Ginnie Mae I Pool ‘737269’ 4.5% 15/5/2040 218,044 0.20
USD 99,825 Ginnie Mae I Pool ‘737271’ 4.5% 15/5/2040 108,211 0.10
USD 140,942 Ginnie Mae I Pool ‘745236’ 4.5% 15/7/2040 152,590 0.14
USD 117,504 Ginnie Mae I Pool ‘759138’ 4% 15/1/2041 125,309 0.12
USD 83,370 Ginnie Mae I Pool ‘762838’ 4% 15/3/2041 88,821 0.08
USD 358,063 Ginnie Mae I Pool ‘783537’ 5% 15/7/2037 400,453 0.37
USD 428,584 Ginnie Mae I Pool ‘783538’ 5% 15/12/2034 472,790 0.43
USD 134,424 Ginnie Mae I Pool ‘783686’ 5.5% 15/12/2040 151,953 0.14
USD 211,678 Ginnie Mae I Pool ‘784439’ 3% 15/2/2045 218,303 0.20
USD 132,537 Ginnie Mae I Pool ‘AB1627’ 3.5% 15/9/2042 139,485 0.13
USD 110,462 Ginnie Mae I Pool ‘AB1647’ 3.5% 15/9/2042 116,250 0.11
USD 24,348 Ginnie Mae II Pool ‘4292’ 6.5% 20/11/2038 28,777 0.03
USD 3,197 Ginnie Mae II Pool ‘4422’ 4% 20/4/2039 3,408 0.00
USD 21,460 Ginnie Mae II Pool ‘4494’ 4% 20/7/2039 22,879 0.02
USD 644,197 Ginnie Mae II Pool ‘4559’ 5% 20/10/2039 709,243 0.65
USD 11,994 Ginnie Mae II Pool ‘4598’ 4.5% 20/12/2039 12,945 0.01
USD 14,994 Ginnie Mae II Pool ‘4617’ 4.5% 20/1/2040 16,186 0.01
USD 11,753 Ginnie Mae II Pool ‘4636’ 4.5% 20/2/2040 12,691 0.01
USD 809 Ginnie Mae II Pool ‘4696’ 4.5% 20/5/2040 874 0.00
USD 16,364 Ginnie Mae II Pool ‘4718’ 6.5% 20/6/2040 19,318 0.02
USD 3,938 Ginnie Mae II Pool ‘4746’ 4.5% 20/7/2040 4,256 0.00
USD 32,140 Ginnie Mae II Pool ‘4771’ 4.5% 20/8/2040 34,734 0.03
USD 5,527 Ginnie Mae II Pool ‘4800’ 4% 20/9/2040 5,893 0.01
USD 176,816 Ginnie Mae II Pool ‘4833’ 4% 20/10/2040 188,597 0.17
USD 6,706 Ginnie Mae II Pool ‘4834’ 4.5% 20/10/2040 7,249 0.01
USD 755,330 Ginnie Mae II Pool ‘4853’ 4% 20/11/2040 805,702 0.74
USD 140,997 Ginnie Mae II Pool ‘4882’ 4% 20/12/2040 150,403 0.14
USD 120,773 Ginnie Mae II Pool ‘4922’ 4% 20/1/2041 128,853 0.12
USD 4,934 Ginnie Mae II Pool ‘4945’ 4% 20/2/2041 5,265 0.00
USD 582,134 Ginnie Mae II Pool ‘783311’ 5.5% 20/5/2041 660,884 0.61
USD 147,681 Ginnie Mae II Pool ‘783393’ 6.5% 20/2/2041 172,036 0.16
USD 477,363 Ginnie Mae II Pool ‘783590’ 4.5% 20/6/2041 515,737 0.47
USD 13,144 Ginnie Mae II Pool ‘AI4166’ 4% 20/8/2044 13,915 0.01
USD 11,995 Ginnie Mae II Pool ‘AI4167’ 4% 20/8/2044 12,760 0.01
USD 13,156 Ginnie Mae II Pool ‘AJ2723’ 4% 20/8/2044 13,995 0.01
USD 17,012 Ginnie Mae II Pool ‘AJ4687’ 4% 20/8/2044 18,109 0.02
USD 29,216 Ginnie Mae II Pool ‘AQ0542’ 4% 20/10/2046 30,724 0.03
USD 58,273 Ginnie Mae II Pool ‘AX4341’ 3.5% 20/10/2046 61,899 0.06
USD 60,072 Ginnie Mae II Pool ‘AX4342’ 3.5% 20/10/2046 63,672 0.06
USD 48,612 Ginnie Mae II Pool ‘AX4343’ 3.5% 20/10/2046 51,397 0.05
USD 130,732 Ginnie Mae II Pool ‘AX4344’ 3.5% 20/10/2046 137,504 0.13
USD 108,258 Ginnie Mae II Pool ‘AX4345’ 3.5% 20/10/2046 113,861 0.10
USD 60,787 Ginnie Mae II Pool ‘MA0023’ 4% 20/4/2042 64,740 0.06
US Government Mortgage Fund continued
Portfolio of Investments 31 August 2019

Transferable Securities and Money Market Instruments Admitted to an Official Stock Exchange Listing or Dealt in on Another Regulated Market
Transferable Securities and Money Market Instruments Admitted to an Official Stock Exchange Listing or Dealt in on Another Regulated Market
Holding
Description
Market Value (USD)
% of Net
Assets
Holding
Description
Market Value (USD)
% of Net
Assets
The notes on pages 728 to 741 form an integral part of these financial statements.
[674] BlackRock Global Funds (BGF)
USD 115,138 Ginnie Mae II Pool ‘MA0934’ 3.5% 20/4/2043 122,201 0.11
USD 78,698 Ginnie Mae II Pool ‘MA1012’ 3.5% 20/5/2043 83,526 0.08
USD 448,524 Ginnie Mae II Pool ‘MA1601’ 4% 20/1/2044 478,768 0.44
USD 13,269 Ginnie Mae II Pool ‘MA1997’ 4.5% 20/6/2044 14,235 0.01
USD 40,087 Ginnie Mae II Pool ‘MA2076’ 5% 20/7/2044 43,808 0.04
USD 542,155 Ginnie Mae II Pool ‘MA2753’ 3% 20/4/2045 560,911 0.52
USD 208,475 Ginnie Mae II Pool ‘MA2826’ 3.5% 20/5/2045 217,734 0.20
USD 163,819 Ginnie Mae II Pool ‘MA3172’ 3% 20/10/2045 169,490 0.16
USD 21,474 Ginnie Mae II Pool ‘MA3662’ 3% 20/5/2046 22,178 0.02
USD 233,376 Ginnie Mae II Pool ‘MA4384’ 4.5% 20/4/2047 245,693 0.23
USD 516,912 Ginnie Mae II Pool ‘MA5331’ 4.5% 20/7/2048 542,170 0.50
USD 211,768 Government National Mortgage Association ‘Series 2014-107 WX’ FRN 20/7/2039 245,181 0.23
USD 657,254 Government National Mortgage Association ‘Series 2019-21 FL’ FRN 20/2/2049 657,763 0.61
USD 653,873 Government National Mortgage Association ‘Series 2019-89 FH’ FRN 20/7/2049 653,435 0.60
USD 2,016,445 Government National Mortgage Association ‘Series 2017-44 IO’ FRN 17/4/2051 119,794 0.11
USD 5,751,603 Government National Mortgage Association ‘Series 2017-53 IO’ FRN 16/11/2056 339,028 0.31
USD 3,536,107 Government National Mortgage Association ‘Series 2017-72 IO’ FRN 16/4/2057 224,077 0.21
USD 2,710,942 Government National Mortgage Association ‘Series 2016-67 IO’ FRN 16/7/2057 220,254 0.20
USD 1,759,262 Government National Mortgage Association ‘Series 2017-64 IO’ FRN 16/11/2057 118,684 0.11
USD 5,218,406 Government National Mortgage Association ‘Series 2016-45 IO’ FRN 16/2/2058 380,332 0.35
USD 2,887,739 Government National Mortgage Association ‘Series 2016-119 IO’ FRN 16/4/2058 217,334 0.20
USD 9,255,195 Government National Mortgage Association ‘Series 2016-151 IO’ FRN 16/6/2058 743,636 0.68
USD 1,982,706 Government National Mortgage Association ‘Series 2017-30 IO’ FRN 16/8/2058 126,434 0.12
USD 3,894,529 Government National Mortgage Association ‘Series 2016-175 IO’ FRN 16/9/2058 289,450 0.27
USD 5,604,223 Government National Mortgage Association ‘Series 2017-127 IO’ FRN 16/2/2059 354,075 0.33
USD 1,353,703 Government National Mortgage Association ‘Series 2017-61 IO’ FRN 16/5/2059 97,058 0.09
USD 3,511,979 Government National Mortgage Association ‘Series 2017-171 IO’ FRN 16/9/2059 229,076 0.21
USD 100,000 Government National Mortgage Association ‘Series 2016-123 LM’ 3% 20/9/2046 107,650 0.10
USD 19,642 Government National Mortgage Association ‘Series 2014-113 NI’ 5% 20/7/2044 3,412 0.00
USD 81,484 Government National Mortgage Association ‘Series 2018-89 CI’ 5% 20/12/2047 15,735 0.01
USD 128,286 Government National Mortgage Association ‘Series 2009-122 PY’ 6% 20/12/2039 144,914 0.13
USD 350,000 IMT Trust 2017-APTS ‘Series 2017-APTS AFX’ ‘144A’ FRN 15/6/2034 370,309 0.34
USD 150,000 JPMDB Commercial Mortgage Securities Trust 2017-C5 ‘Series 2017-C5 A5’ 3.694% 15/3/2050 165,415 0.15
USD 350,000 LCCM 2017-LC26 ‘Series 2017-LC26 ASB’ ‘144A’ 3.357% 12/7/2050 368,889 0.34
USD 127,613 LMREC 2016-CRE2 Inc ‘Series 2016-CRE2 A’ ‘144A’ FRN 24/11/2031 128,384 0.12
USD 110,000 Nissan Auto Receivables 2018-C Owner Trust ‘Series 2018-C A4’ 3.27% 16/6/2025 115,016 0.11
USD 288,942 Progress Residential 2017-SFR1 Trust ‘Series 2017-SFR1 A’ ‘144A’ 2.768% 17/8/2034 291,454 0.27
USD 227,020 Seasoned Credit Risk Transfer Trust Series 2018-2 3.5% 25/11/2057 236,347 0.22
USD 337,281 Seasoned Credit Risk Transfer Trust Series 2018-3 ‘Series 2018-3 MA’ 3.5% 25/8/2057 350,905 0.32
USD 144,857 Seasoned Credit Risk Transfer Trust Series 2019-2 ‘Series 2019-2 MA’ 3.5% 25/8/2058 153,046 0.14
USD 81,008 Tharaldson Hotel Portfolio Trust 2018-THPT ‘Series 2018-THL A’ ‘144A’ FRN 11/11/2034 81,061 0.07
USD 2,463,000 United States Cash Management Bill 16/9/2019 (Zero Coupon) 2,460,631 2.26
USD 980,000 United States Treasury Inflation Indexed Bonds 0.5% 15/4/2024 1,017,322 0.94
USD 2,557,025 Wells Fargo Commercial Mortgage Trust 2017-C41 ‘Series 2017-C41 XA’ FRN 15/11/2050 205,534 0.19
USD 2,500,184 Wells Fargo Commercial Mortgage Trust 2018-C44 ‘Series 2018-C44 XA’ FRN 15/5/2051 133,092 0.12
108,343,490 99.71Total Bonds 108,343,490 99.71Total Transferable Securities and Money Market Instruments Admitted to an Official Stock Exchange Listing or Dealt in on Another Regulated Market 108,343,490 99.71Total Portfolio 108,343,490 99.71
Other Net Assets 316,711 0.29Total Net Assets (USD) 108,660,201 100.00
US Government Mortgage Fund continued
Portfolio of Investments 31 August 2019
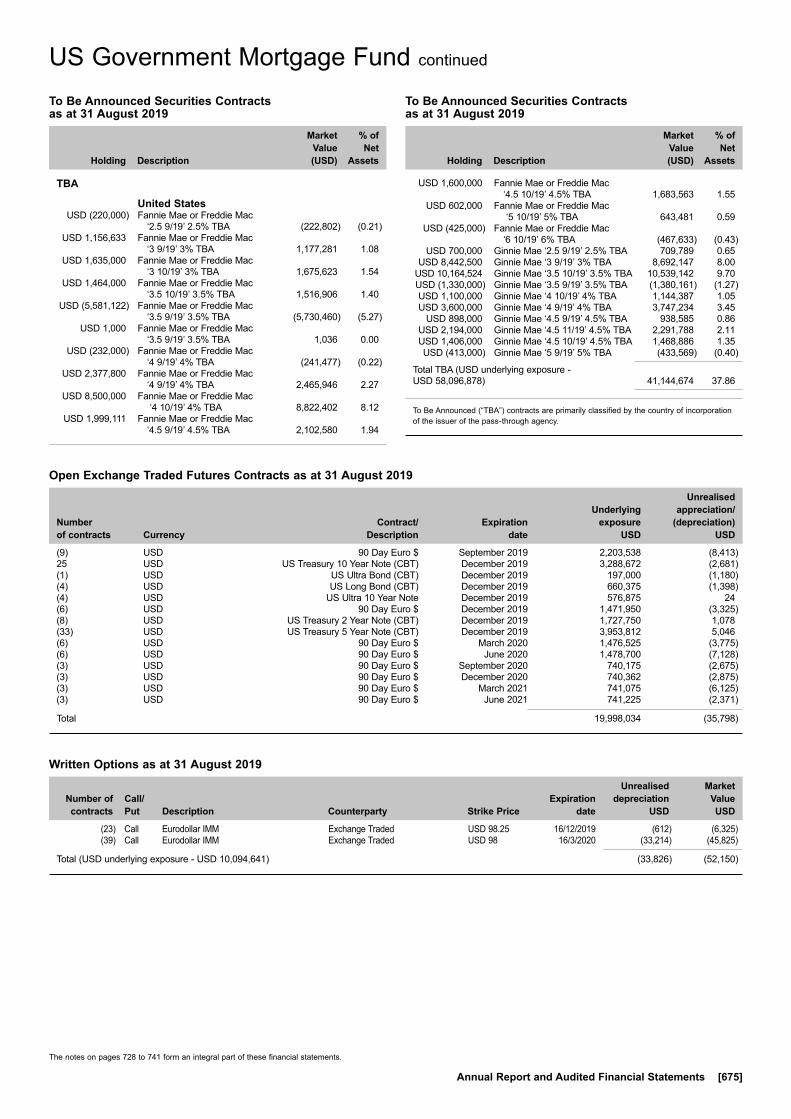
The notes on pages 728 to 741 form an integral part of these financial statements.
Annual Report and Audited Financial Statements [675]
US Government Mortgage Fund continued
To Be Announced Securities Contracts as at 31 August 2019
Holding Description
Market Value (USD)
% of Net
Assets
TBA
United States USD (220,000) Fannie Mae or Freddie Mac
‘2.5 9/19’ 2.5% TBA (222,802) (0.21) USD 1,156,633 Fannie Mae or Freddie Mac
‘3 9/19’ 3% TBA 1,177,281 1.08 USD 1,635,000 Fannie Mae or Freddie Mac
‘3 10/19’ 3% TBA 1,675,623 1.54 USD 1,464,000 Fannie Mae or Freddie Mac
‘3.5 10/19’ 3.5% TBA 1,516,906 1.40 USD (5,581,122) Fannie Mae or Freddie Mac
‘3.5 9/19’ 3.5% TBA (5,730,460) (5.27) USD 1,000 Fannie Mae or Freddie Mac
‘3.5 9/19’ 3.5% TBA 1,036 0.00 USD (232,000) Fannie Mae or Freddie Mac
‘4 9/19’ 4% TBA (241,477) (0.22) USD 2,377,800 Fannie Mae or Freddie Mac
‘4 9/19’ 4% TBA 2,465,946 2.27 USD 8,500,000 Fannie Mae or Freddie Mac
‘4 10/19’ 4% TBA 8,822,402 8.12 USD 1,999,111 Fannie Mae or Freddie Mac
‘4.5 9/19’ 4.5% TBA 2,102,580 1.94
To Be Announced Securities Contracts as at 31 August 2019
Holding Description
Market Value (USD)
% of Net
Assets
USD 1,600,000 Fannie Mae or Freddie Mac ‘4.5 10/19’ 4.5% TBA 1,683,563 1.55
USD 602,000 Fannie Mae or Freddie Mac ‘5 10/19’ 5% TBA 643,481 0.59
USD (425,000) Fannie Mae or Freddie Mac ‘6 10/19’ 6% TBA (467,633) (0.43)
USD 700,000 Ginnie Mae ‘2.5 9/19’ 2.5% TBA 709,789 0.65 USD 8,442,500 Ginnie Mae ‘3 9/19’ 3% TBA 8,692,147 8.00 USD 10,164,524 Ginnie Mae ‘3.5 10/19’ 3.5% TBA 10,539,142 9.70 USD (1,330,000) Ginnie Mae ‘3.5 9/19’ 3.5% TBA (1,380,161) (1.27) USD 1,100,000 Ginnie Mae ‘4 10/19’ 4% TBA 1,144,387 1.05 USD 3,600,000 Ginnie Mae ‘4 9/19’ 4% TBA 3,747,234 3.45 USD 898,000 Ginnie Mae ‘4.5 9/19’ 4.5% TBA 938,585 0.86 USD 2,194,000 Ginnie Mae ‘4.5 11/19’ 4.5% TBA 2,291,788 2.11 USD 1,406,000 Ginnie Mae ‘4.5 10/19’ 4.5% TBA 1,468,886 1.35 USD (413,000) Ginnie Mae ‘5 9/19’ 5% TBA (433,569) (0.40)
Total TBA (USD underlying exposure - USD 58,096,878) 41,144,674 37.86
To Be Announced (“TBA”) contracts are primarily classified by the country of incorporation of the issuer of the pass-through agency.
Open Exchange Traded Futures Contracts as at 31 August 2019
Number of contracts Currency
Contract/ Description
Expiration date
Underlying exposure
USD
Unrealised appreciation/
(depreciation) USD
(9) USD 90 Day Euro $ September 2019 2,203,538 (8,413)25 USD US Treasury 10 Year Note (CBT) December 2019 3,288,672 (2,681)(1) USD US Ultra Bond (CBT) December 2019 197,000 (1,180)(4) USD US Long Bond (CBT) December 2019 660,375 (1,398)(4) USD US Ultra 10 Year Note December 2019 576,875 24(6) USD 90 Day Euro $ December 2019 1,471,950 (3,325)(8) USD US Treasury 2 Year Note (CBT) December 2019 1,727,750 1,078(33) USD US Treasury 5 Year Note (CBT) December 2019 3,953,812 5,046(6) USD 90 Day Euro $ March 2020 1,476,525 (3,775)(6) USD 90 Day Euro $ June 2020 1,478,700 (7,128)(3) USD 90 Day Euro $ September 2020 740,175 (2,675)(3) USD 90 Day Euro $ December 2020 740,362 (2,875)(3) USD 90 Day Euro $ March 2021 741,075 (6,125)(3) USD 90 Day Euro $ June 2021 741,225 (2,371)
Total 19,998,034 (35,798)
Written Options as at 31 August 2019
Number of contracts
Call/ Put
Description Counterparty
Strike Price
Expiration date
Unrealised depreciation
USD
Market Value USD
(23) Call Eurodollar IMM Exchange Traded USD 98.25 16/12/2019 (612) (6,325) (39) Call Eurodollar IMM Exchange Traded USD 98 16/3/2020 (33,214) (45,825)
Total (USD underlying exposure - USD 10,094,641) (33,826) (52,150)
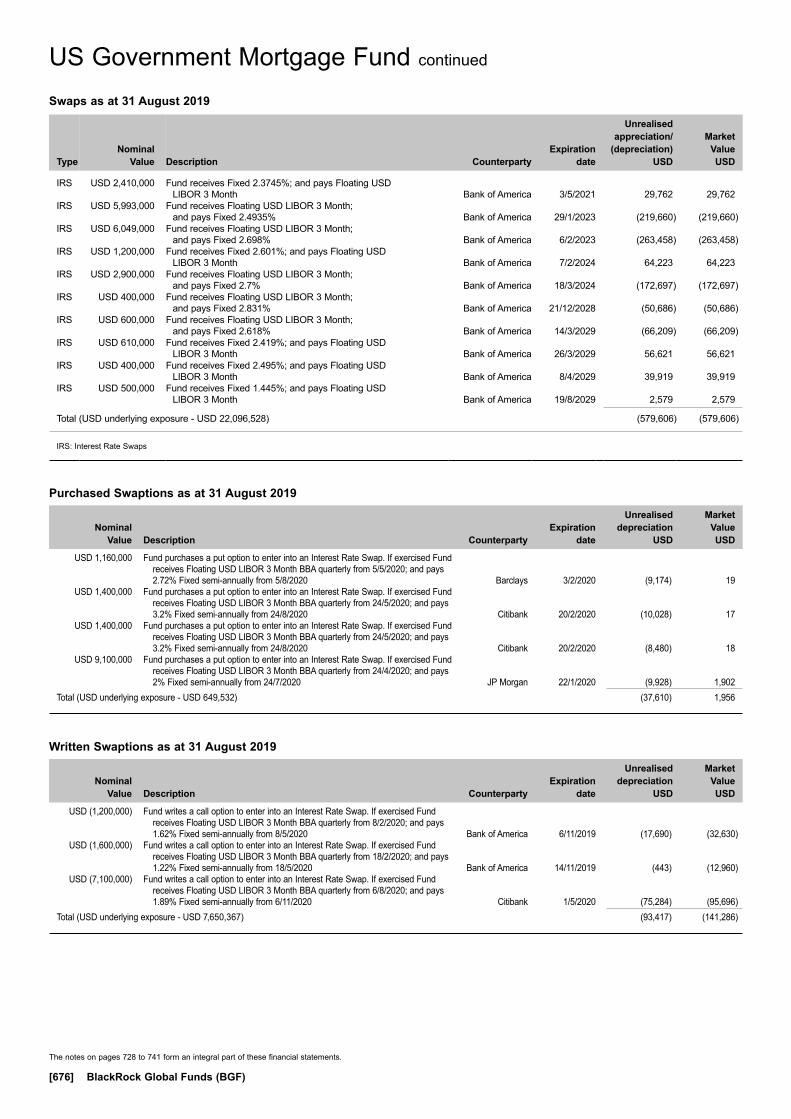
The notes on pages 728 to 741 form an integral part of these financial statements.
[676] BlackRock Global Funds (BGF)
US Government Mortgage Fund continued
Purchased Swaptions as at 31 August 2019
Nominal Value
Description Counterparty
Expiration date
Unrealised depreciation
USD
Market Value USD
USD 1,160,000 Fund purchases a put option to enter into an Interest Rate Swap. If exercised Fund receives Floating USD LIBOR 3 Month BBA quarterly from 5/5/2020; and pays 2.72% Fixed semi-annually from 5/8/2020 Barclays 3/2/2020 (9,174) 19
USD 1,400,000 Fund purchases a put option to enter into an Interest Rate Swap. If exercised Fund receives Floating USD LIBOR 3 Month BBA quarterly from 24/5/2020; and pays 3.2% Fixed semi-annually from 24/8/2020 Citibank 20/2/2020 (10,028) 17
USD 1,400,000 Fund purchases a put option to enter into an Interest Rate Swap. If exercised Fund receives Floating USD LIBOR 3 Month BBA quarterly from 24/5/2020; and pays 3.2% Fixed semi-annually from 24/8/2020 Citibank 20/2/2020 (8,480) 18
USD 9,100,000 Fund purchases a put option to enter into an Interest Rate Swap. If exercised Fund receives Floating USD LIBOR 3 Month BBA quarterly from 24/4/2020; and pays 2% Fixed semi-annually from 24/7/2020 JP Morgan 22/1/2020 (9,928) 1,902
Total (USD underlying exposure - USD 649,532) (37,610) 1,956
Swaps as at 31 August 2019
TypeNominal
Value Description Counterparty
Expiration date
Unrealised appreciation/
(depreciation) USD
Market Value USD
IRS USD 2,410,000 Fund receives Fixed 2.3745%; and pays Floating USD LIBOR 3 Month Bank of America 3/5/2021 29,762 29,762
IRS USD 5,993,000 Fund receives Floating USD LIBOR 3 Month; and pays Fixed 2.4935% Bank of America 29/1/2023 (219,660) (219,660)
IRS USD 6,049,000 Fund receives Floating USD LIBOR 3 Month; and pays Fixed 2.698% Bank of America 6/2/2023 (263,458) (263,458)
IRS USD 1,200,000 Fund receives Fixed 2.601%; and pays Floating USD LIBOR 3 Month Bank of America 7/2/2024 64,223 64,223
IRS USD 2,900,000 Fund receives Floating USD LIBOR 3 Month; and pays Fixed 2.7% Bank of America 18/3/2024 (172,697) (172,697)
IRS USD 400,000 Fund receives Floating USD LIBOR 3 Month; and pays Fixed 2.831% Bank of America 21/12/2028 (50,686) (50,686)
IRS USD 600,000 Fund receives Floating USD LIBOR 3 Month; and pays Fixed 2.618% Bank of America 14/3/2029 (66,209) (66,209)
IRS USD 610,000 Fund receives Fixed 2.419%; and pays Floating USD LIBOR 3 Month Bank of America 26/3/2029 56,621 56,621
IRS USD 400,000 Fund receives Fixed 2.495%; and pays Floating USD LIBOR 3 Month Bank of America 8/4/2029 39,919 39,919
IRS USD 500,000 Fund receives Fixed 1.445%; and pays Floating USD LIBOR 3 Month Bank of America 19/8/2029 2,579 2,579
Total (USD underlying exposure - USD 22,096,528) (579,606) (579,606)
IRS: Interest Rate Swaps
Written Swaptions as at 31 August 2019
Nominal Value
Description Counterparty
Expiration date
Unrealised depreciation
USD
Market Value USD
USD (1,200,000) Fund writes a call option to enter into an Interest Rate Swap. If exercised Fund receives Floating USD LIBOR 3 Month BBA quarterly from 8/2/2020; and pays 1.62% Fixed semi-annually from 8/5/2020 Bank of America 6/11/2019 (17,690) (32,630)
USD (1,600,000) Fund writes a call option to enter into an Interest Rate Swap. If exercised Fund receives Floating USD LIBOR 3 Month BBA quarterly from 18/2/2020; and pays 1.22% Fixed semi-annually from 18/5/2020 Bank of America 14/11/2019 (443) (12,960)
USD (7,100,000) Fund writes a call option to enter into an Interest Rate Swap. If exercised Fund receives Floating USD LIBOR 3 Month BBA quarterly from 6/8/2020; and pays 1.89% Fixed semi-annually from 6/11/2020 Citibank 1/5/2020 (75,284) (95,696)
Total (USD underlying exposure - USD 7,650,367) (93,417) (141,286)

Transferable Securities and Money Market Instruments Admitted to an Official Stock Exchange Listing or Dealt in on Another Regulated Market
Transferable Securities and Money Market Instruments Admitted to an Official Stock Exchange Listing or Dealt in on Another Regulated Market
Holding
Description
Market Value (USD)
% of Net
Assets
Holding
Description
Market Value (USD)
% of Net
Assets
* All or a portion of this security represents a security on loan.
The notes on pages 728 to 741 form an integral part of these financial statements.
Annual Report and Audited Financial Statements [677]
COMMON STOCKS (SHARES)
Cayman Islands 46,754 Alibaba Group Holding Ltd ADR 8,157,171 1.98 134,164 Tencent Holdings Ltd ADR* 5,540,973 1.34 13,698,144 3.32
Netherlands 36,253 ASML Holding NV (NY Shares) 8,097,832 1.96 11,027 Ferrari NV* 1,756,932 0.43 9,854,764 2.39
United States 36,406 Adobe Inc 10,433,231 2.53 29,733 Align Technology Inc 5,411,406 1.31 9,339 Alphabet Inc ‘A’ 11,193,352 2.71 18,622 Amazon.com Inc 33,312,896 8.08 39,153 Autodesk Inc 5,574,604 1.35 50,013 Ball Corp 4,009,542 0.97 20,848 Becton Dickinson and Co 5,320,618 1.29 27,026 Boeing Co/The* 9,845,572 2.39 1,227 Booking Holdings Inc 2,411,399 0.58 193,919 Boston Scientific Corp 8,303,612 2.01 25,489 Burlington Stores Inc* 5,300,692 1.29 35,994 CME Group Inc 7,763,906 1.88 44,579 Constellation Brands Inc ‘A’* 9,132,008 2.21 102,391 Corteva Inc 3,054,324 0.74 18,095 CoStar Group Inc* 11,139,282 2.70 14,583 Domino’s Pizza Inc* 3,290,946 0.80 50,147 Facebook Inc ‘A’ 9,295,248 2.25 45,848 GoDaddy Inc ‘A’ 2,918,225 0.71 13,411 Honeywell International Inc 2,214,693 0.54 6,674 Humana Inc 1,884,003 0.46 43,518 IAC/InterActiveCorp 11,061,840 2.68 13,874 Illumina Inc 3,948,402 0.96 38,775 Intuit Inc 11,143,547 2.70
14,582 Intuitive Surgical Inc 7,472,254 1.81 37,970 IQVIA Holdings Inc 5,907,752 1.43 42,824 Keysight Technologies Inc 4,158,210 1.01 67,499 Mastercard Inc 19,054,968 4.62 12,872 MercadoLibre Inc* 7,712,902 1.87 179,684 Microsoft Corp 24,870,062 6.03 35,665 Netflix Inc 10,517,609 2.55 48,258 NIKE Inc 4,127,507 1.00 37,406 PayPal Holdings Inc 4,107,553 1.00 27,290 PTC Inc 1,789,132 0.43 14,522 Roper Technologies Inc 5,348,598 1.30 35,231 S&P Global Inc 9,200,223 2.23 78,577 salesforce.com Inc 12,393,164 3.00 31,987 SBA Communications Corp (Reit) ‘A’ 8,407,463 2.04 34,766 ServiceNow Inc 9,238,022 2.24 12,875 Sherwin-Williams Co/The* 6,791,048 1.65 61,562 TransUnion 5,147,814 1.25 28,583 Union Pacific Corp 4,664,460 1.13 52,057 UnitedHealth Group Inc 12,186,544 2.95 23,786 Vertex Pharmaceuticals Inc 4,286,475 1.04 118,038 Visa Inc ‘A’ 21,414,454 5.19 30,478 Vulcan Materials Co* 4,310,504 1.04 36,229 Xylem Inc/NY 2,799,415 0.68 36,598 Zoetis Inc 4,639,528 1.12 378,509,009 91.75Total Common Stocks (Shares) 402,061,917 97.46Total Transferable Securities and Money Market Instruments Admitted to an Official Stock Exchange Listing or Dealt in on Another Regulated Market 402,061,917 97.46Total Portfolio 402,061,917 97.46
Other Net Assets 10,472,779 2.54Total Net Assets (USD) 412,534,696 100.00
US Growth Fund
Portfolio of Investments 31 August 2019
US Growth Fund

The notes on pages 728 to 741 form an integral part of these financial statements.
[678] BlackRock Global Funds (BGF)
US Growth Fund continued
Open Forward Foreign Exchange Contracts as at 31 August 2019
Currency
Purchases Currency
Sales Counterparty
Maturity date
Unrealised appreciation/
(depreciation) USD
EUR Hedged Share Class
EUR 17,777,635 USD 19,950,908 BNY Mellon 12/9/2019 (299,264)USD 1,230,889 EUR 1,103,930 BNY Mellon 12/9/2019 10,596
Net unrealised depreciation (USD underlying exposure - USD 20,856,694) (288,668)
Sector Breakdown as at 31 August 2019
% of Net Assets
Information Technology 32.77Consumer Discretionary 16.03Healthcare 14.38Communication Services 11.53Industrials 9.99Materials 4.40Financials 4.11Consumer Staples 2.21Real Estate 2.04Other Net Assets 2.54
100.00
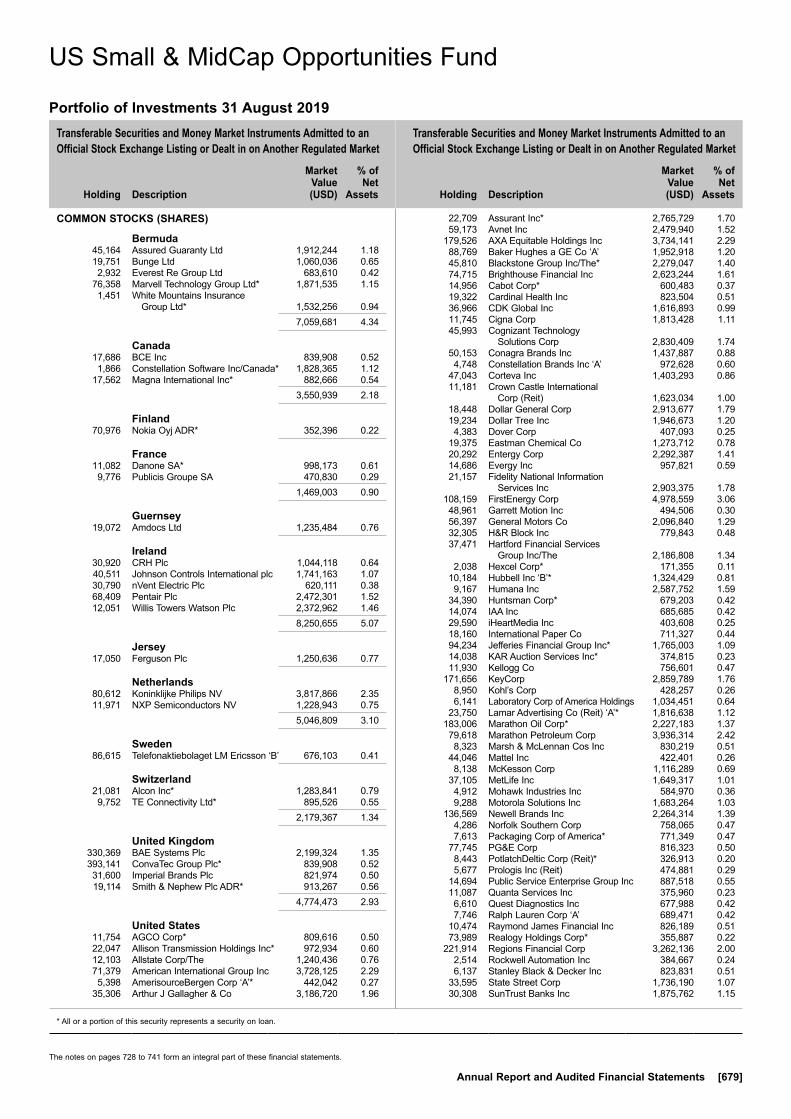
Transferable Securities and Money Market Instruments Admitted to an Official Stock Exchange Listing or Dealt in on Another Regulated Market
Transferable Securities and Money Market Instruments Admitted to an Official Stock Exchange Listing or Dealt in on Another Regulated Market
Holding
Description
Market Value (USD)
% of Net
Assets
Holding
Description
Market Value (USD)
% of Net
Assets
* All or a portion of this security represents a security on loan.
The notes on pages 728 to 741 form an integral part of these financial statements.
Annual Report and Audited Financial Statements [679]
COMMON STOCKS (SHARES)
Bermuda 45,164 Assured Guaranty Ltd 1,912,244 1.18 19,751 Bunge Ltd 1,060,036 0.65 2,932 Everest Re Group Ltd 683,610 0.42 76,358 Marvell Technology Group Ltd* 1,871,535 1.15 1,451 White Mountains Insurance
Group Ltd* 1,532,256 0.94 7,059,681 4.34
Canada 17,686 BCE Inc 839,908 0.52 1,866 Constellation Software Inc/Canada* 1,828,365 1.12 17,562 Magna International Inc* 882,666 0.54 3,550,939 2.18
Finland 70,976 Nokia Oyj ADR* 352,396 0.22
France 11,082 Danone SA* 998,173 0.61 9,776 Publicis Groupe SA 470,830 0.29 1,469,003 0.90
Guernsey 19,072 Amdocs Ltd 1,235,484 0.76
Ireland 30,920 CRH Plc 1,044,118 0.64 40,511 Johnson Controls International plc 1,741,163 1.07 30,790 nVent Electric Plc 620,111 0.38 68,409 Pentair Plc 2,472,301 1.52 12,051 Willis Towers Watson Plc 2,372,962 1.46 8,250,655 5.07
Jersey 17,050 Ferguson Plc 1,250,636 0.77
Netherlands 80,612 Koninklijke Philips NV 3,817,866 2.35 11,971 NXP Semiconductors NV 1,228,943 0.75 5,046,809 3.10
Sweden 86,615 Telefonaktiebolaget LM Ericsson ‘B’ 676,103 0.41
Switzerland 21,081 Alcon Inc* 1,283,841 0.79 9,752 TE Connectivity Ltd* 895,526 0.55 2,179,367 1.34
United Kingdom 330,369 BAE Systems Plc 2,199,324 1.35 393,141 ConvaTec Group Plc* 839,908 0.52 31,600 Imperial Brands Plc 821,974 0.50 19,114 Smith & Nephew Plc ADR* 913,267 0.56 4,774,473 2.93
United States 11,754 AGCO Corp* 809,616 0.50 22,047 Allison Transmission Holdings Inc* 972,934 0.60 12,103 Allstate Corp/The 1,240,436 0.76 71,379 American International Group Inc 3,728,125 2.29 5,398 AmerisourceBergen Corp ‘A’* 442,042 0.27 35,306 Arthur J Gallagher & Co 3,186,720 1.96
22,709 Assurant Inc* 2,765,729 1.70 59,173 Avnet Inc 2,479,940 1.52 179,526 AXA Equitable Holdings Inc 3,734,141 2.29 88,769 Baker Hughes a GE Co ‘A’ 1,952,918 1.20 45,810 Blackstone Group Inc/The* 2,279,047 1.40 74,715 Brighthouse Financial Inc 2,623,244 1.61 14,956 Cabot Corp* 600,483 0.37 19,322 Cardinal Health Inc 823,504 0.51 36,966 CDK Global Inc 1,616,893 0.99 11,745 Cigna Corp 1,813,428 1.11 45,993 Cognizant Technology
Solutions Corp 2,830,409 1.74 50,153 Conagra Brands Inc 1,437,887 0.88 4,748 Constellation Brands Inc ‘A’ 972,628 0.60 47,043 Corteva Inc 1,403,293 0.86 11,181 Crown Castle International
Corp (Reit) 1,623,034 1.00 18,448 Dollar General Corp 2,913,677 1.79 19,234 Dollar Tree Inc 1,946,673 1.20 4,383 Dover Corp 407,093 0.25 19,375 Eastman Chemical Co 1,273,712 0.78 20,292 Entergy Corp 2,292,387 1.41 14,686 Evergy Inc 957,821 0.59 21,157 Fidelity National Information
Services Inc 2,903,375 1.78 108,159 FirstEnergy Corp 4,978,559 3.06 48,961 Garrett Motion Inc 494,506 0.30 56,397 General Motors Co 2,096,840 1.29 32,305 H&R Block Inc 779,843 0.48 37,471 Hartford Financial Services
Group Inc/The 2,186,808 1.34 2,038 Hexcel Corp* 171,355 0.11 10,184 Hubbell Inc ‘B’* 1,324,429 0.81 9,167 Humana Inc 2,587,752 1.59 34,390 Huntsman Corp* 679,203 0.42 14,074 IAA Inc 685,685 0.42 29,590 iHeartMedia Inc 403,608 0.25 18,160 International Paper Co 711,327 0.44 94,234 Jefferies Financial Group Inc* 1,765,003 1.09 14,038 KAR Auction Services Inc* 374,815 0.23 11,930 Kellogg Co 756,601 0.47 171,656 KeyCorp 2,859,789 1.76 8,950 Kohl’s Corp 428,257 0.26 6,141 Laboratory Corp of America Holdings 1,034,451 0.64 23,750 Lamar Advertising Co (Reit) ‘A’* 1,816,638 1.12 183,006 Marathon Oil Corp* 2,227,183 1.37 79,618 Marathon Petroleum Corp 3,936,314 2.42 8,323 Marsh & McLennan Cos Inc 830,219 0.51 44,046 Mattel Inc 422,401 0.26 8,138 McKesson Corp 1,116,289 0.69 37,105 MetLife Inc 1,649,317 1.01 4,912 Mohawk Industries Inc 584,970 0.36 9,288 Motorola Solutions Inc 1,683,264 1.03 136,569 Newell Brands Inc 2,264,314 1.39 4,286 Norfolk Southern Corp 758,065 0.47 7,613 Packaging Corp of America* 771,349 0.47 77,745 PG&E Corp 816,323 0.50 8,443 PotlatchDeltic Corp (Reit)* 326,913 0.20 5,677 Prologis Inc (Reit) 474,881 0.29 14,694 Public Service Enterprise Group Inc 887,518 0.55 11,087 Quanta Services Inc 375,960 0.23 6,610 Quest Diagnostics Inc 677,988 0.42 7,746 Ralph Lauren Corp ‘A’ 689,471 0.42 10,474 Raymond James Financial Inc 826,189 0.51 73,989 Realogy Holdings Corp* 355,887 0.22 221,914 Regions Financial Corp 3,262,136 2.00 2,514 Rockwell Automation Inc 384,667 0.24 6,137 Stanley Black & Decker Inc 823,831 0.51 33,595 State Street Corp 1,736,190 1.07 30,308 SunTrust Banks Inc 1,875,762 1.15
US Small & MidCap Opportunities Fund
Portfolio of Investments 31 August 2019
US Small & MidCap Opportunities Fund
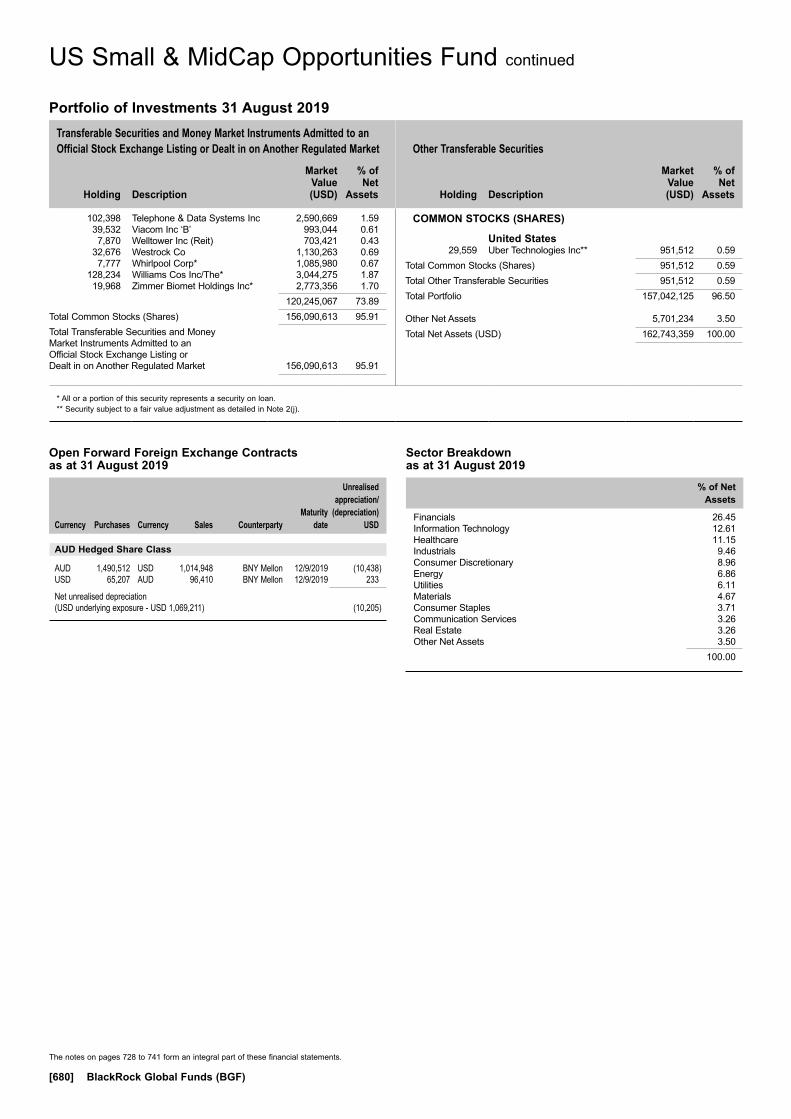
Transferable Securities and Money Market Instruments Admitted to an Official Stock Exchange Listing or Dealt in on Another Regulated Market Other Transferable Securities
Holding
Description
Market Value (USD)
% of Net
Assets
Holding
Description
Market Value (USD)
% of Net
Assets
* All or a portion of this security represents a security on loan.** Security subject to a fair value adjustment as detailed in Note 2(j).
The notes on pages 728 to 741 form an integral part of these financial statements.
[680] BlackRock Global Funds (BGF)
102,398 Telephone & Data Systems Inc 2,590,669 1.59 39,532 Viacom Inc ‘B’ 993,044 0.61 7,870 Welltower Inc (Reit) 703,421 0.43 32,676 Westrock Co 1,130,263 0.69 7,777 Whirlpool Corp* 1,085,980 0.67 128,234 Williams Cos Inc/The* 3,044,275 1.87 19,968 Zimmer Biomet Holdings Inc* 2,773,356 1.70 120,245,067 73.89Total Common Stocks (Shares) 156,090,613 95.91Total Transferable Securities and Money Market Instruments Admitted to an Official Stock Exchange Listing or Dealt in on Another Regulated Market 156,090,613 95.91
COMMON STOCKS (SHARES)
United States 29,559 Uber Technologies Inc** 951,512 0.59Total Common Stocks (Shares) 951,512 0.59Total Other Transferable Securities 951,512 0.59Total Portfolio 157,042,125 96.50
Other Net Assets 5,701,234 3.50Total Net Assets (USD) 162,743,359 100.00
US Small & MidCap Opportunities Fund continued
Portfolio of Investments 31 August 2019
Open Forward Foreign Exchange Contracts as at 31 August 2019
Currency
Purchases Currency
Sales Counterparty
Maturity date
Unrealised appreciation/
(depreciation) USD
AUD Hedged Share Class
AUD 1,490,512 USD 1,014,948 BNY Mellon 12/9/2019 (10,438)USD 65,207 AUD 96,410 BNY Mellon 12/9/2019 233
Net unrealised depreciation (USD underlying exposure - USD 1,069,211) (10,205)
Sector Breakdown as at 31 August 2019
% of Net Assets
Financials 26.45Information Technology 12.61Healthcare 11.15Industrials 9.46Consumer Discretionary 8.96Energy 6.86Utilities 6.11Materials 4.67Consumer Staples 3.71Communication Services 3.26Real Estate 3.26Other Net Assets 3.50
100.00

Transferable Securities and Money Market Instruments Admitted to an Official Stock Exchange Listing or Dealt in on Another Regulated Market
Transferable Securities and Money Market Instruments Admitted to an Official Stock Exchange Listing or Dealt in on Another Regulated Market
Holding
Description
Market Value (USD)
% of Net
Assets
Holding
Description
Market Value (USD)
% of Net
Assets
* All or a portion of this security represents a security on loan.
The notes on pages 728 to 741 form an integral part of these financial statements.
Annual Report and Audited Financial Statements [681]
BONDS
Argentina USD 215,625 Aeropuertos Argentina 2000 SA
‘144A’ 6.875% 1/2/2027 192,984 0.02 CHF 85,000 Argentine Republic Government
International Bond 3.375% 12/10/2020 45,061 0.00
USD 404,000 Argentine Republic Government International Bond 4.625% 11/1/2023 163,241 0.01
USD 2,695,000 Argentine Republic Government International Bond 5.875% 11/1/2028 1,037,575 0.08
USD 1,086,000 Argentine Republic Government International Bond 6.875% 11/1/2048 427,341 0.03
USD 673,000 Argentine Republic Government International Bond 7.125% 6/7/2036 265,835 0.02
USD 460,000 Argentine Republic Government International Bond 7.5% 22/4/2026 181,700 0.01
USD 773,000 Generacion Mediterranea SA / Generacion Frias SA / Central Termica Roca SA ‘144A’ 9.625% 27/7/2023 448,340 0.03
USD 230,000 Genneia SA ‘144A’ 8.75% 20/1/2022 137,713 0.01 USD 230,000 Pampa Energia SA ‘144A’ 7.5%
24/1/2027 147,200 0.01 USD 244,000 Rio Energy SA / UGEN SA /
UENSA SA 6.875% 1/2/2025 113,460 0.01 USD 230,000 Telecom Argentina SA ‘144A’ 6.5%
15/6/2021 207,000 0.02 USD 374,000 Telecom Argentina SA ‘144A’ 8%
18/7/2026 302,063 0.02 3,669,513 0.27
Australia AUD 1,060,000 Australia Government Bond 3%
21/3/2047 961,482 0.07 USD 49,000 Commonwealth Bank of Australia
‘144A’ 3.45% 16/3/2023 51,464 0.00 AUD 2,500,000 New South Wales Treasury Corp
4% 20/4/2023 1,870,426 0.14 EUR 100,000 Origin Energy Finance Ltd FRN
16/9/2074 110,819 0.01 AUD 2,500,000 Queensland Treasury Corp ‘144A’
3.25% 21/7/2026 1,913,689 0.14 EUR 280,000 Telstra Corp Ltd 1.375% 26/3/2029 344,657 0.03 EUR 800,000 Telstra Corp Ltd 3.5% 21/9/2022 986,774 0.07 AUD 2,500,000 Treasury Corp of Victoria 6%
17/10/2022 1,949,313 0.14 8,188,624 0.60
Austria EUR 1,200,000 BAWAG PSK Bank fuer Arbeit und
Wirtschaft und Oesterreichische Postsparkasse AG 0.375% 3/9/2027 1,311,147 0.09
USD 620,000 Eldorado Intl. Finance GmbH ‘144A’ 8.625% 16/6/2021* 648,869 0.05
EUR 600,000 Erste Group Bank AG 0.25% 26/6/2024 688,000 0.05
EUR 700,000 Erste Group Bank AG 0.375% 16/4/2024 793,403 0.06
USD 517,000 JBS Investments II GmbH ‘144A’ 5.75% 15/1/2028 542,850 0.04
EUR 560,000 OeBB-Infrastruktur AG 1% 18/11/2024 672,329 0.05
EUR 1,750,000 Republic of Austria Government Bond ‘144A’ 0.5% 20/2/2029 2,111,915 0.15
EUR 750,000 Republic of Austria Government Bond ‘144A’ 1.5% 2/11/2086 1,287,654 0.09
EUR 650,000 Republic of Austria Government Bond ‘144A’ 3.4% 22/11/2022 817,322 0.06
USD 400,000 Suzano Austria GmbH 5% 15/1/2030 411,000 0.03 USD 901,000 Suzano Austria GmbH 6% 15/1/2029 1,003,489 0.07 USD 430,000 Suzano Austria GmbH ‘144A’ 7%
16/3/2047 500,950 0.04 10,788,928 0.78
Bahamas USD 200,000 Intercorp Peru Ltd ‘144A’ 3.875%
15/8/2029 201,750 0.01
Belgium EUR 1,770,000 Kingdom of Belgium Government
Bond ‘144A’ 0.2% 22/10/2023 2,034,391 0.15 EUR 2,280,000 Kingdom of Belgium Government
Bond ‘144A’ 0.9% 22/6/2029 2,836,021 0.21 EUR 180,000 Kingdom of Belgium Government
Bond ‘144A’ 1.7% 22/6/2050 267,742 0.02 EUR 660,000 Kingdom of Belgium Government
Bond ‘144A’ 2.15% 22/6/2066 1,122,454 0.08 EUR 1,990,000 Kingdom of Belgium Government
Bond ‘144A’ 3% 22/6/2034 3,201,757 0.23 EUR 1,020,000 Kingdom of Belgium Government
Bond 4% 28/3/2022 1,268,748 0.09 10,731,113 0.78
Bermuda USD 77,947 Digicel Group Two Ltd ‘144A’ 9.125%
1/4/2024 7,429 0.00 USD 230,000 Geopark Ltd ‘144A’ 6.5% 21/9/2024 235,175 0.02 USD 440,000 Inkia Energy Ltd ‘144A’ 5.875%
9/11/2027 459,388 0.03 USD 200,000 Ooredoo International Finance Ltd
3.75% 22/6/2026 213,896 0.02 915,888 0.07
Brazil USD 230,000 Banco do Brasil SA/Cayman ‘144A’
FRN 18/6/2024 (Perpetual) 253,503 0.02 BRL 50,000 Brazil Notas do Tesouro Nacional
Serie F 10% 1/1/2029 1,409,606 0.10 USD 1,716,000 Brazilian Government International
Bond 4.5% 30/5/2029 1,817,935 0.13 USD 238,000 Brazilian Government International
Bond 4.625% 13/1/2028 256,864 0.02 USD 305,000 Itau Unibanco Holding SA/Cayman
Island ‘144A’ FRN 12/12/2022 (Perpetual) 307,958 0.02
USD 230,000 Itau Unibanco Holding SA/Cayman Island FRN 12/12/2022 (Perpetual) 232,231 0.02
USD 200,000 Itau Unibanco Holding SA/Cayman Island ‘144A’ FRN 19/3/2023 (Perpetual) 204,281 0.01
USD 1,040,000 Oi SA 10% 27/7/2025 925,600 0.07 USD 337,000 Samarco Mineracao SA (Defaulted)
4.125% 1/11/2022 238,428 0.02 USD 200,000 Samarco Mineracao SA (Defaulted)
‘144A’ 5.375% 26/9/2024 144,000 0.01 5,790,406 0.42
World Bond Fund
Portfolio of Investments 31 August 2019
World Bond Fund

Transferable Securities and Money Market Instruments Admitted to an Official Stock Exchange Listing or Dealt in on Another Regulated Market
Transferable Securities and Money Market Instruments Admitted to an Official Stock Exchange Listing or Dealt in on Another Regulated Market
Holding
Description
Market Value (USD)
% of Net
Assets
Holding
Description
Market Value (USD)
% of Net
Assets
* All or a portion of this security represents a security on loan.
The notes on pages 728 to 741 form an integral part of these financial statements.
[682] BlackRock Global Funds (BGF)
British Virgin Islands USD 400,000 CNOOC Finance 2013 Ltd 4.25%
9/5/2043 473,313 0.03 USD 250,000 GTL Trade Finance Inc / Gerdau
Holdings Inc 5.893% 29/4/2024 276,523 0.02 USD 1,000,000 Sinopec Group Overseas
Development 2017 Ltd 3.625% 12/4/2027 1,067,243 0.08
USD 500,000 State Grid Overseas Investment 2013 Ltd 3.125% 22/5/2023* 515,547 0.04
USD 300,000 State Grid Overseas Investment 2016 Ltd 4% 4/5/2047* 352,436 0.02
USD 500,000 Talent Yield Investments Ltd ‘144A’ 4.5% 25/4/2022 522,500 0.04
3,207,562 0.23
Canada EUR 500,000 Bank of Montreal 0.2% 26/1/2023 565,975 0.04 EUR 200,000 Bausch Health Cos Inc 4.5%
15/5/2023 224,364 0.02 CAD 2,500,000 Canada Housing Trust No 1 ‘144A’
1.9% 15/9/2026 1,927,357 0.14 CAD 2,275,000 Canada Housing Trust No 1 ‘144A’
2.4% 15/12/2022 1,764,083 0.13 CAD 7,820,000 Canadian Government Bond 1.5%
1/9/2024 5,985,852 0.43 CAD 560,000 Canadian Government Bond 2%
1/12/2051 489,288 0.04 CAD 590,000 Canadian Government Bond 2.75%
1/12/2048 588,878 0.04 CAD 483,000 Canadian Government Bond 3.5%
1/12/2045 531,898 0.04 CAD 1,230,000 Canadian Government Bond 4%
1/6/2041 1,376,371 0.10 USD 503,000 Frontera Energy Corp ‘144A’ 9.7%
25/6/2023 535,931 0.04 CAD 1,200,000 Hydro-Quebec 5% 15/2/2050 1,457,341 0.11 CAD 1,000,000 Province of Alberta Canada 3.05%
1/12/2048 873,438 0.06 CAD 760,000 Province of British Columbia
Canada 2.3% 18/6/2026 596,087 0.04 CAD 270,000 Province of British Columbia
Canada 2.95% 18/6/2050 240,239 0.02 CAD 390,000 Province of British Columbia
Canada 3.2% 18/6/2044 350,999 0.03 CAD 450,000 Province of Manitoba Canada 3.2%
5/3/2050 402,463 0.03 CAD 184,000 Province of New Brunswick
Canada 3.05% 14/8/2050 157,452 0.01 CAD 300,000 Province of Nova Scotia Canada
3.15% 1/12/2051 269,914 0.02 CAD 3,345,000 Province of Ontario Canada 2.4%
2/6/2026 2,631,573 0.19 CAD 650,000 Province of Ontario Canada 2.9%
2/6/2028 532,277 0.04 CAD 2,000,000 Province of Ontario Canada 2.9%
2/12/2046 1,709,278 0.12 CAD 1,020,000 Province of Ontario Canada 3.15%
2/6/2022 801,911 0.06 CAD 1,000,000 Province of Ontario Canada 4.7%
2/6/2037 1,029,300 0.07 EUR 550,000 Province of Quebec Canada
0.875% 4/5/2027 665,409 0.05 CAD 670,000 Province of Quebec Canada
3.1% 1/12/2051 610,930 0.04 CAD 7,540,000 Province of Quebec Canada
4.25% 1/12/2021 6,027,188 0.44
CAD 308,000 Province of Saskatchewan Canada 2.95% 2/6/2058 271,297 0.02
USD 1,082,841 Stoneway Capital Corp ‘144A’ 10% 1/3/2027 676,126 0.05
USD 45,000 Suncor Energy Inc 3.6% 1/12/2024 47,419 0.00 USD 20,000 Suncor Energy Inc 4% 15/11/2047 22,023 0.00 USD 20,000 Teck Resources Ltd 6.125%
1/10/2035 23,400 0.00 EUR 1,600,000 Toronto-Dominion Bank/The
0.375% 25/4/2024 1,804,303 0.13 USD 207,000 TransCanada PipeLines Ltd 4.25%
15/5/2028 230,842 0.02 USD 605,000 TransCanada PipeLines Ltd 4.625%
1/3/2034 691,857 0.05 USD 71,000 TransCanada PipeLines Ltd 5.1%
15/3/2049 86,939 0.01 USD 65,000 TransCanada PipeLines Ltd 6.2%
15/10/2037 85,113 0.01 36,285,115 2.64
Cayman Islands USD 775,000 Alibaba Group Holding Ltd 3.4%
6/12/2027 812,491 0.06 USD 500,000 Alibaba Group Holding Ltd 3.6%
28/11/2024 528,043 0.04 USD 605,000 Baidu Inc 4.375% 14/5/2024 650,735 0.05 USD 400,000 DP World Crescent Ltd 3.908%
31/5/2023 415,250 0.03 USD 230,000 DP World Crescent Ltd ‘144A’
4.848% 26/9/2028 255,084 0.02 USD 400,000 Emaar Sukuk Ltd 3.635% 15/9/2026 402,312 0.03 USD 200,000 Energuate Trust ‘144A’ 5.875%
3/5/2027 200,188 0.01 USD 932,000 Gol Finance Inc ‘144A’ 7%
31/1/2025* 919,185 0.07 USD 230,000 Gran Tierra Energy International
Holdings Ltd ‘144A’ 6.25% 15/2/2025 213,900 0.02
USD 400,000 KSA Sukuk Ltd 3.628% 20/4/2027 435,800 0.03 USD 230,000 Latam Finance Ltd ‘144A’ 6.875%
11/4/2024 239,919 0.02 USD 429,000 Latam Finance Ltd ‘144A’ 7%
1/3/2026 446,160 0.03 USD 400,000 MAF Sukuk Ltd 4.5% 3/11/2025 428,500 0.03 USD 126,248 Odebrecht Drilling Norbe VIII/IX Ltd
‘144A’ 6.35% 1/12/2021 125,618 0.01 USD 174,739 Odebrecht Offshore Drilling
Finance Ltd ‘144A’ 6.72% 1/12/2022 171,735 0.01
USD 230,000 Saudi Electricity Global Sukuk Co 4 4.723% 27/9/2028 262,667 0.02
USD 300,000 Tencent Holdings Ltd ‘144A’ 3.595% 19/1/2028* 315,708 0.02
USD 400,000 Tencent Holdings Ltd 3.8% 11/2/2025* 424,947 0.03
USD 285,000 Tencent Holdings Ltd ‘144A’ 3.925% 19/1/2038 309,948 0.02
USD 500,000 Three Gorges Finance I Cayman Islands Ltd 3.15% 2/6/2026* 521,641 0.04
GBP 200,000 Trafford Centre Finance Ltd/The FRN 28/7/2035 215,695 0.02
USD 312,000 Vale Overseas Ltd 4.375% 11/1/2022 323,505 0.02
USD 630,000 Vale Overseas Ltd 6.25% 10/8/2026 725,477 0.05 9,344,508 0.68
World Bond Fund continued
Portfolio of Investments 31 August 2019
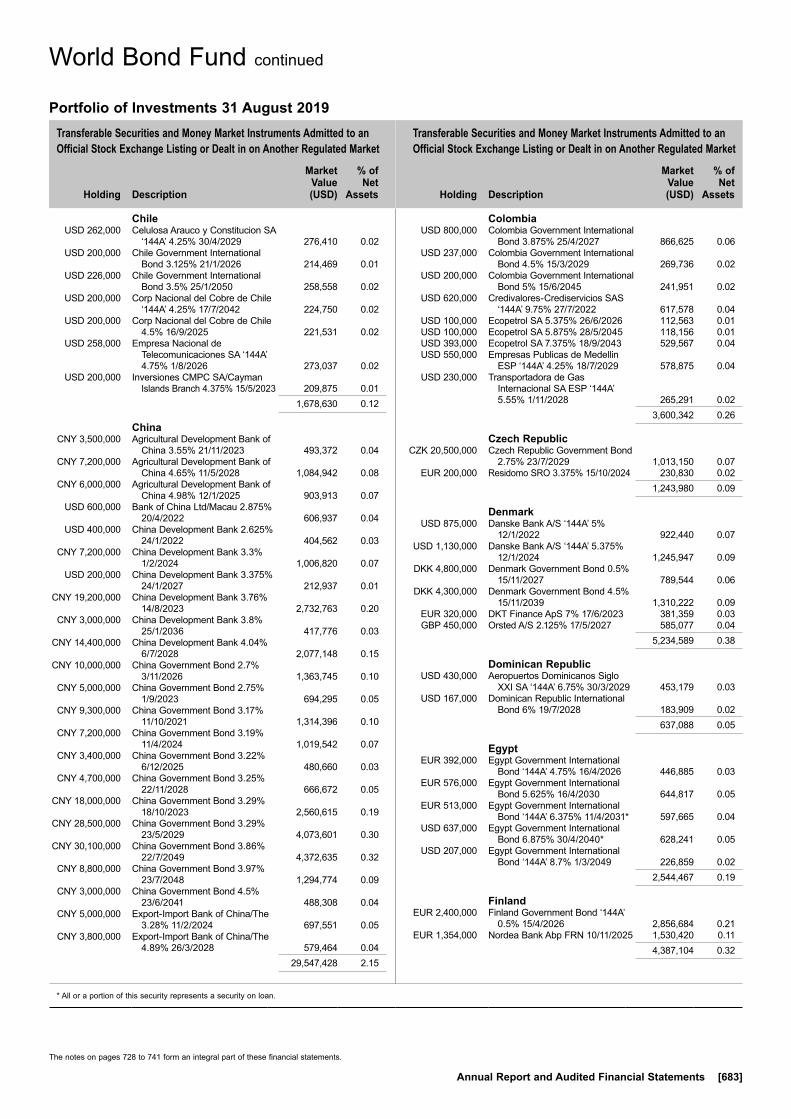
Transferable Securities and Money Market Instruments Admitted to an Official Stock Exchange Listing or Dealt in on Another Regulated Market
Transferable Securities and Money Market Instruments Admitted to an Official Stock Exchange Listing or Dealt in on Another Regulated Market
Holding
Description
Market Value (USD)
% of Net
Assets
Holding
Description
Market Value (USD)
% of Net
Assets
* All or a portion of this security represents a security on loan.
The notes on pages 728 to 741 form an integral part of these financial statements.
Annual Report and Audited Financial Statements [683]
Chile USD 262,000 Celulosa Arauco y Constitucion SA
‘144A’ 4.25% 30/4/2029 276,410 0.02 USD 200,000 Chile Government International
Bond 3.125% 21/1/2026 214,469 0.01 USD 226,000 Chile Government International
Bond 3.5% 25/1/2050 258,558 0.02 USD 200,000 Corp Nacional del Cobre de Chile
‘144A’ 4.25% 17/7/2042 224,750 0.02 USD 200,000 Corp Nacional del Cobre de Chile
4.5% 16/9/2025 221,531 0.02 USD 258,000 Empresa Nacional de
Telecomunicaciones SA ‘144A’ 4.75% 1/8/2026 273,037 0.02
USD 200,000 Inversiones CMPC SA/Cayman Islands Branch 4.375% 15/5/2023 209,875 0.01
1,678,630 0.12
China CNY 3,500,000 Agricultural Development Bank of
China 3.55% 21/11/2023 493,372 0.04 CNY 7,200,000 Agricultural Development Bank of
China 4.65% 11/5/2028 1,084,942 0.08 CNY 6,000,000 Agricultural Development Bank of
China 4.98% 12/1/2025 903,913 0.07 USD 600,000 Bank of China Ltd/Macau 2.875%
20/4/2022 606,937 0.04 USD 400,000 China Development Bank 2.625%
24/1/2022 404,562 0.03 CNY 7,200,000 China Development Bank 3.3%
1/2/2024 1,006,820 0.07 USD 200,000 China Development Bank 3.375%
24/1/2027 212,937 0.01 CNY 19,200,000 China Development Bank 3.76%
14/8/2023 2,732,763 0.20 CNY 3,000,000 China Development Bank 3.8%
25/1/2036 417,776 0.03 CNY 14,400,000 China Development Bank 4.04%
6/7/2028 2,077,148 0.15 CNY 10,000,000 China Government Bond 2.7%
3/11/2026 1,363,745 0.10 CNY 5,000,000 China Government Bond 2.75%
1/9/2023 694,295 0.05 CNY 9,300,000 China Government Bond 3.17%
11/10/2021 1,314,396 0.10 CNY 7,200,000 China Government Bond 3.19%
11/4/2024 1,019,542 0.07 CNY 3,400,000 China Government Bond 3.22%
6/12/2025 480,660 0.03 CNY 4,700,000 China Government Bond 3.25%
22/11/2028 666,672 0.05 CNY 18,000,000 China Government Bond 3.29%
18/10/2023 2,560,615 0.19 CNY 28,500,000 China Government Bond 3.29%
23/5/2029 4,073,601 0.30 CNY 30,100,000 China Government Bond 3.86%
22/7/2049 4,372,635 0.32 CNY 8,800,000 China Government Bond 3.97%
23/7/2048 1,294,774 0.09 CNY 3,000,000 China Government Bond 4.5%
23/6/2041 488,308 0.04 CNY 5,000,000 Export-Import Bank of China/The
3.28% 11/2/2024 697,551 0.05 CNY 3,800,000 Export-Import Bank of China/The
4.89% 26/3/2028 579,464 0.04 29,547,428 2.15
Colombia USD 800,000 Colombia Government International
Bond 3.875% 25/4/2027 866,625 0.06 USD 237,000 Colombia Government International
Bond 4.5% 15/3/2029 269,736 0.02 USD 200,000 Colombia Government International
Bond 5% 15/6/2045 241,951 0.02 USD 620,000 Credivalores-Crediservicios SAS
‘144A’ 9.75% 27/7/2022 617,578 0.04 USD 100,000 Ecopetrol SA 5.375% 26/6/2026 112,563 0.01 USD 100,000 Ecopetrol SA 5.875% 28/5/2045 118,156 0.01 USD 393,000 Ecopetrol SA 7.375% 18/9/2043 529,567 0.04 USD 550,000 Empresas Publicas de Medellin
ESP ‘144A’ 4.25% 18/7/2029 578,875 0.04 USD 230,000 Transportadora de Gas
Internacional SA ESP ‘144A’ 5.55% 1/11/2028 265,291 0.02
3,600,342 0.26
Czech Republic CZK 20,500,000 Czech Republic Government Bond
2.75% 23/7/2029 1,013,150 0.07 EUR 200,000 Residomo SRO 3.375% 15/10/2024 230,830 0.02 1,243,980 0.09
Denmark USD 875,000 Danske Bank A/S ‘144A’ 5%
12/1/2022 922,440 0.07 USD 1,130,000 Danske Bank A/S ‘144A’ 5.375%
12/1/2024 1,245,947 0.09 DKK 4,800,000 Denmark Government Bond 0.5%
15/11/2027 789,544 0.06 DKK 4,300,000 Denmark Government Bond 4.5%
15/11/2039 1,310,222 0.09 EUR 320,000 DKT Finance ApS 7% 17/6/2023 381,359 0.03 GBP 450,000 Orsted A/S 2.125% 17/5/2027 585,077 0.04 5,234,589 0.38
Dominican Republic USD 430,000 Aeropuertos Dominicanos Siglo
XXI SA ‘144A’ 6.75% 30/3/2029 453,179 0.03 USD 167,000 Dominican Republic International
Bond 6% 19/7/2028 183,909 0.02 637,088 0.05
Egypt EUR 392,000 Egypt Government International
Bond ‘144A’ 4.75% 16/4/2026 446,885 0.03 EUR 576,000 Egypt Government International
Bond 5.625% 16/4/2030 644,817 0.05 EUR 513,000 Egypt Government International
Bond ‘144A’ 6.375% 11/4/2031* 597,665 0.04 USD 637,000 Egypt Government International
Bond 6.875% 30/4/2040* 628,241 0.05 USD 207,000 Egypt Government International
Bond ‘144A’ 8.7% 1/3/2049 226,859 0.02 2,544,467 0.19
Finland EUR 2,400,000 Finland Government Bond ‘144A’
0.5% 15/4/2026 2,856,684 0.21 EUR 1,354,000 Nordea Bank Abp FRN 10/11/2025 1,530,420 0.11 4,387,104 0.32
World Bond Fund continued
Portfolio of Investments 31 August 2019
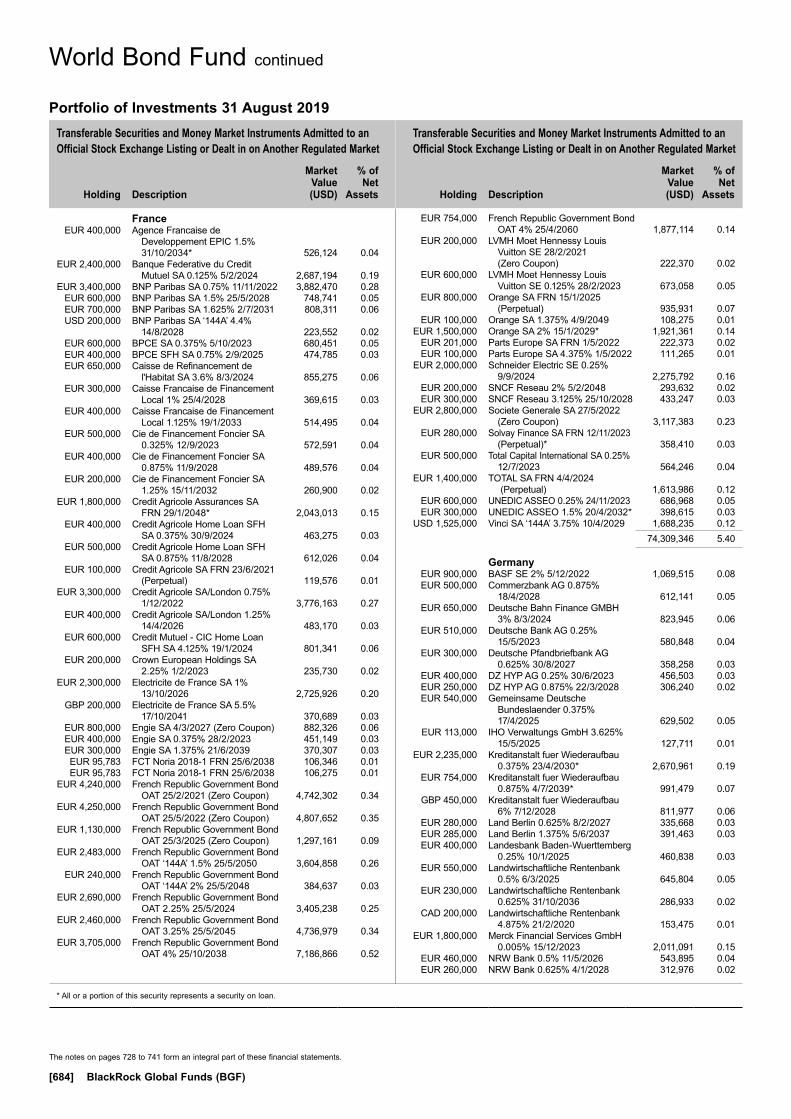
Transferable Securities and Money Market Instruments Admitted to an Official Stock Exchange Listing or Dealt in on Another Regulated Market
Transferable Securities and Money Market Instruments Admitted to an Official Stock Exchange Listing or Dealt in on Another Regulated Market
Holding
Description
Market Value (USD)
% of Net
Assets
Holding
Description
Market Value (USD)
% of Net
Assets
* All or a portion of this security represents a security on loan.
The notes on pages 728 to 741 form an integral part of these financial statements.
[684] BlackRock Global Funds (BGF)
France EUR 400,000 Agence Francaise de
Developpement EPIC 1.5% 31/10/2034* 526,124 0.04
EUR 2,400,000 Banque Federative du Credit Mutuel SA 0.125% 5/2/2024 2,687,194 0.19
EUR 3,400,000 BNP Paribas SA 0.75% 11/11/2022 3,882,470 0.28 EUR 600,000 BNP Paribas SA 1.5% 25/5/2028 748,741 0.05 EUR 700,000 BNP Paribas SA 1.625% 2/7/2031 808,311 0.06 USD 200,000 BNP Paribas SA ‘144A’ 4.4%
14/8/2028 223,552 0.02 EUR 600,000 BPCE SA 0.375% 5/10/2023 680,451 0.05 EUR 400,000 BPCE SFH SA 0.75% 2/9/2025 474,785 0.03 EUR 650,000 Caisse de Refinancement de
l'Habitat SA 3.6% 8/3/2024 855,275 0.06 EUR 300,000 Caisse Francaise de Financement
Local 1% 25/4/2028 369,615 0.03 EUR 400,000 Caisse Francaise de Financement
Local 1.125% 19/1/2033 514,495 0.04 EUR 500,000 Cie de Financement Foncier SA
0.325% 12/9/2023 572,591 0.04 EUR 400,000 Cie de Financement Foncier SA
0.875% 11/9/2028 489,576 0.04 EUR 200,000 Cie de Financement Foncier SA
1.25% 15/11/2032 260,900 0.02 EUR 1,800,000 Credit Agricole Assurances SA
FRN 29/1/2048* 2,043,013 0.15 EUR 400,000 Credit Agricole Home Loan SFH
SA 0.375% 30/9/2024 463,275 0.03 EUR 500,000 Credit Agricole Home Loan SFH
SA 0.875% 11/8/2028 612,026 0.04 EUR 100,000 Credit Agricole SA FRN 23/6/2021
(Perpetual) 119,576 0.01 EUR 3,300,000 Credit Agricole SA/London 0.75%
1/12/2022 3,776,163 0.27 EUR 400,000 Credit Agricole SA/London 1.25%
14/4/2026 483,170 0.03 EUR 600,000 Credit Mutuel - CIC Home Loan
SFH SA 4.125% 19/1/2024 801,341 0.06 EUR 200,000 Crown European Holdings SA
2.25% 1/2/2023 235,730 0.02 EUR 2,300,000 Electricite de France SA 1%
13/10/2026 2,725,926 0.20 GBP 200,000 Electricite de France SA 5.5%
17/10/2041 370,689 0.03 EUR 800,000 Engie SA 4/3/2027 (Zero Coupon) 882,326 0.06 EUR 400,000 Engie SA 0.375% 28/2/2023 451,149 0.03 EUR 300,000 Engie SA 1.375% 21/6/2039 370,307 0.03 EUR 95,783 FCT Noria 2018-1 FRN 25/6/2038 106,346 0.01 EUR 95,783 FCT Noria 2018-1 FRN 25/6/2038 106,275 0.01 EUR 4,240,000 French Republic Government Bond
OAT 25/2/2021 (Zero Coupon) 4,742,302 0.34 EUR 4,250,000 French Republic Government Bond
OAT 25/5/2022 (Zero Coupon) 4,807,652 0.35 EUR 1,130,000 French Republic Government Bond
OAT 25/3/2025 (Zero Coupon) 1,297,161 0.09 EUR 2,483,000 French Republic Government Bond
OAT ‘144A’ 1.5% 25/5/2050 3,604,858 0.26 EUR 240,000 French Republic Government Bond
OAT ‘144A’ 2% 25/5/2048 384,637 0.03 EUR 2,690,000 French Republic Government Bond
OAT 2.25% 25/5/2024 3,405,238 0.25 EUR 2,460,000 French Republic Government Bond
OAT 3.25% 25/5/2045 4,736,979 0.34 EUR 3,705,000 French Republic Government Bond
OAT 4% 25/10/2038 7,186,866 0.52
EUR 754,000 French Republic Government Bond OAT 4% 25/4/2060 1,877,114 0.14
EUR 200,000 LVMH Moet Hennessy Louis Vuitton SE 28/2/2021 (Zero Coupon) 222,370 0.02
EUR 600,000 LVMH Moet Hennessy Louis Vuitton SE 0.125% 28/2/2023 673,058 0.05
EUR 800,000 Orange SA FRN 15/1/2025 (Perpetual) 935,931 0.07
EUR 100,000 Orange SA 1.375% 4/9/2049 108,275 0.01 EUR 1,500,000 Orange SA 2% 15/1/2029* 1,921,361 0.14 EUR 201,000 Parts Europe SA FRN 1/5/2022 222,373 0.02 EUR 100,000 Parts Europe SA 4.375% 1/5/2022 111,265 0.01 EUR 2,000,000 Schneider Electric SE 0.25%
9/9/2024 2,275,792 0.16 EUR 200,000 SNCF Reseau 2% 5/2/2048 293,632 0.02 EUR 300,000 SNCF Reseau 3.125% 25/10/2028 433,247 0.03 EUR 2,800,000 Societe Generale SA 27/5/2022
(Zero Coupon) 3,117,383 0.23 EUR 280,000 Solvay Finance SA FRN 12/11/2023
(Perpetual)* 358,410 0.03 EUR 500,000 Total Capital International SA 0.25%
12/7/2023 564,246 0.04 EUR 1,400,000 TOTAL SA FRN 4/4/2024
(Perpetual) 1,613,986 0.12 EUR 600,000 UNEDIC ASSEO 0.25% 24/11/2023 686,968 0.05 EUR 300,000 UNEDIC ASSEO 1.5% 20/4/2032* 398,615 0.03 USD 1,525,000 Vinci SA ‘144A’ 3.75% 10/4/2029 1,688,235 0.12 74,309,346 5.40
Germany EUR 900,000 BASF SE 2% 5/12/2022 1,069,515 0.08 EUR 500,000 Commerzbank AG 0.875%
18/4/2028 612,141 0.05 EUR 650,000 Deutsche Bahn Finance GMBH
3% 8/3/2024 823,945 0.06 EUR 510,000 Deutsche Bank AG 0.25%
15/5/2023 580,848 0.04 EUR 300,000 Deutsche Pfandbriefbank AG
0.625% 30/8/2027 358,258 0.03 EUR 400,000 DZ HYP AG 0.25% 30/6/2023 456,503 0.03 EUR 250,000 DZ HYP AG 0.875% 22/3/2028 306,240 0.02 EUR 540,000 Gemeinsame Deutsche
Bundeslaender 0.375% 17/4/2025 629,502 0.05
EUR 113,000 IHO Verwaltungs GmbH 3.625% 15/5/2025 127,711 0.01
EUR 2,235,000 Kreditanstalt fuer Wiederaufbau 0.375% 23/4/2030* 2,670,961 0.19
EUR 754,000 Kreditanstalt fuer Wiederaufbau 0.875% 4/7/2039* 991,479 0.07
GBP 450,000 Kreditanstalt fuer Wiederaufbau 6% 7/12/2028 811,977 0.06
EUR 280,000 Land Berlin 0.625% 8/2/2027 335,668 0.03 EUR 285,000 Land Berlin 1.375% 5/6/2037 391,463 0.03 EUR 400,000 Landesbank Baden-Wuerttemberg
0.25% 10/1/2025 460,838 0.03 EUR 550,000 Landwirtschaftliche Rentenbank
0.5% 6/3/2025 645,804 0.05 EUR 230,000 Landwirtschaftliche Rentenbank
0.625% 31/10/2036 286,933 0.02 CAD 200,000 Landwirtschaftliche Rentenbank
4.875% 21/2/2020 153,475 0.01 EUR 1,800,000 Merck Financial Services GmbH
0.005% 15/12/2023 2,011,091 0.15 EUR 460,000 NRW Bank 0.5% 11/5/2026 543,895 0.04 EUR 260,000 NRW Bank 0.625% 4/1/2028 312,976 0.02
World Bond Fund continued
Portfolio of Investments 31 August 2019

Transferable Securities and Money Market Instruments Admitted to an Official Stock Exchange Listing or Dealt in on Another Regulated Market
Transferable Securities and Money Market Instruments Admitted to an Official Stock Exchange Listing or Dealt in on Another Regulated Market
Holding
Description
Market Value (USD)
% of Net
Assets
Holding
Description
Market Value (USD)
% of Net
Assets
* All or a portion of this security represents a security on loan.
The notes on pages 728 to 741 form an integral part of these financial statements.
Annual Report and Audited Financial Statements [685]
EUR 440,000 State of Hesse 0.125% 25/1/2024 502,633 0.04 EUR 370,000 State of Hesse 0.625% 2/8/2028 447,725 0.03 EUR 590,000 State of Lower Saxony 2/8/2024
(Zero Coupon) 672,157 0.05 EUR 370,000 State of Lower Saxony 0.875%
25/10/2028 458,601 0.03 EUR 350,000 State of North Rhine-Westphalia
Germany 0.95% 13/3/2028 433,227 0.03 EUR 305,000 State of North Rhine-Westphalia
Germany 1.25% 12/5/2036 407,203 0.03 EUR 455,000 State of North Rhine-Westphalia
Germany 1.65% 16/5/2047 692,848 0.05 EUR 164,000 thyssenkrupp AG 2.875% 22/2/2024 187,385 0.01 EUR 1,520,000 Volkswagen Financial Services AG
1.5% 1/10/2024 1,758,775 0.13 EUR 490,000 Volkswagen Financial Services AG
2.25% 1/10/2027 596,944 0.04 EUR 450,000 Volkswagen Leasing GmbH 0.5%
20/6/2022 503,570 0.04 21,242,291 1.55
Greece EUR 1,380,000 Hellenic Republic Government
Bond ‘144A’ 1.875% 23/7/2026 1,583,734 0.12 EUR 3,830,000 Hellenic Republic Government
Bond ‘144A’ 3.45% 2/4/2024 4,711,620 0.34 EUR 270,000 Hellenic Republic Government
Bond 3.5% 30/1/2023 326,280 0.02 EUR 2,040,000 Hellenic Republic Government
Bond ‘144A’ 3.875% 12/3/2029 2,707,109 0.20 EUR 171,124 Hellenic Republic Government
Bond 4% 30/1/2037 234,558 0.02 EUR 794,291 Hellenic Republic Government
Bond 4.2% 30/1/2042 1,135,905 0.08 10,699,206 0.78
Guernsey EUR 2,000,000 Credit Suisse Group Funding
Guernsey Ltd 1.25% 14/4/2022 2,290,928 0.16 EUR 200,000 Globalworth Real Estate
Investments Ltd 3% 29/3/2025 239,256 0.02 2,530,184 0.18
Hungary USD 800,000 Hungary Government International
Bond 5.375% 25/3/2024 907,500 0.07
India INR 1,525,500,000 India Government Bond 7.17%
8/1/2028 22,030,908 1.60 INR 621,190,000 India Government Bond 7.27%
8/4/2026 9,086,339 0.66 USD 500,000 Reliance Industries Ltd 4.125%
28/1/2025 535,625 0.04 31,652,872 2.30
Indonesia USD 800,000 Indonesia Government
International Bond 4.35% 8/1/2027* 883,375 0.06
USD 298,000 Indonesia Government International Bond 4.75% 11/2/2029 344,941 0.02
USD 400,000 Indonesia Government International Bond 5.125% 15/1/2045* 492,812 0.04
IDR 58,197,000,000 Indonesia Treasury Bond 6.125% 15/5/2028 3,776,548 0.27
IDR 14,277,000,000 Indonesia Treasury Bond 6.625% 15/5/2033 913,889 0.07
IDR 24,182,000,000 Indonesia Treasury Bond 7.5% 15/6/2035 1,677,482 0.12
IDR 10,010,000,000 Indonesia Treasury Bond 7.5% 15/5/2038 684,505 0.05
IDR 17,000,000,000 Indonesia Treasury Bond 8.125% 15/5/2024 1,264,364 0.09
IDR 105,753,000,000 Indonesia Treasury Bond 8.25% 15/5/2029 7,936,134 0.58
IDR 41,567,000,000 Indonesia Treasury Bond 8.375% 15/3/2034 3,092,983 0.22
IDR 38,174,000,000 Indonesia Treasury Bond 8.375% 15/4/2039 2,825,710 0.21
USD 200,000 Pertamina Persero PT 4.3% 20/5/2023 211,125 0.01
USD 200,000 Pertamina Persero PT 5.625% 20/5/2043 240,469 0.02
USD 200,000 Perusahaan Listrik Negara PT 5.45% 21/5/2028 234,812 0.02
USD 200,000 Perusahaan Listrik Negara PT 5.5% 22/11/2021 213,406 0.02
USD 200,000 Perusahaan Listrik Negara PT 6.15% 21/5/2048 260,094 0.02
USD 500,000 Perusahaan Penerbit SBSN Indonesia III 4.55% 29/3/2026 551,133 0.04
25,603,782 1.86
International USD 4,482,000 African Development Bank 3%
20/9/2023 4,735,443 0.34 USD 690,000 Asian Development Bank 2.5%
2/11/2027 738,520 0.05 USD 1,000,000 Asian Development Bank 2.75%
17/3/2023 1,042,635 0.08 EUR 600,000 Council Of Europe Development
Bank 0.625% 30/1/2029 728,723 0.05 GBP 1,500,000 European Investment Bank
1% 21/9/2026* 1,871,357 0.14 EUR 230,000 European Investment Bank
1.5% 16/10/2048* 353,269 0.03 USD 3,300,000 European Investment Bank
1.875% 10/2/2025* 3,373,035 0.24 EUR 510,000 European Stability Mechanism
0.125% 22/4/2024 584,027 0.04 EUR 630,000 European Stability Mechanism
0.75% 5/9/2028 772,652 0.06 EUR 600,000 European Stability Mechanism
1.75% 20/10/2045 944,674 0.07 EUR 700,000 European Union 3.75% 4/4/2042 1,412,756 0.10 USD 810,000 Inter-American Development
Bank 2% 2/6/2026* 833,465 0.06 USD 100,000 Inter-American Development
Bank 3.125% 18/9/2028 113,072 0.01 USD 780,000 International Bank for
Reconstruction & Development 1.75% 19/4/2023 785,465 0.06
USD 930,000 International Bank for Reconstruction & Development 2.5% 22/11/2027* 996,791 0.07
USD 1,200,000 International Bank for Reconstruction & Development 3% 27/9/2023 1,268,765 0.09
20,554,649 1.49
World Bond Fund continued
Portfolio of Investments 31 August 2019
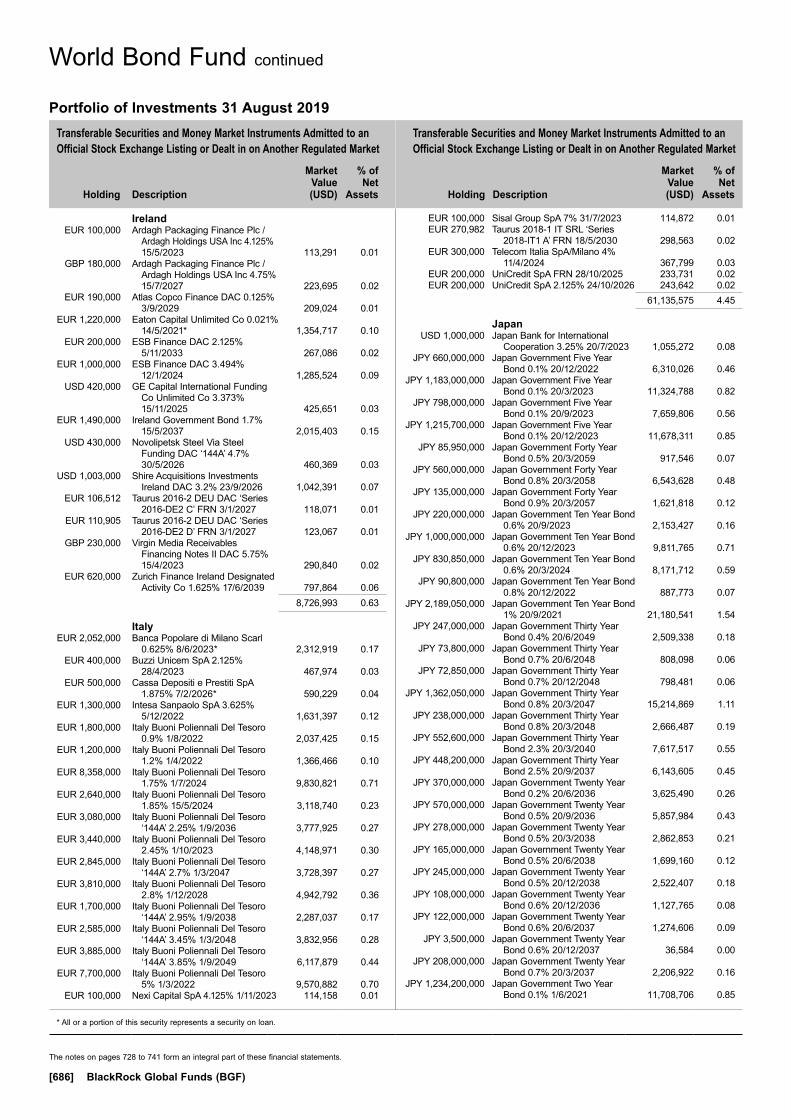
Transferable Securities and Money Market Instruments Admitted to an Official Stock Exchange Listing or Dealt in on Another Regulated Market
Transferable Securities and Money Market Instruments Admitted to an Official Stock Exchange Listing or Dealt in on Another Regulated Market
Holding
Description
Market Value (USD)
% of Net
Assets
Holding
Description
Market Value (USD)
% of Net
Assets
* All or a portion of this security represents a security on loan.
The notes on pages 728 to 741 form an integral part of these financial statements.
[686] BlackRock Global Funds (BGF)
Ireland EUR 100,000 Ardagh Packaging Finance Plc /
Ardagh Holdings USA Inc 4.125% 15/5/2023 113,291 0.01
GBP 180,000 Ardagh Packaging Finance Plc / Ardagh Holdings USA Inc 4.75% 15/7/2027 223,695 0.02
EUR 190,000 Atlas Copco Finance DAC 0.125% 3/9/2029 209,024 0.01
EUR 1,220,000 Eaton Capital Unlimited Co 0.021% 14/5/2021* 1,354,717 0.10
EUR 200,000 ESB Finance DAC 2.125% 5/11/2033 267,086 0.02
EUR 1,000,000 ESB Finance DAC 3.494% 12/1/2024 1,285,524 0.09
USD 420,000 GE Capital International Funding Co Unlimited Co 3.373% 15/11/2025 425,651 0.03
EUR 1,490,000 Ireland Government Bond 1.7% 15/5/2037 2,015,403 0.15
USD 430,000 Novolipetsk Steel Via Steel Funding DAC ‘144A’ 4.7% 30/5/2026 460,369 0.03
USD 1,003,000 Shire Acquisitions Investments Ireland DAC 3.2% 23/9/2026 1,042,391 0.07
EUR 106,512 Taurus 2016-2 DEU DAC ‘Series 2016-DE2 C’ FRN 3/1/2027 118,071 0.01
EUR 110,905 Taurus 2016-2 DEU DAC ‘Series 2016-DE2 D’ FRN 3/1/2027 123,067 0.01
GBP 230,000 Virgin Media Receivables Financing Notes II DAC 5.75% 15/4/2023 290,840 0.02
EUR 620,000 Zurich Finance Ireland Designated Activity Co 1.625% 17/6/2039 797,864 0.06
8,726,993 0.63
Italy EUR 2,052,000 Banca Popolare di Milano Scarl
0.625% 8/6/2023* 2,312,919 0.17 EUR 400,000 Buzzi Unicem SpA 2.125%
28/4/2023 467,974 0.03 EUR 500,000 Cassa Depositi e Prestiti SpA
1.875% 7/2/2026* 590,229 0.04 EUR 1,300,000 Intesa Sanpaolo SpA 3.625%
5/12/2022 1,631,397 0.12 EUR 1,800,000 Italy Buoni Poliennali Del Tesoro
0.9% 1/8/2022 2,037,425 0.15 EUR 1,200,000 Italy Buoni Poliennali Del Tesoro
1.2% 1/4/2022 1,366,466 0.10 EUR 8,358,000 Italy Buoni Poliennali Del Tesoro
1.75% 1/7/2024 9,830,821 0.71 EUR 2,640,000 Italy Buoni Poliennali Del Tesoro
1.85% 15/5/2024 3,118,740 0.23 EUR 3,080,000 Italy Buoni Poliennali Del Tesoro
‘144A’ 2.25% 1/9/2036 3,777,925 0.27 EUR 3,440,000 Italy Buoni Poliennali Del Tesoro
2.45% 1/10/2023 4,148,971 0.30 EUR 2,845,000 Italy Buoni Poliennali Del Tesoro
‘144A’ 2.7% 1/3/2047 3,728,397 0.27 EUR 3,810,000 Italy Buoni Poliennali Del Tesoro
2.8% 1/12/2028 4,942,792 0.36 EUR 1,700,000 Italy Buoni Poliennali Del Tesoro
‘144A’ 2.95% 1/9/2038 2,287,037 0.17 EUR 2,585,000 Italy Buoni Poliennali Del Tesoro
‘144A’ 3.45% 1/3/2048 3,832,956 0.28 EUR 3,885,000 Italy Buoni Poliennali Del Tesoro
‘144A’ 3.85% 1/9/2049 6,117,879 0.44 EUR 7,700,000 Italy Buoni Poliennali Del Tesoro
5% 1/3/2022 9,570,882 0.70 EUR 100,000 Nexi Capital SpA 4.125% 1/11/2023 114,158 0.01
EUR 100,000 Sisal Group SpA 7% 31/7/2023 114,872 0.01 EUR 270,982 Taurus 2018-1 IT SRL ‘Series
2018-IT1 A’ FRN 18/5/2030 298,563 0.02 EUR 300,000 Telecom Italia SpA/Milano 4%
11/4/2024 367,799 0.03 EUR 200,000 UniCredit SpA FRN 28/10/2025 233,731 0.02 EUR 200,000 UniCredit SpA 2.125% 24/10/2026 243,642 0.02 61,135,575 4.45
Japan USD 1,000,000 Japan Bank for International
Cooperation 3.25% 20/7/2023 1,055,272 0.08 JPY 660,000,000 Japan Government Five Year
Bond 0.1% 20/12/2022 6,310,026 0.46 JPY 1,183,000,000 Japan Government Five Year
Bond 0.1% 20/3/2023 11,324,788 0.82 JPY 798,000,000 Japan Government Five Year
Bond 0.1% 20/9/2023 7,659,806 0.56 JPY 1,215,700,000 Japan Government Five Year
Bond 0.1% 20/12/2023 11,678,311 0.85 JPY 85,950,000 Japan Government Forty Year
Bond 0.5% 20/3/2059 917,546 0.07 JPY 560,000,000 Japan Government Forty Year
Bond 0.8% 20/3/2058 6,543,628 0.48 JPY 135,000,000 Japan Government Forty Year
Bond 0.9% 20/3/2057 1,621,818 0.12 JPY 220,000,000 Japan Government Ten Year Bond
0.6% 20/9/2023 2,153,427 0.16 JPY 1,000,000,000 Japan Government Ten Year Bond
0.6% 20/12/2023 9,811,765 0.71 JPY 830,850,000 Japan Government Ten Year Bond
0.6% 20/3/2024 8,171,712 0.59 JPY 90,800,000 Japan Government Ten Year Bond
0.8% 20/12/2022 887,773 0.07 JPY 2,189,050,000 Japan Government Ten Year Bond
1% 20/9/2021 21,180,541 1.54 JPY 247,000,000 Japan Government Thirty Year
Bond 0.4% 20/6/2049 2,509,338 0.18 JPY 73,800,000 Japan Government Thirty Year
Bond 0.7% 20/6/2048 808,098 0.06 JPY 72,850,000 Japan Government Thirty Year
Bond 0.7% 20/12/2048 798,481 0.06 JPY 1,362,050,000 Japan Government Thirty Year
Bond 0.8% 20/3/2047 15,214,869 1.11 JPY 238,000,000 Japan Government Thirty Year
Bond 0.8% 20/3/2048 2,666,487 0.19 JPY 552,600,000 Japan Government Thirty Year
Bond 2.3% 20/3/2040 7,617,517 0.55 JPY 448,200,000 Japan Government Thirty Year
Bond 2.5% 20/9/2037 6,143,605 0.45 JPY 370,000,000 Japan Government Twenty Year
Bond 0.2% 20/6/2036 3,625,490 0.26 JPY 570,000,000 Japan Government Twenty Year
Bond 0.5% 20/9/2036 5,857,984 0.43 JPY 278,000,000 Japan Government Twenty Year
Bond 0.5% 20/3/2038 2,862,853 0.21 JPY 165,000,000 Japan Government Twenty Year
Bond 0.5% 20/6/2038 1,699,160 0.12 JPY 245,000,000 Japan Government Twenty Year
Bond 0.5% 20/12/2038 2,522,407 0.18 JPY 108,000,000 Japan Government Twenty Year
Bond 0.6% 20/12/2036 1,127,765 0.08 JPY 122,000,000 Japan Government Twenty Year
Bond 0.6% 20/6/2037 1,274,606 0.09 JPY 3,500,000 Japan Government Twenty Year
Bond 0.6% 20/12/2037 36,584 0.00 JPY 208,000,000 Japan Government Twenty Year
Bond 0.7% 20/3/2037 2,206,922 0.16 JPY 1,234,200,000 Japan Government Two Year
Bond 0.1% 1/6/2021 11,708,706 0.85
World Bond Fund continued
Portfolio of Investments 31 August 2019
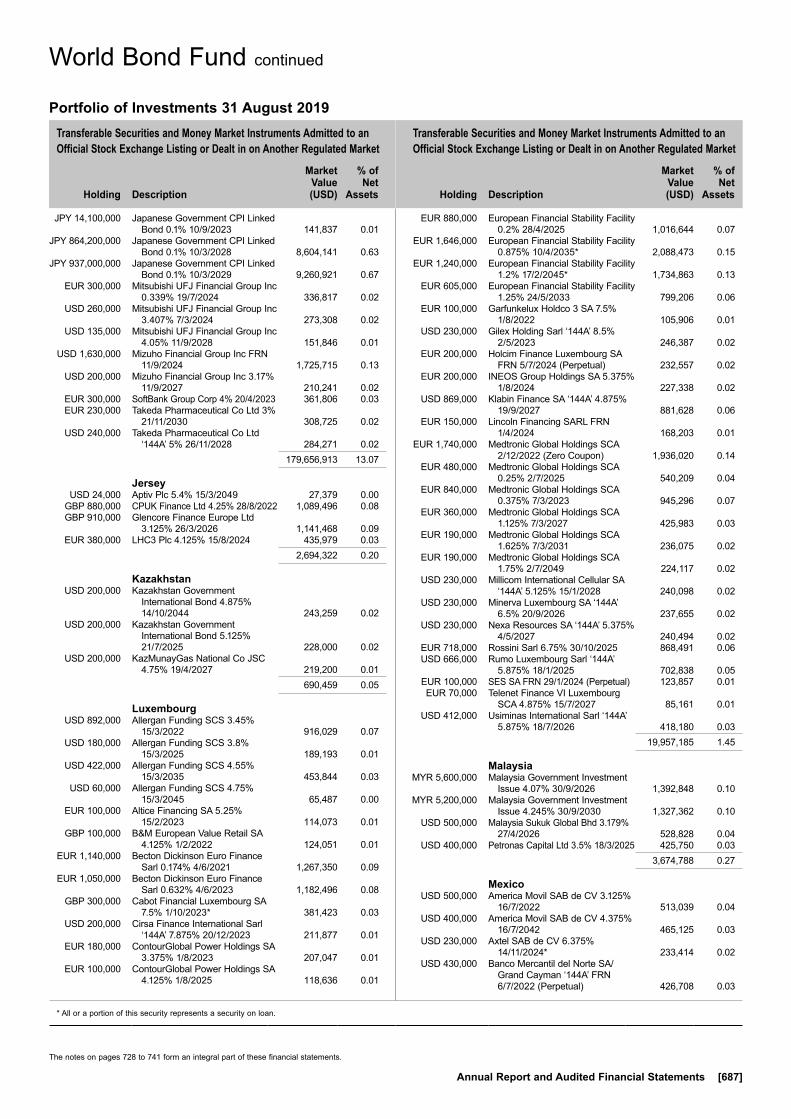
Transferable Securities and Money Market Instruments Admitted to an Official Stock Exchange Listing or Dealt in on Another Regulated Market
Transferable Securities and Money Market Instruments Admitted to an Official Stock Exchange Listing or Dealt in on Another Regulated Market
Holding
Description
Market Value (USD)
% of Net
Assets
Holding
Description
Market Value (USD)
% of Net
Assets
* All or a portion of this security represents a security on loan.
The notes on pages 728 to 741 form an integral part of these financial statements.
Annual Report and Audited Financial Statements [687]
JPY 14,100,000 Japanese Government CPI Linked Bond 0.1% 10/9/2023 141,837 0.01
JPY 864,200,000 Japanese Government CPI Linked Bond 0.1% 10/3/2028 8,604,141 0.63
JPY 937,000,000 Japanese Government CPI Linked Bond 0.1% 10/3/2029 9,260,921 0.67
EUR 300,000 Mitsubishi UFJ Financial Group Inc 0.339% 19/7/2024 336,817 0.02
USD 260,000 Mitsubishi UFJ Financial Group Inc 3.407% 7/3/2024 273,308 0.02
USD 135,000 Mitsubishi UFJ Financial Group Inc 4.05% 11/9/2028 151,846 0.01
USD 1,630,000 Mizuho Financial Group Inc FRN 11/9/2024 1,725,715 0.13
USD 200,000 Mizuho Financial Group Inc 3.17% 11/9/2027 210,241 0.02
EUR 300,000 SoftBank Group Corp 4% 20/4/2023 361,806 0.03 EUR 230,000 Takeda Pharmaceutical Co Ltd 3%
21/11/2030 308,725 0.02 USD 240,000 Takeda Pharmaceutical Co Ltd
‘144A’ 5% 26/11/2028 284,271 0.02 179,656,913 13.07
Jersey USD 24,000 Aptiv Plc 5.4% 15/3/2049 27,379 0.00 GBP 880,000 CPUK Finance Ltd 4.25% 28/8/2022 1,089,496 0.08 GBP 910,000 Glencore Finance Europe Ltd
3.125% 26/3/2026 1,141,468 0.09 EUR 380,000 LHC3 Plc 4.125% 15/8/2024 435,979 0.03 2,694,322 0.20
Kazakhstan USD 200,000 Kazakhstan Government
International Bond 4.875% 14/10/2044 243,259 0.02
USD 200,000 Kazakhstan Government International Bond 5.125% 21/7/2025 228,000 0.02
USD 200,000 KazMunayGas National Co JSC 4.75% 19/4/2027 219,200 0.01
690,459 0.05
Luxembourg USD 892,000 Allergan Funding SCS 3.45%
15/3/2022 916,029 0.07 USD 180,000 Allergan Funding SCS 3.8%
15/3/2025 189,193 0.01 USD 422,000 Allergan Funding SCS 4.55%
15/3/2035 453,844 0.03 USD 60,000 Allergan Funding SCS 4.75%
15/3/2045 65,487 0.00 EUR 100,000 Altice Financing SA 5.25%
15/2/2023 114,073 0.01 GBP 100,000 B&M European Value Retail SA
4.125% 1/2/2022 124,051 0.01 EUR 1,140,000 Becton Dickinson Euro Finance
Sarl 0.174% 4/6/2021 1,267,350 0.09 EUR 1,050,000 Becton Dickinson Euro Finance
Sarl 0.632% 4/6/2023 1,182,496 0.08 GBP 300,000 Cabot Financial Luxembourg SA
7.5% 1/10/2023* 381,423 0.03 USD 200,000 Cirsa Finance International Sarl
‘144A’ 7.875% 20/12/2023 211,877 0.01 EUR 180,000 ContourGlobal Power Holdings SA
3.375% 1/8/2023 207,047 0.01 EUR 100,000 ContourGlobal Power Holdings SA
4.125% 1/8/2025 118,636 0.01
EUR 880,000 European Financial Stability Facility 0.2% 28/4/2025 1,016,644 0.07
EUR 1,646,000 European Financial Stability Facility 0.875% 10/4/2035* 2,088,473 0.15
EUR 1,240,000 European Financial Stability Facility 1.2% 17/2/2045* 1,734,863 0.13
EUR 605,000 European Financial Stability Facility 1.25% 24/5/2033 799,206 0.06
EUR 100,000 Garfunkelux Holdco 3 SA 7.5% 1/8/2022 105,906 0.01
USD 230,000 Gilex Holding Sarl ‘144A’ 8.5% 2/5/2023 246,387 0.02
EUR 200,000 Holcim Finance Luxembourg SA FRN 5/7/2024 (Perpetual) 232,557 0.02
EUR 200,000 INEOS Group Holdings SA 5.375% 1/8/2024 227,338 0.02
USD 869,000 Klabin Finance SA ‘144A’ 4.875% 19/9/2027 881,628 0.06
EUR 150,000 Lincoln Financing SARL FRN 1/4/2024 168,203 0.01
EUR 1,740,000 Medtronic Global Holdings SCA 2/12/2022 (Zero Coupon) 1,936,020 0.14
EUR 480,000 Medtronic Global Holdings SCA 0.25% 2/7/2025 540,209 0.04
EUR 840,000 Medtronic Global Holdings SCA 0.375% 7/3/2023 945,296 0.07
EUR 360,000 Medtronic Global Holdings SCA 1.125% 7/3/2027 425,983 0.03
EUR 190,000 Medtronic Global Holdings SCA 1.625% 7/3/2031 236,075 0.02
EUR 190,000 Medtronic Global Holdings SCA 1.75% 2/7/2049 224,117 0.02
USD 230,000 Millicom International Cellular SA ‘144A’ 5.125% 15/1/2028 240,098 0.02
USD 230,000 Minerva Luxembourg SA ‘144A’ 6.5% 20/9/2026 237,655 0.02
USD 230,000 Nexa Resources SA ‘144A’ 5.375% 4/5/2027 240,494 0.02
EUR 718,000 Rossini Sarl 6.75% 30/10/2025 868,491 0.06 USD 666,000 Rumo Luxembourg Sarl ‘144A’
5.875% 18/1/2025 702,838 0.05 EUR 100,000 SES SA FRN 29/1/2024 (Perpetual) 123,857 0.01 EUR 70,000 Telenet Finance VI Luxembourg
SCA 4.875% 15/7/2027 85,161 0.01 USD 412,000 Usiminas International Sarl ‘144A’
5.875% 18/7/2026 418,180 0.03 19,957,185 1.45
Malaysia MYR 5,600,000 Malaysia Government Investment
Issue 4.07% 30/9/2026 1,392,848 0.10 MYR 5,200,000 Malaysia Government Investment
Issue 4.245% 30/9/2030 1,327,362 0.10 USD 500,000 Malaysia Sukuk Global Bhd 3.179%
27/4/2026 528,828 0.04 USD 400,000 Petronas Capital Ltd 3.5% 18/3/2025 425,750 0.03 3,674,788 0.27
Mexico USD 500,000 America Movil SAB de CV 3.125%
16/7/2022 513,039 0.04 USD 400,000 America Movil SAB de CV 4.375%
16/7/2042 465,125 0.03 USD 230,000 Axtel SAB de CV 6.375%
14/11/2024* 233,414 0.02 USD 430,000 Banco Mercantil del Norte SA/
Grand Cayman ‘144A’ FRN 6/7/2022 (Perpetual) 426,708 0.03
World Bond Fund continued
Portfolio of Investments 31 August 2019

Transferable Securities and Money Market Instruments Admitted to an Official Stock Exchange Listing or Dealt in on Another Regulated Market
Transferable Securities and Money Market Instruments Admitted to an Official Stock Exchange Listing or Dealt in on Another Regulated Market
Holding
Description
Market Value (USD)
% of Net
Assets
Holding
Description
Market Value (USD)
% of Net
Assets
* All or a portion of this security represents a security on loan.
The notes on pages 728 to 741 form an integral part of these financial statements.
[688] BlackRock Global Funds (BGF)
USD 230,000 Banco Santander Mexico SA Institucion de Banca Multiple Grupo Financiero Santand FRN 20/1/2022 (Perpetual) 241,331 0.02
USD 230,000 Controladora Mabe SA de CV ‘144A’ 5.6% 23/10/2028 245,812 0.02
USD 230,000 Credito Real SAB de CV SOFOM ER ‘144A’ 9.5% 7/2/2026 259,541 0.02
USD 826,000 Cydsa SAB de CV ‘144A’ 6.25% 4/10/2027 830,130 0.06
USD 230,000 Grupo Bimbo SAB de CV ‘144A’ FRN 17/4/2023 (Perpetual) 242,255 0.02
USD 200,000 Grupo Bimbo SAB de CV 3.875% 27/6/2024 209,625 0.01
USD 928,000 Grupo KUO SAB De CV ‘144A’ 5.75% 7/7/2027 937,715 0.07
USD 230,000 Grupo Posadas SAB de CV ‘144A’ 7.875% 30/6/2022 230,000 0.02
USD 200,000 Grupo Televisa SAB 5.25% 24/5/2049* 221,043 0.02
MXN 2,576,060 Mexican Bonos 5.75% 5/3/2026 12,007,057 0.87 MXN 1,212,643 Mexican Bonos 6.5% 9/6/2022 5,978,317 0.43 MXN 437,000 Mexican Bonos 7.5% 3/6/2027 2,245,560 0.16 MXN 180,000 Mexican Bonos 7.75% 23/11/2034 935,923 0.07 MXN 345,000 Mexican Bonos 8% 11/6/2020 1,728,529 0.12 MXN 715,280 Mexican Bonos 8% 7/12/2023 3,704,595 0.27 MXN 297,190 Mexican Bonos 8% 5/9/2024 1,547,690 0.11 MXN 1,701,580 Mexican Bonos 10% 5/12/2024 9,639,538 0.70 USD 230,000 Mexichem SAB de CV ‘144A’ 5.5%
15/1/2048 236,577 0.02 USD 655,000 Mexico Government International
Bond 3.75% 11/1/2028 685,457 0.05 USD 1,400,000 Mexico Government International
Bond 4.15% 28/3/2027 1,505,000 0.11 USD 800,000 Mexico Government International
Bond 4.6% 23/1/2046* 867,750 0.06 USD 1,500,000 Petroleos Mexicanos 4.875%
18/1/2024* 1,509,000 0.11 USD 1,237,000 Petroleos Mexicanos 5.35%
12/2/2028 1,169,545 0.08 USD 497,000 Petroleos Mexicanos 5.625%
23/1/2046 423,459 0.03 USD 1,086,000 Petroleos Mexicanos 6.375%
4/2/2021 1,119,123 0.08 USD 400,000 Petroleos Mexicanos 6.375%
23/1/2045 365,687 0.03 USD 630,000 Petroleos Mexicanos 6.5%
13/3/2027 641,655 0.05 USD 917,000 Petroleos Mexicanos 6.875%
4/8/2026 959,182 0.07 USD 369,000 Trust F/1401 ‘144A’ 4.869%
15/1/2030 376,841 0.03 USD 230,000 Trust F/1401 6.95% 30/1/2044 267,591 0.02 USD 430,000 Unifin Financiera SAB de CV
SOFOM ENR ‘144A’ FRN 29/1/2025 (Perpetual) 380,281 0.03
53,350,095 3.88
Netherlands EUR 900,000 ABN AMRO Bank NV FRN
22/9/2020 (Perpetual) 1,040,923 0.08 EUR 2,000,000 ABN AMRO Bank NV 0.25%
3/12/2021 2,238,290 0.16 EUR 300,000 ABN AMRO Bank NV 0.875%
14/1/2026 361,669 0.03 EUR 200,000 ABN AMRO Bank NV 1.45%
12/4/2038 279,512 0.02
EUR 450,000 ABN AMRO Bank NV 2.5% 5/9/2023 559,899 0.04
EUR 200,000 Allianz Finance II BV 0.25% 6/6/2023 225,986 0.02
EUR 500,000 Allianz Finance II BV 3.5% 14/2/2022 605,751 0.04
EUR 2,040,000 ASML Holding NV 1.375% 7/7/2026 2,472,469 0.18 EUR 662,000 ASML Holding NV 1.625% 28/5/2027 821,971 0.06 EUR 200,000 ATF Netherlands BV FRN 20/1/2023
(Perpetual) 232,891 0.02 EUR 100,000 Axalta Coating Systems Dutch
Holding B BV 3.75% 15/1/2025 115,022 0.01 USD 2,500,000 BNG Bank NV ‘144A’ 3% 20/9/2023* 2,638,033 0.19 USD 200,000 Braskem Netherlands Finance BV
4.5% 10/1/2028 200,140 0.01 USD 18,000 CNH Industrial NV 3.85% 15/11/2027 18,730 0.00 EUR 100,000 Cooperatieve Rabobank UA 1.125%
7/5/2031 120,877 0.01 EUR 965,000 Cooperatieve Rabobank UA 1.375%
3/2/2027 1,187,361 0.09 EUR 200,000 Cooperatieve Rabobank UA 1.5%
26/4/2038 281,960 0.02 GBP 1,270,000 Cooperatieve Rabobank UA
4.625% 23/5/2029 1,861,960 0.13 EUR 580,000 Enexis Holding NV 0.75% 2/7/2031 674,373 0.05 EUR 230,000 Hertz Holdings Netherlands BV
5.5% 30/3/2023 268,420 0.02 EUR 600,000 Iberdrola International BV 3.5%
1/2/2021 699,236 0.05 EUR 500,000 ING Bank NV 0.875% 11/4/2028 611,134 0.04 EUR 700,000 ING Groep NV 2.5% 15/11/2030 947,642 0.07 USD 1,940,000 ING Groep NV 4.1% 2/10/2023 2,072,859 0.15 EUR 100,000 InterXion Holding NV 4.75%
15/6/2025 120,471 0.01 USD 200,000 Lukoil International Finance BV
4.75% 2/11/2026 217,750 0.02 USD 312,000 Marfrig Holdings Europe BV ‘144A’
8% 8/6/2023 325,504 0.02 USD 305,000 MV24 Capital BV ‘144A’ 6.748%
1/6/2034 308,812 0.02 EUR 200,000 Naturgy Finance BV FRN
18/11/2022 (Perpetual) 241,028 0.02 EUR 300,000 Nederlandse Waterschapsbank NV
1.25% 27/5/2036 400,629 0.03 EUR 860,000 Netherlands Government Bond
‘144A’ 15/1/2022 (Zero Coupon) 970,198 0.07 EUR 850,000 Netherlands Government Bond
‘144A’ 15/1/2024 (Zero Coupon) 973,723 0.07 EUR 2,240,000 Netherlands Government Bond
‘144A’ 0.5% 15/7/2026 2,688,046 0.20 EUR 600,000 Netherlands Government Bond
‘144A’ 2.75% 15/1/2047 1,212,086 0.09 EUR 1,130,000 Netherlands Government Bond
‘144A’ 4% 15/1/2037 2,218,249 0.16 USD 402,000 NXP BV / NXP Funding LLC ‘144A’
5.35% 1/3/2026 454,164 0.03 USD 200,000 NXP BV / NXP Funding LLC ‘144A’
5.55% 1/12/2028 231,568 0.02 USD 110,000 NXP BV / NXP Funding LLC / NXP
USA Inc ‘144A’ 3.875% 18/6/2026 115,796 0.01 USD 396,000 NXP BV / NXP Funding LLC / NXP
USA Inc ‘144A’ 4.3% 18/6/2029 425,101 0.03 EUR 220,000 OCI NV 5% 15/4/2023 255,099 0.02 USD 230,000 Petrobras Global Finance BV
5.999% 27/1/2028 253,655 0.02 USD 1,111,000 Petrobras Global Finance BV
7.25% 17/3/2044 1,317,924 0.10
World Bond Fund continued
Portfolio of Investments 31 August 2019

Transferable Securities and Money Market Instruments Admitted to an Official Stock Exchange Listing or Dealt in on Another Regulated Market
Transferable Securities and Money Market Instruments Admitted to an Official Stock Exchange Listing or Dealt in on Another Regulated Market
Holding
Description
Market Value (USD)
% of Net
Assets
Holding
Description
Market Value (USD)
% of Net
Assets
* All or a portion of this security represents a security on loan.
The notes on pages 728 to 741 form an integral part of these financial statements.
Annual Report and Audited Financial Statements [689]
USD 585,000 Petrobras Global Finance BV 7.375% 17/1/2027* 696,150 0.05
USD 997,000 Petrobras Global Finance BV 8.75% 23/5/2026 1,253,727 0.09
EUR 200,000 Repsol International Finance BV FRN 25/3/2021 (Perpetual) 233,079 0.02
EUR 300,000 Repsol International Finance BV 0.25% 2/8/2027 335,727 0.02
EUR 725,000 Roche Finance Europe BV 0.5% 27/2/2023 826,109 0.06
USD 632,000 SABIC Capital II BV ‘144A’ 4% 10/10/2023 672,290 0.05
EUR 600,000 Shell International Finance BV 1.25% 12/5/2028 733,808 0.05
USD 1,000 Shell International Finance BV 4% 10/5/2046 1,171 0.00
USD 235,000 Shell International Finance BV 4.125% 11/5/2035 274,505 0.02
USD 229,000 Shell International Finance BV 4.55% 12/8/2043 283,736 0.02
EUR 1,070,000 Siemens Financieringsmaatschappij NV 5/9/2021 (Zero Coupon) 1,191,132 0.09
EUR 240,000 Siemens Financieringsmaatschappij NV 0.125% 5/9/2029 264,030 0.02
EUR 200,000 Siemens Financieringsmaatschappij NV 0.5% 5/9/2034 220,589 0.02
EUR 1,200,000 Siemens Financieringsmaatschappij NV 1.25% 28/2/2031 1,473,999 0.11
EUR 430,000 Sika Capital BV 0.875% 29/4/2027 506,454 0.04 EUR 400,000 Telefonica Europe BV FRN
15/3/2022 (Perpetual) 470,353 0.03 EUR 490,000 TenneT Holding BV 1.5% 3/6/2039* 622,213 0.04 EUR 100,000 United Group BV 4.875% 1/7/2024 116,085 0.01 EUR 533,000 United Group BV 4.875% 1/7/2024 618,100 0.04 GBP 1,000,000 Volkswagen Financial Services NV
1.625% 30/11/2022 1,223,711 0.09 EUR 300,000 Volkswagen International Finance
NV FRN 14/6/2027 (Perpetual) 350,172 0.02 EUR 1,500,000 Volkswagen International Finance
NV 1.125% 2/10/2023 1,714,358 0.12 EUR 300,000 Volkswagen International Finance
NV 1.875% 30/3/2027 355,907 0.03 EUR 100,000 Volkswagen International Finance
NV 4.125% 16/11/2038 147,922 0.01 47,852,238 3.48
New Zealand NZD 1,110,000 New Zealand Government Bond
4.5% 15/4/2027 883,157 0.06
Nigeria USD 367,000 Nigeria Government International
Bond 7.143% 23/2/2030 370,097 0.03
Norway EUR 1,720,000 DNB Boligkreditt AS 1.875%
21/11/2022 2,051,329 0.15 EUR 1,980,000 DNB Boligkreditt AS 2.75%
21/3/2022 2,374,244 0.17 USD 500,000 Kommunalbanken AS ‘144A’ 2.5%
11/1/2023 515,178 0.04 NOK 6,650,000 Norway Government Bond ‘144A’
1.75% 17/2/2027 765,660 0.06 5,706,411 0.42
Panama USD 230,000 AES Panama SRL ‘144A’ 6%
25/6/2022 237,259 0.02 EUR 410,000 Carnival Corp 1.875% 7/11/2022 481,664 0.03 USD 400,000 Panama Government International
Bond 3.875% 17/3/2028 444,625 0.03 USD 200,000 Panama Government International
Bond 4.5% 15/5/2047 248,688 0.02 USD 469,000 Promerica Financial Corp ‘144A’
9.7% 14/5/2024 501,835 0.04 1,914,071 0.14
Peru USD 620,000 Orazul Energy Egenor S en C por
A ‘144A’ 5.625% 28/4/2027 640,731 0.05 USD 600,000 Peruvian Government International
Bond 2.844% 20/6/2030* 635,719 0.04 USD 200,000 Petroleos del Peru SA 4.75%
19/6/2032* 225,437 0.02 1,501,887 0.11
Philippines USD 500,000 Philippine Government International
Bond 3.7% 1/3/2041 587,969 0.04 USD 221,000 Philippine Government
International Bond 3.75% 14/1/2029* 251,111 0.02
USD 500,000 Philippine Government International Bond 4.2% 21/1/2024 545,547 0.04
1,384,627 0.10
Poland PLN 3,300,000 Republic of Poland Government
Bond 2.5% 25/7/2027 874,927 0.06 PLN 4,945,000 Republic of Poland Government
Bond 4% 25/10/2023 1,364,248 0.10 EUR 500,000 Republic of Poland Government
International Bond 1.375% 22/10/2027 624,155 0.05
EUR 500,000 Republic of Poland Government International Bond 1.5% 9/9/2025 613,092 0.04
USD 500,000 Republic of Poland Government International Bond 3.25% 6/4/2026* 537,031 0.04
4,013,453 0.29
Portugal EUR 2,190,000 Portugal Obrigacoes do Tesouro
OT ‘144A’ 2.125% 17/10/2028 2,875,148 0.21 EUR 130,000 Portugal Obrigacoes do Tesouro
OT ‘144A’ 4.1% 15/4/2037 225,161 0.02 EUR 196,459 TAGUS - Sociedade de
Titularizacao de Creditos SA/Volta VII 0.7% 12/2/2024 217,068 0.01
EUR 747,167 TAGUS-Sociedade de Titularizacao de Creditos SA/Volta V 0.85% 12/2/2022 829,650 0.06
4,147,027 0.30
Qatar USD 500,000 Qatar Government International
Bond 3.25% 2/6/2026 536,250 0.04 USD 200,000 Qatar Government International
Bond 3.875% 23/4/2023 213,140 0.01
World Bond Fund continued
Portfolio of Investments 31 August 2019

Transferable Securities and Money Market Instruments Admitted to an Official Stock Exchange Listing or Dealt in on Another Regulated Market
Transferable Securities and Money Market Instruments Admitted to an Official Stock Exchange Listing or Dealt in on Another Regulated Market
Holding
Description
Market Value (USD)
% of Net
Assets
Holding
Description
Market Value (USD)
% of Net
Assets
* All or a portion of this security represents a security on loan.
The notes on pages 728 to 741 form an integral part of these financial statements.
[690] BlackRock Global Funds (BGF)
USD 200,000 Qatar Government International Bond 4.625% 2/6/2046 256,031 0.02
USD 200,000 Qatar Government International Bond 5.103% 23/4/2048 267,438 0.02
1,272,859 0.09
Romania EUR 350,000 Romanian Government
International Bond 2.375% 19/4/2027 421,537 0.03
USD 400,000 Romanian Government International Bond 4.375% 22/8/2023 428,750 0.03
850,287 0.06
Russian Federation RUB 151,400,000 Russian Federal Bond - OFZ
7.05% 19/1/2028 2,296,471 0.17 RUB 208,420,000 Russian Federal Bond - OFZ
7.4% 17/7/2024 3,220,797 0.23 RUB 139,765,000 Russian Federal Bond - OFZ
7.5% 18/8/2021 2,134,701 0.16 RUB 920,429,000 Russian Federal Bond - OFZ
8.5% 17/9/2031 15,401,731 1.12 USD 800,000 Russian Foreign Bond - Eurobond
4.875% 16/9/2023 875,625 0.06 USD 600,000 Russian Foreign Bond - Eurobond
5.625% 4/4/2042 742,500 0.05 24,671,825 1.79
Saudi Arabia USD 600,000 Saudi Arabian Oil Co 4.25%
16/4/2039 683,426 0.05 USD 600,000 Saudi Arabian Oil Co 4.375%
16/4/2049 683,250 0.05 USD 400,000 Saudi Government International
Bond 3.625% 4/3/2028 433,802 0.03 USD 400,000 Saudi Government International
Bond 4.5% 17/4/2030 468,200 0.04 USD 400,000 Saudi Government International
Bond 4.5% 26/10/2046 465,800 0.03 USD 343,000 Saudi Telecom Co ‘144A’ 3.89%
13/5/2029 370,419 0.03 3,104,897 0.23
Singapore EUR 426,339 Mulhacen Pte Ltd 6.5% 1/8/2023 391,225 0.03 SGD 530,000 Singapore Government Bond
2.75% 1/4/2042 436,387 0.03 SGD 1,050,000 Singapore Government Bond
3.5% 1/3/2027 851,516 0.06 USD 250,000 Temasek Financial I Ltd ‘144A’
3.625% 1/8/2028 281,454 0.02 1,960,582 0.14
Slovakia EUR 841,000 Slovakia Government Bond 0.75%
9/4/2030 1,018,921 0.07
South Africa USD 600,000 Eskom Holdings SOC Ltd ‘144A’
5.75% 26/1/2021 603,000 0.04 USD 230,000 Eskom Holdings SOC Ltd ‘144A’
6.35% 10/8/2028 250,269 0.02 USD 488,000 Eskom Holdings SOC Ltd ‘144A’
6.75% 6/8/2023 500,810 0.04
USD 200,000 Eskom Holdings SOC Ltd ‘144A’ 7.125% 11/2/2025 206,250 0.01
ZAR 27,915,000 Republic of South Africa Government Bond 6.25% 31/3/2036 1,326,545 0.10
ZAR 13,830,000 Republic of South Africa Government Bond 8.75% 28/2/2048 807,865 0.06
ZAR 11,390,000 Republic of South Africa Government Bond 9% 31/1/2040 690,434 0.05
ZAR 15,760,000 Republic of South Africa Government Bond 10.5% 21/12/2026 1,161,340 0.08
USD 200,000 Republic of South Africa Government International Bond 4.85% 27/9/2027 208,500 0.02
5,755,013 0.42
South Korea USD 400,000 Korea Development Bank/The
2.25% 18/5/2020* 400,576 0.03 USD 400,000 Korea Development Bank/The
3.75% 22/1/2024* 429,794 0.03 USD 200,000 Korea Gas Corp 2.25% 18/7/2026* 200,063 0.01 USD 600,000 Korea International Bond 2.75%
19/1/2027 629,813 0.05 KRW 1,200,000,000 Korea Treasury Bond 2%
10/3/2046 1,159,688 0.08 KRW 1,068,300,000 Korea Treasury Bond 2%
10/3/2049 1,040,840 0.08 KRW 420,000,000 Korea Treasury Bond 2.125%
10/3/2047 417,881 0.03 KRW 2,169,270,000 Korea Treasury Bond 2.25%
10/12/2025 1,905,071 0.14 KRW 530,000,000 Korea Treasury Bond 2.375%
10/9/2038 518,146 0.04 6,701,872 0.49
Spain EUR 800,000 Autonomous Community of Madrid
Spain 1.773% 30/4/2028 1,008,931 0.07 USD 200,000 Banco Bilbao Vizcaya Argentaria
SA FRN 16/11/2027 (Perpetual) 187,930 0.01 EUR 1,500,000 Banco de Sabadell SA 0.875%
22/7/2025 1,683,945 0.12 USD 600,000 Banco Santander SA 2.706%
27/6/2024 610,539 0.04 USD 600,000 Banco Santander SA 3.306%
27/6/2029 627,938 0.05 EUR 200,000 Bankia SA FRN 19/9/2023
(Perpetual) 229,412 0.02 EUR 5,000,000 Bankia SA 1.125% 5/8/2022 5,790,210 0.42 EUR 2,000,000 CaixaBank SA 1.125% 17/5/2024* 2,327,367 0.17 EUR 100,000 El Corte Ingles SA 3% 15/3/2024 115,748 0.01 EUR 800,000 Fondo De Titulizacion Del Deficit
Del Sistema Electrico FTA 0.5% 17/6/2023 911,822 0.07
EUR 1,200,000 Spain Government Bond 0.05% 31/10/2021 1,342,963 0.10
EUR 890,000 Spain Government Bond 0.4% 30/4/2022 1,008,528 0.07
EUR 2,000,000 Spain Government Bond ‘144A’ 1.4% 30/7/2028 2,483,477 0.18
EUR 6,289,000 Spain Government Bond ‘144A’ 1.45% 30/4/2029 7,871,635 0.57
EUR 2,925,000 Spain Government Bond ‘144A’ 2.7% 31/10/2048 4,616,766 0.34
World Bond Fund continued
Portfolio of Investments 31 August 2019

Transferable Securities and Money Market Instruments Admitted to an Official Stock Exchange Listing or Dealt in on Another Regulated Market
Transferable Securities and Money Market Instruments Admitted to an Official Stock Exchange Listing or Dealt in on Another Regulated Market
Holding
Description
Market Value (USD)
% of Net
Assets
Holding
Description
Market Value (USD)
% of Net
Assets
* All or a portion of this security represents a security on loan.
The notes on pages 728 to 741 form an integral part of these financial statements.
Annual Report and Audited Financial Statements [691]
EUR 1,330,000 Spain Government Bond ‘144A’ 4.2% 31/1/2037 2,356,670 0.17
EUR 2,310,000 Spain Government Bond ‘144A’ 5.15% 31/10/2044 5,010,494 0.36
EUR 200,000 Telefonica Emisiones SA 1.447% 22/1/2027 240,360 0.02
EUR 300,000 Telefonica Emisiones SA 1.715% 12/1/2028* 368,693 0.03
38,793,428 2.82
Sweden EUR 500,000 Atlas Copco AB 2.5% 28/2/2023 609,198 0.04 EUR 200,000 Corral Petroleum Holdings AB
11.75% 15/5/2021 232,555 0.02 SEK 7,400,000 Nordea Hypotek AB 1.25%
20/9/2023 796,843 0.06 EUR 350,000 Stadshypotek AB 0.5% 11/7/2025 408,982 0.03 SEK 11,000,000 Stadshypotek AB 1.5% 1/3/2024 1,201,416 0.09 SEK 11,000,000 Swedbank Hypotek AB 1%
20/12/2023 1,175,151 0.08 SEK 4,110,000 Sweden Government Bond 0.75%
12/5/2028* 464,661 0.03 SEK 2,300,000 Sweden Government Bond 3.5%
30/3/2039 392,338 0.03 EUR 351,000 Verisure Holding AB 3.5%
15/5/2023 405,091 0.03 EUR 100,000 Verisure Midholding AB 5.75%
1/12/2023 114,729 0.01 5,800,964 0.42
Switzerland USD 250,000 Credit Suisse Group AG ‘144A’
FRN 14/12/2023 253,371 0.02 USD 1,814,000 Credit Suisse Group AG ‘144A’
FRN 12/6/2024 1,920,376 0.14 USD 200,000 Credit Suisse Group AG ‘144A’
FRN 18/12/2024 (Perpetual) 211,362 0.01 EUR 470,000 Credit Suisse Group AG FRN
24/6/2027 539,707 0.04 CHF 1,125,000 Swiss Confederation Government
Bond 1.5% 24/7/2025* 1,321,792 0.10 EUR 1,150,000 UBS AG FRN 12/2/2026 1,352,388 0.10 USD 3,732,000 UBS Group Funding Switzerland
AG ‘144A’ FRN 15/8/2023 3,785,520 0.27 USD 2,440,000 UBS Group Funding Switzerland
AG ‘144A’ FRN 31/1/2024 (Perpetual) 2,591,890 0.19
11,976,406 0.87
Turkey USD 230,000 Petkim Petrokimya Holding AS
‘144A’ 5.875% 26/1/2023 223,100 0.02 USD 225,000 Turkey Government International
Bond 5.125% 17/2/2028 202,078 0.01 USD 910,000 Turkey Government International
Bond 7.625% 26/4/2029 936,163 0.07 1,361,341 0.10
Ukraine USD 859,000 Ukraine Government International
Bond 9.75% 1/11/2028* 999,661 0.07
United Arab Emirates USD 200,000 Abu Dhabi Government
International Bond 4.125% 11/10/2047 249,344 0.02
USD 600,000 Abu Dhabi National Energy Co PJSC 3.625% 22/6/2021 613,781 0.04
USD 230,000 Emirates NBD PJSC 3.25% 14/11/2022 235,117 0.02
1,098,242 0.08
United Kingdom USD 22,000 Aon Plc 4% 27/11/2023 23,516 0.00 USD 398,000 Aon Plc 4.6% 14/6/2044 466,463 0.03 USD 297,000 Aon Plc 4.75% 15/5/2045 359,179 0.03 GBP 280,000 Arrow Global Finance Plc 5.125%
15/9/2024* 340,098 0.02 USD 1,920,000 Barclays Plc FRN 7/5/2025 1,973,174 0.14 EUR 200,000 Barclays Plc FRN 11/11/2025 224,048 0.02 EUR 800,000 BAT International Finance Plc
2.25% 16/1/2030 948,944 0.07 GBP 426,000 BAT International Finance Plc
7.25% 12/3/2024 648,994 0.05 EUR 460,000 BP Capital Markets Plc 1.526%
26/9/2022 536,096 0.04 GBP 1,300,000 BP Capital Markets Plc 1.827%
8/9/2025 1,654,279 0.12 EUR 450,000 Channel Link Enterprises Finance
Plc FRN 30/6/2050 529,647 0.04 EUR 650,000 Channel Link Enterprises Finance
Plc FRN 30/6/2050 728,083 0.05 EUR 380,000 Coca-Cola European Partners Plc
1.125% 12/4/2029 450,288 0.03 EUR 437,000 eG Global Finance Plc 3.625%
7/2/2024 469,564 0.03 EUR 111,000 eG Global Finance Plc 4.375%
7/2/2025 119,328 0.01 GBP 100,000 EI Group Plc 6.375% 15/2/2022 123,957 0.01 GBP 202,000 Finsbury Square 2016-2 Plc ‘Series
2016-2 C’ FRN 16/8/2058 247,383 0.02 GBP 178,996 Finsbury Square 2017-1 Plc ‘Series
2017-1 C’ FRN 12/3/2059 219,326 0.02 GBP 101,998 Finsbury Square 2018-1 Plc FRN
12/9/2065 123,726 0.01 GBP 104,998 Finsbury Square 2018-1 Plc ‘Series
2018-1 B’ FRN 12/9/2065 127,648 0.01 GBP 366,000 Finsbury Square 2018-2 Plc FRN
12/9/2068 449,243 0.03 GBP 99,977 Gemgarto 2018-1 Plc FRN
16/9/2065 119,289 0.01 GBP 350,000 GKN Holdings Ltd 5.375%
19/9/2022 467,045 0.03 GBP 476,032 Greene King Finance Plc FRN
15/12/2033 585,209 0.04 GBP 239,159 Greene King Finance Plc 4.064%
15/3/2035 325,115 0.02 USD 200,000 HSBC Holdings Plc FRN 1/6/2021
(Perpetual) 209,620 0.01 USD 335,000 HSBC Holdings Plc FRN 11/3/2025 349,679 0.03 USD 400,000 HSBC Holdings Plc FRN 22/5/2030 429,839 0.03 EUR 100,000 International Game Technology Plc
4.75% 15/2/2023 123,059 0.01 GBP 6,700 Ladbrokes Group Finance Plc
5.125% 16/9/2022 8,643 0.00 GBP 200,000 Ladbrokes Group Finance Plc
5.125% 8/9/2023 259,955 0.02 EUR 730,000 Lloyds Bank Plc 0.625% 26/3/2025 850,497 0.06 USD 205,000 Lloyds Banking Group Plc 4.45%
8/5/2025 220,914 0.02 USD 230,000 MARB BondCo Plc ‘144A’ 6.875%
19/1/2025 235,067 0.02 GBP 50,000 Mitchells & Butlers Finance Plc
FRN 15/6/2036 45,644 0.00
World Bond Fund continued
Portfolio of Investments 31 August 2019

The notes on pages 728 to 741 form an integral part of these financial statements.
[692] BlackRock Global Funds (BGF)
Transferable Securities and Money Market Instruments Admitted to an Official Stock Exchange Listing or Dealt in on Another Regulated Market
Transferable Securities and Money Market Instruments Admitted to an Official Stock Exchange Listing or Dealt in on Another Regulated Market
Holding
Description
Market Value (USD)
% of Net
Assets
Holding
Description
Market Value (USD)
% of Net
Assets
* All or a portion of this security represents a security on loan.
EUR 680,000 Motability Operations Group Plc 0.375% 3/1/2026 766,885 0.06
GBP 397,000 Motor 2016-1 Plc 3.75% 25/11/2025 492,777 0.04 GBP 103,000 Motor 2016-1 Plc 4.25% 25/11/2025 126,404 0.01 GBP 105,000 Motor 2016-1 Plc 5.25% 25/11/2025 127,720 0.01 EUR 500,000 Nationwide Building Society 1.125%
31/5/2028* 617,026 0.04 EUR 32,968 Paragon Mortgages No 10 Plc FRN
15/6/2041 34,439 0.00 EUR 70,970 Paragon Mortgages No 11 Plc FRN
15/10/2041 74,093 0.01 EUR 76,811 Paragon Mortgages No 12 Plc FRN
15/11/2038 79,559 0.01 EUR 209,100 Paragon Mortgages No 13 Plc FRN
15/1/2039 213,449 0.02 EUR 485,000 Paragon Mortgages No 14 Plc FRN
15/9/2039 466,813 0.03 GBP 200,000 Paragon Mortgages NO 23 Plc FRN
15/1/2043 244,669 0.02 GBP 120,000 Paragon Mortgages No 25 Plc FRN
15/5/2050 142,416 0.01 GBP 100,000 Paragon Mortgages No 25 Plc FRN
15/5/2050 119,615 0.01 GBP 200,000 Pinnacle Bidco Plc 6.375%
15/2/2025 259,508 0.02 USD 260,000 Royal Bank of Scotland Group Plc
FRN 22/3/2025 271,502 0.02 EUR 380,000 Santander UK Plc 0.5% 10/1/2025 439,781 0.03 EUR 1,567,000 Santander UK Plc 0.875%
25/11/2020 1,754,035 0.13 EUR 2,020,000 Sky Ltd 1.5% 15/9/2021 2,312,394 0.17 GBP 166,000 Stonegate Pub Co Financing Plc
FRN 15/3/2022 205,577 0.01 EUR 200,000 Tesco Corporate Treasury Services
Plc 1.375% 24/10/2023 228,592 0.02 GBP 156,833 Tesco Property Finance 1 Plc
7.623% 13/7/2039 284,310 0.02 GBP 266,036 Tesco Property Finance 3 Plc
5.744% 13/4/2040 430,941 0.03 GBP 117,060 Tesco Property Finance 4 Plc
5.801% 13/10/2040 191,016 0.01 GBP 100,000 Twin Bridges 2018-1 Plc ‘Series
2018-1 D’ FRN 12/9/2050 121,799 0.01 GBP 110,000 Twin Bridges 2019-1 Plc FRN
12/12/2052 134,231 0.01 GBP 849,161 Unique Pub Finance Co Plc/The
5.659% 30/6/2027 1,183,680 0.09 GBP 2,530,000 United Kingdom Gilt 0.5%
22/7/2022* 3,106,990 0.23 GBP 3,503,000 United Kingdom Gilt 1% 22/4/2024 4,415,497 0.32 GBP 3,000,000 United Kingdom Gilt 1.5% 22/1/2021 3,718,808 0.27 GBP 1,900,000 United Kingdom Gilt 1.5% 22/7/2047 2,613,556 0.19 GBP 6,300,000 United Kingdom Gilt 1.75% 7/9/2037 8,847,844 0.64 GBP 4,000,000 United Kingdom Gilt 1.75%
22/7/2057 6,193,200 0.45 GBP 1,363,000 United Kingdom Gilt 2.5% 22/7/2065 2,666,061 0.19 GBP 204,000 United Kingdom Gilt 3.5% 22/1/2045* 390,207 0.03 GBP 943,021 United Kingdom Gilt 4.25%
7/12/2055 2,327,800 0.17 GBP 1,200,000 Warwick Finance Residential
Mortgages No One Plc FRN 21/9/2049 1,468,034 0.11
GBP 700,000 Warwick Finance Residential Mortgages No Two Plc FRN 21/9/2049 858,396 0.06
EUR 1,855,000 WPP Finance 2013 0.75% 18/11/2019 2,052,347 0.15
64,974,530 4.73
United States USD 750,000 1211 Avenue of the Americas Trust
2015-1211 ‘Series 2015-1211 D’ ‘144A’ FRN 10/8/2035 803,116 0.06
USD 870,000 245 Park Avenue Trust 2017-245P ‘Series 2017-245P C’ ‘144A’ FRN 5/6/2037 938,406 0.07
USD 750,000 245 Park Avenue Trust 2017-245P ‘Series 2017-245P D’ ‘144A’ FRN 5/6/2037 791,808 0.06
USD 730,000 245 Park Avenue Trust 2017-245P ‘Series 2017-245P E’ ‘144A’ FRN 5/6/2037 736,593 0.05
USD 820,000 280 Park Avenue 2017-280P Mortgage Trust ‘Series 2017-280P D’ ‘144A’ FRN 15/9/2034 821,402 0.06
USD 85,000 3M Co 2.25% 19/9/2026 85,513 0.01 USD 120,000 3M Co 3% 7/8/2025 126,244 0.01 USD 195,000 Abbott Laboratories 3.75%
30/11/2026 214,541 0.02 USD 370,000 Abbott Laboratories 3.875%
15/9/2025 403,735 0.03 USD 820,000 AbbVie Inc 4.25% 14/11/2028 895,172 0.07 USD 115,000 AbbVie Inc 4.4% 6/11/2042 121,813 0.01 USD 215,000 AbbVie Inc 4.45% 14/5/2046 227,525 0.02 USD 113,000 AbbVie Inc 4.5% 14/5/2035 123,128 0.01 USD 50,000 AbbVie Inc 4.7% 14/5/2045 54,638 0.00 USD 30,000 AEP Texas Inc 4.15% 1/5/2049 35,922 0.00 USD 355,000 AEP Transmission Co LLC 3.75%
1/12/2047 396,674 0.03 USD 30,000 AEP Transmission Co LLC 3.8%
15/6/2049 33,892 0.00 USD 455,000 Alabama Power Co 3.7% 1/12/2047 506,987 0.04 USD 255,886 Allegro CLO I Ltd ‘Series 2013-1A
A1R’ ‘144A’ FRN 30/1/2026 256,150 0.02 EUR 1,255,000 Altria Group Inc 1% 15/2/2023 1,433,293 0.10 USD 298,000 Altria Group Inc 4% 31/1/2024 318,200 0.02 USD 2,360,000 Altria Group Inc 4.4% 14/2/2026 2,592,912 0.19 USD 367,000 Altria Group Inc 4.75% 5/5/2021 382,850 0.03 USD 760,000 Altria Group Inc 4.8% 14/2/2029 854,850 0.06 USD 2,000 Ameren Illinois Co 4.15% 15/3/2046 2,393 0.00 USD 8,579 American Airlines 2015-2 Class AA
Pass Through Trust 3.6% 22/9/2027 9,127 0.00
USD 225,141 American Airlines 2016-3 Class AA Pass Through Trust 3% 15/10/2028 232,243 0.02
USD 56,956 American Airlines 2017-1 Class AA Pass Through Trust 3.65% 15/2/2029 61,429 0.00
USD 485,000 American Airlines 2019-1 Class AA Pass Through Trust 3.15% 15/2/2032 501,411 0.04
USD 116,000 American Tower Corp 2.8% 1/6/2020 116,369 0.01 USD 574,000 American Tower Corp 3% 15/6/2023 590,744 0.04 USD 680,000 American Tower Corp 3.125%
15/1/2027 703,381 0.05 USD 228,000 American Tower Corp 5% 15/2/2024 253,061 0.02 USD 1,000,000 Anadarko Petroleum Corp
(Restricted) 10/10/2036 (Zero Coupon) 497,474 0.04
USD 650,000 ANCHORAGE CAPITAL CLO 1-R Ltd ‘Series 2018-1RA A1’ ‘144A’ FRN 13/4/2031 643,238 0.05
USD 360,000 Andeavor Logistics LP / Tesoro Logistics Finance Corp (Restricted) 4.25% 1/12/2027 381,429 0.03
USD 300,000 Andeavor Logistics LP / Tesoro Logistics Finance Corp (Restricted) 5.2% 1/12/2047 325,479 0.02
World Bond Fund continued
Portfolio of Investments 31 August 2019

The notes on pages 728 to 741 form an integral part of these financial statements.
Annual Report and Audited Financial Statements [693]
Transferable Securities and Money Market Instruments Admitted to an Official Stock Exchange Listing or Dealt in on Another Regulated Market
Transferable Securities and Money Market Instruments Admitted to an Official Stock Exchange Listing or Dealt in on Another Regulated Market
Holding
Description
Market Value (USD)
% of Net
Assets
Holding
Description
Market Value (USD)
% of Net
Assets
* All or a portion of this security represents a security on loan.
USD 880,000 Anheuser-Busch Cos LLC / Anheuser-Busch InBev Worldwide Inc 4.7% 1/2/2036 1,023,294 0.07
USD 120,000 Anheuser-Busch Cos LLC / Anheuser-Busch InBev Worldwide Inc 4.9% 1/2/2046 143,739 0.01
USD 709,000 Anheuser-Busch InBev Finance Inc 3.65% 1/2/2026 761,162 0.06
USD 457,000 Anheuser-Busch InBev Worldwide Inc 4.15% 23/1/2025 500,203 0.04
USD 20,000 Anheuser-Busch InBev Worldwide Inc 4.375% 15/4/2038 22,766 0.00
USD 970,000 Anheuser-Busch InBev Worldwide Inc 4.75% 23/1/2029 1,135,062 0.08
EUR 1,500,000 Apple Inc 1% 10/11/2022 1,732,140 0.13 USD 165,000 Apple Inc 2.85% 23/2/2023 170,473 0.01 USD 26,000 Apple Inc 3.45% 9/2/2045 28,063 0.00 USD 772,000 Apple Inc 3.85% 4/5/2043 881,696 0.06 USD 15,000 Apple Inc 4.65% 23/2/2046 19,221 0.00 USD 415,000 Applied Materials Inc 3.3% 1/4/2027 447,082 0.03 USD 290,000 Applied Materials Inc 4.35% 1/4/2047 355,376 0.03 USD 517,043 Ares XXIX CLO Ltd ‘Series 2014-
1A A1R’ ‘144A’ FRN 17/4/2026 517,604 0.04 USD 370,000 Ashford Hospitality Trust 2018-
ASHF ‘Series 2018-ASHF D’ ‘144A’ FRN 15/4/2035 371,717 0.03
USD 2,000,000 AT&T Inc ‘144A’ 27/11/2022 (Zero Coupon) 1,840,637 0.13
EUR 620,000 AT&T Inc 1.8% 5/9/2026 756,888 0.06 USD 16,000 AT&T Inc 4.3% 15/12/2042 16,866 0.00 USD 29,000 AT&T Inc 4.35% 15/6/2045 30,946 0.00 GBP 300,000 AT&T Inc 4.375% 14/9/2029 438,406 0.03 USD 70,000 AT&T Inc 4.5% 15/5/2035 77,840 0.01 USD 452,000 AT&T Inc 4.75% 15/5/2046 506,276 0.04 USD 342,000 AT&T Inc 4.8% 15/6/2044 383,269 0.03 USD 130,000 AT&T Inc 4.85% 15/7/2045 149,170 0.01 USD 118,000 AT&T Inc 5.15% 15/3/2042 137,189 0.01 USD 30,000 AT&T Inc 5.15% 15/11/2046 35,282 0.00 USD 73,000 AT&T Inc 5.35% 1/9/2040 87,042 0.01 USD 10,000 AT&T Inc 5.55% 15/8/2041 12,091 0.00 USD 522,000 AT&T Inc 6% 15/8/2040 654,821 0.05 USD 30,000 Atmos Energy Corp 4.125%
15/3/2049 36,180 0.00 USD 640,000 Atrium Hotel Portfolio Trust 2017-
ATRM ‘Series 2017-ATRM D’ ‘144A’ FRN 15/12/2036 641,526 0.05
USD 2,100,000 Atrium XII ‘144A’ FRN 22/4/2027 2,099,019 0.15 USD 466,388 Avery Point III CLO Ltd ‘Series
2013-3A AR’ ‘144A’ FRN 18/1/2025 466,602 0.03
USD 230,000 Azul Investments LLP ‘144A’ 5.875% 26/10/2024* 229,569 0.02
USD 874,344 Babson CLO Ltd 2014-I ‘Series 2014-IA A1R’ ‘144A’ FRN 20/7/2025 875,078 0.06
USD 60,000 BAE Systems Holdings Inc ‘144A’ 3.85% 15/12/2025 63,517 0.00
USD 795,000 Baltimore Gas & Electric Co 3.5% 15/8/2046 850,194 0.06
USD 730,000 BAMLL Commercial Mortgage Securities Trust 2015-200P ‘Series 2015-200P F’ ‘144A’ FRN 14/4/2033 743,625 0.05
USD 710,000 BAMLL Commercial Mortgage Securities Trust 2015-200P ‘Series 2015-200P B’ ‘144A’ 3.49% 14/4/2033 755,731 0.06
USD 922,024 BAMLL Commercial Mortgage Securities Trust 2018-DSNY ‘Series 2018-DSNY D’ ‘144A’ FRN 15/9/2034 922,186 0.07
USD 82,000 Bank of America Corp FRN 23/7/2024 87,122 0.01
USD 240,000 Bank of America Corp FRN 23/10/2024 (Perpetual) 269,408 0.02
USD 956,000 Bank of America Corp FRN 15/3/2025 1,005,399 0.07
USD 335,000 Bank of America Corp FRN 23/1/2026 351,077 0.03
USD 582,000 Bank of America Corp FRN 20/1/2028 630,602 0.05
USD 1,192,000 Bank of America Corp FRN 24/4/2028 1,285,794 0.09
USD 70,000 Bank of America Corp FRN 21/7/2028 74,890 0.01
USD 1,438,000 Bank of America Corp FRN 20/12/2028 1,518,825 0.11
USD 337,000 Bank of America Corp FRN 5/3/2029 370,323 0.03
USD 132,000 Bank of America Corp FRN 23/7/2029 148,513 0.01
USD 15,000 Bank of America Corp FRN 7/2/2030 16,608 0.00
USD 15,000 Bank of America Corp FRN 23/7/2030 15,664 0.00
EUR 3,278,000 Bank of America Corp 1.625% 14/9/2022 3,814,339 0.28
USD 2,684,000 Bank of America Corp 3.5% 19/4/2026 2,883,088 0.21
USD 880,000 Bank of America Corp 4.25% 22/10/2026 959,650 0.07
USD 17,000 Bank of America Corp 4.45% 3/3/2026 18,703 0.00
USD 3,000 Bank of America Corp 4.75% 21/4/2045 3,681 0.00
USD 34,000 Bank of New York Mellon Corp/The FRN 7/2/2028 36,507 0.00
USD 290,000 Bank of New York Mellon Corp/The 2.2% 16/8/2023 292,197 0.02
USD 35,000 Bank of New York Mellon Corp/The 3% 24/2/2025 36,406 0.00
USD 1,000 Bank of New York Mellon Corp/The 3.25% 11/9/2024 1,054 0.00
USD 1,850,000 Bank of New York Mellon Corp/The 3.65% 4/2/2024 1,973,691 0.14
USD 310,000 BAT Capital Corp 3.557% 15/8/2027 317,382 0.02 USD 140,000 Baxalta Inc 4% 23/6/2025 151,025 0.01 USD 670,000 Bayer US Finance II LLC ‘144A’
4.25% 15/12/2025 721,791 0.05 USD 248,000 Bayer US Finance II LLC ‘144A’
4.4% 15/7/2044 256,914 0.02 USD 2,706,039 Bayview Commercial Asset Trust
2006-1 ‘Series 2006-1A A1’ ‘144A’ FRN 25/4/2036 2,612,230 0.19
USD 1,051,456 Bayview Commercial Asset Trust 2007-4 ‘Series 2007-4A A1’ ‘144A’ FRN 25/9/2037 1,004,357 0.07
EUR 300,000 Belden Inc 4.125% 15/10/2026 351,011 0.03 USD 1,130,000 Benchmark 2018-B8 Mortgage
Trust ‘Series 2018-B8 A5’ 4.232% 15/1/2052 1,310,325 0.10
USD 90,000 Boeing Co/The 3.55% 1/3/2038 96,176 0.01 USD 175,000 Boeing Co/The 3.85% 1/11/2048 195,617 0.01 USD 120,000 BP Capital Markets America Inc
3.796% 21/9/2025 129,874 0.01 USD 147,000 BP Capital Markets America Inc
3.937% 21/9/2028 164,181 0.01
World Bond Fund continued
Portfolio of Investments 31 August 2019
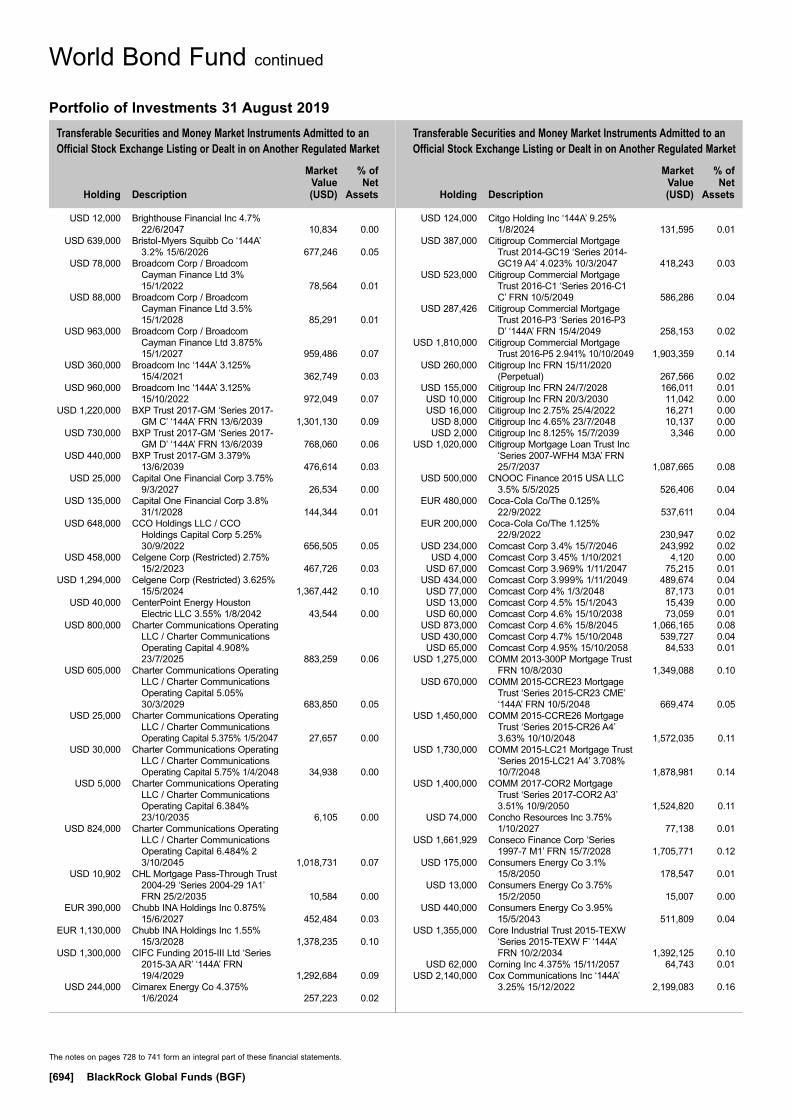
The notes on pages 728 to 741 form an integral part of these financial statements.
[694] BlackRock Global Funds (BGF)
Transferable Securities and Money Market Instruments Admitted to an Official Stock Exchange Listing or Dealt in on Another Regulated Market
Transferable Securities and Money Market Instruments Admitted to an Official Stock Exchange Listing or Dealt in on Another Regulated Market
Holding
Description
Market Value (USD)
% of Net
Assets
Holding
Description
Market Value (USD)
% of Net
Assets
USD 12,000 Brighthouse Financial Inc 4.7% 22/6/2047 10,834 0.00
USD 639,000 Bristol-Myers Squibb Co ‘144A’ 3.2% 15/6/2026 677,246 0.05
USD 78,000 Broadcom Corp / Broadcom Cayman Finance Ltd 3% 15/1/2022 78,564 0.01
USD 88,000 Broadcom Corp / Broadcom Cayman Finance Ltd 3.5% 15/1/2028 85,291 0.01
USD 963,000 Broadcom Corp / Broadcom Cayman Finance Ltd 3.875% 15/1/2027 959,486 0.07
USD 360,000 Broadcom Inc ‘144A’ 3.125% 15/4/2021 362,749 0.03
USD 960,000 Broadcom Inc ‘144A’ 3.125% 15/10/2022 972,049 0.07
USD 1,220,000 BXP Trust 2017-GM ‘Series 2017-GM C’ ‘144A’ FRN 13/6/2039 1,301,130 0.09
USD 730,000 BXP Trust 2017-GM ‘Series 2017-GM D’ ‘144A’ FRN 13/6/2039 768,060 0.06
USD 440,000 BXP Trust 2017-GM 3.379% 13/6/2039 476,614 0.03
USD 25,000 Capital One Financial Corp 3.75% 9/3/2027 26,534 0.00
USD 135,000 Capital One Financial Corp 3.8% 31/1/2028 144,344 0.01
USD 648,000 CCO Holdings LLC / CCO Holdings Capital Corp 5.25% 30/9/2022 656,505 0.05
USD 458,000 Celgene Corp (Restricted) 2.75% 15/2/2023 467,726 0.03
USD 1,294,000 Celgene Corp (Restricted) 3.625% 15/5/2024 1,367,442 0.10
USD 40,000 CenterPoint Energy Houston Electric LLC 3.55% 1/8/2042 43,544 0.00
USD 800,000 Charter Communications Operating LLC / Charter Communications Operating Capital 4.908% 23/7/2025 883,259 0.06
USD 605,000 Charter Communications Operating LLC / Charter Communications Operating Capital 5.05% 30/3/2029 683,850 0.05
USD 25,000 Charter Communications Operating LLC / Charter Communications Operating Capital 5.375% 1/5/2047 27,657 0.00
USD 30,000 Charter Communications Operating LLC / Charter Communications Operating Capital 5.75% 1/4/2048 34,938 0.00
USD 5,000 Charter Communications Operating LLC / Charter Communications Operating Capital 6.384% 23/10/2035 6,105 0.00
USD 824,000 Charter Communications Operating LLC / Charter Communications Operating Capital 6.484% 2 3/10/2045 1,018,731 0.07
USD 10,902 CHL Mortgage Pass-Through Trust 2004-29 ‘Series 2004-29 1A1’ FRN 25/2/2035 10,584 0.00
EUR 390,000 Chubb INA Holdings Inc 0.875% 15/6/2027 452,484 0.03
EUR 1,130,000 Chubb INA Holdings Inc 1.55% 15/3/2028 1,378,235 0.10
USD 1,300,000 CIFC Funding 2015-III Ltd ‘Series 2015-3A AR’ ‘144A’ FRN 19/4/2029 1,292,684 0.09
USD 244,000 Cimarex Energy Co 4.375% 1/6/2024 257,223 0.02
USD 124,000 Citgo Holding Inc ‘144A’ 9.25% 1/8/2024 131,595 0.01
USD 387,000 Citigroup Commercial Mortgage Trust 2014-GC19 ‘Series 2014-GC19 A4’ 4.023% 10/3/2047 418,243 0.03
USD 523,000 Citigroup Commercial Mortgage Trust 2016-C1 ‘Series 2016-C1 C’ FRN 10/5/2049 586,286 0.04
USD 287,426 Citigroup Commercial Mortgage Trust 2016-P3 ‘Series 2016-P3 D’ ‘144A’ FRN 15/4/2049 258,153 0.02
USD 1,810,000 Citigroup Commercial Mortgage Trust 2016-P5 2.941% 10/10/2049 1,903,359 0.14
USD 260,000 Citigroup Inc FRN 15/11/2020 (Perpetual) 267,566 0.02
USD 155,000 Citigroup Inc FRN 24/7/2028 166,011 0.01 USD 10,000 Citigroup Inc FRN 20/3/2030 11,042 0.00 USD 16,000 Citigroup Inc 2.75% 25/4/2022 16,271 0.00 USD 8,000 Citigroup Inc 4.65% 23/7/2048 10,137 0.00 USD 2,000 Citigroup Inc 8.125% 15/7/2039 3,346 0.00 USD 1,020,000 Citigroup Mortgage Loan Trust Inc
‘Series 2007-WFH4 M3A’ FRN 25/7/2037 1,087,665 0.08
USD 500,000 CNOOC Finance 2015 USA LLC 3.5% 5/5/2025 526,406 0.04
EUR 480,000 Coca-Cola Co/The 0.125% 22/9/2022 537,611 0.04
EUR 200,000 Coca-Cola Co/The 1.125% 22/9/2022 230,947 0.02
USD 234,000 Comcast Corp 3.4% 15/7/2046 243,992 0.02 USD 4,000 Comcast Corp 3.45% 1/10/2021 4,120 0.00 USD 67,000 Comcast Corp 3.969% 1/11/2047 75,215 0.01 USD 434,000 Comcast Corp 3.999% 1/11/2049 489,674 0.04 USD 77,000 Comcast Corp 4% 1/3/2048 87,173 0.01 USD 13,000 Comcast Corp 4.5% 15/1/2043 15,439 0.00 USD 60,000 Comcast Corp 4.6% 15/10/2038 73,059 0.01 USD 873,000 Comcast Corp 4.6% 15/8/2045 1,066,165 0.08 USD 430,000 Comcast Corp 4.7% 15/10/2048 539,727 0.04 USD 65,000 Comcast Corp 4.95% 15/10/2058 84,533 0.01 USD 1,275,000 COMM 2013-300P Mortgage Trust
FRN 10/8/2030 1,349,088 0.10 USD 670,000 COMM 2015-CCRE23 Mortgage
Trust ‘Series 2015-CR23 CME’ ‘144A’ FRN 10/5/2048 669,474 0.05
USD 1,450,000 COMM 2015-CCRE26 Mortgage Trust ‘Series 2015-CR26 A4’ 3.63% 10/10/2048 1,572,035 0.11
USD 1,730,000 COMM 2015-LC21 Mortgage Trust ‘Series 2015-LC21 A4’ 3.708% 10/7/2048 1,878,981 0.14
USD 1,400,000 COMM 2017-COR2 Mortgage Trust ‘Series 2017-COR2 A3’ 3.51% 10/9/2050 1,524,820 0.11
USD 74,000 Concho Resources Inc 3.75% 1/10/2027 77,138 0.01
USD 1,661,929 Conseco Finance Corp ‘Series 1997-7 M1’ FRN 15/7/2028 1,705,771 0.12
USD 175,000 Consumers Energy Co 3.1% 15/8/2050 178,547 0.01
USD 13,000 Consumers Energy Co 3.75% 15/2/2050 15,007 0.00
USD 440,000 Consumers Energy Co 3.95% 15/5/2043 511,809 0.04
USD 1,355,000 Core Industrial Trust 2015-TEXW ‘Series 2015-TEXW F’ ‘144A’ FRN 10/2/2034 1,392,125 0.10
USD 62,000 Corning Inc 4.375% 15/11/2057 64,743 0.01 USD 2,140,000 Cox Communications Inc ‘144A’
3.25% 15/12/2022 2,199,083 0.16
World Bond Fund continued
Portfolio of Investments 31 August 2019
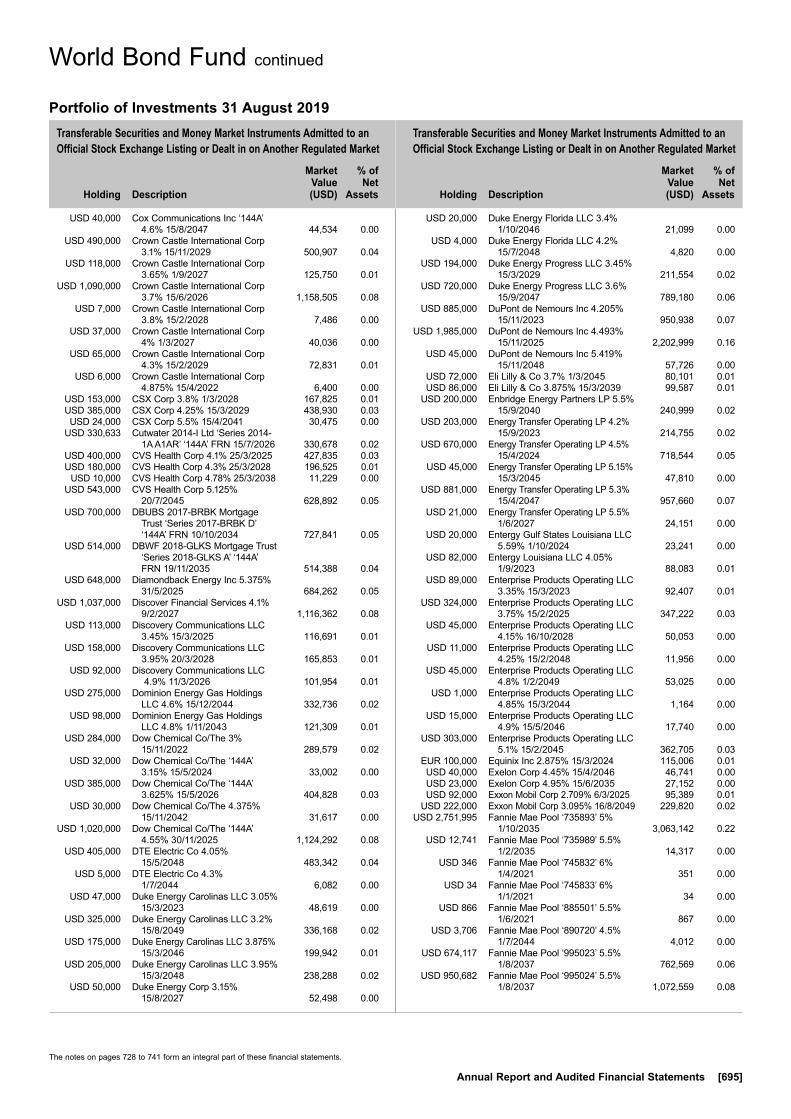
The notes on pages 728 to 741 form an integral part of these financial statements.
Annual Report and Audited Financial Statements [695]
Transferable Securities and Money Market Instruments Admitted to an Official Stock Exchange Listing or Dealt in on Another Regulated Market
Transferable Securities and Money Market Instruments Admitted to an Official Stock Exchange Listing or Dealt in on Another Regulated Market
Holding
Description
Market Value (USD)
% of Net
Assets
Holding
Description
Market Value (USD)
% of Net
Assets
USD 40,000 Cox Communications Inc ‘144A’ 4.6% 15/8/2047 44,534 0.00
USD 490,000 Crown Castle International Corp 3.1% 15/11/2029 500,907 0.04
USD 118,000 Crown Castle International Corp 3.65% 1/9/2027 125,750 0.01
USD 1,090,000 Crown Castle International Corp 3.7% 15/6/2026 1,158,505 0.08
USD 7,000 Crown Castle International Corp 3.8% 15/2/2028 7,486 0.00
USD 37,000 Crown Castle International Corp 4% 1/3/2027 40,036 0.00
USD 65,000 Crown Castle International Corp 4.3% 15/2/2029 72,831 0.01
USD 6,000 Crown Castle International Corp 4.875% 15/4/2022 6,400 0.00
USD 153,000 CSX Corp 3.8% 1/3/2028 167,825 0.01 USD 385,000 CSX Corp 4.25% 15/3/2029 438,930 0.03 USD 24,000 CSX Corp 5.5% 15/4/2041 30,475 0.00 USD 330,633 Cutwater 2014-I Ltd ‘Series 2014-
1A A1AR’ ‘144A’ FRN 15/7/2026 330,678 0.02 USD 400,000 CVS Health Corp 4.1% 25/3/2025 427,835 0.03 USD 180,000 CVS Health Corp 4.3% 25/3/2028 196,525 0.01 USD 10,000 CVS Health Corp 4.78% 25/3/2038 11,229 0.00 USD 543,000 CVS Health Corp 5.125%
20/7/2045 628,892 0.05 USD 700,000 DBUBS 2017-BRBK Mortgage
Trust ‘Series 2017-BRBK D’ ‘144A’ FRN 10/10/2034 727,841 0.05
USD 514,000 DBWF 2018-GLKS Mortgage Trust ‘Series 2018-GLKS A’ ‘144A’ FRN 19/11/2035 514,388 0.04
USD 648,000 Diamondback Energy Inc 5.375% 31/5/2025 684,262 0.05
USD 1,037,000 Discover Financial Services 4.1% 9/2/2027 1,116,362 0.08
USD 113,000 Discovery Communications LLC 3.45% 15/3/2025 116,691 0.01
USD 158,000 Discovery Communications LLC 3.95% 20/3/2028 165,853 0.01
USD 92,000 Discovery Communications LLC 4.9% 11/3/2026 101,954 0.01
USD 275,000 Dominion Energy Gas Holdings LLC 4.6% 15/12/2044 332,736 0.02
USD 98,000 Dominion Energy Gas Holdings LLC 4.8% 1/11/2043 121,309 0.01
USD 284,000 Dow Chemical Co/The 3% 15/11/2022 289,579 0.02
USD 32,000 Dow Chemical Co/The ‘144A’ 3.15% 15/5/2024 33,002 0.00
USD 385,000 Dow Chemical Co/The ‘144A’ 3.625% 15/5/2026 404,828 0.03
USD 30,000 Dow Chemical Co/The 4.375% 15/11/2042 31,617 0.00
USD 1,020,000 Dow Chemical Co/The ‘144A’ 4.55% 30/11/2025 1,124,292 0.08
USD 405,000 DTE Electric Co 4.05% 15/5/2048 483,342 0.04
USD 5,000 DTE Electric Co 4.3% 1/7/2044 6,082 0.00
USD 47,000 Duke Energy Carolinas LLC 3.05% 15/3/2023 48,619 0.00
USD 325,000 Duke Energy Carolinas LLC 3.2% 15/8/2049 336,168 0.02
USD 175,000 Duke Energy Carolinas LLC 3.875% 15/3/2046 199,942 0.01
USD 205,000 Duke Energy Carolinas LLC 3.95% 15/3/2048 238,288 0.02
USD 50,000 Duke Energy Corp 3.15% 15/8/2027 52,498 0.00
USD 20,000 Duke Energy Florida LLC 3.4% 1/10/2046 21,099 0.00
USD 4,000 Duke Energy Florida LLC 4.2% 15/7/2048 4,820 0.00
USD 194,000 Duke Energy Progress LLC 3.45% 15/3/2029 211,554 0.02
USD 720,000 Duke Energy Progress LLC 3.6% 15/9/2047 789,180 0.06
USD 885,000 DuPont de Nemours Inc 4.205% 15/11/2023 950,938 0.07
USD 1,985,000 DuPont de Nemours Inc 4.493% 15/11/2025 2,202,999 0.16
USD 45,000 DuPont de Nemours Inc 5.419% 15/11/2048 57,726 0.00
USD 72,000 Eli Lilly & Co 3.7% 1/3/2045 80,101 0.01 USD 86,000 Eli Lilly & Co 3.875% 15/3/2039 99,587 0.01 USD 200,000 Enbridge Energy Partners LP 5.5%
15/9/2040 240,999 0.02 USD 203,000 Energy Transfer Operating LP 4.2%
15/9/2023 214,755 0.02 USD 670,000 Energy Transfer Operating LP 4.5%
15/4/2024 718,544 0.05 USD 45,000 Energy Transfer Operating LP 5.15%
15/3/2045 47,810 0.00 USD 881,000 Energy Transfer Operating LP 5.3%
15/4/2047 957,660 0.07 USD 21,000 Energy Transfer Operating LP 5.5%
1/6/2027 24,151 0.00 USD 20,000 Entergy Gulf States Louisiana LLC
5.59% 1/10/2024 23,241 0.00 USD 82,000 Entergy Louisiana LLC 4.05%
1/9/2023 88,083 0.01 USD 89,000 Enterprise Products Operating LLC
3.35% 15/3/2023 92,407 0.01 USD 324,000 Enterprise Products Operating LLC
3.75% 15/2/2025 347,222 0.03 USD 45,000 Enterprise Products Operating LLC
4.15% 16/10/2028 50,053 0.00 USD 11,000 Enterprise Products Operating LLC
4.25% 15/2/2048 11,956 0.00 USD 45,000 Enterprise Products Operating LLC
4.8% 1/2/2049 53,025 0.00 USD 1,000 Enterprise Products Operating LLC
4.85% 15/3/2044 1,164 0.00 USD 15,000 Enterprise Products Operating LLC
4.9% 15/5/2046 17,740 0.00 USD 303,000 Enterprise Products Operating LLC
5.1% 15/2/2045 362,705 0.03 EUR 100,000 Equinix Inc 2.875% 15/3/2024 115,006 0.01 USD 40,000 Exelon Corp 4.45% 15/4/2046 46,741 0.00 USD 23,000 Exelon Corp 4.95% 15/6/2035 27,152 0.00 USD 92,000 Exxon Mobil Corp 2.709% 6/3/2025 95,389 0.01 USD 222,000 Exxon Mobil Corp 3.095% 16/8/2049 229,820 0.02 USD 2,751,995 Fannie Mae Pool ‘735893’ 5%
1/10/2035 3,063,142 0.22 USD 12,741 Fannie Mae Pool ‘735989’ 5.5%
1/2/2035 14,317 0.00 USD 346 Fannie Mae Pool ‘745832’ 6%
1/4/2021 351 0.00 USD 34 Fannie Mae Pool ‘745833’ 6%
1/1/2021 34 0.00 USD 866 Fannie Mae Pool ‘885501’ 5.5%
1/6/2021 867 0.00 USD 3,706 Fannie Mae Pool ‘890720’ 4.5%
1/7/2044 4,012 0.00 USD 674,117 Fannie Mae Pool ‘995023’ 5.5%
1/8/2037 762,569 0.06 USD 950,682 Fannie Mae Pool ‘995024’ 5.5%
1/8/2037 1,072,559 0.08
World Bond Fund continued
Portfolio of Investments 31 August 2019
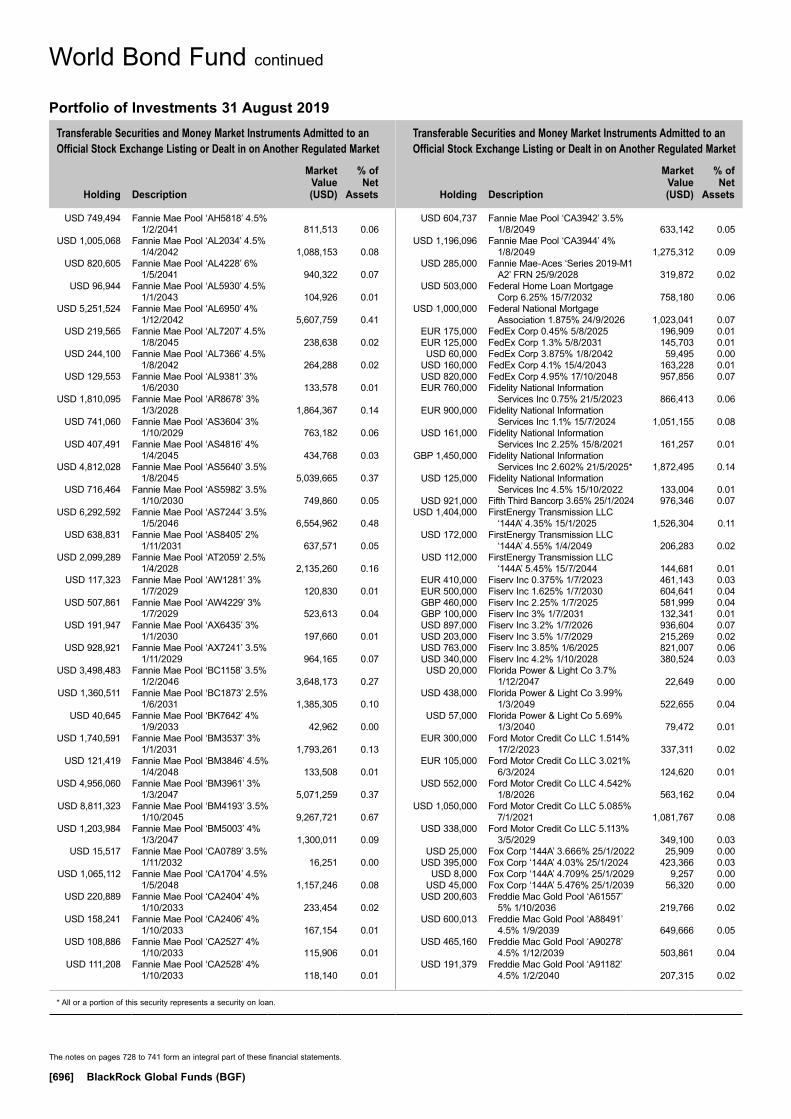
The notes on pages 728 to 741 form an integral part of these financial statements.
[696] BlackRock Global Funds (BGF)
Transferable Securities and Money Market Instruments Admitted to an Official Stock Exchange Listing or Dealt in on Another Regulated Market
Transferable Securities and Money Market Instruments Admitted to an Official Stock Exchange Listing or Dealt in on Another Regulated Market
Holding
Description
Market Value (USD)
% of Net
Assets
Holding
Description
Market Value (USD)
% of Net
Assets
* All or a portion of this security represents a security on loan.
USD 749,494 Fannie Mae Pool ‘AH5818’ 4.5% 1/2/2041 811,513 0.06
USD 1,005,068 Fannie Mae Pool ‘AL2034’ 4.5% 1/4/2042 1,088,153 0.08
USD 820,605 Fannie Mae Pool ‘AL4228’ 6% 1/5/2041 940,322 0.07
USD 96,944 Fannie Mae Pool ‘AL5930’ 4.5% 1/1/2043 104,926 0.01
USD 5,251,524 Fannie Mae Pool ‘AL6950’ 4% 1/12/2042 5,607,759 0.41
USD 219,565 Fannie Mae Pool ‘AL7207’ 4.5% 1/8/2045 238,638 0.02
USD 244,100 Fannie Mae Pool ‘AL7366’ 4.5% 1/8/2042 264,288 0.02
USD 129,553 Fannie Mae Pool ‘AL9381’ 3% 1/6/2030 133,578 0.01
USD 1,810,095 Fannie Mae Pool ‘AR8678’ 3% 1/3/2028 1,864,367 0.14
USD 741,060 Fannie Mae Pool ‘AS3604’ 3% 1/10/2029 763,182 0.06
USD 407,491 Fannie Mae Pool ‘AS4816’ 4% 1/4/2045 434,768 0.03
USD 4,812,028 Fannie Mae Pool ‘AS5640’ 3.5% 1/8/2045 5,039,665 0.37
USD 716,464 Fannie Mae Pool ‘AS5982’ 3.5% 1/10/2030 749,860 0.05
USD 6,292,592 Fannie Mae Pool ‘AS7244’ 3.5% 1/5/2046 6,554,962 0.48
USD 638,831 Fannie Mae Pool ‘AS8405’ 2% 1/11/2031 637,571 0.05
USD 2,099,289 Fannie Mae Pool ‘AT2059’ 2.5% 1/4/2028 2,135,260 0.16
USD 117,323 Fannie Mae Pool ‘AW1281’ 3% 1/7/2029 120,830 0.01
USD 507,861 Fannie Mae Pool ‘AW4229’ 3% 1/7/2029 523,613 0.04
USD 191,947 Fannie Mae Pool ‘AX6435’ 3% 1/1/2030 197,660 0.01
USD 928,921 Fannie Mae Pool ‘AX7241’ 3.5% 1/11/2029 964,165 0.07
USD 3,498,483 Fannie Mae Pool ‘BC1158’ 3.5% 1/2/2046 3,648,173 0.27
USD 1,360,511 Fannie Mae Pool ‘BC1873’ 2.5% 1/6/2031 1,385,305 0.10
USD 40,645 Fannie Mae Pool ‘BK7642’ 4% 1/9/2033 42,962 0.00
USD 1,740,591 Fannie Mae Pool ‘BM3537’ 3% 1/1/2031 1,793,261 0.13
USD 121,419 Fannie Mae Pool ‘BM3846’ 4.5% 1/4/2048 133,508 0.01
USD 4,956,060 Fannie Mae Pool ‘BM3961’ 3% 1/3/2047 5,071,259 0.37
USD 8,811,323 Fannie Mae Pool ‘BM4193’ 3.5% 1/10/2045 9,267,721 0.67
USD 1,203,984 Fannie Mae Pool ‘BM5003’ 4% 1/3/2047 1,300,011 0.09
USD 15,517 Fannie Mae Pool ‘CA0789’ 3.5% 1/11/2032 16,251 0.00
USD 1,065,112 Fannie Mae Pool ‘CA1704’ 4.5% 1/5/2048 1,157,246 0.08
USD 220,889 Fannie Mae Pool ‘CA2404’ 4% 1/10/2033 233,454 0.02
USD 158,241 Fannie Mae Pool ‘CA2406’ 4% 1/10/2033 167,154 0.01
USD 108,886 Fannie Mae Pool ‘CA2527’ 4% 1/10/2033 115,906 0.01
USD 111,208 Fannie Mae Pool ‘CA2528’ 4% 1/10/2033 118,140 0.01
USD 604,737 Fannie Mae Pool ‘CA3942’ 3.5% 1/8/2049 633,142 0.05
USD 1,196,096 Fannie Mae Pool ‘CA3944’ 4% 1/8/2049 1,275,312 0.09
USD 285,000 Fannie Mae-Aces ‘Series 2019-M1 A2’ FRN 25/9/2028 319,872 0.02
USD 503,000 Federal Home Loan Mortgage Corp 6.25% 15/7/2032 758,180 0.06
USD 1,000,000 Federal National Mortgage Association 1.875% 24/9/2026 1,023,041 0.07
EUR 175,000 FedEx Corp 0.45% 5/8/2025 196,909 0.01 EUR 125,000 FedEx Corp 1.3% 5/8/2031 145,703 0.01 USD 60,000 FedEx Corp 3.875% 1/8/2042 59,495 0.00 USD 160,000 FedEx Corp 4.1% 15/4/2043 163,228 0.01 USD 820,000 FedEx Corp 4.95% 17/10/2048 957,856 0.07 EUR 760,000 Fidelity National Information
Services Inc 0.75% 21/5/2023 866,413 0.06 EUR 900,000 Fidelity National Information
Services Inc 1.1% 15/7/2024 1,051,155 0.08 USD 161,000 Fidelity National Information
Services Inc 2.25% 15/8/2021 161,257 0.01 GBP 1,450,000 Fidelity National Information
Services Inc 2.602% 21/5/2025* 1,872,495 0.14 USD 125,000 Fidelity National Information
Services Inc 4.5% 15/10/2022 133,004 0.01 USD 921,000 Fifth Third Bancorp 3.65% 25/1/2024 976,346 0.07 USD 1,404,000 FirstEnergy Transmission LLC
‘144A’ 4.35% 15/1/2025 1,526,304 0.11 USD 172,000 FirstEnergy Transmission LLC
‘144A’ 4.55% 1/4/2049 206,283 0.02 USD 112,000 FirstEnergy Transmission LLC
‘144A’ 5.45% 15/7/2044 144,681 0.01 EUR 410,000 Fiserv Inc 0.375% 1/7/2023 461,143 0.03 EUR 500,000 Fiserv Inc 1.625% 1/7/2030 604,641 0.04 GBP 460,000 Fiserv Inc 2.25% 1/7/2025 581,999 0.04 GBP 100,000 Fiserv Inc 3% 1/7/2031 132,341 0.01 USD 897,000 Fiserv Inc 3.2% 1/7/2026 936,604 0.07 USD 203,000 Fiserv Inc 3.5% 1/7/2029 215,269 0.02 USD 763,000 Fiserv Inc 3.85% 1/6/2025 821,007 0.06 USD 340,000 Fiserv Inc 4.2% 1/10/2028 380,524 0.03 USD 20,000 Florida Power & Light Co 3.7%
1/12/2047 22,649 0.00 USD 438,000 Florida Power & Light Co 3.99%
1/3/2049 522,655 0.04 USD 57,000 Florida Power & Light Co 5.69%
1/3/2040 79,472 0.01 EUR 300,000 Ford Motor Credit Co LLC 1.514%
17/2/2023 337,311 0.02 EUR 105,000 Ford Motor Credit Co LLC 3.021%
6/3/2024 124,620 0.01 USD 552,000 Ford Motor Credit Co LLC 4.542%
1/8/2026 563,162 0.04 USD 1,050,000 Ford Motor Credit Co LLC 5.085%
7/1/2021 1,081,767 0.08 USD 338,000 Ford Motor Credit Co LLC 5.113%
3/5/2029 349,100 0.03 USD 25,000 Fox Corp ‘144A’ 3.666% 25/1/2022 25,909 0.00 USD 395,000 Fox Corp ‘144A’ 4.03% 25/1/2024 423,366 0.03 USD 8,000 Fox Corp ‘144A’ 4.709% 25/1/2029 9,257 0.00 USD 45,000 Fox Corp ‘144A’ 5.476% 25/1/2039 56,320 0.00 USD 200,603 Freddie Mac Gold Pool ‘A61557’
5% 1/10/2036 219,766 0.02 USD 600,013 Freddie Mac Gold Pool ‘A88491’
4.5% 1/9/2039 649,666 0.05 USD 465,160 Freddie Mac Gold Pool ‘A90278’
4.5% 1/12/2039 503,861 0.04 USD 191,379 Freddie Mac Gold Pool ‘A91182’
4.5% 1/2/2040 207,315 0.02
World Bond Fund continued
Portfolio of Investments 31 August 2019
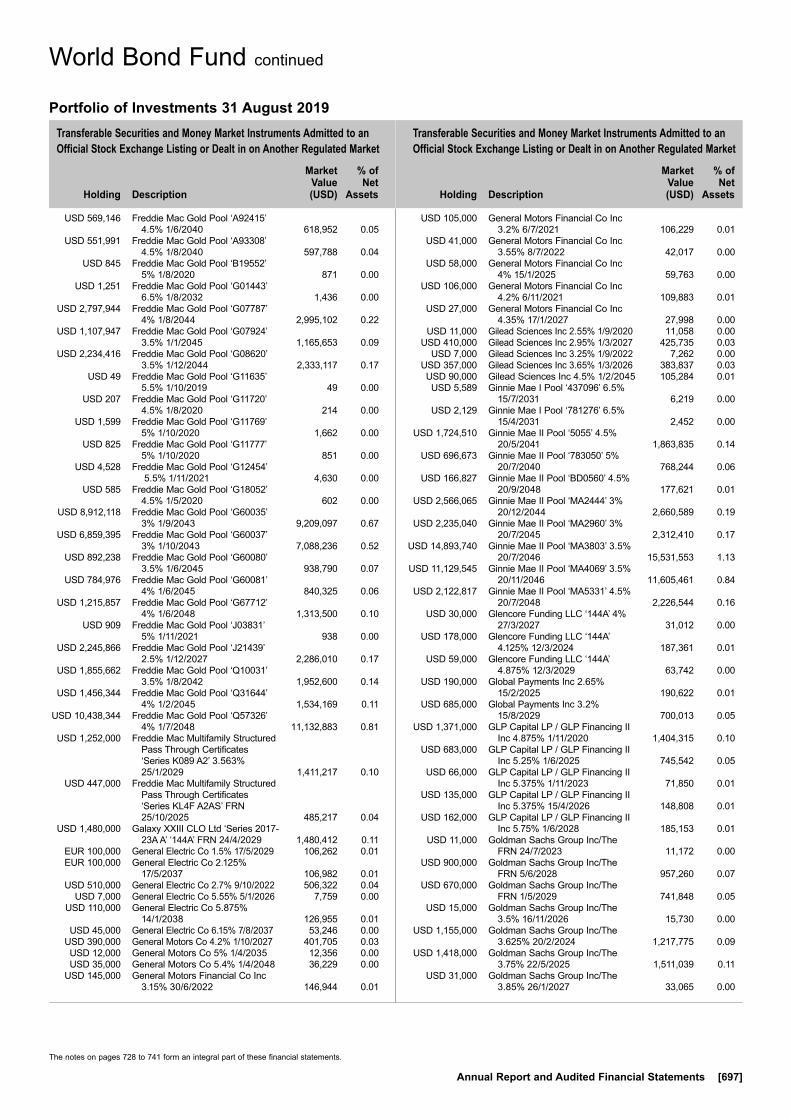
The notes on pages 728 to 741 form an integral part of these financial statements.
Annual Report and Audited Financial Statements [697]
Transferable Securities and Money Market Instruments Admitted to an Official Stock Exchange Listing or Dealt in on Another Regulated Market
Transferable Securities and Money Market Instruments Admitted to an Official Stock Exchange Listing or Dealt in on Another Regulated Market
Holding
Description
Market Value (USD)
% of Net
Assets
Holding
Description
Market Value (USD)
% of Net
Assets
USD 569,146 Freddie Mac Gold Pool ‘A92415’ 4.5% 1/6/2040 618,952 0.05
USD 551,991 Freddie Mac Gold Pool ‘A93308’ 4.5% 1/8/2040 597,788 0.04
USD 845 Freddie Mac Gold Pool ‘B19552’ 5% 1/8/2020 871 0.00
USD 1,251 Freddie Mac Gold Pool ‘G01443’ 6.5% 1/8/2032 1,436 0.00
USD 2,797,944 Freddie Mac Gold Pool ‘G07787’ 4% 1/8/2044 2,995,102 0.22
USD 1,107,947 Freddie Mac Gold Pool ‘G07924’ 3.5% 1/1/2045 1,165,653 0.09
USD 2,234,416 Freddie Mac Gold Pool ‘G08620’ 3.5% 1/12/2044 2,333,117 0.17
USD 49 Freddie Mac Gold Pool ‘G11635’ 5.5% 1/10/2019 49 0.00
USD 207 Freddie Mac Gold Pool ‘G11720’ 4.5% 1/8/2020 214 0.00
USD 1,599 Freddie Mac Gold Pool ‘G11769’ 5% 1/10/2020 1,662 0.00
USD 825 Freddie Mac Gold Pool ‘G11777’ 5% 1/10/2020 851 0.00
USD 4,528 Freddie Mac Gold Pool ‘G12454’ 5.5% 1/11/2021 4,630 0.00
USD 585 Freddie Mac Gold Pool ‘G18052’ 4.5% 1/5/2020 602 0.00
USD 8,912,118 Freddie Mac Gold Pool ‘G60035’ 3% 1/9/2043 9,209,097 0.67
USD 6,859,395 Freddie Mac Gold Pool ‘G60037’ 3% 1/10/2043 7,088,236 0.52
USD 892,238 Freddie Mac Gold Pool ‘G60080’ 3.5% 1/6/2045 938,790 0.07
USD 784,976 Freddie Mac Gold Pool ‘G60081’ 4% 1/6/2045 840,325 0.06
USD 1,215,857 Freddie Mac Gold Pool ‘G67712’ 4% 1/6/2048 1,313,500 0.10
USD 909 Freddie Mac Gold Pool ‘J03831’ 5% 1/11/2021 938 0.00
USD 2,245,866 Freddie Mac Gold Pool ‘J21439’ 2.5% 1/12/2027 2,286,010 0.17
USD 1,855,662 Freddie Mac Gold Pool ‘Q10031’ 3.5% 1/8/2042 1,952,600 0.14
USD 1,456,344 Freddie Mac Gold Pool ‘Q31644’ 4% 1/2/2045 1,534,169 0.11
USD 10,438,344 Freddie Mac Gold Pool ‘Q57326’ 4% 1/7/2048 11,132,883 0.81
USD 1,252,000 Freddie Mac Multifamily Structured Pass Through Certificates ‘Series K089 A2’ 3.563% 25/1/2029 1,411,217 0.10
USD 447,000 Freddie Mac Multifamily Structured Pass Through Certificates ‘Series KL4F A2AS’ FRN 25/10/2025 485,217 0.04
USD 1,480,000 Galaxy XXIII CLO Ltd ‘Series 2017-23A A’ ‘144A’ FRN 24/4/2029 1,480,412 0.11
EUR 100,000 General Electric Co 1.5% 17/5/2029 106,262 0.01 EUR 100,000 General Electric Co 2.125%
17/5/2037 106,982 0.01 USD 510,000 General Electric Co 2.7% 9/10/2022 506,322 0.04 USD 7,000 General Electric Co 5.55% 5/1/2026 7,759 0.00 USD 110,000 General Electric Co 5.875%
14/1/2038 126,955 0.01 USD 45,000 General Electric Co 6.15% 7/8/2037 53,246 0.00 USD 390,000 General Motors Co 4.2% 1/10/2027 401,705 0.03 USD 12,000 General Motors Co 5% 1/4/2035 12,356 0.00 USD 35,000 General Motors Co 5.4% 1/4/2048 36,229 0.00 USD 145,000 General Motors Financial Co Inc
3.15% 30/6/2022 146,944 0.01
USD 105,000 General Motors Financial Co Inc 3.2% 6/7/2021 106,229 0.01
USD 41,000 General Motors Financial Co Inc 3.55% 8/7/2022 42,017 0.00
USD 58,000 General Motors Financial Co Inc 4% 15/1/2025 59,763 0.00
USD 106,000 General Motors Financial Co Inc 4.2% 6/11/2021 109,883 0.01
USD 27,000 General Motors Financial Co Inc 4.35% 17/1/2027 27,998 0.00
USD 11,000 Gilead Sciences Inc 2.55% 1/9/2020 11,058 0.00 USD 410,000 Gilead Sciences Inc 2.95% 1/3/2027 425,735 0.03 USD 7,000 Gilead Sciences Inc 3.25% 1/9/2022 7,262 0.00 USD 357,000 Gilead Sciences Inc 3.65% 1/3/2026 383,837 0.03 USD 90,000 Gilead Sciences Inc 4.5% 1/2/2045 105,284 0.01 USD 5,589 Ginnie Mae I Pool ‘437096’ 6.5%
15/7/2031 6,219 0.00 USD 2,129 Ginnie Mae I Pool ‘781276’ 6.5%
15/4/2031 2,452 0.00 USD 1,724,510 Ginnie Mae II Pool ‘5055’ 4.5%
20/5/2041 1,863,835 0.14 USD 696,673 Ginnie Mae II Pool ‘783050’ 5%
20/7/2040 768,244 0.06 USD 166,827 Ginnie Mae II Pool ‘BD0560’ 4.5%
20/9/2048 177,621 0.01 USD 2,566,065 Ginnie Mae II Pool ‘MA2444’ 3%
20/12/2044 2,660,589 0.19 USD 2,235,040 Ginnie Mae II Pool ‘MA2960’ 3%
20/7/2045 2,312,410 0.17 USD 14,893,740 Ginnie Mae II Pool ‘MA3803’ 3.5%
20/7/2046 15,531,553 1.13 USD 11,129,545 Ginnie Mae II Pool ‘MA4069’ 3.5%
20/11/2046 11,605,461 0.84 USD 2,122,817 Ginnie Mae II Pool ‘MA5331’ 4.5%
20/7/2048 2,226,544 0.16 USD 30,000 Glencore Funding LLC ‘144A’ 4%
27/3/2027 31,012 0.00 USD 178,000 Glencore Funding LLC ‘144A’
4.125% 12/3/2024 187,361 0.01 USD 59,000 Glencore Funding LLC ‘144A’
4.875% 12/3/2029 63,742 0.00 USD 190,000 Global Payments Inc 2.65%
15/2/2025 190,622 0.01 USD 685,000 Global Payments Inc 3.2%
15/8/2029 700,013 0.05 USD 1,371,000 GLP Capital LP / GLP Financing II
Inc 4.875% 1/11/2020 1,404,315 0.10 USD 683,000 GLP Capital LP / GLP Financing II
Inc 5.25% 1/6/2025 745,542 0.05 USD 66,000 GLP Capital LP / GLP Financing II
Inc 5.375% 1/11/2023 71,850 0.01 USD 135,000 GLP Capital LP / GLP Financing II
Inc 5.375% 15/4/2026 148,808 0.01 USD 162,000 GLP Capital LP / GLP Financing II
Inc 5.75% 1/6/2028 185,153 0.01 USD 11,000 Goldman Sachs Group Inc/The
FRN 24/7/2023 11,172 0.00 USD 900,000 Goldman Sachs Group Inc/The
FRN 5/6/2028 957,260 0.07 USD 670,000 Goldman Sachs Group Inc/The
FRN 1/5/2029 741,848 0.05 USD 15,000 Goldman Sachs Group Inc/The
3.5% 16/11/2026 15,730 0.00 USD 1,155,000 Goldman Sachs Group Inc/The
3.625% 20/2/2024 1,217,775 0.09 USD 1,418,000 Goldman Sachs Group Inc/The
3.75% 22/5/2025 1,511,039 0.11 USD 31,000 Goldman Sachs Group Inc/The
3.85% 26/1/2027 33,065 0.00
World Bond Fund continued
Portfolio of Investments 31 August 2019
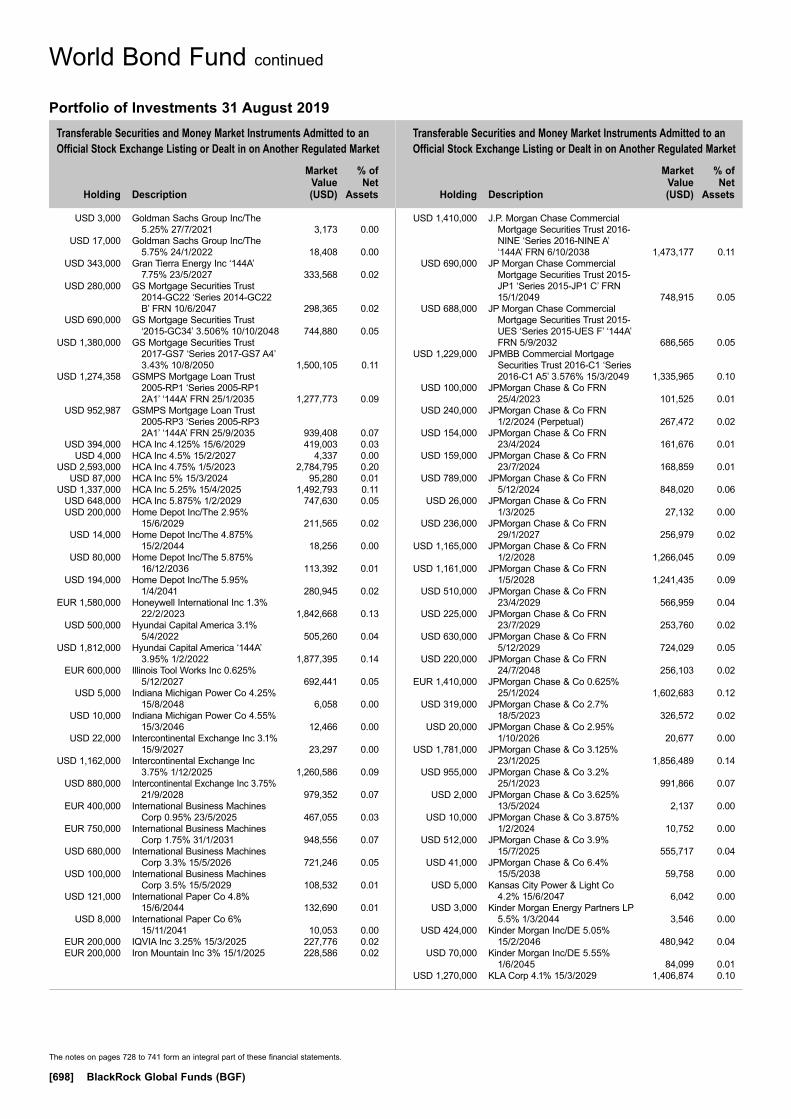
The notes on pages 728 to 741 form an integral part of these financial statements.
[698] BlackRock Global Funds (BGF)
Transferable Securities and Money Market Instruments Admitted to an Official Stock Exchange Listing or Dealt in on Another Regulated Market
Transferable Securities and Money Market Instruments Admitted to an Official Stock Exchange Listing or Dealt in on Another Regulated Market
Holding
Description
Market Value (USD)
% of Net
Assets
Holding
Description
Market Value (USD)
% of Net
Assets
USD 3,000 Goldman Sachs Group Inc/The 5.25% 27/7/2021 3,173 0.00
USD 17,000 Goldman Sachs Group Inc/The 5.75% 24/1/2022 18,408 0.00
USD 343,000 Gran Tierra Energy Inc ‘144A’ 7.75% 23/5/2027 333,568 0.02
USD 280,000 GS Mortgage Securities Trust 2014-GC22 ‘Series 2014-GC22 B’ FRN 10/6/2047 298,365 0.02
USD 690,000 GS Mortgage Securities Trust ‘2015-GC34’ 3.506% 10/10/2048 744,880 0.05
USD 1,380,000 GS Mortgage Securities Trust 2017-GS7 ‘Series 2017-GS7 A4’ 3.43% 10/8/2050 1,500,105 0.11
USD 1,274,358 GSMPS Mortgage Loan Trust 2005-RP1 ‘Series 2005-RP1 2A1’ ‘144A’ FRN 25/1/2035 1,277,773 0.09
USD 952,987 GSMPS Mortgage Loan Trust 2005-RP3 ‘Series 2005-RP3 2A1’ ‘144A’ FRN 25/9/2035 939,408 0.07
USD 394,000 HCA Inc 4.125% 15/6/2029 419,003 0.03 USD 4,000 HCA Inc 4.5% 15/2/2027 4,337 0.00 USD 2,593,000 HCA Inc 4.75% 1/5/2023 2,784,795 0.20 USD 87,000 HCA Inc 5% 15/3/2024 95,280 0.01 USD 1,337,000 HCA Inc 5.25% 15/4/2025 1,492,793 0.11 USD 648,000 HCA Inc 5.875% 1/2/2029 747,630 0.05 USD 200,000 Home Depot Inc/The 2.95%
15/6/2029 211,565 0.02 USD 14,000 Home Depot Inc/The 4.875%
15/2/2044 18,256 0.00 USD 80,000 Home Depot Inc/The 5.875%
16/12/2036 113,392 0.01 USD 194,000 Home Depot Inc/The 5.95%
1/4/2041 280,945 0.02 EUR 1,580,000 Honeywell International Inc 1.3%
22/2/2023 1,842,668 0.13 USD 500,000 Hyundai Capital America 3.1%
5/4/2022 505,260 0.04 USD 1,812,000 Hyundai Capital America ‘144A’
3.95% 1/2/2022 1,877,395 0.14 EUR 600,000 Illinois Tool Works Inc 0.625%
5/12/2027 692,441 0.05 USD 5,000 Indiana Michigan Power Co 4.25%
15/8/2048 6,058 0.00 USD 10,000 Indiana Michigan Power Co 4.55%
15/3/2046 12,466 0.00 USD 22,000 Intercontinental Exchange Inc 3.1%
15/9/2027 23,297 0.00 USD 1,162,000 Intercontinental Exchange Inc
3.75% 1/12/2025 1,260,586 0.09 USD 880,000 Intercontinental Exchange Inc 3.75%
21/9/2028 979,352 0.07 EUR 400,000 International Business Machines
Corp 0.95% 23/5/2025 467,055 0.03 EUR 750,000 International Business Machines
Corp 1.75% 31/1/2031 948,556 0.07 USD 680,000 International Business Machines
Corp 3.3% 15/5/2026 721,246 0.05 USD 100,000 International Business Machines
Corp 3.5% 15/5/2029 108,532 0.01 USD 121,000 International Paper Co 4.8%
15/6/2044 132,690 0.01 USD 8,000 International Paper Co 6%
15/11/2041 10,053 0.00 EUR 200,000 IQVIA Inc 3.25% 15/3/2025 227,776 0.02 EUR 200,000 Iron Mountain Inc 3% 15/1/2025 228,586 0.02
USD 1,410,000 J.P. Morgan Chase Commercial Mortgage Securities Trust 2016-NINE ‘Series 2016-NINE A’ ‘144A’ FRN 6/10/2038 1,473,177 0.11
USD 690,000 JP Morgan Chase Commercial Mortgage Securities Trust 2015-JP1 ‘Series 2015-JP1 C’ FRN 15/1/2049 748,915 0.05
USD 688,000 JP Morgan Chase Commercial Mortgage Securities Trust 2015-UES ‘Series 2015-UES F’ ‘144A’ FRN 5/9/2032 686,565 0.05
USD 1,229,000 JPMBB Commercial Mortgage Securities Trust 2016-C1 ‘Series 2016-C1 A5’ 3.576% 15/3/2049 1,335,965 0.10
USD 100,000 JPMorgan Chase & Co FRN 25/4/2023 101,525 0.01
USD 240,000 JPMorgan Chase & Co FRN 1/2/2024 (Perpetual) 267,472 0.02
USD 154,000 JPMorgan Chase & Co FRN 23/4/2024 161,676 0.01
USD 159,000 JPMorgan Chase & Co FRN 23/7/2024 168,859 0.01
USD 789,000 JPMorgan Chase & Co FRN 5/12/2024 848,020 0.06
USD 26,000 JPMorgan Chase & Co FRN 1/3/2025 27,132 0.00
USD 236,000 JPMorgan Chase & Co FRN 29/1/2027 256,979 0.02
USD 1,165,000 JPMorgan Chase & Co FRN 1/2/2028 1,266,045 0.09
USD 1,161,000 JPMorgan Chase & Co FRN 1/5/2028 1,241,435 0.09
USD 510,000 JPMorgan Chase & Co FRN 23/4/2029 566,959 0.04
USD 225,000 JPMorgan Chase & Co FRN 23/7/2029 253,760 0.02
USD 630,000 JPMorgan Chase & Co FRN 5/12/2029 724,029 0.05
USD 220,000 JPMorgan Chase & Co FRN 24/7/2048 256,103 0.02
EUR 1,410,000 JPMorgan Chase & Co 0.625% 25/1/2024 1,602,683 0.12
USD 319,000 JPMorgan Chase & Co 2.7% 18/5/2023 326,572 0.02
USD 20,000 JPMorgan Chase & Co 2.95% 1/10/2026 20,677 0.00
USD 1,781,000 JPMorgan Chase & Co 3.125% 23/1/2025 1,856,489 0.14
USD 955,000 JPMorgan Chase & Co 3.2% 25/1/2023 991,866 0.07
USD 2,000 JPMorgan Chase & Co 3.625% 13/5/2024 2,137 0.00
USD 10,000 JPMorgan Chase & Co 3.875% 1/2/2024 10,752 0.00
USD 512,000 JPMorgan Chase & Co 3.9% 15/7/2025 555,717 0.04
USD 41,000 JPMorgan Chase & Co 6.4% 15/5/2038 59,758 0.00
USD 5,000 Kansas City Power & Light Co 4.2% 15/6/2047 6,042 0.00
USD 3,000 Kinder Morgan Energy Partners LP 5.5% 1/3/2044 3,546 0.00
USD 424,000 Kinder Morgan Inc/DE 5.05% 15/2/2046 480,942 0.04
USD 70,000 Kinder Morgan Inc/DE 5.55% 1/6/2045 84,099 0.01
USD 1,270,000 KLA Corp 4.1% 15/3/2029 1,406,874 0.10
World Bond Fund continued
Portfolio of Investments 31 August 2019
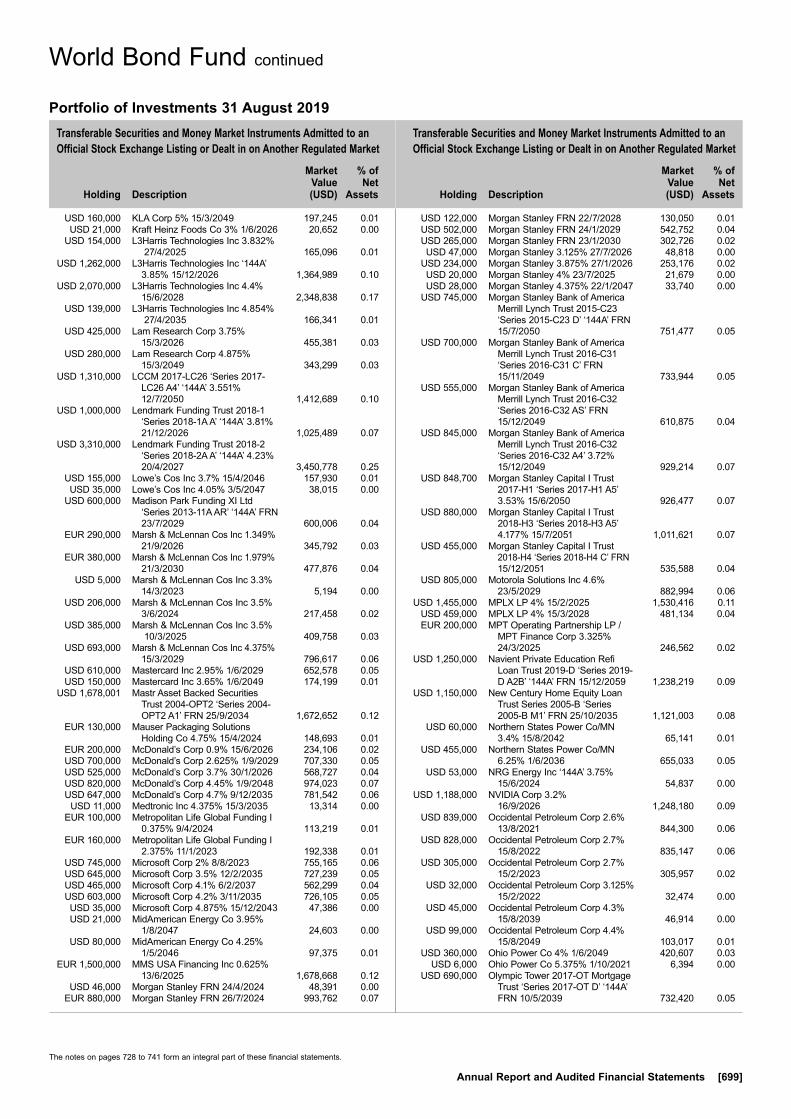
The notes on pages 728 to 741 form an integral part of these financial statements.
Annual Report and Audited Financial Statements [699]
Transferable Securities and Money Market Instruments Admitted to an Official Stock Exchange Listing or Dealt in on Another Regulated Market
Transferable Securities and Money Market Instruments Admitted to an Official Stock Exchange Listing or Dealt in on Another Regulated Market
Holding
Description
Market Value (USD)
% of Net
Assets
Holding
Description
Market Value (USD)
% of Net
Assets
USD 160,000 KLA Corp 5% 15/3/2049 197,245 0.01 USD 21,000 Kraft Heinz Foods Co 3% 1/6/2026 20,652 0.00 USD 154,000 L3Harris Technologies Inc 3.832%
27/4/2025 165,096 0.01 USD 1,262,000 L3Harris Technologies Inc ‘144A’
3.85% 15/12/2026 1,364,989 0.10 USD 2,070,000 L3Harris Technologies Inc 4.4%
15/6/2028 2,348,838 0.17 USD 139,000 L3Harris Technologies Inc 4.854%
27/4/2035 166,341 0.01 USD 425,000 Lam Research Corp 3.75%
15/3/2026 455,381 0.03 USD 280,000 Lam Research Corp 4.875%
15/3/2049 343,299 0.03 USD 1,310,000 LCCM 2017-LC26 ‘Series 2017-
LC26 A4’ ‘144A’ 3.551% 12/7/2050 1,412,689 0.10
USD 1,000,000 Lendmark Funding Trust 2018-1 ‘Series 2018-1A A’ ‘144A’ 3.81% 21/12/2026 1,025,489 0.07
USD 3,310,000 Lendmark Funding Trust 2018-2 ‘Series 2018-2A A’ ‘144A’ 4.23% 20/4/2027 3,450,778 0.25
USD 155,000 Lowe’s Cos Inc 3.7% 15/4/2046 157,930 0.01 USD 35,000 Lowe’s Cos Inc 4.05% 3/5/2047 38,015 0.00 USD 600,000 Madison Park Funding XI Ltd
‘Series 2013-11A AR’ ‘144A’ FRN 23/7/2029 600,006 0.04
EUR 290,000 Marsh & McLennan Cos Inc 1.349% 21/9/2026 345,792 0.03
EUR 380,000 Marsh & McLennan Cos Inc 1.979% 21/3/2030 477,876 0.04
USD 5,000 Marsh & McLennan Cos Inc 3.3% 14/3/2023 5,194 0.00
USD 206,000 Marsh & McLennan Cos Inc 3.5% 3/6/2024 217,458 0.02
USD 385,000 Marsh & McLennan Cos Inc 3.5% 10/3/2025 409,758 0.03
USD 693,000 Marsh & McLennan Cos Inc 4.375% 15/3/2029 796,617 0.06
USD 610,000 Mastercard Inc 2.95% 1/6/2029 652,578 0.05 USD 150,000 Mastercard Inc 3.65% 1/6/2049 174,199 0.01 USD 1,678,001 Mastr Asset Backed Securities
Trust 2004-OPT2 ‘Series 2004-OPT2 A1’ FRN 25/9/2034 1,672,652 0.12
EUR 130,000 Mauser Packaging Solutions Holding Co 4.75% 15/4/2024 148,693 0.01
EUR 200,000 McDonald’s Corp 0.9% 15/6/2026 234,106 0.02 USD 700,000 McDonald’s Corp 2.625% 1/9/2029 707,330 0.05 USD 525,000 McDonald’s Corp 3.7% 30/1/2026 568,727 0.04 USD 820,000 McDonald’s Corp 4.45% 1/9/2048 974,023 0.07 USD 647,000 McDonald’s Corp 4.7% 9/12/2035 781,542 0.06 USD 11,000 Medtronic Inc 4.375% 15/3/2035 13,314 0.00 EUR 100,000 Metropolitan Life Global Funding I
0.375% 9/4/2024 113,219 0.01 EUR 160,000 Metropolitan Life Global Funding I
2.375% 11/1/2023 192,338 0.01 USD 745,000 Microsoft Corp 2% 8/8/2023 755,165 0.06 USD 645,000 Microsoft Corp 3.5% 12/2/2035 727,239 0.05 USD 465,000 Microsoft Corp 4.1% 6/2/2037 562,299 0.04 USD 603,000 Microsoft Corp 4.2% 3/11/2035 726,105 0.05 USD 35,000 Microsoft Corp 4.875% 15/12/2043 47,386 0.00 USD 21,000 MidAmerican Energy Co 3.95%
1/8/2047 24,603 0.00 USD 80,000 MidAmerican Energy Co 4.25%
1/5/2046 97,375 0.01 EUR 1,500,000 MMS USA Financing Inc 0.625%
13/6/2025 1,678,668 0.12 USD 46,000 Morgan Stanley FRN 24/4/2024 48,391 0.00 EUR 880,000 Morgan Stanley FRN 26/7/2024 993,762 0.07
USD 122,000 Morgan Stanley FRN 22/7/2028 130,050 0.01 USD 502,000 Morgan Stanley FRN 24/1/2029 542,752 0.04 USD 265,000 Morgan Stanley FRN 23/1/2030 302,726 0.02 USD 47,000 Morgan Stanley 3.125% 27/7/2026 48,818 0.00 USD 234,000 Morgan Stanley 3.875% 27/1/2026 253,176 0.02 USD 20,000 Morgan Stanley 4% 23/7/2025 21,679 0.00 USD 28,000 Morgan Stanley 4.375% 22/1/2047 33,740 0.00 USD 745,000 Morgan Stanley Bank of America
Merrill Lynch Trust 2015-C23 ‘Series 2015-C23 D’ ‘144A’ FRN 15/7/2050 751,477 0.05
USD 700,000 Morgan Stanley Bank of America Merrill Lynch Trust 2016-C31 ‘Series 2016-C31 C’ FRN 15/11/2049 733,944 0.05
USD 555,000 Morgan Stanley Bank of America Merrill Lynch Trust 2016-C32 ‘Series 2016-C32 AS’ FRN 15/12/2049 610,875 0.04
USD 845,000 Morgan Stanley Bank of America Merrill Lynch Trust 2016-C32 ‘Series 2016-C32 A4’ 3.72% 15/12/2049 929,214 0.07
USD 848,700 Morgan Stanley Capital I Trust 2017-H1 ‘Series 2017-H1 A5’ 3.53% 15/6/2050 926,477 0.07
USD 880,000 Morgan Stanley Capital I Trust 2018-H3 ‘Series 2018-H3 A5’ 4.177% 15/7/2051 1,011,621 0.07
USD 455,000 Morgan Stanley Capital I Trust 2018-H4 ‘Series 2018-H4 C’ FRN 15/12/2051 535,588 0.04
USD 805,000 Motorola Solutions Inc 4.6% 23/5/2029 882,994 0.06
USD 1,455,000 MPLX LP 4% 15/2/2025 1,530,416 0.11 USD 459,000 MPLX LP 4% 15/3/2028 481,134 0.04 EUR 200,000 MPT Operating Partnership LP /
MPT Finance Corp 3.325% 24/3/2025 246,562 0.02
USD 1,250,000 Navient Private Education Refi Loan Trust 2019-D ‘Series 2019-D A2B’ ‘144A’ FRN 15/12/2059 1,238,219 0.09
USD 1,150,000 New Century Home Equity Loan Trust Series 2005-B ‘Series 2005-B M1’ FRN 25/10/2035 1,121,003 0.08
USD 60,000 Northern States Power Co/MN 3.4% 15/8/2042 65,141 0.01
USD 455,000 Northern States Power Co/MN 6.25% 1/6/2036 655,033 0.05
USD 53,000 NRG Energy Inc ‘144A’ 3.75% 15/6/2024 54,837 0.00
USD 1,188,000 NVIDIA Corp 3.2% 16/9/2026 1,248,180 0.09
USD 839,000 Occidental Petroleum Corp 2.6% 13/8/2021 844,300 0.06
USD 828,000 Occidental Petroleum Corp 2.7% 15/8/2022 835,147 0.06
USD 305,000 Occidental Petroleum Corp 2.7% 15/2/2023 305,957 0.02
USD 32,000 Occidental Petroleum Corp 3.125% 15/2/2022 32,474 0.00
USD 45,000 Occidental Petroleum Corp 4.3% 15/8/2039 46,914 0.00
USD 99,000 Occidental Petroleum Corp 4.4% 15/8/2049 103,017 0.01
USD 360,000 Ohio Power Co 4% 1/6/2049 420,607 0.03 USD 6,000 Ohio Power Co 5.375% 1/10/2021 6,394 0.00 USD 690,000 Olympic Tower 2017-OT Mortgage
Trust ‘Series 2017-OT D’ ‘144A’ FRN 10/5/2039 732,420 0.05
World Bond Fund continued
Portfolio of Investments 31 August 2019
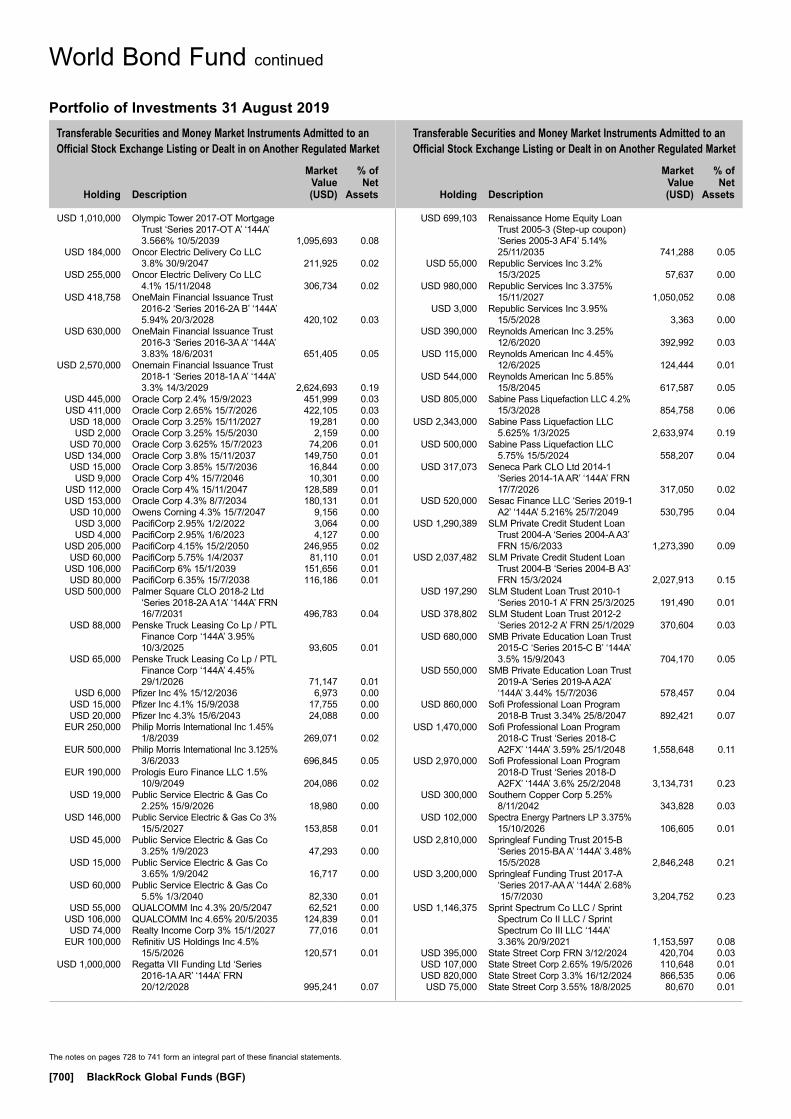
The notes on pages 728 to 741 form an integral part of these financial statements.
[700] BlackRock Global Funds (BGF)
Transferable Securities and Money Market Instruments Admitted to an Official Stock Exchange Listing or Dealt in on Another Regulated Market
Transferable Securities and Money Market Instruments Admitted to an Official Stock Exchange Listing or Dealt in on Another Regulated Market
Holding
Description
Market Value (USD)
% of Net
Assets
Holding
Description
Market Value (USD)
% of Net
Assets
USD 1,010,000 Olympic Tower 2017-OT Mortgage Trust ‘Series 2017-OT A’ ‘144A’ 3.566% 10/5/2039 1,095,693 0.08
USD 184,000 Oncor Electric Delivery Co LLC 3.8% 30/9/2047 211,925 0.02
USD 255,000 Oncor Electric Delivery Co LLC 4.1% 15/11/2048 306,734 0.02
USD 418,758 OneMain Financial Issuance Trust 2016-2 ‘Series 2016-2A B’ ‘144A’ 5.94% 20/3/2028 420,102 0.03
USD 630,000 OneMain Financial Issuance Trust 2016-3 ‘Series 2016-3A A’ ‘144A’ 3.83% 18/6/2031 651,405 0.05
USD 2,570,000 Onemain Financial Issuance Trust 2018-1 ‘Series 2018-1A A’ ‘144A’ 3.3% 14/3/2029 2,624,693 0.19
USD 445,000 Oracle Corp 2.4% 15/9/2023 451,999 0.03 USD 411,000 Oracle Corp 2.65% 15/7/2026 422,105 0.03 USD 18,000 Oracle Corp 3.25% 15/11/2027 19,281 0.00 USD 2,000 Oracle Corp 3.25% 15/5/2030 2,159 0.00 USD 70,000 Oracle Corp 3.625% 15/7/2023 74,206 0.01 USD 134,000 Oracle Corp 3.8% 15/11/2037 149,750 0.01 USD 15,000 Oracle Corp 3.85% 15/7/2036 16,844 0.00 USD 9,000 Oracle Corp 4% 15/7/2046 10,301 0.00 USD 112,000 Oracle Corp 4% 15/11/2047 128,589 0.01 USD 153,000 Oracle Corp 4.3% 8/7/2034 180,131 0.01 USD 10,000 Owens Corning 4.3% 15/7/2047 9,156 0.00 USD 3,000 PacifiCorp 2.95% 1/2/2022 3,064 0.00 USD 4,000 PacifiCorp 2.95% 1/6/2023 4,127 0.00 USD 205,000 PacifiCorp 4.15% 15/2/2050 246,955 0.02 USD 60,000 PacifiCorp 5.75% 1/4/2037 81,110 0.01 USD 106,000 PacifiCorp 6% 15/1/2039 151,656 0.01 USD 80,000 PacifiCorp 6.35% 15/7/2038 116,186 0.01 USD 500,000 Palmer Square CLO 2018-2 Ltd
‘Series 2018-2A A1A’ ‘144A’ FRN 16/7/2031 496,783 0.04
USD 88,000 Penske Truck Leasing Co Lp / PTL Finance Corp ‘144A’ 3.95% 10/3/2025 93,605 0.01
USD 65,000 Penske Truck Leasing Co Lp / PTL Finance Corp ‘144A’ 4.45% 29/1/2026 71,147 0.01
USD 6,000 Pfizer Inc 4% 15/12/2036 6,973 0.00 USD 15,000 Pfizer Inc 4.1% 15/9/2038 17,755 0.00 USD 20,000 Pfizer Inc 4.3% 15/6/2043 24,088 0.00 EUR 250,000 Philip Morris International Inc 1.45%
1/8/2039 269,071 0.02 EUR 500,000 Philip Morris International Inc 3.125%
3/6/2033 696,845 0.05 EUR 190,000 Prologis Euro Finance LLC 1.5%
10/9/2049 204,086 0.02 USD 19,000 Public Service Electric & Gas Co
2.25% 15/9/2026 18,980 0.00 USD 146,000 Public Service Electric & Gas Co 3%
15/5/2027 153,858 0.01 USD 45,000 Public Service Electric & Gas Co
3.25% 1/9/2023 47,293 0.00 USD 15,000 Public Service Electric & Gas Co
3.65% 1/9/2042 16,717 0.00 USD 60,000 Public Service Electric & Gas Co
5.5% 1/3/2040 82,330 0.01 USD 55,000 QUALCOMM Inc 4.3% 20/5/2047 62,521 0.00 USD 106,000 QUALCOMM Inc 4.65% 20/5/2035 124,839 0.01 USD 74,000 Realty Income Corp 3% 15/1/2027 77,016 0.01 EUR 100,000 Refinitiv US Holdings Inc 4.5%
15/5/2026 120,571 0.01 USD 1,000,000 Regatta VII Funding Ltd ‘Series
2016-1A AR’ ‘144A’ FRN 20/12/2028 995,241 0.07
USD 699,103 Renaissance Home Equity Loan Trust 2005-3 (Step-up coupon) ‘Series 2005-3 AF4’ 5.14% 25/11/2035 741,288 0.05
USD 55,000 Republic Services Inc 3.2% 15/3/2025 57,637 0.00
USD 980,000 Republic Services Inc 3.375% 15/11/2027 1,050,052 0.08
USD 3,000 Republic Services Inc 3.95% 15/5/2028 3,363 0.00
USD 390,000 Reynolds American Inc 3.25% 12/6/2020 392,992 0.03
USD 115,000 Reynolds American Inc 4.45% 12/6/2025 124,444 0.01
USD 544,000 Reynolds American Inc 5.85% 15/8/2045 617,587 0.05
USD 805,000 Sabine Pass Liquefaction LLC 4.2% 15/3/2028 854,758 0.06
USD 2,343,000 Sabine Pass Liquefaction LLC 5.625% 1/3/2025 2,633,974 0.19
USD 500,000 Sabine Pass Liquefaction LLC 5.75% 15/5/2024 558,207 0.04
USD 317,073 Seneca Park CLO Ltd 2014-1 ‘Series 2014-1A AR’ ‘144A’ FRN 17/7/2026 317,050 0.02
USD 520,000 Sesac Finance LLC ‘Series 2019-1 A2’ ‘144A’ 5.216% 25/7/2049 530,795 0.04
USD 1,290,389 SLM Private Credit Student Loan Trust 2004-A ‘Series 2004-A A3’ FRN 15/6/2033 1,273,390 0.09
USD 2,037,482 SLM Private Credit Student Loan Trust 2004-B ‘Series 2004-B A3’ FRN 15/3/2024 2,027,913 0.15
USD 197,290 SLM Student Loan Trust 2010-1 ‘Series 2010-1 A’ FRN 25/3/2025 191,490 0.01
USD 378,802 SLM Student Loan Trust 2012-2 ‘Series 2012-2 A’ FRN 25/1/2029 370,604 0.03
USD 680,000 SMB Private Education Loan Trust 2015-C ‘Series 2015-C B’ ‘144A’ 3.5% 15/9/2043 704,170 0.05
USD 550,000 SMB Private Education Loan Trust 2019-A ‘Series 2019-A A2A’ ‘144A’ 3.44% 15/7/2036 578,457 0.04
USD 860,000 Sofi Professional Loan Program 2018-B Trust 3.34% 25/8/2047 892,421 0.07
USD 1,470,000 Sofi Professional Loan Program 2018-C Trust ‘Series 2018-C A2FX’ ‘144A’ 3.59% 25/1/2048 1,558,648 0.11
USD 2,970,000 Sofi Professional Loan Program 2018-D Trust ‘Series 2018-D A2FX’ ‘144A’ 3.6% 25/2/2048 3,134,731 0.23
USD 300,000 Southern Copper Corp 5.25% 8/11/2042 343,828 0.03
USD 102,000 Spectra Energy Partners LP 3.375% 15/10/2026 106,605 0.01
USD 2,810,000 Springleaf Funding Trust 2015-B ‘Series 2015-BA A’ ‘144A’ 3.48% 15/5/2028 2,846,248 0.21
USD 3,200,000 Springleaf Funding Trust 2017-A ‘Series 2017-AA A’ ‘144A’ 2.68% 15/7/2030 3,204,752 0.23
USD 1,146,375 Sprint Spectrum Co LLC / Sprint Spectrum Co II LLC / Sprint Spectrum Co III LLC ‘144A’ 3.36% 20/9/2021 1,153,597 0.08
USD 395,000 State Street Corp FRN 3/12/2024 420,704 0.03 USD 107,000 State Street Corp 2.65% 19/5/2026 110,648 0.01 USD 820,000 State Street Corp 3.3% 16/12/2024 866,535 0.06 USD 75,000 State Street Corp 3.55% 18/8/2025 80,670 0.01
World Bond Fund continued
Portfolio of Investments 31 August 2019

The notes on pages 728 to 741 form an integral part of these financial statements.
Annual Report and Audited Financial Statements [701]
Transferable Securities and Money Market Instruments Admitted to an Official Stock Exchange Listing or Dealt in on Another Regulated Market
Transferable Securities and Money Market Instruments Admitted to an Official Stock Exchange Listing or Dealt in on Another Regulated Market
Holding
Description
Market Value (USD)
% of Net
Assets
Holding
Description
Market Value (USD)
% of Net
Assets
† Securities pledged or given in guarantee, see Note 14, for further details.
EUR 140,000 Stryker Corp 2.625% 30/11/2030 187,340 0.01 USD 461,000 Sunoco Logistics Partners
Operations LP 4.25% 1/4/2024 487,085 0.04 USD 99,000 Sunoco Logistics Partners
Operations LP 5.3% 1/4/2044 105,984 0.01 USD 5,000 SunTrust Bank/Atlanta GA FRN
26/10/2021 5,075 0.00 USD 500,000 Tennessee Valley Authority 2.875%
1/2/2027 537,660 0.04 USD 96,000 Thermo Fisher Scientific Inc 2.95%
19/9/2026 99,261 0.01 USD 581,000 Time Warner Cable LLC 7.3%
1/7/2038 748,237 0.05 USD 648,000 Toll Brothers Finance Corp 4.875%
15/3/2027 706,482 0.05 USD 892,000 Transcontinental Gas Pipe Line Co
LLC 4% 15/3/2028 954,728 0.07 USD 205,000 Transcontinental Gas Pipe Line Co
LLC 7.85% 1/2/2026 262,609 0.02 USD 399,000 TWDC Enterprises 18 Corp 1.85%
30/7/2026 394,359 0.03 USD 176,000 TWDC Enterprises 18 Corp 3%
13/2/2026 185,615 0.01 USD 85,000 Tyson Foods Inc 4.55% 2/6/2047 98,076 0.01 USD 30,000 Union Electric Co 3.5% 15/3/2029 33,195 0.00 USD 335,000 Union Pacific Corp 2.75% 1/3/2026 345,580 0.03 USD 540,000 Union Pacific Corp 2.95% 1/3/2022 552,983 0.04 USD 115,000 Union Pacific Corp 3.375% 1/2/2035 119,255 0.01 USD 142,000 Union Pacific Corp 3.6% 15/9/2037 152,115 0.01 USD 20,000 Union Pacific Corp 3.7% 1/3/2029 22,182 0.00 USD 60,000 Union Pacific Corp 3.95% 15/8/2059 66,076 0.01 USD 210,000 Union Pacific Corp 4.15% 15/1/2045 234,792 0.02 USD 21,000 Union Pacific Corp 4.375%
10/9/2038 24,671 0.00 USD 90,000 Union Pacific Corp 4.75% 15/9/2041 108,542 0.01 USD 736,944 United Airlines 2018-1 Class AA
Pass Through Trust 3.5% 1/3/2030 780,611 0.06 USD 840,000 United Airlines 2019-1 Class AA
Pass Through Trust 4.15% 25/8/2031 942,914 0.07
EUR 265,000 United Parcel Service Inc 1.5% 15/11/2032 331,858 0.02
USD 6,779,000 United States Treasury Inflation Indexed Bonds 0.5% 15/4/2024 7,037,170 0.51
USD 4,272,000 United States Treasury Inflation Indexed Bonds 0.875% 15/1/2029† 4,708,298 0.34
EUR 805,000 United Technologies Corp 1.125% 15/12/2021 914,447 0.07
USD 1,222,000 United Technologies Corp 4.125% 16/11/2028 1,395,320 0.10
USD 575,000 United Technologies Corp 4.5% 1/6/2042 697,941 0.05
USD 71,000 UnitedHealth Group Inc 2.875% 15/8/2029 74,207 0.01
USD 227,000 UnitedHealth Group Inc 2.95% 15/10/2027 237,149 0.02
USD 300,000 UnitedHealth Group Inc 3.1% 15/3/2026 317,027 0.02
USD 83,000 UnitedHealth Group Inc 3.75% 15/7/2025 90,382 0.01
USD 1,105,000 UnitedHealth Group Inc 3.85% 15/6/2028 1,233,341 0.09
USD 335,000 UnitedHealth Group Inc 4.45% 15/12/2048 408,570 0.03
USD 53,000 UnitedHealth Group Inc 4.625% 15/11/2041 64,438 0.01
USD 10,000 UnitedHealth Group Inc 4.75% 15/7/2045 12,482 0.00
GBP 865,000 Verizon Communications Inc 2.5% 8/4/2031 1,137,860 0.08
USD 27,000 Verizon Communications Inc 2.625% 15/8/2026 27,646 0.00
EUR 320,000 Verizon Communications Inc 2.875% 15/1/2038 452,540 0.03
USD 70,000 Verizon Communications Inc 4.125% 16/3/2027 77,937 0.01
USD 807,000 Verizon Communications Inc 4.125% 15/8/2046 916,967 0.07
USD 513,000 Verizon Communications Inc 4.329% 21/9/2028 589,262 0.04
USD 189,000 Verizon Communications Inc 4.4% 1/11/2034 219,354 0.02
USD 839,000 Verizon Communications Inc 4.5% 10/8/2033 990,167 0.07
USD 840,000 Verizon Communications Inc 4.672% 15/3/2055 1,034,392 0.08
USD 271,000 Verizon Communications Inc 4.812% 15/3/2039 333,091 0.02
USD 5,000 Verizon Communications Inc 4.862% 21/8/2046 6,261 0.00
USD 893,000 Virginia Electric & Power Co 3.8% 15/9/2047 995,685 0.07
USD 87,000 Visa Inc 4.15% 14/12/2035 105,924 0.01 USD 18,000 Visa Inc 4.3% 14/12/2045 22,858 0.00 USD 530,000 Vistra Energy Corp 7.625%
1/11/2024 561,551 0.04 USD 1,000,000 Voya CLO 2013-1 Ltd ‘Series
2013-1A A1AR’ ‘144A’ FRN 15/10/2030 999,241 0.07
USD 1,010,000 Voya CLO 2017-3 Ltd ‘Series 2017-3A A1A’ ‘144A’ FRN 20/7/2030 1,013,401 0.07
USD 18,000 Walmart Inc 2.65% 15/12/2024 18,655 0.00 USD 140,000 Walmart Inc 3.05% 8/7/2026 149,729 0.01 USD 494,000 Walmart Inc 3.25% 8/7/2029 541,432 0.04 USD 350,000 Walmart Inc 3.7% 26/6/2028 393,201 0.03 USD 10,000 Walmart Inc 4% 11/4/2043 11,968 0.00 USD 275,000 Walt Disney Co/The ‘144A’ 3.7%
15/9/2024 296,266 0.02 USD 210,000 Walt Disney Co/The ‘144A’ 3.7%
15/10/2025 228,052 0.02 USD 6,000 Walt Disney Co/The ‘144A’ 6.4%
15/12/2035 8,710 0.00 USD 45,000 Walt Disney Co/The ‘144A’ 6.9%
15/8/2039 70,432 0.01 USD 2,719,279 WaMu Mortgage Pass-Through
Certificates Series 2006-AR11 Trust ‘Series 2006-AR11 1A’ FRN 25/9/2046 2,513,768 0.18
USD 4,464,046 WaMu Mortgage Pass-Through Certificates Series 2006-AR13 Trust ‘Series 2006-AR13 1A’ FRN 25/10/2046 4,237,812 0.31
USD 190,000 Waste Management Inc 3.125% 1/3/2025 199,573 0.01
USD 515,000 Waste Management Inc 3.15% 15/11/2027 548,561 0.04
USD 195,000 Waste Management Inc 4.15% 15/7/2049 232,041 0.02
USD 260,000 Wells Fargo & Co FRN 15/6/2025 (Perpetual) 286,948 0.02
USD 54,000 Wells Fargo & Co FRN 17/6/2027 56,295 0.00 USD 267,000 Wells Fargo & Co FRN 22/5/2028 286,168 0.02 GBP 1,070,000 Wells Fargo & Co 2% 28/7/2025 1,341,324 0.10 EUR 1,210,000 Wells Fargo & Co 2.125% 4/6/2024 1,471,364 0.11 USD 1,636,000 Wells Fargo & Co 3% 19/2/2025 1,693,552 0.12 USD 387,000 Wells Fargo & Co 3% 22/4/2026 400,261 0.03 USD 49,000 Wells Fargo & Co 3% 23/10/2026 50,924 0.00
World Bond Fund continued
Portfolio of Investments 31 August 2019
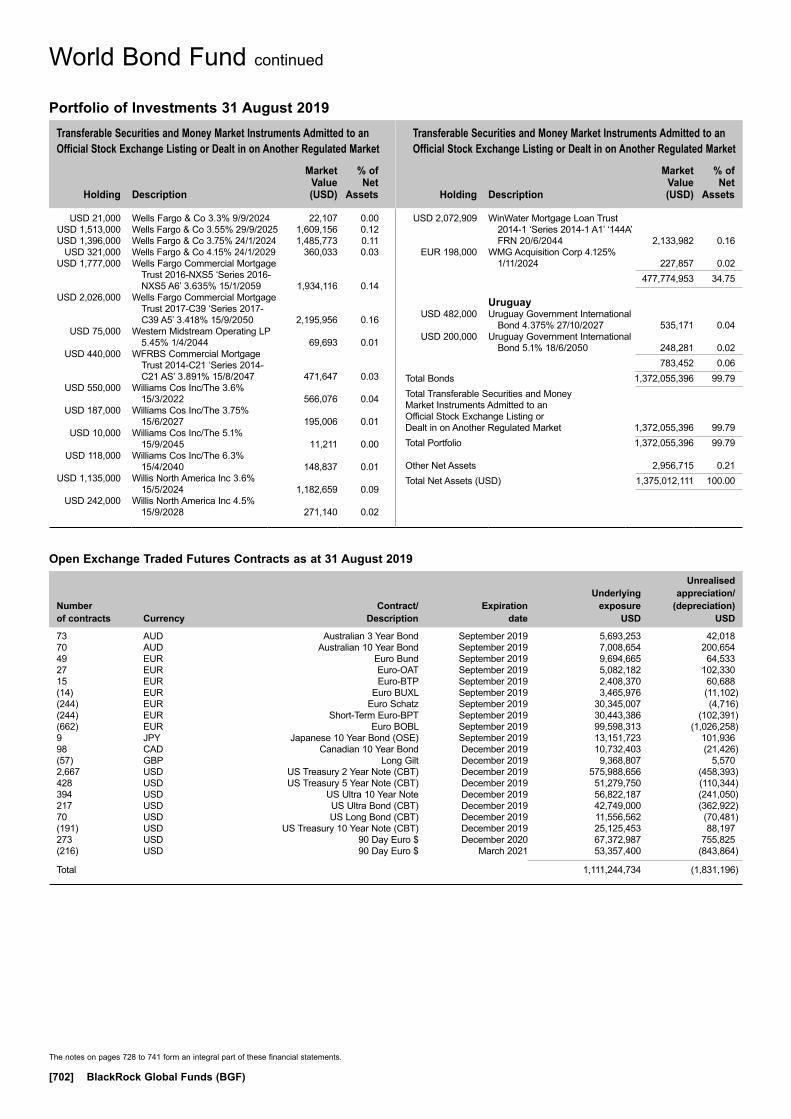
The notes on pages 728 to 741 form an integral part of these financial statements.
[702] BlackRock Global Funds (BGF)
Transferable Securities and Money Market Instruments Admitted to an Official Stock Exchange Listing or Dealt in on Another Regulated Market
Transferable Securities and Money Market Instruments Admitted to an Official Stock Exchange Listing or Dealt in on Another Regulated Market
Holding
Description
Market Value (USD)
% of Net
Assets
Holding
Description
Market Value (USD)
% of Net
Assets
USD 21,000 Wells Fargo & Co 3.3% 9/9/2024 22,107 0.00 USD 1,513,000 Wells Fargo & Co 3.55% 29/9/2025 1,609,156 0.12 USD 1,396,000 Wells Fargo & Co 3.75% 24/1/2024 1,485,773 0.11 USD 321,000 Wells Fargo & Co 4.15% 24/1/2029 360,033 0.03 USD 1,777,000 Wells Fargo Commercial Mortgage
Trust 2016-NXS5 ‘Series 2016-NXS5 A6’ 3.635% 15/1/2059 1,934,116 0.14
USD 2,026,000 Wells Fargo Commercial Mortgage Trust 2017-C39 ‘Series 2017-C39 A5’ 3.418% 15/9/2050 2,195,956 0.16
USD 75,000 Western Midstream Operating LP 5.45% 1/4/2044 69,693 0.01
USD 440,000 WFRBS Commercial Mortgage Trust 2014-C21 ‘Series 2014-C21 AS’ 3.891% 15/8/2047 471,647 0.03
USD 550,000 Williams Cos Inc/The 3.6% 15/3/2022 566,076 0.04
USD 187,000 Williams Cos Inc/The 3.75% 15/6/2027 195,006 0.01
USD 10,000 Williams Cos Inc/The 5.1% 15/9/2045 11,211 0.00
USD 118,000 Williams Cos Inc/The 6.3% 15/4/2040 148,837 0.01
USD 1,135,000 Willis North America Inc 3.6% 15/5/2024 1,182,659 0.09
USD 242,000 Willis North America Inc 4.5% 15/9/2028 271,140 0.02
USD 2,072,909 WinWater Mortgage Loan Trust 2014-1 ‘Series 2014-1 A1’ ‘144A’ FRN 20/6/2044 2,133,982 0.16
EUR 198,000 WMG Acquisition Corp 4.125% 1/11/2024 227,857 0.02
477,774,953 34.75
Uruguay USD 482,000 Uruguay Government International
Bond 4.375% 27/10/2027 535,171 0.04 USD 200,000 Uruguay Government International
Bond 5.1% 18/6/2050 248,281 0.02 783,452 0.06Total Bonds 1,372,055,396 99.79Total Transferable Securities and Money Market Instruments Admitted to an Official Stock Exchange Listing or Dealt in on Another Regulated Market 1,372,055,396 99.79Total Portfolio 1,372,055,396 99.79
Other Net Assets 2,956,715 0.21Total Net Assets (USD) 1,375,012,111 100.00
World Bond Fund continued
Portfolio of Investments 31 August 2019
Open Exchange Traded Futures Contracts as at 31 August 2019
Number of contracts Currency
Contract/ Description
Expiration date
Underlying exposure
USD
Unrealised appreciation/
(depreciation) USD
73 AUD Australian 3 Year Bond September 2019 5,693,253 42,01870 AUD Australian 10 Year Bond September 2019 7,008,654 200,65449 EUR Euro Bund September 2019 9,694,665 64,53327 EUR Euro-OAT September 2019 5,082,182 102,33015 EUR Euro-BTP September 2019 2,408,370 60,688(14) EUR Euro BUXL September 2019 3,465,976 (11,102)(244) EUR Euro Schatz September 2019 30,345,007 (4,716)(244) EUR Short-Term Euro-BPT September 2019 30,443,386 (102,391)(662) EUR Euro BOBL September 2019 99,598,313 (1,026,258)9 JPY Japanese 10 Year Bond (OSE) September 2019 13,151,723 101,93698 CAD Canadian 10 Year Bond December 2019 10,732,403 (21,426)(57) GBP Long Gilt December 2019 9,368,807 5,5702,667 USD US Treasury 2 Year Note (CBT) December 2019 575,988,656 (458,393)428 USD US Treasury 5 Year Note (CBT) December 2019 51,279,750 (110,344)394 USD US Ultra 10 Year Note December 2019 56,822,187 (241,050)217 USD US Ultra Bond (CBT) December 2019 42,749,000 (362,922)70 USD US Long Bond (CBT) December 2019 11,556,562 (70,481)(191) USD US Treasury 10 Year Note (CBT) December 2019 25,125,453 88,197273 USD 90 Day Euro $ December 2020 67,372,987 755,825(216) USD 90 Day Euro $ March 2021 53,357,400 (843,864)
Total 1,111,244,734 (1,831,196)
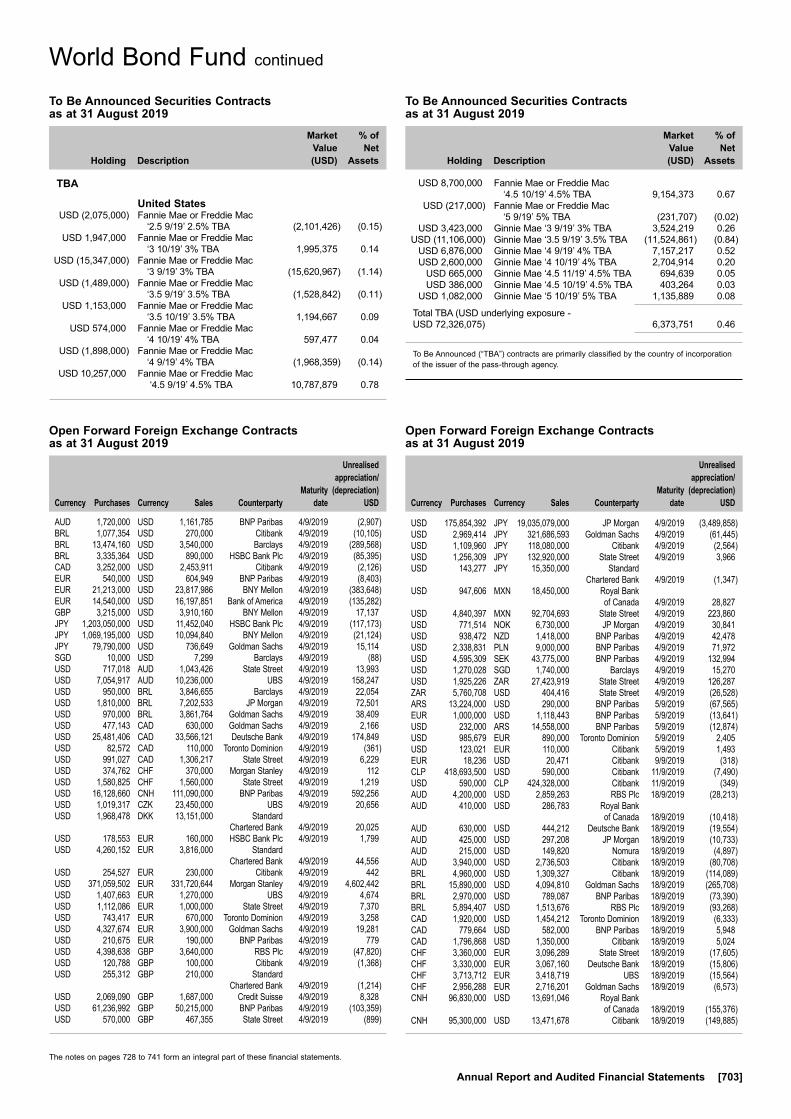
The notes on pages 728 to 741 form an integral part of these financial statements.
Annual Report and Audited Financial Statements [703]
World Bond Fund continued
To Be Announced Securities Contracts as at 31 August 2019
Holding Description
Market Value (USD)
% of Net
Assets
TBA
United States USD (2,075,000) Fannie Mae or Freddie Mac
‘2.5 9/19’ 2.5% TBA (2,101,426) (0.15) USD 1,947,000 Fannie Mae or Freddie Mac
‘3 10/19’ 3% TBA 1,995,375 0.14 USD (15,347,000) Fannie Mae or Freddie Mac
‘3 9/19’ 3% TBA (15,620,967) (1.14) USD (1,489,000) Fannie Mae or Freddie Mac
‘3.5 9/19’ 3.5% TBA (1,528,842) (0.11) USD 1,153,000 Fannie Mae or Freddie Mac
‘3.5 10/19’ 3.5% TBA 1,194,667 0.09 USD 574,000 Fannie Mae or Freddie Mac
‘4 10/19’ 4% TBA 597,477 0.04 USD (1,898,000) Fannie Mae or Freddie Mac
‘4 9/19’ 4% TBA (1,968,359) (0.14) USD 10,257,000 Fannie Mae or Freddie Mac
‘4.5 9/19’ 4.5% TBA 10,787,879 0.78
USD 8,700,000 Fannie Mae or Freddie Mac ‘4.5 10/19’ 4.5% TBA 9,154,373 0.67
USD (217,000) Fannie Mae or Freddie Mac ‘5 9/19’ 5% TBA (231,707) (0.02)
USD 3,423,000 Ginnie Mae ‘3 9/19’ 3% TBA 3,524,219 0.26 USD (11,106,000) Ginnie Mae ‘3.5 9/19’ 3.5% TBA (11,524,861) (0.84) USD 6,876,000 Ginnie Mae ‘4 9/19’ 4% TBA 7,157,217 0.52 USD 2,600,000 Ginnie Mae ‘4 10/19’ 4% TBA 2,704,914 0.20 USD 665,000 Ginnie Mae ‘4.5 11/19’ 4.5% TBA 694,639 0.05 USD 386,000 Ginnie Mae ‘4.5 10/19’ 4.5% TBA 403,264 0.03 USD 1,082,000 Ginnie Mae ‘5 10/19’ 5% TBA 1,135,889 0.08
Total TBA (USD underlying exposure - USD 72,326,075) 6,373,751 0.46
To Be Announced (“TBA”) contracts are primarily classified by the country of incorporation of the issuer of the pass-through agency.
To Be Announced Securities Contracts as at 31 August 2019
Holding Description
Market Value (USD)
% of Net
Assets
Open Forward Foreign Exchange Contracts as at 31 August 2019
Currency
Purchases Currency
Sales Counterparty
Maturity date
Unrealised appreciation/
(depreciation) USD
AUD 1,720,000 USD 1,161,785 BNP Paribas 4/9/2019 (2,907)BRL 1,077,354 USD 270,000 Citibank 4/9/2019 (10,105)BRL 13,474,160 USD 3,540,000 Barclays 4/9/2019 (289,568)BRL 3,335,364 USD 890,000 HSBC Bank Plc 4/9/2019 (85,395)CAD 3,252,000 USD 2,453,911 Citibank 4/9/2019 (2,126)EUR 540,000 USD 604,949 BNP Paribas 4/9/2019 (8,403)EUR 21,213,000 USD 23,817,986 BNY Mellon 4/9/2019 (383,648)EUR 14,540,000 USD 16,197,851 Bank of America 4/9/2019 (135,282)GBP 3,215,000 USD 3,910,160 BNY Mellon 4/9/2019 17,137JPY 1,203,050,000 USD 11,452,040 HSBC Bank Plc 4/9/2019 (117,173)JPY 1,069,195,000 USD 10,094,840 BNY Mellon 4/9/2019 (21,124)JPY 79,790,000 USD 736,649 Goldman Sachs 4/9/2019 15,114SGD 10,000 USD 7,299 Barclays 4/9/2019 (88)USD 717,018 AUD 1,043,426 State Street 4/9/2019 13,993USD 7,054,917 AUD 10,236,000 UBS 4/9/2019 158,247USD 950,000 BRL 3,846,655 Barclays 4/9/2019 22,054USD 1,810,000 BRL 7,202,533 JP Morgan 4/9/2019 72,501USD 970,000 BRL 3,861,764 Goldman Sachs 4/9/2019 38,409USD 477,143 CAD 630,000 Goldman Sachs 4/9/2019 2,166USD 25,481,406 CAD 33,566,121 Deutsche Bank 4/9/2019 174,849USD 82,572 CAD 110,000 Toronto Dominion 4/9/2019 (361)USD 991,027 CAD 1,306,217 State Street 4/9/2019 6,229USD 374,762 CHF 370,000 Morgan Stanley 4/9/2019 112USD 1,580,825 CHF 1,560,000 State Street 4/9/2019 1,219USD 16,128,660 CNH 111,090,000 BNP Paribas 4/9/2019 592,256USD 1,019,317 CZK 23,450,000 UBS 4/9/2019 20,656USD 1,968,478 DKK 13,151,000 Standard Chartered Bank 4/9/2019 20,025USD 178,553 EUR 160,000 HSBC Bank Plc 4/9/2019 1,799USD 4,260,152 EUR 3,816,000 Standard Chartered Bank 4/9/2019 44,556USD 254,527 EUR 230,000 Citibank 4/9/2019 442USD 371,059,502 EUR 331,720,644 Morgan Stanley 4/9/2019 4,602,442USD 1,407,663 EUR 1,270,000 UBS 4/9/2019 4,674USD 1,112,086 EUR 1,000,000 State Street 4/9/2019 7,370USD 743,417 EUR 670,000 Toronto Dominion 4/9/2019 3,258USD 4,327,674 EUR 3,900,000 Goldman Sachs 4/9/2019 19,281USD 210,675 EUR 190,000 BNP Paribas 4/9/2019 779USD 4,398,638 GBP 3,640,000 RBS Plc 4/9/2019 (47,820)USD 120,788 GBP 100,000 Citibank 4/9/2019 (1,368)USD 255,312 GBP 210,000 Standard Chartered Bank 4/9/2019 (1,214)USD 2,069,090 GBP 1,687,000 Credit Suisse 4/9/2019 8,328USD 61,236,992 GBP 50,215,000 BNP Paribas 4/9/2019 (103,359)USD 570,000 GBP 467,355 State Street 4/9/2019 (899)
Open Forward Foreign Exchange Contracts as at 31 August 2019
Currency
Purchases Currency
Sales Counterparty
Maturity date
Unrealised appreciation/
(depreciation) USD
USD 175,854,392 JPY 19,035,079,000 JP Morgan 4/9/2019 (3,489,858)USD 2,969,414 JPY 321,686,593 Goldman Sachs 4/9/2019 (61,445)USD 1,109,960 JPY 118,080,000 Citibank 4/9/2019 (2,564)USD 1,256,309 JPY 132,920,000 State Street 4/9/2019 3,966USD 143,277 JPY 15,350,000 Standard Chartered Bank 4/9/2019 (1,347)USD 947,606 MXN 18,450,000 Royal Bank of Canada 4/9/2019 28,827USD 4,840,397 MXN 92,704,693 State Street 4/9/2019 223,860USD 771,514 NOK 6,730,000 JP Morgan 4/9/2019 30,841USD 938,472 NZD 1,418,000 BNP Paribas 4/9/2019 42,478USD 2,338,831 PLN 9,000,000 BNP Paribas 4/9/2019 71,972USD 4,595,309 SEK 43,775,000 BNP Paribas 4/9/2019 132,994USD 1,270,028 SGD 1,740,000 Barclays 4/9/2019 15,270USD 1,925,226 ZAR 27,423,919 State Street 4/9/2019 126,287ZAR 5,760,708 USD 404,416 State Street 4/9/2019 (26,528)ARS 13,224,000 USD 290,000 BNP Paribas 5/9/2019 (67,565)EUR 1,000,000 USD 1,118,443 BNP Paribas 5/9/2019 (13,641)USD 232,000 ARS 14,558,000 BNP Paribas 5/9/2019 (12,874)USD 985,679 EUR 890,000 Toronto Dominion 5/9/2019 2,405USD 123,021 EUR 110,000 Citibank 5/9/2019 1,493EUR 18,236 USD 20,471 Citibank 9/9/2019 (318)CLP 418,693,500 USD 590,000 Citibank 11/9/2019 (7,490)USD 590,000 CLP 424,328,000 Citibank 11/9/2019 (349)AUD 4,200,000 USD 2,859,263 RBS Plc 18/9/2019 (28,213)AUD 410,000 USD 286,783 Royal Bank of Canada 18/9/2019 (10,418)AUD 630,000 USD 444,212 Deutsche Bank 18/9/2019 (19,554)AUD 425,000 USD 297,208 JP Morgan 18/9/2019 (10,733)AUD 215,000 USD 149,820 Nomura 18/9/2019 (4,897)AUD 3,940,000 USD 2,736,503 Citibank 18/9/2019 (80,708)BRL 4,960,000 USD 1,309,327 Citibank 18/9/2019 (114,089)BRL 15,890,000 USD 4,094,810 Goldman Sachs 18/9/2019 (265,708)BRL 2,970,000 USD 789,087 BNP Paribas 18/9/2019 (73,390)BRL 5,894,407 USD 1,513,676 RBS Plc 18/9/2019 (93,268)CAD 1,920,000 USD 1,454,212 Toronto Dominion 18/9/2019 (6,333)CAD 779,664 USD 582,000 BNP Paribas 18/9/2019 5,948CAD 1,796,868 USD 1,350,000 Citibank 18/9/2019 5,024CHF 3,360,000 EUR 3,096,289 State Street 18/9/2019 (17,605)CHF 3,330,000 EUR 3,067,160 Deutsche Bank 18/9/2019 (15,806)CHF 3,713,712 EUR 3,418,719 UBS 18/9/2019 (15,564)CHF 2,956,288 EUR 2,716,201 Goldman Sachs 18/9/2019 (6,573)CNH 96,830,000 USD 13,691,046 Royal Bank of Canada 18/9/2019 (155,376)CNH 95,300,000 USD 13,471,678 Citibank 18/9/2019 (149,885)

The notes on pages 728 to 741 form an integral part of these financial statements.
[704] BlackRock Global Funds (BGF)
Open Forward Foreign Exchange Contracts as at 31 August 2019
Currency
Purchases Currency
Sales Counterparty
Maturity date
Unrealised appreciation/
(depreciation) USD
Open Forward Foreign Exchange Contracts as at 31 August 2019
Currency
Purchases Currency
Sales Counterparty
Maturity date
Unrealised appreciation/
(depreciation) USD
World Bond Fund continued
CNH 20,070,000 USD 2,916,827 HSBC Bank Plc 18/9/2019 (111,283)CNH 2,830,000 USD 411,726 BNP Paribas 18/9/2019 (16,126)CNY 25,570,000 USD 3,736,392 Standard Chartered Bank 18/9/2019 (154,856)EUR 4,994,063 CHF 5,420,000 Credit Suisse 18/9/2019 27,794EUR 7,309,549 CHF 7,940,000 UBS 18/9/2019 33,553EUR 1,240,000 GBP 1,123,321 UBS 18/9/2019 (1,715)EUR 2,800,000 GBP 2,550,072 Citibank 18/9/2019 (20,424)EUR 1,605,870 GBP 1,445,577 State Street 18/9/2019 9,009EUR 143,480 GBP 128,259 Bank of America 18/9/2019 1,905EUR 1,453,404 GBP 1,303,052 Goldman Sachs 18/9/2019 14,604EUR 411,665 GBP 370,000 Standard Chartered Bank 18/9/2019 3,010EUR 1,224,019 GBP 1,100,046 Deutsche Bank 18/9/2019 9,061EUR 623,001 GBP 559,402 RBS Plc 18/9/2019 5,221EUR 12,760,000 JPY 1,563,786,105 State Street 18/9/2019 (637,542)EUR 32,680,794 USD 36,692,593 Citibank 18/9/2019 (550,348)EUR 3,300,000 USD 3,670,145 State Street 18/9/2019 (20,618)EUR 3,270,000 USD 3,652,111 Morgan Stanley 18/9/2019 (35,762)EUR 2,400,000 USD 2,689,616 Standard Chartered Bank 18/9/2019 (35,415)EUR 10,550,000 USD 11,872,648 HSBC Bank Plc 18/9/2019 (205,224)EUR 1,057,000 USD 1,192,581 BNY Mellon 18/9/2019 (23,627)EUR 9,933,316 USD 11,212,220 Deutsche Bank 18/9/2019 (226,797)EUR 15,919,605 USD 18,136,261 Bank of America 18/9/2019 (530,499)EUR 9,170,000 USD 10,420,284 Barclays 18/9/2019 (279,025)EUR 3,006,286 USD 3,438,908 JP Morgan 18/9/2019 (114,206)EUR 260,000 USD 297,805 RBS Plc 18/9/2019 (10,266)GBP 600,000 EUR 668,482 Barclays 18/9/2019 (5,896)GBP 1,200,000 EUR 1,347,777 Goldman Sachs 18/9/2019 (23,752)GBP 2,265,000 EUR 2,539,449 Citibank 18/9/2019 (39,877)GBP 1,750,000 USD 2,115,908 Royal Bank of Canada 18/9/2019 23,144GBP 437,500 USD 550,986 RBS Plc 18/9/2019 (16,223)GBP 152,500 USD 193,813 Nomura 18/9/2019 (7,410)GBP 600,000 USD 760,578 Deutsche Bank 18/9/2019 (27,189)IDR 177,076,943,348 USD 12,298,509 BNP Paribas 18/9/2019 166,917IDR 10,300,000,000 USD 733,720 Deutsche Bank 18/9/2019 (8,646)IDR 144,738,440,000 USD 9,990,850 Citibank 18/9/2019 198,089IDR 2,113,120,000 USD 147,544 UBS 18/9/2019 1,211IDR 2,113,440,000 USD 147,566 Bank of America 18/9/2019 1,211IDR 159,770,000,000 USD 11,222,089 Morgan Stanley 18/9/2019 25,006INR 60,435,000 USD 867,671 Deutsche Bank 18/9/2019 (24,460)INR 16,465,000 USD 238,710 BNP Paribas 18/9/2019 (8,984)INR 417,426,166 USD 6,041,774 ANZ 18/9/2019 (217,694)JPY 34,340,234 EUR 290,000 RBS Plc 18/9/2019 3,168JPY 505,000,000 USD 4,738,334 Bank of America 18/9/2019 24,636JPY 1,119,000,000 USD 10,542,048 Citibank 18/9/2019 11,940JPY 1,155,811,655 USD 10,775,170 Deutsche Bank 18/9/2019 126,012JPY 538,335,000 USD 5,075,799 HSBC Bank Plc 18/9/2019 1,575JPY 202,624,896 USD 1,890,000 State Street 18/9/2019 21,082JPY 69,210,000 USD 645,688 RBS Plc 18/9/2019 7,074JPY 21,120,000 USD 196,485 Standard Chartered Bank 18/9/2019 2,711JPY 26,335,000 USD 245,898 UBS 18/9/2019 2,484JPY 2,353,784,709 USD 21,845,705 JP Morgan 18/9/2019 354,307KRW 814,970,000 USD 697,020 Bank of America 18/9/2019 (23,071)KRW 779,595,000 USD 662,974 Deutsche Bank 18/9/2019 (18,279)KRW 550,420,000 USD 472,724 JP Morgan 18/9/2019 (17,548)KRW 285,015,000 USD 243,748 Goldman Sachs 18/9/2019 (8,052)MXN 180,270,000 USD 9,236,563 Deutsche Bank 18/9/2019 (281,188)MXN 106,630,000 USD 5,490,731 Bank of America 18/9/2019 (193,613)MXN 14,400,000 USD 743,675 Royal Bank of Canada 18/9/2019 (28,318)MXN 15,400,000 USD 795,479 Toronto Dominion 18/9/2019 (30,445)MXN 119,200,000 USD 6,108,364 Goldman Sachs 18/9/2019 (186,799)NZD 212,500 USD 141,790 Standard Chartered Bank 18/9/2019 (7,463)NZD 112,500 USD 75,246 JP Morgan 18/9/2019 (4,131)NZD 115,000 USD 75,943 Citibank 18/9/2019 (3,248)PHP 26,400,000 USD 516,542 Goldman Sachs 18/9/2019 (9,714)
PHP 6,367,500 USD 124,014 Standard Chartered Bank 18/9/2019 (1,770)PHP 6,365,000 USD 122,817 UBS 18/9/2019 (622)PHP 6,367,500 USD 122,925 BNP Paribas 18/9/2019 (681)RUB 282,200,000 USD 4,439,201 State Street 18/9/2019 (201,534)RUB 287,880,000 USD 4,531,223 Goldman Sachs 18/9/2019 (208,262)RUB 689,468 USD 10,784 Bank of America 18/9/2019 (431)RUB 108,734,191 USD 1,656,322 Deutsche Bank 18/9/2019 (23,511)SGD 2,680,000 USD 1,932,622 UBS 18/9/2019 308SGD 545,000 USD 392,397 Goldman Sachs 18/9/2019 680SGD 7,570,000 USD 5,502,053 Bank of America 18/9/2019 (42,248)SGD 1,780,000 USD 1,292,870 BNP Paribas 18/9/2019 (9,059)TWD 15,365,000 USD 496,481 JP Morgan 18/9/2019 (5,856)TWD 6,065,000 USD 195,851 Deutsche Bank 18/9/2019 (2,188)TWD 3,035,000 USD 98,449 Citibank 18/9/2019 (1,538)TWD 3,035,000 USD 98,507 Bank of America 18/9/2019 (1,596)USD 2,905,862 AUD 4,200,000 Citibank 18/9/2019 74,811USD 8,468,781 BRL 33,040,000 Goldman Sachs 18/9/2019 506,949USD 1,459,011 CAD 1,920,000 Toronto Dominion 18/9/2019 11,133USD 582,000 CAD 771,233 Bank of America 18/9/2019 411USD 14,107,898 CNH 96,790,000 Barclays 18/9/2019 577,821USD 208,065 CNH 1,450,000 Societe Generale 18/9/2019 5,372USD 965,676 CNH 6,800,000 RBS Plc 18/9/2019 15,118USD 5,719,100 CNH 39,680,000 BNP Paribas 18/9/2019 172,313USD 12,335,207 CNH 85,000,000 Bank of America 18/9/2019 453,229USD 4,813,577 CNH 33,620,000 Citibank 18/9/2019 113,905USD 2,389,246 CNH 16,850,000 Royal Bank of Canada 18/9/2019 33,818USD 3,680,807 CNY 25,570,000 Citibank 18/9/2019 99,271USD 3,395,594 EUR 2,985,418 Goldman Sachs 18/9/2019 93,969USD 7,355,045 EUR 6,450,000 Royal Bank of Canada 18/9/2019 221,880USD 3,815,685 EUR 3,330,000 BNP Paribas 18/9/2019 132,981USD 5,792,850 EUR 5,074,161 Standard Chartered Bank 18/9/2019 181,249USD 1,018,783 EUR 895,625 RBS Plc 18/9/2019 28,296USD 6,898,428 EUR 6,122,496 HSBC Bank Plc 18/9/2019 127,455USD 13,800,464 EUR 12,248,237 Deutsche Bank 18/9/2019 254,930USD 4,615,883 EUR 4,131,855 JP Morgan 18/9/2019 46,395USD 15,781,036 EUR 14,157,504 Bank of America 18/9/2019 124,011USD 35,774,641 EUR 31,754,704 Citibank 18/9/2019 656,574USD 3,421,461 EUR 3,080,000 UBS 18/9/2019 15,237USD 19,403,464 EUR 17,210,000 Morgan Stanley 18/9/2019 370,633USD 769,574 GBP 600,000 Bank of America 18/9/2019 36,185USD 2,791,013 GBP 2,190,000 State Street 18/9/2019 114,143USD 1,658,456 GBP 1,350,000 RBS Plc 18/9/2019 8,331USD 2,171,956 GBP 1,750,000 HSBC Bank Plc 18/9/2019 32,904USD 13,737,317 IDR 196,411,000,000 BNP Paribas 18/9/2019 (89,140)USD 1,251,623 IDR 17,895,082,180 State Street 18/9/2019 (8,111)USD 6,620,804 IDR 96,148,710,000 Toronto Dominion 18/9/2019 (147,636)USD 1,375,532 IDR 19,395,000,000 JP Morgan 18/9/2019 10,211USD 28,683,654 IDR 415,626,140,361 Citibank 18/9/2019 (574,571)USD 72,776 INR 5,100,000 BNP Paribas 18/9/2019 1,619USD 27,646,881 INR 1,942,276,296 Standard Chartered Bank 18/9/2019 547,542USD 2,113,955 INR 151,165,290 Bank of America 18/9/2019 4,842USD 2,875,605 INR 204,660,390 HSBC Bank Plc 18/9/2019 20,109USD 1,864,754 INR 134,299,556 UBS 18/9/2019 (9,042)USD 1,864,624 INR 134,299,555 BNY Mellon 18/9/2019 (9,172)USD 314,654 INR 22,600,000 Barclays 18/9/2019 (670)USD 1,452,381 INR 104,455,209 Morgan Stanley 18/9/2019 (5,016)USD 4,050,000 JPY 436,336,996 State Street 18/9/2019 (65,366)USD 2,550,000 JPY 272,244,375 Bank of America 18/9/2019 (17,707)USD 2,923,771 JPY 316,640,000 Royal Bank of Canada 18/9/2019 (62,659)USD 614 JPY 65,028 Barclays 18/9/2019 –USD 2,128,935 JPY 226,469,128 Toronto Dominion 18/9/2019 (7,036)USD 2,309,005 JPY 244,215,575 RBS Plc 18/9/2019 5,656USD 2,731,368 JPY 288,857,162 Goldman Sachs 18/9/2019 6,976USD 11,206,905 JPY 1,195,112,235 Citibank 18/9/2019 (64,944)USD 2,500,153 JPY 264,750,000 JP Morgan 18/9/2019 3,131
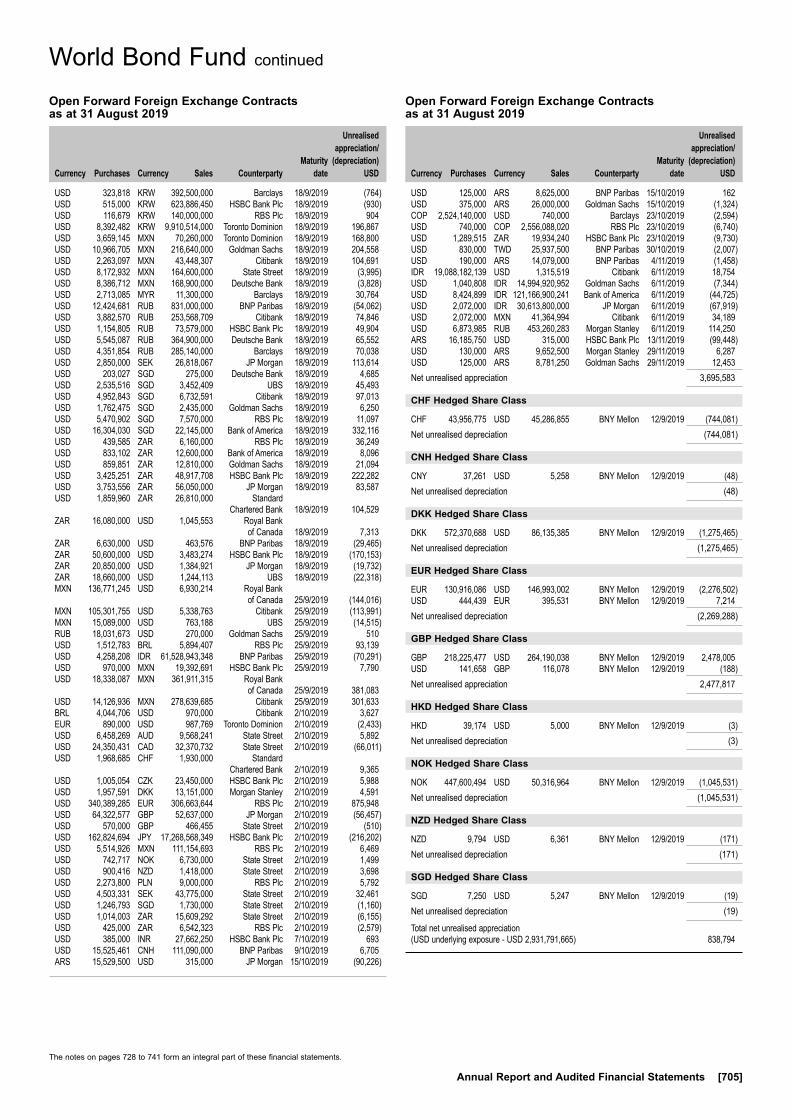
The notes on pages 728 to 741 form an integral part of these financial statements.
Annual Report and Audited Financial Statements [705]
World Bond Fund continued
Open Forward Foreign Exchange Contracts as at 31 August 2019
Currency
Purchases Currency
Sales Counterparty
Maturity date
Unrealised appreciation/
(depreciation) USD
Open Forward Foreign Exchange Contracts as at 31 August 2019
Currency
Purchases Currency
Sales Counterparty
Maturity date
Unrealised appreciation/
(depreciation) USD
USD 323,818 KRW 392,500,000 Barclays 18/9/2019 (764)USD 515,000 KRW 623,886,450 HSBC Bank Plc 18/9/2019 (930)USD 116,679 KRW 140,000,000 RBS Plc 18/9/2019 904USD 8,392,482 KRW 9,910,514,000 Toronto Dominion 18/9/2019 196,867USD 3,659,145 MXN 70,260,000 Toronto Dominion 18/9/2019 168,800USD 10,966,705 MXN 216,640,000 Goldman Sachs 18/9/2019 204,558USD 2,263,097 MXN 43,448,307 Citibank 18/9/2019 104,691USD 8,172,932 MXN 164,600,000 State Street 18/9/2019 (3,995)USD 8,386,712 MXN 168,900,000 Deutsche Bank 18/9/2019 (3,828)USD 2,713,085 MYR 11,300,000 Barclays 18/9/2019 30,764USD 12,424,681 RUB 831,000,000 BNP Paribas 18/9/2019 (54,062)USD 3,882,570 RUB 253,568,709 Citibank 18/9/2019 74,846USD 1,154,805 RUB 73,579,000 HSBC Bank Plc 18/9/2019 49,904USD 5,545,087 RUB 364,900,000 Deutsche Bank 18/9/2019 65,552USD 4,351,854 RUB 285,140,000 Barclays 18/9/2019 70,038USD 2,850,000 SEK 26,818,067 JP Morgan 18/9/2019 113,614USD 203,027 SGD 275,000 Deutsche Bank 18/9/2019 4,685USD 2,535,516 SGD 3,452,409 UBS 18/9/2019 45,493USD 4,952,843 SGD 6,732,591 Citibank 18/9/2019 97,013USD 1,762,475 SGD 2,435,000 Goldman Sachs 18/9/2019 6,250USD 5,470,902 SGD 7,570,000 RBS Plc 18/9/2019 11,097USD 16,304,030 SGD 22,145,000 Bank of America 18/9/2019 332,116USD 439,585 ZAR 6,160,000 RBS Plc 18/9/2019 36,249USD 833,102 ZAR 12,600,000 Bank of America 18/9/2019 8,096USD 859,851 ZAR 12,810,000 Goldman Sachs 18/9/2019 21,094USD 3,425,251 ZAR 48,917,708 HSBC Bank Plc 18/9/2019 222,282USD 3,753,556 ZAR 56,050,000 JP Morgan 18/9/2019 83,587USD 1,859,960 ZAR 26,810,000 Standard Chartered Bank 18/9/2019 104,529ZAR 16,080,000 USD 1,045,553 Royal Bank of Canada 18/9/2019 7,313ZAR 6,630,000 USD 463,576 BNP Paribas 18/9/2019 (29,465)ZAR 50,600,000 USD 3,483,274 HSBC Bank Plc 18/9/2019 (170,153)ZAR 20,850,000 USD 1,384,921 JP Morgan 18/9/2019 (19,732)ZAR 18,660,000 USD 1,244,113 UBS 18/9/2019 (22,318)MXN 136,771,245 USD 6,930,214 Royal Bank of Canada 25/9/2019 (144,016)MXN 105,301,755 USD 5,338,763 Citibank 25/9/2019 (113,991)MXN 15,089,000 USD 763,188 UBS 25/9/2019 (14,515)RUB 18,031,673 USD 270,000 Goldman Sachs 25/9/2019 510USD 1,512,783 BRL 5,894,407 RBS Plc 25/9/2019 93,139USD 4,258,208 IDR 61,528,943,348 BNP Paribas 25/9/2019 (70,291)USD 970,000 MXN 19,392,691 HSBC Bank Plc 25/9/2019 7,790USD 18,338,087 MXN 361,911,315 Royal Bank of Canada 25/9/2019 381,083USD 14,126,936 MXN 278,639,685 Citibank 25/9/2019 301,633BRL 4,044,706 USD 970,000 Citibank 2/10/2019 3,627EUR 890,000 USD 987,769 Toronto Dominion 2/10/2019 (2,433)USD 6,458,269 AUD 9,568,241 State Street 2/10/2019 5,892USD 24,350,431 CAD 32,370,732 State Street 2/10/2019 (66,011)USD 1,968,685 CHF 1,930,000 Standard Chartered Bank 2/10/2019 9,365USD 1,005,054 CZK 23,450,000 HSBC Bank Plc 2/10/2019 5,988USD 1,957,591 DKK 13,151,000 Morgan Stanley 2/10/2019 4,591USD 340,389,285 EUR 306,663,644 RBS Plc 2/10/2019 875,948USD 64,322,577 GBP 52,637,000 JP Morgan 2/10/2019 (56,457)USD 570,000 GBP 466,455 State Street 2/10/2019 (510)USD 162,824,694 JPY 17,268,568,349 HSBC Bank Plc 2/10/2019 (216,202)USD 5,514,926 MXN 111,154,693 RBS Plc 2/10/2019 6,469USD 742,717 NOK 6,730,000 State Street 2/10/2019 1,499USD 900,416 NZD 1,418,000 State Street 2/10/2019 3,698USD 2,273,800 PLN 9,000,000 RBS Plc 2/10/2019 5,792USD 4,503,331 SEK 43,775,000 State Street 2/10/2019 32,461USD 1,246,793 SGD 1,730,000 State Street 2/10/2019 (1,160)USD 1,014,003 ZAR 15,609,292 State Street 2/10/2019 (6,155)USD 425,000 ZAR 6,542,323 RBS Plc 2/10/2019 (2,579)USD 385,000 INR 27,662,250 HSBC Bank Plc 7/10/2019 693USD 15,525,461 CNH 111,090,000 BNP Paribas 9/10/2019 6,705ARS 15,529,500 USD 315,000 JP Morgan 15/10/2019 (90,226)
USD 125,000 ARS 8,625,000 BNP Paribas 15/10/2019 162USD 375,000 ARS 26,000,000 Goldman Sachs 15/10/2019 (1,324)COP 2,524,140,000 USD 740,000 Barclays 23/10/2019 (2,594)USD 740,000 COP 2,556,088,020 RBS Plc 23/10/2019 (6,740)USD 1,289,515 ZAR 19,934,240 HSBC Bank Plc 23/10/2019 (9,730)USD 830,000 TWD 25,937,500 BNP Paribas 30/10/2019 (2,007)USD 190,000 ARS 14,079,000 BNP Paribas 4/11/2019 (1,458)IDR 19,088,182,139 USD 1,315,519 Citibank 6/11/2019 18,754USD 1,040,808 IDR 14,994,920,952 Goldman Sachs 6/11/2019 (7,344)USD 8,424,899 IDR 121,166,900,241 Bank of America 6/11/2019 (44,725)USD 2,072,000 IDR 30,613,800,000 JP Morgan 6/11/2019 (67,919)USD 2,072,000 MXN 41,364,994 Citibank 6/11/2019 34,189USD 6,873,985 RUB 453,260,283 Morgan Stanley 6/11/2019 114,250ARS 16,185,750 USD 315,000 HSBC Bank Plc 13/11/2019 (99,448)USD 130,000 ARS 9,652,500 Morgan Stanley 29/11/2019 6,287USD 125,000 ARS 8,781,250 Goldman Sachs 29/11/2019 12,453Net unrealised appreciation 3,695,583
CHF Hedged Share Class
CHF 43,956,775 USD 45,286,855 BNY Mellon 12/9/2019 (744,081)Net unrealised depreciation (744,081)
CNH Hedged Share Class
CNY 37,261 USD 5,258 BNY Mellon 12/9/2019 (48)Net unrealised depreciation (48)
DKK Hedged Share Class
DKK 572,370,688 USD 86,135,385 BNY Mellon 12/9/2019 (1,275,465)Net unrealised depreciation (1,275,465)
EUR Hedged Share Class
EUR 130,916,086 USD 146,993,002 BNY Mellon 12/9/2019 (2,276,502)USD 444,439 EUR 395,531 BNY Mellon 12/9/2019 7,214Net unrealised depreciation (2,269,288)
GBP Hedged Share Class
GBP 218,225,477 USD 264,190,038 BNY Mellon 12/9/2019 2,478,005USD 141,658 GBP 116,078 BNY Mellon 12/9/2019 (188)Net unrealised appreciation 2,477,817
HKD Hedged Share Class
HKD 39,174 USD 5,000 BNY Mellon 12/9/2019 (3)Net unrealised depreciation (3)
NOK Hedged Share Class
NOK 447,600,494 USD 50,316,964 BNY Mellon 12/9/2019 (1,045,531)Net unrealised depreciation (1,045,531)
NZD Hedged Share Class
NZD 9,794 USD 6,361 BNY Mellon 12/9/2019 (171)Net unrealised depreciation (171)
SGD Hedged Share Class
SGD 7,250 USD 5,247 BNY Mellon 12/9/2019 (19)Net unrealised depreciation (19)
Total net unrealised appreciation (USD underlying exposure - USD 2,931,791,665) 838,794

The notes on pages 728 to 741 form an integral part of these financial statements.
[706] BlackRock Global Funds (BGF)
World Bond Fund continued
Swaps as at 31 August 2019
TypeNominal
Value Description Counterparty
Expiration date
Unrealised appreciation/
(depreciation) USD
Market Value USD
CDS USD 541,752 Fund receives default protection on Colombia Government International Bond; and pays Fixed 1% Bank of America 20/6/2024 (2,408) (1,733)
CDS USD (8,795,160) Fund provides default protection on CDX.NA.HY.32.V2; and receives Fixed 5% Bank of America 20/6/2024 37,013 604,496
CDS USD 221,000 Fund receives default protection on Argentine Republic Government International Bond; and pays Fixed 5% Barclays 20/6/2024 101,279 129,789
CDS USD 358,000 Fund receives default protection on Colombia Government International Bond; and pays Fixed 1% Barclays 20/6/2024 (532) (1,145)
CDS USD 358,000 Fund receives default protection on Colombia Government International Bond; and pays Fixed 1% Barclays 20/6/2024 (1,103) (1,145)
CDS USD 581,000 Fund receives default protection on Colombia Government International Bond; and pays Fixed 1% Barclays 20/6/2024 (1,922) (1,858)
CDS USD 348,000 Fund receives default protection on Colombia Government International Bond; and pays Fixed 1% Barclays 20/6/2024 (1,310) (1,113)
CDS USD 348,000 Fund receives default protection on Colombia Government International Bond; and pays Fixed 1% Barclays 20/6/2024 (1,605) (1,113)
CDS USD 546,000 Fund receives default protection on Colombia Government International Bond; and pays Fixed 1% BNP Paribas 20/6/2024 (2,427) (1,746)
CDS USD 546,000 Fund receives default protection on Colombia Government International Bond; and pays Fixed 1% BNP Paribas 20/6/2024 (2,673) (1,746)
CDS USD 545,000 Fund receives default protection on Colombia Government International Bond; and pays Fixed 1% BNP Paribas 20/6/2024 (2,421) (1,743)
CDS USD 545,000 Fund receives default protection on Colombia Government International Bond; and pays Fixed 1% BNP Paribas 20/6/2024 (2,545) (1,743)
CDS USD 545,000 Fund receives default protection on Colombia Government International Bond; and pays Fixed 1% BNP Paribas 20/6/2024 (2,917) (1,743)
CDS USD 970,000 Fund receives default protection on Brazilian Government International Bond; and pays Fixed 1% BNP Paribas 20/6/2024 (15,337) 14,802
CDS USD 3,510,000 Fund receives default protection on Brazilian Government International Bond; and pays Fixed 1% BNP Paribas 20/6/2024 (55,498) 53,562
CDS USD 4,355,000 Fund receives default protection on Brazilian Government International Bond; and pays Fixed 1% Citibank 20/6/2024 (70,344) 66,457
CDS USD 1,211,000 Fund receives default protection on Brazilian Government International Bond; and pays Fixed 1% Citibank 20/6/2024 (19,561) 18,480
CDS USD 936,092 Fund receives default protection on Mexico Government International Bond; and pays Fixed 1% Citibank 20/6/2024 (10,131) 5,017
CDS USD 4,282,000 Fund receives default protection on Philippine Government International Bond; and pays Fixed 1% Citibank 20/6/2024 (39,460) (101,798)
CDS USD 5,436,000 Fund receives default protection on Colombia Government International Bond; and pays Fixed 1% Citibank 20/6/2024 (66,760) (17,387)
CDS USD 3,462,388 Fund receives default protection on Mexico Government International Bond; and pays Fixed 1% Citibank 20/6/2024 (37,472) 18,557
CDS USD 1,500,000 Fund receives default protection on Turkey Government International Bond; and pays Fixed 1% Citigroup 20/6/2024 65,374 203,228
CDS USD 9,103,000 Fund receives default protection on Brazilian Government International Bond; and pays Fixed 1% Goldman Sachs 20/12/2023 (120,985) 78,505
CDS USD 1,916,728 Fund receives default protection on Republic of South Africa Government Bond; and pays Fixed 1% Goldman Sachs 20/6/2024 (17,801) 67,588
CDS USD 387,248 Fund receives default protection on Colombia Government International Bond; and pays Fixed 1% Goldman Sachs 20/6/2024 (1,633) (1,239)
CDS USD 387,000 Fund receives default protection on Colombia Government International Bond; and pays Fixed 1% Goldman Sachs 20/6/2024 (1,456) (1,238)
CDS USD 208,000 Fund receives default protection on Colombia Government International Bond; and pays Fixed 1% Goldman Sachs 20/6/2024 (358) (665)
CDS USD 322,000 Fund receives default protection on Argentine Republic Government International Bond; and pays Fixed 5% Goldman Sachs 20/6/2024 149,439 189,105
CDS USD 1,807,830 Fund receives default protection on Republic of South Africa Government Bond; and pays Fixed 1% Goldman Sachs 20/6/2024 (10,257) 63,748
CDS USD 313,000 Fund receives default protection on Colombia Government International Bond; and pays Fixed 1% Goldman Sachs 20/6/2024 (539) (1,001)
CDS USD 1,035,000 Fund receives default protection on Turkey Government International Bond; and pays Fixed 1% Goldman Sachs 20/6/2024 43,848 140,227
CDS USD 1,276,272 Fund receives default protection on Republic of South Africa Government Bond; and pays Fixed 1% Goldman Sachs 20/6/2024 (11,090) 45,004
CDS USD 461,000 Fund receives default protection on Colombia Government International Bond; and pays Fixed 1% HSBC Bank Plc 20/6/2024 (1,525) (1,475)
CDS USD 5,562,612 Fund receives default protection on Mexico Government International Bond; and pays Fixed 1% HSBC Bank Plc 20/6/2024 (63,197) 29,813
CDS USD 1,503,908 Fund receives default protection on Mexico Government International Bond; and pays Fixed 1% HSBC Bank Plc 20/6/2024 (17,086) 8,060

The notes on pages 728 to 741 form an integral part of these financial statements.
Annual Report and Audited Financial Statements [707]
World Bond Fund continued
Swaps as at 31 August 2019
TypeNominal
Value Description Counterparty
Expiration date
Unrealised appreciation/
(depreciation) USD
Market Value USD
CDS USD 44,000 Fund receives default protection on Argentine Republic Government International Bond; and pays Fixed 5% HSBC Bank Plc 20/6/2024 20,553 25,840
CDS USD 537,000 Fund receives default protection on CDX.EM.31.V1; and pays Fixed 1% JP Morgan 20/6/2024 2,729 27,362
CDS USD 651,000 Fund receives default protection on Mexico Government International Bond; and pays Fixed 1% JP Morgan 20/6/2024 (3,914) 3,489
CDS USD 479,000 Fund receives default protection on Mexico Government International Bond; and pays Fixed 1% JP Morgan 20/6/2024 (2,666) 2,567
CDS USD 478,000 Fund receives default protection on Mexico Government International Bond; and pays Fixed 1% JP Morgan 20/6/2024 (2,767) 2,562
CDS USD 897,000 Fund receives default protection on CDX.EM.31.V1; and pays Fixed 1% JP Morgan 20/6/2024 4,559 45,706
CDS USD 478,000 Fund receives default protection on Mexico Government International Bond; and pays Fixed 1% JP Morgan 20/6/2024 (2,126) 2,562
CDS USD 478,000 Fund receives default protection on Mexico Government International Bond; and pays Fixed 1% JP Morgan 20/6/2024 (2,340) 2,562
CDS USD 479,000 Fund receives default protection on Mexico Government International Bond; and pays Fixed 1% JP Morgan 20/6/2024 (2,452) 2,567
CDS USD 521,000 Fund receives default protection on Colombia Government International Bond; and pays Fixed 1% Morgan Stanley 20/6/2024 1,112 (1,666)
CDS USD 521,000 Fund receives default protection on Colombia Government International Bond; and pays Fixed 1% Morgan Stanley 20/6/2024 1,224 (1,666)
CDS USD 521,000 Fund receives default protection on Colombia Government International Bond; and pays Fixed 1% Morgan Stanley 20/6/2024 1,232 (1,666)
CDS USD 521,000 Fund receives default protection on Colombia Government International Bond; and pays Fixed 1% Morgan Stanley 20/6/2024 1,588 (1,666)
CDS USD 852,000 Fund receives default protection on Qatar Government International Bond; and pays Fixed 1% Morgan Stanley 20/6/2024 (8,344) (20,238)
CDS USD 521,000 Fund receives default protection on Colombia Government International Bond; and pays Fixed 1% Morgan Stanley 20/6/2024 989 (1,666)
CDS USD 520,000 Fund receives default protection on Colombia Government International Bond; and pays Fixed 1% Morgan Stanley 20/6/2024 869 (1,663)
CDS USD (705,000) Fund provides default protection on CMBX.NA.9.BBB-; and receives Fixed 3% Morgan Stanley 17/9/2058 44,154 (24,722)
IFS EUR 5,550,000 Fund provides default protection on CPTFEMU + 0 bps; and receives Fixed 1.0153% Bank of America 16/7/2024 62,484 62,484
IFS EUR 5,990,000 Fund receives default protection on CPTFEMU + 0 bps; and pays Fixed 1% Bank of America 16/7/2024 61,980 61,980
IFS EUR 2,002,000 Fund provides default protection on CPTFEMU + 0 bps; and receives Fixed 0.88% Bank of America 16/8/2024 3,992 3,992
IFS EUR 5,550,000 Fund provides default protection on CPTFEMU + 0 bps; and receives Fixed 1.2% Bank of America 16/7/2029 (133,070) (133,070)
IFS EUR 5,990,000 Fund provides default protection on CPTFEMU + 0 bps; and receives Fixed 1.16% Bank of America 16/7/2029 (112,722) (112,722)
IFS EUR 2,002,000 Fund receives default protection on CPTFEMU + 0 bps; and pays Fixed 1.0683% Bank of America 16/8/2029 (10,697) (10,697)
IRS MXN 221,890,000 Fund receives Floating MXN MXIBTIIE 1 Month; and pays Fixed 8.51% Bank of America 5/11/2020 141,657 141,657
IRS CAD 49,120,000 Fund receives Fixed 1.905%; and pays Floating CAD CDOR 6 Month Bank of America 9/7/2021 165,665 165,665
IRS MXN 26,768,364 Fund receives Floating MXN MXIBTIIE 1 Month; and pays Fixed 6.86% Bank of America 23/7/2021 (3,520) (3,520)
IRS MXN 37,361,981 Fund receives Floating MXN MXIBTIIE 1 Month; and pays Fixed 6.9% Bank of America 26/7/2021 (5,662) (5,662)
IRS USD 37,060,000 Fund receives Fixed 2.33%; and pays Floating USD LIBOR 3 Month Bank of America 1/8/2021 542,714 542,714
IRS USD 36,960,000 Fund receives Floating USD LIBOR 3 Month; and pays Fixed 2.179% Bank of America 1/8/2021 (435,797) (435,797)
IRS USD 35,320,000 Fund receives Fixed 2.585%; and pays Floating USD LIBOR 3 Month Bank of America 2/8/2021 685,992 685,992
IRS USD 19,800,000 Fund receives Floating USD LIBOR 3 Month; and pays Fixed 2.149% Bank of America 2/8/2021 (221,440) (221,440)
IRS USD 66,000,000 Fund receives Floating USD LIBOR 3 Month; and pays Fixed 2.339% Bank of America 2/8/2021 (975,082) (975,082)
IRS MXN 118,204,126 Fund receives Floating MXN MXIBTIIE 1 Month; and pays Fixed 6.78% Bank of America 6/8/2021 (12,313) (12,313)
IRS USD 18,530,000 Fund receives Fixed 2.342%; and pays Floating USD LIBOR 3 Month Bank of America 9/8/2021 281,361 281,361
IRS USD 59,200,000 Fund receives Floating USD LIBOR 3 Month; and pays Fixed 2.1945% Bank of America 9/8/2021 (732,243) (732,243)
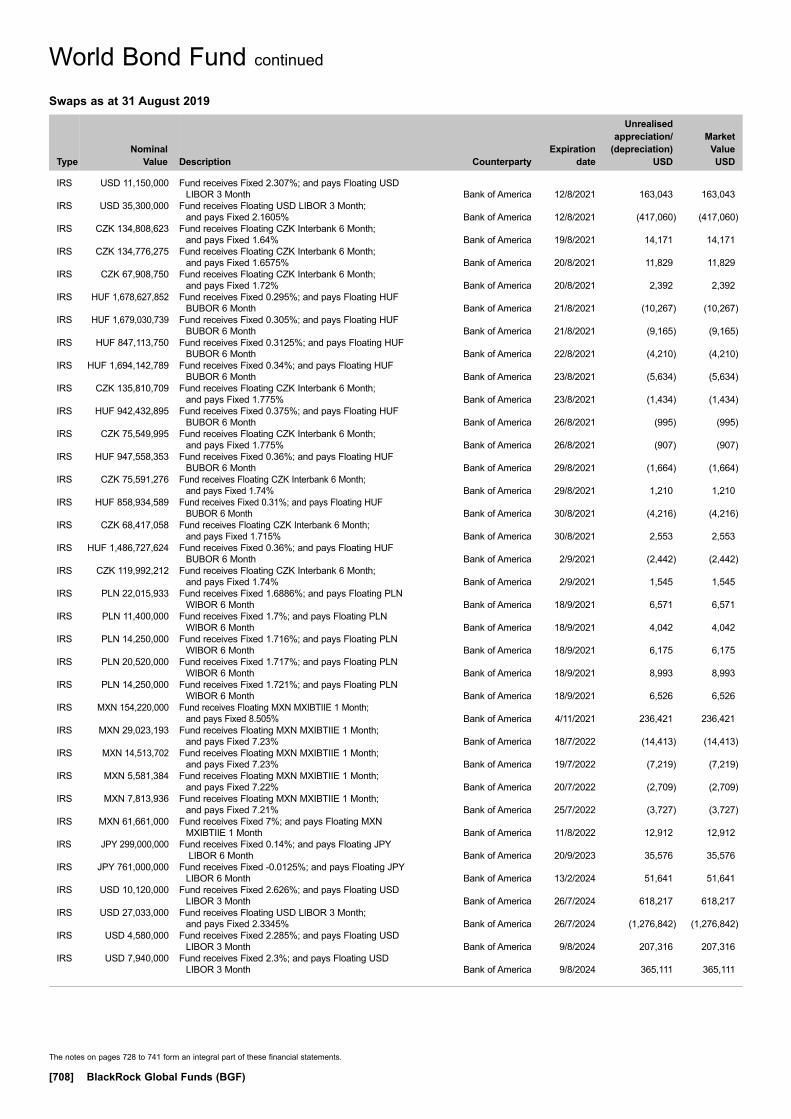
The notes on pages 728 to 741 form an integral part of these financial statements.
[708] BlackRock Global Funds (BGF)
World Bond Fund continued
Swaps as at 31 August 2019
TypeNominal
Value Description Counterparty
Expiration date
Unrealised appreciation/
(depreciation) USD
Market Value USD
IRS USD 11,150,000 Fund receives Fixed 2.307%; and pays Floating USD LIBOR 3 Month Bank of America 12/8/2021 163,043 163,043
IRS USD 35,300,000 Fund receives Floating USD LIBOR 3 Month; and pays Fixed 2.1605% Bank of America 12/8/2021 (417,060) (417,060)
IRS CZK 134,808,623 Fund receives Floating CZK Interbank 6 Month; and pays Fixed 1.64% Bank of America 19/8/2021 14,171 14,171
IRS CZK 134,776,275 Fund receives Floating CZK Interbank 6 Month; and pays Fixed 1.6575% Bank of America 20/8/2021 11,829 11,829
IRS CZK 67,908,750 Fund receives Floating CZK Interbank 6 Month; and pays Fixed 1.72% Bank of America 20/8/2021 2,392 2,392
IRS HUF 1,678,627,852 Fund receives Fixed 0.295%; and pays Floating HUF BUBOR 6 Month Bank of America 21/8/2021 (10,267) (10,267)
IRS HUF 1,679,030,739 Fund receives Fixed 0.305%; and pays Floating HUF BUBOR 6 Month Bank of America 21/8/2021 (9,165) (9,165)
IRS HUF 847,113,750 Fund receives Fixed 0.3125%; and pays Floating HUF BUBOR 6 Month Bank of America 22/8/2021 (4,210) (4,210)
IRS HUF 1,694,142,789 Fund receives Fixed 0.34%; and pays Floating HUF BUBOR 6 Month Bank of America 23/8/2021 (5,634) (5,634)
IRS CZK 135,810,709 Fund receives Floating CZK Interbank 6 Month; and pays Fixed 1.775% Bank of America 23/8/2021 (1,434) (1,434)
IRS HUF 942,432,895 Fund receives Fixed 0.375%; and pays Floating HUF BUBOR 6 Month Bank of America 26/8/2021 (995) (995)
IRS CZK 75,549,995 Fund receives Floating CZK Interbank 6 Month; and pays Fixed 1.775% Bank of America 26/8/2021 (907) (907)
IRS HUF 947,558,353 Fund receives Fixed 0.36%; and pays Floating HUF BUBOR 6 Month Bank of America 29/8/2021 (1,664) (1,664)
IRS CZK 75,591,276 Fund receives Floating CZK Interbank 6 Month; and pays Fixed 1.74% Bank of America 29/8/2021 1,210 1,210
IRS HUF 858,934,589 Fund receives Fixed 0.31%; and pays Floating HUF BUBOR 6 Month Bank of America 30/8/2021 (4,216) (4,216)
IRS CZK 68,417,058 Fund receives Floating CZK Interbank 6 Month; and pays Fixed 1.715% Bank of America 30/8/2021 2,553 2,553
IRS HUF 1,486,727,624 Fund receives Fixed 0.36%; and pays Floating HUF BUBOR 6 Month Bank of America 2/9/2021 (2,442) (2,442)
IRS CZK 119,992,212 Fund receives Floating CZK Interbank 6 Month; and pays Fixed 1.74% Bank of America 2/9/2021 1,545 1,545
IRS PLN 22,015,933 Fund receives Fixed 1.6886%; and pays Floating PLN WIBOR 6 Month Bank of America 18/9/2021 6,571 6,571
IRS PLN 11,400,000 Fund receives Fixed 1.7%; and pays Floating PLN WIBOR 6 Month Bank of America 18/9/2021 4,042 4,042
IRS PLN 14,250,000 Fund receives Fixed 1.716%; and pays Floating PLN WIBOR 6 Month Bank of America 18/9/2021 6,175 6,175
IRS PLN 20,520,000 Fund receives Fixed 1.717%; and pays Floating PLN WIBOR 6 Month Bank of America 18/9/2021 8,993 8,993
IRS PLN 14,250,000 Fund receives Fixed 1.721%; and pays Floating PLN WIBOR 6 Month Bank of America 18/9/2021 6,526 6,526
IRS MXN 154,220,000 Fund receives Floating MXN MXIBTIIE 1 Month; and pays Fixed 8.505% Bank of America 4/11/2021 236,421 236,421
IRS MXN 29,023,193 Fund receives Floating MXN MXIBTIIE 1 Month; and pays Fixed 7.23% Bank of America 18/7/2022 (14,413) (14,413)
IRS MXN 14,513,702 Fund receives Floating MXN MXIBTIIE 1 Month; and pays Fixed 7.23% Bank of America 19/7/2022 (7,219) (7,219)
IRS MXN 5,581,384 Fund receives Floating MXN MXIBTIIE 1 Month; and pays Fixed 7.22% Bank of America 20/7/2022 (2,709) (2,709)
IRS MXN 7,813,936 Fund receives Floating MXN MXIBTIIE 1 Month; and pays Fixed 7.21% Bank of America 25/7/2022 (3,727) (3,727)
IRS MXN 61,661,000 Fund receives Fixed 7%; and pays Floating MXN MXIBTIIE 1 Month Bank of America 11/8/2022 12,912 12,912
IRS JPY 299,000,000 Fund receives Fixed 0.14%; and pays Floating JPY LIBOR 6 Month Bank of America 20/9/2023 35,576 35,576
IRS JPY 761,000,000 Fund receives Fixed -0.0125%; and pays Floating JPY LIBOR 6 Month Bank of America 13/2/2024 51,641 51,641
IRS USD 10,120,000 Fund receives Fixed 2.626%; and pays Floating USD LIBOR 3 Month Bank of America 26/7/2024 618,217 618,217
IRS USD 27,033,000 Fund receives Floating USD LIBOR 3 Month; and pays Fixed 2.3345% Bank of America 26/7/2024 (1,276,842) (1,276,842)
IRS USD 4,580,000 Fund receives Fixed 2.285%; and pays Floating USD LIBOR 3 Month Bank of America 9/8/2024 207,316 207,316
IRS USD 7,940,000 Fund receives Fixed 2.3%; and pays Floating USD LIBOR 3 Month Bank of America 9/8/2024 365,111 365,111
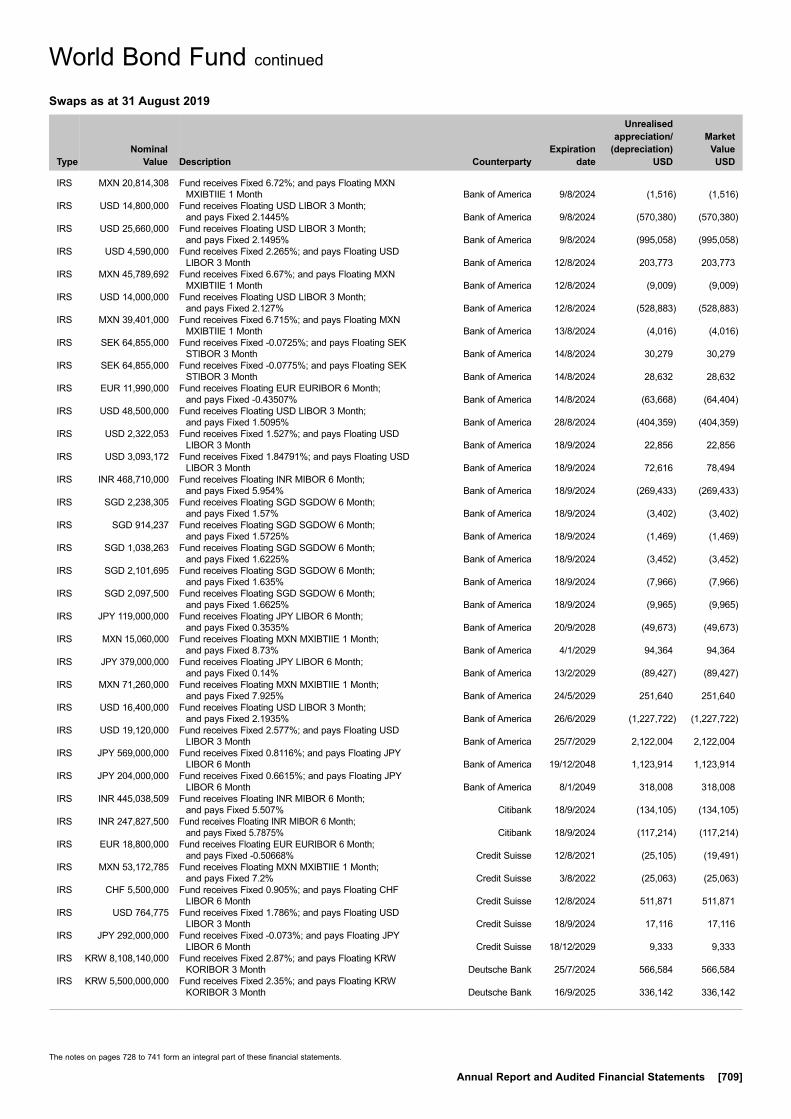
The notes on pages 728 to 741 form an integral part of these financial statements.
Annual Report and Audited Financial Statements [709]
World Bond Fund continued
Swaps as at 31 August 2019
TypeNominal
Value Description Counterparty
Expiration date
Unrealised appreciation/
(depreciation) USD
Market Value USD
IRS MXN 20,814,308 Fund receives Fixed 6.72%; and pays Floating MXN MXIBTIIE 1 Month Bank of America 9/8/2024 (1,516) (1,516)
IRS USD 14,800,000 Fund receives Floating USD LIBOR 3 Month; and pays Fixed 2.1445% Bank of America 9/8/2024 (570,380) (570,380)
IRS USD 25,660,000 Fund receives Floating USD LIBOR 3 Month; and pays Fixed 2.1495% Bank of America 9/8/2024 (995,058) (995,058)
IRS USD 4,590,000 Fund receives Fixed 2.265%; and pays Floating USD LIBOR 3 Month Bank of America 12/8/2024 203,773 203,773
IRS MXN 45,789,692 Fund receives Fixed 6.67%; and pays Floating MXN MXIBTIIE 1 Month Bank of America 12/8/2024 (9,009) (9,009)
IRS USD 14,000,000 Fund receives Floating USD LIBOR 3 Month; and pays Fixed 2.127% Bank of America 12/8/2024 (528,883) (528,883)
IRS MXN 39,401,000 Fund receives Fixed 6.715%; and pays Floating MXN MXIBTIIE 1 Month Bank of America 13/8/2024 (4,016) (4,016)
IRS SEK 64,855,000 Fund receives Fixed -0.0725%; and pays Floating SEK STIBOR 3 Month Bank of America 14/8/2024 30,279 30,279
IRS SEK 64,855,000 Fund receives Fixed -0.0775%; and pays Floating SEK STIBOR 3 Month Bank of America 14/8/2024 28,632 28,632
IRS EUR 11,990,000 Fund receives Floating EUR EURIBOR 6 Month; and pays Fixed -0.43507% Bank of America 14/8/2024 (63,668) (64,404)
IRS USD 48,500,000 Fund receives Floating USD LIBOR 3 Month; and pays Fixed 1.5095% Bank of America 28/8/2024 (404,359) (404,359)
IRS USD 2,322,053 Fund receives Fixed 1.527%; and pays Floating USD LIBOR 3 Month Bank of America 18/9/2024 22,856 22,856
IRS USD 3,093,172 Fund receives Fixed 1.84791%; and pays Floating USD LIBOR 3 Month Bank of America 18/9/2024 72,616 78,494
IRS INR 468,710,000 Fund receives Floating INR MIBOR 6 Month; and pays Fixed 5.954% Bank of America 18/9/2024 (269,433) (269,433)
IRS SGD 2,238,305 Fund receives Floating SGD SGDOW 6 Month; and pays Fixed 1.57% Bank of America 18/9/2024 (3,402) (3,402)
IRS SGD 914,237 Fund receives Floating SGD SGDOW 6 Month; and pays Fixed 1.5725% Bank of America 18/9/2024 (1,469) (1,469)
IRS SGD 1,038,263 Fund receives Floating SGD SGDOW 6 Month; and pays Fixed 1.6225% Bank of America 18/9/2024 (3,452) (3,452)
IRS SGD 2,101,695 Fund receives Floating SGD SGDOW 6 Month; and pays Fixed 1.635% Bank of America 18/9/2024 (7,966) (7,966)
IRS SGD 2,097,500 Fund receives Floating SGD SGDOW 6 Month; and pays Fixed 1.6625% Bank of America 18/9/2024 (9,965) (9,965)
IRS JPY 119,000,000 Fund receives Floating JPY LIBOR 6 Month; and pays Fixed 0.3535% Bank of America 20/9/2028 (49,673) (49,673)
IRS MXN 15,060,000 Fund receives Floating MXN MXIBTIIE 1 Month; and pays Fixed 8.73% Bank of America 4/1/2029 94,364 94,364
IRS JPY 379,000,000 Fund receives Floating JPY LIBOR 6 Month; and pays Fixed 0.14% Bank of America 13/2/2029 (89,427) (89,427)
IRS MXN 71,260,000 Fund receives Floating MXN MXIBTIIE 1 Month; and pays Fixed 7.925% Bank of America 24/5/2029 251,640 251,640
IRS USD 16,400,000 Fund receives Floating USD LIBOR 3 Month; and pays Fixed 2.1935% Bank of America 26/6/2029 (1,227,722) (1,227,722)
IRS USD 19,120,000 Fund receives Fixed 2.577%; and pays Floating USD LIBOR 3 Month Bank of America 25/7/2029 2,122,004 2,122,004
IRS JPY 569,000,000 Fund receives Fixed 0.8116%; and pays Floating JPY LIBOR 6 Month Bank of America 19/12/2048 1,123,914 1,123,914
IRS JPY 204,000,000 Fund receives Fixed 0.6615%; and pays Floating JPY LIBOR 6 Month Bank of America 8/1/2049 318,008 318,008
IRS INR 445,038,509 Fund receives Floating INR MIBOR 6 Month; and pays Fixed 5.507% Citibank 18/9/2024 (134,105) (134,105)
IRS INR 247,827,500 Fund receives Floating INR MIBOR 6 Month; and pays Fixed 5.7875% Citibank 18/9/2024 (117,214) (117,214)
IRS EUR 18,800,000 Fund receives Floating EUR EURIBOR 6 Month; and pays Fixed -0.50668% Credit Suisse 12/8/2021 (25,105) (19,491)
IRS MXN 53,172,785 Fund receives Floating MXN MXIBTIIE 1 Month; and pays Fixed 7.2% Credit Suisse 3/8/2022 (25,063) (25,063)
IRS CHF 5,500,000 Fund receives Fixed 0.905%; and pays Floating CHF LIBOR 6 Month Credit Suisse 12/8/2024 511,871 511,871
IRS USD 764,775 Fund receives Fixed 1.786%; and pays Floating USD LIBOR 3 Month Credit Suisse 18/9/2024 17,116 17,116
IRS JPY 292,000,000 Fund receives Fixed -0.073%; and pays Floating JPY LIBOR 6 Month Credit Suisse 18/12/2029 9,333 9,333
IRS KRW 8,108,140,000 Fund receives Fixed 2.87%; and pays Floating KRW KORIBOR 3 Month Deutsche Bank 25/7/2024 566,584 566,584
IRS KRW 5,500,000,000 Fund receives Fixed 2.35%; and pays Floating KRW KORIBOR 3 Month Deutsche Bank 16/9/2025 336,142 336,142

The notes on pages 728 to 741 form an integral part of these financial statements.
[710] BlackRock Global Funds (BGF)
World Bond Fund continued
Swaps as at 31 August 2019
TypeNominal
Value Description Counterparty
Expiration date
Unrealised appreciation/
(depreciation) USD
Market Value USD
IRS BRL 12,070,849 Fund receives Fixed 8.345%; and pays Floating BRL BROIS 1 Day Goldman Sachs 2/1/2023 195,154 195,154
IRS INR 265,445,600 Fund receives Floating INR MIBOR 6 Month; and pays Fixed 5.55% Goldman Sachs 18/9/2024 (86,972) (86,972)
IRS INR 237,535,891 Fund receives Floating INR MIBOR 6 Month; and pays Fixed 5.51% HSBC Bank Plc 18/9/2024 (72,014) (72,014)
IRS BRL 7,999,290 Fund receives Fixed 8.19%; and pays Floating BRL BROIS 1 Day JP Morgan 2/1/2023 120,181 120,181
IRS BRL 5,780,895 Fund receives Fixed 8.26%; and pays Floating BRL BROIS 1 Day JP Morgan 2/1/2023 88,965 88,965
IRS BRL 12,667,110 Fund receives Fixed 8.27%; and pays Floating BRL BROIS 1 Day JP Morgan 2/1/2023 196,098 196,098
Total (USD underlying exposure - USD 955,326,299) 775,298 2,572,125
CDS: Credit Default SwapsIFS: Inflation SwapsIRS: Interest Rate Swaps
Purchased Swaptions as at 31 August 2019
Nominal Value
Description Counterparty
Expiration date
Unrealised appreciation/
(depreciation) USD
Market Value USD
USD 14,700,000 Fund purchases a put option to enter into an Interest Rate Swap. If exercised Fund receives Floating USD LIBOR 3 Month BBA quarterly from 2/3/2020; and pays 1.476% Fixed semi-annually from 2/6/2020 Bank of America 27/11/2019 (260) 55,600
USD 19,570,000 Fund purchases a call option to enter into an Interest Rate Swap. If exercised Fund receives 2.26% Fixed semi-annually from 25/4/2020; and pays Floating USD LIBOR 3 Month BBA quarterly from 25/1/2020 Barclays 23/10/2019 802,526 900,819
EUR 14,865,000 Fund purchases a put option to enter into an Interest Rate Swap. If exercised Fund receives Floating EUR EURIBOR 6 Month semi-annually from 13/7/2020; and pays 0.25% Fixed annually from 13/1/2021 Barclays 9/1/2020 (119,885) 23,383
Total (USD underlying exposure - USD 25,082,292) 682,381 979,802
Purchased Options as at 31 August 2019
Number of contracts
Call/ Put
Description Counterparty
Strike Price
Expiration date
Unrealised appreciation/
(depreciation) USD
Market Value USD
32,780,000 Put OTC EUR/USD Bank of America EUR 1.1175 3/10/2019 299,649 453,244 16,287,000 Put OTC EUR/GBP Bank of America EUR 0.87 20/12/2019 37,592 189,978 20,000,000 Put OTC EUR/USD Bank of America EUR 1.1537 23/4/2020 245,690 813,541 1,760,000 Put OTC EUR/USD Bank of America EUR 1.115 23/7/2020 11,539 36,108 9,840,000 Put OTC EUR/GBP Goldman Sachs EUR 0.88 22/1/2020 34,893 109,033 156 Put Euro Bund Exchange Traded EUR 173 25/10/2019 (62,914) 52,558
Total (USD underlying exposure - USD 54,721,233) 566,449 1,654,462
Written Options as at 31 August 2019
Number of contracts
Call/ Put
Description Counterparty
Strike Price
Expiration date
Unrealised depreciation
USD
Market Value USD
(1,360) Call 1 Year Eurodollar MIDCV Exchange Traded USD 98.375 13/12/2019 (970,717) (1,351,500)
Total (USD underlying exposure - USD 265,882,574) (970,717) (1,351,500)
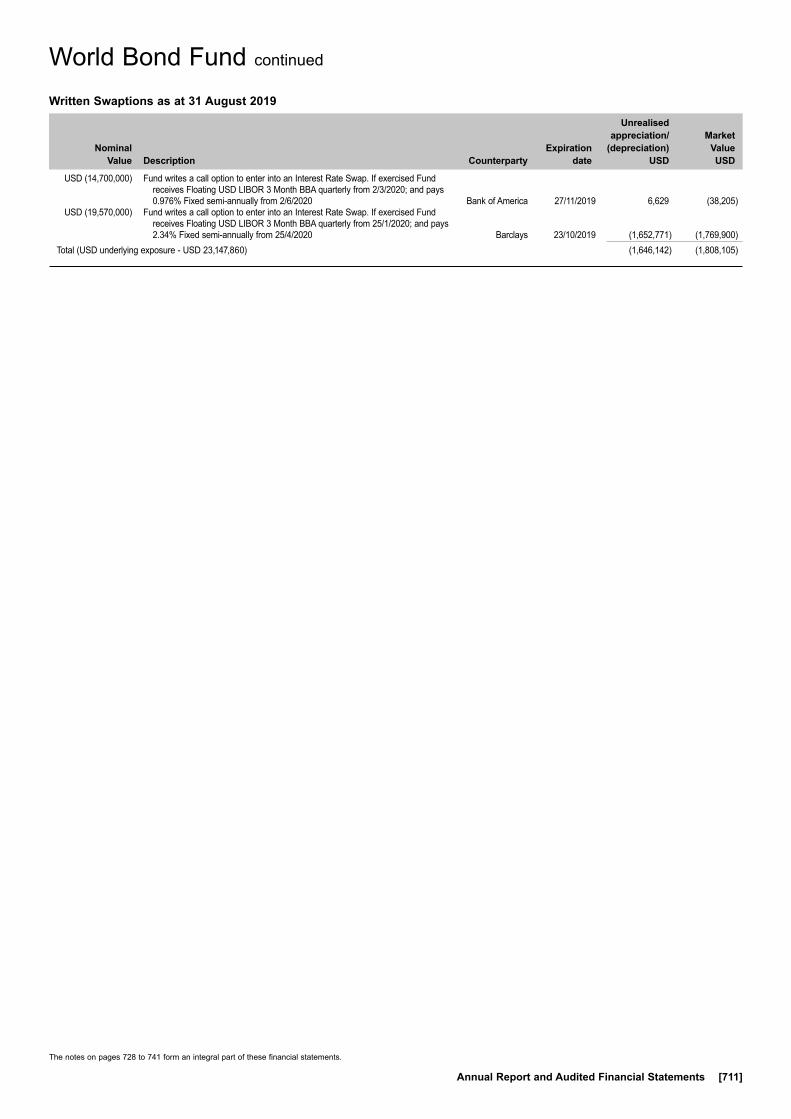
The notes on pages 728 to 741 form an integral part of these financial statements.
Annual Report and Audited Financial Statements [711]
World Bond Fund continued
Written Swaptions as at 31 August 2019
Nominal Value
Description Counterparty
Expiration date
Unrealised appreciation/
(depreciation) USD
Market Value USD
USD (14,700,000) Fund writes a call option to enter into an Interest Rate Swap. If exercised Fund receives Floating USD LIBOR 3 Month BBA quarterly from 2/3/2020; and pays 0.976% Fixed semi-annually from 2/6/2020 Bank of America 27/11/2019 6,629 (38,205)
USD (19,570,000) Fund writes a call option to enter into an Interest Rate Swap. If exercised Fund receives Floating USD LIBOR 3 Month BBA quarterly from 25/1/2020; and pays 2.34% Fixed semi-annually from 25/4/2020 Barclays 23/10/2019 (1,652,771) (1,769,900)
Total (USD underlying exposure - USD 23,147,860) (1,646,142) (1,808,105)

Transferable Securities and Money Market Instruments Admitted to an Official Stock Exchange Listing or Dealt in on Another Regulated Market
Transferable Securities and Money Market Instruments Admitted to an Official Stock Exchange Listing or Dealt in on Another Regulated Market
Holding
Description
Market Value (USD)
% of Net
Assets
Holding
Description
Market Value (USD)
% of Net
Assets
~ Investment in connected party fund, see further information in Note 11.* All or a portion of this security represents a security on loan.** Security subject to a fair value adjustment as detailed in Note 2(j).
The notes on pages 728 to 741 form an integral part of these financial statements.
[712] BlackRock Global Funds (BGF)
FUNDS
Ireland 490,304 BlackRock ICS US Dollar Liquid
Environmentally Aware Fund~ 49,044,448 3.95Total Funds 49,044,448 3.95
COMMON STOCKS (SHARES)
Canada 1,288,689 Canadian Natural Resources Ltd* 30,886,130 2.49 1,884,907 Suncor Energy Inc* 55,094,795 4.43 1,187,560 TC Energy Corp 60,326,956 4.86 146,307,881 11.78
Curacao 359,396 Schlumberger Ltd* 11,863,662 0.95
France 1,881,306 TOTAL SA 94,462,185 7.61
Hong Kong 11,242,000 CNOOC Ltd 16,777,245 1.35
Italy 2,759,278 Eni SpA 41,659,813 3.36
Norway 1,705,460 Equinor ASA 29,298,425 2.36
Papua New Guinea 2,745,373 Oil Search Ltd* 12,281,887 0.99
Portugal 1,055,405 Galp Energia SGPS SA 15,155,818 1.22
Sweden 416,450 Lundin Petroleum AB 12,620,081 1.02
United Kingdom 19,950,444 BP Plc 121,993,553 9.83 6,244,795 Cairn Energy Plc* 12,853,209 1.04 1,980,000 Reabold Resources Plc 33,739 0.00 4,321,720 Royal Dutch Shell Plc 120,466,346 9.70 255,346,847 20.57
United States 1,327,815 Baker Hughes a GE Co ‘A’* 29,211,930 2.35 493,249 Chevron Corp 58,336,559 4.70 388,898 Concho Resources Inc* 28,288,441 2.28 1,365,957 ConocoPhillips 71,685,423 5.77 747,331 EOG Resources Inc 55,728,473 4.49 1,015,129 Exxon Mobil Corp 69,658,152 5.61 200,575 Hess Corp* 12,562,012 1.01 3,428,775 Kosmos Energy Ltd* 21,944,160 1.77 963,110 Marathon Petroleum Corp 47,616,158 3.83 994,891 Noble Energy Inc* 22,673,566 1.83 584,417 Patterson-UTI Energy Inc* 5,213,000 0.42 277,325 Pioneer Natural Resources Co 34,368,887 2.77 522,170 Valero Energy Corp 39,721,472 3.20 2,326,718 Williams Cos Inc/The 55,236,285 4.45 552,244,518 44.48Total Common Stocks (Shares) 1,188,018,362 95.69Total Transferable Securities and Money Market Instruments Admitted to an Official Stock Exchange Listing or Dealt in on Another Regulated Market 1,237,062,810 99.64
Other Transferable Securities
COMMON STOCKS (SHARES)
United States 4,502,180 Caithness Petroleum Ltd** – 0.00Total Common Stocks (Shares) – 0.00Total Other Transferable Securities – 0.00Total Portfolio 1,237,062,810 99.64
Other Net Assets 4,426,995 0.36Total Net Assets (USD) 1,241,489,805 100.00
World Energy Fund
Portfolio of Investments 31 August 2019
World Energy Fund

The notes on pages 728 to 741 form an integral part of these financial statements.
Annual Report and Audited Financial Statements [713]
World Energy Fund continued
Open Forward Foreign Exchange Contracts as at 31 August 2019
Currency
Purchases Currency
Sales Counterparty
Maturity date
Unrealised appreciation/
(depreciation) USD
AUD Hedged Share Class
AUD 29,793,486 USD 20,287,040 BNY Mellon 12/9/2019 (208,144)USD 1,395,336 AUD 2,062,513 BNY Mellon 12/9/2019 5,337Net unrealised depreciation (202,807)
CHF Hedged Share Class
CHF 3,606,173 USD 3,713,355 BNY Mellon 12/9/2019 (59,108)USD 293,765 CHF 286,124 BNY Mellon 12/9/2019 3,828Net unrealised depreciation (55,280)
EUR Hedged Share Class
EUR 55,290,591 USD 62,041,845 BNY Mellon 12/9/2019 (922,868)USD 4,765,429 EUR 4,274,051 BNY Mellon 12/9/2019 40,856Net unrealised depreciation (882,012)
HKD Hedged Share Class
HKD 20,841,526 USD 2,659,560 BNY Mellon 12/9/2019 (1,075)USD 172,545 HKD 1,353,468 BNY Mellon 12/9/2019 (99)Net unrealised depreciation (1,174)
SGD Hedged Share Class
SGD 47,574,607 USD 34,425,062 BNY Mellon 12/9/2019 (114,614)USD 2,507,879 SGD 3,480,627 BNY Mellon 12/9/2019 (2,323)Net unrealised depreciation (116,937)
Total net unrealised depreciation (USD underlying exposure - USD 130,848,479) (1,258,210)
Sector Breakdown as at 31 August 2019
% of Net Assets
Oil, Gas & Consumable Fuels 91.97Investment Funds 3.95Energy Equipment & Services 3.72Other Net Assets 0.36
100.00
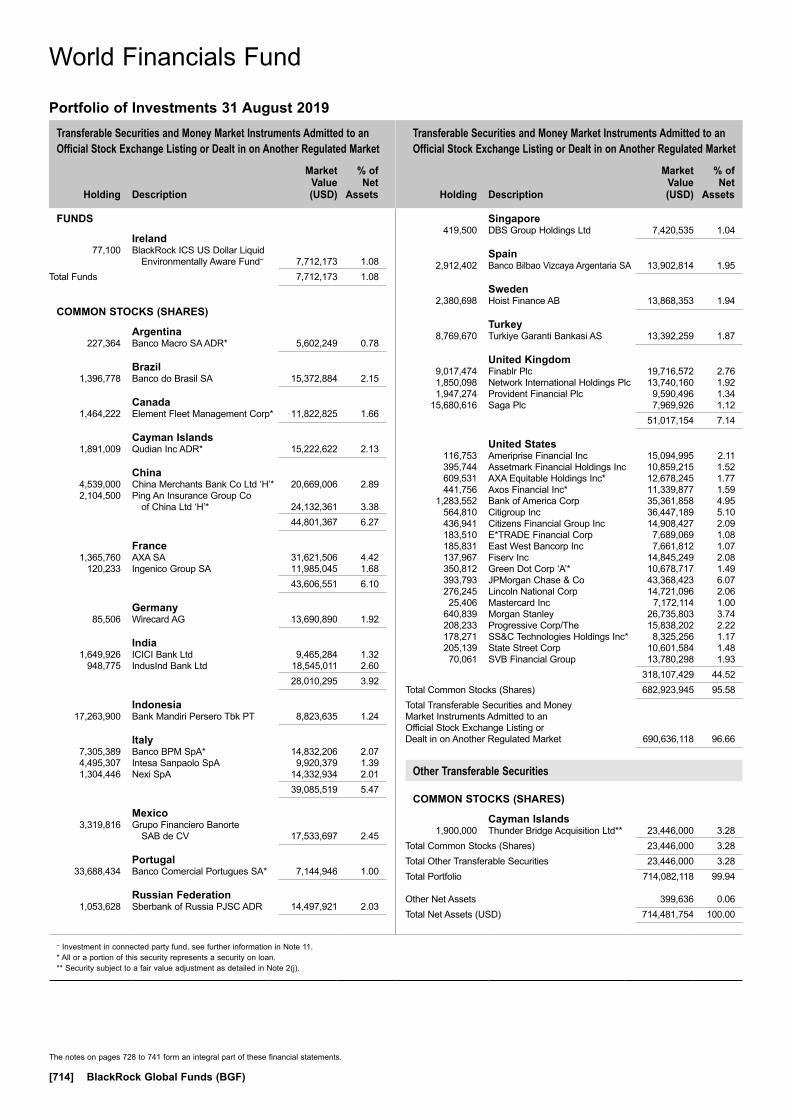
Transferable Securities and Money Market Instruments Admitted to an Official Stock Exchange Listing or Dealt in on Another Regulated Market
Transferable Securities and Money Market Instruments Admitted to an Official Stock Exchange Listing or Dealt in on Another Regulated Market
Holding
Description
Market Value (USD)
% of Net
Assets
Holding
Description
Market Value (USD)
% of Net
Assets
~ Investment in connected party fund, see further information in Note 11.* All or a portion of this security represents a security on loan.** Security subject to a fair value adjustment as detailed in Note 2(j).
The notes on pages 728 to 741 form an integral part of these financial statements.
[714] BlackRock Global Funds (BGF)
FUNDS
Ireland 77,100 BlackRock ICS US Dollar Liquid
Environmentally Aware Fund~ 7,712,173 1.08Total Funds 7,712,173 1.08
COMMON STOCKS (SHARES)
Argentina 227,364 Banco Macro SA ADR* 5,602,249 0.78
Brazil 1,396,778 Banco do Brasil SA 15,372,884 2.15
Canada 1,464,222 Element Fleet Management Corp* 11,822,825 1.66
Cayman Islands 1,891,009 Qudian Inc ADR* 15,222,622 2.13
China 4,539,000 China Merchants Bank Co Ltd ‘H’* 20,669,006 2.89 2,104,500 Ping An Insurance Group Co
of China Ltd ‘H’* 24,132,361 3.38 44,801,367 6.27
France 1,365,760 AXA SA 31,621,506 4.42 120,233 Ingenico Group SA 11,985,045 1.68 43,606,551 6.10
Germany 85,506 Wirecard AG 13,690,890 1.92
India 1,649,926 ICICI Bank Ltd 9,465,284 1.32 948,775 IndusInd Bank Ltd 18,545,011 2.60 28,010,295 3.92
Indonesia 17,263,900 Bank Mandiri Persero Tbk PT 8,823,635 1.24
Italy 7,305,389 Banco BPM SpA* 14,832,206 2.07 4,495,307 Intesa Sanpaolo SpA 9,920,379 1.39 1,304,446 Nexi SpA 14,332,934 2.01 39,085,519 5.47
Mexico 3,319,816 Grupo Financiero Banorte
SAB de CV 17,533,697 2.45
Portugal 33,688,434 Banco Comercial Portugues SA* 7,144,946 1.00
Russian Federation 1,053,628 Sberbank of Russia PJSC ADR 14,497,921 2.03
Singapore 419,500 DBS Group Holdings Ltd 7,420,535 1.04
Spain 2,912,402 Banco Bilbao Vizcaya Argentaria SA 13,902,814 1.95
Sweden 2,380,698 Hoist Finance AB 13,868,353 1.94
Turkey 8,769,670 Turkiye Garanti Bankasi AS 13,392,259 1.87
United Kingdom 9,017,474 Finablr Plc 19,716,572 2.76 1,850,098 Network International Holdings Plc 13,740,160 1.92 1,947,274 Provident Financial Plc 9,590,496 1.34 15,680,616 Saga Plc 7,969,926 1.12 51,017,154 7.14
United States 116,753 Ameriprise Financial Inc 15,094,995 2.11 395,744 Assetmark Financial Holdings Inc 10,859,215 1.52 609,531 AXA Equitable Holdings Inc* 12,678,245 1.77 441,756 Axos Financial Inc* 11,339,877 1.59 1,283,552 Bank of America Corp 35,361,858 4.95 564,810 Citigroup Inc 36,447,189 5.10 436,941 Citizens Financial Group Inc 14,908,427 2.09 183,510 E*TRADE Financial Corp 7,689,069 1.08 185,831 East West Bancorp Inc 7,661,812 1.07 137,967 Fiserv Inc 14,845,249 2.08 350,812 Green Dot Corp ‘A’* 10,678,717 1.49 393,793 JPMorgan Chase & Co 43,368,423 6.07 276,245 Lincoln National Corp 14,721,096 2.06 25,406 Mastercard Inc 7,172,114 1.00 640,839 Morgan Stanley 26,735,803 3.74 208,233 Progressive Corp/The 15,838,202 2.22 178,271 SS&C Technologies Holdings Inc* 8,325,256 1.17 205,139 State Street Corp 10,601,584 1.48 70,061 SVB Financial Group 13,780,298 1.93 318,107,429 44.52Total Common Stocks (Shares) 682,923,945 95.58Total Transferable Securities and Money Market Instruments Admitted to an Official Stock Exchange Listing or Dealt in on Another Regulated Market 690,636,118 96.66
Other Transferable Securities
COMMON STOCKS (SHARES)
Cayman Islands 1,900,000 Thunder Bridge Acquisition Ltd** 23,446,000 3.28Total Common Stocks (Shares) 23,446,000 3.28Total Other Transferable Securities 23,446,000 3.28Total Portfolio 714,082,118 99.94
Other Net Assets 399,636 0.06Total Net Assets (USD) 714,481,754 100.00
World Financials Fund
Portfolio of Investments 31 August 2019
World Financials Fund
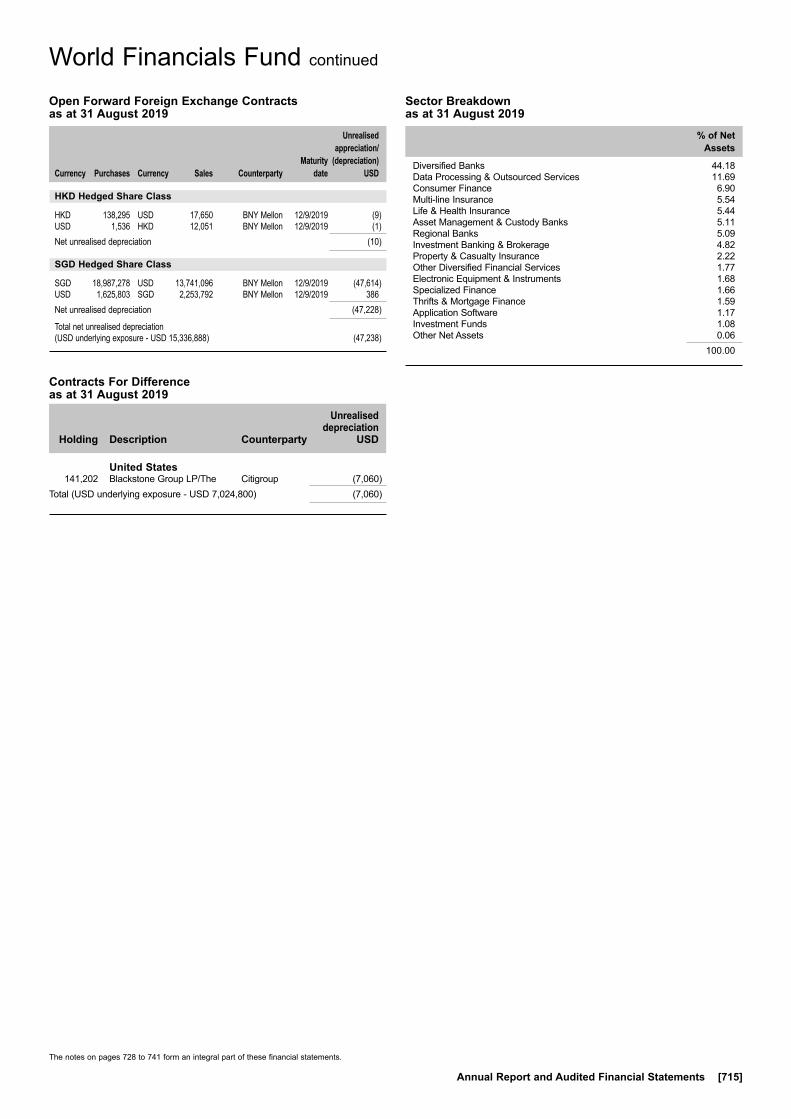
The notes on pages 728 to 741 form an integral part of these financial statements.
Annual Report and Audited Financial Statements [715]
World Financials Fund continued
Sector Breakdown as at 31 August 2019
% of Net Assets
Diversified Banks 44.18Data Processing & Outsourced Services 11.69Consumer Finance 6.90Multi-line Insurance 5.54Life & Health Insurance 5.44Asset Management & Custody Banks 5.11Regional Banks 5.09Investment Banking & Brokerage 4.82Property & Casualty Insurance 2.22Other Diversified Financial Services 1.77Electronic Equipment & Instruments 1.68Specialized Finance 1.66Thrifts & Mortgage Finance 1.59Application Software 1.17Investment Funds 1.08Other Net Assets 0.06
100.00
Open Forward Foreign Exchange Contracts as at 31 August 2019
Currency
Purchases Currency
Sales Counterparty
Maturity date
Unrealised appreciation/
(depreciation) USD
HKD Hedged Share Class
HKD 138,295 USD 17,650 BNY Mellon 12/9/2019 (9)USD 1,536 HKD 12,051 BNY Mellon 12/9/2019 (1)Net unrealised depreciation (10)
SGD Hedged Share Class
SGD 18,987,278 USD 13,741,096 BNY Mellon 12/9/2019 (47,614)USD 1,625,803 SGD 2,253,792 BNY Mellon 12/9/2019 386Net unrealised depreciation (47,228)
Total net unrealised depreciation (USD underlying exposure - USD 15,336,888) (47,238)
Contracts For Difference as at 31 August 2019
Holding
Description Counterparty
Unrealised depreciation
USD
United States 141,202 Blackstone Group LP/The Citigroup (7,060)Total (USD underlying exposure - USD 7,024,800) (7,060)

Transferable Securities and Money Market Instruments Admitted to an Official Stock Exchange Listing or Dealt in on Another Regulated Market
Transferable Securities and Money Market Instruments Admitted to an Official Stock Exchange Listing or Dealt in on Another Regulated Market
Holding
Description
Market Value (USD)
% of Net
Assets
Holding
Description
Market Value (USD)
% of Net
Assets
~ Investment in connected party fund, see further information in Note 11.* All or a portion of this security represents a security on loan.** Security subject to a fair value adjustment as detailed in Note 2(j).
The notes on pages 728 to 741 form an integral part of these financial statements.
[716] BlackRock Global Funds (BGF)
FUNDS
Ireland 1,701,423 BlackRock ICS US Dollar Liquid
Environmentally Aware Fund~ 170,191,093 3.00 375,000 Invesco Physical Gold ETC - ETF 55,691,250 0.98Total Funds 225,882,343 3.98
COMMON STOCKS (SHARES)
Australia 36,032,843 Evolution Mining Ltd* 125,754,622 2.22 47,452,401 Gold Road Resources Ltd 41,881,782 0.74 19,474,340 Newcrest Mining Ltd 485,467,476 8.56 26,477,085 Northern Star Resources Ltd 212,281,818 3.74 26,360,818 Saracen Mineral Holdings Ltd* 64,648,125 1.14 3,867,113 Westgold Resources Ltd 6,096,750 0.11 936,130,573 16.51
Belgium 771,887 Umicore SA* 24,829,157 0.44
Canada 7,793,340 Agnico Eagle Mines Ltd (Unit)* 480,796,191 8.48 17,085,887 Alacer Gold Corp* 75,484,883 1.33 27,059,937 Alamos Gold Inc ‘A’* 189,729,374 3.35 53,543,630 B2Gold Corp 190,534,951 3.36 28,584,554 Barrick Gold Corp 545,107,445 9.61 7,995,768 Belo Sun Mining Corp 2,893,518 0.05 12,081,548 Centerra Gold Inc 109,575,397 1.93 3,400,907 Equinox Gold Corp 20,588,995 0.36 2,734,341 Franco-Nevada Corp 264,383,831 4.66 12,690,288 Gold Standard Ventures Corp* 12,724,712 0.23 2,882,795 Great Panther Mining Ltd 2,312,002 0.04 43,754,047 Kinross Gold Corp 216,394,846 3.82 8,178,974 MAG Silver Corp* 104,333,561 1.84 2,746,299 Mountain Province Diamonds Inc 2,153,307 0.04 44,064,297 OceanaGold Corp 104,978,115 1.85 231,592 Osisko Gold Royalties Ltd* 2,928,070 0.05 12,862,486 Osisko Mining Inc 33,358,630 0.59 11,527,037 Pretium Resources Inc* 150,605,591 2.66 809,812 Teck Resources Ltd 13,783,000 0.24 7,884,367 TMAC Resources Inc 31,504,134 0.56 3,649,512 Torex Gold Resources Inc* 58,165,387 1.03 9,046,407 Wheaton Precious Metals Corp* 262,102,613 4.62 2,874,438,553 50.70
Cayman Islands 8,919,566 Endeavour Mining Corp* 172,150,596 3.04
Jersey 86,370,514 Centamin Plc 147,255,839 2.60
Mexico 846,286 Industrias Penoles SAB de CV 10,029,808 0.18
Peru 566,360 Cia de Minas Buenaventura
SAA ADR 8,512,391 0.15
Russian Federation 3,415,277 Polyus PJSC GDR 193,475,442 3.41
South Africa 10,352,884 AngloGold Ashanti Ltd ADR* 230,248,140 4.06 18,557,585 Gold Fields Ltd ADR 108,376,297 1.91 4,512,861 Impala Platinum Holdings Ltd* 25,509,489 0.45 364,133,926 6.42
United Kingdom 11,366,492 Acacia Mining Plc 36,209,915 0.64 1,603,518 BHP Group Plc* 34,367,302 0.60 14,678,077 Fresnillo Plc* 132,067,011 2.33 202,644,228 3.57
United States 1,339,570 Newmont Goldcorp Corp* 53,182,789 0.94 11,627,330 Newmont Goldcorp Corp* 461,837,548 8.14 515,020,337 9.08Total Common Stocks (Shares) 5,448,620,850 96.10Total Transferable Securities and Money Market Instruments Admitted to an Official Stock Exchange Listing or Dealt in on Another Regulated Market 5,674,503,193 100.08
Other Transferable Securities
COMMON STOCKS (SHARES)
Russian Federation 5,317,500 Vysochajshiy OAO** 46,198,142 0.82
South Africa 8,208,603 Great Basin Gold Ltd** – 0.00Total Common Stocks (Shares) 46,198,142 0.82
BONDS
Canada CAD 3,207,464 Great Basin Gold Ltd (Defaulted)
8% 30/11/2014** – 0.00Total Bonds – 0.00Total Other Transferable Securities 46,198,142 0.82Total Portfolio 5,720,701,335 100.90
Other Net Liabilities (50,949,773) (0.90)Total Net Assets (USD) 5,669,751,562 100.00
World Gold Fund
Portfolio of Investments 31 August 2019
World Gold Fund
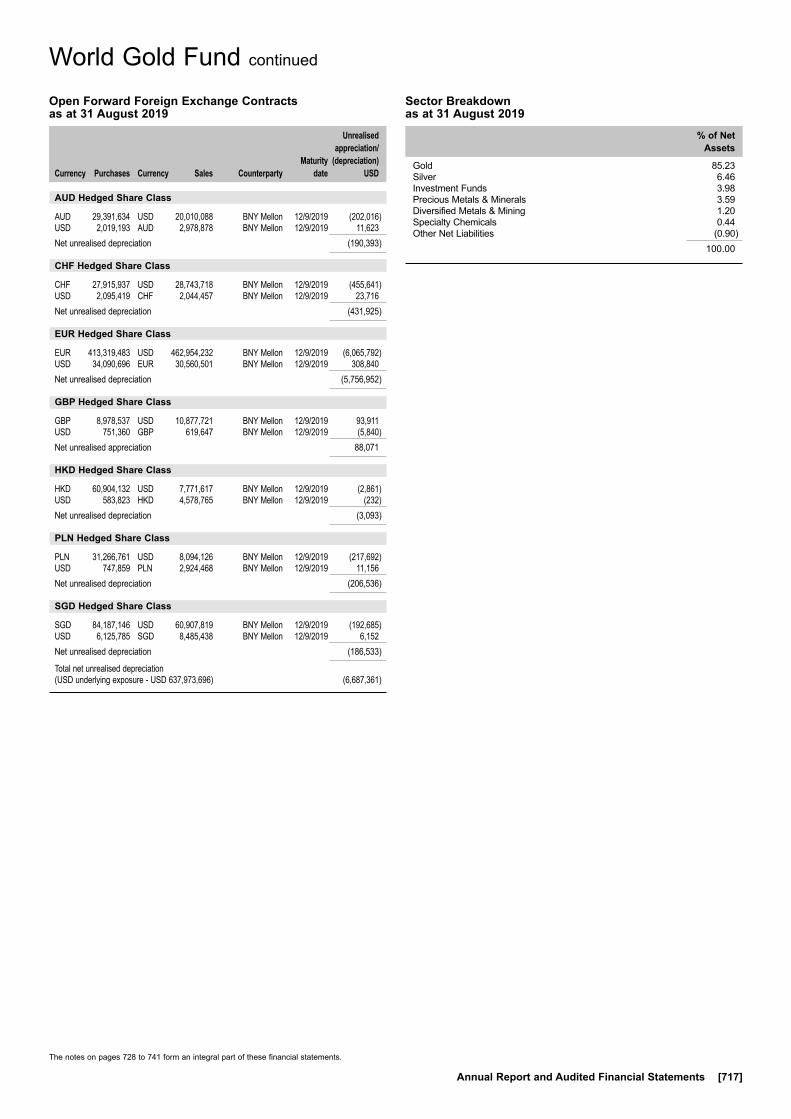
The notes on pages 728 to 741 form an integral part of these financial statements.
Annual Report and Audited Financial Statements [717]
World Gold Fund continued
Open Forward Foreign Exchange Contracts as at 31 August 2019
Currency
Purchases Currency
Sales Counterparty
Maturity date
Unrealised appreciation/
(depreciation) USD
AUD Hedged Share Class
AUD 29,391,634 USD 20,010,088 BNY Mellon 12/9/2019 (202,016)USD 2,019,193 AUD 2,978,878 BNY Mellon 12/9/2019 11,623Net unrealised depreciation (190,393)
CHF Hedged Share Class
CHF 27,915,937 USD 28,743,718 BNY Mellon 12/9/2019 (455,641)USD 2,095,419 CHF 2,044,457 BNY Mellon 12/9/2019 23,716Net unrealised depreciation (431,925)
EUR Hedged Share Class
EUR 413,319,483 USD 462,954,232 BNY Mellon 12/9/2019 (6,065,792)USD 34,090,696 EUR 30,560,501 BNY Mellon 12/9/2019 308,840Net unrealised depreciation (5,756,952)
GBP Hedged Share Class
GBP 8,978,537 USD 10,877,721 BNY Mellon 12/9/2019 93,911USD 751,360 GBP 619,647 BNY Mellon 12/9/2019 (5,840)Net unrealised appreciation 88,071
HKD Hedged Share Class
HKD 60,904,132 USD 7,771,617 BNY Mellon 12/9/2019 (2,861)USD 583,823 HKD 4,578,765 BNY Mellon 12/9/2019 (232)Net unrealised depreciation (3,093)
PLN Hedged Share Class
PLN 31,266,761 USD 8,094,126 BNY Mellon 12/9/2019 (217,692)USD 747,859 PLN 2,924,468 BNY Mellon 12/9/2019 11,156Net unrealised depreciation (206,536)
SGD Hedged Share Class
SGD 84,187,146 USD 60,907,819 BNY Mellon 12/9/2019 (192,685)USD 6,125,785 SGD 8,485,438 BNY Mellon 12/9/2019 6,152Net unrealised depreciation (186,533)
Total net unrealised depreciation (USD underlying exposure - USD 637,973,696) (6,687,361)
Sector Breakdown as at 31 August 2019
% of Net Assets
Gold 85.23Silver 6.46Investment Funds 3.98Precious Metals & Minerals 3.59Diversified Metals & Mining 1.20Specialty Chemicals 0.44Other Net Liabilities (0.90)
100.00
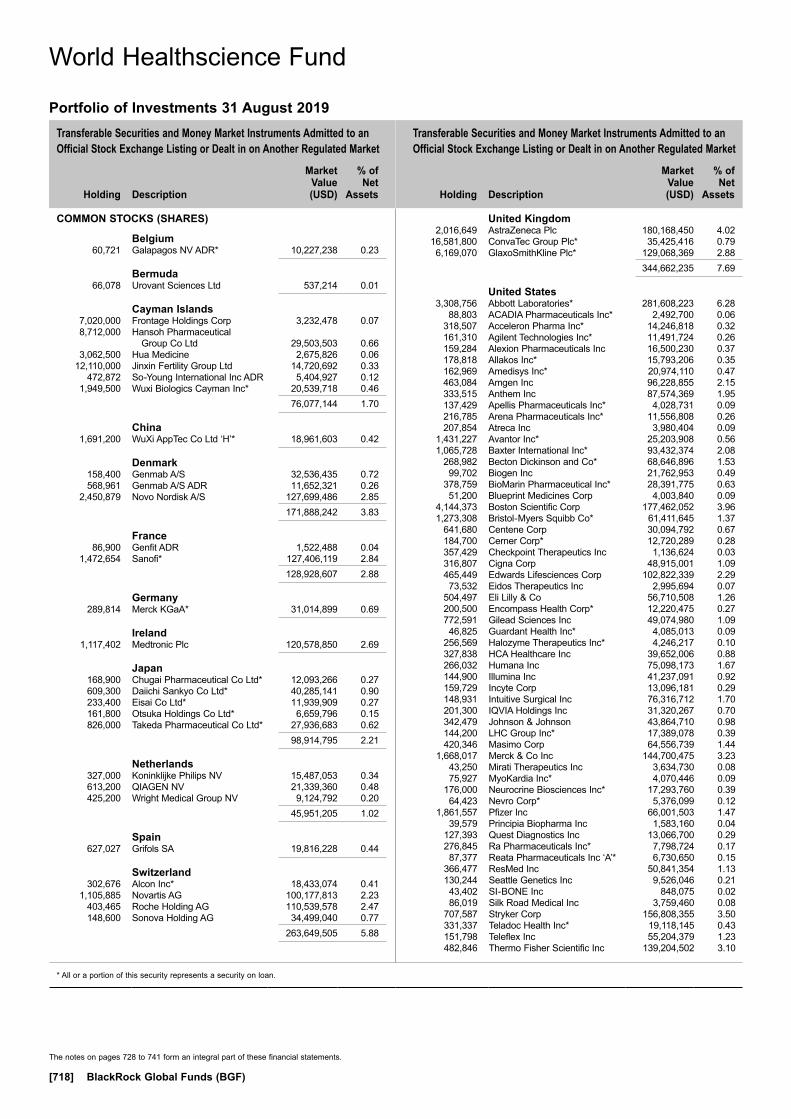
Transferable Securities and Money Market Instruments Admitted to an Official Stock Exchange Listing or Dealt in on Another Regulated Market
Transferable Securities and Money Market Instruments Admitted to an Official Stock Exchange Listing or Dealt in on Another Regulated Market
Holding
Description
Market Value (USD)
% of Net
Assets
Holding
Description
Market Value (USD)
% of Net
Assets
* All or a portion of this security represents a security on loan.
The notes on pages 728 to 741 form an integral part of these financial statements.
[718] BlackRock Global Funds (BGF)
COMMON STOCKS (SHARES)
Belgium 60,721 Galapagos NV ADR* 10,227,238 0.23
Bermuda 66,078 Urovant Sciences Ltd 537,214 0.01
Cayman Islands 7,020,000 Frontage Holdings Corp 3,232,478 0.07 8,712,000 Hansoh Pharmaceutical
Group Co Ltd 29,503,503 0.66 3,062,500 Hua Medicine 2,675,826 0.06 12,110,000 Jinxin Fertility Group Ltd 14,720,692 0.33 472,872 So-Young International Inc ADR 5,404,927 0.12 1,949,500 Wuxi Biologics Cayman Inc* 20,539,718 0.46 76,077,144 1.70
China 1,691,200 WuXi AppTec Co Ltd ‘H’* 18,961,603 0.42
Denmark 158,400 Genmab A/S 32,536,435 0.72 568,961 Genmab A/S ADR 11,652,321 0.26 2,450,879 Novo Nordisk A/S 127,699,486 2.85 171,888,242 3.83
France 86,900 Genfit ADR 1,522,488 0.04 1,472,654 Sanofi* 127,406,119 2.84 128,928,607 2.88
Germany 289,814 Merck KGaA* 31,014,899 0.69
Ireland 1,117,402 Medtronic Plc 120,578,850 2.69
Japan 168,900 Chugai Pharmaceutical Co Ltd* 12,093,266 0.27 609,300 Daiichi Sankyo Co Ltd* 40,285,141 0.90 233,400 Eisai Co Ltd* 11,939,909 0.27 161,800 Otsuka Holdings Co Ltd* 6,659,796 0.15 826,000 Takeda Pharmaceutical Co Ltd* 27,936,683 0.62 98,914,795 2.21
Netherlands 327,000 Koninklijke Philips NV 15,487,053 0.34 613,200 QIAGEN NV 21,339,360 0.48 425,200 Wright Medical Group NV 9,124,792 0.20 45,951,205 1.02
Spain 627,027 Grifols SA 19,816,228 0.44
Switzerland 302,676 Alcon Inc* 18,433,074 0.41 1,105,885 Novartis AG 100,177,813 2.23 403,465 Roche Holding AG 110,539,578 2.47 148,600 Sonova Holding AG 34,499,040 0.77 263,649,505 5.88
United Kingdom 2,016,649 AstraZeneca Plc 180,168,450 4.02 16,581,800 ConvaTec Group Plc* 35,425,416 0.79 6,169,070 GlaxoSmithKline Plc* 129,068,369 2.88 344,662,235 7.69
United States 3,308,756 Abbott Laboratories* 281,608,223 6.28 88,803 ACADIA Pharmaceuticals Inc* 2,492,700 0.06 318,507 Acceleron Pharma Inc* 14,246,818 0.32 161,310 Agilent Technologies Inc* 11,491,724 0.26 159,284 Alexion Pharmaceuticals Inc 16,500,230 0.37 178,818 Allakos Inc* 15,793,206 0.35 162,969 Amedisys Inc* 20,974,110 0.47 463,084 Amgen Inc 96,228,855 2.15 333,515 Anthem Inc 87,574,369 1.95 137,429 Apellis Pharmaceuticals Inc* 4,028,731 0.09 216,785 Arena Pharmaceuticals Inc* 11,556,808 0.26 207,854 Atreca Inc 3,980,404 0.09 1,431,227 Avantor Inc* 25,203,908 0.56 1,065,728 Baxter International Inc* 93,432,374 2.08 268,982 Becton Dickinson and Co* 68,646,896 1.53 99,702 Biogen Inc 21,762,953 0.49 378,759 BioMarin Pharmaceutical Inc* 28,391,775 0.63 51,200 Blueprint Medicines Corp 4,003,840 0.09 4,144,373 Boston Scientific Corp 177,462,052 3.96 1,273,308 Bristol-Myers Squibb Co* 61,411,645 1.37 641,680 Centene Corp 30,094,792 0.67 184,700 Cerner Corp* 12,720,289 0.28 357,429 Checkpoint Therapeutics Inc 1,136,624 0.03 316,807 Cigna Corp 48,915,001 1.09 465,449 Edwards Lifesciences Corp 102,822,339 2.29 73,532 Eidos Therapeutics Inc 2,995,694 0.07 504,497 Eli Lilly & Co 56,710,508 1.26 200,500 Encompass Health Corp* 12,220,475 0.27 772,591 Gilead Sciences Inc 49,074,980 1.09 46,825 Guardant Health Inc* 4,085,013 0.09 256,569 Halozyme Therapeutics Inc* 4,246,217 0.10 327,838 HCA Healthcare Inc 39,652,006 0.88 266,032 Humana Inc 75,098,173 1.67 144,900 Illumina Inc 41,237,091 0.92 159,729 Incyte Corp 13,096,181 0.29 148,931 Intuitive Surgical Inc 76,316,712 1.70 201,300 IQVIA Holdings Inc 31,320,267 0.70 342,479 Johnson & Johnson 43,864,710 0.98 144,200 LHC Group Inc* 17,389,078 0.39 420,346 Masimo Corp 64,556,739 1.44 1,668,017 Merck & Co Inc 144,700,475 3.23 43,250 Mirati Therapeutics Inc 3,634,730 0.08 75,927 MyoKardia Inc* 4,070,446 0.09 176,000 Neurocrine Biosciences Inc* 17,293,760 0.39 64,423 Nevro Corp* 5,376,099 0.12 1,861,557 Pfizer Inc 66,001,503 1.47 39,579 Principia Biopharma Inc 1,583,160 0.04 127,393 Quest Diagnostics Inc 13,066,700 0.29 276,845 Ra Pharmaceuticals Inc* 7,798,724 0.17 87,377 Reata Pharmaceuticals Inc ‘A’* 6,730,650 0.15 366,477 ResMed Inc 50,841,354 1.13 130,244 Seattle Genetics Inc 9,526,046 0.21 43,402 SI-BONE Inc 848,075 0.02 86,019 Silk Road Medical Inc 3,759,460 0.08 707,587 Stryker Corp 156,808,355 3.50 331,337 Teladoc Health Inc* 19,118,145 0.43 151,798 Teleflex Inc 55,204,379 1.23 482,846 Thermo Fisher Scientific Inc 139,204,502 3.10
World Healthscience Fund
Portfolio of Investments 31 August 2019
World Healthscience Fund
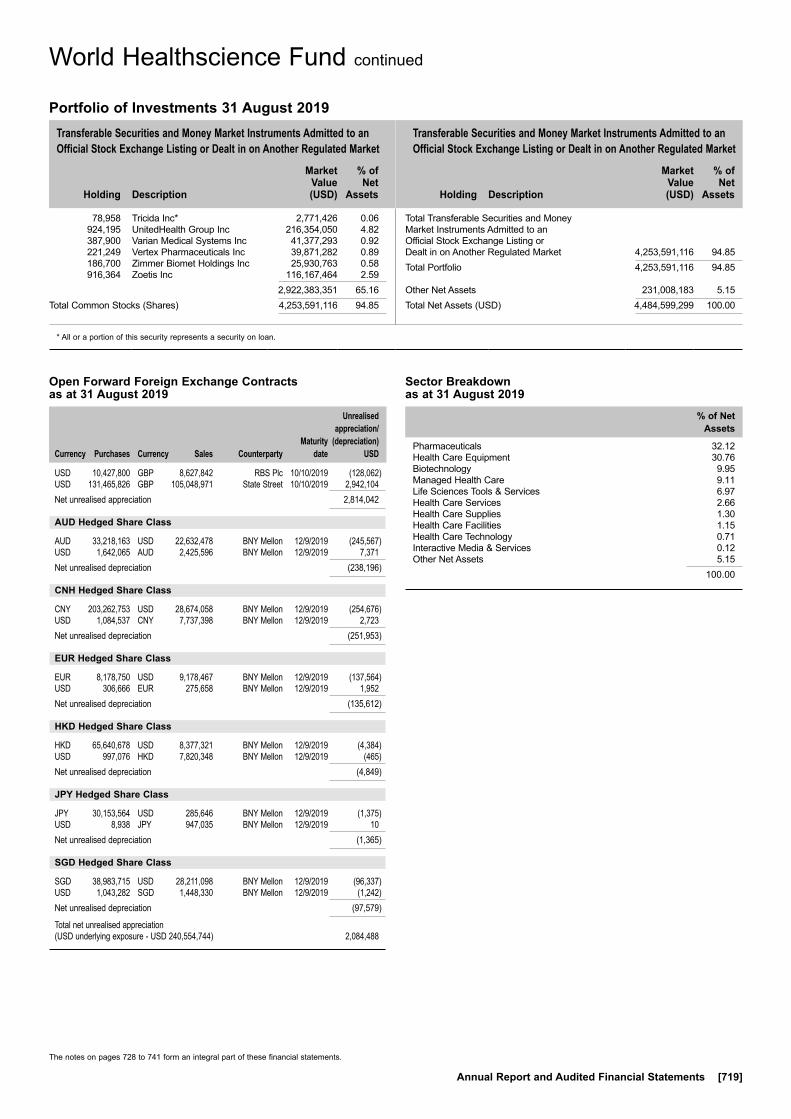
Transferable Securities and Money Market Instruments Admitted to an Official Stock Exchange Listing or Dealt in on Another Regulated Market
Transferable Securities and Money Market Instruments Admitted to an Official Stock Exchange Listing or Dealt in on Another Regulated Market
Holding
Description
Market Value (USD)
% of Net
Assets
Holding
Description
Market Value (USD)
% of Net
Assets
* All or a portion of this security represents a security on loan.
The notes on pages 728 to 741 form an integral part of these financial statements.
Annual Report and Audited Financial Statements [719]
78,958 Tricida Inc* 2,771,426 0.06 924,195 UnitedHealth Group Inc 216,354,050 4.82 387,900 Varian Medical Systems Inc 41,377,293 0.92 221,249 Vertex Pharmaceuticals Inc 39,871,282 0.89 186,700 Zimmer Biomet Holdings Inc 25,930,763 0.58 916,364 Zoetis Inc 116,167,464 2.59 2,922,383,351 65.16Total Common Stocks (Shares) 4,253,591,116 94.85
Total Transferable Securities and Money Market Instruments Admitted to an Official Stock Exchange Listing or Dealt in on Another Regulated Market 4,253,591,116 94.85Total Portfolio 4,253,591,116 94.85
Other Net Assets 231,008,183 5.15Total Net Assets (USD) 4,484,599,299 100.00
World Healthscience Fund continued
Portfolio of Investments 31 August 2019
Open Forward Foreign Exchange Contracts as at 31 August 2019
Currency
Purchases Currency
Sales Counterparty
Maturity date
Unrealised appreciation/
(depreciation) USD
USD 10,427,800 GBP 8,627,842 RBS Plc 10/10/2019 (128,062)USD 131,465,826 GBP 105,048,971 State Street 10/10/2019 2,942,104Net unrealised appreciation 2,814,042
AUD Hedged Share Class
AUD 33,218,163 USD 22,632,478 BNY Mellon 12/9/2019 (245,567)USD 1,642,065 AUD 2,425,596 BNY Mellon 12/9/2019 7,371Net unrealised depreciation (238,196)
CNH Hedged Share Class
CNY 203,262,753 USD 28,674,058 BNY Mellon 12/9/2019 (254,676)USD 1,084,537 CNY 7,737,398 BNY Mellon 12/9/2019 2,723Net unrealised depreciation (251,953)
EUR Hedged Share Class
EUR 8,178,750 USD 9,178,467 BNY Mellon 12/9/2019 (137,564)USD 306,666 EUR 275,658 BNY Mellon 12/9/2019 1,952Net unrealised depreciation (135,612)
HKD Hedged Share Class
HKD 65,640,678 USD 8,377,321 BNY Mellon 12/9/2019 (4,384)USD 997,076 HKD 7,820,348 BNY Mellon 12/9/2019 (465)Net unrealised depreciation (4,849)
JPY Hedged Share Class
JPY 30,153,564 USD 285,646 BNY Mellon 12/9/2019 (1,375)USD 8,938 JPY 947,035 BNY Mellon 12/9/2019 10Net unrealised depreciation (1,365)
SGD Hedged Share Class
SGD 38,983,715 USD 28,211,098 BNY Mellon 12/9/2019 (96,337)USD 1,043,282 SGD 1,448,330 BNY Mellon 12/9/2019 (1,242)Net unrealised depreciation (97,579)
Total net unrealised appreciation (USD underlying exposure - USD 240,554,744) 2,084,488
Sector Breakdown as at 31 August 2019
% of Net Assets
Pharmaceuticals 32.12Health Care Equipment 30.76Biotechnology 9.95Managed Health Care 9.11Life Sciences Tools & Services 6.97Health Care Services 2.66Health Care Supplies 1.30Health Care Facilities 1.15Health Care Technology 0.71Interactive Media & Services 0.12Other Net Assets 5.15
100.00
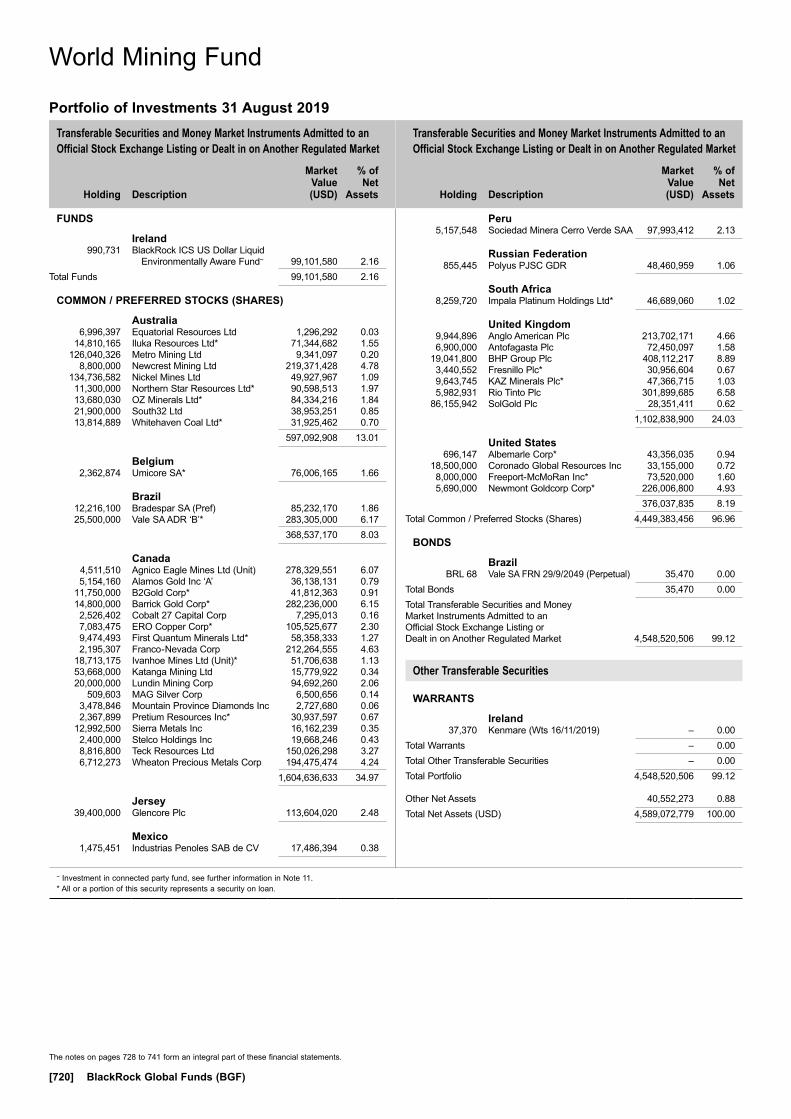
Transferable Securities and Money Market Instruments Admitted to an Official Stock Exchange Listing or Dealt in on Another Regulated Market
Transferable Securities and Money Market Instruments Admitted to an Official Stock Exchange Listing or Dealt in on Another Regulated Market
Holding
Description
Market Value (USD)
% of Net
Assets
Holding
Description
Market Value (USD)
% of Net
Assets
~ Investment in connected party fund, see further information in Note 11.* All or a portion of this security represents a security on loan.
The notes on pages 728 to 741 form an integral part of these financial statements.
[720] BlackRock Global Funds (BGF)
FUNDS
Ireland 990,731 BlackRock ICS US Dollar Liquid
Environmentally Aware Fund~ 99,101,580 2.16Total Funds 99,101,580 2.16
COMMON / PREFERRED STOCKS (SHARES)
Australia 6,996,397 Equatorial Resources Ltd 1,296,292 0.03 14,810,165 Iluka Resources Ltd* 71,344,682 1.55 126,040,326 Metro Mining Ltd 9,341,097 0.20 8,800,000 Newcrest Mining Ltd 219,371,428 4.78 134,736,582 Nickel Mines Ltd 49,927,967 1.09 11,300,000 Northern Star Resources Ltd* 90,598,513 1.97 13,680,030 OZ Minerals Ltd* 84,334,216 1.84 21,900,000 South32 Ltd 38,953,251 0.85 13,814,889 Whitehaven Coal Ltd* 31,925,462 0.70 597,092,908 13.01
Belgium 2,362,874 Umicore SA* 76,006,165 1.66
Brazil 12,216,100 Bradespar SA (Pref) 85,232,170 1.86 25,500,000 Vale SA ADR ‘B’* 283,305,000 6.17 368,537,170 8.03
Canada 4,511,510 Agnico Eagle Mines Ltd (Unit) 278,329,551 6.07 5,154,160 Alamos Gold Inc ‘A’ 36,138,131 0.79 11,750,000 B2Gold Corp* 41,812,363 0.91 14,800,000 Barrick Gold Corp* 282,236,000 6.15 2,526,402 Cobalt 27 Capital Corp 7,295,013 0.16 7,083,475 ERO Copper Corp* 105,525,677 2.30 9,474,493 First Quantum Minerals Ltd* 58,358,333 1.27 2,195,307 Franco-Nevada Corp 212,264,555 4.63 18,713,175 Ivanhoe Mines Ltd (Unit)* 51,706,638 1.13 53,668,000 Katanga Mining Ltd 15,779,922 0.34 20,000,000 Lundin Mining Corp 94,692,260 2.06 509,603 MAG Silver Corp 6,500,656 0.14 3,478,846 Mountain Province Diamonds Inc 2,727,680 0.06 2,367,899 Pretium Resources Inc* 30,937,597 0.67 12,992,500 Sierra Metals Inc 16,162,239 0.35 2,400,000 Stelco Holdings Inc 19,668,246 0.43 8,816,800 Teck Resources Ltd 150,026,298 3.27 6,712,273 Wheaton Precious Metals Corp 194,475,474 4.24 1,604,636,633 34.97
Jersey 39,400,000 Glencore Plc 113,604,020 2.48
Mexico 1,475,451 Industrias Penoles SAB de CV 17,486,394 0.38
Peru 5,157,548 Sociedad Minera Cerro Verde SAA 97,993,412 2.13
Russian Federation 855,445 Polyus PJSC GDR 48,460,959 1.06
South Africa 8,259,720 Impala Platinum Holdings Ltd* 46,689,060 1.02
United Kingdom 9,944,896 Anglo American Plc 213,702,171 4.66 6,900,000 Antofagasta Plc 72,450,097 1.58 19,041,800 BHP Group Plc 408,112,217 8.89 3,440,552 Fresnillo Plc* 30,956,604 0.67 9,643,745 KAZ Minerals Plc* 47,366,715 1.03 5,982,931 Rio Tinto Plc 301,899,685 6.58 86,155,942 SolGold Plc 28,351,411 0.62 1,102,838,900 24.03
United States 696,147 Albemarle Corp* 43,356,035 0.94 18,500,000 Coronado Global Resources Inc 33,155,000 0.72 8,000,000 Freeport-McMoRan Inc* 73,520,000 1.60 5,690,000 Newmont Goldcorp Corp* 226,006,800 4.93 376,037,835 8.19Total Common / Preferred Stocks (Shares) 4,449,383,456 96.96
BONDS
Brazil BRL 68 Vale SA FRN 29/9/2049 (Perpetual) 35,470 0.00Total Bonds 35,470 0.00Total Transferable Securities and Money Market Instruments Admitted to an Official Stock Exchange Listing or Dealt in on Another Regulated Market 4,548,520,506 99.12
Other Transferable Securities
WARRANTS
Ireland 37,370 Kenmare (Wts 16/11/2019) – 0.00Total Warrants – 0.00Total Other Transferable Securities – 0.00Total Portfolio 4,548,520,506 99.12
Other Net Assets 40,552,273 0.88Total Net Assets (USD) 4,589,072,779 100.00
World Mining Fund
Portfolio of Investments 31 August 2019
World Mining Fund
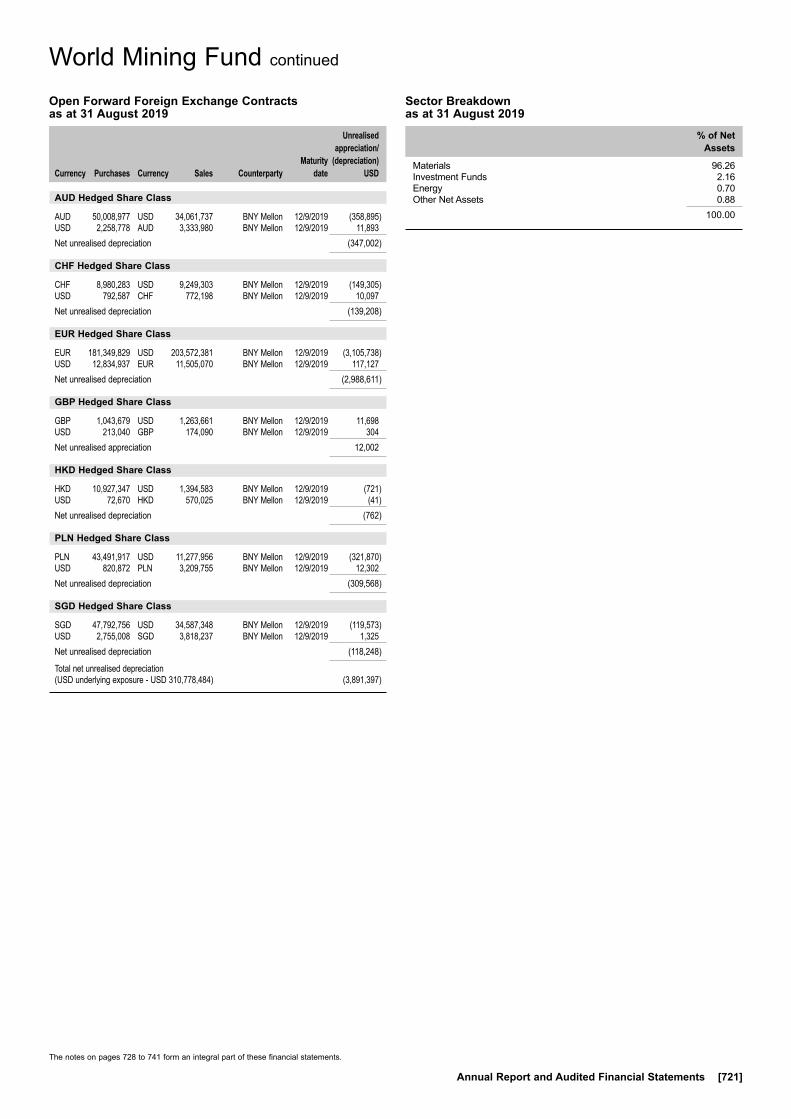
The notes on pages 728 to 741 form an integral part of these financial statements.
Annual Report and Audited Financial Statements [721]
World Mining Fund continued
Open Forward Foreign Exchange Contracts as at 31 August 2019
Currency
Purchases Currency
Sales Counterparty
Maturity date
Unrealised appreciation/
(depreciation) USD
AUD Hedged Share Class
AUD 50,008,977 USD 34,061,737 BNY Mellon 12/9/2019 (358,895)USD 2,258,778 AUD 3,333,980 BNY Mellon 12/9/2019 11,893Net unrealised depreciation (347,002)
CHF Hedged Share Class
CHF 8,980,283 USD 9,249,303 BNY Mellon 12/9/2019 (149,305)USD 792,587 CHF 772,198 BNY Mellon 12/9/2019 10,097Net unrealised depreciation (139,208)
EUR Hedged Share Class
EUR 181,349,829 USD 203,572,381 BNY Mellon 12/9/2019 (3,105,738)USD 12,834,937 EUR 11,505,070 BNY Mellon 12/9/2019 117,127Net unrealised depreciation (2,988,611)
GBP Hedged Share Class
GBP 1,043,679 USD 1,263,661 BNY Mellon 12/9/2019 11,698USD 213,040 GBP 174,090 BNY Mellon 12/9/2019 304Net unrealised appreciation 12,002
HKD Hedged Share Class
HKD 10,927,347 USD 1,394,583 BNY Mellon 12/9/2019 (721)USD 72,670 HKD 570,025 BNY Mellon 12/9/2019 (41)Net unrealised depreciation (762)
PLN Hedged Share Class
PLN 43,491,917 USD 11,277,956 BNY Mellon 12/9/2019 (321,870)USD 820,872 PLN 3,209,755 BNY Mellon 12/9/2019 12,302Net unrealised depreciation (309,568)
SGD Hedged Share Class
SGD 47,792,756 USD 34,587,348 BNY Mellon 12/9/2019 (119,573)USD 2,755,008 SGD 3,818,237 BNY Mellon 12/9/2019 1,325Net unrealised depreciation (118,248)
Total net unrealised depreciation (USD underlying exposure - USD 310,778,484) (3,891,397)
Sector Breakdown as at 31 August 2019
% of Net Assets
Materials 96.26Investment Funds 2.16Energy 0.70Other Net Assets 0.88
100.00
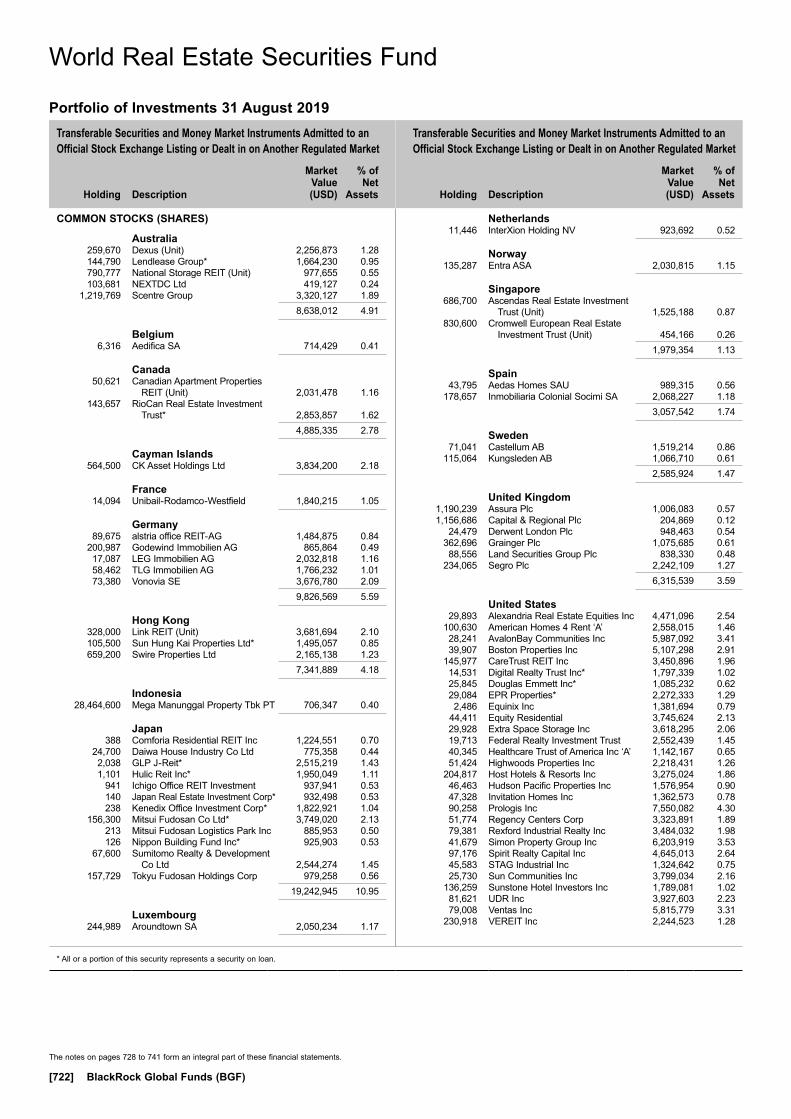
Transferable Securities and Money Market Instruments Admitted to an Official Stock Exchange Listing or Dealt in on Another Regulated Market
Transferable Securities and Money Market Instruments Admitted to an Official Stock Exchange Listing or Dealt in on Another Regulated Market
Holding
Description
Market Value (USD)
% of Net
Assets
Holding
Description
Market Value (USD)
% of Net
Assets
* All or a portion of this security represents a security on loan.
The notes on pages 728 to 741 form an integral part of these financial statements.
[722] BlackRock Global Funds (BGF)
COMMON STOCKS (SHARES)
Australia 259,670 Dexus (Unit) 2,256,873 1.28 144,790 Lendlease Group* 1,664,230 0.95 790,777 National Storage REIT (Unit) 977,655 0.55 103,681 NEXTDC Ltd 419,127 0.24 1,219,769 Scentre Group 3,320,127 1.89 8,638,012 4.91
Belgium 6,316 Aedifica SA 714,429 0.41
Canada 50,621 Canadian Apartment Properties
REIT (Unit) 2,031,478 1.16 143,657 RioCan Real Estate Investment
Trust* 2,853,857 1.62 4,885,335 2.78
Cayman Islands 564,500 CK Asset Holdings Ltd 3,834,200 2.18
France 14,094 Unibail-Rodamco-Westfield 1,840,215 1.05
Germany 89,675 alstria office REIT-AG 1,484,875 0.84 200,987 Godewind Immobilien AG 865,864 0.49 17,087 LEG Immobilien AG 2,032,818 1.16 58,462 TLG Immobilien AG 1,766,232 1.01 73,380 Vonovia SE 3,676,780 2.09 9,826,569 5.59
Hong Kong 328,000 Link REIT (Unit) 3,681,694 2.10 105,500 Sun Hung Kai Properties Ltd* 1,495,057 0.85 659,200 Swire Properties Ltd 2,165,138 1.23 7,341,889 4.18
Indonesia 28,464,600 Mega Manunggal Property Tbk PT 706,347 0.40
Japan 388 Comforia Residential REIT Inc 1,224,551 0.70 24,700 Daiwa House Industry Co Ltd 775,358 0.44 2,038 GLP J-Reit* 2,515,219 1.43 1,101 Hulic Reit Inc* 1,950,049 1.11 941 Ichigo Office REIT Investment 937,941 0.53 140 Japan Real Estate Investment Corp* 932,498 0.53 238 Kenedix Office Investment Corp* 1,822,921 1.04 156,300 Mitsui Fudosan Co Ltd* 3,749,020 2.13 213 Mitsui Fudosan Logistics Park Inc 885,953 0.50 126 Nippon Building Fund Inc* 925,903 0.53 67,600 Sumitomo Realty & Development
Co Ltd 2,544,274 1.45 157,729 Tokyu Fudosan Holdings Corp 979,258 0.56 19,242,945 10.95
Luxembourg 244,989 Aroundtown SA 2,050,234 1.17
Netherlands 11,446 InterXion Holding NV 923,692 0.52
Norway 135,287 Entra ASA 2,030,815 1.15
Singapore 686,700 Ascendas Real Estate Investment
Trust (Unit) 1,525,188 0.87 830,600 Cromwell European Real Estate
Investment Trust (Unit) 454,166 0.26 1,979,354 1.13
Spain 43,795 Aedas Homes SAU 989,315 0.56 178,657 Inmobiliaria Colonial Socimi SA 2,068,227 1.18 3,057,542 1.74
Sweden 71,041 Castellum AB 1,519,214 0.86 115,064 Kungsleden AB 1,066,710 0.61 2,585,924 1.47
United Kingdom 1,190,239 Assura Plc 1,006,083 0.57 1,156,686 Capital & Regional Plc 204,869 0.12 24,479 Derwent London Plc 948,463 0.54 362,696 Grainger Plc 1,075,685 0.61 88,556 Land Securities Group Plc 838,330 0.48 234,065 Segro Plc 2,242,109 1.27 6,315,539 3.59
United States 29,893 Alexandria Real Estate Equities Inc 4,471,096 2.54 100,630 American Homes 4 Rent ‘A’ 2,558,015 1.46 28,241 AvalonBay Communities Inc 5,987,092 3.41 39,907 Boston Properties Inc 5,107,298 2.91 145,977 CareTrust REIT Inc 3,450,896 1.96 14,531 Digital Realty Trust Inc* 1,797,339 1.02 25,845 Douglas Emmett Inc* 1,085,232 0.62 29,084 EPR Properties* 2,272,333 1.29 2,486 Equinix Inc 1,381,694 0.79 44,411 Equity Residential 3,745,624 2.13 29,928 Extra Space Storage Inc 3,618,295 2.06 19,713 Federal Realty Investment Trust 2,552,439 1.45 40,345 Healthcare Trust of America Inc ‘A’ 1,142,167 0.65 51,424 Highwoods Properties Inc 2,218,431 1.26 204,817 Host Hotels & Resorts Inc 3,275,024 1.86 46,463 Hudson Pacific Properties Inc 1,576,954 0.90 47,328 Invitation Homes Inc 1,362,573 0.78 90,258 Prologis Inc 7,550,082 4.30 51,774 Regency Centers Corp 3,323,891 1.89 79,381 Rexford Industrial Realty Inc 3,484,032 1.98 41,679 Simon Property Group Inc 6,203,919 3.53 97,176 Spirit Realty Capital Inc 4,645,013 2.64 45,583 STAG Industrial Inc 1,324,642 0.75 25,730 Sun Communities Inc 3,799,034 2.16 136,259 Sunstone Hotel Investors Inc 1,789,081 1.02 81,621 UDR Inc 3,927,603 2.23 79,008 Ventas Inc 5,815,779 3.31 230,918 VEREIT Inc 2,244,523 1.28
World Real Estate Securities Fund
Portfolio of Investments 31 August 2019
World Real Estate Securities Fund
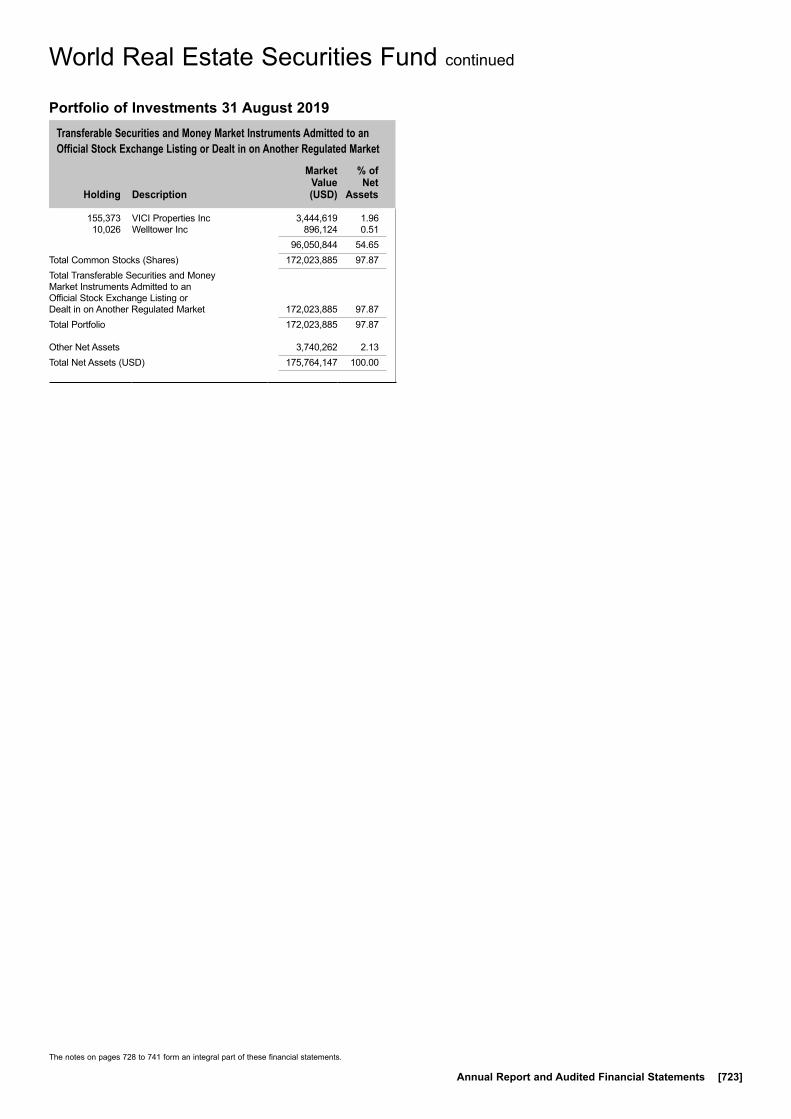
Transferable Securities and Money Market Instruments Admitted to an Official Stock Exchange Listing or Dealt in on Another Regulated Market
Holding
Description
Market Value (USD)
% of Net
Assets
The notes on pages 728 to 741 form an integral part of these financial statements.
Annual Report and Audited Financial Statements [723]
155,373 VICI Properties Inc 3,444,619 1.96 10,026 Welltower Inc 896,124 0.51 96,050,844 54.65Total Common Stocks (Shares) 172,023,885 97.87Total Transferable Securities and Money Market Instruments Admitted to an Official Stock Exchange Listing or Dealt in on Another Regulated Market 172,023,885 97.87Total Portfolio 172,023,885 97.87
Other Net Assets 3,740,262 2.13Total Net Assets (USD) 175,764,147 100.00
World Real Estate Securities Fund continued
Portfolio of Investments 31 August 2019
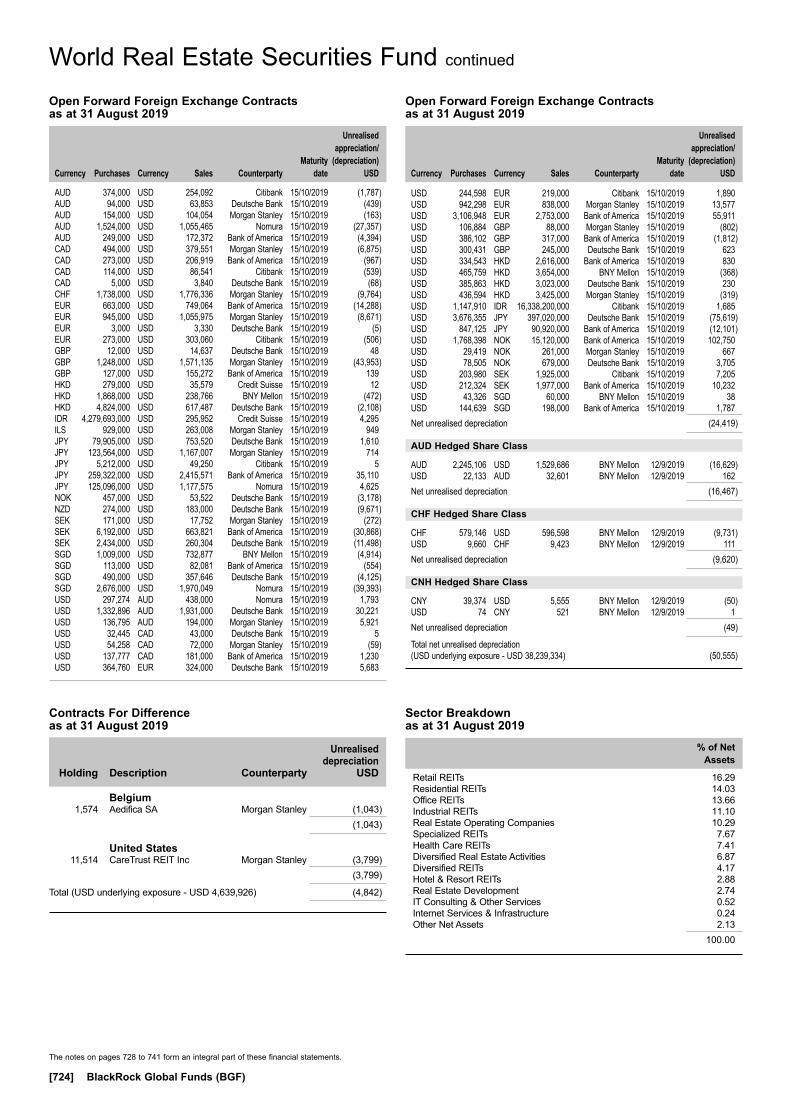
Holding
Description Counterparty
Unrealised depreciation
USD
Belgium 1,574 Aedifica SA Morgan Stanley (1,043) (1,043)
United States 11,514 CareTrust REIT Inc Morgan Stanley (3,799) (3,799)
Total (USD underlying exposure - USD 4,639,926) (4,842)
Contracts For Difference as at 31 August 2019
The notes on pages 728 to 741 form an integral part of these financial statements.
[724] BlackRock Global Funds (BGF)
World Real Estate Securities Fund continued
Open Forward Foreign Exchange Contracts as at 31 August 2019
Currency
Purchases Currency
Sales Counterparty
Maturity date
Unrealised appreciation/
(depreciation) USD
AUD 374,000 USD 254,092 Citibank 15/10/2019 (1,787)AUD 94,000 USD 63,853 Deutsche Bank 15/10/2019 (439)AUD 154,000 USD 104,054 Morgan Stanley 15/10/2019 (163)AUD 1,524,000 USD 1,055,465 Nomura 15/10/2019 (27,357)AUD 249,000 USD 172,372 Bank of America 15/10/2019 (4,394)CAD 494,000 USD 379,551 Morgan Stanley 15/10/2019 (6,875)CAD 273,000 USD 206,919 Bank of America 15/10/2019 (967)CAD 114,000 USD 86,541 Citibank 15/10/2019 (539)CAD 5,000 USD 3,840 Deutsche Bank 15/10/2019 (68)CHF 1,738,000 USD 1,776,336 Morgan Stanley 15/10/2019 (9,764)EUR 663,000 USD 749,064 Bank of America 15/10/2019 (14,288)EUR 945,000 USD 1,055,975 Morgan Stanley 15/10/2019 (8,671)EUR 3,000 USD 3,330 Deutsche Bank 15/10/2019 (5)EUR 273,000 USD 303,060 Citibank 15/10/2019 (506)GBP 12,000 USD 14,637 Deutsche Bank 15/10/2019 48GBP 1,248,000 USD 1,571,135 Morgan Stanley 15/10/2019 (43,953)GBP 127,000 USD 155,272 Bank of America 15/10/2019 139HKD 279,000 USD 35,579 Credit Suisse 15/10/2019 12HKD 1,868,000 USD 238,766 BNY Mellon 15/10/2019 (472)HKD 4,824,000 USD 617,487 Deutsche Bank 15/10/2019 (2,108)IDR 4,279,693,000 USD 295,952 Credit Suisse 15/10/2019 4,295ILS 929,000 USD 263,008 Morgan Stanley 15/10/2019 949JPY 79,905,000 USD 753,520 Deutsche Bank 15/10/2019 1,610JPY 123,564,000 USD 1,167,007 Morgan Stanley 15/10/2019 714JPY 5,212,000 USD 49,250 Citibank 15/10/2019 5JPY 259,322,000 USD 2,415,571 Bank of America 15/10/2019 35,110JPY 125,096,000 USD 1,177,575 Nomura 15/10/2019 4,625NOK 457,000 USD 53,522 Deutsche Bank 15/10/2019 (3,178)NZD 274,000 USD 183,000 Deutsche Bank 15/10/2019 (9,671)SEK 171,000 USD 17,752 Morgan Stanley 15/10/2019 (272)SEK 6,192,000 USD 663,821 Bank of America 15/10/2019 (30,868)SEK 2,434,000 USD 260,304 Deutsche Bank 15/10/2019 (11,498)SGD 1,009,000 USD 732,877 BNY Mellon 15/10/2019 (4,914)SGD 113,000 USD 82,081 Bank of America 15/10/2019 (554)SGD 490,000 USD 357,646 Deutsche Bank 15/10/2019 (4,125)SGD 2,676,000 USD 1,970,049 Nomura 15/10/2019 (39,393)USD 297,274 AUD 438,000 Nomura 15/10/2019 1,793USD 1,332,896 AUD 1,931,000 Deutsche Bank 15/10/2019 30,221USD 136,795 AUD 194,000 Morgan Stanley 15/10/2019 5,921USD 32,445 CAD 43,000 Deutsche Bank 15/10/2019 5USD 54,258 CAD 72,000 Morgan Stanley 15/10/2019 (59)USD 137,777 CAD 181,000 Bank of America 15/10/2019 1,230USD 364,760 EUR 324,000 Deutsche Bank 15/10/2019 5,683
Sector Breakdown as at 31 August 2019
% of Net Assets
Retail REITs 16.29Residential REITs 14.03Office REITs 13.66Industrial REITs 11.10Real Estate Operating Companies 10.29Specialized REITs 7.67Health Care REITs 7.41Diversified Real Estate Activities 6.87Diversified REITs 4.17Hotel & Resort REITs 2.88Real Estate Development 2.74IT Consulting & Other Services 0.52Internet Services & Infrastructure 0.24Other Net Assets 2.13
100.00
Open Forward Foreign Exchange Contracts as at 31 August 2019
Currency
Purchases Currency
Sales Counterparty
Maturity date
Unrealised appreciation/
(depreciation) USD
USD 244,598 EUR 219,000 Citibank 15/10/2019 1,890USD 942,298 EUR 838,000 Morgan Stanley 15/10/2019 13,577USD 3,106,948 EUR 2,753,000 Bank of America 15/10/2019 55,911USD 106,884 GBP 88,000 Morgan Stanley 15/10/2019 (802)USD 386,102 GBP 317,000 Bank of America 15/10/2019 (1,812)USD 300,431 GBP 245,000 Deutsche Bank 15/10/2019 623USD 334,543 HKD 2,616,000 Bank of America 15/10/2019 830USD 465,759 HKD 3,654,000 BNY Mellon 15/10/2019 (368)USD 385,863 HKD 3,023,000 Deutsche Bank 15/10/2019 230USD 436,594 HKD 3,425,000 Morgan Stanley 15/10/2019 (319)USD 1,147,910 IDR 16,338,200,000 Citibank 15/10/2019 1,685USD 3,676,355 JPY 397,020,000 Deutsche Bank 15/10/2019 (75,619)USD 847,125 JPY 90,920,000 Bank of America 15/10/2019 (12,101)USD 1,768,398 NOK 15,120,000 Bank of America 15/10/2019 102,750USD 29,419 NOK 261,000 Morgan Stanley 15/10/2019 667USD 78,505 NOK 679,000 Deutsche Bank 15/10/2019 3,705USD 203,980 SEK 1,925,000 Citibank 15/10/2019 7,205USD 212,324 SEK 1,977,000 Bank of America 15/10/2019 10,232USD 43,326 SGD 60,000 BNY Mellon 15/10/2019 38USD 144,639 SGD 198,000 Bank of America 15/10/2019 1,787Net unrealised depreciation (24,419)
AUD Hedged Share Class
AUD 2,245,106 USD 1,529,686 BNY Mellon 12/9/2019 (16,629)USD 22,133 AUD 32,601 BNY Mellon 12/9/2019 162Net unrealised depreciation (16,467)
CHF Hedged Share Class
CHF 579,146 USD 596,598 BNY Mellon 12/9/2019 (9,731)USD 9,660 CHF 9,423 BNY Mellon 12/9/2019 111Net unrealised depreciation (9,620)
CNH Hedged Share Class
CNY 39,374 USD 5,555 BNY Mellon 12/9/2019 (50)USD 74 CNY 521 BNY Mellon 12/9/2019 1Net unrealised depreciation (49)
Total net unrealised depreciation (USD underlying exposure - USD 38,239,334) (50,555)

Transferable Securities and Money Market Instruments Admitted to an Official Stock Exchange Listing or Dealt in on Another Regulated Market
Transferable Securities and Money Market Instruments Admitted to an Official Stock Exchange Listing or Dealt in on Another Regulated Market
Holding
Description
Market Value (USD)
% of Net
Assets
Holding
Description
Market Value (USD)
% of Net
Assets
* All or a portion of this security represents a security on loan.
The notes on pages 728 to 741 form an integral part of these financial statements.
Annual Report and Audited Financial Statements [725]
COMMON STOCKS (SHARES)
Australia 517,921 Altium Ltd* 12,830,773 0.69
Bermuda 951,833 Marvell Technology Group Ltd* 23,329,427 1.26
Brazil 1,111,986 Linx SA 8,555,128 0.46 284,600 Linx SA ADR 2,171,498 0.12 2,324,420 Magazine Luiza SA 20,793,472 1.12 31,520,098 1.70
Canada 24,047 Shopify Inc* 9,341,057 0.50
Cayman Islands 106,782 58.com Inc ADR 5,833,501 0.31 310,062 Alibaba Group Holding Ltd ADR 54,096,517 2.92 436,949 Arco Platform Ltd 20,711,383 1.12 573,672 Farfetch Ltd* 5,748,193 0.31 270,143 GDS Holdings Ltd ADR* 10,959,702 0.59 12,444,000 Kingdee International Software
Group Co Ltd* 11,269,627 0.61 375,425 Luckin Coffee Inc ADR* 7,801,331 0.42 1,658,215 Meituan Dianping* 15,725,809 0.85 35,255 NetEase Inc ADR 8,990,025 0.48 360,469 Pagseguro Digital Ltd ‘A’ 17,980,194 0.97 2,011,283 Ping An Healthcare and
Technology Co Ltd* 11,916,538 0.64 348,342 StoneCo Ltd ‘A’* 10,805,569 0.58 1,136,400 Sunny Optical Technology
Group Co Ltd* 15,756,217 0.85 1,269,600 Tencent Holdings Ltd* 52,598,593 2.84 17,851,000 Weimob Inc* 9,244,422 0.50 259,437,621 13.99
China 68,588,000 China Tower Corp Ltd ‘H’* 15,660,022 0.85
Cyprus 469,003 HeadHunter Group Plc ADR 8,695,316 0.47
France 179,146 SOITEC* 18,344,410 0.99 171,509 Ubisoft Entertainment SA 13,905,924 0.75 32,250,334 1.74
Germany 781,804 AIXTRON SE* 7,701,623 0.42 292,463 Delivery Hero SE 14,902,916 0.80 108,750 Wirecard AG 17,412,630 0.94 40,017,169 2.16
Israel 100,130 Wix.com Ltd 13,858,993 0.75
Japan 223,300 GMO Payment Gateway Inc* 17,313,661 0.93
Netherlands 17,258 Adyen NV 12,608,736 0.68 78,628 ASML Holding NV 17,570,738 0.95 135,249 Elastic NV* 11,935,724 0.64 191,203 InterXion Holding NV 15,430,082 0.83 614,120 STMicroelectronics NV 10,942,196 0.59 450,948 Yandex NV ‘A’ 16,703,114 0.90 85,190,590 4.59
New Zealand 228,324 Xero Ltd 9,763,729 0.53
South Korea 76,892 Kakao Corp 8,538,265 0.46
Taiwan 266,217 Taiwan Semiconductor
Manufacturing Co Ltd ADR 11,354,155 0.61
United Kingdom 205,286 Atlassian Corp Plc* 27,631,496 1.49 263,349 Endava Plc ADR 9,965,126 0.54 1,282,454 Network International Holdings Plc 9,524,427 0.51 1,350,274 Trainline Plc 7,933,420 0.43 55,054,469 2.97
United States 284,813 Activision Blizzard Inc 14,485,589 0.78 114,880 Adobe Inc 32,922,310 1.78 649,206 Advanced Micro Devices Inc* 20,618,783 1.11 46,126 Alphabet Inc ‘A’ 55,284,779 2.98 281,458 Altair Engineering Inc ‘A’* 9,583,645 0.52 183,300 Alteryx Inc ‘A’ 26,235,729 1.41 30,251 Amazon.com Inc 54,116,014 2.92 213,489 Apple Inc 44,693,922 2.41 128,039 Autodesk Inc 18,230,193 0.98 191,875 Avalara Inc 16,121,337 0.87 108,141 Bandwidth Inc ‘A’* 9,450,442 0.51 152,229 Cadence Design Systems Inc 10,550,992 0.57 310,359 Cree Inc* 13,634,071 0.74 108,485 Crowdstrike Holdings Inc 9,102,976 0.49 165,844 Dynatrace Inc* 3,827,680 0.21 59,225 EPAM Systems Inc 11,336,257 0.61 156,562 Facebook Inc ‘A’ 29,020,332 1.56 169,847 Fastly Inc* 5,080,124 0.27 92,713 IAC/InterActiveCorp 23,566,717 1.27 486,525 II-VI Inc* 18,283,609 0.99 183,158 Inphi Corp* 11,212,933 0.60 61,604 Intuit Inc 17,704,374 0.95 141,982 Keysight Technologies Inc 13,786,452 0.74 96,674 Lam Research Corp 20,481,354 1.10 64,811 Livongo Health Inc 1,990,346 0.11 83,736 Mastercard Inc 23,638,673 1.27 35,268 MercadoLibre Inc 21,132,586 1.14 329,281 Micron Technology Inc 15,081,070 0.81 333,864 Microsoft Corp 46,210,116 2.49 63,850 MongoDB Inc 10,011,041 0.54 105,931 Monolithic Power Systems Inc* 16,035,305 0.86 46,374 Netflix Inc 13,675,693 0.74 64,117 NVIDIA Corp 10,916,560 0.59 176,731 Okta Inc* 22,432,466 1.21 52,316 Pagerduty Inc* 2,022,013 0.11 257,911 PayPal Holdings Inc 28,321,207 1.53
World Technology Fund
Portfolio of Investments 31 August 2019
World Technology Fund
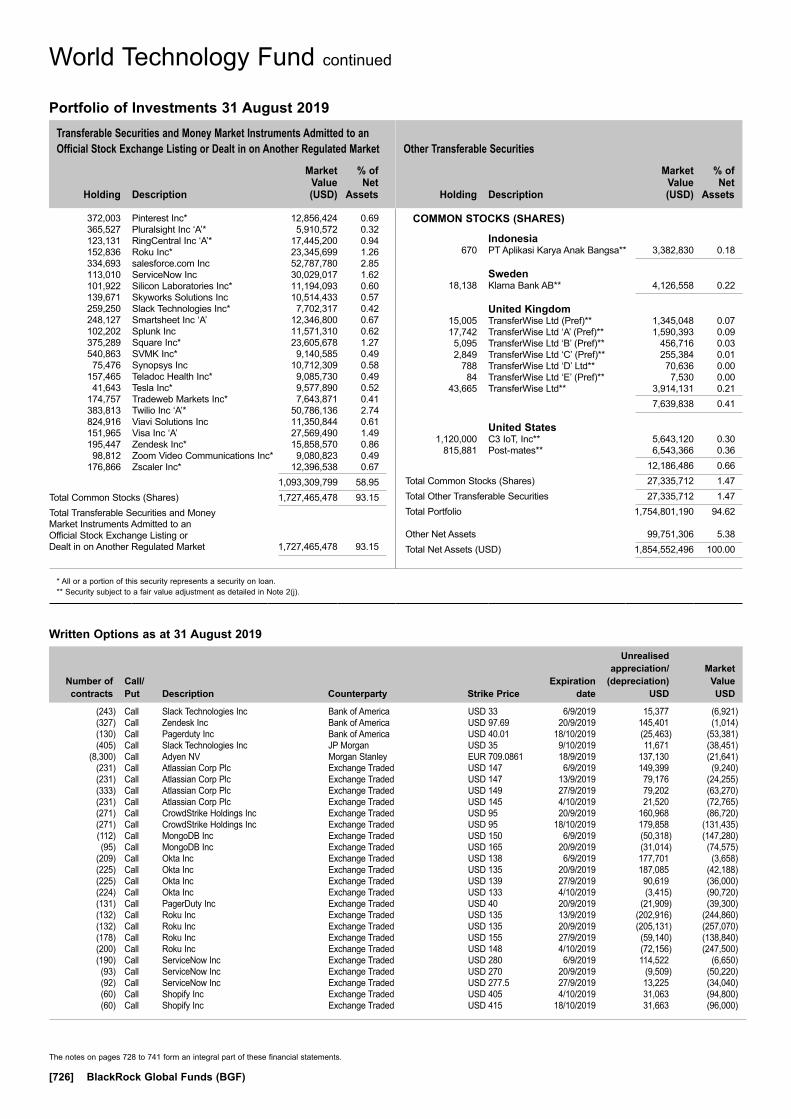
Transferable Securities and Money Market Instruments Admitted to an Official Stock Exchange Listing or Dealt in on Another Regulated Market Other Transferable Securities
Holding
Description
Market Value (USD)
% of Net
Assets
Holding
Description
Market Value (USD)
% of Net
Assets
* All or a portion of this security represents a security on loan.** Security subject to a fair value adjustment as detailed in Note 2(j).
The notes on pages 728 to 741 form an integral part of these financial statements.
[726] BlackRock Global Funds (BGF)
372,003 Pinterest Inc* 12,856,424 0.69 365,527 Pluralsight Inc ‘A’* 5,910,572 0.32 123,131 RingCentral Inc ‘A’* 17,445,200 0.94 152,836 Roku Inc* 23,345,699 1.26 334,693 salesforce.com Inc 52,787,780 2.85 113,010 ServiceNow Inc 30,029,017 1.62 101,922 Silicon Laboratories Inc* 11,194,093 0.60 139,671 Skyworks Solutions Inc 10,514,433 0.57 259,250 Slack Technologies Inc* 7,702,317 0.42 248,127 Smartsheet Inc ‘A’ 12,346,800 0.67 102,202 Splunk Inc 11,571,310 0.62 375,289 Square Inc* 23,605,678 1.27 540,863 SVMK Inc* 9,140,585 0.49 75,476 Synopsys Inc 10,712,309 0.58 157,465 Teladoc Health Inc* 9,085,730 0.49 41,643 Tesla Inc* 9,577,890 0.52 174,757 Tradeweb Markets Inc* 7,643,871 0.41 383,813 Twilio Inc ‘A’* 50,786,136 2.74 824,916 Viavi Solutions Inc 11,350,844 0.61 151,965 Visa Inc ‘A’ 27,569,490 1.49 195,447 Zendesk Inc* 15,858,570 0.86 98,812 Zoom Video Communications Inc* 9,080,823 0.49 176,866 Zscaler Inc* 12,396,538 0.67 1,093,309,799 58.95Total Common Stocks (Shares) 1,727,465,478 93.15Total Transferable Securities and Money Market Instruments Admitted to an Official Stock Exchange Listing or Dealt in on Another Regulated Market 1,727,465,478 93.15
COMMON STOCKS (SHARES)
Indonesia 670 PT Aplikasi Karya Anak Bangsa** 3,382,830 0.18
Sweden 18,138 Klarna Bank AB** 4,126,558 0.22
United Kingdom 15,005 TransferWise Ltd (Pref)** 1,345,048 0.07 17,742 TransferWise Ltd ‘A’ (Pref)** 1,590,393 0.09 5,095 TransferWise Ltd ‘B’ (Pref)** 456,716 0.03 2,849 TransferWise Ltd ‘C’ (Pref)** 255,384 0.01 788 TransferWise Ltd ‘D’ Ltd** 70,636 0.00 84 TransferWise Ltd ‘E’ (Pref)** 7,530 0.00 43,665 TransferWise Ltd** 3,914,131 0.21 7,639,838 0.41
United States 1,120,000 C3 IoT, Inc** 5,643,120 0.30 815,881 Post-mates** 6,543,366 0.36 12,186,486 0.66Total Common Stocks (Shares) 27,335,712 1.47Total Other Transferable Securities 27,335,712 1.47Total Portfolio 1,754,801,190 94.62
Other Net Assets 99,751,306 5.38Total Net Assets (USD) 1,854,552,496 100.00
World Technology Fund continued
Portfolio of Investments 31 August 2019
Written Options as at 31 August 2019
Number of contracts
Call/ Put
Description Counterparty
Strike Price
Expiration date
Unrealised appreciation/
(depreciation) USD
Market Value USD
(243) Call Slack Technologies Inc Bank of America USD 33 6/9/2019 15,377 (6,921) (327) Call Zendesk Inc Bank of America USD 97.69 20/9/2019 145,401 (1,014) (130) Call Pagerduty Inc Bank of America USD 40.01 18/10/2019 (25,463) (53,381) (405) Call Slack Technologies Inc JP Morgan USD 35 9/10/2019 11,671 (38,451) (8,300) Call Adyen NV Morgan Stanley EUR 709.0861 18/9/2019 137,130 (21,641) (231) Call Atlassian Corp Plc Exchange Traded USD 147 6/9/2019 149,399 (9,240) (231) Call Atlassian Corp Plc Exchange Traded USD 147 13/9/2019 79,176 (24,255) (333) Call Atlassian Corp Plc Exchange Traded USD 149 27/9/2019 79,202 (63,270) (231) Call Atlassian Corp Plc Exchange Traded USD 145 4/10/2019 21,520 (72,765) (271) Call CrowdStrike Holdings Inc Exchange Traded USD 95 20/9/2019 160,968 (86,720) (271) Call CrowdStrike Holdings Inc Exchange Traded USD 95 18/10/2019 179,858 (131,435) (112) Call MongoDB Inc Exchange Traded USD 150 6/9/2019 (50,318) (147,280) (95) Call MongoDB Inc Exchange Traded USD 165 20/9/2019 (31,014) (74,575) (209) Call Okta Inc Exchange Traded USD 138 6/9/2019 177,701 (3,658) (225) Call Okta Inc Exchange Traded USD 135 20/9/2019 187,085 (42,188) (225) Call Okta Inc Exchange Traded USD 139 27/9/2019 90,619 (36,000) (224) Call Okta Inc Exchange Traded USD 133 4/10/2019 (3,415) (90,720) (131) Call PagerDuty Inc Exchange Traded USD 40 20/9/2019 (21,909) (39,300) (132) Call Roku Inc Exchange Traded USD 135 13/9/2019 (202,916) (244,860) (132) Call Roku Inc Exchange Traded USD 135 20/9/2019 (205,131) (257,070) (178) Call Roku Inc Exchange Traded USD 155 27/9/2019 (59,140) (138,840) (200) Call Roku Inc Exchange Traded USD 148 4/10/2019 (72,156) (247,500) (190) Call ServiceNow Inc Exchange Traded USD 280 6/9/2019 114,522 (6,650) (93) Call ServiceNow Inc Exchange Traded USD 270 20/9/2019 (9,509) (50,220) (92) Call ServiceNow Inc Exchange Traded USD 277.5 27/9/2019 13,225 (34,040) (60) Call Shopify Inc Exchange Traded USD 405 4/10/2019 31,063 (94,800) (60) Call Shopify Inc Exchange Traded USD 415 18/10/2019 31,663 (96,000)
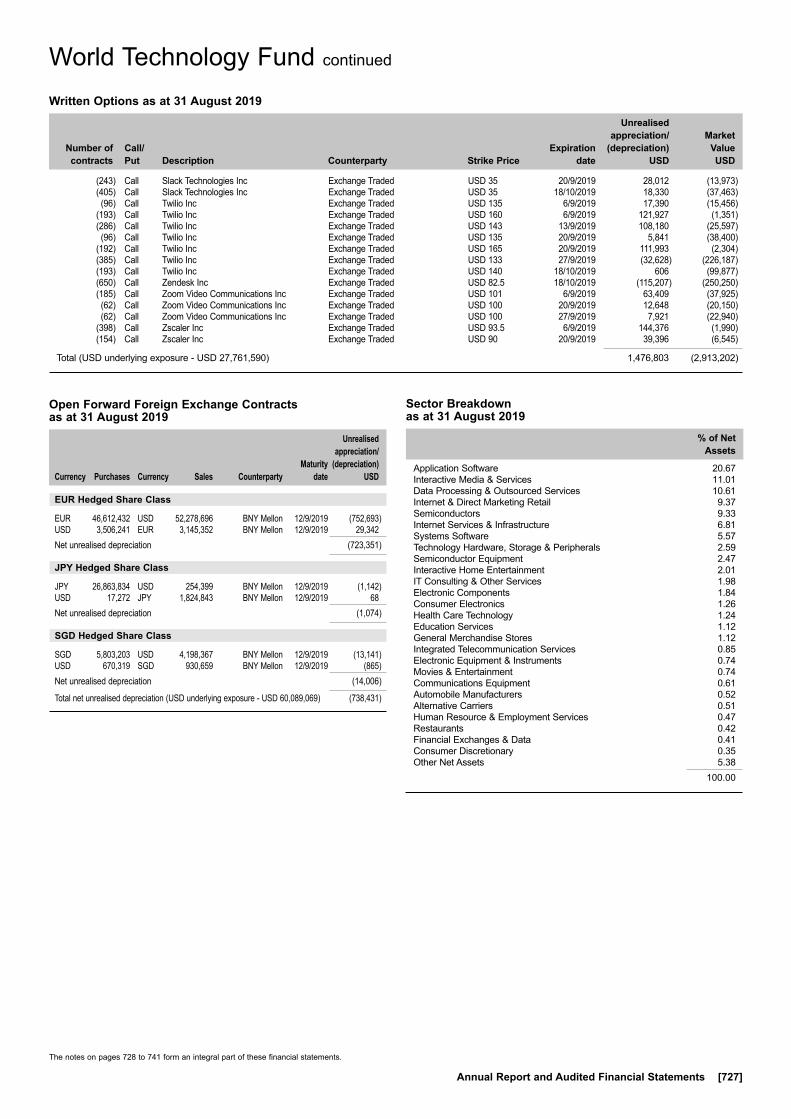
The notes on pages 728 to 741 form an integral part of these financial statements.
Annual Report and Audited Financial Statements [727]
World Technology Fund continued
Sector Breakdown as at 31 August 2019
% of Net Assets
Application Software 20.67Interactive Media & Services 11.01Data Processing & Outsourced Services 10.61Internet & Direct Marketing Retail 9.37Semiconductors 9.33Internet Services & Infrastructure 6.81Systems Software 5.57Technology Hardware, Storage & Peripherals 2.59Semiconductor Equipment 2.47Interactive Home Entertainment 2.01IT Consulting & Other Services 1.98Electronic Components 1.84Consumer Electronics 1.26Health Care Technology 1.24Education Services 1.12General Merchandise Stores 1.12Integrated Telecommunication Services 0.85Electronic Equipment & Instruments 0.74Movies & Entertainment 0.74Communications Equipment 0.61Automobile Manufacturers 0.52Alternative Carriers 0.51Human Resource & Employment Services 0.47Restaurants 0.42Financial Exchanges & Data 0.41Consumer Discretionary 0.35Other Net Assets 5.38
100.00
Open Forward Foreign Exchange Contracts as at 31 August 2019
Currency
Purchases Currency
Sales Counterparty
Maturity date
Unrealised appreciation/
(depreciation) USD
EUR Hedged Share Class
EUR 46,612,432 USD 52,278,696 BNY Mellon 12/9/2019 (752,693)USD 3,506,241 EUR 3,145,352 BNY Mellon 12/9/2019 29,342Net unrealised depreciation (723,351)
JPY Hedged Share Class
JPY 26,863,834 USD 254,399 BNY Mellon 12/9/2019 (1,142)USD 17,272 JPY 1,824,843 BNY Mellon 12/9/2019 68Net unrealised depreciation (1,074)
SGD Hedged Share Class
SGD 5,803,203 USD 4,198,367 BNY Mellon 12/9/2019 (13,141)USD 670,319 SGD 930,659 BNY Mellon 12/9/2019 (865)Net unrealised depreciation (14,006)
Total net unrealised depreciation (USD underlying exposure - USD 60,089,069) (738,431)
(243) Call Slack Technologies Inc Exchange Traded USD 35 20/9/2019 28,012 (13,973) (405) Call Slack Technologies Inc Exchange Traded USD 35 18/10/2019 18,330 (37,463) (96) Call Twilio Inc Exchange Traded USD 135 6/9/2019 17,390 (15,456) (193) Call Twilio Inc Exchange Traded USD 160 6/9/2019 121,927 (1,351) (286) Call Twilio Inc Exchange Traded USD 143 13/9/2019 108,180 (25,597) (96) Call Twilio Inc Exchange Traded USD 135 20/9/2019 5,841 (38,400) (192) Call Twilio Inc Exchange Traded USD 165 20/9/2019 111,993 (2,304) (385) Call Twilio Inc Exchange Traded USD 133 27/9/2019 (32,628) (226,187) (193) Call Twilio Inc Exchange Traded USD 140 18/10/2019 606 (99,877) (650) Call Zendesk Inc Exchange Traded USD 82.5 18/10/2019 (115,207) (250,250) (185) Call Zoom Video Communications Inc Exchange Traded USD 101 6/9/2019 63,409 (37,925) (62) Call Zoom Video Communications Inc Exchange Traded USD 100 20/9/2019 12,648 (20,150) (62) Call Zoom Video Communications Inc Exchange Traded USD 100 27/9/2019 7,921 (22,940) (398) Call Zscaler Inc Exchange Traded USD 93.5 6/9/2019 144,376 (1,990) (154) Call Zscaler Inc Exchange Traded USD 90 20/9/2019 39,396 (6,545)
Total (USD underlying exposure - USD 27,761,590) 1,476,803 (2,913,202)
Written Options as at 31 August 2019
Number of contracts
Call/ Put
Description Counterparty
Strike Price
Expiration date
Unrealised appreciation/
(depreciation) USD
Market Value USD
[728] BlackRock Global Funds (BGF)
Notes to the Financial Statements
1. OrganisationThe Company is a public limited company (société anonyme) established under the laws of the Grand Duchy of Luxembourg as an open ended variable capital investment company (société d’investissement à capital variable). The Company has been authorised by the Commission de Surveillance du Secteur Financier (the “CSSF”) as an undertaking for collective investments in transferable securities (“UCITS”) pursuant to the provisions of Part I of the law of 17 December 2010 as amended from time to time and is regulated pursuant to such law.
The Company is an umbrella structure comprising separate compartments with segregated liability. Each compartment shall have segregated liability from the other compartments and the Company shall not be liable as a whole to third parties for the liabilities of each compartment. Each compartment shall be made up of a separate Portfolio of Investments maintained and invested in accordance with the investment objectives applicable to such compartment.
As at 31 August 2019, the Company offered shares in 81 sub-funds (each a ‘Fund’), together the ‘Funds’. Each Fund is a separate pool of assets and is represented by separate shares of each Fund which are divided into share classes as detailed in Appendix I.
The Share Classes have equivalent rights in the Company but carry different features and charging structures, which are described in more detail in the Company’s Prospectus.
Significant events during the year ended 31 August 2019 The Swiss Small & MidCap Opportunities Fund continues to be closed to subscriptions from new and existing shareholders until further notice. Shareholders can redeem as usual.
Effective 20 February 2019, EY were appointed as the Company’s auditors.
Effective 4 September 2018, the FinTech Fund, the Future Of Transport Fund and the Next Generation Technology Fund denominated in USD were launched.
Effective 12 September 2018, the Global Conservative Income Fund, denominated in EUR was launched.
Effective 29 October 2018, the Global Long-Horizon Equity Fund terminated. As at 31 August 2019, a cash balance of USD 8,200 remained on the Fund, which will be distributed to shareholders.
Effective 16 November 2018, the Market Navigator Fund, denominated in EUR was launched.
Effective 31 December 2018, the Strategic Global Bond Fund terminated. As at 31 August 2019, a cash balance of USD 81,398 remained on the Fund, which will be distributed to shareholders.
An Extraordinary General meeting of the Company was held on the 4 February 2019 to approve the amendments to the Articles of Incorporation.
Effective 11 February 2019, an updated Prospectus of the Company was issued. A letter was sent to shareholders informing them of the updates to the Prospectus.
Effective 11 February 2019, The Bank of New York Mellon (International) Limited, Luxembourg Branch, was replaced by an entity within the same corporate group, The Bank of New York Mellon SA / NV, Luxembourg Branch as Depositary and Administrator of the Company.
Effective 25 March 2019, the Flexible Multi-Asset Fund changed its name to the ESG Multi-Asset Fund, the Global Opportunities Fund changed its name to the Global Long- Horizon Equity Fund, the New Energy Fund changed its name to the Sustainable Energy Fund and the World Agriculture Fund changed its name to the Nutrition Fund.
Effective 20 May 2019, the Euro Reserve Fund and the US Dollar Reserve Fund were subject to Regulation (EU) 2017/1131 on money market funds (the “MMF Regulation”). The MMF Regulation introduces certain changes relevant to money market funds and is designed to create standardised European rules intended to make money market funds more resilient, especially in times of stress.
Amongst other things, the MMF Regulation introduces new fund types. Both funds are categorised as short-term variable net asset value money market funds (“ST VNAV”) and comply with the relevant rules of the MMF Regulation from the effective date.
In accordance with the MMF Regulation the Funds no longer apply an amortised cost basis of valuation on their assets but instead use the mark-to-market process whenever possible. Where the use of mark-to-market is not possible an asset is valued conservatively by using mark-to-model.
Effective 20 May 2019, an updated Prospectus of the Company was issued. A letter was sent to shareholders informing them of the updates to the Prospectus.
Effective 15 July 2019, an addendum to the Prospectus was issued.
2. Summary of Significant Accounting PoliciesThe financial statements have been prepared in accordance with the legal and regulatory requirements relating to the preparation of the financial statements as prescribed by the Luxembourg authorities for Luxembourg investment companies and include the following significant accounting policies:
(a) Valuation of Investments and Other Assets
The Company’s investments and other assets are valued as follows:
} transferable securities which are admitted to an official exchange listing or dealt in on another regulated market, are valued on the basis of the latest available price prevailing on the valuation date. For securities traded on markets closing after the time of the valuation, last known prices as of this time or such other time may be used. Where such securities or
Notes to the Financial Statements

Annual Report and Audited Financial Statements [729]
other assets are quoted or dealt in, on or by more than one stock exchange or regulated market the Board may in its discretion select one of such stock exchanges or regulated markets for such purposes. Discrepancies in the value of securities may result, for example, where the underlying markets are closed for business at the time of calculating the net asset value of certain funds or where governments chose to impose fiscal or transaction charges on foreign investment. As a result, the Directors have implemented fair value techniques in order to estimate the fair value of these investments. Such securities and derivatives shall be valued at their probable realisation value as determined by the competent persons (the Directors). Because of the inherent uncertainty in the fair value process, these estimated values may significantly differ from the values that would have been used had a ready market for the securities existed, and from the values that may be ultimately recovered;
} for non-quoted securities or securities not traded or dealt in on any stock exchange or other regulated market (including securities of closed-ended investment funds), as well as quoted or non quoted securities on such other markets for which no valuation price is available, or securities for which the quoted prices are, in the opinion of the Directors, not representative of the fair market value, the value thereof shall be determined prudently and in good faith by the Directors on the basis of their expected disposal or acquisition prices;
} fixed income securities that are not listed on stock exchanges or traded on other regulated markets are valued at the last available bid price or yield equivalents obtained from one or more dealers or pricing services. Securities traded in the OTC market are valued at the last available bid price. In cases where securities are traded on more than one exchange, the securities are valued on the exchange designated by or under the direction of the Board of Directors of the Management Company as the primary market. Portfolio securities that are traded both in the OTC market and on a stock exchange are valued according to the broadest and most representative market;
} securities lending: securities are delivered to a third party broker in accordance with lending agent instructions and continue to be valued as part of the portfolio of the Fund;
} money market instruments may be valued at nominal values plus any accrued interest or on an amortised cost basis, which approximates their fair market value;
} money market instruments held on the Euro Reserve Fund and the US Dollar Reserve Fund are valued on a mark-to-market basis. Where this is not possible, the assets are valued conservatively by using the mark-to model basis;
} time deposits are valued at amortised cost which approximates their fair market value;
} cash, deposits, bills payable on demand and other debts and prepaid expenses are valued at their nominal amount, unless it appears unlikely that such nominal amount is obtainable;
} assets which include, in particular, interest and dividends receivable, receivable for investments sold and receivable for fund shares subscribed, are valued at nominal value unless it appears unlikely that such nominal amount is obtainable;
} liabilities, which include, in particular, expenses payable, income distribution payable, payable for investments purchased and payable for fund shares redeemed are valued at their nominal value.
Realised gains and losses on the disposal of investments are calculated using the average cost method and are reflected in the Statement of Operations and Changes in Net Assets.
(b) Income/Expense from Investments
The Company takes accounts for income from its investments on the following basis:
} interest income is accrued daily and includes the amortisation on a straight line basis of premiums and accretion of discounts;
} bank interest, fixed deposits, collective investment scheme income and money market deposit income are recognised on an accruals basis;
} dividend income is accrued on the ex-dividend date and is shown net of withholding tax;
} security lending income is accrued on a weekly basis;
} when a bond has been identified as being in default, the interest accrual on the defaulted security is stopped. On confirmation of default from the relevant parties, the amount receivable is written off;
} withholding tax reclaims are accounted for on a cash receipts basis;
} the date included in the description of any perpetual bonds in the Portfolio of Investments is the next callable date of the bonds and the interest rate disclosed under the description in the Portfolio of Investments is the interest rate applicable at the year end and is for information only as these bonds are bearing variable interest rates.
Negative yield expense relating to interest from a negative effective interest rate on assets held is accreted daily and is recognised in the Statement of Operations and Changes in Net Assets over the life of the underlying instrument.
(c) Financial Derivative Instruments
During the year the Funds have entered into a number of forward foreign exchange and futures contracts. Open forward foreign exchange and futures contracts are valued at the cost to close the contracts on the valuation date. Gains/losses arising from these unsettled contracts are taken to unrealised
Notes to the Financial Statements continued

[730] BlackRock Global Funds (BGF)
Notes to the Financial Statements continued
appreciation/(depreciation) and are included under assets or liabilities (as appropriate) in the Statement of Net Assets.
The Funds can write covered call and put options and purchase call and put options. The Funds can also invest in spread options and synthetic cap options. A spread option is a type of option that derives its value from the difference between the prices of two or more assets. A synthetic cap option is an agreement between two parties providing the purchaser an interest rate ceiling or ‘cap’ on interest payment. The rate cap itself provides a periodic payment based upon the positive amount by which the reference index rate exceeds the strike rate. When the Funds write and/or purchase an option, an amount equal to the premium received or paid by the Funds is reflected as a liability or an asset. The liability for a written option and the asset for a purchased option are subsequently marked to market to reflect the current value of the option. The Directors have agreed to value exchange traded options based on mid prices or settlement prices rather than last traded prices as this methodology best reflects their estimated realisation value. Unlisted options are valued based upon daily prices obtained from third party pricing agents. When a security is sold through the exercise of an option, the premium received (or paid) is deducted from (or added to) the basis of the security sold. When an option expires (or the Funds enter into a closing transaction), the Funds realise a gain or loss on the option to the extent of the premiums received or paid (or gain or loss to the extent the cost of the closing transaction exceeds the premium paid or received).
As at 31 August 2019, the Funds have entered into Contracts for Difference (“CFDs”). CFDs allow investors to take synthetic long or synthetic short positions with a variable margin. Unlike shares, with CFDs the buyer is potentially liable for far more than the amount they paid on margin. This will result in the Fund holding cash received from shareholders on deposit with various institutions as described in the Prospectus. CFD positions entered into are subject to a daily financing charge, applied at a previously agreed rate above or below the applicable benchmark. The related dividend income or expense is disclosed net of withholding tax in the Statement of Operations and Changes in Net Assets.
The market value of the CFDs is determined by the last known traded price on the exchange on which the underlying securities or assets are traded or admitted for trading. For underlying securities traded on markets closing after the time of the valuation, last known prices as of this time or such other time may be used. The change in market value, if any, is recorded as net change in unrealised appreciation/(depreciation) in the Statement of Operations and Changes in Net Assets. Realised gains or losses on maturity or termination of the CFDs are presented in the Statement of Operations and Changes in Net Assets.
Gains and losses on sales of CFDs have been determined on a cost basis using the First In First Out (“FIFO”) method.
The Funds have entered into swap agreements to exchange the return generated by one instrument for the return generated
by another investment. In the case of credit default swaps, a series of premiums is paid to the seller of the protection, in return for a payment contingent on a credit event (predefined in the agreement). Where possible, swaps are marked to market based upon daily prices obtained from third party pricing agents and verified against the actual market maker. Where such quotations are not available swaps are priced based upon daily quotations from the market maker. In both cases changes in quotations are recorded as net change in unrealised appreciation/(depreciation) in the Statement of Operations and Changes in Net Assets. Realised gains or losses on maturity or termination of the swaps and the interest earned or incurred in relation to the swaps are presented in the Statement of Operations and Changes in Net Assets.
During the year, the Funds have entered into swaption transactions. These give the purchaser the right, but not the obligation to enter into an interest rate swap at a pre-set interest rate within a specified period of time. The swaption buyer pays a premium to the seller for this right. A written swaption gives the purchaser the right to receive fixed payments in return for paying a floating rate of interest. A purchased swaption gives the purchaser the right to pay a fixed rate of interest in return for receiving a floating rate payment stream. When the Fund writes/purchases a swaption, an amount equal to the premium received/paid by the Fund is recorded as a liability or an asset in the Statement of Net Assets.
During the year the Dynamic High Income Fund, Global Conservative Income Fund and the Global Multi-Asset Income Fund purchased a number of Equity Linked Notes. A principal amount is paid to a broker at the market price of an underlying equity at an agreed date in return for a fixed coupon payment or payments. At maturity the Fund will receive the principal plus (up to an agreed cap level per the agreement) or minus any movements in the value of the underlying equity.
To Be Announced securities (TBAs) are related to mortgage backed securities issued by US government sponsored agencies. These agencies usually pool mortgage loans and sell interests in the pools created. TBAs relate to future pools of these agencies that are bought and sold for future settlement for which either the interest rate or the maturity date is not yet fixed. TBAs are separately disclosed in the Portfolio of Investments.
Although the Funds will generally enter into TBA purchase commitments with the intention of acquiring securities, the Funds may also dispose of a commitment prior to settlement if it is deemed appropriate to do so. Proceeds of TBA sales are not received until the contractual settlement date. During the time a TBA sale commitment is outstanding, equivalent deliverable securities, or an offsetting TBA purchase commitment (deliverable on or before the sale commitment date), are held as cover for the transaction.
If the TBA sale commitment is closed through the acquisition of an offsetting purchase commitment, the Fund realises a gain or loss on the commitment without regard to any unrealised

Annual Report and Audited Financial Statements [731]
Notes to the Financial Statements continued
gain or loss on the underlying security. If the Fund delivers securities under the commitment, the Fund realises a gain or loss from the sale of the securities upon the unit price established at the date the commitment was entered into.
The Funds had unsettled TBAs as of 31 August 2019 which are included within receivable for investments sold and payable for investments purchased in the Statement of Net Assets.
The market values of the TBAs are presented in the Statement of Net Assets. The net change in unrealised appreciation or depreciation and the realised appreciation or depreciation on sales of the TBAs are presented in the Statement of Operations and Changes in Net Assets.
(d) Foreign Exchange
The cost of investments in currencies other than the currency of denomination of the respective Funds has been translated at the rates of exchange ruling at the time of purchase. Investments and other assets in currencies other than the currency of denomination of the respective Funds have been translated at the exchange rate prevailing at the Fund’s valuation point in Luxembourg on 31 August 2019.
(e) Combined Financial Statements
The accounts of each Fund are expressed in the Fund’s base currency.
The combined figures of the Company are expressed in USD and include the total of the financial statements of the different Funds. For the Statement of Net Assets, the exchange rates prevailing at the Fund’s valuation point in Luxembourg on 31 August 2019 are:
CCY EUR GBP JPY CHF CNHUSD 0.9053 0.8187 106.1450 0.9877 7.1501
For the Statement of Operations and Changes in Net Assets, the exchange rates are the average rate calculated over the year:
CCY EUR GBP JPY CHF CNHUSD 0.8825 0.7803 110.4103 0.9934 6.8617
These figures are presented for information purposes only and are rounded to four decimal places. For financial statements purposes exchange rates to nine decimal places are applied.
The combined figures in the Statement of Operations and Changes in Net Assets have been calculated using the average exchange rates throughout the year. The resulting Foreign exchange adjustment of USD (2,026,572,084) represents the movement in exchange rates between 31 August 2018 and 31 August 2019. This is a notional amount, which has no impact on the Net Assets of the individual Funds.
(f) Exchange rates
The following exchange rates were used to translate the investments and other assets and other liabilities denominated in currencies other than the base currency of the Funds as at 31 August 2019.
CCY GBP USD EUR JPY CHF CNHAED 0.2229 0.2722 0.2465 28.8976 0.2689 1.9466ARS 0.0139 0.0169 0.0153 1.7991 0.0167 0.1212AUD 0.5516 0.6737 0.6099 71.5147 0.6654 4.8173BRL 0.1975 0.2413 0.2184 25.6078 0.2383 1.7250CAD 0.6172 0.7539 0.6825 80.0248 0.7446 5.3906CHF 0.8289 1.0125 0.9166 107.4691 1.0000 7.2393CLP 0.0011 0.0014 0.0013 0.1477 0.0014 0.0099CNH 0.1145 0.1399 0.1266 14.8453 0.1381 1.0000CNY 0.1146 0.1400 0.1267 14.8552 0.1382 1.0007COP 0.0002 0.0003 0.0003 0.0311 0.0003 0.0021CZK 0.0349 0.0426 0.0386 4.5203 0.0421 0.3045DKK 0.1213 0.1481 0.1341 15.7251 0.1463 1.0593DOP 0.0159 0.0195 0.0176 2.0663 0.0192 0.1392EGP 0.0495 0.0604 0.0547 6.4136 0.0597 0.4320EUR 0.9043 1.1046 1.0000 117.2510 1.0910 7.8982GBP 1.0000 1.2215 1.1058 129.6561 1.2065 8.7338HKD 0.1044 0.1276 0.1155 13.5391 0.1260 0.9120HUF 0.0027 0.0033 0.0030 0.3539 0.0033 0.0238IDR 0.0001 0.0001 0.0001 0.0075 0.0001 0.0005ILS 0.2320 0.2834 0.2566 30.0847 0.2799 2.0265INR 0.0115 0.0140 0.0127 1.4865 0.0138 0.1001ISK 0.0065 0.0080 0.0072 0.8466 0.0079 0.0570JPY 0.0077 0.0094 0.0085 1.0000 0.0093 0.0674KES 0.0079 0.0096 0.0087 1.0241 0.0095 0.0690KRW 0.0007 0.0008 0.0007 0.0876 0.0008 0.0059KZT 0.0021 0.0026 0.0023 0.2741 0.0026 0.0185LKR 0.0046 0.0056 0.0050 0.5915 0.0055 0.0398MXN 0.0408 0.0498 0.0451 5.2868 0.0492 0.3561MYR 0.1947 0.2378 0.2153 25.2397 0.2349 1.7002NGN 0.0023 0.0028 0.0025 0.2928 0.0027 0.0197NOK 0.0901 0.1101 0.0996 11.6815 0.1087 0.7869NZD 0.5173 0.6319 0.5720 67.0682 0.6241 4.5178PEN 0.2412 0.2946 0.2667 31.2692 0.2910 2.1063PHP 0.0157 0.0192 0.0174 2.0390 0.0190 0.1373PKR 0.0052 0.0064 0.0058 0.6787 0.0063 0.0457PLN 0.2062 0.2519 0.2280 26.7346 0.2488 1.8009QAR 0.2248 0.2746 0.2486 29.1467 0.2712 1.9634RON 0.1913 0.2336 0.2115 24.7999 0.2308 1.6705RUB 0.0123 0.0150 0.0136 1.5972 0.0149 0.1076SAR 0.2183 0.2666 0.2414 28.3015 0.2633 1.9064SEK 0.0834 0.1019 0.0923 10.8194 0.1007 0.7288SGD 0.5904 0.7211 0.6528 76.5430 0.7122 5.1560THB 0.0268 0.0327 0.0296 3.4719 0.0323 0.2339TRY 0.1405 0.1716 0.1553 18.2129 0.1695 1.2268TWD 0.0261 0.0318 0.0288 3.3793 0.0314 0.2276UAH 0.0326 0.0398 0.0361 4.2272 0.0393 0.2847USD 0.8187 1.0000 0.9053 106.1450 0.9877 7.1501UYU 0.0224 0.0273 0.0247 2.9001 0.0270 0.1954VND 0.0000 0.0000 0.0000 0.0046 0.0000 0.0003ZAR 0.0537 0.0656 0.0594 6.9638 0.0648 0.4691ZMW 0.0626 0.0765 0.0692 8.1181 0.0755 0.5468

[732] BlackRock Global Funds (BGF)
Notes to the Financial Statements continued
The Renminbi is subject to foreign exchange restrictions and is not a freely convertible currency. The exchange rate used for the China Bond Fund is in relation to the offshore Renminbi (“CNH”), not the onshore Renminbi (“CNY”). The value of CNH could differ, perhaps significantly, from that of CNY due to a number of factors including without limitation those foreign exchange control policies and repatriation restrictions applied by the Chinese government from time-to-time as well as other external market forces. Any divergence between CNH and CNY may adversely impact investors.
(g) Dilution
The Directors may adjust the Net Asset Value (“NAV”) per Share for a Fund in order to reduce the effect of “dilution” on that Fund. Dilution occurs when the actual cost of purchasing or selling the underlying assets of a Fund, deviates from the carrying value of these assets in the Funds, due to factors such as dealing and brokerage charges, taxes and duties, market movement and any spread between the buying and selling prices of the underlying assets. Dilution may have an adverse effect on the value of a Fund and therefore impact Shareholders. By adjusting the NAV per Share this effect can be reduced or prevented and Shareholders can be protected from the impact of dilution. The Directors may adjust the NAV of a Fund if on any Dealing Day the value of the aggregate transactions in Shares of all Classes of that Fund result in a net increase or decrease of Shares which exceeds one or more thresholds that are set by the Directors for that Fund. The amount by which the NAV of a Fund may be adjusted on any given Dealing Day is related to the anticipated cost of market dealing for that Fund. In such circumstances the NAV of the relevant Fund may be adjusted by an amount not exceeding 1.50%, or 3% in the case of fixed income Funds, of the NAV. As certain stock markets and jurisdictions may have different charging structures on the buy and sell sides, particularly in relation to duties and taxes, the resulting adjustment may be different for net subscriptions (inflows) than for net redemptions (outflows). In addition, the Directors may also agree to include extraordinary fiscal charges in the amount of the adjustment. These extraordinary fiscal charges vary from market to market and are currently expected not to exceed 2.5% of that NAV. Where a Fund invests primarily in certain asset types, such as government bonds or money market securities, the Directors may decide that it is not appropriate to make such an adjustment.
As at 31 August 2019, in accordance with the Prospectus Appendix B, 17.3, such a dilution adjustment was applied to the Global Equity Income Fund and World Real Estate Securities Fund.
The published/dealing NAV per share is disclosed in the Three Year Summary of Net Asset Values and may include a dilution adjustment. This adjustment is not recognised in the Statement of Net Assets or the Statement of Operations and Changes in Net Assets.
(h) Transaction costs
Transaction costs are incremental costs that are directly attributable to the acquisition, issue or disposal of securities.
An incremental cost is one that would not have been incurred if the entity had not acquired, issued or disposed of the security. When a security is recognised initially, it is measured at its market value, plus transaction costs that are directly attributable to the acquisition or issue of the security.
Transaction costs excluding depositary transaction fees on purchases or sales of securities are included within net realised appreciation/(depreciation) or net change in unrealised appreciation/(depreciation) within the Statement of Operations and Changes in Net Assets of each Fund. Depositary transaction fees are included in depositary fees in the Statement of Operations and Changes in Net Assets of the Fund and are also disclosed in Note 18.
(i) Foreign currencies on other transactions
Foreign currencies on other transactions relate to realised and unrealised appreciation or depreciation on cash balances and spot contracts.
(j) Fair valuation
If in any case a particular value is not ascertainable by the methods outlined above, or if the Board of Directors of the Company considers that some other method of valuation more accurately reflects the fair value of the relevant security or other asset for the purpose concerned, the method of valuation of the security or asset will be such as the Board of Directors of the Company in its absolute discretion decides. Discrepancies in the value of securities may result, for example, where the underlying markets are closed for business at the time of calculating the NAV of certain Funds or where governments chose to impose fiscal or transaction charges on foreign investment. The Board of Directors of the Company may set specific thresholds, that, where exceeded, result in an adjustment to the value of these securities to their fair value by applying a specific index adjustment.
The fair valued securities are evidenced by a “**” in the Portfolio of Investments.
As at 31 August 2019, such fair valuation adjustment was applied as per the table below:
Fund Currency Market value of
fair valued securities
% of Net Assets
Asian Dragon Fund USD 46,271,506 1.99Asian Growth Leaders Fund USD 14,104,300 0.61Asian Multi-Asset Growth Fund USD 173,518 0.20China Fund USD 20,827,824 1.73Continental European Flexible Fund EUR 56,735,683 1.60Emerging Markets Bond Fund USD 184 0.00Emerging Markets Fund USD 5,402,430 0.68FinTech Fund(1) USD 1,234,000 3.15Fixed Income Global Opportunities Fund USD 27 0.00Global Allocation Fund USD 155,674,332 1.09Global Corporate Bond Fund USD 4,921 0.00Global Dynamic Equity Fund USD 8,030,668 1.31

Annual Report and Audited Financial Statements [733]
Notes to the Financial Statements continued
Fund Currency Market value of
fair valued securities
% of Net Assets
Global High Yield Bond Fund USD 167,719 0.01Global Long-Horizon Equity Fund(2) USD 298,823 0.07Global Multi-Asset Income Fund USD 218,489 0.00Global SmallCap Fund◊ USD – 0.00Latin American Fund USD 980,535 0.10Natural Resources Growth & Income Fund USD 3 0.00Next Generation Technology Fund(1) USD 911,711 0.96Nutrition Fund(2) USD 51,207 0.09Pacific Equity Fund USD 2,141,963 2.40Sustainable Energy Fund◊(2) USD – 0.00United Kingdom Fund◊ GBP – 0.00US Dollar Bond Fund◊ USD – 0.00US Dollar High Yield Bond Fund USD 529,962 0.02US Small & MidCap Opportunities Fund USD 951,512 0.59World Energy Fund◊ USD – 0.00World Financials Fund USD 23,446,000 3.28World Gold Fund USD 46,198,142 0.82World Technology Fund USD 27,335,712 1.47◊ Fund holds fair valued securities with a market value of zero.(1) Fund launched during the year, see Note 1, for further details.(2) Fund name changed during the year, see Note 1, for further details.
3. The Subsidiary
The India Fund invests at least 70 % of its total assets in equity securities of companies domiciled in, or exercising the predominant part of their economic activity in India exclusively through BlackRock India Equities (Mauritius) Limited (the “Subsidiary”), a wholly owned subsidiary of the Company, in accordance with its investment objectives and policies.
All assets and liabilities, income and expenses of the Subsidiary are consolidated in the Statement of Net Assets and Statement of Operations and Changes in Net Assets of the Company. All investments held by the Subsidiary are disclosed in the Portfolio of Investments of the India Fund. The Subsidiary was incorporated on 1 September 2004 under the laws of Mauritius.
The Subsidiary invests in securities, the majority of which traded in the Indian market and until 31 March 2017, the Subsidiary obtained benefits under the double taxation treaty between Mauritius and India. The Subsidiary had to meet annually certain tests and conditions, including the establishment of Mauritius tax residence and related requirements.
On 10 May 2016, the Indian Tax Board announced a phased removal of the capital gains tax (“CGT”) exemption existing under the India-Mauritius Tax Treaty. The change, effective from 1 April 2017, means that India retains taxation rights on capital gains arising from sales of shares of Indian resident companies acquired by a Mauritian entity on or after 1 April 2017. Shares acquired prior to 1 April 2017 are protected from taxing rights in India. However, the phased approach means that during the transition period from 1 April 2017 to 31 March 2019, the tax
rate is limited to 50 % of Indiaʼs domestic tax rate subject to a limitation of benefits clause. Taxation in India at the full domestic tax rate will apply from financial year 2019 - 2020 onwards.
Until 31 March 2018, the Subsidiary was exempt from Indian tax on long term capital gains on the sale or transfer of listed equity shares chargeable to Securities Transaction Tax in India. Effective 1 April 2018, the 2018 Indian Finance Bill introduces a 10 % tax on long term capital gains (i.e. holding period of at least 12 months) on the disposition of Indian publicly traded shares and certain other securities after 1 April 2018. Prior to this change, long term capital gains were exempt from Indian tax, provided securities transaction tax (STT) had been paid. For sales of publicly traded shares on or before 31 March 2018, long term capital gains should be exempt from Indian tax. For sales of publicly traded shares from 1 April 2018, long term capital gains should be subject to a 10 % tax. However, where securities were acquired prior to 31 January 2018, the ‘cost’ of securities in determining the gain will be their fair market value at 31 January 2018.
At 31 August 2019, the Subsidiary had net surplus brought forward tax losses of USD 18 million (Short-term) and USD 4 million (Long-term) (including realised and unrealised portion as on 31 August 2019) which are available for a maximum period of 8 years (the net surplus brought forward losses, including realised portion only, at 31 August 2019 was USD 45 million (Short-term) and USD 20 million (Long-term)). At 31 August 2019, the Subsidiary had sufficient brought forward tax losses to cover its realised and unrealised gains, however there can be no assurance that this will remain the case for future periods.
Further information on the Subsidiary can be found in the Prospectus and on page 4.
4. Management CompanyBlackRock (Luxembourg) S.A. has been appointed by the Company to act as its Management Company. The Management Company, a Luxembourg société anonyme, is authorised as a fund management company in accordance with Chapter 15 of the 2010 Law.
The Company has signed a management company agreement, with the Management Company. Under this agreement, the Management Company is entrusted with the day-to-day management of the Company, with responsibility for performing directly or by way of delegation all operational functions relating to the Company’s investment management, administration and marketing of the Funds.
In agreement with the Company, the Management Company has decided to delegate several of its functions as is further described in the Prospectus.
BlackRock (Luxembourg) S.A. is a wholly owned subsidiary within the BlackRock Group. It is regulated by the CSSF.
[734] BlackRock Global Funds (BGF)
Notes to the Financial Statements continued
5. Management FeesDuring the year the Company paid management fees to the Management Company, BlackRock (Luxembourg) S.A.
The Company will pay the management fee at an annual rate as shown in Appendix E of the Prospectus. The level of management fee varies from 0.00 % to 1.75 % and will vary according to which Fund and share class the investor buys. These fees accrue daily, are based on the NAV of the relevant Fund (reflecting, when applicable, any adjustment to the NAV of the relevant Fund, as described in paragraph 18.3 of Appendix B) and are paid monthly. Certain costs and fees are paid out of the management fee, including the fees of the Investment Advisers. There are no management fees charged on Class J and Class X Shares.
The ESG Multi-Asset Fund also pays an additional management fee to Schroders in respect of its holding of the Schroder International Selection Fund - Frontier Markets Equity position. This fee amounts to EUR 8,507 and is included within the management fees expense line in the Statement of Operations and Changes in Net Assets. No additional management fees are incurred as a result of any of the investments in other BlackRock Funds.
To assist in achieving the investment objectives of the Reserve Funds (Euro Reserve Fund and US Dollar Reserve Fund), in certain circumstances, including where market conditions cause decreasing yields on the Fund’s underlying investments, the Management Company may determine to waive its right to take the full amount of management fees to which it is entitled on any particular day or days. The Management Company may exercise its discretion to do this without prejudice to its entitlement to take the full amount of the management fee accruing on any future days.
The management fee waiver is disclosed separately from management fees in the Statement of Operations and Changes in Net Assets. During the year the Euro Reserve Fund was subject to a management fee waiver.
During the year, the following Funds were subject to management fee rebates linked to investments into target funds managed by BlackRock:
Dynamic High Income Fund, Emerging Europe Fund, ESG Multi-Asset Fund, Euro Bond Fund, Euro Corporate Bond Fund, Euro Short Duration Bond Fund, Global Allocation Fund, Global Conservative Income Fund, Global Corporate Bond Fund, Global Government Bond Fund, Global Multi-Asset Income Fund, Market Navigator Fund and World Bond Fund.
Management fees payable at 31 August 2019 are included in the Statement of Net Assets as other liabilities.
6. Distribution FeesThe Company pays annual distribution fees as shown in Appendix E of the Prospectus. The level of distribution fee varies from 0.00 % to 1.25 %. Class A, D, I, J, S, X and Z Shares do not pay a distribution fee. Class C Shares do not
pay a distribution fee for the Euro Reserve Fund and the US Dollar Reserve Fund. These fees accrue daily, are based on the NAV of the relevant Fund (reflecting, when applicable, any adjustment to the NAV of the relevant Fund, as described in paragraph 17.3 of Appendix B) and are paid monthly.
The Company pays distribution fees as detailed in the Statement of Operations and Changes in Net Assets. Distribution fees payable at 31 August 2019 are included in the Statement of Net Assets as other liabilities.
7. Administration FeesThe Company pays an administration fee to the Management Company.
The level of administration fee may vary at the Directors’ discretion, as agreed with the Management Company and will apply at different rates across the various Funds and Share Classes issued by the Company. However, it has been agreed between the Directors and the Management Company that the administration fee currently paid shall not exceed 0.25 % per annum. It is accrued daily, based on the NAV of the relevant Share Class (reflecting, when applicable, any adjustment to the NAV of the relevant Fund, as described in paragraph 17.3 of Appendix B) and paid monthly.
The Directors and the Management Company set the level of the administration fee at a rate which aims to ensure that the ongoing charges of each Fund remain competitive when compared across a broad market of similar investment products available to investors in the Funds, taking into account a number of criteria such as the market sector of each Fund and the Fund’s performance relative to its peer group.
The ongoing charge is calculated based on the total expenses per share class (excluding bank interest, transaction costs and negative yield expense on financial assets, and including administration fee subsidies) divided by the average net assets of the respective share class, expressed as a percentage.
The ongoing charge of the Asian Multi-Asset Growth Fund, China A-Share Opportunities Fund, Emerging Europe Fund, Emerging Markets Bond Fund, Emerging Markets Corporate Bond Fund, Emerging Markets Local Currency Bond Fund, ESG Emerging Markets Blended Bond Fund, ESG Emerging Markets Bond Fund, ESG Emerging Markets Corporate Bond Fund, ESG Emerging Markets Local Currency Bond Fund, FinTech Fund, Future Of Transport Fund, Global SmallCap Fund, Market Navigator Fund, Natural Resources Growth & Income Fund, Next Generation Technology Fund, North American Equity Income Fund and the Nutrition Fund is capped with the delta being offset against administration fees in the Statement of Operations and Changes in Net Assets.
The administration fee is used by the Management Company to meet all fixed and variable operating and administrative costs and expenses incurred by the Company, with the exception of the Depositary fees, Distribution fees, Securities Lending fees, any fees arising from borrowings (including for the avoidance

Annual Report and Audited Financial Statements [735]
Notes to the Financial Statements continued
of doubt any commitment fee that may due to the lender), any costs relating to European Union (“EU”) and non-EU withholding tax reclaims (plus any taxes or interest thereon) and any taxes at an investment or Company level.
The Company pays any professional costs relating to European Union withholding tax reclaims. Any costs relating to withholding tax reclaims will be allocated between the relevant sub-funds on a fair and equitable basis. As the Company has had a good degree of success with its EU withholding tax reclaims (which are paid by the Company) to date, any costs associated with non-EU withholding tax reclaims will no longer be paid out of the administration Fee and will now be paid by the Company and allocated between the relevant sub-funds on a fair and equitable basis.
The administration fee is also used to meet fees paid to Ernst & Young S.A. for audit and services related to investor reporting and other tax compliance matters. The fees were EUR 565,450 for the year ended 31 August 2019. Services related to investor reporting provided by Ernst & Young S.A. relate to reporting required for investors resident in particular jurisdictions. There were no other fees paid to Ernst & Young S.A. for services provided to the Company.
These operating and administrative expenses include all third party expenses and other recoverable costs incurred by or on behalf of the Company from time to time, including but not limited to, fund accounting fees, transfer agency fees (including sub-transfer agency and associated platform dealing charges), all professional costs, such as consultancy, legal, tax advisory and audit fees, Directors’ fees (for those Directors who are not employees of the BlackRock Group), travel expenses, reasonable out-of-pocket expenses, printing, publication, translation and all other costs relating to shareholder reporting, regulatory filing and licence fees, correspondent and other banking charges, software support and maintenance, operational costs and expenses attributed to the Investor Servicing teams and other global administration services provided by various BlackRock Group companies.
The Management Company bears the financial risk of ensuring that the Fund’s ongoing charges remain competitive. Accordingly the Management Company is entitled to retain any amount of the administration fee paid to it which is in excess of the actual expenses incurred by the Company during any year whereas any costs and expenses incurred by the Company in any year which exceed the amount of administration fee that is paid to the Management Company, shall be borne by the Management Company or another BlackRock Group company.
Directors who are not employees of the BlackRock Group in return for their duties performed, received a fee of EUR 55,000 per annum, gross of taxation. The Chairman’s fee is EUR 60,000 per annum, gross of taxation. Directors who are employees of the BlackRock Group are not entitled to Directors’ fees.
Taxation applicable in certain jurisdictions is also charged directly to the Funds (see Note 9).
During the year the following Funds were subject to an administration fee subsidy:
Asian Multi-Asset Growth Fund Natural Resources Growth & Income FundChina A-Share Opportunities Fund North American Equity Income FundESG Multi-Asset Fund(1) Nutrition Fund(1)
European High Yield Bond Fund Strategic Global Bond Fund(2)
Global Long-Horizon Equity Fund(2) (1) Fund name changed during the year, see Note 1, for further details(2) Fund terminated during the year, see Note 1, for further details
The administration fees are disclosed net of subsidy in the Statement of Operations and Changes in Net Assets.
Administration fees payable at 31 August 2019 are included in the Statement of Net Assets as other liabilities.
8. Depositary FeesThroughout the year the Depositary of the Company was the Bank of New York Mellon SA / NV, Luxembourg Branch. The Depositary receives annual fees, based on the value of securities, which accrue daily, plus transaction fees which are further disclosed in the Prospectus. The rates for both categories of fees will vary according to the country of investment and, in some cases, according to asset class. Investments in bonds and developed equity markets will be at the lower end of these ranges, while some investments in emerging or developing markets will be at the upper end. Thus the custody cost to each Fund will depend on its asset allocation at any time.
The depositary fees are charged directly to the Funds. Depositary fees payable at 31 August 2019 are included in the Statement of Net Assets as other liabilities.
9. Tax
LuxembourgUnder present Luxembourg law and practice, the Company is not liable to any Luxembourg income or capital gains tax, nor are dividends paid by the Company subject to any Luxembourg withholding tax. However, the Company is liable to a tax in Luxembourg of 0.05 % per annum or, in the case of the Reserve Funds, Class I, Class J and Class X Shares, 0.01 % per annum of its NAV, payable quarterly on the basis of the value of the net assets of the respective Funds at the end of the relevant calendar quarter. No stamp or other tax is payable in Luxembourg on the issue of Shares. For the year ended 31 August 2019, USD 46,459,243 was charged in relation to Luxembourg tax.
BelgiumThe Company is registered with the Belgium Financial Services and Markets Authority in accordance with Article 154 of the Law of 3 August 2012 relating to financial markets. Funds registered for public distribution in Belgium are subject to an annual tax of 0.0925 % on the net asset value of units distributed in Belgium via Belgian intermediaries as at 31 December of the previous year. For the year ended 31 August 2019, USD 3,692,541 in relation to Belgium tax.
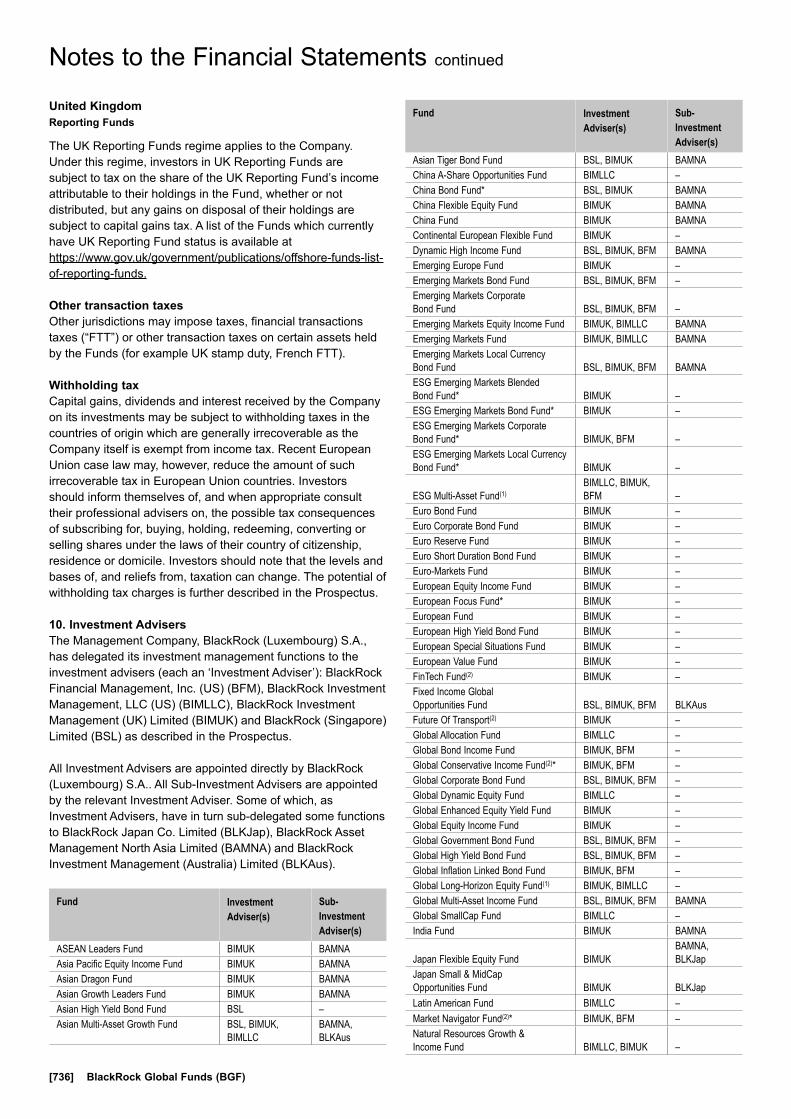
[736] BlackRock Global Funds (BGF)
Notes to the Financial Statements continued
United KingdomReporting Funds
The UK Reporting Funds regime applies to the Company. Under this regime, investors in UK Reporting Funds are subject to tax on the share of the UK Reporting Fund’s income attributable to their holdings in the Fund, whether or not distributed, but any gains on disposal of their holdings are subject to capital gains tax. A list of the Funds which currently have UK Reporting Fund status is available at https://www.gov.uk/government/publications/offshore-funds-list-of-reporting-funds.
Other transaction taxesOther jurisdictions may impose taxes, financial transactions taxes (“FTT”) or other transaction taxes on certain assets held by the Funds (for example UK stamp duty, French FTT).
Withholding taxCapital gains, dividends and interest received by the Company on its investments may be subject to withholding taxes in the countries of origin which are generally irrecoverable as the Company itself is exempt from income tax. Recent European Union case law may, however, reduce the amount of such irrecoverable tax in European Union countries. Investors should inform themselves of, and when appropriate consult their professional advisers on, the possible tax consequences of subscribing for, buying, holding, redeeming, converting or selling shares under the laws of their country of citizenship, residence or domicile. Investors should note that the levels and bases of, and reliefs from, taxation can change. The potential of withholding tax charges is further described in the Prospectus.
10. Investment AdvisersThe Management Company, BlackRock (Luxembourg) S.A., has delegated its investment management functions to the investment advisers (each an ‘Investment Adviser’): BlackRock Financial Management, Inc. (US) (BFM), BlackRock Investment Management, LLC (US) (BIMLLC), BlackRock Investment Management (UK) Limited (BIMUK) and BlackRock (Singapore) Limited (BSL) as described in the Prospectus.
All Investment Advisers are appointed directly by BlackRock (Luxembourg) S.A.. All Sub-Investment Advisers are appointed by the relevant Investment Adviser. Some of which, as Investment Advisers, have in turn sub-delegated some functions to BlackRock Japan Co. Limited (BLKJap), BlackRock Asset Management North Asia Limited (BAMNA) and BlackRock Investment Management (Australia) Limited (BLKAus).
Fund Investment Adviser(s)
Sub-Investment Adviser(s)
ASEAN Leaders Fund BIMUK BAMNAAsia Pacific Equity Income Fund BIMUK BAMNAAsian Dragon Fund BIMUK BAMNAAsian Growth Leaders Fund BIMUK BAMNAAsian High Yield Bond Fund BSL –Asian Multi-Asset Growth Fund BSL, BIMUK,
BIMLLCBAMNA, BLKAus
Fund Investment Adviser(s)
Sub-Investment Adviser(s)
Asian Tiger Bond Fund BSL, BIMUK BAMNAChina A-Share Opportunities Fund BIMLLC –China Bond Fund* BSL, BIMUK BAMNAChina Flexible Equity Fund BIMUK BAMNAChina Fund BIMUK BAMNAContinental European Flexible Fund BIMUK –Dynamic High Income Fund BSL, BIMUK, BFM BAMNAEmerging Europe Fund BIMUK –Emerging Markets Bond Fund BSL, BIMUK, BFM –Emerging Markets Corporate Bond Fund BSL, BIMUK, BFM –Emerging Markets Equity Income Fund BIMUK, BIMLLC BAMNAEmerging Markets Fund BIMUK, BIMLLC BAMNAEmerging Markets Local Currency Bond Fund BSL, BIMUK, BFM BAMNAESG Emerging Markets Blended Bond Fund* BIMUK –ESG Emerging Markets Bond Fund* BIMUK –ESG Emerging Markets Corporate Bond Fund* BIMUK, BFM –ESG Emerging Markets Local Currency Bond Fund* BIMUK –
ESG Multi-Asset Fund(1)BIMLLC, BIMUK, BFM –
Euro Bond Fund BIMUK –Euro Corporate Bond Fund BIMUK –Euro Reserve Fund BIMUK –Euro Short Duration Bond Fund BIMUK –Euro-Markets Fund BIMUK –European Equity Income Fund BIMUK –European Focus Fund* BIMUK –European Fund BIMUK –European High Yield Bond Fund BIMUK –European Special Situations Fund BIMUK –European Value Fund BIMUK –FinTech Fund(2) BIMUK –Fixed Income Global Opportunities Fund BSL, BIMUK, BFM BLKAusFuture Of Transport(2) BIMUK –Global Allocation Fund BIMLLC –Global Bond Income Fund BIMUK, BFM –Global Conservative Income Fund(2)* BIMUK, BFM –Global Corporate Bond Fund BSL, BIMUK, BFM –Global Dynamic Equity Fund BIMLLC –Global Enhanced Equity Yield Fund BIMUK –Global Equity Income Fund BIMUK –Global Government Bond Fund BSL, BIMUK, BFM –Global High Yield Bond Fund BSL, BIMUK, BFM –Global Inflation Linked Bond Fund BIMUK, BFM –Global Long-Horizon Equity Fund(1) BIMUK, BIMLLC –Global Multi-Asset Income Fund BSL, BIMUK, BFM BAMNAGlobal SmallCap Fund BIMLLC –India Fund BIMUK BAMNA
Japan Flexible Equity Fund BIMUKBAMNA, BLKJap
Japan Small & MidCap Opportunities Fund BIMUK BLKJapLatin American Fund BIMLLC –Market Navigator Fund(2)* BIMUK, BFM –Natural Resources Growth & Income Fund BIMLLC, BIMUK –
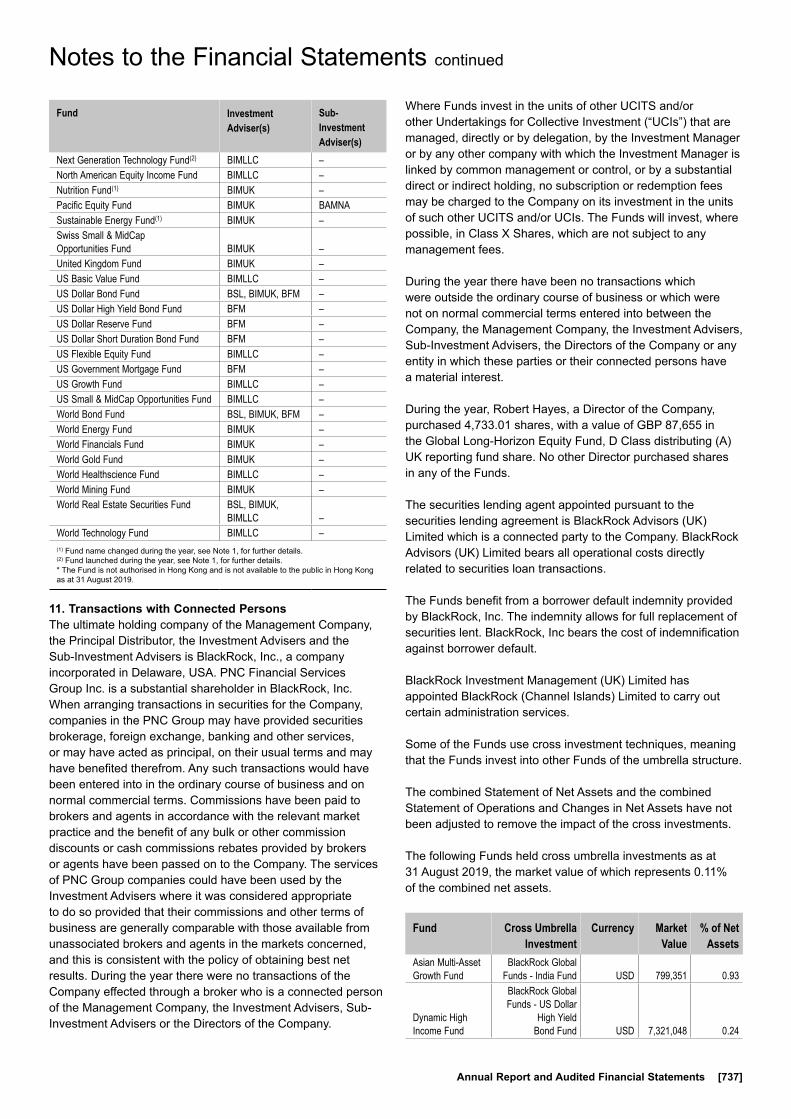
Annual Report and Audited Financial Statements [737]
Notes to the Financial Statements continued
Fund Investment Adviser(s)
Sub-Investment Adviser(s)
Next Generation Technology Fund(2) BIMLLC –North American Equity Income Fund BIMLLC –Nutrition Fund(1) BIMUK –Pacific Equity Fund BIMUK BAMNASustainable Energy Fund(1) BIMUK –Swiss Small & MidCap Opportunities Fund BIMUK –United Kingdom Fund BIMUK –US Basic Value Fund BIMLLC –US Dollar Bond Fund BSL, BIMUK, BFM –US Dollar High Yield Bond Fund BFM –US Dollar Reserve Fund BFM –US Dollar Short Duration Bond Fund BFM –US Flexible Equity Fund BIMLLC –US Government Mortgage Fund BFM –US Growth Fund BIMLLC –US Small & MidCap Opportunities Fund BIMLLC –World Bond Fund BSL, BIMUK, BFM –World Energy Fund BIMUK –World Financials Fund BIMUK –World Gold Fund BIMUK –World Healthscience Fund BIMLLC –World Mining Fund BIMUK –World Real Estate Securities Fund BSL, BIMUK,
BIMLLC –World Technology Fund BIMLLC – (1) Fund name changed during the year, see Note 1, for further details.(2) Fund launched during the year, see Note 1, for further details.* The Fund is not authorised in Hong Kong and is not available to the public in Hong Kong as at 31 August 2019.
11. Transactions with Connected PersonsThe ultimate holding company of the Management Company, the Principal Distributor, the Investment Advisers and the Sub-Investment Advisers is BlackRock, Inc., a company incorporated in Delaware, USA. PNC Financial Services Group Inc. is a substantial shareholder in BlackRock, Inc. When arranging transactions in securities for the Company, companies in the PNC Group may have provided securities brokerage, foreign exchange, banking and other services, or may have acted as principal, on their usual terms and may have benefited therefrom. Any such transactions would have been entered into in the ordinary course of business and on normal commercial terms. Commissions have been paid to brokers and agents in accordance with the relevant market practice and the benefit of any bulk or other commission discounts or cash commissions rebates provided by brokers or agents have been passed on to the Company. The services of PNC Group companies could have been used by the Investment Advisers where it was considered appropriate to do so provided that their commissions and other terms of business are generally comparable with those available from unassociated brokers and agents in the markets concerned, and this is consistent with the policy of obtaining best net results. During the year there were no transactions of the Company effected through a broker who is a connected person of the Management Company, the Investment Advisers, Sub-Investment Advisers or the Directors of the Company.
Where Funds invest in the units of other UCITS and/or other Undertakings for Collective Investment (“UCIs”) that are managed, directly or by delegation, by the Investment Manager or by any other company with which the Investment Manager is linked by common management or control, or by a substantial direct or indirect holding, no subscription or redemption fees may be charged to the Company on its investment in the units of such other UCITS and/or UCIs. The Funds will invest, where possible, in Class X Shares, which are not subject to any management fees.
During the year there have been no transactions which were outside the ordinary course of business or which were not on normal commercial terms entered into between the Company, the Management Company, the Investment Advisers, Sub-Investment Advisers, the Directors of the Company or any entity in which these parties or their connected persons have a material interest.
During the year, Robert Hayes, a Director of the Company, purchased 4,733.01 shares, with a value of GBP 87,655 in the Global Long-Horizon Equity Fund, D Class distributing (A) UK reporting fund share. No other Director purchased shares in any of the Funds.
The securities lending agent appointed pursuant to the securities lending agreement is BlackRock Advisors (UK) Limited which is a connected party to the Company. BlackRock Advisors (UK) Limited bears all operational costs directly related to securities loan transactions.
The Funds benefit from a borrower default indemnity provided by BlackRock, Inc. The indemnity allows for full replacement of securities lent. BlackRock, Inc bears the cost of indemnification against borrower default.
BlackRock Investment Management (UK) Limited has appointed BlackRock (Channel Islands) Limited to carry out certain administration services.
Some of the Funds use cross investment techniques, meaning that the Funds invest into other Funds of the umbrella structure.
The combined Statement of Net Assets and the combined Statement of Operations and Changes in Net Assets have not been adjusted to remove the impact of the cross investments.
The following Funds held cross umbrella investments as at 31 August 2019, the market value of which represents 0.11% of the combined net assets.
Fund Cross Umbrella Investment
Currency Market Value
% of Net Assets
Asian Multi-Asset Growth Fund
BlackRock Global Funds - India Fund USD 799,351 0.93
Dynamic High Income Fund
BlackRock Global Funds - US Dollar
High Yield Bond Fund USD 7,321,048 0.24

[738] BlackRock Global Funds (BGF)
Notes to the Financial Statements continued
Fund Cross Umbrella Investment
Currency Market Value
% of Net Assets
Emerging Markets Bond Fund
BlackRock Global Funds - Emerging
Markets Corporate Bond Fund USD 57,427,500 2.29
Global Multi-Asset Income Fund
BlackRock Global Funds - US Dollar
High Yield Bond Fund USD 73,243,442 0.94
12. Use of CommissionsWhere permitted by applicable regulation (excluding, for the avoidance of doubt, any sub-funds which are in scope for MiFID II), certain BlackRock Group companies acting as investment adviser to the sub-funds may accept commissions generated when trading equities with certain brokers in certain jurisdictions. Commissions may be reallocated to purchase eligible research services. Such arrangements may benefit one sub-fund over another because research can be used for a broader range of clients than just those whose trading funded it. BlackRock Group has a Use of Commissions Policy designed to ensure only eligible services are purchased and excess commissions are reallocated to an eligible service provider where appropriate.
13. Financial Derivative InstrumentsThe Funds may buy and sell financial derivative instruments which is further described in the Prospectus. Please refer to the Fund’s Portfolio of Investments for financial derivative investments held as at 31 August 2019.
Underlying exposure, as disclosed in the Portfolio of Investments, has been calculated according to the guidelines issued by ESMA and represents the market value of an equivalent position in the assets underlying each financial instrument. The underlying exposure on the bond futures is calculated off the market value of the bonds rather than the cheapest to deliver security.
14. Securities Pledged or Given in Guarantee and Received in GuaranteeSecurities which are pledged as collateral or given in guarantee by the Funds are disclosed in the Portfolio of Investments of the Funds. As at 31 August 2019 the value of these securities, evidenced by a “†” in the Portfolio of Investments of the Fund, amounts to USD 166,354,938.
For the Global Enhanced Equity Yield Fund, the collateral on written call options is pledged under a tri-party agreement between BlackRock Investment Management (UK) Limited, Merrill Lynch International and Bank of New York Mellon (International) Limited. As at 31 August 2019 the value of the collateral, evidenced by a “^” in the Portfolio of Investments of the Fund, amounts to USD 45,584,032.
Securities which have been received in guarantee by the Funds are detailed in the table below. As at 31 August 2019 the value of these securities amounts to USD 8,674,185.
Fund Holdings Description Value (USD)
Emerging Markets Local Currency Bond Fund
381,000 United States Treasury Note/Bond 1.25% 31/03/2021 369,431
Emerging Markets Local Currency Bond Fund
4,791,000 United States Treasury Note/Bond 1.875% 31/10/2022 4,741,005
Emerging Markets Local Currency Bond Fund
652,000 United States Treasury Note/Bond 3.5% 15/05/2020 659,455
Euro Bond Fund 281,000 French Republic Government Bond OAT 2.25% 25/10/2022 333,057
Euro Bond Fund 546,000 French Republic Government Bond OAT 4.75% 25/04/2035 999,669
Fixed Income Global Opportunities Fund
311,000 United States Treasury Note/Bond 2% 15/11/2026 311,585
Fixed Income Global Opportunities Fund
375,000 United States Treasury Note/Bond 3% 15/11/2044 430,233
Global Government Bond Fund
102,000 United States Treasury Note/Bond 1.5% 31/10/2019 100,372
Global Government Bond Fund
4,000 United States Treasury Note/Bond 2.125% 29/02/2024 4,041
Global Government Bond Fund
145,000 United States Treasury Note/Bond 3% 15/11/2044 166,220
World Bond Fund 61,000 United States Treasury Note/Bond 2.75% 30/11/2020 60,970
World Bond Fund 226,000 United States Treasury Note/Bond 3.125% 15/05/2021 224,514
World Bond Fund 196,000 United States Treasury Note/Bond 4.625% 15/02/2040 273,633
15. Cash CollateralThe Funds trade derivatives with a range of counterparties. The counterparties to the derivatives are shown in the Portfolio of Investments. The derivatives are traded with the following counterparties: ANZ, Bank of America, Barclays, BNP Paribas, BNY Mellon, Citibank, Citigroup, Credit Suisse, Deutsche Bank, Goldman Sachs, HSBC Bank Plc, JP Morgan, Merrill Lynch, Morgan Stanley, Nomura, RBS Plc, Royal Bank of Canada, Societe Generale, Standard Chartered Bank, State Street, Toronto Dominion and UBS. Collateral/Margin is paid or received on swap contracts, CFDs, futures contracts, options written (put and call), options purchased (put and call) and swaptions to cover any exposure by the counterparty to the Company or by the Company to the counterparty. “Due from brokers” consists of cash collateral paid to the Portfolio’s clearing brokers and various counterparties. “Due to brokers” consists of cash collateral received from the Portfolio’s clearing brokers and various counterparties. Futures Contracts Cash forms part of Cash at Bank in the Statement of Net Assets.

Annual Report and Audited Financial Statements [739]
Notes to the Financial Statements continued
The table below provides the cash collateral balances due from/(due to) the brokers in relation to the CFDs, swap contracts and OTC Options as at 31 August 2019. Futures Contracts Cash balances relate to cash held at brokers and are in part used to satisfy margin requirements as at 31 August 2019.
Fund CCY CFD Swap OTC
Options Cash
Collateral Due from
Broker
CFD Swap OTC
Options Cash
Collateral Due to Broker
Futures Contracts Due from
Broker
Futures Contracts
Due to Broker
ASEAN Leaders Fund USD – – 190,849 (13)Asian Growth Leaders Fund USD 40,000 – 5,268,583 (63,375)Asian Multi-Asset Growth Fund USD 309,048 (74,371) 157,930 – Asian Tiger Bond Fund USD 2,824,000 (10,000) 1,574,856 (280,734)China A-Share Opportunities Fund USD – – 268,000 (29,569)China Bond Fund CNH 126,000 – 777,407 – Dynamic High Income Fund USD – (810,000) 18,565,195 (7,116,060)Emerging Markets Bond Fund USD – (15,758,440) – – Emerging Markets Corporate Bond Fund USD – – 27,666 – Emerging Markets Equity Income Fund USD 1,000,000 – 1,262,178 – Emerging Markets Fund USD 510,000 (510,000) 844,556 – Emerging Markets Local Currency Bond Fund USD 5,736,969 (7,803,403) 2,752,939 (377)ESG Emerging Markets Blended Bond Fund USD 1,766,397 (172,515) 213,084 (176)ESG Emerging Markets Bond Fund USD – (1,390,000) – – ESG Emerging Markets Local Currency Bond Fund USD 1,042,000 (223,009) 182,243 – ESG Multi-Asset Fund(1) EUR 171,660 (710,636) 1,289,521 (21,255)Euro Bond Fund EUR 29,941,015 (1,825,835) 12,692,864 (679,905)Euro Corporate Bond Fund EUR 13,576,615 (10,504,164) 19,539,436 (170,818)Euro Short Duration Bond Fund EUR 42,756,203 (6,847,034) 82,687,702 (1,374,183)European Fund EUR – – 6 – European High Yield Bond Fund EUR 32,000 (71,159) 94,173 (28)
Fund CCY CFD Swap OTC
Options Cash
Collateral Due from
Broker
CFD Swap OTC
Options Cash
Collateral Due to Broker
Futures Contracts Due from
Broker
Futures Contracts
Due to Broker
Fixed Income Global Opportunities Fund USD 69,289,050 (24,077,485) 85,682,680 – Global Allocation Fund USD 8,600,015 (27,584,449) 23,616,453 (8,874,766)Global Bond Income Fund USD 78,000 (116,716) 12,594 – Global Conservative Income Fund(2) EUR 20,213 – 7,047,379 – Global Corporate Bond Fund USD 19,224,440 (7,912,829) 8,162,356 (567,236)Global Dynamic Equity Fund USD – (510,000) 2,343,443 (563,804)Global Enhanced Equity Yield Fund USD – – 68,578,929 (265,508)Global Government Bond Fund USD 863,822 (438,848) 2,314,709 (434,521)Global High Yield Bond Fund USD 1,570,000 (1,108,202) 735,511 (94)Global Inflation Linked Bond Fund USD 2,218,816 – 1,555,741 (8,223)Global Multi-Asset Income Fund USD 678,000 (136,245) 42,677,827 (10,635,474)Global SmallCap Fund USD – – 452,174 – Market Navigator Fund(2) EUR 532,709 (777,922) 428,694 (303,415)US Dollar Bond Fund USD 499,531 (31,766) 2,180,044 (369,988)US Dollar High Yield Bond Fund USD 2,350,016 (2,321,282) 857,226 – US Dollar Short Duration Bond Fund USD 970,546 (1,836,728) 2,624,130 (27,224)US Government Mortgage Fund USD 800,413 – 170,836 – World Bond Fund USD 6,522,739 (6,347,004) 8,486,108 (360,099)World Technology Fund USD – – 19,147,443 – (1) Fund name changed during the year, see Note 1, for further details.(2) Fund launched during the year, see Note 1, for further details.
16. DividendsThe Directors’ current policy in relation to the payment of dividends depends on the Share Class. For Non-Distributing Share Classes the current policy is to retain and reinvest all net income. In this regard the income is retained in the NAV and reflected in the NAV per share of the relevant Class. For the Distributing Share Classes, the policy is to distribute

[740] BlackRock Global Funds (BGF)
Notes to the Financial Statements continued
substantially all the investment income (where available) for the period after deduction of expenses for Share Classes which distribute net or all of the investment income for the period and potentially a portion of capital before deduction of expenses for Share Classes which distribute gross. Please refer to the “Calculation of Dividends” section in the Prospectus for further information regarding the distribution policies for each Distributing Share Class. The Directors may also determine if and to what extent dividends may include distributions from both net realised and net unrealised capital gains. Certain Funds and/or certain Share Classes (e.g. Distributing (S) Shares, Distributing (R) Shares and Distributing (Y) Shares) may make distributions from capital as well as from income and net realised and net unrealised capital gains. Where Distributing Share Classes pay dividends that include net realised capital gains or net unrealised capital gains, or, in the case of Funds which distribute income gross of expenses, dividends may include initially subscribed capital. In the event dividend income is paid from the capital of the Fund, it will result in capital erosion and may constrain further capital growth.
Where a Fund has UK Reporting Fund status and reported income exceeds distributions made then the surplus shall be treated as a deemed dividend and will be taxed as income, subject to the tax status of the investor.
For those Funds which offer distributing shares, the frequency at which the dividend payment is made is determined by the Fund type. Further information on the payment of dividends is set out in the Prospectus.
The declaration and payment of dividends and the reinvestment options available to shareholders are set out in the Prospectus.
17. Credit FacilityIn April 2016 (and subsequently amended on 1 April 2017, 1 April 2018 and 1 April 2019), BGF entered into a credit facility with JPMorgan Chase Bank, N.A. (“JPMorgan”) whereby JPMorgan, together with other syndicated lenders, made a credit facility available to the Funds, which currently stands at USD 1,262.5 million for Luxembourg funds. This credit facility will be utilised by the Funds for temporary funding purposes, including, without limitation, the funding of investor redemptions. Any interest and commitment fees in relation to drawdowns from such credit facility are borne out of the net assets of the Company. Any new Funds will not automatically be subject to a credit line and will therefore be required to be added by way of a joinder process. This process includes, inter alia, any necessary due diligence being carried out by the lenders in order to approve the addition of the new Funds. During this year, such Funds will not be subject to, or able to draw down on, any credit line. Furthermore, there is no guarantee that the addition of any new Funds will be approved by the lenders, or that credit will be available to a Fund since the credit line is subject to availability (on an equitable allocation basis) between the Funds and other BlackRock funds participating in the credit agreement. As such, certain Funds may not be subject to the credit line and will not incur any fees
with respect to same. As at 31 August 2019 the Funds did not have any outstanding amounts from such credit facility. The credit facility was not used during the year from 1 September 2018 to 31 August 2019.
18. Transaction CostsIn order to achieve its investment objective, a Fund will incur transactions costs in relation to trading activity on its portfolio. Disclosed in the table below are separately identifiable transaction costs incurred by each Fund for the year ended 31 August 2019. These include commission costs, settlement fees and broker fees.
Fund CCY Transaction Cost
ASEAN Leaders Fund USD 340,111Asia Pacific Equity Income Fund USD 949,433Asian Dragon Fund USD 7,004,270Asian Growth Leaders Fund USD 11,561,783Asian High Yield Bond Fund USD 7,608Asian Multi-Asset Growth Fund USD 240,448Asian Tiger Bond Fund USD 32,217China A-Share Opportunities Fund USD 1,509,855China Bond Fund CNH 446,160China Flexible Equity Fund USD 73,078China Fund USD 2,982,819Continental European Flexible Fund EUR 4,147,595Dynamic High Income Fund USD 740,839Emerging Europe Fund EUR 857,789Emerging Markets Bond Fund USD 17,873Emerging Markets Corporate Bond Fund USD 9,917Emerging Markets Equity Income Fund USD 1,166,189Emerging Markets Fund USD 2,653,510Emerging Markets Local Currency Bond Fund USD 50,701ESG Emerging Markets Blended Bond Fund USD 2,034ESG Emerging Markets Bond Fund USD 1,596ESG Emerging Markets Corporate Bond Fund USD 813ESG Emerging Markets Local Currency Bond Fund USD 6,603ESG Multi-Asset Fund(1) EUR 645,376Euro Bond Fund EUR 28,343Euro Corporate Bond Fund EUR 43,938Euro Reserve Fund EUR 3,982Euro Short Duration Bond Fund EUR 21,737Euro-Markets Fund EUR 3,496,031European Equity Income Fund EUR 6,376,708European Focus Fund EUR 1,850,679European Fund EUR 3,114,465European High Yield Bond Fund EUR 9,154European Special Situations Fund EUR 1,030,373European Value Fund EUR 4,158,870FinTech Fund(2) USD 29,369Fixed Income Global Opportunities Fund USD 468,632Future Of Transport Fund(2) USD 149,357Global Allocation Fund USD 6,478,276Global Bond Income Fund USD 1,788Global Conservative Income Fund(2) EUR 96,478Global Corporate Bond Fund USD 15,768Global Dynamic Equity Fund USD 587,989Global Enhanced Equity Yield Fund USD 1,802,850
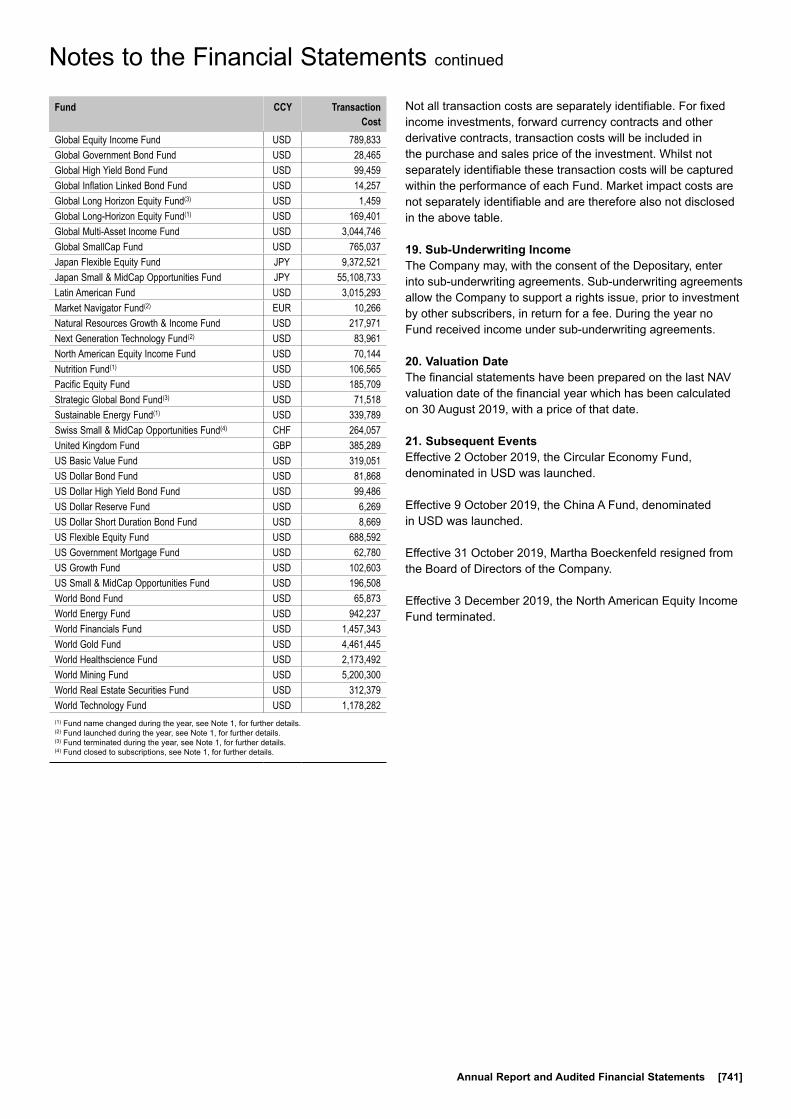
Annual Report and Audited Financial Statements [741]
Notes to the Financial Statements continued
Fund CCY Transaction Cost
Global Equity Income Fund USD 789,833Global Government Bond Fund USD 28,465Global High Yield Bond Fund USD 99,459Global Inflation Linked Bond Fund USD 14,257Global Long Horizon Equity Fund(3) USD 1,459Global Long-Horizon Equity Fund(1) USD 169,401Global Multi-Asset Income Fund USD 3,044,746Global SmallCap Fund USD 765,037Japan Flexible Equity Fund JPY 9,372,521Japan Small & MidCap Opportunities Fund JPY 55,108,733Latin American Fund USD 3,015,293Market Navigator Fund(2) EUR 10,266Natural Resources Growth & Income Fund USD 217,971Next Generation Technology Fund(2) USD 83,961North American Equity Income Fund USD 70,144Nutrition Fund(1) USD 106,565Pacific Equity Fund USD 185,709Strategic Global Bond Fund(3) USD 71,518Sustainable Energy Fund(1) USD 339,789Swiss Small & MidCap Opportunities Fund(4) CHF 264,057United Kingdom Fund GBP 385,289US Basic Value Fund USD 319,051US Dollar Bond Fund USD 81,868US Dollar High Yield Bond Fund USD 99,486US Dollar Reserve Fund USD 6,269US Dollar Short Duration Bond Fund USD 8,669US Flexible Equity Fund USD 688,592US Government Mortgage Fund USD 62,780US Growth Fund USD 102,603US Small & MidCap Opportunities Fund USD 196,508World Bond Fund USD 65,873World Energy Fund USD 942,237World Financials Fund USD 1,457,343World Gold Fund USD 4,461,445World Healthscience Fund USD 2,173,492World Mining Fund USD 5,200,300World Real Estate Securities Fund USD 312,379World Technology Fund USD 1,178,282(1) Fund name changed during the year, see Note 1, for further details.(2) Fund launched during the year, see Note 1, for further details.(3) Fund terminated during the year, see Note 1, for further details.(4) Fund closed to subscriptions, see Note 1, for further details.
Not all transaction costs are separately identifiable. For fixed income investments, forward currency contracts and other derivative contracts, transaction costs will be included in the purchase and sales price of the investment. Whilst not separately identifiable these transaction costs will be captured within the performance of each Fund. Market impact costs are not separately identifiable and are therefore also not disclosed in the above table.
19. Sub-Underwriting IncomeThe Company may, with the consent of the Depositary, enter into sub-underwriting agreements. Sub-underwriting agreements allow the Company to support a rights issue, prior to investment by other subscribers, in return for a fee. During the year no Fund received income under sub-underwriting agreements.
20. Valuation DateThe financial statements have been prepared on the last NAV valuation date of the financial year which has been calculated on 30 August 2019, with a price of that date.
21. Subsequent EventsEffective 2 October 2019, the Circular Economy Fund, denominated in USD was launched.
Effective 9 October 2019, the China A Fund, denominated in USD was launched.
Effective 31 October 2019, Martha Boeckenfeld resigned from the Board of Directors of the Company.
Effective 3 December 2019, the North American Equity Income Fund terminated.
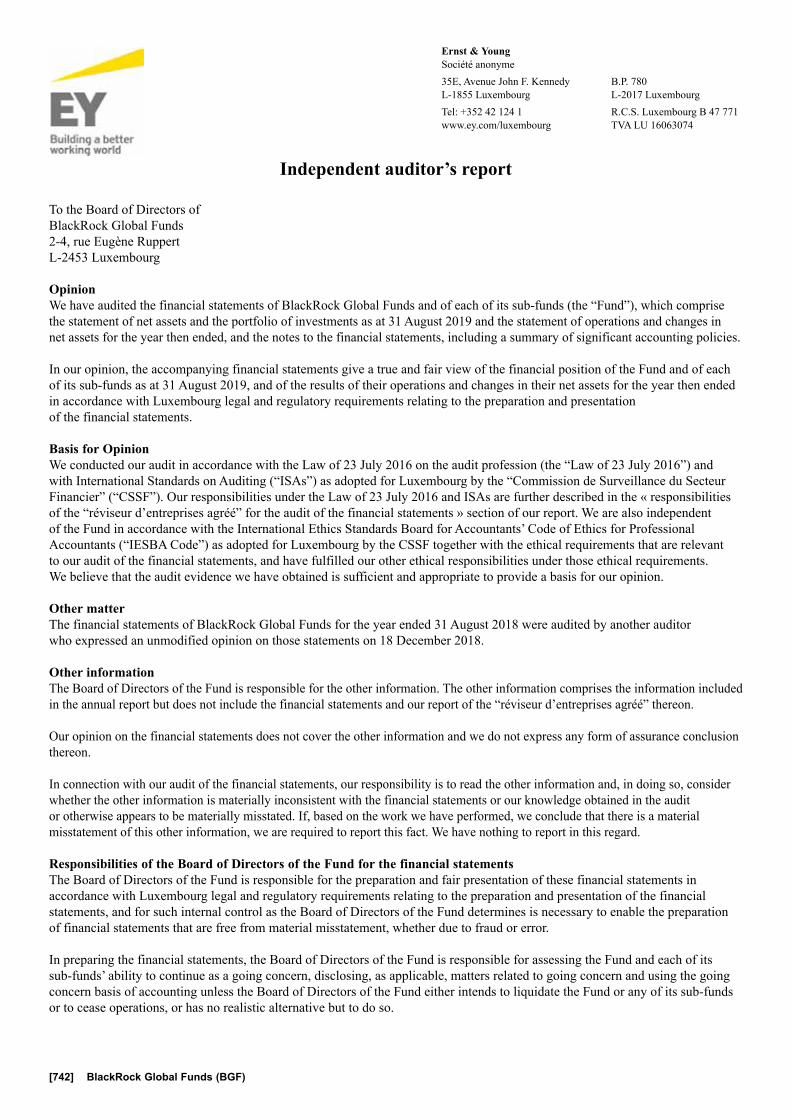
[742] BlackRock Global Funds (BGF)
Audit Report
Independent auditor’s report
To the Board of Directors ofBlackRock Global Funds2-4, rue Eugène RuppertL-2453 Luxembourg
Opinion We have audited the financial statements of BlackRock Global Funds and of each of its sub-funds (the “Fund”), which comprise the statement of net assets and the portfolio of investments as at 31 August 2019 and the statement of operations and changes in net assets for the year then ended, and the notes to the financial statements, including a summary of significant accounting policies.
In our opinion, the accompanying financial statements give a true and fair view of the financial position of the Fund and of each of its sub-funds as at 31 August 2019, and of the results of their operations and changes in their net assets for the year then ended in accordance with Luxembourg legal and regulatory requirements relating to the preparation and presentation of the financial statements.
Basis for OpinionWe conducted our audit in accordance with the Law of 23 July 2016 on the audit profession (the “Law of 23 July 2016”) and with International Standards on Auditing (“ISAs”) as adopted for Luxembourg by the “Commission de Surveillance du Secteur Financier” (“CSSF”). Our responsibilities under the Law of 23 July 2016 and ISAs are further described in the « responsibilities of the “réviseur d’entreprises agréé” for the audit of the financial statements » section of our report. We are also independent of the Fund in accordance with the International Ethics Standards Board for Accountants’ Code of Ethics for Professional Accountants (“IESBA Code”) as adopted for Luxembourg by the CSSF together with the ethical requirements that are relevant to our audit of the financial statements, and have fulfilled our other ethical responsibilities under those ethical requirements. We believe that the audit evidence we have obtained is sufficient and appropriate to provide a basis for our opinion.
Other matterThe financial statements of BlackRock Global Funds for the year ended 31 August 2018 were audited by another auditor who expressed an unmodified opinion on those statements on 18 December 2018.
Other informationThe Board of Directors of the Fund is responsible for the other information. The other information comprises the information included in the annual report but does not include the financial statements and our report of the “réviseur d’entreprises agréé” thereon.
Our opinion on the financial statements does not cover the other information and we do not express any form of assurance conclusion thereon.
In connection with our audit of the financial statements, our responsibility is to read the other information and, in doing so, consider whether the other information is materially inconsistent with the financial statements or our knowledge obtained in the audit or otherwise appears to be materially misstated. If, based on the work we have performed, we conclude that there is a material misstatement of this other information, we are required to report this fact. We have nothing to report in this regard.
Responsibilities of the Board of Directors of the Fund for the financial statementsThe Board of Directors of the Fund is responsible for the preparation and fair presentation of these financial statements in accordance with Luxembourg legal and regulatory requirements relating to the preparation and presentation of the financial statements, and for such internal control as the Board of Directors of the Fund determines is necessary to enable the preparation of financial statements that are free from material misstatement, whether due to fraud or error.
In preparing the financial statements, the Board of Directors of the Fund is responsible for assessing the Fund and each of its sub-funds’ ability to continue as a going concern, disclosing, as applicable, matters related to going concern and using the going concern basis of accounting unless the Board of Directors of the Fund either intends to liquidate the Fund or any of its sub-funds or to cease operations, or has no realistic alternative but to do so.
Ernst & YoungSociété anonyme35E, Avenue John F. Kennedy B.P. 780L-1855 Luxembourg L-2017 LuxembourgTel: +352 42 124 1 R.C.S. Luxembourg B 47 771www.ey.com/luxembourg TVA LU 16063074

Annual Report and Audited Financial Statements [743]
Responsibilities of the “réviseur d’entreprises agréé” for the audit of the financial statements Our objectives are to obtain reasonable assurance about whether the financial statements as a whole are free from material misstatement, whether due to fraud or error, and to issue a report of the “réviseur d’entreprises agréé” that includes our opinion. Reasonable assurance is a high level of assurance, but is not a guarantee that an audit conducted in accordance with the Law of 23 July 2016 and with ISAs as adopted for Luxembourg by the CSSF will always detect a material misstatement when it exists. Misstatements can arise from fraud or error and are considered material if, individually or in the aggregate, they could reasonably be expected to influence the economic decisions of users taken on the basis of these financial statements.
As part of an audit in accordance with the Law of 23 July 2016 and with ISAs as adopted for Luxembourg by the CSSF, we exercise professional judgment and maintain professional skepticism throughout the audit. We also:
• Identify and assess the risks of material misstatement of the financial statements, whether due to fraud or error, design and perform audit procedures responsive to those risks, and obtain audit evidence that is sufficient and appropriate to provide a basis for our opinion. The risk of not detecting a material misstatement resulting from fraud is higher than for one resulting from error, as fraud may involve collusion, forgery, intentional omissions, misrepresentations, or the override of internal control.
• Obtain an understanding of internal control relevant to the audit in order to design audit procedures that are appropriate in the circumstances, but not for the purpose of expressing an opinion on the effectiveness of the Fund’s internal control.
• Evaluate the appropriateness of accounting policies used and the reasonableness of accounting estimates and related disclosures made by the Board of Directors of the Fund.
• Conclude on the appropriateness of the Board of Directors of the Fund’s use of the going concern basis of accounting and, based on the audit evidence obtained, whether a material uncertainty exists related to events or conditions that may cast significant doubt on the Fund or any of its sub-funds’ ability to continue as a going concern. If we conclude that a material uncertainty exists, we are required to draw attention in our report of the “réviseur d’entreprises agréé” to the related disclosures in the financial statements or, if such disclosures are inadequate, to modify our opinion. Our conclusions are based on the audit evidence obtained up to the date of our report of the “réviseur d’entreprises agréé”. However, future events or conditions may cause the Fund or any of its sub-funds to cease to continue as a going concern.
• In respect of sub-funds where a decision or an intention to close exists, we conclude on the appropriateness of the Board of Directors of the Fund use of the non-going concern basis of accounting. We also evaluate the adequacy of the disclosures describing the non-going basis of accounting and reasons for its use. Our conclusions are based on the audit evidence obtained up to the date of our report of the “réviseur d’entreprises agréé”.
• Evaluate the overall presentation, structure and content of the financial statements, including the disclosures, and whether the financial statements represent the underlying transactions and events in a manner that achieves fair presentation.
We communicate with the Board of Directors regarding, among other matters, the planned scope and timing of the audit and significant audit findings, including any significant deficiencies in internal control that we identify during our audit.
We also provide those charged with governance with a statement that we have complied with relevant ethical requirements regarding independence, and communicate to them all relationships and other matters that may reasonably be thought to bear on our independence, and where applicable, related safeguards.
Ernst & Young Société anonyme Cabinet de révision agréé
Michael Ferguson
Luxembourg, 17 December 2019
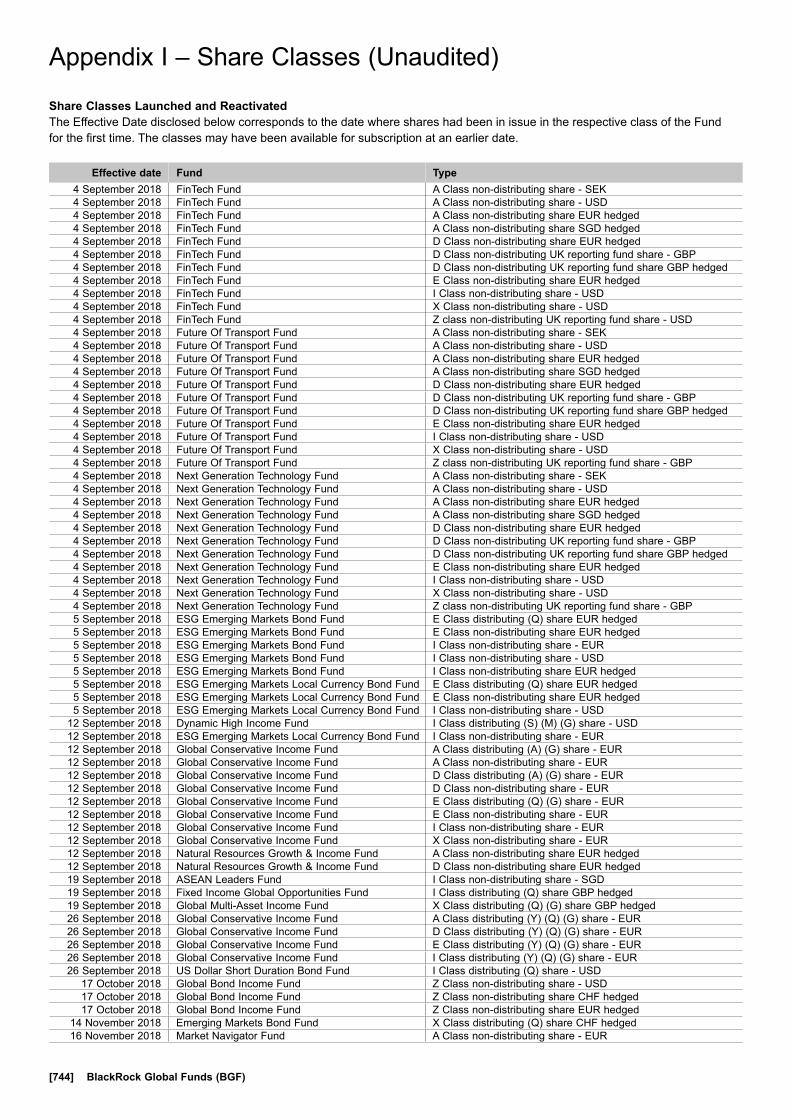
[744] BlackRock Global Funds (BGF)
Appendix I – Share Classes (Unaudited)
Share Classes Launched and ReactivatedThe Effective Date disclosed below corresponds to the date where shares had been in issue in the respective class of the Fund for the first time. The classes may have been available for subscription at an earlier date.
Effective date Fund Type4 September 2018 FinTech Fund A Class non-distributing share - SEK4 September 2018 FinTech Fund A Class non-distributing share - USD4 September 2018 FinTech Fund A Class non-distributing share EUR hedged4 September 2018 FinTech Fund A Class non-distributing share SGD hedged4 September 2018 FinTech Fund D Class non-distributing share EUR hedged4 September 2018 FinTech Fund D Class non-distributing UK reporting fund share - GBP4 September 2018 FinTech Fund D Class non-distributing UK reporting fund share GBP hedged4 September 2018 FinTech Fund E Class non-distributing share EUR hedged4 September 2018 FinTech Fund I Class non-distributing share - USD4 September 2018 FinTech Fund X Class non-distributing share - USD4 September 2018 FinTech Fund Z class non-distributing UK reporting fund share - USD4 September 2018 Future Of Transport Fund A Class non-distributing share - SEK4 September 2018 Future Of Transport Fund A Class non-distributing share - USD4 September 2018 Future Of Transport Fund A Class non-distributing share EUR hedged4 September 2018 Future Of Transport Fund A Class non-distributing share SGD hedged4 September 2018 Future Of Transport Fund D Class non-distributing share EUR hedged4 September 2018 Future Of Transport Fund D Class non-distributing UK reporting fund share - GBP4 September 2018 Future Of Transport Fund D Class non-distributing UK reporting fund share GBP hedged4 September 2018 Future Of Transport Fund E Class non-distributing share EUR hedged4 September 2018 Future Of Transport Fund I Class non-distributing share - USD4 September 2018 Future Of Transport Fund X Class non-distributing share - USD4 September 2018 Future Of Transport Fund Z class non-distributing UK reporting fund share - GBP4 September 2018 Next Generation Technology Fund A Class non-distributing share - SEK4 September 2018 Next Generation Technology Fund A Class non-distributing share - USD4 September 2018 Next Generation Technology Fund A Class non-distributing share EUR hedged4 September 2018 Next Generation Technology Fund A Class non-distributing share SGD hedged4 September 2018 Next Generation Technology Fund D Class non-distributing share EUR hedged4 September 2018 Next Generation Technology Fund D Class non-distributing UK reporting fund share - GBP4 September 2018 Next Generation Technology Fund D Class non-distributing UK reporting fund share GBP hedged4 September 2018 Next Generation Technology Fund E Class non-distributing share EUR hedged4 September 2018 Next Generation Technology Fund I Class non-distributing share - USD4 September 2018 Next Generation Technology Fund X Class non-distributing share - USD4 September 2018 Next Generation Technology Fund Z class non-distributing UK reporting fund share - GBP5 September 2018 ESG Emerging Markets Bond Fund E Class distributing (Q) share EUR hedged5 September 2018 ESG Emerging Markets Bond Fund E Class non-distributing share EUR hedged5 September 2018 ESG Emerging Markets Bond Fund I Class non-distributing share - EUR5 September 2018 ESG Emerging Markets Bond Fund I Class non-distributing share - USD5 September 2018 ESG Emerging Markets Bond Fund I Class non-distributing share EUR hedged5 September 2018 ESG Emerging Markets Local Currency Bond Fund E Class distributing (Q) share EUR hedged5 September 2018 ESG Emerging Markets Local Currency Bond Fund E Class non-distributing share EUR hedged5 September 2018 ESG Emerging Markets Local Currency Bond Fund I Class non-distributing share - USD
12 September 2018 Dynamic High Income Fund I Class distributing (S) (M) (G) share - USD12 September 2018 ESG Emerging Markets Local Currency Bond Fund I Class non-distributing share - EUR12 September 2018 Global Conservative Income Fund A Class distributing (A) (G) share - EUR12 September 2018 Global Conservative Income Fund A Class non-distributing share - EUR12 September 2018 Global Conservative Income Fund D Class distributing (A) (G) share - EUR12 September 2018 Global Conservative Income Fund D Class non-distributing share - EUR12 September 2018 Global Conservative Income Fund E Class distributing (Q) (G) share - EUR12 September 2018 Global Conservative Income Fund E Class non-distributing share - EUR12 September 2018 Global Conservative Income Fund I Class non-distributing share - EUR12 September 2018 Global Conservative Income Fund X Class non-distributing share - EUR12 September 2018 Natural Resources Growth & Income Fund A Class non-distributing share EUR hedged12 September 2018 Natural Resources Growth & Income Fund D Class non-distributing share EUR hedged19 September 2018 ASEAN Leaders Fund I Class non-distributing share - SGD19 September 2018 Fixed Income Global Opportunities Fund I Class distributing (Q) share GBP hedged19 September 2018 Global Multi-Asset Income Fund X Class distributing (Q) (G) share GBP hedged26 September 2018 Global Conservative Income Fund A Class distributing (Y) (Q) (G) share - EUR26 September 2018 Global Conservative Income Fund D Class distributing (Y) (Q) (G) share - EUR26 September 2018 Global Conservative Income Fund E Class distributing (Y) (Q) (G) share - EUR26 September 2018 Global Conservative Income Fund I Class distributing (Y) (Q) (G) share - EUR26 September 2018 US Dollar Short Duration Bond Fund I Class distributing (Q) share - USD
17 October 2018 Global Bond Income Fund Z Class non-distributing share - USD17 October 2018 Global Bond Income Fund Z Class non-distributing share CHF hedged17 October 2018 Global Bond Income Fund Z Class non-distributing share EUR hedged
14 November 2018 Emerging Markets Bond Fund X Class distributing (Q) share CHF hedged16 November 2018 Market Navigator Fund A Class non-distributing share - EUR
Appendix I – Share Classes (Unaudited)

Annual Report and Audited Financial Statements [745]
Appendix I – Share Classes (Unaudited) continued
Effective date Fund Type16 November 2018 Market Navigator Fund D Class non-distributing share - EUR16 November 2018 Market Navigator Fund E Class non-distributing share - EUR16 November 2018 Market Navigator Fund I Class non-distributing share - EUR16 November 2018 Market Navigator Fund X Class non-distributing share - EUR28 November 2018 Emerging Markets Local Currency Bond Fund S Class distributing (M) UK reporting fund share GBP hedged5 December 2018 FinTech Fund D Class non-distributing share - EUR5 December 2018 FinTech Fund E Class non-distributing share - EUR5 December 2018 FinTech Fund I Class non-distributing share - EUR5 December 2018 FinTech Fund I Class non-distributing share EUR hedged5 December 2018 Future Of Transport Fund D Class non-distributing share - EUR5 December 2018 Future Of Transport Fund E Class non-distributing share - EUR5 December 2018 Future Of Transport Fund I Class non-distributing share - EUR5 December 2018 Future Of Transport Fund I Class non-distributing share EUR hedged
12 December 2018 Next Generation Technology Fund D Class non-distributing share - EUR12 December 2018 Next Generation Technology Fund E Class non-distributing share - EUR12 December 2018 Next Generation Technology Fund I Class non-distributing share - EUR12 December 2018 Next Generation Technology Fund I Class non-distributing share EUR hedged19 December 2018 Asia Pacific Equity Income Fund A Class distributing (R) (M) (G) UK reporting fund share
CNH hedged19 December 2018 Asian High Yield Bond Fund A Class distributing (R) (M) (G) UK reporting fund share
CNH hedged19 December 2018 Emerging Markets Bond Fund A Class distributing (R) (M) (G) UK reporting fund share
CNH hedged19 December 2018 Global High Yield Bond Fund A Class distributing (R) (M) (G) UK reporting fund share
CNH hedged19 December 2018 US Dollar High Yield Bond Fund A Class distributing (R) (M) (G) UK reporting fund share
CNH hedged2 January 2019 Fixed Income Global Opportunities Fund I Class distributing (Q) share - JPY
27 February 2019 China Bond Fund I Class distributing (S) (M) (G) share - CNH27 February 2019 Dynamic High Income Fund D Class distributing (Q) UK reporting fund share GBP hedged27 February 2019 US Flexible Equity Fund A Class non-distributing share JPY hedged27 February 2019 World Healthscience Fund A Class non-distributing share JPY hedged27 February 2019 World Technology Fund A Class non-distributing share JPY hedged
6 March 2019 Emerging Markets Local Currency Bond Fund X Class distributing (Q) share GBP hedged13 March 2019 World Healthscience Fund I Class non-distributing share - USD20 March 2019 Continental European Flexible Fund AI Class non-distributing share - EUR20 March 2019 Dynamic High Income Fund AI Class distributing (Q) share EUR hedged20 March 2019 Dynamic High Income Fund AI Class non-distributing share EUR hedged20 March 2019 Emerging Markets Bond Fund AI Class distributing (Q) share EUR hedged20 March 2019 Emerging Markets Bond Fund AI Class non-distributing share EUR hedged20 March 2019 Emerging Markets Corporate Bond Fund AI Class non-distributing share - EUR20 March 2019 Emerging Markets Fund AI Class non-distributing share - EUR20 March 2019 Emerging Markets Local Currency Bond Fund AI Class non-distributing share - EUR20 March 2019 World Mining Fund AI Class non-distributing share - EUR20 March 2019 World Mining Fund AI Class non-distributing share - USD27 March 2019 Emerging Markets Local Currency Bond Fund AI Class distributing (Q) share - EUR27 March 2019 Euro Bond Fund AI Class non-distributing share - EUR27 March 2019 Euro Corporate Bond Fund AI Class non-distributing share - EUR27 March 2019 Euro Short Duration Bond Fund AI Class non-distributing share - EUR27 March 2019 Euro Short Duration Bond Fund SI Class non-distributing share - EUR27 March 2019 Euro Short Duration Bond Fund SI Class non-distributing share USD hedged27 March 2019 European Equity Income Fund AI Class distributing (Q) (G) share - EUR27 March 2019 European Equity Income Fund AI Class non-distributing share - EUR27 March 2019 European Focus Fund AI Class non-distributing share - EUR27 March 2019 Fixed Income Global Opportunities Fund AI Class non-distributing share - EUR27 March 2019 Fixed Income Global Opportunities Fund AI Class non-distributing share EUR hedged27 March 2019 Japan Flexible Equity Fund X Class non-distributing share - GBP
3 April 2019 Emerging Markets Equity Income Fund AI Class distributing (Q) (G) share EUR hedged3 April 2019 Emerging Markets Equity Income Fund AI Class non-distributing share - EUR3 April 2019 Euro-Markets Fund AI Class non-distributing share - EUR3 April 2019 Future Of Transport Fund AI Class non-distributing share - EUR3 April 2019 Global Allocation Fund AI Class non-distributing share - EUR3 April 2019 Global Allocation Fund AI Class non-distributing share EUR hedged3 April 2019 Global Equity Income Fund AI Class distributing (Q) (G) share EUR hedged3 April 2019 Global Equity Income Fund AI Class non-distributing share - EUR3 April 2019 Global Equity Income Fund AI Class non-distributing share EUR hedged3 April 2019 Global High Yield Bond Fund AI Class non-distributing share EUR hedged
10 April 2019 Global High Yield Bond Fund AI Class distributing (Q) share EUR hedged10 April 2019 Market Navigator Fund AI Class non-distributing share - EUR10 April 2019 Next Generation Technology Fund AI Class non-distributing share - EUR10 April 2019 US Dollar Short Duration Bond Fund AI Class non-distributing share - EUR10 April 2019 US Dollar Short Duration Bond Fund AI Class non-distributing share - USD
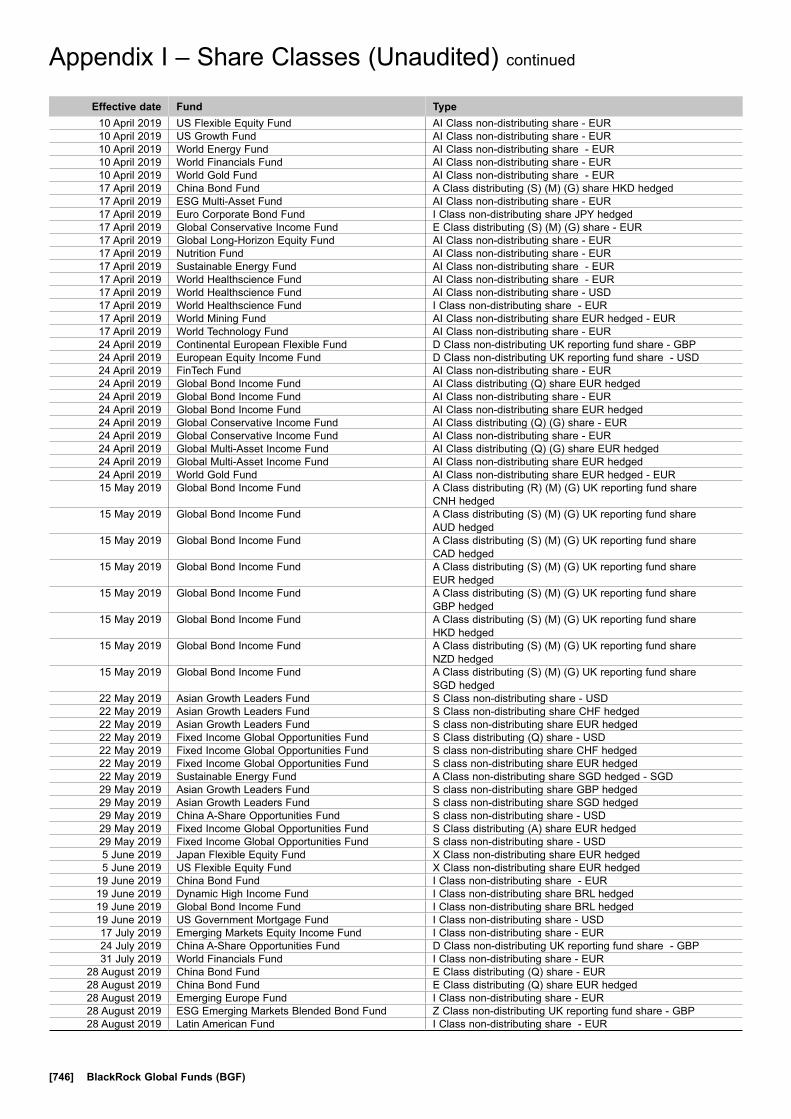
[746] BlackRock Global Funds (BGF)
Appendix I – Share Classes (Unaudited) continued
Effective date Fund Type10 April 2019 US Flexible Equity Fund AI Class non-distributing share - EUR10 April 2019 US Growth Fund AI Class non-distributing share - EUR10 April 2019 World Energy Fund AI Class non-distributing share - EUR10 April 2019 World Financials Fund AI Class non-distributing share - EUR10 April 2019 World Gold Fund AI Class non-distributing share - EUR17 April 2019 China Bond Fund A Class distributing (S) (M) (G) share HKD hedged17 April 2019 ESG Multi-Asset Fund AI Class non-distributing share - EUR17 April 2019 Euro Corporate Bond Fund I Class non-distributing share JPY hedged17 April 2019 Global Conservative Income Fund E Class distributing (S) (M) (G) share - EUR17 April 2019 Global Long-Horizon Equity Fund AI Class non-distributing share - EUR17 April 2019 Nutrition Fund AI Class non-distributing share - EUR17 April 2019 Sustainable Energy Fund AI Class non-distributing share - EUR17 April 2019 World Healthscience Fund AI Class non-distributing share - EUR17 April 2019 World Healthscience Fund AI Class non-distributing share - USD 17 April 2019 World Healthscience Fund I Class non-distributing share - EUR17 April 2019 World Mining Fund AI Class non-distributing share EUR hedged - EUR17 April 2019 World Technology Fund AI Class non-distributing share - EUR24 April 2019 Continental European Flexible Fund D Class non-distributing UK reporting fund share - GBP24 April 2019 European Equity Income Fund D Class non-distributing UK reporting fund share - USD24 April 2019 FinTech Fund AI Class non-distributing share - EUR24 April 2019 Global Bond Income Fund AI Class distributing (Q) share EUR hedged24 April 2019 Global Bond Income Fund AI Class non-distributing share - EUR24 April 2019 Global Bond Income Fund AI Class non-distributing share EUR hedged24 April 2019 Global Conservative Income Fund AI Class distributing (Q) (G) share - EUR24 April 2019 Global Conservative Income Fund AI Class non-distributing share - EUR24 April 2019 Global Multi-Asset Income Fund AI Class distributing (Q) (G) share EUR hedged24 April 2019 Global Multi-Asset Income Fund AI Class non-distributing share EUR hedged24 April 2019 World Gold Fund AI Class non-distributing share EUR hedged - EUR15 May 2019 Global Bond Income Fund A Class distributing (R) (M) (G) UK reporting fund share
CNH hedged15 May 2019 Global Bond Income Fund A Class distributing (S) (M) (G) UK reporting fund share
AUD hedged15 May 2019 Global Bond Income Fund A Class distributing (S) (M) (G) UK reporting fund share
CAD hedged15 May 2019 Global Bond Income Fund A Class distributing (S) (M) (G) UK reporting fund share
EUR hedged15 May 2019 Global Bond Income Fund A Class distributing (S) (M) (G) UK reporting fund share
GBP hedged15 May 2019 Global Bond Income Fund A Class distributing (S) (M) (G) UK reporting fund share
HKD hedged15 May 2019 Global Bond Income Fund A Class distributing (S) (M) (G) UK reporting fund share
NZD hedged15 May 2019 Global Bond Income Fund A Class distributing (S) (M) (G) UK reporting fund share
SGD hedged22 May 2019 Asian Growth Leaders Fund S Class non-distributing share - USD22 May 2019 Asian Growth Leaders Fund S Class non-distributing share CHF hedged22 May 2019 Asian Growth Leaders Fund S class non-distributing share EUR hedged22 May 2019 Fixed Income Global Opportunities Fund S Class distributing (Q) share - USD22 May 2019 Fixed Income Global Opportunities Fund S class non-distributing share CHF hedged22 May 2019 Fixed Income Global Opportunities Fund S class non-distributing share EUR hedged22 May 2019 Sustainable Energy Fund A Class non-distributing share SGD hedged - SGD29 May 2019 Asian Growth Leaders Fund S class non-distributing share GBP hedged29 May 2019 Asian Growth Leaders Fund S class non-distributing share SGD hedged29 May 2019 China A-Share Opportunities Fund S class non-distributing share - USD29 May 2019 Fixed Income Global Opportunities Fund S Class distributing (A) share EUR hedged29 May 2019 Fixed Income Global Opportunities Fund S class non-distributing share - USD5 June 2019 Japan Flexible Equity Fund X Class non-distributing share EUR hedged5 June 2019 US Flexible Equity Fund X Class non-distributing share EUR hedged
19 June 2019 China Bond Fund I Class non-distributing share - EUR19 June 2019 Dynamic High Income Fund I Class non-distributing share BRL hedged19 June 2019 Global Bond Income Fund I Class non-distributing share BRL hedged19 June 2019 US Government Mortgage Fund I Class non-distributing share - USD17 July 2019 Emerging Markets Equity Income Fund I Class non-distributing share - EUR24 July 2019 China A-Share Opportunities Fund D Class non-distributing UK reporting fund share - GBP31 July 2019 World Financials Fund I Class non-distributing share - EUR
28 August 2019 China Bond Fund E Class distributing (Q) share - EUR28 August 2019 China Bond Fund E Class distributing (Q) share EUR hedged28 August 2019 Emerging Europe Fund I Class non-distributing share - EUR28 August 2019 ESG Emerging Markets Blended Bond Fund Z Class non-distributing UK reporting fund share - GBP28 August 2019 Latin American Fund I Class non-distributing share - EUR

Annual Report and Audited Financial Statements [747]
Appendix I – Share Classes (Unaudited) continued
Share Classes In IssueAs at 31 August 2019, the Company offers the following share classes. For those Funds with more than one Dealing Currency, the additional Dealing Currency prices are calculated by converting the price at the relevant spot exchange rate at the time of valuation.
A ClassA Class distributing (A) (G) shareA Class distributing (A) (G) share CHF hedgedA Class distributing (A) (G) share EUR hedgedA Class distributing (A) shareA Class distributing (A) share EUR hedgedA Class distributing (A) UK reporting fund shareA Class distributing (A) UK reporting fund share GBP hedgedA Class distributing (A) UK reporting fund share USD hedgedA Class distributing (D) shareA Class distributing (D) share EUR hedgedA Class distributing (D) UK reporting fund shareA Class distributing (D) UK reporting fund share EUR hedgedA Class distributing (M) (G) shareA Class distributing (M) shareA Class distributing (M) share AUD hedgedA Class distributing (M) share CAD hedgedA Class distributing (M) share EUR hedgedA Class distributing (M) share GBP hedgedA Class distributing (M) share HKD hedgedA Class distributing (M) share NZD hedgedA Class distributing (M) share SGD hedgedA Class distributing (Q) (G) shareA Class distributing (Q) (G) share AUD hedgedA Class distributing (Q) (G) share EUR hedgedA Class distributing (Q) (G) share SGD hedgedA Class distributing (Q) (G) share USD hedgedA Class distributing (Q) (G) UK reporting fund shareA Class distributing (Q) shareA Class distributing (Q) share EUR hedgedA Class distributing (Q) share SGD hedgedA Class distributing (R) (M) (G) share AUD hedgedA Class distributing (R) (M) (G) share CAD hedgedA Class distributing (R) (M) (G) share CNH hedgedA Class distributing (R) (M) (G) share GBP hedgedA Class distributing (R) (M) (G) share NZD hedgedA Class distributing (R) (M) (G) share ZAR hedgedA Class distributing (R) (M) (G) UK reporting fund share CNH hedgedA Class distributing (S) (M) (G) shareA Class distributing (S) (M) (G) share AUD hedgedA Class distributing (S) (M) (G) share CAD hedgedA Class distributing (S) (M) (G) share CNH hedgedA Class distributing (S) (M) (G) share EUR hedgedA Class distributing (S) (M) (G) share GBP hedgedA Class distributing (S) (M) (G) share HKD hedgedA Class distributing (S) (M) (G) share SGD hedgedA Class distributing (S) (M) (G) share USD hedgedA Class distributing (S) (M) (G) UK reporting fund share AUD hedgedA Class distributing (S) (M) (G) UK reporting fund share CAD hedgedA Class distributing (S) (M) (G) UK reporting fund share EUR hedged
A Class continued A Class distributing (S) (M) (G) UK reporting fund share GBP hedgedA Class distributing (S) (M) (G) UK reporting fund share HKD hedgedA Class distributing (S) (M) (G) UK reporting fund share NZD hedgedA Class distributing (S) (M) (G) UK reporting fund share SGD hedgedA Class distributing (Y) (Q) (G) shareA Class non-distributing shareA Class non-distributing share AUD hedgedA Class non-distributing share CAD hedgedA Class non-distributing share CHF hedgedA Class non-distributing share CNH hedgedA Class non-distributing share EUR hedgedA Class non-distributing share GBP hedgedA Class non-distributing share HKDA Class non-distributing share HKD hedgedA Class non-distributing share JPY hedgedA Class non-distributing share NZD hedgedA Class non-distributing share PLN hedgedA Class non-distributing share SEK hedgedA Class non-distributing share SGD hedgedA Class non-distributing share USD hedgedA Class non-distributing UK reporting fund shareA Class non-distributing UK reporting fund share EUR hedgedA Class non-distributing UK reporting fund share GBP hedged
AI ClassAI Class distributing (Q) (G) shareAI Class distributing (Q) (G) share EUR hedgedAI Class distributing (Q) shareAI Class distributing (Q) share EUR hedgedAI Class non-distributing shareAI Class non-distributing share EUR hedged
C ClassC Class distributing (D) shareC Class distributing (D) share EUR hedgedC Class distributing (M) shareC Class distributing (Q) (G) shareC Class distributing (Q) (G) share SGD hedgedC Class distributing (Q) shareC Class distributing (S) (M) (G) shareC Class non-distributing shareC Class non-distributing share EUR hedgedC Class non-distributing share USD hedged
D ClassD Class distributing (A) (G) shareD Class distributing (A) (G) share CHF hedgedD Class distributing (A) (G) share EUR hedgedD Class distributing (A) (G) UK reporting fund shareD Class distributing (A) shareD Class distributing (A) share CAD hedgedD Class distributing (A) share EUR hedgedD Class distributing (A) UK reporting fund shareD Class distributing (A) UK reporting fund share GBP hedgedD Class distributing (A) UK reporting fund share USD hedgedD Class distributing (M) share

[748] BlackRock Global Funds (BGF)
Appendix I – Share Classes (Unaudited) continued
D Class continuedD Class distributing (M) share AUD hedgedD Class distributing (M) share EUR hedgedD Class distributing (M) share HKD hedgedD Class distributing (M) share SGD hedgedD Class distributing (M) UK reporting fund shareD Class distributing (M) UK reporting fund share GBP hedgedD Class distributing (Q) (G) shareD Class distributing (Q) (G) share EUR hedgedD Class distributing (Q) (G) share SGD hedgedD Class distributing (Q) (G) UK reporting fund shareD Class distributing (Q) (G) UK reporting fund share GBP hedgedD Class distributing (Q) shareD Class distributing (Q) share CHF hedgedD Class distributing (Q) share EUR hedgedD Class distributing (Q) share GBP hedgedD Class distributing (Q) UK reporting fund shareD Class distributing (Q) UK reporting fund share GBP HedgedD Class distributing (S) (M) (G) shareD Class distributing (S) (M) (G) share GBP hedgedD Class distributing (S) (M) (G) share USD hedgedD Class distributing (Y) (Q) (G) shareD Class non-distributing shareD Class non-distributing share AUD hedgedD Class non-distributing share CHF hedgedD Class non-distributing share EUR hedgedD Class non-distributing share GBP hedgedD Class non-distributing share HKDD Class non-distributing share PLN hedgedD Class non-distributing share SGD hedgedD Class non-distributing share USD hedgedD Class non-distributing UK reporting fund shareD Class non-distributing UK reporting fund share CHF hedgedD Class non-distributing UK reporting fund share EUR hedgedD Class non-distributing UK reporting fund share GBP hedgedD Class non-distributing UK reporting fund share USD hedged
E ClassE Class distributing (Q) (G) shareE Class distributing (Q) (G) share EUR hedgedE Class distributing (Q) shareE Class distributing (Q) share EUR hedgedE Class distributing (S) (M) (G) shareE Class distributing (Y) (Q) (G) shareE Class distributing (Y) (Q) (G) share EUR hedgedE Class non-distributing shareE Class non-distributing share EUR hedgedE Class non-distributing share GBP hedgedE Class non-distributing share PLN hedgedE Class non-distributing share USD hedged
I Class*I Class distributing (A) (G) shareI Class distributing (A) shareI Class distributing (A) share EUR hedgedI Class distributing (A) UK reporting fund shareI Class distributing (A) UK reporting fund share GBP hedgedI Class distributing (A) UK reporting fund share USD hedgedI Class distributing (M) (G) shareI Class distributing (M) share
I Class* continuedI Class distributing (M) share CAD hedgedI Class distributing (M) UK reporting fund share GBP hedgedI Class distributing (Q) (G) shareI Class distributing (Q) (G) share EUR hedgedI Class distributing (Q) shareI Class distributing (Q) share EUR hedgedI Class distributing (Q) share GBP hedgedI Class distributing (Q) share JPY hedgedI Class distributing (Q) UK reporting fund shareI Class distributing (S) (M) (G) shareI Class distributing (Y) (Q) (G) shareI Class non-distributing shareI Class non-distributing share AUD hedgedI Class non-distributing share BRL hedgedI Class non-distributing share CAD hedgedI Class non-distributing share CHF hedgedI Class non-distributing share EUR hedgedI Class non-distributing share GBP hedgedI Class non-distributing share JPY hedgedI Class non-distributing share SGD hedgedI Class non-distributing share USD hedgedI Class non-distributing UK reporting fund share CHF hedgedI Class non-distributing UK reporting fund share GBP hedged
J Class*J Class distributing (M) shareJ Class non-distributing share
S ClassS Class distributing (A) shareS Class distributing (A) share EUR hedgedS Class distributing (M) UK reporting fund share GBP hedged S Class distributing (Q) shareS Class non-distributing shareS Class non-distributing share CHF hedgedS class non-distributing share EUR hedgedS class non-distributing share GBP hedgedS class non-distributing share SGD hedged
SI ClassSI Class non-distributing shareSI Class non-distributing share USD hedged
X Class*X Class distributing (A) shareX Class distributing (A) share EUR hedgedX Class distributing (A) UK reporting fund shareX Class distributing (A) UK reporting fund share GBP hedgedX Class distributing (M) shareX Class distributing (M) share AUD hedgedX Class distributing (M) share EUR hedgedX Class distributing (Q) (G) share X Class distributing (Q) (G) share GBP hedged X Class distributing (Q) (G) UK reporting fund shareX Class distributing (Q) shareX Class distributing (Q) share CHF hedged X Class distributing (Q) share EUR hedgedX Class distributing (Q) share GBP hedgedX Class distributing (R) (M) (G) share AUD hedgedX Class distributing (S) (M) (G) shareX Class non-distributing shareX Class non-distributing share AUD hedgedX Class non-distributing share CAD hedged
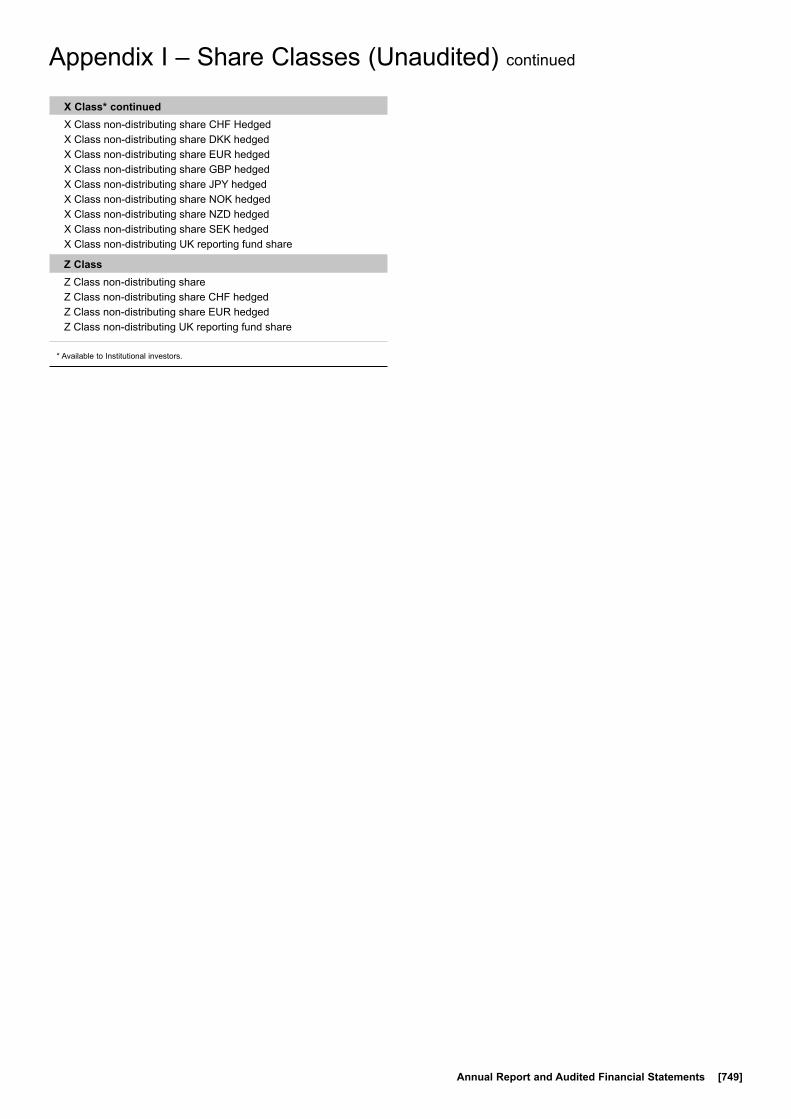
Annual Report and Audited Financial Statements [749]
Appendix I – Share Classes (Unaudited) continued
X Class* continuedX Class non-distributing share CHF HedgedX Class non-distributing share DKK hedgedX Class non-distributing share EUR hedgedX Class non-distributing share GBP hedgedX Class non-distributing share JPY hedgedX Class non-distributing share NOK hedgedX Class non-distributing share NZD hedgedX Class non-distributing share SEK hedgedX Class non-distributing UK reporting fund share
Z ClassZ Class non-distributing shareZ Class non-distributing share CHF hedgedZ Class non-distributing share EUR hedgedZ Class non-distributing UK reporting fund share
* Available to Institutional investors.
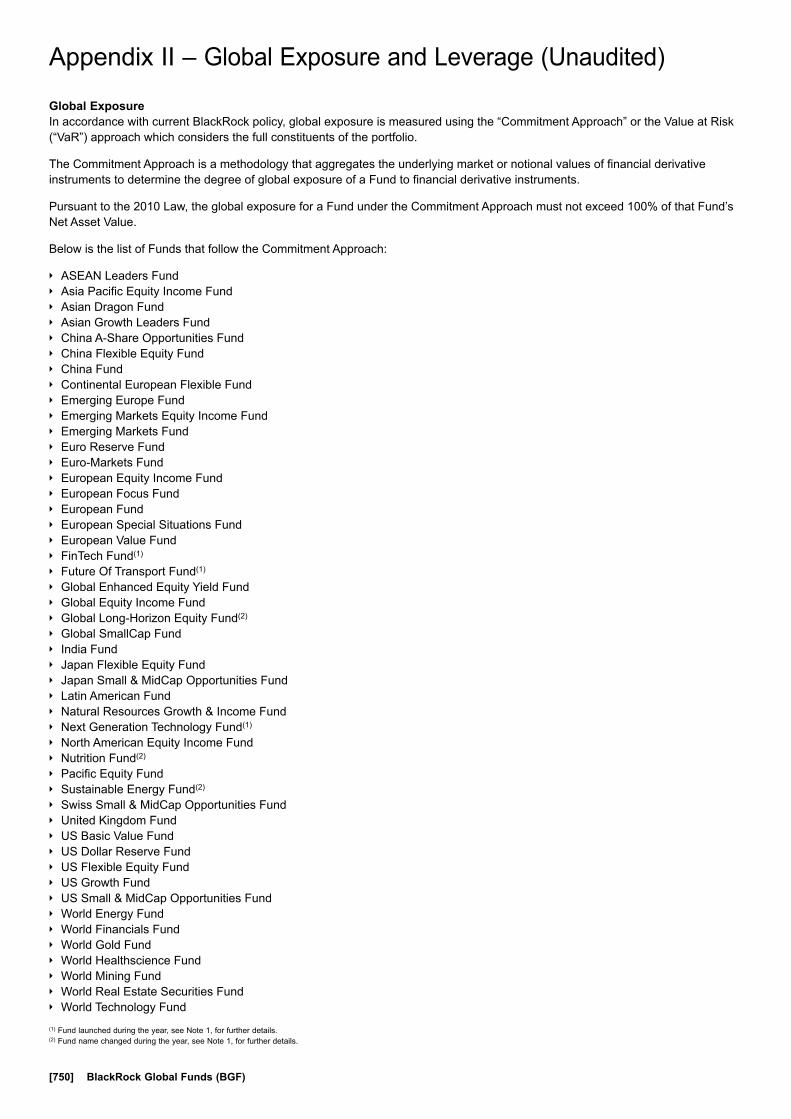
[750] BlackRock Global Funds (BGF)
Appendix II – Global Exposure and Leverage (Unaudited)
Appendix II – Global Exposure and Leverage (Unaudited)
Global ExposureIn accordance with current BlackRock policy, global exposure is measured using the “Commitment Approach” or the Value at Risk (“VaR”) approach which considers the full constituents of the portfolio.
The Commitment Approach is a methodology that aggregates the underlying market or notional values of financial derivative instruments to determine the degree of global exposure of a Fund to financial derivative instruments.
Pursuant to the 2010 Law, the global exposure for a Fund under the Commitment Approach must not exceed 100% of that Fund’s Net Asset Value.
Below is the list of Funds that follow the Commitment Approach:
} ASEAN Leaders Fund} Asia Pacific Equity Income Fund} Asian Dragon Fund} Asian Growth Leaders Fund} China A-Share Opportunities Fund} China Flexible Equity Fund} China Fund} Continental European Flexible Fund} Emerging Europe Fund} Emerging Markets Equity Income Fund} Emerging Markets Fund} Euro Reserve Fund} Euro-Markets Fund} European Equity Income Fund} European Focus Fund} European Fund} European Special Situations Fund} European Value Fund} FinTech Fund(1)
} Future Of Transport Fund(1)
} Global Enhanced Equity Yield Fund} Global Equity Income Fund} Global Long-Horizon Equity Fund(2)
} Global SmallCap Fund} India Fund} Japan Flexible Equity Fund} Japan Small & MidCap Opportunities Fund} Latin American Fund} Natural Resources Growth & Income Fund} Next Generation Technology Fund(1)
} North American Equity Income Fund} Nutrition Fund(2)
} Pacific Equity Fund} Sustainable Energy Fund(2)
} Swiss Small & MidCap Opportunities Fund} United Kingdom Fund} US Basic Value Fund} US Dollar Reserve Fund} US Flexible Equity Fund} US Growth Fund} US Small & MidCap Opportunities Fund} World Energy Fund} World Financials Fund} World Gold Fund} World Healthscience Fund} World Mining Fund} World Real Estate Securities Fund} World Technology Fund(1) Fund launched during the year, see Note 1, for further details.(2) Fund name changed during the year, see Note 1, for further details.
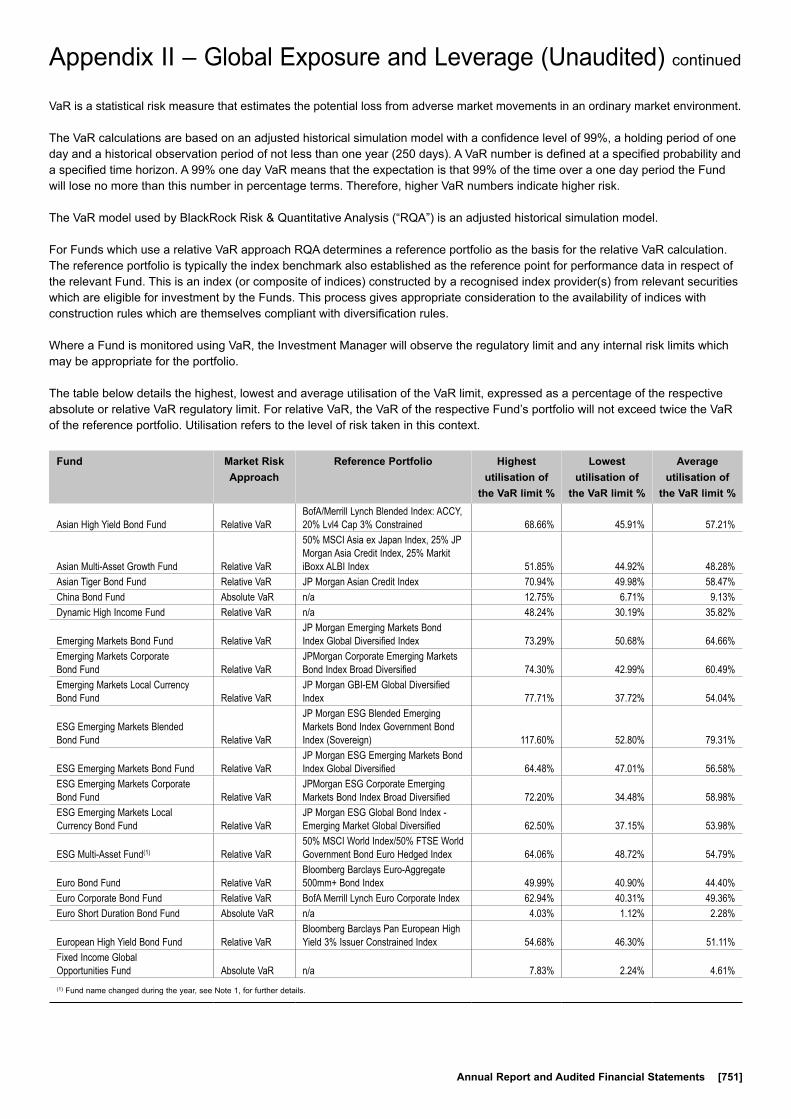
Annual Report and Audited Financial Statements [751]
Appendix II – Global Exposure and Leverage (Unaudited) continued
VaR is a statistical risk measure that estimates the potential loss from adverse market movements in an ordinary market environment.
The VaR calculations are based on an adjusted historical simulation model with a confidence level of 99%, a holding period of one day and a historical observation period of not less than one year (250 days). A VaR number is defined at a specified probability and a specified time horizon. A 99% one day VaR means that the expectation is that 99% of the time over a one day period the Fund will lose no more than this number in percentage terms. Therefore, higher VaR numbers indicate higher risk.
The VaR model used by BlackRock Risk & Quantitative Analysis (“RQA”) is an adjusted historical simulation model.
For Funds which use a relative VaR approach RQA determines a reference portfolio as the basis for the relative VaR calculation. The reference portfolio is typically the index benchmark also established as the reference point for performance data in respect of the relevant Fund. This is an index (or composite of indices) constructed by a recognised index provider(s) from relevant securities which are eligible for investment by the Funds. This process gives appropriate consideration to the availability of indices with construction rules which are themselves compliant with diversification rules.
Where a Fund is monitored using VaR, the Investment Manager will observe the regulatory limit and any internal risk limits which may be appropriate for the portfolio.
The table below details the highest, lowest and average utilisation of the VaR limit, expressed as a percentage of the respective absolute or relative VaR regulatory limit. For relative VaR, the VaR of the respective Fund’s portfolio will not exceed twice the VaR of the reference portfolio. Utilisation refers to the level of risk taken in this context.
Fund Market Risk Approach
Reference Portfolio Highest utilisation of
the VaR limit %
Lowest utilisation of
the VaR limit %
Average utilisation of
the VaR limit %
Asian High Yield Bond Fund Relative VaRBofA/Merrill Lynch Blended Index: ACCY, 20% Lvl4 Cap 3% Constrained 68.66% 45.91% 57.21%
Asian Multi-Asset Growth Fund Relative VaR
50% MSCI Asia ex Japan Index, 25% JP Morgan Asia Credit Index, 25% Markit iBoxx ALBI Index 51.85% 44.92% 48.28%
Asian Tiger Bond Fund Relative VaR JP Morgan Asian Credit Index 70.94% 49.98% 58.47%China Bond Fund Absolute VaR n/a 12.75% 6.71% 9.13%Dynamic High Income Fund Relative VaR n/a 48.24% 30.19% 35.82%
Emerging Markets Bond Fund Relative VaRJP Morgan Emerging Markets Bond Index Global Diversified Index 73.29% 50.68% 64.66%
Emerging Markets Corporate Bond Fund Relative VaR
JPMorgan Corporate Emerging Markets Bond Index Broad Diversified 74.30% 42.99% 60.49%
Emerging Markets Local Currency Bond Fund Relative VaR
JP Morgan GBI-EM Global Diversified Index 77.71% 37.72% 54.04%
ESG Emerging Markets Blended Bond Fund Relative VaR
JP Morgan ESG Blended Emerging Markets Bond Index Government Bond Index (Sovereign) 117.60% 52.80% 79.31%
ESG Emerging Markets Bond Fund Relative VaRJP Morgan ESG Emerging Markets Bond Index Global Diversified 64.48% 47.01% 56.58%
ESG Emerging Markets Corporate Bond Fund Relative VaR
JPMorgan ESG Corporate Emerging Markets Bond Index Broad Diversified 72.20% 34.48% 58.98%
ESG Emerging Markets Local Currency Bond Fund Relative VaR
JP Morgan ESG Global Bond Index - Emerging Market Global Diversified 62.50% 37.15% 53.98%
ESG Multi-Asset Fund(1) Relative VaR50% MSCI World Index/50% FTSE World Government Bond Euro Hedged Index 64.06% 48.72% 54.79%
Euro Bond Fund Relative VaRBloomberg Barclays Euro-Aggregate 500mm+ Bond Index 49.99% 40.90% 44.40%
Euro Corporate Bond Fund Relative VaR BofA Merrill Lynch Euro Corporate Index 62.94% 40.31% 49.36%Euro Short Duration Bond Fund Absolute VaR n/a 4.03% 1.12% 2.28%
European High Yield Bond Fund Relative VaRBloomberg Barclays Pan European High Yield 3% Issuer Constrained Index 54.68% 46.30% 51.11%
Fixed Income Global Opportunities Fund Absolute VaR n/a 7.83% 2.24% 4.61%(1) Fund name changed during the year, see Note 1, for further details.

[752] BlackRock Global Funds (BGF)
Appendix II – Global Exposure and Leverage (Unaudited) continued
Fund Market Risk Approach
Reference Portfolio Highest utilisation of
the VaR limit %
Lowest utilisation of
the VaR limit %
Average utilisation of
the VaR limit %
Global Allocation Fund Relative VaR
36% S&P 500 Index, 24% FTSE World Index (Ex-US) Index, 24% ICE BofAML Current 5Yr US Treasury Index, 16% FTSE Non-USD World Government Bond Index 55.10% 39.21% 44.35%
Global Bond Income Fund Absolute VaR n/a 6.49% 2.24% 4.75%
Global Conservative Income Fund(2) Relative VaR
30% MSCI World Index EUR Hedged/ 70% Bloomberg Barclays Global Aggregate Bond Index EUR Hedged 19.38% 8.95% 11.46%
Global Corporate Bond Fund Relative VaRBloomberg Barclays Global Aggregate Corporate Bond USD Hedged Index 60.79% 46.99% 53.34%
Global Dynamic Equity Fund Relative VaR60% S&P 500 Index, 40% FTSE World (ex US) Index 55.53% 44.47% 48.56%
Global Government Bond Fund Relative VaRFTSE World Government Bond USD Hedged Index 58.96% 39.12% 52.15%
Global High Yield Bond Fund Relative VaRBofA Merrill Lynch Global High Yield Constrained USD Hedged Index 87.28% 46.04% 52.99%
Global Inflation Linked Bond Fund Relative VaR
Bloomberg Barclays World Government Inflation-Linked 1-20yr Index USD Hedged 53.74% 42.67% 48.06%
Global Multi-Asset Income Fund Relative VaR n/a 37.05% 23.91% 29.15%Market Navigator Fund(2) Absolute VaR n/a 28.19% 15.21% 20.63%Strategic Global Bond Fund(3) Absolute VaR n/a 8.95% 0.00% 5.82%US Dollar Bond Fund Relative VaR Bloomberg Barclays US Aggregate Index 54.53% 45.23% 50.11%
US Dollar High Yield Bond Fund Relative VaRBloomberg Barclays US High Yield 2% Constrained Index 71.61% 45.83% 51.91%
US Dollar Short Duration Bond Fund Absolute VaR n/a 5.82% 2.01% 3.33%US Government Mortgage Fund Relative VaR FTSE Mortgage Index 54.53% 36.35% 47.19%
World Bond Fund Relative VaRBloomberg Barclays Global Aggregate USD Hedged Index 64.79% 46.41% 56.89%
(2) Fund launched during the year, see Note 1, for further details.(3) Fund terminated during the year, see Note 1, for further details.
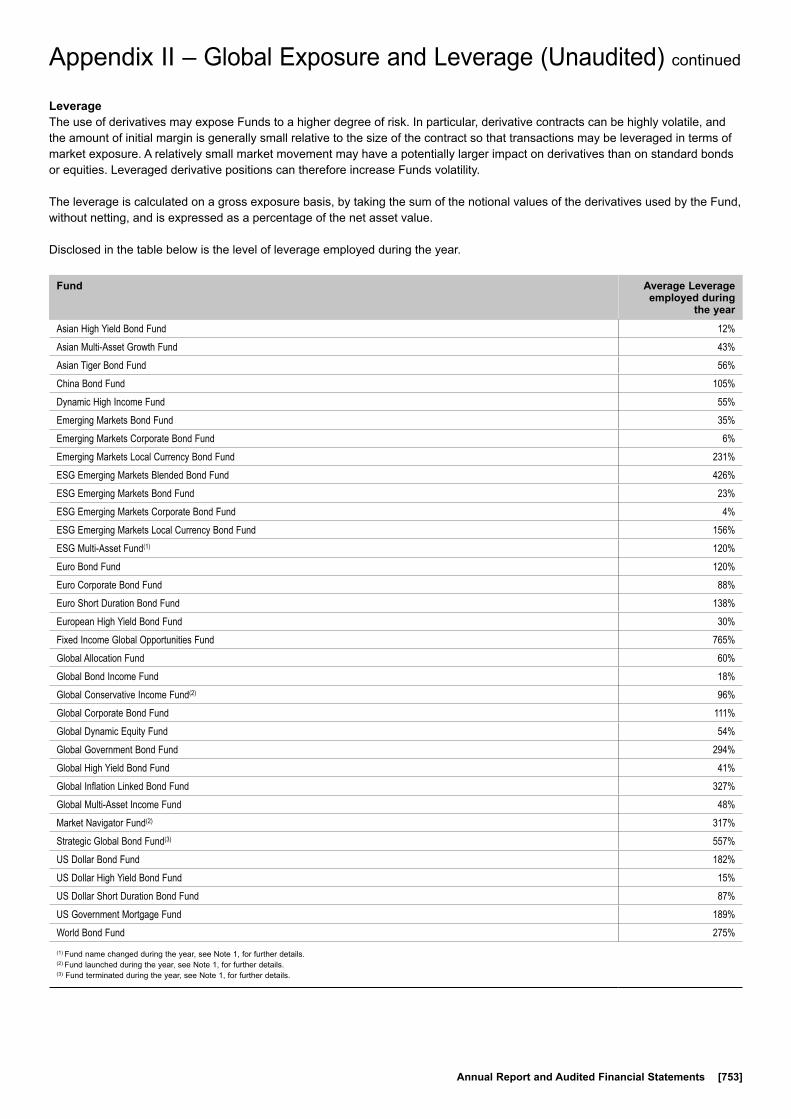
Annual Report and Audited Financial Statements [753]
Appendix II – Global Exposure and Leverage (Unaudited) continued
LeverageThe use of derivatives may expose Funds to a higher degree of risk. In particular, derivative contracts can be highly volatile, and the amount of initial margin is generally small relative to the size of the contract so that transactions may be leveraged in terms of market exposure. A relatively small market movement may have a potentially larger impact on derivatives than on standard bonds or equities. Leveraged derivative positions can therefore increase Funds volatility.
The leverage is calculated on a gross exposure basis, by taking the sum of the notional values of the derivatives used by the Fund, without netting, and is expressed as a percentage of the net asset value.
Disclosed in the table below is the level of leverage employed during the year.
Fund Average Leverage employed during
the year
Asian High Yield Bond Fund 12%Asian Multi-Asset Growth Fund 43%Asian Tiger Bond Fund 56%China Bond Fund 105%Dynamic High Income Fund 55%Emerging Markets Bond Fund 35%Emerging Markets Corporate Bond Fund 6%Emerging Markets Local Currency Bond Fund 231%ESG Emerging Markets Blended Bond Fund 426%ESG Emerging Markets Bond Fund 23%ESG Emerging Markets Corporate Bond Fund 4%ESG Emerging Markets Local Currency Bond Fund 156%ESG Multi-Asset Fund(1) 120%Euro Bond Fund 120%Euro Corporate Bond Fund 88%Euro Short Duration Bond Fund 138%European High Yield Bond Fund 30%Fixed Income Global Opportunities Fund 765%Global Allocation Fund 60%Global Bond Income Fund 18%Global Conservative Income Fund(2) 96%Global Corporate Bond Fund 111%Global Dynamic Equity Fund 54%Global Government Bond Fund 294%Global High Yield Bond Fund 41%Global Inflation Linked Bond Fund 327%Global Multi-Asset Income Fund 48%Market Navigator Fund(2) 317%Strategic Global Bond Fund(3) 557%US Dollar Bond Fund 182%US Dollar High Yield Bond Fund 15%US Dollar Short Duration Bond Fund 87%US Government Mortgage Fund 189%World Bond Fund 275%(1) Fund name changed during the year, see Note 1, for further details.(2) Fund launched during the year, see Note 1, for further details.(3) Fund terminated during the year, see Note 1, for further details.

[754] BlackRock Global Funds (BGF)
Appendix III – Eligibility for French “Plan d’Epargne en Actions” (“PEA”) (Unaudited)A PEA is a French equity savings plan intended to encourage French tax resident individuals to invest in European equities. PEA eligible funds must invest on a permanent basis at least 75 % of their assets in PEA eligible securities issued by companies (i) established in a Member State of the European Union or in Iceland, Liechtenstein or Norway and (ii) subject to corporate income tax, or an equivalent tax.
Throughout the year ended 31 August 2019, the Funds listed below invested more than 75 % of their total net assets in PEA eligible securities.
As at 31 August 2019, the below Funds had the following percentage of their total net assets invested in eligible PEA securities:
Fund % Invested in PEA eligible securities
Euro-Markets Fund 90.50European Focus Fund 78.90European Fund 76.24European Special Situations Fund 82.07European Value Fund 79.33
The PEA eligibility of these Funds results from, to the best knowledge of the Company, tax law and practices in force in France as at 31 August 2019. Such tax law and practices may change from time to time and, therefore, the Funds which may currently be held within the framework of a PEA could lose their PEA eligibility. Further the Funds could lose their PEA eligibility due to changes impacting their investment universe or benchmark index. In such circumstances, investors will be informed by the publication of a notice on the website of the Company. In such a case, the investors should seek professional tax and financial advice.
Appendix III – Eligibility for French “Plan d’Epargne en Actions” (“PEA”) (Unaudited)
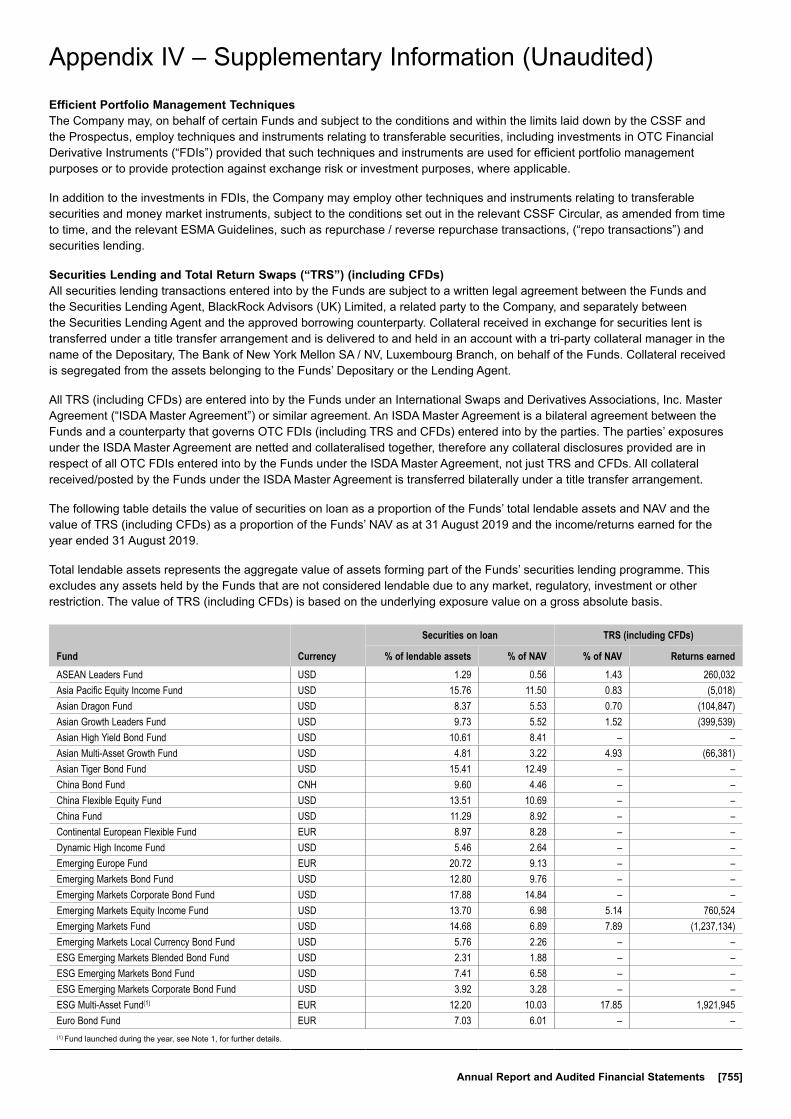
Annual Report and Audited Financial Statements [755]
Appendix IV – Supplementary Information (Unaudited)
Efficient Portfolio Management TechniquesThe Company may, on behalf of certain Funds and subject to the conditions and within the limits laid down by the CSSF and the Prospectus, employ techniques and instruments relating to transferable securities, including investments in OTC Financial Derivative Instruments (“FDIs”) provided that such techniques and instruments are used for efficient portfolio management purposes or to provide protection against exchange risk or investment purposes, where applicable.
In addition to the investments in FDIs, the Company may employ other techniques and instruments relating to transferable securities and money market instruments, subject to the conditions set out in the relevant CSSF Circular, as amended from time to time, and the relevant ESMA Guidelines, such as repurchase / reverse repurchase transactions, (“repo transactions”) and securities lending.
Securities Lending and Total Return Swaps (“TRS”) (including CFDs)All securities lending transactions entered into by the Funds are subject to a written legal agreement between the Funds and the Securities Lending Agent, BlackRock Advisors (UK) Limited, a related party to the Company, and separately between the Securities Lending Agent and the approved borrowing counterparty. Collateral received in exchange for securities lent is transferred under a title transfer arrangement and is delivered to and held in an account with a tri-party collateral manager in the name of the Depositary, The Bank of New York Mellon SA / NV, Luxembourg Branch, on behalf of the Funds. Collateral received is segregated from the assets belonging to the Funds’ Depositary or the Lending Agent.
All TRS (including CFDs) are entered into by the Funds under an International Swaps and Derivatives Associations, Inc. Master Agreement (“ISDA Master Agreement”) or similar agreement. An ISDA Master Agreement is a bilateral agreement between the Funds and a counterparty that governs OTC FDIs (including TRS and CFDs) entered into by the parties. The parties’ exposures under the ISDA Master Agreement are netted and collateralised together, therefore any collateral disclosures provided are in respect of all OTC FDIs entered into by the Funds under the ISDA Master Agreement, not just TRS and CFDs. All collateral received/posted by the Funds under the ISDA Master Agreement is transferred bilaterally under a title transfer arrangement.
The following table details the value of securities on loan as a proportion of the Funds’ total lendable assets and NAV and the value of TRS (including CFDs) as a proportion of the Funds’ NAV as at 31 August 2019 and the income/returns earned for the year ended 31 August 2019.
Total lendable assets represents the aggregate value of assets forming part of the Funds’ securities lending programme. This excludes any assets held by the Funds that are not considered lendable due to any market, regulatory, investment or other restriction. The value of TRS (including CFDs) is based on the underlying exposure value on a gross absolute basis.
Fund Currency
Securities on loan TRS (including CFDs)
% of lendable assets % of NAV % of NAV Returns earnedASEAN Leaders Fund USD 1.29 0.56 1.43 260,032Asia Pacific Equity Income Fund USD 15.76 11.50 0.83 (5,018)Asian Dragon Fund USD 8.37 5.53 0.70 (104,847)Asian Growth Leaders Fund USD 9.73 5.52 1.52 (399,539)Asian High Yield Bond Fund USD 10.61 8.41 – –Asian Multi-Asset Growth Fund USD 4.81 3.22 4.93 (66,381)Asian Tiger Bond Fund USD 15.41 12.49 – –China Bond Fund CNH 9.60 4.46 – –China Flexible Equity Fund USD 13.51 10.69 – –China Fund USD 11.29 8.92 – –Continental European Flexible Fund EUR 8.97 8.28 – –Dynamic High Income Fund USD 5.46 2.64 – –Emerging Europe Fund EUR 20.72 9.13 – –Emerging Markets Bond Fund USD 12.80 9.76 – –Emerging Markets Corporate Bond Fund USD 17.88 14.84 – –Emerging Markets Equity Income Fund USD 13.70 6.98 5.14 760,524Emerging Markets Fund USD 14.68 6.89 7.89 (1,237,134)Emerging Markets Local Currency Bond Fund USD 5.76 2.26 – –ESG Emerging Markets Blended Bond Fund USD 2.31 1.88 – –ESG Emerging Markets Bond Fund USD 7.41 6.58 – –ESG Emerging Markets Corporate Bond Fund USD 3.92 3.28 – –ESG Multi-Asset Fund(1) EUR 12.20 10.03 17.85 1,921,945Euro Bond Fund EUR 7.03 6.01 – –(1) Fund launched during the year, see Note 1, for further details.
Appendix IV – Supplementary Information (Unaudited)
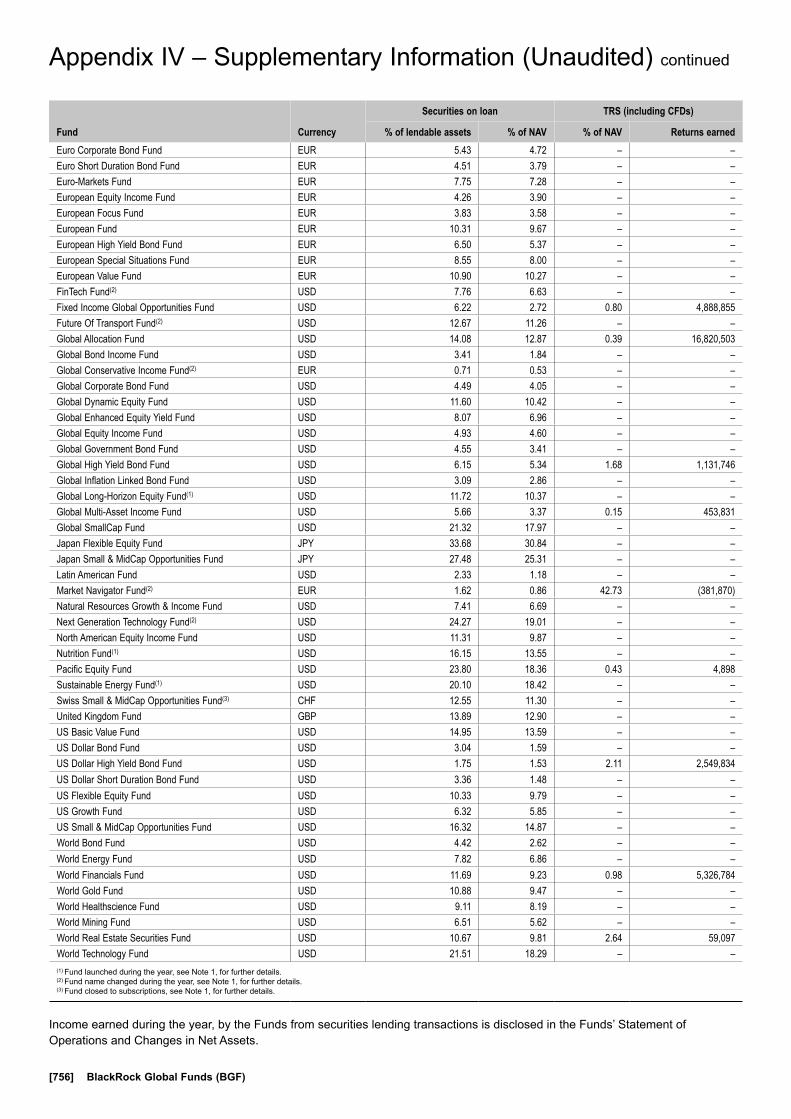
[756] BlackRock Global Funds (BGF)
Appendix IV – Supplementary Information (Unaudited) continued
Fund Currency
Securities on loan TRS (including CFDs)
% of lendable assets % of NAV % of NAV Returns earnedEuro Corporate Bond Fund EUR 5.43 4.72 – –Euro Short Duration Bond Fund EUR 4.51 3.79 – –Euro-Markets Fund EUR 7.75 7.28 – –European Equity Income Fund EUR 4.26 3.90 – –European Focus Fund EUR 3.83 3.58 – –European Fund EUR 10.31 9.67 – –European High Yield Bond Fund EUR 6.50 5.37 – –European Special Situations Fund EUR 8.55 8.00 – –European Value Fund EUR 10.90 10.27 – –FinTech Fund(2) USD 7.76 6.63 – –Fixed Income Global Opportunities Fund USD 6.22 2.72 0.80 4,888,855Future Of Transport Fund(2) USD 12.67 11.26 – –Global Allocation Fund USD 14.08 12.87 0.39 16,820,503Global Bond Income Fund USD 3.41 1.84 – –Global Conservative Income Fund(2) EUR 0.71 0.53 – –Global Corporate Bond Fund USD 4.49 4.05 – –Global Dynamic Equity Fund USD 11.60 10.42 – –Global Enhanced Equity Yield Fund USD 8.07 6.96 – –Global Equity Income Fund USD 4.93 4.60 – –Global Government Bond Fund USD 4.55 3.41 – –Global High Yield Bond Fund USD 6.15 5.34 1.68 1,131,746Global Inflation Linked Bond Fund USD 3.09 2.86 – –Global Long-Horizon Equity Fund(1) USD 11.72 10.37 – –Global Multi-Asset Income Fund USD 5.66 3.37 0.15 453,831Global SmallCap Fund USD 21.32 17.97 – –Japan Flexible Equity Fund JPY 33.68 30.84 – –Japan Small & MidCap Opportunities Fund JPY 27.48 25.31 – –Latin American Fund USD 2.33 1.18 – –Market Navigator Fund(2) EUR 1.62 0.86 42.73 (381,870)Natural Resources Growth & Income Fund USD 7.41 6.69 – –Next Generation Technology Fund(2) USD 24.27 19.01 – –North American Equity Income Fund USD 11.31 9.87 – –Nutrition Fund(1) USD 16.15 13.55 – –Pacific Equity Fund USD 23.80 18.36 0.43 4,898Sustainable Energy Fund(1) USD 20.10 18.42 – –Swiss Small & MidCap Opportunities Fund(3) CHF 12.55 11.30 – –United Kingdom Fund GBP 13.89 12.90 – –US Basic Value Fund USD 14.95 13.59 – –US Dollar Bond Fund USD 3.04 1.59 – –US Dollar High Yield Bond Fund USD 1.75 1.53 2.11 2,549,834US Dollar Short Duration Bond Fund USD 3.36 1.48 – –US Flexible Equity Fund USD 10.33 9.79 – –US Growth Fund USD 6.32 5.85 – –US Small & MidCap Opportunities Fund USD 16.32 14.87 – –World Bond Fund USD 4.42 2.62 – –World Energy Fund USD 7.82 6.86 – –World Financials Fund USD 11.69 9.23 0.98 5,326,784World Gold Fund USD 10.88 9.47 – –World Healthscience Fund USD 9.11 8.19 – –World Mining Fund USD 6.51 5.62 – –World Real Estate Securities Fund USD 10.67 9.81 2.64 59,097World Technology Fund USD 21.51 18.29 – –(1) Fund launched during the year, see Note 1, for further details.(2) Fund name changed during the year, see Note 1, for further details.(3) Fund closed to subscriptions, see Note 1, for further details.
Income earned during the year, by the Funds from securities lending transactions is disclosed in the Funds’ Statement of Operations and Changes in Net Assets.
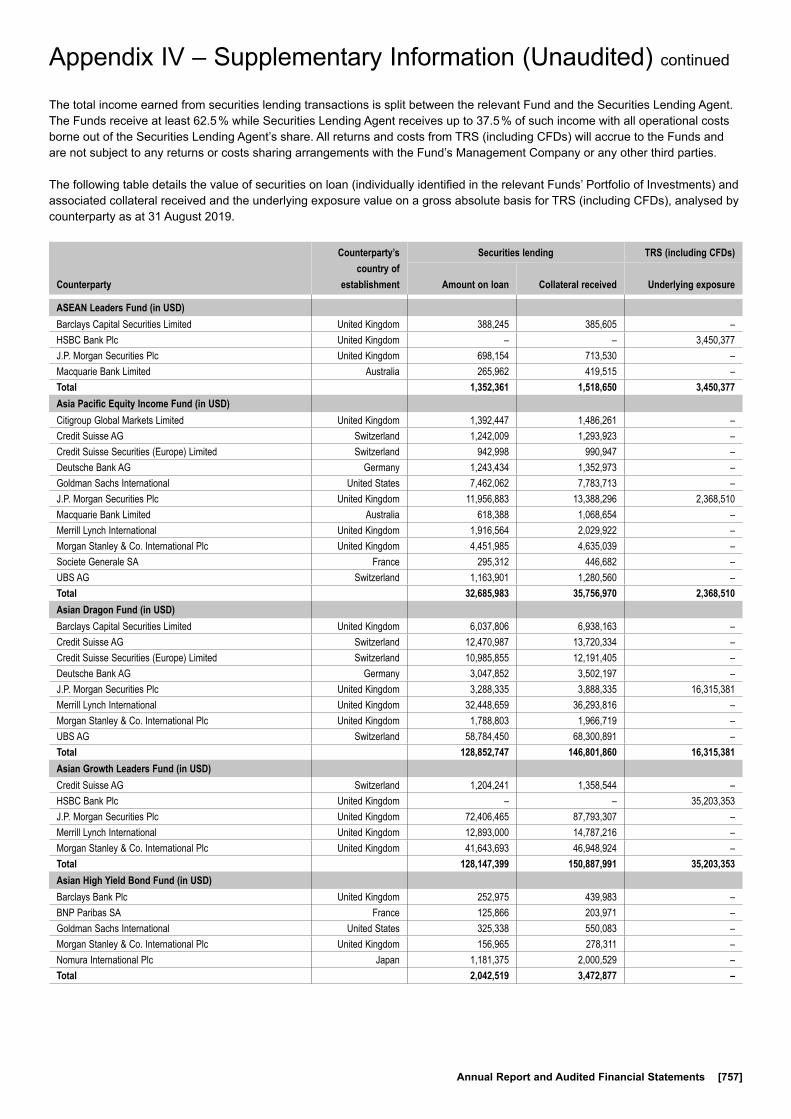
Annual Report and Audited Financial Statements [757]
Appendix IV – Supplementary Information (Unaudited) continued
The total income earned from securities lending transactions is split between the relevant Fund and the Securities Lending Agent. The Funds receive at least 62.5 % while Securities Lending Agent receives up to 37.5 % of such income with all operational costs borne out of the Securities Lending Agent’s share. All returns and costs from TRS (including CFDs) will accrue to the Funds and are not subject to any returns or costs sharing arrangements with the Fund’s Management Company or any other third parties.
The following table details the value of securities on loan (individually identified in the relevant Funds’ Portfolio of Investments) and associated collateral received and the underlying exposure value on a gross absolute basis for TRS (including CFDs), analysed by counterparty as at 31 August 2019.
Counterparty
Counterparty’s country of
establishment
Securities lending TRS (including CFDs)
Amount on loan Collateral received Underlying exposure
ASEAN Leaders Fund (in USD) Barclays Capital Securities Limited United Kingdom 388,245 385,605 –HSBC Bank Plc United Kingdom – – 3,450,377 J.P. Morgan Securities Plc United Kingdom 698,154 713,530 –Macquarie Bank Limited Australia 265,962 419,515 –Total 1,352,361 1,518,650 3,450,377 Asia Pacific Equity Income Fund (in USD) Citigroup Global Markets Limited United Kingdom 1,392,447 1,486,261 –Credit Suisse AG Switzerland 1,242,009 1,293,923 –Credit Suisse Securities (Europe) Limited Switzerland 942,998 990,947 –Deutsche Bank AG Germany 1,243,434 1,352,973 –Goldman Sachs International United States 7,462,062 7,783,713 –J.P. Morgan Securities Plc United Kingdom 11,956,883 13,388,296 2,368,510 Macquarie Bank Limited Australia 618,388 1,068,654 –Merrill Lynch International United Kingdom 1,916,564 2,029,922 –Morgan Stanley & Co. International Plc United Kingdom 4,451,985 4,635,039 –Societe Generale SA France 295,312 446,682 –UBS AG Switzerland 1,163,901 1,280,560 –Total 32,685,983 35,756,970 2,368,510 Asian Dragon Fund (in USD) Barclays Capital Securities Limited United Kingdom 6,037,806 6,938,163 –Credit Suisse AG Switzerland 12,470,987 13,720,334 –Credit Suisse Securities (Europe) Limited Switzerland 10,985,855 12,191,405 –Deutsche Bank AG Germany 3,047,852 3,502,197 –J.P. Morgan Securities Plc United Kingdom 3,288,335 3,888,335 16,315,381 Merrill Lynch International United Kingdom 32,448,659 36,293,816 –Morgan Stanley & Co. International Plc United Kingdom 1,788,803 1,966,719 –UBS AG Switzerland 58,784,450 68,300,891 –Total 128,852,747 146,801,860 16,315,381 Asian Growth Leaders Fund (in USD) Credit Suisse AG Switzerland 1,204,241 1,358,544 –HSBC Bank Plc United Kingdom – – 35,203,353 J.P. Morgan Securities Plc United Kingdom 72,406,465 87,793,307 –Merrill Lynch International United Kingdom 12,893,000 14,787,216 –Morgan Stanley & Co. International Plc United Kingdom 41,643,693 46,948,924 –Total 128,147,399 150,887,991 35,203,353 Asian High Yield Bond Fund (in USD)Barclays Bank Plc United Kingdom 252,975 439,983 –BNP Paribas SA France 125,866 203,971 –Goldman Sachs International United States 325,338 550,083 –Morgan Stanley & Co. International Plc United Kingdom 156,965 278,311 –Nomura International Plc Japan 1,181,375 2,000,529 –Total 2,042,519 3,472,877 –
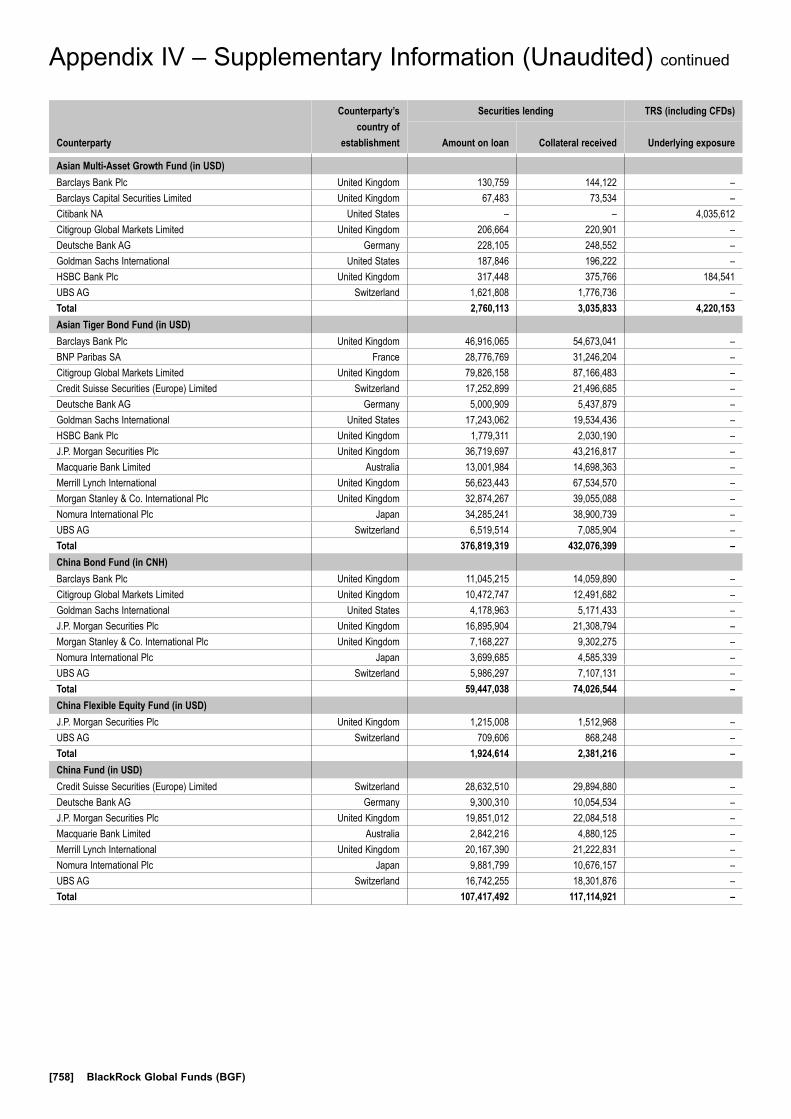
[758] BlackRock Global Funds (BGF)
Counterparty
Counterparty’s country of
establishment
Securities lending TRS (including CFDs)
Amount on loan Collateral received Underlying exposure
Asian Multi-Asset Growth Fund (in USD)Barclays Bank Plc United Kingdom 130,759 144,122 –Barclays Capital Securities Limited United Kingdom 67,483 73,534 –Citibank NA United States – – 4,035,612 Citigroup Global Markets Limited United Kingdom 206,664 220,901 –Deutsche Bank AG Germany 228,105 248,552 –Goldman Sachs International United States 187,846 196,222 –HSBC Bank Plc United Kingdom 317,448 375,766 184,541UBS AG Switzerland 1,621,808 1,776,736 –Total 2,760,113 3,035,833 4,220,153 Asian Tiger Bond Fund (in USD)Barclays Bank Plc United Kingdom 46,916,065 54,673,041 –BNP Paribas SA France 28,776,769 31,246,204 –Citigroup Global Markets Limited United Kingdom 79,826,158 87,166,483 –Credit Suisse Securities (Europe) Limited Switzerland 17,252,899 21,496,685 –Deutsche Bank AG Germany 5,000,909 5,437,879 –Goldman Sachs International United States 17,243,062 19,534,436 –HSBC Bank Plc United Kingdom 1,779,311 2,030,190 –J.P. Morgan Securities Plc United Kingdom 36,719,697 43,216,817 –Macquarie Bank Limited Australia 13,001,984 14,698,363 –Merrill Lynch International United Kingdom 56,623,443 67,534,570 –Morgan Stanley & Co. International Plc United Kingdom 32,874,267 39,055,088 –Nomura International Plc Japan 34,285,241 38,900,739 –UBS AG Switzerland 6,519,514 7,085,904 –Total 376,819,319 432,076,399 –China Bond Fund (in CNH)Barclays Bank Plc United Kingdom 11,045,215 14,059,890 –Citigroup Global Markets Limited United Kingdom 10,472,747 12,491,682 –Goldman Sachs International United States 4,178,963 5,171,433 –J.P. Morgan Securities Plc United Kingdom 16,895,904 21,308,794 –Morgan Stanley & Co. International Plc United Kingdom 7,168,227 9,302,275 –Nomura International Plc Japan 3,699,685 4,585,339 –UBS AG Switzerland 5,986,297 7,107,131 –Total 59,447,038 74,026,544 –China Flexible Equity Fund (in USD)J.P. Morgan Securities Plc United Kingdom 1,215,008 1,512,968 –UBS AG Switzerland 709,606 868,248 –Total 1,924,614 2,381,216 –China Fund (in USD)Credit Suisse Securities (Europe) Limited Switzerland 28,632,510 29,894,880 –Deutsche Bank AG Germany 9,300,310 10,054,534 –J.P. Morgan Securities Plc United Kingdom 19,851,012 22,084,518 –Macquarie Bank Limited Australia 2,842,216 4,880,125 –Merrill Lynch International United Kingdom 20,167,390 21,222,831 –Nomura International Plc Japan 9,881,799 10,676,157 –UBS AG Switzerland 16,742,255 18,301,876 –Total 107,417,492 117,114,921 –
Appendix IV – Supplementary Information (Unaudited) continued
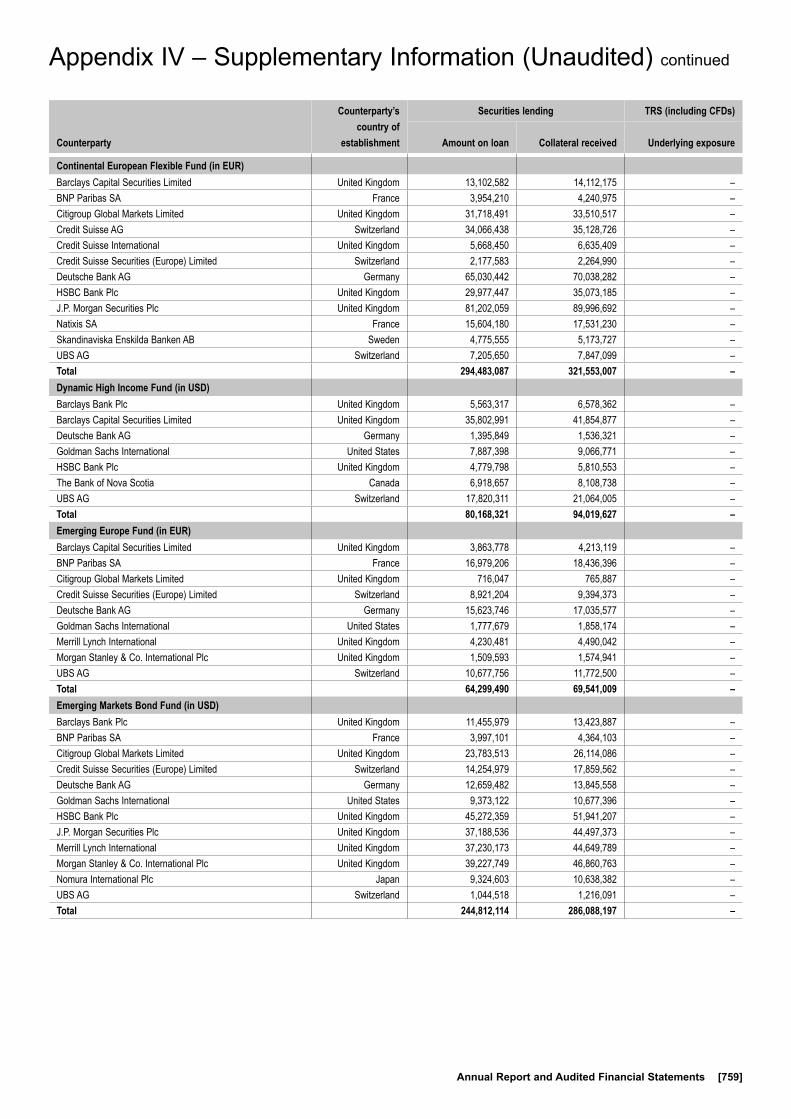
Annual Report and Audited Financial Statements [759]
Appendix IV – Supplementary Information (Unaudited) continued
Counterparty
Counterparty’s country of
establishment
Securities lending TRS (including CFDs)
Amount on loan Collateral received Underlying exposure
Continental European Flexible Fund (in EUR)Barclays Capital Securities Limited United Kingdom 13,102,582 14,112,175 –BNP Paribas SA France 3,954,210 4,240,975 –Citigroup Global Markets Limited United Kingdom 31,718,491 33,510,517 –Credit Suisse AG Switzerland 34,066,438 35,128,726 –Credit Suisse International United Kingdom 5,668,450 6,635,409 –Credit Suisse Securities (Europe) Limited Switzerland 2,177,583 2,264,990 –Deutsche Bank AG Germany 65,030,442 70,038,282 –HSBC Bank Plc United Kingdom 29,977,447 35,073,185 –J.P. Morgan Securities Plc United Kingdom 81,202,059 89,996,692 –Natixis SA France 15,604,180 17,531,230 –Skandinaviska Enskilda Banken AB Sweden 4,775,555 5,173,727 –UBS AG Switzerland 7,205,650 7,847,099 –Total 294,483,087 321,553,007 –Dynamic High Income Fund (in USD)Barclays Bank Plc United Kingdom 5,563,317 6,578,362 –Barclays Capital Securities Limited United Kingdom 35,802,991 41,854,877 –Deutsche Bank AG Germany 1,395,849 1,536,321 –Goldman Sachs International United States 7,887,398 9,066,771 –HSBC Bank Plc United Kingdom 4,779,798 5,810,553 –The Bank of Nova Scotia Canada 6,918,657 8,108,738 –UBS AG Switzerland 17,820,311 21,064,005 –Total 80,168,321 94,019,627 –Emerging Europe Fund (in EUR)Barclays Capital Securities Limited United Kingdom 3,863,778 4,213,119 –BNP Paribas SA France 16,979,206 18,436,396 –Citigroup Global Markets Limited United Kingdom 716,047 765,887 –Credit Suisse Securities (Europe) Limited Switzerland 8,921,204 9,394,373 –Deutsche Bank AG Germany 15,623,746 17,035,577 –Goldman Sachs International United States 1,777,679 1,858,174 –Merrill Lynch International United Kingdom 4,230,481 4,490,042 –Morgan Stanley & Co. International Plc United Kingdom 1,509,593 1,574,941 –UBS AG Switzerland 10,677,756 11,772,500 –Total 64,299,490 69,541,009 –Emerging Markets Bond Fund (in USD)Barclays Bank Plc United Kingdom 11,455,979 13,423,887 –BNP Paribas SA France 3,997,101 4,364,103 –Citigroup Global Markets Limited United Kingdom 23,783,513 26,114,086 –Credit Suisse Securities (Europe) Limited Switzerland 14,254,979 17,859,562 –Deutsche Bank AG Germany 12,659,482 13,845,558 –Goldman Sachs International United States 9,373,122 10,677,396 –HSBC Bank Plc United Kingdom 45,272,359 51,941,207 –J.P. Morgan Securities Plc United Kingdom 37,188,536 44,497,373 –Merrill Lynch International United Kingdom 37,230,173 44,649,789 –Morgan Stanley & Co. International Plc United Kingdom 39,227,749 46,860,763 –Nomura International Plc Japan 9,324,603 10,638,382 –UBS AG Switzerland 1,044,518 1,216,091 –Total 244,812,114 286,088,197 –
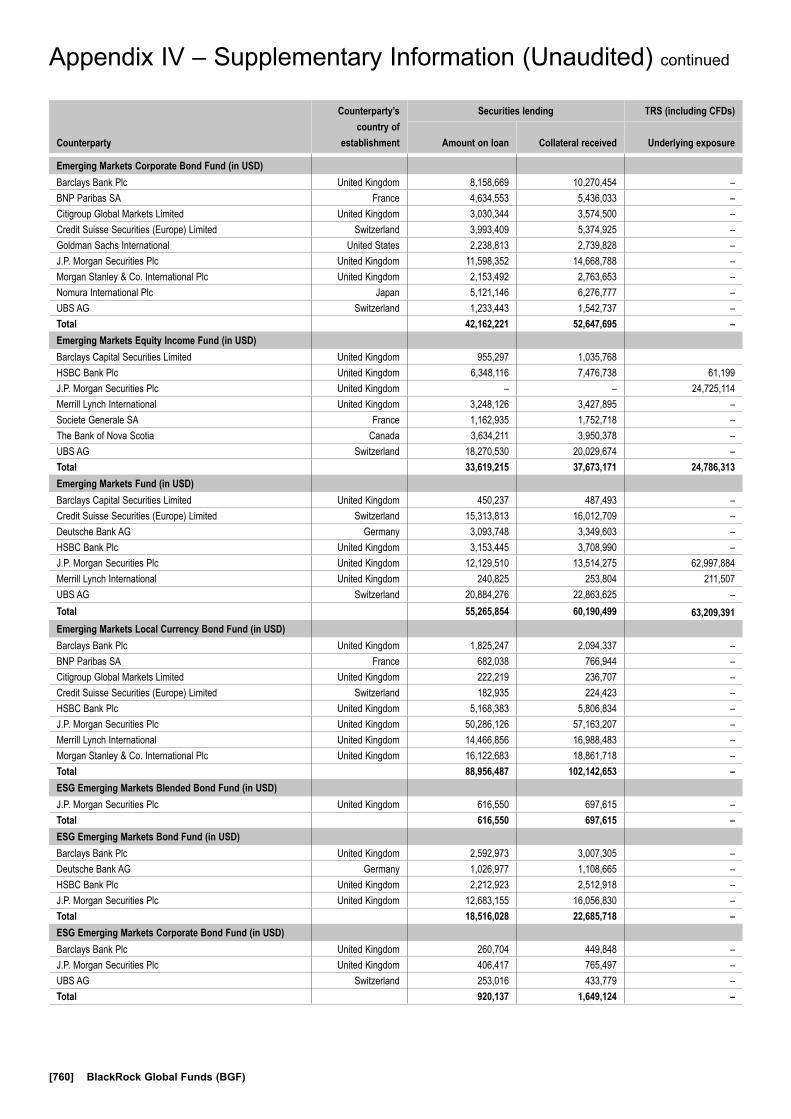
[760] BlackRock Global Funds (BGF)
Appendix IV – Supplementary Information (Unaudited) continued
Counterparty
Counterparty’s country of
establishment
Securities lending TRS (including CFDs)
Amount on loan Collateral received Underlying exposure
Emerging Markets Corporate Bond Fund (in USD)Barclays Bank Plc United Kingdom 8,158,669 10,270,454 –BNP Paribas SA France 4,634,553 5,436,033 –Citigroup Global Markets Limited United Kingdom 3,030,344 3,574,500 –Credit Suisse Securities (Europe) Limited Switzerland 3,993,409 5,374,925 –Goldman Sachs International United States 2,238,813 2,739,828 –J.P. Morgan Securities Plc United Kingdom 11,598,352 14,668,788 –Morgan Stanley & Co. International Plc United Kingdom 2,153,492 2,763,653 –Nomura International Plc Japan 5,121,146 6,276,777 –UBS AG Switzerland 1,233,443 1,542,737 –Total 42,162,221 52,647,695 –Emerging Markets Equity Income Fund (in USD)Barclays Capital Securities Limited United Kingdom 955,297 1,035,768HSBC Bank Plc United Kingdom 6,348,116 7,476,738 61,199J.P. Morgan Securities Plc United Kingdom – – 24,725,114Merrill Lynch International United Kingdom 3,248,126 3,427,895 –Societe Generale SA France 1,162,935 1,752,718 –The Bank of Nova Scotia Canada 3,634,211 3,950,378 –UBS AG Switzerland 18,270,530 20,029,674 –Total 33,619,215 37,673,171 24,786,313 Emerging Markets Fund (in USD)Barclays Capital Securities Limited United Kingdom 450,237 487,493 –Credit Suisse Securities (Europe) Limited Switzerland 15,313,813 16,012,709 –Deutsche Bank AG Germany 3,093,748 3,349,603 –HSBC Bank Plc United Kingdom 3,153,445 3,708,990 –J.P. Morgan Securities Plc United Kingdom 12,129,510 13,514,275 62,997,884Merrill Lynch International United Kingdom 240,825 253,804 211,507UBS AG Switzerland 20,884,276 22,863,625 –Total 55,265,854 60,190,499 63,209,391 Emerging Markets Local Currency Bond Fund (in USD)Barclays Bank Plc United Kingdom 1,825,247 2,094,337 –BNP Paribas SA France 682,038 766,944 –Citigroup Global Markets Limited United Kingdom 222,219 236,707 –Credit Suisse Securities (Europe) Limited Switzerland 182,935 224,423 –HSBC Bank Plc United Kingdom 5,168,383 5,806,834 –J.P. Morgan Securities Plc United Kingdom 50,286,126 57,163,207 –Merrill Lynch International United Kingdom 14,466,856 16,988,483 –Morgan Stanley & Co. International Plc United Kingdom 16,122,683 18,861,718 –Total 88,956,487 102,142,653 –ESG Emerging Markets Blended Bond Fund (in USD)J.P. Morgan Securities Plc United Kingdom 616,550 697,615 –Total 616,550 697,615 –ESG Emerging Markets Bond Fund (in USD)Barclays Bank Plc United Kingdom 2,592,973 3,007,305 –Deutsche Bank AG Germany 1,026,977 1,108,665 –HSBC Bank Plc United Kingdom 2,212,923 2,512,918 –J.P. Morgan Securities Plc United Kingdom 12,683,155 16,056,830 –Total 18,516,028 22,685,718 –ESG Emerging Markets Corporate Bond Fund (in USD)Barclays Bank Plc United Kingdom 260,704 449,848 –J.P. Morgan Securities Plc United Kingdom 406,417 765,497 –UBS AG Switzerland 253,016 433,779 –Total 920,137 1,649,124 –
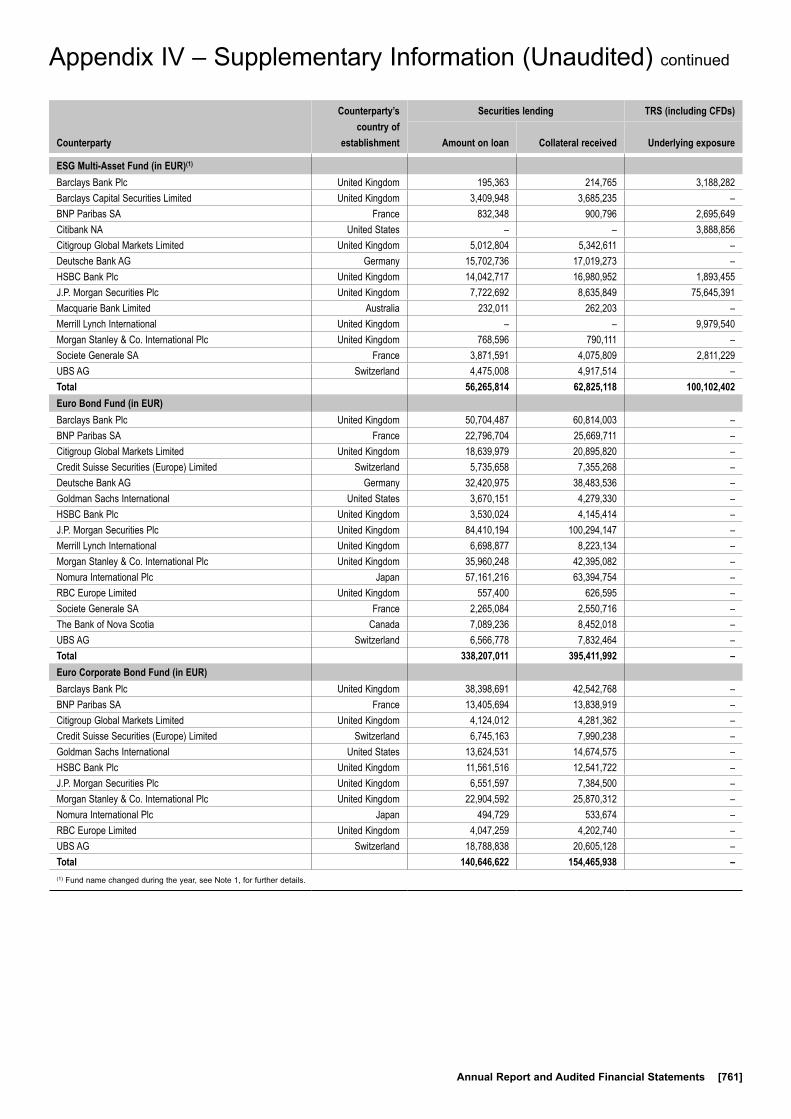
Annual Report and Audited Financial Statements [761]
Counterparty
Counterparty’s country of
establishment
Securities lending TRS (including CFDs)
Amount on loan Collateral received Underlying exposure
ESG Multi-Asset Fund (in EUR)(1)
Barclays Bank Plc United Kingdom 195,363 214,765 3,188,282 Barclays Capital Securities Limited United Kingdom 3,409,948 3,685,235 –BNP Paribas SA France 832,348 900,796 2,695,649 Citibank NA United States – – 3,888,856 Citigroup Global Markets Limited United Kingdom 5,012,804 5,342,611 –Deutsche Bank AG Germany 15,702,736 17,019,273 –HSBC Bank Plc United Kingdom 14,042,717 16,980,952 1,893,455 J.P. Morgan Securities Plc United Kingdom 7,722,692 8,635,849 75,645,391 Macquarie Bank Limited Australia 232,011 262,203 –Merrill Lynch International United Kingdom – – 9,979,540 Morgan Stanley & Co. International Plc United Kingdom 768,596 790,111 –Societe Generale SA France 3,871,591 4,075,809 2,811,229 UBS AG Switzerland 4,475,008 4,917,514 –Total 56,265,814 62,825,118 100,102,402 Euro Bond Fund (in EUR)Barclays Bank Plc United Kingdom 50,704,487 60,814,003 –BNP Paribas SA France 22,796,704 25,669,711 –Citigroup Global Markets Limited United Kingdom 18,639,979 20,895,820 –Credit Suisse Securities (Europe) Limited Switzerland 5,735,658 7,355,268 –Deutsche Bank AG Germany 32,420,975 38,483,536 –Goldman Sachs International United States 3,670,151 4,279,330 –HSBC Bank Plc United Kingdom 3,530,024 4,145,414 –J.P. Morgan Securities Plc United Kingdom 84,410,194 100,294,147 –Merrill Lynch International United Kingdom 6,698,877 8,223,134 –Morgan Stanley & Co. International Plc United Kingdom 35,960,248 42,395,082 –Nomura International Plc Japan 57,161,216 63,394,754 –RBC Europe Limited United Kingdom 557,400 626,595 –Societe Generale SA France 2,265,084 2,550,716 –The Bank of Nova Scotia Canada 7,089,236 8,452,018 –UBS AG Switzerland 6,566,778 7,832,464 –Total 338,207,011 395,411,992 –Euro Corporate Bond Fund (in EUR)Barclays Bank Plc United Kingdom 38,398,691 42,542,768 –BNP Paribas SA France 13,405,694 13,838,919 –Citigroup Global Markets Limited United Kingdom 4,124,012 4,281,362 –Credit Suisse Securities (Europe) Limited Switzerland 6,745,163 7,990,238 –Goldman Sachs International United States 13,624,531 14,674,575 –HSBC Bank Plc United Kingdom 11,561,516 12,541,722 –J.P. Morgan Securities Plc United Kingdom 6,551,597 7,384,500 –Morgan Stanley & Co. International Plc United Kingdom 22,904,592 25,870,312 –Nomura International Plc Japan 494,729 533,674 –RBC Europe Limited United Kingdom 4,047,259 4,202,740 –UBS AG Switzerland 18,788,838 20,605,128 –Total 140,646,622 154,465,938 –(1) Fund name changed during the year, see Note 1, for further details.
Appendix IV – Supplementary Information (Unaudited) continued
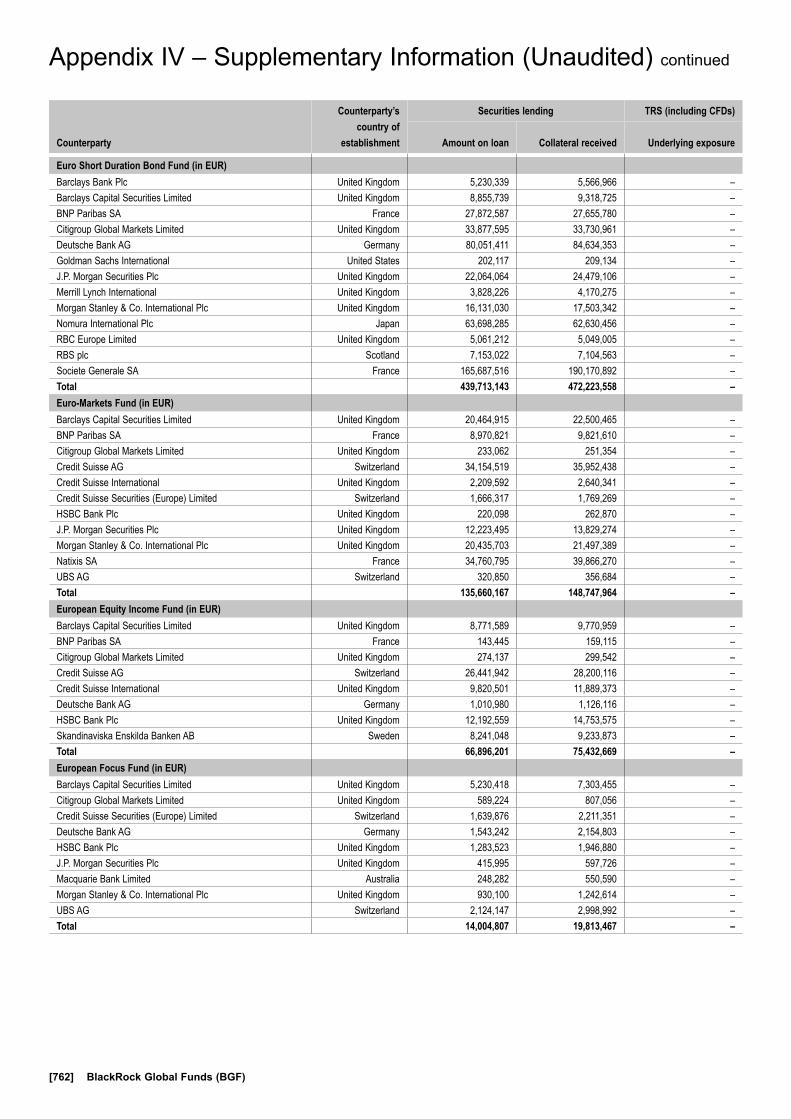
[762] BlackRock Global Funds (BGF)
Appendix IV – Supplementary Information (Unaudited) continued
Counterparty
Counterparty’s country of
establishment
Securities lending TRS (including CFDs)
Amount on loan Collateral received Underlying exposure
Euro Short Duration Bond Fund (in EUR)Barclays Bank Plc United Kingdom 5,230,339 5,566,966 –Barclays Capital Securities Limited United Kingdom 8,855,739 9,318,725 –BNP Paribas SA France 27,872,587 27,655,780 –Citigroup Global Markets Limited United Kingdom 33,877,595 33,730,961 –Deutsche Bank AG Germany 80,051,411 84,634,353 –Goldman Sachs International United States 202,117 209,134 –J.P. Morgan Securities Plc United Kingdom 22,064,064 24,479,106 –Merrill Lynch International United Kingdom 3,828,226 4,170,275 –Morgan Stanley & Co. International Plc United Kingdom 16,131,030 17,503,342 –Nomura International Plc Japan 63,698,285 62,630,456 –RBC Europe Limited United Kingdom 5,061,212 5,049,005 –RBS plc Scotland 7,153,022 7,104,563 –Societe Generale SA France 165,687,516 190,170,892 –Total 439,713,143 472,223,558 –Euro-Markets Fund (in EUR)Barclays Capital Securities Limited United Kingdom 20,464,915 22,500,465 –BNP Paribas SA France 8,970,821 9,821,610 –Citigroup Global Markets Limited United Kingdom 233,062 251,354 –Credit Suisse AG Switzerland 34,154,519 35,952,438 –Credit Suisse International United Kingdom 2,209,592 2,640,341 –Credit Suisse Securities (Europe) Limited Switzerland 1,666,317 1,769,269 –HSBC Bank Plc United Kingdom 220,098 262,870 –J.P. Morgan Securities Plc United Kingdom 12,223,495 13,829,274 –Morgan Stanley & Co. International Plc United Kingdom 20,435,703 21,497,389 –Natixis SA France 34,760,795 39,866,270 –UBS AG Switzerland 320,850 356,684 –Total 135,660,167 148,747,964 –European Equity Income Fund (in EUR)Barclays Capital Securities Limited United Kingdom 8,771,589 9,770,959 –BNP Paribas SA France 143,445 159,115 –Citigroup Global Markets Limited United Kingdom 274,137 299,542 –Credit Suisse AG Switzerland 26,441,942 28,200,116 –Credit Suisse International United Kingdom 9,820,501 11,889,373 –Deutsche Bank AG Germany 1,010,980 1,126,116 –HSBC Bank Plc United Kingdom 12,192,559 14,753,575 –Skandinaviska Enskilda Banken AB Sweden 8,241,048 9,233,873 –Total 66,896,201 75,432,669 –European Focus Fund (in EUR)Barclays Capital Securities Limited United Kingdom 5,230,418 7,303,455 –Citigroup Global Markets Limited United Kingdom 589,224 807,056 –Credit Suisse Securities (Europe) Limited Switzerland 1,639,876 2,211,351 –Deutsche Bank AG Germany 1,543,242 2,154,803 –HSBC Bank Plc United Kingdom 1,283,523 1,946,880 –J.P. Morgan Securities Plc United Kingdom 415,995 597,726 –Macquarie Bank Limited Australia 248,282 550,590 –Morgan Stanley & Co. International Plc United Kingdom 930,100 1,242,614 –UBS AG Switzerland 2,124,147 2,998,992 –Total 14,004,807 19,813,467 –
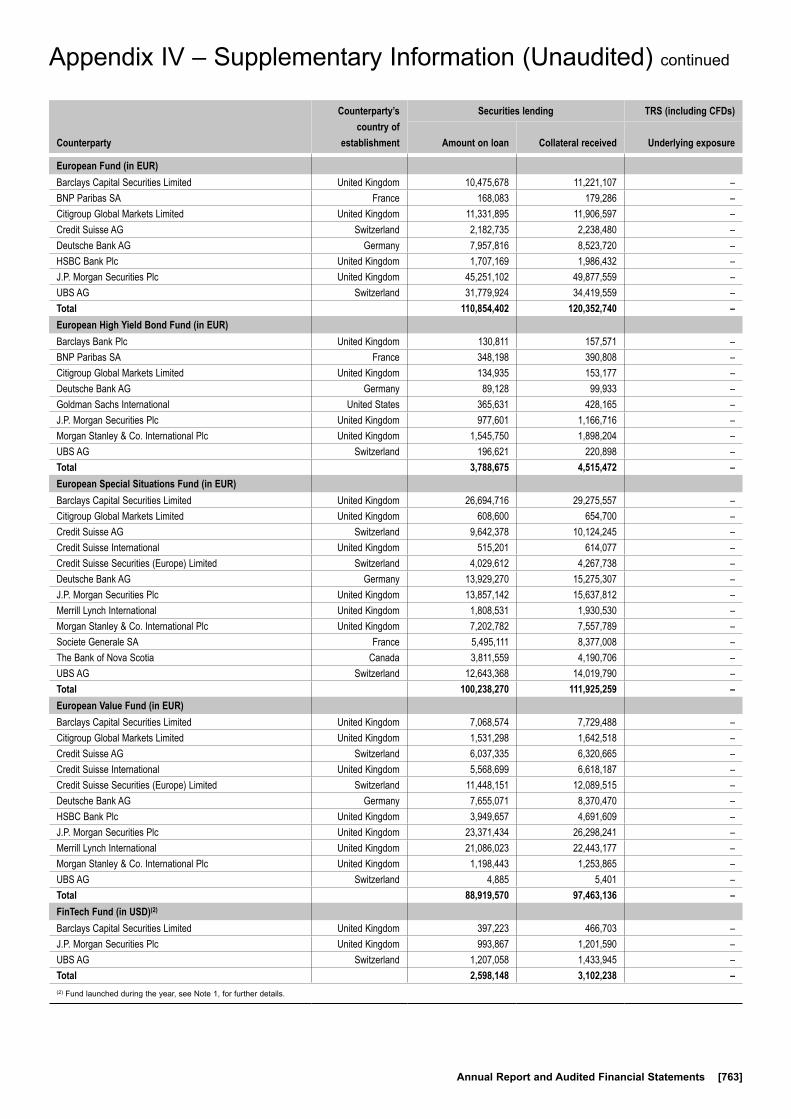
Annual Report and Audited Financial Statements [763]
Appendix IV – Supplementary Information (Unaudited) continued
Counterparty
Counterparty’s country of
establishment
Securities lending TRS (including CFDs)
Amount on loan Collateral received Underlying exposure
European Fund (in EUR)Barclays Capital Securities Limited United Kingdom 10,475,678 11,221,107 –BNP Paribas SA France 168,083 179,286 –Citigroup Global Markets Limited United Kingdom 11,331,895 11,906,597 –Credit Suisse AG Switzerland 2,182,735 2,238,480 –Deutsche Bank AG Germany 7,957,816 8,523,720 –HSBC Bank Plc United Kingdom 1,707,169 1,986,432 –J.P. Morgan Securities Plc United Kingdom 45,251,102 49,877,559 –UBS AG Switzerland 31,779,924 34,419,559 –Total 110,854,402 120,352,740 –European High Yield Bond Fund (in EUR)Barclays Bank Plc United Kingdom 130,811 157,571 –BNP Paribas SA France 348,198 390,808 –Citigroup Global Markets Limited United Kingdom 134,935 153,177 –Deutsche Bank AG Germany 89,128 99,933 –Goldman Sachs International United States 365,631 428,165 –J.P. Morgan Securities Plc United Kingdom 977,601 1,166,716 –Morgan Stanley & Co. International Plc United Kingdom 1,545,750 1,898,204 –UBS AG Switzerland 196,621 220,898 –Total 3,788,675 4,515,472 –European Special Situations Fund (in EUR)Barclays Capital Securities Limited United Kingdom 26,694,716 29,275,557 –Citigroup Global Markets Limited United Kingdom 608,600 654,700 –Credit Suisse AG Switzerland 9,642,378 10,124,245 –Credit Suisse International United Kingdom 515,201 614,077 –Credit Suisse Securities (Europe) Limited Switzerland 4,029,612 4,267,738 –Deutsche Bank AG Germany 13,929,270 15,275,307 –J.P. Morgan Securities Plc United Kingdom 13,857,142 15,637,812 –Merrill Lynch International United Kingdom 1,808,531 1,930,530 –Morgan Stanley & Co. International Plc United Kingdom 7,202,782 7,557,789 –Societe Generale SA France 5,495,111 8,377,008 –The Bank of Nova Scotia Canada 3,811,559 4,190,706 –UBS AG Switzerland 12,643,368 14,019,790 –Total 100,238,270 111,925,259 –European Value Fund (in EUR)Barclays Capital Securities Limited United Kingdom 7,068,574 7,729,488 –Citigroup Global Markets Limited United Kingdom 1,531,298 1,642,518 –Credit Suisse AG Switzerland 6,037,335 6,320,665 –Credit Suisse International United Kingdom 5,568,699 6,618,187 –Credit Suisse Securities (Europe) Limited Switzerland 11,448,151 12,089,515 –Deutsche Bank AG Germany 7,655,071 8,370,470 –HSBC Bank Plc United Kingdom 3,949,657 4,691,609 –J.P. Morgan Securities Plc United Kingdom 23,371,434 26,298,241 –Merrill Lynch International United Kingdom 21,086,023 22,443,177 –Morgan Stanley & Co. International Plc United Kingdom 1,198,443 1,253,865 –UBS AG Switzerland 4,885 5,401 –Total 88,919,570 97,463,136 –FinTech Fund (in USD)(2)
Barclays Capital Securities Limited United Kingdom 397,223 466,703 –J.P. Morgan Securities Plc United Kingdom 993,867 1,201,590 –UBS AG Switzerland 1,207,058 1,433,945 –Total 2,598,148 3,102,238 –(2) Fund launched during the year, see Note 1, for further details.

[764] BlackRock Global Funds (BGF)
Counterparty
Counterparty’s country of
establishment
Securities lending TRS (including CFDs)
Amount on loan Collateral received Underlying exposure
Fixed Income Global Opportunities Fund (in USD)Barclays Bank Plc United Kingdom 17,544,877 19,799,742 –BNP Paribas SA France 53,777,479 57,067,047 5,141,599Citibank NA United States – – 4,482,457Citigroup Global Markets Limited United Kingdom 16,078,544 17,002,333 –Credit Suisse AG Switzerland 1,454,623 1,553,822 1,314,421Credit Suisse Securities (Europe) Limited Switzerland 15,226,980 18,247,166 –Deutsche Bank AG Germany 19,415,213 21,560,588 –Goldman Sachs International United States 15,279,595 16,763,159 –HSBC Bank Plc United Kingdom 6,172,768 6,820,588 –J.P. Morgan Securities Plc United Kingdom 26,820,099 31,134,279 58,212,557Merrill Lynch International United Kingdom 25,389,602 28,908,445 6,449,018Morgan Stanley & Co. International Plc United Kingdom 27,525,174 31,667,167 2,657,723Natixis SA France 107,758 125,411 –Nomura International Plc Japan 13,145,529 14,443,961 –RBC Europe Limited United Kingdom 1,065,985 1,127,515 –Societe Generale SA France 1,899,872 2,013,049 –UBS AG Switzerland 24,007,457 26,444,218 –Total 264,911,555 294,678,490 78,257,775 Future Of Transport Fund (in USD)(2)
Citigroup Global Markets Limited United Kingdom 988,194 1,036,507 –Goldman Sachs International United States 5,679,312 5,821,533 –HSBC Bank Plc United Kingdom 835,786 970,817 –UBS AG Switzerland 4,890,656 5,287,672 –Total 12,393,948 13,116,529 –Global Allocation Fund (in USD)Barclays Capital Securities Limited United Kingdom 146,351,072 161,177,136 –BNP Paribas SA France 141,691,384 153,876,102 5,217,075 Citigroup Global Markets Limited United Kingdom 38,876,692 41,962,978 20,559,670Credit Suisse AG Switzerland 126,319,205 133,191,203 –Credit Suisse International United Kingdom 25,630,160 30,677,870 –Credit Suisse Securities (Europe) Limited Switzerland 3,807,940 4,049,974 –Deutsche Bank AG Germany 168,013,589 185,026,382 –Goldman Sachs International United States 19,344,410 20,422,370 4,131,300 HSBC Bank Plc United Kingdom 394,958,769 601,595,061 –J.P. Morgan Securities Plc United Kingdom 137,087,931 155,356,420 25,776,665Macquarie Bank Limited Australia 382,998,479 417,394,949 –Merrill Lynch International United Kingdom 13,668,914 14,652,520 –Morgan Stanley & Co. International Plc United Kingdom 22,086,696 23,273,029 –Natixis SA France 23,381,806 26,860,863 –Nomura International Plc Japan 25,771,779 28,362,717 –Societe Generale SA France 103,087,259 157,813,866 –The Bank of Nova Scotia Canada 2,707,894 2,989,812 –UBS AG Switzerland 59,631,125 66,401,736 –Total 1,835,415,104 2,225,084,988 55,684,710 Global Bond Income Fund (in USD)Barclays Capital Securities Limited United Kingdom 1,630,361 1,935,898 –Total 1,630,361 1,935,898 –Global Conservative Income Fund (in EUR)(2)
Barclays Bank Plc United Kingdom 316,117 337,407 –HSBC Bank Plc United Kingdom 386,507 443,048 –J.P. Morgan Securities Plc United Kingdom 221,609 234,349 –UBS AG Switzerland 296,750 316,620 –Total 1,220,983 1,331,424 –(2) Fund launched during the year, see Note 1, for further details.
Appendix IV – Supplementary Information (Unaudited) continued

Annual Report and Audited Financial Statements [765]
Appendix IV – Supplementary Information (Unaudited) continued
Counterparty
Counterparty’s country of
establishment
Securities lending TRS (including CFDs)
Amount on loan Collateral received Underlying exposure
Global Corporate Bond Fund (in USD)Barclays Bank Plc United Kingdom 9,862,456 10,908,485 –BNP Paribas SA France 14,787,102 15,239,348 –Citigroup Global Markets Limited United Kingdom 5,598,053 5,801,883 –Credit Suisse Securities (Europe) Limited Switzerland 4,161,245 4,921,081 –Goldman Sachs International United States 16,482,956 17,410,082 –HSBC Bank Plc United Kingdom 2,425,667 2,626,900 –J.P. Morgan Securities Plc United Kingdom 1,807,564 2,182,361 –Merrill Lynch International United Kingdom 6,087,707 6,891,464 –Morgan Stanley & Co. International Plc United Kingdom 15,826,109 17,845,282 –Nomura International Plc Japan 7,500,874 8,077,753 –UBS AG Switzerland 1,228,934 1,267,757 –Total 85,768,667 93,172,396 –Global Dynamic Equity Fund (in USD)Barclays Capital Securities Limited United Kingdom 10,211,255 11,280,653 –BNP Paribas SA France 1,444,099 1,588,623 –Citigroup Global Markets Limited United Kingdom 3,761,395 4,076,014 –Credit Suisse AG Switzerland 4,038,868 4,271,825 –Credit Suisse Securities (Europe) Limited Switzerland 2,118,909 2,260,591 –Deutsche Bank AG Germany 16,438,282 18,159,057 –HSBC Bank Plc United Kingdom 3,453,902 4,144,848 –J.P. Morgan Securities Plc United Kingdom 2,757,214 3,134,355 –Merrill Lynch International United Kingdom 722,238 776,615 –Societe Generale SA France 3,135,567 4,815,083 –The Bank of Nova Scotia Canada 3,042,579 3,369,780 –UBS AG Switzerland 12,938,570 14,452,410 –Total 64,062,878 72,329,854 –Global Enhanced Equity Yield Fund (in USD)Barclays Capital Securities Limited United Kingdom 14,233,542 17,713,844 –Citigroup Global Markets Limited United Kingdom 829,184 1,012,238 –Credit Suisse AG Switzerland 40,667,722 48,456,083 –Credit Suisse Securities (Europe) Limited Switzerland 3,856,582 4,635,080 –Deutsche Bank AG Germany 15,929,678 19,823,875 –HSBC Bank Plc United Kingdom 5,224,810 7,063,401 –J.P. Morgan Securities Plc United Kingdom 4,933,905 6,318,486 –Macquarie Bank Limited Australia 5,658,136 11,183,142 –Merrill Lynch International United Kingdom 1,612,614 1,953,444 –Societe Generale SA France 6,270,758 10,848,071 –The Bank of Nova Scotia Canada 1,400,542 1,747,433 –UBS AG Switzerland 1,486,392 1,870,389 –Total 102,103,865 132,625,486 –Global Equity Income Fund (in USD)Barclays Capital Securities Limited United Kingdom 6,010,331 9,575,349 –Credit Suisse AG Switzerland 18,606,871 28,381,036 –Deutsche Bank AG Germany 14,325,539 22,821,750 –HSBC Bank Plc United Kingdom 846,174 1,464,399 –Merrill Lynch International United Kingdom 17,177,154 26,636,565 –UBS AG Switzerland 2,798,020 4,507,191 –Total 59,764,089 93,386,290 –
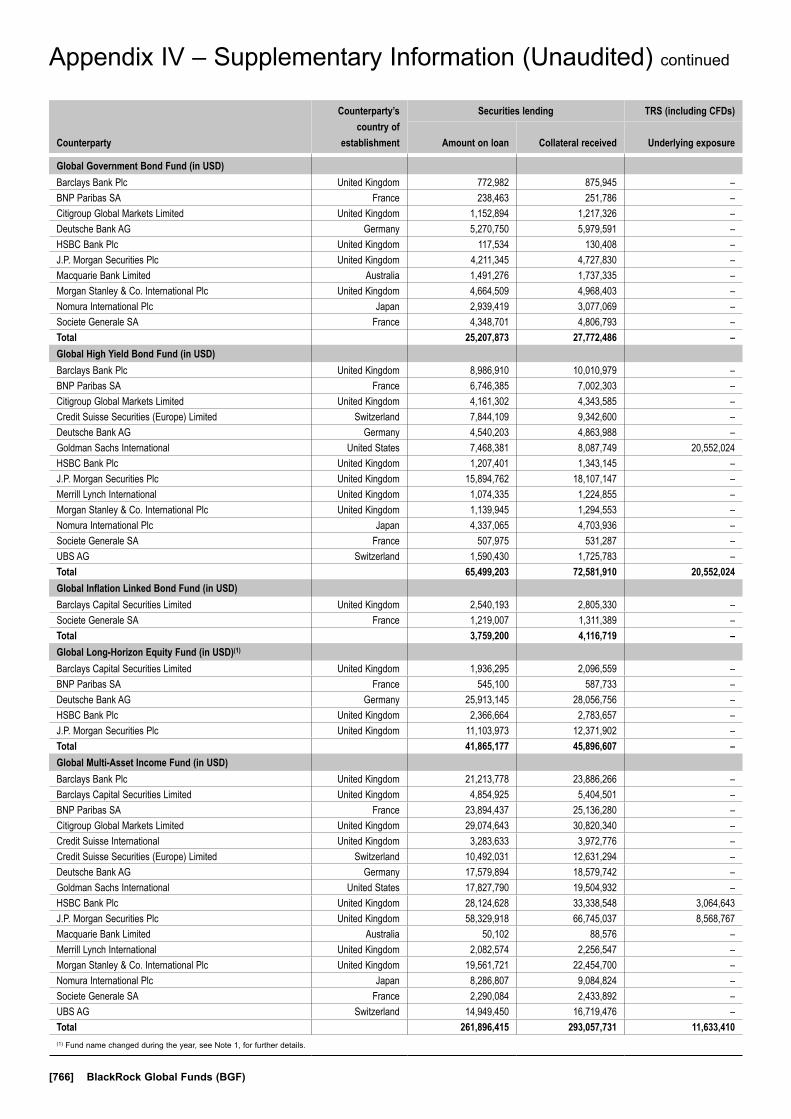
[766] BlackRock Global Funds (BGF)
Appendix IV – Supplementary Information (Unaudited) continued
Counterparty
Counterparty’s country of
establishment
Securities lending TRS (including CFDs)
Amount on loan Collateral received Underlying exposure
Global Government Bond Fund (in USD)Barclays Bank Plc United Kingdom 772,982 875,945 –BNP Paribas SA France 238,463 251,786 –Citigroup Global Markets Limited United Kingdom 1,152,894 1,217,326 –Deutsche Bank AG Germany 5,270,750 5,979,591 –HSBC Bank Plc United Kingdom 117,534 130,408 –J.P. Morgan Securities Plc United Kingdom 4,211,345 4,727,830 –Macquarie Bank Limited Australia 1,491,276 1,737,335 –Morgan Stanley & Co. International Plc United Kingdom 4,664,509 4,968,403 –Nomura International Plc Japan 2,939,419 3,077,069 –Societe Generale SA France 4,348,701 4,806,793 –Total 25,207,873 27,772,486 –Global High Yield Bond Fund (in USD)Barclays Bank Plc United Kingdom 8,986,910 10,010,979 –BNP Paribas SA France 6,746,385 7,002,303 –Citigroup Global Markets Limited United Kingdom 4,161,302 4,343,585 –Credit Suisse Securities (Europe) Limited Switzerland 7,844,109 9,342,600 –Deutsche Bank AG Germany 4,540,203 4,863,988 –Goldman Sachs International United States 7,468,381 8,087,749 20,552,024 HSBC Bank Plc United Kingdom 1,207,401 1,343,145 –J.P. Morgan Securities Plc United Kingdom 15,894,762 18,107,147 –Merrill Lynch International United Kingdom 1,074,335 1,224,855 –Morgan Stanley & Co. International Plc United Kingdom 1,139,945 1,294,553 –Nomura International Plc Japan 4,337,065 4,703,936 –Societe Generale SA France 507,975 531,287 –UBS AG Switzerland 1,590,430 1,725,783 –Total 65,499,203 72,581,910 20,552,024 Global Inflation Linked Bond Fund (in USD)Barclays Capital Securities Limited United Kingdom 2,540,193 2,805,330 –Societe Generale SA France 1,219,007 1,311,389 –Total 3,759,200 4,116,719 –Global Long-Horizon Equity Fund (in USD)(1)
Barclays Capital Securities Limited United Kingdom 1,936,295 2,096,559 –BNP Paribas SA France 545,100 587,733 –Deutsche Bank AG Germany 25,913,145 28,056,756 –HSBC Bank Plc United Kingdom 2,366,664 2,783,657 –J.P. Morgan Securities Plc United Kingdom 11,103,973 12,371,902 –Total 41,865,177 45,896,607 –Global Multi-Asset Income Fund (in USD)Barclays Bank Plc United Kingdom 21,213,778 23,886,266 –Barclays Capital Securities Limited United Kingdom 4,854,925 5,404,501 –BNP Paribas SA France 23,894,437 25,136,280 –Citigroup Global Markets Limited United Kingdom 29,074,643 30,820,340 –Credit Suisse International United Kingdom 3,283,633 3,972,776 –Credit Suisse Securities (Europe) Limited Switzerland 10,492,031 12,631,294 –Deutsche Bank AG Germany 17,579,894 18,579,742 –Goldman Sachs International United States 17,827,790 19,504,932 –HSBC Bank Plc United Kingdom 28,124,628 33,338,548 3,064,643J.P. Morgan Securities Plc United Kingdom 58,329,918 66,745,037 8,568,767Macquarie Bank Limited Australia 50,102 88,576 –Merrill Lynch International United Kingdom 2,082,574 2,256,547 –Morgan Stanley & Co. International Plc United Kingdom 19,561,721 22,454,700 –Nomura International Plc Japan 8,286,807 9,084,824 –Societe Generale SA France 2,290,084 2,433,892 –UBS AG Switzerland 14,949,450 16,719,476 –Total 261,896,415 293,057,731 11,633,410 (1) Fund name changed during the year, see Note 1, for further details.
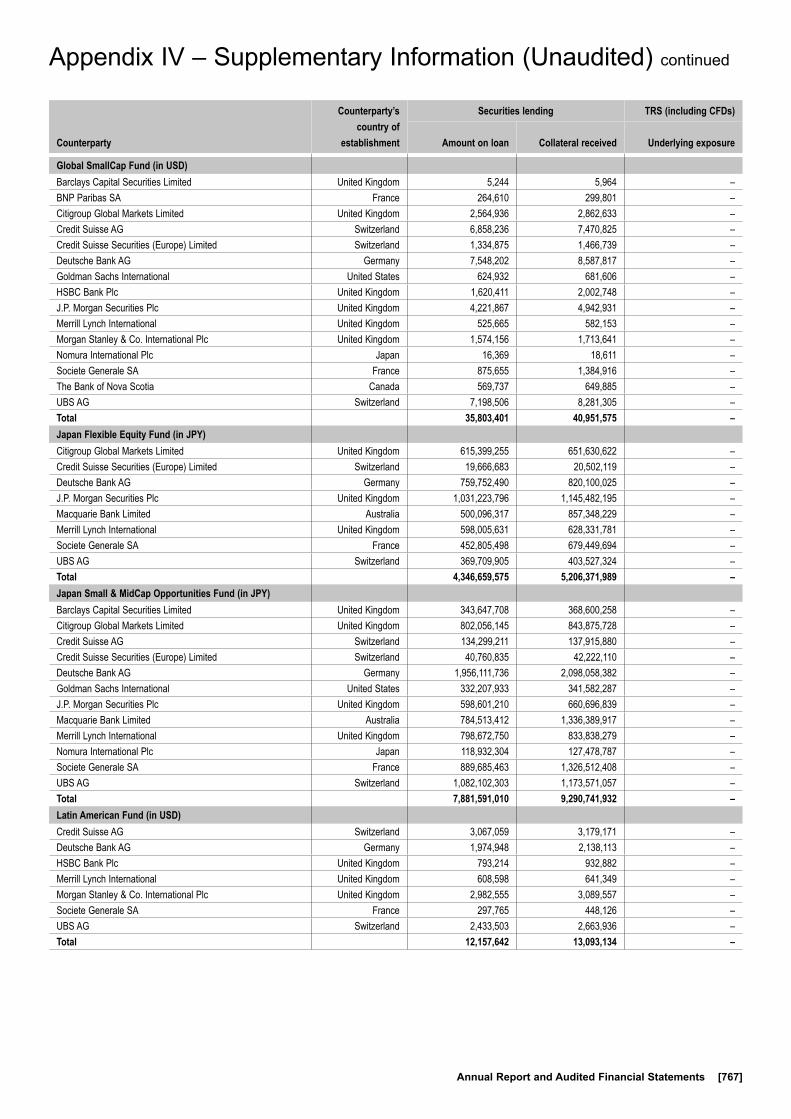
Annual Report and Audited Financial Statements [767]
Appendix IV – Supplementary Information (Unaudited) continued
Counterparty
Counterparty’s country of
establishment
Securities lending TRS (including CFDs)
Amount on loan Collateral received Underlying exposure
Global SmallCap Fund (in USD)Barclays Capital Securities Limited United Kingdom 5,244 5,964 –BNP Paribas SA France 264,610 299,801 –Citigroup Global Markets Limited United Kingdom 2,564,936 2,862,633 –Credit Suisse AG Switzerland 6,858,236 7,470,825 –Credit Suisse Securities (Europe) Limited Switzerland 1,334,875 1,466,739 –Deutsche Bank AG Germany 7,548,202 8,587,817 –Goldman Sachs International United States 624,932 681,606 –HSBC Bank Plc United Kingdom 1,620,411 2,002,748 –J.P. Morgan Securities Plc United Kingdom 4,221,867 4,942,931 –Merrill Lynch International United Kingdom 525,665 582,153 –Morgan Stanley & Co. International Plc United Kingdom 1,574,156 1,713,641 –Nomura International Plc Japan 16,369 18,611 –Societe Generale SA France 875,655 1,384,916 –The Bank of Nova Scotia Canada 569,737 649,885 –UBS AG Switzerland 7,198,506 8,281,305 –Total 35,803,401 40,951,575 –Japan Flexible Equity Fund (in JPY)Citigroup Global Markets Limited United Kingdom 615,399,255 651,630,622 –Credit Suisse Securities (Europe) Limited Switzerland 19,666,683 20,502,119 –Deutsche Bank AG Germany 759,752,490 820,100,025 –J.P. Morgan Securities Plc United Kingdom 1,031,223,796 1,145,482,195 –Macquarie Bank Limited Australia 500,096,317 857,348,229 –Merrill Lynch International United Kingdom 598,005,631 628,331,781 –Societe Generale SA France 452,805,498 679,449,694 –UBS AG Switzerland 369,709,905 403,527,324 –Total 4,346,659,575 5,206,371,989 –Japan Small & MidCap Opportunities Fund (in JPY)Barclays Capital Securities Limited United Kingdom 343,647,708 368,600,258 –Citigroup Global Markets Limited United Kingdom 802,056,145 843,875,728 –Credit Suisse AG Switzerland 134,299,211 137,915,880 –Credit Suisse Securities (Europe) Limited Switzerland 40,760,835 42,222,110 –Deutsche Bank AG Germany 1,956,111,736 2,098,058,382 –Goldman Sachs International United States 332,207,933 341,582,287 –J.P. Morgan Securities Plc United Kingdom 598,601,210 660,696,839 –Macquarie Bank Limited Australia 784,513,412 1,336,389,917 –Merrill Lynch International United Kingdom 798,672,750 833,838,279 –Nomura International Plc Japan 118,932,304 127,478,787 –Societe Generale SA France 889,685,463 1,326,512,408 –UBS AG Switzerland 1,082,102,303 1,173,571,057 –Total 7,881,591,010 9,290,741,932 –Latin American Fund (in USD)Credit Suisse AG Switzerland 3,067,059 3,179,171 –Deutsche Bank AG Germany 1,974,948 2,138,113 –HSBC Bank Plc United Kingdom 793,214 932,882 –Merrill Lynch International United Kingdom 608,598 641,349 –Morgan Stanley & Co. International Plc United Kingdom 2,982,555 3,089,557 –Societe Generale SA France 297,765 448,126 –UBS AG Switzerland 2,433,503 2,663,936 –Total 12,157,642 13,093,134 –
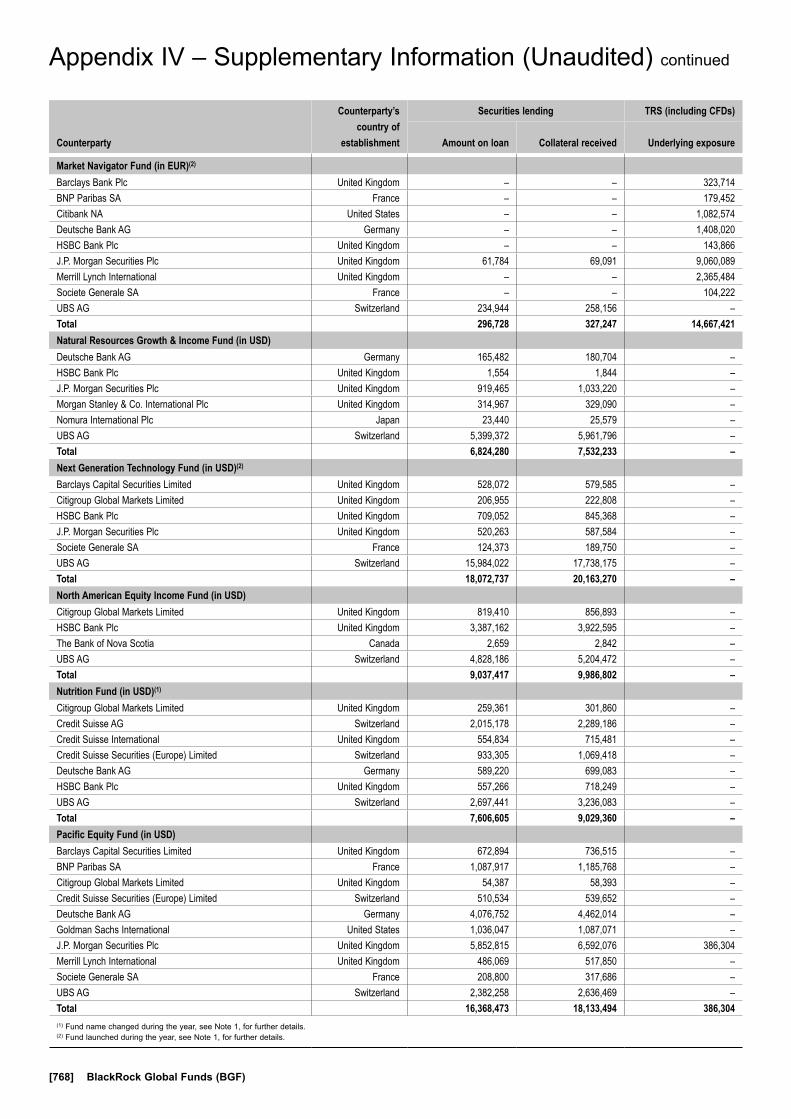
[768] BlackRock Global Funds (BGF)
Appendix IV – Supplementary Information (Unaudited) continued
Counterparty
Counterparty’s country of
establishment
Securities lending TRS (including CFDs)
Amount on loan Collateral received Underlying exposure
Market Navigator Fund (in EUR)(2)
Barclays Bank Plc United Kingdom – – 323,714 BNP Paribas SA France – – 179,452 Citibank NA United States – – 1,082,574 Deutsche Bank AG Germany – – 1,408,020 HSBC Bank Plc United Kingdom – – 143,866 J.P. Morgan Securities Plc United Kingdom 61,784 69,091 9,060,089 Merrill Lynch International United Kingdom – – 2,365,484 Societe Generale SA France – – 104,222 UBS AG Switzerland 234,944 258,156 –Total 296,728 327,247 14,667,421 Natural Resources Growth & Income Fund (in USD)Deutsche Bank AG Germany 165,482 180,704 –HSBC Bank Plc United Kingdom 1,554 1,844 –J.P. Morgan Securities Plc United Kingdom 919,465 1,033,220 –Morgan Stanley & Co. International Plc United Kingdom 314,967 329,090 –Nomura International Plc Japan 23,440 25,579 –UBS AG Switzerland 5,399,372 5,961,796 –Total 6,824,280 7,532,233 –Next Generation Technology Fund (in USD)(2)
Barclays Capital Securities Limited United Kingdom 528,072 579,585 –Citigroup Global Markets Limited United Kingdom 206,955 222,808 –HSBC Bank Plc United Kingdom 709,052 845,368 –J.P. Morgan Securities Plc United Kingdom 520,263 587,584 –Societe Generale SA France 124,373 189,750 –UBS AG Switzerland 15,984,022 17,738,175 –Total 18,072,737 20,163,270 –North American Equity Income Fund (in USD)Citigroup Global Markets Limited United Kingdom 819,410 856,893 –HSBC Bank Plc United Kingdom 3,387,162 3,922,595 –The Bank of Nova Scotia Canada 2,659 2,842 –UBS AG Switzerland 4,828,186 5,204,472 –Total 9,037,417 9,986,802 –Nutrition Fund (in USD)(1)
Citigroup Global Markets Limited United Kingdom 259,361 301,860 –Credit Suisse AG Switzerland 2,015,178 2,289,186 –Credit Suisse International United Kingdom 554,834 715,481 –Credit Suisse Securities (Europe) Limited Switzerland 933,305 1,069,418 –Deutsche Bank AG Germany 589,220 699,083 –HSBC Bank Plc United Kingdom 557,266 718,249 –UBS AG Switzerland 2,697,441 3,236,083 –Total 7,606,605 9,029,360 –Pacific Equity Fund (in USD)Barclays Capital Securities Limited United Kingdom 672,894 736,515 –BNP Paribas SA France 1,087,917 1,185,768 –Citigroup Global Markets Limited United Kingdom 54,387 58,393 –Credit Suisse Securities (Europe) Limited Switzerland 510,534 539,652 –Deutsche Bank AG Germany 4,076,752 4,462,014 –Goldman Sachs International United States 1,036,047 1,087,071 –J.P. Morgan Securities Plc United Kingdom 5,852,815 6,592,076 386,304Merrill Lynch International United Kingdom 486,069 517,850 –Societe Generale SA France 208,800 317,686 –UBS AG Switzerland 2,382,258 2,636,469 –Total 16,368,473 18,133,494 386,304 (1) Fund name changed during the year, see Note 1, for further details.(2) Fund launched during the year, see Note 1, for further details.

Annual Report and Audited Financial Statements [769]
Appendix IV – Supplementary Information (Unaudited) continued
Counterparty
Counterparty’s country of
establishment
Securities lending TRS (including CFDs)
Amount on loan Collateral received Underlying exposure
Sustainable Energy Fund (in USD)(1)
Barclays Capital Securities Limited United Kingdom 51,190,526 55,621,957 –BNP Paribas SA France 1,180,832 1,277,655 –Citigroup Global Markets Limited United Kingdom 11,566,839 12,328,291 –Credit Suisse AG Switzerland 33,494,121 34,843,665 –Credit Suisse International United Kingdom 5,370,477 6,342,140 –Credit Suisse Securities (Europe) Limited Switzerland 3,996,514 4,193,654 –Deutsche Bank AG Germany 34,988,147 38,015,376 –Goldman Sachs International United States 3,381,881 3,522,558 –HSBC Bank Plc United Kingdom 3,755,944 4,433,219 –J.P. Morgan Securities Plc United Kingdom 25,176,724 28,149,993 –Morgan Stanley & Co. International Plc United Kingdom 13,135,444 13,655,764 –Total 187,237,449 202,384,272 –Swiss Small & MidCap Opportunities Fund (in CHF)BNP Paribas SA France 256,109 266,269 –Citigroup Global Markets Limited United Kingdom 361,994 370,732 –Deutsche Bank AG Germany 1,402,753 1,464,501 –HSBC Bank Plc United Kingdom 27,364,064 31,034,936 –J.P. Morgan Securities Plc United Kingdom 30,530,377 32,800,570 –Macquarie Bank Limited Australia 255,276 423,279 –Morgan Stanley & Co. International Plc United Kingdom 34,765,562 34,728,870 –UBS AG Switzerland 2,239,267 2,363,912 –Total 97,175,402 103,453,069 –United Kingdom Fund (in GBP)Citigroup Global Markets Limited United Kingdom 184,968 205,517 –Credit Suisse Securities (Europe) Limited Switzerland 1,564,503 1,711,398 –Deutsche Bank AG Germany 1,170,381 1,325,650 –Goldman Sachs International United States 458,675 498,044 –HSBC Bank Plc United Kingdom 254,405 313,032 –J.P. Morgan Securities Plc United Kingdom 165,165 192,514 –Merrill Lynch International United Kingdom 3,241,749 3,574,126 –Morgan Stanley & Co. International Plc United Kingdom 300,296 325,449 –The Bank of Nova Scotia Canada 1,298,139 1,474,164 –UBS AG Switzerland 10,143,963 11,617,863 –Total 18,782,244 21,237,757 –US Basic Value Fund (in USD)Barclays Capital Securities Limited United Kingdom 1,766,437 1,956,712 –Citigroup Global Markets Limited United Kingdom 7,800,815 8,476,183 –Credit Suisse Securities (Europe) Limited Switzerland 1,661,639 1,777,542 –Deutsche Bank AG Germany 17,129,451 18,973,783 –HSBC Bank Plc United Kingdom 8,071,445 9,712,334 –Merrill Lynch International United Kingdom 7,658,779 8,257,700 –The Bank of Nova Scotia Canada 12,237,463 13,590,168 –UBS AG Switzerland 20,968,621 23,485,376 –Total 77,294,650 86,229,798 –US Dollar Bond Fund (in USD)Barclays Bank Plc United Kingdom 489,238 547,336 –HSBC Bank Plc United Kingdom 5,675,197 8,746,079 –J.P. Morgan Securities Plc United Kingdom 764,963 872,759 –Macquarie Bank Limited Australia 3,523,028 3,823,474 –Nomura International Plc Japan 502,229 547,060 –The Bank of Nova Scotia Canada 53,011 58,953 –Total 11,007,666 14,595,661 –(1) Fund name changed during the year, see Note 1, for further details.

[770] BlackRock Global Funds (BGF)
Counterparty
Counterparty’s country of
establishment
Securities lending TRS (including CFDs)
Amount on loan Collateral received Underlying exposure
US Dollar High Yield Bond Fund (in USD)Barclays Bank Plc United Kingdom 6,797,777 7,434,117 –BNP Paribas SA France 339,584 350,988 –Credit Suisse AG Switzerland 918,751 951,047 –Credit Suisse Securities (Europe) Limited Switzerland 2,893,152 3,382,923 –Deutsche Bank AG Germany 5,140,831 5,558,025 –Goldman Sachs International United States 712,534 757,536 44,468,284 J.P. Morgan Securities Plc United Kingdom 5,993,393 6,494,706 –Merrill Lynch International United Kingdom 1,911,277 2,139,263 –Morgan Stanley & Co. International Plc United Kingdom 622,823 694,380 –Nomura International Plc Japan 5,423,281 5,774,626 –RBC Europe Limited United Kingdom 342,180 350,735 –Societe Generale SA France 1,034,758 1,062,483 –UBS AG Switzerland 61,022 66,305 –Total 32,191,363 35,017,134 44,468,284 US Dollar Short Duration Bond Fund (in USD)Barclays Bank Plc United Kingdom 1,010,134 1,133,938 –Barclays Capital Securities Limited United Kingdom 19,946,803 22,013,577 –BNP Paribas SA France 3,279,498 3,430,211 –J.P. Morgan Securities Plc United Kingdom 985,802 1,096,401 –Societe Generale SA France 702,377 740,289 –Total 25,924,614 28,414,416 –US Flexible Equity Fund (in USD)Credit Suisse AG Switzerland 24,865,543 25,854,505 –Credit Suisse Securities (Europe) Limited Switzerland 6,364,989 6,675,625 –Deutsche Bank AG Germany 4,897,396 5,318,468 –HSBC Bank Plc United Kingdom 19,175,302 22,621,707 –J.P. Morgan Securities Plc United Kingdom 15,932,592 17,805,270 –Merrill Lynch International United Kingdom 19,499,293 20,612,435 –The Bank of Nova Scotia Canada 29,486,286 32,104,387 –UBS AG Switzerland 19,778,349 21,718,437 –Total 139,999,750 152,710,834 –US Growth Fund (in USD)Credit Suisse AG Switzerland 2,680,266 3,409,604 –Credit Suisse Securities (Europe) Limited Switzerland 437,945 561,956 –Deutsche Bank AG Germany 9,078,865 12,062,595 –HSBC Bank Plc United Kingdom 3,646,101 5,262,591 –UBS AG Switzerland 8,277,440 11,120,451 –Total 24,120,617 32,417,197 –US Small & MidCap Opportunities Fund (in USD)Barclays Capital Securities Limited United Kingdom 581,542 635,722 –BNP Paribas SA France 1,156,604 1,259,041 –Credit Suisse AG Switzerland 5,339,754 5,588,642 –Deutsche Bank AG Germany 5,196,169 5,680,040 –HSBC Bank Plc United Kingdom 3,691,125 4,383,174 –The Bank of Nova Scotia Canada 430,955 472,305 –UBS AG Switzerland 7,804,513 8,626,429 –Total 24,200,662 26,645,353 –
Appendix IV – Supplementary Information (Unaudited) continued
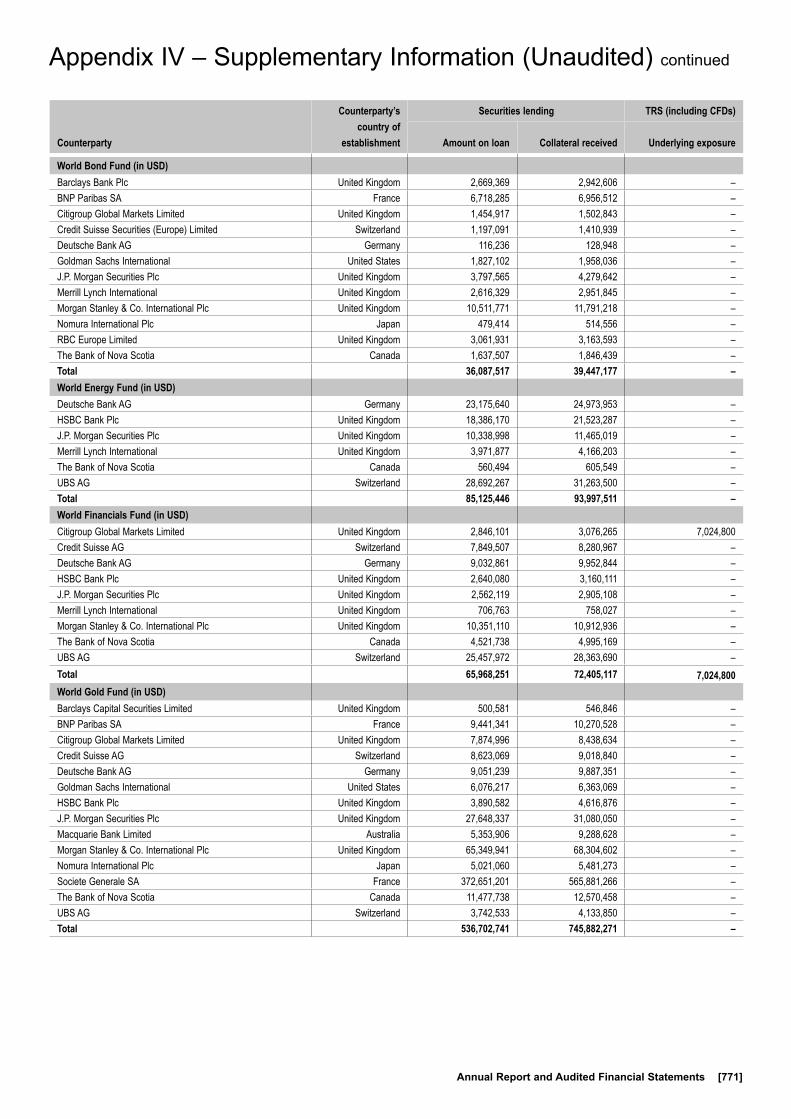
Annual Report and Audited Financial Statements [771]
Counterparty
Counterparty’s country of
establishment
Securities lending TRS (including CFDs)
Amount on loan Collateral received Underlying exposure
World Bond Fund (in USD)Barclays Bank Plc United Kingdom 2,669,369 2,942,606 –BNP Paribas SA France 6,718,285 6,956,512 –Citigroup Global Markets Limited United Kingdom 1,454,917 1,502,843 –Credit Suisse Securities (Europe) Limited Switzerland 1,197,091 1,410,939 –Deutsche Bank AG Germany 116,236 128,948 –Goldman Sachs International United States 1,827,102 1,958,036 –J.P. Morgan Securities Plc United Kingdom 3,797,565 4,279,642 –Merrill Lynch International United Kingdom 2,616,329 2,951,845 –Morgan Stanley & Co. International Plc United Kingdom 10,511,771 11,791,218 –Nomura International Plc Japan 479,414 514,556 –RBC Europe Limited United Kingdom 3,061,931 3,163,593 –The Bank of Nova Scotia Canada 1,637,507 1,846,439 –Total 36,087,517 39,447,177 –World Energy Fund (in USD)Deutsche Bank AG Germany 23,175,640 24,973,953 –HSBC Bank Plc United Kingdom 18,386,170 21,523,287 –J.P. Morgan Securities Plc United Kingdom 10,338,998 11,465,019 –Merrill Lynch International United Kingdom 3,971,877 4,166,203 –The Bank of Nova Scotia Canada 560,494 605,549 –UBS AG Switzerland 28,692,267 31,263,500 –Total 85,125,446 93,997,511 –World Financials Fund (in USD)Citigroup Global Markets Limited United Kingdom 2,846,101 3,076,265 7,024,800Credit Suisse AG Switzerland 7,849,507 8,280,967 –Deutsche Bank AG Germany 9,032,861 9,952,844 –HSBC Bank Plc United Kingdom 2,640,080 3,160,111 –J.P. Morgan Securities Plc United Kingdom 2,562,119 2,905,108 –Merrill Lynch International United Kingdom 706,763 758,027 –Morgan Stanley & Co. International Plc United Kingdom 10,351,110 10,912,936 –The Bank of Nova Scotia Canada 4,521,738 4,995,169 –UBS AG Switzerland 25,457,972 28,363,690 –Total 65,968,251 72,405,117 7,024,800 World Gold Fund (in USD)Barclays Capital Securities Limited United Kingdom 500,581 546,846 –BNP Paribas SA France 9,441,341 10,270,528 –Citigroup Global Markets Limited United Kingdom 7,874,996 8,438,634 –Credit Suisse AG Switzerland 8,623,069 9,018,840 –Deutsche Bank AG Germany 9,051,239 9,887,351 –Goldman Sachs International United States 6,076,217 6,363,069 –HSBC Bank Plc United Kingdom 3,890,582 4,616,876 –J.P. Morgan Securities Plc United Kingdom 27,648,337 31,080,050 –Macquarie Bank Limited Australia 5,353,906 9,288,628 –Morgan Stanley & Co. International Plc United Kingdom 65,349,941 68,304,602 –Nomura International Plc Japan 5,021,060 5,481,273 –Societe Generale SA France 372,651,201 565,881,266 –The Bank of Nova Scotia Canada 11,477,738 12,570,458 –UBS AG Switzerland 3,742,533 4,133,850 –Total 536,702,741 745,882,271 –
Appendix IV – Supplementary Information (Unaudited) continued

[772] BlackRock Global Funds (BGF)
Counterparty
Counterparty’s country of
establishment
Securities lending TRS (including CFDs)
Amount on loan Collateral received Underlying exposure
World Healthscience Fund (in USD)Barclays Capital Securities Limited United Kingdom 25,071,252 27,305,383 –BNP Paribas SA France 219,673 238,241 –Credit Suisse AG Switzerland 33,881,519 35,329,195 –Credit Suisse International United Kingdom 1,944,413 2,301,585 –Credit Suisse Securities (Europe) Limited Switzerland 14,764,722 15,529,310 –Deutsche Bank AG Germany 140,032,916 152,505,005 –HSBC Bank Plc United Kingdom 13,226,026 15,647,506 –J.P. Morgan Securities Plc United Kingdom 28,612,758 32,066,710 –Macquarie Bank Limited Australia 4,827,195 8,349,448 –Nomura International Plc Japan 3,271,344 3,560,364 –The Bank of Nova Scotia Canada 10,420,274 11,377,740 –UBS AG Switzerland 90,938,078 100,142,145 –Total 367,210,170 404,352,632 –World Mining Fund (in USD)Barclays Capital Securities Limited United Kingdom 10,155,959 10,828,780 –BNP Paribas SA France 24,286,924 25,786,955 –Citigroup Global Markets Limited United Kingdom 625,146 653,840 –Credit Suisse AG Switzerland 23,603,351 24,095,221 –Credit Suisse Securities (Europe) Limited Switzerland 21,906,678 22,557,441 –Deutsche Bank AG Germany 28,626,381 30,521,564 –Goldman Sachs International United States 44,011,190 44,984,708 –HSBC Bank Plc United Kingdom 16,187,915 18,749,643 –J.P. Morgan Securities Plc United Kingdom 29,864,655 32,767,142 –Macquarie Bank Limited Australia 9,960,753 16,867,143 –Merrill Lynch International United Kingdom 2,100,427 2,179,902 –Morgan Stanley & Co. International Plc United Kingdom 38,534,727 39,312,033 –Nomura International Plc Japan 4,013,719 4,276,628 –Societe Generale SA France 1,407,577 2,086,236 –The Bank of Nova Scotia Canada 550,512 588,477 –UBS AG Switzerland 2,138,971 2,306,016 –Total 257,974,885 278,561,729 –World Real Estate Securities Fund (in USD)BNP Paribas SA France 2,018,926 2,190,518 –Goldman Sachs International United States 3,590,374 3,750,078 –HSBC Bank Plc United Kingdom 791,473 936,779 –J.P. Morgan Securities Plc United Kingdom 4,537,768 5,087,708 –Morgan Stanley & Co. International Plc United Kingdom – – 4,639,926 The Bank of Nova Scotia Canada 3,623,606 3,958,248 –UBS AG Switzerland 2,680,127 2,952,647 –Total 17,242,274 18,875,978 4,639,926 World Technology Fund (in USD)Barclays Capital Securities Limited United Kingdom 1,405,904 1,525,982 –Citigroup Global Markets Limited United Kingdom 4,982,801 5,305,158 –Credit Suisse AG Switzerland 75,334,311 78,286,124 –Credit Suisse Securities (Europe) Limited Switzerland 19,957,167 20,919,283 –Deutsche Bank AG Germany 202,265 219,529 –Goldman Sachs International United States 2,082,245 2,166,548 –HSBC Bank Plc United Kingdom 83,898,721 98,921,821 –J.P. Morgan Securities Plc United Kingdom 33,834,024 37,789,347 –Merrill Lynch International United Kingdom 4,055,912 4,285,017 –Morgan Stanley & Co. International Plc United Kingdom 10,612,111 11,020,713 –The Bank of Nova Scotia Canada 45,943,405 49,994,370 –UBS AG Switzerland 56,834,521 62,374,111 –Total 339,143,387 372,808,003 –
Appendix IV – Supplementary Information (Unaudited) continued
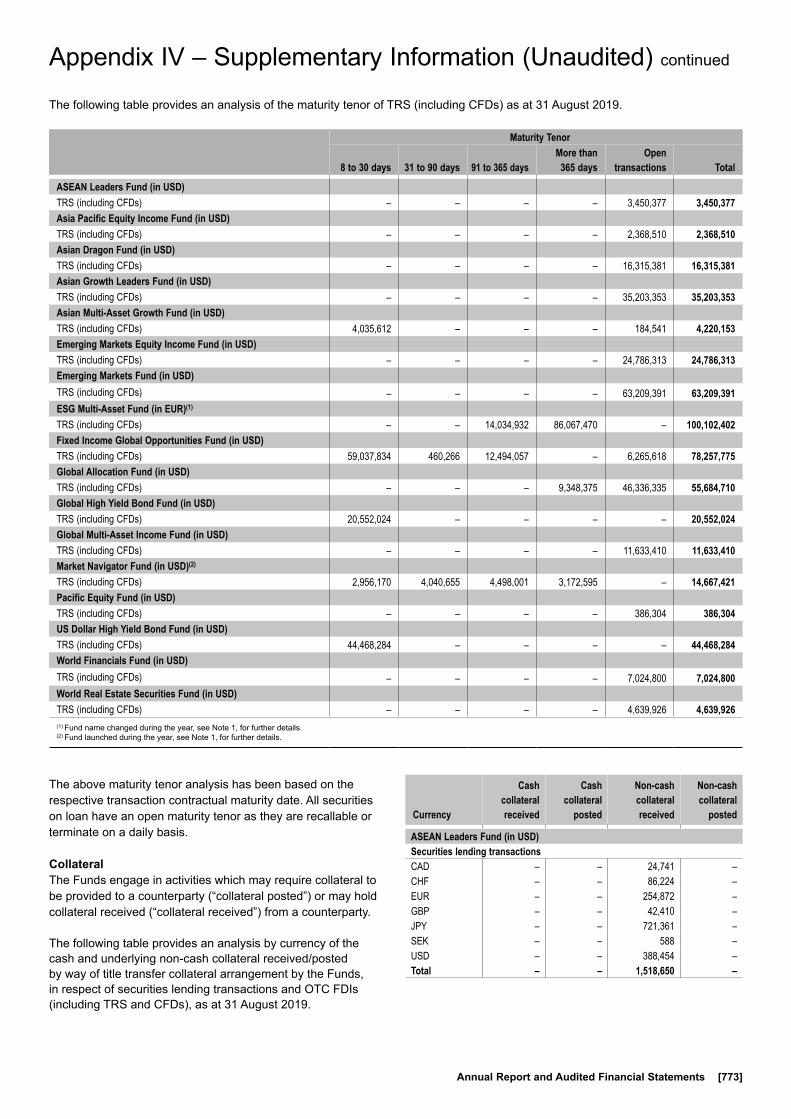
Annual Report and Audited Financial Statements [773]
Appendix IV – Supplementary Information (Unaudited) continued
The following table provides an analysis of the maturity tenor of TRS (including CFDs) as at 31 August 2019.
Maturity Tenor
8 to 30 days 31 to 90 days 91 to 365 daysMore than 365 days
Open transactions Total
ASEAN Leaders Fund (in USD)TRS (including CFDs) – – – – 3,450,377 3,450,377Asia Pacific Equity Income Fund (in USD)TRS (including CFDs) – – – – 2,368,510 2,368,510Asian Dragon Fund (in USD)TRS (including CFDs) – – – – 16,315,381 16,315,381Asian Growth Leaders Fund (in USD)TRS (including CFDs) – – – – 35,203,353 35,203,353Asian Multi-Asset Growth Fund (in USD)TRS (including CFDs) 4,035,612 – – – 184,541 4,220,153Emerging Markets Equity Income Fund (in USD)TRS (including CFDs) – – – – 24,786,313 24,786,313Emerging Markets Fund (in USD)TRS (including CFDs) – – – – 63,209,391 63,209,391ESG Multi-Asset Fund (in EUR)(1)
TRS (including CFDs) – – 14,034,932 86,067,470 – 100,102,402Fixed Income Global Opportunities Fund (in USD)TRS (including CFDs) 59,037,834 460,266 12,494,057 – 6,265,618 78,257,775Global Allocation Fund (in USD)TRS (including CFDs) – – – 9,348,375 46,336,335 55,684,710Global High Yield Bond Fund (in USD)TRS (including CFDs) 20,552,024 – – – – 20,552,024Global Multi-Asset Income Fund (in USD)TRS (including CFDs) – – – – 11,633,410 11,633,410Market Navigator Fund (in USD)(2)
TRS (including CFDs) 2,956,170 4,040,655 4,498,001 3,172,595 – 14,667,421Pacific Equity Fund (in USD)TRS (including CFDs) – – – – 386,304 386,304US Dollar High Yield Bond Fund (in USD)TRS (including CFDs) 44,468,284 – – – – 44,468,284World Financials Fund (in USD)TRS (including CFDs) – – – – 7,024,800 7,024,800World Real Estate Securities Fund (in USD)TRS (including CFDs) – – – – 4,639,926 4,639,926(1) Fund name changed during the year, see Note 1, for further details.(2) Fund launched during the year, see Note 1, for further details.
The above maturity tenor analysis has been based on the respective transaction contractual maturity date. All securities on loan have an open maturity tenor as they are recallable or terminate on a daily basis.
Collateral The Funds engage in activities which may require collateral to be provided to a counterparty (“collateral posted”) or may hold collateral received (“collateral received”) from a counterparty.
The following table provides an analysis by currency of the cash and underlying non-cash collateral received/posted by way of title transfer collateral arrangement by the Funds, in respect of securities lending transactions and OTC FDIs (including TRS and CFDs), as at 31 August 2019.
Currency
Cash collateral received
Cash collateral
posted
Non-cash collateral received
Non-cash collateral
posted
ASEAN Leaders Fund (in USD)Securities lending transactionsCAD – – 24,741 –CHF – – 86,224 –EUR – – 254,872 –GBP – – 42,410 –JPY – – 721,361 –SEK – – 588 –USD – – 388,454 –Total – – 1,518,650 –
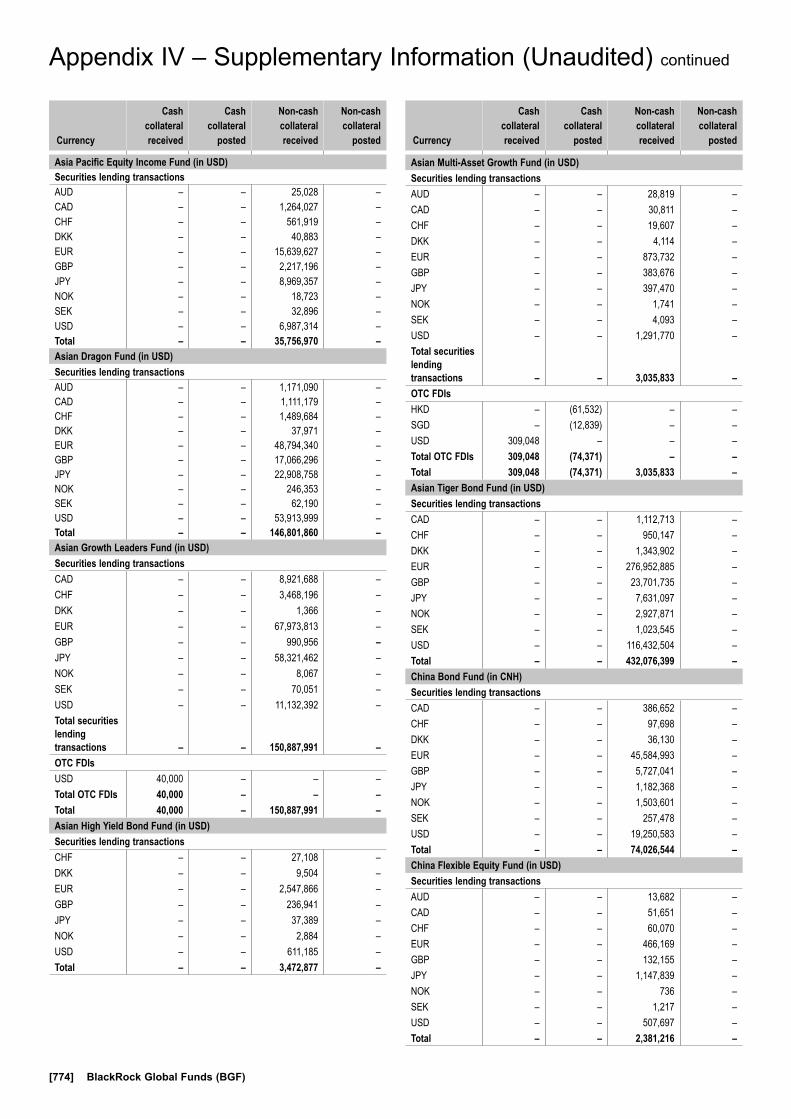
[774] BlackRock Global Funds (BGF)
Appendix IV – Supplementary Information (Unaudited) continued
Currency
Cash collateral received
Cash collateral
posted
Non-cash collateral received
Non-cash collateral
posted
Asia Pacific Equity Income Fund (in USD)Securities lending transactionsAUD – – 25,028 –CAD – – 1,264,027 –CHF – – 561,919 –DKK – – 40,883 –EUR – – 15,639,627 –GBP – – 2,217,196 –JPY – – 8,969,357 –NOK – – 18,723 –SEK – – 32,896 –USD – – 6,987,314 –Total – – 35,756,970 –Asian Dragon Fund (in USD)Securities lending transactionsAUD – – 1,171,090 –CAD – – 1,111,179 –CHF – – 1,489,684 –DKK – – 37,971 –EUR – – 48,794,340 –GBP – – 17,066,296 –JPY – – 22,908,758 –NOK – – 246,353 –SEK – – 62,190 –USD – – 53,913,999 –Total – – 146,801,860 –Asian Growth Leaders Fund (in USD)Securities lending transactionsCAD – – 8,921,688 –CHF – – 3,468,196 –DKK – – 1,366 –EUR – – 67,973,813 –GBP – – 990,956 –JPY – – 58,321,462 –NOK – – 8,067 –SEK – – 70,051 –USD – – 11,132,392 –Total securities lending transactions – – 150,887,991 –OTC FDIsUSD 40,000 – – –Total OTC FDIs 40,000 – – –Total 40,000 – 150,887,991 –Asian High Yield Bond Fund (in USD)Securities lending transactionsCHF – – 27,108 –DKK – – 9,504 –EUR – – 2,547,866 –GBP – – 236,941 –JPY – – 37,389 –NOK – – 2,884 –USD – – 611,185 –Total – – 3,472,877 –
Currency
Cash collateral received
Cash collateral
posted
Non-cash collateral received
Non-cash collateral
posted
Asian Multi-Asset Growth Fund (in USD)Securities lending transactionsAUD – – 28,819 –CAD – – 30,811 –CHF – – 19,607 –DKK – – 4,114 –EUR – – 873,732 –GBP – – 383,676 –JPY – – 397,470 –NOK – – 1,741 –SEK – – 4,093 –USD – – 1,291,770 –Total securities lending transactions – – 3,035,833 –OTC FDIsHKD – (61,532) – –SGD – (12,839) – –USD 309,048 – – –Total OTC FDIs 309,048 (74,371) – –Total 309,048 (74,371) 3,035,833 –Asian Tiger Bond Fund (in USD)Securities lending transactionsCAD – – 1,112,713 –CHF – – 950,147 –DKK – – 1,343,902 –EUR – – 276,952,885 –GBP – – 23,701,735 –JPY – – 7,631,097 –NOK – – 2,927,871 –SEK – – 1,023,545 –USD – – 116,432,504 –Total – – 432,076,399 –China Bond Fund (in CNH)Securities lending transactionsCAD – – 386,652 –CHF – – 97,698 –DKK – – 36,130 –EUR – – 45,584,993 –GBP – – 5,727,041 –JPY – – 1,182,368 –NOK – – 1,503,601 –SEK – – 257,478 –USD – – 19,250,583 –Total – – 74,026,544 –China Flexible Equity Fund (in USD)Securities lending transactionsAUD – – 13,682 –CAD – – 51,651 –CHF – – 60,070 –EUR – – 466,169 –GBP – – 132,155 –JPY – – 1,147,839 –NOK – – 736 –SEK – – 1,217 –USD – – 507,697 –Total – – 2,381,216 –
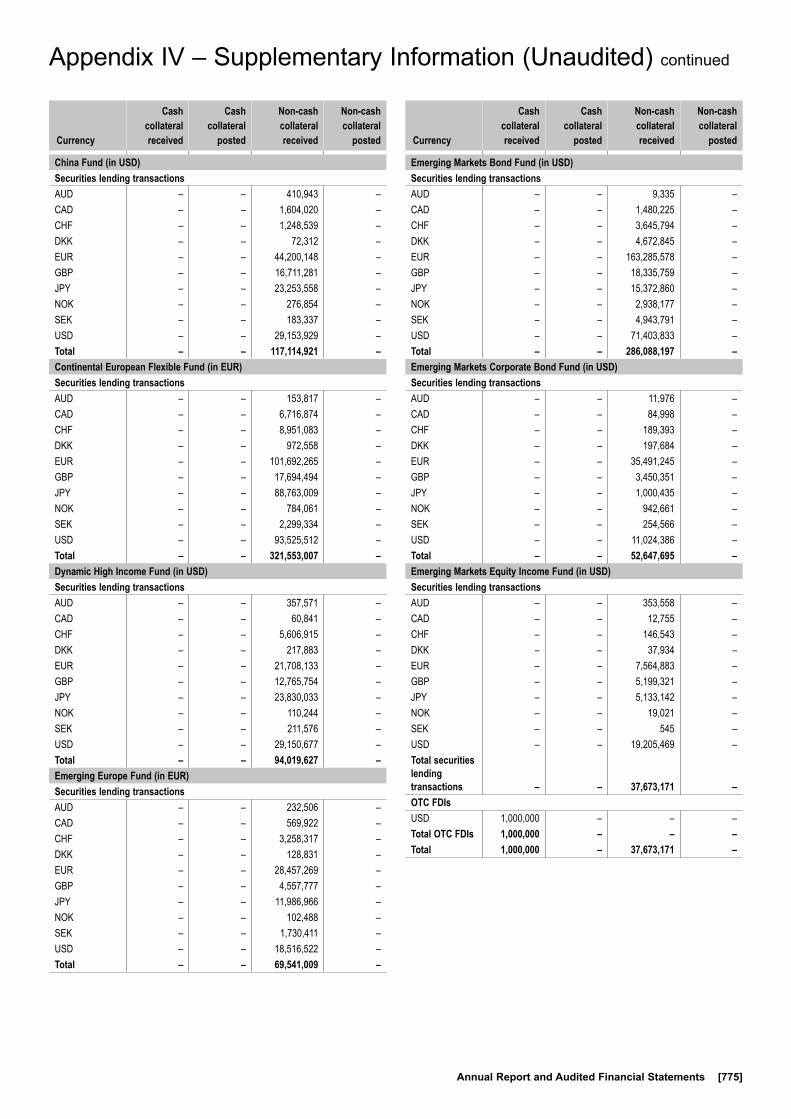
Annual Report and Audited Financial Statements [775]
Appendix IV – Supplementary Information (Unaudited) continued
Currency
Cash collateral received
Cash collateral
posted
Non-cash collateral received
Non-cash collateral
posted
China Fund (in USD)Securities lending transactionsAUD – – 410,943 –CAD – – 1,604,020 –CHF – – 1,248,539 –DKK – – 72,312 –EUR – – 44,200,148 –GBP – – 16,711,281 –JPY – – 23,253,558 –NOK – – 276,854 –SEK – – 183,337 –USD – – 29,153,929 –Total – – 117,114,921 –Continental European Flexible Fund (in EUR)Securities lending transactionsAUD – – 153,817 –CAD – – 6,716,874 –CHF – – 8,951,083 –DKK – – 972,558 –EUR – – 101,692,265 –GBP – – 17,694,494 –JPY – – 88,763,009 –NOK – – 784,061 –SEK – – 2,299,334 –USD – – 93,525,512 –Total – – 321,553,007 –Dynamic High Income Fund (in USD)Securities lending transactionsAUD – – 357,571 –CAD – – 60,841 –CHF – – 5,606,915 –DKK – – 217,883 –EUR – – 21,708,133 –GBP – – 12,765,754 –JPY – – 23,830,033 –NOK – – 110,244 –SEK – – 211,576 –USD – – 29,150,677 –Total – – 94,019,627 –Emerging Europe Fund (in EUR)Securities lending transactionsAUD – – 232,506 –CAD – – 569,922 –CHF – – 3,258,317 –DKK – – 128,831 –EUR – – 28,457,269 –GBP – – 4,557,777 –JPY – – 11,986,966 –NOK – – 102,488 –SEK – – 1,730,411 –USD – – 18,516,522 –Total – – 69,541,009 –
Currency
Cash collateral received
Cash collateral
posted
Non-cash collateral received
Non-cash collateral
posted
Emerging Markets Bond Fund (in USD)Securities lending transactionsAUD – – 9,335 –CAD – – 1,480,225 –CHF – – 3,645,794 –DKK – – 4,672,845 –EUR – – 163,285,578 –GBP – – 18,335,759 –JPY – – 15,372,860 –NOK – – 2,938,177 –SEK – – 4,943,791 –USD – – 71,403,833 –Total – – 286,088,197 –Emerging Markets Corporate Bond Fund (in USD)Securities lending transactionsAUD – – 11,976 –CAD – – 84,998 –CHF – – 189,393 –DKK – – 197,684 –EUR – – 35,491,245 –GBP – – 3,450,351 –JPY – – 1,000,435 –NOK – – 942,661 –SEK – – 254,566 –USD – – 11,024,386 –Total – – 52,647,695 –Emerging Markets Equity Income Fund (in USD)Securities lending transactionsAUD – – 353,558 –CAD – – 12,755 –CHF – – 146,543 –DKK – – 37,934 –EUR – – 7,564,883 –GBP – – 5,199,321 –JPY – – 5,133,142 –NOK – – 19,021 –SEK – – 545 –USD – – 19,205,469 –Total securities lending transactions – – 37,673,171 –OTC FDIsUSD 1,000,000 – – –Total OTC FDIs 1,000,000 – – –Total 1,000,000 – 37,673,171 –

[776] BlackRock Global Funds (BGF)
Appendix IV – Supplementary Information (Unaudited) continued
Currency
Cash collateral received
Cash collateral
posted
Non-cash collateral received
Non-cash collateral
posted
Emerging Markets Fund (in USD)Securities lending transactionsAUD – – 448,572 –CAD – – 916,728 –CHF – – 715,508 –DKK – – 23,975 –EUR – – 15,310,348 –GBP – – 5,953,899 –JPY – – 16,050,714 –NOK – – 158,208 –SEK – – 65,520 –USD – – 20,547,027 –Total securities lending transactions – – 60,190,499 –OTC FDIsUSD 510,000 (510,000) – –Total OTC FDIs 510,000 (510,000) – –Total 510,000 (510,000) 60,190,499 –Emerging Markets Local Currency Bond Fund (in USD)Securities lending transactionsCAD – – 106,475 –CHF – – 365,031 –DKK – – 527,335 –EUR – – 69,600,600 –GBP – – 5,063,259 –JPY – – 4,141,460 –NOK – – 3,956,687 –SEK – – 1,142,118 –USD – – 17,239,688 –Total – – 102,142,653 –ESG Emerging Markets Blended Bond Fund (in USD)Securities lending transactionsCAD – – 31,242 –CHF – – 25,861 –DKK – – 18,493 –EUR – – 255,512 –GBP – – 111,867 –JPY – – 91,112 –NOK – – 8,932 –SEK – – 40,176 –USD – – 114,420 –Total – – 697,615 –ESG Emerging Markets Bond Fund (in USD)Securities lending transactionsCAD – – 743,275 –CHF – – 730,079 –DKK – – 625,095 –EUR – – 8,735,231 –GBP – – 3,358,009 –JPY – – 2,405,334 –NOK – – 199,121 –SEK – – 1,087,071 –USD – – 4,802,503 –Total – – 22,685,718 –
Currency
Cash collateral received
Cash collateral
posted
Non-cash collateral received
Non-cash collateral
posted
ESG Emerging Markets Corporate Bond Fund (in USD)Securities lending transactionsAUD – – 2,335 –CAD – – 20,431 –CHF – – 17,165 –DKK – – 12,096 –EUR – – 863,335 –GBP – – 229,220 –JPY – – 161,424 –NOK – – 24,910 –SEK – – 29,539 –USD – – 288,669 –Total – – 1,649,124 –ESG Multi-Asset Fund (in EUR)(1)
Securities lending transactionsAUD – – 104,962 –CAD – – 847,565 –CHF – – 1,123,683 –DKK – – 153,062 –EUR – – 20,141,680 –GBP – – 4,288,172 –JPY – – 12,943,662 –NOK – – 121,892 –SEK – – 267,049 –USD – – 22,833,391 –Total securities lending transactions – – 62,825,118 –OTC FDIsCZK – (927) – –EUR 161,482 (680,000) – 1,534,126GBP – (8,618) – –HUF 925 – – –JPY 6,050 – – –PLN – (4,789) – –SEK – (3,778) – –SGD 3,203 – – –USD – (12,524) – –Total OTC FDIs 171,660 (710,636) – 1,534,126Total 171,660 (710,636) 62,825,118 1,534,126Euro Bond Fund (in EUR)Securities lending transactionsCAD – – 91,917 –CHF – – 2,286,120 –DKK – – 2,589,894 –EUR – – 250,446,675 –GBP – – 25,283,794 –JPY – – 18,141,132 –NOK – – 7,221,907 –SEK – – 2,533,577 –USD – – 86,816,976 –Total – – 395,411,992 –(1) Fund name changed during the year, see Note 1, for further details.

Annual Report and Audited Financial Statements [777]
Appendix IV – Supplementary Information (Unaudited) continued
Currency
Cash collateral received
Cash collateral
posted
Non-cash collateral received
Non-cash collateral
posted
Euro Corporate Bond Fund (in EUR)Securities lending transactionsAUD – – 314,166 –CAD – – 494,475 –CHF – – 877,072 –DKK – – 1,471,890 –EUR – – 85,347,963 –GBP – – 19,628,334 –JPY – – 8,618,430 –NOK – – 783,154 –SEK – – 1,150,352 –USD – – 35,780,102 –Total – – 154,465,938 –Euro Short Duration Bond Fund (in EUR)Securities lending transactionsCAD – – 552,549 –CHF – – 9,469,686 –DKK – – 4,033,816 –EUR – – 284,713,884 –GBP – – 29,033,341 –JPY – – 33,016,519 –NOK – – 2,975,950 –SEK – – 3,989,038 –USD – – 104,438,775 –Total – – 472,223,558 –Euro-Markets Fund (in EUR)Securities lending transactionsAUD – – 13,991 –CAD – – 3,805,919 –CHF – – 4,938,630 –DKK – – 60,993 –EUR – – 36,056,168 –GBP – – 10,073,124 –JPY – – 40,534,270 –NOK – – 241,483 –SEK – – 848,360 –USD – – 52,175,026 –Total – – 148,747,964 –European Equity Income Fund (in EUR)Securities lending transactionsCAD – – 354,211 –CHF – – 1,932,095 –DKK – – 161,202 –EUR – – 17,493,252 –GBP – – 12,469,082 –JPY – – 11,931,006 –NOK – – 1,005,102 –SEK – – 1,292,455 –USD – – 28,794,264 –Total – – 75,432,669 –
Currency
Cash collateral received
Cash collateral
posted
Non-cash collateral received
Non-cash collateral
posted
European Focus Fund (in EUR)Securities lending transactionsAUD – – 59,274 –CAD – – 342,363 –CHF – – 1,095,346 –DKK – – 24,060 –EUR – – 5,730,410 –GBP – – 1,636,745 –JPY – – 5,291,326 –NOK – – 23,161 –SEK – – 36,017 –USD – – 5,574,765 –Total – – 19,813,467 –European Fund (in EUR)Securities lending transactionsAUD – – 606,943 –CAD – – 2,832,692 –CHF – – 3,738,147 –DKK – – 191,782 –EUR – – 31,062,588 –GBP – – 7,798,082 –JPY – – 43,780,939 –NOK – – 53,656 –SEK – – 192,725 –USD – – 30,095,186 –Total – – 120,352,740 –European High Yield Bond Fund (in EUR)Securities lending transactionsCAD – – 14,724 –CHF – – 1,287 –DKK – – 9,975 –EUR – – 2,939,536 –GBP – – 480,173 –JPY – – 243,792 –NOK – – 88,468 –SEK – – 14,236 –USD – – 723,281 –Total – – 4,515,472 –European Special Situations Fund (in EUR)Securities lending transactionsAUD – – 257,508 –CAD – – 1,837,971 –CHF – – 5,201,599 –DKK – – 311,686 –EUR – – 34,959,428 –GBP – – 10,066,909 –JPY – – 28,337,748 –NOK – – 125,371 –SEK – – 281,261 –USD – – 30,545,778 –Total – – 111,925,259 –
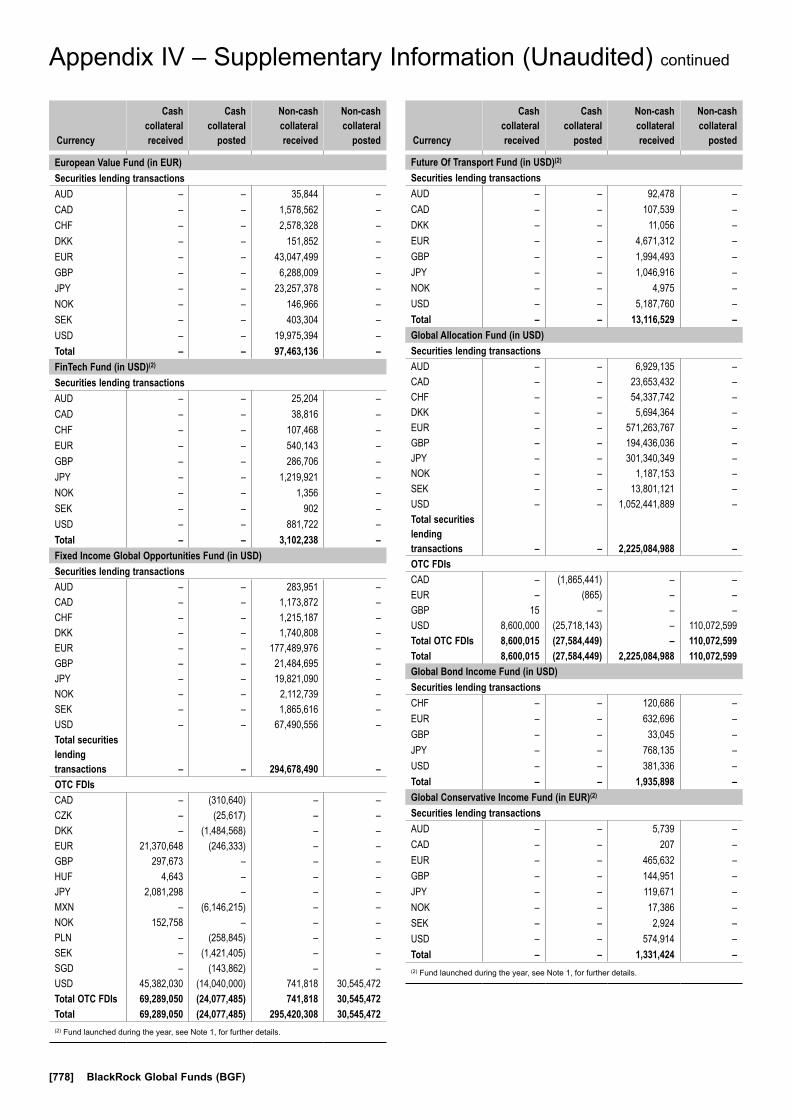
[778] BlackRock Global Funds (BGF)
Appendix IV – Supplementary Information (Unaudited) continued
Currency
Cash collateral received
Cash collateral
posted
Non-cash collateral received
Non-cash collateral
posted
European Value Fund (in EUR)Securities lending transactionsAUD – – 35,844 –CAD – – 1,578,562 –CHF – – 2,578,328 –DKK – – 151,852 –EUR – – 43,047,499 –GBP – – 6,288,009 –JPY – – 23,257,378 –NOK – – 146,966 –SEK – – 403,304 –USD – – 19,975,394 –Total – – 97,463,136 –FinTech Fund (in USD)(2)
Securities lending transactionsAUD – – 25,204 –CAD – – 38,816 –CHF – – 107,468 –EUR – – 540,143 –GBP – – 286,706 –JPY – – 1,219,921 –NOK – – 1,356 –SEK – – 902 –USD – – 881,722 –Total – – 3,102,238 –Fixed Income Global Opportunities Fund (in USD)Securities lending transactionsAUD – – 283,951 –CAD – – 1,173,872 –CHF – – 1,215,187 –DKK – – 1,740,808 –EUR – – 177,489,976 –GBP – – 21,484,695 –JPY – – 19,821,090 –NOK – – 2,112,739 –SEK – – 1,865,616 –USD – – 67,490,556 –Total securities lending transactions – – 294,678,490 –OTC FDIsCAD – (310,640) – –CZK – (25,617) – –DKK – (1,484,568) – –EUR 21,370,648 (246,333) – –GBP 297,673 – – –HUF 4,643 – – –JPY 2,081,298 – – –MXN – (6,146,215) – –NOK 152,758 – – –PLN – (258,845) – –SEK – (1,421,405) – –SGD – (143,862) – –USD 45,382,030 (14,040,000) 741,818 30,545,472Total OTC FDIs 69,289,050 (24,077,485) 741,818 30,545,472Total 69,289,050 (24,077,485) 295,420,308 30,545,472(2) Fund launched during the year, see Note 1, for further details.
Currency
Cash collateral received
Cash collateral
posted
Non-cash collateral received
Non-cash collateral
posted
Future Of Transport Fund (in USD)(2)
Securities lending transactionsAUD – – 92,478 –CAD – – 107,539 –DKK – – 11,056 –EUR – – 4,671,312 –GBP – – 1,994,493 –JPY – – 1,046,916 –NOK – – 4,975 –USD – – 5,187,760 –Total – – 13,116,529 –Global Allocation Fund (in USD)Securities lending transactionsAUD – – 6,929,135 –CAD – – 23,653,432 –CHF – – 54,337,742 –DKK – – 5,694,364 –EUR – – 571,263,767 –GBP – – 194,436,036 –JPY – – 301,340,349 –NOK – – 1,187,153 –SEK – – 13,801,121 –USD – – 1,052,441,889 –Total securities lending transactions – – 2,225,084,988 –OTC FDIsCAD – (1,865,441) – –EUR – (865) – –GBP 15 – – –USD 8,600,000 (25,718,143) – 110,072,599Total OTC FDIs 8,600,015 (27,584,449) – 110,072,599Total 8,600,015 (27,584,449) 2,225,084,988 110,072,599Global Bond Income Fund (in USD)Securities lending transactionsCHF – – 120,686 –EUR – – 632,696 –GBP – – 33,045 –JPY – – 768,135 –USD – – 381,336 –Total – – 1,935,898 –Global Conservative Income Fund (in EUR)(2)
Securities lending transactionsAUD – – 5,739 –CAD – – 207 –EUR – – 465,632 –GBP – – 144,951 –JPY – – 119,671 –NOK – – 17,386 –SEK – – 2,924 –USD – – 574,914 –Total – – 1,331,424 –(2) Fund launched during the year, see Note 1, for further details.

Annual Report and Audited Financial Statements [779]
Appendix IV – Supplementary Information (Unaudited) continued
Currency
Cash collateral received
Cash collateral
posted
Non-cash collateral received
Non-cash collateral
posted
Global Corporate Bond Fund (in USD)Securities lending transactionsCAD – – 239,285 –CHF – – 383,873 –DKK – – 691,985 –EUR – – 62,554,765 –GBP – – 8,941,234 –JPY – – 3,062,428 –NOK – – 244,345 –SEK – – 358,113 –USD – – 16,696,368 –Total – – 93,172,396 –Global Dynamic Equity Fund (in USD)Securities lending transactionsAUD – – 258,303 –CAD – – 639,627 –CHF – – 2,548,769 –DKK – – 282,728 –EUR – – 23,069,488 –GBP – – 6,694,429 –JPY – – 13,112,363 –NOK – – 73,566 –SEK – – 427,607 –USD – – 25,222,974 –Total – – 72,329,854 –Global Enhanced Equity Yield Fund (in USD)Securities lending transactionsAUD – – 40,727 –CAD – – 881,467 –CHF – – 3,335,108 –DKK – – 385,919 –EUR – – 28,655,191 –GBP – – 12,877,950 –JPY – – 17,720,423 –NOK – – 320,240 –SEK – – 292,125 –USD – – 68,116,336 –Total – – 132,625,486 –Global Equity Income Fund (in USD)Securities lending transactionsAUD – – 54,746 –CAD – – 234,198 –CHF – – 1,658,318 –DKK – – 134,469 –EUR – – 30,327,819 –GBP – – 8,219,690 –JPY – – 9,918,718 –NOK – – 141,254 –SEK – – 259,976 –USD – – 42,437,102 –Total – – 93,386,290 –
Currency
Cash collateral received
Cash collateral
posted
Non-cash collateral received
Non-cash collateral
posted
Global Government Bond Fund (in USD)Securities lending transactionsCAD – – 2,399 –CHF – – 116,726 –DKK – – 219,312 –EUR – – 15,136,691 –GBP – – 2,772,486 –JPY – – 2,093,245 –NOK – – 881,309 –SEK – – 122,411 –USD – – 6,427,907 –Total – – 27,772,486 –Global High Yield Bond Fund (in USD)Securities lending transactionsAUD – – 10,202 –CAD – – 331,880 –CHF – – 370,137 –DKK – – 443,608 –EUR – – 45,901,858 –GBP – – 5,377,122 –JPY – – 1,993,733 –NOK – – 1,062,532 –SEK – – 595,684 –USD – – 16,495,154 –Total securities lending transactions – – 72,581,910 –OTC FDIsUSD 1,570,000 (1,108,202) – –Total OTC FDIs 1,570,000 (1,108,202) – –Total 1,570,000 (1,108,202) 72,581,910 –Global Inflation Linked Bond Fund (in USD)Securities lending transactionsCHF – – 189,504 –EUR – – 1,279,261 –GBP – – 556,081 –JPY – – 1,296,455 –USD – – 795,418 –Total – – 4,116,719 –Global Long-Horizon Equity Fund (in USD)(1)
Securities lending transactionsCAD – – 389,974 –CHF – – 1,890,915 –DKK – – 201,070 –EUR – – 18,879,293 –GBP – – 1,353,813 –JPY – – 12,136,006 –NOK – – 21,494 –SEK – – 518,302 –USD – – 10,505,740 –Total – – 45,896,607 –(1) Fund name changed during the year, see Note 1, for further details.
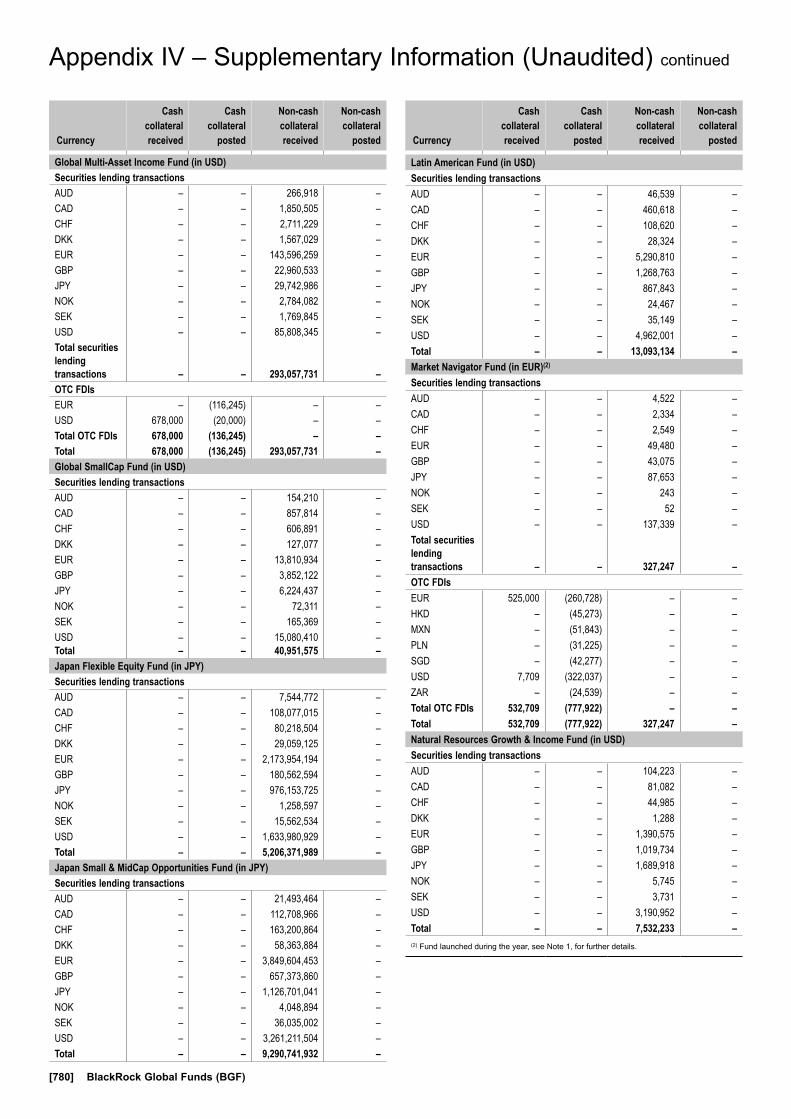
[780] BlackRock Global Funds (BGF)
Appendix IV – Supplementary Information (Unaudited) continued
Currency
Cash collateral received
Cash collateral
posted
Non-cash collateral received
Non-cash collateral
posted
Global Multi-Asset Income Fund (in USD)Securities lending transactionsAUD – – 266,918 –CAD – – 1,850,505 –CHF – – 2,711,229 –DKK – – 1,567,029 –EUR – – 143,596,259 –GBP – – 22,960,533 –JPY – – 29,742,986 –NOK – – 2,784,082 –SEK – – 1,769,845 –USD – – 85,808,345 –Total securities lending transactions – – 293,057,731 –OTC FDIsEUR – (116,245) – –USD 678,000 (20,000) – –Total OTC FDIs 678,000 (136,245) – –Total 678,000 (136,245) 293,057,731 –Global SmallCap Fund (in USD)Securities lending transactionsAUD – – 154,210 –CAD – – 857,814 –CHF – – 606,891 –DKK – – 127,077 –EUR – – 13,810,934 –GBP – – 3,852,122 –JPY – – 6,224,437 –NOK – – 72,311 –SEK – – 165,369 –USD – – 15,080,410 –Total – – 40,951,575 –Japan Flexible Equity Fund (in JPY)Securities lending transactionsAUD – – 7,544,772 –CAD – – 108,077,015 –CHF – – 80,218,504 –DKK – – 29,059,125 –EUR – – 2,173,954,194 –GBP – – 180,562,594 –JPY – – 976,153,725 –NOK – – 1,258,597 –SEK – – 15,562,534 –USD – – 1,633,980,929 –Total – – 5,206,371,989 –Japan Small & MidCap Opportunities Fund (in JPY)Securities lending transactionsAUD – – 21,493,464 –CAD – – 112,708,966 –CHF – – 163,200,864 –DKK – – 58,363,884 –EUR – – 3,849,604,453 –GBP – – 657,373,860 –JPY – – 1,126,701,041 –NOK – – 4,048,894 –SEK – – 36,035,002 –USD – – 3,261,211,504 –Total – – 9,290,741,932 –
Currency
Cash collateral received
Cash collateral
posted
Non-cash collateral received
Non-cash collateral
posted
Latin American Fund (in USD)Securities lending transactionsAUD – – 46,539 –CAD – – 460,618 –CHF – – 108,620 –DKK – – 28,324 –EUR – – 5,290,810 –GBP – – 1,268,763 –JPY – – 867,843 –NOK – – 24,467 –SEK – – 35,149 –USD – – 4,962,001 –Total – – 13,093,134 –Market Navigator Fund (in EUR)(2)
Securities lending transactionsAUD – – 4,522 –CAD – – 2,334 –CHF – – 2,549 –EUR – – 49,480 –GBP – – 43,075 –JPY – – 87,653 –NOK – – 243 –SEK – – 52 –USD – – 137,339 –Total securities lending transactions – – 327,247 –OTC FDIsEUR 525,000 (260,728) – –HKD – (45,273) – –MXN – (51,843) – –PLN – (31,225) – –SGD – (42,277) – –USD 7,709 (322,037) – –ZAR – (24,539) – –Total OTC FDIs 532,709 (777,922) – –Total 532,709 (777,922) 327,247 –Natural Resources Growth & Income Fund (in USD)Securities lending transactionsAUD – – 104,223 –CAD – – 81,082 –CHF – – 44,985 –DKK – – 1,288 –EUR – – 1,390,575 –GBP – – 1,019,734 –JPY – – 1,689,918 –NOK – – 5,745 –SEK – – 3,731 –USD – – 3,190,952 –Total – – 7,532,233 –(2) Fund launched during the year, see Note 1, for further details.
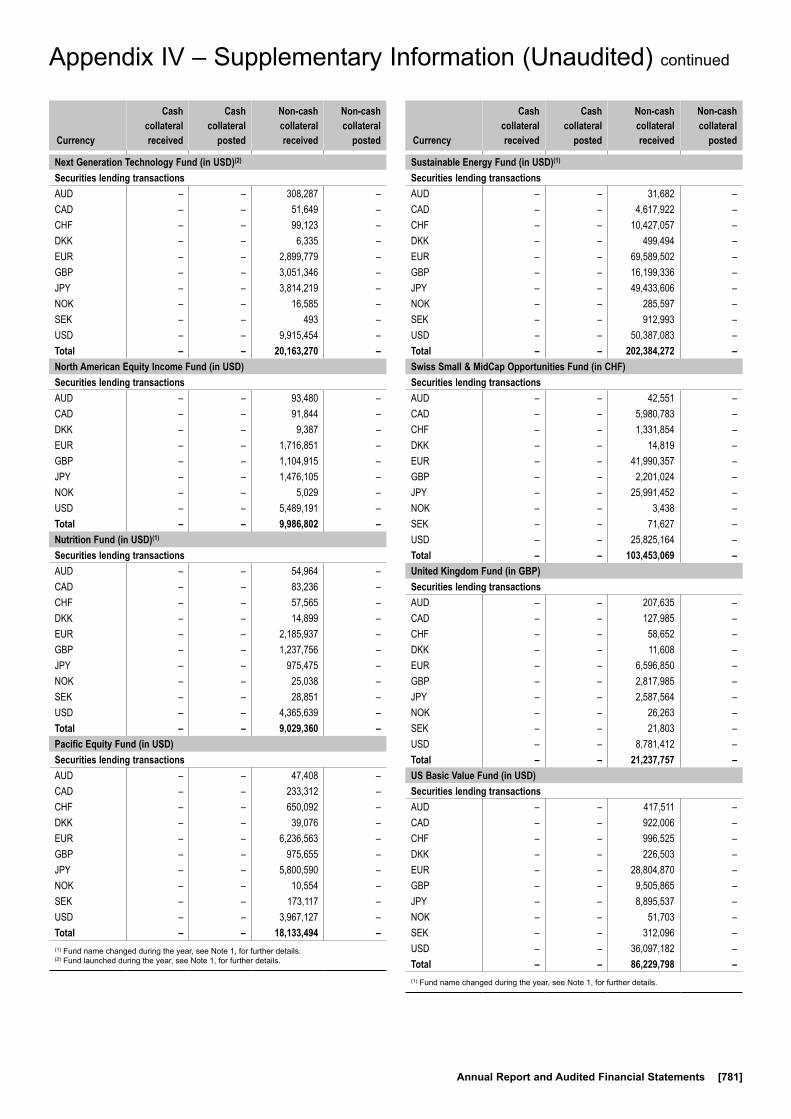
Annual Report and Audited Financial Statements [781]
Appendix IV – Supplementary Information (Unaudited) continued
Currency
Cash collateral received
Cash collateral
posted
Non-cash collateral received
Non-cash collateral
posted
Next Generation Technology Fund (in USD)(2)
Securities lending transactionsAUD – – 308,287 –CAD – – 51,649 –CHF – – 99,123 –DKK – – 6,335 –EUR – – 2,899,779 –GBP – – 3,051,346 –JPY – – 3,814,219 –NOK – – 16,585 –SEK – – 493 –USD – – 9,915,454 –Total – – 20,163,270 –North American Equity Income Fund (in USD)Securities lending transactionsAUD – – 93,480 –CAD – – 91,844 –DKK – – 9,387 –EUR – – 1,716,851 –GBP – – 1,104,915 –JPY – – 1,476,105 –NOK – – 5,029 –USD – – 5,489,191 –Total – – 9,986,802 –Nutrition Fund (in USD)(1)
Securities lending transactionsAUD – – 54,964 –CAD – – 83,236 –CHF – – 57,565 –DKK – – 14,899 –EUR – – 2,185,937 –GBP – – 1,237,756 –JPY – – 975,475 –NOK – – 25,038 –SEK – – 28,851 –USD – – 4,365,639 –Total – – 9,029,360 –Pacific Equity Fund (in USD)Securities lending transactionsAUD – – 47,408 –CAD – – 233,312 –CHF – – 650,092 –DKK – – 39,076 –EUR – – 6,236,563 –GBP – – 975,655 –JPY – – 5,800,590 –NOK – – 10,554 –SEK – – 173,117 –USD – – 3,967,127 –Total – – 18,133,494 –(1) Fund name changed during the year, see Note 1, for further details.(2) Fund launched during the year, see Note 1, for further details.
Currency
Cash collateral received
Cash collateral
posted
Non-cash collateral received
Non-cash collateral
posted
Sustainable Energy Fund (in USD)(1)
Securities lending transactionsAUD – – 31,682 –CAD – – 4,617,922 –CHF – – 10,427,057 –DKK – – 499,494 –EUR – – 69,589,502 –GBP – – 16,199,336 –JPY – – 49,433,606 –NOK – – 285,597 –SEK – – 912,993 –USD – – 50,387,083 –Total – – 202,384,272 –Swiss Small & MidCap Opportunities Fund (in CHF)Securities lending transactionsAUD – – 42,551 –CAD – – 5,980,783 –CHF – – 1,331,854 –DKK – – 14,819 –EUR – – 41,990,357 –GBP – – 2,201,024 –JPY – – 25,991,452 –NOK – – 3,438 –SEK – – 71,627 –USD – – 25,825,164 –Total – – 103,453,069 –United Kingdom Fund (in GBP)Securities lending transactionsAUD – – 207,635 –CAD – – 127,985 –CHF – – 58,652 –DKK – – 11,608 –EUR – – 6,596,850 –GBP – – 2,817,985 –JPY – – 2,587,564 –NOK – – 26,263 –SEK – – 21,803 –USD – – 8,781,412 –Total – – 21,237,757 –US Basic Value Fund (in USD)Securities lending transactionsAUD – – 417,511 –CAD – – 922,006 –CHF – – 996,525 –DKK – – 226,503 –EUR – – 28,804,870 –GBP – – 9,505,865 –JPY – – 8,895,537 –NOK – – 51,703 –SEK – – 312,096 –USD – – 36,097,182 –Total – – 86,229,798 –(1) Fund name changed during the year, see Note 1, for further details.
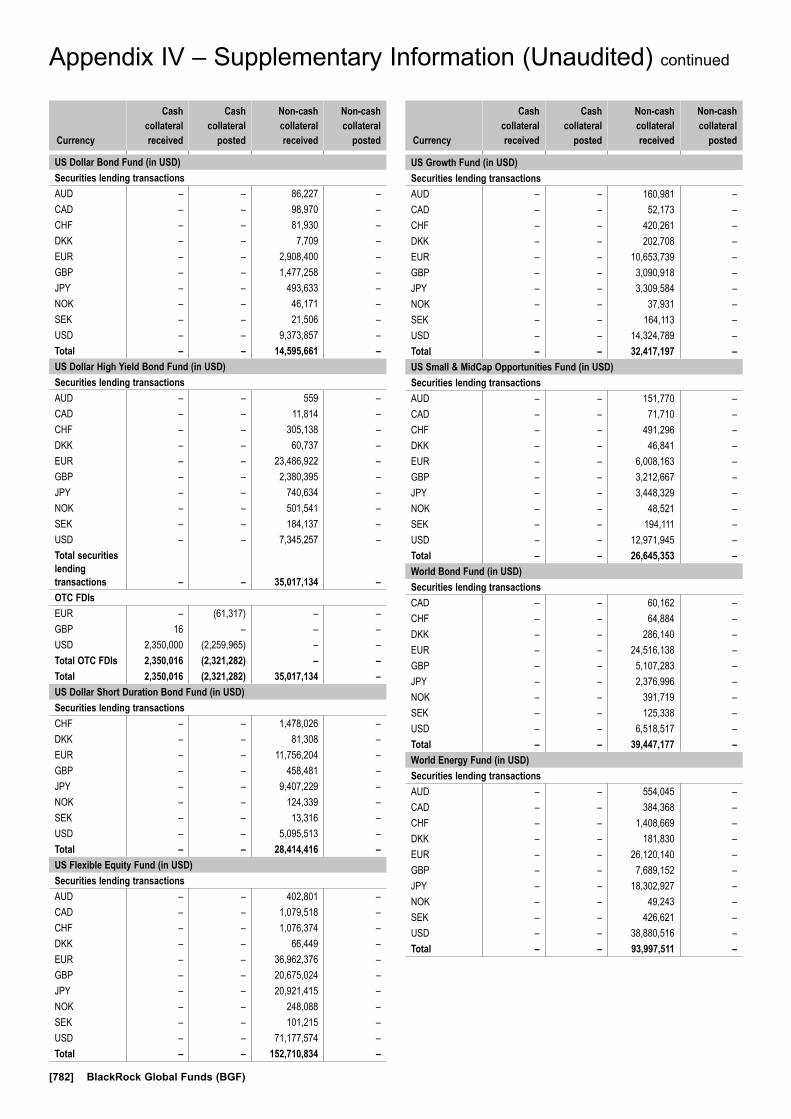
[782] BlackRock Global Funds (BGF)
Appendix IV – Supplementary Information (Unaudited) continued
Currency
Cash collateral received
Cash collateral
posted
Non-cash collateral received
Non-cash collateral
posted
US Dollar Bond Fund (in USD)Securities lending transactionsAUD – – 86,227 –CAD – – 98,970 –CHF – – 81,930 –DKK – – 7,709 –EUR – – 2,908,400 –GBP – – 1,477,258 –JPY – – 493,633 –NOK – – 46,171 –SEK – – 21,506 –USD – – 9,373,857 –Total – – 14,595,661 –US Dollar High Yield Bond Fund (in USD)Securities lending transactionsAUD – – 559 –CAD – – 11,814 –CHF – – 305,138 –DKK – – 60,737 –EUR – – 23,486,922 –GBP – – 2,380,395 –JPY – – 740,634 –NOK – – 501,541 –SEK – – 184,137 –USD – – 7,345,257 –Total securities lending transactions – – 35,017,134 –OTC FDIsEUR – (61,317) – –GBP 16 – – –USD 2,350,000 (2,259,965) – –Total OTC FDIs 2,350,016 (2,321,282) – –Total 2,350,016 (2,321,282) 35,017,134 –US Dollar Short Duration Bond Fund (in USD)Securities lending transactionsCHF – – 1,478,026 –DKK – – 81,308 –EUR – – 11,756,204 –GBP – – 458,481 –JPY – – 9,407,229 –NOK – – 124,339 –SEK – – 13,316 –USD – – 5,095,513 –Total – – 28,414,416 –US Flexible Equity Fund (in USD)Securities lending transactionsAUD – – 402,801 –CAD – – 1,079,518 –CHF – – 1,076,374 –DKK – – 66,449 –EUR – – 36,962,376 –GBP – – 20,675,024 –JPY – – 20,921,415 –NOK – – 248,088 –SEK – – 101,215 –USD – – 71,177,574 –Total – – 152,710,834 –
Currency
Cash collateral received
Cash collateral
posted
Non-cash collateral received
Non-cash collateral
posted
US Growth Fund (in USD)Securities lending transactionsAUD – – 160,981 –CAD – – 52,173 –CHF – – 420,261 –DKK – – 202,708 –EUR – – 10,653,739 –GBP – – 3,090,918 –JPY – – 3,309,584 –NOK – – 37,931 –SEK – – 164,113 –USD – – 14,324,789 –Total – – 32,417,197 –US Small & MidCap Opportunities Fund (in USD)Securities lending transactionsAUD – – 151,770 –CAD – – 71,710 –CHF – – 491,296 –DKK – – 46,841 –EUR – – 6,008,163 –GBP – – 3,212,667 –JPY – – 3,448,329 –NOK – – 48,521 –SEK – – 194,111 –USD – – 12,971,945 –Total – – 26,645,353 –World Bond Fund (in USD)Securities lending transactionsCAD – – 60,162 –CHF – – 64,884 –DKK – – 286,140 –EUR – – 24,516,138 –GBP – – 5,107,283 –JPY – – 2,376,996 –NOK – – 391,719 –SEK – – 125,338 –USD – – 6,518,517 –Total – – 39,447,177 –World Energy Fund (in USD)Securities lending transactionsAUD – – 554,045 –CAD – – 384,368 –CHF – – 1,408,669 –DKK – – 181,830 –EUR – – 26,120,140 –GBP – – 7,689,152 –JPY – – 18,302,927 –NOK – – 49,243 –SEK – – 426,621 –USD – – 38,880,516 –Total – – 93,997,511 –

Annual Report and Audited Financial Statements [783]
Appendix IV – Supplementary Information (Unaudited) continued
Currency
Cash collateral received
Cash collateral
posted
Non-cash collateral received
Non-cash collateral
posted
World Financials Fund (in USD)Securities lending transactionsAUD – – 494,677 –CAD – – 2,013,607 –CHF – – 554,491 –DKK – – 112,557 –EUR – – 23,288,094 –GBP – – 8,266,511 –JPY – – 8,426,001 –NOK – – 87,115 –SEK – – 165,004 –USD – – 28,997,060 –Total – – 72,405,117 –World Gold Fund (in USD)Securities lending transactionsAUD – – 72,495 –CAD – – 11,333,716 –CHF – – 4,497,390 –DKK – – 12,403,206 –EUR – – 381,879,648 –GBP – – 48,273,747 –JPY – – 27,357,781 –NOK – – 69,188 –SEK – – 1,179,123 –USD – – 258,815,977 –Total – – 745,882,271 –World Healthscience Fund (in USD)Securities lending transactionsAUD – – 1,800,453 –CAD – – 1,962,752 –CHF – – 11,208,571 –DKK – – 1,146,744 –EUR – – 123,859,522 –GBP – – 40,999,114 –JPY – – 72,465,456 –NOK – – 570,668 –SEK – – 2,614,284 –USD – – 147,725,068 –Total – – 404,352,632 –World Mining Fund (in USD)Securities lending transactionsAUD – – 107,836 –CAD – – 7,411,977 –CHF – – 6,945,669 –DKK – – 295,939 –EUR – – 111,906,030 –GBP – – 23,365,619 –JPY – – 44,085,841 –NOK – – 369,791 –SEK – – 2,572,427 –USD – – 81,500,600 –Total – – 278,561,729 –
Currency
Cash collateral received
Cash collateral
posted
Non-cash collateral received
Non-cash collateral
posted
World Real Estate Securities Fund (in USD)Securities lending transactionsAUD – – 52,049 –CAD – – 162,930 –CHF – – 434,290 –EUR – – 4,807,528 –GBP – – 2,301,885 –JPY – – 4,519,494 –NOK – – 2,800 –SEK – – 178,319 –USD – – 6,416,683 –Total – – 18,875,978 –World Technology Fund (in USD)Securities lending transactionsAUD – – 1,195,449 –CAD – – 4,862,346 –CHF – – 2,278,136 –DKK – – 144,605 –EUR – – 68,165,753 –GBP – – 48,820,344 –JPY – – 55,619,798 –NOK – – 745,321 –SEK – – 32,516 –USD – – 190,943,735 –Total – – 372,808,003 –
As at 31 August 2019, all cash collateral received by the Funds was re-invested in money market funds managed by the Management Company or its affiliates, as disclosed in the Fund’s Portfolio of Investments. The Funds are the legal owner of inbound collateral and can sell the assets and withhold the cash in the case of default. All cash received or posted as collateral has an open maturity tenor as it’s not subject to a contractual maturity date.
Non-cash collateral received by way of title transfer collateral arrangement in relation to securities lending transactions and OTC FDIs, cannot be sold, re-invested or pledged.
The returns earned by the Funds from the reinvestment of cash collateral in money market funds during the year ended 31 August 2019 are summarised below. These returns represent the accumulative total return of the representative money market fund for the year ended 31 August 2019. These returns do not take into account any interest payable to the counterparty under the relevant collateral arrangements.
Money Market Fund Total Return %Institutional Cash Series plc- BlackRock ICS US Dollar Liquidity Fund 2.58%- BlackRock ICS US Dollar Liquid Environmentally Aware Fund 0.20%
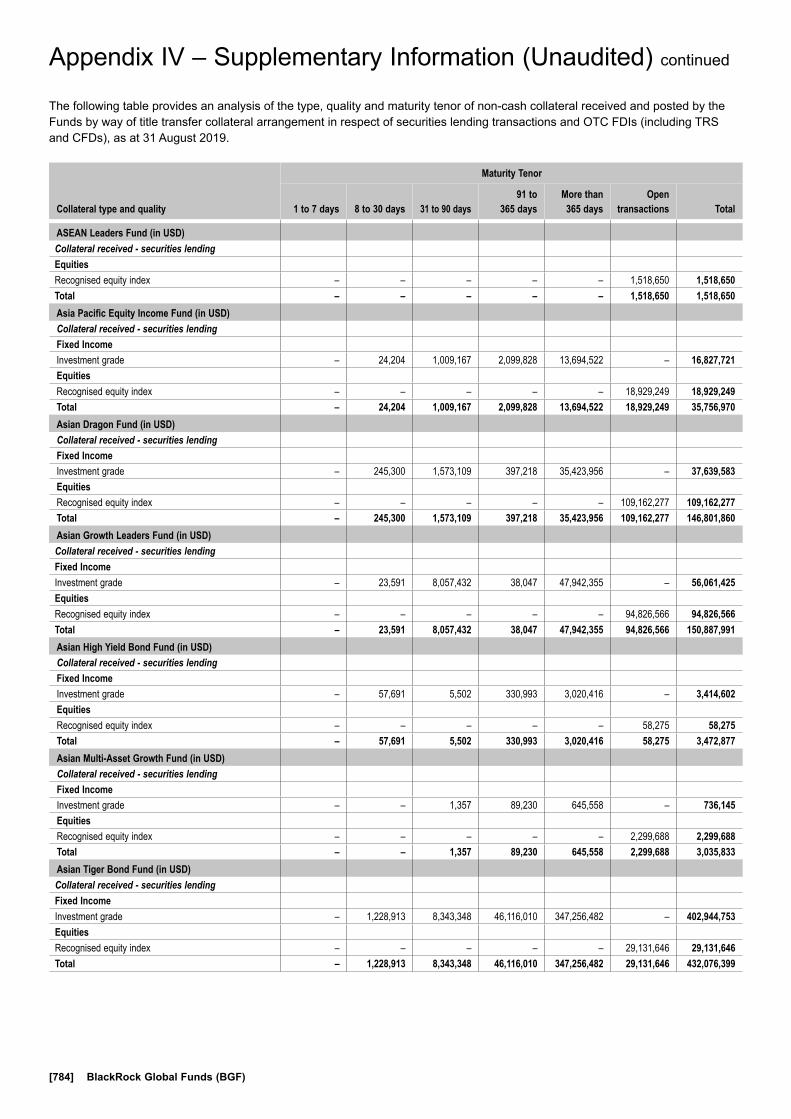
[784] BlackRock Global Funds (BGF)
Appendix IV – Supplementary Information (Unaudited) continued
The following table provides an analysis of the type, quality and maturity tenor of non-cash collateral received and posted by the Funds by way of title transfer collateral arrangement in respect of securities lending transactions and OTC FDIs (including TRS and CFDs), as at 31 August 2019.
Collateral type and quality
Maturity Tenor
1 to 7 days 8 to 30 days 31 to 90 days91 to
365 daysMore than 365 days
Open transactions Total
ASEAN Leaders Fund (in USD)Collateral received - securities lendingEquitiesRecognised equity index – – – – – 1,518,650 1,518,650Total – – – – – 1,518,650 1,518,650Asia Pacific Equity Income Fund (in USD)Collateral received - securities lendingFixed IncomeInvestment grade – 24,204 1,009,167 2,099,828 13,694,522 – 16,827,721EquitiesRecognised equity index – – – – – 18,929,249 18,929,249Total – 24,204 1,009,167 2,099,828 13,694,522 18,929,249 35,756,970Asian Dragon Fund (in USD)Collateral received - securities lendingFixed IncomeInvestment grade – 245,300 1,573,109 397,218 35,423,956 – 37,639,583EquitiesRecognised equity index – – – – – 109,162,277 109,162,277Total – 245,300 1,573,109 397,218 35,423,956 109,162,277 146,801,860Asian Growth Leaders Fund (in USD)Collateral received - securities lendingFixed IncomeInvestment grade – 23,591 8,057,432 38,047 47,942,355 – 56,061,425EquitiesRecognised equity index – – – – – 94,826,566 94,826,566Total – 23,591 8,057,432 38,047 47,942,355 94,826,566 150,887,991Asian High Yield Bond Fund (in USD)Collateral received - securities lendingFixed IncomeInvestment grade – 57,691 5,502 330,993 3,020,416 – 3,414,602EquitiesRecognised equity index – – – – – 58,275 58,275Total – 57,691 5,502 330,993 3,020,416 58,275 3,472,877Asian Multi-Asset Growth Fund (in USD)Collateral received - securities lendingFixed IncomeInvestment grade – – 1,357 89,230 645,558 – 736,145EquitiesRecognised equity index – – – – – 2,299,688 2,299,688Total – – 1,357 89,230 645,558 2,299,688 3,035,833Asian Tiger Bond Fund (in USD)Collateral received - securities lendingFixed IncomeInvestment grade – 1,228,913 8,343,348 46,116,010 347,256,482 – 402,944,753EquitiesRecognised equity index – – – – – 29,131,646 29,131,646Total – 1,228,913 8,343,348 46,116,010 347,256,482 29,131,646 432,076,399
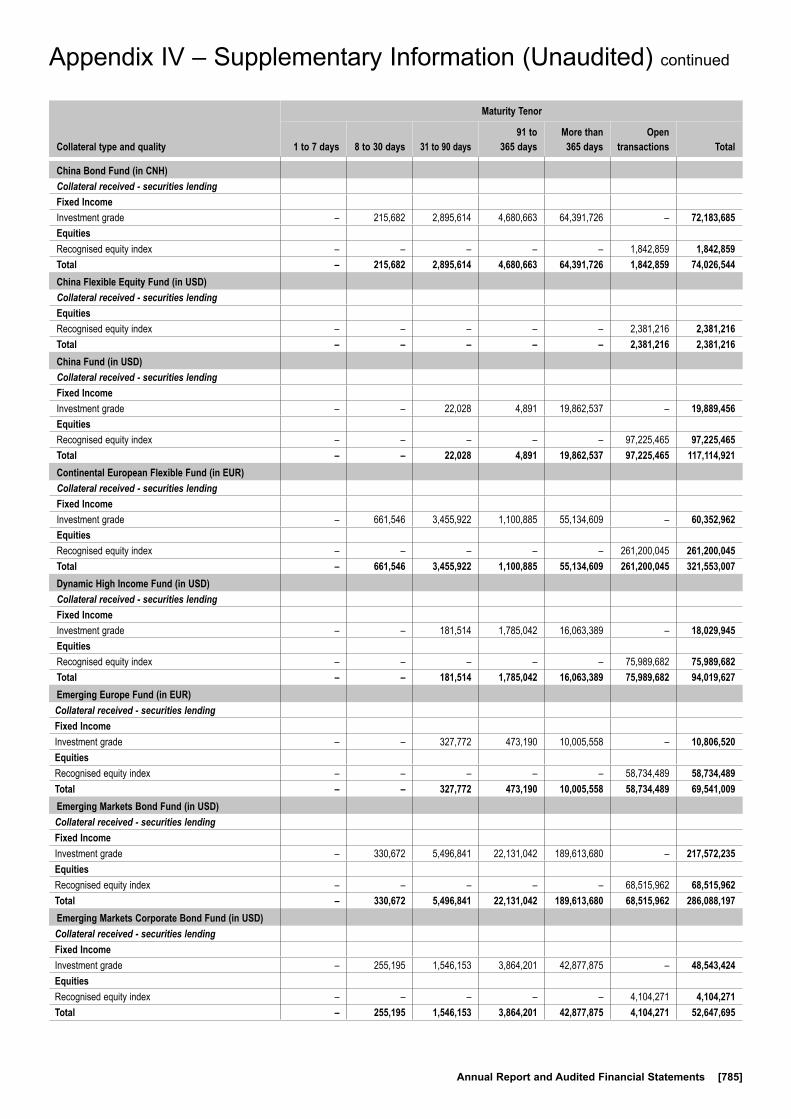
Annual Report and Audited Financial Statements [785]
Appendix IV – Supplementary Information (Unaudited) continued
Collateral type and quality
Maturity Tenor
1 to 7 days 8 to 30 days 31 to 90 days91 to
365 daysMore than 365 days
Open transactions Total
China Bond Fund (in CNH)Collateral received - securities lendingFixed IncomeInvestment grade – 215,682 2,895,614 4,680,663 64,391,726 – 72,183,685EquitiesRecognised equity index – – – – – 1,842,859 1,842,859Total – 215,682 2,895,614 4,680,663 64,391,726 1,842,859 74,026,544China Flexible Equity Fund (in USD)Collateral received - securities lendingEquitiesRecognised equity index – – – – – 2,381,216 2,381,216Total – – – – – 2,381,216 2,381,216China Fund (in USD)Collateral received - securities lendingFixed IncomeInvestment grade – – 22,028 4,891 19,862,537 – 19,889,456EquitiesRecognised equity index – – – – – 97,225,465 97,225,465Total – – 22,028 4,891 19,862,537 97,225,465 117,114,921Continental European Flexible Fund (in EUR)Collateral received - securities lendingFixed IncomeInvestment grade – 661,546 3,455,922 1,100,885 55,134,609 – 60,352,962EquitiesRecognised equity index – – – – – 261,200,045 261,200,045Total – 661,546 3,455,922 1,100,885 55,134,609 261,200,045 321,553,007Dynamic High Income Fund (in USD)Collateral received - securities lendingFixed IncomeInvestment grade – – 181,514 1,785,042 16,063,389 – 18,029,945EquitiesRecognised equity index – – – – – 75,989,682 75,989,682Total – – 181,514 1,785,042 16,063,389 75,989,682 94,019,627Emerging Europe Fund (in EUR)Collateral received - securities lendingFixed IncomeInvestment grade – – 327,772 473,190 10,005,558 – 10,806,520EquitiesRecognised equity index – – – – – 58,734,489 58,734,489Total – – 327,772 473,190 10,005,558 58,734,489 69,541,009Emerging Markets Bond Fund (in USD)Collateral received - securities lendingFixed IncomeInvestment grade – 330,672 5,496,841 22,131,042 189,613,680 – 217,572,235EquitiesRecognised equity index – – – – – 68,515,962 68,515,962Total – 330,672 5,496,841 22,131,042 189,613,680 68,515,962 286,088,197Emerging Markets Corporate Bond Fund (in USD)Collateral received - securities lendingFixed IncomeInvestment grade – 255,195 1,546,153 3,864,201 42,877,875 – 48,543,424EquitiesRecognised equity index – – – – – 4,104,271 4,104,271Total – 255,195 1,546,153 3,864,201 42,877,875 4,104,271 52,647,695

[786] BlackRock Global Funds (BGF)
Appendix IV – Supplementary Information (Unaudited) continued
Collateral type and quality
Maturity Tenor
1 to 7 days 8 to 30 days 31 to 90 days91 to
365 daysMore than 365 days
Open transactions Total
Emerging Markets Equity Income Fund (in USD)Collateral received - securities lendingFixed IncomeInvestment grade – – – 168,227 3,130,342 – 3,298,569EquitiesRecognised equity index – – – – – 34,374,602 34,374,602Total – – – 168,227 3,130,342 34,374,602 37,673,171Emerging Markets Fund (in USD)Collateral received - securities lendingFixed IncomeInvestment grade – – 7,304 1,622 780,319 – 789,245EquitiesRecognised equity index – – – – – 59,401,254 59,401,254Total – – 7,304 1,622 780,319 59,401,254 60,190,499Emerging Markets Local Currency Bond Fund (in USD)Collateral received - securities lendingFixed IncomeInvestment grade – – 6,088,059 4,641,144 79,862,309 – 90,591,512EquitiesRecognised equity index – – – – – 11,551,141 11,551,141Total – – 6,088,059 4,641,144 79,862,309 11,551,141 102,142,653ESG Emerging Markets Blended Bond Fund (in USD)Collateral received - securities lendingEquitiesRecognised equity index – – – – – 697,615 697,615Total – – – – – 697,615 697,615ESG Emerging Markets Bond Fund (in USD)Collateral received - securities lendingFixed IncomeInvestment grade – – 4,932 873,112 3,970,606 – 4,848,650EquitiesRecognised equity index – – – – – 17,837,068 17,837,068Total – – 4,932 873,112 3,970,606 17,837,068 22,685,718ESG Emerging Markets Corporate Bond Fund (in USD)Collateral received - securities lendingFixed IncomeInvestment grade – – 29,659 57,398 745,672 – 832,729EquitiesRecognised equity index – – – – – 816,395 816,395Total – – 29,659 57,398 745,672 816,395 1,649,124ESG Multi-Asset Fund (in EUR)(1)
Collateral received - securities lendingFixed IncomeInvestment grade – – 64,066 49,315 11,322,500 – 11,435,881EquitiesRecognised equity index – – – – – 51,389,237 51,389,237Total – – 64,066 49,315 11,322,500 51,389,237 62,825,118Collateral posted - OTC FDIsFixed IncomeInvestment grade – – – – 1,534,126 – 1,534,126Total – – – – 1,534,126 – 1,534,126(1) Fund name changed during the year, see Note 1, for further details.
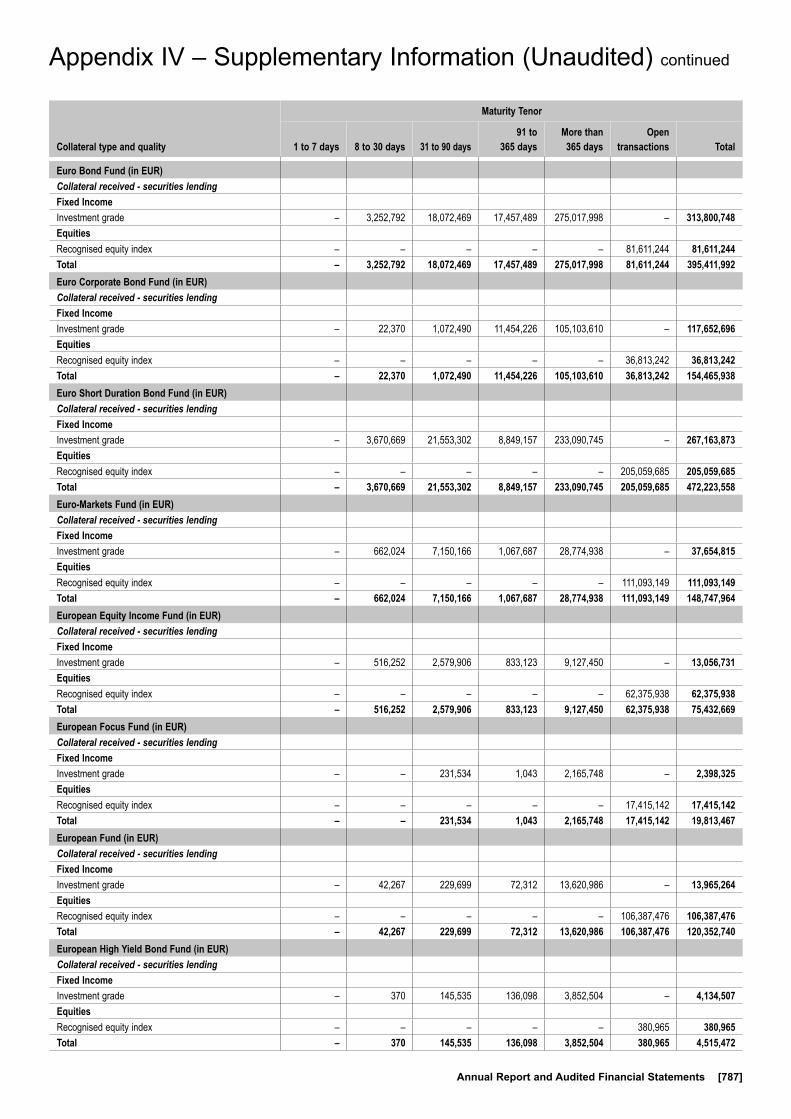
Annual Report and Audited Financial Statements [787]
Appendix IV – Supplementary Information (Unaudited) continued
Collateral type and quality
Maturity Tenor
1 to 7 days 8 to 30 days 31 to 90 days91 to
365 daysMore than 365 days
Open transactions Total
Euro Bond Fund (in EUR)Collateral received - securities lendingFixed IncomeInvestment grade – 3,252,792 18,072,469 17,457,489 275,017,998 – 313,800,748EquitiesRecognised equity index – – – – – 81,611,244 81,611,244Total – 3,252,792 18,072,469 17,457,489 275,017,998 81,611,244 395,411,992Euro Corporate Bond Fund (in EUR)Collateral received - securities lendingFixed IncomeInvestment grade – 22,370 1,072,490 11,454,226 105,103,610 – 117,652,696EquitiesRecognised equity index – – – – – 36,813,242 36,813,242Total – 22,370 1,072,490 11,454,226 105,103,610 36,813,242 154,465,938Euro Short Duration Bond Fund (in EUR)Collateral received - securities lendingFixed IncomeInvestment grade – 3,670,669 21,553,302 8,849,157 233,090,745 – 267,163,873EquitiesRecognised equity index – – – – – 205,059,685 205,059,685Total – 3,670,669 21,553,302 8,849,157 233,090,745 205,059,685 472,223,558Euro-Markets Fund (in EUR)Collateral received - securities lendingFixed IncomeInvestment grade – 662,024 7,150,166 1,067,687 28,774,938 – 37,654,815EquitiesRecognised equity index – – – – – 111,093,149 111,093,149Total – 662,024 7,150,166 1,067,687 28,774,938 111,093,149 148,747,964European Equity Income Fund (in EUR)Collateral received - securities lendingFixed IncomeInvestment grade – 516,252 2,579,906 833,123 9,127,450 – 13,056,731EquitiesRecognised equity index – – – – – 62,375,938 62,375,938Total – 516,252 2,579,906 833,123 9,127,450 62,375,938 75,432,669European Focus Fund (in EUR)Collateral received - securities lendingFixed IncomeInvestment grade – – 231,534 1,043 2,165,748 – 2,398,325EquitiesRecognised equity index – – – – – 17,415,142 17,415,142Total – – 231,534 1,043 2,165,748 17,415,142 19,813,467European Fund (in EUR)Collateral received - securities lendingFixed IncomeInvestment grade – 42,267 229,699 72,312 13,620,986 – 13,965,264EquitiesRecognised equity index – – – – – 106,387,476 106,387,476Total – 42,267 229,699 72,312 13,620,986 106,387,476 120,352,740European High Yield Bond Fund (in EUR)Collateral received - securities lendingFixed IncomeInvestment grade – 370 145,535 136,098 3,852,504 – 4,134,507EquitiesRecognised equity index – – – – – 380,965 380,965Total – 370 145,535 136,098 3,852,504 380,965 4,515,472
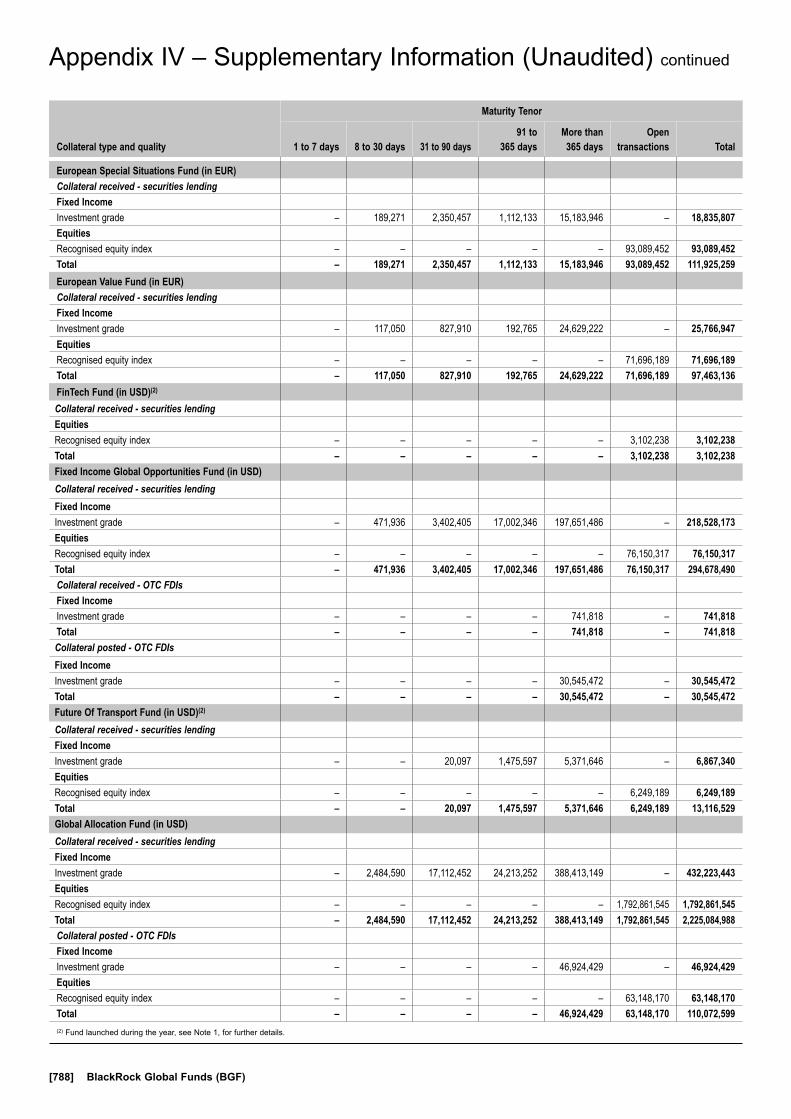
[788] BlackRock Global Funds (BGF)
Appendix IV – Supplementary Information (Unaudited) continued
Collateral type and quality
Maturity Tenor
1 to 7 days 8 to 30 days 31 to 90 days91 to
365 daysMore than 365 days
Open transactions Total
European Special Situations Fund (in EUR)Collateral received - securities lendingFixed IncomeInvestment grade – 189,271 2,350,457 1,112,133 15,183,946 – 18,835,807EquitiesRecognised equity index – – – – – 93,089,452 93,089,452Total – 189,271 2,350,457 1,112,133 15,183,946 93,089,452 111,925,259European Value Fund (in EUR)Collateral received - securities lendingFixed IncomeInvestment grade – 117,050 827,910 192,765 24,629,222 – 25,766,947EquitiesRecognised equity index – – – – – 71,696,189 71,696,189Total – 117,050 827,910 192,765 24,629,222 71,696,189 97,463,136FinTech Fund (in USD)(2)
Collateral received - securities lendingEquitiesRecognised equity index – – – – – 3,102,238 3,102,238Total – – – – – 3,102,238 3,102,238Fixed Income Global Opportunities Fund (in USD)Collateral received - securities lendingFixed IncomeInvestment grade – 471,936 3,402,405 17,002,346 197,651,486 – 218,528,173EquitiesRecognised equity index – – – – – 76,150,317 76,150,317Total – 471,936 3,402,405 17,002,346 197,651,486 76,150,317 294,678,490Collateral received - OTC FDIsFixed IncomeInvestment grade – – – – 741,818 – 741,818Total – – – – 741,818 – 741,818Collateral posted - OTC FDIsFixed IncomeInvestment grade – – – – 30,545,472 – 30,545,472Total – – – – 30,545,472 – 30,545,472Future Of Transport Fund (in USD)(2)
Collateral received - securities lendingFixed IncomeInvestment grade – – 20,097 1,475,597 5,371,646 – 6,867,340EquitiesRecognised equity index – – – – – 6,249,189 6,249,189Total – – 20,097 1,475,597 5,371,646 6,249,189 13,116,529Global Allocation Fund (in USD)Collateral received - securities lendingFixed IncomeInvestment grade – 2,484,590 17,112,452 24,213,252 388,413,149 – 432,223,443EquitiesRecognised equity index – – – – – 1,792,861,545 1,792,861,545Total – 2,484,590 17,112,452 24,213,252 388,413,149 1,792,861,545 2,225,084,988Collateral posted - OTC FDIsFixed IncomeInvestment grade – – – – 46,924,429 – 46,924,429EquitiesRecognised equity index – – – – – 63,148,170 63,148,170Total – – – – 46,924,429 63,148,170 110,072,599(2) Fund launched during the year, see Note 1, for further details.

Annual Report and Audited Financial Statements [789]
Appendix IV – Supplementary Information (Unaudited) continued
Collateral type and quality
Maturity Tenor
1 to 7 days 8 to 30 days 31 to 90 days91 to
365 daysMore than 365 days
Open transactions Total
Global Bond Income Fund (in USD)Collateral received - securities lendingFixed IncomeInvestment grade – – 123 27,201 107,386 – 134,710EquitiesRecognised equity index – – – – – 1,801,188 1,801,188Total – – 123 27,201 107,386 1,801,188 1,935,898Global Conservative Income Fund (in EUR)(2)
Collateral received - securities lendingFixed IncomeInvestment grade – – 26,643 69,321 479,184 – 575,148EquitiesRecognised equity index – – – – – 756,276 756,276Total – – 26,643 69,321 479,184 756,276 1,331,424Global Corporate Bond Fund (in USD)Collateral received - securities lendingFixed IncomeInvestment grade – 243,018 556,767 10,408,280 73,242,384 – 84,450,449EquitiesRecognised equity index – – – – – 8,721,947 8,721,947Total – 243,018 556,767 10,408,280 73,242,384 8,721,947 93,172,396Global Dynamic Equity Fund (in USD)Collateral received - securities lendingFixed IncomeInvestment grade – 79,611 437,015 600,178 9,550,500 – 10,667,304EquitiesRecognised equity index – – – – – 61,662,550 61,662,550Total – 79,611 437,015 600,178 9,550,500 61,662,550 72,329,854Global Enhanced Equity Yield Fund (in USD)Collateral received - securities lendingFixed IncomeInvestment grade – 793,513 3,999,580 2,203,745 19,646,531 – 26,643,369EquitiesRecognised equity index – – – – – 105,982,117 105,982,117Total – 793,513 3,999,580 2,203,745 19,646,531 105,982,117 132,625,486Global Equity Income Fund (in USD)Collateral received - securities lendingFixed IncomeInvestment grade – 369,135 1,877,451 602,977 24,635,868 – 27,485,431EquitiesRecognised equity index – – – – – 65,900,859 65,900,859Total – 369,135 1,877,451 602,977 24,635,868 65,900,859 93,386,290Global Government Bond Fund (in USD)Collateral received - securities lendingFixed IncomeInvestment grade – 164,854 965,481 234,011 15,823,491 – 17,187,837EquitiesRecognised equity index – – – – – 10,584,649 10,584,649Total – 164,854 965,481 234,011 15,823,491 10,584,649 27,772,486(2) Fund launched during the year, see Note 1, for further details.
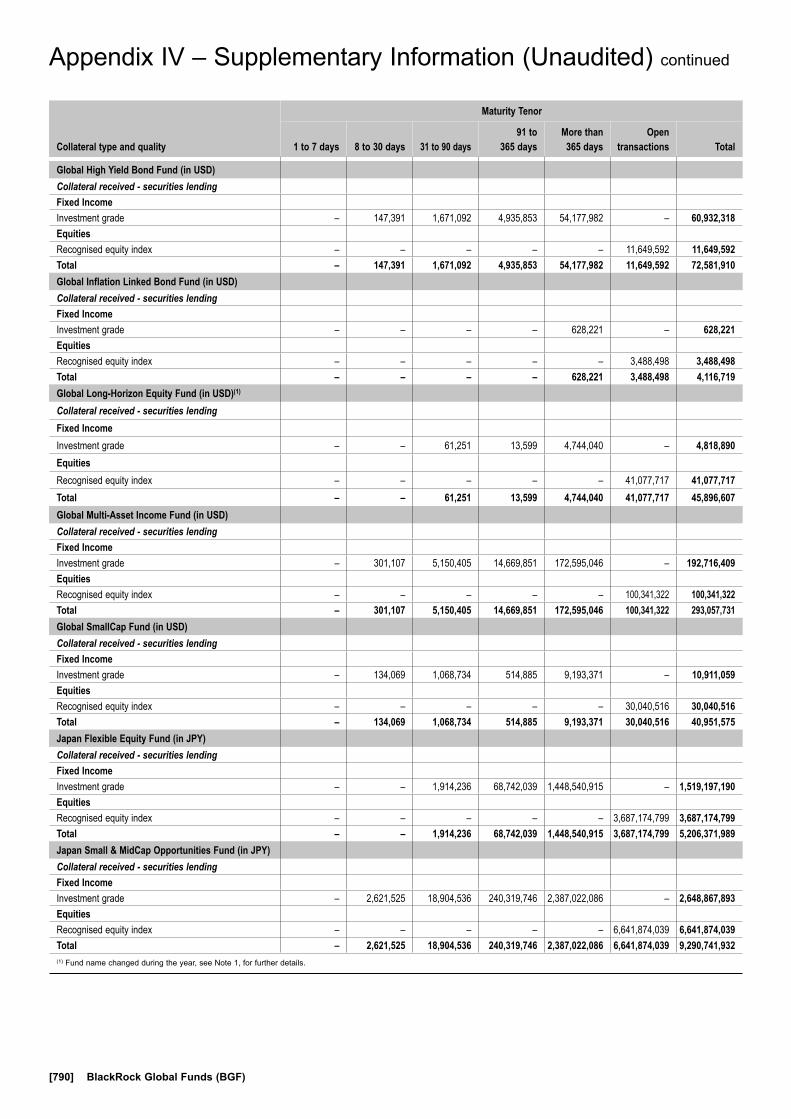
[790] BlackRock Global Funds (BGF)
Appendix IV – Supplementary Information (Unaudited) continued
Collateral type and quality
Maturity Tenor
1 to 7 days 8 to 30 days 31 to 90 days91 to
365 daysMore than 365 days
Open transactions Total
Global High Yield Bond Fund (in USD)Collateral received - securities lendingFixed IncomeInvestment grade – 147,391 1,671,092 4,935,853 54,177,982 – 60,932,318EquitiesRecognised equity index – – – – – 11,649,592 11,649,592Total – 147,391 1,671,092 4,935,853 54,177,982 11,649,592 72,581,910Global Inflation Linked Bond Fund (in USD)Collateral received - securities lendingFixed IncomeInvestment grade – – – – 628,221 – 628,221EquitiesRecognised equity index – – – – – 3,488,498 3,488,498Total – – – – 628,221 3,488,498 4,116,719Global Long-Horizon Equity Fund (in USD)(1)
Collateral received - securities lendingFixed IncomeInvestment grade – – 61,251 13,599 4,744,040 – 4,818,890EquitiesRecognised equity index – – – – – 41,077,717 41,077,717Total – – 61,251 13,599 4,744,040 41,077,717 45,896,607Global Multi-Asset Income Fund (in USD)Collateral received - securities lendingFixed IncomeInvestment grade – 301,107 5,150,405 14,669,851 172,595,046 – 192,716,409EquitiesRecognised equity index – – – – – 100,341,322 100,341,322Total – 301,107 5,150,405 14,669,851 172,595,046 100,341,322 293,057,731Global SmallCap Fund (in USD)Collateral received - securities lendingFixed IncomeInvestment grade – 134,069 1,068,734 514,885 9,193,371 – 10,911,059EquitiesRecognised equity index – – – – – 30,040,516 30,040,516Total – 134,069 1,068,734 514,885 9,193,371 30,040,516 40,951,575Japan Flexible Equity Fund (in JPY)Collateral received - securities lendingFixed IncomeInvestment grade – – 1,914,236 68,742,039 1,448,540,915 – 1,519,197,190EquitiesRecognised equity index – – – – – 3,687,174,799 3,687,174,799Total – – 1,914,236 68,742,039 1,448,540,915 3,687,174,799 5,206,371,989Japan Small & MidCap Opportunities Fund (in JPY)Collateral received - securities lendingFixed IncomeInvestment grade – 2,621,525 18,904,536 240,319,746 2,387,022,086 – 2,648,867,893EquitiesRecognised equity index – – – – – 6,641,874,039 6,641,874,039Total – 2,621,525 18,904,536 240,319,746 2,387,022,086 6,641,874,039 9,290,741,932(1) Fund name changed during the year, see Note 1, for further details.

Annual Report and Audited Financial Statements [791]
Appendix IV – Supplementary Information (Unaudited) continued
Collateral type and quality
Maturity Tenor
1 to 7 days 8 to 30 days 31 to 90 days91 to
365 daysMore than 365 days
Open transactions Total
Latin American Fund (in USD)Collateral received - securities lendingFixed IncomeInvestment grade – 59,473 862,942 139,744 4,494,078 – 5,556,237EquitiesRecognised equity index – – – – – 7,536,897 7,536,897Total – 59,473 862,942 139,744 4,494,078 7,536,897 13,093,134Market Navigator Fund (in EUR)(2)
Collateral received - securities lendingEquitiesRecognised equity index – – – – – 327,247 327,247Total – – – – – 327,247 327,247Natural Resources Growth & Income Fund (in USD)Collateral received - securities lendingFixed IncomeInvestment grade – – 60,227 87 301,648 – 361,962EquitiesRecognised equity index – – – – – 7,170,271 7,170,271Total – – 60,227 87 301,648 7,170,271 7,532,233Next Generation Technology Fund (in USD)(2)
Collateral received - securities lendingFixed IncomeInvestment grade – – – 17,640 232,514 – 250,154EquitiesRecognised equity index – – – – – 19,913,116 19,913,116Total – – – 17,640 232,514 19,913,116 20,163,270North American Equity Income Fund (in USD)Collateral received - securities lendingFixed IncomeInvestment grade – – – – 840,511 – 840,511EquitiesRecognised equity index – – – – – 9,146,291 9,146,291Total – – – – 840,511 9,146,291 9,986,802Nutrition Fund (in USD)(1)
Collateral received - securities lendingFixed IncomeInvestment grade – 39,407 198,146 63,865 1,034,374 – 1,335,792EquitiesRecognised equity index – – – – – 7,693,568 7,693,568Total – 39,407 198,146 63,865 1,034,374 7,693,568 9,029,360Pacific Equity Fund (in USD)Collateral received - securities lendingFixed IncomeInvestment grade – – 13,372 307,416 2,091,927 – 2,412,715EquitiesRecognised equity index – – – – – 15,720,779 15,720,779Total – – 13,372 307,416 2,091,927 15,720,779 18,133,494(1) Fund name changed during the year, see Note 1, for further details. (2) Fund launched during the year, see Note 1, for further details.

[792] BlackRock Global Funds (BGF)
Appendix IV – Supplementary Information (Unaudited) continued
Collateral type and quality
Maturity Tenor
1 to 7 days 8 to 30 days 31 to 90 days91 to
365 daysMore than 365 days
Open transactions Total
Sustainable Energy Fund (in USD)(1)
Collateral received - securities lendingFixed IncomeInvestment grade – 646,085 5,778,870 1,938,532 43,935,301 – 52,298,788EquitiesRecognised equity index – – – – – 150,085,484 150,085,484Total – 646,085 5,778,870 1,938,532 43,935,301 150,085,484 202,384,272Swiss Small & MidCap Opportunities Fund (in CHF)Collateral received - securities lendingFixed IncomeInvestment grade – – 6,504,979 727 30,092,963 – 36,598,669EquitiesRecognised equity index – – – – – 66,854,400 66,854,400Total – – 6,504,979 727 30,092,963 66,854,400 103,453,069United Kingdom Fund (in GBP)Collateral received - securities lendingFixed IncomeInvestment grade – – 63,581 125,668 4,058,499 – 4,247,748EquitiesRecognised equity index – – – – – 16,990,009 16,990,009Total – – 63,581 125,668 4,058,499 16,990,009 21,237,757US Basic Value Fund (in USD)Collateral received - securities lendingFixed IncomeInvestment grade – – 41,361 9,183 18,309,275 – 18,359,819EquitiesRecognised equity index – – – – – 67,869,979 67,869,979Total – – 41,361 9,183 18,309,275 67,869,979 86,229,798US Dollar Bond Fund (in USD)Collateral received - securities lendingFixed IncomeInvestment grade – 15,511 66,824 162,553 3,718,181 – 3,963,069EquitiesRecognised equity index – – – – – 10,632,592 10,632,592Total – 15,511 66,824 162,553 3,718,181 10,632,592 14,595,661US Dollar High Yield Bond Fund (in USD)Collateral received - securities lendingFixed IncomeInvestment grade – 185,922 850,225 2,856,693 25,531,301 – 29,424,141EquitiesRecognised equity index – – – – – 5,592,993 5,592,993Total – 185,922 850,225 2,856,693 25,531,301 5,592,993 35,017,134US Dollar Short Duration Bond Fund (in USD)Collateral received - securities lendingFixed IncomeInvestment grade – – 167,119 637,847 5,550,570 – 6,355,536EquitiesRecognised equity index – – – – – 22,058,880 22,058,880Total – – 167,119 637,847 5,550,570 22,058,880 28,414,416(1) Fund name changed during the year, see Note 1, for further details.
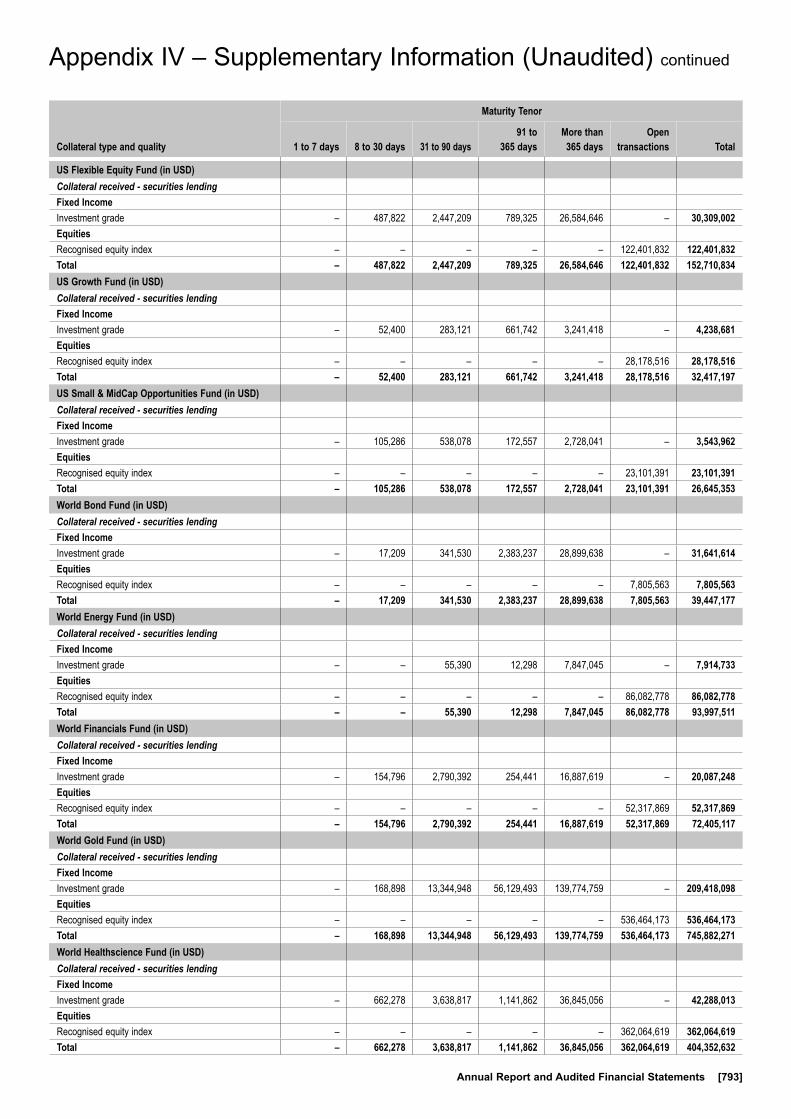
Annual Report and Audited Financial Statements [793]
Appendix IV – Supplementary Information (Unaudited) continued
Collateral type and quality
Maturity Tenor
1 to 7 days 8 to 30 days 31 to 90 days91 to
365 daysMore than 365 days
Open transactions Total
US Flexible Equity Fund (in USD)Collateral received - securities lendingFixed IncomeInvestment grade – 487,822 2,447,209 789,325 26,584,646 – 30,309,002EquitiesRecognised equity index – – – – – 122,401,832 122,401,832Total – 487,822 2,447,209 789,325 26,584,646 122,401,832 152,710,834US Growth Fund (in USD)Collateral received - securities lendingFixed IncomeInvestment grade – 52,400 283,121 661,742 3,241,418 – 4,238,681EquitiesRecognised equity index – – – – – 28,178,516 28,178,516Total – 52,400 283,121 661,742 3,241,418 28,178,516 32,417,197US Small & MidCap Opportunities Fund (in USD)Collateral received - securities lendingFixed IncomeInvestment grade – 105,286 538,078 172,557 2,728,041 – 3,543,962EquitiesRecognised equity index – – – – – 23,101,391 23,101,391Total – 105,286 538,078 172,557 2,728,041 23,101,391 26,645,353World Bond Fund (in USD)Collateral received - securities lendingFixed IncomeInvestment grade – 17,209 341,530 2,383,237 28,899,638 – 31,641,614EquitiesRecognised equity index – – – – – 7,805,563 7,805,563Total – 17,209 341,530 2,383,237 28,899,638 7,805,563 39,447,177World Energy Fund (in USD)Collateral received - securities lendingFixed IncomeInvestment grade – – 55,390 12,298 7,847,045 – 7,914,733EquitiesRecognised equity index – – – – – 86,082,778 86,082,778Total – – 55,390 12,298 7,847,045 86,082,778 93,997,511World Financials Fund (in USD)Collateral received - securities lendingFixed IncomeInvestment grade – 154,796 2,790,392 254,441 16,887,619 – 20,087,248EquitiesRecognised equity index – – – – – 52,317,869 52,317,869Total – 154,796 2,790,392 254,441 16,887,619 52,317,869 72,405,117World Gold Fund (in USD)Collateral received - securities lendingFixed IncomeInvestment grade – 168,898 13,344,948 56,129,493 139,774,759 – 209,418,098EquitiesRecognised equity index – – – – – 536,464,173 536,464,173Total – 168,898 13,344,948 56,129,493 139,774,759 536,464,173 745,882,271World Healthscience Fund (in USD)Collateral received - securities lendingFixed IncomeInvestment grade – 662,278 3,638,817 1,141,862 36,845,056 – 42,288,013EquitiesRecognised equity index – – – – – 362,064,619 362,064,619Total – 662,278 3,638,817 1,141,862 36,845,056 362,064,619 404,352,632
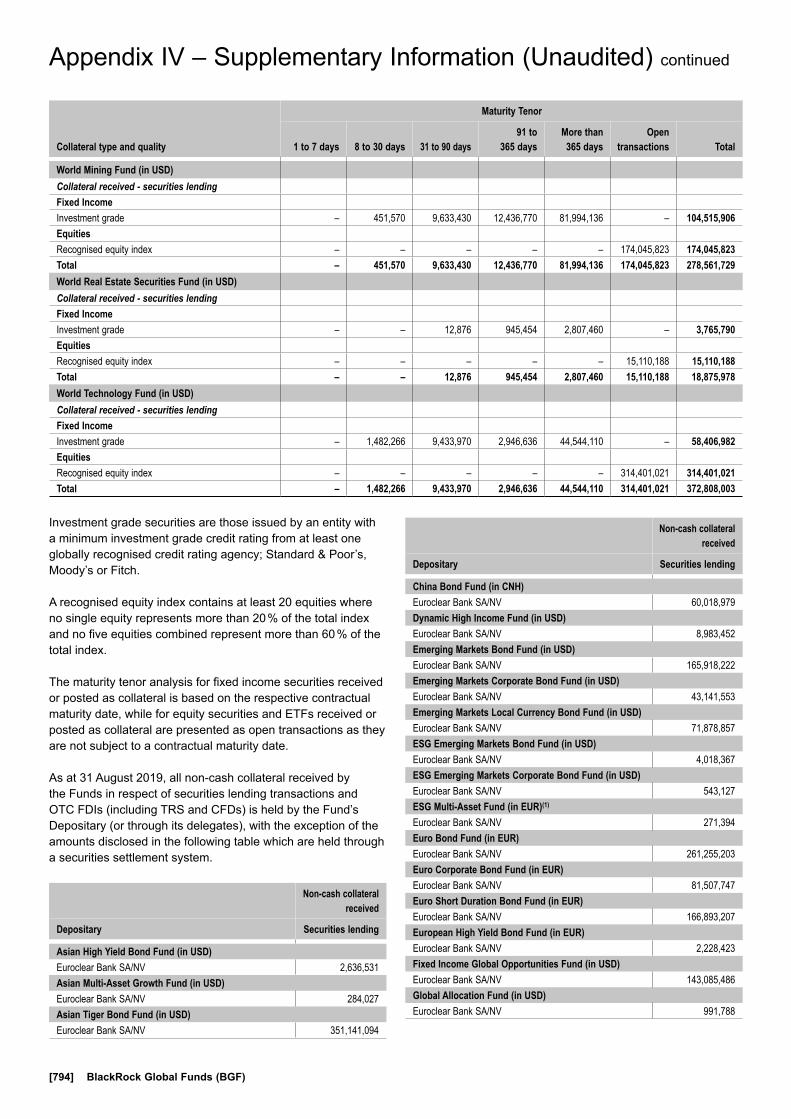
[794] BlackRock Global Funds (BGF)
Appendix IV – Supplementary Information (Unaudited) continued
Collateral type and quality
Maturity Tenor
1 to 7 days 8 to 30 days 31 to 90 days91 to
365 daysMore than 365 days
Open transactions Total
World Mining Fund (in USD)Collateral received - securities lendingFixed IncomeInvestment grade – 451,570 9,633,430 12,436,770 81,994,136 – 104,515,906EquitiesRecognised equity index – – – – – 174,045,823 174,045,823Total – 451,570 9,633,430 12,436,770 81,994,136 174,045,823 278,561,729World Real Estate Securities Fund (in USD)Collateral received - securities lendingFixed IncomeInvestment grade – – 12,876 945,454 2,807,460 – 3,765,790EquitiesRecognised equity index – – – – – 15,110,188 15,110,188Total – – 12,876 945,454 2,807,460 15,110,188 18,875,978World Technology Fund (in USD)Collateral received - securities lendingFixed IncomeInvestment grade – 1,482,266 9,433,970 2,946,636 44,544,110 – 58,406,982EquitiesRecognised equity index – – – – – 314,401,021 314,401,021Total – 1,482,266 9,433,970 2,946,636 44,544,110 314,401,021 372,808,003
Investment grade securities are those issued by an entity with a minimum investment grade credit rating from at least one globally recognised credit rating agency; Standard & Poor’s, Moody’s or Fitch.
A recognised equity index contains at least 20 equities where no single equity represents more than 20 % of the total index and no five equities combined represent more than 60 % of the total index.
The maturity tenor analysis for fixed income securities received or posted as collateral is based on the respective contractual maturity date, while for equity securities and ETFs received or posted as collateral are presented as open transactions as they are not subject to a contractual maturity date.
As at 31 August 2019, all non-cash collateral received by the Funds in respect of securities lending transactions and OTC FDIs (including TRS and CFDs) is held by the Fund’s Depositary (or through its delegates), with the exception of the amounts disclosed in the following table which are held through a securities settlement system.
Non-cash collateral received
Depositary Securities lending
Asian High Yield Bond Fund (in USD) Euroclear Bank SA/NV 2,636,531Asian Multi-Asset Growth Fund (in USD) Euroclear Bank SA/NV 284,027Asian Tiger Bond Fund (in USD) Euroclear Bank SA/NV 351,141,094World Bond Fund (in USD)
Euroclear Bank SA/NV 26,948,458
Non-cash collateral received
Depositary Securities lending
China Bond Fund (in CNH) Euroclear Bank SA/NV 60,018,979Dynamic High Income Fund (in USD) Euroclear Bank SA/NV 8,983,452Emerging Markets Bond Fund (in USD) Euroclear Bank SA/NV 165,918,222Emerging Markets Corporate Bond Fund (in USD) Euroclear Bank SA/NV 43,141,553Emerging Markets Local Currency Bond Fund (in USD) Euroclear Bank SA/NV 71,878,857ESG Emerging Markets Bond Fund (in USD) Euroclear Bank SA/NV 4,018,367ESG Emerging Markets Corporate Bond Fund (in USD) Euroclear Bank SA/NV 543,127ESG Multi-Asset Fund (in EUR)(1)
Euroclear Bank SA/NV 271,394Euro Bond Fund (in EUR) Euroclear Bank SA/NV 261,255,203Euro Corporate Bond Fund (in EUR) Euroclear Bank SA/NV 81,507,747Euro Short Duration Bond Fund (in EUR) Euroclear Bank SA/NV 166,893,207European High Yield Bond Fund (in EUR) Euroclear Bank SA/NV 2,228,423Fixed Income Global Opportunities Fund (in USD) Euroclear Bank SA/NV 143,085,486Global Allocation Fund (in USD) Euroclear Bank SA/NV 991,788World Bond Fund (in USD)
Euroclear Bank SA/NV 26,948,458

Annual Report and Audited Financial Statements [795]
Appendix IV – Supplementary Information (Unaudited) continued
Non-cash collateral issuer Value % of the Fund’s NAV
Asian Dragon Fund (in USD)UBS AG 68,300,891 2.93Merrill Lynch International 36,293,816 1.56Credit Suisse AG 13,720,334 0.59Credit Suisse Securities (Europe) Limited 12,191,405 0.52Barclays Capital Securities Limited 6,938,163 0.30J.P. Morgan Securities Plc 3,888,335 0.17Deutsche Bank AG 3,502,197 0.15Morgan Stanley & Co. International Plc 1,966,719 0.08Total 146,801,860 6.30Asian Growth Leaders Fund (in USD)J.P. Morgan Securities Plc 87,793,307 3.78Morgan Stanley & Co. International Plc 46,948,924 2.02Merrill Lynch International 14,787,216 0.64Credit Suisse AG 1,358,544 0.06Total 150,887,991 6.50Asian High Yield Bond Fund (in USD)Nomura International Plc 2,000,529 8.23Goldman Sachs International 550,083 2.26Barclays Bank Plc 439,983 1.81Morgan Stanley & Co. International Plc 278,311 1.15BNP Paribas SA 203,971 0.84Total 3,472,877 14.29Asian Multi-Asset Growth Fund (in USD)UBS AG 1,776,736 2.07HSBC Bank Plc 375,766 0.44Deutsche Bank AG 248,552 0.29Citigroup Global Markets Limited 220,901 0.26Goldman Sachs International 196,222 0.23Barclays Bank Plc 144,122 0.17Barclays Capital Securities Limited 73,534 0.09Total 3,035,833 3.55Asian Tiger Bond Fund (in USD)Citigroup Global Markets Limited 87,166,483 2.89Merrill Lynch International 67,534,570 2.24Barclays Bank Plc 54,673,041 1.81J.P. Morgan Securities Plc 43,216,817 1.43Morgan Stanley & Co. International Plc 39,055,088 1.29Nomura International Plc 38,900,739 1.29BNP Paribas SA 31,246,204 1.04Credit Suisse Securities (Europe) Limited 21,496,686 0.71Goldman Sachs International 19,534,436 0.65Macquarie Bank Limited 14,698,363 0.49Other issuers 14,553,972 0.48Total 432,076,399 14.32China Bond Fund (in CNH)J.P. Morgan Securities Plc 21,308,794 1.60Barclays Bank Plc 14,059,890 1.06Citigroup Global Markets Limited 12,491,682 0.94Morgan Stanley & Co. International Plc 9,302,275 0.70UBS AG 7,107,131 0.53Goldman Sachs International 5,171,433 0.39Nomura International Plc 4,585,339 0.34Total 74,026,544 5.56
Non-cash collateral received
Depositary Securities lending
Global Bond Income Fund (in USD) Euroclear Bank SA/NV 134,710Global Conservative Income Fund (in EUR)(2)
Euroclear Bank SA/NV 575,148Global Corporate Bond Fund (in USD) Euroclear Bank SA/NV 52,710,263Global Government Bond Fund (in USD) Euroclear Bank SA/NV 10,340,611Global High Yield Bond Fund (in USD) Euroclear Bank SA/NV 51,499,896Global Multi-Asset Income Fund (in USD) Euroclear Bank SA/NV 147,488,948US Dollar Bond Fund (in USD) Euroclear Bank SA/NV 1,647,570US Dollar High Yield Bond Fund (in USD) Euroclear Bank SA/NV 26,692,203US Dollar Short Duration Bond Fund (in USD) Euroclear Bank SA/NV 6,355,536World Bond Fund (in USD) Euroclear Bank SA/NV 21,022,189(1) Fund name changed during the year, see Note 1, for further details.(2) Fund launched during the year, see Note 1, for further details.
The following table lists the ten largest issuers by value of non-cash collateral received by the Funds by way of title transfer collateral arrangement across securities lending transactions and OTC FDIs (including TRS and CFDs) as at 31 August 2019.
Non-cash collateral issuer Value % of the Fund’s NAV
ASEAN Leaders Fund (in USD)J.P. Morgan Securities Plc 713,530 0.30Macquarie Bank Limited 419,515 0.17Barclays Capital Securities Limited 385,605 0.16Total 1,518,650 0.63Asia Pacific Equity Income Fund (in USD)J.P. Morgan Securities Plc 13,388,296 4.71Goldman Sachs International 7,783,713 2.74Morgan Stanley & Co. International Plc 4,635,039 1.63Merrill Lynch International 2,029,922 0.71Citigroup Global Markets Limited 1,486,261 0.52Deutsche Bank AG 1,352,973 0.48Credit Suisse AG 1,293,923 0.46UBS AG 1,280,560 0.45Macquarie Bank Limited 1,068,654 0.38Credit Suisse Securities (Europe) Limited 990,947 0.35Other issuers 446,682 0.16Total 35,756,970 12.59

[796] BlackRock Global Funds (BGF)
Appendix IV – Supplementary Information (Unaudited) continued
Non-cash collateral issuer Value % of the Fund’s NAV
China Flexible Equity Fund (in USD)J.P. Morgan Securities Plc 1,512,968 8.40UBS AG 868,248 4.82Total 2,381,216 13.22China Fund (in USD)Credit Suisse Securities (Europe) Limited 29,894,880 2.48J.P. Morgan Securities Plc 22,084,518 1.83Merrill Lynch International 21,222,831 1.76UBS AG 18,301,876 1.52Nomura International Plc 10,676,157 0.89Deutsche Bank AG 10,054,534 0.83Macquarie Bank Limited 4,880,125 0.41Total 117,114,921 9.72Continental European Flexible Fund (in EUR)J.P. Morgan Securities Plc 89,996,692 2.53Deutsche Bank AG 70,038,282 1.97Credit Suisse AG 35,128,726 0.99HSBC Bank Plc 35,073,185 0.99Citigroup Global Markets Limited 33,510,517 0.94Natixis SA 17,531,230 0.49Barclays Capital Securities Limited 14,112,175 0.40UBS AG 7,847,099 0.22Credit Suisse International 6,635,409 0.19Skandinaviska Enskilda Banken AB 5,173,727 0.15Other issuers 6,505,965 0.18Total 321,553,007 9.05Dynamic High Income Fund (in USD)Barclays Capital Securities Limited 41,854,877 1.38UBS AG 21,064,005 0.69Goldman Sachs International 9,066,771 0.30The Bank of Nova Scotia 8,108,738 0.27Barclays Bank Plc 6,578,362 0.22HSBC Bank Plc 5,810,553 0.19Deutsche Bank AG 1,536,321 0.05Total 94,019,627 3.10Emerging Europe Fund (in EUR)BNP Paribas SA 18,436,396 2.62Deutsche Bank AG 17,035,577 2.42UBS AG 11,772,500 1.67Credit Suisse Securities (Europe) Limited 9,394,373 1.33Merrill Lynch International 4,490,042 0.64Barclays Capital Securities Limited 4,213,119 0.60Goldman Sachs International 1,858,174 0.26Morgan Stanley & Co. International Plc 1,574,941 0.22Citigroup Global Markets Limited 765,887 0.11Total 69,541,009 9.87Emerging Markets Bond Fund (in USD)HSBC Bank Plc 51,941,207 2.07Morgan Stanley & Co. International Plc 46,860,763 1.87Merrill Lynch International 44,649,789 1.78J.P. Morgan Securities Plc 44,497,373 1.77Citigroup Global Markets Limited 26,114,086 1.04Credit Suisse Securities (Europe) Limited 17,859,562 0.71Deutsche Bank AG 13,845,558 0.55Barclays Bank Plc 13,423,887 0.54Goldman Sachs International 10,677,396 0.43Nomura International Plc 10,638,382 0.42Other issuers 5,580,194 0.22Total 286,088,197 11.40
Non-cash collateral issuer Value % of the Fund’s NAV
Emerging Markets Corporate Bond Fund (in USD)J.P. Morgan Securities Plc 14,668,788 5.16Barclays Bank Plc 10,270,454 3.62Nomura International Plc 6,276,777 2.21BNP Paribas SA 5,436,033 1.91Credit Suisse Securities (Europe) Limited 5,374,925 1.89Citigroup Global Markets Limited 3,574,500 1.26Morgan Stanley & Co. International Plc 2,763,653 0.97Goldman Sachs International 2,739,828 0.96UBS AG 1,542,737 0.54Total 52,647,695 18.52Emerging Markets Equity Income Fund (in USD)UBS AG 20,029,674 4.16HSBC Bank Plc 7,476,738 1.55The Bank of Nova Scotia 3,950,378 0.82Merrill Lynch International 3,427,895 0.71Societe Generale SA 1,752,718 0.36Barclays Capital Securities Limited 1,035,768 0.21Total 37,673,171 7.81Emerging Markets Fund (in USD)UBS AG 22,863,625 2.85Credit Suisse Securities (Europe) Limited 16,012,709 2.00J.P. Morgan Securities Plc 13,514,275 1.69HSBC Bank Plc 3,708,990 0.46Deutsche Bank AG 3,349,603 0.42Barclays Capital Securities Limited 487,493 0.06Merrill Lynch International 253,804 0.03Total 60,190,499 7.51Emerging Markets Local Currency Bond Fund (in USD)J.P. Morgan Securities Plc 57,163,207 1.45Morgan Stanley & Co. International Plc 18,861,718 0.48Merrill Lynch International 16,988,483 0.43HSBC Bank Plc 5,806,834 0.15Barclays Bank Plc 2,094,337 0.05BNP Paribas SA 766,944 0.02Citigroup Global Markets Limited 236,707 0.01Credit Suisse Securities (Europe) Limited 224,423 0.01Total 102,142,653 2.60ESG Emerging Markets Blended Bond Fund (in USD)J.P. Morgan Securities Plc 697,615 2.13Total 697,615 2.13ESG Emerging Markets Bond Fund (in USD)J.P. Morgan Securities Plc 16,056,830 5.70Barclays Bank Plc 3,007,305 1.07HSBC Bank Plc 2,512,918 0.89Deutsche Bank AG 1,108,665 0.39Total 22,685,718 8.05ESG Emerging Markets Corporate Bond Fund (in USD)J.P. Morgan Securities Plc 765,497 2.73Barclays Bank Plc 449,848 1.60UBS AG 433,779 1.54Total 1,649,124 5.87

Annual Report and Audited Financial Statements [797]
Appendix IV – Supplementary Information (Unaudited) continued
Non-cash collateral issuer Value % of the Fund’s NAV
ESG Multi-Asset Fund (in EUR)(1)
Deutsche Bank AG 17,019,273 3.03HSBC Bank Plc 16,980,952 3.03J.P. Morgan Securities Plc 8,635,849 1.54Citigroup Global Markets Limited 5,342,611 0.95UBS AG 4,917,514 0.88Societe Generale SA 4,075,809 0.73Barclays Capital Securities Limited 3,685,235 0.66BNP Paribas SA 900,796 0.16Morgan Stanley & Co. International Plc 790,111 0.14Macquarie Bank Limited 262,203 0.05Other issuers 214,765 0.03Total 62,825,118 11.20Euro Bond Fund (in EUR)J.P. Morgan Securities Plc 100,294,147 1.78Nomura International Plc 63,394,754 1.13Barclays Bank Plc 60,814,003 1.08Morgan Stanley & Co. International Plc 42,395,082 0.75Deutsche Bank AG 38,483,536 0.68BNP Paribas SA 25,669,711 0.46Citigroup Global Markets Limited 20,895,820 0.37The Bank of Nova Scotia 8,452,018 0.15Merrill Lynch International 8,223,134 0.15UBS AG 7,832,464 0.14Other issuers 18,957,323 0.34Total 395,411,992 7.03Euro Corporate Bond Fund (in EUR)Barclays Bank Plc 42,542,768 1.43Morgan Stanley & Co. International Plc 25,870,312 0.87UBS AG 20,605,128 0.69Goldman Sachs International 14,674,575 0.49BNP Paribas SA 13,838,919 0.46HSBC Bank Plc 12,541,722 0.42Credit Suisse Securities (Europe) Limited 7,990,238 0.27J.P. Morgan Securities Plc 7,384,500 0.25Citigroup Global Markets Limited 4,281,362 0.14RBC Europe Limited 4,202,740 0.14Other issuers 533,674 0.02Total 154,465,938 5.18Euro Short Duration Bond Fund (in EUR)Societe Generale SA 190,170,892 1.64Deutsche Bank AG 84,634,353 0.73Nomura International Plc 62,630,456 0.54Citigroup Global Markets Limited 33,730,961 0.29BNP Paribas SA 27,655,780 0.24J.P. Morgan Securities Plc 24,479,106 0.21Morgan Stanley & Co. International Plc 17,503,342 0.15Barclays Capital Securities Limited 9,318,725 0.08RBS plc 7,104,563 0.06Barclays Bank Plc 5,566,966 0.05Other issuers 9,428,414 0.08Total 472,223,558 4.07(1) Fund name changed during the year, see Note 1, for further details.
Non-cash collateral issuer Value % of the Fund’s NAV
Euro-Markets Fund (in EUR)Natixis SA 39,866,270 2.14Credit Suisse AG 35,952,438 1.93Barclays Capital Securities Limited 22,500,465 1.21Morgan Stanley & Co. International Plc 21,497,389 1.15J.P. Morgan Securities Plc 13,829,274 0.74BNP Paribas SA 9,821,610 0.53Credit Suisse International 2,640,341 0.14Credit Suisse Securities (Europe) Limited 1,769,269 0.10UBS AG 356,684 0.02HSBC Bank Plc 262,870 0.01Other issuers 251,354 0.01Total 148,747,964 7.98European Equity Income Fund (in EUR)Credit Suisse AG 28,200,115 1.64HSBC Bank Plc 14,753,575 0.86Credit Suisse International 11,889,373 0.69Barclays Capital Securities Limited 9,770,959 0.57Skandinaviska Enskilda Banken AB 9,233,873 0.54Deutsche Bank AG 1,126,116 0.07Citigroup Global Markets Limited 299,542 0.02BNP Paribas SA 159,116 0.01Total 75,432,669 4.40European Focus Fund (in EUR)Barclays Capital Securities Limited 7,303,455 1.87UBS AG 2,998,992 0.77Credit Suisse Securities (Europe) Limited 2,211,351 0.57Deutsche Bank AG 2,154,803 0.55HSBC Bank Plc 1,946,880 0.50Morgan Stanley & Co. International Plc 1,242,614 0.32Citigroup Global Markets Limited 807,056 0.21J.P. Morgan Securities Plc 597,726 0.15Macquarie Bank Limited 550,590 0.14Total 19,813,467 5.08European Fund (in EUR)J.P. Morgan Securities Plc 49,877,559 4.35UBS AG 34,419,559 3.00Citigroup Global Markets Limited 11,906,597 1.04Barclays Capital Securities Limited 11,221,107 0.98Deutsche Bank AG 8,523,720 0.74Credit Suisse AG 2,238,480 0.20HSBC Bank Plc 1,986,432 0.17BNP Paribas SA 179,286 0.02Total 120,352,740 10.50European High Yield Bond Fund (in EUR)Morgan Stanley & Co. International Plc 1,898,204 2.69J.P. Morgan Securities Plc 1,166,716 1.65Goldman Sachs International 428,165 0.61BNP Paribas SA 390,808 0.55UBS AG 220,898 0.31Barclays Bank Plc 157,571 0.22Citigroup Global Markets Limited 153,177 0.22Deutsche Bank AG 99,933 0.14Total 4,515,472 6.39

[798] BlackRock Global Funds (BGF)
Appendix IV – Supplementary Information (Unaudited) continued
Non-cash collateral issuer Value % of the Fund’s NAV
European Special Situations Fund (in EUR)Barclays Capital Securities Limited 29,275,557 2.34J.P. Morgan Securities Plc 15,637,812 1.25Deutsche Bank AG 15,275,307 1.22UBS AG 14,019,790 1.12Credit Suisse AG 10,124,245 0.81Societe Generale SA 8,377,008 0.67Morgan Stanley & Co. International Plc 7,557,789 0.60Credit Suisse Securities (Europe) Limited 4,267,738 0.34The Bank of Nova Scotia 4,190,706 0.33Merrill Lynch International 1,930,530 0.15Other issuers 1,268,777 0.10Total 111,925,259 8.93European Value Fund (in EUR)J.P. Morgan Securities Plc 26,298,241 3.04Merrill Lynch International 22,443,177 2.59Credit Suisse Securities (Europe) Limited 12,089,515 1.40Deutsche Bank AG 8,370,470 0.97Barclays Capital Securities Limited 7,729,488 0.89Credit Suisse International 6,618,187 0.76Credit Suisse AG 6,320,665 0.73HSBC Bank Plc 4,691,609 0.54Citigroup Global Markets Limited 1,642,518 0.19Morgan Stanley & Co. International Plc 1,253,865 0.14Other issuers 5,401 0.00Total 97,463,136 11.25FinTech Fund (in USD)(2)
UBS AG 1,433,945 3.66J.P. Morgan Securities Plc 1,201,590 3.07Barclays Capital Securities Limited 466,703 1.19Total 3,102,238 7.92Fixed Income Global Opportunities Fund (in USD)BNP Paribas SA 57,067,047 0.59Morgan Stanley & Co. International Plc 31,667,167 0.33J.P. Morgan Securities Plc 31,134,279 0.32Merrill Lynch International 28,908,445 0.30UBS AG 26,444,218 0.27Deutsche Bank AG 21,560,588 0.22Barclays Bank Plc 19,799,742 0.20Credit Suisse Securities (Europe) Limited 18,247,166 0.19Citigroup Global Markets Limited 17,002,333 0.17Goldman Sachs International 16,763,159 0.17Other issuers 26,826,164 0.27Total 295,420,308 3.03Future Of Transport Fund (in USD)(2)
Goldman Sachs International 5,821,533 5.29UBS AG 5,287,672 4.81Citigroup Global Markets Limited 1,036,507 0.94HSBC Bank Plc 970,817 0.88Total 13,116,529 11.92(2) Fund launched during the year, see Note 1, for further details.
Non-cash collateral issuer Value % of the Fund’s NAV
Global Allocation Fund (in USD)HSBC Bank Plc 601,595,061 4.22Macquarie Bank Limited 417,394,949 2.93Deutsche Bank AG 185,026,382 1.30Barclays Capital Securities Limited 161,177,136 1.13Societe Generale SA 157,813,866 1.11J.P. Morgan Securities Plc 155,356,420 1.09BNP Paribas SA 153,876,102 1.08Credit Suisse AG 133,191,203 0.93UBS AG 66,401,736 0.47Citigroup Global Markets Limited 41,962,978 0.29Other issuers 151,289,155 1.06Total 2,225,084,988 15.61Global Bond Income Fund (in USD)Barclays Capital Securities Limited 1,935,898 2.19Total 1,935,898 2.19Global Conservative Income Fund (in EUR)(2)
HSBC Bank Plc 443,048 0.19Barclays Bank Plc 337,407 0.15UBS AG 316,620 0.14J.P. Morgan Securities Plc 234,349 0.10Total 1,331,424 0.58Global Corporate Bond Fund (in USD)Morgan Stanley & Co. International Plc 17,845,282 0.84Goldman Sachs International 17,410,082 0.82BNP Paribas SA 15,239,348 0.72Barclays Bank Plc 10,908,485 0.52Nomura International Plc 8,077,753 0.38Merrill Lynch International 6,891,464 0.33Citigroup Global Markets Limited 5,801,883 0.27Credit Suisse Securities (Europe) Limited 4,921,081 0.23HSBC Bank Plc 2,626,900 0.12J.P. Morgan Securities Plc 2,182,361 0.10Other issuers 1,267,757 0.06Total 93,172,396 4.39Global Dynamic Equity Fund (in USD)Deutsche Bank AG 18,159,057 2.95UBS AG 14,452,410 2.35Barclays Capital Securities Limited 11,280,653 1.84Societe Generale SA 4,815,083 0.78Credit Suisse AG 4,271,825 0.70HSBC Bank Plc 4,144,848 0.67Citigroup Global Markets Limited 4,076,014 0.66The Bank of Nova Scotia 3,369,780 0.55J.P. Morgan Securities Plc 3,134,355 0.51Credit Suisse Securities (Europe) Limited 2,260,591 0.37Other issuers 2,365,238 0.38Total 72,329,854 11.76(2) Fund launched during the year, see Note 1, for further details.
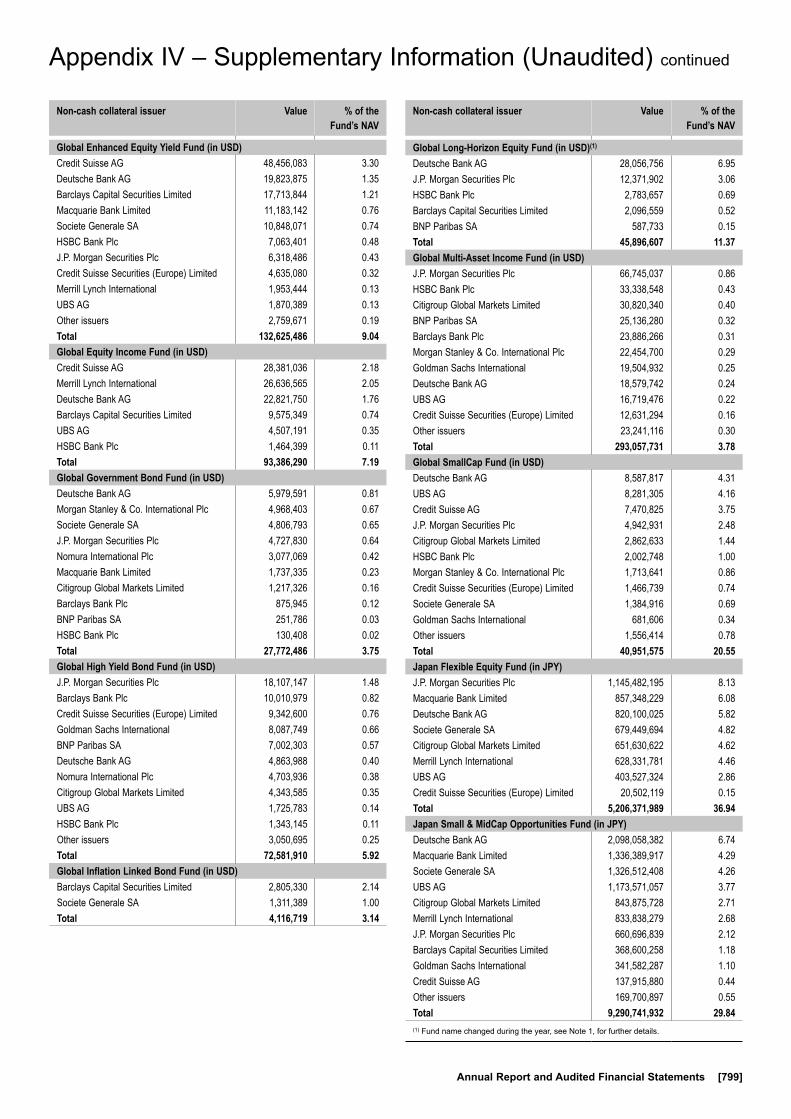
Annual Report and Audited Financial Statements [799]
Appendix IV – Supplementary Information (Unaudited) continued
Non-cash collateral issuer Value % of the Fund’s NAV
Global Enhanced Equity Yield Fund (in USD)Credit Suisse AG 48,456,083 3.30Deutsche Bank AG 19,823,875 1.35Barclays Capital Securities Limited 17,713,844 1.21Macquarie Bank Limited 11,183,142 0.76Societe Generale SA 10,848,071 0.74HSBC Bank Plc 7,063,401 0.48J.P. Morgan Securities Plc 6,318,486 0.43Credit Suisse Securities (Europe) Limited 4,635,080 0.32Merrill Lynch International 1,953,444 0.13UBS AG 1,870,389 0.13Other issuers 2,759,671 0.19Total 132,625,486 9.04Global Equity Income Fund (in USD)Credit Suisse AG 28,381,036 2.18Merrill Lynch International 26,636,565 2.05Deutsche Bank AG 22,821,750 1.76Barclays Capital Securities Limited 9,575,349 0.74UBS AG 4,507,191 0.35HSBC Bank Plc 1,464,399 0.11Total 93,386,290 7.19Global Government Bond Fund (in USD)Deutsche Bank AG 5,979,591 0.81Morgan Stanley & Co. International Plc 4,968,403 0.67Societe Generale SA 4,806,793 0.65J.P. Morgan Securities Plc 4,727,830 0.64Nomura International Plc 3,077,069 0.42Macquarie Bank Limited 1,737,335 0.23Citigroup Global Markets Limited 1,217,326 0.16Barclays Bank Plc 875,945 0.12BNP Paribas SA 251,786 0.03HSBC Bank Plc 130,408 0.02Total 27,772,486 3.75Global High Yield Bond Fund (in USD)J.P. Morgan Securities Plc 18,107,147 1.48Barclays Bank Plc 10,010,979 0.82Credit Suisse Securities (Europe) Limited 9,342,600 0.76Goldman Sachs International 8,087,749 0.66BNP Paribas SA 7,002,303 0.57Deutsche Bank AG 4,863,988 0.40Nomura International Plc 4,703,936 0.38Citigroup Global Markets Limited 4,343,585 0.35UBS AG 1,725,783 0.14HSBC Bank Plc 1,343,145 0.11Other issuers 3,050,695 0.25Total 72,581,910 5.92Global Inflation Linked Bond Fund (in USD)Barclays Capital Securities Limited 2,805,330 2.14Societe Generale SA 1,311,389 1.00Total 4,116,719 3.14
Non-cash collateral issuer Value % of the Fund’s NAV
Global Long-Horizon Equity Fund (in USD)(1)
Deutsche Bank AG 28,056,756 6.95J.P. Morgan Securities Plc 12,371,902 3.06HSBC Bank Plc 2,783,657 0.69Barclays Capital Securities Limited 2,096,559 0.52BNP Paribas SA 587,733 0.15Total 45,896,607 11.37Global Multi-Asset Income Fund (in USD)J.P. Morgan Securities Plc 66,745,037 0.86HSBC Bank Plc 33,338,548 0.43Citigroup Global Markets Limited 30,820,340 0.40BNP Paribas SA 25,136,280 0.32Barclays Bank Plc 23,886,266 0.31Morgan Stanley & Co. International Plc 22,454,700 0.29Goldman Sachs International 19,504,932 0.25Deutsche Bank AG 18,579,742 0.24UBS AG 16,719,476 0.22Credit Suisse Securities (Europe) Limited 12,631,294 0.16Other issuers 23,241,116 0.30Total 293,057,731 3.78Global SmallCap Fund (in USD)Deutsche Bank AG 8,587,817 4.31UBS AG 8,281,305 4.16Credit Suisse AG 7,470,825 3.75J.P. Morgan Securities Plc 4,942,931 2.48Citigroup Global Markets Limited 2,862,633 1.44HSBC Bank Plc 2,002,748 1.00Morgan Stanley & Co. International Plc 1,713,641 0.86Credit Suisse Securities (Europe) Limited 1,466,739 0.74Societe Generale SA 1,384,916 0.69Goldman Sachs International 681,606 0.34Other issuers 1,556,414 0.78Total 40,951,575 20.55Japan Flexible Equity Fund (in JPY)J.P. Morgan Securities Plc 1,145,482,195 8.13Macquarie Bank Limited 857,348,229 6.08Deutsche Bank AG 820,100,025 5.82Societe Generale SA 679,449,694 4.82Citigroup Global Markets Limited 651,630,622 4.62Merrill Lynch International 628,331,781 4.46UBS AG 403,527,324 2.86Credit Suisse Securities (Europe) Limited 20,502,119 0.15Total 5,206,371,989 36.94Japan Small & MidCap Opportunities Fund (in JPY)Deutsche Bank AG 2,098,058,382 6.74Macquarie Bank Limited 1,336,389,917 4.29Societe Generale SA 1,326,512,408 4.26UBS AG 1,173,571,057 3.77Citigroup Global Markets Limited 843,875,728 2.71Merrill Lynch International 833,838,279 2.68J.P. Morgan Securities Plc 660,696,839 2.12Barclays Capital Securities Limited 368,600,258 1.18Goldman Sachs International 341,582,287 1.10Credit Suisse AG 137,915,880 0.44Other issuers 169,700,897 0.55Total 9,290,741,932 29.84(1) Fund name changed during the year, see Note 1, for further details.

[800] BlackRock Global Funds (BGF)
Appendix IV – Supplementary Information (Unaudited) continued
Non-cash collateral issuer Value % of the Fund’s NAV
Latin American Fund (in USD)Credit Suisse AG 3,179,171 0.31Morgan Stanley & Co. International Plc 3,089,557 0.30UBS AG 2,663,936 0.26Deutsche Bank AG 2,138,113 0.21HSBC Bank Plc 932,882 0.09Merrill Lynch International 641,349 0.06Societe Generale SA 448,126 0.04Total 13,093,134 1.27Market Navigator Fund (in EUR)(2)
UBS AG 258,156 0.75J.P. Morgan Securities Plc 69,091 0.20Total 327,247 0.95Natural Resources Growth & Income Fund (in USD)UBS AG 5,961,796 5.85J.P. Morgan Securities Plc 1,033,220 1.01Morgan Stanley & Co. International Plc 329,090 0.32Deutsche Bank AG 180,704 0.18Nomura International Plc 25,579 0.03HSBC Bank Plc 1,844 0.00Total 7,532,233 7.39Next Generation Technology Fund (in USD)(2)
UBS AG 17,738,175 18.66HSBC Bank Plc 845,368 0.89J.P. Morgan Securities Plc 587,584 0.62Barclays Capital Securities Limited 579,585 0.61Citigroup Global Markets Limited 222,808 0.23Societe Generale SA 189,750 0.20Total 20,163,270 21.21North American Equity Income Fund (in USD)UBS AG 5,204,472 5.69HSBC Bank Plc 3,922,595 4.29Citigroup Global Markets Limited 856,893 0.94The Bank of Nova Scotia 2,842 0.00Total 9,986,802 10.92Nutrition Fund (in USD)(1)
UBS AG 3,236,083 5.76Credit Suisse AG 2,289,186 4.08Credit Suisse Securities (Europe) Limited 1,069,418 1.90HSBC Bank Plc 718,249 1.28Credit Suisse International 715,481 1.27Deutsche Bank AG 699,083 1.24Citigroup Global Markets Limited 301,860 0.54Total 9,029,360 16.07Pacific Equity Fund (in USD)J.P. Morgan Securities Plc 6,592,076 7.39Deutsche Bank AG 4,462,014 5.00UBS AG 2,636,469 2.96BNP Paribas SA 1,185,768 1.33Goldman Sachs International 1,087,071 1.22Barclays Capital Securities Limited 736,515 0.83Credit Suisse Securities (Europe) Limited 539,652 0.61Merrill Lynch International 517,850 0.58Societe Generale SA 317,686 0.36Citigroup Global Markets Limited 58,393 0.07Total 18,133,494 20.35(1) Fund name changed during the year, see Note 1, for further details.(2) Fund launched during the year, see Note 1, for further details.
Non-cash collateral issuer Value % of the Fund’s NAV
Sustainable Energy Fund (in USD)(1)
Barclays Capital Securities Limited 55,621,957 5.47Deutsche Bank AG 38,015,376 3.74Credit Suisse AG 34,843,665 3.43J.P. Morgan Securities Plc 28,149,993 2.77Morgan Stanley & Co. International Plc 13,655,764 1.34Citigroup Global Markets Limited 12,328,291 1.21Credit Suisse International 6,342,140 0.62HSBC Bank Plc 4,433,219 0.44Credit Suisse Securities (Europe) Limited 4,193,654 0.41Goldman Sachs International 3,522,558 0.35Other issuers 1,277,655 0.13Total 202,384,272 19.91Swiss Small & MidCap Opportunities Fund (in CHF)Morgan Stanley & Co. International Plc 34,728,870 4.04J.P. Morgan Securities Plc 32,800,570 3.82HSBC Bank Plc 31,034,936 3.61UBS AG 2,363,912 0.27Deutsche Bank AG 1,464,501 0.17Macquarie Bank Limited 423,279 0.05Citigroup Global Markets Limited 370,732 0.04BNP Paribas SA 266,269 0.03Total 103,453,069 12.03United Kingdom Fund (in GBP)UBS AG 11,617,863 7.98Merrill Lynch International 3,574,126 2.46Credit Suisse Securities (Europe) Limited 1,711,398 1.18The Bank of Nova Scotia 1,474,164 1.01Deutsche Bank AG 1,325,650 0.91Goldman Sachs International 498,044 0.34Morgan Stanley & Co. International Plc 325,449 0.22HSBC Bank Plc 313,032 0.22Citigroup Global Markets Limited 205,517 0.14J.P. Morgan Securities Plc 192,514 0.13Total 21,237,757 14.59US Basic Value Fund (in USD)UBS AG 23,485,376 4.13Deutsche Bank AG 18,973,783 3.34The Bank of Nova Scotia 13,590,168 2.39HSBC Bank Plc 9,712,334 1.71Citigroup Global Markets Limited 8,476,183 1.49Merrill Lynch International 8,257,700 1.45Barclays Capital Securities Limited 1,956,712 0.34Credit Suisse Securities (Europe) Limited 1,777,542 0.31Total 86,229,798 15.16US Dollar Bond Fund (in USD)HSBC Bank Plc 8,746,079 1.26Macquarie Bank Limited 3,823,474 0.55J.P. Morgan Securities Plc 872,759 0.13Barclays Bank Plc 547,336 0.08Nomura International Plc 547,060 0.08The Bank of Nova Scotia 58,953 0.01Total 14,595,661 2.11(1) Fund name changed during the year, see Note 1, for further details.

Annual Report and Audited Financial Statements [801]
Appendix IV – Supplementary Information (Unaudited) continued
Non-cash collateral issuer Value % of the Fund’s NAV
US Dollar High Yield Bond Fund (in USD)Barclays Bank Plc 7,434,117 0.35J.P. Morgan Securities Plc 6,494,706 0.31Nomura International Plc 5,774,626 0.27Deutsche Bank AG 5,558,025 0.26Credit Suisse Securities (Europe) Limited 3,382,923 0.16Merrill Lynch International 2,139,263 0.10Societe Generale SA 1,062,483 0.05Credit Suisse AG 951,047 0.05Goldman Sachs International 757,536 0.04Morgan Stanley & Co. International Plc 694,380 0.03Other issuers 768,028 0.04Total 35,017,134 1.66US Dollar Short Duration Bond Fund (in USD)Barclays Capital Securities Limited 22,013,577 1.25BNP Paribas SA 3,430,211 0.20Barclays Bank Plc 1,133,938 0.06J.P. Morgan Securities Plc 1,096,401 0.06Societe Generale SA 740,289 0.04Total 28,414,416 1.61US Flexible Equity Fund (in USD)The Bank of Nova Scotia 32,104,387 2.25Credit Suisse AG 25,854,505 1.81HSBC Bank Plc 22,621,707 1.58UBS AG 21,718,437 1.52Merrill Lynch International 20,612,435 1.44J.P. Morgan Securities Plc 17,805,270 1.25Credit Suisse Securities (Europe) Limited 6,675,625 0.47Deutsche Bank AG 5,318,468 0.37Total 152,710,834 10.69US Growth Fund (in USD)Deutsche Bank AG 12,062,595 2.92UBS AG 11,120,451 2.70HSBC Bank Plc 5,262,591 1.28Credit Suisse AG 3,409,604 0.83Credit Suisse Securities (Europe) Limited 561,956 0.14Total 32,417,197 7.87US Small & MidCap Opportunities Fund (in USD)UBS AG 8,626,429 5.30Deutsche Bank AG 5,680,040 3.49Credit Suisse AG 5,588,642 3.43HSBC Bank Plc 4,383,174 2.69BNP Paribas SA 1,259,041 0.77Barclays Capital Securities Limited 635,722 0.39The Bank of Nova Scotia 472,305 0.29Total 26,645,353 16.36
Non-cash collateral issuer Value % of the Fund’s NAV
World Bond Fund (in USD)Morgan Stanley & Co. International Plc 11,791,218 0.86BNP Paribas SA 6,956,512 0.51J.P. Morgan Securities Plc 4,279,642 0.31RBC Europe Limited 3,163,593 0.23Merrill Lynch International 2,951,845 0.21Barclays Bank Plc 2,942,606 0.21Goldman Sachs International 1,958,036 0.14The Bank of Nova Scotia 1,846,439 0.13Citigroup Global Markets Limited 1,502,843 0.11Credit Suisse Securities (Europe) Limited 1,410,939 0.10Other issuers 643,504 0.05Total 39,447,177 2.86World Energy Fund (in USD)UBS AG 31,263,500 2.52Deutsche Bank AG 24,973,953 2.01HSBC Bank Plc 21,523,287 1.73J.P. Morgan Securities Plc 11,465,019 0.92Merrill Lynch International 4,166,203 0.34The Bank of Nova Scotia 605,549 0.05Total 93,997,511 7.57World Financials Fund (in USD)UBS AG 28,363,690 3.97Morgan Stanley & Co. International Plc 10,912,936 1.53Deutsche Bank AG 9,952,844 1.39Credit Suisse AG 8,280,967 1.16The Bank of Nova Scotia 4,995,169 0.70HSBC Bank Plc 3,160,111 0.44Citigroup Global Markets Limited 3,076,265 0.43J.P. Morgan Securities Plc 2,905,108 0.41Merrill Lynch International 758,027 0.11Total 72,405,117 10.14World Gold Fund (in USD)Societe Generale SA 565,881,266 9.98Morgan Stanley & Co. International Plc 68,304,602 1.21J.P. Morgan Securities Plc 31,080,050 0.55The Bank of Nova Scotia 12,570,458 0.22BNP Paribas SA 10,270,528 0.18Deutsche Bank AG 9,887,351 0.17Macquarie Bank Limited 9,288,628 0.16Credit Suisse AG 9,018,840 0.16Citigroup Global Markets Limited 8,438,634 0.15Goldman Sachs International 6,363,069 0.11Other issuers 14,778,845 0.26Total 745,882,271 13.15World Healthscience Fund (in USD)Deutsche Bank AG 152,505,005 3.40UBS AG 100,142,145 2.23Credit Suisse AG 35,329,195 0.79J.P. Morgan Securities Plc 32,066,710 0.72Barclays Capital Securities Limited 27,305,383 0.61HSBC Bank Plc 15,647,506 0.35Credit Suisse Securities (Europe) Limited 15,529,310 0.35The Bank of Nova Scotia 11,377,740 0.25Macquarie Bank Limited 8,349,448 0.19Nomura International Plc 3,560,364 0.08Other issuers 2,539,826 0.06Total 404,352,632 9.03
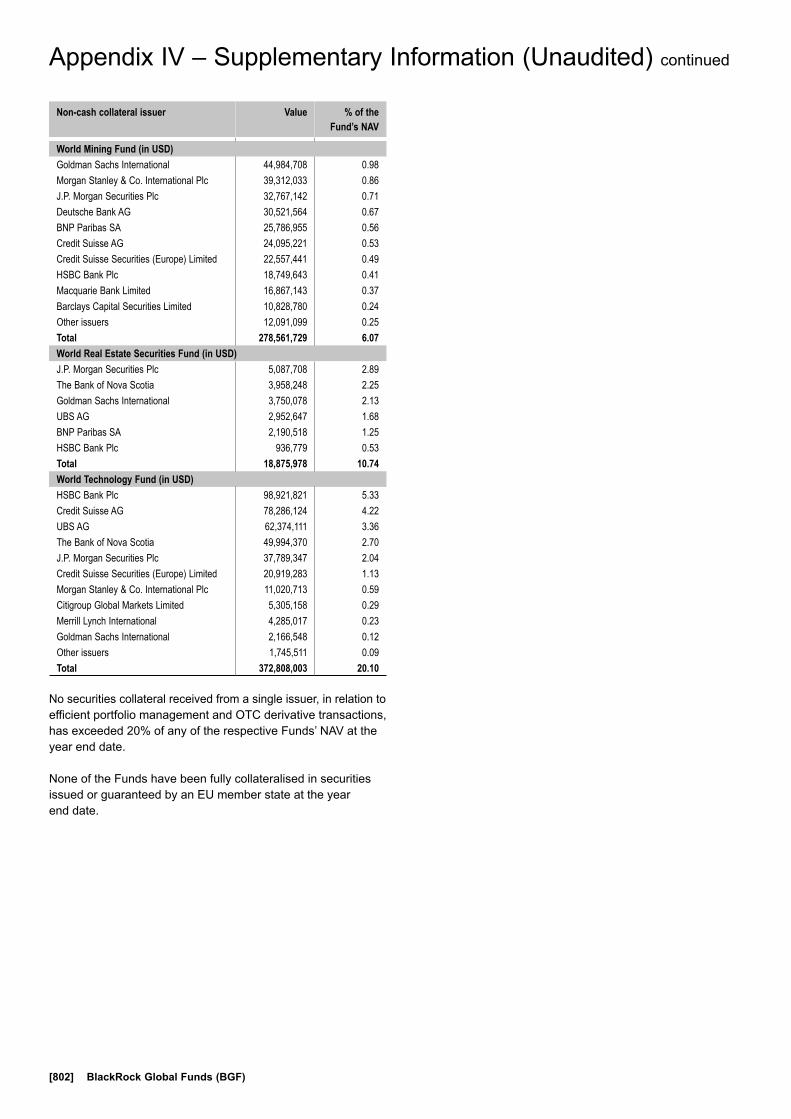
[802] BlackRock Global Funds (BGF)
Appendix IV – Supplementary Information (Unaudited) continued
Non-cash collateral issuer Value % of the Fund’s NAV
World Mining Fund (in USD)Goldman Sachs International 44,984,708 0.98Morgan Stanley & Co. International Plc 39,312,033 0.86J.P. Morgan Securities Plc 32,767,142 0.71Deutsche Bank AG 30,521,564 0.67BNP Paribas SA 25,786,955 0.56Credit Suisse AG 24,095,221 0.53Credit Suisse Securities (Europe) Limited 22,557,441 0.49HSBC Bank Plc 18,749,643 0.41Macquarie Bank Limited 16,867,143 0.37Barclays Capital Securities Limited 10,828,780 0.24Other issuers 12,091,099 0.25Total 278,561,729 6.07World Real Estate Securities Fund (in USD)J.P. Morgan Securities Plc 5,087,708 2.89The Bank of Nova Scotia 3,958,248 2.25Goldman Sachs International 3,750,078 2.13UBS AG 2,952,647 1.68BNP Paribas SA 2,190,518 1.25HSBC Bank Plc 936,779 0.53Total 18,875,978 10.74World Technology Fund (in USD)HSBC Bank Plc 98,921,821 5.33Credit Suisse AG 78,286,124 4.22UBS AG 62,374,111 3.36The Bank of Nova Scotia 49,994,370 2.70J.P. Morgan Securities Plc 37,789,347 2.04Credit Suisse Securities (Europe) Limited 20,919,283 1.13Morgan Stanley & Co. International Plc 11,020,713 0.59Citigroup Global Markets Limited 5,305,158 0.29Merrill Lynch International 4,285,017 0.23Goldman Sachs International 2,166,548 0.12Other issuers 1,745,511 0.09Total 372,808,003 20.10
No securities collateral received from a single issuer, in relation to efficient portfolio management and OTC derivative transactions, has exceeded 20% of any of the respective Funds’ NAV at the year end date.
None of the Funds have been fully collateralised in securities issued or guaranteed by an EU member state at the year end date.


© 2019 BlackRock, Inc. All Rights reserved. BLACKROCK, BLACKROCK SOLUTIONS, iSHARES, SO WHAT DO I DO WITH MY MONEY, INVESTING FOR A NEW WORLD, and BUILT FOR THESE TIMES are registered and unregistered trademarks of BlackRock, Inc. or its subsidiaries in the United States and elsewhere. All other trademarks are those of their respective owners. PRISMA 19/1433 BGF AR ENG 0819
Want to know more? +44 (0)20 7743 3300 blackrockinternational.com