Matthews Asia Funds | Annual Report
172
Matthews Asia Funds | Annual Report December 31, 2019 | matthewsasia.com ASIA FIXED INCOME STRATEGIES Matthews Asia Total Return Bond Fund Matthews Asia Credit Opportunities Fund ASIA GROWTH AND INCOME STRATEGIES Matthews Asian Growth and Income Fund Matthews Asia Dividend Fund Matthews China Dividend Fund ASIA VALUE STRATEGY Matthews Asia Value Fund ASIA GROWTH STRATEGIES Matthews Asia Growth Fund Matthews Pacific Tiger Fund Matthews Asia ESG Fund Matthews Emerging Asia Fund Matthews Asia Innovators Fund Matthews China Fund Matthews India Fund Matthews Japan Fund Matthews Korea Fund ASIA SMALL COMPANY STRATEGIES Matthews Asia Small Companies Fund Matthews China Small Companies Fund '19 Beginning on January 1, 2021, as permitted by regulations adopted by the Securities and Exchange Commission, paper copies of the Funds’ annual and semi-annual shareholder reports will no longer be sent by mail, unless you specifically request paper copies of the reports. Instead, the reports will be made available on the Funds’ website matthewsasia.com, and you will be notified by mail each time a report is posted and provided with a website link to access the report. If you already elected to receive shareholder reports electronically, you will not be affected by this change and you need not take any action. You may elect to receive shareholder reports and other communications from the Funds electronically anytime by contacting your financial intermediary (such as a broker-dealer or bank) or, if you are a direct investor, by calling 800.789.ASIA (2742). You may elect to receive all future reports in paper free of charge. If you invest through a financial intermediary, you can contact your financial intermediary to request that you continue to receive paper copies of your shareholder reports. If you invest directly with a Fund, you can call 800.789.ASIA (2742) to let the Fund know you wish to continue receiving paper copies of your shareholder reports. Your election to receive reports in paper will apply to all Funds held in your account if you invest through your financial intermediary or all Funds held directly with Matthews Asia Funds.
-
Upload
khangminh22 -
Category
Documents
-
view
1 -
download
0
Transcript of Matthews Asia Funds | Annual Report
Matthews Asia Funds | Annual ReportDecember 31, 2019 | matthewsasia.com
ASIA FIXED INCOME STRATEGIESMatthews Asia Total Return Bond Fund
Matthews Asia Credit Opportunities Fund
ASIA GROWTH AND INCOME STRATEGIESMatthews Asian Growth and Income Fund
Matthews Asia Dividend Fund
Matthews China Dividend Fund
ASIA VALUE STRATEGYMatthews Asia Value Fund
ASIA GROWTH STRATEGIESMatthews Asia Growth Fund
Matthews Pacific Tiger Fund
Matthews Asia ESG Fund
Matthews Emerging Asia Fund
Matthews Asia Innovators Fund
Matthews China Fund
Matthews India Fund
Matthews Japan Fund
Matthews Korea Fund
ASIA SMALL COMPANY STRATEGIESMatthews Asia Small Companies Fund
Matthews China Small Companies Fund
'19
Beginning on January 1, 2021, as permitted by regulations adopted by the Securities and Exchange Commission, paper copies of the Funds’ annual and semi-annualshareholder reports will no longer be sent by mail, unless you specifically request paper copies of the reports. Instead, the reports will be made available on the Funds’website matthewsasia.com, and you will be notified by mail each time a report is posted and provided with a website link to access the report. If you already electedto receive shareholder reports electronically, you will not be affected by this change and you need not take any action. You may elect to receive shareholder reportsand other communications from the Funds electronically anytime by contacting your financial intermediary (such as a broker-dealer or bank) or, if you are a directinvestor, by calling 800.789.ASIA (2742).
You may elect to receive all future reports in paper free of charge. If you invest through a financial intermediary, you can contact your financial intermediary torequest that you continue to receive paper copies of your shareholder reports. If you invest directly with a Fund, you can call 800.789.ASIA (2742) to let the Fundknow you wish to continue receiving paper copies of your shareholder reports. Your election to receive reports in paper will apply to all Funds held in youraccount if you invest through your financial intermediary or all Funds held directly with Matthews Asia Funds.
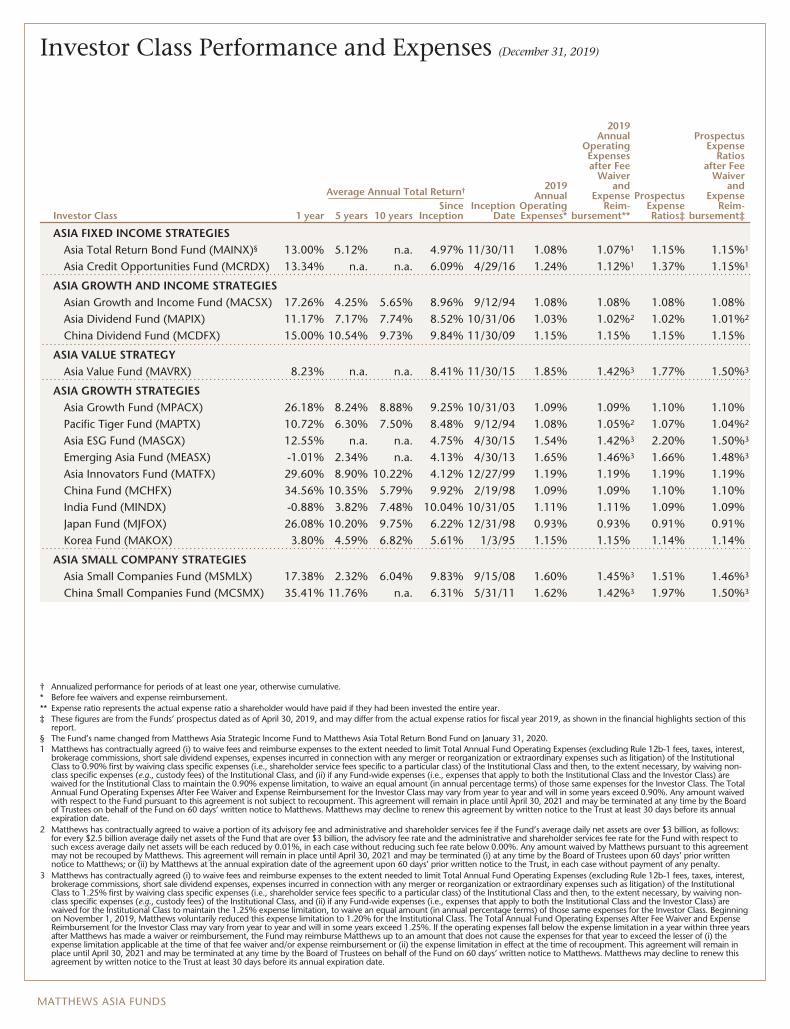
Investor Class Performance and Expenses (December 31, 2019)
Investor Class
Average Annual Total Return†
InceptionDate
2019Annual
OperatingExpenses*
2019Annual
OperatingExpensesafter Fee
Waiverand
ExpenseReim-
bursement**
ProspectusExpenseRatios‡
ProspectusExpense
Ratiosafter Fee
Waiverand
ExpenseReim-
bursement‡1 year 5 years 10 yearsSince
Inception
ASIA FIXED INCOME STRATEGIESAsia Total Return Bond Fund (MAINX)§ 13.00% 5.12% n.a. 4.97% 11/30/11 1.08% 1.07%1 1.15% 1.15%1
Asia Credit Opportunities Fund (MCRDX) 13.34% n.a. n.a. 6.09% 4/29/16 1.24% 1.12%1 1.37% 1.15%1
ASIA GROWTH AND INCOME STRATEGIESAsian Growth and Income Fund (MACSX) 17.26% 4.25% 5.65% 8.96% 9/12/94 1.08% 1.08% 1.08% 1.08%Asia Dividend Fund (MAPIX) 11.17% 7.17% 7.74% 8.52% 10/31/06 1.03% 1.02%2 1.02% 1.01%2
China Dividend Fund (MCDFX) 15.00% 10.54% 9.73% 9.84% 11/30/09 1.15% 1.15% 1.15% 1.15%
ASIA VALUE STRATEGYAsia Value Fund (MAVRX) 8.23% n.a. n.a. 8.41% 11/30/15 1.85% 1.42%3 1.77% 1.50%3
ASIA GROWTH STRATEGIESAsia Growth Fund (MPACX) 26.18% 8.24% 8.88% 9.25% 10/31/03 1.09% 1.09% 1.10% 1.10%Pacific Tiger Fund (MAPTX) 10.72% 6.30% 7.50% 8.48% 9/12/94 1.08% 1.05%2 1.07% 1.04%2
Asia ESG Fund (MASGX) 12.55% n.a. n.a. 4.75% 4/30/15 1.54% 1.42%3 2.20% 1.50%3
Emerging Asia Fund (MEASX) -1.01% 2.34% n.a. 4.13% 4/30/13 1.65% 1.46%3 1.66% 1.48%3
Asia Innovators Fund (MATFX) 29.60% 8.90% 10.22% 4.12% 12/27/99 1.19% 1.19% 1.19% 1.19%China Fund (MCHFX) 34.56% 10.35% 5.79% 9.92% 2/19/98 1.09% 1.09% 1.10% 1.10%India Fund (MINDX) -0.88% 3.82% 7.48% 10.04% 10/31/05 1.11% 1.11% 1.09% 1.09%Japan Fund (MJFOX) 26.08% 10.20% 9.75% 6.22% 12/31/98 0.93% 0.93% 0.91% 0.91%Korea Fund (MAKOX) 3.80% 4.59% 6.82% 5.61% 1/3/95 1.15% 1.15% 1.14% 1.14%
ASIA SMALL COMPANY STRATEGIESAsia Small Companies Fund (MSMLX) 17.38% 2.32% 6.04% 9.83% 9/15/08 1.60% 1.45%3 1.51% 1.46%3
China Small Companies Fund (MCSMX) 35.41% 11.76% n.a. 6.31% 5/31/11 1.62% 1.42%3 1.97% 1.50%3
† Annualized performance for periods of at least one year, otherwise cumulative.* Before fee waivers and expense reimbursement.** Expense ratio represents the actual expense ratio a shareholder would have paid if they had been invested the entire year.‡ These figures are from the Funds’ prospectus dated as of April 30, 2019, and may differ from the actual expense ratios for fiscal year 2019, as shown in the financial highlights section of this
report.§ The Fund’s name changed from Matthews Asia Strategic Income Fund to Matthews Asia Total Return Bond Fund on January 31, 2020.1 Matthews has contractually agreed (i) to waive fees and reimburse expenses to the extent needed to limit Total Annual Fund Operating Expenses (excluding Rule 12b-1 fees, taxes, interest,
brokerage commissions, short sale dividend expenses, expenses incurred in connection with any merger or reorganization or extraordinary expenses such as litigation) of the InstitutionalClass to 0.90% first by waiving class specific expenses (i.e., shareholder service fees specific to a particular class) of the Institutional Class and then, to the extent necessary, by waiving non-class specific expenses (e.g., custody fees) of the Institutional Class, and (ii) if any Fund-wide expenses (i.e., expenses that apply to both the Institutional Class and the Investor Class) arewaived for the Institutional Class to maintain the 0.90% expense limitation, to waive an equal amount (in annual percentage terms) of those same expenses for the Investor Class. The TotalAnnual Fund Operating Expenses After Fee Waiver and Expense Reimbursement for the Investor Class may vary from year to year and will in some years exceed 0.90%. Any amount waivedwith respect to the Fund pursuant to this agreement is not subject to recoupment. This agreement will remain in place until April 30, 2021 and may be terminated at any time by the Boardof Trustees on behalf of the Fund on 60 days’ written notice to Matthews. Matthews may decline to renew this agreement by written notice to the Trust at least 30 days before its annualexpiration date.
2 Matthews has contractually agreed to waive a portion of its advisory fee and administrative and shareholder services fee if the Fund’s average daily net assets are over $3 billion, as follows:for every $2.5 billion average daily net assets of the Fund that are over $3 billion, the advisory fee rate and the administrative and shareholder services fee rate for the Fund with respect tosuch excess average daily net assets will be each reduced by 0.01%, in each case without reducing such fee rate below 0.00%. Any amount waived by Matthews pursuant to this agreementmay not be recouped by Matthews. This agreement will remain in place until April 30, 2021 and may be terminated (i) at any time by the Board of Trustees upon 60 days’ prior writtennotice to Matthews; or (ii) by Matthews at the annual expiration date of the agreement upon 60 days’ prior written notice to the Trust, in each case without payment of any penalty.
3 Matthews has contractually agreed (i) to waive fees and reimburse expenses to the extent needed to limit Total Annual Fund Operating Expenses (excluding Rule 12b-1 fees, taxes, interest,brokerage commissions, short sale dividend expenses, expenses incurred in connection with any merger or reorganization or extraordinary expenses such as litigation) of the InstitutionalClass to 1.25% first by waiving class specific expenses (i.e., shareholder service fees specific to a particular class) of the Institutional Class and then, to the extent necessary, by waiving non-class specific expenses (e.g., custody fees) of the Institutional Class, and (ii) if any Fund-wide expenses (i.e., expenses that apply to both the Institutional Class and the Investor Class) arewaived for the Institutional Class to maintain the 1.25% expense limitation, to waive an equal amount (in annual percentage terms) of those same expenses for the Investor Class. Beginningon November 1, 2019, Matthews voluntarily reduced this expense limitation to 1.20% for the Institutional Class. The Total Annual Fund Operating Expenses After Fee Waiver and ExpenseReimbursement for the Investor Class may vary from year to year and will in some years exceed 1.25%. If the operating expenses fall below the expense limitation in a year within three yearsafter Matthews has made a waiver or reimbursement, the Fund may reimburse Matthews up to an amount that does not cause the expenses for that year to exceed the lesser of (i) theexpense limitation applicable at the time of that fee waiver and/or expense reimbursement or (ii) the expense limitation in effect at the time of recoupment. This agreement will remain inplace until April 30, 2021 and may be terminated at any time by the Board of Trustees on behalf of the Fund on 60 days’ written notice to Matthews. Matthews may decline to renew thisagreement by written notice to the Trust at least 30 days before its annual expiration date.
MATTHEWS ASIA FUNDS
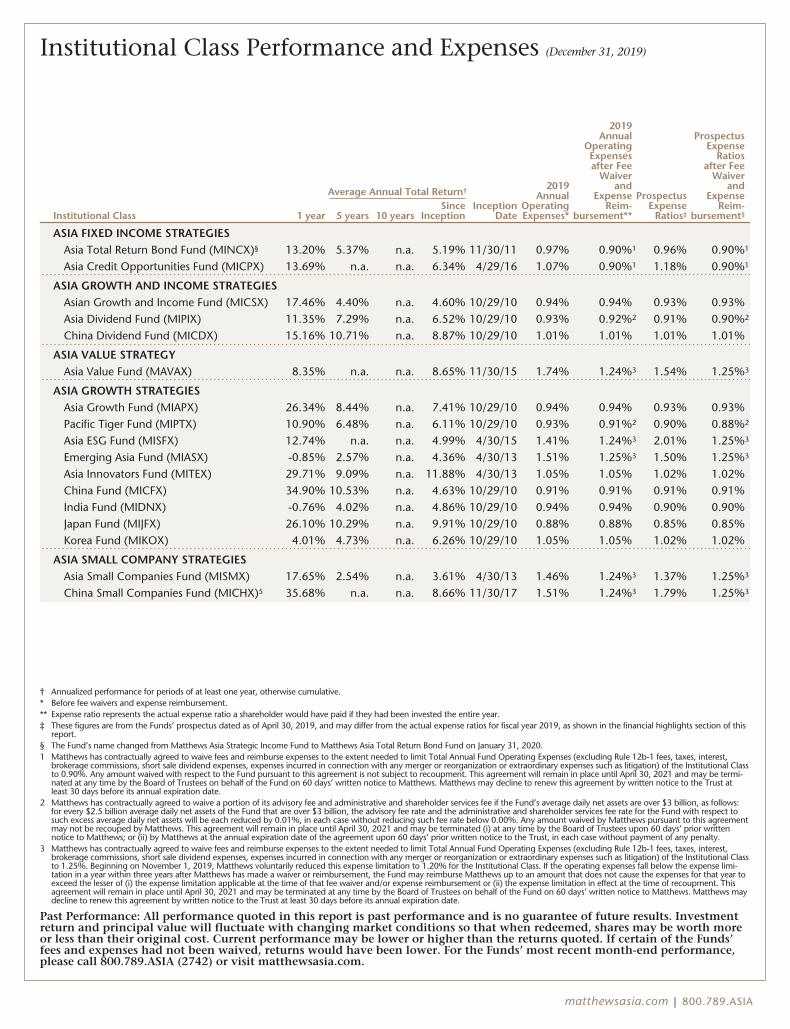
Institutional Class Performance and Expenses (December 31, 2019)
Institutional Class
Average Annual Total Return†
InceptionDate
2019Annual
OperatingExpenses*
2019Annual
OperatingExpensesafter Fee
Waiverand
ExpenseReim-
bursement**
ProspectusExpense
Ratios‡
ProspectusExpense
Ratiosafter Fee
Waiverand
ExpenseReim-
bursement‡1 year 5 years 10 yearsSince
Inception
ASIA FIXED INCOME STRATEGIESAsia Total Return Bond Fund (MINCX)§ 13.20% 5.37% n.a. 5.19% 11/30/11 0.97% 0.90%1 0.96% 0.90%1
Asia Credit Opportunities Fund (MICPX) 13.69% n.a. n.a. 6.34% 4/29/16 1.07% 0.90%1 1.18% 0.90%1
ASIA GROWTH AND INCOME STRATEGIESAsian Growth and Income Fund (MICSX) 17.46% 4.40% n.a. 4.60% 10/29/10 0.94% 0.94% 0.93% 0.93%Asia Dividend Fund (MIPIX) 11.35% 7.29% n.a. 6.52% 10/29/10 0.93% 0.92%2 0.91% 0.90%2
China Dividend Fund (MICDX) 15.16% 10.71% n.a. 8.87% 10/29/10 1.01% 1.01% 1.01% 1.01%
ASIA VALUE STRATEGYAsia Value Fund (MAVAX) 8.35% n.a. n.a. 8.65% 11/30/15 1.74% 1.24%3 1.54% 1.25%3
ASIA GROWTH STRATEGIESAsia Growth Fund (MIAPX) 26.34% 8.44% n.a. 7.41% 10/29/10 0.94% 0.94% 0.93% 0.93%Pacific Tiger Fund (MIPTX) 10.90% 6.48% n.a. 6.11% 10/29/10 0.93% 0.91%2 0.90% 0.88%2
Asia ESG Fund (MISFX) 12.74% n.a. n.a. 4.99% 4/30/15 1.41% 1.24%3 2.01% 1.25%3
Emerging Asia Fund (MIASX) -0.85% 2.57% n.a. 4.36% 4/30/13 1.51% 1.25%3 1.50% 1.25%3
Asia Innovators Fund (MITEX) 29.71% 9.09% n.a. 11.88% 4/30/13 1.05% 1.05% 1.02% 1.02%China Fund (MICFX) 34.90% 10.53% n.a. 4.63% 10/29/10 0.91% 0.91% 0.91% 0.91%India Fund (MIDNX) -0.76% 4.02% n.a. 4.86% 10/29/10 0.94% 0.94% 0.90% 0.90%Japan Fund (MIJFX) 26.10% 10.29% n.a. 9.91% 10/29/10 0.88% 0.88% 0.85% 0.85%Korea Fund (MIKOX) 4.01% 4.73% n.a. 6.26% 10/29/10 1.05% 1.05% 1.02% 1.02%
ASIA SMALL COMPANY STRATEGIESAsia Small Companies Fund (MISMX) 17.65% 2.54% n.a. 3.61% 4/30/13 1.46% 1.24%3 1.37% 1.25%3
China Small Companies Fund (MICHX)5 35.68% n.a. n.a. 8.66% 11/30/17 1.51% 1.24%3 1.79% 1.25%3
† Annualized performance for periods of at least one year, otherwise cumulative.* Before fee waivers and expense reimbursement.** Expense ratio represents the actual expense ratio a shareholder would have paid if they had been invested the entire year.‡ These figures are from the Funds’ prospectus dated as of April 30, 2019, and may differ from the actual expense ratios for fiscal year 2019, as shown in the financial highlights section of this
report.§ The Fund’s name changed from Matthews Asia Strategic Income Fund to Matthews Asia Total Return Bond Fund on January 31, 2020.1 Matthews has contractually agreed to waive fees and reimburse expenses to the extent needed to limit Total Annual Fund Operating Expenses (excluding Rule 12b-1 fees, taxes, interest,
brokerage commissions, short sale dividend expenses, expenses incurred in connection with any merger or reorganization or extraordinary expenses such as litigation) of the Institutional Classto 0.90%. Any amount waived with respect to the Fund pursuant to this agreement is not subject to recoupment. This agreement will remain in place until April 30, 2021 and may be termi-nated at any time by the Board of Trustees on behalf of the Fund on 60 days’ written notice to Matthews. Matthews may decline to renew this agreement by written notice to the Trust atleast 30 days before its annual expiration date.
2 Matthews has contractually agreed to waive a portion of its advisory fee and administrative and shareholder services fee if the Fund’s average daily net assets are over $3 billion, as follows:for every $2.5 billion average daily net assets of the Fund that are over $3 billion, the advisory fee rate and the administrative and shareholder services fee rate for the Fund with respect tosuch excess average daily net assets will be each reduced by 0.01%, in each case without reducing such fee rate below 0.00%. Any amount waived by Matthews pursuant to this agreementmay not be recouped by Matthews. This agreement will remain in place until April 30, 2021 and may be terminated (i) at any time by the Board of Trustees upon 60 days’ prior writtennotice to Matthews; or (ii) by Matthews at the annual expiration date of the agreement upon 60 days’ prior written notice to the Trust, in each case without payment of any penalty.
3 Matthews has contractually agreed to waive fees and reimburse expenses to the extent needed to limit Total Annual Fund Operating Expenses (excluding Rule 12b-1 fees, taxes, interest,brokerage commissions, short sale dividend expenses, expenses incurred in connection with any merger or reorganization or extraordinary expenses such as litigation) of the Institutional Classto 1.25%. Beginning on November 1, 2019, Matthews voluntarily reduced this expense limitation to 1.20% for the Institutional Class. If the operating expenses fall below the expense limi-tation in a year within three years after Matthews has made a waiver or reimbursement, the Fund may reimburse Matthews up to an amount that does not cause the expenses for that year toexceed the lesser of (i) the expense limitation applicable at the time of that fee waiver and/or expense reimbursement or (ii) the expense limitation in effect at the time of recoupment. Thisagreement will remain in place until April 30, 2021 and may be terminated at any time by the Board of Trustees on behalf of the Fund on 60 days’ written notice to Matthews. Matthews maydecline to renew this agreement by written notice to the Trust at least 30 days before its annual expiration date.
Past Performance: All performance quoted in this report is past performance and is no guarantee of future results. Investmentreturn and principal value will fluctuate with changing market conditions so that when redeemed, shares may be worth moreor less than their original cost. Current performance may be lower or higher than the returns quoted. If certain of the Funds’fees and expenses had not been waived, returns would have been lower. For the Funds’ most recent month-end performance,please call 800.789.ASIA (2742) or visit matthewsasia.com.
matthewsasia.com | 800.789.ASIA

Cover photo: Asian Palace
This report has been prepared for Matthews International Funds (d/b/a Matthews Asia Funds) shareholders. It is not authorized for distribution toprospective investors unless accompanied or preceded by a current Matthews Asia Funds prospectus, which contains more complete informationabout the Funds’ investment objectives, risks and expenses. Additional copies of the prospectus or summary prospectus may be obtained atmatthewsasia.com. Please read the prospectus carefully before you invest or send money.
The views and opinions in this report were current as of December 31, 2019. They are not guarantees of performance or investment results andshould not be taken as investment advice. Investment decisions reflect a variety of factors, and the managers reserve the right to change theirviews about individual stocks, sectors and the markets at any time. As a result, the views expressed should not be relied upon as a forecast of aFund’s future investment intent. Current and future portfolio holdings are subject to risk.
Statements of fact are from sources considered reliable, but neither the Funds nor the Investment Advisor makes any representation or guaranteeas to their completeness or accuracy.
ContentsMessage to Shareholders from the President of Matthews Asia Funds 2
Message to Shareholders from the Investment Advisor 3
Manager Commentaries, Fund Characteristics and Schedules of Investments:
ASIA FIXED INCOME STRATEGIESMatthews Asia Total Return Bond Fund* 4Matthews Asia Credit Opportunities Fund 9
ASIA GROWTH AND INCOME STRATEGIESMatthews Asian Growth and Income Fund 14Matthews Asia Dividend Fund 19Matthews China Dividend Fund 24
ASIA VALUE STRATEGYMatthews Asia Value Fund 29
ASIA GROWTH STRATEGIESMatthews Asia Growth Fund 33Matthews Pacific Tiger Fund 37Matthews Asia ESG Fund 42Matthews Emerging Asia Fund 47Matthews Asia Innovators Fund 51Matthews China Fund 55Matthews India Fund 60Matthews Japan Fund 65Matthews Korea Fund 70
ASIA SMALL COMPANY STRATEGIESMatthews Asia Small Companies Fund 75Matthews China Small Companies Fund 80
Index Definitions 85Disclosures 86Disclosure of Fund Expenses 87Statements of Assets and Liabilities 90Statements of Operations 102Statements of Changes in Net Assets 108Financial Highlights 117Notes to Financial Statements 1341. Organization 1342. Significant Accounting Policies 1343. Derivative Financial Instruments 1404. Capital Shares Transactions 1425. Investment Advisory Fees and Other Transactions with Affiliates 1466. Investments 1487. Holdings of 5% Voting Shares of Portfolio Companies 1488. Income Tax Information 1509. Subsequent Events 152Report of Independent Registered Public Accounting Firm 153Tax Information 154Approval of Investment Advisory Agreement 157Statement Regarding Liquidity Risk Management Program 163Trustees and Officers of the Funds 164
*The Fund’s name changed from Matthews Asia Strategic income Fund to Matthews Asia Total Return Bond Fund on January 31, 2020.
Investment Risk: Mutual fund shares are not deposits or obligations of, or guaranteed by, any depositary institution. Shares are not insuredby the FDIC, Federal Reserve Board or any government agency and are subject to investment risks, including possible loss of principalamount invested. Investing in international and emerging markets may involve additional risks, such as social and political instability,market illiquidity, exchange-rate fluctuations, a high level of volatility and limited regulation. Fixed income investments are subject toadditional risks, including, but not limited to, interest rate, credit and inflation risks. In addition, single-country and sector funds may besubject to a higher degree of market risk than diversified funds because of a concentration in a specific industry, sector or geographiclocation. Investing in small and mid-size companies is more risky than investing in large companies as they may be more volatile and lessliquid than larger companies. Please see the Funds’ Prospectuses and Statement of Additional Information for more risk disclosure.
Message to Shareholders from the President of Matthews Asia FundsDear Valued Shareholder,
Asian markets were volatile through the first nine months of the year amid U.S.–China trade tensions, intensified geopolitical ten-sions, and slowing economic growth. However, markets—global, Asian, emerging and developed alike—posted strong results in thefinal quarter of the year. The uptick in sentiment in the fourth quarter, largely driven by positive trade rhetoric, helped drive marketshigher, especially in December. Chinese equities were some of the region’s strongest performers in the fourth quarter, after negativereturns in the prior quarter when stocks suffered as investors remained sidelined watching the televised protests in Hong Kong andreading about the U.S.–China trade dispute.
We are accustomed to these kinds of swings in markets, given our long history of focusing on Asia. This strengthens our resolve toremain focused on our core investment principles with a bottom-up approach and long-range view. Amid the volatile environment, Iam proud of the continued positive absolute performance delivered across most of the Matthews Asia Funds.
Asia Dominates Emerging Markets
Over the past year we saw investors pay increasing attention towards China. In particular, the inclusion of China’s domestically listed Ashares in many emerging market indices has been one of the major drivers of investors’ interest to learn more about the country’s invest-ment opportunities and how to consider allocating to China within a diversified portfolio. As an Asia specialist, we believe an importantpart of our role is to provide investors with thoughtful insights and perspectives on the region based on in-depth knowledge and experi-ence. With China contributing to Asia’s dominant weight in many emerging market indices, with Asia representing over 70% of the MSCIEmerging Market Index and China alone representing over one-third of the Index weight, more and more investors are realizing that to getemerging markets right, you have to get Asia right. We will continue to evaluate how to enhance our firm’s investment capabilities in orderto provide investors with compelling investment opportunities.
Corporate Governance
With the growing inclusion of China’s domestic A-shares into major global indexes, China’s equity markets have attracted attentionfrom investors worldwide. However, there are still investor concerns on governance practices. It is important to note that China’sregulatory environment around corporate governance has made significant strides forward. The country has taken many steps to giveinvestors more confidence to invest in the country’s capital markets by focusing policy on corporate governance reforms. Policy-makers introduced laws and policies in recent years to promote better ESG (Environmental, Social and Governance) practices and dis-closure among corporations. As active managers, assessing a company’s governance is a key part of our investment process as webelieve the quality of corporate governance is a key factor in long-term business sustainability. Strong corporate governance as well asgood ESG practices may show little direct link to short-term stock performance, but we believe they are critical to delivering long-term, risk-adjusted shareholder value.
2020 and Beyond
Although the U.S. and China have differing political and economic ideologies, the phase-one trade deal that was recently reached isan important step. However, some near-term market uncertainty is already on the horizon as we enter the new year, with weakenedinvestor sentiment continuing amid worries over the coronavirus, COVID-19, and the impact on China’s economy. But along withvolatility and uncertainty come opportunities for active investors. Our investment team will continue to do its utmost in identifyingwell-managed, sustainable businesses, trading at reasonable valuations, on behalf of our clients. I encourage you to visitmatthewsasia.com for our current perspectives and market updates from members of our investment team, including our latestthoughts on the coronavirus and its possible impact on China’s markets, consumers and the global economy.
Finally, during 2019 we welcomed Robert J. Horrocks, PhD, our firm’s Chief Investment Officer, as a Trustee on the Matthews AsiaFunds Board of Trustees. We are delighted to have Robert join the Board of Trustees and incorporate his investment experience andinsights into Board governance considerations. At Matthews Asia, and among my fellow Matthews Asia Funds Board of Trustees, wetake pride in our role and our reputation as a firm and a governing body. We are mindful of our fiduciary duty to you—our valuedshareholder—and of the importance of our role to engage in industry governance matters so that we can understand how changesmay impact you. Jon Zeschin, our Chairman of the Board of Trustees, has served as Chairman of the Independent Directors Council(IDC) Governing Council and fellow Trustee, Gale Caruso, is also on the Governing Council of IDC. Additionally, Jon and I have beenmembers of Investment Company Institute’s (ICI) Board of Governors over the past several years. We hope knowing that members ofthe Matthews Asia Funds Board of Trustees are engaged and involved to represent and provide effective advocacy on your behalf pro-vides confidence in our commitment to our fiduciary duty to do what’s best for you.
As always, thank you for being a valued shareholder.
William J. HackettPresident of Matthews Asia Funds
2 MATTHEWS ASIA FUNDS

Message to Shareholders from the Investment AdvisorDear Valued Investors,
The last quarter of 2019 brought some promise to the markets—a partial resolution of the U.S.–China trade dispute as well as denoue-ment in the violence on the fringes of the Hong Kong protest movement, after pro-democracy candidates won in local elections. Thestrong rally in the market was also backed by better economic news coming from the U.S., which appeared to have skirted a recession,and renewed hopes for continued moderate fiscal and monetary stimulus across the Asian region.
In some respects, however, 2019 was a difficult year for investors with the highly concentrated nature of the market’s returns withinlarge-cap growth companies, particularly in the technology and consumer discretionary sectors. For example, companies like Tencentand Alibaba—already large positions in the MSCI All Country Asia ex Japan Index—had particularly strong final quarters to 2019. Inturn, many of the smaller, more cheaply valued stocks and many small company stocks lagged far behind the indices. These effectswere a drag on some of our portfolios. China’s A share markets rallied in the final quarter, too, albeit not as powerfully as they had inthe first three months of the year. Indeed, it was China that led the year-end rally: India and Japan both lagging. So the concentrationof market performance was not just in sectors, but also in countries, and that meant just a few stocks have driven the majority of thebenchmark performance over the past three years.
The performance of “large-cap growth” in Asia over the past few years in one sense is unsurprising—as growth expectations declineand the yield curve flattens, large-cap growth stocks tend to outperform. And yet the scale of this outperformance—particularly acutein the latter stages of 2019—has been surprising. In addition, the duration of the outperformance of growth over value in Asia hasbeen unusual. The so-called “jobless recovery” in global economies caused a gradual, incessant flattening of the yield curve and a frus-tration of growth expectations that pushed investors to pay higher and higher multiples for growth and to declare value investing tobe dead. It is perhaps not too much of an exaggeration to say that some investors were rewarded over the past year for almost entirelyignoring valuations. That made the markets playgrounds for the speculator and the momentum trader—it made them a much harderenvironment for the fundamental investor.
At Matthews Asia, we have always focused on fundamental investing. None of our portfolios fit easily into momentum-driven or trad-ing markets. However, we do have portfolios that invest a higher portion of their assets in emerging businesses and sectors; indeed, thebest performing portfolios were those that focused on faster-growing companies with less tested business models, often in technologyand health care. We do not seek to time style swings—only to try and understand them and so we are in a position to be more mindfulof some of the risks and the opportunities in the markets. As some stocks were beaten down or ignored due to a combination of tradeworries, Hong Kong politics and slow growth, valuations in parts of the market became noticeably cheap, as cheap as other areas of themarket seemed expensive. The overall level of the region’s price-to-earnings ratio, a little above average, masked the underlying polar-ized nature of valuations. So, as we look to 2020, being mindful of some of these disparities, trading in portfolios may rise as we managerisks and take advantage of new opportunities.
An important question as we go into the new year is whether these trends are likely to continue. Over the closing weeks of 2019, therewere hints that some of these trends may be losing steam. The disparity in valuations between fast- and slow-growing companies hadbecome quite stark. Some popular and high-flying stocks faltered badly as they marginally missed earnings forecasts. A reversal in theyield curve, which had inverted but then started to steepen, suggested that the economic environment might be changing. Fiscal andmonetary stimulus from China, joining that from other countries across the region, could drive rising margins and a broadening ofearnings growth that will make growth seem less scarce and investors less willing to be cavalier about valuations of some companies.
I am optimistic overall about 2020. Slow growth in the global economy outside of Asia, may simply work to create a moderately softerU.S. dollar. That softening of the dollar ought to create a beneficial environment for Asia’s economies to continue their stimulusmeasures. Even though Chinese stocks had a strong 2019, that may just mean they have momentum going into 2020 and the con-tinued favorable environment means that the rally has a good chance of continuing. For now, it is being led by China. Given the factthat the Japanese rally is much longer in the tooth and the Indian economy is suffering from weakening nominal demand, it wouldnot be too optimistic to expect China’s leadership to continue their stimulus into the New Year. But should growth broaden across theregion, it would bring back the kind of liquid financial conditions that have traditionally favored smaller capitalization stocks. Whatis less certain is whether global asset allocators yet believe in this trend, and so they appear to be staying on the sidelines. If this bull-ish trend is to continue, it must climb that wall of suspicion.
We will remain dedicated to finding the best companies that, based on our intuition and knowledge of the region, we believe willdominate their industries in years to come. As always, we will temper our enthusiasm for the region’s growth with a proper focus on thequality of each company’s governance and the price we are being asked to pay.
Robert Horrocks, PhDChief Investment Officer
matthewsasia.com | 800.789.ASIA 3
ASIA FIXED INCOME STRATEGIES
PORTFOLIO MANAGERS
Teresa Kong, CFALead Manager
Satya Patel Wei ZhangCo-Manager Co-Manager
FUND FACTS
Investor InstitutionalTicker MAINX MINCXCUSIP 577125503 577125602Inception 11/30/11 11/30/11NAV $11.12 $11.12Initial Investment $2,500 $100,000Gross Expense Ratio1 1.08% 0.97%After Fee Waiver andReimbursement2 1.07% 0.90%
Portfolio StatisticsTotal # of Positions 39Net Assets $116.7 millionModified Duration3 4.86Portfolio Turnover4 84.38%
BenchmarkJ.P. Morgan Asia Credit Index*
OBJECTIVE
Total return over the long term with an emphasis onincome.
STRATEGY
Under normal market conditions, the Fund seeks toachieve its investment objective by investing at least80% of its net assets, which include borrowings forinvestment purposes, in debt and debt-relatedinstruments issued by governments, quasi-governmental entities, supra-national institutions,and companies in Asia. Asia consists of all countriesand markets in Asia, such as China and India, andincludes developed, emerging, and frontier countriesand markets in the Asian region. The Fund’sinvestments in debt securities may be denominatedin any currency, may be of any quality or may beunrated, and may have no stated maturity orduration target.
Matthews Asia Total Return Bond Fund†
Portfolio Manager Commentary (unaudited)For the year ending December 31, 2019, the Matthews Asia Total Return Bond Fundreturned 13.00% (Investor Class) and 13.20% (Institutional Class), while its bench-mark, the Markit iBoxx Asian Local Bond Index, returned 8.99%. For the fourth quar-ter, the Fund returned 3.53% (Investor Class) and 3.42% (Institutional Class) versus2.80% for the Index.We would also like to inform you that effective January 31, 2020, the Fund namewas changed from the Matthews Asia Strategic Income Fund to the Matthews AsiaTotal Return Bond Fund to better reflect the Fund’s investment objective, which hasalways been total return over the long term with an emphasis on income, and toconform with the naming convention of its global peer group. Effective the samedate, the Fund’s benchmark was also changed to a blended benchmark comprisedof 50% Markit iBoxx Asian Local Bond Index and 50% J.P. Morgan Asia CreditIndex to better reflect the Fund’s investment strategy. Additionally, the Fund’s dis-tribution frequency was changed from quarterly to monthly as it reflects the stan-dard of our global peers, the majority of which distribute on a monthly basis.Market Environment:2019 was a tale of trial, caused by political and economic turbulence. By the fourthquarter, it also was a tale of triumph. The year started with a strong rally, whichwas cut short by a surprise escalation in the trade war by the Trump administrationin May. Negativity in the markets was compounded by rapidly declining globalmanufacturing PMI, a key gauge of global activity, which had been declining sincelate 2018 and slipped to contractionary levels (i.e., below 50) by May.Acknowledging growing risks, the U.S. Federal Reserve put rate hikes on pause andeventually cut rates twice. U.S. Treasury yields decreased by 102 basis points in thefirst three quarters of 2019. The Fed action was supportive of the U.S. and globaleconomies, though not enough to curb growing fears of recession. Yields acrossAsian local government markets came down, helped by dovishness from the Fed,which allowed other central banks to cut rates.In many ways the fourth quarter, December in particular, was a reversal of much ofthe previous six months. On December 12, the White House indicated that a“phase one” trade deal had been reached, paving the way for a risk-on rally intoyear end. Asian equities outperformed the S&P 500 Index. Within fixed income,high yield outperformed investment grade bonds. In fact, returns for U.S. Treas-uries were negative, in a quick reversal of their strong performance throughout2019. The risk-on mood also helped local currency assets outperform, driven bystronger foreign exchange (FX) versus the U.S. dollar (USD).Markets saw the partial trade deal as a positive development because a Decembertariff increase was taken off the table, and the initial agreement was seen as bodingwell for a permanent tariff detente. With Trump and Xi increasingly aware of theeconomic costs of the trade war, both appeared to be turning more pragmatic. Allof this warranted a re-rating of risk in the markets.Within Asian local government markets, almost all countries posted positive returnsin the fourth quarter—except Hong Kong and India, both driven by idiosyncraticissues. In Hong Kong, protests depressed economic sentiment. In India, the increasein inflation, driven by food prices, hampered policymakers’ ability to further easepolicy, which was needed for the economy to recover from a crisis in the non-banking financial sector.Performance Contributors and Detractors:For 2019, USD-denominated high yield positions, particularly Chinese propertycompanies, were the top-returning holdings in the portfolio. Since sentimentaround Chinese property became negative in 2018, it set the sector up for outperformance in 2019 as many of the risks impacting the sector faded throughout2019. These risks included de-leveraging efforts in China, rising U.S. interest ratesand escalation of the U.S.–China trade war. South Korea FX and rates were thebiggest detractors, generating negative returns. South Korea was the main target of
(continued)
† The Fund’s name changed from Matthews Asia Strategic Income Fund to Matthews Asia Total Return Bond Fund on January 31, 2020.* Effective January 31, 2020, the Fund changed its benchmark to a blended benchmark comprised of 50% Markit iBoxx Asian Local Bond Index and 50% J.P. Morgan Asia Credit Index. Prior to January 31, 2020,
the Fund’s benchmark was the Markit iBoxx Asian Local Bond Index. Matthews believes that the blended benchmark is more appropriate in light of the Fund’s current investment strategy. The Markit iBoxx LocalBond Index performance reflects the returns of the discontinued predecessor HSBC Asia Local Bond Index up to December 31, 2012 and the returns of the successor Markit iBoxx Local Bond Index thereafter.
1 Actual 2019 expense ratios.2 Matthews has contractually agreed (i) to waive fees and reimburse expenses to the extent needed to limit Total Annual Fund Operating Expenses (excluding Rule 12b-1 fees, taxes, interest, brokerage commissions,
short sale dividend expenses, expenses incurred in connection with any merger or reorganization or extraordinary expenses such as litigation) of the Institutional Class to 0.90% first by waiving class specific expenses(i.e., shareholder service fees specific to a particular class) of the Institutional Class and then, to the extent necessary, by waiving non-class specific expenses (e.g. custody fees) of the Institutional Class, and (ii) if anyFund-wide expenses (i.e., expenses that apply to both the Institutional Class and the Investor Class) are waived for the Institutional Class to maintain the 0.90% expense limitation, to waive an equal amount (inannual percentage terms) of those same expenses for the Investor Class. The Total Annual Fund Operating Expenses After Fee Waiver and Expense Reimbursement for the Investor Class may vary from year to yearand will in some years exceed 0.90%. Any amount waived with respect to the Fund pursuant to this agreement is not subject to recoupment. This agreement will remain in place until April 30, 2021 and may beterminated at any time by the Board of Trustees on behalf of the Fund on 60 days’ written notice to Matthews. Matthews may decline to renew this agreement by written notice to the Trust at least 30 days before itsannual expiration date.
3 Modified duration measures the percent change in value of the fixed income portion of the portfolio in response to a 1% change in interest rates. In a multi-currency denominated portfolio with sensitivitiesto different interest rate regimes, modified duration will not accurately reflect the change in value of the overall portfolio from a change in any one interest rate regime.
4 The lesser of fiscal year 2019 long-term purchase costs or sales proceeds divided by the average monthly market value of long-term securities.
4 MATTHEWS ASIA FUNDS

PERFORMANCE AS OF DECEMBER 31, 2019
Average Annual Total Returns
3 Months 1 Year 3 Years 5 YearsSince
InceptionInception
Date
Investor Class (MAINX) 3.53% 13.00% 5.85% 5.12% 4.97% 11/30/11
Institutional Class (MINCX) 3.42% 13.20% 6.10% 5.37% 5.19% 11/30/11
Markit iBoxx Asian Local Bond Index5 2.80% 8.99% 6.41% 3.55% 3.06%
50% Markit iBoxx Asian Local Bond Index, 50% J.P. Morgan Asia Credit Index5 1.97% 10.18% 5.89% 4.25% 4.39%
Performance assumes reinvestment of all dividends and/or distributions before taxes. All performance quoted represents past performance and is noguarantee of future results. Investment return and principal value will fluctuate with market conditions so that when redeemed, shares may be worth moreor less than their original cost. Current performance may be lower or higher than the return figures quoted. Returns would have been lower if certain of theFund’s fees and expenses had not been waived. For the Fund’s most recent month-end performance visit matthewsasia.com.
INCOME DISTRIBUTION HISTORY
2019 2018Q1 Q2 Q3 Q4 Total Q1 Q2 Q3 Q4 Total
Investor (MAINX) $0.08 $0.10 $0.14 $0.12 $0.44 $0.12 $0.10 $0.07 $0.00 $0.29
Inst’l (MINCX) $0.09 $0.11 $0.14 $0.12 $0.46 $0.13 $0.11 $0.08 $0.00 $0.31
Note: This table does not include capital gains distributions. Totals may differ by $0.02 due to rounding. For income distribution history, visit matthewsasia.com.
30-DAY YIELD:
Investor Class: 4.99% (4.99% excluding waivers)Institutional Class: 4.83% (4.73% excluding waivers)The 30-Day Yield represents net investment income earned by the Fund over the 30-dayperiod ended 12/31/19, expressed as an annual percentage rate based on the Fund’sshare price at the end of the 30-day period. The 30-Day Yield should be regarded as anestimate of the Fund’s rate of investment income, and it may not equal the Fund’s actualincome distribution rate.
Source: BNY Mellon Investment Servicing (US) Inc.
YIELD TO WORST: 5.68%
Yield to worst is the lowest yield that can be received on a bond assuming that the issuerdoes not default. It is calculated by utilizing the worst case assumptions for a bond withrespect to certain income-reducing factors, including prepayment, call or sinking fundprovisions. It does not represent the yield that an investor should expect to receive. Pastyields are no guarantee of future yields.
Source: FactSet Research Systems
GROWTH OF A HYPOTHETICAL $10,000 INVESTMENT SINCE INCEPTION—INVESTOR CLASS
12/1212/1111/11 12/13 12/14 12/17 12/1912/1812/1612/15
$14,804 Matthews Asia Total Return Bond Fund
$12,756 Markit iBoxx Asian Local Bond Index5
$9,000
$15,000
$14,000
$13,000
$12,000
$11,000
$10,000
Plotted monthly. The performance data and graph do not reflect the deduction of taxes that a shareholder would pay on dividends, capital gains distributions or redemption of Fund shares. Valuesare in US$.5 It is not possible to invest directly in an index. Source: Index data from HSBC, Markit iBoxx and Bloomberg; total return calculations performed by BNY Mellon Investment Servicing (US)
Inc. Please see page 85 for index definitions. Effective January 31, 2020, the Fund changed its benchmark to a blended benchmark comprised of 50% Markit iBoxx Asian Local Bond Indexand 50% J.P. Morgan Asia Credit Index. Prior to January 31, 2020, the Fund’s benchmark was the Markit iBoxx Asian Local Bond Index. Matthews believes that the blended benchmark ismore appropriate in light of the Fund’s current investment strategy. The Markit iBoxx Asian Local Bond Index performance reflects the returns of the discontinued predecessor HSBC AsianLocal Bond Index up to December 31, 2012 and the returns of the successor Markit iBoxx Asian Local Bond Index thereafter.
TOP TEN HOLDINGS
Sector Currency % of Net Assets
Sri Lanka Government Bond, 7.850%, 03/14/2029 Foreign Government Bonds U.S. Dollar 4.8%
HSBC Holdings PLC, 6.375%, 12/29/2049 Financials U.S. Dollar 4.6%
Debt and Asset Trading Corp., 1.000%, 10/10/2025 Financials U.S. Dollar 4.5%
PB International BV, 7.625%, 01/26/2022 Consumer Discretionary U.S. Dollar 4.5%
Wanda Properties International Co., Ltd., 7.250%, 01/29/2024 Real Estate U.S. Dollar 4.5%
Network i2i, Ltd., 5.650%, 04/15/2068 Communication Services U.S. Dollar 4.2%
CIFI Holdings Group Co., Ltd., 6.550%, 03/28/2024 Real Estate U.S. Dollar 4.0%
ABJA Investment Co. Pte, Ltd., 5.450%, 01/24/2028 Materials U.S. Dollar 3.7%
Logan Property Holdings Co., Ltd., 5.250%, 02/23/2023 Real Estate U.S. Dollar 3.3%
Malaysia Government Bond, 4.642%, 11/07/2033 Foreign Government Bonds Malaysian Ringgit 3.0%
% OF ASSETS IN TOP TEN 41.1%
matthewsasia.com | 800.789.ASIA 5
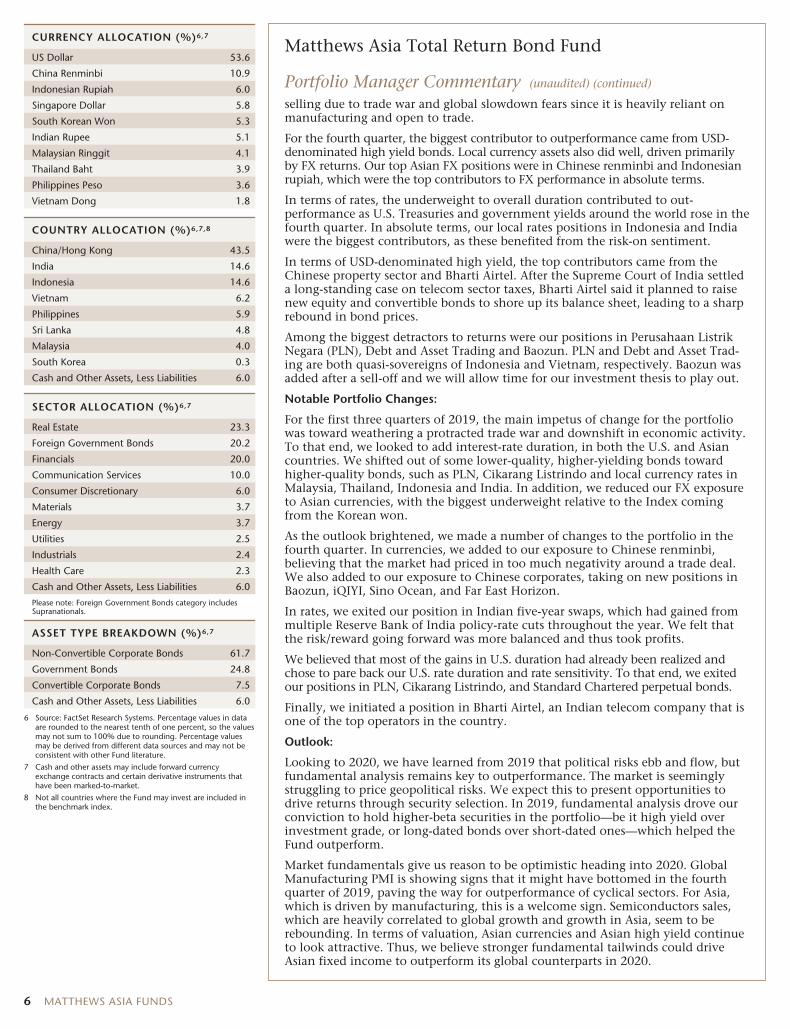
CURRENCY ALLOCATION (%)6,7
US Dollar 53.6
China Renminbi 10.9
Indonesian Rupiah 6.0
Singapore Dollar 5.8
South Korean Won 5.3
Indian Rupee 5.1
Malaysian Ringgit 4.1
Thailand Baht 3.9
Philippines Peso 3.6
Vietnam Dong 1.8
COUNTRY ALLOCATION (%)6,7,8
China/Hong Kong 43.5
India 14.6
Indonesia 14.6
Vietnam 6.2
Philippines 5.9
Sri Lanka 4.8
Malaysia 4.0
South Korea 0.3
Cash and Other Assets, Less Liabilities 6.0
SECTOR ALLOCATION (%)6,7
Real Estate 23.3
Foreign Government Bonds 20.2
Financials 20.0
Communication Services 10.0
Consumer Discretionary 6.0
Materials 3.7
Energy 3.7
Utilities 2.5
Industrials 2.4
Health Care 2.3
Cash and Other Assets, Less Liabilities 6.0
Please note: Foreign Government Bonds category includesSupranationals.
ASSET TYPE BREAKDOWN (%)6,7
Non-Convertible Corporate Bonds 61.7
Government Bonds 24.8
Convertible Corporate Bonds 7.5
Cash and Other Assets, Less Liabilities 6.0
6 Source: FactSet Research Systems. Percentage values in dataare rounded to the nearest tenth of one percent, so the valuesmay not sum to 100% due to rounding. Percentage valuesmay be derived from different data sources and may not beconsistent with other Fund literature.
7 Cash and other assets may include forward currencyexchange contracts and certain derivative instruments thathave been marked-to-market.
8 Not all countries where the Fund may invest are included inthe benchmark index.
Matthews Asia Total Return Bond Fund
Portfolio Manager Commentary (unaudited) (continued)
selling due to trade war and global slowdown fears since it is heavily reliant onmanufacturing and open to trade.
For the fourth quarter, the biggest contributor to outperformance came from USD-denominated high yield bonds. Local currency assets also did well, driven primarilyby FX returns. Our top Asian FX positions were in Chinese renminbi and Indonesianrupiah, which were the top contributors to FX performance in absolute terms.
In terms of rates, the underweight to overall duration contributed to out-performance as U.S. Treasuries and government yields around the world rose in thefourth quarter. In absolute terms, our local rates positions in Indonesia and Indiawere the biggest contributors, as these benefited from the risk-on sentiment.
In terms of USD-denominated high yield, the top contributors came from theChinese property sector and Bharti Airtel. After the Supreme Court of India settleda long-standing case on telecom sector taxes, Bharti Airtel said it planned to raisenew equity and convertible bonds to shore up its balance sheet, leading to a sharprebound in bond prices.
Among the biggest detractors to returns were our positions in Perusahaan ListrikNegara (PLN), Debt and Asset Trading and Baozun. PLN and Debt and Asset Trad-ing are both quasi-sovereigns of Indonesia and Vietnam, respectively. Baozun wasadded after a sell-off and we will allow time for our investment thesis to play out.
Notable Portfolio Changes:
For the first three quarters of 2019, the main impetus of change for the portfoliowas toward weathering a protracted trade war and downshift in economic activity.To that end, we looked to add interest-rate duration, in both the U.S. and Asiancountries. We shifted out of some lower-quality, higher-yielding bonds towardhigher-quality bonds, such as PLN, Cikarang Listrindo and local currency rates inMalaysia, Thailand, Indonesia and India. In addition, we reduced our FX exposureto Asian currencies, with the biggest underweight relative to the Index comingfrom the Korean won.
As the outlook brightened, we made a number of changes to the portfolio in thefourth quarter. In currencies, we added to our exposure to Chinese renminbi,believing that the market had priced in too much negativity around a trade deal.We also added to our exposure to Chinese corporates, taking on new positions inBaozun, iQIYI, Sino Ocean, and Far East Horizon.
In rates, we exited our position in Indian five-year swaps, which had gained frommultiple Reserve Bank of India policy-rate cuts throughout the year. We felt thatthe risk/reward going forward was more balanced and thus took profits.
We believed that most of the gains in U.S. duration had already been realized andchose to pare back our U.S. rate duration and rate sensitivity. To that end, we exitedour positions in PLN, Cikarang Listrindo, and Standard Chartered perpetual bonds.
Finally, we initiated a position in Bharti Airtel, an Indian telecom company that isone of the top operators in the country.
Outlook:
Looking to 2020, we have learned from 2019 that political risks ebb and flow, butfundamental analysis remains key to outperformance. The market is seeminglystruggling to price geopolitical risks. We expect this to present opportunities todrive returns through security selection. In 2019, fundamental analysis drove ourconviction to hold higher-beta securities in the portfolio—be it high yield overinvestment grade, or long-dated bonds over short-dated ones—which helped theFund outperform.
Market fundamentals give us reason to be optimistic heading into 2020. GlobalManufacturing PMI is showing signs that it might have bottomed in the fourthquarter of 2019, paving the way for outperformance of cyclical sectors. For Asia,which is driven by manufacturing, this is a welcome sign. Semiconductors sales,which are heavily correlated to global growth and growth in Asia, seem to berebounding. In terms of valuation, Asian currencies and Asian high yield continueto look attractive. Thus, we believe stronger fundamental tailwinds could driveAsian fixed income to outperform its global counterparts in 2020.
6 MATTHEWS ASIA FUNDS
Matthews Asia Total Return Bond Fund December 31, 2019
Schedule of Investmentsa
NON-CONVERTIBLE CORPORATE BONDS: 61.7% FOREIGN GOVERNMENT OBLIGATIONS: 24.8%
Face Amount* Value
CHINA/HONG KONG: 36.0%HSBC Holdings PLC
6.375%b, 03/30/25c 4,900,000 $5,328,750Wanda Properties International Co., Ltd.
7.250%, 01/29/24d 5,300,000 5,215,624CIFI Holdings Group Co., Ltd.
6.550%, 03/28/24d 4,500,000 4,611,483Logan Property Holdings Co., Ltd.
5.250%, 02/23/23d 3,900,000 3,894,974Franshion Brilliant, Ltd.
5.750%b, 01/17/22c,d 3,400,000 3,367,696KWG Group Holdings, Ltd.
5.875%, 11/10/24d 3,400,000 3,257,208King Talent Management, Ltd.
5.600%b, 12/04/22c,d 3,500,000 3,151,646China Huaneng Group Co., Ltd.
3.950%, 04/21/26 CNY 20,000,000 2,879,837CITIC Telecom International Finance, Ltd.
6.100%, 03/05/25d 2,300,000 2,391,840KWG Group Holdings, Ltd.
7.875%, 09/01/23d 2,050,000 2,148,326CIFI Holdings Group Co., Ltd.
7.750%, 09/20/20d CNY 12,000,000 1,751,213Agricultural Bank of China, Ltd.
4.300%, 04/11/29d CNY 10,000,000 1,464,137Sino-Ocean Land Treasure III, Ltd.
4.900%b, 09/21/22c,d 1,400,000 1,223,571Honghua Group, Ltd.
6.375%, 08/01/22d 1,100,000 1,100,326Deutsche Bank AG
5.600%b, 04/10/25d CNY 2,000,000 261,612
Total China/Hong Kong 42,048,243
INDIA: 14.6%Network i2i, Ltd.
5.650%b, 01/15/25c,f 5,000,000 4,940,000ABJA Investment Co. Pte, Ltd.
5.450%, 01/24/28d 4,440,000 4,330,553Bajaj Finance, Ltd., Series 246
8.538%, 06/07/22 INR 200,000,000 2,870,716Housing Development Finance Corp., Ltd.
9.000%, 11/29/28 INR 190,000,000 2,825,747ICICI Bank UK PLC
5.375%b, 09/26/28d SGD 2,750,000 2,091,999
Total India 17,059,015
INDONESIA: 8.7%PB International BV
7.625%, 01/26/22d 5,100,000 5,222,391Indika Energy Capital III Pte, Ltd.
5.875%, 11/09/24d 3,300,000 3,169,438Modernland Overseas Pte, Ltd.
6.950%, 04/13/24d 1,900,000 1,710,856
Total Indonesia 10,102,685
PHILIPPINES: 2.4%Royal Capital BV
4.875%b, 05/05/24c,d 2,800,000 2,831,153
Total Philippines 2,831,153
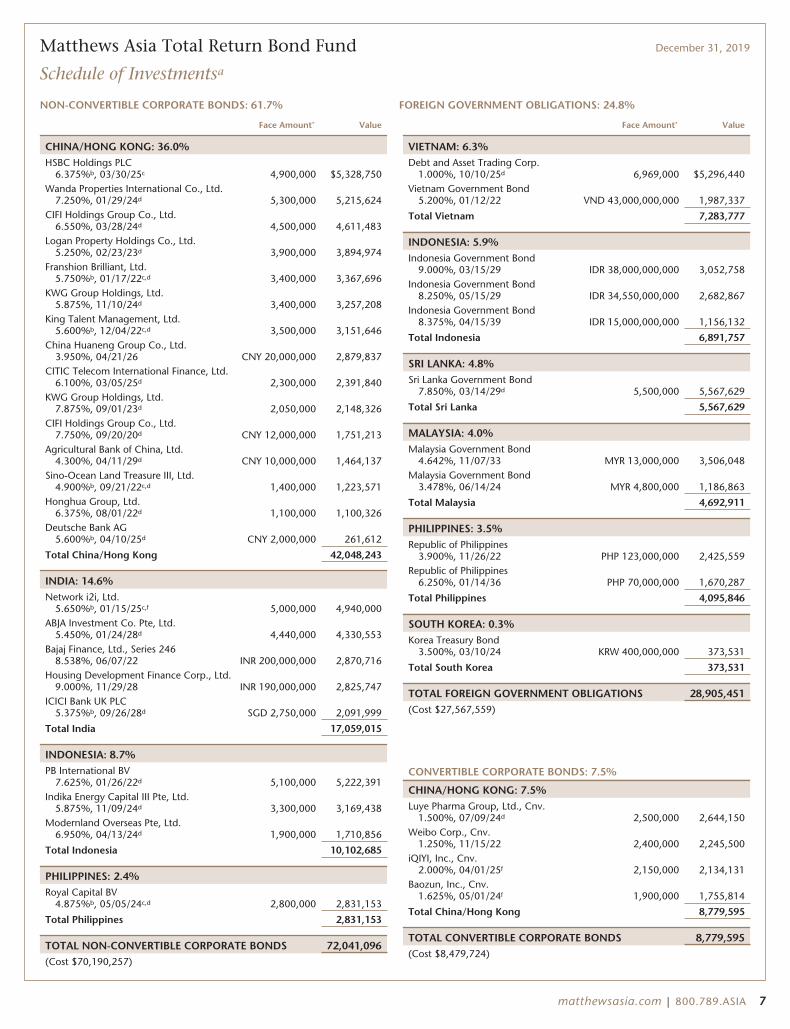
TOTAL NON-CONVERTIBLE CORPORATE BONDS 72,041,096(Cost $70,190,257)
Face Amount* Value
VIETNAM: 6.3%Debt and Asset Trading Corp.
1.000%, 10/10/25d 6,969,000 $5,296,440Vietnam Government Bond
5.200%, 01/12/22 VND 43,000,000,000 1,987,337
Total Vietnam 7,283,777
INDONESIA: 5.9%Indonesia Government Bond
9.000%, 03/15/29 IDR 38,000,000,000 3,052,758Indonesia Government Bond
8.250%, 05/15/29 IDR 34,550,000,000 2,682,867Indonesia Government Bond
8.375%, 04/15/39 IDR 15,000,000,000 1,156,132
Total Indonesia 6,891,757
SRI LANKA: 4.8%Sri Lanka Government Bond
7.850%, 03/14/29d 5,500,000 5,567,629
Total Sri Lanka 5,567,629
MALAYSIA: 4.0%Malaysia Government Bond
4.642%, 11/07/33 MYR 13,000,000 3,506,048Malaysia Government Bond
3.478%, 06/14/24 MYR 4,800,000 1,186,863
Total Malaysia 4,692,911
PHILIPPINES: 3.5%Republic of Philippines
3.900%, 11/26/22 PHP 123,000,000 2,425,559Republic of Philippines
6.250%, 01/14/36 PHP 70,000,000 1,670,287
Total Philippines 4,095,846
SOUTH KOREA: 0.3%Korea Treasury Bond
3.500%, 03/10/24 KRW 400,000,000 373,531
Total South Korea 373,531
TOTAL FOREIGN GOVERNMENT OBLIGATIONS 28,905,451(Cost $27,567,559)
CONVERTIBLE CORPORATE BONDS: 7.5%
CHINA/HONG KONG: 7.5%Luye Pharma Group, Ltd., Cnv.
1.500%, 07/09/24d 2,500,000 2,644,150Weibo Corp., Cnv.
1.250%, 11/15/22 2,400,000 2,245,500iQIYI, Inc., Cnv.
2.000%, 04/01/25f 2,150,000 2,134,131Baozun, Inc., Cnv.
1.625%, 05/01/24f 1,900,000 1,755,814
Total China/Hong Kong 8,779,595
TOTAL CONVERTIBLE CORPORATE BONDS 8,779,595(Cost $8,479,724)
matthewsasia.com | 800.789.ASIA 7
Matthews Asia Total Return Bond Fund December 31, 2019
Schedule of Investmentsa (continued)
CONVERTIBLE CORPORATE BONDS (continued)
Value
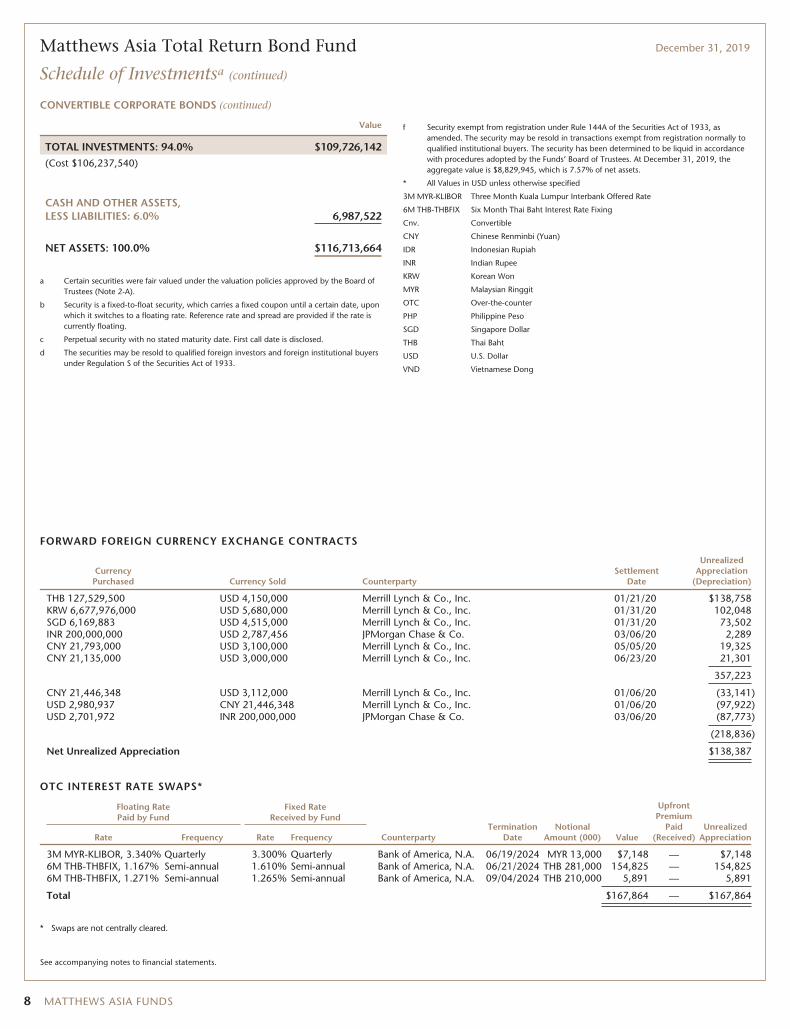
TOTAL INVESTMENTS: 94.0% $109,726,142(Cost $106,237,540)
CASH AND OTHER ASSETS,LESS LIABILITIES: 6.0% 6,987,522
NET ASSETS: 100.0% $116,713,664
a Certain securities were fair valued under the valuation policies approved by the Board ofTrustees (Note 2-A).
b Security is a fixed-to-float security, which carries a fixed coupon until a certain date, uponwhich it switches to a floating rate. Reference rate and spread are provided if the rate iscurrently floating.
c Perpetual security with no stated maturity date. First call date is disclosed.
d The securities may be resold to qualified foreign investors and foreign institutional buyersunder Regulation S of the Securities Act of 1933.
f Security exempt from registration under Rule 144A of the Securities Act of 1933, asamended. The security may be resold in transactions exempt from registration normally toqualified institutional buyers. The security has been determined to be liquid in accordancewith procedures adopted by the Funds’ Board of Trustees. At December 31, 2019, theaggregate value is $8,829,945, which is 7.57% of net assets.
* All Values in USD unless otherwise specified
3M MYR-KLIBOR Three Month Kuala Lumpur Interbank Offered Rate
6M THB-THBFIX Six Month Thai Baht Interest Rate Fixing
Cnv. Convertible
CNY Chinese Renminbi (Yuan)
IDR Indonesian Rupiah
INR Indian Rupee
KRW Korean Won
MYR Malaysian Ringgit
OTC Over-the-counter
PHP Philippine Peso
SGD Singapore Dollar
THB Thai Baht
USD U.S. Dollar
VND Vietnamese Dong
FORWARD FOREIGN CURRENCY EXCHANGE CONTRACTS
CurrencyPurchased Currency Sold Counterparty
SettlementDate
UnrealizedAppreciation
(Depreciation)
THB 127,529,500 USD 4,150,000 Merrill Lynch & Co., Inc. 01/21/20 $138,758KRW 6,677,976,000 USD 5,680,000 Merrill Lynch & Co., Inc. 01/31/20 102,048SGD 6,169,883 USD 4,515,000 Merrill Lynch & Co., Inc. 01/31/20 73,502INR 200,000,000 USD 2,787,456 JPMorgan Chase & Co. 03/06/20 2,289CNY 21,793,000 USD 3,100,000 Merrill Lynch & Co., Inc. 05/05/20 19,325CNY 21,135,000 USD 3,000,000 Merrill Lynch & Co., Inc. 06/23/20 21,301
357,223
CNY 21,446,348 USD 3,112,000 Merrill Lynch & Co., Inc. 01/06/20 (33,141)USD 2,980,937 CNY 21,446,348 Merrill Lynch & Co., Inc. 01/06/20 (97,922)USD 2,701,972 INR 200,000,000 JPMorgan Chase & Co. 03/06/20 (87,773)
(218,836)
Net Unrealized Appreciation $138,387
OTC INTEREST RATE SWAPS*
Floating RatePaid by Fund
Fixed RateReceived by Fund
CounterpartyTermination
DateNotional
Amount (000) Value
UpfrontPremium
Paid(Received)
UnrealizedAppreciationRate Frequency Rate Frequency
3M MYR-KLIBOR, 3.340% Quarterly 3.300% Quarterly Bank of America, N.A. 06/19/2024 MYR 13,000 $7,148 — $7,1486M THB-THBFIX, 1.167% Semi-annual 1.610% Semi-annual Bank of America, N.A. 06/21/2024 THB 281,000 154,825 — 154,8256M THB-THBFIX, 1.271% Semi-annual 1.265% Semi-annual Bank of America, N.A. 09/04/2024 THB 210,000 5,891 — 5,891
Total $167,864 — $167,864
* Swaps are not centrally cleared.
See accompanying notes to financial statements.
8 MATTHEWS ASIA FUNDS

ASIA FIXED INCOME STRATEGIES
PORTFOLIO MANAGERS
Teresa Kong, CFA Satya PatelLead Manager Lead Manager
FUND FACTS
Investor InstitutionalTicker MCRDX MICPXCUSIP 577130677 577130669Inception 4/29/16 4/29/16NAV $10.57 $10.57Initial Investment $2,500 $100,000Gross Expense Ratio1 1.24% 1.07%After Fee Waiver andReimbursement2 1.12% 0.90%
Portfolio StatisticsTotal # of Positions 36Net Assets $92.4 millionModified Duration3 3.96Portfolio Turnover4 81.08%
BenchmarkJ.P. Morgan Asia Credit Index
OBJECTIVE
Total return over the long term.
STRATEGY
Under normal market conditions, the Fund seeks toachieve its investment objective by investing at least80% of its net assets, which include borrowings forinvestment purposes, in debt and debt-relatedinstruments issued by companies as well asgovernments, quasi-governmental entities, andsupra-national institutions in Asia. Debt and debt-related instruments typically include bonds,debentures, bills, securitized instruments (which arevehicles backed by pools of assets such as loans orother receivables), notes, certificates of deposit andother bank obligations, bank loans, senior securedbank debt, convertible debt securities, exchangeablebonds, credit-linked notes, inflation-linkedinstruments, repurchase agreements, payment-in-kind securities and derivative instruments with fixedincome characteristics. Asia consists of all countriesand markets in Asia, such as China and Indonesia, inaddition to the developed, emerging, and frontiercountries and markets in the Asian region.
Matthews Asia Credit Opportunities Fund
Portfolio Manager Commentary (unaudited)
For the year ending December 31, 2019, the Matthews Asia Credit OpportunitiesFund returned 13.34% (Investor Class) and 13.69% (Institutional Class), while itsbenchmark, the J.P. Morgan Asia Credit Index, returned 11.35%. For the fourthquarter, the Fund returned 2.15% (Investor Class) and 2.18% (Institutional Class)versus 1.15% for the Index.
We would also like to inform you that effective January 31, 2020, the Fund’s dis-tribution frequency was changed from quarterly to monthly as it reflects the stan-dard of our global peers, the majority of which distribute on a monthly basis.
Market Environment:
Despite the U.S.–China trade conflict and a challenging macro environment,returns were stellar for Asian credit in 2019. Trade war disruptions, slowing growth,low inflation and dovish central banks pushed risk-free interest rates to recordlows. Credit spreads also started the year higher than historical averages. As tradede-escalation began in the fall, credit spreads began falling. Asian high yield creditspreads tightened 70 basis points (0.7%) in all of 2019, and tightened 50 basispoints (0.50%) just in the fourth quarter. This combination of falling credit spreadsand U.S. interest rates led to one of the decade’s best years for returns.
U.S. dollar-denominated bonds of Chinese issuers performed particularly well in thefourth quarter, benefiting from positive trade news and supportive domestic policies.Growth in China had been slowing for some time, with third-quarter growth at 6%.With this, Chinese policymakers acknowledged that the 6% growth target shouldbecome more flexible and that the focus should be on quality growth, not just thequantity of growth. We think this translates into less credit-fueled stimulus as wehave seen in the past. We expect policymakers to continue to be accommodative,however, with the goal of managing a smooth growth transition. Consumption,employment and higher value-add sectors will be the prime focus.
Indian financials topped headlines in 2019 as bad loans from banks and non-bankfinancial companies (NBFCs) caused liquidity and solvency issues for a few issuers.Given the credit crisis, lending dropped sharply, especially for commercial loans,and impacted growth. Nevertheless, as poorly managed banks retreated from themarkets, we were able to invest in bonds of well-run lenders facing less competi-tion and gaining market share.
Performance Contributors and Detractors:
In terms of sectors, the top contributors to performance in 2019 were Chineseproperty developers, frontier Asian government bonds and long-dated and high-quality bonds. Long-dated and high-quality bonds, such as HSBC, Debt and AssetTrading, Perusahaan Listrik Negara (PLN) and Indonesia Asahan Aluminium Per-sero (InAlum), benefited from a nearly yearlong decline in risk-free yields.
Almost all of the bonds in the portfolio finished positive for the year. One exceptionwas our holding of Baozun, added late in the fourth quarter after a sell-off.
The biggest contributor to performance in the fourth quarter came from the over-weight to BB- and B-rated securities. In terms of sectors, Chinese property devel-opers did particularly well in the fourth quarter, as the trade deal improved marketsentiment and Chinese policymakers focused on supporting domestic growth.Another sector to outperform was Sri Lanka and Pakistan government bonds, asthe default risk of these two frontier holdings looked reasonable compared to otherfrontier emerging market countries.
(continued)
1 Actual 2019 expense ratios.2 Matthews has contractually agreed (i) to waive fees and reimburse expenses to the extent needed to limit Total Annual Fund Operating Expenses (excluding Rule 12b-1 fees, taxes, interest, brokerage
commissions, short sale dividend expenses, expenses incurred in connection with any merger or reorganization or extraordinary expenses such as litigation) of the Institutional Class to 0.90% first by waivingclass specific expenses (i.e., shareholder service fees specific to a particular class) of the Institutional Class and then, to the extent necessary, by waiving non-class specific expenses (e.g., custody fees) of theInstitutional Class, and (ii) if any Fund-wide expenses (i.e., expenses that apply to both the Institutional Class and the Investor Class) are waived for the Institutional Class to maintain the 0.90% expenselimitation, to waive an equal amount (in annual percentage terms) of those same expenses for the Investor Class. The Total Annual Fund Operating Expenses After Fee Waiver and Expense Reimbursement forthe Investor Class may vary from year to year and will in some years exceed 0.90%. Any amount waived with respect to the Fund pursuant to this agreement is not subject to recoupment. This agreement willremain in place until April 30, 2021 and may be terminated at any time by the Board of Trustees on behalf of the Fund on 60 days’ written notice to Matthews. Matthews may decline to renew thisagreement by written notice to the Trust at least 30 days before its annual expiration date.
3 Modified duration measures the percent change in value of the fixed income portion of the portfolio in response to a 1% change in interest rates. In a multi-currency denominated portfolio with sensitivitiesto different interest rate regimes, modified duration will not accurately reflect the change in value of the overall portfolio from a change in any one interest rate regime.
4 The lesser of fiscal year 2019 long-term purchase costs or sales proceeds divided by the average monthly market value of long-term securities.
matthewsasia.com | 800.789.ASIA 9
PERFORMANCE AS OF DECEMBER 31, 2019
Average Annual Total Retuns
3 Months 1 Year 3 YearsSince
InceptionInception
Date
Investor Class (MCRDX) 2.15% 13.34% 5.89% 6.09% 4/29/16
Institutional Class (MICPX) 2.18% 13.69% 6.13% 6.34% 4/29/16
J.P. Morgan Asia Credit Index5 1.15% 11.35% 5.33% 4.73%
Performance assumes reinvestment of all dividends and/or distributions before taxes. All performance quoted represents past performance and is noguarantee of future results. Investment return and principal value will fluctuate with market conditions so that when redeemed, shares may be worth moreor less than their original cost. Current performance may be lower or higher than the return figures quoted. Returns would have been lower if certain of theFund’s fees and expenses had not been waived. For the Fund’s most recent month-end performance, visit matthewsasia.com.
INCOME DISTRIBUTION HISTORY
2019 2018
Q1 Q2 Q3 Q4 Total Q1 Q2 Q3 Q4 Total
Investor (MCRDX) $0.10 $0.10 $0.13 $0.11 $0.44 $0.09 $0.09 $0.06 $0.10 $0.33
Inst’l (MICPX) $0.10 $0.11 $0.14 $0.11 $0.46 $0.09 $0.09 $0.06 $0.11 $0.36
Note: This table does not include capital gains distributions. Totals may differ by $0.02 due to rounding. For income distribution history, visit matthewsasia.com.
30-DAY YIELD:
Investor Class: 4.64% (4.68% excluding waivers)Institutional Class: 4.75% (4.72% excluding waivers)The 30-Day Yield represents net investment income earned by the Fund over the 30-dayperiod ended 12/31/19, expressed as an annual percentage rate based on the Fund’sshare price at the end of the 30-day period. The 30-Day Yield should be regarded as anestimate of the Fund’s rate of investment income, and it may not equal the Fund’s actualincome distribution rate.
Source: BNY Mellon Investment Servicing (US) Inc.
YIELD TO WORST: 5.87%
Yield to worst is the lowest yield that can be received on a bond assuming that the issuerdoes not default. It is calculated by utilizing the worst case assumptions for a bond withrespect to certain income-reducing factors, including prepayment, call or sinking fundprovisions. It does not represent the yield that an investor should expect to receive. Pastyields are no guarantee of future yields.
Source: FactSet Research Systems
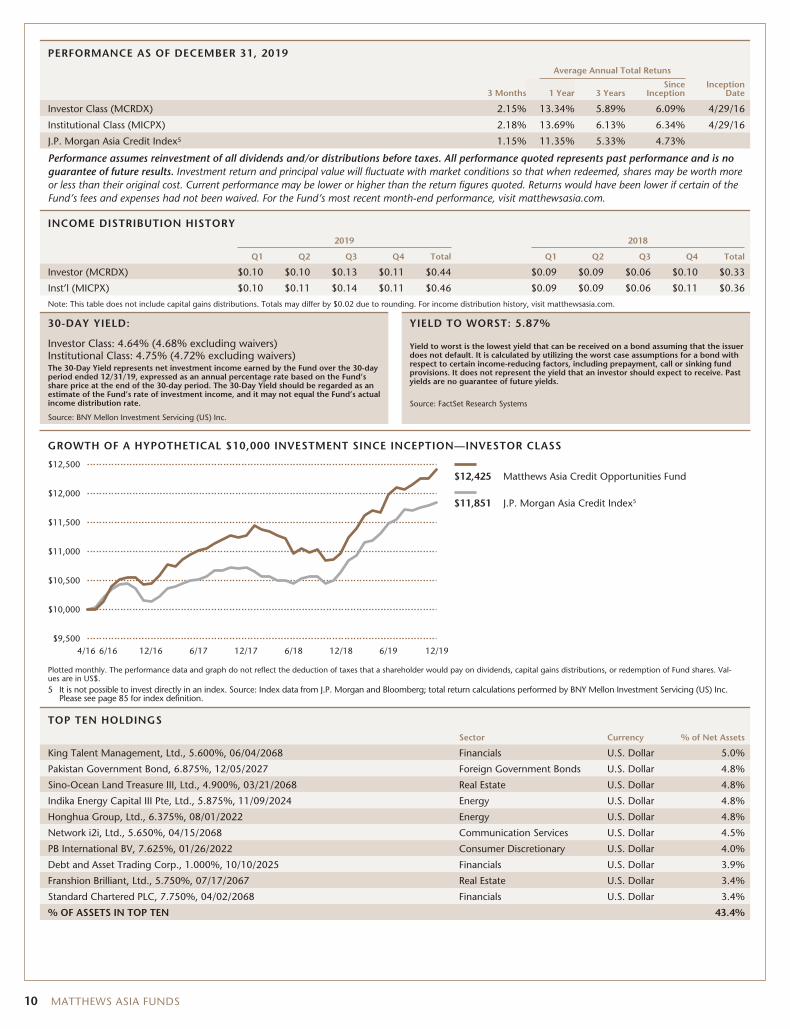
GROWTH OF A HYPOTHETICAL $10,000 INVESTMENT SINCE INCEPTION—INVESTOR CLASS
4/16 6/16 12/196/196/18 12/186/17 12/1712/16
$12,425 Matthews Asia Credit Opportunities Fund
$11,851 J.P. Morgan Asia Credit Index5
$9,500
$12,500
$11,500
$12,000
$11,000
$10,500
$10,000
Plotted monthly. The performance data and graph do not reflect the deduction of taxes that a shareholder would pay on dividends, capital gains distributions, or redemption of Fund shares. Val-ues are in US$.5 It is not possible to invest directly in an index. Source: Index data from J.P. Morgan and Bloomberg; total return calculations performed by BNY Mellon Investment Servicing (US) Inc.
Please see page 85 for index definition.
TOP TEN HOLDINGS
Sector Currency % of Net Assets
King Talent Management, Ltd., 5.600%, 06/04/2068 Financials U.S. Dollar 5.0%
Pakistan Government Bond, 6.875%, 12/05/2027 Foreign Government Bonds U.S. Dollar 4.8%
Sino-Ocean Land Treasure III, Ltd., 4.900%, 03/21/2068 Real Estate U.S. Dollar 4.8%
Indika Energy Capital III Pte, Ltd., 5.875%, 11/09/2024 Energy U.S. Dollar 4.8%
Honghua Group, Ltd., 6.375%, 08/01/2022 Energy U.S. Dollar 4.8%
Network i2i, Ltd., 5.650%, 04/15/2068 Communication Services U.S. Dollar 4.5%
PB International BV, 7.625%, 01/26/2022 Consumer Discretionary U.S. Dollar 4.0%
Debt and Asset Trading Corp., 1.000%, 10/10/2025 Financials U.S. Dollar 3.9%
Franshion Brilliant, Ltd., 5.750%, 07/17/2067 Real Estate U.S. Dollar 3.4%
Standard Chartered PLC, 7.750%, 04/02/2068 Financials U.S. Dollar 3.4%
% OF ASSETS IN TOP TEN 43.4%
10 MATTHEWS ASIA FUNDS
Matthews Asia Credit Opportunities Fund
Portfolio Manager Commentary (unaudited) (continued)
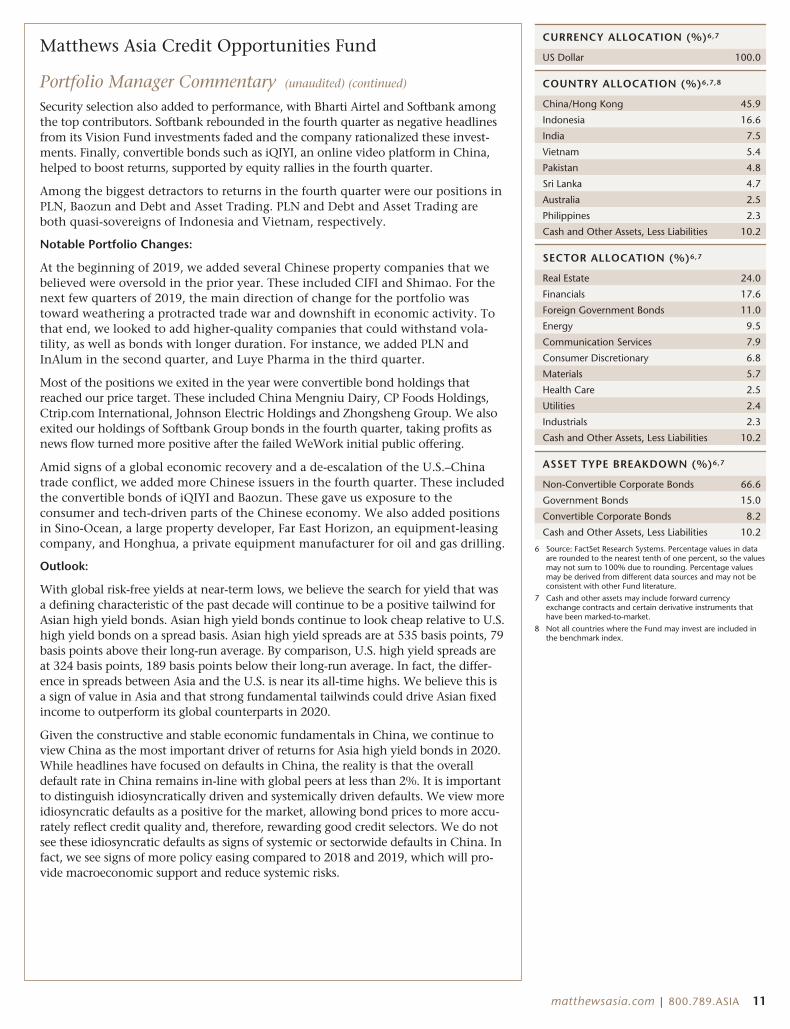
Security selection also added to performance, with Bharti Airtel and Softbank amongthe top contributors. Softbank rebounded in the fourth quarter as negative headlinesfrom its Vision Fund investments faded and the company rationalized these invest-ments. Finally, convertible bonds such as iQIYI, an online video platform in China,helped to boost returns, supported by equity rallies in the fourth quarter.
Among the biggest detractors to returns in the fourth quarter were our positions inPLN, Baozun and Debt and Asset Trading. PLN and Debt and Asset Trading areboth quasi-sovereigns of Indonesia and Vietnam, respectively.
Notable Portfolio Changes:
At the beginning of 2019, we added several Chinese property companies that webelieved were oversold in the prior year. These included CIFI and Shimao. For thenext few quarters of 2019, the main direction of change for the portfolio wastoward weathering a protracted trade war and downshift in economic activity. Tothat end, we looked to add higher-quality companies that could withstand vola-tility, as well as bonds with longer duration. For instance, we added PLN andInAlum in the second quarter, and Luye Pharma in the third quarter.
Most of the positions we exited in the year were convertible bond holdings thatreached our price target. These included China Mengniu Dairy, CP Foods Holdings,Ctrip.com International, Johnson Electric Holdings and Zhongsheng Group. We alsoexited our holdings of Softbank Group bonds in the fourth quarter, taking profits asnews flow turned more positive after the failed WeWork initial public offering.
Amid signs of a global economic recovery and a de-escalation of the U.S.–Chinatrade conflict, we added more Chinese issuers in the fourth quarter. These includedthe convertible bonds of iQIYI and Baozun. These gave us exposure to theconsumer and tech-driven parts of the Chinese economy. We also added positionsin Sino-Ocean, a large property developer, Far East Horizon, an equipment-leasingcompany, and Honghua, a private equipment manufacturer for oil and gas drilling.
Outlook:
With global risk-free yields at near-term lows, we believe the search for yield that wasa defining characteristic of the past decade will continue to be a positive tailwind forAsian high yield bonds. Asian high yield bonds continue to look cheap relative to U.S.high yield bonds on a spread basis. Asian high yield spreads are at 535 basis points, 79basis points above their long-run average. By comparison, U.S. high yield spreads areat 324 basis points, 189 basis points below their long-run average. In fact, the differ-ence in spreads between Asia and the U.S. is near its all-time highs. We believe this isa sign of value in Asia and that strong fundamental tailwinds could drive Asian fixedincome to outperform its global counterparts in 2020.
Given the constructive and stable economic fundamentals in China, we continue toview China as the most important driver of returns for Asia high yield bonds in 2020.While headlines have focused on defaults in China, the reality is that the overalldefault rate in China remains in-line with global peers at less than 2%. It is importantto distinguish idiosyncratically driven and systemically driven defaults. We view moreidiosyncratic defaults as a positive for the market, allowing bond prices to more accu-rately reflect credit quality and, therefore, rewarding good credit selectors. We do notsee these idiosyncratic defaults as signs of systemic or sectorwide defaults in China. Infact, we see signs of more policy easing compared to 2018 and 2019, which will pro-vide macroeconomic support and reduce systemic risks.
CURRENCY ALLOCATION (%)6,7
US Dollar 100.0
COUNTRY ALLOCATION (%)6,7,8
China/Hong Kong 45.9
Indonesia 16.6
India 7.5
Vietnam 5.4
Pakistan 4.8
Sri Lanka 4.7
Australia 2.5
Philippines 2.3
Cash and Other Assets, Less Liabilities 10.2
SECTOR ALLOCATION (%)6,7
Real Estate 24.0
Financials 17.6
Foreign Government Bonds 11.0
Energy 9.5
Communication Services 7.9
Consumer Discretionary 6.8
Materials 5.7
Health Care 2.5
Utilities 2.4
Industrials 2.3
Cash and Other Assets, Less Liabilities 10.2
ASSET TYPE BREAKDOWN (%)6,7
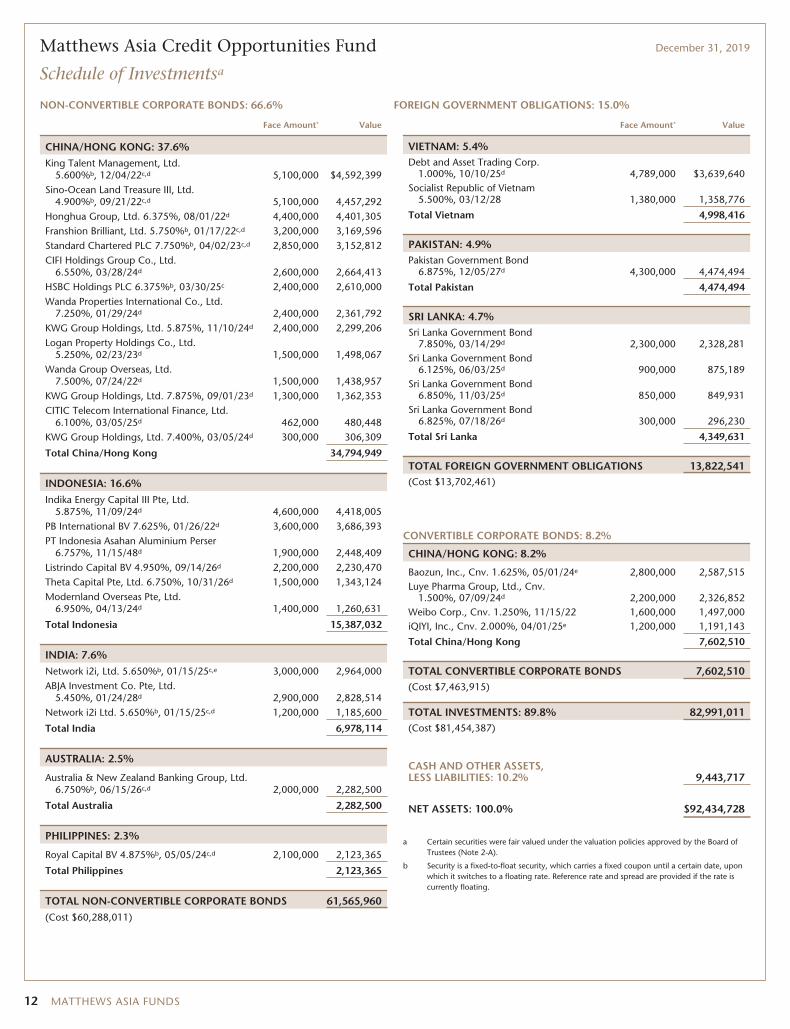
Non-Convertible Corporate Bonds 66.6
Government Bonds 15.0
Convertible Corporate Bonds 8.2
Cash and Other Assets, Less Liabilities 10.2
6 Source: FactSet Research Systems. Percentage values in dataare rounded to the nearest tenth of one percent, so the valuesmay not sum to 100% due to rounding. Percentage valuesmay be derived from different data sources and may not beconsistent with other Fund literature.
7 Cash and other assets may include forward currencyexchange contracts and certain derivative instruments thathave been marked-to-market.
8 Not all countries where the Fund may invest are included inthe benchmark index.
matthewsasia.com | 800.789.ASIA 11
Matthews Asia Credit Opportunities Fund December 31, 2019
Schedule of Investmentsa
NON-CONVERTIBLE CORPORATE BONDS: 66.6% FOREIGN GOVERNMENT OBLIGATIONS: 15.0%
Face Amount* Value
CHINA/HONG KONG: 37.6%King Talent Management, Ltd.
5.600%b, 12/04/22c,d 5,100,000 $4,592,399Sino-Ocean Land Treasure III, Ltd.
4.900%b, 09/21/22c,d 5,100,000 4,457,292Honghua Group, Ltd. 6.375%, 08/01/22d 4,400,000 4,401,305Franshion Brilliant, Ltd. 5.750%b, 01/17/22c,d 3,200,000 3,169,596Standard Chartered PLC 7.750%b, 04/02/23c,d 2,850,000 3,152,812CIFI Holdings Group Co., Ltd.
6.550%, 03/28/24d 2,600,000 2,664,413HSBC Holdings PLC 6.375%b, 03/30/25c 2,400,000 2,610,000Wanda Properties International Co., Ltd.
7.250%, 01/29/24d 2,400,000 2,361,792KWG Group Holdings, Ltd. 5.875%, 11/10/24d 2,400,000 2,299,206Logan Property Holdings Co., Ltd.
5.250%, 02/23/23d 1,500,000 1,498,067Wanda Group Overseas, Ltd.
7.500%, 07/24/22d 1,500,000 1,438,957KWG Group Holdings, Ltd. 7.875%, 09/01/23d 1,300,000 1,362,353CITIC Telecom International Finance, Ltd.
6.100%, 03/05/25d 462,000 480,448KWG Group Holdings, Ltd. 7.400%, 03/05/24d 300,000 306,309
Total China/Hong Kong 34,794,949
INDONESIA: 16.6%Indika Energy Capital III Pte, Ltd.
5.875%, 11/09/24d 4,600,000 4,418,005PB International BV 7.625%, 01/26/22d 3,600,000 3,686,393PT Indonesia Asahan Aluminium Perser
6.757%, 11/15/48d 1,900,000 2,448,409Listrindo Capital BV 4.950%, 09/14/26d 2,200,000 2,230,470Theta Capital Pte, Ltd. 6.750%, 10/31/26d 1,500,000 1,343,124Modernland Overseas Pte, Ltd.
6.950%, 04/13/24d 1,400,000 1,260,631
Total Indonesia 15,387,032
INDIA: 7.6%Network i2i, Ltd. 5.650%b, 01/15/25c,e 3,000,000 2,964,000ABJA Investment Co. Pte, Ltd.
5.450%, 01/24/28d 2,900,000 2,828,514Network i2i Ltd. 5.650%b, 01/15/25c,d 1,200,000 1,185,600
Total India 6,978,114
AUSTRALIA: 2.5%
Australia & New Zealand Banking Group, Ltd.6.750%b, 06/15/26c,d 2,000,000 2,282,500
Total Australia 2,282,500
PHILIPPINES: 2.3%
Royal Capital BV 4.875%b, 05/05/24c,d 2,100,000 2,123,365
Total Philippines 2,123,365
TOTAL NON-CONVERTIBLE CORPORATE BONDS 61,565,960(Cost $60,288,011)
Face Amount* Value
VIETNAM: 5.4%Debt and Asset Trading Corp.
1.000%, 10/10/25d 4,789,000 $3,639,640Socialist Republic of Vietnam
5.500%, 03/12/28 1,380,000 1,358,776
Total Vietnam 4,998,416
PAKISTAN: 4.9%Pakistan Government Bond
6.875%, 12/05/27d 4,300,000 4,474,494
Total Pakistan 4,474,494
SRI LANKA: 4.7%Sri Lanka Government Bond
7.850%, 03/14/29d 2,300,000 2,328,281Sri Lanka Government Bond
6.125%, 06/03/25d 900,000 875,189Sri Lanka Government Bond
6.850%, 11/03/25d 850,000 849,931Sri Lanka Government Bond
6.825%, 07/18/26d 300,000 296,230
Total Sri Lanka 4,349,631
TOTAL FOREIGN GOVERNMENT OBLIGATIONS 13,822,541(Cost $13,702,461)
CONVERTIBLE CORPORATE BONDS: 8.2%
CHINA/HONG KONG: 8.2%
Baozun, Inc., Cnv. 1.625%, 05/01/24e 2,800,000 2,587,515Luye Pharma Group, Ltd., Cnv.
1.500%, 07/09/24d 2,200,000 2,326,852Weibo Corp., Cnv. 1.250%, 11/15/22 1,600,000 1,497,000iQIYI, Inc., Cnv. 2.000%, 04/01/25e 1,200,000 1,191,143
Total China/Hong Kong 7,602,510
TOTAL CONVERTIBLE CORPORATE BONDS 7,602,510(Cost $7,463,915)
TOTAL INVESTMENTS: 89.8% 82,991,011(Cost $81,454,387)
CASH AND OTHER ASSETS,LESS LIABILITIES: 10.2% 9,443,717
NET ASSETS: 100.0% $92,434,728
a Certain securities were fair valued under the valuation policies approved by the Board ofTrustees (Note 2-A).
b Security is a fixed-to-float security, which carries a fixed coupon until a certain date, uponwhich it switches to a floating rate. Reference rate and spread are provided if the rate iscurrently floating.
12 MATTHEWS ASIA FUNDS
Matthews Asia Credit Opportunities Fund December 31, 2019
Schedule of Investmentsa (continued)
c Perpetual security with no stated maturity date. First call date is disclosed.
d The securities may be resold to qualified foreign investors and foreign institutional buyersunder Regulation S of the Securities Act of 1933.
e Security exempt from registration under Rule 144A of the Securities Act of 1933, asamended. The security may be resold in transactions exempt from registration normally toqualified institutional buyers. The security has been determined to be liquid in accordancewith procedures adopted by the Funds’ Board of Trustees. At December 31, 2019, theaggregate value is $6,742,658, which is 7.29% of net assets.
* All Values in USD unless otherwise specified
Cnv. Convertible
USD U.S. Dollar
See accompanying notes to financial statements.
matthewsasia.com | 800.789.ASIA 13

ASIA GROWTH ANDINCOME STRATEGIES
PORTFOLIO MANAGERS
Robert J. Horrocks, PhD Kenneth Lowe, CFALead Manager Lead Manager
John Paul LechCo-Manager
FUND FACTS
Investor InstitutionalTicker MACSX MICSXCUSIP 577130206 577130842Inception 9/12/94 10/29/10NAV $15.73 $15.70Initial Investment $2,500 $100,000Gross Expense Ratio1 1.08% 0.94%
Portfolio StatisticsTotal # of Positions 63Net Assets $1.5 billionWeighted Average Market Cap $71.7 billionPortfolio Turnover2 21.89%
BenchmarkMSCI AC Asia ex Japan Index
OBJECTIVE
Long-term capital appreciation. The Fund also seeksto provide some current income.
STRATEGY
Under normal market conditions, the Fund seeks toachieve its investment objective by investing at least80% of its net assets, which include borrowings forinvestment purposes, in dividend-paying commonstock, preferred stock and other equity securities, andconvertible securities as well as fixed-incomesecurities, of any duration or quality, including highyield securities, of companies located in Asia, whichconsists of all countries and markets in Asia, includingdeveloped, emerging and frontier countries andmarkets in the Asian region.
Matthews Asian Growth and Income Fund
Portfolio Manager Commentary (unaudited)
For the year ending December 31, 2019, the Matthews Asian Growth and IncomeFund returned 17.26% (Investor Class) and 17.46% (Institutional Class), while itsbenchmark, the MSCI All Country Asia ex Japan Index, returned 18.52%. For thefourth quarter of the year, the Fund returned 8.02% (Investor Class) and 8.04%(Institutional Class) versus 11.85% for the Index.
Market Environment:
2018’s concerns over tightening monetary policy and reducing U.S. dollar liquiditywere swiftly reversed in 2019 as central banks committed to returning to an easingpath as inflation remained elusive and growth was patchy. Asian equities werevolatile through the first nine months of the year, however, as this central banklargesse was offset by the U.S.–China trade war. Tensions stopped escalating in thefourth quarter as a “phase one” trade deal was agreed upon. This created a sig-nificantly more constructive environment for risk assets, leading to strongperformance for Asia in the fourth quarter and for the full year.
The North Asian markets of Taiwan and China were particularly strong. Taiwan bene-fited from a major rally in information technology stocks, while China saw relief fromeasing trade tensions. Elsewhere, India struggled to keep pace with the rest of theregion as GDP growth came in weaker than expected and Southeast Asia lagged.
Performance Contributors and Detractors:
Although the portfolio marginally underperformed its benchmark for the full year,absolute performance was robust. We view this as a solid outcome given the Strat-egy’s more conservative investment approach.
The largest contributors to performance for both the quarter and the year camefrom the information technology sector, although an underweight here alsocaused it to be a drag on the portfolio’s relative performance. Taiwan Semi-conductor Manufacturing gained significantly as it solidified its position as theoutright leader in leading-edge technology. Growth is expected to return todouble-digit levels as silicon content demand should remain strong due to themajor secular trends of 5G and high-performance computing. Shares of fellowchipmaker Samsung Electronics also rose as earnings are expected to improve in2020 with memory prices bouncing back and 5G phone shipments increasing.Further, the company has been enhancing its corporate governance with much-improved dividends.
Similarly, the consumer discretionary sector helped absolute performance but wasmildly negative for relative performance over both time periods. Appliancecompanies Midea Group and Zhejiang Supor in China’s A-share market deliveredstrong performance as stock prices moved up alongside impressive fundamentals.The former gained on rising market share and strong operational efficiency, whilethe latter continued to deliver double-digit sales growth through online sales andan increased product offering. Additionally, the financial sector contributed toreturns, with AIA Group notably strong. Shares of the company gained over theyear despite protests in Hong Kong weighing on the near-term value of new busi-ness growth. The market appeared to be looking through this and toward AIA’scontinued growth in a liberalized Chinese insurance market, particularly given itsnew CEO and his experience in China.
The portfolio suffered a relative performance drag through the year from a decisionnot to invest in major benchmark constituent Alibaba, which gained rapidly.Although the decision impacted near-term relative performance, we remain farmore focused on the Fund’s absolute risk adjusted returns over the medium term.
(continued)
1 Actual 2019 expense ratios.2 The lesser of fiscal year 2019 long-term purchase costs or sales proceeds divided by the average monthly market value of long-term securities.
14 MATTHEWS ASIA FUNDS
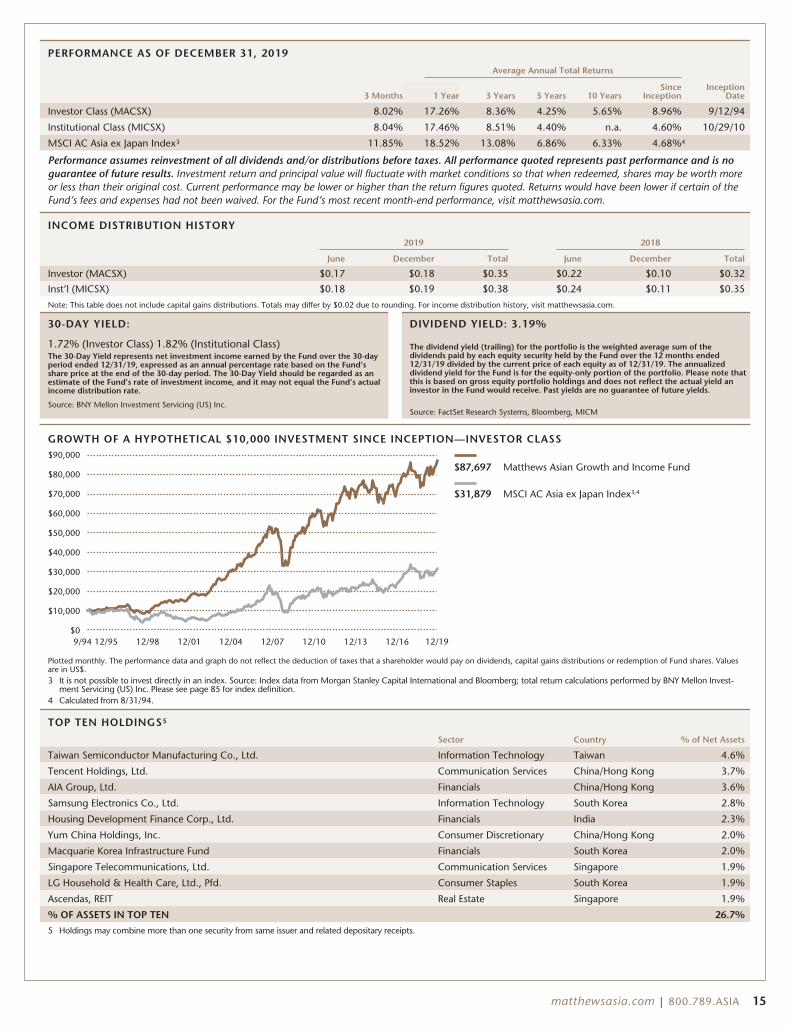
PERFORMANCE AS OF DECEMBER 31, 2019
Average Annual Total Returns
3 Months 1 Year 3 Years 5 Years 10 YearsSince
InceptionInception
Date
Investor Class (MACSX) 8.02% 17.26% 8.36% 4.25% 5.65% 8.96% 9/12/94
Institutional Class (MICSX) 8.04% 17.46% 8.51% 4.40% n.a. 4.60% 10/29/10
MSCI AC Asia ex Japan Index3 11.85% 18.52% 13.08% 6.86% 6.33% 4.68%4
Performance assumes reinvestment of all dividends and/or distributions before taxes. All performance quoted represents past performance and is noguarantee of future results. Investment return and principal value will fluctuate with market conditions so that when redeemed, shares may be worth moreor less than their original cost. Current performance may be lower or higher than the return figures quoted. Returns would have been lower if certain of theFund’s fees and expenses had not been waived. For the Fund’s most recent month-end performance, visit matthewsasia.com.
INCOME DISTRIBUTION HISTORY
2019 2018
June December Total June December Total
Investor (MACSX) $0.17 $0.18 $0.35 $0.22 $0.10 $0.32
Inst’l (MICSX) $0.18 $0.19 $0.38 $0.24 $0.11 $0.35
Note: This table does not include capital gains distributions. Totals may differ by $0.02 due to rounding. For income distribution history, visit matthewsasia.com.
30-DAY YIELD:
1.72% (Investor Class) 1.82% (Institutional Class)The 30-Day Yield represents net investment income earned by the Fund over the 30-dayperiod ended 12/31/19, expressed as an annual percentage rate based on the Fund’sshare price at the end of the 30-day period. The 30-Day Yield should be regarded as anestimate of the Fund’s rate of investment income, and it may not equal the Fund’s actualincome distribution rate.
Source: BNY Mellon Investment Servicing (US) Inc.
DIVIDEND YIELD: 3.19%
The dividend yield (trailing) for the portfolio is the weighted average sum of thedividends paid by each equity security held by the Fund over the 12 months ended12/31/19 divided by the current price of each equity as of 12/31/19. The annualizeddividend yield for the Fund is for the equity-only portion of the portfolio. Please note thatthis is based on gross equity portfolio holdings and does not reflect the actual yield aninvestor in the Fund would receive. Past yields are no guarantee of future yields.
Source: FactSet Research Systems, Bloomberg, MICM
GROWTH OF A HYPOTHETICAL $10,000 INVESTMENT SINCE INCEPTION—INVESTOR CLASS
9/94 12/95 12/98 12/01 12/04 12/07 12/10 12/13 12/16 12/19
$87,697 Matthews Asian Growth and Income Fund
$31,879 MSCI AC Asia ex Japan Index3,4
$0
$90,000
$80,000
$70,000
$60,000
$50,000
$40,000
$20,000
$30,000
$10,000
Plotted monthly. The performance data and graph do not reflect the deduction of taxes that a shareholder would pay on dividends, capital gains distributions or redemption of Fund shares. Valuesare in US$.3 It is not possible to invest directly in an index. Source: Index data from Morgan Stanley Capital International and Bloomberg; total return calculations performed by BNY Mellon Invest-
ment Servicing (US) Inc. Please see page 85 for index definition.4 Calculated from 8/31/94.
TOP TEN HOLDINGS5
Sector Country % of Net Assets
Taiwan Semiconductor Manufacturing Co., Ltd. Information Technology Taiwan 4.6%
Tencent Holdings, Ltd. Communication Services China/Hong Kong 3.7%
AIA Group, Ltd. Financials China/Hong Kong 3.6%
Samsung Electronics Co., Ltd. Information Technology South Korea 2.8%
Housing Development Finance Corp., Ltd. Financials India 2.3%
Yum China Holdings, Inc. Consumer Discretionary China/Hong Kong 2.0%
Macquarie Korea Infrastructure Fund Financials South Korea 2.0%
Singapore Telecommunications, Ltd. Communication Services Singapore 1.9%
LG Household & Health Care, Ltd., Pfd. Consumer Staples South Korea 1.9%
Ascendas, REIT Real Estate Singapore 1.9%
% OF ASSETS IN TOP TEN 26.7%
5 Holdings may combine more than one security from same issuer and related depositary receipts.
matthewsasia.com | 800.789.ASIA 15

COUNTRY ALLOCATION (%)6,7
China/Hong Kong 40.5
South Korea 10.4
Singapore 10.4
Taiwan 7.8
India 5.5
Australia 5.4
United States 3.2
France 3.1
Indonesia 2.8
Malaysia 2.3
United Kingdom 1.6
Philippines 1.4
Thailand 1.2
Japan 1.2
Vietnam 1.2
Cash and Other Assets, Less Liabilities 2.1
SECTOR ALLOCATION (%)7
Financials 19.6
Consumer Discretionary 17.2
Information Technology 13.8
Industrials 10.7
Communication Services 10.4
Consumer Staples 10.0
Real Estate 7.3
Health Care 4.7
Materials 2.7
Utilities 1.4
Cash and Other Assets, Less Liabilities 2.1
MARKET CAP EXPOSURE (%)7
Mega Cap (over $25B) 48.6
Large Cap ($10B–$25B) 16.8
Mid Cap ($3B–10B) 21.2
Small Cap (under $3B) 11.3
Cash and Other Assets, Less Liabilities 2.1
ASSET TYPE BREAKDOWN (%)7,8
Common Equities and ADRs 86.9
Convertible Corporate Bonds 9.2
Preferred Equities 1.9
Cash and Other Assets, Less Liabilities 2.1
6 Not all countries where the Fund may invest are included inthe benchmark index.
7 Source: FactSet Research Systems. Percentage values in dataare rounded to the nearest tenth of one percent, so the valuesmay not sum to 100% due to rounding. Percentage valuesmay be derived from different data sources and may not beconsistent with other Fund literature.
8 Bonds are not included in the MSCI All Country Asia exJapan Index.
Matthews Asian Growth and Income Fund
Portfolio Manager Commentary (unaudited) (continued)
More notably, detractors to performance came largely from Hong Kong. Industrialconglomerate Jardine Matheson was the largest of these, dropping as earningsdisappointed with subsidiaries such as Mandarin Oriental, Dairy Farm and Astrasputtering on weak consumer sentiment. Shares of Pacific Textiles also declined asa warm winter led to poor orders from a major customer, causing sales and earn-ings to contract. Within the financial sector, Thailand’s leading small andmedium-sized enterprise-focused lender Kasikornbank struggled with poor earningsas most major metrics such as margins, loans and fee income disappointed.
Notable Portfolio Changes:
After what was a reasonably active year for the portfolio, including increasing ourweighting within China and India, the fourth quarter saw significantly fewerchanges and no new additions. We did decide to exit three holdings, however,including two convertible bonds.
One of these was our holding in Chinese social network site Weibo. The bondgained from spread tightening after issuing U.S. dollar notes that garnered it a rat-ing from the major credit-rating agencies. This left little room for additionalupside. We exited fellow convertible bond China Overseas Land & Investment tofund higher-conviction ideas. Within equities, we exited Indian tower companyBharti Infratel. Although we like the business model, the Indian telecom market’sweak operators may weigh on tenancy ratios—a key driver of profitability. Despitethe stock’s attractive 6% dividend yield, we believe growth may remain elusive andthat there are superior holdings available for the portfolio.
Outlook:
The backdrop for Asian equities appears reasonable as we look to 2020. Althoughthere are differing political and economic ideologies between the U.S. and China,the recent trade deal is an important step to, at a minimum, pause the proposeddismantling of global supply chains that has been mooted for the past two years.Further, monetary policy is unlikely to create a headwind for asset values as recentbehavior suggests that the central bank put is still very much in place. Fiscal policyis also a potential support as stimulus measures remain possibilities in countriessuch as China. Added to this is a returning growth gap between emerging anddeveloped markets. These factors may help limit U.S. dollar strength.
If these are reasons to be constructive, one should also be cognizant of forces thatare prospective volatility generators. U.S. elections, rising geopolitical tensions inthe Middle East, high debt levels, the sheer length of the economic expansion andrelatively high valuations all pose threats. For Asian equities, the market is cur-rently trading at a relatively rich 14.1x P/E. High-growth companies are at evenloftier valuations, suggesting that the rebound in EPS growth to around 14% thatis expected this year is largely priced in.
Against this backdrop, it remains the Strategy’s central case that volatility mayremain elevated and returns less spectacular than in prior periods unless there isfurther valuation multiple expansion. We view this as somewhat favorable forinvestors such as ourselves. A focus on owning quality companies that are tradingat attractive valuations and can deliver a balance of both growth and incomeshould be well-placed to deliver for our clients over the medium term.
16 MATTHEWS ASIA FUNDS
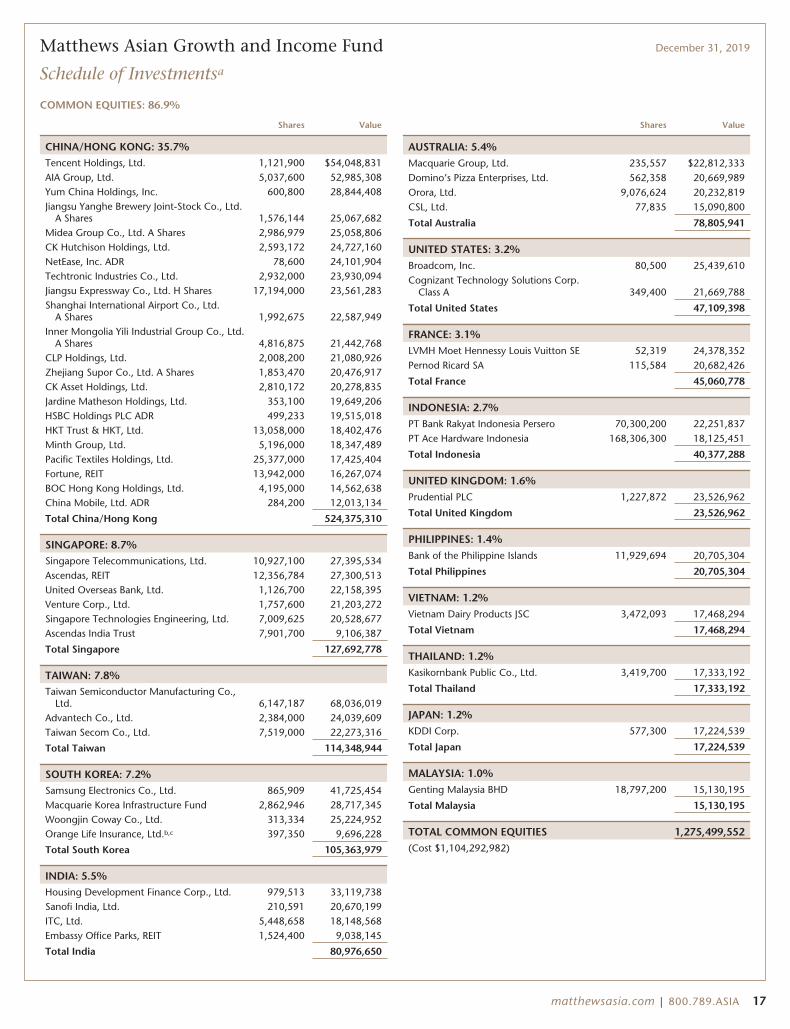
Matthews Asian Growth and Income Fund December 31, 2019
Schedule of Investmentsa
COMMON EQUITIES: 86.9%
Shares Value
CHINA/HONG KONG: 35.7%Tencent Holdings, Ltd. 1,121,900 $54,048,831AIA Group, Ltd. 5,037,600 52,985,308Yum China Holdings, Inc. 600,800 28,844,408Jiangsu Yanghe Brewery Joint-Stock Co., Ltd.
A Shares 1,576,144 25,067,682Midea Group Co., Ltd. A Shares 2,986,979 25,058,806CK Hutchison Holdings, Ltd. 2,593,172 24,727,160NetEase, Inc. ADR 78,600 24,101,904Techtronic Industries Co., Ltd. 2,932,000 23,930,094Jiangsu Expressway Co., Ltd. H Shares 17,194,000 23,561,283Shanghai International Airport Co., Ltd.
A Shares 1,992,675 22,587,949Inner Mongolia Yili Industrial Group Co., Ltd.
A Shares 4,816,875 21,442,768CLP Holdings, Ltd. 2,008,200 21,080,926Zhejiang Supor Co., Ltd. A Shares 1,853,470 20,476,917CK Asset Holdings, Ltd. 2,810,172 20,278,835Jardine Matheson Holdings, Ltd. 353,100 19,649,206HSBC Holdings PLC ADR 499,233 19,515,018HKT Trust & HKT, Ltd. 13,058,000 18,402,476Minth Group, Ltd. 5,196,000 18,347,489Pacific Textiles Holdings, Ltd. 25,377,000 17,425,404Fortune, REIT 13,942,000 16,267,074BOC Hong Kong Holdings, Ltd. 4,195,000 14,562,638China Mobile, Ltd. ADR 284,200 12,013,134
Total China/Hong Kong 524,375,310
SINGAPORE: 8.7%Singapore Telecommunications, Ltd. 10,927,100 27,395,534Ascendas, REIT 12,356,784 27,300,513United Overseas Bank, Ltd. 1,126,700 22,158,395Venture Corp., Ltd. 1,757,600 21,203,272Singapore Technologies Engineering, Ltd. 7,009,625 20,528,677Ascendas India Trust 7,901,700 9,106,387
Total Singapore 127,692,778
TAIWAN: 7.8%Taiwan Semiconductor Manufacturing Co.,
Ltd. 6,147,187 68,036,019Advantech Co., Ltd. 2,384,000 24,039,609Taiwan Secom Co., Ltd. 7,519,000 22,273,316
Total Taiwan 114,348,944
SOUTH KOREA: 7.2%Samsung Electronics Co., Ltd. 865,909 41,725,454Macquarie Korea Infrastructure Fund 2,862,946 28,717,345Woongjin Coway Co., Ltd. 313,334 25,224,952Orange Life Insurance, Ltd.b,c 397,350 9,696,228
Total South Korea 105,363,979
INDIA: 5.5%Housing Development Finance Corp., Ltd. 979,513 33,119,738Sanofi India, Ltd. 210,591 20,670,199ITC, Ltd. 5,448,658 18,148,568Embassy Office Parks, REIT 1,524,400 9,038,145
Total India 80,976,650
Shares Value
AUSTRALIA: 5.4%Macquarie Group, Ltd. 235,557 $22,812,333Domino’s Pizza Enterprises, Ltd. 562,358 20,669,989Orora, Ltd. 9,076,624 20,232,819CSL, Ltd. 77,835 15,090,800
Total Australia 78,805,941
UNITED STATES: 3.2%Broadcom, Inc. 80,500 25,439,610Cognizant Technology Solutions Corp.
Class A 349,400 21,669,788
Total United States 47,109,398
FRANCE: 3.1%LVMH Moet Hennessy Louis Vuitton SE 52,319 24,378,352Pernod Ricard SA 115,584 20,682,426
Total France 45,060,778
INDONESIA: 2.7%PT Bank Rakyat Indonesia Persero 70,300,200 22,251,837PT Ace Hardware Indonesia 168,306,300 18,125,451
Total Indonesia 40,377,288
UNITED KINGDOM: 1.6%Prudential PLC 1,227,872 23,526,962
Total United Kingdom 23,526,962
PHILIPPINES: 1.4%Bank of the Philippine Islands 11,929,694 20,705,304
Total Philippines 20,705,304
VIETNAM: 1.2%Vietnam Dairy Products JSC 3,472,093 17,468,294
Total Vietnam 17,468,294
THAILAND: 1.2%Kasikornbank Public Co., Ltd. 3,419,700 17,333,192
Total Thailand 17,333,192
JAPAN: 1.2%KDDI Corp. 577,300 17,224,539
Total Japan 17,224,539
MALAYSIA: 1.0%Genting Malaysia BHD 18,797,200 15,130,195
Total Malaysia 15,130,195
TOTAL COMMON EQUITIES 1,275,499,552(Cost $1,104,292,982)
matthewsasia.com | 800.789.ASIA 17
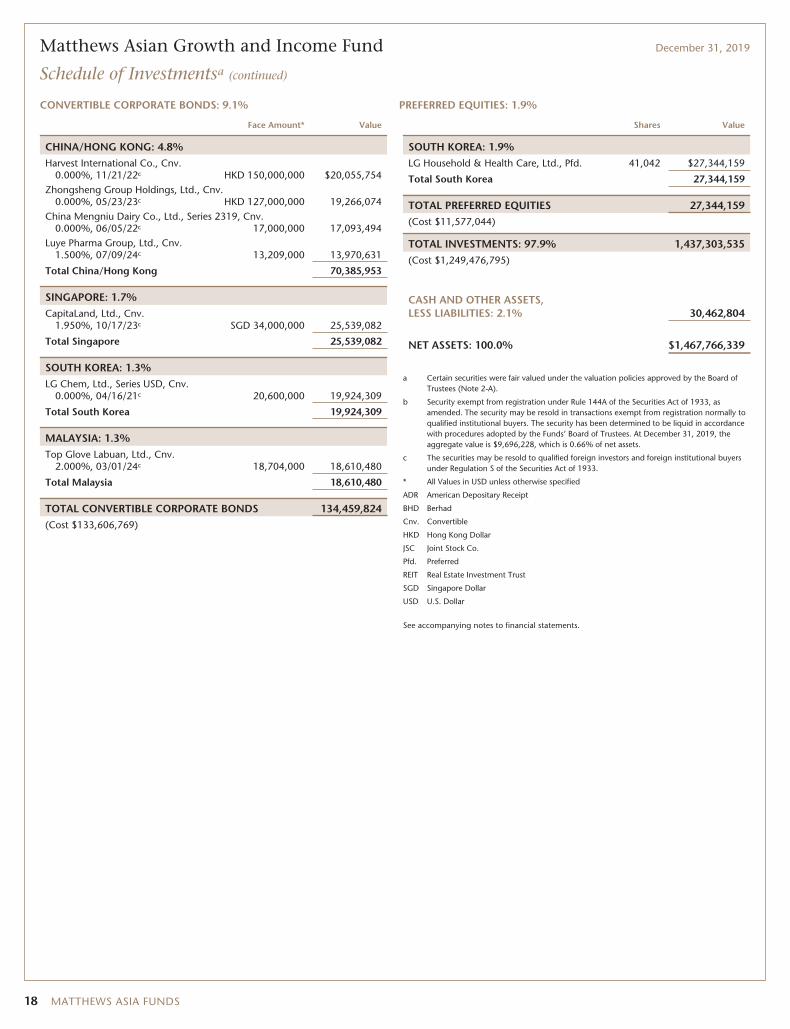
Matthews Asian Growth and Income Fund December 31, 2019
Schedule of Investmentsa (continued)
CONVERTIBLE CORPORATE BONDS: 9.1% PREFERRED EQUITIES: 1.9%
Face Amount* Value
CHINA/HONG KONG: 4.8%Harvest International Co., Cnv.
0.000%, 11/21/22c HKD 150,000,000 $20,055,754Zhongsheng Group Holdings, Ltd., Cnv.
0.000%, 05/23/23c HKD 127,000,000 19,266,074China Mengniu Dairy Co., Ltd., Series 2319, Cnv.
0.000%, 06/05/22c 17,000,000 17,093,494Luye Pharma Group, Ltd., Cnv.
1.500%, 07/09/24c 13,209,000 13,970,631
Total China/Hong Kong 70,385,953
SINGAPORE: 1.7%CapitaLand, Ltd., Cnv.
1.950%, 10/17/23c SGD 34,000,000 25,539,082
Total Singapore 25,539,082
SOUTH KOREA: 1.3%LG Chem, Ltd., Series USD, Cnv.
0.000%, 04/16/21c 20,600,000 19,924,309
Total South Korea 19,924,309
MALAYSIA: 1.3%Top Glove Labuan, Ltd., Cnv.
2.000%, 03/01/24c 18,704,000 18,610,480
Total Malaysia 18,610,480
TOTAL CONVERTIBLE CORPORATE BONDS 134,459,824(Cost $133,606,769)
Shares Value
SOUTH KOREA: 1.9%LG Household & Health Care, Ltd., Pfd. 41,042 $27,344,159
Total South Korea 27,344,159
TOTAL PREFERRED EQUITIES 27,344,159(Cost $11,577,044)
TOTAL INVESTMENTS: 97.9% 1,437,303,535(Cost $1,249,476,795)
CASH AND OTHER ASSETS,LESS LIABILITIES: 2.1% 30,462,804
NET ASSETS: 100.0% $1,467,766,339
a Certain securities were fair valued under the valuation policies approved by the Board ofTrustees (Note 2-A).
b Security exempt from registration under Rule 144A of the Securities Act of 1933, asamended. The security may be resold in transactions exempt from registration normally toqualified institutional buyers. The security has been determined to be liquid in accordancewith procedures adopted by the Funds’ Board of Trustees. At December 31, 2019, theaggregate value is $9,696,228, which is 0.66% of net assets.
c The securities may be resold to qualified foreign investors and foreign institutional buyersunder Regulation S of the Securities Act of 1933.
* All Values in USD unless otherwise specified
ADR American Depositary Receipt
BHD Berhad
Cnv. Convertible
HKD Hong Kong Dollar
JSC Joint Stock Co.
Pfd. Preferred
REIT Real Estate Investment Trust
SGD Singapore Dollar
USD U.S. Dollar
See accompanying notes to financial statements.
18 MATTHEWS ASIA FUNDS
ASIA GROWTH ANDINCOME STRATEGIES
PORTFOLIO MANAGERS
Yu Zhang, CFALead Manager
Robert Horrocks, PhD Vivek TanneeruCo-Manager Co-Manager
Sherwood Zhang, CFACo-Manager
FUND FACTS
Investor InstitutionalTicker MAPIX MIPIXCUSIP 577125107 577130750Inception 10/31/06 10/29/10NAV $17.47 $17.47Initial Investment $2,500 $100,000Gross Expense Ratio1 1.03% 0.93%After Fee Waiver andReimbursement2 1.02% 0.92%
Portfolio StatisticsTotal # of Positions 60Net Assets $5.4 billionWeighted Average Market Cap $47.5 billionPortfolio Turnover3 30.32%
BenchmarkMSCI AC Asia Pacific Index
OBJECTIVE
Total return with an emphasis on providing currentincome.
STRATEGY
Under normal market conditions, the Fund seeks toachieve its investment objective by investing at least80% of its net assets, which include borrowings forinvestment purposes, in dividend-paying equitysecurities of companies located in Asia. Asia consistsof all countries and markets in Asia, and includesdeveloped, emerging and frontier countries andmarkets in the Asian region. The Fund may alsoinvest in convertible debt and equity securities ofcompanies located in Asia.
Matthews Asia Dividend Fund
Portfolio Manager Commentary (unaudited)
For the year ending December 31, 2019, the Matthews Asia Dividend Fundreturned 11.17% (Investor Class) and 11.35% (Institutional Class), while itsbenchmark, the MSCI All Country Asia Pacific Index, returned 19.74%. For thefourth quarter, the Fund returned 6.71% (Investor Class) and 6.79% (InstitutionalClass), while its benchmark returned 9.51%. The Fund began 2019 with a shareprice of US $16.05 (Investor Class) and US $16.04 (Institutional Class), and share-holders who were invested throughout the year would have received total dis-tributions of approximately US$0.36 (Investor Class) or US$0.37 (InstitutionalClass) per share.
Market Environment:
Asian equities finished 2019 strongly, despite several macro-related headwinds. Forthe most part of the year, the specter of an escalating trade war between China andthe U.S. remained the biggest market overhang. Such risk was materially deflatedduring the fourth quarter, as an interim “phase one” trade deal was reached. Assetprices, including equities, responded favorably.
Performance Contributors and Detractors:
The Fund delivered a positive return in 2019 but underperformed its benchmark,driven by negative stock selection and country allocation. Challenges in stockselection were most visible from our holdings in the consumer staples sector dur-ing the first half of the year. A few holdings related to tobacco and retail businessesfaced stock-specific headwinds from consumer-preference changes and inter-ventionist regulations, resulting in weakened long-term dividend growth pros-pects. Our dividend strategy takes a holistic view of dividend-paying stocks,evaluating not just the ability of a company to pay ongoing dividends, but also itsability to grow dividends. As some of our portfolio stocks no longer met our total-return criteria due to a reset in growth potential, we exited the positions.
On allocation, the Fund’s overweight in China/Hong Kong detracted from relativeperformance in 2019, particularly during the second half of the year. Politicalunrest in Hong Kong severely impacted the local economy and weakened senti-ment toward Hong Kong-listed Chinese stocks. We believe the short-term under-performance of our China/Hong Kong stocks was driven mostly by marketsentiment, not by company fundamentals. Most of our Hong Kong-listed holdingshave their businesses within mainland China and their earnings growth is notimpacted by Hong Kong. We believe improvement in investor sentiment andattractive valuations in the Hong Kong market will turn into tailwinds for Chinesecompanies listed there.
Turning to individual stocks, the Fund’s information technology holdings con-tributed the most to performance. Hoya, a Japanese IT component company, sawstrong profit growth driven by its mask blanks business. Hoya has a dominantglobal market share in this key component used in the EUV lithography process,the most-advanced semiconductor chip-making technology. Hoya’s stock per-formed strongly during the year and was the top individual contributor. Anritsu,another Japanese IT equipment company, also saw its earnings surge on the backof strong 5G-related order demand for its testing and measurement products used
(continued)
1 Actual 2019 expense ratios.2 Matthews has contractually agreed to waive a portion of its advisory fee and administrative and shareholder services fee if the Fund’s average daily net assets are over $3 billion, as follows: for every
$2.5 billion average daily net assets of the Fund that are over $3 billion, the advisory fee rate and the administrative and shareholder services fee rate for the Fund with respect to such excess average daily netassets will be each reduced by 0.01%, in each case without reducing such fee rate below 0.00%. Any amount waived by Matthews pursuant to this agreement may not be recouped by Matthews. Thisagreement will remain in place until April 30, 2021 and may be terminated (i) at any time by the Board of Trustees upon 60 days’ prior written notice to Matthews; or (ii) by Matthews at the annualexpiration date of the agreement upon 60 days’ prior written notice to the Trust, in each case without payment of any penalty.
3 The lesser of fiscal year 2019 long-term purchase costs or sales proceeds divided by the average monthly market value of long-term securities.
matthewsasia.com | 800.789.ASIA 19

PERFORMANCE AS OF DECEMBER 31, 2019
Average Annual Total Returns
3 Months 1 Year 3 Years 5 Years 10 YearsSince
InceptionInception
Date
Investor Class (MAPIX) 6.71% 11.17% 9.33% 7.17% 7.74% 8.52% 10/31/06
Institutional Class (MIPIX) 6.79% 11.35% 9.45% 7.29% n.a. 6.52% 10/29/10
MSCI AC Asia Pacific Index4 9.51% 19.74% 11.11% 7.25% 6.43% 4.70%5
Performance assumes reinvestment of all dividends and/or distributions before taxes. All performance quoted represents past performance and is noguarantee of future results. Investment return and principal value will fluctuate with market conditions so that when redeemed, shares may be worth moreor less than their original cost. Current performance may be lower or higher than the return figures quoted. Returns would have been lower if certain of theFund’s fees and expenses had not been waived. For the Fund’s most recent month-end performance, visit matthewsasia.com.
INCOME DISTRIBUTION HISTORY
2019 2018
Q1 Q2 Q3 Q4 Total Q1 Q2 Q3 Q4 Total
Investor (MAPIX) $0.03 $0.12 $0.11 $0.09 $0.36 $0.01 $0.19 $0.11 $0.00 $0.31
Inst’l (MIPIX) $0.04 $0.12 $0.12 $0.10 $0.37 $0.02 $0.20 $0.11 $0.00 $0.33
Note: This table does not include capital gains distributions. Totals may differ by $0.02 due to rounding and a return of capital. For distribution history please visit matthewsasia.com.
30-DAY YIELD:
Investor Class: 1.24% (1.23% excluding waivers)Institutional Class: 1.30% (1.29% excluding waivers)The 30-Day Yield represents net investment income earned by the Fund over the 30-dayperiod ended 12/31/19, expressed as an annual percentage rate based on the Fund’sshare price at the end of the 30-day period. The 30-Day Yield should be regarded as anestimate of the Fund’s rate of investment income, and it may not equal the Fund’s actualincome distribution rate.
Source: BNY Mellon Investment Servicing (US) Inc.
DIVIDEND YIELD: 2.74%
The dividend yield (trailing) for the portfolio is the weighted average sum of thedividends paid by each equity security held by the Fund over the 12 months ended12/31/19 divided by the current price of each equity as of 12/31/19. The annualizeddividend yield for the Fund is for the equity-only portion of the portfolio. Please note thatthis is based on gross equity portfolio holdings and does not reflect the actual yield aninvestor in the Fund would receive. Past yields are no guarantee of future yields.
Source: FactSet Research Systems, Bloomberg, MICM.
GROWTH OF A HYPOTHETICAL $10,000 INVESTMENT SINCE INCEPTION—INVESTOR CLASS
$29,334 Matthews Asia Dividend Fund
$18,313 MSCI AC Asia Pacific Index4,5
10/06 12/09 12/11 12/13 12/1512/07 12/1912/17$0
$20,000
$10,000
$30,000
$40,000
Plotted monthly. The performance data and graph do not reflect the deduction of taxes that a shareholder would pay on dividends, capital gains distributions or redemption of Fund shares. Valuesare in US$.4 It is not possible to invest directly in an index. Source: Index data from Morgan Stanley Capital International and Bloomberg; total return calculations performed by BNY Mellon Invest-
ment Servicing (US) Inc. Please see page 85 for index definition.5 Calculated from 10/31/06.
TOP TEN HOLDINGS6
Sector Country % of Net Assets
Taiwan Semiconductor Manufacturing Co., Ltd. Information Technology Taiwan 5.2%
Minth Group, Ltd. Consumer Discretionary China/Hong Kong 4.4%
Hyundai Mobis Co., Ltd. Consumer Discretionary South Korea 3.6%
Anritsu Corp. Information Technology Japan 3.1%
Hoya Corp. Health Care Japan 2.8%
MISUMI Group, Inc. Industrials Japan 2.6%
Shenzhou International Group Holdings, Ltd. Consumer Discretionary China/Hong Kong 2.5%
AIA Group, Ltd. Financials China/Hong Kong 2.4%
NTT DoCoMo, Inc. Communication Services Japan 2.3%
BGF Retail Co., Ltd. Consumer Staples South Korea 2.2%
% OF ASSETS IN TOP TEN 31.1%
6 Holdings may combine more than one security from same issuer and related depositary receipts.
20 MATTHEWS ASIA FUNDS
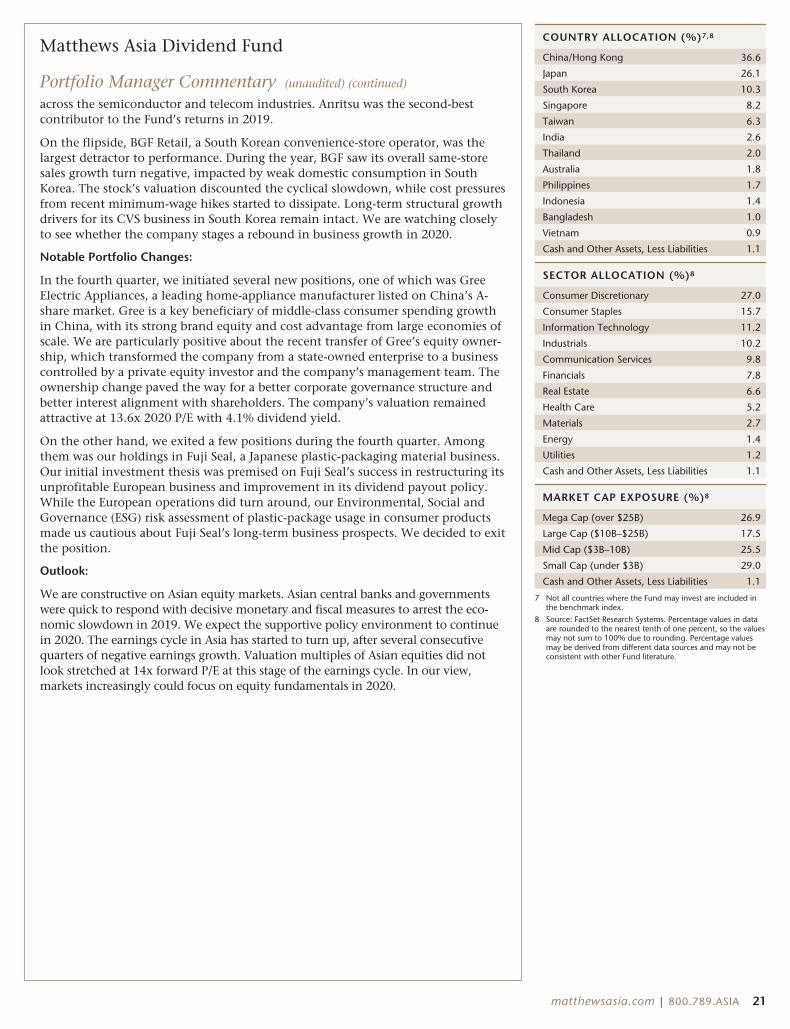
Matthews Asia Dividend Fund
Portfolio Manager Commentary (unaudited) (continued)
across the semiconductor and telecom industries. Anritsu was the second-bestcontributor to the Fund’s returns in 2019.
On the flipside, BGF Retail, a South Korean convenience-store operator, was thelargest detractor to performance. During the year, BGF saw its overall same-storesales growth turn negative, impacted by weak domestic consumption in SouthKorea. The stock’s valuation discounted the cyclical slowdown, while cost pressuresfrom recent minimum-wage hikes started to dissipate. Long-term structural growthdrivers for its CVS business in South Korea remain intact. We are watching closelyto see whether the company stages a rebound in business growth in 2020.
Notable Portfolio Changes:
In the fourth quarter, we initiated several new positions, one of which was GreeElectric Appliances, a leading home-appliance manufacturer listed on China’s A-share market. Gree is a key beneficiary of middle-class consumer spending growthin China, with its strong brand equity and cost advantage from large economies ofscale. We are particularly positive about the recent transfer of Gree’s equity owner-ship, which transformed the company from a state-owned enterprise to a businesscontrolled by a private equity investor and the company’s management team. Theownership change paved the way for a better corporate governance structure andbetter interest alignment with shareholders. The company’s valuation remainedattractive at 13.6x 2020 P/E with 4.1% dividend yield.
On the other hand, we exited a few positions during the fourth quarter. Amongthem was our holdings in Fuji Seal, a Japanese plastic-packaging material business.Our initial investment thesis was premised on Fuji Seal’s success in restructuring itsunprofitable European business and improvement in its dividend payout policy.While the European operations did turn around, our Environmental, Social andGovernance (ESG) risk assessment of plastic-package usage in consumer productsmade us cautious about Fuji Seal’s long-term business prospects. We decided to exitthe position.
Outlook:
We are constructive on Asian equity markets. Asian central banks and governmentswere quick to respond with decisive monetary and fiscal measures to arrest the eco-nomic slowdown in 2019. We expect the supportive policy environment to continuein 2020. The earnings cycle in Asia has started to turn up, after several consecutivequarters of negative earnings growth. Valuation multiples of Asian equities did notlook stretched at 14x forward P/E at this stage of the earnings cycle. In our view,markets increasingly could focus on equity fundamentals in 2020.
COUNTRY ALLOCATION (%)7,8
China/Hong Kong 36.6
Japan 26.1
South Korea 10.3
Singapore 8.2
Taiwan 6.3
India 2.6
Thailand 2.0
Australia 1.8
Philippines 1.7
Indonesia 1.4
Bangladesh 1.0
Vietnam 0.9
Cash and Other Assets, Less Liabilities 1.1
SECTOR ALLOCATION (%)8
Consumer Discretionary 27.0
Consumer Staples 15.7
Information Technology 11.2
Industrials 10.2
Communication Services 9.8
Financials 7.8
Real Estate 6.6
Health Care 5.2
Materials 2.7
Energy 1.4
Utilities 1.2
Cash and Other Assets, Less Liabilities 1.1
MARKET CAP EXPOSURE (%)8
Mega Cap (over $25B) 26.9
Large Cap ($10B–$25B) 17.5
Mid Cap ($3B–10B) 25.5
Small Cap (under $3B) 29.0
Cash and Other Assets, Less Liabilities 1.1
7 Not all countries where the Fund may invest are included inthe benchmark index.
8 Source: FactSet Research Systems. Percentage values in dataare rounded to the nearest tenth of one percent, so the valuesmay not sum to 100% due to rounding. Percentage valuesmay be derived from different data sources and may not beconsistent with other Fund literature.
matthewsasia.com | 800.789.ASIA 21
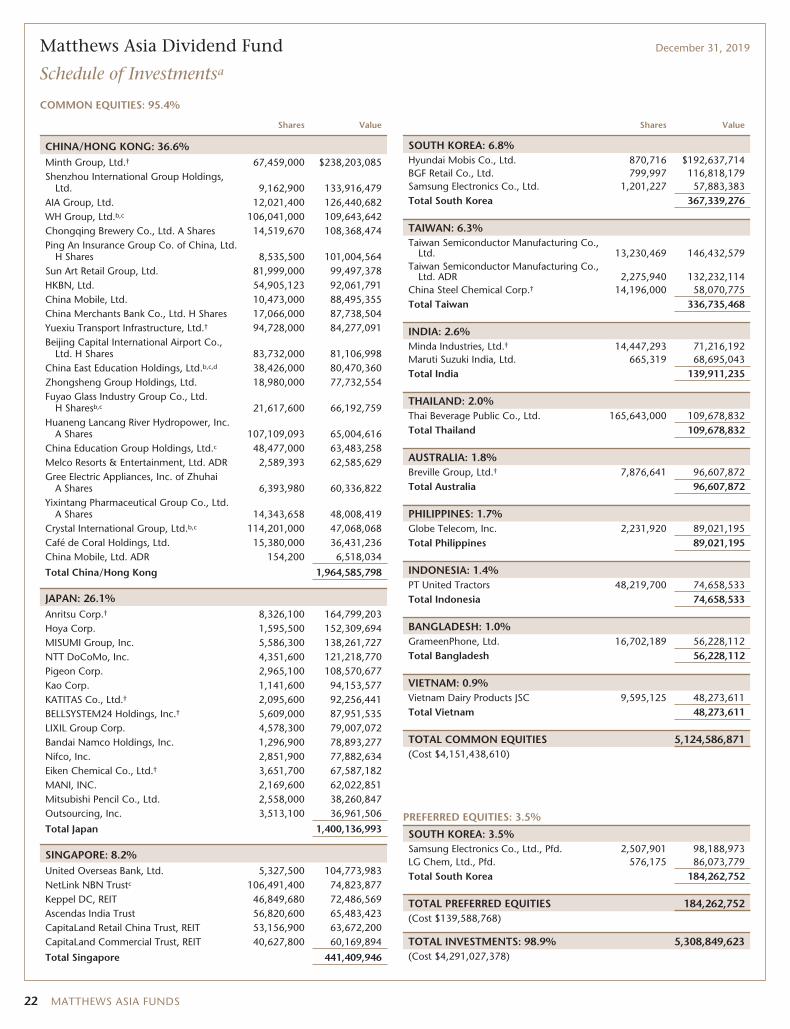
Matthews Asia Dividend Fund December 31, 2019
Schedule of Investmentsa
COMMON EQUITIES: 95.4%
Shares Value
CHINA/HONG KONG: 36.6%Minth Group, Ltd.† 67,459,000 $238,203,085Shenzhou International Group Holdings,
Ltd. 9,162,900 133,916,479AIA Group, Ltd. 12,021,400 126,440,682WH Group, Ltd.b,c 106,041,000 109,643,642Chongqing Brewery Co., Ltd. A Shares 14,519,670 108,368,474Ping An Insurance Group Co. of China, Ltd.
H Shares 8,535,500 101,004,564Sun Art Retail Group, Ltd. 81,999,000 99,497,378HKBN, Ltd. 54,905,123 92,061,791China Mobile, Ltd. 10,473,000 88,495,355China Merchants Bank Co., Ltd. H Shares 17,066,000 87,738,504Yuexiu Transport Infrastructure, Ltd.† 94,728,000 84,277,091Beijing Capital International Airport Co.,
Ltd. H Shares 83,732,000 81,106,998China East Education Holdings, Ltd.b,c,d 38,426,000 80,470,360Zhongsheng Group Holdings, Ltd. 18,980,000 77,732,554Fuyao Glass Industry Group Co., Ltd.
H Sharesb,c 21,617,600 66,192,759Huaneng Lancang River Hydropower, Inc.
A Shares 107,109,093 65,004,616China Education Group Holdings, Ltd.c 48,477,000 63,483,258Melco Resorts & Entertainment, Ltd. ADR 2,589,393 62,585,629Gree Electric Appliances, Inc. of Zhuhai
A Shares 6,393,980 60,336,822Yixintang Pharmaceutical Group Co., Ltd.
A Shares 14,343,658 48,008,419Crystal International Group, Ltd.b,c 114,201,000 47,068,068Café de Coral Holdings, Ltd. 15,380,000 36,431,236China Mobile, Ltd. ADR 154,200 6,518,034
Total China/Hong Kong 1,964,585,798
JAPAN: 26.1%Anritsu Corp.† 8,326,100 164,799,203Hoya Corp. 1,595,500 152,309,694MISUMI Group, Inc. 5,586,300 138,261,727NTT DoCoMo, Inc. 4,351,600 121,218,770Pigeon Corp. 2,965,100 108,570,677Kao Corp. 1,141,600 94,153,577KATITAS Co., Ltd.† 2,095,600 92,256,441BELLSYSTEM24 Holdings, Inc.† 5,609,000 87,951,535LIXIL Group Corp. 4,578,300 79,007,072Bandai Namco Holdings, Inc. 1,296,900 78,893,277Nifco, Inc. 2,851,900 77,882,634Eiken Chemical Co., Ltd.† 3,651,700 67,587,182MANI, INC. 2,169,600 62,022,851Mitsubishi Pencil Co., Ltd. 2,558,000 38,260,847Outsourcing, Inc. 3,513,100 36,961,506
Total Japan 1,400,136,993
SINGAPORE: 8.2%United Overseas Bank, Ltd. 5,327,500 104,773,983NetLink NBN Trustc 106,491,400 74,823,877Keppel DC, REIT 46,849,680 72,486,569Ascendas India Trust 56,820,600 65,483,423CapitaLand Retail China Trust, REIT 53,156,900 63,672,200CapitaLand Commercial Trust, REIT 40,627,800 60,169,894
Total Singapore 441,409,946
Shares Value
SOUTH KOREA: 6.8%Hyundai Mobis Co., Ltd. 870,716 $192,637,714BGF Retail Co., Ltd. 799,997 116,818,179Samsung Electronics Co., Ltd. 1,201,227 57,883,383Total South Korea 367,339,276
TAIWAN: 6.3%Taiwan Semiconductor Manufacturing Co.,
Ltd. 13,230,469 146,432,579Taiwan Semiconductor Manufacturing Co.,
Ltd. ADR 2,275,940 132,232,114China Steel Chemical Corp.† 14,196,000 58,070,775Total Taiwan 336,735,468
INDIA: 2.6%Minda Industries, Ltd.† 14,447,293 71,216,192Maruti Suzuki India, Ltd. 665,319 68,695,043Total India 139,911,235
THAILAND: 2.0%Thai Beverage Public Co., Ltd. 165,643,000 109,678,832Total Thailand 109,678,832
AUSTRALIA: 1.8%Breville Group, Ltd.† 7,876,641 96,607,872Total Australia 96,607,872
PHILIPPINES: 1.7%Globe Telecom, Inc. 2,231,920 89,021,195Total Philippines 89,021,195
INDONESIA: 1.4%PT United Tractors 48,219,700 74,658,533Total Indonesia 74,658,533
BANGLADESH: 1.0%GrameenPhone, Ltd. 16,702,189 56,228,112Total Bangladesh 56,228,112
VIETNAM: 0.9%Vietnam Dairy Products JSC 9,595,125 48,273,611Total Vietnam 48,273,611
TOTAL COMMON EQUITIES 5,124,586,871(Cost $4,151,438,610)
PREFERRED EQUITIES: 3.5%
SOUTH KOREA: 3.5%Samsung Electronics Co., Ltd., Pfd. 2,507,901 98,188,973LG Chem, Ltd., Pfd. 576,175 86,073,779Total South Korea 184,262,752
TOTAL PREFERRED EQUITIES 184,262,752(Cost $139,588,768)
TOTAL INVESTMENTS: 98.9% 5,308,849,623(Cost $4,291,027,378)
22 MATTHEWS ASIA FUNDS
Matthews Asia Dividend Fund December 31, 2019
Schedule of Investmentsa (continued)
PREFERRED EQUITIES (continued)
Value
CASH AND OTHER ASSETS,LESS LIABILITIES: 1.1% $61,606,251
NET ASSETS: 100.0% $5,370,455,874
a Certain securities were fair valued under the valuation policies approved by the Board ofTrustees (Note 2-A).
b Security exempt from registration under Rule 144A of the Securities Act of 1933, asamended. The security may be resold in transactions exempt from registration normally toqualified institutional buyers. The security has been determined to be liquid in accordancewith procedures adopted by the Funds’ Board of Trustees. At December 31, 2019, theaggregate value is $303,374,829, which is 5.65% of net assets.
c The securities may be resold to qualified foreign investors and foreign institutional buyersunder Regulation S of the Securities Act of 1933.
d Non-income producing security.
† Affiliated Issuer, as defined under the Investment Company Act of 1940 (ownership of 5%or more of the outstanding voting securities of this issuer)
ADR American Depositary Receipt
JSC Joint Stock Co.
Pfd. Preferred
REIT Real Estate Investment Trust
See accompanying notes to financial statements.
matthewsasia.com | 800.789.ASIA 23
ASIA GROWTH ANDINCOME STRATEGIES
PORTFOLIO MANAGERS
Sherwood Zhang, CFALead Manager
Yu Zhang, CFA S. Joyce Li, CFACo-Manager Co-Manager
FUND FACTS
Investor InstitutionalTicker MCDFX MICDXCUSIP 577125305 577130735Inception 11/30/09 10/29/10NAV $16.20 $16.20Initial Investment $2,500 $100,000Gross ExpenseRatio1 1.15% 1.01%
Portfolio StatisticsTotal # of Positions 48Net Assets $380.7 millionWeighted Average Market Cap $47.4 billionPortfolio Turnover2 65.69%
BenchmarkMSCI China Index
OBJECTIVE
Total return with an emphasis on providing currentincome.
STRATEGY
Under normal market conditions, the Fund seeks toachieve its investment objective by investing at least80% of its net assets, which include borrowings forinvestment purposes, in dividend-paying equitysecurities of companies located in China. Chinaincludes its administrative and other districts, such asHong Kong. The Fund may also invest in convertibledebt and equity securities of companies located inChina.
Matthews China Dividend Fund
Portfolio Manager Commentary (unaudited)
For the year ending December 31, 2019, the Matthews China Dividend Fundreturned 15.00% (Investor Class) and 15.16% (Institutional Class), while itsbenchmark, the MSCI China Index, rose 23.66%. For the fourth quarter, the Fundreturned 5.72% (Investor Class) and 5.75% (Institutional Class) versus 14.72% forthe Index. The Fund began 2019 with a share price of US$14.32 for both theInvestor and Institutional Classes, and shareholders who were invested throughoutthe year would have received total distributions of approximately US$0.26(Investor Class) or US$0.28 (Institutional Class) per share.
Market Environment:
Chinese equities had another dramatic year, enduring the back and forth of tradenegotiations between the U.S. and China. Market expectations were high at thebeginning of the year and a “phase one” trade deal was reached at year end. In addi-tion, Hong Kong endured social unrest that was triggered by an unpopular extraditionbill. Initial peaceful protests often erupted into violence that targeted public trans-portation and mainland Chinese business outlets. Hong Kong still set a record in 2019as the world’s biggest IPO market, thanks in part to Alibaba’s listing in Hong Kong.
Among Chinese equities, A-shares performed the best, helped by increasing inflowsfrom global investors due to MSCI index inclusion in 2019. China’s new Scienceand Technology Innovation Board, or “STAR Market,” also excited some investorswho were eyeing new growth opportunities. Prices of American depositary receipts(ADRs) were initially suppressed due to trade war concerns and news surroundingpossible legislation threatening their listing status in U.S. capital markets due to alack of accounting supervision by U.S. regulators. ADRs performed strongly in thefourth quarter, however, as Alibaba’s successful secondary listing in Hong Kongboosted investor confidence. Hong Kong stocks were the worst-performing inChina due to the social unrest, as investors worried about Hong Kong’s future asChina’s international financial center.
During the year, central banks led by the U.S. Federal Reserve started a fairlyaggressive cycle of interest-rate cuts. One notable exception was China’s centralbank, which almost did not change its policy rate at all in 2019. This was due tothe spread of African swine flu that caused a spike in pork prices in China, whichin turn caused consumer inflation (CPI) to exceed the central bank’s comfort zone.
Performance Contributors and Detractors:
As an all-cap strategy, the Fund benefited from the growth potential of small-capcompanies during an up cycle in the market. Our stock selection among small capsin 2019, however, underperformed versus the benchmark and compared with ourown track record. Thus it was not surprising that for the full-year 2019, two ofthree largest performance detractors were small-cap companies: Yixintang Pharma-ceutical and JNBY Design, both retailers that faced significant challenges in theirsectors. While Yixintang coped with changing regulations for Chinese pharmaceut-ical distribution and reimbursement systems, JNBY dealt with slower discretionaryspending by cautious consumers. We are carefully re-evaluating whether these twocompanies, as relatively small operators, still have enough resources to survive thechallenge. The largest performance detractor for the year was Shenwan Hongyuan.We had hoped that Shenwan Hongyuan, as China’s oldest securities broker, couldclose the gap with its peers given its vast retail network, but the revival plan fellbelow our expectations and we decided to exit the position.
From a sector perspective, our security selection in consumer discretionary was thelargest performance detractor on a relative basis. This was largely due to the strong
(continued)
1 Actual 2019 expense ratios.2 The lesser of fiscal year 2019 long-term purchase costs or sales proceeds divided by the average monthly market value of long-term securities.
24 MATTHEWS ASIA FUNDS
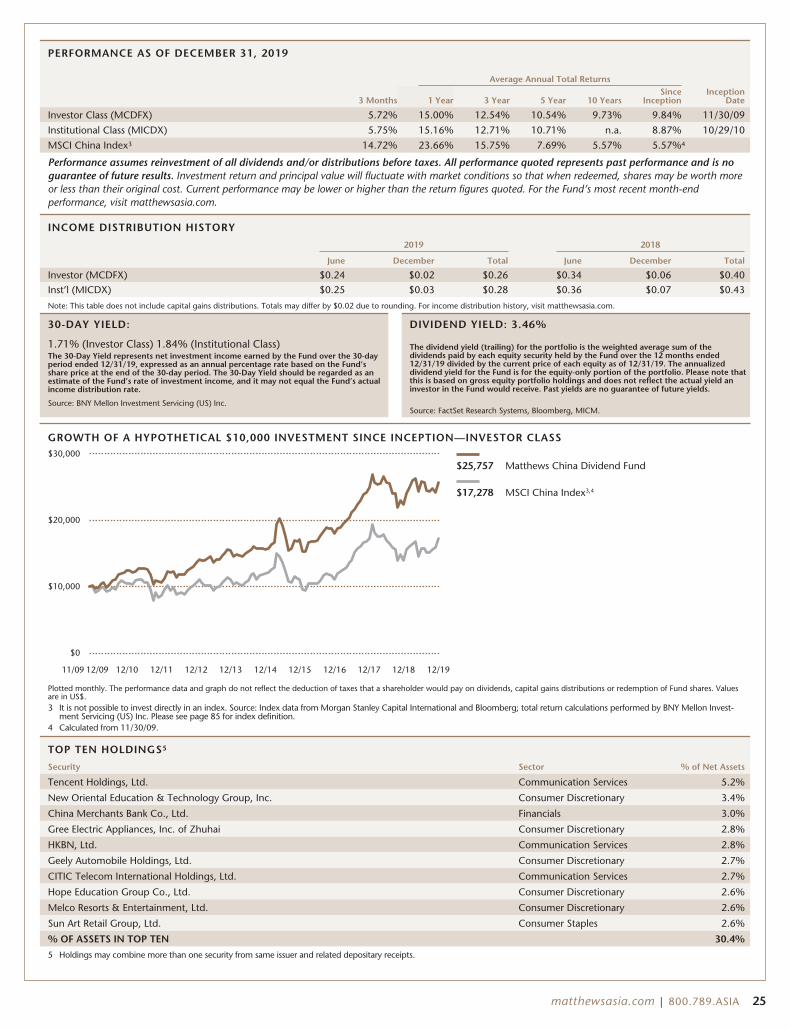
PERFORMANCE AS OF DECEMBER 31, 2019
Average Annual Total Returns
3 Months 1 Year 3 Year 5 Year 10 YearsSince
InceptionInception
Date
Investor Class (MCDFX) 5.72% 15.00% 12.54% 10.54% 9.73% 9.84% 11/30/09
Institutional Class (MICDX) 5.75% 15.16% 12.71% 10.71% n.a. 8.87% 10/29/10
MSCI China Index3 14.72% 23.66% 15.75% 7.69% 5.57% 5.57%4
Performance assumes reinvestment of all dividends and/or distributions before taxes. All performance quoted represents past performance and is noguarantee of future results. Investment return and principal value will fluctuate with market conditions so that when redeemed, shares may be worth moreor less than their original cost. Current performance may be lower or higher than the return figures quoted. For the Fund’s most recent month-endperformance, visit matthewsasia.com.
INCOME DISTRIBUTION HISTORY
2019 2018
June December Total June December Total
Investor (MCDFX) $0.24 $0.02 $0.26 $0.34 $0.06 $0.40Inst’l (MICDX) $0.25 $0.03 $0.28 $0.36 $0.07 $0.43
Note: This table does not include capital gains distributions. Totals may differ by $0.02 due to rounding. For income distribution history, visit matthewsasia.com.
30-DAY YIELD:
1.71% (Investor Class) 1.84% (Institutional Class)The 30-Day Yield represents net investment income earned by the Fund over the 30-dayperiod ended 12/31/19, expressed as an annual percentage rate based on the Fund’sshare price at the end of the 30-day period. The 30-Day Yield should be regarded as anestimate of the Fund’s rate of investment income, and it may not equal the Fund’s actualincome distribution rate.
Source: BNY Mellon Investment Servicing (US) Inc.
DIVIDEND YIELD: 3.46%
The dividend yield (trailing) for the portfolio is the weighted average sum of thedividends paid by each equity security held by the Fund over the 12 months ended12/31/19 divided by the current price of each equity as of 12/31/19. The annualizeddividend yield for the Fund is for the equity-only portion of the portfolio. Please note thatthis is based on gross equity portfolio holdings and does not reflect the actual yield aninvestor in the Fund would receive. Past yields are no guarantee of future yields.
Source: FactSet Research Systems, Bloomberg, MICM.
GROWTH OF A HYPOTHETICAL $10,000 INVESTMENT SINCE INCEPTION—INVESTOR CLASS
11/09 12/1012/09 12/11 12/12 12/13 12/14 12/15 12/16 12/1912/1812/17
$25,757 Matthews China Dividend Fund
$17,278 MSCI China Index3,4
$0
$30,000
$20,000
$10,000
Plotted monthly. The performance data and graph do not reflect the deduction of taxes that a shareholder would pay on dividends, capital gains distributions or redemption of Fund shares. Valuesare in US$.3 It is not possible to invest directly in an index. Source: Index data from Morgan Stanley Capital International and Bloomberg; total return calculations performed by BNY Mellon Invest-
ment Servicing (US) Inc. Please see page 85 for index definition.4 Calculated from 11/30/09.
TOP TEN HOLDINGS5
Security Sector % of Net Assets
Tencent Holdings, Ltd. Communication Services 5.2%
New Oriental Education & Technology Group, Inc. Consumer Discretionary 3.4%
China Merchants Bank Co., Ltd. Financials 3.0%
Gree Electric Appliances, Inc. of Zhuhai Consumer Discretionary 2.8%
HKBN, Ltd. Communication Services 2.8%
Geely Automobile Holdings, Ltd. Consumer Discretionary 2.7%
CITIC Telecom International Holdings, Ltd. Communication Services 2.7%
Hope Education Group Co., Ltd. Consumer Discretionary 2.6%
Melco Resorts & Entertainment, Ltd. Consumer Discretionary 2.6%
Sun Art Retail Group, Ltd. Consumer Staples 2.6%
% OF ASSETS IN TOP TEN 30.4%
5 Holdings may combine more than one security from same issuer and related depositary receipts.
matthewsasia.com | 800.789.ASIA 25
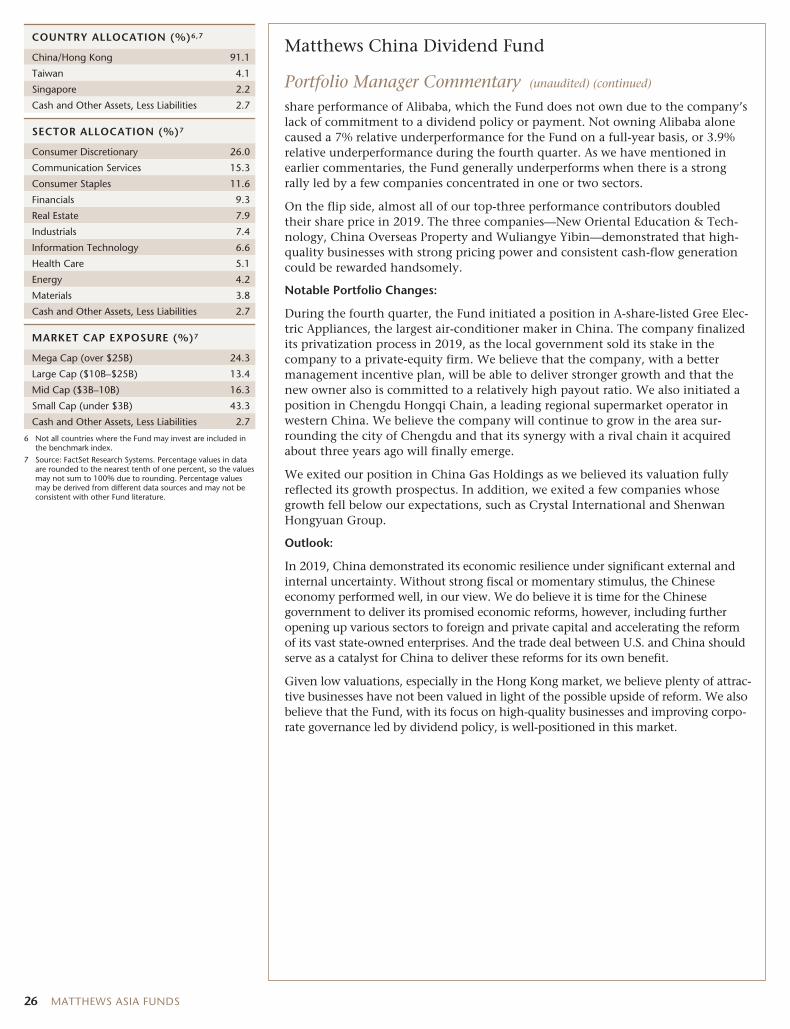
COUNTRY ALLOCATION (%)6,7
China/Hong Kong 91.1
Taiwan 4.1
Singapore 2.2
Cash and Other Assets, Less Liabilities 2.7
SECTOR ALLOCATION (%)7
Consumer Discretionary 26.0
Communication Services 15.3
Consumer Staples 11.6
Financials 9.3
Real Estate 7.9
Industrials 7.4
Information Technology 6.6
Health Care 5.1
Energy 4.2
Materials 3.8
Cash and Other Assets, Less Liabilities 2.7
MARKET CAP EXPOSURE (%)7
Mega Cap (over $25B) 24.3
Large Cap ($10B–$25B) 13.4
Mid Cap ($3B–10B) 16.3
Small Cap (under $3B) 43.3
Cash and Other Assets, Less Liabilities 2.7
6 Not all countries where the Fund may invest are included inthe benchmark index.
7 Source: FactSet Research Systems. Percentage values in dataare rounded to the nearest tenth of one percent, so the valuesmay not sum to 100% due to rounding. Percentage valuesmay be derived from different data sources and may not beconsistent with other Fund literature.
Matthews China Dividend Fund
Portfolio Manager Commentary (unaudited) (continued)
share performance of Alibaba, which the Fund does not own due to the company’slack of commitment to a dividend policy or payment. Not owning Alibaba alonecaused a 7% relative underperformance for the Fund on a full-year basis, or 3.9%relative underperformance during the fourth quarter. As we have mentioned inearlier commentaries, the Fund generally underperforms when there is a strongrally led by a few companies concentrated in one or two sectors.
On the flip side, almost all of our top-three performance contributors doubledtheir share price in 2019. The three companies—New Oriental Education & Tech-nology, China Overseas Property and Wuliangye Yibin—demonstrated that high-quality businesses with strong pricing power and consistent cash-flow generationcould be rewarded handsomely.
Notable Portfolio Changes:
During the fourth quarter, the Fund initiated a position in A-share-listed Gree Elec-tric Appliances, the largest air-conditioner maker in China. The company finalizedits privatization process in 2019, as the local government sold its stake in thecompany to a private-equity firm. We believe that the company, with a bettermanagement incentive plan, will be able to deliver stronger growth and that thenew owner also is committed to a relatively high payout ratio. We also initiated aposition in Chengdu Hongqi Chain, a leading regional supermarket operator inwestern China. We believe the company will continue to grow in the area sur-rounding the city of Chengdu and that its synergy with a rival chain it acquiredabout three years ago will finally emerge.
We exited our position in China Gas Holdings as we believed its valuation fullyreflected its growth prospectus. In addition, we exited a few companies whosegrowth fell below our expectations, such as Crystal International and ShenwanHongyuan Group.
Outlook:
In 2019, China demonstrated its economic resilience under significant external andinternal uncertainty. Without strong fiscal or momentary stimulus, the Chineseeconomy performed well, in our view. We do believe it is time for the Chinesegovernment to deliver its promised economic reforms, however, including furtheropening up various sectors to foreign and private capital and accelerating the reformof its vast state-owned enterprises. And the trade deal between U.S. and China shouldserve as a catalyst for China to deliver these reforms for its own benefit.
Given low valuations, especially in the Hong Kong market, we believe plenty of attrac-tive businesses have not been valued in light of the possible upside of reform. We alsobelieve that the Fund, with its focus on high-quality businesses and improving corpo-rate governance led by dividend policy, is well-positioned in this market.
26 MATTHEWS ASIA FUNDS

Matthews China Dividend Fund December 31, 2019
Schedule of Investmentsa
COMMON EQUITIES: 97.3%
Shares Value
CONSUMER DISCRETIONARY: 26.0%Diversified Consumer Services: 8.3%New Oriental Education & Technology Group,
Inc. ADRb 107,700 $13,058,625Hope Education Group Co., Ltd.c,d 58,150,000 10,073,077China East Education Holdings, Ltd.b,c,d 4,036,500 8,453,095
31,584,797
Textiles, Apparel & Luxury Goods: 6.0%Lao Feng Xiang Co., Ltd. B Shares 2,328,129 7,615,310JNBY Design, Ltd.d 4,216,000 5,663,302Nan Liu Enterprise Co., Ltd. 1,144,000 5,244,254Pacific Textiles Holdings, Ltd. 6,504,000 4,466,045
22,988,911
Hotels, Restaurants & Leisure: 4.6%Melco Resorts & Entertainment, Ltd. ADR 410,300 9,916,951Shanghai Jin Jiang Capital Co., Ltd. H Shares 37,388,000 7,671,279
17,588,230
Household Durables: 2.8%Gree Electric Appliances, Inc. of Zhuhai
A Shares 1,137,104 10,730,287
Automobiles: 2.8%Geely Automobile Holdings, Ltd. 5,337,000 10,449,357
Leisure Products: 1.5%Topkey Corp. 1,197,000 5,565,685
Total Consumer Discretionary 98,907,267
COMMUNICATION SERVICES: 15.3%Diversified Telecommunication Services: 7.9%HKBN, Ltd. 6,346,457 10,641,379CITIC Telecom International Holdings, Ltd. 28,155,000 10,261,546China Unicom Hong Kong, Ltd. 9,950,000 9,369,126
30,272,051
Interactive Media & Services: 5.2%Tencent Holdings, Ltd. 409,600 19,732,954
Wireless Telecommunication Services: 2.2%China Mobile, Ltd. ADR 198,930 8,408,771
Total Communication Services 58,413,776
CONSUMER STAPLES: 11.6%Food & Staples Retailing: 6.2%Sun Art Retail Group, Ltd. 8,021,500 9,733,268Chengdu Hongqi Chain Co., Ltd. A Shares 7,076,941 7,678,777Yixintang Pharmaceutical Group Co., Ltd.
A Shares 1,837,200 6,149,133
23,561,178
Food Products: 3.5%WH Group, Ltd.c,d 7,588,000 7,845,795Nissin Foods Co., Ltd. 7,141,000 5,675,132
13,520,927
Beverages: 1.9%Wuliangye Yibin Co., Ltd. A Shares 369,049 7,066,981
Total Consumer Staples 44,149,086
Shares Value
FINANCIALS: 9.4%Capital Markets: 4.3%China Everbright, Ltd. 4,622,000 $8,632,155China International Capital Corp., Ltd.
H Sharesc,d 3,900,400 7,520,226
16,152,381
Banks: 3.0%China Merchants Bank Co., Ltd. H Shares 2,231,000 11,469,859
Insurance: 2.1%Ping An Insurance Group Co. of China, Ltd.
H Shares 674,000 7,975,757
Total Financials 35,597,997
REAL ESTATE: 7.9%Real Estate Management & Development: 5.7%Sunac China Holdings, Ltd. 1,630,000 9,731,152KWG Group Holdings, Ltd. 4,181,000 5,857,932China Overseas Property Holdings, Ltd. 5,940,000 3,735,938Shanghai Lujiazui Finance & Trade Zone
Development Co., Ltd. B Shares 2,562,195 2,476,210
21,801,232
Equity REITs: 2.2%CapitaLand Retail China Trust, REIT 6,943,561 8,317,110
Total Real Estate 30,118,342
INDUSTRIALS: 7.4%Machinery: 2.7%Shanghai Mechanical and Electrical Industry
Co., Ltd. B Shares 4,976,114 7,384,314Guangzhou Guangri Stock Co., Ltd. A Shares 2,703,110 2,917,215
10,301,529
Marine: 2.5%SITC International Holdings Co., Ltd. 7,806,000 9,526,192
Transportation Infrastructure: 2.2%Guangdong Provincial Expressway
Development Co., Ltd. B Shares 10,498,218 8,462,068
Total Industrials 28,289,789
INFORMATION TECHNOLOGY: 6.6%Semiconductors & Semiconductor Equipment: 2.0%Hua Hong Semiconductor, Ltd.c,d 3,258,000 7,420,989
Software: 1.9%Shanghai Baosight Software Co., Ltd. B Shares 3,806,503 7,265,590
IT Services: 1.5%SUNeVision Holdings, Ltd. 8,633,000 5,837,489
Electronic Equipment, Instruments & Components: 1.2%Vivotek, Inc. 1,542,624 4,724,291
Total Information Technology 25,248,359
HEALTH CARE: 5.1%Health Care Providers & Services: 1.6%Genertec Universal Medical Group Co., Ltd.c,d 7,748,500 5,863,881
matthewsasia.com | 800.789.ASIA 27
Matthews China Dividend Fund December 31, 2019
Schedule of Investmentsa (continued)
COMMON EQUITIES (continued)
Shares Value
Pharmaceuticals: 1.5%Tianjin Zhongxin Pharmaceutical Group
Corp., Ltd. S Shares 6,837,100 $5,815,678
Biotechnology: 1.1%Shanghai Haohai Biological Technology Co.,
Ltd. H Sharesb,c,d 702,300 4,245,301
Life Sciences Tools & Services: 0.9%Pharmaron Beijing Co., Ltd. H Sharesb,c,d 625,900 3,494,046
Total Health Care 19,418,906
ENERGY: 4.2%Oil, Gas & Consumable Fuels: 4.2%China Petroleum & Chemical Corp. H Shares 13,470,000 8,110,707China Suntien Green Energy Corp., Ltd.
H Shares 26,906,000 7,771,001
Total Energy 15,881,708
MATERIALS: 3.8%Construction Materials: 2.3%Huaxin Cement Co., Ltd. B Shares 4,276,992 8,887,940
Containers & Packaging: 1.5%Greatview Aseptic Packaging Co., Ltd. 12,346,000 5,656,253
Total Materials 14,544,193
TOTAL INVESTMENTS: 97.3% 370,569,423(Cost $346,291,261)
CASH AND OTHER ASSETS,LESS LIABILITIES: 2.7% 10,171,196
NET ASSETS: 100.0% $380,740,619
a Certain securities were fair valued under the valuation policies approved by the Board ofTrustees (Note 2-A).
b Non-income producing security.
c Security exempt from registration under Rule 144A of the Securities Act of 1933, asamended. The security may be resold in transactions exempt from registration normally toqualified institutional buyers. The security has been determined to be liquid in accordancewith procedures adopted by the Funds’ Board of Trustees. At December 31, 2019, theaggregate value is $54,916,410, which is 14.42% of net assets.
d The securities may be resold to qualified foreign investors and foreign institutional buyersunder Regulation S of the Securities Act of 1933.
ADR American Depositary Receipt
REIT Real Estate Investment Trust
See accompanying notes to financial statements.
28 MATTHEWS ASIA FUNDS
ASIA VALUE STRATEGY
PORTFOLIO MANAGER
Beini Zhou, CFALead Manager
FUND FACTS
Investor InstitutionalTicker MAVRX MAVAXCUSIP 577130693 577130685Inception 11/30/15 11/30/15NAV $11.06 $10.97Initial Investment $2,500 $100,000Gross Expense Ratio1 1.85% 1.74%After Fee Waiver andReimbursement2 1.42% 1.24%
Portfolio StatisticsTotal # of Positions 32Net Assets $19.8 millionWeighted Average Market Cap $29.9 billionPortfolio Turnover3 32.03%
BenchmarkMSCI AC Asia ex Japan Index
OBJECTIVE
Long-term capital appreciation.
STRATEGY
Under normal market conditions, the Fund seeks toachieve its investment objective by investing at least80% of its net assets, which include borrowings forinvestment purposes, in common stock, preferredstock and other equity securities, and convertiblesecurities of companies located in Asia. The Fundseeks to create an investable universe of valuecompanies that it believes trade at market values withdiscounts to their intrinsic value, have strong financialand market positions, have strong management andare oriented to creating value for their shareholders.Matthews assesses companies within this universeaccording to each of these factors.
Matthews Asia Value Fund
Portfolio Manager Commentary (unaudited)
For the year ending December 31, 2019, the Matthews Asia Value Fund returned8.23% (Investor Class) and 8.35% (Institutional Class), while its benchmark, theMSCI All Country Asia ex Japan Index, returned 18.52%. For the fourth quarter,the Fund returned 6.66% (Investor Class) and 6.57% (Institutional Class) versus11.85% for the Index.
Market Environment:
2019 seemed unprecedented as gold, oil, bonds and major stock markets aroundthe world all went up by double digits. Two share prices of one stock epitomizedthe equity market in 2019: $142.19 and $293.65. Both are related to Apple, nowthe biggest company in the world in terms of market capitalization. The firstnumber was its share price on January 3, 2019, after dropping 10% that day follow-ing a profit warning due to China. The second number was its share price onDecember 31, 2019. Its share price more than doubled in between those two dates.Fundamentally, it was not a good year for Apple. Its operating earnings actuallydeclined year-over-year through its latest fiscal year. Outside of Apple, the U.S.–China trade war raged on, with resolution dates repeatedly pushed back. Thisuncertainty created a drag on worldwide economic growth. Finally, the Hong Kongprotests that started in the summer further dampened growth in the region. Whatdrove the excitement? It appears only one factor—the U.S. Federal Reserve reversedcourse and cut interest rates three times in 2019.
Performance Contributors and Detractors:
The Fund significantly lagged its benchmark index in 2019 by more than 10 per-centage points. Our overweight to South Korea, one of the worst-performing majormarkets in 2019 in U.S dollars, was the biggest contributor to underperformance.Individual stock selection also was a moderate detractor.
Two questions arise: any lessons from 2019 and are you doing anything differentlynow? We wished the portfolio were more concentrated toward fewer yet higher-conviction stocks. To that end, we sold several lower-conviction holdings andended the year with around 30 stocks in the portfolio; second, index-heavycompanies like Taiwan Semiconductor Manufacturing Co. in Taiwan and Alibabain China both did well and a lack of exposure to these companies meaningfullycontributed to our underperformance. Why didn’t we consider companies likethese? In fact, I looked at both closely in the past year. Both looked attractive butwere put on a watch list due to valuation concerns. To be clear, simply becauseprevailing interest rates are substantially lower, we are not altering our criteria bylowering the minimum return rate in our valuation model. We continue to requireat least a 15% annual return when buying a stock.
Among individual stocks in the portfolio, Gakujo in Japan and NAVER in SouthKorea were among the top contributors both for the quarter and the year. We ini-tiated a position in Gakujo shortly after we visited the company in Osaka in thefirst quarter of the year. Gakujo is in the recruitment business and is one of thebiggest players in Japan in recruiting college graduates and those in their 20s forinternships and full-time positions. In addition to running online portals, it organ-izes offline college-recruiting fairs. Japan’s job market has been tight, especially
(continued)
1 Actual 2019 expense ratios.2 Matthews has contractually agreed (i) to waive fees and reimburse expenses to the extent needed to limit Total Annual Fund Operating Expenses (excluding Rule 12b-1 fees, taxes, interest, brokerage
commissions, short sale dividend expenses, expenses incurred in connection with any merger or reorganization or extraordinary expenses such as litigation) of the Institutional Class to 1.25% first by waivingclass specific expenses (i.e., shareholder service fees specific to a particular class) of the Institutional Class and then, to the extent necessary, by waiving non-class specific expenses (e.g., custody fees) of theInstitutional Class, and (ii) if any Fund-wide expenses (i.e., expenses that apply to both the Institutional Class and the Investor Class) are waived for the Institutional Class to maintain the 1.25% expenselimitation, to waive an equal amount (in annual percentage terms) of those same expenses for the Investor Class. Beginning on November 1, 2019, Matthews voluntarily reduced this expense limitation to1.20% for the Institutional Class. The Total Annual Fund Operating Expenses After Fee Waiver and Expense Reimbursement for the Investor Class may vary from year to year and will in some years exceed1.25%. If the operating expenses fall below the expense limitation in a year within three years after Matthews has made a waiver or reimbursement, the Fund may reimburse Matthews up to an amount thatdoes not cause the expenses for that year to exceed the lesser of (i) the expense limitation applicable at the time of that fee waiver and/or expense reimbursement or (ii) the expense limitation in effect at thetime of recoupment. This agreement will remain in place until April 30, 2021 and may be terminated at any time by the Board of Trustees on behalf of the Fund on 60 days’ written notice to Matthews.Matthews may decline to renew this agreement by written notice to the Trust at least 30 days before its annual expiration date.
3 The lesser of fiscal year 2019 long-term purchase costs or sales proceeds divided by the average monthly market value of long-term securities.
matthewsasia.com | 800.789.ASIA 29
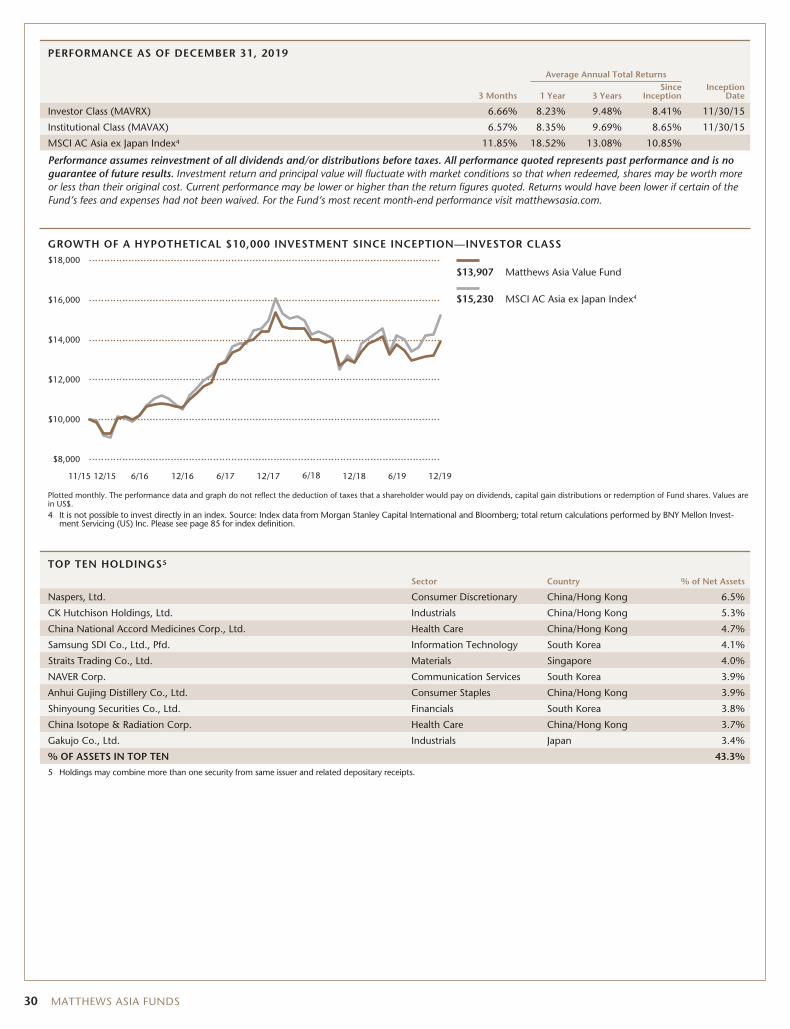
PERFORMANCE AS OF DECEMBER 31, 2019
Average Annual Total Returns
3 Months 1 Year 3 YearsSince
InceptionInception
Date
Investor Class (MAVRX) 6.66% 8.23% 9.48% 8.41% 11/30/15
Institutional Class (MAVAX) 6.57% 8.35% 9.69% 8.65% 11/30/15
MSCI AC Asia ex Japan Index4 11.85% 18.52% 13.08% 10.85%
Performance assumes reinvestment of all dividends and/or distributions before taxes. All performance quoted represents past performance and is noguarantee of future results. Investment return and principal value will fluctuate with market conditions so that when redeemed, shares may be worth moreor less than their original cost. Current performance may be lower or higher than the return figures quoted. Returns would have been lower if certain of theFund’s fees and expenses had not been waived. For the Fund’s most recent month-end performance visit matthewsasia.com.
GROWTH OF A HYPOTHETICAL $10,000 INVESTMENT SINCE INCEPTION—INVESTOR CLASS
11/15 12/166/1612/15 12/196/1912/1812/176/17 6/18
$13,907 Matthews Asia Value Fund
$15,230 MSCI AC Asia ex Japan Index4
$8,000
$18,000
$16,000
$14,000
$12,000
$10,000
Plotted monthly. The performance data and graph do not reflect the deduction of taxes that a shareholder would pay on dividends, capital gain distributions or redemption of Fund shares. Values arein US$.4 It is not possible to invest directly in an index. Source: Index data from Morgan Stanley Capital International and Bloomberg; total return calculations performed by BNY Mellon Invest-
ment Servicing (US) Inc. Please see page 85 for index definition.
TOP TEN HOLDINGS5
Sector Country % of Net Assets
Naspers, Ltd. Consumer Discretionary China/Hong Kong 6.5%
CK Hutchison Holdings, Ltd. Industrials China/Hong Kong 5.3%
China National Accord Medicines Corp., Ltd. Health Care China/Hong Kong 4.7%
Samsung SDI Co., Ltd., Pfd. Information Technology South Korea 4.1%
Straits Trading Co., Ltd. Materials Singapore 4.0%
NAVER Corp. Communication Services South Korea 3.9%
Anhui Gujing Distillery Co., Ltd. Consumer Staples China/Hong Kong 3.9%
Shinyoung Securities Co., Ltd. Financials South Korea 3.8%
China Isotope & Radiation Corp. Health Care China/Hong Kong 3.7%
Gakujo Co., Ltd. Industrials Japan 3.4%
% OF ASSETS IN TOP TEN 43.3%
5 Holdings may combine more than one security from same issuer and related depositary receipts.
30 MATTHEWS ASIA FUNDS
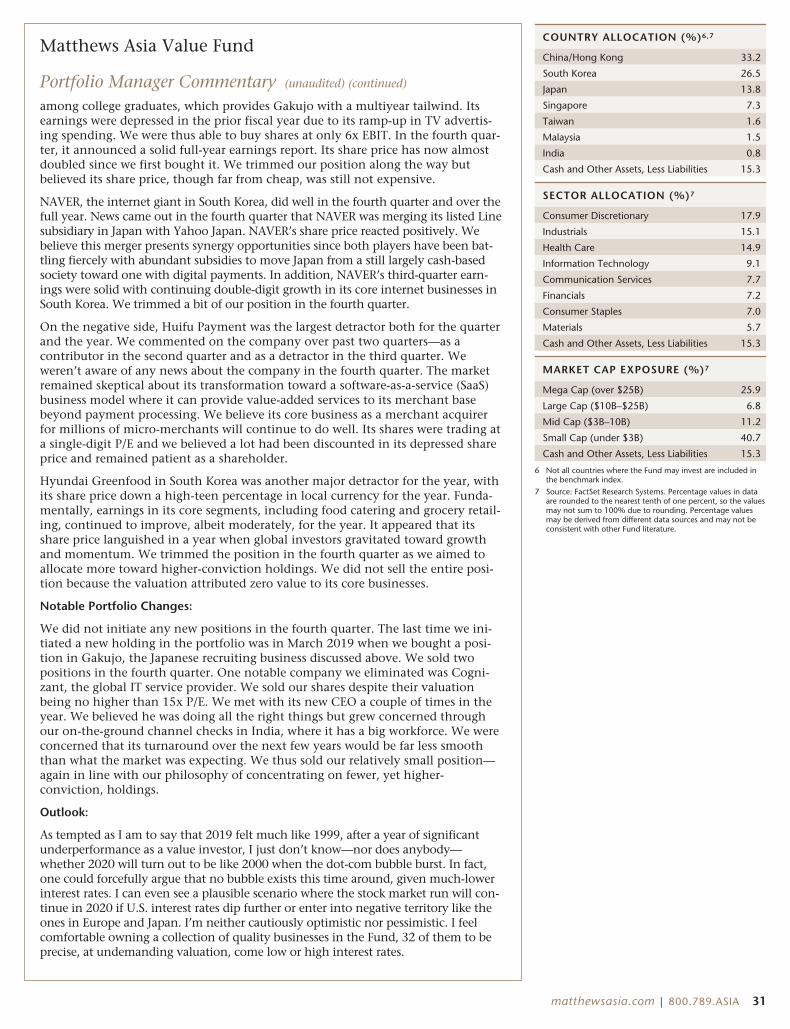
Matthews Asia Value Fund
Portfolio Manager Commentary (unaudited) (continued)
among college graduates, which provides Gakujo with a multiyear tailwind. Itsearnings were depressed in the prior fiscal year due to its ramp-up in TV advertis-ing spending. We were thus able to buy shares at only 6x EBIT. In the fourth quar-ter, it announced a solid full-year earnings report. Its share price has now almostdoubled since we first bought it. We trimmed our position along the way butbelieved its share price, though far from cheap, was still not expensive.
NAVER, the internet giant in South Korea, did well in the fourth quarter and over thefull year. News came out in the fourth quarter that NAVER was merging its listed Linesubsidiary in Japan with Yahoo Japan. NAVER’s share price reacted positively. Webelieve this merger presents synergy opportunities since both players have been bat-tling fiercely with abundant subsidies to move Japan from a still largely cash-basedsociety toward one with digital payments. In addition, NAVER’s third-quarter earn-ings were solid with continuing double-digit growth in its core internet businesses inSouth Korea. We trimmed a bit of our position in the fourth quarter.
On the negative side, Huifu Payment was the largest detractor both for the quarterand the year. We commented on the company over past two quarters—as acontributor in the second quarter and as a detractor in the third quarter. Weweren’t aware of any news about the company in the fourth quarter. The marketremained skeptical about its transformation toward a software-as-a-service (SaaS)business model where it can provide value-added services to its merchant basebeyond payment processing. We believe its core business as a merchant acquirerfor millions of micro-merchants will continue to do well. Its shares were trading ata single-digit P/E and we believed a lot had been discounted in its depressed shareprice and remained patient as a shareholder.
Hyundai Greenfood in South Korea was another major detractor for the year, withits share price down a high-teen percentage in local currency for the year. Funda-mentally, earnings in its core segments, including food catering and grocery retail-ing, continued to improve, albeit moderately, for the year. It appeared that itsshare price languished in a year when global investors gravitated toward growthand momentum. We trimmed the position in the fourth quarter as we aimed toallocate more toward higher-conviction holdings. We did not sell the entire posi-tion because the valuation attributed zero value to its core businesses.
Notable Portfolio Changes:
We did not initiate any new positions in the fourth quarter. The last time we ini-tiated a new holding in the portfolio was in March 2019 when we bought a posi-tion in Gakujo, the Japanese recruiting business discussed above. We sold twopositions in the fourth quarter. One notable company we eliminated was Cogni-zant, the global IT service provider. We sold our shares despite their valuationbeing no higher than 15x P/E. We met with its new CEO a couple of times in theyear. We believed he was doing all the right things but grew concerned throughour on-the-ground channel checks in India, where it has a big workforce. We wereconcerned that its turnaround over the next few years would be far less smooththan what the market was expecting. We thus sold our relatively small position—again in line with our philosophy of concentrating on fewer, yet higher-conviction, holdings.
Outlook:
As tempted as I am to say that 2019 felt much like 1999, after a year of significantunderperformance as a value investor, I just don’t know—nor does anybody—whether 2020 will turn out to be like 2000 when the dot-com bubble burst. In fact,one could forcefully argue that no bubble exists this time around, given much-lowerinterest rates. I can even see a plausible scenario where the stock market run will con-tinue in 2020 if U.S. interest rates dip further or enter into negative territory like theones in Europe and Japan. I’m neither cautiously optimistic nor pessimistic. I feelcomfortable owning a collection of quality businesses in the Fund, 32 of them to beprecise, at undemanding valuation, come low or high interest rates.
COUNTRY ALLOCATION (%)6,7
China/Hong Kong 33.2
South Korea 26.5
Japan 13.8
Singapore 7.3
Taiwan 1.6
Malaysia 1.5
India 0.8
Cash and Other Assets, Less Liabilities 15.3
SECTOR ALLOCATION (%)7
Consumer Discretionary 17.9
Industrials 15.1
Health Care 14.9
Information Technology 9.1
Communication Services 7.7
Financials 7.2
Consumer Staples 7.0
Materials 5.7
Cash and Other Assets, Less Liabilities 15.3
MARKET CAP EXPOSURE (%)7
Mega Cap (over $25B) 25.9
Large Cap ($10B–$25B) 6.8
Mid Cap ($3B–10B) 11.2
Small Cap (under $3B) 40.7
Cash and Other Assets, Less Liabilities 15.3
6 Not all countries where the Fund may invest are included inthe benchmark index.
7 Source: FactSet Research Systems. Percentage values in dataare rounded to the nearest tenth of one percent, so the valuesmay not sum to 100% due to rounding. Percentage valuesmay be derived from different data sources and may not beconsistent with other Fund literature.
matthewsasia.com | 800.789.ASIA 31
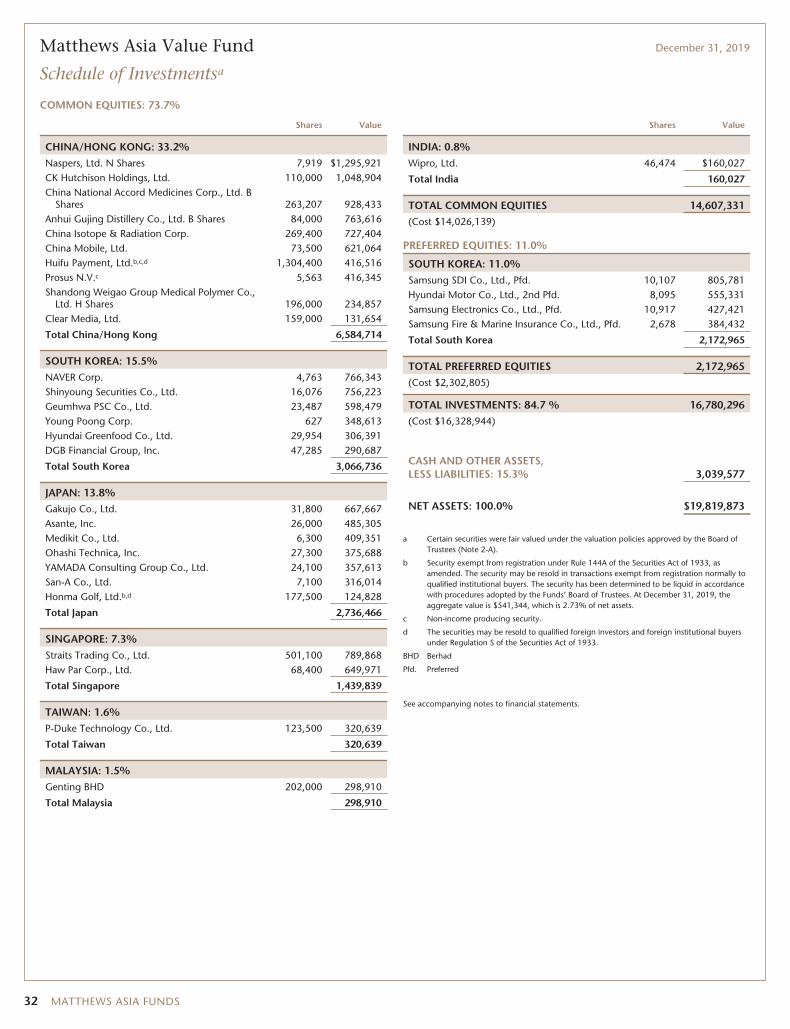
Matthews Asia Value Fund December 31, 2019
Schedule of Investmentsa
COMMON EQUITIES: 73.7%
Shares Value
CHINA/HONG KONG: 33.2%Naspers, Ltd. N Shares 7,919 $1,295,921CK Hutchison Holdings, Ltd. 110,000 1,048,904China National Accord Medicines Corp., Ltd. B
Shares 263,207 928,433Anhui Gujing Distillery Co., Ltd. B Shares 84,000 763,616China Isotope & Radiation Corp. 269,400 727,404China Mobile, Ltd. 73,500 621,064Huifu Payment, Ltd.b,c,d 1,304,400 416,516Prosus N.V.c 5,563 416,345Shandong Weigao Group Medical Polymer Co.,
Ltd. H Shares 196,000 234,857Clear Media, Ltd. 159,000 131,654
Total China/Hong Kong 6,584,714
SOUTH KOREA: 15.5%NAVER Corp. 4,763 766,343Shinyoung Securities Co., Ltd. 16,076 756,223Geumhwa PSC Co., Ltd. 23,487 598,479Young Poong Corp. 627 348,613Hyundai Greenfood Co., Ltd. 29,954 306,391DGB Financial Group, Inc. 47,285 290,687
Total South Korea 3,066,736
JAPAN: 13.8%Gakujo Co., Ltd. 31,800 667,667Asante, Inc. 26,000 485,305Medikit Co., Ltd. 6,300 409,351Ohashi Technica, Inc. 27,300 375,688YAMADA Consulting Group Co., Ltd. 24,100 357,613San-A Co., Ltd. 7,100 316,014Honma Golf, Ltd.b,d 177,500 124,828
Total Japan 2,736,466
SINGAPORE: 7.3%Straits Trading Co., Ltd. 501,100 789,868Haw Par Corp., Ltd. 68,400 649,971
Total Singapore 1,439,839
TAIWAN: 1.6%P-Duke Technology Co., Ltd. 123,500 320,639
Total Taiwan 320,639
MALAYSIA: 1.5%Genting BHD 202,000 298,910
Total Malaysia 298,910
Shares Value
INDIA: 0.8%Wipro, Ltd. 46,474 $160,027
Total India 160,027
TOTAL COMMON EQUITIES 14,607,331(Cost $14,026,139)
PREFERRED EQUITIES: 11.0%
SOUTH KOREA: 11.0%Samsung SDI Co., Ltd., Pfd. 10,107 805,781Hyundai Motor Co., Ltd., 2nd Pfd. 8,095 555,331Samsung Electronics Co., Ltd., Pfd. 10,917 427,421Samsung Fire & Marine Insurance Co., Ltd., Pfd. 2,678 384,432
Total South Korea 2,172,965
TOTAL PREFERRED EQUITIES 2,172,965(Cost $2,302,805)
TOTAL INVESTMENTS: 84.7 % 16,780,296(Cost $16,328,944)
CASH AND OTHER ASSETS,LESS LIABILITIES: 15.3% 3,039,577
NET ASSETS: 100.0% $19,819,873
a Certain securities were fair valued under the valuation policies approved by the Board ofTrustees (Note 2-A).
b Security exempt from registration under Rule 144A of the Securities Act of 1933, asamended. The security may be resold in transactions exempt from registration normally toqualified institutional buyers. The security has been determined to be liquid in accordancewith procedures adopted by the Funds’ Board of Trustees. At December 31, 2019, theaggregate value is $541,344, which is 2.73% of net assets.
c Non-income producing security.
d The securities may be resold to qualified foreign investors and foreign institutional buyersunder Regulation S of the Securities Act of 1933.
BHD Berhad
Pfd. Preferred
See accompanying notes to financial statements.
32 MATTHEWS ASIA FUNDS
ASIA GROWTH STRATEGIES
PORTFOLIO MANAGERS
Taizo IshidaLead Manager
FUND FACTS
Investor InstitutionalTicker MPACX MIAPXCUSIP 577130867 577130776Inception 10/31/03 10/29/10NAV $28.10 $28.34Initial Investment $2,500 $100,000Gross Expense Ratio1 1.09% 0.94%
Portfolio StatisticsTotal # of Positions 59Net Assets $1.2 billionWeighted Average Market Cap $42.4 billionPortfolio Turnover2 38.05%
BenchmarkMSCI AC Asia Pacific Index
OBJECTIVE
Long-term capital appreciation.
STRATEGY
Under normal market conditions, the Fund seeks toachieve its investment objective by investing at least80% of its net assets, which include borrowings forinvestment purposes, in the common and preferredstocks of companies located in Asia. Asia consists ofall countries and markets in Asia, and includesdeveloped, emerging and frontier countries andmarkets in the Asian region. The Fund may alsoinvest in the convertible securities, of any duration orquality, of Asian companies.
Matthews Asia Growth Fund
Portfolio Manager Commentary (unaudited)
For the year ending December 31, 2019, the Matthews Asia Growth Fund returned26.18% (Investor Class) and 26.34% (Institutional Class), while its benchmark, theMSCI All Country Asia Pacific Index, returned 19.74%. For the fourth quarter, theFund returned 9.61% (Investor Class) and 9.64% (Institutional Class) versus 9.51%for the Index.
Market Environment:
The health care sector was a strong performer in 2019, driven by a combination ofinnovation and growing demand for health care services across Asia. Aging pop-ulations, rising incomes and specific regional health care needs created oppor-tunities for entrepreneurial health care companies of all sizes, from micro caps tomega caps. Information technology was the top-performing sector in the region forthe year. Demand for high-end chips, driven by the rollout of 5G, aided the stockprices of some technology hardware companies. Meanwhile, utilities was theweakest sector.
From a country perspective, China was a strong performer in 2019, led by A-sharesand select large-cap consumer discretionary, financials and communication serv-ices companies. Local A-shares were largely unfazed by trade issues and Hong Kongdisruptions as local traders focused on solid corporate earnings, the prospect ofincreased A-share inclusion in global indices and the government’s intent in meet-ing growth targets and ensuring financial stability. Late in 2019, the U.S. andChina agreed to “phase one” of a trade agreement. Corporate earnings are expectedto lead Asia and emerging markets with growth in the mid-teens. And governmentpolicy should remain supportive, although not outright stimulative, in an effort tomaintain steady growth, improve household income and continue economicrebalancing in favor of domestic consumption and services.
Japanese equity returns were some of the strongest in the region in 2019 despiteheadwinds related to U.S.–China trade in the first half. Low single-digit earningsgrowth was fortified by record-high share buybacks, relatively attractive valuationsand strong developed-market stock prices. All of these trends contributed to strongequity performance in 2019. Going forward, Japan could benefit from a combinedmacro and micro influence. A macro global PMI recovery should lift Japaneseshares due to many export links to the global economy, especially cyclical growthcompanies. Micro catalysts include the structural improvement in ROEs driven bybuybacks and dividend payouts along with continued balance sheet usage tofinance growth, including investment and M&A.
Performance Contributors and Detractors:
The Fund outperformed its benchmark for the full year and the fourth quarter. Forboth periods, stock selection in the health care sector was the top contributor toperformance. Within the health care sector, NextCure, a clinical-stage bio-pharmaceutical company, was a strong contributor for the full year and the fourthquarter. The company, founded by Dr. Lieping Chen, a top-tier scientist in thefield of tumor immunity at Yale University, has a strong pipeline of new productsin development and we believe the company has attractive prospects for growth.
Meanwhile, the Fund’s underweight to the information technology sectordetracted from performance in the full year and the fourth quarter. Within thefinancials sector, Sri Lanka-based Sampath Bank also was a detractor across the fullyear. The underperformance was due to a large rights issue in March 2019 and thenegative impact from a sluggish local economy. Our long-term outlook for thebank, however, remains constructive. We believe this is one of the best banks, notonly in the country but also in the whole Indian subcontinent, and that its growthprofile is intact.
(continued)
1 Actual 2019 expense ratios.2 The lesser of fiscal year 2019 long-term purchase costs or sales proceeds divided by the average monthly market value of long-term securities.
matthewsasia.com | 800.789.ASIA 33
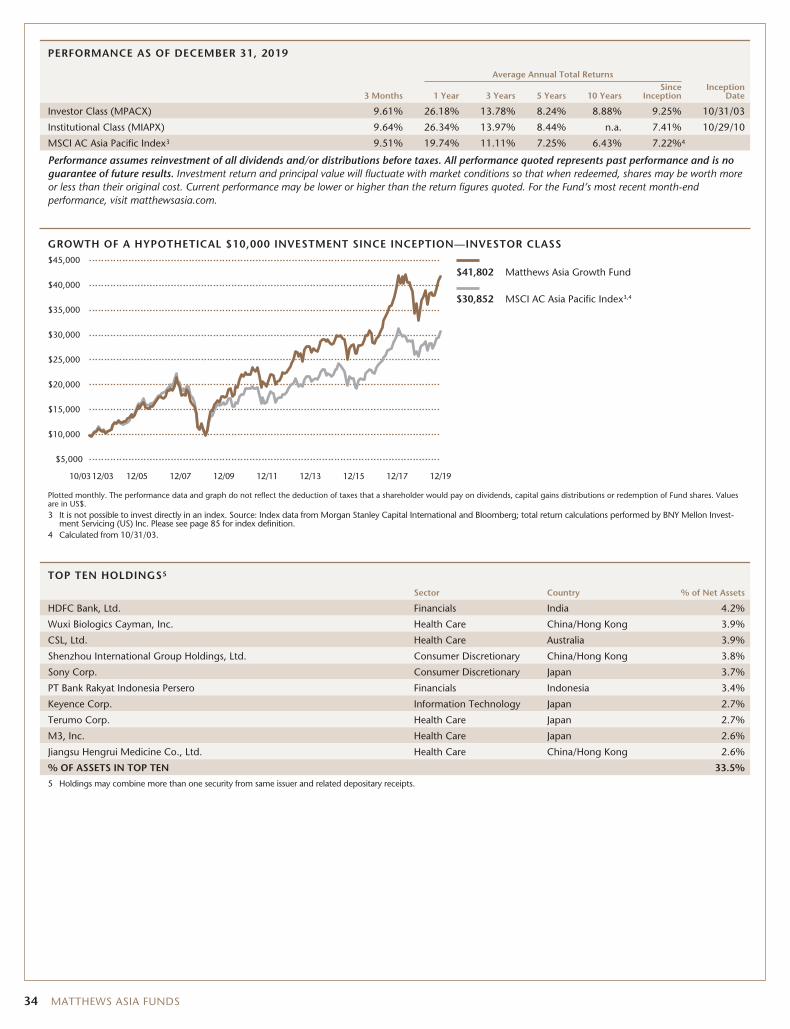
PERFORMANCE AS OF DECEMBER 31, 2019
Average Annual Total Returns
3 Months 1 Year 3 Years 5 Years 10 YearsSince
InceptionInception
Date
Investor Class (MPACX) 9.61% 26.18% 13.78% 8.24% 8.88% 9.25% 10/31/03
Institutional Class (MIAPX) 9.64% 26.34% 13.97% 8.44% n.a. 7.41% 10/29/10
MSCI AC Asia Pacific Index3 9.51% 19.74% 11.11% 7.25% 6.43% 7.22%4
Performance assumes reinvestment of all dividends and/or distributions before taxes. All performance quoted represents past performance and is noguarantee of future results. Investment return and principal value will fluctuate with market conditions so that when redeemed, shares may be worth moreor less than their original cost. Current performance may be lower or higher than the return figures quoted. For the Fund’s most recent month-endperformance, visit matthewsasia.com.
GROWTH OF A HYPOTHETICAL $10,000 INVESTMENT SINCE INCEPTION—INVESTOR CLASS
10/0312/03 12/05 12/07 12/09 12/11 12/13 12/15 12/17 12/19
$41,802 Matthews Asia Growth Fund
$30,852 MSCI AC Asia Pacific Index3,4
$5,000
$45,000
$40,000
$35,000
$30,000
$25,000
$20,000
$10,000
$15,000
Plotted monthly. The performance data and graph do not reflect the deduction of taxes that a shareholder would pay on dividends, capital gains distributions or redemption of Fund shares. Valuesare in US$.3 It is not possible to invest directly in an index. Source: Index data from Morgan Stanley Capital International and Bloomberg; total return calculations performed by BNY Mellon Invest-
ment Servicing (US) Inc. Please see page 85 for index definition.4 Calculated from 10/31/03.
TOP TEN HOLDINGS5
Sector Country % of Net Assets
HDFC Bank, Ltd. Financials India 4.2%
Wuxi Biologics Cayman, Inc. Health Care China/Hong Kong 3.9%
CSL, Ltd. Health Care Australia 3.9%
Shenzhou International Group Holdings, Ltd. Consumer Discretionary China/Hong Kong 3.8%
Sony Corp. Consumer Discretionary Japan 3.7%
PT Bank Rakyat Indonesia Persero Financials Indonesia 3.4%
Keyence Corp. Information Technology Japan 2.7%
Terumo Corp. Health Care Japan 2.7%
M3, Inc. Health Care Japan 2.6%
Jiangsu Hengrui Medicine Co., Ltd. Health Care China/Hong Kong 2.6%
% OF ASSETS IN TOP TEN 33.5%
5 Holdings may combine more than one security from same issuer and related depositary receipts.
34 MATTHEWS ASIA FUNDS
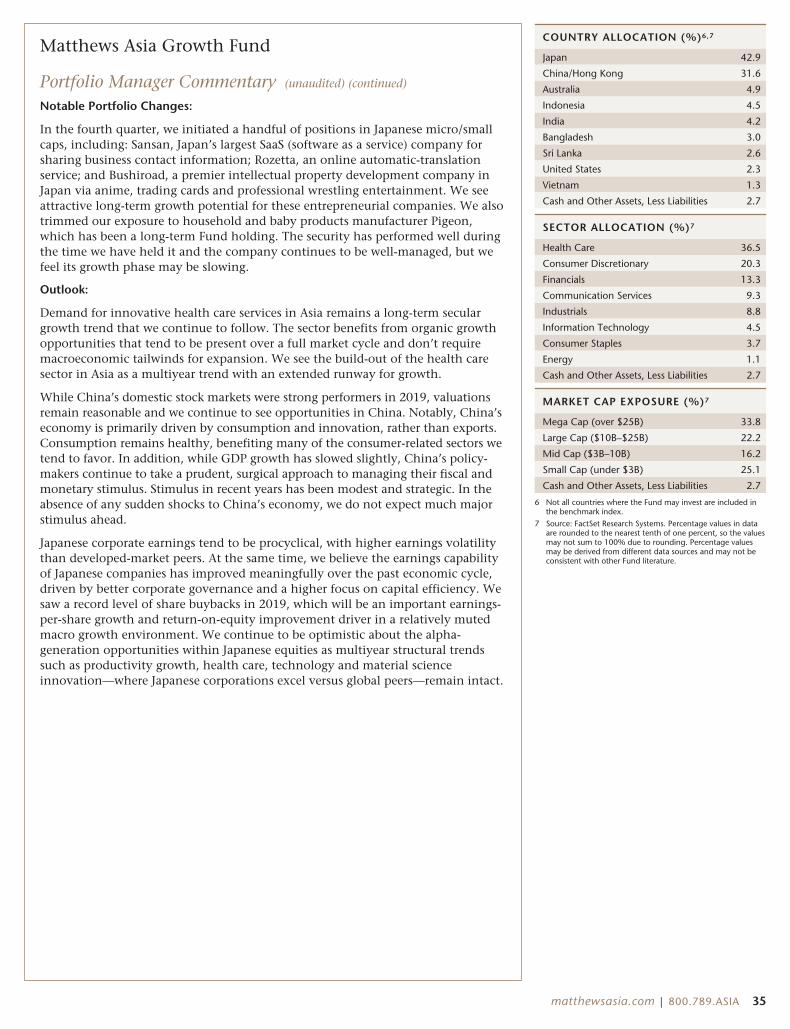
Matthews Asia Growth Fund
Portfolio Manager Commentary (unaudited) (continued)
Notable Portfolio Changes:
In the fourth quarter, we initiated a handful of positions in Japanese micro/smallcaps, including: Sansan, Japan’s largest SaaS (software as a service) company forsharing business contact information; Rozetta, an online automatic-translationservice; and Bushiroad, a premier intellectual property development company inJapan via anime, trading cards and professional wrestling entertainment. We seeattractive long-term growth potential for these entrepreneurial companies. We alsotrimmed our exposure to household and baby products manufacturer Pigeon,which has been a long-term Fund holding. The security has performed well duringthe time we have held it and the company continues to be well-managed, but wefeel its growth phase may be slowing.
Outlook:
Demand for innovative health care services in Asia remains a long-term seculargrowth trend that we continue to follow. The sector benefits from organic growthopportunities that tend to be present over a full market cycle and don’t requiremacroeconomic tailwinds for expansion. We see the build-out of the health caresector in Asia as a multiyear trend with an extended runway for growth.
While China’s domestic stock markets were strong performers in 2019, valuationsremain reasonable and we continue to see opportunities in China. Notably, China’seconomy is primarily driven by consumption and innovation, rather than exports.Consumption remains healthy, benefiting many of the consumer-related sectors wetend to favor. In addition, while GDP growth has slowed slightly, China’s policy-makers continue to take a prudent, surgical approach to managing their fiscal andmonetary stimulus. Stimulus in recent years has been modest and strategic. In theabsence of any sudden shocks to China’s economy, we do not expect much majorstimulus ahead.
Japanese corporate earnings tend to be procyclical, with higher earnings volatilitythan developed-market peers. At the same time, we believe the earnings capabilityof Japanese companies has improved meaningfully over the past economic cycle,driven by better corporate governance and a higher focus on capital efficiency. Wesaw a record level of share buybacks in 2019, which will be an important earnings-per-share growth and return-on-equity improvement driver in a relatively mutedmacro growth environment. We continue to be optimistic about the alpha-generation opportunities within Japanese equities as multiyear structural trendssuch as productivity growth, health care, technology and material scienceinnovation—where Japanese corporations excel versus global peers—remain intact.
COUNTRY ALLOCATION (%)6,7
Japan 42.9
China/Hong Kong 31.6
Australia 4.9
Indonesia 4.5
India 4.2
Bangladesh 3.0
Sri Lanka 2.6
United States 2.3
Vietnam 1.3
Cash and Other Assets, Less Liabilities 2.7
SECTOR ALLOCATION (%)7
Health Care 36.5
Consumer Discretionary 20.3
Financials 13.3
Communication Services 9.3
Industrials 8.8
Information Technology 4.5
Consumer Staples 3.7
Energy 1.1
Cash and Other Assets, Less Liabilities 2.7
MARKET CAP EXPOSURE (%)7
Mega Cap (over $25B) 33.8
Large Cap ($10B–$25B) 22.2
Mid Cap ($3B–10B) 16.2
Small Cap (under $3B) 25.1
Cash and Other Assets, Less Liabilities 2.7
6 Not all countries where the Fund may invest are included inthe benchmark index.
7 Source: FactSet Research Systems. Percentage values in dataare rounded to the nearest tenth of one percent, so the valuesmay not sum to 100% due to rounding. Percentage valuesmay be derived from different data sources and may not beconsistent with other Fund literature.
matthewsasia.com | 800.789.ASIA 35

Matthews Asia Growth Fund December 31, 2019
Schedule of Investmentsa
COMMON EQUITIES: 97.3%
Shares Value
JAPAN: 42.9%Sony Corp. 656,600 $44,581,640Keyence Corp. 93,800 32,936,799Terumo Corp. 921,900 32,703,780M3, Inc. 1,049,000 31,633,232Nintendo Co., Ltd. 74,900 29,957,015TechnoPro Holdings, Inc. 399,800 27,902,468Nitori Holdings Co., Ltd. 174,800 27,592,417SoftBank Group Corp. 552,400 23,983,577SBI Holdings, Inc. 1,050,600 22,180,555PeptiDream, Inc.b 411,000 21,003,477Nidec Corp. 140,900 19,244,659Rozetta Corp.b,† 516,600 18,601,381Hikari Tsushin, Inc. 73,700 18,520,657Eisai Co., Ltd. 238,500 17,846,001Kudan, Inc.b 226,500 17,258,190Kyoritsu Maintenance Co., Ltd. 320,200 15,164,227HEALIOS KKb 980,300 13,399,260Ariake Japan Co., Ltd. 176,100 13,089,560FANUC Corp. 63,400 11,707,756Bushiroad, Inc.b 330,000 11,378,110Takeda Pharmaceutical Co., Ltd. 280,800 11,106,264Sosei Group Corp.b 550,900 10,939,686Sysmex Corp. 153,200 10,430,613Japan Elevator Service Holdings Co., Ltd. 402,600 10,107,642SanBio Co., Ltd.b 364,200 8,750,541Pigeon Corp. 204,600 7,491,673Freee KKb 72,400 2,148,912CYBERDYNE, Inc.b 401,300 2,082,376Seria Co., Ltd. 60,600 1,650,958Sansan, Inc.b 25,200 1,279,748
Total Japan 516,673,174
CHINA/HONG KONG: 31.6%Wuxi Biologics Cayman, Inc.b,c,d 3,693,000 46,773,500Shenzhou International Group Holdings, Ltd. 3,155,000 46,110,564Jiangsu Hengrui Medicine Co., Ltd. A Shares 2,492,224 31,373,133Alibaba Group Holding, Ltd. ADRb 146,700 31,115,070BeiGene, Ltd. ADRb 174,100 28,858,816Huazhu Group, Ltd. ADR 686,700 27,516,069Genscript Biotech Corp.b 11,934,000 27,116,733Baozun, Inc. ADRb 818,500 27,108,720Bilibili, Inc. ADRb 1,434,500 26,710,390Alphamab Oncologyb,c,d 11,948,000 21,466,319Autohome, Inc. ADRb 248,400 19,874,484Shenzhen Inovance Technology Co., Ltd.
A Shares 4,069,575 17,940,549Innovent Biologics, Inc.b,c,d 4,908,500 16,753,552Hansoh Pharmaceutical Group Co., Ltd.b,c,d 3,472,000 11,562,943
Total China/Hong Kong 380,280,842
AUSTRALIA: 4.9%CSL, Ltd. 240,892 46,704,607Oil Search, Ltd. 2,481,915 12,655,379
Total Australia 59,359,986
Shares Value
INDONESIA: 4.5%PT Bank Rakyat Indonesia Persero 129,492,600 $40,987,766PT Mayora Indah 54,105,900 7,985,311PT Ace Hardware Indonesia 46,718,400 5,031,256
Total Indonesia 54,004,333
INDIA: 4.2%HDFC Bank, Ltd. 2,837,251 50,626,616
Total India 50,626,616
BANGLADESH: 3.0%Square Pharmaceuticals, Ltd. 9,381,451 20,996,239BRAC Bank, Ltd.b 22,667,262 15,245,900
Total Bangladesh 36,242,139
SRI LANKA: 2.6%Sampath Bank PLC† 21,899,216 19,610,214LOLC Holdings PLCb 11,792,496 11,540,554
Total Sri Lanka 31,150,768
UNITED STATES: 2.3%Frequency Therapeutics, Inc.b 437,079 7,661,995Turning Point Therapeutics, Inc.b 118,000 7,350,220NextCure, Inc.b 120,000 6,759,600Oyster Point Pharma, Inc.b 225,000 5,499,000
Total United States 27,270,815
VIETNAM: 1.3%Vietnam Dairy Products JSC 3,116,592 15,679,749
Total Vietnam 15,679,749
TOTAL INVESTMENTS: 97.3% 1,171,288,422(Cost $864,736,839)
CASH AND OTHER ASSETS,LESS LIABILITIES: 2.7% 32,045,967
NET ASSETS: 100.0% $1,203,334,389
a Certain securities were fair valued under the valuation policies approved by the Board ofTrustees (Note 2-A).
b Non-income producing security.
c Security exempt from registration under Rule 144A of the Securities Act of 1933, asamended. The security may be resold in transactions exempt from registration normally toqualified institutional buyers. The security has been determined to be liquid in accordancewith procedures adopted by the Funds’ Board of Trustees. At December 31, 2019, theaggregate value is $96,556,314, which is 8.02% of net assets.
d The securities may be resold to qualified foreign investors and foreign institutional buyersunder Regulation S of the Securities Act of 1933.
† Affiliated Issuer, as defined under the Investment Company Act of 1940 (ownership of 5%or more of the outstanding voting securities of this issuer)
ADR American Depositary Receipt
JSC Joint Stock Co.
See accompanying notes to financial statements.
36 MATTHEWS ASIA FUNDS
ASIA GROWTH STRATEGIES
PORTFOLIO MANAGERS
Sharat Shroff, CFALead Manager
Rahul Gupta Raymond DengCo-Manager Co-Manager
Inbok SongCo-Manager
FUND FACTS
Investor InstitutionalTicker MAPTX MIPTXCUSIP 577130107 577130834Inception 9/12/94 10/29/10NAV $28.74 $28.71Initial Investment $2,500 $100,000Gross Expense Ratio1 1.08% 0.93%After Fee Waiver andReimbursement2 1.05% 0.91%
Portfolio StatisticsTotal # of Positions 60Net Assets $8.7 billionWeighted Average Market Cap $102.4 billionPortfolio Turnover3 17.08%
BenchmarkMSCI AC Asia ex Japan Index
OBJECTIVE
Long-term capital appreciation.
STRATEGY
Under normal market conditions, the Fund seeks toachieve its investment objective by investing at least80% of its net assets, which include borrowings forinvestment purposes, in the common and preferredstocks of companies located in Asia ex Japan, whichconsists of all countries and markets in Asia excludingJapan, but including all other developed, emergingand frontier countries and markets in the Asian region.
Matthews Pacific Tiger Fund
Portfolio Manager Commentary (unaudited)
For the year ending December 31, 2019, the Matthews Pacific Tiger Fund returned10.72% (Investor Class) and 10.90% (Institutional Class), while its benchmark, theMSCI All Country Asia ex Japan Index, returned 18.52% over the same period. For thefourth quarter, the Fund returned 7.09% (Investor Class) and 7.15% (Institutional Class)versus 11.85% for the Index.
Market Environment:
Asian equity markets generated attractive gains in 2019. The rally was narrow in scope,however, led by a small group of stocks. Information technology and consumer discre-tionary were the only two sectors to outperform Asia’s broader markets. Informationtechnology stocks in particular outperformed the rest of the market by a wide margin.In addition, market gains were concentrated among large and mega-cap stocks. Whilelarge and mega-cap stocks have been in favor since 2015, we believe that a deepeningmacroeconomic recovery might also lead to a favorable economic backdrop for smallerand midsize companies.
Volatility lingered throughout much of the year. Many factors impacting markets overthe short term were political in nature, as U.S.–China trade tensions, Hong Kong pro-tests and Indian election results made headlines. By the fourth quarter, however,sentiment throughout the region seemed largely improved on easing trade tensions anda sense of political stability throughout the region. Asian currencies were largely stablein 2019, recovering from earlier weakness in 2018.
From a country perspective, domestic Chinese and Taiwanese markets were top perform-ers, while South Korea’s market was the weakest. There was a welcome detente in U.S.–China trade tensions toward the end of 2019, although the contours of a trade deal hadnot yet taken shape. Nonetheless, foreign sentiment toward Chinese shares was notablyimproved at year end. China’s performance in 2019 was led by A-shares and selectlarge-cap consumer discretionary, financials and communication services companies.
Elsewhere, India’s equity markets were positive in 2019, but lagged the broader region.Throughout much of 2017 and 2018, Indian policymakers dealt with sticky inflationand persistent current and fiscal account deficits. At the same time, India implementedfinancial reforms to increase tax collections and create a more-level playing field forbusinesses. These reforms were positive for the long term, but created softer growth inthe short term. The incumbent Bharatiya Janata Party scored a resounding electionvictory in 2019, giving the majority party a clear mandate for action. India’s policy-makers gave markets a positive surprise in the second half of 2019 by lowering interestrates and cutting corporate taxes, both of which should be positive for growth.
Performance Contributors and Detractors:
The Strategy’s underweight to information technology and Taiwan, home to many of theregion’s IT hardware companies, was the single-biggest detractor from 2019’s relative per-formance. The IT hardware sector attracted investor attention in 2019 on the back of twodrivers. First, there was increased demand for high-end chips as necessitated by the rolloutof 5G. Second, trade-related tension between the U.S. and China may increase demand forlocal sources of semiconductors within Asia. Both of these trends aided semiconductor andIT hardware stocks, principally in Taiwan. We remained cautious about expectations thatseemed to be getting priced into many hardware companies across the region. At the sametime, we recognized that our underweight in tech hardware detracted from performance.Accordingly, the team re-examined the IT hardware ecosystem in Asia (outside of Japan).We identified a handful of businesses that we believe are able to maintain and grow theirprofitability across cycles, including a new holding discussed in the next section.
The Strategy’s overweight to India also detracted from relative performance in 2019, asdid stock selection in India. Stock-selection underperformance in India largely camefrom a single security, Tata Power. The company faced short-term regulatory setbacksregarding its ownership of mines in Indonesia that created negative sentiment toward
(continued)
1 Actual 2019 expense ratios.2 Matthews has contractually agreed to waive a portion of its advisory fee and administrative and shareholder services fee if the Fund’s average daily net assets are over $3 billion, as follows: for every
$2.5 billion average daily net assets of the Fund that are over $3 billion, the advisory fee rate and the administrative and shareholder services fee rate for the Fund with respect to such excess average daily netassets will be each reduced by 0.01%, in each case without reducing such fee rate below 0.00%. Any amount waived by Matthews pursuant to this agreement may not be recouped by Matthews. Thisagreement will remain in place until April 30, 2021 and may be terminated (i) at any time by the Board of Trustees upon 60 days’ prior written notice to Matthews; or (ii) by Matthews at the annualexpiration date of the agreement upon 60 days’ prior written notice to the Trust, in each case without payment of any penalty.
3 The lesser of fiscal year 2019 long-term purchase costs or sales proceeds divided by the average monthly market value of long-term securities.
matthewsasia.com | 800.789.ASIA 37
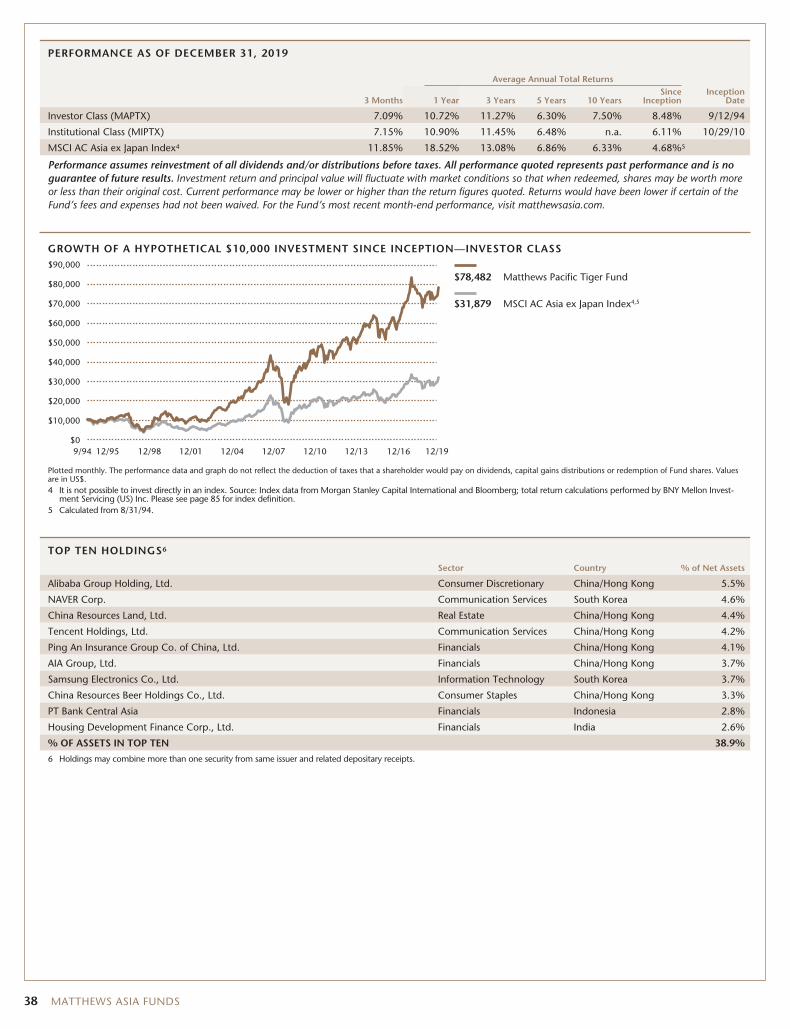
PERFORMANCE AS OF DECEMBER 31, 2019
Average Annual Total Returns
3 Months 1 Year 3 Years 5 Years 10 YearsSince
InceptionInception
Date
Investor Class (MAPTX) 7.09% 10.72% 11.27% 6.30% 7.50% 8.48% 9/12/94
Institutional Class (MIPTX) 7.15% 10.90% 11.45% 6.48% n.a. 6.11% 10/29/10
MSCI AC Asia ex Japan Index4 11.85% 18.52% 13.08% 6.86% 6.33% 4.68%5
Performance assumes reinvestment of all dividends and/or distributions before taxes. All performance quoted represents past performance and is noguarantee of future results. Investment return and principal value will fluctuate with market conditions so that when redeemed, shares may be worth moreor less than their original cost. Current performance may be lower or higher than the return figures quoted. Returns would have been lower if certain of theFund’s fees and expenses had not been waived. For the Fund’s most recent month-end performance, visit matthewsasia.com.
GROWTH OF A HYPOTHETICAL $10,000 INVESTMENT SINCE INCEPTION—INVESTOR CLASS
9/94 12/95 12/98 12/01 12/04 12/07 12/10 12/13 12/16 12/19
$78,482 Matthews Pacific Tiger Fund
$31,879 MSCI AC Asia ex Japan Index4,5
$0
$90,000
$80,000
$40,000
$50,000
$60,000
$70,000
$10,000
$20,000
$30,000
Plotted monthly. The performance data and graph do not reflect the deduction of taxes that a shareholder would pay on dividends, capital gains distributions or redemption of Fund shares. Valuesare in US$.4 It is not possible to invest directly in an index. Source: Index data from Morgan Stanley Capital International and Bloomberg; total return calculations performed by BNY Mellon Invest-
ment Servicing (US) Inc. Please see page 85 for index definition.5 Calculated from 8/31/94.
TOP TEN HOLDINGS6
Sector Country % of Net Assets
Alibaba Group Holding, Ltd. Consumer Discretionary China/Hong Kong 5.5%
NAVER Corp. Communication Services South Korea 4.6%
China Resources Land, Ltd. Real Estate China/Hong Kong 4.4%
Tencent Holdings, Ltd. Communication Services China/Hong Kong 4.2%
Ping An Insurance Group Co. of China, Ltd. Financials China/Hong Kong 4.1%
AIA Group, Ltd. Financials China/Hong Kong 3.7%
Samsung Electronics Co., Ltd. Information Technology South Korea 3.7%
China Resources Beer Holdings Co., Ltd. Consumer Staples China/Hong Kong 3.3%
PT Bank Central Asia Financials Indonesia 2.8%
Housing Development Finance Corp., Ltd. Financials India 2.6%
% OF ASSETS IN TOP TEN 38.9%
6 Holdings may combine more than one security from same issuer and related depositary receipts.
38 MATTHEWS ASIA FUNDS
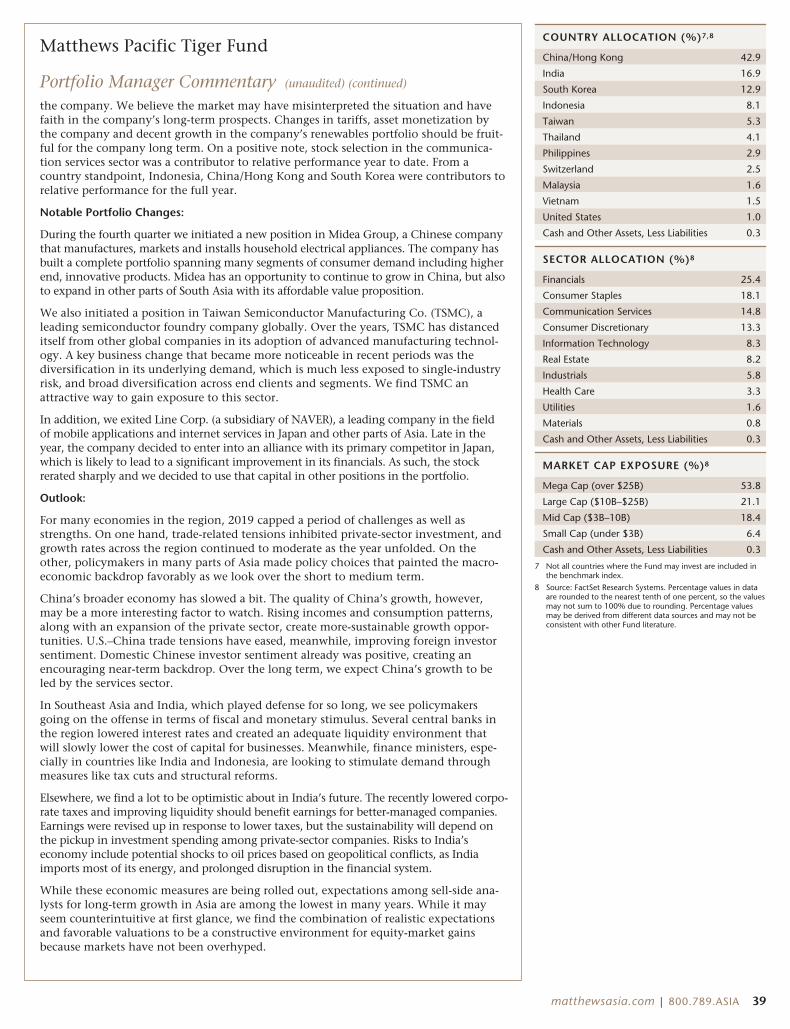
Matthews Pacific Tiger Fund
Portfolio Manager Commentary (unaudited) (continued)
the company. We believe the market may have misinterpreted the situation and havefaith in the company’s long-term prospects. Changes in tariffs, asset monetization bythe company and decent growth in the company’s renewables portfolio should be fruit-ful for the company long term. On a positive note, stock selection in the communica-tion services sector was a contributor to relative performance year to date. From acountry standpoint, Indonesia, China/Hong Kong and South Korea were contributors torelative performance for the full year.
Notable Portfolio Changes:
During the fourth quarter we initiated a new position in Midea Group, a Chinese companythat manufactures, markets and installs household electrical appliances. The company hasbuilt a complete portfolio spanning many segments of consumer demand including higherend, innovative products. Midea has an opportunity to continue to grow in China, but alsoto expand in other parts of South Asia with its affordable value proposition.
We also initiated a position in Taiwan Semiconductor Manufacturing Co. (TSMC), aleading semiconductor foundry company globally. Over the years, TSMC has distanceditself from other global companies in its adoption of advanced manufacturing technol-ogy. A key business change that became more noticeable in recent periods was thediversification in its underlying demand, which is much less exposed to single-industryrisk, and broad diversification across end clients and segments. We find TSMC anattractive way to gain exposure to this sector.
In addition, we exited Line Corp. (a subsidiary of NAVER), a leading company in the fieldof mobile applications and internet services in Japan and other parts of Asia. Late in theyear, the company decided to enter into an alliance with its primary competitor in Japan,which is likely to lead to a significant improvement in its financials. As such, the stockrerated sharply and we decided to use that capital in other positions in the portfolio.
Outlook:
For many economies in the region, 2019 capped a period of challenges as well asstrengths. On one hand, trade-related tensions inhibited private-sector investment, andgrowth rates across the region continued to moderate as the year unfolded. On theother, policymakers in many parts of Asia made policy choices that painted the macro-economic backdrop favorably as we look over the short to medium term.
China’s broader economy has slowed a bit. The quality of China’s growth, however,may be a more interesting factor to watch. Rising incomes and consumption patterns,along with an expansion of the private sector, create more-sustainable growth oppor-tunities. U.S.–China trade tensions have eased, meanwhile, improving foreign investorsentiment. Domestic Chinese investor sentiment already was positive, creating anencouraging near-term backdrop. Over the long term, we expect China’s growth to beled by the services sector.
In Southeast Asia and India, which played defense for so long, we see policymakersgoing on the offense in terms of fiscal and monetary stimulus. Several central banks inthe region lowered interest rates and created an adequate liquidity environment thatwill slowly lower the cost of capital for businesses. Meanwhile, finance ministers, espe-cially in countries like India and Indonesia, are looking to stimulate demand throughmeasures like tax cuts and structural reforms.
Elsewhere, we find a lot to be optimistic about in India’s future. The recently lowered corpo-rate taxes and improving liquidity should benefit earnings for better-managed companies.Earnings were revised up in response to lower taxes, but the sustainability will depend onthe pickup in investment spending among private-sector companies. Risks to India’seconomy include potential shocks to oil prices based on geopolitical conflicts, as Indiaimports most of its energy, and prolonged disruption in the financial system.
While these economic measures are being rolled out, expectations among sell-side ana-lysts for long-term growth in Asia are among the lowest in many years. While it mayseem counterintuitive at first glance, we find the combination of realistic expectationsand favorable valuations to be a constructive environment for equity-market gainsbecause markets have not been overhyped.
COUNTRY ALLOCATION (%)7,8
China/Hong Kong 42.9
India 16.9
South Korea 12.9
Indonesia 8.1
Taiwan 5.3
Thailand 4.1
Philippines 2.9
Switzerland 2.5
Malaysia 1.6
Vietnam 1.5
United States 1.0
Cash and Other Assets, Less Liabilities 0.3
SECTOR ALLOCATION (%)8
Financials 25.4
Consumer Staples 18.1
Communication Services 14.8
Consumer Discretionary 13.3
Information Technology 8.3
Real Estate 8.2
Industrials 5.8
Health Care 3.3
Utilities 1.6
Materials 0.8
Cash and Other Assets, Less Liabilities 0.3
MARKET CAP EXPOSURE (%)8
Mega Cap (over $25B) 53.8
Large Cap ($10B–$25B) 21.1
Mid Cap ($3B–10B) 18.4
Small Cap (under $3B) 6.4
Cash and Other Assets, Less Liabilities 0.3
7 Not all countries where the Fund may invest are included inthe benchmark index.
8 Source: FactSet Research Systems. Percentage values in dataare rounded to the nearest tenth of one percent, so the valuesmay not sum to 100% due to rounding. Percentage valuesmay be derived from different data sources and may not beconsistent with other Fund literature.
matthewsasia.com | 800.789.ASIA 39
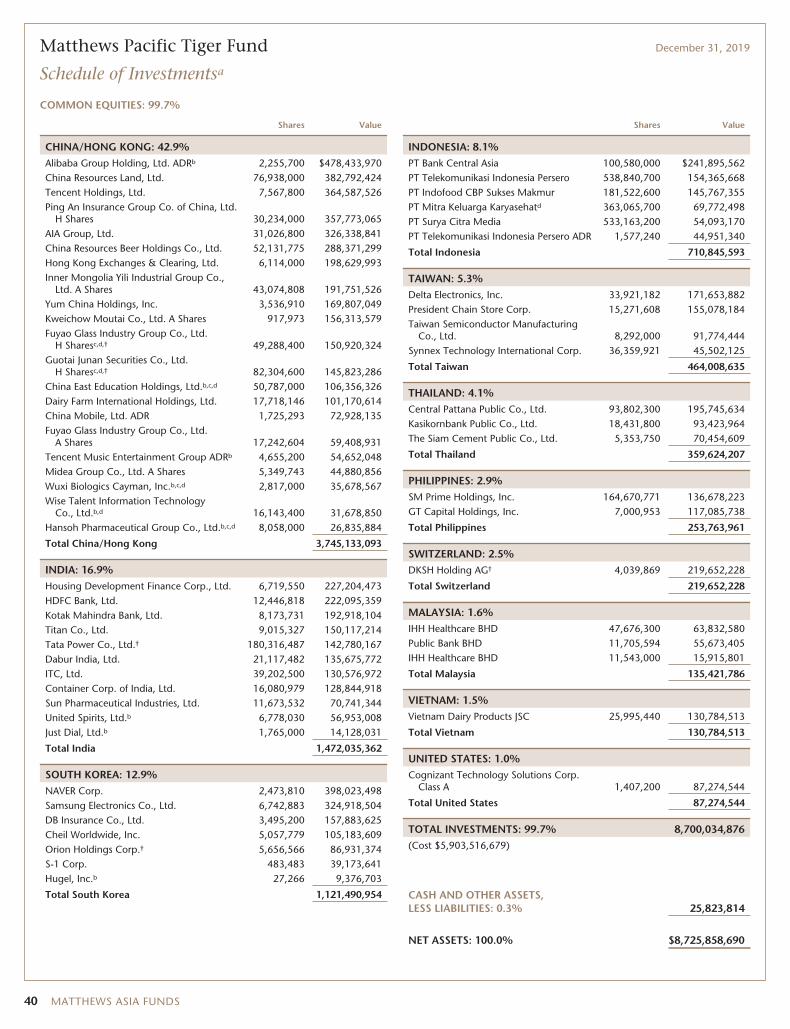
Matthews Pacific Tiger Fund December 31, 2019
Schedule of Investmentsa
COMMON EQUITIES: 99.7%
Shares Value
CHINA/HONG KONG: 42.9%Alibaba Group Holding, Ltd. ADRb 2,255,700 $478,433,970China Resources Land, Ltd. 76,938,000 382,792,424Tencent Holdings, Ltd. 7,567,800 364,587,526Ping An Insurance Group Co. of China, Ltd.
H Shares 30,234,000 357,773,065AIA Group, Ltd. 31,026,800 326,338,841China Resources Beer Holdings Co., Ltd. 52,131,775 288,371,299Hong Kong Exchanges & Clearing, Ltd. 6,114,000 198,629,993Inner Mongolia Yili Industrial Group Co.,
Ltd. A Shares 43,074,808 191,751,526Yum China Holdings, Inc. 3,536,910 169,807,049Kweichow Moutai Co., Ltd. A Shares 917,973 156,313,579Fuyao Glass Industry Group Co., Ltd.
H Sharesc,d,† 49,288,400 150,920,324Guotai Junan Securities Co., Ltd.
H Sharesc,d,† 82,304,600 145,823,286China East Education Holdings, Ltd.b,c,d 50,787,000 106,356,326Dairy Farm International Holdings, Ltd. 17,718,146 101,170,614China Mobile, Ltd. ADR 1,725,293 72,928,135Fuyao Glass Industry Group Co., Ltd.
A Shares 17,242,604 59,408,931Tencent Music Entertainment Group ADRb 4,655,200 54,652,048Midea Group Co., Ltd. A Shares 5,349,743 44,880,856Wuxi Biologics Cayman, Inc.b,c,d 2,817,000 35,678,567Wise Talent Information Technology
Co., Ltd.b,d 16,143,400 31,678,850Hansoh Pharmaceutical Group Co., Ltd.b,c,d 8,058,000 26,835,884
Total China/Hong Kong 3,745,133,093
INDIA: 16.9%Housing Development Finance Corp., Ltd. 6,719,550 227,204,473HDFC Bank, Ltd. 12,446,818 222,095,359Kotak Mahindra Bank, Ltd. 8,173,731 192,918,104Titan Co., Ltd. 9,015,327 150,117,214Tata Power Co., Ltd.† 180,316,487 142,780,167Dabur India, Ltd. 21,117,482 135,675,772ITC, Ltd. 39,202,500 130,576,972Container Corp. of India, Ltd. 16,080,979 128,844,918Sun Pharmaceutical Industries, Ltd. 11,673,532 70,741,344United Spirits, Ltd.b 6,778,030 56,953,008Just Dial, Ltd.b 1,765,000 14,128,031
Total India 1,472,035,362
SOUTH KOREA: 12.9%NAVER Corp. 2,473,810 398,023,498Samsung Electronics Co., Ltd. 6,742,883 324,918,504DB Insurance Co., Ltd. 3,495,200 157,883,625Cheil Worldwide, Inc. 5,057,779 105,183,609Orion Holdings Corp.† 5,656,566 86,931,374S-1 Corp. 483,483 39,173,641Hugel, Inc.b 27,266 9,376,703
Total South Korea 1,121,490,954
Shares Value
INDONESIA: 8.1%PT Bank Central Asia 100,580,000 $241,895,562PT Telekomunikasi Indonesia Persero 538,840,700 154,365,668PT Indofood CBP Sukses Makmur 181,522,600 145,767,355PT Mitra Keluarga Karyasehatd 363,065,700 69,772,498PT Surya Citra Media 533,163,200 54,093,170PT Telekomunikasi Indonesia Persero ADR 1,577,240 44,951,340
Total Indonesia 710,845,593
TAIWAN: 5.3%Delta Electronics, Inc. 33,921,182 171,653,882President Chain Store Corp. 15,271,608 155,078,184Taiwan Semiconductor Manufacturing
Co., Ltd. 8,292,000 91,774,444Synnex Technology International Corp. 36,359,921 45,502,125
Total Taiwan 464,008,635
THAILAND: 4.1%Central Pattana Public Co., Ltd. 93,802,300 195,745,634Kasikornbank Public Co., Ltd. 18,431,800 93,423,964The Siam Cement Public Co., Ltd. 5,353,750 70,454,609
Total Thailand 359,624,207
PHILIPPINES: 2.9%SM Prime Holdings, Inc. 164,670,771 136,678,223GT Capital Holdings, Inc. 7,000,953 117,085,738
Total Philippines 253,763,961
SWITZERLAND: 2.5%DKSH Holding AG† 4,039,869 219,652,228
Total Switzerland 219,652,228
MALAYSIA: 1.6%
IHH Healthcare BHD 47,676,300 63,832,580Public Bank BHD 11,705,594 55,673,405IHH Healthcare BHD 11,543,000 15,915,801
Total Malaysia 135,421,786
VIETNAM: 1.5%Vietnam Dairy Products JSC 25,995,440 130,784,513
Total Vietnam 130,784,513
UNITED STATES: 1.0%Cognizant Technology Solutions Corp.
Class A 1,407,200 87,274,544
Total United States 87,274,544
TOTAL INVESTMENTS: 99.7% 8,700,034,876(Cost $5,903,516,679)
CASH AND OTHER ASSETS,LESS LIABILITIES: 0.3% 25,823,814
NET ASSETS: 100.0% $8,725,858,690
40 MATTHEWS ASIA FUNDS
Matthews Pacific Tiger Fund December 31, 2019
Schedule of Investmentsa (continued)
a Certain securities were fair valued under the valuation policies approved by the Board ofTrustees (Note 2-A).
b Non-income producing security.
c Security exempt from registration under Rule 144A of the Securities Act of 1933, asamended. The security may be resold in transactions exempt from registration normally toqualified institutional buyers. The security has been determined to be liquid in accordancewith procedures adopted by the Funds’ Board of Trustees. At December 31, 2019, theaggregate value is $465,614,387, which is 5.34% of net assets.
d The securities may be resold to qualified foreign investors and foreign institutional buyersunder Regulation S of the Securities Act of 1933.
† Affiliated Issuer, as defined under the Investment Company Act of 1940 (ownership of 5%or more of the outstanding voting securities of this issuer)
ADR American Depositary Receipt
BHD Berhad
JSC Joint Stock Co.
See accompanying notes to financial statements.
matthewsasia.com | 800.789.ASIA 41
ASIA GROWTH STRATEGIES
PORTFOLIO MANAGERS
Vivek TanneeruLead Manager
Winnie ChwangCo-Manager
FUND FACTS
Investor InstitutionalTicker MASGX MISFXCUSIP 577130727 577130719Inception 4/30/15 4/30/15NAV $11.08 $11.06Initial Investment $2,500 $100,000Gross Expense Ratio1 1.54% 1.41%After Fee Waiver andReimbursement2 1.42% 1.24%
Portfolio StatisticsTotal # of Positions 58Net Assets $55.3 millionWeighted Average Market Cap $17.0 billionPortfolio Turnover3 29.67%
BenchmarkMSCI AC Asia ex Japan Index
OBJECTIVE
Long-term capital appreciation.
STRATEGY
Under normal market conditions, the Fund seeks toachieve its investment objective by investing at least80% of its net assets, which include borrowings forinvestment purposes, in the common and preferredstocks of companies of any market capitalizationlocated in Asia that Matthews believes satisfy one ormore of its environmental, social and governance(“ESG”) standards. Asia consists of all countries andmarkets in Asia and includes developed, emerging,and frontier countries and markets in the Asia region.The Fund may also invest in convertible securities andfixed-income securities, of any duration or quality,including high yield securities, of Asian companies.
Matthews Asia ESG Fund
Portfolio Manager Commentary (unaudited)
For the year ending December 31, 2019, the Matthews Asia ESG Fund returned12.55% (Investor Class) and 12.74% (Institutional Class), while its benchmark, theMSCI All Country Asia ex Japan Index, returned 18.52%. For the fourth quarter,the Fund returned 6.16% (Investor Class) and 6.14% (Institutional Class) versus11.85% for the Index.
Market Environment:
Asia ex Japan equities performed well in 2019 despite periodic volatility due toU.S.–China trade tensions. The MSCI All Country Asia ex Japan Index returnednearly 12% in December alone after a trade deal was announced, accounting fornearly two-thirds of the year’s return.
While index returns were strong in aggregate, they tended to be concentrated inthe information technology sector (up 43% for the full year 2019) on investorexpectations around 5G rollout globally, among other factors. Technology andinternet sectors can be a bit of a double-edged sword for ESG-minded investors,creating both opportunities for generating attractive returns and pitfalls inherentin the sector—especially in areas such as data privacy, surveillance, human rightsand governance structures. Meanwhile, utilities (up 2%) and health care (up 3%)were the worst-performing sectors for the full year for the index.
Taiwan (up 37%), led by its technology sector, was the best-performing Asianmarket in 2019, followed by China (up 21%), while Malaysia (down 2%) was theworst-performing market. South East Asian currencies in general and the Thai baht(up 8.6%) in particular had strong performance against the U.S. dollar in 2019. TheSouth Korean won (-3.5%) and Indian rupee (-2.25%) depreciated the most againstthe U.S. dollar during the year.
Performance Contributors and Detractors:
The Fund’s underweight to the information technology and communication serv-ices sectors, as well as stock selection in these sectors, detracted from performancefor the year. Technology was a big driver of index returns, but some of the compa-nies with the biggest gains in the index did not meet the Fund’s positive ESGscreening process. We were positive on the tech sector, but maintained a selectiveexposure to it, in line with the Fund’s focus on creating positive ESG outcomes.
Stock selection in health care, meanwhile, was a strong contributor to relative perform-ance despite the overweight allocation to the sector detracting a bit from performance.The health care sector has an outsized influence on ESG outcomes, as good health careat affordable prices is essential to Asia’s citizens leading healthy, productive lives. Accessto affordable health care remains a core tenet of our investing philosophy.
From a geographic perspective, the Fund’s overweight to India, as well as stock selection,detracted from relative performance for the year. India’s equity markets were positive in2019, but lagged the broader region. The lingering aftereffects of demonetization, GSTimplementation and more recently the fallout from a mishandled non-banking finan-cial company (NBFC) crisis led to a material slowdown in GDP growth. The slowdownwas manifested in weak auto sales, weak credit off-take and rising non-performing loansin the banking system and weak rural demand. Turning to individual companies domi-ciled in India, automobile and tractor maker Mahindra & Mahindra was the biggest
(continued)
1 Actual 2019 expense ratios.2 Matthews has contractually agreed (i) to waive fees and reimburse expenses to the extent needed to limit Total Annual Fund Operating Expenses (excluding Rule 12b-1 fees, taxes, interest, brokerage
commissions, short sale dividend expenses, expenses incurred in connection with any merger or reorganization or extraordinary expenses such as litigation) of the Institutional Class to 1.25% first by waivingclass specific expenses (i.e., shareholder service fees specific to a particular class) of the Institutional Class and then, to the extent necessary, by waiving non-class specific expenses (e.g., custody fees) of theInstitutional Class, and (ii) if any Fund-wide expenses (i.e., expenses that apply to both the Institutional Class and the Investor Class) are waived for the Institutional Class to maintain the 1.25% expenselimitation, to waive an equal amount (in annual percentage terms) of those same expenses for the Investor Class. Beginning on November 1, 2019, Matthews voluntarily reduced this expense limitation to1.20% for the Institutional Class. The Total Annual Fund Operating Expenses After Fee Waiver and Expense Reimbursement for the Investor Class may vary from year to year and will in some years exceed1.25%. If the operating expenses fall below the expense limitation in a year within three years after Matthews has made a waiver or reimbursement, the Fund may reimburse Matthews up to an amount thatdoes not cause the expenses for that year to exceed the lesser of (i) the expense limitation applicable at the time of that fee waiver and/or expense reimbursement or (ii) the expense limitation in effect at thetime of recoupment. This agreement will remain in place until April 30, 2021 and may be terminated at any time by the Board of Trustees on behalf of the Fund on 60 days’ written notice to Matthews.Matthews may decline to renew this agreement by written notice to the Trust at least 30 days before its annual expiration date.
3 The lesser of fiscal year 2019 long-term purchase costs or sales proceeds divided by the average monthly market value of long-term securities.
42 MATTHEWS ASIA FUNDS
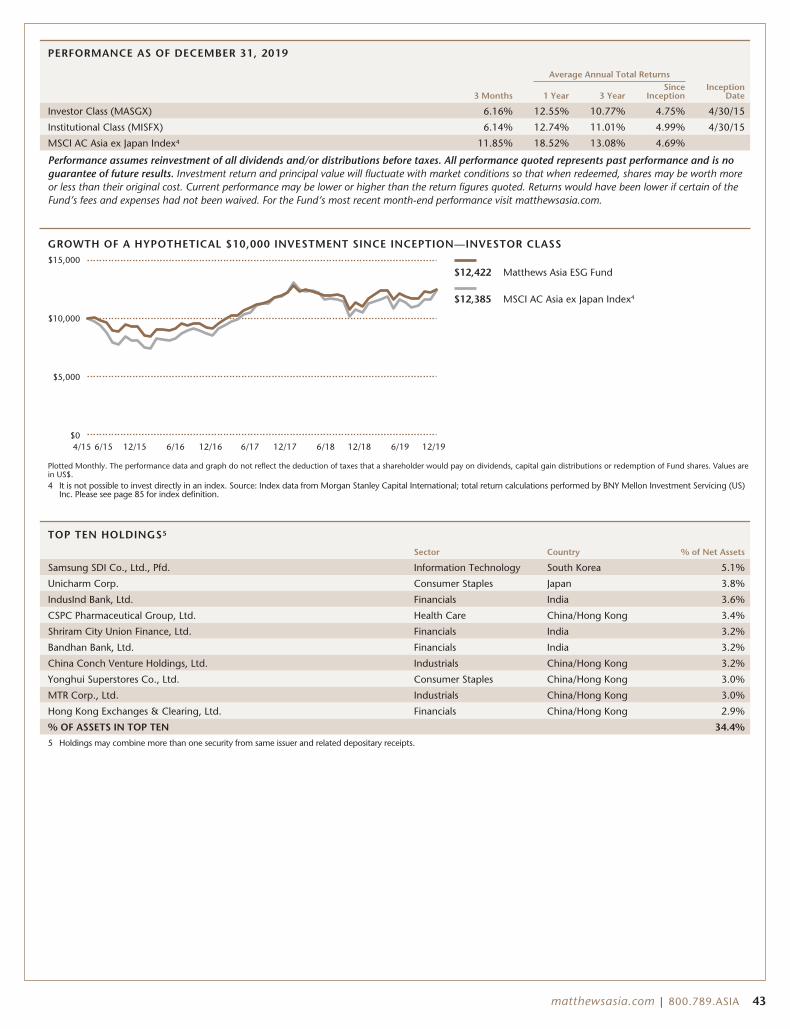
PERFORMANCE AS OF DECEMBER 31, 2019
Average Annual Total Returns
3 Months 1 Year 3 YearSince
InceptionInception
Date
Investor Class (MASGX) 6.16% 12.55% 10.77% 4.75% 4/30/15
Institutional Class (MISFX) 6.14% 12.74% 11.01% 4.99% 4/30/15
MSCI AC Asia ex Japan Index4 11.85% 18.52% 13.08% 4.69%
Performance assumes reinvestment of all dividends and/or distributions before taxes. All performance quoted represents past performance and is noguarantee of future results. Investment return and principal value will fluctuate with market conditions so that when redeemed, shares may be worth moreor less than their original cost. Current performance may be lower or higher than the return figures quoted. Returns would have been lower if certain of theFund’s fees and expenses had not been waived. For the Fund’s most recent month-end performance visit matthewsasia.com.
GROWTH OF A HYPOTHETICAL $10,000 INVESTMENT SINCE INCEPTION—INVESTOR CLASS
4/15 12/15 12/16 12/1912/18 6/196/186/176/166/15 12/17
$12,422 Matthews Asia ESG Fund
$12,385 MSCI AC Asia ex Japan Index4
$0
$15,000
$10,000
$5,000
Plotted Monthly. The performance data and graph do not reflect the deduction of taxes that a shareholder would pay on dividends, capital gain distributions or redemption of Fund shares. Values arein US$.4 It is not possible to invest directly in an index. Source: Index data from Morgan Stanley Capital International; total return calculations performed by BNY Mellon Investment Servicing (US)
Inc. Please see page 85 for index definition.
TOP TEN HOLDINGS5
Sector Country % of Net Assets
Samsung SDI Co., Ltd., Pfd. Information Technology South Korea 5.1%
Unicharm Corp. Consumer Staples Japan 3.8%
IndusInd Bank, Ltd. Financials India 3.6%
CSPC Pharmaceutical Group, Ltd. Health Care China/Hong Kong 3.4%
Shriram City Union Finance, Ltd. Financials India 3.2%
Bandhan Bank, Ltd. Financials India 3.2%
China Conch Venture Holdings, Ltd. Industrials China/Hong Kong 3.2%
Yonghui Superstores Co., Ltd. Consumer Staples China/Hong Kong 3.0%
MTR Corp., Ltd. Industrials China/Hong Kong 3.0%
Hong Kong Exchanges & Clearing, Ltd. Financials China/Hong Kong 2.9%
% OF ASSETS IN TOP TEN 34.4%
5 Holdings may combine more than one security from same issuer and related depositary receipts.
matthewsasia.com | 800.789.ASIA 43
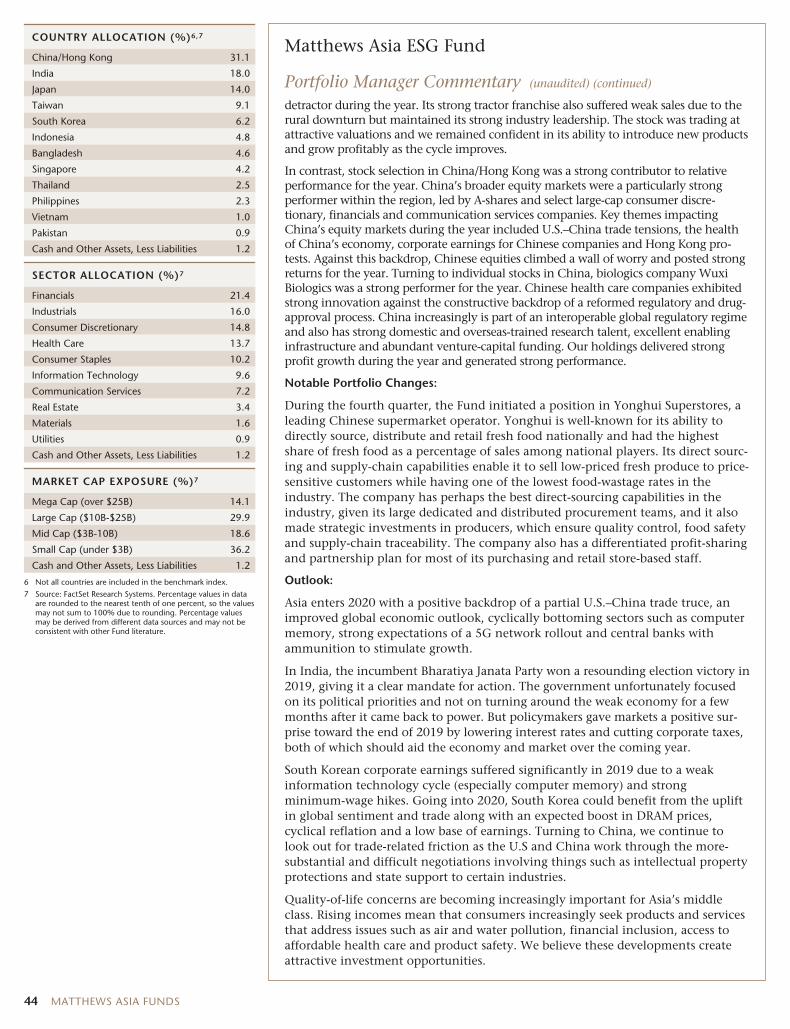
COUNTRY ALLOCATION (%)6,7
China/Hong Kong 31.1
India 18.0
Japan 14.0
Taiwan 9.1
South Korea 6.2
Indonesia 4.8
Bangladesh 4.6
Singapore 4.2
Thailand 2.5
Philippines 2.3
Vietnam 1.0
Pakistan 0.9
Cash and Other Assets, Less Liabilities 1.2
SECTOR ALLOCATION (%)7
Financials 21.4
Industrials 16.0
Consumer Discretionary 14.8
Health Care 13.7
Consumer Staples 10.2
Information Technology 9.6
Communication Services 7.2
Real Estate 3.4
Materials 1.6
Utilities 0.9
Cash and Other Assets, Less Liabilities 1.2
MARKET CAP EXPOSURE (%)7
Mega Cap (over $25B) 14.1
Large Cap ($10B-$25B) 29.9
Mid Cap ($3B-10B) 18.6
Small Cap (under $3B) 36.2
Cash and Other Assets, Less Liabilities 1.2
6 Not all countries are included in the benchmark index.
7 Source: FactSet Research Systems. Percentage values in dataare rounded to the nearest tenth of one percent, so the valuesmay not sum to 100% due to rounding. Percentage valuesmay be derived from different data sources and may not beconsistent with other Fund literature.
Matthews Asia ESG Fund
Portfolio Manager Commentary (unaudited) (continued)
detractor during the year. Its strong tractor franchise also suffered weak sales due to therural downturn but maintained its strong industry leadership. The stock was trading atattractive valuations and we remained confident in its ability to introduce new productsand grow profitably as the cycle improves.
In contrast, stock selection in China/Hong Kong was a strong contributor to relativeperformance for the year. China’s broader equity markets were a particularly strongperformer within the region, led by A-shares and select large-cap consumer discre-tionary, financials and communication services companies. Key themes impactingChina’s equity markets during the year included U.S.–China trade tensions, the healthof China’s economy, corporate earnings for Chinese companies and Hong Kong pro-tests. Against this backdrop, Chinese equities climbed a wall of worry and posted strongreturns for the year. Turning to individual stocks in China, biologics company WuxiBiologics was a strong performer for the year. Chinese health care companies exhibitedstrong innovation against the constructive backdrop of a reformed regulatory and drug-approval process. China increasingly is part of an interoperable global regulatory regimeand also has strong domestic and overseas-trained research talent, excellent enablinginfrastructure and abundant venture-capital funding. Our holdings delivered strongprofit growth during the year and generated strong performance.
Notable Portfolio Changes:
During the fourth quarter, the Fund initiated a position in Yonghui Superstores, aleading Chinese supermarket operator. Yonghui is well-known for its ability todirectly source, distribute and retail fresh food nationally and had the highestshare of fresh food as a percentage of sales among national players. Its direct sourc-ing and supply-chain capabilities enable it to sell low-priced fresh produce to price-sensitive customers while having one of the lowest food-wastage rates in theindustry. The company has perhaps the best direct-sourcing capabilities in theindustry, given its large dedicated and distributed procurement teams, and it alsomade strategic investments in producers, which ensure quality control, food safetyand supply-chain traceability. The company also has a differentiated profit-sharingand partnership plan for most of its purchasing and retail store-based staff.
Outlook:
Asia enters 2020 with a positive backdrop of a partial U.S.–China trade truce, animproved global economic outlook, cyclically bottoming sectors such as computermemory, strong expectations of a 5G network rollout and central banks withammunition to stimulate growth.
In India, the incumbent Bharatiya Janata Party won a resounding election victory in2019, giving it a clear mandate for action. The government unfortunately focusedon its political priorities and not on turning around the weak economy for a fewmonths after it came back to power. But policymakers gave markets a positive sur-prise toward the end of 2019 by lowering interest rates and cutting corporate taxes,both of which should aid the economy and market over the coming year.
South Korean corporate earnings suffered significantly in 2019 due to a weakinformation technology cycle (especially computer memory) and strongminimum-wage hikes. Going into 2020, South Korea could benefit from the upliftin global sentiment and trade along with an expected boost in DRAM prices,cyclical reflation and a low base of earnings. Turning to China, we continue tolook out for trade-related friction as the U.S and China work through the more-substantial and difficult negotiations involving things such as intellectual propertyprotections and state support to certain industries.
Quality-of-life concerns are becoming increasingly important for Asia’s middleclass. Rising incomes mean that consumers increasingly seek products and servicesthat address issues such as air and water pollution, financial inclusion, access toaffordable health care and product safety. We believe these developments createattractive investment opportunities.
44 MATTHEWS ASIA FUNDS
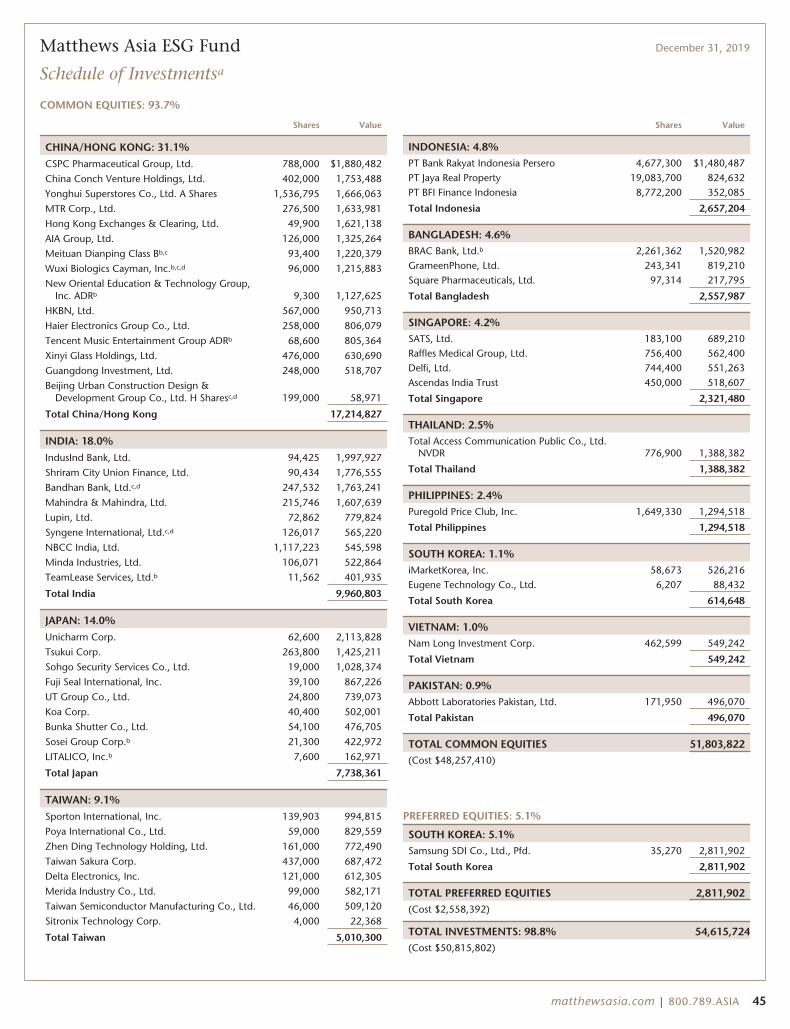
Matthews Asia ESG Fund December 31, 2019
Schedule of Investmentsa
COMMON EQUITIES: 93.7%
Shares Value
CHINA/HONG KONG: 31.1%
CSPC Pharmaceutical Group, Ltd. 788,000 $1,880,482
China Conch Venture Holdings, Ltd. 402,000 1,753,488
Yonghui Superstores Co., Ltd. A Shares 1,536,795 1,666,063
MTR Corp., Ltd. 276,500 1,633,981
Hong Kong Exchanges & Clearing, Ltd. 49,900 1,621,138
AIA Group, Ltd. 126,000 1,325,264
Meituan Dianping Class Bb,c 93,400 1,220,379
Wuxi Biologics Cayman, Inc.b,c,d 96,000 1,215,883
New Oriental Education & Technology Group,Inc. ADRb 9,300 1,127,625
HKBN, Ltd. 567,000 950,713
Haier Electronics Group Co., Ltd. 258,000 806,079
Tencent Music Entertainment Group ADRb 68,600 805,364
Xinyi Glass Holdings, Ltd. 476,000 630,690
Guangdong Investment, Ltd. 248,000 518,707
Beijing Urban Construction Design &Development Group Co., Ltd. H Sharesc,d 199,000 58,971
Total China/Hong Kong 17,214,827
INDIA: 18.0%
IndusInd Bank, Ltd. 94,425 1,997,927
Shriram City Union Finance, Ltd. 90,434 1,776,555
Bandhan Bank, Ltd.c,d 247,532 1,763,241
Mahindra & Mahindra, Ltd. 215,746 1,607,639
Lupin, Ltd. 72,862 779,824
Syngene International, Ltd.c,d 126,017 565,220
NBCC India, Ltd. 1,117,223 545,598
Minda Industries, Ltd. 106,071 522,864
TeamLease Services, Ltd.b 11,562 401,935
Total India 9,960,803
JAPAN: 14.0%
Unicharm Corp. 62,600 2,113,828
Tsukui Corp. 263,800 1,425,211
Sohgo Security Services Co., Ltd. 19,000 1,028,374
Fuji Seal International, Inc. 39,100 867,226
UT Group Co., Ltd. 24,800 739,073
Koa Corp. 40,400 502,001
Bunka Shutter Co., Ltd. 54,100 476,705
Sosei Group Corp.b 21,300 422,972
LITALICO, Inc.b 7,600 162,971
Total Japan 7,738,361
TAIWAN: 9.1%
Sporton International, Inc. 139,903 994,815
Poya International Co., Ltd. 59,000 829,559
Zhen Ding Technology Holding, Ltd. 161,000 772,490
Taiwan Sakura Corp. 437,000 687,472
Delta Electronics, Inc. 121,000 612,305
Merida Industry Co., Ltd. 99,000 582,171
Taiwan Semiconductor Manufacturing Co., Ltd. 46,000 509,120
Sitronix Technology Corp. 4,000 22,368
Total Taiwan 5,010,300
Shares Value
INDONESIA: 4.8%PT Bank Rakyat Indonesia Persero 4,677,300 $1,480,487PT Jaya Real Property 19,083,700 824,632PT BFI Finance Indonesia 8,772,200 352,085
Total Indonesia 2,657,204
BANGLADESH: 4.6%BRAC Bank, Ltd.b 2,261,362 1,520,982GrameenPhone, Ltd. 243,341 819,210Square Pharmaceuticals, Ltd. 97,314 217,795
Total Bangladesh 2,557,987
SINGAPORE: 4.2%SATS, Ltd. 183,100 689,210Raffles Medical Group, Ltd. 756,400 562,400Delfi, Ltd. 744,400 551,263Ascendas India Trust 450,000 518,607
Total Singapore 2,321,480
THAILAND: 2.5%Total Access Communication Public Co., Ltd.
NVDR 776,900 1,388,382
Total Thailand 1,388,382
PHILIPPINES: 2.4%Puregold Price Club, Inc. 1,649,330 1,294,518
Total Philippines 1,294,518
SOUTH KOREA: 1.1%iMarketKorea, Inc. 58,673 526,216Eugene Technology Co., Ltd. 6,207 88,432
Total South Korea 614,648
VIETNAM: 1.0%Nam Long Investment Corp. 462,599 549,242
Total Vietnam 549,242
PAKISTAN: 0.9%Abbott Laboratories Pakistan, Ltd. 171,950 496,070
Total Pakistan 496,070
TOTAL COMMON EQUITIES 51,803,822(Cost $48,257,410)
PREFERRED EQUITIES: 5.1%
SOUTH KOREA: 5.1%Samsung SDI Co., Ltd., Pfd. 35,270 2,811,902
Total South Korea 2,811,902
TOTAL PREFERRED EQUITIES 2,811,902(Cost $2,558,392)
TOTAL INVESTMENTS: 98.8% 54,615,724(Cost $50,815,802)
matthewsasia.com | 800.789.ASIA 45
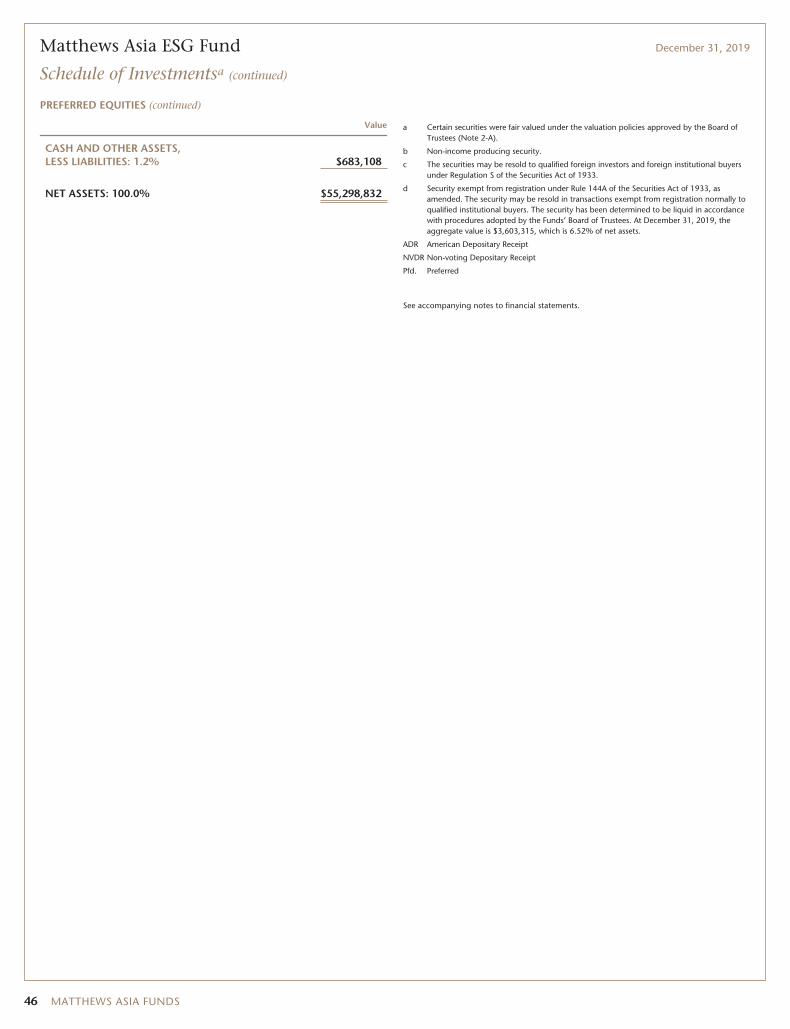
Matthews Asia ESG Fund December 31, 2019
Schedule of Investmentsa (continued)
PREFERRED EQUITIES (continued)
Value
CASH AND OTHER ASSETS,LESS LIABILITIES: 1.2% $683,108
NET ASSETS: 100.0% $55,298,832
a Certain securities were fair valued under the valuation policies approved by the Board ofTrustees (Note 2-A).
b Non-income producing security.
c The securities may be resold to qualified foreign investors and foreign institutional buyersunder Regulation S of the Securities Act of 1933.
d Security exempt from registration under Rule 144A of the Securities Act of 1933, asamended. The security may be resold in transactions exempt from registration normally toqualified institutional buyers. The security has been determined to be liquid in accordancewith procedures adopted by the Funds’ Board of Trustees. At December 31, 2019, theaggregate value is $3,603,315, which is 6.52% of net assets.
ADR American Depositary Receipt
NVDR Non-voting Depositary Receipt
Pfd. Preferred
See accompanying notes to financial statements.
46 MATTHEWS ASIA FUNDS

ASIA GROWTH STRATEGIES
PORTFOLIO MANAGERS
Taizo Ishida Robert Harvey, CFALead Manager Lead Manager
FUND FACTS
Investor InstitutionalTicker MEASX MIASXCUSIP 577125883 577125875Inception 4/30/13 4/30/13NAV $12.07 $12.13Initial Investment $2,500 $100,000Gross Expense Ratio1 1.65% 1.51%After Fee Waiver andReimbursement2 1.46% 1.25%
Portfolio StatisticsTotal # of Positions 57Net Assets $320.2 millionWeighted Average Market Cap $1.9 billionPortfolio Turnover3 18.77%
BenchmarkMSCI Emerging Markets Asia Index
OBJECTIVE
Long-term capital appreciation.
STRATEGY
Under normal market conditions, the Fund seeks toachieve its investment objective by investing at least80% of its net assets, which include borrowings forinvestment purposes, in the common and preferredstocks of companies located in Asia excluding Japan,South Korea, Hong Kong and Singapore. The Fundmay also invest in the convertible securities, of anyduration or quality, of companies located in Asiaexcluding Japan, South Korea, Hong Kong andSingapore. Under normal market conditions, theFund is expected to invest a substantial portion of itsnet assets in the emerging countries and markets inthe Asian region, including, but not limited to,Bangladesh, Cambodia, China (including Taiwan, butexcluding Hong Kong), India, Indonesia, Laos,Malaysia, Mongolia, Myanmar, Pakistan, Papua NewGuinea, Philippines, Sri Lanka, Thailand, and Vietnam.
Matthews Emerging Asia Fund
Portfolio Manager Commentary (unaudited)
For the year ending December 31, 2019, the Matthews Emerging Asia Fundreturned -1.01% (Investor Class) and -0.85% (Institutional Class), while its bench-mark the MSCI Emerging Markets Asia Index, returned 19.65%. For the fourthquarter, the Fund returned 5.94% (Investor Class) and 5.91% (Institutional Class)versus 12.59% for the Index.
Market Environment:
The North Asian markets of Taiwan, China and South Korea were strong perform-ers in 2019, while the South and Southeast Asian markets of India, Malaysia, thePhilippines and Indonesia ended the year with positive, but less robust, returns.Despite U.S.–China trade tensions and political protests in Hong Kong, Chineseequities climbed a wall of worry and delivered some of the highest returns in theregion. Meanwhile, expectations for 5G rollout globally led to positive sentimentfor IT hardware companies in Taiwan.
In contrast, sentiment was weaker in 2019 toward many frontier and less-developed markets in Asia. India’s economy suffered a significant slowdown ingrowth throughout the year, which depressed earnings in many sectors—especiallyin consumer discretionary, health care and industrials. India’s broader equitymarket generated positive, but single digit, returns. A bombing in Sri Lanka inApril 2019 caused economic disruption and dampened sentiment. In Pakistan,sharp currency weakness and the resulting tepid economy may have kept someinvestors on the sidelines, even as equity prices showed modest gains. Thailand’sequity markets were slightly negative for the year.
While equity returns in less-developed parts of Asia lagged their more-developedpeers in the benchmark, there were positive developments in 2019 for frontier Asiaeconomies. Policymakers in many frontier and less-developed Asian markets tookconstructive steps to support growth. Interest rates remained low across much ofthe region. And U.S.–China trade tensions, while appearing to ease, nonethelessspurred interest in building out local supply chains within Asia, including in Southand Southeast Asia.
Performance Contributors and Detractors:
The Fund’s focus on less-developed markets accounted for much of the Fund’s relativeunderperformance versus its benchmark for the full year 2019. Taiwan, China andSouth Korea collectively made up more than three-quarters of the benchmark at year-end 2019, resulting in benchmark returns heavily swayed by more-developed coun-tries within Asia. The Fund has no holdings in Taiwan, China or South Korea. Overlonger time horizons, we believe that less-developed markets have attractive growthpotential and are fertile environments for active management.
From an individual stock perspective, PC Jeweller was a detractor from perform-ance in 2019. The stock price declined amid negative investor sentiment about thecompany, subject to persistent rumors and hearsay. We decided to exit the stock.Other detractors include two cigarette producers: Gudang Garam, based inIndonesia; and British American Tobacco, based in Bangladesh. The primary rea-sons for the softness in share prices were concerns over higher local excise taxes
(continued)
1 Actual 2019 expense ratios.2 Matthews has contractually agreed (i) to waive fees and reimburse expenses to the extent needed to limit Total Annual Fund Operating Expenses (excluding Rule 12b-1 fees, taxes, interest, brokerage commissions,
short sale dividend expenses, expenses incurred in connection with any merger or reorganization or extraordinary expenses such as litigation) of the Institutional Class to 1.25% first by waiving class specific expenses(i.e., shareholder service fees specific to a particular class) of the Institutional Class and then, to the extent necessary, by waiving non-class specific expenses (e.g., custody fees) of the Institutional Class, and (ii) if anyFund-wide expenses (i.e., expenses that apply to both the Institutional Class and the Investor Class) are waived for the Institutional Class to maintain the 1.25% expense limitation, to waive an equal amount (inannual percentage terms) of those same expenses for the Investor Class. Beginning on November 1, 2019, Matthews voluntarily reduced this expense limitation to 1.20% for the Institutional Class. The Total AnnualFund Operating Expenses After Fee Waiver and Expense Reimbursement for the Investor Class may vary from year to year and will in some years exceed 1.25%. If the operating expenses fall below the expenselimitation in a year within three years after Matthews has made a waiver or reimbursement, the Fund may reimburse Matthews up to an amount that does not cause the expenses for that year to exceed the lesser of(i) the expense limitation applicable at the time of that fee waiver and/or expense reimbursement or (ii) the expense limitation in effect at the time of recoupment. This agreement will remain in place until April 30,2021 and may be terminated at any time by the Board of Trustees on behalf of the Fund on 60 days’ written notice to Matthews. Matthews may decline to renew this agreement by written notice to the Trust at least30 days before its annual expiration date.
3 The lesser of fiscal year 2019 long-term purchase costs or sales proceeds divided by the average monthly market value of long-term securities.
matthewsasia.com | 800.789.ASIA 47

PERFORMANCE AS OF DECEMBER 31, 2019
Average Annual Total Returns
3 Months 1 Year 3 Years 5 YearsSince
InceptionInception
Date
Investor Class (MEASX) 5.94% -1.01% -1.14% 2.34% 4.13% 4/30/13
Institutional Class (MIASX) 5.91% -0.85% -0.94% 2.57% 4.36% 4/30/13
MSCI Emerging Markets Asia Index4 12.59% 19.65% 13.30% 7.00% 6.35%
Performance assumes reinvestment of all dividends and/or distributions before taxes. All performance quoted represents past performance and is noguarantee of future results. Investment return and principal value will fluctuate with market conditions so that when redeemed, shares may be worth moreor less than their original cost. Current performance may be lower or higher than the return figures quoted. Returns would have been lower if certain of theFund’s fees and expenses had not been waived. For the Fund’s most recent month-end performance visit matthewsasia.com.
GROWTH OF A HYPOTHETICAL $10,000 INVESTMENT SINCE INCEPTION—INVESTOR CLASS
$13,098 Matthews Emerging Asia Fund
$15,079 MSCI Emerging Markets Asia Index4
4/13 12/1912/1812/1712/13$6,000
$8,000
$10,000
$12,000
$14,000
$18,000
$16,000
12/1612/1512/14
Plotted monthly. The performance data and graph do not reflect the deduction of taxes that a shareholder would pay on dividends, capital gain distributions or redemption of Fund shares. Values arein US$.4 It is not possible to invest directly in an index. Source: Index data from Morgan Stanley Capital International and Bloomberg; total return calculations performed by BNY Mellon Invest-
ment Servicing (US) Inc. Please see page 85 for index definition.
TOP TEN HOLDINGS5
Sector Country % of Net Assets
PT Kino Indonesia Consumer Staples Indonesia 3.7%
Cosco Capital, Inc. Consumer Staples Philippines 3.7%
Sampath Bank PLC Financials Sri Lanka 3.5%
Phu Nhuan Jewelry JSC Consumer Discretionary Vietnam 3.5%
Vinh Hoan Corp. Consumer Staples Vietnam 3.4%
L&T Finance Holdings, Ltd. Financials India 3.1%
John Keells Holdings PLC Industrials Sri Lanka 3.0%
PT Bank Mandiri Persero Financials Indonesia 2.8%
PT Adira Dinamika Multi Finance Financials Indonesia 2.8%
Indus Motor Co., Ltd. Consumer Discretionary Pakistan 2.7%
% OF ASSETS IN TOP TEN 32.2%
5 Holdings may combine more than one security from same issuer and related depositary receipts.
48 MATTHEWS ASIA FUNDS
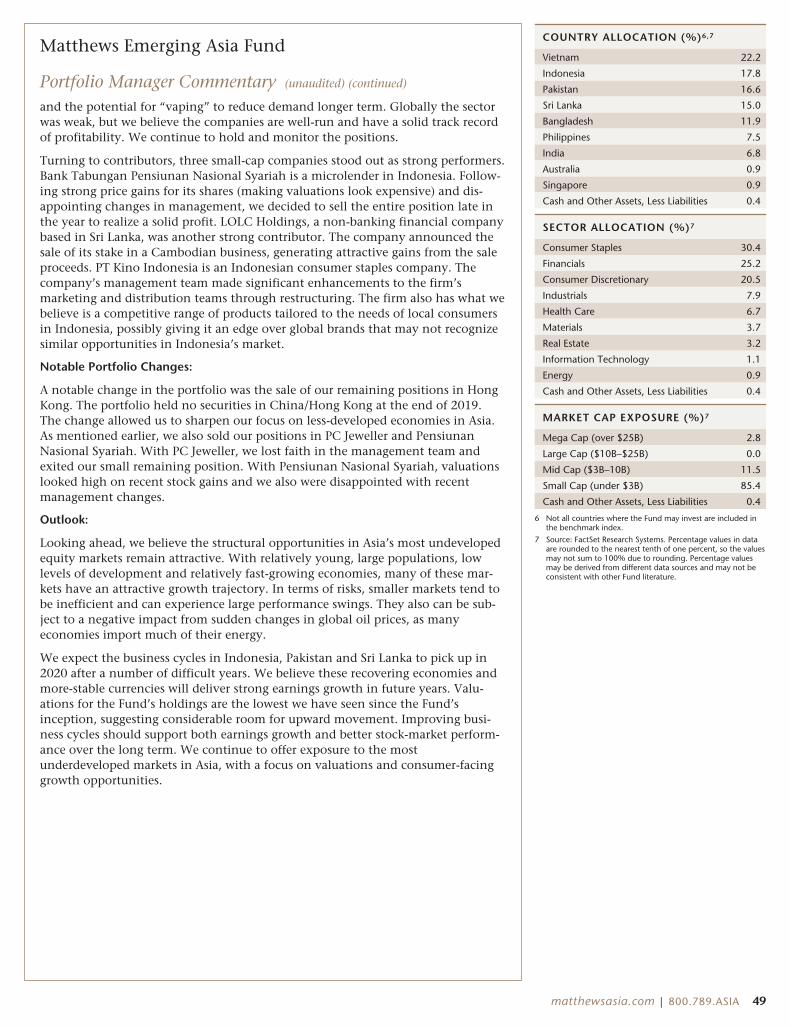
Matthews Emerging Asia Fund
Portfolio Manager Commentary (unaudited) (continued)
and the potential for “vaping” to reduce demand longer term. Globally the sectorwas weak, but we believe the companies are well-run and have a solid track recordof profitability. We continue to hold and monitor the positions.
Turning to contributors, three small-cap companies stood out as strong performers.Bank Tabungan Pensiunan Nasional Syariah is a microlender in Indonesia. Follow-ing strong price gains for its shares (making valuations look expensive) and dis-appointing changes in management, we decided to sell the entire position late inthe year to realize a solid profit. LOLC Holdings, a non-banking financial companybased in Sri Lanka, was another strong contributor. The company announced thesale of its stake in a Cambodian business, generating attractive gains from the saleproceeds. PT Kino Indonesia is an Indonesian consumer staples company. Thecompany’s management team made significant enhancements to the firm’smarketing and distribution teams through restructuring. The firm also has what webelieve is a competitive range of products tailored to the needs of local consumersin Indonesia, possibly giving it an edge over global brands that may not recognizesimilar opportunities in Indonesia’s market.
Notable Portfolio Changes:
A notable change in the portfolio was the sale of our remaining positions in HongKong. The portfolio held no securities in China/Hong Kong at the end of 2019.The change allowed us to sharpen our focus on less-developed economies in Asia.As mentioned earlier, we also sold our positions in PC Jeweller and PensiunanNasional Syariah. With PC Jeweller, we lost faith in the management team andexited our small remaining position. With Pensiunan Nasional Syariah, valuationslooked high on recent stock gains and we also were disappointed with recentmanagement changes.
Outlook:
Looking ahead, we believe the structural opportunities in Asia’s most undevelopedequity markets remain attractive. With relatively young, large populations, lowlevels of development and relatively fast-growing economies, many of these mar-kets have an attractive growth trajectory. In terms of risks, smaller markets tend tobe inefficient and can experience large performance swings. They also can be sub-ject to a negative impact from sudden changes in global oil prices, as manyeconomies import much of their energy.
We expect the business cycles in Indonesia, Pakistan and Sri Lanka to pick up in2020 after a number of difficult years. We believe these recovering economies andmore-stable currencies will deliver strong earnings growth in future years. Valu-ations for the Fund’s holdings are the lowest we have seen since the Fund’sinception, suggesting considerable room for upward movement. Improving busi-ness cycles should support both earnings growth and better stock-market perform-ance over the long term. We continue to offer exposure to the mostunderdeveloped markets in Asia, with a focus on valuations and consumer-facinggrowth opportunities.
COUNTRY ALLOCATION (%)6,7
Vietnam 22.2
Indonesia 17.8
Pakistan 16.6
Sri Lanka 15.0
Bangladesh 11.9
Philippines 7.5
India 6.8
Australia 0.9
Singapore 0.9
Cash and Other Assets, Less Liabilities 0.4
SECTOR ALLOCATION (%)7
Consumer Staples 30.4
Financials 25.2
Consumer Discretionary 20.5
Industrials 7.9
Health Care 6.7
Materials 3.7
Real Estate 3.2
Information Technology 1.1
Energy 0.9
Cash and Other Assets, Less Liabilities 0.4
MARKET CAP EXPOSURE (%)7
Mega Cap (over $25B) 2.8
Large Cap ($10B–$25B) 0.0
Mid Cap ($3B–10B) 11.5
Small Cap (under $3B) 85.4
Cash and Other Assets, Less Liabilities 0.4
6 Not all countries where the Fund may invest are included inthe benchmark index.
7 Source: FactSet Research Systems. Percentage values in dataare rounded to the nearest tenth of one percent, so the valuesmay not sum to 100% due to rounding. Percentage valuesmay be derived from different data sources and may not beconsistent with other Fund literature.
matthewsasia.com | 800.789.ASIA 49
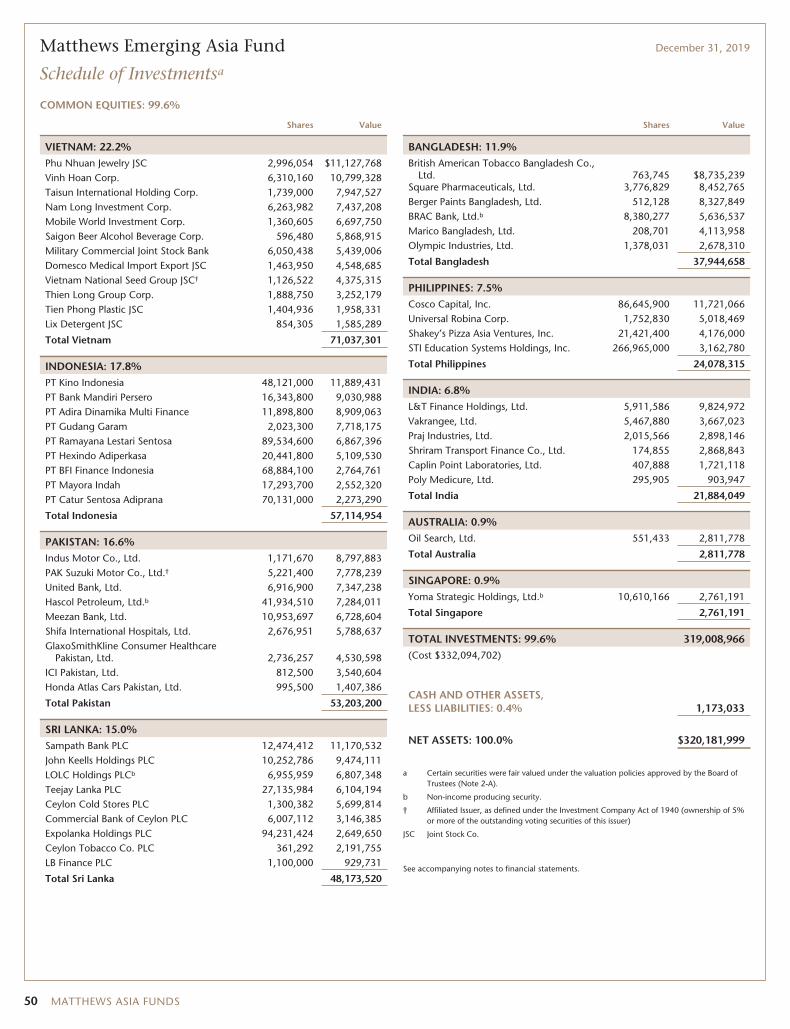
Matthews Emerging Asia Fund December 31, 2019
Schedule of Investmentsa
COMMON EQUITIES: 99.6%
Shares Value
VIETNAM: 22.2%Phu Nhuan Jewelry JSC 2,996,054 $11,127,768Vinh Hoan Corp. 6,310,160 10,799,328Taisun International Holding Corp. 1,739,000 7,947,527Nam Long Investment Corp. 6,263,982 7,437,208Mobile World Investment Corp. 1,360,605 6,697,750Saigon Beer Alcohol Beverage Corp. 596,480 5,868,915Military Commercial Joint Stock Bank 6,050,438 5,439,006Domesco Medical Import Export JSC 1,463,950 4,548,685Vietnam National Seed Group JSC† 1,126,522 4,375,315Thien Long Group Corp. 1,888,750 3,252,179Tien Phong Plastic JSC 1,404,936 1,958,331Lix Detergent JSC 854,305 1,585,289
Total Vietnam 71,037,301
INDONESIA: 17.8%PT Kino Indonesia 48,121,000 11,889,431PT Bank Mandiri Persero 16,343,800 9,030,988PT Adira Dinamika Multi Finance 11,898,800 8,909,063PT Gudang Garam 2,023,300 7,718,175PT Ramayana Lestari Sentosa 89,534,600 6,867,396PT Hexindo Adiperkasa 20,441,800 5,109,530PT BFI Finance Indonesia 68,884,100 2,764,761PT Mayora Indah 17,293,700 2,552,320PT Catur Sentosa Adiprana 70,131,000 2,273,290
Total Indonesia 57,114,954
PAKISTAN: 16.6%Indus Motor Co., Ltd. 1,171,670 8,797,883PAK Suzuki Motor Co., Ltd.† 5,221,400 7,778,239United Bank, Ltd. 6,916,900 7,347,238Hascol Petroleum, Ltd.b 41,934,510 7,284,011Meezan Bank, Ltd. 10,953,697 6,728,604Shifa International Hospitals, Ltd. 2,676,951 5,788,637GlaxoSmithKline Consumer Healthcare
Pakistan, Ltd. 2,736,257 4,530,598ICI Pakistan, Ltd. 812,500 3,540,604Honda Atlas Cars Pakistan, Ltd. 995,500 1,407,386
Total Pakistan 53,203,200
SRI LANKA: 15.0%Sampath Bank PLC 12,474,412 11,170,532John Keells Holdings PLC 10,252,786 9,474,111LOLC Holdings PLCb 6,955,959 6,807,348Teejay Lanka PLC 27,135,984 6,104,194Ceylon Cold Stores PLC 1,300,382 5,699,814Commercial Bank of Ceylon PLC 6,007,112 3,146,385Expolanka Holdings PLC 94,231,424 2,649,650Ceylon Tobacco Co. PLC 361,292 2,191,755LB Finance PLC 1,100,000 929,731
Total Sri Lanka 48,173,520
Shares Value
BANGLADESH: 11.9%British American Tobacco Bangladesh Co.,
Ltd. 763,745 $8,735,239Square Pharmaceuticals, Ltd. 3,776,829 8,452,765Berger Paints Bangladesh, Ltd. 512,128 8,327,849BRAC Bank, Ltd.b 8,380,277 5,636,537Marico Bangladesh, Ltd. 208,701 4,113,958Olympic Industries, Ltd. 1,378,031 2,678,310
Total Bangladesh 37,944,658
PHILIPPINES: 7.5%Cosco Capital, Inc. 86,645,900 11,721,066Universal Robina Corp. 1,752,830 5,018,469Shakey’s Pizza Asia Ventures, Inc. 21,421,400 4,176,000STI Education Systems Holdings, Inc. 266,965,000 3,162,780
Total Philippines 24,078,315
INDIA: 6.8%L&T Finance Holdings, Ltd. 5,911,586 9,824,972Vakrangee, Ltd. 5,467,880 3,667,023Praj Industries, Ltd. 2,015,566 2,898,146Shriram Transport Finance Co., Ltd. 174,855 2,868,843Caplin Point Laboratories, Ltd. 407,888 1,721,118Poly Medicure, Ltd. 295,905 903,947
Total India 21,884,049
AUSTRALIA: 0.9%Oil Search, Ltd. 551,433 2,811,778
Total Australia 2,811,778
SINGAPORE: 0.9%Yoma Strategic Holdings, Ltd.b 10,610,166 2,761,191
Total Singapore 2,761,191
TOTAL INVESTMENTS: 99.6% 319,008,966(Cost $332,094,702)
CASH AND OTHER ASSETS,LESS LIABILITIES: 0.4% 1,173,033
NET ASSETS: 100.0% $320,181,999
a Certain securities were fair valued under the valuation policies approved by the Board ofTrustees (Note 2-A).
b Non-income producing security.
† Affiliated Issuer, as defined under the Investment Company Act of 1940 (ownership of 5%or more of the outstanding voting securities of this issuer)
JSC Joint Stock Co.
See accompanying notes to financial statements.
50 MATTHEWS ASIA FUNDS
ASIA GROWTH STRATEGIES
PORTFOLIO MANAGERS
Michael J. Oh, CFALead Manager
Tiffany Hsiao, CFACo-Manager
FUND FACTS
Investor InstitutionalTicker MATFX MITEXCUSIP 577130883 577125859Inception 12/27/99 4/30/13NAV $14.55 $14.64Initial Investment $2,500 $100,000Gross Expense Ratio1 1.19% 1.05%
Portfolio StatisticsTotal # of Positions 36Net Assets $304.5 millionWeighted Average Market Cap $117.6 billionPortfolio Turnover2 80.10%
BenchmarkMSCI AC Asia ex Japan Index
OBJECTIVE
Long-term capital appreciation.
STRATEGY
Under normal market conditions, the Fund seeks toachieve its investment objective by investing at least80% of its net assets, which include borrowings forinvestment purposes, in the common and preferredstocks of companies located in Asia that Matthewsbelieves are innovators in their products, services,processes, business models, management, use oftechnology, or approach to creating, expanding orservicing their markets. Asia consists of all countriesand markets in Asia, including developed, emerging,and frontier countries and markets in the Asianregion.
Matthews Asia Innovators Fund
Portfolio Manager Commentary (unaudited)
For the year ending December 31, 2019, the Matthews Asia Innovators Fundreturned 29.60% (Investor Class) and 29.71% (Institutional Class), while itsbenchmark, the MSCI All Country Asia ex Japan Index, returned 18.52% over thesame period. For the quarter of the year, the Fund returned 13.21% (Investor Class)and 13.30% (Institutional Class) versus 11.85% for the Index.
Market Environment:
Asia ex Japan equities generated attractive returns in 2019, amid periods of vola-tility. China was a particularly strong performer, led by A-shares and select large-capconsumer discretionary, financials and communication services companies. Keythemes impacting China’s equity markets during the year included U.S.–Chinatrade tensions, the health of China’s economy, corporate earnings for Chinesecompanies and Hong Kong protests. Against this background, Chinese equitiesclimbed a wall of worry and posted strong returns.
India’s equity market was positive in 2019, but lagged the broader region. Over thepast couple of years, India implemented financial reforms to increase tax collec-tions and create a more-level playing field for businesses. These reforms were pos-itive for the long term, but created softer growth in the short term. India’spolicymakers gave markets a positive surprise in the second half of 2019 by low-ering interest rates and cutting corporate taxes, both of which should be positivefor growth.
South Korea’s equities also underperformed broader Asia and emerging markets in2019. Government policies showed mixed results as corporate earnings and hiringtendencies were negatively affected by stiff hikes in the minimum wage over the pasttwo years. In fact, South Korean corporate earnings suffered significantly in 2019,which was a primary reason for underperformance. Going into 2020, however, SouthKorea should benefit from an uplift in global sentiment and trade, along with anexpected boost in DRAM prices, cyclical reflation and a low base of earnings.
Performance Contributors and Detractors:
The Fund outperformed its benchmark for the full year 2019. The largest contributorto performance was the Fund’s overweight to China. Despite all the media noise overU.S.–China trade tensions, we believed that fundamentals ultimately drove China’sstrong returns. With conviction in our bottom-up stock selection process, we stuck toour investment thesis around our China holdings. Notably, we looked for companiesthat we believed had the potential to perform well regardless of the outcome of U.S.–China trade negotiations. Chinese information-technology company Silergy was aperformance contributor for the year. As China’s largest analog semiconductor com-pany, its share price benefited from China’s trend of looking for local technologysolutions, as well as the semiconductor demand recovery.
The Fund’s underweight to Taiwan, meanwhile, was a detractor. Sentiment towardinformation technology hardware companies, particularly those domiciled inTaiwan, was strong during the year on investor expectations related to the rolloutof 5G globally. South Korean confectionary maker Orion also detracted from per-formance. The company was slow to introduce new products into China, butrecent product launches showed momentum. We remain constructive on thecompany’s underlying business and continue to monitor the position.
Notable Portfolio Changes:
In the fourth quarter, we initiated a position in Alphamab Oncology, a Chineseclinical-stage biopharmaceutical company, by participating in the company’s initial
(continued)
1 Actual 2019 expense ratios.2 The lesser of fiscal year 2019 long-term purchase costs or sales proceeds divided by the average monthly market value of long-term securities.
matthewsasia.com | 800.789.ASIA 51
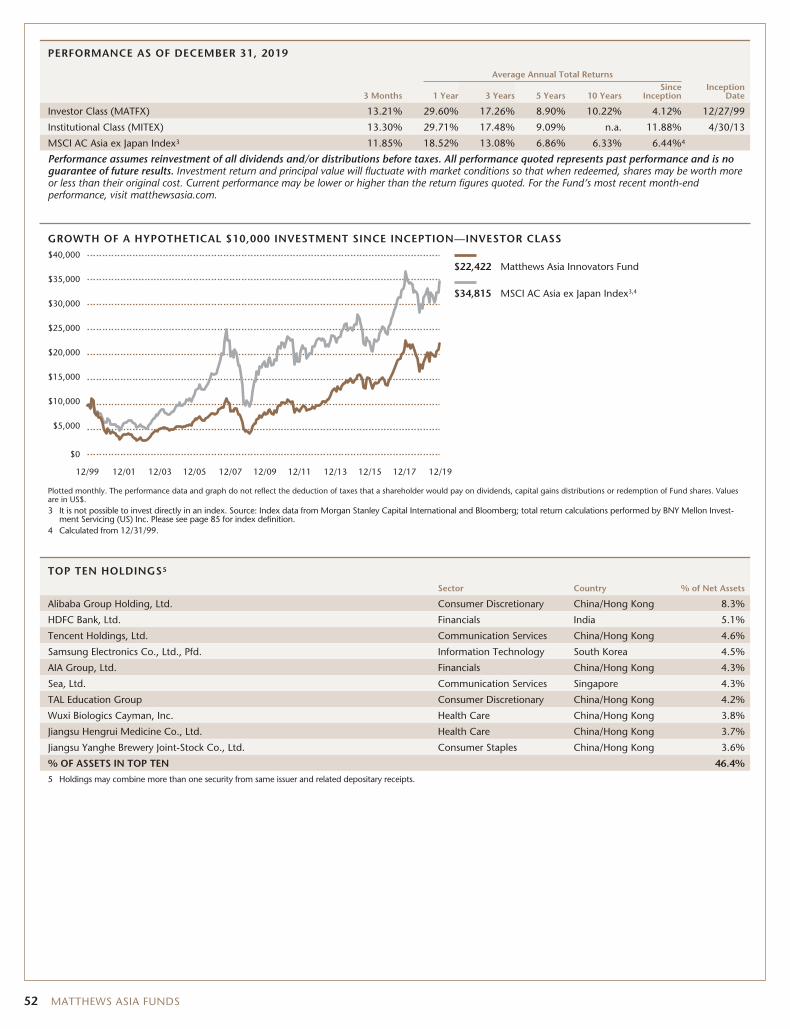
PERFORMANCE AS OF DECEMBER 31, 2019
Average Annual Total Returns
3 Months 1 Year 3 Years 5 Years 10 YearsSince
InceptionInception
Date
Investor Class (MATFX) 13.21% 29.60% 17.26% 8.90% 10.22% 4.12% 12/27/99
Institutional Class (MITEX) 13.30% 29.71% 17.48% 9.09% n.a. 11.88% 4/30/13
MSCI AC Asia ex Japan Index3 11.85% 18.52% 13.08% 6.86% 6.33% 6.44%4
Performance assumes reinvestment of all dividends and/or distributions before taxes. All performance quoted represents past performance and is noguarantee of future results. Investment return and principal value will fluctuate with market conditions so that when redeemed, shares may be worth moreor less than their original cost. Current performance may be lower or higher than the return figures quoted. For the Fund’s most recent month-endperformance, visit matthewsasia.com.
GROWTH OF A HYPOTHETICAL $10,000 INVESTMENT SINCE INCEPTION—INVESTOR CLASS
12/0112/99 12/03 12/05 12/07 12/09 12/11 12/13 12/15 12/17 12/19
$22,422 Matthews Asia Innovators Fund
$34,815 MSCI AC Asia ex Japan Index3,4
$0
$40,000
$35,000
$20,000
$25,000
$30,000
$15,000
$10,000
$5,000
Plotted monthly. The performance data and graph do not reflect the deduction of taxes that a shareholder would pay on dividends, capital gains distributions or redemption of Fund shares. Valuesare in US$.3 It is not possible to invest directly in an index. Source: Index data from Morgan Stanley Capital International and Bloomberg; total return calculations performed by BNY Mellon Invest-
ment Servicing (US) Inc. Please see page 85 for index definition.4 Calculated from 12/31/99.
TOP TEN HOLDINGS5
Sector Country % of Net Assets
Alibaba Group Holding, Ltd. Consumer Discretionary China/Hong Kong 8.3%
HDFC Bank, Ltd. Financials India 5.1%
Tencent Holdings, Ltd. Communication Services China/Hong Kong 4.6%
Samsung Electronics Co., Ltd., Pfd. Information Technology South Korea 4.5%
AIA Group, Ltd. Financials China/Hong Kong 4.3%
Sea, Ltd. Communication Services Singapore 4.3%
TAL Education Group Consumer Discretionary China/Hong Kong 4.2%
Wuxi Biologics Cayman, Inc. Health Care China/Hong Kong 3.8%
Jiangsu Hengrui Medicine Co., Ltd. Health Care China/Hong Kong 3.7%
Jiangsu Yanghe Brewery Joint-Stock Co., Ltd. Consumer Staples China/Hong Kong 3.6%
% OF ASSETS IN TOP TEN 46.4%
5 Holdings may combine more than one security from same issuer and related depositary receipts.
52 MATTHEWS ASIA FUNDS
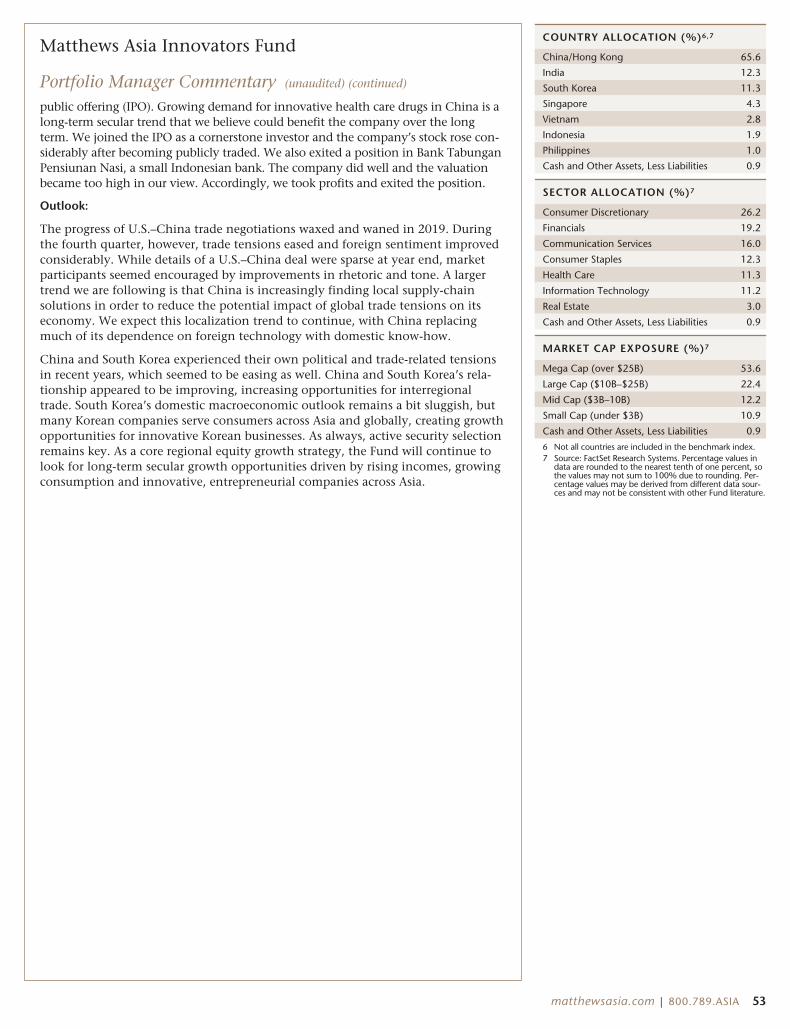
Matthews Asia Innovators Fund
Portfolio Manager Commentary (unaudited) (continued)
public offering (IPO). Growing demand for innovative health care drugs in China is along-term secular trend that we believe could benefit the company over the longterm. We joined the IPO as a cornerstone investor and the company’s stock rose con-siderably after becoming publicly traded. We also exited a position in Bank TabunganPensiunan Nasi, a small Indonesian bank. The company did well and the valuationbecame too high in our view. Accordingly, we took profits and exited the position.
Outlook:
The progress of U.S.–China trade negotiations waxed and waned in 2019. Duringthe fourth quarter, however, trade tensions eased and foreign sentiment improvedconsiderably. While details of a U.S.–China deal were sparse at year end, marketparticipants seemed encouraged by improvements in rhetoric and tone. A largertrend we are following is that China is increasingly finding local supply-chainsolutions in order to reduce the potential impact of global trade tensions on itseconomy. We expect this localization trend to continue, with China replacingmuch of its dependence on foreign technology with domestic know-how.
China and South Korea experienced their own political and trade-related tensionsin recent years, which seemed to be easing as well. China and South Korea’s rela-tionship appeared to be improving, increasing opportunities for interregionaltrade. South Korea’s domestic macroeconomic outlook remains a bit sluggish, butmany Korean companies serve consumers across Asia and globally, creating growthopportunities for innovative Korean businesses. As always, active security selectionremains key. As a core regional equity growth strategy, the Fund will continue tolook for long-term secular growth opportunities driven by rising incomes, growingconsumption and innovative, entrepreneurial companies across Asia.
COUNTRY ALLOCATION (%)6,7
China/Hong Kong 65.6
India 12.3
South Korea 11.3
Singapore 4.3
Vietnam 2.8
Indonesia 1.9
Philippines 1.0
Cash and Other Assets, Less Liabilities 0.9
SECTOR ALLOCATION (%)7
Consumer Discretionary 26.2
Financials 19.2
Communication Services 16.0
Consumer Staples 12.3
Health Care 11.3
Information Technology 11.2
Real Estate 3.0
Cash and Other Assets, Less Liabilities 0.9
MARKET CAP EXPOSURE (%)7
Mega Cap (over $25B) 53.6
Large Cap ($10B–$25B) 22.4
Mid Cap ($3B–10B) 12.2
Small Cap (under $3B) 10.9
Cash and Other Assets, Less Liabilities 0.9
6 Not all countries are included in the benchmark index.7 Source: FactSet Research Systems. Percentage values in
data are rounded to the nearest tenth of one percent, sothe values may not sum to 100% due to rounding. Per-centage values may be derived from different data sour-ces and may not be consistent with other Fund literature.
matthewsasia.com | 800.789.ASIA 53
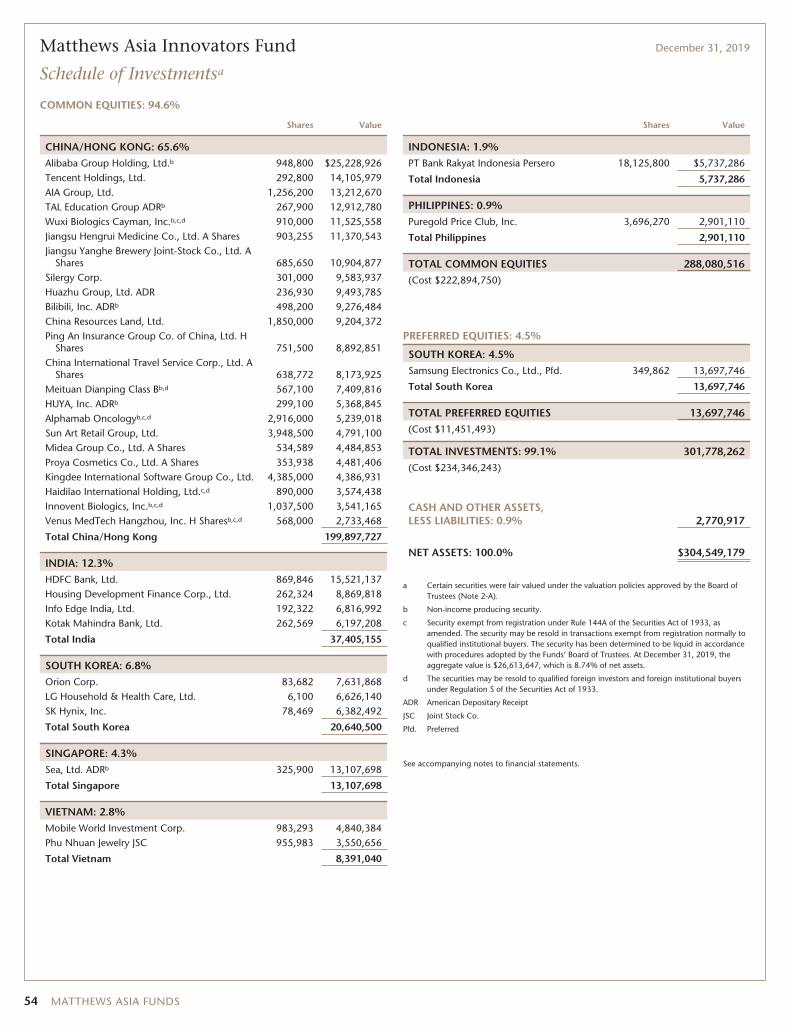
Matthews Asia Innovators Fund December 31, 2019
Schedule of Investmentsa
COMMON EQUITIES: 94.6%
Shares Value
CHINA/HONG KONG: 65.6%Alibaba Group Holding, Ltd.b 948,800 $25,228,926Tencent Holdings, Ltd. 292,800 14,105,979AIA Group, Ltd. 1,256,200 13,212,670TAL Education Group ADRb 267,900 12,912,780Wuxi Biologics Cayman, Inc.b,c,d 910,000 11,525,558Jiangsu Hengrui Medicine Co., Ltd. A Shares 903,255 11,370,543Jiangsu Yanghe Brewery Joint-Stock Co., Ltd. A
Shares 685,650 10,904,877Silergy Corp. 301,000 9,583,937Huazhu Group, Ltd. ADR 236,930 9,493,785Bilibili, Inc. ADRb 498,200 9,276,484China Resources Land, Ltd. 1,850,000 9,204,372Ping An Insurance Group Co. of China, Ltd. H
Shares 751,500 8,892,851China International Travel Service Corp., Ltd. A
Shares 638,772 8,173,925Meituan Dianping Class Bb,d 567,100 7,409,816HUYA, Inc. ADRb 299,100 5,368,845Alphamab Oncologyb,c,d 2,916,000 5,239,018Sun Art Retail Group, Ltd. 3,948,500 4,791,100Midea Group Co., Ltd. A Shares 534,589 4,484,853Proya Cosmetics Co., Ltd. A Shares 353,938 4,481,406Kingdee International Software Group Co., Ltd. 4,385,000 4,386,931Haidilao International Holding, Ltd.c,d 890,000 3,574,438Innovent Biologics, Inc.b,c,d 1,037,500 3,541,165Venus MedTech Hangzhou, Inc. H Sharesb,c,d 568,000 2,733,468
Total China/Hong Kong 199,897,727
INDIA: 12.3%HDFC Bank, Ltd. 869,846 15,521,137Housing Development Finance Corp., Ltd. 262,324 8,869,818Info Edge India, Ltd. 192,322 6,816,992Kotak Mahindra Bank, Ltd. 262,569 6,197,208
Total India 37,405,155
SOUTH KOREA: 6.8%Orion Corp. 83,682 7,631,868LG Household & Health Care, Ltd. 6,100 6,626,140SK Hynix, Inc. 78,469 6,382,492
Total South Korea 20,640,500
SINGAPORE: 4.3%Sea, Ltd. ADRb 325,900 13,107,698
Total Singapore 13,107,698
VIETNAM: 2.8%
Mobile World Investment Corp. 983,293 4,840,384Phu Nhuan Jewelry JSC 955,983 3,550,656
Total Vietnam 8,391,040
Shares Value
INDONESIA: 1.9%PT Bank Rakyat Indonesia Persero 18,125,800 $5,737,286
Total Indonesia 5,737,286
PHILIPPINES: 0.9%Puregold Price Club, Inc. 3,696,270 2,901,110
Total Philippines 2,901,110
TOTAL COMMON EQUITIES 288,080,516(Cost $222,894,750)
PREFERRED EQUITIES: 4.5%
SOUTH KOREA: 4.5%Samsung Electronics Co., Ltd., Pfd. 349,862 13,697,746
Total South Korea 13,697,746
TOTAL PREFERRED EQUITIES 13,697,746(Cost $11,451,493)
TOTAL INVESTMENTS: 99.1% 301,778,262(Cost $234,346,243)
CASH AND OTHER ASSETS,LESS LIABILITIES: 0.9% 2,770,917
NET ASSETS: 100.0% $304,549,179
a Certain securities were fair valued under the valuation policies approved by the Board ofTrustees (Note 2-A).
b Non-income producing security.
c Security exempt from registration under Rule 144A of the Securities Act of 1933, asamended. The security may be resold in transactions exempt from registration normally toqualified institutional buyers. The security has been determined to be liquid in accordancewith procedures adopted by the Funds’ Board of Trustees. At December 31, 2019, theaggregate value is $26,613,647, which is 8.74% of net assets.
d The securities may be resold to qualified foreign investors and foreign institutional buyersunder Regulation S of the Securities Act of 1933.
ADR American Depositary Receipt
JSC Joint Stock Co.
Pfd. Preferred
See accompanying notes to financial statements.
54 MATTHEWS ASIA FUNDS
ASIA GROWTH STRATEGIES
PORTFOLIO MANAGERS
Andrew Mattock, CFALead Manager
Winnie ChwangCo-Manager
FUND FACTS
Investor InstitutionalTicker MCHFX MICFXCUSIP 577130701 577130818Inception 2/19/98 10/29/10NAV $19.12 $19.08Initial Investment $2,500 $100,000Gross Expense Ratio1 1.09% 0.91%
Portfolio StatisticsTotal # of Positions 44Net Assets $902.4 millionWeighted Average Market Cap $189.7 billionPortfolio Turnover2 68.93%
BenchmarksMSCI China Index
MSCI China All Shares Index
OBJECTIVE
Long-term capital appreciation.
STRATEGY
Under normal market conditions, the Fund seeks toachieve its investment objective by investing at least80% of its net assets, which include borrowings forinvestment purposes, in the common and preferredstocks of companies located in China. Chinaincludes its administrative and other districts, such asHong Kong.
Matthews China Fund
Portfolio Manager Commentary (unaudited)
For the year ending December 31, 2019, the Matthews China Fund returned 34.56%(Investor Class) and 34.90% (Institutional Class), while its benchmark, the MSCIChina Index, returned 23.66%. For the fourth quarter, the Fund returned 16.56%(Investor Class) and 16.59% (Institutional Class) versus 14.72% for the Index.
Market Environment:
Amid bouts of volatility, Chinese equities ultimately generated attractive perform-ance over the course of 2019. Key themes impacting China’s equity markets duringthe year included U.S.–China trade tensions, the health of China’s economy,corporate earnings for Chinese companies and Hong Kong protests. Against thisbackdrop, Chinese equities climbed a wall of worry and posted strong returns forthe Fund.
Amid global macroeconomic concerns, China’s domestic A-share market(represented by the Shanghai and Shenzhen stock exchanges) performed consid-erably better during the reporting period than the offshore China Hong Kong stockexchange and U.S.-listed Chinese American depositary receipts (ADRs). Companieslisted in the A-share market tend to represent domestic demand and the domesticconsumer base, where local sentiment was fairly optimistic. In contrast, companieslisted on the Hong Kong exchange and U.S. exchanges tend to have a larger shareof foreign investors, whose sentiment was weak during the year on global macro-economic worries. Accordingly, we often saw more-attractive relative valuations inthe Hong Kong and U.S. markets compared with China’s onshore markets. Nota-bly, the Fund takes an all-shares approach and has the flexibility to buy securitieson the exchanges where valuations appear attractive.
In terms of global macroeconomic headlines, the progress of U.S.–China tradenegotiations waxed and waned considerably during the period. During the fourthquarter, trade tensions eased and foreign sentiment improved considerably. Whiledetails of a U.S.–China trade deal were sparse at year end, market participantsseemed encouraged by the improvement in rhetoric and tone, as well as a possiblerollback of tariffs. Amid trade tensions, we noticed an impetus on the ground inChina for companies to substitute foreign technology for domestic know-how.Regardless of the outcome of trade tensions, we believe China is on a path towardgreater technological independence. New supply-chain formations are creatingopportunities for long-term investors in China’s equity markets, in our view.
Performance Contributors and Detractors:
The Fund outperformed its benchmark for the full-year 2019, as well as in thefourth quarter. From a sector perspective, consumer staples and health care werecontributors to performance. Liquor producer Wuliangye Yibin is an example ofpositive stock selection in the consumer staples sector for the Fund. As the second-largest liquor company in China, Wuliangye Yibin specializes in manufacturing“baijiu,” a clear liquor made from grain. Demonstrating high return on investedcapital, Wuliangye Yibin also enjoyed improving earnings and a solid growth out-look. Sino Biopharmaceutical is an example of positive stock selection in thehealth care sector. Sino Biopharm is a leading pharmaceutical drug manufacturerin China. Despite the government’s push for affordable health care and the over-hang of price cuts in generic drugs, Sino Biopharm executed well in terms ofdiversifying and enhancing its product mix to include more innovative oncologydrugs, which showed considerable growth.
In contrast, the consumer discretionary sector was a detractor. Travel and leisure-related names such as Trip.com, Galaxy and Shangri-La all contributed to under-performance in this sector. Official statistics painted a mixed picture of the health
(continued)
1 Actual 2019 expense ratios.2 The lesser of fiscal year 2019 long-term purchase costs or sales proceeds divided by the average monthly market value of long-term securities.
matthewsasia.com | 800.789.ASIA 55
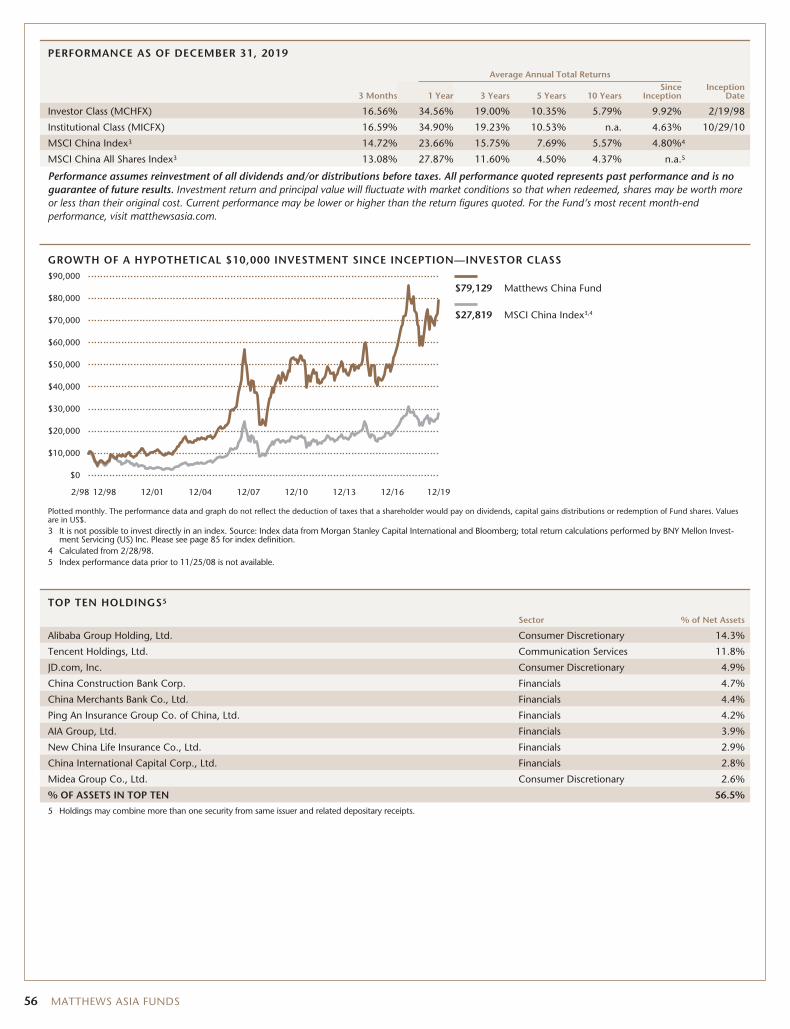
PERFORMANCE AS OF DECEMBER 31, 2019
Average Annual Total Returns
3 Months 1 Year 3 Years 5 Years 10 YearsSince
InceptionInception
Date
Investor Class (MCHFX) 16.56% 34.56% 19.00% 10.35% 5.79% 9.92% 2/19/98
Institutional Class (MICFX) 16.59% 34.90% 19.23% 10.53% n.a. 4.63% 10/29/10
MSCI China Index3 14.72% 23.66% 15.75% 7.69% 5.57% 4.80%4
MSCI China All Shares Index3 13.08% 27.87% 11.60% 4.50% 4.37% n.a.5
Performance assumes reinvestment of all dividends and/or distributions before taxes. All performance quoted represents past performance and is noguarantee of future results. Investment return and principal value will fluctuate with market conditions so that when redeemed, shares may be worth moreor less than their original cost. Current performance may be lower or higher than the return figures quoted. For the Fund’s most recent month-endperformance, visit matthewsasia.com.
GROWTH OF A HYPOTHETICAL $10,000 INVESTMENT SINCE INCEPTION—INVESTOR CLASS
2/98 12/98 12/01 12/04 12/07 12/10 12/13 12/16 12/19
$79,129 Matthews China Fund
$27,819 MSCI China Index3,4
$0
$90,000
$70,000
$80,000
$60,000
$20,000
$30,000
$40,000
$50,000
$10,000
Plotted monthly. The performance data and graph do not reflect the deduction of taxes that a shareholder would pay on dividends, capital gains distributions or redemption of Fund shares. Valuesare in US$.3 It is not possible to invest directly in an index. Source: Index data from Morgan Stanley Capital International and Bloomberg; total return calculations performed by BNY Mellon Invest-
ment Servicing (US) Inc. Please see page 85 for index definition.4 Calculated from 2/28/98.5 Index performance data prior to 11/25/08 is not available.
TOP TEN HOLDINGS5
Sector % of Net Assets
Alibaba Group Holding, Ltd. Consumer Discretionary 14.3%
Tencent Holdings, Ltd. Communication Services 11.8%
JD.com, Inc. Consumer Discretionary 4.9%
China Construction Bank Corp. Financials 4.7%
China Merchants Bank Co., Ltd. Financials 4.4%
Ping An Insurance Group Co. of China, Ltd. Financials 4.2%
AIA Group, Ltd. Financials 3.9%
New China Life Insurance Co., Ltd. Financials 2.9%
China International Capital Corp., Ltd. Financials 2.8%
Midea Group Co., Ltd. Consumer Discretionary 2.6%
% OF ASSETS IN TOP TEN 56.5%
5 Holdings may combine more than one security from same issuer and related depositary receipts.
56 MATTHEWS ASIA FUNDS
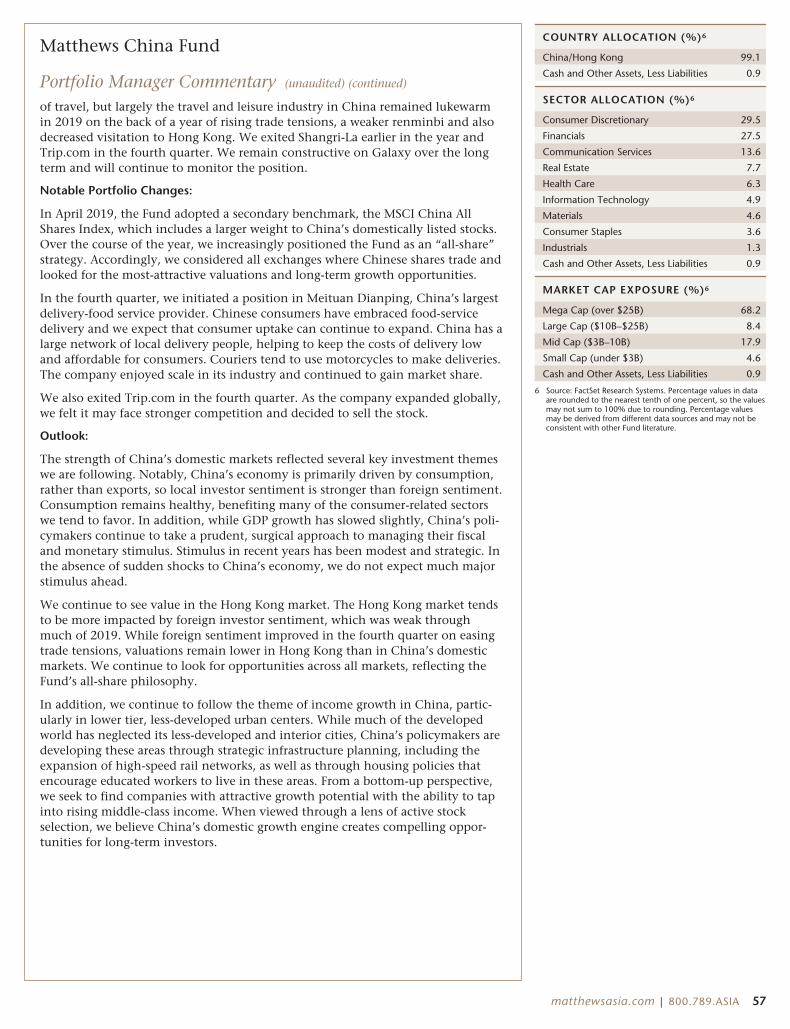
Matthews China Fund
Portfolio Manager Commentary (unaudited) (continued)
of travel, but largely the travel and leisure industry in China remained lukewarmin 2019 on the back of a year of rising trade tensions, a weaker renminbi and alsodecreased visitation to Hong Kong. We exited Shangri-La earlier in the year andTrip.com in the fourth quarter. We remain constructive on Galaxy over the longterm and will continue to monitor the position.
Notable Portfolio Changes:
In April 2019, the Fund adopted a secondary benchmark, the MSCI China AllShares Index, which includes a larger weight to China’s domestically listed stocks.Over the course of the year, we increasingly positioned the Fund as an “all-share”strategy. Accordingly, we considered all exchanges where Chinese shares trade andlooked for the most-attractive valuations and long-term growth opportunities.
In the fourth quarter, we initiated a position in Meituan Dianping, China’s largestdelivery-food service provider. Chinese consumers have embraced food-servicedelivery and we expect that consumer uptake can continue to expand. China has alarge network of local delivery people, helping to keep the costs of delivery lowand affordable for consumers. Couriers tend to use motorcycles to make deliveries.The company enjoyed scale in its industry and continued to gain market share.
We also exited Trip.com in the fourth quarter. As the company expanded globally,we felt it may face stronger competition and decided to sell the stock.
Outlook:
The strength of China’s domestic markets reflected several key investment themeswe are following. Notably, China’s economy is primarily driven by consumption,rather than exports, so local investor sentiment is stronger than foreign sentiment.Consumption remains healthy, benefiting many of the consumer-related sectorswe tend to favor. In addition, while GDP growth has slowed slightly, China’s poli-cymakers continue to take a prudent, surgical approach to managing their fiscaland monetary stimulus. Stimulus in recent years has been modest and strategic. Inthe absence of sudden shocks to China’s economy, we do not expect much majorstimulus ahead.
We continue to see value in the Hong Kong market. The Hong Kong market tendsto be more impacted by foreign investor sentiment, which was weak throughmuch of 2019. While foreign sentiment improved in the fourth quarter on easingtrade tensions, valuations remain lower in Hong Kong than in China’s domesticmarkets. We continue to look for opportunities across all markets, reflecting theFund’s all-share philosophy.
In addition, we continue to follow the theme of income growth in China, partic-ularly in lower tier, less-developed urban centers. While much of the developedworld has neglected its less-developed and interior cities, China’s policymakers aredeveloping these areas through strategic infrastructure planning, including theexpansion of high-speed rail networks, as well as through housing policies thatencourage educated workers to live in these areas. From a bottom-up perspective,we seek to find companies with attractive growth potential with the ability to tapinto rising middle-class income. When viewed through a lens of active stockselection, we believe China’s domestic growth engine creates compelling oppor-tunities for long-term investors.
COUNTRY ALLOCATION (%)6
China/Hong Kong 99.1
Cash and Other Assets, Less Liabilities 0.9
SECTOR ALLOCATION (%)6
Consumer Discretionary 29.5
Financials 27.5
Communication Services 13.6
Real Estate 7.7
Health Care 6.3
Information Technology 4.9
Materials 4.6
Consumer Staples 3.6
Industrials 1.3
Cash and Other Assets, Less Liabilities 0.9
MARKET CAP EXPOSURE (%)6
Mega Cap (over $25B) 68.2
Large Cap ($10B–$25B) 8.4
Mid Cap ($3B–10B) 17.9
Small Cap (under $3B) 4.6
Cash and Other Assets, Less Liabilities 0.9
6 Source: FactSet Research Systems. Percentage values in dataare rounded to the nearest tenth of one percent, so the valuesmay not sum to 100% due to rounding. Percentage valuesmay be derived from different data sources and may not beconsistent with other Fund literature.
matthewsasia.com | 800.789.ASIA 57
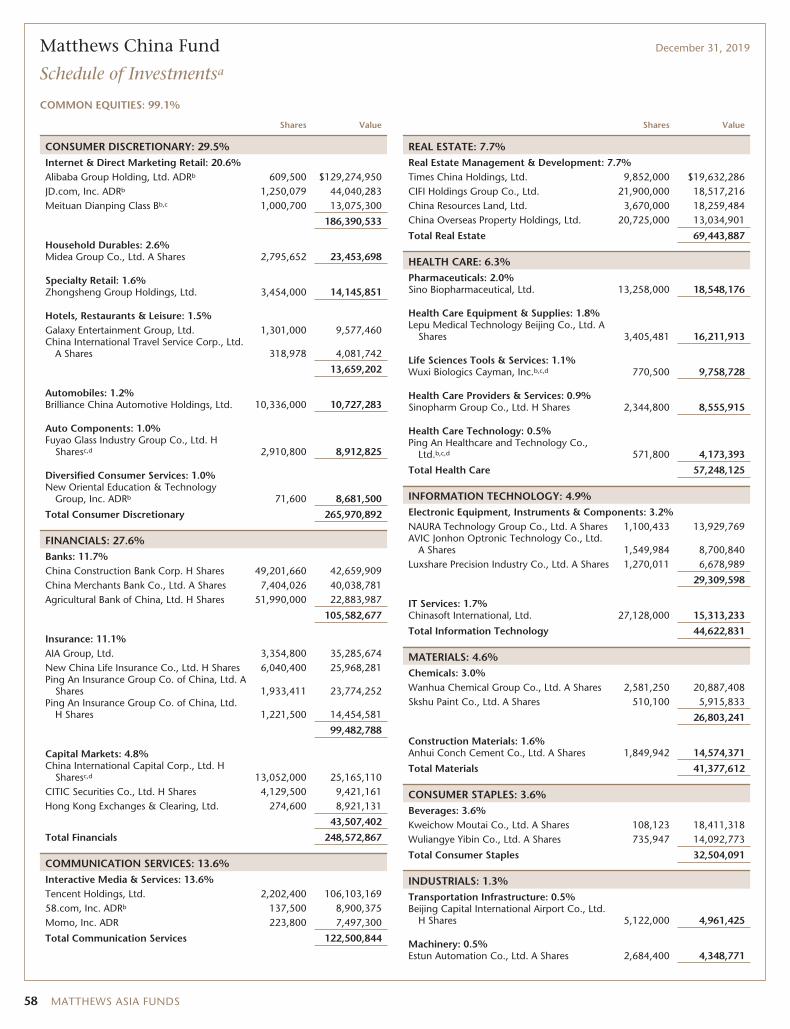
Matthews China Fund December 31, 2019
Schedule of Investmentsa
COMMON EQUITIES: 99.1%
Shares Value
CONSUMER DISCRETIONARY: 29.5%Internet & Direct Marketing Retail: 20.6%Alibaba Group Holding, Ltd. ADRb 609,500 $129,274,950JD.com, Inc. ADRb 1,250,079 44,040,283Meituan Dianping Class Bb,c 1,000,700 13,075,300
186,390,533
Household Durables: 2.6%Midea Group Co., Ltd. A Shares 2,795,652 23,453,698
Specialty Retail: 1.6%Zhongsheng Group Holdings, Ltd. 3,454,000 14,145,851
Hotels, Restaurants & Leisure: 1.5%Galaxy Entertainment Group, Ltd. 1,301,000 9,577,460China International Travel Service Corp., Ltd.
A Shares 318,978 4,081,742
13,659,202
Automobiles: 1.2%Brilliance China Automotive Holdings, Ltd. 10,336,000 10,727,283
Auto Components: 1.0%Fuyao Glass Industry Group Co., Ltd. H
Sharesc,d 2,910,800 8,912,825
Diversified Consumer Services: 1.0%New Oriental Education & Technology
Group, Inc. ADRb 71,600 8,681,500
Total Consumer Discretionary 265,970,892
FINANCIALS: 27.6%Banks: 11.7%China Construction Bank Corp. H Shares 49,201,660 42,659,909China Merchants Bank Co., Ltd. A Shares 7,404,026 40,038,781Agricultural Bank of China, Ltd. H Shares 51,990,000 22,883,987
105,582,677
Insurance: 11.1%AIA Group, Ltd. 3,354,800 35,285,674New China Life Insurance Co., Ltd. H Shares 6,040,400 25,968,281Ping An Insurance Group Co. of China, Ltd. A
Shares 1,933,411 23,774,252Ping An Insurance Group Co. of China, Ltd.
H Shares 1,221,500 14,454,581
99,482,788
Capital Markets: 4.8%China International Capital Corp., Ltd. H
Sharesc,d 13,052,000 25,165,110CITIC Securities Co., Ltd. H Shares 4,129,500 9,421,161Hong Kong Exchanges & Clearing, Ltd. 274,600 8,921,131
43,507,402
Total Financials 248,572,867
COMMUNICATION SERVICES: 13.6%Interactive Media & Services: 13.6%Tencent Holdings, Ltd. 2,202,400 106,103,16958.com, Inc. ADRb 137,500 8,900,375Momo, Inc. ADR 223,800 7,497,300
Total Communication Services 122,500,844
Shares Value
REAL ESTATE: 7.7%Real Estate Management & Development: 7.7%Times China Holdings, Ltd. 9,852,000 $19,632,286CIFI Holdings Group Co., Ltd. 21,900,000 18,517,216China Resources Land, Ltd. 3,670,000 18,259,484China Overseas Property Holdings, Ltd. 20,725,000 13,034,901
Total Real Estate 69,443,887
HEALTH CARE: 6.3%Pharmaceuticals: 2.0%Sino Biopharmaceutical, Ltd. 13,258,000 18,548,176
Health Care Equipment & Supplies: 1.8%Lepu Medical Technology Beijing Co., Ltd. A
Shares 3,405,481 16,211,913
Life Sciences Tools & Services: 1.1%Wuxi Biologics Cayman, Inc.b,c,d 770,500 9,758,728
Health Care Providers & Services: 0.9%Sinopharm Group Co., Ltd. H Shares 2,344,800 8,555,915
Health Care Technology: 0.5%Ping An Healthcare and Technology Co.,
Ltd.b,c,d 571,800 4,173,393
Total Health Care 57,248,125
INFORMATION TECHNOLOGY: 4.9%Electronic Equipment, Instruments & Components: 3.2%NAURA Technology Group Co., Ltd. A Shares 1,100,433 13,929,769AVIC Jonhon Optronic Technology Co., Ltd.
A Shares 1,549,984 8,700,840Luxshare Precision Industry Co., Ltd. A Shares 1,270,011 6,678,989
29,309,598
IT Services: 1.7%Chinasoft International, Ltd. 27,128,000 15,313,233
Total Information Technology 44,622,831
MATERIALS: 4.6%Chemicals: 3.0%Wanhua Chemical Group Co., Ltd. A Shares 2,581,250 20,887,408Skshu Paint Co., Ltd. A Shares 510,100 5,915,833
26,803,241
Construction Materials: 1.6%Anhui Conch Cement Co., Ltd. A Shares 1,849,942 14,574,371
Total Materials 41,377,612
CONSUMER STAPLES: 3.6%Beverages: 3.6%Kweichow Moutai Co., Ltd. A Shares 108,123 18,411,318Wuliangye Yibin Co., Ltd. A Shares 735,947 14,092,773
Total Consumer Staples 32,504,091
INDUSTRIALS: 1.3%Transportation Infrastructure: 0.5%Beijing Capital International Airport Co., Ltd.
H Shares 5,122,000 4,961,425
Machinery: 0.5%Estun Automation Co., Ltd. A Shares 2,684,400 4,348,771
58 MATTHEWS ASIA FUNDS
Matthews China Fund December 31, 2019
Schedule of Investmentsa (continued)
COMMON EQUITIES (continued)
Shares Value
Commercial Services & Supplies: 0.3%Times Neighborhood Holdings, Ltd.b,c 4,199,730 $2,613,951
Total Industrials 11,924,147
TOTAL INVESTMENTS: 99.1% 894,165,296(Cost $782,836,701)
CASH AND OTHER ASSETS,LESS LIABILITIES: 0.9% 8,229,729
NET ASSETS: 100.0% $902,395,025
a Certain securities were fair valued under the valuation policies approved by the Board ofTrustees (Note 2-A).
b Non-income producing security.
c The securities may be resold to qualified foreign investors and foreign institutional buyersunder Regulation S of the Securities Act of 1933.
d Security exempt from registration under Rule 144A of the Securities Act of 1933, asamended. The security may be resold in transactions exempt from registration normally toqualified institutional buyers. The security has been determined to be liquid in accordancewith procedures adopted by the Funds’ Board of Trustees. At December 31, 2019, theaggregate value is $48,010,056, which is 5.32% of net assets.
ADR American Depositary Receipt
See accompanying notes to financial statements.
matthewsasia.com | 800.789.ASIA 59
ASIA GROWTH STRATEGIES
PORTFOLIO MANAGERS
Peeyush Mittal,CFALead Manager
Sharat Shroff, CFACo-Manager
FUND FACTS
Investor InstitutionalTicker MINDX MIDNXCUSIP 577130859 577130768Inception 10/31/05 10/29/10NAV $23.27 $23.55Initial Investment $2,500 $100,000Gross Expense Ratio1 1.11% 0.94%
Portfolio StatisticsTotal # of Positions 46Net Assets $964.4 millionWeighted Average Market Cap $19.7 billionPortfolio Turnover2 24.00%
BenchmarkS&P Bombay Stock Exchange 100 Index
OBJECTIVE
Long-term capital appreciation.
STRATEGY
Under normal market conditions, the Fund seeks toachieve its investment objective by investing at least80% of its net assets, which include borrowings forinvestment purposes, in publicly traded commonstocks, preferred stocks and convertible securities ofcompanies located in India.
Matthews India Fund
Portfolio Manager Commentary (unaudited)
For the year ending December 31, 2019, the Matthews India Fund returned -0.88%(Investor Class) and -0.76% (Institutional Class), while its benchmark, the S&PBombay Stock Exchange 100 Index, returned 8.53%. For the fourth quarter, theFund returned 2.15% (Investor Class) and 2.13% (Institutional Class), while itsbenchmark returned 4.95%.
Market Environment:
India’s equity markets experienced a significant divergence between the returns oflarge-cap and small-cap stocks in 2019. Investors, led by fears of an economicslowdown, sought safety in large-cap stocks but shunned mid-cap and small-capstocks. Modi’s landslide victory in elections held in May 2019 assured investors ofcontinuity of reforms and accelerated economic growth. Lack of liquidity providedto small and medium-size companies, however, was a substantial headwind toeconomic growth. Non-bank financial lenders continued to suffer due to a lack offunding availability. This consequently led to diminished funds availability tomany small businesses and consumers. Lower loan approvals for consumers hin-dered the durable goods and real estate sectors.
From a policy perspective, India moved from defense to offense in the second halfof 2019, as Indian policymakers surprised markets by announcing a series of stim-ulative policies. In August, the prior- announced surcharge on capital gains (bothdomestic and foreign) was reversed, new capital injections into public sector bankswere announced and tweaks to tax depreciation rules and expedited Goods andServices Tax refunds were implemented. In September, the Indian governmentannounced a significant cut in corporate tax rates from an effective rate of 30% toroughly 22% with additional cuts for manufacturing companies. In addition, aseries of rate cuts was implemented by the central bank throughout 2019. Goinginto 2020, aggregate policy actions along with expected fiscal spending shouldstabilize economic growth and earnings from a relatively low base, providing amore-favorable backdrop for equities.
Performance Contributors and Detractors:
Similar to 2018, the Fund’s higher allocation to small caps and lower allocation tomega-cap stocks hurt relative performance in 2019. Given the fears of an economicslowdown and distress in the financial sector, investors continued to move awayfrom small- and mid-cap stocks. We believe small caps can be a rich source ofalpha over a full market cycle and that recent stimulus may benefit smallercompanies as we look ahead, but our overweight to small caps was a detractor inthe reporting period.
By sector, our higher allocation in health care and significant underweight in theenergy sector were also detractors. In health care, pricing pressure led by the fastpace of new drug approvals by the U.S. Food and Drug Administration continuedto drag down growth and profitability for Indian generic drug manufacturers. Thefinancial sector was another detractor as investors favored large-cap banks andhighly rated non-bank financials as compared to relatively small non-bank finan-cial companies that were adversely impacted by liquidity concerns throughout2019. Shriram City Union Finance was one such stock that detracted from ourperformance. An impending change in ownership structure combined with liquid-ity issues and a change in senior management hurt the stock price in the reportingperiod. We continue to like the business, however, given the retail nature of itscustomers and the attractive valuation at which the stock was recently trading.Our avoidance of holdings in the utilities and metals sector and stock selectionwithin industrials and information technology were performance contributors.
(continued)
1 Actual 2019 expense ratios.2 The lesser of fiscal year 2019 long-term purchase costs or sales proceeds divided by the average monthly market value of long-term securities.
60 MATTHEWS ASIA FUNDS
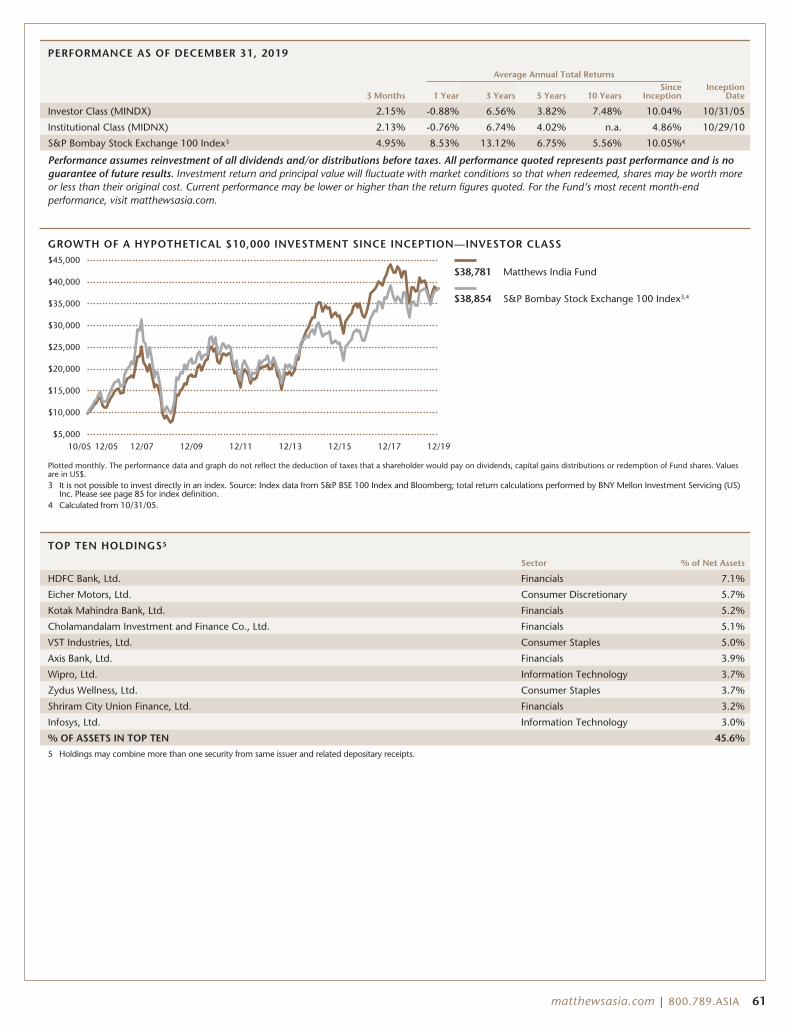
PERFORMANCE AS OF DECEMBER 31, 2019
Average Annual Total Returns
3 Months 1 Year 3 Years 5 Years 10 YearsSince
InceptionInception
Date
Investor Class (MINDX) 2.15% -0.88% 6.56% 3.82% 7.48% 10.04% 10/31/05
Institutional Class (MIDNX) 2.13% -0.76% 6.74% 4.02% n.a. 4.86% 10/29/10
S&P Bombay Stock Exchange 100 Index3 4.95% 8.53% 13.12% 6.75% 5.56% 10.05%4
Performance assumes reinvestment of all dividends and/or distributions before taxes. All performance quoted represents past performance and is noguarantee of future results. Investment return and principal value will fluctuate with market conditions so that when redeemed, shares may be worth moreor less than their original cost. Current performance may be lower or higher than the return figures quoted. For the Fund’s most recent month-endperformance, visit matthewsasia.com.
GROWTH OF A HYPOTHETICAL $10,000 INVESTMENT SINCE INCEPTION—INVESTOR CLASS
10/05 12/0912/0712/05 12/13 12/15 12/1712/11 12/19
$38,781 Matthews India Fund
$38,854 S&P Bombay Stock Exchange 100 Index3,4
$5,000
$45,000
$40,000
$35,000
$30,000
$25,000
$10,000
$15,000
$20,000
Plotted monthly. The performance data and graph do not reflect the deduction of taxes that a shareholder would pay on dividends, capital gains distributions or redemption of Fund shares. Valuesare in US$.3 It is not possible to invest directly in an index. Source: Index data from S&P BSE 100 Index and Bloomberg; total return calculations performed by BNY Mellon Investment Servicing (US)
Inc. Please see page 85 for index definition.4 Calculated from 10/31/05.
TOP TEN HOLDINGS5
Sector % of Net Assets
HDFC Bank, Ltd. Financials 7.1%
Eicher Motors, Ltd. Consumer Discretionary 5.7%
Kotak Mahindra Bank, Ltd. Financials 5.2%
Cholamandalam Investment and Finance Co., Ltd. Financials 5.1%
VST Industries, Ltd. Consumer Staples 5.0%
Axis Bank, Ltd. Financials 3.9%
Wipro, Ltd. Information Technology 3.7%
Zydus Wellness, Ltd. Consumer Staples 3.7%
Shriram City Union Finance, Ltd. Financials 3.2%
Infosys, Ltd. Information Technology 3.0%
% OF ASSETS IN TOP TEN 45.6%
5 Holdings may combine more than one security from same issuer and related depositary receipts.
matthewsasia.com | 800.789.ASIA 61
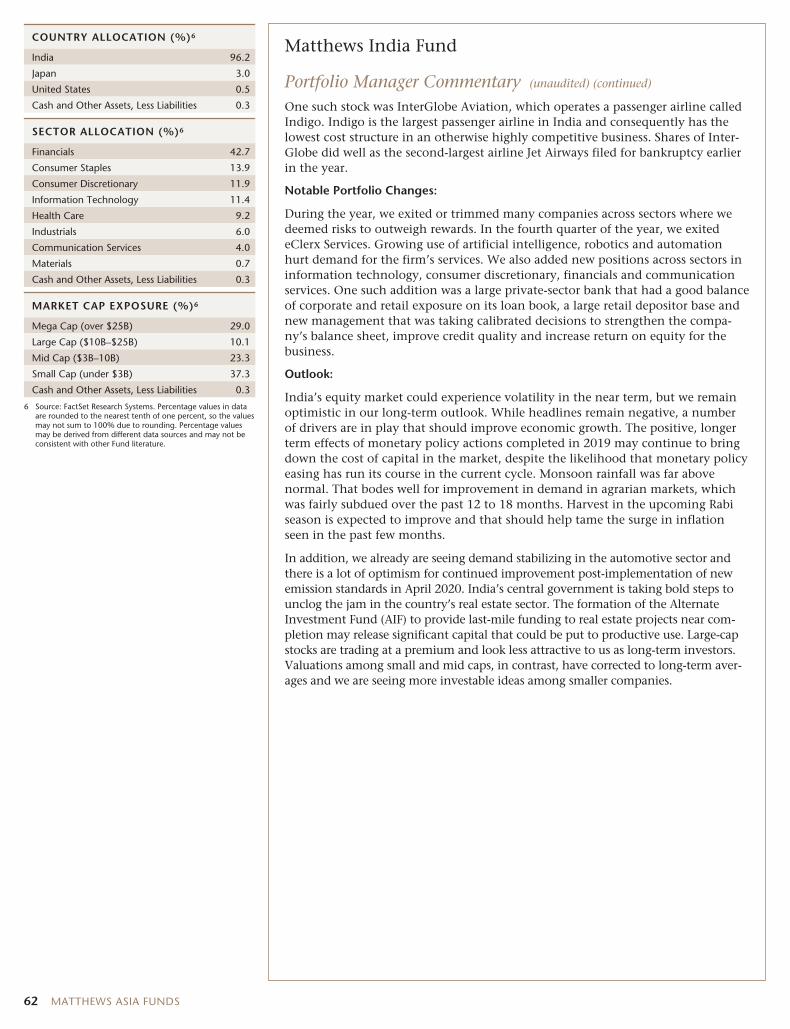
COUNTRY ALLOCATION (%)6
India 96.2
Japan 3.0
United States 0.5
Cash and Other Assets, Less Liabilities 0.3
SECTOR ALLOCATION (%)6
Financials 42.7
Consumer Staples 13.9
Consumer Discretionary 11.9
Information Technology 11.4
Health Care 9.2
Industrials 6.0
Communication Services 4.0
Materials 0.7
Cash and Other Assets, Less Liabilities 0.3
MARKET CAP EXPOSURE (%)6
Mega Cap (over $25B) 29.0
Large Cap ($10B–$25B) 10.1
Mid Cap ($3B–10B) 23.3
Small Cap (under $3B) 37.3
Cash and Other Assets, Less Liabilities 0.3
6 Source: FactSet Research Systems. Percentage values in dataare rounded to the nearest tenth of one percent, so the valuesmay not sum to 100% due to rounding. Percentage valuesmay be derived from different data sources and may not beconsistent with other Fund literature.
Matthews India Fund
Portfolio Manager Commentary (unaudited) (continued)
One such stock was InterGlobe Aviation, which operates a passenger airline calledIndigo. Indigo is the largest passenger airline in India and consequently has thelowest cost structure in an otherwise highly competitive business. Shares of Inter-Globe did well as the second-largest airline Jet Airways filed for bankruptcy earlierin the year.
Notable Portfolio Changes:
During the year, we exited or trimmed many companies across sectors where wedeemed risks to outweigh rewards. In the fourth quarter of the year, we exitedeClerx Services. Growing use of artificial intelligence, robotics and automationhurt demand for the firm’s services. We also added new positions across sectors ininformation technology, consumer discretionary, financials and communicationservices. One such addition was a large private-sector bank that had a good balanceof corporate and retail exposure on its loan book, a large retail depositor base andnew management that was taking calibrated decisions to strengthen the compa-ny’s balance sheet, improve credit quality and increase return on equity for thebusiness.
Outlook:
India’s equity market could experience volatility in the near term, but we remainoptimistic in our long-term outlook. While headlines remain negative, a numberof drivers are in play that should improve economic growth. The positive, longerterm effects of monetary policy actions completed in 2019 may continue to bringdown the cost of capital in the market, despite the likelihood that monetary policyeasing has run its course in the current cycle. Monsoon rainfall was far abovenormal. That bodes well for improvement in demand in agrarian markets, whichwas fairly subdued over the past 12 to 18 months. Harvest in the upcoming Rabiseason is expected to improve and that should help tame the surge in inflationseen in the past few months.
In addition, we already are seeing demand stabilizing in the automotive sector andthere is a lot of optimism for continued improvement post-implementation of newemission standards in April 2020. India’s central government is taking bold steps tounclog the jam in the country’s real estate sector. The formation of the AlternateInvestment Fund (AIF) to provide last-mile funding to real estate projects near com-pletion may release significant capital that could be put to productive use. Large-capstocks are trading at a premium and look less attractive to us as long-term investors.Valuations among small and mid caps, in contrast, have corrected to long-term aver-ages and we are seeing more investable ideas among smaller companies.
62 MATTHEWS ASIA FUNDS
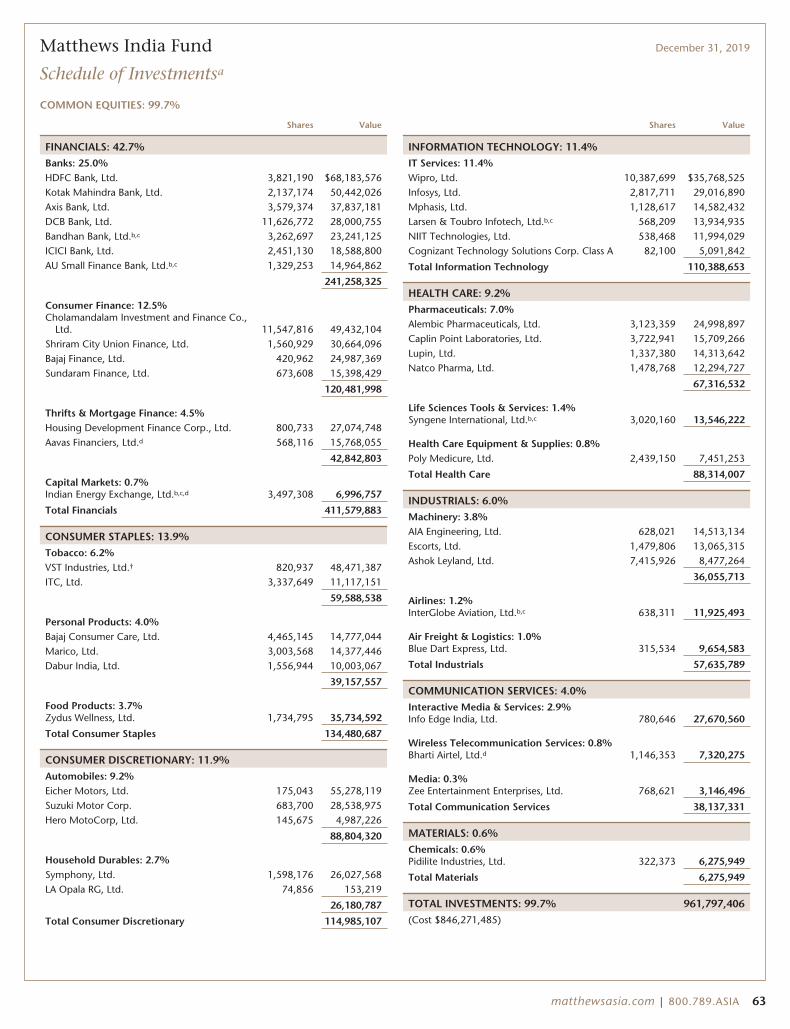
Matthews India Fund December 31, 2019
Schedule of Investmentsa
COMMON EQUITIES: 99.7%
Shares Value
FINANCIALS: 42.7%Banks: 25.0%HDFC Bank, Ltd. 3,821,190 $68,183,576Kotak Mahindra Bank, Ltd. 2,137,174 50,442,026Axis Bank, Ltd. 3,579,374 37,837,181DCB Bank, Ltd. 11,626,772 28,000,755Bandhan Bank, Ltd.b,c 3,262,697 23,241,125ICICI Bank, Ltd. 2,451,130 18,588,800AU Small Finance Bank, Ltd.b,c 1,329,253 14,964,862
241,258,325
Consumer Finance: 12.5%Cholamandalam Investment and Finance Co.,
Ltd. 11,547,816 49,432,104Shriram City Union Finance, Ltd. 1,560,929 30,664,096Bajaj Finance, Ltd. 420,962 24,987,369Sundaram Finance, Ltd. 673,608 15,398,429
120,481,998
Thrifts & Mortgage Finance: 4.5%Housing Development Finance Corp., Ltd. 800,733 27,074,748Aavas Financiers, Ltd.d 568,116 15,768,055
42,842,803
Capital Markets: 0.7%Indian Energy Exchange, Ltd.b,c,d 3,497,308 6,996,757
Total Financials 411,579,883
CONSUMER STAPLES: 13.9%Tobacco: 6.2%VST Industries, Ltd.† 820,937 48,471,387ITC, Ltd. 3,337,649 11,117,151
59,588,538
Personal Products: 4.0%Bajaj Consumer Care, Ltd. 4,465,145 14,777,044Marico, Ltd. 3,003,568 14,377,446Dabur India, Ltd. 1,556,944 10,003,067
39,157,557
Food Products: 3.7%Zydus Wellness, Ltd. 1,734,795 35,734,592
Total Consumer Staples 134,480,687
CONSUMER DISCRETIONARY: 11.9%Automobiles: 9.2%Eicher Motors, Ltd. 175,043 55,278,119Suzuki Motor Corp. 683,700 28,538,975Hero MotoCorp, Ltd. 145,675 4,987,226
88,804,320
Household Durables: 2.7%Symphony, Ltd. 1,598,176 26,027,568LA Opala RG, Ltd. 74,856 153,219
26,180,787
Total Consumer Discretionary 114,985,107
Shares Value
INFORMATION TECHNOLOGY: 11.4%IT Services: 11.4%Wipro, Ltd. 10,387,699 $35,768,525Infosys, Ltd. 2,817,711 29,016,890Mphasis, Ltd. 1,128,617 14,582,432Larsen & Toubro Infotech, Ltd.b,c 568,209 13,934,935NIIT Technologies, Ltd. 538,468 11,994,029Cognizant Technology Solutions Corp. Class A 82,100 5,091,842
Total Information Technology 110,388,653
HEALTH CARE: 9.2%Pharmaceuticals: 7.0%Alembic Pharmaceuticals, Ltd. 3,123,359 24,998,897Caplin Point Laboratories, Ltd. 3,722,941 15,709,266Lupin, Ltd. 1,337,380 14,313,642Natco Pharma, Ltd. 1,478,768 12,294,727
67,316,532
Life Sciences Tools & Services: 1.4%Syngene International, Ltd.b,c 3,020,160 13,546,222
Health Care Equipment & Supplies: 0.8%Poly Medicure, Ltd. 2,439,150 7,451,253
Total Health Care 88,314,007
INDUSTRIALS: 6.0%Machinery: 3.8%AIA Engineering, Ltd. 628,021 14,513,134Escorts, Ltd. 1,479,806 13,065,315Ashok Leyland, Ltd. 7,415,926 8,477,264
36,055,713
Airlines: 1.2%InterGlobe Aviation, Ltd.b,c 638,311 11,925,493
Air Freight & Logistics: 1.0%Blue Dart Express, Ltd. 315,534 9,654,583
Total Industrials 57,635,789
COMMUNICATION SERVICES: 4.0%Interactive Media & Services: 2.9%Info Edge India, Ltd. 780,646 27,670,560
Wireless Telecommunication Services: 0.8%Bharti Airtel, Ltd.d 1,146,353 7,320,275
Media: 0.3%Zee Entertainment Enterprises, Ltd. 768,621 3,146,496
Total Communication Services 38,137,331
MATERIALS: 0.6%Chemicals: 0.6%Pidilite Industries, Ltd. 322,373 6,275,949
Total Materials 6,275,949
TOTAL INVESTMENTS: 99.7% 961,797,406(Cost $846,271,485)
matthewsasia.com | 800.789.ASIA 63
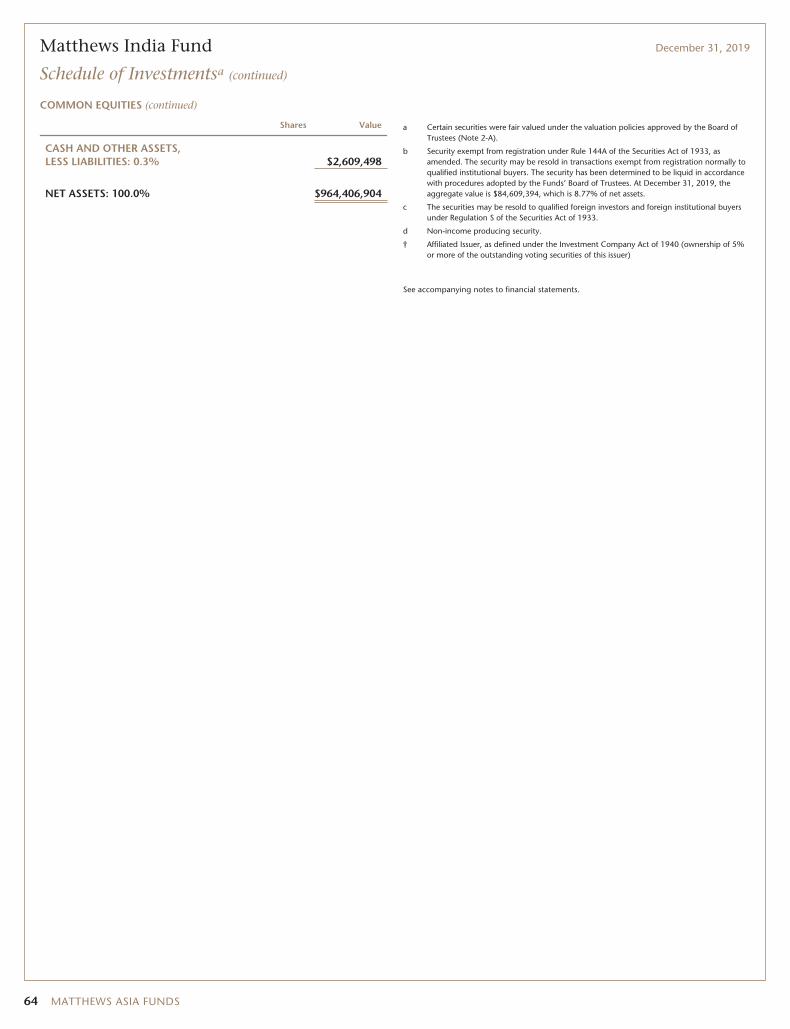
Matthews India Fund December 31, 2019
Schedule of Investmentsa (continued)
COMMON EQUITIES (continued)
Shares Value
CASH AND OTHER ASSETS,LESS LIABILITIES: 0.3% $2,609,498
NET ASSETS: 100.0% $964,406,904
a Certain securities were fair valued under the valuation policies approved by the Board ofTrustees (Note 2-A).
b Security exempt from registration under Rule 144A of the Securities Act of 1933, asamended. The security may be resold in transactions exempt from registration normally toqualified institutional buyers. The security has been determined to be liquid in accordancewith procedures adopted by the Funds’ Board of Trustees. At December 31, 2019, theaggregate value is $84,609,394, which is 8.77% of net assets.
c The securities may be resold to qualified foreign investors and foreign institutional buyersunder Regulation S of the Securities Act of 1933.
d Non-income producing security.
† Affiliated Issuer, as defined under the Investment Company Act of 1940 (ownership of 5%or more of the outstanding voting securities of this issuer)
See accompanying notes to financial statements.
64 MATTHEWS ASIA FUNDS
ASIA GROWTH STRATEGIES
PORTFOLIO MANAGERS
Taizo IshidaLead Manager
Shuntaro TakeuchiCo-Manager
FUND FACTS
Investor InstitutionalTicker MJFOX MIJFXCUSIP 577130800 577130792Inception 12/31/98 10/29/10NAV $21.51 $21.55Initial Investment $2,500 $100,000Gross Expense Ratio1 0.93% 0.88%
Portfolio StatisticsTotal # of Positions 56Net Assets $2.3 billionWeighted Average Market Cap $27.7 billionPortfolio Turnover2 25.42%
BenchmarkMSCI Japan Index
OBJECTIVE
Long-term capital appreciation.
STRATEGY
Under normal market conditions, the Fund seeks toachieve its investment objective by investing at least80% of its net assets, which include borrowings forinvestment purposes, in the common and preferredstocks of companies located in Japan.
Matthews Japan Fund
Portfolio Manager Commentary (unaudited)
For the year ending December 31, 2019, the Matthews Japan Fund returned26.08% (Investor Class) and 26.10% (Institutional Class), while its benchmark, theMSCI Japan Index, returned 20.07%. For the fourth quarter of the year, the Fundreturned 8.62% (Investor Class) and 8.61% (Institutional Class), versus 7.67% forthe Index.
Market Environment:
Japanese equities rose strongly in the fourth quarter, as global manufacturing activ-ity formed a bottom and climbed out of contraction amid a tepid macro-economic environment.
2019 started strongly for equity markets as the U.S. Federal Reserve’s pause on rateincreases improved investor sentiment and Japan equity valuations came backfrom their lowest levels since the start of the Abenomics era. In May, trade frictionsbetween the U.S. and China intensified, with tariff hikes and a temporary U.S. banon Huawei products dampening shares of export companies and the technologysector in particular. As bond yields increased worldwide in summer, global invest-ors started to increase their weighting to Japan for early-cycle exposure.
The larger macro environment did not indicate a full-fledged recovery, but startedto form a bottom and return to a growth trend. Global manufacturing PMI forDecember came in at 50.1, the second-straight month of an above-50 reading aftersix months of sub-50, indicating a contraction of manufacturing activity. The Bankof Japan’s Tankan Survey for December 2019 showed further deterioration in themanufacturing sector while productivity-enhancement investments in softwareand IT services remained strong. Domestic consumption remained sluggish as theconsumption tax increased to 10% from 8% as scheduled in October 2019.
Performance Contributors and Detractors:
For 2019 as a whole, quality and growth factors worked well in general, except fora few months during late August to mid-November when we saw a reversal invalue factors.
With regard to market cap, 2019 saw mega cap (over US$25 billion) and large cap(US$10 billion to US$25 billion) outperform small and mid cap (underUS$10 billion). As small and midsize companies make up roughly half of the port-folio, the allocation effect was a negative drag but the Fund was able to overcomeand generate outperformance via stock selection.
From a sector perspective, our three key overweight sectors—information technol-ogy, industrials and health care—all contributed positively to performance. Ourfocus on productivity improvement through software, IT services and automationhelped capture attractive returns within the sector amid the cyclical downturn.
Turning to individual securities, Lasertec was the top contributor to Fund perform-ance for both the fourth quarter and full-year 2019. Leading-edge development inareas such as extreme ultraviolet (EUV) picked up momentum, benefiting thecompany that makes EUV mask blank inspection systems and EUV mask-defectinspection systems.
Media and technology conglomerate Sony also contributed to performance in thefourth quarter. We meaningfully increased our weight in the company in the firstquarter of 2019 when Sony shares were pressured in a semiconductor downturnand a potential competitive threat in Google’s announcement of Stadia games. Inthe end, Sony succeeded to further increase its dominant market share in comple-mentary metal oxide semiconductor (CMOS) sensors and also produced robustcash flow from its PlayStation business.
(continued)
1 Actual 2019 expense ratios.2 The lesser of fiscal year 2019 long-term purchase costs or sales proceeds divided by the average monthly market value of long-term securities.
matthewsasia.com | 800.789.ASIA 65

PERFORMANCE AS OF DECEMBER 31, 2019
Average Annual Total Returns
3 Months 1 Year 3 Years 5 Years 10 YearsSince
InceptionInception
Date
Investor Class (MJFOX) 8.62% 26.08% 10.24% 10.20% 9.75% 6.22% 12/31/98
Institutional Class (MIJFX) 8.61% 26.10% 10.32% 10.29% n.a. 9.91% 10/29/10
MSCI Japan Index3 7.67% 20.07% 9.30% 8.07% 6.87% 3.81%4
Performance assumes reinvestment of all dividends and/or distributions before taxes. All performance quoted represents past performance and is noguarantee of future results. Investment return and principal value will fluctuate with market conditions so that when redeemed, shares may be worth moreor less than their original cost. Current performance may be lower or higher than the return figures quoted. For the Fund’s most recent month-endperformance, visit matthewsasia.com.
GROWTH OF A HYPOTHETICAL $10,000 INVESTMENT SINCE INCEPTION—INVESTOR CLASS
12/98 12/01 12/04 12/07 12/10 12/13 12/16 12/19
$35,511 Matthews Japan Fund
$21,910 MSCI Japan Index3,4
$5,000
$40,000
$35,000
$30,000
$25,000
$10,000
$15,000
$20,000
Plotted monthly. The performance data and graph do not reflect the deduction of taxes that a shareholder would pay on dividends, capital gains distributions or redemption of Fund shares. Valuesare in US$.3 It is not possible to invest directly in an index. Source: Index data from Morgan Stanley Capital International and Bloomberg; total return calculations performed by BNY Mellon Invest-
ment Servicing (US) Inc. Please see page 85 for index definitions.4 Calculated from 12/31/98.
TOP TEN HOLDINGS5
Sector % Net Assets
Sony Corp. Consumer Discretionary 4.0%
Tokio Marine Holdings, Inc. Financials 3.5%
Nippon Telegraph & Telephone Corp. Communication Services 3.5%
Terumo Corp. Health Care 3.0%
Nitori Holdings Co., Ltd. Consumer Discretionary 3.0%
Daikin Industries, Ltd. Industrials 3.0%
Keyence Corp. Information Technology 3.0%
Lasertec Corp. Information Technology 3.0%
TechnoPro Holdings, Inc. Industrials 2.9%
Asahi Intecc Co., Ltd. Health Care 2.8%
% OF ASSETS IN TOP TEN 31.7%
5 Holdings may combine more than one security from same issuer and related depositary receipts.
66 MATTHEWS ASIA FUNDS
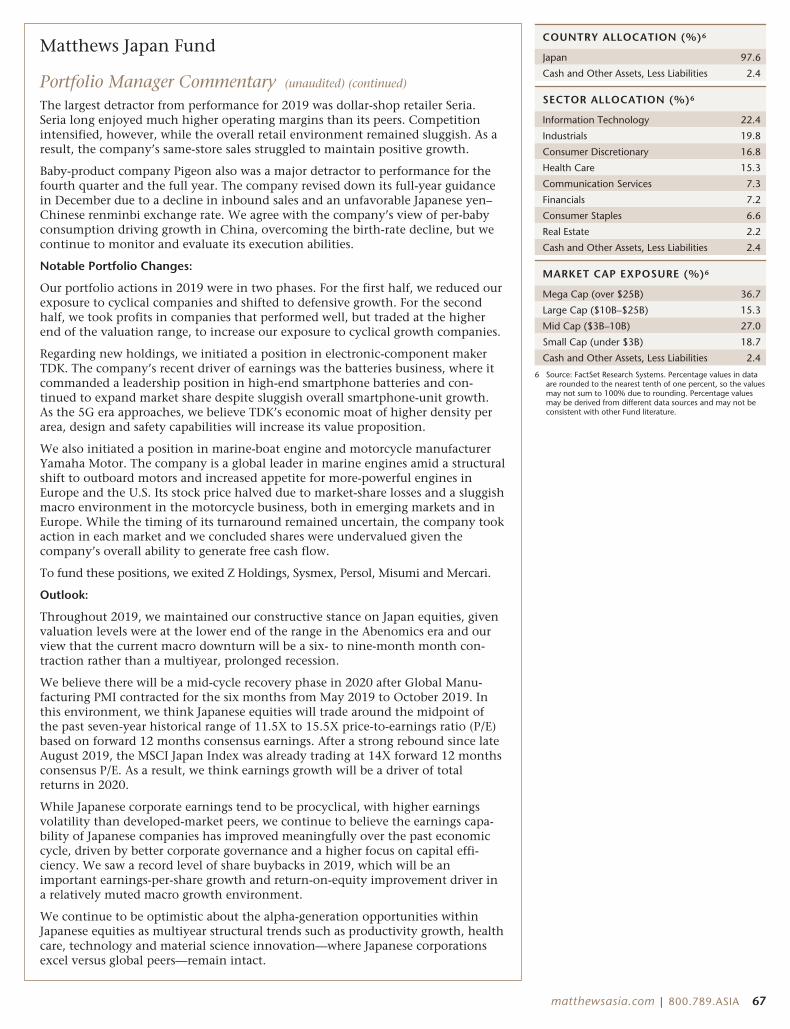
Matthews Japan Fund
Portfolio Manager Commentary (unaudited) (continued)
The largest detractor from performance for 2019 was dollar-shop retailer Seria.Seria long enjoyed much higher operating margins than its peers. Competitionintensified, however, while the overall retail environment remained sluggish. As aresult, the company’s same-store sales struggled to maintain positive growth.
Baby-product company Pigeon also was a major detractor to performance for thefourth quarter and the full year. The company revised down its full-year guidancein December due to a decline in inbound sales and an unfavorable Japanese yen–Chinese renminbi exchange rate. We agree with the company’s view of per-babyconsumption driving growth in China, overcoming the birth-rate decline, but wecontinue to monitor and evaluate its execution abilities.
Notable Portfolio Changes:
Our portfolio actions in 2019 were in two phases. For the first half, we reduced ourexposure to cyclical companies and shifted to defensive growth. For the secondhalf, we took profits in companies that performed well, but traded at the higherend of the valuation range, to increase our exposure to cyclical growth companies.
Regarding new holdings, we initiated a position in electronic-component makerTDK. The company’s recent driver of earnings was the batteries business, where itcommanded a leadership position in high-end smartphone batteries and con-tinued to expand market share despite sluggish overall smartphone-unit growth.As the 5G era approaches, we believe TDK’s economic moat of higher density perarea, design and safety capabilities will increase its value proposition.
We also initiated a position in marine-boat engine and motorcycle manufacturerYamaha Motor. The company is a global leader in marine engines amid a structuralshift to outboard motors and increased appetite for more-powerful engines inEurope and the U.S. Its stock price halved due to market-share losses and a sluggishmacro environment in the motorcycle business, both in emerging markets and inEurope. While the timing of its turnaround remained uncertain, the company tookaction in each market and we concluded shares were undervalued given thecompany’s overall ability to generate free cash flow.
To fund these positions, we exited Z Holdings, Sysmex, Persol, Misumi and Mercari.
Outlook:
Throughout 2019, we maintained our constructive stance on Japan equities, givenvaluation levels were at the lower end of the range in the Abenomics era and ourview that the current macro downturn will be a six- to nine-month month con-traction rather than a multiyear, prolonged recession.
We believe there will be a mid-cycle recovery phase in 2020 after Global Manu-facturing PMI contracted for the six months from May 2019 to October 2019. Inthis environment, we think Japanese equities will trade around the midpoint ofthe past seven-year historical range of 11.5X to 15.5X price-to-earnings ratio (P/E)based on forward 12 months consensus earnings. After a strong rebound since lateAugust 2019, the MSCI Japan Index was already trading at 14X forward 12 monthsconsensus P/E. As a result, we think earnings growth will be a driver of totalreturns in 2020.
While Japanese corporate earnings tend to be procyclical, with higher earningsvolatility than developed-market peers, we continue to believe the earnings capa-bility of Japanese companies has improved meaningfully over the past economiccycle, driven by better corporate governance and a higher focus on capital effi-ciency. We saw a record level of share buybacks in 2019, which will be animportant earnings-per-share growth and return-on-equity improvement driver ina relatively muted macro growth environment.
We continue to be optimistic about the alpha-generation opportunities withinJapanese equities as multiyear structural trends such as productivity growth, healthcare, technology and material science innovation—where Japanese corporationsexcel versus global peers—remain intact.
COUNTRY ALLOCATION (%)6
Japan 97.6
Cash and Other Assets, Less Liabilities 2.4
SECTOR ALLOCATION (%)6
Information Technology 22.4
Industrials 19.8
Consumer Discretionary 16.8
Health Care 15.3
Communication Services 7.3
Financials 7.2
Consumer Staples 6.6
Real Estate 2.2
Cash and Other Assets, Less Liabilities 2.4
MARKET CAP EXPOSURE (%)6
Mega Cap (over $25B) 36.7
Large Cap ($10B–$25B) 15.3
Mid Cap ($3B–10B) 27.0
Small Cap (under $3B) 18.7
Cash and Other Assets, Less Liabilities 2.4
6 Source: FactSet Research Systems. Percentage values in dataare rounded to the nearest tenth of one percent, so the valuesmay not sum to 100% due to rounding. Percentage valuesmay be derived from different data sources and may not beconsistent with other Fund literature.
matthewsasia.com | 800.789.ASIA 67
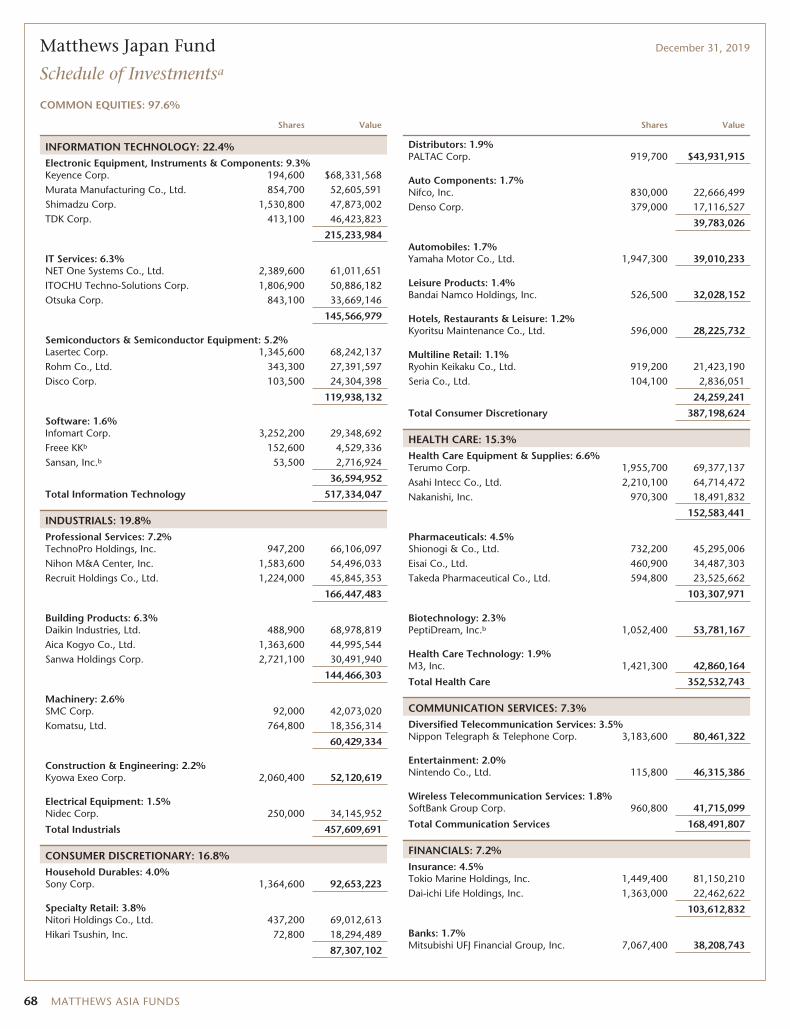
Matthews Japan Fund December 31, 2019
Schedule of Investmentsa
COMMON EQUITIES: 97.6%
Shares Value
INFORMATION TECHNOLOGY: 22.4%Electronic Equipment, Instruments & Components: 9.3%Keyence Corp. 194,600 $68,331,568Murata Manufacturing Co., Ltd. 854,700 52,605,591Shimadzu Corp. 1,530,800 47,873,002TDK Corp. 413,100 46,423,823
215,233,984
IT Services: 6.3%NET One Systems Co., Ltd. 2,389,600 61,011,651ITOCHU Techno-Solutions Corp. 1,806,900 50,886,182Otsuka Corp. 843,100 33,669,146
145,566,979
Semiconductors & Semiconductor Equipment: 5.2%Lasertec Corp. 1,345,600 68,242,137Rohm Co., Ltd. 343,300 27,391,597Disco Corp. 103,500 24,304,398
119,938,132
Software: 1.6%Infomart Corp. 3,252,200 29,348,692Freee KKb 152,600 4,529,336Sansan, Inc.b 53,500 2,716,924
36,594,952
Total Information Technology 517,334,047
INDUSTRIALS: 19.8%Professional Services: 7.2%TechnoPro Holdings, Inc. 947,200 66,106,097Nihon M&A Center, Inc. 1,583,600 54,496,033Recruit Holdings Co., Ltd. 1,224,000 45,845,353
166,447,483
Building Products: 6.3%Daikin Industries, Ltd. 488,900 68,978,819Aica Kogyo Co., Ltd. 1,363,600 44,995,544Sanwa Holdings Corp. 2,721,100 30,491,940
144,466,303
Machinery: 2.6%SMC Corp. 92,000 42,073,020Komatsu, Ltd. 764,800 18,356,314
60,429,334
Construction & Engineering: 2.2%Kyowa Exeo Corp. 2,060,400 52,120,619
Electrical Equipment: 1.5%Nidec Corp. 250,000 34,145,952
Total Industrials 457,609,691
CONSUMER DISCRETIONARY: 16.8%Household Durables: 4.0%Sony Corp. 1,364,600 92,653,223
Specialty Retail: 3.8%Nitori Holdings Co., Ltd. 437,200 69,012,613Hikari Tsushin, Inc. 72,800 18,294,489
87,307,102
Shares Value
Distributors: 1.9%PALTAC Corp. 919,700 $43,931,915
Auto Components: 1.7%Nifco, Inc. 830,000 22,666,499Denso Corp. 379,000 17,116,527
39,783,026
Automobiles: 1.7%Yamaha Motor Co., Ltd. 1,947,300 39,010,233
Leisure Products: 1.4%Bandai Namco Holdings, Inc. 526,500 32,028,152
Hotels, Restaurants & Leisure: 1.2%Kyoritsu Maintenance Co., Ltd. 596,000 28,225,732
Multiline Retail: 1.1%Ryohin Keikaku Co., Ltd. 919,200 21,423,190Seria Co., Ltd. 104,100 2,836,051
24,259,241
Total Consumer Discretionary 387,198,624
HEALTH CARE: 15.3%Health Care Equipment & Supplies: 6.6%Terumo Corp. 1,955,700 69,377,137Asahi Intecc Co., Ltd. 2,210,100 64,714,472Nakanishi, Inc. 970,300 18,491,832
152,583,441
Pharmaceuticals: 4.5%Shionogi & Co., Ltd. 732,200 45,295,006Eisai Co., Ltd. 460,900 34,487,303Takeda Pharmaceutical Co., Ltd. 594,800 23,525,662
103,307,971
Biotechnology: 2.3%PeptiDream, Inc.b 1,052,400 53,781,167
Health Care Technology: 1.9%M3, Inc. 1,421,300 42,860,164
Total Health Care 352,532,743
COMMUNICATION SERVICES: 7.3%Diversified Telecommunication Services: 3.5%Nippon Telegraph & Telephone Corp. 3,183,600 80,461,322
Entertainment: 2.0%Nintendo Co., Ltd. 115,800 46,315,386
Wireless Telecommunication Services: 1.8%SoftBank Group Corp. 960,800 41,715,099
Total Communication Services 168,491,807
FINANCIALS: 7.2%Insurance: 4.5%Tokio Marine Holdings, Inc. 1,449,400 81,150,210Dai-ichi Life Holdings, Inc. 1,363,000 22,462,622
103,612,832
Banks: 1.7%Mitsubishi UFJ Financial Group, Inc. 7,067,400 38,208,743
68 MATTHEWS ASIA FUNDS
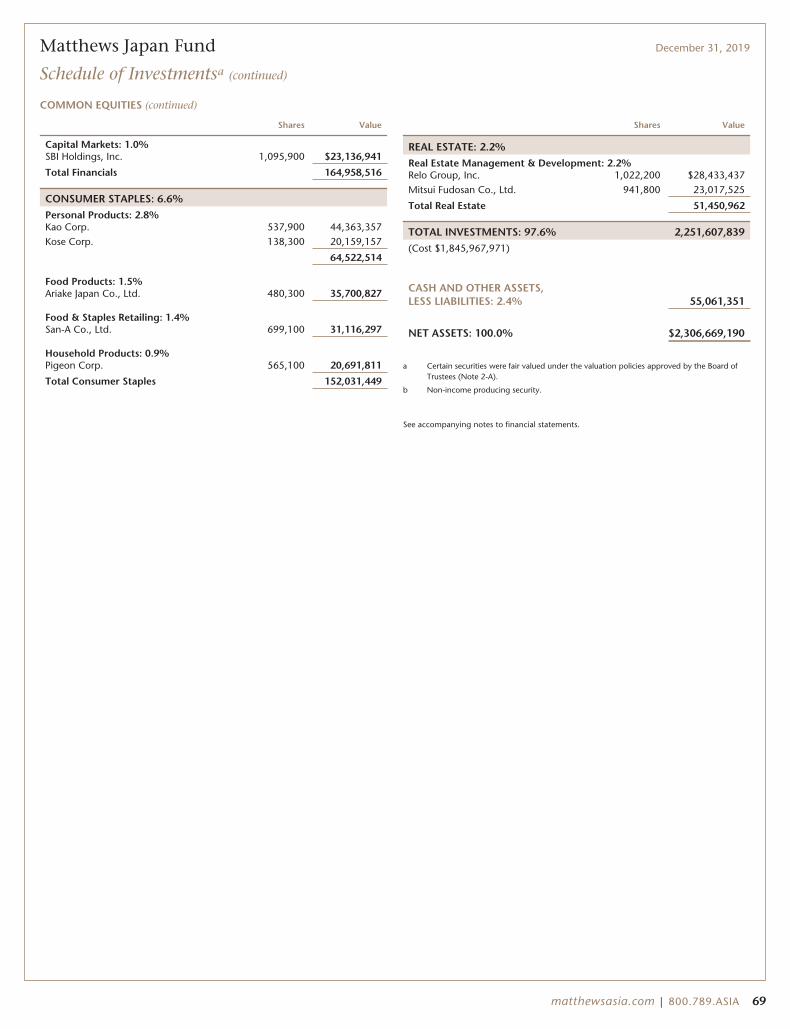
Matthews Japan Fund December 31, 2019
Schedule of Investmentsa (continued)
COMMON EQUITIES (continued)
Shares Value
Capital Markets: 1.0%SBI Holdings, Inc. 1,095,900 $23,136,941
Total Financials 164,958,516
CONSUMER STAPLES: 6.6%Personal Products: 2.8%Kao Corp. 537,900 44,363,357Kose Corp. 138,300 20,159,157
64,522,514
Food Products: 1.5%Ariake Japan Co., Ltd. 480,300 35,700,827
Food & Staples Retailing: 1.4%San-A Co., Ltd. 699,100 31,116,297
Household Products: 0.9%Pigeon Corp. 565,100 20,691,811
Total Consumer Staples 152,031,449
Shares Value
REAL ESTATE: 2.2%Real Estate Management & Development: 2.2%Relo Group, Inc. 1,022,200 $28,433,437Mitsui Fudosan Co., Ltd. 941,800 23,017,525
Total Real Estate 51,450,962
TOTAL INVESTMENTS: 97.6% 2,251,607,839(Cost $1,845,967,971)
CASH AND OTHER ASSETS,LESS LIABILITIES: 2.4% 55,061,351
NET ASSETS: 100.0% $2,306,669,190
a Certain securities were fair valued under the valuation policies approved by the Board ofTrustees (Note 2-A).
b Non-income producing security.
See accompanying notes to financial statements.
matthewsasia.com | 800.789.ASIA 69
ASIA GROWTH STRATEGIES
PORTFOLIO MANAGERS
Michael J. Oh, CFALead Manager
Elli LeeCo-Manager
FUND FACTS
Investor InstitutionalTicker MAKOX MIKOXCUSIP 577130305 577130826Inception 1/3/95 10/29/10NAV $4.38 $4.42Initial Investment $2,500 $100,000Gross ExpenseRatio1 1.15% 1.05%
Portfolio StatisticsTotal # of Positions 37Net Assets $136.8 millionWeighted Average Market Cap $79.2 billionPortfolio Turnover2 36.63%
BenchmarkKorea Composite Stock Price Index
OBJECTIVE
Long-term capital appreciation.
STRATEGY
Under normal market conditions, the Fund seeks toachieve its investment objective by investing at least80% of its net assets, which include borrowings forinvestment purposes, in the common and preferredstocks of companies located in South Korea.
Matthews Korea Fund
Portfolio Manager Commentary (unaudited)
For the year ending December 31, 2019, the Matthews Korea Fund returned 3.80%(Investor Class) and 4.01% (Institutional Class), while its benchmark, the KoreaComposite Stock Price Index, returned 4.46%. For the fourth quarter, the Fundreturned 10.81% (Investor Class) and 10.73% (Institutional Class) versus 10.41%for the Index.
Market Environment:
South Korea’s equities generated modest gains in 2019. The strongest sector wasinformation technology, as share prices rose on expectations related to the rolloutof 5G and easing U.S.–China trade tensions. Looking back at 2017 and 2018,information technology (IT) company share prices suffered amid weaker-than-expected demand, so they started 2019 with relatively low valuations. Shares of ITcompanies then rebounded sharply in 2019, outperforming all other sectors glob-ally. While sentiment seems to have improved ahead of the actual recovery, weexpect to see a more balanced supply-and-demand environment for semiconductormemory products ahead. The surge in IT stock prices created a notable divergencein equity returns between the sector and the broader market.
Equity prices in other sectors were softer. Consumer-related companies were hardhit, especially in the consumer staples, consumer discretionary and health caresectors. Government policies showed mixed results as corporate earnings and hir-ing tendencies were negatively affected by stiff hikes in the minimum wage overthe past two years and controlling working hours. South Korea continued toexperience soft disposable-income growth as tax-related expenses rose. Going into2020, we remain cautious on domestic stocks that may lack clear catalysts forgrowth. We believe bottom-up stock selection remains key in South Korea’s equitymarket, particularly in the current environment.
Performance Contributors and Detractors:
For the full year 2019, the Fund underperformed its benchmark. The Fund’s under-weight to the IT sector was the biggest detractor from relative performance. Closeto a third of the benchmark is concentrated in the IT sector, which generated thestrongest returns of any sector in the year. While maintaining a meaningful alloca-tion to IT, the Fund was underweight relative to the benchmark. We have a pos-itive view of the IT sector, but also seek to avoid significant sector concentrationsand maintain a diversified approach to investing in South Korea. Stock selection inhealth care and communication services, meanwhile, was a contributor for theyear and helped to reduce the impact of our underweight to IT.
Turning to individual securities, household products manufacturer Lock & Lockwas a detractor from performance. The company was still going through arestructuring and revamping of its product lineup. We think the restructuring isclose to an end and remain optimistic about the company’s prospects. The com-pany appears to have a strong vision for its marketing channels and products, sowe expect to see healthy revenue growth along with margin improvement.
South Korean search engine and internet content provider NAVER was a strong con-tributor to performance. As South Korea lacks a dominant e-commerce platform,consumers increasingly are using NAVER’s search-engine functions as a primaryshopping tool. NAVER also has introduced its own digital-payments service, turningits search engine into an e-commerce platform. The company reported stronger-than-expected results for its core business in the second quarter of 2019, noting that itexpected losses at a subsidiary to have peaked. NAVER also announced it would spinoff its payments platform to enhance competitiveness and revealed plans to spin offother businesses via public offerings in the next few years.
(continued)
1 Actual 2019 expense ratios.2 The lesser of fiscal year 2019 long-term purchase costs or sales proceeds divided by the average monthly market value of long-term securities.
70 MATTHEWS ASIA FUNDS
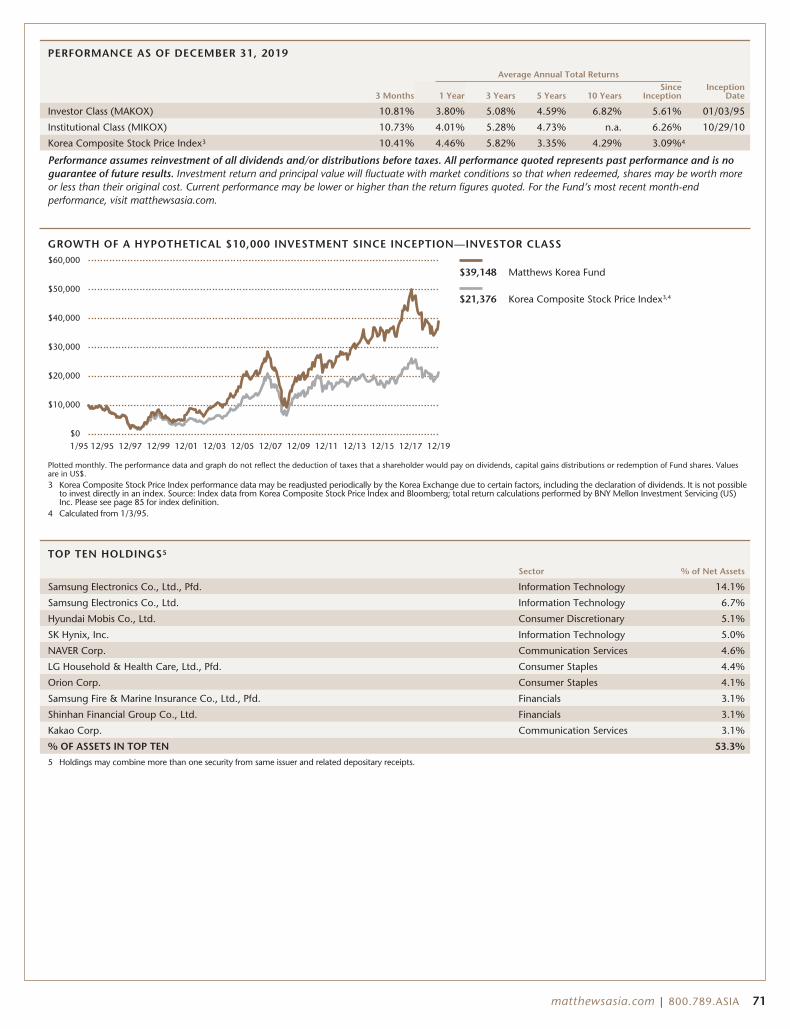
PERFORMANCE AS OF DECEMBER 31, 2019
Average Annual Total Returns
3 Months 1 Year 3 Years 5 Years 10 YearsSince
InceptionInception
Date
Investor Class (MAKOX) 10.81% 3.80% 5.08% 4.59% 6.82% 5.61% 01/03/95
Institutional Class (MIKOX) 10.73% 4.01% 5.28% 4.73% n.a. 6.26% 10/29/10
Korea Composite Stock Price Index3 10.41% 4.46% 5.82% 3.35% 4.29% 3.09%4
Performance assumes reinvestment of all dividends and/or distributions before taxes. All performance quoted represents past performance and is noguarantee of future results. Investment return and principal value will fluctuate with market conditions so that when redeemed, shares may be worth moreor less than their original cost. Current performance may be lower or higher than the return figures quoted. For the Fund’s most recent month-endperformance, visit matthewsasia.com.
GROWTH OF A HYPOTHETICAL $10,000 INVESTMENT SINCE INCEPTION—INVESTOR CLASS
$39,148 Matthews Korea Fund
$21,376 Korea Composite Stock Price Index3,4
1/95 12/95 12/97 12/99 12/01 12/03 12/05 12/07 12/09 12/11 12/13 12/15 12/17 12/19$0
$20,000
$10,000
$60,000
$30,000
$40,000
$50,000
Plotted monthly. The performance data and graph do not reflect the deduction of taxes that a shareholder would pay on dividends, capital gains distributions or redemption of Fund shares. Valuesare in US$.3 Korea Composite Stock Price Index performance data may be readjusted periodically by the Korea Exchange due to certain factors, including the declaration of dividends. It is not possible
to invest directly in an index. Source: Index data from Korea Composite Stock Price Index and Bloomberg; total return calculations performed by BNY Mellon Investment Servicing (US)Inc. Please see page 85 for index definition.
4 Calculated from 1/3/95.
TOP TEN HOLDINGS5
Sector % of Net Assets
Samsung Electronics Co., Ltd., Pfd. Information Technology 14.1%
Samsung Electronics Co., Ltd. Information Technology 6.7%
Hyundai Mobis Co., Ltd. Consumer Discretionary 5.1%
SK Hynix, Inc. Information Technology 5.0%
NAVER Corp. Communication Services 4.6%
LG Household & Health Care, Ltd., Pfd. Consumer Staples 4.4%
Orion Corp. Consumer Staples 4.1%
Samsung Fire & Marine Insurance Co., Ltd., Pfd. Financials 3.1%
Shinhan Financial Group Co., Ltd. Financials 3.1%
Kakao Corp. Communication Services 3.1%
% OF ASSETS IN TOP TEN 53.3%
5 Holdings may combine more than one security from same issuer and related depositary receipts.
matthewsasia.com | 800.789.ASIA 71

COUNTRY ALLOCATION (%)6
South Korea 98.1
Cash and Other Assets, Less Liabilities 1.9
SECTOR ALLOCATION (%)6
Information Technology 33.3
Consumer Staples 14.3
Financials 12.6
Consumer Discretionary 12.0
Communication Services 7.7
Health Care 7.4
Materials 5.5
Industrials 1.9
Energy 1.9
Real Estate 1.6
Cash and Other Assets, Less Liabilities 1.9
MARKET CAP EXPOSURE (%)6
Mega Cap (over $25B) 34.4
Large Cap ($10B–$25B) 29.6
Mid Cap ($3B–10B) 7.9
Small Cap (under $3B) 26.2
Cash and Other Assets, Less Liabilities 1.9
6 Source: FactSet Research Systems. Percentage values in dataare rounded to the nearest tenth of one percent, so the valuesmay not sum to 100% due to rounding. Percentage valuesmay be derived from different data sources and may not beconsistent with other Fund literature.
Matthews Korea Fund
Portfolio Manager Commentary (unaudited) (continued)
Notable Portfolio Changes:
In the fourth quarter, we initiated a new position in LEENO Industrial, a SouthKorea-based company that develops and manufactures components used in thesemiconductor industry. The company is a provider of test pins to a broad range oftechnology industries. Increasingly, its application is used for the health care area.As its pin is used in the research and development (R&D) stage, the company pro-vides a good way to invest in R&D with a favorable valuation. We believe thecompany’s customer base is well-diversified and that the management team isstrong. We were able to buy the stock when valuations appeared attractive fortechnical reasons. We also exited travel and tourism company Modetour. As apackage tour operator, Modetour was negatively impacted by weakness inconsumer spending and South Korea and Japan issues. The company was also fac-ing increased competition, losing market share to online travel agency platforms.
Outlook:
Information technology plays a big role in South Korea’s economy. Looking ahead,we remain positive in our outlook for the sector, mainly due to improving supply-and-demand dynamics in 2020. When the sector is performing well, it can helpthe entire value chain across South Korea in some way. Apart from the IT sector,we think South Korean automotive companies can enjoy an earnings recoveryfrom improving product cycles in 2020. With a generational change in itsmanagement team, Hyundai Motor has been launching better products globallyand continues to improve corporate governance. We remain positive on SouthKorean EV battery manufacturers in 2020, driven by Europe to meet emission-reduction targets in 2020-2021. These trends are positive to potential benchmarkreturns, as the Korea Composite Stock Price Index is heavily concentrated among afew large weights within the IT sector.
In 2020, consumer spending in South Korea could remain softer over the nearterm, but the share prices of individual companies may grow attractively, in ourview. Bottom-up stock selection becomes even more important, as the number ofcompanies generating growth appears limited to a select group of innovators. Asever, we also look to invest in South Korean companies with exposure to customersacross Asia and globally. We continue to look for companies with better growthprofiles, whether serving domestic Korean consumers, Asian consumers morebroadly or global consumers.
72 MATTHEWS ASIA FUNDS
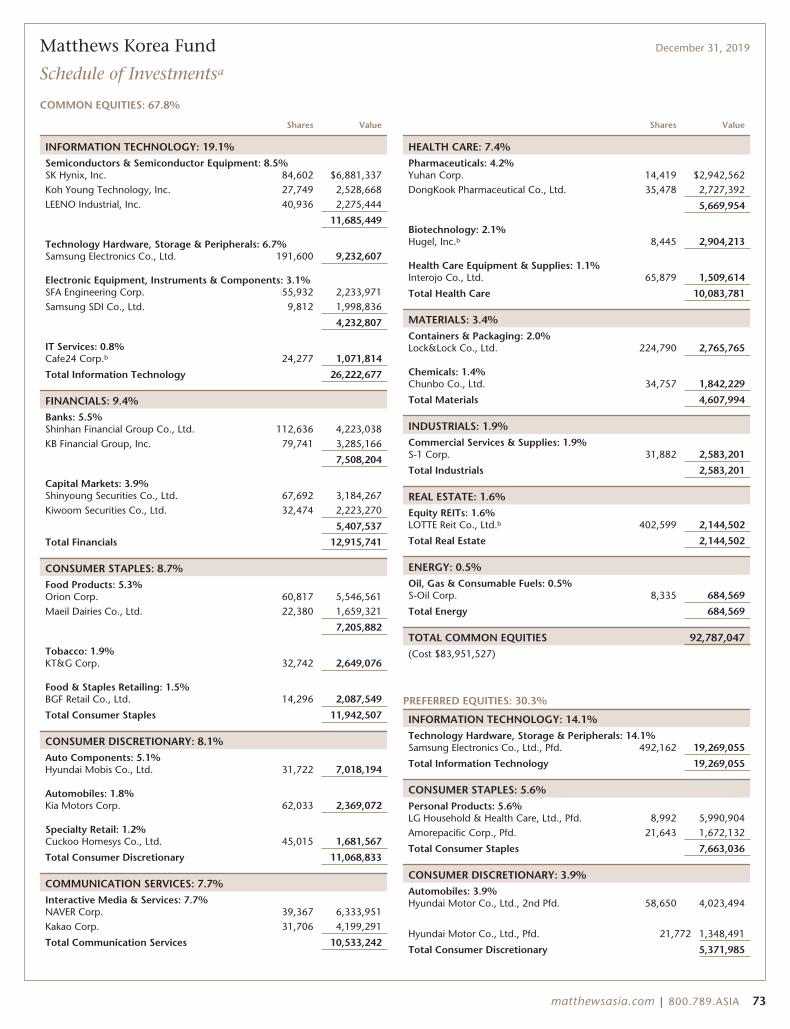
Matthews Korea Fund December 31, 2019
Schedule of Investmentsa
COMMON EQUITIES: 67.8%
Shares Value
INFORMATION TECHNOLOGY: 19.1%Semiconductors & Semiconductor Equipment: 8.5%SK Hynix, Inc. 84,602 $6,881,337Koh Young Technology, Inc. 27,749 2,528,668LEENO Industrial, Inc. 40,936 2,275,444
11,685,449
Technology Hardware, Storage & Peripherals: 6.7%Samsung Electronics Co., Ltd. 191,600 9,232,607
Electronic Equipment, Instruments & Components: 3.1%SFA Engineering Corp. 55,932 2,233,971Samsung SDI Co., Ltd. 9,812 1,998,836
4,232,807
IT Services: 0.8%Cafe24 Corp.b 24,277 1,071,814
Total Information Technology 26,222,677
FINANCIALS: 9.4%Banks: 5.5%Shinhan Financial Group Co., Ltd. 112,636 4,223,038KB Financial Group, Inc. 79,741 3,285,166
7,508,204
Capital Markets: 3.9%Shinyoung Securities Co., Ltd. 67,692 3,184,267Kiwoom Securities Co., Ltd. 32,474 2,223,270
5,407,537
Total Financials 12,915,741
CONSUMER STAPLES: 8.7%Food Products: 5.3%Orion Corp. 60,817 5,546,561Maeil Dairies Co., Ltd. 22,380 1,659,321
7,205,882
Tobacco: 1.9%KT&G Corp. 32,742 2,649,076
Food & Staples Retailing: 1.5%BGF Retail Co., Ltd. 14,296 2,087,549
Total Consumer Staples 11,942,507
CONSUMER DISCRETIONARY: 8.1%Auto Components: 5.1%Hyundai Mobis Co., Ltd. 31,722 7,018,194
Automobiles: 1.8%Kia Motors Corp. 62,033 2,369,072
Specialty Retail: 1.2%Cuckoo Homesys Co., Ltd. 45,015 1,681,567
Total Consumer Discretionary 11,068,833
COMMUNICATION SERVICES: 7.7%Interactive Media & Services: 7.7%NAVER Corp. 39,367 6,333,951Kakao Corp. 31,706 4,199,291
Total Communication Services 10,533,242
Shares Value
HEALTH CARE: 7.4%Pharmaceuticals: 4.2%Yuhan Corp. 14,419 $2,942,562DongKook Pharmaceutical Co., Ltd. 35,478 2,727,392
5,669,954
Biotechnology: 2.1%Hugel, Inc.b 8,445 2,904,213
Health Care Equipment & Supplies: 1.1%Interojo Co., Ltd. 65,879 1,509,614
Total Health Care 10,083,781
MATERIALS: 3.4%Containers & Packaging: 2.0%Lock&Lock Co., Ltd. 224,790 2,765,765
Chemicals: 1.4%Chunbo Co., Ltd. 34,757 1,842,229
Total Materials 4,607,994
INDUSTRIALS: 1.9%Commercial Services & Supplies: 1.9%S-1 Corp. 31,882 2,583,201
Total Industrials 2,583,201
REAL ESTATE: 1.6%Equity REITs: 1.6%LOTTE Reit Co., Ltd.b 402,599 2,144,502
Total Real Estate 2,144,502
ENERGY: 0.5%Oil, Gas & Consumable Fuels: 0.5%S-Oil Corp. 8,335 684,569
Total Energy 684,569
TOTAL COMMON EQUITIES 92,787,047(Cost $83,951,527)
PREFERRED EQUITIES: 30.3%
INFORMATION TECHNOLOGY: 14.1%Technology Hardware, Storage & Peripherals: 14.1%Samsung Electronics Co., Ltd., Pfd. 492,162 19,269,055
Total Information Technology 19,269,055
CONSUMER STAPLES: 5.6%Personal Products: 5.6%LG Household & Health Care, Ltd., Pfd. 8,992 5,990,904Amorepacific Corp., Pfd. 21,643 1,672,132
Total Consumer Staples 7,663,036
CONSUMER DISCRETIONARY: 3.9%Automobiles: 3.9%Hyundai Motor Co., Ltd., 2nd Pfd. 58,650 4,023,494
Hyundai Motor Co., Ltd., Pfd. 21,772 1,348,491
Total Consumer Discretionary 5,371,985
matthewsasia.com | 800.789.ASIA 73
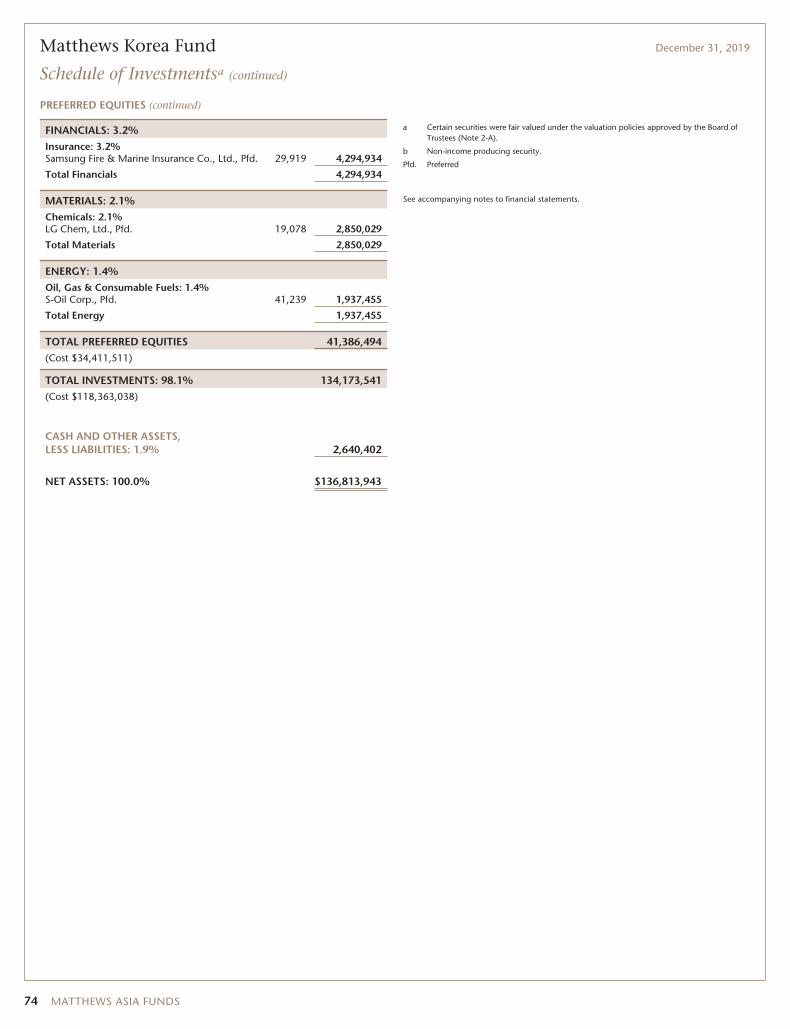
Matthews Korea Fund December 31, 2019
Schedule of Investmentsa (continued)
PREFERRED EQUITIES (continued)
FINANCIALS: 3.2%Insurance: 3.2%Samsung Fire & Marine Insurance Co., Ltd., Pfd. 29,919 4,294,934
Total Financials 4,294,934
MATERIALS: 2.1%Chemicals: 2.1%LG Chem, Ltd., Pfd. 19,078 2,850,029
Total Materials 2,850,029
ENERGY: 1.4%Oil, Gas & Consumable Fuels: 1.4%S-Oil Corp., Pfd. 41,239 1,937,455
Total Energy 1,937,455
TOTAL PREFERRED EQUITIES 41,386,494(Cost $34,411,511)
TOTAL INVESTMENTS: 98.1% 134,173,541(Cost $118,363,038)
CASH AND OTHER ASSETS,LESS LIABILITIES: 1.9% 2,640,402
NET ASSETS: 100.0% $136,813,943
a Certain securities were fair valued under the valuation policies approved by the Board ofTrustees (Note 2-A).
b Non-income producing security.
Pfd. Preferred
See accompanying notes to financial statements.
74 MATTHEWS ASIA FUNDS
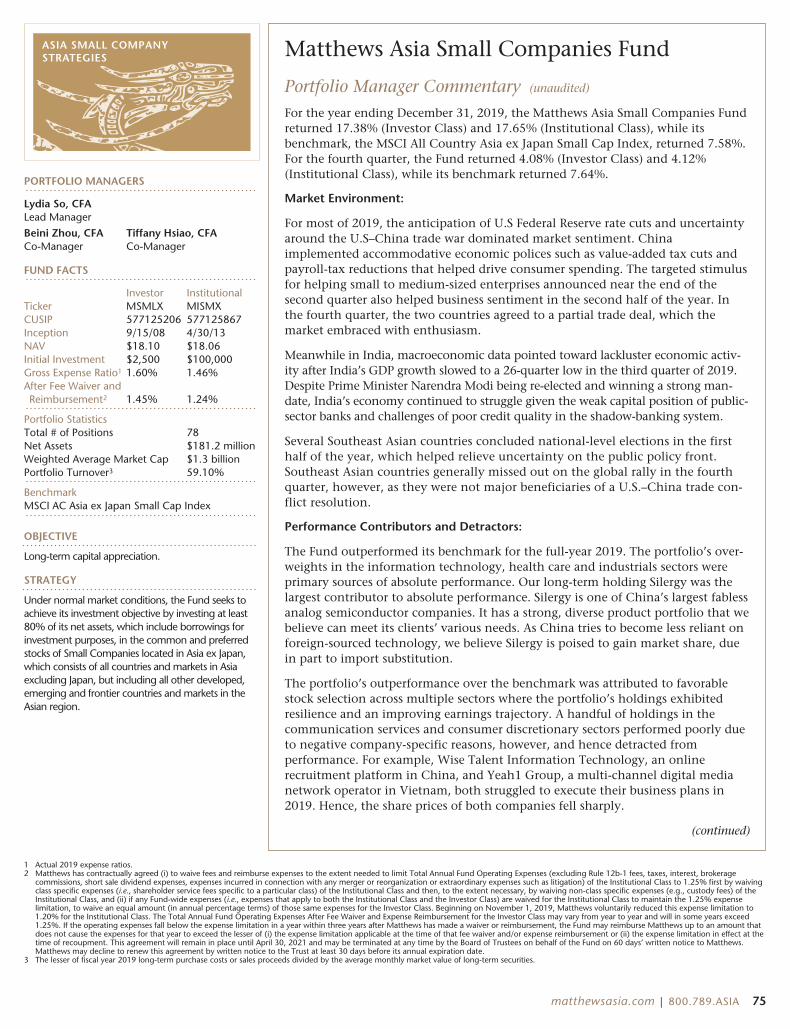
ASIA SMALL COMPANYSTRATEGIES
PORTFOLIO MANAGERS
Lydia So, CFALead Manager
Beini Zhou, CFA Tiffany Hsiao, CFACo-Manager Co-Manager
FUND FACTS
Investor InstitutionalTicker MSMLX MISMXCUSIP 577125206 577125867Inception 9/15/08 4/30/13NAV $18.10 $18.06Initial Investment $2,500 $100,000Gross Expense Ratio1 1.60% 1.46%After Fee Waiver andReimbursement2 1.45% 1.24%
Portfolio StatisticsTotal # of Positions 78Net Assets $181.2 millionWeighted Average Market Cap $1.3 billionPortfolio Turnover3 59.10%
BenchmarkMSCI AC Asia ex Japan Small Cap Index
OBJECTIVE
Long-term capital appreciation.
STRATEGY
Under normal market conditions, the Fund seeks toachieve its investment objective by investing at least80% of its net assets, which include borrowings forinvestment purposes, in the common and preferredstocks of Small Companies located in Asia ex Japan,which consists of all countries and markets in Asiaexcluding Japan, but including all other developed,emerging and frontier countries and markets in theAsian region.
Matthews Asia Small Companies Fund
Portfolio Manager Commentary (unaudited)
For the year ending December 31, 2019, the Matthews Asia Small Companies Fundreturned 17.38% (Investor Class) and 17.65% (Institutional Class), while itsbenchmark, the MSCI All Country Asia ex Japan Small Cap Index, returned 7.58%.For the fourth quarter, the Fund returned 4.08% (Investor Class) and 4.12%(Institutional Class), while its benchmark returned 7.64%.
Market Environment:
For most of 2019, the anticipation of U.S Federal Reserve rate cuts and uncertaintyaround the U.S–China trade war dominated market sentiment. Chinaimplemented accommodative economic polices such as value-added tax cuts andpayroll-tax reductions that helped drive consumer spending. The targeted stimulusfor helping small to medium-sized enterprises announced near the end of thesecond quarter also helped business sentiment in the second half of the year. Inthe fourth quarter, the two countries agreed to a partial trade deal, which themarket embraced with enthusiasm.
Meanwhile in India, macroeconomic data pointed toward lackluster economic activ-ity after India’s GDP growth slowed to a 26-quarter low in the third quarter of 2019.Despite Prime Minister Narendra Modi being re-elected and winning a strong man-date, India’s economy continued to struggle given the weak capital position of public-sector banks and challenges of poor credit quality in the shadow-banking system.
Several Southeast Asian countries concluded national-level elections in the firsthalf of the year, which helped relieve uncertainty on the public policy front.Southeast Asian countries generally missed out on the global rally in the fourthquarter, however, as they were not major beneficiaries of a U.S.–China trade con-flict resolution.
Performance Contributors and Detractors:
The Fund outperformed its benchmark for the full-year 2019. The portfolio’s over-weights in the information technology, health care and industrials sectors wereprimary sources of absolute performance. Our long-term holding Silergy was thelargest contributor to absolute performance. Silergy is one of China’s largest fablessanalog semiconductor companies. It has a strong, diverse product portfolio that webelieve can meet its clients’ various needs. As China tries to become less reliant onforeign-sourced technology, we believe Silergy is poised to gain market share, duein part to import substitution.
The portfolio’s outperformance over the benchmark was attributed to favorablestock selection across multiple sectors where the portfolio’s holdings exhibitedresilience and an improving earnings trajectory. A handful of holdings in thecommunication services and consumer discretionary sectors performed poorly dueto negative company-specific reasons, however, and hence detracted fromperformance. For example, Wise Talent Information Technology, an onlinerecruitment platform in China, and Yeah1 Group, a multi-channel digital medianetwork operator in Vietnam, both struggled to execute their business plans in2019. Hence, the share prices of both companies fell sharply.
(continued)
1 Actual 2019 expense ratios.2 Matthews has contractually agreed (i) to waive fees and reimburse expenses to the extent needed to limit Total Annual Fund Operating Expenses (excluding Rule 12b-1 fees, taxes, interest, brokerage
commissions, short sale dividend expenses, expenses incurred in connection with any merger or reorganization or extraordinary expenses such as litigation) of the Institutional Class to 1.25% first by waivingclass specific expenses (i.e., shareholder service fees specific to a particular class) of the Institutional Class and then, to the extent necessary, by waiving non-class specific expenses (e.g., custody fees) of theInstitutional Class, and (ii) if any Fund-wide expenses (i.e., expenses that apply to both the Institutional Class and the Investor Class) are waived for the Institutional Class to maintain the 1.25% expenselimitation, to waive an equal amount (in annual percentage terms) of those same expenses for the Investor Class. Beginning on November 1, 2019, Matthews voluntarily reduced this expense limitation to1.20% for the Institutional Class. The Total Annual Fund Operating Expenses After Fee Waiver and Expense Reimbursement for the Investor Class may vary from year to year and will in some years exceed1.25%. If the operating expenses fall below the expense limitation in a year within three years after Matthews has made a waiver or reimbursement, the Fund may reimburse Matthews up to an amount thatdoes not cause the expenses for that year to exceed the lesser of (i) the expense limitation applicable at the time of that fee waiver and/or expense reimbursement or (ii) the expense limitation in effect at thetime of recoupment. This agreement will remain in place until April 30, 2021 and may be terminated at any time by the Board of Trustees on behalf of the Fund on 60 days’ written notice to Matthews.Matthews may decline to renew this agreement by written notice to the Trust at least 30 days before its annual expiration date.
3 The lesser of fiscal year 2019 long-term purchase costs or sales proceeds divided by the average monthly market value of long-term securities.
matthewsasia.com | 800.789.ASIA 75
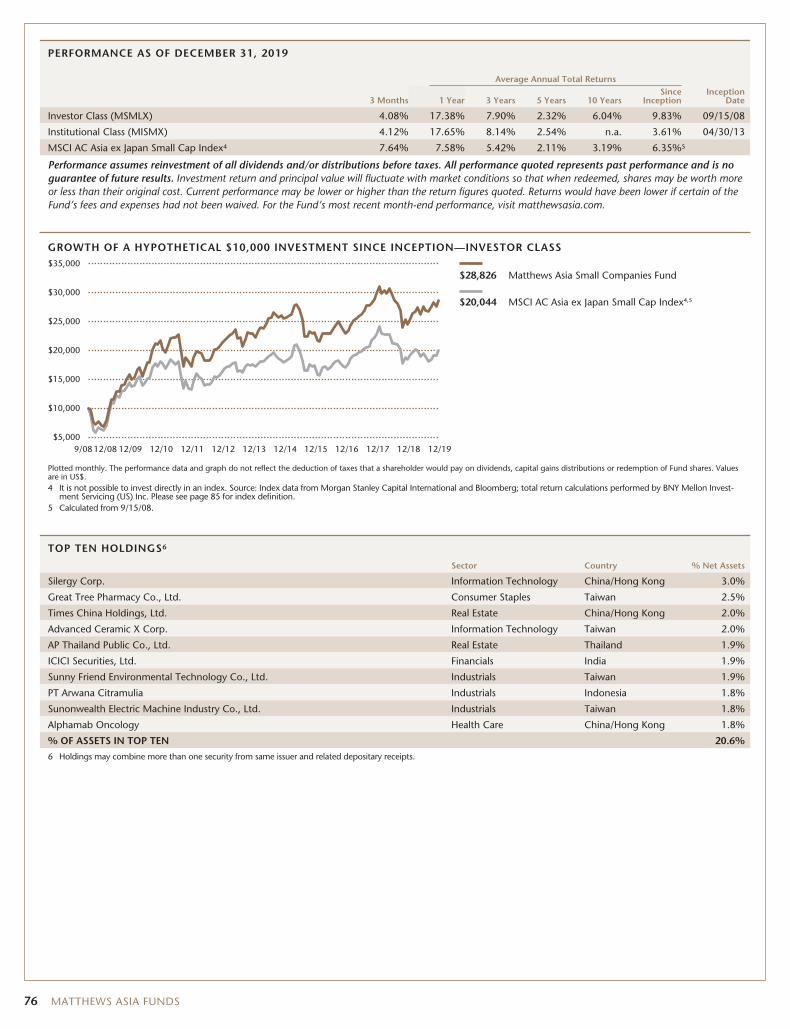
PERFORMANCE AS OF DECEMBER 31, 2019
Average Annual Total Returns
3 Months 1 Year 3 Years 5 Years 10 YearsSince
InceptionInception
Date
Investor Class (MSMLX) 4.08% 17.38% 7.90% 2.32% 6.04% 9.83% 09/15/08
Institutional Class (MISMX) 4.12% 17.65% 8.14% 2.54% n.a. 3.61% 04/30/13
MSCI AC Asia ex Japan Small Cap Index4 7.64% 7.58% 5.42% 2.11% 3.19% 6.35%5
Performance assumes reinvestment of all dividends and/or distributions before taxes. All performance quoted represents past performance and is noguarantee of future results. Investment return and principal value will fluctuate with market conditions so that when redeemed, shares may be worth moreor less than their original cost. Current performance may be lower or higher than the return figures quoted. Returns would have been lower if certain of theFund’s fees and expenses had not been waived. For the Fund’s most recent month-end performance, visit matthewsasia.com.
GROWTH OF A HYPOTHETICAL $10,000 INVESTMENT SINCE INCEPTION—INVESTOR CLASS
$28,826 Matthews Asia Small Companies Fund
$20,044 MSCI AC Asia ex Japan Small Cap Index4,5
9/08 12/0912/08 12/1312/1212/1112/10 12/14 12/1912/1812/1712/1612/15$5,000
$15,000
$20,000
$10,000
$25,000
$35,000
$30,000
Plotted monthly. The performance data and graph do not reflect the deduction of taxes that a shareholder would pay on dividends, capital gains distributions or redemption of Fund shares. Valuesare in US$.4 It is not possible to invest directly in an index. Source: Index data from Morgan Stanley Capital International and Bloomberg; total return calculations performed by BNY Mellon Invest-
ment Servicing (US) Inc. Please see page 85 for index definition.5 Calculated from 9/15/08.
TOP TEN HOLDINGS6
Sector Country % Net Assets
Silergy Corp. Information Technology China/Hong Kong 3.0%
Great Tree Pharmacy Co., Ltd. Consumer Staples Taiwan 2.5%
Times China Holdings, Ltd. Real Estate China/Hong Kong 2.0%
Advanced Ceramic X Corp. Information Technology Taiwan 2.0%
AP Thailand Public Co., Ltd. Real Estate Thailand 1.9%
ICICI Securities, Ltd. Financials India 1.9%
Sunny Friend Environmental Technology Co., Ltd. Industrials Taiwan 1.9%
PT Arwana Citramulia Industrials Indonesia 1.8%
Sunonwealth Electric Machine Industry Co., Ltd. Industrials Taiwan 1.8%
Alphamab Oncology Health Care China/Hong Kong 1.8%
% OF ASSETS IN TOP TEN 20.6%
6 Holdings may combine more than one security from same issuer and related depositary receipts.
76 MATTHEWS ASIA FUNDS
Matthews Asia Small Companies Fund
Portfolio Manager Commentary (unaudited) (continued)
By country, holdings in China/Hong Kong, Taiwan and India registered healthygains, generating the bulk of the absolute performance for the year. Yihai Interna-tional, a dominant hot-pot soup company based in China, performed strongly onthe back of strong revenue and profit growth. Some holdings in Vietnam andSingapore performed below expectations, however, detracting from absolute per-formance. Delfi in Singapore, a leading chocolate-confectionary maker with ameaningful market presence in Indonesia, delivered lackluster performance asconsumption activities in Indonesia remained soft.
Notable Portfolio Changes:
In 2019, the portfolio accumulated a number of new holdings in India as the sell-offamong India’s small caps presented attractive opportunities. The portfolio gainednew exposure to India’s rural economy through companies that we believe are well-positioned to benefit from improving demand. In China/Hong Kong, we focused oncompanies that are competitive and adaptive to the high value-adding segments ofthe economy by initiating positions in companies in biopharmaceuticals, softwareand tech hardware-related industries. The portfolio also increased its positions in anumber of A-share companies that are poised to grow nicely as their businesses areprimed to address rising domestic consumption and corporate demand.
We also were mindful of valuations. As a result, we trimmed positions in someconsumer staples high-flyers and exited positions that we believed had anunattractive risk/reward profile after a share price run-up. The portfolio also exitedholdings in companies that failed to show earnings improvement after severalquarters. The proceeds were deployed in initiating positions in a handful of SouthKorean and Taiwanese companies. Toward the second half of 2019, the teamincreased weightings in a number of companies that are positioned to participatein the recovery of the semiconductor supply chain.
Outlook:
2019 concluded with cheery market sentiment thanks to a partial resolution of theU.S–China trade war. There still could be bumps along the way as the two coun-tries work out their differences. The upcoming U.S. presidential election and recentgeopolitical tensions could contribute to more investor uncertainty.
To be sure, large Asian economies such as China and India are in transition as well.China is experiencing short-term pains in deleveraging its economy while India’seconomy is hampered by the immediate negative impact of continued disruptionin the non-banking financial sector. We recognize that global macroeconomicevents can be unpredictable. We continue to focus on identifying structural driversof Asia’s evolving economy, especially in areas such as consumption upgrades,productivity improvements and innovations.
We seek to identify companies that possess competitive moats and financialstrengths to execute their business plans. Entrepreneurial and nimble companies inAsia present some of the world’s most exciting growth opportunities for long-terminvestors. We are optimistic that there will be an expanding opportunity set in thesmall-cap universe in Asia, where many long-term winners may emerge.
COUNTRY ALLOCATION (%)7,8
China/Hong Kong 27.5
Taiwan 18.7
India 14.9
South Korea 12.7
Thailand 5.9
Vietnam 5.4
Indonesia 3.2
Malaysia 1.6
Philippines 1.4
Japan 1.4
Singapore 1.2
Australia 1.2
Cash and Other Assets, Less Liabilities 4.8
SECTOR ALLOCATION (%)8
Information Technology 21.1
Industrials 17.4
Health Care 14.7
Consumer Discretionary 11.1
Consumer Staples 8.8
Real Estate 7.0
Financials 6.2
Materials 5.5
Communication Services 3.3
Cash and Other Assets, Less Liabilities 4.8
MARKET CAP EXPOSURE (%)8,9
Mega Cap (over $25B) 0.0
Large Cap ($10B–$25B) 0.0
Mid Cap ($3B–10B) 10.8
Small Cap (under $3B) 84.4
Cash and Other Assets, Less Liabilities 4.8
7 Not all countries where the Fund may invest are included inthe benchmark index.
8 Source: FactSet Research Systems. Percentage values in dataare rounded to the nearest tenth of one percent, so the valuesmay not sum to 100% due to rounding. Percentage valuesmay be derived from different data sources and may not beconsistent with other Fund literature.
9 The Fund defines Small Companies as companies with marketcapitalization no higher than the greater of $5 billion or themarket capitalization of the largest company included in theFund’s primary benchmark, the MSCI All Country Asia exJapan Small Cap Index.
matthewsasia.com | 800.789.ASIA 77
Matthews Asia Small Companies Fund December 31, 2019
Schedule of Investmentsa
COMMON EQUITIES: 95.2%
Shares Value
CHINA/HONG KONG: 27.5%Silergy Corp. 168,000 $5,349,174Times China Holdings, Ltd. 1,854,000 3,694,505Alphamab Oncologyb,c,d 1,795,000 3,224,978Jiajiayue Group Co., Ltd. A Shares 811,989 2,838,468Innovent Biologics, Inc.b,c,d 828,000 2,826,106Joyoung Co., Ltd. A Shares 779,711 2,820,753China Isotope & Radiation Corp. 1,022,600 2,761,110BBI Life Sciences Corp.d 8,709,000 2,725,000Hua Hong Semiconductor, Ltd.b,d 1,165,000 2,653,607Aoyuan Healthy Life Group Co., Ltd.d 3,274,000 2,460,994Kingdee International Software Group Co., Ltd. 2,396,000 2,397,055SITC International Holdings Co., Ltd. 1,915,000 2,337,005Vitasoy International Holdings, Ltd. 604,000 2,191,080Precision Tsugami China Corp., Ltd.d 2,368,000 2,030,098Mobvista, Inc.b,d 4,288,000 1,864,047SUNeVision Holdings, Ltd. 2,752,000 1,860,856Genscript Biotech Corp.c 750,000 1,704,169Centre Testing International Group Co., Ltd. A
Shares 712,470 1,528,273Yihai International Holding, Ltd. 210,000 1,232,740Venus MedTech Hangzhou, Inc. H Sharesb,c,d 185,500 892,708Times Neighborhood Holdings, Ltd.c,d 790,326 491,906
Total China/Hong Kong 49,884,632
TAIWAN: 18.7%Great Tree Pharmacy Co., Ltd. 1,632,282 4,448,659Advanced Ceramic X Corp. 302,000 3,559,477Sunny Friend Environmental Technology Co., Ltd. 431,000 3,360,406Sunonwealth Electric Machine Industry Co., Ltd. 2,039,000 3,225,116Chroma ATE, Inc. 600,000 2,918,078Global Unichip Corp. 302,000 2,430,860Taiwan Paiho, Ltd. 846,000 2,378,763Chief Telecom, Inc. 303,000 2,223,744Foxsemicon Integrated Technology, Inc. 361,000 2,154,600Global PMX Co., Ltd. 360,000 2,087,981FIT Hon Teng, Ltd.b,d 5,405,000 1,818,823K.S. Terminals, Inc. 1,101,000 1,817,971Kuobrothers Corp. 1,103,952 1,430,715
Total Taiwan 33,855,193
INDIA: 14.9%ICICI Securities, Ltd.b,d 593,149 3,382,969Galaxy Surfactants, Ltd.d 131,835 2,772,388Syngene International, Ltd.b,d 531,669 2,384,677Procter & Gamble Health, Ltd. 36,693 2,244,767Amrutanjan Health Care, Ltd. 355,487 2,192,841NIIT Technologies, Ltd. 76,602 1,706,260Cholamandalam Investment and Finance Co., Ltd. 398,560 1,706,094Zydus Wellness, Ltd. 78,857 1,624,355Elgi Equipments, Ltd. 446,725 1,609,078M.M. Forgings, Ltd. 276,964 1,486,324Escorts, Ltd. 166,169 1,467,118Gabriel India, Ltd. 824,086 1,417,770DCB Bank, Ltd. 547,544 1,318,650Shankara Building Products, Ltd. 272,933 1,199,323Spencer’s Retail, Ltd.c 671,221 532,251
Total India 27,044,865
Shares Value
SOUTH KOREA: 12.7%Value Added Technology Co., Ltd. 121,233 $3,057,306Yuhan Corp. 12,500 2,550,942Chunbo Co., Ltd. 47,360 2,510,227Koentec Co., Ltd. 258,946 2,224,989SFA Engineering Corp. 53,103 2,120,979LEENO Industrial, Inc. 35,854 1,992,959Hy-Lok Corp. 116,533 1,934,584Douzone Bizon Co., Ltd. 27,603 1,929,611Cafe24 Corp.c 35,372 1,561,651Vitzrocell Co., Ltd.c 109,300 1,262,891Tongyang Pile, Inc.c 377,111 1,017,141Cosmecca Korea Co., Ltd. 91,586 897,052
Total South Korea 23,060,332
THAILAND: 5.9%AP Thailand Public Co., Ltd. 13,707,300 3,426,919Humanica Public Co., Ltd. 11,168,100 2,888,028Rich Sport Public Co., Ltd. 22,687,700 2,502,700Plan B Media Public Co., Ltd. F Shares 7,289,000 1,859,851
Total Thailand 10,677,498
VIETNAM: 5.4%Nam Long Investment Corp. 2,600,002 3,086,975Saigon Cargo Service Corp. 482,000 2,496,062Ho Chi Minh City Securities Corp. 2,234,190 2,062,784FPT Digital Retail JSC 1,105,180 1,003,950FPT Corp. 360,000 906,539Mobile World Investment Corp. 40,000 196,905
Total Vietnam 9,753,215
INDONESIA: 3.2%PT Arwana Citramulia 103,521,400 3,251,239PT Sarimelati Kencanad 31,809,100 2,543,353
Total Indonesia 5,794,592
MALAYSIA: 1.6%Bursa Malaysia BHD 1,904,500 2,836,526
Total Malaysia 2,836,526
PHILIPPINES: 1.5%Wilcon Depot, Inc. 7,384,400 2,624,528
Total Philippines 2,624,528
JAPAN: 1.4%CKD Corp. 151,000 2,505,485
Total Japan 2,505,485
SINGAPORE: 1.2%Delfi, Ltd. 3,032,700 2,245,858
Total Singapore 2,245,858
78 MATTHEWS ASIA FUNDS
Matthews Asia Small Companies Fund December 31, 2019
Schedule of Investmentsa (continued)
COMMON EQUITIES (continued)
Shares Value
AUSTRALIA: 1.2%OZ Minerals, Ltd. 302,465 $2,244,604
Total Australia 2,244,604
TOTAL INVESTMENTS: 95.2% 172,527,328(Cost $172,438,182)
CASH AND OTHER ASSETS,LESS LIABILITIES: 4.8% 8,706,928
NET ASSETS: 100.0% $181,234,256
a Certain securities were fair valued under the valuation policies approved by the Board ofTrustees (Note 2-A).
b Security exempt from registration under Rule 144A of the Securities Act of 1933, asamended. The security may be resold in transactions exempt from registration normally toqualified institutional buyers. The security has been determined to be liquid in accordancewith procedures adopted by the Funds’ Board of Trustees. At December 31, 2019, theaggregate value is $19,047,915, which is 10.51% of net assets.
c Non-income producing security.
d The securities may be resold to qualified foreign investors and foreign institutional buyersunder Regulation S of the Securities Act of 1933.
BHD Berhad
JSC Joint Stock Co.
See accompanying notes to financial statements.
matthewsasia.com | 800.789.ASIA 79
ASIA SMALL COMPANYSTRATEGIES
PORTFOLIO MANAGERS
Tiffany Hsiao, CFALead Manager
Lydia So, CFACo-Manager
FUND FACTS
Investor InstitutionalTicker MCSMX MICHXCUSIP 577125404 577125842Inception 5/31/11 11/30/17NAV $12.84 $12.86Initial Investment $2,500 $100,000Gross Expense Ratio1 1.62% 1.51%After Fee Waiver andReimbursement2 1.42% 1.24%
Portfolio StatisticsTotal # of Positions 56Net Assets $95.8 millionWeighted Average Market Cap $2.3 billionPortfolio Turnover3 68.17%
BenchmarkMSCI China Small Cap Index
OBJECTIVE
Long-term capital appreciation.
STRATEGY
Under normal market conditions, the Fund seeks toachieve its investment objective by investing at least80% of its net assets, which include borrowings forinvestment purposes, in the common and preferredstocks of Small Companies located in China. Chinaincludes its administrative and other districts, such asHong Kong.
Matthews China Small Companies Fund
Portfolio Manager Commentary (unaudited)
For the year ending December 31, 2019, the Matthews China Small CompaniesFund returned 35.41% (Investor Class) and 35.68% (Institutional Class), out-performing its benchmark, the MSCI China Small Cap Index, which returned 6.63%over the same period. For the fourth quarter of the year, the Fund returned 11.16%(Investor Class) and 11.21% (Institutional Class), versus 7.19% for the Index.
Market Environment:
Thanks to accommodative monetary policies around the globe and a U.S.–Chinatrade truce, Chinese equity markets performed well in the fourth quarter. Weexpect the trade negotiations to be an ongoing process for the foreseeable futurewhile China works on areas of self-sufficiency.
Economic data from China were generally healthy in 2019. On the consumer end,value-added tax cuts and payroll tax reductions drove positive effects on consumerspending, keeping retail sales in high single-digit growth year-over-year into thefourth quarter. The targeted stimulus toward helping small to medium enterprisesannounced near the end of the second quarter also helped business sentiment. TheCaixin China General Manufacturing PMI signaled continued expansion toward athree-year high. Longer term, we still expect structural growth in China’seconomy—particularly among companies that benefit from an increase in domes-tic sourcing of key value-added components as trade conflicts remain a risk.
From both a top-down and bottom-up perspective, we anticipate long-term sustain-able growth in the Chinese economy and in corporate earnings. Market concernsover trade tensions should, in our view, have little impact on China’s smallercompanies, given their domestic focus and lower dependence on financial leverage.
Performance Contributors and Detractors:
During the fourth quarter, strong stock selection in the consumer discretionary,information technology and health care sectors contributed most of the Fund’soutperformance versus the benchmark. Our overweight in consumer staples was adrag on performance. For the full-year 2019, all sectors provided positive attribu-tion to performance. The largest positive performance attributors were strong stockselection in information technology, industrials, health care, consumer staples andconsumer discretionary.
Top contributors to Fund performance during the fourth quarter included Silergyand China Meidong Auto. Top contributors for the year included Silergy, YihaiInternational and China Meidong Auto. Silergy is our top holding and is the larg-est fabless analog semiconductor company in China. Silergy has strong product,process and systems technologies to allow it to make integrated analog circuits forits clients’ various needs. In a seemingly deglobalizing world, Silergy’s scarcityvalue has emerged as China tries to become more self-sufficient. Although thesemiconductor cycle is still far from a full recovery, we expect Silergy to gain shareas the cycle recovers. China Meidong Auto is one of the largest luxury import cardealers and service companies in China, specializing in Lexus, BMW and Porsche.The company has embraced data-driven decision-making and management tosuccessfully expand its business. Yihai is a company we discussed throughout theyear. It is a top condiment and hot-pot sauce provider in China. It strives to offer
(continued)
1 Actual 2019 expense ratios.2 Matthews has contractually agreed (i) to waive fees and reimburse expenses to the extent needed to limit Total Annual Fund Operating Expenses (excluding Rule 12b-1 fees, taxes, interest, brokerage
commissions, short sale dividend expenses, expenses incurred in connection with any merger or reorganization or extraordinary expenses such as litigation) of the Institutional Class to 1.25% first by waivingclass specific expenses (i.e., shareholder service fees specific to a particular class) of the Institutional Class and then, to the extent necessary, by waiving non-class specific expenses (e.g., custody fees) of theInstitutional Class, and (ii) if any Fund-wide expenses (i.e., expenses that apply to both the Institutional Class and the Investor Class) are waived for the Institutional Class to maintain the 1.25% expenselimitation, to waive an equal amount (in annual percentage terms) of those same expenses for the Investor Class. Beginning on November 1, 2019, Matthews voluntarily reduced this expense limitation to1.20% for the Institutional Class. The Total Annual Fund Operating Expenses After Fee Waiver and Expense Reimbursement for the Investor Class may vary from year to year and will in some years exceed1.25%. If the operating expenses fall below the expense limitation in a year within three years after Matthews has made a waiver or reimbursement, the Fund may reimburse Matthews up to an amount thatdoes not cause the expenses for that year to exceed the lesser of (i) the expense limitation applicable at the time of that fee waiver and/or expense reimbursement or (ii) the expense limitation in effect at thetime of recoupment. This agreement will remain in place until April 30, 2021 and may be terminated at any time by the Board of Trustees on behalf of the Fund on 60 days’ written notice to Matthews.Matthews may decline to renew this agreement by written notice to the Trust at least 30 days before its annual expiration date.
3 The lesser of fiscal year 2019 long-term purchase costs or sales proceeds divided by the average monthly market value of long-term securities.
80 MATTHEWS ASIA FUNDS
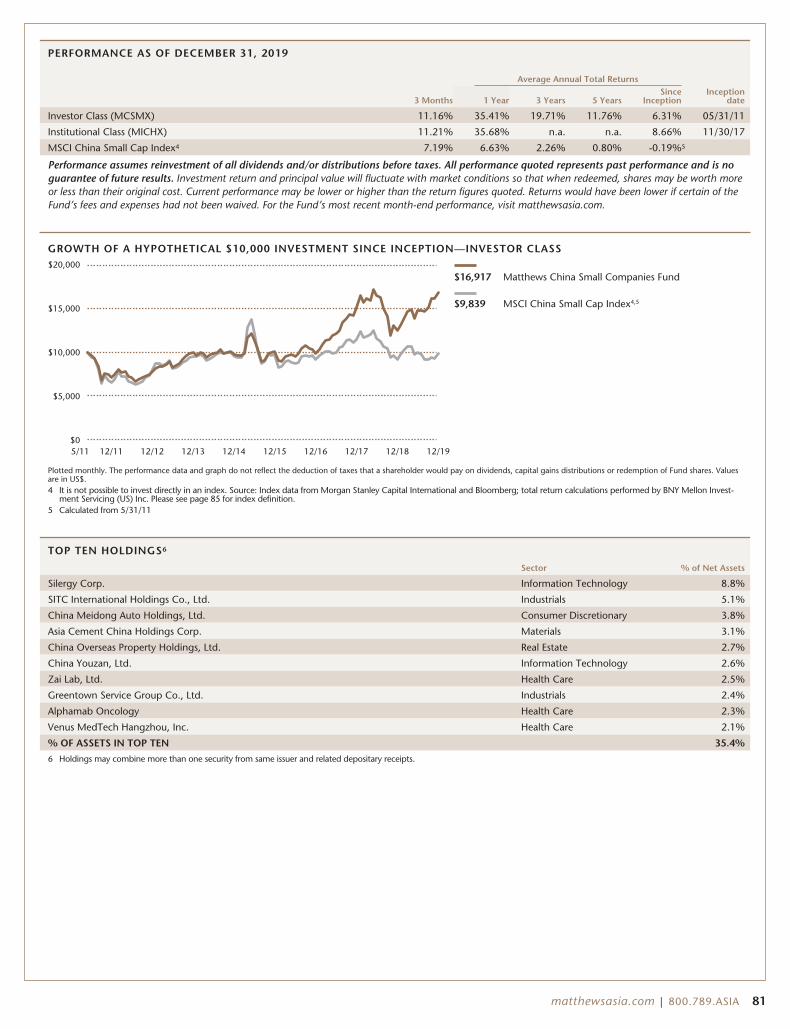
PERFORMANCE AS OF DECEMBER 31, 2019
Average Annual Total Returns
3 Months 1 Year 3 Years 5 YearsSince
InceptionInception
date
Investor Class (MCSMX) 11.16% 35.41% 19.71% 11.76% 6.31% 05/31/11
Institutional Class (MICHX) 11.21% 35.68% n.a. n.a. 8.66% 11/30/17
MSCI China Small Cap Index4 7.19% 6.63% 2.26% 0.80% -0.19%5
Performance assumes reinvestment of all dividends and/or distributions before taxes. All performance quoted represents past performance and is noguarantee of future results. Investment return and principal value will fluctuate with market conditions so that when redeemed, shares may be worth moreor less than their original cost. Current performance may be lower or higher than the return figures quoted. Returns would have been lower if certain of theFund’s fees and expenses had not been waived. For the Fund’s most recent month-end performance, visit matthewsasia.com.
GROWTH OF A HYPOTHETICAL $10,000 INVESTMENT SINCE INCEPTION—INVESTOR CLASS
5/11 12/1212/11 12/13 12/14 12/15 12/1912/1812/1712/16
$16,917 Matthews China Small Companies Fund
$9,839 MSCI China Small Cap Index4,5
$0
$20,000
$15,000
$10,000
$5,000
Plotted monthly. The performance data and graph do not reflect the deduction of taxes that a shareholder would pay on dividends, capital gains distributions or redemption of Fund shares. Valuesare in US$.4 It is not possible to invest directly in an index. Source: Index data from Morgan Stanley Capital International and Bloomberg; total return calculations performed by BNY Mellon Invest-
ment Servicing (US) Inc. Please see page 85 for index definition.5 Calculated from 5/31/11
TOP TEN HOLDINGS6
Sector % of Net Assets
Silergy Corp. Information Technology 8.8%
SITC International Holdings Co., Ltd. Industrials 5.1%
China Meidong Auto Holdings, Ltd. Consumer Discretionary 3.8%
Asia Cement China Holdings Corp. Materials 3.1%
China Overseas Property Holdings, Ltd. Real Estate 2.7%
China Youzan, Ltd. Information Technology 2.6%
Zai Lab, Ltd. Health Care 2.5%
Greentown Service Group Co., Ltd. Industrials 2.4%
Alphamab Oncology Health Care 2.3%
Venus MedTech Hangzhou, Inc. Health Care 2.1%
% OF ASSETS IN TOP TEN 35.4%
6 Holdings may combine more than one security from same issuer and related depositary receipts.
matthewsasia.com | 800.789.ASIA 81
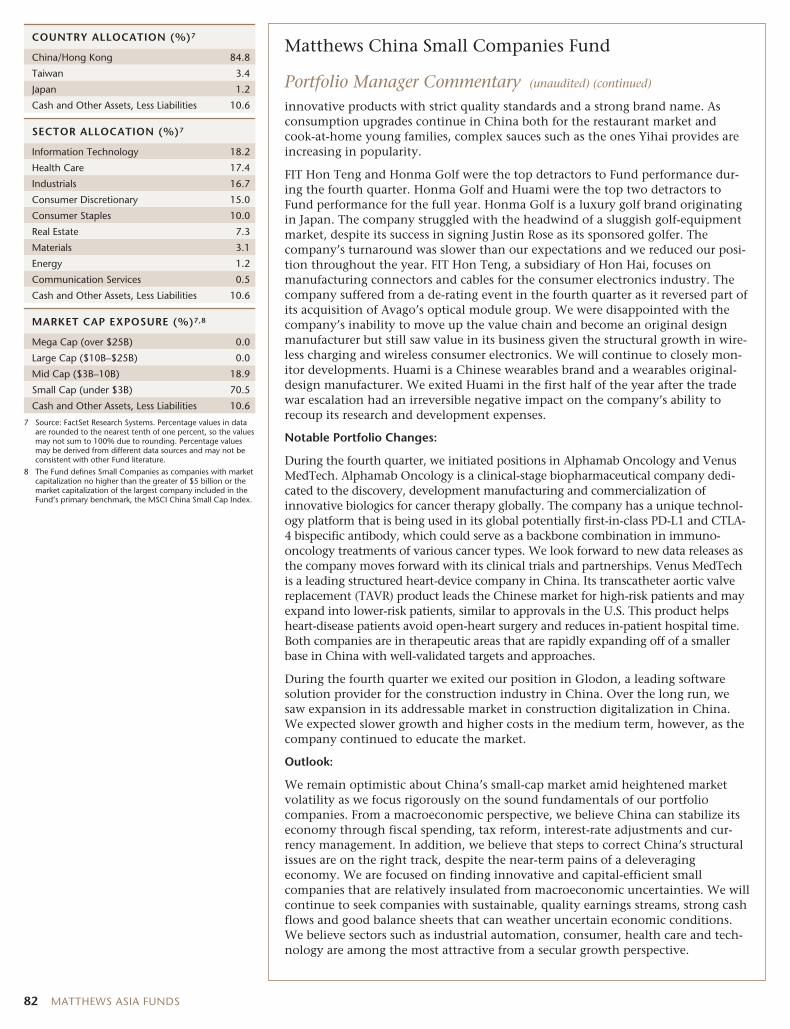
COUNTRY ALLOCATION (%)7
China/Hong Kong 84.8
Taiwan 3.4
Japan 1.2
Cash and Other Assets, Less Liabilities 10.6
SECTOR ALLOCATION (%)7
Information Technology 18.2
Health Care 17.4
Industrials 16.7
Consumer Discretionary 15.0
Consumer Staples 10.0
Real Estate 7.3
Materials 3.1
Energy 1.2
Communication Services 0.5
Cash and Other Assets, Less Liabilities 10.6
MARKET CAP EXPOSURE (%)7,8
Mega Cap (over $25B) 0.0
Large Cap ($10B–$25B) 0.0
Mid Cap ($3B–10B) 18.9
Small Cap (under $3B) 70.5
Cash and Other Assets, Less Liabilities 10.6
7 Source: FactSet Research Systems. Percentage values in dataare rounded to the nearest tenth of one percent, so the valuesmay not sum to 100% due to rounding. Percentage valuesmay be derived from different data sources and may not beconsistent with other Fund literature.
8 The Fund defines Small Companies as companies with marketcapitalization no higher than the greater of $5 billion or themarket capitalization of the largest company included in theFund’s primary benchmark, the MSCI China Small Cap Index.
Matthews China Small Companies Fund
Portfolio Manager Commentary (unaudited) (continued)
innovative products with strict quality standards and a strong brand name. Asconsumption upgrades continue in China both for the restaurant market andcook-at-home young families, complex sauces such as the ones Yihai provides areincreasing in popularity.
FIT Hon Teng and Honma Golf were the top detractors to Fund performance dur-ing the fourth quarter. Honma Golf and Huami were the top two detractors toFund performance for the full year. Honma Golf is a luxury golf brand originatingin Japan. The company struggled with the headwind of a sluggish golf-equipmentmarket, despite its success in signing Justin Rose as its sponsored golfer. Thecompany’s turnaround was slower than our expectations and we reduced our posi-tion throughout the year. FIT Hon Teng, a subsidiary of Hon Hai, focuses onmanufacturing connectors and cables for the consumer electronics industry. Thecompany suffered from a de-rating event in the fourth quarter as it reversed part ofits acquisition of Avago’s optical module group. We were disappointed with thecompany’s inability to move up the value chain and become an original designmanufacturer but still saw value in its business given the structural growth in wire-less charging and wireless consumer electronics. We will continue to closely mon-itor developments. Huami is a Chinese wearables brand and a wearables original-design manufacturer. We exited Huami in the first half of the year after the tradewar escalation had an irreversible negative impact on the company’s ability torecoup its research and development expenses.
Notable Portfolio Changes:
During the fourth quarter, we initiated positions in Alphamab Oncology and VenusMedTech. Alphamab Oncology is a clinical-stage biopharmaceutical company dedi-cated to the discovery, development manufacturing and commercialization ofinnovative biologics for cancer therapy globally. The company has a unique technol-ogy platform that is being used in its global potentially first-in-class PD-L1 and CTLA-4 bispecific antibody, which could serve as a backbone combination in immuno-oncology treatments of various cancer types. We look forward to new data releases asthe company moves forward with its clinical trials and partnerships. Venus MedTechis a leading structured heart-device company in China. Its transcatheter aortic valvereplacement (TAVR) product leads the Chinese market for high-risk patients and mayexpand into lower-risk patients, similar to approvals in the U.S. This product helpsheart-disease patients avoid open-heart surgery and reduces in-patient hospital time.Both companies are in therapeutic areas that are rapidly expanding off of a smallerbase in China with well-validated targets and approaches.
During the fourth quarter we exited our position in Glodon, a leading softwaresolution provider for the construction industry in China. Over the long run, wesaw expansion in its addressable market in construction digitalization in China.We expected slower growth and higher costs in the medium term, however, as thecompany continued to educate the market.
Outlook:
We remain optimistic about China’s small-cap market amid heightened marketvolatility as we focus rigorously on the sound fundamentals of our portfoliocompanies. From a macroeconomic perspective, we believe China can stabilize itseconomy through fiscal spending, tax reform, interest-rate adjustments and cur-rency management. In addition, we believe that steps to correct China’s structuralissues are on the right track, despite the near-term pains of a deleveragingeconomy. We are focused on finding innovative and capital-efficient smallcompanies that are relatively insulated from macroeconomic uncertainties. We willcontinue to seek companies with sustainable, quality earnings streams, strong cashflows and good balance sheets that can weather uncertain economic conditions.We believe sectors such as industrial automation, consumer, health care and tech-nology are among the most attractive from a secular growth perspective.
82 MATTHEWS ASIA FUNDS
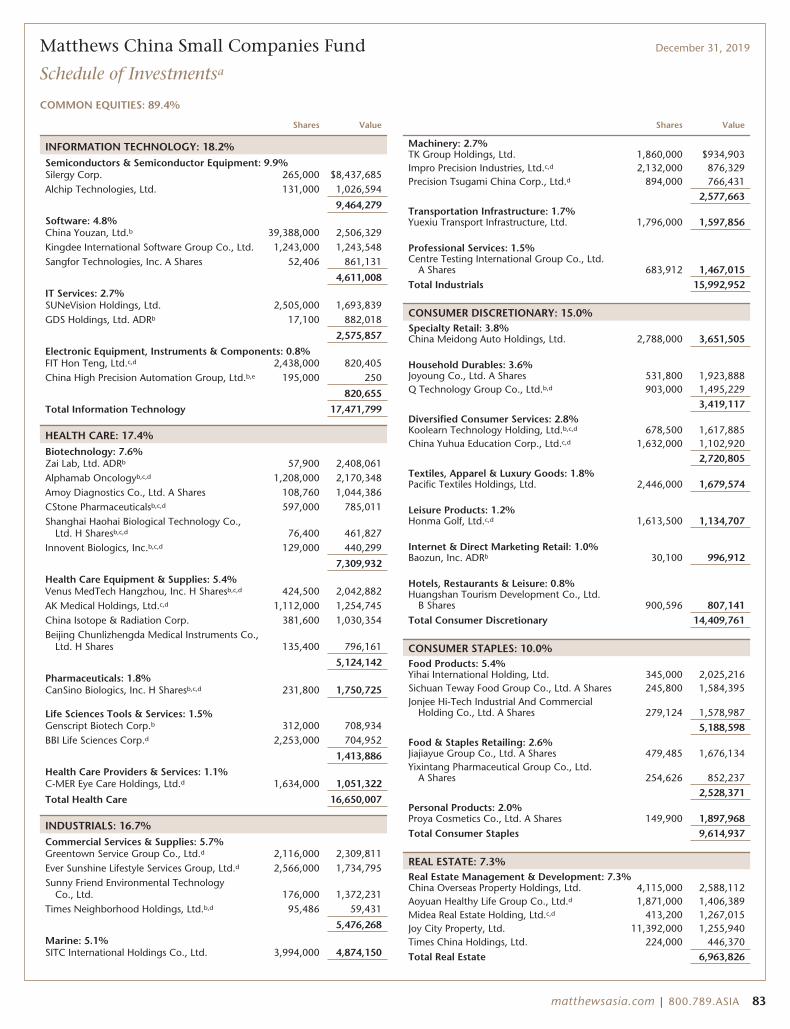
Matthews China Small Companies Fund December 31, 2019
Schedule of Investmentsa
COMMON EQUITIES: 89.4%
Shares Value
INFORMATION TECHNOLOGY: 18.2%Semiconductors & Semiconductor Equipment: 9.9%Silergy Corp. 265,000 $8,437,685Alchip Technologies, Ltd. 131,000 1,026,594
9,464,279
Software: 4.8%China Youzan, Ltd.b 39,388,000 2,506,329Kingdee International Software Group Co., Ltd. 1,243,000 1,243,548Sangfor Technologies, Inc. A Shares 52,406 861,131
4,611,008
IT Services: 2.7%SUNeVision Holdings, Ltd. 2,505,000 1,693,839GDS Holdings, Ltd. ADRb 17,100 882,018
2,575,857
Electronic Equipment, Instruments & Components: 0.8%FIT Hon Teng, Ltd.c,d 2,438,000 820,405China High Precision Automation Group, Ltd.b,e 195,000 250
820,655
Total Information Technology 17,471,799
HEALTH CARE: 17.4%Biotechnology: 7.6%Zai Lab, Ltd. ADRb 57,900 2,408,061Alphamab Oncologyb,c,d 1,208,000 2,170,348Amoy Diagnostics Co., Ltd. A Shares 108,760 1,044,386CStone Pharmaceuticalsb,c,d 597,000 785,011Shanghai Haohai Biological Technology Co.,
Ltd. H Sharesb,c,d 76,400 461,827Innovent Biologics, Inc.b,c,d 129,000 440,299
7,309,932
Health Care Equipment & Supplies: 5.4%Venus MedTech Hangzhou, Inc. H Sharesb,c,d 424,500 2,042,882AK Medical Holdings, Ltd.c,d 1,112,000 1,254,745China Isotope & Radiation Corp. 381,600 1,030,354Beijing Chunlizhengda Medical Instruments Co.,
Ltd. H Shares 135,400 796,161
5,124,142
Pharmaceuticals: 1.8%CanSino Biologics, Inc. H Sharesb,c,d 231,800 1,750,725
Life Sciences Tools & Services: 1.5%Genscript Biotech Corp.b 312,000 708,934BBI Life Sciences Corp.d 2,253,000 704,952
1,413,886
Health Care Providers & Services: 1.1%C-MER Eye Care Holdings, Ltd.d 1,634,000 1,051,322
Total Health Care 16,650,007
INDUSTRIALS: 16.7%Commercial Services & Supplies: 5.7%Greentown Service Group Co., Ltd.d 2,116,000 2,309,811Ever Sunshine Lifestyle Services Group, Ltd.d 2,566,000 1,734,795Sunny Friend Environmental Technology
Co., Ltd. 176,000 1,372,231Times Neighborhood Holdings, Ltd.b,d 95,486 59,431
5,476,268
Marine: 5.1%SITC International Holdings Co., Ltd. 3,994,000 4,874,150
Shares Value
Machinery: 2.7%TK Group Holdings, Ltd. 1,860,000 $934,903Impro Precision Industries, Ltd.c,d 2,132,000 876,329Precision Tsugami China Corp., Ltd.d 894,000 766,431
2,577,663Transportation Infrastructure: 1.7%Yuexiu Transport Infrastructure, Ltd. 1,796,000 1,597,856
Professional Services: 1.5%Centre Testing International Group Co., Ltd.
A Shares 683,912 1,467,015Total Industrials 15,992,952
CONSUMER DISCRETIONARY: 15.0%Specialty Retail: 3.8%China Meidong Auto Holdings, Ltd. 2,788,000 3,651,505
Household Durables: 3.6%Joyoung Co., Ltd. A Shares 531,800 1,923,888Q Technology Group Co., Ltd.b,d 903,000 1,495,229
3,419,117Diversified Consumer Services: 2.8%Koolearn Technology Holding, Ltd.b,c,d 678,500 1,617,885China Yuhua Education Corp., Ltd.c,d 1,632,000 1,102,920
2,720,805Textiles, Apparel & Luxury Goods: 1.8%Pacific Textiles Holdings, Ltd. 2,446,000 1,679,574
Leisure Products: 1.2%Honma Golf, Ltd.c,d 1,613,500 1,134,707
Internet & Direct Marketing Retail: 1.0%Baozun, Inc. ADRb 30,100 996,912
Hotels, Restaurants & Leisure: 0.8%Huangshan Tourism Development Co., Ltd.
B Shares 900,596 807,141Total Consumer Discretionary 14,409,761
CONSUMER STAPLES: 10.0%Food Products: 5.4%Yihai International Holding, Ltd. 345,000 2,025,216Sichuan Teway Food Group Co., Ltd. A Shares 245,800 1,584,395Jonjee Hi-Tech Industrial And Commercial
Holding Co., Ltd. A Shares 279,124 1,578,987
5,188,598Food & Staples Retailing: 2.6%Jiajiayue Group Co., Ltd. A Shares 479,485 1,676,134Yixintang Pharmaceutical Group Co., Ltd.
A Shares 254,626 852,237
2,528,371Personal Products: 2.0%Proya Cosmetics Co., Ltd. A Shares 149,900 1,897,968Total Consumer Staples 9,614,937
REAL ESTATE: 7.3%Real Estate Management & Development: 7.3%China Overseas Property Holdings, Ltd. 4,115,000 2,588,112Aoyuan Healthy Life Group Co., Ltd.d 1,871,000 1,406,389Midea Real Estate Holding, Ltd.c,d 413,200 1,267,015Joy City Property, Ltd. 11,392,000 1,255,940Times China Holdings, Ltd. 224,000 446,370
Total Real Estate 6,963,826
matthewsasia.com | 800.789.ASIA 83
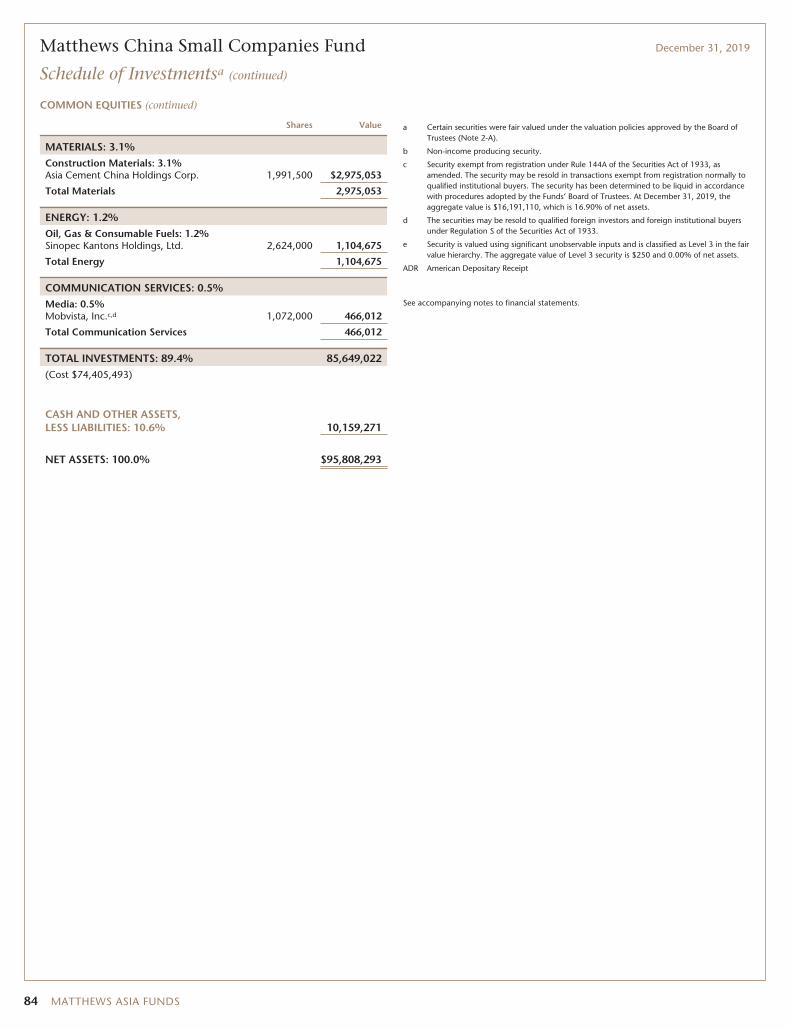
Matthews China Small Companies Fund December 31, 2019
Schedule of Investmentsa (continued)
COMMON EQUITIES (continued)
Shares Value
MATERIALS: 3.1%Construction Materials: 3.1%Asia Cement China Holdings Corp. 1,991,500 $2,975,053
Total Materials 2,975,053
ENERGY: 1.2%Oil, Gas & Consumable Fuels: 1.2%Sinopec Kantons Holdings, Ltd. 2,624,000 1,104,675
Total Energy 1,104,675
COMMUNICATION SERVICES: 0.5%Media: 0.5%Mobvista, Inc.c,d 1,072,000 466,012
Total Communication Services 466,012
TOTAL INVESTMENTS: 89.4% 85,649,022(Cost $74,405,493)
CASH AND OTHER ASSETS,LESS LIABILITIES: 10.6% 10,159,271
NET ASSETS: 100.0% $95,808,293
a Certain securities were fair valued under the valuation policies approved by the Board ofTrustees (Note 2-A).
b Non-income producing security.
c Security exempt from registration under Rule 144A of the Securities Act of 1933, asamended. The security may be resold in transactions exempt from registration normally toqualified institutional buyers. The security has been determined to be liquid in accordancewith procedures adopted by the Funds’ Board of Trustees. At December 31, 2019, theaggregate value is $16,191,110, which is 16.90% of net assets.
d The securities may be resold to qualified foreign investors and foreign institutional buyersunder Regulation S of the Securities Act of 1933.
e Security is valued using significant unobservable inputs and is classified as Level 3 in the fairvalue hierarchy. The aggregate value of Level 3 security is $250 and 0.00% of net assets.
ADR American Depositary Receipt
See accompanying notes to financial statements.
84 MATTHEWS ASIA FUNDS
Index Definitions
The Markit iBoxx Asian Local Bond Index (ALBI) tracks thetotal return performance of a bond portfolio consisting of localcurrency denominated, high quality and liquid bonds in Asiaex Japan. The ALBI includes bonds from the following countries:China, Hong Kong, India, Indonesia, Malaysia, Philippines,Singapore, South Korea, Taiwan and Thailand.
The J.P. Morgan Asia Credit Index (JACI) tracks the total returnperformance of the Asia fixed-rate dollar bond market. JACI is amarket capitalization-weighted index comprising sovereign, quasi-sovereign and corporate bonds and is partitioned by country,sector and credit rating. JACI includes bonds from the followingcountries: China, Hong Kong, India, Indonesia, Malaysia, Philip-pines, Singapore, South Korea and Thailand.
The MSCI All Country Asia ex Japan Index is a free float-adjusted market capitalization-weighted index of the stock mar-kets of China, Hong Kong, India, Indonesia, Malaysia, Pakistan,Philippines, Singapore, South Korea, Taiwan and Thailand.
The MSCI All Country Asia Pacific Index is a free float-adjustedmarket capitalization-weighted index of the stock markets ofAustralia, China, Hong Kong, India, Indonesia, Japan, Malaysia,New Zealand, Pakistan, Philippines, Singapore, South Korea,Taiwan and Thailand.
The MSCI China Index is a free float-adjusted marketcapitalization-weighted index of Chinese equities that includes Hshares listed on the Hong Kong exchange, B shares listed on theShanghai and Shenzhen exchanges, Hong Kong-listed securitiesknown as Red Chips (issued by entities owned by national orlocal governments in China) and P Chips (issued by companiescontrolled by individuals in China and deriving substantial rev-enues in China), and foreign listings (e.g., ADRs).
The MSCI Emerging Markets (EM) Asia Index is a free float-adjusted market capitalization-weighted index of the stock
markets of China, India, Indonesia, Malaysia, Pakistan, Philip-pines, South Korea, Taiwan and Thailand.
The MSCI China All Shares Index captures large and mid-caprepresentation across China A shares, B shares, H shares, RedChips (issued by entities owned by national or local governmentsin China), P Chips (issued by companies controlled byindividuals in China and deriving substantial revenues in China),and foreign listings (e.g., ADRs). The index aims to reflect theopportunity set of China share classes listed in Hong Kong,Shanghai, Shenzhen and outside of China.
The S&P Bombay Stock Exchange (BSE) 100 Index is a freefloat-adjusted market capitalization-weighted index of the 100stocks listed on the Bombay Stock Exchange.
The MSCI Japan Index is a free float-adjusted marketcapitalization-weighted index of Japanese equities listed in Japan.
The Korea Composite Stock Price Index (KOSPI) is a marketcapitalization-weighted index of all common stocks listed on theKorea Stock Exchange.
The MSCI All Country Asia ex Japan Small Cap Index is a freefloat-adjusted market capitalization-weighted small cap index ofthe stock markets of China, Hong Kong, India, Indonesia,Malaysia, Pakistan, Philippines, Singapore, South Korea, Taiwanand Thailand.
The MSCI China Small Cap Index is a free float-adjusted marketcapitalization-weighted small cap index of the Chinese equitysecurities markets, including H shares listed on the Hong Kongexchange, B shares listed on the Shanghai and Shenzhenexchanges, and Hong Kong-listed securities known as Red Chips(issued by entities owned by national or local governments inChina) and P Chips (issued by companies controlled byindividuals in China and deriving substantial revenues in China),and foreign listings (e.g., ADRs).
matthewsasia.com | 800.789.ASIA 85
Disclosures
Fund Holdings: The Fund holdings shown in this report are as ofDecember 31, 2019. Holdings are subject to change at any time,so holdings shown in this report may not reflect current Fundholdings. The Funds file complete schedules of portfolio holdingswith the Securities and Exchange Commission (the “SEC”) forthe first and third quarters of each fiscal year on Form N-PORT.The Funds’ Forms N-PORT are available on the SEC’s website atwww.sec.gov. Complete schedules of investments are also avail-able without charge, upon request, from the Funds by calling usat 800.789.ASIA (2742).
Proxy Voting Record: The Funds’ Statement of AdditionalInformation containing a description of the policies and proce-dures that the Funds have used to vote proxies relating to portfo-lio securities, along with each Fund’s proxy voting record relating
to portfolio securities held during the most recent 12-monthperiod ended June 30, is available upon request, at no charge, atthe Funds’ website at matthewsasia.com or by calling800.789.ASIA (2742), or on the SEC’s website at www.sec.gov.
Shareholder Reports and Prospectuses: To reduce the Funds’expenses, we try to identify related shareholders in a householdand send only one copy of the Funds’ prospectus and financialreports to that address. This process, called “householding,” willcontinue indefinitely unless you instruct us otherwise. At anytime you may view the Funds’ current prospectus, summaryprospectus and financial reports on our website. If you prefer toreceive individual copies of the Funds’ prospectus or financialreports, please call us at 800.789.ASIA (2742).
86 MATTHEWS ASIA FUNDS
Disclosure of Fund Expenses (unaudited)
We believe it is important for you to understand the impactof fees regarding your investment. All mutual funds haveoperating expenses. As a shareholder of a mutual fund, youincur ongoing costs, which include costs for portfoliomanagement, administrative services, and shareholder reports(like this one), among others. Operating expenses, which arededucted from a fund’s gross income, directly reduce theinvestment return of the fund. A fund’s operating expensesare expressed as a percentage of its average net assets. Thisfigure is known as the expense ratio. The following examplesare intended to help you understand the ongoing fees (indollars) of investing in your fund and to compare these costswith those of other mutual funds. The examples are based onan investment of $1,000 made at the beginning of the periodshown and held for the entire period.
This table illustrates your fund’s costs in two ways:
Actual Fund Return: This section helps you to estimate theactual operating expenses, after any applicable fee waivers, thatyou paid over the period. The “Ending Account Value” shownis derived from the fund’s actual return for the past six monthperiod, the “Expense Ratio” column shows the period’s annual-ized expense ratio, and the “Operating Expenses Paid DuringPeriod” column shows the dollar amount that would have beenpaid by an investor who started with $1,000 in the fund at thebeginning of the period. You may use the information here,together with your account value, to estimate the expenses thatyou paid over the period. To do so, simply divide your accountvalue by $1,000 (for example, an $8,600 account value divided
by $1,000 = 8.6), then multiply the result by the number givenfor your fund in the first line under the heading entitled“Operating Expenses Paid During Period.”
Hypothetical 5% Return: This section is intended to helpyou compare your fund’s costs with those of other mutualfunds. It assumes that the fund had an annual return of 5%before operating expenses, but that the expense ratio isunchanged. In this case, because the return used is not thefund’s actual return, the results do not apply to your invest-ment. This example is useful in making comparisons to othermutual funds because the Securities and Exchange Commis-sion requires all mutual funds to calculate expenses based onan assumed 5% annual return. You can assess your fund’scosts by comparing this hypothetical example with the hypo-thetical examples that appear in shareholder reports of otherfunds.
Please note that the operating expenses shown in the tableare meant to highlight and help you compare your ongoingcosts only and do not reflect any transactional costs such assales charges (loads), redemption fees, or exchange fees.
Matthews Asia Funds does not charge any sales loads,exchange fees, or 12b-1 fees, but these may be present inother funds to which you compare this data. Therefore, thehypothetical portions of the table are useful in comparingongoing costs only, and will not help you determine the rela-tive total costs of owning different funds.
matthewsasia.com | 800.789.ASIA 87
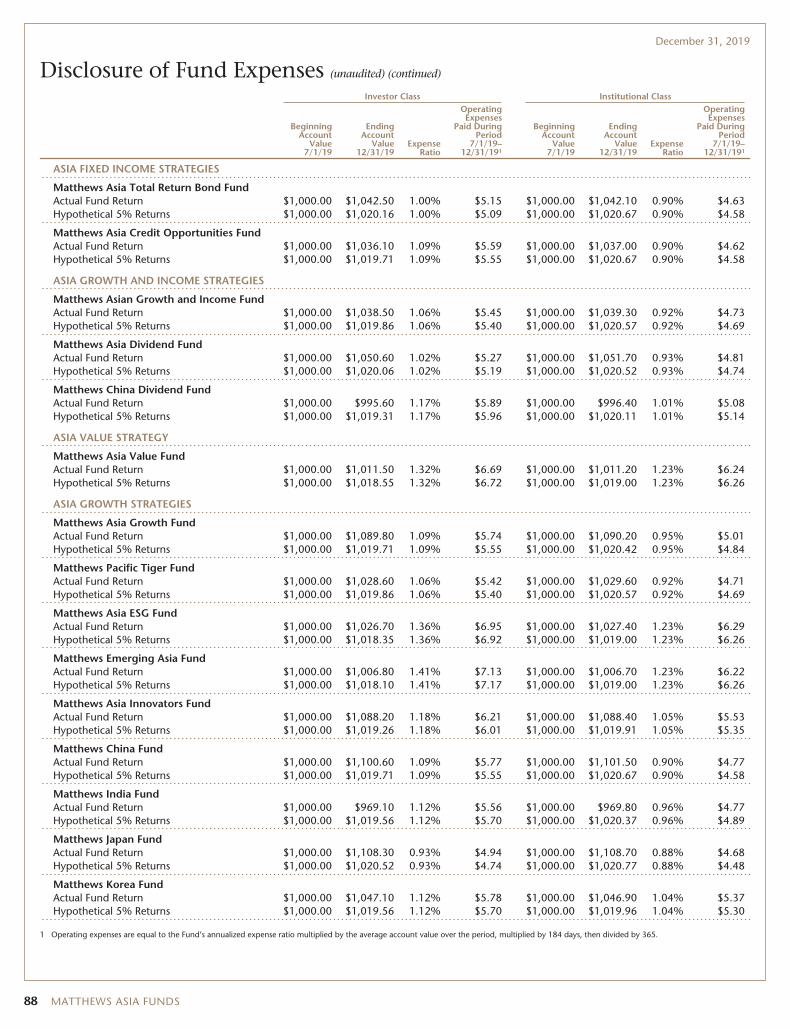
December 31, 2019
Disclosure of Fund Expenses (unaudited) (continued)
Investor Class Institutional Class
BeginningAccount
Value7/1/19
EndingAccount
Value12/31/19
ExpenseRatio
OperatingExpenses
Paid DuringPeriod
7/1/19–12/31/191
BeginningAccount
Value7/1/19
EndingAccount
Value12/31/19
ExpenseRatio
OperatingExpenses
Paid DuringPeriod
7/1/19–12/31/191
ASIA FIXED INCOME STRATEGIES
Matthews Asia Total Return Bond FundActual Fund Return $1,000.00 $1,042.50 1.00% $5.15 $1,000.00 $1,042.10 0.90% $4.63Hypothetical 5% Returns $1,000.00 $1,020.16 1.00% $5.09 $1,000.00 $1,020.67 0.90% $4.58
Matthews Asia Credit Opportunities FundActual Fund Return $1,000.00 $1,036.10 1.09% $5.59 $1,000.00 $1,037.00 0.90% $4.62Hypothetical 5% Returns $1,000.00 $1,019.71 1.09% $5.55 $1,000.00 $1,020.67 0.90% $4.58
ASIA GROWTH AND INCOME STRATEGIES
Matthews Asian Growth and Income FundActual Fund Return $1,000.00 $1,038.50 1.06% $5.45 $1,000.00 $1,039.30 0.92% $4.73Hypothetical 5% Returns $1,000.00 $1,019.86 1.06% $5.40 $1,000.00 $1,020.57 0.92% $4.69
Matthews Asia Dividend FundActual Fund Return $1,000.00 $1,050.60 1.02% $5.27 $1,000.00 $1,051.70 0.93% $4.81Hypothetical 5% Returns $1,000.00 $1,020.06 1.02% $5.19 $1,000.00 $1,020.52 0.93% $4.74
Matthews China Dividend FundActual Fund Return $1,000.00 $995.60 1.17% $5.89 $1,000.00 $996.40 1.01% $5.08Hypothetical 5% Returns $1,000.00 $1,019.31 1.17% $5.96 $1,000.00 $1,020.11 1.01% $5.14
ASIA VALUE STRATEGY
Matthews Asia Value FundActual Fund Return $1,000.00 $1,011.50 1.32% $6.69 $1,000.00 $1,011.20 1.23% $6.24Hypothetical 5% Returns $1,000.00 $1,018.55 1.32% $6.72 $1,000.00 $1,019.00 1.23% $6.26
ASIA GROWTH STRATEGIES
Matthews Asia Growth FundActual Fund Return $1,000.00 $1,089.80 1.09% $5.74 $1,000.00 $1,090.20 0.95% $5.01Hypothetical 5% Returns $1,000.00 $1,019.71 1.09% $5.55 $1,000.00 $1,020.42 0.95% $4.84
Matthews Pacific Tiger FundActual Fund Return $1,000.00 $1,028.60 1.06% $5.42 $1,000.00 $1,029.60 0.92% $4.71Hypothetical 5% Returns $1,000.00 $1,019.86 1.06% $5.40 $1,000.00 $1,020.57 0.92% $4.69
Matthews Asia ESG FundActual Fund Return $1,000.00 $1,026.70 1.36% $6.95 $1,000.00 $1,027.40 1.23% $6.29Hypothetical 5% Returns $1,000.00 $1,018.35 1.36% $6.92 $1,000.00 $1,019.00 1.23% $6.26
Matthews Emerging Asia FundActual Fund Return $1,000.00 $1,006.80 1.41% $7.13 $1,000.00 $1,006.70 1.23% $6.22Hypothetical 5% Returns $1,000.00 $1,018.10 1.41% $7.17 $1,000.00 $1,019.00 1.23% $6.26
Matthews Asia Innovators FundActual Fund Return $1,000.00 $1,088.20 1.18% $6.21 $1,000.00 $1,088.40 1.05% $5.53Hypothetical 5% Returns $1,000.00 $1,019.26 1.18% $6.01 $1,000.00 $1,019.91 1.05% $5.35
Matthews China FundActual Fund Return $1,000.00 $1,100.60 1.09% $5.77 $1,000.00 $1,101.50 0.90% $4.77Hypothetical 5% Returns $1,000.00 $1,019.71 1.09% $5.55 $1,000.00 $1,020.67 0.90% $4.58
Matthews India FundActual Fund Return $1,000.00 $969.10 1.12% $5.56 $1,000.00 $969.80 0.96% $4.77Hypothetical 5% Returns $1,000.00 $1,019.56 1.12% $5.70 $1,000.00 $1,020.37 0.96% $4.89
Matthews Japan FundActual Fund Return $1,000.00 $1,108.30 0.93% $4.94 $1,000.00 $1,108.70 0.88% $4.68Hypothetical 5% Returns $1,000.00 $1,020.52 0.93% $4.74 $1,000.00 $1,020.77 0.88% $4.48
Matthews Korea FundActual Fund Return $1,000.00 $1,047.10 1.12% $5.78 $1,000.00 $1,046.90 1.04% $5.37Hypothetical 5% Returns $1,000.00 $1,019.56 1.12% $5.70 $1,000.00 $1,019.96 1.04% $5.30
1 Operating expenses are equal to the Fund’s annualized expense ratio multiplied by the average account value over the period, multiplied by 184 days, then divided by 365.
88 MATTHEWS ASIA FUNDS
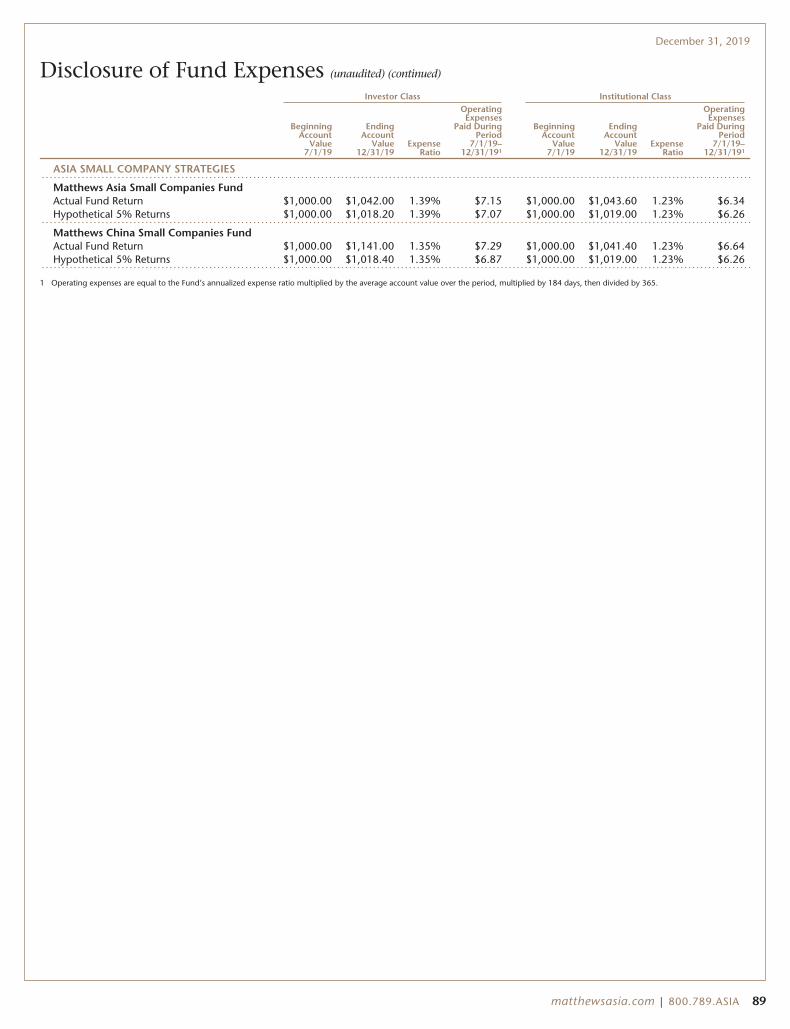
December 31, 2019
Disclosure of Fund Expenses (unaudited) (continued)
Investor Class Institutional Class
BeginningAccount
Value7/1/19
EndingAccount
Value12/31/19
ExpenseRatio
OperatingExpenses
Paid DuringPeriod
7/1/19–12/31/191
BeginningAccount
Value7/1/19
EndingAccount
Value12/31/19
ExpenseRatio
OperatingExpenses
Paid DuringPeriod
7/1/19–12/31/191
ASIA SMALL COMPANY STRATEGIES
Matthews Asia Small Companies FundActual Fund Return $1,000.00 $1,042.00 1.39% $7.15 $1,000.00 $1,043.60 1.23% $6.34Hypothetical 5% Returns $1,000.00 $1,018.20 1.39% $7.07 $1,000.00 $1,019.00 1.23% $6.26
Matthews China Small Companies FundActual Fund Return $1,000.00 $1,141.00 1.35% $7.29 $1,000.00 $1,041.40 1.23% $6.64Hypothetical 5% Returns $1,000.00 $1,018.40 1.35% $6.87 $1,000.00 $1,019.00 1.23% $6.26
1 Operating expenses are equal to the Fund’s annualized expense ratio multiplied by the average account value over the period, multiplied by 184 days, then divided by 365.
matthewsasia.com | 800.789.ASIA 89
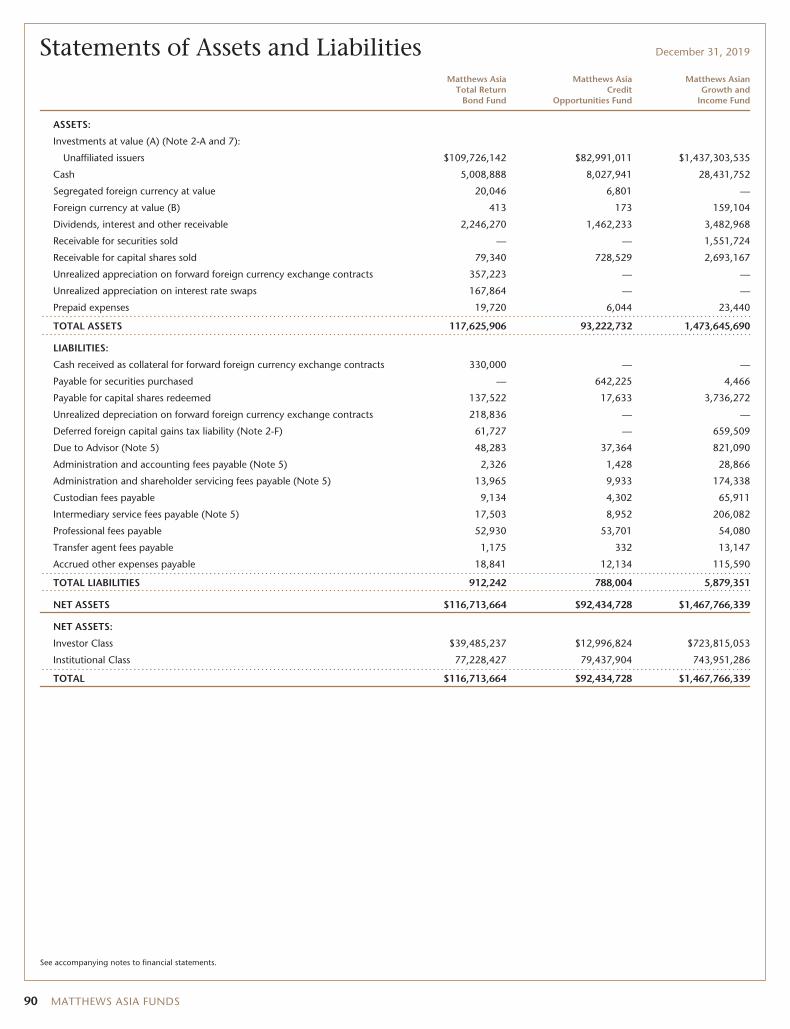
Statements of Assets and Liabilities December 31, 2019
Matthews AsiaTotal Return
Bond Fund
Matthews AsiaCredit
Opportunities Fund
Matthews AsianGrowth and
Income Fund
ASSETS:
Investments at value (A) (Note 2-A and 7):
Unaffiliated issuers $109,726,142 $82,991,011 $1,437,303,535
Cash 5,008,888 8,027,941 28,431,752
Segregated foreign currency at value 20,046 6,801 —
Foreign currency at value (B) 413 173 159,104
Dividends, interest and other receivable 2,246,270 1,462,233 3,482,968
Receivable for securities sold — — 1,551,724
Receivable for capital shares sold 79,340 728,529 2,693,167
Unrealized appreciation on forward foreign currency exchange contracts 357,223 — —
Unrealized appreciation on interest rate swaps 167,864 — —
Prepaid expenses 19,720 6,044 23,440
TOTAL ASSETS 117,625,906 93,222,732 1,473,645,690
LIABILITIES:
Cash received as collateral for forward foreign currency exchange contracts 330,000 — —
Payable for securities purchased — 642,225 4,466
Payable for capital shares redeemed 137,522 17,633 3,736,272
Unrealized depreciation on forward foreign currency exchange contracts 218,836 — —
Deferred foreign capital gains tax liability (Note 2-F) 61,727 — 659,509
Due to Advisor (Note 5) 48,283 37,364 821,090
Administration and accounting fees payable (Note 5) 2,326 1,428 28,866
Administration and shareholder servicing fees payable (Note 5) 13,965 9,933 174,338
Custodian fees payable 9,134 4,302 65,911
Intermediary service fees payable (Note 5) 17,503 8,952 206,082
Professional fees payable 52,930 53,701 54,080
Transfer agent fees payable 1,175 332 13,147
Accrued other expenses payable 18,841 12,134 115,590
TOTAL LIABILITIES 912,242 788,004 5,879,351
NET ASSETS $116,713,664 $92,434,728 $1,467,766,339
NET ASSETS:
Investor Class $39,485,237 $12,996,824 $723,815,053
Institutional Class 77,228,427 79,437,904 743,951,286
TOTAL $116,713,664 $92,434,728 $1,467,766,339
See accompanying notes to financial statements.
90 MATTHEWS ASIA FUNDS
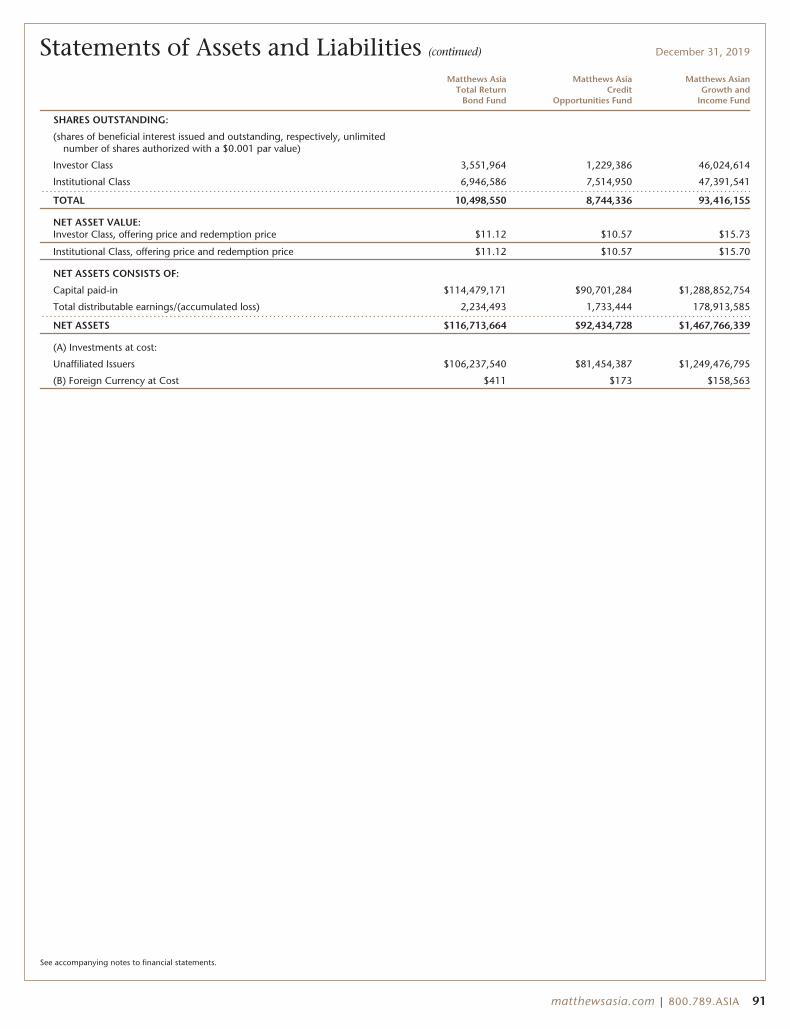
Statements of Assets and Liabilities (continued) December 31, 2019
Matthews AsiaTotal Return
Bond Fund
Matthews AsiaCredit
Opportunities Fund
Matthews AsianGrowth and
Income Fund
SHARES OUTSTANDING:
(shares of beneficial interest issued and outstanding, respectively, unlimitednumber of shares authorized with a $0.001 par value)
Investor Class 3,551,964 1,229,386 46,024,614
Institutional Class 6,946,586 7,514,950 47,391,541
TOTAL 10,498,550 8,744,336 93,416,155
NET ASSET VALUE:Investor Class, offering price and redemption price $11.12 $10.57 $15.73
Institutional Class, offering price and redemption price $11.12 $10.57 $15.70
NET ASSETS CONSISTS OF:
Capital paid-in $114,479,171 $90,701,284 $1,288,852,754
Total distributable earnings/(accumulated loss) 2,234,493 1,733,444 178,913,585
NET ASSETS $116,713,664 $92,434,728 $1,467,766,339
(A) Investments at cost:
Unaffiliated Issuers $106,237,540 $81,454,387 $1,249,476,795
(B) Foreign Currency at Cost $411 $173 $158,563
See accompanying notes to financial statements.
matthewsasia.com | 800.789.ASIA 91
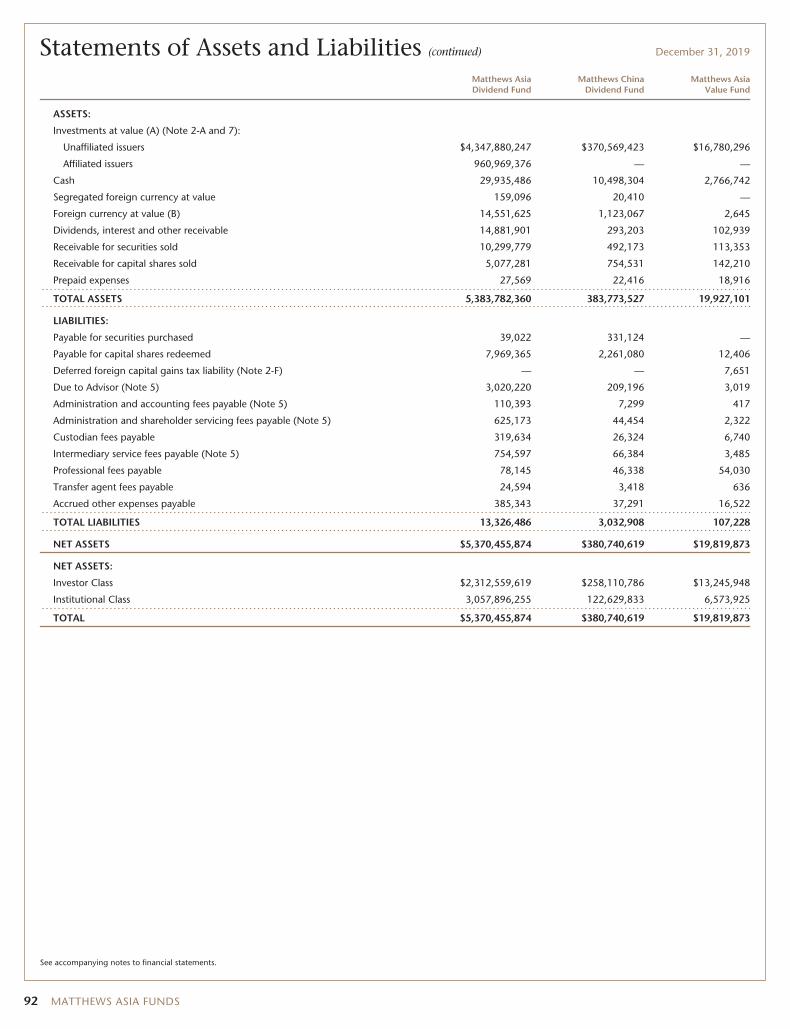
Statements of Assets and Liabilities (continued) December 31, 2019
Matthews AsiaDividend Fund
Matthews ChinaDividend Fund
Matthews AsiaValue Fund
ASSETS:
Investments at value (A) (Note 2-A and 7):
Unaffiliated issuers $4,347,880,247 $370,569,423 $16,780,296
Affiliated issuers 960,969,376 — —
Cash 29,935,486 10,498,304 2,766,742
Segregated foreign currency at value 159,096 20,410 —
Foreign currency at value (B) 14,551,625 1,123,067 2,645
Dividends, interest and other receivable 14,881,901 293,203 102,939
Receivable for securities sold 10,299,779 492,173 113,353
Receivable for capital shares sold 5,077,281 754,531 142,210
Prepaid expenses 27,569 22,416 18,916
TOTAL ASSETS 5,383,782,360 383,773,527 19,927,101
LIABILITIES:
Payable for securities purchased 39,022 331,124 —
Payable for capital shares redeemed 7,969,365 2,261,080 12,406
Deferred foreign capital gains tax liability (Note 2-F) — — 7,651
Due to Advisor (Note 5) 3,020,220 209,196 3,019
Administration and accounting fees payable (Note 5) 110,393 7,299 417
Administration and shareholder servicing fees payable (Note 5) 625,173 44,454 2,322
Custodian fees payable 319,634 26,324 6,740
Intermediary service fees payable (Note 5) 754,597 66,384 3,485
Professional fees payable 78,145 46,338 54,030
Transfer agent fees payable 24,594 3,418 636
Accrued other expenses payable 385,343 37,291 16,522
TOTAL LIABILITIES 13,326,486 3,032,908 107,228
NET ASSETS $5,370,455,874 $380,740,619 $19,819,873
NET ASSETS:
Investor Class $2,312,559,619 $258,110,786 $13,245,948
Institutional Class 3,057,896,255 122,629,833 6,573,925
TOTAL $5,370,455,874 $380,740,619 $19,819,873
See accompanying notes to financial statements.
92 MATTHEWS ASIA FUNDS
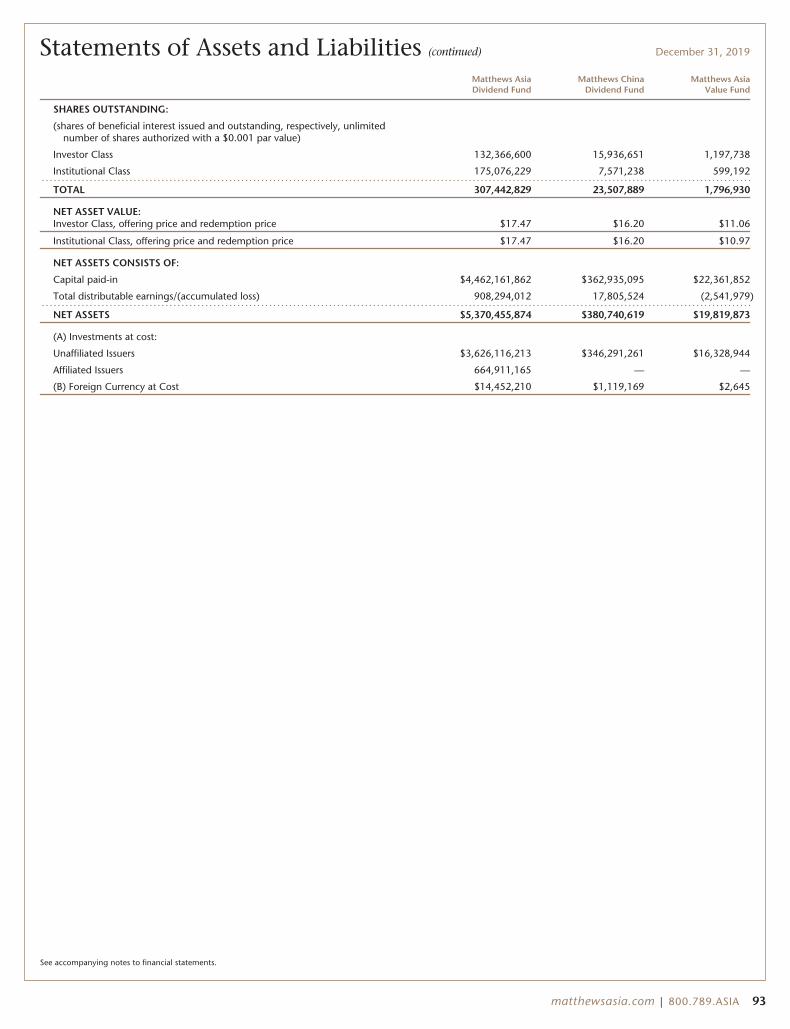
Statements of Assets and Liabilities (continued) December 31, 2019
Matthews AsiaDividend Fund
Matthews ChinaDividend Fund
Matthews AsiaValue Fund
SHARES OUTSTANDING:
(shares of beneficial interest issued and outstanding, respectively, unlimitednumber of shares authorized with a $0.001 par value)
Investor Class 132,366,600 15,936,651 1,197,738
Institutional Class 175,076,229 7,571,238 599,192
TOTAL 307,442,829 23,507,889 1,796,930
NET ASSET VALUE:Investor Class, offering price and redemption price $17.47 $16.20 $11.06
Institutional Class, offering price and redemption price $17.47 $16.20 $10.97
NET ASSETS CONSISTS OF:
Capital paid-in $4,462,161,862 $362,935,095 $22,361,852
Total distributable earnings/(accumulated loss) 908,294,012 17,805,524 (2,541,979)
NET ASSETS $5,370,455,874 $380,740,619 $19,819,873
(A) Investments at cost:
Unaffiliated Issuers $3,626,116,213 $346,291,261 $16,328,944
Affiliated Issuers 664,911,165 — —
(B) Foreign Currency at Cost $14,452,210 $1,119,169 $2,645
See accompanying notes to financial statements.
matthewsasia.com | 800.789.ASIA 93
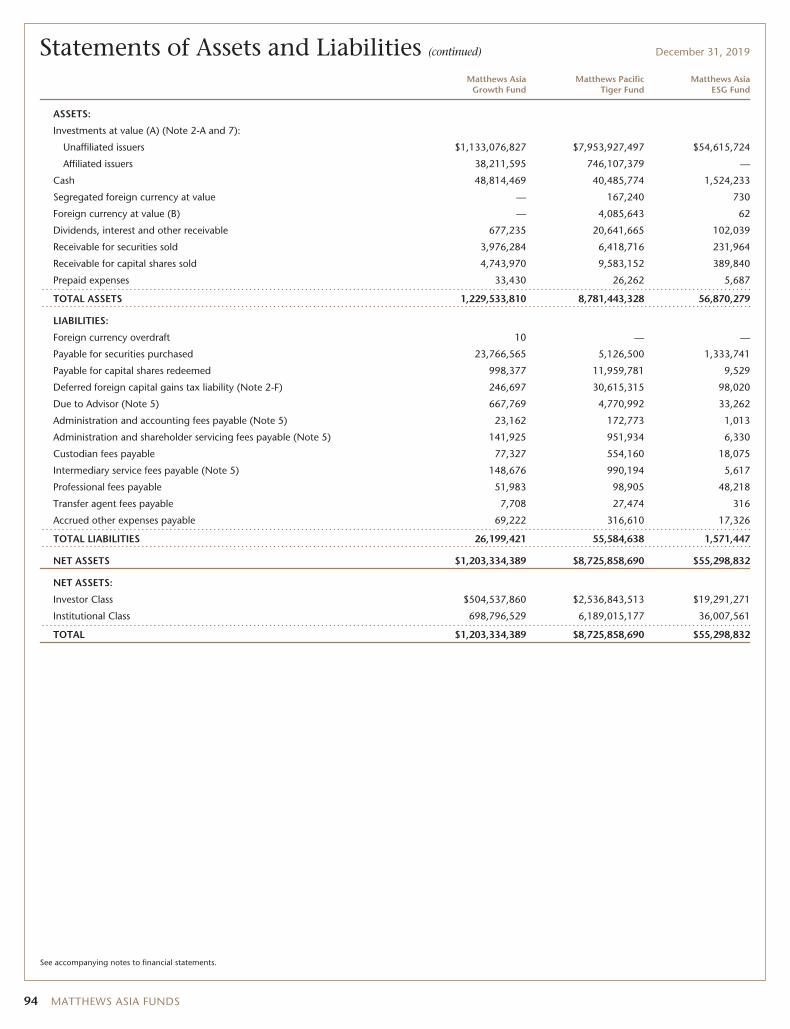
Statements of Assets and Liabilities (continued) December 31, 2019
Matthews AsiaGrowth Fund
Matthews PacificTiger Fund
Matthews AsiaESG Fund
ASSETS:
Investments at value (A) (Note 2-A and 7):
Unaffiliated issuers $1,133,076,827 $7,953,927,497 $54,615,724
Affiliated issuers 38,211,595 746,107,379 —
Cash 48,814,469 40,485,774 1,524,233
Segregated foreign currency at value — 167,240 730
Foreign currency at value (B) — 4,085,643 62
Dividends, interest and other receivable 677,235 20,641,665 102,039
Receivable for securities sold 3,976,284 6,418,716 231,964
Receivable for capital shares sold 4,743,970 9,583,152 389,840
Prepaid expenses 33,430 26,262 5,687
TOTAL ASSETS 1,229,533,810 8,781,443,328 56,870,279
LIABILITIES:
Foreign currency overdraft 10 — —
Payable for securities purchased 23,766,565 5,126,500 1,333,741
Payable for capital shares redeemed 998,377 11,959,781 9,529
Deferred foreign capital gains tax liability (Note 2-F) 246,697 30,615,315 98,020
Due to Advisor (Note 5) 667,769 4,770,992 33,262
Administration and accounting fees payable (Note 5) 23,162 172,773 1,013
Administration and shareholder servicing fees payable (Note 5) 141,925 951,934 6,330
Custodian fees payable 77,327 554,160 18,075
Intermediary service fees payable (Note 5) 148,676 990,194 5,617
Professional fees payable 51,983 98,905 48,218
Transfer agent fees payable 7,708 27,474 316
Accrued other expenses payable 69,222 316,610 17,326
TOTAL LIABILITIES 26,199,421 55,584,638 1,571,447
NET ASSETS $1,203,334,389 $8,725,858,690 $55,298,832
NET ASSETS:
Investor Class $504,537,860 $2,536,843,513 $19,291,271
Institutional Class 698,796,529 6,189,015,177 36,007,561
TOTAL $1,203,334,389 $8,725,858,690 $55,298,832
See accompanying notes to financial statements.
94 MATTHEWS ASIA FUNDS
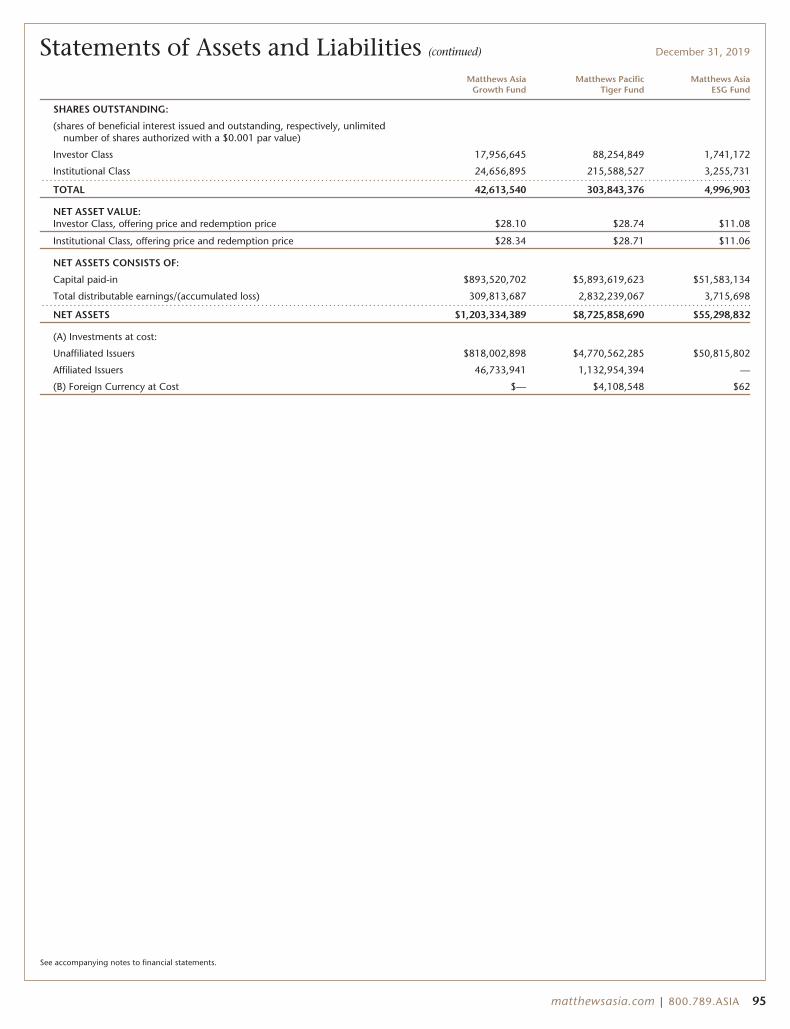
Statements of Assets and Liabilities (continued) December 31, 2019
Matthews AsiaGrowth Fund
Matthews PacificTiger Fund
Matthews AsiaESG Fund
SHARES OUTSTANDING:
(shares of beneficial interest issued and outstanding, respectively, unlimitednumber of shares authorized with a $0.001 par value)
Investor Class 17,956,645 88,254,849 1,741,172
Institutional Class 24,656,895 215,588,527 3,255,731
TOTAL 42,613,540 303,843,376 4,996,903
NET ASSET VALUE:Investor Class, offering price and redemption price $28.10 $28.74 $11.08
Institutional Class, offering price and redemption price $28.34 $28.71 $11.06
NET ASSETS CONSISTS OF:
Capital paid-in $893,520,702 $5,893,619,623 $51,583,134
Total distributable earnings/(accumulated loss) 309,813,687 2,832,239,067 3,715,698
NET ASSETS $1,203,334,389 $8,725,858,690 $55,298,832
(A) Investments at cost:
Unaffiliated Issuers $818,002,898 $4,770,562,285 $50,815,802
Affiliated Issuers 46,733,941 1,132,954,394 —
(B) Foreign Currency at Cost $— $4,108,548 $62
See accompanying notes to financial statements.
matthewsasia.com | 800.789.ASIA 95
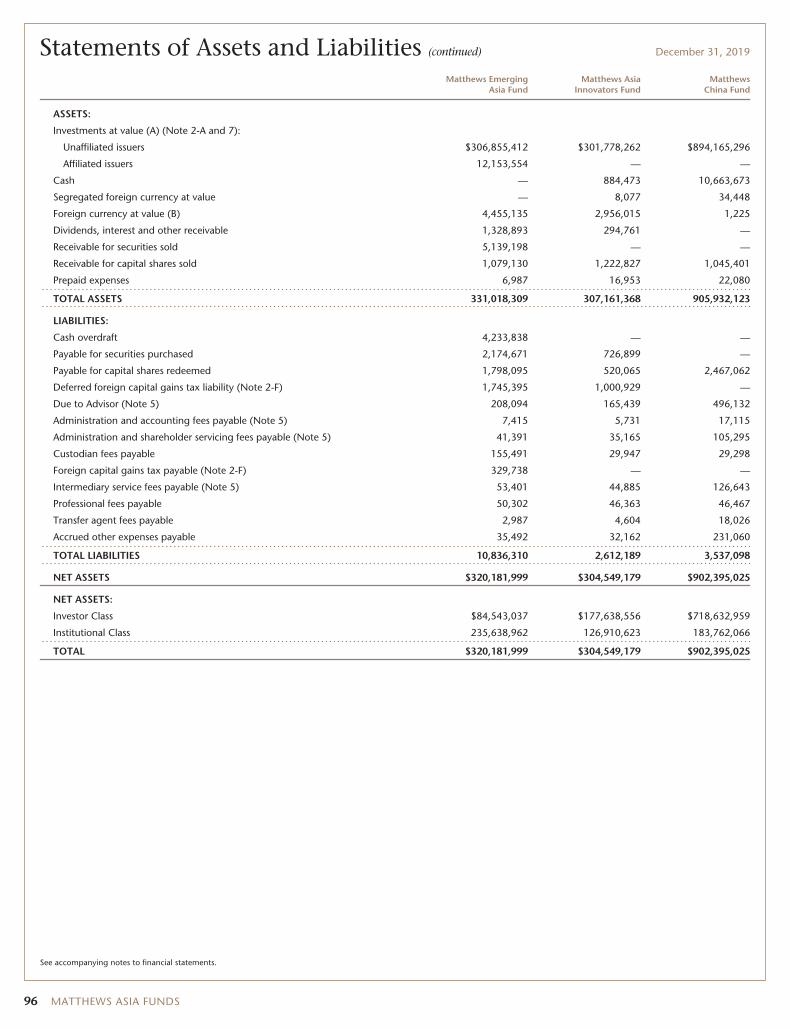
Statements of Assets and Liabilities (continued) December 31, 2019
Matthews EmergingAsia Fund
Matthews AsiaInnovators Fund
MatthewsChina Fund
ASSETS:
Investments at value (A) (Note 2-A and 7):
Unaffiliated issuers $306,855,412 $301,778,262 $894,165,296
Affiliated issuers 12,153,554 — —
Cash — 884,473 10,663,673
Segregated foreign currency at value — 8,077 34,448
Foreign currency at value (B) 4,455,135 2,956,015 1,225
Dividends, interest and other receivable 1,328,893 294,761 —
Receivable for securities sold 5,139,198 — —
Receivable for capital shares sold 1,079,130 1,222,827 1,045,401
Prepaid expenses 6,987 16,953 22,080
TOTAL ASSETS 331,018,309 307,161,368 905,932,123
LIABILITIES:
Cash overdraft 4,233,838 — —
Payable for securities purchased 2,174,671 726,899 —
Payable for capital shares redeemed 1,798,095 520,065 2,467,062
Deferred foreign capital gains tax liability (Note 2-F) 1,745,395 1,000,929 —
Due to Advisor (Note 5) 208,094 165,439 496,132
Administration and accounting fees payable (Note 5) 7,415 5,731 17,115
Administration and shareholder servicing fees payable (Note 5) 41,391 35,165 105,295
Custodian fees payable 155,491 29,947 29,298
Foreign capital gains tax payable (Note 2-F) 329,738 — —
Intermediary service fees payable (Note 5) 53,401 44,885 126,643
Professional fees payable 50,302 46,363 46,467
Transfer agent fees payable 2,987 4,604 18,026
Accrued other expenses payable 35,492 32,162 231,060
TOTAL LIABILITIES 10,836,310 2,612,189 3,537,098
NET ASSETS $320,181,999 $304,549,179 $902,395,025
NET ASSETS:
Investor Class $84,543,037 $177,638,556 $718,632,959
Institutional Class 235,638,962 126,910,623 183,762,066
TOTAL $320,181,999 $304,549,179 $902,395,025
See accompanying notes to financial statements.
96 MATTHEWS ASIA FUNDS

Statements of Assets and Liabilities (continued) December 31, 2019
Matthews EmergingAsia Fund
Matthews AsiaInnovators Fund
MatthewsChina Fund
SHARES OUTSTANDING:
(shares of beneficial interest issued and outstanding, respectively, unlimitednumber of shares authorized with a $0.001 par value)
Investor Class 7,007,202 12,207,820 37,585,979
Institutional Class 19,428,870 8,667,456 9,632,127
TOTAL 26,436,072 20,875,276 47,218,106
NET ASSET VALUE:Investor Class, offering price and redemption price $12.07 $14.55 $19.12
Institutional Class, offering price and redemption price $12.13 $14.64 $19.08
NET ASSETS CONSISTS OF:
Capital paid-in $364,001,282 $236,696,430 $823,735,748
Total distributable earnings/(accumulated loss) (43,819,283) 67,852,749 78,659,277
NET ASSETS $320,181,999 $304,549,179 $902,395,025
(A) Investments at cost:
Unaffiliated Issuers $313,708,791 $234,346,243 $782,836,701
Affiliated Issuers 18,385,911 — —
(B) Foreign Currency at Cost $4,455,823 $2,933,119 $1,225
See accompanying notes to financial statements.
matthewsasia.com | 800.789.ASIA 97
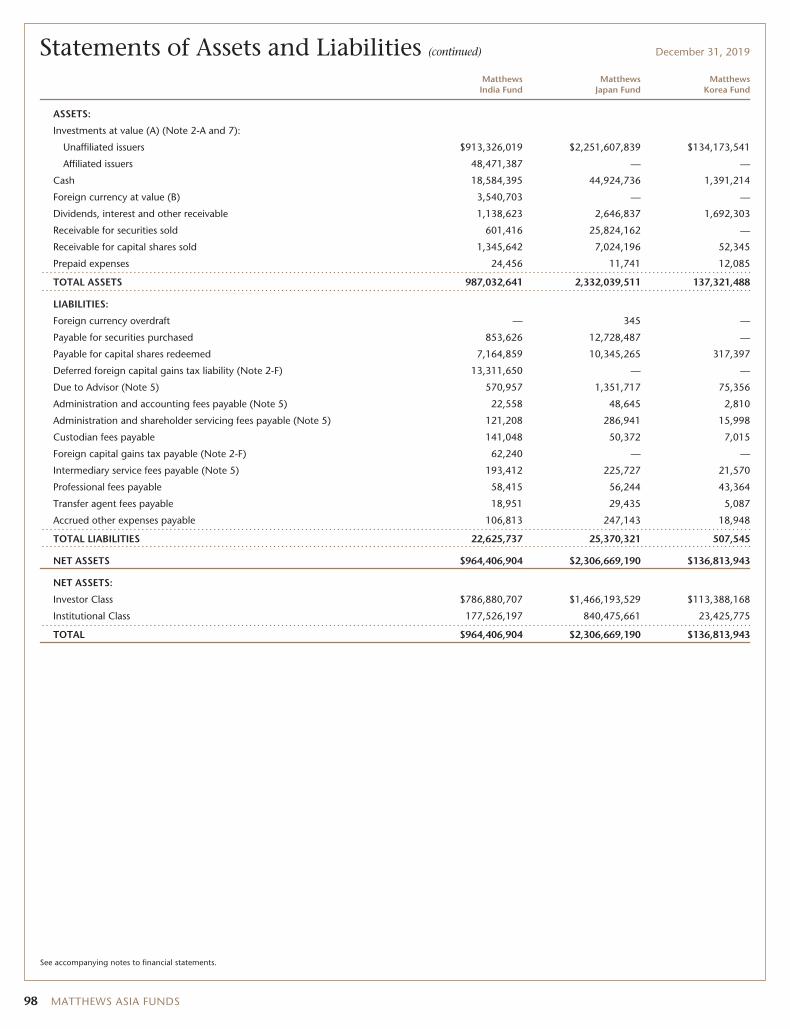
Statements of Assets and Liabilities (continued) December 31, 2019
MatthewsIndia Fund
MatthewsJapan Fund
MatthewsKorea Fund
ASSETS:
Investments at value (A) (Note 2-A and 7):
Unaffiliated issuers $913,326,019 $2,251,607,839 $134,173,541
Affiliated issuers 48,471,387 — —
Cash 18,584,395 44,924,736 1,391,214
Foreign currency at value (B) 3,540,703 — —
Dividends, interest and other receivable 1,138,623 2,646,837 1,692,303
Receivable for securities sold 601,416 25,824,162 —
Receivable for capital shares sold 1,345,642 7,024,196 52,345
Prepaid expenses 24,456 11,741 12,085
TOTAL ASSETS 987,032,641 2,332,039,511 137,321,488
LIABILITIES:
Foreign currency overdraft — 345 —
Payable for securities purchased 853,626 12,728,487 —
Payable for capital shares redeemed 7,164,859 10,345,265 317,397
Deferred foreign capital gains tax liability (Note 2-F) 13,311,650 — —
Due to Advisor (Note 5) 570,957 1,351,717 75,356
Administration and accounting fees payable (Note 5) 22,558 48,645 2,810
Administration and shareholder servicing fees payable (Note 5) 121,208 286,941 15,998
Custodian fees payable 141,048 50,372 7,015
Foreign capital gains tax payable (Note 2-F) 62,240 — —
Intermediary service fees payable (Note 5) 193,412 225,727 21,570
Professional fees payable 58,415 56,244 43,364
Transfer agent fees payable 18,951 29,435 5,087
Accrued other expenses payable 106,813 247,143 18,948
TOTAL LIABILITIES 22,625,737 25,370,321 507,545
NET ASSETS $964,406,904 $2,306,669,190 $136,813,943
NET ASSETS:
Investor Class $786,880,707 $1,466,193,529 $113,388,168
Institutional Class 177,526,197 840,475,661 23,425,775
TOTAL $964,406,904 $2,306,669,190 $136,813,943
See accompanying notes to financial statements.
98 MATTHEWS ASIA FUNDS

Statements of Assets and Liabilities (continued) December 31, 2019
MatthewsIndia Fund
MatthewsJapan Fund
MatthewsKorea Fund
SHARES OUTSTANDING:
(shares of beneficial interest issued and outstanding, respectively, unlimitednumber of shares authorized with a $0.001 par value)
Investor Class 33,812,192 68,179,068 25,870,262
Institutional Class 7,538,582 39,010,212 5,301,332
TOTAL 41,350,774 107,189,280 31,171,594
NET ASSET VALUE:Investor Class, offering price and redemption price $23.27 $21.51 $4.38
Institutional Class, offering price and redemption price $23.55 $21.55 $4.42
NET ASSETS CONSISTS OF:
Capital paid-in $843,175,893 $1,914,203,282 $126,365,089
Total distributable earnings/(accumulated loss) 121,231,011 392,465,908 10,448,854
NET ASSETS $964,406,904 $2,306,669,190 $136,813,943
(A) Investments at cost:
Unaffiliated Issuers $823,523,649 $1,845,967,971 $118,363,038
Affiliated Issuers 22,747,836 — —
(B) Foreign Currency at Cost $3,542,806 $— $—
See accompanying notes to financial statements.
matthewsasia.com | 800.789.ASIA 99
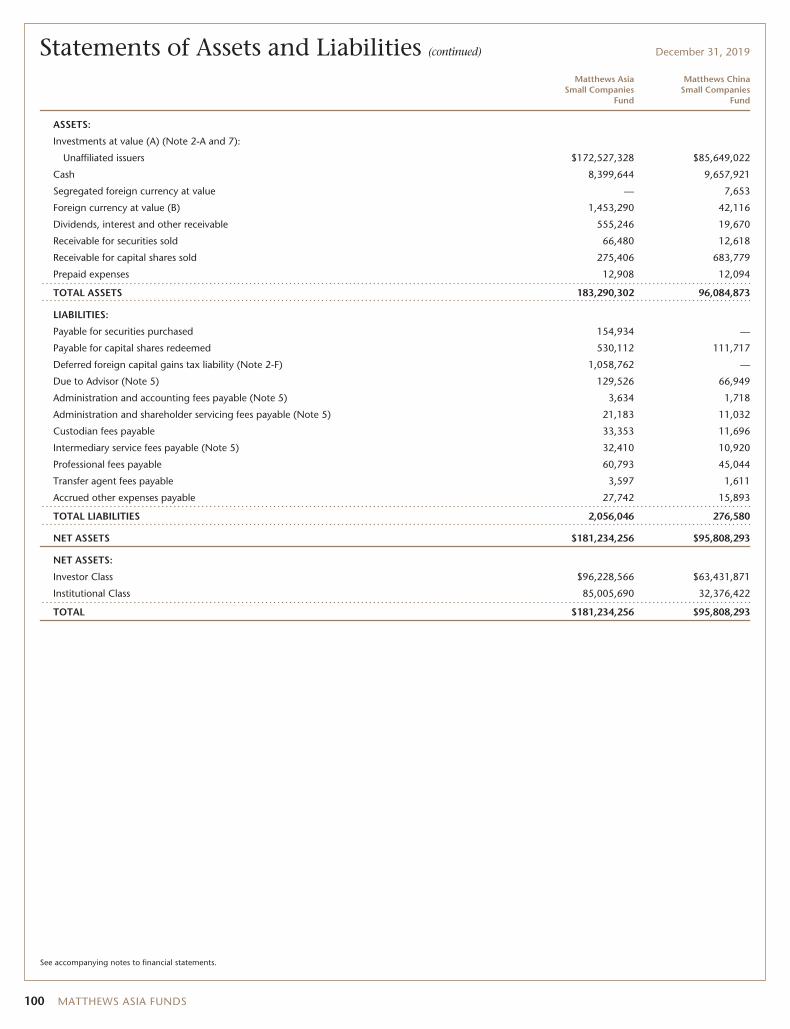
Statements of Assets and Liabilities (continued) December 31, 2019
Matthews AsiaSmall Companies
Fund
Matthews ChinaSmall Companies
Fund
ASSETS:
Investments at value (A) (Note 2-A and 7):
Unaffiliated issuers $172,527,328 $85,649,022
Cash 8,399,644 9,657,921
Segregated foreign currency at value — 7,653
Foreign currency at value (B) 1,453,290 42,116
Dividends, interest and other receivable 555,246 19,670
Receivable for securities sold 66,480 12,618
Receivable for capital shares sold 275,406 683,779
Prepaid expenses 12,908 12,094
TOTAL ASSETS 183,290,302 96,084,873
LIABILITIES:
Payable for securities purchased 154,934 —
Payable for capital shares redeemed 530,112 111,717
Deferred foreign capital gains tax liability (Note 2-F) 1,058,762 —
Due to Advisor (Note 5) 129,526 66,949
Administration and accounting fees payable (Note 5) 3,634 1,718
Administration and shareholder servicing fees payable (Note 5) 21,183 11,032
Custodian fees payable 33,353 11,696
Intermediary service fees payable (Note 5) 32,410 10,920
Professional fees payable 60,793 45,044
Transfer agent fees payable 3,597 1,611
Accrued other expenses payable 27,742 15,893
TOTAL LIABILITIES 2,056,046 276,580
NET ASSETS $181,234,256 $95,808,293
NET ASSETS:
Investor Class $96,228,566 $63,431,871
Institutional Class 85,005,690 32,376,422
TOTAL $181,234,256 $95,808,293
See accompanying notes to financial statements.
100 MATTHEWS ASIA FUNDS
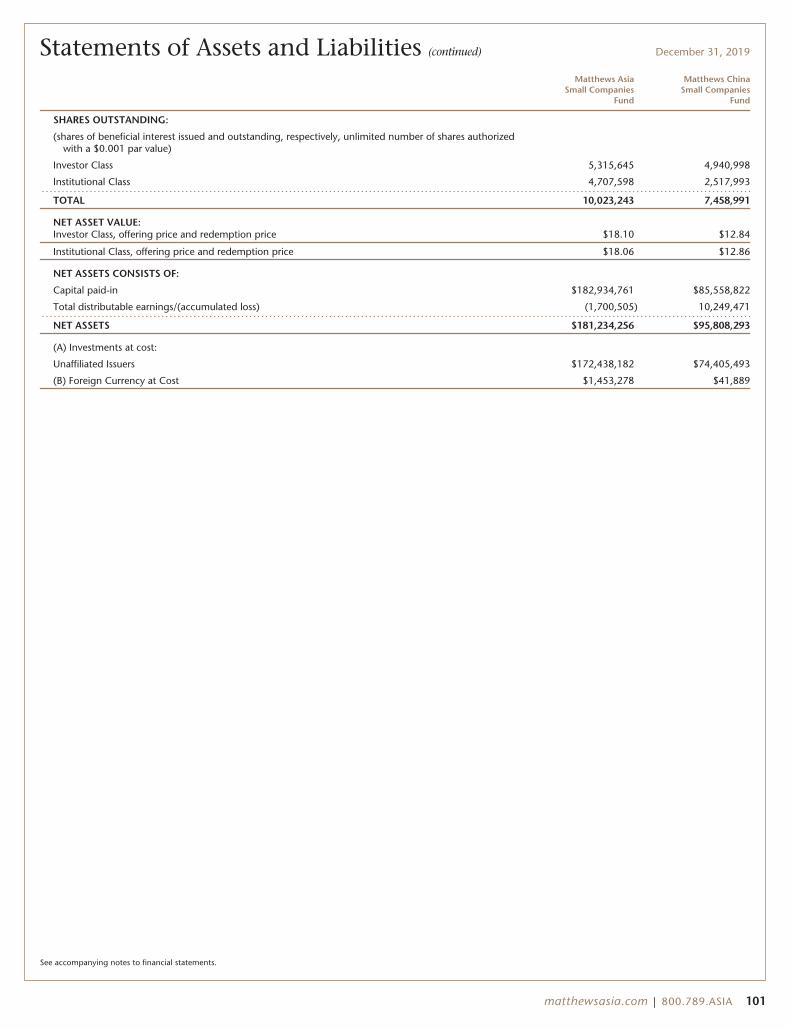
Statements of Assets and Liabilities (continued) December 31, 2019
Matthews AsiaSmall Companies
Fund
Matthews ChinaSmall Companies
Fund
SHARES OUTSTANDING:
(shares of beneficial interest issued and outstanding, respectively, unlimited number of shares authorizedwith a $0.001 par value)
Investor Class 5,315,645 4,940,998
Institutional Class 4,707,598 2,517,993
TOTAL 10,023,243 7,458,991
NET ASSET VALUE:Investor Class, offering price and redemption price $18.10 $12.84
Institutional Class, offering price and redemption price $18.06 $12.86
NET ASSETS CONSISTS OF:
Capital paid-in $182,934,761 $85,558,822
Total distributable earnings/(accumulated loss) (1,700,505) 10,249,471
NET ASSETS $181,234,256 $95,808,293
(A) Investments at cost:
Unaffiliated Issuers $172,438,182 $74,405,493
(B) Foreign Currency at Cost $1,453,278 $41,889
See accompanying notes to financial statements.
matthewsasia.com | 800.789.ASIA 101
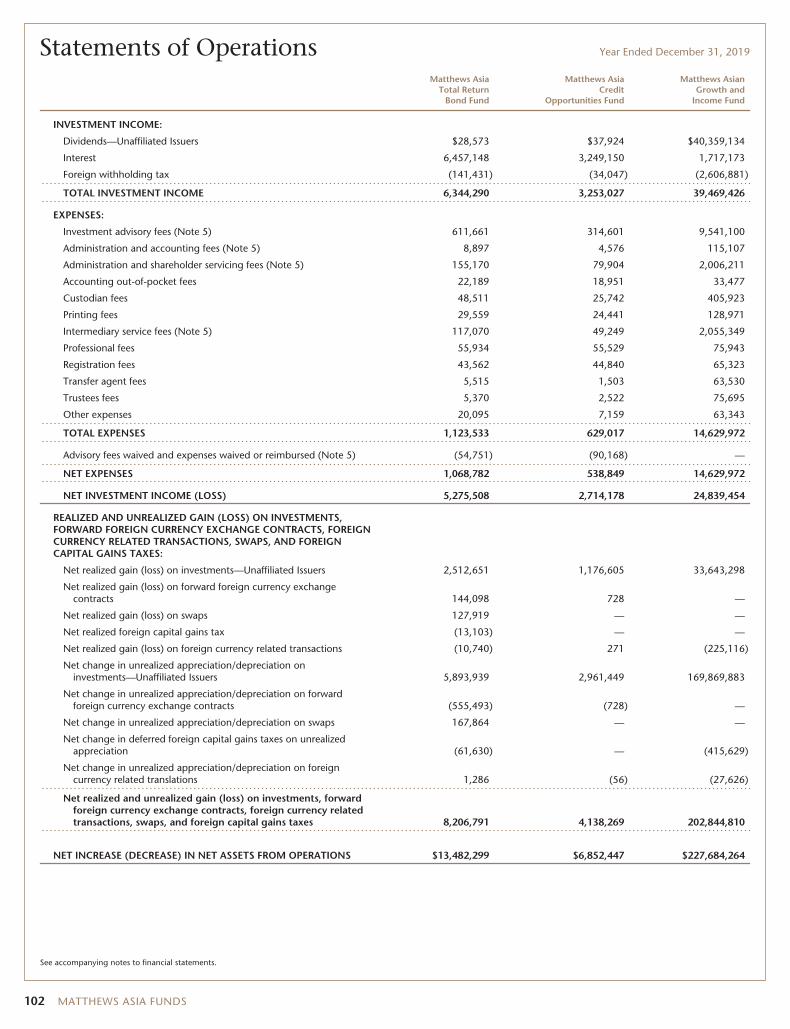
Statements of Operations Year Ended December 31, 2019
Matthews AsiaTotal Return
Bond Fund
Matthews AsiaCredit
Opportunities Fund
Matthews AsianGrowth and
Income Fund
INVESTMENT INCOME:
Dividends—Unaffiliated Issuers $28,573 $37,924 $40,359,134
Interest 6,457,148 3,249,150 1,717,173
Foreign withholding tax (141,431) (34,047) (2,606,881)
TOTAL INVESTMENT INCOME 6,344,290 3,253,027 39,469,426
EXPENSES:
Investment advisory fees (Note 5) 611,661 314,601 9,541,100
Administration and accounting fees (Note 5) 8,897 4,576 115,107
Administration and shareholder servicing fees (Note 5) 155,170 79,904 2,006,211
Accounting out-of-pocket fees 22,189 18,951 33,477
Custodian fees 48,511 25,742 405,923
Printing fees 29,559 24,441 128,971
Intermediary service fees (Note 5) 117,070 49,249 2,055,349
Professional fees 55,934 55,529 75,943
Registration fees 43,562 44,840 65,323
Transfer agent fees 5,515 1,503 63,530
Trustees fees 5,370 2,522 75,695
Other expenses 20,095 7,159 63,343
TOTAL EXPENSES 1,123,533 629,017 14,629,972
Advisory fees waived and expenses waived or reimbursed (Note 5) (54,751) (90,168) —
NET EXPENSES 1,068,782 538,849 14,629,972
NET INVESTMENT INCOME (LOSS) 5,275,508 2,714,178 24,839,454
REALIZED AND UNREALIZED GAIN (LOSS) ON INVESTMENTS,FORWARD FOREIGN CURRENCY EXCHANGE CONTRACTS, FOREIGNCURRENCY RELATED TRANSACTIONS, SWAPS, AND FOREIGNCAPITAL GAINS TAXES:
Net realized gain (loss) on investments—Unaffiliated Issuers 2,512,651 1,176,605 33,643,298
Net realized gain (loss) on forward foreign currency exchangecontracts 144,098 728 —
Net realized gain (loss) on swaps 127,919 — —
Net realized foreign capital gains tax (13,103) — —
Net realized gain (loss) on foreign currency related transactions (10,740) 271 (225,116)
Net change in unrealized appreciation/depreciation oninvestments—Unaffiliated Issuers 5,893,939 2,961,449 169,869,883
Net change in unrealized appreciation/depreciation on forwardforeign currency exchange contracts (555,493) (728) —
Net change in unrealized appreciation/depreciation on swaps 167,864 — —
Net change in deferred foreign capital gains taxes on unrealizedappreciation (61,630) — (415,629)
Net change in unrealized appreciation/depreciation on foreigncurrency related translations 1,286 (56) (27,626)
Net realized and unrealized gain (loss) on investments, forwardforeign currency exchange contracts, foreign currency relatedtransactions, swaps, and foreign capital gains taxes 8,206,791 4,138,269 202,844,810
NET INCREASE (DECREASE) IN NET ASSETS FROM OPERATIONS $13,482,299 $6,852,447 $227,684,264
See accompanying notes to financial statements.
102 MATTHEWS ASIA FUNDS
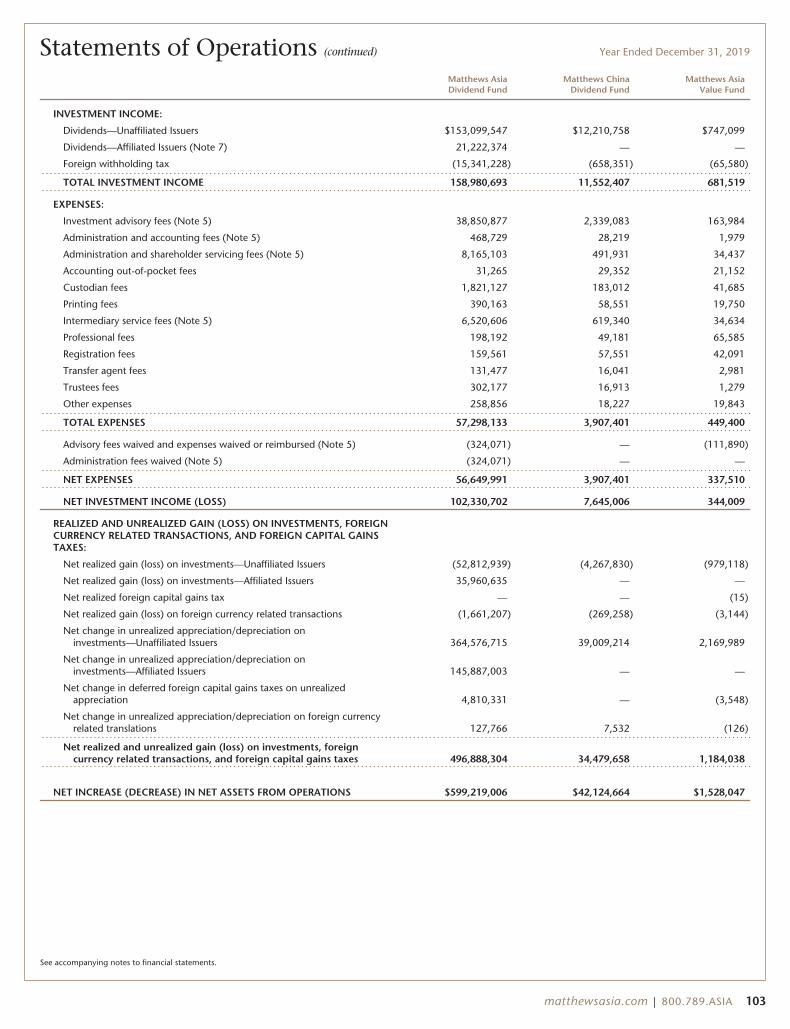
Statements of Operations (continued) Year Ended December 31, 2019
Matthews AsiaDividend Fund
Matthews ChinaDividend Fund
Matthews AsiaValue Fund
INVESTMENT INCOME:
Dividends—Unaffiliated Issuers $153,099,547 $12,210,758 $747,099
Dividends—Affiliated Issuers (Note 7) 21,222,374 — —
Foreign withholding tax (15,341,228) (658,351) (65,580)
TOTAL INVESTMENT INCOME 158,980,693 11,552,407 681,519
EXPENSES:
Investment advisory fees (Note 5) 38,850,877 2,339,083 163,984
Administration and accounting fees (Note 5) 468,729 28,219 1,979
Administration and shareholder servicing fees (Note 5) 8,165,103 491,931 34,437
Accounting out-of-pocket fees 31,265 29,352 21,152
Custodian fees 1,821,127 183,012 41,685
Printing fees 390,163 58,551 19,750
Intermediary service fees (Note 5) 6,520,606 619,340 34,634
Professional fees 198,192 49,181 65,585
Registration fees 159,561 57,551 42,091
Transfer agent fees 131,477 16,041 2,981
Trustees fees 302,177 16,913 1,279
Other expenses 258,856 18,227 19,843
TOTAL EXPENSES 57,298,133 3,907,401 449,400
Advisory fees waived and expenses waived or reimbursed (Note 5) (324,071) — (111,890)
Administration fees waived (Note 5) (324,071) — —
NET EXPENSES 56,649,991 3,907,401 337,510
NET INVESTMENT INCOME (LOSS) 102,330,702 7,645,006 344,009
REALIZED AND UNREALIZED GAIN (LOSS) ON INVESTMENTS, FOREIGNCURRENCY RELATED TRANSACTIONS, AND FOREIGN CAPITAL GAINSTAXES:
Net realized gain (loss) on investments—Unaffiliated Issuers (52,812,939) (4,267,830) (979,118)
Net realized gain (loss) on investments—Affiliated Issuers 35,960,635 — —
Net realized foreign capital gains tax — — (15)
Net realized gain (loss) on foreign currency related transactions (1,661,207) (269,258) (3,144)
Net change in unrealized appreciation/depreciation oninvestments—Unaffiliated Issuers 364,576,715 39,009,214 2,169,989
Net change in unrealized appreciation/depreciation oninvestments—Affiliated Issuers 145,887,003 — —
Net change in deferred foreign capital gains taxes on unrealizedappreciation 4,810,331 — (3,548)
Net change in unrealized appreciation/depreciation on foreign currencyrelated translations 127,766 7,532 (126)
Net realized and unrealized gain (loss) on investments, foreigncurrency related transactions, and foreign capital gains taxes 496,888,304 34,479,658 1,184,038
NET INCREASE (DECREASE) IN NET ASSETS FROM OPERATIONS $599,219,006 $42,124,664 $1,528,047
See accompanying notes to financial statements.
matthewsasia.com | 800.789.ASIA 103
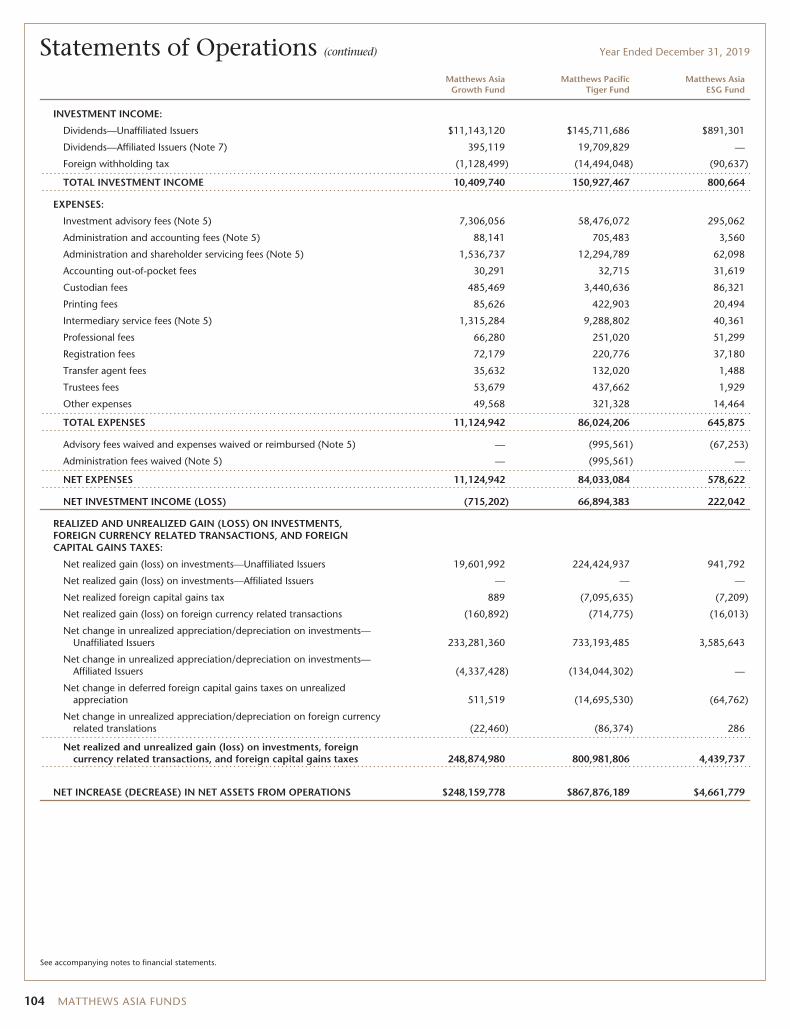
Statements of Operations (continued) Year Ended December 31, 2019
Matthews AsiaGrowth Fund
Matthews PacificTiger Fund
Matthews AsiaESG Fund
INVESTMENT INCOME:
Dividends—Unaffiliated Issuers $11,143,120 $145,711,686 $891,301
Dividends—Affiliated Issuers (Note 7) 395,119 19,709,829 —
Foreign withholding tax (1,128,499) (14,494,048) (90,637)
TOTAL INVESTMENT INCOME 10,409,740 150,927,467 800,664
EXPENSES:
Investment advisory fees (Note 5) 7,306,056 58,476,072 295,062
Administration and accounting fees (Note 5) 88,141 705,483 3,560
Administration and shareholder servicing fees (Note 5) 1,536,737 12,294,789 62,098
Accounting out-of-pocket fees 30,291 32,715 31,619
Custodian fees 485,469 3,440,636 86,321
Printing fees 85,626 422,903 20,494
Intermediary service fees (Note 5) 1,315,284 9,288,802 40,361
Professional fees 66,280 251,020 51,299
Registration fees 72,179 220,776 37,180
Transfer agent fees 35,632 132,020 1,488
Trustees fees 53,679 437,662 1,929
Other expenses 49,568 321,328 14,464
TOTAL EXPENSES 11,124,942 86,024,206 645,875
Advisory fees waived and expenses waived or reimbursed (Note 5) — (995,561) (67,253)
Administration fees waived (Note 5) — (995,561) —
NET EXPENSES 11,124,942 84,033,084 578,622
NET INVESTMENT INCOME (LOSS) (715,202) 66,894,383 222,042
REALIZED AND UNREALIZED GAIN (LOSS) ON INVESTMENTS,FOREIGN CURRENCY RELATED TRANSACTIONS, AND FOREIGNCAPITAL GAINS TAXES:
Net realized gain (loss) on investments—Unaffiliated Issuers 19,601,992 224,424,937 941,792
Net realized gain (loss) on investments—Affiliated Issuers — — —
Net realized foreign capital gains tax 889 (7,095,635) (7,209)
Net realized gain (loss) on foreign currency related transactions (160,892) (714,775) (16,013)
Net change in unrealized appreciation/depreciation on investments—Unaffiliated Issuers 233,281,360 733,193,485 3,585,643
Net change in unrealized appreciation/depreciation on investments—Affiliated Issuers (4,337,428) (134,044,302) —
Net change in deferred foreign capital gains taxes on unrealizedappreciation 511,519 (14,695,530) (64,762)
Net change in unrealized appreciation/depreciation on foreign currencyrelated translations (22,460) (86,374) 286
Net realized and unrealized gain (loss) on investments, foreigncurrency related transactions, and foreign capital gains taxes 248,874,980 800,981,806 4,439,737
NET INCREASE (DECREASE) IN NET ASSETS FROM OPERATIONS $248,159,778 $867,876,189 $4,661,779
See accompanying notes to financial statements.
104 MATTHEWS ASIA FUNDS
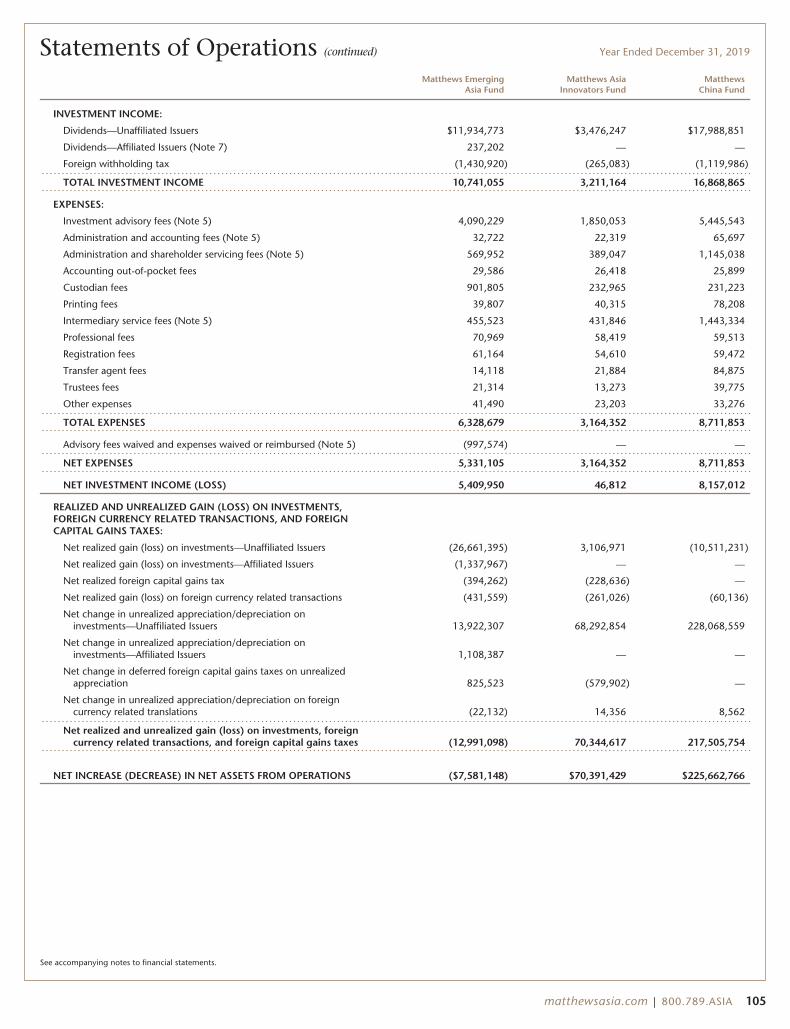
Statements of Operations (continued) Year Ended December 31, 2019
Matthews EmergingAsia Fund
Matthews AsiaInnovators Fund
MatthewsChina Fund
INVESTMENT INCOME:
Dividends—Unaffiliated Issuers $11,934,773 $3,476,247 $17,988,851
Dividends—Affiliated Issuers (Note 7) 237,202 — —
Foreign withholding tax (1,430,920) (265,083) (1,119,986)
TOTAL INVESTMENT INCOME 10,741,055 3,211,164 16,868,865
EXPENSES:
Investment advisory fees (Note 5) 4,090,229 1,850,053 5,445,543
Administration and accounting fees (Note 5) 32,722 22,319 65,697
Administration and shareholder servicing fees (Note 5) 569,952 389,047 1,145,038
Accounting out-of-pocket fees 29,586 26,418 25,899
Custodian fees 901,805 232,965 231,223
Printing fees 39,807 40,315 78,208
Intermediary service fees (Note 5) 455,523 431,846 1,443,334
Professional fees 70,969 58,419 59,513
Registration fees 61,164 54,610 59,472
Transfer agent fees 14,118 21,884 84,875
Trustees fees 21,314 13,273 39,775
Other expenses 41,490 23,203 33,276
TOTAL EXPENSES 6,328,679 3,164,352 8,711,853
Advisory fees waived and expenses waived or reimbursed (Note 5) (997,574) — —
NET EXPENSES 5,331,105 3,164,352 8,711,853
NET INVESTMENT INCOME (LOSS) 5,409,950 46,812 8,157,012
REALIZED AND UNREALIZED GAIN (LOSS) ON INVESTMENTS,FOREIGN CURRENCY RELATED TRANSACTIONS, AND FOREIGNCAPITAL GAINS TAXES:
Net realized gain (loss) on investments—Unaffiliated Issuers (26,661,395) 3,106,971 (10,511,231)
Net realized gain (loss) on investments—Affiliated Issuers (1,337,967) — —
Net realized foreign capital gains tax (394,262) (228,636) —
Net realized gain (loss) on foreign currency related transactions (431,559) (261,026) (60,136)
Net change in unrealized appreciation/depreciation oninvestments—Unaffiliated Issuers 13,922,307 68,292,854 228,068,559
Net change in unrealized appreciation/depreciation oninvestments—Affiliated Issuers 1,108,387 — —
Net change in deferred foreign capital gains taxes on unrealizedappreciation 825,523 (579,902) —
Net change in unrealized appreciation/depreciation on foreigncurrency related translations (22,132) 14,356 8,562
Net realized and unrealized gain (loss) on investments, foreigncurrency related transactions, and foreign capital gains taxes (12,991,098) 70,344,617 217,505,754
NET INCREASE (DECREASE) IN NET ASSETS FROM OPERATIONS ($7,581,148) $70,391,429 $225,662,766
See accompanying notes to financial statements.
matthewsasia.com | 800.789.ASIA 105
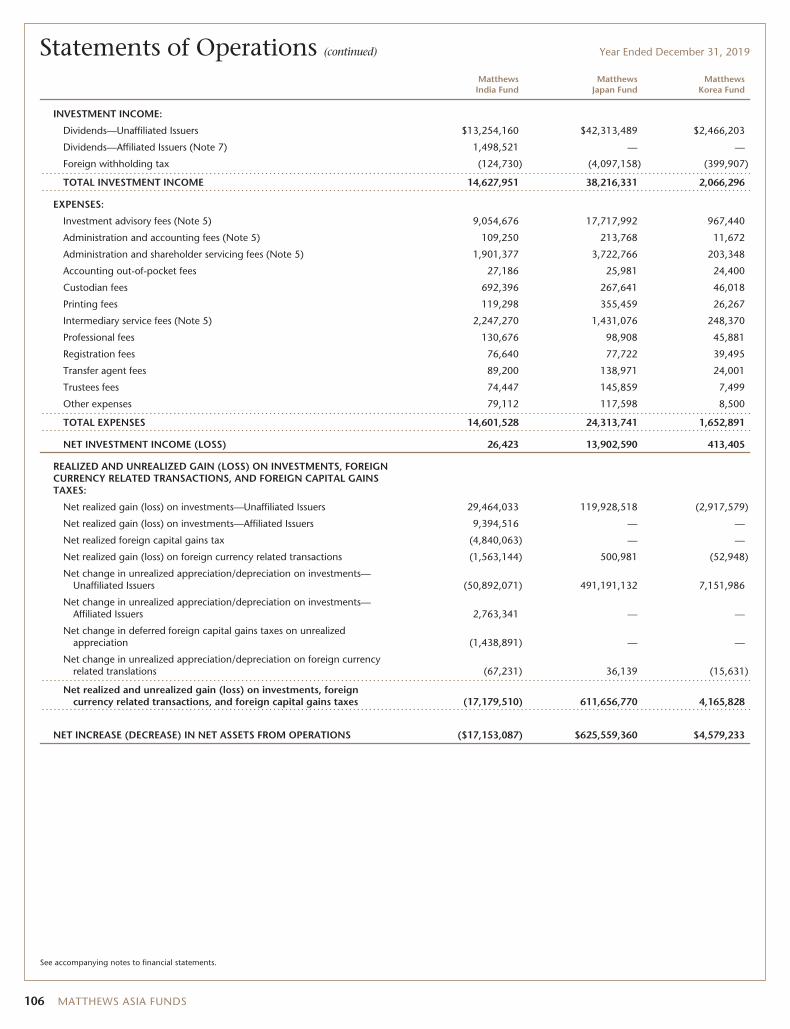
Statements of Operations (continued) Year Ended December 31, 2019
MatthewsIndia Fund
MatthewsJapan Fund
MatthewsKorea Fund
INVESTMENT INCOME:
Dividends—Unaffiliated Issuers $13,254,160 $42,313,489 $2,466,203
Dividends—Affiliated Issuers (Note 7) 1,498,521 — —
Foreign withholding tax (124,730) (4,097,158) (399,907)
TOTAL INVESTMENT INCOME 14,627,951 38,216,331 2,066,296
EXPENSES:
Investment advisory fees (Note 5) 9,054,676 17,717,992 967,440
Administration and accounting fees (Note 5) 109,250 213,768 11,672
Administration and shareholder servicing fees (Note 5) 1,901,377 3,722,766 203,348
Accounting out-of-pocket fees 27,186 25,981 24,400
Custodian fees 692,396 267,641 46,018
Printing fees 119,298 355,459 26,267
Intermediary service fees (Note 5) 2,247,270 1,431,076 248,370
Professional fees 130,676 98,908 45,881
Registration fees 76,640 77,722 39,495
Transfer agent fees 89,200 138,971 24,001
Trustees fees 74,447 145,859 7,499
Other expenses 79,112 117,598 8,500
TOTAL EXPENSES 14,601,528 24,313,741 1,652,891
NET INVESTMENT INCOME (LOSS) 26,423 13,902,590 413,405
REALIZED AND UNREALIZED GAIN (LOSS) ON INVESTMENTS, FOREIGNCURRENCY RELATED TRANSACTIONS, AND FOREIGN CAPITAL GAINSTAXES:
Net realized gain (loss) on investments—Unaffiliated Issuers 29,464,033 119,928,518 (2,917,579)
Net realized gain (loss) on investments—Affiliated Issuers 9,394,516 — —
Net realized foreign capital gains tax (4,840,063) — —
Net realized gain (loss) on foreign currency related transactions (1,563,144) 500,981 (52,948)
Net change in unrealized appreciation/depreciation on investments—Unaffiliated Issuers (50,892,071) 491,191,132 7,151,986
Net change in unrealized appreciation/depreciation on investments—Affiliated Issuers 2,763,341 — —
Net change in deferred foreign capital gains taxes on unrealizedappreciation (1,438,891) — —
Net change in unrealized appreciation/depreciation on foreign currencyrelated translations (67,231) 36,139 (15,631)
Net realized and unrealized gain (loss) on investments, foreigncurrency related transactions, and foreign capital gains taxes (17,179,510) 611,656,770 4,165,828
NET INCREASE (DECREASE) IN NET ASSETS FROM OPERATIONS ($17,153,087) $625,559,360 $4,579,233
See accompanying notes to financial statements.
106 MATTHEWS ASIA FUNDS
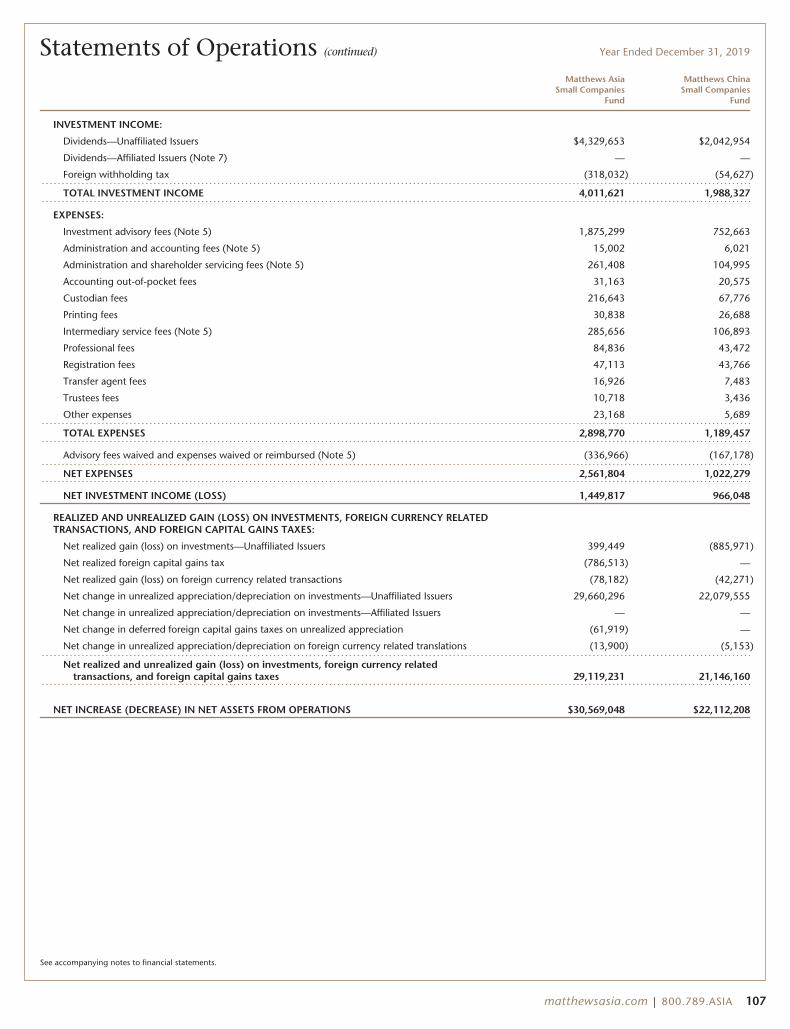
Statements of Operations (continued) Year Ended December 31, 2019
Matthews AsiaSmall Companies
Fund
Matthews ChinaSmall Companies
Fund
INVESTMENT INCOME:
Dividends—Unaffiliated Issuers $4,329,653 $2,042,954
Dividends—Affiliated Issuers (Note 7) — —
Foreign withholding tax (318,032) (54,627)
TOTAL INVESTMENT INCOME 4,011,621 1,988,327
EXPENSES:
Investment advisory fees (Note 5) 1,875,299 752,663
Administration and accounting fees (Note 5) 15,002 6,021
Administration and shareholder servicing fees (Note 5) 261,408 104,995
Accounting out-of-pocket fees 31,163 20,575
Custodian fees 216,643 67,776
Printing fees 30,838 26,688
Intermediary service fees (Note 5) 285,656 106,893
Professional fees 84,836 43,472
Registration fees 47,113 43,766
Transfer agent fees 16,926 7,483
Trustees fees 10,718 3,436
Other expenses 23,168 5,689
TOTAL EXPENSES 2,898,770 1,189,457
Advisory fees waived and expenses waived or reimbursed (Note 5) (336,966) (167,178)
NET EXPENSES 2,561,804 1,022,279
NET INVESTMENT INCOME (LOSS) 1,449,817 966,048
REALIZED AND UNREALIZED GAIN (LOSS) ON INVESTMENTS, FOREIGN CURRENCY RELATEDTRANSACTIONS, AND FOREIGN CAPITAL GAINS TAXES:
Net realized gain (loss) on investments—Unaffiliated Issuers 399,449 (885,971)
Net realized foreign capital gains tax (786,513) —
Net realized gain (loss) on foreign currency related transactions (78,182) (42,271)
Net change in unrealized appreciation/depreciation on investments—Unaffiliated Issuers 29,660,296 22,079,555
Net change in unrealized appreciation/depreciation on investments—Affiliated Issuers — —
Net change in deferred foreign capital gains taxes on unrealized appreciation (61,919) —
Net change in unrealized appreciation/depreciation on foreign currency related translations (13,900) (5,153)
Net realized and unrealized gain (loss) on investments, foreign currency relatedtransactions, and foreign capital gains taxes 29,119,231 21,146,160
NET INCREASE (DECREASE) IN NET ASSETS FROM OPERATIONS $30,569,048 $22,112,208
See accompanying notes to financial statements.
matthewsasia.com | 800.789.ASIA 107
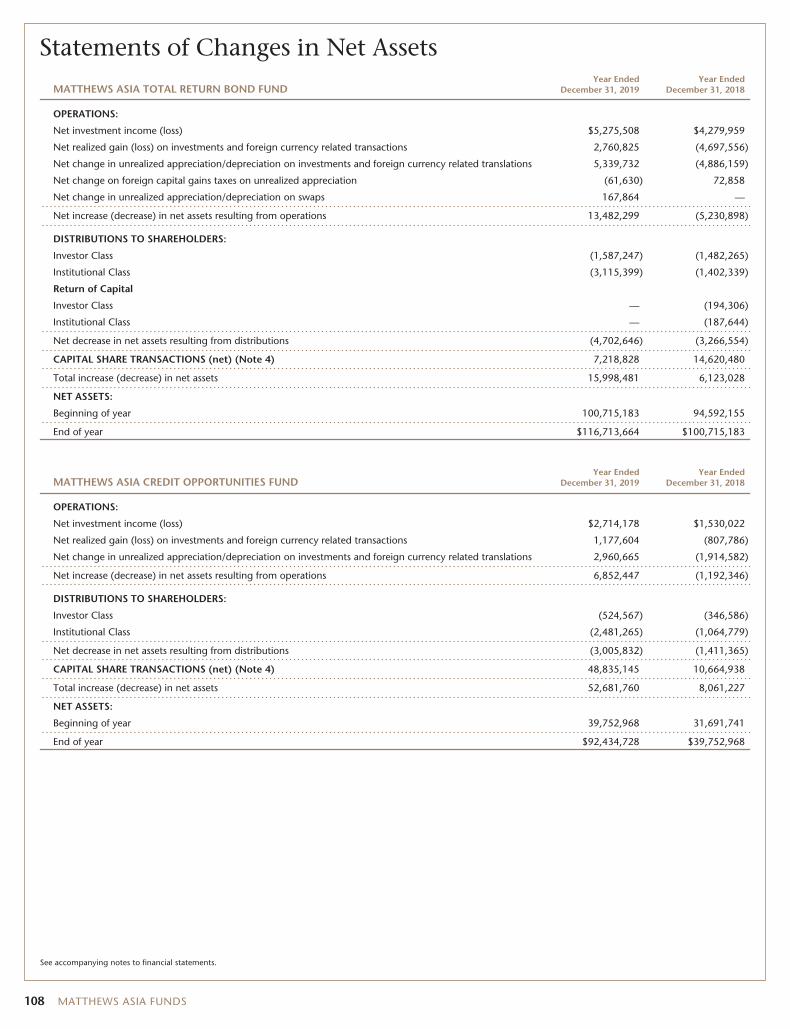
Statements of Changes in Net Assets
MATTHEWS ASIA TOTAL RETURN BOND FUNDYear Ended
December 31, 2019Year Ended
December 31, 2018
OPERATIONS:
Net investment income (loss) $5,275,508 $4,279,959
Net realized gain (loss) on investments and foreign currency related transactions 2,760,825 (4,697,556)
Net change in unrealized appreciation/depreciation on investments and foreign currency related translations 5,339,732 (4,886,159)
Net change on foreign capital gains taxes on unrealized appreciation (61,630) 72,858
Net change in unrealized appreciation/depreciation on swaps 167,864 —
Net increase (decrease) in net assets resulting from operations 13,482,299 (5,230,898)
DISTRIBUTIONS TO SHAREHOLDERS:
Investor Class (1,587,247) (1,482,265)
Institutional Class (3,115,399) (1,402,339)
Return of Capital
Investor Class — (194,306)
Institutional Class — (187,644)
Net decrease in net assets resulting from distributions (4,702,646) (3,266,554)
CAPITAL SHARE TRANSACTIONS (net) (Note 4) 7,218,828 14,620,480
Total increase (decrease) in net assets 15,998,481 6,123,028
NET ASSETS:
Beginning of year 100,715,183 94,592,155
End of year $116,713,664 $100,715,183
MATTHEWS ASIA CREDIT OPPORTUNITIES FUNDYear Ended
December 31, 2019Year Ended
December 31, 2018
OPERATIONS:
Net investment income (loss) $2,714,178 $1,530,022
Net realized gain (loss) on investments and foreign currency related transactions 1,177,604 (807,786)
Net change in unrealized appreciation/depreciation on investments and foreign currency related translations 2,960,665 (1,914,582)
Net increase (decrease) in net assets resulting from operations 6,852,447 (1,192,346)
DISTRIBUTIONS TO SHAREHOLDERS:
Investor Class (524,567) (346,586)
Institutional Class (2,481,265) (1,064,779)
Net decrease in net assets resulting from distributions (3,005,832) (1,411,365)
CAPITAL SHARE TRANSACTIONS (net) (Note 4) 48,835,145 10,664,938
Total increase (decrease) in net assets 52,681,760 8,061,227
NET ASSETS:
Beginning of year 39,752,968 31,691,741
End of year $92,434,728 $39,752,968
See accompanying notes to financial statements.
108 MATTHEWS ASIA FUNDS
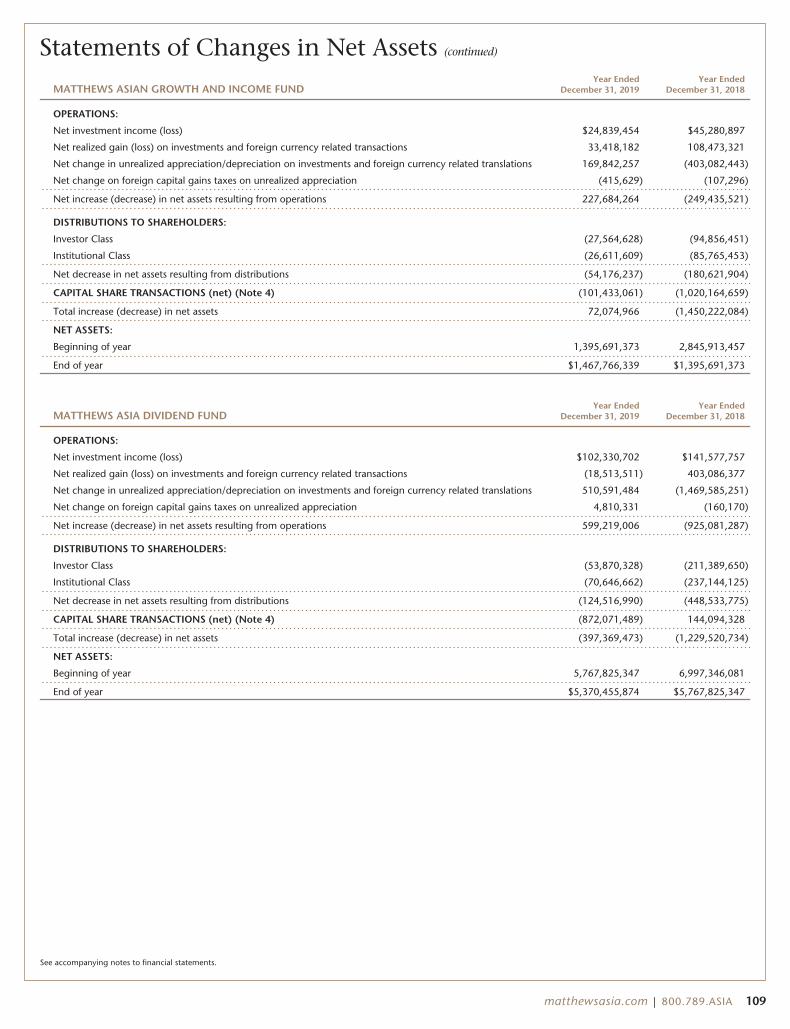
Statements of Changes in Net Assets (continued)
MATTHEWS ASIAN GROWTH AND INCOME FUNDYear Ended
December 31, 2019Year Ended
December 31, 2018
OPERATIONS:
Net investment income (loss) $24,839,454 $45,280,897
Net realized gain (loss) on investments and foreign currency related transactions 33,418,182 108,473,321
Net change in unrealized appreciation/depreciation on investments and foreign currency related translations 169,842,257 (403,082,443)
Net change on foreign capital gains taxes on unrealized appreciation (415,629) (107,296)
Net increase (decrease) in net assets resulting from operations 227,684,264 (249,435,521)
DISTRIBUTIONS TO SHAREHOLDERS:
Investor Class (27,564,628) (94,856,451)
Institutional Class (26,611,609) (85,765,453)
Net decrease in net assets resulting from distributions (54,176,237) (180,621,904)
CAPITAL SHARE TRANSACTIONS (net) (Note 4) (101,433,061) (1,020,164,659)
Total increase (decrease) in net assets 72,074,966 (1,450,222,084)
NET ASSETS:
Beginning of year 1,395,691,373 2,845,913,457
End of year $1,467,766,339 $1,395,691,373
MATTHEWS ASIA DIVIDEND FUNDYear Ended
December 31, 2019Year Ended
December 31, 2018
OPERATIONS:
Net investment income (loss) $102,330,702 $141,577,757
Net realized gain (loss) on investments and foreign currency related transactions (18,513,511) 403,086,377
Net change in unrealized appreciation/depreciation on investments and foreign currency related translations 510,591,484 (1,469,585,251)
Net change on foreign capital gains taxes on unrealized appreciation 4,810,331 (160,170)
Net increase (decrease) in net assets resulting from operations 599,219,006 (925,081,287)
DISTRIBUTIONS TO SHAREHOLDERS:
Investor Class (53,870,328) (211,389,650)
Institutional Class (70,646,662) (237,144,125)
Net decrease in net assets resulting from distributions (124,516,990) (448,533,775)
CAPITAL SHARE TRANSACTIONS (net) (Note 4) (872,071,489) 144,094,328
Total increase (decrease) in net assets (397,369,473) (1,229,520,734)
NET ASSETS:
Beginning of year 5,767,825,347 6,997,346,081
End of year $5,370,455,874 $5,767,825,347
See accompanying notes to financial statements.
matthewsasia.com | 800.789.ASIA 109
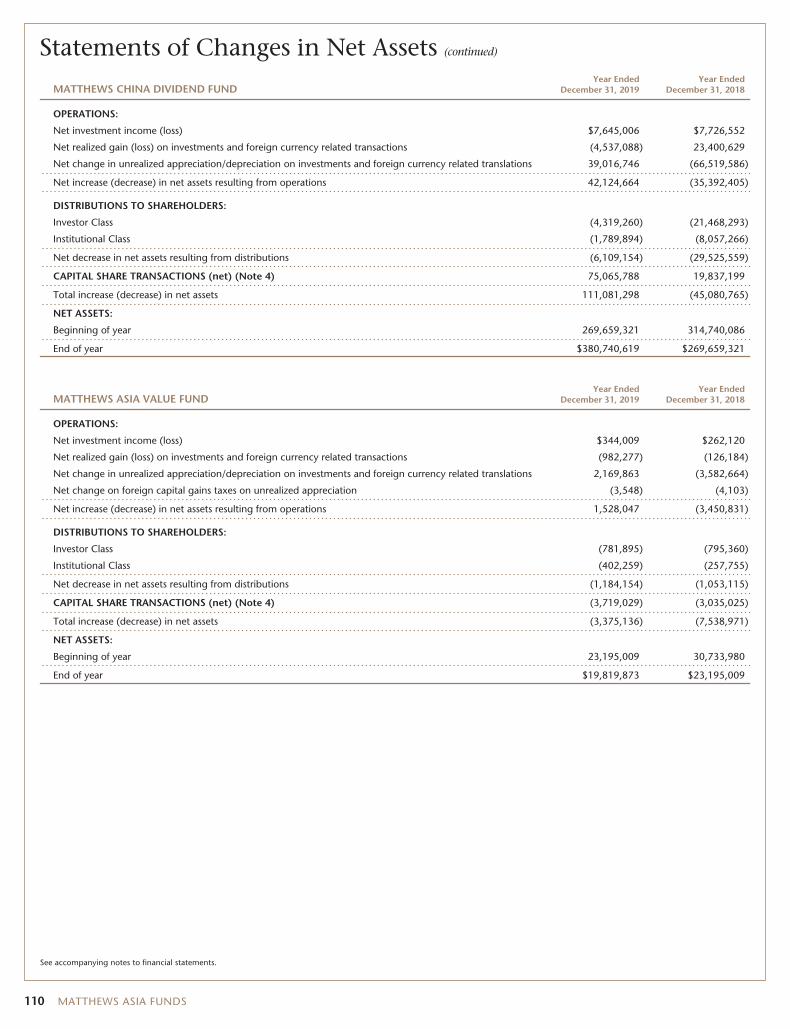
Statements of Changes in Net Assets (continued)
MATTHEWS CHINA DIVIDEND FUNDYear Ended
December 31, 2019Year Ended
December 31, 2018
OPERATIONS:
Net investment income (loss) $7,645,006 $7,726,552
Net realized gain (loss) on investments and foreign currency related transactions (4,537,088) 23,400,629
Net change in unrealized appreciation/depreciation on investments and foreign currency related translations 39,016,746 (66,519,586)
Net increase (decrease) in net assets resulting from operations 42,124,664 (35,392,405)
DISTRIBUTIONS TO SHAREHOLDERS:
Investor Class (4,319,260) (21,468,293)
Institutional Class (1,789,894) (8,057,266)
Net decrease in net assets resulting from distributions (6,109,154) (29,525,559)
CAPITAL SHARE TRANSACTIONS (net) (Note 4) 75,065,788 19,837,199
Total increase (decrease) in net assets 111,081,298 (45,080,765)
NET ASSETS:
Beginning of year 269,659,321 314,740,086
End of year $380,740,619 $269,659,321
MATTHEWS ASIA VALUE FUNDYear Ended
December 31, 2019Year Ended
December 31, 2018
OPERATIONS:
Net investment income (loss) $344,009 $262,120
Net realized gain (loss) on investments and foreign currency related transactions (982,277) (126,184)
Net change in unrealized appreciation/depreciation on investments and foreign currency related translations 2,169,863 (3,582,664)
Net change on foreign capital gains taxes on unrealized appreciation (3,548) (4,103)
Net increase (decrease) in net assets resulting from operations 1,528,047 (3,450,831)
DISTRIBUTIONS TO SHAREHOLDERS:
Investor Class (781,895) (795,360)
Institutional Class (402,259) (257,755)
Net decrease in net assets resulting from distributions (1,184,154) (1,053,115)
CAPITAL SHARE TRANSACTIONS (net) (Note 4) (3,719,029) (3,035,025)
Total increase (decrease) in net assets (3,375,136) (7,538,971)
NET ASSETS:
Beginning of year 23,195,009 30,733,980
End of year $19,819,873 $23,195,009
See accompanying notes to financial statements.
110 MATTHEWS ASIA FUNDS
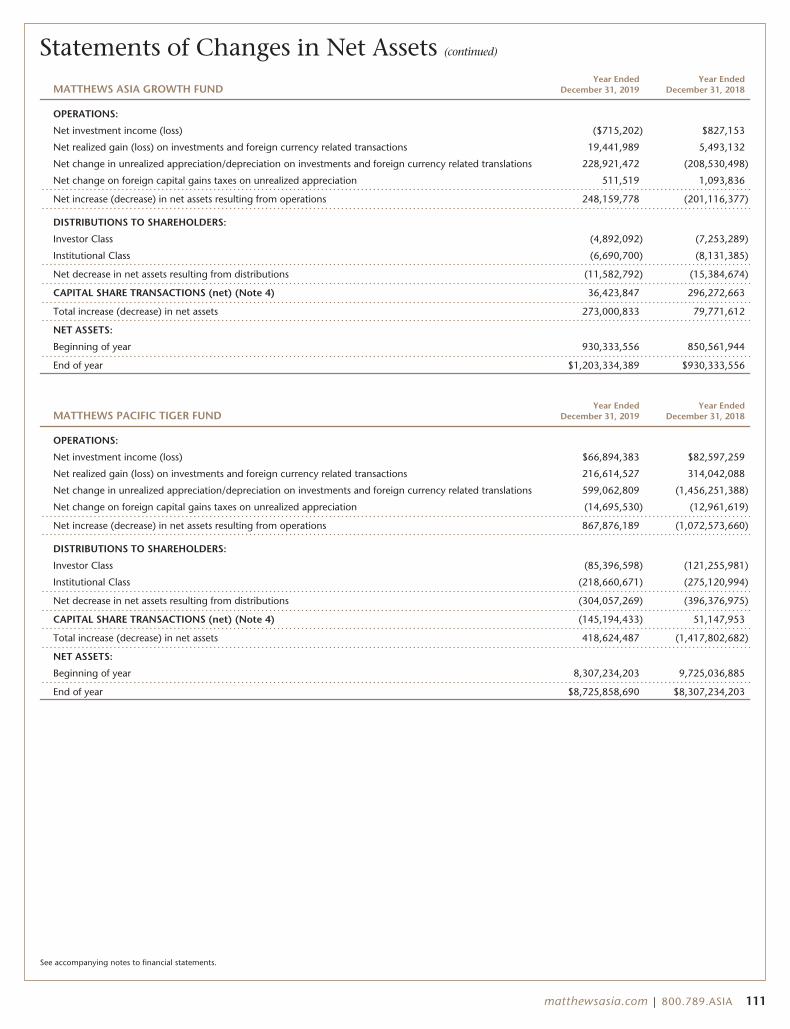
Statements of Changes in Net Assets (continued)
MATTHEWS ASIA GROWTH FUNDYear Ended
December 31, 2019Year Ended
December 31, 2018
OPERATIONS:
Net investment income (loss) ($715,202) $827,153
Net realized gain (loss) on investments and foreign currency related transactions 19,441,989 5,493,132
Net change in unrealized appreciation/depreciation on investments and foreign currency related translations 228,921,472 (208,530,498)
Net change on foreign capital gains taxes on unrealized appreciation 511,519 1,093,836
Net increase (decrease) in net assets resulting from operations 248,159,778 (201,116,377)
DISTRIBUTIONS TO SHAREHOLDERS:
Investor Class (4,892,092) (7,253,289)
Institutional Class (6,690,700) (8,131,385)
Net decrease in net assets resulting from distributions (11,582,792) (15,384,674)
CAPITAL SHARE TRANSACTIONS (net) (Note 4) 36,423,847 296,272,663
Total increase (decrease) in net assets 273,000,833 79,771,612
NET ASSETS:
Beginning of year 930,333,556 850,561,944
End of year $1,203,334,389 $930,333,556
MATTHEWS PACIFIC TIGER FUNDYear Ended
December 31, 2019Year Ended
December 31, 2018
OPERATIONS:
Net investment income (loss) $66,894,383 $82,597,259
Net realized gain (loss) on investments and foreign currency related transactions 216,614,527 314,042,088
Net change in unrealized appreciation/depreciation on investments and foreign currency related translations 599,062,809 (1,456,251,388)
Net change on foreign capital gains taxes on unrealized appreciation (14,695,530) (12,961,619)
Net increase (decrease) in net assets resulting from operations 867,876,189 (1,072,573,660)
DISTRIBUTIONS TO SHAREHOLDERS:
Investor Class (85,396,598) (121,255,981)
Institutional Class (218,660,671) (275,120,994)
Net decrease in net assets resulting from distributions (304,057,269) (396,376,975)
CAPITAL SHARE TRANSACTIONS (net) (Note 4) (145,194,433) 51,147,953
Total increase (decrease) in net assets 418,624,487 (1,417,802,682)
NET ASSETS:
Beginning of year 8,307,234,203 9,725,036,885
End of year $8,725,858,690 $8,307,234,203
See accompanying notes to financial statements.
matthewsasia.com | 800.789.ASIA 111
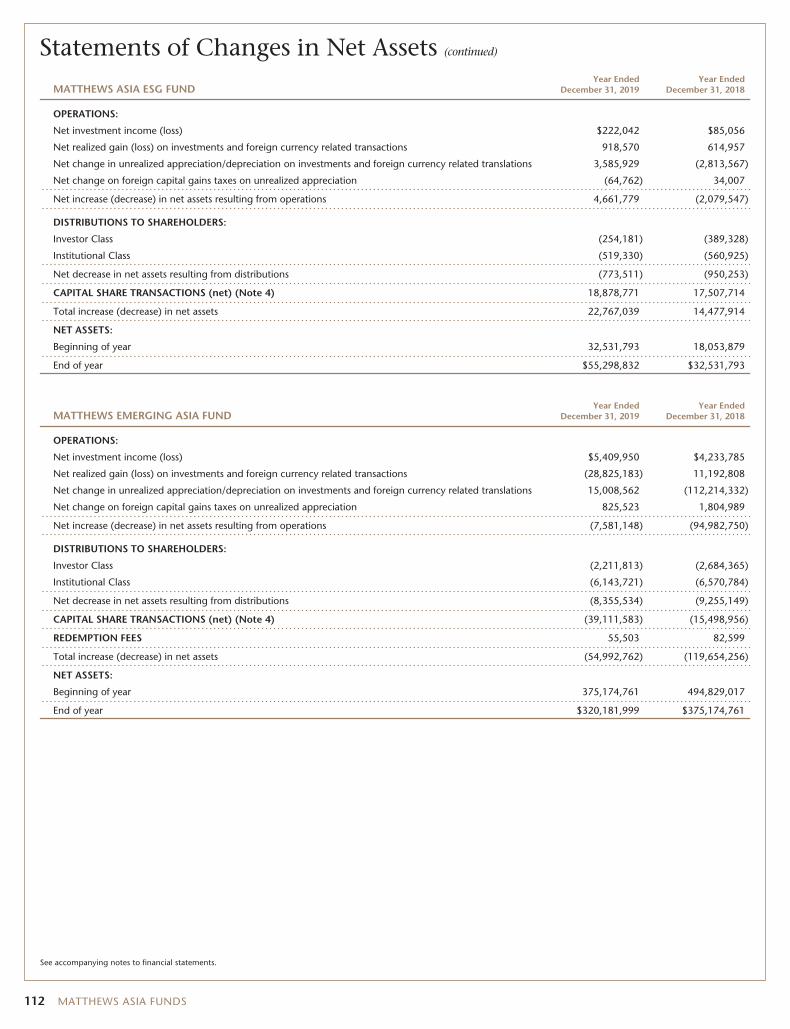
Statements of Changes in Net Assets (continued)
MATTHEWS ASIA ESG FUNDYear Ended
December 31, 2019Year Ended
December 31, 2018
OPERATIONS:
Net investment income (loss) $222,042 $85,056
Net realized gain (loss) on investments and foreign currency related transactions 918,570 614,957
Net change in unrealized appreciation/depreciation on investments and foreign currency related translations 3,585,929 (2,813,567)
Net change on foreign capital gains taxes on unrealized appreciation (64,762) 34,007
Net increase (decrease) in net assets resulting from operations 4,661,779 (2,079,547)
DISTRIBUTIONS TO SHAREHOLDERS:
Investor Class (254,181) (389,328)
Institutional Class (519,330) (560,925)
Net decrease in net assets resulting from distributions (773,511) (950,253)
CAPITAL SHARE TRANSACTIONS (net) (Note 4) 18,878,771 17,507,714
Total increase (decrease) in net assets 22,767,039 14,477,914
NET ASSETS:
Beginning of year 32,531,793 18,053,879
End of year $55,298,832 $32,531,793
MATTHEWS EMERGING ASIA FUNDYear Ended
December 31, 2019Year Ended
December 31, 2018
OPERATIONS:
Net investment income (loss) $5,409,950 $4,233,785
Net realized gain (loss) on investments and foreign currency related transactions (28,825,183) 11,192,808
Net change in unrealized appreciation/depreciation on investments and foreign currency related translations 15,008,562 (112,214,332)
Net change on foreign capital gains taxes on unrealized appreciation 825,523 1,804,989
Net increase (decrease) in net assets resulting from operations (7,581,148) (94,982,750)
DISTRIBUTIONS TO SHAREHOLDERS:
Investor Class (2,211,813) (2,684,365)
Institutional Class (6,143,721) (6,570,784)
Net decrease in net assets resulting from distributions (8,355,534) (9,255,149)
CAPITAL SHARE TRANSACTIONS (net) (Note 4) (39,111,583) (15,498,956)
REDEMPTION FEES 55,503 82,599
Total increase (decrease) in net assets (54,992,762) (119,654,256)
NET ASSETS:
Beginning of year 375,174,761 494,829,017
End of year $320,181,999 $375,174,761
See accompanying notes to financial statements.
112 MATTHEWS ASIA FUNDS
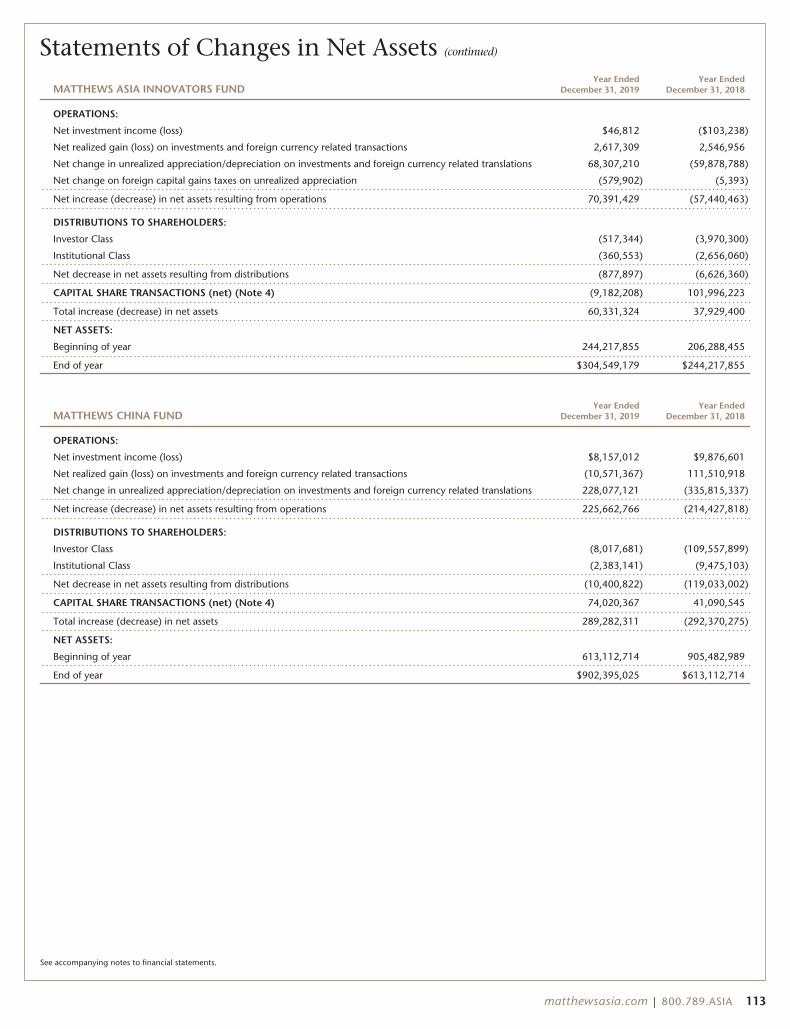
Statements of Changes in Net Assets (continued)
MATTHEWS ASIA INNOVATORS FUNDYear Ended
December 31, 2019Year Ended
December 31, 2018
OPERATIONS:
Net investment income (loss) $46,812 ($103,238)
Net realized gain (loss) on investments and foreign currency related transactions 2,617,309 2,546,956
Net change in unrealized appreciation/depreciation on investments and foreign currency related translations 68,307,210 (59,878,788)
Net change on foreign capital gains taxes on unrealized appreciation (579,902) (5,393)
Net increase (decrease) in net assets resulting from operations 70,391,429 (57,440,463)
DISTRIBUTIONS TO SHAREHOLDERS:
Investor Class (517,344) (3,970,300)
Institutional Class (360,553) (2,656,060)
Net decrease in net assets resulting from distributions (877,897) (6,626,360)
CAPITAL SHARE TRANSACTIONS (net) (Note 4) (9,182,208) 101,996,223
Total increase (decrease) in net assets 60,331,324 37,929,400
NET ASSETS:
Beginning of year 244,217,855 206,288,455
End of year $304,549,179 $244,217,855
MATTHEWS CHINA FUNDYear Ended
December 31, 2019Year Ended
December 31, 2018
OPERATIONS:
Net investment income (loss) $8,157,012 $9,876,601
Net realized gain (loss) on investments and foreign currency related transactions (10,571,367) 111,510,918
Net change in unrealized appreciation/depreciation on investments and foreign currency related translations 228,077,121 (335,815,337)
Net increase (decrease) in net assets resulting from operations 225,662,766 (214,427,818)
DISTRIBUTIONS TO SHAREHOLDERS:
Investor Class (8,017,681) (109,557,899)
Institutional Class (2,383,141) (9,475,103)
Net decrease in net assets resulting from distributions (10,400,822) (119,033,002)
CAPITAL SHARE TRANSACTIONS (net) (Note 4) 74,020,367 41,090,545
Total increase (decrease) in net assets 289,282,311 (292,370,275)
NET ASSETS:
Beginning of year 613,112,714 905,482,989
End of year $902,395,025 $613,112,714
See accompanying notes to financial statements.
matthewsasia.com | 800.789.ASIA 113

Statements of Changes in Net Assets (continued)
MATTHEWS INDIA FUNDYear Ended
December 31, 2019Year Ended
December 31, 2018
OPERATIONS:
Net investment income (loss) $26,423 ($2,070,170)
Net realized gain (loss) on investments and foreign currency related transactions 32,455,342 331,211,413
Net change in unrealized appreciation/depreciation on investments and foreign currency related translations (48,195,961) (567,019,183)
Net change on foreign capital gains taxes on unrealized appreciation (1,438,891) (2,413,851)
Net increase (decrease) in net assets resulting from operations (17,153,087) (240,291,791)
DISTRIBUTIONS TO SHAREHOLDERS:
Investor Class (88,576,196) (159,591,192)
Institutional Class (20,261,209) (75,460,576)
Net decrease in net assets resulting from distributions (108,837,405) (235,051,768)
CAPITAL SHARE TRANSACTIONS (net) (Note 4) (451,382,627) (255,309,634)
Total increase (decrease) in net assets (577,373,119) (730,653,193)
NET ASSETS:
Beginning of year 1,541,780,023 2,272,433,216
End of year $964,406,904 $1,541,780,023
MATTHEWS JAPAN FUNDYear Ended
December 31, 2019Year Ended
December 31, 2018
OPERATIONS:
Net investment income (loss) $13,902,590 $18,472,839
Net realized gain (loss) on investments and foreign currency related transactions 120,429,499 194,213,809
Net change in unrealized appreciation/depreciation on investments and foreign currency related translations 491,227,271 (1,069,641,926)
Net increase (decrease) in net assets resulting from operations 625,559,360 (856,955,278)
DISTRIBUTIONS TO SHAREHOLDERS:
Investor Class (120,196,392) (71,970,442)
Institutional Class (74,901,937) (51,381,225)
Net decrease in net assets resulting from distributions (195,098,329) (123,351,667)
CAPITAL SHARE TRANSACTIONS (net) (Note 4) (995,366,160) (260,612,861)
Total increase (decrease) in net assets (564,905,129) (1,240,919,806)
NET ASSETS:
Beginning of year 2,871,574,319 4,112,494,125
End of year $2,306,669,190 $2,871,574,319
See accompanying notes to financial statements.
114 MATTHEWS ASIA FUNDS
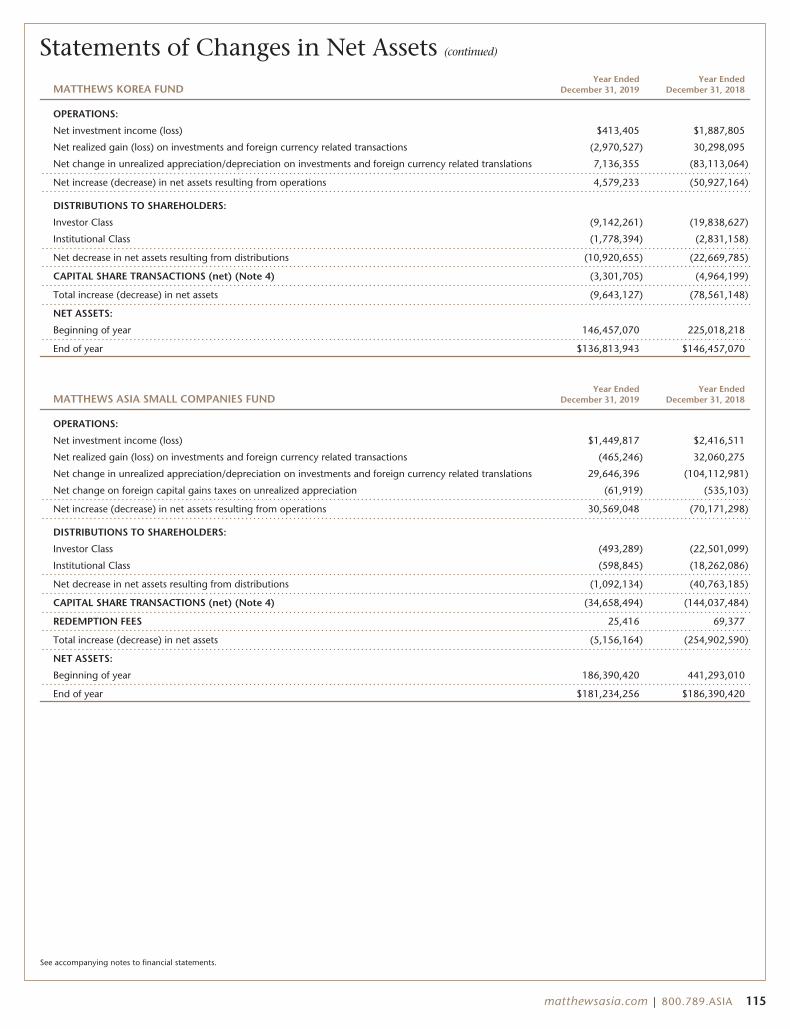
Statements of Changes in Net Assets (continued)
MATTHEWS KOREA FUNDYear Ended
December 31, 2019Year Ended
December 31, 2018
OPERATIONS:
Net investment income (loss) $413,405 $1,887,805
Net realized gain (loss) on investments and foreign currency related transactions (2,970,527) 30,298,095
Net change in unrealized appreciation/depreciation on investments and foreign currency related translations 7,136,355 (83,113,064)
Net increase (decrease) in net assets resulting from operations 4,579,233 (50,927,164)
DISTRIBUTIONS TO SHAREHOLDERS:
Investor Class (9,142,261) (19,838,627)
Institutional Class (1,778,394) (2,831,158)
Net decrease in net assets resulting from distributions (10,920,655) (22,669,785)
CAPITAL SHARE TRANSACTIONS (net) (Note 4) (3,301,705) (4,964,199)
Total increase (decrease) in net assets (9,643,127) (78,561,148)
NET ASSETS:
Beginning of year 146,457,070 225,018,218
End of year $136,813,943 $146,457,070
MATTHEWS ASIA SMALL COMPANIES FUNDYear Ended
December 31, 2019Year Ended
December 31, 2018
OPERATIONS:
Net investment income (loss) $1,449,817 $2,416,511
Net realized gain (loss) on investments and foreign currency related transactions (465,246) 32,060,275
Net change in unrealized appreciation/depreciation on investments and foreign currency related translations 29,646,396 (104,112,981)
Net change on foreign capital gains taxes on unrealized appreciation (61,919) (535,103)
Net increase (decrease) in net assets resulting from operations 30,569,048 (70,171,298)
DISTRIBUTIONS TO SHAREHOLDERS:
Investor Class (493,289) (22,501,099)
Institutional Class (598,845) (18,262,086)
Net decrease in net assets resulting from distributions (1,092,134) (40,763,185)
CAPITAL SHARE TRANSACTIONS (net) (Note 4) (34,658,494) (144,037,484)
REDEMPTION FEES 25,416 69,377
Total increase (decrease) in net assets (5,156,164) (254,902,590)
NET ASSETS:
Beginning of year 186,390,420 441,293,010
End of year $181,234,256 $186,390,420
See accompanying notes to financial statements.
matthewsasia.com | 800.789.ASIA 115
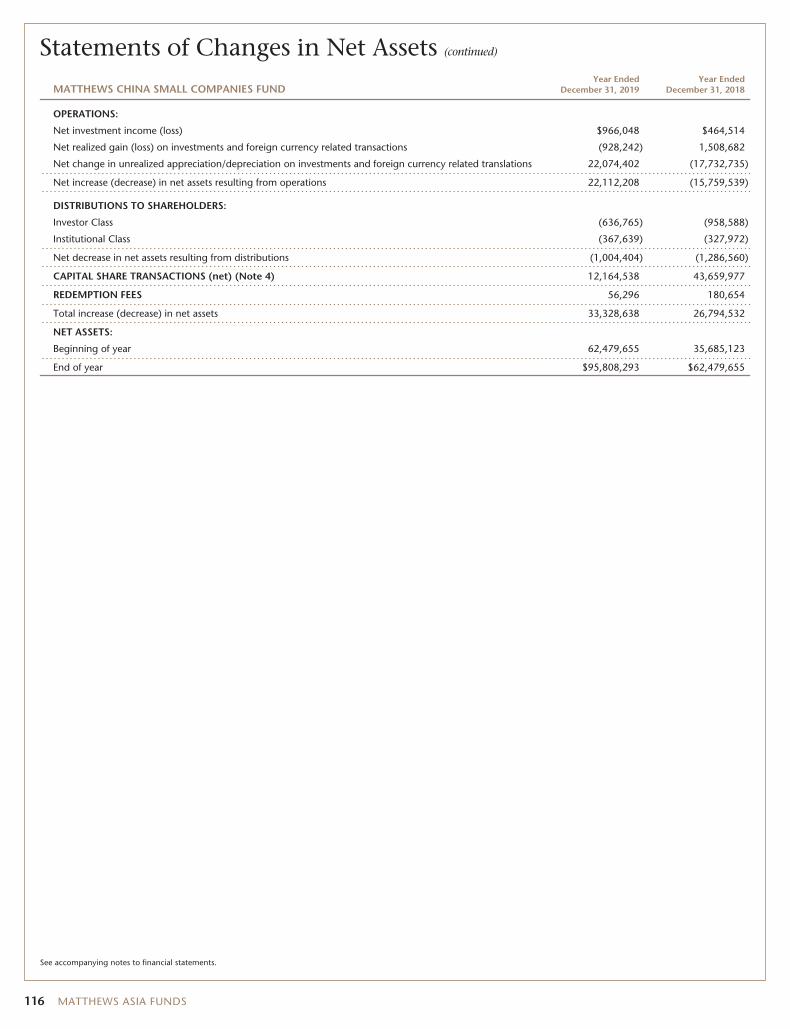
Statements of Changes in Net Assets (continued)
MATTHEWS CHINA SMALL COMPANIES FUNDYear Ended
December 31, 2019Year Ended
December 31, 2018
OPERATIONS:
Net investment income (loss) $966,048 $464,514
Net realized gain (loss) on investments and foreign currency related transactions (928,242) 1,508,682
Net change in unrealized appreciation/depreciation on investments and foreign currency related translations 22,074,402 (17,732,735)
Net increase (decrease) in net assets resulting from operations 22,112,208 (15,759,539)
DISTRIBUTIONS TO SHAREHOLDERS:
Investor Class (636,765) (958,588)
Institutional Class (367,639) (327,972)
Net decrease in net assets resulting from distributions (1,004,404) (1,286,560)
CAPITAL SHARE TRANSACTIONS (net) (Note 4) 12,164,538 43,659,977
REDEMPTION FEES 56,296 180,654
Total increase (decrease) in net assets 33,328,638 26,794,532
NET ASSETS:
Beginning of year 62,479,655 35,685,123
End of year $95,808,293 $62,479,655
See accompanying notes to financial statements.
116 MATTHEWS ASIA FUNDS
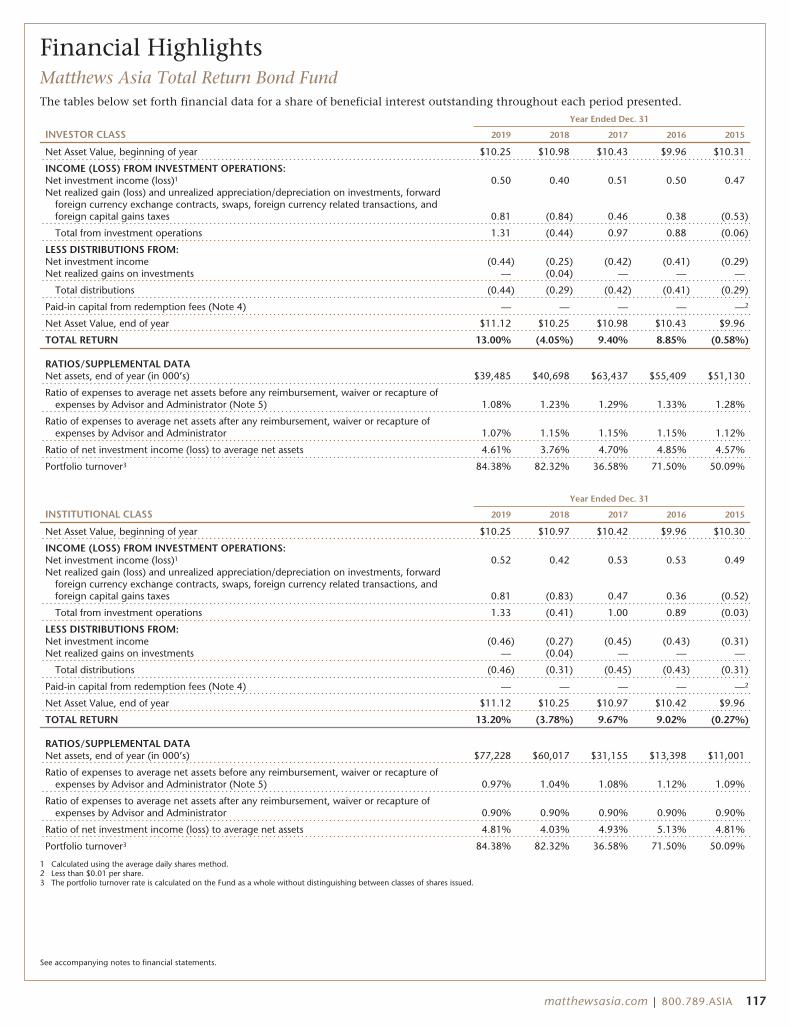
Financial HighlightsMatthews Asia Total Return Bond FundThe tables below set forth financial data for a share of beneficial interest outstanding throughout each period presented.
Year Ended Dec. 31
INVESTOR CLASS 2019 2018 2017 2016 2015
Net Asset Value, beginning of year $10.25 $10.98 $10.43 $9.96 $10.31
INCOME (LOSS) FROM INVESTMENT OPERATIONS:Net investment income (loss)1 0.50 0.40 0.51 0.50 0.47Net realized gain (loss) and unrealized appreciation/depreciation on investments, forward
foreign currency exchange contracts, swaps, foreign currency related transactions, andforeign capital gains taxes 0.81 (0.84) 0.46 0.38 (0.53)
Total from investment operations 1.31 (0.44) 0.97 0.88 (0.06)
LESS DISTRIBUTIONS FROM:Net investment income (0.44) (0.25) (0.42) (0.41) (0.29)Net realized gains on investments — (0.04) — — —
Total distributions (0.44) (0.29) (0.42) (0.41) (0.29)
Paid-in capital from redemption fees (Note 4) — — — — —2
Net Asset Value, end of year $11.12 $10.25 $10.98 $10.43 $9.96
TOTAL RETURN 13.00% (4.05%) 9.40% 8.85% (0.58%)
RATIOS/SUPPLEMENTAL DATANet assets, end of year (in 000’s) $39,485 $40,698 $63,437 $55,409 $51,130
Ratio of expenses to average net assets before any reimbursement, waiver or recapture ofexpenses by Advisor and Administrator (Note 5) 1.08% 1.23% 1.29% 1.33% 1.28%
Ratio of expenses to average net assets after any reimbursement, waiver or recapture ofexpenses by Advisor and Administrator 1.07% 1.15% 1.15% 1.15% 1.12%
Ratio of net investment income (loss) to average net assets 4.61% 3.76% 4.70% 4.85% 4.57%
Portfolio turnover3 84.38% 82.32% 36.58% 71.50% 50.09%
Year Ended Dec. 31
INSTITUTIONAL CLASS 2019 2018 2017 2016 2015
Net Asset Value, beginning of year $10.25 $10.97 $10.42 $9.96 $10.30
INCOME (LOSS) FROM INVESTMENT OPERATIONS:Net investment income (loss)1 0.52 0.42 0.53 0.53 0.49Net realized gain (loss) and unrealized appreciation/depreciation on investments, forward
foreign currency exchange contracts, swaps, foreign currency related transactions, andforeign capital gains taxes 0.81 (0.83) 0.47 0.36 (0.52)
Total from investment operations 1.33 (0.41) 1.00 0.89 (0.03)
LESS DISTRIBUTIONS FROM:Net investment income (0.46) (0.27) (0.45) (0.43) (0.31)Net realized gains on investments — (0.04) — — —
Total distributions (0.46) (0.31) (0.45) (0.43) (0.31)
Paid-in capital from redemption fees (Note 4) — — — — —2
Net Asset Value, end of year $11.12 $10.25 $10.97 $10.42 $9.96
TOTAL RETURN 13.20% (3.78%) 9.67% 9.02% (0.27%)
RATIOS/SUPPLEMENTAL DATANet assets, end of year (in 000’s) $77,228 $60,017 $31,155 $13,398 $11,001
Ratio of expenses to average net assets before any reimbursement, waiver or recapture ofexpenses by Advisor and Administrator (Note 5) 0.97% 1.04% 1.08% 1.12% 1.09%
Ratio of expenses to average net assets after any reimbursement, waiver or recapture ofexpenses by Advisor and Administrator 0.90% 0.90% 0.90% 0.90% 0.90%
Ratio of net investment income (loss) to average net assets 4.81% 4.03% 4.93% 5.13% 4.81%
Portfolio turnover3 84.38% 82.32% 36.58% 71.50% 50.09%
1 Calculated using the average daily shares method.2 Less than $0.01 per share.3 The portfolio turnover rate is calculated on the Fund as a whole without distinguishing between classes of shares issued.
See accompanying notes to financial statements.
matthewsasia.com | 800.789.ASIA 117
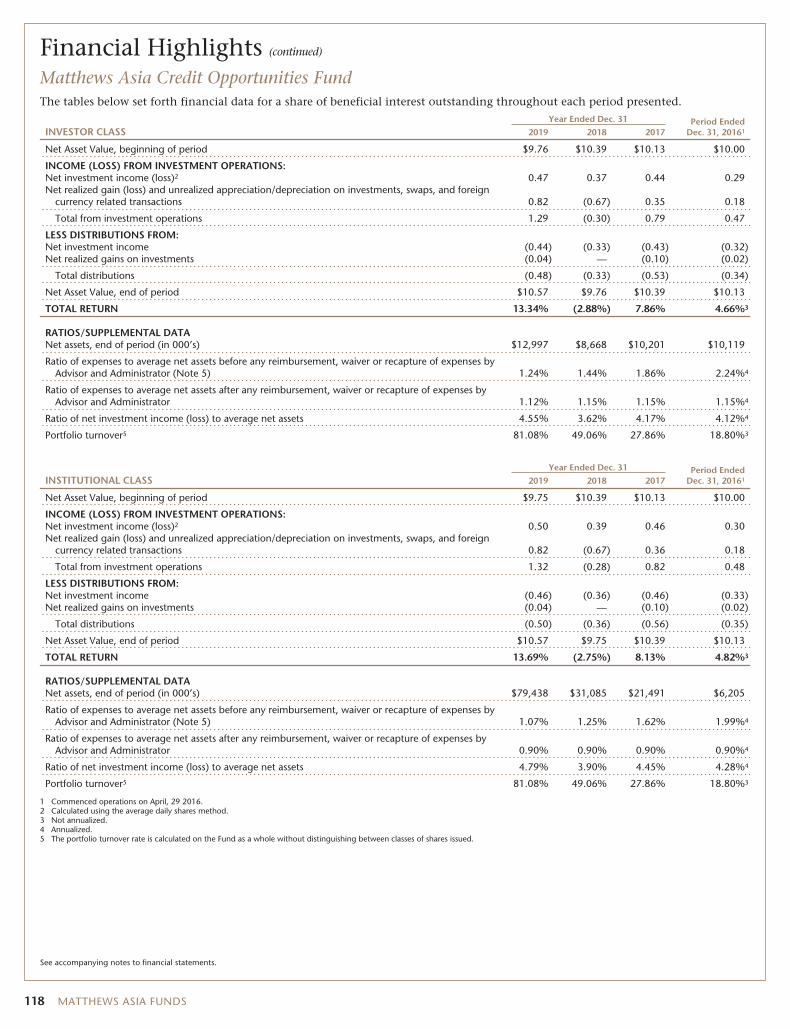
Financial Highlights (continued)
Matthews Asia Credit Opportunities FundThe tables below set forth financial data for a share of beneficial interest outstanding throughout each period presented.
INVESTOR CLASSYear Ended Dec. 31 Period Ended
Dec. 31, 201612019 2018 2017
Net Asset Value, beginning of period $9.76 $10.39 $10.13 $10.00
INCOME (LOSS) FROM INVESTMENT OPERATIONS:Net investment income (loss)2 0.47 0.37 0.44 0.29Net realized gain (loss) and unrealized appreciation/depreciation on investments, swaps, and foreign
currency related transactions 0.82 (0.67) 0.35 0.18
Total from investment operations 1.29 (0.30) 0.79 0.47
LESS DISTRIBUTIONS FROM:Net investment income (0.44) (0.33) (0.43) (0.32)Net realized gains on investments (0.04) — (0.10) (0.02)
Total distributions (0.48) (0.33) (0.53) (0.34)
Net Asset Value, end of period $10.57 $9.76 $10.39 $10.13
TOTAL RETURN 13.34% (2.88%) 7.86% 4.66%3
RATIOS/SUPPLEMENTAL DATANet assets, end of period (in 000’s) $12,997 $8,668 $10,201 $10,119
Ratio of expenses to average net assets before any reimbursement, waiver or recapture of expenses byAdvisor and Administrator (Note 5) 1.24% 1.44% 1.86% 2.24%4
Ratio of expenses to average net assets after any reimbursement, waiver or recapture of expenses byAdvisor and Administrator 1.12% 1.15% 1.15% 1.15%4
Ratio of net investment income (loss) to average net assets 4.55% 3.62% 4.17% 4.12%4
Portfolio turnover5 81.08% 49.06% 27.86% 18.80%3
Year Ended Dec. 31 Period EndedDec. 31, 20161INSTITUTIONAL CLASS 2019 2018 2017
Net Asset Value, beginning of period $9.75 $10.39 $10.13 $10.00
INCOME (LOSS) FROM INVESTMENT OPERATIONS:Net investment income (loss)2 0.50 0.39 0.46 0.30Net realized gain (loss) and unrealized appreciation/depreciation on investments, swaps, and foreign
currency related transactions 0.82 (0.67) 0.36 0.18
Total from investment operations 1.32 (0.28) 0.82 0.48
LESS DISTRIBUTIONS FROM:Net investment income (0.46) (0.36) (0.46) (0.33)Net realized gains on investments (0.04) — (0.10) (0.02)
Total distributions (0.50) (0.36) (0.56) (0.35)
Net Asset Value, end of period $10.57 $9.75 $10.39 $10.13
TOTAL RETURN 13.69% (2.75%) 8.13% 4.82%3
RATIOS/SUPPLEMENTAL DATANet assets, end of period (in 000’s) $79,438 $31,085 $21,491 $6,205
Ratio of expenses to average net assets before any reimbursement, waiver or recapture of expenses byAdvisor and Administrator (Note 5) 1.07% 1.25% 1.62% 1.99%4
Ratio of expenses to average net assets after any reimbursement, waiver or recapture of expenses byAdvisor and Administrator 0.90% 0.90% 0.90% 0.90%4
Ratio of net investment income (loss) to average net assets 4.79% 3.90% 4.45% 4.28%4
Portfolio turnover5 81.08% 49.06% 27.86% 18.80%3
1 Commenced operations on April, 29 2016.2 Calculated using the average daily shares method.3 Not annualized.4 Annualized.5 The portfolio turnover rate is calculated on the Fund as a whole without distinguishing between classes of shares issued.
See accompanying notes to financial statements.
118 MATTHEWS ASIA FUNDS
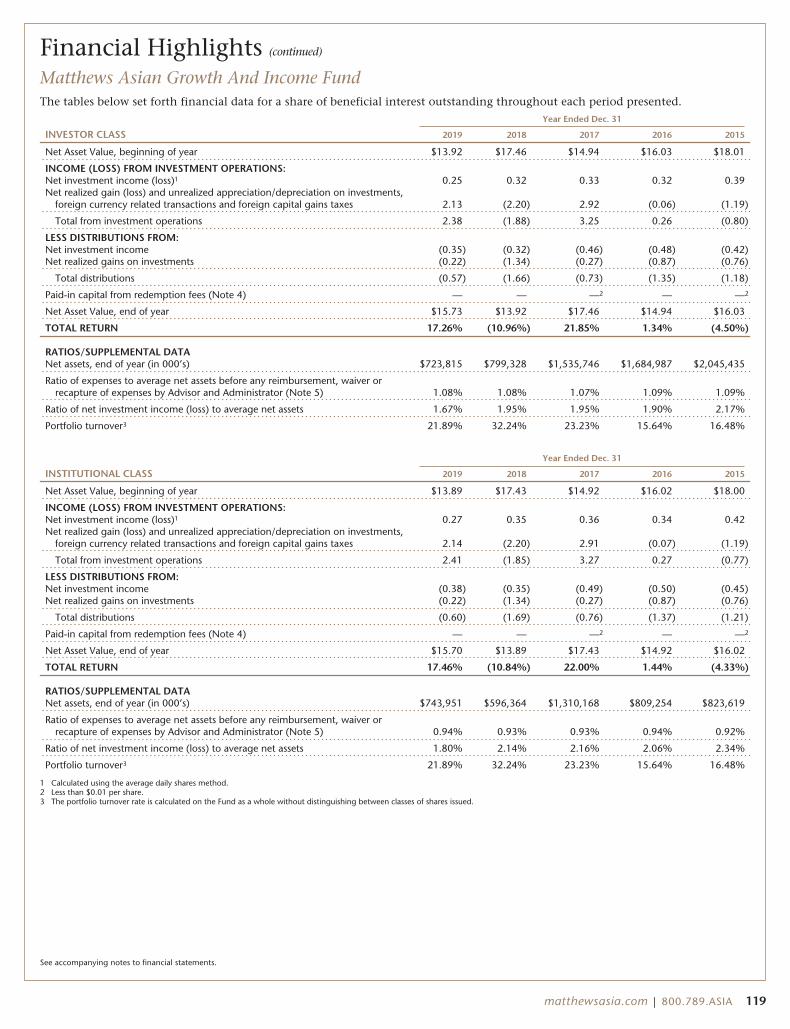
Financial Highlights (continued)
Matthews Asian Growth And Income FundThe tables below set forth financial data for a share of beneficial interest outstanding throughout each period presented.
Year Ended Dec. 31
INVESTOR CLASS 2019 2018 2017 2016 2015
Net Asset Value, beginning of year $13.92 $17.46 $14.94 $16.03 $18.01
INCOME (LOSS) FROM INVESTMENT OPERATIONS:Net investment income (loss)1 0.25 0.32 0.33 0.32 0.39Net realized gain (loss) and unrealized appreciation/depreciation on investments,
foreign currency related transactions and foreign capital gains taxes 2.13 (2.20) 2.92 (0.06) (1.19)
Total from investment operations 2.38 (1.88) 3.25 0.26 (0.80)
LESS DISTRIBUTIONS FROM:Net investment income (0.35) (0.32) (0.46) (0.48) (0.42)Net realized gains on investments (0.22) (1.34) (0.27) (0.87) (0.76)
Total distributions (0.57) (1.66) (0.73) (1.35) (1.18)
Paid-in capital from redemption fees (Note 4) — — —2 — —2
Net Asset Value, end of year $15.73 $13.92 $17.46 $14.94 $16.03
TOTAL RETURN 17.26% (10.96%) 21.85% 1.34% (4.50%)
RATIOS/SUPPLEMENTAL DATANet assets, end of year (in 000’s) $723,815 $799,328 $1,535,746 $1,684,987 $2,045,435
Ratio of expenses to average net assets before any reimbursement, waiver orrecapture of expenses by Advisor and Administrator (Note 5) 1.08% 1.08% 1.07% 1.09% 1.09%
Ratio of net investment income (loss) to average net assets 1.67% 1.95% 1.95% 1.90% 2.17%
Portfolio turnover3 21.89% 32.24% 23.23% 15.64% 16.48%
Year Ended Dec. 31
INSTITUTIONAL CLASS 2019 2018 2017 2016 2015
Net Asset Value, beginning of year $13.89 $17.43 $14.92 $16.02 $18.00
INCOME (LOSS) FROM INVESTMENT OPERATIONS:Net investment income (loss)1 0.27 0.35 0.36 0.34 0.42Net realized gain (loss) and unrealized appreciation/depreciation on investments,
foreign currency related transactions and foreign capital gains taxes 2.14 (2.20) 2.91 (0.07) (1.19)
Total from investment operations 2.41 (1.85) 3.27 0.27 (0.77)
LESS DISTRIBUTIONS FROM:Net investment income (0.38) (0.35) (0.49) (0.50) (0.45)Net realized gains on investments (0.22) (1.34) (0.27) (0.87) (0.76)
Total distributions (0.60) (1.69) (0.76) (1.37) (1.21)
Paid-in capital from redemption fees (Note 4) — — —2 — —2
Net Asset Value, end of year $15.70 $13.89 $17.43 $14.92 $16.02
TOTAL RETURN 17.46% (10.84%) 22.00% 1.44% (4.33%)
RATIOS/SUPPLEMENTAL DATANet assets, end of year (in 000’s) $743,951 $596,364 $1,310,168 $809,254 $823,619
Ratio of expenses to average net assets before any reimbursement, waiver orrecapture of expenses by Advisor and Administrator (Note 5) 0.94% 0.93% 0.93% 0.94% 0.92%
Ratio of net investment income (loss) to average net assets 1.80% 2.14% 2.16% 2.06% 2.34%
Portfolio turnover3 21.89% 32.24% 23.23% 15.64% 16.48%
1 Calculated using the average daily shares method.2 Less than $0.01 per share.3 The portfolio turnover rate is calculated on the Fund as a whole without distinguishing between classes of shares issued.
See accompanying notes to financial statements.
matthewsasia.com | 800.789.ASIA 119
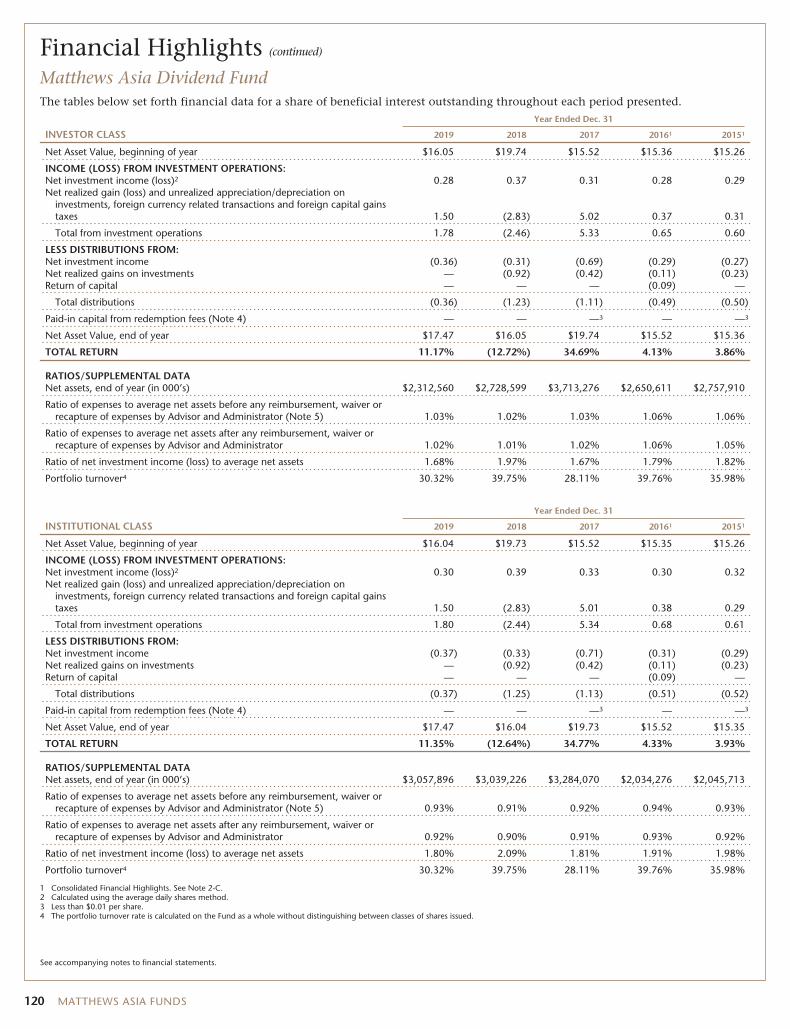
Financial Highlights (continued)
Matthews Asia Dividend FundThe tables below set forth financial data for a share of beneficial interest outstanding throughout each period presented.
Year Ended Dec. 31
INVESTOR CLASS 2019 2018 2017 20161 20151
Net Asset Value, beginning of year $16.05 $19.74 $15.52 $15.36 $15.26
INCOME (LOSS) FROM INVESTMENT OPERATIONS:Net investment income (loss)2 0.28 0.37 0.31 0.28 0.29Net realized gain (loss) and unrealized appreciation/depreciation on
investments, foreign currency related transactions and foreign capital gainstaxes 1.50 (2.83) 5.02 0.37 0.31
Total from investment operations 1.78 (2.46) 5.33 0.65 0.60
LESS DISTRIBUTIONS FROM:Net investment income (0.36) (0.31) (0.69) (0.29) (0.27)Net realized gains on investments — (0.92) (0.42) (0.11) (0.23)Return of capital — — — (0.09) —
Total distributions (0.36) (1.23) (1.11) (0.49) (0.50)
Paid-in capital from redemption fees (Note 4) — — —3 — —3
Net Asset Value, end of year $17.47 $16.05 $19.74 $15.52 $15.36
TOTAL RETURN 11.17% (12.72%) 34.69% 4.13% 3.86%
RATIOS/SUPPLEMENTAL DATANet assets, end of year (in 000’s) $2,312,560 $2,728,599 $3,713,276 $2,650,611 $2,757,910
Ratio of expenses to average net assets before any reimbursement, waiver orrecapture of expenses by Advisor and Administrator (Note 5) 1.03% 1.02% 1.03% 1.06% 1.06%
Ratio of expenses to average net assets after any reimbursement, waiver orrecapture of expenses by Advisor and Administrator 1.02% 1.01% 1.02% 1.06% 1.05%
Ratio of net investment income (loss) to average net assets 1.68% 1.97% 1.67% 1.79% 1.82%
Portfolio turnover4 30.32% 39.75% 28.11% 39.76% 35.98%
Year Ended Dec. 31
INSTITUTIONAL CLASS 2019 2018 2017 20161 20151
Net Asset Value, beginning of year $16.04 $19.73 $15.52 $15.35 $15.26
INCOME (LOSS) FROM INVESTMENT OPERATIONS:Net investment income (loss)2 0.30 0.39 0.33 0.30 0.32Net realized gain (loss) and unrealized appreciation/depreciation on
investments, foreign currency related transactions and foreign capital gainstaxes 1.50 (2.83) 5.01 0.38 0.29
Total from investment operations 1.80 (2.44) 5.34 0.68 0.61
LESS DISTRIBUTIONS FROM:Net investment income (0.37) (0.33) (0.71) (0.31) (0.29)Net realized gains on investments — (0.92) (0.42) (0.11) (0.23)Return of capital — — — (0.09) —
Total distributions (0.37) (1.25) (1.13) (0.51) (0.52)
Paid-in capital from redemption fees (Note 4) — — —3 — —3
Net Asset Value, end of year $17.47 $16.04 $19.73 $15.52 $15.35
TOTAL RETURN 11.35% (12.64%) 34.77% 4.33% 3.93%
RATIOS/SUPPLEMENTAL DATANet assets, end of year (in 000’s) $3,057,896 $3,039,226 $3,284,070 $2,034,276 $2,045,713
Ratio of expenses to average net assets before any reimbursement, waiver orrecapture of expenses by Advisor and Administrator (Note 5) 0.93% 0.91% 0.92% 0.94% 0.93%
Ratio of expenses to average net assets after any reimbursement, waiver orrecapture of expenses by Advisor and Administrator 0.92% 0.90% 0.91% 0.93% 0.92%
Ratio of net investment income (loss) to average net assets 1.80% 2.09% 1.81% 1.91% 1.98%
Portfolio turnover4 30.32% 39.75% 28.11% 39.76% 35.98%
1 Consolidated Financial Highlights. See Note 2-C.2 Calculated using the average daily shares method.3 Less than $0.01 per share.4 The portfolio turnover rate is calculated on the Fund as a whole without distinguishing between classes of shares issued.
See accompanying notes to financial statements.
120 MATTHEWS ASIA FUNDS
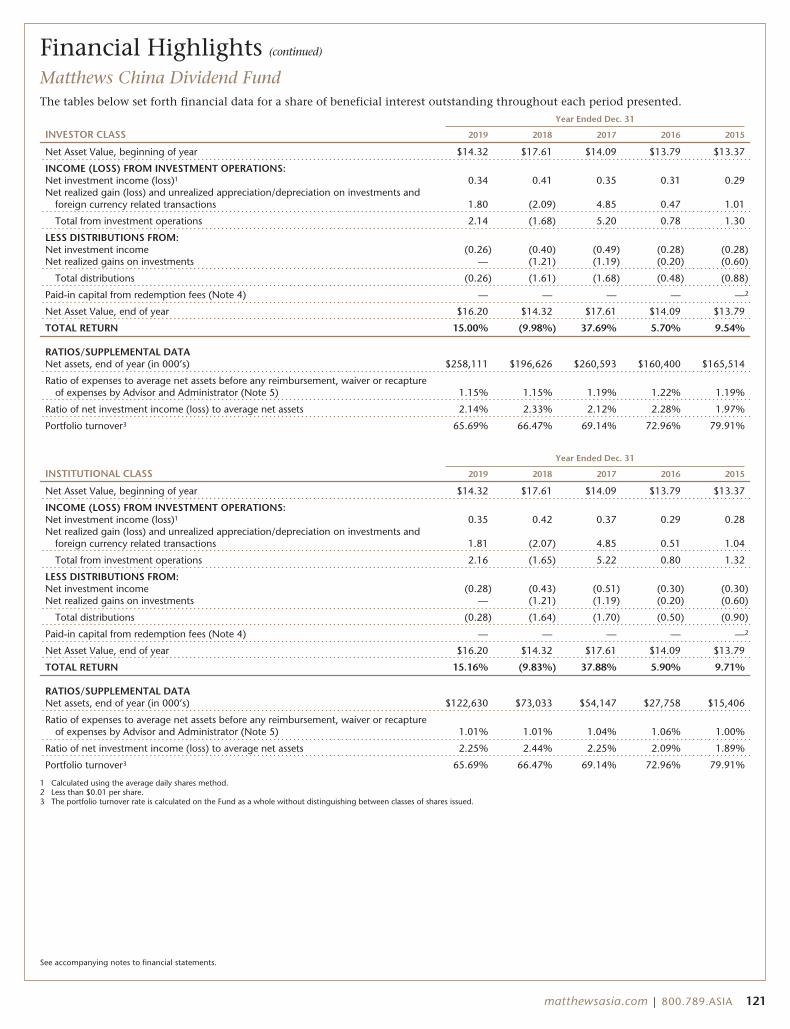
Financial Highlights (continued)
Matthews China Dividend FundThe tables below set forth financial data for a share of beneficial interest outstanding throughout each period presented.
Year Ended Dec. 31
INVESTOR CLASS 2019 2018 2017 2016 2015
Net Asset Value, beginning of year $14.32 $17.61 $14.09 $13.79 $13.37
INCOME (LOSS) FROM INVESTMENT OPERATIONS:Net investment income (loss)1 0.34 0.41 0.35 0.31 0.29Net realized gain (loss) and unrealized appreciation/depreciation on investments and
foreign currency related transactions 1.80 (2.09) 4.85 0.47 1.01
Total from investment operations 2.14 (1.68) 5.20 0.78 1.30
LESS DISTRIBUTIONS FROM:Net investment income (0.26) (0.40) (0.49) (0.28) (0.28)Net realized gains on investments — (1.21) (1.19) (0.20) (0.60)
Total distributions (0.26) (1.61) (1.68) (0.48) (0.88)
Paid-in capital from redemption fees (Note 4) — — — — —2
Net Asset Value, end of year $16.20 $14.32 $17.61 $14.09 $13.79
TOTAL RETURN 15.00% (9.98%) 37.69% 5.70% 9.54%
RATIOS/SUPPLEMENTAL DATANet assets, end of year (in 000’s) $258,111 $196,626 $260,593 $160,400 $165,514
Ratio of expenses to average net assets before any reimbursement, waiver or recaptureof expenses by Advisor and Administrator (Note 5) 1.15% 1.15% 1.19% 1.22% 1.19%
Ratio of net investment income (loss) to average net assets 2.14% 2.33% 2.12% 2.28% 1.97%
Portfolio turnover3 65.69% 66.47% 69.14% 72.96% 79.91%
Year Ended Dec. 31
INSTITUTIONAL CLASS 2019 2018 2017 2016 2015
Net Asset Value, beginning of year $14.32 $17.61 $14.09 $13.79 $13.37
INCOME (LOSS) FROM INVESTMENT OPERATIONS:Net investment income (loss)1 0.35 0.42 0.37 0.29 0.28Net realized gain (loss) and unrealized appreciation/depreciation on investments and
foreign currency related transactions 1.81 (2.07) 4.85 0.51 1.04
Total from investment operations 2.16 (1.65) 5.22 0.80 1.32
LESS DISTRIBUTIONS FROM:Net investment income (0.28) (0.43) (0.51) (0.30) (0.30)Net realized gains on investments — (1.21) (1.19) (0.20) (0.60)
Total distributions (0.28) (1.64) (1.70) (0.50) (0.90)
Paid-in capital from redemption fees (Note 4) — — — — —2
Net Asset Value, end of year $16.20 $14.32 $17.61 $14.09 $13.79
TOTAL RETURN 15.16% (9.83%) 37.88% 5.90% 9.71%
RATIOS/SUPPLEMENTAL DATANet assets, end of year (in 000’s) $122,630 $73,033 $54,147 $27,758 $15,406
Ratio of expenses to average net assets before any reimbursement, waiver or recaptureof expenses by Advisor and Administrator (Note 5) 1.01% 1.01% 1.04% 1.06% 1.00%
Ratio of net investment income (loss) to average net assets 2.25% 2.44% 2.25% 2.09% 1.89%
Portfolio turnover3 65.69% 66.47% 69.14% 72.96% 79.91%
1 Calculated using the average daily shares method.2 Less than $0.01 per share.3 The portfolio turnover rate is calculated on the Fund as a whole without distinguishing between classes of shares issued.
See accompanying notes to financial statements.
matthewsasia.com | 800.789.ASIA 121
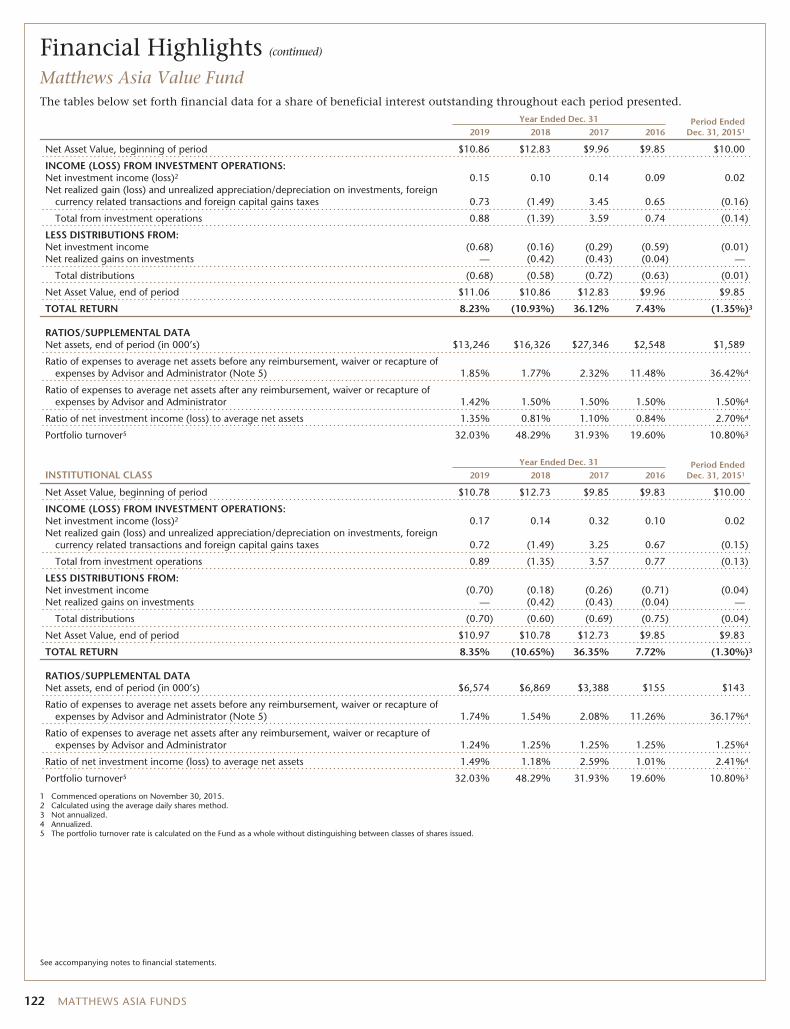
Financial Highlights (continued)
Matthews Asia Value FundThe tables below set forth financial data for a share of beneficial interest outstanding throughout each period presented.
Year Ended Dec. 31 Period EndedDec. 31, 201512019 2018 2017 2016
Net Asset Value, beginning of period $10.86 $12.83 $9.96 $9.85 $10.00
INCOME (LOSS) FROM INVESTMENT OPERATIONS:Net investment income (loss)2 0.15 0.10 0.14 0.09 0.02Net realized gain (loss) and unrealized appreciation/depreciation on investments, foreign
currency related transactions and foreign capital gains taxes 0.73 (1.49) 3.45 0.65 (0.16)
Total from investment operations 0.88 (1.39) 3.59 0.74 (0.14)
LESS DISTRIBUTIONS FROM:Net investment income (0.68) (0.16) (0.29) (0.59) (0.01)Net realized gains on investments — (0.42) (0.43) (0.04) —
Total distributions (0.68) (0.58) (0.72) (0.63) (0.01)
Net Asset Value, end of period $11.06 $10.86 $12.83 $9.96 $9.85
TOTAL RETURN 8.23% (10.93%) 36.12% 7.43% (1.35%)3
RATIOS/SUPPLEMENTAL DATANet assets, end of period (in 000’s) $13,246 $16,326 $27,346 $2,548 $1,589
Ratio of expenses to average net assets before any reimbursement, waiver or recapture ofexpenses by Advisor and Administrator (Note 5) 1.85% 1.77% 2.32% 11.48% 36.42%4
Ratio of expenses to average net assets after any reimbursement, waiver or recapture ofexpenses by Advisor and Administrator 1.42% 1.50% 1.50% 1.50% 1.50%4
Ratio of net investment income (loss) to average net assets 1.35% 0.81% 1.10% 0.84% 2.70%4
Portfolio turnover5 32.03% 48.29% 31.93% 19.60% 10.80%3
INSTITUTIONAL CLASSYear Ended Dec. 31 Period Ended
Dec. 31, 201512019 2018 2017 2016
Net Asset Value, beginning of period $10.78 $12.73 $9.85 $9.83 $10.00
INCOME (LOSS) FROM INVESTMENT OPERATIONS:Net investment income (loss)2 0.17 0.14 0.32 0.10 0.02Net realized gain (loss) and unrealized appreciation/depreciation on investments, foreign
currency related transactions and foreign capital gains taxes 0.72 (1.49) 3.25 0.67 (0.15)
Total from investment operations 0.89 (1.35) 3.57 0.77 (0.13)
LESS DISTRIBUTIONS FROM:Net investment income (0.70) (0.18) (0.26) (0.71) (0.04)Net realized gains on investments — (0.42) (0.43) (0.04) —
Total distributions (0.70) (0.60) (0.69) (0.75) (0.04)
Net Asset Value, end of period $10.97 $10.78 $12.73 $9.85 $9.83
TOTAL RETURN 8.35% (10.65%) 36.35% 7.72% (1.30%)3
RATIOS/SUPPLEMENTAL DATANet assets, end of period (in 000’s) $6,574 $6,869 $3,388 $155 $143
Ratio of expenses to average net assets before any reimbursement, waiver or recapture ofexpenses by Advisor and Administrator (Note 5) 1.74% 1.54% 2.08% 11.26% 36.17%4
Ratio of expenses to average net assets after any reimbursement, waiver or recapture ofexpenses by Advisor and Administrator 1.24% 1.25% 1.25% 1.25% 1.25%4
Ratio of net investment income (loss) to average net assets 1.49% 1.18% 2.59% 1.01% 2.41%4
Portfolio turnover5 32.03% 48.29% 31.93% 19.60% 10.80%3
1 Commenced operations on November 30, 2015.2 Calculated using the average daily shares method.3 Not annualized.4 Annualized.5 The portfolio turnover rate is calculated on the Fund as a whole without distinguishing between classes of shares issued.
See accompanying notes to financial statements.
122 MATTHEWS ASIA FUNDS
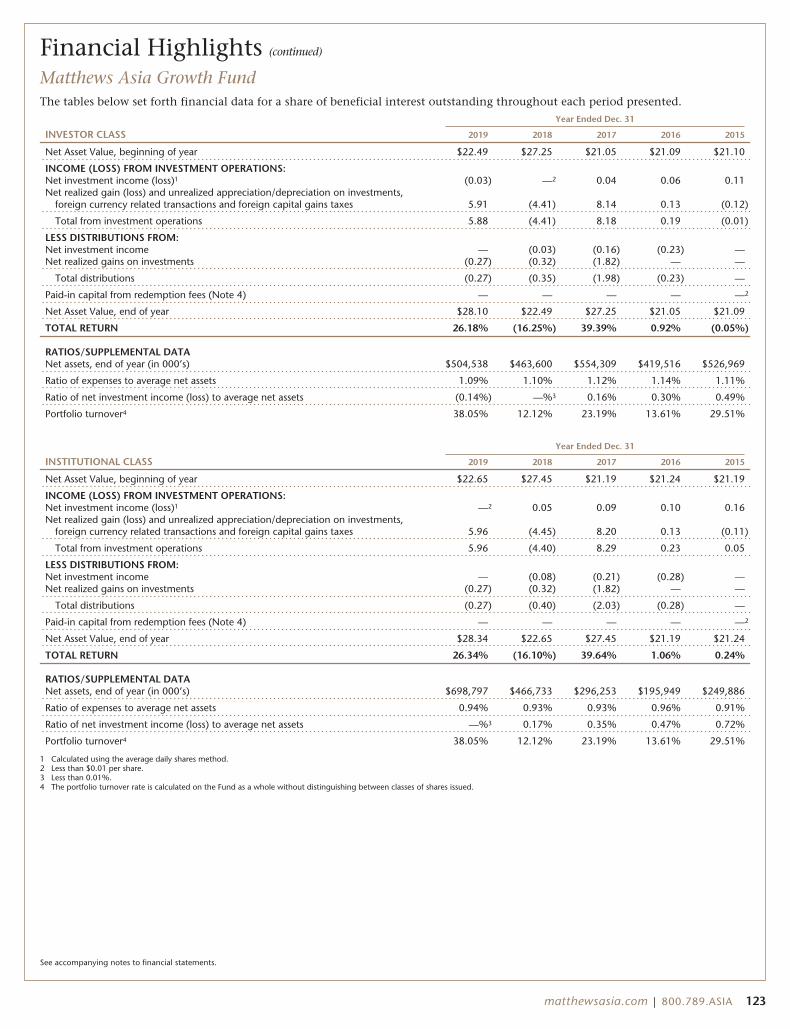
Financial Highlights (continued)
Matthews Asia Growth FundThe tables below set forth financial data for a share of beneficial interest outstanding throughout each period presented.
Year Ended Dec. 31
INVESTOR CLASS 2019 2018 2017 2016 2015
Net Asset Value, beginning of year $22.49 $27.25 $21.05 $21.09 $21.10
INCOME (LOSS) FROM INVESTMENT OPERATIONS:Net investment income (loss)1 (0.03) —2 0.04 0.06 0.11Net realized gain (loss) and unrealized appreciation/depreciation on investments,
foreign currency related transactions and foreign capital gains taxes 5.91 (4.41) 8.14 0.13 (0.12)
Total from investment operations 5.88 (4.41) 8.18 0.19 (0.01)
LESS DISTRIBUTIONS FROM:Net investment income — (0.03) (0.16) (0.23) —Net realized gains on investments (0.27) (0.32) (1.82) — —
Total distributions (0.27) (0.35) (1.98) (0.23) —
Paid-in capital from redemption fees (Note 4) — — — — —2
Net Asset Value, end of year $28.10 $22.49 $27.25 $21.05 $21.09
TOTAL RETURN 26.18% (16.25%) 39.39% 0.92% (0.05%)
RATIOS/SUPPLEMENTAL DATANet assets, end of year (in 000’s) $504,538 $463,600 $554,309 $419,516 $526,969
Ratio of expenses to average net assets 1.09% 1.10% 1.12% 1.14% 1.11%
Ratio of net investment income (loss) to average net assets (0.14%) —%3 0.16% 0.30% 0.49%
Portfolio turnover4 38.05% 12.12% 23.19% 13.61% 29.51%
Year Ended Dec. 31
INSTITUTIONAL CLASS 2019 2018 2017 2016 2015
Net Asset Value, beginning of year $22.65 $27.45 $21.19 $21.24 $21.19
INCOME (LOSS) FROM INVESTMENT OPERATIONS:Net investment income (loss)1 —2 0.05 0.09 0.10 0.16Net realized gain (loss) and unrealized appreciation/depreciation on investments,
foreign currency related transactions and foreign capital gains taxes 5.96 (4.45) 8.20 0.13 (0.11)
Total from investment operations 5.96 (4.40) 8.29 0.23 0.05
LESS DISTRIBUTIONS FROM:Net investment income — (0.08) (0.21) (0.28) —Net realized gains on investments (0.27) (0.32) (1.82) — —
Total distributions (0.27) (0.40) (2.03) (0.28) —
Paid-in capital from redemption fees (Note 4) — — — — —2
Net Asset Value, end of year $28.34 $22.65 $27.45 $21.19 $21.24
TOTAL RETURN 26.34% (16.10%) 39.64% 1.06% 0.24%
RATIOS/SUPPLEMENTAL DATANet assets, end of year (in 000’s) $698,797 $466,733 $296,253 $195,949 $249,886
Ratio of expenses to average net assets 0.94% 0.93% 0.93% 0.96% 0.91%
Ratio of net investment income (loss) to average net assets —%3 0.17% 0.35% 0.47% 0.72%
Portfolio turnover4 38.05% 12.12% 23.19% 13.61% 29.51%
1 Calculated using the average daily shares method.2 Less than $0.01 per share.3 Less than 0.01%.4 The portfolio turnover rate is calculated on the Fund as a whole without distinguishing between classes of shares issued.
See accompanying notes to financial statements.
matthewsasia.com | 800.789.ASIA 123
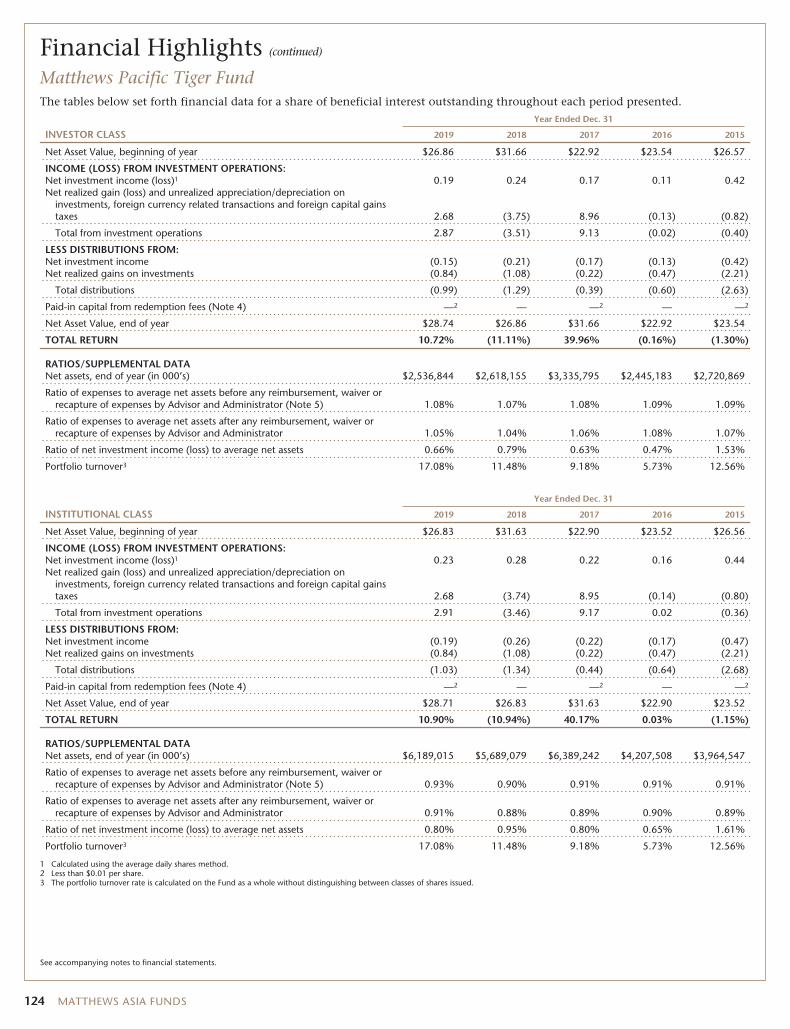
Financial Highlights (continued)
Matthews Pacific Tiger FundThe tables below set forth financial data for a share of beneficial interest outstanding throughout each period presented.
Year Ended Dec. 31
INVESTOR CLASS 2019 2018 2017 2016 2015
Net Asset Value, beginning of year $26.86 $31.66 $22.92 $23.54 $26.57
INCOME (LOSS) FROM INVESTMENT OPERATIONS:Net investment income (loss)1 0.19 0.24 0.17 0.11 0.42Net realized gain (loss) and unrealized appreciation/depreciation on
investments, foreign currency related transactions and foreign capital gainstaxes 2.68 (3.75) 8.96 (0.13) (0.82)
Total from investment operations 2.87 (3.51) 9.13 (0.02) (0.40)
LESS DISTRIBUTIONS FROM:Net investment income (0.15) (0.21) (0.17) (0.13) (0.42)Net realized gains on investments (0.84) (1.08) (0.22) (0.47) (2.21)
Total distributions (0.99) (1.29) (0.39) (0.60) (2.63)
Paid-in capital from redemption fees (Note 4) —2 — —2 — —2
Net Asset Value, end of year $28.74 $26.86 $31.66 $22.92 $23.54
TOTAL RETURN 10.72% (11.11%) 39.96% (0.16%) (1.30%)
RATIOS/SUPPLEMENTAL DATANet assets, end of year (in 000’s) $2,536,844 $2,618,155 $3,335,795 $2,445,183 $2,720,869
Ratio of expenses to average net assets before any reimbursement, waiver orrecapture of expenses by Advisor and Administrator (Note 5) 1.08% 1.07% 1.08% 1.09% 1.09%
Ratio of expenses to average net assets after any reimbursement, waiver orrecapture of expenses by Advisor and Administrator 1.05% 1.04% 1.06% 1.08% 1.07%
Ratio of net investment income (loss) to average net assets 0.66% 0.79% 0.63% 0.47% 1.53%
Portfolio turnover3 17.08% 11.48% 9.18% 5.73% 12.56%
Year Ended Dec. 31
INSTITUTIONAL CLASS 2019 2018 2017 2016 2015
Net Asset Value, beginning of year $26.83 $31.63 $22.90 $23.52 $26.56
INCOME (LOSS) FROM INVESTMENT OPERATIONS:Net investment income (loss)1 0.23 0.28 0.22 0.16 0.44Net realized gain (loss) and unrealized appreciation/depreciation on
investments, foreign currency related transactions and foreign capital gainstaxes 2.68 (3.74) 8.95 (0.14) (0.80)
Total from investment operations 2.91 (3.46) 9.17 0.02 (0.36)
LESS DISTRIBUTIONS FROM:Net investment income (0.19) (0.26) (0.22) (0.17) (0.47)Net realized gains on investments (0.84) (1.08) (0.22) (0.47) (2.21)
Total distributions (1.03) (1.34) (0.44) (0.64) (2.68)
Paid-in capital from redemption fees (Note 4) —2 — —2 — —2
Net Asset Value, end of year $28.71 $26.83 $31.63 $22.90 $23.52
TOTAL RETURN 10.90% (10.94%) 40.17% 0.03% (1.15%)
RATIOS/SUPPLEMENTAL DATANet assets, end of year (in 000’s) $6,189,015 $5,689,079 $6,389,242 $4,207,508 $3,964,547
Ratio of expenses to average net assets before any reimbursement, waiver orrecapture of expenses by Advisor and Administrator (Note 5) 0.93% 0.90% 0.91% 0.91% 0.91%
Ratio of expenses to average net assets after any reimbursement, waiver orrecapture of expenses by Advisor and Administrator 0.91% 0.88% 0.89% 0.90% 0.89%
Ratio of net investment income (loss) to average net assets 0.80% 0.95% 0.80% 0.65% 1.61%
Portfolio turnover3 17.08% 11.48% 9.18% 5.73% 12.56%
1 Calculated using the average daily shares method.2 Less than $0.01 per share.3 The portfolio turnover rate is calculated on the Fund as a whole without distinguishing between classes of shares issued.
See accompanying notes to financial statements.
124 MATTHEWS ASIA FUNDS
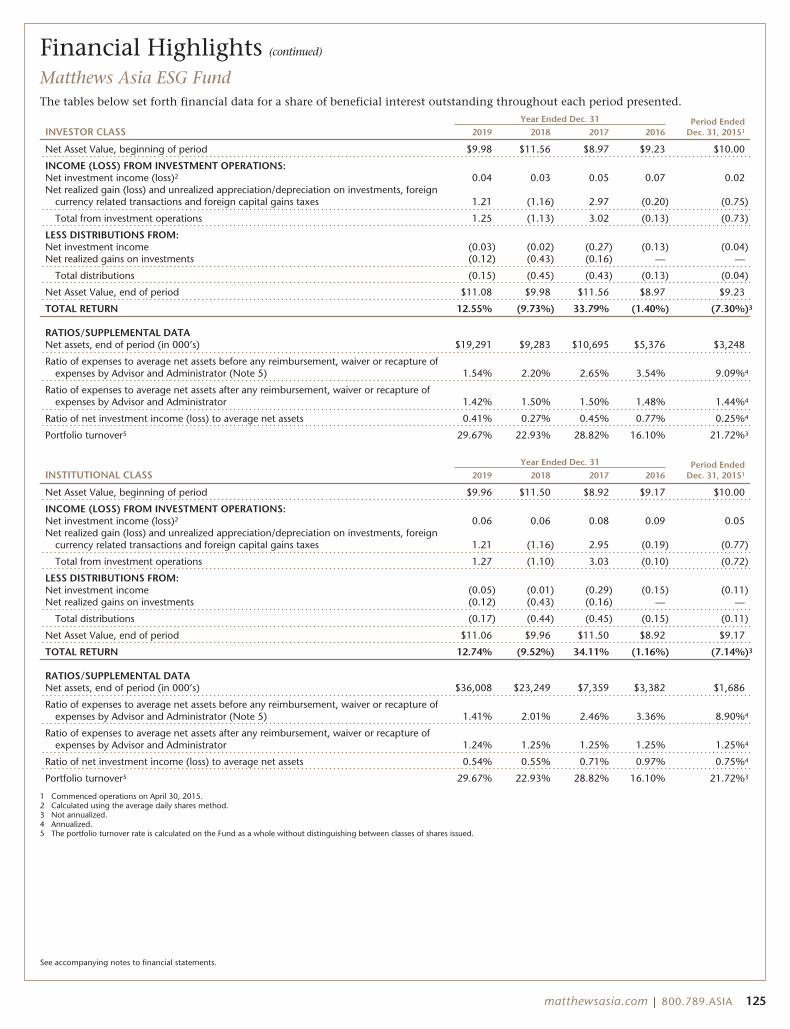
Financial Highlights (continued)
Matthews Asia ESG FundThe tables below set forth financial data for a share of beneficial interest outstanding throughout each period presented.
INVESTOR CLASSYear Ended Dec. 31 Period Ended
Dec. 31, 201512019 2018 2017 2016
Net Asset Value, beginning of period $9.98 $11.56 $8.97 $9.23 $10.00
INCOME (LOSS) FROM INVESTMENT OPERATIONS:Net investment income (loss)2 0.04 0.03 0.05 0.07 0.02Net realized gain (loss) and unrealized appreciation/depreciation on investments, foreign
currency related transactions and foreign capital gains taxes 1.21 (1.16) 2.97 (0.20) (0.75)
Total from investment operations 1.25 (1.13) 3.02 (0.13) (0.73)
LESS DISTRIBUTIONS FROM:Net investment income (0.03) (0.02) (0.27) (0.13) (0.04)Net realized gains on investments (0.12) (0.43) (0.16) — —
Total distributions (0.15) (0.45) (0.43) (0.13) (0.04)
Net Asset Value, end of period $11.08 $9.98 $11.56 $8.97 $9.23
TOTAL RETURN 12.55% (9.73%) 33.79% (1.40%) (7.30%)3
RATIOS/SUPPLEMENTAL DATANet assets, end of period (in 000’s) $19,291 $9,283 $10,695 $5,376 $3,248
Ratio of expenses to average net assets before any reimbursement, waiver or recapture ofexpenses by Advisor and Administrator (Note 5) 1.54% 2.20% 2.65% 3.54% 9.09%4
Ratio of expenses to average net assets after any reimbursement, waiver or recapture ofexpenses by Advisor and Administrator 1.42% 1.50% 1.50% 1.48% 1.44%4
Ratio of net investment income (loss) to average net assets 0.41% 0.27% 0.45% 0.77% 0.25%4
Portfolio turnover5 29.67% 22.93% 28.82% 16.10% 21.72%3
INSTITUTIONAL CLASSYear Ended Dec. 31 Period Ended
Dec. 31, 201512019 2018 2017 2016
Net Asset Value, beginning of period $9.96 $11.50 $8.92 $9.17 $10.00
INCOME (LOSS) FROM INVESTMENT OPERATIONS:Net investment income (loss)2 0.06 0.06 0.08 0.09 0.05Net realized gain (loss) and unrealized appreciation/depreciation on investments, foreign
currency related transactions and foreign capital gains taxes 1.21 (1.16) 2.95 (0.19) (0.77)
Total from investment operations 1.27 (1.10) 3.03 (0.10) (0.72)
LESS DISTRIBUTIONS FROM:Net investment income (0.05) (0.01) (0.29) (0.15) (0.11)Net realized gains on investments (0.12) (0.43) (0.16) — —
Total distributions (0.17) (0.44) (0.45) (0.15) (0.11)
Net Asset Value, end of period $11.06 $9.96 $11.50 $8.92 $9.17
TOTAL RETURN 12.74% (9.52%) 34.11% (1.16%) (7.14%)3
RATIOS/SUPPLEMENTAL DATANet assets, end of period (in 000’s) $36,008 $23,249 $7,359 $3,382 $1,686
Ratio of expenses to average net assets before any reimbursement, waiver or recapture ofexpenses by Advisor and Administrator (Note 5) 1.41% 2.01% 2.46% 3.36% 8.90%4
Ratio of expenses to average net assets after any reimbursement, waiver or recapture ofexpenses by Advisor and Administrator 1.24% 1.25% 1.25% 1.25% 1.25%4
Ratio of net investment income (loss) to average net assets 0.54% 0.55% 0.71% 0.97% 0.75%4
Portfolio turnover5 29.67% 22.93% 28.82% 16.10% 21.72%3
1 Commenced operations on April 30, 2015.2 Calculated using the average daily shares method.3 Not annualized.4 Annualized.5 The portfolio turnover rate is calculated on the Fund as a whole without distinguishing between classes of shares issued.
See accompanying notes to financial statements.
matthewsasia.com | 800.789.ASIA 125

Financial Highlights (continued)
Matthews Emerging Asia FundThe tables below set forth financial data for a share of beneficial interest outstanding throughout each period presented.
Year Ended Dec. 31
INVESTOR CLASS 2019 2018 2017 2016 2015
Net Asset Value, beginning of year $12.50 $15.51 $13.18 $11.27 $11.60
INCOME (LOSS) FROM INVESTMENT OPERATIONS:Net investment income (loss)1 0.14 0.10 0.07 0.15 0.04Net realized gain (loss) and unrealized appreciation/depreciation on investments,
foreign currency related transactions and foreign capital gains taxes (0.27) (2.82) 2.35 2.01 (0.34)
Total from investment operations (0.13) (2.72) 2.42 2.16 (0.30)
LESS DISTRIBUTIONS FROM:Net investment income — (0.10) (0.04) (0.13) —2
Net realized gains on investments (0.30) (0.19) (0.05) (0.13) (0.03)
Total distributions (0.30) (0.29) (0.09) (0.26) (0.03)
Paid-in capital from redemption fees (Note 4) —3 —2 —2 0.01 —2
Net Asset Value, end of year $12.07 $12.50 $15.51 $13.18 $11.27
TOTAL RETURN (1.01%) (17.58%) 18.42% 19.25% (2.56%)
RATIOS/SUPPLEMENTAL DATANet assets, end of year (in 000’s) $84,543 $118,505 $219,596 $145,164 $114,590
Ratio of expenses to average net assets before any reimbursement, waiver or recaptureof expenses by Advisor and Administrator (Note 5) 1.65% 1.66% 1.70% 1.77% 1.75%
Ratio of expenses to average net assets after any reimbursement, waiver or recapture ofexpenses by Advisor and Administrator 1.46% 1.48% 1.48% 1.47% 1.50%
Ratio of net investment income (loss) to average net assets 1.15% 0.72% 0.49% 1.26% 0.33%
Portfolio turnover4 18.77% 26.09% 7.74% 34.90% 12.14%
Year Ended Dec. 31
INSTITUTIONAL CLASS 2019 2018 2017 2016 2015
Net Asset Value, beginning of year $12.54 $15.57 $13.22 $11.29 $11.60
INCOME (LOSS) FROM INVESTMENT OPERATIONS:Net investment income (loss)1 0.17 0.14 0.10 0.21 0.07Net realized gain (loss) and unrealized appreciation/depreciation on investments,
foreign currency related transactions and foreign capital gains taxes (0.28) (2.85) 2.37 1.99 (0.34)
Total from investment operations (0.11) (2.71) 2.47 2.20 (0.27)
LESS DISTRIBUTIONS FROM:Net investment income — (0.13) (0.07) (0.15) (0.01)Net realized gains on investments (0.30) (0.19) (0.05) (0.13) (0.03)
Total distributions (0.30) (0.32) (0.12) (0.28) (0.04)
Paid-in capital from redemption fees (Note 4) —3 —2 —2 0.01 —2
Net Asset Value, end of year $12.13 $12.54 $15.57 $13.22 $11.29
TOTAL RETURN (0.85%) (17.41%) 18.70% 19.61% (2.33%)
RATIOS/SUPPLEMENTAL DATANet assets, end of year (in 000’s) $235,639 $256,669 $275,233 $95,724 $55,278
Ratio of expenses to average net assets before any reimbursement, waiver or recaptureof expenses by Advisor and Administrator (Note 5) 1.51% 1.50% 1.52% 1.62% 1.57%
Ratio of expenses to average net assets after any reimbursement, waiver or recapture ofexpenses by Advisor and Administrator 1.25% 1.25% 1.25% 1.25% 1.25%
Ratio of net investment income (loss) to average net assets 1.39% 0.97% 0.70% 1.72% 0.65%
Portfolio turnover4 18.77% 26.09% 7.74% 34.90% 12.14%
1 Calculated using the average daily shares method.2 Less than $0.01 per share.3 The Fund charged redemption fees through October 31, 2019.4 The portfolio turnover rate is calculated on the Fund as a whole without distinguishing between classes of shares issued.
See accompanying notes to financial statements.
126 MATTHEWS ASIA FUNDS
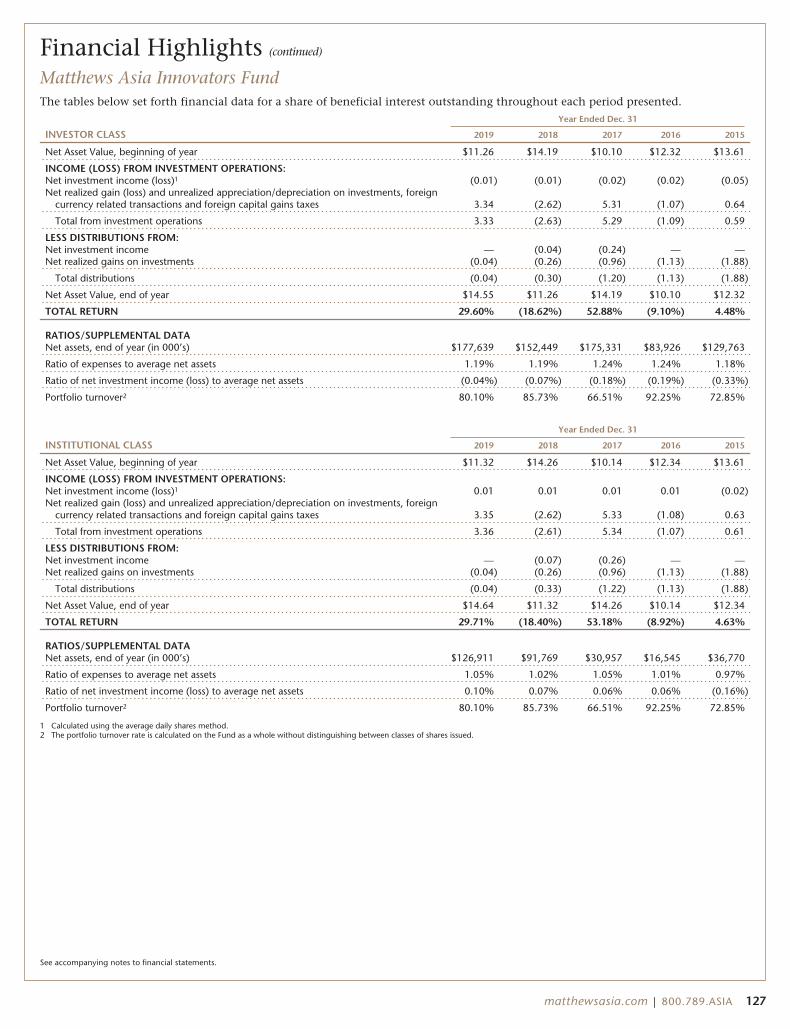
Financial Highlights (continued)
Matthews Asia Innovators FundThe tables below set forth financial data for a share of beneficial interest outstanding throughout each period presented.
Year Ended Dec. 31
INVESTOR CLASS 2019 2018 2017 2016 2015
Net Asset Value, beginning of year $11.26 $14.19 $10.10 $12.32 $13.61
INCOME (LOSS) FROM INVESTMENT OPERATIONS:Net investment income (loss)1 (0.01) (0.01) (0.02) (0.02) (0.05)Net realized gain (loss) and unrealized appreciation/depreciation on investments, foreign
currency related transactions and foreign capital gains taxes 3.34 (2.62) 5.31 (1.07) 0.64
Total from investment operations 3.33 (2.63) 5.29 (1.09) 0.59
LESS DISTRIBUTIONS FROM:Net investment income — (0.04) (0.24) — —Net realized gains on investments (0.04) (0.26) (0.96) (1.13) (1.88)
Total distributions (0.04) (0.30) (1.20) (1.13) (1.88)
Net Asset Value, end of year $14.55 $11.26 $14.19 $10.10 $12.32
TOTAL RETURN 29.60% (18.62%) 52.88% (9.10%) 4.48%
RATIOS/SUPPLEMENTAL DATANet assets, end of year (in 000’s) $177,639 $152,449 $175,331 $83,926 $129,763
Ratio of expenses to average net assets 1.19% 1.19% 1.24% 1.24% 1.18%
Ratio of net investment income (loss) to average net assets (0.04%) (0.07%) (0.18%) (0.19%) (0.33%)
Portfolio turnover2 80.10% 85.73% 66.51% 92.25% 72.85%
Year Ended Dec. 31
INSTITUTIONAL CLASS 2019 2018 2017 2016 2015
Net Asset Value, beginning of year $11.32 $14.26 $10.14 $12.34 $13.61
INCOME (LOSS) FROM INVESTMENT OPERATIONS:Net investment income (loss)1 0.01 0.01 0.01 0.01 (0.02)Net realized gain (loss) and unrealized appreciation/depreciation on investments, foreign
currency related transactions and foreign capital gains taxes 3.35 (2.62) 5.33 (1.08) 0.63
Total from investment operations 3.36 (2.61) 5.34 (1.07) 0.61
LESS DISTRIBUTIONS FROM:Net investment income — (0.07) (0.26) — —Net realized gains on investments (0.04) (0.26) (0.96) (1.13) (1.88)
Total distributions (0.04) (0.33) (1.22) (1.13) (1.88)
Net Asset Value, end of year $14.64 $11.32 $14.26 $10.14 $12.34
TOTAL RETURN 29.71% (18.40%) 53.18% (8.92%) 4.63%
RATIOS/SUPPLEMENTAL DATANet assets, end of year (in 000’s) $126,911 $91,769 $30,957 $16,545 $36,770
Ratio of expenses to average net assets 1.05% 1.02% 1.05% 1.01% 0.97%
Ratio of net investment income (loss) to average net assets 0.10% 0.07% 0.06% 0.06% (0.16%)
Portfolio turnover2 80.10% 85.73% 66.51% 92.25% 72.85%
1 Calculated using the average daily shares method.2 The portfolio turnover rate is calculated on the Fund as a whole without distinguishing between classes of shares issued.
See accompanying notes to financial statements.
matthewsasia.com | 800.789.ASIA 127
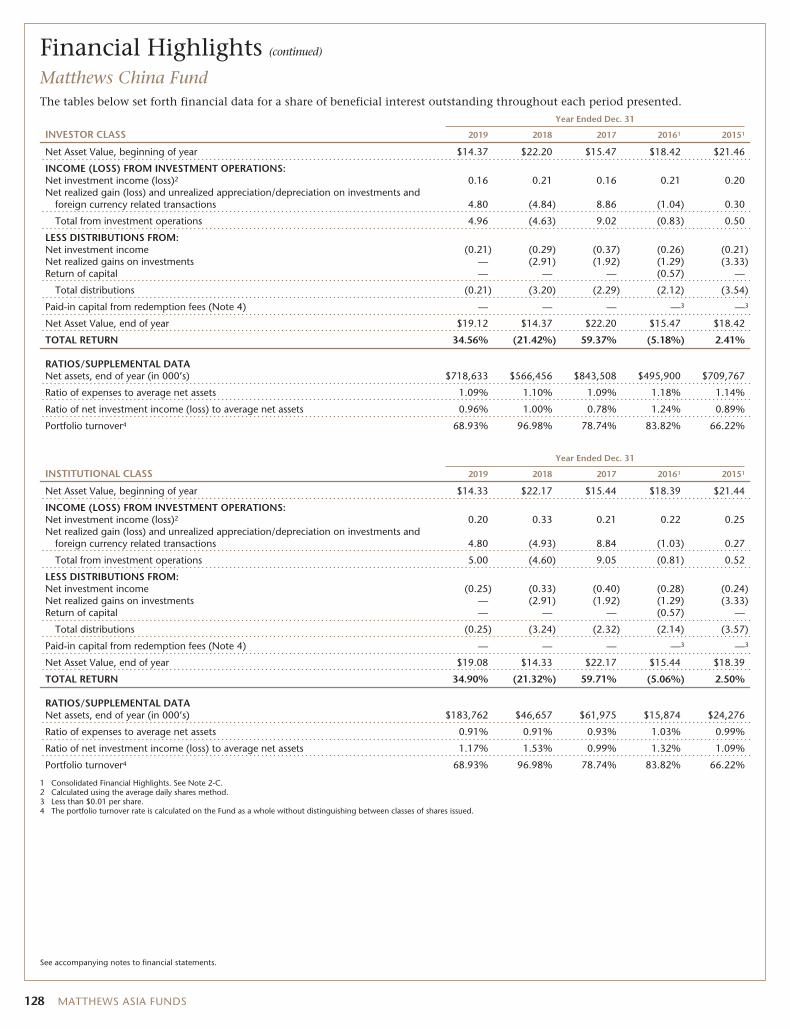
Financial Highlights (continued)
Matthews China FundThe tables below set forth financial data for a share of beneficial interest outstanding throughout each period presented.
Year Ended Dec. 31
INVESTOR CLASS 2019 2018 2017 20161 20151
Net Asset Value, beginning of year $14.37 $22.20 $15.47 $18.42 $21.46
INCOME (LOSS) FROM INVESTMENT OPERATIONS:Net investment income (loss)2 0.16 0.21 0.16 0.21 0.20Net realized gain (loss) and unrealized appreciation/depreciation on investments and
foreign currency related transactions 4.80 (4.84) 8.86 (1.04) 0.30
Total from investment operations 4.96 (4.63) 9.02 (0.83) 0.50
LESS DISTRIBUTIONS FROM:Net investment income (0.21) (0.29) (0.37) (0.26) (0.21)Net realized gains on investments — (2.91) (1.92) (1.29) (3.33)Return of capital — — — (0.57) —
Total distributions (0.21) (3.20) (2.29) (2.12) (3.54)
Paid-in capital from redemption fees (Note 4) — — — —3 —3
Net Asset Value, end of year $19.12 $14.37 $22.20 $15.47 $18.42
TOTAL RETURN 34.56% (21.42%) 59.37% (5.18%) 2.41%
RATIOS/SUPPLEMENTAL DATANet assets, end of year (in 000’s) $718,633 $566,456 $843,508 $495,900 $709,767
Ratio of expenses to average net assets 1.09% 1.10% 1.09% 1.18% 1.14%
Ratio of net investment income (loss) to average net assets 0.96% 1.00% 0.78% 1.24% 0.89%
Portfolio turnover4 68.93% 96.98% 78.74% 83.82% 66.22%
Year Ended Dec. 31
INSTITUTIONAL CLASS 2019 2018 2017 20161 20151
Net Asset Value, beginning of year $14.33 $22.17 $15.44 $18.39 $21.44
INCOME (LOSS) FROM INVESTMENT OPERATIONS:Net investment income (loss)2 0.20 0.33 0.21 0.22 0.25Net realized gain (loss) and unrealized appreciation/depreciation on investments and
foreign currency related transactions 4.80 (4.93) 8.84 (1.03) 0.27
Total from investment operations 5.00 (4.60) 9.05 (0.81) 0.52
LESS DISTRIBUTIONS FROM:Net investment income (0.25) (0.33) (0.40) (0.28) (0.24)Net realized gains on investments — (2.91) (1.92) (1.29) (3.33)Return of capital — — — (0.57) —
Total distributions (0.25) (3.24) (2.32) (2.14) (3.57)
Paid-in capital from redemption fees (Note 4) — — — —3 —3
Net Asset Value, end of year $19.08 $14.33 $22.17 $15.44 $18.39
TOTAL RETURN 34.90% (21.32%) 59.71% (5.06%) 2.50%
RATIOS/SUPPLEMENTAL DATANet assets, end of year (in 000’s) $183,762 $46,657 $61,975 $15,874 $24,276
Ratio of expenses to average net assets 0.91% 0.91% 0.93% 1.03% 0.99%
Ratio of net investment income (loss) to average net assets 1.17% 1.53% 0.99% 1.32% 1.09%
Portfolio turnover4 68.93% 96.98% 78.74% 83.82% 66.22%
1 Consolidated Financial Highlights. See Note 2-C.2 Calculated using the average daily shares method.3 Less than $0.01 per share.4 The portfolio turnover rate is calculated on the Fund as a whole without distinguishing between classes of shares issued.
See accompanying notes to financial statements.
128 MATTHEWS ASIA FUNDS
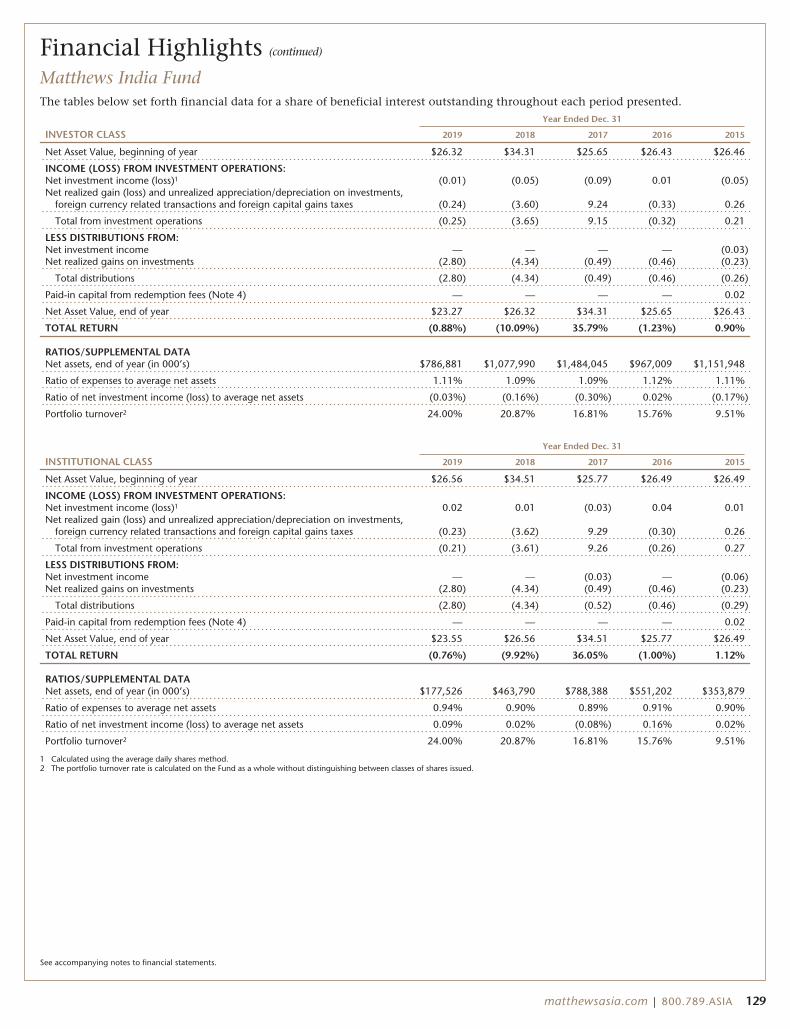
Financial Highlights (continued)
Matthews India FundThe tables below set forth financial data for a share of beneficial interest outstanding throughout each period presented.
Year Ended Dec. 31
INVESTOR CLASS 2019 2018 2017 2016 2015
Net Asset Value, beginning of year $26.32 $34.31 $25.65 $26.43 $26.46
INCOME (LOSS) FROM INVESTMENT OPERATIONS:Net investment income (loss)1 (0.01) (0.05) (0.09) 0.01 (0.05)Net realized gain (loss) and unrealized appreciation/depreciation on investments,
foreign currency related transactions and foreign capital gains taxes (0.24) (3.60) 9.24 (0.33) 0.26
Total from investment operations (0.25) (3.65) 9.15 (0.32) 0.21
LESS DISTRIBUTIONS FROM:Net investment income — — — — (0.03)Net realized gains on investments (2.80) (4.34) (0.49) (0.46) (0.23)
Total distributions (2.80) (4.34) (0.49) (0.46) (0.26)
Paid-in capital from redemption fees (Note 4) — — — — 0.02
Net Asset Value, end of year $23.27 $26.32 $34.31 $25.65 $26.43
TOTAL RETURN (0.88%) (10.09%) 35.79% (1.23%) 0.90%
RATIOS/SUPPLEMENTAL DATANet assets, end of year (in 000’s) $786,881 $1,077,990 $1,484,045 $967,009 $1,151,948
Ratio of expenses to average net assets 1.11% 1.09% 1.09% 1.12% 1.11%
Ratio of net investment income (loss) to average net assets (0.03%) (0.16%) (0.30%) 0.02% (0.17%)
Portfolio turnover2 24.00% 20.87% 16.81% 15.76% 9.51%
Year Ended Dec. 31
INSTITUTIONAL CLASS 2019 2018 2017 2016 2015
Net Asset Value, beginning of year $26.56 $34.51 $25.77 $26.49 $26.49
INCOME (LOSS) FROM INVESTMENT OPERATIONS:Net investment income (loss)1 0.02 0.01 (0.03) 0.04 0.01Net realized gain (loss) and unrealized appreciation/depreciation on investments,
foreign currency related transactions and foreign capital gains taxes (0.23) (3.62) 9.29 (0.30) 0.26
Total from investment operations (0.21) (3.61) 9.26 (0.26) 0.27
LESS DISTRIBUTIONS FROM:Net investment income — — (0.03) — (0.06)Net realized gains on investments (2.80) (4.34) (0.49) (0.46) (0.23)
Total distributions (2.80) (4.34) (0.52) (0.46) (0.29)
Paid-in capital from redemption fees (Note 4) — — — — 0.02
Net Asset Value, end of year $23.55 $26.56 $34.51 $25.77 $26.49
TOTAL RETURN (0.76%) (9.92%) 36.05% (1.00%) 1.12%
RATIOS/SUPPLEMENTAL DATANet assets, end of year (in 000’s) $177,526 $463,790 $788,388 $551,202 $353,879
Ratio of expenses to average net assets 0.94% 0.90% 0.89% 0.91% 0.90%
Ratio of net investment income (loss) to average net assets 0.09% 0.02% (0.08%) 0.16% 0.02%
Portfolio turnover2 24.00% 20.87% 16.81% 15.76% 9.51%
1 Calculated using the average daily shares method.2 The portfolio turnover rate is calculated on the Fund as a whole without distinguishing between classes of shares issued.
See accompanying notes to financial statements.
matthewsasia.com | 800.789.ASIA 129
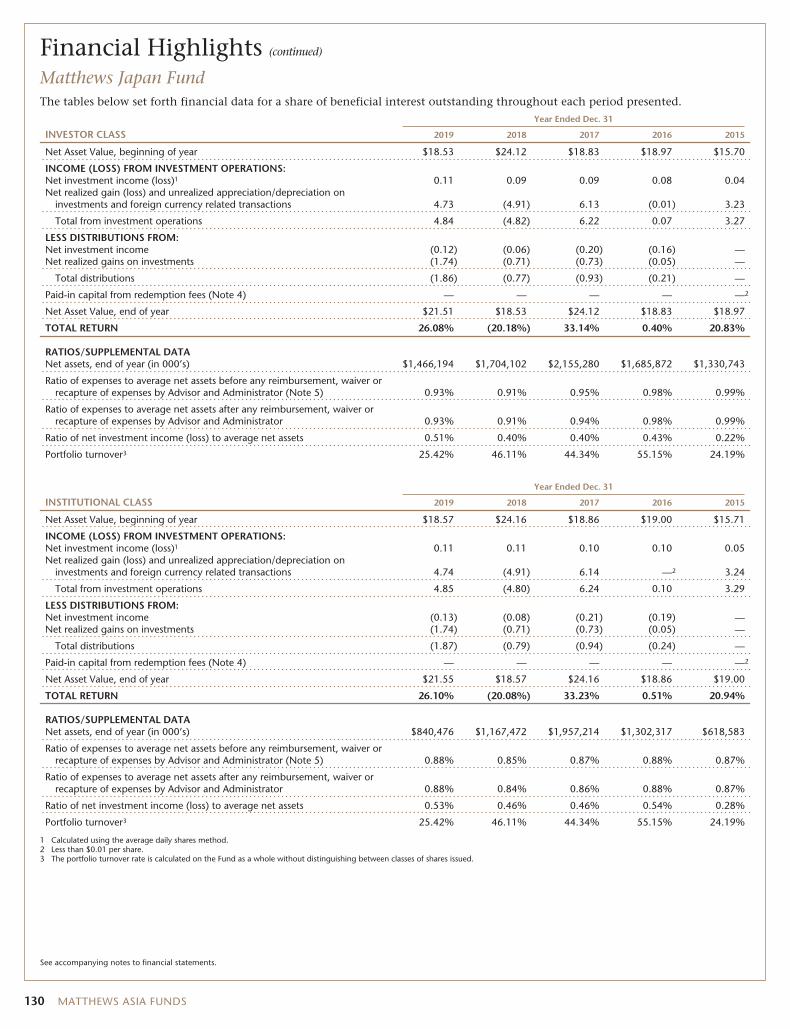
Financial Highlights (continued)
Matthews Japan FundThe tables below set forth financial data for a share of beneficial interest outstanding throughout each period presented.
Year Ended Dec. 31
INVESTOR CLASS 2019 2018 2017 2016 2015
Net Asset Value, beginning of year $18.53 $24.12 $18.83 $18.97 $15.70
INCOME (LOSS) FROM INVESTMENT OPERATIONS:Net investment income (loss)1 0.11 0.09 0.09 0.08 0.04Net realized gain (loss) and unrealized appreciation/depreciation on
investments and foreign currency related transactions 4.73 (4.91) 6.13 (0.01) 3.23
Total from investment operations 4.84 (4.82) 6.22 0.07 3.27
LESS DISTRIBUTIONS FROM:Net investment income (0.12) (0.06) (0.20) (0.16) —Net realized gains on investments (1.74) (0.71) (0.73) (0.05) —
Total distributions (1.86) (0.77) (0.93) (0.21) —
Paid-in capital from redemption fees (Note 4) — — — — —2
Net Asset Value, end of year $21.51 $18.53 $24.12 $18.83 $18.97
TOTAL RETURN 26.08% (20.18%) 33.14% 0.40% 20.83%
RATIOS/SUPPLEMENTAL DATANet assets, end of year (in 000’s) $1,466,194 $1,704,102 $2,155,280 $1,685,872 $1,330,743
Ratio of expenses to average net assets before any reimbursement, waiver orrecapture of expenses by Advisor and Administrator (Note 5) 0.93% 0.91% 0.95% 0.98% 0.99%
Ratio of expenses to average net assets after any reimbursement, waiver orrecapture of expenses by Advisor and Administrator 0.93% 0.91% 0.94% 0.98% 0.99%
Ratio of net investment income (loss) to average net assets 0.51% 0.40% 0.40% 0.43% 0.22%
Portfolio turnover3 25.42% 46.11% 44.34% 55.15% 24.19%
Year Ended Dec. 31
INSTITUTIONAL CLASS 2019 2018 2017 2016 2015
Net Asset Value, beginning of year $18.57 $24.16 $18.86 $19.00 $15.71
INCOME (LOSS) FROM INVESTMENT OPERATIONS:Net investment income (loss)1 0.11 0.11 0.10 0.10 0.05Net realized gain (loss) and unrealized appreciation/depreciation on
investments and foreign currency related transactions 4.74 (4.91) 6.14 —2 3.24
Total from investment operations 4.85 (4.80) 6.24 0.10 3.29
LESS DISTRIBUTIONS FROM:Net investment income (0.13) (0.08) (0.21) (0.19) —Net realized gains on investments (1.74) (0.71) (0.73) (0.05) —
Total distributions (1.87) (0.79) (0.94) (0.24) —
Paid-in capital from redemption fees (Note 4) — — — — —2
Net Asset Value, end of year $21.55 $18.57 $24.16 $18.86 $19.00
TOTAL RETURN 26.10% (20.08%) 33.23% 0.51% 20.94%
RATIOS/SUPPLEMENTAL DATANet assets, end of year (in 000’s) $840,476 $1,167,472 $1,957,214 $1,302,317 $618,583
Ratio of expenses to average net assets before any reimbursement, waiver orrecapture of expenses by Advisor and Administrator (Note 5) 0.88% 0.85% 0.87% 0.88% 0.87%
Ratio of expenses to average net assets after any reimbursement, waiver orrecapture of expenses by Advisor and Administrator 0.88% 0.84% 0.86% 0.88% 0.87%
Ratio of net investment income (loss) to average net assets 0.53% 0.46% 0.46% 0.54% 0.28%
Portfolio turnover3 25.42% 46.11% 44.34% 55.15% 24.19%
1 Calculated using the average daily shares method.2 Less than $0.01 per share.3 The portfolio turnover rate is calculated on the Fund as a whole without distinguishing between classes of shares issued.
See accompanying notes to financial statements.
130 MATTHEWS ASIA FUNDS
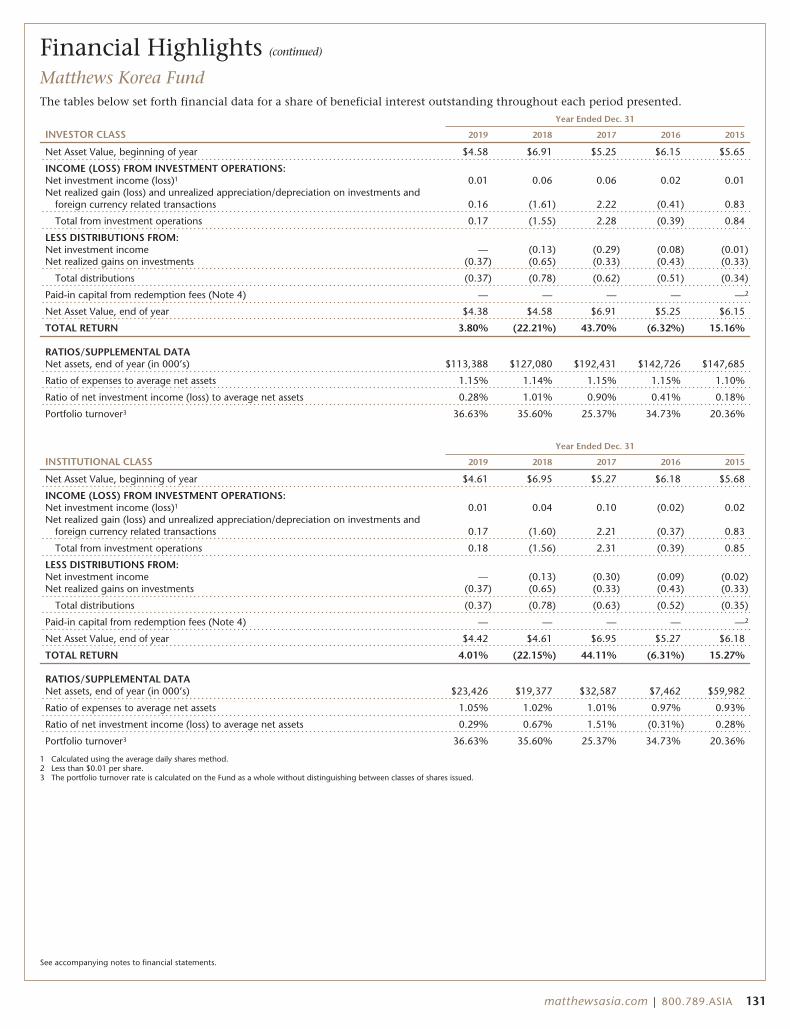
Financial Highlights (continued)
Matthews Korea FundThe tables below set forth financial data for a share of beneficial interest outstanding throughout each period presented.
Year Ended Dec. 31
INVESTOR CLASS 2019 2018 2017 2016 2015
Net Asset Value, beginning of year $4.58 $6.91 $5.25 $6.15 $5.65
INCOME (LOSS) FROM INVESTMENT OPERATIONS:Net investment income (loss)1 0.01 0.06 0.06 0.02 0.01Net realized gain (loss) and unrealized appreciation/depreciation on investments and
foreign currency related transactions 0.16 (1.61) 2.22 (0.41) 0.83
Total from investment operations 0.17 (1.55) 2.28 (0.39) 0.84
LESS DISTRIBUTIONS FROM:Net investment income — (0.13) (0.29) (0.08) (0.01)Net realized gains on investments (0.37) (0.65) (0.33) (0.43) (0.33)
Total distributions (0.37) (0.78) (0.62) (0.51) (0.34)
Paid-in capital from redemption fees (Note 4) — — — — —2
Net Asset Value, end of year $4.38 $4.58 $6.91 $5.25 $6.15
TOTAL RETURN 3.80% (22.21%) 43.70% (6.32%) 15.16%
RATIOS/SUPPLEMENTAL DATANet assets, end of year (in 000’s) $113,388 $127,080 $192,431 $142,726 $147,685
Ratio of expenses to average net assets 1.15% 1.14% 1.15% 1.15% 1.10%
Ratio of net investment income (loss) to average net assets 0.28% 1.01% 0.90% 0.41% 0.18%
Portfolio turnover3 36.63% 35.60% 25.37% 34.73% 20.36%
Year Ended Dec. 31
INSTITUTIONAL CLASS 2019 2018 2017 2016 2015
Net Asset Value, beginning of year $4.61 $6.95 $5.27 $6.18 $5.68
INCOME (LOSS) FROM INVESTMENT OPERATIONS:Net investment income (loss)1 0.01 0.04 0.10 (0.02) 0.02Net realized gain (loss) and unrealized appreciation/depreciation on investments and
foreign currency related transactions 0.17 (1.60) 2.21 (0.37) 0.83
Total from investment operations 0.18 (1.56) 2.31 (0.39) 0.85
LESS DISTRIBUTIONS FROM:Net investment income — (0.13) (0.30) (0.09) (0.02)Net realized gains on investments (0.37) (0.65) (0.33) (0.43) (0.33)
Total distributions (0.37) (0.78) (0.63) (0.52) (0.35)
Paid-in capital from redemption fees (Note 4) — — — — —2
Net Asset Value, end of year $4.42 $4.61 $6.95 $5.27 $6.18
TOTAL RETURN 4.01% (22.15%) 44.11% (6.31%) 15.27%
RATIOS/SUPPLEMENTAL DATANet assets, end of year (in 000’s) $23,426 $19,377 $32,587 $7,462 $59,982
Ratio of expenses to average net assets 1.05% 1.02% 1.01% 0.97% 0.93%
Ratio of net investment income (loss) to average net assets 0.29% 0.67% 1.51% (0.31%) 0.28%
Portfolio turnover3 36.63% 35.60% 25.37% 34.73% 20.36%
1 Calculated using the average daily shares method.2 Less than $0.01 per share.3 The portfolio turnover rate is calculated on the Fund as a whole without distinguishing between classes of shares issued.
See accompanying notes to financial statements.
matthewsasia.com | 800.789.ASIA 131

Financial Highlights (continued)
Matthews Asia Small Companies FundThe tables below set forth financial data for a share of beneficial interest outstanding throughout each period presented.
Year Ended Dec. 31
INVESTOR CLASS 2019 2018 2017 2016 2015
Net Asset Value, beginning of year $15.50 $22.89 $19.05 $19.41 $21.46
INCOME (LOSS) FROM INVESTMENT OPERATIONS:Net investment income (loss)1 0.12 0.12 0.02 0.09 0.02Net realized gain (loss) and unrealized appreciation/depreciation on investments, foreign
currency related transactions and foreign capital gains taxes 2.57 (4.20) 5.68 (0.37) (2.05)
Total from investment operations 2.69 (4.08) 5.70 (0.28) (2.03)
LESS DISTRIBUTIONS FROM:Net investment income (0.09) (0.08) (0.10) (0.08) (0.03)Net realized gains on investments — (3.23) (1.76) — —
Total distributions (0.09) (3.31) (1.86) (0.08) (0.03)
Paid-in capital from redemption fees (Note 4) —2 —3 —3 —3 0.01
Net Asset Value, end of year $18.10 $15.50 $22.89 $19.05 $19.41
TOTAL RETURN 17.38% (18.05%) 30.59% (1.44%) (9.43%)
RATIOS/SUPPLEMENTAL DATANet assets, end of year (in 000’s) $96,229 $111,456 $208,339 $254,226 $387,747
Ratio of expenses to average net assets before any reimbursement, waiver or recaptureof expenses by Advisor and Administrator (Note 5) 1.60% 1.51% 1.49% 1.49% 1.48%
Ratio of expenses to average net assets after any reimbursement, waiver or recapture ofexpenses by Advisor and Administrator 1.45% 1.46% 1.46% 1.47% 1.47%
Ratio of net investment income (loss) to average net assets 0.72% 0.53% 0.09% 0.45% 0.08%
Portfolio turnover4 59.10% 69.79% 67.13% 44.44% 48.29%
Year Ended Dec. 31
INSTITUTIONAL CLASS 2019 2018 2017 2016 2015
Net Asset Value, beginning of year $15.46 $22.86 $19.03 $19.40 $21.46
INCOME (LOSS) FROM INVESTMENT OPERATIONS:Net investment income (loss)1 0.15 0.16 0.07 0.12 0.11Net realized gain (loss) and unrealized appreciation/depreciation on investments, foreign
currency related transactions and foreign capital gains taxes 2.58 (4.19) 5.67 (0.36) (2.10)
Total from investment operations 2.73 (4.03) 5.74 (0.24) (1.99)
LESS DISTRIBUTIONS FROM:Net investment income (0.13) (0.14) (0.15) (0.13) (0.08)Net realized gains on investments — (3.23) (1.76) — —
Total distributions (0.13) (3.37) (1.91) (0.13) (0.08)
Paid-in capital from redemption fees (Note 4) —2 —3 —3 —3 0.01
Net Asset Value, end of year $18.06 $15.46 $22.86 $19.03 $19.40
TOTAL RETURN 17.65% (17.86%) 30.85% (1.24%) (9.23%)
RATIOS/SUPPLEMENTAL DATANet assets, end of year (in 000’s) $85,006 $74,935 $232,954 $174,962 $222,168
Ratio of expenses to average net assets before any reimbursement, waiver or recaptureof expenses by Advisor and Administrator (Note 5) 1.46% 1.37% 1.35% 1.34% 1.30%
Ratio of expenses to average net assets after any reimbursement, waiver or recapture ofexpenses by Advisor and Administrator 1.24% 1.25% 1.25% 1.25% 1.25%
Ratio of net investment income (loss) to average net assets 0.85% 0.73% 0.34% 0.64% 0.53%
Portfolio turnover4 59.10% 69.79% 67.13% 44.44% 48.29%
1 Calculated using the average daily shares method.2 The Fund charged redemption fees through October 31, 2019.3 Less than $0.01 per share.4 The portfolio turnover rate is calculated on the Fund as a whole without distinguishing between classes of shares issued.
See accompanying notes to financial statements.
132 MATTHEWS ASIA FUNDS
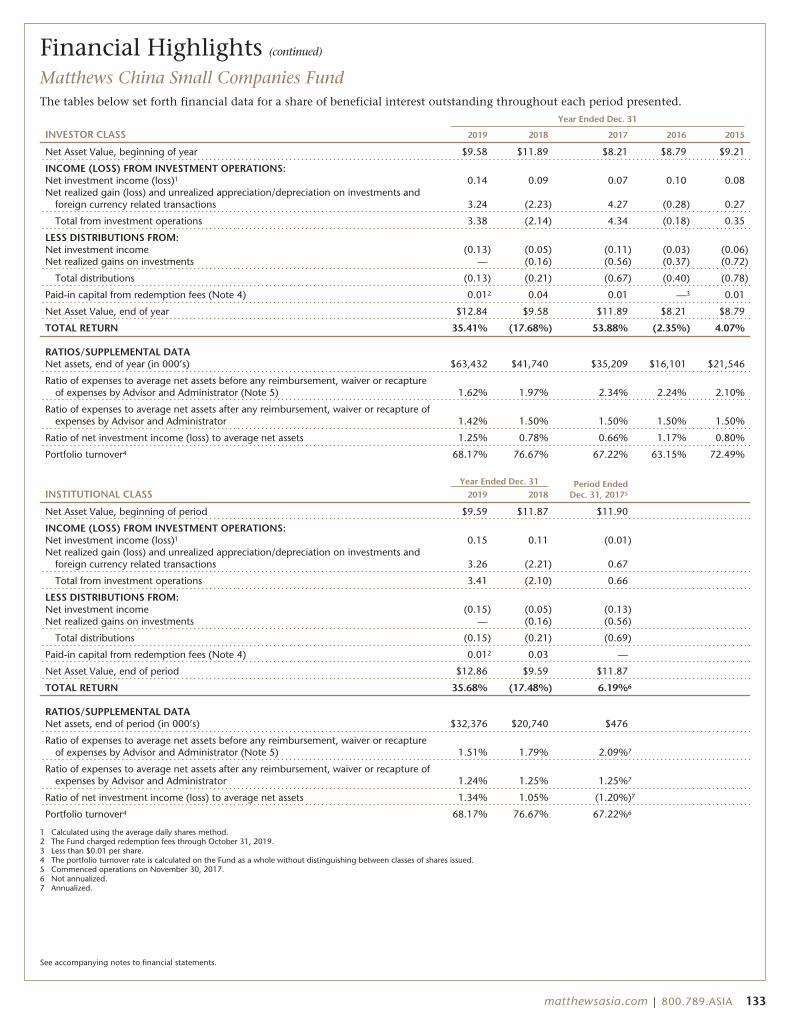
Financial Highlights (continued)
Matthews China Small Companies FundThe tables below set forth financial data for a share of beneficial interest outstanding throughout each period presented.
Year Ended Dec. 31
INVESTOR CLASS 2019 2018 2017 2016 2015
Net Asset Value, beginning of year $9.58 $11.89 $8.21 $8.79 $9.21
INCOME (LOSS) FROM INVESTMENT OPERATIONS:Net investment income (loss)1 0.14 0.09 0.07 0.10 0.08Net realized gain (loss) and unrealized appreciation/depreciation on investments and
foreign currency related transactions 3.24 (2.23) 4.27 (0.28) 0.27
Total from investment operations 3.38 (2.14) 4.34 (0.18) 0.35
LESS DISTRIBUTIONS FROM:Net investment income (0.13) (0.05) (0.11) (0.03) (0.06)Net realized gains on investments — (0.16) (0.56) (0.37) (0.72)
Total distributions (0.13) (0.21) (0.67) (0.40) (0.78)
Paid-in capital from redemption fees (Note 4) 0.012 0.04 0.01 —3 0.01
Net Asset Value, end of year $12.84 $9.58 $11.89 $8.21 $8.79
TOTAL RETURN 35.41% (17.68%) 53.88% (2.35%) 4.07%
RATIOS/SUPPLEMENTAL DATANet assets, end of year (in 000’s) $63,432 $41,740 $35,209 $16,101 $21,546
Ratio of expenses to average net assets before any reimbursement, waiver or recaptureof expenses by Advisor and Administrator (Note 5) 1.62% 1.97% 2.34% 2.24% 2.10%
Ratio of expenses to average net assets after any reimbursement, waiver or recapture ofexpenses by Advisor and Administrator 1.42% 1.50% 1.50% 1.50% 1.50%
Ratio of net investment income (loss) to average net assets 1.25% 0.78% 0.66% 1.17% 0.80%
Portfolio turnover4 68.17% 76.67% 67.22% 63.15% 72.49%
INSTITUTIONAL CLASSYear Ended Dec. 31 Period Ended
Dec. 31, 201752019 2018
Net Asset Value, beginning of period $9.59 $11.87 $11.90
INCOME (LOSS) FROM INVESTMENT OPERATIONS:Net investment income (loss)1 0.15 0.11 (0.01)Net realized gain (loss) and unrealized appreciation/depreciation on investments and
foreign currency related transactions 3.26 (2.21) 0.67
Total from investment operations 3.41 (2.10) 0.66
LESS DISTRIBUTIONS FROM:Net investment income (0.15) (0.05) (0.13)Net realized gains on investments — (0.16) (0.56)
Total distributions (0.15) (0.21) (0.69)
Paid-in capital from redemption fees (Note 4) 0.012 0.03 —
Net Asset Value, end of period $12.86 $9.59 $11.87
TOTAL RETURN 35.68% (17.48%) 6.19%6
RATIOS/SUPPLEMENTAL DATANet assets, end of period (in 000’s) $32,376 $20,740 $476
Ratio of expenses to average net assets before any reimbursement, waiver or recaptureof expenses by Advisor and Administrator (Note 5) 1.51% 1.79% 2.09%7
Ratio of expenses to average net assets after any reimbursement, waiver or recapture ofexpenses by Advisor and Administrator 1.24% 1.25% 1.25%7
Ratio of net investment income (loss) to average net assets 1.34% 1.05% (1.20%)7
Portfolio turnover4 68.17% 76.67% 67.22%6
1 Calculated using the average daily shares method.2 The Fund charged redemption fees through October 31, 2019.3 Less than $0.01 per share.4 The portfolio turnover rate is calculated on the Fund as a whole without distinguishing between classes of shares issued.5 Commenced operations on November 30, 2017.6 Not annualized.7 Annualized.
See accompanying notes to financial statements.
matthewsasia.com | 800.789.ASIA 133
Notes to Financial Statements1. ORGANIZATION
Matthews Asia Funds (the “Trust”) is an open-end management investment company registered under the Investment Company Act of 1940, asamended (the “1940 Act”). The Trust currently issues seventeen separate series of shares (each a “Fund”, and collectively, the “Funds”): MatthewsAsia Total Return Bond Fund (previously known as the Matthews Asia Strategic Income Fund), Matthews Asia Credit Opportunities Fund, MatthewsAsian Growth and Income Fund, Matthews Asia Dividend Fund, Matthews China Dividend Fund, Matthews Asia Value Fund, Matthews Asia GrowthFund, Matthews Pacific Tiger Fund, Matthews Asia ESG Fund, Matthews Emerging Asia Fund, Matthews Asia Innovators Fund, Matthews China Fund,Matthews India Fund, Matthews Japan Fund, Matthews Korea Fund, Matthews Asia Small Companies Fund, and Matthews China Small CompaniesFund. Each Fund currently offers two classes of shares: Investor Class and Institutional Class. Each class of shares has identical voting, dividend,liquidation and other rights and the same terms and conditions, except each class may be subject to different class expenses as outlined in the rele-vant prospectus and each class has exclusive voting rights with respect to matters solely affecting such class.
2. SIGNIFICANT ACCOUNTING POLICIESThe following is a summary of significant accounting policies consistently followed by the Funds in preparation of their financial statements. EachFund follows the investment company accounting and reporting guidance of the Financial Accounting Standards Board (FASB) Accounting StandardCodification Topic 946 Financial Services—Investment Companies. The accounting policies are in conformity with accounting principles generallyaccepted in the United States of America (“U.S. GAAP”).
A. SECURITY VALUATION: The value of the Trust’s securities is based on market quotations for those securities, or on their fair value determined bythe valuation policies approved by the Funds’ Board of Trustees (the “Board”). Market quotations and valuation information are provided bycommercial pricing services or securities dealers that are independent of the Funds and Matthews International Capital Management, LLC(“Matthews”), in accordance with procedures established by the Funds’ Board. Foreign exchange-traded securities are valued as of the close of tradingon the primary exchange on which they trade. Securities that trade in over-the-counter markets, including most debt securities (bonds), may be val-ued by other third-party vendors or by using indicative bid quotations from dealers or market makers, or other available market information. Marketvalues for securities are determined based on quotations, market data or other information from the principal (or most advantageous) market onwhich the security is traded. Market quotations for equity securities used by the Funds include last reported sale prices, or, if such prices are notreported or available, bid and ask prices. Swap agreements are valued utilizing quotes received daily by the Funds’ pricing service or through brokers,which are derived using daily swap curves and models that incorporate a number of market data factors, such as discounted cash flows, trades andvalues of the underlying reference instruments. Foreign currency exchange contracts are valued at the mean between the bid and ask prices and aredetermined at the close of business on the New York Stock Exchange (“NYSE”). Interpolated values are derived when the settlement date of the con-tract is an interim date for which quotations are not available. The Funds may also utilize independent pricing services to assist them in determininga current market value for each security based on sources believed to be reliable.
The Board has delegated to the Board’s Valuation Committee the responsibility for oversight of the fair valuation process under the Trust’s Pricingand Valuation Policy. The Board’s Valuation Committee, in turn, has delegated the determination of fair value prices under Matthews’ Pricing andValuation Procedures to Matthews’ Valuation Committee. The Board’s Valuation Committee will review and approve fair value determinations byMatthews’ Valuation Committee in accordance with the Pricing and Valuation Policy. When fair value pricing is employed, the prices of securitiesused by a Fund to calculate its Net Asset Value (“NAV”) may differ from any quoted or published prices for the same securities for that day. All fairvalue determinations are made subject to the Board’s oversight. Events affecting the value of foreign investments may occur between the time atwhich they are determined and when the Funds calculate their NAV, which is normally the close of trading on the NYSE. If such events render mar-ket quotations unreliable, and the impact of such events can be reasonably determined, the investments will be valued at their fair value in accord-ance with pricing policies. The fair value of a security held by the Funds may be determined using the services of third-party pricing services to assistin this process.
The books and records of the Funds are maintained in U.S. dollars. Transactions, portfolio securities, and assets and liabilities denominated in a for-eign currency are translated and recorded in U.S. dollars at the prevailing exchange rate as of the close of trading on the NYSE. The Fund does notisolate the effect of changes in foreign exchange rates from changes in market prices on securities held. Accordingly, such changes are includedwithin “Net change in unrealized appreciation/depreciation on investments” on the Statements of Operations. Translation gains or losses resultingfrom changes in the exchange rate during the reporting period and realized gains and losses on the settlement of foreign currency transactions arereported in the results of operations for the current period. The Funds isolate that portion of realized gains and losses on investments in fixed incomesecurities that is due to changes in foreign exchange rate from that which is due to changes in market prices of securities.
Foreign securities held by the Funds may be traded on days and at times when the NYSE is closed. Accordingly, the value of the Funds may be sig-nificantly affected on days when shareholders have no access to the Funds.
B. FAIR VALUE MEASUREMENTS: The Funds follow a fair value hierarchy that distinguishes between market data obtained from independent sources(observable inputs) and the Funds’ own market assumptions (unobservable inputs). These inputs are used in determining the value of the Funds’financial instruments and are summarized in the following fair value hierarchy:
Level 1: Quoted prices in active markets for identical securities (foreign securities that are valued based on market quotations).
Level 2: Other significant observable inputs. Certain foreign securities may be fair valued by Matthews using information such as quoted prices forsimilar securities, interest rates, prepayment speeds, credit risk, and foreign exchange. Additionally, external pricing services are used when the Fundsdetermine that events affecting the value of foreign securities which occur between the time at which they are determined and the close of tradingon the NYSE render market quotations unreliable.
Level 3: Significant unobservable inputs. As described in Note 2-A, Level 3 securities are valued based on significant unobservable inputs asdetermined under the direction of the Board. Characterization of such securities as Level 3 securities are not necessarily an indication of their liquid-ity or the risk associated with investing in these securities. A significant change in the unobservable inputs could result in a significantly lower orhigher value in such Level 3 securities and could impact overall Fund performance. Level 3 securities consisted of equities that, as of December 31,2019, were suspended from trading.
The input levels are not necessarily an indication of the risk or liquidity associated with financial instruments at that level.
134 MATTHEWS ASIA FUNDS
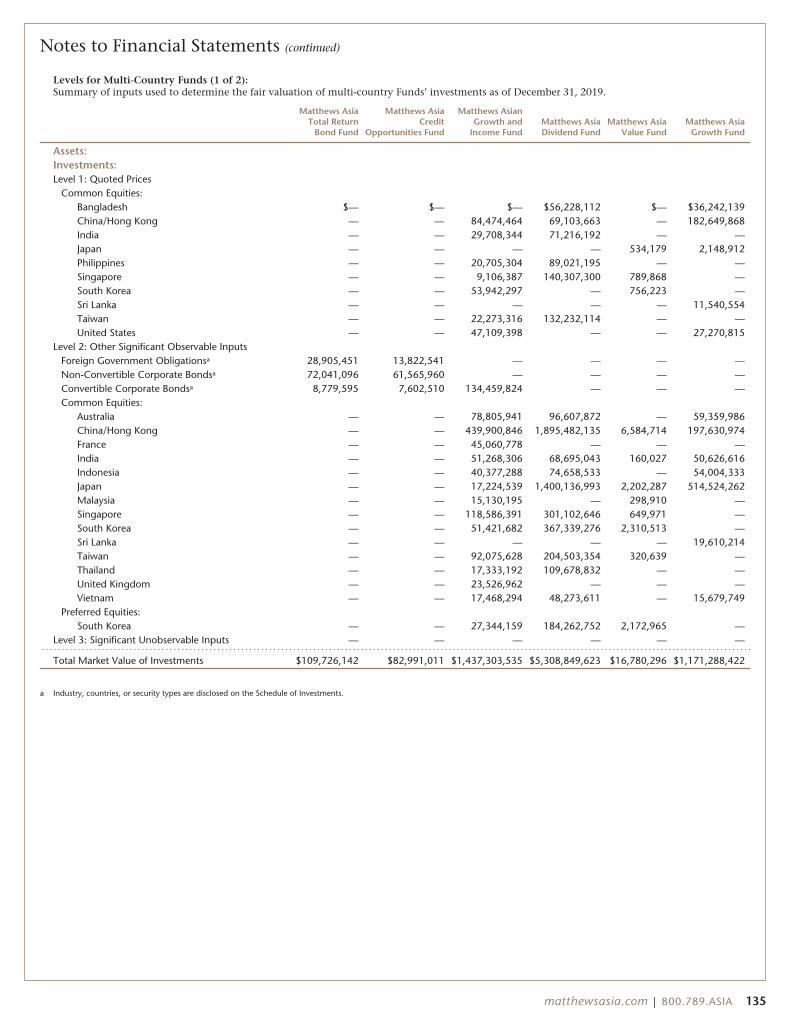
Notes to Financial Statements (continued)
Levels for Multi-Country Funds (1 of 2):Summary of inputs used to determine the fair valuation of multi-country Funds’ investments as of December 31, 2019.
Matthews AsiaTotal Return
Bond Fund
Matthews AsiaCredit
Opportunities Fund
Matthews AsianGrowth and
Income FundMatthews AsiaDividend Fund
Matthews AsiaValue Fund
Matthews AsiaGrowth Fund
Assets:Investments:Level 1: Quoted Prices
Common Equities:Bangladesh $— $— $— $56,228,112 $— $36,242,139China/Hong Kong — — 84,474,464 69,103,663 — 182,649,868India — — 29,708,344 71,216,192 — —Japan — — — — 534,179 2,148,912Philippines — — 20,705,304 89,021,195 — —Singapore — — 9,106,387 140,307,300 789,868 —South Korea — — 53,942,297 — 756,223 —Sri Lanka — — — — — 11,540,554Taiwan — — 22,273,316 132,232,114 — —United States — — 47,109,398 — — 27,270,815
Level 2: Other Significant Observable InputsForeign Government Obligationsa 28,905,451 13,822,541 — — — —Non-Convertible Corporate Bondsa 72,041,096 61,565,960 — — — —Convertible Corporate Bondsa 8,779,595 7,602,510 134,459,824 — — —Common Equities:
Australia — — 78,805,941 96,607,872 — 59,359,986China/Hong Kong — — 439,900,846 1,895,482,135 6,584,714 197,630,974France — — 45,060,778 — — —India — — 51,268,306 68,695,043 160,027 50,626,616Indonesia — — 40,377,288 74,658,533 — 54,004,333Japan — — 17,224,539 1,400,136,993 2,202,287 514,524,262Malaysia — — 15,130,195 — 298,910 —Singapore — — 118,586,391 301,102,646 649,971 —South Korea — — 51,421,682 367,339,276 2,310,513 —Sri Lanka — — — — — 19,610,214Taiwan — — 92,075,628 204,503,354 320,639 —Thailand — — 17,333,192 109,678,832 — —United Kingdom — — 23,526,962 — — —Vietnam — — 17,468,294 48,273,611 — 15,679,749
Preferred Equities:South Korea — — 27,344,159 184,262,752 2,172,965 —
Level 3: Significant Unobservable Inputs — — — — — —
Total Market Value of Investments $109,726,142 $82,991,011 $1,437,303,535 $5,308,849,623 $16,780,296 $1,171,288,422
a Industry, countries, or security types are disclosed on the Schedule of Investments.
matthewsasia.com | 800.789.ASIA 135
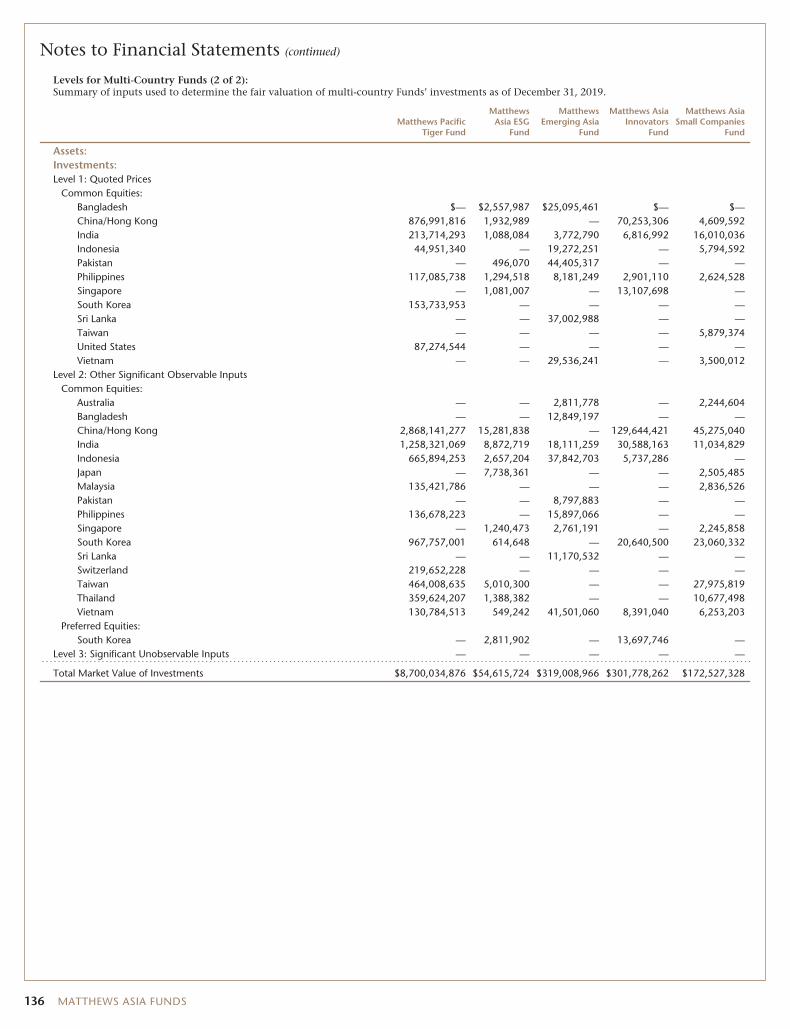
Notes to Financial Statements (continued)
Levels for Multi-Country Funds (2 of 2):Summary of inputs used to determine the fair valuation of multi-country Funds’ investments as of December 31, 2019.
Matthews PacificTiger Fund
MatthewsAsia ESG
Fund
MatthewsEmerging Asia
Fund
Matthews AsiaInnovators
Fund
Matthews AsiaSmall Companies
Fund
Assets:Investments:Level 1: Quoted Prices
Common Equities:Bangladesh $— $2,557,987 $25,095,461 $— $—China/Hong Kong 876,991,816 1,932,989 — 70,253,306 4,609,592India 213,714,293 1,088,084 3,772,790 6,816,992 16,010,036Indonesia 44,951,340 — 19,272,251 — 5,794,592Pakistan — 496,070 44,405,317 — —Philippines 117,085,738 1,294,518 8,181,249 2,901,110 2,624,528Singapore — 1,081,007 — 13,107,698 —South Korea 153,733,953 — — — —Sri Lanka — — 37,002,988 — —Taiwan — — — — 5,879,374United States 87,274,544 — — — —Vietnam — — 29,536,241 — 3,500,012
Level 2: Other Significant Observable InputsCommon Equities:
Australia — — 2,811,778 — 2,244,604Bangladesh — — 12,849,197 — —China/Hong Kong 2,868,141,277 15,281,838 — 129,644,421 45,275,040India 1,258,321,069 8,872,719 18,111,259 30,588,163 11,034,829Indonesia 665,894,253 2,657,204 37,842,703 5,737,286 —Japan — 7,738,361 — — 2,505,485Malaysia 135,421,786 — — — 2,836,526Pakistan — — 8,797,883 — —Philippines 136,678,223 — 15,897,066 — —Singapore — 1,240,473 2,761,191 — 2,245,858South Korea 967,757,001 614,648 — 20,640,500 23,060,332Sri Lanka — — 11,170,532 — —Switzerland 219,652,228 — — — —Taiwan 464,008,635 5,010,300 — — 27,975,819Thailand 359,624,207 1,388,382 — — 10,677,498Vietnam 130,784,513 549,242 41,501,060 8,391,040 6,253,203
Preferred Equities:South Korea — 2,811,902 — 13,697,746 —
Level 3: Significant Unobservable Inputs — — — — —
Total Market Value of Investments $8,700,034,876 $54,615,724 $319,008,966 $301,778,262 $172,527,328
136 MATTHEWS ASIA FUNDS
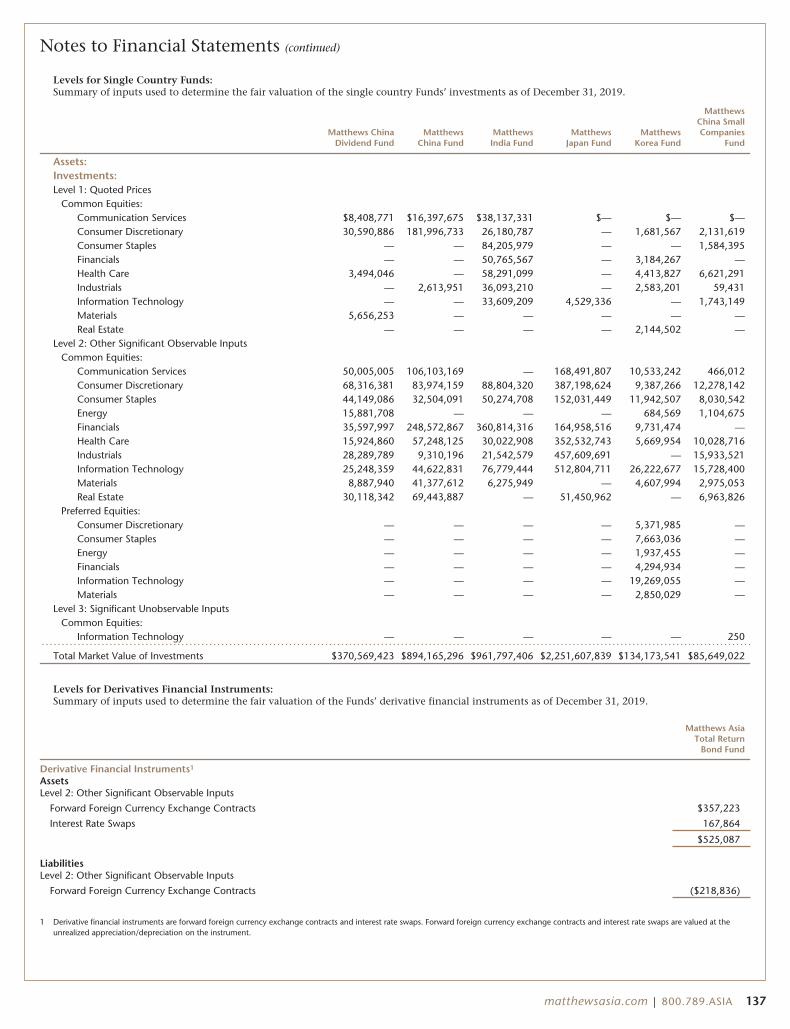
Notes to Financial Statements (continued)
Levels for Single Country Funds:Summary of inputs used to determine the fair valuation of the single country Funds’ investments as of December 31, 2019.
Matthews ChinaDividend Fund
MatthewsChina Fund
MatthewsIndia Fund
MatthewsJapan Fund
MatthewsKorea Fund
MatthewsChina SmallCompanies
Fund
Assets:Investments:Level 1: Quoted Prices
Common Equities:Communication Services $8,408,771 $16,397,675 $38,137,331 $— $— $—Consumer Discretionary 30,590,886 181,996,733 26,180,787 — 1,681,567 2,131,619Consumer Staples — — 84,205,979 — — 1,584,395Financials — — 50,765,567 — 3,184,267 —Health Care 3,494,046 — 58,291,099 — 4,413,827 6,621,291Industrials — 2,613,951 36,093,210 — 2,583,201 59,431Information Technology — — 33,609,209 4,529,336 — 1,743,149Materials 5,656,253 — — — — —Real Estate — — — — 2,144,502 —
Level 2: Other Significant Observable InputsCommon Equities:
Communication Services 50,005,005 106,103,169 — 168,491,807 10,533,242 466,012Consumer Discretionary 68,316,381 83,974,159 88,804,320 387,198,624 9,387,266 12,278,142Consumer Staples 44,149,086 32,504,091 50,274,708 152,031,449 11,942,507 8,030,542Energy 15,881,708 — — — 684,569 1,104,675Financials 35,597,997 248,572,867 360,814,316 164,958,516 9,731,474 —Health Care 15,924,860 57,248,125 30,022,908 352,532,743 5,669,954 10,028,716Industrials 28,289,789 9,310,196 21,542,579 457,609,691 — 15,933,521Information Technology 25,248,359 44,622,831 76,779,444 512,804,711 26,222,677 15,728,400Materials 8,887,940 41,377,612 6,275,949 — 4,607,994 2,975,053Real Estate 30,118,342 69,443,887 — 51,450,962 — 6,963,826
Preferred Equities:Consumer Discretionary — — — — 5,371,985 —Consumer Staples — — — — 7,663,036 —Energy — — — — 1,937,455 —Financials — — — — 4,294,934 —Information Technology — — — — 19,269,055 —Materials — — — — 2,850,029 —
Level 3: Significant Unobservable InputsCommon Equities:
Information Technology — — — — — 250
Total Market Value of Investments $370,569,423 $894,165,296 $961,797,406 $2,251,607,839 $134,173,541 $85,649,022
Levels for Derivatives Financial Instruments:Summary of inputs used to determine the fair valuation of the Funds’ derivative financial instruments as of December 31, 2019.
Matthews AsiaTotal Return
Bond Fund
Derivative Financial Instruments1
AssetsLevel 2: Other Significant Observable Inputs
Forward Foreign Currency Exchange Contracts $357,223
Interest Rate Swaps 167,864
$525,087
LiabilitiesLevel 2: Other Significant Observable Inputs
Forward Foreign Currency Exchange Contracts ($218,836)
1 Derivative financial instruments are forward foreign currency exchange contracts and interest rate swaps. Forward foreign currency exchange contracts and interest rate swaps are valued at theunrealized appreciation/depreciation on the instrument.
matthewsasia.com | 800.789.ASIA 137
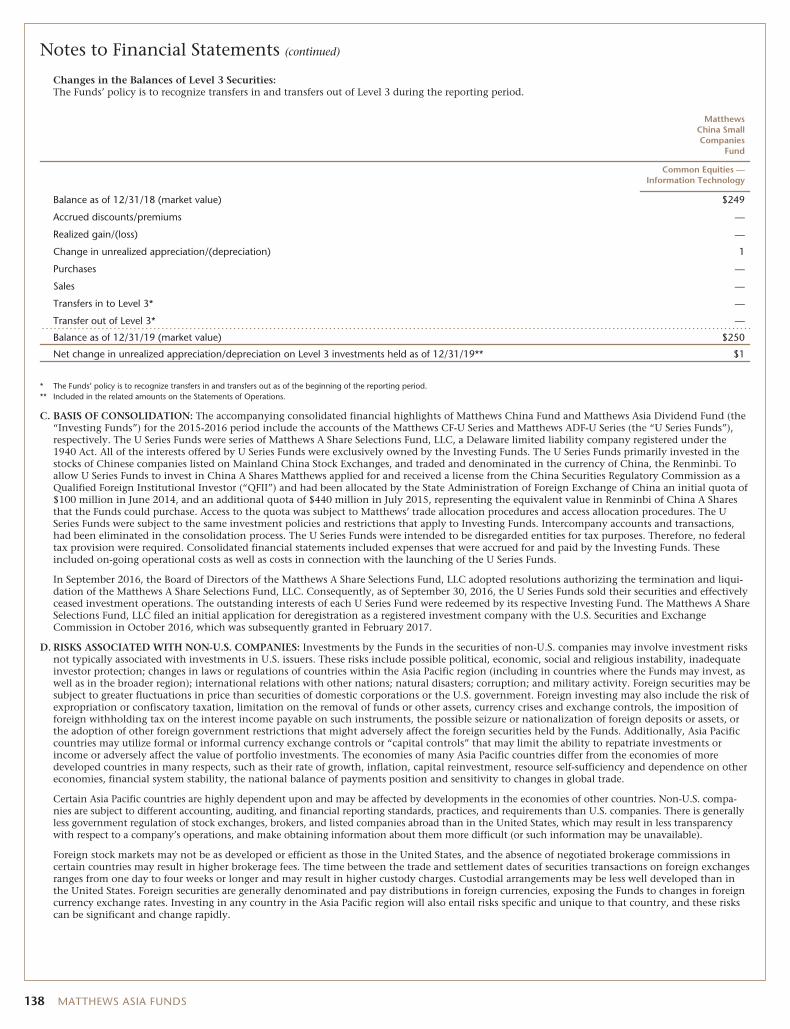
Notes to Financial Statements (continued)
Changes in the Balances of Level 3 Securities:The Funds’ policy is to recognize transfers in and transfers out of Level 3 during the reporting period.
MatthewsChina SmallCompanies
Fund
Common Equities —Information Technology
Balance as of 12/31/18 (market value) $249
Accrued discounts/premiums —
Realized gain/(loss) —
Change in unrealized appreciation/(depreciation) 1
Purchases —
Sales —
Transfers in to Level 3* —
Transfer out of Level 3* —
Balance as of 12/31/19 (market value) $250
Net change in unrealized appreciation/depreciation on Level 3 investments held as of 12/31/19** $1
* The Funds’ policy is to recognize transfers in and transfers out as of the beginning of the reporting period.** Included in the related amounts on the Statements of Operations.
C. BASIS OF CONSOLIDATION: The accompanying consolidated financial highlights of Matthews China Fund and Matthews Asia Dividend Fund (the“Investing Funds”) for the 2015-2016 period include the accounts of the Matthews CF-U Series and Matthews ADF-U Series (the “U Series Funds”),respectively. The U Series Funds were series of Matthews A Share Selections Fund, LLC, a Delaware limited liability company registered under the1940 Act. All of the interests offered by U Series Funds were exclusively owned by the Investing Funds. The U Series Funds primarily invested in thestocks of Chinese companies listed on Mainland China Stock Exchanges, and traded and denominated in the currency of China, the Renminbi. Toallow U Series Funds to invest in China A Shares Matthews applied for and received a license from the China Securities Regulatory Commission as aQualified Foreign Institutional Investor (“QFII”) and had been allocated by the State Administration of Foreign Exchange of China an initial quota of$100 million in June 2014, and an additional quota of $440 million in July 2015, representing the equivalent value in Renminbi of China A Sharesthat the Funds could purchase. Access to the quota was subject to Matthews’ trade allocation procedures and access allocation procedures. The USeries Funds were subject to the same investment policies and restrictions that apply to Investing Funds. Intercompany accounts and transactions,had been eliminated in the consolidation process. The U Series Funds were intended to be disregarded entities for tax purposes. Therefore, no federaltax provision were required. Consolidated financial statements included expenses that were accrued for and paid by the Investing Funds. Theseincluded on-going operational costs as well as costs in connection with the launching of the U Series Funds.
In September 2016, the Board of Directors of the Matthews A Share Selections Fund, LLC adopted resolutions authorizing the termination and liqui-dation of the Matthews A Share Selections Fund, LLC. Consequently, as of September 30, 2016, the U Series Funds sold their securities and effectivelyceased investment operations. The outstanding interests of each U Series Fund were redeemed by its respective Investing Fund. The Matthews A ShareSelections Fund, LLC filed an initial application for deregistration as a registered investment company with the U.S. Securities and ExchangeCommission in October 2016, which was subsequently granted in February 2017.
D. RISKS ASSOCIATED WITH NON-U.S. COMPANIES: Investments by the Funds in the securities of non-U.S. companies may involve investment risksnot typically associated with investments in U.S. issuers. These risks include possible political, economic, social and religious instability, inadequateinvestor protection; changes in laws or regulations of countries within the Asia Pacific region (including in countries where the Funds may invest, aswell as in the broader region); international relations with other nations; natural disasters; corruption; and military activity. Foreign securities may besubject to greater fluctuations in price than securities of domestic corporations or the U.S. government. Foreign investing may also include the risk ofexpropriation or confiscatory taxation, limitation on the removal of funds or other assets, currency crises and exchange controls, the imposition offoreign withholding tax on the interest income payable on such instruments, the possible seizure or nationalization of foreign deposits or assets, orthe adoption of other foreign government restrictions that might adversely affect the foreign securities held by the Funds. Additionally, Asia Pacificcountries may utilize formal or informal currency exchange controls or “capital controls” that may limit the ability to repatriate investments orincome or adversely affect the value of portfolio investments. The economies of many Asia Pacific countries differ from the economies of moredeveloped countries in many respects, such as their rate of growth, inflation, capital reinvestment, resource self-sufficiency and dependence on othereconomies, financial system stability, the national balance of payments position and sensitivity to changes in global trade.
Certain Asia Pacific countries are highly dependent upon and may be affected by developments in the economies of other countries. Non-U.S. compa-nies are subject to different accounting, auditing, and financial reporting standards, practices, and requirements than U.S. companies. There is generallyless government regulation of stock exchanges, brokers, and listed companies abroad than in the United States, which may result in less transparencywith respect to a company’s operations, and make obtaining information about them more difficult (or such information may be unavailable).
Foreign stock markets may not be as developed or efficient as those in the United States, and the absence of negotiated brokerage commissions incertain countries may result in higher brokerage fees. The time between the trade and settlement dates of securities transactions on foreign exchangesranges from one day to four weeks or longer and may result in higher custody charges. Custodial arrangements may be less well developed than inthe United States. Foreign securities are generally denominated and pay distributions in foreign currencies, exposing the Funds to changes in foreigncurrency exchange rates. Investing in any country in the Asia Pacific region will also entail risks specific and unique to that country, and these riskscan be significant and change rapidly.
138 MATTHEWS ASIA FUNDS
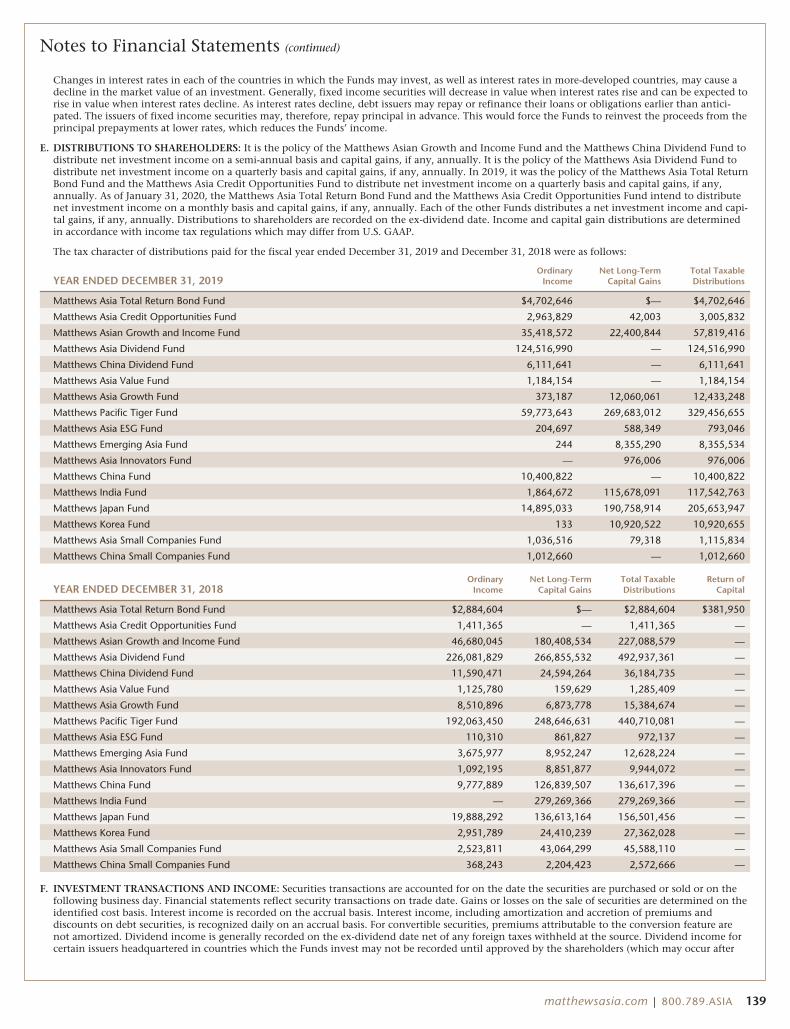
Notes to Financial Statements (continued)
Changes in interest rates in each of the countries in which the Funds may invest, as well as interest rates in more-developed countries, may cause adecline in the market value of an investment. Generally, fixed income securities will decrease in value when interest rates rise and can be expected torise in value when interest rates decline. As interest rates decline, debt issuers may repay or refinance their loans or obligations earlier than antici-pated. The issuers of fixed income securities may, therefore, repay principal in advance. This would force the Funds to reinvest the proceeds from theprincipal prepayments at lower rates, which reduces the Funds’ income.
E. DISTRIBUTIONS TO SHAREHOLDERS: It is the policy of the Matthews Asian Growth and Income Fund and the Matthews China Dividend Fund todistribute net investment income on a semi-annual basis and capital gains, if any, annually. It is the policy of the Matthews Asia Dividend Fund todistribute net investment income on a quarterly basis and capital gains, if any, annually. In 2019, it was the policy of the Matthews Asia Total ReturnBond Fund and the Matthews Asia Credit Opportunities Fund to distribute net investment income on a quarterly basis and capital gains, if any,annually. As of January 31, 2020, the Matthews Asia Total Return Bond Fund and the Matthews Asia Credit Opportunities Fund intend to distributenet investment income on a monthly basis and capital gains, if any, annually. Each of the other Funds distributes a net investment income and capi-tal gains, if any, annually. Distributions to shareholders are recorded on the ex-dividend date. Income and capital gain distributions are determinedin accordance with income tax regulations which may differ from U.S. GAAP.
The tax character of distributions paid for the fiscal year ended December 31, 2019 and December 31, 2018 were as follows:
YEAR ENDED DECEMBER 31, 2019Ordinary
IncomeNet Long-Term
Capital GainsTotal TaxableDistributions
Matthews Asia Total Return Bond Fund $4,702,646 $— $4,702,646
Matthews Asia Credit Opportunities Fund 2,963,829 42,003 3,005,832
Matthews Asian Growth and Income Fund 35,418,572 22,400,844 57,819,416
Matthews Asia Dividend Fund 124,516,990 — 124,516,990
Matthews China Dividend Fund 6,111,641 — 6,111,641
Matthews Asia Value Fund 1,184,154 — 1,184,154
Matthews Asia Growth Fund 373,187 12,060,061 12,433,248
Matthews Pacific Tiger Fund 59,773,643 269,683,012 329,456,655
Matthews Asia ESG Fund 204,697 588,349 793,046
Matthews Emerging Asia Fund 244 8,355,290 8,355,534
Matthews Asia Innovators Fund — 976,006 976,006
Matthews China Fund 10,400,822 — 10,400,822
Matthews India Fund 1,864,672 115,678,091 117,542,763
Matthews Japan Fund 14,895,033 190,758,914 205,653,947
Matthews Korea Fund 133 10,920,522 10,920,655
Matthews Asia Small Companies Fund 1,036,516 79,318 1,115,834
Matthews China Small Companies Fund 1,012,660 — 1,012,660
YEAR ENDED DECEMBER 31, 2018Ordinary
IncomeNet Long-Term
Capital GainsTotal TaxableDistributions
Return ofCapital
Matthews Asia Total Return Bond Fund $2,884,604 $— $2,884,604 $381,950
Matthews Asia Credit Opportunities Fund 1,411,365 — 1,411,365 —
Matthews Asian Growth and Income Fund 46,680,045 180,408,534 227,088,579 —
Matthews Asia Dividend Fund 226,081,829 266,855,532 492,937,361 —
Matthews China Dividend Fund 11,590,471 24,594,264 36,184,735 —
Matthews Asia Value Fund 1,125,780 159,629 1,285,409 —
Matthews Asia Growth Fund 8,510,896 6,873,778 15,384,674 —
Matthews Pacific Tiger Fund 192,063,450 248,646,631 440,710,081 —
Matthews Asia ESG Fund 110,310 861,827 972,137 —
Matthews Emerging Asia Fund 3,675,977 8,952,247 12,628,224 —
Matthews Asia Innovators Fund 1,092,195 8,851,877 9,944,072 —
Matthews China Fund 9,777,889 126,839,507 136,617,396 —
Matthews India Fund — 279,269,366 279,269,366 —
Matthews Japan Fund 19,888,292 136,613,164 156,501,456 —
Matthews Korea Fund 2,951,789 24,410,239 27,362,028 —
Matthews Asia Small Companies Fund 2,523,811 43,064,299 45,588,110 —
Matthews China Small Companies Fund 368,243 2,204,423 2,572,666 —
F. INVESTMENT TRANSACTIONS AND INCOME: Securities transactions are accounted for on the date the securities are purchased or sold or on thefollowing business day. Financial statements reflect security transactions on trade date. Gains or losses on the sale of securities are determined on theidentified cost basis. Interest income is recorded on the accrual basis. Interest income, including amortization and accretion of premiums anddiscounts on debt securities, is recognized daily on an accrual basis. For convertible securities, premiums attributable to the conversion feature arenot amortized. Dividend income is generally recorded on the ex-dividend date net of any foreign taxes withheld at the source. Dividend income forcertain issuers headquartered in countries which the Funds invest may not be recorded until approved by the shareholders (which may occur after
matthewsasia.com | 800.789.ASIA 139
Notes to Financial Statements (continued)
the ex-dividend date) if, in the judgment of management, such dividends are not reasonably determined as of the ex-dividend date. Income and real-ized and unrealized gains or losses on investments are allocated to each class of shares based on its relative net assets.
The Funds may be subject to foreign taxation related to income received, capital gains on the sale of securities and certain foreign currency trans-actions in the foreign jurisdictions in which they invest. Foreign taxes, if any, are recorded based on the tax regulations and rates that exist in theforeign markets in which the Funds invest. When a capital gain tax is determined to apply, the Funds record an estimated deferred tax liability in anamount that may be payable if the securities were disposed of on the valuation date.
G. FUND EXPENSE ALLOCATIONS: The Funds account separately for the assets, liabilities and operations of each Fund. Estimated expenses are accrueddaily. Direct expenses of each Fund or class are charged to that Fund or class while general expenses are allocated pro-rata among the Funds based onnet assets or other appropriate methods.
H. CASH, CASH OVERDRAFTS, AND FOREIGN CURRENCY: QFII accounts (i.e., the accounts through which the QFII quota is accessed) are requiredby the local market to maintain a cash reserve. The cash reserve is based upon a fixed ratio of the QFII’s approved investment quota, which is definedas the amount remitted into its special Renminbi (RMB) cash account. These amounts, if any, are included in “Segregated foreign currency at value”on the Statements of Assets and Liabilities. The fixed ratio is set at 0.08 percent for the Shanghai and 0.06 percent for the Shenzhen market. Whenany of the Funds’ cash balances are overdrawn, a Fund is charged an overdraft fee by the custodian of 1.00% above the 30-day LIBOR rate on out-standing balances. These amounts, if any, are included in “Other expenses” on the Statements of Operations.
I. USE OF ESTIMATES: The preparation of financial statements in conformity with U.S. GAAP requires management to make estimates and assump-tions that affect the amounts reported in the financial statements and accompanying notes. Actual results may differ from those estimates.
J. RECENT ACCOUNTING GUIDANCE: In March 2017, the Financial Accounting Standards Board issued amended guidance to shorten the amor-tization period for certain callable debt securities, held at premium. The guidance is effective for fiscal years and interim periods beginning afterDecember 15, 2018. Adoption will have no effect on the Funds’ net assets. Management is evaluating the impact, if any, of this guidance on theFunds’ results of operations and financial disclosures.
On August 28, 2018, the FASB issued ASU 2018-13, “Disclosure Framework—Changes to the Disclosure Requirements for Fair Value Measurement”,which amends the fair value measurement disclosure requirements under U.S. GAAP. The amendments of ASU 2018-13 include new, eliminated, andmodified disclosure requirements. In addition, the amendments clarify that materiality is an appropriate consideration of entities when evaluatingdisclosure requirements. The ASU is effective for all entities for fiscal years beginning after December 15, 2019, including interim periods therein. Anentity is permitted to early adopt any eliminated or modified disclosures upon issuance of this ASU and delay adoption of the new disclosures untiltheir effective date. As such, each Fund has early adopted the eliminated and modified disclosures, including the amount of and reasons for transfersbetween Level 1 and Level 2 of the fair value hierarchy, as permitted by this ASU. Management believes this guidance will have an immaterial impacton the Funds.
3. DERIVATIVE FINANCIAL INSTRUMENTSEach of the Matthews Asia Total Return Bond Fund and the Matthews Asia Credit Opportunities Fund engages in derivative transactions for a varietyof purposes, including managing interest rate, currency and credit exposure. Derivative transactions in which each Fund may engage include finan-cial futures contracts, swaps and/or forward foreign currency exchange contracts.
Certain derivative transactions may result in each Fund’s exposure to a currency to exceed the value of the Fund’s assets and the Fund could beexposed to currency risk whether or not it holds a bond or other instrument denominated in that currency. The gross notional value of derivativefinancial instruments and transactions could exceed the value of the Fund’s net assets, although the net market value of these instruments andtransactions, on a marked-to-market basis, at most times, is expected to be substantially lower.
The primary risks associated with the use of derivative financial instruments are: (i) Matthews may not correctly predict the direction of currencyexchange rates, interest rates, security prices, or other economic factors; (ii) Matthews may not correctly predict changes in the value of derivativefinancial instruments and related underlying instruments or assets, which may result in disproportionately increased losses and/or reduced oppor-tunities for gains; (iii) imperfect correlation between the change in market value of the securities held by a Fund and the price of financial futurescontracts and credit default swaps contracts; (iv) the lack of, or a reduction in the liquidity of, any secondary market for the instrument, and theresulting inability to close the position (or exit the position) when desired; (v) losses, which are potentially unlimited, due to unanticipated marketmovements; (vi) the value of the instrument may change unfavorably due to movements in the value of the referenced foreign currencies; (vii) aFund may suffer disproportionately heavy losses relative to the amount invested; (viii) changes in the value of the derivatives may not match or fullyoffset changes in the value of hedged or related portfolio securities, thereby failing to achieve the hedging or investment purpose for the derivativetransaction; and (ix) the other party to the instrument may fail to fulfill its obligation.
Forward Foreign Currency Exchange Contracts: The Matthews Asia Total Return Bond Fund and the Matthews Asia Credit Opportunities Fundenter into forward foreign currency exchange contracts to gain or reduce exposure to foreign currency exchange rate risk. A forward foreign currencyexchange contract is an agreement between two parties to buy and sell a currency at a set exchange rate on a future date. The contract is marked-to-market daily and the change in market value is recorded by the Fund as an unrealized gain or loss. When the contract is closed, the Fund records arealized gain or loss equal to the difference between the value at the time it was opened and the value at the time it was closed. The Matthews AsiaTotal Return Bond Fund and the Matthews Asia Credit Opportunities Fund do not offset financial assets and financial liabilities on forward foreigncurrency contacts in the Statements of Assets and Liabilities as they are not subject to netting arrangements.
Swaps: The Matthews Asia Total Return Bond Fund and the Matthews Asia Credit Opportunities Fund enter into swap contracts to manage exposureto issuers, markets and securities to reduce their risk exposure to defaults of corporate and/or sovereign issuers or to create exposure to corporate and/or sovereign issuers to which they are not otherwise exposed (credit risk). Such contracts are agreements between the Funds and a counterparty tomake periodic net payments on a specified notional amount or a net payment upon termination. Swap agreements are privately negotiated in theOTC market and may be entered into as a bilateral contract (“OTC Swaps”) or centrally cleared (“centrally cleared swaps”).
For OTC swaps, any upfront premiums paid and any upfront fees received are shown as swap premiums paid and swap premiums received,respectively, in the Statements of Assets and Liabilities and amortized over the term of the contract. The daily fluctuation in market value is recordedas unrealized appreciation (depreciation) on OTC Swaps in the Statements of Assets and Liabilities. Payments received or paid are recorded in theStatements of Operations as realized gains or losses, respectively. When an OTC swap is terminated, a realized gain or loss is recorded in theStatements of Operations equal to the difference between the proceeds from (or cost of) the closing transaction and the Funds’ basis in the contract,if any. Generally, the basis of the contract is the amortized premium received or paid.
140 MATTHEWS ASIA FUNDS
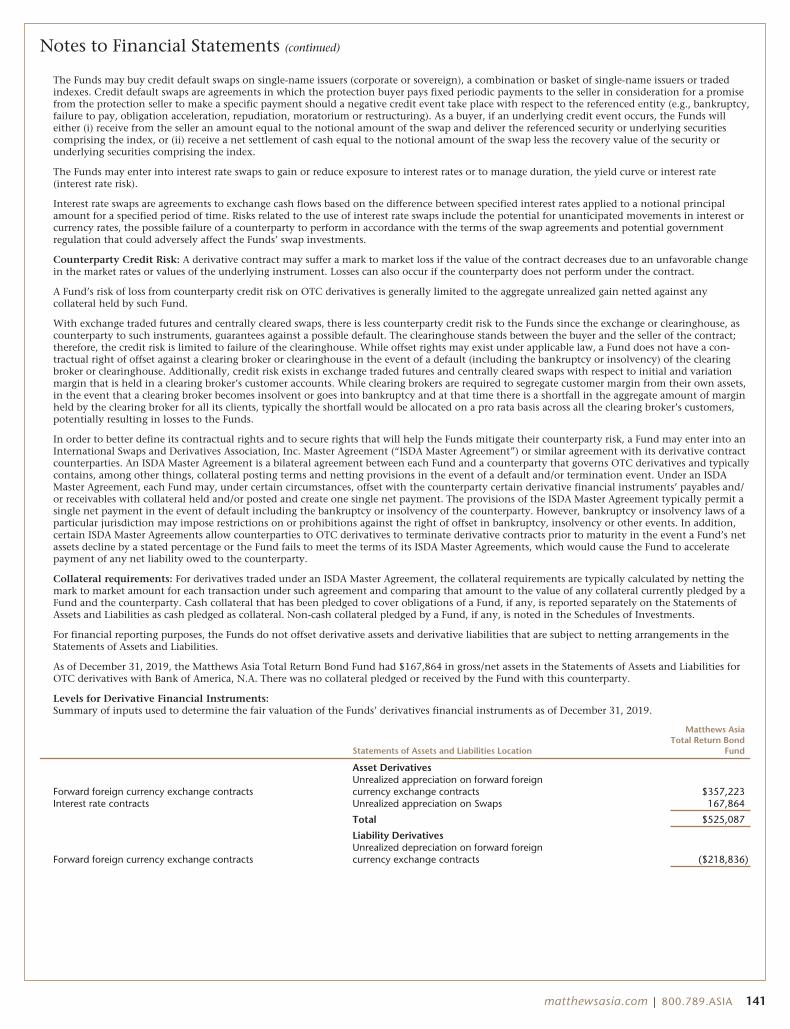
Notes to Financial Statements (continued)
The Funds may buy credit default swaps on single-name issuers (corporate or sovereign), a combination or basket of single-name issuers or tradedindexes. Credit default swaps are agreements in which the protection buyer pays fixed periodic payments to the seller in consideration for a promisefrom the protection seller to make a specific payment should a negative credit event take place with respect to the referenced entity (e.g., bankruptcy,failure to pay, obligation acceleration, repudiation, moratorium or restructuring). As a buyer, if an underlying credit event occurs, the Funds willeither (i) receive from the seller an amount equal to the notional amount of the swap and deliver the referenced security or underlying securitiescomprising the index, or (ii) receive a net settlement of cash equal to the notional amount of the swap less the recovery value of the security orunderlying securities comprising the index.
The Funds may enter into interest rate swaps to gain or reduce exposure to interest rates or to manage duration, the yield curve or interest rate(interest rate risk).
Interest rate swaps are agreements to exchange cash flows based on the difference between specified interest rates applied to a notional principalamount for a specified period of time. Risks related to the use of interest rate swaps include the potential for unanticipated movements in interest orcurrency rates, the possible failure of a counterparty to perform in accordance with the terms of the swap agreements and potential governmentregulation that could adversely affect the Funds’ swap investments.
Counterparty Credit Risk: A derivative contract may suffer a mark to market loss if the value of the contract decreases due to an unfavorable changein the market rates or values of the underlying instrument. Losses can also occur if the counterparty does not perform under the contract.
A Fund’s risk of loss from counterparty credit risk on OTC derivatives is generally limited to the aggregate unrealized gain netted against anycollateral held by such Fund.
With exchange traded futures and centrally cleared swaps, there is less counterparty credit risk to the Funds since the exchange or clearinghouse, ascounterparty to such instruments, guarantees against a possible default. The clearinghouse stands between the buyer and the seller of the contract;therefore, the credit risk is limited to failure of the clearinghouse. While offset rights may exist under applicable law, a Fund does not have a con-tractual right of offset against a clearing broker or clearinghouse in the event of a default (including the bankruptcy or insolvency) of the clearingbroker or clearinghouse. Additionally, credit risk exists in exchange traded futures and centrally cleared swaps with respect to initial and variationmargin that is held in a clearing broker’s customer accounts. While clearing brokers are required to segregate customer margin from their own assets,in the event that a clearing broker becomes insolvent or goes into bankruptcy and at that time there is a shortfall in the aggregate amount of marginheld by the clearing broker for all its clients, typically the shortfall would be allocated on a pro rata basis across all the clearing broker’s customers,potentially resulting in losses to the Funds.
In order to better define its contractual rights and to secure rights that will help the Funds mitigate their counterparty risk, a Fund may enter into anInternational Swaps and Derivatives Association, Inc. Master Agreement (“ISDA Master Agreement”) or similar agreement with its derivative contractcounterparties. An ISDA Master Agreement is a bilateral agreement between each Fund and a counterparty that governs OTC derivatives and typicallycontains, among other things, collateral posting terms and netting provisions in the event of a default and/or termination event. Under an ISDAMaster Agreement, each Fund may, under certain circumstances, offset with the counterparty certain derivative financial instruments’ payables and/or receivables with collateral held and/or posted and create one single net payment. The provisions of the ISDA Master Agreement typically permit asingle net payment in the event of default including the bankruptcy or insolvency of the counterparty. However, bankruptcy or insolvency laws of aparticular jurisdiction may impose restrictions on or prohibitions against the right of offset in bankruptcy, insolvency or other events. In addition,certain ISDA Master Agreements allow counterparties to OTC derivatives to terminate derivative contracts prior to maturity in the event a Fund’s netassets decline by a stated percentage or the Fund fails to meet the terms of its ISDA Master Agreements, which would cause the Fund to acceleratepayment of any net liability owed to the counterparty.
Collateral requirements: For derivatives traded under an ISDA Master Agreement, the collateral requirements are typically calculated by netting themark to market amount for each transaction under such agreement and comparing that amount to the value of any collateral currently pledged by aFund and the counterparty. Cash collateral that has been pledged to cover obligations of a Fund, if any, is reported separately on the Statements ofAssets and Liabilities as cash pledged as collateral. Non-cash collateral pledged by a Fund, if any, is noted in the Schedules of Investments.
For financial reporting purposes, the Funds do not offset derivative assets and derivative liabilities that are subject to netting arrangements in theStatements of Assets and Liabilities.
As of December 31, 2019, the Matthews Asia Total Return Bond Fund had $167,864 in gross/net assets in the Statements of Assets and Liabilities forOTC derivatives with Bank of America, N.A. There was no collateral pledged or received by the Fund with this counterparty.
Levels for Derivative Financial Instruments:Summary of inputs used to determine the fair valuation of the Funds’ derivatives financial instruments as of December 31, 2019.
Statements of Assets and Liabilities Location
Matthews AsiaTotal Return Bond
Fund
Asset DerivativesUnrealized appreciation on forward foreign
Forward foreign currency exchange contracts currency exchange contracts $357,223Interest rate contracts Unrealized appreciation on Swaps 167,864
Total $525,087
Liability DerivativesUnrealized depreciation on forward foreign
Forward foreign currency exchange contracts currency exchange contracts ($218,836)
matthewsasia.com | 800.789.ASIA 141
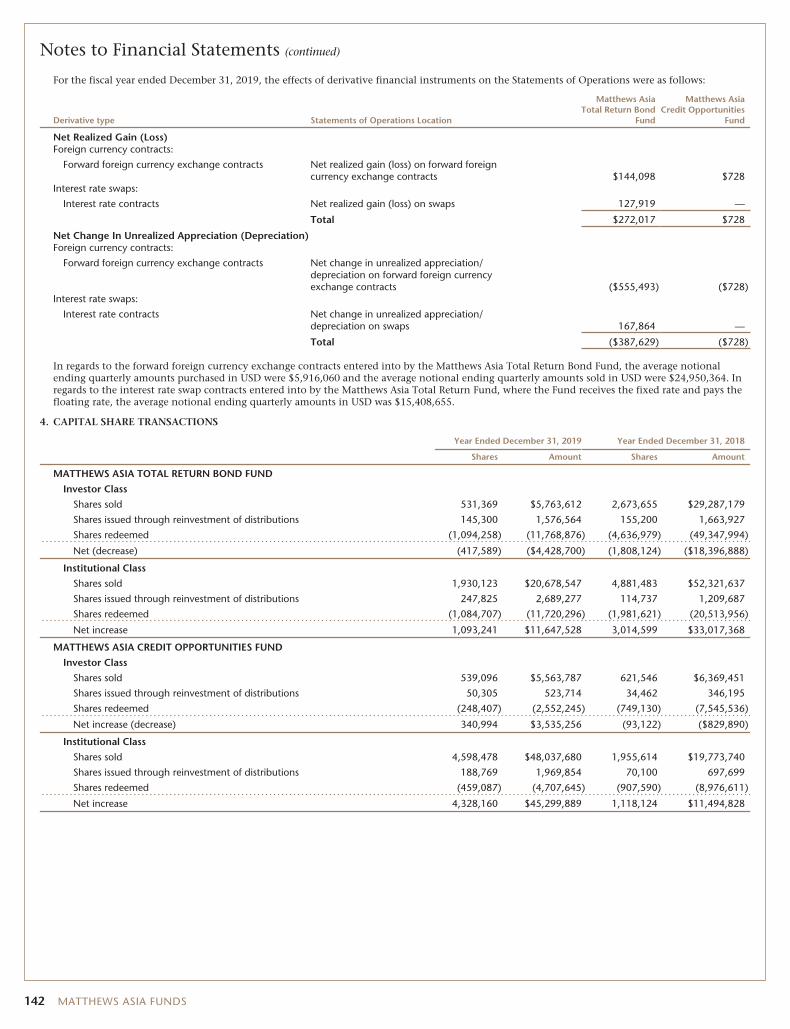
Notes to Financial Statements (continued)
For the fiscal year ended December 31, 2019, the effects of derivative financial instruments on the Statements of Operations were as follows:
Derivative type Statements of Operations Location
Matthews AsiaTotal Return Bond
Fund
Matthews AsiaCredit Opportunities
Fund
Net Realized Gain (Loss)Foreign currency contracts:
Forward foreign currency exchange contracts Net realized gain (loss) on forward foreigncurrency exchange contracts $144,098 $728
Interest rate swaps:
Interest rate contracts Net realized gain (loss) on swaps 127,919 —
Total $272,017 $728
Net Change In Unrealized Appreciation (Depreciation)Foreign currency contracts:
Forward foreign currency exchange contracts Net change in unrealized appreciation/depreciation on forward foreign currencyexchange contracts ($555,493) ($728)
Interest rate swaps:
Interest rate contracts Net change in unrealized appreciation/depreciation on swaps 167,864 —
Total ($387,629) ($728)
In regards to the forward foreign currency exchange contracts entered into by the Matthews Asia Total Return Bond Fund, the average notionalending quarterly amounts purchased in USD were $5,916,060 and the average notional ending quarterly amounts sold in USD were $24,950,364. Inregards to the interest rate swap contracts entered into by the Matthews Asia Total Return Fund, where the Fund receives the fixed rate and pays thefloating rate, the average notional ending quarterly amounts in USD was $15,408,655.
4. CAPITAL SHARE TRANSACTIONS
Year Ended December 31, 2019 Year Ended December 31, 2018
Shares Amount Shares Amount
MATTHEWS ASIA TOTAL RETURN BOND FUND
Investor Class
Shares sold 531,369 $5,763,612 2,673,655 $29,287,179
Shares issued through reinvestment of distributions 145,300 1,576,564 155,200 1,663,927
Shares redeemed (1,094,258) (11,768,876) (4,636,979) (49,347,994)
Net (decrease) (417,589) ($4,428,700) (1,808,124) ($18,396,888)
Institutional Class
Shares sold 1,930,123 $20,678,547 4,881,483 $52,321,637
Shares issued through reinvestment of distributions 247,825 2,689,277 114,737 1,209,687
Shares redeemed (1,084,707) (11,720,296) (1,981,621) (20,513,956)
Net increase 1,093,241 $11,647,528 3,014,599 $33,017,368
MATTHEWS ASIA CREDIT OPPORTUNITIES FUND
Investor Class
Shares sold 539,096 $5,563,787 621,546 $6,369,451
Shares issued through reinvestment of distributions 50,305 523,714 34,462 346,195
Shares redeemed (248,407) (2,552,245) (749,130) (7,545,536)
Net increase (decrease) 340,994 $3,535,256 (93,122) ($829,890)
Institutional Class
Shares sold 4,598,478 $48,037,680 1,955,614 $19,773,740
Shares issued through reinvestment of distributions 188,769 1,969,854 70,100 697,699
Shares redeemed (459,087) (4,707,645) (907,590) (8,976,611)
Net increase 4,328,160 $45,299,889 1,118,124 $11,494,828
142 MATTHEWS ASIA FUNDS

Notes to Financial Statements (continued)
Year Ended December 31, 2019 Year Ended December 31, 2018
Shares Amount Shares Amount
MATTHEWS ASIAN GROWTH AND INCOME FUND
Investor Class
Shares sold 4,872,266 $72,535,793 7,692,701 $124,999,548
Shares issued through reinvestment of distributions 1,729,925 26,744,737 6,291,585 90,673,150
Shares redeemed (18,009,566) (272,354,103) (44,530,783) (727,925,822)
Net (decrease) (11,407,375) ($173,073,573) (30,546,497) ($512,253,124)
Institutional Class
Shares sold 25,459,302 $387,665,569 19,468,288 $325,288,280
Shares issued through reinvestment of distributions 1,643,462 25,409,900 5,846,765 84,477,052
Shares redeemed (22,634,082) (341,434,957) (57,543,636) (917,676,867)
Net increase (decrease) 4,468,682 $71,640,512 (32,228,583) ($507,911,535)
MATTHEWS ASIA DIVIDEND FUND
Investor Class
Shares sold 23,080,251 $386,877,636 41,217,543 $788,692,238
Shares issued through reinvestment of distributions 3,039,442 51,047,011 11,593,833 197,404,775
Shares redeemed (63,800,331) (1,067,632,982) (70,902,063) (1,313,499,842)
Net (decrease) (37,680,638) ($629,708,335) (18,090,687) ($327,402,829)
Institutional Class
Shares sold 47,879,707 $804,748,356 60,848,321 $1,153,786,170
Shares issued through reinvestment of distributions 3,784,649 63,570,444 13,060,327 222,009,324
Shares redeemed (66,039,551) (1,110,681,954) (50,882,787) (904,298,337)
Net increase (decrease) (14,375,195) ($242,363,154) 23,025,861 $471,497,157
MATTHEWS CHINA DIVIDEND FUND
Investor Class
Shares sold 8,109,547 $128,681,746 5,966,861 $103,895,668
Shares issued through reinvestment of distributions 266,077 4,182,441 1,359,166 20,830,044
Shares redeemed (6,173,811) (97,098,245) (8,392,276) (143,578,333)
Net increase (decrease) 2,201,813 $35,765,942 (1,066,249) ($18,852,621)
Institutional Class
Shares sold 4,062,893 $64,306,979 3,759,608 $67,020,667
Shares issued through reinvestment of distributions 113,134 1,780,502 525,095 8,055,027
Shares redeemed (1,706,106) (26,787,635) (2,258,122) (36,385,874)
Net increase 2,469,921 $39,299,846 2,026,581 $38,689,820
MATTHEWS ASIA VALUE FUND
Investor Class
Shares sold 519,639 $5,951,759 1,051,874 $13,252,147
Shares issued through reinvestment of distributions 71,981 781,711 72,411 795,079
Shares redeemed (896,532) (10,062,716) (1,753,683) (21,328,776)
Net (decrease) (304,912) ($3,329,246) (629,398) ($7,281,550)
Institutional Class
Shares sold 517,708 $5,900,220 466,954 $5,447,710
Shares issued through reinvestment of distributions 31,352 337,973 18,592 202,462
Shares redeemed (586,821) (6,627,976) (114,752) (1,403,647)
Net increase (decrease) (37,761) ($389,783) 370,794 $4,246,525
MATTHEWS ASIA GROWTH FUND
Investor Class
Shares sold 4,541,007 $115,967,177 10,786,092 $298,040,265
Shares issued through reinvestment of distributions 171,836 4,780,476 261,406 6,250,221
Shares redeemed (7,367,330) (188,876,592) (10,780,916) (285,324,564)
Net increase (decrease) (2,654,487) ($68,128,939) 266,582 $18,965,922
Institutional Class
Shares sold 7,619,976 $196,483,749 13,280,478 $366,402,524
Shares issued through reinvestment of distributions 173,818 4,875,584 254,228 6,121,801
Shares redeemed (3,742,483) (96,806,547) (3,723,336) (95,217,584)
Net increase 4,051,311 $104,552,786 9,811,370 $277,306,741
matthewsasia.com | 800.789.ASIA 143
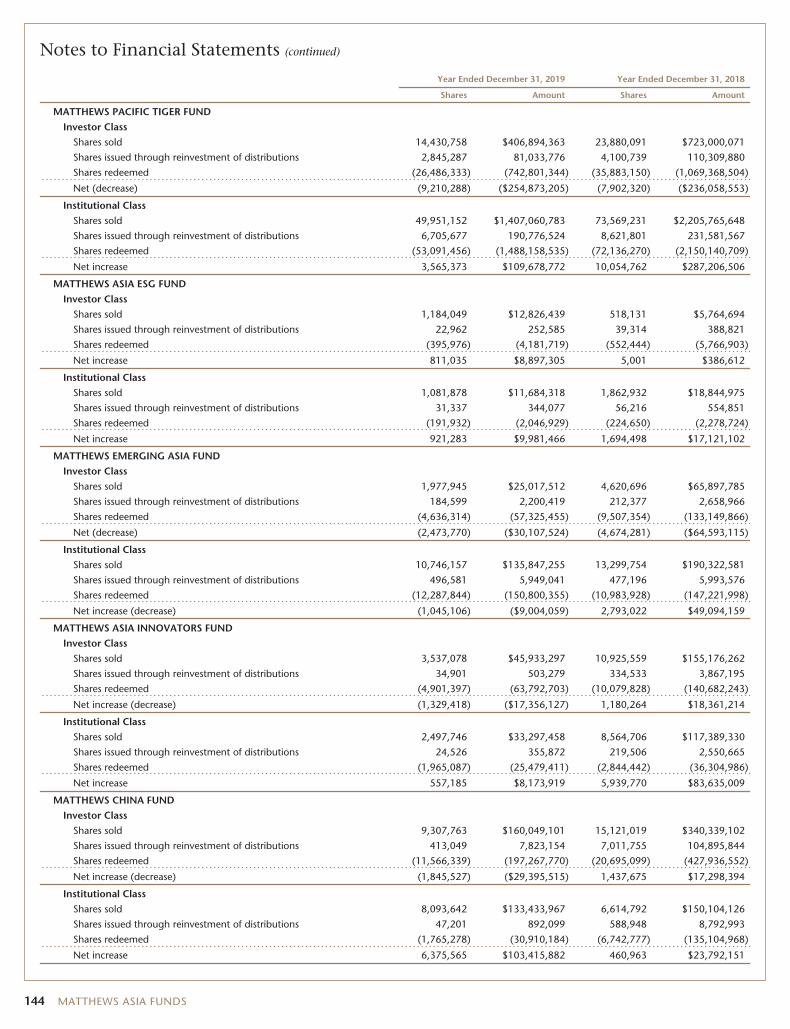
Notes to Financial Statements (continued)
Year Ended December 31, 2019 Year Ended December 31, 2018
Shares Amount Shares Amount
MATTHEWS PACIFIC TIGER FUND
Investor Class
Shares sold 14,430,758 $406,894,363 23,880,091 $723,000,071
Shares issued through reinvestment of distributions 2,845,287 81,033,776 4,100,739 110,309,880
Shares redeemed (26,486,333) (742,801,344) (35,883,150) (1,069,368,504)
Net (decrease) (9,210,288) ($254,873,205) (7,902,320) ($236,058,553)
Institutional Class
Shares sold 49,951,152 $1,407,060,783 73,569,231 $2,205,765,648
Shares issued through reinvestment of distributions 6,705,677 190,776,524 8,621,801 231,581,567
Shares redeemed (53,091,456) (1,488,158,535) (72,136,270) (2,150,140,709)
Net increase 3,565,373 $109,678,772 10,054,762 $287,206,506
MATTHEWS ASIA ESG FUND
Investor Class
Shares sold 1,184,049 $12,826,439 518,131 $5,764,694
Shares issued through reinvestment of distributions 22,962 252,585 39,314 388,821
Shares redeemed (395,976) (4,181,719) (552,444) (5,766,903)
Net increase 811,035 $8,897,305 5,001 $386,612
Institutional Class
Shares sold 1,081,878 $11,684,318 1,862,932 $18,844,975
Shares issued through reinvestment of distributions 31,337 344,077 56,216 554,851
Shares redeemed (191,932) (2,046,929) (224,650) (2,278,724)
Net increase 921,283 $9,981,466 1,694,498 $17,121,102
MATTHEWS EMERGING ASIA FUND
Investor Class
Shares sold 1,977,945 $25,017,512 4,620,696 $65,897,785
Shares issued through reinvestment of distributions 184,599 2,200,419 212,377 2,658,966
Shares redeemed (4,636,314) (57,325,455) (9,507,354) (133,149,866)
Net (decrease) (2,473,770) ($30,107,524) (4,674,281) ($64,593,115)
Institutional Class
Shares sold 10,746,157 $135,847,255 13,299,754 $190,322,581
Shares issued through reinvestment of distributions 496,581 5,949,041 477,196 5,993,576
Shares redeemed (12,287,844) (150,800,355) (10,983,928) (147,221,998)
Net increase (decrease) (1,045,106) ($9,004,059) 2,793,022 $49,094,159
MATTHEWS ASIA INNOVATORS FUND
Investor Class
Shares sold 3,537,078 $45,933,297 10,925,559 $155,176,262
Shares issued through reinvestment of distributions 34,901 503,279 334,533 3,867,195
Shares redeemed (4,901,397) (63,792,703) (10,079,828) (140,682,243)
Net increase (decrease) (1,329,418) ($17,356,127) 1,180,264 $18,361,214
Institutional Class
Shares sold 2,497,746 $33,297,458 8,564,706 $117,389,330
Shares issued through reinvestment of distributions 24,526 355,872 219,506 2,550,665
Shares redeemed (1,965,087) (25,479,411) (2,844,442) (36,304,986)
Net increase 557,185 $8,173,919 5,939,770 $83,635,009
MATTHEWS CHINA FUND
Investor Class
Shares sold 9,307,763 $160,049,101 15,121,019 $340,339,102
Shares issued through reinvestment of distributions 413,049 7,823,154 7,011,755 104,895,844
Shares redeemed (11,566,339) (197,267,770) (20,695,099) (427,936,552)
Net increase (decrease) (1,845,527) ($29,395,515) 1,437,675 $17,298,394
Institutional Class
Shares sold 8,093,642 $133,433,967 6,614,792 $150,104,126
Shares issued through reinvestment of distributions 47,201 892,099 588,948 8,792,993
Shares redeemed (1,765,278) (30,910,184) (6,742,777) (135,104,968)
Net increase 6,375,565 $103,415,882 460,963 $23,792,151
144 MATTHEWS ASIA FUNDS
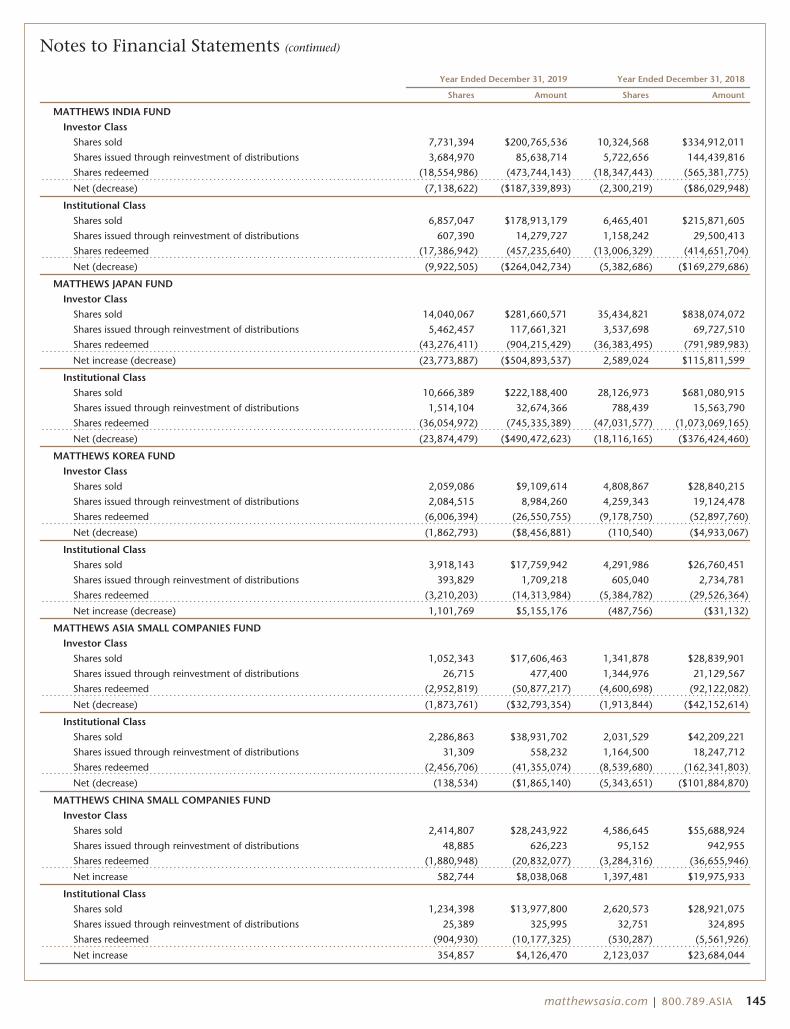
Notes to Financial Statements (continued)
Year Ended December 31, 2019 Year Ended December 31, 2018
Shares Amount Shares Amount
MATTHEWS INDIA FUND
Investor Class
Shares sold 7,731,394 $200,765,536 10,324,568 $334,912,011
Shares issued through reinvestment of distributions 3,684,970 85,638,714 5,722,656 144,439,816
Shares redeemed (18,554,986) (473,744,143) (18,347,443) (565,381,775)
Net (decrease) (7,138,622) ($187,339,893) (2,300,219) ($86,029,948)
Institutional Class
Shares sold 6,857,047 $178,913,179 6,465,401 $215,871,605
Shares issued through reinvestment of distributions 607,390 14,279,727 1,158,242 29,500,413
Shares redeemed (17,386,942) (457,235,640) (13,006,329) (414,651,704)
Net (decrease) (9,922,505) ($264,042,734) (5,382,686) ($169,279,686)
MATTHEWS JAPAN FUND
Investor Class
Shares sold 14,040,067 $281,660,571 35,434,821 $838,074,072
Shares issued through reinvestment of distributions 5,462,457 117,661,321 3,537,698 69,727,510
Shares redeemed (43,276,411) (904,215,429) (36,383,495) (791,989,983)
Net increase (decrease) (23,773,887) ($504,893,537) 2,589,024 $115,811,599
Institutional Class
Shares sold 10,666,389 $222,188,400 28,126,973 $681,080,915
Shares issued through reinvestment of distributions 1,514,104 32,674,366 788,439 15,563,790
Shares redeemed (36,054,972) (745,335,389) (47,031,577) (1,073,069,165)
Net (decrease) (23,874,479) ($490,472,623) (18,116,165) ($376,424,460)
MATTHEWS KOREA FUND
Investor Class
Shares sold 2,059,086 $9,109,614 4,808,867 $28,840,215
Shares issued through reinvestment of distributions 2,084,515 8,984,260 4,259,343 19,124,478
Shares redeemed (6,006,394) (26,550,755) (9,178,750) (52,897,760)
Net (decrease) (1,862,793) ($8,456,881) (110,540) ($4,933,067)
Institutional Class
Shares sold 3,918,143 $17,759,942 4,291,986 $26,760,451
Shares issued through reinvestment of distributions 393,829 1,709,218 605,040 2,734,781
Shares redeemed (3,210,203) (14,313,984) (5,384,782) (29,526,364)
Net increase (decrease) 1,101,769 $5,155,176 (487,756) ($31,132)
MATTHEWS ASIA SMALL COMPANIES FUND
Investor Class
Shares sold 1,052,343 $17,606,463 1,341,878 $28,839,901
Shares issued through reinvestment of distributions 26,715 477,400 1,344,976 21,129,567
Shares redeemed (2,952,819) (50,877,217) (4,600,698) (92,122,082)
Net (decrease) (1,873,761) ($32,793,354) (1,913,844) ($42,152,614)
Institutional Class
Shares sold 2,286,863 $38,931,702 2,031,529 $42,209,221
Shares issued through reinvestment of distributions 31,309 558,232 1,164,500 18,247,712
Shares redeemed (2,456,706) (41,355,074) (8,539,680) (162,341,803)
Net (decrease) (138,534) ($1,865,140) (5,343,651) ($101,884,870)
MATTHEWS CHINA SMALL COMPANIES FUND
Investor Class
Shares sold 2,414,807 $28,243,922 4,586,645 $55,688,924
Shares issued through reinvestment of distributions 48,885 626,223 95,152 942,955
Shares redeemed (1,880,948) (20,832,077) (3,284,316) (36,655,946)
Net increase 582,744 $8,038,068 1,397,481 $19,975,933
Institutional Class
Shares sold 1,234,398 $13,977,800 2,620,573 $28,921,075
Shares issued through reinvestment of distributions 25,389 325,995 32,751 324,895
Shares redeemed (904,930) (10,177,325) (530,287) (5,561,926)
Net increase 354,857 $4,126,470 2,123,037 $23,684,044
matthewsasia.com | 800.789.ASIA 145
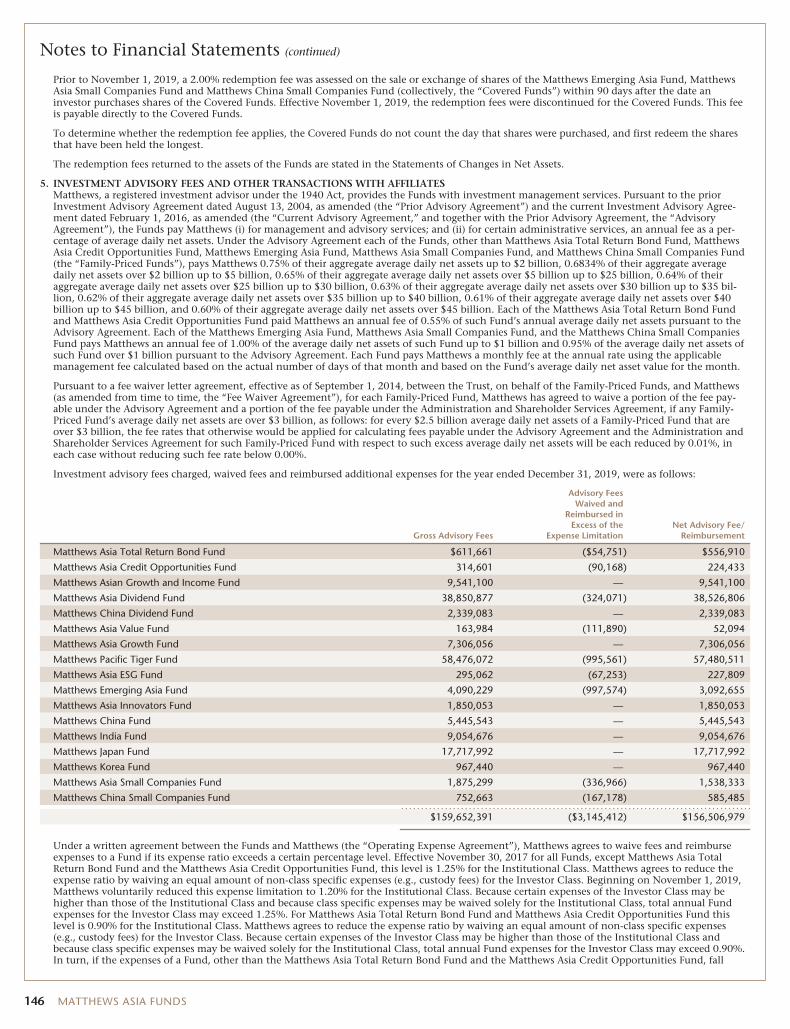
Notes to Financial Statements (continued)
Prior to November 1, 2019, a 2.00% redemption fee was assessed on the sale or exchange of shares of the Matthews Emerging Asia Fund, MatthewsAsia Small Companies Fund and Matthews China Small Companies Fund (collectively, the “Covered Funds”) within 90 days after the date aninvestor purchases shares of the Covered Funds. Effective November 1, 2019, the redemption fees were discontinued for the Covered Funds. This feeis payable directly to the Covered Funds.
To determine whether the redemption fee applies, the Covered Funds do not count the day that shares were purchased, and first redeem the sharesthat have been held the longest.
The redemption fees returned to the assets of the Funds are stated in the Statements of Changes in Net Assets.
5. INVESTMENT ADVISORY FEES AND OTHER TRANSACTIONS WITH AFFILIATESMatthews, a registered investment advisor under the 1940 Act, provides the Funds with investment management services. Pursuant to the priorInvestment Advisory Agreement dated August 13, 2004, as amended (the “Prior Advisory Agreement”) and the current Investment Advisory Agree-ment dated February 1, 2016, as amended (the “Current Advisory Agreement,” and together with the Prior Advisory Agreement, the “AdvisoryAgreement”), the Funds pay Matthews (i) for management and advisory services; and (ii) for certain administrative services, an annual fee as a per-centage of average daily net assets. Under the Advisory Agreement each of the Funds, other than Matthews Asia Total Return Bond Fund, MatthewsAsia Credit Opportunities Fund, Matthews Emerging Asia Fund, Matthews Asia Small Companies Fund, and Matthews China Small Companies Fund(the “Family-Priced Funds”), pays Matthews 0.75% of their aggregate average daily net assets up to $2 billion, 0.6834% of their aggregate averagedaily net assets over $2 billion up to $5 billion, 0.65% of their aggregate average daily net assets over $5 billion up to $25 billion, 0.64% of theiraggregate average daily net assets over $25 billion up to $30 billion, 0.63% of their aggregate average daily net assets over $30 billion up to $35 bil-lion, 0.62% of their aggregate average daily net assets over $35 billion up to $40 billion, 0.61% of their aggregate average daily net assets over $40billion up to $45 billion, and 0.60% of their aggregate average daily net assets over $45 billion. Each of the Matthews Asia Total Return Bond Fundand Matthews Asia Credit Opportunities Fund paid Matthews an annual fee of 0.55% of such Fund’s annual average daily net assets pursuant to theAdvisory Agreement. Each of the Matthews Emerging Asia Fund, Matthews Asia Small Companies Fund, and the Matthews China Small CompaniesFund pays Matthews an annual fee of 1.00% of the average daily net assets of such Fund up to $1 billion and 0.95% of the average daily net assets ofsuch Fund over $1 billion pursuant to the Advisory Agreement. Each Fund pays Matthews a monthly fee at the annual rate using the applicablemanagement fee calculated based on the actual number of days of that month and based on the Fund’s average daily net asset value for the month.
Pursuant to a fee waiver letter agreement, effective as of September 1, 2014, between the Trust, on behalf of the Family-Priced Funds, and Matthews(as amended from time to time, the “Fee Waiver Agreement”), for each Family-Priced Fund, Matthews has agreed to waive a portion of the fee pay-able under the Advisory Agreement and a portion of the fee payable under the Administration and Shareholder Services Agreement, if any Family-Priced Fund’s average daily net assets are over $3 billion, as follows: for every $2.5 billion average daily net assets of a Family-Priced Fund that areover $3 billion, the fee rates that otherwise would be applied for calculating fees payable under the Advisory Agreement and the Administration andShareholder Services Agreement for such Family-Priced Fund with respect to such excess average daily net assets will be each reduced by 0.01%, ineach case without reducing such fee rate below 0.00%.
Investment advisory fees charged, waived fees and reimbursed additional expenses for the year ended December 31, 2019, were as follows:
Gross Advisory Fees
Advisory FeesWaived and
Reimbursed inExcess of the
Expense LimitationNet Advisory Fee/
Reimbursement
Matthews Asia Total Return Bond Fund $611,661 ($54,751) $556,910
Matthews Asia Credit Opportunities Fund 314,601 (90,168) 224,433
Matthews Asian Growth and Income Fund 9,541,100 — 9,541,100
Matthews Asia Dividend Fund 38,850,877 (324,071) 38,526,806
Matthews China Dividend Fund 2,339,083 — 2,339,083
Matthews Asia Value Fund 163,984 (111,890) 52,094
Matthews Asia Growth Fund 7,306,056 — 7,306,056
Matthews Pacific Tiger Fund 58,476,072 (995,561) 57,480,511
Matthews Asia ESG Fund 295,062 (67,253) 227,809
Matthews Emerging Asia Fund 4,090,229 (997,574) 3,092,655
Matthews Asia Innovators Fund 1,850,053 — 1,850,053
Matthews China Fund 5,445,543 — 5,445,543
Matthews India Fund 9,054,676 — 9,054,676
Matthews Japan Fund 17,717,992 — 17,717,992
Matthews Korea Fund 967,440 — 967,440
Matthews Asia Small Companies Fund 1,875,299 (336,966) 1,538,333
Matthews China Small Companies Fund 752,663 (167,178) 585,485
$159,652,391 ($3,145,412) $156,506,979
Under a written agreement between the Funds and Matthews (the “Operating Expense Agreement”), Matthews agrees to waive fees and reimburseexpenses to a Fund if its expense ratio exceeds a certain percentage level. Effective November 30, 2017 for all Funds, except Matthews Asia TotalReturn Bond Fund and the Matthews Asia Credit Opportunities Fund, this level is 1.25% for the Institutional Class. Matthews agrees to reduce theexpense ratio by waiving an equal amount of non-class specific expenses (e.g., custody fees) for the Investor Class. Beginning on November 1, 2019,Matthews voluntarily reduced this expense limitation to 1.20% for the Institutional Class. Because certain expenses of the Investor Class may behigher than those of the Institutional Class and because class specific expenses may be waived solely for the Institutional Class, total annual Fundexpenses for the Investor Class may exceed 1.25%. For Matthews Asia Total Return Bond Fund and Matthews Asia Credit Opportunities Fund thislevel is 0.90% for the Institutional Class. Matthews agrees to reduce the expense ratio by waiving an equal amount of non-class specific expenses(e.g., custody fees) for the Investor Class. Because certain expenses of the Investor Class may be higher than those of the Institutional Class andbecause class specific expenses may be waived solely for the Institutional Class, total annual Fund expenses for the Investor Class may exceed 0.90%.In turn, if the expenses of a Fund, other than the Matthews Asia Total Return Bond Fund and the Matthews Asia Credit Opportunities Fund, fall
146 MATTHEWS ASIA FUNDS
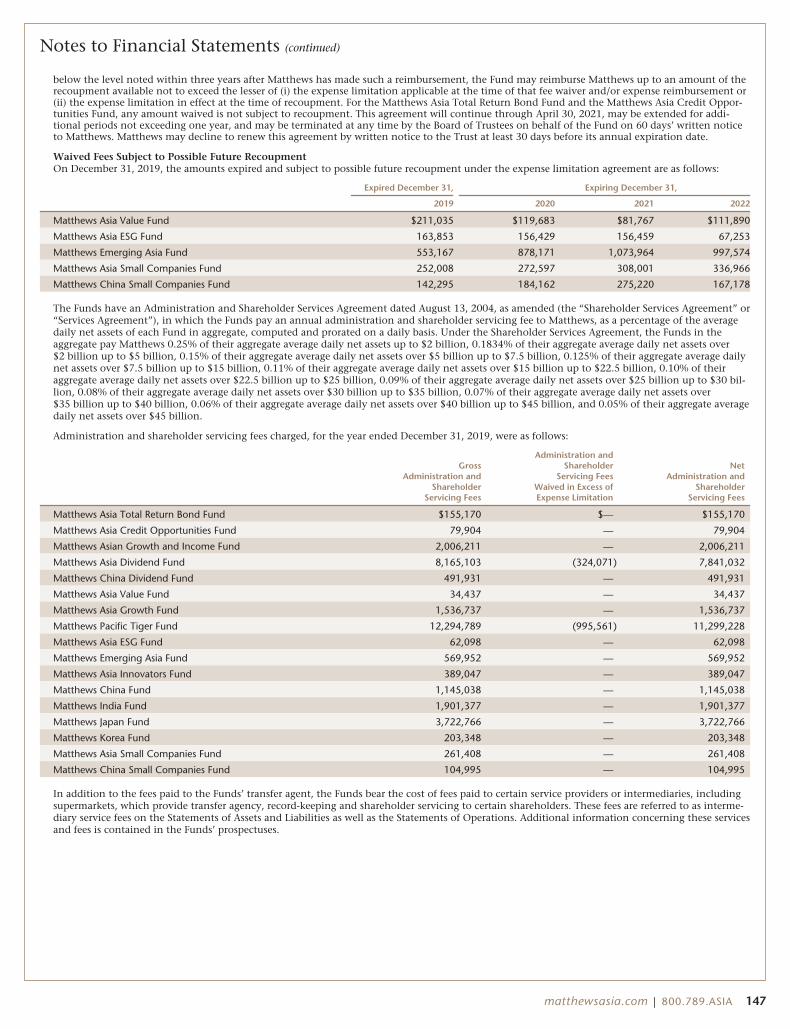
Notes to Financial Statements (continued)
below the level noted within three years after Matthews has made such a reimbursement, the Fund may reimburse Matthews up to an amount of therecoupment available not to exceed the lesser of (i) the expense limitation applicable at the time of that fee waiver and/or expense reimbursement or(ii) the expense limitation in effect at the time of recoupment. For the Matthews Asia Total Return Bond Fund and the Matthews Asia Credit Oppor-tunities Fund, any amount waived is not subject to recoupment. This agreement will continue through April 30, 2021, may be extended for addi-tional periods not exceeding one year, and may be terminated at any time by the Board of Trustees on behalf of the Fund on 60 days’ written noticeto Matthews. Matthews may decline to renew this agreement by written notice to the Trust at least 30 days before its annual expiration date.
Waived Fees Subject to Possible Future RecoupmentOn December 31, 2019, the amounts expired and subject to possible future recoupment under the expense limitation agreement are as follows:
Expired December 31, Expiring December 31,
2019 2020 2021 2022
Matthews Asia Value Fund $211,035 $119,683 $81,767 $111,890
Matthews Asia ESG Fund 163,853 156,429 156,459 67,253
Matthews Emerging Asia Fund 553,167 878,171 1,073,964 997,574
Matthews Asia Small Companies Fund 252,008 272,597 308,001 336,966
Matthews China Small Companies Fund 142,295 184,162 275,220 167,178
The Funds have an Administration and Shareholder Services Agreement dated August 13, 2004, as amended (the “Shareholder Services Agreement” or“Services Agreement”), in which the Funds pay an annual administration and shareholder servicing fee to Matthews, as a percentage of the averagedaily net assets of each Fund in aggregate, computed and prorated on a daily basis. Under the Shareholder Services Agreement, the Funds in theaggregate pay Matthews 0.25% of their aggregate average daily net assets up to $2 billion, 0.1834% of their aggregate average daily net assets over$2 billion up to $5 billion, 0.15% of their aggregate average daily net assets over $5 billion up to $7.5 billion, 0.125% of their aggregate average dailynet assets over $7.5 billion up to $15 billion, 0.11% of their aggregate average daily net assets over $15 billion up to $22.5 billion, 0.10% of theiraggregate average daily net assets over $22.5 billion up to $25 billion, 0.09% of their aggregate average daily net assets over $25 billion up to $30 bil-lion, 0.08% of their aggregate average daily net assets over $30 billion up to $35 billion, 0.07% of their aggregate average daily net assets over$35 billion up to $40 billion, 0.06% of their aggregate average daily net assets over $40 billion up to $45 billion, and 0.05% of their aggregate averagedaily net assets over $45 billion.
Administration and shareholder servicing fees charged, for the year ended December 31, 2019, were as follows:
GrossAdministration and
ShareholderServicing Fees
Administration andShareholder
Servicing FeesWaived in Excess ofExpense Limitation
NetAdministration and
ShareholderServicing Fees
Matthews Asia Total Return Bond Fund $155,170 $— $155,170
Matthews Asia Credit Opportunities Fund 79,904 — 79,904
Matthews Asian Growth and Income Fund 2,006,211 — 2,006,211
Matthews Asia Dividend Fund 8,165,103 (324,071) 7,841,032
Matthews China Dividend Fund 491,931 — 491,931
Matthews Asia Value Fund 34,437 — 34,437
Matthews Asia Growth Fund 1,536,737 — 1,536,737
Matthews Pacific Tiger Fund 12,294,789 (995,561) 11,299,228
Matthews Asia ESG Fund 62,098 — 62,098
Matthews Emerging Asia Fund 569,952 — 569,952
Matthews Asia Innovators Fund 389,047 — 389,047
Matthews China Fund 1,145,038 — 1,145,038
Matthews India Fund 1,901,377 — 1,901,377
Matthews Japan Fund 3,722,766 — 3,722,766
Matthews Korea Fund 203,348 — 203,348
Matthews Asia Small Companies Fund 261,408 — 261,408
Matthews China Small Companies Fund 104,995 — 104,995
In addition to the fees paid to the Funds’ transfer agent, the Funds bear the cost of fees paid to certain service providers or intermediaries, includingsupermarkets, which provide transfer agency, record-keeping and shareholder servicing to certain shareholders. These fees are referred to as interme-diary service fees on the Statements of Assets and Liabilities as well as the Statements of Operations. Additional information concerning these servicesand fees is contained in the Funds’ prospectuses.
matthewsasia.com | 800.789.ASIA 147
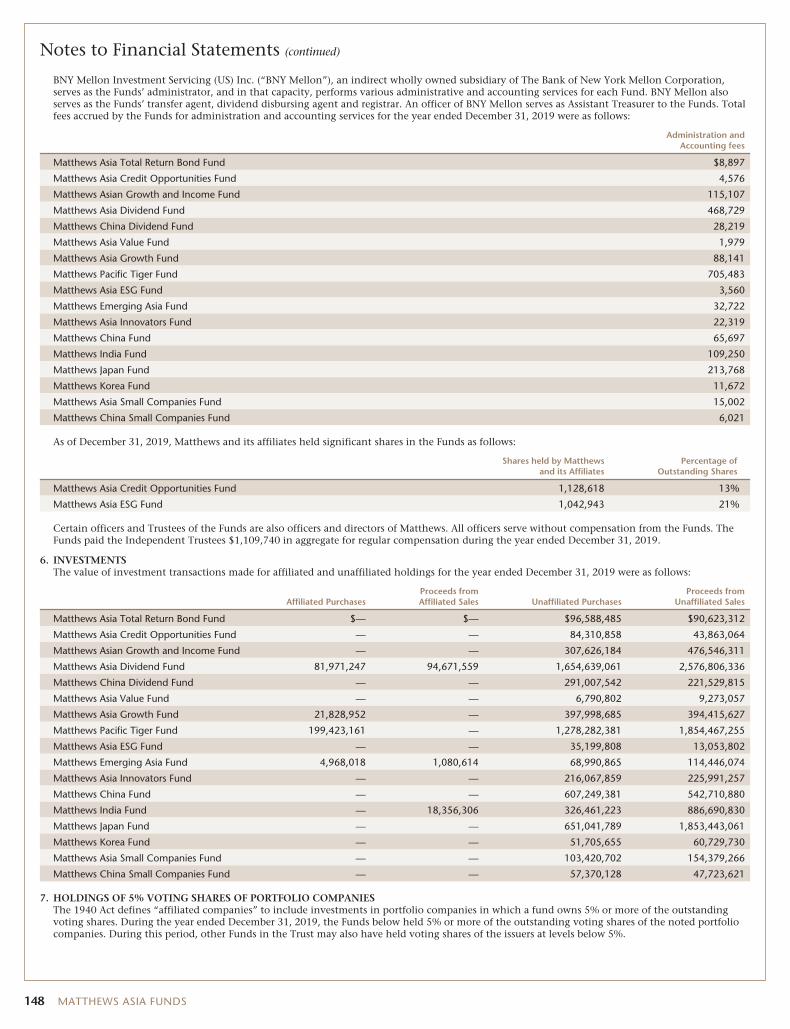
Notes to Financial Statements (continued)
BNY Mellon Investment Servicing (US) Inc. (“BNY Mellon”), an indirect wholly owned subsidiary of The Bank of New York Mellon Corporation,serves as the Funds’ administrator, and in that capacity, performs various administrative and accounting services for each Fund. BNY Mellon alsoserves as the Funds’ transfer agent, dividend disbursing agent and registrar. An officer of BNY Mellon serves as Assistant Treasurer to the Funds. Totalfees accrued by the Funds for administration and accounting services for the year ended December 31, 2019 were as follows:
Administration andAccounting fees
Matthews Asia Total Return Bond Fund $8,897
Matthews Asia Credit Opportunities Fund 4,576
Matthews Asian Growth and Income Fund 115,107
Matthews Asia Dividend Fund 468,729
Matthews China Dividend Fund 28,219
Matthews Asia Value Fund 1,979
Matthews Asia Growth Fund 88,141
Matthews Pacific Tiger Fund 705,483
Matthews Asia ESG Fund 3,560
Matthews Emerging Asia Fund 32,722
Matthews Asia Innovators Fund 22,319
Matthews China Fund 65,697
Matthews India Fund 109,250
Matthews Japan Fund 213,768
Matthews Korea Fund 11,672
Matthews Asia Small Companies Fund 15,002
Matthews China Small Companies Fund 6,021
As of December 31, 2019, Matthews and its affiliates held significant shares in the Funds as follows:
Shares held by Matthewsand its Affiliates
Percentage ofOutstanding Shares
Matthews Asia Credit Opportunities Fund 1,128,618 13%
Matthews Asia ESG Fund 1,042,943 21%
Certain officers and Trustees of the Funds are also officers and directors of Matthews. All officers serve without compensation from the Funds. TheFunds paid the Independent Trustees $1,109,740 in aggregate for regular compensation during the year ended December 31, 2019.
6. INVESTMENTSThe value of investment transactions made for affiliated and unaffiliated holdings for the year ended December 31, 2019 were as follows:
Affiliated PurchasesProceeds fromAffiliated Sales Unaffiliated Purchases
Proceeds fromUnaffiliated Sales
Matthews Asia Total Return Bond Fund $— $— $96,588,485 $90,623,312
Matthews Asia Credit Opportunities Fund — — 84,310,858 43,863,064
Matthews Asian Growth and Income Fund — — 307,626,184 476,546,311
Matthews Asia Dividend Fund 81,971,247 94,671,559 1,654,639,061 2,576,806,336
Matthews China Dividend Fund — — 291,007,542 221,529,815
Matthews Asia Value Fund — — 6,790,802 9,273,057
Matthews Asia Growth Fund 21,828,952 — 397,998,685 394,415,627
Matthews Pacific Tiger Fund 199,423,161 — 1,278,282,381 1,854,467,255
Matthews Asia ESG Fund — — 35,199,808 13,053,802
Matthews Emerging Asia Fund 4,968,018 1,080,614 68,990,865 114,446,074
Matthews Asia Innovators Fund — — 216,067,859 225,991,257
Matthews China Fund — — 607,249,381 542,710,880
Matthews India Fund — 18,356,306 326,461,223 886,690,830
Matthews Japan Fund — — 651,041,789 1,853,443,061
Matthews Korea Fund — — 51,705,655 60,729,730
Matthews Asia Small Companies Fund — — 103,420,702 154,379,266
Matthews China Small Companies Fund — — 57,370,128 47,723,621
7. HOLDINGS OF 5% VOTING SHARES OF PORTFOLIO COMPANIESThe 1940 Act defines “affiliated companies” to include investments in portfolio companies in which a fund owns 5% or more of the outstandingvoting shares. During the year ended December 31, 2019, the Funds below held 5% or more of the outstanding voting shares of the noted portfoliocompanies. During this period, other Funds in the Trust may also have held voting shares of the issuers at levels below 5%.
148 MATTHEWS ASIA FUNDS
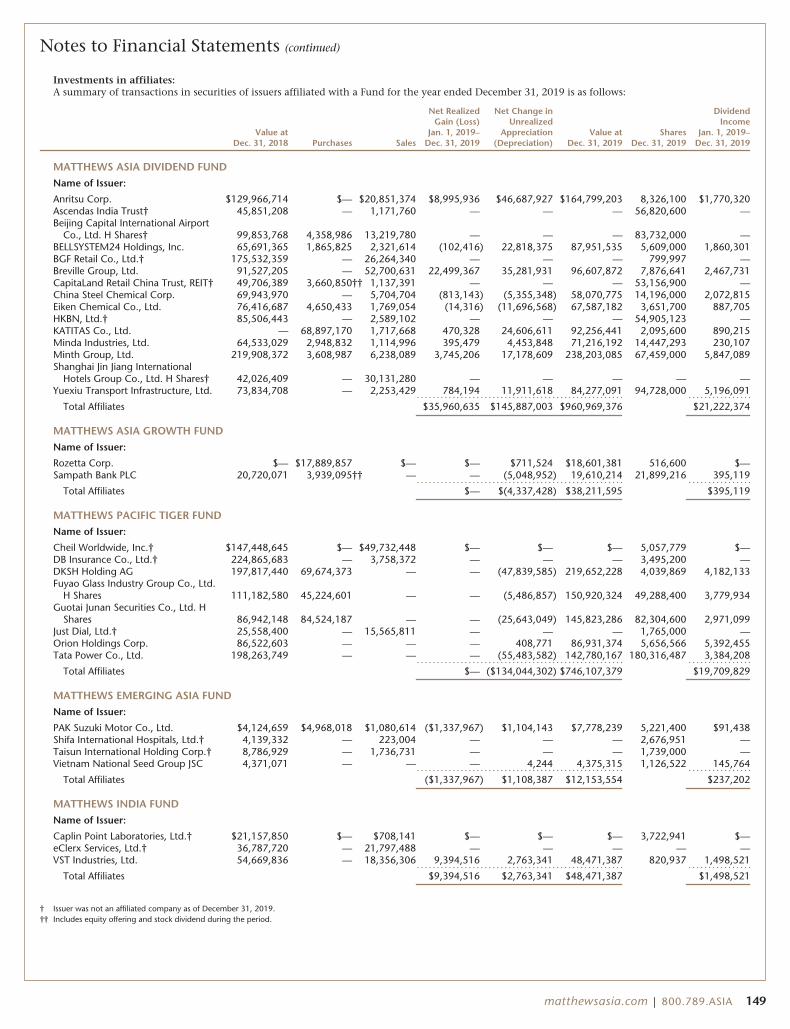
Notes to Financial Statements (continued)
Investments in affiliates:A summary of transactions in securities of issuers affiliated with a Fund for the year ended December 31, 2019 is as follows:
Value atDec. 31, 2018 Purchases Sales
Net RealizedGain (Loss)
Jan. 1, 2019–Dec. 31, 2019
Net Change inUnrealized
Appreciation(Depreciation)
Value atDec. 31, 2019
SharesDec. 31, 2019
DividendIncome
Jan. 1, 2019–Dec. 31, 2019
MATTHEWS ASIA DIVIDEND FUNDName of Issuer:
Anritsu Corp. $129,966,714 $— $20,851,374 $8,995,936 $46,687,927 $164,799,203 8,326,100 $1,770,320Ascendas India Trust† 45,851,208 — 1,171,760 — — — 56,820,600 —Beijing Capital International Airport
Co., Ltd. H Shares† 99,853,768 4,358,986 13,219,780 — — — 83,732,000 —BELLSYSTEM24 Holdings, Inc. 65,691,365 1,865,825 2,321,614 (102,416) 22,818,375 87,951,535 5,609,000 1,860,301BGF Retail Co., Ltd.† 175,532,359 — 26,264,340 — — — 799,997 —Breville Group, Ltd. 91,527,205 — 52,700,631 22,499,367 35,281,931 96,607,872 7,876,641 2,467,731CapitaLand Retail China Trust, REIT† 49,706,389 3,660,850†† 1,137,391 — — — 53,156,900 —China Steel Chemical Corp. 69,943,970 — 5,704,704 (813,143) (5,355,348) 58,070,775 14,196,000 2,072,815Eiken Chemical Co., Ltd. 76,416,687 4,650,433 1,769,054 (14,316) (11,696,568) 67,587,182 3,651,700 887,705HKBN, Ltd.† 85,506,443 — 2,589,102 — — — 54,905,123 —KATITAS Co., Ltd. — 68,897,170 1,717,668 470,328 24,606,611 92,256,441 2,095,600 890,215Minda Industries, Ltd. 64,533,029 2,948,832 1,114,996 395,479 4,453,848 71,216,192 14,447,293 230,107Minth Group, Ltd. 219,908,372 3,608,987 6,238,089 3,745,206 17,178,609 238,203,085 67,459,000 5,847,089Shanghai Jin Jiang International
Hotels Group Co., Ltd. H Shares† 42,026,409 — 30,131,280 — — — — —Yuexiu Transport Infrastructure, Ltd. 73,834,708 — 2,253,429 784,194 11,911,618 84,277,091 94,728,000 5,196,091
Total Affiliates $35,960,635 $145,887,003 $960,969,376 $21,222,374
MATTHEWS ASIA GROWTH FUNDName of Issuer:
Rozetta Corp. $— $17,889,857 $— $— $711,524 $18,601,381 516,600 $—Sampath Bank PLC 20,720,071 3,939,095†† — — (5,048,952) 19,610,214 21,899,216 395,119
Total Affiliates $— $(4,337,428) $38,211,595 $395,119
MATTHEWS PACIFIC TIGER FUNDName of Issuer:
Cheil Worldwide, Inc.† $147,448,645 $— $49,732,448 $— $— $— 5,057,779 $—DB Insurance Co., Ltd.† 224,865,683 — 3,758,372 — — — 3,495,200 —DKSH Holding AG 197,817,440 69,674,373 — — (47,839,585) 219,652,228 4,039,869 4,182,133Fuyao Glass Industry Group Co., Ltd.
H Shares 111,182,580 45,224,601 — — (5,486,857) 150,920,324 49,288,400 3,779,934Guotai Junan Securities Co., Ltd. H
Shares 86,942,148 84,524,187 — — (25,643,049) 145,823,286 82,304,600 2,971,099Just Dial, Ltd.† 25,558,400 — 15,565,811 — — — 1,765,000 —Orion Holdings Corp. 86,522,603 — — — 408,771 86,931,374 5,656,566 5,392,455Tata Power Co., Ltd. 198,263,749 — — — (55,483,582) 142,780,167 180,316,487 3,384,208
Total Affiliates $— ($134,044,302) $746,107,379 $19,709,829
MATTHEWS EMERGING ASIA FUNDName of Issuer:
PAK Suzuki Motor Co., Ltd. $4,124,659 $4,968,018 $1,080,614 ($1,337,967) $1,104,143 $7,778,239 5,221,400 $91,438Shifa International Hospitals, Ltd.† 4,139,332 — 223,004 — — — 2,676,951 —Taisun International Holding Corp.† 8,786,929 — 1,736,731 — — — 1,739,000 —Vietnam National Seed Group JSC 4,371,071 — — — 4,244 4,375,315 1,126,522 145,764
Total Affiliates ($1,337,967) $1,108,387 $12,153,554 $237,202
MATTHEWS INDIA FUNDName of Issuer:
Caplin Point Laboratories, Ltd.† $21,157,850 $— $708,141 $— $— $— 3,722,941 $—eClerx Services, Ltd.† 36,787,720 — 21,797,488 — — — — —VST Industries, Ltd. 54,669,836 — 18,356,306 9,394,516 2,763,341 48,471,387 820,937 1,498,521
Total Affiliates $9,394,516 $2,763,341 $48,471,387 $1,498,521
† Issuer was not an affiliated company as of December 31, 2019.†† Includes equity offering and stock dividend during the period.
matthewsasia.com | 800.789.ASIA 149
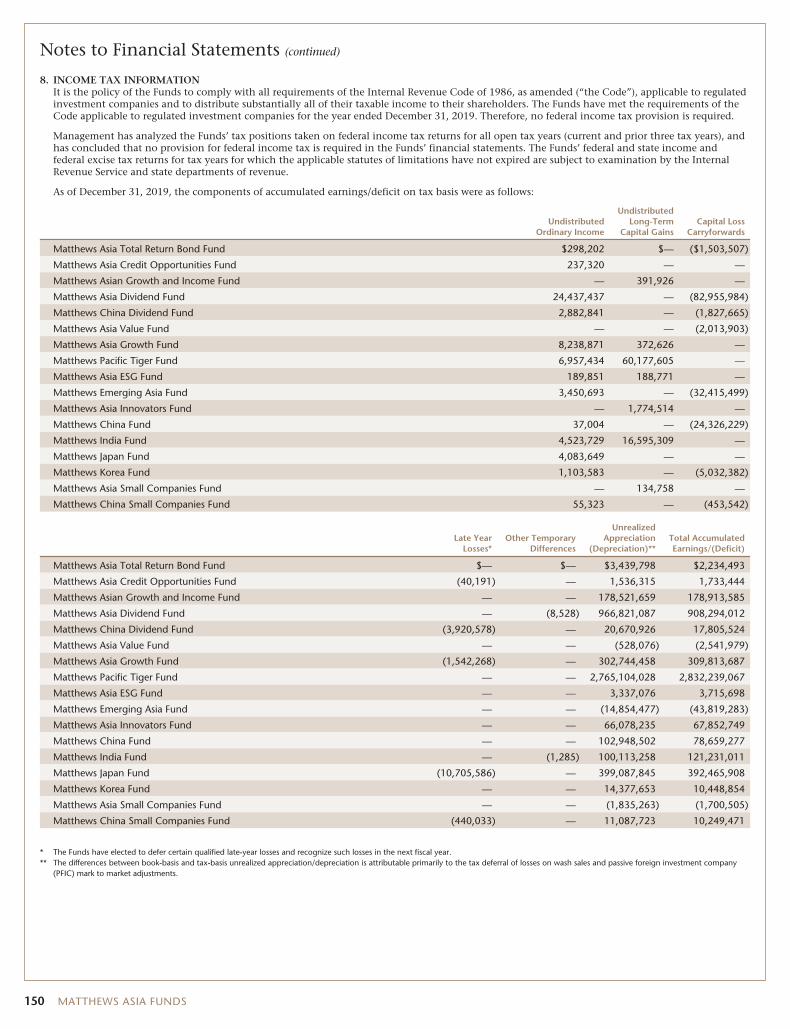
Notes to Financial Statements (continued)
8. INCOME TAX INFORMATIONIt is the policy of the Funds to comply with all requirements of the Internal Revenue Code of 1986, as amended (“the Code”), applicable to regulatedinvestment companies and to distribute substantially all of their taxable income to their shareholders. The Funds have met the requirements of theCode applicable to regulated investment companies for the year ended December 31, 2019. Therefore, no federal income tax provision is required.
Management has analyzed the Funds’ tax positions taken on federal income tax returns for all open tax years (current and prior three tax years), andhas concluded that no provision for federal income tax is required in the Funds’ financial statements. The Funds’ federal and state income andfederal excise tax returns for tax years for which the applicable statutes of limitations have not expired are subject to examination by the InternalRevenue Service and state departments of revenue.
As of December 31, 2019, the components of accumulated earnings/deficit on tax basis were as follows:
UndistributedOrdinary Income
UndistributedLong-Term
Capital GainsCapital Loss
Carryforwards
Matthews Asia Total Return Bond Fund $298,202 $— ($1,503,507)
Matthews Asia Credit Opportunities Fund 237,320 — —
Matthews Asian Growth and Income Fund — 391,926 —
Matthews Asia Dividend Fund 24,437,437 — (82,955,984)
Matthews China Dividend Fund 2,882,841 — (1,827,665)
Matthews Asia Value Fund — — (2,013,903)
Matthews Asia Growth Fund 8,238,871 372,626 —
Matthews Pacific Tiger Fund 6,957,434 60,177,605 —
Matthews Asia ESG Fund 189,851 188,771 —
Matthews Emerging Asia Fund 3,450,693 — (32,415,499)
Matthews Asia Innovators Fund — 1,774,514 —
Matthews China Fund 37,004 — (24,326,229)
Matthews India Fund 4,523,729 16,595,309 —
Matthews Japan Fund 4,083,649 — —
Matthews Korea Fund 1,103,583 — (5,032,382)
Matthews Asia Small Companies Fund — 134,758 —
Matthews China Small Companies Fund 55,323 — (453,542)
Late YearLosses*
Other TemporaryDifferences
UnrealizedAppreciation
(Depreciation)**Total AccumulatedEarnings/(Deficit)
Matthews Asia Total Return Bond Fund $— $— $3,439,798 $2,234,493
Matthews Asia Credit Opportunities Fund (40,191) — 1,536,315 1,733,444
Matthews Asian Growth and Income Fund — — 178,521,659 178,913,585
Matthews Asia Dividend Fund — (8,528) 966,821,087 908,294,012
Matthews China Dividend Fund (3,920,578) — 20,670,926 17,805,524
Matthews Asia Value Fund — — (528,076) (2,541,979)
Matthews Asia Growth Fund (1,542,268) — 302,744,458 309,813,687
Matthews Pacific Tiger Fund — — 2,765,104,028 2,832,239,067
Matthews Asia ESG Fund — — 3,337,076 3,715,698
Matthews Emerging Asia Fund — — (14,854,477) (43,819,283)
Matthews Asia Innovators Fund — — 66,078,235 67,852,749
Matthews China Fund — — 102,948,502 78,659,277
Matthews India Fund — (1,285) 100,113,258 121,231,011
Matthews Japan Fund (10,705,586) — 399,087,845 392,465,908
Matthews Korea Fund — — 14,377,653 10,448,854
Matthews Asia Small Companies Fund — — (1,835,263) (1,700,505)
Matthews China Small Companies Fund (440,033) — 11,087,723 10,249,471
* The Funds have elected to defer certain qualified late-year losses and recognize such losses in the next fiscal year.** The differences between book-basis and tax-basis unrealized appreciation/depreciation is attributable primarily to the tax deferral of losses on wash sales and passive foreign investment company
(PFIC) mark to market adjustments.
150 MATTHEWS ASIA FUNDS
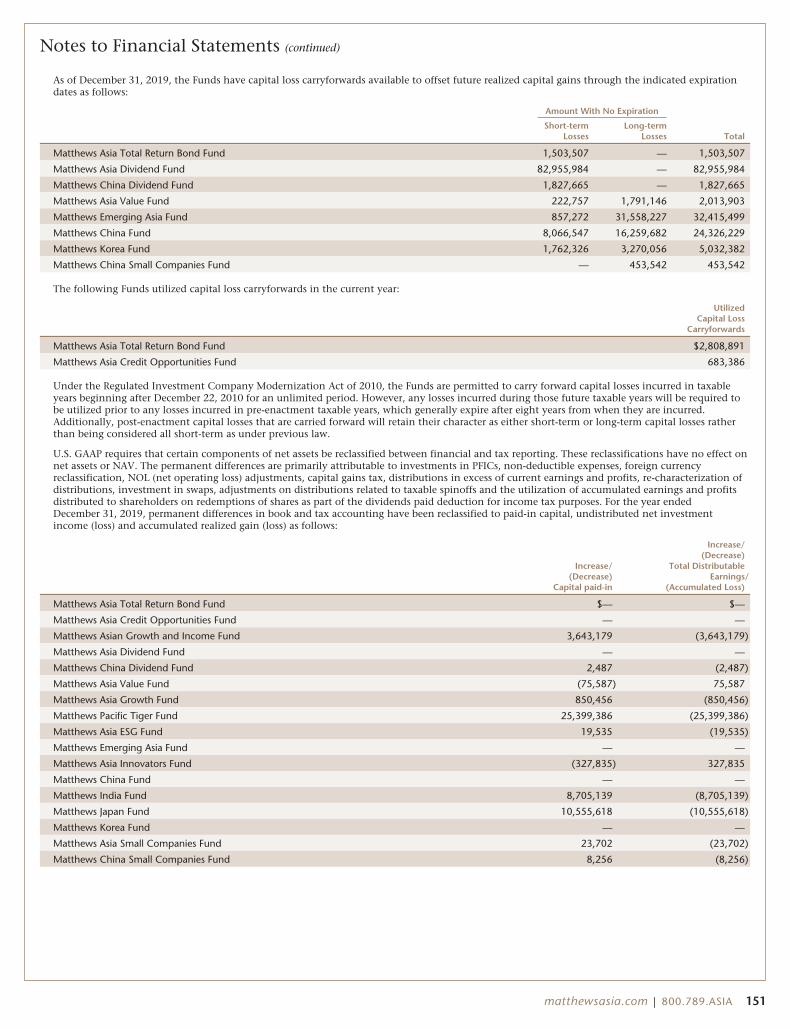
Notes to Financial Statements (continued)
As of December 31, 2019, the Funds have capital loss carryforwards available to offset future realized capital gains through the indicated expirationdates as follows:
Amount With No Expiration
Short-termLosses
Long-termLosses Total
Matthews Asia Total Return Bond Fund 1,503,507 — 1,503,507
Matthews Asia Dividend Fund 82,955,984 — 82,955,984
Matthews China Dividend Fund 1,827,665 — 1,827,665
Matthews Asia Value Fund 222,757 1,791,146 2,013,903
Matthews Emerging Asia Fund 857,272 31,558,227 32,415,499
Matthews China Fund 8,066,547 16,259,682 24,326,229
Matthews Korea Fund 1,762,326 3,270,056 5,032,382
Matthews China Small Companies Fund — 453,542 453,542
The following Funds utilized capital loss carryforwards in the current year:
UtilizedCapital Loss
Carryforwards
Matthews Asia Total Return Bond Fund $2,808,891
Matthews Asia Credit Opportunities Fund 683,386
Under the Regulated Investment Company Modernization Act of 2010, the Funds are permitted to carry forward capital losses incurred in taxableyears beginning after December 22, 2010 for an unlimited period. However, any losses incurred during those future taxable years will be required tobe utilized prior to any losses incurred in pre-enactment taxable years, which generally expire after eight years from when they are incurred.Additionally, post-enactment capital losses that are carried forward will retain their character as either short-term or long-term capital losses ratherthan being considered all short-term as under previous law.
U.S. GAAP requires that certain components of net assets be reclassified between financial and tax reporting. These reclassifications have no effect onnet assets or NAV. The permanent differences are primarily attributable to investments in PFICs, non-deductible expenses, foreign currencyreclassification, NOL (net operating loss) adjustments, capital gains tax, distributions in excess of current earnings and profits, re-characterization ofdistributions, investment in swaps, adjustments on distributions related to taxable spinoffs and the utilization of accumulated earnings and profitsdistributed to shareholders on redemptions of shares as part of the dividends paid deduction for income tax purposes. For the year endedDecember 31, 2019, permanent differences in book and tax accounting have been reclassified to paid-in capital, undistributed net investmentincome (loss) and accumulated realized gain (loss) as follows:
Increase/(Decrease)
Capital paid-in
Increase/(Decrease)
Total DistributableEarnings/
(Accumulated Loss)
Matthews Asia Total Return Bond Fund $— $—
Matthews Asia Credit Opportunities Fund — —
Matthews Asian Growth and Income Fund 3,643,179 (3,643,179)
Matthews Asia Dividend Fund — —
Matthews China Dividend Fund 2,487 (2,487)
Matthews Asia Value Fund (75,587) 75,587
Matthews Asia Growth Fund 850,456 (850,456)
Matthews Pacific Tiger Fund 25,399,386 (25,399,386)
Matthews Asia ESG Fund 19,535 (19,535)
Matthews Emerging Asia Fund — —
Matthews Asia Innovators Fund (327,835) 327,835
Matthews China Fund — —
Matthews India Fund 8,705,139 (8,705,139)
Matthews Japan Fund 10,555,618 (10,555,618)
Matthews Korea Fund — —
Matthews Asia Small Companies Fund 23,702 (23,702)
Matthews China Small Companies Fund 8,256 (8,256)
matthewsasia.com | 800.789.ASIA 151

Notes to Financial Statements (continued)
As of December 31, 2019, the tax cost of investments, including derivatives, and the related net unrealized appreciation and depreciation wereas follows:
Tax Cost
GrossUnrealized
Appreciation
GrossUnrealized
Depreciation
Net UnrealizedAppreciation
(Depreciation)
Matthews Asia Total Return Bond Fund $106,608,231 $3,978,067 $(646,840) $3,331,227
Matthews Asia Credit Opportunities Fund 81,454,387 1,978,969 (442,345) 1,536,624
Matthews Asian Growth and Income Fund 1,258,135,166 270,863,467 (91,695,098) 179,168,369
Matthews Asia Dividend Fund 4,342,218,963 1,241,698,732 (275,068,072) 966,630,660
Matthews China Dividend Fund 349,901,429 50,786,248 (30,118,254) 20,667,994
Matthews Asia Value Fund 17,301,207 2,151,738 (2,672,649) (520,911)
Matthews Asia Growth Fund 868,270,893 352,136,570 (49,119,041) 303,017,529
Matthews Pacific Tiger Fund 5,904,405,487 3,562,479,504 (766,850,115) 2,795,629,389
Matthews Asia ESG Fund 51,180,116 5,958,836 (2,523,228) 3,435,608
Matthews Emerging Asia Fund 332,094,706 52,723,727 (65,809,467) (13,085,740)
Matthews Asia Innovators Fund 234,723,844 71,035,986 (3,981,568) 67,054,418
Matthews China Fund 791,216,765 119,326,650 (16,378,119) 102,948,531
Matthews India Fund 848,201,108 221,055,904 (107,459,606) 113,596,298
Matthews Japan Fund 1,852,692,276 458,179,099 (59,263,536) 398,915,563
Matthews Korea Fund 119,803,557 21,998,073 (7,628,089) 14,369,984
Matthews Asia Small Companies Fund 173,280,819 24,207,806 (24,961,297) (753,491)
Matthews China Small Companies Fund 74,561,567 17,270,767 (6,183,312) 11,087,455
9. SUBSEQUENT EVENTSEffective January 31, 2020 (after the close of the NYSE), the Matthews Asia Strategic Income Fund was renamed the Matthews Asia Total Return Bond Fund.
152 MATTHEWS ASIA FUNDS

Report of Independent Registered Public Accounting FirmTo the Board of Trustees of Matthews Asia Funds and Shareholders of Matthews Asia Total Return Bond Fund (formerly known asMatthews Asia Strategic Income Fund), Matthews Asia Credit Opportunities Fund, Matthews Asian Growth and Income Fund, Mat-thews Asia Dividend Fund, Matthews China Dividend Fund, Matthews Asia Value Fund, Matthews Asia Growth Fund, MatthewsPacific Tiger Fund, Matthews Asia ESG Fund, Matthews Emerging Asia Fund, Matthews Asia Innovators Fund, Matthews China Fund,Matthews India Fund, Matthews Japan Fund, Matthews Korea Fund, Matthews Asia Small Companies Fund, and Matthews ChinaSmall Companies Fund
Opinions on the Financial StatementsWe have audited the accompanying statements of assets and liabilities, including the schedules of investments, of Matthews AsiaTotal Return Bond Fund (formerly known as Matthews Asia Strategic Income Fund), Matthews Asia Credit Opportunities Fund,Matthews Asian Growth and Income Fund, Matthews Asia Dividend Fund, Matthews China Dividend Fund, Matthews Asia ValueFund, Matthews Asia Growth Fund, Matthews Pacific Tiger Fund, Matthews Asia ESG Fund, Matthews Emerging Asia Fund, Mat-thews Asia Innovators Fund, Matthews China Fund, Matthews India Fund, Matthews Japan Fund, Matthews Korea Fund, MatthewsAsia Small Companies Fund, and Matthews China Small Companies Fund (constituting Matthews Asia Funds, hereafter collectivelyreferred to as the “Funds”) as of December 31, 2019, the related statements of operations for the year ended December 31, 2019, thestatements of changes in net assets for each of the two years in the period ended December 31, 2019, including the related notes,and the financial highlights for each of the periods indicated therein (collectively referred to as the “financial statements”). In ouropinion, the financial statements present fairly, in all material respects, the financial position of each of the Funds as of December31, 2019, the results of each of their operations for the year then ended, the changes in each of their net assets for each of the twoyears in the period ended December 31, 2019 and each of the financial highlights for each of the periods indicated therein in con-formity with accounting principles generally accepted in the United States of America.
Basis for OpinionsThese financial statements are the responsibility of the Funds’ management. Our responsibility is to express an opinion on the Funds’financial statements based on our audits. We are a public accounting firm registered with the Public Company Accounting OversightBoard (United States) (PCAOB) and are required to be independent with respect to the Funds in accordance with the U.S. federal secu-rities laws and the applicable rules and regulations of the Securities and Exchange Commission and the PCAOB.
We conducted our audits of these financial statements in accordance with the standards of the PCAOB. Those standardsrequire that we plan and perform the audit to obtain reasonable assurance about whether the financial statements are free ofmaterial misstatement, whether due to error or fraud.
Our audits included performing procedures to assess the risks of material misstatement of the financial statements, whether due toerror or fraud, and performing procedures that respond to those risks. Such procedures included examining, on a test basis, evi-dence regarding the amounts and disclosures in the financial statements. Our audits also included evaluating the accountingprinciples used and significant estimates made by management, as well as evaluating the overall presentation of the financialstatements. Our procedures included confirmation of securities owned as of December 31, 2019 by correspondence with the cus-todian and brokers; when replies were not received from brokers, we performed other auditing procedures. We believe that ouraudits provide a reasonable basis for our opinions.
PricewaterhouseCoopers LLPSan Francisco, CAFebruary 26, 2020
We have served as the auditor of one or more investment companies in Matthews Asia Funds since 2007.
matthewsasia.com | 800.789.ASIA 153
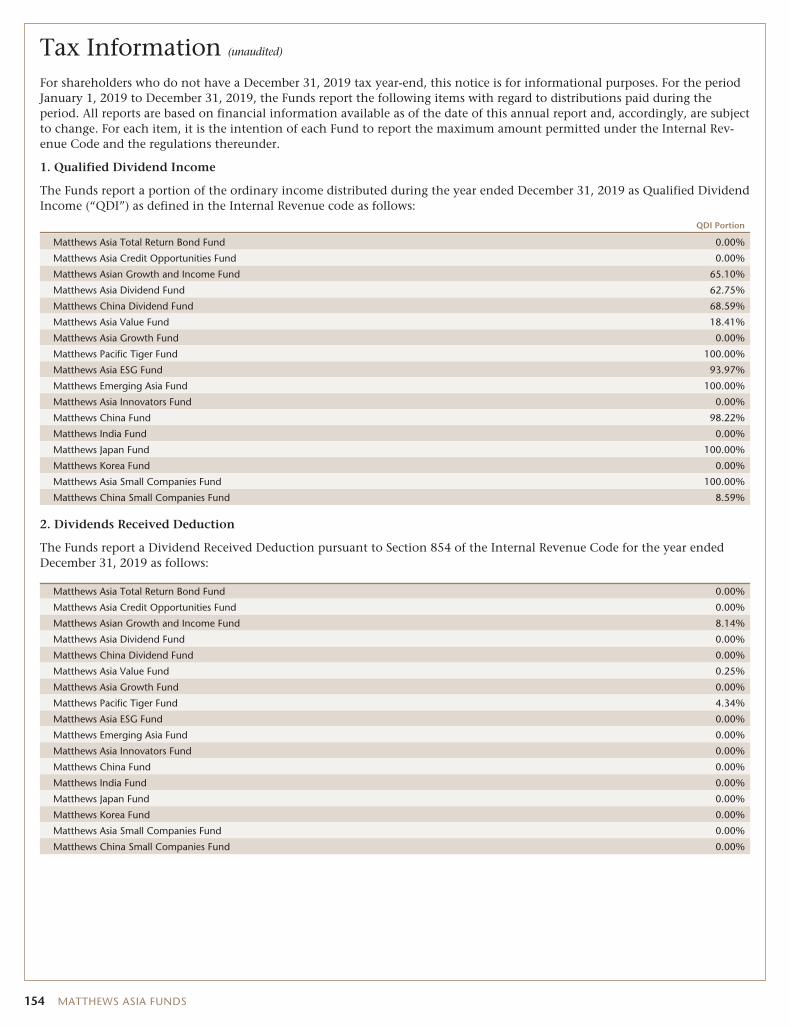
Tax Information (unaudited)
For shareholders who do not have a December 31, 2019 tax year-end, this notice is for informational purposes. For the periodJanuary 1, 2019 to December 31, 2019, the Funds report the following items with regard to distributions paid during theperiod. All reports are based on financial information available as of the date of this annual report and, accordingly, are subjectto change. For each item, it is the intention of each Fund to report the maximum amount permitted under the Internal Rev-enue Code and the regulations thereunder.
1. Qualified Dividend Income
The Funds report a portion of the ordinary income distributed during the year ended December 31, 2019 as Qualified DividendIncome (“QDI”) as defined in the Internal Revenue code as follows:
QDI Portion
Matthews Asia Total Return Bond Fund 0.00%
Matthews Asia Credit Opportunities Fund 0.00%
Matthews Asian Growth and Income Fund 65.10%
Matthews Asia Dividend Fund 62.75%
Matthews China Dividend Fund 68.59%
Matthews Asia Value Fund 18.41%
Matthews Asia Growth Fund 0.00%
Matthews Pacific Tiger Fund 100.00%
Matthews Asia ESG Fund 93.97%
Matthews Emerging Asia Fund 100.00%
Matthews Asia Innovators Fund 0.00%
Matthews China Fund 98.22%
Matthews India Fund 0.00%
Matthews Japan Fund 100.00%
Matthews Korea Fund 0.00%
Matthews Asia Small Companies Fund 100.00%
Matthews China Small Companies Fund 8.59%
2. Dividends Received Deduction
The Funds report a Dividend Received Deduction pursuant to Section 854 of the Internal Revenue Code for the year endedDecember 31, 2019 as follows:
Matthews Asia Total Return Bond Fund 0.00%
Matthews Asia Credit Opportunities Fund 0.00%
Matthews Asian Growth and Income Fund 8.14%
Matthews Asia Dividend Fund 0.00%
Matthews China Dividend Fund 0.00%
Matthews Asia Value Fund 0.25%
Matthews Asia Growth Fund 0.00%
Matthews Pacific Tiger Fund 4.34%
Matthews Asia ESG Fund 0.00%
Matthews Emerging Asia Fund 0.00%
Matthews Asia Innovators Fund 0.00%
Matthews China Fund 0.00%
Matthews India Fund 0.00%
Matthews Japan Fund 0.00%
Matthews Korea Fund 0.00%
Matthews Asia Small Companies Fund 0.00%
Matthews China Small Companies Fund 0.00%
154 MATTHEWS ASIA FUNDS
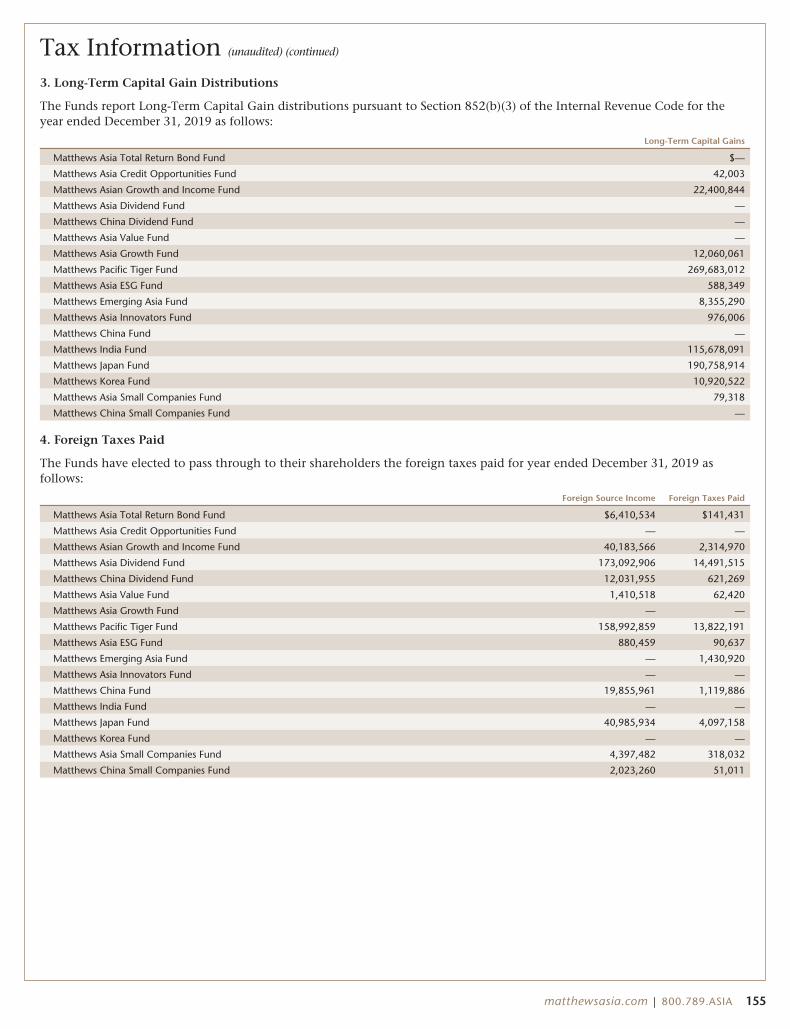
Tax Information (unaudited) (continued)
3. Long-Term Capital Gain Distributions
The Funds report Long-Term Capital Gain distributions pursuant to Section 852(b)(3) of the Internal Revenue Code for theyear ended December 31, 2019 as follows:
Long-Term Capital Gains
Matthews Asia Total Return Bond Fund $—
Matthews Asia Credit Opportunities Fund 42,003
Matthews Asian Growth and Income Fund 22,400,844
Matthews Asia Dividend Fund —
Matthews China Dividend Fund —
Matthews Asia Value Fund —
Matthews Asia Growth Fund 12,060,061
Matthews Pacific Tiger Fund 269,683,012
Matthews Asia ESG Fund 588,349
Matthews Emerging Asia Fund 8,355,290
Matthews Asia Innovators Fund 976,006
Matthews China Fund —
Matthews India Fund 115,678,091
Matthews Japan Fund 190,758,914
Matthews Korea Fund 10,920,522
Matthews Asia Small Companies Fund 79,318
Matthews China Small Companies Fund —
4. Foreign Taxes Paid
The Funds have elected to pass through to their shareholders the foreign taxes paid for year ended December 31, 2019 asfollows:
Foreign Source Income Foreign Taxes Paid
Matthews Asia Total Return Bond Fund $6,410,534 $141,431
Matthews Asia Credit Opportunities Fund — —
Matthews Asian Growth and Income Fund 40,183,566 2,314,970
Matthews Asia Dividend Fund 173,092,906 14,491,515
Matthews China Dividend Fund 12,031,955 621,269
Matthews Asia Value Fund 1,410,518 62,420
Matthews Asia Growth Fund — —
Matthews Pacific Tiger Fund 158,992,859 13,822,191
Matthews Asia ESG Fund 880,459 90,637
Matthews Emerging Asia Fund — 1,430,920
Matthews Asia Innovators Fund — —
Matthews China Fund 19,855,961 1,119,886
Matthews India Fund — —
Matthews Japan Fund 40,985,934 4,097,158
Matthews Korea Fund — —
Matthews Asia Small Companies Fund 4,397,482 318,032
Matthews China Small Companies Fund 2,023,260 51,011
matthewsasia.com | 800.789.ASIA 155
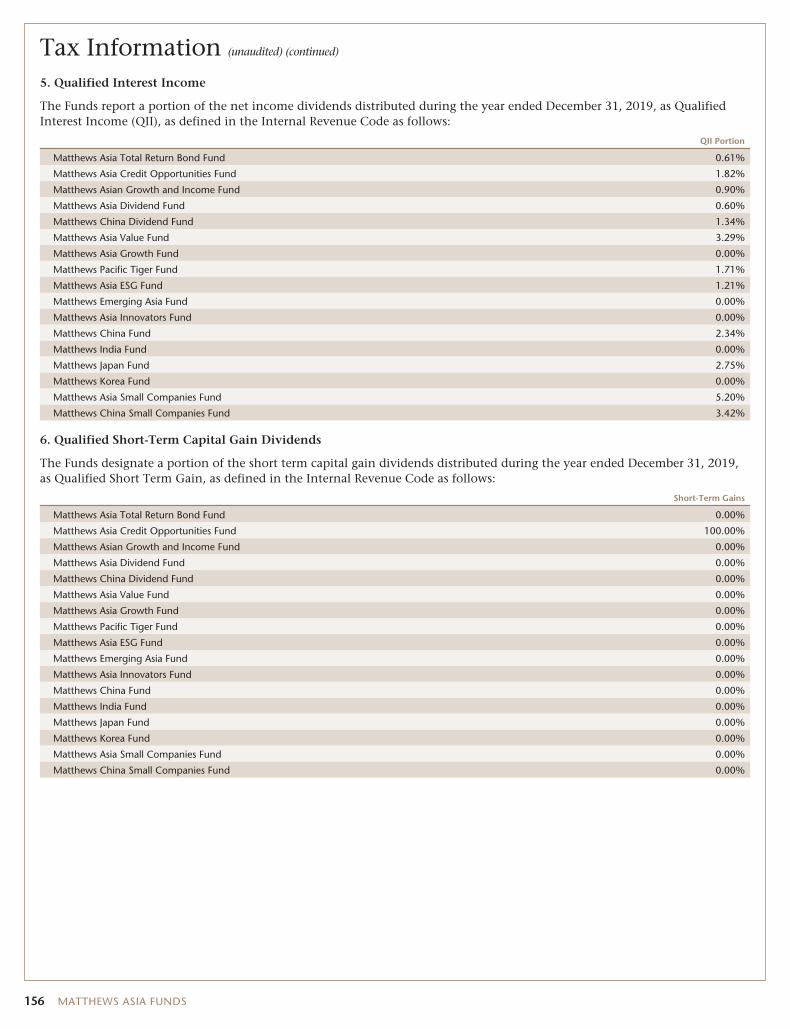
Tax Information (unaudited) (continued)
5. Qualified Interest Income
The Funds report a portion of the net income dividends distributed during the year ended December 31, 2019, as QualifiedInterest Income (QII), as defined in the Internal Revenue Code as follows:
QII Portion
Matthews Asia Total Return Bond Fund 0.61%
Matthews Asia Credit Opportunities Fund 1.82%
Matthews Asian Growth and Income Fund 0.90%
Matthews Asia Dividend Fund 0.60%
Matthews China Dividend Fund 1.34%
Matthews Asia Value Fund 3.29%
Matthews Asia Growth Fund 0.00%
Matthews Pacific Tiger Fund 1.71%
Matthews Asia ESG Fund 1.21%
Matthews Emerging Asia Fund 0.00%
Matthews Asia Innovators Fund 0.00%
Matthews China Fund 2.34%
Matthews India Fund 0.00%
Matthews Japan Fund 2.75%
Matthews Korea Fund 0.00%
Matthews Asia Small Companies Fund 5.20%
Matthews China Small Companies Fund 3.42%
6. Qualified Short-Term Capital Gain Dividends
The Funds designate a portion of the short term capital gain dividends distributed during the year ended December 31, 2019,as Qualified Short Term Gain, as defined in the Internal Revenue Code as follows:
Short-Term Gains
Matthews Asia Total Return Bond Fund 0.00%
Matthews Asia Credit Opportunities Fund 100.00%
Matthews Asian Growth and Income Fund 0.00%
Matthews Asia Dividend Fund 0.00%
Matthews China Dividend Fund 0.00%
Matthews Asia Value Fund 0.00%
Matthews Asia Growth Fund 0.00%
Matthews Pacific Tiger Fund 0.00%
Matthews Asia ESG Fund 0.00%
Matthews Emerging Asia Fund 0.00%
Matthews Asia Innovators Fund 0.00%
Matthews China Fund 0.00%
Matthews India Fund 0.00%
Matthews Japan Fund 0.00%
Matthews Korea Fund 0.00%
Matthews Asia Small Companies Fund 0.00%
Matthews China Small Companies Fund 0.00%
156 MATTHEWS ASIA FUNDS
Approval of Investment Advisory Agreement (unaudited)
The Funds, which are series of the Trust, have retained Mat-thews International Capital Management, LLC (“Matthews”)to manage their assets pursuant to an Investment AdvisoryAgreement dated as of February 1, 2016, as amended (the“Advisory Agreement”), which has been approved by theBoard of Trustees of the Funds, including all of the Trusteeswho are not “interested persons” (“Independent Trustees”),within the meaning of the Investment Company Act of 1940,as amended (the “1940 Act”), as well as by the shareholders ofeach Fund in accordance with the requirements of the 1940Act. Following an initial two-year term with respect to eachFund upon its commencement of operations, the AdvisoryAgreement continues in effect from year-to-year providedthat the continuance is specifically approved at least annuallyby the vote of the holders of at least a majority of the out-standing shares of the Funds, or by the Board of Trustees,and, in either event, by a majority of the Independent Trust-ees of the Trust casting votes in person at a meeting called forthat purpose (the “Annual 15(c) Process”).
At a meeting held on August 28 and 29, 2019 (the“Meeting”), the Board, including the Independent Trustees ofthe Trust, approved the continuation of the Advisory Agree-ment for an additional one-year term beginning February 1,2020 with respect to each Fund.
At the Meeting and at prior meetings, the Board received andconsidered information (both written and oral) provided toassist it in the review of the Advisory Agreement and madeassessments with respect to each Fund. The IndependentTrustees were advised by independent legal counsel withrespect to these matters. In addition, the Board receivedin-person presentations about the Funds throughout the year.Among the information considered by the Board wereresponses to a detailed information request sent on behalf ofthe Independent Trustees by their independent legal counsel.Matthews furnished extensive information in response to thisrequest with respect to many subjects relating to the AdvisoryAgreement and addressed many of the factors discussedbelow, including but not limited to information about theservices provided by Matthews, its structure, organization,operations and personnel, the financial condition of Mat-thews and the profitability to Matthews from the AdvisoryAgreement, compliance procedures and resources, investmentperformance of the Funds, expenses of the Funds, brokerageand portfolio transactions, distribution and marketing of theFunds, shareholder services and relationships with inter-mediaries, and other information considered relevant.
In considering information relating to management fee levels,which the Board considers to be the advisory and admin-istrative fees both separately and on a combined basis, theBoard considered, among other things, information providedby Matthews as to Fund management services and fees ascompared to advisory services and fees charged by Matthewsto its institutional clients and pooled vehicles organized out-side of the United States. The Trustees also consideredinformation provided by an independent data provider,Broadridge, comparing the investment performance and thefee and expense levels of each Fund to appropriate peer
groups of mutual funds, as well as performance data providedby Matthews with respect to pooled vehicles or otheraccounts managed by Matthews with similar investmentobjectives and/or strategies to the Funds, as applicable.
The Independent Trustees also considered that in 2017 they hadengaged an Independent Consultant (“IndependentConsultant”) with substantial industry experience in providingfund boards with analysis to assist them in their Annual 15(c)Process. The Independent Trustees considered the work andanalysis performed by the Independent Consultant in thatengagement to review the process for selecting appropriate peergroups for the Funds as helpful in their review for the Annual15(c) Process. Furthermore, throughout the course of the year,the Board received a wide variety of materials relating to theservices provided by Matthews, including reports on eachFund’s investment results, portfolio composition, portfolio trad-ing practices, shareholder services, and other information relat-ing to the nature, extent, and quality of services provided byMatthews to the Funds. The Board also took into account that,under the Administration and Shareholder Services Agreement,Matthews provides additional services to the Funds that areessential to the operation of the Funds and that, althoughMatthews is separately compensated under that agreement,these additional services are provided in connection with Mat-thews’ advisory relationship with the Funds.
In addition to the information furnished by Matthews, theTrustees were provided with a legal memorandum from theirindependent legal counsel discussing their fiduciary dutiesrelated to their approval of the continuation of the AdvisoryAgreement and discussed these matters with their counsel.
Prior to the Meeting, a working group of Independent Trust-ees and independent legal counsel had met with representa-tives of Matthews to review relevant information inconnection with the Annual 15(c) Process. Thereafter, all ofthe Independent Trustees had met separately with theirindependent legal counsel to review all of the informationprovided in connection with the Annual 15(c) Process. Atthese sessions, the Independent Trustees asked Matthews toprovide certain additional information and to respond tocertain additional questions at the Meeting. The IndependentTrustees then reviewed this supplemental information whichwas provided prior to and at the Meeting. The IndependentTrustees discussed the renewal of the Advisory Agreementwith representatives of Matthews and among themselves inprivate sessions on various occasions at which no representa-tives of Matthews were present.
The Trustees’ determinations at the Meeting were made on thebasis of each Trustee’s business judgment after considerationof all the information presented. In deciding to recommendthe renewal of the Advisory Agreement with respect to eachFund, the Independent Trustees did not identify any single orparticular piece of information that, in isolation, was the con-trolling factor. Each Independent Trustee may also haveweighed factors differently. This summary describes the mostimportant, but not all, of the factors considered by the Boardand the Independent Trustees.
matthewsasia.com | 800.789.ASIA 157
Approval of Investment Advisory Agreement (unaudited) (continued)
1. The nature, extent and quality of the services providedby Matthews under the Advisory Agreement.
The Trustees considered the overall financial strength andstability of Matthews and its ability to provide a high leveland quality of services to the Funds. The Trustees consideredthe experience and qualifications of the executive and portfo-lio management personnel at Matthews who are responsiblefor providing services to the Funds and who are responsiblefor the daily management of the Funds’ portfolios. The Trust-ees noted that Matthews has expanded its professional staff atboth senior and junior levels over the past several years, andhas enjoyed relative stability of its senior executives and port-folio management teams. They also reviewed Matthews’recent hirings to further strengthen or maintain currentcapabilities and to support future potential growth of assetsand the expansion of its business. Among the improvedcapabilities noted by the Independent Trustees over the pastseveral years are enhanced risk analytical resources andrelated professionals, including the appointment of a newGlobal Head of Risk and Compliance in 2017 and ongoingenhancements to compliance, risk management, technology,business infrastructure, operations, marketing and client serv-ice, as well as enhancements to financial intermediary over-sight and valuation practices.
The Trustees considered Matthews as well positioned to con-tinue to provide high quality services to the Funds undervarious market conditions, as demonstrated by past periods ofvolatile and challenging securities markets that have causedeither contracting revenues or rapidly expanding assets atdifferent times. The Trustees attributed much of that paststability to Matthews’ emphasis on preserving and enhancingportfolio management team resources, careful business plan-ning and management, as well as its solid financial conditionand strong cash reserves.
As in past years, the Trustees considered the technical capa-bilities of Matthews, including the design andimplementation of its disaster recovery and business con-tinuity infrastructure. The Trustees also considered the ChiefCompliance Officer’s report regarding Matthews’ complianceresources, risk assessment and other compliance initiativesand programs. The Trustees concluded that Matthews hasimplemented a robust and diligent compliance process, anddemonstrates a strong commitment to a culture of com-pliance. The Independent Trustees took into considerationMatthews’ description of its supervision of the activities ofthe Funds’ various service providers, as well as supporting theIndependent Trustees’ responsibilities and requests and itsresponsiveness to questions and/or concerns raised by theTrustees throughout the year.
The Trustees noted the significant role played by Matthewswith respect to the valuation of portfolio securities, includingresearch and analysis related to fair valued securities and duediligence and oversight of pricing vendors.
The Trustees concluded that Matthews had the quality ofpersonnel and other investment resources essential to per-forming its duties under the Advisory Agreement, and that
the nature, overall quality, cost and extent of such manage-ment services are fully satisfactory.
2. The investment performance of the Funds.The Trustees reviewed the short-term and long-term perform-ance of each Fund on both an absolute basis and in compar-ison to appropriate peer funds and benchmark indices forvarious periods ending June 30, 2019. The Trustees consid-ered investment results in light of each Fund’s objective,strategies and market conditions, noting periods duringwhich there were challenging investment conditions in vari-ous Asian markets. The Trustees also noted the difficulty offairly benchmarking performance for certain of the Funds aswell as the difficulty of establishing appropriate peer groupsor benchmark indices for certain of the Funds because of thelack of other funds with a similar investment focus. TheIndependent Trustees reviewed information as to peer groupselections presented by Broadridge and took into account thework previously done by the Independent Consultant inreviewing the peer group selection process.
The Trustees reviewed each Fund’s performance on acase-by-case basis and noted that some Funds had out-performed their Selected Performance Peer Group over certainperiods and/or exceeded the return of their respectivebenchmark while others underperformed their Selected Per-formance Peer Group over certain periods and/or trailed thereturn of their respective benchmark. In considering eachFund’s investment results, the Board placed greater emphasison each Fund’s long-term performance track record ratherthan shorter-term performance. The Board also took intoaccount that each Fund’s track record was measured as of aspecific ending date, and that track records can vary as ofdifferent measurement dates. Therefore, in reviewing a Fundthat is currently underperforming, the Trustees also consid-ered the broader perspective of the Fund’s performance overvarying time periods, the market conditions experiencedduring the periods under review, as well as the outlook forthe Fund going forward in light of expected future marketconditions.
The Trustees discussed with Matthews the fact that certainperiods of underperformance may be transitory while otherperiods of underperformance may be caused by factors thatwarrant further consideration. To the extent of any concernsabout performance with respect to any particular period for aFund, the Trustees noted that Matthews had provided anexplanation for that performance and explained its reasonsfor maintaining a consistent investment philosophy. In addi-tion, the Trustees recognized actions taken by Matthews fromtime to time in response to performance concerns, such aschanges to members of a portfolio management team. Asummary of each Fund’s performance track record is providedbelow.
For Matthews Pacific Tiger Fund, the Trustees noted thatthe Fund’s performance was very strong in the five-year andsince inception periods, ranking in the first quintile for thoseperiods against the peer group, in the fourth quintile forthree years and second quintile for one year. The Trustees
158 MATTHEWS ASIA FUNDS
Approval of Investment Advisory Agreement (unaudited) (continued)
also noted that the Fund outperformed the median of its peergroup for the one-year, five-year and since inception periodsand underperformed the median for the three-year period.
For Matthews Asian Growth and Income Fund, the Trust-ees noted that the Fund has experienced difficult perform-ance for the three- and five-year periods, ranking in thefifth quintile of its peer group, but that recent performancehad improved, with the Fund ranking in the first quintilefor the one-year period. The Trustees also noted that theFund’s performance ranked in the third quintile for thesince inception period. The Trustees further noted that theFund outperformed its peer group median for the one-yearperiod but underperformed for the three-year, five-year andsince inception periods. The Trustees took into accountMatthews’ explanation that much of the longer-termunderperformance was the result of a relatively weak 2016,but that the Fund had less volatility compared to the peergroup. The Board also considered that Matthews had madechanges the previous year to the portfolio managementand research teams for the Fund and noted the improvedperformance since that time.
For Matthews Korea Fund, the Trustees noted that theFund had enjoyed favorable relative performance for thefive-year and since inception periods, but performed belowthe median for the one- and three-year periods. The Trust-ees took into account, however, that the peer universe forthe Fund was very small, with only a few comparable fundsand that, therefore, relative peer performance was less use-ful than if the peer universe were larger.
For Matthews China Fund, the Trustees noted that theFund’s performance had ranked in the third quintile for theone-year and since inception periods, first quintile for thethree-year period and second quintile for the five-yearperiod. The Trustees also noted that the Fund out-performed the median of its peer funds over each of thoseperiods.
For Matthews Japan Fund, the Trustees noted that theFund’s performance had ranked in the fourth quintile forthe one- and three-year periods, but that longer-term per-formance was favorable compared to its peer funds, withthe Fund ranking in the second quintile and exceeding themedian for the five-year and since inception periods. TheTrustees took into consideration Matthews’ discussionsregarding the reasons for the shorter-term under-performance.
For Matthews Asia Innovators Fund, the Trustees notedthat the Fund has experienced recent underperformance,ranking in the fifth quintile for the one-year period, butthat the Fund was above the median of its peer funds overthe three-year period and well above the median for thefive-year and since inception periods, ranking in the firstquintile for all of those periods. The Trustees noted theabsence of a directly comparable peer group with the sameAsia-focused industry concentration even though the Fundslightly expanded its investment focus starting in 2016.
For Matthews Asia Growth Fund, the Trustees noted thatthe Fund ranked in the fifth quintile for the one-yearperiod, but that the Fund had stronger longer-termperformance, ranking in the third quintile for the three-and five-year periods and outperforming the median of itspeers for the three-year, five-year and since inception peri-ods. The Trustees took into account, however, that princi-pally due to the Fund’s exposure to Japan, the peeruniverse for the Fund was small, with only a few com-parable funds and that therefore relative peer performancewas of less use than if the peer universe were larger. TheBoard also considered Matthews’ discussion regarding thefactors contributing to the recent underperformance.
For Matthews India Fund, the Trustees noted that theFund ranked in the fourth quintile for the one- and three-year periods ,underperforming the median of its peergroup, but outperformed the median of its peer funds andranked in the first quintile over the five-year and sinceinception periods. The Trustees took into considerationMatthews’ discussions regarding the factors that had con-tributed to the shorter-term underperformance.
For Matthews Asia Dividend Fund, the Trustees noted thatthe Fund outperformed the median performance of its peergroup for the five-year and since inception periods, rankingin the third quintile over the five-year period, but laggedthe median for the peer group for the one-and three-yearperiods, ranking in the fourth and fifth quintile for thoseperiods, respectively. The Trustees took into account, how-ever, that principally due to the Fund’s exposure to Japan,the peer universe for the Fund was small, with only a fewcomparable funds and that therefore relative peer perform-ance was of less use than if the peer universe were larger.
For Matthews Asia Small Companies Fund, the Trusteesnoted that the Fund ranked above the median for the one-and three-year periods, with only two funds in the peergroup (and was the only fund in the peer group for thefive-year and since inception periods). The Trustees alsonoted that a possible larger peer group had been reviewedand determined not to be sufficiently similar to the Fundto be useful. The Trustees considered further that most ofthe peer group funds were not focused on Asian small capinvestments and, therefore, were considered to be of lim-ited use in evaluating the Fund’s performance.
For Matthews China Dividend Fund, the Trustees notedthe Fund’s strong relative performance, ranking in thesecond quintile of its peer group for the one-year periodand first quintile for the three-year, five-year and sinceinception periods. The Trustees also noted that the Fundhad outperformed its peer group median for the one-year,three-year, five-year and since inception periods.
For Matthews China Small Companies Fund, the Trusteesnoted that the Fund’s performance was equal to themedian for its peer group for the one-year period and out-performed the median for the since inception period, withonly three funds in the peer group.
matthewsasia.com | 800.789.ASIA 159
Approval of Investment Advisory Agreement (unaudited) (continued)
For Matthews Asia Total Return Bond Fund, the Trusteesnoted that the Fund’s performance had ranked in the fifthquintile for the one-year period, but that the Fund’s longer-term performance was stronger, ranking in the secondquintile for the three- and five-year periods and the thirdquintile for the period since inception. The Trustees notedthat the Fund had underperformed its peer group medianfor the one-year and since inception periods but had out-performed for the three- and five-year periods. The Trusteesrecognized that the peer groups included mostly broaderemerging market hard currency debt funds not focused onAsia, making the peer group less useful in comparing rela-tive performance than if their principal investment strat-egies were more closely aligned with the Fund’s investmentfocus. The Trustees also considered that the Advisor wasproposing changes to the Fund’s name and principalinvestment strategy, noting that those changes are notexpected to impact the way the Fund is managed or theFund’s risk/return profile.
For Matthews Emerging Asia Fund, the Trustees notedthat the Fund’s performance had ranked above the medianof its peer group for the five-year and since inception peri-ods, ranking in the first and second quintile for those peri-ods, respectively, but had experienced difficult relative one-and three-year performance, ranking in the fifth quintileamong its peers. The Trustees took into account Matthews’explanation that the Fund differs from most funds in itspeer group due to its investment focus on frontier coun-tries, such as Pakistan. Recent weak performance of frontiercountry stocks has resulted in relative underperformance ofthe Fund against its peer universe.
For Matthews Asia ESG Fund, the Trustees noted that theFund had outperformed its peer group median for theone-year and since inception periods and had ranked in thesecond quintile for those periods and that the Fund hadunderperformed its peer group median for the three-yearperiod and ranked in the third quintile. The Trustees notedthat the peer group funds did not have a similar ESG strat-egy as the Fund.
For Matthews Asia Value Fund, the Trustees noted thatthe Fund’s performance had ranked in the fourth quintilefor the one-year period, second quintile for the three-yearperiod and third quintile since inception. The Trustees alsonoted that the Fund’s performance exceeded the peergroup median for the three-year and since inception peri-ods with strong positive performance.
For Matthews Asia Credit Opportunities Funds, the Trust-ees noted that the Fund’s performance had ranked abovethe peer group median for the one-year, three-year andsince inception periods. The Trustees took into account,however, that the peer universe for the Fund was verysmall, with only a few comparable funds and that thereforerelative peer performance was of less use than if the peeruniverse were larger.
After review, the Trustees concluded that each Fund’s overallperformance was satisfactory or was being addressed as
needed. The Trustees also reviewed Matthews’ trading policiesand efforts to obtain best overall execution for the Funds inthe various markets in which the Funds trade securities. TheTrustees noted the relatively low turnover rates in the variousequity Funds and Matthews’ consistent adherence to its long-standing investment approach, which emphasizes funda-mental bottom-up driven investment selection in light of itsview of regional economic conditions.
3. The extent to which Matthews realizes economies ofscale as the Funds grow larger and whether Fundinvestors benefit from any economies of scale.
The Trustees first noted the substantial work done over recentyears between the Board and Matthews to establish fee structuresfor both the Advisory Agreement and other agreements thatrecognize the sharing of economies of scale that can arise asassets in the Funds grow through the use of breakpoints. Inparticular, they noted that the management fee structure con-tains breakpoints for the group-priced Funds as well as for certainindividually priced Funds. That structure enhances the ability ofthe Funds and their shareholders to benefit from past and futurepotential economies of scale. They discussed the structure andlevel of these breakpoints and concluded that they continue tobe appropriate given the sizes of the Funds and potential futuregrowth. The Trustees further noted that additional economies ofscale have been and will continue to be shared with shareholdersof the Funds through fee waivers and/or expense reimbursementspursuant to the Operating Expenses Agreement, fee waivers pur-suant to the Fee Waiver Agreement, and the breakpoints in thefees payable under the Services Agreement. The Trustees alsonoted that the Advisor had recommended, and the Trusteesagreed, to remove redemption fees from the Matthews EmergingAsia Fund, Matthews Asia Small Companies Fund and MatthewsChina Small Companies Fund in an effort to promote assetgrowth and realize greater economies of scale.
The Trustees next discussed Matthews’ ongoing investment inits technology, systems, staffing and other aspects of its busi-ness that can benefit the Funds, noting that all theseendeavors are a means by which Matthews is sharing econo-mies of scale with the Funds and their shareholders throughreinvestment in products and services that are designed tobenefit the Funds and their shareholders. The Trusteesconsidered the new personnel hired over recent years, as wellas planned hiring, and the extent to which that hiring couldbe expected to benefit shareholders. The Trustees also recog-nize that the Funds’ total assets have fluctuated, especially incertain strategies. Those fluctuations affect any economies ofscale that could be enjoyed. As a result, the Trustees remainsatisfied about the extent to which economies of scale havebeen and will continue to be shared with the Funds and theirshareholders.
4. The costs of the services provided by Matthews andothers.
The Trustees considered the management fees and total feesand expenses of each Fund in comparison to the managementand advisory fees and other fees and expenses of other fundsin each Fund’s relevant peer group. The Trustees reviewedinformation developed by Broadridge as to appropriate peer
160 MATTHEWS ASIA FUNDS

Approval of Investment Advisory Agreement (unaudited) (continued)
groups for each Fund for these purposes and took into accountthe work previously done by the Independent Consultant inreviewing these peer groups. The Board placed greateremphasis on management fees, which include both advisoryand administrative fees, as the basis of comparison rather thanadvisory fees alone.
The Trustees considered both the gross management fee ratescharged by Matthews, as well as the effective management feerates after taking into consideration the fees waived andexpenses reimbursed pursuant to the Operating ExpensesAgreement and the Fee Waiver Agreement. The Trustees con-sidered that the contractual advisory rates (excluding admin-istrative services) for the Funds were generally verycompetitive and often lower than those of the relevant peergroup averages. The Trustees also considered that the totalexpense ratios paid by shareholders of the Funds, which aremost representative of a shareholder’s net investment results,were also very competitive, with all but the relatively newer orsmaller Funds ranking below the peer group averages. TheTrustees noted that Matthews’ continued efforts in recentyears had resulted in, for many of the Funds, reduced expensesover time. The Trustees also noted that, as an example ofthose efforts, the Advisor had agreed to lower the level of theexpense cap for the Institutional Class of each Fund (otherthan the Matthews Asia Total Return Bond Fund andMatthews Asia Credit Opportunities Fund) by 5 basis pointsto 1.20%, thereby effectively lowering the expenses for theInvestor Class of those Funds by the same amount, which isexpected to result in immediate cost reductions for theMatthews Emerging Asia Fund, Matthews Asia SmallCompanies Fund, Matthews China Small Companies Fund,Matthews Asia ESG Fund and Matthews Asia Value Fund. Itwas noted that the larger Funds are already operating underthe reduced expense cap but will have additional downsideprotection in the event that their assets decrease.
The Trustees also compared Matthews’ advisory fees withthose of Matthews’ separate accounts and other investmentproducts, noting that the Funds’ advisory expenses were notdisadvantageous (not being substantially higher than theseparate accounts’ rates). The Trustees agreed that advisoryfees for the Funds appeared to be appropriate in comparisonand taking into account the services differences betweenthese products and the Funds, including the differences in thefrequency of net asset value calculations and other opera-tional and compliance activities.
The Trustees’ overall assessment with respect to each Fundwas that, taking into account the considerations noted below,the contractual advisory fee rates, the total expense ratio, andthe effective or net advisory fee rates were fair and reasonable.
For the Matthews Asia Total Return Bond Fund and theMatthews Asia Credit Opportunities Fund, actual manage-ment fees were above the peer group medians, but the con-tractual management fees were below the peer groupmedians. The Trustees noted that Matthews had agreed theprevious year to a reduction in its advisory fee rate from0.65% to 0.55% and to forego recovery of any fees waivedprior to that reduction.
For the Matthews Asia Small Companies Fund, MatthewsAsia Value Fund, Matthews China Small Companies Fundand Matthews Emerging Asia Fund, the actual managementfees were above the peer group medians due to their small size,but the contractual management fee for the Matthews AsiaValue Fund and Matthews Emerging Asia Fund were belowtheir peer group medians while the contractual management feefor the Matthews Asia Small Companies Fund and MatthewsChina Small Companies Fund was above their peer groupmedians. The Trustees considered that these Funds each hadbreakpoints in its management fee schedule and noted that theAdvisor had recommended, and the Trustees agreed, to removeredemption fees from the Matthews Emerging Asia Fund,Matthews Asia Small Companies Fund and Matthews ChinaSmall Companies Fund in order to promote asset growth andrealize economies of scale.
For the Matthews Japan Fund, Matthews Korea Fund,Matthews Pacific Tiger Fund and Matthews AsiaInnovators Fund, the actual management fees were abovepeer group medians, but the contractual management feeswere at or below the peer group medians.
For the Matthews China Fund, Matthews Asia GrowthFund, Matthews India Fund, Matthews Asia DividendFund, Matthews China Dividend Fund and Matthews AsiaESG Fund, both the actual management fees and the con-tractual management fees were below the respective peergroup medians.
5. The profits to be realized by Matthews and its affiliatesfrom the relationships with the Funds.
The Trustees reviewed information provided by Matthewsregarding the costs of sponsoring and operating the Fundsand information regarding the profitability to Matthews ofthe Advisory Agreement both on a fund-by-fund basis andoverall for the family of Funds. In considering profitability,the Trustees discussed and considered the methodologyemployed by Matthews in calculating profit margins but alsoconsidered other elements relevant to discussions of profit-ability, such as the entrepreneurial risk undertaken byMatthews in sponsoring and maintaining the Funds and risksassociated with commitments to maintain Fund expenseratios. The Trustees also reviewed information providedregarding the structure and manner in which Matthews’investment professionals were compensated and theirrespective views of the relationship of such compensation tothe attraction and retention of quality personnel. The Trust-ees considered Matthews’ willingness to invest in technology,infrastructure and professional staff to reinforce and offerservices and to accommodate changing regulatory require-ments and industry practices.
The Trustees noted that Matthews appeared to be sufficientlyprofitable to operate as a viable investment managementfirm, able to honor its obligations as a sponsor of the Funds,including the Funds that did not generate a profit forMatthews, without earning excessive profits from any partic-ular Fund or from the overall relationship with the Funds.The Trustees noted that, with fluctuations in asset levels insome prior years, volatility in revenues and profitability could
matthewsasia.com | 800.789.ASIA 161
Approval of Investment Advisory Agreement (unaudited) (continued)
be expected from time to time in the future, but they alsonoted the continued expenditures on personnel and otherresources. The Board also considered information relating tothe profitability of a limited number of publicly tradedinvestment advisers, although the Board noted that thisinformation was of limited utility because it was comprised ofa limited universe of advisers, did not provide anyinformation as to how profitability was determined and didnot limit profitability analysis to the performance of advisoryservices to registered investment companies. The Board fur-ther noted that these advisers differed significantly fromMatthews because they were not solely dedicated to invest-ment in the Asian markets.
Based on information received, the Trustees noted that Mat-thews’ overall profitability from the Advisory Agreementappeared not to be excessive at the current time, whetherconsidered inclusive or exclusive of distribution costs.
6. Ancillary benefits.The Trustees requested and received from Matthewsinformation concerning other benefits received by Matthewsas a result of its respective relationship with the Funds,including various service arrangements with Matthews. Thesepotential benefits included, among other things, the use ofsoft dollars as well as potential benefits resulting from thestructure of compensation arrangements between the Trust,the Adviser and financial intermediaries in the areas of share-holder servicing and sub-transfer agency services. The Boardconcluded that such benefits were consistent with thosegenerally derived by investment advisers to mutual funds orwere otherwise not unusual.
7. Conclusions.Based on their review, including their consideration of eachof the factors referred to above, and assisted by the advice ofindependent counsel to the Independent Trustees, the Board,including the Independent Trustees, concluded that the Advi-sory Agreement was fair and reasonable with respect to eachFund and its shareholders, and that the renewal of the Advi-sory Agreement would be in the best interests of each Fundand its shareholders. The Board did not indicate that anysingle factor was determinative of its decision to approve theAdvisory Agreement, but indicated that the Board based itsdetermination on the total mix of information available to it.
162 MATTHEWS ASIA FUNDS
Statement Regarding Liquidity RiskManagement ProgramThe Securities and Exchange Commission adopted Rule 22e-4 under the Invest-ment Company Act of 1940, as amended (the “Liquidity Rule”) to promote effec-tive liquidity risk management throughout the open-end investment companyindustry.
The Board of Trustees (the “Board”) of the Matthews International Funds, (the“Funds”) met on November 13-14, 2019 (the “Meeting”) to review the LiquidityRisk Management Program (the “Program”) of the Funds, in accordance with therequirements of the Liquidity Rule. The Board has appointed Matthews Interna-tional Capital Management, LLC (“MICM”) as Program Administrator. MICM hasfurther delegated these duties to the members of the Liquidity Risk ManagementCommittee (“LRMC”), a sub-committee of the Enterprise Risk ManagementCommittee of MICM.
At the Meeting, the LRMC provided the Board with a report that addressed theoperation of the Program and assessed its adequacy and effectiveness ofimplementation, including the operation of each Fund’s Highly Liquid InvestmentMinimum (“HLIM”) where applicable, and any material changes to the Program(the “Report”). The Report covered the period from December 1, 2018 throughSeptember 30, 2019 (the “Program Reporting Period”).
The Report included a Portfolio Liquidity Profile of each Fund, and during theProgram Reporting Period, MICM provided the Board information relating to theProgram’s liquidity classification methodology for categorizing a Fund’s invest-ments (including derivative transactions) into one of four liquidity buckets duringboth normal and reasonably foreseeable stressed market periods. The Report alsodiscussed the methodology utilized in establishing a Fund’s HLIM and ReasonablyAnticipated Trading Size (“RATS”) and noted that the LRMC was not proposingany changes to the HLIM or RATS assigned to each Fund.
There were no material changes to the Program during the Program ReportingPeriod. The Report provided to the Board stated that the LRMC concluded thatbased on the operation of the functions, as described in the Report, the Program isoperating as intended and is effective in implementing the requirements of theLiquidity Rule.
matthewsasia.com | 800.789.ASIA 163
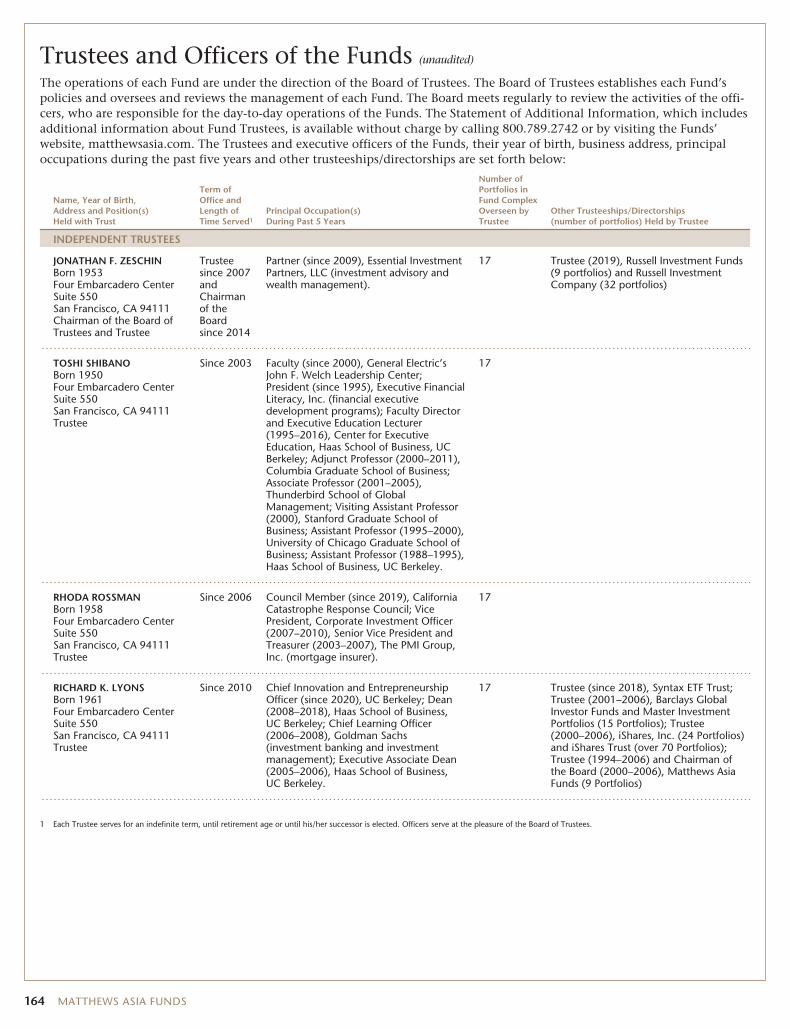
Trustees and Officers of the Funds (unaudited)
The operations of each Fund are under the direction of the Board of Trustees. The Board of Trustees establishes each Fund’spolicies and oversees and reviews the management of each Fund. The Board meets regularly to review the activities of the offi-cers, who are responsible for the day-to-day operations of the Funds. The Statement of Additional Information, which includesadditional information about Fund Trustees, is available without charge by calling 800.789.2742 or by visiting the Funds’website, matthewsasia.com. The Trustees and executive officers of the Funds, their year of birth, business address, principaloccupations during the past five years and other trusteeships/directorships are set forth below:
Name, Year of Birth,Address and Position(s)Held with Trust
Term ofOffice andLength ofTime Served1
Principal Occupation(s)During Past 5 Years
Number ofPortfolios inFund ComplexOverseen byTrustee
Other Trusteeships/Directorships(number of portfolios) Held by Trustee
INDEPENDENT TRUSTEES
JONATHAN F. ZESCHINBorn 1953Four Embarcadero CenterSuite 550San Francisco, CA 94111Chairman of the Board ofTrustees and Trustee
Trusteesince 2007andChairmanof theBoardsince 2014
Partner (since 2009), Essential InvestmentPartners, LLC (investment advisory andwealth management).
17 Trustee (2019), Russell Investment Funds(9 portfolios) and Russell InvestmentCompany (32 portfolios)
TOSHI SHIBANOBorn 1950Four Embarcadero CenterSuite 550San Francisco, CA 94111Trustee
Since 2003 Faculty (since 2000), General Electric’sJohn F. Welch Leadership Center;President (since 1995), Executive FinancialLiteracy, Inc. (financial executivedevelopment programs); Faculty Directorand Executive Education Lecturer(1995–2016), Center for ExecutiveEducation, Haas School of Business, UCBerkeley; Adjunct Professor (2000–2011),Columbia Graduate School of Business;Associate Professor (2001–2005),Thunderbird School of GlobalManagement; Visiting Assistant Professor(2000), Stanford Graduate School ofBusiness; Assistant Professor (1995–2000),University of Chicago Graduate School ofBusiness; Assistant Professor (1988–1995),Haas School of Business, UC Berkeley.
17
RHODA ROSSMANBorn 1958Four Embarcadero CenterSuite 550San Francisco, CA 94111Trustee
Since 2006 Council Member (since 2019), CaliforniaCatastrophe Response Council; VicePresident, Corporate Investment Officer(2007–2010), Senior Vice President andTreasurer (2003–2007), The PMI Group,Inc. (mortgage insurer).
17
RICHARD K. LYONSBorn 1961Four Embarcadero CenterSuite 550San Francisco, CA 94111Trustee
Since 2010 Chief Innovation and EntrepreneurshipOfficer (since 2020), UC Berkeley; Dean(2008–2018), Haas School of Business,UC Berkeley; Chief Learning Officer(2006–2008), Goldman Sachs(investment banking and investmentmanagement); Executive Associate Dean(2005–2006), Haas School of Business,UC Berkeley.
17 Trustee (since 2018), Syntax ETF Trust;Trustee (2001–2006), Barclays GlobalInvestor Funds and Master InvestmentPortfolios (15 Portfolios); Trustee(2000–2006), iShares, Inc. (24 Portfolios)and iShares Trust (over 70 Portfolios);Trustee (1994–2006) and Chairman ofthe Board (2000–2006), Matthews AsiaFunds (9 Portfolios)
1 Each Trustee serves for an indefinite term, until retirement age or until his/her successor is elected. Officers serve at the pleasure of the Board of Trustees.
164 MATTHEWS ASIA FUNDS
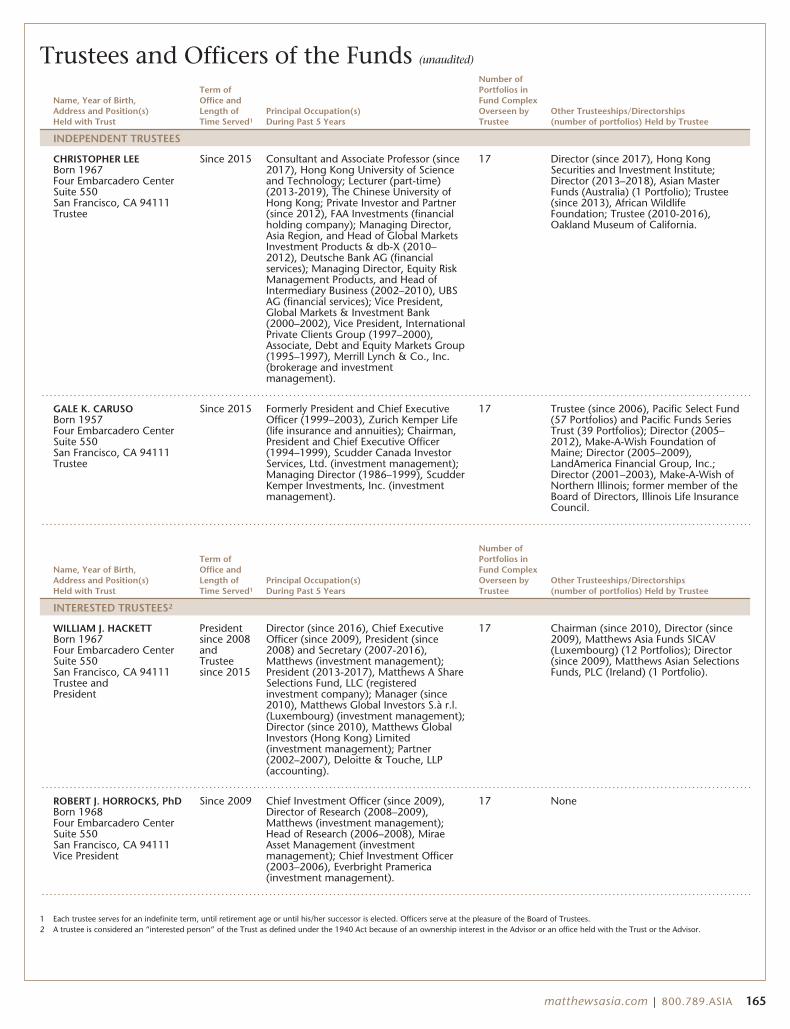
Trustees and Officers of the Funds (unaudited)
Name, Year of Birth,Address and Position(s)Held with Trust
Term ofOffice andLength ofTime Served1
Principal Occupation(s)During Past 5 Years
Number ofPortfolios inFund ComplexOverseen byTrustee
Other Trusteeships/Directorships(number of portfolios) Held by Trustee
INDEPENDENT TRUSTEES
CHRISTOPHER LEEBorn 1967Four Embarcadero CenterSuite 550San Francisco, CA 94111Trustee
Since 2015 Consultant and Associate Professor (since2017), Hong Kong University of Scienceand Technology; Lecturer (part-time)(2013-2019), The Chinese University ofHong Kong; Private Investor and Partner(since 2012), FAA Investments (financialholding company); Managing Director,Asia Region, and Head of Global MarketsInvestment Products & db-X (2010–2012), Deutsche Bank AG (financialservices); Managing Director, Equity RiskManagement Products, and Head ofIntermediary Business (2002–2010), UBSAG (financial services); Vice President,Global Markets & Investment Bank(2000–2002), Vice President, InternationalPrivate Clients Group (1997–2000),Associate, Debt and Equity Markets Group(1995–1997), Merrill Lynch & Co., Inc.(brokerage and investmentmanagement).
17 Director (since 2017), Hong KongSecurities and Investment Institute;Director (2013–2018), Asian MasterFunds (Australia) (1 Portfolio); Trustee(since 2013), African WildlifeFoundation; Trustee (2010-2016),Oakland Museum of California.
GALE K. CARUSOBorn 1957Four Embarcadero CenterSuite 550San Francisco, CA 94111Trustee
Since 2015 Formerly President and Chief ExecutiveOfficer (1999–2003), Zurich Kemper Life(life insurance and annuities); Chairman,President and Chief Executive Officer(1994–1999), Scudder Canada InvestorServices, Ltd. (investment management);Managing Director (1986–1999), ScudderKemper Investments, Inc. (investmentmanagement).
17 Trustee (since 2006), Pacific Select Fund(57 Portfolios) and Pacific Funds SeriesTrust (39 Portfolios); Director (2005–2012), Make-A-Wish Foundation ofMaine; Director (2005–2009),LandAmerica Financial Group, Inc.;Director (2001–2003), Make-A-Wish ofNorthern Illinois; former member of theBoard of Directors, Illinois Life InsuranceCouncil.
Name, Year of Birth,Address and Position(s)Held with Trust
Term ofOffice andLength ofTime Served1
Principal Occupation(s)During Past 5 Years
Number ofPortfolios inFund ComplexOverseen byTrustee
Other Trusteeships/Directorships(number of portfolios) Held by Trustee
INTERESTED TRUSTEES2
WILLIAM J. HACKETTBorn 1967Four Embarcadero CenterSuite 550San Francisco, CA 94111Trustee andPresident
Presidentsince 2008andTrusteesince 2015
Director (since 2016), Chief ExecutiveOfficer (since 2009), President (since2008) and Secretary (2007-2016),Matthews (investment management);President (2013-2017), Matthews A ShareSelections Fund, LLC (registeredinvestment company); Manager (since2010), Matthews Global Investors S.à r.l.(Luxembourg) (investment management);Director (since 2010), Matthews GlobalInvestors (Hong Kong) Limited(investment management); Partner(2002–2007), Deloitte & Touche, LLP(accounting).
17 Chairman (since 2010), Director (since2009), Matthews Asia Funds SICAV(Luxembourg) (12 Portfolios); Director(since 2009), Matthews Asian SelectionsFunds, PLC (Ireland) (1 Portfolio).
ROBERT J. HORROCKS, PhDBorn 1968Four Embarcadero CenterSuite 550San Francisco, CA 94111Vice President
Since 2009 Chief Investment Officer (since 2009),Director of Research (2008–2009),Matthews (investment management);Head of Research (2006–2008), MiraeAsset Management (investmentmanagement); Chief Investment Officer(2003–2006), Everbright Pramerica(investment management).
17 None
1 Each trustee serves for an indefinite term, until retirement age or until his/her successor is elected. Officers serve at the pleasure of the Board of Trustees.2 A trustee is considered an “interested person” of the Trust as defined under the 1940 Act because of an ownership interest in the Advisor or an office held with the Trust or the Advisor.
matthewsasia.com | 800.789.ASIA 165

Trustees and Officers of the Funds (unaudited)
Name, Year of Birth,Address and Position(s)Held with Trust
Term of Officeand Length ofTime Served1 Principal Occupation(s) During Past 5 Years
Other Trusteeships/Directorships(number ofportfolios)Held by Officer
OFFICERS WHO ARE NOT TRUSTEES
JOHN P. McGOWANBorn 1964Four Embarcadero CenterSuite 550San Francisco, CA 94111Vice President andSecretary
Since 2005 Head of Fund Administration (since 2009), Chief Administrative Officer (2007–2008), Chief Operating Officer (2004–2007), Matthews (investmentmanagement); Vice President and Secretary (2013-2017), Matthews A ShareSelections Fund, LLC (registered investment company); Director (since 2010),Matthews Asia Funds SICAV (Luxembourg) (investments); Director (since 2010),Matthews Global Investors S.à r.l. (Luxembourg) (investment management);Director (since 2004), Matthews Asian Selections Funds, PLC (Ireland)(investments).
Director,Matthews AsianSelections FundsPlc (1 Portfolio);Director,Matthews AsiaFunds SICAV(Luxembourg)(12 Portfolios).
SHAI A. MALKABorn 1973Four Embarcadero CenterSuite 550San Francisco, CA 94111Treasurer
Since 2005 Vice President of Fund Accounting and Operations (since 2010), Senior Managerof Fund Accounting and Operations (2004–2009), Matthews (investmentmanagement); Treasurer (2013-2017), Matthews A Share Selections Fund, LLC(registered investment company).
None
DAVID MONROEBorn 1963Four Embarcadero CenterSuite 550San Francisco, CA 94111Vice President
Since 2014 General Counsel (since 2015), Deputy General Counsel (2014), Matthews(investment management); Chief Legal Officer (2006–2013), Nikko AssetManagement Co., Ltd. (investment management).
None
GAZALA KHANBorn 1969Four Embarcadero CenterSuite 550San Francisco, CA 94111Chief Compliance Officerand Anti-MoneyLaundering Officer
Since 2019 Chief Compliance Officer and Anti-Money Laundering Officer (since 2019),Matthews Asia Funds (registered investment company); Chief ComplianceOfficer (2009-2019), Goldman Sachs Trust and Variable Insurance Trust(registered investment company).
None
1 Each trustee serves for an indefinite term, until retirement age or until his/her successor is elected. Officers serve at the pleasure of the Board of Trustees.
166 MATTHEWS ASIA FUNDS
Matthews Asia FundsINVESTMENT ADVISORMatthews International Capital Management, LLCFour Embarcadero Center, Suite 550San Francisco, CA 94111800.789.ASIA
CUSTODIANBrown Brothers Harriman & Co.50 Post Office SquareBoston, MA 02110
ACCOUNT SERVICESMatthews Asia FundsP.O. Box 9791Providence, RI 02940800.789.ASIA
LEGAL COUNSELPaul Hastings LLP101 California Street, 48th FloorSan Francisco, CA 94111
matthewsasia.com | 800.789.ASIA 167

P.O. Box 9791 | Providence, RI 02940 | matthewsasia.com | 800.789.ASIA (2742)
Matthews Asia Funds are distributed in the United States by Foreside Funds Distributors LLC, Berwyn, PennsylvaniaMatthews Asia Funds are distributed in Latin America by HMC Partners AR-1219
168