USER NOTE CONSOLIDATED FEDERAL FUNDS REPORT ...
110
USER NOTE CONSOLIDATED FEDERAL FUNDS REPORT for Fiscal Year 1995 (Revised January 2004) Department of Housing and Urban Development's program, "Lower Income Housing Assistance Program -- Section 8 Moderate Rehabilitation" (CFDA program 14.856) has been reclassified from CFFR's "Other Direct Payments" (DO) assistance type to the "Grants" (GG) assistance type. This change affects Tables 1, 3, 4, 10 ,11, 13, and 15, and involves a significant shift of $18.4 billion (nationally) from "Other Direct Payments" to "Grants." The change is NOT represented in this PDF version of the publication, but is available via the Online Query System and downloads at http://www.census.gov/govs/www/cffr.html. CFFR Object Code Category DR Direct Payments for Individuals (Retirement and Disability only) DO Direct Payments for Individuals (Other than Retirement and Disability) DX Direct Payments Other than for Individuals GG Grants (Block, Grants, Formula Grants, Project Grants and Cooperative Agreements) PC Procurement Contracts SW Salaries and Wages DL Direct Loans GL Guaranteed/Insured Loans II Insurance
-
Upload
khangminh22 -
Category
Documents
-
view
0 -
download
0
Transcript of USER NOTE CONSOLIDATED FEDERAL FUNDS REPORT ...

USER NOTE CONSOLIDATED FEDERAL FUNDS REPORT
for Fiscal Year 1995 (Revised January 2004)
Department of Housing and Urban Development's program, "Lower Income Housing Assistance Program -- Section 8 Moderate Rehabilitation" (CFDA program 14.856) has been reclassified from CFFR's "Other Direct Payments" (DO) assistance type to the "Grants" (GG) assistance type. This change affects Tables 1, 3, 4, 10 ,11, 13, and 15, and involves a significant shift of $18.4 billion (nationally) from "Other Direct Payments" to "Grants." The change is NOT represented in this PDF version of the publication, but is available via the Online Query System and downloads at http://www.census.gov/govs/www/cffr.html. CFFR Object Code Category
DR Direct Payments for Individuals (Retirement and Disability only) DO Direct Payments for Individuals (Other than Retirement and Disability) DX Direct Payments Other than for Individuals GG Grants (Block, Grants, Formula Grants, Project Grants and Cooperative Agreements)PC Procurement Contracts SW Salaries and Wages DL Direct Loans GL Guaranteed/Insured Loans II Insurance

����� �"�#%�� %� !�� !���#����! !���$� � �� �%�%�$%��$� ���� �$%#�%�!
������� ��� � �� �����
�!#� %��
������� !�� �� ����� %� � �� �&���%
!& %'� �#��$
����������������� �����
�� ������$���� ���#� ����
������

Acknowledgments
This report was prepared in the Governments Division by Kheang Hang under thesupervision of Robert McArthur , Chief of the Federal Programs Branch. Janet Allen,Carol Cropper, Betty Ford, Diane Glaspie, Sue Jones, Susan Long, and GlendaPickett assisted in data review.
Computer processing operations were performed by Linda Huang and MichaelFreeman under the supervision of Kathy Chamberlain, Chief of the InformationSystems Branch.
The staff of the Administrative and Customer Services Division, Walter C. Odom,Chief, performed publication planning, design, composition, editorial review, and printingplanning and procurement. Frances B. Scott provided publication coordination andediting.
Guidance and supervision for this report were provided by the Budget ReviewDivision, and the General Management Division, of the Office of Management andBudget.
Grateful acknowledgment is made of the cooperation of the Federal Governmentdepartments and agencies for providing information needed for this report.
For information regarding data in this report, contact Robert McArthur, GovernmentsDivision, Bureau of the Census, Washington, DC 20233. Telephone 301-457-1565.E-mail [email protected].

������ ����� ����
������� �����
����������������� �����
�� ����
������ ���� ����
�����
U.S. Department of CommerceMichael Kantor , Secretary
Economics and Statistics AdministrationEverett M. Ehrlich, Under Secretary
for Economic Affairs
BUREAU OF THE CENSUSMartha Farnsworth Riche, Director

GOVERNMENTS DIVISIONGordon W. Green , Chief
SUGGESTED CITATION
U.S. Bureau of the Census. Consolidated Federal Funds Report: Fiscal Year 1995.U.S. Government Printing Office, Washington, DC 1996.
For sale by Superintendent of Documents, U.S. Government Printing Office, Washington, DC 20402.
BUREAU OF THE CENSUSMartha Farnsworth Riche , DirectorBryant Benton , Deputy Director
Paula J. Schneider , Principal AssociateDirector for ProgramsFrederick T. Knickerbocker , AssociateDirector for Economic ProgramsThomas L. Mesenbourg , Assistant Directorfor Economic Programs
ECONOMICS
AND STATISTICS
ADMINISTRATION
Economics and StatisticsAdministrationEverett M. Ehrlich , Under Secretaryfor Economic Affairs

Page
Introduction. . . . . . . . . . . . . . . . . . . . . . . . . . . . . . . . . . . . . . . . . . . . . . . . . . . . . . . . . . . . . . . . . . . . . . . . . . . . . . . . . . . . . . . . . v
Table
Federal Government Expenditures or Obligations by State and County Area: Fiscal Year1995. . . . . . . . . . . . . . . . . . . . . . . . . . . . . . . . . . . . . . . . . . . . . . . . . . . . . . . . . . . . . . . . . . . . . . . . . . . . . . . . . . . . . . . . . . . . . . . 2
Appendix
A. County-Type Areas Without County Government . . . . . . . . . . . . . . . . . . . . . . . . . . . . . . . . . . . . . . . . A-1B. Geographic Areas With More Than Four Congressional Districts . . . . . . . . . . . . . . . . . . . . . . . B-1C. County Locations of State Capital Cities. . . . . . . . . . . . . . . . . . . . . . . . . . . . . . . . . . . . . . . . . . . . . . . . . . C-1D. CFFR Data Sources. . . . . . . . . . . . . . . . . . . . . . . . . . . . . . . . . . . . . . . . . . . . . . . . . . . . . . . . . . . . . . . . . . . . . . . . D-1E. State Coordinating Agencies, State Data Center Program, Bureau of the Census . . . . E-1F. Use of County Area Allocations for Selected Federal Pass-Through Assistance
Programs, by State: Fiscal Year 1995 . . . . . . . . . . . . . . . . . . . . . . . . . . . . . . . . . . . . . . . . . . . . . . . . . . . F-1
iii
Contents

Introduction
The Consolidated Federal Funds Report is a presenta-tion of Federal Government expenditures or obligations inState, county, and subcounty areas of the United States.U.S. Territories and the District of Columbia are included.The data for this report were obtained from reportingsystems which exist in various Federal Government agen-cies. These data have been consolidated and tabulated ina standard format for presentation in publications andelectronic form covering different levels of geographicdetail. The publications are:
x Federal Expenditures by State for Fiscal Year 1995,
x Consolidated Federal Funds Report, Fiscal Year 1995:County Areas
Data are also available on magnetic computer tape andCD-ROM. Information on publications, computer tapes,and CD-ROMs appears at the end of this section.
REPORT COVERAGE
The Consolidated Federal Funds Report (CFFR) coversFederal Government expenditures or obligations for theobject categories listed below. For fiscal year 1995, amountsreported totaled $1.4 trillion for the direct expenditure orobligation categories, and $488 billion for other Federalassistance (loans and insurance programs):
x Grants ($243 billion)
x Salaries and wages ($168 billion)
x Procurement ($203 billion)
x Direct payments for individuals ($730 billion)
x Other direct payments ($26 billion)
x Direct loans ($26 billion)
x Guaranteed or insured loans ($102 billion)
x Insurance ($360 billion)
Dollar amounts reported under these categories canrepresent actual expenditures or obligations. Users shouldbe aware of the differences in this coverage which varies inaccordance with the data, as described later under ‘‘DataSources.’’ As a general guide, the grants and procurementdata in this report represent obligated funds, while salaries,
wages and direct payments represent actual expenditures(outlays)1. Data on loan and insurance programs generallyrepresent the contingent liability of the Federal Govern-ment.
Certain categories of Federal Government spendinghave been intentionally excluded from this report. Theseinclude such items as interest on Federal Governmentdebt, travel expenses when not provided under contract,and international payments and foreign aid. These aredescribed under the heading ‘‘Amounts Excluded FromCFFR Coverage.’’
The financial activity of all Federal Government agen-cies is covered, with exceptions for those agencies whichdo not submit data to any of the Federal reporting systemsthat served as sources of information for the CFFR. Theseagencies are also listed under the heading ‘‘AmountsExcluded From CFFR Coverage.’’
DATA PRESENTATION
The Consolidated Federal Funds Report presents databy State and county area. Coverage includes all objectcategories of Federal Government finance.
Geographic detail of Federal finances on a programbasis can be found in the publication Federal Expendituresby State for Fiscal Year 1995, or on the CFFR data fileavailable on magnetic computer tape and CD-ROM.
The basis for the geographic distribution in the CFFRvaried according to the object category and the datasource. These are detailed later under the heading ‘‘DataSources.’’ The following general guidelines applied:
x Grants-location of initial recipient
x Salaries and wages-place of employment
x Procurement-place of performance
x All other object categories-recipient location
For grants, users should note that some dollar amountsappear at the State capital county areas. This reflects thecoding of grants to the State governments, even whensuch grants represent payments that are subsequently
1Several grant programs in the CFFR were reported on the basis ofexpenditures since the data were taken directly from the Federal Expen-ditures by State publication. These are detailed in the ‘‘Data Sources’’section.
v

passed through to local jurisdictions, or represent pro-grams that are spread out over all areas of the State interms of financial impact. Appendix C lists the State capitalcities and their respective county areas.
The geographic presentation of data on grants is describedmore fully in the section ‘‘Estimates of Substate GrantDistribution.’’ Most large volume grant programs involve adirect Federal-to-State transfer of aid which the Stategovernments subsequently redistribute. Data for several ofthese grant programs were treated differently in the CFFRas described below.
Included in the geographic listings are the terms ‘‘U.S.undistributed’’ and ‘‘State undistributed.’’ These are usedfor data that were reported, without specific geographicdesignations for the State or county. Examples of such datainclude procurement actions of less than $25,000 whichwere reported as one data record and assigned to ‘‘U.S.undistributed.’’
The congressional districts shown in the CFFR reflectthe districts of the 104th Congress. For those States whichhave only one at-large representative, the congressionaldistrict is shown as ‘‘00.’’
As indicated previously and explained in detail laterunder ‘‘Data Sources,’’ dollar amounts reported can reflectexpenditures or obligations. In some cases, dollar amountsshown will be negative. Such amounts reflect deobligationsof financial assistance that had been previously awarded,and generally appear in the grant object category.
SUMMARY OF METHODOLOGY
This is a consolidated report, developed by bringingtogether available statistics on Federal Government expen-ditures or obligations. The first phase of the CFFR programwas to identify the available data sources. The CFFR Actspecified that the following reporting systems and agenciesbe used as data sources:
x Federal Assistance Award Data System
x Federal Procurement Data System
x Office of Personnel Management
x Department of Defense
x U.S. Postal Service
x Internal Revenue Service
x U.S. Coast Guard
x Public Health Service
x National Oceanic and Atmospheric Administration
In addition to these, several other Federal agencieswere requested to provide data, usually for selected pro-grams (see section on ‘‘Data Sources’’). Most of thesewere agencies which had not yet begun reporting under therequirements of the Federal Assistance Award Data Sys-tem.
Finally, selected data were obtained from the informa-tion on payments to State or local governments reported byFederal agencies for the Census Bureau’s Federal Aid toStates survey, in accordance with the CFFR Act and OMBCircular A-11. These data covered Federal Governmentgrants that were not required to be reported in the FederalAssistance Award Data System, such as the FederalGovernment annual payment to the District of Columbia.
All data submitted for the CFFR were assigned aprogram identification code, an agency identification code,and an object code. The program identification code formatwas patterned after the Catalog of Federal DomesticAssistance (CFDA) program number. For all data takenfrom the Federal Assistance Award Data System, theCFDA number was used for the program identificationcode. For all other data submissions, a unique code wasassigned. Although not presented in this CFFR publication,the program identification code is contained on the CFFRdata file available onmagnetic computer tape and CD-ROM.
The agency identification code assigned to each datarecord is the four character Federal Information ProcessingStandards (FIPS) code issued by the National Institute ofStandards and Technology. The two leftmost charactersform a component data element, called the TreasuryAgency Symbol (TAS), which is identical to the two-digitnumerical code used in the budgetary process to identifymajor Federal agencies.
The object code assigned to each data record submittedfor the CFFR consisted of two alphabetic characters todesignate the broad object category of Federal expenditureto which each data record belonged. These were thecategories described previously (grants, salaries and wages,etc.).
Both the program identification code and the object codewere used throughout the CFFR processing. For example,during the data edit and review stages, dollar amountswere tallied by program or object category for comparisonwith other sources of information on Federal outlays. Inaddition, the object code became the primary basis for thetable presentation in the CFFR publications (all grants datawere grouped together, and so forth).
The processing of all data submitted for the CFFRinvolved the six steps detailed below. Exceptions existedfor some submissions, often the result of the geographiccoding methods used by the Federal agency. These excep-tions are detailed later under ‘‘Data Sources.’’
1. Verification of edit totals required comparing dollaramounts and record counts actually submitted withtotals provided on transmittal documentation from eachagency. Since most submissions were on magneticcomputer tape, this process involved ensuring that thetape submissions were in the prescribed format. Anydiscrepancies were brought to the attention of thesubmitting agency, and corrections made as needed.
2. Verification of geographic coding applied to thosesubmissions received on computer tape. This process
vi

is described in more detail later, under the section‘‘Geographic Presentation and Coding.’’
3. The third step in processing was to sort all data byprogram identification code and geographic unit. Thisenabled review tables to be compiled which showeddata by State, county, or subcounty area for eachFederal program or object category. At this stage, anational total of Federal program amounts in the CFFRwas compared to totals for the same programs thatappeared in other data sources such as the FederalBudget. Data were also reviewed by program or objectcategory at the State and county level. In this manner,patterns of Federal Government spending for anycategory, such as Defense salaries and wages, werereviewed. This third phase of processing was thusconcerned with review and verification of dollar amountsby program and object category. Corrections weremade as needed, based upon consultation with theFederal agency submitting the original data.
4. Since data from different sources were generally sub-mitted on the basis of different geographic coding, thenext step in CFFR processing was to convert all datarecords to standard geographic designations.
5. Once converted to a standard geographic designation(government unit codes), program and object totalswere again reviewed. At this time, data records werecombined so that only one record existed for eachunique combination of geographic code, program iden-tification code, agency code, and object code. Eventhough multiple grant awards may have been madeunder a single program to any given geographic area,they were all combined into a single record for thefiscal year. If 10 Community Development Block Grantswere awarded to New York City during fiscal year1995, they were combined into a single record forCommunity Development Block Grants funding withinNew York City. Combining like data records in thismanner was the final step in processing for eachCFFR submission, or data file.
6. All data files were then merged together to form aconsolidated file. This enabled the compilation of totalFederal expenditure or obligation by object categoryand geographic area. These data were reviewed andfinal corrections made to the CFFR data file.
This final data file contained records in geographic detailonly. County, State, or United States total records were notpart of the data file. Nor were summary totals by objectcategory actually contained in the data file. All of thesesummary records were tallied during preparation of thetables in the CFFR. In this way, totals published in theCFFR represent summations of the more detailed datacontained on the CFFR data file.
Table preparation also entailed processing the CFFRdata file in conjunction with the CFFR geographic refer-ence file. The former contained all information associated
with the Federal program or object category of spendingbeing reported. The geographic reference file contained allpertinent information concerning the government unit forwhich data were published. This information included theState, county, and municipal/township name, the 1994population, the congressional districts, and all associatedgeographic coding.
RELATIONSHIP TO FEDERAL EXPENDITURESBY STATE
The publication Federal Expenditures by State for FiscalYear 1995 presents State-by-State distributions of FederalGovernment expenditures. Data in that publication are thesame that appear in the CFFR, with three exceptions. Oneis amounts for Federal grants to State and local govern-ments. In the CFFR, Federal grants generally representobligations and include payments to State and local gov-ernments, and grants to nongovernmental recipients.
Table 2 of the Federal Expenditures by State reportcovers actual Federal grant outlays to State and localgovernments, by agency and program. Data reported weresubmitted to the Census Bureau in accordance with OMBCircular A-11 and the Census Bureau’s annual Federal Aidto States reporting guidelines. These data were formerlypublished in the annual Treasury Department report Fed-eral Aid to States. The detailed presentation contained intable 2 replaced that publication, effective with fiscal year1983 data.
The data on grants to State and local governments inFederal Expenditures by State were reconciled with amountsin the Federal Budget. The definitions applied in the Budgetfor grants to governments served as the basis for reportingin table 2 of that publication. Grants to nongovernmentalrecipients are included in table 6.
The second exception is for data on Department ofHousing and Urban Development housing assistance (Sec-tion 8) payments. In Federal Expenditures by State, thesepayments are classified as grants where the landlord is apublic agency, and direct payments where the landlord is aprivate agency. In the CFFR, all Section 8 payments areclassified as direct payments. This is because data usedfor the CFFR required subcounty geographic detail and thepublic versus nonpublic landlord data were available onlyat the state level of detail.
The third exception is for data on Federal EmergencyManagement Agency payments under the Disaster Assis-tance Program. In the CFFR, these payments are classi-fied as grants, while in the Federal Expenditures by Statereport, individual assistance payments under this programare classified as direct payments for individuals. The grantsversus direct payments data were not available at thesubstate level.
Federal Expenditures by State also contains data onFederal salaries and wages (table 3), Federal direct pay-ments for individuals (table 4), Federal procurement (table
vii

5), and other direct Federal expenditures (table 6). Thesedata correspond to those presented by object category inthe CFFR, but are shown by program or Federal agencywherever possible. The CFFR publication does not containsuch program or agency detail.
One other significant difference between Federal Expen-ditures by State and the CFFR is the level of geographicdetail for which data are shown. The former distributes dataonly on a State-by-State basis, while the CFFR containscounty area information.
Users should consult the introductory text in the publi-cation Federal Expenditures by State for a detailed expla-nation of the grants data that appear in that report.
DATA SOURCES
Appendix D lists the data sources used for the CFFR,arranged bymajor category of Federal Government finances.The description of the data sources which follows includesexplanations of the coverage, conceptual basis for report-ing (expenditures versus obligations), geographic basis forreporting, and other information important for interpretingthe data in the CFFR. The use of the term FIPS geographiccodes in the following text refers to the Federal InformationProcessing codes maintained by the National Institute ofStandards and Technology, Department of Commerce.
GRANTS
As indicated in appendix D, the principal source of thegrants data in the CFFR was the information submitted forthe Federal Assistance Award Data System (FAADS). TheBureau of the Census is the Executive Agent for the Officeof Management and Budget, and is responsible for theoperation of the FAADS reporting system. Data on financialassistance awards are submitted quarterly by FederalGovernment agencies, and combined to form a singlereport on Federal Government financial assistance awards.The report is distributed to the Congress and to Stategovernments. In addition to grant awards, the FAADSprogram covers direct payments to individuals (such asretirement benefits), direct payments for specified use(such as food stamps awards), cooperative agreements,guaranteed loans, direct loans, and insurance programs ofthe Federal Government. All financial assistance awards inFAADS are identified by a Catalog of Federal DomesticAssistance program number. Coverage of these types offinancial assistance other than grants are described underthe appropriate data source section later in this text.
For grants, the FAADS data represent the Federalobligation incurred at the time the grant is awarded. Theamounts reported do not represent actual expenditures,since obligations in one time period may not result inoutlays during the same time period. Moreover, initialamounts obligated may be adjusted at a later date, either
through enhancements or deobligations. These deobliga-tions may appear in the CFFR data as negative amounts.Users should be aware of what these amounts representand use care in interpreting such data.
FAADS data on grants for fiscal year 1995 were derivedby summing the quarterly reports that covered financialassistance awarded between October 1, 1994, and Sep-tember 30, 1995. The grants data from FAADS that werecarried forward to the CFFR totaled about 98 percent of allgrants reported.
All grant awards in FAADS were reported by State,county, and, usually, city of initial grant recipient. Submit-ting agencies used either FIPS codes for States, counties,and places, or General Services Administration locationcodes. The remaining grants data for the CFFR were takenfrom data submitted to the Census Bureau pursuant to theannual Federal Aid to States survey, and OMB CircularA-11. These submissions are required annually by allFederal Government agencies which make payments toState or local governments.
Such data were previously collected and publishedannually by the Division of Government Accounts andReports, Fiscal Service, Bureau of Government FinancialOperation, Department of the Treasury. The annual Trea-sury Department publication Federal Aid to States, whichcontained these data, has been replaced by the annualCensus Bureau publication Federal Expenditures by State.Reference should be made to that publication for additionalinformation on the coverage and reporting requirementsassociated with these grant data.
Selected grant programs data were taken from theFederal Expenditures by State publication to ensure com-prehensive coverage in the CFFR. These grants are notpart of the FAADS reporting because they are not listed inthe Catalog of Federal Domestic Assistance. Data wereavailable only at the State area level of reporting.
SALARIES AND WAGES
Amounts reported for Federal Government salaries andwages were obtained from four sources: the Office ofPersonnel Management, the Department of Defense, thePostal Service, and the Department of Transportation.
The Defense Department provided information on mili-tary payrolls, with separate amounts for active military andinactive military (reserve and National Guard). These datawere obtained from the Directorate for Information, Opera-tions and Reports of the Washington Headquarters Ser-vices, Department of Defense. (It should be noted thatsalaries and wages data covering civilian employees of theDefense Department were obtained from the Office ofPersonnel Management, as described below.)
Amounts reported represent estimates of fiscal yearoutlays by State and county, and include gross compensa-tion. This covers salaries and wages, housing allowances,and in general all other personnel compensation, except
viii

retired military pay, which is reported separately under thecategory direct payments for individuals. Other features ofthe Department of Defense salaries and wages include:
1. Amounts for military personnel stationed overseas areexcluded from totals.
2. Salaries and wages for inactive personnel refer tomilitary reserve and National Guard payroll.
3. Amounts reported reflect the State (territory) and placeof employment (duty station) rather than home resi-dence.
The submission from the Defense Department was acomputer tape file containing data records that were dis-tributed using FIPS geographic codes for States andcounties. No special processing of the geographic codeswas required for inclusion in the CFFR.
Salaries and wages data for U.S. Postal Service employ-ees were provided by the U.S. Postal Service. Amountsrepresent actual outlays during the fiscal year, but with thenational total distributed among the States and counties onan estimated basis. Estimates were derived by calculatingthe ‘‘per employee’’ payroll cost and applying this cost toeach postal facility based upon the number of employees.
The Postal Service data were geographically distributedbased upon place of employment (postal facility). Datarecords were submitted on magnetic computer tape, andcontained FIPS State and county area codes.
Statistics on salaries and wages for uniformed employ-ees of the U.S. Coast Guard were reported by the Depart-ment of Transportation. Data were reported by ZIP code,for the place of employment. Amounts were then aggre-gated by county area.
Salaries and wages for all other Federal employeeswere obtained from the Office of Personnel Management.Coverage included all other Federal civilian employees(excluding the Central Intelligence Agency, Defense Intel-ligenceAgency, and the National SecurityAgency) employedin the United States and the U.S. Territories. Data werereported separately for each major Federal agency. Thedata included:
x Basic annual salaries
x Premium pay (overtime, night differential, cost ofliving allowances, station allowances, holiday pay,and any retroactive pay), and
x Lump sum payments (for annual Leave)
National totals represent actual expenditure during fiscalyear 1995. The geographic distribution of these amountsby State (territory) and county were estimated, based uponplace of employment. The following assumptions apply forthe estimation procedures:
1. The basis for the geographic distribution was place ofemployment, using data on salary and employmentdistributions from theOffice of Personnel Management’s(OPM) Central Personnel Data File (CPDF) as ofMarch 31, 1995. Data were geographically prorated tototal fiscal year payroll and payment data from the SF113-A, ‘‘Monthly Report of Federal Civilian Employ-ment.’’
2. Estimated payroll data were produced at the State,county, and territory levels only.
3. Both defense and non-defense agency State, county,and territory payroll data were estimates. These esti-mates were predicated on the assumption that pre-mium pay and lump sum payments as well as part-time, intermittent, and full-time seasonal pay wereproportional to the salaries of full-time Federal civilianemployees (Defense and nondefense) in the countiesand territories.
The methodology used to estimate the geographic dis-tribution was to obtain actual expenditures for salaries andwages from the SF 113-A. Salary and wage data on the SF113-A were expenditures (including basic, premium, andlump sum payments) for all Federal civilian employees.(These data were not reported by State and county on theSF 113-A).
From OPM’s CPDF and agency survey data, aggregatebasic salaries for full-time employees only (Department ofDefense and other agencies) were computed for eachcounty, each United States Territory, total United States,and total territories. Based on these aggregate basicsalaries, Department of Defense and other agencies per-centages were computed. These percentages determinedeach county’s and territory’s proportion of the total UnitedStates and U.S. Territories full-time salaries.
The percentages referenced above for Department ofDefense and other agencies were applied to SF 113-ADefense and nondefense payroll data for the States andU.S. Territories to estimate actual expenditures in U.S.counties and U.S. Territories, respectively.
The District of Columbia’s nondefense estimated expen-ditures were computed by the above methodology. How-ever, a supplement was then added to this estimateconsisting of SF 113-A agency payroll data for the followingagencies: U.S. Congress (including Congressional BudgetOffice), White House Office, Office of the Vice President,Federal Reserve Board, Architect of the Capitol, U.S.Botanic Gardens, Library of Congress, U.S. Tax Court,Copyright Royalty Tribunal, Office of Technology Assess-ment, and the Supreme Court. These agencies were not inthe survey agency file or in the CPDF. Since their employ-ment is primarily or totally in the District of Columbia, theirSF 113-A payroll data were added to the District’s nonde-fense estimate.
ix

DIRECT PAYMENTS FOR INDIVIDUALS
Data covering Federal Government direct payments forindividuals were separated into two object categories-direct payments for retirement and disability benefits, andall other direct payments for individuals. Retirement anddisability programs include Federal employee retirementand disability benefits, Social Security payments of alltypes, selected Veterans Administration programs, andselected other Federal programs (see appendix D).
While the individual Federal programs included underthe direct payments category are not shown separately inthe CFFR publication, program data are published by Statein the Federal Expenditures by State report, and areincluded in the CFFR data file available on magneticcomputer tape and CD-ROM.
Unless otherwise indicated, all data covering directpayments for individuals were taken from information reportedfor the Federal Assistance Award Data System. All datarepresent obligations during the fiscal year, except asnoted below. Direct payments for individuals are shown byState and county area only, in accordance with the report-ing requirements of the Federal Assistance Award DataSystem. The following direct payment programs (retire-ment and disability) were not available from FAADS andwere obtained from other data sources.
1. Military retirement benefits data were supplied by theDepartment of Defense, along with that agency’s dataon military payroll. Amounts represent actual expendi-tures during the fiscal year. Coverage includes recur-rent benefit payments, as well as permanent andtemporary disability payments. Data were provided byState and county area of recipient. Fiscal year 1995payments totaled $28 billion.
2. Amounts for benefit payments to retired U.S. CoastGuard service personnel were obtained from thatagency. These payments totaled $535 million. Cover-age includes taxable benefits financed by employer orgeneral fund contributions. Retired civilian employeesof the Coast Guard are excluded from these data, butincluded in data from the Office of Personnel Manage-ment.
3. Federal civilian employee retirement and disabilitypayments were obtained from the Office of PersonnelManagement, Compensation Group. Amounts includeexpenditures for all periodic annuity, survivor annuity,and lump sum death claims, as well as withdrawals.Administrative expenses and funds transferred to otherretirement systems are excluded. Amounts reportedtotaled $38 billion.Retirement benefits for Federal civilian employees
also included data for former Postal Service employ-ees.
It should be noted that the amounts reported byOPM include payments from employee contributions.
No data covering the payments associated only withemployer contributions, earnings on investments, orother nonemployee financed amounts could be obtained.
The OPM data represent an estimated geographicdistribution of actual fiscal year 1995 disbursements.The methodology used by OPM was based on propor-tionate calendar year-to-date annuity disbursementsthrough October 1, 1995. The calendar year-to-datedata were accumulated by ZIP code, and proportion-ate shares were then applied against the actual total offiscal year 1995 disbursements. ZIP codes reflectedrecipient location except for payments made via elec-tronic funds transfer, which reflected correspondenceZIP code.
Like other data submitted on the basis of ZIP codes,these data were converted to State and county areasusing standard methodology.
4. Pension plan termination insurance payments reflectbenefits paid by the Pension Benefit Guaranty Corpo-ration under the Pension Plan Termination InsuranceProgram (Catalog of Federal Domestic Assistanceprogram 86.001). Data include only those paymentsmade directly by the Pension Benefit Guaranty Corpo-ration. Amounts paid by interim custodians such asbanks or other financial institutions were not reported.Total payments for fiscal year 1995 under this programwere $732 million.
The data submitted for the CFFR were geographi-cally distributed by postal ZIP code.
5. Payments to retirees and other beneficiaries from thePublic Health Service, Commissioned Corps, werereported by that Federal agency.Amounts were reportedby mailing address (ZIP code) of the beneficiaryconverted to county level data by the Census Bureau.Amounts reported totaled $109 million.
6. Benefit payments to retirees from the National Oce-anic andAtmospheric Administration (NOAA) Commis-sioned Corps totaled $9 million for fiscal year 1995.Data were obtained from the Commerce Department,National Oceanic andAtmospheric Administration, andwere available only at the State level.
7. The State Department Foreign Service Officers retire-ment system provided data on fiscal year 1995 benefitpayments. These totaled $334million, andwere reportedgeographically by ZIP code.
8. The Tennessee Valley Authority reported $203 millionin benefit payments to retirees. Data were reported byState and county area.
Programs classified as direct payments for individuals,other than retirement and disability, were all obtained fromthe Federal Assistance Award Data System, except as
x

noted in appendix D. These were reported by State andcounty area only. The four quarterly FAADS reports wereconsolidated to obtain fiscal year totals.
Amounts reported for the Housing Assistance Payments(the Section 8 program) under this object category reflectthe entire amount of obligations for the year. That is, allSection 8 (and voucher) payments have been classified asdirect payments for individuals, regardless of whether theywere paid to public or private landlords. This is also anothersource of difference in the data between the CFFR publi-cation and Federal Expenditures by State.
Excess earned income tax credits represent FederalGovernment payments during calendar year 1995. Infor-mation was obtained from the Department of the Treasury,Internal Revenue Service, Statistics of Income Division.Amounts reflect only the excess earned income tax creditamount actually refunded. Aggregate figures by State werereported. No substate detail was available.
PROCUREMENT
Statistics covering Federal Government procurementwere provided by the U.S. Postal Service (USPS) forPostal Service procurement and the General ServicesAdministration, Federal Procurement Data Center (FPDC)for procurement actions of all other Federal agencies,including the Defense Department.
Amounts provided by the USPS represent actual outlaysfor contractual commitments, while amounts provided bythe FPDC represent the value of obligations for contractactions, and do no reflect actual Federal Governmentexpenditures. In general, only current year contract actionsare reported for data provided by the FPDC; however,multiple-year obligations may be reflected for contractactions of less than 3 years duration.
The FPDC collects procurement statistics on a quarterlybasis from most Federal Government departments andagencies, and provides these data according to the placeof performance rather than the location of the primecontractor. Excluded from the procurement totals reportedare the amounts for the judicial and legislative branches ofgovernment and most intergovernmental transfers of funds.Also excluded from the totals are amounts for procurementin foreign countries. However, foreign procurement awardswere $7.5 billion in fiscal year 1995, with $6.1 billion for theDefense Department, and $1.4 billion for all other FederalGovernment agencies other than the USPS.
Most contract actions provided by the FPDC with valuesunder $25,000 were not distributed by State and territory.Such amounts were reported as ‘‘U.S. undistributed.’’
Procurement data awarded by the USPS include alloutlays made under formal contractual agreements. TheFPDC data include contractual actions for construction,purchases of equipment, and other purchases of tangibleitems by the Federal Government. Also included with theFPDC data are contractual actions for services often not
generally associated with procurement, such as the pur-chase of utilities, building leases, and other services enteredinto via contractual agreement.
Procurement data provided by the FPDC were distrib-uted according to place of performance, as designated byFIPS State/county/place geographic coding. These geo-graphic codes were matched against the government unitcodes comprising the geographic basis for CFFR, andassigned to any units where a match was found. Unmatcheddata records were distributed to ‘‘balance of county’’ rep-resented by the State/county portion of the FIPS geo-graphic code. (For those FPDC data records submittedonly with a State/place code, a county code was firstassigned via a geographic conversion file.)
OTHER DIRECT FEDERAL EXPENDITURE
Most data reported were submitted by Federal agenciesfor the Federal Assistance Award Data System. Amountsreported in each of the four quarters of fiscal year 1995were consolidated for the CFFR. Data not from FAADS arelisted below, and detailed in appendix D.
Crop Insurance data on the amount of indemnity pay-ments (claims) and premium subsidies were provided bythe Agriculture Department. Expenditures totaled $1.4 bil-lion. Coverage included the claims paid directly by theFederal Government to farmers, and premium subsidies toprivate insurers. Federal indemnity payments to privateinsurance carriers were not reported. Amounts reflect theresident county of the claimant for direct payment, orlocation of county of the private carrier for premium subsi-dies.
The Federal Emergency Management Agency suppliedcounty level data on fiscal year 1995 payments under theNational Flood Insurance program. Amounts representclaims and adjustor expenses. Total expenditures for thisprogram were $1 billion.
U.S. Postal Service expenditures for current operations,other than procurement and salaries, were provided by thePostal Service as part of that agency’s total submission forCFFR. Data were provided by State and county area, withthe distribution based on the methodology described ear-lier for Postal Service salaries and wages.Amounts reportedtotaled $2 billion.
Data for the Federal Government (employer) share ofpremiums on Federal employee life and health insurancewere obtained from the Office of Personnel Management,Compensation Group. Data for life insurance programs($390 million) were allocated by State based upon the1994 claims experience of the largest health carrier. Healthinsurance premium payments totaled $10.3 billion. Allexpenditures for life and health insurance premiums wereassigned to the ‘‘State undistributed’’ level of geography.
The Education Department reported fiscal year 1995payments under the National Guaranteed Student LoanProgram. Amounts included under the ‘‘Other direct pay-ments’’ category include default payments, advances, and
xi

administrative cost allowances for guarantee agencies.Amounts totaled $2.9 billion. (Interest subsidies and spe-cial allowances paid on behalf of borrowers are includedunder the ‘‘direct payments for Individuals’’ category intable 4.)
Other data that were obtained from sources other thanFAADS included Legal Services Corporation grants ($390million).
GUARANTEED LOANS, DIRECT LOANS, ANDINSURANCE
All data on loans and insurance programs of the FederalGovernment, with the exception of data on Flood Insuranceand student loan programs, were taken from the FederalAssistance Award Data System. Amounts reported in theseobject categories reflect the contingent liability of theFederal Government, in accordance with the FAADS report-ing instructions. Data do not represent actual expendituresassociated with the loan or insurance programs. Any actualoutlays under these programs, such as insurance claimspaid by the Federal Government, appear in the directpayments categories in the CFFR.
Federal Government contingent liability can vary byprogram, and caution should be used in comparing oneFederal loan or insurance program to another, or in inter-preting the data presented to reflect actual Federal outlaysover time. The following should be noted:
1. Amounts guaranteed or insured do not necessarilyrepresent future outlays.
2. All amounts reflect the dollar value of loans or insur-ance coverage provided during the fiscal year, and notthe cumulative totals of such activity over the life of theprogram.
3. Direct loans are not reported on a net basis, as in theFederal Budget, but rather are shown in terms of totalamount loaned.
4. Programs otherwise similar can vary in the share ofthe total liability that the Federal Government guaran-tees or insures. Certain veterans guaranteed loanprograms are guaranteed only up to a stated maxi-mum dollar value, for example. In these cases, theFederal Government contingent liability is less thanthe total value of the loan or insured policy agreement.
Guaranteed loans, direct loans, and insurance are reportedin FAADS by State and county area, or by State, county,and place.
Data on the Federal Direct Student Loan and NationalGuaranteed Student Loan programs are not reported forthe Federal Assistance Award Data System, and wereobtained separately from the Department of Education, asindicated.
National Flood Insurance data (CFDA number 83.100),reflecting insurance in force on September 30, 1995, wereobtained from the Federal EmergencyManagementAgency.
Detail on particular loan or insurance programs is avail-able in Federal Expenditures by State (on a State-by-Statebasis only) or on the CFFR data file available on magneticcomputer tape and CD-ROM.
GEOGRAPHIC PRESENTATION AND CODING
Background
The Consolidated Federal Funds Report Act calls forreporting by State (including territories), county or parish,municipality, and congressional district. At the subcountylevel, the Act refers to municipality as any subcounty unit ofgeneral local government. For this reason, the geographicbasis for presentation in the Consolidated Federal FundsReport is the government classification system developedby the Bureau of the Census in its census of governmentsprogram.
This report presents data by State and county area. TheDistrict of Columbia and the United States Territories ofAmerican Samoa, Guam, Northern Mariana Island, PuertoRico, and the U.S. Virgin Islands are included. In addition tocounty areas, municipal governments which are indepen-dent of any organized county are included here as countyequivalent areas. Appendix A contains a listing of thesemunicipalities.
Government Units
There were 86,743 government units in the UnitedStates according to the 1992 Census of Governments,distributed as follows:
U.S. Government. . . . . . . . . . . . . . . . . . . . . . 1
State governments . . . . . . . . . . . . . . . . . . . . 50Local governments . . . . . . . . . . . . . . . . . . . . 86,692County . . . . . . . . . . . . . . . . . . . . . . . . . . . . . . . . . 3,043Municipal. . . . . . . . . . . . . . . . . . . . . . . . . . . . . . . 19,296Township. . . . . . . . . . . . . . . . . . . . . . . . . . . . . . . 16,666School district . . . . . . . . . . . . . . . . . . . . . . . . . 14,556Special district . . . . . . . . . . . . . . . . . . . . . . . . . 33,131
Exact definitions of government units are available inVolume 1 of the 1992 Census of Governments, Govern-ment Organization. That publication describes the structureand organization of State and local governments through-out the Nation.
The general local governments that defined the universefor this publication were those in existence (active andincorporated) during the Federal fiscal year 1995. All such
xii

governments were contained in the Governments Inte-grated Directory, the Census Bureau’s major file of allgovernment units in the Nation.
The Consolidated Federal Funds Report contains databy State, county, and subcounty area, making use ofgovernment units to represent geographic area. For Statesand territories, government jurisdictions have fixed, stableboundaries which correspond to well-defined geographicareas. For county and subcounty government units, how-ever, there can be significant differences between theconcept of government unit and a specified geographicarea.
Where county governments exist, they correspond togenerally accepted county geographic boundaries. How-ever, many areas of the United States lack county govern-ment. Organized county governments are not found inConnecticut and Rhode Island, as well as in some territo-ries, and the District of Columbia. Numerous cities, such asBaltimore, MD (which is not located within a county gov-ernment area), and San Francisco, CA (which is a consoli-dated city/county government), also exist independently ofany county government.
County-equivalent areas are included in the Consoli-dated Federal Funds Report as if they were legitimatecounties to ensure consistency in the geographic presen-tation of the data. A complete listing of these areas can befound in appendix A.
It is important to note that the CFFR covers FederalGovernment payments to government units and otherrecipients located in the geographic areas over whichthese governments have jurisdiction. The Federal pay-ments to the New York City area could represent moniesallocated to the city government, a private company locatedin the city, or a private citizen residing in the city. No attemptis made in the CFFR to provide information on the recipi-ents of Federal money.
In most cases, the effect of this assignment on thestatistical presentation of the data is negligible. However,users should be aware of this treatment, particularly ifusing data for one of these multicounty jurisdictions. Themunicipalities of over 50,000 population which exist inmore than one county area, and their respective counties,are shown in text table A.
The government structure of New York City deservesspecial mention. Classified for census purposes as amunicipality, the city is actually comprised of five countyequivalent areas (Bronx, Kings, New York, Queens, andRichmond). None of these are presented separately in thisreport. New York City is presented as a single countyequivalent area.
Congressional District Reporting
The congressional district or districts for each countyarea are displayed in the CFFR table. For those places thathave multiple districts, all such districts are displayed. The
congressional districts shown in this publication representthe boundaries of the 104th Congress, in session as ofJanuary 1995.
In those places with more than one congressionaldistrict, dollar amounts are not reported separately for eachdistrict. The Federal financial data in the reporting systems(data sources) used for the CFFR did not contain suchdetail, with the exception of partial data records of theFederal Assistance Award Data System.
Several other aspects of the congressional district cod-ing should be noted:
x For States with an at-large representative, the code ‘‘00’’is reported.
x For territories with a nonvoting representative to Con-gress, the congressional district is reported as ‘‘98’’.
x Territories with no representatives have ‘‘99’’ for a con-gressional district code.
x To derive totals of all funds to any particular congres-sional district, amounts for all government units in thatdistrict would have to be aggregated.
x For counties that exist in more than one district, allcongressional districts are reported.
The geographic reference file used in the CFFR isavailable along with the CFFR data file, on magneticcomputer tape and CD-ROM. Interested users shouldcontact theAdministrative and Customer Services Division,Bureau of the Census.
ESTIMATES FOR SUBSTATE GRANTDISTRIBUTIONS
Many Federal grant programs involve a direct paymentto State governments, which are then responsible forprogram administration. Examples include: grants that are‘‘passed-through’’ to local governments (such as blockgrant programs); grants, such as for highway construction,in which the financial impact of Federal funds is spread outover all areas of the State; and grants or assistanceprograms such asAid to Families with Dependent Children,which the State can administer but for which the ultimatebeneficiaries are found throughout the States.
The CFFR contains data on the substate allocation offunds for the major Federal grant programs. These data areallocated by county or county-equivalent area.
For the Highway Planning and Construction program(program number 20.205), the Transportation Departmentreports the actual place of performance (county area)where the funded project is located. If the project is in morethan one county area, each county is reported, along withits share of the funding. Funding for this grant programtotaled $20 billion in fiscal year 1995.
xiii

The substate allocation of funds for twelve major pro-grams was derived by the Census Bureau from a survey ofState government agencies:
x Food Stamps (10.551)-$22.8 billion
x National School Lunch (10.555)-$5.2 billion
x Special Supplemental Food Program for Women, Infantsand Children (WIC) (10.557)-$3.5 billion
x Social Services Block Grant (93.667)-$2.8 billion
x Low Income Home Energy Assistance (93.568)-$1.7billion
x Job Training Partnership Act (17.250)-$1.9 billion
x Handicapped Education-State Grants (84.027)-$2.5billion
x Rehabilitation Services Basic Support (84.126)-$2 billion
x Medicaid (93.778)-$83.5 billion
x Family Assistance Payments (AFDC) (93.560)-$14.9billion
x Child Support Enforcement (93.563)-$1.8 billion
x SubstanceAbuse Prevention and Treatment Block Grants(93.959) -$1.2 billion
Substate allocations for these programs were availablefor some, but not all, of the States and territories. AppendixF contains detail, by program and State.
The derived county allocations were based upon aSurvey of State Government Pass-Through Expenditures,conducted by the Census Bureau during fiscal year 1996.For each program, the administering State agencies wereasked to provide information on the county allocation ofprogram fundswithin their State. Responses, where received,were used as the basis for prorating total program fundingby State among the county areas within each State. Totalprogram funding for each State had been reported by theadministering Federal agency, in the Federal AssistanceAward Data System.
AMOUNTS EXCLUDED FROM CFFR COVERAGE
Federal Government expenditures covered in the CFFRtotal $1.4 trillion for fiscal year 1995. This amount does notrepresent all Federal Government expenditures. Amountsexcluded from the CFFR can be grouped into two generalcategories-conceptual exclusions and agency/program omis-sions.
Federal expenditures excluded conceptually were thosethat could not be geographically distributed, all interna-tional transactions and foreign payments, and Federaloutlay categories not covered by any of the reportingsystems that served as data sources for the CFFR. Thelargest item was net interest on Federal Government debt,
which was estimated to be $233 billion in fiscal year 1995.The fiscal year 1995 total outlays for the internationalaffairs function in the Federal Budget was estimated at $20billion.
Expenditures for the Central IntelligenceAgency and theNational Security Agency were excluded from coverage.
The CFFR data were compiled by object categories ofFederal expenditures. The reporting systems and Federalagencies that served as data sources excluded Federaltravel expenditures, to the extent that they were notcovered by contractual agreements. No estimate of themagnitude of these expenditures is available.
For some agencies, data for selected object categoriescould not be obtained. These included the procurementactions of the judicial and legislative sectors of the FederalGovernment. Expenditures other than salaries and procure-ment were not available for the Federal Deposit InsuranceCorporation, National Credit Union Administration, FederalSaving and Loans Insurance Corporation and ResolutionTrust Corporation.
The Federal Budget outlays estimated for fiscal year1995 totaled $1.7 trillion. However, comparison of theFederal Budget amount with data reported in the CFFRcould be misleading, since the Federal Budget amountsdiffer from CFFR in accounting concepts and the treatmentof intragovernmental transfers. For example, outlays formany programs in the Federal Budget are reported on anet basis.
AVAILABILITY OF DATA
Copies of the Consolidated Federal Funds Report pub-lication are available from the Superintendent of Docu-ments, U.S. Government Printing Office, Washington, DC20402. The publication Federal Expenditures by State canalso be purchased from the Superintendent of Documents.
The CFFR data file is also available on magneticcomputer tape and CD-ROM. As indicated earlier, the dataavailable on computer tape and CD-ROM are more detailedthan the summarized data presented in the publishedreports. Each record in the CFFR data file contains thefollowing fields:
x Government unit code (State, type, county, unit)
x Program identification code
x Object code
x Federal funding sign
x Federal funding amount
x Federal Information Processing Standard (FIPS) loca-tion code (State, county, place)
x FIPS Federal agency code
xiv
All appropriate documentation and data file descriptionsare provided with each CFFR computer tape or CD-ROMfile.
An accompanying CFFR geographic reference file isalso available on computer tape and CD-ROM. This filecontains the names and government unit codes for allState, county, municipal, and township units in the Nation.In addition, the file contains associated geographic codes(FIPS, GSA, and Census Bureau place codes), the 1994population, and the congressional districts serving eachgovernment unit.
Users interested in obtaining computer tapes or CD-ROMsof the Consolidated Federal Funds Report data files shouldcontact theAdministrative and Customer Services Division,Bureau of the Census, Washington, DC 20233. Telephone301-457-4100. Users can visit the Census Bureau via theInternet at http://www.census.gov.
The Consolidated Federal Funds Report is also beingmade available to the public through the Census Bureau’sState Data Center Program. Through this program, theCensus Bureau provides participating State organizations(government agencies and university centers) with publi-cations, tape and CD-ROM files, and general information
assistance. The State organizations, in turn, provide dataaccess services such as tape processing, publication ref-erence centers, inquiry handling and general assistance indata use. They also establish affiliates in key locationsaround the States by placing basic sets of census publica-tions in local libraries, city and regional planning agenciesand so forth.
Users can contact the State Data Centers (or affiliates)to determine if the Consolidated Federal Funds Reportpublication or the related computer tape or CD-ROM datafiles are available, or to request further information aboutthe data. A list of the State Data Center lead agencies canbe found in appendix E.
MEANING OF SYMBOLS
The symbols in the tables have the following meanings:
- Represents zero or rounds to zero.
NA Not available
X Not applicable
xv

Table A. Multicounty Municipal Governments of Over 50,000 Population
State and municipalityCounty
Assigned Other
Alabama:Birmingham. . . . . . . . . . Jefferson ShelbyDothan . . . . . . . . . . . . . . Houston DaleHuntsville . . . . . . . . . . . . Madison Limestone
Colorado:Arvada . . . . . . . . . . . . . . Jefferson AdamsAurora . . . . . . . . . . . . . . Arapahoe Adams, DouglasWestminster . . . . . . . . . Adams Jefferson
Georgia:Atlanta . . . . . . . . . . . . . . Fulton De KalbMacon . . . . . . . . . . . . . . Bibb Jones
Illinois:Aurora . . . . . . . . . . . . . . Kane Du PageChicago . . . . . . . . . . . . . Cook Du PageElgin . . . . . . . . . . . . . . . . Kane CookNaperville. . . . . . . . . . . . DuPage WillSchaumburg . . . . . . . . . Cook Du Page
Louisiana:Shreveport. . . . . . . . . . . Caddo Parish Bossier Parish
Michigan:Lansing . . . . . . . . . . . . . Ingham Eaton
Mississippi:Jackson . . . . . . . . . . . . . Hinds Madison, Rankin
Missouri:Independence . . . . . . . . Jackson ClayKansas City. . . . . . . . . . Jackson Cass, Clay PlatteSpringfield . . . . . . . . . . . Greene Christian
New York:New York City . . . . . . . . New York Bronx, Kings,
Queens, RichmondNorth Carolina:Durham . . . . . . . . . . . . . Durham Orange
High Point . . . . . . . . . . . Guilford Davidson, Forsyth,Randolph
Ohio:Columbus . . . . . . . . . . . Franklin FairfieldKettering . . . . . . . . . . . . Montgomery GreeneYoungstown. . . . . . . . . . Mahoning Trumbull
Oklahoma:Broken Arrow . . . . . . . . Tulsa WagonerOklahoma City . . . . . . . Oklahoma Canadian, Cleveland,
McClain,Pottawatomie
State and municipalityCounty
Assigned Other
Tulsa. . . . . . . . . . . . . . . . Tulsa Osage, Rogers
Oregon:Portland . . . . . . . . . . . . . Multnomah Clackamas,
Washington
Salem. . . . . . . . . . . . . . . Marion Polk
Pennsylvania:Bethlehem . . . . . . . . . . Northampton Lehigh
South Carolina:North Charleston . . . . . Charleston Berkeley,
DorchesterSouth Dakota:Sioux Falls. . . . . . . . . . . Minnehaha Lincoln
Texas:Abilene . . . . . . . . . . . . . . Taylor JonesAmarillo . . . . . . . . . . . . . Potter RandallAustin . . . . . . . . . . . . . . . Travis WilliamsonBaytown . . . . . . . . . . . . . Harris ChambersCarrollton . . . . . . . . . . . . Dallas Denton, CollinCorpus Christi . . . . . . . . Nueces Kleberg,
San Patricio
Dallas . . . . . . . . . . . . . . . Dallas Collin, Denton,Kaufman, Rickwall
Fort Worth . . . . . . . . . . . Tarrant DentonGarland . . . . . . . . . . . . . Dallas Collin, Rockwall
Grand Prairie . . . . . . . . Dallas Ellis, TarrantHouston . . . . . . . . . . . . . Harris Fort Bend,
Montgomery
Longview . . . . . . . . . . . . Gregg Harrison
Midland . . . . . . . . . . . . . Midland MartinOdessa. . . . . . . . . . . . . . Ector MidlandPlano . . . . . . . . . . . . . . . Collin DentonRichardson . . . . . . . . . . Dallas CollinWichita Falls . . . . . . . . . Wichita Archer
West Virginia:Huntington . . . . . . . . . . . Cabell Wayne
Wisconsin:Appleton. . . . . . . . . . . . . Outagamie Calumet,
WinnebagoEau Claire . . . . . . . . . . . Eau Claire ChippewaMilwaukee . . . . . . . . . . . Milwaukee Washington,
Waukesha
xvi
Federal Government Expenditures or Obligations by Stateand County Area: Fiscal Year 1995
County Area 1

TIPS PS [APS_PPGB,F_SCOTT] 6/ 3/96 12:37:43 MCVX09 TLP:CFFR1.TLP;15 6/ 3/96 11:04:06 DATA:NONE PSC:TIPS_12353107_01.PSC PAGE: 1TSF:TIPS92~12353107.DAT;1 6/ 3/96 12:35:33 UTF:TIPS93~12353107.DAT;1 6/ 3/96 12:35:33 META:TIPS96~12353107.DAT;1 6/ 3/96 12:37:03
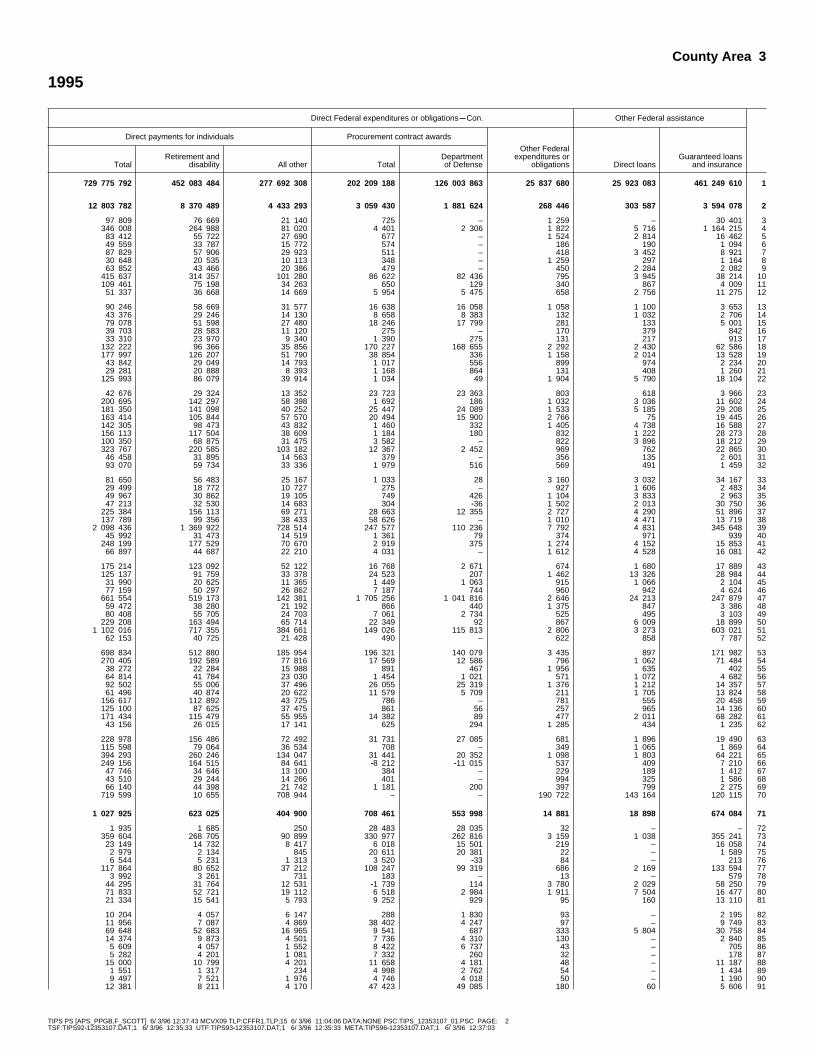
Federal Government Expenditures or Obligations by State and County Area: Fiscal Year[Thousand dollars]
State and county area
Congressional district
Direct Federal expenditures or obligations
Total direct expenditres or obligations Salaries and wages
United Statesresident
population1 TotalDepartment of
DefenseAll other
agencies Grant awards TotalDepartmentof Defense
United States, total -------------------- 264 188 106 1 368 571 219 227 199 619 1 141 371 600 242 597 946 168 150 613 71 192 2091
Alabama ------------------------------------ 4 218 733 22 796 055 4 145 927 18 650 128 3 704 320 2 960 077 1 534 3522
Autauga County 02---------------------------- 38 317 120 777 19 158 101 619 16 492 4 491 1 2003Baldwin County 01---------------------------- 115 685 413 107 32 676 380 431 48 931 11 946 1 5444Barbour County 02---------------------------- 25 544 118 180 13 248 104 932 28 737 3 829 1 2465Bibb County 03 06------------------------------- 17 603 69 034 2 653 66 381 14 996 3 719 1 1486Blount County 04------------------------------ 41 438 125 628 3 409 122 219 32 539 4 330 9737Bullock County 02----------------------------- 11 221 44 597 873 43 724 10 491 1 850 2438Butler County 02------------------------------ 21 930 103 104 2 334 100 770 35 874 2 449 3269Calhoun County 03---------------------------- 116 872 823 408 360 960 462 448 74 820 245 535 228 35710Chambers County 03-------------------------- 37 237 137 347 4 160 133 187 23 859 3 037 37511Cherokee County 04--------------------------- 20 475 70 919 7 514 63 405 10 595 2 375 34812
Chilton County 03----------------------------- 34 197 144 977 19 965 125 012 33 784 3 250 31313Choctaw County 07---------------------------- 16 082 64 548 9 543 55 005 10 742 1 640 20514Clarke County 01 07------------------------------ 28 130 119 935 21 357 98 578 17 819 4 510 1 43415Clay County 03------------------------------- 13 489 52 558 3 030 49 528 9 332 3 080 1 32216Cleburne County 03--------------------------- 13 238 43 993 1 522 42 471 6 217 2 945 31017Coffee County 02----------------------------- 42 005 345 041 208 811 136 230 24 609 15 690 10 75918Colbert County 05----------------------------- 52 535 338 762 5 798 332 964 28 759 91 994 1 74519Conecuh County 02--------------------------- 14 102 59 054 2 350 56 704 11 022 2 273 35320Coosa County 03------------------------------ 11 510 39 046 2 868 36 178 6 591 1 876 43221Covington County 02-------------------------- 36 997 168 981 9 538 159 443 32 558 7 494 2 33722
Crenshaw County 02-------------------------- 13 550 81 977 26 149 55 828 12 204 2 571 59323Cullman County 04---------------------------- 71 580 249 533 12 003 237 530 34 176 11 937 4 46924Dale County 02------------------------------- 50 632 517 379 349 596 167 783 28 000 281 048 276 09925Dallas County 07------------------------------ 48 063 244 729 25 200 219 529 49 670 8 384 3 11726De Kalb County 04---------------------------- 57 488 192 902 6 352 186 550 39 907 7 825 1 82427Elmore County 02----------------------------- 55 464 205 692 23 209 182 483 40 647 6 917 2 08028Escambia County 01--------------------------- 36 414 137 042 4 518 132 524 28 098 4 190 1 00429Etowah County 04----------------------------- 100 427 428 013 16 568 411 445 73 576 17 334 5 51430Fayette County 04----------------------------- 18 063 60 834 1 956 58 878 11 130 2 512 65231Franklin County 04---------------------------- 29 024 138 500 1 586 136 914 39 328 3 555 –32
Geneva County 02---------------------------- 24 568 105 420 6 054 99 366 16 003 3 574 89733Greene County 07----------------------------- 10 122 53 779 984 52 795 21 260 1 819 34034Hale County 07------------------------------- 16 188 70 621 2 555 68 066 15 900 2 901 84635Henry County 02------------------------------ 15 725 63 966 3 925 60 041 12 343 2 605 78636Houston County 02---------------------------- 83 865 315 642 23 796 291 846 42 919 15 948 2 55037Jackson County 05---------------------------- 49 551 272 358 5 557 266 801 29 482 45 450 82838Jefferson County 06 07--------------------------- 656 613 3 361 220 238 163 3 123 057 573 866 433 548 79 36739Lamar County 04------------------------------ 15 736 59 748 2 719 57 029 9 015 3 006 1 10240Lauderdale County 05------------------------- 83 153 305 420 9 652 295 768 39 279 13 748 2 22141Lawrence County 04 05--------------------------- 32 439 104 475 1 433 103 042 27 648 4 288 28442
Lee County 03-------------------------------- 91 935 297 845 31 451 266 394 83 125 22 063 8 60843Limestone County 05-------------------------- 58 099 179 646 7 169 172 477 20 912 7 611 1 67044Lowndes County 07--------------------------- 12 843 48 482 2 854 45 628 12 201 1 928 70945Macon County 03----------------------------- 24 159 180 899 10 660 170 239 45 224 50 369 3 17946Madison County 05---------------------------- 258 036 3 209 678 1 581 770 1 627 908 149 127 691 095 453 47147Marengo County 07--------------------------- 23 524 93 022 4 476 88 546 25 793 5 516 2 81648Marion County 04----------------------------- 30 231 109 959 6 844 103 115 16 990 4 974 2 27749Marshall County 04---------------------------- 76 716 327 381 13 444 313 937 58 960 15 996 3 34950Mobile County 01----------------------------- 396 465 1 692 737 191 367 1 501 370 297 853 141 035 41 36051Monroe County 01---------------------------- 24 432 81 577 2 456 79 121 15 020 3 291 89852
Montgomery County 02 07------------------------ 218 239 1 937 678 583 093 1 354 585 599 884 439 205 329 78653Morgan County 05---------------------------- 106 178 473 580 28 225 445 355 70 401 114 409 4 71054Perry County 07------------------------------ 12 599 57 926 2 476 55 450 14 536 2 270 44655Pickens County 04 07---------------------------- 20 938 89 164 3 914 85 250 18 954 3 370 1 14156Pike County 02------------------------------- 28 676 157 120 33 650 123 470 29 557 7 629 4 70057Randolph County 03--------------------------- 20 312 88 457 8 168 80 289 12 658 2 513 28758Russell County 03----------------------------- 51 596 204 665 16 371 188 294 41 634 4 847 91159St. Clair County 03---------------------------- 55 930 159 410 6 836 152 574 27 663 5 528 1 59960Shelby County 06----------------------------- 118 244 223 462 6 880 216 582 25 570 11 599 54761Sumter County 07----------------------------- 16 382 65 000 2 110 62 890 17 442 2 491 83762
Talladega County 03--------------------------- 75 964 349 398 36 104 313 294 60 694 27 314 2 79163Tallapoosa County 03-------------------------- 39 602 154 448 6 574 147 874 32 804 4 990 99264Tuscaloosa County 06 07------------------------- 157 091 634 283 45 824 588 459 141 682 65 769 10 92765Walker County 04----------------------------- 69 179 315 919 ~3 412 319 331 64 017 10 421 2 05366Washington County 01------------------------- 17 180 69 909 15 302 54 607 9 917 11 633 9 84867Wilcox County 07----------------------------- 13 782 73 256 2 325 70 931 24 733 3 619 1 54268Winston County 04---------------------------- 23 129 89 168 5 253 83 915 14 371 7 079 3 35569State undistributed ------------------------- 1 059 743 – 1 059 743 149 381 41 –70
Alaska -------------------------------------- 605 324 4 230 203 1 425 478 2 804 725 1 192 264 1 286 672 758 70171
Aleutians West Census Ar 00------------------- 6 832 68 009 60 549 7 460 4 048 33 511 31 85072Anchorage City/Borough 00-------------------- 253 649 1 727 472 764 875 962 597 323 707 710 024 442 96873Bethel Census Area 00------------------------ 14 984 102 896 26 736 76 160 62 903 10 607 3 00474Bristol Bay Borough 00------------------------- 1 416 35 318 20 934 14 384 8 428 3 279 39675Dillingham Census Area 00--------------------- 4 370 25 534 867 24 667 12 544 2 840 –76Fairbanks~North Star Bor 00-------------------- 85 418 621 799 372 774 249 025 97 496 297 506 256 13477Haines Borough 00---------------------------- 2 179 9 118 153 8 965 4 368 561 –78Juneau city and Borough 00-------------------- 28 758 376 374 3 589 372 785 277 267 52 771 2 27679Kenai Peninsula Borough 00-------------------- 45 216 130 177 9 692 120 485 32 041 17 874 6280Ketchikan~Gateway Boro 00-------------------- 14 361 61 491 1 560 59 931 12 009 18 800 10681
Northwest Arctic Borough 00------------------- 6 561 31 998 2 391 29 607 17 018 4 396 43082Kodiak Island Borough 00---------------------- 14 963 101 724 5 446 96 278 7 621 43 647 35883Matanuska~Susitna Boro 00-------------------- 48 684 122 695 9 120 113 575 37 120 6 052 78684Nome Census Area 00------------------------- 8 800 67 878 10 969 56 909 37 752 7 886 2 43985North Slope Borough 00------------------------ 6 794 25 861 7 048 18 813 9 183 2 604 7886Prince of Wales Area 00----------------------- 6 941 26 889 351 26 538 9 720 4 523 –87Sitka city and Borough 00---------------------- 8 780 54 721 4 776 49 945 10 826 17 189 27588Skagway~Hoonah~Angoon 00------------------- 3 790 20 590 3 647 16 943 10 021 3 966 9889Southeast Fairbanks Area 00------------------- 5 840 51 164 19 359 31 805 20 496 16 376 13 65390Valdez~Cordova Area 00----------------------- 10 364 87 653 49 823 37 830 19 976 7 693 –91
See footnotes at end of table.
2 Consolidated Federal Funds Report
TIPS PS [APS_PPGB,F_SCOTT] 6/ 3/96 12:37:43 MCVX09 TLP:CFFR1.TLP;15 6/ 3/96 11:04:06 DATA:NONE PSC:TIPS_12353107_01.PSC PAGE: 2TSF:TIPS92~12353107.DAT;1 6/ 3/96 12:35:33 UTF:TIPS93~12353107.DAT;1 6/ 3/96 12:35:33 META:TIPS96~12353107.DAT;1 6/ 3/96 12:37:03
1995
Direct Federal expenditures or obligationsmCon. Other Federal assistance
Direct payments for individuals Procurement contract awards
TotalRetirement and
disability All other TotalDepartmentof Defense
Other Federalexpenditures or
obligations Direct loansGuaranteed loans
and insurance
729 775 792 452 083 484 277 692 308 202 209 188 126 003 863 25 837 680 25 923 083 461 249 610 1
12 803 782 8 370 489 4 433 293 3 059 430 1 881 624 268 446 303 587 3 594 078 2
97 809 76 669 21 140 725 – 1 259 – 30 401 3346 008 264 988 81 020 4 401 2 306 1 822 5 716 1 164 215 4
83 412 55 722 27 690 677 – 1 524 2 814 16 462 549 559 33 787 15 772 574 – 186 190 1 094 687 829 57 906 29 923 511 – 418 3 452 8 921 730 648 20 535 10 113 348 – 1 259 297 1 164 863 852 43 466 20 386 479 – 450 2 284 2 082 9
415 637 314 357 101 280 86 622 82 436 795 3 945 38 214 10109 461 75 198 34 263 650 129 340 867 4 009 11
51 337 36 668 14 669 5 954 5 475 658 2 756 11 275 12
90 246 58 669 31 577 16 638 16 058 1 058 1 100 3 653 1343 376 29 246 14 130 8 658 8 383 132 1 032 2 706 1479 078 51 598 27 480 18 246 17 799 281 133 5 001 1539 703 28 583 11 120 275 – 170 379 842 1633 310 23 970 9 340 1 390 275 131 217 913 17
132 222 96 366 35 856 170 227 168 655 2 292 2 430 62 586 18177 997 126 207 51 790 38 854 336 1 158 2 014 13 528 19
43 842 29 049 14 793 1 017 556 899 974 2 234 2029 281 20 888 8 393 1 168 864 131 408 1 260 21
125 993 86 079 39 914 1 034 49 1 904 5 790 18 104 22
42 676 29 324 13 352 23 723 23 363 803 618 3 966 23200 695 142 297 58 398 1 692 186 1 032 3 036 11 602 24181 350 141 098 40 252 25 447 24 089 1 533 5 185 29 208 25163 414 105 844 57 570 20 494 15 900 2 766 75 19 445 26142 305 98 473 43 832 1 460 332 1 405 4 738 16 588 27156 113 117 504 38 609 1 184 180 832 1 222 28 273 28100 350 68 875 31 475 3 582 – 822 3 896 18 212 29323 767 220 585 103 182 12 367 2 452 969 762 22 865 30
46 458 31 895 14 563 379 – 356 135 2 601 3193 070 59 734 33 336 1 979 516 569 491 1 459 32
81 650 56 483 25 167 1 033 28 3 160 3 032 34 167 3329 499 18 772 10 727 275 – 927 1 606 2 483 3449 967 30 862 19 105 749 426 1 104 3 833 2 963 3547 213 32 530 14 683 304 ~36 1 502 2 013 30 750 36
225 384 156 113 69 271 28 663 12 355 2 727 4 290 51 896 37137 789 99 356 38 433 58 626 – 1 010 4 471 13 719 38
2 098 436 1 369 922 728 514 247 577 110 236 7 792 4 831 345 648 3945 992 31 473 14 519 1 361 79 374 971 939 40
248 199 177 529 70 670 2 919 375 1 274 4 152 15 853 4166 897 44 687 22 210 4 031 – 1 612 4 528 16 081 42
175 214 123 092 52 122 16 768 2 671 674 1 680 17 889 43125 137 91 759 33 378 24 523 207 1 462 13 326 28 984 44
31 990 20 625 11 365 1 449 1 063 915 1 066 2 104 4577 159 50 297 26 862 7 187 744 960 942 4 624 46
661 554 519 173 142 381 1 705 256 1 041 816 2 646 24 213 247 879 4759 472 38 280 21 192 866 440 1 375 847 3 386 4880 408 55 705 24 703 7 061 2 734 525 495 3 103 49
229 208 163 494 65 714 22 349 92 867 6 009 18 899 501 102 016 717 355 384 661 149 026 115 813 2 806 3 273 603 021 51
62 153 40 725 21 428 490 – 622 858 7 787 52
698 834 512 880 185 954 196 321 140 079 3 435 897 171 982 53270 405 192 589 77 816 17 569 12 586 796 1 062 71 484 54
38 272 22 284 15 988 891 467 1 956 635 402 5564 814 41 784 23 030 1 454 1 021 571 1 072 4 682 5692 502 55 006 37 496 26 055 25 319 1 376 1 212 14 357 5761 496 40 874 20 622 11 579 5 709 211 1 705 13 824 58
156 617 112 892 43 725 786 – 781 555 20 458 59125 100 87 625 37 475 861 56 257 965 14 136 60171 434 115 479 55 955 14 382 89 477 2 011 68 282 61
43 156 26 015 17 141 625 294 1 285 434 1 235 62
228 978 156 486 72 492 31 731 27 085 681 1 896 19 490 63115 598 79 064 36 534 708 – 349 1 065 1 869 64394 293 260 246 134 047 31 441 20 352 1 098 1 803 64 221 65249 156 164 515 84 641 ~8 212 ~11 015 537 409 7 210 66
47 746 34 646 13 100 384 – 229 189 1 412 6743 510 29 244 14 266 401 – 994 325 1 586 6866 140 44 398 21 742 1 181 200 397 799 2 275 69
719 599 10 655 708 944 – – 190 722 143 164 120 115 70
1 027 925 623 025 404 900 708 461 553 998 14 881 18 898 674 084 71
1 935 1 685 250 28 483 28 035 32 – – 72359 604 268 705 90 899 330 977 262 816 3 159 1 038 355 241 73
23 149 14 732 8 417 6 018 15 501 219 – 16 058 742 979 2 134 845 20 611 20 381 22 – 1 589 756 544 5 231 1 313 3 520 ~33 84 – 213 76
117 864 80 652 37 212 108 247 99 319 686 2 169 133 594 773 992 3 261 731 183 – 13 – 579 78
44 295 31 764 12 531 ~1 739 114 3 780 2 029 58 250 7971 833 52 721 19 112 6 518 2 984 1 911 7 504 16 477 8021 334 15 541 5 793 9 252 929 95 160 13 110 81
10 204 4 057 6 147 288 1 830 93 – 2 195 8211 956 7 087 4 869 38 402 4 247 97 – 9 749 8369 648 52 683 16 965 9 541 687 333 5 804 30 758 8414 374 9 873 4 501 7 736 4 310 130 – 2 840 855 609 4 057 1 552 8 422 6 737 43 – 705 865 282 4 201 1 081 7 332 260 32 – 178 87
15 000 10 799 4 201 11 658 4 181 48 – 11 187 881 551 1 317 234 4 998 2 762 54 – 1 434 899 497 7 521 1 976 4 746 4 018 50 – 1 190 90
12 381 8 211 4 170 47 423 49 085 180 60 5 606 91
County Area 3

TIPS PS [APS_PPGB,F_SCOTT] 6/ 3/96 12:37:43 MCVX09 TLP:CFFR1.TLP;15 6/ 3/96 11:04:06 DATA:NONE PSC:TIPS_12353107_01.PSC PAGE: 3TSF:TIPS92~12353107.DAT;1 6/ 3/96 12:35:33 UTF:TIPS93~12353107.DAT;1 6/ 3/96 12:35:33 META:TIPS96~12353107.DAT;1 6/ 3/96 12:37:03
Federal Government Expenditures or Obligations by State and County Area: Fiscal Year[Thousand dollars]
State and county area
Congressional district
Direct Federal expenditures or obligations
Total direct expenditres or obligations Salaries and wages
United Statesresident
population1 TotalDepartment of
DefenseAll other
agencies Grant awards TotalDepartmentof Defense
AlaskamCon.
Wade Hampton Census Area 00---------------- 6 446 36 356 5 129 31 227 19 978 1 820 –1Wrangell~Petersburg Area 00------------------- 7 171 30 714 619 30 095 4 088 7 867 –2Yukon~Koyukuk Area 00----------------------- 6 360 80 023 35 140 44 883 27 138 5 706 –3Aleutians East Borough 00--------------------- 2 264 14 803 4 366 10 437 6 475 968 –4Lake and Peninsula Boro 00-------------------- 1 750 7 111 1 663 5 448 1 217 903 –5Denali Borough 00---------------------------- 1 923 7 542 3 874 3 668 112 6 817 3 7886Yakutat city borough are 00-------------------- 710 1 003 – 1 003 403 487 –7State undistributed ------------------------- 303 290 28 303 262 118 309 – –8
Arizona ------------------------------------- 4 075 088 20 906 317 4 239 109 16 667 208 3 544 322 2 412 841 1 002 2749
Apache County 06----------------------------- 65 512 393 905 5 643 388 262 189 308 72 880 –10Cochise County 05---------------------------- 106 915 834 296 441 356 392 940 61 881 266 989 242 48611Coconino County 03 06--------------------------- 108 276 438 002 19 059 418 943 93 375 93 683 4 88012Gila County 06-------------------------------- 44 620 386 065 5 584 380 481 55 383 17 788 11413Graham County 05 06---------------------------- 28 876 115 825 3 012 112 813 27 254 15 883 50914Greenlee County 06--------------------------- 9 034 25 565 3 084 22 481 3 410 1 240 –15Maricopa County 2
--------------------------- 2 346 640 10 259 285 1 709 000 8 550 285 1 803 407 1 030 468 311 09216Mohave County 03---------------------------- 116 178 532 262 20 315 511 947 71 482 19 221 66417Navajo County 03 06----------------------------- 85 983 363 809 8 165 355 644 99 709 69 015 2 24418Pima County 02 05------------------------------- 731 524 4 715 653 1 747 793 2 967 860 639 481 535 163 296 33719
Pinal County 02 05 06------------------------------- 126 743 552 914 18 902 534 012 125 371 35 028 2 29720Santa Cruz County 02------------------------- 35 107 129 296 2 819 126 477 38 691 23 704 16321Yavapai County 03---------------------------- 127 844 617 944 30 361 587 583 82 464 43 837 94222Yuma County 02------------------------------ 127 680 632 428 175 954 456 474 96 102 182 578 140 54623La Paz County 03----------------------------- 14 156 114 479 48 061 66 418 22 576 5 361 –24State undistributed ------------------------- 794 588 – 794 588 134 428 – –25
Arkansas ----------------------------------- 2 452 660 11 768 073 912 593 10 855 480 2 117 653 1 005 271 337 76926
Arkansas County 01--------------------------- 21 153 136 715 9 193 127 522 11 969 6 672 1 10727Ashley County 04----------------------------- 24 698 104 226 1 540 102 686 22 654 3 580 17928Baxter County 03----------------------------- 34 648 192 238 10 736 181 502 14 020 6 617 2 20329Benton County 03----------------------------- 115 268 392 209 26 663 365 546 35 160 15 955 1 92930Boone County 03------------------------------ 30 736 129 729 6 466 123 263 17 106 10 347 2 30031Bradley County 04----------------------------- 11 640 61 338 2 107 59 231 19 517 2 120 86032Calhoun County 04---------------------------- 5 831 21 056 1 434 19 622 4 482 612 –33Carroll County 03----------------------------- 21 323 72 157 6 333 65 824 5 764 5 384 1 29934Chicot County 04------------------------------ 15 528 78 384 3 121 75 263 14 819 2 177 60735Clark County 04------------------------------- 22 128 104 790 5 048 99 742 28 439 4 977 1 97736
Clay County 01------------------------------- 17 733 93 108 1 435 91 673 8 588 2 981 28037Cleburne County 01--------------------------- 21 338 99 885 8 715 91 170 12 461 4 614 1 55538Cleveland County 04-------------------------- 8 011 28 841 600 28 241 6 604 804 –39Columbia County 04--------------------------- 25 711 108 534 10 821 97 713 15 689 3 006 41540Conway County 02---------------------------- 19 433 85 906 3 112 82 794 11 089 2 979 55541Craighead County 01-------------------------- 73 383 264 507 10 269 254 238 42 269 21 041 3 16542Crawford County 03--------------------------- 46 494 165 971 7 493 158 478 36 226 4 479 29343Crittenden County 01-------------------------- 49 935 165 848 3 687 162 161 33 796 5 752 97344Cross County 01------------------------------ 19 071 107 913 17 150 90 763 13 438 2 820 78245Dallas County 04------------------------------ 9 482 50 494 976 49 518 15 624 1 311 23846
Desha County 04------------------------------ 15 916 79 189 3 349 75 840 14 173 5 216 38847Drew County 04------------------------------- 17 618 84 514 5 995 78 519 14 793 3 340 46448Faulkner County 02---------------------------- 69 331 224 627 12 090 212 537 60 071 7 892 1 37049Franklin County 03---------------------------- 15 686 84 300 21 811 62 489 7 694 11 817 7 36850Fulton County 01------------------------------ 10 427 43 247 1 289 41 958 5 305 1 474 –51Garland County 04---------------------------- 79 777 434 429 28 727 405 702 46 237 24 094 4 33552Grant County 04------------------------------ 14 830 41 350 1 801 39 549 4 889 1 756 26053Greene County 01----------------------------- 34 003 122 070 3 250 118 820 13 889 3 865 53454Hempstead County 04------------------------- 22 117 93 629 1 908 91 721 26 239 4 278 20955Hot Spring County 04-------------------------- 27 463 104 261 4 542 99 719 12 636 3 708 1 15556
Howard County 04---------------------------- 13 675 53 581 2 300 51 281 8 795 3 283 1 03057Independence County 01----------------------- 32 348 129 472 4 830 124 642 23 393 7 623 34658Izard County 01------------------------------- 12 348 63 268 2 142 61 126 10 355 1 765 –59Jackson County 01---------------------------- 18 788 105 223 1 705 103 518 12 794 2 760 44160Jefferson County 04--------------------------- 84 032 461 860 55 835 406 025 92 632 62 225 36 05561Johnson County 03---------------------------- 19 859 73 791 3 084 70 707 9 168 4 052 32462Lafayette County 04--------------------------- 9 282 39 688 3 050 36 638 6 304 1 288 –63Lawrence County 01--------------------------- 17 448 98 334 2 381 95 953 11 844 3 426 39164Lee County 01-------------------------------- 12 824 66 786 2 517 64 269 14 750 2 213 37365Lincoln County 04----------------------------- 14 031 46 591 360 46 231 8 478 1 015 –66
Little River County 04-------------------------- 13 520 53 650 1 934 51 716 8 037 1 785 35567Logan County 03------------------------------ 20 949 92 293 4 074 88 219 17 029 5 933 99868Lonoke County 01----------------------------- 44 117 164 501 14 965 149 536 21 424 4 420 34669Madison County 03---------------------------- 12 923 49 604 3 484 46 120 12 950 2 134 6770Marion County 03----------------------------- 13 212 58 935 3 510 55 425 7 046 1 504 –71Miller County 04------------------------------- 39 068 172 545 4 857 167 688 52 218 1 979 47172Mississippi County 01-------------------------- 51 099 214 375 19 467 194 908 39 494 7 196 22973Monroe County 01---------------------------- 10 683 62 885 950 61 935 10 835 1 785 22874Montgomery County 04------------------------ 8 184 35 895 1 525 34 370 4 152 2 557 –75Nevada County 04---------------------------- 10 134 41 165 1 366 39 799 8 015 2 043 34676
Newton County 03----------------------------- 7 904 27 645 794 26 851 4 585 1 961 –77Ouachita County 04--------------------------- 29 052 154 823 34 704 120 119 19 554 6 620 2 00278Perry County 02------------------------------ 8 642 39 909 2 062 37 847 6 228 2 275 21379Phillips County 01----------------------------- 28 253 141 916 2 469 139 447 35 347 3 732 20780Pike County 04------------------------------- 10 080 38 704 2 023 36 681 4 746 2 741 78381Poinsett County 01---------------------------- 24 425 124 508 2 459 122 049 15 314 3 392 48582Polk County 03------------------------------- 18 434 79 661 4 244 75 417 10 197 3 778 21683Pope County 03------------------------------- 50 204 184 295 16 295 168 000 29 930 14 468 3 85684Prairie County 01------------------------------ 9 225 52 642 1 576 51 066 5 418 1 998 79885Pulaski County 02----------------------------- 352 952 2 269 289 355 389 1 913 900 559 895 515 959 215 10486
See footnotes at end of table.
4 Consolidated Federal Funds Report

TIPS PS [APS_PPGB,F_SCOTT] 6/ 3/96 12:37:43 MCVX09 TLP:CFFR1.TLP;15 6/ 3/96 11:04:06 DATA:NONE PSC:TIPS_12353107_01.PSC PAGE: 4TSF:TIPS92~12353107.DAT;1 6/ 3/96 12:35:33 UTF:TIPS93~12353107.DAT;1 6/ 3/96 12:35:33 META:TIPS96~12353107.DAT;1 6/ 3/96 12:37:03
1995mCon.
Direct Federal expenditures or obligationsmCon. Other Federal assistance
Direct payments for individuals Procurement contract awards
TotalRetirement and
disability All other TotalDepartmentof Defense
Other Federalexpenditures or
obligations Direct loansGuaranteed loans
and insurance
8 848 3 477 5 371 5 629 4 961 82 – 411 111 206 8 125 3 081 7 516 421 37 – 5 249 210 954 7 527 3 427 36 025 34 530 199 134 3 950 32 595 1 522 1 073 4 735 4 315 30 – 42 43 152 1 399 1 753 1 797 1 608 43 – 116 5
544 543 1 57 – 13 – 554 6– – – 84 – 29 – – 7
181 594 14 200 167 394 – – 3 386 – 2 810 8
11 696 780 7 776 675 3 920 105 3 097 967 2 433 313 154 407 102 380 4 037 113 9
118 662 77 492 41 170 12 745 3 782 310 3 552 5 788 10363 253 281 331 81 922 139 807 133 814 2 367 3 844 87 316 11210 256 146 039 64 217 39 762 4 591 925 1 379 57 877 12169 898 118 093 51 805 142 810 – 185 3 354 37 000 13
70 476 47 093 23 383 2 224 530 ~13 2 808 18 160 1417 880 12 712 5 168 2 893 2 689 142 – 5 803 15
6 123 626 4 160 548 1 963 078 1 279 679 976 783 22 105 10 923 2 417 132 16432 665 316 436 116 229 8 227 2 620 667 16 345 125 727 17183 288 128 743 54 545 11 176 – 621 3 905 25 200 18
2 181 936 1 535 839 646 097 1 354 717 1 250 496 4 356 7 010 533 979 19
369 864 252 043 117 821 20 646 277 2 004 11 262 183 954 2065 556 44 940 20 616 1 202 352 142 13 308 24 237 21
477 655 377 170 100 485 12 921 1 596 1 067 8 194 83 634 22330 170 234 452 95 718 21 865 11 597 1 714 2 767 71 923 23
39 001 36 572 2 429 47 294 44 186 248 415 19 222 24542 595 7 172 535 423 – – 117 566 13 315 340 161 25
7 740 431 5 063 997 2 676 434 420 563 222 881 484 155 759 706 1 759 773 26
67 309 42 521 24 788 11 443 6 776 39 322 274 887 29 841 2770 394 47 981 22 413 1 006 125 6 591 20 237 21 658 28
169 252 122 176 47 076 1 911 756 438 214 15 582 29325 643 253 652 71 991 14 429 4 013 1 022 4 020 62 961 30
98 818 70 871 27 947 1 999 598 1 459 1 634 12 085 3141 403 28 118 13 285 237 – ~1 939 113 2 101 3214 505 10 198 4 307 1 354 1 071 104 30 10 872 3359 196 44 995 14 201 1 367 856 446 819 5 551 3446 659 29 843 16 816 2 194 1 919 12 536 19 661 29 883 3569 275 44 201 25 074 925 304 1 173 2 428 9 857 36
62 087 41 504 20 583 511 – 18 941 12 703 12 831 3781 107 60 898 20 209 1 292 514 411 6 339 6 772 3821 109 14 738 6 371 211 – 112 73 775 3980 964 55 415 25 549 8 660 8 158 216 270 4 003 4063 426 45 480 17 946 7 561 395 852 661 7 858 41
178 648 121 389 57 259 2 792 260 19 757 22 879 74 394 42122 647 88 120 34 527 2 290 1 206 330 5 192 20 323 43117 908 74 470 43 438 1 556 251 6 835 11 825 94 393 44
51 243 34 605 16 638 15 893 15 400 24 519 16 524 18 043 4533 219 21 985 11 234 208 – 133 – 1 241 46
45 502 27 905 17 597 2 679 2 385 11 618 10 022 26 045 4756 313 30 350 25 963 4 540 4 123 5 529 3 099 14 462 48
151 700 105 267 46 433 2 948 1 626 2 016 2 827 46 291 4950 575 35 502 15 073 14 018 12 302 197 2 696 3 778 5035 408 25 654 9 754 264 – 794 848 15 090 51
355 258 254 637 100 621 8 346 4 016 494 5 374 39 315 5234 245 25 130 9 115 383 87 78 384 2 934 5389 858 63 836 26 022 836 – 13 622 11 958 34 857 5461 617 39 550 22 067 520 84 976 297 4 607 5586 689 59 725 26 964 785 125 443 392 8 827 56
40 788 26 699 14 089 523 229 193 857 3 336 5791 500 64 696 26 804 3 852 635 3 104 3 275 15 861 5850 157 35 918 14 239 359 – 633 629 2 963 5966 663 37 301 29 362 426 – 22 580 11 312 18 918 60
261 678 175 010 86 668 32 674 13 257 12 651 16 643 45 891 6159 400 43 028 16 372 1 069 92 102 1 322 10 513 6227 098 17 904 9 194 2 788 2 561 2 209 1 131 5 217 6363 160 41 606 21 554 960 367 18 945 18 784 16 786 6438 298 23 237 15 061 1 968 1 637 9 558 7 149 7 965 6529 006 19 490 9 516 22 ~218 8 070 12 757 5 961 66
38 576 27 517 11 059 4 297 141 956 651 2 900 6768 206 49 347 18 859 687 58 438 636 4 990 68
114 287 82 115 32 172 2 243 418 22 129 15 602 44 149 6931 826 23 710 8 116 1 961 1 677 733 1 381 9 051 7049 718 36 526 13 192 278 79 389 1 727 2 113 71
113 162 72 460 40 702 1 800 294 3 386 3 042 23 853 72147 029 97 903 49 126 13 371 12 016 7 285 7 298 31 989 73
36 529 22 812 13 717 430 123 13 307 9 074 19 856 7428 200 20 135 8 065 937 144 50 71 3 584 7530 430 20 539 9 891 358 – 319 51 1 188 76
20 627 15 581 5 046 213 – 260 320 445 7797 930 67 867 30 063 30 459 29 482 260 330 9 212 7827 715 20 562 7 153 2 966 562 725 942 2 592 7992 514 56 855 35 659 2 220 1 210 8 103 5 475 39 964 8030 415 21 466 8 949 522 289 280 37 1 306 8173 569 48 482 25 087 3 070 460 29 163 27 383 34 196 8264 701 46 823 17 878 841 61 145 1 192 3 121 83
122 871 89 744 33 127 16 455 6 206 572 4 843 21 702 8426 081 17 341 8 740 363 141 18 781 3 441 22 119 85
1 068 941 754 795 314 146 116 605 50 798 7 890 6 383 302 225 86
County Area 5

TIPS PS [APS_PPGB,F_SCOTT] 6/ 3/96 12:37:43 MCVX09 TLP:CFFR1.TLP;15 6/ 3/96 11:04:06 DATA:NONE PSC:TIPS_12353107_01.PSC PAGE: 5TSF:TIPS92~12353107.DAT;1 6/ 3/96 12:35:33 UTF:TIPS93~12353107.DAT;1 6/ 3/96 12:35:33 META:TIPS96~12353107.DAT;1 6/ 3/96 12:37:03
Federal Government Expenditures or Obligations by State and County Area: Fiscal Year[Thousand dollars]
State and county area
Congressional district
Direct Federal expenditures or obligations
Total direct expenditres or obligations Salaries and wages
United Statesresident
population1 TotalDepartment of
DefenseAll other
agencies Grant awards TotalDepartmentof Defense
Arkansas mCon.
Randolph County 01--------------------------- 17 286 73 177 1 560 71 617 15 272 1 690 –1St. Francis County 01-------------------------- 28 104 147 710 1 870 145 840 36 220 4 586 2812Saline County 02------------------------------ 71 143 178 767 4 985 173 782 45 388 4 357 4153Scott County 03------------------------------- 10 551 41 522 1 951 39 571 5 264 2 952 –4Searcy County 01----------------------------- 7 603 37 462 3 048 34 414 6 187 1 887 4105Sebastian County 03-------------------------- 103 373 416 578 55 065 361 513 44 801 54 777 26 6676Sevier County 04------------------------------ 14 420 51 199 2 337 48 862 7 222 2 956 3877Sharp County 01------------------------------ 15 816 90 218 2 791 87 427 15 753 2 115 –8Stone County 01------------------------------ 10 590 44 824 1 614 43 210 6 562 2 131 –9Union County 04------------------------------ 46 290 191 867 11 805 180 062 26 301 9 030 1 60210
Van Buren County 02-------------------------- 14 636 74 010 3 611 70 399 11 630 2 053 –11Washington County 03------------------------- 127 201 467 461 28 556 438 905 120 387 47 239 2 70012White County 02------------------------------ 59 454 221 335 9 535 211 800 35 784 7 996 1 27713Woodruff County 01--------------------------- 9 276 57 050 644 56 406 8 354 1 536 15214Yell County 02-------------------------------- 18 510 84 608 5 209 79 399 15 217 6 389 1 41415State undistributed ------------------------- 616 984 – 616 984 70 746 – –16
California ----------------------------------- 31 430 901 153 835 178 31 629 964 122 205 214 29 805 680 18 375 680 9 394 56217
Alameda County 09 10 13--------------------------- 1 319 480 7 560 728 1 047 753 6 512 975 1 411 454 1 242 350 634 78518Alpine County 04------------------------------ 1 192 6 075 68 6 007 1 628 257 –19Amador County 04---------------------------- 32 799 119 495 4 955 114 540 11 991 3 815 –20Butte County 02 03------------------------------- 192 253 814 263 26 126 788 137 129 347 23 922 1 72921Calaveras County 04-------------------------- 37 146 142 649 6 881 135 768 16 646 4 980 32422Colusa County 03----------------------------- 17 239 105 482 2 382 103 100 13 114 2 954 7923Contra Costa County 07 10----------------------- 862 935 2 934 849 285 410 2 649 439 462 569 341 417 103 16824Del Norte County 01--------------------------- 26 867 99 347 2 070 97 277 21 584 6 463 –25El Dorado County 04-------------------------- 144 842 423 561 22 289 401 272 49 925 28 943 8526Fresno County 18 19 20----------------------------- 729 736 2 619 940 85 767 2 534 173 618 128 388 565 36 38927
Glenn County 03------------------------------ 25 788 178 046 48 963 129 083 20 366 9 632 40428Humboldt County 01--------------------------- 121 749 539 707 12 703 527 004 155 388 41 957 1 35829Imperial County 52---------------------------- 137 053 494 871 42 913 451 958 124 291 59 330 11 93330Inyo County 40------------------------------- 18 434 195 708 101 172 94 536 17 858 11 504 –31Kern County 20 21------------------------------- 609 333 2 980 610 891 497 2 089 113 416 937 652 321 530 22732Kings County 20------------------------------ 110 091 460 416 203 627 256 789 77 679 169 448 161 80133Lake County 01------------------------------- 55 766 303 775 6 914 296 861 54 285 6 923 21134Lassen County 02----------------------------- 28 079 156 242 43 997 112 245 25 532 43 174 31 23535Los Angeles County 2
------------------------ 9 149 811 40 228 691 7 912 169 32 316 522 8 051 263 3 145 334 594 07336Madera County 18 19---------------------------- 104 925 331 108 9 919 321 189 73 552 11 627 1 16237
Marin County 06------------------------------ 235 037 800 282 66 358 733 924 84 895 55 563 10 20638Mariposa County 19--------------------------- 15 637 79 290 2 971 76 319 8 886 17 887 38039Mendocino County 01-------------------------- 81 895 359 303 12 704 346 599 106 629 14 151 1 59340Merced County 18----------------------------- 196 850 683 883 83 107 600 776 206 048 30 441 11 97341Modoc County 02----------------------------- 9 672 55 781 3 309 52 472 10 239 10 737 1 63242Mono County 04------------------------------ 10 393 30 061 8 794 21 267 4 881 10 969 6 93643Monterey County 17--------------------------- 351 927 1 557 401 516 002 1 041 399 225 931 341 061 286 58444Napa County 01------------------------------- 114 969 486 274 18 963 467 311 81 571 14 287 28845Nevada County 02---------------------------- 85 832 368 801 79 185 289 616 34 337 18 209 3 32046Orange County 2
----------------------------- 2 543 168 9 166 652 2 173 122 6 993 530 1 293 063 964 566 370 92947
Placer County 04------------------------------ 198 485 660 527 45 807 614 720 69 750 31 054 7 04748Plumas County 02----------------------------- 20 511 103 596 1 802 101 794 18 378 12 408 2749Riverside County 43 44 48--------------------------- 1 352 932 4 509 104 499 018 4 010 086 670 573 393 162 209 69050Sacramento County 03 04 05 11------------------------ 1 098 148 10 754 346 1 560 116 9 194 230 5 787 540 899 263 571 62751San Benito County 17-------------------------- 40 995 123 113 19 247 103 866 34 893 5 072 34352San Bernardino County 40 41 42--------------------- 1 553 625 5 276 350 1 046 953 4 229 397 996 040 756 825 466 47153San Diego County 2
-------------------------- 2 632 078 16 453 136 7 423 069 9 030 067 2 066 577 4 330 639 3 588 61254San Francisco City/Co. 08 12---------------------- 734 676 4 988 367 392 196 4 596 171 1 137 003 1 049 548 99 40855San Joaquin County 11 18------------------------ 518 168 1 850 766 200 626 1 650 140 391 815 232 731 149 85456San Luis Obispo County 22--------------------- 223 710 780 508 103 507 677 001 95 591 37 306 13 43857
San Mateo County 12 14-------------------------- 676 237 2 346 436 216 099 2 130 337 289 399 270 644 25 61258Santa Barbara County 22 23---------------------- 380 494 2 044 871 711 992 1 332 879 239 631 253 349 145 98759Santa Clara County 13 14 15 16------------------------- 1 557 233 8 585 253 3 214 846 5 370 407 1 315 224 641 664 120 87660Santa Cruz County 15 17------------------------- 234 972 705 054 45 992 659 062 132 447 29 092 3 78861Shasta County 02----------------------------- 160 021 719 209 15 048 704 161 127 044 49 817 51762Sierra County 02------------------------------ 3 352 19 523 275 19 248 3 891 2 540 –63Siskiyou County 02---------------------------- 43 928 226 068 5 814 220 254 33 352 26 435 37964Solano County 01 03 07----------------------------- 367 585 1 936 422 1 001 026 935 396 101 770 593 113 543 31865Sonoma County 01 06---------------------------- 410 192 1 500 290 68 616 1 431 674 259 107 106 364 6 09266Stanislaus County 18-------------------------- 406 764 1 241 905 31 793 1 210 112 274 769 38 703 2 34767
Sutter County 03------------------------------ 73 171 273 676 20 104 253 572 49 163 7 718 28668Tehama County 03---------------------------- 52 876 203 633 4 963 198 670 37 188 9 365 35469Trinity County 02------------------------------ 13 482 78 634 2 027 76 607 19 111 8 136 –70Tulare County 19 20 21------------------------------ 343 257 1 150 853 21 855 1 128 998 369 487 49 191 1 22371Tuolumne County 04-------------------------- 51 933 210 811 6 690 204 121 28 130 16 711 3072Ventura County 23 24---------------------------- 702 741 3 030 170 1 098 096 1 932 074 404 679 624 111 531 14273Yolo County 03------------------------------- 146 422 657 321 29 271 628 050 186 736 112 532 3 65674Yuba County 02------------------------------- 62 015 367 168 121 025 246 143 55 488 115 401 99 63475State undistributed ------------------------- 8 754 781 – 8 754 781 800 886 – –76
Colorado ----------------------------------- 3 655 714 19 192 627 4 273 643 14 918 984 2 616 060 3 390 008 1 395 24477
Adams County 01 02 04----------------------------- 294 083 1 167 601 298 175 869 426 124 171 248 907 143 69978Alamosa County 03---------------------------- 14 138 52 065 1 044 51 021 15 229 5 717 –79Arapahoe County 01 04 05 06--------------------------- 443 327 1 426 200 439 634 986 566 114 625 161 659 72 28580Archuleta County 03--------------------------- 6 523 25 748 1 158 24 590 6 840 1 613 –81Baca County 04------------------------------- 4 342 34 083 199 33 884 3 191 1 282 –82Bent County 04------------------------------- 5 115 48 275 1 435 46 840 3 830 20 909 51083Boulder County 02---------------------------- 249 623 971 734 125 042 846 692 160 928 154 104 6 97584Chaffee County 03---------------------------- 13 795 54 003 2 274 51 729 6 713 3 852 –85Cheyenne County 04-------------------------- 2 350 17 630 200 17 430 735 706 –86Clear Creek County 02------------------------- 8 520 16 479 489 15 990 4 996 1 280 –87
See footnotes at end of table.
6 Consolidated Federal Funds Report
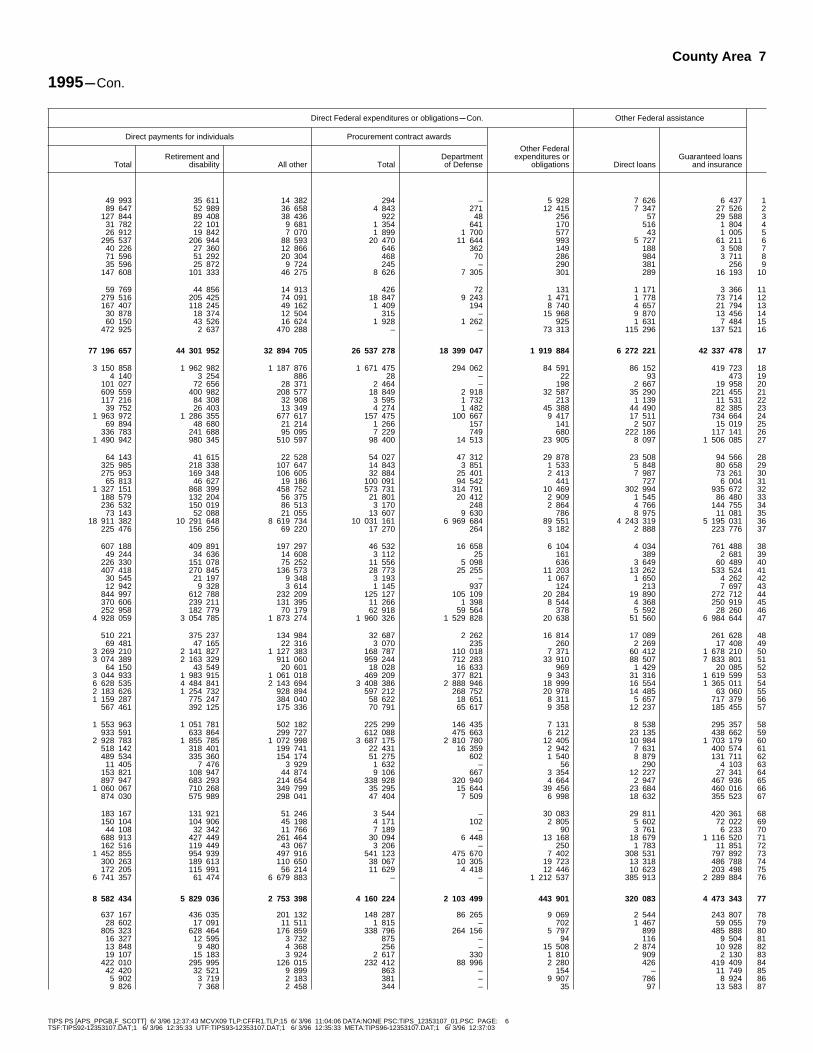
TIPS PS [APS_PPGB,F_SCOTT] 6/ 3/96 12:37:43 MCVX09 TLP:CFFR1.TLP;15 6/ 3/96 11:04:06 DATA:NONE PSC:TIPS_12353107_01.PSC PAGE: 6TSF:TIPS92~12353107.DAT;1 6/ 3/96 12:35:33 UTF:TIPS93~12353107.DAT;1 6/ 3/96 12:35:33 META:TIPS96~12353107.DAT;1 6/ 3/96 12:37:03
1995mCon.
Direct Federal expenditures or obligationsmCon. Other Federal assistance
Direct payments for individuals Procurement contract awards
TotalRetirement and
disability All other TotalDepartmentof Defense
Other Federalexpenditures or
obligations Direct loansGuaranteed loans
and insurance
49 993 35 611 14 382 294 – 5 928 7 626 6 437 189 647 52 989 36 658 4 843 271 12 415 7 347 27 526 2
127 844 89 408 38 436 922 48 256 57 29 588 331 782 22 101 9 681 1 354 641 170 516 1 804 426 912 19 842 7 070 1 899 1 700 577 43 1 005 5
295 537 206 944 88 593 20 470 11 644 993 5 727 61 211 640 226 27 360 12 866 646 362 149 188 3 508 771 596 51 292 20 304 468 70 286 984 3 711 835 596 25 872 9 724 245 – 290 381 256 9
147 608 101 333 46 275 8 626 7 305 301 289 16 193 10
59 769 44 856 14 913 426 72 131 1 171 3 366 11279 516 205 425 74 091 18 847 9 243 1 471 1 778 73 714 12167 407 118 245 49 162 1 409 194 8 740 4 657 21 794 13
30 878 18 374 12 504 315 – 15 968 9 870 13 456 1460 150 43 526 16 624 1 928 1 262 925 1 631 7 484 15
472 925 2 637 470 288 – – 73 313 115 296 137 521 16
77 196 657 44 301 952 32 894 705 26 537 278 18 399 047 1 919 884 6 272 221 42 337 478 17
3 150 858 1 962 982 1 187 876 1 671 475 294 062 84 591 86 152 419 723 184 140 3 254 886 28 – 22 93 473 19
101 027 72 656 28 371 2 464 – 198 2 667 19 958 20609 559 400 982 208 577 18 849 2 918 32 587 35 290 221 455 21117 216 84 308 32 908 3 595 1 732 213 1 139 11 531 22
39 752 26 403 13 349 4 274 1 482 45 388 44 490 82 385 231 963 972 1 286 355 677 617 157 475 100 667 9 417 17 511 734 664 24
69 894 48 680 21 214 1 266 157 141 2 507 15 019 25336 783 241 688 95 095 7 229 749 680 222 186 117 141 26
1 490 942 980 345 510 597 98 400 14 513 23 905 8 097 1 506 085 27
64 143 41 615 22 528 54 027 47 312 29 878 23 508 94 566 28325 985 218 338 107 647 14 843 3 851 1 533 5 848 80 658 29275 953 169 348 106 605 32 884 25 401 2 413 7 987 73 261 30
65 813 46 627 19 186 100 091 94 542 441 727 6 004 311 327 151 868 399 458 752 573 731 314 791 10 469 302 994 935 672 32
188 579 132 204 56 375 21 801 20 412 2 909 1 545 86 480 33236 532 150 019 86 513 3 170 248 2 864 4 766 144 755 34
73 143 52 088 21 055 13 607 9 630 786 8 975 11 081 3518 911 382 10 291 648 8 619 734 10 031 161 6 969 684 89 551 4 243 319 5 195 031 36
225 476 156 256 69 220 17 270 264 3 182 2 888 223 776 37
607 188 409 891 197 297 46 532 16 658 6 104 4 034 761 488 3849 244 34 636 14 608 3 112 25 161 389 2 681 39
226 330 151 078 75 252 11 556 5 098 636 3 649 60 489 40407 418 270 845 136 573 28 773 25 255 11 203 13 262 533 524 41
30 545 21 197 9 348 3 193 – 1 067 1 650 4 262 4212 942 9 328 3 614 1 145 937 124 213 7 697 43
844 997 612 788 232 209 125 127 105 109 20 284 19 890 272 712 44370 606 239 211 131 395 11 266 1 398 8 544 4 368 250 919 45252 958 182 779 70 179 62 918 59 564 378 5 592 28 260 46
4 928 059 3 054 785 1 873 274 1 960 326 1 529 828 20 638 51 560 6 984 644 47
510 221 375 237 134 984 32 687 2 262 16 814 17 089 261 628 4869 481 47 165 22 316 3 070 235 260 2 269 17 408 49
3 269 210 2 141 827 1 127 383 168 787 110 018 7 371 60 412 1 678 210 503 074 389 2 163 329 911 060 959 244 712 283 33 910 88 507 7 833 801 51
64 150 43 549 20 601 18 028 16 633 969 1 429 20 085 523 044 933 1 983 915 1 061 018 469 209 377 821 9 343 31 316 1 619 599 536 628 535 4 484 841 2 143 694 3 408 386 2 888 946 18 999 16 554 1 365 011 542 183 626 1 254 732 928 894 597 212 268 752 20 978 14 485 63 060 551 159 287 775 247 384 040 58 622 18 651 8 311 5 657 717 379 56
567 461 392 125 175 336 70 791 65 617 9 358 12 237 185 455 57
1 553 963 1 051 781 502 182 225 299 146 435 7 131 8 538 295 357 58933 591 633 864 299 727 612 088 475 663 6 212 23 135 438 662 59
2 928 783 1 855 785 1 072 998 3 687 175 2 810 780 12 405 10 984 1 703 179 60518 142 318 401 199 741 22 431 16 359 2 942 7 631 400 574 61489 534 335 360 154 174 51 275 602 1 540 8 879 131 711 62
11 405 7 476 3 929 1 632 – 56 290 4 103 63153 821 108 947 44 874 9 106 667 3 354 12 227 27 341 64897 947 683 293 214 654 338 928 320 940 4 664 2 947 467 936 65
1 060 067 710 268 349 799 35 295 15 644 39 456 23 684 460 016 66874 030 575 989 298 041 47 404 7 509 6 998 18 632 355 523 67
183 167 131 921 51 246 3 544 – 30 083 29 811 420 361 68150 104 104 906 45 198 4 171 102 2 805 5 602 72 022 69
44 108 32 342 11 766 7 189 – 90 3 761 6 233 70688 913 427 449 261 464 30 094 6 448 13 168 18 679 1 116 520 71162 516 119 449 43 067 3 206 – 250 1 783 11 851 72
1 452 855 954 939 497 916 541 123 475 670 7 402 308 531 797 892 73300 263 189 613 110 650 38 067 10 305 19 723 13 318 486 788 74172 205 115 991 56 214 11 629 4 418 12 446 10 623 203 498 75
6 741 357 61 474 6 679 883 – – 1 212 537 385 913 2 289 884 76
8 582 434 5 829 036 2 753 398 4 160 224 2 103 499 443 901 320 083 4 473 343 77
637 167 436 035 201 132 148 287 86 265 9 069 2 544 243 807 7828 602 17 091 11 511 1 815 – 702 1 467 59 055 79
805 323 628 464 176 859 338 796 264 156 5 797 899 485 888 8016 327 12 595 3 732 875 – 94 116 9 504 8113 848 9 480 4 368 256 – 15 508 2 874 10 928 8219 107 15 183 3 924 2 617 330 1 810 909 2 130 83
422 010 295 995 126 015 232 412 88 996 2 280 426 419 409 8442 420 32 521 9 899 863 – 154 – 11 749 855 902 3 719 2 183 381 – 9 907 786 8 924 869 826 7 368 2 458 344 – 35 97 13 583 87
County Area 7
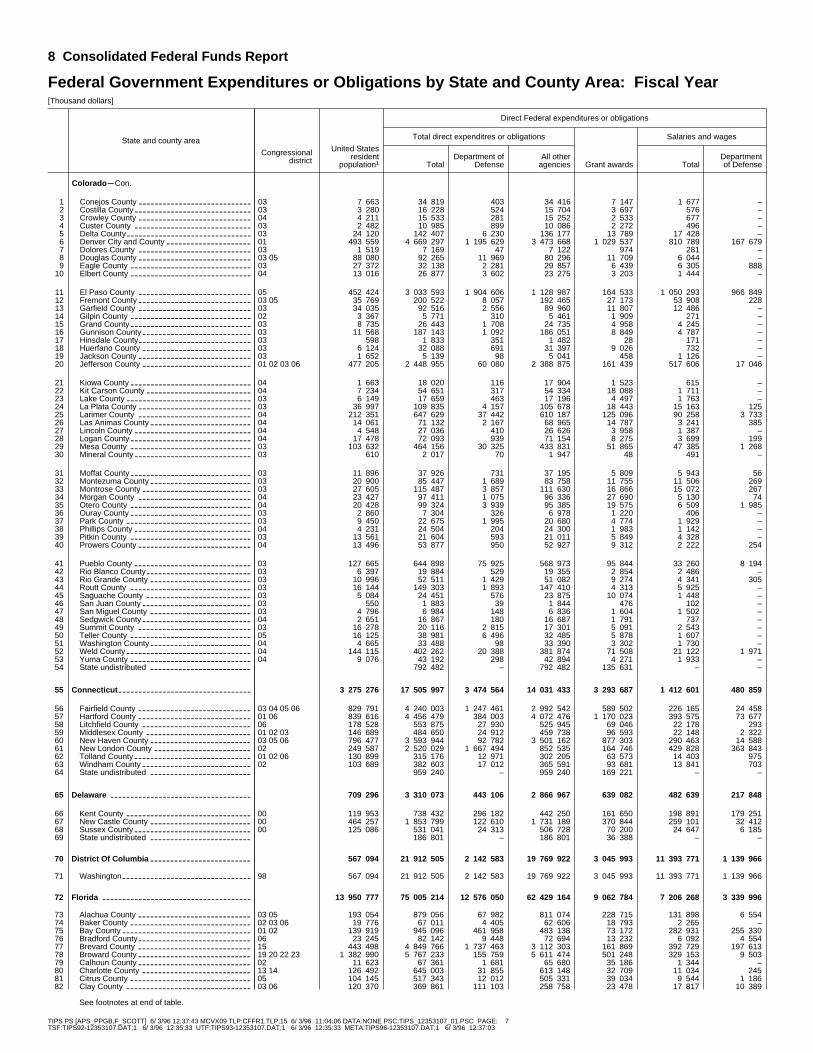
TIPS PS [APS_PPGB,F_SCOTT] 6/ 3/96 12:37:43 MCVX09 TLP:CFFR1.TLP;15 6/ 3/96 11:04:06 DATA:NONE PSC:TIPS_12353107_01.PSC PAGE: 7TSF:TIPS92~12353107.DAT;1 6/ 3/96 12:35:33 UTF:TIPS93~12353107.DAT;1 6/ 3/96 12:35:33 META:TIPS96~12353107.DAT;1 6/ 3/96 12:37:03
Federal Government Expenditures or Obligations by State and County Area: Fiscal Year[Thousand dollars]
State and county area
Congressional district
Direct Federal expenditures or obligations
Total direct expenditres or obligations Salaries and wages
United Statesresident
population1 TotalDepartment of
DefenseAll other
agencies Grant awards TotalDepartmentof Defense
Colorado mCon.
Conejos County 03---------------------------- 7 663 34 819 403 34 416 7 147 1 677 –1Costilla County 03----------------------------- 3 280 16 228 524 15 704 3 697 576 –2Crowley County 04---------------------------- 4 211 15 533 281 15 252 2 533 677 –3Custer County 03----------------------------- 2 482 10 985 899 10 086 2 272 496 –4Delta County 03------------------------------- 24 120 142 407 6 230 136 177 13 789 17 428 –5Denver City and County 01--------------------- 493 559 4 669 297 1 195 629 3 473 668 1 029 537 810 789 167 6796Dolores County 03---------------------------- 1 519 7 169 47 7 122 974 281 –7Douglas County 03 05---------------------------- 88 080 92 265 11 969 80 296 11 709 6 044 –8Eagle County 03------------------------------ 27 372 32 138 2 281 29 857 6 439 6 305 8889Elbert County 04------------------------------ 13 016 26 877 3 602 23 275 3 203 1 444 –10
El Paso County 05---------------------------- 452 424 3 033 593 1 904 606 1 128 987 164 533 1 050 293 966 84911Fremont County 03 05---------------------------- 35 769 200 522 8 057 192 465 27 173 53 908 22812Garfield County 03---------------------------- 34 035 92 516 2 556 89 960 11 807 12 486 –13Gilpin County 02------------------------------ 3 367 5 771 310 5 461 1 909 271 –14Grand County 03------------------------------ 8 735 26 443 1 708 24 735 4 958 4 245 –15Gunnison County 03--------------------------- 11 568 187 143 1 092 186 051 8 849 4 787 –16Hinsdale County 03---------------------------- 598 1 833 351 1 482 28 171 –17Huerfano County 03--------------------------- 6 124 32 088 691 31 397 9 026 732 –18Jackson County 03---------------------------- 1 652 5 139 98 5 041 458 1 126 –19Jefferson County 01 02 03 06--------------------------- 477 205 2 448 955 60 080 2 388 875 161 439 517 606 17 04620
Kiowa County 04------------------------------ 1 663 18 020 116 17 904 1 523 615 –21Kit Carson County 04-------------------------- 7 234 54 651 317 54 334 18 088 1 711 –22Lake County 03------------------------------- 6 149 17 659 463 17 196 4 497 1 763 –23La Plata County 03---------------------------- 36 997 109 835 4 157 105 678 18 443 15 163 12524Larimer County 04---------------------------- 212 351 647 629 37 442 610 187 125 096 90 258 3 73325Las Animas County 04------------------------- 14 061 71 132 2 167 68 965 14 787 3 241 38526Lincoln County 04----------------------------- 4 548 27 036 410 26 626 3 958 1 387 –27Logan County 04------------------------------ 17 478 72 093 939 71 154 8 275 3 699 19928Mesa County 03------------------------------ 103 632 464 156 30 325 433 831 51 865 47 385 1 26829Mineral County 03----------------------------- 610 2 017 70 1 947 48 491 –30
Moffat County 03------------------------------ 11 896 37 926 731 37 195 5 809 5 943 5631Montezuma County 03------------------------- 20 900 85 447 1 689 83 758 11 755 11 506 26932Montrose County 03--------------------------- 27 605 115 487 3 857 111 630 16 866 15 072 26733Morgan County 04---------------------------- 23 427 97 411 1 075 96 336 27 690 5 130 7434Otero County 04------------------------------ 20 428 99 324 3 939 95 385 19 575 6 509 1 98535Ouray County 03------------------------------ 2 860 7 304 326 6 978 1 220 406 –36Park County 03------------------------------- 9 450 22 675 1 995 20 680 4 774 1 929 –37Phillips County 04----------------------------- 4 231 24 504 204 24 300 1 983 1 142 –38Pitkin County 03------------------------------ 13 561 21 604 593 21 011 5 849 4 328 –39Prowers County 04---------------------------- 13 496 53 877 950 52 927 9 312 2 222 25440
Pueblo County 03----------------------------- 127 665 644 898 75 925 568 973 95 844 33 260 8 19441Rio Blanco County 03-------------------------- 6 397 19 884 529 19 355 2 854 2 486 –42Rio Grande County 03------------------------- 10 996 52 511 1 429 51 082 9 274 4 341 30543Routt County 03------------------------------ 16 144 149 303 1 893 147 410 4 313 5 925 –44Saguache County 03-------------------------- 5 084 24 451 576 23 875 10 074 1 448 –45San Juan County 03--------------------------- 550 1 883 39 1 844 476 102 –46San Miguel County 03------------------------- 4 796 6 984 148 6 836 1 604 1 502 –47Sedgwick County 04--------------------------- 2 651 16 867 180 16 687 1 791 737 –48Summit County 03---------------------------- 16 278 20 116 2 815 17 301 5 091 2 543 –49Teller County 05------------------------------ 16 125 38 981 6 496 32 485 5 878 1 607 –50Washington County 04------------------------- 4 665 33 488 98 33 390 3 302 1 730 –51Weld County 04------------------------------- 144 115 402 262 20 388 381 874 71 508 21 122 1 97152Yuma County 04------------------------------ 9 076 43 192 298 42 894 4 271 1 933 –53State undistributed ------------------------- 792 482 – 792 482 135 631 – –54
Connecticut --------------------------------- 3 275 276 17 505 997 3 474 564 14 031 433 3 293 687 1 412 601 480 85955
Fairfield County 03 04 05 06---------------------------- 829 791 4 240 003 1 247 461 2 992 542 589 502 226 165 24 45856Hartford County 01 06---------------------------- 839 616 4 456 479 384 003 4 072 476 1 170 023 393 575 73 67757Litchfield County 06--------------------------- 178 528 553 875 27 930 525 945 69 046 22 178 29358Middlesex County 01 02 03-------------------------- 146 689 484 650 24 912 459 738 96 593 22 148 2 32259New Haven County 03 05 06------------------------- 796 477 3 593 944 92 782 3 501 162 877 303 290 463 14 58860New London County 02------------------------ 249 587 2 520 029 1 667 494 852 535 164 746 429 828 363 84361Tolland County 01 02 06----------------------------- 130 899 315 176 12 971 302 205 63 573 14 403 97562Windham County 02--------------------------- 103 689 382 603 17 012 365 591 93 681 13 841 70363State undistributed ------------------------- 959 240 – 959 240 169 221 – –64
Delaware ----------------------------------- 709 296 3 310 073 443 106 2 866 967 639 082 482 639 217 84865
Kent County 00------------------------------- 119 953 738 432 296 182 442 250 161 650 198 891 179 25166New Castle County 00------------------------- 464 257 1 853 799 122 610 1 731 189 370 844 259 101 32 41267Sussex County 00----------------------------- 125 086 531 041 24 313 506 728 70 200 24 647 6 18568State undistributed ------------------------- 186 801 – 186 801 36 388 – –69
District Of Columbia ------------------------- 567 094 21 912 505 2 142 583 19 769 922 3 045 993 11 393 771 1 139 96670
Washington 98-------------------------------- 567 094 21 912 505 2 142 583 19 769 922 3 045 993 11 393 771 1 139 96671
Florida ------------------------------------- 13 950 777 75 005 214 12 576 050 62 429 164 9 062 784 7 206 268 3 339 99672
Alachua County 03 05---------------------------- 193 054 879 056 67 982 811 074 228 715 131 898 6 55473Baker County 02 03 06------------------------------ 19 776 67 011 4 405 62 606 18 793 2 265 –74Bay County 01 02-------------------------------- 139 919 945 096 461 958 483 138 73 172 282 931 255 33075Bradford County 06---------------------------- 23 245 82 142 9 448 72 694 13 232 6 092 4 55476Brevard County 15---------------------------- 443 498 4 849 766 1 737 463 3 112 303 161 869 392 729 197 61377Broward County 19 20 22 23---------------------------- 1 382 990 5 767 233 155 759 5 611 474 501 248 329 153 9 50378Calhoun County 02---------------------------- 11 623 67 361 1 681 65 680 35 186 1 344 –79Charlotte County 13 14--------------------------- 126 492 645 003 31 855 613 148 32 709 11 034 24580Citrus County 05------------------------------ 104 145 517 343 12 012 505 331 39 034 9 544 1 18681Clay County 03 06------------------------------- 120 370 369 861 111 103 258 758 23 478 17 817 10 38982
See footnotes at end of table.
8 Consolidated Federal Funds Report
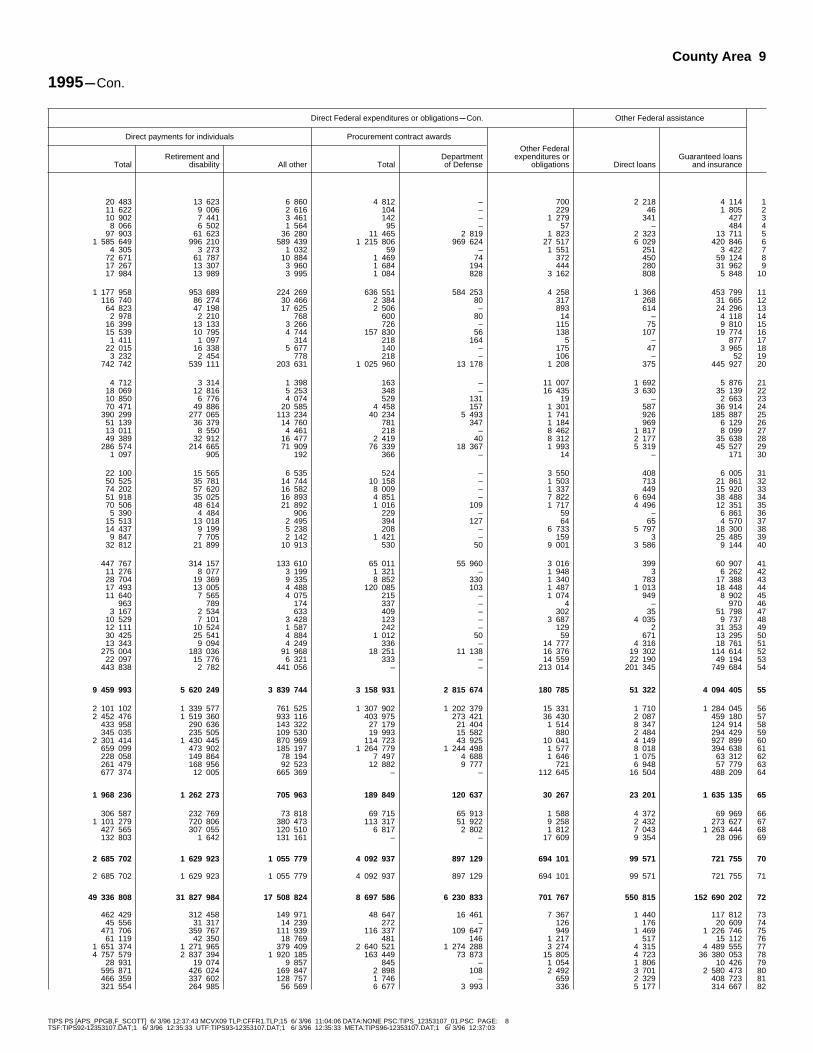
TIPS PS [APS_PPGB,F_SCOTT] 6/ 3/96 12:37:43 MCVX09 TLP:CFFR1.TLP;15 6/ 3/96 11:04:06 DATA:NONE PSC:TIPS_12353107_01.PSC PAGE: 8TSF:TIPS92~12353107.DAT;1 6/ 3/96 12:35:33 UTF:TIPS93~12353107.DAT;1 6/ 3/96 12:35:33 META:TIPS96~12353107.DAT;1 6/ 3/96 12:37:03
1995mCon.
Direct Federal expenditures or obligationsmCon. Other Federal assistance
Direct payments for individuals Procurement contract awards
TotalRetirement and
disability All other TotalDepartmentof Defense
Other Federalexpenditures or
obligations Direct loansGuaranteed loans
and insurance
20 483 13 623 6 860 4 812 – 700 2 218 4 114 111 622 9 006 2 616 104 – 229 46 1 805 210 902 7 441 3 461 142 – 1 279 341 427 38 066 6 502 1 564 95 – 57 – 484 4
97 903 61 623 36 280 11 465 2 819 1 823 2 323 13 711 51 585 649 996 210 589 439 1 215 806 969 624 27 517 6 029 420 846 6
4 305 3 273 1 032 59 – 1 551 251 3 422 772 671 61 787 10 884 1 469 74 372 450 59 124 817 267 13 307 3 960 1 684 194 444 280 31 962 917 984 13 989 3 995 1 084 828 3 162 808 5 848 10
1 177 958 953 689 224 269 636 551 584 253 4 258 1 366 453 799 11116 740 86 274 30 466 2 384 80 317 268 31 665 12
64 823 47 198 17 625 2 506 – 893 614 24 296 132 978 2 210 768 600 80 14 – 4 118 14
16 399 13 133 3 266 726 – 115 75 9 810 1515 539 10 795 4 744 157 830 56 138 107 19 774 161 411 1 097 314 218 164 5 – 877 17
22 015 16 338 5 677 140 – 175 47 3 965 183 232 2 454 778 218 – 106 – 52 19
742 742 539 111 203 631 1 025 960 13 178 1 208 375 445 927 20
4 712 3 314 1 398 163 – 11 007 1 692 5 876 2118 069 12 816 5 253 348 – 16 435 3 630 35 139 2210 850 6 776 4 074 529 131 19 – 2 663 2370 471 49 886 20 585 4 458 157 1 301 587 36 914 24
390 299 277 065 113 234 40 234 5 493 1 741 926 185 887 2551 139 36 379 14 760 781 347 1 184 969 6 129 2613 011 8 550 4 461 218 – 8 462 1 817 8 099 2749 389 32 912 16 477 2 419 40 8 312 2 177 35 638 28
286 574 214 665 71 909 76 339 18 367 1 993 5 319 45 527 291 097 905 192 366 – 14 – 171 30
22 100 15 565 6 535 524 – 3 550 408 6 005 3150 525 35 781 14 744 10 158 – 1 503 713 21 861 3274 202 57 620 16 582 8 009 – 1 337 449 15 920 3351 918 35 025 16 893 4 851 – 7 822 6 694 38 488 3470 506 48 614 21 892 1 016 109 1 717 4 496 12 351 355 390 4 484 906 229 – 59 – 6 861 36
15 513 13 018 2 495 394 127 64 65 4 570 3714 437 9 199 5 238 208 – 6 733 5 797 18 300 389 847 7 705 2 142 1 421 – 159 3 25 485 39
32 812 21 899 10 913 530 50 9 001 3 586 9 144 40
447 767 314 157 133 610 65 011 55 960 3 016 399 60 907 4111 276 8 077 3 199 1 321 – 1 948 3 6 262 4228 704 19 369 9 335 8 852 330 1 340 783 17 388 4317 493 13 005 4 488 120 085 103 1 487 1 013 18 448 4411 640 7 565 4 075 215 – 1 074 949 8 902 45
963 789 174 337 – 4 – 970 463 167 2 534 633 409 – 302 35 51 798 47
10 529 7 101 3 428 123 – 3 687 4 035 9 737 4812 111 10 524 1 587 242 – 129 2 31 353 4930 425 25 541 4 884 1 012 50 59 671 13 295 5013 343 9 094 4 249 336 – 14 777 4 316 18 761 51
275 004 183 036 91 968 18 251 11 138 16 376 19 302 114 614 5222 097 15 776 6 321 333 – 14 559 22 190 49 194 53
443 838 2 782 441 056 – – 213 014 201 345 749 684 54
9 459 993 5 620 249 3 839 744 3 158 931 2 815 674 180 785 51 322 4 094 405 55
2 101 102 1 339 577 761 525 1 307 902 1 202 379 15 331 1 710 1 284 045 562 452 476 1 519 360 933 116 403 975 273 421 36 430 2 087 459 180 57
433 958 290 636 143 322 27 179 21 404 1 514 8 347 124 914 58345 035 235 505 109 530 19 993 15 582 880 2 484 294 429 59
2 301 414 1 430 445 870 969 114 723 43 925 10 041 4 149 927 899 60659 099 473 902 185 197 1 264 779 1 244 498 1 577 8 018 394 638 61228 058 149 864 78 194 7 497 4 688 1 646 1 075 63 312 62261 479 168 956 92 523 12 882 9 777 721 6 948 57 779 63677 374 12 005 665 369 – – 112 645 16 504 488 209 64
1 968 236 1 262 273 705 963 189 849 120 637 30 267 23 201 1 635 135 65
306 587 232 769 73 818 69 715 65 913 1 588 4 372 69 969 661 101 279 720 806 380 473 113 317 51 922 9 258 2 432 273 627 67
427 565 307 055 120 510 6 817 2 802 1 812 7 043 1 263 444 68132 803 1 642 131 161 – – 17 609 9 354 28 096 69
2 685 702 1 629 923 1 055 779 4 092 937 897 129 694 101 99 571 721 755 70
2 685 702 1 629 923 1 055 779 4 092 937 897 129 694 101 99 571 721 755 71
49 336 808 31 827 984 17 508 824 8 697 586 6 230 833 701 767 550 815 152 690 202 72
462 429 312 458 149 971 48 647 16 461 7 367 1 440 117 812 7345 556 31 317 14 239 272 – 126 176 20 609 74
471 706 359 767 111 939 116 337 109 647 949 1 469 1 226 746 7561 119 42 350 18 769 481 146 1 217 517 15 112 76
1 651 374 1 271 965 379 409 2 640 521 1 274 288 3 274 4 315 4 489 555 774 757 579 2 837 394 1 920 185 163 449 73 873 15 805 4 723 36 380 053 78
28 931 19 074 9 857 845 – 1 054 1 806 10 426 79595 871 426 024 169 847 2 898 108 2 492 3 701 2 580 473 80466 359 337 602 128 757 1 746 – 659 2 329 408 723 81321 554 264 985 56 569 6 677 3 993 336 5 177 314 667 82
County Area 9

TIPS PS [APS_PPGB,F_SCOTT] 6/ 3/96 12:37:43 MCVX09 TLP:CFFR1.TLP;15 6/ 3/96 11:04:06 DATA:NONE PSC:TIPS_12353107_01.PSC PAGE: 9TSF:TIPS92~12353107.DAT;1 6/ 3/96 12:35:33 UTF:TIPS93~12353107.DAT;1 6/ 3/96 12:35:33 META:TIPS96~12353107.DAT;1 6/ 3/96 12:37:03
Federal Government Expenditures or Obligations by State and County Area: Fiscal Year[Thousand dollars]
State and county area
Congressional district
Direct Federal expenditures or obligations
Total direct expenditres or obligations Salaries and wages
United Statesresident
population1 TotalDepartment of
DefenseAll other
agencies Grant awards TotalDepartmentof Defense
Florida mCon.
Collier County 14------------------------------ 176 421 744 395 44 686 699 709 59 606 24 339 1051Columbia County 02 03--------------------------- 46 860 238 892 11 284 227 608 57 319 37 956 1 1412Dade County 2
------------------------------- 2 025 045 8 620 505 303 275 8 317 230 1 678 907 877 923 60 5053De Soto County 12---------------------------- 24 791 101 597 3 577 98 020 16 041 2 491 2624Dixie County 05------------------------------- 11 759 53 961 12 230 41 731 6 252 884 –5Duval County 03 04 06------------------------------ 703 563 4 193 156 1 616 075 2 577 081 397 972 1 359 441 1 047 0026Escambia County 01--------------------------- 271 793 2 012 200 948 517 1 063 683 178 703 467 508 399 3397Flagler County 03 04----------------------------- 38 048 181 693 6 229 175 464 13 760 3 867 –8Franklin County 02---------------------------- 9 657 42 707 2 575 40 132 8 417 1 445 2279Gadsden County 02--------------------------- 42 863 164 703 6 848 157 855 40 666 4 845 1 38910
Gilchrist County 05---------------------------- 11 640 37 906 1 469 36 437 6 747 948 –11Glades County 16----------------------------- 7 556 17 805 666 17 139 3 105 500 13912Gulf County 02-------------------------------- 12 117 55 342 3 596 51 746 12 328 720 –13Hamilton County 02--------------------------- 11 451 39 452 1 083 38 369 9 351 1 087 –14Hardee County 12----------------------------- 20 109 71 118 1 621 69 497 15 075 2 350 22315Hendry County 16 23----------------------------- 28 375 85 123 3 545 81 578 19 367 3 779 1 41316Hernando County 05--------------------------- 116 595 650 814 14 998 635 816 42 963 12 887 58617Highlands County 12 16-------------------------- 73 449 426 395 27 464 398 931 34 647 13 979 5 25318Hillsborough County 09 11 12 13------------------------ 874 292 3 904 520 627 907 3 276 613 581 191 615 374 205 68319Holmes County 01----------------------------- 16 826 73 749 5 901 67 848 12 105 3 222 1 31120
Indian River County 15------------------------- 95 680 524 881 24 108 500 773 27 791 16 118 3921Jackson County 02---------------------------- 42 851 203 685 9 703 193 982 39 486 24 940 59922Jefferson County 02--------------------------- 11 893 50 199 1 741 48 458 15 547 1 503 34023Lafayette County 02--------------------------- 5 814 14 428 668 13 760 2 260 632 –24Lake County 03 06------------------------------- 173 541 863 213 46 033 817 180 56 986 23 177 3 61925Lee County 14-------------------------------- 367 437 1 745 467 59 438 1 686 029 158 963 81 067 74326Leon County 02------------------------------- 210 504 2 287 757 239 557 2 048 200 1 552 148 82 246 9 37527Levy County 03 05------------------------------- 28 861 117 682 5 948 111 734 16 106 2 937 –28Liberty County 02----------------------------- 6 031 24 274 1 014 23 260 8 699 1 333 –29Madison County 02---------------------------- 17 197 62 076 1 895 60 181 11 754 1 836 –30
Manatee County 13--------------------------- 225 530 1 063 954 65 239 998 715 95 304 58 864 1 20931Marion County 03 05 06----------------------------- 219 808 1 005 973 30 707 975 266 110 435 27 502 1 74332Martin County 16 23------------------------------ 109 118 538 044 18 729 519 315 30 910 13 005 34933Monroe County 20---------------------------- 82 207 357 140 105 825 251 315 29 661 92 902 62 26434Nassau County 04----------------------------- 49 601 227 347 51 034 176 313 22 867 45 834 4 82835Okaloosa County 01--------------------------- 160 811 1 797 251 1 326 656 470 595 52 027 696 556 673 03236Okeechobee County 16 23------------------------ 30 579 134 040 7 718 126 322 17 216 3 058 2737Orange County 03 07 08----------------------------- 738 110 3 987 162 1 708 594 2 278 568 365 368 453 061 243 20938Osceola County 08 15---------------------------- 126 101 380 102 26 627 353 475 52 411 11 536 2739Palm Beach County 16 19 22 23------------------------- 954 543 5 411 697 986 553 4 425 144 406 968 233 445 17 46240
Pasco County 05 09 12------------------------------ 298 462 1 536 073 115 772 1 420 301 104 856 30 736 2 81441Pinellas County 09 10---------------------------- 867 196 5 163 362 682 226 4 481 136 365 219 291 573 13 36942Polk County 12 15------------------------------- 429 577 1 633 952 67 469 1 566 483 213 903 69 288 6 82443Putnam County 03 06---------------------------- 68 676 275 066 11 896 263 170 43 404 6 490 1 25144St. John County 03 04---------------------------- 98 294 423 451 70 469 352 982 50 128 22 630 14 22045St. Lucie County 16 23--------------------------- 169 164 765 333 21 613 743 720 81 154 21 989 8646Santa Rosa County 01------------------------- 98 968 428 549 149 973 278 576 39 605 73 936 60 20147Sarasota County 13--------------------------- 292 403 1 726 575 54 388 1 672 187 98 216 40 005 84148Seminole County 03 07--------------------------- 323 738 834 934 89 917 745 017 81 856 67 339 65649Sumter County 05----------------------------- 33 340 185 815 6 520 179 295 36 749 4 008 –50
Suwannee County 02-------------------------- 29 567 131 686 9 106 122 580 19 620 5 253 1 02051Taylor County 02------------------------------ 17 346 83 351 17 271 66 080 13 048 2 071 53652Union County 06------------------------------ 10 691 24 128 1 347 22 781 3 284 767 –53Volusia County 03 04 07----------------------------- 402 446 1 953 146 222 403 1 730 743 187 933 63 928 2 60554Wakulla County 02---------------------------- 16 601 121 932 74 007 47 925 9 117 2 513 7355Walton County 01----------------------------- 31 670 132 136 20 803 111 333 19 474 8 971 5 58156Washington County 02------------------------- 18 099 82 847 5 870 76 977 16 142 2 868 1 10257State undistributed ------------------------- 2 800 599 – 2 800 599 284 208 – –58
Georgia ------------------------------------- 7 055 235 33 414 551 7 753 446 25 661 105 5 897 573 5 800 507 3 174 57559
Appling County 01----------------------------- 16 169 48 735 1 560 47 175 11 173 2 160 14160Atkinson County 08---------------------------- 6 535 22 552 333 22 219 4 451 722 –61Bacon County 01------------------------------ 10 378 35 236 396 34 840 9 901 940 –62Baker County 02------------------------------ 3 692 11 375 206 11 169 3 745 300 –63Baldwin County 03 11---------------------------- 41 309 158 921 6 659 152 262 56 243 3 732 80464Banks County 10------------------------------ 11 052 23 540 1 110 22 430 4 177 643 –65Barrow County 10----------------------------- 34 415 98 358 5 670 92 688 15 896 7 937 4 07666Bartow County 07----------------------------- 61 675 171 590 23 798 147 792 29 458 7 068 1 45267Ben Hill County 08---------------------------- 17 149 66 696 2 011 64 685 13 575 1 696 30068Berrien County 08----------------------------- 15 214 54 533 3 054 51 479 10 072 1 381 –69
Bibb County 02 08------------------------------- 154 794 789 896 56 788 733 108 145 036 82 715 14 83070Bleckley County 08---------------------------- 10 753 48 888 1 465 47 423 8 143 1 042 –71Brantley County 01---------------------------- 12 342 35 004 1 205 33 799 6 136 963 –72Brooks County 02----------------------------- 15 582 53 143 1 593 51 550 12 076 1 240 –73Bryan County 01------------------------------ 19 942 568 506 516 940 51 566 11 700 467 749 466 26074Bulloch County 01----------------------------- 47 835 133 975 9 003 124 972 27 367 8 574 3 28975Burke County 11------------------------------ 21 601 81 325 2 955 78 370 18 354 2 666 29376Butts County 11------------------------------- 15 630 68 570 3 397 65 173 21 177 3 296 1 67177Calhoun County 02---------------------------- 4 939 25 605 407 25 198 4 988 722 –78Camden County 01---------------------------- 41 662 347 232 285 363 61 869 14 542 221 698 218 57279
Candler County 01---------------------------- 8 477 34 990 898 34 092 10 056 1 108 16880Carroll County 07----------------------------- 76 564 222 495 7 682 214 813 37 884 9 149 44481Catoosa County 09---------------------------- 46 478 112 780 2 612 110 168 26 597 2 554 –82Charlton County 01---------------------------- 9 232 34 157 1 088 33 069 10 771 1 653 –83Chatham County 01 11--------------------------- 225 215 1 161 428 276 216 885 212 178 150 241 934 180 85684Chattahoochee County 02---------------------- 15 645 93 841 83 304 10 537 2 641 181 –85Chattooga County 07-------------------------- 22 764 73 134 1 589 71 545 10 963 1 710 –86Cherokee County 06 09--------------------------- 108 857 172 313 8 861 163 452 25 529 10 512 27087Clarke County 10------------------------------ 90 256 534 071 33 353 500 718 123 562 72 625 18 32388Clay County 02------------------------------- 3 455 17 391 2 964 14 427 3 903 1 848 1 45989
See footnotes at end of table.
10 Consolidated Federal Funds Report
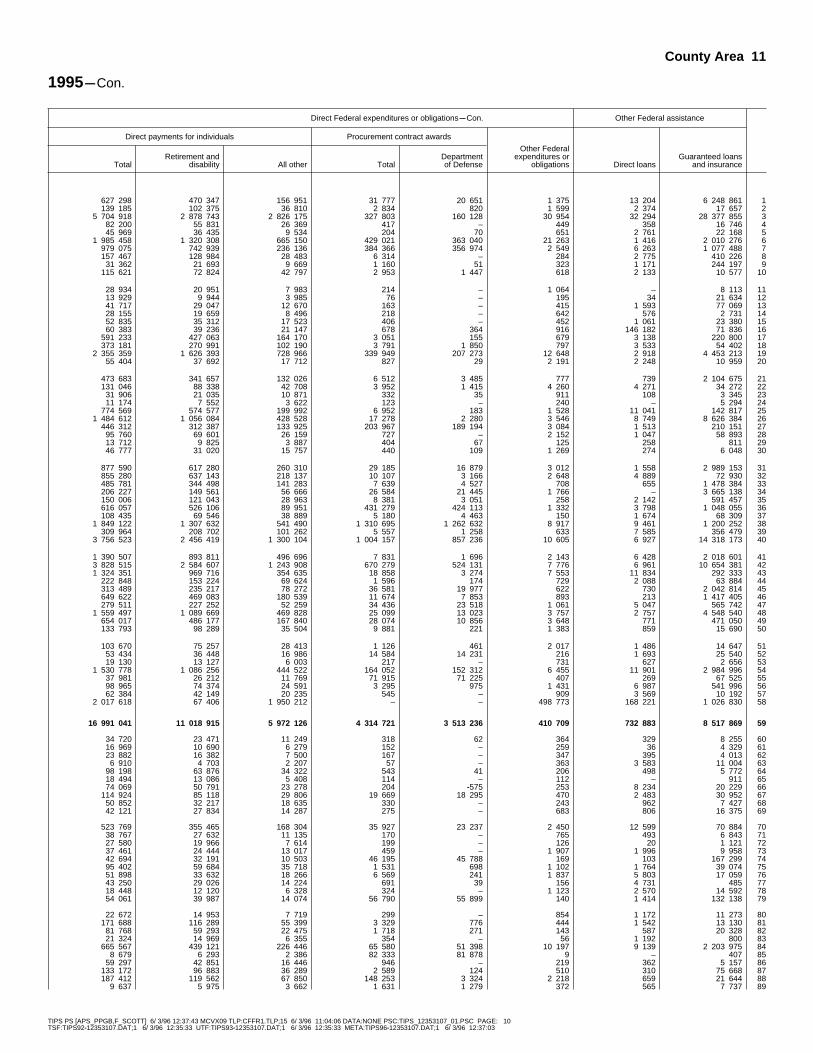
TIPS PS [APS_PPGB,F_SCOTT] 6/ 3/96 12:37:43 MCVX09 TLP:CFFR1.TLP;15 6/ 3/96 11:04:06 DATA:NONE PSC:TIPS_12353107_01.PSC PAGE: 10TSF:TIPS92~12353107.DAT;1 6/ 3/96 12:35:33 UTF:TIPS93~12353107.DAT;1 6/ 3/96 12:35:33 META:TIPS96~12353107.DAT;1 6/ 3/96 12:37:03
1995mCon.
Direct Federal expenditures or obligationsmCon. Other Federal assistance
Direct payments for individuals Procurement contract awards
TotalRetirement and
disability All other TotalDepartmentof Defense
Other Federalexpenditures or
obligations Direct loansGuaranteed loans
and insurance
627 298 470 347 156 951 31 777 20 651 1 375 13 204 6 248 861 1139 185 102 375 36 810 2 834 820 1 599 2 374 17 657 2
5 704 918 2 878 743 2 826 175 327 803 160 128 30 954 32 294 28 377 855 382 200 55 831 26 369 417 – 449 358 16 746 445 969 36 435 9 534 204 70 651 2 761 22 168 5
1 985 458 1 320 308 665 150 429 021 363 040 21 263 1 416 2 010 276 6979 075 742 939 236 136 384 366 356 974 2 549 6 263 1 077 488 7157 467 128 984 28 483 6 314 – 284 2 775 410 226 8
31 362 21 693 9 669 1 160 51 323 1 171 244 197 9115 621 72 824 42 797 2 953 1 447 618 2 133 10 577 10
28 934 20 951 7 983 214 – 1 064 – 8 113 1113 929 9 944 3 985 76 – 195 34 21 634 1241 717 29 047 12 670 163 – 415 1 593 77 069 1328 155 19 659 8 496 218 – 642 576 2 731 1452 835 35 312 17 523 406 – 452 1 061 23 380 1560 383 39 236 21 147 678 364 916 146 182 71 836 16
591 233 427 063 164 170 3 051 155 679 3 138 220 800 17373 181 270 991 102 190 3 791 1 850 797 3 533 54 402 18
2 355 359 1 626 393 728 966 339 949 207 273 12 648 2 918 4 453 213 1955 404 37 692 17 712 827 29 2 191 2 248 10 959 20
473 683 341 657 132 026 6 512 3 485 777 739 2 104 675 21131 046 88 338 42 708 3 952 1 415 4 260 4 271 34 272 22
31 906 21 035 10 871 332 35 911 108 3 345 2311 174 7 552 3 622 123 – 240 – 5 294 24
774 569 574 577 199 992 6 952 183 1 528 11 041 142 817 251 484 612 1 056 084 428 528 17 278 2 280 3 546 8 749 8 626 384 26
446 312 312 387 133 925 203 967 189 194 3 084 1 513 210 151 2795 760 69 601 26 159 727 – 2 152 1 047 58 893 2813 712 9 825 3 887 404 67 125 258 811 2946 777 31 020 15 757 440 109 1 269 274 6 048 30
877 590 617 280 260 310 29 185 16 879 3 012 1 558 2 989 153 31855 280 637 143 218 137 10 107 3 166 2 648 4 889 72 930 32485 781 344 498 141 283 7 639 4 527 708 655 1 478 384 33206 227 149 561 56 666 26 584 21 445 1 766 – 3 665 138 34150 006 121 043 28 963 8 381 3 051 258 2 142 591 457 35616 057 526 106 89 951 431 279 424 113 1 332 3 798 1 048 055 36108 435 69 546 38 889 5 180 4 463 150 1 674 68 309 37
1 849 122 1 307 632 541 490 1 310 695 1 262 632 8 917 9 461 1 200 252 38309 964 208 702 101 262 5 557 1 258 633 7 585 356 479 39
3 756 523 2 456 419 1 300 104 1 004 157 857 236 10 605 6 927 14 318 173 40
1 390 507 893 811 496 696 7 831 1 696 2 143 6 428 2 018 601 413 828 515 2 584 607 1 243 908 670 279 524 131 7 776 6 961 10 654 381 421 324 351 969 716 354 635 18 858 3 274 7 553 11 834 292 333 43
222 848 153 224 69 624 1 596 174 729 2 088 63 884 44313 489 235 217 78 272 36 581 19 977 622 730 2 042 814 45649 622 469 083 180 539 11 674 7 853 893 213 1 417 405 46279 511 227 252 52 259 34 436 23 518 1 061 5 047 565 742 47
1 559 497 1 089 669 469 828 25 099 13 023 3 757 2 757 4 548 540 48654 017 486 177 167 840 28 074 10 856 3 648 771 471 050 49133 793 98 289 35 504 9 881 221 1 383 859 15 690 50
103 670 75 257 28 413 1 126 461 2 017 1 486 14 647 5153 434 36 448 16 986 14 584 14 231 216 1 693 25 540 5219 130 13 127 6 003 217 – 731 627 2 656 53
1 530 778 1 086 256 444 522 164 052 152 312 6 455 11 901 2 984 996 5437 981 26 212 11 769 71 915 71 225 407 269 67 525 5598 965 74 374 24 591 3 295 975 1 431 6 987 541 996 5662 384 42 149 20 235 545 – 909 3 569 10 192 57
2 017 618 67 406 1 950 212 – – 498 773 168 221 1 026 830 58
16 991 041 11 018 915 5 972 126 4 314 721 3 513 236 410 709 732 883 8 517 869 59
34 720 23 471 11 249 318 62 364 329 8 255 6016 969 10 690 6 279 152 – 259 36 4 329 6123 882 16 382 7 500 167 – 347 395 4 013 626 910 4 703 2 207 57 – 363 3 583 11 004 63
98 198 63 876 34 322 543 41 206 498 5 772 6418 494 13 086 5 408 114 – 112 – 911 6574 069 50 791 23 278 204 ~575 253 8 234 20 229 66
114 924 85 118 29 806 19 669 18 295 470 2 483 30 952 6750 852 32 217 18 635 330 – 243 962 7 427 6842 121 27 834 14 287 275 – 683 806 16 375 69
523 769 355 465 168 304 35 927 23 237 2 450 12 599 70 884 7038 767 27 632 11 135 170 – 765 493 6 843 7127 580 19 966 7 614 199 – 126 20 1 121 7237 461 24 444 13 017 459 – 1 907 1 996 9 958 7342 694 32 191 10 503 46 195 45 788 169 103 167 299 7495 402 59 684 35 718 1 531 698 1 102 1 764 39 074 7551 898 33 632 18 266 6 569 241 1 837 5 803 17 059 7643 250 29 026 14 224 691 39 156 4 731 485 7718 448 12 120 6 328 324 – 1 123 2 570 14 592 7854 061 39 987 14 074 56 790 55 899 140 1 414 132 138 79
22 672 14 953 7 719 299 – 854 1 172 11 273 80171 688 116 289 55 399 3 329 776 444 1 542 13 130 81
81 768 59 293 22 475 1 718 271 143 587 20 328 8221 324 14 969 6 355 354 – 56 1 192 800 83
665 567 439 121 226 446 65 580 51 398 10 197 9 139 2 203 975 848 679 6 293 2 386 82 333 81 878 9 – 407 85
59 297 42 851 16 446 946 – 219 362 5 157 86133 172 96 883 36 289 2 589 124 510 310 75 668 87187 412 119 562 67 850 148 253 3 324 2 218 659 21 644 88
9 637 5 975 3 662 1 631 1 279 372 565 7 737 89
County Area 11

TIPS PS [APS_PPGB,F_SCOTT] 6/ 3/96 12:37:43 MCVX09 TLP:CFFR1.TLP;15 6/ 3/96 11:04:06 DATA:NONE PSC:TIPS_12353107_01.PSC PAGE: 11TSF:TIPS92~12353107.DAT;1 6/ 3/96 12:35:33 UTF:TIPS93~12353107.DAT;1 6/ 3/96 12:35:33 META:TIPS96~12353107.DAT;1 6/ 3/96 12:37:03
Federal Government Expenditures or Obligations by State and County Area: Fiscal Year[Thousand dollars]
State and county area
Congressional district
Direct Federal expenditures or obligations
Total direct expenditres or obligations Salaries and wages
United Statesresident
population1 TotalDepartment of
DefenseAll other
agencies Grant awards TotalDepartmentof Defense
Georgia mCon.
Clayton County 03 05----------------------------- 194 884 532 249 71 162 461 087 87 790 56 357 28 2051Clinch County 08------------------------------ 6 420 25 680 3 321 22 359 5 881 677 –2Cobb County 05 06 07------------------------------- 508 931 3 491 833 2 477 284 1 014 549 196 973 197 447 140 4323Coffee County 08----------------------------- 32 038 106 197 2 804 103 393 26 980 4 608 4344Colquitt County 02 08----------------------------- 37 529 144 883 6 094 138 789 31 718 4 199 1385Columbia County 10--------------------------- 79 923 491 440 361 702 129 738 29 995 223 408 220 5256Cook County 08------------------------------- 14 008 59 352 1 993 57 359 17 984 1 217 –7Coweta County 03----------------------------- 67 798 184 898 8 426 176 472 32 775 7 046 8548Crawford County 02 03--------------------------- 9 825 24 405 326 24 079 6 944 451 –9Crisp County 02 08------------------------------- 20 633 84 340 1 807 82 533 22 257 2 409 20110
Dade County 09------------------------------- 13 911 39 465 617 38 848 8 755 812 –11Dawson County 09---------------------------- 11 340 26 007 522 25 485 3 633 1 038 –12Decatur County 02---------------------------- 26 222 106 553 9 094 97 459 25 811 2 735 20813De Kalb County 04 05 06 11---------------------------- 577 772 1 812 545 130 335 1 682 210 288 020 485 690 33 54614Dodge County 08----------------------------- 17 849 71 918 1 548 70 370 14 499 1 921 24215Dooly County 02 08------------------------------ 10 256 47 016 489 46 527 13 311 1 588 –16Dougherty County 02 08-------------------------- 98 004 573 930 181 736 392 194 92 281 147 284 128 52617Douglas County 07---------------------------- 79 864 177 301 8 159 169 142 30 681 6 493 25318Early County 02------------------------------- 12 084 48 580 980 47 600 10 965 1 720 11819Echols County 08----------------------------- 2 187 4 981 135 4 846 1 266 90 –20
Effingham County 01 11-------------------------- 30 500 70 250 3 498 66 752 11 445 2 432 34721Elbert County 10------------------------------ 19 109 95 478 19 896 75 582 12 678 6 659 2 91822Emanuel County 01--------------------------- 20 941 92 342 3 547 88 795 22 159 4 516 49923Evans County 01------------------------------ 9 275 34 396 1 069 33 327 5 784 1 542 8824Fannin County 09----------------------------- 17 047 76 712 1 855 74 857 15 408 2 064 –25Fayette County 03----------------------------- 75 930 149 707 21 084 128 623 9 869 8 651 –26Floyd County 07------------------------------ 83 284 299 596 8 639 290 957 55 556 10 488 1 35427Forsyth County 09----------------------------- 56 828 94 145 3 303 90 842 13 558 5 174 –28Franklin County 10---------------------------- 17 451 77 750 2 014 75 736 19 648 2 507 21729Fulton County 04 05 06------------------------------ 690 490 5 682 931 578 214 5 104 717 1 794 763 1 305 261 246 15330
Gilmer County 09----------------------------- 15 155 65 609 1 918 63 691 17 312 2 425 –31Glascock County 11--------------------------- 2 346 10 775 147 10 628 1 976 451 –32Glynn County 01------------------------------ 65 019 338 717 23 437 315 280 53 570 60 704 4 30733Gordon County 09----------------------------- 37 733 111 148 4 514 106 634 27 019 4 935 1 77534Grady County 02------------------------------ 21 165 69 175 1 894 67 281 12 475 1 620 –35Greene County 11----------------------------- 12 646 48 205 3 067 45 138 9 258 2 235 56636Gwinnett County 04 06 10--------------------------- 434 039 860 719 155 258 705 461 100 492 149 773 3 13937Habersham County 09------------------------- 29 557 90 650 4 464 86 186 11 143 4 652 –38Hall County 09-------------------------------- 104 967 331 038 29 659 301 379 62 064 19 525 91539Hancock County 11---------------------------- 9 076 42 539 690 41 849 12 214 632 –40
Haralson County 07--------------------------- 23 014 76 126 1 623 74 503 15 921 2 303 7341Harris County 03------------------------------ 19 797 57 114 7 818 49 296 6 695 1 748 –42Hart County 10------------------------------- 20 430 65 244 5 853 59 391 12 441 3 603 1 86443Heard County 07------------------------------ 9 299 25 171 457 24 714 6 169 632 –44Henry County 03 11------------------------------ 78 815 224 184 10 079 214 105 17 666 58 321 –45Houston County 02 08---------------------------- 98 336 1 182 579 884 368 298 211 49 048 616 741 607 68946Irwin County 08------------------------------- 8 569 29 763 944 28 819 7 397 1 167 14547Jackson County 10---------------------------- 33 077 104 902 2 958 101 944 19 761 3 813 –48Jasper County 11----------------------------- 8 981 27 950 893 27 057 4 451 1 339 –49Jeff Davis County 08-------------------------- 12 272 38 108 908 37 200 7 437 1 089 –50
Jefferson County 11--------------------------- 17 671 84 145 11 105 73 040 17 519 2 083 20651Jenkins County 11----------------------------- 8 562 34 268 564 33 704 8 361 996 –52Johnson County 08---------------------------- 8 396 32 104 495 31 609 7 150 667 –53Jones County 03 08------------------------------ 21 650 46 220 939 45 281 7 965 1 230 –54Lamar County 03------------------------------ 13 645 47 927 1 952 45 975 7 985 1 684 23855Lanier County 08------------------------------ 6 148 22 706 921 21 785 6 327 490 –56Laurens County 08---------------------------- 42 262 194 859 7 786 187 073 37 470 35 848 2 09157Lee County 02 08-------------------------------- 18 967 34 979 2 430 32 549 6 338 1 421 –58Liberty County 01----------------------------- 59 042 183 520 84 706 98 814 32 957 65 928 62 11259Lincoln County 10----------------------------- 7 916 34 129 1 629 32 500 4 560 1 034 6460
Long County 01------------------------------- 7 374 14 620 1 283 13 337 3 007 271 –61Lowndes County 02 08--------------------------- 82 178 441 348 180 133 261 215 66 824 132 617 121 96862Lumpkin County 09---------------------------- 16 346 45 588 8 876 36 712 6 620 8 353 6 46963McDuffie County 10--------------------------- 21 217 76 153 3 648 72 505 15 488 2 052 36264McIntosh County 01--------------------------- 9 132 49 709 13 570 36 139 10 830 975 –65Macon County 02----------------------------- 13 146 47 907 1 684 46 223 11 288 1 339 18266Madison County 10---------------------------- 22 874 69 049 2 253 66 796 13 435 2 057 –67Marion County 02----------------------------- 6 163 21 354 1 525 19 829 5 613 1 023 –68Meriwether County 02 03------------------------- 23 000 78 262 5 768 72 494 15 676 2 101 –69Miller County 02------------------------------- 6 234 23 009 521 22 488 5 240 701 –70
Mitchell County 02----------------------------- 20 686 78 511 1 744 76 767 18 213 2 667 –71Monroe County 03---------------------------- 18 511 55 426 2 822 52 604 12 884 2 647 1 25572Montgomery County 01------------------------ 7 657 24 760 486 24 274 3 596 943 –73Morgan County 10---------------------------- 13 784 46 479 1 276 45 203 11 677 1 893 –74Murray County 09----------------------------- 29 005 63 902 5 007 58 895 10 861 3 522 1 02575Muscogee County 02 03-------------------------- 187 097 1 326 509 663 208 663 301 150 002 584 553 555 92576Newton County 10----------------------------- 48 375 145 352 4 427 140 925 23 503 5 344 36577Oconee County 10---------------------------- 20 195 48 695 2 358 46 337 8 297 3 716 –78Oglethorpe County 10------------------------- 10 637 23 706 1 096 22 610 4 526 769 –79Paulding County 07---------------------------- 55 719 87 436 2 960 84 476 15 040 3 435 –80
Peach County 02 03------------------------------ 22 748 119 861 12 909 106 952 22 540 4 476 1 11181Pickens County 09---------------------------- 16 286 57 391 2 047 55 344 9 744 1 975 –82Pierce County 01------------------------------ 14 437 48 063 2 029 46 034 8 503 1 766 –83Pike County 03------------------------------- 10 933 35 489 3 545 31 944 5 334 1 195 –84Polk County 07------------------------------- 34 606 139 941 6 951 132 990 29 711 3 970 34885Pulaski County 08----------------------------- 8 238 36 614 1 091 35 523 6 259 855 11986Putnam County 11---------------------------- 15 619 54 757 2 353 52 404 10 830 2 007 18087Quitman County 02---------------------------- 2 377 12 388 905 11 483 2 209 406 –88Rabun County 09----------------------------- 12 238 49 615 1 499 48 116 6 423 2 256 –89Randolph County 02--------------------------- 8 130 35 643 717 34 926 9 787 861 –90
See footnotes at end of table.
12 Consolidated Federal Funds Report

TIPS PS [APS_PPGB,F_SCOTT] 6/ 3/96 12:37:43 MCVX09 TLP:CFFR1.TLP;15 6/ 3/96 11:04:06 DATA:NONE PSC:TIPS_12353107_01.PSC PAGE: 12TSF:TIPS92~12353107.DAT;1 6/ 3/96 12:35:33 UTF:TIPS93~12353107.DAT;1 6/ 3/96 12:35:33 META:TIPS96~12353107.DAT;1 6/ 3/96 12:37:03
1995mCon.
Direct Federal expenditures or obligationsmCon. Other Federal assistance
Direct payments for individuals Procurement contract awards
TotalRetirement and
disability All other TotalDepartmentof Defense
Other Federalexpenditures or
obligations Direct loansGuaranteed loans
and insurance
369 065 250 670 118 395 18 340 14 386 698 1 882 166 177 115 989 10 173 5 816 3 041 2 899 92 209 819 2
790 405 569 301 221 104 2 304 788 2 277 168 2 219 839 378 832 372 929 47 358 25 571 577 51 1 102 2 143 18 602 4
105 612 68 144 37 468 2 492 1 738 862 4 771 43 021 5136 421 111 949 24 472 101 454 100 658 162 999 37 263 6
38 121 26 085 12 036 1 553 – 477 619 14 126 7141 931 95 745 46 186 2 787 1 174 358 3 858 47 330 8
16 289 11 306 4 983 343 – 379 292 2 634 958 284 37 366 20 918 431 31 959 15 522 36 652 10
29 640 21 914 7 726 198 – 60 108 1 066 1121 033 14 843 6 190 218 – 85 22 2 350 1267 758 44 000 23 758 8 094 6 470 2 155 5 884 45 608 13
996 402 606 502 389 900 37 049 5 359 5 384 5 706 425 602 1453 807 37 009 16 798 341 – 1 350 1 445 8 164 1530 406 20 238 10 168 242 – 1 469 5 287 57 759 16
271 520 188 024 83 496 57 387 31 233 5 458 135 367 194 149 17138 341 93 341 45 000 1 447 140 339 751 52 613 18
33 620 20 827 12 793 862 – 1 413 1 942 25 661 193 287 2 252 1 035 19 – 319 607 1 598 20
54 758 37 169 17 589 1 286 39 329 413 16 910 2160 216 40 670 19 546 15 611 15 204 314 627 1 483 2262 444 39 148 23 296 1 880 1 302 1 343 739 9 210 2325 303 17 039 8 264 1 390 98 377 34 1 767 2458 592 41 994 16 598 516 – 132 2 238 8 869 25
126 550 101 944 24 606 4 238 2 863 399 1 621 32 625 26224 394 155 451 68 943 8 598 738 560 1 222 44 951 27
74 160 54 116 20 044 960 60 294 856 27 137 2854 765 37 808 16 957 590 149 240 2 764 6 225 29
1 995 580 1 284 756 710 824 556 787 254 364 30 539 12 207 416 708 30
45 314 32 993 12 321 428 – 130 312 9 718 318 034 4 913 3 121 95 – 220 8 70 32
195 956 137 853 58 103 28 114 2 652 373 177 1 178 653 3377 711 56 359 21 352 1 187 234 296 1 574 10 716 3452 692 35 217 17 475 930 – 1 458 1 128 12 756 3536 279 25 207 11 072 314 – 118 314 504 36
430 416 321 002 109 414 173 910 126 680 6 129 1 418 323 440 3772 254 53 425 18 829 2 260 1 426 343 726 7 204 38
219 899 159 183 60 716 28 850 20 447 700 4 528 26 793 3929 394 19 070 10 324 169 – 131 3 364 318 40
57 068 40 909 16 159 686 222 148 1 531 1 911 4148 070 37 133 10 937 480 87 120 253 7 289 4245 744 32 882 12 862 2 909 2 558 547 767 7 326 4318 157 12 021 6 136 133 – 80 87 376 44
141 124 107 111 34 013 6 538 1 300 535 9 768 62 929 45298 989 247 484 51 505 216 333 213 378 1 468 9 335 63 394 46
20 357 14 426 5 931 179 – 663 1 060 19 139 4775 586 51 740 23 846 5 415 560 327 2 261 5 854 4821 849 15 511 6 338 192 – 120 486 583 4928 910 20 498 8 412 227 – 444 330 8 144 50
53 252 34 901 18 351 9 807 9 391 1 484 1 354 4 036 5123 205 15 255 7 950 431 – 1 274 2 033 5 996 5223 240 15 412 7 828 191 – 857 682 1 820 5336 307 27 166 9 141 635 25 82 170 1 042 5437 246 25 337 11 909 800 – 211 758 3 668 5515 618 10 135 5 483 111 – 161 195 2 752 56
113 351 83 404 29 947 5 918 2 546 2 272 2 623 16 379 5724 809 18 976 5 833 968 288 1 443 24 333 65 404 5883 181 61 771 21 410 1 235 506 219 143 77 439 5922 226 15 665 6 561 6 144 – 165 1 210 527 60
11 177 8 000 3 177 57 – 108 84 1 688 61203 504 137 407 66 097 37 388 34 822 1 014 2 199 38 405 62
29 758 21 478 8 280 534 169 323 1 826 2 405 6358 052 39 072 18 980 392 33 167 372 1 486 6425 692 17 375 8 317 12 170 12 000 42 227 23 519 6532 632 21 692 10 940 1 106 379 1 542 6 735 14 725 6652 803 37 126 15 677 417 – 338 306 4 830 6714 054 9 295 4 759 343 – 322 130 4 606 6859 299 42 980 16 319 827 – 359 350 2 340 6916 486 10 241 6 245 153 38 429 523 19 864 70
52 080 34 748 17 332 3 061 – 2 489 100 886 32 877 7138 279 26 338 11 941 1 007 80 609 1 696 6 285 7219 423 11 325 8 098 180 – 619 174 3 259 7332 206 22 250 9 956 322 – 382 306 1 452 7445 838 33 110 12 728 3 524 2 715 155 259 10 652 75
582 071 437 121 144 950 8 871 2 717 1 011 24 104 218 76114 617 77 855 36 762 1 592 533 295 8 581 21 640 77
35 315 26 333 8 982 1 076 – 292 ~42 5 137 7817 732 12 616 5 116 480 328 199 149 1 116 7967 814 48 241 19 573 974 86 172 20 749 47 042 80
84 135 60 842 23 293 8 024 7 010 685 3 926 11 772 8141 718 30 081 11 637 3 643 27 310 2 968 8 828 8236 268 25 990 10 278 876 – 650 672 6 099 8328 189 21 074 7 115 329 – 440 1 267 658 8499 590 69 715 29 875 6 401 4 061 270 840 9 537 8528 710 20 435 8 275 152 – 639 1 169 14 198 8641 367 30 206 11 161 420 – 133 495 2 731 878 929 6 336 2 593 744 390 99 326 1 736 88
40 253 28 525 11 728 372 50 311 153 4 779 8922 858 13 950 8 908 1 051 211 1 086 1 823 14 076 90
County Area 13

TIPS PS [APS_PPGB,F_SCOTT] 6/ 3/96 12:37:43 MCVX09 TLP:CFFR1.TLP;15 6/ 3/96 11:04:06 DATA:NONE PSC:TIPS_12353107_01.PSC PAGE: 13TSF:TIPS92~12353107.DAT;1 6/ 3/96 12:35:33 UTF:TIPS93~12353107.DAT;1 6/ 3/96 12:35:33 META:TIPS96~12353107.DAT;1 6/ 3/96 12:37:03
Federal Government Expenditures or Obligations by State and County Area: Fiscal Year[Thousand dollars]
State and county area
Congressional district
Direct Federal expenditures or obligations
Total direct expenditres or obligations Salaries and wages
United Statesresident
population1 TotalDepartment of
DefenseAll other
agencies Grant awards TotalDepartmentof Defense
Georgia mCon.
Richmond County 10 11-------------------------- 196 021 1 080 723 180 891 899 832 232 759 188 648 73 2671Rockdale County 04--------------------------- 62 033 151 642 5 520 146 122 40 720 4 762 –2Schley County 02----------------------------- 3 729 10 123 428 9 695 982 309 –3Screven County 11---------------------------- 14 125 52 706 1 019 51 687 9 200 1 865 –4Seminole County 02--------------------------- 9 258 35 579 1 102 34 477 7 176 899 –5Spalding County 03---------------------------- 57 014 186 680 7 348 179 332 34 240 6 467 5326Stephens County 09--------------------------- 24 735 94 344 3 023 91 321 14 710 3 294 3997Stewart County 02---------------------------- 5 472 24 552 738 23 814 5 070 677 –8Sumter County 02----------------------------- 31 345 123 427 3 102 120 325 33 448 5 583 3889Talbot County 02------------------------------ 6 743 23 631 1 382 22 249 4 008 647 –10
Taliaferro County 11--------------------------- 1 821 9 327 324 9 003 1 541 361 –11Tattnall County 01----------------------------- 18 166 74 822 3 779 71 043 17 022 2 097 52212Taylor County 02------------------------------ 7 918 34 705 1 035 33 670 6 619 1 354 16813Telfair County 08------------------------------ 11 578 51 540 919 50 621 12 204 1 591 –14Terrell County 02------------------------------ 10 900 45 034 1 143 43 891 10 741 2 726 17915Thomas County 02---------------------------- 40 334 163 982 4 716 159 266 30 981 8 787 40016Tift County 08-------------------------------- 35 493 122 161 3 710 118 451 22 791 9 462 69317Toombs County 01---------------------------- 24 842 92 795 2 656 90 139 22 753 3 084 39418Towns County 09----------------------------- 7 350 33 429 1 387 32 042 2 746 891 –19Treutlen County 08---------------------------- 5 960 22 164 324 21 840 5 801 624 –20
Troup County 07------------------------------ 57 610 242 489 39 992 202 497 44 632 6 715 1 49721Turner County 08----------------------------- 8 905 38 461 714 37 747 13 284 1 314 –22Twiggs County 08 11----------------------------- 9 891 37 954 658 37 296 15 186 496 –23Union County 09------------------------------ 13 606 56 843 2 074 54 769 6 754 2 254 –24Upson County 03------------------------------ 26 761 94 168 2 740 91 428 17 227 2 342 24425Walker County 09----------------------------- 59 912 215 793 4 595 211 198 29 757 5 533 –26Walton County 10----------------------------- 44 703 131 767 2 603 129 164 23 675 4 982 56427Ware County 01------------------------------ 35 630 161 165 4 194 156 971 32 969 7 501 60428Warren County 11----------------------------- 6 108 25 550 399 25 151 6 054 812 –29Washington County 11------------------------- 19 814 70 080 1 431 68 649 16 845 2 295 33630
Wayne County 01----------------------------- 24 277 95 168 3 505 91 663 17 209 18 418 13531Webster County 02---------------------------- 2 255 8 396 146 8 250 2 551 316 –32Wheeler County 08---------------------------- 4 817 20 628 314 20 314 5 724 534 –33White County 09------------------------------ 14 591 49 487 2 067 47 420 7 853 1 732 –34Whitfield County 09---------------------------- 76 731 217 907 5 723 212 184 38 687 8 130 30235Wilcox County 08----------------------------- 7 084 33 748 650 33 098 8 067 990 –36Wilkes County 10 11----------------------------- 10 562 42 498 1 978 40 520 7 092 2 460 98137Wilkinson County 11--------------------------- 10 490 37 572 2 552 35 020 5 575 903 –38Worth County 08------------------------------ 21 213 61 447 6 265 55 182 12 320 1 815 1139State undistributed ------------------------- 1 440 794 – 1 440 794 187 843 – –40
Hawaii -------------------------------------- 1 178 540 7 449 969 2 900 627 4 549 342 1 083 473 2 310 213 1 987 67741
Hawaii County 02----------------------------- 135 496 498 724 32 815 465 909 99 606 36 692 9 35942Honolulu City and County 01 02-------------------- 874 330 5 934 451 2 776 743 3 157 708 795 201 2 226 284 1 957 75843Kauai County 02------------------------------ 55 687 243 923 55 874 188 049 43 965 23 557 14 79044Maui County 02------------------------------- 112 930 357 215 35 195 322 020 72 924 23 680 5 77045State undistributed ------------------------- 415 656 – 415 656 71 777 – –46
Idaho --------------------------------------- 1 133 054 5 300 837 428 876 4 871 961 858 219 604 434 178 35247
Ada County 01 02-------------------------------- 243 341 1 045 909 119 952 925 957 291 665 209 405 50 18848Adams County 01----------------------------- 3 850 18 452 269 18 183 1 154 3 257 –49Bannock County 02---------------------------- 70 933 232 696 7 597 225 099 41 336 19 909 2 42750Bear Lake County 02-------------------------- 6 426 22 789 443 22 346 2 132 1 552 –51Benewah County 01--------------------------- 8 539 42 951 1 147 41 804 12 256 3 315 –52Bingham County 02--------------------------- 40 991 114 366 4 750 109 616 23 080 9 045 24053Blaine County 02------------------------------ 15 990 30 099 1 326 28 773 4 562 3 934 9154Boise County 01------------------------------ 4 498 30 824 723 30 101 3 339 3 377 –55Bonner County 01----------------------------- 31 891 106 279 8 324 97 955 11 528 8 433 1 20956Bonneville County 02-------------------------- 79 215 976 629 19 785 956 844 38 032 51 568 9 63757
Boundary County 01--------------------------- 9 189 33 005 1 153 31 852 5 659 4 455 6258Butte County 02------------------------------- 3 044 18 474 236 18 238 2 358 5 494 –59Camas County 02----------------------------- 793 4 332 63 4 269 382 671 –60Canyon County 01---------------------------- 104 432 307 202 11 667 295 535 63 515 11 328 1 54761Caribou County 02---------------------------- 7 182 27 712 194 27 518 3 914 1 535 –62Cassia County 02----------------------------- 20 811 72 527 1 198 71 329 10 901 6 600 26063Clark County 02------------------------------- 814 6 207 671 5 536 151 1 279 –64Clearwater County 01-------------------------- 9 061 47 358 5 090 42 268 6 162 9 593 1 59965Custer County 02----------------------------- 3 984 20 845 1 781 19 064 3 117 4 242 –66Elmore County 02----------------------------- 22 589 230 031 160 697 69 334 24 772 102 954 99 89767
Franklin County 02---------------------------- 10 071 26 609 743 25 866 2 302 1 466 22168Fremont County 02---------------------------- 11 525 38 923 1 033 37 890 2 853 6 085 15069Gem County 01------------------------------- 13 468 47 456 2 080 45 376 5 772 3 821 24370Gooding County 02---------------------------- 12 679 41 833 1 349 40 484 6 054 2 143 11371Idaho County 01------------------------------ 14 588 82 808 1 550 81 258 19 225 16 593 5972Jefferson County 02--------------------------- 18 427 42 427 1 043 41 384 8 319 1 964 13873Jerome County 02----------------------------- 16 597 47 333 2 703 44 630 8 766 3 157 1 25974Kootenai County 01--------------------------- 87 278 301 198 24 799 276 399 38 255 26 589 3 73375Latah County 01------------------------------ 32 277 119 658 6 218 113 440 30 487 11 302 2 04176Lemhi County 02------------------------------ 7 425 41 105 1 037 40 068 5 179 8 899 –77
Lewis County 01------------------------------ 3 838 22 427 608 21 819 1 900 1 663 –78Lincoln County 02----------------------------- 3 570 14 028 291 13 737 1 301 3 012 –79Madison County 02---------------------------- 23 744 40 720 1 823 38 897 6 259 2 242 23480Minidoka County 02--------------------------- 20 699 80 581 1 779 78 802 11 964 3 783 40381Nez Perce County 01-------------------------- 36 349 160 830 4 773 156 057 27 527 9 792 1 12982Oneida County 02----------------------------- 3 657 19 459 168 19 291 3 774 915 –83Owyhee County 01---------------------------- 9 052 25 589 1 019 24 570 3 866 2 715 24584Payette County 01---------------------------- 18 956 64 327 1 831 62 496 11 950 1 692 21685Power County 02------------------------------ 7 892 27 910 481 27 429 3 126 1 049 –86Shoshone County 01-------------------------- 13 871 91 487 16 313 75 174 10 576 4 651 –87
See footnotes at end of table.
14 Consolidated Federal Funds Report

TIPS PS [APS_PPGB,F_SCOTT] 6/ 3/96 12:37:43 MCVX09 TLP:CFFR1.TLP;15 6/ 3/96 11:04:06 DATA:NONE PSC:TIPS_12353107_01.PSC PAGE: 14TSF:TIPS92~12353107.DAT;1 6/ 3/96 12:35:33 UTF:TIPS93~12353107.DAT;1 6/ 3/96 12:35:33 META:TIPS96~12353107.DAT;1 6/ 3/96 12:37:03
1995mCon.
Direct Federal expenditures or obligationsmCon. Other Federal assistance
Direct payments for individuals Procurement contract awards
TotalRetirement and
disability All other TotalDepartmentof Defense
Other Federalexpenditures or
obligations Direct loansGuaranteed loans
and insurance
611 645 438 359 173 286 41 946 27 356 5 725 766 116 167 1104 526 78 892 25 634 1 420 – 213 462 26 298 2
8 392 5 439 2 953 294 41 148 46 3 583 339 873 26 050 13 823 324 – 1 443 838 9 697 426 942 18 285 8 657 181 – 382 1 034 18 452 5
141 756 96 019 45 737 3 946 2 422 273 2 138 14 480 675 311 52 959 22 352 872 380 157 3 042 4 109 718 223 11 032 7 191 279 – 303 218 3 928 880 149 50 696 29 453 2 898 – 1 347 10 678 26 654 918 581 12 790 5 791 299 – 95 85 322 10
7 300 4 524 2 776 76 – 49 33 – 1154 493 36 801 17 692 373 44 836 2 238 5 734 1225 323 18 443 6 880 347 – 1 062 2 305 21 017 1336 463 23 126 13 337 372 – 911 821 4 702 1428 411 17 990 10 421 1 512 – 1 644 2 563 15 996 15
120 480 82 219 38 261 1 696 76 2 039 2 602 15 508 1685 696 58 395 27 301 3 106 29 1 106 2 289 28 383 1765 223 44 417 20 806 598 119 1 138 397 6 039 1829 457 21 522 7 935 240 – 95 733 535 1915 138 10 248 4 890 108 – 492 56 928 20
157 814 108 246 49 568 33 091 31 235 236 535 9 714 2122 944 14 906 8 038 214 – 705 512 20 201 2221 778 15 191 6 587 221 – 272 212 2 923 2346 883 34 763 12 120 805 – 148 198 4 026 2473 468 52 229 21 239 937 – 195 793 2 912 25
178 255 123 637 54 618 1 894 26 353 1 032 15 873 26101 384 66 190 35 194 1 070 180 655 4 144 19 239 27119 021 85 228 33 793 1 153 33 522 88 10 752 28
17 972 11 348 6 624 330 – 381 935 768 2949 494 32 660 16 834 432 46 1 015 902 3 818 30
57 501 39 014 18 487 1 696 709 344 400 6 656 314 804 3 441 1 363 174 – 551 550 6 662 32
13 414 9 162 4 252 105 – 850 322 1 937 3339 219 28 965 10 254 429 – 254 1 210 8 483 34
165 639 106 792 58 847 5 098 1 847 352 335 23 185 3523 918 15 887 8 031 199 – 575 815 12 761 3632 476 21 223 11 253 275 – 195 859 2 878 3728 903 20 978 7 925 2 009 1 820 182 97 6 355 3846 025 32 913 13 112 395 25 893 4 370 37 324 39
996 351 7 575 988 776 – – 256 600 173 805 595 980 40
3 221 662 2 043 781 1 177 881 777 265 653 393 57 356 48 367 4 798 189 41
341 331 226 517 114 814 19 059 11 633 2 036 16 720 424 613 422 223 559 1 579 990 643 569 683 401 582 708 6 007 20 744 2 812 612 43
135 614 82 220 53 394 40 071 36 831 715 3 082 396 517 44225 225 148 829 76 396 34 734 22 221 652 7 737 1 149 194 45295 933 6 225 289 708 – – 47 947 84 15 253 46
2 711 950 1 857 412 854 538 975 795 97 880 150 439 166 944 998 342 47
492 155 377 442 114 713 49 510 19 207 3 175 2 243 264 728 4812 773 7 823 4 950 931 – 336 425 639 49
160 469 115 720 44 749 6 654 433 4 327 460 34 720 5015 751 12 077 3 674 371 – 2 982 224 2 452 5124 511 17 164 7 347 1 049 – 1 820 954 5 942 5273 150 53 541 19 609 2 624 1 618 6 467 6 041 38 938 5319 768 14 831 4 937 850 – 985 3 411 101 405 5415 649 8 206 7 443 8 311 29 148 299 1 655 5582 329 63 592 18 737 3 646 1 900 342 2 348 18 401 56
143 485 107 542 35 943 736 305 2 638 7 239 3 050 48 059 57
20 681 16 304 4 377 1 397 – 814 2 012 2 395 587 430 5 311 2 119 1 824 – 1 368 1 577 5 782 592 084 1 712 372 136 – 1 060 591 180 60
225 336 167 141 58 195 3 995 848 3 028 8 605 79 523 6114 816 10 793 4 023 877 – 6 571 2 436 3 547 6239 978 27 924 12 054 6 233 – 8 816 5 883 33 406 631 684 1 194 490 1 588 613 1 505 533 1 253 64
25 183 18 928 6 255 5 861 2 612 559 340 3 065 659 983 7 636 2 347 2 931 1 274 572 518 1 605 66
54 614 45 844 8 770 45 510 43 901 2 182 474 20 654 67
19 622 14 878 4 744 208 – 3 011 894 2 020 6824 701 17 887 6 814 1 862 – 3 422 1 306 14 133 6935 787 27 707 8 080 756 94 1 320 576 5 633 7032 350 23 635 8 715 494 – 792 672 9 438 7138 592 28 567 10 025 4 494 177 3 904 1 569 9 350 7228 749 21 523 7 226 445 – 2 950 2 359 21 134 7333 825 25 300 8 525 315 – 1 270 929 11 265 74
224 836 169 964 54 872 9 814 5 548 1 704 8 677 63 363 7563 163 42 215 20 948 7 934 263 6 773 2 667 22 556 7623 855 18 068 5 787 2 595 – 577 523 4 694 77
15 410 11 977 3 433 133 – 3 322 1 990 7 979 788 125 6 225 1 900 122 – 1 468 365 4 917 79
28 159 17 573 10 586 1 355 958 2 705 2 878 12 070 8041 714 31 120 10 594 19 807 332 3 313 6 459 19 714 81
106 864 74 752 32 112 11 168 286 5 479 2 147 21 892 829 301 6 471 2 830 229 – 5 239 330 2 912 83
15 687 11 621 4 066 1 539 – 1 782 2 556 4 790 8448 286 31 119 17 167 1 106 – 1 294 2 028 10 279 8513 288 8 696 4 592 379 209 10 067 2 224 12 911 8650 274 36 345 13 929 25 908 14 825 79 767 11 677 87
County Area 15

TIPS PS [APS_PPGB,F_SCOTT] 6/ 3/96 12:37:43 MCVX09 TLP:CFFR1.TLP;15 6/ 3/96 11:04:06 DATA:NONE PSC:TIPS_12353107_01.PSC PAGE: 15TSF:TIPS92~12353107.DAT;1 6/ 3/96 12:35:33 UTF:TIPS93~12353107.DAT;1 6/ 3/96 12:35:33 META:TIPS96~12353107.DAT;1 6/ 3/96 12:37:03
Federal Government Expenditures or Obligations by State and County Area: Fiscal Year[Thousand dollars]
State and county area
Congressional district
Direct Federal expenditures or obligations
Total direct expenditres or obligations Salaries and wages
United Statesresident
population1 TotalDepartment of
DefenseAll other
agencies Grant awards TotalDepartmentof Defense
IdahomCon.
Teton County 02------------------------------ 4 269 11 754 432 11 322 1 393 1 151 661Twin Falls County 02-------------------------- 58 463 198 836 6 311 192 525 32 820 15 919 9452Valley County 01------------------------------ 7 637 39 065 2 464 36 601 2 862 9 963 –3Washington County 01------------------------- 9 149 40 537 962 39 575 8 171 1 923 –4State undistributed ------------------------- 285 244 – 285 244 53 502 – –5
Illinois -------------------------------------- 11 751 679 50 889 161 3 116 125 47 773 036 9 489 548 5 436 234 1 489 1286
Adams County 17 20----------------------------- 67 714 284 825 14 862 269 963 58 275 15 594 2 2947Alexander County 12-------------------------- 10 308 61 130 1 585 59 545 21 563 1 943 2918Bond County 20------------------------------- 15 250 72 267 2 688 69 579 7 435 16 399 –9Boone County 16------------------------------ 34 786 80 097 702 79 395 5 332 3 197 –10Brown County 20------------------------------ 6 019 21 297 775 20 522 4 054 1 595 41411Bureau County 17----------------------------- 36 075 136 735 1 155 135 580 16 866 6 911 –12Calhoun County 20---------------------------- 5 016 49 153 18 486 30 667 9 016 1 297 –13Carroll County 17----------------------------- 16 787 96 885 25 130 71 755 7 891 17 176 14 50014Cass County 18------------------------------- 13 359 52 674 1 533 51 141 5 447 3 578 57115Champaign County 15------------------------- 167 487 644 466 72 861 571 605 228 701 66 308 21 24716
Christian County 19 20--------------------------- 34 737 143 022 1 440 141 582 14 714 4 185 –17Clark County 19------------------------------- 16 243 60 157 898 59 259 6 452 2 417 –18Clay County 19------------------------------- 14 408 63 177 935 62 242 13 215 2 765 –19Clinton County 20----------------------------- 34 777 102 301 7 577 94 724 8 660 4 339 1 00920Coles County 19------------------------------ 52 130 156 217 3 674 152 543 18 001 7 044 1 01621Cook County 2
------------------------------- 5 141 209 22 917 661 726 596 22 191 065 4 723 254 2 631 011 144 04822Crawford County 19--------------------------- 19 969 69 542 1 404 68 138 5 884 2 755 –23Cumberland County 19------------------------ 11 030 36 584 573 36 011 6 373 1 363 –24De Kalb County 14---------------------------- 82 060 185 618 2 394 183 224 19 136 9 803 51425De Witt County 15----------------------------- 16 906 60 602 833 59 769 6 476 2 416 2526
Douglas County 15---------------------------- 19 647 54 119 779 53 340 5 649 2 735 –27Du Page County 06 13 14---------------------------- 843 084 2 026 157 60 042 1 966 115 133 643 295 946 1 48928Edgar County 15------------------------------ 19 616 75 699 2 031 73 668 7 280 3 509 52029Edwards County 19---------------------------- 7 287 26 441 568 25 873 3 352 1 292 –30Effingham County 19-------------------------- 32 676 112 589 9 506 103 083 12 876 8 162 49931Fayette County 20----------------------------- 20 961 72 412 1 350 71 062 7 928 3 041 –32Ford County 15------------------------------- 13 920 55 678 1 895 53 783 3 361 2 371 –33Franklin County 19---------------------------- 40 624 340 668 4 201 336 467 27 718 9 448 1 14634Fulton County 17------------------------------ 38 122 155 889 2 231 153 658 20 156 6 001 66835Gallatin County 19----------------------------- 6 801 34 801 396 34 405 5 213 1 207 –36
Greene County 20----------------------------- 15 358 62 616 1 613 61 003 9 939 2 683 –37Grundy County 11----------------------------- 34 735 104 826 1 474 103 352 14 768 4 978 42438Hamilton County 19--------------------------- 8 453 39 009 436 38 573 5 558 1 803 –39Hancock County 17---------------------------- 21 448 85 700 2 014 83 686 13 489 4 144 –40Hardin County 19----------------------------- 5 162 24 633 273 24 360 5 099 1 005 –41Henderson County 17-------------------------- 8 244 32 536 810 31 726 4 231 1 788 43242Henry County 17------------------------------ 51 521 167 767 3 831 163 936 11 043 8 586 1 42243Iroquois County 15---------------------------- 31 428 121 334 1 228 120 106 15 500 5 127 2944Jackson County 12---------------------------- 61 741 223 363 13 009 210 354 50 073 16 974 1 53545Jasper County 19----------------------------- 10 638 34 673 312 34 361 4 020 1 877 –46
Jefferson County 20--------------------------- 37 261 166 528 4 643 161 885 30 217 7 986 50347Jersey County 20----------------------------- 20 976 63 380 2 190 61 190 8 192 2 487 –48Jo Daviess County 16-------------------------- 22 108 74 901 784 74 117 6 497 3 331 –49Johnson County 19---------------------------- 11 992 43 154 825 42 329 5 391 2 767 –50Kane County 14------------------------------- 348 595 1 141 888 48 807 1 093 081 85 565 99 735 1 48151Kankakee County 11 15-------------------------- 101 288 385 939 10 374 375 565 61 024 20 493 82352Kendall County 14----------------------------- 44 092 80 583 12 036 68 547 4 700 8 190 4 57953Knox County 17------------------------------- 55 855 233 209 3 477 229 732 35 086 10 015 41954Lake County 08 10------------------------------- 559 399 1 992 369 726 104 1 266 265 117 608 705 024 562 83655La Salle County 11 14---------------------------- 109 410 419 575 23 771 395 804 51 765 20 440 4 07856
Lawrence County 19--------------------------- 15 941 67 688 1 698 65 990 8 467 2 704 46757Lee County 14-------------------------------- 35 490 110 968 1 359 109 609 9 523 4 513 35058Livingston County 15-------------------------- 40 184 124 675 1 161 123 514 10 413 5 258 23059Logan County 18------------------------------ 30 768 105 533 1 359 104 174 11 599 4 535 –60McDonough County 17------------------------- 35 580 99 571 2 295 97 276 10 733 5 309 80661McHenry County 16--------------------------- 215 950 409 160 7 298 401 862 27 806 24 515 39562McLean County 15 18---------------------------- 137 579 359 593 7 448 352 145 46 449 32 992 1 75763Macon County 18 19----------------------------- 116 589 468 483 10 721 457 762 65 118 21 651 5 69564Macoupin County 20--------------------------- 48 595 188 907 2 698 186 209 18 302 6 825 –65Madison County 12 20---------------------------- 255 107 1 021 299 58 974 962 325 184 221 36 005 8 28466
Marion County 20----------------------------- 41 783 195 879 2 862 193 017 24 160 9 541 45367Marshall County 18---------------------------- 12 761 48 544 361 48 183 7 268 1 939 –68Mason County 18----------------------------- 16 790 70 611 699 69 912 7 837 2 888 2769Massac County 19---------------------------- 15 190 78 752 16 397 62 355 10 095 2 058 49370Menard County 18---------------------------- 11 925 43 857 817 43 040 9 036 1 525 –71Mercer County 17----------------------------- 17 452 61 066 1 262 59 804 7 905 2 916 43872Monroe County 12---------------------------- 24 166 74 874 4 969 69 905 8 470 2 672 –73Montgomery County 20------------------------ 30 722 119 402 2 703 116 699 14 552 5 849 37574Morgan County 18---------------------------- 36 200 133 705 2 184 131 521 24 534 4 886 –75Moultrie County 19---------------------------- 14 084 52 272 1 466 50 806 4 441 2 272 78376
Ogle County 16 17------------------------------- 48 803 128 579 3 043 125 536 10 555 7 193 –77Peoria County 18------------------------------ 183 159 794 121 68 172 725 949 105 298 88 806 26 63478Perry County 12------------------------------ 21 268 79 277 1 175 78 102 8 726 2 391 –79Piatt County 15------------------------------- 15 967 53 945 974 52 971 3 932 2 353 –80Pike County 20------------------------------- 17 162 79 698 2 061 77 637 12 003 3 355 –81Pope County 19------------------------------- 4 576 18 192 ~11 18 203 3 048 2 704 50382Pulaski County 19----------------------------- 7 404 48 358 1 756 46 602 16 928 2 488 99483Putnam County 18---------------------------- 5 783 18 752 366 18 386 993 1 020 7284Randolph County 12--------------------------- 34 443 139 319 4 799 134 520 13 930 5 605 75185Richland County 19---------------------------- 16 845 62 492 840 61 652 8 831 2 638 –86
See footnotes at end of table.
16 Consolidated Federal Funds Report

TIPS PS [APS_PPGB,F_SCOTT] 6/ 3/96 12:37:43 MCVX09 TLP:CFFR1.TLP;15 6/ 3/96 11:04:06 DATA:NONE PSC:TIPS_12353107_01.PSC PAGE: 16TSF:TIPS92~12353107.DAT;1 6/ 3/96 12:35:33 UTF:TIPS93~12353107.DAT;1 6/ 3/96 12:35:33 META:TIPS96~12353107.DAT;1 6/ 3/96 12:37:03
1995mCon.
Direct Federal expenditures or obligationsmCon. Other Federal assistance
Direct payments for individuals Procurement contract awards
TotalRetirement and
disability All other TotalDepartmentof Defense
Other Federalexpenditures or
obligations Direct loansGuaranteed loans
and insurance
7 049 5 239 1 810 147 – 2 014 1 301 5 061 1143 984 102 975 41 009 2 224 115 3 889 853 35 291 2
24 208 19 903 4 305 1 806 – 226 387 3 347 328 103 21 465 6 638 354 – 1 987 706 5 545 4
204 190 1 463 202 727 – – 27 553 79 358 8 025 5
31 792 813 18 820 626 12 972 187 3 255 409 1 129 884 915 157 1 247 474 8 935 809 6
190 448 132 431 58 017 15 163 9 488 5 345 6 761 39 974 735 830 22 978 12 852 1 152 650 643 4 713 9 766 842 284 28 290 13 994 3 349 1 740 2 800 3 679 8 494 967 039 45 331 21 708 1 414 – 3 116 8 129 22 685 1012 932 9 043 3 889 283 60 2 434 2 673 7 164 11
101 326 70 733 30 593 1 133 40 10 499 23 467 70 860 1216 928 10 408 6 520 19 676 18 201 2 237 2 147 11 700 1354 596 39 977 14 619 11 647 9 605 5 574 14 885 13 337 1439 470 27 300 12 170 839 375 3 339 4 889 30 469 15
307 757 213 719 94 038 29 870 17 620 11 831 12 288 104 725 16
116 718 75 690 41 028 852 – 6 553 15 980 60 570 1747 741 33 945 13 796 520 – 3 027 9 624 9 826 1843 140 30 358 12 782 734 220 3 323 9 268 8 974 1984 826 58 535 26 291 1 223 491 3 253 5 278 14 796 20
125 055 82 854 42 201 1 488 133 4 630 8 732 19 120 2113 836 414 8 111 363 5 725 051 1 653 999 484 926 72 983 33 292 2 715 793 22
57 641 41 599 16 042 810 – 2 452 7 483 10 633 2326 224 18 616 7 608 275 – 2 350 4 386 4 859 24
146 426 96 897 49 529 2 160 74 8 093 14 697 56 853 2547 810 33 568 14 242 464 – 3 436 7 153 18 324 26
40 179 29 970 10 209 585 – 4 971 11 846 28 157 271 455 692 996 581 459 111 126 127 41 921 14 749 5 949 686 242 28
57 825 42 363 15 462 869 231 6 218 13 078 23 853 2919 696 13 273 6 423 345 79 1 757 2 141 3 852 3079 394 53 875 25 519 9 264 7 763 2 893 11 311 10 329 3155 768 37 886 17 882 1 119 473 4 556 7 889 16 251 3244 614 32 774 11 840 487 – 4 845 9 263 41 843 33
147 609 105 567 42 042 152 661 224 3 231 7 032 7 307 34124 407 81 615 42 792 1 265 209 4 060 7 990 19 120 35
23 533 15 486 8 047 2 217 – 2 630 3 065 4 457 36
44 960 31 542 13 418 1 131 591 3 904 7 321 19 872 3780 051 54 639 25 412 1 073 238 3 954 9 370 41 671 3827 090 18 432 8 658 322 – 4 237 3 926 4 707 3960 487 42 843 17 644 1 746 950 5 835 14 446 25 032 4018 015 10 761 7 254 152 – 362 257 408 4122 121 14 585 7 536 407 30 3 990 14 953 21 041 42
135 817 95 671 40 146 1 655 343 10 667 22 935 48 690 4387 927 63 779 24 148 1 582 – 11 199 29 250 90 043 44
140 347 81 984 58 363 13 591 7 639 2 378 2 678 13 773 4525 271 17 047 8 224 369 – 3 136 8 931 11 211 46
114 719 72 095 42 624 9 392 1 779 4 214 3 114 8 750 4747 412 31 234 16 178 1 477 1 013 3 811 8 704 20 874 4859 609 43 497 16 112 653 – 4 809 7 160 13 837 4933 035 22 994 10 041 506 27 1 456 653 2 786 50
632 570 424 200 208 370 318 556 40 977 5 462 7 749 291 924 51287 053 181 269 105 784 10 313 7 219 7 055 16 878 123 446 52
62 903 48 087 14 816 1 602 219 3 189 8 704 52 582 53178 691 122 317 56 374 2 420 133 6 997 14 911 29 205 54
1 002 594 691 571 311 023 160 803 115 617 6 340 1 386 465 815 55310 138 217 953 92 185 26 282 16 926 10 951 20 712 124 724 56
53 193 35 801 17 392 410 – 2 914 7 252 6 110 5787 786 62 654 25 132 990 126 8 157 20 930 42 074 5897 319 64 353 32 966 1 027 33 10 657 21 677 95 485 5981 497 55 596 25 901 1 115 281 6 788 17 890 37 930 6077 596 48 482 29 114 1 029 84 4 906 11 520 22 619 61
345 246 239 956 105 290 7 039 1 654 4 555 10 190 237 801 62254 276 172 811 81 465 7 552 457 18 324 25 401 174 539 63336 764 231 324 105 440 35 512 333 9 438 9 837 76 906 64156 485 105 385 51 100 2 253 218 5 043 13 267 23 776 65757 481 503 263 254 218 38 986 30 612 4 605 12 013 262 167 66
155 446 98 345 57 101 2 402 26 4 330 7 844 9 780 6735 486 24 061 11 425 591 – 3 260 5 458 19 985 6852 278 34 171 18 107 2 408 100 5 199 4 678 21 816 6949 678 32 816 16 862 15 666 15 163 1 256 1 364 4 593 7029 846 20 579 9 267 294 – 3 156 7 643 16 089 7143 528 30 752 12 776 571 66 6 145 21 865 26 106 7256 383 40 486 15 897 4 252 3 662 3 098 6 937 21 407 7392 228 63 188 29 040 1 585 680 5 188 10 534 19 147 7498 222 67 575 30 647 1 353 350 4 710 9 305 17 701 7541 841 30 411 11 430 364 51 3 353 5 223 14 019 76
98 864 72 659 26 205 3 247 1 904 8 720 20 625 73 367 77543 469 357 813 185 656 51 402 35 775 5 144 7 371 60 830 78
65 443 45 623 19 820 1 005 – 1 713 3 114 6 698 7942 207 30 958 11 249 492 – 4 960 11 058 30 183 8052 648 35 983 16 665 4 910 1 389 6 783 6 930 22 110 8112 351 8 332 4 019 ~787 ~931 876 364 363 8227 038 17 013 10 025 810 333 1 094 1 709 3 285 8315 304 10 911 4 393 199 – 1 236 1 190 7 110 8495 098 66 131 28 967 22 028 2 095 2 658 9 009 14 127 8547 797 31 737 16 060 558 – 2 667 8 717 5 490 86
County Area 17

TIPS PS [APS_PPGB,F_SCOTT] 6/ 3/96 12:37:43 MCVX09 TLP:CFFR1.TLP;15 6/ 3/96 11:04:06 DATA:NONE PSC:TIPS_12353107_01.PSC PAGE: 17TSF:TIPS92~12353107.DAT;1 6/ 3/96 12:35:33 UTF:TIPS93~12353107.DAT;1 6/ 3/96 12:35:33 META:TIPS96~12353107.DAT;1 6/ 3/96 12:37:03
Federal Government Expenditures or Obligations by State and County Area: Fiscal Year[Thousand dollars]
State and county area
Congressional district
Direct Federal expenditures or obligations
Total direct expenditres or obligations Salaries and wages
United Statesresident
population1 TotalDepartment of
DefenseAll other
agencies Grant awards TotalDepartmentof Defense
Illinois mCon.
Rock Island County 17------------------------- 150 305 851 899 280 913 570 986 74 989 260 487 230 2141St. Clair County 12---------------------------- 265 432 1 633 784 562 397 1 071 387 241 216 428 068 390 8272Saline County 19------------------------------ 26 698 199 466 2 764 196 702 24 160 5 956 –3Sangamon County 18 20-------------------------- 183 910 2 013 032 69 772 1 943 260 1 317 224 111 348 33 5784Schuyler County 20---------------------------- 7 630 30 150 313 29 837 6 174 1 307 –5Scott County 20------------------------------- 5 644 20 355 507 19 848 3 151 893 –6Shelby County 19----------------------------- 22 478 85 940 2 969 82 971 8 242 4 107 7897Stark County 18------------------------------- 6 305 28 058 842 27 216 1 777 1 354 –8Stephenson County 16------------------------- 49 096 165 596 3 527 162 069 19 738 6 841 2699Tazewell County 18--------------------------- 126 420 396 197 4 112 392 085 43 979 25 176 80910
Union County 12------------------------------ 17 990 74 694 4 706 69 988 15 869 2 228 –11Vermilion County 15--------------------------- 87 327 422 587 14 971 407 616 44 540 55 972 61512Wabash County 19---------------------------- 12 898 45 878 802 45 076 4 791 1 680 –13Warren County 17----------------------------- 18 934 82 507 966 81 541 19 995 3 617 25414Washington County 20------------------------- 15 055 61 769 1 134 60 635 10 522 2 638 –15Wayne County 19----------------------------- 17 168 67 197 1 033 66 164 8 722 2 938 9816White County 19------------------------------ 15 914 78 161 1 136 77 025 12 875 2 929 –17Whiteside County 17--------------------------- 60 299 211 980 13 155 198 825 21 587 8 982 1 51518Will County 11 13-------------------------------- 398 711 847 397 36 425 810 972 105 270 38 687 4 10719Williamson County 12 19-------------------------- 59 408 314 182 20 728 293 454 35 004 46 321 1 60120Winnebago County 16------------------------- 263 124 847 391 53 236 794 155 112 825 56 864 6 13321Woodford County 18--------------------------- 33 955 84 451 699 83 752 6 843 3 197 –22State undistributed ------------------------- 3 322 071 – 3 322 071 701 198 – –23
Indiana ------------------------------------- 5 752 151 23 027 799 2 266 335 20 761 464 3 650 682 2 031 158 752 16924
Adams County 04----------------------------- 32 124 100 936 524 100 412 15 070 2 795 2825Allen County 04------------------------------- 307 690 1 296 595 394 625 901 970 127 420 113 591 28 31126Bartholomew County 02 09------------------------ 66 966 290 835 79 583 211 252 53 659 21 513 11 12327Benton County 05----------------------------- 9 594 35 003 405 34 598 1 554 1 643 11928Blackford County 05--------------------------- 13 991 46 891 982 45 909 4 448 1 683 21629Boone County 06 07------------------------------ 40 912 101 015 1 730 99 285 11 882 4 181 27830Brown County 09------------------------------ 14 809 23 264 751 22 513 2 847 856 –31Carroll County 05----------------------------- 19 493 51 383 1 246 50 137 7 107 3 000 47932Cass County 05------------------------------- 38 521 147 377 11 726 135 651 21 044 5 281 1 00433Clark County 09------------------------------- 90 869 369 771 38 899 330 872 42 932 39 135 1 58334
Clay County 07------------------------------- 25 762 94 401 2 372 92 029 11 636 3 939 88435Clinton County 06----------------------------- 32 308 99 573 1 704 97 869 8 060 3 889 40036Crawford County 09--------------------------- 10 309 38 319 823 37 496 7 257 1 441 –37Daviess County 08---------------------------- 28 252 98 396 2 095 96 301 12 566 4 971 45638Dearborn County 09--------------------------- 43 256 128 967 1 648 127 319 30 487 3 743 3439Decatur County 02---------------------------- 24 776 71 089 1 282 69 807 7 136 2 880 –40De Kalb County 04---------------------------- 37 509 130 327 44 574 85 753 7 231 3 773 –41Delaware County 02--------------------------- 119 244 448 456 19 932 428 524 84 960 22 219 1 47842Dubois County 09----------------------------- 38 180 103 317 6 298 97 019 6 711 6 167 1 59843Elkhart County 03----------------------------- 163 995 396 011 6 577 389 434 48 684 14 630 1 10644
Fayette County 09----------------------------- 26 445 90 314 1 707 88 607 12 594 2 869 71545Floyd County 09------------------------------ 69 095 217 384 5 659 211 725 37 096 7 981 1 55346Fountain County 07---------------------------- 17 996 70 209 909 69 300 10 838 2 602 –47Franklin County 09---------------------------- 20 280 49 897 630 49 267 8 313 1 860 11848Fulton County 05------------------------------ 19 653 58 467 1 093 57 374 4 061 2 170 –49Gibson County 08----------------------------- 32 139 112 671 1 766 110 905 16 214 3 348 –50Grant County 05------------------------------ 73 778 305 824 3 750 302 074 45 497 43 956 1 07051Greene County 08----------------------------- 32 239 135 390 11 782 123 608 21 995 4 613 31352Hamilton County 06--------------------------- 134 260 233 821 10 534 223 287 20 900 15 865 25553Hancock County 06---------------------------- 49 428 117 441 3 301 114 140 12 002 4 773 31154
Harrison County 09---------------------------- 31 891 85 440 2 076 83 364 10 104 4 429 –55Hendricks County 07-------------------------- 84 107 178 724 4 099 174 625 22 052 7 654 23356Henry County 02 06------------------------------ 48 969 167 713 2 126 165 587 23 078 5 081 35457Howard County 05---------------------------- 82 996 287 329 7 123 280 206 37 556 17 088 1 09558Huntington County 04-------------------------- 36 409 111 961 1 705 110 256 17 414 4 712 57359Jackson County 09---------------------------- 39 530 120 005 2 241 117 764 15 834 4 983 42860Jasper County 05----------------------------- 27 375 78 890 1 857 77 033 6 283 4 654 1 09061Jay County 02 04-------------------------------- 21 786 72 828 623 72 205 9 986 2 305 17662Jefferson County 09--------------------------- 30 537 113 038 12 396 100 642 14 634 8 800 5 22963Jennings County 09--------------------------- 25 513 69 841 1 994 67 847 9 319 2 964 19164
Johnson County 02 06---------------------------- 99 023 260 554 15 715 244 839 20 596 14 367 3 18365Knox County 08------------------------------- 40 070 180 638 4 887 175 751 38 484 8 065 70366Kosciusko County 03 05-------------------------- 67 958 160 636 3 167 157 469 12 762 7 413 40667Lagrange County 04--------------------------- 31 226 62 540 977 61 563 10 850 3 024 5568Lake County 01 05------------------------------- 481 632 1 900 634 53 295 1 847 339 355 498 124 536 5 81769La Porte County 03---------------------------- 109 628 334 374 9 765 324 609 39 874 12 677 2 00670Lawrence County 08--------------------------- 44 365 152 140 4 014 148 126 21 644 6 947 1 36771Madison County 02---------------------------- 132 768 472 292 7 929 464 363 58 342 16 415 2 47472Marion County 06 10----------------------------- 818 014 4 594 553 776 538 3 818 015 1 055 358 852 100 402 13573Marshall County 05---------------------------- 44 207 107 147 3 345 103 802 8 790 4 738 37174
Martin County 08------------------------------ 10 582 242 625 204 692 37 933 4 156 171 094 169 56675Miami County 05------------------------------ 34 499 150 226 49 603 100 623 11 405 45 036 41 49576Monroe County 07 08---------------------------- 113 833 364 181 35 924 328 257 113 785 20 623 3 09977Montgomery County 07------------------------ 35 698 109 229 4 246 104 983 10 421 5 588 1 12178Morgan County 06 07---------------------------- 61 000 147 072 5 462 141 610 14 346 5 515 33579Newton County 05----------------------------- 14 131 40 956 407 40 549 3 963 1 736 –80Noble County 04------------------------------ 39 972 96 782 1 357 95 425 11 880 4 027 –81Ohio County 09------------------------------- 5 452 19 388 271 19 117 5 519 587 –82Orange County 08----------------------------- 18 848 62 098 1 077 61 021 9 104 1 954 –83Owen County 07------------------------------ 19 224 50 761 1 276 49 485 7 027 2 146 29684
Parke County 07------------------------------ 15 868 66 786 11 629 55 157 8 611 2 221 23085Perry County 09------------------------------ 18 998 68 089 2 883 65 206 12 856 3 686 81886Pike County 08------------------------------- 12 631 46 124 828 45 296 5 904 1 771 –87Porter County 01 05------------------------------ 138 246 323 917 8 006 315 911 29 187 16 817 49688Posey County 08------------------------------ 26 345 77 551 1 511 76 040 12 953 3 054 56089Pulaski County 05----------------------------- 13 003 41 165 330 40 835 4 227 1 732 –90Putnam County 07---------------------------- 32 520 99 516 1 969 97 547 19 666 3 584 38791Randolph County 02--------------------------- 27 144 91 152 1 788 89 364 8 811 4 136 64992Ripley County 09------------------------------ 26 418 91 796 4 345 87 451 12 817 3 597 –93
See footnotes at end of table.
18 Consolidated Federal Funds Report

TIPS PS [APS_PPGB,F_SCOTT] 6/ 3/96 12:37:43 MCVX09 TLP:CFFR1.TLP;15 6/ 3/96 11:04:06 DATA:NONE PSC:TIPS_12353107_01.PSC PAGE: 18TSF:TIPS92~12353107.DAT;1 6/ 3/96 12:35:33 UTF:TIPS93~12353107.DAT;1 6/ 3/96 12:35:33 META:TIPS96~12353107.DAT;1 6/ 3/96 12:37:03
1995mCon.
Direct Federal expenditures or obligationsmCon. Other Federal assistance
Direct payments for individuals Procurement contract awards
TotalRetirement and
disability All other TotalDepartmentof Defense
Other Federalexpenditures or
obligations Direct loansGuaranteed loans
and insurance
461 837 318 801 143 036 50 575 43 746 4 010 9 765 73 206 1843 489 567 561 275 928 116 557 95 012 4 454 23 861 201 477 2100 066 67 628 32 438 67 678 907 1 606 3 493 6 128 3560 277 385 576 174 701 15 039 1 079 9 144 18 231 65 211 4
20 169 14 079 6 090 261 – 2 240 3 900 7 848 513 867 9 932 3 935 340 121 2 104 1 815 8 537 665 402 44 349 21 053 1 754 1 101 6 434 9 275 23 741 720 275 13 098 7 177 955 664 3 696 9 031 16 822 8
129 680 91 715 37 965 3 396 1 770 5 942 14 764 21 871 9315 151 213 789 101 362 6 269 243 5 623 6 361 49 752 10
51 095 35 923 15 172 3 582 3 184 1 920 1 182 6 002 11284 474 197 736 86 738 29 170 9 955 8 431 18 465 66 036 12
37 181 25 521 11 660 355 – 1 872 3 803 4 347 1351 815 36 226 15 589 692 – 6 388 22 647 30 974 1444 088 29 334 14 754 503 – 4 017 4 572 9 821 1549 781 33 544 16 237 612 63 5 143 5 179 7 183 1658 195 39 567 18 628 606 – 3 555 2 538 7 172 17
161 844 114 608 47 236 11 165 9 801 8 402 16 807 37 687 18660 228 448 622 211 606 38 100 25 283 5 112 10 716 263 913 19179 788 127 457 52 331 51 782 14 734 1 287 4 722 13 326 20621 623 436 261 185 362 50 020 39 536 6 059 7 479 98 753 21
68 959 46 615 22 344 712 – 4 739 11 575 32 438 222 270 599 3 990 2 266 609 – – 350 274 253 249 1 019 231 23
14 688 716 9 633 055 5 055 661 1 678 352 1 223 331 978 890 664 167 8 731 992 24
79 996 46 352 33 644 810 – 2 265 7 846 12 237 25660 225 474 309 185 916 389 871 355 136 5 489 5 592 200 429 26144 503 103 055 41 448 68 395 65 451 2 764 4 428 54 980 27
27 256 18 602 8 654 313 – 4 237 11 383 20 617 2838 683 26 530 12 153 618 205 1 459 1 320 4 922 2981 117 56 911 24 206 874 – 2 961 10 997 81 985 3019 116 14 596 4 520 204 34 240 782 4 035 3137 885 27 724 10 161 444 35 2 947 11 492 21 991 32
109 434 79 638 29 796 8 784 7 932 2 834 7 494 19 961 33251 773 172 461 79 312 34 745 31 294 1 186 2 199 55 248 34
76 511 56 041 20 470 604 – 1 711 3 486 4 647 3583 860 59 751 24 109 760 64 3 005 11 771 19 855 3628 790 20 404 8 386 301 – 531 1 083 1 810 3776 976 55 140 21 836 909 97 2 973 10 685 11 305 3893 377 64 965 28 412 969 48 392 2 146 11 632 3956 999 38 829 18 170 590 – 3 484 8 023 19 290 4070 823 54 446 16 377 44 322 43 687 4 179 7 827 8 697 41
312 162 204 045 108 117 26 158 14 119 2 957 6 591 44 479 4275 855 55 108 20 747 12 149 3 375 2 435 5 087 4 652 43
312 788 230 847 81 941 17 832 1 700 2 078 4 444 52 399 44
72 959 50 260 22 699 449 – 1 442 4 090 13 247 45170 245 118 240 52 005 1 696 308 366 304 16 424 46
52 302 38 593 13 709 1 069 – 3 397 6 421 21 697 4738 115 26 518 11 597 385 52 1 224 1 814 5 235 4848 923 35 951 12 972 445 – 2 868 7 415 13 101 4989 020 61 934 27 086 733 46 3 356 5 819 8 526 50
210 866 148 934 61 932 3 337 92 2 169 6 496 18 098 5197 530 73 373 24 157 9 673 8 915 1 579 2 669 6 283 52
190 276 140 528 49 748 4 681 1 835 2 098 3 002 92 455 5397 627 72 979 24 648 1 151 160 1 888 6 868 37 356 54
68 772 50 176 18 596 815 – 1 320 1 979 13 565 55144 893 105 905 38 988 2 183 607 1 943 7 657 51 022 56136 016 95 679 40 337 1 105 133 2 433 6 664 27 019 57226 905 155 979 70 926 3 212 78 2 568 6 380 22 660 58
85 194 64 913 20 281 2 369 80 2 272 8 214 17 307 5995 412 68 584 26 828 1 119 43 2 657 4 644 22 660 6062 377 42 745 19 632 608 – 4 967 13 100 30 535 6156 620 39 891 16 729 485 – 3 431 4 883 21 765 6283 137 56 201 26 936 5 715 5 129 752 3 499 10 931 6355 114 40 425 14 689 1 085 662 1 360 6 861 7 060 64
200 739 146 210 54 529 22 822 7 494 2 029 5 336 93 072 65126 856 81 066 45 790 2 629 1 094 4 604 14 701 16 905 66132 763 100 114 32 649 4 130 370 3 569 11 301 59 238 67
46 030 34 413 11 617 618 – 2 019 12 613 8 880 681 347 676 853 500 494 176 64 551 39 959 8 373 8 243 429 064 69
268 884 182 636 86 248 8 412 5 063 4 528 7 808 55 914 70120 858 87 335 33 523 978 – 1 712 3 445 6 806 71391 294 268 572 122 722 3 416 499 2 825 5 885 45 400 72
2 269 555 1 452 563 816 992 406 462 300 121 11 078 4 054 695 713 7388 738 66 106 22 632 2 172 1 261 2 709 7 252 14 698 74
31 931 25 338 6 593 34 626 34 360 818 1 751 1 831 7590 871 66 771 24 100 795 65 2 118 4 101 10 378 76
198 037 137 687 60 350 30 612 25 771 1 124 3 834 25 698 7787 355 59 509 27 846 2 276 1 424 3 589 9 335 24 503 78
121 195 86 559 34 636 4 193 3 081 1 823 8 191 41 527 7930 202 19 906 10 296 342 – 4 712 8 575 25 025 8077 120 57 305 19 815 918 151 2 837 5 289 16 064 8113 048 8 514 4 534 123 – 110 315 2 188 8249 075 34 901 14 174 411 – 1 554 1 331 4 131 8340 014 29 212 10 802 373 – 1 201 686 5 119 84
42 189 30 006 12 183 11 147 10 547 2 616 4 606 12 910 8549 307 33 572 15 735 1 660 1 117 581 245 2 844 8636 886 25 684 11 202 482 165 1 081 2 873 3 483 87
266 497 183 051 83 446 8 758 4 347 2 659 4 204 56 815 8856 610 38 479 18 131 2 223 74 2 710 1 860 10 734 8931 333 23 228 8 105 331 – 3 542 11 341 24 119 9072 829 50 374 22 455 665 81 2 772 7 934 12 567 9175 053 52 438 22 615 691 – 2 460 4 498 11 728 9266 328 45 883 20 445 7 281 3 264 1 773 5 227 11 698 93
County Area 19
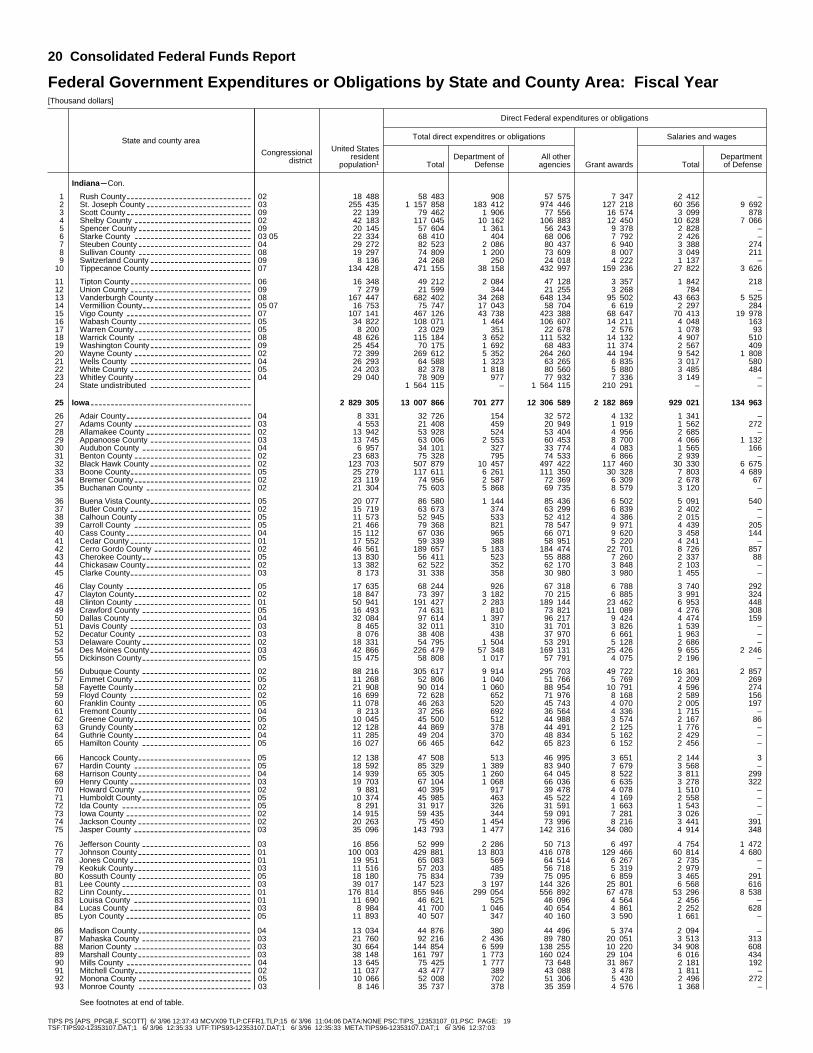
TIPS PS [APS_PPGB,F_SCOTT] 6/ 3/96 12:37:43 MCVX09 TLP:CFFR1.TLP;15 6/ 3/96 11:04:06 DATA:NONE PSC:TIPS_12353107_01.PSC PAGE: 19TSF:TIPS92~12353107.DAT;1 6/ 3/96 12:35:33 UTF:TIPS93~12353107.DAT;1 6/ 3/96 12:35:33 META:TIPS96~12353107.DAT;1 6/ 3/96 12:37:03
Federal Government Expenditures or Obligations by State and County Area: Fiscal Year[Thousand dollars]
State and county area
Congressional district
Direct Federal expenditures or obligations
Total direct expenditres or obligations Salaries and wages
United Statesresident
population1 TotalDepartment of
DefenseAll other
agencies Grant awards TotalDepartmentof Defense
Indiana mCon.
Rush County 02------------------------------- 18 488 58 483 908 57 575 7 347 2 412 –1St. Joseph County 03-------------------------- 255 435 1 157 858 183 412 974 446 127 218 60 356 9 6922Scott County 09------------------------------- 22 139 79 462 1 906 77 556 16 574 3 099 8783Shelby County 02----------------------------- 42 183 117 045 10 162 106 883 12 450 10 628 7 0664Spencer County 09---------------------------- 20 145 57 604 1 361 56 243 9 378 2 828 –5Starke County 03 05----------------------------- 22 334 68 410 404 68 006 7 792 2 426 –6Steuben County 04---------------------------- 29 272 82 523 2 086 80 437 6 940 3 388 2747Sullivan County 08---------------------------- 19 297 74 809 1 200 73 609 8 007 3 049 2118Switzerland County 09------------------------- 8 136 24 268 250 24 018 4 222 1 137 –9Tippecanoe County 07------------------------- 134 428 471 155 38 158 432 997 159 236 27 822 3 62610
Tipton County 06------------------------------ 16 348 49 212 2 084 47 128 3 357 1 842 21811Union County 09------------------------------ 7 279 21 599 344 21 255 3 268 784 –12Vanderburgh County 08------------------------ 167 447 682 402 34 268 648 134 95 502 43 663 5 52513Vermillion County 05 07--------------------------- 16 753 75 747 17 043 58 704 6 619 2 297 28414Vigo County 07------------------------------- 107 141 467 126 43 738 423 388 68 647 70 413 19 97815Wabash County 05---------------------------- 34 822 108 071 1 464 106 607 14 211 4 048 16316Warren County 05----------------------------- 8 200 23 029 351 22 678 2 576 1 078 9317Warrick County 08---------------------------- 48 626 115 184 3 652 111 532 14 132 4 907 51018Washington County 09------------------------- 25 454 70 175 1 692 68 483 11 374 2 567 40919Wayne County 02----------------------------- 72 399 269 612 5 352 264 260 44 194 9 542 1 80820Wells County 04------------------------------ 26 293 64 588 1 323 63 265 6 835 3 017 58021White County 05------------------------------ 24 203 82 378 1 818 80 560 5 880 3 485 48422Whitley County 04----------------------------- 29 040 78 909 977 77 932 7 336 3 149 –23State undistributed ------------------------- 1 564 115 – 1 564 115 210 291 – –24
Iowa ---------------------------------------- 2 829 305 13 007 866 701 277 12 306 589 2 182 869 929 021 134 96325
Adair County 04------------------------------- 8 331 32 726 154 32 572 4 132 1 341 –26Adams County 03----------------------------- 4 553 21 408 459 20 949 1 919 1 562 27227Allamakee County 02-------------------------- 13 942 53 928 524 53 404 4 956 2 685 –28Appanoose County 03------------------------- 13 745 63 006 2 553 60 453 8 700 4 066 1 13229Audubon County 04--------------------------- 6 957 34 101 327 33 774 4 083 1 565 16630Benton County 02----------------------------- 23 683 75 328 795 74 533 6 866 2 939 –31Black Hawk County 02------------------------- 123 703 507 879 10 457 497 422 117 460 30 330 6 67532Boone County 05------------------------------ 25 279 117 611 6 261 111 350 30 328 7 803 4 68933Bremer County 02----------------------------- 23 119 74 956 2 587 72 369 6 309 2 678 6734Buchanan County 02-------------------------- 21 304 75 603 5 868 69 735 8 579 3 120 –35
Buena Vista County 05------------------------- 20 077 86 580 1 144 85 436 6 502 5 091 54036Butler County 02------------------------------ 15 719 63 673 374 63 299 6 839 2 402 –37Calhoun County 05---------------------------- 11 573 52 945 533 52 412 4 386 2 015 –38Carroll County 05----------------------------- 21 466 79 368 821 78 547 9 971 4 439 20539Cass County 04------------------------------- 15 112 67 036 965 66 071 9 620 3 458 14440Cedar County 01------------------------------ 17 552 59 339 388 58 951 5 220 4 241 –41Cerro Gordo County 02------------------------ 46 561 189 657 5 183 184 474 22 701 8 726 85742Cherokee County 05--------------------------- 13 830 56 411 523 55 888 7 260 2 337 8843Chickasaw County 02-------------------------- 13 382 62 522 352 62 170 3 848 2 103 –44Clarke County 03------------------------------ 8 173 31 338 358 30 980 3 980 1 455 –45
Clay County 05------------------------------- 17 635 68 244 926 67 318 6 788 3 740 29246Clayton County 02----------------------------- 18 847 73 397 3 182 70 215 6 885 3 991 32447Clinton County 01----------------------------- 50 941 191 427 2 283 189 144 23 462 6 953 44848Crawford County 05--------------------------- 16 493 74 631 810 73 821 11 089 4 276 30849Dallas County 04------------------------------ 32 084 97 614 1 397 96 217 9 424 4 474 15950Davis County 03------------------------------ 8 465 32 011 310 31 701 3 826 1 539 –51Decatur County 03---------------------------- 8 076 38 408 438 37 970 6 661 1 963 –52Delaware County 02--------------------------- 18 331 54 795 1 504 53 291 5 128 2 686 –53Des Moines County 03------------------------- 42 866 226 479 57 348 169 131 25 426 9 655 2 24654Dickinson County 05--------------------------- 15 475 58 808 1 017 57 791 4 075 2 196 –55
Dubuque County 02--------------------------- 88 216 305 617 9 914 295 703 49 722 16 361 2 85756Emmet County 05----------------------------- 11 268 52 806 1 040 51 766 5 769 2 209 26957Fayette County 02----------------------------- 21 908 90 014 1 060 88 954 10 791 4 596 27458Floyd County 02------------------------------ 16 699 72 628 652 71 976 8 168 2 589 15659Franklin County 05---------------------------- 11 078 46 263 520 45 743 4 070 2 005 19760Fremont County 04---------------------------- 8 213 37 256 692 36 564 4 336 1 715 –61Greene County 05----------------------------- 10 045 45 500 512 44 988 3 574 2 167 8662Grundy County 02----------------------------- 12 128 44 869 378 44 491 2 125 1 776 –63Guthrie County 04----------------------------- 11 285 49 204 370 48 834 5 162 2 429 –64Hamilton County 05--------------------------- 16 027 66 465 642 65 823 6 152 2 456 –65
Hancock County 05---------------------------- 12 138 47 508 513 46 995 3 651 2 144 366Hardin County 05----------------------------- 18 592 85 329 1 389 83 940 7 679 3 568 –67Harrison County 04---------------------------- 14 939 65 305 1 260 64 045 8 522 3 811 29968Henry County 03------------------------------ 19 703 67 104 1 068 66 036 6 635 3 278 32269Howard County 02---------------------------- 9 881 40 395 917 39 478 4 078 1 510 –70Humboldt County 05--------------------------- 10 374 45 985 463 45 522 4 169 2 558 –71Ida County 05-------------------------------- 8 291 31 917 326 31 591 1 663 1 543 –72Iowa County 02------------------------------- 14 915 59 435 344 59 091 7 281 3 026 –73Jackson County 02---------------------------- 20 263 75 450 1 454 73 996 8 216 3 441 39174Jasper County 03----------------------------- 35 096 143 793 1 477 142 316 34 080 4 914 34875
Jefferson County 03--------------------------- 16 856 52 999 2 286 50 713 6 497 4 754 1 47276Johnson County 01---------------------------- 100 003 429 881 13 803 416 078 129 466 60 814 4 68077Jones County 01------------------------------ 19 951 65 083 569 64 514 6 267 2 735 –78Keokuk County 03----------------------------- 11 516 57 203 485 56 718 5 319 2 979 –79Kossuth County 05---------------------------- 18 180 75 834 739 75 095 6 859 3 465 29180Lee County 03-------------------------------- 39 017 147 523 3 197 144 326 25 801 6 568 61681Linn County 01-------------------------------- 176 814 855 946 299 054 556 892 67 478 53 296 8 53882Louisa County 01----------------------------- 11 690 46 621 525 46 096 4 564 2 456 –83Lucas County 03------------------------------ 8 984 41 700 1 046 40 654 4 861 2 252 62884Lyon County 05------------------------------- 11 893 40 507 347 40 160 3 590 1 661 –85
Madison County 04---------------------------- 13 034 44 876 380 44 496 5 374 2 094 –86Mahaska County 03--------------------------- 21 760 92 216 2 436 89 780 20 051 3 513 31387Marion County 03----------------------------- 30 664 144 854 6 599 138 255 10 220 34 908 60888Marshall County 03---------------------------- 38 148 161 797 1 773 160 024 29 104 6 016 43489Mills County 04------------------------------- 13 645 75 425 1 777 73 648 31 867 2 181 19290Mitchell County 02----------------------------- 11 037 43 477 389 43 088 3 478 1 811 –91Monona County 05---------------------------- 10 066 52 008 702 51 306 5 430 2 496 27292Monroe County 03---------------------------- 8 146 35 737 378 35 359 4 576 1 368 –93
See footnotes at end of table.
20 Consolidated Federal Funds Report
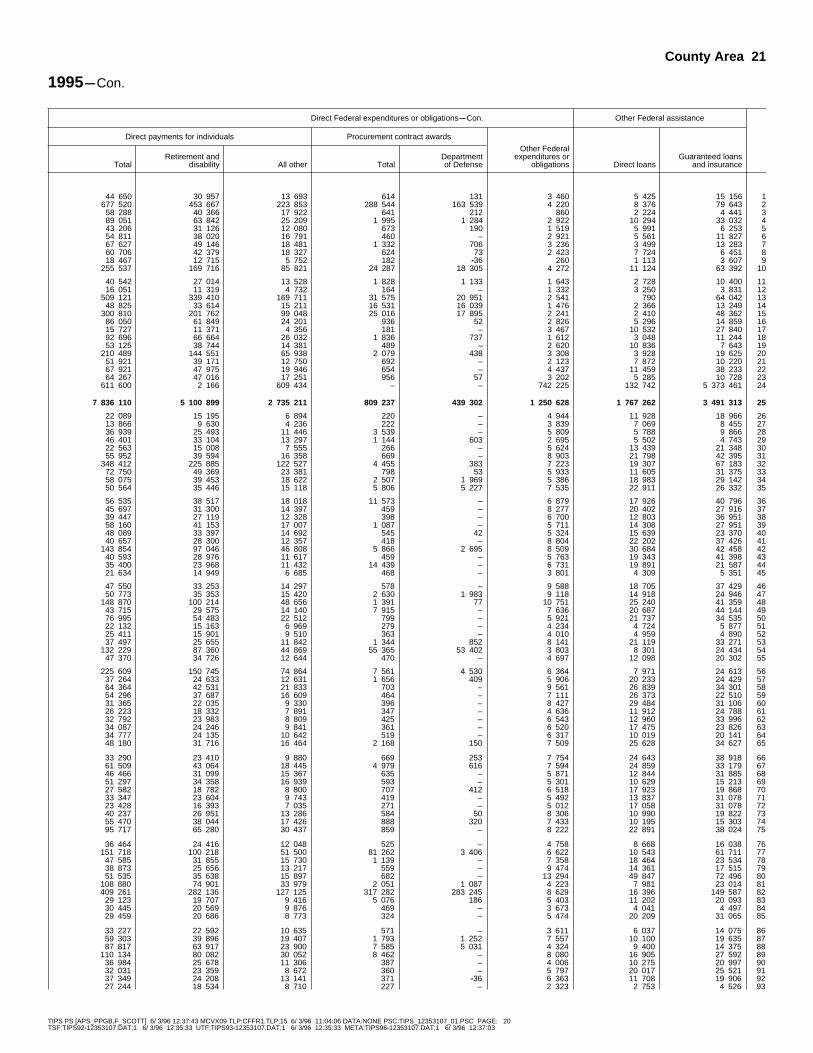
TIPS PS [APS_PPGB,F_SCOTT] 6/ 3/96 12:37:43 MCVX09 TLP:CFFR1.TLP;15 6/ 3/96 11:04:06 DATA:NONE PSC:TIPS_12353107_01.PSC PAGE: 20TSF:TIPS92~12353107.DAT;1 6/ 3/96 12:35:33 UTF:TIPS93~12353107.DAT;1 6/ 3/96 12:35:33 META:TIPS96~12353107.DAT;1 6/ 3/96 12:37:03
1995mCon.
Direct Federal expenditures or obligationsmCon. Other Federal assistance
Direct payments for individuals Procurement contract awards
TotalRetirement and
disability All other TotalDepartmentof Defense
Other Federalexpenditures or
obligations Direct loansGuaranteed loans
and insurance
44 650 30 957 13 693 614 131 3 460 5 425 15 156 1677 520 453 667 223 853 288 544 163 539 4 220 8 376 79 643 2
58 288 40 366 17 922 641 212 860 2 224 4 441 389 051 63 842 25 209 1 995 1 284 2 922 10 294 33 032 443 206 31 126 12 080 673 190 1 519 5 991 6 253 554 811 38 020 16 791 460 – 2 921 5 561 11 827 667 627 49 146 18 481 1 332 706 3 236 3 499 13 283 760 706 42 379 18 327 624 73 2 423 7 724 6 451 818 467 12 715 5 752 182 ~36 260 1 113 3 607 9
255 537 169 716 85 821 24 287 18 305 4 272 11 124 63 392 10
40 542 27 014 13 528 1 828 1 133 1 643 2 728 10 400 1116 051 11 319 4 732 164 – 1 332 3 250 3 831 12
509 121 339 410 169 711 31 575 20 951 2 541 790 64 042 1348 825 33 614 15 211 16 531 16 039 1 476 2 366 13 249 14
300 810 201 762 99 048 25 016 17 895 2 241 2 410 48 362 1586 050 61 849 24 201 936 52 2 826 5 296 14 859 1615 727 11 371 4 356 181 – 3 467 10 532 27 840 1792 696 66 664 26 032 1 836 737 1 612 3 048 11 244 1853 125 38 744 14 381 489 – 2 620 10 836 7 643 19
210 489 144 551 65 938 2 079 438 3 308 3 928 19 625 2051 921 39 171 12 750 692 – 2 123 7 872 10 220 2167 921 47 975 19 946 654 – 4 437 11 459 38 233 2264 267 47 016 17 251 956 57 3 202 5 285 10 728 23
611 600 2 166 609 434 – – 742 225 132 742 5 373 461 24
7 836 110 5 100 899 2 735 211 809 237 439 302 1 250 628 1 767 262 3 491 313 25
22 089 15 195 6 894 220 – 4 944 11 928 18 966 2613 866 9 630 4 236 222 – 3 839 7 069 8 455 2736 939 25 493 11 446 3 539 – 5 809 5 788 9 866 2846 401 33 104 13 297 1 144 603 2 695 5 502 4 743 2922 563 15 008 7 555 266 – 5 624 13 439 21 348 3055 952 39 594 16 358 669 – 8 903 21 798 42 395 31
348 412 225 885 122 527 4 455 383 7 223 19 307 67 183 3272 750 49 369 23 381 798 53 5 933 11 605 31 375 3358 075 39 453 18 622 2 507 1 969 5 386 18 983 29 142 3450 564 35 446 15 118 5 806 5 227 7 535 22 911 26 332 35
56 535 38 517 18 018 11 573 – 6 879 17 926 40 796 3645 697 31 300 14 397 459 – 8 277 20 402 27 916 3739 447 27 119 12 328 398 – 6 700 12 803 36 951 3858 160 41 153 17 007 1 087 – 5 711 14 308 27 951 3948 089 33 397 14 692 545 42 5 324 15 639 23 370 4040 657 28 300 12 357 418 – 8 804 22 202 37 426 41
143 854 97 046 46 808 5 866 2 695 8 509 30 684 42 458 4240 593 28 976 11 617 459 – 5 763 19 343 41 398 4335 400 23 968 11 432 14 439 – 6 731 19 891 21 587 4421 634 14 949 6 685 468 – 3 801 4 309 5 351 45
47 550 33 253 14 297 578 – 9 588 18 705 37 429 4650 773 35 353 15 420 2 630 1 983 9 118 14 918 24 946 47
148 870 100 214 48 656 1 391 77 10 751 25 240 41 359 4843 715 29 575 14 140 7 915 – 7 636 20 687 44 144 4976 995 54 483 22 512 799 – 5 921 21 737 34 535 5022 132 15 163 6 969 279 – 4 234 4 724 5 877 5125 411 15 901 9 510 363 – 4 010 4 959 4 890 5237 497 25 655 11 842 1 344 852 8 141 21 119 33 271 53
132 229 87 360 44 869 55 365 53 402 3 803 8 301 24 434 5447 370 34 726 12 644 470 – 4 697 12 098 20 302 55
225 609 150 745 74 864 7 561 4 530 6 364 7 971 24 613 5637 264 24 633 12 631 1 656 409 5 906 20 233 24 429 5764 364 42 531 21 833 703 – 9 561 26 839 34 301 5854 296 37 687 16 609 464 – 7 111 26 373 22 510 5931 365 22 035 9 330 396 – 8 427 29 484 31 106 6026 223 18 332 7 891 347 – 4 636 11 912 24 788 6132 792 23 983 8 809 425 – 6 543 12 960 33 996 6234 087 24 246 9 841 361 – 6 520 17 475 23 826 6334 777 24 135 10 642 519 – 6 317 10 019 20 141 6448 180 31 716 16 464 2 168 150 7 509 25 628 34 627 65
33 290 23 410 9 880 669 253 7 754 24 643 38 918 6661 509 43 064 18 445 4 979 616 7 594 24 859 33 179 6746 466 31 099 15 367 635 – 5 871 12 844 31 885 6851 297 34 358 16 939 593 – 5 301 10 629 15 213 6927 582 18 782 8 800 707 412 6 518 17 923 19 868 7033 347 23 604 9 743 419 – 5 492 13 837 31 078 7123 428 16 393 7 035 271 – 5 012 17 058 31 078 7240 237 26 951 13 286 584 50 8 306 10 990 19 822 7355 470 38 044 17 426 888 320 7 433 10 195 15 303 7495 717 65 280 30 437 859 – 8 222 22 891 38 024 75
36 464 24 416 12 048 525 – 4 758 8 668 16 038 76151 718 100 218 51 500 81 262 3 406 6 622 10 543 61 711 77
47 585 31 855 15 730 1 139 – 7 358 18 464 23 534 7838 873 25 656 13 217 559 – 9 474 14 361 17 515 7951 535 35 638 15 897 682 – 13 294 49 847 72 496 80
108 880 74 901 33 979 2 051 1 087 4 223 7 981 23 014 81409 261 282 136 127 125 317 282 283 245 8 629 16 396 149 587 82
29 123 19 707 9 416 5 076 186 5 403 11 202 20 093 8330 445 20 569 9 876 469 – 3 673 4 041 4 497 8429 459 20 686 8 773 324 – 5 474 20 209 31 065 85
33 227 22 592 10 635 571 – 3 611 6 037 14 075 8659 303 39 896 19 407 1 793 1 252 7 557 10 100 19 635 8787 817 63 917 23 900 7 585 5 031 4 324 9 400 14 375 88
110 134 80 082 30 052 8 462 – 8 080 16 905 27 592 8936 984 25 678 11 306 387 – 4 006 10 275 20 997 9032 031 23 359 8 672 360 – 5 797 20 017 25 521 9137 349 24 208 13 141 371 ~36 6 363 11 708 19 906 9227 244 18 534 8 710 227 – 2 323 2 753 4 526 93
County Area 21

TIPS PS [APS_PPGB,F_SCOTT] 6/ 3/96 12:37:43 MCVX09 TLP:CFFR1.TLP;15 6/ 3/96 11:04:06 DATA:NONE PSC:TIPS_12353107_01.PSC PAGE: 21TSF:TIPS92~12353107.DAT;1 6/ 3/96 12:35:33 UTF:TIPS93~12353107.DAT;1 6/ 3/96 12:35:33 META:TIPS96~12353107.DAT;1 6/ 3/96 12:37:03
Federal Government Expenditures or Obligations by State and County Area: Fiscal Year[Thousand dollars]
State and county area
Congressional district
Direct Federal expenditures or obligations
Total direct expenditres or obligations Salaries and wages
United Statesresident
population1 TotalDepartment of
DefenseAll other
agencies Grant awards TotalDepartmentof Defense
IowamCon.
Montgomery County 04------------------------ 12 023 54 621 1 617 53 004 6 579 2 949 7011Muscatine County 01-------------------------- 41 238 128 873 4 445 124 428 16 464 5 869 4952O’Brien County 05----------------------------- 15 374 62 118 817 61 301 5 145 2 973 2493Osceola County 05---------------------------- 7 141 26 780 118 26 662 1 300 1 196 –4Page County 03------------------------------- 16 739 74 900 1 491 73 409 11 117 3 040 1675Palo Alto County 05--------------------------- 10 421 50 366 572 49 794 6 664 2 045 –6Plymouth County 05--------------------------- 24 280 79 729 1 232 78 497 9 853 4 363 3497Pocahontas County 05------------------------- 9 129 44 407 838 43 569 4 244 2 071 2318Polk County 04------------------------------- 345 896 2 224 243 111 361 2 112 882 596 070 307 078 52 4299Pottawattamie County 04----------------------- 83 389 470 239 7 622 462 617 54 694 12 402 2 02010
Poweshiek County 03-------------------------- 19 018 70 013 883 69 130 6 653 2 620 –11Ringgold County 03--------------------------- 5 413 26 725 386 26 339 2 642 1 455 –12Sac County 05-------------------------------- 12 141 49 600 538 49 062 4 004 2 308 5013Scott County 01------------------------------- 155 950 567 096 32 744 534 352 89 199 34 583 9 71214Shelby County 04----------------------------- 13 116 54 502 305 54 197 7 612 2 447 –15Sioux County 05------------------------------ 31 028 94 846 556 94 290 7 514 4 279 17216Story County 03------------------------------- 74 837 320 542 8 255 312 287 83 870 39 416 2 23417Tama County 02------------------------------ 17 784 72 208 627 71 581 7 563 3 736 4718Taylor County 03------------------------------ 7 118 35 665 235 35 430 4 818 1 856 –19Union County 03------------------------------ 12 468 60 026 502 59 524 8 412 3 685 –20
Van Buren County 03-------------------------- 7 717 33 492 401 33 091 3 242 1 963 –21Wapello County 03---------------------------- 35 918 158 766 2 749 156 017 22 994 6 474 43722Warren County 03----------------------------- 38 506 94 580 1 927 92 653 12 807 5 160 –23Washington County 03------------------------- 20 279 88 789 1 937 86 852 19 039 3 771 1 14424Wayne County 03----------------------------- 6 939 36 425 471 35 954 3 648 1 923 –25Webster County 05---------------------------- 39 498 172 385 6 413 165 972 21 515 15 245 3 00626Winnebago County 05------------------------- 11 935 46 669 659 46 010 4 159 2 105 –27Winneshiek County 02------------------------- 21 009 67 970 1 167 66 803 7 500 3 812 45928Woodbury County 05-------------------------- 101 189 403 950 37 713 366 237 58 810 44 076 18 78229Worth County 02------------------------------ 7 874 34 688 308 34 380 2 302 1 500 –30Wright County 05----------------------------- 14 201 65 711 1 071 64 640 5 807 3 331 42131State undistributed ------------------------- 579 181 – 579 181 153 561 – –32
Kansas ------------------------------------- 2 554 075 12 471 283 1 990 278 10 481 005 1 748 962 1 740 703 835 73333
Allen County 02------------------------------- 14 794 57 036 2 578 54 458 6 973 3 628 1 47234Anderson County 02--------------------------- 7 905 32 372 858 31 514 2 323 1 798 18535Atchison County 02---------------------------- 16 755 79 287 5 976 73 311 10 060 2 522 17936Barber County 01----------------------------- 5 609 28 289 227 28 062 1 955 1 249 –37Barton County 01----------------------------- 28 897 117 939 1 775 116 164 11 529 4 361 39538Bourbon County 02---------------------------- 14 863 68 843 1 966 66 877 10 428 5 325 85439Brown County 02------------------------------ 11 031 57 527 1 600 55 927 12 427 3 552 59340Butler County 04------------------------------ 55 736 149 910 5 523 144 387 17 990 5 915 65741Chase County 01------------------------------ 2 917 13 918 194 13 724 3 013 937 –42Chautauqua County 04------------------------ 4 372 21 224 373 20 851 3 550 898 –43
Cherokee County 02--------------------------- 22 054 88 051 5 832 82 219 12 920 2 754 6444Cheyenne County 01-------------------------- 3 266 23 032 97 22 935 4 501 580 –45Clark County 01------------------------------- 2 409 15 196 63 15 133 673 383 –46Clay County 01------------------------------- 9 266 38 667 2 226 36 441 3 265 1 537 8447Cloud County 01------------------------------ 10 516 53 007 1 042 51 965 5 679 2 382 21448Coffey County 02----------------------------- 8 651 32 736 1 876 30 860 3 516 1 937 39749Comanche County 01-------------------------- 2 151 14 273 138 14 135 1 293 304 –50Cowley County 04----------------------------- 37 240 150 881 10 096 140 785 17 590 4 833 74151Crawford County 02--------------------------- 36 333 158 245 3 688 154 557 26 510 6 436 84352Decatur County 01---------------------------- 3 586 19 937 126 19 811 1 039 933 –53
Dickinson County 01--------------------------- 19 726 115 900 6 407 109 493 7 536 4 607 14154Doniphan County 02--------------------------- 7 625 33 004 890 32 114 4 661 1 741 23355Douglas County 02 03---------------------------- 88 032 247 892 15 411 232 481 60 417 26 748 3 81456Edwards County 01---------------------------- 3 557 23 162 174 22 988 1 651 975 –57Elk County 04--------------------------------- 3 332 17 712 347 17 365 1 781 939 –58Ellis County 01-------------------------------- 26 016 91 771 3 109 88 662 10 232 8 696 1 65359Ellsworth County 01--------------------------- 6 459 29 834 515 29 319 2 792 1 037 –60Finney County 01----------------------------- 34 726 85 462 1 286 84 176 15 741 6 536 32261Ford County 01------------------------------- 28 477 100 440 2 015 98 425 16 701 9 392 1 06362Franklin County 02---------------------------- 23 208 97 796 4 147 93 649 25 337 4 697 1 46463
Geary County 02------------------------------ 31 099 590 061 510 379 79 682 16 589 436 403 433 68764Gove County 01------------------------------ 3 162 16 925 269 16 656 1 009 830 –65Graham County 01---------------------------- 3 390 21 736 168 21 568 3 235 854 –66Grant County 01------------------------------ 7 676 22 798 207 22 591 2 493 878 –67Gray County 01------------------------------- 5 380 23 829 200 23 629 1 373 852 –68Greeley County 01---------------------------- 1 803 13 427 82 13 345 470 303 –69Greenwood County 04------------------------- 7 995 41 797 826 40 971 6 173 2 112 26970Hamilton County 01--------------------------- 2 311 19 324 39 19 285 974 506 –71Harper County 04----------------------------- 6 694 38 962 452 38 510 3 561 1 778 7872Harvey County 04----------------------------- 31 727 116 110 2 209 113 901 14 751 3 203 5773
Haskell County 01----------------------------- 3 994 16 512 53 16 459 812 757 –74Hodgeman County 01-------------------------- 2 242 12 602 110 12 492 664 614 –75Jackson County 02---------------------------- 11 634 39 852 1 218 38 634 4 354 2 789 17976Jefferson County 02--------------------------- 16 822 51 741 2 133 49 608 5 272 2 739 35377Jewell County 01------------------------------ 3 943 23 689 419 23 270 1 056 1 497 11178Johnson County 03---------------------------- 392 983 1 212 285 44 302 1 167 983 156 894 194 453 10 94079Kearny County 01----------------------------- 4 139 18 464 68 18 396 1 941 387 –80Kingman County 04--------------------------- 8 469 38 287 632 37 655 2 921 1 898 7481Kiowa County 01------------------------------ 3 605 20 192 177 20 015 1 726 939 –82Labette County 02----------------------------- 23 149 98 408 6 189 92 219 13 866 4 530 1 11683
Lane County 01------------------------------- 2 322 13 603 80 13 523 514 385 –84Leavenworth County 02------------------------ 68 853 515 566 262 649 252 917 21 893 222 324 149 58285Lincoln County 01----------------------------- 3 454 19 780 530 19 250 1 345 1 215 24686Linn County 02-------------------------------- 8 571 40 541 705 39 836 6 256 1 811 9787Logan County 01------------------------------ 3 145 18 052 100 17 952 1 217 684 –88Lyon County 01------------------------------- 34 704 103 189 2 274 100 915 14 438 6 953 58689McPherson County 01------------------------- 28 101 128 752 3 899 124 853 28 957 3 917 40090Marion County 01 04----------------------------- 13 077 57 031 1 023 56 008 7 106 2 684 21791Marshall County 01---------------------------- 11 271 49 925 1 726 48 199 1 279 3 034 31392Meade County 01----------------------------- 4 289 22 106 92 22 014 1 239 676 –93
See footnotes at end of table.
22 Consolidated Federal Funds Report

TIPS PS [APS_PPGB,F_SCOTT] 6/ 3/96 12:37:43 MCVX09 TLP:CFFR1.TLP;15 6/ 3/96 11:04:06 DATA:NONE PSC:TIPS_12353107_01.PSC PAGE: 22TSF:TIPS92~12353107.DAT;1 6/ 3/96 12:35:33 UTF:TIPS93~12353107.DAT;1 6/ 3/96 12:35:33 META:TIPS96~12353107.DAT;1 6/ 3/96 12:37:03
1995mCon.
Direct Federal expenditures or obligationsmCon. Other Federal assistance
Direct payments for individuals Procurement contract awards
TotalRetirement and
disability All other TotalDepartmentof Defense
Other Federalexpenditures or
obligations Direct loansGuaranteed loans
and insurance
40 532 26 684 13 848 406 – 4 155 10 268 15 319 196 564 66 503 30 061 4 950 2 716 5 025 13 521 29 309 247 011 32 411 14 600 486 – 6 504 21 908 33 924 319 469 14 207 5 262 208 – 4 606 14 702 26 872 455 440 37 731 17 709 565 – 4 738 8 896 11 231 533 170 23 333 9 837 360 – 8 127 23 135 32 917 655 943 39 685 16 258 892 242 8 677 20 124 52 266 730 354 21 361 8 993 617 274 7 121 15 573 37 534 8
844 197 554 915 289 282 97 954 34 237 378 943 25 111 262 057 9237 143 162 933 74 210 3 714 – 162 285 17 979 97 320 10
50 768 34 766 16 002 522 – 9 450 15 079 24 600 1117 017 11 845 5 172 309 – 5 301 4 758 5 502 1237 150 26 316 10 834 405 – 5 734 18 103 40 278 13
411 354 287 107 124 247 26 140 15 638 5 819 13 827 130 971 1437 220 25 920 11 300 585 – 6 637 16 745 35 320 1565 706 45 496 20 210 8 431 90 8 916 25 249 47 382 16
141 857 93 881 47 976 48 440 1 933 6 959 19 435 48 765 1750 410 34 403 16 007 603 – 9 896 23 016 31 375 1822 036 14 930 7 106 1 379 – 5 577 6 808 7 843 1943 617 27 677 15 940 531 – 3 779 8 119 8 399 20
24 032 16 003 8 029 354 – 3 901 6 145 9 208 21123 791 84 297 39 494 1 800 – 3 706 7 357 17 712 22
71 139 49 917 21 222 1 326 220 4 148 12 648 17 312 2356 996 39 093 17 903 975 – 8 008 15 650 27 554 2425 320 17 102 8 218 397 35 5 137 4 526 8 578 25
123 858 85 366 38 492 3 618 1 873 8 150 18 564 51 088 2633 038 23 250 9 788 477 31 6 890 25 303 25 266 2747 295 30 188 17 107 671 102 8 692 10 942 16 757 28
269 607 182 660 86 947 20 457 13 714 10 999 22 559 84 260 2924 689 15 854 8 835 303 – 5 894 24 501 25 913 3047 939 34 114 13 825 561 – 8 073 20 701 39 640 31
346 498 1 290 345 208 – – 79 122 204 016 237 762 32
7 135 984 4 597 618 2 538 366 1 204 032 881 567 641 602 215 386 2 075 591 33
44 622 29 647 14 975 490 77 1 322 1 812 8 695 3426 398 17 932 8 466 322 – 1 530 2 888 5 935 3549 340 31 984 17 356 15 501 4 512 1 864 2 397 9 676 3620 821 14 142 6 679 237 – 4 026 1 068 7 890 3789 338 58 236 31 102 6 087 3 6 625 2 142 35 412 3850 363 33 855 16 508 796 – 1 931 1 406 7 780 3936 702 23 795 12 907 1 411 60 3 435 3 696 12 611 40
121 784 83 412 38 372 1 448 – 2 775 1 658 34 557 419 347 6 511 2 836 133 – 489 264 1 470 42
16 084 11 076 5 008 180 – 513 191 558 43
64 959 43 451 21 508 5 818 4 376 1 600 2 815 5 441 4411 436 7 745 3 691 104 – 6 410 2 602 11 851 459 862 5 852 4 010 66 – 4 212 220 1 859 46
29 238 21 931 7 307 527 252 4 100 3 420 10 705 4740 100 26 458 13 642 655 40 4 191 1 702 17 742 4824 480 16 468 8 012 1 009 692 1 794 1 718 5 473 498 736 6 147 2 589 57 – 3 884 315 4 013 50
112 315 73 753 38 562 12 766 6 638 3 377 879 23 722 51122 012 80 972 41 040 1 106 104 2 180 3 116 11 348 52
13 625 8 997 4 628 204 – 4 137 2 456 9 458 53
64 269 47 214 17 055 34 412 2 311 5 076 2 330 25 248 5423 365 14 788 8 577 392 – 2 846 4 251 29 541 55
148 555 99 069 49 486 10 716 5 641 1 455 1 741 32 088 5613 812 8 391 5 421 189 – 6 536 2 979 14 493 5714 075 9 055 5 020 170 – 745 100 744 5867 533 42 313 25 220 917 121 4 393 1 205 29 608 5922 084 13 831 8 253 308 60 3 612 978 11 132 6052 466 36 856 15 610 1 011 305 9 706 2 774 26 560 6163 226 43 501 19 725 2 666 – 8 455 3 374 28 171 6264 902 42 676 22 226 1 409 869 1 451 1 677 7 630 63
78 955 64 885 14 070 57 222 56 599 893 592 11 275 6410 250 6 707 3 543 152 – 4 683 965 11 872 6511 517 7 277 4 240 142 – 5 988 983 8 670 6612 392 8 706 3 686 161 – 6 874 1 000 9 897 6711 736 8 289 3 447 161 – 9 706 5 354 18 316 684 518 3 471 1 047 47 – 8 089 894 9 528 69
32 434 21 014 11 420 382 31 695 4 303 1 701 708 157 5 369 2 788 66 – 9 621 1 657 6 874 71
26 859 17 020 9 839 313 – 6 451 654 12 542 7292 758 64 256 28 502 1 569 770 3 830 1 418 39 077 73
7 068 4 901 2 167 76 – 7 800 5 118 12 057 746 467 3 987 2 480 114 – 4 743 529 8 376 75
30 041 21 999 8 042 605 – 2 063 813 3 850 7641 056 30 542 10 514 699 146 1 976 1 125 11 215 7715 469 10 225 5 244 250 – 5 417 2 542 11 668 78
760 738 536 484 224 254 45 622 15 997 54 577 6 675 199 362 798 280 5 586 2 694 66 – 7 789 595 8 423 80
27 004 17 612 9 392 360 – 6 104 3 577 15 693 8112 172 8 007 4 165 180 – 5 175 283 6 065 8274 088 49 343 24 745 3 761 3 174 2 163 2 943 12 745 83
7 666 5 203 2 463 68 – 4 970 434 8 375 84173 953 132 354 41 599 96 256 80 936 1 140 903 18 702 85
13 307 8 618 4 689 223 – 3 689 648 10 526 8629 772 20 458 9 314 399 68 2 303 2 201 2 572 8710 549 7 280 3 269 114 – 5 488 775 13 947 8878 244 52 969 25 275 1 124 – 2 430 901 11 142 8979 400 53 923 25 477 10 796 2 069 5 681 1 511 22 550 9042 441 28 526 13 915 633 111 4 166 928 19 264 9139 392 27 378 12 014 1 053 452 5 166 3 056 19 455 9213 555 8 546 5 009 95 – 6 541 2 060 10 752 93
County Area 23

TIPS PS [APS_PPGB,F_SCOTT] 6/ 3/96 12:37:43 MCVX09 TLP:CFFR1.TLP;15 6/ 3/96 11:04:06 DATA:NONE PSC:TIPS_12353107_01.PSC PAGE: 23TSF:TIPS92~12353107.DAT;1 6/ 3/96 12:35:33 UTF:TIPS93~12353107.DAT;1 6/ 3/96 12:35:33 META:TIPS96~12353107.DAT;1 6/ 3/96 12:37:03
Federal Government Expenditures or Obligations by State and County Area: Fiscal Year[Thousand dollars]
State and county area
Congressional district
Direct Federal expenditures or obligations
Total direct expenditres or obligations Salaries and wages
United Statesresident
population1 TotalDepartment of
DefenseAll other
agencies Grant awards TotalDepartmentof Defense
KansasmCon.
Miami County 03------------------------------ 24 722 77 004 1 535 75 469 10 832 3 045 3211Mitchell County 01----------------------------- 7 080 34 587 532 34 055 2 563 1 811 572Montgomery County 04------------------------ 37 706 177 852 6 002 171 850 22 263 7 109 9993Morris County 01------------------------------ 6 321 28 498 1 641 26 857 2 815 1 674 3894Morton County 01----------------------------- 3 399 19 291 129 19 162 2 346 662 –5Nemaha County 02---------------------------- 10 443 49 491 1 166 48 325 9 023 2 981 5516Neosho County 02---------------------------- 16 967 72 141 1 619 70 522 11 717 2 898 1447Ness County 01------------------------------- 3 840 23 269 134 23 135 2 135 1 345 –8Norton County 01----------------------------- 5 744 31 051 654 30 397 5 440 1 508 3499Osage County 02----------------------------- 16 325 60 432 3 273 57 159 6 207 3 363 94210
Osborne County 01---------------------------- 4 695 27 360 327 27 033 2 283 1 377 –11Ottawa County 01----------------------------- 5 635 24 722 583 24 139 3 150 1 007 –12Pawnee County 01---------------------------- 7 721 37 382 589 36 793 3 884 1 917 13413Phillips County 01----------------------------- 6 362 30 291 472 29 819 2 501 1 690 16414Pottawatomie County 02----------------------- 17 425 51 330 2 418 48 912 5 146 2 634 19715Pratt County 01------------------------------- 9 605 46 359 735 45 624 4 093 1 811 11516Rawlins County 01---------------------------- 3 299 18 820 102 18 718 1 599 767 –17Reno County 01------------------------------- 62 551 237 241 6 523 230 718 29 459 12 931 1 93818Republic County 01---------------------------- 6 240 32 610 675 31 935 3 628 1 779 16619Rice County 01------------------------------- 10 321 45 955 719 45 236 4 481 1 986 –20
Riley County 02------------------------------- 67 779 194 875 33 123 161 752 47 760 16 931 4 50221Rooks County 01------------------------------ 5 936 28 934 375 28 559 2 078 1 141 –22Rush County 01------------------------------- 3 566 23 317 225 23 092 1 127 1 224 –23Russell County 01----------------------------- 7 668 43 636 755 42 881 4 818 1 868 22824Saline County 01------------------------------ 51 434 197 405 17 779 179 626 21 111 19 859 6 02625Scott County 01------------------------------- 5 157 22 039 217 21 822 1 242 871 10426Sedgwick County 04--------------------------- 419 369 2 300 673 852 774 1 447 899 207 048 318 514 163 59527Seward County 01----------------------------- 19 123 73 178 14 133 59 045 11 637 4 373 24928Shawnee County 02--------------------------- 165 122 1 154 914 77 850 1 077 064 416 485 148 039 35 82329Sheridan County 01--------------------------- 2 826 15 289 31 15 258 1 041 482 –30
Sherman County 01--------------------------- 6 886 36 563 567 35 996 4 382 2 361 17931Smith County 01------------------------------ 4 806 26 992 382 26 610 1 937 1 617 16632Stafford County 01---------------------------- 5 232 31 498 254 31 244 2 824 1 499 –33Stanton County 01---------------------------- 2 299 16 224 – 16 224 725 299 –34Stevens County 01---------------------------- 5 177 23 301 29 23 272 1 598 729 –35Sumner County 04---------------------------- 26 436 108 310 2 707 105 603 10 792 4 237 15036Thomas County 01---------------------------- 8 341 36 796 492 36 304 3 865 2 170 24237Trego County 01------------------------------ 3 470 19 661 190 19 471 1 026 670 –38Wabaunsee County 01------------------------- 6 638 38 536 15 375 23 161 2 388 1 240 –39Wallace County 01---------------------------- 1 816 13 873 137 13 736 520 413 –40
Washington County 01------------------------- 6 810 36 391 523 35 868 3 113 2 542 5841Wichita County 01----------------------------- 2 886 17 451 2 147 15 304 704 521 –42Wilson County 02----------------------------- 10 292 42 937 909 42 028 5 456 2 023 7643Woodson County 02--------------------------- 4 020 19 231 452 18 779 1 364 993 9544Wyandotte County 03-------------------------- 155 072 805 548 15 259 790 289 150 614 132 155 4 10145State undistributed ------------------------- 549 140 – 549 140 79 280 – –46
Kentucky ----------------------------------- 3 826 839 19 535 766 2 187 966 17 347 800 3 422 281 2 379 837 1 350 82647
Adair County 01 02------------------------------- 16 029 122 785 638 122 147 12 693 1 656 –48Allen County 01------------------------------- 15 375 49 243 825 48 418 8 326 1 526 –49Anderson County 06--------------------------- 16 671 38 391 1 528 36 863 4 435 1 470 –50Ballard County 01----------------------------- 8 080 39 057 653 38 404 4 588 1 467 –51Barren County 02----------------------------- 35 145 117 295 4 361 112 934 20 434 5 737 1 27552Bath County 06------------------------------- 10 070 42 028 501 41 527 11 628 1 163 14653Bell County 05-------------------------------- 30 766 364 996 2 371 362 625 32 840 6 806 1 21754Boone County 04------------------------------ 67 492 200 824 30 773 170 051 18 846 27 952 1 15255Bourbon County 06---------------------------- 19 195 62 057 1 182 60 875 9 544 1 786 2656Boyd County 04------------------------------- 50 564 251 262 10 388 240 874 34 618 31 583 3 19157
Boyle County 06------------------------------ 26 476 82 874 4 296 78 578 9 094 3 746 59558Bracken County 04---------------------------- 8 149 26 105 264 25 841 3 681 1 334 –59Breathitt County 05---------------------------- 15 395 80 679 1 514 79 165 21 401 2 987 1 07560Breckinridge County 02------------------------ 16 525 63 897 2 582 61 315 9 892 2 632 33961Bullitt County 02------------------------------ 54 776 198 122 99 595 98 527 15 974 2 304 –62Butler County 01------------------------------ 11 556 41 914 469 41 445 8 593 1 438 –63Caldwell County 01---------------------------- 13 140 55 680 1 090 54 590 8 137 2 439 –64Calloway County 01--------------------------- 32 193 116 408 4 024 112 384 18 070 4 239 49265Campbell County 04--------------------------- 86 260 288 992 5 157 283 835 47 577 12 551 1 91866Carlisle County 01----------------------------- 5 283 21 727 205 21 522 2 393 920 –67
Carroll County 04----------------------------- 9 539 36 589 762 35 827 8 519 1 379 28768Carter County 04------------------------------ 25 651 99 923 4 802 95 121 19 718 2 972 59669Casey County 02------------------------------ 14 419 46 551 1 003 45 548 9 185 1 366 –70Christian County 01--------------------------- 66 846 1 052 204 861 264 190 940 41 826 734 103 726 20171Clark County 06------------------------------- 30 496 102 910 2 396 100 514 15 327 4 900 –72Clay County 05------------------------------- 22 777 118 115 2 072 116 043 27 419 18 119 –73Clinton County 01----------------------------- 9 255 43 455 379 43 076 10 572 1 010 –74Crittenden County 01-------------------------- 9 407 39 371 895 38 476 5 275 1 519 24175Cumberland County 01------------------------ 6 824 30 563 299 30 264 7 673 816 –76Daviess County 02---------------------------- 90 140 352 575 10 970 341 605 65 458 14 553 1 94577
Edmonson County 02-------------------------- 10 473 37 468 2 361 35 107 4 898 6 036 41778Elliott County 04------------------------------ 6 561 21 063 61 21 002 5 672 323 –79Estill County 06------------------------------- 15 460 65 225 1 482 63 743 11 877 1 244 35180Lexington~Fayette County 06------------------- 237 612 1 129 168 189 649 939 519 207 532 173 775 6 36781Fleming County 04---------------------------- 12 860 44 892 458 44 434 9 777 1 934 –82Floyd County 05------------------------------ 44 091 226 428 1 522 224 906 46 061 6 497 38483Franklin County 06---------------------------- 45 606 756 761 25 012 731 749 557 540 24 614 15 29784Fulton County 01------------------------------ 7 388 46 326 1 115 45 211 7 118 2 021 10585Gallatin County 04----------------------------- 6 044 17 671 960 16 711 2 622 1 109 40886Garrard County 06---------------------------- 12 679 40 131 542 39 589 5 975 1 422 –87
See footnotes at end of table.
24 Consolidated Federal Funds Report

TIPS PS [APS_PPGB,F_SCOTT] 6/ 3/96 12:37:43 MCVX09 TLP:CFFR1.TLP;15 6/ 3/96 11:04:06 DATA:NONE PSC:TIPS_12353107_01.PSC PAGE: 24TSF:TIPS92~12353107.DAT;1 6/ 3/96 12:35:33 UTF:TIPS93~12353107.DAT;1 6/ 3/96 12:35:33 META:TIPS96~12353107.DAT;1 6/ 3/96 12:37:03
1995mCon.
Direct Federal expenditures or obligationsmCon. Other Federal assistance
Direct payments for individuals Procurement contract awards
TotalRetirement and
disability All other TotalDepartmentof Defense
Other Federalexpenditures or
obligations Direct loansGuaranteed loans
and insurance
60 925 39 878 21 047 945 82 1 256 1 769 7 499 124 647 16 457 8 190 294 – 5 273 2 607 16 888 2
129 706 88 306 41 400 16 946 264 1 827 1 878 18 594 322 036 15 745 6 291 307 103 1 666 944 5 220 48 870 5 821 3 049 89 – 7 324 359 6 991 5
32 325 21 818 10 507 509 – 4 654 2 494 15 909 654 189 37 277 16 912 1 175 241 2 163 762 6 784 713 717 9 324 4 393 218 – 5 854 1 200 10 098 818 450 12 749 5 701 199 – 5 454 2 649 17 368 947 900 35 033 12 867 973 497 1 988 950 5 608 10
19 106 12 389 6 717 227 – 4 367 2 323 11 435 1116 837 11 946 4 891 180 – 3 549 408 13 883 1224 115 16 527 7 588 246 – 7 219 1 509 12 188 1321 374 14 440 6 934 389 – 4 336 2 016 8 286 1440 844 27 727 13 117 483 – 2 224 1 493 11 442 1532 811 21 078 11 733 313 – 7 331 3 543 14 505 1610 954 7 374 3 580 142 – 5 358 2 729 14 435 17
181 583 124 605 56 978 2 091 58 11 176 1 534 35 704 1821 657 15 539 6 118 304 – 5 242 5 157 18 264 1934 046 23 467 10 579 360 – 5 083 1 747 17 405 20
104 998 74 008 30 990 23 441 14 324 1 745 1 372 39 009 2120 488 14 066 6 422 218 – 5 010 580 7 794 2215 743 10 130 5 613 227 – 4 995 858 9 450 2330 069 19 703 10 366 1 763 – 5 117 304 8 088 24
139 754 98 745 41 009 12 369 4 850 4 312 1 206 36 683 2513 624 8 351 5 273 146 – 6 156 1 320 9 959 26
1 053 321 701 882 351 439 711 129 638 825 10 662 2 846 263 892 2737 181 25 040 12 141 13 923 13 340 6 064 1 408 13 664 28
506 076 372 552 133 524 32 957 13 651 51 358 681 92 640 297 930 5 575 2 355 85 – 5 750 2 933 15 583 30
21 157 13 907 7 250 216 – 8 447 2 990 21 826 3118 201 12 644 5 557 237 – 5 000 3 301 10 112 3219 964 12 805 7 159 422 – 6 789 3 059 12 447 335 130 3 379 1 751 47 – 10 023 2 173 10 987 34
12 524 8 207 4 317 123 – 8 326 1 895 7 928 3582 077 54 698 27 379 1 654 877 9 550 1 069 35 768 3621 279 13 899 7 380 369 – 9 112 6 659 33 159 3713 633 7 678 5 955 123 – 4 209 512 7 797 3833 108 28 036 5 072 227 – 1 573 436 3 776 395 414 3 666 1 748 652 – 6 873 1 051 10 574 40
24 591 17 101 7 490 455 – 5 690 4 957 15 703 417 114 4 440 2 674 2 234 2 104 6 877 420 8 698 42
33 236 22 980 10 256 376 – 1 847 1 404 4 534 4315 701 10 294 5 407 215 – 959 168 2 465 44
468 405 293 529 174 876 50 219 5 937 4 155 2 394 112 723 45413 080 1 800 411 280 – – 56 779 17 709 23 926 46
11 030 891 7 128 108 3 902 783 2 329 726 538 936 373 033 353 839 2 018 960 47
45 792 26 963 18 829 62 330 – 315 528 1 754 4838 319 26 074 12 245 614 31 459 145 1 372 4931 412 22 522 8 890 907 634 166 657 6 212 5031 358 20 084 11 274 256 – 1 388 1 627 12 598 5185 698 58 316 27 382 4 606 1 088 821 645 4 372 5228 918 18 958 9 960 189 – 130 1 507 3 827 53
112 412 77 666 34 746 212 843 40 94 324 20 424 54124 046 87 109 36 937 29 597 25 954 384 3 088 23 536 55
50 019 31 986 18 033 374 – 334 1 274 13 411 56176 270 120 570 55 700 8 403 4 063 388 182 7 634 57
66 582 48 237 18 345 3 202 1 928 249 922 3 277 5820 714 13 722 6 992 256 – 121 545 3 516 5954 702 36 795 17 907 1 517 – 72 213 4 053 6049 058 34 115 14 943 407 – 1 908 2 541 3 510 6181 812 56 820 24 992 97 747 97 132 286 1 764 16 006 6230 716 19 100 11 616 256 – 911 1 873 1 277 6342 559 27 914 14 645 284 – 2 260 2 444 2 663 6491 190 59 771 31 419 729 – 2 181 2 853 6 493 65
225 184 149 490 75 694 3 331 297 348 981 28 422 6616 764 11 160 5 604 152 – 1 499 839 3 055 67
26 283 16 966 9 317 318 – 90 1 442 2 527 6873 642 52 019 21 623 3 456 2 976 135 1 012 6 493 6935 232 23 854 11 378 413 147 355 344 2 831 70
147 058 103 822 43 236 124 432 121 541 4 785 1 802 39 040 7181 413 59 004 22 409 985 160 285 952 16 425 7265 364 42 337 23 027 7 101 1 606 111 1 064 1 875 7331 487 19 963 11 524 234 – 151 3 132 589 7430 811 19 507 11 304 311 65 1 455 469 963 7521 760 12 951 8 809 161 – 153 963 540 76
238 587 162 131 76 456 31 881 3 308 2 096 5 206 62 332 77
24 648 16 770 7 878 1 488 1 336 399 616 407 7814 976 9 341 5 635 66 – 26 133 137 7951 171 36 381 14 790 835 655 99 872 557 80
528 841 356 630 172 211 216 659 173 614 2 362 99 004 113 988 8132 347 20 824 11 523 375 – 460 1 032 6 085 82
154 463 107 130 47 333 19 044 87 363 2 909 63 097 83169 804 114 150 55 654 4 493 3 108 310 970 39 327 84
35 198 22 718 12 480 671 330 1 317 1 518 5 805 8513 250 8 827 4 423 623 415 67 528 755 8632 328 23 536 8 792 275 – 132 500 2 313 87
County Area 25

TIPS PS [APS_PPGB,F_SCOTT] 6/ 3/96 12:37:43 MCVX09 TLP:CFFR1.TLP;15 6/ 3/96 11:04:06 DATA:NONE PSC:TIPS_12353107_01.PSC PAGE: 25TSF:TIPS92~12353107.DAT;1 6/ 3/96 12:35:33 UTF:TIPS93~12353107.DAT;1 6/ 3/96 12:35:33 META:TIPS96~12353107.DAT;1 6/ 3/96 12:37:03
Federal Government Expenditures or Obligations by State and County Area: Fiscal Year[Thousand dollars]
State and county area
Congressional district
Direct Federal expenditures or obligations
Total direct expenditres or obligations Salaries and wages
United Statesresident
population1 TotalDepartment of
DefenseAll other
agencies Grant awards TotalDepartmentof Defense
Kentucky mCon.
Grant County 04------------------------------ 18 014 55 864 790 55 074 8 532 2 108 –1Graves County 01----------------------------- 34 778 146 200 1 869 144 331 19 145 6 614 –2Grayson County 02---------------------------- 22 539 86 226 2 420 83 806 15 884 2 750 2573Green County 02------------------------------ 10 360 39 198 294 38 904 8 542 933 –4Greenup County 04--------------------------- 37 111 133 137 4 069 129 068 17 923 2 657 4655Hancock County 02---------------------------- 8 121 22 920 665 22 255 3 419 900 –6Hardin County 02----------------------------- 90 391 711 021 459 647 251 374 36 304 413 411 400 9577Harlan County 05----------------------------- 36 289 378 453 11 327 367 126 32 689 5 863 8198Harrison County 06---------------------------- 16 830 58 885 5 485 53 400 8 984 2 931 4549Hart County 02------------------------------- 16 044 53 888 660 53 228 10 614 1 837 –10
Henderson County 01-------------------------- 44 211 165 519 4 525 160 994 25 029 4 395 40811Henry County 04------------------------------ 13 870 47 339 866 46 473 7 751 2 145 18412Hickman County 01---------------------------- 5 379 21 873 171 21 702 4 444 835 –13Hopkins County 01---------------------------- 46 308 367 366 4 874 362 492 34 317 7 923 1 04914Jackson County 05---------------------------- 12 520 58 700 7 754 50 946 13 932 3 961 2 51715Jefferson County 02 03--------------------------- 672 310 2 917 664 227 322 2 690 342 469 625 379 968 129 28016Jessamine County 06-------------------------- 33 558 86 690 1 815 84 875 23 275 3 136 –17Johnson County 05---------------------------- 23 860 127 097 1 418 125 679 33 219 4 082 39018Kenton County 04----------------------------- 144 850 640 298 5 995 634 303 99 662 127 912 9519Knott County 05------------------------------- 18 337 80 747 651 80 096 18 241 2 512 24920
Knox County 05------------------------------- 31 137 131 520 2 543 128 977 34 443 7 583 1 26121Larue County 02------------------------------ 12 420 47 611 1 129 46 482 7 322 1 656 –22Laurel County 05------------------------------ 47 300 168 527 11 091 157 436 32 788 13 457 1 55823Lawrence County 04 05--------------------------- 15 071 59 976 1 008 58 968 16 227 1 792 28124Lee County 05-------------------------------- 7 749 36 190 2 306 33 884 8 928 960 –25Leslie County 05------------------------------ 13 806 75 722 285 75 437 15 396 1 758 –26Letcher County 05----------------------------- 26 991 166 304 724 165 580 70 166 3 237 –27Lewis County 04------------------------------ 13 254 46 445 533 45 912 11 350 933 –28Lincoln County 02 06----------------------------- 21 245 72 646 937 71 709 14 959 2 025 –29Livingston County 01-------------------------- 9 255 50 549 4 429 46 120 4 717 3 088 80230
Logan County 01------------------------------ 25 436 88 449 2 333 86 116 15 399 2 963 16231Lyon County 01------------------------------- 7 570 29 047 1 188 27 859 3 088 1 359 64332McCracken County 01------------------------- 64 631 541 488 7 850 533 638 39 289 38 990 2 49133McCreary County 05--------------------------- 16 239 86 519 4 223 82 296 21 574 3 553 –34McLean County 01---------------------------- 9 675 38 693 904 37 789 7 074 1 391 19235Madison County 06---------------------------- 61 962 237 006 35 939 201 067 49 832 27 049 21 13236Magoffin County 05---------------------------- 13 649 58 120 160 57 960 19 393 1 326 –37Marion County 02----------------------------- 16 604 62 071 1 241 60 830 14 568 2 767 64338Marshall County 01---------------------------- 28 739 109 832 2 475 107 357 14 413 3 739 50239Martin County 05------------------------------ 12 931 55 921 265 55 656 12 818 767 –40
Mason County 04----------------------------- 17 213 60 139 1 533 58 606 12 774 3 301 97241Meade County 02----------------------------- 26 473 55 897 6 004 49 893 7 375 1 652 20842Menifee County 05---------------------------- 5 267 29 725 7 836 21 889 4 942 7 943 5 89643Mercer County 06----------------------------- 19 795 62 794 1 476 61 318 9 821 2 343 35744Metcalfe County 02---------------------------- 9 219 33 131 317 32 814 6 446 1 119 –45Monroe County 01---------------------------- 11 663 48 490 768 47 722 10 212 1 980 32946Montgomery County 06------------------------ 20 304 67 745 904 66 841 13 753 2 528 –47Morgan County 05---------------------------- 13 313 44 972 332 44 640 11 716 1 273 –48Muhlenberg County 01------------------------- 31 064 310 130 5 003 305 127 21 011 32 690 2 42949Nelson County 02----------------------------- 32 638 91 455 3 154 88 301 14 947 3 864 45350
Nicholas County 04 06---------------------------- 6 902 26 128 1 160 24 968 5 051 1 499 73051Ohio County 01------------------------------- 21 492 90 640 1 308 89 332 24 263 2 895 –52Oldham County 04---------------------------- 39 775 56 669 2 118 54 551 10 895 3 051 –53Owen County 04------------------------------ 9 575 27 183 182 27 001 5 736 1 130 –54Owsley County 05----------------------------- 5 413 31 183 191 30 992 10 079 932 –55Pendleton County 04-------------------------- 13 189 36 210 537 35 673 6 020 1 210 –56Perry County 05------------------------------ 31 140 237 637 1 778 235 859 35 491 6 549 66257Pike County 05------------------------------- 73 476 319 941 3 940 316 001 66 364 13 723 60558Powell County 06----------------------------- 12 153 47 857 480 47 377 9 339 1 640 5359Pulaski County 05----------------------------- 53 393 210 249 5 197 205 052 50 473 8 435 1 34760
Robertson County 04-------------------------- 2 200 7 280 70 7 210 1 789 181 –61Rockcastle County 05-------------------------- 15 312 58 438 1 287 57 151 15 142 1 422 –62Rowan County 04----------------------------- 21 458 68 934 1 716 67 218 16 628 3 706 48363Russell County 01----------------------------- 15 786 64 245 1 961 62 284 13 199 2 389 79564Scott County 06------------------------------- 26 790 73 963 1 698 72 265 14 552 2 817 56465Shelby County 04----------------------------- 27 045 75 785 1 687 74 098 12 712 3 131 17666Simpson County 01---------------------------- 15 850 45 613 589 45 024 7 208 1 443 –67Spencer County 02---------------------------- 7 636 23 320 1 073 22 247 3 831 994 16968Taylor County 02------------------------------ 22 413 80 076 2 303 77 773 12 864 3 730 62669Todd County 01------------------------------- 11 258 38 477 812 37 665 5 674 1 589 –70
Trigg County 01------------------------------- 11 195 51 241 2 653 48 588 4 481 8 330 –71Trimble County 04----------------------------- 6 717 21 883 398 21 485 4 331 684 –72Union County 01------------------------------ 16 469 265 564 1 508 264 056 8 193 2 172 –73Warren County 02----------------------------- 83 049 284 065 12 947 271 118 58 773 21 358 2 37274Washington County 02------------------------- 10 569 41 105 543 40 562 13 075 1 581 21975Wayne County 05----------------------------- 18 219 71 153 1 026 70 127 17 607 1 533 29676Webster County 01---------------------------- 13 545 197 571 683 196 888 5 762 1 783 –77Whitley County 05----------------------------- 34 926 178 092 4 651 173 441 34 738 5 289 26978Wolfe County 05------------------------------ 7 099 35 368 184 35 184 10 661 1 345 –79Woodford County 06--------------------------- 21 234 48 687 1 359 47 328 5 641 1 889 –80State undistributed ------------------------- 983 290 – 983 290 140 631 – –81
Louisiana ----------------------------------- 4 314 974 22 526 319 2 377 054 20 149 265 5 509 687 2 058 603 922 82882
Acadia Parish 07------------------------------ 56 855 252 524 2 675 249 849 76 897 5 368 15183Allen Parish 07-------------------------------- 23 322 136 523 8 950 127 573 27 005 34 633 31384Ascension Parish 03 04--------------------------- 63 884 186 825 6 740 180 085 50 477 5 401 70485Assumption Parish 03-------------------------- 22 677 75 163 756 74 407 20 175 1 573 23486Avoyelles Parish 06--------------------------- 39 839 180 960 2 559 178 401 56 677 4 048 33387Beauregard Parish 07-------------------------- 31 398 117 609 9 689 107 920 23 784 6 204 30888Bienville Parish 05----------------------------- 16 084 79 343 2 483 76 860 24 130 2 552 –89Bossier Parish 05----------------------------- 89 368 696 133 398 264 297 869 74 820 236 541 227 39090Caddo Parish 04 05------------------------------ 246 777 1 141 025 67 728 1 073 297 267 668 105 202 2 91391Calcasieu Parish 07--------------------------- 173 337 738 662 78 130 660 532 150 991 28 360 4 84392
See footnotes at end of table.
26 Consolidated Federal Funds Report

TIPS PS [APS_PPGB,F_SCOTT] 6/ 3/96 12:37:43 MCVX09 TLP:CFFR1.TLP;15 6/ 3/96 11:04:06 DATA:NONE PSC:TIPS_12353107_01.PSC PAGE: 26TSF:TIPS92~12353107.DAT;1 6/ 3/96 12:35:33 UTF:TIPS93~12353107.DAT;1 6/ 3/96 12:35:33 META:TIPS96~12353107.DAT;1 6/ 3/96 12:37:03
1995mCon.
Direct Federal expenditures or obligationsmCon. Other Federal assistance
Direct payments for individuals Procurement contract awards
TotalRetirement and
disability All other TotalDepartmentof Defense
Other Federalexpenditures or
obligations Direct loansGuaranteed loans
and insurance
44 502 29 994 14 508 575 168 147 872 1 522 1114 164 76 090 38 074 1 802 90 4 476 2 451 6 154 2
65 270 42 881 22 389 927 453 1 396 4 882 4 013 329 284 18 138 11 146 180 – 259 241 2 069 4
111 466 81 426 30 040 956 486 136 456 13 046 518 087 11 960 6 127 215 – 299 437 6 350 6
256 211 203 353 52 858 3 733 1 585 1 362 3 215 27 087 7207 432 169 322 38 110 132 314 8 861 155 645 30 990 8
42 255 28 790 13 465 4 469 4 115 246 2 086 12 805 940 716 27 218 13 498 294 – 428 1 654 2 330 10
112 886 74 943 37 943 21 151 2 076 2 057 2 503 21 353 1136 787 21 418 15 369 369 – 286 2 124 2 477 1214 159 8 975 5 184 133 – 2 302 3 389 12 120 13
143 921 101 799 42 122 179 894 778 1 311 3 272 3 109 1440 271 27 983 12 288 423 91 113 1 510 2 593 15
1 949 499 1 266 270 683 229 110 899 44 419 7 672 168 427 788 1658 706 42 449 16 257 1 399 – 175 2 097 15 017 1776 558 53 450 23 108 13 136 159 104 320 34 429 18
356 832 235 858 120 974 55 387 947 504 1 035 42 722 1951 649 34 547 17 102 8 253 91 92 57 1 845 20
88 378 57 615 30 763 985 396 131 1 611 12 887 2137 633 24 420 13 213 358 – 642 1 479 3 393 22
112 065 77 849 34 216 9 701 7 424 516 5 480 3 839 2341 522 28 556 12 966 342 39 93 701 1 158 2424 197 15 959 8 238 2 040 1 868 64 2 065 2 720 2542 164 29 828 12 336 16 337 – 68 213 1 065 2691 508 64 339 27 169 1 200 – 194 192 4 801 2733 848 23 150 10 698 189 – 126 803 4 017 2854 761 38 560 16 201 510 – 391 723 5 456 2930 903 21 318 9 585 10 445 3 073 1 395 322 2 406 30
66 317 42 560 23 757 928 445 2 843 4 665 28 539 3123 788 16 507 7 281 142 – 670 542 1 398 32
207 094 138 917 68 177 252 683 1 102 3 433 1 486 20 734 3354 128 36 350 17 778 7 075 3 279 190 628 456 3428 260 19 235 9 025 526 – 1 441 2 769 5 233 35
151 540 98 064 53 476 8 165 5 934 420 3 594 12 347 3636 896 24 453 12 443 434 27 72 1 254 2 445 3743 809 29 526 14 283 398 – 530 1 590 2 479 3889 491 60 926 28 565 1 065 – 1 123 1 014 4 910 3941 939 29 805 12 134 359 – 38 574 22 734 40
43 314 30 085 13 229 331 – 418 502 3 376 4145 119 35 689 9 430 875 400 875 676 4 666 4216 332 12 159 4 173 486 – 21 361 312 4349 888 35 400 14 488 474 – 268 1 154 5 417 4425 101 17 654 7 447 227 – 238 19 1 365 4535 734 21 846 13 888 294 – 271 1 510 615 4650 955 36 734 14 221 331 – 178 2 323 6 404 4731 606 21 445 10 161 288 29 89 311 1 724 48
102 854 74 107 28 747 152 309 1 155 1 265 1 488 1 154 4970 616 45 987 24 629 1 401 727 626 1 060 7 373 50
19 336 13 469 5 867 152 – 90 138 7 159 5161 637 41 908 19 729 873 – 972 1 774 4 354 5241 704 26 925 14 779 655 49 365 2 828 22 159 5319 958 12 753 7 205 199 – 160 227 9 294 5419 809 12 986 6 823 189 – 173 382 494 5528 563 19 132 9 431 295 49 121 275 5 301 56
111 169 77 966 33 203 84 241 110 188 254 16 220 57232 258 172 917 59 341 7 258 1 802 338 1 622 130 093 58
27 210 17 990 9 220 9 597 – 71 365 2 811 59149 628 110 345 39 283 1 241 53 473 2 338 13 140 60
5 233 3 332 1 901 38 – 39 141 1 086 6141 415 28 497 12 918 279 33 180 605 904 6247 898 27 613 20 285 529 42 172 2 483 3 362 6348 104 31 937 16 167 369 90 185 260 12 212 6455 787 37 321 18 466 480 – 326 2 811 11 371 6556 689 37 683 19 006 2 641 – 612 2 528 7 790 6635 226 24 345 10 881 294 – 1 443 3 215 8 228 6717 480 10 875 6 605 763 602 253 – 6 115 6862 246 42 652 19 594 763 356 473 473 7 742 6928 438 19 092 9 346 227 – 2 549 5 175 9 834 70
36 840 27 210 9 630 412 – 1 178 1 418 3 758 7116 550 11 120 5 430 142 – 176 965 900 7240 916 28 735 12 181 212 039 456 2 243 4 658 6 811 73
195 587 129 153 66 434 6 618 3 348 1 729 4 193 20 146 7424 909 16 611 8 298 270 33 1 271 350 2 488 7551 611 34 237 17 374 208 – 192 2 792 2 391 7642 274 29 518 12 756 145 891 – 1 861 2 705 4 729 77
134 646 92 069 42 577 3 126 1 181 293 – 8 626 7822 915 15 536 7 379 342 – 105 383 111 7940 624 29 628 10 996 368 – 164 1 195 15 201 80
559 629 2 414 557 215 – – 283 030 83 344 295 390 81
11 920 612 6 963 724 4 956 888 2 098 108 1 046 728 939 309 452 750 26 675 521 82
138 069 90 868 47 201 7 622 433 24 568 7 660 58 381 8359 422 37 486 21 936 8 123 7 197 7 341 2 951 12 454 84
125 128 75 114 50 014 5 038 3 530 780 3 162 182 037 8552 608 32 136 20 472 409 – 398 16 968 41 330 86
113 224 71 897 41 327 2 428 49 4 583 4 259 30 026 8784 695 61 104 23 591 800 136 2 126 825 9 280 8851 525 33 650 17 875 919 522 219 555 3 559 89
275 821 220 923 54 898 108 156 106 675 795 1 850 255 947 90707 564 431 645 275 919 56 796 29 224 3 795 18 197 416 379 91459 555 290 067 169 488 91 291 58 940 8 466 4 640 336 334 92
County Area 27

TIPS PS [APS_PPGB,F_SCOTT] 6/ 3/96 12:37:43 MCVX09 TLP:CFFR1.TLP;15 6/ 3/96 11:04:06 DATA:NONE PSC:TIPS_12353107_01.PSC PAGE: 27TSF:TIPS92~12353107.DAT;1 6/ 3/96 12:35:33 UTF:TIPS93~12353107.DAT;1 6/ 3/96 12:35:33 META:TIPS96~12353107.DAT;1 6/ 3/96 12:37:03
Federal Government Expenditures or Obligations by State and County Area: Fiscal Year[Thousand dollars]
State and county area
Congressional district
Direct Federal expenditures or obligations
Total direct expenditres or obligations Salaries and wages
United Statesresident
population1 TotalDepartment of
DefenseAll other
agencies Grant awards TotalDepartmentof Defense
Louisiana mCon.
Caldwell Parish 05---------------------------- 10 334 51 432 902 50 530 16 642 1 296 2171Cameron Parish 07---------------------------- 8 912 29 448 4 719 24 729 4 010 1 351 992Catahoula Parish 06--------------------------- 11 260 60 235 1 870 58 365 24 241 2 049 5823Claiborne Parish 05--------------------------- 17 362 76 129 2 842 73 287 20 519 2 203 1384Concordia Parish 06--------------------------- 20 844 94 408 7 098 87 310 25 646 3 342 1 1475De Soto Parish 04----------------------------- 25 036 106 159 2 612 103 547 29 478 3 055 5786East Baton Rouge Parish 04 06-------------------- 396 340 2 292 864 215 314 2 077 550 1 091 778 104 239 12 1457East Carroll Parish 05-------------------------- 9 467 54 702 193 54 509 20 297 1 215 –8East Feliciana Parish 06----------------------- 20 412 89 074 1 855 87 219 36 224 2 747 9609Evangeline Parish 04 07-------------------------- 33 966 181 551 1 674 179 877 60 349 3 070 24310
Franklin Parish 06----------------------------- 22 433 107 686 4 797 102 889 36 427 3 245 87411Grant Parish 06------------------------------- 17 775 77 264 4 099 73 165 21 564 3 132 64312Iberia Parish 03------------------------------- 70 782 240 358 9 381 230 977 63 939 6 698 81613Iberville Parish 03 04----------------------------- 31 016 135 210 9 750 125 460 34 146 11 543 1 64314Jackson Parish 05----------------------------- 15 683 74 463 3 155 71 308 19 022 3 492 1 77615Jefferson Parish 01 02 03---------------------------- 456 589 2 032 433 70 870 1 961 563 308 025 89 559 19 09116Jefferson Davis Parish 07---------------------- 31 380 144 893 2 187 142 706 36 752 3 341 37417Lafayette Parish 04 07---------------------------- 176 590 546 454 22 018 524 436 132 986 45 799 5 28818Lafourche Parish 03--------------------------- 86 912 318 371 43 441 274 930 73 953 6 982 82819La Salle Parish 06----------------------------- 13 795 62 394 3 052 59 342 13 963 2 674 1 60520
Lincoln Parish 05------------------------------ 43 226 169 304 7 902 161 402 57 373 5 614 1 21921Livingston Parish 06--------------------------- 77 864 196 348 3 707 192 641 49 276 4 892 3022Madison Parish 06---------------------------- 12 472 70 564 3 721 66 843 26 987 1 862 10523Morehouse Parish 05-------------------------- 32 061 154 033 1 877 152 156 45 648 3 280 19524Natchitoches Parish 04 06------------------------ 37 252 160 901 4 373 156 528 45 224 7 251 65425Orleans Parish 01 02----------------------------- 484 149 4 134 355 490 799 3 643 556 750 877 669 725 217 85126Ouachita Parish 05---------------------------- 146 447 541 530 16 278 525 252 137 935 23 707 4 39527Plaquemines Parish 03------------------------ 25 454 149 857 37 513 112 344 43 791 30 122 19 89728Pointe Coupee Parish 04 06----------------------- 23 015 83 867 2 005 81 862 26 412 3 223 1 09629Rapides Parish 04 06----------------------------- 126 480 744 038 65 633 678 405 253 716 91 463 19 46630
Red River Parish 04 05--------------------------- 9 322 47 359 6 136 41 223 13 099 1 929 50431Richland Parish 05---------------------------- 20 570 108 195 1 373 106 822 38 345 4 518 19132Sabine Parish 04------------------------------ 23 473 111 011 4 735 106 276 32 162 2 287 14933St. Bernard Parish 03-------------------------- 66 984 269 492 5 442 264 050 51 861 4 927 5734St. Charles Parish 03-------------------------- 45 749 189 549 2 174 187 375 26 333 6 350 16935St. Helena Parish 06--------------------------- 9 868 29 701 623 29 078 10 306 969 27336St. James Parish 03--------------------------- 20 998 88 500 1 935 86 565 18 711 4 698 8037St. John the Baptist Psh 03--------------------- 41 742 170 221 5 359 164 862 32 940 2 531 –38St. Landry Parish 04 07--------------------------- 82 154 499 008 130 562 368 446 116 162 8 220 83139St. Martin Parish 03 04--------------------------- 45 739 138 794 4 857 133 937 40 448 3 688 90240
St. Mary Parish 03---------------------------- 57 184 225 678 21 856 203 822 56 722 8 873 1 14341St. Tammany Parish 01------------------------ 167 242 603 329 55 105 548 224 129 641 21 586 2 03342Tangipahoa Parish 01------------------------- 91 257 413 239 8 891 404 348 143 507 12 812 2 87843Tensas Parish 06----------------------------- 6 908 37 517 262 37 255 13 509 776 –44Terrebonne Parish 03-------------------------- 100 359 338 042 7 345 330 697 87 960 12 945 33745Union Parish 05------------------------------- 21 474 89 700 2 368 87 332 24 321 3 136 29946Vermilion Parish 07---------------------------- 50 794 201 572 3 528 198 044 50 718 6 249 1 99747Vernon Parish 07------------------------------ 57 008 607 312 464 880 142 432 40 526 360 655 355 85048Washington Parish 01------------------------- 42 898 217 222 6 348 210 874 58 319 6 239 1 96749Webster Parish 05---------------------------- 42 227 194 659 5 476 189 183 46 808 4 603 24150
West Baton Rouge Parish 04------------------- 20 056 70 411 1 232 69 179 24 694 2 724 79251West Carroll Parish 05------------------------- 11 999 56 600 924 55 676 15 131 1 795 30852West Feliciana Parish 06----------------------- 13 132 36 955 10 521 26 434 9 309 803 7253Winn Parish 06------------------------------- 16 988 80 940 1 512 79 428 27 039 3 242 61154State undistributed ------------------------- 916 220 – 916 220 121 292 – –55
Maine -------------------------------------- 1 240 280 6 650 159 1 254 806 5 395 353 1 413 533 728 341 381 03456
Androscoggin County 02----------------------- 103 882 413 722 18 542 395 180 88 748 18 420 3 84857Aroostook County 02-------------------------- 81 920 422 571 48 414 374 157 103 353 26 378 5 33458Cumberland County 01------------------------ 248 009 1 134 939 158 832 976 107 186 815 211 109 98 62459Franklin County 02---------------------------- 29 645 104 535 2 772 101 763 23 248 4 173 9760Hancock County 02---------------------------- 48 837 226 911 24 611 202 300 53 078 28 485 13 56461Kennebec County 01 02-------------------------- 117 262 810 180 37 379 772 801 384 081 85 298 20 08762Knox County 01------------------------------- 37 074 149 468 6 875 142 593 30 042 7 733 –63Lincoln County 01----------------------------- 31 023 121 681 6 211 115 470 20 557 5 486 –64Oxford County 02----------------------------- 53 031 207 527 5 007 202 520 44 166 7 602 29065Penobscot County 02-------------------------- 146 501 641 621 59 395 582 226 147 670 77 273 28 83566
Piscataquis County 02------------------------- 18 549 74 355 2 505 71 850 15 343 2 500 –67Sagadahoc County 01------------------------- 33 870 704 158 609 399 94 759 27 200 29 405 26 45168Somerset County 02--------------------------- 51 219 182 786 4 096 178 690 48 576 6 896 30169Waldo County 02------------------------------ 35 002 133 453 14 313 119 140 31 295 5 746 68470Washington County 02------------------------- 35 883 196 950 18 135 178 815 48 423 16 950 6 26771York County 01------------------------------- 168 573 806 349 238 320 568 029 98 624 194 888 176 65272State undistributed ------------------------- 318 951 – 318 951 62 314 – –73
Maryland ----------------------------------- 5 001 909 37 090 137 7 746 739 29 343 398 4 484 748 7 191 838 2 472 67774
Allegany County 06---------------------------- 73 867 410 344 8 807 401 537 77 684 27 630 2 40775Anne Arundel County 01 02 03 05----------------------- 456 176 2 709 798 1 064 708 1 645 090 336 220 604 232 491 92476Baltimore County 02 03 07--------------------------- 711 787 3 330 496 238 697 3 091 799 273 683 753 733 64 19677Baltimore city area 01 03 07-------------------------- 702 979 6 568 427 980 260 5 588 167 1 963 120 692 275 83 67078Calvert County 05----------------------------- 62 179 163 244 19 070 144 174 16 702 6 824 2 73779Caroline County 01---------------------------- 28 720 98 212 6 712 91 500 14 821 3 759 34480Carroll County 06----------------------------- 136 446 468 914 110 368 358 546 34 857 14 672 77281Cecil County 01------------------------------- 77 038 287 448 18 872 268 576 29 722 59 235 1 20382Charles County 05---------------------------- 109 295 482 916 199 860 283 056 39 606 138 067 124 91783Dorchester County 01------------------------- 30 423 130 889 7 323 123 566 24 598 5 817 –84
See footnotes at end of table.
28 Consolidated Federal Funds Report
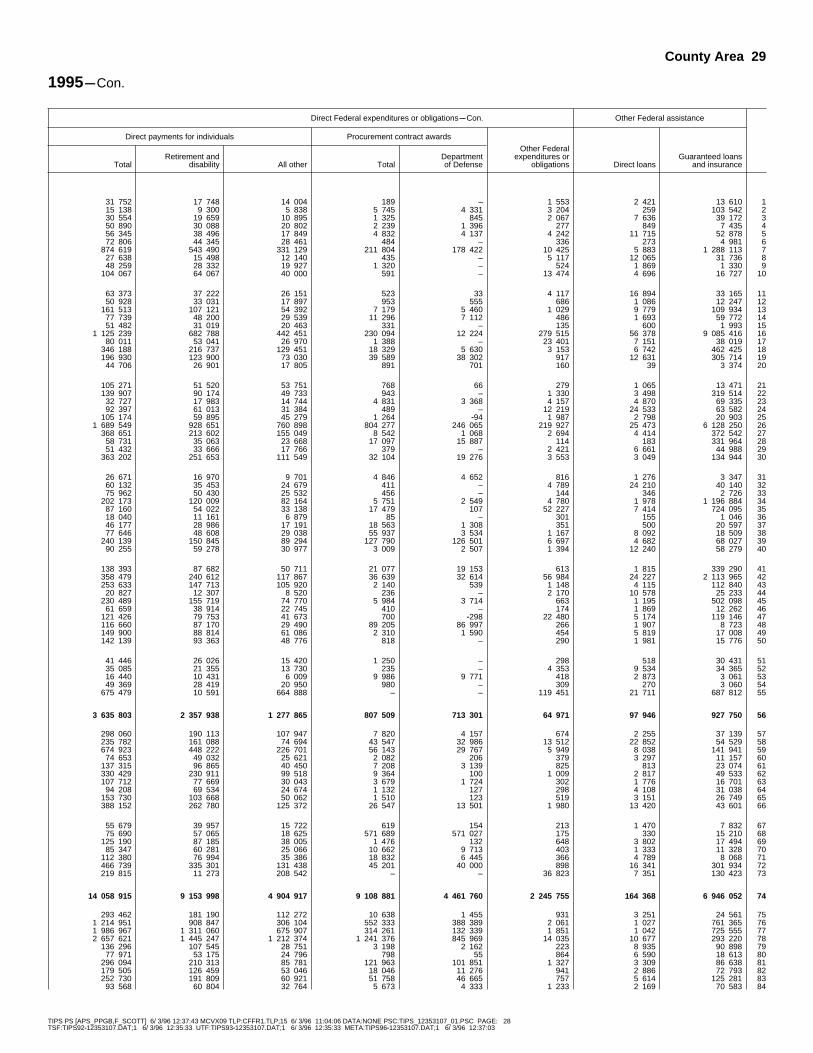
TIPS PS [APS_PPGB,F_SCOTT] 6/ 3/96 12:37:43 MCVX09 TLP:CFFR1.TLP;15 6/ 3/96 11:04:06 DATA:NONE PSC:TIPS_12353107_01.PSC PAGE: 28TSF:TIPS92~12353107.DAT;1 6/ 3/96 12:35:33 UTF:TIPS93~12353107.DAT;1 6/ 3/96 12:35:33 META:TIPS96~12353107.DAT;1 6/ 3/96 12:37:03
1995mCon.
Direct Federal expenditures or obligationsmCon. Other Federal assistance
Direct payments for individuals Procurement contract awards
TotalRetirement and
disability All other TotalDepartmentof Defense
Other Federalexpenditures or
obligations Direct loansGuaranteed loans
and insurance
31 752 17 748 14 004 189 – 1 553 2 421 13 610 115 138 9 300 5 838 5 745 4 331 3 204 259 103 542 230 554 19 659 10 895 1 325 845 2 067 7 636 39 172 350 890 30 088 20 802 2 239 1 396 277 849 7 435 456 345 38 496 17 849 4 832 4 137 4 242 11 715 52 878 572 806 44 345 28 461 484 – 336 273 4 981 6
874 619 543 490 331 129 211 804 178 422 10 425 5 883 1 288 113 727 638 15 498 12 140 435 – 5 117 12 065 31 736 848 259 28 332 19 927 1 320 – 524 1 869 1 330 9
104 067 64 067 40 000 591 – 13 474 4 696 16 727 10
63 373 37 222 26 151 523 33 4 117 16 894 33 165 1150 928 33 031 17 897 953 555 686 1 086 12 247 12
161 513 107 121 54 392 7 179 5 460 1 029 9 779 109 934 1377 739 48 200 29 539 11 296 7 112 486 1 693 59 772 1451 482 31 019 20 463 331 – 135 600 1 993 15
1 125 239 682 788 442 451 230 094 12 224 279 515 56 378 9 085 416 1680 011 53 041 26 970 1 388 – 23 401 7 151 38 019 17
346 188 216 737 129 451 18 329 5 630 3 153 6 742 462 425 18196 930 123 900 73 030 39 589 38 302 917 12 631 305 714 19
44 706 26 901 17 805 891 701 160 39 3 374 20
105 271 51 520 53 751 768 66 279 1 065 13 471 21139 907 90 174 49 733 943 – 1 330 3 498 319 514 22
32 727 17 983 14 744 4 831 3 368 4 157 4 870 69 335 2392 397 61 013 31 384 489 – 12 219 24 533 63 582 24
105 174 59 895 45 279 1 264 ~94 1 987 2 798 20 903 251 689 549 928 651 760 898 804 277 246 065 219 927 25 473 6 128 250 26
368 651 213 602 155 049 8 542 1 068 2 694 4 414 372 542 2758 731 35 063 23 668 17 097 15 887 114 183 331 964 2851 432 33 666 17 766 379 – 2 421 6 661 44 988 29
363 202 251 653 111 549 32 104 19 276 3 553 3 049 134 944 30
26 671 16 970 9 701 4 846 4 652 816 1 276 3 347 3160 132 35 453 24 679 411 – 4 789 24 210 40 140 3275 962 50 430 25 532 456 – 144 346 2 726 33
202 173 120 009 82 164 5 751 2 549 4 780 1 978 1 196 884 3487 160 54 022 33 138 17 479 107 52 227 7 414 724 095 3518 040 11 161 6 879 85 – 301 155 1 046 3646 177 28 986 17 191 18 563 1 308 351 500 20 597 3777 646 48 608 29 038 55 937 3 534 1 167 8 092 18 509 38
240 139 150 845 89 294 127 790 126 501 6 697 4 682 68 027 3990 255 59 278 30 977 3 009 2 507 1 394 12 240 58 279 40
138 393 87 682 50 711 21 077 19 153 613 1 815 339 290 41358 479 240 612 117 867 36 639 32 614 56 984 24 227 2 113 965 42253 633 147 713 105 920 2 140 539 1 148 4 115 112 840 43
20 827 12 307 8 520 236 – 2 170 10 578 25 233 44230 489 155 719 74 770 5 984 3 714 663 1 195 502 098 45
61 659 38 914 22 745 410 – 174 1 869 12 262 46121 426 79 753 41 673 700 ~298 22 480 5 174 119 146 47116 660 87 170 29 490 89 205 86 997 266 1 907 8 723 48149 900 88 814 61 086 2 310 1 590 454 5 819 17 008 49142 139 93 363 48 776 818 – 290 1 981 15 776 50
41 446 26 026 15 420 1 250 – 298 518 30 431 5135 085 21 355 13 730 235 – 4 353 9 534 34 365 5216 440 10 431 6 009 9 986 9 771 418 2 873 3 061 5349 369 28 419 20 950 980 – 309 270 3 060 54
675 479 10 591 664 888 – – 119 451 21 711 687 812 55
3 635 803 2 357 938 1 277 865 807 509 713 301 64 971 97 946 927 750 56
298 060 190 113 107 947 7 820 4 157 674 2 255 37 139 57235 782 161 088 74 694 43 547 32 986 13 512 22 852 54 529 58674 923 448 222 226 701 56 143 29 767 5 949 8 038 141 941 59
74 653 49 032 25 621 2 082 206 379 3 297 11 157 60137 315 96 865 40 450 7 208 3 139 825 813 23 074 61330 429 230 911 99 518 9 364 100 1 009 2 817 49 533 62107 712 77 669 30 043 3 679 1 724 302 1 776 16 701 63
94 208 69 534 24 674 1 132 127 298 4 108 31 038 64153 730 103 668 50 062 1 510 123 519 3 151 26 749 65388 152 262 780 125 372 26 547 13 501 1 980 13 420 43 601 66
55 679 39 957 15 722 619 154 213 1 470 7 832 6775 690 57 065 18 625 571 689 571 027 175 330 15 210 68
125 190 87 185 38 005 1 476 132 648 3 802 17 494 6985 347 60 281 25 066 10 662 9 713 403 1 333 11 328 70
112 380 76 994 35 386 18 832 6 445 366 4 789 8 068 71466 739 335 301 131 438 45 201 40 000 898 16 341 301 934 72219 815 11 273 208 542 – – 36 823 7 351 130 423 73
14 058 915 9 153 998 4 904 917 9 108 881 4 461 760 2 245 755 164 368 6 946 052 74
293 462 181 190 112 272 10 638 1 455 931 3 251 24 561 751 214 951 908 847 306 104 552 333 388 389 2 061 1 027 761 365 761 986 967 1 311 060 675 907 314 261 132 339 1 851 1 042 725 555 772 657 621 1 445 247 1 212 374 1 241 376 845 969 14 035 10 677 293 220 78
136 296 107 545 28 751 3 198 2 162 223 8 935 90 898 7977 971 53 175 24 796 798 55 864 6 590 18 613 80
296 094 210 313 85 781 121 963 101 851 1 327 3 309 86 638 81179 505 126 459 53 046 18 046 11 276 941 2 886 72 793 82252 730 191 809 60 921 51 758 46 665 757 5 614 125 281 83
93 568 60 804 32 764 5 673 4 333 1 233 2 169 70 583 84
County Area 29

TIPS PS [APS_PPGB,F_SCOTT] 6/ 3/96 12:37:43 MCVX09 TLP:CFFR1.TLP;15 6/ 3/96 11:04:06 DATA:NONE PSC:TIPS_12353107_01.PSC PAGE: 29TSF:TIPS92~12353107.DAT;1 6/ 3/96 12:35:33 UTF:TIPS93~12353107.DAT;1 6/ 3/96 12:35:33 META:TIPS96~12353107.DAT;1 6/ 3/96 12:37:03
Federal Government Expenditures or Obligations by State and County Area: Fiscal Year[Thousand dollars]
State and county area
Congressional district
Direct Federal expenditures or obligations
Total direct expenditres or obligations Salaries and wages
United Statesresident
population1 TotalDepartment of
DefenseAll other
agencies Grant awards TotalDepartmentof Defense
Maryland mCon.
Frederick County 06--------------------------- 171 276 604 930 133 026 471 904 80 013 126 526 75 0151Garrett County 06----------------------------- 29 372 98 787 3 609 95 178 19 057 4 655 1 2372Harford County 02----------------------------- 201 988 1 199 235 702 176 497 059 58 359 393 141 371 8793Howard County 03 06---------------------------- 212 980 624 851 115 728 509 123 57 716 34 257 3 5944Kent County 01------------------------------- 18 687 85 076 3 380 81 696 11 619 4 067 3965Montgomery County 04 08------------------------ 802 729 8 516 009 1 964 544 6 551 465 612 983 2 527 775 482 6936Prince George’s County 04 05--------------------- 759 744 6 068 420 1 366 401 4 702 019 455 023 1 423 616 466 2297Queen Anne’s County 01----------------------- 36 070 108 954 13 135 95 819 21 988 4 122 1018St. Mary’s County 05-------------------------- 80 324 868 590 657 698 210 892 39 864 251 973 243 3009Somerset County 01--------------------------- 23 726 98 899 3 870 95 029 28 222 4 120 20710
Talbot County 01------------------------------ 32 015 154 012 6 650 147 362 26 399 12 625 35811Washington County 06------------------------- 126 601 512 787 101 422 411 365 72 191 74 197 54 00912Wicomico County 01--------------------------- 78 472 261 850 11 034 250 816 46 884 15 491 1 48913Worcester County 01-------------------------- 39 015 178 140 9 390 168 750 20 611 8 970 –14State undistributed ------------------------- 3 058 911 – 3 058 911 122 806 58 –15
Massachusetts ------------------------------ 6 041 185 35 823 062 5 994 364 29 828 698 7 605 866 2 952 993 649 49216
Barnstable County 10-------------------------- 196 178 1 106 632 112 509 994 123 117 582 116 923 34 59817Berkshire County 01--------------------------- 136 214 817 975 170 078 647 897 89 002 37 256 16 35218Bristol County 03 04 09------------------------------ 510 410 2 089 179 183 208 1 905 971 439 351 77 779 9 58119Dukes County 10------------------------------ 12 420 45 165 961 44 204 5 239 2 929 –20Essex County 05 06------------------------------ 678 165 3 945 752 1 346 472 2 599 280 425 387 206 593 17 00721Franklin County 01---------------------------- 70 713 244 285 9 011 235 274 45 195 10 569 65422Hampden County 01 02--------------------------- 446 462 2 074 281 126 511 1 947 770 374 163 278 787 80 76823Hampshire County 01 02-------------------------- 149 229 509 266 40 583 468 683 93 408 59 755 1 73424Middlesex County 2
-------------------------- 1 403 302 8 835 442 3 347 429 5 488 013 1 234 256 696 811 348 90325Nantucket County 10-------------------------- 6 794 23 401 606 22 795 3 763 2 753 –26
Norfolk County 2----------------------------- 631 349 2 232 766 313 937 1 918 829 365 793 127 023 42 06827
Plymouth County 04 09 10--------------------------- 449 629 1 500 029 38 102 1 461 927 211 346 157 677 7 13828Suffolk County 07 08 09----------------------------- 633 248 7 807 306 190 439 7 616 867 3 397 117 1 017 320 74 53029Worcester County 01 02 03 05-------------------------- 717 072 2 716 703 114 519 2 602 184 504 384 160 818 16 15930State undistributed ------------------------- 1 874 879 – 1 874 879 299 881 – –31
Michigan ----------------------------------- 9 496 539 39 568 460 2 210 760 37 357 700 8 126 869 2 867 464 593 24332
Alcona County 05----------------------------- 10 389 60 958 2 657 58 301 6 713 2 061 –33Alger County 01------------------------------- 9 819 41 348 1 055 40 293 5 008 3 134 –34Allegan County 02 06----------------------------- 96 087 210 486 3 159 207 327 27 635 8 759 19335Alpena County 01----------------------------- 30 814 145 690 7 435 138 255 28 629 8 032 3 25436Antrim County 01----------------------------- 19 528 78 229 2 845 75 384 12 482 2 804 –37Arenac County 05----------------------------- 15 954 75 634 1 887 73 747 13 152 2 234 8038Baraga County 01----------------------------- 8 061 36 420 879 35 541 7 418 1 469 25439Barry County 02 03 07------------------------------ 52 232 122 552 3 388 119 164 18 378 4 494 7540Bay County 05-------------------------------- 111 773 403 608 7 086 396 522 71 669 13 793 1 60841Benzie County 01----------------------------- 13 264 53 475 1 598 51 877 9 230 1 888 –42
Berrien County 06----------------------------- 161 734 687 707 83 449 604 258 115 840 20 206 10843Branch County 07----------------------------- 41 990 130 745 1 601 129 144 23 110 4 096 17644Calhoun County 07---------------------------- 139 991 724 737 146 368 578 369 94 142 171 428 101 83345Cass County 06------------------------------- 48 921 137 806 3 404 134 402 22 281 5 063 1 45746Charlevoix County 01-------------------------- 22 834 85 240 3 493 81 747 16 036 4 893 30447Cheboygan County 01------------------------- 22 472 92 583 3 657 88 926 12 481 5 018 17148Chippewa County 01-------------------------- 36 591 152 069 16 450 135 619 31 414 17 943 5 98449Clare County 04------------------------------- 27 590 125 572 1 332 124 240 18 355 2 708 –50Clinton County 04----------------------------- 60 898 147 480 11 235 136 245 31 183 21 372 9 54951Crawford County 01 04--------------------------- 13 387 55 665 10 685 44 980 8 248 9 870 8 15352
Delta County 01------------------------------- 38 606 154 554 4 198 150 356 23 350 9 568 56453Dickinson County 01--------------------------- 27 058 143 050 16 552 126 498 15 882 25 711 43054Eaton County 07------------------------------ 96 806 612 444 21 680 590 764 416 038 22 588 15 50555Emmet County 01----------------------------- 27 034 91 770 1 858 89 912 14 012 5 245 3356Genesee County 05 08 09--------------------------- 433 297 1 589 068 13 827 1 575 241 321 122 71 893 4 18757Gladwin County 04---------------------------- 23 938 99 376 860 98 516 12 741 2 230 –58Gogebic County 01---------------------------- 18 016 96 027 2 978 93 049 16 463 7 094 62259Grand Traverse County 01--------------------- 69 583 254 799 7 642 247 157 37 309 25 028 1 34060Gratiot County 04----------------------------- 39 785 139 069 2 131 136 938 24 448 5 694 82761Hillsdale County 07---------------------------- 44 830 140 463 1 577 138 886 25 867 5 055 –62
Houghton County 01--------------------------- 36 376 157 966 7 291 150 675 39 196 9 418 1 75763Huron County 05------------------------------ 35 215 151 653 1 826 149 827 21 778 5 335 48764Ingham County 08----------------------------- 278 426 1 831 891 50 079 1 781 812 949 285 108 339 14 29065Ionia County 03------------------------------- 59 194 138 112 1 269 136 843 20 925 5 995 73966Iosco County 05------------------------------ 24 035 142 239 18 187 124 052 17 138 4 680 59967Iron County 01-------------------------------- 13 132 71 200 1 976 69 224 12 761 2 935 73368Isabella County 04---------------------------- 57 055 159 810 2 131 157 679 47 473 6 691 29769Jackson County 07---------------------------- 153 289 516 983 21 408 495 575 82 119 23 316 4 07570Kalamazoo County 06------------------------- 228 798 729 859 34 765 695 094 110 358 63 178 7 93071Kalkaska County 01--------------------------- 14 537 46 801 1 336 45 465 10 164 1 942 72372
Kent County 03------------------------------- 520 129 1 638 083 128 287 1 509 796 243 901 150 354 19 56373Keweenaw County 01-------------------------- 1 880 9 244 362 8 882 710 362 –74Lake County 02------------------------------- 9 631 52 804 801 52 003 10 700 1 827 –75Lapeer County 05 09----------------------------- 81 242 178 260 2 887 175 373 33 422 7 603 63576Leelanau County 01--------------------------- 18 122 58 250 1 744 56 506 8 426 4 427 –77Lenawee County 07--------------------------- 95 669 292 102 5 617 286 485 40 320 11 411 1 22978Livingston County 08-------------------------- 129 083 221 747 7 084 214 663 24 749 11 642 45079Luce County 01------------------------------- 5 571 28 562 566 27 996 7 012 866 –80Mackinac County 01--------------------------- 10 910 58 711 855 57 856 12 249 3 425 –81Macomb County 10 12---------------------------- 728 902 2 993 966 713 611 2 280 355 257 233 346 516 261 31882
Manistee County 02--------------------------- 22 633 98 361 2 597 95 764 17 495 4 338 59283Marquette County 01-------------------------- 70 684 266 123 44 411 221 712 37 382 26 590 14 72784Mason County 02----------------------------- 27 200 111 847 2 538 109 309 21 011 4 572 –85Mecosta County 04---------------------------- 38 621 114 699 3 136 111 563 15 626 4 966 1 03786Menominee County 01------------------------- 24 533 90 386 1 940 88 446 17 210 3 572 28087Midland County 04---------------------------- 79 247 219 686 17 984 201 702 36 988 8 895 1 67688Missaukee County 04-------------------------- 13 347 39 847 967 38 880 6 069 1 521 –89Monroe County 16---------------------------- 137 718 373 283 5 024 368 259 49 905 12 955 1 07390Montcalm County 04--------------------------- 56 887 177 725 3 910 173 815 23 907 8 246 2 02491Montmorency County 01----------------------- 9 513 52 096 678 51 418 6 074 809 –92
See footnotes at end of table.
30 Consolidated Federal Funds Report

TIPS PS [APS_PPGB,F_SCOTT] 6/ 3/96 12:37:43 MCVX09 TLP:CFFR1.TLP;15 6/ 3/96 11:04:06 DATA:NONE PSC:TIPS_12353107_01.PSC PAGE: 30TSF:TIPS92~12353107.DAT;1 6/ 3/96 12:35:33 UTF:TIPS93~12353107.DAT;1 6/ 3/96 12:35:33 META:TIPS96~12353107.DAT;1 6/ 3/96 12:37:03
1995mCon.
Direct Federal expenditures or obligationsmCon. Other Federal assistance
Direct payments for individuals Procurement contract awards
TotalRetirement and
disability All other TotalDepartmentof Defense
Other Federalexpenditures or
obligations Direct loansGuaranteed loans
and insurance
329 667 247 749 81 918 66 728 40 786 1 996 6 513 150 087 172 143 47 920 24 223 2 731 823 201 1 375 8 089 2
437 867 333 529 104 338 308 443 282 499 1 425 3 803 185 458 3312 344 230 859 81 485 219 384 84 785 1 148 672 168 656 4
66 230 47 145 19 085 1 343 552 1 817 6 027 33 916 52 040 579 1 536 309 504 270 3 326 603 1 314 127 8 070 4 164 407 635 61 769 884 1 305 119 464 765 2 409 929 774 024 9 968 1 318 812 014 7
77 392 56 539 20 853 3 181 566 2 270 3 144 184 876 8192 178 148 813 43 365 384 106 381 427 469 2 938 64 567 9
63 416 40 689 22 727 2 650 1 822 490 1 253 69 023 10
109 314 78 905 30 409 3 716 636 1 958 3 507 129 442 11320 351 232 125 88 226 45 167 37 038 880 1 827 51 224 12191 050 130 194 60 856 7 425 3 547 999 2 562 47 753 13140 199 107 121 33 078 7 433 4 634 928 4 353 2 174 370 14747 133 14 531 732 602 – – 2 188 913 75 412 189 437 15
18 689 717 10 425 692 8 264 025 6 193 046 4 942 367 381 440 328 769 6 352 305 16
824 826 566 863 257 963 44 931 24 066 2 371 6 348 934 841 17447 595 276 739 170 856 243 116 147 784 1 005 15 785 75 872 18
1 397 607 881 395 516 212 171 618 154 134 2 823 3 678 335 086 1935 362 23 555 11 807 1 512 28 123 254 78 710 20
1 947 031 1 195 417 751 614 1 362 802 1 303 659 3 940 5 563 476 431 21181 243 120 726 60 517 6 639 4 039 639 9 046 21 147 22
1 344 373 854 062 490 311 66 208 22 470 10 750 3 988 180 182 23321 182 212 873 108 309 33 925 26 420 997 3 221 50 953 24
3 417 231 1 921 551 1 495 680 3 479 145 2 852 014 7 998 3 491 414 855 2515 637 11 349 4 288 982 32 266 1 500 97 032 26
1 440 355 717 728 722 627 297 646 247 460 1 950 1 713 367 191 271 082 841 686 518 396 323 43 675 7 863 4 490 5 688 909 563 283 045 549 1 759 675 1 285 874 320 122 84 626 27 198 19 889 362 640 291 924 695 1 180 473 744 222 120 724 67 772 6 083 26 706 232 901 301 264 190 16 768 1 247 422 – – 310 808 221 900 1 814 900 31
26 150 406 15 727 795 10 422 611 2 014 285 1 249 569 409 436 720 927 3 936 181 32
51 380 35 276 16 104 459 3 344 273 9 100 3332 360 22 255 10 105 713 131 133 2 198 2 015 34
167 517 114 966 52 551 1 817 80 4 757 10 748 35 565 35105 289 70 584 34 705 3 146 2 244 595 2 367 6 172 36
60 122 41 882 18 240 2 030 1 488 791 2 385 3 063 3756 573 37 017 19 556 2 016 1 028 1 659 1 160 15 144 3824 841 17 602 7 239 2 565 317 127 147 1 417 3994 482 68 068 26 414 2 555 1 779 2 643 7 374 19 615 40
308 825 196 028 112 797 4 245 1 176 5 076 20 073 48 947 4141 212 30 330 10 882 962 644 183 1 628 2 425 42
457 827 309 418 148 409 87 328 78 465 6 506 5 184 50 737 4397 761 68 710 29 051 960 157 4 818 5 869 9 827 44
402 324 283 451 118 873 52 888 36 690 3 955 4 995 36 256 45106 689 72 497 34 192 878 – 2 895 5 755 7 897 46
61 314 44 539 16 775 2 661 1 895 336 1 470 24 579 4771 980 49 190 22 790 2 875 2 085 228 575 3 291 4892 398 65 538 26 860 9 664 7 300 652 3 038 7 312 49
103 205 69 103 34 102 879 131 424 893 2 718 5090 625 61 250 29 375 1 100 59 3 200 4 179 18 958 5135 644 24 629 11 015 1 831 1 531 72 876 287 52
119 203 84 529 34 674 1 824 853 608 1 791 10 870 5381 800 61 510 20 290 18 808 14 513 848 4 219 4 667 54
169 006 103 253 65 753 1 538 – 3 273 4 934 28 501 5571 262 50 533 20 729 975 – 276 1 187 6 751 56
1 169 170 706 900 462 270 22 186 1 506 4 696 5 120 96 208 5783 241 54 716 28 525 445 – 719 676 2 182 5869 517 50 072 19 445 2 578 870 374 443 1 191 59
179 381 127 529 51 852 11 274 1 486 1 806 11 108 22 280 60101 264 67 805 33 459 1 306 215 6 357 3 909 17 898 61102 676 69 579 33 097 1 485 106 5 381 8 621 9 096 62
104 771 71 256 33 515 4 327 2 311 254 5 715 3 187 63115 664 76 412 39 252 1 075 118 7 802 6 714 28 146 64726 374 482 922 243 452 40 182 8 101 7 712 5 644 132 527 65106 489 72 259 34 230 1 049 ~895 3 655 4 224 25 365 66109 580 80 483 29 097 10 215 8 986 626 1 105 14 380 67
54 911 38 473 16 438 464 – 129 560 1 519 6899 764 65 621 34 143 3 354 310 2 529 3 435 13 782 69
390 659 262 005 128 654 17 805 12 870 3 085 5 097 34 970 70511 409 336 120 175 289 40 583 19 721 4 330 4 010 62 471 71
34 274 24 320 9 954 246 – 174 885 765 72
1 094 073 756 974 337 099 143 188 94 680 6 567 4 372 198 464 738 060 5 717 2 343 103 65 9 – 496 74
39 678 26 551 13 127 478 128 122 2 200 1 137 75131 955 88 905 43 050 2 533 1 131 2 749 4 100 18 884 76
43 479 29 515 13 964 1 465 324 454 1 107 9 155 77228 664 155 229 73 435 4 983 2 154 6 725 19 332 37 334 78176 116 122 530 53 586 7 411 4 008 1 829 2 344 44 668 79
20 398 13 939 6 459 239 78 46 – 860 8042 351 23 961 18 390 566 – 120 1 482 1 751 81
1 926 909 1 241 936 684 973 458 907 432 801 4 402 851 436 377 82
73 835 52 571 21 264 2 126 637 568 630 4 016 83181 146 123 964 57 182 20 616 18 671 389 3 406 7 626 84
81 038 55 992 25 046 4 558 1 243 668 1 432 3 346 8592 033 60 162 31 871 898 45 1 176 1 538 4 895 8666 547 48 929 17 618 1 405 93 1 651 4 064 7 733 87
161 463 110 383 51 080 10 665 7 974 1 675 895 27 109 8830 846 21 909 8 937 800 408 612 795 17 188 89
303 750 200 929 102 821 4 036 1 041 2 637 6 124 137 570 90138 456 93 278 45 178 3 235 – 3 882 3 408 19 597 91
44 952 31 949 13 003 142 – 118 425 1 534 92
County Area 31

TIPS PS [APS_PPGB,F_SCOTT] 6/ 3/96 12:37:43 MCVX09 TLP:CFFR1.TLP;15 6/ 3/96 11:04:06 DATA:NONE PSC:TIPS_12353107_01.PSC PAGE: 31TSF:TIPS92~12353107.DAT;1 6/ 3/96 12:35:33 UTF:TIPS93~12353107.DAT;1 6/ 3/96 12:35:33 META:TIPS96~12353107.DAT;1 6/ 3/96 12:37:03
Federal Government Expenditures or Obligations by State and County Area: Fiscal Year[Thousand dollars]
State and county area
Congressional district
Direct Federal expenditures or obligations
Total direct expenditres or obligations Salaries and wages
United Statesresident
population1 TotalDepartment of
DefenseAll other
agencies Grant awards TotalDepartmentof Defense
Michigan mCon.
Muskegon County 02-------------------------- 163 436 638 006 71 127 566 879 105 454 21 927 3 7151Newaygo County 02--------------------------- 42 739 129 884 4 958 124 926 22 390 4 722 –2Oakland County 08 09 11 12---------------------------- 1 142 013 3 628 140 214 633 3 413 507 408 785 263 131 15 3523Oceana County 02---------------------------- 23 493 98 527 1 956 96 571 16 776 2 694 –4Ogemaw County 04--------------------------- 20 251 82 726 1 283 81 443 12 062 2 234 –5Ontonagon County 01------------------------- 8 673 45 282 3 063 42 219 8 882 2 469 –6Osceola County 04---------------------------- 21 375 81 379 2 082 79 297 12 808 2 576 –7Oscoda County 04---------------------------- 8 493 31 832 226 31 606 4 155 1 452 –8Otsego County 01----------------------------- 20 102 66 249 1 053 65 196 8 452 7 785 789Ottawa County 02----------------------------- 205 338 507 599 47 198 460 401 51 071 27 556 1 73210
Presque Isle County 01------------------------ 14 028 64 532 741 63 791 7 360 2 297 –11Roscommon County 04------------------------ 21 881 122 786 1 453 121 333 13 731 1 707 –12Saginaw County 04 05---------------------------- 211 287 819 579 14 025 805 554 144 970 70 517 4 61213St. Clair County 10---------------------------- 152 413 498 220 16 923 481 297 129 675 21 748 66314St. Joseph County 06-------------------------- 60 000 185 957 5 372 180 585 30 006 7 745 2 49315Sanilac County 05----------------------------- 41 568 154 804 1 317 153 487 27 286 4 808 7216Schoolcraft County 01------------------------- 8 596 48 634 1 532 47 102 10 685 2 868 89917Shiawassee County 04 08------------------------- 71 645 210 696 3 374 207 322 33 778 7 692 1 13318Tuscola County 05---------------------------- 57 018 182 806 1 481 181 325 34 937 6 365 4219Van Buren County 06-------------------------- 73 848 245 548 4 778 240 770 46 490 8 078 64720Washtenaw County 07 08 13------------------------- 290 546 1 619 957 118 023 1 501 934 810 800 158 841 8 84921Wayne County 2
----------------------------- 2 064 819 9 929 646 161 347 9 768 299 2 254 511 892 660 58 29722Wexford County 02---------------------------- 28 116 160 591 60 583 100 008 17 377 7 495 1 71823State undistributed ------------------------- 2 104 160 – 2 104 160 252 211 – –24
Minnesota ---------------------------------- 4 567 341 19 015 559 1 622 340 17 393 219 4 062 321 1 648 683 251 34625
Aitkin County 08------------------------------ 13 193 61 729 1 506 60 223 10 886 1 978 8226Anoka County 06------------------------------ 270 293 690 782 22 049 668 733 87 736 13 291 5 41827Becker County 07----------------------------- 28 897 123 155 3 267 119 888 29 819 8 400 1 46628Beltrami County 07---------------------------- 37 394 150 168 3 166 147 002 43 276 16 030 79129Benton County 07 08----------------------------- 32 503 105 081 4 689 100 392 29 435 4 076 2 49330Big Stone County 02--------------------------- 6 009 33 416 949 32 467 5 167 2 137 73231Blue Earth County 01-------------------------- 54 022 186 982 4 363 182 619 32 212 20 769 2 22932Brown County 02------------------------------ 27 049 93 337 1 855 91 482 13 126 4 097 85633Carlton County 08----------------------------- 30 304 109 701 2 471 107 230 26 459 4 236 64934Carver County 02----------------------------- 56 540 106 352 5 473 100 879 14 734 5 605 4235
Cass County 08------------------------------- 23 874 115 297 3 201 112 096 26 533 10 186 73336Chippewa County 02-------------------------- 13 092 51 894 1 474 50 420 8 868 2 643 1 01837Chisago County 08---------------------------- 35 422 89 908 1 049 88 859 13 533 4 328 –38Clay County 07------------------------------- 51 873 170 889 4 348 166 541 36 026 7 397 2 19539Clearwater County 07-------------------------- 8 320 34 060 490 33 570 8 080 1 565 –40Cook County 08------------------------------- 4 373 23 194 413 22 781 5 859 3 319 –41Cottonwood County 02------------------------- 12 504 53 577 319 53 258 7 392 2 700 –42Crow Wing County 08-------------------------- 48 872 193 699 6 906 186 793 27 810 8 533 1 96943Dakota County 01 03 04 06----------------------------- 308 569 657 107 61 767 595 340 122 556 105 672 24 01444Dodge County 01----------------------------- 16 539 47 536 460 47 076 7 118 1 740 –45
Douglas County 07---------------------------- 30 000 114 300 2 346 111 954 23 010 5 906 33846Faribault County 01---------------------------- 16 552 73 453 601 72 852 10 319 2 732 –47Fillmore County 01---------------------------- 20 756 96 918 1 265 95 653 22 069 3 478 –48Freeborn County 01--------------------------- 32 404 131 822 1 465 130 357 16 497 4 860 34949Goodhue County 01--------------------------- 42 000 137 556 3 378 134 178 22 089 6 437 1 37150Grant County 07------------------------------ 6 131 31 386 247 31 139 5 516 1 309 –51Hennepin County 02 03 04 05--------------------------- 1 050 465 5 257 541 994 452 4 263 089 1 058 930 656 889 84 46052Houston County 01---------------------------- 19 116 62 584 2 303 60 281 10 059 3 071 76253Hubbard County 07---------------------------- 15 925 67 416 1 913 65 503 16 263 1 803 –54Isanti County 08------------------------------ 27 845 65 969 1 339 64 630 13 654 3 366 63855
Itasca County 08------------------------------ 42 762 159 219 3 504 155 715 32 314 7 653 46756Jackson County 02---------------------------- 11 772 46 391 677 45 714 7 060 1 836 25757Kanabec County 08--------------------------- 13 315 42 729 614 42 115 9 141 1 696 –58Kandiyohi County 02--------------------------- 40 556 138 299 3 060 135 239 21 219 9 415 1 61259Kittson County 07----------------------------- 5 465 38 396 202 38 194 4 412 2 685 –60Koochiching County 08------------------------ 16 067 77 478 3 408 74 070 13 374 4 932 14261Lac qui Parle County 02------------------------ 8 512 40 242 653 39 589 5 434 2 191 47962Lake County 08------------------------------- 10 534 45 415 656 44 759 8 929 1 082 –63Lake of the Woods County 07------------------- 4 367 16 302 823 15 479 2 299 1 035 –64Le Sueur County 01 02--------------------------- 24 109 90 369 1 251 89 118 18 084 2 668 –65
Lincoln County 02----------------------------- 6 805 35 469 156 35 313 4 839 1 296 –66Lyon County 02------------------------------- 24 963 89 736 2 326 87 410 16 725 5 774 33667McLeod County 02---------------------------- 33 103 96 964 1 478 95 486 17 514 4 134 43268Mahnomen County 07------------------------- 5 120 48 572 25 189 23 383 5 685 934 –69Marshall County 07---------------------------- 10 625 76 393 6 947 69 446 11 307 2 942 –70Martin County 02------------------------------ 22 513 90 524 1 948 88 576 12 073 4 056 62371Meeker County 02----------------------------- 21 165 75 131 1 103 74 028 16 487 3 792 44972Mille Lacs County 08-------------------------- 19 673 80 993 1 265 79 728 15 977 2 919 21273Morrison County 07 08--------------------------- 30 055 128 481 26 423 102 058 23 308 28 093 24 30174Mower County 01----------------------------- 37 487 165 771 4 810 160 961 23 504 7 369 70975
Murray County 02----------------------------- 9 581 40 376 272 40 104 5 435 1 852 –76Nicollet County 01 02----------------------------- 29 421 62 849 881 61 968 13 370 2 287 21977Nobles County 02----------------------------- 20 348 77 554 936 76 618 13 870 4 592 37878Norman County 07---------------------------- 7 750 46 331 392 45 939 6 789 1 891 –79Olmsted County 01---------------------------- 112 910 393 599 16 074 377 525 104 632 48 511 3 28280Otter Tail County 07--------------------------- 52 573 210 602 4 815 205 787 35 789 9 996 42081Pennington County 07------------------------- 13 388 56 838 981 55 857 8 894 3 831 55882Pine County 08------------------------------- 22 750 92 848 1 388 91 460 15 174 16 394 25483Pipestone County 02-------------------------- 10 398 42 136 601 41 535 6 848 2 805 35884Polk County 07------------------------------- 32 678 160 560 4 255 156 305 28 905 6 539 26385
Pope County 07------------------------------- 10 954 54 021 6 629 47 392 6 381 1 679 –86Ramsey County 04---------------------------- 483 404 2 897 663 256 798 2 640 865 1 003 900 269 155 47 07587Red Lake County 07--------------------------- 4 483 29 713 127 29 586 5 682 1 030 –88Redwood County 02--------------------------- 17 090 73 364 981 72 383 15 113 3 467 55889Renville County 02---------------------------- 17 308 68 307 1 020 67 287 11 604 3 249 54990Rice County 01------------------------------- 51 565 143 157 8 863 134 294 30 011 7 554 1 88891Rock County 02------------------------------- 9 871 41 986 577 41 409 10 178 2 134 22792Roseau County 07---------------------------- 15 571 50 069 747 49 322 7 441 3 302 27693
See footnotes at end of table.
32 Consolidated Federal Funds Report

TIPS PS [APS_PPGB,F_SCOTT] 6/ 3/96 12:37:43 MCVX09 TLP:CFFR1.TLP;15 6/ 3/96 11:04:06 DATA:NONE PSC:TIPS_12353107_01.PSC PAGE: 32TSF:TIPS92~12353107.DAT;1 6/ 3/96 12:35:33 UTF:TIPS93~12353107.DAT;1 6/ 3/96 12:35:33 META:TIPS96~12353107.DAT;1 6/ 3/96 12:37:03
1995mCon.
Direct Federal expenditures or obligationsmCon. Other Federal assistance
Direct payments for individuals Procurement contract awards
TotalRetirement and
disability All other TotalDepartmentof Defense
Other Federalexpenditures or
obligations Direct loansGuaranteed loans
and insurance
445 080 308 670 136 410 63 632 60 197 1 913 1 392 28 106 196 662 67 069 29 593 3 749 2 872 2 361 1 602 17 477 2
2 716 842 1 716 771 1 000 071 227 157 160 186 12 224 12 921 369 617 366 129 47 143 18 986 12 375 1 010 552 1 064 8 268 467 529 44 733 22 796 455 63 445 1 046 1 423 529 714 20 879 8 835 4 055 2 625 162 477 1 203 664 073 44 836 19 237 1 311 781 610 656 2 121 725 960 18 581 7 379 208 – 56 584 173 848 157 36 712 11 445 1 433 – 422 1 919 6 771 9
355 282 265 283 89 999 70 318 40 947 3 372 8 569 69 295 10
52 823 36 821 16 002 1 560 25 493 236 2 113 11107 560 73 015 34 545 ~297 – 84 585 3 293 12580 115 384 268 195 847 17 699 4 418 6 277 4 967 105 662 13332 130 208 703 123 427 13 027 9 640 1 639 2 298 114 757 14139 804 98 803 41 001 4 457 747 3 946 10 175 18 091 15114 959 74 888 40 071 1 124 144 6 627 10 661 15 728 16
30 705 21 315 9 390 4 270 – 106 378 980 17164 430 112 023 52 407 2 367 291 2 430 7 004 26 741 18135 288 90 973 44 315 1 355 100 4 861 6 157 22 053 19178 120 121 476 56 644 8 621 1 546 4 238 7 382 38 559 20525 139 326 411 198 728 119 503 79 576 5 674 6 324 80 803 21
6 383 853 3 706 315 2 677 538 365 860 53 418 32 762 6 729 710 532 2277 059 54 820 22 239 58 398 57 228 261 2 685 2 343 23
1 664 460 13 335 1 651 125 – – 187 490 406 026 488 253 24
10 798 173 6 792 573 4 005 600 1 594 573 1 109 220 911 809 1 428 411 4 997 523 25
47 847 34 865 12 982 740 315 278 515 4 972 26305 099 205 323 99 776 19 059 10 669 265 597 1 456 214 917 27
76 010 51 413 24 597 4 108 – 4 817 6 778 20 270 2886 284 55 871 30 413 3 060 – 1 518 2 071 9 555 2969 377 55 365 14 012 518 – 1 674 6 086 38 328 3021 042 13 807 7 235 282 – 4 789 7 762 16 419 31
122 304 82 318 39 986 3 642 239 8 056 37 465 58 037 3269 911 48 662 21 249 1 068 192 5 135 18 680 42 597 3377 720 57 087 20 633 1 024 183 262 656 8 170 3467 149 46 456 20 693 16 721 4 385 2 143 6 129 58 432 35
75 800 54 415 21 385 2 447 33 330 244 3 227 3636 202 23 955 12 247 325 – 3 856 20 347 32 133 3769 841 48 409 21 432 1 116 – 1 090 11 461 24 274 38
117 066 75 967 41 099 1 125 86 9 275 106 381 81 208 3923 201 14 975 8 226 275 – 941 783 2 103 4011 457 8 974 2 483 2 512 108 48 865 3 822 4136 072 25 057 11 015 464 – 6 949 32 973 39 998 42
154 875 107 426 47 449 1 914 588 567 2 668 14 131 43387 958 276 040 111 918 35 128 19 161 5 792 14 232 299 175 44
34 086 20 213 13 873 398 48 4 194 21 064 25 591 45
81 001 57 470 23 531 984 – 3 400 5 119 11 124 4651 558 34 918 16 640 1 234 46 7 610 30 002 55 436 4761 607 39 155 22 452 693 – 9 070 20 898 29 349 4893 533 66 328 27 205 7 998 – 8 934 35 566 44 221 49
100 681 66 961 33 720 2 805 141 5 545 21 918 33 855 5020 041 13 696 6 345 316 – 4 205 13 189 16 278 51
2 523 332 1 613 448 909 884 998 660 810 693 19 730 2 596 686 902 5244 491 31 365 13 126 1 267 655 3 696 4 589 14 175 5348 391 34 486 13 905 413 – 545 2 004 6 685 5446 951 32 999 13 952 578 – 1 419 8 913 17 333 55
117 724 85 344 32 380 1 199 48 329 731 7 761 5629 132 19 701 9 431 378 75 7 984 24 687 49 831 5730 964 21 196 9 768 440 127 488 1 736 4 718 5895 871 65 704 30 167 4 865 231 6 929 29 457 32 215 5916 260 11 308 4 952 442 137 14 597 9 842 34 621 6044 586 32 243 12 343 14 226 2 553 359 609 5 355 6125 795 17 248 8 547 313 – 6 509 26 286 31 850 6235 055 26 937 8 118 289 – 60 469 3 333 6311 350 8 309 3 041 433 319 1 186 625 2 508 6463 124 38 458 24 666 939 390 5 554 16 809 20 332 65
22 581 14 294 8 287 237 – 6 516 11 593 16 252 6658 467 39 099 19 368 2 122 1 261 6 648 27 855 48 052 6767 600 46 243 21 357 4 797 58 2 918 13 794 26 879 6813 675 9 312 4 363 25 106 24 928 3 171 3 708 7 538 6928 128 19 475 8 653 7 467 6 650 26 549 10 004 51 555 7064 924 43 973 20 951 1 061 459 8 409 44 563 50 373 7149 396 33 103 16 293 604 40 4 852 17 527 23 952 7260 752 41 371 19 381 665 – 680 4 471 9 275 7373 506 51 265 22 241 949 203 2 624 4 630 20 901 74
123 785 84 530 39 255 3 782 2 777 7 331 29 010 55 857 75
26 394 17 346 9 048 360 – 6 335 27 803 46 902 7642 833 28 667 14 166 384 42 3 975 23 668 29 245 7751 536 35 813 15 723 641 43 6 915 33 360 58 421 7822 956 15 650 7 306 382 41 14 314 10 815 37 422 79
213 335 135 251 78 084 19 849 9 270 7 272 15 740 109 155 80149 675 103 277 46 398 6 899 1 083 8 244 9 843 64 870 81
34 091 22 076 12 015 502 – 9 520 3 365 11 787 8258 958 42 088 16 870 1 588 84 734 1 313 10 152 8328 647 20 026 8 621 378 – 3 458 12 111 31 213 8493 018 59 539 33 479 3 232 2 063 28 865 17 101 121 420 85
34 859 23 405 11 454 6 394 6 047 4 710 11 599 14 199 861 351 080 867 911 483 169 265 124 178 878 8 405 20 014 212 856 87
11 430 7 573 3 857 5 353 – 6 219 2 761 10 108 8845 404 31 770 13 634 1 006 – 8 374 37 031 62 666 8944 954 31 540 13 414 652 109 7 847 80 911 63 296 9098 751 68 512 30 239 1 482 257 5 359 13 747 27 504 9125 042 18 196 6 846 265 – 4 366 18 950 33 011 9228 054 19 203 8 851 500 33 10 772 7 236 26 878 93
County Area 33

TIPS PS [APS_PPGB,F_SCOTT] 6/ 3/96 12:37:43 MCVX09 TLP:CFFR1.TLP;15 6/ 3/96 11:04:06 DATA:NONE PSC:TIPS_12353107_01.PSC PAGE: 33TSF:TIPS92~12353107.DAT;1 6/ 3/96 12:35:33 UTF:TIPS93~12353107.DAT;1 6/ 3/96 12:35:33 META:TIPS96~12353107.DAT;1 6/ 3/96 12:37:03
Federal Government Expenditures or Obligations by State and County Area: Fiscal Year[Thousand dollars]
State and county area
Congressional district
Direct Federal expenditures or obligations
Total direct expenditres or obligations Salaries and wages
United Statesresident
population1 TotalDepartment of
DefenseAll other
agencies Grant awards TotalDepartmentof Defense
Minnesota mCon.
St. Louis County 08--------------------------- 198 026 907 540 45 246 862 294 169 541 101 219 25 0081Scott County 01 02 03------------------------------- 67 489 123 462 4 088 119 374 30 944 10 866 –2Sherburne County 07 08-------------------------- 50 285 86 119 1 732 84 387 13 052 8 438 1523Sibley County 02------------------------------ 14 598 49 108 380 48 728 7 570 1 920 1964Stearns County 02 07---------------------------- 124 412 362 929 6 089 356 840 52 435 62 615 1 1715Steele County 01------------------------------ 31 392 103 094 3 098 99 996 23 803 3 808 1646Stevens County 07---------------------------- 10 382 42 126 684 41 442 4 419 3 927 5157Swift County 02------------------------------- 10 452 52 202 868 51 334 9 626 2 591 4108Todd County 07------------------------------- 23 750 80 301 1 312 78 989 16 866 3 808 2769Traverse County 07--------------------------- 4 332 25 147 260 24 887 4 614 941 9610
Wabasha County 01--------------------------- 20 417 82 182 2 546 79 636 11 545 3 429 69511Wadena County 07---------------------------- 13 090 53 147 1 405 51 742 10 649 2 498 37612Waseca County 01---------------------------- 18 059 61 261 567 60 694 7 682 3 136 –13Washington County 06------------------------- 173 546 228 819 8 828 219 991 42 036 13 264 1 55314Watonwan County 02-------------------------- 11 523 53 684 3 214 50 470 6 460 2 562 26115Wilkin County 07------------------------------ 7 400 33 404 122 33 282 8 363 1 316 –16Winona County 01----------------------------- 48 231 142 658 5 700 136 958 21 126 7 146 1 21617Wright County 02 03----------------------------- 76 435 159 417 3 535 155 882 28 960 7 672 32818Yellow Medicine County 02--------------------- 11 675 51 748 312 51 436 7 178 2 204 –19State undistributed ------------------------- 1 055 551 – 1 055 551 230 719 – –20
Mississippi --------------------------------- 2 669 348 14 251 492 2 869 930 11 381 562 2 766 449 1 553 668 938 56121
Adams County 04----------------------------- 34 734 155 232 11 240 143 992 31 111 5 553 85622Alcorn County 01------------------------------ 32 654 130 757 3 447 127 310 25 892 4 649 63923Amite County 04------------------------------ 13 242 49 890 1 333 48 557 13 027 2 208 26124Attala County 02 03------------------------------ 18 398 86 046 2 218 83 828 16 007 3 540 23025Benton County 01----------------------------- 7 924 42 803 477 42 326 18 744 912 –26Bolivar County 02----------------------------- 41 514 195 166 3 837 191 329 48 661 4 819 27427Calhoun County 01---------------------------- 14 934 60 215 1 618 58 597 10 230 2 768 75528Carroll County 02----------------------------- 9 773 29 042 1 181 27 861 4 526 1 047 –29Chickasaw County 01-------------------------- 18 150 74 501 2 189 72 312 16 782 3 161 1 05230Choctaw County 01---------------------------- 8 981 30 372 829 29 543 6 837 1 884 21431
Claiborne County 02--------------------------- 11 284 41 687 1 843 39 844 9 040 1 379 30932Clarke County 03------------------------------ 17 542 60 952 1 690 59 262 10 230 1 815 15533Clay County 03------------------------------- 21 548 81 733 6 353 75 380 17 314 5 239 1 01134Coahoma County 02--------------------------- 31 451 156 632 3 871 152 761 40 774 6 056 2 50135Copiah County 04----------------------------- 28 286 146 733 17 992 128 741 28 900 5 135 2 19036Covington County 04-------------------------- 16 943 60 543 1 800 58 743 10 856 2 432 25637Desoto County 01----------------------------- 79 995 180 387 7 955 172 432 21 182 6 007 34138Forrest County 05----------------------------- 70 936 327 097 34 232 292 865 63 060 31 951 17 19939Franklin County 04---------------------------- 8 379 32 949 438 32 511 6 707 1 695 7940George County 05----------------------------- 17 815 66 928 3 109 63 819 15 135 2 274 75041
Greene County 05----------------------------- 11 115 40 216 1 248 38 968 9 157 1 273 33842Grenada County 01 02--------------------------- 22 173 98 333 6 950 91 383 18 343 9 860 3 93443Hancock County 05---------------------------- 36 594 463 035 199 671 263 364 22 926 92 363 68 08944Harrison County 05---------------------------- 176 794 1 341 675 619 505 722 170 115 755 489 890 392 03345Hinds County 02 04------------------------------ 251 906 1 639 261 90 315 1 548 946 650 963 211 623 28 39546Holmes County 02----------------------------- 21 033 108 876 1 981 106 895 24 149 3 038 21347Humphreys County 02------------------------- 11 716 51 478 404 51 074 14 272 1 659 16048Issaquena County 02-------------------------- 1 732 7 266 38 7 228 1 286 271 –49Itawamba County 01--------------------------- 20 650 60 457 3 179 57 278 8 859 2 045 66350Jackson County 05---------------------------- 125 754 1 415 514 1 050 908 364 606 71 624 103 057 88 20251
Jasper County 03----------------------------- 17 345 69 277 1 354 67 923 17 563 2 650 35252Jefferson County 02--------------------------- 8 499 49 914 753 49 161 16 537 1 422 21653Jefferson Davis County 04--------------------- 14 029 53 479 1 041 52 438 13 434 1 339 15654Jones County 03 04------------------------------ 63 034 285 344 7 826 277 518 72 955 10 442 2 14155Kemper County 03---------------------------- 10 246 45 750 1 417 44 333 14 442 1 772 48756Lafayette County 01--------------------------- 32 781 105 825 5 066 100 759 31 082 11 967 1 65057Lamar County 05------------------------------ 32 740 75 984 3 090 72 894 12 794 2 220 31558Lauderdale County 03------------------------- 76 493 399 154 112 025 287 129 53 940 97 150 85 06659Lawrence County 04--------------------------- 12 636 59 294 3 280 56 014 8 054 3 803 1 83360Leake County 02 03------------------------------ 18 814 78 946 1 655 77 291 15 131 2 701 35561
Lee County 01-------------------------------- 70 801 255 317 12 150 243 167 50 743 26 268 6 63762Leflore County 02----------------------------- 37 460 180 346 11 351 168 995 41 549 9 071 2 22163Lincoln County 04----------------------------- 31 162 116 108 3 248 112 860 26 283 5 224 1 42364Lowndes County 03--------------------------- 60 866 303 862 124 046 179 816 34 232 64 588 55 94165Madison County 02 03---------------------------- 63 681 343 065 159 888 183 177 36 660 7 679 1 08466Marion County 04----------------------------- 25 834 125 998 21 943 104 055 23 146 3 251 94167Marshall County 01---------------------------- 31 665 120 983 3 973 117 010 30 624 4 885 58268Monroe County 01---------------------------- 37 278 136 951 9 260 127 691 33 126 5 660 2 00369Montgomery County 01 02------------------------ 12 336 60 985 4 065 56 920 16 147 4 255 2 72970Neshoba County 03--------------------------- 26 113 110 396 4 628 105 768 36 076 6 139 2 25771
Newton County 03----------------------------- 21 071 92 574 4 480 88 094 15 851 5 745 2 31072Noxubee County 03--------------------------- 12 552 50 504 433 50 071 11 370 1 754 –73Oktibbeha County 01 03-------------------------- 38 521 168 105 6 965 161 140 64 163 14 245 2 82374Panola County 01 02----------------------------- 31 943 100 107 ~23 307 123 414 32 195 5 547 2 64075Pearl River County 05------------------------- 42 036 175 312 30 314 144 998 21 597 5 772 1 95376Perry County 05------------------------------ 11 425 36 867 1 502 35 365 6 870 1 673 57277Pike County 04------------------------------- 37 658 164 064 4 465 159 599 31 049 7 449 1 43078Pontotoc County 01--------------------------- 23 621 74 555 2 072 72 483 16 277 3 320 79279Prentiss County 01---------------------------- 23 744 81 329 3 612 77 717 11 082 2 748 60480Quitman County 02---------------------------- 10 129 50 916 546 50 370 10 462 1 720 31881
Rankin County 03----------------------------- 96 280 259 717 33 805 225 912 54 196 29 300 22 71482Scott County 03------------------------------- 24 766 98 287 3 372 94 915 21 095 7 845 1 36983Sharkey County 02---------------------------- 6 951 34 128 790 33 338 8 239 1 868 57284Simpson County 04---------------------------- 24 639 100 677 3 627 97 050 28 808 3 800 1 64085Smith County 03------------------------------ 14 997 55 712 2 574 53 138 14 805 3 324 1 37086Stone County 05------------------------------ 11 840 56 664 3 016 53 648 7 257 2 924 16387Sunflower County 02-------------------------- 36 011 129 414 3 068 126 346 32 463 4 790 1 80888Tallahatchie County 01 02------------------------- 14 700 69 744 7 601 62 143 13 265 3 423 1 26789Tate County 01------------------------------- 22 229 74 474 6 516 67 958 10 566 4 374 2 30590Tippah County 01----------------------------- 20 341 81 598 2 090 79 508 18 414 3 042 90591
See footnotes at end of table.
34 Consolidated Federal Funds Report

TIPS PS [APS_PPGB,F_SCOTT] 6/ 3/96 12:37:43 MCVX09 TLP:CFFR1.TLP;15 6/ 3/96 11:04:06 DATA:NONE PSC:TIPS_12353107_01.PSC PAGE: 34TSF:TIPS92~12353107.DAT;1 6/ 3/96 12:35:33 UTF:TIPS93~12353107.DAT;1 6/ 3/96 12:35:33 META:TIPS96~12353107.DAT;1 6/ 3/96 12:37:03
1995mCon.
Direct Federal expenditures or obligationsmCon. Other Federal assistance
Direct payments for individuals Procurement contract awards
TotalRetirement and
disability All other TotalDepartmentof Defense
Other Federalexpenditures or
obligations Direct loansGuaranteed loans
and insurance
603 767 412 716 191 051 30 517 8 198 2 496 3 977 46 462 174 519 51 232 23 287 5 335 2 425 1 798 4 141 65 071 262 253 45 186 17 067 1 210 419 1 165 5 461 47 291 333 919 22 476 11 443 1 470 – 4 230 24 765 35 905 4
225 419 149 529 75 890 14 174 1 745 8 285 16 938 80 523 565 489 45 266 20 223 4 528 2 253 5 466 26 456 27 594 626 122 16 048 10 074 1 412 – 6 246 16 946 30 375 733 729 22 078 11 651 407 – 5 849 29 659 34 101 856 416 39 150 17 266 634 – 2 577 2 838 11 000 914 254 9 774 4 480 196 26 5 142 9 023 18 428 10
52 141 35 168 16 973 11 400 867 3 667 7 949 16 116 1138 711 27 506 11 205 464 41 826 3 556 4 449 1239 849 27 847 12 002 5 126 – 5 467 26 359 25 880 13
167 456 119 849 47 607 3 185 668 2 879 3 881 136 070 1430 374 22 103 8 271 9 309 2 636 4 978 26 203 31 048 1518 387 12 721 5 666 293 28 5 045 6 965 38 268 16
105 977 71 884 34 093 4 672 2 490 3 737 7 772 33 546 17116 902 81 980 34 922 3 255 1 676 2 629 19 146 70 333 18
34 342 23 308 11 034 805 – 7 219 31 547 40 067 19643 567 2 374 641 193 – – 181 265 85 647 818 012 20
7 769 580 4 867 651 2 901 929 1 935 998 1 582 335 225 797 675 823 3 669 256 21
107 023 72 598 34 425 10 861 8 212 685 578 9 254 2297 432 65 912 31 520 1 876 704 908 1 747 5 739 2333 328 22 476 10 852 598 164 730 432 531 2463 091 42 022 21 069 2 511 – 898 2 240 5 759 2522 444 15 400 7 044 229 – 473 252 2 088 26
118 516 72 439 46 077 2 805 2 066 20 365 28 546 43 158 2745 320 29 499 15 821 375 – 1 522 3 559 7 268 2821 668 14 680 6 988 699 519 1 102 1 905 3 596 2951 944 35 123 16 821 390 – 2 223 3 362 8 572 3020 978 14 859 6 119 215 – 457 345 1 736 31
28 870 18 993 9 877 1 624 940 774 735 3 206 3248 336 33 856 14 480 307 – 264 468 4 617 3353 299 37 056 16 243 4 453 3 730 1 427 895 11 973 3499 829 56 724 43 105 1 223 600 8 749 20 063 27 904 3584 505 56 972 27 533 27 626 13 405 567 1 334 5 416 3646 329 33 051 13 278 333 – 594 550 5 567 37
147 550 108 894 38 656 4 156 2 221 1 492 5 564 100 434 38219 695 137 176 82 519 11 585 6 794 806 156 59 779 39
23 836 17 015 6 821 375 – 336 380 799 4048 583 32 797 15 786 728 444 208 256 3 484 41
26 290 17 458 8 832 3 331 – 165 321 846 4266 282 43 076 23 206 2 437 1 535 1 412 2 195 19 043 43
104 814 71 832 32 982 241 547 124 764 1 386 1 450 289 648 44568 183 416 631 151 552 157 803 138 562 10 044 4 461 861 121 45705 078 448 460 256 618 66 872 19 301 4 725 1 807 499 742 46
76 714 42 828 33 886 2 900 938 2 075 10 084 10 440 4731 927 19 398 12 529 443 – 3 178 6 187 25 973 483 138 1 940 1 198 57 – 2 513 2 546 15 848 49
46 808 31 821 14 987 2 122 1 612 624 450 3 391 50312 449 225 577 86 872 927 678 924 477 706 915 434 970 51
47 990 33 011 14 979 621 – 453 1 150 3 460 5230 628 16 857 13 771 372 210 955 1 389 2 382 5337 917 23 815 14 102 285 – 505 479 1 880 54
199 353 133 072 66 281 2 021 133 572 1 759 26 475 5528 462 17 961 10 501 311 – 763 772 1 188 5659 576 39 523 20 053 2 398 200 802 575 4 275 5759 960 41 211 18 749 524 174 485 371 7 150 58
233 728 161 773 71 955 13 794 11 299 543 1 090 38 062 5946 206 31 720 14 486 856 – 375 731 4 677 6060 146 39 672 20 474 515 – 454 1 257 13 319 61
172 599 120 029 52 570 4 575 117 1 132 1 561 38 382 62113 803 67 609 46 194 8 187 6 391 7 735 400 028 100 580 63
83 508 58 090 25 418 617 – 476 771 5 958 64146 304 101 251 45 053 56 761 52 993 1 977 2 647 105 347 65114 395 77 752 36 643 181 058 154 522 3 273 9 949 82 744 66
79 408 53 519 25 889 19 618 19 172 575 4 709 18 782 6780 897 51 410 29 487 2 653 1 892 1 924 1 234 4 132 6890 246 63 859 26 387 5 704 4 701 2 213 4 373 14 060 6938 997 25 990 13 007 1 061 353 526 1 401 4 618 7066 469 45 501 20 968 1 236 622 477 942 17 316 71
69 966 46 658 23 308 590 – 421 395 11 189 7234 324 22 694 11 630 816 – 2 240 2 305 6 550 7383 951 55 113 28 838 4 795 142 952 1 033 10 365 7483 513 56 275 27 238 ~23 675 ~27 610 2 528 5 399 20 218 75
122 184 80 442 41 742 24 343 23 593 1 415 2 229 24 569 7627 685 18 409 9 276 337 68 301 249 4 767 77
124 250 83 593 40 657 871 – 445 294 7 551 7852 653 37 088 15 565 530 – 1 775 6 976 2 234 7963 883 41 847 22 036 2 434 1 964 1 181 903 2 362 8033 106 19 038 14 068 227 – 5 400 6 491 17 450 81
173 803 129 026 44 777 1 694 – 724 3 281 141 796 8267 285 47 454 19 831 1 417 784 644 733 7 945 8318 962 11 715 7 247 288 28 4 773 7 750 20 856 8467 109 44 880 22 229 498 – 461 516 10 892 8536 837 26 015 10 822 286 – 461 617 18 454 8644 896 28 303 16 593 1 425 102 163 291 1 166 8779 541 44 618 34 923 862 389 11 758 24 020 39 869 8841 763 25 957 15 806 6 333 5 987 4 960 9 434 26 342 8955 040 34 543 20 497 3 581 3 064 913 1 173 9 343 9058 787 40 842 17 945 601 199 755 1 212 1 462 91
County Area 35

TIPS PS [APS_PPGB,F_SCOTT] 6/ 3/96 12:37:43 MCVX09 TLP:CFFR1.TLP;15 6/ 3/96 11:04:06 DATA:NONE PSC:TIPS_12353107_01.PSC PAGE: 35TSF:TIPS92~12353107.DAT;1 6/ 3/96 12:35:33 UTF:TIPS93~12353107.DAT;1 6/ 3/96 12:35:33 META:TIPS96~12353107.DAT;1 6/ 3/96 12:37:03
Federal Government Expenditures or Obligations by State and County Area: Fiscal Year[Thousand dollars]
State and county area
Congressional district
Direct Federal expenditures or obligations
Total direct expenditres or obligations Salaries and wages
United Statesresident
population1 TotalDepartment of
DefenseAll other
agencies Grant awards TotalDepartmentof Defense
Mississippi mCon.
Tishomingo County 01------------------------- 18 161 118 654 19 451 99 203 11 994 4 315 1 5291Tunica County 02----------------------------- 8 294 38 171 1 166 37 005 7 711 1 025 –2Union County 01------------------------------ 22 726 73 523 3 389 70 134 10 094 3 664 7973Walthall County 04---------------------------- 14 309 52 309 1 447 50 862 11 865 1 726 6814Warren County 02----------------------------- 49 032 346 208 148 655 197 553 35 198 105 871 97 8105Washington County 02------------------------- 66 736 282 203 12 693 269 510 60 541 23 403 5 1366Wayne County 03 05----------------------------- 19 660 62 173 2 529 59 644 13 813 3 073 1 6197Webster County 01---------------------------- 10 374 49 840 1 731 48 109 15 374 2 221 4348Wilkinson County 04--------------------------- 9 537 63 652 250 63 402 31 659 632 –9Winston County 03---------------------------- 19 567 72 112 2 700 69 412 14 349 3 081 1 23410Yalobusha County 01-------------------------- 12 383 61 636 2 713 58 923 9 502 4 364 1 53711Yazoo County 02------------------------------ 25 352 122 101 1 756 120 345 28 695 3 546 74112State undistributed ------------------------- 741 408 – 741 408 148 764 – –13
Missouri ------------------------------------ 5 277 657 31 541 694 7 415 945 24 125 749 4 402 873 3 166 805 1 091 08114
Adair County 09------------------------------- 24 628 89 647 1 960 87 687 22 417 4 393 51915Andrew County 06----------------------------- 15 024 43 016 3 288 39 728 5 123 3 271 1 49816Atchison County 06---------------------------- 7 171 31 067 276 30 791 3 459 1 517 –17Audrain County 09---------------------------- 23 582 105 609 2 486 103 123 18 516 4 385 87118Barry County 07------------------------------ 30 308 115 495 4 198 111 297 14 301 5 663 26019Barton County 07----------------------------- 11 687 44 999 1 348 43 651 5 570 2 092 25420Bates County 04------------------------------ 15 289 64 670 1 256 63 414 8 514 2 752 –21Benton County 04----------------------------- 15 134 81 131 5 660 75 471 8 995 4 019 2 09322Bollinger County 08---------------------------- 11 156 35 952 673 35 279 5 121 1 386 –23Boone County 09------------------------------ 121 479 457 989 12 427 445 562 110 553 88 179 1 60024
Buchanan County 06-------------------------- 82 964 377 480 20 081 357 399 52 551 44 775 8 96225Butler County 08------------------------------ 40 199 210 520 5 456 205 064 38 876 21 186 1 23426Caldwell County 06---------------------------- 8 647 40 314 575 39 739 6 725 1 826 –27Callaway County 09--------------------------- 34 572 141 948 17 199 124 749 27 025 20 907 9 77828Camden County 04---------------------------- 30 595 119 453 7 678 111 775 16 228 2 832 7829Cape Girardeau County 08--------------------- 64 508 212 488 15 265 197 223 29 406 20 059 3 60830Carroll County 06----------------------------- 10 486 52 728 1 102 51 626 7 100 2 499 15431Carter County 08------------------------------ 5 952 27 514 748 26 766 5 152 2 683 –32Cass County 04------------------------------- 71 385 227 018 40 617 186 401 23 370 34 237 24 79533Cedar County 07------------------------------ 12 548 59 147 2 997 56 150 6 602 2 418 57834
Chariton County 06---------------------------- 8 838 41 790 644 41 146 5 406 2 240 –35Christian County 07--------------------------- 40 592 102 684 4 756 97 928 13 340 4 197 –36Clark County 09------------------------------- 7 397 35 368 311 35 057 11 452 1 522 –37Clay County 06------------------------------- 163 334 381 575 28 592 352 983 40 354 33 095 15 26238Clinton County 06----------------------------- 17 415 56 213 1 295 54 918 6 576 2 640 –39Cole County 04------------------------------- 67 047 945 588 54 737 890 851 712 963 14 159 8 01440Cooper County 06----------------------------- 15 680 56 920 2 547 54 373 8 049 2 534 43241Crawford County 08--------------------------- 20 767 72 874 2 271 70 603 10 099 1 805 –42Dade County 07------------------------------- 7 851 37 548 685 36 863 9 210 1 460 –43Dallas County 04------------------------------ 14 233 48 016 1 550 46 466 6 146 1 505 –44
Daviess County 06---------------------------- 7 675 38 097 1 056 37 041 7 977 1 904 –45De Kalb County 06---------------------------- 10 176 33 915 622 33 293 7 397 1 594 –46Dent County 08------------------------------- 13 947 60 518 1 872 58 646 8 737 3 373 12447Douglas County 07---------------------------- 12 111 40 046 1 163 38 883 6 214 1 824 –48Dunklin County 08----------------------------- 32 895 159 337 2 921 156 416 36 769 4 690 16449Franklin County 09---------------------------- 85 859 259 349 7 940 251 409 31 088 11 716 1 44150Gasconade County 09------------------------- 14 369 57 036 2 056 54 980 5 483 2 071 18651Gentry County 06----------------------------- 6 869 36 832 874 35 958 4 506 2 225 33352Greene County 07----------------------------- 222 432 836 133 39 743 796 390 100 386 113 566 13 20053Grundy County 06----------------------------- 10 374 51 195 1 479 49 716 8 398 3 155 74854
Harrison County 06---------------------------- 8 348 44 568 895 43 673 6 217 2 405 23555Henry County 04------------------------------ 20 763 111 096 6 315 104 781 17 728 3 977 31956Hickory County 04----------------------------- 8 045 42 926 2 098 40 828 4 475 1 571 39957Holt County 06-------------------------------- 5 677 27 517 419 27 098 3 653 1 448 –58Howard County 06---------------------------- 9 605 43 689 3 466 40 223 6 120 1 836 12359Howell County 08----------------------------- 33 838 152 603 6 828 145 775 38 220 4 787 61560Iron County 08-------------------------------- 10 939 49 656 987 48 669 9 483 1 173 –61Jackson County 04 05 06---------------------------- 634 733 4 179 653 339 782 3 839 871 509 366 745 523 67 47162Jasper County 07----------------------------- 94 871 434 615 20 091 414 524 54 229 17 792 3 00863Jefferson County 03--------------------------- 183 546 422 457 8 676 413 781 74 235 14 603 1 16764
Johnson County 04---------------------------- 46 194 305 543 196 144 109 399 17 019 131 364 126 11565Knox County 09------------------------------- 4 349 24 437 266 24 171 2 329 1 542 –66Laclede County 04---------------------------- 28 682 102 355 6 386 95 969 13 792 3 775 35667Lafayette County 04--------------------------- 31 946 133 863 6 768 127 095 25 612 6 108 2 08068Lawrence County 07--------------------------- 31 374 114 043 4 664 109 379 17 735 5 631 88669Lewis County 09------------------------------ 10 155 41 600 713 40 887 7 779 2 603 42970Lincoln County 09----------------------------- 31 782 86 441 2 451 83 990 10 913 4 192 49471Linn County 06-------------------------------- 13 971 71 508 963 70 545 10 302 2 757 –72Livingston County 06-------------------------- 14 433 63 614 955 62 659 8 837 5 107 27273McDonald County 07-------------------------- 18 151 58 221 2 682 55 539 10 031 3 642 24274
Macon County 09----------------------------- 15 075 73 401 1 595 71 806 10 700 4 134 58575Madison County 08---------------------------- 11 313 46 129 688 45 441 7 887 1 307 –76Maries County 04----------------------------- 8 315 26 506 508 25 998 5 711 677 –77Marion County 09----------------------------- 27 850 120 597 4 333 116 264 29 872 2 941 67078Mercer County 06----------------------------- 3 969 17 056 202 16 854 1 833 779 –79Miller County 04------------------------------- 21 819 79 662 3 083 76 579 10 554 2 938 40080Mississippi County 08-------------------------- 14 039 67 232 2 632 64 600 16 658 1 725 –81Moniteau County 04--------------------------- 12 725 41 373 1 022 40 351 4 098 2 077 –82Monroe County 09---------------------------- 8 764 40 500 2 434 38 066 5 454 2 725 95783Montgomery County 09------------------------ 11 494 53 273 572 52 701 10 386 2 291 –84
Morgan County 04---------------------------- 16 720 74 271 2 707 71 564 8 735 1 805 –85New Madrid County 08------------------------- 20 784 100 724 1 898 98 826 34 579 2 951 37486Newton County 07----------------------------- 46 872 160 613 15 334 145 279 38 034 8 073 3 14587Nodaway County 06--------------------------- 21 092 71 351 1 526 69 825 9 970 4 474 41888Oregon County 08----------------------------- 9 856 40 927 1 343 39 584 6 974 1 343 2889Osage County 04----------------------------- 12 203 33 981 593 33 388 4 446 1 726 –90Ozark County 07------------------------------ 9 229 39 175 1 645 37 530 5 077 2 495 –91Pemiscot County 08--------------------------- 21 579 110 692 5 603 105 089 27 262 4 521 50692Perry County 08------------------------------ 17 265 58 101 2 659 55 442 6 532 3 099 88393
See footnotes at end of table.
36 Consolidated Federal Funds Report

TIPS PS [APS_PPGB,F_SCOTT] 6/ 3/96 12:37:43 MCVX09 TLP:CFFR1.TLP;15 6/ 3/96 11:04:06 DATA:NONE PSC:TIPS_12353107_01.PSC PAGE: 36TSF:TIPS92~12353107.DAT;1 6/ 3/96 12:35:33 UTF:TIPS93~12353107.DAT;1 6/ 3/96 12:35:33 META:TIPS96~12353107.DAT;1 6/ 3/96 12:37:03
1995mCon.
Direct Federal expenditures or obligationsmCon. Other Federal assistance
Direct payments for individuals Procurement contract awards
TotalRetirement and
disability All other TotalDepartmentof Defense
Other Federalexpenditures or
obligations Direct loansGuaranteed loans
and insurance
60 450 43 035 17 415 41 437 16 467 458 551 1 530 122 477 14 350 8 127 1 122 961 5 837 10 290 24 308 256 692 40 147 16 545 2 003 1 541 1 071 688 3 056 337 910 25 327 12 583 180 – 629 562 6 390 4
139 770 98 753 41 017 60 847 46 062 4 523 943 35 514 5176 882 119 768 57 114 10 462 4 332 10 916 23 643 158 347 6
44 652 29 869 14 783 437 – 199 519 8 008 730 709 21 006 9 703 894 381 643 1 173 4 265 829 342 19 249 10 093 309 – 1 710 881 4 880 953 721 37 525 16 196 362 – 599 742 3 214 1046 734 31 461 15 273 370 – 666 417 4 096 1179 126 47 422 31 704 7 993 114 2 741 12 836 47 978 12
536 727 5 042 531 685 – – 55 916 6 303 15 605 13
15 500 999 9 756 435 5 744 564 7 239 749 5 854 274 1 231 267 517 764 3 480 375 14
59 374 34 919 24 455 1 006 429 2 458 2 657 3 437 1532 049 21 451 10 598 321 – 2 251 2 886 6 226 1621 534 14 767 6 767 256 – 4 301 8 039 22 460 1777 163 49 828 27 335 653 – 4 892 4 358 16 532 1893 067 65 664 27 403 1 838 467 626 1 435 10 527 1933 427 21 926 11 501 341 – 3 570 6 432 8 878 2048 772 32 494 16 278 449 – 4 182 4 078 7 529 2166 025 44 919 21 106 1 178 764 913 1 444 2 857 2228 193 20 031 8 162 371 – 880 1 045 3 527 23
235 759 149 663 86 096 19 702 2 740 3 796 4 465 29 043 24
262 905 172 991 89 914 13 898 5 741 3 351 2 565 55 970 25133 512 93 006 40 506 2 162 330 14 783 8 117 29 682 26
28 692 17 463 11 229 350 – 2 721 1 564 4 168 2786 915 58 749 28 166 2 879 304 4 222 2 903 9 102 2899 034 72 484 26 550 1 179 222 180 324 8 425 29
150 106 106 014 44 092 9 689 6 431 3 229 3 990 47 197 3035 817 23 741 12 076 733 201 6 579 3 131 14 945 3119 492 14 013 5 479 123 – 64 132 2 618 32
162 440 118 116 44 324 4 729 2 995 2 241 9 062 42 301 3348 452 33 914 14 538 984 624 691 1 103 4 026 34
27 964 18 330 9 634 863 – 5 316 5 942 9 746 3583 995 62 578 21 417 798 – 354 1 381 11 092 3618 901 12 195 6 706 314 33 3 179 4 839 10 801 37
285 154 170 972 114 182 20 700 499 2 272 5 018 99 610 3844 527 31 028 13 499 552 – 1 917 3 637 5 862 39
181 140 130 500 50 640 36 122 21 199 1 204 1 447 26 644 4042 674 29 269 13 405 734 317 2 930 2 973 8 725 4160 160 41 306 18 854 640 – 170 932 3 534 4225 074 17 328 7 746 329 45 1 475 912 1 771 4339 744 26 629 13 115 284 – 337 128 1 309 44
22 960 15 560 7 400 794 383 4 461 4 387 7 543 4521 009 14 538 6 471 265 – 3 650 1 337 4 672 4647 856 32 357 15 499 369 – 182 400 2 740 4731 622 21 377 10 245 263 – 123 198 624 48
114 246 72 685 41 561 820 84 2 811 5 880 28 917 49209 896 144 415 65 481 4 447 1 989 2 201 5 555 39 415 50
45 757 32 596 13 161 2 651 791 1 074 1 178 6 431 5125 165 16 716 8 449 364 – 4 571 2 789 2 629 52
580 998 401 216 179 782 38 799 3 310 2 384 1 991 80 713 5335 778 24 622 11 156 388 – 3 476 1 659 5 132 54
30 329 18 803 11 526 407 – 5 210 4 765 4 704 5573 051 51 153 21 898 14 074 3 137 2 267 3 620 7 027 5635 495 24 683 10 812 879 505 506 443 538 5719 187 12 730 6 457 484 26 2 745 8 235 20 326 5830 309 18 577 11 732 2 708 2 411 2 717 1 345 4 052 59
106 735 74 424 32 311 2 578 1 124 283 3 893 20 173 6038 666 25 999 12 667 246 – 88 214 2 175 61
1 999 722 1 268 932 730 790 909 562 234 370 15 479 5 475 403 788 62293 310 197 485 95 825 65 418 6 350 3 866 1 539 30 802 63326 898 221 695 105 203 3 800 590 2 922 5 025 109 138 64
96 752 65 815 30 937 57 184 56 341 3 225 3 896 12 624 6516 067 10 054 6 013 262 – 4 237 3 973 7 538 6683 828 61 692 22 136 714 – 246 512 14 071 6795 826 61 138 34 688 2 763 2 026 3 554 7 507 19 226 6888 810 60 523 28 287 803 – 1 064 2 278 4 594 6927 133 18 334 8 799 236 ~169 3 850 2 573 14 724 7066 795 44 416 22 379 1 644 936 2 897 4 183 25 766 7152 673 34 897 17 776 795 46 4 981 3 594 5 423 7245 216 29 274 15 942 845 – 3 609 3 539 6 573 7343 601 30 896 12 705 634 – 314 892 5 426 74
51 691 33 169 18 522 2 768 – 4 108 2 018 4 894 7536 435 25 852 10 583 342 – 158 291 3 829 7619 848 13 114 6 734 133 – 136 1 125 1 900 7782 333 56 171 26 162 2 705 2 277 2 746 6 172 22 828 7811 497 7 906 3 591 127 – 2 821 1 894 4 474 7965 357 44 191 21 166 530 54 285 381 8 341 8043 124 27 635 15 489 2 407 2 027 3 317 4 189 25 308 8132 631 22 338 10 293 939 162 1 629 748 4 254 8227 069 18 216 8 853 1 172 841 4 080 3 901 11 150 8336 879 24 116 12 763 667 – 3 051 2 392 7 934 84
62 885 44 878 18 007 390 – 456 950 4 489 8555 489 36 315 19 174 1 031 315 6 675 10 403 27 810 86
101 760 72 296 29 464 11 694 4 801 1 053 800 23 791 8751 025 32 197 18 828 748 – 5 135 5 269 10 658 8832 215 23 447 8 768 265 – 130 1 198 1 893 8926 707 17 948 8 759 458 51 643 617 8 326 9030 533 22 220 8 313 492 – 578 99 272 9170 356 42 815 27 541 4 349 3 885 4 203 6 719 31 042 9242 981 29 289 13 692 3 859 753 1 630 2 003 6 255 93
County Area 37

TIPS PS [APS_PPGB,F_SCOTT] 6/ 3/96 12:37:43 MCVX09 TLP:CFFR1.TLP;15 6/ 3/96 11:04:06 DATA:NONE PSC:TIPS_12353107_01.PSC PAGE: 37TSF:TIPS92~12353107.DAT;1 6/ 3/96 12:35:33 UTF:TIPS93~12353107.DAT;1 6/ 3/96 12:35:33 META:TIPS96~12353107.DAT;1 6/ 3/96 12:37:03
Federal Government Expenditures or Obligations by State and County Area: Fiscal Year[Thousand dollars]
State and county area
Congressional district
Direct Federal expenditures or obligations
Total direct expenditres or obligations Salaries and wages
United Statesresident
population1 TotalDepartment of
DefenseAll other
agencies Grant awards TotalDepartmentof Defense
Missouri mCon.
Pettis County 04------------------------------ 36 568 143 573 7 644 135 929 17 511 7 301 1 5441Phelps County 08----------------------------- 36 988 174 601 13 636 160 965 23 179 30 282 3 2322Pike County 09------------------------------- 16 073 82 270 1 900 80 370 21 641 3 230 4613Platte County 06------------------------------ 64 788 201 136 7 167 193 969 22 685 52 271 4534Polk County 07------------------------------- 23 822 87 253 3 011 84 242 12 303 3 285 –5Pulaski County 04----------------------------- 39 802 447 962 343 185 104 777 22 382 282 490 279 3956Putnam County 06---------------------------- 5 052 23 625 259 23 366 2 581 1 262 –7Ralls County 09------------------------------- 8 795 33 180 956 32 224 4 744 3 564 4328Randolph County 09--------------------------- 24 011 100 634 2 179 98 455 17 601 4 265 7819Ray County 06-------------------------------- 22 012 71 108 1 618 69 490 12 826 3 025 45810
Reynolds County 08--------------------------- 6 608 26 901 319 26 582 5 619 1 128 –11Ripley County 08------------------------------ 13 265 60 933 2 144 58 789 11 132 2 383 40812St. Charles County 02 09------------------------- 239 288 589 894 23 499 566 395 105 864 26 396 1 85813St. Clair County 04---------------------------- 8 731 43 286 740 42 546 9 155 1 322 –14St. Francois County 08------------------------- 51 798 218 895 5 583 213 312 38 470 7 346 1 62715St. Louis County 01 02 03--------------------------- 1 005 096 3 542 629 242 515 3 300 114 333 198 347 179 145 39716St. Louis city area 01 03-------------------------- 368 215 8 875 257 5 745 111 3 130 146 764 691 831 204 335 09017Ste. Genevieve County 03---------------------- 16 442 50 953 3 699 47 254 5 960 1 759 35118Saline County 04------------------------------ 22 785 116 778 2 624 114 154 33 387 4 793 95019Schuyler County 06---------------------------- 4 263 23 077 1 210 21 867 2 380 2 219 75220
Scotland County 09---------------------------- 4 789 24 838 152 24 686 3 514 994 –21Scott County 08------------------------------- 40 109 156 990 3 349 153 641 32 858 5 617 43322Shannon County 08--------------------------- 7 975 31 204 801 30 403 7 146 2 280 –23Shelby County 09----------------------------- 6 839 30 711 365 30 346 3 701 2 019 –24Stoddard County 08--------------------------- 29 220 132 339 3 834 128 505 21 583 8 040 1 32725Stone County 07------------------------------ 23 974 85 836 3 644 82 192 8 662 1 818 –26Sullivan County 06---------------------------- 6 410 39 091 433 38 658 10 398 2 216 –27Taney County 07------------------------------ 31 037 134 933 8 461 126 472 20 784 5 892 2 83728Texas County 08------------------------------ 22 077 90 043 4 813 85 230 13 816 3 544 –29Vernon County 04----------------------------- 19 129 95 237 4 014 91 223 25 829 5 808 2 41330
Warren County 09----------------------------- 21 842 63 508 1 779 61 729 8 529 3 076 74731Washington County 08------------------------- 21 481 70 062 642 69 420 16 296 2 402 –32Wayne County 08----------------------------- 12 622 62 700 3 447 59 253 9 032 2 878 1 07333Webster County 04---------------------------- 25 966 80 481 3 445 77 036 10 170 3 210 –34Worth County 06------------------------------ 2 384 12 474 189 12 285 1 250 920 –35Wright County 08----------------------------- 17 861 67 926 3 248 64 678 10 530 3 118 69936State undistributed ------------------------- 1 794 187 – 1 794 187 182 472 – –37
Montana ------------------------------------ 856 057 4 828 909 413 526 4 415 383 996 472 627 871 183 02238
Beaverhead County 00------------------------- 8 849 46 385 3 797 42 588 8 518 7 517 30339Big Horn County 00---------------------------- 12 060 78 591 354 78 237 36 995 14 125 –40Blaine County 00------------------------------ 7 054 69 198 678 68 520 26 865 6 551 53741Broadwater County 00------------------------- 3 677 16 963 310 16 653 1 577 1 375 –42Carbon County 00----------------------------- 8 947 31 912 575 31 337 2 701 2 486 –43Carter County 00------------------------------ 1 531 7 627 59 7 568 171 553 –44Cascade County 00--------------------------- 81 167 742 769 215 010 527 759 47 003 169 511 143 97745Chouteau County 00--------------------------- 5 451 41 140 306 40 834 2 713 1 291 –46Custer County 00----------------------------- 12 126 60 532 795 59 737 7 288 13 942 13047Daniels County 00----------------------------- 2 152 18 433 132 18 301 357 963 –48
Dawson County 00---------------------------- 8 994 37 661 572 37 089 3 938 2 257 10049Anaconda~Deer Lodge Co. 00------------------ 10 229 49 252 910 48 342 7 014 3 063 14550Fallon County 00------------------------------ 3 061 11 805 126 11 679 985 455 –51Fergus County 00----------------------------- 12 588 56 820 945 55 875 5 707 5 763 13852Flathead County 00---------------------------- 67 285 278 109 20 173 257 936 39 819 30 188 1 39253Gallatin County 00----------------------------- 57 773 175 959 11 056 164 903 40 784 23 320 2 40854Garfield County 00---------------------------- 1 433 12 100 150 11 950 2 639 717 –55Glacier County 00----------------------------- 12 426 104 625 290 104 335 51 657 13 108 –56Golden Valley County 00----------------------- 949 5 629 82 5 547 54 316 –57Granite County 00----------------------------- 2 655 10 855 213 10 642 2 381 1 189 –58
Hill County 00--------------------------------- 17 480 93 719 1 730 91 989 25 037 6 069 50559Jefferson County 00--------------------------- 8 988 29 975 6 029 23 946 2 989 6 808 4 94860Judith Basin County 00------------------------ 2 246 12 193 174 12 019 782 1 252 –61Lake County 00------------------------------- 23 653 122 243 14 191 108 052 32 768 5 820 7562Lewis and Clark County 00--------------------- 51 524 435 305 25 622 409 683 201 142 59 908 14 39263Liberty County 00----------------------------- 2 238 16 018 87 15 931 165 666 –64Lincoln County 00----------------------------- 18 409 96 444 3 759 92 685 20 351 18 233 1 16865McCone County 00---------------------------- 2 140 21 040 17 21 023 6 816 568 –66Madison County 00---------------------------- 6 384 21 458 654 20 804 1 069 2 541 –67Meagher County 00--------------------------- 1 830 8 918 142 8 776 1 147 843 –68
Mineral County 00----------------------------- 3 633 18 509 280 18 229 4 630 2 055 –69Missoula County 00--------------------------- 85 670 335 386 10 017 325 369 62 853 56 089 2 99570Musselshell County 00------------------------- 4 422 25 213 412 24 801 8 771 798 –71Park County 00------------------------------- 15 651 52 363 2 352 50 011 4 257 3 519 19472Petroleum County 00-------------------------- 534 2 902 25 2 877 224 161 –73Phillips County 00----------------------------- 5 039 26 295 375 25 920 2 353 1 948 17574Pondera County 00---------------------------- 6 218 50 919 322 50 597 20 508 1 605 –75Powder River County 00----------------------- 2 006 7 885 15 7 870 1 278 684 –76Powell County 00----------------------------- 6 792 24 369 642 23 727 3 397 3 057 14377Prairie County 00------------------------------ 1 331 6 939 94 6 845 217 268 –78
Ravalli County 00----------------------------- 30 701 140 806 5 580 135 226 10 574 15 890 20979Richland County 00---------------------------- 10 381 38 146 400 37 746 3 660 2 174 8780Roosevelt County 00-------------------------- 11 127 84 182 2 120 82 062 34 686 9 068 57981Rosebud County 00--------------------------- 10 755 51 752 1 483 50 269 23 752 6 730 1 06982Sanders County 00---------------------------- 9 733 52 558 1 525 51 033 16 126 4 544 –83Sheridan County 00--------------------------- 4 434 28 906 335 28 571 1 093 2 707 9784Butte~Silver Bow County 00--------------------- 34 814 191 110 3 722 187 388 29 423 13 708 1 57485Stillwater County 00--------------------------- 7 222 26 450 610 25 840 2 824 1 361 –86Sweet Grass County 00------------------------ 3 269 12 717 221 12 496 1 104 1 172 –87Teton County 00------------------------------ 6 438 33 692 626 33 066 2 526 2 188 –88
See footnotes at end of table.
38 Consolidated Federal Funds Report

TIPS PS [APS_PPGB,F_SCOTT] 6/ 3/96 12:37:43 MCVX09 TLP:CFFR1.TLP;15 6/ 3/96 11:04:06 DATA:NONE PSC:TIPS_12353107_01.PSC PAGE: 38TSF:TIPS92~12353107.DAT;1 6/ 3/96 12:35:33 UTF:TIPS93~12353107.DAT;1 6/ 3/96 12:35:33 META:TIPS96~12353107.DAT;1 6/ 3/96 12:37:03
1995mCon.
Direct Federal expenditures or obligationsmCon. Other Federal assistance
Direct payments for individuals Procurement contract awards
TotalRetirement and
disability All other TotalDepartmentof Defense
Other Federalexpenditures or
obligations Direct loansGuaranteed loans
and insurance
112 049 77 470 34 579 3 612 183 3 100 7 201 18 078 1117 292 84 677 32 615 3 568 1 614 281 731 15 513 2
51 499 30 959 20 540 2 745 448 3 155 2 115 13 765 3114 192 80 289 33 903 9 537 479 2 452 2 115 60 158 4
70 507 48 418 22 089 706 62 452 742 2 690 5101 438 80 342 21 096 41 483 40 826 169 391 8 486 6
17 631 11 327 6 304 ~10 ~251 2 160 360 2 199 720 514 15 191 5 323 1 028 345 3 331 2 963 6 786 874 743 48 316 26 427 671 – 3 354 2 156 2 832 951 199 32 100 19 099 805 34 3 254 2 596 19 341 10
19 837 13 315 6 522 227 – 90 330 5 915 1146 014 30 780 15 234 275 – 1 129 1 392 5 351 12
385 711 275 505 110 206 64 179 5 842 7 742 4 457 239 443 1331 133 20 445 10 688 246 – 1 429 404 1 498 14
171 139 111 817 59 322 1 595 382 345 2 684 7 697 152 738 935 1 838 399 900 536 113 803 50 174 9 515 38 313 798 649 161 551 690 851 727 699 963 5 706 351 5 376 118 21 321 14 349 168 684 17
39 349 28 691 10 658 2 488 2 204 1 397 1 246 11 320 1871 947 46 892 25 055 809 – 5 843 8 804 15 572 1916 364 10 571 5 793 284 – 1 830 922 1 610 20
16 378 9 825 6 553 189 – 3 762 5 224 8 149 21112 826 77 396 35 430 1 848 958 3 840 2 984 55 160 22
21 477 14 872 6 605 180 – 121 116 546 2322 304 15 155 7 149 388 – 2 298 2 188 6 300 2485 823 59 962 25 861 1 075 52 15 818 15 365 19 891 2574 737 54 977 19 760 508 148 112 427 4 452 2622 443 13 258 9 185 315 – 3 720 1 232 3 086 27
106 560 73 735 32 825 1 439 559 259 504 37 481 2871 911 52 458 19 453 511 – 260 1 073 14 002 2957 542 39 580 17 962 625 – 5 435 3 450 8 412 30
49 420 32 851 16 569 474 – 2 008 2 458 9 262 3150 885 34 717 16 168 391 50 87 1 049 1 244 3249 138 35 326 13 812 1 397 1 018 255 411 3 835 3365 969 46 733 19 236 897 272 235 536 4 102 348 084 5 463 2 621 189 – 2 032 1 523 1 318 35
53 634 37 790 15 844 474 – 172 113 2 588 36710 123 7 103 703 020 – – 901 593 143 858 279 458 37
2 373 212 1 612 838 760 374 335 560 133 725 495 794 128 411 1 051 284 38
25 876 18 203 7 673 3 388 – 1 087 598 8 867 3921 561 13 992 7 569 1 871 179 4 039 3 541 15 780 4015 766 10 724 5 042 10 919 – 9 098 2 430 15 329 4110 593 8 021 2 572 994 – 2 424 1 075 3 672 4224 378 16 711 7 667 731 – 1 615 594 7 780 433 171 2 325 846 208 – 3 524 354 1 307 44
244 900 179 158 65 742 50 629 45 938 230 725 2 950 83 507 4515 722 10 507 5 215 243 – 21 170 6 649 44 557 4635 306 26 081 9 225 2 106 29 1 889 538 14 881 477 599 5 428 2 171 1 775 – 7 739 4 850 11 391 48
25 588 18 307 7 281 406 113 5 472 2 804 12 048 4938 444 26 269 12 175 594 – 138 45 2 983 507 000 5 271 1 729 66 – 3 300 1 067 1 826 51
37 017 26 868 10 149 883 – 7 451 1 362 15 094 52175 092 133 777 41 315 31 768 9 764 1 242 3 990 60 575 53100 648 73 435 27 213 8 401 1 896 2 806 770 44 378 54
3 132 2 253 879 174 – 5 438 579 2 860 5526 432 16 810 9 622 6 414 – 7 015 3 420 13 306 562 809 2 018 791 66 – 2 384 193 1 282 577 048 5 185 1 863 169 – 68 90 1 998 58
45 304 31 267 14 037 1 267 420 16 042 6 768 36 381 5919 135 14 463 4 672 582 – 461 1 388 3 235 606 076 4 326 1 750 343 – 3 740 875 7 091 61
63 133 45 407 17 726 19 439 11 895 1 082 962 13 377 62153 554 103 112 50 442 19 648 1 435 1 053 619 41 706 63
6 953 4 971 1 982 442 – 7 793 3 381 16 254 6452 932 41 506 11 426 4 830 458 100 567 9 854 655 281 3 696 1 585 110 – 8 265 2 367 39 205 66
15 997 12 102 3 895 894 26 957 263 3 493 675 544 3 798 1 746 492 – 892 390 1 897 68
11 188 8 584 2 604 602 – 34 752 773 69194 967 135 966 59 001 20 663 852 814 800 99 003 70
13 412 9 515 3 897 141 – 2 090 358 2 079 7142 083 33 053 9 030 1 360 502 1 143 3 968 9 514 721 348 808 540 82 – 1 087 394 719 73
13 650 8 988 4 662 310 – 8 034 2 268 12 161 7418 957 12 484 6 473 615 – 9 233 3 332 19 948 753 680 2 833 847 114 – 2 130 146 2 394 76
17 182 13 112 4 070 446 – 287 404 3 186 774 398 3 166 1 232 75 – 1 980 2 113 4 692 78
89 778 71 913 17 865 24 158 – 406 1 813 12 728 7926 081 16 796 9 285 331 – 5 899 4 101 18 060 8027 562 16 787 10 775 3 845 1 180 9 021 4 457 18 101 8116 883 12 097 4 786 1 253 100 3 135 712 6 525 8230 335 23 010 7 325 1 026 – 528 1 516 4 399 8315 055 11 078 3 977 323 – 9 728 2 975 16 515 84
113 369 79 732 33 637 34 257 165 352 1 002 11 863 8517 854 13 149 4 705 601 41 3 810 698 7 175 869 519 6 597 2 922 297 – 625 509 2 097 87
18 228 12 333 5 895 275 – 10 474 3 937 18 299 88
County Area 39
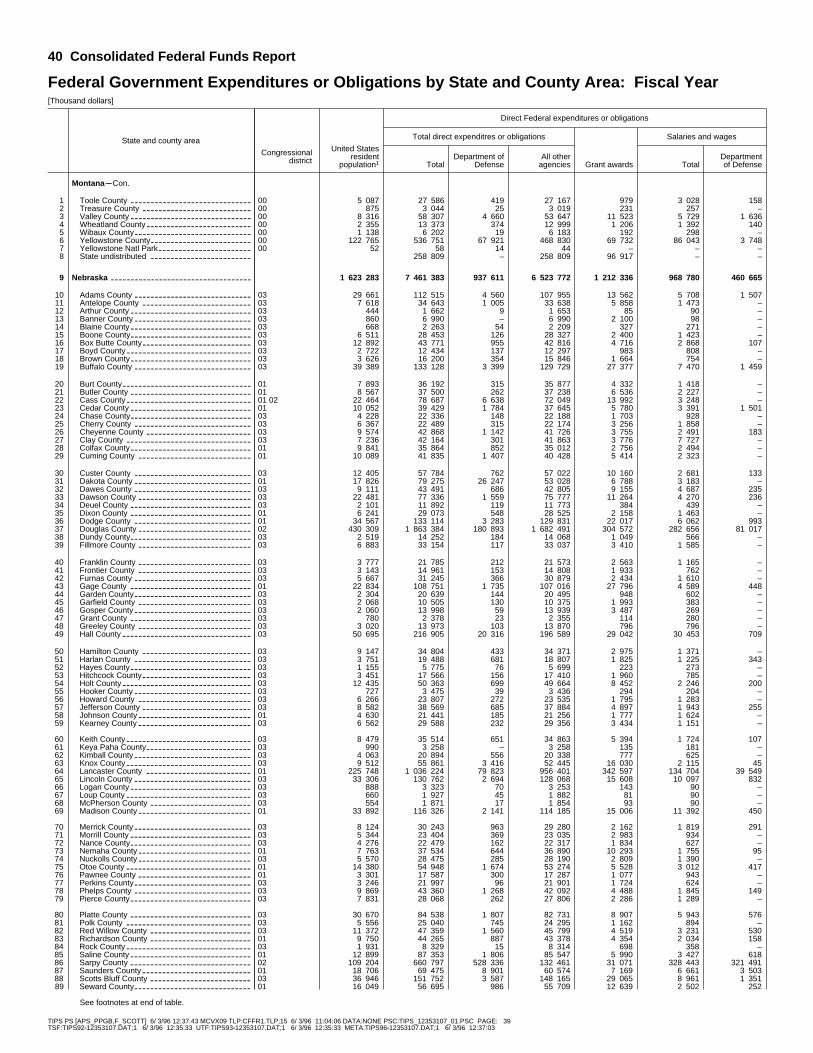
TIPS PS [APS_PPGB,F_SCOTT] 6/ 3/96 12:37:43 MCVX09 TLP:CFFR1.TLP;15 6/ 3/96 11:04:06 DATA:NONE PSC:TIPS_12353107_01.PSC PAGE: 39TSF:TIPS92~12353107.DAT;1 6/ 3/96 12:35:33 UTF:TIPS93~12353107.DAT;1 6/ 3/96 12:35:33 META:TIPS96~12353107.DAT;1 6/ 3/96 12:37:03
Federal Government Expenditures or Obligations by State and County Area: Fiscal Year[Thousand dollars]
State and county area
Congressional district
Direct Federal expenditures or obligations
Total direct expenditres or obligations Salaries and wages
United Statesresident
population1 TotalDepartment of
DefenseAll other
agencies Grant awards TotalDepartmentof Defense
Montana mCon.
Toole County 00------------------------------ 5 087 27 586 419 27 167 979 3 028 1581Treasure County 00--------------------------- 875 3 044 25 3 019 231 257 –2Valley County 00------------------------------ 8 316 58 307 4 660 53 647 11 523 5 729 1 6363Wheatland County 00-------------------------- 2 355 13 373 374 12 999 1 206 1 392 1404Wibaux County 00----------------------------- 1 138 6 202 19 6 183 192 298 –5Yellowstone County 00------------------------- 122 765 536 751 67 921 468 830 69 732 86 043 3 7486Yellowstone Natl Park 00----------------------- 52 58 14 44 – – –7State undistributed ------------------------- 258 809 – 258 809 96 917 – –8
Nebraska ----------------------------------- 1 623 283 7 461 383 937 611 6 523 772 1 212 336 968 780 460 6659
Adams County 03----------------------------- 29 661 112 515 4 560 107 955 13 562 5 708 1 50710Antelope County 03--------------------------- 7 618 34 643 1 005 33 638 5 858 1 473 –11Arthur County 03------------------------------ 444 1 662 9 1 653 85 90 –12Banner County 03----------------------------- 860 6 990 – 6 990 2 100 98 –13Blaine County 03------------------------------ 668 2 263 54 2 209 327 271 –14Boone County 03------------------------------ 6 511 28 453 126 28 327 2 400 1 423 –15Box Butte County 03--------------------------- 12 892 43 771 955 42 816 4 716 2 868 10716Boyd County 03------------------------------- 2 722 12 434 137 12 297 983 808 –17Brown County 03------------------------------ 3 626 16 200 354 15 846 1 664 754 –18Buffalo County 03----------------------------- 39 389 133 128 3 399 129 729 27 377 7 470 1 45919
Burt County 01-------------------------------- 7 893 36 192 315 35 877 4 332 1 418 –20Butler County 01------------------------------ 8 567 37 500 262 37 238 6 536 2 227 –21Cass County 01 02------------------------------- 22 464 78 687 6 638 72 049 13 992 3 248 –22Cedar County 01------------------------------ 10 052 39 429 1 784 37 645 5 780 3 391 1 50123Chase County 03------------------------------ 4 228 22 336 148 22 188 1 703 928 –24Cherry County 03----------------------------- 6 367 22 489 315 22 174 3 256 1 858 –25Cheyenne County 03-------------------------- 9 574 42 868 1 142 41 726 3 755 2 491 18326Clay County 03------------------------------- 7 236 42 164 301 41 863 3 776 7 727 –27Colfax County 01------------------------------ 9 841 35 864 852 35 012 2 756 2 494 –28Cuming County 01---------------------------- 10 089 41 835 1 407 40 428 5 414 2 323 –29
Custer County 03----------------------------- 12 405 57 784 762 57 022 10 160 2 681 13330Dakota County 01----------------------------- 17 826 79 275 26 247 53 028 6 788 3 183 –31Dawes County 03----------------------------- 9 111 43 491 686 42 805 9 155 4 687 23532Dawson County 03---------------------------- 22 481 77 336 1 559 75 777 11 264 4 270 23633Deuel County 03------------------------------ 2 101 11 892 119 11 773 384 439 –34Dixon County 01------------------------------ 6 241 29 073 548 28 525 2 158 1 463 –35Dodge County 01----------------------------- 34 567 133 114 3 283 129 831 22 017 6 062 99336Douglas County 02---------------------------- 430 309 1 863 384 180 893 1 682 491 304 572 282 656 81 01737Dundy County 03------------------------------ 2 519 14 252 184 14 068 1 049 566 –38Fillmore County 03---------------------------- 6 883 33 154 117 33 037 3 410 1 585 –39
Franklin County 03---------------------------- 3 777 21 785 212 21 573 2 563 1 165 –40Frontier County 03---------------------------- 3 143 14 961 153 14 808 1 933 762 –41Furnas County 03----------------------------- 5 667 31 245 366 30 879 2 434 1 610 –42Gage County 01------------------------------ 22 834 108 751 1 735 107 016 27 796 4 589 44843Garden County 03----------------------------- 2 304 20 639 144 20 495 948 602 –44Garfield County 03---------------------------- 2 068 10 505 130 10 375 1 993 383 –45Gosper County 03----------------------------- 2 060 13 998 59 13 939 3 487 269 –46Grant County 03------------------------------ 780 2 378 23 2 355 114 280 –47Greeley County 03---------------------------- 3 020 13 973 103 13 870 796 796 –48Hall County 03-------------------------------- 50 695 216 905 20 316 196 589 29 042 30 453 70949
Hamilton County 03--------------------------- 9 147 34 804 433 34 371 2 975 1 371 –50Harlan County 03----------------------------- 3 751 19 488 681 18 807 1 825 1 225 34351Hayes County 03------------------------------ 1 155 5 775 76 5 699 223 273 –52Hitchcock County 03--------------------------- 3 451 17 566 156 17 410 1 960 785 –53Holt County 03-------------------------------- 12 435 50 363 699 49 664 8 452 2 246 20054Hooker County 03----------------------------- 727 3 475 39 3 436 294 204 –55Howard County 03---------------------------- 6 266 23 807 272 23 535 1 795 1 283 –56Jefferson County 03--------------------------- 8 582 38 569 685 37 884 4 897 1 943 25557Johnson County 01---------------------------- 4 630 21 441 185 21 256 1 777 1 624 –58Kearney County 03---------------------------- 6 562 29 588 232 29 356 3 434 1 151 –59
Keith County 03------------------------------- 8 479 35 514 651 34 863 5 394 1 724 10760Keya Paha County 03-------------------------- 990 3 258 – 3 258 135 181 –61Kimball County 03----------------------------- 4 063 20 894 556 20 338 777 625 –62Knox County 03------------------------------- 9 512 55 861 3 416 52 445 16 030 2 115 4563Lancaster County 01-------------------------- 225 748 1 036 224 79 823 956 401 342 597 134 704 39 54964Lincoln County 03----------------------------- 33 306 130 762 2 694 128 068 15 608 10 097 83265Logan County 03------------------------------ 888 3 323 70 3 253 143 90 –66Loup County 03------------------------------- 660 1 927 45 1 882 81 90 –67McPherson County 03------------------------- 554 1 871 17 1 854 93 90 –68Madison County 01---------------------------- 33 892 116 326 2 141 114 185 15 006 11 392 45069
Merrick County 03----------------------------- 8 124 30 243 963 29 280 2 162 1 819 29170Morrill County 03------------------------------ 5 344 23 404 369 23 035 2 983 934 –71Nance County 03------------------------------ 4 276 22 479 162 22 317 1 834 627 –72Nemaha County 01---------------------------- 7 763 37 534 644 36 890 10 293 1 755 9573Nuckolls County 03---------------------------- 5 570 28 475 285 28 190 2 809 1 390 –74Otoe County 01------------------------------- 14 380 54 948 1 674 53 274 5 528 3 012 41775Pawnee County 01---------------------------- 3 301 17 587 300 17 287 1 077 943 –76Perkins County 03----------------------------- 3 246 21 997 96 21 901 1 724 624 –77Phelps County 03----------------------------- 9 869 43 360 1 268 42 092 4 488 1 845 14978Pierce County 03------------------------------ 7 831 28 068 262 27 806 2 286 1 289 –79
Platte County 03------------------------------ 30 670 84 538 1 807 82 731 8 907 5 943 57680Polk County 03------------------------------- 5 556 25 040 745 24 295 1 162 894 –81Red Willow County 03------------------------- 11 372 47 359 1 560 45 799 4 519 3 231 53082Richardson County 01------------------------- 9 750 44 265 887 43 378 4 354 2 034 15883Rock County 03------------------------------- 1 931 8 329 15 8 314 698 358 –84Saline County 01------------------------------ 12 899 87 353 1 806 85 547 5 990 3 427 61885Sarpy County 02------------------------------ 109 204 660 797 528 336 132 461 31 071 328 443 321 49186Saunders County 01--------------------------- 18 706 69 475 8 901 60 574 7 169 6 661 3 50387Scotts Bluff County 03------------------------- 36 946 151 752 3 587 148 165 29 065 8 961 1 35188Seward County 01----------------------------- 16 049 56 695 986 55 709 12 639 2 502 25289
See footnotes at end of table.
40 Consolidated Federal Funds Report

TIPS PS [APS_PPGB,F_SCOTT] 6/ 3/96 12:37:43 MCVX09 TLP:CFFR1.TLP;15 6/ 3/96 11:04:06 DATA:NONE PSC:TIPS_12353107_01.PSC PAGE: 40TSF:TIPS92~12353107.DAT;1 6/ 3/96 12:35:33 UTF:TIPS93~12353107.DAT;1 6/ 3/96 12:35:33 META:TIPS96~12353107.DAT;1 6/ 3/96 12:37:03
1995mCon.
Direct Federal expenditures or obligationsmCon. Other Federal assistance
Direct payments for individuals Procurement contract awards
TotalRetirement and
disability All other TotalDepartmentof Defense
Other Federalexpenditures or
obligations Direct loansGuaranteed loans
and insurance
12 884 8 746 4 138 339 28 10 356 5 126 16 211 12 010 1 471 539 63 – 483 35 3 417 2
27 557 19 555 8 002 2 069 1 423 11 429 3 948 20 486 37 493 5 480 2 013 844 – 2 439 404 2 056 43 205 2 234 971 70 – 2 436 503 2 092 5
299 805 216 350 83 455 71 533 57 281 9 639 1 429 103 681 644 44 – 14 – – – – 7
132 697 965 131 732 – – 29 195 25 231 97 195 8
4 191 048 2 882 099 1 308 949 517 300 282 481 571 920 730 687 2 982 783 9
80 516 57 371 23 145 4 988 1 308 7 741 8 215 25 509 1019 542 13 264 6 278 284 – 7 485 22 382 18 888 11
957 774 183 19 – 511 61 653 12947 773 174 19 – 3 827 727 5 576 13
1 291 904 387 57 – 316 142 834 1417 271 12 149 5 122 246 – 7 112 14 283 12 872 1529 659 22 454 7 205 723 184 5 806 3 231 19 976 169 580 6 125 3 455 152 – 911 2 536 2 101 17
10 811 7 896 2 915 133 – 2 838 4 946 3 764 1878 200 55 368 22 832 11 497 180 8 583 13 034 43 308 19
25 401 17 111 8 290 289 – 4 752 13 378 20 919 2022 080 16 463 5 617 410 – 6 247 12 378 15 809 2157 128 42 816 14 312 778 27 3 541 8 613 70 848 2224 676 16 924 7 752 680 – 4 902 15 135 19 025 2313 133 9 025 4 108 152 – 6 421 9 043 14 397 2415 624 11 674 3 950 307 – 1 445 1 687 1 784 2528 775 21 698 7 077 765 348 7 083 1 401 24 964 2620 897 15 488 5 409 1 498 – 8 266 8 447 20 280 2726 598 18 327 8 271 1 097 548 2 920 8 279 18 463 2825 490 17 680 7 810 4 991 1 043 3 616 8 244 22 888 29
36 513 25 447 11 066 498 – 7 932 16 399 29 707 3040 464 27 449 13 015 26 075 25 678 2 765 6 186 13 189 3124 499 17 057 7 442 1 190 – 3 960 3 553 5 074 3252 547 37 453 15 094 1 308 619 7 946 26 026 45 270 337 883 5 598 2 285 66 – 3 121 1 799 8 182 34
16 328 11 084 5 244 3 596 382 5 526 7 241 8 959 3599 683 71 076 28 607 1 145 255 4 207 13 861 101 199 36
1 124 451 770 580 353 871 144 982 42 826 6 723 3 416 247 353 377 422 5 466 1 956 104 – 5 110 5 588 11 723 38
19 932 14 592 5 340 313 – 7 914 19 345 20 848 39
13 390 9 416 3 974 227 – 4 440 8 913 8 472 407 773 5 366 2 407 142 – 4 352 9 671 13 001 41
21 755 15 400 6 355 319 – 5 128 6 144 13 630 4267 190 50 321 16 869 1 166 266 8 010 12 863 19 215 438 627 6 171 2 456 7 982 – 2 479 1 035 5 963 446 937 4 989 1 948 437 – 755 525 752 456 543 4 863 1 680 47 – 3 651 7 796 13 806 461 906 1 283 623 57 – 20 – – 478 912 6 008 2 904 195 – 3 274 3 693 7 818 48
126 631 92 552 34 079 21 314 17 521 9 466 12 492 72 897 49
19 662 14 898 4 764 275 – 10 522 22 840 30 891 5012 205 8 874 3 331 196 35 4 036 7 066 13 105 511 874 1 267 607 38 – 3 368 2 031 8 600 52
10 662 7 997 2 665 142 – 4 016 3 805 9 681 5330 408 21 387 9 021 367 – 8 890 26 474 18 743 542 907 2 044 863 19 – 52 99 277 55
16 106 11 433 4 673 322 – 4 300 11 033 10 841 5626 795 20 504 6 291 303 – 4 630 7 570 10 255 5713 903 9 724 4 179 282 – 3 855 3 207 5 739 5816 333 12 336 3 997 283 65 8 386 14 022 25 513 59
23 286 17 599 5 687 909 49 4 202 4 265 12 768 602 363 1 597 766 38 – 542 735 912 61
11 853 9 298 2 555 533 410 7 106 1 715 7 719 6228 843 20 029 8 814 3 892 3 074 4 980 9 062 16 543 63
513 526 356 304 157 222 36 880 15 330 8 516 7 373 158 936 6494 409 70 595 23 814 1 825 – 8 824 9 765 168 201 652 173 1 719 454 19 – 897 694 2 104 661 436 938 498 19 – 300 850 806 671 348 901 447 19 – 321 246 440 68
82 338 57 858 24 480 2 297 276 5 294 12 883 27 454 69
19 822 14 401 5 421 560 257 5 879 8 888 22 051 7014 994 10 334 4 660 170 – 4 322 3 185 14 083 7111 650 7 882 3 768 4 409 – 3 961 5 995 10 847 7222 043 15 306 6 737 499 120 2 944 6 679 16 850 7319 030 13 549 5 481 1 161 – 4 084 6 635 8 596 7441 085 29 761 11 324 1 025 200 4 299 6 184 17 291 7511 378 8 128 3 250 184 – 4 006 5 576 4 888 769 651 7 019 2 632 123 – 9 875 9 280 22 293 77
26 201 19 023 7 178 1 081 778 9 745 20 318 40 168 7818 863 13 764 5 099 237 – 5 392 12 533 16 677 79
62 585 47 225 15 360 909 165 6 193 20 156 38 467 8016 879 11 381 5 498 709 529 5 395 14 223 17 510 8133 985 24 363 9 622 829 425 4 795 7 351 15 108 8233 504 23 707 9 797 386 – 3 986 3 199 16 610 834 767 3 496 1 271 57 – 2 451 3 993 2 627 84
34 545 25 375 9 170 38 076 531 5 314 8 168 26 422 85158 539 134 690 23 849 141 387 140 381 1 355 1 860 102 497 86
44 882 32 526 12 356 5 191 4 473 5 572 9 369 45 684 87105 664 75 558 30 106 3 813 187 4 249 2 784 39 902 88
34 560 25 264 9 296 491 – 6 503 10 395 17 609 89
County Area 41

TIPS PS [APS_PPGB,F_SCOTT] 6/ 3/96 12:37:43 MCVX09 TLP:CFFR1.TLP;15 6/ 3/96 11:04:06 DATA:NONE PSC:TIPS_12353107_01.PSC PAGE: 41TSF:TIPS92~12353107.DAT;1 6/ 3/96 12:35:33 UTF:TIPS93~12353107.DAT;1 6/ 3/96 12:35:33 META:TIPS96~12353107.DAT;1 6/ 3/96 12:37:03
Federal Government Expenditures or Obligations by State and County Area: Fiscal Year[Thousand dollars]
State and county area
Congressional district
Direct Federal expenditures or obligations
Total direct expenditres or obligations Salaries and wages
United Statesresident
population1 TotalDepartment of
DefenseAll other
agencies Grant awards TotalDepartmentof Defense
Nebraska mCon.
Sheridan County 03--------------------------- 6 669 29 057 282 28 775 2 970 1 137 –1Sherman County 03--------------------------- 3 611 17 656 131 17 525 3 448 813 –2Sioux County 03------------------------------ 1 566 5 180 82 5 098 132 342 –3Stanton County 01---------------------------- 6 148 14 323 125 14 198 2 169 618 –4Thayer County 03----------------------------- 6 537 32 581 233 32 348 2 884 1 398 –5Thomas County 03---------------------------- 825 4 784 11 4 773 289 1 749 –6Thurston County 01--------------------------- 7 199 68 601 23 348 45 253 18 062 5 441 –7Valley County 03------------------------------ 4 900 22 260 266 21 994 2 985 1 518 –8Washington County 01------------------------- 17 445 45 440 2 263 43 177 3 857 2 021 –9Wayne County 01----------------------------- 9 564 29 131 956 28 175 4 466 2 291 67210Webster County 03---------------------------- 4 190 21 426 158 21 268 1 868 1 071 –11Wheeler County 03---------------------------- 975 4 847 44 4 803 176 271 –12York County 01------------------------------- 14 576 54 437 787 53 650 4 804 2 630 25313State undistributed ------------------------- 327 809 – 327 809 47 539 – –14
Nevada ------------------------------------- 1 457 046 6 665 118 930 656 5 734 462 1 007 095 816 246 354 99315
Churchill County 02---------------------------- 20 300 168 630 99 195 69 435 13 972 48 115 43 87116Clark County 01 02------------------------------- 938 227 4 035 376 617 685 3 417 691 408 505 542 209 273 25317Douglas County 02---------------------------- 33 221 85 620 7 791 77 829 8 014 3 235 –18Elko County 02------------------------------- 40 400 91 584 3 084 88 500 26 400 15 128 56519Esmeralda County 02-------------------------- 1 134 8 447 2 768 5 679 214 271 –20Eureka County 02----------------------------- 1 375 3 883 – 3 883 366 135 –21Humboldt County 02--------------------------- 15 261 33 823 690 33 133 5 417 5 548 7622Lander County 02----------------------------- 6 570 12 475 413 12 062 1 238 3 155 –23Lincoln County 02----------------------------- 3 814 16 534 1 289 15 245 3 288 1 766 20624Lyon County 02------------------------------- 24 453 98 306 5 205 93 101 19 017 2 512 49025
Mineral County 02----------------------------- 5 914 76 062 46 877 29 185 4 766 4 080 2 28326Nye County 02-------------------------------- 21 861 96 532 10 276 86 256 10 198 7 696 33627Carson City city area 02------------------------ 45 117 351 102 36 437 314 665 153 676 27 273 9 15528Pershing County 02--------------------------- 4 480 16 262 972 15 290 2 303 615 –29Storey County 02----------------------------- 2 705 2 982 201 2 781 286 135 –30Washoe County 02---------------------------- 282 936 1 129 708 96 858 1 032 850 266 430 148 487 24 61131White Pine County 02-------------------------- 9 278 35 598 915 34 683 6 402 5 884 14732State undistributed ------------------------- 402 192 – 402 192 76 605 – –33
New Hampshire ----------------------------- 1 136 859 4 890 469 830 669 4 059 800 942 514 453 587 98 29634
Belknap County 01 02---------------------------- 49 815 204 197 10 626 193 571 34 370 10 757 27735Carroll County 01----------------------------- 37 055 151 562 6 827 144 735 25 100 6 708 –36Cheshire County 02--------------------------- 70 924 223 059 8 728 214 331 38 138 9 649 72137Coos County 02------------------------------- 33 903 160 329 4 612 155 717 38 276 7 195 1 46838Grafton County 02----------------------------- 77 098 345 420 37 853 307 567 108 055 28 967 14 94739Hillsborough County 01 02------------------------ 346 784 1 646 130 507 469 1 138 661 176 652 223 126 20 54140Merrimack County 01 02-------------------------- 122 140 589 597 30 648 558 949 233 088 42 342 10 37641Rockingham County 01 02------------------------ 253 855 849 160 186 182 662 978 107 410 103 576 48 19042Strafford County 01---------------------------- 106 290 370 254 25 842 344 412 80 885 16 573 1 63443Sullivan County 02---------------------------- 38 995 151 214 11 881 139 333 32 237 4 694 14244State undistributed ------------------------- 199 548 – 199 548 68 303 – –45
New Jersey --------------------------------- 7 903 996 37 921 188 4 546 795 33 374 393 6 794 346 3 549 227 1 215 14746
Atlantic County 02----------------------------- 232 231 1 068 550 40 421 1 028 129 160 456 149 675 19 72947Bergen County 05 09----------------------------- 842 383 3 204 520 351 216 2 853 304 280 339 168 311 10 65448Burlington County 01 02 03 04-------------------------- 398 812 2 318 090 1 088 569 1 229 521 142 456 391 624 302 07949Camden County 01 03---------------------------- 506 585 2 084 448 125 877 1 958 571 356 407 175 162 12 12450Cape May County 02-------------------------- 97 774 484 219 24 264 459 955 50 721 48 461 1 50351Cumberland County 02------------------------ 138 803 593 601 35 715 557 886 117 543 37 631 2 37652Essex County 2
------------------------------ 765 348 4 245 526 56 236 4 189 290 1 494 404 435 289 9 24453Gloucester County 01 02-------------------------- 241 527 819 004 77 823 741 181 162 306 26 372 3 45754Hudson County 09 10 13---------------------------- 552 387 2 616 657 220 626 2 396 031 543 793 458 587 100 35755Hunterdon County 12-------------------------- 115 210 260 289 7 306 252 983 37 510 14 940 3356
Mercer County 04 12----------------------------- 329 431 2 713 121 167 992 2 545 129 1 182 272 156 354 39 47757Middlesex County 06 07 12 13-------------------------- 692 869 2 450 901 84 879 2 366 022 414 428 210 095 16 24258Monmouth County 04 06 12-------------------------- 578 509 2 772 737 902 096 1 870 641 230 306 492 644 378 13559Morris County 11------------------------------ 438 471 1 850 604 685 999 1 164 605 195 743 241 712 181 03560Ocean County 03 04----------------------------- 456 518 2 170 725 178 601 1 992 124 197 311 161 550 104 07961Passaic County 05 08 11---------------------------- 461 782 1 910 153 214 565 1 695 588 428 118 93 745 5 33362Salem County 02------------------------------ 64 786 255 299 12 256 243 043 51 460 9 107 1 43963Somerset County 07 11 12--------------------------- 260 677 890 058 182 143 707 915 85 679 107 388 4 19664Sussex County 05 11----------------------------- 138 261 318 390 8 560 309 830 40 847 16 280 32165Union County 07 10 13------------------------------ 496 230 1 899 165 65 852 1 833 313 250 244 139 507 20 34966Warren County 05----------------------------- 95 402 323 938 15 799 308 139 36 293 14 794 2 98567State undistributed ------------------------- 2 671 191 – 2 671 191 335 710 – –68
New Mexico --------------------------------- 1 653 537 11 825 830 1 815 798 10 010 032 2 043 426 1 621 827 780 25869
Bernalillo County 01 02 03--------------------------- 515 578 4 572 506 838 854 3 733 652 473 773 743 827 299 26970Catron County 02----------------------------- 2 603 14 468 437 14 031 1 205 2 618 –71Chaves County 02----------------------------- 60 964 308 297 19 703 288 594 49 714 17 374 2 36872Colfax County 03------------------------------ 13 761 52 024 2 691 49 333 9 004 2 931 85873Curry County 03------------------------------ 47 909 356 890 196 264 160 626 40 059 153 445 147 05474De Baca County 02---------------------------- 2 278 18 451 229 18 222 7 411 649 –75Dona Ana County 02-------------------------- 155 469 870 769 286 081 584 688 160 371 163 027 128 69176Eddy County 02------------------------------- 52 793 280 063 ~287 280 350 37 960 19 553 66277Grant County 02------------------------------ 29 333 130 659 3 521 127 138 30 036 8 147 34578Guadalupe County 02-------------------------- 4 151 21 739 510 21 229 7 380 1 075 26479
Harding County 03---------------------------- 939 5 324 105 5 219 238 486 –80Hidalgo County 02----------------------------- 6 133 24 539 683 23 856 7 314 1 611 17881Lea County 02-------------------------------- 57 112 177 730 2 435 175 295 35 835 5 371 29282Lincoln County 02----------------------------- 14 165 69 795 3 842 65 953 18 160 4 164 19783Los Alamos County 03------------------------- 18 521 1 171 951 13 513 1 158 438 20 685 9 297 8384Luna County 02------------------------------- 21 541 89 020 2 997 86 023 13 669 6 011 47885McKinley County 03--------------------------- 65 506 317 255 16 760 300 495 97 471 84 517 28186Mora County 03------------------------------- 4 502 22 487 420 22 067 3 687 1 319 –87Otero County 02------------------------------ 54 307 486 050 317 619 168 431 30 525 187 164 169 94988Quay County 03------------------------------ 10 561 55 454 1 427 54 027 13 560 3 022 40589
See footnotes at end of table.
42 Consolidated Federal Funds Report

TIPS PS [APS_PPGB,F_SCOTT] 6/ 3/96 12:37:43 MCVX09 TLP:CFFR1.TLP;15 6/ 3/96 11:04:06 DATA:NONE PSC:TIPS_12353107_01.PSC PAGE: 42TSF:TIPS92~12353107.DAT;1 6/ 3/96 12:35:33 UTF:TIPS93~12353107.DAT;1 6/ 3/96 12:35:33 META:TIPS96~12353107.DAT;1 6/ 3/96 12:37:03
1995mCon.
Direct Federal expenditures or obligationsmCon. Other Federal assistance
Direct payments for individuals Procurement contract awards
TotalRetirement and
disability All other TotalDepartmentof Defense
Other Federalexpenditures or
obligations Direct loansGuaranteed loans
and insurance
20 005 14 621 5 384 275 – 4 670 2 930 7 671 19 903 6 925 2 978 142 – 3 351 5 109 9 399 22 333 1 626 707 32 – 2 342 485 4 992 37 524 5 777 1 747 104 – 3 906 5 786 10 414 4
22 022 15 894 6 128 284 – 5 992 10 189 17 116 52 169 1 495 674 468 – 110 50 1 228 6
17 687 11 112 6 575 23 075 22 821 4 336 5 615 12 739 714 596 10 616 3 980 199 – 2 963 4 747 8 982 835 485 25 444 10 041 1 550 1 190 2 527 11 476 15 590 917 959 12 524 5 435 246 – 4 169 8 402 14 378 1014 379 10 001 4 378 187 – 3 921 2 775 8 009 112 039 1 341 698 57 – 2 305 2 716 4 422 12
37 277 27 342 9 935 479 – 9 248 29 308 29 022 13142 653 874 141 779 – – 137 618 5 883 803 194 14
3 878 828 2 651 235 1 227 593 917 315 218 890 45 633 36 941 2 109 757 15
57 036 42 766 14 270 49 331 45 343 176 437 16 402 162 372 162 1 743 033 629 129 706 497 92 753 6 003 5 152 1 432 293 17
70 535 57 567 12 968 3 661 2 107 175 2 230 63 636 1842 592 31 305 11 287 5 395 435 2 069 3 806 24 213 197 891 7 042 849 57 – 13 – – 202 934 1 833 1 101 155 – 291 1 352 282 21
20 997 15 053 5 944 553 – 1 309 557 7 323 226 697 5 034 1 663 1 115 149 269 110 5 819 23
11 112 8 459 2 653 304 49 65 364 2 803 2472 703 56 550 16 153 3 691 2 382 2 980 22 880 25
22 362 17 177 5 185 44 789 43 138 65 41 17 385 2671 746 59 042 12 704 6 709 1 898 185 1 443 32 580 27
146 224 110 093 36 131 23 665 11 963 264 34 71 833 287 566 5 430 2 136 5 021 750 756 1 857 1 294 292 519 2 025 494 28 – 14 921 9 016 30
646 503 468 764 177 739 65 609 20 303 2 680 3 241 317 856 3122 190 16 657 5 533 736 – 387 907 4 801 32
295 057 3 404 291 653 – – 30 530 11 510 79 343 33
2 770 425 1 931 012 839 413 667 530 579 604 56 413 36 300 751 425 34
152 818 111 024 41 794 5 899 3 662 353 2 838 23 848 35118 002 88 545 29 457 1 442 – 312 4 216 24 507 36170 663 121 144 49 519 4 068 1 388 541 5 552 41 887 37111 936 76 036 35 900 2 621 50 300 5 207 13 259 38184 985 134 702 50 283 22 553 12 699 860 2 639 44 688 39756 045 538 005 218 040 484 435 447 137 5 871 5 230 182 378 40304 152 206 302 97 850 9 156 1 544 858 2 359 62 414 41518 408 388 205 130 203 117 575 101 180 2 192 3 723 222 693 42261 917 189 893 72 024 10 256 3 427 623 1 870 37 553 43104 472 73 148 31 324 9 526 8 517 285 1 207 11 870 44
87 027 4 007 83 020 – – 44 219 1 458 86 329 45
23 053 282 13 642 835 9 410 447 4 263 074 2 970 923 261 259 246 368 18 982 674 46
661 893 419 016 242 877 93 549 8 904 2 977 3 337 2 486 765 472 340 445 1 593 611 746 834 408 442 326 121 6 984 66 697 502 48
990 959 729 086 261 873 790 471 698 976 2 579 9 857 420 615 491 397 520 899 582 497 938 147 483 88 747 7 875 4 757 366 799 50
356 883 238 778 118 105 26 798 16 012 1 354 1 706 4 273 510 51396 251 247 839 148 412 41 430 28 746 747 2 931 148 001 52
2 180 568 1 237 528 943 040 124 307 35 231 10 958 1 061 378 928 53543 792 356 957 186 835 84 857 63 012 1 678 3 116 175 841 54
1 359 441 776 759 582 682 238 507 112 476 16 328 57 349 919 55194 937 136 727 58 210 11 884 4 545 1 018 1 253 111 818 56
961 593 622 132 339 461 408 423 93 767 4 478 5 697 165 811 571 560 548 1 032 901 527 647 259 063 48 744 6 767 6 268 353 307 581 509 950 1 027 390 482 560 534 691 481 670 5 145 1 256 1 443 006 59
905 212 636 378 268 834 505 585 486 471 2 353 315 395 263 601 750 657 1 210 208 540 449 58 572 43 997 2 635 2 742 5 020 649 611 156 767 722 693 434 074 227 567 204 480 3 957 329 408 526 62
181 558 118 299 63 259 12 400 8 288 775 3 652 122 860 63504 683 367 159 137 524 190 584 170 797 1 725 433 225 158 64247 954 176 509 71 445 12 522 4 291 788 6 206 45 776 65
1 431 986 917 290 514 696 72 550 35 363 4 878 700 479 987 66258 345 165 112 93 233 13 389 10 285 1 118 2 157 61 034 67
2 161 341 10 882 2 150 459 – – 174 140 188 472 851 599 68
4 318 738 2 946 094 1 372 644 3 689 872 653 835 151 966 74 620 1 174 211 69
1 412 932 1 031 073 381 859 1 936 620 323 151 5 355 757 320 578 708 559 6 783 1 776 1 910 25 177 58 86 71
164 892 120 417 44 475 71 647 6 628 4 670 2 323 41 196 7239 042 28 477 10 565 593 – 453 179 2 138 73
113 265 81 466 31 799 34 797 33 619 15 324 1 266 62 010 748 764 6 123 2 641 335 – 1 292 121 352 75
361 366 255 041 106 325 184 922 128 002 1 082 2 217 85 792 76141 732 99 878 41 854 79 590 ~4 257 1 228 324 40 382 77
88 690 62 015 26 675 3 434 263 352 1 736 2 936 7812 046 7 761 4 285 252 84 986 166 2 299 79
3 247 2 371 876 85 – 1 268 48 141 8014 612 10 122 4 490 104 – 898 364 816 81
131 893 85 593 46 300 1 364 39 3 268 53 56 098 8245 236 36 382 8 854 962 237 1 273 412 10 502 8328 115 21 472 6 643 1 113 737 9 936 117 – 1 454 8468 114 48 589 19 525 330 – 896 2 844 7 308 85
114 207 77 222 36 985 20 674 15 405 386 85 9 917 8612 567 9 317 3 250 4 631 – 283 71 455 87
150 355 124 997 25 358 117 199 113 849 808 151 59 909 8831 550 22 238 9 312 398 – 6 925 700 5 117 89
County Area 43

TIPS PS [APS_PPGB,F_SCOTT] 6/ 3/96 12:37:43 MCVX09 TLP:CFFR1.TLP;15 6/ 3/96 11:04:06 DATA:NONE PSC:TIPS_12353107_01.PSC PAGE: 43TSF:TIPS92~12353107.DAT;1 6/ 3/96 12:35:33 UTF:TIPS93~12353107.DAT;1 6/ 3/96 12:35:33 META:TIPS96~12353107.DAT;1 6/ 3/96 12:37:03
Federal Government Expenditures or Obligations by State and County Area: Fiscal Year[Thousand dollars]
State and county area
Congressional district
Direct Federal expenditures or obligations
Total direct expenditres or obligations Salaries and wages
United Statesresident
population1 TotalDepartment of
DefenseAll other
agencies Grant awards TotalDepartmentof Defense
New Mexico mCon.
Rio Arriba County 03-------------------------- 36 297 159 570 5 927 153 643 52 063 12 323 3821Roosevelt County 03-------------------------- 18 507 76 816 2 386 74 430 13 692 3 019 5232Sandoval County 01 03--------------------------- 76 147 207 593 8 169 199 424 41 839 13 143 1 8213San Juan County 03--------------------------- 99 250 344 144 16 009 328 135 70 621 65 343 9 1444San Miguel County 03------------------------- 27 358 132 480 3 112 129 368 45 059 5 979 6235Santa Fe County 01 03--------------------------- 112 240 667 128 32 592 634 536 346 777 61 600 13 0716Sierra County 02------------------------------ 10 533 74 203 2 812 71 391 15 180 3 587 1947Socorro County 02---------------------------- 15 676 68 658 7 178 61 480 14 545 7 517 1 8498Taos County 03------------------------------- 24 988 96 131 2 220 93 911 24 757 10 604 3759Torrance County 01--------------------------- 11 969 41 969 1 920 40 049 10 123 2 134 –10Union County 03------------------------------ 4 136 25 440 393 25 047 8 299 1 986 7911Valencia County 01 02---------------------------- 53 809 204 212 10 109 194 103 56 455 5 201 69112Cibola County 02 03------------------------------ 24 501 95 368 15 165 80 203 30 871 13 785 13213State undistributed ------------------------- 586 643 – 586 643 255 087 – –14
New York ----------------------------------- 18 172 614 94 664 977 5 282 006 89 382 971 25 261 028 7 159 627 1 238 83115
Albany County 21----------------------------- 291 292 4 304 481 135 077 4 169 404 2 945 555 321 293 87 24516Allegany County 31---------------------------- 51 273 178 681 3 399 175 282 38 281 6 739 38917Broome County 23 25 26---------------------------- 208 537 997 342 184 948 812 394 149 275 46 036 7 60218Cattaraugus County 31------------------------ 85 575 344 422 6 310 338 112 56 888 14 104 1 13319Cayuga County 25 27 31---------------------------- 83 115 280 661 7 008 273 653 54 480 10 305 1 81920Chautauqua County 31------------------------ 142 171 578 438 18 279 560 159 119 755 21 410 2 77321Chemung County 31--------------------------- 94 528 386 352 7 992 378 360 78 483 24 200 2 99422Chenango County 23-------------------------- 52 343 190 701 14 608 176 093 38 084 6 095 7323Clinton County 24----------------------------- 86 978 322 907 48 304 274 603 68 026 38 240 15 37224Columbia County 22--------------------------- 63 405 244 306 2 672 241 634 50 300 8 724 3325
Cortland County 25---------------------------- 49 373 160 265 4 044 156 221 40 387 6 584 42726Delaware County 23 26--------------------------- 47 737 206 642 9 354 197 288 45 551 10 432 3 72527Dutchess County 19 22 26--------------------------- 261 481 981 646 9 302 972 344 255 992 63 139 58728Erie County 27 29 30-------------------------------- 967 617 4 481 260 181 307 4 299 953 888 984 409 376 37 14429Essex County 22 24------------------------------ 37 950 181 452 10 275 171 177 37 131 21 044 57030Franklin County 24---------------------------- 49 121 194 742 6 342 188 400 53 621 8 836 1 40331Fulton County 24------------------------------ 54 436 196 877 6 646 190 231 41 729 5 233 26332Genesee County 27--------------------------- 61 292 217 016 4 177 212 839 30 102 21 115 62333Greene County 22----------------------------- 47 332 177 783 2 805 174 978 27 041 6 010 29034Hamilton County 24--------------------------- 5 238 22 466 462 22 004 3 835 903 –35
Herkimer County 23 24--------------------------- 66 820 241 330 4 785 236 545 42 150 7 203 67136Jefferson County 24--------------------------- 114 891 747 102 394 628 352 474 80 487 356 863 336 18937Lewis County 24------------------------------ 27 611 92 984 1 345 91 639 27 651 3 181 –38Livingston County 27-------------------------- 64 971 184 678 5 875 178 803 30 794 9 752 2 13839Madison County 23---------------------------- 71 711 207 645 3 605 204 040 40 359 7 934 8740Monroe County 27 28 29---------------------------- 726 948 2 937 835 102 270 2 835 565 698 065 192 870 17 44041Montgomery County 21 23------------------------ 52 096 233 554 9 317 224 237 32 873 5 938 –42Nassau County 03 04 05----------------------------- 1 302 427 6 197 626 1 216 393 4 981 233 615 487 358 943 60 35443New York city area 2
------------------------- 7 333 253 40 569 100 618 837 39 950 263 13 682 206 3 120 408 128 76444Niagara County 29---------------------------- 221 618 911 957 72 080 839 877 151 884 75 875 44 30845
Oneida County 23----------------------------- 249 546 1 295 232 246 995 1 048 237 215 652 159 198 112 80646Onondaga County 25-------------------------- 473 336 2 017 508 228 816 1 788 692 341 310 214 833 41 82147Ontario County 27----------------------------- 98 778 359 422 14 438 344 984 48 922 53 226 76248Orange County 19 20 26----------------------------- 320 510 1 357 935 326 118 1 031 817 198 528 281 703 185 96649Orleans County 29---------------------------- 45 619 129 254 1 054 128 200 24 923 5 200 –50Oswego County 24---------------------------- 125 818 373 377 8 332 365 045 71 411 14 340 87351Otsego County 23----------------------------- 61 586 222 634 3 736 218 898 42 457 9 123 29752Putnam County 19---------------------------- 89 217 193 307 1 704 191 603 19 186 10 439 5053Rensselaer County 21 22------------------------- 156 346 587 295 21 155 566 140 131 206 26 337 5 80454Rockland County 20--------------------------- 274 867 922 742 15 729 907 013 181 333 43 924 2 27455
St. Lawrence County 24------------------------ 115 490 429 298 9 792 419 506 115 783 25 804 3 62856Saratoga County 21 22--------------------------- 192 886 536 555 46 112 490 443 86 495 52 823 34 38157Schenectady County 21------------------------ 149 583 1 191 437 288 767 902 670 113 855 53 203 27 14558Schoharie County 22 23-------------------------- 33 036 104 325 1 212 103 113 21 993 3 985 –59Schuyler County 31---------------------------- 19 013 66 823 1 259 65 564 17 518 2 513 –60Seneca County 27 31----------------------------- 32 638 125 516 15 246 110 270 16 061 12 936 8 11661Steuben County 31---------------------------- 100 620 413 668 11 466 402 202 77 104 37 875 1 04462Suffolk County 01 02 05----------------------------- 1 349 317 5 564 233 401 825 5 162 408 780 050 576 649 34 84763Sullivan County 20 26---------------------------- 70 636 334 226 2 142 332 084 86 582 11 690 –64Tioga County 25 26------------------------------ 53 425 447 984 306 365 141 619 28 795 10 505 5 13865
Tompkins County 26 31--------------------------- 96 309 405 390 44 414 360 976 170 405 18 604 2 38866Ulster County 26------------------------------ 168 876 586 495 10 022 576 473 126 497 23 895 1 47567Warren County 22----------------------------- 61 336 243 134 5 752 237 382 58 573 15 090 2 44768Washington County 22------------------------- 60 788 197 463 3 538 193 925 38 790 7 398 63169Wayne County 27----------------------------- 92 988 276 385 7 356 269 029 54 606 11 220 1 01170Westchester County 17 18 19 20------------------------ 888 945 3 746 757 161 247 3 585 510 627 873 278 914 10 77571Wyoming County 27--------------------------- 44 054 116 272 2 467 113 805 16 864 5 111 –72Yates County 31------------------------------ 23 911 86 434 2 502 83 932 11 842 4 308 73673State undistributed ------------------------- 5 361 626 – 5 361 626 1 110 962 – –74
North Carolina ------------------------------ 7 068 870 30 694 683 5 195 012 25 499 671 5 896 622 4 532 473 2 839 48775
Alamance County 06 12-------------------------- 113 453 375 879 8 804 367 075 57 557 11 916 91076Alexander County 10-------------------------- 29 435 72 947 1 788 71 159 13 260 2 441 49177Alleghany County 05--------------------------- 9 736 39 560 1 080 38 480 5 649 1 887 –78Anson County 08------------------------------ 24 122 92 122 2 614 89 508 24 036 2 955 43079Ashe County 05------------------------------- 23 127 87 409 4 170 83 239 17 216 4 473 1 78980Avery County 10------------------------------ 15 220 57 656 2 045 55 611 11 513 1 871 –81Beaufort County 01 03---------------------------- 43 871 169 366 7 508 161 858 36 836 6 340 1 35682Bertie County 01------------------------------ 20 640 87 620 1 302 86 318 21 576 3 928 8683Bladen County 01 07----------------------------- 29 645 123 929 4 514 119 415 26 528 4 970 1 83084Brunswick County 07-------------------------- 58 362 259 990 41 976 218 014 40 431 12 964 7 09185
See footnotes at end of table.
44 Consolidated Federal Funds Report

TIPS PS [APS_PPGB,F_SCOTT] 6/ 3/96 12:37:43 MCVX09 TLP:CFFR1.TLP;15 6/ 3/96 11:04:06 DATA:NONE PSC:TIPS_12353107_01.PSC PAGE: 44TSF:TIPS92~12353107.DAT;1 6/ 3/96 12:35:33 UTF:TIPS93~12353107.DAT;1 6/ 3/96 12:35:33 META:TIPS96~12353107.DAT;1 6/ 3/96 12:37:03
1995mCon.
Direct Federal expenditures or obligationsmCon. Other Federal assistance
Direct payments for individuals Procurement contract awards
TotalRetirement and
disability All other TotalDepartmentof Defense
Other Federalexpenditures or
obligations Direct loansGuaranteed loans
and insurance
84 945 58 315 26 630 9 605 1 539 634 380 8 428 150 051 28 376 21 675 536 34 9 519 3 419 31 162 2
142 783 107 332 35 451 9 613 1 570 216 551 121 428 3178 142 128 282 49 860 25 389 3 002 4 647 1 296 22 888 4
71 231 46 130 25 101 9 726 576 485 1 092 3 895 5230 751 172 881 57 870 27 036 2 219 964 3 061 45 418 6
54 207 40 967 13 240 843 – 387 1 087 3 409 735 559 23 282 12 277 10 593 3 477 444 632 6 596 858 894 41 459 17 435 1 340 – 536 560 11 643 927 752 19 702 8 050 542 199 1 419 1 070 2 487 1012 373 8 597 3 776 340 – 2 443 1 172 7 375 11
139 482 103 560 35 922 2 717 407 357 6 515 96 267 1232 458 28 128 4 330 18 006 13 831 247 1 458 5 322 13
248 927 1 748 247 179 – – 82 629 38 452 98 410 14
55 250 502 30 343 351 24 907 151 6 083 109 3 531 924 910 711 588 299 18 869 376 15
969 361 630 245 339 116 62 665 14 048 5 607 4 374 115 943 16130 314 84 630 45 684 2 556 372 790 2 674 22 059 17616 112 413 933 202 179 184 207 168 648 1 711 3 030 73 453 18234 390 161 107 73 283 37 562 1 732 1 477 5 993 59 596 19209 497 140 008 69 489 4 308 1 890 2 071 6 745 52 397 20415 171 280 293 134 878 20 500 9 484 1 601 2 694 61 126 21277 535 189 445 88 090 5 063 996 1 071 1 403 86 013 22132 096 94 249 37 847 13 852 12 293 574 1 553 21 925 23191 371 132 867 58 504 24 287 16 190 984 3 026 20 289 24177 701 120 189 57 512 6 790 474 791 1 176 18 426 25
108 919 76 044 32 875 3 857 1 924 518 2 162 35 075 26141 566 93 406 48 160 8 590 3 359 505 312 35 326 27649 004 429 703 219 301 11 948 2 234 1 563 1 035 92 302 28
2 931 407 1 938 432 992 975 241 658 118 563 9 834 7 276 491 697 29112 985 78 468 34 517 9 940 5 701 353 2 581 12 071 30121 956 82 207 39 749 9 822 2 448 508 556 10 133 31144 552 100 096 44 456 5 004 4 009 360 1 578 11 309 32155 811 108 463 47 348 8 394 2 057 1 594 4 623 35 247 33137 705 92 908 44 797 6 581 389 446 2 952 17 608 34
17 491 12 442 5 049 189 – 47 – 2 590 35
188 502 128 950 59 552 2 835 1 502 640 2 792 24 139 36253 169 178 992 74 177 55 030 50 059 1 552 7 233 36 232 37
61 075 42 917 18 158 695 – 384 1 283 11 050 38139 331 95 167 44 164 1 909 305 2 892 9 393 42 313 39157 251 106 499 50 752 1 413 164 688 2 217 37 690 40
1 913 427 1 200 740 712 687 124 864 65 354 8 608 10 477 354 388 41179 598 121 423 58 175 14 194 7 472 951 1 773 15 143 42
3 985 792 2 496 741 1 489 051 1 220 914 1 127 682 16 490 1 818 2 570 704 4322 261 569 11 124 061 11 137 508 1 376 160 416 140 128 757 59 030 2 810 839 44
652 750 442 593 210 157 28 889 19 568 2 559 3 986 125 053 45
798 440 542 131 256 309 119 322 107 265 2 620 3 313 77 516 461 245 923 830 383 415 540 207 571 166 352 7 871 8 406 214 260 47
238 886 174 398 64 488 15 958 9 725 2 431 5 596 66 940 48721 495 481 659 239 836 152 308 123 713 3 900 2 227 131 674 49
95 608 66 146 29 462 1 684 142 1 839 8 655 17 182 50281 897 193 023 88 874 4 688 1 792 1 042 1 410 47 687 51160 573 112 020 48 553 9 829 28 652 719 26 062 52160 929 109 909 51 020 2 253 84 500 546 27 364 53419 377 276 346 143 031 8 999 3 888 1 376 1 271 90 612 54672 627 401 166 271 461 22 963 9 301 1 895 – 113 528 55
282 096 195 659 86 437 4 437 829 1 178 4 757 15 818 56388 778 277 989 110 789 7 373 2 082 1 087 9 443 91 259 57483 358 328 978 154 380 540 044 243 657 978 47 63 734 58
76 928 54 691 22 237 847 – 573 1 755 17 663 5945 590 32 132 13 458 884 264 318 470 6 688 6088 855 64 548 24 307 6 188 4 796 1 476 4 091 18 018 61
285 885 200 195 85 690 10 872 6 264 1 932 1 399 83 197 623 294 328 2 131 330 1 162 998 899 139 330 689 14 066 6 659 3 689 847 63
224 917 143 128 81 789 10 402 75 635 184 27 363 64107 577 75 855 31 722 300 558 299 371 549 2 855 33 967 65
182 137 113 820 68 317 33 136 24 334 1 108 1 861 37 955 66424 274 289 596 134 678 10 552 3 633 1 276 1 159 80 525 67166 638 115 755 50 883 2 304 – 528 457 34 905 68146 501 101 749 44 752 4 067 303 706 2 781 14 111 69202 534 144 969 57 565 6 335 4 157 1 691 8 559 47 530 70
2 629 370 1 562 058 1 067 312 200 912 132 702 9 689 760 414 832 7190 434 64 520 25 914 2 438 1 386 1 426 2 459 18 116 7266 882 48 230 18 652 2 367 35 1 035 3 907 21 826 73
3 600 257 13 752 3 586 505 – – 650 407 346 811 6 037 061 74
18 028 693 12 237 129 5 791 564 2 009 164 1 352 804 227 731 446 034 9 293 950 75
301 765 214 132 87 633 3 918 625 722 1 588 32 304 7656 473 38 498 17 975 590 – 183 274 5 811 7731 421 22 189 9 232 458 – 145 246 382 7862 462 41 427 21 035 1 733 729 936 833 4 022 7964 490 43 769 20 721 829 241 401 809 6 542 8043 593 31 114 12 479 397 – 282 934 3 488 81
121 852 88 619 33 233 2 230 169 2 108 4 669 192 081 8260 858 41 680 19 178 529 88 728 4 115 20 968 8376 237 52 627 23 610 15 387 84 807 5 700 27 083 84
177 280 136 652 40 628 26 895 24 882 2 420 1 448 931 567 85
County Area 45

TIPS PS [APS_PPGB,F_SCOTT] 6/ 3/96 12:37:43 MCVX09 TLP:CFFR1.TLP;15 6/ 3/96 11:04:06 DATA:NONE PSC:TIPS_12353107_01.PSC PAGE: 45TSF:TIPS92~12353107.DAT;1 6/ 3/96 12:35:33 UTF:TIPS93~12353107.DAT;1 6/ 3/96 12:35:33 META:TIPS96~12353107.DAT;1 6/ 3/96 12:37:03
Federal Government Expenditures or Obligations by State and County Area: Fiscal Year[Thousand dollars]
State and county area
Congressional district
Direct Federal expenditures or obligations
Total direct expenditres or obligations Salaries and wages
United Statesresident
population1 TotalDepartment of
DefenseAll other
agencies Grant awards TotalDepartmentof Defense
North Carolina mCon.
Buncombe County 10 11-------------------------- 185 915 839 288 59 254 780 034 135 494 101 292 6 5691Burke County 05 10------------------------------ 78 893 243 624 6 045 237 579 49 793 6 271 862Cabarrus County 08--------------------------- 107 485 345 686 9 288 336 398 54 649 11 240 1 4723Caldwell County 05 10---------------------------- 73 126 212 021 7 320 204 701 44 400 6 788 1 4134Camden County 03---------------------------- 6 366 28 319 1 593 26 726 3 801 614 –5Carteret County 03---------------------------- 56 418 233 574 23 736 209 838 29 966 19 582 2 4636Caswell County 05---------------------------- 21 010 62 750 1 261 61 489 13 430 2 155 4047Catawba County 10--------------------------- 124 327 368 714 15 224 353 490 57 233 26 218 1 2008Chatham County 04--------------------------- 41 747 129 232 3 519 125 713 33 408 5 068 6009Cherokee County 11--------------------------- 21 089 97 889 3 789 94 100 17 486 4 724 20210
Chowan County 01---------------------------- 13 901 58 470 3 008 55 462 13 733 1 957 47511Clay County 11------------------------------- 7 624 34 356 1 612 32 744 6 002 1 032 –12Cleveland County 09 11-------------------------- 88 511 295 132 13 866 281 266 51 841 8 698 66513Columbus County 01 07-------------------------- 50 982 224 324 6 343 217 981 52 577 5 925 35814Craven County 01 03----------------------------- 83 169 791 128 486 242 304 886 62 839 388 957 378 45215Cumberland County 01 07 08------------------------ 286 373 2 756 764 1 965 846 790 918 143 543 1 429 038 1 323 24916Currituck County 03--------------------------- 15 781 55 559 6 312 49 247 6 201 2 429 –17Dare County 03------------------------------- 25 102 100 223 12 984 87 239 11 889 10 845 1 06618Davidson County 06 12--------------------------- 133 274 348 370 18 907 329 463 57 859 9 530 1 43919Davie County 06 10------------------------------ 29 444 90 004 2 645 87 359 13 596 2 389 8520
Duplin County 01 03------------------------------ 41 440 152 927 7 820 145 107 34 069 5 946 1 03021Durham County 02 12---------------------------- 192 271 1 207 008 53 354 1 153 654 364 573 203 567 7 72022Edgecombe County 01 02------------------------- 56 118 229 727 8 590 221 137 51 590 24 939 3 19923Forsyth County 05 10 12----------------------------- 277 889 1 045 860 80 780 965 080 218 079 52 494 2 70124Franklin County 02---------------------------- 40 382 117 939 7 626 110 313 25 768 4 351 1 71825Gaston County 09 12----------------------------- 180 035 545 681 13 663 532 018 101 618 18 420 1 54426Gates County 01------------------------------ 9 722 34 823 1 862 32 961 6 069 1 251 –27Graham County 11---------------------------- 7 572 39 443 834 38 609 6 609 2 105 –28Granville County 02 05--------------------------- 40 328 154 364 7 575 146 789 25 994 26 349 1 98529Greene County 01----------------------------- 16 406 46 725 1 966 44 759 12 858 2 118 82230
Guilford County 05 06 12---------------------------- 368 076 1 663 100 286 464 1 376 636 236 631 223 675 14 00931Halifax County 01 02----------------------------- 57 102 250 575 5 593 244 982 65 338 6 245 84732Harnett County 02----------------------------- 73 804 217 126 10 593 206 533 44 692 5 713 1 00633Haywood County 11--------------------------- 49 065 224 752 21 321 203 431 49 891 5 913 82934Henderson County 10 11-------------------------- 75 065 324 850 14 620 310 230 38 031 9 649 46035Hertford County 01---------------------------- 22 685 93 930 4 779 89 151 22 388 4 518 2 23236Hoke County 08------------------------------- 26 893 69 516 6 541 62 975 19 198 3 127 1 45637Hyde County 03------------------------------- 5 324 28 773 495 28 278 5 131 1 903 –38Iredell County 08 10 12------------------------------ 100 603 297 968 8 345 289 623 47 345 11 339 1 49239Jackson County 11---------------------------- 28 331 93 114 3 734 89 380 16 877 3 326 63140
Johnston County 02--------------------------- 90 910 275 247 10 803 264 444 56 969 8 958 1 67541Jones County 01 03------------------------------ 9 701 39 444 1 924 37 520 8 161 978 –42Lee County 02-------------------------------- 44 827 168 745 11 049 157 696 27 066 6 571 53543Lenoir County 01 03------------------------------ 58 655 254 438 13 574 240 864 51 519 15 759 3 87744Lincoln County 10----------------------------- 55 567 140 318 5 396 134 922 23 907 4 690 66845McDowell County 10 11--------------------------- 37 055 136 538 3 910 132 628 39 699 3 443 16746Macon County 11----------------------------- 25 410 119 811 6 414 113 397 15 290 7 366 42747Madison County 11---------------------------- 17 629 74 039 1 602 72 437 26 199 2 220 –48Martin County 01 03------------------------------ 26 367 104 396 3 799 100 597 28 211 3 714 31449Mecklenburg County 08 09 12------------------------ 563 663 1 756 376 102 959 1 653 417 359 871 233 915 35 00750
Mitchell County 10----------------------------- 14 492 61 229 1 261 59 968 15 432 1 807 –51Montgomery County 08------------------------ 23 285 91 476 13 489 77 987 17 252 2 393 –52Moore County 02 08------------------------------ 65 390 289 289 29 884 259 405 30 841 6 749 33053Nash County 01 02------------------------------- 83 580 257 588 8 019 249 569 54 682 3 273 20054New Hanover County 01 07----------------------- 135 056 562 012 62 440 499 572 104 554 44 748 16 94955Northampton County 01------------------------ 20 661 93 084 2 637 90 447 25 754 2 683 49256Onslow County 03 07----------------------------- 146 326 1 237 233 979 550 257 683 53 742 776 379 766 02657Orange County 04 12----------------------------- 105 592 460 986 20 926 440 060 228 294 17 039 3 34758Pamlico County 03---------------------------- 11 935 50 594 5 239 45 355 7 769 1 605 –59Pasquotank County 01 03------------------------- 33 545 176 566 6 736 169 830 25 837 44 964 28760
Pender County 01 03 07----------------------------- 33 583 117 304 7 217 110 087 22 435 2 939 –61Perquimans County 01------------------------- 10 713 45 888 3 351 42 537 7 390 1 281 –62Person County 05----------------------------- 31 684 98 358 2 256 96 102 21 823 2 655 44663Pitt County 01 03-------------------------------- 116 341 367 851 16 664 351 187 91 265 19 928 4 75264Polk County 10 11------------------------------- 15 482 68 059 3 433 64 626 8 542 1 709 –65Randolph County 06--------------------------- 112 773 278 026 7 860 270 166 48 516 9 835 1 67066Richmond County 08-------------------------- 45 350 176 238 4 809 171 429 36 946 5 391 42867Robeson County 07 08--------------------------- 110 669 417 663 15 577 402 086 112 511 32 497 3 18068Rockingham County 05------------------------ 87 513 298 645 10 462 288 183 51 784 8 361 1 23669Rowan County 06 08 12----------------------------- 117 154 418 184 12 832 405 352 66 255 61 831 4 32270
Rutherford County 10 11-------------------------- 58 889 186 681 6 125 180 556 30 184 5 792 59471Sampson County 03--------------------------- 49 942 175 306 6 018 169 288 41 506 5 824 1 31772Scotland County 08---------------------------- 34 921 121 001 3 502 117 499 36 886 2 669 23273Stanly County 08------------------------------ 53 867 170 275 7 078 163 197 26 885 7 734 3 02274Stokes County 05----------------------------- 39 877 87 918 1 700 86 218 17 324 2 567 –75Surry County 05------------------------------ 64 384 212 729 5 022 207 707 32 618 7 651 73676Swain County 11------------------------------ 11 726 70 968 1 423 69 545 19 359 12 472 8077Transylvania County 11------------------------ 26 959 114 146 5 398 108 748 16 495 5 817 55678Tyrrell County 03------------------------------ 3 897 15 648 429 15 219 3 734 476 –79Union County 08------------------------------ 95 186 204 986 9 910 195 076 41 213 8 191 60080
Vance County 01 02------------------------------ 40 442 162 711 3 481 159 230 41 982 4 290 25281Wake County 02 04------------------------------ 494 226 2 334 125 203 382 2 130 743 1 078 307 216 607 48 49882Warren County 01----------------------------- 17 681 69 462 1 455 68 007 20 603 1 803 25383Washington County 01------------------------- 14 255 49 733 1 395 48 338 6 380 2 004 –84Watauga County 05--------------------------- 39 107 97 519 4 211 93 308 20 435 5 038 68485Wayne County 01 03----------------------------- 109 254 609 192 267 950 341 242 86 235 169 611 154 50286Wilkes County 05 10----------------------------- 60 826 178 785 3 863 174 922 34 624 8 131 68187Wilson County 01 02----------------------------- 66 983 237 407 8 524 228 883 54 496 7 992 1 47188Yadkin County 10----------------------------- 32 265 97 615 5 474 92 141 16 942 4 647 1 81289Yancey County 11----------------------------- 16 016 57 488 1 449 56 039 10 304 2 030 –90State undistributed ------------------------- 1 285 256 – 1 285 256 84 501 – –91
See footnotes at end of table.
46 Consolidated Federal Funds Report
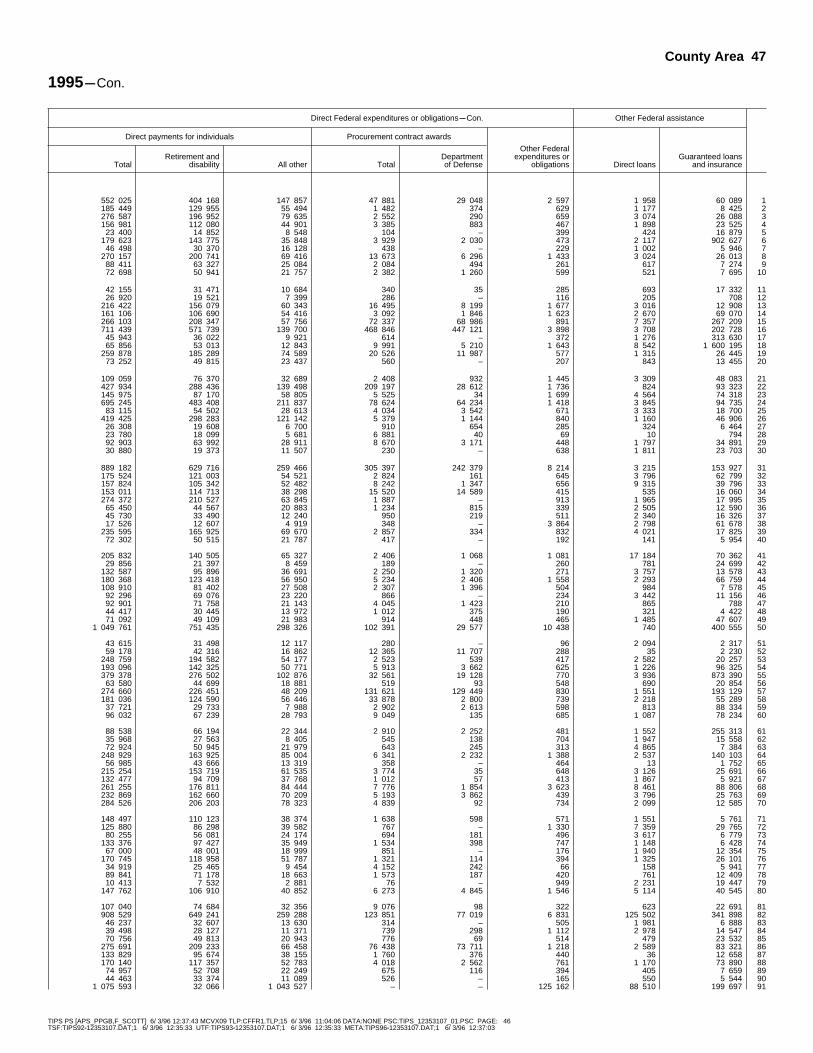
TIPS PS [APS_PPGB,F_SCOTT] 6/ 3/96 12:37:43 MCVX09 TLP:CFFR1.TLP;15 6/ 3/96 11:04:06 DATA:NONE PSC:TIPS_12353107_01.PSC PAGE: 46TSF:TIPS92~12353107.DAT;1 6/ 3/96 12:35:33 UTF:TIPS93~12353107.DAT;1 6/ 3/96 12:35:33 META:TIPS96~12353107.DAT;1 6/ 3/96 12:37:03
1995mCon.
Direct Federal expenditures or obligationsmCon. Other Federal assistance
Direct payments for individuals Procurement contract awards
TotalRetirement and
disability All other TotalDepartmentof Defense
Other Federalexpenditures or
obligations Direct loansGuaranteed loans
and insurance
552 025 404 168 147 857 47 881 29 048 2 597 1 958 60 089 1185 449 129 955 55 494 1 482 374 629 1 177 8 425 2276 587 196 952 79 635 2 552 290 659 3 074 26 088 3156 981 112 080 44 901 3 385 883 467 1 898 23 525 4
23 400 14 852 8 548 104 – 399 424 16 879 5179 623 143 775 35 848 3 929 2 030 473 2 117 902 627 6
46 498 30 370 16 128 438 – 229 1 002 5 946 7270 157 200 741 69 416 13 673 6 296 1 433 3 024 26 013 8
88 411 63 327 25 084 2 084 494 261 617 7 274 972 698 50 941 21 757 2 382 1 260 599 521 7 695 10
42 155 31 471 10 684 340 35 285 693 17 332 1126 920 19 521 7 399 286 – 116 205 708 12
216 422 156 079 60 343 16 495 8 199 1 677 3 016 12 908 13161 106 106 690 54 416 3 092 1 846 1 623 2 670 69 070 14266 103 208 347 57 756 72 337 68 986 891 7 357 267 209 15711 439 571 739 139 700 468 846 447 121 3 898 3 708 202 728 16
45 943 36 022 9 921 614 – 372 1 276 313 630 1765 856 53 013 12 843 9 991 5 210 1 643 8 542 1 600 195 18
259 878 185 289 74 589 20 526 11 987 577 1 315 26 445 1973 252 49 815 23 437 560 – 207 843 13 455 20
109 059 76 370 32 689 2 408 932 1 445 3 309 48 083 21427 934 288 436 139 498 209 197 28 612 1 736 824 93 323 22145 975 87 170 58 805 5 525 34 1 699 4 564 74 318 23695 245 483 408 211 837 78 624 64 234 1 418 3 845 94 735 24
83 115 54 502 28 613 4 034 3 542 671 3 333 18 700 25419 425 298 283 121 142 5 379 1 144 840 1 160 46 906 26
26 308 19 608 6 700 910 654 285 324 6 464 2723 780 18 099 5 681 6 881 40 69 10 794 2892 903 63 992 28 911 8 670 3 171 448 1 797 34 891 2930 880 19 373 11 507 230 – 638 1 811 23 703 30
889 182 629 716 259 466 305 397 242 379 8 214 3 215 153 927 31175 524 121 003 54 521 2 824 161 645 3 796 62 799 32157 824 105 342 52 482 8 242 1 347 656 9 315 39 796 33153 011 114 713 38 298 15 520 14 589 415 535 16 060 34274 372 210 527 63 845 1 887 – 913 1 965 17 995 35
65 450 44 567 20 883 1 234 815 339 2 505 12 590 3645 730 33 490 12 240 950 219 511 2 340 16 326 3717 526 12 607 4 919 348 – 3 864 2 798 61 678 38
235 595 165 925 69 670 2 857 334 832 4 021 17 825 3972 302 50 515 21 787 417 – 192 141 5 954 40
205 832 140 505 65 327 2 406 1 068 1 081 17 184 70 362 4129 856 21 397 8 459 189 – 260 781 24 699 42
132 587 95 896 36 691 2 250 1 320 271 3 757 13 578 43180 368 123 418 56 950 5 234 2 406 1 558 2 293 66 759 44108 910 81 402 27 508 2 307 1 396 504 984 7 578 45
92 296 69 076 23 220 866 – 234 3 442 11 156 4692 901 71 758 21 143 4 045 1 423 210 865 788 4744 417 30 445 13 972 1 012 375 190 321 4 422 4871 092 49 109 21 983 914 448 465 1 485 47 607 49
1 049 761 751 435 298 326 102 391 29 577 10 438 740 400 555 50
43 615 31 498 12 117 280 – 96 2 094 2 317 5159 178 42 316 16 862 12 365 11 707 288 35 2 230 52
248 759 194 582 54 177 2 523 539 417 2 582 20 257 53193 096 142 325 50 771 5 913 3 662 625 1 226 96 325 54379 378 276 502 102 876 32 561 19 128 770 3 936 873 390 55
63 580 44 699 18 881 519 93 548 690 20 854 56274 660 226 451 48 209 131 621 129 449 830 1 551 193 129 57181 036 124 590 56 446 33 878 2 800 739 2 218 55 289 58
37 721 29 733 7 988 2 902 2 613 598 813 88 334 5996 032 67 239 28 793 9 049 135 685 1 087 78 234 60
88 538 66 194 22 344 2 910 2 252 481 1 552 255 313 6135 968 27 563 8 405 545 138 704 1 947 15 558 6272 924 50 945 21 979 643 245 313 4 865 7 384 63
248 929 163 925 85 004 6 341 2 232 1 388 2 537 140 103 6456 985 43 666 13 319 358 – 464 13 1 752 65
215 254 153 719 61 535 3 774 35 648 3 126 25 691 66132 477 94 709 37 768 1 012 57 413 1 867 5 921 67261 255 176 811 84 444 7 776 1 854 3 623 8 461 88 806 68232 869 162 660 70 209 5 193 3 862 439 3 796 25 763 69284 526 206 203 78 323 4 839 92 734 2 099 12 585 70
148 497 110 123 38 374 1 638 598 571 1 551 5 761 71125 880 86 298 39 582 767 – 1 330 7 359 29 765 72
80 255 56 081 24 174 694 181 496 3 617 6 779 73133 376 97 427 35 949 1 534 398 747 1 148 6 428 74
67 000 48 001 18 999 851 – 176 1 940 12 354 75170 745 118 958 51 787 1 321 114 394 1 325 26 101 76
34 919 25 465 9 454 4 152 242 66 158 5 941 7789 841 71 178 18 663 1 573 187 420 761 12 409 7810 413 7 532 2 881 76 – 949 2 231 19 447 79
147 762 106 910 40 852 6 273 4 845 1 546 5 114 40 545 80
107 040 74 684 32 356 9 076 98 322 623 22 691 81908 529 649 241 259 288 123 851 77 019 6 831 125 502 341 898 82
46 237 32 607 13 630 314 – 505 1 981 6 888 8339 498 28 127 11 371 739 298 1 112 2 978 14 547 8470 756 49 813 20 943 776 69 514 479 23 532 85
275 691 209 233 66 458 76 438 73 711 1 218 2 589 83 321 86133 829 95 674 38 155 1 760 376 440 36 12 658 87170 140 117 357 52 783 4 018 2 562 761 1 170 73 890 88
74 957 52 708 22 249 675 116 394 405 7 659 8944 463 33 374 11 089 526 – 165 550 5 544 90
1 075 593 32 066 1 043 527 – – 125 162 88 510 199 697 91
County Area 47

TIPS PS [APS_PPGB,F_SCOTT] 6/ 3/96 12:37:43 MCVX09 TLP:CFFR1.TLP;15 6/ 3/96 11:04:06 DATA:NONE PSC:TIPS_12353107_01.PSC PAGE: 47TSF:TIPS92~12353107.DAT;1 6/ 3/96 12:35:33 UTF:TIPS93~12353107.DAT;1 6/ 3/96 12:35:33 META:TIPS96~12353107.DAT;1 6/ 3/96 12:37:03
Federal Government Expenditures or Obligations by State and County Area: Fiscal Year[Thousand dollars]
State and county area
Congressional district
Direct Federal expenditures or obligations
Total direct expenditres or obligations Salaries and wages
United Statesresident
population1 TotalDepartment of
DefenseAll other
agencies Grant awards TotalDepartmentof Defense
North Dakota -------------------------------- 638 351 3 778 876 520 206 3 258 670 817 077 598 991 343 6201
Adams County 00----------------------------- 2 759 17 190 218 16 972 1 456 770 1072Barnes County 00----------------------------- 12 096 65 408 2 784 62 624 10 222 4 639 1 8753Benson County 00----------------------------- 7 005 61 367 2 635 58 732 22 294 4 724 734Billings County 00----------------------------- 1 145 6 733 32 6 701 3 262 952 –5Bottineau County 00--------------------------- 7 716 45 339 806 44 533 4 182 2 819 1116Bowman County 00---------------------------- 3 248 19 451 46 19 405 1 943 783 –7Burke County 00------------------------------ 2 580 21 096 58 21 038 1 091 2 161 –8Burleigh County 00---------------------------- 63 925 428 836 26 897 401 939 212 605 50 280 16 6279Cass County 00------------------------------- 109 769 475 601 41 303 434 298 71 128 97 463 24 89210Cavalier County 00---------------------------- 5 659 40 625 344 40 281 3 944 1 618 4911
Dickey County 00----------------------------- 5 883 33 996 437 33 559 7 335 1 624 26712Divide County 00------------------------------ 2 609 19 362 68 19 294 1 714 1 035 –13Dunn County 00------------------------------- 3 822 16 436 72 16 364 3 767 951 –14Eddy County 00------------------------------- 2 860 18 944 126 18 818 3 083 873 –15Emmons County 00--------------------------- 4 565 23 839 132 23 707 2 916 1 077 –16Foster County 00------------------------------ 3 893 45 370 317 45 053 26 626 1 339 24717Golden Valley County 00----------------------- 1 947 15 071 174 14 897 4 656 414 –18Grand Forks County 00------------------------ 70 942 411 390 203 789 207 601 51 637 163 294 142 89319Grant County 00------------------------------ 3 231 17 566 100 17 466 1 740 968 –20Griggs County 00----------------------------- 3 088 18 593 138 18 455 1 658 1 029 –21
Hettinger County 00--------------------------- 3 066 21 063 310 20 753 2 004 1 109 27322Kidder County 00------------------------------ 3 080 17 900 24 17 876 2 247 981 –23La Moure County 00--------------------------- 5 139 28 379 427 27 952 3 140 2 194 26324Logan County 00------------------------------ 2 573 15 614 51 15 563 1 563 719 –25McHenry County 00--------------------------- 6 226 37 950 339 37 611 4 682 2 310 –26McIntosh County 00--------------------------- 3 695 23 961 317 23 644 3 625 1 029 14627McKenzie County 00--------------------------- 5 889 24 101 175 23 926 5 319 2 350 –28McLean County 00---------------------------- 9 945 56 545 3 384 53 161 6 856 4 391 1 74929Mercer County 00----------------------------- 9 404 27 695 252 27 443 4 085 1 655 7530Morton County 00----------------------------- 24 230 93 349 1 367 91 982 21 307 5 100 32731
Mountrail County 00--------------------------- 6 738 50 740 276 50 464 16 748 4 319 6532Nelson County 00----------------------------- 4 086 32 778 312 32 466 4 592 1 335 –33Oliver County 00------------------------------ 2 212 6 487 11 6 476 938 193 –34Pembina County 00--------------------------- 8 789 59 117 7 761 51 356 5 032 5 878 1 18235Pierce County 00------------------------------ 4 656 24 824 306 24 518 2 862 1 231 18236Ramsey County 00---------------------------- 12 679 76 172 6 164 70 008 10 809 9 694 5 15737Ransom County 00---------------------------- 5 864 37 708 418 37 290 8 295 1 731 19038Renville County 00---------------------------- 2 929 17 861 611 17 250 1 257 935 –39Richland County 00---------------------------- 18 339 68 725 685 68 040 10 323 3 415 22640Rolette County 00----------------------------- 13 512 123 214 7 801 115 413 35 216 17 560 6741
Sargent County 00---------------------------- 4 452 22 881 320 22 561 2 665 1 546 –42Sheridan County 00--------------------------- 1 947 12 656 – 12 656 1 051 546 –43Sioux County 00------------------------------ 4 033 34 956 870 34 086 18 280 6 504 –44Slope County 00------------------------------ 848 5 038 – 5 038 276 90 –45Stark County 00------------------------------- 22 919 88 061 1 126 86 935 18 060 6 271 49846Steele County 00------------------------------ 2 297 18 769 830 17 939 2 048 804 4247Stutsman County 00--------------------------- 21 652 114 191 6 135 108 056 19 155 9 647 1 34648Towner County 00----------------------------- 3 232 27 165 1 903 25 262 2 356 1 038 12949Traill County 00------------------------------- 8 592 47 730 1 041 46 689 6 433 2 018 14650Walsh County 00------------------------------ 12 874 69 557 668 68 889 15 128 2 832 5551Ward County 00------------------------------ 57 911 393 945 194 381 199 564 37 694 154 760 143 83152Wells County 00------------------------------ 5 356 35 159 133 35 026 4 672 1 548 –53Williams County 00---------------------------- 20 445 86 799 1 332 85 467 16 130 4 444 53054State undistributed ------------------------- 175 575 – 175 575 84 971 – –55
Ohio ---------------------------------------- 11 102 268 50 516 356 5 073 485 45 442 871 9 101 028 4 615 392 1 874 25456
Adams County 02----------------------------- 27 201 104 643 1 667 102 976 22 978 3 380 –57Allen County 04------------------------------- 109 235 509 440 24 700 484 740 60 153 28 085 8 06758Ashland County 16---------------------------- 49 888 136 725 2 477 134 248 17 645 4 935 44059Ashtabula County 19-------------------------- 101 939 406 403 11 849 394 554 72 373 12 703 34860Athens County 06----------------------------- 60 466 201 998 5 765 196 233 40 653 10 564 75161Auglaize County 04 08---------------------------- 46 622 128 691 6 247 122 444 14 613 4 794 50562Belmont County 18---------------------------- 70 572 334 831 4 410 330 421 58 159 9 060 50463Brown County 02------------------------------ 38 271 112 445 1 343 111 102 21 161 3 534 –64Butler County 08------------------------------ 312 842 871 455 38 195 833 260 148 011 27 810 2 39065Carroll County 18----------------------------- 27 849 70 044 1 301 68 743 15 075 2 270 5966
Champaign County 07------------------------- 37 357 133 314 11 803 121 511 20 753 3 833 47167Clark County 07------------------------------- 147 858 622 158 42 952 579 206 100 102 36 310 19 75168Clermont County 02--------------------------- 164 015 359 012 9 500 349 512 67 743 14 448 2 20469Clinton County 06----------------------------- 37 666 125 878 3 462 122 416 16 947 6 328 –70Columbiana County 17 18------------------------- 111 408 407 597 13 885 393 712 59 174 11 260 19971Coshocton County 18-------------------------- 36 005 124 651 2 310 122 341 23 996 5 152 34072Crawford County 04--------------------------- 47 497 168 037 3 843 164 194 22 511 4 061 –73Cuyahoga County 10 11 13 19-------------------------- 1 403 217 7 851 589 249 521 7 602 068 1 525 623 833 137 90 33174Darke County 08------------------------------ 54 142 164 842 3 110 161 732 27 549 5 732 31375Defiance County 05--------------------------- 39 682 116 837 1 210 115 627 15 879 4 974 2776
Delaware County 12--------------------------- 76 577 177 893 8 656 169 237 42 819 10 143 1 14977Erie County 05-------------------------------- 77 910 285 909 5 508 280 401 41 032 10 219 66278Fairfield County 07---------------------------- 114 741 302 998 7 580 295 418 53 062 10 999 5279Fayette County 07----------------------------- 28 215 94 604 1 396 93 208 18 693 2 246 –80Franklin County 12 15---------------------------- 1 005 164 5 394 449 693 934 4 700 515 2 014 891 663 494 386 66481Fulton County 09------------------------------ 40 098 118 867 1 616 117 251 13 385 4 625 4082Gallia County 06------------------------------ 32 181 134 041 1 610 132 431 42 213 3 430 783Geauga County 13---------------------------- 83 002 149 329 1 092 148 237 20 463 6 005 –84Greene County 07----------------------------- 139 908 1 860 489 1 490 515 369 974 62 947 969 815 959 31985Guernsey County 18--------------------------- 39 852 167 829 2 073 165 756 42 336 5 005 5886
Hamilton County 01 02--------------------------- 867 723 5 150 819 988 949 4 161 870 733 273 520 754 37 63787Hancock County 04---------------------------- 67 684 172 698 4 998 167 700 25 030 8 269 75188Hardin County 04----------------------------- 31 436 80 992 3 489 77 503 14 778 4 201 56189Harrison County 18---------------------------- 15 988 70 028 1 292 68 736 10 186 3 289 41890Henry County 05------------------------------ 29 574 89 299 653 88 646 13 105 3 602 12891Highland County 06--------------------------- 38 480 134 621 4 911 129 710 20 441 4 192 15692Hocking County 06---------------------------- 27 501 86 054 1 242 84 812 16 996 2 348 –93Holmes County 16----------------------------- 35 069 55 504 453 55 051 12 696 3 103 6294
See footnotes at end of table.
48 Consolidated Federal Funds Report

TIPS PS [APS_PPGB,F_SCOTT] 6/ 3/96 12:37:43 MCVX09 TLP:CFFR1.TLP;15 6/ 3/96 11:04:06 DATA:NONE PSC:TIPS_12353107_01.PSC PAGE: 48TSF:TIPS92~12353107.DAT;1 6/ 3/96 12:35:33 UTF:TIPS93~12353107.DAT;1 6/ 3/96 12:35:33 META:TIPS96~12353107.DAT;1 6/ 3/96 12:37:03
1995mCon.
Direct Federal expenditures or obligationsmCon. Other Federal assistance
Direct payments for individuals Procurement contract awards
TotalRetirement and
disability All other TotalDepartmentof Defense
Other Federalexpenditures or
obligations Direct loansGuaranteed loans
and insurance
1 681 300 1 069 420 611 880 231 318 127 579 450 190 318 600 1 372 662 1
9 271 5 318 3 953 187 – 5 508 1 933 7 114 238 731 25 985 12 746 856 352 10 959 11 073 36 335 317 772 11 842 5 930 10 285 2 394 6 293 4 127 15 060 41 215 889 326 21 – 1 281 271 1 782 5
26 924 16 944 9 980 432 – 10 982 4 532 25 497 611 572 7 185 4 387 123 – 5 030 972 4 349 710 636 6 591 4 045 1 971 – 5 238 1 511 10 736 8
151 443 98 651 52 792 6 392 482 8 117 6 137 54 092 9221 202 152 589 68 613 22 054 10 262 63 754 20 388 189 221 10
16 336 11 011 5 325 252 25 18 474 13 353 30 357 11
18 710 11 425 7 285 232 – 6 096 4 694 9 691 129 242 6 570 2 672 149 – 7 222 1 382 14 185 138 148 5 142 3 006 492 53 3 079 1 346 8 215 14
10 526 6 946 3 580 142 – 4 320 3 147 4 271 1514 144 9 082 5 062 169 – 5 531 4 984 13 786 1612 573 8 252 4 321 865 – 3 967 7 232 9 595 176 920 4 578 2 342 66 – 3 015 1 332 2 972 18
123 057 78 406 44 651 56 737 50 112 16 665 10 227 133 698 1910 013 5 824 4 189 133 – 4 711 2 520 6 643 209 929 6 567 3 362 170 – 5 807 5 362 6 933 21
10 872 6 830 4 042 199 – 6 880 4 722 14 596 228 792 5 623 3 169 152 – 5 728 1 857 4 844 23
16 101 10 589 5 512 305 – 6 638 9 888 13 145 248 851 4 803 4 048 114 – 4 367 3 093 6 206 25
21 738 14 925 6 813 520 – 8 700 1 443 12 146 2614 876 9 198 5 678 161 – 4 270 2 772 8 051 2712 352 8 044 4 308 337 – 3 743 2 019 11 427 2833 316 22 086 11 230 2 235 1 102 9 747 3 213 23 711 2919 252 12 474 6 778 270 – 2 433 1 354 10 915 3061 090 40 825 20 265 794 – 5 059 5 253 20 189 31
20 991 13 748 7 243 1 232 42 7 451 810 17 835 3217 166 11 155 6 011 250 – 9 435 6 626 14 265 333 726 2 258 1 468 19 – 1 611 986 4 127 34
25 156 17 746 7 410 10 516 6 169 12 535 9 570 59 737 3514 584 9 962 4 622 204 – 5 943 2 145 9 530 3639 690 27 102 12 588 5 322 193 10 657 5 161 37 054 3719 009 12 163 6 846 2 361 – 6 313 8 066 17 593 389 994 6 519 3 475 161 – 5 514 1 997 15 574 39
43 349 27 945 15 404 656 – 10 982 59 102 43 980 4030 897 18 204 12 693 34 305 7 502 5 236 3 266 7 993 41
12 735 7 973 4 762 584 210 5 351 8 077 15 031 426 257 4 018 2 239 95 – 4 706 2 492 6 531 437 284 4 327 2 957 1 082 849 1 806 2 282 1 607 441 182 848 334 820 – 2 669 1 052 4 485 45
58 199 36 495 21 704 657 48 4 875 6 861 20 148 467 322 4 983 2 339 893 709 7 702 5 474 16 194 47
64 008 43 901 20 107 5 734 4 025 15 646 9 296 30 626 4810 651 6 847 3 804 4 689 1 703 8 431 7 540 12 667 4925 949 17 530 8 419 2 363 273 10 966 6 296 45 049 5038 706 26 496 12 210 634 132 12 257 12 363 70 498 51
142 414 101 016 41 398 48 876 40 774 10 201 3 298 89 564 5220 223 13 354 6 869 434 – 8 282 7 347 18 845 5356 172 39 425 16 747 2 617 168 7 436 2 916 26 966 5470 032 211 69 821 – – 20 571 3 438 76 996 55
31 819 538 19 215 210 12 604 328 4 475 318 2 630 805 505 080 696 154 4 845 300 56
76 414 50 974 25 440 725 – 1 146 1 500 5 018 57400 584 304 533 96 051 17 405 13 317 3 213 4 259 26 273 58110 651 76 005 34 646 2 015 557 1 479 2 842 11 425 59303 748 192 396 111 352 15 911 8 421 1 669 2 219 20 157 60144 547 83 298 61 249 5 558 1 496 677 1 565 28 647 61100 995 67 148 33 847 5 240 4 231 3 050 6 312 24 472 62265 078 171 944 93 134 2 016 284 519 2 046 11 607 63
85 638 54 874 30 764 858 – 1 255 3 215 12 522 64662 962 439 392 223 570 30 343 24 035 2 327 2 058 115 185 65
51 713 35 236 16 477 426 – 559 1 037 2 140 66
88 802 58 030 30 772 16 443 9 481 3 484 9 815 21 259 67473 206 316 880 156 326 9 438 6 033 3 102 12 710 49 242 68270 476 175 129 95 347 5 416 2 485 929 2 760 56 537 69
97 875 65 166 32 709 1 434 133 3 293 8 802 18 352 70323 817 215 202 108 615 12 200 9 741 1 146 4 789 17 512 71
92 811 61 811 31 000 1 269 530 1 422 2 234 11 306 72134 960 90 982 43 978 3 505 2 270 3 000 7 794 19 022 73
4 895 414 2 802 770 2 092 644 579 891 123 318 17 523 3 343 357 161 74124 687 85 136 39 551 3 523 1 273 3 351 10 566 23 383 75
87 632 59 955 27 677 5 398 146 2 954 2 377 15 509 76
117 581 81 680 35 901 5 114 2 541 2 236 5 096 35 337 77222 274 145 388 76 886 10 591 2 130 1 794 4 172 96 561 78231 490 157 148 74 342 4 080 182 3 367 4 860 69 506 79
69 029 46 175 22 854 981 – 3 656 10 887 22 169 802 330 947 1 476 738 854 209 373 236 210 782 11 881 19 693 698 519 81
95 624 63 520 32 104 1 783 432 3 449 7 877 12 632 8287 443 57 001 30 442 690 – 265 403 10 658 83
120 841 81 609 39 232 1 399 74 620 354 12 710 84326 800 236 924 89 876 498 353 492 578 2 573 5 898 69 414 85118 802 76 508 42 294 1 198 230 487 1 166 4 398 86
2 576 520 1 577 223 999 297 1 307 318 916 636 12 954 1 242 251 242 87132 688 89 396 43 292 3 268 2 017 3 444 3 833 79 118 88
55 644 31 179 24 465 2 434 1 572 3 936 4 982 12 785 8955 676 36 277 19 399 572 42 304 392 4 933 9069 027 46 106 22 921 732 – 2 834 2 777 12 145 91
102 160 68 875 33 285 3 522 2 515 4 306 8 862 8 298 9265 457 42 220 23 237 939 – 314 776 9 192 9336 382 27 095 9 287 2 557 – 766 986 10 831 94
County Area 49
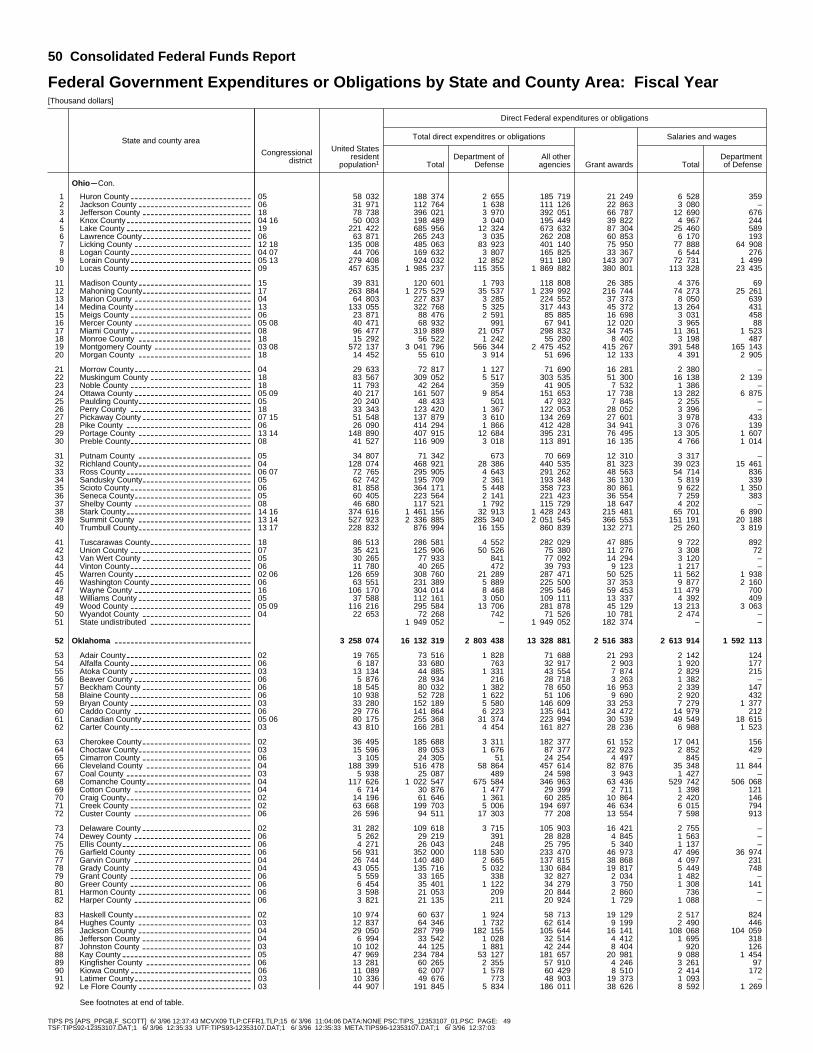
TIPS PS [APS_PPGB,F_SCOTT] 6/ 3/96 12:37:43 MCVX09 TLP:CFFR1.TLP;15 6/ 3/96 11:04:06 DATA:NONE PSC:TIPS_12353107_01.PSC PAGE: 49TSF:TIPS92~12353107.DAT;1 6/ 3/96 12:35:33 UTF:TIPS93~12353107.DAT;1 6/ 3/96 12:35:33 META:TIPS96~12353107.DAT;1 6/ 3/96 12:37:03
Federal Government Expenditures or Obligations by State and County Area: Fiscal Year[Thousand dollars]
State and county area
Congressional district
Direct Federal expenditures or obligations
Total direct expenditres or obligations Salaries and wages
United Statesresident
population1 TotalDepartment of
DefenseAll other
agencies Grant awards TotalDepartmentof Defense
OhiomCon.
Huron County 05------------------------------ 58 032 188 374 2 655 185 719 21 249 6 528 3591Jackson County 06---------------------------- 31 971 112 764 1 638 111 126 22 863 3 080 –2Jefferson County 18--------------------------- 78 738 396 021 3 970 392 051 66 787 12 690 6763Knox County 04 16------------------------------- 50 003 198 489 3 040 195 449 39 822 4 967 2444Lake County 19------------------------------- 221 422 685 956 12 324 673 632 87 304 25 460 5895Lawrence County 06--------------------------- 63 871 265 243 3 035 262 208 60 853 6 170 1936Licking County 12 18----------------------------- 135 008 485 063 83 923 401 140 75 950 77 888 64 9087Logan County 04 07------------------------------ 44 706 169 632 3 807 165 825 33 367 6 544 2768Lorain County 05 13------------------------------ 279 408 924 032 12 852 911 180 143 307 72 731 1 4999Lucas County 09------------------------------ 457 635 1 985 237 115 355 1 869 882 380 801 113 328 23 43510
Madison County 15---------------------------- 39 831 120 601 1 793 118 808 26 385 4 376 6911Mahoning County 17--------------------------- 263 884 1 275 529 35 537 1 239 992 216 744 74 273 25 26112Marion County 04----------------------------- 64 803 227 837 3 285 224 552 37 373 8 050 63913Medina County 13----------------------------- 133 055 322 768 5 325 317 443 45 372 13 264 43114Meigs County 06------------------------------ 23 871 88 476 2 591 85 885 16 698 3 031 45815Mercer County 05 08----------------------------- 40 471 68 932 991 67 941 12 020 3 965 8816Miami County 08------------------------------ 96 477 319 889 21 057 298 832 34 745 11 361 1 52317Monroe County 18---------------------------- 15 292 56 522 1 242 55 280 8 402 3 198 48718Montgomery County 03 08------------------------ 572 137 3 041 796 566 344 2 475 452 415 267 391 548 165 14319Morgan County 18---------------------------- 14 452 55 610 3 914 51 696 12 133 4 391 2 90520
Morrow County 04----------------------------- 29 633 72 817 1 127 71 690 16 281 2 380 –21Muskingum County 18------------------------- 83 567 309 052 5 517 303 535 51 300 16 138 2 13922Noble County 18------------------------------ 11 793 42 264 359 41 905 7 532 1 386 –23Ottawa County 05 09----------------------------- 40 217 161 507 9 854 151 653 17 738 13 282 6 87524Paulding County 05---------------------------- 20 240 48 433 501 47 932 7 845 2 255 –25Perry County 18------------------------------ 33 343 123 420 1 367 122 053 28 052 3 396 –26Pickaway County 07 15--------------------------- 51 548 137 879 3 610 134 269 27 601 3 978 43327Pike County 06------------------------------- 26 090 414 294 1 866 412 428 34 941 3 076 13928Portage County 13 14---------------------------- 148 890 407 915 12 684 395 231 76 495 13 305 1 60729Preble County 08------------------------------ 41 527 116 909 3 018 113 891 16 135 4 766 1 01430
Putnam County 05---------------------------- 34 807 71 342 673 70 669 12 310 3 317 –31Richland County 04---------------------------- 128 074 468 921 28 386 440 535 81 323 39 023 15 46132Ross County 06 07------------------------------- 72 765 295 905 4 643 291 262 48 563 54 714 83633Sandusky County 05--------------------------- 62 742 195 709 2 361 193 348 36 130 5 819 33934Scioto County 06------------------------------ 81 858 364 171 5 448 358 723 80 861 9 622 1 35035Seneca County 05----------------------------- 60 405 223 564 2 141 221 423 36 554 7 259 38336Shelby County 08----------------------------- 46 680 117 521 1 792 115 729 18 647 4 202 –37Stark County 14 16------------------------------- 374 616 1 461 156 32 913 1 428 243 215 481 65 701 6 89038Summit County 13 14---------------------------- 527 923 2 336 885 285 340 2 051 545 366 553 151 191 20 18839Trumbull County 13 17---------------------------- 228 832 876 994 16 155 860 839 132 271 25 260 3 81940
Tuscarawas County 18------------------------- 86 513 286 581 4 552 282 029 47 885 9 722 89241Union County 07------------------------------ 35 421 125 906 50 526 75 380 11 276 3 308 7242Van Wert County 05--------------------------- 30 265 77 933 841 77 092 14 294 3 120 –43Vinton County 06------------------------------ 11 780 40 265 472 39 793 9 123 1 217 –44Warren County 02 06----------------------------- 126 659 308 760 21 289 287 471 50 525 11 562 1 93845Washington County 06------------------------- 63 551 231 389 5 889 225 500 37 353 9 877 2 16046Wayne County 16----------------------------- 106 170 304 014 8 468 295 546 59 453 11 479 70047Williams County 05---------------------------- 37 588 112 161 3 050 109 111 13 337 4 392 40948Wood County 05 09------------------------------ 116 216 295 584 13 706 281 878 45 129 13 213 3 06349Wyandot County 04--------------------------- 22 653 72 268 742 71 526 10 781 2 474 –50State undistributed ------------------------- 1 949 052 – 1 949 052 182 374 – –51
Oklahoma ---------------------------------- 3 258 074 16 132 319 2 803 438 13 328 881 2 516 383 2 613 914 1 592 11352
Adair County 02------------------------------- 19 765 73 516 1 828 71 688 21 293 2 142 12453Alfalfa County 06------------------------------ 6 187 33 680 763 32 917 2 903 1 920 17754Atoka County 03------------------------------ 13 134 44 885 1 331 43 554 7 874 2 829 21555Beaver County 06----------------------------- 5 876 28 934 216 28 718 3 263 1 382 –56Beckham County 06--------------------------- 18 545 80 032 1 382 78 650 16 953 2 339 14757Blaine County 06------------------------------ 10 938 52 728 1 622 51 106 9 690 2 920 43258Bryan County 03------------------------------ 33 280 152 189 5 580 146 609 33 253 7 279 1 37759Caddo County 06----------------------------- 29 776 141 864 6 223 135 641 24 472 14 979 21260Canadian County 05 06--------------------------- 80 175 255 368 31 374 223 994 30 539 49 549 18 61561Carter County 03------------------------------ 43 810 166 281 4 454 161 827 28 236 6 988 1 52362
Cherokee County 02--------------------------- 36 495 185 688 3 311 182 377 61 152 17 041 15663Choctaw County 03---------------------------- 15 596 89 053 1 676 87 377 22 923 2 852 42964Cimarron County 06--------------------------- 3 105 24 305 51 24 254 4 497 845 –65Cleveland County 04-------------------------- 188 399 516 478 58 864 457 614 82 876 35 348 11 84466Coal County 03------------------------------- 5 938 25 087 489 24 598 3 943 1 427 –67Comanche County 04-------------------------- 117 626 1 022 547 675 584 346 963 63 436 529 742 506 06868Cotton County 04----------------------------- 6 714 30 876 1 477 29 399 2 711 1 398 12169Craig County 02------------------------------- 14 196 61 646 1 361 60 285 10 864 2 420 14670Creek County 02------------------------------ 63 668 199 703 5 006 194 697 46 634 6 015 79471Custer County 06----------------------------- 26 596 94 511 17 303 77 208 13 554 7 598 91372
Delaware County 02--------------------------- 31 282 109 618 3 715 105 903 16 421 2 755 –73Dewey County 06----------------------------- 5 262 29 219 391 28 828 4 845 1 563 –74Ellis County 06-------------------------------- 4 271 26 043 248 25 795 5 340 1 137 –75Garfield County 06---------------------------- 56 931 352 000 118 530 233 470 46 973 47 496 36 97476Garvin County 04----------------------------- 26 744 140 480 2 665 137 815 38 868 4 097 23177Grady County 04------------------------------ 43 055 135 716 5 032 130 684 19 817 5 449 74878Grant County 06------------------------------ 5 559 33 165 338 32 827 2 034 1 482 –79Greer County 06------------------------------ 6 454 35 401 1 122 34 279 3 750 1 308 14180Harmon County 06---------------------------- 3 598 21 053 209 20 844 2 860 736 –81Harper County 06----------------------------- 3 821 21 135 211 20 924 1 729 1 088 –82
Haskell County 02----------------------------- 10 974 60 637 1 924 58 713 19 129 2 517 82483Hughes County 03---------------------------- 12 837 64 346 1 732 62 614 9 199 2 490 44684Jackson County 04---------------------------- 29 050 287 799 182 155 105 644 16 141 108 068 104 05985Jefferson County 04--------------------------- 6 994 33 542 1 028 32 514 4 412 1 695 31886Johnston County 03--------------------------- 10 102 44 125 1 881 42 244 8 404 920 12687Kay County 05-------------------------------- 47 969 234 784 53 127 181 657 20 981 9 088 1 45488Kingfisher County 06-------------------------- 13 281 60 265 2 355 57 910 4 246 3 261 9789Kiowa County 06------------------------------ 11 089 62 007 1 578 60 429 8 510 2 414 17290Latimer County 03----------------------------- 10 336 49 676 773 48 903 19 373 1 093 –91Le Flore County 03---------------------------- 44 907 191 845 5 834 186 011 38 626 8 592 1 26992
See footnotes at end of table.
50 Consolidated Federal Funds Report

TIPS PS [APS_PPGB,F_SCOTT] 6/ 3/96 12:37:43 MCVX09 TLP:CFFR1.TLP;15 6/ 3/96 11:04:06 DATA:NONE PSC:TIPS_12353107_01.PSC PAGE: 50TSF:TIPS92~12353107.DAT;1 6/ 3/96 12:35:33 UTF:TIPS93~12353107.DAT;1 6/ 3/96 12:35:33 META:TIPS96~12353107.DAT;1 6/ 3/96 12:37:03
1995mCon.
Direct Federal expenditures or obligationsmCon. Other Federal assistance
Direct payments for individuals Procurement contract awards
TotalRetirement and
disability All other TotalDepartmentof Defense
Other Federalexpenditures or
obligations Direct loansGuaranteed loans
and insurance
154 845 106 469 48 376 2 053 822 3 700 8 706 22 772 185 302 58 531 26 771 1 117 – 401 892 4 851 2
312 288 199 444 112 844 3 535 606 721 1 096 15 089 3149 977 84 994 64 983 1 393 156 2 329 8 951 19 485 4558 524 371 229 187 295 13 173 7 157 1 494 1 713 97 473 5195 183 135 481 59 702 2 737 227 299 3 462 23 093 6316 823 224 472 92 351 11 632 8 990 2 770 8 530 66 862 7119 748 78 010 41 738 6 075 1 070 3 897 7 959 24 794 8677 010 433 506 243 504 28 662 5 712 2 321 4 205 120 941 9
1 384 939 801 855 583 084 101 786 79 390 4 382 1 528 173 916 10
85 773 53 872 31 901 924 83 3 143 8 533 22 931 11966 588 586 228 380 360 15 383 4 185 2 540 1 959 47 393 12174 940 119 752 55 188 4 021 470 3 452 19 144 24 165 13258 280 171 802 86 478 4 635 1 902 1 218 2 981 44 426 14
65 824 42 873 22 951 1 445 915 1 477 686 7 841 1548 459 19 786 28 673 899 – 3 590 7 250 45 380 16
243 904 159 642 84 262 27 772 14 851 2 107 5 575 35 522 1744 023 26 958 17 065 724 163 174 192 2 082 18
1 768 903 1 180 581 588 322 458 472 294 869 7 607 5 881 242 305 1935 847 24 434 11 413 2 887 289 352 288 2 909 20
51 238 35 368 15 870 626 171 2 293 10 300 7 576 21237 349 159 789 77 560 2 798 – 1 467 5 338 15 321 22
26 783 16 765 10 018 6 434 – 128 73 1 009 23124 697 82 725 41 972 4 387 1 335 1 403 3 108 118 135 24
34 635 21 615 13 020 1 109 – 2 588 3 505 16 771 2589 605 60 552 29 053 1 658 – 710 4 418 5 910 26
100 719 67 995 32 724 1 458 388 4 124 6 812 50 634 2773 867 49 165 24 702 301 636 400 774 2 256 5 299 28
307 123 187 259 119 864 9 854 7 387 1 138 2 502 48 278 2991 812 62 562 29 250 1 554 426 2 642 4 498 18 588 30
51 129 29 446 21 683 2 113 – 2 472 2 839 21 499 31332 382 227 398 104 984 13 532 8 662 2 661 4 642 24 070 32181 581 128 836 52 745 7 298 100 3 748 6 378 35 912 33149 287 97 276 52 011 1 853 247 2 620 9 193 21 373 34271 092 176 605 94 487 1 799 – 797 2 260 20 419 35173 900 116 438 57 462 1 774 285 4 077 3 108 22 121 36
90 493 60 815 29 678 1 481 446 2 699 7 688 16 165 371 080 298 723 297 357 001 96 369 15 432 3 307 1 928 66 842 381 526 732 916 063 610 669 286 705 250 298 5 705 3 300 153 270 39
708 554 440 473 268 081 9 314 5 127 1 596 2 209 55 006 40
224 761 157 264 67 497 3 111 787 1 102 2 093 21 752 4158 101 36 807 21 294 50 019 49 309 3 201 6 055 20 904 4257 158 39 757 17 401 685 48 2 676 3 658 16 138 4329 446 19 018 10 428 297 – 181 425 486 44
228 298 157 745 70 553 16 792 14 041 1 582 5 614 78 897 45180 056 116 084 63 972 3 423 732 679 1 607 39 203 46222 968 155 479 67 489 7 814 5 254 2 299 5 746 26 617 47
88 046 60 321 27 725 2 180 1 310 4 206 3 713 8 297 48222 962 138 507 84 455 9 613 7 281 4 666 5 288 58 602 49
55 258 38 819 16 439 522 – 3 233 4 070 16 558 501 495 630 7 123 1 488 507 – – 271 048 295 495 522 244 51
9 448 933 6 302 331 3 146 602 1 151 774 730 888 401 316 167 319 2 422 012 52
48 913 32 558 16 355 1 024 364 144 52 1 668 5322 173 14 555 7 618 288 – 6 396 1 326 16 673 5433 654 24 058 9 596 389 – 140 448 858 5514 793 10 245 4 548 301 45 9 195 736 7 510 5653 895 35 573 18 322 417 – 6 429 1 030 5 545 5733 832 22 155 11 677 596 211 5 689 1 461 8 132 58
109 257 73 509 35 748 1 271 148 1 129 2 521 11 343 5994 548 66 328 28 220 2 178 394 5 688 3 048 36 154 60
155 534 112 418 43 116 14 618 2 541 5 128 757 60 593 61129 288 91 661 37 627 1 290 58 480 275 10 515 62
101 289 66 111 35 178 5 869 42 337 1 298 9 026 6357 068 36 095 20 973 5 875 – 335 1 555 4 184 648 976 6 545 2 431 246 – 9 741 3 446 10 552 65
377 820 292 271 85 549 19 725 12 755 708 439 116 439 6619 430 12 931 6 499 189 – 98 292 246 67
331 590 263 430 68 160 94 694 88 793 3 085 770 113 315 6821 246 15 225 6 021 481 250 5 039 763 8 249 6947 155 32 162 14 993 515 96 693 2 796 10 586 70
144 814 102 191 42 623 1 722 377 518 504 16 898 7150 273 27 147 23 126 15 205 14 365 7 881 2 793 11 065 72
89 243 61 975 27 268 925 484 275 551 11 522 7316 893 11 086 5 807 313 – 5 605 705 5 080 7414 695 9 400 5 295 203 – 4 667 340 4 031 75
176 657 124 627 52 030 71 931 69 852 8 942 2 797 41 294 7695 001 64 944 30 057 1 773 – 741 752 12 339 77
106 731 77 421 29 310 1 402 511 2 316 1 546 23 433 7819 219 13 106 6 113 429 – 10 002 1 911 25 177 7925 778 15 605 10 173 218 – 4 347 248 3 623 8013 497 7 830 5 667 87 73 3 874 1 089 5 619 8112 556 8 692 3 864 180 – 5 582 526 5 769 82
38 325 27 807 10 518 294 – 372 1 702 14 950 8351 815 34 889 16 926 423 – 419 616 4 716 8495 197 62 264 32 933 62 383 61 649 6 010 2 250 29 532 8524 859 17 166 7 693 366 120 2 210 449 1 779 8632 184 20 879 11 305 2 207 654 410 548 1 072 87
149 000 102 287 46 713 49 945 47 516 5 770 2 773 37 281 8834 463 24 348 10 115 12 660 1 425 5 635 1 758 20 038 8942 702 27 857 14 845 750 – 7 631 3 502 7 905 9028 891 18 238 10 653 233 – 86 153 2 013 91
140 321 98 573 41 748 3 711 34 596 4 252 21 569 92
County Area 51

TIPS PS [APS_PPGB,F_SCOTT] 6/ 3/96 12:37:43 MCVX09 TLP:CFFR1.TLP;15 6/ 3/96 11:04:06 DATA:NONE PSC:TIPS_12353107_01.PSC PAGE: 51TSF:TIPS92~12353107.DAT;1 6/ 3/96 12:35:33 UTF:TIPS93~12353107.DAT;1 6/ 3/96 12:35:33 META:TIPS96~12353107.DAT;1 6/ 3/96 12:37:03
Federal Government Expenditures or Obligations by State and County Area: Fiscal Year[Thousand dollars]
State and county area
Congressional district
Direct Federal expenditures or obligations
Total direct expenditres or obligations Salaries and wages
United Statesresident
population1 TotalDepartment of
DefenseAll other
agencies Grant awards TotalDepartmentof Defense
Oklahoma mCon.
Lincoln County 03----------------------------- 30 070 102 050 4 216 97 834 16 019 4 280 1 0491Logan County 05------------------------------ 29 828 109 062 2 504 106 558 19 125 3 355 1902Love County 03------------------------------- 8 587 29 791 1 003 28 788 5 655 993 –3McClain County 04---------------------------- 24 542 70 039 2 449 67 590 11 495 2 630 –4McCurtain County 03-------------------------- 33 971 140 003 3 323 136 680 31 702 5 707 6695McIntosh County 02--------------------------- 18 074 89 592 3 053 86 539 13 034 1 818 1636Major County 06------------------------------ 7 730 33 339 658 32 681 2 697 1 630 –7Marshall County 03---------------------------- 11 546 49 237 1 737 47 500 5 651 1 227 1728Mayes County 02----------------------------- 35 438 122 587 3 314 119 273 26 259 3 450 1969Murray County 03----------------------------- 12 055 54 339 1 650 52 689 8 015 2 833 33710
Muskogee County 02-------------------------- 69 375 341 445 17 483 323 962 48 575 54 571 5 53011Noble County 05------------------------------ 11 269 46 961 1 672 45 289 8 706 2 285 16612Nowata County 02----------------------------- 9 824 37 864 1 405 36 459 4 948 1 472 10213Okfuskee County 02--------------------------- 11 193 68 318 2 533 65 785 10 766 1 815 29214Oklahoma County 04 05 06-------------------------- 623 752 4 293 184 1 271 280 3 021 904 743 503 1 237 003 797 06115Okmulgee County 02-------------------------- 37 347 169 261 5 509 163 752 37 772 7 013 2 37816Osage County 02 05----------------------------- 42 547 130 735 27 476 103 259 17 127 28 371 16 18317Ottawa County 02----------------------------- 30 995 170 903 4 750 166 153 40 797 5 664 50318Pawnee County 02 03---------------------------- 15 825 64 235 1 199 63 036 14 753 4 148 –19Payne County 03------------------------------ 63 726 261 842 28 554 233 288 63 262 18 361 2 66920
Pittsburg County 03--------------------------- 42 840 228 256 49 078 179 178 27 307 37 849 27 93421Pontotoc County 03--------------------------- 34 347 174 030 4 856 169 174 37 634 16 199 1 64522Pottawatomie County 03----------------------- 60 601 258 410 8 240 250 170 51 990 10 384 76523Pushmataha County 03------------------------ 11 305 51 870 1 657 50 213 10 329 1 580 29724Roger Mills County 06------------------------- 3 869 17 265 225 17 040 1 552 1 429 –25Rogers County 02----------------------------- 60 691 162 379 4 925 157 454 33 645 18 038 86326Seminole County 03--------------------------- 25 017 123 487 2 673 120 814 24 988 5 787 64827Sequoyah County 02-------------------------- 35 257 128 747 5 769 122 978 22 818 6 836 2 43928Stephens County 04--------------------------- 43 172 193 341 5 558 187 783 34 752 5 288 25929Texas County 06------------------------------ 16 232 67 827 1 248 66 579 7 341 2 643 43230
Tillman County 04----------------------------- 9 869 50 608 1 297 49 311 6 845 1 758 19931Tulsa County 01------------------------------ 524 611 1 949 703 112 722 1 836 981 251 617 189 753 36 80432Wagoner County 01 02--------------------------- 51 593 101 676 3 242 98 434 17 226 3 314 1 18333Washington County 05------------------------- 47 635 206 073 5 892 200 181 20 293 3 200 23634Washita County 06---------------------------- 11 557 48 451 3 168 45 283 1 468 2 140 –35Woods County 06----------------------------- 8 663 44 386 763 43 623 3 439 1 998 22036Woodward County 06-------------------------- 18 786 63 139 1 616 61 523 6 852 5 241 37737State undistributed ------------------------- 605 660 – 605 660 43 703 7 591 –38
Oregon ------------------------------------- 3 086 239 13 641 396 677 807 12 963 589 2 807 519 1 405 429 207 99439
Baker County 02------------------------------ 16 274 81 057 1 937 79 120 8 108 13 631 31840Benton County 04 05----------------------------- 74 493 281 544 24 905 256 639 91 524 30 128 3 14141Clackamas County 01 03 05------------------------- 310 161 845 575 94 347 751 228 84 155 88 137 52 21842Clatsop County 01----------------------------- 35 148 162 435 17 160 145 275 14 293 21 515 4 48943Columbia County 01--------------------------- 40 880 133 599 3 608 129 991 34 980 4 141 26644Coos County 04------------------------------- 62 732 293 980 16 414 277 566 40 011 26 010 2 37345Crook County 02------------------------------ 15 895 74 835 1 226 73 609 6 766 12 736 –46Curry County 04------------------------------ 20 806 109 863 4 181 105 682 13 264 6 134 –47Deschutes County 02-------------------------- 90 925 307 124 17 693 289 431 26 516 33 652 2 77648Douglas County 04---------------------------- 98 303 450 449 12 312 438 137 57 716 56 965 48249
Gilliam County 02----------------------------- 1 851 13 449 208 13 241 2 371 383 –50Grant County 02------------------------------ 7 939 42 350 484 41 866 4 262 10 484 –51Harney County 02----------------------------- 7 068 39 022 492 38 530 7 571 7 856 4052Hood River County 02------------------------- 17 989 70 734 5 180 65 554 13 307 5 767 34253Jackson County 02---------------------------- 162 370 632 915 25 804 607 111 75 043 65 381 3 84854Jefferson County 02--------------------------- 15 564 57 667 867 56 800 13 622 5 846 –55Josephine County 02 04-------------------------- 69 421 321 782 22 135 299 647 37 256 13 656 76956Klamath County 02---------------------------- 60 485 273 389 26 366 247 023 35 368 41 310 13 58857Lake County 02------------------------------- 7 330 37 985 437 37 548 2 326 10 501 –58Lane County 04------------------------------- 298 999 1 099 635 36 563 1 063 072 222 165 84 903 6 42659
Lincoln County 05----------------------------- 43 259 193 456 8 497 184 959 29 335 10 567 26960Linn County 04-------------------------------- 97 924 333 588 15 576 318 012 45 708 21 275 2 87261Malheur County 02---------------------------- 27 422 105 241 1 963 103 278 21 788 7 740 33862Marion County 05----------------------------- 250 138 1 383 488 60 841 1 322 647 564 461 79 259 22 33263Morrow County 02----------------------------- 8 648 43 183 11 081 32 102 2 635 2 953 80264Multnomah County 01 03------------------------- 611 735 3 381 537 141 435 3 240 102 710 112 615 958 71 16965Polk County 05------------------------------- 55 650 266 454 7 498 258 956 160 854 5 603 1 98766Sherman County 02--------------------------- 1 901 16 763 2 885 13 878 ~197 3 054 2 13367Tillamook County 05--------------------------- 23 315 104 859 3 461 101 398 14 055 5 841 –68Umatilla County 02---------------------------- 63 068 295 099 14 973 280 126 46 325 27 632 9 44469
Union County 02------------------------------ 24 950 103 008 3 683 99 325 22 599 8 705 1 39670Wallowa County 02---------------------------- 7 466 38 018 848 37 170 4 128 4 959 –71Wasco County 02----------------------------- 22 607 99 399 3 248 96 151 9 971 11 018 28272Washington County 01------------------------- 359 026 757 312 76 663 680 649 136 748 33 163 3 42773Wheeler County 02---------------------------- 1 578 6 269 179 6 090 194 203 –74Yamhill County 01----------------------------- 72 919 236 485 12 657 223 828 27 658 28 362 46775State undistributed ------------------------- 947 848 – 947 848 220 520 – –76
Pennsylvania ------------------------------- 12 052 410 64 609 866 5 811 926 58 797 940 11 220 501 5 921 858 2 065 22877
Adams County 19----------------------------- 83 460 254 614 13 284 241 330 31 254 17 460 99778Allegheny County 04 14 18 20--------------------------- 1 320 708 8 523 789 726 679 7 797 110 1 433 662 796 597 122 03979Armstrong County 05 12-------------------------- 74 600 328 168 5 365 322 803 40 495 11 310 1 70580Beaver County 04----------------------------- 188 299 784 273 9 815 774 458 118 215 19 893 1 73281Bedford County 09---------------------------- 48 985 171 107 6 101 165 006 23 347 6 331 44482Berks County 06------------------------------ 347 630 1 234 879 43 781 1 191 098 190 026 60 539 7 24283Blair County 09------------------------------- 131 821 607 716 16 130 591 586 95 710 41 852 2 38884Bradford County 10---------------------------- 62 057 233 516 7 405 226 111 37 790 10 174 2385Bucks County 08------------------------------ 567 247 1 824 008 242 416 1 581 592 216 509 176 222 105 18986Butler County 04 21------------------------------ 161 893 617 560 10 944 606 616 83 118 70 142 2 35387
See footnotes at end of table.
52 Consolidated Federal Funds Report

TIPS PS [APS_PPGB,F_SCOTT] 6/ 3/96 12:37:43 MCVX09 TLP:CFFR1.TLP;15 6/ 3/96 11:04:06 DATA:NONE PSC:TIPS_12353107_01.PSC PAGE: 52TSF:TIPS92~12353107.DAT;1 6/ 3/96 12:35:33 UTF:TIPS93~12353107.DAT;1 6/ 3/96 12:35:33 META:TIPS96~12353107.DAT;1 6/ 3/96 12:37:03
1995mCon.
Direct Federal expenditures or obligationsmCon. Other Federal assistance
Direct payments for individuals Procurement contract awards
TotalRetirement and
disability All other TotalDepartmentof Defense
Other Federalexpenditures or
obligations Direct loansGuaranteed loans
and insurance
80 709 59 169 21 540 616 – 426 2 544 12 029 171 222 46 969 24 253 12 125 – 3 235 1 336 16 221 222 587 16 174 6 413 189 – 369 490 2 811 354 698 39 315 15 383 525 30 691 1 900 9 293 498 783 63 853 34 930 2 885 84 928 3 861 4 873 573 848 54 924 18 924 309 ~22 583 604 2 813 620 408 14 291 6 117 2 857 279 5 747 1 627 11 342 741 886 30 010 11 876 281 – 192 979 3 963 891 848 62 841 29 007 698 82 333 4 855 8 575 939 519 29 326 10 193 3 784 – 188 360 1 897 10
222 917 157 863 65 054 14 259 5 576 1 123 3 083 23 063 1130 760 20 432 10 328 1 951 544 3 260 919 7 770 1229 786 21 072 8 714 1 245 705 412 206 1 873 1339 448 27 300 12 148 15 903 – 387 84 581 14
1 835 439 1 294 636 540 803 470 079 332 693 7 158 11 235 414 901 15122 928 80 702 42 226 971 241 577 1 769 12 199 16
80 290 58 500 21 790 3 275 – 1 672 811 11 334 17118 444 80 310 38 134 4 242 623 1 756 2 083 27 908 18
43 951 30 832 13 119 732 – 651 1 044 3 015 19152 989 94 082 58 907 26 018 17 546 1 211 1 174 27 737 20
145 655 110 558 35 097 17 117 14 393 330 5 492 6 639 21113 298 72 148 41 150 6 564 ~95 335 706 4 771 22191 779 142 998 48 781 3 270 432 987 394 16 292 23
39 559 27 503 12 056 312 94 91 793 1 155 2410 868 6 836 4 032 227 – 3 188 119 1 478 25
108 186 77 083 31 103 1 826 107 684 1 093 30 538 2691 158 58 804 32 354 1 232 26 322 27 5 990 2797 937 68 796 29 141 904 207 252 1 556 7 538 28
141 710 100 762 40 948 10 071 – 1 521 1 014 7 671 2937 347 26 015 11 332 437 – 20 058 1 999 26 511 30
33 379 22 126 11 253 356 – 8 271 844 14 550 311 377 445 898 852 478 593 124 776 49 638 6 112 5 344 533 583 32
79 965 53 514 26 451 427 – 743 1 425 20 581 33142 425 105 794 36 631 39 688 2 984 467 88 33 298 34
35 317 25 084 10 233 2 424 1 851 7 101 1 174 19 844 3529 998 19 882 10 116 1 263 – 7 689 320 9 418 3645 954 32 377 13 577 611 113 4 481 1 119 13 307 37
390 917 4 436 386 481 – – 163 449 48 070 326 356 38
8 600 975 5 640 419 2 960 556 629 542 133 878 197 930 242 733 2 147 335 39
55 648 39 862 15 786 2 761 27 908 1 014 7 235 40146 965 103 303 43 662 12 243 2 083 684 471 39 815 41647 721 471 091 176 630 24 290 9 189 1 271 5 341 196 121 42103 398 71 831 31 567 23 023 8 659 204 6 389 94 681 43
92 974 65 441 27 533 1 216 406 288 1 675 23 962 44211 779 151 985 59 794 15 607 5 824 573 2 017 32 389 45
43 951 32 163 11 788 10 904 – 478 667 14 494 4688 340 68 369 19 971 1 829 316 296 1 837 18 348 47
236 760 181 185 55 575 9 597 769 598 4 519 34 677 48309 188 233 409 75 779 25 657 586 922 10 983 83 876 49
5 478 4 316 1 162 57 – 5 161 947 6 467 5022 194 16 974 5 220 4 556 – 852 162 4 045 5118 502 14 187 4 315 2 928 – 2 166 571 6 823 5245 228 29 787 15 441 6 156 3 457 277 2 548 10 974 53
470 230 350 323 119 907 21 098 461 1 163 6 975 110 231 5435 887 26 596 9 291 362 109 1 950 2 151 8 396 55
259 099 192 705 66 394 11 450 7 530 321 4 586 47 611 56179 893 128 048 51 845 15 271 3 999 1 546 3 151 16 465 57
21 790 16 875 4 915 1 650 – 1 718 214 1 833 58771 032 550 622 220 410 19 263 1 347 2 272 5 280 208 875 59
149 499 112 727 36 772 3 848 777 206 5 759 94 324 60259 848 186 756 73 092 5 808 2 749 949 2 569 38 869 61
71 858 48 850 23 008 887 – 2 967 1 832 29 406 62716 450 510 541 205 909 20 656 1 112 2 663 15 894 104 851 63
18 119 13 249 4 870 10 498 9 716 8 980 2 401 19 742 641 775 836 1 158 818 617 018 270 238 38 024 9 393 3 084 289 996 65
98 077 64 846 33 231 827 218 1 094 1 627 17 884 667 057 4 703 2 354 694 570 6 155 980 11 025 67
82 043 59 063 22 980 2 526 26 394 853 79 640 68166 181 117 459 48 722 40 959 1 152 14 003 13 070 66 264 69
67 591 46 790 20 801 1 908 – 2 205 1 203 11 434 7023 612 16 798 6 814 3 179 – 2 140 668 3 488 7169 331 49 530 19 801 2 871 1 243 6 207 653 9 270 72
538 976 361 744 177 232 46 086 28 064 2 338 2 682 185 580 735 305 4 051 1 254 38 – 529 – 139 74
169 097 117 048 52 049 8 601 5 465 2 766 8 245 57 583 75616 036 18 373 597 663 – – 111 293 119 715 160 525 76
41 313 591 24 114 086 17 199 505 5 360 408 2 986 169 793 507 283 707 7 809 151 77
191 383 140 595 50 788 11 798 1 689 2 719 6 926 37 090 785 019 166 2 897 252 2 121 914 1 252 787 527 384 21 577 7 238 394 935 79
273 076 176 939 96 137 2 615 504 673 1 852 22 796 80638 397 398 925 239 472 6 835 1 773 932 734 38 237 81137 922 95 623 42 299 2 857 1 641 649 2 516 28 994 82935 103 629 118 305 985 42 128 21 923 7 083 6 923 124 223 83453 157 299 094 154 063 15 413 4 733 1 583 4 119 47 688 84164 176 116 971 47 205 20 322 2 984 1 055 2 545 36 959 85
1 295 546 861 643 433 903 132 228 109 547 3 502 5 537 400 222 86444 537 293 520 151 017 18 143 1 869 1 620 1 726 54 772 87
County Area 53

TIPS PS [APS_PPGB,F_SCOTT] 6/ 3/96 12:37:43 MCVX09 TLP:CFFR1.TLP;15 6/ 3/96 11:04:06 DATA:NONE PSC:TIPS_12353107_01.PSC PAGE: 53TSF:TIPS92~12353107.DAT;1 6/ 3/96 12:35:33 UTF:TIPS93~12353107.DAT;1 6/ 3/96 12:35:33 META:TIPS96~12353107.DAT;1 6/ 3/96 12:37:03
Federal Government Expenditures or Obligations by State and County Area: Fiscal Year[Thousand dollars]
State and county area
Congressional district
Direct Federal expenditures or obligations
Total direct expenditres or obligations Salaries and wages
United Statesresident
population1 TotalDepartment of
DefenseAll other
agencies Grant awards TotalDepartmentof Defense
Pennsylvania mCon.
Cambria County 12---------------------------- 160 732 929 688 125 724 803 964 135 341 55 568 8 4351Cameron County 05--------------------------- 5 783 29 228 353 28 875 8 340 812 –2Carbon County 11----------------------------- 58 870 281 309 44 958 236 351 25 077 6 617 1 1613Centre County 05 09----------------------------- 129 836 500 579 101 979 398 600 145 382 30 388 11 5094Chester County 07 16---------------------------- 397 313 1 265 862 69 305 1 196 557 139 794 156 993 4 6275Clarion County 05 12----------------------------- 42 124 157 878 2 816 155 062 24 259 5 748 2016Clearfield County 05 09--------------------------- 79 397 344 657 13 140 331 517 54 231 14 063 1 7077Clinton County 05----------------------------- 37 435 155 402 8 173 147 229 27 288 9 302 4 7818Columbia County 11--------------------------- 63 898 243 952 19 323 224 629 30 310 9 615 1 8529Crawford County 05 21--------------------------- 87 986 331 725 6 737 324 988 52 121 12 542 1 47410
Cumberland County 17 19------------------------ 204 615 1 056 109 393 934 662 175 54 980 327 436 300 30711Dauphin County 17---------------------------- 245 561 2 710 895 83 162 2 627 733 1 615 600 163 142 37 83412Delaware County 01 02 07 16--------------------------- 548 367 2 340 305 185 587 2 154 718 293 943 135 144 40 81013Elk County 05--------------------------------- 35 173 129 866 2 657 127 209 16 301 5 852 1 36814Erie County 21-------------------------------- 280 321 1 080 308 43 338 1 036 970 193 247 75 951 13 39515Fayette County 12 20----------------------------- 146 536 767 699 22 161 745 538 112 780 25 192 5 20816Forest County 05------------------------------ 4 812 29 011 1 014 27 997 4 645 1 891 27017Franklin County 09---------------------------- 125 999 710 950 300 925 410 025 52 697 133 647 121 81518Fulton County 09------------------------------ 14 262 46 588 2 823 43 765 6 362 1 399 –19Greene County 20----------------------------- 40 170 208 935 9 146 199 789 47 333 7 243 1 42920
Huntingdon County 09------------------------- 44 530 158 357 7 688 150 669 25 731 7 864 2 67821Indiana County 12----------------------------- 90 639 354 460 12 631 341 829 53 614 15 575 3 40322Jefferson County 05--------------------------- 46 616 193 151 5 908 187 243 28 879 8 664 3 03223Juniata County 09----------------------------- 21 451 67 354 1 204 66 150 7 992 3 167 –24Lackawanna County 10------------------------ 216 011 1 280 620 86 827 1 193 793 296 847 61 174 10 27425Lancaster County 16 17-------------------------- 442 686 1 331 840 104 834 1 227 006 144 729 87 891 8 28326Lawrence County 04--------------------------- 96 582 484 230 9 386 474 844 65 401 25 247 3 27327Lebanon County 17---------------------------- 116 419 537 462 111 959 425 503 48 538 134 665 81 14328Lehigh County 15----------------------------- 297 882 1 106 272 38 416 1 067 856 185 199 77 564 5 79629Luzerne County 11---------------------------- 327 731 1 673 800 48 870 1 624 930 208 855 146 129 16 54730
Lycoming County 05 10--------------------------- 120 941 471 383 23 535 447 848 64 100 34 584 4 20231McKean County 05---------------------------- 48 530 213 929 3 992 209 937 34 498 24 975 1 40532Mercer County 21----------------------------- 122 161 523 420 16 831 506 589 64 839 18 065 5 52733Mifflin County 09------------------------------ 47 012 177 772 7 543 170 229 30 849 7 276 2 78034Monroe County 10 11---------------------------- 112 112 468 331 131 442 336 889 38 504 112 039 100 73635Montgomery County 2
------------------------ 700 317 2 957 426 378 117 2 579 309 240 871 272 663 94 82636Montour County 11---------------------------- 18 218 81 039 1 469 79 570 21 988 1 738 11337Northampton County 15------------------------ 255 012 1 014 006 15 743 998 263 120 814 69 653 3 19338Northumberland County 06 11--------------------- 95 734 407 833 9 275 398 558 48 635 11 015 39739Perry County 09 17------------------------------ 43 118 123 601 2 972 120 629 12 773 4 202 –40
Philadelphia County 01 02 03------------------------ 1 524 249 12 203 581 1 839 380 10 364 201 2 927 970 1 982 084 781 39741Pike County 10------------------------------- 35 489 112 490 1 718 110 772 20 704 8 393 –42Potter County 05------------------------------ 17 061 65 182 1 327 63 855 11 745 2 356 –43Schuylkill County 06--------------------------- 153 354 789 803 11 541 778 262 66 569 37 464 2 02944Snyder County 09----------------------------- 37 699 139 984 1 977 138 007 47 023 3 956 6645Somerset County 12--------------------------- 79 031 333 435 7 749 325 686 55 638 10 802 67446Sullivan County 10---------------------------- 6 088 30 045 638 29 407 5 746 1 297 3347Susquehanna County 10----------------------- 41 530 144 061 3 237 140 824 22 228 6 009 51348Tioga County 05------------------------------ 41 895 179 581 15 295 164 286 43 082 7 670 93149Union County 05------------------------------ 37 298 604 169 4 776 599 393 32 444 79 258 1 78550
Venango County 05--------------------------- 59 212 274 723 3 637 271 086 73 496 8 113 62251Warren County 05----------------------------- 45 062 173 036 8 577 164 459 27 672 9 743 53452Washington County 20------------------------- 208 121 953 750 16 948 936 802 142 477 33 227 5 10753Wayne County 10----------------------------- 43 112 182 814 3 412 179 402 15 403 6 742 37454Westmoreland County 04 12 20---------------------- 376 451 1 597 669 28 149 1 569 520 214 973 55 048 5 81555Wyoming County 10--------------------------- 29 354 89 092 2 182 86 910 12 294 3 115 –56York County 19------------------------------- 357 812 1 344 046 323 567 1 020 479 126 730 153 292 115 44557State undistributed ------------------------- 3 865 544 – 3 865 544 320 497 75 –58
Rhode Island -------------------------------- 996 769 5 788 697 821 187 4 967 510 1 285 002 637 874 338 80259
Bristol County 01------------------------------ 48 993 179 453 8 159 171 294 30 419 8 435 2 17260Kent County 02------------------------------- 162 808 693 251 29 601 663 650 121 505 39 312 9 66961Newport County 01---------------------------- 84 710 928 451 635 888 292 563 52 240 296 026 283 38962Providence County 01 02------------------------- 584 712 3 104 996 95 508 3 009 488 919 936 254 067 24 99963Washington County 02------------------------- 115 546 470 578 52 031 418 547 113 883 40 035 18 57364State undistributed ------------------------- 411 967 – 411 967 47 019 – –65
South Carolina ------------------------------ 3 663 915 17 839 258 3 340 139 14 499 119 3 112 701 2 289 129 1 583 65366
Abbeville County 03--------------------------- 24 167 70 005 3 577 66 428 10 911 2 654 99367Aiken County 02 03------------------------------ 132 060 1 915 956 22 787 1 893 169 55 934 52 037 1 80868Allendale County 02--------------------------- 11 690 40 980 946 40 034 10 421 1 383 23869Anderson County 03--------------------------- 152 675 480 877 24 063 456 814 75 564 20 311 4 47970Bamberg County 06--------------------------- 16 701 66 944 2 259 64 685 14 132 2 341 86471Barnwell County 02---------------------------- 21 417 86 376 15 444 70 932 14 814 2 860 1 04572Beaufort County 02 06---------------------------- 97 119 575 821 279 811 296 010 54 678 216 955 207 20273Berkeley County 01 06---------------------------- 138 839 307 692 73 825 233 867 46 149 12 037 5 35074Calhoun County 02 06---------------------------- 13 385 33 816 1 921 31 895 5 044 1 712 63275Charleston County 01 06-------------------------- 293 550 2 646 479 1 281 313 1 365 166 426 084 826 113 696 93376
Cherokee County 05--------------------------- 46 730 131 706 3 890 127 816 20 353 4 771 1 08077Chester County 05---------------------------- 32 975 99 759 3 910 95 849 14 353 3 422 88378Chesterfield County 05------------------------- 39 250 129 072 4 543 124 529 25 526 5 501 1 88779Clarendon County 06-------------------------- 29 350 99 046 3 694 95 352 17 270 3 035 65080Colleton County 02 06---------------------------- 36 259 154 228 19 817 134 411 33 825 4 871 1 11081Darlington County 05 06-------------------------- 64 708 195 979 6 865 189 114 42 034 6 856 2 06582Dillon County 05------------------------------ 29 694 98 834 2 646 96 188 19 880 4 139 59083Dorchester County 01 06------------------------- 89 887 270 073 48 292 221 781 39 737 8 765 1 53084Edgefield County 03--------------------------- 19 212 123 152 4 001 119 151 8 392 5 046 2 75385Fairfield County 05---------------------------- 22 464 74 622 3 942 70 680 15 987 2 868 99686
See footnotes at end of table.
54 Consolidated Federal Funds Report

TIPS PS [APS_PPGB,F_SCOTT] 6/ 3/96 12:37:43 MCVX09 TLP:CFFR1.TLP;15 6/ 3/96 11:04:06 DATA:NONE PSC:TIPS_12353107_01.PSC PAGE: 54TSF:TIPS92~12353107.DAT;1 6/ 3/96 12:35:33 UTF:TIPS93~12353107.DAT;1 6/ 3/96 12:35:33 META:TIPS96~12353107.DAT;1 6/ 3/96 12:37:03
1995mCon.
Direct Federal expenditures or obligationsmCon. Other Federal assistance
Direct payments for individuals Procurement contract awards
TotalRetirement and
disability All other TotalDepartmentof Defense
Other Federalexpenditures or
obligations Direct loansGuaranteed loans
and insurance
632 237 394 991 237 246 104 624 95 123 1 918 2 805 174 839 119 850 13 906 5 944 170 – 55 80 2 720 2
206 766 136 848 69 918 42 458 40 155 393 2 093 18 581 3250 803 157 719 93 084 72 860 66 968 1 147 4 498 16 310 4814 395 548 839 265 556 149 489 43 001 5 191 6 271 142 508 5125 468 77 724 47 744 1 767 684 637 1 070 15 385 6260 124 166 416 93 708 15 591 3 513 649 2 197 27 000 7113 478 72 823 40 655 4 892 1 098 443 1 752 52 625 8188 084 121 397 66 687 14 449 13 039 1 494 1 168 23 143 9262 935 171 967 90 968 2 994 304 1 132 3 600 30 679 10
617 470 457 970 159 500 50 629 45 048 5 593 5 217 124 053 11840 278 561 676 278 602 86 552 25 218 5 324 5 420 263 761 12
1 763 369 1 089 927 673 442 144 343 117 038 3 505 10 834 175 010 13106 228 70 485 35 743 1 302 61 185 225 9 322 14777 044 497 297 279 747 31 090 19 798 2 977 4 235 65 607 15614 634 371 968 242 666 14 050 9 398 1 042 3 751 39 906 16
21 413 13 944 7 469 1 012 176 50 170 3 195 17350 279 269 257 81 022 172 603 159 528 1 723 4 438 22 358 18
35 487 25 951 9 536 2 920 1 987 419 2 488 2 531 19140 828 88 303 52 525 13 138 5 411 392 595 9 874 20
120 002 82 968 37 034 3 933 2 117 827 3 592 18 325 21279 891 173 951 105 940 4 268 1 256 1 111 1 677 16 203 22152 370 102 869 49 501 1 516 132 1 724 2 649 22 084 23
54 690 35 604 19 086 688 107 817 462 7 414 24831 507 535 578 295 929 88 961 65 944 2 131 1 167 82 804 25995 341 704 120 291 221 99 608 76 360 4 271 25 033 147 073 26382 044 238 075 143 969 10 233 2 888 1 305 2 195 21 635 27327 540 233 595 93 945 26 045 13 912 672 2 684 36 441 28784 134 473 023 311 111 56 155 19 496 3 220 2 569 92 513 29
1 271 328 833 215 438 113 44 708 13 748 2 779 4 335 1 175 239 30
351 143 231 757 119 386 19 450 12 338 2 107 2 600 120 531 31151 372 98 794 52 578 2 598 – 487 2 024 12 819 32429 255 280 115 149 140 9 962 6 859 1 299 1 691 26 329 33135 977 87 280 48 697 3 235 2 106 435 1 090 30 171 34287 220 201 961 85 259 29 937 23 836 631 3 830 36 874 35
2 045 943 1 364 425 681 518 393 415 234 126 4 533 4 834 278 500 3655 985 34 013 21 972 857 428 471 811 13 116 37
800 680 514 355 286 325 19 001 3 884 3 860 2 977 161 841 38340 078 225 245 114 833 6 432 2 900 1 673 2 376 118 464 39104 761 71 849 32 912 924 – 942 2 462 29 196 40
5 980 486 3 169 794 2 810 692 1 281 336 958 460 31 705 3 492 338 003 4182 250 60 429 21 821 965 – 177 5 137 23 650 4249 610 34 129 15 481 680 166 791 1 456 8 274 43
572 647 388 659 183 988 111 504 2 180 1 618 2 334 46 419 4487 656 58 541 29 115 793 26 556 1 305 17 994 45
259 623 165 859 93 764 6 295 4 334 1 077 1 939 45 019 4621 223 14 681 6 542 1 628 – 151 61 2 259 47
113 778 76 599 37 179 1 508 337 537 1 122 17 356 48114 359 79 628 34 731 13 674 11 301 796 2 694 15 867 49
87 089 59 939 27 150 404 989 509 389 1 537 32 999 50
190 889 122 818 68 071 1 722 237 504 1 235 21 385 51125 885 87 849 38 036 9 334 6 081 402 2 223 13 650 52764 876 475 756 289 120 11 580 2 060 1 589 19 075 48 565 53158 180 110 443 47 737 2 053 – 436 2 084 13 601 54
1 293 176 802 943 490 233 31 727 7 538 2 745 3 141 86 790 5572 127 47 349 24 778 1 187 408 369 2 024 19 106 56
835 284 598 832 236 452 225 449 188 500 3 290 12 815 168 937 572 909 554 17 956 2 891 598 – – 635 417 45 952 2 036 376 58
3 348 081 1 918 318 1 429 763 464 034 377 699 53 705 73 261 1 499 285 59
136 205 91 498 44 707 4 149 986 245 142 148 474 60518 726 331 320 187 406 12 854 6 934 854 1 724 198 814 61258 617 189 084 69 533 321 021 316 481 546 2 476 203 166 62
1 818 680 1 110 142 708 538 104 647 38 909 7 666 6 302 320 281 63294 020 194 237 99 783 21 364 14 389 1 278 4 049 487 590 64321 832 2 036 319 796 – – 43 116 58 567 140 959 65
9 511 896 6 639 346 2 872 550 2 779 417 998 486 146 115 158 247 12 100 564 66
55 563 42 969 12 594 583 197 294 ~1 856 1 024 67318 183 234 675 83 508 1 488 685 123 1 118 2 515 31 500 68
27 298 18 608 8 690 347 111 1 531 954 2 309 69371 241 274 954 96 287 12 433 3 822 1 328 5 075 11 479 70
45 122 27 592 17 530 3 915 – 1 434 1 719 3 028 7153 696 37 602 16 094 13 076 12 600 1 929 1 086 5 651 72
270 016 217 154 52 862 30 588 28 568 3 585 3 139 4 098 275 73236 952 193 395 43 557 11 891 10 048 663 997 92 789 74
25 244 17 739 7 505 259 38 1 557 1 112 5 931 75872 138 661 822 210 316 518 119 485 571 4 025 859 4 213 011 76
105 159 73 485 31 674 916 – 507 2 665 7 155 7780 639 57 284 23 355 961 487 386 1 170 3 799 7895 626 65 015 30 611 1 029 309 1 391 1 101 4 912 7976 384 54 000 22 384 456 – 1 901 5 606 16 851 80
100 072 73 700 26 372 14 398 13 799 1 062 1 540 146 791 81144 577 100 885 43 692 778 ~404 1 733 5 570 41 757 82
73 276 50 014 23 262 436 – 1 103 2 193 13 206 83218 831 180 651 38 180 2 031 230 709 2 524 71 097 84
38 971 27 707 11 264 69 889 – 854 1 198 4 496 8555 034 38 476 16 558 569 – 164 78 5 827 86
County Area 55
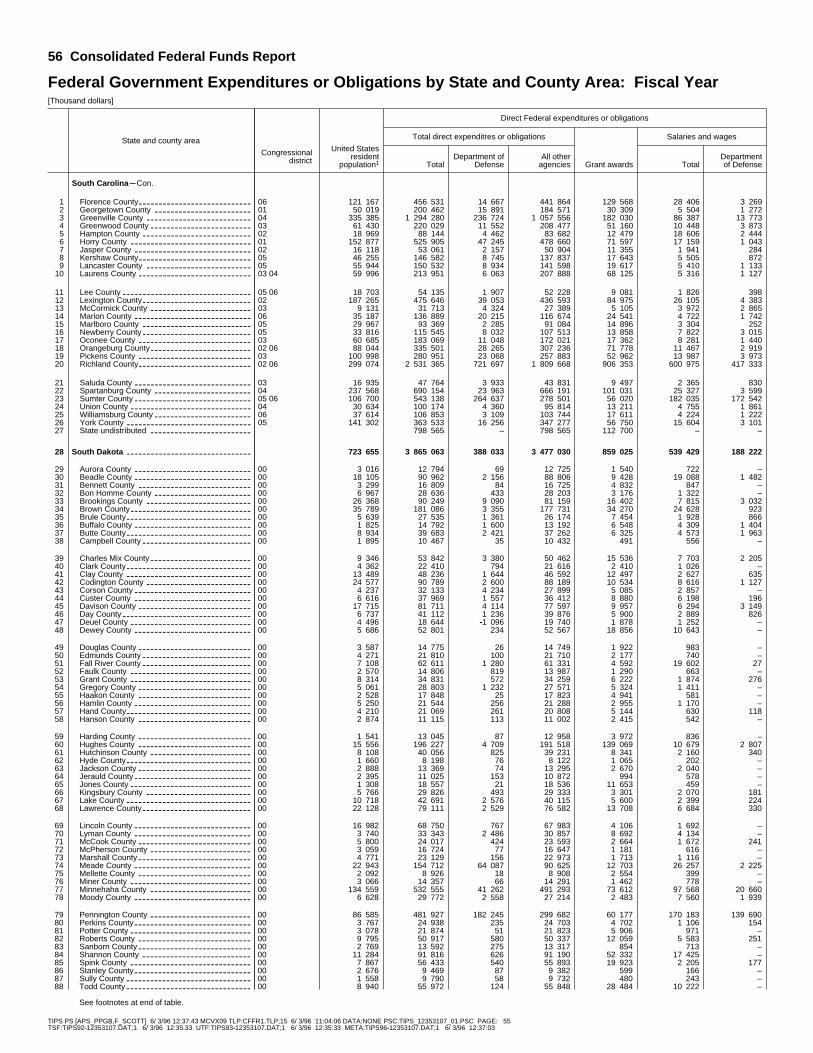
TIPS PS [APS_PPGB,F_SCOTT] 6/ 3/96 12:37:43 MCVX09 TLP:CFFR1.TLP;15 6/ 3/96 11:04:06 DATA:NONE PSC:TIPS_12353107_01.PSC PAGE: 55TSF:TIPS92~12353107.DAT;1 6/ 3/96 12:35:33 UTF:TIPS93~12353107.DAT;1 6/ 3/96 12:35:33 META:TIPS96~12353107.DAT;1 6/ 3/96 12:37:03
Federal Government Expenditures or Obligations by State and County Area: Fiscal Year[Thousand dollars]
State and county area
Congressional district
Direct Federal expenditures or obligations
Total direct expenditres or obligations Salaries and wages
United Statesresident
population1 TotalDepartment of
DefenseAll other
agencies Grant awards TotalDepartmentof Defense
South Carolina mCon.
Florence County 06---------------------------- 121 167 456 531 14 667 441 864 129 568 28 406 3 2691Georgetown County 01------------------------ 50 019 200 462 15 891 184 571 30 309 5 504 1 2722Greenville County 04-------------------------- 335 385 1 294 280 236 724 1 057 556 182 030 86 387 13 7733Greenwood County 03------------------------- 61 430 220 029 11 552 208 477 51 160 10 448 3 8734Hampton County 02--------------------------- 18 969 88 144 4 462 83 682 12 479 18 606 2 4445Horry County 01------------------------------ 152 877 525 905 47 245 478 660 71 597 17 159 1 0436Jasper County 02----------------------------- 16 118 53 061 2 157 50 904 11 355 1 941 2847Kershaw County 05---------------------------- 46 255 146 582 8 745 137 837 17 643 5 505 8728Lancaster County 05-------------------------- 55 944 150 532 8 934 141 598 19 617 5 410 1 1339Laurens County 03 04---------------------------- 59 996 213 951 6 063 207 888 68 125 5 316 1 12710
Lee County 05 06-------------------------------- 18 703 54 135 1 907 52 228 9 081 1 826 39811Lexington County 02--------------------------- 187 265 475 646 39 053 436 593 84 975 26 105 4 38312McCormick County 03------------------------- 9 131 31 713 4 324 27 389 5 105 3 972 2 86513Marion County 06----------------------------- 35 187 136 889 20 215 116 674 24 541 4 722 1 74214Marlboro County 05--------------------------- 29 967 93 369 2 285 91 084 14 896 3 304 25215Newberry County 05--------------------------- 33 816 115 545 8 032 107 513 13 858 7 822 3 01516Oconee County 03---------------------------- 60 685 183 069 11 048 172 021 17 362 8 281 1 44017Orangeburg County 02 06------------------------- 88 044 335 501 28 265 307 236 71 778 11 467 2 91918Pickens County 03---------------------------- 100 998 280 951 23 068 257 883 52 962 13 987 3 97319Richland County 02 06---------------------------- 299 074 2 531 365 721 697 1 809 668 906 353 600 975 417 33320
Saluda County 03----------------------------- 16 935 47 764 3 933 43 831 9 497 2 365 83021Spartanburg County 04------------------------ 237 568 690 154 23 963 666 191 101 031 25 327 3 59922Sumter County 05 06----------------------------- 106 700 543 138 264 637 278 501 56 020 182 035 172 54223Union County 04------------------------------ 30 634 100 174 4 360 95 814 13 211 4 755 1 86124Williamsburg County 06------------------------ 37 614 106 853 3 109 103 744 17 611 4 224 1 22225York County 05------------------------------- 141 302 363 533 16 256 347 277 56 750 15 604 3 10126State undistributed ------------------------- 798 565 – 798 565 112 700 – –27
South Dakota ------------------------------- 723 655 3 865 063 388 033 3 477 030 859 025 539 429 188 22228
Aurora County 00----------------------------- 3 016 12 794 69 12 725 1 540 722 –29Beadle County 00----------------------------- 18 105 90 962 2 156 88 806 9 428 19 088 1 48230Bennett County 00---------------------------- 3 299 16 809 84 16 725 4 832 847 –31Bon Homme County 00------------------------ 6 967 28 636 433 28 203 3 176 1 322 –32Brookings County 00-------------------------- 26 368 90 249 9 090 81 159 16 402 7 815 3 03233Brown County 00------------------------------ 35 789 181 086 3 355 177 731 34 270 24 628 92334Brule County 00------------------------------- 5 639 27 535 1 361 26 174 7 454 1 928 86635Buffalo County 00----------------------------- 1 825 14 792 1 600 13 192 6 548 4 309 1 40436Butte County 00------------------------------- 8 934 39 683 2 421 37 262 6 325 4 573 1 96337Campbell County 00--------------------------- 1 895 10 467 35 10 432 491 556 –38
Charles Mix County 00------------------------- 9 346 53 842 3 380 50 462 15 536 7 703 2 20539Clark County 00------------------------------- 4 362 22 410 794 21 616 2 410 1 026 –40Clay County 00------------------------------- 13 489 48 236 1 644 46 592 12 497 2 627 63541Codington County 00-------------------------- 24 577 90 789 2 600 88 189 10 534 8 616 1 12742Corson County 00----------------------------- 4 237 32 133 4 234 27 899 5 085 2 857 –43Custer County 00----------------------------- 6 616 37 969 1 557 36 412 8 880 6 198 19644Davison County 00---------------------------- 17 715 81 711 4 114 77 597 9 957 6 294 3 14945Day County 00-------------------------------- 6 737 41 112 1 236 39 876 5 900 2 889 82646Deuel County 00------------------------------ 4 496 18 644 ~1 096 19 740 1 878 1 252 –47Dewey County 00----------------------------- 5 686 52 801 234 52 567 18 856 10 643 –48
Douglas County 00---------------------------- 3 587 14 775 26 14 749 1 922 983 –49Edmunds County 00--------------------------- 4 271 21 810 100 21 710 2 177 740 –50Fall River County 00--------------------------- 7 108 62 611 1 280 61 331 4 592 19 602 2751Faulk County 00------------------------------ 2 570 14 806 819 13 987 1 290 663 –52Grant County 00------------------------------ 8 314 34 831 572 34 259 6 222 1 874 27653Gregory County 00---------------------------- 5 061 28 803 1 232 27 571 5 324 1 411 –54Haakon County 00---------------------------- 2 528 17 848 25 17 823 4 941 581 –55Hamlin County 00----------------------------- 5 250 21 544 256 21 288 2 955 1 170 –56Hand County 00------------------------------- 4 210 21 069 261 20 808 5 144 630 11857Hanson County 00---------------------------- 2 874 11 115 113 11 002 2 415 542 –58
Harding County 00---------------------------- 1 541 13 045 87 12 958 3 972 836 –59Hughes County 00---------------------------- 15 556 196 227 4 709 191 518 139 069 10 679 2 80760Hutchinson County 00------------------------- 8 108 40 056 825 39 231 8 341 2 160 34061Hyde County 00------------------------------- 1 660 8 198 76 8 122 1 065 202 –62Jackson County 00---------------------------- 2 888 13 369 74 13 295 2 670 2 040 –63Jerauld County 00----------------------------- 2 395 11 025 153 10 872 994 578 –64Jones County 00------------------------------ 1 308 18 557 21 18 536 11 653 459 –65Kingsbury County 00-------------------------- 5 766 29 826 493 29 333 3 301 2 070 18166Lake County 00------------------------------- 10 718 42 691 2 576 40 115 5 600 2 399 22467Lawrence County 00--------------------------- 22 128 79 111 2 529 76 582 13 708 6 684 33068
Lincoln County 00----------------------------- 16 982 68 750 767 67 983 4 106 1 692 –69Lyman County 00----------------------------- 3 740 33 343 2 486 30 857 8 692 4 134 –70McCook County 00---------------------------- 5 800 24 017 424 23 593 2 664 1 672 24171McPherson County 00------------------------- 3 059 16 724 77 16 647 1 181 616 –72Marshall County 00---------------------------- 4 771 23 129 156 22 973 1 713 1 116 –73Meade County 00----------------------------- 22 943 154 712 64 087 90 625 12 703 26 257 2 22574Mellette County 00---------------------------- 2 092 8 926 18 8 908 2 554 399 –75Miner County 00------------------------------ 3 066 14 357 66 14 291 1 462 778 –76Minnehaha County 00------------------------- 134 559 532 555 41 262 491 293 73 612 97 568 20 66077Moody County 00----------------------------- 6 628 29 772 2 558 27 214 2 483 7 560 1 93978
Pennington County 00------------------------- 86 585 481 927 182 245 299 682 60 177 170 183 139 69079Perkins County 00----------------------------- 3 767 24 938 235 24 703 4 702 1 106 15480Potter County 00------------------------------ 3 078 21 874 51 21 823 5 906 971 –81Roberts County 00---------------------------- 9 795 50 917 580 50 337 12 059 5 583 25182Sanborn County 00---------------------------- 2 769 13 592 275 13 317 854 713 –83Shannon County 00--------------------------- 11 284 91 816 626 91 190 52 332 17 425 –84Spink County 00------------------------------ 7 867 56 433 540 55 893 19 923 2 205 17785Stanley County 00----------------------------- 2 676 9 469 87 9 382 599 166 –86Sully County 00------------------------------- 1 558 9 790 58 9 732 480 243 –87Todd County 00------------------------------- 8 940 55 972 124 55 848 28 484 10 222 –88
See footnotes at end of table.
56 Consolidated Federal Funds Report

TIPS PS [APS_PPGB,F_SCOTT] 6/ 3/96 12:37:43 MCVX09 TLP:CFFR1.TLP;15 6/ 3/96 11:04:06 DATA:NONE PSC:TIPS_12353107_01.PSC PAGE: 56TSF:TIPS92~12353107.DAT;1 6/ 3/96 12:35:33 UTF:TIPS93~12353107.DAT;1 6/ 3/96 12:35:33 META:TIPS96~12353107.DAT;1 6/ 3/96 12:37:03
1995mCon.
Direct Federal expenditures or obligationsmCon. Other Federal assistance
Direct payments for individuals Procurement contract awards
TotalRetirement and
disability All other TotalDepartmentof Defense
Other Federalexpenditures or
obligations Direct loansGuaranteed loans
and insurance
290 486 200 165 90 321 5 830 1 084 2 242 11 506 40 014 1159 010 121 104 37 906 5 165 4 539 473 3 602 587 745 2777 842 569 251 208 591 244 547 189 438 3 473 1 645 77 573 3155 816 119 333 36 483 2 281 480 325 1 479 3 892 4
53 682 37 451 16 231 2 189 415 1 188 1 962 4 768 5413 985 319 499 94 486 21 505 8 417 1 659 2 103 1 781 161 6
39 570 27 575 11 995 ~58 ~295 253 1 470 10 809 7121 855 93 983 27 872 833 54 746 5 126 14 211 8123 837 91 279 32 558 1 197 183 470 1 275 5 644 9139 119 106 314 32 805 748 – 642 247 23 540 10
40 072 27 357 12 715 1 048 521 2 106 2 882 15 230 11356 133 276 708 79 425 7 310 1 919 1 124 3 688 123 997 12
22 027 17 336 4 691 522 167 88 120 1 166 1393 408 65 498 27 910 13 423 12 855 795 6 490 16 785 1473 030 51 292 21 738 696 32 1 443 1 354 12 060 1592 126 69 502 22 624 1 126 145 614 1 227 12 598 16
154 196 120 675 33 521 2 505 670 724 2 264 3 889 17229 773 164 245 65 528 18 467 15 833 4 018 5 337 18 922 18208 137 156 236 51 901 5 357 2 876 508 1 874 17 915 19802 715 593 035 209 680 217 184 159 711 4 139 379 190 062 20
32 724 25 398 7 326 2 344 1 988 835 2 759 1 766 21555 598 407 608 147 990 6 715 808 1 483 3 619 32 007 22260 726 200 488 60 238 42 232 39 927 2 125 2 113 44 826 23
81 437 59 858 21 579 590 – 180 1 300 2 183 2482 755 57 732 25 023 604 56 1 658 2 160 23 323 25
286 755 208 458 78 297 3 700 1 164 724 1 418 32 081 26601 059 4 237 596 822 – – 84 806 49 602 221 510 27
1 937 744 1 277 882 659 862 261 835 129 090 267 030 356 021 1 053 259 28
8 195 5 346 2 849 123 – 2 215 2 959 7 194 2954 482 38 326 16 156 1 826 47 6 137 11 116 16 408 307 186 4 596 2 590 997 – 2 947 1 343 4 668 31
21 231 13 635 7 596 327 71 2 581 7 523 11 388 3253 812 33 912 19 900 6 517 4 269 5 704 14 377 34 350 33
108 829 66 236 42 593 3 229 764 10 129 12 090 71 264 3414 833 9 401 5 432 1 144 253 2 175 4 271 7 346 352 854 2 092 762 235 184 847 600 2 891 36
22 513 16 889 5 624 2 546 ~427 3 727 2 648 3 135 376 070 4 627 1 443 95 – 3 255 2 392 4 547 38
25 243 17 254 7 989 942 625 4 418 8 271 11 412 3912 801 9 072 3 729 781 601 5 393 3 537 10 576 4029 707 16 513 13 194 704 73 2 702 11 742 18 059 4159 828 41 646 18 182 8 829 – 2 980 9 188 32 345 4210 988 7 827 3 161 8 260 4 218 4 944 1 048 2 166 4320 996 16 861 4 135 947 – 948 879 3 229 4452 149 33 450 18 699 11 375 – 1 936 7 140 12 517 4523 949 15 648 8 301 314 – 8 060 7 339 11 966 4612 859 8 590 4 269 ~1 087 ~1 361 3 742 7 734 16 572 4710 255 6 777 3 478 8 186 97 4 861 991 2 004 48
10 065 6 663 3 402 190 – 1 615 6 019 7 450 4912 708 8 554 4 154 114 – 6 072 1 730 9 376 5032 117 26 874 5 243 4 731 245 1 570 735 4 841 519 094 6 206 2 888 872 758 2 887 2 555 8 115 52
23 828 15 556 8 272 307 – 2 601 8 073 16 571 5317 305 11 697 5 608 3 044 929 1 720 1 250 4 917 545 671 4 210 1 461 59 – 6 595 1 704 6 423 55
14 646 9 953 4 693 237 – 2 535 7 584 18 088 5610 477 7 212 3 265 128 – 4 690 3 430 7 488 576 292 4 058 2 234 114 – 1 752 6 669 6 822 58
3 062 2 270 792 365 – 4 810 281 2 968 5938 871 28 794 10 077 4 108 704 3 499 2 967 11 760 6025 684 16 844 8 840 531 209 3 341 10 766 20 209 615 055 3 383 1 672 28 – 1 846 1 824 2 352 625 405 4 046 1 359 340 – 2 914 1 107 3 067 637 387 5 347 2 040 104 – 1 962 933 2 452 643 382 2 377 1 005 169 – 2 894 1 600 2 273 65
20 311 14 407 5 904 380 – 3 764 9 201 23 466 6629 370 20 025 9 345 2 425 1 671 2 897 11 933 25 910 6756 847 40 705 16 142 1 480 – 393 445 13 808 68
58 805 19 810 38 995 313 – 3 834 14 359 31 758 699 000 5 793 3 207 4 397 2 393 7 120 4 103 8 189 70
16 455 11 388 5 067 243 – 2 983 10 959 15 092 719 198 5 604 3 594 104 – 5 625 907 3 306 72
14 439 9 669 4 770 226 – 5 634 5 937 10 230 7349 697 40 021 9 676 59 234 58 158 6 820 4 256 12 774 744 538 2 792 1 746 90 – 1 346 682 1 069 759 750 6 535 3 215 152 – 2 215 4 307 9 928 76
302 914 211 137 91 777 51 929 12 315 6 531 19 056 97 259 7716 031 11 045 4 986 417 225 3 282 11 371 27 940 78
224 332 169 327 55 005 23 250 8 680 3 985 6 117 71 364 7912 279 7 979 4 300 152 – 6 701 2 119 3 962 8010 285 6 681 3 604 123 – 4 589 4 765 9 120 8124 653 17 108 7 545 3 195 – 5 427 7 879 15 440 829 234 5 947 3 287 142 – 2 649 2 747 4 050 83
19 966 11 977 7 989 728 521 1 366 783 1 536 8425 467 16 240 9 227 399 – 8 439 9 317 23 501 854 996 3 685 1 311 19 – 3 690 2 983 8 445 863 577 2 336 1 241 155 – 5 336 5 622 8 787 87
15 965 9 310 6 655 762 – 539 859 2 131 88
County Area 57

TIPS PS [APS_PPGB,F_SCOTT] 6/ 3/96 12:37:43 MCVX09 TLP:CFFR1.TLP;15 6/ 3/96 11:04:06 DATA:NONE PSC:TIPS_12353107_01.PSC PAGE: 57TSF:TIPS92~12353107.DAT;1 6/ 3/96 12:35:33 UTF:TIPS93~12353107.DAT;1 6/ 3/96 12:35:33 META:TIPS96~12353107.DAT;1 6/ 3/96 12:37:03
Federal Government Expenditures or Obligations by State and County Area: Fiscal Year[Thousand dollars]
State and county area
Congressional district
Direct Federal expenditures or obligations
Total direct expenditres or obligations Salaries and wages
United Statesresident
population1 TotalDepartment of
DefenseAll other
agencies Grant awards TotalDepartmentof Defense
South Dakota mCon.
Tripp County 00------------------------------- 6 882 29 706 710 28 996 3 699 1 784 1561Turner County 00----------------------------- 8 534 32 528 330 32 198 3 669 1 611 –2Union County 00------------------------------ 10 998 83 900 32 178 51 722 10 867 1 935 –3Walworth County 00--------------------------- 5 819 25 494 607 24 887 3 118 1 630 2684Yankton County 00---------------------------- 20 352 74 654 1 958 72 696 12 660 9 392 3505Ziebach County 00---------------------------- 2 172 16 768 – 16 768 9 010 273 –6State undistributed ------------------------- 185 022 – 185 022 109 963 – –7
Tennessee ---------------------------------- 5 175 233 26 610 889 2 197 512 24 413 377 4 638 329 2 691 464 544 2638
Anderson County 03--------------------------- 71 217 2 236 755 18 240 2 218 515 48 951 82 141 8939Bedford County 04---------------------------- 32 484 104 316 3 976 100 340 17 469 4 303 49910Benton County 08----------------------------- 15 512 67 478 2 524 64 954 9 271 2 478 79911Bledsoe County 03---------------------------- 9 940 34 012 543 33 469 7 688 678 –12Blount County 02------------------------------ 94 567 334 117 18 959 315 158 47 326 14 769 5 52913Bradley County 02 03----------------------------- 77 571 227 369 5 420 221 949 37 872 11 358 3014Campbell County 04--------------------------- 36 445 186 930 5 032 181 898 41 985 4 583 37915Cannon County 06---------------------------- 11 171 38 550 1 025 37 525 6 134 1 458 –16Carroll County 08----------------------------- 28 213 192 432 55 445 136 987 40 020 6 174 2 78617Carter County 01------------------------------ 52 824 173 625 5 527 168 098 30 424 5 579 92718
Cheatham County 07-------------------------- 31 103 75 663 4 682 70 981 18 045 3 168 95319Chester County 07---------------------------- 13 492 53 474 2 490 50 984 16 512 2 845 1 66220Claiborne County 04--------------------------- 28 115 132 815 1 583 131 232 30 802 3 619 22321Clay County 06------------------------------- 7 115 30 221 1 673 28 548 7 473 1 798 78322Cocke County 01------------------------------ 30 802 113 687 2 745 110 942 23 758 3 222 46023Coffee County 04----------------------------- 42 853 481 610 310 837 170 773 24 915 20 467 17 80824Crockett County 08---------------------------- 13 441 54 137 2 546 51 591 9 099 2 201 23825Cumberland County 04------------------------ 39 290 165 147 5 313 159 834 30 409 3 868 –26Davidson County 05 06--------------------------- 527 195 3 219 833 167 783 3 052 050 1 114 549 377 812 81 94127Decatur County 07---------------------------- 10 619 48 610 3 554 45 056 9 890 1 664 15228
De Kalb County 06---------------------------- 14 939 57 499 2 155 55 344 8 429 1 897 20529Dickson County 07---------------------------- 37 919 125 143 5 292 119 851 20 532 4 574 96430Dyer County 08------------------------------- 35 569 140 765 5 657 135 108 25 782 6 019 1 24531Fayette County 07----------------------------- 26 500 85 328 2 148 83 180 27 300 2 977 53132Fentress County 04--------------------------- 15 386 64 503 1 911 62 592 12 451 1 991 54833Franklin County 04---------------------------- 36 000 131 642 8 647 122 995 18 112 7 249 89134Gibson County 08----------------------------- 47 166 203 494 8 105 195 389 38 067 9 773 4 37135Giles County 04------------------------------- 27 660 93 465 3 941 89 524 9 033 3 855 65236Grainger County 04--------------------------- 18 178 62 416 1 052 61 364 11 011 2 037 –37Greene County 01----------------------------- 57 281 263 102 11 127 251 975 63 760 8 266 96038
Grundy County 03----------------------------- 13 653 55 778 1 441 54 337 11 342 1 524 50439Hamblen County 04--------------------------- 52 554 185 909 6 310 179 599 37 450 8 236 72640Hamilton County 03--------------------------- 292 769 1 879 556 53 857 1 825 699 211 118 415 675 12 67741Hancock County 01---------------------------- 6 846 28 217 361 27 856 7 180 531 –42Hardeman County 07-------------------------- 24 136 128 366 22 974 105 392 30 530 3 664 1 16943Hardin County 04----------------------------- 24 337 95 495 2 551 92 944 17 823 4 823 53744Hawkins County 01---------------------------- 47 083 277 634 103 745 173 889 28 218 14 667 23445Haywood County 08--------------------------- 19 373 72 788 1 126 71 662 17 844 2 252 21646Henderson County 07-------------------------- 22 805 91 965 1 989 89 976 24 290 2 554 25647Henry County 08------------------------------ 29 015 128 432 5 044 123 388 20 667 6 185 63848
Hickman County 07---------------------------- 18 374 63 500 4 369 59 131 9 401 4 383 1 87449Houston County 08---------------------------- 7 478 32 916 1 905 31 011 6 882 1 346 54350Humphreys County 08------------------------- 16 268 116 730 11 690 105 040 9 926 19 565 32151Jackson County 06---------------------------- 9 131 37 246 432 36 814 10 798 1 023 –52Jefferson County 01--------------------------- 36 946 143 642 17 003 126 639 17 811 5 911 49953Johnson County 01---------------------------- 15 940 59 708 1 658 58 050 11 314 2 181 39554Knox County 01 02 04------------------------------- 357 450 1 559 549 73 587 1 485 962 285 989 214 559 21 74855Lake County 08------------------------------- 7 379 40 222 8 231 31 991 9 019 2 900 2 08856Lauderdale County 08------------------------- 23 977 99 101 2 875 96 226 21 933 3 028 54657Lawrence County 04--------------------------- 37 855 141 216 4 111 137 105 24 347 5 405 95658
Lewis County 07------------------------------ 10 072 36 344 1 281 35 063 7 694 1 490 49659Lincoln County 04----------------------------- 28 632 112 523 4 115 108 408 26 732 3 009 21960Loudon County 02----------------------------- 35 079 145 208 18 490 126 718 17 096 7 298 1 18061McMinn County 02---------------------------- 44 476 170 768 16 215 154 553 26 198 7 332 1 54662McNairy County 07---------------------------- 23 183 117 319 2 792 114 527 36 211 3 831 36763Macon County 06----------------------------- 16 681 53 443 991 52 452 11 577 1 775 31464Madison County 08---------------------------- 82 558 329 117 9 848 319 269 75 871 26 334 3 21165Marion County 03----------------------------- 26 116 114 698 2 093 112 605 17 537 3 914 49666Marshall County 06---------------------------- 24 185 75 921 3 065 72 856 11 461 3 117 44967Maury County 07------------------------------ 63 889 219 179 16 792 202 387 34 926 11 885 2 43568
Meigs County 03------------------------------ 8 942 34 004 1 295 32 709 6 982 1 476 41469Monroe County 02---------------------------- 32 408 123 749 4 840 118 909 25 124 4 026 56470Montgomery County 07------------------------ 119 171 369 475 87 700 281 775 55 270 14 990 5 37571Moore County 04------------------------------ 5 113 10 959 241 10 718 2 407 304 –72Morgan County 03---------------------------- 17 922 59 324 888 58 436 11 842 1 544 –73Obion County 08------------------------------ 32 107 119 489 3 251 116 238 20 293 4 728 59074Overton County 06---------------------------- 18 242 74 203 1 324 72 879 20 897 2 119 31075Perry County 07------------------------------ 6 893 26 449 942 25 507 4 549 1 027 21276Pickett County 04----------------------------- 4 532 16 620 211 16 409 3 327 410 –77Polk County 03------------------------------- 14 029 63 414 1 140 62 274 9 905 4 086 678
Putnam County 06---------------------------- 55 752 202 681 10 634 192 047 31 411 11 688 1 84979Rhea County 04------------------------------- 26 282 301 920 2 723 299 197 20 593 79 373 40280Roane County 03----------------------------- 48 508 266 578 6 341 260 237 30 224 27 052 1 12681Robertson County 05 07-------------------------- 46 212 135 708 4 287 131 421 22 924 4 114 35282Rutherford County 06-------------------------- 140 701 411 574 46 138 365 436 58 971 82 589 23 69883Scott County 04------------------------------- 19 330 140 858 11 342 129 516 24 166 4 086 64084Sequatchie County 03------------------------- 9 370 62 140 1 285 60 855 5 887 1 399 59185Sevier County 01------------------------------ 58 185 173 627 6 926 166 701 23 779 12 123 98286Shelby County 07 08 09----------------------------- 857 616 4 374 833 805 574 3 569 259 783 147 836 215 303 90487Smith County 06------------------------------ 14 743 58 941 8 054 50 887 8 558 4 865 2 60688
See footnotes at end of table.
58 Consolidated Federal Funds Report

TIPS PS [APS_PPGB,F_SCOTT] 6/ 3/96 12:37:43 MCVX09 TLP:CFFR1.TLP;15 6/ 3/96 11:04:06 DATA:NONE PSC:TIPS_12353107_01.PSC PAGE: 58TSF:TIPS92~12353107.DAT;1 6/ 3/96 12:35:33 UTF:TIPS93~12353107.DAT;1 6/ 3/96 12:35:33 META:TIPS96~12353107.DAT;1 6/ 3/96 12:37:03
1995mCon.
Direct Federal expenditures or obligationsmCon. Other Federal assistance
Direct payments for individuals Procurement contract awards
TotalRetirement and
disability All other TotalDepartmentof Defense
Other Federalexpenditures or
obligations Direct loansGuaranteed loans
and insurance
18 550 12 168 6 382 644 365 5 028 2 789 8 442 123 389 16 522 6 867 303 – 3 556 11 002 22 838 229 864 20 783 9 081 36 846 31 513 4 389 13 983 32 896 316 881 10 920 5 961 287 60 3 577 2 873 6 517 448 638 32 714 15 924 1 673 930 2 290 6 967 22 476 53 492 2 103 1 389 38 – 3 955 581 1 457 6
58 990 408 58 582 – – 16 069 703 110 359 7
14 571 538 9 308 441 5 263 097 4 471 481 1 071 392 238 076 347 879 3 081 575 8
236 441 173 170 63 271 1 869 083 7 323 141 608 15 836 979 661 57 029 22 632 2 125 96 758 2 951 7 454 1054 630 37 444 17 186 510 – 589 368 3 236 1125 280 14 123 11 157 133 – 233 836 787 12
268 746 184 514 84 232 2 839 1 084 438 1 113 38 170 13176 113 121 153 54 960 1 632 – 395 1 621 28 823 14132 837 94 107 38 730 7 379 1 725 147 2 501 3 577 15
30 383 20 110 10 273 246 – 329 1 417 2 703 1693 427 62 096 31 331 50 908 50 084 1 904 7 392 4 681 17
136 303 94 444 41 859 1 070 87 249 13 12 329 18
52 541 35 580 16 961 1 727 1 282 182 1 142 29 160 1932 931 21 175 11 756 227 – 959 946 1 809 2082 835 56 193 26 642 15 379 – 181 4 401 2 013 2119 921 11 219 8 702 908 697 121 699 333 2285 461 59 023 26 438 1 042 183 204 225 4 526 23
132 261 93 463 38 798 303 308 283 127 659 4 029 11 311 2439 910 25 577 14 333 2 118 1 281 809 21 215 9 169 25
129 553 95 947 33 606 876 – 441 417 2 710 261 401 988 888 246 513 742 313 921 22 461 11 563 2 811 460 465 27
33 794 21 258 12 536 2 828 2 525 435 323 527 28
45 552 28 712 16 840 1 283 833 338 310 1 938 2997 995 64 858 33 137 1 683 56 358 2 343 14 359 30
104 525 66 178 38 347 2 278 1 549 2 160 5 198 20 229 3151 666 31 651 20 015 512 50 2 873 8 797 12 909 3249 216 30 527 18 689 581 – 264 1 135 980 33
103 249 71 361 31 888 2 508 978 523 2 181 4 822 34150 709 99 885 50 824 1 375 295 3 571 17 479 21 847 35
78 332 50 280 28 052 1 461 565 785 3 848 6 695 3648 764 34 059 14 705 494 109 110 333 1 188 37
156 108 111 749 44 359 34 280 6 299 689 2 331 6 590 38
42 261 27 340 14 921 331 – 320 758 1 156 39136 806 94 706 42 100 3 144 2 008 274 8 883 9 121 40883 543 597 284 286 259 365 401 15 704 3 818 1 338 172 892 41
20 367 11 561 8 806 95 – 43 471 336 4271 864 45 298 26 566 20 930 20 055 1 379 3 984 4 751 4368 302 46 086 22 216 3 208 57 1 339 1 004 4 868 44
120 265 82 473 37 792 114 220 100 522 264 1 973 3 439 4550 581 30 220 20 361 405 – 1 706 20 462 19 275 4662 449 42 879 19 570 802 – 1 871 1 621 2 960 4798 645 70 925 27 720 1 088 186 1 847 2 626 6 409 48
48 934 32 934 16 000 529 131 254 1 163 2 996 4924 300 17 420 6 880 315 – 73 190 1 973 5049 050 32 537 16 513 37 907 9 782 282 1 055 4 443 5125 106 15 635 9 471 208 – 110 562 25 755 52
105 795 75 980 29 815 13 872 13 005 252 2 177 6 222 5345 700 31 421 14 279 396 – 117 483 1 685 54
975 868 667 139 308 729 80 243 15 244 2 889 21 048 154 429 5526 504 18 009 8 495 1 114 944 683 2 139 4 975 5670 804 44 989 25 815 1 030 425 2 306 7 265 15 012 57
107 569 73 152 34 417 2 337 – 1 557 3 891 4 794 58
26 292 16 994 9 298 726 – 142 294 426 5980 425 56 277 24 148 1 384 70 973 1 739 7 005 60
106 992 78 272 28 720 13 595 12 808 228 1 323 6 588 61122 753 84 943 37 810 14 069 11 497 415 2 784 4 611 62
74 884 49 984 24 900 587 – 1 805 1 411 5 885 6339 302 24 127 15 175 561 250 229 2 319 2 187 64
218 960 144 581 74 379 6 035 154 1 915 9 029 37 374 6574 651 50 239 24 412 18 418 40 177 1 740 8 411 6659 143 38 072 21 071 1 967 1 118 232 1 639 6 874 67
154 715 102 922 51 793 17 110 10 212 542 1 346 19 567 68
25 243 18 240 7 003 163 – 139 842 741 6989 128 61 373 27 755 5 190 2 010 282 3 528 1 926 70
272 817 209 224 63 593 25 356 20 990 1 042 1 266 62 088 718 160 6 199 1 961 57 – 31 196 179 72
45 196 30 590 14 606 582 – 161 431 595 7389 750 63 686 26 064 1 261 597 3 456 4 408 12 544 7450 610 32 713 17 897 353 – 225 883 531 7520 526 12 736 7 790 142 – 206 113 329 7612 729 7 679 5 050 66 – 88 196 11 7747 878 32 366 15 512 1 296 – 249 950 6 303 78
154 071 109 420 44 651 5 064 2 631 446 1 128 7 495 7978 287 54 065 24 222 123 232 – 434 3 302 8 072 80
161 259 109 904 51 355 47 655 – 388 4 266 8 736 81103 751 68 138 35 613 3 742 – 1 177 7 608 34 332 82256 470 173 513 82 957 12 605 5 713 939 12 241 221 325 83
62 722 40 831 21 891 49 775 9 433 108 4 221 388 8420 675 13 531 7 144 34 060 286 119 595 949 85
135 720 100 110 35 610 1 622 142 383 3 237 55 331 862 169 159 1 418 171 750 988 573 186 400 395 13 126 5 675 647 901 87
40 172 26 334 13 838 5 178 4 621 167 783 11 148 88
County Area 59

TIPS PS [APS_PPGB,F_SCOTT] 6/ 3/96 12:37:43 MCVX09 TLP:CFFR1.TLP;15 6/ 3/96 11:04:06 DATA:NONE PSC:TIPS_12353107_01.PSC PAGE: 59TSF:TIPS92~12353107.DAT;1 6/ 3/96 12:35:33 UTF:TIPS93~12353107.DAT;1 6/ 3/96 12:35:33 META:TIPS96~12353107.DAT;1 6/ 3/96 12:37:03
Federal Government Expenditures or Obligations by State and County Area: Fiscal Year[Thousand dollars]
State and county area
Congressional district
Direct Federal expenditures or obligations
Total direct expenditres or obligations Salaries and wages
United Statesresident
population1 TotalDepartment of
DefenseAll other
agencies Grant awards TotalDepartmentof Defense
Tennessee mCon.
Stewart County 08---------------------------- 10 326 152 658 4 200 148 458 6 294 22 958 –1Sullivan County 01---------------------------- 147 657 571 886 28 615 543 271 85 905 25 389 5 9742Sumner County 06---------------------------- 113 562 346 693 14 209 332 484 47 600 22 310 2 0923Tipton County 08------------------------------ 42 051 140 971 19 642 121 329 25 781 4 856 6114Trousdale County 06-------------------------- 6 318 24 785 386 24 399 4 473 2 987 –5Unicoi County 01------------------------------ 16 743 120 387 1 975 118 412 13 146 3 166 2436Union County 04------------------------------ 14 608 39 405 710 38 695 8 376 979 327Van Buren County 03-------------------------- 5 094 14 064 200 13 864 3 640 248 –8Warren County 04----------------------------- 34 733 131 456 5 019 126 437 22 151 5 066 2749Washington County 01------------------------- 97 412 448 813 19 634 429 179 54 156 75 478 3 87910
Wayne County 04----------------------------- 15 525 46 860 1 130 45 730 9 468 1 691 19411Weakley County 08---------------------------- 32 344 121 554 5 063 116 491 25 882 7 765 2 07312White County 04------------------------------ 21 039 81 220 2 315 78 905 15 888 2 283 35613Williamson County 06-------------------------- 97 892 180 561 9 528 171 033 11 793 12 211 2514Wilson County 06----------------------------- 75 064 202 194 8 877 193 317 39 424 8 548 1 82015State undistributed ------------------------- 1 150 209 – 1 150 209 207 838 4 094 –16
Texas--------------------------------------- 18 378 280 83 865 061 17 220 978 66 644 083 14 483 849 10 593 647 5 032 00317
Anderson County 05--------------------------- 49 049 184 548 7 485 177 063 25 231 6 653 54718Andrews County 19---------------------------- 14 452 39 348 317 39 031 6 657 958 –19Angelina County 02---------------------------- 73 925 276 195 10 241 265 954 38 957 18 110 17420Aransas County 14---------------------------- 20 785 83 959 6 960 76 999 15 621 1 258 –21Archer County 13----------------------------- 7 941 39 851 7 070 32 781 2 263 2 448 1 66422Armstrong County 13-------------------------- 2 076 10 976 101 10 875 1 307 315 –23Atascosa County 28--------------------------- 32 876 102 060 4 104 97 956 25 832 2 411 –24Austin County 08 14------------------------------ 21 780 521 982 447 423 74 559 14 794 4 881 1 86325Bailey County 19------------------------------ 6 746 30 629 190 30 439 4 278 1 158 –26Bandera County 21---------------------------- 12 523 53 284 10 931 42 353 2 966 5 381 4 65927
Bastrop County 14---------------------------- 42 587 140 577 10 638 129 939 18 935 19 081 1 57628Baylor County 13------------------------------ 4 262 24 262 320 23 942 3 230 811 –29Bee County 15-------------------------------- 23 845 104 739 14 359 90 380 21 279 2 471 19630Bell County 11-------------------------------- 215 481 2 036 674 1 418 387 618 287 104 025 1 184 439 1 101 35431Bexar County 20 21 23 28------------------------------ 1 280 079 7 625 870 3 147 925 4 477 945 948 131 2 238 138 1 891 94432Blanco County 14----------------------------- 7 062 42 806 2 174 40 632 1 295 2 618 –33Borden County 17----------------------------- 767 3 645 10 3 635 103 90 –34Bosque County 11----------------------------- 16 167 63 636 3 046 60 590 5 744 2 688 68135Bowie County 01------------------------------ 83 577 570 579 174 286 396 293 58 125 156 543 123 57236Brazoria County 14 22---------------------------- 211 527 514 040 24 053 489 987 82 506 20 593 91037
Brazos County 05 08----------------------------- 130 390 425 540 41 438 384 102 144 872 44 756 7 62138Brewster County 23--------------------------- 8 762 34 893 1 150 33 743 3 677 6 169 –39Briscoe County 13----------------------------- 1 809 13 944 131 13 813 690 436 –40Brooks County 15----------------------------- 8 266 35 803 348 35 455 9 061 3 221 –41Brown County 17------------------------------ 35 272 139 998 8 836 131 162 19 339 5 213 1 05242Burleson County 14--------------------------- 14 678 53 120 1 981 51 139 6 337 2 015 34243Burnet County 21----------------------------- 25 376 114 282 10 821 103 461 10 197 2 446 –44Caldwell County 14---------------------------- 28 062 85 466 4 971 80 495 13 694 2 375 –45Calhoun County 14---------------------------- 20 403 64 533 4 590 59 943 10 918 2 597 –46Callahan County 17--------------------------- 12 278 48 320 3 739 44 581 9 167 1 251 –47
Cameron County 27--------------------------- 299 591 1 022 316 29 089 993 227 349 376 64 914 4 09048Camp County 01------------------------------ 10 457 42 526 1 119 41 407 4 439 1 313 –49Carson County 13----------------------------- 6 570 41 902 13 479 28 423 3 879 1 929 98150Cass County 01------------------------------- 30 393 128 799 4 116 124 683 21 626 3 489 20751Castro County 13----------------------------- 8 594 33 948 749 33 199 5 560 841 –52Chambers County 09-------------------------- 21 324 58 553 4 084 54 469 5 709 3 327 1 67053Cherokee County 02--------------------------- 40 811 156 018 3 221 152 797 26 227 3 656 –54Childress County 13--------------------------- 6 375 35 937 597 35 340 8 857 1 362 –55Clay County 13------------------------------- 9 976 30 073 1 294 28 779 3 083 1 150 –56Cochran County 19---------------------------- 4 180 19 789 92 19 697 2 372 550 –57
Coke County 17------------------------------- 3 497 16 533 404 16 129 1 324 574 –58Coleman County 17--------------------------- 9 663 52 600 1 668 50 932 7 814 2 152 38859Collin County 03 04 26 30------------------------------ 326 160 589 696 180 956 408 740 48 010 29 598 5 14960Collingsworth County 13----------------------- 3 397 19 241 408 18 833 2 571 1 028 26361Colorado County 14--------------------------- 18 591 89 530 1 312 88 218 12 562 2 631 14562Comal County 21 28------------------------------ 60 830 285 483 82 551 202 932 31 634 15 394 10 73563Comanche County 17-------------------------- 13 450 55 718 1 559 54 159 8 907 2 155 25964Concho County 17---------------------------- 3 056 15 504 252 15 252 1 714 611 –65Cooke County 04 13------------------------------ 31 269 108 576 3 860 104 716 15 092 3 783 16666Coryell County 11----------------------------- 71 689 162 294 49 056 113 238 19 837 14 074 10 18267
Cottle County 13------------------------------ 2 065 12 486 91 12 395 1 243 553 –68Crane County 23------------------------------ 4 621 10 511 46 10 465 1 679 271 –69Crockett County 23---------------------------- 4 228 14 065 212 13 853 1 978 245 –70Crosby County 13----------------------------- 7 277 32 757 119 32 638 6 226 855 –71Culberson County 23-------------------------- 3 261 10 069 201 9 868 1 756 1 721 –72Dallam County 19----------------------------- 5 944 38 614 954 37 660 6 647 1 061 –73Dallas County 2
------------------------------ 1 942 289 8 059 421 1 894 087 6 165 334 1 124 510 1 326 417 159 18174Dawson County 17---------------------------- 14 143 64 341 386 63 955 12 427 2 308 –75Deaf Smith County 19------------------------- 19 251 68 125 263 67 862 11 779 1 966 –76Delta County 01------------------------------- 4 808 25 540 2 897 22 643 3 629 989 –77
Denton County 04 13 26----------------------------- 320 130 912 260 484 638 427 622 57 480 44 007 4 15378De Witt County 15----------------------------- 18 438 73 851 2 091 71 760 14 663 2 422 42579Dickens County 13---------------------------- 2 437 16 389 133 16 256 1 895 660 –80Dimmit County 23----------------------------- 10 706 41 089 268 40 821 14 199 2 590 –81Donley County 13----------------------------- 3 703 18 349 313 18 036 1 691 633 –82Duval County 28------------------------------ 12 827 53 841 539 53 302 14 166 2 601 –83Eastland County 17---------------------------- 17 866 87 376 2 406 84 970 13 617 2 830 –84Ector County 19 23------------------------------- 123 130 361 035 5 282 355 753 84 378 9 967 38685Edwards County 23---------------------------- 2 934 10 261 72 10 189 930 716 –86Ellis County 06 24-------------------------------- 91 851 274 879 7 057 267 822 40 834 11 555 60287
See footnotes at end of table.
60 Consolidated Federal Funds Report

TIPS PS [APS_PPGB,F_SCOTT] 6/ 3/96 12:37:43 MCVX09 TLP:CFFR1.TLP;15 6/ 3/96 11:04:06 DATA:NONE PSC:TIPS_12353107_01.PSC PAGE: 60TSF:TIPS92~12353107.DAT;1 6/ 3/96 12:35:33 UTF:TIPS93~12353107.DAT;1 6/ 3/96 12:35:33 META:TIPS96~12353107.DAT;1 6/ 3/96 12:37:03
1995mCon.
Direct Federal expenditures or obligationsmCon. Other Federal assistance
Direct payments for individuals Procurement contract awards
TotalRetirement and
disability All other TotalDepartmentof Defense
Other Federalexpenditures or
obligations Direct loansGuaranteed loans
and insurance
37 702 28 738 8 964 85 598 – 106 2 498 2 618 1444 763 317 048 127 715 15 301 10 359 527 2 728 37 784 2235 152 161 720 73 432 40 903 2 383 728 4 633 71 065 3101 657 71 312 30 345 7 315 6 576 1 363 8 763 32 143 4
17 115 9 445 7 670 175 80 35 419 1 030 561 043 43 556 17 487 42 956 – 76 760 3 732 629 803 19 977 9 826 189 – 58 2 330 1 097 710 071 6 564 3 507 47 – 58 381 17 8
100 436 63 143 37 293 3 092 2 127 711 4 765 6 575 9288 647 202 765 85 882 29 647 4 724 885 1 197 16 446 10
34 796 24 157 10 639 499 56 407 966 1 119 1182 474 56 231 26 243 1 486 467 3 946 2 630 8 597 1262 185 41 706 20 479 596 185 267 258 1 892 13
150 845 107 929 42 916 4 987 684 724 1 781 102 088 14152 494 100 889 51 605 1 362 32 366 496 85 107 15794 069 4 906 789 163 – – 144 207 51 702 351 744 16
43 331 629 26 701 985 16 629 644 13 769 174 9 296 614 1 686 762 1 031 050 33 908 377 17
134 517 85 889 48 628 17 762 1 812 385 360 3 365 1829 673 19 818 9 855 142 – 1 918 213 4 315 19
210 751 132 882 77 869 7 077 4 074 1 299 1 142 17 247 2065 925 45 098 20 827 1 037 810 117 188 315 901 2133 767 27 324 6 443 133 – 1 241 123 2 337 225 693 4 174 1 519 131 – 3 530 270 4 781 23
72 793 47 663 25 130 515 13 509 802 9 848 2455 317 37 274 18 043 445 301 444 518 1 688 1 517 11 947 2518 056 10 762 7 294 197 27 6 939 3 173 28 951 2644 311 35 372 8 939 312 – 315 – 11 415 27
101 311 74 117 27 194 847 29 403 2 500 17 063 2817 829 11 837 5 992 123 – 2 269 109 6 725 2971 092 48 621 22 471 8 041 7 578 1 857 1 050 15 482 30
518 198 395 432 122 766 227 927 210 405 2 084 3 894 138 263 313 676 488 2 662 465 1 014 023 752 043 611 540 11 070 425 590 772 32
38 388 30 318 8 070 174 – 331 – 3 361 33797 505 292 19 – 2 636 333 3 381 34
54 043 40 278 13 765 505 72 657 1 229 2 153 35291 412 205 646 85 766 62 380 42 203 2 118 1 809 24 748 36366 641 248 010 118 631 15 500 10 370 28 801 10 796 2 002 326 37
209 377 124 216 85 161 25 400 11 611 1 135 1 517 80 841 3824 215 16 042 8 173 410 146 421 – 13 732 399 601 4 106 5 495 76 – 3 142 887 6 260 40
22 658 12 791 9 867 133 – 731 196 7 541 41109 933 77 085 32 848 4 464 3 558 1 049 1 535 29 516 42
43 864 30 890 12 974 516 203 389 403 5 927 43100 573 66 952 33 621 582 137 484 596 31 075 44
68 084 46 457 21 627 666 134 647 1 573 10 146 4543 843 29 498 14 345 4 174 3 102 3 002 2 440 190 041 4635 713 25 033 10 680 1 197 726 991 2 386 3 263 47
586 289 346 100 240 189 18 957 6 663 2 780 5 147 926 186 4836 156 24 134 12 022 249 – 369 308 2 011 4917 395 11 199 6 196 12 140 12 026 6 560 1 960 8 246 50
102 616 69 877 32 739 780 90 287 527 11 245 5117 030 10 353 6 677 133 – 10 385 7 718 28 768 5235 888 23 266 12 622 2 018 910 11 611 5 984 72 401 53
120 790 72 003 48 787 930 82 4 414 1 588 6 824 5421 917 14 484 7 433 412 – 3 389 575 4 956 5524 045 17 382 6 663 305 – 1 490 277 4 757 5611 319 6 008 5 311 85 – 5 463 1 333 17 941 57
12 938 8 317 4 621 104 – 1 593 110 1 451 5839 790 25 070 14 720 452 102 2 392 136 1 509 59
348 446 253 222 95 224 161 505 140 712 2 137 2 845 239 476 6011 567 7 385 4 182 146 – 3 930 1 001 9 511 6159 719 38 290 21 429 451 – 14 169 6 483 14 191 62
236 502 196 121 40 381 1 637 348 316 – 73 163 6343 198 28 974 14 224 631 154 828 3 597 6 276 648 795 5 747 3 048 104 – 4 278 453 5 195 65
87 710 58 170 29 540 1 012 349 980 3 593 18 730 66122 580 100 978 21 602 4 588 3 654 1 214 640 30 490 67
7 854 5 029 2 825 66 – 2 771 991 4 509 688 369 5 941 2 428 57 – 135 – 150 698 417 5 759 2 658 38 – 3 387 45 652 70
21 877 11 301 10 576 142 – 3 657 2 297 27 055 714 976 3 304 1 672 943 58 673 216 3 171 72
20 204 13 132 7 072 922 465 9 780 6 659 18 587 733 689 011 2 358 275 1 330 736 1 888 133 1 587 469 31 351 12 168 1 134 680 74
38 638 22 743 15 895 284 – 10 684 4 512 39 287 7537 787 23 339 14 448 771 – 15 822 720 28 134 7617 754 10 860 6 894 2 469 2 280 699 720 834 77
346 274 236 275 109 999 462 185 455 907 2 315 7 900 214 323 7856 023 35 188 20 835 369 – 374 418 7 514 7911 169 6 285 4 884 95 – 2 569 758 2 219 8023 792 13 420 10 372 133 – 375 113 1 631 8114 101 9 264 4 837 76 – 1 848 894 1 970 8235 360 19 787 15 573 152 – 1 562 286 2 991 8369 670 45 952 23 718 568 – 691 99 055 3 639 84
261 121 165 979 95 142 5 088 114 481 3 48 902 856 148 3 410 2 738 47 – 2 421 – – 86
189 829 127 418 62 411 30 188 274 2 474 7 827 44 767 87
County Area 61

TIPS PS [APS_PPGB,F_SCOTT] 6/ 3/96 12:37:43 MCVX09 TLP:CFFR1.TLP;15 6/ 3/96 11:04:06 DATA:NONE PSC:TIPS_12353107_01.PSC PAGE: 61TSF:TIPS92~12353107.DAT;1 6/ 3/96 12:35:33 UTF:TIPS93~12353107.DAT;1 6/ 3/96 12:35:33 META:TIPS96~12353107.DAT;1 6/ 3/96 12:37:03
Federal Government Expenditures or Obligations by State and County Area: Fiscal Year[Thousand dollars]
State and county area
Congressional district
Direct Federal expenditures or obligations
Total direct expenditres or obligations Salaries and wages
United Statesresident
population1 TotalDepartment of
DefenseAll other
agencies Grant awards TotalDepartmentof Defense
TexasmCon.
El Paso County 16 23---------------------------- 664 812 2 878 466 899 404 1 979 062 480 679 695 698 498 6441Erath County 17------------------------------ 29 576 103 083 3 915 99 168 19 065 4 043 2582Falls County 11------------------------------- 17 849 81 686 1 886 79 800 12 631 13 088 2193Fannin County 04----------------------------- 25 083 131 623 3 238 128 385 15 411 18 504 884Fayette County 14----------------------------- 20 887 80 047 1 377 78 670 7 599 3 318 –5Fisher County 17------------------------------ 4 442 24 293 393 23 900 1 873 1 100 –6Floyd County 13------------------------------ 8 224 37 423 412 37 011 6 162 1 359 –7Foard County 13------------------------------ 1 637 10 768 144 10 624 1 801 315 428Fort Bend County 22 25-------------------------- 280 029 389 834 22 150 367 684 60 003 20 092 1 4719Franklin County 01---------------------------- 8 654 28 446 1 414 27 032 3 606 686 –10
Freestone County 05-------------------------- 15 762 54 262 1 151 53 111 7 927 1 701 –11Frio County 28-------------------------------- 15 357 48 659 644 48 015 16 793 1 078 –12Gaines County 19----------------------------- 14 472 42 842 196 42 646 7 699 983 –13Galveston County 09-------------------------- 234 689 852 335 62 463 789 872 145 673 52 331 13 34714Garza County 13------------------------------ 4 810 21 583 119 21 464 3 296 745 –15Gillespie County 21---------------------------- 18 832 82 380 6 365 76 015 8 126 3 589 57916Glasscock County 21-------------------------- 1 442 4 513 45 4 468 294 162 –17Goliad County 15------------------------------ 6 080 21 116 797 20 319 3 159 725 –18Gonzales County 14--------------------------- 17 334 74 600 9 153 65 447 10 864 6 889 3 72219Gray County 13------------------------------- 23 420 94 864 1 804 93 060 8 649 2 952 16520
Grayson County 04---------------------------- 97 268 371 768 24 456 347 312 44 432 14 076 2 10221Gregg County 01 04------------------------------ 109 785 394 128 12 954 381 174 53 771 21 615 1 03422Grimes County 02----------------------------- 20 634 63 469 1 075 62 394 11 136 1 898 –23Guadalupe County 21 28-------------------------- 70 585 230 970 41 875 189 095 27 547 8 866 20324Hale County 13------------------------------- 35 677 128 220 1 561 126 659 23 241 5 232 21125Hall County 13-------------------------------- 3 750 22 771 134 22 637 4 305 953 –26Hamilton County 11--------------------------- 7 588 34 375 1 072 33 303 2 511 1 339 –27Hansford County 19--------------------------- 5 403 24 590 73 24 517 1 267 741 –28Hardeman County 13-------------------------- 4 909 26 696 348 26 348 2 750 774 –29Hardin County 02----------------------------- 45 628 148 142 2 873 145 269 18 865 3 296 –30
Harris County 2------------------------------ 3 045 193 11 711 039 712 140 10 998 899 2 174 444 1 242 498 81 32731
Harrison County 01---------------------------- 58 076 201 007 19 479 181 528 39 266 7 813 2 30632Hartley County 19----------------------------- 3 738 10 572 7 10 565 1 480 310 –33Haskell County 17----------------------------- 6 530 36 175 440 35 735 2 923 1 432 –34Hays County 14------------------------------- 74 222 211 773 20 129 191 644 30 512 7 397 1 35935Hemphill County 13---------------------------- 3 541 14 927 99 14 828 5 581 473 –36Henderson County 05-------------------------- 62 120 194 817 6 339 188 478 30 340 4 088 21437Hidalgo County 15----------------------------- 461 026 1 462 484 30 321 1 432 163 481 936 108 604 3 50638Hill County 11--------------------------------- 28 150 118 514 3 756 114 758 17 131 3 931 25839Hockley County 19---------------------------- 24 468 81 134 924 80 210 18 005 2 157 –40
Hood County 17------------------------------- 31 537 121 767 9 634 112 133 9 154 3 877 –41Hopkins County 01---------------------------- 29 368 100 858 2 371 98 487 13 939 4 219 8942Houston County 02---------------------------- 21 669 92 406 2 295 90 111 14 484 3 501 20943Howard County 17---------------------------- 32 126 169 873 10 688 159 185 20 442 32 020 19844Hudspeth County 23--------------------------- 2 912 12 395 198 12 197 1 312 3 107 –45Hunt County 01 04------------------------------- 65 951 621 813 252 878 368 935 33 349 18 510 7 50746Hutchinson County 13------------------------- 24 868 86 163 1 134 85 029 8 736 3 014 –47Irion County 21------------------------------- 1 671 5 897 88 5 809 394 222 –48Jack County 17------------------------------- 6 888 25 166 447 24 719 3 471 922 –49Jackson County 14---------------------------- 13 579 62 372 508 61 864 7 423 1 283 –50
Jasper County 02----------------------------- 32 321 143 535 16 152 127 383 24 936 3 841 1 35751Jeff Davis County 23-------------------------- 2 115 7 364 313 7 051 556 830 –52Jefferson County 09--------------------------- 242 853 1 139 350 23 791 1 115 559 148 959 96 644 4 24453Jim Hogg County 28--------------------------- 5 097 22 285 207 22 078 5 478 2 997 –54Jim Wells County 15 28--------------------------- 39 390 144 324 4 869 139 455 37 143 5 538 1 54955Johnson County 06 12---------------------------- 104 280 309 802 14 924 294 878 53 430 10 881 1 37656Jones County 17------------------------------ 16 010 72 569 5 187 67 382 8 193 4 427 2 31657Karnes County 15----------------------------- 12 363 55 389 1 227 54 162 15 049 1 571 –58Kaufman County 04 05--------------------------- 58 270 233 544 7 520 226 024 28 737 7 872 79459Kendall County 21----------------------------- 18 486 74 402 12 337 62 065 4 410 1 891 –60
Kenedy County 27----------------------------- 427 854 21 833 83 136 –61Kent County 17------------------------------- 959 5 587 366 5 221 438 405 15962Kerr County 21------------------------------- 39 553 220 353 16 356 203 997 14 177 25 001 14263Kimble County 21----------------------------- 4 137 17 751 582 17 169 934 837 –64King County 13------------------------------- 345 1 760 11 1 749 246 181 –65Kinney County 23----------------------------- 3 243 19 340 1 455 17 885 3 966 1 989 –66Kleberg County 15 27---------------------------- 30 802 185 820 77 044 108 776 26 752 52 529 47 10267Knox County 13------------------------------- 4 630 23 376 384 22 992 2 497 1 506 22068Lamar County 01------------------------------ 44 953 188 388 7 571 180 817 28 083 8 183 2 09969Lamb County 13------------------------------ 14 817 64 294 466 63 828 9 406 1 775 –70
Lampasas County 11-------------------------- 15 269 71 749 11 729 60 020 9 642 1 672 –71La Salle County 28---------------------------- 5 380 25 811 307 25 504 10 254 1 478 –72Lavaca County 14----------------------------- 18 593 86 972 1 568 85 404 8 067 2 523 2173Lee County 14-------------------------------- 13 553 35 296 650 34 646 3 852 1 267 –74Leon County 05------------------------------- 13 570 62 910 1 196 61 714 7 025 1 910 –75Liberty County 02----------------------------- 58 033 233 885 4 181 229 704 49 629 5 226 –76Limestone County 05-------------------------- 20 913 81 581 1 969 79 612 12 806 2 578 14677Lipscomb County 13--------------------------- 2 951 13 782 92 13 690 666 989 –78Live Oak County 15--------------------------- 10 172 81 701 38 237 43 464 6 416 15 936 –79Llano County 21------------------------------ 12 495 73 668 5 551 68 117 4 181 1 623 –80
Loving County 23----------------------------- 137 506 – 506 1 135 –81Lubbock County 13 19---------------------------- 230 527 876 699 117 190 759 509 150 152 109 267 51 60282Lynn County 13------------------------------- 6 625 29 905 197 29 708 3 979 1 080 –83McCulloch County 11 21-------------------------- 8 481 39 446 1 216 38 230 5 008 1 764 29184McLennan County 11-------------------------- 197 172 904 695 176 796 727 899 99 825 103 049 6 33185McMullen County 28--------------------------- 806 2 150 43 2 107 343 231 –86Madison County 05---------------------------- 11 352 36 165 978 35 187 7 372 980 –87Marion County 01----------------------------- 10 068 46 194 2 759 43 435 11 056 1 949 1 27288Martin County 17------------------------------ 4 937 29 501 137 29 364 12 721 702 –89Mason County 21----------------------------- 3 504 16 330 504 15 826 1 912 585 –90
See footnotes at end of table.
62 Consolidated Federal Funds Report

TIPS PS [APS_PPGB,F_SCOTT] 6/ 3/96 12:37:43 MCVX09 TLP:CFFR1.TLP;15 6/ 3/96 11:04:06 DATA:NONE PSC:TIPS_12353107_01.PSC PAGE: 62TSF:TIPS92~12353107.DAT;1 6/ 3/96 12:35:33 UTF:TIPS93~12353107.DAT;1 6/ 3/96 12:35:33 META:TIPS96~12353107.DAT;1 6/ 3/96 12:37:03
1995mCon.
Direct Federal expenditures or obligationsmCon. Other Federal assistance
Direct payments for individuals Procurement contract awards
TotalRetirement and
disability All other TotalDepartmentof Defense
Other Federalexpenditures or
obligations Direct loansGuaranteed loans
and insurance
1 423 224 966 644 456 580 276 810 230 577 2 055 28 487 421 887 176 998 50 635 26 363 1 977 – 999 730 9 624 253 728 37 479 16 249 900 99 1 339 3 586 5 919 392 147 60 623 31 524 2 515 549 3 046 992 10 293 467 925 45 527 22 398 653 – 552 219 24 250 514 092 9 519 4 573 180 – 7 049 1 543 11 716 622 233 13 013 9 220 497 247 7 171 4 383 37 524 76 133 4 181 1 952 72 34 2 447 104 2 917 8
252 046 177 662 74 384 8 458 4 025 49 234 136 253 620 281 923 888 14 695 9 193 142 – 124 324 3 005 10
44 120 30 518 13 602 349 – 165 86 1 482 1129 725 16 857 12 868 187 – 876 379 13 658 1224 059 14 741 9 318 161 – 9 940 4 306 65 523 13
558 720 352 908 205 812 86 530 27 248 9 081 1 699 4 184 416 1414 237 8 134 6 103 123 – 3 182 1 095 6 289 1568 110 51 583 16 527 816 427 1 739 1 001 5 539 161 709 947 762 28 – 2 319 952 12 076 17
16 745 10 906 5 839 161 – 326 157 1 211 1855 918 38 770 17 148 445 – 484 62 15 038 1978 281 49 188 29 093 1 048 584 3 933 1 041 7 270 20
306 421 207 692 98 729 4 653 2 053 2 187 910 39 549 21312 813 212 294 100 519 5 120 735 810 30 36 221 22
49 851 32 040 17 811 403 – 181 316 4 165 23191 593 148 138 43 455 2 020 386 944 942 106 356 24
87 503 53 648 33 855 1 384 150 10 860 8 941 73 181 2513 681 9 276 4 405 162 – 3 672 1 021 12 624 2629 459 19 463 9 996 320 – 747 62 8 823 2713 231 8 702 4 529 123 – 9 227 795 18 478 2818 698 12 101 6 597 142 – 4 332 308 3 853 29
114 549 72 758 41 791 629 – 10 803 5 544 94 298 30
5 051 072 3 101 833 1 949 239 3 151 206 494 793 91 819 74 360 10 602 490 31141 178 96 642 44 536 12 358 10 948 391 329 9 065 32
2 649 1 885 764 47 – 6 087 3 196 11 588 3324 099 16 004 8 095 227 – 7 493 1 183 18 926 34
135 019 93 018 42 001 38 332 2 461 513 4 268 44 094 357 522 4 817 2 705 66 – 1 284 68 476 36
159 122 106 850 52 272 806 – 461 1 140 7 509 37836 699 461 417 375 282 27 913 10 066 7 330 14 744 304 118 38
93 412 64 377 29 035 1 174 446 2 866 1 203 6 009 3954 371 31 877 22 494 421 – 6 180 4 263 43 924 40
107 501 83 651 23 850 968 172 268 286 16 889 4181 081 54 111 26 970 826 – 792 2 072 14 838 4273 071 48 078 24 993 586 36 763 2 962 5 363 43
101 152 69 574 31 578 10 615 6 673 5 644 701 22 277 447 358 6 016 1 342 140 – 477 769 4 789 45
191 039 124 750 66 289 377 544 235 059 1 371 2 254 13 618 4667 370 48 262 19 108 3 828 71 3 215 99 7 493 473 875 2 665 1 210 38 – 1 368 – 264 48
20 388 13 212 7 176 180 – 206 551 329 4939 926 24 142 15 784 218 – 13 521 14 844 45 682 50
101 096 63 520 37 576 13 466 12 154 197 807 4 395 515 471 4 182 1 289 47 – 461 – 533 52
766 010 445 431 320 579 103 787 8 052 23 950 16 458 1 384 070 5313 077 6 969 6 108 66 – 666 153 749 5498 017 58 181 39 836 1 831 988 1 794 1 737 33 000 55
242 004 173 780 68 224 2 344 507 1 144 4 285 51 292 5651 358 32 759 18 599 360 – 8 231 1 349 16 557 5737 920 24 179 13 741 305 – 544 423 2 913 58
194 577 132 554 62 023 1 382 – 977 3 622 21 011 5966 783 53 988 12 795 656 127 662 237 14 744 60
532 338 194 95 – 6 – 112 613 166 2 218 948 38 – 1 541 260 1 369 62
177 692 134 631 43 061 2 616 891 867 605 25 963 6314 501 9 305 5 196 114 – 1 366 300 1 356 64
325 290 35 38 – 970 272 534 6511 608 9 027 2 581 28 – 1 748 1 192 100 6694 524 60 860 33 664 10 568 9 737 1 448 567 57 157 6715 401 10 189 5 212 181 – 3 791 308 5 584 68
142 437 89 998 52 439 7 204 231 2 480 2 603 8 506 6943 108 26 519 16 589 313 – 9 691 2 270 49 676 70
58 528 43 030 15 498 1 032 719 875 736 9 844 7112 479 7 303 5 176 142 – 1 458 31 1 567 7272 529 46 678 25 851 2 047 – 1 806 1 903 8 441 7329 659 20 700 8 959 246 – 271 93 1 764 7453 395 36 027 17 368 379 – 200 835 1 545 75
159 522 94 763 64 759 2 696 1 412 16 813 15 055 93 981 7663 827 43 692 20 135 1 115 309 1 255 1 085 4 695 778 632 5 578 3 054 142 – 3 353 ~17 1 751 78
20 391 14 276 6 115 37 762 37 466 1 196 882 2 690 7967 103 49 669 17 434 484 33 276 1 151 38 115 80
295 199 96 28 – 45 – – 81555 087 340 810 214 277 56 761 36 071 5 432 111 608 230 414 82
17 707 10 521 7 186 170 – 6 967 2 508 35 390 8330 283 19 699 10 584 272 – 2 120 567 9 351 84
547 188 390 198 156 990 151 680 140 274 2 952 4 258 66 175 851 464 1 124 340 38 – 75 – 260 86
27 493 17 965 9 528 189 – 132 210 1 072 8732 737 22 671 10 066 396 235 56 35 1 492 889 742 6 525 3 217 118 – 6 218 944 23 634 89
12 977 8 428 4 549 104 – 752 1 195 884 90
County Area 63

TIPS PS [APS_PPGB,F_SCOTT] 6/ 3/96 12:37:43 MCVX09 TLP:CFFR1.TLP;15 6/ 3/96 11:04:06 DATA:NONE PSC:TIPS_12353107_01.PSC PAGE: 63TSF:TIPS92~12353107.DAT;1 6/ 3/96 12:35:33 UTF:TIPS93~12353107.DAT;1 6/ 3/96 12:35:33 META:TIPS96~12353107.DAT;1 6/ 3/96 12:37:03
Federal Government Expenditures or Obligations by State and County Area: Fiscal Year[Thousand dollars]
State and county area
Congressional district
Direct Federal expenditures or obligations
Total direct expenditres or obligations Salaries and wages
United Statesresident
population1 TotalDepartment of
DefenseAll other
agencies Grant awards TotalDepartmentof Defense
TexasmCon.
Matagorda County 14-------------------------- 38 710 143 729 9 942 133 787 33 500 4 166 6191Maverick County 23--------------------------- 44 228 147 191 1 967 145 224 48 942 12 430 5882Medina County 23----------------------------- 30 446 109 310 10 127 99 183 24 212 3 862 1 4733Menard County 21---------------------------- 2 333 12 190 302 11 888 1 275 406 –4Midland County 19 21 23---------------------------- 114 166 308 095 9 969 298 126 59 799 25 445 1 6195Milam County 11------------------------------ 23 473 89 553 4 020 85 533 11 847 2 613 –6Mills County 11------------------------------- 4 686 20 806 518 20 288 2 272 791 –7Mitchell County 17----------------------------- 7 729 34 957 436 34 521 3 880 1 027 –8Montague County 13-------------------------- 17 743 80 145 2 610 77 535 9 528 2 914 –9Montgomery County 02 08------------------------ 222 161 586 555 22 443 564 112 87 761 23 719 4 81410
Moore County 19------------------------------ 18 890 48 629 558 48 071 4 288 5 708 –11Morris County 01------------------------------ 13 216 59 432 1 501 57 931 11 111 1 510 3412Motley County 13----------------------------- 1 378 8 780 147 8 633 637 384 –13Nacogdoches County 01 02----------------------- 56 185 195 518 5 804 189 714 36 360 8 065 38614Navarro County 24---------------------------- 40 315 171 287 4 594 166 693 39 420 5 070 58915Newton County 02----------------------------- 13 894 47 038 1 031 46 007 9 436 1 128 –16Nolan County 17------------------------------ 16 439 68 183 1 221 66 962 10 835 2 174 –17Nueces County 27----------------------------- 310 887 1 512 045 477 836 1 034 209 220 224 277 862 200 74018Ochiltree County 19--------------------------- 8 690 30 236 202 30 034 3 133 971 –19Oldham County 19---------------------------- 2 233 14 228 189 14 039 5 708 367 –20
Orange County 02----------------------------- 84 254 275 848 9 509 266 339 45 334 6 652 96521Palo Pinto County 17-------------------------- 25 099 104 673 8 956 95 717 16 888 3 895 1 20022Panola County 01----------------------------- 22 551 73 175 1 519 71 656 9 019 2 722 1323Parker County 06 12----------------------------- 71 305 187 099 21 144 165 955 22 428 6 190 57024Parmer County 19----------------------------- 10 245 40 270 362 39 908 4 234 2 053 –25Pecos County 23------------------------------ 14 433 40 428 343 40 085 10 856 1 780 –26Polk County 02------------------------------- 37 280 199 388 10 901 188 487 26 982 3 199 –27Potter County 13------------------------------ 102 928 864 178 23 727 840 451 79 799 82 664 3 55328Presidio County 23---------------------------- 7 425 30 458 274 30 184 7 214 6 426 –29Rains County 04------------------------------ 7 389 24 151 534 23 617 3 151 722 –30
Randall County 19----------------------------- 94 110 94 809 2 446 92 363 14 771 2 448 2431Reagan County 23---------------------------- 4 524 9 302 73 9 229 1 820 358 –32Real County 21------------------------------- 2 442 12 617 741 11 876 1 383 361 –33Red River County 01-------------------------- 13 968 68 135 1 481 66 654 12 136 2 092 –34Reeves County 23----------------------------- 15 395 45 142 513 44 629 11 671 2 221 –35Refugio County 14---------------------------- 7 814 30 991 570 30 421 3 759 1 375 –36Roberts County 13---------------------------- 996 8 001 71 7 930 4 070 238 –37Robertson County 05-------------------------- 15 431 62 673 1 220 61 453 11 189 2 090 –38Rockwall County 04--------------------------- 31 399 59 333 4 381 54 952 8 829 2 781 –39Runnels County 17---------------------------- 11 157 49 883 1 387 48 496 5 288 2 184 29740
Rusk County 01------------------------------- 44 228 135 548 2 877 132 671 19 792 4 289 18441Sabine County 02----------------------------- 10 131 58 018 2 034 55 984 4 968 1 589 –42San Augustine County 02---------------------- 7 885 36 109 607 35 502 5 086 1 283 –43San Jacinto County 02------------------------- 18 640 62 124 1 246 60 878 12 259 1 139 –44San Patricio County 15------------------------- 64 799 299 677 104 276 195 401 43 915 62 351 58 49045San Saba County 11--------------------------- 5 842 27 158 610 26 548 6 378 1 020 –46Schleicher County 21-------------------------- 2 983 14 794 3 389 11 405 1 634 2 772 2 46547Scurry County 17----------------------------- 18 202 61 332 527 60 805 9 612 1 854 –48Shackelford County 17------------------------- 3 325 13 360 503 12 857 1 525 483 –49Shelby County 02----------------------------- 22 321 101 089 2 176 98 913 17 340 3 682 –50
Sherman County 19--------------------------- 2 868 16 130 154 15 976 1 319 294 –51Smith County 04 05------------------------------ 158 998 586 264 52 953 533 311 75 278 35 564 1 59752Somervell County 17-------------------------- 5 712 15 154 449 14 705 2 137 768 –53Starr County 28------------------------------- 49 532 146 091 749 145 342 58 910 8 671 11554Stephens County 17--------------------------- 8 895 33 076 831 32 245 4 439 1 037 –55Sterling County 21----------------------------- 1 536 3 977 64 3 913 399 214 –56Stonewall County 17--------------------------- 1 960 11 085 110 10 975 714 366 –57Sutton County 23----------------------------- 4 299 11 887 106 11 781 1 403 434 –58Swisher County 13---------------------------- 8 293 39 286 214 39 072 5 007 1 249 –59Tarrant County 2
----------------------------- 1 257 196 7 443 719 3 900 309 3 543 410 621 165 660 244 102 57460
Taylor County 17------------------------------ 121 903 714 669 309 888 404 781 69 193 193 150 155 79161Terrell County 23------------------------------ 1 309 5 917 96 5 821 431 527 –62Terry County 19------------------------------- 12 869 52 454 692 51 762 8 445 1 485 16463Throckmorton County 17----------------------- 1 815 8 760 92 8 668 1 143 445 –64Titus County 01------------------------------- 24 469 87 936 2 080 85 856 13 320 4 642 16865Tom Green County 17 21------------------------- 101 244 487 932 154 512 333 420 59 036 108 159 86 60666Travis County 10 14------------------------------ 646 443 4 699 131 611 535 4 087 596 2 673 137 428 980 75 97467Trinity County 02------------------------------ 12 236 58 515 1 557 56 958 8 701 1 947 –68Tyler County 02------------------------------- 18 336 76 608 2 099 74 509 13 292 2 011 17569Upshur County 01----------------------------- 33 478 109 641 3 501 106 140 13 803 3 087 6170
Upton County 23------------------------------ 4 112 11 468 138 11 330 1 577 316 –71Uvalde County 23----------------------------- 24 965 89 751 2 018 87 733 21 177 4 020 –72Val Verde County 23--------------------------- 42 737 238 069 100 123 137 946 29 324 81 897 63 66473Van Zandt County 04-------------------------- 40 660 145 240 4 050 141 190 18 491 3 424 –74Victoria County 14----------------------------- 79 438 255 701 6 133 249 568 56 063 10 426 48975Walker County 02----------------------------- 53 492 133 848 8 958 124 890 19 562 6 289 81676Waller County 08 14------------------------------ 25 823 97 190 8 006 89 184 28 262 2 542 56177Ward County 23------------------------------ 12 258 38 143 522 37 621 8 988 1 125 –78Washington County 08------------------------- 27 575 88 463 2 680 85 783 9 776 3 018 33279Webb County 23------------------------------ 163 066 529 647 6 694 522 953 189 132 58 827 85780
Wharton County 14---------------------------- 39 964 156 398 3 407 152 991 20 493 4 488 74081Wheeler County 13---------------------------- 5 450 30 695 300 30 395 5 828 1 119 –82Wichita County 13----------------------------- 124 054 753 864 334 286 419 578 61 821 203 631 184 06983Wilbarger County 13--------------------------- 14 557 60 314 1 298 59 016 7 336 2 731 784Willacy County 15 27----------------------------- 19 035 63 168 677 62 491 22 199 1 916 –85Williamson County 14 21-------------------------- 172 669 318 898 32 555 286 343 54 025 13 907 56486Wilson County 28----------------------------- 25 811 73 921 4 792 69 129 10 880 2 188 –87Winkler County 23----------------------------- 8 094 25 603 271 25 332 3 969 496 –88Wise County 17------------------------------- 37 321 104 476 3 983 100 493 20 772 3 906 16289Wood County 01------------------------------ 31 894 147 281 7 191 140 090 20 318 4 070 67890
See footnotes at end of table.
64 Consolidated Federal Funds Report

TIPS PS [APS_PPGB,F_SCOTT] 6/ 3/96 12:37:43 MCVX09 TLP:CFFR1.TLP;15 6/ 3/96 11:04:06 DATA:NONE PSC:TIPS_12353107_01.PSC PAGE: 64TSF:TIPS92~12353107.DAT;1 6/ 3/96 12:35:33 UTF:TIPS93~12353107.DAT;1 6/ 3/96 12:35:33 META:TIPS96~12353107.DAT;1 6/ 3/96 12:37:03
1995mCon.
Direct Federal expenditures or obligationsmCon. Other Federal assistance
Direct payments for individuals Procurement contract awards
TotalRetirement and
disability All other TotalDepartmentof Defense
Other Federalexpenditures or
obligations Direct loansGuaranteed loans
and insurance
85 337 56 070 29 267 7 481 6 608 13 245 10 756 219 875 183 225 45 358 37 867 1 958 715 637 1 671 5 542 279 261 57 672 21 589 812 59 1 163 825 15 547 38 735 5 582 3 153 66 – 1 708 118 2 176 4
212 021 146 127 65 894 8 266 2 836 2 565 128 110 960 571 389 47 440 23 949 2 330 1 780 1 375 935 8 451 615 900 11 198 4 702 207 29 1 635 43 12 497 726 383 17 657 8 726 199 – 3 467 687 7 033 865 876 45 816 20 060 955 28 872 242 3 206 9
409 056 265 435 143 621 7 662 4 111 58 358 58 698 506 395 10
30 667 22 572 8 095 227 – 7 738 2 125 20 934 1146 375 33 082 13 293 348 – 88 164 699 125 879 3 477 2 402 57 – 1 822 400 2 263 13
149 365 88 824 60 541 1 187 72 542 1 110 16 352 14124 248 80 449 43 799 836 82 1 714 1 248 11 973 15
36 163 23 294 12 869 237 – 74 390 4 079 1651 843 33 488 18 355 424 – 2 907 535 8 822 17
742 449 485 960 256 489 265 616 233 801 5 894 7 813 1 183 014 1816 971 12 032 4 939 170 – 8 990 1 847 11 997 194 930 3 961 969 66 – 3 157 5 2 205 20
217 482 137 373 80 109 4 487 3 147 1 894 513 297 968 2180 909 55 172 25 737 2 711 1 748 270 229 5 828 2260 850 39 794 21 056 279 ~176 304 90 2 847 23
156 527 117 656 38 871 1 144 – 809 1 765 22 401 2418 236 13 085 5 151 3 209 – 12 537 4 566 41 296 2525 189 16 932 8 257 289 – 2 315 1 124 5 515 26
163 904 116 307 47 597 4 536 507 767 3 052 13 542 27393 712 284 445 109 267 296 615 4 238 11 387 339 44 947 28
15 647 10 567 5 080 611 – 561 55 1 088 2919 954 13 409 6 545 152 – 172 – 881 30
71 405 39 675 31 730 481 – 5 703 228 45 805 315 579 3 869 1 710 57 – 1 488 334 3 726 32
10 381 7 815 2 566 143 – 349 – 1 277 3350 994 34 741 16 253 829 276 2 083 1 550 2 520 3428 240 18 053 10 187 438 163 2 573 742 4 998 3524 364 15 798 8 566 170 – 1 322 2 052 14 200 362 348 1 668 680 38 – 1 307 46 598 37
48 302 31 500 16 802 579 85 514 1 064 6 214 3846 648 35 490 11 158 745 – 330 703 18 213 3936 201 24 186 12 015 350 – 5 860 420 7 610 40
110 377 74 144 36 233 794 – 296 239 4 276 4151 000 34 589 16 411 324 – 139 35 465 4229 170 19 207 9 963 202 – 369 – 1 642 4346 884 29 929 16 955 285 – 1 558 914 8 467 44
148 598 94 740 53 858 41 794 40 795 3 019 2 763 144 319 4517 799 11 802 5 997 948 147 1 014 1 009 1 639 467 055 4 724 2 331 789 742 2 544 456 1 357 47
42 432 29 194 13 238 361 – 7 073 488 10 473 4810 643 7 472 3 171 165 80 543 363 1 590 4979 082 49 545 29 537 763 – 222 524 10 000 50
5 565 4 372 1 193 28 – 8 923 1 197 16 928 51431 339 292 836 138 503 42 673 33 564 1 409 2 167 28 757 52
12 050 8 406 3 644 104 – 96 – 2 581 5373 933 37 862 36 071 776 122 3 800 2 907 8 205 5427 056 18 731 8 325 238 30 306 145 5 742 552 515 1 711 804 28 – 821 – 169 567 083 4 131 2 952 66 – 2 855 322 1 367 577 642 5 051 2 591 66 – 2 341 112 1 567 58
21 828 14 874 6 954 189 – 11 013 4 288 26 805 592 389 951 1 683 281 706 670 3 754 909 3 578 720 17 449 5 553 934 265 60
328 345 235 600 92 745 118 901 111 803 5 081 415 242 234 613 705 2 770 935 64 – 1 190 16 400 62
34 105 20 198 13 907 246 – 8 173 2 323 44 612 636 221 4 267 1 954 76 – 875 – 1 620 64
69 276 43 879 25 397 554 72 145 789 4 273 65272 659 191 900 80 759 42 860 39 685 5 219 4 387 51 684 66
1 232 133 886 290 345 843 358 420 249 428 6 461 1 854 761 234 6747 220 32 549 14 671 465 – 182 525 954 6860 520 41 544 18 976 524 29 261 2 902 2 841 6991 899 62 628 29 271 587 – 265 404 3 787 70
8 279 5 716 2 563 66 – 1 230 518 1 996 7160 150 35 985 24 165 462 55 3 943 1 389 11 101 7296 177 66 390 29 787 27 117 25 172 3 554 254 15 944 73
121 856 82 770 39 086 1 168 – 302 263 6 607 74182 037 117 578 64 459 3 628 – 3 547 4 360 95 145 75105 473 64 122 41 351 1 855 317 668 545 8 637 76
56 165 29 778 26 387 5 346 4 794 4 875 3 020 24 919 7727 606 18 550 9 056 227 – 197 – 2 089 7874 594 51 878 22 716 846 382 228 1 553 1 321 79
258 780 144 466 114 314 21 705 2 065 1 203 279 72 348 80
104 589 65 602 38 987 812 55 26 017 24 981 75 277 8120 199 12 738 7 461 208 – 3 342 572 850 82
374 947 278 780 96 167 109 695 105 104 3 769 1 197 170 230 8345 237 30 116 15 121 341 – 4 671 742 12 498 8436 539 19 847 16 692 282 – 2 232 3 478 118 505 85
244 759 184 694 60 065 3 265 377 2 942 19 101 188 618 8659 387 43 912 15 475 466 – 1 000 1 924 7 918 8720 849 14 749 6 100 228 – 61 – 440 8878 138 55 173 22 965 965 246 694 3 738 14 851 89
121 774 84 486 37 288 824 133 296 858 6 145 90
County Area 65

TIPS PS [APS_PPGB,F_SCOTT] 6/ 3/96 12:37:43 MCVX09 TLP:CFFR1.TLP;15 6/ 3/96 11:04:06 DATA:NONE PSC:TIPS_12353107_01.PSC PAGE: 65TSF:TIPS92~12353107.DAT;1 6/ 3/96 12:35:33 UTF:TIPS93~12353107.DAT;1 6/ 3/96 12:35:33 META:TIPS96~12353107.DAT;1 6/ 3/96 12:37:03
Federal Government Expenditures or Obligations by State and County Area: Fiscal Year[Thousand dollars]
State and county area
Congressional district
Direct Federal expenditures or obligations
Total direct expenditres or obligations Salaries and wages
United Statesresident
population1 TotalDepartment of
DefenseAll other
agencies Grant awards TotalDepartmentof Defense
TexasmCon.
Yoakum County 19---------------------------- 8 472 24 684 98 24 586 5 054 540 –1Young County 17------------------------------ 17 643 70 511 2 311 68 200 8 291 2 135 –2Zapata County 28----------------------------- 10 740 32 234 823 31 411 7 303 1 235 –3Zavala County 23----------------------------- 12 331 43 737 464 43 273 14 669 673 –4State undistributed ------------------------- 4 781 860 – 4 781 860 810 380 – –5
Utah ---------------------------------------- 1 907 975 8 582 760 1 474 973 7 107 787 1 502 148 1 518 500 794 3336
Beaver County 01----------------------------- 5 169 19 570 1 052 18 518 3 106 1 742 7117Box Elder County 01--------------------------- 38 731 619 762 77 808 541 954 11 913 14 739 9 1348Cache County 01------------------------------ 75 665 222 842 31 268 191 574 56 103 14 313 2 1439Carbon County 03----------------------------- 20 465 414 407 3 532 410 875 16 187 6 468 18110Daggett County 03---------------------------- 738 10 565 73 10 492 4 151 2 664 –11Davis County 01------------------------------ 210 948 1 118 962 672 670 446 292 57 124 527 118 511 98212Duchesne County 03-------------------------- 13 641 41 635 422 41 213 8 781 3 449 –13Emery County 03----------------------------- 10 600 134 276 372 133 904 6 504 1 670 –14Garfield County 03---------------------------- 4 032 23 761 199 23 562 5 279 3 681 –15Grand County 03------------------------------ 7 677 31 162 354 30 808 4 913 6 310 –16
Iron County 01-------------------------------- 24 426 79 099 2 407 76 692 14 292 11 338 49717Juab County 01------------------------------- 6 355 20 445 259 20 186 3 187 753 118Kane County 03------------------------------- 5 815 18 390 500 17 890 2 061 2 112 –19Millard County 01----------------------------- 11 913 34 559 842 33 717 5 083 3 248 29220Morgan County 03---------------------------- 6 318 15 743 824 14 919 1 409 498 –21Piute County 03------------------------------- 1 391 5 436 149 5 287 806 271 –22Rich County 01------------------------------- 1 779 5 187 97 5 090 705 422 –23Salt Lake County 01 02 03--------------------------- 795 340 2 914 202 309 478 2 604 724 791 140 464 735 99 09524San Juan County 03--------------------------- 13 655 47 754 393 47 361 18 020 5 785 17025Sanpete County 03---------------------------- 18 932 53 523 1 951 51 572 8 333 3 272 96726
Sevier County 03------------------------------ 16 793 65 287 1 715 63 572 8 356 7 349 45927Summit County 03---------------------------- 21 526 42 276 6 612 35 664 12 121 5 089 2 67128Tooele County 01----------------------------- 28 782 310 291 194 462 115 829 29 519 83 101 80 35129Uintah County 03------------------------------ 24 472 77 009 1 136 75 873 20 249 13 586 21630Utah County 03------------------------------- 290 990 654 317 36 182 618 135 166 733 45 197 7 24231Wasatch County 03--------------------------- 11 404 36 505 557 35 948 7 296 1 966 –32Washington County 01------------------------- 66 125 217 731 8 790 208 941 27 690 13 954 72833Wayne County 03----------------------------- 2 246 13 955 57 13 898 5 251 2 842 –34Weber County 01----------------------------- 172 047 903 944 120 812 783 132 85 559 270 828 77 49335State undistributed ------------------------- 430 166 – 430 166 120 277 – –36
Vermont ------------------------------------ 580 234 2 663 766 310 251 2 353 515 642 751 274 922 58 06137
Addison County 00---------------------------- 34 399 102 245 10 530 91 715 21 549 6 195 72438Bennington County 00------------------------- 36 232 133 431 7 160 126 271 23 233 5 728 31739Caledonia County 00-------------------------- 28 525 95 212 3 517 91 695 15 843 5 621 1 01340Chittenden County 00-------------------------- 137 570 738 842 246 127 492 715 156 396 99 529 43 96241Essex County 00------------------------------ 6 515 25 700 691 25 009 3 781 3 146 –42Franklin County 00---------------------------- 42 637 145 982 4 973 141 009 23 109 29 337 1 84043Grand Isle County 00-------------------------- 5 747 17 203 506 16 697 2 761 1 013 –44Lamoille County 00---------------------------- 20 937 67 874 1 872 66 002 16 801 3 252 29145Orange County 00----------------------------- 27 191 85 776 2 647 83 129 20 043 4 940 37246Orleans County 00---------------------------- 24 854 102 158 1 769 100 389 25 482 8 196 25447
Rutland County 00---------------------------- 62 574 239 998 9 207 230 791 49 416 16 612 2 78048Washington County 00------------------------- 55 993 361 770 10 994 350 776 188 730 17 796 4 08749Windham County 00--------------------------- 42 413 148 581 4 479 144 102 31 769 8 343 96050Windsor County 00---------------------------- 54 647 253 634 5 779 247 855 22 840 65 213 1 46151State undistributed ------------------------- 145 359 – 145 359 40 998 – –52
Virginia ------------------------------------- 6 550 826 51 490 236 23 315 130 28 175 106 3 923 265 12 016 238 8 864 85353
Accomack County 01-------------------------- 32 369 241 040 29 774 211 266 15 604 41 258 8 84654Albemarle County 05 07-------------------------- 71 851 150 587 18 754 131 833 11 939 3 424 50155Alleghany County 06--------------------------- 12 877 26 814 122 26 692 6 272 271 –56Amelia County 04----------------------------- 9 541 29 453 827 28 626 5 884 887 –57Amherst County 06---------------------------- 29 453 82 712 2 976 79 736 6 930 2 246 8058Appomattox County 05------------------------- 12 643 36 898 1 645 35 253 3 120 1 966 –59Arlington County 08--------------------------- 174 603 5 271 969 3 281 120 1 990 849 141 726 2 792 101 2 022 91360Augusta County 06---------------------------- 57 891 115 563 4 038 111 525 11 804 4 407 –61Bath County 06------------------------------- 4 854 19 319 472 18 847 1 190 1 386 –62Bedford County 05 06---------------------------- 51 578 139 402 5 634 133 768 11 792 4 696 –63
Bland County 09------------------------------ 6 777 22 085 304 21 781 1 830 767 –64Botetourt County 06--------------------------- 26 610 68 948 2 558 66 390 3 340 2 604 –65Brunswick County 04-------------------------- 16 216 62 971 1 689 61 282 9 914 2 142 –66Buchanan County 09-------------------------- 30 819 126 950 1 065 125 885 14 849 2 732 19167Buckingham County 05------------------------ 13 105 41 861 1 026 40 835 8 894 1 027 –68Campbell County 05--------------------------- 48 803 144 835 39 348 105 487 12 614 5 427 2 51769Caroline County 01---------------------------- 20 616 78 784 18 362 60 422 7 109 12 978 10 51670Carroll County 09----------------------------- 27 713 77 139 1 444 75 695 8 479 2 045 –71Charles City County 03------------------------ 6 659 16 671 529 16 142 2 097 719 –72Charlotte County 05--------------------------- 12 133 47 937 1 798 46 139 5 435 1 983 –73
Chesterfield County 04 07------------------------- 231 808 362 336 81 700 280 636 61 244 18 877 6 73274Clarke County 10------------------------------ 12 206 34 007 1 915 32 092 1 643 1 884 –75Craig County 09------------------------------- 4 632 13 807 700 13 107 863 987 –76Culpeper County 07--------------------------- 29 914 91 811 7 268 84 543 6 837 5 379 54277Cumberland County 05------------------------ 7 705 24 481 727 23 754 6 849 831 –78Dickenson County 09-------------------------- 17 683 76 606 1 276 75 330 8 785 1 817 26279Dinwiddie County 04--------------------------- 24 453 58 224 2 840 55 384 9 526 1 589 –80Essex County 03------------------------------ 9 163 37 041 2 168 34 873 3 136 1 253 –81Fairfax County 08 10 11----------------------------- 881 632 7 516 012 4 213 568 3 302 444 244 796 877 860 418 79082Fauquier County 10--------------------------- 51 415 225 550 110 551 114 999 12 043 41 200 34 31783
See footnotes at end of table.
66 Consolidated Federal Funds Report

TIPS PS [APS_PPGB,F_SCOTT] 6/ 3/96 12:37:43 MCVX09 TLP:CFFR1.TLP;15 6/ 3/96 11:04:06 DATA:NONE PSC:TIPS_12353107_01.PSC PAGE: 66TSF:TIPS92~12353107.DAT;1 6/ 3/96 12:35:33 UTF:TIPS93~12353107.DAT;1 6/ 3/96 12:35:33 META:TIPS96~12353107.DAT;1 6/ 3/96 12:37:03
1995mCon.
Direct Federal expenditures or obligationsmCon. Other Federal assistance
Direct payments for individuals Procurement contract awards
TotalRetirement and
disability All other TotalDepartmentof Defense
Other Federalexpenditures or
obligations Direct loansGuaranteed loans
and insurance
13 850 9 674 4 176 104 – 5 135 3 064 24 960 157 612 38 448 19 164 1 274 818 1 198 29 6 093 223 312 14 421 8 891 104 – 280 575 389 326 058 14 233 11 825 123 – 2 215 476 3 117 4
3 293 930 27 735 3 266 195 – – 677 550 65 015 2 107 665 5
3 764 353 2 694 216 1 070 137 1 625 394 495 771 172 365 318 205 1 396 818 6
13 940 10 277 3 663 575 – 206 855 1 983 778 936 62 987 15 949 506 043 65 834 8 132 4 730 18 070 8
118 115 80 369 37 746 31 296 23 169 3 016 2 052 38 977 963 353 43 763 19 590 328 106 2 370 293 2 228 7 870 101 874 1 465 409 1 758 – 119 145 124 11
375 420 309 044 66 376 158 251 118 617 1 049 277 116 184 1227 411 19 575 7 836 650 – 1 343 623 4 024 1318 607 13 999 4 608 106 776 – 719 561 2 346 1410 933 8 497 2 436 3 677 – 192 1 536 1 572 1517 547 13 479 4 068 2 299 – 93 47 6 475 16
49 865 34 949 14 916 2 819 130 786 1 526 10 505 1714 591 10 749 3 842 139 – 1 776 96 1 955 1813 778 10 714 3 064 353 – 85 81 1 265 1923 431 17 134 6 297 405 – 2 392 1 880 4 749 2013 443 11 379 2 064 95 – 298 – 2 738 213 817 3 015 802 57 – 486 155 127 223 302 2 553 749 76 – 682 16 1 386 23
1 381 801 1 005 963 375 838 268 113 145 370 8 413 1 701 560 717 2419 346 12 686 6 660 2 489 – 2 113 629 3 576 2539 331 27 985 11 346 1 126 – 1 461 1 445 6 446 26
39 020 29 105 9 915 10 176 – 385 1 400 9 660 2721 685 18 105 3 580 2 810 1 902 570 424 21 170 2884 103 71 159 12 944 113 149 111 082 419 144 12 851 2937 243 28 514 8 729 4 289 75 1 642 2 148 8 925 30
411 614 293 796 117 818 27 315 12 394 3 460 410 174 831 3118 577 14 065 4 512 8 499 – 167 43 1 276 32
171 788 136 766 35 022 2 227 159 2 073 1 255 41 000 335 388 3 981 1 407 140 – 335 396 1 698 34
504 988 397 055 107 933 41 688 14 669 881 291 127 133 082 35181 108 1 091 180 017 – – 128 781 280 201 236 36
1 466 286 945 502 520 784 259 499 207 402 20 308 53 529 401 672 37
64 339 44 097 20 242 9 342 7 812 820 2 496 16 333 3898 349 67 888 30 461 5 815 4 258 305 597 25 771 3972 357 51 733 20 624 927 – 462 2 780 14 910 40
274 214 176 140 98 074 207 334 189 042 1 368 1 255 43 688 4118 191 13 330 4 861 467 99 116 450 2 445 4288 464 61 405 27 059 4 002 482 1 071 6 330 15 369 4312 970 9 933 3 037 303 – 156 167 2 343 4446 716 31 645 15 071 695 104 410 2 585 11 938 4559 149 41 216 17 933 1 317 147 328 1 530 11 734 4667 196 45 853 21 343 918 – 366 1 911 10 255 47
168 763 119 381 49 382 4 597 1 894 609 1 689 26 324 48148 938 100 745 48 193 5 826 1 503 479 5 638 61 725 49103 776 73 054 30 722 4 278 1 252 415 1 507 23 847 50150 287 108 248 42 039 13 677 809 1 618 918 34 007 51
92 577 835 91 742 – – 11 784 23 676 100 984 52
17 960 699 12 944 321 5 016 378 16 598 065 12 119 771 991 969 469 875 9 546 439 53
114 960 86 821 28 139 68 054 7 416 1 164 1 607 190 183 54122 868 87 531 35 337 11 937 10 671 418 253 20 268 55
20 029 17 167 2 862 175 – 68 628 7 430 5621 968 15 923 6 045 191 – 524 279 3 881 5770 618 52 999 17 619 2 776 49 141 485 8 589 5831 353 23 081 8 272 265 – 193 167 1 730 59
498 016 374 867 123 149 1 837 544 1 201 634 2 584 787 66 954 6097 294 72 339 24 955 1 618 239 440 5 513 20 715 6116 200 11 357 4 843 458 – 85 290 1 200 62
120 932 98 102 22 830 1 674 614 307 1 386 8 075 63
18 336 12 814 5 522 1 066 – 86 62 1 328 6461 713 48 779 12 934 1 061 200 229 597 16 443 6549 810 31 067 18 743 538 131 567 826 5 175 66
107 295 84 224 23 071 1 929 236 146 4 15 514 6731 456 20 702 10 754 291 83 194 316 1 031 6893 379 70 353 23 026 32 930 32 351 485 1 523 13 680 6952 630 38 695 13 935 5 634 3 388 432 1 129 9 552 7065 868 45 017 20 851 443 – 304 259 5 180 7113 315 9 182 4 133 326 – 213 378 1 992 7239 396 30 059 9 337 800 144 322 85 2 361 73
274 290 211 424 62 866 7 352 2 380 572 3 035 186 949 7427 841 22 007 5 834 2 394 – 245 330 5 046 7511 539 8 577 2 962 367 218 51 20 4 305 7675 258 54 020 21 238 3 757 1 724 580 1 241 16 444 7716 377 10 867 5 510 272 149 153 878 1 246 7864 955 48 911 16 044 797 483 252 362 5 122 7945 910 32 703 13 207 727 237 472 2 016 9 322 8030 450 21 050 9 400 1 443 1 198 759 1 413 8 275 81
1 628 969 1 429 074 199 895 4 752 279 3 309 092 12 108 932 507 761 82106 443 83 726 22 717 65 357 61 613 507 1 053 31 432 83
County Area 67

TIPS PS [APS_PPGB,F_SCOTT] 6/ 3/96 12:37:43 MCVX09 TLP:CFFR1.TLP;15 6/ 3/96 11:04:06 DATA:NONE PSC:TIPS_12353107_01.PSC PAGE: 67TSF:TIPS92~12353107.DAT;1 6/ 3/96 12:35:33 UTF:TIPS93~12353107.DAT;1 6/ 3/96 12:35:33 META:TIPS96~12353107.DAT;1 6/ 3/96 12:37:03
Federal Government Expenditures or Obligations by State and County Area: Fiscal Year[Thousand dollars]
State and county area
Congressional district
Direct Federal expenditures or obligations
Total direct expenditres or obligations Salaries and wages
United Statesresident
population1 TotalDepartment of
DefenseAll other
agencies Grant awards TotalDepartmentof Defense
Virginia mCon.
Floyd County 09------------------------------ 12 556 35 431 801 34 630 3 086 1 796 –1Fluvanna County 05--------------------------- 15 226 47 902 4 212 43 690 4 319 1 535 –2Franklin County 05---------------------------- 42 429 105 858 2 681 103 177 8 871 4 527 233Frederick County 10--------------------------- 49 632 109 835 16 819 93 016 19 827 2 032 –4Giles County 09------------------------------- 16 408 63 214 1 515 61 699 6 345 1 994 –5Gloucester County 01-------------------------- 32 666 108 418 13 097 95 321 13 447 3 786 –6Goochland County 04-------------------------- 15 855 30 372 829 29 543 2 991 1 118 –7Grayson County 09---------------------------- 16 092 54 094 5 438 48 656 6 598 1 665 –8Greene County 07----------------------------- 12 564 27 748 1 551 26 197 3 280 1 543 319Greensville County 04------------------------- 11 532 19 336 167 19 169 4 902 90 –10
Halifax County 05----------------------------- 30 109 96 625 2 941 93 684 12 598 3 073 –11Hanover County 01 07---------------------------- 71 543 196 338 20 621 175 717 20 623 12 264 5 80612Henrico County 03 07---------------------------- 229 552 393 845 34 364 359 481 44 231 33 011 23 99913Henry County 05------------------------------ 56 716 142 050 2 586 139 464 12 613 3 051 36914Highland County 06--------------------------- 2 561 9 071 278 8 793 809 587 –15Isle Of Wight County 04------------------------ 27 098 90 709 12 298 78 411 8 851 3 947 –16James City County 01 03------------------------- 39 048 76 257 1 070 75 187 9 684 975 –17King and Queen County 03--------------------- 6 340 27 243 4 992 22 251 4 642 5 371 4 55918King George County 01------------------------ 16 630 410 606 369 657 40 949 3 879 195 767 194 01919King William County 03------------------------ 12 079 36 242 1 409 34 833 5 897 1 399 40620
Lancaster County 01-------------------------- 11 095 68 465 6 760 61 705 3 751 2 010 10221Lee County 09-------------------------------- 24 373 111 988 1 114 110 874 18 692 2 591 2222Loudoun County 10---------------------------- 108 116 479 577 63 831 415 746 17 807 192 089 11 36323Louisa County 04----------------------------- 22 347 69 590 3 532 66 058 6 835 2 188 –24Lunenburg County 05-------------------------- 11 129 39 764 1 297 38 467 5 203 1 084 –25Madison County 07---------------------------- 12 273 37 467 3 176 34 291 5 283 2 634 –26Mathews County 01--------------------------- 8 863 45 189 6 013 39 176 2 864 2 238 –27Mecklenburg County 05------------------------ 30 423 132 615 28 341 104 274 10 625 4 759 1 56428Middlesex County 01-------------------------- 9 152 47 639 2 305 45 334 9 167 1 113 3029Montgomery County 09------------------------ 75 782 365 553 141 670 223 883 65 281 12 493 3 44230
Nelson County 05----------------------------- 13 358 53 749 3 283 50 466 4 996 2 442 3331New Kent County 03--------------------------- 11 277 36 069 2 259 33 810 4 341 1 354 –32Northampton County 01------------------------ 12 992 85 809 10 746 75 063 8 158 4 663 –33Northumberland County 01--------------------- 11 118 48 677 2 591 46 086 2 820 1 334 –34Nottoway County 04--------------------------- 15 276 86 164 26 174 59 990 6 426 18 946 17 26735Orange County 07----------------------------- 23 442 97 512 6 984 90 528 7 434 2 495 –36Page County 10------------------------------- 22 544 80 137 7 067 73 070 6 280 4 990 –37Patrick County 05----------------------------- 17 618 55 265 4 953 50 312 4 834 2 233 –38Pittsylvania County 05------------------------- 55 734 151 462 6 297 145 165 23 066 4 283 –39Powhatan County 04-------------------------- 18 132 34 448 1 713 32 735 2 210 1 934 30540
Prince Edward County 05---------------------- 18 394 71 430 6 928 64 502 8 083 3 505 541Prince George County 03 04---------------------- 24 453 362 356 299 369 62 987 5 657 247 767 226 98142Prince William County 10 11----------------------- 239 257 921 616 564 373 357 243 78 825 303 900 274 82943Pulaski County 09----------------------------- 34 699 115 678 3 817 111 861 11 496 3 696 92744Rappahannock County 10---------------------- 7 015 25 135 2 551 22 584 2 184 1 551 –45Richmond County 03-------------------------- 7 445 33 716 1 067 32 649 5 887 1 047 –46Roanoke County 06 09--------------------------- 81 131 180 533 46 849 133 684 24 622 32 745 30 51547Rockbridge County 06------------------------- 19 031 45 909 2 666 43 243 5 149 1 930 –48Rockingham County 06 10------------------------ 60 659 144 283 3 990 140 293 11 400 6 911 –49Russell County 09----------------------------- 29 164 121 371 780 120 591 28 404 2 728 –50
Scott County 09------------------------------- 23 229 89 574 3 467 86 107 11 061 4 864 2 66651Shenandoah County 10------------------------ 32 987 112 715 6 716 105 999 7 109 5 861 –52Smyth County 09------------------------------ 32 967 125 996 16 021 109 975 13 686 4 152 64253Southampton County 04----------------------- 16 786 51 216 3 598 47 618 7 701 1 879 –54Spotsylvania County 01 07------------------------ 65 382 91 457 6 354 85 103 14 781 2 183 6255Stafford County 01---------------------------- 77 711 144 257 34 664 109 593 10 253 6 277 98856Surry County 03------------------------------ 6 356 22 959 1 277 21 682 3 307 908 –57Sussex County 04----------------------------- 10 052 44 599 1 059 43 540 5 742 2 436 –58Tazewell County 09--------------------------- 47 041 210 838 3 028 207 810 21 341 7 561 78259Warren County 10----------------------------- 28 843 94 713 4 683 90 030 7 383 6 424 –60
Washington County 09------------------------- 47 624 134 780 4 418 130 362 17 699 4 346 63761Westmoreland County 01---------------------- 16 255 77 446 3 244 74 202 8 011 3 644 –62Wise County 09------------------------------- 40 057 253 266 3 260 250 006 37 238 6 341 5663Wythe County 09------------------------------ 26 260 105 398 2 792 102 606 16 062 4 998 –64York County 01------------------------------- 52 068 309 555 171 372 138 183 11 938 106 113 77 78765Alexandria city area 08------------------------- 112 879 2 125 400 1 257 978 867 422 63 705 650 715 519 41566Bristol city area 09---------------------------- 18 069 115 670 3 320 112 350 16 776 12 404 78167Buena Vista city area 06----------------------- 6 484 27 500 4 046 23 454 2 011 1 328 5968Charlottesville City 05-------------------------- 41 034 337 341 69 798 267 543 106 528 55 643 28 31069Chesapeake city area 04----------------------- 180 577 614 774 184 896 429 878 40 252 74 929 49 46470
Clifton Forge city area 06----------------------- 4 339 25 475 619 24 856 2 261 587 –71Colonial Heights 04---------------------------- 16 447 83 140 12 649 70 491 2 348 1 798 –72Covington city area 06------------------------- 6 861 56 913 1 768 55 145 4 709 3 297 65573Danville city area 05--------------------------- 54 227 232 013 7 070 224 943 24 499 8 859 2 26574Fairfax city area 11---------------------------- 20 654 1 658 027 531 745 1 126 282 49 785 48 008 25 23875Falls Church city area 08----------------------- 9 181 539 836 198 089 341 747 125 282 168 824 71 30576Franklin city area 04--------------------------- 8 815 46 859 1 181 45 678 5 961 1 245 –77Fredericksburg city area 01--------------------- 22 160 174 137 31 282 142 855 7 429 10 709 28378Galax city area 09----------------------------- 6 460 46 599 2 436 44 163 3 931 2 660 1 12779Hampton city area 01 03-------------------------- 139 628 1 514 372 665 009 849 363 71 179 679 373 460 44680
Harrisonburg city area 06---------------------- 33 267 98 597 3 680 94 917 8 201 8 149 27781Hopewell city area 03 04-------------------------- 24 453 156 417 63 690 92 727 12 875 1 814 –82Lexington city area 06------------------------- 7 004 40 938 6 830 34 108 2 415 3 440 1 75183Lynchburg city area 06------------------------- 66 491 513 457 28 048 485 409 31 027 45 452 3 29884Martinsville city area 05------------------------ 15 818 96 671 7 350 89 321 6 721 3 649 23885Newport News city area 01 03--------------------- 179 127 4 844 530 4 224 389 620 141 83 148 399 810 361 82186Norfolk city area 02 03---------------------------- 241 426 4 410 316 3 395 116 1 015 200 167 764 2 629 861 2 492 11187Norton city area 09---------------------------- 4 039 35 195 2 748 32 447 3 346 5 729 –88Petersburg city area 03 04------------------------ 40 934 237 690 26 676 211 014 32 665 9 506 29189Portsmouth city area 03 04------------------------ 103 464 1 268 634 774 177 494 457 59 191 570 226 511 85490
See footnotes at end of table.
68 Consolidated Federal Funds Report

TIPS PS [APS_PPGB,F_SCOTT] 6/ 3/96 12:37:43 MCVX09 TLP:CFFR1.TLP;15 6/ 3/96 11:04:06 DATA:NONE PSC:TIPS_12353107_01.PSC PAGE: 68TSF:TIPS92~12353107.DAT;1 6/ 3/96 12:35:33 UTF:TIPS93~12353107.DAT;1 6/ 3/96 12:35:33 META:TIPS96~12353107.DAT;1 6/ 3/96 12:37:03
1995mCon.
Direct Federal expenditures or obligationsmCon. Other Federal assistance
Direct payments for individuals Procurement contract awards
TotalRetirement and
disability All other TotalDepartmentof Defense
Other Federalexpenditures or
obligations Direct loansGuaranteed loans
and insurance
29 999 21 971 8 028 420 – 130 120 1 592 141 569 32 549 9 020 367 – 111 432 7 813 290 920 68 896 22 024 1 179 323 361 2 429 8 800 372 596 53 682 18 914 14 828 14 287 553 3 127 24 437 453 930 38 707 15 223 738 81 207 901 4 895 590 077 71 496 18 581 831 186 276 1 850 90 289 625 877 18 676 7 201 227 – 159 656 4 867 740 717 28 907 11 810 4 718 4 355 396 1 181 2 497 822 133 16 743 5 390 686 70 106 1 102 7 473 914 115 8 844 5 271 19 – 210 915 6 973 10
78 062 54 528 23 534 2 234 1 165 658 1 385 17 337 11156 409 117 377 39 032 6 247 4 200 796 1 357 43 501 12313 575 195 748 117 827 2 775 824 254 239 133 514 13125 627 92 295 33 332 567 – 193 1 790 21 474 14
7 354 5 438 1 916 194 39 127 130 241 1570 035 50 331 19 704 7 241 6 649 636 2 374 20 056 1665 249 54 012 11 237 297 221 53 752 41 101 1716 482 11 650 4 832 205 35 542 139 2 743 1838 844 31 907 6 937 171 789 171 337 327 9 461 8 324 1928 316 19 878 8 438 208 – 422 1 526 8 929 20
62 138 48 318 13 820 398 – 168 67 34 094 2189 071 62 405 26 666 1 559 – 76 645 4 530 22
161 035 128 654 32 381 103 987 29 612 4 659 1 614 139 349 2359 540 42 315 17 225 758 370 267 594 4 351 2432 942 24 101 8 841 199 – 336 1 444 4 132 2527 311 19 941 7 370 1 828 1 297 412 2 694 2 974 2637 829 29 334 8 495 2 145 1 832 113 122 83 749 2792 911 68 942 23 969 23 878 23 262 442 1 146 12 696 2836 885 26 941 9 944 227 – 246 172 25 165 29
132 948 90 879 42 069 154 403 126 055 427 3 909 28 299 30
44 334 31 903 12 431 1 748 580 229 442 4 786 3129 914 22 622 7 292 284 – 176 153 7 003 3257 392 31 455 25 937 14 186 8 771 1 410 1 180 29 151 3343 602 32 526 11 076 534 – 388 522 30 631 3453 673 38 640 15 033 6 819 6 475 301 464 1 334 3586 720 65 562 21 158 483 – 380 1 713 8 412 3662 564 45 552 17 012 6 123 4 756 181 864 10 224 3743 672 30 769 12 903 4 210 3 739 316 2 323 4 894 38
118 002 83 860 34 142 5 343 4 003 768 3 760 19 019 3929 834 22 148 7 686 313 – 157 1 782 10 347 40
54 340 38 207 16 133 4 993 4 439 508 1 723 3 287 4144 545 36 027 8 518 64 020 63 060 367 1 637 13 821 42
372 182 319 265 52 917 165 710 148 625 998 737 248 573 4399 151 64 732 34 419 959 396 376 1 270 10 884 4420 705 17 145 3 560 434 – 261 218 1 773 4526 004 17 326 8 678 339 159 440 403 12 294 46
121 164 91 153 30 011 1 880 811 122 110 63 244 4735 305 26 412 8 893 2 424 1 311 1 101 3 021 14 957 48
119 478 87 708 31 770 5 733 934 761 2 662 30 663 4989 428 64 754 24 674 639 35 172 1 837 2 420 50
72 986 49 821 23 165 511 – 152 868 3 316 5195 938 73 422 22 516 3 287 500 521 4 126 20 177 5291 840 67 230 24 610 16 097 13 044 221 8 579 8 322 5337 928 24 936 12 992 3 104 2 588 605 2 798 21 768 5473 649 55 096 18 553 587 35 257 11 238 39 879 55
124 995 106 600 18 395 2 456 1 258 276 659 109 243 5618 156 12 171 5 985 176 34 412 1 290 6 403 5735 492 23 410 12 082 416 104 513 903 12 937 58
180 591 130 472 50 119 1 122 44 223 1 702 13 478 5968 657 53 401 15 256 12 054 64 194 2 408 35 718 60
110 951 82 733 28 218 1 537 884 247 2 379 7 193 6164 287 46 612 17 675 636 – 868 879 15 984 62
159 683 111 757 47 926 49 850 1 139 155 174 15 010 6382 706 57 862 24 844 1 299 639 333 5 901 4 254 64
159 976 144 488 15 488 31 382 21 455 145 170 193 827 65548 587 413 674 134 913 858 220 598 829 4 173 2 774 163 495 66
83 454 57 924 25 530 2 603 109 432 – 5 580 6719 598 13 994 5 604 3 635 3 396 928 1 127 15 604 68
132 554 86 811 45 743 41 558 30 229 1 058 12 10 991 69420 811 331 943 88 868 77 673 69 377 1 109 1 087 128 357 70
22 448 11 976 10 472 151 – 28 – 1 099 7178 384 64 697 13 687 525 156 84 13 17 950 7248 466 34 152 14 314 360 – 81 10 5 300 73
197 091 130 732 66 359 1 280 – 284 54 11 897 74243 966 178 364 65 602 1 315 518 394 679 749 – 46 146 75121 557 84 412 37 145 123 599 93 717 575 395 13 123 76
38 458 26 245 12 213 1 145 – 50 31 024 1 760 77140 618 108 094 32 524 14 889 12 426 493 244 33 474 78
39 577 27 193 12 384 370 – 61 – 1 701 79424 388 321 012 103 376 338 802 124 486 630 25 854 686 80
80 336 56 152 24 184 1 713 437 197 – 19 846 8185 769 61 071 24 698 55 879 54 134 80 – 10 200 8233 434 25 364 8 070 1 543 1 230 107 1 334 1 213 83
236 598 158 047 78 551 198 381 19 206 2 000 1 342 26 713 8477 441 53 536 23 905 8 730 5 243 130 750 6 010 85
456 430 323 409 133 021 3 903 695 3 807 845 1 447 – 134 149 86749 615 506 641 242 974 858 092 809 222 4 982 2 975 790 465 87
22 869 15 860 7 009 3 223 2 336 28 – 1 403 88169 639 108 984 60 655 25 550 22 616 330 2 347 30 612 89394 473 281 566 112 907 244 391 237 113 353 – 245 937 90
County Area 69

TIPS PS [APS_PPGB,F_SCOTT] 6/ 3/96 12:37:43 MCVX09 TLP:CFFR1.TLP;15 6/ 3/96 11:04:06 DATA:NONE PSC:TIPS_12353107_01.PSC PAGE: 69TSF:TIPS92~12353107.DAT;1 6/ 3/96 12:35:33 UTF:TIPS93~12353107.DAT;1 6/ 3/96 12:35:33 META:TIPS96~12353107.DAT;1 6/ 3/96 12:37:03
Federal Government Expenditures or Obligations by State and County Area: Fiscal Year[Thousand dollars]
State and county area
Congressional district
Direct Federal expenditures or obligations
Total direct expenditres or obligations Salaries and wages
United Statesresident
population1 TotalDepartment of
DefenseAll other
agencies Grant awards TotalDepartmentof Defense
Virginia mCon.
Radford city area 09--------------------------- 15 789 57 997 11 051 46 946 4 121 6 970 5 1311Richmond city area 03 07------------------------- 201 108 2 671 590 300 270 2 371 320 891 018 504 014 216 4972Roanoke city area 06-------------------------- 96 643 630 881 58 769 572 112 54 740 70 366 6263South Boston city area 05---------------------- 7 143 29 036 468 28 568 1 055 1 698 254Staunton city area 06-------------------------- 24 840 114 902 7 158 107 744 13 314 7 721 2 8595Suffolk city area 03 04---------------------------- 54 922 223 443 19 868 203 575 27 405 9 882 4 2176Virginia Beach city area 02 04--------------------- 430 295 1 959 488 1 177 071 782 417 72 592 712 453 677 3387Waynesboro city area 06----------------------- 18 749 79 515 2 855 76 660 6 440 2 420 2068Williamsburg city area 01----------------------- 12 560 151 511 57 890 93 621 8 894 19 266 12 7799Winchester city area 10------------------------ 23 796 162 410 20 538 141 872 6 014 21 560 13 86710
Bedford city area 05--------------------------- 6 570 36 342 1 973 34 369 134 2 047 –11Emporia city area 04--------------------------- 5 175 36 577 1 909 34 668 2 386 2 286 1 10612Salem city area 06---------------------------- 24 218 188 350 5 749 182 601 4 798 75 021 1 79813Manassas city area 10------------------------- 31 873 404 648 249 768 154 880 19 727 22 011 8 51214Manassas Park city area 10-------------------- 7 351 9 924 3 359 6 565 3 928 – –15Poquoson city area 01------------------------- 11 684 50 750 29 870 20 880 884 2 479 2 47916State undistributed ------------------------- 2 041 424 – 2 041 424 436 671 117 –17
Washington --------------------------------- 5 343 183 28 834 151 5 951 885 22 882 266 4 695 737 4 395 797 2 587 49918
Adams County 04 05----------------------------- 15 047 88 234 897 87 337 37 821 2 028 –19Asotin County 05------------------------------ 19 788 77 896 3 883 74 013 13 534 2 436 48920Benton County 04----------------------------- 129 297 2 109 590 30 497 2 079 093 64 414 49 726 2 20221Chelan County 04----------------------------- 55 916 242 774 9 660 233 114 42 172 27 003 66622Clallam County 06----------------------------- 61 788 315 003 22 055 292 948 41 736 25 391 –23Clark County 03------------------------------- 281 727 906 517 48 741 857 776 133 680 118 220 9 81524Columbia County 05--------------------------- 4 102 26 015 3 118 22 897 2 953 2 052 1 19025Cowlitz County 03----------------------------- 87 615 328 274 11 507 316 767 63 640 10 554 1 19426Douglas County 04---------------------------- 30 373 88 691 4 394 84 297 14 631 5 537 3 27627Ferry County 05------------------------------- 7 034 28 737 644 28 093 6 913 5 258 –28
Franklin County 04---------------------------- 42 711 175 128 8 971 166 157 48 046 21 880 4 11529Garfield County 05---------------------------- 2 305 21 040 4 266 16 774 1 007 3 271 1 54430Grant County 04------------------------------ 62 311 241 309 7 188 234 121 47 052 29 801 1 18231Grays Harbor County 03 06----------------------- 66 912 304 634 15 878 288 756 60 748 11 626 70932Island County 02------------------------------ 67 674 501 211 350 252 150 959 15 391 264 473 258 79733Jefferson County 06--------------------------- 24 094 118 798 19 031 99 767 13 324 10 019 5 93634King County 01 07 08 09------------------------------- 1 587 529 7 827 574 1 586 781 6 240 793 1 477 620 996 550 98 83635Kitsap County 01 06------------------------------ 220 396 2 075 140 1 433 078 642 062 96 752 1 101 843 1 080 98236Kittitas County 04----------------------------- 29 727 100 766 3 937 96 829 19 776 6 834 78837Klickitat County 03 04---------------------------- 17 821 77 753 5 345 72 408 13 921 8 223 3 75938
Lewis County 03------------------------------ 64 693 260 976 11 641 249 335 44 495 11 618 1 06539Lincoln County 05----------------------------- 9 429 58 892 1 686 57 206 4 793 2 591 –40Mason County 06----------------------------- 45 866 200 569 11 864 188 705 34 776 4 287 –41Okanogan County 04-------------------------- 35 781 177 164 14 024 163 140 39 962 16 810 5742Pacific County 03----------------------------- 20 303 111 495 4 661 106 834 20 140 4 559 –43Pend Oreille County 05------------------------ 10 317 48 672 3 118 45 554 10 797 3 325 –44Pierce County 06 08 09------------------------------ 638 339 3 374 300 1 374 905 1 999 395 404 651 990 528 854 69145San Juan County 02--------------------------- 11 454 43 012 3 215 39 797 3 052 2 634 –46Skagit County 02------------------------------ 91 838 355 949 18 620 337 329 61 400 15 170 40347Skamania County 03-------------------------- 8 958 36 156 1 194 34 962 7 542 8 595 19248
Snohomish County 01 02------------------------- 524 337 1 507 756 241 297 1 266 459 243 399 114 287 45 82949Spokane County 05--------------------------- 395 881 1 783 501 336 336 1 447 165 266 908 303 340 172 63850Stevens County 05---------------------------- 36 389 134 253 7 752 126 501 29 646 14 047 18551Thurston County 03 09--------------------------- 187 239 1 294 059 95 249 1 198 810 701 718 53 084 6 31252Wahkiakum County 03------------------------- 3 648 14 800 2 015 12 785 1 427 667 –53Walla Walla County 05------------------------- 52 583 250 006 39 677 210 329 35 568 37 190 13 21254Whatcom County 02--------------------------- 145 410 582 626 147 867 434 759 78 314 37 928 2 84255Whitman County 05--------------------------- 38 866 177 831 8 149 169 682 58 484 11 017 65156Yakima County 04----------------------------- 207 685 837 202 58 492 778 710 228 371 61 397 13 94257State undistributed ------------------------- 1 929 846 – 1 929 846 205 161 – –58
West Virginia ------------------------------- 1 822 640 10 208 650 458 813 9 749 837 2 337 838 797 004 125 46159
Barbour County 01---------------------------- 16 108 59 907 1 347 58 560 7 164 1 931 –60Berkeley County 02---------------------------- 65 456 432 032 57 290 374 742 46 121 120 870 18 40461Boone County 03------------------------------ 26 283 142 754 1 259 141 495 14 611 4 457 –62Braxton County 02---------------------------- 13 170 82 309 1 761 80 548 35 888 2 587 83563Brooke County 01----------------------------- 26 712 99 930 1 510 98 420 14 264 2 426 36864Cabell County 03------------------------------ 96 793 562 079 31 800 530 279 122 497 50 941 22 82665Calhoun County 02---------------------------- 7 935 31 177 590 30 587 4 666 1 232 21166Clay County 02------------------------------- 10 209 40 894 415 40 479 5 736 1 399 –67Doddridge County 01-------------------------- 7 291 20 503 821 19 682 2 430 808 –68Fayette County 03----------------------------- 48 317 287 691 3 930 283 761 39 600 13 381 49969
Gilmer County 02----------------------------- 7 467 31 705 605 31 100 6 784 1 265 –70Grant County 01------------------------------ 10 929 45 147 1 331 43 816 14 153 2 533 18771Greenbrier County 03-------------------------- 35 418 176 209 11 633 164 576 33 455 6 165 1 04572Hampshire County 02-------------------------- 18 141 65 582 2 327 63 255 13 170 2 337 29473Hancock County 01---------------------------- 34 809 161 692 1 128 160 564 20 508 3 475 –74Hardy County 02------------------------------ 11 480 38 304 1 218 37 086 5 249 2 485 –75Harrison County 01---------------------------- 70 742 400 729 7 132 393 597 84 963 48 695 1 59276Jackson County 02---------------------------- 26 671 100 061 2 022 98 039 20 302 3 911 37977Jefferson County 02--------------------------- 38 888 138 547 7 709 130 838 15 687 23 777 38978Kanawha County 02--------------------------- 206 796 1 526 018 62 164 1 463 854 596 356 117 563 27 58879
Lewis County 02------------------------------ 17 514 75 120 2 315 72 805 11 951 2 720 46480Lincoln County 03----------------------------- 21 901 79 273 737 78 536 10 711 2 052 –81Logan County 03------------------------------ 42 890 274 218 1 959 272 259 43 965 6 799 50782McDowell County 03--------------------------- 33 060 221 390 10 887 210 503 42 746 5 234 15583Marion County 01----------------------------- 58 096 320 936 51 595 269 341 37 005 9 424 1 02984Marshall County 01---------------------------- 37 289 141 439 3 146 138 293 29 413 4 924 1 81185Mason County 02----------------------------- 25 345 128 509 16 246 112 263 35 352 8 481 5 53586Mercer County 03----------------------------- 65 056 327 880 8 247 319 633 39 782 14 540 1 61887Mineral County 01----------------------------- 27 242 142 091 37 895 104 196 17 895 2 801 24388Mingo County 03------------------------------ 33 947 225 554 10 001 215 553 89 938 4 330 96389
See footnotes at end of table.
70 Consolidated Federal Funds Report

TIPS PS [APS_PPGB,F_SCOTT] 6/ 3/96 12:37:43 MCVX09 TLP:CFFR1.TLP;15 6/ 3/96 11:04:06 DATA:NONE PSC:TIPS_12353107_01.PSC PAGE: 70TSF:TIPS92~12353107.DAT;1 6/ 3/96 12:35:33 UTF:TIPS93~12353107.DAT;1 6/ 3/96 12:35:33 META:TIPS96~12353107.DAT;1 6/ 3/96 12:37:03
1995mCon.
Direct Federal expenditures or obligationsmCon. Other Federal assistance
Direct payments for individuals Procurement contract awards
TotalRetirement and
disability All other TotalDepartmentof Defense
Other Federalexpenditures or
obligations Direct loansGuaranteed loans
and insurance
40 854 26 477 14 377 5 948 4 647 104 – 1 939 11 098 515 743 735 354 780 171 616 37 909 6 426 493 138 406 2
429 565 293 774 135 791 74 224 58 143 1 986 655 106 894 325 964 18 092 7 872 262 – 56 12 3 490 493 039 66 000 27 039 681 – 147 171 12 234 5
174 102 118 264 55 838 11 353 5 969 701 2 599 69 667 6974 754 802 497 172 257 197 130 177 688 2 558 88 1 982 239 7
69 990 52 215 17 775 560 105 105 – 16 071 8111 700 85 782 25 918 11 341 8 805 309 90 3 617 9
88 491 69 123 19 368 46 057 1 226 288 – 3 567 10
32 654 25 154 7 500 1 450 – 58 – 1 402 1131 645 20 457 11 188 213 – 48 – 3 392 1298 283 72 114 26 169 9 289 466 958 – 8 525 1394 513 73 577 20 936 265 019 227 695 3 379 154 80 308 145 982 4 384 1 598 14 – – – 23 344 15
47 299 43 075 4 224 87 – – – 263 654 16702 981 51 069 651 912 – – 901 656 277 084 1 241 373 17
14 511 345 9 412 523 5 098 822 4 760 423 2 297 754 470 848 275 750 4 234 872 18
30 102 18 913 11 189 356 76 17 927 7 786 56 130 1957 205 40 313 16 892 2 199 1 610 2 523 179 7 480 20
249 578 183 801 65 777 1 739 010 14 215 6 861 6 286 82 061 21162 827 117 425 45 402 9 967 1 020 806 7 852 144 368 22238 796 180 743 58 053 8 740 2 474 340 4 217 40 722 23603 581 444 171 159 410 44 670 6 703 6 365 4 573 135 433 24
13 726 9 657 4 069 2 202 1 428 5 082 2 131 13 306 25236 848 166 751 70 097 16 785 3 661 446 427 91 484 26
55 772 39 652 16 120 1 106 712 11 645 3 041 28 405 2715 072 11 270 3 802 1 200 – 294 10 722 28
85 388 56 553 28 835 12 385 2 351 7 429 3 490 35 619 298 614 6 264 2 350 2 758 2 610 5 390 1 490 10 125 30
148 211 108 503 39 708 4 947 352 11 299 9 053 72 916 31215 386 149 683 65 703 16 173 8 682 700 5 176 117 685 32179 847 147 194 32 653 41 124 39 908 376 1 401 76 479 33
90 661 70 967 19 694 4 667 3 444 128 547 11 008 343 612 717 2 481 039 1 131 678 1 707 378 1 293 178 33 310 6 493 826 566 35
620 670 500 493 120 177 255 083 246 889 793 4 302 121 383 3668 535 46 958 21 577 4 910 558 711 1 168 24 608 3749 620 35 753 13 867 1 149 – 4 841 597 9 316 38
197 886 139 626 58 260 6 349 1 610 627 2 996 67 998 3932 034 23 576 8 458 358 – 19 115 5 124 30 922 40
157 403 119 920 37 483 3 684 – 419 1 859 22 273 4198 004 71 518 26 486 20 364 11 240 2 025 5 192 39 359 4283 000 59 186 23 814 3 388 1 481 408 6 130 37 816 4332 837 25 045 7 792 1 325 – 388 71 2 408 44
1 675 622 1 266 875 408 747 294 130 249 203 9 369 5 792 289 355 4536 493 27 604 8 889 725 – 107 169 6 174 46
262 160 186 203 75 957 16 265 2 431 956 3 564 301 409 4716 751 12 499 4 252 3 211 478 58 101 2 377 48
980 774 687 564 293 210 165 804 140 340 3 492 10 418 380 060 491 097 828 767 716 330 112 104 777 71 634 10 649 2 134 209 086 50
85 414 62 920 22 494 3 920 2 568 1 226 3 065 7 561 51524 934 406 346 118 588 13 037 2 028 1 285 1 917 96 718 52
11 043 8 258 2 785 1 585 1 471 80 335 5 300 53140 522 101 361 39 161 23 137 21 545 13 589 4 193 48 823 54324 678 228 627 96 051 140 660 127 748 1 047 4 586 129 359 55
73 785 46 654 27 131 10 265 3 116 24 280 3 559 60 414 56463 413 314 604 148 809 70 635 30 990 13 385 4 609 124 150 57
1 473 608 40 316 1 433 292 – – 251 077 139 719 467 492 58
6 311 823 4 134 981 2 176 842 707 507 203 305 54 478 166 017 889 755 59
49 495 33 522 15 973 1 148 338 169 400 8 811 60165 615 127 091 38 524 97 691 30 971 1 735 5 752 35 200 61
87 837 61 442 26 395 35 705 390 145 235 17 934 6242 930 31 073 11 857 759 69 144 240 2 411 6382 748 52 918 29 830 414 – 78 891 9 756 64
364 301 250 400 113 901 23 424 2 826 916 2 112 40 926 6525 009 16 390 8 619 207 – 64 550 3 998 6633 379 22 900 10 479 294 – 87 2 026 1 466 6717 034 11 782 5 252 161 – 69 73 2 830 68
195 813 136 304 59 509 38 627 – 270 306 6 821 69
23 277 14 306 8 971 280 – 101 70 5 709 7027 975 20 285 7 690 377 25 109 417 8 239 71
125 736 87 897 37 839 10 326 7 225 527 2 113 17 741 7248 651 36 424 12 227 408 29 1 016 3 422 8 927 73
136 178 84 517 51 661 1 302 216 229 35 9 025 7429 193 21 957 7 236 1 125 100 252 552 14 865 75
250 010 169 357 80 653 16 141 573 921 2 730 25 143 7674 931 52 262 22 669 656 – 261 3 639 13 414 7793 494 72 453 21 041 4 728 2 020 861 3 405 24 987 78
732 820 493 068 239 752 75 597 14 297 3 681 1 414 120 061 79
59 273 40 335 18 938 1 031 474 145 700 5 597 8066 014 47 333 18 681 398 – 99 456 6 436 81
164 078 115 238 48 840 58 520 131 856 673 38 133 82161 868 112 473 49 395 11 342 9 530 200 3 293 11 141 83217 578 146 134 71 444 56 656 42 240 272 672 15 211 84106 231 73 876 32 355 684 – 187 1 060 11 353 85
74 250 51 286 22 964 10 103 9 386 323 1 346 7 084 86265 924 180 366 85 558 6 529 2 210 1 105 2 926 14 339 87
84 497 57 016 27 481 36 542 35 788 357 765 10 221 88122 461 83 484 38 977 8 682 8 057 143 230 47 665 89
County Area 71

TIPS PS [APS_PPGB,F_SCOTT] 6/ 3/96 12:37:43 MCVX09 TLP:CFFR1.TLP;15 6/ 3/96 11:04:06 DATA:NONE PSC:TIPS_12353107_01.PSC PAGE: 71TSF:TIPS92~12353107.DAT;1 6/ 3/96 12:35:33 UTF:TIPS93~12353107.DAT;1 6/ 3/96 12:35:33 META:TIPS96~12353107.DAT;1 6/ 3/96 12:37:03
Federal Government Expenditures or Obligations by State and County Area: Fiscal Year[Thousand dollars]
State and county area
Congressional district
Direct Federal expenditures or obligations
Total direct expenditres or obligations Salaries and wages
United Statesresident
population1 TotalDepartment of
DefenseAll other
agencies Grant awards TotalDepartmentof Defense
West Virginia mCon.
Monongalia County 01------------------------- 78 041 418 826 16 282 402 544 57 282 62 561 3 5061Monroe County 03---------------------------- 12 959 67 242 1 719 65 523 6 179 13 824 –2Morgan County 02---------------------------- 12 946 47 612 1 955 45 657 6 331 1 093 –3Nicholas County 02---------------------------- 27 377 210 746 3 200 207 546 114 522 4 797 6304Ohio County 01------------------------------- 50 013 313 090 9 127 303 963 93 204 21 108 2 0995Pendleton County 02-------------------------- 8 057 39 330 10 760 28 570 6 013 7 103 6 2046Pleasants County 01--------------------------- 7 496 31 085 332 30 753 9 968 587 –7Pocahontas County 03------------------------- 9 042 72 073 691 71 382 38 192 2 580 –8Preston County 01---------------------------- 29 835 113 597 6 084 107 513 17 802 6 724 3 5999Putnam County 02---------------------------- 47 960 122 094 3 898 118 196 18 198 6 743 1 26110
Raleigh County 03----------------------------- 78 137 466 374 13 340 453 034 83 281 46 632 7 54911Randolph County 02--------------------------- 28 564 146 769 5 881 140 888 33 908 11 092 60512Ritchie County 01----------------------------- 10 289 41 070 598 40 472 7 555 1 619 –13Roane County 02----------------------------- 15 233 60 311 1 302 59 009 15 266 1 739 20314Summers County 03--------------------------- 14 131 64 753 3 115 61 638 9 424 2 039 42015Taylor County 01------------------------------ 15 263 57 846 1 765 56 081 8 975 2 261 53716Tucker County 01----------------------------- 7 843 29 967 1 079 28 888 4 440 2 289 –17Tyler County 01------------------------------- 10 032 30 536 611 29 925 4 429 1 140 –18Upshur County 02----------------------------- 23 683 93 089 5 854 87 235 20 393 6 228 3 81319Wayne County 03----------------------------- 42 475 216 826 5 038 211 788 76 548 36 416 2 95620
Webster County 03---------------------------- 10 416 44 494 531 43 963 6 796 948 –21Wetzel County 01----------------------------- 18 956 81 508 1 007 80 501 16 783 2 760 19522Wirt County 02-------------------------------- 5 443 38 086 9 682 28 404 12 639 785 7323Wood County 01------------------------------ 88 009 453 368 11 446 441 922 91 817 75 616 4 86924Wyoming County 03--------------------------- 28 485 121 784 2 496 119 288 12 483 4 781 –25State undistributed ------------------------- 446 493 – 446 493 103 046 – –26
Wisconsin ---------------------------------- 5 081 711 19 839 346 957 555 18 881 791 3 921 366 1 376 889 238 87827
Adams County 06----------------------------- 17 025 70 651 861 69 790 6 879 18 806 –28Ashland County 07---------------------------- 16 458 82 730 4 257 78 473 16 165 6 607 9529Barron County 03----------------------------- 42 466 146 360 2 702 143 658 22 843 6 989 32430Bayfield County 07---------------------------- 14 739 54 153 ~1 282 55 435 10 675 4 545 7031Brown County 06 08------------------------------ 207 269 616 428 15 150 601 278 73 184 49 712 5 13132Buffalo County 03----------------------------- 13 905 52 685 5 043 47 642 7 510 4 957 3 06333Burnett County 07----------------------------- 13 795 54 086 4 114 49 972 3 847 1 640 8334Calumet County 06 08---------------------------- 36 859 71 639 4 414 67 225 8 499 7 825 2 62635Chippewa County 03 07-------------------------- 54 007 204 798 14 306 190 492 32 492 10 594 4 16636Clark County 03 07------------------------------- 32 433 116 072 1 965 114 107 26 034 5 100 44437
Columbia County 02--------------------------- 48 374 207 080 5 437 201 643 26 342 8 439 39438Crawford County 03--------------------------- 16 267 83 055 27 226 55 829 9 717 3 105 86539Dane County 02------------------------------- 390 261 2 114 086 129 284 1 984 802 1 023 564 200 337 40 86140Dodge County 02 09----------------------------- 78 264 199 278 11 607 187 671 29 984 8 186 78441Door County 08------------------------------- 26 402 111 454 13 213 98 241 10 613 6 202 1 26742Douglas County 07---------------------------- 42 892 190 663 4 520 186 143 45 823 7 431 65443Dunn County 03------------------------------- 37 852 103 413 1 990 101 423 20 917 4 599 62644Eau Claire County 03 07-------------------------- 87 939 324 986 10 427 314 559 56 653 18 017 47445Florence County 08---------------------------- 5 193 15 998 280 15 718 2 448 771 –46Fond du Lac County 06 09------------------------ 92 951 279 166 6 419 272 747 33 529 11 895 96547
Forest County 08------------------------------ 9 337 47 726 569 47 157 11 716 3 960 –48Grant County 03------------------------------ 49 705 160 370 2 926 157 444 21 438 7 635 68449Green County 01 02------------------------------ 31 973 95 282 1 025 94 257 14 058 3 954 20550Green Lake County 06------------------------- 19 292 67 718 1 439 66 279 7 176 2 528 16651Iowa County 02------------------------------- 21 269 54 565 618 53 947 7 225 3 245 27952Iron County 07-------------------------------- 6 478 28 620 935 27 685 3 562 1 325 42253Jackson County 03---------------------------- 16 954 60 122 1 885 58 237 9 830 3 039 72754Jefferson County 01 02 09--------------------------- 72 405 246 513 5 533 240 980 32 363 9 019 1 22355Juneau County 06----------------------------- 23 173 123 828 30 129 93 699 20 394 20 993 17 49856Kenosha County 01--------------------------- 137 810 421 673 18 293 403 380 73 449 14 577 1 80157
Kewaunee County 08-------------------------- 19 276 68 393 1 535 66 858 5 586 3 139 98358La Crosse County 03-------------------------- 101 004 334 781 16 631 318 150 53 539 24 407 3 70959Lafayette County 02--------------------------- 16 225 48 368 295 48 073 6 121 2 275 –60Langlade County 08--------------------------- 20 277 77 251 1 758 75 493 12 937 2 486 39161Lincoln County 07----------------------------- 28 684 98 552 2 225 96 327 13 935 3 479 47062Manitowoc County 06 08-------------------------- 82 145 255 944 4 494 251 450 31 507 8 812 56363Marathon County 07--------------------------- 120 111 373 363 53 987 319 376 48 111 25 921 3 94664Marinette County 08--------------------------- 41 846 158 838 2 782 156 056 23 880 8 189 37065Marquette County 06-------------------------- 13 570 60 088 4 034 56 054 4 188 2 076 7366Menominee County 08------------------------- 4 410 33 388 93 33 295 16 521 431 –67
Milwaukee County 04 05-------------------------- 938 105 4 295 336 114 335 4 181 001 923 621 480 436 76 86768Monroe County 03 06---------------------------- 38 356 236 488 74 429 162 059 19 303 73 902 38 94269Oconto County 08----------------------------- 31 729 101 017 3 723 97 294 17 214 4 369 –70Oneida County 07 08----------------------------- 34 353 149 588 3 046 146 542 18 869 11 374 26671Outagamie County 06 08------------------------- 147 458 382 119 9 725 372 394 49 873 18 591 55572Ozaukee County 09--------------------------- 78 026 220 574 6 438 214 136 27 223 7 340 –73Pepin County 03------------------------------ 7 189 29 238 280 28 958 5 273 1 164 –74Pierce County 03------------------------------ 34 162 88 741 1 695 87 046 14 688 4 916 64975Polk County 03 07------------------------------- 36 668 122 891 1 850 121 041 23 039 5 664 –76Portage County 07---------------------------- 64 040 167 316 3 650 163 666 28 423 10 579 1 54877
Price County 07------------------------------- 15 886 64 332 1 168 63 164 11 724 5 011 8278Racine County 01----------------------------- 181 704 588 704 18 706 569 998 112 860 21 790 2 79379Richland County 02---------------------------- 17 832 53 592 687 52 905 6 934 2 270 –80Rock County 01------------------------------- 145 958 480 413 28 904 451 509 71 840 16 410 1 30281Rusk County 07------------------------------- 15 185 59 046 1 122 57 924 11 066 2 792 36882St. Croix County 03---------------------------- 53 994 131 669 2 544 129 125 31 452 5 954 37883Sauk County 02------------------------------- 50 234 169 135 14 139 154 996 24 842 6 894 76984Sawyer County 07----------------------------- 15 290 71 234 2 544 68 690 16 976 3 489 84885Shawano County 08--------------------------- 37 973 129 336 1 330 128 006 23 903 4 886 –86Sheboygan County 06 09------------------------- 107 031 324 123 13 319 310 804 38 798 12 356 1 71287
See footnotes at end of table.
72 Consolidated Federal Funds Report

TIPS PS [APS_PPGB,F_SCOTT] 6/ 3/96 12:37:43 MCVX09 TLP:CFFR1.TLP;15 6/ 3/96 11:04:06 DATA:NONE PSC:TIPS_12353107_01.PSC PAGE: 72TSF:TIPS92~12353107.DAT;1 6/ 3/96 12:35:33 UTF:TIPS93~12353107.DAT;1 6/ 3/96 12:35:33 META:TIPS96~12353107.DAT;1 6/ 3/96 12:37:03
1995mCon.
Direct Federal expenditures or obligationsmCon. Other Federal assistance
Direct payments for individuals Procurement contract awards
TotalRetirement and
disability All other TotalDepartmentof Defense
Other Federalexpenditures or
obligations Direct loansGuaranteed loans
and insurance
177 893 115 583 62 310 120 697 8 034 393 878 27 732 145 991 31 650 14 341 1 018 630 228 1 393 1 491 239 666 30 881 8 785 415 – 107 245 7 551 389 599 64 016 25 583 1 664 973 164 1 318 4 206 4
189 222 120 517 68 705 9 064 4 394 492 48 53 336 520 762 15 977 4 785 5 245 3 649 207 298 3 993 620 337 14 119 6 218 153 – 41 746 2 326 730 004 20 105 9 899 1 110 – 187 183 11 862 887 969 61 537 26 432 929 275 173 1 208 9 773 995 526 70 174 25 352 1 339 364 288 4 407 21 727 10
304 569 213 872 90 697 31 366 465 525 1 439 17 881 1196 868 66 445 30 423 4 646 2 583 254 227 12 294 1231 629 20 991 10 638 166 ~164 102 302 1 628 1342 740 28 529 14 211 433 158 134 2 076 2 437 1451 236 35 582 15 654 1 964 1 699 90 568 5 348 1545 617 33 255 12 362 554 66 440 277 1 255 1622 590 16 538 6 052 581 294 67 – 28 232 1724 580 16 919 7 661 307 – 79 1 793 2 756 1865 570 44 184 21 386 655 40 242 1 691 12 677 19
101 531 72 492 29 039 2 192 989 138 990 15 518 20
36 198 25 558 10 640 494 – 58 426 4 415 2161 064 42 184 18 880 764 – 136 458 17 218 2215 225 10 001 5 224 9 384 9 242 52 70 2 134 23
275 446 180 873 94 573 9 994 1 025 495 1 370 53 770 24101 898 77 056 24 842 2 514 1 694 108 37 11 893 25309 495 2 056 307 439 – – 33 952 101 066 10 860 26
12 988 400 8 408 895 4 579 505 1 109 696 506 628 442 994 350 872 3 199 103 27
42 068 30 831 11 237 934 186 1 963 2 617 19 437 2850 840 35 453 15 387 8 960 3 228 159 1 344 3 448 29
112 810 80 744 32 066 2 112 209 1 605 3 813 14 094 3038 396 28 700 9 696 351 ~2 652 186 923 3 399 31
400 197 286 258 113 939 89 886 3 615 3 450 2 237 120 630 3234 075 24 432 9 643 3 543 1 491 2 600 2 322 11 606 3343 880 31 769 12 111 4 310 3 149 410 579 4 527 3453 348 37 625 15 723 547 45 1 419 2 306 23 688 35
128 999 90 923 38 076 30 375 6 853 2 339 3 558 28 753 3681 179 55 507 25 672 1 723 402 2 035 6 289 29 973 37
134 544 93 743 40 801 32 992 2 563 4 762 5 829 28 235 3841 969 29 440 12 529 26 358 25 663 1 906 1 072 6 507 39
769 296 524 090 245 206 103 836 49 345 17 053 16 550 76 009 40145 686 102 148 43 538 10 808 8 890 4 614 9 507 60 626 41
78 293 56 027 22 266 14 300 10 263 2 047 1 448 15 821 42132 945 92 997 39 948 4 184 1 638 280 146 4 218 43
73 029 48 660 24 369 1 038 200 3 830 5 490 16 365 44205 420 139 031 66 389 10 525 7 317 34 370 1 313 28 748 45
12 572 8 985 3 587 87 – 120 120 1 910 46221 178 158 832 62 346 8 146 2 339 4 419 5 476 78 300 47
29 942 22 640 7 302 1 968 27 140 96 527 48121 061 82 175 38 886 2 452 784 7 784 6 891 35 513 49
71 815 50 240 21 575 740 39 4 716 9 689 33 612 5054 225 38 906 15 319 1 254 368 2 535 2 621 17 838 5137 368 26 896 10 472 829 – 5 898 2 926 14 659 5222 809 16 545 6 264 862 133 62 306 263 5344 601 32 217 12 384 978 – 1 673 2 181 20 819 54
173 857 119 729 54 128 27 285 2 149 3 990 5 628 53 478 5568 764 50 539 18 225 11 739 10 904 1 939 3 847 15 675 56
327 220 213 435 113 785 4 250 691 2 178 5 458 41 773 57
44 861 32 894 11 967 13 174 114 1 633 1 668 10 296 58233 263 159 756 73 507 21 286 8 178 2 286 2 501 56 557 59
34 210 24 260 9 950 426 – 5 335 11 085 25 469 6060 051 43 608 16 443 994 208 783 221 9 839 6180 253 57 538 22 715 611 – 274 1 158 10 592 62
210 002 148 838 61 164 3 036 1 051 2 587 2 742 45 142 63240 017 169 238 70 779 56 651 46 100 2 662 1 935 40 062 64124 089 92 051 32 038 1 591 90 1 090 780 11 344 65
48 739 36 199 12 540 3 755 3 354 1 330 1 696 4 277 668 134 5 512 2 622 8 290 – 12 203 1 234 67
2 805 337 1 738 092 1 067 245 75 105 13 541 10 837 1 411 207 504 68102 827 79 503 23 324 38 085 32 708 2 372 3 518 25 052 69
73 927 53 990 19 937 3 162 2 420 2 345 2 996 16 603 70116 929 85 371 31 558 1 933 – 483 3 084 25 336 71286 191 209 233 76 958 22 952 5 947 4 512 4 966 74 984 72157 107 113 867 43 240 27 579 4 196 1 324 817 39 755 73
20 314 13 476 6 838 1 159 – 1 328 1 785 5 409 7464 228 44 281 19 947 1 136 – 3 773 6 909 17 283 7590 673 64 503 26 170 1 180 233 2 335 4 234 21 614 76
121 697 82 254 39 443 2 840 143 3 776 4 665 42 910 77
46 917 33 934 12 983 476 – 205 722 2 599 78435 617 308 846 126 771 15 323 10 426 3 113 11 082 44 225 79
42 063 29 460 12 603 401 32 1 924 939 8 188 80340 582 237 805 102 777 43 763 23 412 7 818 17 666 56 442 81
43 956 31 209 12 747 457 – 776 988 3 686 8286 275 62 065 24 210 3 179 452 4 809 9 227 30 919 83
120 811 85 630 35 181 12 486 11 104 4 102 7 917 21 744 8446 562 33 877 12 685 3 917 236 290 852 4 775 8593 754 70 112 23 642 4 815 – 1 978 1 477 13 640 86
254 085 183 002 71 083 16 822 8 246 2 063 2 648 52 862 87
County Area 73

TIPS PS [APS_PPGB,F_SCOTT] 6/ 3/96 12:37:43 MCVX09 TLP:CFFR1.TLP;15 6/ 3/96 11:04:06 DATA:NONE PSC:TIPS_12353107_01.PSC PAGE: 73TSF:TIPS92~12353107.DAT;1 6/ 3/96 12:35:33 UTF:TIPS93~12353107.DAT;1 6/ 3/96 12:35:33 META:TIPS96~12353107.DAT;1 6/ 3/96 12:37:03
Federal Government Expenditures or Obligations by State and County Area: Fiscal Year[Thousand dollars]
State and county area
Congressional district
Direct Federal expenditures or obligations
Total direct expenditres or obligations Salaries and wages
United Statesresident
population1 TotalDepartment of
DefenseAll other
agencies Grant awards TotalDepartmentof Defense
Wisconsin mCon.
Taylor County 07------------------------------ 19 221 57 586 1 520 56 066 12 226 3 103 1981Trempealeau County 03------------------------ 25 806 109 762 4 454 105 308 26 638 4 946 6682Vernon County 03----------------------------- 26 755 92 138 3 127 89 011 15 514 4 472 7483Vilas County 08------------------------------- 19 711 87 705 1 252 86 453 12 244 2 850 –4Walworth County 01--------------------------- 80 720 221 652 2 845 218 807 29 057 8 195 4805Washburn County 07-------------------------- 14 788 74 598 1 679 72 919 10 910 6 050 2166Washington County 09------------------------- 107 234 248 175 7 010 241 165 33 960 14 812 4 8087Waukesha County 01 04 09-------------------------- 332 207 914 048 58 055 855 993 79 093 44 007 3 1118Waupaca County 06--------------------------- 48 468 201 280 11 788 189 492 38 938 6 633 6279Waushara County 06-------------------------- 20 762 73 478 968 72 510 8 399 2 526 –10Winnebago County 06------------------------- 147 869 555 516 142 750 412 766 58 309 31 420 3 17011Wood County 07------------------------------ 75 702 248 432 5 353 243 079 33 911 10 440 1 37112State undistributed ------------------------- 1 175 918 – 1 175 918 198 994 – –13
Wyoming ----------------------------------- 475 991 2 491 914 305 223 2 186 691 755 760 380 754 149 35314
Albany County 00----------------------------- 31 080 104 484 5 125 99 359 29 282 10 112 1 20015Big Horn County 00---------------------------- 10 844 49 077 1 172 47 905 6 220 3 961 34116Campbell County 00--------------------------- 30 891 60 671 1 241 59 430 21 655 3 767 19217Carbon County 00----------------------------- 16 247 109 042 42 481 66 561 17 011 7 688 6618Converse County 00--------------------------- 11 704 35 252 820 34 432 8 647 2 403 20719Crook County 00------------------------------ 5 612 21 865 410 21 455 6 393 2 206 –20Fremont County 00---------------------------- 35 128 146 536 2 827 143 709 44 589 14 110 32721Goshen County 00---------------------------- 12 602 49 646 1 397 48 249 7 572 3 585 41322Hot Springs County 00------------------------- 4 699 23 467 495 22 972 4 668 1 051 11323Johnson County 00---------------------------- 6 503 31 023 848 30 175 8 002 2 596 –24
Laramie County 00---------------------------- 78 040 623 446 203 705 419 741 165 692 195 024 137 58225Lincoln County 00----------------------------- 13 666 45 942 3 624 42 318 10 480 6 789 2 38826Natrona County 00---------------------------- 63 886 242 017 5 075 236 942 44 037 32 385 80627Niobrara County 00---------------------------- 2 554 13 243 151 13 092 2 960 992 –28Park County 00------------------------------- 24 928 124 695 3 440 121 255 20 944 26 008 1 42129Platte County 00------------------------------ 8 312 48 040 3 533 44 507 13 608 4 944 2 64330Sheridan County 00--------------------------- 24 829 131 859 3 915 127 944 25 528 25 293 80531Sublette County 00---------------------------- 5 375 25 154 756 24 398 9 839 3 341 22232Sweetwater County 00------------------------- 40 662 115 323 2 024 113 299 31 252 12 405 22833Teton County 00------------------------------ 13 152 38 268 1 503 36 765 4 489 10 945 –34Uinta County 00------------------------------- 20 127 50 794 826 49 968 18 767 2 722 18335Washakie County 00--------------------------- 8 590 35 425 708 34 717 5 548 6 277 12936Weston County 00---------------------------- 6 560 40 876 19 147 21 729 2 654 2 064 8737State undistributed ------------------------- 325 771 – 325 771 245 926 86 –38
American Samoa 98---------------------------- 46 773 106 006 5 979 100 027 62 135 2 741 3039
Eastern District 98----------------------------- 21 175 84 465 3 443 81 022 47 493 – –40Manu’a District 98----------------------------- 1 714 1 253 686 567 419 – –41Swains Island 98------------------------------ 16 13 – 13 11 – –42Western District 98---------------------------- 23 868 2 407 – 2 407 1 120 – –43State undistributed ------------------------- 17 868 1 850 16 018 13 092 2 741 3044
Guam 98-------------------------------------- 133 152 809 748 495 286 314 462 133 176 370 473 350 00045
Northern Mariana Islands 99-------------------- 43 345 62 410 1 229 61 181 54 521 1 787 –46
Rota 99-------------------------------------- 2 295 280 – 280 55 – –47Saipan 99------------------------------------ 38 896 48 726 312 48 414 44 057 – –48Tinian 99------------------------------------- 2 118 750 386 364 235 – –49State undistributed ------------------------- 12 654 531 12 123 10 174 1 787 –50
Puerto Rico 98--------------------------------- 3 522 037 10 002 829 599 891 9 402 938 3 453 740 704 025 266 15051
Adjuntas Municipio 98------------------------- 19 451 21 773 – 21 773 13 330 – –52Aguada Municipio 98-------------------------- 35 911 25 510 – 25 510 15 295 – –53Aguadilla Municipio 98------------------------- 59 335 73 737 1 963 71 774 27 232 – –54Aguas Buenas Municipio 98-------------------- 25 424 17 810 – 17 810 11 061 – –55Aibonito Municipio 98-------------------------- 24 971 23 651 6 228 17 423 9 569 – –56Anasco Municipio 98--------------------------- 25 234 16 919 32 16 887 8 706 – –57Arecibo Municipio 98-------------------------- 93 385 83 924 375 83 549 40 089 – –58Arroyo Municipio 98--------------------------- 18 910 19 061 34 19 027 11 889 – –59Barceloneta Municipio 98----------------------- 20 947 19 473 256 19 217 10 032 – –60Barranquitas Municipio 98---------------------- 25 605 36 831 – 36 831 18 806 – –61
Bayamon Municipio 98------------------------- 220 262 328 587 8 917 319 670 166 107 – –62Cabo Rojo Municipio 98------------------------ 38 521 28 576 2 162 26 414 12 924 – –63Caguas Municipio 98-------------------------- 133 447 149 248 11 596 137 652 58 223 – –64Camuy Municipio 98--------------------------- 28 917 26 736 – 26 736 14 887 – –65Canovanas Municipio 98----------------------- 36 816 19 503 – 19 503 15 740 – –66Carolina Municipio 98-------------------------- 177 806 104 800 700 104 100 54 100 – –67Catano Municipio 98--------------------------- 34 587 29 018 – 29 018 13 909 – –68Cayey Municipio 98---------------------------- 46 553 40 312 – 40 312 21 085 – –69Ceiba Municipio 98---------------------------- 17 145 53 377 39 087 14 290 5 890 – –70Ciales Municipio 98---------------------------- 18 084 20 472 – 20 472 11 179 – –71
Cidra Municipio 98---------------------------- 35 601 31 976 167 31 809 19 343 – –72Coamo Municipio 98--------------------------- 33 837 29 536 – 29 536 16 326 – –73Comerio Municipio 98-------------------------- 20 265 16 639 – 16 639 10 244 – –74Corozal Municipio 98-------------------------- 33 095 27 826 – 27 826 18 177 – –75Culebra Municipio 98-------------------------- 1 542 1 759 247 1 512 448 – –76Dorado Municipio 98--------------------------- 30 759 21 984 256 21 728 11 812 – –77Fajardo Municipio 98-------------------------- 36 882 31 603 181 31 422 13 855 – –78Florida Municipio 98--------------------------- 8 689 9 302 – 9 302 5 755 – –79Guanica Municipio 98-------------------------- 19 984 17 657 – 17 657 10 803 – –80Guayama Municipio 98------------------------- 41 588 46 322 85 46 237 25 507 – –81
See footnotes at end of table.
74 Consolidated Federal Funds Report

TIPS PS [APS_PPGB,F_SCOTT] 6/ 3/96 12:37:43 MCVX09 TLP:CFFR1.TLP;15 6/ 3/96 11:04:06 DATA:NONE PSC:TIPS_12353107_01.PSC PAGE: 74TSF:TIPS92~12353107.DAT;1 6/ 3/96 12:35:33 UTF:TIPS93~12353107.DAT;1 6/ 3/96 12:35:33 META:TIPS96~12353107.DAT;1 6/ 3/96 12:37:03
1995mCon.
Direct Federal expenditures or obligationsmCon. Other Federal assistance
Direct payments for individuals Procurement contract awards
TotalRetirement and
disability All other TotalDepartmentof Defense
Other Federalexpenditures or
obligations Direct loansGuaranteed loans
and insurance
40 382 29 033 11 349 1 142 716 734 840 3 523 170 484 48 482 22 002 3 851 2 587 3 843 5 583 16 321 266 690 48 570 18 120 3 097 1 196 2 364 1 134 11 169 369 160 50 442 18 718 2 964 – 486 426 6 469 4
177 518 123 874 53 644 2 716 170 4 166 12 513 22 810 555 068 40 036 15 032 1 895 184 675 1 137 3 748 6
195 445 141 119 54 326 2 470 34 1 487 1 805 27 551 7647 247 470 585 176 662 140 455 46 531 3 247 2 820 86 724 8143 104 104 016 39 088 10 240 8 927 2 364 10 279 47 771 9
60 772 44 184 16 588 521 – 1 260 2 242 11 854 10320 051 223 722 96 329 141 553 134 070 4 182 2 403 73 628 11197 758 139 758 58 000 4 838 183 1 486 2 188 27 775 12758 864 5 156 753 708 – – 218 060 83 031 1 118 964 13
1 142 513 788 989 353 524 164 348 91 854 48 540 26 059 413 071 14
59 959 38 915 21 044 4 840 272 291 398 11 468 1530 399 22 358 8 041 7 375 – 1 122 2 703 15 258 1631 238 22 719 8 519 1 054 297 2 958 2 569 17 879 1736 486 25 721 10 765 47 079 41 360 778 583 8 893 1822 272 15 489 6 783 308 – 1 621 452 5 925 1911 179 8 880 2 299 448 – 1 639 454 1 578 2082 547 58 695 23 852 4 126 235 1 165 3 094 22 051 2133 134 24 982 8 152 569 59 4 787 2 477 12 933 2217 540 12 098 5 442 ~107 – 315 120 4 118 2318 048 14 187 3 861 426 – 1 951 9 2 595 24
214 989 165 454 49 535 41 396 29 902 6 345 666 73 587 2526 199 20 613 5 586 1 576 – 898 715 12 626 26
158 799 113 409 45 390 4 743 202 2 052 200 59 990 277 894 5 038 2 856 105 – 1 292 205 1 241 28
60 878 43 975 16 903 15 542 85 1 323 2 439 33 606 2923 710 17 434 6 276 2 562 159 3 216 344 8 310 3075 738 59 354 16 384 4 446 – 855 2 270 14 937 3111 194 8 284 2 910 440 – 339 215 1 343 3266 588 48 128 18 460 3 887 572 1 192 1 511 35 090 3319 905 15 182 4 723 2 826 64 103 162 31 248 3427 358 19 721 7 637 900 27 1 047 2 829 10 325 3521 186 15 427 5 759 834 – 1 580 1 077 20 911 3616 611 12 472 4 139 18 975 18 620 574 304 3 349 3768 659 453 68 206 – – 11 099 262 3 806 38
23 456 20 899 2 557 17 626 4 129 48 49 1 761 39
20 230 17 859 2 371 16 722 3 443 20 49 – 40148 126 22 686 686 – – – 41
2 2 – – – – – – 421 192 1 028 164 95 – – – – 431 884 1 884 – 123 – 28 – 1 761 44
167 352 123 449 43 903 124 753 120 872 13 993 5 535 17 975 45
4 506 2 324 2 182 1 567 698 28 3 283 90 46
225 34 191 – – – – – 473 611 1 748 1 863 1 058 312 – 1 648 90 48
128 – 128 386 386 – 1 635 – 49542 542 – 123 – 28 – – 50
5 400 221 3 529 511 1 870 710 365 553 252 316 79 289 197 003 2 860 599 51
8 298 2 161 6 137 – – 144 1 421 844 5210 215 2 862 7 353 – – – – 2 167 5331 170 12 671 18 499 15 335 1 963 – 2 367 20 661 546 749 882 5 867 – – – 20 29 557 855 468 7 387 6 228 6 228 – – 2 438 568 180 2 161 6 019 32 32 – – 3 243 57
42 745 15 751 26 994 599 375 491 30 24 170 587 138 343 6 795 34 34 – – 1 102 599 185 2 140 7 045 256 256 – – 703 60
18 025 1 899 16 126 – – – 13 832 1 734 61
129 607 22 839 106 768 32 735 8 917 139 117 332 487 6213 332 4 832 8 500 2 320 2 162 – – 26 915 6378 882 10 164 68 718 11 876 11 596 268 8 655 87 862 6411 850 3 364 8 486 – – – 14 320 932 653 764 1 808 1 956 – – – – 1 184 66
49 362 7 415 41 947 1 338 700 – 80 186 240 6714 670 755 13 915 440 – – – 2 171 6819 228 3 669 15 559 – – – – 25 591 697 678 1 512 6 166 39 809 39 087 – 13 411 709 293 2 276 7 017 – – – 9 285 6 081 71
12 465 1 515 10 950 167 167 – 4 516 4 038 7213 210 3 410 9 800 – – – 2 147 13 982 736 396 1 039 5 357 – – – – 317 749 649 2 298 7 351 – – – 5 113 1 566 751 064 152 912 247 247 – 186 234 769 916 3 046 6 870 256 256 – – 1 647 77
17 568 3 225 14 343 181 181 – 2 384 6 903 783 547 1 402 2 145 – – – – 755 796 854 2 404 4 450 – – – – 1 225 80
20 730 7 414 13 316 85 85 – 1 440 22 808 81
County Area 75

TIPS PS [APS_PPGB,F_SCOTT] 6/ 3/96 12:37:43 MCVX09 TLP:CFFR1.TLP;15 6/ 3/96 11:04:06 DATA:NONE PSC:TIPS_12353107_01.PSC PAGE: 75TSF:TIPS92~12353107.DAT;1 6/ 3/96 12:35:33 UTF:TIPS93~12353107.DAT;1 6/ 3/96 12:35:33 META:TIPS96~12353107.DAT;1 6/ 3/96 12:37:03
Federal Government Expenditures or Obligations by State and County Area: Fiscal Year[Thousand dollars]
State and county area
Congressional district
Direct Federal expenditures or obligations
Total direct expenditres or obligations Salaries and wages
United Statesresident
population1 TotalDepartment of
DefenseAll other
agencies Grant awards TotalDepartmentof Defense
Puerto Rico mCon. 98
Guayanilla Municipio 98------------------------ 21 581 17 973 – 17 973 10 914 – –1Guaynabo Municipio 98------------------------ 92 886 69 634 13 927 55 707 26 883 – –2Gurabo Municipio 98--------------------------- 28 737 32 639 200 32 439 13 376 – –3Hatillo Municipio 98---------------------------- 32 703 34 117 – 34 117 25 049 – –4Hormigueros Municipio 98---------------------- 15 212 10 187 – 10 187 4 491 – –5Humacao Municipio 98------------------------- 55 203 57 004 698 56 306 28 189 – –6Isabela Municipio 98--------------------------- 39 147 32 729 – 32 729 16 796 – –7Juyuya Municipio 98--------------------------- 15 527 15 525 – 15 525 10 354 – –8Juana Diaz Municipio 98----------------------- 45 198 36 822 – 36 822 21 882 – –9Juncos Municipio 98--------------------------- 30 612 23 575 – 23 575 14 456 – –10
Lajas Municipio 98---------------------------- 23 271 25 402 8 109 17 293 8 678 – –11Lares Municipio 98---------------------------- 29 015 26 506 – 26 506 17 531 – –12Las Marias Municipio 98----------------------- 9 306 6 525 – 6 525 4 988 – –13Las Piedras Municipio 98----------------------- 27 896 37 767 – 37 767 30 673 – –14Loiza Municipio 98---------------------------- 29 307 26 858 34 26 824 17 016 – –15Luquillo Municipio 98-------------------------- 18 100 14 807 36 14 771 8 587 – –16Manati Municipio 98--------------------------- 38 692 35 797 – 35 797 18 447 – –17Maricao Municipio 98-------------------------- 6 206 5 617 334 5 283 3 710 – –18Maunabo Municipio 98------------------------- 12 347 10 982 – 10 982 7 318 – –19Mayaguez Municipio 98------------------------ 100 371 167 500 66 546 100 954 59 588 – –20
Moca Municipio 98---------------------------- 32 926 21 950 – 21 950 15 394 – –21Morovis Municipio 98-------------------------- 25 288 32 865 9 954 22 911 15 364 – –22Naguabo Municipio 98------------------------- 22 620 18 529 – 18 529 10 581 – –23Naranjito Municipio 98------------------------- 27 914 29 045 – 29 045 19 177 – –24Orocovis Municipio 98------------------------- 21 158 22 350 – 22 350 15 367 – –25Patillas Municipio 98--------------------------- 19 633 18 849 – 18 849 12 102 – –26Penuelas Municipio 98------------------------- 22 515 18 951 ~30 18 981 11 345 – –27Ponce Municipio 98---------------------------- 187 749 272 096 15 611 256 485 108 820 – –28Quebradillas Municipio 98---------------------- 21 425 15 064 – 15 064 8 983 – –29Rincon Municipio 98--------------------------- 12 213 12 524 – 12 524 6 670 – –30
Rio Grande Municipio 98----------------------- 45 648 62 991 – 62 991 42 254 – –31Sabana Grande Municipio 98------------------- 22 843 17 461 326 17 135 9 288 – –32Salinas Municipio 98--------------------------- 28 335 25 129 – 25 129 16 096 – –33San German Municipio 98---------------------- 34 962 25 072 – 25 072 13 523 – –34San Juan Municipio 98------------------------- 437 745 4 677 927 19 696 4 658 231 957 757 – –35San Lorenzo Municipio 98---------------------- 35 163 61 224 31 174 30 050 19 582 – –36San Sebastian Municipio 98-------------------- 38 799 33 032 128 32 904 19 005 – –37Santa Isabel Municipio 98---------------------- 19 318 19 730 37 19 693 13 016 – –38Toa Alta Municipio 98-------------------------- 44 101 21 976 107 21 869 14 416 – –39Toa Baja Municipio 98------------------------- 89 454 62 877 4 300 58 577 29 765 – –40
Trujillo Alto Municipio 98----------------------- 61 120 34 140 – 34 140 19 025 – –41Utuado Municipio 98--------------------------- 34 980 32 474 – 32 474 24 018 – –42Vega Alta Municipio 98------------------------- 34 559 22 446 – 22 446 13 843 – –43Vega Baja Municipio 98------------------------ 55 997 44 254 – 44 254 23 418 – –44Vieques Municipio 98-------------------------- 8 602 11 260 240 11 020 4 571 – –45Villalba Municipio 98--------------------------- 23 559 22 419 – 22 419 13 969 – –46Yabucoa Municipio 98------------------------- 36 483 47 810 19 698 28 112 18 284 – –47Yauco Municipio 98---------------------------- 42 058 33 153 – 33 153 21 221 – –48State undistributed ------------------------- 2 223 342 336 479 1 886 863 935 638 704 025 266 15049
Virgin Islands 98------------------------------- 101 809 471 843 42 999 428 844 237 044 45 463 11 48450
U.S. undistributed --------------------------- 25 380 874 16 373 740 9 007 134 155 413 1 302 924 –51
11For States and the District of Columbia represents the resident population as of July 1, 1994. April 1, 1990 population data are used for U.S. territories.2See appendix B for listing of congressional districts.3The cities of Baltimore, Maryland and St. Louis, Missouri are not within the boundaries of Baltimore and St. Louis Counties, respectively.
76 Consolidated Federal Funds Report

TIPS PS [APS_PPGB,F_SCOTT] 6/ 3/96 12:37:43 MCVX09 TLP:CFFR1.TLP;15 6/ 3/96 11:04:06 DATA:NONE PSC:TIPS_12353107_01.PSC PAGE: 76TSF:TIPS92~12353107.DAT;1 6/ 3/96 12:35:33 UTF:TIPS93~12353107.DAT;1 6/ 3/96 12:35:33 META:TIPS96~12353107.DAT;1 6/ 3/96 12:37:03
1995mCon.
Direct Federal expenditures or obligationsmCon. Other Federal assistance
Direct payments for individuals Procurement contract awards
TotalRetirement and
disability All other TotalDepartmentof Defense
Other Federalexpenditures or
obligations Direct loansGuaranteed loans
and insurance
6 915 800 6 115 144 – – 150 954 127 693 4 470 23 223 15 058 13 927 – 169 7 917 219 063 1 208 17 855 200 200 – – 11 640 39 068 3 072 5 996 – – – 125 9 669 45 696 2 045 3 651 – – – 40 536 5
28 457 8 218 20 239 357 332 – 8 217 93 521 615 932 6 851 9 081 – – – – 1 296 75 171 1 450 3 721 – – – 5 741 886 8
14 941 3 723 11 218 – – – 3 882 8 099 98 962 923 8 039 158 – – – 1 730 10
8 616 3 205 5 411 8 109 8 109 – – 264 118 975 2 799 6 176 – – – 1 243 1 682 121 538 39 1 499 – – – – – 137 095 1 070 6 025 – – – – 568 149 808 840 8 968 34 34 – – 119 156 184 1 483 4 701 36 36 – – 1 453 16
17 350 1 269 16 081 – – – – 2 650 171 573 232 1 341 334 334 – – – 183 663 1 134 2 529 – – – – 216 19
38 187 8 375 29 812 69 575 66 388 151 5 119 25 733 20
6 556 895 5 661 – – – 25 936 217 546 895 6 651 9 954 9 954 – 4 108 185 227 948 2 020 5 928 – – – 140 668 239 857 4 067 5 790 11 – – – 1 177 246 983 2 597 4 386 – – – – 1 062 256 747 819 5 928 – – – – 1 209 267 636 788 6 848 ~30 ~30 – – 581 27
146 877 21 601 125 276 16 124 15 611 275 671 70 362 286 081 1 113 4 968 – – – – 1 123 295 852 540 5 312 1 – – – 820 30
17 531 5 979 11 552 3 206 – – 5 970 2 139 317 846 1 453 6 393 328 326 – – 470 329 022 1 920 7 102 11 – – – 567 33
11 470 714 10 756 78 – – 4 745 4 507 343 682 255 3 203 547 478 708 37 545 9 125 371 3 319 279 074 35
10 469 1 137 9 332 31 174 31 174 – 6 881 1 018 3613 899 1 544 12 355 128 128 – 6 539 6 032 376 677 501 6 176 37 37 – – 838 387 452 1 601 5 851 107 107 – – 5 018 39
28 782 5 358 23 424 4 329 4 300 1 275 6 507 40
15 115 3 006 12 109 – – – 73 4 479 418 456 1 925 6 531 – – – 4 098 10 261 428 562 1 086 7 476 40 – – 40 1 233 43
20 072 1 299 18 773 763 – – – 128 021 446 449 2 084 4 365 240 240 – 37 142 458 450 1 938 6 512 – – – – 993 469 808 2 618 7 190 19 718 19 698 – 45 7 318 47
11 932 1 004 10 928 – – – 8 250 15 915 48470 383 76 381 394 002 35 846 – 77 450 61 174 1 358 570 49
154 232 89 892 64 340 33 616 27 119 1 488 9 414 262 083 50
18 537 2 132 16 405 23 904 000 16 373 740 – – – 51
County Area 77

Appendix A.County-Type Areas WithoutCounty Government
Areas with governments legally designated as citycounties and operating primarily as cities (9):
Alaska . . . . . . . . . . . . . . . . . . . . . . . . . . . . . . . . . . . . . . . . . . . . . . . . . . . . . . City and borough of Anchorage, city and borough ofJuneau, city and borough of Sitka, and city and boroughof Yakutat.
California . . . . . . . . . . . . . . . . . . . . . . . . . . . . . . . . . . . . . . . . . . . . . . . . . . . City and county of San Francisco.
Colorado . . . . . . . . . . . . . . . . . . . . . . . . . . . . . . . . . . . . . . . . . . . . . . . . . . . City and county of Denver.
Hawaii . . . . . . . . . . . . . . . . . . . . . . . . . . . . . . . . . . . . . . . . . . . . . . . . . . . . . . City and county of Honolulu.
Montana. . . . . . . . . . . . . . . . . . . . . . . . . . . . . . . . . . . . . . . . . . . . . . . . . . . . Anaconda-Deer Lodge County and Butte-Silver Bow.
Areas designated as metropolitan governments andoperating primarily as cities (2):
Tennessee . . . . . . . . . . . . . . . . . . . . . . . . . . . . . . . . . . . . . . . . . . . . . . . . . Metropolitan government of Nashville and DavidsonCounty, and Metropolitan government of Lynchburg andMoore County.
Areas having certain types of county offices, but as partof another government (city, township, State) (16):
Florida . . . . . . . . . . . . . . . . . . . . . . . . . . . . . . . . . . . . . . . . . . . . . . . . . . . . . . County of Duval (city of Jacksonville).
Georgia. . . . . . . . . . . . . . . . . . . . . . . . . . . . . . . . . . . . . . . . . . . . . . . . . . . . . County of Clarke (unified government of Athens-ClarkeCounty).County of Muscogee (city of Columbus).
Hawaii . . . . . . . . . . . . . . . . . . . . . . . . . . . . . . . . . . . . . . . . . . . . . . . . . . . . . . County of Kalawao (State of Hawaii).
Indiana . . . . . . . . . . . . . . . . . . . . . . . . . . . . . . . . . . . . . . . . . . . . . . . . . . . . . County of Marion (city of Indianapolis).
Kentucky . . . . . . . . . . . . . . . . . . . . . . . . . . . . . . . . . . . . . . . . . . . . . . . . . . . Lexington-Fayette Urban County
Louisiana . . . . . . . . . . . . . . . . . . . . . . . . . . . . . . . . . . . . . . . . . . . . . . . . . . . Parish of East Baton Rouge (city of Baton Rouge), Parishof Orleans (city of New Orleans), and Terrebonne ParishConsolidated Government.
Massachusetts . . . . . . . . . . . . . . . . . . . . . . . . . . . . . . . . . . . . . . . . . . . . . County of Nantucket (town of Nantucket) and county ofSuffolk (city of Boston).
New York . . . . . . . . . . . . . . . . . . . . . . . . . . . . . . . . . . . . . . . . . . . . . . . . . . . Counties of Bronx, Kings, New York, Queens, and Rich-mond (all part of the city of New York).
Pennsylvania. . . . . . . . . . . . . . . . . . . . . . . . . . . . . . . . . . . . . . . . . . . . . . . County of Philadelphia (city of Philadelphia).
A-1

Area classified as a separate county area and as a sepa-rate State area in population statistics, but counted as amunicipal government in census statistics on govern-ments (1):
District of Columbia. . . . . . . . . . . . . . . . . . . . . . . . . . . . . . . . . . . . . . . . Washington city.
Cities located outside of any ‘‘county’’ area and adminis-tering functions elsewhere commonly performed bycounties (44):
Maryland . . . . . . . . . . . . . . . . . . . . . . . . . . . . . . . . . . . . . . . . . . . . . . . . . . . Baltimore city (distinct from Baltimore County).
Missouri . . . . . . . . . . . . . . . . . . . . . . . . . . . . . . . . . . . . . . . . . . . . . . . . . . . . St. Louis city (distinct from St. Louis County).
Nevada . . . . . . . . . . . . . . . . . . . . . . . . . . . . . . . . . . . . . . . . . . . . . . . . . . . . . Carson city.
Virginia (41 cities) . . . . . . . . . . . . . . . . . . . . . . . . . . . . . . . . . . . . . . . . . Alexandria, Bedford, Bristol, Buena Vista, Charlottesville,Chesapeake, Clifton Forge, Colonial Heights, Covington,Danville, Emporia, Falls Church, Fairfax, Franklin, Freder-icksburg, Galax, Hampton, Harrisonburg, Hopewell, Lex-ington, Lynchburg, Manassas, Manasas Park, Martins-ville, Newport News, Norfolk, Norton, Petersburg,Poquoson, Portsmouth, Radford, Richmond, Roanoke,Salem, South Boston, Staunton, Suffolk, Virginia Beach,Waynesboro, Williamsburg, and Winchester.1
Unorganized areas bearing county designations (13):2
Connecticut (8 county areas with no government) . . . . . . Fairfield, Hartford, Litchfield, Middlesex, New Haven, NewLondon, Tolland, and Windham.
Rhode Island (5 county areas with no countygovernment) . . . . . . . . . . . . . . . . . . . . . . . . . . . . . . . . . . . . . . . . . . . . . . Bristol, Kent, Newport, Providence, and Washington.
Other unorganized county-type areas (12):
Alaska . . . . . . . . . . . . . . . . . . . . . . . . . . . . . . . . . . . . . . . . . . . . . . . . . . . . . . 11 census areas.
Montana. . . . . . . . . . . . . . . . . . . . . . . . . . . . . . . . . . . . . . . . . . . . . . . . . . . . Areas of Yellowstone National Park (areas of the parklocated in Idaho and Wyoming are included in countyareas in those States).
1Effective July 1, 1995, South Boston was located within Halifax County, and was no longer an independent city outside the area of any county.2Effective with fiscal year 1993, Shannon and Todd counties in South Dakota are counted as separate county governments. Although these two counties
contract with adjacent counties for the performance of most county government functions, Shannon and Todd counties now each have an elected countygoverning body and perform some governmental services.
A-2 Consolidated Federal Funds Report

Appendix B.Geographic Areas With More ThanFour Congressional Districts
State and county area Congressional districts
Arizona:Maricopa County . . . . . . . . . . . . . . . . . . . . . . . . . . . . . . . . . . . . . . . . . . . . . . . . . . . . . . . . 1, 2, 3, 4, 6
California:Los Angeles County . . . . . . . . . . . . . . . . . . . . . . . . . . . . . . . . . . . . . . . . . . . . . . . . . . . . . . 24, 25, 26, 27, 28, 29, 30, 31, 32, 33, 34, 35, 36, 37, 38, 39, 41Orange County. . . . . . . . . . . . . . . . . . . . . . . . . . . . . . . . . . . . . . . . . . . . . . . . . . . . . . . . . . . 39, 41, 45, 46, 47, 48San Diego County . . . . . . . . . . . . . . . . . . . . . . . . . . . . . . . . . . . . . . . . . . . . . . . . . . . . . . . . 48, 49, 50, 51, 52
Florida:Dade County . . . . . . . . . . . . . . . . . . . . . . . . . . . . . . . . . . . . . . . . . . . . . . . . . . . . . . . . . . . . 17, 18, 20, 21, 22, 23
Illinois:Cook County. . . . . . . . . . . . . . . . . . . . . . . . . . . . . . . . . . . . . . . . . . . . . . . . . . . . . . . . . . . . . 1, 2, 3, 4, 5, 6, 7, 8, 9, 10, 11, 13
Massachusetts:Middlesex County . . . . . . . . . . . . . . . . . . . . . . . . . . . . . . . . . . . . . . . . . . . . . . . . . . . . . . . . 1, 3, 4, 5, 6, 7, 8Norfolk County . . . . . . . . . . . . . . . . . . . . . . . . . . . . . . . . . . . . . . . . . . . . . . . . . . . . . . . . . . . 2, 3, 4, 9, 10
Michigan:Wayne County . . . . . . . . . . . . . . . . . . . . . . . . . . . . . . . . . . . . . . . . . . . . . . . . . . . . . . . . . . . 11, 13, 14, 15, 16
New York: . . . . . . . . . . . . . . . . . . . . . . . . . . . . . . . . . . . . . . . . . . . . . . . . . . . . . . . . . . . . . . . . .New York City. . . . . . . . . . . . . . . . . . . . . . . . . . . . . . . . . . . . . . . . . . . . . . . . . . . . . . . . . . . . 5, 6, 7, 8, 9, 10, 11, 12, 13, 14, 15, 16, 17, 18
New Jersey:Essex County . . . . . . . . . . . . . . . . . . . . . . . . . . . . . . . . . . . . . . . . . . . . . . . . . . . . . . . . . . . . 7, 8, 10, 11, 13
Pennsylvania:Montgomery County . . . . . . . . . . . . . . . . . . . . . . . . . . . . . . . . . . . . . . . . . . . . . . . . . . . . . . 6, 7, 8, 13, 15
Texas:Dallas County. . . . . . . . . . . . . . . . . . . . . . . . . . . . . . . . . . . . . . . . . . . . . . . . . . . . . . . . . . . . 3, 4, 5, 6, 24, 26, 30Harris County . . . . . . . . . . . . . . . . . . . . . . . . . . . . . . . . . . . . . . . . . . . . . . . . . . . . . . . . . . . . 7, 8, 9, 18, 22, 25, 29Tarrant County . . . . . . . . . . . . . . . . . . . . . . . . . . . . . . . . . . . . . . . . . . . . . . . . . . . . . . . . . . . 6, 12, 24, 26, 30
Note: These are congressional districts of the 104th Congress, in session beginning in Federal fiscal year 1995.
B-1

Appendix C.County Locations of StateCapital Cities
State Capital County area
Alabama . . . . . . . . . . . . . . . . . . . . . . . . . . . . . . . . . . . Montgomery Montgomery CountyAlaska . . . . . . . . . . . . . . . . . . . . . . . . . . . . . . . . . . . . . Juneau Juneau BoroughArizona . . . . . . . . . . . . . . . . . . . . . . . . . . . . . . . . . . . . Phoenix Maricopa CountyArkansas. . . . . . . . . . . . . . . . . . . . . . . . . . . . . . . . . . . Little Rock Pulaski CountyCalifornia. . . . . . . . . . . . . . . . . . . . . . . . . . . . . . . . . . . Sacramento Sacramento County
Colorado . . . . . . . . . . . . . . . . . . . . . . . . . . . . . . . . . . . Denver Denver City/CountyConnecticut . . . . . . . . . . . . . . . . . . . . . . . . . . . . . . . . Hartford Hartford CountyDelaware. . . . . . . . . . . . . . . . . . . . . . . . . . . . . . . . . . . Dover Kent CountyFlorida . . . . . . . . . . . . . . . . . . . . . . . . . . . . . . . . . . . . . Tallahassee Leon CountyGeorgia . . . . . . . . . . . . . . . . . . . . . . . . . . . . . . . . . . . . Atlanta Fulton County
Hawaii . . . . . . . . . . . . . . . . . . . . . . . . . . . . . . . . . . . . . Honolulu Honolulu City/CountyIdaho . . . . . . . . . . . . . . . . . . . . . . . . . . . . . . . . . . . . . . Boise Ada CountyIllinois . . . . . . . . . . . . . . . . . . . . . . . . . . . . . . . . . . . . . . Springfield Sangamon CountyIndiana. . . . . . . . . . . . . . . . . . . . . . . . . . . . . . . . . . . . . Indianapolis Marion CountyIowa . . . . . . . . . . . . . . . . . . . . . . . . . . . . . . . . . . . . . . . Des Moines Polk County
Kansas. . . . . . . . . . . . . . . . . . . . . . . . . . . . . . . . . . . . . Topeka Shawnee CountyKentucky . . . . . . . . . . . . . . . . . . . . . . . . . . . . . . . . . . . Frankfort Franklin CountyLouisiana . . . . . . . . . . . . . . . . . . . . . . . . . . . . . . . . . . Baton Rouge East Baton Rouge ParishMaine . . . . . . . . . . . . . . . . . . . . . . . . . . . . . . . . . . . . . . Augusta Kennebec CountyMaryland . . . . . . . . . . . . . . . . . . . . . . . . . . . . . . . . . . . Annapolis Anne Arundel County
Massachusetts . . . . . . . . . . . . . . . . . . . . . . . . . . . . . Boston Suffolk CountyMichigan . . . . . . . . . . . . . . . . . . . . . . . . . . . . . . . . . . . Lansing Ingham CountyMinnesota. . . . . . . . . . . . . . . . . . . . . . . . . . . . . . . . . . St. Paul Ramsey CountyMississippi . . . . . . . . . . . . . . . . . . . . . . . . . . . . . . . . . Jackson Hinds CountyMissouri . . . . . . . . . . . . . . . . . . . . . . . . . . . . . . . . . . . . Jefferson City Cole County
Montana . . . . . . . . . . . . . . . . . . . . . . . . . . . . . . . . . . . Helena Lewis Clark CountyNebraska . . . . . . . . . . . . . . . . . . . . . . . . . . . . . . . . . . Lincoln Lancaster CountyNevada . . . . . . . . . . . . . . . . . . . . . . . . . . . . . . . . . . . . Carson City Carson CityNew Hampshire . . . . . . . . . . . . . . . . . . . . . . . . . . . . Concord Merrimack CountyNew Jersey . . . . . . . . . . . . . . . . . . . . . . . . . . . . . . . . Trenton Mercer County
New Mexico. . . . . . . . . . . . . . . . . . . . . . . . . . . . . . . . Santa Fe Santa Fe CountyNew York . . . . . . . . . . . . . . . . . . . . . . . . . . . . . . . . . . Albany Albany CountyNorth Carolina. . . . . . . . . . . . . . . . . . . . . . . . . . . . . . Raleigh Wake CountyNorth Dakota. . . . . . . . . . . . . . . . . . . . . . . . . . . . . . . Bismarck Burleigh CountyOhio . . . . . . . . . . . . . . . . . . . . . . . . . . . . . . . . . . . . . . . Columbus Franklin County
Oklahoma . . . . . . . . . . . . . . . . . . . . . . . . . . . . . . . . . . Oklahoma City Oklahoma CountyOregon. . . . . . . . . . . . . . . . . . . . . . . . . . . . . . . . . . . . . Salem Marion CountyPennsylvania. . . . . . . . . . . . . . . . . . . . . . . . . . . . . . . Harrisburg Dauphin CountyRhode Island. . . . . . . . . . . . . . . . . . . . . . . . . . . . . . . Providence Providence CountySouth Carolina . . . . . . . . . . . . . . . . . . . . . . . . . . . . . Columbia Richland County
South Dakota . . . . . . . . . . . . . . . . . . . . . . . . . . . . . . Pierre Hughes CountyTennessee . . . . . . . . . . . . . . . . . . . . . . . . . . . . . . . . . Nashville Metro Nashville-Davidson1
Texas . . . . . . . . . . . . . . . . . . . . . . . . . . . . . . . . . . . . . . Austin Travis CountyUtah . . . . . . . . . . . . . . . . . . . . . . . . . . . . . . . . . . . . . . . Salt Lake City Salt Lake CountyVermont . . . . . . . . . . . . . . . . . . . . . . . . . . . . . . . . . . . . Montpelier Washington County
Virginia. . . . . . . . . . . . . . . . . . . . . . . . . . . . . . . . . . . . . Richmond Richmond CityWashington . . . . . . . . . . . . . . . . . . . . . . . . . . . . . . . . Olympia Thurston CountyWest Virginia . . . . . . . . . . . . . . . . . . . . . . . . . . . . . . . Charleston Kanawha CountyWisconsin . . . . . . . . . . . . . . . . . . . . . . . . . . . . . . . . . . Madison Dane CountyWyoming. . . . . . . . . . . . . . . . . . . . . . . . . . . . . . . . . . . Cheyenne Laramie County
1Metropolitan Nashville-Davidson is listed as Davidson County in the Consolidated Federal Funds Report.
C-1

Appendix D.CFFR Data Sources
Note: Catalog of Federal Domestic Assistance codes are noted in parenthesis where appropriate.
Category Source
GRANTS
Corporation for Public Broadcasting—public broadcasting fund grants Corporation for Public Broadcasting *
Federal Government annual payment to the District of Columbia Department of the Treasury *
Federal Government payment to Washington Metropolitan TransitAuthority for interest on outstanding indebtedness
Washington Metropolitan Area Transit Authority *
Federal Government payments to Puerto Rico for Customs service andATF tax collections
Department of the Treasury *
Housing assistance programs— Department of Housing and Urban Development *
Congregate Services (14.170)
Housing Demonstration Grants (14.235)
Fair Housing Grants (14.401)
Supplemental Assistance for Facilities to Assist the Homeless (14.236)
Interior Department— Interior Department *
Bureau of Indian Affairs—grants to Indian Tribes Bureau of Indian Affairs *
Shared revenues from mineral leases, grazing lands and otherpayments to State and local governments.
Bureau of Land Management, and MineralsManagement Services *
Payments to U.S. Territories Office of Territorial Affairs *
Neighborhood Reinvestment Corporation—grants Neighborhood Reinvestment Corporation*
State Justice Institute—grants State Justice Institute *
Tennessee Valley Authority—payments in lieu of taxes Tennessee Valley Authority *
U.S. Information Agency— U.S. Information Agency
Educational Exchange Grants Graduate Students (82.001)
University Lecturers (82.002)
All other data Federal Assistance Award Data System (Bureau of the Census)
SALARIES AND WAGES
Military, active Military, inactive (Reserve and National Guard) Department of Defense, Directorate for Information Operations and Reports
Postal Service U.S. Postal Service
Defense Department, civilian employees Office of Personnel Management, Workforce Analysisand Statistics Division
All other Federal civilian employees Federal Bureau of Investigation (FBI employees), Department ofTransportation (U.S. Coast Guard uniformed employees), andOffice of Personnel Management, Workforce Analysis andStatistics Division (all other non-Defense Department employees)
D-1

Category Source
DIRECT PAYMENTS FOR INDIVIDUALS:RETIREMENT AND DISABILITY
U.S. Coast Guard retirement benefit payments (uniformed personnel) Department of Transportation, U.S. Coast Guard
Federal Government civilian employees (includes Defense Departmentcivilian Coast Guard civilian, U.S. Postal Service annuitants)
Office of Personnel Management, Compensation Group
Military retirees Department of Defense, Directorate for InformationOperations and Reports
Pension Benefit Guaranty Corporation payments under Pension PlanTermination Insurance Program (86.001)
Pension Benefit Guaranty Corporation
Public Health Service, Commissioned Corps employee retirement payments. Public Health Service benefit
Foreign Service Officers employee retirement benefit payments Department of State
National Oceanic and Atmospheric Administration (NOAA) Corps retirementbenefit payments
Department of Commerce, National Oceanic and AtmosphericAdministration
Tennessee Valley Authority employee retirement benefit payments Tennessee Valley Authority
All other data Federal Assistance Award Data System (Bureau of the Census)
DIRECT PAYMENTS FOR INDIVIDUALS:OTHER THAN RETIREMENT AND DISABILITY
Excess (refundable portion) earned income tax credit payments Department of the Treasury, Internal Revenue Service,Statistics of Income Division
Federal Government payments to State unemployment trust funds foradvances, payments for ex-Federal and military employees,for extended benefits, and regular benefit payments
State Government Finances (annual survey), Governments Division,Bureau of the Census
Higher Education Act Insured Loans (National Guaranteed StudentLoans) — interest subsidies and special allowances
Department of Education
Housing assistance programs— Department of Housing and Urban Development
Rent Supplements—Rental Housing for Lower Income Families (14.149) .
Public Safety Officers’ Benefits Program (16.571) Department of Justice
All other data Federal Assistance Award Data System (Bureau of the Census)
PROCUREMENT
Postal Service U.S. Postal Service
All other Federal Government, including Defense Department General Services Administration, Federal Procurement Data Center
OTHER DIRECT PAYMENTS
Crop Insurance indemnity payments and premium subsidies premiumsubsidies (10.450)
Department of Agriculture
National Flood Insurance loss and adjustor expenses (83.100) Federal Emergency Management Agency
Postal Service, direct expenditure other than salaries and procurement U.S. Postal Service
Higher Education Act Insured Loans (Guaranteed Student Loans)—administrative cost allowances and reinsurance
Department of Education
Legal Services Corporation payments Legal Services Corporation
Payments under Protection of Ship from Foreign Seizure program(19.201)
Department of State
Federal Government payments for Federal employee life and healthinsurance programs
Office of Personnel Management Compensation Group
All other data Federal Assistance Award Data System (Bureau of the Census)
D-2 Consolidated Federal Funds Report

Category Source
DIRECT LOANS
Direct Investment Loans and Pre-Investment Assistance (70.005) Overseas Private Investment Corporation
All other data Federal Assistance Award Data System (Bureau of the Census)
GUARANTEED/INSURED LOANS
Higher Education Act Insured Loans (Guaranteed Student Loans—84.032)
Department of Education
Foreign Investment Guarantees (70.002) Overseas Private Investment Corporation
All other data Federal Assistance Award Data System (Bureau of the Census)
INSURANCE
Foreign Investment Insurance (70.003) Overseas Private Investment Corporation
National Flood Insurance Program (83.100) Federal Emergency Management Agency
All other data Federal Assistance Award Data System (Bureau of the Census)
Note 1: For dollar amounts reported by State, see the publication, Federal Expenditures by State for Fiscal Year 1995.Note 2: For several major programs, the Pass-Through Survey was used to determine the amount of Federal funding going to each county. For more
information on the Pass-Through Survey, see ‘‘Estimates for Substate Grant Distributions’’ in the Introduction.
*Indicates agencies that submit an annual ‘‘Federal Aid to States’’ report to the Census Bureau, in accordance with OMB Circular A-11 and pursuantto Public Law 99-547.
Consolidated Federal Funds Report D-3

Appendix E.State Coordinating Agencies, State Data Center Program,Bureau of the Census
ALABAMA
Center for Business andEconomic ResearchUniversity of AlabamaBox 870221Tuscaloosa, AL 35487-0221Ms. Annette Watters(205) 348-6191Fax (205) [email protected]
ALASKA
Census & Geographic InformationNetworkResearch & AnalysisAlaska Department of LaborP.O. Box 25504Juneau, AK 99802-5504Ms. Kathryn Lizik(907) 465-2437Fax (907) [email protected]
ARIZONA
Arizona Department ofEconomic SecurityDES 045ZFirst Floor, Southeast Wing1789 West Jefferson St.Phoenix, AZ 85007Ms. Betty Jeffries(602) 542-5984Fax (602) 542-6474
ARKANSAS
State Data CenterUniversity of Arkansas-Little Rock2801 South UniversityLittle Rock, AR 72204Ms. Sarah Breshears(501) 569-8530Fax (501) [email protected]
CALIFORNIA
State Census Data CenterDepartment of Finance915 L Street, 8th floorSacramento, CA 95814Ms. Linda Gage, Director(916) 322-4651Mr. Richard Lovelady(916) 323-4141Fax (916) [email protected]
COLORADO
Division of Local GovernmentColorado Department of Local Affairs1313 Sherman Street, Room 521Denver, CO 80203Ms. Rebecca Picaso(303) 866-2156Fax (303) 866-2803
CONNECTICUT
Office of Policy and ManagementPolicy Development and Planning Division450 Capitol Avenue—MS#52ASPP.O. Box 341441Hartford, CT 06134-1441Mr. Bill Kraynak(860) 418-6230Fax (860) [email protected]
DELAWARE
Delaware Economic DevelopmentOffice99 Kings HighwayP.O. Box 1401Dover, DE 19903Mr. Mike Mahaffie(302) 739-4271Fax (302) [email protected]
E-1

DISTRICT OF COLUMBIA
Data Services DivisionMayor’s Office of PlanningRoom 570, Presidential Bldg.415 12th Street, N.W.Washington, DC 20004Mr. Herb Bixhorn(202) 727-6533Fax (202) 727-6964
FLORIDA
Florida Department of Labor andEmployment SecurityBureau of Labor Market InformationHartman Building, Suite 2002012 Capital Circle, South EastTallahassee, FL 32399-2151Ms. Pam Schenker(904) 488-1048Fax (904) [email protected]
GEORGIA
Division of Demographic & StatisticalServicesGeorgia Office of Planning and Budget254 Washington Street, S.W.,Room 640Atlanta, GA 30334Ms. Marty Sik(404) 656-0911Fax (404) [email protected]
GUAM
Guam Department of Commerce102 M. StreetTiyan, Guam 96913Rose Deaver(671) 475-0325/6Fax (671) 646-0774
HAWAII
Hawaii State Data CenterDepartment of Business, EconomicDevelopment, & Tourism220 S. King Street, Suite 400Honolulu, HI 96813(Mailing Address)P.O. Box 2359 Honolulu, HI 96804Ms. Jan Nakamoto(808) 586-2493Fax (808) [email protected]
IDAHO
Idaho Department of Commerce700 West State StreetBoise, ID 83720Mr. Alan Porter(208) 334-2470Fax (208) [email protected]
ILLINOIS
Illinois Bureau of the BudgetWilliam Stratton Building, Room 605400 Springs StreetSpringfield, IL 62706Ms. Suzanne Ebetsch(217) 782-1381Fax (217) [email protected]
INDIANA
Indiana State LibraryIndiana State Data Center140 North Senate AvenueIndianapolis, IN 46204Mr. Ray Ewick, DirectorMs. Sylvia Andrews(317) 232-3733Fax (317) [email protected]
E-2 Consolidated Federal Funds Report

IOWA
State Library of IowaEast 12th and GrandDes Moines, IA 50319Ms. Beth Henning(515) 281-4350Fax (515) [email protected]
KANSAS
State LibraryRoom 343-NState Capitol BuildingTopeka, KS 66612Mr. Marc Galbraith(913) 296-3296Fax (913) [email protected]
KENTUCKY
Center for Urban & EconomicResearchCollege of Business & PublicAdministrationUniversity of LouisvilleLouisville, KY 40292Mr. Ron CrouchMs. Beverly Daly(502) 852-7990Fax (502) [email protected]@ulkyvm.louisville.edu
LOUISIANA
Office of Planning and BudgetDivision of AdministrationP.O. Box 940951051 N. 3rd StreetBaton Rouge, LA 70804Ms. Karen Paterson(504) 342-7410Fax (504) [email protected]
MAINE
Division of Economic Analysis andResearchMaine Department of Labor20 Union StreetAugusta, ME 04330Mr. Raynold Fongemie, DirectorStaff(207) 287-2271Fax (207) 287-5292
MARYLAND
Maryland Office of Planning301 West Preston StreetBaltimore, MD 21201Ms Jane Traynham(410) 225-4450Fax (410) [email protected]
MASSACHUSETTS
Massachusetts Institute for Social andEconomic Research128 Thompson HallUniversity of MassachusettsAmherst, MA 01003Dr. Stephen Coelen, DirectorMs. Valerie Conti(413) 545-3460Fax (413) [email protected]
MICHIGAN
Michigan Information CenterDepartment of Management & BudgetDemographic Research and StatisticsP.O. Box 30026Lansing, MI 48909Mr. Eric SwansonMs. Carolyn Lauer(517) 373-7910Fax (517) [email protected][email protected]
Consolidated Federal Funds Report E-3

MINNESOTA
State Demographer’s OfficeMinnesota Planning300 Centennial Office Building658 Cedar StreetSt. Paul, MN 55155Mr. David Birkholz(612) 296-2557Mr. David Rademacher(612) 297-3255Fax (612) [email protected]
MISSISSIPPI
Center for Population StudiesThe University of MississippiBondurant Bldg., Room 3WUniversity, MS 38677Dr. Max Williams, DirectorMs Rachel McNeely, Manager(601) 232-7288Fax (601) [email protected]
MISSOURI
Missouri State Library600 W. Main StreetPO Box 387Jefferson City, MO 65102Ms. Kate Graf(573) 751-1823Fax (573) [email protected]
MONTANA
Census and Economic InformationCenterMontana Department of CommerceP.O. Box 2005011424 9th AvenueHelena, MT 59620-0501Ms. Patricia Roberts(406) 444-2896Fax (406) [email protected]
NEBRASKA
Center for Public Affairs ResearchNebraska State Data CenterPeter Kiewit Conference Center, # 232University of Nebraska at OmahaOmaha, NE 68182Mr. Jerome Deichert(402) 595-2311Mr. Tim Himberger(402) 554-4883Fax (402) [email protected]@unomalia.edu
NEVADA
Nevada State LibraryCapitol Complex100 Stewart StreetCarson City, NV 89710Ms. Joan KerschnerLinda Nary(702) 687-8326Fax (702) [email protected]
NEW HAMPSHIRE
Office of State Planning2 1/2 Beacon StreetConcord, NH 03301Mr. Tom Duffy(603) 271-2155Fax (603) 271-1728
NEW JERSEY
New Jersey State Data CenterDivision of Labor Market andDemographic ResearchNew Jersey Department of Labor,CN 388Trenton, NJ 08625-0388Mr. Doug Moore(609) 984-2595Fax (609) [email protected]
E-4 Consolidated Federal Funds Report

NEW MEXICO
Economic Development Department1100 St. Francis DriveSanta Fe, NM 87503Ms. Laurie Moye(505) 827-0182Fax (505) [email protected]
NEW YORK
Division of Policy & ResearchDepartment of Economic Development1 Commerce Plaza, Room 90599 Washington AvenueAlbany, NY 12245Mr. Robert ScardamaliaStaff(518) 474-1141Fax (518) [email protected]
NORTH CAROLINA
North Carolina Office of State Planning116 West Jones StreetRaleigh, NC 27603-8003Ms. Francine StephensonContact State Library InformationDesk, (919) 733-3270Fax (919) [email protected]
NORTH DAKOTA
Department of Agricultural EconomicsNorth Dakota State UniversityMorrill Hall, Room 217P.O. Box 5636Fargo, ND 58105Dr. Richard Rathge(701) 231-8621Fax (701) [email protected]
NORTHERN MARIANA ISLANDS
Department of CommerceCentral Statistics DivisionCaller Box 1007, Donnie Hill Apts.SaipanMariana Islands 96950Mr. Juan Borja(670) 664-3000Fax (670) 664-3066
OHIO
Office of Strategic ResearchOhio Department of DevelopmentP.O.Box 100177 High Street, 27th FloorColumbus, OH 43266-0101Mr. Barry Bennett(614) 466-2115Fax (614) [email protected]
OKLAHOMA
Oklahoma State Data CenterOklahoma Department of Commerce6601 Broadway Extension(Mailing address)P.O. Box 26980Oklahoma City, OK 73126-0980Mr. Jeff Wallace(405) 841-5184Fax (405) [email protected]
OREGON
Center for Population Research andCensusSchool of Urban and Public AffairsPortland State UniversityP.O. Box 751Portland, OR 97207-0751Mr. Ed ShaferMr. George Hough(800) 547-8887(503) 725-5159Fax (503) [email protected]
PENNYSLVANIA
Pennsylvania State Data CenterInstitute of State and Regional AffairsPenn State Harrisburg777 West Harrisburg PikeMiddletown, PA 17057-4898Mr. Michael Behney, DirectorMs. Diane Shoop, Asst. Director(717) 948-6336Fax (717) [email protected]
Consolidated Federal Funds Report E-5

PUERTO RICO
Junta de PlanificacionP.O. Box 41119Centro Gubernamental MinillasSan Juan, PR 00940-1119Sra. Lillian Torrez Aguirre(787) 728-4430Fax (787) 268-0506
RHODE ISLAND
Rhode Island Department ofAdministrationOffice of Municipal AffairsOne Capitol HillProvidence, RI 02908-5873Mr. Paul Egan(401) 277-6493Fax (401) 277-3809
SOUTH CAROLINA
Division of Research and StatisticalServicesSouth Carolina Budget and ControlBoardRembert Dennis Bldg. Room 425Columbia, SC 29201Mr. Bobby BowersMr. Mike MacFarlaneMr. Grant Gibson(803) 734-3780Fax (803) [email protected]
SOUTH DAKOTA
Business Research BureauSchool of BusinessUniversity of South Dakota414 East ClarkVermillion, SD 57069Ms DeVee Dykstra(605) 677-5287Fax (605) [email protected]
TENNESSEE
Tennessee Department of Economicand Community DevelopmentResearch Division320 Sixth Avenue, North8th Floor, Rachel Jackson BuildingNashville, TN 37243-0405Mr. Charles Brown(615) 741-1676Fax (615) [email protected]
TEXAS
Department of Rural SociologyTexas A & M University SystemSpecial Services BuildingCollege Station, TX 77843-2125Dr. Steve MurdockMs. Beverly Pecotte(409) 845-5115 or 5332Fax (409) [email protected]@txsdcsun.tamu.edu
UTAH
Office of Planning & BudgetState Capitol, Room 116Salt Lake City, UT 84114Ms. Kirin McInnis(801) 538-1550Mr. David AbelMs. Jennifer Taylor(801) 538-1036Fax (801) [email protected]@email.state.ut.us
VERMONT
Vermont Department of Libraries109 State StreetMontpelier, VT 05609-0601Ms. Sybil McShane(802) 828-3261Fax (802) [email protected]
E-6 Consolidated Federal Funds Report

VIRGINIA
Virginia Employment Commission703 East Main StreetRichmond, VA 23219Mr. Dan Jones(804) 786-8308Fax (804) 786-7844
VIRGIN ISLANDS
University of the Virgin IslandsEastern Caribbean CenterNo. 2 John Brewer’s BayCharlotte AmalieSt. Thomas, VI 00802Dr. Frank Mills(809) 693-1027Fax (809) [email protected]
WASHINGTON
Forecasting DivisionOffice of Financial Management450 Insurance Bldg., BOX 43113Olympia, WA 98504-3113Ms. Yi Zhao(360) 586-2504Fax (360) [email protected]
WEST VIRGINIA
West Virginia Development OfficeResearch and Strategic PlanningDivisionCapitol ComplexBuilding 6, Room 553Charleston, WV 25305Ms. Mary C. Harless(304) 558-4010Fax (304) 558-3248
WISCONSIN
Department of AdministrationDemographic Services Center101 E. Wilson St., 6th FloorP.O. Box 7868Madison, WI 53707-7868Ms. Nadene RoenspiesMr. Robert Naylor(608) 266-1927Fax (608) [email protected]
WYOMING
Department of Admin. and InformationEconomic Analysis DivisionEmerson Building 327ECheyenne, WY 82002-0060Mr. Steve FurtneyMr. Wenlin Liu(307) 777-7504Fax (307) [email protected]
Note: If you plan to publish any information from this address list, you should be aware that changes are made regularly.Please contact the Customer Liaison Office of the Bureau of the Census at 301-457-1305 for the latest listing.
To purchase CFFR data on tape or CD-ROM, contact:
Bureau of the CensusCustomer Services
Washington, DC 20233301-457-4100
FAX for orders only: 301-457-3842FAX for general information: 301-457-4714
Visit the Census Bureau’s Home Page athttp://www.census.gov.
Consolidated Federal Funds Report E-7

Appendix F.Use of County Area Allocations
Table F-1. Use of County Area Allocations for Selected Federal Pass-Through Assistance Programs by State:Fiscal Year 1995
[For meaning of symbols, see text]
State and territory
FoodStamps(10.551)
NationalSchoolLunchPro-gram
(10.555)
SpecialSupple-mentalFoodPro-gramfor
Women,Infants,
andChil-dren
(WIC)(10.557)
Nutri-tion
Assis-tance
forPuertoRico
(10.566)
JobTrainingPartner-
shipAct:
Title II(17.250)
Handi-cappedEduca-tion -Stategrants
(84.027)
Reha-bilitationServices-
BasicSupport(84.126)
FamilySupport
Paymentsto States -
Assis-tance
Payments(93.560)
ChildSupportEnforce-
ment(93.563)
LowIncomeHomeEnergyAssis-tance
(93.568)
SocialSer-vicesBlockGrant
(93.667)
MedicalAssis-tancePro-gram
(Medic-aid)
(93.778)
BlockGrants
forPreven-
tionand
Treat-ment
ofSub-
stanceAbuse
(93.959)
Compen-satoryEduca-
tionfor theDisad-
vantaged1(84.010)
Alabama . . . . . . . . . . . . . . . . . A A A (X) A A C A A A A A A AAlaska . . . . . . . . . . . . . . . . . . A A B (X) C A C A A A A A C AArizona . . . . . . . . . . . . . . . . . . A A A (X) B A A A A A C A C AArkansas. . . . . . . . . . . . . . . . . A A A (X) A A C A A A A A C ACalifornia . . . . . . . . . . . . . . . . A A B (X) A A C A A A A A A AColorado . . . . . . . . . . . . . . . . . A A A (X) C A C A A A A A A AConnecticut . . . . . . . . . . . . . . . A A A (X) A A C A A C A A C ADelaware . . . . . . . . . . . . . . . . A A C (X) A A C A A C A A A AFlorida . . . . . . . . . . . . . . . . . . A A A (X) A A C A A A B A C A
Georgia . . . . . . . . . . . . . . . . . A A A (X) C A C A A A A A C AHawaii . . . . . . . . . . . . . . . . . . A C A (X) A C C A A A A A C AIdaho . . . . . . . . . . . . . . . . . . . A A A (X) A C C A A A A A A AIllinois. . . . . . . . . . . . . . . . . . . A A A (X) C C C A A A C A A AIndiana . . . . . . . . . . . . . . . . . . A A A (X) C C C A A A A A C AIowa. . . . . . . . . . . . . . . . . . . . A A A (X) C C A A A A C A A AKansas . . . . . . . . . . . . . . . . . . A A A (X) A C C A A A A A C AKentucky. . . . . . . . . . . . . . . . . A A A (X) C A C A A A A A C ALouisiana . . . . . . . . . . . . . . . . A A A (X) A A C A A A A A C AMaine . . . . . . . . . . . . . . . . . . . A A A (X) A C A A A A A A A A
Maryland. . . . . . . . . . . . . . . . . A A A (X) B C A A A A A A A AMassachusetts . . . . . . . . . . . . . A A A (X) C A C A A A A A C AMichigan . . . . . . . . . . . . . . . . . A A A (X) A A C A A A A A C AMinnesota . . . . . . . . . . . . . . . . A A C (X) C A C A A A A A C AMississippi. . . . . . . . . . . . . . . . A A A (X) C C A A A A C A C AMissouri . . . . . . . . . . . . . . . . . A A A (X) A A C A A A C A A AMontana . . . . . . . . . . . . . . . . . A A A (X) C A C A A A A A A ANebraska . . . . . . . . . . . . . . . . A A A (X) A A C A A A A A C ANevada. . . . . . . . . . . . . . . . . . A A A (X) C A C A A C C A A ANew Hampshire . . . . . . . . . . . . A A A (X) C A C A A A A A A A
New Jersey . . . . . . . . . . . . . . . A A A (X) A C A A A A C A A ANew Mexico. . . . . . . . . . . . . . . A A A (X) C C A A A A C A A ANew York . . . . . . . . . . . . . . . . A A A (X) C A C A A A A A A ANorth Carolina . . . . . . . . . . . . . A A A (X) A A A A A A A A A ANorth Dakota . . . . . . . . . . . . . . A A A (X) C C C A A A A A C AOhio. . . . . . . . . . . . . . . . . . . . A A A (X) A A A A A A A A C AOklahoma . . . . . . . . . . . . . . . . A A A (X) A A A A A A A A A AOregon . . . . . . . . . . . . . . . . . . A A A (X) C A C A A A C A A APennsylvania . . . . . . . . . . . . . . A A A (X) A C C A A A A A A ARhode Island . . . . . . . . . . . . . . A A A (X) C A A A A A A A A A
South Carolina . . . . . . . . . . . . . A A A (X) C A C A A A A A A ASouth Dakota. . . . . . . . . . . . . . A A C (X) A C C A A A C A C ATennessee. . . . . . . . . . . . . . . . A A A (X) A A A A A A A A A ATexas . . . . . . . . . . . . . . . . . . . A A C (X) A C C A A A A A A AUtah. . . . . . . . . . . . . . . . . . . . A A A (X) C C C A A A A A A AVermont . . . . . . . . . . . . . . . . . A A A (X) A C C A A A A A C AVirginia . . . . . . . . . . . . . . . . . . A A A (X) C A C A A A A A C AWashington . . . . . . . . . . . . . . . A A A (X) A A C A A A C A A AWest Virginia . . . . . . . . . . . . . . A A A (X) A A C A A C A A C AWisconsin . . . . . . . . . . . . . . . . A A A (X) C A C A A A A A A AWyoming. . . . . . . . . . . . . . . . . A A A (X) A C A A A A A A A A
American Samoa . . . . . . . . . . . C C C (X) C C C C C C C A C CGuam . . . . . . . . . . . . . . . . . . . C C C X C C C C C C C C C CNorthern Mariana Islands . . . . . . A C C X C C C C C C C A C CPuerto Rico . . . . . . . . . . . . . . . C C A A C C C C C C A A A CVirgin Islands . . . . . . . . . . . . . . C C C (X) C C C C C C C C C C
Coding key: A = Program data are allocated to all county areas. The distribution is based on data supplied by the State for all of its county areas.B = Program data are allocated to all county areas. The distribution is based on data supplied by the State for most of its county areas. The Census Bureau
estimated remaining county allocations.C = All program data are allocated to State undistributed.X = Not applicable.
1County allocations are derived from Education Department data. See text for additional details.
F-1