JPMorgan ETF (Ireland) ICAV - extraETF
188
JPMorgan ETFs (Ireland) ICAV Unaudited Semi-Annual Report (An Irish collective asset-management vehicle constituted as an umbrella fund with segregated liability between Sub-Funds) (CBI Reg No C171821) 30 June 2020
-
Upload
khangminh22 -
Category
Documents
-
view
2 -
download
0
Transcript of JPMorgan ETF (Ireland) ICAV - extraETF

JPMorgan ETFs (Ireland) ICAV
Unaudited Semi-Annual Report
(An Irish collective asset-management vehicle constituted as an umbrella fund with segregated liability between Sub-Funds)
(CBI Reg No C171821)
30 June 2020

JPMorgan ETFs (Ireland) ICAV
Unaudited Semi-Annual Report
For the six month period ended 30 June 2020
Contents Page
Directors and General Information 1
Unaudited Financial StatementsStatement of Financial Position 2Statement of Comprehensive Income 12Statement of Changes in Net Assets Attributable to Holders of Redeemable Participating Shares 21Statement of Cash Flows 30
Notes to the Unaudited Financial Statements 39
Schedule of Investments (Unaudited)JPMorgan ETFs (Ireland) ICAV - BetaBuilders EUR Govt Bond 1-3 yr UCITS ETF 62JPMorgan ETFs (Ireland) ICAV - BetaBuilders EUR Govt Bond UCITS ETF 64JPMorgan ETFs (Ireland) ICAV - BetaBuilders UK Gilt 1-5 yr UCITS ETF 69JPMorgan ETFs (Ireland) ICAV - BetaBuilders US Equity UCITS ETF 70JPMorgan ETFs (Ireland) ICAV - BetaBuilders US Treasury Bond 0-1 yr UCITS ETF 75JPMorgan ETFs (Ireland) ICAV - BetaBuilders US Treasury Bond 1-3 yr UCITS ETF 77JPMorgan ETFs (Ireland) ICAV - BetaBuilders US Treasury Bond UCITS ETF 79JPMorgan ETFs (Ireland) ICAV - Equity Long-Short UCITS ETF 81JPMorgan ETFs (Ireland) ICAV - EUR Corporate Bond 1-5 yr Research Enhanced Index UCITS ETF 82JPMorgan ETFs (Ireland) ICAV - EUR Corporate Bond Research Enhanced Index UCITS ETF 85JPMorgan ETFs (Ireland) ICAV - EUR Ultra-Short Income UCITS ETF 90JPMorgan ETFs (Ireland) ICAV - Europe Research Enhanced Index Equity (ESG) UCITS ETF 94JPMorgan ETFs (Ireland) ICAV - GBP Ultra-Short Income UCITS ETF 96JPMorgan ETFs (Ireland) ICAV - Global Emerging Markets Research Enhanced Index Equity (ESG) UCITS ETF 99JPMorgan ETFs (Ireland) ICAV - Global Equity Multi-Factor UCITS ETF 103JPMorgan ETFs (Ireland) ICAV - Global High Yield Corporate Bond Multi-Factor UCITS ETF 108JPMorgan ETFs (Ireland) ICAV - Global Research Enhanced Index Equity (ESG) UCITS ETF 116JPMorgan ETFs (Ireland) ICAV - Managed Futures UCITS ETF 122JPMorgan ETFs (Ireland) ICAV - US Equity Multi-Factor UCITS ETF 127JPMorgan ETFs (Ireland) ICAV - US Research Enhanced Index Equity (ESG) UCITS ETF 131JPMorgan ETFs (Ireland) ICAV - USD Corporate Bond Research Enhanced Index UCITS ETF 134JPMorgan ETFs (Ireland) ICAV - USD Emerging Markets Sovereign Bond UCITS ETF 140JPMorgan ETFs (Ireland) ICAV - USD Ultra-Short Income UCITS ETF 148
Unaudited Appendix1. Statement of Significant Portfolio Changes
JPMorgan ETFs (Ireland) ICAV - BetaBuilders EUR Govt Bond 1-3 yr UCITS ETF 152JPMorgan ETFs (Ireland) ICAV - BetaBuilders EUR Govt Bond UCITS ETF 153JPMorgan ETFs (Ireland) ICAV - BetaBuilders UK Gilt 1-5 yr UCITS ETF 154JPMorgan ETFs (Ireland) ICAV - BetaBuilders US Equity UCITS ETF 155JPMorgan ETFs (Ireland) ICAV - BetaBuilders US Treasury Bond 0-1 yr UCITS ETF 156JPMorgan ETFs (Ireland) ICAV - BetaBuilders US Treasury Bond 1-3 yr UCITS ETF 157JPMorgan ETFs (Ireland) ICAV - BetaBuilders US Treasury Bond UCITS ETF 159JPMorgan ETFs (Ireland) ICAV - Equity Long-Short UCITS ETF 160JPMorgan ETFs (Ireland) ICAV - EUR Corporate Bond 1-5 yr Research Enhanced Index UCITS ETF 161JPMorgan ETFs (Ireland) ICAV - EUR Corporate Bond Research Enhanced Index UCITS ETF 162JPMorgan ETFs (Ireland) ICAV - EUR Ultra-Short Income UCITS ETF 164JPMorgan ETFs (Ireland) ICAV - Europe Research Enhanced Index Equity (ESG) UCITS ETF 165JPMorgan ETFs (Ireland) ICAV - GBP Ultra-Short Income UCITS ETF 166JPMorgan ETFs (Ireland) ICAV - Global Emerging Markets Research Enhanced Index Equity (ESG) UCITS ETF 167JPMorgan ETFs (Ireland) ICAV - Global Equity Multi-Factor UCITS ETF 168JPMorgan ETFs (Ireland) ICAV - Global High Yield Corporate Bond Multi-Factor UCITS ETF 169JPMorgan ETFs (Ireland) ICAV - Global Research Enhanced Index Equity (ESG) UCITS ETF 170JPMorgan ETFs (Ireland) ICAV - Managed Futures UCITS ETF 171JPMorgan ETFs (Ireland) ICAV - US Equity Multi-Factor UCITS ETF 172JPMorgan ETFs (Ireland) ICAV - US Research Enhanced Index Equity (ESG) UCITS ETF 173JPMorgan ETFs (Ireland) ICAV - USD Corporate Bond Research Enhanced Index UCITS ETF 174JPMorgan ETFs (Ireland) ICAV - USD Emerging Markets Sovereign Bond UCITS ETF 175JPMorgan ETFs (Ireland) ICAV - USD Ultra-Short Income UCITS ETF 176
2. Total Expense Ratios 1773. Securities Financing Transactions 1794. Sub-Fund Tracking Errors 1835. UCITS Remuneration Disclosures 184
For additional information, please consult www.jpmorganassetmanagement.ie.
Before subscribing for Shares, each investor will be required to confirm that they have received the relevant key investor information documents (“KIID”).The KIIDs and the latest annual and any semi-annual reports of the ICAV are available to download on the website.

JPMorgan ETFs (Ireland) ICAVDirectors and General Information
DirectorsDaniel J. Watkins (Connected Non-Executive Director and Chair)Lorcan Murphy (Independent Non-Executive Director and Irishresident)Bronwyn Wright (Independent Non-Executive Director and Irishresident)Samantha McConnell (Independent Non-Executive Director and Irishresident)
Investment ManagersJ.P. Morgan Investment Inc270 Park AvenueNew York, NY 10017United States of America
JPMorgan Asset Management (UK) Limited60 Victoria EmbankmentLondonEC4Y 0JPUnited Kingdom
Administrator and RegistrarBrown Brothers HarrimanFund Administration Services (Ireland) Limited30 Herbert StreetDublin 2Ireland
Independent AuditorsPricewaterhouseCoopersOne Spencer DockNorth Wall QuayDublin 1Ireland
Management CompanyJPMorgan Asset Management (Europe) S.à r.l.6, route de Trèves,L-2633 Senningerberg,Grand Duchy of Luxembourg
DepositaryBrown Brothers Harriman Trustee Services (Ireland) Limited30 Herbert StreetDublin 2Ireland
Legal AdvisorsMatheson70 Sir John Rogerson’s QuayDublin 2Ireland
SecretaryJ.P. Morgan Administration Services (Ireland) Limited79 Sir John Rogerson’s QuayDublin 2, D02 RK57Ireland
Registered Office79 Sir John Rogerson’s QuayDublin 2, D02 RK57Ireland
1

JPMorgan ETFs (Ireland) ICAVStatement of Financial PositionAs at 30 June 2020
NotesBetaBuilders
EUR Govt Bond1-3 yr UCITS ETF
EUR
BetaBuildersEUR Govt Bond
UCITS ETFEUR
AssetsFinancial assets at fair value through profit or loss 2 95,735,896 17,947,303Cash 40,681 47,822Cash equivalents - -Amounts due from brokers - -Dividend receivable - -Interest receivable 745,815 131,988Securities sold awaiting settlement 4,150,773 210,294Receivable for shares issued - -Other receivables* - -
Total Assets 100,673,165 18,337,407
LiabilitiesFinancial liabilities at fair value through profit or loss 2 - -Bank overdraft - -Fees and expenses payable 3 (14,750) (2,699)Securities purchased awaiting settlement (4,134,893) (240,631)Payable for shares redeemed - -Distributions payable - -Other payables* - -
Total Liabilities (excluding net assets attributable to holders of redeemable participating shares) (4,149,643) (243,330)
Net assets attributable to holders of redeemable participating shares 96,523,522 18,094,077
*Other receivables are principally comprised of securities lending income receivable as at the period end. Other payables are principally comprised of the adjustments to account for balances inthe name of the Sub-Funds in accordance with the Central Bank (Supervision and Enforcement Act 2013(Section 48(1)) Investor Money Regulations 2015 for Fund Service Providers (“theRegulations”) and short CFDs’ dividends payable at the period end.
The accompanying notes form an integral part of the financial statements.
2

JPMorgan ETFs (Ireland) ICAVStatement of Financial Position (continued)As at 30 June 2020
BetaBuildersUK Gilt 1-5 yr
UCITS ETFGBP
BetaBuildersUS EquityUCITS ETF
USD
BetaBuildersUS Treasury Bond
0-1 yr UCITS ETFUSD
BetaBuildersUS Treasury Bond
1-3 yr UCITS ETFUSD
BetaBuildersUS Treasury Bond
UCITS ETFUSD
24,297,532 9,630,188 806,857,341 127,167,748 101,326,18764,482 1,530 7,351,166 279,368 135
- 22,963 - - 108,338- 11,759 - - -- 6,611 - - -
148,121 - 861,015 434,439 462,2712,570,938 27 144,676,566 5,124,172 1,197,013
- - - - -- 28 - - -
27,081,073 9,673,106 959,746,088 133,005,727 103,093,944
- - (20,715,982) - (287,228)- - - - -
(4,080) (623) (102,937) (22,577) (16,067)(2,555,357) - (138,477,142) (5,291,784) (1,758,215)
- - - - -(7,176) - - - -
- - - - -
(2,566,613) (623) (159,296,061) (5,314,361) (2,061,510)
24,514,460 9,672,483 800,450,027 127,691,366 101,032,434
The accompanying notes form an integral part of the financial statements.
3

JPMorgan ETFs (Ireland) ICAVStatement of Financial Position (continued)As at 30 June 2020
EquityLong-Short
UCITS ETFUSD
EUR Corporate Bond1-5 yr Research Enhanced
Index UCITS ETFEUR
EUR Corporate BondResearch Enhanced
Index UCITS ETFEUR
EUR Ultra-ShortIncome
UCITS ETFEUR
Europe Research EnhancedIndex Equity
(ESG) UCITS ETFEUR
- 30,033,622 166,684,159 499,849,995 154,684,473315,742 198,321 1,035,672 7,700,098 691,566
- - - 52,068,973 -- 17,020 168,952 - -
42,000 - - - 200,317- 189,303 980,708 1,910,910 -
15 - - 1,585 -- - - 2,980,830 -
1,103 - - 2,981 -
358,860 30,438,266 168,869,491 564,515,372 155,576,356
(84) (1,365) (107,080) (153,533) -- - - - -
(29,721) (9,577) (44,782) (67,322) (62,567)- (64) (28) (7,966,885) -- - - - -- - - - -
(329,055) - - - -
(358,860) (11,006) (151,890) (8,187,740) (62,567)
- 30,427,260 168,717,601 556,327,632 155,513,789
The accompanying notes form an integral part of the financial statements.
4

JPMorgan ETFs (Ireland) ICAVStatement of Financial Position (continued)As at 30 June 2020
GBP Ultra-ShortIncome
UCITS ETFGBP
Global Emerging MarketsResearch Enhanced Index
Equity (ESG) UCITS ETFUSD
Global EquityMulti-Factor
UCITS ETFUSD
Global High Yield CorporateBond Multi-Factor
UCITS ETFUSD
Global Research EnhancedIndex Equity
(ESG) UCITS ETFUSD
ManagedFutures
UCITS ETFUSD
91,486,063 238,762,605 23,355,478 109,075,822 69,392,220 74,963,671647,025 1,324,028 61,316 1,810,006 143,005 4,250,349
9,287,116 2,079,172 - - 510,015 9,535,193- - 14,361 - 170,689 3,329,069- 850,618 44,200 - 62,310 -
419,316 - - 1,704,454 - 165,972- 148,820 - 6,289,122 - -- - - - - -- - 88 - - 574,110
101,839,520 243,165,243 23,475,443 118,879,404 70,278,239 92,818,364
(205,179) - - (483,706) - (2,441,361)- - - - - -
(16,104) (111,630) (7,269) (53,417) (20,622) (86,276)(399,721) (595,376) (102) (7,387,649) - -
- - - - - -(65,721) - - - - -
(201,146) - - - - (2,170,851)
(887,871) (707,006) (7,371) (7,924,772) (20,622) (4,698,488)
100,951,649 242,458,237 23,468,072 110,954,632 70,257,617 88,119,876
The accompanying notes form an integral part of the financial statements.
5

JPMorgan ETFs (Ireland) ICAVStatement of Financial Position (continued)As at 30 June 2020
US EquityMulti-Factor
UCITS ETFUSD
US Research EnhancedIndex Equity
(ESG) UCITS ETFUSD
USD Corporate BondResearch Enhanced
Index UCITS ETFUSD
USD EmergingMarkets Sovereign
Bond UCITS ETFUSD
USD Ultra-ShortIncome
UCITS ETFUSD
10,524,422 241,205,649 120,539,688 513,635,168 159,360,0896,358 - 7,959 440,589 66
- 402,826 736,263 2,114,561 4,979,7147,146 93,523 99,626 - -
14,155 175,118 - - -- - 991,535 8,162,940 794,223- 4,066,827 11 5,756,492 -- 91 - - -
38 - - - 495
10,552,119 245,944,034 122,375,082 530,109,750 165,134,587
- - (36,992) (1,329,373) -- (6,704) - - -
(3,266) (79,290) (36,312) (297,427) (51,048)- - - (13,511,312) (1,487,288)- (4,213,350) - - (2,023,600)- - - (458,062) (200,939)- (593) - - -
(3,266) (4,299,937) (73,304) (15,596,174) (3,762,875)
10,548,853 241,644,097 122,301,778 514,513,576 161,371,712
The accompanying notes form an integral part of the financial statements.
6

JPMorgan ETFs (Ireland) ICAVStatement of Financial PositionAs at 31 December 2019
NotesBetaBuilders
EUR Govt Bond1-3 yr UCITS ETF
EUR
BetaBuildersEUR Govt Bond
UCITS ETFEUR
AssetsFinancial assets at fair value through profit or loss 2 86,525,432 12,404,990Cash 3 24,871 3,008Cash equivalents 3 - -Amounts due from brokers - -Dividend receivable - -Interest receivable 737,614 110,190Securities sold awaiting settlement 2,653,619 65,175Receivable for shares issued 21 -Other receivables* - -
Total Assets 89,941,557 12,583,363
LiabilitiesFinancial liabilities at fair value through profit or loss 2 - -Bank overdraft 3 - -Fees and expenses payable 4 (13,941) (2,067)Securities purchased awaiting settlement (633,403) (56,137)Payable for shares redeemed (2,004,040) -Distributions payable - -Other payables* - -
Total Liabilities (excluding net assets attributable to holders of redeemable participating shares) (2,651,384) (58,204)
Net assets attributable to holders of redeemable participating shares 87,290,173 12,525,159
*Other receivables are principally comprised of securities lending income receivable as at year end. Other payables are principally comprised of the adjustments to account for balances in thename of the Sub-Funds in accordance with the Central Bank (Supervision and Enforcement Act 2013(Section 48(1)) Investor Money Regulations 2015 for Fund Service Providers (“theRegulations”), short CFDs’ dividends and capital gains tax payable as at year end.
The accompanying notes form an integral part of the financial statements.
7

JPMorgan ETFs (Ireland) ICAVStatement of Financial Position (continued)As at 31 December 2019
BetaBuildersUK Gilt 1-5 yr
UCITS ETFGBP
BetaBuildersUS EquityUCITS ETF
USD
BetaBuildersUS Treasury Bond
0-1 yr UCITS ETFUSD
BetaBuildersUS Treasury Bond
1-3 yr UCITS ETFUSD
BetaBuildersUS Treasury Bond
UCITS ETFUSD
23,964,365 7,063,317 199,846,986 99,966,289 85,923,79661,024 2,685 10,916,792 1,313,160 129
- 15,977 - - 137,800- 11,223 - - -- 6,541 - - -
156,678 - 351,367 394,744 478,6942,692,640 - 19,189,364 2,780,872 649,628
- - - - -- - - - -
26,874,707 7,099,743 230,304,509 104,455,065 87,190,047
- - (4,124) - (799,762)- - - - -
(4,100) (521) (32,627) (16,784) (14,015)(2,733,690) - (30,022,526) (3,025,104) (3,275,510)
- - - - -(8,832) - - - -
- - - (1,042,044) -
(2,746,622) (521) (30,059,277) (4,083,932) (4,089,287)
24,128,085 7,099,222 200,245,232 100,371,133 83,100,760
The accompanying notes form an integral part of the financial statements.
8

JPMorgan ETFs (Ireland) ICAVStatement of Financial Position (continued)As at 31 December 2019
EquityLong-Short
UCITS ETFUSD
EUR Corporate Bond1-5 yr Research Enhanced
Index UCITS ETFEUR
EUR Corporate BondResearch Enhanced
Index UCITS ETFEUR
EUR Ultra-ShortIncome
UCITS ETFEUR
Europe Research EnhancedIndex Equity
(ESG) UCITS ETFEUR
17,039,430 24,318,001 35,714,671 525,602,866 41,451,568581,602 69,822 112,645 124,437 193,699
4,367,128 - - 50,257,937 211,765923,121 22,445 39,022 - -43,782 - - 1,886 25,694
101 207,548 297,311 1,902,305 -11,883 - - 26,965 -
268,154 - - - -218 - - - -
23,235,419 24,617,816 36,163,649 577,916,396 41,882,726
(1,115,339) (2,180) (15,880) (46,725) -- - - (6,249) -
(24,293) (7,814) (11,485) (70,786) (16,535)(24,526) - - - (156,329)
(266,388) - - - -- - - - -
(24,134) - - - -
(1,454,680) (9,994) (27,365) (123,760) (172,864)
21,780,739 24,607,822 36,136,284 577,792,636 41,709,862
The accompanying notes form an integral part of the financial statements.
9

JPMorgan ETFs (Ireland) ICAVStatement of Financial Position (continued)As at 31 December 2019
GBP Ultra-ShortIncome
UCITS ETFGBP
Global Emerging MarketsResearch Enhanced Index
Equity (ESG) UCITS ETFUSD
Global EquityMulti-Factor
UCITS ETFUSD
Global Research EnhancedIndex Equity
(ESG) UCITS ETFUSD
ManagedFutures
UCITS ETFUSD
106,883,608 245,438,189 21,232,043 38,887,625 68,982,849113,548 6,703,772 34,084 256,988 2,187,308
4,038,348 310,416 - 622,019 26,380,490- - 4,237 20,235 4,689,592- 582,751 34,083 33,611 -
646,253 - - - 29,280- - 1,139 - 5,418- - - - -- - 48 - -
111,681,757 253,035,128 21,305,634 39,820,478 102,274,937
(10,514) - - (6,274) (2,465,726)- - - - -
(35,073) (86,107) (5,904) (16,148) (91,693)(136,266) (5,407,839) - - -
- - - - -(81,483) - - - -
- (148,323) - - (811)
(263,336) (5,642,269) (5,904) (22,422) (2,558,230)
111,418,421 247,392,859 21,299,730 39,798,056 99,716,707
The accompanying notes form an integral part of the financial statements.
10

JPMorgan ETFs (Ireland) ICAVStatement of Financial Position (continued)As at 31 December 2019
US EquityMulti-Factor
UCITS ETFUSD
US Research EnhancedIndex Equity
(ESG) UCITS ETFUSD
USD Corporate BondResearch Enhanced
Index UCITS ETFUSD
USD EmergingMarkets Sovereign
Bond UCITS ETFUSD
USD Ultra-ShortIncome
UCITS ETFUSD
11,939,634 225,200,019 81,776,209 355,345,604 254,313,49021,641 6,532 3,730 3,344,313 218
- 1,119,934 987,267 1,112,598 21,282,8501,948 34,497 60,391 - -17,815 133,368 - - -
- - 732,193 5,545,142 1,392,609- - 61,416 1,766,636 -- - - - -5 - - - -
11,981,043 226,494,350 83,621,206 367,114,293 276,989,167
- - (48,414) (705,061) -- - - - -
(3,709) (56,089) (25,787) (220,701) (79,772)- - - (5,923,415) -- - - - -- - - (457,960) (381,687)- - - - -
(3,709) (56,089) (74,201) (7,307,137) (461,459)
11,977,334 226,438,261 83,547,005 359,807,156 276,527,708
The accompanying notes form an integral part of the financial statements.
11

JPMorgan ETFs (Ireland) ICAVStatement of Comprehensive IncomeFor the six month period ended 30 June 2020
NotesBetaBuilders
EUR Govt Bond1-3 yr UCITS ETF
EUR
BetaBuildersEUR Govt Bond
UCITS ETFEUR
Investment incomeNet gain/(loss) in fair value on financial assets and financial liabilities at fair value through profit or loss 23,647 344,527Dividend income - -Interest from financial assets at fair value through profit or loss - 30,206Interest income - -Securities lending income 16 - -
Total operating income/(loss) 23,647 374,733
ExpensesFees and expenses 4 (44,503) (7,220)Interest expense (117,964) -
Total operating expenses (162,467) (7,220)
Finance costsOverdraft expense (294) (245)Distributions 11 - -
Total finance costs (294) (245)
Net (loss)/income from operations before tax (139,114) 367,268
Withholding tax - -Capital gain tax - -
Net (decrease)/increase in net assets attributable to holders of redeemable participating shares from operations (139,114) 367,268
The net income arose solely from continuing operations. There were no other recognised gains or losses for the period other than as set out in the above Statement of Comprehensive Income.
The accompanying notes form an integral part of the financial statements.
1 Sub-Fund liquidated on 19 June 2020. See Note 17e.2 Sub-Fund launched on 4 February 2020.
12

JPMorgan ETFs (Ireland) ICAVStatement of Comprehensive Income (continued)For the six month period ended 30 June 2020
BetaBuildersUK Gilt 1-5 yr
UCITS ETFGBP
BetaBuildersUS EquityUCITS ETF
USD
BetaBuildersUS Treasury Bond
0-1 yr UCITS ETFUSD
BetaBuildersUS Treasury Bond
1-3 yr UCITS ETFUSD
BetaBuildersUS Treasury Bond
UCITS ETFUSD
388,953 (473,598) (2,715,488) 2,984,685 1,550,218- 84,826 - - 917
62,827 - 1,132,353 1,087,391 809,27413 58 5,250 185 9
- 61 - - -
451,793 (388,653) (1,577,885) 4,072,261 2,360,418
(12,042) (1,582) (167,879) (66,551) (43,817)- - - - -
(12,042) (1,582) (167,879) (66,551) (43,817)
- (2) (307) - -(53,376) (23,055) - - -
(53,376) (23,057) (307) - -
386,375 (413,292) (1,746,071) 4,005,710 2,316,601
- (12,307) - - -- - - - -
386,375 (425,599) (1,746,071) 4,005,710 2,316,601
The net income arose solely from continuing operations. There were no other recognised gains or losses for the period other than as set out in the above Statement of Comprehensive Income.
The accompanying notes form an integral part of the financial statements.
1 Sub-Fund liquidated on 19 June 2020. See Note 17e.2 Sub-Fund launched on 4 February 2020.
13

JPMorgan ETFs (Ireland) ICAVStatement of Comprehensive Income (continued)For the six month period ended 30 June 2020
EquityLong-ShortUCITS ETF1
USD
EUR Corporate Bond1-5 yr Research Enhanced
Index UCITS ETFEUR
EUR Corporate BondResearch Enhanced
Index UCITS ETFEUR
EUR Ultra-ShortIncome
UCITS ETFEUR
Europe Research EnhancedIndex Equity
(ESG) UCITS ETFEUR
(5,297,376) (333,658) 560,520 (3,501,160) 1,834,180139,615 - - 1,967 1,895,22110,947 85,935 370,271 197,634 -11,853 8 1 - -
575 - - - -
(5,134,386) (247,715) 930,792 (3,301,559) 3,729,401
(89,815) (26,327) (79,011) (210,861) (115,100)- - - (33,748) -
(89,815) (26,327) (79,011) (244,609) (115,100)
(4) (874) (3,053) (3,833) (1,212)- - - - -
(4) (874) (3,053) (3,833) (1,212)
(5,224,205) (274,916) 848,728 (3,550,001) 3,613,089
(39,704) (942) (7,668) 258 (201,118)- - - - -
(5,263,909) (275,858) 841,060 (3,549,743) 3,411,971
The net income arose solely from continuing operations. There were no other recognised gains or losses for the period other than as set out in the above Statement of Comprehensive Income.
The accompanying notes form an integral part of the financial statements.
1 Sub-Fund liquidated on 19 June 2020. See Note 17e.2 Sub-Fund launched on 4 February 2020.
14

JPMorgan ETFs (Ireland) ICAVStatement of Comprehensive Income (continued)For the six month period ended 30 June 2020
GBP Ultra-ShortIncome
UCITS ETFGBP
Global Emerging MarketsResearch Enhanced Index
Equity (ESG) UCITS ETFUSD
Global EquityMulti-Factor
UCITS ETFUSD
Global High Yield CorporateBond Multi-Factor
UCITS ETF2
USD
Global Research EnhancedIndex Equity
(ESG) UCITS ETFUSD
ManagedFutures
UCITS ETFUSD
(55,990) (26,947,623) (2,190,295) (2,599,729) (3,379,060) (17,410,560)29,538 2,616,406 337,313 - 501,431 70,640
449,122 - - 1,511,450 - 463,6621,448 1,394 66 - 179 48,037
- - 786 - - -
424,118 (24,329,823) (1,852,130) (1,088,279) (2,877,450) (16,828,221)
(71,236) (329,605) (19,450) (87,491) (53,131) (270,660)- - - - - -
(71,236) (329,605) (19,450) (87,491) (53,131) (270,660)
(42) (156) (2) (348) (4) -(383,145) - - - - -
(383,187) (156) (2) (348) (4) -
(30,305) (24,659,584) (1,871,582) (1,176,118) (2,930,585) (17,098,881)
(2,902) (285,226) (45,352) (3,971) (71,590) -- 128,991 - - - -
(33,207) (24,815,819) (1,916,934) (1,180,089) (3,002,175) (17,098,881)
The net income arose solely from continuing operations. There were no other recognised gains or losses for the period other than as set out in the above Statement of Comprehensive Income.
The accompanying notes form an integral part of the financial statements.
1 Sub-Fund liquidated on 19 June 2020. See Note 17e.2 Sub-Fund launched on 4 February 2020.
15

JPMorgan ETFs (Ireland) ICAVStatement of Comprehensive Income (continued)For the six month period ended 30 June 2020
US EquityMulti-Factor
UCITS ETFUSD
US Research EnhancedIndex Equity
(ESG) UCITS ETFUSD
USD Corporate BondResearch Enhanced
Index UCITS ETFUSD
USD EmergingMarkets Sovereign
Bond UCITS ETFUSD
USD Ultra-ShortIncome
UCITS ETFUSD
(1,535,717) (6,275,990) 5,774,860 (39,123,126) 410,339136,462 2,105,593 9,919 8,068 58,259
- - 1,533,779 10,710,263 2,256,96358 146 138 - 52153 - - - -
(1,399,144) (4,170,251) 7,318,696 (28,404,795) 2,726,082
(9,968) (225,293) (93,601) (861,918) (184,115)- - - - -
(9,968) (225,293) (93,601) (861,918) (184,115)
- (92) - (1,832) (197)- - - (2,944,971) (1,866,605)
- (92) - (2,946,803) (1,866,802)
(1,409,112) (4,395,636) 7,225,095 (32,213,516) 675,165
(19,369) (346,043) (1,790) (22,826) (5,186)- - - - -
(1,428,481) (4,741,679) 7,223,305 (32,236,342) 669,979
The net income arose solely from continuing operations. There were no other recognised gains or losses for the period other than as set out in the above Statement of Comprehensive Income.
The accompanying notes form an integral part of the financial statements.
1 Sub-Fund liquidated on 19 June 2020. See Note 17e.2 Sub-Fund launched on 4 February 2020.
16

JPMorgan ETFs (Ireland) ICAVStatement of Comprehensive IncomeFor the six month period ended 30 June 2019
NotesBetaBuilders
EUR Govt Bond1-3 yr UCITS ETF
EUR
BetaBuildersEUR Govt Bond
UCITS ETF1
EUR
BetaBuildersUK Gilt 1-5 yr
UCITS ETFGBP
Investment incomeNet gain/(loss) in fair value on financial assets and financial liabilities at fair value through profit or loss 296,714 362,866 60,868Dividend income - - -Interest income - 10,447 45,941Securities lending income 16 - - -
Total operating income/(loss) 296,714 373,313 106,809
ExpensesFees and expenses 4 (24,935) (1,861) (5,460)Interest expense (28,802) - -
Total operating expenses (53,737) (1,861) (5,460)
Finance costsOverdraft expense (262) (153) (38)Distributions 11 - - (74,118)
Total finance costs (262) (153) (74,156)
Net income/(loss) from operations before tax 242,715 371,299 27,193
Withholding tax - - -Capital gain tax - - -
Net increase/(decrease) in net assets attributable to holders of redeemable participating shares from operations 242,715 371,299 27,193
The net income arose solely from continuing operations. There were no other recognised gains or losses for the period other than as set out in the above Statement of Comprehensive Income.
The accompanying notes form an integral part of the financial statements.
1 Sub-Fund launched on 25 April 2019.2 Sub-Fund launched on 3 April 2019.
17

JPMorgan ETFs (Ireland) ICAVStatement of Comprehensive Income (continued)For the six month period ended 30 June 2019
BetaBuildersUS Equity
UCITS ETF2
USD
BetaBuildersUS Treasury Bond
1-3 yr UCITS ETFUSD
BetaBuildersUS Treasury Bond
UCITS ETF1
USD
EquityLong-Short
UCITS ETFUSD
EUR Corporate Bond1-5 yr Research Enhanced
Index UCITS ETFEUR
EUR Corporate BondResearch Enhanced
Index UCITS ETFEUR
234,592 879,578 1,571,909 (1,170,743) 466,599 1,307,29848,450 - - 197,321 - -
32 843,288 188,407 56,930 83,149 162,83610 - - 337 - -
283,084 1,722,866 1,760,316 (916,155) 549,748 1,470,134
(896) (33,026) (8,325) (79,101) (21,187) (26,876)- - - - - -
(896) (33,026) (8,325) (79,101) (21,187) (26,876)
(2) (2) - (57) (332) (440)- - - - - -
(2) (2) - (57) (332) (440)
282,186 1,689,838 1,751,991 (995,313) 528,229 1,442,818
(6,926) - - (61,414) - (292)- - - - - -
275,260 1,689,838 1,751,991 (1,056,727) 528,229 1,442,526
The net income arose solely from continuing operations. There were no other recognised gains or losses for the period other than as set out in the above Statement of Comprehensive Income.
The accompanying notes form an integral part of the financial statements.
1 Sub-Fund launched on 25 April 2019.2 Sub-Fund launched on 3 April 2019.
18

JPMorgan ETFs (Ireland) ICAVStatement of Comprehensive Income (continued)For the six month period ended 30 June 2019
EUR Ultra-ShortIncome
UCITS ETFEUR
Europe Research EnhancedIndex Equity
(ESG) UCITS ETFEUR
GBP Ultra-ShortIncome
UCITS ETFGBP
Global Emerging MarketsResearch Enhanced Index
Equity (ESG) UCITS ETFUSD
Global Research EnhancedIndex Equity
(ESG) UCITS ETFUSD
498,029 1,428,508 264,313 990,633 4,225,6811,394 314,983 14,900 159,230 434,471
- - 349,772 903 1,083- - - - -
499,423 1,743,491 628,985 1,150,766 4,661,235
(105,598) (13,311) (75,193) (15,197) (36,061)(3,802) - - - -
(109,400) (13,311) (75,193) (15,197) (36,061)
(558) (125) (44) (163) (1)- - (265,155) - -
(558) (125) (265,199) (163) (1)
389,465 1,730,055 288,593 1,135,406 4,625,173
(9,472) (26,409) (1,199) (19,196) (37,767)- - - (11,728) -
379,993 1,703,646 287,394 1,104,482 4,587,406
The net income arose solely from continuing operations. There were no other recognised gains or losses for the period other than as set out in the above Statement of Comprehensive Income.
The accompanying notes form an integral part of the financial statements.
1 Sub-Fund launched on 25 April 2019.2 Sub-Fund launched on 3 April 2019.
19

JPMorgan ETFs (Ireland) ICAVStatement of Comprehensive Income (continued)For the six month period ended 30 June 2019
ManagedFutures
UCITS ETFUSD
US Research EnhancedIndex Equity
(ESG) UCITS ETFUSD
USD Corporate BondResearch Enhanced
Index UCITS ETFUSD
USD EmergingMarkets Sovereign
Bond UCITS ETFUSD
USD Ultra-ShortIncome
UCITS ETFUSD
3,314,556 1,961,764 2,388,115 8,558,443 1,236,26187,773 123,431 3,505 9,985 108,641
729,162 - 600,706 3,172,920 3,458,645- - - - -
4,131,491 2,085,195 2,992,326 11,741,348 4,803,547
(197,883) (16,488) (27,411) (225,598) (209,659)- - - - -
(197,883) (16,488) (27,411) (225,598) (209,659)
- (690) (22) (369) (172)- - - (1,465,925) (3,046,587)
- (690) (22) (1,466,294) (3,046,759)
3,933,608 2,068,017 2,964,893 10,049,456 1,547,129
- (10,623) - (11,779) (7,381)- - - - -
3,933,608 2,057,394 2,964,893 10,037,677 1,539,748
The net income arose solely from continuing operations. There were no other recognised gains or losses for the period other than as set out in the above Statement of Comprehensive Income.
The accompanying notes form an integral part of the financial statements.
1 Sub-Fund launched on 25 April 2019.2 Sub-Fund launched on 3 April 2019.
20

JPMorgan ETFs (Ireland) ICAVStatement of Changes in Net Assets Attributable to Holders of Redeemable Participating SharesFor the six month period ended 30 June 2020
BetaBuildersEUR Govt Bond
1-3 yr UCITS ETFEUR
BetaBuildersEUR Govt Bond
UCITS ETFEUR
Net assets attributable to holders of redeemable participating shares at the beginning of the period 87,290,173 12,525,159
Share transactionsIssue of shares 11,975,853 9,459,390Redemption of shares (2,603,390) (4,257,740)
Net increase/(decrease) in net assets from share transactions 9,372,463 5,201,650
Net (decrease)/increase in net assets attributable to holders of redeemable participating shares from operations (139,114) 367,268
Net assets attributable to holders of redeemable participating shares at the end of the period 96,523,522 18,094,077
The accompanying notes form an integral part of the financial statements.
1 Sub-Fund liquidated on 19 June 2020. See Note 17e.2 Sub-Fund launched on 4 February 2020.
21

JPMorgan ETFs (Ireland) ICAVStatement of Changes in Net Assets Attributable to Holders of Redeemable Participating Shares (continued)For the six month period ended 30 June 2020
BetaBuildersUK Gilt 1-5 yr
UCITS ETFGBP
BetaBuildersUS EquityUCITS ETF
USD
BetaBuildersUS Treasury Bond
0-1 yr UCITS ETFUSD
BetaBuildersUS Treasury Bond
1-3 yr UCITS ETFUSD
BetaBuildersUS Treasury Bond
UCITS ETFUSD
24,128,085 7,099,222 200,245,232 100,371,133 83,100,760
- 2,998,860 627,935,967 75,743,633 24,311,606- - (25,985,101) (52,429,110) (8,696,533)
- 2,998,860 601,950,866 23,314,523 15,615,073
386,375 (425,599) (1,746,071) 4,005,710 2,316,601
24,514,460 9,672,483 800,450,027 127,691,366 101,032,434
The accompanying notes form an integral part of the financial statements.
1 Sub-Fund liquidated on 19 June 2020. See Note 17e.2 Sub-Fund launched on 4 February 2020.
22

JPMorgan ETFs (Ireland) ICAVStatement of Changes in Net Assets Attributable to Holders of Redeemable Participating Shares (continued)For the six month period ended 30 June 2020
EquityLong-ShortUCITS ETF1
USD
EUR Corporate Bond1-5 yr Research Enhanced
Index UCITS ETFEUR
EUR Corporate BondResearch Enhanced
Index UCITS ETFEUR
EUR Ultra-ShortIncome
UCITS ETFEUR
Europe Research EnhancedIndex Equity
(ESG) UCITS ETFEUR
21,780,739 24,607,822 36,136,284 577,792,636 41,709,862
17,002,589 6,095,296 133,878,757 335,678,339 112,880,056(33,519,419) - (2,138,500) (353,593,600) (2,488,100)
(16,516,830) 6,095,296 131,740,257 (17,915,261) 110,391,956
(5,263,909) (275,858) 841,060 (3,549,743) 3,411,971
- 30,427,260 168,717,601 556,327,632 155,513,789
The accompanying notes form an integral part of the financial statements.
1 Sub-Fund liquidated on 19 June 2020. See Note 17e.2 Sub-Fund launched on 4 February 2020.
23

JPMorgan ETFs (Ireland) ICAVStatement of Changes in Net Assets Attributable to Holders of Redeemable Participating Shares (continued)For the six month period ended 30 June 2020
GBP Ultra-ShortIncome
UCITS ETFGBP
Global Emerging MarketsResearch Enhanced Index
Equity (ESG) UCITS ETFUSD
Global EquityMulti-Factor
UCITS ETFUSD
Global High Yield CorporateBond Multi-Factor
UCITS ETF2
USD
Global Research EnhancedIndex Equity
(ESG) UCITS ETFUSD
ManagedFutures
UCITS ETFUSD
111,418,421 247,392,859 21,299,730 - 39,798,056 99,716,707
26,943,255 24,027,797 4,085,276 113,869,455 33,461,736 14,167,051(37,376,820) (4,146,600) - (1,734,734) - (8,665,001)
(10,433,565) 19,881,197 4,085,276 112,134,721 33,461,736 5,502,050
(33,207) (24,815,819) (1,916,934) (1,180,089) (3,002,175) (17,098,881)
100,951,649 242,458,237 23,468,072 110,954,632 70,257,617 88,119,876
The accompanying notes form an integral part of the financial statements.
1 Sub-Fund liquidated on 19 June 2020. See Note 17e.2 Sub-Fund launched on 4 February 2020.
24

JPMorgan ETFs (Ireland) ICAVStatement of Changes in Net Assets Attributable to Holders of Redeemable Participating Shares (continued)For the six month period ended 30 June 2020
US EquityMulti-Factor
UCITS ETFUSD
US Research EnhancedIndex Equity
(ESG) UCITS ETFUSD
USD Corporate BondResearch Enhanced
Index UCITS ETFUSD
USD EmergingMarkets Sovereign
Bond UCITS ETFUSD
USD Ultra-ShortIncome
UCITS ETFUSD
11,977,334 226,438,261 83,547,005 359,807,156 276,527,708
- 38,447,330 37,529,568 373,626,018 25,543,692- (18,499,815) (5,998,100) (186,683,256) (141,369,667)
- 19,947,515 31,531,468 186,942,762 (115,825,975)
(1,428,481) (4,741,679) 7,223,305 (32,236,342) 669,979
10,548,853 241,644,097 122,301,778 514,513,576 161,371,712
The accompanying notes form an integral part of the financial statements.
1 Sub-Fund liquidated on 19 June 2020. See Note 17e.2 Sub-Fund launched on 4 February 2020.
25

JPMorgan ETFs (Ireland) ICAVStatement of Changes in Net Assets Attributable to Holders of Redeemable Participating SharesFor the six month period ended 30 June 2019
BetaBuildersEUR Govt Bond
1-3 yr UCITS ETFEUR
BetaBuildersEUR Govt Bond
UCITS ETF1
EUR
BetaBuildersUK Gilt 1-5 yr
UCITS ETFGBP
Net assets attributable to holders of redeemable participating shares at the beginning of the period 42,987,589 - 11,029,316
Share transactionsIssue of shares 20,005,366 9,984,161 1,004,257Redemption of shares - - (1,003,620)
Net increase in net assets from share transactions 20,005,366 9,984,161 637
Net increase/(decrease) in net assets attributable to holders of redeemable participating shares from operations 242,715 371,299 27,193
Net assets attributable to holders of redeemable participating shares at the end of the period 63,235,670 10,355,460 11,057,146
The accompanying notes form an integral part of the financial statements.
1 Sub-Fund launched on 25 April 2019.2 Sub-Fund launched on 3 April 2019.
26

JPMorgan ETFs (Ireland) ICAVStatement of Changes in Net Assets Attributable to Holders of Redeemable Participating Shares (continued)For the six month period ended 30 June 2019
BetaBuildersUS Equity
UCITS ETF2
USD
BetaBuildersUS Treasury Bond
1-3 yr UCITS ETFUSD
BetaBuildersUS Treasury Bond
UCITS ETF1
USD
EquityLong-Short
UCITS ETFUSD
EUR Corporate Bond1-5 yr Research Enhanced
Index UCITS ETFEUR
EUR Corporate BondResearch Enhanced
Index UCITS ETFEUR
- 53,347,658 - 24,741,548 21,025,270 22,056,657
10,023,018 26,432,006 70,678,160 - 3,055,740 14,505,325- - - - - (2,084,780)
10,023,018 26,432,006 70,678,160 - 3,055,740 12,420,545
275,260 1,689,838 1,751,991 (1,056,727) 528,229 1,442,526
10,298,278 81,469,502 72,430,151 23,684,821 24,609,239 35,919,728
The accompanying notes form an integral part of the financial statements.
1 Sub-Fund launched on 25 April 2019.2 Sub-Fund launched on 3 April 2019.
27

JPMorgan ETFs (Ireland) ICAVStatement of Changes in Net Assets Attributable to Holders of Redeemable Participating Shares (continued)For the six month period ended 30 June 2019
EUR Ultra-ShortIncome
UCITS ETFEUR
Europe Research EnhancedIndex Equity
(ESG) UCITS ETFEUR
GBP Ultra-ShortIncome
UCITS ETFGBP
Global Emerging MarketsResearch Enhanced Index
Equity (ESG) UCITS ETFUSD
Global Research EnhancedIndex Equity
(ESG) UCITS ETFUSD
112,525,741 9,221,909 52,058,749 9,502,319 26,530,240
140,775,678 2,710,621 56,136,846 5,301,000 -(1,996,980) (1,358,200) (2,003,240) - -
138,778,698 1,352,421 54,133,606 5,301,000 -
379,993 1,703,646 287,394 1,104,482 4,587,406
251,684,432 12,277,976 106,479,749 15,907,801 31,117,646
The accompanying notes form an integral part of the financial statements.
1 Sub-Fund launched on 25 April 2019.2 Sub-Fund launched on 3 April 2019.
28

JPMorgan ETFs (Ireland) ICAVStatement of Changes in Net Assets Attributable to Holders of Redeemable Participating Shares (continued)For the six month period ended 30 June 2019
ManagedFutures
UCITS ETFUSD
US Research EnhancedIndex Equity
(ESG) UCITS ETFUSD
USD Corporate BondResearch Enhanced
Index UCITS ETFUSD
USD EmergingMarkets Sovereign
Bond UCITS ETFUSD
USD Ultra-ShortIncome
UCITS ETFUSD
69,006,615 11,125,275 25,206,300 66,374,776 197,343,473
8,701,649 2,558,925 7,369,676 104,710,162 134,744,455(2,433,806) (1,316,250) - (4,900,250) (55,363,790)
6,267,843 1,242,675 7,369,676 99,809,912 79,380,665
3,933,608 2,057,394 2,964,893 10,037,677 1,539,748
79,208,066 14,425,344 35,540,869 176,222,365 278,263,886
The accompanying notes form an integral part of the financial statements.
1 Sub-Fund launched on 25 April 2019.2 Sub-Fund launched on 3 April 2019.
29

JPMorgan ETFs (Ireland) ICAVStatement of Cash FlowsFor the six month period ended 30 June 2020
BetaBuildersEUR Govt Bond
1-3 yr UCITS ETFEUR
BetaBuildersEUR Govt Bond
UCITS ETFEUR
Cash flows from operating activitiesNet (decrease)/increase in net assets attributable to holders of redeemable participating shares resulting from operations (139,114) 367,268
Adjustments to reconcile net gain/(loss) to net cash (used in)/provided by operating activities:
Distributions - -
(Increase)/decrease in operating assets:(Increase)/decrease in financial assets at fair value through profit or loss (9,210,464) (5,542,313)(Increase)/decrease in amounts due from brokers - -(Increase)/decrease in dividend receivable - -(Increase)/decrease in interest receivable (8,201) (21,798)(Increase)/decrease in securities sold awaiting settlement (1,497,154) (145,119)(Increase) in other receivables - -
Increase/(decrease) in operating liabilities:Increase/(decrease) in financial liabilities at fair value through profit or loss - -Increase/(decrease) in fees and expenses payable 809 632Increase/(decrease) in securities purchased awaiting settlement 3,501,490 184,494(Decrease)/increase in other payables - -
Net cash (used in)/provided by operating activities (7,352,634) (5,156,836)
Cash flows from financing activitiesProceeds from issue of redeemable participating shares 11,975,874 9,459,390Redemptions of shares (4,607,430) (4,257,740)Distributions paid - -
Net cash provided by/(used in) financing activities 7,368,444 5,201,650
Net increase/(decrease) in cash for the period 15,810 44,814Cash and Cash equivalents at the beginning of the period 24,871 3,008
Cash and Cash equivalents at the end of the period 40,681 47,822
Supplementary informationDividend received - -Interest received (8,201) 8,408Interest paid (294) (245)
The accompanying notes form an integral part of the financial statements.
1 Sub-Fund liquidated on 19 June 2020. See Note 17e.2 Sub-Fund launched on 4 February 2020.
30

JPMorgan ETFs (Ireland) ICAVStatement of Cash Flows (continued)For the six month period ended 30 June 2020
BetaBuildersUK Gilt 1-5 yr
UCITS ETFGBP
BetaBuildersUS EquityUCITS ETF
USD
BetaBuildersUS Treasury Bond
0-1 yr UCITS ETFUSD
BetaBuildersUS Treasury Bond
1-3 yr UCITS ETFUSD
BetaBuildersUS Treasury Bond
UCITS ETFUSD
386,375 (425,599) (1,746,071) 4,005,710 2,316,601
53,376 23,055 - - -
(333,167) (2,566,871) (607,010,355) (27,201,459) (15,402,391)- (536) - - -- (70) - - -
8,557 - (509,648) (39,695) 16,423121,702 (27) (125,487,202) (2,343,300) (547,385)
- (28) - - -
- - 20,711,858 - (512,534)(20) 102 70,310 5,793 2,052
(178,333) - 108,454,616 2,266,680 (1,517,295)- - - (1,042,044) -
58,490 (2,969,974) (605,516,492) (24,348,315) (15,644,529)
- 2,998,860 627,935,967 75,743,633 24,311,606- - (25,985,101) (52,429,110) (8,696,533)
(55,032) (23,055) - - -
(55,032) 2,975,805 601,950,866 23,314,523 15,615,073
3,458 5,831 (3,565,626) (1,033,792) (29,456)61,024 18,662 10,916,792 1,313,160 137,929
64,482 24,493 7,351,166 279,368 108,473
- 84,756 - - 91771,397 58 627,955 1,047,881 825,706
- (2) (307) - -
The accompanying notes form an integral part of the financial statements.
1 Sub-Fund liquidated on 19 June 2020. See Note 17e.2 Sub-Fund launched on 4 February 2020.
31

JPMorgan ETFs (Ireland) ICAVStatement of Cash Flows (continued)For the six month period ended 30 June 2020
EquityLong-ShortUCITS ETF1
USD
EUR Corporate Bond1-5 yr Research Enhanced
Index UCITS ETFEUR
EUR Corporate BondResearch Enhanced
Index UCITS ETFEUR
EUR Ultra-ShortIncome
UCITS ETFEUR
Europe Research EnhancedIndex Equity
(ESG) UCITS ETFEUR
(5,263,909) (275,858) 841,060 (3,549,743) 3,411,971
- - - - -
17,039,430 (5,715,621) (130,969,488) 25,752,871 (113,232,905)923,121 5,425 (129,930) - -
1,782 - - 1,886 (174,623)101 18,245 (683,397) (8,605) -
11,868 - - 25,380 -(885) - - (2,981) -
(1,115,255) (815) 91,200 106,808 -5,428 1,763 33,297 (3,464) 46,032
(24,526) 64 28 7,966,885 (156,329)304,921 - - - -
11,882,076 (5,966,797) (130,817,230) 30,289,037 (110,105,854)
17,270,743 6,095,296 133,878,757 332,697,509 112,880,056(33,785,807) - (2,138,500) (353,593,600) (2,488,100)
- - - - -
(16,515,064) 6,095,296 131,740,257 (20,896,091) 110,391,956
(4,632,988) 128,499 923,027 9,392,946 286,1024,948,730 69,822 112,645 50,376,125 405,464
315,742 198,321 1,035,672 59,769,071 691,566
141,397 - - 3,853 1,720,59822,901 104,188 (313,125) 189,029 -
(4) (874) (3,053) (3,833) (1,212)
The accompanying notes form an integral part of the financial statements.
1 Sub-Fund liquidated on 19 June 2020. See Note 17e.2 Sub-Fund launched on 4 February 2020.
32

JPMorgan ETFs (Ireland) ICAVStatement of Cash Flows (continued)For the six month period ended 30 June 2020
GBP Ultra-ShortIncome
UCITS ETFGBP
Global Emerging MarketsResearch Enhanced Index
Equity (ESG) UCITS ETFUSD
Global EquityMulti-Factor
UCITS ETFUSD
Global High Yield CorporateBond Multi-Factor
UCITS ETF2
USD
Global Research EnhancedIndex Equity
(ESG) UCITS ETFUSD
ManagedFutures
UCITS ETFUSD
(33,207) (24,815,819) (1,916,934) (1,180,089) (3,002,175) (17,098,881)
383,145 - - - - -
15,397,545 6,675,584 (2,123,435) (109,075,822) (30,504,595) (5,980,822)- - (10,124) - (150,454) 1,360,523- (267,867) (10,117) - (28,699) -
226,937 - - (1,704,454) - (136,692)- (148,820) 1,139 (6,289,122) - 5,418- - (40) - - (574,110)
194,665 - - 483,706 (6,274) (24,365)(18,969) 25,523 1,365 53,417 4,474 (5,417)263,455 (4,812,463) 102 7,387,649 - -201,146 (148,323) - - - 2,170,040
16,614,717 (23,492,185) (4,058,044) (110,324,715) (33,687,723) (20,284,306)
26,943,255 24,027,797 4,085,276 113,869,455 33,461,736 14,167,051(37,376,820) (4,146,600) - (1,734,734) - (8,665,001)
(398,907) - - - - -
(10,832,472) 19,881,197 4,085,276 112,134,721 33,461,736 5,502,050
5,782,245 (3,610,988) 27,232 1,810,006 (225,987) (14,782,256)4,151,896 7,014,188 34,084 - 879,007 28,567,798
9,934,141 3,403,200 61,316 1,810,006 653,020 13,785,542
29,538 2,348,539 327,196 - 472,732 70,640677,507 1,394 66 (193,004) 179 375,007
(42) (156) (2) (348) (4) -
The accompanying notes form an integral part of the financial statements.
1 Sub-Fund liquidated on 19 June 2020. See Note 17e.2 Sub-Fund launched on 4 February 2020.
33

JPMorgan ETFs (Ireland) ICAVStatement of Cash Flows (continued)For the six month period ended 30 June 2020
US EquityMulti-Factor
UCITS ETFUSD
US Research EnhancedIndex Equity
(ESG) UCITS ETFUSD
USD Corporate BondResearch Enhanced
Index UCITS ETFUSD
USD EmergingMarkets Sovereign
Bond UCITS ETFUSD
USD Ultra-ShortIncome
UCITS ETFUSD
(1,428,481) (4,741,679) 7,223,305 (32,236,342) 669,979
- - - 2,944,971 1,866,605
1,415,212 (16,005,630) (38,763,479) (158,289,564) 94,953,401(5,198) (59,026) (39,235) - -3,660 (41,750) - - -
- - (259,342) (2,617,798) 598,386- (4,066,827) 61,405 (3,989,856) -
(33) - - - (495)
- - (11,422) 624,312 -(443) 23,201 10,525 76,726 (28,724)
- - - 7,587,897 1,487,288- 593 - - -
(15,283) (24,891,118) (31,778,243) (185,899,654) 99,546,440
- 38,447,239 37,529,568 373,626,018 25,543,692- (14,286,465) (5,998,100) (186,683,256) (139,346,067)- - - (2,944,869) (2,047,353)
- 24,160,774 31,531,468 183,997,893 (115,849,728)
(15,283) (730,344) (246,775) (1,901,761) (16,303,288)21,641 1,126,466 990,997 4,456,911 21,283,068
6,358 396,122 744,222 2,555,150 4,979,780
140,122 2,063,843 9,919 8,068 58,25958 146 1,274,575 8,092,465 2,855,870
- (92) - (1,832) (197)
The accompanying notes form an integral part of the financial statements.
1 Sub-Fund liquidated on 19 June 2020. See Note 17e.2 Sub-Fund launched on 4 February 2020.
34

JPMorgan ETFs (Ireland) ICAVStatement of Cash FlowsFor the six month period ended 30 June 2019
BetaBuildersEUR Govt Bond
1-3 yr UCITS ETFEUR
BetaBuildersEUR Govt Bond
UCITS ETF1
EUR
BetaBuildersUK Gilt 1-5 yr
UCITS ETFGBP
Cash flows from operating activitiesNet increase/(decrease) in net assets attributable to holders of redeemable participating shares resulting from operations 242,715 371,299 27,193
Adjustments to reconcile net gain/(loss) to net cash (used in)/provided by operating activities:
Distributions - - 74,118
(Increase)/decrease in operating assets:(Increase)/decrease in financial assets at fair value through profit or loss (20,088,924) (10,268,483) (21,775)(Increase)/decrease in amounts due from brokers - - -(Increase) in dividend receivable - - -(Increase)/decrease in interest receivable (165,409) (81,956) 16,073(Increase)/decrease in securities sold awaiting settlement (3,501,872) (140,691) (1,101,951)(Increase)/decrease in other receivables - - -
Increase/(decrease) in operating liabilities:Increase/(decrease) in financial liabilities at fair value through profit or loss - - -Increase in fees and expenses payable 10,461 1,724 1,166Increase/(decrease) in securities purchased awaiting settlement 3,506,748 140,004 1,126,254Increase/(decrease) in other payables - - -
Net cash (used in)/provided by operating activities (19,996,281) (9,978,103) 121,078
Cash flows from financing activitiesProceeds from issue of redeemable participating shares 20,005,366 9,984,161 1,004,257Redemptions of shares - - (1,003,620)Distributions paid - - (103,202)
Net cash provided by/(used in) financing activities 20,005,366 9,984,161 (102,565)
Net increase/(decrease) in cash for the period 9,085 6,058 18,513Cash and Cash equivalents at the beginning of the period 2,374 - (16,965)
Cash and Cash equivalents at the end of the period 11,459 6,058 1,548
Supplementary informationDividend received - - -Interest received (165,409) (71,509) 62,014Interest paid (262) (153) (38)
The accompanying notes form an integral part of the financial statements.
1 Sub-Fund launched on 25 April 2019.2 Sub-Fund launched on 3 April 2019.
35

JPMorgan ETFs (Ireland) ICAVStatement of Cash Flows (continued)For the six month period ended 30 June 2019
BetaBuildersUS Equity
UCITS ETF2
USD
BetaBuildersUS Treasury Bond
1-3 yr UCITS ETFUSD
BetaBuildersUS Treasury Bond
UCITS ETF1
USD
EquityLong-Short
UCITS ETFUSD
EUR Corporate Bond1-5 yr Research Enhanced
Index UCITS ETFEUR
EUR Corporate BondResearch Enhanced
Index UCITS ETFEUR
275,260 1,689,838 1,751,991 (1,056,727) 528,229 1,442,526
- - - - - -
(10,271,860) (27,913,790) (72,563,059) 513,211 (3,596,600) (13,805,531)- - - 49,597 1,289 1,468
(7,478) - - (55,874) - -- (206,123) (469,308) (2) 26,856 (31,080)
(16,468) (1,719,208) (1,007,633) 277,889 - -(5) - - - - -
- - 187,360 467,823 4,180 6,105649 12,361 8,174 937 7,522 10,687
- 1,873,947 1,436,762 (587,831) 3 (103,779)- - - (5,511) - -
(10,019,902) (26,262,975) (70,655,713) (396,488) (3,028,521) (12,479,604)
10,023,018 26,432,006 70,678,160 - 3,055,740 14,505,325- - - - - (2,084,780)- - - - - -
10,023,018 26,432,006 70,678,160 - 3,055,740 12,420,545
3,116 169,031 22,447 (396,488) 27,219 (59,059)- 83,553 - 6,224,168 43,236 164,542
3,116 252,584 22,447 5,827,680 70,455 105,483
40,972 - - 141,447 - -32 637,165 (280,901) 56,928 110,005 131,756(2) (2) - (57) (332) (440)
The accompanying notes form an integral part of the financial statements.
1 Sub-Fund launched on 25 April 2019.2 Sub-Fund launched on 3 April 2019.
36

JPMorgan ETFs (Ireland) ICAVStatement of Cash Flows (continued)For the six month period ended 30 June 2019
EUR Ultra-ShortIncome
UCITS ETFEUR
Europe Research EnhancedIndex Equity
(ESG) UCITS ETFEUR
GBP Ultra-ShortIncome
UCITS ETFGBP
Global Emerging MarketsResearch Enhanced Index
Equity (ESG) UCITS ETFUSD
Global Research EnhancedIndex Equity
(ESG) UCITS ETFUSD
379,993 1,703,646 287,394 1,104,482 4,587,406
- - 265,155 - -
(137,972,658) (3,051,229) (59,304,536) (6,297,265) (4,553,525)- - - - -
(1,385) (14,304) - (32,872) (9,289)(572,937) - (461,669) - -
- - - (3,107) -- 3,841 - (5,289,695) -
22,425 - 24,562 - -14,599 - 24,761 5,007 11,073
7,315,015 - 2,499,730 5,074,957 -(2,277,422) - - - -
(133,092,370) (1,358,046) (56,664,603) (5,438,493) 35,665
140,775,678 2,710,621 56,136,846 5,301,000 -(1,996,980) (1,358,200) (2,003,240) - -
- - (230,455) - -
138,778,698 1,352,421 53,903,151 5,301,000 -
5,686,328 (5,625) (2,761,452) (137,493) 35,6654,589,119 49,908 4,701,369 51,911 131,550
10,275,447 44,283 1,939,917 (85,582) 167,215
9 300,679 14,900 126,358 425,182(572,937) - (111,897) 903 1,083
(558) (125) (44) (163) (1)
The accompanying notes form an integral part of the financial statements.
1 Sub-Fund launched on 25 April 2019.2 Sub-Fund launched on 3 April 2019.
37

JPMorgan ETFs (Ireland) ICAVStatement of Cash Flows (continued)For the six month period ended 30 June 2019
ManagedFutures
UCITS ETFUSD
US Research EnhancedIndex Equity
(ESG) UCITS ETFUSD
USD Corporate BondResearch Enhanced
Index UCITS ETFUSD
USD EmergingMarkets Sovereign
Bond UCITS ETFUSD
USD Ultra-ShortIncome
UCITS ETFUSD
3,933,608 2,057,394 2,964,893 10,037,677 1,539,748
- - - 1,465,925 3,046,587
(10,070,710) (3,335,959) (10,289,162) (110,042,459) (88,633,596)2,348,242 - (15,878) - -
- (884) - - -(80,885) - (60,075) (1,606,878) (527,256)(14,437) (1,833) - (2,279,061) (13,564,333)
- 4,938 - - -
(2,703,305) - 26,446 85,873 -18,118 30 10,621 56,273 56,595
49,327 - 49,919 8,126,245 (27,970)(538) - - - 19,914
(6,520,580) (1,276,314) (7,313,236) (94,156,405) (98,090,311)
8,701,649 2,558,925 7,369,676 104,710,162 134,744,455(2,433,806) (1,316,250) - (4,900,250) (36,209,320)
- - - (1,488,190) (2,830,019)
6,267,843 1,242,675 7,369,676 98,321,722 95,705,116
(252,737) (33,639) 56,440 4,165,317 (2,385,195)20,013,721 49,867 69,351 510,477 5,857,534
19,760,984 16,228 125,791 4,675,794 3,472,339
87,773 122,547 3,505 9,985 108,641648,277 - 540,631 1,566,042 2,931,389
- (690) (22) (369) (172)
The accompanying notes form an integral part of the financial statements.
1 Sub-Fund launched on 25 April 2019.2 Sub-Fund launched on 3 April 2019.
38

The JPMorgan ETFs (Ireland) ICAV (the “Fund” or the “ICAV”) was registered in Ireland pursuant to the Irish Collective Asset-management Vehicles Act 2015on 18 July 2017 under registration number C171821 and is authorized by the Central Bank of Ireland (the “Central Bank”) as an Undertaking for CollectiveInvestments in Transferable Securities (“UCITS”) pursuant to the European Communities (Undertakings for Collective Investment in Transferable Securities)Regulations, 2011 (as amended) (“UCITS Regulations”).
The ICAV has appointed JPMorgan Asset Management (Europe) S.à.r.l., (the “Management Company”) as its management company pursuant to themanagement agreement signed on 28 September 2017. The Management Company was incorporated in Luxembourg on 20 April 1988. The ManagementCompany is regulated by the Commission de Surveillance du Secteur Financier in Luxembourg and authorised to act as a management company to UCITSand as an Alternative Investment Fund Manager (“AIFM”).
The objective of the ICAV is to invest in transferable securities in accordance with the UCITS Regulations. The ICAV has been structured as an umbrella fundwith segregated liability between Sub-Funds. Each Sub-Fund will bear its own liabilities, under applicable Irish law, none will have access to the assets of aSub-Fund in satisfaction of a liability of any other Sub-Fund. The Directors may establish Sub-Funds that will seek to track an Index (“Index TrackingSub-Funds”) or will be managed actively by the Management Company to seek to achieve a specific investment objective, which may include outperformingan Index (“Actively Managed Sub-Funds”).
The portfolio of assets maintained for each Sub-Fund will be invested in accordance with the investment objectives and policies applicable to such Sub-Fundas specified in the Prospectus and Supplements. Shares may be divided into different Share Classes to accommodate, amongst other things, differentdividend policies, charges, fee arrangements (including different fee structures), currencies, or to provide for foreign exchange hedging in accordance withthe policies and requirements of the Central Bank from time to time.
As at 30 June 2020, there were twenty-three Sub-Funds in existence:
Actively Managed Sub-Funds:• JPMorgan ETFs (Ireland) ICAV - Equity Long-Short UCITS ETF (launched on 8 November 2017)*• JPMorgan ETFs (Ireland) ICAV - EUR Corporate Bond 1-5 yr Research Enhanced Index UCITS ETF (launched on 6 December 2018)• JPMorgan ETFs (Ireland) ICAV - EUR Corporate Bond Research Enhanced Index UCITS ETF (launched on 6 December 2018)• JPMorgan ETFs (Ireland) ICAV - EUR Ultra-Short Income UCITS ETF (launched on 6 June 2018)• JPMorgan ETFs (Ireland) ICAV - Europe Research Enhanced Index Equity (ESG) UCITS ETF (launched on 10 October 2018)• JPMorgan ETFs (Ireland) ICAV - GBP Ultra-Short Income UCITS ETF (launched on 6 June 2018)• JPMorgan ETFs (Ireland) ICAV - Global Emerging Markets Research Enhanced Index Equity (ESG) UCITS ETF (launched on 6 December 2018)• JPMorgan ETFs (Ireland) ICAV - Global Research Enhanced Index Equity (ESG) UCITS ETF (launched on 10 October 2018)• JPMorgan ETFs (Ireland) ICAV - Managed Futures UCITS ETF (launched on 8 November 2017)• JPMorgan ETFs (Ireland) ICAV - US Research Enhanced Index Equity (ESG) UCITS ETF (launched on 10 October 2018)• JPMorgan ETFs (Ireland) ICAV - USD Corporate Bond Research Enhanced Index UCITS ETF (launched on 6 December 2018)• JPMorgan ETFs (Ireland) ICAV - USD Ultra-Short Income UCITS ETF (launched on 15 February 2018)
Index Tracking Sub-Funds:• JPMorgan ETFs (Ireland) ICAV - BetaBuilders EUR Govt Bond 1-3 yr UCITS ETF (launched on 15 February 2018)• JPMorgan ETFs (Ireland) ICAV - BetaBuilders EUR Govt Bond UCITS ETF (launched on 25 April 2019)• JPMorgan ETFs (Ireland) ICAV - BetaBuilders UK Gilt 1-5 yr UCITS ETF (launched on 6 June 2018)• JPMorgan ETFs (Ireland) ICAV - BetaBuilders US Equity UCITS ETF (launched on 3 April 2019)• JPMorgan ETFs (Ireland) ICAV - BetaBuilders US Treasury Bond 0-1 yr UCITS ETF (launched on 9 July 2019)• JPMorgan ETFs (Ireland) ICAV - BetaBuilders US Treasury Bond 1-3 yr UCITS ETF (launched on 6 June 2018)• JPMorgan ETFs (Ireland) ICAV - BetaBuilders US Treasury Bond UCITS ETF (launched on 25 April 2019)• JPMorgan ETFs (Ireland) ICAV - Global Equity Multi-Factor UCITS ETF (launched on 9 July 2019)• JPMorgan ETFs (Ireland) ICAV - Global High Yield Corporate Bond Multi-Factor UCITS ETF (launched on 4 February 2020)• JPMorgan ETFs (Ireland) ICAV - US Equity Multi-Factor UCITS ETF (launched on 9 July 2019)• JPMorgan ETFs (Ireland) ICAV - USD Emerging Markets Sovereign Bond UCITS ETF (launched on 15 February 2018)
*JPMorgan ETFs (Ireland) ICAV - Equity Long-Short UCITS ETF was liquidated on 19 June 2020 and therefore is no longer available for subscription.
2. Significant accounting policies
Basis of preparationThe financial statements are prepared in accordance with International Accounting Standard (“IAS”) 34 (Interim Financial Reporting) as adopted by theEuropean Union and applied in accordance with the provisions of the ICAV Act 2015, the Central Bank (Supervision and Enforcement) Act 2013 Section 48 (1)UCITS Regulations 2015 (the “Central Bank Regulations”), and the UCITS Regulations. They should be read in conjunction with the annual report and auditedfinancial statements for the year ended 31 December 2019, which were prepared in accordance with International Financial Reporting Standards (“IFRS”) asadopted by the European Union.
The financial statements are prepared on a going concern basis and on a historical cost basis, as modified by the revaluation of financial assets and financialliabilities classified at fair value through profit or loss except for JPMorgan ETFs (Ireland) ICAV - Equity Long-Short UCITS ETF as indicated in Note 17e.
The period-end valuation was completed as at 30 June 2020 which was the last business day of the period.
The preparation of the financial statements in conformity with IAS 34 requires the Board to make estimates, assumptions and judgements that affect thereported amounts of assets and liabilities and disclosures of contingent assets and liabilities at the date of the financial statements and the reportedamounts of revenues and expenses during the reporting period. Although these estimates, assumptions and judgements are based on management’s bestknowledge of current events and actions, actual results may ultimately differ from those estimates, assumptions and judgements.
The accounting policies used in these unaudited interim financial statements are consistent with those used in the last audited financial statements.
39
JPMorgan ETFs (Ireland) ICAVNotes to the Unaudited Financial StatementsFor the six month period ended 30 June 2020
1. Organisation

The following table analyses the fees and expenses payable as at 30 June 2020:
BetaBuildersEUR Govt Bond
1-3 yr UCITS ETFEUR
BetaBuildersEUR Govt Bond
UCITS ETFEUR
BetaBuildersUK Gilt 1-5 yr
UCITS ETFGBP
BetaBuildersUS EquityUCITS ETF
USD
BetaBuildersUS Treasury Bond
0-1 yr UCITS ETFUSD
BetaBuildersUS Treasury Bond
1-3 yr UCITS ETFUSD
Audit fees payable 4,943 4,943 4,503 5,532 5,532 5,532
Depositary, Corporate, Administration andDomiciliary Agency fees payable 14,880 16,288 10,301 27,911 25,565 13,684
Directors’ fees payable (Note 10) 760 760 678 843 843 843
Organisational expenses payable 26 26 24 29 57 29
Management and Advisory fees payable – – – – 33,387 –
Sundry fees payable* 9,845 10,769 10,199 16,536 37,553 15,367
Fee waiver (15,704) (30,087) (21,625) (50,228) – (12,878)
Total fees and expenses payable 14,750 2,699 4,080 623 102,937 22,577
BetaBuildersUS Treasury Bond
UCITS ETFUSD
EquityLong-Short
UCITS ETFUSD
EUR Corporate Bond1-5 yr Research
EnhancedIndex UCITS ETF
EUR
EUR Corporate BondResearch Enhanced
Index UCITS ETFEUR
EUR Ultra-ShortIncome
UCITS ETFEUR
Europe ResearchEnhanced
Index Equity(ESG) UCITS ETF
EUR
Audit fees payable 5,738 8,699 4,943 7,403 4,943 4,943
Depositary, Corporate, Administration andDomiciliary Agency fees payable 21,425 43,027 13,624 23,175 40,659 54,852
Directors’ fees payable (Note 10) 843 843 760 760 760 760
Organisational expenses payable 57 201 26 26 26 29
Management and Advisory fees payable – – – 856 – –
Sundry fees payable* 15,706 38,755 12,345 15,242 20,934 12,345
Fee waiver (27,702) (61,804) (22,121) (2,680) – (10,362)
Total fees and expenses payable 16,067 29,721 9,577 44,782 67,322 62,567
GBP Ultra-ShortIncome
UCITS ETFGBP
Global EmergingMarkets Research
Enhanced IndexEquity (ESG)
UCITS ETFUSD
Global EquityMulti-Factor
UCITS ETFUSD
Global High YieldCorporate Bond
Multi-FactorUCITS ETF
USD
Global ResearchEnhanced
Index Equity(ESG) UCITS ETF
USD
ManagedFutures
UCITS ETFUSD
Audit fees payable 5,830 5,532 5,532 – 8,286 7,573
Depositary, Corporate, Administration andDomiciliary Agency fees payable 25,046 81,991 77,137 33,703 83,374 65,651
Directors’ fees payable (Note 10) 678 843 843 767 843 843
Organisational expenses payable 24 29 32 43 32 115
Management and Advisory fees payable – 5,363 – 11,677 – 20,587
Sundry fees payable* 15,605 18,010 10,876 32,279 13,791 25,276
Fee waiver (31,079) (138) (87,151) (25,052) (85,704) (33,769)
Total fees and expenses payable 16,104 111,630 7,269 53,417 20,622 86,276
*Sundry Fees are principally comprised of tax related fees, registration, publication, mailing, printing fees, broker collateral charges as well as legal and marketing expenses.
40
JPMorgan ETFs (Ireland) ICAVNotes to the Unaudited Financial Statements (continued)For the six month period ended 30 June 2020
3. Fees and expenses payable

US EquityMulti-Factor
UCITS ETFUSD
US ResearchEnhanced Index
Equity (ESG)UCITS ETF
USD
USD Corporate BondResearch Enhanced
Index UCITS ETFUSD
USD EmergingMarkets Sovereign
Bond UCITS ETFUSD
USD Ultra-ShortIncome
UCITS ETFUSD
Audit fees payable 5,532 5,532 8,286 8,493 8,286Depositary, Corporate, Administration andDomiciliary Agency fees payable 5,512 27,133 37,654 85,899 31,980Directors’ fees payable (Note 10) 843 843 843 843 843
Organisational expenses payable 29 29 29 125 29
Management and Advisory fees payable – 23,781 – 191,361 2,720
Sundry fees payable* 10,876 21,972 13,791 35,934 17,443
Fee waiver (19,526) – (24,291) (25,228) (10,253)
Total fees and expenses payable 3,266 79,290 36,312 297,427 51,048
*Sundry Fees are principally comprised of tax related fees, registration, publication, mailing, printing fees, broker collateral charges as well as legal and marketing expenses.
The following table analyses the fees and expenses payable as at 31 December 2019:
BetaBuildersEUR Govt Bond
1-3 yr UCITS ETFEUR
BetaBuildersEUR Govt Bond
UCITS ETFEUR
BetaBuildersUK Gilt 1-5 yr
UCITS ETFGBP
BetaBuildersUS EquityUCITS ETF
USD
BetaBuildersUS Treasury Bond
0-1 yr UCITS ETFUSD
BetaBuildersUS Treasury Bond
1-3 yr UCITS ETFUSD
Audit fees payable 1,086 1,086 925 1,207 1,207 1,207
Depositary, Corporate, Administration andDomiciliary Agency fees payable 20,763 11,880 7,779 11,977 25,469 14,115
Directors’ fees payable (Note 10) 405 405 345 450 450 450
Organisational expenses payable 26 26 22 29 32 29
Management and Advisory fees payable – – – – – –
Sundry fees payable* 7,686 7,686 6,543 8,569 10,811 8,569
Fee waiver (16,025) (19,016) (11,514) (21,711) (5,342) (7,586)
Total fees and expenses payable 13,941 2,067 4,100 521 32,627 16,784
BetaBuildersUS Treasury Bond
UCITS ETFUSD
EquityLong-Short
UCITS ETFUSD
EUR Corporate Bond1-5 yr Research
EnhancedIndex UCITS ETF
EUR
EUR Corporate BondResearch Enhanced
Index UCITS ETFEUR
EUR Ultra-ShortIncome
UCITS ETFEUR
Europe ResearchEnhanced
Index Equity(ESG) UCITS ETF
EUR
Audit fees payable 1,207 1,207 1,086 1,086 1,086 1,086
Depositary, Corporate, Administration andDomiciliary Agency fees payable 19,732 38,700 13,613 17,925 54,169 9,736
Directors’ fees payable (Note 10) 450 450 405 405 405 405
Organisational expenses payable 57 172 26 26 26 28
Management and Advisory fees payable – – – – – 125
Sundry fees payable* 8,569 8,569 7,686 7,686 15,100 8,307
Fee waiver (16,000) (24,805) (15,002) (15,643) – (3,152)
Total fees and expenses payable 14,015 24,293 7,814 11,485 70,786 16,535
*Sundry Fees are principally comprised of tax related fees, registration, publication, mailing, printing fees, broker collateral charges as well as legal and marketing expenses.
41
JPMorgan ETFs (Ireland) ICAVNotes to the Unaudited Financial Statements (continued)For the six month period ended 30 June 2020
3. Fees and expenses payable (continued)As at 30 June 2020 (continued)

GBP Ultra-ShortIncome
UCITS ETFGBP
Global EmergingMarkets Research
Enhanced IndexEquity (ESG)
UCITS ETFUSD
Global EquityMulti-Factor
UCITS ETFUSD
Global ResearchEnhanced
Index Equity(ESG) UCITS ETF
USD
ManagedFutures
UCITS ETFUSD
US EquityMulti-Factor
UCITS ETFUSD
Audit fees payable 925 1,207 1,207 1,207 1,207 1,207
Depositary, Corporate, Administration andDomiciliary Agency fees payable 18,828 39,626 13,126 25,299 59,102 7,299
Directors’ fees payable (Note 10) 345 450 450 450 450 450
Organisational expenses payable 22 29 36 31 115 33
Management and Advisory fees payable 8,016 30,614 – – 42,516 –
Sundry fees payable* 10,008 14,181 8,569 8,569 11,450 8,569
Fee waiver (3,071) – (17,484) (19,408) (23,147) (13,849)
Total fees and expenses payable 35,073 86,107 5,904 16,148 91,693 3,709
US ResearchEnhanced Index
Equity (ESG)UCITS ETF
USD
USD Corporate BondResearch Enhanced
Index UCITS ETFUSD
USD EmergingMarkets Sovereign
Bond UCITS ETFUSD
USD Ultra-ShortIncome
UCITS ETFUSD
Audit fees payable 1,207 1,207 1,207 1,207
Depositary, Corporate, Administration andDomiciliary Agency fees payable 17,374 47,562 81,235 38,601
Directors’ fees payable (Note 10) 450 450 450 450
Organisational expenses payable 29 29 57 29
Management and Advisory fees payable 24,058 – 133,008 26,683
Sundry fees payable* 14,076 8,569 22,316 16,039
Fee waiver (1,105) (32,030) (17,572) (3,237)
Total fees and expenses payable 56,089 25,787 220,701 79,772
*Sundry Fees are principally comprised of tax related fees, registration, publication, mailing, printing fees, broker collateral charges as well as legal and marketing expenses.
4. Fees and expensesThe following table analyses the fees and expenses for the six month period ended 30 June 2020:
BetaBuildersEUR Govt Bond
1-3 yr UCITS ETFEUR
BetaBuildersEUR Govt Bond
UCITS ETFEUR
BetaBuildersUK Gilt 1-5 yr
UCITS ETFGBP
BetaBuildersUS EquityUCITS ETF
USD
BetaBuildersUS Treasury Bond
0-1 yr UCITS ETFUSD
BetaBuildersUS Treasury Bond
1-3 yr UCITS ETFUSD
Audit fees 7,464 7,464 6,677 8,296 8,296 8,296
Depositary, Corporate, Administration andDomiciliary Agency fees 40,101 39,907 27,258 40,901 51,912 54,808
Directors’ fees (Note 10) 1,647 1,647 1,442 1,817 1,817 1,817
Organisational expenses 79 79 67 36 191 86
Management and Advisory fees – – – – 42,738 –
Sundry fees* 31,211 30,259 26,306 37,756 63,667 36,101
Fee waiver (35,999) (72,136) (49,708) (87,224) (742) (34,557)
Total fees and expenses 44,503 7,220 12,042 1,582 167,879 66,551
*Sundry Fees are principally comprised of tax related fees, registration, publication, mailing, printing fees, broker collateral charges as well as legal and marketing expenses.
42
JPMorgan ETFs (Ireland) ICAVNotes to the Unaudited Financial Statements (continued)For the six month period ended 30 June 2020
3. Fees and expenses payable (continued)As at 31 December 2019 (continued)

BetaBuildersUS Treasury Bond
UCITS ETFUSD
EquityLong-Short
UCITS ETFUSD
EUR Corporate Bond1-5 yr Research
EnhancedIndex UCITS ETF
EUR
EUR Corporate BondResearch Enhanced
Index UCITS ETFEUR
EUR Ultra-ShortIncome
UCITS ETFEUR
Europe ResearchEnhanced
Index Equity(ESG) UCITS ETF
EUR
Audit fees 8,503 11,464 7,464 9,924 7,464 7,464
Depositary, Corporate, Administration andDomiciliary Agency fees 49,825 109,176 36,972 56,685 134,525 85,042
Directors’ fees (Note 10) 1,817 1,817 1,647 1,647 1,647 1,647
Organisational expenses 172 615 79 79 79 83
Management and Advisory fees – 88 – 856 2,706 2,014
Sundry fees* 40,665 72,977 30,899 33,795 64,440 33,530
Fee waiver (57,165) (106,322) (50,734) (23,975) – (14,680)
Total fees and expenses 43,817 89,815 26,327 79,011 210,861 115,100
GBP Ultra-ShortIncome
UCITS ETFGBP
Global EmergingMarkets Research
Enhanced IndexEquity (ESG)
UCITS ETFUSD
Global EquityMulti-Factor
UCITS ETFUSD
Global High YieldCorporate Bond
Multi-FactorUCITS ETF
USD
Global ResearchEnhanced
Index Equity(ESG) UCITS ETF
USD
ManagedFutures
UCITS ETFUSD
Audit fees 8,004 8,296 8,296 – 11,051 10,338
Depositary, Corporate, Administration andDomiciliary Agency fees 55,878 183,943 108,043 46,809 122,854 144,559
Directors’ fees (Note 10) 1,442 1,817 1,817 1,450 1,817 1,817
Organisational expenses 67 86 92 72 91 344
Management and Advisory fees 10,393 80,649 – 11,677 – 122,017
Sundry fees* 36,267 54,814 32,117 77,003 33,985 51,317
Fee waiver (40,815) – (130,915) (49,520) (116,667) (59,732)
Total fees and expenses 71,236 329,605 19,450 87,491 53,131 270,660
US EquityMulti-Factor
UCITS ETFUSD
US ResearchEnhanced Index
Equity (ESG)UCITS ETF
USD
USD Corporate BondResearch Enhanced
Index UCITS ETFUSD
USD EmergingMarkets Sovereign
Bond UCITS ETFUSD
USD Ultra-ShortIncome
UCITS ETFUSD
Audit fees 8,296 8,296 11,051 11,258 11,051
Depositary, Corporate, Administration andDomiciliary Agency fees 15,491 66,368 87,713 238,077 93,785
Directors’ fees (Note 10) 1,817 1,817 1,817 1,817 1,817
Organisational expenses – 86 86 353 86
Management and Advisory fees – 83,828 1,305 563,622 41,387
Sundry fees* 32,406 64,898 35,454 104,840 52,898
Fee waiver (48,042) – (43,825) (58,049) (16,909)
Total fees and expenses 9,968 225,293 93,601 861,918 184,115
*Sundry Fees are principally comprised of tax related fees, registration, publication, mailing, printing fees, broker collateral charges as well as legal and marketing expenses.
43
JPMorgan ETFs (Ireland) ICAVNotes to the Unaudited Financial Statements (continued)For the six month period ended 30 June 2020
4. Fees and expenses (continued)For the six month period ended 30 June 2020 (continued)

The following table analyses the fees and expenses for the six month period ended 30 June 2019:
BetaBuildersEUR Govt Bond
1-3 yr UCITS ETFEUR
BetaBuildersEUR Govt Bond
UCITS ETFEUR
BetaBuildersUK Gilt 1-5 yr
UCITS ETFGBP
BetaBuildersUS EquityUCITS ETF
USD
BetaBuildersUS Treasury Bond
1-3 yr UCITS ETFUSD
Audit fees 4,398 1,271 3,834 1,431 4,978
Depositary, Corporate, Administration andDomiciliary Agency fees 35,245 92 10,613 92 26,562
Directors’ fees (Note 10) 1,583 469 1,380 528 1,791
Organisational expenses 76 – 65 – 86
Management and Advisory fees – – 536 – –
Sundry fees* 33,980 30,184 30,139 54,093 34,127
Fee waiver (50,347) (30,155) (41,107) (55,248) (34,518)
Total fees and expenses 24,935 1,861 5,460 896 33,026
BetaBuildersUS Treasury Bond
UCITS ETFUSD
EquityLong-Short
UCITS ETFUSD
EUR Corporate Bond1-5 yr Research Enhanced
Index UCITS ETFEUR
EUR Corporate BondResearch Enhanced
Index UCITS ETFEUR
EUR Ultra-ShortIncome
UCITS ETFEUR
Audit fees 1,431 4,978 3,572 3,572 4,398
Depositary, Corporate, Administration andDomiciliary Agency fees 399 75,094 31,959 39,519 54,131
Directors’ fees (Note 10) 528 1,791 1,583 1,583 1,583
Organisational expenses – 387 88 88 76
Management and Advisory fees – 2,597 – – 11,062
Sundry fees* 13,770 59,083 52,103 51,453 39,332
Fee waiver (7,803) (64,829) (68,118) (69,339) (4,984)
Total fees and expenses 8,325 79,101 21,187 26,876 105,598
Europe ResearchEnhanced Index Equity
(ESG) UCITS ETFEUR
GBP Ultra-ShortIncome
UCITS ETFGBP
Global Emerging MarketsResearch Enhanced Index
Equity (ESG) UCITS ETFUSD
Global ResearchEnhanced Index Equity
(ESG) UCITS ETFUSD
ManagedFutures
UCITS ETFUSD
Audit fees 4,398 3,834 4,978 4,978 4,978
Depositary, Corporate, Administration andDomiciliary Agency fees 33,351 40,286 59,574 64,663 116,730
Directors’ fees payable (Note 10) 1,583 1,380 1,791 1,791 1,791
Organisational expenses 92 65 98 303 258
Management and Advisory fees – 1,379 – – 26,592
Sundry fees* 52,083 33,991 85,416 82,805 64,730
Fee waiver (78,196) (5,742) (136,660) (118,479) (17,196)
Total fees and expenses 13,311 75,193 15,197 36,061 197,883
*Sundry Fees are principally comprised of tax related fees, registration, publication, mailing, printing fees, broker collateral charges as well as legal and marketing expenses.
44
JPMorgan ETFs (Ireland) ICAVNotes to the Unaudited Financial Statements (continued)For the six month period ended 30 June 2020
4. Fees and expenses (continued)

US Research EnhancedIndex Equity
(ESG) UCITS ETFUSD
USD Corporate BondResearch Enhanced
Index UCITS ETFUSD
USD EmergingMarkets Sovereign
Bond UCITS ETFUSD
USD Ultra-ShortIncome
UCITS ETFUSD
Audit fees 4,978 4,042 4,978 4,978
Depositary, Corporate, Administration andDomiciliary Agency fees 31,912 89,642 69,175 85,704
Directors’ fees (Note 10) 1,791 1,791 1,791 1,791
Organisational expenses 94 98 182 86
Management and Advisory fees – – 88,644 58,267
Sundry fees* 53,771 52,545 64,271 62,761
Fee waiver (76,058) (120,707) (3,443) (3,928)
Total fees and expenses 16,488 27,411 225,598 209,659
*Sundry Fees are principally comprised of tax related fees, registration, publication, mailing, printing fees, broker collateral charges as well as legal and marketing expenses.
5. Transaction costsIn order to achieve its investment objective, each Sub-Fund incurs transaction costs in relation to trading activity on its portfolio. These costs may includebroker commissions, settlement fees, stamp duties, and financial transaction taxes.
Sub-Funds Currency
For the six monthperiod ended30 June 2020
For the six monthperiod ended30 June 2019
BetaBuilders EUR Govt Bond 1-3 yr UCITS ETF EUR 1,766 3,076BetaBuilders EUR Govt Bond UCITS ETF* EUR 2,609 51BetaBuilders UK Gilt 1-5 yr UCITS ETF GBP 981 2,822BetaBuilders US Equity UCITS ETF* USD 22,424 686BetaBuilders US Treasury Bond 0-1 yr UCITS ETF* USD 10,418 –BetaBuilders US Treasury Bond 1-3 yr UCITS ETF USD 9,260 602BetaBuilders US Treasury Bond UCITS ETF* USD 11,290 229Equity Long-Short UCITS ETF# USD 77,765 47,748EUR Corporate Bond 1-5 yr Research Enhanced Index UCITS ETF EUR 3,110 1,980EUR Corporate Bond Research Enhanced Index UCITS ETF EUR 7,149 3,203EUR Ultra-Short Income UCITS ETF EUR 5,903 –Europe Research Enhanced Index Equity (ESG) UCITS ETF EUR 331,943 33,858GBP Ultra-Short Income UCITS ETF GBP 10,003 2,327Global Emerging Markets Research Enhanced Index Equity (ESG) UCITS ETF USD 223,553 49,231Global Equity Multi-Factor UCITS ETF* USD 91,070 –Global High Yield Corporate Bond Multi-Factor UCITS ETF** USD 4,232 –Global Research Enhanced Index Equity (ESG) UCITS ETF USD 112,998 43,697Managed Futures UCITS ETF USD 81,123 58,850US Equity Multi-Factor UCITS ETF* USD 5,228 –US Research Enhanced Index Equity (ESG) UCITS ETF USD 34,623 21,640USD Corporate Bond Research Enhanced Index UCITS ETF USD 18,639 26,966USD Emerging Markets Sovereign Bond UCITS ETF USD 44,433 9,116USD Ultra-Short Income UCITS ETF USD 15,744 –
* Sub-Fund launched in the prior reporting year.** Sub-Fund launched in the current reporting period.# Sub-Fund liquidated on 19 June 2020. See Note 17e.
6. Share CapitalThe authorised share capital of the ICAV is 500,000,000,002 Shares of no par value divided into 2 Subscriber Shares of no par value and 500,000,000,000shares of no par value. The Directors are empowered to issue up to all of the Shares of the ICAV on such terms as they think fit. The Subscriber Shares entitlethe holders to attend and vote at any general meetings of the ICAV but do not entitle the holders to participate in the profits or assets of the ICAV except for areturn of capital on a winding-up. The Shares entitle the holders to attend and vote at general meetings of the ICAV and (other than the Subscriber Shares) toparticipate equally in the profits and assets of the Sub-Fund to which the Shares relate, subject to any differences between fees, charges and expensesapplicable to different Share Classes. The ICAV may from time to time by ordinary resolution increase its capital, consolidate the Shares or any of them into asmaller number of Shares, sub-divide the Shares or any of them into a larger number of Shares or cancel any Shares not taken or agreed to be taken by anyperson. The ICAV may by special resolution from time to time reduce its share capital in any way permitted by law. At a meeting of Shareholders, on a show ofhands, each Shareholder shall have one vote and, on a poll, each Shareholder shall have one vote for each whole Share held by such Shareholder.
45
JPMorgan ETFs (Ireland) ICAVNotes to the Unaudited Financial Statements (continued)For the six month period ended 30 June 2020
4. Fees and expenses (continued)For the six month period ended 30 June 2019 (continued)
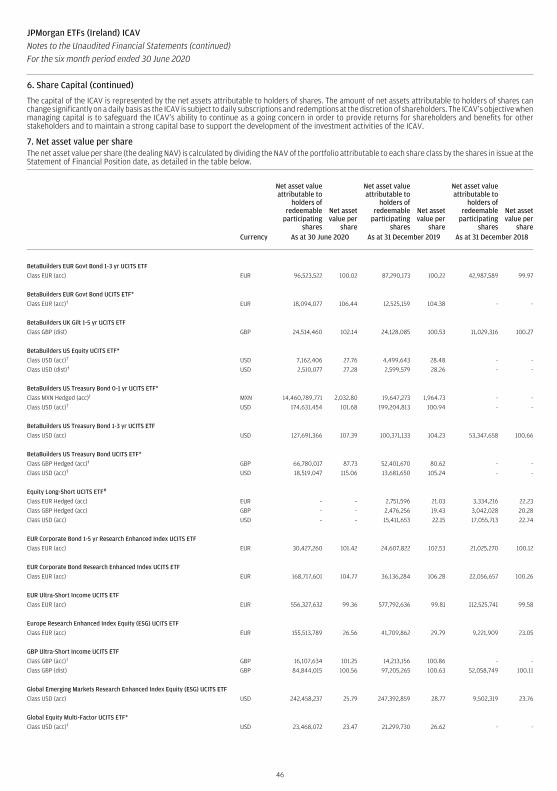
The capital of the ICAV is represented by the net assets attributable to holders of shares. The amount of net assets attributable to holders of shares canchange significantly on a daily basis as the ICAV is subject to daily subscriptions and redemptions at the discretion of shareholders. The ICAV’s objective whenmanaging capital is to safeguard the ICAV’s ability to continue as a going concern in order to provide returns for shareholders and benefits for otherstakeholders and to maintain a strong capital base to support the development of the investment activities of the ICAV.
7. Net asset value per shareThe net asset value per share (the dealing NAV) is calculated by dividing the NAV of the portfolio attributable to each share class by the shares in issue at theStatement of Financial Position date, as detailed in the table below.
Net asset valueattributable to
holders ofredeemable
participatingshares
Net assetvalue per
share
Net asset valueattributable to
holders ofredeemable
participatingshares
Net assetvalue per
share
Net asset valueattributable to
holders ofredeemable
participatingshares
Net assetvalue per
shareCurrency As at 30 June 2020 As at 31 December 2019 As at 31 December 2018
BetaBuilders EUR Govt Bond 1-3 yr UCITS ETF
Class EUR (acc) EUR 96,523,522 100.02 87,290,173 100.22 42,987,589 99.97
BetaBuilders EUR Govt Bond UCITS ETF*
Class EUR (acc)† EUR 18,094,077 106.44 12,525,159 104.38 - -
BetaBuilders UK Gilt 1-5 yr UCITS ETF
Class GBP (dist) GBP 24,514,460 102.14 24,128,085 100.53 11,029,316 100.27
BetaBuilders US Equity UCITS ETF*
Class USD (acc)† USD 7,162,406 27.76 4,499,643 28.48 - -
Class USD (dist)† USD 2,510,077 27.28 2,599,579 28.26 - -
BetaBuilders US Treasury Bond 0-1 yr UCITS ETF*
Class MXN Hedged (acc)† MXN 14,460,789,771 2,032.80 19,647,273 1,964.73 - -
Class USD (acc)† USD 174,631,454 101.68 199,204,813 100.94 - -
BetaBuilders US Treasury Bond 1-3 yr UCITS ETF
Class USD (acc) USD 127,691,366 107.39 100,371,133 104.23 53,347,658 100.66
BetaBuilders US Treasury Bond UCITS ETF*
Class GBP Hedged (acc)† GBP 66,780,017 87.73 52,401,670 80.62 - -
Class USD (acc)† USD 18,519,047 115.06 13,681,650 105.24 - -
Equity Long-Short UCITS ETF#
Class EUR Hedged (acc) EUR – – 2,751,596 21.03 3,334,216 22.23
Class GBP Hedged (acc) GBP – – 2,476,256 19.43 3,042,028 20.28
Class USD (acc) USD – – 15,411,653 22.15 17,055,713 22.74
EUR Corporate Bond 1-5 yr Research Enhanced Index UCITS ETF
Class EUR (acc) EUR 30,427,260 101.42 24,607,822 102.53 21,025,270 100.12
EUR Corporate Bond Research Enhanced Index UCITS ETF
Class EUR (acc) EUR 168,717,601 104.77 36,136,284 106.28 22,056,657 100.26
EUR Ultra-Short Income UCITS ETF
Class EUR (acc) EUR 556,327,632 99.36 577,792,636 99.81 112,525,741 99.58
Europe Research Enhanced Index Equity (ESG) UCITS ETF
Class EUR (acc) EUR 155,513,789 26.56 41,709,862 29.79 9,221,909 23.05
GBP Ultra-Short Income UCITS ETF
Class GBP (acc)† GBP 16,107,634 101.25 14,213,156 100.86 - -
Class GBP (dist) GBP 84,844,015 100.56 97,205,265 100.63 52,058,749 100.11
Global Emerging Markets Research Enhanced Index Equity (ESG) UCITS ETF
Class USD (acc) USD 242,458,237 25.79 247,392,859 28.77 9,502,319 23.76
Global Equity Multi-Factor UCITS ETF*
Class USD (acc)† USD 23,468,072 23.47 21,299,730 26.62 - -
46
JPMorgan ETFs (Ireland) ICAVNotes to the Unaudited Financial Statements (continued)For the six month period ended 30 June 2020
6. Share Capital (continued)

47
Net asset valueattributable to
holders ofredeemable
participatingshares
Net assetvalue per
share
Net asset valueattributable to
holders ofredeemable
participatingshares
Net assetvalue per
share
Net asset valueattributable to
holders ofredeemable
participatingshares
Net assetvalue per
shareCurrency As at 30 June 2020 As at 31 December 2019 As at 31 December 2018
Global High Yield Corporate Bond Multi-Factor UCITS ETF*
Class GBP Hedged (dist)† GBP 34,601,494 5.31 - - - -
Class MXN Hedged (acc)† MXN 12,099,050 2,103.09 - - - -
Class USD (acc)† USD 66,216,099 94.44 - - - -
Class USD Hedged (acc)† USD 1,461,318 94.28 - - - -
Global Research Enhanced Index Equity (ESG) UCITS ETF
Class USD (acc) USD 70,257,617 27.02 39,798,056 28.43 26,530,240 22.11
Managed Futures UCITS ETF
Class EUR Hedged (acc) EUR 2,103,409 18.93 2,942,972 22.53 3,226,637 21.51
Class GBP Hedged (acc) GBP 12,517,105 17.56 7,012,151 20.83 1,963,384 19.63
Class USD (acc) USD 70,291,298 22.05 87,123,874 26.06 62,817,520 24.16
US Equity Multi-Factor UCITS ETF*
Class USD (acc)† USD 10,548,853 23.44 11,977,334 26.62 - -
US Research Enhanced Index Equity (ESG) UCITS ETF
Class USD (acc) USD 167,570,598 28.54 153,788,203 29.15 11,125,275 22.25
Class USD (dist)† USD 74,073,499 27.79 72,650,058 28.38 - -
USD Corporate Bond Research Enhanced Index UCITS ETF
Class USD (acc) USD 122,301,778 122.06 83,547,005 115.72 25,206,300 100.83
USD Emerging Markets Sovereign Bond UCITS ETF
Class CHF Hedged (acc)† CHF 12,564,903 96.18 - - - -
Class EUR Hedged (acc) EUR 269,562,937 93.96 188,918,669 99.51 8,679,516 86.80
Class GBP Hedged (dist)† GBP 801,691 77.01 829,799 82.98 - -
Class MXN Hedged (acc)† MXN 5,487,494 2,231.60 - - - -
Class USD (acc)† USD 64,628,982 102.03 9,759,626 106.67 - -
Class USD (dist) USD 132,636,524 99.21 136,887,049 106.00 56,452,787 94.09
USD Ultra-Short Income UCITS ETF
Class USD (acc)† USD 41,255,913 103.82 50,341,967 102.30 - -
Class USD (dist) USD 120,115,799 101.18 226,185,741 100.87 197,343,473 100.17
* Sub-Fund launched in the current or prior reporting period/year.† Share Class launched in the current or prior reporting period/year.# Sub-Fund liquidated on 19 June 2020. See Note 17e.
8. Fair Value EstimationThe Sub-Funds are required to classify fair value measurements using a fair value hierarchy that reflects the significance of the inputs used in making themeasurements. The fair value hierarchy has the following levels:
• Level 1: Inputs that are quoted market prices (unadjusted) in active markets for identical instruments;• Level 2: Inputs other than quoted prices included within Level 1 that are observable either directly (i.e. as prices) or indirectly (i.e. derived from prices).
This category includes instruments valued using: quoted market prices in active markets for similar instruments; quoted prices for identical or similarinstruments in markets that are considered less than active; or other valuation techniques in which all significant inputs are directly or indirectlyobservable from market data; and
• Level 3: Inputs that are unobservable. This category includes all instruments for which the valuation technique includes inputs not based on observabledata and the unobservable inputs have a significant effect on the instrument’s valuation. This category includes instruments that are valued based onquoted prices for similar instruments but for which significant unobservable adjustments or assumptions are required to reflect differences between theinstruments.
The level in the fair value hierarchy within which the fair value measurement is categorised in its entirety is determined on the basis of the lowest level inputthat is significant to the fair value measurement. For this purpose, the significance of an input is assessed against the fair value measurement in its entirety. Ifa fair value measurement uses observable inputs that require significant adjustment based on unobservable inputs, that measurement is a Level 3measurement. Assessing the significance of a particular input to the fair value measurement in its entirety requires judgement, considering factors specificto the asset or liability.
The determination of what constitutes ‘observable’ requires significant judgement by the ICAV. The ICAV considers observable data to be market data that isreadily available, regularly distributed or updated, reliable and verifiable, not proprietary, and provided by independent sources that are actively involved inthe relevant market.
JPMorgan ETFs (Ireland) ICAVNotes to the Unaudited Financial Statements (continued)For the six month period ended 30 June 2020
7. Net asset value per share (continued)

The following table analyses within the fair value hierarchy the Sub-Funds’ financial assets and liabilities measured at fair value at 30 June 2020:
Currency Level 1 Level 2 Level 3 Total
BetaBuilders EUR Govt Bond 1-3 yr UCITS ETFFinancial assets at fair value through profit or loss:Bonds EUR – 95,735,896 – 95,735,896
Total Financial assets EUR – 95,735,896 – 95,735,896
BetaBuilders EUR Govt Bond UCITS ETFFinancial assets at fair value through profit or loss:Bonds EUR – 17,947,303 – 17,947,303
Total Financial assets EUR – 17,947,303 – 17,947,303
BetaBuilders UK Gilt 1-5 yr UCITS ETFFinancial assets at fair value through profit or loss:Bonds GBP – 24,297,532 – 24,297,532
Total Financial assets GBP – 24,297,532 – 24,297,532
BetaBuilders US Equity UCITS ETFFinancial assets at fair value through profit or loss:Equities USD 9,629,522 – – 9,629,522Financial Futures Contracts USD 666 – – 666
Total Financial assets USD 9,630,188 – – 9,630,188
BetaBuilders US Treasury Bond 0-1 yr UCITS ETFFinancial assets at fair value through profit or loss:Bonds USD – 803,382,815 – 803,382,815Forward Currency Contracts USD – 3,474,526 – 3,474,526
Total Financial assets USD – 806,857,341 – 806,857,341
Financial liabilities at fair value through profit or loss:Forward Currency Contracts USD – (20,715,982) – (20,715,982)
Total Financial liabilities USD – (20,715,982) – (20,715,982)
BetaBuilders US Treasury Bond 1-3 yr UCITS ETFFinancial assets at fair value through profit or loss:Bonds USD – 127,167,748 – 127,167,748
Total Financial assets USD – 127,167,748 – 127,167,748
BetaBuilders US Treasury Bond UCITS ETFFinancial assets at fair value through profit or loss:Bonds USD – 100,611,658 – 100,611,658Forward Currency Contracts USD – 714,529 – 714,529
Total Financial assets USD – 101,326,187 – 101,326,187
Financial liabilities at fair value through profit or loss:Forward Currency Contracts USD – (287,228) – (287,228)
Total Financial liabilities USD – (287,228) – (287,228)
48
JPMorgan ETFs (Ireland) ICAVNotes to the Unaudited Financial Statements (continued)For the six month period ended 30 June 2020
8. Fair Value Estimation (continued)

Currency Level 1 Level 2 Level 3 Total
Equity Long-Short UCITS ETF*Financial liabilities at fair value through profit or loss:Contracts for Differences USD (84) – – (84)
Total Financial liabilities USD (84) – – (84)
EUR Corporate Bond 1-5 yr Research Enhanced Index UCITS ETFFinancial assets at fair value through profit or loss:Bonds EUR – 30,027,372 – 30,027,372Financial Futures Contracts EUR 6,250 – – 6,250
Total Financial assets EUR 6,250 30,027,372 – 30,033,622
Financial liabilities at fair value through profit or loss:Financial Futures Contracts EUR (1,365) – – (1,365)
Total Financial liabilities EUR (1,365) – – (1,365)
EUR Corporate Bond Research Enhanced Index UCITS ETFFinancial assets at fair value through profit or loss:Bonds EUR – 166,578,449 – 166,578,449Financial Futures Contracts EUR 105,710 – – 105,710
Total Financial assets EUR 105,710 166,578,449 – 166,684,159
Financial liabilities at fair value through profit or loss:Financial Futures Contracts EUR (107,080) – – (107,080)
Total Financial liabilities EUR (107,080) – – (107,080)
EUR Ultra-Short Income UCITS ETFFinancial assets at fair value through profit or loss:Bonds EUR – 499,249,369 – 499,249,369Forward Currency Contracts EUR – 600,626 – 600,626
Total Financial assets EUR – 499,849,995 – 499,849,995
Financial liabilities at fair value through profit or loss:Forward Currency Contracts EUR – (153,533) – (153,533)
Total Financial liabilities EUR – (153,533) – (153,533)
Europe Research Enhanced Index Equity (ESG) UCITS ETFFinancial assets at fair value through profit or loss:Equities EUR 154,684,473 – – 154,684,473
Total Financial assets EUR 154,684,473 – – 154,684,473
*Sub-Fund liquidated on 19 June 2020. See Note 17e.
49
JPMorgan ETFs (Ireland) ICAVNotes to the Unaudited Financial Statements (continued)For the six month period ended 30 June 2020
8. Fair Value Estimation (continued)As at 30 June 2020 (continued)
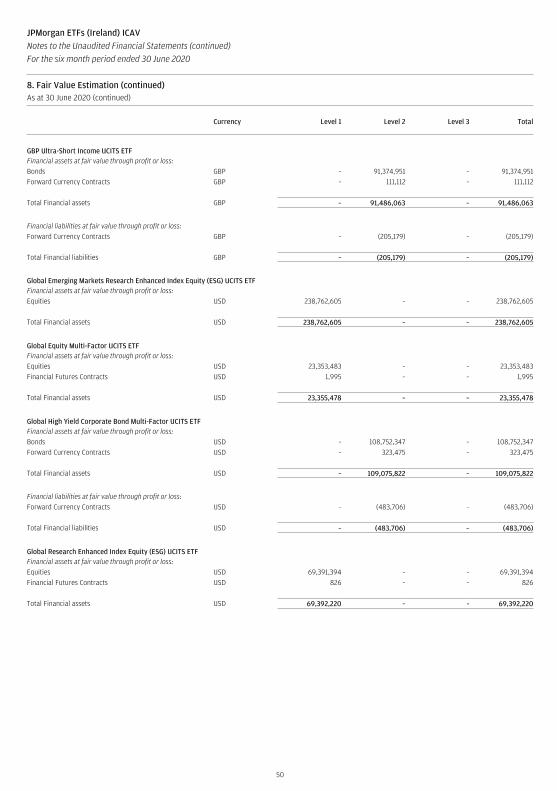
Currency Level 1 Level 2 Level 3 Total
GBP Ultra-Short Income UCITS ETFFinancial assets at fair value through profit or loss:Bonds GBP – 91,374,951 – 91,374,951Forward Currency Contracts GBP – 111,112 – 111,112
Total Financial assets GBP – 91,486,063 – 91,486,063
Financial liabilities at fair value through profit or loss:Forward Currency Contracts GBP – (205,179) – (205,179)
Total Financial liabilities GBP – (205,179) – (205,179)
Global Emerging Markets Research Enhanced Index Equity (ESG) UCITS ETFFinancial assets at fair value through profit or loss:Equities USD 238,762,605 – – 238,762,605
Total Financial assets USD 238,762,605 – – 238,762,605
Global Equity Multi-Factor UCITS ETFFinancial assets at fair value through profit or loss:Equities USD 23,353,483 – – 23,353,483Financial Futures Contracts USD 1,995 – – 1,995
Total Financial assets USD 23,355,478 – – 23,355,478
Global High Yield Corporate Bond Multi-Factor UCITS ETFFinancial assets at fair value through profit or loss:Bonds USD – 108,752,347 – 108,752,347Forward Currency Contracts USD – 323,475 – 323,475
Total Financial assets USD – 109,075,822 – 109,075,822
Financial liabilities at fair value through profit or loss:Forward Currency Contracts USD – (483,706) – (483,706)
Total Financial liabilities USD – (483,706) – (483,706)
Global Research Enhanced Index Equity (ESG) UCITS ETFFinancial assets at fair value through profit or loss:Equities USD 69,391,394 – - 69,391,394Financial Futures Contracts USD 826 – – 826
Total Financial assets USD 69,392,220 – - 69,392,220
50
JPMorgan ETFs (Ireland) ICAVNotes to the Unaudited Financial Statements (continued)For the six month period ended 30 June 2020
8. Fair Value Estimation (continued)As at 30 June 2020 (continued)

51
Currency Level 1 Level 2 Level 3 Total
Managed Futures UCITS ETFFinancial assets at fair value through profit or loss:Bonds USD – 72,159,672 – 72,159,672Forward Currency Contracts USD – 930,466 – 930,466Financial Futures Contracts USD 496,881 – – 496,881Commodity Index Swap Contracts USD – 1,376,652 – 1,376,652
Total Financial assets USD 496,881 74,466,790 – 74,963,671
Financial liabilities at fair value through profit or loss:Forward Currency Contracts USD – (378,148) – (378,148)Financial Futures Contracts USD (196,788) – – (196,788)Commodity Index Swap Contracts USD – (1,866,425) – (1,866,425)
Total Financial liabilities USD (196,788) (2,244,573) – (2,441,361)
US Equity Multi-Factor UCITS ETFFinancial assets at fair value through profit or loss:Equities USD 10,523,757 – – 10,523,757Financial Futures Contracts USD 665 – – 665
Total Financial assets USD 10,524,422 – – 10,524,422
US Research Enhanced Index Equity (ESG) UCITS ETFFinancial assets at fair value through profit or loss:Equities USD 241,200,917 – – 241,200,917Financial Futures Contracts USD 4,732 – – 4,732
Total Financial assets USD 241,205,649 – – 241,205,649
USD Corporate Bond Research Enhanced Index UCITS ETFFinancial assets at fair value through profit or loss:Bonds USD – 120,484,766 – 120,484,766Financial Futures Contracts USD 54,922 – – 54,922
Total Financial assets USD 54,922 120,484,766 – 120,539,688
Financial liabilities at fair value through profit or loss:Financial Futures Contracts USD (36,992) – – (36,992)
Total Financial liabilities USD (36,992) – – (36,992)
USD Emerging Markets Sovereign Bond UCITS ETFFinancial assets at fair value through profit or loss:Bonds USD – 507,106,985 – 507,106,985Forward Currency Contracts USD – 6,528,183 – 6,528,183
Total Financial assets USD – 513,635,168 – 513,635,168
Financial liabilities at fair value through profit or loss:Forward Currency Contracts USD – (1,329,373) – (1,329,373)
Total Financial liabilities USD – (1,329,373) – (1,329,373)
JPMorgan ETFs (Ireland) ICAVNotes to the Unaudited Financial Statements (continued)For the six month period ended 30 June 2020
8. Fair Value Estimation (continued)As at 30 June 2020 (continued)

Currency Level 1 Level 2 Level 3 Total
USD Ultra-Short Income UCITS ETFFinancial assets at fair value through profit or loss:Bonds USD – 159,360,089 – 159,360,089
Total Financial assets USD – 159,360,089 – 159,360,089
The following table analyses within the fair value hierarchy the Sub-Funds’ financial assets and liabilities measured at fair value at 31 December 2019:
Currency Level 1 Level 2 Level 3 Total
BetaBuilders EUR Govt Bond 1-3 yr UCITS ETFFinancial assets at fair value through profit or loss:Bonds EUR – 86,525,432 – 86,525,432
Total Financial assets EUR – 86,525,432 – 86,525,432
BetaBuilders EUR Govt Bond UCITS ETFFinancial assets at fair value through profit or loss:Bonds EUR – 12,404,990 – 12,404,990
Total Financial assets EUR – 12,404,990 – 12,404,990
BetaBuilders UK Gilt 1-5 yr UCITS ETFFinancial assets at fair value through profit or loss:Bonds GBP – 23,964,365 – 23,964,365
Total Financial assets GBP – 23,964,365 – 23,964,365
BetaBuilders US Equity UCITS ETFFinancial assets at fair value through profit or loss:Equities USD 7,062,466 – – 7,062,466Financial Futures Contracts USD 851 – – 851
Total Financial assets USD 7,063,317 – – 7,063,317
BetaBuilders US Treasury Bond 0-1 yr UCITS ETFFinancial assets at fair value through profit or loss:Bonds USD – 199,804,727 – 199,804,727Forward Currency Contracts USD – 42,259 – 42,259
Total Financial assets USD – 199,846,986 – 199,846,986
Financial liabilities at fair value through profit or loss:Forward Currency Contracts USD – (4,124) – (4,124)
Total Financial liabilities USD – (4,124) – (4,124)
BetaBuilders US Treasury Bond 1-3 yr UCITS ETFFinancial assets at fair value through profit or loss:Bonds USD – 99,966,289 – 99,966,289
Total Financial assets USD – 99,966,289 – 99,966,289
52
JPMorgan ETFs (Ireland) ICAVNotes to the Unaudited Financial Statements (continued)For the six month period ended 30 June 2020
8. Fair Value Estimation (continued)As at 30 June 2020 (continued)

Currency Level 1 Level 2 Level 3 Total
BetaBuilders US Treasury Bond UCITS ETFFinancial assets at fair value through profit or loss:Bonds USD – 83,326,447 – 83,326,447Forward Currency Contracts USD – 2,597,349 – 2,597,349
Total Financial assets USD – 85,923,796 – 85,923,796
Financial liabilities at fair value through profit or loss:Forward Currency Contracts USD – (799,762) – (799,762)
Total Financial liabilities USD – (799,762) – (799,762)
Equity Long-Short UCITS ETFFinancial assets at fair value through profit or loss:Equities USD 14,527,283 – – 14,527,283Bonds USD – 1,765,136 – 1,765,136Forward Currency Contracts USD – 159,473 – 159,473Financial Futures Contracts USD 5,624 – – 5,624Contracts for Differences USD 581,914 – – 581,914
Total Financial assets USD 15,114,821 1,924,609 – 17,039,430
Financial liabilities at fair value through profit or loss:Forward Currency Contracts USD – (45,574) – (45,574)Financial Futures Contracts USD (25,202) – – (25,202)Contracts for Differences USD (1,044,563) – – (1,044,563)
Total Financial liabilities USD (1,069,765) (45,574) – (1,115,339)
EUR Corporate Bond 1-5 yr Research Enhanced Index UCITS ETFFinancial assets at fair value through profit or loss:Bonds EUR – 24,317,451 – 24,317,451Financial Futures Contracts EUR 550 – – 550
Total Financial assets EUR 550 24,317,451 – 24,318,001
Financial liabilities at fair value through profit or loss:Financial Futures Contracts EUR (2,180) – – (2,180)
Total Financial liabilities EUR (2,180) – – (2,180)
EUR Corporate Bond Research Enhanced Index UCITS ETFFinancial assets at fair value through profit or loss:Bonds EUR – 35,703,881 – 35,703,881Financial Futures Contracts EUR 10,790 – – 10,790
Total Financial assets EUR 10,790 35,703,881 – 35,714,671
Financial liabilities at fair value through profit or loss:Financial Futures Contracts EUR (15,880) – – (15,880)
Total Financial liabilities EUR (15,880) – – (15,880)
53
JPMorgan ETFs (Ireland) ICAVNotes to the Unaudited Financial Statements (continued)For the six month period ended 30 June 2020
8. Fair Value Estimation (continued)As at 31 December 2019 (continued)

Currency Level 1 Level 2 Level 3 Total
EUR Ultra-Short Income UCITS ETFFinancial assets at fair value through profit or loss:Exchange Traded Funds EUR 2,365,256 – – 2,365,256Bonds EUR – 522,525,642 – 522,525,642Forward Currency Contracts EUR – 711,968 – 711,968
Total Financial assets EUR 2,365,256 523,237,610 – 525,602,866
Financial liabilities at fair value through profit or loss:Forward Currency Contracts EUR – (46,725) – (46,725)
Total Financial liabilities EUR – (46,725) – (46,725)
Europe Research Enhanced Index Equity (ESG) UCITS ETFFinancial assets at fair value through profit or loss:Equities EUR 41,451,568 – – 41,451,568
Total Financial assets EUR 41,451,568 – – 41,451,568
GBP Ultra-Short Income UCITS ETFFinancial assets at fair value through profit or loss:Exchange Traded Funds GBP 846,777 – – 846,777Bonds GBP – 105,553,939 – 105,553,939Forward Currency Contracts GBP – 482,892 – 482,892
Total Financial assets GBP 846,777 106,036,831 – 106,883,608
Financial liabilities at fair value through profit or loss:Forward Currency Contracts GBP – (10,514) – (10,514)
Total Financial liabilities GBP – (10,514) – (10,514)
Global Emerging Markets Research Enhanced Index Equity (ESG) UCITS ETFFinancial assets at fair value through profit or loss:Exchange Traded Funds USD 17,910,241 – – 17,910,241Equities USD 227,526,330 – – 227,526,330Forward Currency Contracts USD – 1,618 – 1,618
Total Financial assets USD 245,436,571 1,618 – 245,438,189
Global Equity Multi-Factor UCITS ETFFinancial assets at fair value through profit or loss:Equities USD 21,231,050 – – 21,231,050Financial Futures Contracts USD 993 – – 993
Total Financial assets USD 21,232,043 – – 21,232,043
54
JPMorgan ETFs (Ireland) ICAVNotes to the Unaudited Financial Statements (continued)For the six month period ended 30 June 2020
8. Fair Value Estimation (continued)As at 31 December 2019 (continued)

Currency Level 1 Level 2 Level 3 Total
Global Research Enhanced Index Equity (ESG) UCITS ETFFinancial assets at fair value through profit or loss:Equities USD 38,885,646 – – 38,885,646Financial Futures Contracts USD 1,979 – – 1,979
Total Financial assets USD 38,887,625 – – 38,887,625
Financial liabilities at fair value through profit or loss:Financial Futures Contracts USD (6,274) – – (6,274)
Total Financial liabilities USD (6,274) – – (6,274)
Managed Futures UCITS ETFFinancial assets at fair value through profit or loss:Bonds USD – 67,250,812 – 67,250,812Forward Currency Contracts USD – 838,190 – 838,190Financial Futures Contracts USD 236,691 – – 236,691Commodity Index Swap Contracts USD – 657,156 – 657,156
Total Financial assets USD 236,691 68,746,158 – 68,982,849
Financial liabilities at fair value through profit or loss:Forward Currency Contracts USD – (1,137,600) – (1,137,600)Financial Futures Contracts USD (617,586) – – (617,586)Commodity Index Swap Contracts USD – (710,540) – (710,540)
Total Financial liabilities USD (617,586) (1,848,140) – (2,465,726)
US Equity Multi-Factor UCITS ETFFinancial assets at fair value through profit or loss:Equities USD 11,939,120 – – 11,939,120Financial Futures Contracts USD 514 – – 514
Total Financial assets USD 11,939,634 – – 11,939,634
US Research Enhanced Index Equity (ESG) UCITS ETFFinancial assets at fair value through profit or loss:Equities USD 225,183,856 – – 225,183,856Financial Futures Contracts USD 16,163 – – 16,163
Total Financial assets USD 225,200,019 – – 225,200,019
USD Corporate Bond Research Enhanced Index UCITS ETFFinancial assets at fair value through profit or loss:Bonds USD – 81,743,256 – 81,743,256Financial Futures Contracts USD 32,953 – – 32,953
Total Financial assets USD 32,953 81,743,256 – 81,776,209
Financial liabilities at fair value through profit or loss:Financial Futures Contracts USD (48,414) – – (48,414)
Total Financial liabilities USD (48,414) – – (48,414)
55
JPMorgan ETFs (Ireland) ICAVNotes to the Unaudited Financial Statements (continued)For the six month period ended 30 June 2020
8. Fair Value Estimation (continued)As at 31 December 2019 (continued)

Currency Level 1 Level 2 Level 3 Total
USD Emerging Markets Sovereign Bond UCITS ETFFinancial assets at fair value through profit or loss:Bonds USD – 350,749,054 – 350,749,054Forward Currency Contracts USD – 4,596,550 – 4,596,550
Total Financial assets USD – 355,345,604 – 355,345,604
Financial liabilities at fair value through profit or loss:Forward Currency Contracts USD – (705,061) – (705,061)
Total Financial liabilities USD – (705,061) – (705,061)
USD Ultra-Short Income UCITS ETFFinancial assets at fair value through profit or loss:Bonds USD – 254,313,490 – 254,313,490
Total Financial assets USD – 254,313,490 – 254,313,490
There were no transfers between levels during the six month period ended 30 June 2020 and the year ended 31 December 2019.
All other current assets and current liabilities included in the Statement of Financial Position as at 30 June 2020 and 31 December 2019 are carried at valuesthat reflect a reasonable approximation of their fair value.
As at 30 June 2020 and 31 December 2019, cash, bank overdraft and amounts due from brokers are classified as Level 1. Cash equivalents are classified asLevel 2. All other assets and liabilities not measured at fair value but for which fair value is disclosed are classified as Level 2.
9. Taxation of the ICAVThe ICAV is an investment undertaking as defined in Section 739B of the Taxes Consolidation Act 1997, as amended (“TCA”). The ICAV will not be liable to Irishtax in respect of its income and gains, other than on the occurrence of a chargeable event.
Generally a chargeable event arises on any distribution, redemption, repurchase, cancellation, transfer of shares or on the ending of a ‘Relevant Period’. A‘Relevant Period’ being an eight year period beginning with the acquisition of the shares by the shareholder and each subsequent period of eight yearsbeginning immediately after the preceding Relevant Period.
No Irish tax will arise on the ICAV in respect of chargeable events in respect of:
a) A shareholder who is neither Irish resident nor ordinarily resident in Ireland for tax purposes, at the time of the chargeable event, providedappropriate valid declarations in accordance with the provisions of the Taxes Consolidation Act, 1997, as amended, are held by the ICAV; or the ICAV hasbeen authorised by the Irish Revenue to make gross payments in the absence of appropriate declarations; and
b) Certain exempted Irish tax resident shareholders who have provided the ICAV with the necessary signed statutory declarations.
Dividends, interest and capital gains (if any) received on investments by the ICAV may be subject to taxes imposed by the country from which the investmentincome/gains are received and such taxes may not be recoverable by the ICAV or its shareholders.
The Directors intend to seek UK reporting fund status for all Share Classes. For further information on UK reporting fund status including details of thereportable income of each relevant Share Class (available annually within 6 months of the end of the relevant reporting period), please go to the Website.
10. Related party transactions and holdingsRelated party disclosuresParties are considered to be related if one party has the ability to control the other party or exercise significant influence over the party in making financial oroperational decisions.
The Board of Directors is not aware of any transactions with related parties during the the six month period ended 30 June 2020 and 30 June 2019 other thanthose disclosed in these financial statements.
56
JPMorgan ETFs (Ireland) ICAVNotes to the Unaudited Financial Statements (continued)For the six month period ended 30 June 2020
8. Fair Value Estimation (continued)As at 31 December 2019 (continued)

As at 30 June 2020 and 31 December 2019, certain Sub-Funds had made investments in JPMorgan Liquidity Funds which is deemed to be related party of theICAV. Details of investments in JPMorgan Liquidity Funds are outlined in Sub-Funds’ Schedules of Investments. The table below details the percentage of netassets of JPMorgan Liquidity Funds held by each Sub-Fund as at the reporting date:
% of Net Assets held bySub-Fund Realised Gain/(Loss) Income
Sub-Fund Currency Investment30 June
202031 December
201930 June
202031 December
201930 June
202031 December
2019
JPMorgan ETFs (Ireland) ICAV - BetaBuildersUS Equity UCITS ETF
USD JPMorgan Liquidity Funds - USD LiquidityLVNAV Fund 0.00 0.00 - - 216 221
JPMorgan ETFs (Ireland) ICAV - BetaBuildersUS Treasury Bond UCITS ETF
USD JPMorgan Liquidity Funds - USD LiquidityLVNAV Fund 0.00 0.00 - - 917 999
JPMorgan ETFs (Ireland) ICAV - EquityLong-Short UCITS ETF#
USD JPMorgan Liquidity Funds - USD LiquidityLVNAV Fund -* 0.00 - - 15,599 45,939
JPMorgan ETFs (Ireland) ICAV - EURUltra-Short Income UCITS ETF
EUR JPMorgan Liquidity Funds - EUR LiquidityLVNAV Fund 0.43 0.42 (89,959) (34,388) - -
JPMorgan ETFs (Ireland) ICAV - EuropeResearch Enhanced Index Equity (ESG) UCITSETF
EUR JPMorgan Liquidity Funds - EUR LiquidityLVNAV Fund
-* 0.00 - (182) - -
JPMorgan ETFs (Ireland) ICAV - GBPUltra-Short Income UCITS ETF
GBP JPMorgan Liquidity Funds - GBP LiquidityLVNAV Fund 0.06 0.03 - - 29,538 30,027
JPMorgan ETFs (Ireland) ICAV - GlobalEmerging Markets Research Enhanced IndexEquity (ESG) UCITS ETF
USDJPMorgan Liquidity Funds - USD LiquidityLVNAV Fund 0.00 0.00 - - 4,817 852
JPMorgan ETFs (Ireland) ICAV - GlobalResearch Enhanced Index Equity (ESG) UCITSETF
USD JPMorgan Liquidity Funds - USD LiquidityLVNAV Fund
0.00 0.00 - - 5,816 3,715
JPMorgan ETFs (Ireland) ICAV - ManagedFutures UCITS ETF
USD JPMorgan Liquidity Funds - USD LiquidityLVNAV Fund 0.01 0.01 - - 70,640 150,735
JPMorgan ETFs (Ireland) ICAV - US ResearchEnhanced Index Equity (ESG) UCITS ETF
USD JPMorgan Liquidity Funds - USD LiquidityLVNAV Fund 0.00 0.00 - - 6,843 2,433
JPMorgan ETFs (Ireland) ICAV - USDCorporate Bond Research Enhanced IndexUCITS ETF
USD JPMorgan Liquidity Funds - USD LiquidityLVNAV Fund
0.00 0.00 - - 9,919 12,253
JPMorgan ETFs (Ireland) ICAV - USD EmergingMarkets Sovereign Bond UCITS ETF
USD JPMorgan Liquidity Funds - USD LiquidityLVNAV Fund 0.00 0.00 - - 8,068 21,489
JPMorgan ETFs (Ireland) ICAV - USDUltra-Short Income UCITS ETF
USD JPMorgan Liquidity Funds - USD LiquidityLVNAV Fund 0.00 0.02 - - 58,259 137,685
*Investment not held as at 30 June 2020.#Sub-Fund liquidated on 19 June 2020. See Note 17e.
As at 30 June 2020 and 31 December 2019, shares of certain Sub-Funds are held by an affiliated entity of JPMorgan Chase & Co.
JPMC ownership %
Sub-Fund 30 June 2020 31 December 2019
JPMorgan ETFs (Ireland) ICAV - BetaBuilders EUR Govt Bond 1-3 yr UCITS ETF 41.45 45.92
JPMorgan ETFs (Ireland) ICAV - BetaBuilders EUR Govt Bond UCITS ETF 52.10 73.81
JPMorgan ETFs (Ireland) ICAV - BetaBuilders UK Gilt 1-5 yr UCITS ETF 42.03 42.01
JPMorgan ETFs (Ireland) ICAV - BetaBuilders US Treasury Bond 0-1 yr UCITS ETF -* 3.04
JPMorgan ETFs (Ireland) ICAV - BetaBuilders US Treasury Bond 1-3 yr UCITS ETF 42.05 51.93
JPMorgan ETFs (Ireland) ICAV - BetaBuilders US Treasury Bond UCITS ETF 11.41 12.70
JPMorgan ETFs (Ireland) ICAV - Equity Long-Short UCITS ETF# -* 83.89
JPMorgan ETFs (Ireland) ICAV - EUR Corporate Bond 1-5 yr Research Enhanced Index UCITS ETF 66.27 82.87
JPMorgan ETFs (Ireland) ICAV - EUR Corporate Bond Research Enhanced Index UCITS ETF 67.83 62.91
JPMorgan ETFs (Ireland) ICAV - Europe Research Enhanced Index Equity (ESG) UCITS ETF 70.51 25.46
JPMorgan ETFs (Ireland) ICAV - GBP Ultra-Short Income UCITS ETF 39.85 36.10
JPMorgan ETFs (Ireland) ICAV - Global Emerging Markets Research Enhanced Index Equity (ESG) UCITS ETF -* 4.41
JPMorgan ETFs (Ireland) ICAV - Global Equity Multi-Factor UCITS ETF 36.01 45.01
JPMorgan ETFs (Ireland) ICAV - Global High Yield Corporate Bond Multi-Factor UCITS ETF 21.01 -*
JPMorgan ETFs (Ireland) ICAV - Global Research Enhanced Index Equity (ESG) UCITS ETF 39.35 73.08
JPMorgan ETFs (Ireland) ICAV - Managed Futures UCITS ETF 53.71 56.39
JPMorgan ETFs (Ireland) ICAV - US Equity Multi-Factor UCITS ETF 88.69 88.91
JPMorgan ETFs (Ireland) ICAV - US Research Enhanced Index Equity (ESG) UCITS ETF 2.42 5.22
JPMorgan ETFs (Ireland) ICAV - USD Corporate Bond Research Enhanced Index UCITS ETF 24.71 34.23
JPMorgan ETFs (Ireland) ICAV - USD Emerging Markets Sovereign Bond UCITS ETF 0.05 0.61
JPMorgan ETFs (Ireland) ICAV - USD Ultra-Short Income UCITS ETF 8.62 10.55
*There were no shares owned by JPMC as at 30 June 2020 or 31 December 2019.#Sub-Fund liquidated on 19 June 2020. See Note 17e.
57
JPMorgan ETFs (Ireland) ICAVNotes to the Unaudited Financial Statements (continued)For the six month period ended 30 June 2020
10. Related party transactions and holdings (continued)

As at 30 June 2020, the following Sub-Fund held shares of JPMorgan Chase & Co.:
Sub-Fund Currency Investment Shares Fair Value% of Net
AssetsRealised
Gain/(Loss)
JPMorgan ETFs (Ireland) ICAV - BetaBuilders US Equity UCITS ETF USD JPMorgan Chase & Co. 1,093 102,808 1.06 (333)
As at 31 December 2019, the following Sub-Fund held shares of JPMorgan Chase & Co.:
Sub-Fund Currency Investment Shares Fair Value% of Net
AssetsRealised
Gain/(Loss)
JPMorgan ETFs (Ireland) ICAV - BetaBuilders US Equity UCITS ETF USD JPMorgan Chase & Co. 791 110,265 1.55 11,665
All transactions with related parties were carried out on an arm’s length basis.
Connected person transactionsIn accordance with the Central Bank’s UCITS Regulation 48(1), any transaction carried out with the ICAV by the Distributor, the Investment Manager, theDepositary, the Investment Adviser and/or associated or group companies of these entities (a “connected person”) must be carried out as if negotiated atarm’s length. Such transactions must be in the best interest of the shareholders of the ICAV.
The Board of Directors of the ICAV is satisfied that (i) there are arrangements (evidenced by written procedures) in place to ensure that the obligations setout above are applied to all transactions with a connected person; and (ii) transactions with a connected person entered into during the period complied withthese obligations.
All transactions with connected parties were carried out on an arm’s length basis. The Management Company and Secretary, Investment Managers andother related agents of the ICAV are considered as connected parties as they are affiliated entities of JPMorgan Chase & Co.
Directors’ FeesEach Director is entitled to a fee by way of remuneration for their services at a rate to be determined from time to time by the Directors. All Directors areentitled to reimbursement by the ICAV of expenses properly incurred in connection with the business of the ICAV or discharge of their duties.
The aggregate emoluments of the Directors six month period ended 30 June 2020 was USD 41,403 (30 June 2019: USD 30,218), of which USD 19,361 isoutstanding at the period end (31 December 2019: USD 9,941).
The only remuneration paid to Directors is an annual fee. This is waived by Mr. Watkins.
58
JPMorgan ETFs (Ireland) ICAVNotes to the Unaudited Financial Statements (continued)For the six month period ended 30 June 2020
10. Related party transactions and holdings (continued)Related party disclosures (continued)

Distributions for the six month period ended 30 June 2020 were as follows:
Sub-Funds Share ClassSub-FundCurrency Ex-Date Distribution per Share Amount
BetaBuilders UK Gilt 1-5 yr UCITS ETF GBP (dist) GBP 09/01/2020 0.0392 9,408
BetaBuilders UK Gilt 1-5 yr UCITS ETF GBP (dist) GBP 13/02/2020 0.0431 10,344
BetaBuilders UK Gilt 1-5 yr UCITS ETF GBP (dist) GBP 12/03/2020 0.0367 8,808
BetaBuilders UK Gilt 1-5 yr UCITS ETF GBP (dist) GBP 16/04/2020 0.0359 8,616
BetaBuilders UK Gilt 1-5 yr UCITS ETF GBP (dist) GBP 14/05/2020 0.0376 9,024
BetaBuilders UK Gilt 1-5 yr UCITS ETF GBP (dist) GBP 11/06/2020 0.0299 7,176
BetaBuilders US Equity UCITS ETF USD (dist) USD 09/01/2020 0.1351 12,429
BetaBuilders US Equity UCITS ETF USD (dist) USD 16/04/2020 0.1155 10,626
GBP Ultra-Short Income UCITS ETF GBP (dist) GBP 09/01/2020 0.0840 82,824
GBP Ultra-Short Income UCITS ETF GBP (dist) GBP 13/02/2020 0.0770 66,524
GBP Ultra-Short Income UCITS ETF GBP (dist) GBP 12/03/2020 0.0851 69,436
GBP Ultra-Short Income UCITS ETF GBP (dist) GBP 16/04/2020 0.0607 48,079
GBP Ultra-Short Income UCITS ETF GBP (dist) GBP 14/05/2020 0.0647 50,562
GBP Ultra-Short Income UCITS ETF GBP (dist) GBP 11/06/2020 0.0781 65,720
USD Emerging Markets Sovereign Bond UCITS ETF GBP Hedged (dist) USD 09/01/2020 0.3683 4,788
USD Emerging Markets Sovereign Bond UCITS ETF GBP Hedged (dist) USD 13/02/2020 0.4192 5,449
USD Emerging Markets Sovereign Bond UCITS ETF GBP Hedged (dist) USD 12/03/2020 0.3523 6,341
USD Emerging Markets Sovereign Bond UCITS ETF GBP Hedged (dist) USD 16/04/2020 0.2513 4,994
USD Emerging Markets Sovereign Bond UCITS ETF GBP Hedged (dist) USD 14/05/2020 0.1515 3,769
USD Emerging Markets Sovereign Bond UCITS ETF GBP Hedged (dist) USD 11/06/2020 0.3426 3,567
USD Emerging Markets Sovereign Bond UCITS ETF USD (dist) USD 09/01/2020 0.3645 494,512
USD Emerging Markets Sovereign Bond UCITS ETF USD (dist) USD 13/02/2020 0.4209 608,317
USD Emerging Markets Sovereign Bond UCITS ETF USD (dist) USD 12/03/2020 0.3220 465,705
USD Emerging Markets Sovereign Bond UCITS ETF USD (dist) USD 16/04/2020 0.4437 569,151
USD Emerging Markets Sovereign Bond UCITS ETF USD (dist) USD 14/05/2020 0.2463 323,802
USD Emerging Markets Sovereign Bond UCITS ETF USD (dist) USD 11/06/2020 0.3500 454,576
USD Ultra-Short Income UCITS ETF USD (dist) USD 09/01/2020 0.1914 429,189
USD Ultra-Short Income UCITS ETF USD (dist) USD 13/02/2020 0.2593 443,239
USD Ultra-Short Income UCITS ETF USD (dist) USD 12/03/2020 0.1748 262,822
USD Ultra-Short Income UCITS ETF USD (dist) USD 16/04/2020 0.1948 270,697
USD Ultra-Short Income UCITS ETF USD (dist) USD 14/05/2020 0.1869 259,719
USD Ultra-Short Income UCITS ETF USD (dist) USD 11/06/2020 0.1655 200,939
Distributions for the six month period ended 30 June 2019 were as follows:
Sub-Funds Share ClassSub-FundCurrency Ex-Date Distribution per Share Amount
BetaBuilders UK Gilt 1-5 yr UCITS ETF GBP (dist) GBP 10/01/2019 0.3615 39,765BetaBuilders UK Gilt 1-5 yr UCITS ETF GBP (dist) GBP 14/02/2019 0.0673 7,403BetaBuilders UK Gilt 1-5 yr UCITS ETF GBP (dist) GBP 14/03/2019 0.0575 6,325BetaBuilders UK Gilt 1-5 yr UCITS ETF GBP (dist) GBP 11/04/2019 0.0581 6,391BetaBuilders UK Gilt 1-5 yr UCITS ETF GBP (dist) GBP 09/05/2019 0.0572 6,292BetaBuilders UK Gilt 1-5 yr UCITS ETF GBP (dist) GBP 13/06/2019 0.0722 7,942GBP Ultra-Short Income UCITS ETF GBP (dist) GBP 10/01/2019 0.0679 34,629GBP Ultra-Short Income UCITS ETF GBP (dist) GBP 14/02/2019 0.0598 34,086GBP Ultra-Short Income UCITS ETF GBP (dist) GBP 14/03/2019 0.0381 34,671GBP Ultra-Short Income UCITS ETF GBP (dist) GBP 11/04/2019 0.0458 43,052GBP Ultra-Short Income UCITS ETF GBP (dist) GBP 09/05/2019 0.0557 54,029GBP Ultra-Short Income UCITS ETF GBP (dist) GBP 13/06/2019 0.0622 64,688USD Emerging Markets Sovereign Bond UCITS ETF USD (dist) USD 10/01/2019 0.4165 249,900USD Emerging Markets Sovereign Bond UCITS ETF USD (dist) USD 14/02/2019 0.4879 292,740USD Emerging Markets Sovereign Bond UCITS ETF USD (dist) USD 14/03/2019 0.3752 206,360USD Emerging Markets Sovereign Bond UCITS ETF USD (dist) USD 11/04/2019 0.4228 232,540USD Emerging Markets Sovereign Bond UCITS ETF USD (dist) USD 09/05/2019 0.3898 214,390USD Emerging Markets Sovereign Bond UCITS ETF USD (dist) USD 13/06/2019 0.4909 269,995USD Ultra-Short Income UCITS ETF USD (dist) USD 10/01/2019 0.1653 333,906USD Ultra-Short Income UCITS ETF USD (dist) USD 14/02/2019 0.2709 555,345USD Ultra-Short Income UCITS ETF USD (dist) USD 14/03/2019 0.2160 468,720USD Ultra-Short Income UCITS ETF USD (dist) USD 11/04/2019 0.2372 552,676USD Ultra-Short Income UCITS ETF USD (dist) USD 09/05/2019 0.1894 450,772USD Ultra-Short Income UCITS ETF USD (dist) USD 13/06/2019 0.2519 685,168
59
JPMorgan ETFs (Ireland) ICAVNotes to the Unaudited Financial Statements (continued)For the six month period ended 30 June 2020
11. Distributions

The following exchange rates were used at 30 June 2020 and 31 December 2019:
* Currency not held at 31 December 2019.
13. Commission Sharing ArrangementsThe Investment Managers may enter into commission sharing arrangements only where there is a direct and identifiable benefit to the clients of theInvestment Managers, including the ICAV, and where the Investment Managers are satisfied that the transactions generating the shared commissions aremade in good faith, in strict compliance with applicable regulatory requirements and in the best interests of the ICAV and the Shareholders. Any sucharrangement must be made by the Investment Manager on terms commensurate with best market practice. Due to their local regulatory rights, certainInvestment Managers may make use of soft commission to pay for research or execution services. Other jurisdictions may have other arrangements in placeto pay for such services in accordance with local regulatory obligations.
For the six month period ended 30 June 2020, JPMorgan ETFs (Ireland) ICAV - BetaBuilders US Equity UCITS ETF paid USD 193 of soft dollar commissionsattributed to research (30 June 2019: USD Nil).
For the six month period ended 30 June 2020, JPMorgan ETFs (Ireland) ICAV - US Research Enhanced Index Equity (ESG) UCITS ETF paid USD 20,064 of softdollar commissions attributed to research (30 June 2019: USD 279).
14. Efficient portfolio managementThe ICAV may employ investment techniques and use financial derivative instruments for efficient portfolio management of the assets of any Sub-Fundincluding hedging against market movements, currency exchange or interest rate risks subject to the conditions and within the limits laid down by theCentral Bank and the Prospectus. The ICAV did not employ any efficient portfolio management techniques in the form of investment in repurchase or reverserepurchase agreements during the six month period ended 30 June 2020 and 30 June 2019. The information on securities lending transactions entered bythe ICAV during the six month period ended 30 June 2020 and 30 June 2019 are detailed in Note 16 and the Securities Financing Transactions appendix.
The use of FDI by any Sub-Fund for investment purposes or for efficient portfolio management will be described in the Relevant Supplement to theProspectus. In this context, efficient portfolio management means the reduction of risks, including the risk of tracking error between the performance of aSub-Fund and the performance of the Index tracked by the relevant Sub-Fund, the reduction of costs to the ICAV, the generation of additional capital orincome for the ICAV and hedging against market movements, currency exchange or interest rate risks, subject to the general restrictions outlined in the“Investment Restrictions” section of the Prospectus. To the extent that a Sub-Fund uses FDI, there may be a risk that the volatility of the Sub-Fund’s Net AssetValue may increase.
15. Commitments and contingent liabilitiesThere were no significant commitments or contingent liabilities as at 30 June 2020 and 31 December 2019.
16. Securities LendingThe Sub-Fund may lend portions of its securities portfolio to third parties for the purpose of generating additional income or for reducing costs, to themaximum extent allowed by and within the limits set forth in the securities lending agency agreement.
A significant proportion of the income generated from the securities lending program is credited to participating Sub-Funds, with a portion of the incomebeing paid to Brown Brothers Harriman & Co. for its role as securities lending agent for the ICAV. Borrowers of securities lent by participating Sub-Funds areapproved by the Management Company after appropriate assessment of such borrowers’ status and financial standing. The Management Company waivesthe incremental income received from the portion of income generated from the securities lending program, for its oversight of the program; hence, 90% ofany incremental income earned from the securities lending is accrued to the applicable Sub-Fund, whilst the remaining 10% income is paid to the securitieslending agent which arranges the transaction. The net income earned from the securities lending program is detailed in the Statement of ComprehensiveIncome.
For each loan of securities Brown Brothers Harriman & Co. (“BBH”), the securities lending agent, accepts non-cash collateral on behalf of the ICAVparticipating in the BBH Securities Lending Programme. Non-cash collateral is limited to securities issued or fully guaranteed by the United Statesgovernment or issued and unconditionally guaranteed by any agencies thereof or issued or fully guaranteed by any of the G-10 sovereigns.
60
JPMorgan ETFs (Ireland) ICAVNotes to the Unaudited Financial Statements (continued)For the six month period ended 30 June 2020
12. Exchange rates
Currency30 June
202031 December
2019
EUR = 1CHF 1.0642 1.0870DKK 7.4532 7.4725GBP 0.9090 0.8473JPY 121.1710 121.9877NOK 10.8350 9.8637SEK 10.4640 10.5078USD 1.1232 1.1225
GBP = 1EUR 1.1001 1.1802JPY 133.3027 143.9672USD 1.2356 1.3248
USD = 1AED 3.6732 *AUD 1.4524 1.4226
Currency30 June
202031 December
2019
USD = 1BRL 5.4908 4.0227CAD 1.3620 1.2968CHF 0.9476 0.9684CLP 820.6000 751.9500CNH 7.0678 6.9652CNY 7.0741 6.9657COP 3,739.2800 3,281.5000CZK 23.7213 22.6406DKK 6.6360 6.6570EUR 0.8904 0.8909GBP 0.8093 0.7549HKD 7.7505 7.7918HUF 315.5768 294.6192IDR 14,285.0000 13,882.5000INR 75.5038 71.2870JPY 107.8850 108.6750
Currency30 June
202031 December
2019
USD = 1KRW 1,202.8500 1,156.4500MXN 23.1070 18.8840MYR 4.2850 4.0905NOK 9.6470 8.7873NZD 1.5534 1.4823PHP 49.8250 50.6450PLN 3.9557 3.7873QAR 3.6410 3.6410RUB 71.3605 62.2017SAR 3.7510 3.7513SEK 9.3167 9.3611SGD 1.3951 1.3447THB 30.9075 29.9538TRY 6.8548 5.9510TWD 29.5045 29.9770ZAR 17.3750 13.9835

Valuation of securities on loan and received collateral as at 30 June 2020 and 31 December 2019 is detailed below:
Securities Lent Market Value Collateral30 June 2020 31 December 2019 30 June 2020 31 December 2019
USD USD USD USD
BetaBuilders US Equity UCITS ETF 38,927 5,947 40,879 6,245Equity Long-Short UCITS ETF* - 72,721 - 76,360Global Equity Multi-Factor UCITS ETF 67,825 89,393 71,228 93,867US Equity Multi-Factor UCITS ETF 34,648 15,261 36,386 16,024
Securities lending income earned by the ICAV during the six month period ended 30 June 2020 and 30 June 2019 is detailed below:
Lending Income (Gross) Lending Agent Fee Lending Income (Net)Base Currency 30 June 2020 30 June 2019 30 June 2020 30 June 2019 30 June 2020 30 June 2019
BetaBuilders US Equity UCITS ETF USD 68 11 7 1 61 10Equity Long-Short UCITS ETF* USD 639 374 64 37 575 337Global Equity Multi-Factor UCITS ETF USD 873 - 87 - 786 -US Equity Multi-Factor UCITS ETF USD 59 - 6 - 53 -
* Sub-Fund liquidated on 19 June 2020. See Note 17e.
17. Significant events during the perioda) COVID-19Beginning in January 2020, global financial markets have experienced and may continue to experience significant volatility resulting from the spread ofCOVID-19. The outbreak of COVID-19 has resulted in travel and border restrictions, quarantines, supply chain disruptions, lower consumer demand andgeneral market uncertainty. This has led to a significant correction in the financial markets. The effects of COVID-19 have and may continue to adverselyaffect the global economy, the economies of certain nations and individual issuers, all of which may negatively impact the market. The ICAV’s serviceproviders have implemented contingency measures and continue to operate as expected.
b) Board of Director appointmentAt the Board Meeting on 26 March 2020 the Directors resolved to appoint Samantha McConnell as an Independent Non-Executive Director. The appointmentwas approved by the Central Bank of Ireland (CBI) on 28 April 2020.
c) Prospectus changeThe Prospectus was updated on the 28 January 2020 to reflect the change to the maximum TER for the JPMorgan ETFs (Ireland) ICAV - BetaBuilders USTreasury Bond 0-1 yr UCITS ETF Mexican Peso (MXN) hedged share class from 0.15% to 0.12%.
d) Sub-Fund launchJPMorgan ETFs (Ireland) ICAV - Global High Yield Corporate Bond Multi-Factor UCITS ETF was launched on 4 February 2020.
e) Sub-Fund liquidationOn 16 April 2020, the Board of the ICAV resolved to put JPMorgan ETFs (Ireland) ICAV - Equity Long-Short UCITS ETF into liquidation. The Sub-Fund wasliquidated on 19 June 2020. The Financial Statements for this Sub-Fund has been prepared on a non-going concern basis of accounting which has no materialadjustments to the published net asset values.
18. Significant events after the period endThere were no other subsequent events since the period end date.
19. Approval of the financial statementsThe Directors approved the financial statements on 20 August 2020.
61
JPMorgan ETFs (Ireland) ICAVNotes to the Unaudited Financial Statements (continued)For the six month period ended 30 June 2020
16. Securities Lending (continued)

Bonds
Government Debt Securities (31 December 2019: 99.12%)
Austria (31 December 2019: 3.73%)Austria Government Bond 3.50%15/09/2021 EUR 1,052,000 1,104,011 1.15Austria Government Bond 3.65%20/04/2022 EUR 939,000 1,011,829 1.05Austria Government Bond 0.00%20/09/2022 EUR 440,000 446,133 0.46Austria Government Bond 3.40%22/11/2022 EUR 970,000 1,063,993 1.10Austria Government Bond 0.00%20/04/2023 EUR 278,000 282,565 0.29
Austria total 3,908,531 4.05
Belgium (31 December 2019: 4.28%)Belgium Government Bond 4.25%28/09/2021 EUR 1,531,000 1,623,625 1.68Belgium Government Bond 4.00%28/03/2022 EUR 508,000 549,285 0.57Belgium Government Bond 4.25%28/09/2022 EUR 1,534,000 1,703,231 1.76Belgium Government Bond 2.25%22/06/2023 EUR 1,019,000 1,106,298 1.15
Belgium total 4,982,439 5.16
Finland (31 December 2019: 1.39%)Finland Government Bond 0.00%15/04/2022 EUR 381,000 385,305 0.40Finland Government Bond 1.63%15/09/2022 EUR 433,000 454,854 0.47Finland Government Bond 1.50%15/04/2023 EUR 370,000 392,152 0.41
Finland total 1,232,311 1.28
France (31 December 2019: 24.28%)France Government Bond OAT 3.25%25/10/2021 EUR 2,748,000 2,888,230 2.99France Government Bond OAT 0.00%25/02/2022 EUR 2,867,000 2,896,559 3.00France Government Bond OAT 3.00%25/04/2022 EUR 2,470,000 2,633,638 2.73France Government Bond OAT 0.00%25/05/2022 EUR 3,544,000 3,586,138 3.72France Government Bond OAT 2.25%25/10/2022 EUR 2,576,000 2,748,850 2.85France Government Bond OAT 0.00%25/02/2023 EUR 1,181,000 1,200,132 1.24France Government Bond OAT 0.00%25/03/2023 EUR 3,662,000 3,725,279 3.86France Government Bond OAT 8.50%25/04/2023 EUR 930,000 1,171,261 1.21France Government Bond OAT 1.75%25/05/2023 EUR 2,746,000 2,935,968 3.04
France total 23,786,055 24.64
Germany (31 December 2019: 19.00%)Bundesobligation 0.00% 08/10/2021 EUR 2,023,000 2,040,155 2.11Bundesobligation 0.00% 08/04/2022 EUR 1,369,000 1,386,003 1.44Bundesobligation 0.00% 07/10/2022 EUR 1,843,000 1,873,096 1.94Bundesobligation 0.00% 14/04/2023 EUR 1,987,000 2,027,813 2.10Bundesrepublik DeutschlandBundesanleihe 3.25% 04/07/2021 EUR 735,000 763,900 0.79Bundesrepublik DeutschlandBundesanleihe 2.25% 04/09/2021 EUR 1,044,000 1,079,956 1.12Bundesrepublik DeutschlandBundesanleihe 2.00% 04/01/2022 EUR 1,802,000 1,876,747 1.94Bundesrepublik DeutschlandBundesanleihe 1.75% 04/07/2022 EUR 2,235,000 2,345,744 2.43Bundesrepublik DeutschlandBundesanleihe 1.50% 04/09/2022 EUR 1,299,000 1,362,547 1.41Bundesrepublik DeutschlandBundesanleihe 1.50% 15/02/2023 EUR 1,067,000 1,130,337 1.17Bundesrepublik DeutschlandBundesanleihe 1.50% 15/05/2023 EUR 1,232,000 1,311,982 1.36Bundesschatzanweisungen 0.00%10/09/2021 EUR 936,000 943,441 0.98Bundesschatzanweisungen 0.00%10/12/2021 EUR 481,000 485,882 0.50Bundesschatzanweisungen 0.00%11/03/2022 EUR 120,000 121,401 0.13
Germany total 18,749,004 19.42
Ireland (31 December 2019: 1.01%)Ireland Government Bond 0.80%15/03/2022 EUR 394,000 403,219 0.42Ireland Government Bond 0.00%18/10/2022 EUR 1,005,000 1,017,794 1.05
Ireland Government Bond 3.90%20/03/2023 EUR 115,000 129,000 0.13
Ireland total 1,550,013 1.60
Italy (31 December 2019: 28.39%)Italy Buoni Poliennali Del Tesoro 0.45%01/06/2021 EUR 674,000 677,572 0.70Italy Buoni Poliennali Del Tesoro 3.75%01/08/2021 EUR 1,131,000 1,178,536 1.22Italy Buoni Poliennali Del Tesoro 4.75%01/09/2021 EUR 3,154,000 3,332,832 3.45Italy Buoni Poliennali Del Tesoro 2.30%15/10/2021 EUR 228,000 235,057 0.24Italy Buoni Poliennali Del Tesoro 0.35%01/11/2021 EUR 1,382,000 1,390,112 1.44Italy Buoni Poliennali Del Tesoro 2.15%15/12/2021 EUR 989,000 1,021,073 1.06Italy Buoni Poliennali Del Tesoro 5.00%01/03/2022 EUR 1,782,000 1,930,565 2.00Italy Buoni Poliennali Del Tesoro 1.20%01/04/2022 EUR 1,794,000 1,829,342 1.90Italy Buoni Poliennali Del Tesoro 1.35%15/04/2022 EUR 992,000 1,014,568 1.05Italy Buoni Poliennali Del Tesoro 1.00%15/07/2022 EUR 481,000 490,076 0.51Italy Buoni Poliennali Del Tesoro 0.90%01/08/2022 EUR 2,988,000 3,038,378 3.15Italy Buoni Poliennali Del Tesoro 5.50%01/09/2022 EUR 1,290,000 1,440,414 1.49Italy Buoni Poliennali Del Tesoro 1.45%15/09/2022 EUR 7,000 7,204 0.01Italy Buoni Poliennali Del Tesoro 5.50%01/11/2022 EUR 1,909,000 2,145,506 2.22Italy Buoni Poliennali Del Tesoro 0.05%15/01/2023 EUR 2,262,000 2,254,943 2.34Italy Buoni Poliennali Del Tesoro 0.95%01/03/2023 EUR 1,506,000 1,535,623 1.59Italy Buoni Poliennali Del Tesoro 0.95%15/03/2023 EUR 223,000 227,402 0.24Italy Buoni Poliennali Del Tesoro 4.50%01/05/2023 EUR 1,679,000 1,880,715 1.95Italy Buoni Poliennali Del Tesoro 0.60%15/06/2023 EUR 1,160,000 1,172,203 1.21
Italy total 26,802,121 27.77
Netherlands (31 December 2019: 4.12%)Netherlands Government Bond 0.00%15/01/2022 EUR 1,518,000 1,532,755 1.59Netherlands Government Bond 2.25%15/07/2022 EUR 902,000 955,922 0.99Netherlands Government Bond 3.75%15/01/2023 EUR 1,013,000 1,127,864 1.17Netherlands Government Bond 7.50%15/01/2023 EUR 4,000 4,839 0.00
Netherlands total 3,621,380 3.75
Portugal (31 December 2019: 1.77%)Portugal Obrigacoes do Tesouro OT 2.20%17/10/2022 EUR 796,000 845,408 0.88
Portugal total 845,408 0.88
Spain (31 December 2019: 11.15%)Spain Government Bond 0.05%31/10/2021 EUR 1,662,000 1,672,969 1.73Spain Government Bond 5.85%31/01/2022 EUR 1,692,000 1,861,234 1.93Spain Government Bond 0.40%30/04/2022 EUR 1,705,000 1,730,729 1.79Spain Government Bond 0.45%31/10/2022 EUR 1,729,000 1,763,061 1.83Spain Government Bond 5.40%31/01/2023 EUR 1,594,000 1,831,713 1.90Spain Government Bond 0.00%30/04/2023 EUR 1,387,000 1,398,928 1.45
Spain total 10,258,634 10.63
Total investments in Government Debt Securities 95,735,896 99.18
Total Bonds 95,735,896 99.18
62
JPMorgan ETFs (Ireland) ICAV - BetaBuilders EUR Govt Bond 1-3 yr UCITS ETFSchedule of InvestmentsAs at 30 June 2020
Investments Currency
Quantity/Nominal
Value
FairValue
EUR
% ofNet
Assets Investments Currency
Quantity/Nominal
Value
FairValue
EUR
% ofNet
Assets

JPMorgan ETFs (Ireland) ICAV - BetaBuilders EUR Govt Bond 1-3 yr UCITS ETFSchedule of Investments (continued)As at 30 June 2020
FairValue
EUR
% ofNet
Assets
Total financial assets at fair value through profit or loss 95,735,896 99.18Cash 40,681 0.04Other assets and liabilities 746,945 0.78
Net asset value attributable to holders of redeemable participating shares 96,523,522 100.00
Analysis of total assets
% ofTotal
Assets
Transferable securities and money market instruments admitted to official stock exchange listing 94.65Transferable securities and money market instruments dealt in on another regulated market 0.45Other assets 4.90
Total Assets 100.00
63

64
Bonds
Government Debt Securities (31 December 2019: 99.04%)
Austria (31 December 2019: 3.55%)Austria Government Bond 3.50%15/09/2021 EUR 48,000 50,373 0.28Austria Government Bond 3.65%20/04/2022 EUR 13,000 14,008 0.08Austria Government Bond 0.00%20/09/2022 EUR 6,000 6,084 0.03Austria Government Bond 0.00%20/04/2023 EUR 7,000 7,115 0.04Austria Government Bond 0.00%15/07/2023 EUR 89,000 90,591 0.50Austria Government Bond 1.75%20/10/2023 EUR 27,000 29,116 0.16Austria Government Bond 0.00%15/07/2024 EUR 8,000 8,181 0.05Austria Government Bond 1.20%20/10/2025 EUR 3,000 3,278 0.02Austria Government Bond 4.85%15/03/2026 EUR 108,000 141,532 0.78Austria Government Bond 0.75%20/10/2026 EUR 32,000 34,468 0.19Austria Government Bond 0.50%20/04/2027 EUR 23,000 24,458 0.14Austria Government Bond 0.75%20/02/2028 EUR 22,000 23,887 0.13Austria Government Bond 0.50%20/02/2029 EUR 19,000 20,318 0.11Austria Government Bond 0.00%20/02/2030 EUR 29,000 29,648 0.16Austria Government Bond 2.40%23/05/2034 EUR 19,000 25,457 0.14Austria Government Bond 4.15%15/03/2037 EUR 21,000 35,356 0.20Austria Government Bond 3.15%20/06/2044 EUR 12,000 20,342 0.11Austria Government Bond 1.50%20/02/2047 EUR 60,000 79,184 0.44Austria Government Bond 0.75%20/03/2051 EUR 1,000 1,127 0.01Austria Government Bond 3.80%26/01/2062 EUR 5,000 11,541 0.06Austria Government Bond 1.50%02/11/2086 EUR 10,000 15,399 0.08Austria Government Bond 2.10%20/09/2117 EUR 12,000 23,799 0.13Austria Government Bond 0.85%30/06/2120 EUR 5,000 5,577 0.03
Austria total 700,839 3.87
Belgium (31 December 2019: 6.09%)Belgium Government Bond 4.25%28/09/2021 EUR 42,000 44,541 0.25Belgium Government Bond 4.00%28/03/2022 EUR 20,000 21,625 0.12Belgium Government Bond 2.25%22/06/2023 EUR 78,000 84,682 0.47Belgium Government Bond 0.20%22/10/2023 EUR 35,000 35,918 0.20Belgium Government Bond 2.60%22/06/2024 EUR 72,000 81,124 0.45Belgium Government Bond 0.50%22/10/2024 EUR 18,000 18,803 0.10Belgium Government Bond 0.80%22/06/2025 EUR 61,000 64,974 0.36Belgium Government Bond 4.50%28/03/2026 EUR 38,000 48,877 0.27Belgium Government Bond 1.00%22/06/2026 EUR 36,000 39,058 0.22Belgium Government Bond 0.80%22/06/2027 EUR 67,000 72,374 0.40Belgium Government Bond 0.00%22/10/2027 EUR 34,000 34,753 0.19Belgium Government Bond 5.50%28/03/2028 EUR 23,000 33,461 0.18Belgium Government Bond 0.90%22/06/2029 EUR 2,000 2,202 0.01Belgium Government Bond 0.10%22/06/2030 EUR 33,000 33,809 0.19Belgium Government Bond 4.00%28/03/2032 EUR 95,000 140,154 0.77Belgium Government Bond 1.25%22/04/2033 EUR 32,000 37,116 0.21Belgium Government Bond 5.00%28/03/2035 EUR 22,000 37,634 0.21Belgium Government Bond 1.45%22/06/2037 EUR 38,000 45,557 0.25Belgium Government Bond 0.40%22/06/2040 EUR 22,000 22,048 0.12
Belgium Government Bond 4.25%28/03/2041 EUR 56,000 98,869 0.55Belgium Government Bond 3.75%22/06/2045 EUR 2,000 3,527 0.02Belgium Government Bond 1.60%22/06/2047 EUR 47,000 59,301 0.33Belgium Government Bond 1.70%22/06/2050 EUR 38,000 49,546 0.27Belgium Government Bond 2.25%22/06/2057 EUR 6,000 9,170 0.05Belgium Government Bond 2.15%22/06/2066 EUR 16,000 25,236 0.14
Belgium total 1,144,359 6.33
Finland (31 December 2019: 1.44%)Finland Government Bond 0.38%15/09/2020 EUR 2,000 2,004 0.01Finland Government Bond 0.00%15/04/2022 EUR 18,000 18,203 0.10Finland Government Bond 0.00%15/09/2023 EUR 46,000 46,923 0.26Finland Government Bond 2.00%15/04/2024 EUR 17,000 18,711 0.10Finland Government Bond 4.00%04/07/2025 EUR 1,000 1,233 0.01Finland Government Bond 0.88%15/09/2025 EUR 4,000 4,298 0.02Finland Government Bond 0.50%15/04/2026 EUR 15,000 15,863 0.09Finland Government Bond 0.50%15/09/2027 EUR 23,000 24,508 0.14Finland Government Bond 2.75%04/07/2028 EUR 2,000 2,503 0.01Finland Government Bond 0.50%15/09/2028 EUR 52,000 55,602 0.31Finland Government Bond 0.50%15/09/2029 EUR 24,000 25,700 0.14Finland Government Bond 0.75%15/04/2031 EUR 2,000 2,206 0.01Finland Government Bond 1.13%15/04/2034 EUR 4,000 4,642 0.03Finland Government Bond 0.13%15/04/2036 EUR 24,000 24,315 0.13Finland Government Bond 0.25%15/09/2040 EUR 3,000 3,075 0.02Finland Government Bond 2.63%04/07/2042 EUR 8,000 12,402 0.07Finland Government Bond 1.38%15/04/2047 EUR 8,000 10,514 0.06
Finland total 272,702 1.51
France (31 December 2019: 25.58%)France Government Bond OAT 2.50%25/10/2020 EUR 59,000 59,565 0.33France Government Bond OAT 0.25%25/11/2020 EUR 34,000 34,109 0.19France Government Bond OAT 0.00%25/05/2021 EUR 27,000 27,142 0.15France Government Bond OAT 3.25%25/10/2021 EUR 92,000 96,695 0.53France Government Bond OAT 2.25%25/10/2022 EUR 286,000 305,191 1.69France Government Bond OAT 0.00%25/03/2023 EUR 131,000 133,264 0.74France Government Bond OAT 8.50%25/04/2023 EUR 32,000 40,301 0.22France Government Bond OAT 1.75%25/05/2023 EUR 39,000 41,698 0.23France Government Bond OAT 0.00%25/03/2024 EUR 388,000 396,602 2.19France Government Bond OAT 2.25%25/05/2024 EUR 154,000 171,216 0.95France Government Bond OAT 1.75%25/11/2024 EUR 83,000 91,551 0.51France Government Bond OAT 0.00%25/03/2025 EUR 180,000 184,545 1.02France Government Bond OAT 0.50%25/05/2025 EUR 52,000 54,674 0.30France Government Bond OAT 1.00%25/11/2025 EUR 11,000 11,904 0.07France Government Bond OAT 0.00%25/02/2026 EUR 3,000 3,078 0.02France Government Bond OAT 3.50%25/04/2026 EUR 101,000 124,705 0.69France Government Bond OAT 0.50%25/05/2026 EUR 48,000 50,787 0.28France Government Bond OAT 0.25%25/11/2026 EUR 196,000 204,581 1.13France Government Bond OAT 1.00%25/05/2027 EUR 98,000 107,472 0.59France Government Bond OAT 2.75%25/10/2027 EUR 36,000 44,368 0.25
JPMorgan ETFs (Ireland) ICAV - BetaBuilders EUR Govt Bond UCITS ETFSchedule of InvestmentsAs at 30 June 2020
Investments Currency
Quantity/Nominal
Value
FairValue
EUR
% ofNet
Assets Investments Currency
Quantity/Nominal
Value
FairValue
EUR
% ofNet
Assets

France Government Bond OAT 0.75%25/05/2028 EUR 327,000 354,975 1.96France Government Bond OAT 0.75%25/11/2028 EUR 166,000 180,585 1.00France Government Bond OAT 0.50%25/05/2029 EUR 16,000 17,074 0.09France Government Bond OAT 0.00%25/11/2029 EUR 50,000 50,952 0.28France Government Bond OAT 2.50%25/05/2030 EUR 280,000 355,169 1.96France Government Bond OAT 1.50%25/05/2031 EUR 64,000 75,396 0.42France Government Bond OAT 1.25%25/05/2034 EUR 48,000 55,851 0.31France Government Bond OAT 4.75%25/04/2035 EUR 84,000 141,942 0.78France Government Bond OAT 1.25%25/05/2036 EUR 123,000 144,005 0.80France Government Bond OAT 4.00%25/10/2038 EUR 239,000 401,066 2.22France Government Bond OAT 1.75%25/06/2039 EUR 16,000 20,407 0.11France Government Bond OAT 0.50%25/05/2040 EUR 10,000 10,321 0.06France Government Bond OAT 3.25%25/05/2045 EUR 71,000 117,736 0.65France Government Bond OAT 2.00%25/05/2048 EUR 109,000 151,237 0.84France Government Bond OAT 1.50%25/05/2050 EUR 44,000 55,491 0.31France Government Bond OAT 0.75%25/05/2052 EUR 23,000 24,041 0.13France Government Bond OAT 4.00%25/04/2055 EUR 31,000 64,198 0.35France Government Bond OAT 4.00%25/04/2060 EUR 64,000 139,864 0.77France Government Bond OAT 1.75%25/05/2066 EUR 22,000 31,510 0.17
France total 4,575,268 25.29
Germany (31 December 2019: 16.07%)Bundesobligation 0.25% 16/10/2020 EUR 7,000 7,017 0.04Bundesobligation 0.00% 08/10/2021 EUR 71,000 71,602 0.40Bundesobligation 0.00% 08/04/2022 EUR 10,000 10,124 0.06Bundesobligation 0.00% 07/10/2022 EUR 139,000 141,270 0.78Bundesobligation 0.00% 13/10/2023 EUR 6,000 6,146 0.03Bundesobligation 0.00% 05/04/2024 EUR 143,000 146,950 0.81Bundesobligation 0.00% 18/10/2024 EUR 57,000 58,781 0.33Bundesobligation 0.00% 11/04/2025 EUR 109,000 112,752 0.62Bundesrepublik DeutschlandBundesanleihe 3.25% 04/07/2021 EUR 30,000 31,180 0.17Bundesrepublik DeutschlandBundesanleihe 2.25% 04/09/2021 EUR 50,000 51,722 0.29Bundesrepublik DeutschlandBundesanleihe 2.00% 04/01/2022 EUR 2,000 2,083 0.01Bundesrepublik DeutschlandBundesanleihe 1.50% 04/09/2022 EUR 28,000 29,370 0.16Bundesrepublik DeutschlandBundesanleihe 1.50% 15/02/2023 EUR 11,000 11,653 0.06Bundesrepublik DeutschlandBundesanleihe 1.50% 15/05/2023 EUR 39,000 41,532 0.23Bundesrepublik DeutschlandBundesanleihe 2.00% 15/08/2023 EUR 7,000 7,606 0.04Bundesrepublik DeutschlandBundesanleihe 6.25% 04/01/2024 EUR 107,000 133,532 0.74Bundesrepublik DeutschlandBundesanleihe 1.75% 15/02/2024 EUR 255,000 278,302 1.54Bundesrepublik DeutschlandBundesanleihe 1.50% 15/05/2024 EUR 3,000 3,263 0.02Bundesrepublik DeutschlandBundesanleihe 0.50% 15/02/2025 EUR 39,000 41,247 0.23Bundesrepublik DeutschlandBundesanleihe 0.50% 15/02/2026 EUR 2,000 2,138 0.01Bundesrepublik DeutschlandBundesanleihe 0.00% 15/08/2026 EUR 5,000 5,215 0.03Bundesrepublik DeutschlandBundesanleihe 0.25% 15/02/2027 EUR 24,000 25,504 0.14Bundesrepublik DeutschlandBundesanleihe 0.50% 15/08/2027 EUR 251,000 272,061 1.50Bundesrepublik DeutschlandBundesanleihe 0.00% 15/11/2027 EUR 12,000 12,554 0.07Bundesrepublik DeutschlandBundesanleihe 5.63% 04/01/2028 EUR 21,000 31,052 0.17Bundesrepublik DeutschlandBundesanleihe 0.50% 15/02/2028 EUR 50,000 54,398 0.30Bundesrepublik DeutschlandBundesanleihe 0.25% 15/08/2028 EUR 130,000 139,214 0.77Bundesrepublik DeutschlandBundesanleihe 0.25% 15/02/2029 EUR 24,000 25,746 0.14Bundesrepublik DeutschlandBundesanleihe 0.00% 15/08/2029 EUR 68,000 71,419 0.40
Bundesrepublik DeutschlandBundesanleihe 6.25% 04/01/2030 EUR 4,000 6,650 0.04Bundesrepublik DeutschlandBundesanleihe 0.00% 15/02/2030 EUR 105,000 110,212 0.61Bundesrepublik DeutschlandBundesanleihe 0.00% 15/08/2030 EUR 12,000 12,583 0.07Bundesrepublik DeutschlandBundesanleihe 5.50% 04/01/2031 EUR 9,000 14,786 0.08Bundesrepublik DeutschlandBundesanleihe 4.75% 04/07/2034 EUR 77,000 133,754 0.74Bundesrepublik DeutschlandBundesanleihe 0.00% 15/05/2035 EUR 24,000 24,977 0.14Bundesrepublik DeutschlandBundesanleihe 4.00% 04/01/2037 EUR 26,000 44,802 0.25Bundesrepublik DeutschlandBundesanleihe 4.25% 04/07/2039 EUR 41,000 76,591 0.42Bundesrepublik DeutschlandBundesanleihe 4.75% 04/07/2040 EUR 74,000 149,012 0.82Bundesrepublik DeutschlandBundesanleihe 3.25% 04/07/2042 EUR 28,000 49,424 0.27Bundesrepublik DeutschlandBundesanleihe 2.50% 04/07/2044 EUR 36,000 58,982 0.33Bundesrepublik DeutschlandBundesanleihe 2.50% 15/08/2046 EUR 84,000 141,116 0.78Bundesrepublik DeutschlandBundesanleihe 1.25% 15/08/2048 EUR 85,000 116,048 0.64Bundesrepublik DeutschlandBundesanleihe 0.00% 15/08/2050 EUR 24,000 24,119 0.13Bundesschatzanweisungen 0.00%11/09/2020 EUR 10,000 10,012 0.06Bundesschatzanweisungen 0.00%11/12/2020 EUR 8,000 8,023 0.04Bundesschatzanweisungen 0.00%12/03/2021 EUR 36,000 36,171 0.20Bundesschatzanweisungen 0.00%10/09/2021 EUR 18,000 18,143 0.10Bundesschatzanweisungen 0.00%10/12/2021 EUR 27,000 27,274 0.15
Germany total 2,888,112 15.96
Ireland (31 December 2019: 1.80%)Ireland Government Bond 0.80%15/03/2022 EUR 5,000 5,117 0.03Ireland Government Bond 0.00%18/10/2022 EUR 13,000 13,165 0.07Ireland Government Bond 3.90%20/03/2023 EUR 17,000 19,069 0.11Ireland Government Bond 3.40%18/03/2024 EUR 47,000 53,816 0.30Ireland Government Bond 5.40%13/03/2025 EUR 27,000 34,472 0.19Ireland Government Bond 1.00%15/05/2026 EUR 24,000 25,887 0.14Ireland Government Bond 0.90%15/05/2028 EUR 24,000 26,073 0.14Ireland Government Bond 1.10%15/05/2029 EUR 13,000 14,404 0.08Ireland Government Bond 2.40%15/05/2030 EUR 37,000 45,996 0.25Ireland Government Bond 1.35%18/03/2031 EUR 27,000 30,901 0.17Ireland Government Bond 1.30%15/05/2033 EUR 19,000 21,895 0.12Ireland Government Bond 0.40%15/05/2035 EUR 9,000 9,223 0.05Ireland Government Bond 1.70%15/05/2037 EUR 10,000 12,296 0.07Ireland Government Bond 2.00%18/02/2045 EUR 26,000 35,209 0.20Ireland Government Bond 1.50%15/05/2050 EUR 10,000 12,366 0.07
Ireland total 359,889 1.99
Italy (31 December 2019: 23.12%)Italy Buoni Poliennali Del Tesoro 3.75%01/05/2021 EUR 30,000 30,970 0.17Italy Buoni Poliennali Del Tesoro 3.75%01/08/2021 EUR 128,000 133,380 0.74Italy Buoni Poliennali Del Tesoro 0.35%01/11/2021 EUR 83,000 83,487 0.46Italy Buoni Poliennali Del Tesoro 2.15%15/12/2021 EUR 21,000 21,681 0.12Italy Buoni Poliennali Del Tesoro 5.00%01/03/2022 EUR 1,000 1,083 0.01Italy Buoni Poliennali Del Tesoro 1.20%01/04/2022 EUR 83,000 84,635 0.47Italy Buoni Poliennali Del Tesoro 1.35%15/04/2022 EUR 147,000 150,344 0.83Italy Buoni Poliennali Del Tesoro 1.00%15/07/2022 EUR 58,000 59,094 0.33Italy Buoni Poliennali Del Tesoro 5.50%01/11/2022 EUR 135,000 151,725 0.84
65
JPMorgan ETFs (Ireland) ICAV - BetaBuilders EUR Govt Bond UCITS ETFSchedule of Investments (continued)As at 30 June 2020
Investments Currency
Quantity/Nominal
Value
FairValue
EUR
% ofNet
Assets Investments Currency
Quantity/Nominal
Value
FairValue
EUR
% ofNet
Assets

Italy Buoni Poliennali Del Tesoro 0.05%15/01/2023 EUR 123,000 122,616 0.68Italy Buoni Poliennali Del Tesoro 0.95%01/03/2023 EUR 129,000 131,537 0.73Italy Buoni Poliennali Del Tesoro 0.95%15/03/2023 EUR 62,000 63,224 0.35Italy Buoni Poliennali Del Tesoro 4.50%01/05/2023 EUR 52,000 58,247 0.32Italy Buoni Poliennali Del Tesoro 2.45%01/10/2023 EUR 25,000 26,728 0.15Italy Buoni Poliennali Del Tesoro 0.65%15/10/2023 EUR 38,000 38,448 0.21Italy Buoni Poliennali Del Tesoro 4.50%01/03/2024 EUR 169,000 193,971 1.07Italy Buoni Poliennali Del Tesoro 3.75%01/09/2024 EUR 25,000 28,285 0.16Italy Buoni Poliennali Del Tesoro 2.50%01/12/2024 EUR 19,000 20,579 0.11Italy Buoni Poliennali Del Tesoro 5.00%01/03/2025 EUR 91,000 109,292 0.60Italy Buoni Poliennali Del Tesoro 1.50%01/06/2025 EUR 15,000 15,617 0.09Italy Buoni Poliennali Del Tesoro 1.85%01/07/2025 EUR 48,000 50,679 0.28Italy Buoni Poliennali Del Tesoro 4.50%01/03/2026 EUR 12,000 14,469 0.08Italy Buoni Poliennali Del Tesoro 1.60%01/06/2026 EUR 1,000 1,046 0.01Italy Buoni Poliennali Del Tesoro 1.25%01/12/2026 EUR 111,000 113,702 0.63Italy Buoni Poliennali Del Tesoro 0.85%15/01/2027 EUR 11,000 10,966 0.06Italy Buoni Poliennali Del Tesoro 2.20%01/06/2027 EUR 25,000 27,092 0.15Italy Buoni Poliennali Del Tesoro 2.05%01/08/2027 EUR 539,000 578,633 3.20Italy Buoni Poliennali Del Tesoro 2.00%01/02/2028 EUR 163,000 174,642 0.96Italy Buoni Poliennali Del Tesoro 4.75%01/09/2028 EUR 135,000 173,687 0.96Italy Buoni Poliennali Del Tesoro 2.80%01/12/2028 EUR 29,000 32,971 0.18Italy Buoni Poliennali Del Tesoro 3.00%01/08/2029 EUR 62,000 71,856 0.40Italy Buoni Poliennali Del Tesoro 5.25%01/11/2029 EUR 2,000 2,716 0.01Italy Buoni Poliennali Del Tesoro 1.65%12/01/2030 EUR 1,000 1,033 0.01Italy Buoni Poliennali Del Tesoro 3.50%01/03/2030 EUR 155,000 187,128 1.03Italy Buoni Poliennali Del Tesoro 1.35%01/04/2030 EUR 51,000 51,680 0.29Italy Buoni Poliennali Del Tesoro 0.95%01/08/2030 EUR 93,000 90,460 0.50Italy Buoni Poliennali Del Tesoro 6.00%01/05/2031 EUR 29,000 42,500 0.23Italy Buoni Poliennali Del Tesoro 1.65%01/03/2032 EUR 73,000 75,131 0.41Italy Buoni Poliennali Del Tesoro 5.75%01/02/2033 EUR 10,000 14,838 0.08Italy Buoni Poliennali Del Tesoro 2.45%01/09/2033 EUR 31,000 34,398 0.19Italy Buoni Poliennali Del Tesoro 5.00%01/08/2034 EUR 23,000 32,707 0.18Italy Buoni Poliennali Del Tesoro 1.45%01/03/2036 EUR 15,000 14,575 0.08Italy Buoni Poliennali Del Tesoro 2.25%01/09/2036 EUR 3,000 3,236 0.02Italy Buoni Poliennali Del Tesoro 4.00%01/02/2037 EUR 54,000 71,018 0.39Italy Buoni Poliennali Del Tesoro 5.00%01/08/2039 EUR 80,000 119,675 0.66Italy Buoni Poliennali Del Tesoro 3.10%01/03/2040 EUR 36,000 42,892 0.24Italy Buoni Poliennali Del Tesoro 5.00%01/09/2040 EUR 136,000 204,400 1.13Italy Buoni Poliennali Del Tesoro 4.75%01/09/2044 EUR 47,000 70,509 0.39Italy Buoni Poliennali Del Tesoro 3.25%01/09/2046 EUR 39,000 47,585 0.26Italy Buoni Poliennali Del Tesoro 2.70%01/03/2047 EUR 62,000 69,023 0.38Italy Buoni Poliennali Del Tesoro 3.85%01/09/2049 EUR 82,000 111,033 0.61Italy Buoni Poliennali Del Tesoro 2.45%01/09/2050 EUR 15,000 15,788 0.09Italy Buoni Poliennali Del Tesoro 2.80%01/03/2067 EUR 23,000 25,685 0.14
Italy total 4,102,696 22.67
Netherlands (31 December 2019: 4.80%)Netherlands Government Bond 0.00%15/01/2022 EUR 60,000 60,583 0.33Netherlands Government Bond 2.25%15/07/2022 EUR 27,000 28,614 0.16Netherlands Government Bond 3.75%15/01/2023 EUR 17,000 18,928 0.10Netherlands Government Bond 7.50%15/01/2023 EUR 8,000 9,679 0.05Netherlands Government Bond 1.75%15/07/2023 EUR 30,000 32,212 0.18Netherlands Government Bond 0.00%15/01/2024 EUR 62,000 63,428 0.35Netherlands Government Bond 2.00%15/07/2024 EUR 41,000 45,428 0.25Netherlands Government Bond 0.25%15/07/2025 EUR 48,000 50,088 0.28Netherlands Government Bond 0.50%15/07/2026 EUR 103,000 109,652 0.61Netherlands Government Bond 0.75%15/07/2027 EUR 30,000 32,653 0.18Netherlands Government Bond 0.75%15/07/2028 EUR 12,000 13,171 0.07Netherlands Government Bond 0.25%15/07/2029 EUR 17,000 17,990 0.10Netherlands Government Bond 0.00%15/07/2030 EUR 52,000 53,674 0.30Netherlands Government Bond 2.50%15/01/2033 EUR 63,000 84,997 0.47Netherlands Government Bond 4.00%15/01/2037 EUR 32,000 54,119 0.30Netherlands Government Bond 0.50%15/01/2040 EUR 32,000 35,479 0.20Netherlands Government Bond 3.75%15/01/2042 EUR 35,000 63,919 0.35Netherlands Government Bond 2.75%15/01/2047 EUR 43,000 74,464 0.41
Netherlands total 849,078 4.69
Portugal (31 December 2019: 2.26%)Portugal Obrigacoes do Tesouro OT 2.20%17/10/2022 EUR 51,000 54,166 0.30Portugal Obrigacoes do Tesouro OT 5.65%15/02/2024 EUR 40,000 48,725 0.27Portugal Obrigacoes do Tesouro OT 2.88%15/10/2025 EUR 33,000 38,184 0.21Portugal Obrigacoes do Tesouro OT 2.88%21/07/2026 EUR 27,000 31,731 0.18Portugal Obrigacoes do Tesouro OT 4.13%14/04/2027 EUR 35,000 44,530 0.25Portugal Obrigacoes do Tesouro OT0.70% 15/10/2027 EUR 11,000 11,414 0.06Portugal Obrigacoes do Tesouro OT 2.13%17/10/2028 EUR 36,000 41,390 0.23Portugal Obrigacoes do Tesouro OT 1.95%15/06/2029 EUR 2,000 2,278 0.01Portugal Obrigacoes do Tesouro OT3.88% 15/02/2030 EUR 27,000 35,748 0.20Portugal Obrigacoes do Tesouro OT0.48% 18/10/2030 EUR 6,000 6,002 0.03Portugal Obrigacoes do Tesouro OT 2.25%18/04/2034 EUR 39,000 46,543 0.26Portugal Obrigacoes do Tesouro OT 4.10%15/04/2037 EUR 26,000 38,728 0.21Portugal Obrigacoes do Tesouro OT 4.10%15/02/2045 EUR 4,000 6,390 0.03
Portugal total 405,829 2.24
Spain (31 December 2019: 14.33%)Spain Government Bond 0.05%31/01/2021 EUR 22,000 22,073 0.12Spain Government Bond 0.75%30/07/2021 EUR 45,000 45,599 0.25Spain Government Bond 0.05%31/10/2021 EUR 30,000 30,198 0.17Spain Government Bond 0.40%30/04/2022 EUR 143,000 145,158 0.80Spain Government Bond 5.40%31/01/2023 EUR 81,000 93,080 0.51Spain Government Bond 0.00%30/04/2023 EUR 53,000 53,456 0.30Spain Government Bond 0.35%30/07/2023 EUR 33,000 33,661 0.19Spain Government Bond 4.40%31/10/2023 EUR 89,000 103,055 0.57Spain Government Bond 4.80%31/01/2024 EUR 40,000 47,312 0.26Spain Government Bond 3.80%30/04/2024 EUR 58,000 67,052 0.37Spain Government Bond 0.25%30/07/2024 EUR 43,000 43,828 0.24
66
JPMorgan ETFs (Ireland) ICAV - BetaBuilders EUR Govt Bond UCITS ETFSchedule of Investments (continued)As at 30 June 2020
Investments Currency
Quantity/Nominal
Value
FairValue
EUR
% ofNet
Assets Investments Currency
Quantity/Nominal
Value
FairValue
EUR
% ofNet
Assets

Spain Government Bond 1.60%30/04/2025 EUR 182,000 197,386 1.09Spain Government Bond 2.15%31/10/2025 EUR 2,000 2,238 0.01Spain Government Bond 1.95%30/04/2026 EUR 74,000 82,562 0.46Spain Government Bond 1.30%31/10/2026 EUR 83,000 89,660 0.50Spain Government Bond 1.50%30/04/2027 EUR 4,000 4,385 0.02Spain Government Bond 0.80%30/07/2027 EUR 152,000 158,975 0.88Spain Government Bond 1.45%31/10/2027 EUR 39,000 42,653 0.24Spain Government Bond 1.40%30/04/2028 EUR 20,000 21,860 0.12Spain Government Bond 1.40%30/07/2028 EUR 11,000 12,036 0.07Spain Government Bond 5.15%31/10/2028 EUR 307,000 430,408 2.38Spain Government Bond 1.45%30/04/2029 EUR 60,000 65,939 0.36Spain Government Bond 0.60%31/10/2029 EUR 17,000 17,398 0.10Spain Government Bond 0.50%30/04/2030 EUR 25,000 25,251 0.14Spain Government Bond 1.95%30/07/2030 EUR 16,000 18,420 0.10Spain Government Bond 1.25%31/10/2030 EUR 25,000 26,986 0.15Spain Government Bond 2.35%30/07/2033 EUR 49,000 59,415 0.33Spain Government Bond 1.85%30/07/2035 EUR 130,000 149,682 0.83Spain Government Bond 4.20%31/01/2037 EUR 124,000 188,822 1.04Spain Government Bond 4.90%30/07/2040 EUR 25,000 42,804 0.24Spain Government Bond 1.20%31/10/2040 EUR 22,000 22,602 0.12Spain Government Bond 4.70%30/07/2041 EUR 8,000 13,552 0.07Spain Government Bond 5.15%31/10/2044 EUR 44,000 81,603 0.45Spain Government Bond 2.90%31/10/2046 EUR 43,000 59,660 0.33Spain Government Bond 2.70%31/10/2048 EUR 67,000 90,640 0.50Spain Government Bond 1.00%31/10/2050 EUR 5,000 4,676 0.03Spain Government Bond 3.45%30/07/2066 EUR 33,000 54,446 0.30
Spain total 2,648,531 14.64
Total investments in Government Debt Securities 17,947,303 99.19
Total Bonds 17,947,303 99.19
67
JPMorgan ETFs (Ireland) ICAV - BetaBuilders EUR Govt Bond UCITS ETFSchedule of Investments (continued)As at 30 June 2020
Investments Currency
Quantity/Nominal
Value
FairValue
EUR
% ofNet
Assets Investments Currency
Quantity/Nominal
Value
FairValue
EUR
% ofNet
Assets

JPMorgan ETFs (Ireland) ICAV - BetaBuilders EUR Govt Bond UCITS ETFSchedule of Investments (continued)As at 30 June 2020
FairValue
EUR
% ofNet
Assets
Total financial assets at fair value through profit or loss 17,947,303 99.19Cash 47,822 0.26Other assets and liabilities 98,952 0.55
Net asset value attributable to holders of redeemable participating shares 18,094,077 100.00
Analysis of total assets
% ofTotal
Assets
Transferable securities and money market instruments admitted to official stock exchange listing 97.79Transferable securities and money market instruments dealt in on another regulated market 0.08Other assets 2.13
Total Assets 100.00
68

Bonds
Government Debt Securities (31 December 2019: 99.32%)
United Kingdom (31 December 2019: 99.32%)UK Gilt 3.75% 07/09/2021 GBP 1,875,092 1,958,927 7.99UK Gilt 4.00% 07/03/2022 GBP 2,513,881 2,687,238 10.96UK Gilt 0.50% 22/07/2022 GBP 1,996,450 2,020,827 8.24UK Gilt 1.75% 07/09/2022 GBP 1,969,904 2,049,035 8.36UK Gilt 0.13% 31/01/2023 GBP 1,087,300 1,092,106 4.46UK Gilt 0.75% 22/07/2023 GBP 2,304,194 2,362,398 9.64UK Gilt 2.25% 07/09/2023 GBP 2,141,243 2,300,295 9.38UK Gilt 1.00% 22/04/2024 GBP 2,338,200 2,434,019 9.93UK Gilt 2.75% 07/09/2024 GBP 2,320,500 2,595,247 10.59UK Gilt 5.00% 07/03/2025 GBP 1,929,700 2,387,155 9.74UK Gilt 0.63% 07/06/2025 GBP 2,332,000 2,410,285 9.83
United Kingdom total 24,297,532 99.12
Total investments in Government Debt Securities 24,297,532 99.12
Total Bonds 24,297,532 99.12
69
JPMorgan ETFs (Ireland) ICAV - BetaBuilders UK Gilt 1-5 yr UCITS ETFSchedule of InvestmentsAs at 30 June 2020
Investments Currency
Quantity/Nominal
Value
FairValue
GBP
% ofNet
Assets Investments Currency
Quantity/Nominal
Value
FairValue
GBP
% ofNet
Assets
Fair ValueGBP
% ofNet
Assets
Total financial assets at fair value through profit or loss 24,297,532 99.12Cash 64,482 0.26Other assets and liabilities 152,446 0.62
Net asset value attributable to holders of redeemable participating shares 24,514,460 100.00
Analysis of total assets
% ofTotal
Assets
Transferable securities and money market instruments admitted to official stock exchange listing 89.72Other assets 10.28
Total Assets 100.00

70
Equities (31 December 2019: 99.48%)
Argentina (31 December 2019: 0.09%)MercadoLibre, Inc. USD 16 15,772 0.16
Argentina total 15,772 0.16
Bermuda (31 December 2019: 0.10%)Arch Capital Group Ltd. USD 145 4,154 0.04Everest Re Group Ltd. USD 14 2,887 0.03
Bermuda total 7,041 0.07
Canada (31 December 2019: 0.10%)Lululemon Athletica, Inc. USD 41 12,793 0.13
Canada total 12,793 0.13
Ireland (31 December 2019: 1.19%)Accenture plc ‘A’ USD 228 48,956 0.51Allegion plc USD 33 3,373 0.03Aptiv plc USD 96 7,481 0.08Jazz Pharmaceuticals plc USD 20 2,207 0.02Medtronic plc USD 481 44,108 0.46Perrigo Co. plc USD 49 2,708 0.03Trane Technologies plc USD 86 7,652 0.08
Ireland total 116,485 1.21
Peru (31 December 2019: 0.01%)Southern Copper Corp. USD 30 1,193 0.01
Peru total 1,193 0.01
Sweden (31 December 2019: 0.02%)Autoliv, Inc. USD 28 1,806 0.02
Sweden total 1,806 0.02
Switzerland (31 December 2019: 0.41%)Chubb Ltd. USD 162 20,512 0.21Garmin Ltd. USD 52 5,070 0.05TE Connectivity Ltd. USD 118 9,623 0.10
Switzerland total 35,205 0.36
United Kingdom (31 December 2019: 0.89%)Amcor plc USD 565 5,769 0.06Aon plc ‘A’ USD 83 15,986 0.17Clarivate plc USD 92 2,054 0.02IHS Markit Ltd. USD 143 10,796 0.11Linde plc USD 188 39,877 0.41Pentair plc USD 59 2,241 0.02Willis Towers Watson plc USD 46 9,060 0.10
United Kingdom total 85,783 0.89
United States (31 December 2019: 96.67%)3M Co. USD 206 32,134 0.33Abbott Laboratories USD 634 57,967 0.60AbbVie, Inc. USD 632 62,050 0.64ABIOMED, Inc. USD 16 3,865 0.04Activision Blizzard, Inc. USD 276 20,948 0.22Adobe, Inc. USD 173 75,309 0.78Advance Auto Parts, Inc. USD 25 3,561 0.04Advanced Micro Devices, Inc. USD 420 22,096 0.23AES Corp. (The) USD 238 3,449 0.04Aflac, Inc. USD 257 9,260 0.10Agilent Technologies, Inc. USD 111 9,809 0.10AGNC Investment Corp., REIT USD 201 2,593 0.03Air Products & Chemicals, Inc. USD 79 19,075 0.20Akamai Technologies, Inc. USD 58 6,211 0.06Alaska Air Group, Inc. USD 44 1,595 0.02Albemarle Corp. USD 38 2,934 0.03Alexandria Real Estate Equities, Inc., REIT USD 45 7,301 0.08Alexion Pharmaceuticals, Inc. USD 79 8,867 0.09Align Technology, Inc. USD 26 7,135 0.07Alleghany Corp. USD 5 2,446 0.03Alliant Energy Corp. USD 89 4,258 0.04Allstate Corp. (The) USD 113 10,960 0.11Ally Financial, Inc. USD 134 2,657 0.03Alnylam Pharmaceuticals, Inc. USD 41 6,073 0.06Alphabet, Inc. ‘A’ USD 108 153,149 1.58Alphabet, Inc. ‘C’ USD 105 148,429 1.53Altice USA, Inc. ‘A’ USD 98 2,209 0.02Altria Group, Inc. USD 666 26,140 0.27Amazon.com, Inc. USD 150 413,823 4.28Ameren Corp. USD 89 6,262 0.06American Electric Power Co., Inc. USD 178 14,176 0.15American Express Co. USD 237 22,562 0.23American Financial Group, Inc. USD 27 1,713 0.02American International Group, Inc. USD 309 9,635 0.10
American Tower Corp., REIT USD 159 41,108 0.42American Water Works Co., Inc. USD 65 8,363 0.09Ameriprise Financial, Inc. USD 44 6,602 0.07AmerisourceBergen Corp. ‘A’ USD 53 5,341 0.06AMETEK, Inc. USD 82 7,328 0.08Amgen, Inc. USD 211 49,766 0.51Amphenol Corp. ‘A’ USD 106 10,156 0.10Analog Devices, Inc. USD 132 16,188 0.17Annaly Capital Management, Inc., REIT USD 513 3,365 0.03ANSYS, Inc. USD 31 9,044 0.09Anthem, Inc. USD 90 23,668 0.24Apache Corp. USD 135 1,822 0.02Apollo Global Management, Inc. ‘A’ USD 74 3,694 0.04Apple, Inc. USD 1,461 532,973 5.51Applied Materials, Inc. USD 329 19,888 0.21Aramark USD 91 2,054 0.02Archer-Daniels-Midland Co. USD 199 7,940 0.08Arista Networks, Inc. USD 19 3,991 0.04Arthur J Gallagher & Co. USD 68 6,629 0.07AT&T, Inc. USD 2,555 77,238 0.80Atmos Energy Corp. USD 44 4,382 0.05Autodesk, Inc. USD 79 18,896 0.20Automatic Data Processing, Inc. USD 154 22,929 0.24AutoZone, Inc. USD 8 9,025 0.09AvalonBay Communities, Inc., REIT USD 50 7,732 0.08Avangrid, Inc. USD 20 840 0.01Avantor, Inc. USD 97 1,649 0.02Avery Dennison Corp. USD 30 3,423 0.04Axalta Coating Systems Ltd. USD 75 1,691 0.02Baker Hughes Co. ‘A’ USD 235 3,617 0.04Ball Corp. USD 117 8,130 0.08Bank of America Corp. USD 2,800 66,500 0.69Bank of New York Mellon Corp. (The) USD 289 11,170 0.12Baxter International, Inc. USD 182 15,670 0.16Becton Dickinson & Co. USD 106 25,363 0.26Berkshire Hathaway, Inc. ‘B’ USD 697 124,421 1.29Best Buy Co., Inc. USD 82 7,156 0.07Biogen, Inc. USD 59 15,785 0.16BioMarin Pharmaceutical, Inc. USD 65 8,017 0.08Bio-Rad Laboratories, Inc. ‘A’ USD 8 3,612 0.04BlackRock, Inc. ‘A’ USD 55 29,925 0.31Blackstone Group, Inc. (The) ‘A’ USD 240 13,598 0.14Boeing Co. (The) USD 192 35,194 0.36Booking Holdings, Inc. USD 15 23,885 0.25BorgWarner, Inc. USD 74 2,612 0.03Boston Properties, Inc., REIT USD 52 4,700 0.05Boston Scientific Corp. USD 512 17,976 0.19Bristol-Myers Squibb Co. USD 811 47,687 0.49Broadcom, Inc. USD 143 45,132 0.47Broadridge Financial Solutions, Inc. USD 41 5,174 0.05Brown-Forman Corp. ‘A’ USD 20 1,151 0.01Brown-Forman Corp. ‘B’ USD 65 4,138 0.04Bunge Ltd. USD 51 2,098 0.02Burlington Stores, Inc. USD 24 4,726 0.05Cabot Oil & Gas Corp. USD 143 2,457 0.03Cadence Design Systems, Inc. USD 100 9,596 0.10Camden Property Trust, REIT USD 35 3,193 0.03Campbell Soup Co. USD 61 3,027 0.03Capital One Financial Corp. USD 163 10,202 0.11Cardinal Health, Inc. USD 105 5,480 0.06Carlyle Group, Inc. (The) USD 41 1,144 0.01CarMax, Inc. USD 58 5,194 0.05Carnival Corp. USD 170 2,791 0.03Carrier Global Corp. USD 292 6,488 0.07Caterpillar, Inc. USD 194 24,541 0.25CBRE Group, Inc. ‘A’ USD 120 5,426 0.06CDK Global, Inc. USD 44 1,822 0.02CDW Corp. USD 51 5,925 0.06Celanese Corp. ‘A’ USD 42 3,626 0.04Centene Corp. USD 208 13,218 0.14CenterPoint Energy, Inc. USD 195 3,641 0.04CenturyLink, Inc. USD 354 3,551 0.04Cerner Corp. USD 109 7,472 0.08CF Industries Holdings, Inc. USD 77 2,167 0.02CH Robinson Worldwide, Inc. USD 48 3,795 0.04Charles Schwab Corp. (The) USD 411 13,867 0.14Charter Communications, Inc. ‘A’ USD 54 27,542 0.28Cheniere Energy, Inc. USD 82 3,962 0.04Chevron Corp. USD 670 59,784 0.62Chipotle Mexican Grill, Inc. ‘A’ USD 9 9,471 0.10Church & Dwight Co., Inc. USD 88 6,802 0.07Cigna Corp. USD 132 24,770 0.26Cincinnati Financial Corp. USD 54 3,458 0.04Cintas Corp. USD 30 7,991 0.08Cisco Systems, Inc. USD 1,521 70,939 0.73Citigroup, Inc. USD 747 38,172 0.39Citizens Financial Group, Inc. USD 153 3,862 0.04
JPMorgan ETFs (Ireland) ICAV - BetaBuilders US Equity UCITS ETFSchedule of InvestmentsAs at 30 June 2020
Investments Currency
Quantity/Nominal
Value
FairValue
USD
% ofNet
Assets Investments Currency
Quantity/Nominal
Value
FairValue
USD
% ofNet
Assets

Citrix Systems, Inc. USD 42 6,212 0.06Clorox Co. (The) USD 45 9,872 0.10CME Group, Inc. ‘A’ USD 129 20,968 0.22CMS Energy Corp. USD 103 6,017 0.06Coca-Cola Co. (The) USD 1,386 61,926 0.64Cognex Corp. USD 62 3,703 0.04Cognizant Technology Solutions Corp. ‘A’ USD 194 11,023 0.11Colgate-Palmolive Co. USD 307 22,491 0.23Comcast Corp. ‘A’ USD 1,633 63,654 0.66Comerica, Inc. USD 50 1,905 0.02Conagra Brands, Inc. USD 175 6,155 0.06Concho Resources, Inc. USD 71 3,656 0.04ConocoPhillips USD 385 16,178 0.17Consolidated Edison, Inc. USD 120 8,632 0.09Constellation Brands, Inc. ‘A’ USD 60 10,497 0.11Cooper Cos., Inc. (The) USD 18 5,106 0.05Copart, Inc. USD 74 6,162 0.06Corning, Inc. USD 272 7,045 0.07Corteva, Inc. USD 268 7,180 0.07CoStar Group, Inc. USD 14 9,949 0.10Costco Wholesale Corp. USD 158 47,907 0.50Coty, Inc. ‘A’ USD 107 478 0.00Crowdstrike Holdings, Inc. ‘A’ USD 7 702 0.01Crown Castle International Corp., REIT USD 149 24,935 0.26Crown Holdings, Inc. USD 48 3,126 0.03CSX Corp. USD 275 19,178 0.20Cummins, Inc. USD 53 9,183 0.09CVS Health Corp. USD 469 30,471 0.32Danaher Corp. USD 226 39,964 0.41Darden Restaurants, Inc. USD 47 3,561 0.04DaVita, Inc. USD 31 2,453 0.03Deere & Co. USD 112 17,601 0.18Dell Technologies, Inc. ‘C’ USD 55 3,022 0.03Delta Air Lines, Inc. USD 204 5,722 0.06DENTSPLY SIRONA, Inc. USD 79 3,481 0.04Devon Energy Corp. USD 137 1,554 0.02DexCom, Inc. USD 33 13,378 0.14Diamondback Energy, Inc. USD 57 2,384 0.02Digital Realty Trust, Inc., REIT USD 96 13,643 0.14Discover Financial Services USD 110 5,510 0.06Discovery, Inc. ‘A’ USD 57 1,203 0.01Discovery, Inc. ‘C’ USD 113 2,176 0.02DISH Network Corp. ‘A’ USD 92 3,175 0.03DocuSign, Inc. ‘A’ USD 47 8,094 0.08Dollar General Corp. USD 90 17,146 0.18Dollar Tree, Inc. USD 85 7,878 0.08Dominion Energy, Inc. USD 301 24,435 0.25Domino’s Pizza, Inc. USD 14 5,172 0.05Donaldson Co., Inc. USD 45 2,093 0.02Dover Corp. USD 52 5,021 0.05Dow, Inc. USD 266 10,842 0.11DR Horton, Inc. USD 119 6,599 0.07DTE Energy Co. USD 69 7,417 0.08Duke Energy Corp. USD 264 21,091 0.22Duke Realty Corp., REIT USD 132 4,671 0.05DuPont de Nemours, Inc. USD 263 13,973 0.14DXC Technology Co. USD 91 1,501 0.02E*TRADE Financial Corp. USD 79 3,929 0.04East West Bancorp, Inc. USD 51 1,848 0.02Eastman Chemical Co. USD 49 3,412 0.04Eaton Corp. plc USD 143 12,510 0.13eBay, Inc. USD 237 12,431 0.13Ecolab, Inc. USD 89 17,707 0.18Edison International USD 136 7,386 0.08Edwards Lifesciences Corp. USD 222 15,342 0.16Elanco Animal Health, Inc. USD 143 3,067 0.03Electronic Arts, Inc. USD 104 13,733 0.14Eli Lilly & Co. USD 302 49,582 0.51Emerson Electric Co. USD 214 13,274 0.14Entergy Corp. USD 72 6,754 0.07EOG Resources, Inc. USD 209 10,588 0.11Equifax, Inc. USD 44 7,563 0.08Equinix, Inc., REIT USD 32 22,474 0.23Equitable Holdings, Inc. USD 145 2,797 0.03Equity LifeStyle Properties, Inc., REIT USD 65 4,061 0.04Equity Residential, REIT USD 125 7,353 0.08Essex Property Trust, Inc., REIT USD 23 5,271 0.05Estee Lauder Cos., Inc. (The) ‘A’ USD 81 15,283 0.16Evergy, Inc. USD 81 4,802 0.05Eversource Energy USD 121 10,076 0.10Exact Sciences Corp. USD 51 4,434 0.05Exelon Corp. USD 349 12,665 0.13Expedia Group, Inc. USD 49 4,028 0.04Expeditors International of Washington,Inc. USD 60 4,562 0.05Extra Space Storage, Inc., REIT USD 46 4,249 0.04Exxon Mobil Corp. USD 1,516 67,796 0.70
F5 Networks, Inc. USD 22 3,069 0.03Facebook, Inc. ‘A’ USD 862 195,734 2.02Fastenal Co. USD 205 8,782 0.09Federal Realty Investment Trust, REIT USD 25 2,130 0.02FedEx Corp. USD 86 12,059 0.12Fidelity National Financial, Inc. USD 104 3,189 0.03Fidelity National Information Services, Inc. USD 222 29,768 0.31Fifth Third Bancorp USD 255 4,916 0.05First Republic Bank USD 61 6,465 0.07FirstEnergy Corp. USD 194 7,523 0.08Fiserv, Inc. USD 202 19,719 0.20FleetCor Technologies, Inc. USD 30 7,546 0.08Flex Ltd. USD 181 1,855 0.02FMC Corp. USD 46 4,583 0.05Ford Motor Co. USD 1,401 8,518 0.09Fortinet, Inc. USD 48 6,589 0.07Fortive Corp. USD 106 7,172 0.07Fortune Brands Home & Security, Inc. USD 50 3,197 0.03Fox Corp. ‘A’ USD 123 3,299 0.03Fox Corp. ‘B’ USD 57 1,530 0.02Franklin Resources, Inc. USD 99 2,076 0.02Freeport-McMoRan, Inc. USD 521 6,028 0.06Gartner, Inc. USD 32 3,883 0.04General Dynamics Corp. USD 83 12,405 0.13General Electric Co. USD 3,137 21,426 0.22General Mills, Inc. USD 217 13,378 0.14General Motors Co. USD 452 11,436 0.12Genuine Parts Co. USD 52 4,522 0.05Gilead Sciences, Inc. USD 450 34,623 0.36Global Payments, Inc. USD 107 18,149 0.19Globe Life, Inc. USD 35 2,598 0.03GoDaddy, Inc. ‘A’ USD 59 4,326 0.04Goldman Sachs Group, Inc. (The) USD 111 21,936 0.23Halliburton Co. USD 315 4,089 0.04Hartford Financial Services Group, Inc.(The) USD 128 4,934 0.05Hasbro, Inc. USD 46 3,448 0.04HCA Healthcare, Inc. USD 94 9,124 0.09Healthpeak Properties, Inc., REIT USD 193 5,319 0.05HEICO Corp. USD 15 1,495 0.02HEICO Corp. ‘A’ USD 26 2,112 0.02Henry Schein, Inc. USD 51 2,978 0.03Herbalife Nutrition Ltd. USD 33 1,484 0.02Hershey Co. (The) USD 53 6,870 0.07Hess Corp. USD 94 4,870 0.05Hewlett Packard Enterprise Co. USD 461 4,486 0.05Hilton Worldwide Holdings, Inc. USD 99 7,272 0.08HollyFrontier Corp. USD 53 1,548 0.02Hologic, Inc. USD 93 5,301 0.05Home Depot, Inc. (The) USD 386 96,697 1.00Honeywell International, Inc. USD 252 36,437 0.38Hormel Foods Corp. USD 101 4,875 0.05Host Hotels & Resorts, Inc., REIT USD 253 2,730 0.03Howmet Aerospace, Inc. USD 138 2,187 0.02HP, Inc. USD 513 8,942 0.09Hubbell, Inc. ‘B’ USD 19 2,382 0.02Humana, Inc. USD 47 18,224 0.19Huntington Bancshares, Inc. USD 364 3,289 0.03Huntington Ingalls Industries, Inc. USD 15 2,617 0.03IAC/interactivecorp USD 26 8,408 0.09IDEX Corp. USD 27 4,267 0.04IDEXX Laboratories, Inc. USD 30 9,905 0.10Illinois Tool Works, Inc. USD 103 18,010 0.19Illumina, Inc. USD 53 19,629 0.20Incyte Corp. USD 65 6,758 0.07Ingredion, Inc. USD 24 1,992 0.02Intel Corp. USD 1,518 90,822 0.94Intercontinental Exchange, Inc. USD 196 17,954 0.19International Business Machines Corp. USD 318 38,405 0.40International Flavors & Fragrances, Inc. USD 38 4,653 0.05International Paper Co. USD 141 4,965 0.05Interpublic Group of Cos., Inc. (The) USD 140 2,402 0.02Intuit, Inc. USD 94 27,842 0.29Intuitive Surgical, Inc. USD 42 23,933 0.25Invesco Ltd. USD 135 1,453 0.02Invitation Homes, Inc., REIT USD 195 5,368 0.06IPG Photonics Corp. USD 13 2,085 0.02IQVIA Holdings, Inc. USD 64 9,080 0.09Iron Mountain, Inc., REIT USD 103 2,688 0.03Jack Henry & Associates, Inc. USD 27 4,969 0.05Jacobs Engineering Group, Inc. USD 47 3,986 0.04JB Hunt Transport Services, Inc. USD 30 3,610 0.04Jefferies Financial Group, Inc. USD 81 1,260 0.01JM Smucker Co. (The) USD 41 4,338 0.04Johnson & Johnson USD 945 132,895 1.37Johnson Controls International plc USD 267 9,115 0.09JPMorgan Chase & Co.1 USD 1,093 102,808 1.06
71
JPMorgan ETFs (Ireland) ICAV - BetaBuilders US Equity UCITS ETFSchedule of Investments (continued)As at 30 June 2020
Investments Currency
Quantity/Nominal
Value
FairValue
USD
% ofNet
Assets Investments Currency
Quantity/Nominal
Value
FairValue
USD
% ofNet
Assets

Juniper Networks, Inc. USD 119 2,720 0.03Kansas City Southern USD 34 5,076 0.05Kellogg Co. USD 90 5,945 0.06Keurig Dr Pepper, Inc. USD 121 3,436 0.04KeyCorp USD 350 4,263 0.04Keysight Technologies, Inc. USD 67 6,752 0.07Kimberly-Clark Corp. USD 122 17,245 0.18Kimco Realty Corp., REIT USD 155 1,990 0.02Kinder Morgan, Inc. USD 697 10,573 0.11KKR & Co., Inc. USD 200 6,176 0.06KLA Corp. USD 56 10,891 0.11Kraft Heinz Co. (The) USD 223 7,111 0.07Kroger Co. (The) USD 282 9,546 0.10L3Harris Technologies, Inc. USD 77 13,065 0.14Laboratory Corp. of America Holdings USD 35 5,814 0.06Lam Research Corp. USD 52 16,820 0.17Lamb Weston Holdings, Inc. USD 52 3,324 0.03Las Vegas Sands Corp. USD 121 5,510 0.06Lear Corp. USD 20 2,180 0.02Leidos Holdings, Inc. USD 48 4,496 0.05Lennar Corp. ‘A’ USD 98 6,039 0.06Lennar Corp. ‘B’ USD 6 277 0.00Lennox International, Inc. USD 12 2,796 0.03Liberty Broadband Corp. ‘A’ USD 9 1,100 0.01Liberty Broadband Corp. ‘C’ USD 55 6,818 0.07Liberty Media Corp.-Liberty SiriusXM ‘A’ USD 30 1,036 0.01Liberty Media Corp.-Liberty SiriusXM ‘C’ USD 60 2,067 0.02Lincoln National Corp. USD 69 2,539 0.03Live Nation Entertainment, Inc. USD 51 2,261 0.02LKQ Corp. USD 109 2,856 0.03Lockheed Martin Corp. USD 88 32,113 0.33Loews Corp. USD 87 2,983 0.03Lowe’s Cos., Inc. USD 271 36,618 0.38Lyft, Inc. ‘A’ USD 76 2,509 0.03LyondellBasell Industries NV ‘A’ USD 92 6,046 0.06M&T Bank Corp. USD 46 4,783 0.05ManpowerGroup, Inc. USD 21 1,444 0.01Marathon Oil Corp. USD 283 1,732 0.02Marathon Petroleum Corp. USD 233 8,710 0.09Markel Corp. USD 5 4,616 0.05MarketAxess Holdings, Inc. USD 14 7,013 0.07Marriott International, Inc. ‘A’ USD 97 8,316 0.09Marsh & McLennan Cos., Inc. USD 183 19,649 0.20Martin Marietta Materials, Inc. USD 22 4,545 0.05Marvell Technology Group Ltd. USD 238 8,344 0.09Masco Corp. USD 95 4,770 0.05Mastercard, Inc. ‘A’ USD 317 93,737 0.97Maxim Integrated Products, Inc. USD 96 5,819 0.06McCormick & Co., Inc. USD 44 7,894 0.08McDonald’s Corp. USD 267 49,253 0.51McKesson Corp. USD 58 8,898 0.09Merck & Co., Inc. USD 905 69,984 0.72MetLife, Inc. USD 277 10,116 0.10Mettler-Toledo International, Inc. USD 9 7,250 0.07MGM Resorts International USD 177 2,974 0.03Microchip Technology, Inc. USD 88 9,267 0.10Micron Technology, Inc. USD 399 20,556 0.21Microsoft Corp. USD 2,719 553,344 5.72Mid-America Apartment Communities,Inc., REIT USD 41 4,701 0.05Moderna, Inc. USD 106 6,806 0.07Mohawk Industries, Inc. USD 21 2,137 0.02Molson Coors Beverage Co. ‘B’ USD 67 2,302 0.02Mondelez International, Inc. ‘A’ USD 512 26,179 0.27Monster Beverage Corp. USD 134 9,289 0.10Moody’s Corp. USD 58 15,934 0.16Morgan Stanley USD 429 20,721 0.21Mosaic Co. (The) USD 125 1,564 0.02Motorola Solutions, Inc. USD 61 8,548 0.09MSCI, Inc. ‘A’ USD 30 10,015 0.10Mylan NV USD 185 2,975 0.03Nasdaq, Inc. USD 41 4,898 0.05National Oilwell Varco, Inc. USD 139 1,703 0.02NetApp, Inc. USD 79 3,505 0.04Netflix, Inc. USD 158 71,896 0.74Neurocrine Biosciences, Inc. USD 33 4,026 0.04New York Community Bancorp, Inc. USD 166 1,693 0.02Newell Brands, Inc. USD 137 2,176 0.02Newmont Corp. USD 288 17,781 0.18News Corp. ‘A’ USD 139 1,649 0.02News Corp. ‘B’ USD 44 526 0.01NextEra Energy, Inc. USD 176 42,270 0.44Nielsen Holdings plc USD 128 1,902 0.02NIKE, Inc. ‘B’ USD 445 43,632 0.45NiSource, Inc. USD 137 3,115 0.03Noble Energy, Inc. USD 172 1,541 0.02Norfolk Southern Corp. USD 92 16,152 0.17
Northern Trust Corp. USD 75 5,951 0.06Northrop Grumman Corp. USD 56 17,217 0.18NortonLifeLock, Inc. USD 194 3,847 0.04NRG Energy, Inc. USD 88 2,865 0.03Nucor Corp. USD 108 4,472 0.05NVIDIA Corp. USD 221 83,960 0.87NVR, Inc. USD 1 3,259 0.03Occidental Petroleum Corp. USD 323 5,911 0.06OGE Energy Corp. USD 72 2,186 0.02Okta, Inc. ‘A’ USD 42 8,410 0.09Old Dominion Freight Line, Inc. USD 34 5,766 0.06Omnicom Group, Inc. USD 77 4,204 0.04ONEOK, Inc. USD 157 5,216 0.05Oracle Corp. USD 746 41,231 0.43O’Reilly Automotive, Inc. USD 27 11,385 0.12Otis Worldwide Corp. USD 146 8,302 0.09Owens Corning USD 39 2,175 0.02PACCAR, Inc. USD 124 9,281 0.10Packaging Corp. of America USD 34 3,393 0.04Palo Alto Networks, Inc. USD 35 8,038 0.08Parker-Hannifin Corp. USD 46 8,430 0.09Paychex, Inc. USD 114 8,636 0.09Paycom Software, Inc. USD 17 5,265 0.05PayPal Holdings, Inc. USD 421 73,351 0.76PepsiCo, Inc. USD 498 65,865 0.68PerkinElmer, Inc. USD 40 3,924 0.04Pfizer, Inc. USD 1,992 65,138 0.67Philip Morris International, Inc. USD 558 39,093 0.40Phillips 66 USD 157 11,288 0.12Pinnacle West Capital Corp. USD 40 2,932 0.03Pioneer Natural Resources Co. USD 59 5,764 0.06PNC Financial Services Group, Inc. (The) USD 152 15,992 0.17Polaris, Inc. USD 21 1,944 0.02PPD, Inc. USD 23 616 0.01PPG Industries, Inc. USD 85 9,015 0.09PPL Corp. USD 276 7,132 0.07Principal Financial Group, Inc. USD 91 3,780 0.04Procter & Gamble Co. (The) USD 888 106,178 1.10Progressive Corp. (The) USD 210 16,823 0.17Prologis, Inc., REIT USD 265 24,732 0.26Prudential Financial, Inc. USD 142 8,648 0.09PTC, Inc. USD 37 2,878 0.03Public Service Enterprise Group, Inc. USD 181 8,898 0.09Public Storage, REIT USD 54 10,362 0.11PulteGroup, Inc. USD 90 3,063 0.03Qorvo, Inc. USD 41 4,532 0.05QUALCOMM, Inc. USD 403 36,758 0.38Quanta Services, Inc. USD 49 1,922 0.02Quest Diagnostics, Inc. USD 48 5,470 0.06Raymond James Financial, Inc. USD 44 3,029 0.03Raytheon Technologies Corp. USD 527 32,474 0.34Realty Income Corp., REIT USD 123 7,319 0.08Regency Centers Corp., REIT USD 61 2,799 0.03Regeneron Pharmaceuticals, Inc. USD 36 22,451 0.23Regions Financial Corp. USD 343 3,814 0.04Reinsurance Group of America, Inc. ‘A’ USD 24 1,883 0.02Republic Services, Inc. ‘A’ USD 75 6,154 0.06ResMed, Inc. USD 52 9,984 0.10RingCentral, Inc. ‘A’ USD 28 7,980 0.08Rockwell Automation, Inc. USD 42 8,946 0.09Roku, Inc. ‘A’ USD 33 3,845 0.04Rollins, Inc. USD 51 2,162 0.02Roper Technologies, Inc. USD 37 14,366 0.15Ross Stores, Inc. USD 127 10,825 0.11Royal Caribbean Cruises Ltd. USD 62 3,119 0.03S&P Global, Inc. USD 86 28,335 0.29salesforce.com, Inc. USD 323 60,508 0.63Santander Consumer USA Holdings, Inc. USD 35 644 0.01SBA Communications Corp., REIT ‘A’ USD 40 11,917 0.12Schlumberger Ltd. USD 498 9,158 0.09Seagate Technology plc USD 81 3,921 0.04Sealed Air Corp. USD 56 1,840 0.02Seattle Genetics, Inc. USD 42 7,137 0.07SEI Investments Co. USD 45 2,474 0.03Sempra Energy USD 105 12,309 0.13Sensata Technologies Holding plc USD 56 2,085 0.02ServiceNow, Inc. USD 68 27,544 0.28Sherwin-Williams Co. (The) USD 29 16,758 0.17Simon Property Group, Inc., REIT USD 110 7,522 0.08Sirius XM Holdings, Inc. USD 487 2,859 0.03Skyworks Solutions, Inc. USD 60 7,672 0.08SL Green Realty Corp., REIT USD 27 1,331 0.01Snap, Inc. ‘A’ USD 294 6,906 0.07Snap-on, Inc. USD 19 2,632 0.03Southern Co. (The) USD 379 19,651 0.20Southwest Airlines Co. USD 192 6,563 0.07Splunk, Inc. USD 57 11,326 0.12
72
JPMorgan ETFs (Ireland) ICAV - BetaBuilders US Equity UCITS ETFSchedule of Investments (continued)As at 30 June 2020
Investments Currency
Quantity/Nominal
Value
FairValue
USD
% ofNet
Assets Investments Currency
Quantity/Nominal
Value
FairValue
USD
% ofNet
Assets

Square, Inc. ‘A’ USD 122 12,803 0.13SS&C Technologies Holdings, Inc. USD 80 4,518 0.05Stanley Black & Decker, Inc. USD 55 7,666 0.08Starbucks Corp. USD 419 30,834 0.32State Street Corp. USD 126 8,007 0.08Steel Dynamics, Inc. USD 75 1,957 0.02Stericycle, Inc. USD 33 1,847 0.02STERIS plc USD 30 4,603 0.05Stryker Corp. USD 116 20,902 0.22Sun Communities, Inc., REIT USD 35 4,749 0.05SVB Financial Group USD 18 3,880 0.04Synchrony Financial USD 193 4,277 0.04Synopsys, Inc. USD 54 10,530 0.11Sysco Corp. USD 182 9,948 0.10T Rowe Price Group, Inc. USD 82 10,127 0.10Take-Two Interactive Software, Inc. USD 41 5,722 0.06Tapestry, Inc. USD 99 1,315 0.01Target Corp. USD 179 21,467 0.22TD Ameritrade Holding Corp. USD 95 3,456 0.04Teledyne Technologies, Inc. USD 13 4,042 0.04Teleflex, Inc. USD 17 6,188 0.06Tesla, Inc. USD 53 57,230 0.59Texas Instruments, Inc. USD 329 41,773 0.43Textron, Inc. USD 82 2,699 0.03Thermo Fisher Scientific, Inc. USD 142 51,452 0.53Tiffany & Co. USD 39 4,756 0.05TJX Cos., Inc. (The) USD 430 21,741 0.22T-Mobile US, Inc. USD 204 21,247 0.22Tractor Supply Co. USD 41 5,403 0.06TransDigm Group, Inc. USD 18 7,957 0.08TransUnion USD 68 5,919 0.06Travelers Cos., Inc. (The) USD 91 10,379 0.11Trimble, Inc. USD 90 3,887 0.04Truist Financial Corp. USD 483 18,137 0.19Twilio, Inc. ‘A’ USD 46 10,093 0.10Twitter, Inc. USD 281 8,371 0.09Tyson Foods, Inc. ‘A’ USD 106 6,329 0.07Uber Technologies, Inc. USD 75 2,331 0.02Ubiquiti, Inc. USD 4 698 0.01UDR, Inc., REIT USD 106 3,962 0.04UGI Corp. USD 75 2,385 0.02Ulta Beauty, Inc. USD 20 4,068 0.04Under Armour, Inc. ‘A’ USD 68 662 0.01Under Armour, Inc. ‘C’ USD 70 619 0.01Union Pacific Corp. USD 243 41,084 0.42United Airlines Holdings, Inc. USD 91 3,150 0.03United Parcel Service, Inc. ‘B’ USD 253 28,129 0.29United Rentals, Inc. USD 26 3,875 0.04UnitedHealth Group, Inc. USD 340 100,283 1.04Universal Health Services, Inc. ‘B’ USD 28 2,601 0.03US Bancorp USD 492 18,115 0.19Vail Resorts, Inc. USD 14 2,550 0.03Valero Energy Corp. USD 146 8,588 0.09Varian Medical Systems, Inc. USD 33 4,043 0.04Veeva Systems, Inc. ‘A’ USD 48 11,252 0.12Ventas, Inc., REIT USD 134 4,907 0.05VEREIT, Inc., REIT USD 387 2,488 0.03VeriSign, Inc. USD 36 7,446 0.08Verisk Analytics, Inc. ‘A’ USD 58 9,872 0.10Verizon Communications, Inc. USD 1,484 81,813 0.85Vertex Pharmaceuticals, Inc. USD 93 26,999 0.28VF Corp. USD 114 6,947 0.07ViacomCBS, Inc. ‘A’ USD 4 102 0.00ViacomCBS, Inc. ‘B’ USD 194 4,524 0.05VICI Properties, Inc., REIT USD 168 3,392 0.04Visa, Inc. ‘A’ USD 605 116,868 1.21Vistra Energy Corp. USD 161 2,998 0.03VMware, Inc. ‘A’ USD 29 4,491 0.05Vornado Realty Trust, REIT USD 57 2,178 0.02Voya Financial, Inc. USD 45 2,099 0.02Vulcan Materials Co. USD 47 5,445 0.06W R Berkley Corp. USD 51 2,922 0.03Walgreens Boots Alliance, Inc. USD 264 11,191 0.12Walmart, Inc. USD 508 60,848 0.63Walt Disney Co. (The) USD 648 72,258 0.75Waste Management, Inc. USD 139 14,721 0.15Waters Corp. USD 22 3,969 0.04Watsco, Inc. USD 12 2,132 0.02WEC Energy Group, Inc. USD 113 9,904 0.10Wells Fargo & Co. USD 1,338 34,253 0.35Welltower, Inc., REIT USD 150 7,763 0.08Western Digital Corp. USD 107 4,724 0.05Western Union Co. (The) USD 147 3,178 0.03Westinghouse Air Brake TechnologiesCorp. USD 65 3,742 0.04Westlake Chemical Corp. USD 12 644 0.01Westrock Co. USD 93 2,628 0.03
Weyerhaeuser Co., REIT USD 268 6,019 0.06Whirlpool Corp. USD 22 2,850 0.03Williams Cos., Inc. (The) USD 435 8,274 0.09Workday, Inc. ‘A’ USD 59 11,054 0.11WP Carey, Inc., REIT USD 62 4,194 0.04WW Grainger, Inc. USD 16 5,027 0.05Wynn Resorts Ltd. USD 35 2,607 0.03Xcel Energy, Inc. USD 188 11,750 0.12Xerox Holdings Corp. USD 66 1,009 0.01Xilinx, Inc. USD 87 8,560 0.09XPO Logistics, Inc. USD 33 2,549 0.03Xylem, Inc. USD 65 4,222 0.04Yum! Brands, Inc. USD 108 9,386 0.10Zebra Technologies Corp. ‘A’ USD 19 4,863 0.05Zimmer Biomet Holdings, Inc. USD 74 8,833 0.09Zions Bancorp NA USD 59 2,006 0.02Zoetis, Inc. ‘A’ USD 170 23,297 0.24Zoom Video Communications, Inc. ‘A’ USD 10 2,535 0.03
United States total 9,353,444 96.70
Total investments in Equities 9,629,522 99.55
73
JPMorgan ETFs (Ireland) ICAV - BetaBuilders US Equity UCITS ETFSchedule of Investments (continued)As at 30 June 2020
Investments Currency
Quantity/Nominal
Value
FairValue
USD
% ofNet
Assets Investments Currency
Quantity/Nominal
Value
FairValue
USD
% ofNet
Assets

JPMorgan ETFs (Ireland) ICAV - BetaBuilders US Equity UCITS ETF
Schedule of Investments (continued)
As at 30 June 2020
Financial Futures Contracts
Security DescriptionNo. of
Contracts Currency
UnderlyingExposure
USD Counterparty
FairValue
USD
% ofNet
Assets
United States (31 December 2019: 0.01%)S&P 500 Micro E-Mini Index, 18/09/2020 2 USD 30,237 Citibank NA 666 0.01
United States total 666 0.01
Total unrealised gain on Financial Futures Contracts (31 December 2019: 0.01%) 666 0.01
Fair ValueUSD
% ofNet
Assets
Total financial assets at fair value through profit or lossCash and margin cash 9,630,188 99.56
13,289 0.14Cash equivalents
Currency
Quantity/Nominal
ValueUndertaking for collective investment schemes (31 December 2019: 0.23%)JPMorgan Liquidity Funds - USD Liquidity LVNAV Fund - Class X (dist.)1 USD 22,963 22,963 0.24
Total Cash equivalents 22,963 0.24Other assets and liabilities 6,043 0.06
Net asset value attributable to holders of redeemable participating shares 9,672,483 100.00
Analysis of total assets
% ofTotal
Assets
Transferable securities and money market instruments admitted to official stock exchange listing 99.55Collective investment schemes 0.24Financial derivative instruments dealt in on a regulated market 0.01Other assets 0.20
Total Assets 100.00
1A related party to the Fund.
74

75
Bonds
Government Debt Securities (31 December 2019: 99.78%)
United States (31 December 2019: 99.78%)US Cash Management Bill 0.00%15/09/2020 USD 48,716,000 48,701,602 6.08US Cash Management Bill 0.00%29/09/2020 USD 37,713,000 37,699,989 4.71US Cash Management Bill 0.00%20/10/2020 USD 8,970,000 8,965,851 1.12US Cash Management Bill 0.00%24/11/2020 USD 11,117,000 11,110,241 1.39US Treasury Bill 0.00% 02/07/2020 USD 23,814,000 23,813,939 2.98US Treasury Bill 0.00% 09/07/2020 USD 27,216,000 27,215,304 3.40US Treasury Bill 0.00% 14/07/2020 USD 10,362,000 10,361,588 1.29US Treasury Bill 0.00% 16/07/2020 USD 15,657,000 15,656,168 1.96US Treasury Bill 0.00% 21/07/2020 USD 8,336,000 8,335,456 1.04US Treasury Bill 0.00% 23/07/2020 USD 32,828,000 32,825,543 4.10US Treasury Bill 0.00% 30/07/2020 USD 25,808,000 25,805,297 3.22US Treasury Bill 0.00% 06/08/2020 USD 30,741,000 30,737,311 3.84US Treasury Bill 0.00% 13/08/2020 USD 36,968,000 36,962,039 4.62US Treasury Bill 0.00% 18/08/2020 USD 4,580,000 4,579,160 0.57US Treasury Bill 0.00% 20/08/2020 USD 21,262,000 21,258,161 2.66US Treasury Bill 0.00% 27/08/2020 USD 24,734,000 24,728,517 3.09US Treasury Bill 0.00% 03/09/2020 USD 21,554,000 21,548,540 2.69US Treasury Bill 0.00% 10/09/2020 USD 11,219,600 11,216,613 1.40US Treasury Bill 0.00% 17/09/2020 USD 26,968,000 26,959,528 3.37US Treasury Bill 0.00% 24/09/2020 USD 14,246,000 14,241,123 1.78US Treasury Bill 0.00% 01/10/2020 USD 5,359,000 5,356,877 0.67US Treasury Bill 0.00% 08/10/2020 USD 23,435,000 23,425,011 2.93US Treasury Bill 0.00% 15/10/2020 USD 17,053,000 17,045,092 2.13US Treasury Bill 0.00% 22/10/2020 USD 7,704,000 7,700,131 0.96US Treasury Bill 0.00% 29/10/2020 USD 885,000 884,535 0.11US Treasury Bill 0.00% 05/11/2020 USD 19,066,000 19,055,238 2.38US Treasury Bill 0.00% 12/11/2020 USD 9,156,000 9,150,632 1.14US Treasury Bill 0.00% 19/11/2020 USD 17,025,000 17,014,164 2.13US Treasury Bill 0.00% 27/11/2020 USD 14,570,000 14,560,050 1.82US Treasury Bill 0.00% 03/12/2020 USD 25,532,000 25,514,961 3.19US Treasury Bill 0.00% 31/12/2020 USD 4,811,000 4,806,720 0.60US Treasury Bill 0.00% 28/01/2021 USD 8,415,000 8,406,862 1.05US Treasury Bill 0.00% 25/02/2021 USD 6,770,000 6,762,809 0.85US Treasury Bill 0.00% 25/03/2021 USD 11,293,000 11,279,180 1.41US Treasury Bill 0.00% 22/04/2021 USD 7,766,000 7,755,500 0.97US Treasury Bill 0.00% 20/05/2021 USD 10,887,000 10,870,639 1.36US Treasury Bill 0.00% 17/06/2021 USD 8,936,000 8,921,184 1.11US Treasury Note 1.50% 15/07/2020 USD 24,077,000 24,089,305 3.01US Treasury Note 2.00% 31/07/2020 USD 1,918,000 1,920,890 0.24US Treasury Note 2.63% 31/07/2020 USD 17,431,000 17,466,237 2.18US Treasury Note 1.50% 15/08/2020 USD 11,867,000 11,886,346 1.49US Treasury Note 1.38% 31/08/2020 USD 5,719,600 5,730,918 0.72US Treasury Note 2.63% 31/08/2020 USD 883,000 886,575 0.11US Treasury Note 1.38% 15/09/2020 USD 6,294,000 6,309,518 0.79US Treasury Note 1.63% 15/10/2020 USD 6,154,000 6,179,551 0.77US Treasury Note 1.75% 31/10/2020 USD 1,689,000 1,697,726 0.21US Treasury Note 2.88% 31/10/2020 USD 2,872,000 2,897,540 0.36US Treasury Note 1.63% 30/11/2020 USD 1,809,000 1,819,600 0.23US Treasury Note 2.00% 30/11/2020 USD 9,644,000 9,714,823 1.21US Treasury Note 2.75% 30/11/2020 USD 3,660,000 3,698,888 0.46US Treasury Note 1.88% 15/12/2020 USD 9,293,000 9,364,876 1.17US Treasury Note 2.38% 31/12/2020 USD 5,898,000 5,961,588 0.74US Treasury Note 2.50% 31/12/2020 USD 4,230,000 4,278,248 0.53US Treasury Note 2.50% 31/01/2021 USD 5,067,000 5,134,692 0.64US Treasury Note 2.25% 15/02/2021 USD 8,727,000 8,839,496 1.10US Treasury Note 2.50% 28/02/2021 USD 5,171,000 5,249,979 0.66US Treasury Note 2.38% 15/03/2021 USD 5,402,000 5,485,351 0.69US Treasury Note 1.25% 31/03/2021 USD 497,000 500,999 0.06US Treasury Note 2.25% 31/03/2021 USD 50,000 50,777 0.01US Treasury Note 2.38% 15/04/2021 USD 3,327,000 3,384,443 0.42US Treasury Note 2.63% 15/05/2021 USD 19,195,000 19,602,894 2.45
United States total 803,382,815 100.37
Total investments in Government Debt Securities 803,382,815 100.37
Total Bonds 803,382,815 100.37
JPMorgan ETFs (Ireland) ICAV - BetaBuilders US Treasury Bond 0-1 yr UCITS ETFSchedule of InvestmentsAs at 30 June 2020
Investments Currency
Quantity/Nominal
Value
FairValue
USD
% ofNet
Assets Investments Currency
Quantity/Nominal
Value
FairValue
USD
% ofNet
Assets

JPMorgan ETFs (Ireland) ICAV - BetaBuilders US Treasury Bond 0-1 yr UCITS ETF
Schedule of Investments (continued)
As at 30 June 2020
Forward Currency Contracts
CurrencyPurchased
AmountPurchased Currency Sold Amount Sold
MaturityDate Counterparty
Fair ValueUSD
% ofNet
Assets
Class MXN Hedged (acc)*MXN 72,678,122 USD 3,124,674 04/08/2020 BNP Paribas 5,909 -MXN 620,160 USD 26,677 02/07/2020 Goldman Sachs 161 -MXN 143,640 USD 6,148 02/07/2020 Goldman Sachs 68 -USD 616,771,766 MXN 14,171,601,884 02/07/2020 Goldman Sachs 3,468,357 0.43USD 1,104 MXN 24,803 02/07/2020 Goldman Sachs 31 -
Total unrealised gain on Forward Currency Contracts (31 December 2019: 0.02%) 3,474,526 0.43
Class MXN Hedged (acc)*MXN 1,152,024,150 USD 50,013,530 02/07/2020 Citibank NA (157,462) (0.02)MXN 1,152,644,310 USD 50,250,866 02/07/2020 Citibank NA (367,960) (0.05)MXN 25,920 USD 1,172 02/07/2020 Goldman Sachs (50) -MXN 43,512 USD 1,949 02/07/2020 Goldman Sachs (66) -MXN 33,938 USD 1,550 02/07/2020 Goldman Sachs (81) -MXN 138,600 USD 6,184 02/07/2020 Goldman Sachs (186) -MXN 119,280 USD 5,358 02/07/2020 Goldman Sachs (196) -MXN 217,333 USD 9,738 02/07/2020 Goldman Sachs (333) -MXN 468,000 USD 20,708 02/07/2020 Goldman Sachs (454) -MXN 13,328,297 USD 577,289 02/07/2020 Goldman Sachs (481) -MXN 308,890 USD 14,214 02/07/2020 Goldman Sachs (846) -MXN 19,393,242 USD 865,751 02/07/2020 Goldman Sachs (26,471) -MXN 25,133,255 USD 1,125,513 02/07/2020 Goldman Sachs (37,823) -MXN 20,248,030 USD 927,755 02/07/2020 Goldman Sachs (51,483) (0.01)MXN 110,982,145 USD 5,109,440 02/07/2020 Goldman Sachs (306,474) (0.04)MXN 365,213,880 USD 16,117,861 02/07/2020 Goldman Sachs (312,526) (0.04)MXN 242,715,840 USD 10,879,247 02/07/2020 Goldman Sachs (375,251) (0.05)MXN 300,329,740 USD 13,450,273 02/07/2020 Goldman Sachs (452,924) (0.06)MXN 344,558,040 USD 15,862,900 02/07/2020 Goldman Sachs (951,486) (0.12)MXN 1,035,543,780 USD 45,785,398 02/07/2020 Goldman Sachs (970,244) (0.12)MXN 445,456,660 USD 20,410,615 02/07/2020 Goldman Sachs (1,132,619) (0.14)MXN 912,480,300 USD 40,652,896 02/07/2020 Goldman Sachs (1,163,550) (0.15)MXN 1,112,141,250 USD 49,723,964 02/07/2020 Goldman Sachs (1,593,906) (0.20)MXN 1,557,288,040 USD 69,035,996 02/07/2020 Goldman Sachs (1,641,352) (0.20)MXN 5,360,026,455 USD 239,230,719 02/07/2020 Goldman Sachs (7,265,234) (0.91)MXN 59,500 USD 2,595 04/08/2020 Goldman Sachs (32) -MXN 67,320 USD 2,972 04/08/2020 Goldman Sachs (72) -MXN 284,373,040 USD 12,530,246 04/08/2020 Goldman Sachs (280,984) (0.03)MXN 14,171,601,884 USD 614,061,852 04/08/2020 Goldman Sachs (3,625,436) (0.45)
Total unrealised loss on Forward Currency Contracts (31 December 2019: (0.00)%)1(20,715,982) (2.59)
*Contracts entered into for share class currency hedging purpose.
FairValue
USD
% ofNet
Assets
Total financial assets at fair value through profit or loss 806,857,341 100.80Total financial liabilities at fair value through profit or loss (20,715,982) (2.59)Cash 7,351,166 0.92Other assets and liabilities 6,957,502 0.87
Net asset value attributable to holders of redeemable participating shares 800,450,027 100.00
Analysis of total assets
% ofTotal
Assets
Transferable securities and money market instruments admitted to official stock exchange listing 83.71OTC financial derivative instruments 0.36Other assets 15.93
Total Assets 100.001 Prior year percentage of net asset value rounds to 0.00%.
76

77
Bonds
Government Debt Securities (31 December 2019: 99.60%)
United States (31 December 2019: 99.60%)US Treasury Note 1.13% 30/06/2021 USD 3,158,800 3,189,092 2.50US Treasury Note 1.13% 31/07/2021 USD 2,789,200 2,818,182 2.21US Treasury Note 2.25% 31/07/2021 USD 430,000 439,650 0.34US Treasury Note 2.13% 15/08/2021 USD 2,267,200 2,316,972 1.81US Treasury Note 1.13% 31/08/2021 USD 3,159,300 3,194,595 2.50US Treasury Note 1.50% 31/08/2021 USD 754,000 765,737 0.60US Treasury Note 2.00% 31/08/2021 USD 1,378,000 1,407,498 1.10US Treasury Note 2.75% 15/09/2021 USD 436,200 449,814 0.35US Treasury Note 1.13% 30/09/2021 USD 3,485,200 3,527,199 2.76US Treasury Note 1.50% 30/09/2021 USD 199,000 202,319 0.16US Treasury Note 2.13% 30/09/2021 USD 649,000 664,870 0.52US Treasury Note 1.25% 31/10/2021 USD 2,241,000 2,273,565 1.78US Treasury Note 2.00% 31/10/2021 USD 360,000 368,817 0.29US Treasury Note 2.00% 15/11/2021 USD 352,000 360,876 0.28US Treasury Note 1.50% 30/11/2021 USD 503,000 512,549 0.40US Treasury Note 1.75% 30/11/2021 USD 4,655,000 4,760,010 3.73US Treasury Note 1.88% 30/11/2021 USD 281,000 287,827 0.23US Treasury Note 2.63% 15/12/2021 USD 384,000 397,778 0.31US Treasury Note 1.63% 31/12/2021 USD 750,000 766,479 0.60US Treasury Note 2.00% 31/12/2021 USD 1,075,000 1,104,542 0.86US Treasury Note 2.13% 31/12/2021 USD 1,554,000 1,599,618 1.25US Treasury Note 2.50% 15/01/2022 USD 469,000 485,864 0.38US Treasury Note 1.38% 31/01/2022 USD 500,000 509,619 0.40US Treasury Note 1.50% 31/01/2022 USD 3,314,000 3,384,034 2.65US Treasury Note 1.88% 31/01/2022 USD 2,215,000 2,274,961 1.78US Treasury Note 2.00% 15/02/2022 USD 1,856,000 1,911,390 1.50US Treasury Note 2.50% 15/02/2022 USD 1,032,000 1,071,063 0.84US Treasury Note 1.13% 28/02/2022 USD 433,000 439,960 0.34US Treasury Note 1.75% 28/02/2022 USD 2,358,000 2,420,266 1.89US Treasury Note 1.88% 28/02/2022 USD 500,000 514,238 0.40US Treasury Note 2.38% 15/03/2022 USD 2,233,000 2,317,174 1.81US Treasury Note 1.75% 31/03/2022 USD 132,000 135,664 0.11US Treasury Note 1.88% 31/03/2022 USD 1,777,000 1,830,171 1.43US Treasury Note 2.25% 15/04/2022 USD 750,000 777,979 0.61US Treasury Note 0.13% 30/04/2022 USD 1,487,000 1,486,129 1.16US Treasury Note 1.75% 30/04/2022 USD 1,497,000 1,540,653 1.21US Treasury Note 1.88% 30/04/2022 USD 1,114,000 1,148,878 0.90US Treasury Note 1.75% 15/05/2022 USD 1,985,000 2,044,085 1.60US Treasury Note 2.13% 15/05/2022 USD 1,443,000 1,495,901 1.17US Treasury Note 1.75% 31/05/2022 USD 1,850,000 1,906,078 1.49US Treasury Note 1.88% 31/05/2022 USD 2,224,000 2,296,888 1.80US Treasury Note 1.75% 15/06/2022 USD 1,850,000 1,907,632 1.49US Treasury Note 1.75% 30/06/2022 USD 1,939,000 2,000,427 1.57US Treasury Note 2.13% 30/06/2022 USD 1,755,000 1,824,000 1.43US Treasury Note 1.75% 15/07/2022 USD 505,000 521,334 0.41US Treasury Note 1.88% 31/07/2022 USD 791,000 819,241 0.64US Treasury Note 2.00% 31/07/2022 USD 548,000 568,978 0.45US Treasury Note 1.50% 15/08/2022 USD 1,100,000 1,131,367 0.89US Treasury Note 1.63% 15/08/2022 USD 1,296,000 1,336,449 1.05US Treasury Note 1.63% 31/08/2022 USD 2,014,000 2,077,724 1.63US Treasury Note 1.88% 31/08/2022 USD 2,067,000 2,143,624 1.68US Treasury Note 1.50% 15/09/2022 USD 1,993,000 2,052,089 1.61US Treasury Note 1.75% 30/09/2022 USD 3,965,000 4,106,718 3.22US Treasury Note 1.88% 30/09/2022 USD 998,000 1,036,517 0.81US Treasury Note 1.38% 15/10/2022 USD 1,371,000 1,408,917 1.10US Treasury Note 1.88% 31/10/2022 USD 4,919,000 5,115,183 4.01US Treasury Note 2.00% 31/10/2022 USD 1,559,000 1,625,623 1.27US Treasury Note 1.63% 15/11/2022 USD 1,800,000 1,862,367 1.46US Treasury Note 2.00% 30/11/2022 USD 1,661,000 1,734,577 1.36US Treasury Note 1.63% 15/12/2022 USD 901,000 933,415 0.73US Treasury Note 2.13% 31/12/2022 USD 1,663,000 1,744,331 1.37US Treasury Note 1.50% 15/01/2023 USD 750,000 775,313 0.61US Treasury Note 1.75% 31/01/2023 USD 769,000 800,331 0.63US Treasury Note 2.38% 31/01/2023 USD 750,000 792,686 0.62US Treasury Note 1.38% 15/02/2023 USD 740,000 763,443 0.60US Treasury Note 2.00% 15/02/2023 USD 500,000 524,023 0.41US Treasury Note 1.50% 28/02/2023 USD 4,150,000 4,297,357 3.37US Treasury Note 2.63% 28/02/2023 USD 392,000 417,618 0.33US Treasury Note 0.50% 15/03/2023 USD 750,000 756,709 0.59US Treasury Note 1.50% 31/03/2023 USD 4,244,000 4,399,669 3.45US Treasury Note 2.50% 31/03/2023 USD 774,000 823,494 0.64US Treasury Note 0.25% 15/04/2023 USD 12,250,000 12,279,189 9.62US Treasury Note 1.63% 30/04/2023 USD 475,000 494,501 0.39US Treasury Note 2.75% 30/04/2023 USD 500,000 536,406 0.42US Treasury Note 0.13% 15/05/2023 USD 500,000 499,336 0.39US Treasury Note 1.75% 15/05/2023 USD 250,000 261,348 0.20US Treasury Note 1.63% 31/05/2023 USD 336,000 350,227 0.27US Treasury Note 2.75% 31/05/2023 USD 250,000 268,730 0.21US Treasury Note 0.25% 15/06/2023 USD 250,000 250,557 0.20
US Treasury Note 1.38% 30/06/2023 USD 250,000 258,994 0.20US Treasury Note 2.63% 30/06/2023 USD 250,000 268,320 0.21
United States total 127,167,748 99.59
Total investments in Government Debt Securities 127,167,748 99.59
Total Bonds 127,167,748 99.59
JPMorgan ETFs (Ireland) ICAV - BetaBuilders US Treasury Bond 1-3 yr UCITS ETFSchedule of InvestmentsAs at 30 June 2020
Investments Currency
Quantity/Nominal
Value
FairValue
USD
% ofNet
Assets Investments Currency
Quantity/Nominal
Value
FairValue
USD
% ofNet
Assets

JPMorgan ETFs (Ireland) ICAV - BetaBuilders US Treasury Bond 1-3 yr UCITS ETFSchedule of Investments (continued)As at 30 June 2020
Fair ValueUSD
% ofNet
Assets
Total financial assets at fair value through profit or loss 127,167,748 99.59Cash 279,368 0.22Other assets and liabilities 244,250 0.19
Net asset value attributable to holders of redeemable participating shares 127,691,366 100.00
Analysis of total assets
% ofTotal
Assets
Transferable securities and money market instruments admitted to official stock exchange listing 90.66Transferable securities and money market instruments dealt in on another regulated market 4.95Other assets 4.39
Total Assets 100.00
78

79
Bonds
Government Debt Securities (31 December 2019: 100.27%)
United States (31 December 2019: 100.27%)US Treasury Bond 4.50% 15/02/2036 USD 505,000 773,597 0.77US Treasury Bond 4.75% 15/02/2037 USD 276,000 440,522 0.44US Treasury Bond 4.38% 15/02/2038 USD 224,000 348,390 0.34US Treasury Bond 4.50% 15/05/2038 USD 428,000 675,705 0.67US Treasury Bond 3.50% 15/02/2039 USD 450,000 637,102 0.63US Treasury Bond 4.25% 15/05/2039 USD 681,000 1,052,996 1.04US Treasury Bond 4.38% 15/11/2039 USD 689,000 1,084,098 1.07US Treasury Bond 4.63% 15/02/2040 USD 500,000 811,406 0.80US Treasury Bond 1.13% 15/05/2040 USD 320,000 317,125 0.31US Treasury Bond 4.38% 15/05/2040 USD 268,000 423,691 0.42US Treasury Bond 4.75% 15/02/2041 USD 509,000 844,860 0.84US Treasury Bond 3.75% 15/08/2041 USD 368,000 542,512 0.54US Treasury Bond 3.13% 15/11/2041 USD 385,000 521,555 0.52US Treasury Bond 3.13% 15/02/2042 USD 384,000 521,340 0.52US Treasury Bond 3.00% 15/05/2042 USD 440,000 586,231 0.58US Treasury Bond 2.75% 15/08/2042 USD 279,000 357,992 0.35US Treasury Bond 2.75% 15/11/2042 USD 1,374,000 1,761,082 1.74US Treasury Bond 3.13% 15/02/2043 USD 230,000 311,973 0.31US Treasury Bond 2.88% 15/05/2043 USD 139,000 181,699 0.18US Treasury Bond 3.63% 15/08/2043 USD 161,000 235,286 0.23US Treasury Bond 3.75% 15/11/2043 USD 47,000 69,990 0.07US Treasury Bond 3.63% 15/02/2044 USD 150,000 219,727 0.22US Treasury Bond 3.38% 15/05/2044 USD 530,000 749,991 0.74US Treasury Bond 2.50% 15/02/2045 USD 939,000 1,158,565 1.15US Treasury Bond 3.00% 15/05/2045 USD 225,000 302,186 0.30US Treasury Bond 3.00% 15/11/2045 USD 1,077,000 1,451,846 1.44US Treasury Bond 2.50% 15/02/2046 USD 377,000 467,068 0.46US Treasury Bond 2.50% 15/05/2046 USD 905,000 1,122,907 1.11US Treasury Bond 2.25% 15/08/2046 USD 163,000 193,371 0.19US Treasury Bond 3.00% 15/02/2047 USD 25,000 34,062 0.03US Treasury Bond 3.00% 15/05/2047 USD 233,000 317,681 0.31US Treasury Bond 2.75% 15/11/2047 USD 262,000 342,892 0.34US Treasury Bond 3.00% 15/02/2048 USD 443,000 606,668 0.60US Treasury Bond 3.13% 15/05/2048 USD 615,000 862,105 0.85US Treasury Bond 3.00% 15/08/2048 USD 697,000 958,811 0.95US Treasury Bond 3.00% 15/02/2049 USD 887,000 1,225,099 1.21US Treasury Bond 2.88% 15/05/2049 USD 323,000 437,085 0.43US Treasury Bond 2.25% 15/08/2049 USD 824,000 991,246 0.98US Treasury Bond 2.38% 15/11/2049 USD 455,000 562,067 0.56US Treasury Bond 2.00% 15/02/2050 USD 894,000 1,024,189 1.01US Treasury Bond 1.25% 15/05/2050 USD 70,000 67,277 0.07US Treasury Note 1.13% 31/08/2021 USD 583,000 589,513 0.58US Treasury Note 1.50% 31/08/2021 USD 204,000 207,176 0.21US Treasury Note 2.75% 15/09/2021 USD 130,000 134,057 0.13US Treasury Note 1.13% 30/09/2021 USD 849,000 859,231 0.85US Treasury Note 1.50% 30/09/2021 USD 365,000 371,088 0.37US Treasury Note 2.13% 30/09/2021 USD 551,000 564,474 0.56US Treasury Note 2.88% 15/10/2021 USD 795,000 822,794 0.81US Treasury Note 1.25% 31/10/2021 USD 549,000 556,978 0.55US Treasury Note 1.50% 31/10/2021 USD 140,000 142,494 0.14US Treasury Note 2.00% 15/11/2021 USD 794,000 814,021 0.81US Treasury Note 2.88% 15/11/2021 USD 193,000 200,162 0.20US Treasury Note 1.75% 30/11/2021 USD 552,000 564,452 0.56US Treasury Note 2.00% 31/12/2021 USD 824,000 846,644 0.84US Treasury Note 2.50% 15/01/2022 USD 666,000 689,947 0.68US Treasury Note 1.38% 31/01/2022 USD 718,000 731,813 0.72US Treasury Note 1.50% 31/01/2022 USD 1,250,000 1,276,416 1.26US Treasury Note 1.88% 31/01/2022 USD 549,000 563,862 0.56US Treasury Note 2.00% 15/02/2022 USD 879,000 905,233 0.90US Treasury Note 2.50% 15/02/2022 USD 510,000 529,304 0.52US Treasury Note 1.13% 28/02/2022 USD 281,000 285,517 0.28US Treasury Note 1.88% 28/02/2022 USD 53,000 54,509 0.05US Treasury Note 2.38% 15/03/2022 USD 615,000 638,183 0.63US Treasury Note 0.38% 31/03/2022 USD 296,000 297,110 0.29US Treasury Note 1.75% 31/03/2022 USD 498,000 511,821 0.51US Treasury Note 1.88% 31/03/2022 USD 811,000 835,267 0.83US Treasury Note 1.88% 30/04/2022 USD 587,000 605,378 0.60US Treasury Note 1.75% 15/05/2022 USD 694,000 714,657 0.71US Treasury Note 1.75% 31/05/2022 USD 501,000 516,187 0.51US Treasury Note 1.75% 15/06/2022 USD 433,000 446,489 0.44US Treasury Note 1.75% 30/06/2022 USD 581,000 599,406 0.59US Treasury Note 2.13% 30/06/2022 USD 500,000 519,658 0.51US Treasury Note 1.75% 15/07/2022 USD 160,000 165,175 0.16US Treasury Note 1.88% 31/07/2022 USD 1,161,000 1,202,451 1.19US Treasury Note 2.00% 31/07/2022 USD 550,000 571,055 0.57US Treasury Note 1.50% 15/08/2022 USD 397,000 408,321 0.40US Treasury Note 1.63% 15/08/2022 USD 806,000 831,156 0.82US Treasury Note 1.63% 31/08/2022 USD 522,000 538,516 0.53US Treasury Note 1.75% 30/09/2022 USD 216,000 223,720 0.22US Treasury Note 1.88% 30/09/2022 USD 588,000 610,693 0.60US Treasury Note 1.38% 15/10/2022 USD 728,000 748,134 0.74US Treasury Note 1.88% 31/10/2022 USD 480,000 499,144 0.49US Treasury Note 2.00% 31/10/2022 USD 462,000 481,743 0.48
US Treasury Note 1.63% 15/11/2022 USD 74,000 76,564 0.08US Treasury Note 1.75% 31/01/2023 USD 700,000 728,520 0.72US Treasury Note 2.00% 15/02/2023 USD 568,000 595,291 0.59US Treasury Note 1.50% 28/02/2023 USD 519,000 537,429 0.53US Treasury Note 2.63% 28/02/2023 USD 347,000 369,677 0.37US Treasury Note 1.50% 31/03/2023 USD 1,311,000 1,359,087 1.35US Treasury Note 0.25% 15/04/2023 USD 1,343,000 1,346,200 1.33US Treasury Note 1.63% 30/04/2023 USD 470,000 489,296 0.48US Treasury Note 0.13% 15/05/2023 USD 280,000 279,628 0.28US Treasury Note 1.75% 15/05/2023 USD 422,000 441,155 0.44US Treasury Note 0.25% 15/06/2023 USD 500,000 501,113 0.50US Treasury Note 1.38% 30/06/2023 USD 332,000 343,944 0.34US Treasury Note 2.63% 30/06/2023 USD 160,000 171,725 0.17US Treasury Note 2.50% 15/08/2023 USD 882,000 945,911 0.94US Treasury Note 1.38% 31/08/2023 USD 1,310,000 1,359,688 1.35US Treasury Note 1.38% 30/09/2023 USD 534,000 554,755 0.55US Treasury Note 2.88% 30/09/2023 USD 117,000 127,187 0.13US Treasury Note 1.63% 31/10/2023 USD 1,314,000 1,376,826 1.36US Treasury Note 2.13% 30/11/2023 USD 1,172,000 1,249,141 1.24US Treasury Note 2.88% 30/11/2023 USD 26,000 28,377 0.03US Treasury Note 2.63% 31/12/2023 USD 198,000 214,768 0.21US Treasury Note 2.50% 31/01/2024 USD 450,000 486,949 0.48US Treasury Note 2.13% 29/02/2024 USD 430,000 460,150 0.46US Treasury Note 2.38% 29/02/2024 USD 86,000 92,813 0.09US Treasury Note 2.13% 31/03/2024 USD 696,000 745,753 0.74US Treasury Note 2.50% 15/05/2024 USD 160,000 174,069 0.17US Treasury Note 2.00% 31/05/2024 USD 516,000 551,797 0.55US Treasury Note 1.75% 30/06/2024 USD 70,000 74,255 0.07US Treasury Note 2.00% 30/06/2024 USD 608,000 650,916 0.64US Treasury Note 2.13% 31/07/2024 USD 563,000 606,281 0.60US Treasury Note 2.38% 15/08/2024 USD 688,000 748,442 0.74US Treasury Note 1.25% 31/08/2024 USD 646,000 673,102 0.67US Treasury Note 1.88% 31/08/2024 USD 371,000 396,231 0.39US Treasury Note 1.50% 30/09/2024 USD 639,000 672,997 0.67US Treasury Note 2.13% 30/09/2024 USD 579,000 625,049 0.62US Treasury Note 1.50% 31/10/2024 USD 412,000 434,209 0.43US Treasury Note 2.25% 31/10/2024 USD 645,000 700,556 0.69US Treasury Note 2.25% 15/11/2024 USD 669,000 727,145 0.72US Treasury Note 2.25% 31/12/2024 USD 815,000 887,681 0.88US Treasury Note 2.50% 31/01/2025 USD 851,000 937,662 0.93US Treasury Note 2.00% 15/02/2025 USD 815,000 879,882 0.87US Treasury Note 1.13% 28/02/2025 USD 735,000 764,371 0.76US Treasury Note 2.75% 28/02/2025 USD 1,415,000 1,577,504 1.56US Treasury Note 0.50% 31/03/2025 USD 1,033,000 1,043,855 1.03US Treasury Note 2.63% 31/03/2025 USD 1,051,000 1,167,431 1.16US Treasury Note 0.38% 30/04/2025 USD 822,000 825,693 0.82US Treasury Note 2.88% 30/04/2025 USD 170,000 191,137 0.19US Treasury Note 0.25% 31/05/2025 USD 500,000 499,355 0.49US Treasury Note 2.88% 31/05/2025 USD 190,000 213,958 0.21US Treasury Note 3.00% 30/09/2025 USD 61,000 69,502 0.07US Treasury Note 3.00% 31/10/2025 USD 83,000 94,708 0.09US Treasury Note 2.25% 15/11/2025 USD 319,000 351,498 0.35US Treasury Note 2.88% 30/11/2025 USD 188,000 213,586 0.21US Treasury Note 2.63% 31/12/2025 USD 1,057,000 1,188,010 1.18US Treasury Note 2.63% 31/01/2026 USD 106,000 119,291 0.12US Treasury Note 1.63% 15/02/2026 USD 1,130,000 1,209,012 1.20US Treasury Note 2.25% 31/03/2026 USD 854,000 945,104 0.94US Treasury Note 2.38% 30/04/2026 USD 383,000 427,030 0.42US Treasury Note 1.63% 15/05/2026 USD 986,000 1,056,676 1.05US Treasury Note 1.63% 31/10/2026 USD 219,000 235,305 0.23US Treasury Note 2.00% 15/11/2026 USD 717,000 787,384 0.78US Treasury Note 1.63% 30/11/2026 USD 472,000 507,345 0.50US Treasury Note 2.25% 15/02/2027 USD 293,000 327,302 0.32US Treasury Note 0.63% 31/03/2027 USD 482,000 486,895 0.48US Treasury Note 0.50% 30/04/2027 USD 1,420,000 1,422,219 1.41US Treasury Note 2.38% 15/05/2027 USD 554,000 625,263 0.62US Treasury Note 0.50% 31/05/2027 USD 728,000 728,768 0.72US Treasury Note 2.25% 15/08/2027 USD 959,000 1,077,189 1.07US Treasury Note 2.25% 15/11/2027 USD 959,000 1,080,074 1.07US Treasury Note 2.75% 15/02/2028 USD 501,000 584,526 0.58US Treasury Note 2.88% 15/05/2028 USD 554,000 653,958 0.65US Treasury Note 2.88% 15/08/2028 USD 615,000 728,511 0.72US Treasury Note 3.13% 15/11/2028 USD 573,000 692,860 0.69US Treasury Note 2.63% 15/02/2029 USD 846,000 991,538 0.98US Treasury Note 2.38% 15/05/2029 USD 203,000 234,314 0.23US Treasury Note 1.63% 15/08/2029 USD 991,000 1,081,506 1.07US Treasury Note 1.75% 15/11/2029 USD 799,000 882,271 0.87US Treasury Note 1.50% 15/02/2030 USD 1,152,000 1,245,555 1.23US Treasury Note 0.63% 15/05/2030 USD 392,000 390,989 0.39
United States total 100,611,658 99.58
Total investments in Government Debt Securities 100,611,658 99.58
Total Bonds 100,611,658 99.58
JPMorgan ETFs (Ireland) ICAV - BetaBuilders US Treasury Bond UCITS ETFSchedule of InvestmentsAs at 30 June 2020
Investments Currency
Quantity/Nominal
Value
FairValue
USD
% ofNet
Assets Investments Currency
Quantity/Nominal
Value
FairValue
USD
% ofNet
Assets

JPMorgan ETFs (Ireland) ICAV - BetaBuilders US Treasury Bond UCITS ETF
Schedule of Investments (continued)
As at 30 June 2020
Forward Currency Contracts
CurrencyPurchased
AmountPurchased Currency Sold Amount Sold
MaturityDate Counterparty
Fair ValueUSD
% ofNet
Assets
Class GBP Hedged (acc)*GBP 149,978 USD 183,011 02/07/2020 Barclays 2,302 -GBP 63,563,285 USD 78,025,966 02/07/2020 Toronto-Dominion Bank 512,868 0.51USD 313,100 GBP 247,125 02/07/2020 Bank of America Merrill Lynch 7,753 0.01USD 167,243 GBP 133,253 02/07/2020 Bank of America Merrill Lynch 2,595 -USD 81,298,336 GBP 65,663,359 02/07/2020 Barclays 164,650 0.16USD 327,548 GBP 258,093 02/07/2020 Barclays 8,648 0.01USD 484,099 GBP 386,355 02/07/2020 Barclays 6,718 0.01USD 358,551 GBP 285,220 02/07/2020 Barclays 6,133 0.01USD 237,637 GBP 190,009 02/07/2020 Barclays 2,862 -
Total unrealised gain on Forward Currency Contracts (31 December 2019: 3.13%) 714,529 0.71
Class GBP Hedged (acc)*GBP 291,867 USD 369,710 02/07/2020 Bank of America Merrill Lynch (9,080) (0.01)GBP 187,007 USD 231,330 04/08/2020 Bank of America Merrill Lynch (212) -GBP 281,190 USD 350,116 02/07/2020 Barclays (2,677) -GBP 255,942 USD 319,143 02/07/2020 Barclays (2,901) -GBP 414,494 USD 522,036 02/07/2020 Barclays (9,887) (0.01)GBP 358,631 USD 457,842 02/07/2020 Barclays (14,717) (0.02)GBP 157,169 USD 195,062 04/08/2020 Barclays (820) -GBP 65,663,359 USD 81,313,045 04/08/2020 Barclays (161,109) (0.16)GBP 8,712 USD 11,109 02/07/2020 Goldman Sachs (344) -GBP 345,480 USD 439,597 02/07/2020 Goldman Sachs (12,722) (0.01)GBP 1,727,400 USD 2,197,987 02/07/2020 Goldman Sachs (63,610) (0.06)GBP 873,930 USD 1,088,081 04/08/2020 Goldman Sachs (8,010) (0.01)USD 127,574 GBP 103,573 02/07/2020 Bank of America Merrill Lynch (400) -USD 159,882 GBP 129,994 02/07/2020 Barclays (739) -
Total unrealised loss on Forward Currency Contracts (31 December 2019: (0.96)%) (287,228) (0.28)
*Contracts entered into for share class currency hedging purpose.
Fair ValueUSD
% ofNet
Assets
Total financial assets at fair value through profit or loss 101,326,187 100.29Total financial liabilities at fair value through profit or loss (287,228) (0.28)Cash 135 0.00
Cash equivalents
Currency
Quantity/Nominal
ValueUndertaking for collective investment schemes (31 December 2019: 0.17%)JPMorgan Liquidity Funds - USD Liquidity LVNAV Fund - Class X (dist.)1 USD 108,338 108,338 0.11
Total Cash equivalents 108,338 0.11Other assets and liabilities (114,998) (0.12)
Net asset value attributable to holders of redeemable participating shares 101,032,434 100.00
Analysis of total assets
% ofTotal
Assets
Transferable securities and money market instruments admitted to official stock exchange listing 91.52Transferable securities and money market instruments dealt in on another regulated market 6.07Collective investment schemes 0.11OTC financial derivative instruments 0.69Other assets 1.61
Total Assets 100.00
1A related party to the Fund.
80

JPMorgan ETFs (Ireland) ICAV - Equity Long-Short UCITS ETF*
Schedule of Investments
As at 30 June 2020
Contracts for Differences
Security Description Counterparty Long/(Short) Units Currency
UnrealisedGain/(Loss)
USD
% ofNet
Assets
United Kingdom (31 December 2019: (0.49)%)Vistry Group plc Bank of America Merrill Lynch L 116 GBP (84) -
United Kingdom total (84) -
Total loss on Contracts for Differences (31 December 2019: (4.80)%) (84) -
Fair ValueUSD
% ofNet
Assets
Total financial liabilities at fair value through profit or loss (84) -Cash 315,742 -Other assets and liabilities (315,658) -
Net asset value attributable to holders of redeemable participating shares - -
Analysis of total assets
% ofTotal
Assets
Other assets 100.00
Total Assets 100.00
* Sub-Fund liquidated on 19 June 2020. See Note 17e.
81

82
Bonds
Corporate Debt Securities (31 December 2019: 98.82%)
Australia (31 December 2019: 2.11%)APT Pipelines Ltd. 1.38% 22/03/2022 EUR 100,000 101,284 0.33Australia & New Zealand Banking GroupLtd. 0.63% 21/02/2023 EUR 103,000 104,715 0.35Macquarie Group Ltd., FRN 1.25%05/03/2025 EUR 100,000 100,394 0.33
Australia total 306,393 1.01
Belgium (31 December 2019: 2.65%)Anheuser-Busch InBev SA/NV 0.88%17/03/2022 EUR 175,000 177,149 0.58Anheuser-Busch InBev SA/NV 0.80%20/04/2023 EUR 260,000 264,307 0.87Anheuser-Busch InBev SA/NV 1.50%17/03/2025 EUR 100,000 105,218 0.35Belfius Bank SA 0.75% 12/09/2022 EUR 100,000 100,369 0.33KBC Group NV 1.13% 25/01/2024 EUR 100,000 102,676 0.34KBC Group NV, FRN 1.88% 11/03/2027 EUR 100,000 100,806 0.33
Belgium total 850,525 2.80
Canada (31 December 2019: 0.42%)Toronto-Dominion Bank (The) 0.63%20/07/2023 EUR 100,000 101,963 0.34
Canada total 101,963 0.34
Cayman Islands (31 December 2019: 0.42%)CK Hutchison Finance 16 Ltd. 1.25%06/04/2023 EUR 200,000 202,354 0.67
Cayman Islands total 202,354 0.67
Denmark (31 December 2019: 0.54%)Danske Bank A/S 0.88% 22/05/2023 EUR 132,000 131,887 0.43
Denmark total 131,887 0.43
France (31 December 2019: 18.72%)Air Liquide Finance SA 1.00% 02/04/2025 EUR 300,000 312,445 1.03APRR SA 1.50% 15/01/2024 EUR 100,000 103,859 0.34Autoroutes du Sud de la France SA 5.63%04/07/2022 EUR 200,000 221,454 0.73AXA SA, FRN 5.13% 04/07/2043 EUR 100,000 111,381 0.36Banque Federative du Credit Mutuel SA0.50% 16/11/2022 EUR 200,000 201,808 0.66Banque Federative du Credit Mutuel SA2.63% 18/03/2024 EUR 100,000 109,116 0.36BNP Paribas SA 0.75% 11/11/2022 EUR 150,000 152,428 0.50BNP Paribas SA 1.13% 15/01/2023 EUR 125,000 128,418 0.42BNP Paribas SA 1.00% 17/04/2024 EUR 350,000 355,725 1.17BPCE SA 1.13% 14/12/2022 EUR 100,000 102,203 0.33BPCE SA 4.63% 18/07/2023 EUR 200,000 222,031 0.73BPCE SA 1.00% 15/07/2024 EUR 100,000 103,155 0.34BPCE SA 0.63% 26/09/2024 EUR 100,000 99,973 0.33BPCE SA 0.13% 04/12/2024 EUR 100,000 99,609 0.33Carrefour SA 1.75% 15/07/2022 EUR 103,000 105,600 0.35Carrefour SA 0.88% 12/06/2023 EUR 100,000 101,717 0.33Credit Agricole SA 3.90% 19/04/2021 EUR 350,000 359,774 1.18Credit Agricole SA 0.50% 24/06/2024 EUR 500,000 498,926 1.64Credit Agricole SA, FRN 1.00%22/04/2026 EUR 100,000 100,927 0.33Credit Mutuel Arkea SA, FRN 1.88%25/10/2029 EUR 100,000 100,001 0.33Engie SA, FRN 3.88% 31/12/2049 EUR 100,000 106,526 0.35Engie SA 0.88% 27/03/2024 EUR 100,000 102,716 0.34Legrand SA 0.50% 09/10/2023 EUR 100,000 100,951 0.33Orange SA 2.50% 01/03/2023 EUR 300,000 318,364 1.05RCI Banque SA 0.75% 26/09/2022 EUR 190,000 185,294 0.61RCI Banque SA 0.75% 10/04/2023 EUR 174,000 169,057 0.55Societe Generale SA, FRN 2.50%16/09/2026 EUR 100,000 100,607 0.33Societe Generale SA, FRN 1.38%23/02/2028 EUR 100,000 99,539 0.33Total Capital International SA 0.25%12/07/2023 EUR 100,000 100,518 0.33Total Capital International SA 1.38%19/03/2025 EUR 100,000 105,526 0.35TOTAL SA, FRN 3.88% 31/12/2049 EUR 450,000 465,277 1.53
France total 5,444,925 17.89
Germany (31 December 2019: 1.77%)Daimler AG 2.63% 07/04/2025 EUR 200,000 212,944 0.70E.ON SE 0.00% 18/12/2023 EUR 200,000 198,234 0.65E.ON SE 0.88% 22/05/2024 EUR 100,000 102,209 0.34HeidelbergCement AG 2.25% 30/03/2023 EUR 45,000 46,620 0.15
MuenchenerRueckversicherungs-Gesellschaft AG inMuenchen, FRN 6.25% 26/05/2042 EUR 100,000 109,872 0.36Volkswagen Financial Services AG 0.88%12/04/2023 EUR 265,000 263,054 0.87
Germany total 932,933 3.07
Guernsey (31 December 2019: 1.04%)Credit Suisse Group Funding GuernseyLtd. 1.25% 14/04/2022 EUR 350,000 355,923 1.17
Guernsey total 355,923 1.17
Ireland (31 December 2019: 4.68%)Abbott Ireland Financing DAC 0.88%27/09/2023 EUR 225,000 230,212 0.76AIB Group plc 1.25% 28/05/2024 EUR 210,000 209,960 0.69Bank of Ireland Group plc, FRN 1.00%25/11/2025 EUR 100,000 98,091 0.32Bank of Ireland Group plc, FRN 2.38%14/10/2029 EUR 100,000 96,532 0.32CRH Finance DAC 3.13% 03/04/2023 EUR 250,000 268,742 0.88Liberty Mutual Finance Europe DAC 1.75%27/03/2024 EUR 100,000 103,914 0.34
Ireland total 1,007,451 3.31
Italy (31 December 2019: 1.30%)Assicurazioni Generali SpA 5.13%16/09/2024 EUR 50,000 59,702 0.20Intesa Sanpaolo SpA 1.13% 04/03/2022 EUR 150,000 150,911 0.49Intesa Sanpaolo SpA 1.00% 04/07/2024 EUR 110,000 109,413 0.36
Italy total 320,026 1.05
Japan (31 December 2019: 2.20%)Asahi Group Holdings Ltd. 0.32%19/09/2021 EUR 100,000 99,559 0.33Sumitomo Mitsui Banking Corp. 1.00%19/01/2022 EUR 103,000 104,383 0.34Takeda Pharmaceutical Co. Ltd. 1.13%21/11/2022 EUR 325,000 330,764 1.09
Japan total 534,706 1.76
Jersey (31 December 2019: 1.86%)Glencore Finance Europe Ltd. 1.88%13/09/2023 EUR 100,000 101,210 0.34Heathrow Funding Ltd. 1.88% 23/05/2022 EUR 339,000 344,617 1.13
Jersey total 445,827 1.47
Luxembourg (31 December 2019: 2.92%)CK Hutchison Group Telecom Finance SA0.38% 17/10/2023 EUR 200,000 198,226 0.65Medtronic Global Holdings SCA 0.38%07/03/2023 EUR 410,000 410,827 1.35SELP Finance Sarl 1.25% 25/10/2023 EUR 100,000 100,789 0.33
Luxembourg total 709,842 2.33
Mexico (31 December 2019: 0.49%)America Movil SAB de CV, FRN 6.38%06/09/2073 EUR 100,000 112,536 0.37
Mexico total 112,536 0.37
Netherlands (31 December 2019: 11.23%)ABN AMRO Bank NV 0.88% 15/01/2024 EUR 100,000 102,902 0.34Airbus SE 1.63% 07/04/2025 EUR 150,000 154,500 0.51BMW Finance NV 0.38% 10/07/2023 EUR 225,000 225,132 0.74BMW Finance NV 2.63% 17/01/2024 EUR 100,000 108,107 0.36Cooperatieve Rabobank UA 0.75%29/08/2023 EUR 100,000 101,290 0.33Cooperatieve Rabobank UA 0.63%27/02/2024 EUR 100,000 101,005 0.33Deutsche Telekom International FinanceBV 0.63% 03/04/2023 EUR 150,000 151,881 0.50EDP Finance BV 2.63% 18/01/2022 EUR 400,000 415,219 1.37EDP Finance BV 1.88% 29/09/2023 EUR 100,000 105,021 0.35Enel Finance International NV 4.88%17/04/2023 EUR 100,000 113,502 0.37Enel Finance International NV 1.00%16/09/2024 EUR 100,000 103,219 0.34Iberdrola International BV 1.13%27/01/2023 EUR 200,000 205,018 0.67ING Groep NV, FRN 3.00% 11/04/2028 EUR 300,000 314,664 1.03innogy Finance BV 0.75% 30/11/2022 EUR 22,000 22,243 0.07Linde Finance BV 1.88% 22/05/2024 EUR 150,000 161,608 0.53Roche Finance Europe BV 0.50%27/02/2023 EUR 100,000 101,619 0.33Siemens Financieringsmaatschappij NV0.30% 28/02/2024 EUR 200,000 202,123 0.66
JPMorgan ETFs (Ireland) ICAV - EUR Corporate Bond 1-5 yr Research Enhanced Index UCITS ETFSchedule of InvestmentsAs at 30 June 2020
Investments Currency
Quantity/Nominal
Value
FairValue
EUR
% ofNet
Assets Investments Currency
Quantity/Nominal
Value
FairValue
EUR
% ofNet
Assets

Volkswagen International Finance NV1.13% 02/10/2023 EUR 200,000 200,016 0.66Volkswagen International Finance NV,FRN 2.70% 31/12/2049 EUR 300,000 293,481 0.96Volkswagen International Finance NV,FRN 3.38% 31/12/2049 EUR 100,000 99,007 0.33Vonovia Finance BV 1.25% 06/12/2024 EUR 200,000 207,593 0.68Vonovia Finance BV 1.50% 31/03/2025 EUR 100,000 104,972 0.35Wintershall Dea Finance BV 0.45%25/09/2023 EUR 100,000 96,549 0.32WPC Eurobond BV 2.25% 19/07/2024 EUR 100,000 104,288 0.34
Netherlands total 3,794,959 12.47
New Zealand (31 December 2019: 1.88%)ANZ New Zealand Int’l Ltd. 0.63%01/06/2021 EUR 130,000 130,760 0.43ASB Finance Ltd. 0.50% 10/06/2022 EUR 223,000 224,533 0.74BNZ International Funding Ltd. 0.50%13/05/2023 EUR 103,000 103,688 0.34
New Zealand total 458,981 1.51
Norway (31 December 2019: 0.42%)DNB Bank ASA, FRN 1.25% 01/03/2027 EUR 100,000 99,883 0.33
Norway total 99,883 0.33
Spain (31 December 2019: 5.87%)Banco Bilbao Vizcaya Argentaria SA0.75% 11/09/2022 EUR 200,000 200,821 0.66Banco Bilbao Vizcaya Argentaria SA 1.13%28/02/2024 EUR 200,000 201,065 0.66Banco Santander SA 1.38% 09/02/2022 EUR 200,000 202,547 0.67CaixaBank SA 1.13% 17/05/2024 EUR 100,000 101,509 0.33CaixaBank SA, FRN 3.50% 15/02/2027 EUR 200,000 204,290 0.67Ferrovial Emisiones SA 0.38%14/09/2022 EUR 100,000 99,720 0.33Ferrovial Emisiones SA 2.50% 15/07/2024 EUR 100,000 107,034 0.35Iberdrola Finanzas SA 1.00% 07/03/2024 EUR 100,000 102,769 0.34Iberdrola Finanzas SA 1.00% 07/03/2025 EUR 200,000 207,091 0.68NorteGas Energia Distribucion SA 0.92%28/09/2022 EUR 200,000 200,615 0.66Telefonica Emisiones SA 1.53%17/01/2025 EUR 100,000 104,913 0.34
Spain total 1,732,374 5.69
Sweden (31 December 2019: 1.27%)Svenska Handelsbanken AB 1.13%14/12/2022 EUR 203,000 208,772 0.69Svenska Handelsbanken AB 0.13%18/06/2024 EUR 310,000 311,251 1.02
Sweden total 520,023 1.71
Switzerland (31 December 2019: 1.48%)Credit Suisse Group AG, FRN 1.25%17/07/2025 EUR 125,000 127,495 0.42UBS Group AG, FRN 1.25% 17/04/2025 EUR 425,000 435,852 1.43
Switzerland total 563,347 1.85
United Kingdom (31 December 2019: 12.10%)AstraZeneca plc 0.75% 12/05/2024 EUR 100,000 102,325 0.34Barclays plc 1.88% 23/03/2021 EUR 100,000 101,132 0.33Barclays plc, FRN 0.63% 14/11/2023 EUR 200,000 199,081 0.65Barclays plc 1.88% 08/12/2023 EUR 200,000 206,667 0.68BAT International Finance plc 1.00%23/05/2022 EUR 150,000 151,103 0.50BP Capital Markets plc 2.18% 28/09/2021 EUR 400,000 409,570 1.35BP Capital Markets plc 0.90% 03/07/2024 EUR 200,000 202,755 0.67Diageo Finance plc 1.75% 23/09/2024 EUR 300,000 318,692 1.05HSBC Holdings plc 0.88% 06/09/2024 EUR 100,000 101,954 0.33Lloyds Bank Corporate Markets plc 0.38%28/01/2025 EUR 100,000 98,507 0.32Lloyds Banking Group plc, FRN 0.63%15/01/2024 EUR 100,000 99,420 0.33Lloyds Banking Group plc, FRN 0.50%12/11/2025 EUR 100,000 97,771 0.32Motability Operations Group plc 1.63%09/06/2023 EUR 203,000 212,471 0.70Nationwide Building Society 1.25%03/03/2025 EUR 100,000 105,736 0.35NatWest Markets plc 2.75% 02/04/2025 EUR 100,000 107,158 0.35Royal Bank of Scotland Group plc, FRN2.00% 08/03/2023 EUR 581,000 591,219 1.94Santander UK plc 1.13% 10/03/2025 EUR 250,000 260,964 0.86Sky Ltd. 1.50% 15/09/2021 EUR 300,000 304,650 1.00Sky Ltd. 1.88% 24/11/2023 EUR 125,000 131,617 0.43SSE plc 1.75% 08/09/2023 EUR 100,000 104,434 0.34Standard Chartered plc, FRN 0.75%03/10/2023 EUR 100,000 99,874 0.33
Vodafone Group plc 0.50% 30/01/2024 EUR 300,000 302,232 0.99Yorkshire Building Society 1.25%17/03/2022 EUR 100,000 100,997 0.33
United Kingdom total 4,410,329 14.49
United States (31 December 2019: 23.45%)AbbVie, Inc. 1.50% 15/11/2023 EUR 200,000 206,560 0.68AbbVie, Inc. 1.38% 17/05/2024 EUR 200,000 206,168 0.68Altria Group, Inc. 1.00% 15/02/2023 EUR 150,000 151,378 0.50American International Group, Inc. 1.50%08/06/2023 EUR 246,000 253,527 0.83Apple, Inc. 1.38% 17/01/2024 EUR 200,000 210,805 0.69AT&T, Inc. 2.40% 15/03/2024 EUR 100,000 105,923 0.35Bank of America Corp. 0.75% 26/07/2023 EUR 385,000 388,983 1.28Bank of America Corp. 2.38% 19/06/2024 EUR 100,000 107,523 0.35BAT Capital Corp. 1.13% 16/11/2023 EUR 100,000 101,050 0.33Becton Dickinson & Co. 1.00% 15/12/2022 EUR 345,000 346,741 1.14Berkshire Hathaway, Inc. 1.30%15/03/2024 EUR 100,000 104,195 0.34Citigroup, Inc. 0.75% 26/10/2023 EUR 475,000 480,977 1.58Coca-Cola Co. (The) 0.50% 08/03/2024 EUR 100,000 101,448 0.33Fidelity National Information Services, Inc.0.75% 21/05/2023 EUR 225,000 226,601 0.74Fidelity National Information Services, Inc.1.10% 15/07/2024 EUR 100,000 102,121 0.34General Electric Co. 0.38% 17/05/2022 EUR 395,000 391,315 1.29Goldman Sachs Group, Inc. (The) 1.38%26/07/2022 EUR 140,000 142,760 0.47Goldman Sachs Group, Inc. (The) 2.00%27/07/2023 EUR 215,000 224,057 0.74Goldman Sachs Group, Inc. (The) 2.13%30/09/2024 EUR 130,000 137,137 0.45Honeywell International, Inc. 1.30%22/02/2023 EUR 203,000 208,584 0.68Honeywell International, Inc. 0.00%10/03/2024 EUR 200,000 197,647 0.65International Business Machines Corp.1.13% 06/09/2024 EUR 100,000 103,549 0.34International Business Machines Corp.0.88% 31/01/2025 EUR 100,000 102,498 0.34International Flavors & Fragrances, Inc.1.75% 14/03/2024 EUR 100,000 102,536 0.34Metropolitan Life Global Funding I 1.25%17/09/2021 EUR 150,000 152,285 0.50Metropolitan Life Global Funding I 2.38%11/01/2023 EUR 120,000 126,806 0.42Metropolitan Life Global Funding I 0.38%09/04/2024 EUR 100,000 100,526 0.33Morgan Stanley 2.38% 31/03/2021 EUR 206,000 209,657 0.69Morgan Stanley 1.75% 11/03/2024 EUR 300,000 313,374 1.03National Grid North America, Inc. 0.75%11/02/2022 EUR 100,000 100,650 0.33Pfizer, Inc. 0.25% 06/03/2022 EUR 365,000 366,550 1.20Philip Morris International, Inc. 1.88%03/03/2021 EUR 150,000 151,629 0.50Philip Morris International, Inc. 2.75%19/03/2025 EUR 100,000 109,708 0.36Thermo Fisher Scientific, Inc. 0.75%12/09/2024 EUR 235,000 238,038 0.78Toyota Motor Credit Corp. 0.63%21/11/2024 EUR 100,000 101,190 0.33Verizon Communications, Inc. 1.63%01/03/2024 EUR 200,000 210,297 0.69Wells Fargo & Co. 1.50% 12/09/2022 EUR 103,000 105,392 0.35
United States total 6,990,185 22.97
Total investments in Corporate Debt Securities 30,027,372 98.69
Total Bonds 30,027,372 98.69
83
JPMorgan ETFs (Ireland) ICAV - EUR Corporate Bond 1-5 yr Research Enhanced Index UCITS ETFSchedule of Investments (continued)As at 30 June 2020
Investments Currency
Quantity/Nominal
Value
FairValue
EUR
% ofNet
Assets Investments Currency
Quantity/Nominal
Value
FairValue
EUR
% ofNet
Assets

JPMorgan ETFs (Ireland) ICAV - EUR Corporate Bond 1-5 yr Research Enhanced Index UCITS ETF
Schedule of Investments (continued)
As at 30 June 2020
Financial Futures Contracts
Security DescriptionNo. of
Contracts Currency
UnderlyingExposure
EUR Counterparty
FairValue
EUR
% ofNet
Assets
Germany (31 December 2019: 0.00%)1
Euro-Bobl, 08/09/2020 14 EUR 1,883,470 Goldman Sachs 6,250 0.02
Germany total 6,250 0.02
Total unrealised gain on Financial Futures Contracts (31 December 2019: 0.00%)1 6,250 0.02
Germany (31 December 2019: (0.01)%)Euro-Schatz, 08/09/2020 (21) EUR (2,353,575) Goldman Sachs (1,365) -
Germany total (1,365) -
Total unrealised loss on Financial Futures Contracts (31 December 2019: (0.01)%) (1,365) -
FairValue
EUR
% ofNet
Assets
Total financial assets at fair value through profit or loss 30,033,622 98.71Total financial liabilities at fair value through profit or loss (1,365) (0.00)Cash and margin cash 215,341 0.71Other assets and liabilities 179,662 0.58
Net asset value attributable to holders of redeemable participating shares 30,427,260 100.00
Analysis of total assets
% ofTotal
Assets
Transferable securities and money market instruments admitted to official stock exchange listing 95.38Transferable securities and money market instruments dealt in on another regulated market 2.59Transferable securities and money market instruments other than those admitted to an official stock exchange listing or dealt in on another regulated market 0.68Financial derivative instruments dealt in on a regulated market 0.02Other assets 1.33
Total Assets 100.00
1Prior year percentage of net asset value rounds to 0.00%.
84

85
Bonds
Corporate Debt Securities (31 December 2019: 98.80%)
Australia (31 December 2019: 2.32%)Australia & New Zealand Banking GroupLtd., FRN 1.13% 21/11/2029 EUR 100,000 99,035 0.06Goodman Australia Finance Pty. Ltd.1.38% 27/09/2025 EUR 440,000 439,992 0.26Macquarie Group Ltd. 0.63% 03/02/2027 EUR 150,000 146,127 0.09National Australia Bank Ltd. 1.38%30/08/2028 EUR 100,000 109,451 0.06Scentre Group Trust 1 2.25% 16/07/2024 EUR 100,000 103,100 0.06Transurban Finance Co. Pty. Ltd. 1.88%16/09/2024 EUR 200,000 207,544 0.12Transurban Finance Co. Pty. Ltd. 1.75%29/03/2028 EUR 575,000 588,801 0.35
Australia total 1,694,050 1.00
Belgium (31 December 2019: 1.64%)Anheuser-Busch InBev SA/NV 2.88%25/09/2024 EUR 328,000 361,029 0.21Anheuser-Busch InBev SA/NV 1.50%18/04/2030 EUR 1,875,000 1,936,751 1.15Anheuser-Busch InBev SA/NV 2.00%23/01/2035 EUR 100,000 102,662 0.06Belfius Bank SA 0.38% 13/02/2026 EUR 100,000 97,833 0.06Belfius Bank SA 3.13% 11/05/2026 EUR 300,000 330,163 0.20KBC Group NV 0.75% 01/03/2022 EUR 100,000 100,915 0.06KBC Group NV, FRN 1.88% 11/03/2027 EUR 1,800,000 1,814,500 1.07
Belgium total 4,743,853 2.81
British Virgin Islands (31 December 2019: 0.28%)Cheung Kong Infrastructure Finance BVILtd. 1.00% 12/12/2024 EUR 200,000 198,642 0.12
British Virgin Islands total 198,642 0.12
Canada (31 December 2019: 0.29%)Toronto-Dominion Bank (The) 0.63%20/07/2023 EUR 102,000 104,002 0.06
Canada total 104,002 0.06
Cayman Islands (31 December 2019: 0.85%)CK Hutchison Europe Finance 18 Ltd.1.25% 13/04/2025 EUR 1,049,000 1,058,697 0.63CK Hutchison Finance 16 Ltd. 1.25%06/04/2023 EUR 200,000 202,354 0.12Hutchison Whampoa Finance 14 Ltd.1.38% 31/10/2021 EUR 100,000 101,122 0.06XLIT Ltd., FRN 3.25% 29/06/2047 EUR 200,000 212,143 0.12
Cayman Islands total 1,574,316 0.93
Finland (31 December 2019: 0.29%)Nordea Bank Abp 1.00% 22/02/2023 EUR 100,000 102,762 0.06Nordea Bank Abp, FRN 1.00%07/09/2026 EUR 869,000 866,099 0.51
Finland total 968,861 0.57
France (31 December 2019: 18.78%)Air Liquide Finance SA 0.75%13/06/2024 EUR 400,000 411,016 0.24Air Liquide Finance SA 1.38%02/04/2030 EUR 200,000 218,673 0.13APRR SA 1.88% 15/01/2025 EUR 200,000 213,458 0.13APRR SA 1.13% 09/01/2026 EUR 200,000 208,386 0.12Arkema SA 1.50% 20/01/2025 EUR 100,000 104,513 0.06Autoroutes du Sud de la France SA 1.13%20/04/2026 EUR 600,000 631,657 0.37AXA SA, FRN 3.38% 06/07/2047 EUR 500,000 547,744 0.33AXA SA, FRN 3.25% 28/05/2049 EUR 101,000 110,643 0.07Banque Federative du Credit Mutuel SA0.50% 16/11/2022 EUR 400,000 403,616 0.24Banque Federative du Credit Mutuel SA3.00% 21/05/2024 EUR 565,000 604,982 0.36Banque Federative du Credit Mutuel SA1.25% 14/01/2025 EUR 300,000 314,276 0.19Banque Federative du Credit Mutuel SA1.25% 26/05/2027 EUR 1,000,000 1,069,258 0.63BNP Paribas SA 0.50% 01/06/2022 EUR 200,000 202,002 0.12BNP Paribas SA 2.38% 17/02/2025 EUR 110,000 116,271 0.07BNP Paribas SA 1.50% 17/11/2025 EUR 950,000 991,501 0.59BNP Paribas SA, FRN 2.13% 23/01/2027 EUR 600,000 641,477 0.38Bouygues SA 1.38% 07/06/2027 EUR 200,000 213,626 0.13Bouygues SA 1.13% 24/07/2028 EUR 100,000 103,934 0.06BPCE SA 0.63% 26/09/2023 EUR 200,000 203,010 0.12BPCE SA 0.13% 04/12/2024 EUR 200,000 199,218 0.12
BPCE SA 0.25% 15/01/2026 EUR 200,000 198,669 0.12BPCE SA 1.38% 23/03/2026 EUR 600,000 620,484 0.37BPCE SA 2.88% 22/04/2026 EUR 800,000 878,915 0.52BPCE SA 1.00% 05/10/2028 EUR 500,000 528,956 0.31Carrefour SA 1.75% 04/05/2026 EUR 300,000 320,525 0.19Carrefour SA 2.63% 15/12/2027 EUR 100,000 111,925 0.07Cie de Saint-Gobain 0.88% 21/09/2023 EUR 900,000 915,586 0.54Cie Financiere et Industrielle desAutoroutes SA 0.38% 07/02/2025 EUR 500,000 504,768 0.30Cie Generale des Etablissements MichelinSCA 0.88% 03/09/2025 EUR 300,000 309,854 0.18Credit Agricole SA 0.50% 24/06/2024 EUR 300,000 299,355 0.18Credit Agricole SA, FRN 1.00%22/04/2026 EUR 1,600,000 1,614,833 0.96Credit Agricole SA 2.63% 17/03/2027 EUR 600,000 646,697 0.38Credit Agricole SA 1.38% 03/05/2027 EUR 500,000 540,209 0.32Credit Agricole SA 2.00% 25/03/2029 EUR 200,000 207,345 0.12Credit Mutuel Arkea SA 3.25%01/06/2026 EUR 400,000 443,910 0.26Credit Mutuel Arkea SA 0.88%07/05/2027 EUR 200,000 203,629 0.12Credit Mutuel Arkea SA, FRN 1.88%25/10/2029 EUR 200,000 200,002 0.12Engie SA, FRN 1.63% 31/12/2049 EUR 700,000 682,195 0.40Engie SA, FRN 3.88% 31/12/2049 EUR 500,000 532,628 0.32Engie SA 1.38% 27/03/2025 EUR 700,000 736,327 0.44Engie SA 0.88% 19/09/2025 EUR 100,000 103,081 0.06Engie SA 2.38% 19/05/2026 EUR 500,000 561,106 0.33Engie SA 1.50% 27/03/2028 EUR 200,000 215,657 0.13Engie SA 1.88% 19/09/2033 EUR 100,000 112,731 0.07EssilorLuxottica SA 0.13% 27/05/2025 EUR 300,000 298,338 0.18EssilorLuxottica SA 0.38% 05/01/2026 EUR 200,000 200,063 0.12EssilorLuxottica SA 0.38% 27/11/2027 EUR 600,000 598,075 0.35Kering SA 1.25% 10/05/2026 EUR 300,000 315,745 0.19Legrand SA 0.50% 09/10/2023 EUR 100,000 100,951 0.06Legrand SA 0.75% 06/07/2024 EUR 400,000 408,985 0.24Legrand SA 1.00% 06/03/2026 EUR 200,000 206,754 0.12LVMH Moet Hennessy Louis Vuitton SE0.00% 11/02/2026 EUR 600,000 591,913 0.35Orange SA, FRN 2.38% 31/12/2049 EUR 300,000 303,677 0.18Orange SA 1.13% 15/07/2024 EUR 100,000 102,911 0.06Orange SA 1.38% 20/03/2028 EUR 500,000 532,180 0.32Orange SA 2.00% 15/01/2029 EUR 1,200,000 1,341,810 0.80Pernod Ricard SA 2.13% 27/09/2024 EUR 400,000 428,453 0.25RCI Banque SA 1.13% 15/01/2027 EUR 490,000 460,609 0.27Sanofi 1.00% 21/03/2026 EUR 300,000 316,093 0.19Societe Fonciere Lyonnaise SA 1.50%29/05/2025 EUR 100,000 103,393 0.06Societe Generale SA 1.13% 23/01/2025 EUR 300,000 302,440 0.18Societe Generale SA 0.13% 24/02/2026 EUR 400,000 395,012 0.23Societe Generale SA, FRN 2.50%16/09/2026 EUR 200,000 201,213 0.12Societe Generale SA, FRN 1.38%23/02/2028 EUR 1,100,000 1,094,931 0.65Suez SA 1.00% 03/04/2025 EUR 300,000 309,150 0.18Total Capital International SA 0.75%12/07/2028 EUR 400,000 407,789 0.24Total Capital International SA 1.49%04/09/2030 EUR 600,000 651,484 0.39Total Capital International SA 0.95%18/05/2031 EUR 100,000 102,651 0.06TOTAL SA, FRN 1.75% 31/12/2049 EUR 1,450,000 1,432,744 0.85TOTAL SA, FRN 2.71% 31/12/2049 EUR 400,000 407,576 0.24TOTAL SA, FRN 3.88% 31/12/2049 EUR 300,000 310,185 0.18Unibail-Rodamco-Westfield SE 1.13%15/09/2025 EUR 500,000 495,107 0.29Veolia Environnement SA 0.67%30/03/2022 EUR 400,000 402,538 0.24Veolia Environnement SA 1.50%30/11/2026 EUR 300,000 320,930 0.19Vinci SA 1.75% 26/09/2030 EUR 300,000 337,224 0.20
France total 32,479,572 19.25
Germany (31 December 2019: 2.20%)Allianz SE, FRN 4.75% 31/12/2049 EUR 100,000 109,830 0.06Allianz SE, FRN 5.63% 17/10/2042 EUR 100,000 109,990 0.07Allianz SE, FRN 2.24% 07/07/2045 EUR 100,000 104,138 0.06BASF SE 0.88% 22/05/2025 EUR 311,000 324,138 0.19BASF SE 0.88% 15/11/2027 EUR 210,000 221,140 0.13Bertelsmann SE & Co. KGaA 1.25%29/09/2025 EUR 300,000 312,387 0.19Commerzbank AG 0.50% 04/12/2026 EUR 190,000 187,185 0.11E.ON SE 0.88% 22/05/2024 EUR 352,000 359,774 0.21E.ON SE 0.38% 29/09/2027 EUR 730,000 727,818 0.43Hannover Rueck SE, FRN 3.38%31/12/2049 EUR 300,000 323,152 0.19
JPMorgan ETFs (Ireland) ICAV - EUR Corporate Bond Research Enhanced Index UCITS ETFSchedule of InvestmentsAs at 30 June 2020
Investments Currency
Quantity/Nominal
Value
FairValue
EUR
% ofNet
Assets Investments Currency
Quantity/Nominal
Value
FairValue
EUR
% ofNet
Assets

MuenchenerRueckversicherungs-Gesellschaft AG inMuenchen, FRN 3.25% 26/05/2049 EUR 100,000 114,043 0.07SAP SE 1.00% 01/04/2025 EUR 610,000 637,219 0.38
Germany total 3,530,814 2.09
Guernsey (31 December 2019: 0.71%)Credit Suisse Group Funding GuernseyLtd. 1.25% 14/04/2022 EUR 350,000 355,923 0.21
Guernsey total 355,923 0.21
Ireland (31 December 2019: 3.90%)Abbott Ireland Financing DAC 0.88%27/09/2023 EUR 115,000 117,664 0.07Abbott Ireland Financing DAC 1.50%27/09/2026 EUR 975,000 1,042,307 0.62AIB Group plc 2.25% 03/07/2025 EUR 675,000 709,289 0.42Bank of Ireland Group plc, FRN 1.00%25/11/2025 EUR 250,000 245,228 0.15Bank of Ireland Group plc, FRN 2.38%14/10/2029 EUR 250,000 241,330 0.14CRH Finance DAC 1.38% 18/10/2028 EUR 200,000 210,575 0.12Eaton Capital Unlimited Co. 0.75%20/09/2024 EUR 202,000 202,957 0.12Eaton Capital Unlimited Co. 0.70%14/05/2025 EUR 300,000 300,674 0.18GE Capital European Funding UnlimitedCo. 4.63% 22/02/2027 EUR 200,000 229,454 0.14Kerry Group Financial Services Unltd Co.2.38% 10/09/2025 EUR 295,000 325,169 0.19Zurich Finance Ireland DesignatedActivity Co. 1.63% 17/06/2039 EUR 200,000 222,126 0.13
Ireland total 3,846,773 2.28
Italy (31 December 2019: 2.21%)Assicurazioni Generali SpA 5.13%16/09/2024 EUR 329,000 392,839 0.23Assicurazioni Generali SpA, FRN 10.13%10/07/2042 EUR 100,000 116,992 0.07ENI SpA 3.75% 12/09/2025 EUR 100,000 116,734 0.07ENI SpA 1.50% 02/02/2026 EUR 739,000 775,373 0.46Intesa Sanpaolo SpA 1.13% 04/03/2022 EUR 200,000 201,215 0.12Intesa Sanpaolo SpA 1.00% 19/11/2026 EUR 1,025,000 1,002,341 0.60Italgas SpA 1.13% 14/03/2024 EUR 380,000 392,114 0.23Italgas SpA 1.63% 19/01/2027 EUR 100,000 107,040 0.06Italgas SpA 1.00% 11/12/2031 EUR 100,000 101,724 0.06Snam SpA 0.88% 25/10/2026 EUR 601,000 618,041 0.37
Italy total 3,824,413 2.27
Japan (31 December 2019: 1.25%)Asahi Group Holdings Ltd. 1.15%19/09/2025 EUR 100,000 101,783 0.06Mitsubishi UFJ Financial Group, Inc.0.87% 07/09/2024 EUR 870,000 881,761 0.52Sumitomo Mitsui Financial Group, Inc.0.47% 30/05/2024 EUR 150,000 149,945 0.09Sumitomo Mitsui Financial Group, Inc.1.55% 15/06/2026 EUR 520,000 556,143 0.33Takeda Pharmaceutical Co. Ltd. 1.13%21/11/2022 EUR 100,000 101,773 0.06Takeda Pharmaceutical Co. Ltd. 2.25%21/11/2026 EUR 825,000 903,651 0.54
Japan total 2,695,056 1.60
Jersey (31 December 2019: 0.87%)Glencore Finance Europe Ltd. 1.88%13/09/2023 EUR 350,000 354,237 0.21Glencore Finance Europe Ltd. 1.75%17/03/2025 EUR 450,000 451,815 0.27Heathrow Funding Ltd. 1.88%23/05/2022 EUR 100,000 101,657 0.06Heathrow Funding Ltd. 1.50%11/02/2030 EUR 477,000 478,280 0.28
Jersey total 1,385,989 0.82
Luxembourg (31 December 2019: 4.13%)CK Hutchison Group Telecom Finance SA0.38% 17/10/2023 EUR 700,000 693,791 0.41CK Hutchison Group Telecom Finance SA1.13% 17/10/2028 EUR 590,000 582,707 0.35DH Europe Finance II Sarl 0.20%18/03/2026 EUR 600,000 590,318 0.35DH Europe Finance II Sarl 0.75%18/09/2031 EUR 150,000 144,626 0.09DH Europe Finance Sarl 1.20%30/06/2027 EUR 208,000 215,381 0.13HeidelbergCement Finance LuxembourgSA 1.63% 07/04/2026 EUR 512,000 523,977 0.31
John Deere Cash Management SA 0.50%15/09/2023 EUR 100,000 100,808 0.06John Deere Cash Management SA 1.85%02/04/2028 EUR 617,000 668,074 0.40Medtronic Global Holdings SCA 0.38%07/03/2023 EUR 350,000 350,706 0.21Medtronic Global Holdings SCA 1.13%07/03/2027 EUR 1,170,000 1,221,978 0.72Medtronic Global Holdings SCA 2.25%07/03/2039 EUR 125,000 140,696 0.08Medtronic Global Holdings SCA 1.75%02/07/2049 EUR 105,000 102,514 0.06Nestle Finance International Ltd. 1.13%01/04/2026 EUR 527,000 556,918 0.33Novartis Finance SA 0.13% 20/09/2023 EUR 875,000 882,318 0.52Richemont International Holding SA1.00% 26/03/2026 EUR 450,000 470,758 0.28SELP Finance Sarl 1.25% 25/10/2023 EUR 825,000 831,509 0.49SELP Finance Sarl 1.50% 20/11/2025 EUR 300,000 299,550 0.18
Luxembourg total 8,376,629 4.97
Mexico (31 December 2019: 0.59%)America Movil SAB de CV 1.50%10/03/2024 EUR 352,000 361,086 0.21
Mexico total 361,086 0.21
Netherlands (31 December 2019: 13.91%)ABN AMRO Bank NV 0.88% 22/04/2025 EUR 275,000 285,451 0.17ABN AMRO Bank NV, FRN 2.88%18/01/2028 EUR 600,000 623,444 0.37Airbus Finance BV 2.38% 02/04/2024 EUR 100,000 105,451 0.06Airbus SE 1.38% 09/06/2026 EUR 700,000 709,629 0.42Argentum Netherlands BV for ZurichInsurance Co. Ltd., FRN 3.50%01/10/2046 EUR 100,000 111,545 0.07BMW Finance NV 0.38% 10/07/2023 EUR 75,000 75,044 0.04BMW Finance NV 0.38% 14/01/2027 EUR 800,000 790,903 0.47BMW Finance NV 1.13% 10/01/2028 EUR 190,000 197,058 0.12Brenntag Finance BV 1.13% 27/09/2025 EUR 941,000 938,875 0.56Coca-Cola HBC Finance BV 1.88%11/11/2024 EUR 136,000 144,972 0.09Cooperatieve Rabobank UA 0.63%27/02/2024 EUR 700,000 707,035 0.42Cooperatieve Rabobank UA 1.25%23/03/2026 EUR 315,000 336,709 0.20CRH Funding BV 1.88% 09/01/2024 EUR 930,000 975,629 0.58Daimler International Finance BV 0.25%06/11/2023 EUR 1,350,000 1,316,138 0.78Daimler International Finance BV 0.63%06/05/2027 EUR 1,250,000 1,184,260 0.70Deutsche Telekom International FinanceBV 0.63% 03/04/2023 EUR 250,000 253,134 0.15Deutsche Telekom International FinanceBV 0.88% 30/01/2024 EUR 1,750,000 1,797,226 1.07Deutsche Telekom International FinanceBV 2.75% 24/10/2024 EUR 60,000 66,547 0.04Deutsche Telekom International FinanceBV 4.88% 22/04/2025 EUR 375,000 459,278 0.27Digital Dutch Finco BV 0.63% 15/07/2025 EUR 120,000 118,547 0.07EDP Finance BV 1.13% 12/02/2024 EUR 350,000 359,965 0.21EDP Finance BV 2.00% 22/04/2025 EUR 230,000 246,894 0.15EDP Finance BV 1.63% 26/01/2026 EUR 100,000 105,489 0.06EDP Finance BV 1.50% 22/11/2027 EUR 757,000 801,031 0.47Enel Finance International NV 0.00%17/06/2024 EUR 100,000 98,827 0.06Enel Finance International NV 1.00%16/09/2024 EUR 100,000 103,219 0.06Enel Finance International NV 1.97%27/01/2025 EUR 617,000 665,028 0.39Enel Finance International NV 0.38%17/06/2027 EUR 640,000 632,803 0.37Heineken NV 3.50% 19/03/2024 EUR 110,000 123,062 0.07Heineken NV 1.63% 30/03/2025 EUR 684,000 724,627 0.43Iberdrola International BV, FRN 1.88%31/12/2049 EUR 1,300,000 1,299,284 0.77Iberdrola International BV, FRN 2.63%31/12/2049 EUR 400,000 411,655 0.24ING Groep NV, FRN 0.10% 03/09/2025 EUR 300,000 293,442 0.17ING Groep NV 2.13% 10/01/2026 EUR 200,000 217,488 0.13ING Groep NV, FRN 3.00% 11/04/2028 EUR 400,000 419,552 0.25ING Groep NV 2.00% 20/09/2028 EUR 100,000 111,245 0.07ING Groep NV, FRN 1.63% 26/09/2029 EUR 900,000 905,365 0.54innogy Finance BV 1.50% 31/07/2029 EUR 50,000 53,559 0.03Linde Finance BV 1.00% 20/04/2028 EUR 1,000,000 1,073,482 0.64Shell International Finance BV 1.63%20/01/2027 EUR 1,050,000 1,139,476 0.68Siemens Financieringsmaatschappij NV1.00% 06/09/2027 EUR 275,000 290,288 0.17Siemens Financieringsmaatschappij NV0.25% 20/02/2029 EUR 1,000,000 987,632 0.59
86
JPMorgan ETFs (Ireland) ICAV - EUR Corporate Bond Research Enhanced Index UCITS ETFSchedule of Investments (continued)As at 30 June 2020
Investments Currency
Quantity/Nominal
Value
FairValue
EUR
% ofNet
Assets Investments Currency
Quantity/Nominal
Value
FairValue
EUR
% ofNet
Assets

Siemens Financieringsmaatschappij NV1.38% 06/09/2030 EUR 30,000 32,694 0.02Sika Capital BV 0.88% 29/04/2027 EUR 450,000 464,217 0.28Unilever NV 0.50% 29/04/2024 EUR 405,000 415,309 0.25Unilever NV 1.25% 25/03/2025 EUR 788,000 833,282 0.49Volkswagen International Finance NV,FRN 4.63% 31/12/2049 EUR 400,000 415,825 0.25Volkswagen International Finance NV1.88% 30/03/2027 EUR 1,700,000 1,742,471 1.03Volkswagen International Finance NV2.63% 16/11/2027 EUR 200,000 214,905 0.13Volkswagen International Finance NV1.63% 16/01/2030 EUR 330,000 327,720 0.19Volkswagen International Finance NV,FRN 2.70% 31/12/2049 EUR 800,000 782,616 0.46Vonovia Finance BV 2.25% 15/12/2023 EUR 1,600,000 1,706,173 1.01Vonovia Finance BV 1.25% 06/12/2024 EUR 100,000 103,797 0.06Vonovia Finance BV 1.13% 08/09/2025 EUR 600,000 617,774 0.37Wintershall Dea Finance BV 0.84%25/09/2025 EUR 500,000 473,719 0.28WPC Eurobond BV 2.25% 19/07/2024 EUR 801,000 835,346 0.49WPC Eurobond BV 2.25% 09/04/2026 EUR 250,000 262,088 0.16WPC Eurobond BV 2.13% 15/04/2027 EUR 100,000 103,604 0.06
Netherlands total 31,591,828 18.73
New Zealand (31 December 2019: 0.98%)Chorus Ltd. 0.88% 05/12/2026 EUR 200,000 200,902 0.12Westpac Securities NZ Ltd. 0.30%25/06/2024 EUR 388,000 390,347 0.23
New Zealand total 591,249 0.35
Spain (31 December 2019: 5.71%)Abertis Infraestructuras SA 1.00%27/02/2027 EUR 500,000 464,275 0.28Banco Bilbao Vizcaya Argentaria SA0.75% 11/09/2022 EUR 200,000 200,820 0.12Banco Bilbao Vizcaya Argentaria SA1.38% 14/05/2025 EUR 100,000 101,889 0.06Banco Bilbao Vizcaya Argentaria SA0.50% 14/01/2027 EUR 1,000,000 956,878 0.57Banco de Sabadell SA 0.88% 05/03/2023 EUR 100,000 97,866 0.06Banco Santander SA 1.38% 09/02/2022 EUR 300,000 303,820 0.18Banco Santander SA 0.30% 04/10/2026 EUR 200,000 199,311 0.12Bankinter SA 0.88% 05/03/2024 EUR 200,000 202,802 0.12Bankinter SA 0.63% 06/10/2027 EUR 500,000 472,163 0.28CaixaBank SA 1.13% 17/05/2024 EUR 200,000 203,018 0.12CaixaBank SA 1.38% 19/06/2026 EUR 500,000 498,739 0.30CaixaBank SA, FRN 3.50% 15/02/2027 EUR 500,000 510,725 0.30CaixaBank SA, FRN 2.75% 14/07/2028 EUR 100,000 101,369 0.06Ferrovial Emisiones SA 1.38%31/03/2025 EUR 500,000 512,526 0.30Ferrovial Emisiones SA 1.38%14/05/2026 EUR 300,000 303,738 0.18Iberdrola Finanzas SA 1.00% 07/03/2025 EUR 300,000 310,637 0.18Iberdrola Finanzas SA 1.62% 29/11/2029 EUR 200,000 222,059 0.13NorteGas Energia Distribucion SA 0.92%28/09/2022 EUR 200,000 200,615 0.12NorteGas Energia Distribucion SA 2.07%28/09/2027 EUR 551,000 583,616 0.35Red Electrica Financiaciones SAU 1.13%24/04/2025 EUR 200,000 210,219 0.12Telefonica Emisiones SA 1.50%11/09/2025 EUR 100,000 105,098 0.06Telefonica Emisiones SA 1.46%13/04/2026 EUR 1,100,000 1,154,814 0.68
Spain total 7,916,997 4.69
Sweden (31 December 2019: 0.28%)Essity AB 1.13% 27/03/2024 EUR 206,000 212,031 0.12Skandinaviska Enskilda Banken AB, FRN1.38% 31/10/2028 EUR 100,000 100,424 0.06Svenska Handelsbanken AB 0.05%03/09/2026 EUR 1,188,000 1,160,439 0.69Telia Co. AB 3.88% 01/10/2025 EUR 400,000 468,805 0.28
Sweden total 1,941,699 1.15
Switzerland (31 December 2019: 1.22%)Credit Suisse Group AG, FRN 1.25%17/07/2025 EUR 275,000 280,489 0.17Credit Suisse Group AG, FRN 1.00%24/06/2027 EUR 100,000 99,880 0.06Credit Suisse Group AG, FRN 0.65%14/01/2028 EUR 794,000 771,699 0.46UBS Group AG, FRN 1.25% 17/04/2025 EUR 650,000 666,597 0.39UBS Group AG 1.25% 01/09/2026 EUR 813,000 844,033 0.50
Switzerland total 2,662,698 1.58
United Kingdom (31 December 2019: 10.32%)AstraZeneca plc 0.75% 12/05/2024 EUR 780,000 798,132 0.47Aviva plc, FRN 3.88% 03/07/2044 EUR 100,000 106,796 0.06Barclays plc, FRN 1.38% 24/01/2026 EUR 1,182,000 1,190,510 0.71BAT International Finance plc 1.00%23/05/2022 EUR 100,000 100,735 0.06BAT International Finance plc 1.25%13/03/2027 EUR 200,000 197,259 0.12BAT International Finance plc 2.25%16/01/2030 EUR 130,000 134,855 0.08BP Capital Markets plc 0.90%03/07/2024 EUR 353,000 357,862 0.21BP Capital Markets plc 2.97% 27/02/2026 EUR 540,000 604,847 0.36BP Capital Markets plc 2.52%07/04/2028 EUR 300,000 330,241 0.20BP Capital Markets plc 1.64%26/06/2029 EUR 715,000 741,059 0.44British Telecommunications plc 1.75%10/03/2026 EUR 490,000 518,063 0.31Cadent Finance plc 0.75% 11/03/2032 EUR 135,000 132,271 0.08Coca-Cola European Partners plc 1.13%26/05/2024 EUR 490,000 505,794 0.30Diageo Finance plc 1.88% 27/03/2027 EUR 899,000 986,297 0.58GlaxoSmithKline Capital plc 1.38%02/12/2024 EUR 390,000 411,146 0.24HSBC Holdings plc 0.88% 06/09/2024 EUR 200,000 203,907 0.12HSBC Holdings plc 2.50% 15/03/2027 EUR 200,000 227,708 0.13Lloyds Bank plc 1.25% 13/01/2025 EUR 100,000 106,169 0.06Lloyds Banking Group plc, FRN 0.63%15/01/2024 EUR 202,000 200,828 0.12Lloyds Banking Group plc 1.50%12/09/2027 EUR 200,000 210,206 0.12Motability Operations Group plc 1.63%09/06/2023 EUR 202,000 211,424 0.13Motability Operations Group plc 0.38%03/01/2026 EUR 390,000 388,576 0.23Nationwide Building Society, FRN 1.50%08/03/2026 EUR 781,000 809,657 0.48Royal Bank of Scotland Group plc, FRN1.75% 02/03/2026 EUR 1,746,000 1,788,122 1.06Santander UK plc 1.13% 10/03/2025 EUR 700,000 730,698 0.43Sky Ltd. 2.25% 17/11/2025 EUR 325,000 357,386 0.21Sky Ltd. 2.50% 15/09/2026 EUR 400,000 450,456 0.27SSE plc 1.75% 08/09/2023 EUR 202,000 210,957 0.13SSE plc 1.38% 04/09/2027 EUR 170,000 177,627 0.11Standard Chartered plc, FRN 0.90%02/07/2027 EUR 100,000 99,283 0.06Tesco Corporate Treasury Services plc2.50% 01/07/2024 EUR 100,000 106,457 0.06Vodafone Group plc 2.20% 25/08/2026 EUR 1,690,000 1,858,638 1.10Vodafone Group plc 1.88% 20/11/2029 EUR 100,000 110,102 0.07Yorkshire Building Society 1.25%17/03/2022 EUR 100,000 100,997 0.06Yorkshire Building Society 0.88%20/03/2023 EUR 150,000 150,273 0.09
United Kingdom total 15,615,338 9.26
United States (31 December 2019: 26.07%)AbbVie, Inc. 0.50% 01/06/2021 EUR 171,000 170,980 0.10AbbVie, Inc. 1.50% 15/11/2023 EUR 300,000 309,840 0.18AbbVie, Inc. 1.38% 17/05/2024 EUR 200,000 206,168 0.12AbbVie, Inc. 1.25% 01/06/2024 EUR 150,000 153,327 0.09AbbVie, Inc. 0.75% 18/11/2027 EUR 625,000 625,231 0.37Altria Group, Inc. 1.70% 15/06/2025 EUR 210,000 215,747 0.13Altria Group, Inc. 2.20% 15/06/2027 EUR 385,000 405,120 0.24American Honda Finance Corp. 1.95%18/10/2024 EUR 570,000 601,402 0.36American International Group, Inc. 1.50%08/06/2023 EUR 150,000 154,590 0.09American International Group, Inc. 1.88%21/06/2027 EUR 501,000 526,485 0.31American Tower Corp. 1.38%04/04/2025 EUR 100,000 103,087 0.06American Tower Corp. 1.95% 22/05/2026 EUR 186,000 197,595 0.12Apple, Inc. 1.63% 10/11/2026 EUR 255,000 280,055 0.17Apple, Inc. 2.00% 17/09/2027 EUR 661,000 750,199 0.44AT&T, Inc. 2.40% 15/03/2024 EUR 810,000 857,975 0.51AT&T, Inc. 1.80% 05/09/2026 EUR 1,400,000 1,463,942 0.87Bank of America Corp. 0.75%26/07/2023 EUR 400,000 404,138 0.24Bank of America Corp., FRN 1.78%04/05/2027 EUR 500,000 529,085 0.31Bank of America Corp., FRN 1.38%09/05/2030 EUR 625,000 644,137 0.38Baxter International, Inc. 0.40%15/05/2024 EUR 110,000 110,735 0.07Becton Dickinson & Co. 1.40%24/05/2023 EUR 400,000 406,296 0.24Becton Dickinson & Co. 1.90%15/12/2026 EUR 656,000 679,964 0.40
87
JPMorgan ETFs (Ireland) ICAV - EUR Corporate Bond Research Enhanced Index UCITS ETFSchedule of Investments (continued)As at 30 June 2020
Investments Currency
Quantity/Nominal
Value
FairValue
EUR
% ofNet
Assets Investments Currency
Quantity/Nominal
Value
FairValue
EUR
% ofNet
Assets

Berkshire Hathaway, Inc. 0.75%16/03/2023 EUR 665,000 676,520 0.40Berkshire Hathaway, Inc. 1.13%16/03/2027 EUR 100,000 105,315 0.06Boston Scientific Corp. 0.63% 01/12/2027 EUR 200,000 197,480 0.12Brown-Forman Corp. 1.20% 07/07/2026 EUR 100,000 102,345 0.06Chubb INA Holdings, Inc. 0.30%15/12/2024 EUR 375,000 371,012 0.22Citigroup, Inc. 0.75% 26/10/2023 EUR 100,000 101,258 0.06Citigroup, Inc., FRN 1.50% 24/07/2026 EUR 663,000 685,684 0.41Citigroup, Inc. 1.25% 10/04/2029 EUR 576,000 598,105 0.35Coca-Cola Co. (The) 0.75% 22/09/2026 EUR 720,000 742,020 0.44Colgate-Palmolive Co. 0.50%06/03/2026 EUR 390,000 398,693 0.24Comcast Corp. 0.75% 20/02/2032 EUR 440,000 428,618 0.25Discovery Communications LLC 1.90%19/03/2027 EUR 110,000 112,192 0.07Dow Chemical Co. (The) 0.50%15/03/2027 EUR 330,000 312,540 0.19Eli Lilly & Co. 1.63% 02/06/2026 EUR 464,000 505,050 0.30Eli Lilly & Co. 0.63% 01/11/2031 EUR 100,000 101,436 0.06Fidelity National Information Services,Inc. 1.10% 15/07/2024 EUR 400,000 408,486 0.24Fidelity National Information Services,Inc. 1.50% 21/05/2027 EUR 920,000 951,282 0.56Fidelity National Information Services,Inc. 2.00% 21/05/2030 EUR 150,000 160,490 0.10General Electric Co. 0.88% 17/05/2025 EUR 481,000 463,905 0.27General Mills, Inc. 0.45% 15/01/2026 EUR 100,000 98,483 0.06Goldman Sachs Group, Inc. (The) 1.38%15/05/2024 EUR 425,000 432,823 0.26Goldman Sachs Group, Inc. (The) 2.88%03/06/2026 EUR 300,000 333,797 0.20Goldman Sachs Group, Inc. (The) 1.63%27/07/2026 EUR 1,114,000 1,164,236 0.69Goldman Sachs Group, Inc. (The) 3.00%12/02/2031 EUR 30,000 35,427 0.02Honeywell International, Inc. 0.00%10/03/2024 EUR 1,150,000 1,136,471 0.67Honeywell International, Inc. 0.75%10/03/2032 EUR 200,000 195,772 0.12Illinois Tool Works, Inc. 0.63%05/12/2027 EUR 420,000 422,552 0.25International Business Machines Corp.2.88% 07/11/2025 EUR 225,000 254,259 0.15International Business Machines Corp.1.25% 29/01/2027 EUR 1,271,000 1,327,820 0.79International Flavors & Fragrances, Inc.1.80% 25/09/2026 EUR 351,000 353,953 0.21Liberty Mutual Group, Inc. 2.75%04/05/2026 EUR 725,000 799,215 0.47Marsh & McLennan Cos., Inc. 1.35%21/09/2026 EUR 100,000 104,576 0.06McDonald’s Corp. 2.38% 27/11/2024 EUR 400,000 433,537 0.26Merck & Co., Inc. 1.88% 15/10/2026 EUR 218,000 241,272 0.14Metropolitan Life Global Funding I 0.88%20/01/2022 EUR 225,000 227,894 0.14Metropolitan Life Global Funding I 0.38%09/04/2024 EUR 1,130,000 1,135,949 0.67Microsoft Corp. 3.13% 06/12/2028 EUR 160,000 199,916 0.12Mondelez International, Inc. 1.63%20/01/2023 EUR 475,000 490,739 0.29Moody’s Corp. 0.95% 25/02/2030 EUR 170,000 174,019 0.10Morgan Stanley 1.00% 02/12/2022 EUR 100,000 101,173 0.06Morgan Stanley 1.75% 11/03/2024 EUR 200,000 208,916 0.12Morgan Stanley, FRN 1.34% 23/10/2026 EUR 379,000 390,914 0.23Morgan Stanley 1.88% 27/04/2027 EUR 464,000 502,476 0.30National Grid North America, Inc. 0.75%11/02/2022 EUR 100,000 100,650 0.06Nestle Holdings, Inc. 0.88% 18/07/2025 EUR 35,000 36,508 0.02PepsiCo, Inc. 2.63% 28/04/2026 EUR 500,000 570,025 0.34Pfizer, Inc. 1.00% 06/03/2027 EUR 730,000 766,125 0.45Philip Morris International, Inc. 2.88%30/05/2024 EUR 540,000 590,957 0.35Philip Morris International, Inc. 2.88%14/05/2029 EUR 625,000 725,993 0.43Procter & Gamble Co. (The) 0.50%25/10/2024 EUR 564,000 579,395 0.34Prologis Euro Finance LLC 0.25%10/09/2027 EUR 250,000 244,626 0.15Prologis LP 3.38% 20/02/2024 EUR 1,300,000 1,434,823 0.85Prologis LP 3.00% 02/06/2026 EUR 200,000 229,627 0.14Raytheon Technologies Corp. 2.15%18/05/2030 EUR 285,000 313,719 0.19Stryker Corp. 0.25% 03/12/2024 EUR 425,000 420,464 0.25Thermo Fisher Scientific, Inc. 1.40%23/01/2026 EUR 310,000 323,789 0.19Thermo Fisher Scientific, Inc. 0.50%01/03/2028 EUR 1,100,000 1,079,398 0.64Toyota Motor Credit Corp. 0.63%21/11/2024 EUR 700,000 708,330 0.42
US Bancorp 0.85% 07/06/2024 EUR 200,000 203,193 0.12Verizon Communications, Inc. 3.25%17/02/2026 EUR 900,000 1,032,231 0.61Verizon Communications, Inc. 0.88%08/04/2027 EUR 780,000 790,648 0.47Verizon Communications, Inc. 1.38%02/11/2028 EUR 300,000 315,899 0.19Walmart, Inc. 2.55% 08/04/2026 EUR 185,000 210,914 0.13Wells Fargo & Co., FRN 1.34%04/05/2025 EUR 300,000 305,491 0.18Wells Fargo & Co. 1.00% 02/02/2027 EUR 951,000 958,830 0.57Westlake Chemical Corp. 1.63%17/07/2029 EUR 200,000 192,308 0.11
United States total 40,118,661 23.78
Total investments in Corporate Debt Securities 166,578,449 98.73
Total Bonds 166,578,449 98.73
88
JPMorgan ETFs (Ireland) ICAV - EUR Corporate Bond Research Enhanced Index UCITS ETFSchedule of Investments (continued)As at 30 June 2020
Investments Currency
Quantity/Nominal
Value
FairValue
EUR
% ofNet
Assets Investments Currency
Quantity/Nominal
Value
FairValue
EUR
% ofNet
Assets

JPMorgan ETFs (Ireland) ICAV - EUR Corporate Bond Research Enhanced Index UCITS ETF
Schedule of Investments (continued)
As at 30 June 2020
Financial Futures Contracts
Security DescriptionNo. of
Contracts Currency
UnderlyingExposure
EUR Counterparty
FairValue
EUR
% ofNet
Assets
Germany (31 December 2019: 0.03%)Euro-Bund, 08/09/2020 46 EUR 8,070,180 Goldman Sachs 49,740 0.03Euro-Buxl 30-Year Bond, 08/09/2020 14 EUR 3,030,060 Goldman Sachs 49,380 0.03Euro-Schatz, 08/09/2020 129 EUR 14,459,470 Goldman Sachs 6,590 -
Germany total 105,710 0.06
Total unrealised gain on Financial Futures Contracts (31 December 2019: 0.03%) 105,710 0.06
Germany (31 December 2019: (0.04)%)Euro-Bobl, 08/09/2020 (217) EUR (29,183,580) Goldman Sachs (107,080) (0.06)
Germany total (107,080) (0.06)
Total unrealised loss on Financial Futures Contracts (31 December 2019: (0.04)%) (107,080) (0.06)
FairValue
EUR
% ofNet
Assets
Total financial assets at fair value through profit or loss 166,684,159 98.79Total financial liabilities at fair value through profit or loss (107,080) (0.06)Cash and margin cash 1,204,624 0.71Other assets and liabilities 935,898 0.56
Net asset value attributable to holders of redeemable participating shares 168,717,601 100.00
Analysis of total assets
% ofTotal
Assets
Transferable securities and money market instruments admitted to official stock exchange listing 95.94Transferable securities and money market instruments dealt in on another regulated market 2.08Transferable securities and money market instruments other than those admitted to an official stock exchange listing or dealt in on another regulated market 0.63Financial derivative instruments dealt in on a regulated market 0.06Other assets 1.29
Total Assets 100.00
89

90
Bonds
Asset-Backed Securities (31 December 2019: 3.83%)
Cayman Islands (31 December 2019: 3.34%)AIMCO CLO Series 2017-A ‘AR’, FRN2.07% 15/01/2028 USD 1,537,946 1,349,935 0.24Apidos CLO XXI ‘A1R’, FRN 2.07%18/07/2027 USD 1,500,000 1,322,270 0.24BlueMountain CLO 2012-2X Ltd. ‘AR2’,FRN 1.43% 20/11/2028 USD 4,396,700 3,853,199 0.69Dryden Senior Loan Fund 2013-30X ‘AR’,FRN 1.21% 15/11/2028 USD 750,000 656,612 0.12Magnetite XVI Ltd. ‘AR’, FRN 1.94%18/01/2028 USD 929,058 816,085 0.15
Cayman Islands total 7,998,101 1.44
France (31 December 2019: 0.13%)BPCE Home Loans FCT 2018-1 ‘A’, FRN0.22% 31/10/2053 EUR 627,846 628,663 0.11
France total 628,663 0.11
Luxembourg (31 December 2019: 0.03%)Bavarian Sky SA ‘A’, FRN 0.20%20/05/2027 EUR 2,920,711 2,942,549 0.53Silver Arrow SA Compartment 11 ‘A’, FRN0.22% 15/02/2027 EUR 2,920,759 2,943,935 0.53
Luxembourg total 5,886,484 1.06
Netherlands (31 December 2019: 0.33%)SAECURE 16 BV ‘A’, FRN 0.17%30/10/2091 EUR 1,806,520 1,812,077 0.32
Netherlands total 1,812,077 0.32
Total investments in Asset-Backed Securities 16,325,325 2.93
Corporate Debt Securities (31 December 2019: 84.56%)
Australia (31 December 2019: 5.54%)AusNet Services Holdings Pty. Ltd. 2.38%24/07/2020 EUR 3,300,000 3,304,237 0.60Bank of China Ltd., Sydney Branch 0.00%22/07/2020 USD 10,000,000 8,903,188 1.60Macquarie Bank Ltd. 1.13% 20/01/2022 EUR 5,797,000 5,870,042 1.06National Australia Bank Ltd. 2.00%12/11/2020 EUR 3,500,000 3,526,635 0.63National Australia Bank Ltd. 0.88%20/01/2022 EUR 2,750,000 2,788,974 0.50Optus Finance Pty. Ltd. 3.50%15/09/2020 EUR 1,648,000 1,658,148 0.30Origin Energy Finance Ltd. 2.50%23/10/2020 EUR 2,800,000 2,815,915 0.51Scentre Group Trust 1 1.50% 16/07/2020 EUR 7,300,000 7,300,934 1.31Sydney Airport Finance Co. Pty. Ltd.5.13% 22/02/2021 USD 1,235,000 1,121,922 0.20Telstra Corp. Ltd. 3.63% 15/03/2021 EUR 5,050,000 5,176,028 0.93Transurban Finance Co. Pty. Ltd. 2.50%08/10/2020 EUR 3,300,000 3,301,644 0.59Westpac Banking Corp., FRN 0.17%04/12/2020 EUR 4,500,000 4,505,490 0.81Westpac Banking Corp. 0.88%16/02/2021 EUR 550,000 553,323 0.10
Australia total 50,826,480 9.14
Belgium (31 December 2019: 1.10%)Anheuser-Busch InBev SA/NV 1.95%30/09/2021 EUR 4,000,000 4,089,416 0.74
Belgium total 4,089,416 0.74
Canada (31 December 2019: 1.90%)Bank of Montreal 0.25% 17/11/2021 EUR 6,500,000 6,512,545 1.17Bank of Nova Scotia (The), FRN 0.18%18/01/2021 EUR 2,000,000 2,001,152 0.36Federation des Caisses Desjardins duQuebec 0.25% 27/09/2021 EUR 700,000 702,552 0.13Royal Bank of Canada 0.13% 23/07/2024 EUR 1,000,000 991,702 0.18
Canada total 10,207,951 1.84
Cayman Islands (31 December 2019: 0.68%)CK Hutchison Finance 16 Ltd. 1.25%06/04/2023 EUR 1,680,000 1,698,315 0.31CK Hutchison International 16 Ltd. 1.88%03/10/2021 USD 900,000 805,982 0.14Hutchison Whampoa Finance 14 Ltd.1.38% 31/10/2021 EUR 500,000 505,510 0.09
Cayman Islands total 3,009,807 0.54
Finland (31 December 2019: 1.88%)CRH Finland Services OYJ 2.75%15/10/2020 EUR 1,978,000 1,980,571 0.36CRH Finland Services OYJ 0.88%05/11/2023 EUR 700,000 710,009 0.13Nordea Bank Abp, FRN 0.20%07/02/2022 EUR 3,000,000 3,008,010 0.54OP Corporate Bank plc, FRN 0.22%22/05/2021 EUR 1,800,000 1,803,924 0.32OP Corporate Bank plc 0.88%21/06/2021 EUR 1,000,000 1,009,412 0.18OP Corporate Bank plc 0.75%03/03/2022 EUR 2,000,000 2,023,480 0.36
Finland total 10,535,406 1.89
France (31 December 2019: 9.82%)Banque Federative du Credit Mutuel SA0.13% 30/08/2021 EUR 2,000,000 2,001,000 0.36Banque Federative du Credit Mutuel SA0.38% 13/01/2022 EUR 1,200,000 1,204,392 0.22BNP Paribas SA 3.75% 25/11/2020 EUR 1,000,000 1,015,494 0.18BPCE SA 2.13% 17/03/2021 EUR 1,700,000 1,727,013 0.31BRED Banque Populaire SA 0.00%11/11/2020 EUR 3,000,000 3,004,653 0.54Engie SA 0.00% 28/07/2020 EUR 2,000,000 2,000,798 0.36EssilorLuxottica SA 0.25% 05/01/2024 EUR 2,500,000 2,508,010 0.45Kering SA 1.38% 01/10/2021 EUR 3,000,000 3,046,920 0.55Kering SA 0.25% 13/05/2023 EUR 1,500,000 1,507,140 0.27Legrand France SA 0.00% 15/07/2020 EUR 6,000,000 6,001,293 1.08RCI Banque SA 0.25% 12/07/2021 EUR 800,000 787,496 0.14Schneider Electric SE 0.00% 12/06/2023 EUR 1,000,000 998,616 0.18Societe Generale SA 4.75% 02/03/2021 EUR 2,000,000 2,063,692 0.37Societe Generale SA, FRN 0.30%06/09/2021 EUR 2,000,000 2,005,372 0.36Societe Generale SA 0.25% 18/01/2022 EUR 1,000,000 1,002,241 0.18Svenska Handelsbanken AB, Paris Branch0.00% 21/07/2020 EUR 2,000,000 2,000,599 0.36Total Capital International SA 2.13%19/11/2021 EUR 1,900,000 1,951,957 0.35Unibail-Rodamco-Westfield SE 0.13%14/05/2021 EUR 4,200,000 4,169,550 0.75Veolia Environnement SA 0.00%23/11/2020 EUR 2,700,000 2,699,730 0.48
France total 41,695,966 7.49
Germany (31 December 2019: 3.27%)BASF SE 0.00% 14/08/2020 EUR 2,000,000 1,999,591 0.36BASF SE 0.10% 05/06/2023 EUR 4,500,000 4,504,824 0.81Deutsche Bahn Finance BV 0.00%31/07/2020 EUR 4,000,000 4,001,840 0.72DZ Bank AG, FRN 0.60% 28/06/2023 EUR 6,000,000 6,090,120 1.09E.ON SE 0.00% 24/10/2022 EUR 3,000,000 2,986,062 0.54Landesbank Hessen 0.00% 17/08/2020 EUR 4,000,000 4,003,433 0.72Landesbank Hessen 0.00% 01/10/2020 EUR 1,500,000 1,502,375 0.27SAP SE 0.00% 17/05/2023 EUR 5,500,000 5,502,640 0.99Volkswagen Bank GmbH 1.25%01/08/2022 EUR 1,500,000 1,504,905 0.27Volkswagen Financial Services AG, FRN0.10% 16/07/2020 EUR 500,000 499,962 0.09Volkswagen Financial Services AG 0.25%16/10/2020 EUR 1,000,000 998,898 0.18
Germany total 33,594,650 6.04
Ireland (31 December 2019: 4.37%)Abbott Ireland Financing DAC 0.00%27/09/2020 EUR 2,565,000 2,563,831 0.46Matchpoint Finance plc 0.00%22/07/2020 EUR 2,000,000 2,000,611 0.36Weinberg Capital Ltd. 0.00% 21/08/2020 EUR 3,000,000 3,001,539 0.54
Ireland total 7,565,981 1.36
Italy (31 December 2019: 0.64%)FCA Bank SpA 1.25% 23/09/2020 EUR 1,000,000 1,000,586 0.18Snam SpA 0.00% 03/08/2020 EUR 3,500,000 3,501,697 0.63
Italy total 4,502,283 0.81
Japan (31 December 2019: 1.51%)Asahi Group Holdings Ltd. 0.32%19/09/2021 EUR 6,000,000 5,971,296 1.07Chiba Bank Ltd. (The) 2.75% 29/07/2020 USD 2,000,000 1,782,998 0.32Nidec Corp. 0.49% 27/09/2021 EUR 1,400,000 1,390,362 0.25Sumitomo Mitsui Financial Group, Inc.0.61% 18/01/2022 EUR 1,500,000 1,504,800 0.27Sumitomo Mitsui Trust Bank Ltd., FRN0.09% 25/09/2020 EUR 2,000,000 2,000,876 0.36
JPMorgan ETFs (Ireland) ICAV - EUR Ultra-Short Income UCITS ETFSchedule of InvestmentsAs at 30 June 2020
Investments Currency
Quantity/Nominal
Value
FairValue
EUR
% ofNet
Assets Investments Currency
Quantity/Nominal
Value
FairValue
EUR
% ofNet
Assets

Takeda Pharmaceutical Co. Ltd., FRN0.29% 21/11/2020 EUR 5,000,000 5,002,570 0.90Takeda Pharmaceutical Co. Ltd. 0.38%21/11/2020 EUR 2,650,000 2,647,562 0.48
Japan total 20,300,464 3.65
Jersey (31 December 2019: 1.26%)Glencore Finance Europe Ltd. 1.25%17/03/2021 EUR 2,356,000 2,354,878 0.42
Jersey total 2,354,878 0.42
Luxembourg (31 December 2019: 6.33%)Agricultural Bank of China Ltd.,Luxembourg Branch 0.00% 07/09/2020 EUR 1,000,000 1,000,758 0.18Bank of China Ltd., Sydney Branch 0.00%02/10/2020 EUR 1,000,000 1,000,944 0.18CK Hutchison Group Telecom Finance SA0.38% 17/10/2023 EUR 3,250,000 3,220,152 0.58DH Europe Finance SA 0.00%23/07/2020 EUR 3,500,000 3,501,156 0.63DH Europe Finance Sarl 1.70%04/01/2022 EUR 2,500,000 2,548,860 0.45John Deere Cash Management SA, FRN0.00% 15/09/2020 EUR 8,350,000 8,349,148 1.50Medtronic Global Holdings SCA 0.00%07/03/2021 EUR 1,550,000 1,549,736 0.28Mohawk Capital Finance SA, FRN 0.00%04/09/2021 EUR 1,000,000 991,200 0.18
Luxembourg total 22,161,954 3.98
Netherlands (31 December 2019: 6.68%)ABB Finance BV 0.00% 06/07/2020 EUR 3,000,000 2,999,633 0.54ABN AMRO Bank NV 0.25% 03/12/2021 EUR 3,500,000 3,510,045 0.63ABN AMRO Bank NV 0.63% 31/05/2022 EUR 4,000,000 4,049,776 0.73Bayer Capital Corp. BV 0.63% 15/12/2022 EUR 4,800,000 4,842,048 0.87BMW Finance NV, FRN 0.00% 21/12/2020 EUR 2,500,000 2,497,950 0.45Cooperatieve Rabobank UA 4.13%12/01/2021 EUR 485,000 495,820 0.09Daimler International Finance BV 0.25%11/05/2022 EUR 974,000 968,684 0.17EDP Finance BV 4.13% 20/01/2021 EUR 1,000,000 1,022,030 0.18Heineken NV 2.00% 06/04/2021 EUR 1,500,000 1,520,856 0.27Iberdrola International BV 2.88%11/11/2020 EUR 2,400,000 2,423,568 0.44ING Bank NV 0.00% 04/12/2020 EUR 4,000,000 4,006,867 0.72ING Groep NV 0.75% 09/03/2022 EUR 700,000 705,543 0.13Koninklijke DSM NV 1.38% 26/09/2022 EUR 1,300,000 1,341,986 0.24Linde Finance BV 0.25% 18/01/2022 EUR 2,229,000 2,239,565 0.40LYB International Finance II BV 1.88%02/03/2022 EUR 2,300,000 2,327,706 0.42Siemens Financieringsmaatschappij NV0.00% 05/09/2021 EUR 5,000,000 4,998,350 0.90Siemens Financieringsmaatschappij NV0.13% 05/06/2022 EUR 1,300,000 1,302,964 0.23Siemens Financieringsmaatschappij NV0.25% 05/06/2024 EUR 1,000,000 1,005,258 0.18Upjohn Finance BV 0.82% 23/06/2022 EUR 1,200,000 1,206,960 0.22Vonovia Finance BV 0.13% 06/04/2023 EUR 900,000 893,360 0.16
Netherlands total 44,358,969 7.97
New Zealand (31 December 2019: 2.38%)ANZ New Zealand Int’l Ltd. 0.63%01/06/2021 EUR 5,026,000 5,055,653 0.91ANZ New Zealand Int’l Ltd. 0.40%01/03/2022 EUR 2,500,000 2,512,435 0.45
New Zealand total 7,568,088 1.36
Norway (31 December 2019: 0.26%)DNB Bank ASA 0.05% 14/11/2023 EUR 5,000,000 4,992,028 0.90
Norway total 4,992,028 0.90
South Korea (31 December 2019: 0.00%)Hyundai Capital Services, Inc. 2.88%16/03/2021 USD 3,270,000 2,933,945 0.53
South Korea total 2,933,945 0.53
Spain (31 December 2019: 1.89%)Ferrovial SA 0.00% 30/07/2020 EUR 2,000,000 2,000,862 0.36
Spain total 2,000,862 0.36
Sweden (31 December 2019: 1.13%)Skandinaviska Enskilda Banken AB 0.75%24/08/2021 EUR 1,000,000 1,008,924 0.18Skandinaviska Enskilda Banken AB 0.25%19/05/2023 EUR 3,000,000 3,017,826 0.54
Svenska Handelsbanken AB 0.25%28/02/2022 EUR 661,000 663,946 0.12Volvo Treasury AB 0.00% 21/09/2020 EUR 4,500,000 4,504,840 0.81
Sweden total 9,195,536 1.65
Switzerland (31 December 2019: 2.05%)Credit Suisse AG, FRN 0.33% 27/08/2021 EUR 2,500,000 2,509,590 0.45Credit Suisse AG, FRN 0.69% 18/05/2022 EUR 5,000,000 5,049,100 0.91UBS AG, FRN 0.27% 23/04/2021 EUR 750,000 751,626 0.14UBS AG 1.75% 21/04/2022 USD 4,345,000 3,942,554 0.71UBS AG 0.75% 21/04/2023 EUR 2,000,000 2,030,689 0.36
Switzerland total 14,283,559 2.57
United Kingdom (31 December 2019: 11.67%)BAT International Finance plc 4.88%24/02/2021 EUR 700,000 719,008 0.13BP Capital Markets plc 2.18% 28/09/2021 EUR 3,000,000 3,071,130 0.55BP Capital Markets plc 1.11% 16/02/2023 EUR 3,500,000 3,579,114 0.64GlaxoSmithKline Capital plc 0.00%12/09/2020 EUR 4,000,000 3,999,416 0.72GlaxoSmithKline Capital plc 0.13%12/05/2023 EUR 3,000,000 2,999,400 0.54HSBC Bank plc, FRN 0.25% 07/06/2021 EUR 1,000,000 1,003,040 0.18HSBC Holdings plc, FRN 0.57%04/12/2021 EUR 400,000 400,573 0.07HSBC Holdings plc, FRN 2.18%27/06/2023 GBP 3,500,000 3,889,618 0.70KEB Hana Bank 0.00% 05/08/2020 USD 3,000,000 2,670,685 0.48Lloyds Banking Group plc 0.75%09/11/2021 EUR 4,000,000 4,014,528 0.72Mizuho Bank Ltd. 0.00% 13/11/2020 EUR 3,000,000 3,005,222 0.54NatWest Markets plc, FRN 0.35%18/06/2021 EUR 400,000 400,920 0.07NatWest Markets plc, FRN 0.50%27/09/2021 EUR 1,100,000 1,104,673 0.20Reckitt Benckiser Treasury Services plc0.00% 23/07/2020 EUR 3,000,000 3,000,984 0.54Reckitt Benckiser Treasury Services plc0.00% 06/08/2020 EUR 3,000,000 3,001,583 0.54Santander UK plc 0.88% 25/11/2020 EUR 797,000 799,829 0.14Santander UK plc 1.13% 14/01/2022 EUR 800,000 811,307 0.15Sky Ltd. 1.50% 15/09/2021 EUR 3,000,000 3,045,270 0.55SSE plc 0.00% 03/08/2020 EUR 8,000,000 7,999,200 1.44Standard Chartered plc 1.63%13/06/2021 EUR 2,000,000 2,026,824 0.36State Grid Europe Development 2014 plc1.50% 26/01/2022 EUR 5,100,000 5,165,382 0.93Sumitomo Corp. Capital Europe plc0.00% 22/10/2020 EUR 5,000,000 5,007,008 0.90Tesco Corporate Treasury Services plc1.38% 24/10/2023 EUR 2,000,000 2,040,636 0.37
United Kingdom total 63,755,350 11.46
United States (31 December 2019: 19.37%)3M Co. 1.88% 15/11/2021 EUR 2,500,000 2,564,950 0.46AbbVie, Inc., FRN 0.10% 15/11/2020 EUR 1,000,000 998,770 0.18AbbVie, Inc. 2.15% 19/11/2021 USD 1,400,000 1,270,196 0.23Air Products & Chemicals, Inc. 0.38%01/06/2021 EUR 7,362,000 7,370,260 1.32Albemarle Corp. 1.88% 08/12/2021 EUR 3,000,000 2,997,294 0.54American Express Credit Corp. 0.63%22/11/2021 EUR 4,700,000 4,723,857 0.85AT&T, Inc., FRN 0.14% 03/08/2020 EUR 1,515,000 1,515,161 0.27Bank of America Corp. 2.50%27/07/2020 EUR 3,000,000 3,004,818 0.54Bank of America Corp. 1.38% 10/09/2021 EUR 1,500,000 1,522,182 0.27Bank of America Corp., FRN 0.00%21/09/2021 EUR 1,500,000 1,499,550 0.27Bank of America Corp., FRN 0.50%07/02/2022 EUR 1,250,000 1,252,002 0.23Bank of America Corp., FRN 0.74%07/02/2022 EUR 500,000 500,770 0.09Barclays Bank plc, New York Branch0.90% 24/06/2021 USD 7,500,000 6,677,576 1.20BAT Capital Corp., FRN 0.24%16/08/2021 EUR 2,200,000 2,190,606 0.39Boeing Co. (The) 4.51% 01/05/2023 USD 1,223,000 1,150,347 0.21Citigroup, Inc., FRN 0.55% 24/05/2021 EUR 1,200,000 1,206,034 0.22Citigroup, Inc. 0.50% 29/01/2022 EUR 3,000,000 3,013,710 0.54Exxon Mobil Corp. 0.14% 26/06/2024 EUR 11,000,000 10,987,680 1.97Fidelity National Information Services,Inc. 0.13% 21/05/2021 EUR 3,400,000 3,388,855 0.61Fidelity National Information Services,Inc., FRN 0.14% 21/05/2021 EUR 600,000 597,547 0.11Fidelity National Information Services,Inc. 0.13% 03/12/2022 EUR 1,000,000 994,534 0.18Goldman Sachs Group, Inc. (The), FRN0.84% 27/07/2021 EUR 1,650,000 1,657,273 0.30
91
JPMorgan ETFs (Ireland) ICAV - EUR Ultra-Short Income UCITS ETFSchedule of Investments (continued)As at 30 June 2020
Investments Currency
Quantity/Nominal
Value
FairValue
EUR
% ofNet
Assets Investments Currency
Quantity/Nominal
Value
FairValue
EUR
% ofNet
Assets

Goldman Sachs Group, Inc. (The) 2.50%18/10/2021 EUR 3,000,000 3,089,046 0.56Goldman Sachs Group, Inc. (The), FRN0.31% 21/04/2023 EUR 2,000,000 1,972,164 0.35Mastercard, Inc. 1.10% 01/12/2022 EUR 2,050,000 2,094,464 0.38Merck & Co., Inc. 1.13% 15/10/2021 EUR 5,000,000 5,057,550 0.91Metropolitan Life Global Funding I, FRN0.13% 15/07/2020 EUR 2,000,000 2,000,140 0.36Metropolitan Life Global Funding I 0.88%20/01/2022 EUR 4,000,000 4,050,880 0.73Metropolitan Life Global Funding I 0.00%23/09/2022 EUR 500,000 498,545 0.09Mohawk Industries, Inc. 2.00%14/01/2022 EUR 2,500,000 2,547,555 0.46Morgan Stanley 2.38% 31/03/2021 EUR 1,000,000 1,017,688 0.18Morgan Stanley, FRN 0.14% 21/05/2021 EUR 3,000,000 3,002,790 0.54Morgan Stanley, FRN 0.54% 27/01/2022 EUR 1,650,000 1,650,901 0.30MPLX LP, FRN 1.21% 09/09/2021 USD 400,000 353,318 0.06Oracle Corp. 2.25% 10/01/2021 EUR 900,000 909,972 0.16Pfizer, Inc. 0.25% 06/03/2022 EUR 3,500,000 3,514,217 0.63Procter & Gamble Co. (The) 2.00%16/08/2022 EUR 5,000,000 5,220,664 0.94Simon Property Group LP 2.38%02/10/2020 EUR 3,125,000 3,129,819 0.56Stanley Black & Decker, Inc. 0.00%02/07/2020 EUR 5,000,000 5,000,069 0.90Stanley Black & Decker, Inc. 0.00%30/07/2020 EUR 5,000,000 5,000,856 0.90Toyota Motor Credit Corp. 1.80%23/07/2020 EUR 3,000,000 3,002,886 0.54US Bancorp 0.85% 07/06/2024 EUR 2,000,000 2,027,700 0.36Volkswagen Group of America FinanceLLC 2.50% 24/09/2021 USD 424,000 383,524 0.07Wells Fargo & Co., FRN 0.46%26/04/2021 EUR 3,750,000 3,757,762 0.68Wells Fargo & Co. 1.13% 29/10/2021 EUR 1,800,000 1,825,600 0.33Wells Fargo & Co., FRN 0.27% 31/01/2022 EUR 800,000 798,389 0.14
United States total 122,990,471 22.11
Total investments in Corporate Debt Securities 482,924,044 86.81
Total Bonds 499,249,369 89.74
92
JPMorgan ETFs (Ireland) ICAV - EUR Ultra-Short Income UCITS ETFSchedule of Investments (continued)As at 30 June 2020
Investments Currency
Quantity/Nominal
Value
FairValue
EUR
% ofNet
Assets Investments Currency
Quantity/Nominal
Value
FairValue
EUR
% ofNet
Assets

JPMorgan ETFs (Ireland) ICAV - EUR Ultra-Short Income UCITS ETF
Schedule of Investments (continued)
As at 30 June 2020
Forward Currency Contracts
CurrencyPurchased
AmountPurchased Currency Sold Amount Sold
MaturityDate Counterparty
Fair ValueEUR
% ofNet
Assets
EUR 1,796,169 USD 2,016,418 06/07/2020 BNP Paribas 987 -EUR 1,229,693 USD 1,380,480 06/07/2020 BNP Paribas 676 -EUR 980 USD 1,100 06/07/2020 BNP Paribas - -EUR 4,238,253 JPY 505,917,692 06/07/2020 Citibank NA 63,172 0.01EUR 3,357,037 JPY 400,629,090 06/07/2020 Citibank NA 50,849 0.01EUR 4,020,875 GBP 3,614,182 06/07/2020 Citibank NA 45,070 0.01EUR 32,019,947 USD 35,682,113 06/07/2020 HSBC 252,787 0.05EUR 39,859,588 USD 44,702,496 05/08/2020 HSBC 89,675 0.02EUR 1,328,830 USD 1,491,801 06/07/2020 Standard Chartered 706 -GBP 3,614,182 EUR 3,955,352 06/07/2020 Citibank NA 20,454 -JPY 500,874,354 EUR 4,057,210 06/07/2020 Standard Chartered 76,250 0.01
Total unrealised gain on Forward Currency Contracts (31 December 2019: 0.12%) 600,626 0.11
EUR 3,953,545 GBP 3,614,182 05/08/2020 Citibank NA (20,298) -EUR 2,636,752 USD 2,965,257 06/07/2020 HSBC (3,164) -EUR 378,691 USD 427,148 06/07/2020 State Street (1,592) -EUR 651,406 USD 738,179 06/07/2020 State Street (5,782) -JPY 3,072,428 EUR 25,602 06/07/2020 BNP Paribas (247) -USD 44,702,496 EUR 39,884,771 06/07/2020 HSBC (86,922) (0.02)JPY 402,600,000 EUR 3,357,980 06/07/2020 Toronto-Dominion Bank (35,528) (0.01)
Total unrealised loss on Forward Currency Contracts (31 December 2019: (0.01)%) (153,533) (0.03)
Fair ValueEUR
% ofNet
Assets
Total financial assets at fair value through profit or loss 499,849,995 89.85Total financial liabilities at fair value through profit or loss (153,533) (0.03)Cash 7,700,098 1.38
Cash equivalents
Currency
Quantity/Nominal
ValueUndertaking for collective investment schemes (31 December 2019: 8.70%)JPMorgan Liquidity Funds - EUR Liquidity LVNAV Fund - Class X (flex dist.)1 EUR 5,237 52,068,973 9.36
Total Cash equivalents 52,068,973 9.36Other assets and liabilities (3,137,901) (0.56)
Net asset value attributable to holders of redeemable participating shares 556,327,632 100.00
Analysis of total assets
% ofTotal
Assets
Transferable securities and money market instruments admitted to official stock exchange listing 66.46Transferable securities and money market instruments dealt in on another regulated market 3.68Transferable securities and money market instruments other than those admitted to an official stock exchange listing or dealt in on another regulated market 18.30Collective investment schemes 9.22OTC financial derivative instruments 0.11Other assets 2.23
Total Assets 100.00
1A related party to the Fund.
93

Equities (31 December 2019: 99.38%)
Australia (31 December 2019: 0.88%)BHP Group plc GBP 73,119 1,330,794 0.86
Australia total 1,330,794 0.86
Austria (31 December 2019: 0.74%)Erste Group Bank AG EUR 34,999 733,229 0.47
Austria total 733,229 0.47
Belgium (31 December 2019: 1.14%)Anheuser-Busch InBev SA/NV EUR 12,209 535,548 0.34
Belgium total 535,548 0.34
Denmark (31 December 2019: 3.87%)Carlsberg A/S ‘B’ DKK 11,643 1,369,385 0.88Novo Nordisk A/S ‘B’ DKK 54,537 3,142,045 2.02Novozymes A/S ‘B’ DKK 20,332 1,046,176 0.67Orsted A/S DKK 10,710 1,099,859 0.71
Denmark total 6,657,465 4.28
Finland (31 December 2019: 1.34%)Elisa OYJ EUR 9,614 520,502 0.33UPM-Kymmene OYJ EUR 46,368 1,192,585 0.77
Finland total 1,713,087 1.10
France (31 December 2019: 17.94%)Accor SA EUR 31,957 773,679 0.50Air Liquide SA EUR 11,752 1,508,957 0.97Alstom SA EUR 24,290 1,005,849 0.65Arkema SA EUR 8,930 760,300 0.49AXA SA EUR 65,934 1,227,164 0.79BioMerieux EUR 5,378 657,729 0.42BNP Paribas SA EUR 43,657 1,544,148 0.99Capgemini SE EUR 12,825 1,307,509 0.84Danone SA EUR 11,284 694,643 0.45Dassault Systemes SE EUR 6,074 932,966 0.60Eiffage SA EUR 6,891 560,927 0.36EssilorLuxottica SA EUR 4,400 502,700 0.32Kering SA EUR 2,710 1,312,318 0.84Legrand SA EUR 6,579 444,872 0.29L’Oreal SA EUR 4,293 1,226,510 0.79LVMH Moet Hennessy Louis Vuitton SE EUR 7,429 2,901,024 1.86Orange SA EUR 98,141 1,044,711 0.67Pernod Ricard SA EUR 3,361 470,708 0.30Peugeot SA EUR 49,030 709,954 0.46Sanofi EUR 21,750 1,971,638 1.27Schneider Electric SE EUR 20,752 2,051,958 1.32TOTAL SA EUR 55,842 1,897,232 1.22Vinci SA EUR 16,722 1,371,204 0.88Vivendi SA EUR 8,244 188,293 0.12
France total 27,066,993 17.40
Germany (31 December 2019: 14.14%)adidas AG EUR 6,444 1,505,318 0.97Allianz SE EUR 11,448 2,080,788 1.34BASF SE EUR 12,135 605,294 0.39Daimler AG EUR 31,398 1,134,881 0.73Deutsche Boerse AG EUR 2,963 477,191 0.31Deutsche Post AG EUR 47,801 1,555,922 1.00Deutsche Telekom AG EUR 129,509 1,935,512 1.24Henkel AG & Co. KGaA, Preference EUR 3,162 262,067 0.17Infineon Technologies AG EUR 73,331 1,530,785 0.98Merck KGaA EUR 12,610 1,302,613 0.84MTU Aero Engines AG EUR 6,021 928,137 0.60MuenchenerRueckversicherungs-Gesellschaft AG inMuenchen EUR 5,417 1,253,494 0.81RWE AG EUR 27,519 856,116 0.55SAP SE EUR 27,457 3,413,454 2.19Siemens AG EUR 26,467 2,772,683 1.78Volkswagen AG, Preference EUR 12,246 1,652,475 1.06Vonovia SE EUR 10,441 569,870 0.37
Germany total 23,836,600 15.33
Ireland (31 December 2019: 2.48%)CRH plc EUR 36,096 1,100,928 0.71DCC plc GBP 3,095 229,148 0.15Kerry Group plc ‘A’ EUR 9,500 1,045,950 0.67Kingspan Group plc EUR 14,324 816,468 0.52Ryanair Holdings plc EUR 47,823 506,445 0.33
Ireland total 3,698,939 2.38
Italy (31 December 2019: 3.09%)Davide Campari-Milano SpA EUR 53,111 398,333 0.26Enel SpA EUR 248,703 1,909,542 1.23FinecoBank Banca Fineco SpA EUR 69,741 837,938 0.54Snam SpA EUR 213,726 926,288 0.59UniCredit SpA EUR 117,729 963,965 0.62
Italy total 5,036,066 3.24
Netherlands (31 December 2019: 10.28%)Akzo Nobel NV EUR 19,345 1,542,570 0.99ASML Holding NV EUR 11,421 3,733,525 2.40Heineken NV EUR 12,255 1,005,645 0.65ING Groep NV EUR 193,214 1,197,540 0.77Koninklijke Ahold Delhaize NV EUR 49,578 1,202,762 0.77Koninklijke KPN NV EUR 300,160 708,378 0.46Koninklijke Philips NV EUR 20,216 839,368 0.54NN Group NV EUR 27,772 830,383 0.53NXP Semiconductors NV USD 4,592 466,253 0.30Prosus NV EUR 11,374 941,085 0.61Randstad NV EUR 11,619 460,810 0.30Royal Dutch Shell plc ‘A’ GBP 108,200 1,531,955 0.98Royal Dutch Shell plc ‘B’ GBP 72,803 980,327 0.63Wolters Kluwer NV EUR 15,597 1,084,303 0.70
Netherlands total 16,524,904 10.63
Norway (31 December 2019: 0.59%)Telenor ASA NOK 61,133 790,467 0.51
Norway total 790,467 0.51
Portugal (31 December 2019: 0.00%)Galp Energia SGPS SA EUR 14,540 149,689 0.10
Portugal total 149,689 0.10
Spain (31 December 2019: 3.29%)Banco Bilbao Vizcaya Argentaria SA EUR 63,239 193,764 0.12Banco Santander SA EUR 341,927 743,520 0.48Endesa SA EUR 17,698 388,117 0.25Iberdrola SA EUR 224,341 2,315,199 1.49Industria de Diseno Textil SA EUR 30,510 719,121 0.46Naturgy Energy Group SA EUR 22,215 367,992 0.24
Spain total 4,727,713 3.04
Sweden (31 December 2019: 3.57%)Alfa Laval AB SEK 20,354 397,588 0.26Atlas Copco AB ‘A’ SEK 47,609 1,795,348 1.16Boliden AB SEK 24,733 501,089 0.32Essity AB ‘B’ SEK 14,642 421,321 0.27Lundin Energy AB SEK 10,349 222,132 0.14Sandvik AB SEK 95,506 1,589,029 1.02SKF AB ‘B’ SEK 35,156 581,734 0.37Svenska Handelsbanken AB ‘A’ SEK 145,888 1,233,022 0.79
Sweden total 6,741,263 4.33
Switzerland (31 December 2019: 14.54%)ABB Ltd. CHF 35,254 706,577 0.45Adecco Group AG CHF 7,310 305,385 0.20Credit Suisse Group AG CHF 101,310 932,717 0.60Givaudan SA CHF 88 291,723 0.19LafargeHolcim Ltd. CHF 29,219 1,139,668 0.73Lonza Group AG CHF 3,971 1,866,395 1.20Nestle SA CHF 70,996 6,987,254 4.49Novartis AG CHF 59,133 4,579,548 2.95Roche Holding AG CHF 18,002 5,554,153 3.57Swiss Re AG CHF 6,551 449,725 0.29UBS Group AG CHF 77,775 796,940 0.51Zurich Insurance Group AG CHF 1,225 384,683 0.25
Switzerland total 23,994,768 15.43
United Kingdom (31 December 2019: 21.49%)3i Group plc GBP 102,800 941,607 0.61AstraZeneca plc GBP 28,051 2,598,676 1.67Barclays plc GBP 666,958 839,538 0.54Beazley plc GBP 151,660 684,061 0.44BP plc GBP 596,462 2,015,785 1.30Burberry Group plc GBP 46,638 820,662 0.53Compass Group plc GBP 53,483 654,276 0.42Diageo plc GBP 72,547 2,140,116 1.38GlaxoSmithKline plc GBP 88,737 1,597,671 1.03HSBC Holdings plc GBP 266,168 1,108,604 0.71InterContinental Hotels Group plc GBP 22,018 864,015 0.56Intertek Group plc GBP 10,308 616,898 0.40ITV plc GBP 266,377 218,847 0.14Lloyds Banking Group plc GBP 2,625,999 900,619 0.58London Stock Exchange Group plc GBP 11,239 1,033,404 0.66
94
JPMorgan ETFs (Ireland) ICAV - Europe Research Enhanced Index Equity (ESG) UCITS ETFSchedule of InvestmentsAs at 30 June 2020
Investments Currency
Quantity/Nominal
Value
FairValue
EUR
% ofNet
Assets Investments Currency
Quantity/Nominal
Value
FairValue
EUR
% ofNet
Assets

M&G plc GBP 321,432 592,480 0.38Next plc GBP 4,025 216,706 0.14Persimmon plc GBP 21,932 551,562 0.35Prudential plc GBP 94,823 1,271,099 0.82Reckitt Benckiser Group plc GBP 20,569 1,681,741 1.08RELX plc GBP 71,291 1,466,616 0.94Rio Tinto plc GBP 39,612 1,982,361 1.27Severn Trent plc GBP 10,347 282,183 0.18SSE plc GBP 12,916 193,884 0.12Standard Chartered plc GBP 182,280 882,532 0.57Taylor Wimpey plc GBP 501,640 786,959 0.51Tesco plc GBP 379,820 953,110 0.61Unilever plc GBP 64,870 3,107,937 2.00Vodafone Group plc GBP 100,873 142,999 0.09
United Kingdom total 31,146,948 20.03
Total investments in Equities 154,684,473 99.47
95
JPMorgan ETFs (Ireland) ICAV - Europe Research Enhanced Index Equity (ESG) UCITS ETFSchedule of Investments (continued)As at 30 June 2020
Investments Currency
Quantity/Nominal
Value
FairValue
EUR
% ofNet
Assets Investments Currency
Quantity/Nominal
Value
FairValue
EUR
% ofNet
Assets
FairValue
EUR
% ofNet
Assets
Total financial assets at fair value through profit or loss 154,684,473 99.47Cash 691,566 0.44Other assets and liabilities 137,750 0.09
Net asset value attributable to holders of redeemable participating shares 155,513,789 100.00
Analysis of total assets
% ofTotal
Assets
Transferable securities and money market instruments admitted to official stock exchange listing 99.43Other assets 0.57
Total Assets 100.00

96
Bonds
Asset-Backed Securities (31 December 2019: 8.37%)
Cayman Islands (31 December 2019: 2.07%)AIMCO CLO ‘AR’, FRN 2.07% 15/01/2028 USD 496,112 395,832 0.39Apidos CLO XXI ‘A1R’, FRN 2.07%18/07/2027 USD 750,000 600,966 0.60BlueMountain CLO 2012-2X Ltd. ‘AR2’, FRN1.43% 20/11/2028 USD 1,000,000 796,626 0.79Dryden Senior Loan Fund 2013-30X ‘AR’,FRN 1.21% 15/11/2028 USD 250,000 198,952 0.20Magnetite XVI Ltd. ‘AR’, FRN 1.94%18/01/2028 USD 496,822 396,692 0.39
Cayman Islands total 2,389,068 2.37
Luxembourg (31 December 2019: 0.76%)Silver Arrow Compartment Silver ArrowUK 2018-1 ‘A’, FRN 0.58% 20/06/2024 GBP 318,380 318,353 0.31
Luxembourg total 318,353 0.31
United Kingdom (31 December 2019: 5.54%)Bavarian Sky UK 1 plc ‘A’, FRN 0.47%20/11/2025 GBP 49,994 49,987 0.05Bavarian Sky UK 2 plc ‘A’, FRN 0.65%20/07/2026 GBP 812,091 811,472 0.80E-Carat 9 plc ‘A’, FRN 0.49% 18/01/2025 GBP 859,547 858,356 0.85Globaldrive Auto Receivables UK 2018-Aplc ‘A’, FRN 0.60% 20/06/2026 GBP 858,666 857,955 0.85Gosforth Funding 2018-1X plc ‘A2’, FRN0.83% 25/08/2060 GBP 233,717 233,669 0.23Permanent Master Issuer plc ‘1A2’, FRN1.05% 15/07/2058 GBP 1,500,000 1,498,401 1.49
United Kingdom total 4,309,840 4.27
Total investments in Asset-Backed Securities 7,017,261 6.95
Corporate Debt Securities (31 December 2019: 83.60%)
Australia (31 December 2019: 7.26%)Australia & New Zealand Banking GroupLtd., FRN 0.82% 17/12/2021 GBP 1,300,000 1,302,184 1.29Commonwealth Bank of Australia, FRN1.12% 12/07/2021 GBP 1,000,000 1,001,410 0.99Macquarie Bank Ltd. 3.50% 18/12/2020 GBP 1,785,000 1,807,491 1.79National Australia Bank Ltd., FRN 1.06%17/07/2020 GBP 500,000 500,190 0.49National Australia Bank Ltd., FRN 0.96%24/04/2021 GBP 250,000 249,608 0.25National Australia Bank Ltd. 5.13%09/12/2021 GBP 1,100,000 1,167,802 1.16Scentre Group Trust 1 / Scentre GroupTrust 2 2.38% 08/04/2022 GBP 780,000 782,886 0.77SGSP Australia Assets Pty. Ltd. 2.00%30/06/2022 EUR 900,000 837,318 0.83Sydney Airport Finance Co. Pty. Ltd. 5.13%22/02/2021 USD 350,000 289,017 0.29
Australia total 7,937,906 7.86
Canada (31 December 2019: 9.76%)Bank of Montreal, FRN 0.86% 20/07/2020 GBP 460,000 460,116 0.46Bank of Montreal 1.38% 29/12/2021 GBP 500,000 504,825 0.50Bank of Montreal, FRN 0.95% 16/04/2023 GBP 1,000,000 993,870 0.98Bank of Nova Scotia (The), FRN 0.52%30/09/2021 GBP 2,000,000 2,000,740 1.98Royal Bank of Canada, FRN 0.49%08/06/2021 GBP 550,000 549,941 0.55Toronto-Dominion Bank (The), FRN 1.02%13/07/2020 GBP 1,000,000 1,000,270 0.99Toronto-Dominion Bank (The), FRN 0.53%24/06/2022 GBP 850,000 850,671 0.84
Canada total 6,360,433 6.30
Cayman Islands (31 December 2019: 0.98%)CK Hutchison International 16 Ltd. 1.88%03/10/2021 USD 420,000 341,894 0.34Hutchison Whampoa International 11 Ltd.4.63% 13/01/2022 USD 500,000 423,949 0.42
Cayman Islands total 765,843 0.76
Finland (31 December 2019: 0.00%)OP Corporate Bank plc 2.50% 20/05/2022 GBP 1,500,000 1,550,280 1.53
Finland total 1,550,280 1.53
France (31 December 2019: 6.78%)Antalis SA 0.00% 22/07/2020 GBP 1,500,000 1,500,000 1.48Banque Federative du Credit Mutuel SA1.38% 20/12/2021 GBP 1,500,000 1,512,551 1.50BNP Paribas SA 0.47% 18/06/2021 GBP 1,000,000 999,605 0.99EssilorLuxottica SA 0.00% 27/05/2023 EUR 300,000 271,656 0.27LMA SA 0.00% 24/09/2020 GBP 2,000,000 1,999,378 1.98Orange SA 7.25% 10/11/2020 GBP 750,000 766,862 0.76Societe Generale SA 0.88% 15/02/2021 GBP 300,000 300,929 0.30Total Capital International SA 2.25%17/12/2020 GBP 1,600,000 1,612,090 1.60
France total 8,963,071 8.88
Germany (31 December 2019: 3.78%)BASF SE 0.10% 05/06/2023 EUR 1,000,000 909,966 0.90E.ON SE 0.00% 29/09/2022 EUR 400,000 362,369 0.36Henkel AG & Co. KGaA 1.00% 30/09/2022 GBP 1,000,000 1,007,476 1.00
Germany total 2,279,811 2.26
Guernsey (31 December 2019: 0.00%)Credit Suisse Group Funding GuernseyLtd. 3.00% 27/05/2022 GBP 500,000 515,760 0.51
Guernsey total 515,760 0.51
Ireland (31 December 2019: 2.23%)Matchpoint Finance plc 0.00%09/07/2020 GBP 1,000,000 1,000,000 0.99Weinberg Capital Ltd. 0.00% 03/09/2020 GBP 2,500,000 2,497,963 2.47
Ireland total 3,497,963 3.46
Japan (31 December 2019: 2.42%)Sumitomo Mitsui Banking Corp., FRN0.57% 07/09/2020 GBP 1,000,000 998,959 0.99
Japan total 998,959 0.99
Jersey (31 December 2019: 4.00%)Glencore Finance Europe Ltd. 1.25%17/03/2021 EUR 250,000 227,140 0.23Porterbrook Rail Finance Ltd. 6.50%20/10/2020 GBP 1,150,000 1,165,755 1.15
Jersey total 1,392,895 1.38
Luxembourg (31 December 2019: 2.40%)CK Hutchison Group Telecom Finance SA0.38% 17/10/2023 EUR 750,000 675,483 0.67
Luxembourg total 675,483 0.67
Netherlands (31 December 2019: 8.16%)ABN AMRO Bank NV 2.38% 07/12/2021 GBP 700,000 715,942 0.71Cooperatieve Rabobank UA, FRN 0.52%22/03/2021 GBP 600,000 599,957 0.59Daimler International Finance BV 2.75%04/12/2020 GBP 900,000 906,422 0.90Deutsche Telekom International FinanceBV 6.50% 08/04/2022 GBP 750,000 824,719 0.82EDP Finance BV 4.13% 20/01/2021 EUR 200,000 185,803 0.18ING Bank NV, FRN 0.73% 14/11/2020 GBP 1,000,000 999,825 0.99innogy Finance BV 6.50% 20/04/2021 GBP 500,000 521,802 0.52Siemens Financieringsmaatschappij NV0.88% 05/06/2023 GBP 500,000 503,706 0.50Toyota Motor Finance Netherlands BV1.38% 23/05/2023 GBP 1,000,000 1,010,162 1.00Upjohn Finance BV 0.82% 23/06/2022 EUR 300,000 274,279 0.27Volkswagen Financial Services NV 1.50%12/04/2021 GBP 800,000 799,205 0.79Volkswagen Financial Services NV 1.63%10/02/2024 GBP 200,000 198,584 0.20Vonovia Finance BV 0.13% 06/04/2023 EUR 100,000 90,229 0.09
Netherlands total 7,630,635 7.56
New Zealand (31 December 2019: 1.18%)ASB Finance Ltd. 1.00% 07/09/2020 GBP 500,000 500,409 0.49Westpac Securities NZ Ltd. 2.50%13/01/2021 GBP 800,000 808,214 0.80
New Zealand total 1,308,623 1.29
Norway (31 December 2019: 1.57%)DNB Bank ASA 1.38% 12/06/2023 GBP 600,000 612,200 0.61
Norway total 612,200 0.61
JPMorgan ETFs (Ireland) ICAV - GBP Ultra-Short Income UCITS ETFSchedule of InvestmentsAs at 30 June 2020
Investments Currency
Quantity/Nominal
Value
FairValue
GBP
% ofNet
Assets Investments Currency
Quantity/Nominal
Value
FairValue
GBP
% ofNet
Assets

Sweden (31 December 2019: 4.01%)Skandinaviska Enskilda Banken AB 3.00%18/12/2020 GBP 1,150,000 1,162,822 1.15Skandinaviska Enskilda Banken AB, FRN0.53% 22/03/2021 GBP 650,000 649,550 0.65Svenska Handelsbanken AB 1.63%18/06/2022 GBP 1,000,000 1,019,610 1.01Volvo Treasury AB 0.00% 21/09/2020 EUR 1,500,000 1,364,954 1.35
Sweden total 4,196,936 4.16
Switzerland (31 December 2019: 3.19%)UBS AG 1.25% 10/12/2020 GBP 1,350,000 1,353,234 1.34UBS AG 0.75% 21/04/2023 EUR 500,000 461,470 0.46
Switzerland total 1,814,704 1.80
United Kingdom (31 December 2019: 12.15%)Barclays Bank UK plc, FRN 0.54%15/05/2023 GBP 500,000 501,314 0.50BAT International Finance plc 1.75%05/07/2021 GBP 500,000 503,506 0.50BP Capital Markets plc 1.11% 16/02/2023 EUR 1,000,000 929,538 0.92HSBC Holdings plc, FRN 2.18%27/06/2023 GBP 500,000 505,090 0.50HSBC UK Bank plc 0.00% 10/08/2020 GBP 1,000,000 999,961 0.99KEB Hana Bank 0.00% 05/08/2020 USD 1,000,000 809,210 0.80Lloyds Bank Corporate Markets plc 1.50%23/06/2023 GBP 1,000,000 1,005,087 1.00Lloyds Bank plc, FRN 0.49% 13/09/2021 GBP 250,000 250,348 0.25Lloyds Bank plc, FRN 0.44% 27/03/2023 GBP 100,000 99,948 0.10Lloyds Bank plc, FRN 0.63% 16/05/2024 GBP 1,000,000 1,003,756 0.99Nationwide Building Society 1.00%24/01/2023 GBP 900,000 902,664 0.89Next Group plc 5.38% 26/10/2021 GBP 500,000 517,151 0.51Santander UK plc, FRN 0.89% 13/04/2021 GBP 500,000 499,889 0.49Santander UK plc 1.63% 10/05/2021 GBP 250,000 252,293 0.25Santander UK plc, FRN 0.49% 20/09/2021 GBP 500,000 500,670 0.50Severn Trent Utilities Finance plc 1.13%07/09/2021 GBP 700,000 701,910 0.70Sky Ltd. 2.88% 24/11/2020 GBP 1,250,000 1,259,988 1.25Societe Generale SA, London Branch0.00% 05/01/2021 GBP 500,000 499,145 0.49SSE plc 0.00% 03/08/2020 EUR 500,000 454,450 0.45SSE plc 4.25% 14/09/2021 GBP 1,000,000 1,038,380 1.03Tesco Corporate Treasury Services plc1.38% 24/10/2023 EUR 500,000 463,730 0.46
United Kingdom total 13,698,028 13.57
United States (31 December 2019: 11.21%)AbbVie, Inc. 2.15% 19/11/2021 USD 350,000 288,649 0.29AbbVie, Inc. 2.30% 21/11/2022 USD 350,000 293,001 0.29Albemarle Corp. 1.88% 08/12/2021 EUR 1,000,000 908,172 0.90Bank of America Corp. 6.13% 15/09/2021 GBP 1,200,000 1,275,012 1.26Barclays Bank plc, New York Branch0.90% 24/06/2021 USD 500,000 404,657 0.40Boeing Co. (The) 4.51% 01/05/2023 USD 282,000 241,108 0.24Exxon Mobil Corp. 0.14% 26/06/2024 EUR 2,000,000 1,815,947 1.80Fidelity National Information Services, Inc.0.13% 03/12/2022 EUR 200,000 180,805 0.18General Electric Co. 6.25% 29/09/2020 GBP 250,000 252,642 0.25International Business Machines Corp.2.75% 21/12/2020 GBP 1,200,000 1,211,902 1.20Metropolitan Life Global Funding I 1.13%15/12/2021 GBP 1,350,000 1,357,665 1.34MPLX LP, FRN 1.21% 09/09/2021 USD 200,000 160,582 0.16Nestle Holdings, Inc. 1.00% 11/06/2021 GBP 1,000,000 1,005,243 1.00New York Life Global Funding 1.00%15/12/2021 GBP 1,105,000 1,108,686 1.10US Bancorp 0.85% 07/06/2024 EUR 500,000 460,791 0.46Volkswagen Group of America FinanceLLC 2.50% 24/09/2021 USD 200,000 164,443 0.16Wells Fargo & Co. 2.13% 22/04/2022 GBP 1,094,000 1,112,392 1.10Wells Fargo & Co. 1.38% 30/06/2022 GBP 718,000 720,476 0.71
United States total 12,962,173 12.84
Total investments in Corporate Debt Securities 77,161,703 76.43
Government Debt Securities (31 December 2019: 2.77%)
Canada (31 December 2019: 0.00%)CPPIB Capital, Inc. 0.38% 25/07/2023 GBP 1,250,000 1,250,009 1.24
Canada total 1,250,009 1.24
United Kingdom (31 December 2019: 0.00%)UK Treasury Bill 0.00% 07/09/2020 GBP 2,400,000 2,399,780 2.38UK Treasury Bill 0.00% 14/12/2020 GBP 3,547,000 3,546,198 3.51
United Kingdom total 5,945,978 5.89
Total investments in Government Debt Securities 7,195,987 7.13
Total Bonds 91,374,951 90.51
97
JPMorgan ETFs (Ireland) ICAV - GBP Ultra-Short Income UCITS ETFSchedule of Investments (continued)As at 30 June 2020
Investments Currency
Quantity/Nominal
Value
FairValue
GBP
% ofNet
Assets Investments Currency
Quantity/Nominal
Value
FairValue
GBP
% ofNet
Assets

JPMorgan ETFs (Ireland) ICAV - GBP Ultra-Short Income UCITS ETF
Schedule of Investments (continued)
As at 30 June 2020
Forward Currency Contracts
CurrencyPurchased
AmountPurchased Currency Sold Amount Sold
MaturityDate Counterparty
FairValue
GBP
% ofNet
Assets
EUR 500,000 GBP 447,054 06/07/2020 Bank of America Merrill Lynch 7,469 0.01EUR 1,618,000 GBP 1,465,403 06/07/2020 Standard Chartered 5,431 0.01EUR 1,000,000 GBP 905,692 06/07/2020 Standard Chartered 3,353 -GBP 5,767,152 USD 7,077,928 05/08/2020 Bank of America Merrill Lynch 40,136 0.04GBP 756,773 JPY 100,205,849 06/07/2020 Citibank NA 5,041 -GBP 348,406 JPY 45,941,657 06/07/2020 Citibank NA 3,757 -GBP 3,335,584 USD 4,113,446 06/07/2020 Toronto-Dominion Bank 6,546 0.01GBP 10,891,430 EUR 11,931,982 05/08/2020 Bank of America Merrill Lynch 39,379 0.04
Total unrealised gain on Forward Currency Contracts (31 December 2019: 0.43%) 111,112 0.11
EUR 11,931,982 GBP 10,886,430 06/07/2020 Bank of America Merrill Lynch (39,726) (0.04)GBP 792,061 USD 984,324 06/07/2020 Bank of America Merrill Lynch (4,558) -GBP 194,314 USD 245,740 06/07/2020 BNP Paribas (4,565) (0.01)GBP 601,852 USD 745,999 06/07/2020 HSBC (1,890) -GBP 786,288 USD 988,419 06/07/2020 Standard Chartered (13,645) (0.01)GBP 1,860,129 EUR 2,056,000 06/07/2020 BNP Paribas (8,867) (0.01)GBP 1,804,856 EUR 1,999,550 06/07/2020 HSBC (12,824) (0.01)GBP 270,752 EUR 299,759 06/07/2020 Standard Chartered (1,742) -GBP 2,254,547 EUR 2,504,150 06/07/2020 Standard Chartered (21,837) (0.02)GBP 7,397,673 EUR 8,190,524 06/07/2020 Toronto-Dominion Bank (47,879) (0.05)USD 7,077,928 GBP 5,768,182 06/07/2020 Bank of America Merrill Lynch (39,969) (0.04)JPY 1,211,735 GBP 9,153 06/07/2020 BNP Paribas (63) -JPY 144,935,771 GBP 1,094,905 06/07/2020 Standard Chartered (7,614) (0.01)
Total unrealised loss on Forward Currency Contracts (31 December 2019: (0.01)%) (205,179) (0.20)
FairValue
GBP
% ofNet
Assets
Total financial assets at fair value through profit or loss 91,486,063 90.62Total financial liabilities at fair value through profit or loss (205,179) (0.20)Cash 647,025 0.64
Cash equivalents
Currency
Quantity/Nominal
ValueUndertaking for collective investment schemes (31 December 2019: 3.62%)JPMorgan Liquidity Funds - GBP Liquidity LVNAV Fund - Class X (dist.)1 GBP 9,287,116 9,287,116 9.20
Total Cash equivalents 9,287,116 9.20Other assets and liabilities (263,376) (0.26)
Net asset value attributable to holders of redeemable participating shares 100,951,649 100.00
Analysis of total assets
% ofTotal
Assets
Transferable securities and money market instruments admitted to official stock exchange listing 69.15Transferable securities and money market instruments dealt in on another regulated market 2.14Transferable securities and money market instruments other than those admitted to an official stock exchange listing or dealt in on another regulated market 18.43Collective investment schemes 9.12OTC financial derivative instruments 0.11Other assets 1.05
Total Assets 100.00
1A related party to the Fund.
98

99
Equities (31 December 2019: 91.97%)
Argentina (31 December 2019: 0.08%)MercadoLibre, Inc. USD 405 399,237 0.16
Argentina total 399,237 0.16
Brazil (31 December 2019: 7.18%)Ambev SA BRL 265,478 683,664 0.28Atacadao SA BRL 93,528 336,413 0.14B3 SA - Brasil Bolsa Balcao BRL 137,580 1,380,360 0.57Banco Bradesco SA, Preference BRL 332,850 1,254,826 0.52Banco do Brasil SA BRL 40,116 234,889 0.10CVC Brasil Operadora e Agencia deViagens SA BRL 27,583 91,126 0.04Equatorial Energia SA BRL 43,401 183,538 0.07Gerdau SA, Preference BRL 183,361 534,642 0.22Hapvida Participacoes e InvestimentosSA BRL 22,023 249,357 0.10Itau Unibanco Holding SA, Preference BRL 304,953 1,413,465 0.58Itausa SA, Preference BRL 269,457 470,622 0.19Localiza Rent a Car SA BRL 61,610 459,034 0.19Lojas Renner SA BRL 72,260 550,096 0.23Petroleo Brasileiro SA, Preference BRL 357,445 1,402,881 0.58Raia Drogasil SA BRL 23,241 468,223 0.19Telefonica Brasil SA, Preference BRL 29,821 260,855 0.11TIM Participacoes SA ADR USD 42,764 553,366 0.23Vale SA ADR ‘B’ USD 156,605 1,614,598 0.67
Brazil total 12,141,955 5.01
Chile (31 December 2019: 0.28%)Banco Santander Chile ADR USD 16,747 274,651 0.11Cencosud SA CLP 132,592 185,816 0.08Compania Cervecerias Unidas SA ADR USD 10,974 157,148 0.07
Chile total 617,615 0.26
China (31 December 2019: 31.22%)51job, Inc. ADR USD 6,535 469,148 0.19Aier Eye Hospital Group Co. Ltd. ‘A’ CNH 49,920 306,890 0.13Alibaba Group Holding Ltd. ADR USD 82,088 17,706,382 7.30ANTA Sports Products Ltd. HKD 29,000 255,934 0.11Baidu, Inc. ADR USD 10,859 1,301,886 0.54Bank of China Ltd. ‘H’ HKD 3,245,000 1,201,627 0.50Baoshan Iron & Steel Co. Ltd. ‘A’ CNH 958,900 618,667 0.26BeiGene Ltd. ADR USD 1,261 237,572 0.10BOE Technology Group Co. Ltd. ‘A’ CNH 980,200 647,665 0.27CGN Power Co. Ltd. ‘H’ HKD 1,974,000 407,512 0.17China Conch Venture Holdings Ltd. HKD 141,000 594,895 0.25China Construction Bank Corp. ‘H’ HKD 4,967,000 4,018,230 1.66China Lesso Group Holdings Ltd. HKD 281,000 365,460 0.15China Life Insurance Co. Ltd. ‘H’ HKD 563,000 1,133,199 0.47China Merchants Bank Co. Ltd. ‘H’ HKD 364,000 1,674,303 0.69China Merchants Shekou Industrial ZoneHoldings Co. Ltd. ‘A’ CNH 255,105 593,389 0.24China Molybdenum Co. Ltd. ‘H’ HKD 1,113,000 363,320 0.15China Oilfield Services Ltd. ‘H’ HKD 472,000 423,862 0.17China Pacific Insurance Group Co. Ltd. ‘H’ HKD 197,200 526,684 0.22China Petroleum & Chemical Corp. ‘H’ HKD 998,000 415,917 0.17China Vanke Co. Ltd. ‘H’ HKD 214,900 679,322 0.28China Yangtze Power Co. Ltd. ‘A’ CNH 240,200 643,683 0.27CNOOC Ltd. HKD 1,319,000 1,466,983 0.60Country Garden Holdings Co. Ltd. HKD 406,000 498,696 0.21Country Garden Services Holdings Co.Ltd. HKD 128,000 594,546 0.25CSPC Pharmaceutical Group Ltd. HKD 451,200 852,282 0.35ENN Energy Holdings Ltd. HKD 62,000 697,560 0.29Fosun International Ltd. HKD 235,500 299,599 0.12GDS Holdings Ltd. ADR USD 6,708 534,359 0.22Hangzhou Robam Appliances Co. Ltd. ‘A’ CNH 113,000 497,390 0.21Industrial & Commercial Bank of ChinaLtd. ‘H’ HKD 2,877,000 1,744,660 0.72Inner Mongolia Yili Industrial Group Co.Ltd. ‘A’ CNH 65,900 290,257 0.12Innovent Biologics, Inc. HKD 146,500 1,086,872 0.45JD.com, Inc. ADR USD 45,204 2,720,377 1.12Jiangsu Hengrui Medicine Co. Ltd. ‘A’ CNH 58,008 757,545 0.31Jiangsu Yanghe Brewery Joint-Stock Co.Ltd. ‘A’ CNH 37,900 563,801 0.23Jointown Pharmaceutical Group Co. Ltd.‘A’ CNH 111,000 292,430 0.12Jonjee Hi-Tech Industrial And CommercialHolding Co. Ltd. ‘A’ CNH 49,796 412,375 0.17Kingdee International Software Group Co.Ltd. HKD 417,000 969,536 0.40Kingsoft Corp. Ltd. HKD 172,000 800,031 0.33Kweichow Moutai Co. Ltd. ‘A’ CNH 4,000 827,918 0.34Laobaixing Pharmacy Chain JSC ‘A’ CNH 41,100 581,747 0.24Longfor Group Holdings Ltd. HKD 190,500 905,744 0.37Meituan Dianping ‘B’ HKD 122,900 2,725,843 1.12
Midea Group Co. Ltd. ‘A’ CNH 41,800 353,609 0.15NARI Technology Co. Ltd. ‘A’ CNH 197,257 565,166 0.23NetEase, Inc. ADR USD 4,612 1,980,301 0.82New Oriental Education & TechnologyGroup, Inc. ADR USD 10,484 1,365,331 0.56PICC Property & Casualty Co. Ltd. ‘H’ HKD 660,000 544,149 0.22Ping An Bank Co. Ltd. ‘A’ CNH 338,400 612,857 0.25Ping An Insurance Group Co. of ChinaLtd. ‘H’ HKD 327,000 3,269,810 1.35Poly Developments & Holdings Group Co.Ltd. ‘A’ CNH 325,000 679,636 0.28Postal Savings Bank of China Co. Ltd. ‘H’ HKD 1,409,000 808,992 0.33Shenzhen Mindray Bio-MedicalElectronics Co. Ltd. ‘A’ CNH 9,100 393,601 0.16Shenzhou International Group HoldingsLtd. HKD 70,300 847,179 0.35Silergy Corp. TWD 9,000 585,673 0.24Sinopharm Group Co. Ltd. ‘H’ HKD 111,600 285,679 0.12Sunny Optical Technology Group Co. Ltd. HKD 61,300 980,743 0.40Suofeiya Home Collection Co. Ltd. ‘A’ CNH 285,900 977,709 0.40Tencent Holdings Ltd. HKD 256,300 16,488,227 6.80Trip.com Group Ltd. ADR USD 24,488 634,729 0.26Vipshop Holdings Ltd. ADR USD 30,807 613,367 0.25Weifu High-Technology Group Co. Ltd. ‘A’ CNH 80,300 234,955 0.10WuXi AppTec Co. Ltd. ‘H’ HKD 23,800 309,229 0.13Wuxi Biologics Cayman, Inc. HKD 70,500 1,289,848 0.53Xinyangfeng Agricultural Technology Co.Ltd. ‘A’ CNH 291,400 364,469 0.15Yum China Holdings, Inc. USD 23,877 1,147,767 0.47Zai Lab Ltd. ADR USD 5,403 443,748 0.18Zhejiang Chint Electrics Co. Ltd. ‘A’ CNH 115,899 432,095 0.18Zhejiang Expressway Co. Ltd. ‘H’ HKD 328,000 231,914 0.10
China total 91,146,881 37.59
Colombia (31 December 2019: 0.25%)Ecopetrol SA ADR USD 42,386 471,756 0.19
Colombia total 471,756 0.19
Czech Republic (31 December 2019: 0.38%)Komercni banka A/S CZK 14,726 342,057 0.14Moneta Money Bank A/S CZK 128,655 290,164 0.12
Czech Republic total 632,221 0.26
Greece (31 December 2019: 0.10%)OPAP SA EUR 42,323 401,434 0.17
Greece total 401,434 0.17
Hong Kong (31 December 2019: 3.58%)Beijing Enterprises Holdings Ltd. HKD 47,500 158,733 0.07China Gas Holdings Ltd. HKD 254,600 785,108 0.32China Mobile Ltd. HKD 297,000 2,004,155 0.83China Overseas Land & Investment Ltd. HKD 345,500 1,045,355 0.43China Resources Land Ltd. HKD 260,000 984,588 0.41China State Construction InternationalHoldings Ltd. HKD 478,000 278,766 0.12China Unicom Hong Kong Ltd. HKD 782,000 422,760 0.17Far East Horizon Ltd. HKD 238,000 202,058 0.08Geely Automobile Holdings Ltd. HKD 331,000 521,028 0.21Hutchison China MediTech Ltd. ADR USD 11,185 308,482 0.13Kunlun Energy Co. Ltd. HKD 564,000 365,305 0.15Sino Biopharmaceutical Ltd. HKD 150,000 282,564 0.12Techtronic Industries Co. Ltd. HKD 47,000 459,664 0.19
Hong Kong total 7,818,566 3.23
Hungary (31 December 2019: 0.68%)OTP Bank Nyrt HUF 24,290 848,211 0.35Richter Gedeon Nyrt HUF 10,363 214,106 0.09
Hungary total 1,062,317 0.44
India (31 December 2019: 1.94%)Ashok Leyland Ltd. INR 394,555 246,127 0.10Axis Bank Ltd. INR 146,703 791,380 0.33Britannia Industries Ltd. INR 5,403 257,900 0.11Container Corp. Of India Ltd. INR 56,315 311,768 0.13Dr Reddy’s Laboratories Ltd. ADR USD 7,050 373,721 0.15Eicher Motors Ltd. INR 1,139 276,364 0.11HCL Technologies Ltd. INR 47,807 352,678 0.15HDFC Bank Ltd. ADR USD 11,878 539,974 0.22Hindalco Industries Ltd. INR 212,459 414,626 0.17Hindustan Unilever Ltd. INR 44,049 1,270,065 0.52Housing Development Finance Corp. Ltd. INR 98,130 2,288,720 0.94Infosys Ltd. ADR USD 204,321 1,973,741 0.81Kotak Mahindra Bank Ltd. INR 28,450 509,550 0.21Maruti Suzuki India Ltd. INR 13,625 1,052,050 0.43NTPC Ltd. INR 523,204 660,382 0.27
JPMorgan ETFs (Ireland) ICAV - Global Emerging Markets Research Enhanced Index Equity (ESG) UCITS ETFSchedule of InvestmentsAs at 30 June 2020
Investments Currency
Quantity/Nominal
Value
FairValue
USD
% ofNet
Assets Investments Currency
Quantity/Nominal
Value
FairValue
USD
% ofNet
Assets

Oil & Natural Gas Corp. Ltd. INR 593,895 641,060 0.27Petronet LNG Ltd. INR 116,643 401,819 0.17Power Grid Corp. of India Ltd. INR 295,664 684,497 0.28Reliance Industries Ltd., Partly PaidRights Issue INR 5,549 58,787 0.02Reliance Industries Ltd. INR 95,133 2,151,411 0.89Reliance Industries Ltd. GDR USD 25,950 1,198,890 0.50Shriram Transport Finance Co. Ltd. INR 43,861 401,410 0.17State Bank of India GDR USD 17,485 411,772 0.17Tata Consultancy Services Ltd. INR 58,491 1,615,240 0.67UltraTech Cement Ltd. INR 15,547 801,073 0.33United Spirits Ltd. INR 82,461 645,457 0.27UPL Ltd. INR 98,664 557,718 0.23
India total 20,888,180 8.62
Indonesia (31 December 2019: 1.73%)Astra International Tbk. PT IDR 1,395,000 468,743 0.19Bank Central Asia Tbk. PT IDR 713,800 1,422,853 0.59Bank Rakyat Indonesia Persero Tbk. PT IDR 4,088,900 867,299 0.36Telekomunikasi Indonesia PerseroTbk. PT IDR 4,759,400 1,016,183 0.42
Indonesia total 3,775,078 1.56
Malaysia (31 December 2019: 1.10%)CIMB Group Holdings Bhd. MYR 343,300 285,216 0.12Petronas Chemicals Group Bhd. MYR 366,100 529,713 0.22Public Bank Bhd. MYR 182,900 704,282 0.29Tenaga Nasional Bhd. MYR 201,300 545,882 0.22
Malaysia total 2,065,093 0.85
Mexico (31 December 2019: 3.19%)America Movil SAB de CV MXN 1,667,178 1,065,660 0.44Fomento Economico Mexicano SAB de CVADR USD 12,987 805,324 0.33Grupo Aeroportuario del Pacifico SAB deCV ‘B’ MXN 50,859 365,193 0.15Grupo Aeroportuario del Sureste SAB deCV ‘B’ MXN 38,969 434,263 0.18Grupo Financiero Banorte SAB de CV ‘O’ MXN 214,415 737,977 0.30Grupo Mexico SAB de CV MXN 383,864 887,105 0.37Kimberly-Clark de Mexico SAB de CV ‘A’ MXN 327,502 507,829 0.21Wal-Mart de Mexico SAB de CV MXN 399,099 949,430 0.39
Mexico total 5,752,781 2.37
Peru (31 December 2019: 0.45%)Credicorp Ltd. USD 6,260 836,774 0.35
Peru total 836,774 0.35
Philippines (31 December 2019: 0.54%)Ayala Corp. PHP 23,340 363,978 0.15Ayala Land, Inc. PHP 535,100 362,998 0.15International Container TerminalServices, Inc. PHP 133,080 273,772 0.11Jollibee Foods Corp. PHP 73,220 205,736 0.09
Philippines total 1,206,484 0.50
Poland (31 December 2019: 0.87%)CD Projekt SA PLN 8,089 807,540 0.33Dino Polska SA PLN 9,060 459,453 0.19
Poland total 1,266,993 0.52
Qatar (31 December 2019: 0.42%)Qatar National Bank QPSC QAR 199,275 951,769 0.39
Qatar total 951,769 0.39
Russia (31 December 2019: 4.29%)Alrosa PJSC USD 602,228 544,972 0.23Gazprom PJSC ADR USD 163,781 887,693 0.37LUKOIL PJSC ADR USD 25,951 1,926,083 0.79Magnitogorsk Iron & Steel Works PJSC USD 852,032 442,252 0.18MMC Norilsk Nickel PJSC ADR USD 14,405 379,284 0.16Moscow Exchange MICEX-RTS PJSC USD 413,738 657,295 0.27Sberbank of Russia PJSC ADR USD 160,897 1,824,572 0.75Severstal PAO GDR USD 53,174 643,405 0.27Tatneft PJSC ADR USD 20,961 979,298 0.40X5 Retail Group NV GDR USD 21,772 770,729 0.32
Russia total 9,055,583 3.74
Saudi Arabia (31 December 2019: 2.19%)Al Rajhi Bank SAR 91,773 1,384,791 0.57Alinma Bank SAR 146,419 567,564 0.24Almarai Co. JSC SAR 35,446 489,497 0.20Bupa Arabia for Cooperative InsuranceCo. SAR 9,927 288,997 0.12
Mouwasat Medical Services Co. SAR 16,058 386,573 0.16National Commercial Bank SAR 74,686 741,683 0.31Saudi Basic Industries Corp. SAR 36,339 853,497 0.35Saudi Telecom Co. SAR 21,085 556,496 0.23Savola Group (The) SAR 28,692 322,030 0.13
Saudi Arabia total 5,591,128 2.31
Singapore (31 December 2019: 0.16%)BOC Aviation Ltd. HKD 31,600 201,821 0.08
Singapore total 201,821 0.08
South Africa (31 December 2019: 3.91%)Absa Group Ltd. ZAR 101,042 496,051 0.20AngloGold Ashanti Ltd. ADR USD 14,907 439,607 0.18Bid Corp. Ltd. ZAR 45,781 746,988 0.31Bidvest Group Ltd. (The) ZAR 74,804 611,520 0.25Capitec Bank Holdings Ltd. ZAR 10,750 531,282 0.22Clicks Group Ltd. ZAR 45,142 546,536 0.23FirstRand Ltd. ZAR 384,396 842,021 0.35Impala Platinum Holdings Ltd. ZAR 35,038 233,923 0.10Mr Price Group Ltd. ZAR 56,647 466,217 0.19MTN Group Ltd. ZAR 121,916 370,695 0.15Naspers Ltd. ‘N’ ZAR 14,384 2,618,600 1.08Pick n Pay Stores Ltd. ZAR 101,809 298,835 0.12Shoprite Holdings Ltd. ZAR 29,365 180,246 0.07SPAR Group Ltd. (The) ZAR 56,508 558,088 0.23Vodacom Group Ltd. ZAR 57,244 405,073 0.17
South Africa total 9,345,682 3.85
South Korea (31 December 2019: 12.43%)BGF retail Co. Ltd. KRW 2,863 330,845 0.14Hana Financial Group, Inc. KRW 33,111 743,232 0.31Hanon Systems KRW 56,409 424,879 0.17Hyundai Glovis Co. Ltd. KRW 2,881 243,107 0.10Hyundai Mobis Co. Ltd. KRW 6,313 1,007,687 0.41Hyundai Motor Co. KRW 8,530 692,839 0.29KIWOOM Securities Co. Ltd. KRW 3,706 268,665 0.11LG Chem Ltd. KRW 3,797 1,548,346 0.64LG Household & Health Care Ltd. KRW 901 1,008,227 0.42Lotte Chemical Corp. KRW 3,433 476,627 0.20Mando Corp. KRW 20,125 373,940 0.15NAVER Corp. KRW 9,648 2,141,594 0.88NCSoft Corp. KRW 1,855 1,374,074 0.57POSCO KRW 6,751 976,576 0.40Samsung Electronics Co. Ltd. KRW 245,239 10,764,949 4.44Samsung SDI Co. Ltd. KRW 2,051 619,810 0.25Shinhan Financial Group Co. Ltd. KRW 36,632 875,562 0.36SK Holdings Co. Ltd. KRW 2,062 498,850 0.21SK Hynix, Inc. KRW 30,510 2,158,541 0.89SK Innovation Co. Ltd. KRW 6,586 717,268 0.30SK Telecom Co. Ltd. KRW 2,654 465,556 0.19S-Oil Corp. KRW 10,523 555,523 0.23
South Korea total 28,266,697 11.66
Taiwan (31 December 2019: 11.35%)Accton Technology Corp. TWD 44,000 340,016 0.14Advantech Co. Ltd. TWD 70,000 701,079 0.29ASE Technology Holding Co. Ltd. TWD 162,000 371,170 0.15Catcher Technology Co. Ltd. TWD 110,000 827,670 0.34Chailease Holding Co. Ltd. TWD 219,024 927,926 0.38Delta Electronics, Inc. TWD 220,000 1,248,962 0.52E.Sun Financial Holding Co. Ltd. TWD 1,078,972 1,016,639 0.42Formosa Chemicals & Fibre Corp. TWD 137,000 351,502 0.14Formosa Petrochemical Corp. TWD 223,000 668,898 0.28Formosa Plastics Corp. TWD 221,000 656,158 0.27Fubon Financial Holding Co. Ltd. TWD 475,000 706,757 0.29Global Unichip Corp. TWD 35,000 299,531 0.12Globalwafers Co. Ltd. TWD 51,000 696,606 0.29Hiwin Technologies Corp. TWD 77,000 765,968 0.32Hon Hai Precision Industry Co. Ltd. TWD 314,000 918,443 0.38Inventec Corp. TWD 283,000 240,753 0.10Largan Precision Co. Ltd. TWD 9,000 1,246,081 0.51MediaTek, Inc. TWD 66,000 1,295,192 0.53Nanya Technology Corp. TWD 140,000 289,447 0.12Quanta Computer, Inc. TWD 151,000 363,368 0.15Taiwan Semiconductor Manufacturing Co.Ltd. ADR USD 206,445 11,719,883 4.83Uni-President Enterprises Corp. TWD 437,000 1,056,046 0.44Vanguard International SemiconductorCorp. TWD 199,000 524,740 0.22Yuanta Financial Holding Co. Ltd. TWD 1,192,000 704,991 0.29
Taiwan total 27,937,826 11.52
100
JPMorgan ETFs (Ireland) ICAV - Global Emerging Markets Research Enhanced Index Equity (ESG) UCITS ETFSchedule of Investments (continued)As at 30 June 2020
Investments Currency
Quantity/Nominal
Value
FairValue
USD
% ofNet
Assets Investments Currency
Quantity/Nominal
Value
FairValue
USD
% ofNet
Assets

Thailand (31 December 2019: 2.09%)Kasikornbank PCL NVDR THB 161,800 488,161 0.20Minor International PCL NVDR THB 516,800 339,434 0.14Minor International PCL NVDR, Rights THB 516,800 23,409 0.01PTT Exploration & Production PCL NVDR THB 210,500 624,877 0.26PTT Global Chemical PCL NVDR THB 123,300 184,506 0.07PTT PCL NVDR THB 488,800 597,014 0.25Siam Cement PCL (The) NVDR THB 82,700 984,667 0.41Thai Oil PCL NVDR THB 311,000 445,256 0.18
Thailand total 3,687,324 1.52
Turkey (31 December 2019: 0.96%)BIM Birlesik Magazalar A/S TRY 76,023 754,158 0.31Eregli Demir ve Celik Fabrikalari TAS TRY 337,976 423,040 0.17Ford Otomotiv Sanayi A/S TRY 28,584 295,650 0.12KOC Holding A/S TRY 116,489 305,890 0.13Tupras Turkiye Petrol Rafinerileri A/S TRY 29,280 382,298 0.16Turkcell Iletisim Hizmetleri A/S TRY 214,248 513,839 0.21
Turkey total 2,674,875 1.10
United Arab Emirates (31 December 2019: 0.10%)Emaar Properties PJSC AED 392,374 291,625 0.12
United Arab Emirates total 291,625 0.12
United Kingdom (31 December 2019: 0.13%)Mondi plc ZAR 14,727 274,910 0.11
United Kingdom total 274,910 0.11
Total investments in Equities 238,762,605 98.48
101
JPMorgan ETFs (Ireland) ICAV - Global Emerging Markets Research Enhanced Index Equity (ESG) UCITS ETFSchedule of Investments (continued)As at 30 June 2020
Investments Currency
Quantity/Nominal
Value
FairValue
USD
% ofNet
Assets Investments Currency
Quantity/Nominal
Value
FairValue
USD
% ofNet
Assets

JPMorgan ETFs (Ireland) ICAV - Global Emerging Markets Research Enhanced Index Equity (ESG) UCITS ETFSchedule of Investments (continued)As at 30 June 2020
Fair ValueUSD
% ofNet
Assets
Total financial assets at fair value through profit or loss 238,762,605 98.48Cash 1,324,028 0.55
Cash equivalents
Currency
Quantity/Nominal
ValueUndertaking for collective investment schemes (31 December 2019: 0.13%)JPMorgan Liquidity Funds - USD Liquidity LVNAV Fund - Class X (dist.)1 USD 2,079,172 2,079,172 0.86
Total Cash equivalents 2,079,172 0.86Other assets and liabilities 292,432 0.11
Net asset value attributable to holders of redeemable participating shares 242,458,237 100.00
Analysis of total assets
% ofTotal
Assets
Transferable securities and money market instruments admitted to official stock exchange listing 94.78Transferable securities and money market instruments dealt in on another regulated market 3.40Collective investment schemes 0.86Other assets 0.96
Total Assets 100.00
1A related party to the Fund.
102

103
Equities (31 December 2019: 99.68%)
Australia (31 December 2019: 3.13%)AGL Energy Ltd. AUD 3,931 46,146 0.20Alumina Ltd. AUD 27,221 30,455 0.13Ampol Ltd. AUD 1,617 32,642 0.14APA Group AUD 5,561 42,614 0.18Aristocrat Leisure Ltd. AUD 977 17,153 0.07Aurizon Holdings Ltd. AUD 9,310 31,537 0.13BHP Group plc GBP 2,403 49,122 0.21Cochlear Ltd. AUD 296 38,503 0.16CSL Ltd. AUD 127 25,095 0.11Dexus, REIT AUD 2,867 18,160 0.08Fortescue Metals Group Ltd. AUD 7,572 72,204 0.31GPT Group (The), REIT AUD 12,925 37,108 0.16Origin Energy Ltd. AUD 2,289 9,204 0.04Qantas Airways Ltd. AUD 5,530 14,392 0.06Scentre Group, REIT AUD 10,142 15,153 0.07Sonic Healthcare Ltd. AUD 2,548 53,383 0.23Sydney Airport AUD 6,532 25,500 0.11Telstra Corp. Ltd. AUD 16,213 34,939 0.15Transurban Group AUD 1,540 14,982 0.06Wesfarmers Ltd. AUD 2,369 73,120 0.31Woodside Petroleum Ltd. AUD 1,472 21,942 0.09Woolworths Group Ltd. AUD 1,223 31,391 0.13
Australia total 734,745 3.13
Austria (31 December 2019: 0.14%)OMV AG EUR 653 21,827 0.09
Austria total 21,827 0.09
Belgium (31 December 2019: 0.39%)Galapagos NV EUR 27 5,309 0.03Galapagos NV EUR 193 37,945 0.16Proximus SADP EUR 1,642 33,454 0.14
Belgium total 76,708 0.33
Bermuda (31 December 2019: 0.04%)Arch Capital Group Ltd. USD 789 22,605 0.10
Bermuda total 22,605 0.10
Canada (31 December 2019: 8.44%)Agnico Eagle Mines Ltd. CAD 588 37,529 0.16Alimentation Couche-Tard, Inc. ‘B’ CAD 973 30,412 0.13Bank of Montreal CAD 960 50,932 0.22Bank of Nova Scotia (The) CAD 1,149 47,394 0.20Barrick Gold Corp. CAD 2,917 78,236 0.33BCE, Inc. CAD 1,648 68,509 0.29Brookfield Asset Management, Inc. ‘A’ CAD 1,837 60,262 0.26Canadian Imperial Bank of Commerce CAD 828 55,164 0.24Canadian National Railway Co. CAD 820 72,313 0.31Canadian Natural Resources Ltd. CAD 2,560 44,264 0.19Cenovus Energy, Inc. CAD 6,531 30,449 0.13CGI, Inc. ‘A’ CAD 947 59,469 0.25Enbridge, Inc. CAD 1,511 45,796 0.20Fortis, Inc. CAD 1,807 68,499 0.29Franco-Nevada Corp. CAD 500 69,622 0.30Hydro One Ltd. CAD 1,259 23,599 0.10Imperial Oil Ltd. CAD 2,193 35,165 0.15Intact Financial Corp. CAD 624 59,198 0.25Inter Pipeline Ltd. CAD 2,799 25,976 0.11Lululemon Athletica, Inc. USD 233 72,698 0.31Magna International, Inc. CAD 1,447 64,233 0.27Metro, Inc. CAD 194 7,977 0.03National Bank of Canada CAD 1,387 62,649 0.27Nutrien Ltd. CAD 1,499 48,008 0.20Pembina Pipeline Corp. CAD 1,700 42,363 0.18Power Corp. of Canada CAD 2,960 51,898 0.22Restaurant Brands International, Inc. CAD 639 34,666 0.15Royal Bank of Canada CAD 972 65,735 0.28Saputo, Inc. CAD 34 808 0.00Sun Life Financial, Inc. CAD 1,668 61,099 0.26Suncor Energy, Inc. CAD 2,214 37,209 0.16TC Energy Corp. CAD 1,001 42,627 0.18Teck Resources Ltd. ‘B’ CAD 1,831 19,117 0.08TELUS Corp. CAD 3,871 64,716 0.28Thomson Reuters Corp. CAD 985 66,708 0.28Toronto-Dominion Bank (The) CAD 1,291 57,432 0.25Wheaton Precious Metals Corp. CAD 1,628 71,371 0.30
Canada total 1,834,102 7.81
China (31 December 2019: 0.04%)Lenovo Group Ltd. HKD 26,000 14,391 0.06
China total 14,391 0.06
Denmark (31 December 2019: 0.73%)Coloplast A/S ‘B’ DKK 417 64,599 0.28H Lundbeck A/S DKK 463 17,401 0.07Novo Nordisk A/S ‘B’ DKK 1,089 70,467 0.30Vestas Wind Systems A/S DKK 231 23,511 0.10
Denmark total 175,978 0.75
Finland (31 December 2019: 1.32%)Elisa OYJ EUR 518 31,498 0.13Fortum OYJ EUR 2,901 55,081 0.23Kone OYJ ‘B’ EUR 1,046 71,922 0.31Neste OYJ EUR 1,733 67,755 0.29Sampo OYJ ‘A’ EUR 56 1,926 0.01Stora Enso OYJ ‘R’ EUR 1,023 12,214 0.05UPM-Kymmene OYJ EUR 1,994 57,601 0.25
Finland total 297,997 1.27
France (31 December 2019: 2.58%)Capgemini SE EUR 626 71,680 0.30Cie Generale des Etablissements MichelinSCA EUR 477 49,471 0.21Dassault Systemes SE EUR 404 69,696 0.30Engie SA EUR 3,427 42,339 0.18Gecina SA, REIT EUR 148 18,285 0.08Orange SA EUR 3,228 38,594 0.16Peugeot SA EUR 244 3,968 0.02Sanofi EUR 728 74,120 0.32TOTAL SA EUR 1,374 52,431 0.22Vinci SA EUR 690 63,548 0.27
France total 484,132 2.06
Germany (31 December 2019: 0.71%)Deutsche Lufthansa AG EUR 1,909 19,172 0.08Deutsche Telekom AG EUR 4,220 70,835 0.30Deutsche Wohnen SE EUR 57 2,558 0.01Hannover Rueck SE EUR 378 65,126 0.28ProSiebenSat.1 Media SE EUR 812 9,658 0.04SAP SE EUR 127 17,733 0.08
Germany total 185,082 0.79
Hong Kong (31 December 2019: 1.35%)ASM Pacific Technology Ltd. HKD 400 4,198 0.02CK Hutchison Holdings Ltd. HKD 3,000 19,276 0.08CLP Holdings Ltd. HKD 6,500 63,738 0.27Hong Kong & China Gas Co. Ltd. HKD 7,550 11,690 0.05Link REIT HKD 6,000 49,042 0.21PCCW Ltd. HKD 14,000 7,984 0.04Power Assets Holdings Ltd. HKD 6,500 35,350 0.15Swire Pacific Ltd. ‘A’ HKD 4,500 23,863 0.10Techtronic Industries Co. Ltd. HKD 8,000 78,241 0.33
Hong Kong total 293,382 1.25
Ireland (31 December 2019: 0.82%)Accenture plc ‘A’ USD 347 74,508 0.32Experian plc GBP 1,737 60,502 0.26Flutter Entertainment plc GBP 190 24,873 0.11Jazz Pharmaceuticals plc USD 240 26,482 0.11Medtronic plc USD 704 64,557 0.27
Ireland total 250,922 1.07
Israel (31 December 2019: 0.07%)Check Point Software Technologies Ltd. USD 168 18,048 0.08
Israel total 18,048 0.08
Italy (31 December 2019: 1.24%)A2A SpA EUR 19,172 27,142 0.12Assicurazioni Generali SpA EUR 2,604 39,396 0.17Enel SpA EUR 8,810 75,973 0.32ENI SpA EUR 374 3,566 0.01Poste Italiane SpA EUR 1,452 12,623 0.05Snam SpA EUR 14,887 72,466 0.31Telecom Italia SpA EUR 69,434 27,271 0.12Terna Rete Elettrica Nazionale SpA EUR 3,054 20,985 0.09Unione di Banche Italiane SpA EUR 2,533 8,279 0.03
Italy total 287,701 1.22
Japan (31 December 2019: 8.83%)Aozora Bank Ltd. JPY 200 3,478 0.01Asahi Group Holdings Ltd. JPY 200 7,000 0.03Astellas Pharma, Inc. JPY 1,500 25,020 0.11Bandai Namco Holdings, Inc. JPY 1,300 68,287 0.29Bridgestone Corp. JPY 1,400 45,016 0.19Brother Industries Ltd. JPY 3,300 59,402 0.25Capcom Co. Ltd. JPY 1,100 39,968 0.17
JPMorgan ETFs (Ireland) ICAV - Global Equity Multi-Factor UCITS ETFSchedule of InvestmentsAs at 30 June 2020
Investments Currency
Quantity/Nominal
Value
FairValue
USD
% ofNet
Assets Investments Currency
Quantity/Nominal
Value
FairValue
USD
% ofNet
Assets

Central Japan Railway Co. JPY 300 46,410 0.20Chubu Electric Power Co., Inc. JPY 3,200 40,102 0.17Concordia Financial Group Ltd. JPY 5,400 17,268 0.07Dai Nippon Printing Co. Ltd. JPY 1,300 29,751 0.13Daicel Corp. JPY 2,900 22,391 0.10Daiichi Sankyo Co. Ltd. JPY 700 57,137 0.24ENEOS Holdings, Inc. JPY 17,300 61,256 0.26FamilyMart Co. Ltd. JPY 1,000 17,139 0.07Fuji Electric Co. Ltd. JPY 800 21,831 0.09FUJIFILM Holdings Corp. JPY 500 21,365 0.09Hikari Tsushin, Inc. JPY 100 22,756 0.10Hoya Corp. JPY 700 66,571 0.28Inpex Corp. JPY 6,400 39,562 0.17Japan Airlines Co. Ltd. JPY 1,300 23,401 0.10Kansai Electric Power Co., Inc. (The) JPY 4,900 47,463 0.20KDDI Corp. JPY 2,200 65,948 0.28Lawson, Inc. JPY 500 25,073 0.11Marubeni Corp. JPY 4,000 18,075 0.08Matsumotokiyoshi Holdings Co. Ltd. JPY 700 25,402 0.11Mitsubishi Chemical Holdings Corp. JPY 5,300 30,822 0.13Mitsubishi Corp. JPY 1,800 37,874 0.16Mitsubishi Gas Chemical Co., Inc. JPY 1,700 25,685 0.11Mitsubishi Heavy Industries Ltd. JPY 1,200 28,286 0.12Mitsui Chemicals, Inc. JPY 1,000 20,828 0.09Mochida Pharmaceutical Co. Ltd. JPY 1,400 52,037 0.22MS&AD Insurance Group Holdings, Inc. JPY 600 16,467 0.07Nippon Telegraph & Telephone Corp. JPY 3,000 69,949 0.30Nomura Real Estate Holdings, Inc. JPY 1,800 33,369 0.14Nomura Research Institute Ltd. JPY 2,500 67,827 0.29NTT DOCOMO, Inc. JPY 2,600 69,455 0.30ORIX Corp. JPY 3,400 41,868 0.18Osaka Gas Co. Ltd. JPY 2,300 45,367 0.19Otsuka Corp. JPY 200 10,530 0.04Rakuten, Inc. JPY 4,300 37,785 0.16Resona Holdings, Inc. JPY 17,100 58,297 0.25Sankyo Co. Ltd. JPY 400 9,662 0.04Secom Co. Ltd. JPY 300 26,203 0.11Sekisui Chemical Co. Ltd. JPY 1,300 18,581 0.08Showa Denko KK JPY 700 15,676 0.07Skylark Holdings Co. Ltd. JPY 800 12,688 0.05Softbank Corp. JPY 1,200 15,294 0.07Sojitz Corp. JPY 14,700 32,020 0.14Subaru Corp. JPY 1,700 35,320 0.15Sumitomo Chemical Co. Ltd. JPY 1,200 3,582 0.02Sumitomo Rubber Industries Ltd. JPY 1,600 15,750 0.07Tohoku Electric Power Co., Inc. JPY 2,800 26,628 0.11Tokio Marine Holdings, Inc. JPY 300 13,064 0.06Tokyo Gas Co. Ltd. JPY 2,100 50,220 0.21Toppan Printing Co. Ltd. JPY 900 14,991 0.06Toyo Suisan Kaisha Ltd. JPY 700 39,125 0.17Ube Industries Ltd. JPY 2,400 41,199 0.18West Japan Railway Co. JPY 300 16,812 0.07Zeon Corp. JPY 1,200 11,023 0.05
Japan total 1,961,356 8.36
Luxembourg (31 December 2019: 0.05%)SES SA ‘A’ EUR 1,033 7,054 0.03
Luxembourg total 7,054 0.03
Netherlands (31 December 2019: 1.86%)Aegon NV EUR 2,803 8,352 0.04Altice Europe NV ‘A’ EUR 2,470 9,529 0.04ASML Holding NV EUR 206 75,634 0.32Heineken Holding NV EUR 242 19,801 0.08Koninklijke Ahold Delhaize NV EUR 1,948 53,078 0.23Koninklijke DSM NV EUR 277 38,329 0.16Koninklijke KPN NV EUR 19,033 50,449 0.22Koninklijke Philips NV EUR 920 42,903 0.18NN Group NV EUR 1,731 58,131 0.25Royal Dutch Shell plc ‘B’ GBP 1,688 25,529 0.11Wolters Kluwer NV EUR 879 68,634 0.29
Netherlands total 450,369 1.92
New Zealand (31 December 2019: 0.26%)Spark New Zealand Ltd. NZD 24,558 72,090 0.31
New Zealand total 72,090 0.31
Norway (31 December 2019: 0.81%)DNB ASA NOK 3,399 44,782 0.19Equinor ASA NOK 613 8,680 0.04Mowi ASA NOK 1,961 37,128 0.16Telenor ASA NOK 2,514 36,510 0.15
Norway total 127,100 0.54
Peru (31 December 2019: 0.24%)Southern Copper Corp. USD 1,526 60,689 0.26
Peru total 60,689 0.26
Portugal (31 December 2019: 0.27%)EDP - Energias de Portugal SA EUR 14,900 71,124 0.30
Portugal total 71,124 0.30
Russia (31 December 2019: 0.05%)Evraz plc GBP 2,409 8,584 0.04
Russia total 8,584 0.04
Singapore (31 December 2019: 0.06%)Mapletree Commercial Trust, REIT SGD 13,600 18,815 0.08
Singapore total 18,815 0.08
South Korea (31 December 2019: 1.10%)Hyundai Mobis Co. Ltd. KRW 68 10,854 0.05KT&G Corp. KRW 93 6,046 0.03LG Corp. KRW 88 5,209 0.02LG Household & Health Care Ltd. KRW 7 7,833 0.03LG Uplus Corp. KRW 1,229 12,465 0.05Lotte Chemical Corp. KRW 53 7,358 0.03NCSoft Corp. KRW 53 39,259 0.17Samsung Electronics Co. Ltd. KRW 1,646 72,253 0.31SK Holdings Co. Ltd. KRW 120 29,031 0.12SK Hynix, Inc. KRW 94 6,651 0.03SK Telecom Co. Ltd. KRW 180 31,575 0.13
South Korea total 228,534 0.97
Spain (31 December 2019: 1.88%)ACS Actividades de Construccion yServicios SA EUR 470 11,846 0.05ACS Actividades de Construccion yServicios SA, Rights EUR 470 733 0.00Amadeus IT Group SA EUR 967 50,373 0.21Enagas SA EUR 1,968 48,075 0.21Endesa SA EUR 2,860 70,444 0.30Iberdrola SA EUR 5,539 64,202 0.27Naturgy Energy Group SA EUR 2,560 47,629 0.20Red Electrica Corp. SA EUR 2,204 41,104 0.18Telefonica SA EUR 8,178 39,009 0.17Telefonica SA, Rights EUR 8,178 1,608 0.01
Spain total 375,023 1.60
Sweden (31 December 2019: 2.25%)Atlas Copco AB ‘A’ SEK 1,789 75,772 0.32Boliden AB SEK 2,150 48,923 0.21Hennes & Mauritz AB ‘B’ SEK 3,913 56,700 0.24Hexagon AB ‘B’ SEK 684 39,939 0.17Investor AB ‘B’ SEK 904 47,710 0.20Lundin Energy AB SEK 1,104 26,614 0.12Sandvik AB SEK 2,473 46,213 0.20Skandinaviska Enskilda Banken AB ‘A’ SEK 2,217 19,203 0.08Swedish Match AB SEK 1,008 70,867 0.30Tele2 AB ‘B’ SEK 5,085 67,433 0.29Telia Co. AB SEK 15,121 56,481 0.24
Sweden total 555,855 2.37
Switzerland (31 December 2019: 3.37%)ABB Ltd. CHF 1,259 28,341 0.12Adecco Group AG CHF 252 11,824 0.05Chubb Ltd. USD 485 61,411 0.26Garmin Ltd. USD 775 75,563 0.32Geberit AG CHF 47 23,521 0.10Givaudan SA CHF 20 74,466 0.32Logitech International SA CHF 395 25,787 0.11Nestle SA CHF 677 74,834 0.32Novartis AG CHF 830 72,195 0.31Roche Holding AG CHF 209 72,424 0.31Sonova Holding AG CHF 310 61,882 0.26Swiss Life Holding AG CHF 64 23,708 0.10Swisscom AG CHF 135 70,652 0.30TE Connectivity Ltd. USD 717 58,471 0.25Zurich Insurance Group AG CHF 143 50,436 0.22
Switzerland total 785,515 3.35
United Kingdom (31 December 2019: 4.43%)Anglo American plc GBP 2,478 57,238 0.24Auto Trader Group plc GBP 3,871 25,178 0.11Berkeley Group Holdings plc GBP 1,069 55,014 0.23BT Group plc ‘A’ GBP 21,050 29,664 0.13Coca-Cola European Partners plc USD 1,342 50,674 0.22Compass Group plc GBP 2,779 38,183 0.16
104
JPMorgan ETFs (Ireland) ICAV - Global Equity Multi-Factor UCITS ETFSchedule of Investments (continued)As at 30 June 2020
Investments Currency
Quantity/Nominal
Value
FairValue
USD
% ofNet
Assets Investments Currency
Quantity/Nominal
Value
FairValue
USD
% ofNet
Assets

Ferguson plc GBP 319 26,062 0.11InterContinental Hotels Group plc GBP 599 26,400 0.11International Consolidated Airlines GroupSA GBP 3,172 8,709 0.04ITV plc GBP 1,161 1,071 0.00Linde plc USD 345 73,178 0.31Mondi plc GBP 203 3,789 0.02Pearson plc GBP 649 4,617 0.02Persimmon plc GBP 1,693 47,820 0.20RELX plc GBP 2,109 48,730 0.21Rio Tinto plc GBP 1,283 72,114 0.31Sage Group plc (The) GBP 2,633 21,856 0.09Segro plc, REIT GBP 1,880 20,790 0.09Smith & Nephew plc GBP 519 9,654 0.04Smiths Group plc GBP 1,058 18,459 0.08SSE plc GBP 2,602 43,869 0.19Tate & Lyle plc GBP 1,523 12,563 0.05Unilever NV EUR 1,225 65,009 0.28Unilever plc GBP 1,201 64,626 0.27Vodafone Group plc GBP 28,847 45,930 0.20Wm Morrison Supermarkets plc GBP 23,642 55,664 0.24WPP plc GBP 1,348 10,506 0.04
United Kingdom total 937,367 3.99
United States (31 December 2019: 53.22%)3M Co. USD 254 39,621 0.17Abbott Laboratories USD 736 67,293 0.29AbbVie, Inc. USD 754 74,028 0.32AES Corp. (The) USD 4,217 61,104 0.26AGNC Investment Corp., REIT USD 4,228 54,541 0.23Air Products & Chemicals, Inc. USD 289 69,782 0.30Alaska Air Group, Inc. USD 923 33,468 0.14Alexion Pharmaceuticals, Inc. USD 388 43,549 0.19Allstate Corp. (The) USD 695 67,408 0.29Ally Financial, Inc. USD 1,728 34,266 0.15Altria Group, Inc. USD 860 33,755 0.14Amdocs Ltd. USD 418 25,448 0.11Ameren Corp. USD 926 65,153 0.28American Electric Power Co., Inc. USD 808 64,349 0.27American Water Works Co., Inc. USD 550 70,763 0.30Amgen, Inc. USD 304 71,701 0.31Anthem, Inc. USD 238 62,589 0.27Apache Corp. USD 1,297 17,510 0.07Apple, Inc. USD 220 80,256 0.34Applied Materials, Inc. USD 829 50,113 0.21Arconic Corp. USD 409 5,697 0.02Assurant, Inc. USD 388 40,077 0.17AT&T, Inc. USD 2,078 62,818 0.27Automatic Data Processing, Inc. USD 448 66,703 0.28AutoZone, Inc. USD 54 60,918 0.26Avangrid, Inc. USD 693 29,092 0.12Avery Dennison Corp. USD 610 69,595 0.30Baxter International, Inc. USD 776 66,814 0.28Becton Dickinson & Co. USD 283 67,713 0.29Best Buy Co., Inc. USD 895 78,107 0.33Biogen, Inc. USD 177 47,356 0.20Booking Holdings, Inc. USD 29 46,178 0.20BorgWarner, Inc. USD 1,482 52,315 0.22Bristol-Myers Squibb Co. USD 1,170 68,796 0.29Broadcom, Inc. USD 238 75,115 0.32Broadridge Financial Solutions, Inc. USD 573 72,307 0.31Brown-Forman Corp. ‘B’ USD 435 27,692 0.12Cabot Oil & Gas Corp. USD 3,501 60,147 0.26Campbell Soup Co. USD 902 44,766 0.19Cardinal Health, Inc. USD 852 44,466 0.19Carnival plc GBP 453 5,518 0.02Carrier Global Corp. USD 554 12,310 0.05Caterpillar, Inc. USD 460 58,190 0.25CDW Corp. USD 590 68,546 0.29Celanese Corp. ‘A’ USD 758 65,446 0.28CenturyLink, Inc. USD 4,793 48,074 0.20CF Industries Holdings, Inc. USD 1,722 48,457 0.21Charter Communications, Inc. ‘A’ USD 98 49,984 0.21Chevron Corp. USD 680 60,676 0.26Church & Dwight Co., Inc. USD 931 71,966 0.31Cigna Corp. USD 236 44,285 0.19Cincinnati Financial Corp. USD 271 17,352 0.07Cintas Corp. USD 189 50,342 0.21Cisco Systems, Inc. USD 1,414 65,949 0.28Citrix Systems, Inc. USD 472 69,814 0.30Clorox Co. (The) USD 266 58,352 0.25CMS Energy Corp. USD 1,190 69,520 0.30Coca-Cola Co. (The) USD 687 30,695 0.13Colgate-Palmolive Co. USD 830 60,806 0.26Comcast Corp. ‘A’ USD 1,719 67,007 0.29ConocoPhillips USD 1,126 47,315 0.20Consolidated Edison, Inc. USD 838 60,277 0.26
Cooper Cos., Inc. (The) USD 222 62,968 0.27Cummins, Inc. USD 412 71,383 0.30CVS Health Corp. USD 1,029 66,854 0.29Danaher Corp. USD 280 49,512 0.21Darden Restaurants, Inc. USD 622 47,129 0.20DaVita, Inc. USD 575 45,506 0.19Delta Air Lines, Inc. USD 1,207 33,856 0.14DENTSPLY SIRONA, Inc. USD 674 29,696 0.13Dollar General Corp. USD 365 69,536 0.30Dominion Energy, Inc. USD 365 29,631 0.13Dover Corp. USD 220 21,243 0.09Dow, Inc. USD 1,189 48,464 0.21DTE Energy Co. USD 582 62,565 0.27Duke Energy Corp. USD 787 62,873 0.27Eastman Chemical Co. USD 1,012 70,476 0.30Eaton Corp. plc USD 728 63,685 0.27eBay, Inc. USD 1,534 80,458 0.34Ecolab, Inc. USD 329 65,455 0.28Edwards Lifesciences Corp. USD 622 42,986 0.18Electronic Arts, Inc. USD 531 70,119 0.30Eli Lilly & Co. USD 457 75,030 0.32Entergy Corp. USD 617 57,881 0.25EOG Resources, Inc. USD 760 38,502 0.16Equity Residential, REIT USD 554 32,586 0.14Estee Lauder Cos., Inc. (The) ‘A’ USD 354 66,793 0.28Evergy, Inc. USD 1,119 66,346 0.28Eversource Energy USD 642 53,459 0.23Exelon Corp. USD 1,600 58,064 0.25Exxon Mobil Corp. USD 730 32,646 0.14Fidelity National Financial, Inc. USD 1,859 56,997 0.24Fidelity National Information Services, Inc. USD 178 23,868 0.10Fifth Third Bancorp USD 2,199 42,397 0.18FirstEnergy Corp. USD 1,643 63,716 0.27Fiserv, Inc. USD 654 63,843 0.27FMC Corp. USD 513 51,105 0.22Ford Motor Co. USD 3,706 22,532 0.10Fortinet, Inc. USD 292 40,083 0.17Fortune Brands Home & Security, Inc. USD 303 19,371 0.08Fox Corp. ‘A’ USD 323 8,663 0.04Gap, Inc. (The) USD 2,335 29,468 0.13General Mills, Inc. USD 1,108 68,308 0.29Gentex Corp. USD 2,642 68,084 0.29Genuine Parts Co. USD 277 24,088 0.10Gilead Sciences, Inc. USD 898 69,092 0.29Globe Life, Inc. USD 775 57,528 0.25Harley-Davidson, Inc. USD 974 23,152 0.10Hartford Financial Services Group, Inc.(The) USD 989 38,126 0.16Hasbro, Inc. USD 688 51,566 0.22Healthpeak Properties, Inc., REIT USD 2,177 59,998 0.26Henry Schein, Inc. USD 632 36,902 0.16Hershey Co. (The) USD 501 64,940 0.28Hilton Worldwide Holdings, Inc. USD 497 36,505 0.16HollyFrontier Corp. USD 1,481 43,245 0.18Home Depot, Inc. (The) USD 281 70,393 0.30Honeywell International, Inc. USD 446 64,487 0.27Hormel Foods Corp. USD 1,312 63,330 0.27Howmet Aerospace, Inc. USD 1,637 25,946 0.11HP, Inc. USD 3,040 52,987 0.23Humana, Inc. USD 113 43,816 0.19Illinois Tool Works, Inc. USD 395 69,066 0.29Ingredion, Inc. USD 91 7,553 0.03Intel Corp. USD 1,110 66,411 0.28International Flavors & Fragrances, Inc. USD 401 49,106 0.21International Paper Co. USD 1,718 60,491 0.26Interpublic Group of Cos., Inc. (The) USD 3,430 58,859 0.25Intuit, Inc. USD 241 71,382 0.30JM Smucker Co. (The) USD 488 51,635 0.22Johnson & Johnson USD 470 66,096 0.28Johnson Controls International plc USD 968 33,048 0.14Keurig Dr Pepper, Inc. USD 1,189 33,768 0.14Keysight Technologies, Inc. USD 431 43,436 0.19Kimberly-Clark Corp. USD 494 69,827 0.30Kinder Morgan, Inc. USD 2,948 44,721 0.19KLA Corp. USD 265 51,537 0.22Kohl’s Corp. USD 1,064 22,099 0.09L3Harris Technologies, Inc. USD 350 59,385 0.25Laboratory Corp. of America Holdings USD 350 58,139 0.25Lam Research Corp. USD 247 79,895 0.34Las Vegas Sands Corp. USD 1,062 48,363 0.21Lear Corp. USD 401 43,717 0.19Leggett & Platt, Inc. USD 1,311 46,082 0.20Leidos Holdings, Inc. USD 664 62,197 0.27Lockheed Martin Corp. USD 180 65,686 0.28Lowe’s Cos., Inc. USD 482 65,128 0.28LyondellBasell Industries NV ‘A’ USD 860 56,519 0.24Macy’s, Inc. USD 2,101 14,455 0.06
105
JPMorgan ETFs (Ireland) ICAV - Global Equity Multi-Factor UCITS ETFSchedule of Investments (continued)As at 30 June 2020
Investments Currency
Quantity/Nominal
Value
FairValue
USD
% ofNet
Assets Investments Currency
Quantity/Nominal
Value
FairValue
USD
% ofNet
Assets

Marathon Oil Corp. USD 4,309 26,371 0.11Marathon Petroleum Corp. USD 1,012 37,829 0.16Markel Corp. USD 23 21,233 0.09Marriott International, Inc. ‘A’ USD 360 30,863 0.13Masco Corp. USD 998 50,110 0.21Maxim Integrated Products, Inc. USD 1,211 73,399 0.31McCormick & Co., Inc. USD 181 32,473 0.14McDonald’s Corp. USD 348 64,196 0.27Merck & Co., Inc. USD 865 66,890 0.29Micron Technology, Inc. USD 1,391 71,664 0.31Microsoft Corp. USD 381 77,537 0.33Mid-America Apartment Communities,Inc., REIT USD 297 34,057 0.15Mondelez International, Inc. ‘A’ USD 1,338 68,412 0.29Motorola Solutions, Inc. USD 384 53,810 0.23NetApp, Inc. USD 460 20,410 0.09Newmont Corp. USD 1,195 73,779 0.31NextEra Energy, Inc. USD 273 65,566 0.28NIKE, Inc. ‘B’ USD 624 61,183 0.26Noble Energy, Inc. USD 879 7,876 0.03Norfolk Southern Corp. USD 156 27,389 0.12Northrop Grumman Corp. USD 129 39,660 0.17NortonLifeLock, Inc. USD 2,587 51,300 0.22Nucor Corp. USD 1,412 58,471 0.25NVIDIA Corp. USD 131 49,768 0.21NVR, Inc. USD 20 65,175 0.28Old Republic International Corp. USD 3,377 55,079 0.23Omnicom Group, Inc. USD 757 41,332 0.18ONEOK, Inc. USD 794 26,377 0.11Oracle Corp. USD 1,299 71,796 0.31Otis Worldwide Corp. USD 264 15,011 0.06Packaging Corp. of America USD 351 35,030 0.15Parker-Hannifin Corp. USD 372 68,176 0.29Paychex, Inc. USD 764 57,873 0.25PepsiCo, Inc. USD 531 70,230 0.30Pfizer, Inc. USD 1,774 58,010 0.25Philip Morris International, Inc. USD 894 62,634 0.27Phillips 66 USD 694 49,899 0.21Pinnacle West Capital Corp. USD 792 58,046 0.25Pioneer Natural Resources Co. USD 391 38,201 0.16PPG Industries, Inc. USD 617 65,439 0.28PPL Corp. USD 1,573 40,646 0.17Procter & Gamble Co. (The) USD 603 72,101 0.31Progressive Corp. (The) USD 583 46,704 0.20Public Service Enterprise Group, Inc. USD 1,243 61,106 0.26PulteGroup, Inc. USD 1,820 61,935 0.26Qorvo, Inc. USD 445 49,186 0.21QUALCOMM, Inc. USD 576 52,537 0.22Quest Diagnostics, Inc. USD 591 67,350 0.29Ralph Lauren Corp. ‘A’ USD 553 40,104 0.17Raytheon Technologies Corp. USD 1,083 66,734 0.28Regeneron Pharmaceuticals, Inc. USD 76 47,397 0.20Republic Services, Inc. ‘A’ USD 799 65,558 0.28ResMed, Inc. USD 434 83,328 0.36Rockwell Automation, Inc. USD 214 45,582 0.19Ross Stores, Inc. USD 673 57,367 0.24Royal Caribbean Cruises Ltd. USD 550 27,665 0.12Santander Consumer USA Holdings, Inc. USD 2,952 54,346 0.23Seagate Technology plc USD 878 42,504 0.18Sempra Energy USD 513 60,139 0.26Skyworks Solutions, Inc. USD 393 50,249 0.21Southern Co. (The) USD 1,211 62,790 0.27Southwest Airlines Co. USD 579 19,790 0.08Starbucks Corp. USD 786 57,842 0.25Steel Dynamics, Inc. USD 2,359 61,546 0.26STERIS plc USD 421 64,598 0.28Stryker Corp. USD 342 61,625 0.26Synopsys, Inc. USD 257 50,115 0.21Target Corp. USD 571 68,480 0.29Texas Instruments, Inc. USD 588 74,658 0.32Thermo Fisher Scientific, Inc. USD 200 72,468 0.31TJX Cos., Inc. (The) USD 1,223 61,835 0.26T-Mobile US, Inc. USD 447 46,555 0.20T-Mobile US, Inc., Rights USD 447 75 0.00Toll Brothers, Inc. USD 1,971 64,235 0.27Tractor Supply Co. USD 573 75,516 0.32Tyson Foods, Inc. ‘A’ USD 813 48,544 0.21Union Pacific Corp. USD 411 69,488 0.30UnitedHealth Group, Inc. USD 229 67,544 0.29Universal Health Services, Inc. ‘B’ USD 442 41,057 0.18US Bancorp USD 1,258 46,320 0.20Valero Energy Corp. USD 797 46,880 0.20VEREIT, Inc., REIT USD 5,898 37,924 0.16Verizon Communications, Inc. USD 1,218 67,148 0.29Vertex Pharmaceuticals, Inc. USD 162 47,030 0.20VF Corp. USD 292 17,794 0.08Vistra Energy Corp. USD 2,903 54,054 0.23
W R Berkley Corp. USD 1,067 61,128 0.26Walmart, Inc. USD 563 67,436 0.29Walt Disney Co. (The) USD 526 58,654 0.25Waste Management, Inc. USD 630 66,723 0.28WEC Energy Group, Inc. USD 762 66,789 0.28Wells Fargo & Co. USD 936 23,962 0.10Welltower, Inc., REIT USD 499 25,823 0.11Western Union Co. (The) USD 3,264 70,568 0.30Westlake Chemical Corp. USD 223 11,964 0.05Williams Cos., Inc. (The) USD 2,280 43,366 0.18WP Carey, Inc., REIT USD 844 57,097 0.24WW Grainger, Inc. USD 158 49,637 0.21Xcel Energy, Inc. USD 1,074 67,125 0.29Xerox Holdings Corp. USD 2,002 30,611 0.13Yum! Brands, Inc. USD 428 37,197 0.16Zebra Technologies Corp. ‘A’ USD 178 45,559 0.19Zoetis, Inc. ‘A’ USD 501 68,657 0.29
United States total 12,996,388 55.38
Total investments in Equities 23,353,483 99.51
106
JPMorgan ETFs (Ireland) ICAV - Global Equity Multi-Factor UCITS ETFSchedule of Investments (continued)As at 30 June 2020
Investments Currency
Quantity/Nominal
Value
FairValue
USD
% ofNet
Assets Investments Currency
Quantity/Nominal
Value
FairValue
USD
% ofNet
Assets

JPMorgan ETFs (Ireland) ICAV - Global Equity Multi-Factor UCITS ETF
Schedule of Investments (continued)
As at 30 June 2020
Financial Futures Contracts
Security DescriptionNo. of
Contracts Currency
UnderlyingExposure
USD Counterparty
FairValue
USD
% ofNet
Assets
United States (31 December 2019: 0.00%)1
S&P 500 Micro E-Mini Index, 18/09/2020 6 USD 90,713 Citibank NA 1,995 0.01
United States total 1,995 0.01
Total unrealised gain on Financial Futures Contracts (31 December 2019: 0.00%)1 1,995 0.01
FairValue
USD
% ofNet
Assets
Total financial assets at fair value through profit or loss 23,355,478 99.52Cash and margin cash 75,677 0.32Other assets and liabilities 36,917 0.16
Net asset value attributable to holders of redeemable participating shares 23,468,072 100.00
Analysis of total assets
% ofTotal
Assets
Transferable securities and money market instruments admitted to official stock exchange listing 98.50Transferable securities and money market instruments dealt in on another regulated market 0.98Financial derivative instruments dealt in on a regulated market 0.01Other assets 0.51
Total Assets 100.00
1 Prior year percentage of net asset value rounds to 0.00%.
107

108
Bonds
Corporate Debt Securities
ArgentinaAES Argentina Generacion SA 7.75%02/02/2024 USD 150,000 108,000 0.10AES Argentina Generacion SA, 144A7.75% 02/02/2024 USD 223,000 160,560 0.14Capex SA 6.88% 15/05/2024 USD 50,000 36,875 0.03Capex SA, 144A 6.88% 15/05/2024 USD 252,000 185,850 0.17IRSA Propiedades Comerciales SA 8.75%23/03/2023 USD 80,000 57,136 0.05Pampa Energia SA 7.38% 21/07/2023 USD 156,000 132,614 0.12Pampa Energia SA 7.50% 24/01/2027 USD 160,000 129,112 0.12Telecom Argentina SA 8.00%18/07/2026 USD 50,000 44,630 0.04Telecom Argentina SA, 144A 8.00%18/07/2026 USD 50,000 44,630 0.04Transportadora de Gas del Sur SA 6.75%02/05/2025 USD 150,000 129,000 0.12Transportadora de Gas del Sur SA, 144A6.75% 02/05/2025 USD 160,000 137,600 0.12
Argentina total 1,166,007 1.05
AustraliaEmeco Pty. Ltd. 9.25% 31/03/2022 USD 140,000 140,700 0.13Emeco Pty. Ltd., 144A 9.25% 31/03/2022 USD 45,000 45,225 0.04FMG Resources August 2006 Pty. Ltd.4.75% 15/05/2022 USD 437,000 445,421 0.40FMG Resources August 2006 Pty. Ltd.5.13% 15/03/2023 USD 151,000 155,152 0.14FMG Resources August 2006 Pty. Ltd.5.13% 15/05/2024 USD 163,000 167,890 0.15FMG Resources August 2006 Pty. Ltd.4.50% 15/09/2027 USD 297,000 297,110 0.27Mineral Resources Ltd. 8.13%01/05/2027 USD 280,000 297,500 0.27
Australia total 1,548,998 1.40
AustriaWienerberger AG 2.00% 02/05/2024 EUR 167,000 187,660 0.17
Austria total 187,660 0.17
BermudaCosan Ltd. 5.50% 20/09/2029 USD 220,000 208,122 0.19Geopark Ltd. 6.50% 21/09/2024 USD 200,000 183,880 0.16Inkia Energy Ltd. 5.88% 09/11/2027 USD 200,000 197,500 0.18
Bermuda total 589,502 0.53
BrazilCemig Geracao e Transmissao SA 9.25%05/12/2024 USD 427,000 471,088 0.43Light Servicos de Eletricidade SA/LightEnergia SA 7.25% 03/05/2023 USD 200,000 201,802 0.18
Brazil total 672,890 0.61
British Virgin IslandsRKI Overseas Finance 2016 B Ltd. 4.70%06/09/2021 USD 250,000 248,084 0.22RKP Overseas Finance 2016 A Ltd. 7.95%31/12/2049 USD 200,000 181,906 0.17RKPF Overseas 2019 A Ltd. 7.88%01/02/2023 USD 200,000 208,818 0.19Star Energy Geothermal Wayang WinduLtd. 6.75% 24/04/2033 USD 181,400 188,710 0.17
British Virgin Islands total 827,518 0.75
CanadaCanacol Energy Ltd. 7.25% 03/05/2025 USD 200,000 202,002 0.18Clearwater Seafoods, Inc. 6.88%01/05/2025 USD 54,000 53,460 0.05Eldorado Gold Corp. 9.50% 01/06/2024 USD 130,000 138,450 0.13goeasy Ltd. 5.38% 01/12/2024 USD 151,000 146,470 0.13IAMGOLD Corp. 7.00% 15/04/2025 USD 241,000 242,256 0.22Masonite International Corp. 5.75%15/09/2026 USD 156,000 160,680 0.15Masonite International Corp. 5.38%01/02/2028 USD 72,000 73,620 0.07MDC Partners, Inc. 6.50% 01/05/2024 USD 482,000 448,260 0.40Norbord, Inc. 6.25% 15/04/2023 USD 110,000 115,523 0.10Norbord, Inc. 5.75% 15/07/2027 USD 119,000 121,380 0.11Open Text Corp. 5.88% 01/06/2026 USD 201,000 208,560 0.19Parkland Corp. 6.00% 01/04/2026 USD 105,000 107,625 0.10Parkland Corp. 5.88% 15/07/2027 USD 151,000 156,662 0.14Primo Water Corp. 5.50% 01/07/2024 EUR 227,000 256,347 0.23Quebecor Media, Inc. 5.75% 15/01/2023 USD 267,000 279,682 0.25
Ritchie Bros Auctioneers, Inc. 5.38%15/01/2025 USD 256,000 263,360 0.24Seven Generations Energy Ltd. 5.38%30/09/2025 USD 287,000 252,560 0.23Superior Plus LP / Superior GeneralPartner, Inc. 7.00% 15/07/2026 USD 100,000 104,750 0.09Telesat Canada / Telesat LLC 4.88%01/06/2027 USD 157,000 153,860 0.14Telesat Canada / Telesat LLC 6.50%15/10/2027 USD 118,000 115,678 0.10TransAlta Corp. 4.50% 15/11/2022 USD 178,000 179,810 0.16TransAlta Corp. 6.50% 15/03/2040 USD 100,000 99,538 0.09Vale Canada Ltd. 7.20% 15/09/2032 USD 132,000 162,195 0.15Vermilion Energy, Inc. 5.63% 15/03/2025 USD 185,000 156,325 0.14Videotron Ltd. 5.00% 15/07/2022 USD 396,000 408,870 0.37Videotron Ltd. 5.13% 15/04/2027 USD 422,000 437,880 0.39
Canada total 5,045,803 4.55
Cayman IslandsCAR, Inc. 8.88% 10/05/2022 USD 200,000 123,997 0.11Fantasia Holdings Group Co. Ltd. 7.38%04/10/2021 USD 420,000 413,778 0.37Fantasia Holdings Group Co. Ltd. 11.75%17/04/2022 USD 201,000 207,778 0.19Fantasia Holdings Group Co. Ltd. 10.88%09/01/2023 USD 200,000 201,990 0.18Golden Eagle Retail Group Ltd. 4.63%21/05/2023 USD 200,000 192,500 0.17Gran Tierra Energy InternationalHoldings Ltd. 6.25% 15/02/2025 USD 200,000 88,000 0.08Grupo Aval Ltd. 4.75% 26/09/2022 USD 280,000 281,912 0.25Grupo Aval Ltd. 4.38% 04/02/2030 USD 200,000 190,250 0.17Health & Happiness H&H InternationalHoldings Ltd. 5.63% 24/10/2024 USD 200,000 204,469 0.19Logan Group Co. Ltd. 7.50% 25/08/2022 USD 200,000 206,741 0.19Logan Group Co. Ltd. 5.25% 23/02/2023 USD 400,000 396,976 0.36Melco Resorts Finance Ltd. 4.88%06/06/2025 USD 200,000 201,009 0.18Melco Resorts Finance Ltd., 144A 4.88%06/06/2025 USD 240,000 241,210 0.22Melco Resorts Finance Ltd. 5.25%26/04/2026 USD 220,000 221,506 0.20Metropolitan Light Co. Ltd. 5.50%21/11/2022 USD 210,000 212,063 0.19Metropolitan Light Co. Ltd., 144A 5.50%21/11/2022 USD 200,000 201,965 0.18Redsun Properties Group Ltd. 10.50%03/10/2022 USD 220,000 221,366 0.20Ronshine China Holdings Ltd. 8.95%22/01/2023 USD 400,000 417,478 0.38Wynn Macau Ltd. 4.88% 01/10/2024 USD 200,000 195,000 0.18Wynn Macau Ltd. 5.50% 01/10/2027 USD 430,000 425,700 0.38
Cayman Islands total 4,845,688 4.37
ColombiaColombia Telecomunicaciones SA ESP5.38% 27/09/2022 USD 264,000 263,937 0.24
Colombia total 263,937 0.24
FranceCasino Guichard Perrachon SA 1.87%13/06/2022 EUR 100,000 107,825 0.10Casino Guichard Perrachon SA 4.56%25/01/2023 EUR 100,000 107,380 0.10Casino Guichard Perrachon SA 4.50%07/03/2024 EUR 100,000 100,909 0.09Casino Guichard Perrachon SA 3.58%07/02/2025 EUR 300,000 284,988 0.26Casino Guichard Perrachon SA 4.05%05/08/2026 EUR 100,000 94,906 0.08Constellium SE 4.25% 15/02/2026 EUR 140,000 153,970 0.14Faurecia SE 2.63% 15/06/2025 EUR 251,000 273,453 0.25Faurecia SE 3.13% 15/06/2026 EUR 150,000 164,508 0.15Faurecia SE 2.38% 15/06/2027 EUR 130,000 136,033 0.12Quatrim SASU 5.88% 15/01/2024 EUR 200,000 229,572 0.20Rexel SA 2.13% 15/06/2025 EUR 200,000 219,576 0.20Rexel SA 2.75% 15/06/2026 EUR 250,000 277,278 0.25
France total 2,150,398 1.94
GermanyKME SE 6.75% 01/02/2023 EUR 100,000 74,130 0.07Nordex SE 6.50% 01/02/2023 EUR 103,000 114,551 0.10Techem Verwaltungsgesellschaft 675mbH 2.00% 15/07/2025 EUR 420,000 449,552 0.41
Germany total 638,233 0.58
JPMorgan ETFs (Ireland) ICAV - Global High Yield Corporate Bond Multi-Factor UCITS ETFSchedule of InvestmentsAs at 30 June 2020
Investments Currency
Quantity/Nominal
Value
FairValue
USD
% ofNet
Assets Investments Currency
Quantity/Nominal
Value
FairValue
USD
% ofNet
Assets

Hong KongChina South City Holdings Ltd. 7.25%20/11/2022 USD 267,000 213,590 0.19Hong Kong Red Star Macalline UniversalHome Furnishings Ltd. 3.38%21/09/2022 USD 200,000 173,493 0.16Yanlord Land HK Co. Ltd. 5.88%23/01/2022 USD 400,000 399,991 0.36Yanlord Land HK Co. Ltd. 6.80%27/02/2024 USD 200,000 195,979 0.18Zoomlion HK SPV Co. Ltd. 6.13%20/12/2022 USD 200,000 204,500 0.18
Hong Kong total 1,187,553 1.07
IndiaJSW Steel Ltd. 5.25% 13/04/2022 USD 200,000 194,994 0.18JSW Steel Ltd. 5.95% 18/04/2024 USD 200,000 192,477 0.17JSW Steel Ltd. 5.38% 04/04/2025 USD 400,000 371,932 0.33
India total 759,403 0.68
IndonesiaABM Investama Tbk. PT 7.13%01/08/2022 USD 230,000 154,105 0.14Chandra Asri Petrochemical Tbk. PT4.95% 08/11/2024 USD 241,000 225,919 0.20Gajah Tunggal Tbk. PT 8.38% 10/08/2022 USD 208,000 139,355 0.13
Indonesia total 519,379 0.47
IrelandCimpress plc 7.00% 15/06/2026 USD 150,000 138,375 0.13Credit Bank of Moscow Via CBOM Financeplc 5.88% 07/11/2021 USD 200,000 206,292 0.19Credit Bank of Moscow Via CBOM Financeplc 5.55% 14/02/2023 USD 200,000 204,907 0.18Credit Bank of Moscow Via CBOM Financeplc 5.15% 20/02/2024 EUR 218,000 253,059 0.23Credit Bank of Moscow Via CBOM Financeplc 4.70% 29/01/2025 USD 250,000 248,750 0.22James Hardie International Finance DAC4.75% 15/01/2025 USD 200,000 203,500 0.18James Hardie International Finance DAC3.63% 01/10/2026 EUR 200,000 227,586 0.21Smurfit Kappa Acquisitions ULC 2.75%01/02/2025 EUR 135,000 156,359 0.14Smurfit Kappa Treasury Funding DAC7.50% 20/11/2025 USD 231,000 267,891 0.24
Ireland total 1,906,719 1.72
Isle of ManPlaytech plc 3.75% 12/10/2023 EUR 237,000 262,171 0.24Playtech plc 4.25% 07/03/2026 EUR 201,000 222,367 0.20
Isle of Man total 484,538 0.44
ItalyBanca Monte dei Paschi di Siena SpA3.63% 24/09/2024 EUR 175,000 199,957 0.18LKQ Italia Bondco SpA 3.88%01/04/2024 EUR 300,000 347,768 0.31Unipol Gruppo SpA 3.00% 18/03/2025 EUR 120,000 137,711 0.13
Italy total 685,436 0.62
JapanSoftBank Group Corp. 4.00%20/04/2023 EUR 207,000 234,352 0.21SoftBank Group Corp. 3.13% 19/09/2025 EUR 352,000 375,517 0.34SoftBank Group Corp. 4.00% 19/09/2029 EUR 236,000 259,762 0.23
Japan total 869,631 0.78
JerseyAdient Global Holdings Ltd. 3.50%15/08/2024 EUR 445,000 441,230 0.40Delphi Technologies plc 5.00%01/10/2025 USD 295,000 316,756 0.28Petropavlovsk 2016 Ltd. 8.13%14/11/2022 USD 200,000 208,500 0.19
Jersey total 966,486 0.87
LuxembourgAdecoagro SA 6.00% 21/09/2027 USD 160,000 150,200 0.13Atento Luxco 1 SA 6.13% 10/08/2022 USD 220,000 178,202 0.16Codere Finance 2 Luxembourg SA 6.75%01/11/2021 EUR 138,000 100,747 0.09Codere Finance 2 Luxembourg SA 7.63%01/11/2021 USD 265,000 172,383 0.15Corestate Capital Holding SA 3.50%15/04/2023 EUR 200,000 186,443 0.17
Cosan Luxembourg SA 7.00%20/01/2027 USD 200,000 209,502 0.19Dana Financing Luxembourg Sarl 5.75%15/04/2025 USD 115,000 116,725 0.10Fiat Chrysler Finance Europe SENC 4.75%15/07/2022 EUR 140,000 163,111 0.15Gestamp Funding Luxembourg SA 3.50%15/05/2023 EUR 200,000 217,591 0.20Gol Finance SA 7.00% 31/01/2025 USD 114,000 63,841 0.06Gol Finance SA, 144A 7.00% 31/01/2025 USD 214,000 119,842 0.11Minerva Luxembourg SA 6.50%20/09/2026 USD 200,000 201,500 0.18Minerva Luxembourg SA, 144A 6.50%20/09/2026 USD 400,000 403,000 0.36Minerva Luxembourg SA 5.88%19/01/2028 USD 200,000 195,440 0.18Samsonite Finco Sarl 3.50% 15/05/2026 EUR 260,000 252,007 0.23Telenet Finance Luxembourg Notes Sarl3.50% 01/03/2028 EUR 400,000 454,876 0.41Telenet Finance Luxembourg Notes Sarl5.50% 01/03/2028 USD 200,000 208,500 0.19Trinseo Materials Operating SCA /Trinseo Materials Finance, Inc. 5.38%01/09/2025 USD 215,000 203,712 0.18Tupy Overseas SA 6.63% 17/07/2024 USD 200,000 200,002 0.18
Luxembourg total 3,797,624 3.42
MauritiusMTN Mauritius Investments Ltd. 4.76%11/11/2024 USD 605,000 602,217 0.54
Mauritius total 602,217 0.54
MexicoAxtel SAB de CV 6.38% 14/11/2024 USD 200,000 207,704 0.19Cydsa SAB de CV 6.25% 04/10/2027 USD 200,000 195,952 0.18Nemak SAB de CV 3.25% 15/03/2024 EUR 111,000 117,911 0.11Nemak SAB de CV 4.75% 23/01/2025 USD 400,000 395,004 0.35TV Azteca SAB de CV 8.25% 09/08/2024 USD 200,000 87,500 0.08Unifin Financiera SAB de CV 7.00%15/01/2025 USD 405,000 303,750 0.27Unifin Financiera SAB de CV 8.38%27/01/2028 USD 220,000 161,700 0.14
Mexico total 1,469,521 1.32
MultinationalEndo Dac / Endo Finance LLC / EndoFinco, Inc. 6.00% 15/07/2023 USD 405,000 303,750 0.27Endo Dac / Endo Finance LLC / EndoFinco, Inc. 5.88% 15/10/2024 USD 200,000 193,542 0.18Endo Dac / Endo Finance LLC / EndoFinco, Inc. 6.00% 01/02/2025 USD 220,000 169,950 0.15Endo Dac / Endo Finance LLC / EndoFinco, Inc. 6.00% 30/06/2028 USD 109,000 70,305 0.06Garrett LX I Sarl / Garrett Borrowing LLC5.13% 15/10/2026 EUR 200,000 183,722 0.17Herbalife Nutrition Ltd. / HLF Financing,Inc. 7.88% 01/09/2025 USD 117,000 120,803 0.11Navios Maritime Acquisition Corp. /Navios Acquisition Finance US, Inc. 8.13%15/11/2021 USD 220,000 124,300 0.11
Multinational total 1,166,372 1.05
NetherlandsAxalta Coating Systems Dutch Holding BBV 3.75% 15/01/2025 EUR 228,000 252,196 0.23Darling Global Finance BV 3.63%15/05/2026 EUR 148,000 167,057 0.15Energizer Gamma Acquisition BV 4.63%15/07/2026 EUR 213,000 243,716 0.22Fiat Chrysler Automobiles NV 5.25%15/04/2023 USD 714,000 737,705 0.66Fiat Chrysler Automobiles NV 3.75%29/03/2024 EUR 226,000 260,408 0.23Listrindo Capital BV 4.95% 14/09/2026 USD 200,000 201,000 0.18Listrindo Capital BV, 144A 4.95%14/09/2026 USD 210,000 211,050 0.19LKQ European Holdings BV 3.63%01/04/2026 EUR 200,000 227,887 0.21LKQ European Holdings BV 4.13%01/04/2028 EUR 100,000 116,603 0.11Petrobras Global Finance BV 7.38%17/01/2027 USD 179,000 199,367 0.18Petrobras Global Finance BV 6.00%27/01/2028 USD 332,000 347,936 0.31Petrobras Global Finance BV 5.63%20/05/2043 USD 371,000 353,377 0.32Petrobras Global Finance BV 6.90%19/03/2049 USD 117,000 123,143 0.11Petrobras Global Finance BV 6.85%05/06/2115 USD 171,000 169,700 0.15
109
JPMorgan ETFs (Ireland) ICAV - Global High Yield Corporate Bond Multi-Factor UCITS ETFSchedule of Investments (continued)As at 30 June 2020
Investments Currency
Quantity/Nominal
Value
FairValue
USD
% ofNet
Assets Investments Currency
Quantity/Nominal
Value
FairValue
USD
% ofNet
Assets

Samvardhana Motherson AutomotiveSystems Group BV 1.80% 06/07/2024 EUR 132,000 127,500 0.12Schoeller Packaging BV 6.38%01/11/2024 EUR 200,000 206,639 0.19Teva Pharmaceutical FinanceNetherlands II BV 1.88% 31/03/2027 EUR 416,000 392,991 0.35
Netherlands total 4,338,275 3.91
NigeriaFidelity Bank plc 10.50% 16/10/2022 USD 200,000 204,040 0.18
Nigeria total 204,040 0.18
NorwayAker BP ASA 5.88% 31/03/2025 USD 344,000 349,625 0.31
Norway total 349,625 0.31
PeruInretail Pharma SA 5.38% 02/05/2023 USD 100,000 103,000 0.09Patrimonio EN Fideicomiso DS093-2002-EF-Inretail Shopping Malls5.75% 03/04/2028 USD 201,000 197,231 0.18
Peru total 300,231 0.27
RomaniaRCS & RDS SA 2.50% 05/02/2025 EUR 100,000 107,261 0.10RCS & RDS SA 3.25% 05/02/2028 EUR 100,000 105,320 0.09
Romania total 212,581 0.19
SingaporeABJA Investment Co. Pte Ltd. 5.45%24/01/2028 USD 201,000 185,521 0.17Alam Synergy Pte Ltd. 6.63%24/04/2022 USD 226,000 101,810 0.09APL Realty Holdings Pte Ltd. 5.95%02/06/2024 USD 200,000 112,000 0.10SSMS Plantation Holdings Pte Ltd. 7.75%23/01/2023 USD 200,000 88,098 0.08
Singapore total 487,429 0.44
SpainGestamp Automocion SA 3.25%30/04/2026 EUR 102,000 109,061 0.10Grifols SA 1.63% 15/02/2025 EUR 242,000 264,953 0.24Grifols SA 3.20% 01/05/2025 EUR 307,000 343,438 0.31
Spain total 717,452 0.65
SwedenDometic Group AB 3.00% 13/09/2023 EUR 100,000 109,952 0.10Dometic Group AB 3.00% 08/05/2026 EUR 100,000 105,351 0.09Telefonaktiebolaget LM Ericsson 4.13%15/05/2022 USD 408,000 427,176 0.39Telefonaktiebolaget LM Ericsson 1.88%01/03/2024 EUR 200,000 229,856 0.21
Sweden total 872,335 0.79
TurkeyArcelik A/S 3.88% 16/09/2021 EUR 120,000 135,364 0.12KOC Holding A/S 6.50% 11/03/2025 USD 214,000 218,630 0.20KOC Holding A/S, 144A 6.50%11/03/2025 USD 200,000 204,327 0.18Petkim Petrokimya Holding A/S 5.88%26/01/2023 USD 220,000 217,800 0.20Tupras Turkiye Petrol Rafinerileri A/S4.50% 18/10/2024 USD 319,000 296,647 0.27Turk Telekomunikasyon A/S 4.88%19/06/2024 USD 381,000 375,370 0.34Turkcell Iletisim Hizmetleri A/S 5.75%15/10/2025 USD 456,000 461,718 0.42Turkiye Halk Bankasi A/S 5.00%13/07/2021 USD 313,000 308,649 0.28Turkiye Sinai Kalkinma Bankasi A/S5.50% 16/01/2023 USD 200,000 194,032 0.17Turkiye Sise ve Cam Fabrikalari A/S6.95% 14/03/2026 USD 240,000 247,053 0.22Yapi ve Kredi Bankasi A/S 6.10%16/03/2023 USD 229,000 226,222 0.20Yapi ve Kredi Bankasi A/S, 144A 6.10%16/03/2023 USD 400,000 395,148 0.36Yapi ve Kredi Bankasi A/S 8.25%15/10/2024 USD 220,000 228,421 0.20
Turkey total 3,509,381 3.16
United KingdomDrax Finco plc 6.63% 01/11/2025 USD 200,000 205,000 0.19Evraz plc 6.75% 31/01/2022 USD 200,000 211,996 0.19Evraz plc 5.38% 20/03/2023 USD 476,000 506,940 0.46
Ferroglobe plc / Globe Specialty Metals,Inc. 9.38% 01/03/2022 USD 160,000 59,200 0.05Jaguar Land Rover Automotive plc 5.88%15/11/2024 EUR 370,000 357,594 0.32Jaguar Land Rover Automotive plc 4.50%15/01/2026 EUR 223,000 197,364 0.18Jaguar Land Rover Automotive plc 6.88%15/11/2026 EUR 150,000 143,014 0.13Merlin Entertainments Ltd. 5.75%15/06/2026 USD 200,000 192,636 0.17Nomad Foods Bondco plc 3.25%15/05/2024 EUR 211,000 237,727 0.21Polyus Finance plc 5.25% 07/02/2023 USD 490,000 523,594 0.47Polyus Finance plc 4.70% 29/01/2024 USD 210,000 224,465 0.20Titan Global Finance plc 3.50%17/06/2021 EUR 103,000 116,876 0.11
United Kingdom total 2,976,406 2.68
United StatesACI Worldwide, Inc. 5.75% 15/08/2026 USD 170,000 177,097 0.16Advanced Micro Devices, Inc. 7.50%15/08/2022 USD 100,000 110,500 0.10AECOM 5.88% 15/10/2024 USD 298,000 321,840 0.29AECOM 5.13% 15/03/2027 USD 418,000 449,350 0.40AES Corp. (The) 5.50% 15/04/2025 USD 152,000 155,998 0.14AES Corp. (The) 6.00% 15/05/2026 USD 365,000 379,144 0.34AES Corp. (The) 5.13% 01/09/2027 USD 250,000 259,375 0.23Alliance Resource Operating Partners LP/ Alliance Resource Finance Corp. 7.50%01/05/2025 USD 205,000 137,862 0.12Allison Transmission, Inc. 5.00%01/10/2024 USD 352,000 351,120 0.32Allison Transmission, Inc. 5.88%01/06/2029 USD 289,000 300,560 0.27AMC Networks, Inc. 4.75% 15/12/2022 USD 276,000 275,310 0.25AMC Networks, Inc. 5.00% 01/04/2024 USD 312,000 308,880 0.28AMC Networks, Inc. 4.75% 01/08/2025 USD 332,000 327,086 0.29AmeriGas Partners LP / AmeriGasFinance Corp. 5.63% 20/05/2024 USD 253,000 262,412 0.24AmeriGas Partners LP / AmeriGasFinance Corp. 5.50% 20/05/2025 USD 339,000 349,170 0.31AmeriGas Partners LP / AmeriGasFinance Corp. 5.88% 20/08/2026 USD 194,000 204,670 0.18AmeriGas Partners LP / AmeriGasFinance Corp. 5.75% 20/05/2027 USD 235,000 248,512 0.22AMN Healthcare, Inc. 5.13% 01/10/2024 USD 279,000 279,000 0.25AMN Healthcare, Inc. 4.63% 01/10/2027 USD 50,000 48,687 0.04Antero Midstream Partners LP / AnteroMidstream Finance Corp. 5.38%15/09/2024 USD 347,000 295,641 0.27Antero Midstream Partners LP / AnteroMidstream Finance Corp. 5.75%01/03/2027 USD 249,000 196,710 0.18Archrock Partners LP / Archrock PartnersFinance Corp. 6.25% 01/04/2028 USD 164,000 149,240 0.13ASGN, Inc. 4.63% 15/05/2028 USD 171,000 167,002 0.15Ashland LLC 4.75% 15/08/2022 USD 199,000 209,696 0.19Ashland LLC 6.88% 15/05/2043 USD 122,000 140,300 0.13Berry Petroleum Co. LLC 7.00%15/02/2026 USD 161,000 130,410 0.12BMC East LLC 5.50% 01/10/2024 USD 98,000 98,735 0.09Boise Cascade Co. 5.63% 01/09/2024 USD 154,000 155,155 0.14Booz Allen Hamilton, Inc. 5.13%01/05/2025 USD 160,000 162,400 0.15Brink’s Co. (The) 4.63% 15/10/2027 USD 325,000 312,000 0.28Buckeye Partners LP 3.95% 01/12/2026 USD 150,000 141,345 0.13Buckeye Partners LP 4.13% 01/12/2027 USD 50,000 47,625 0.04Buckeye Partners LP 5.60% 15/10/2044 USD 50,000 40,000 0.04BWX Technologies, Inc. 5.38%15/07/2026 USD 120,000 123,646 0.11Cardtronics, Inc. / Cardtronics USA, Inc.5.50% 01/05/2025 USD 116,000 112,520 0.10Catalent Pharma Solutions, Inc. 5.00%15/07/2027 USD 203,000 210,740 0.19Catalent Pharma Solutions, Inc. 2.38%01/03/2028 EUR 286,000 303,554 0.27CDK Global, Inc. 5.00% 15/10/2024 USD 50,000 53,000 0.05CDK Global, Inc. 4.88% 01/06/2027 USD 370,000 379,601 0.34Cedar Fair LP 5.25% 15/07/2029 USD 50,000 45,250 0.04Cedar Fair LP / Canada’s Wonderland Co./ Magnum Management Corp. 5.38%01/06/2024 USD 219,000 207,367 0.19Cedar Fair LP / Canada’s Wonderland Co./ Magnum Management Corp. /Millennium Op 5.38% 15/04/2027 USD 338,000 302,510 0.27Cengage Learning, Inc. 9.50%15/06/2024 USD 204,000 142,800 0.13Central Garden & Pet Co. 6.13%15/11/2023 USD 184,000 187,680 0.17Central Garden & Pet Co. 5.13%01/02/2028 USD 60,000 62,048 0.06
110
JPMorgan ETFs (Ireland) ICAV - Global High Yield Corporate Bond Multi-Factor UCITS ETFSchedule of Investments (continued)As at 30 June 2020
Investments Currency
Quantity/Nominal
Value
FairValue
USD
% ofNet
Assets Investments Currency
Quantity/Nominal
Value
FairValue
USD
% ofNet
Assets

Century Aluminum Co. 7.50% 01/06/2021 USD 110,000 110,088 0.10CGG Holding US, Inc. 7.88% 01/05/2023 EUR 400,000 456,924 0.41ChampionX Corp. 6.38% 01/05/2026 USD 297,000 275,993 0.25Charles River Laboratories International,Inc. 5.50% 01/04/2026 USD 110,000 114,400 0.10Charles River Laboratories International,Inc. 4.25% 01/05/2028 USD 272,000 271,861 0.25Chemours Co. (The) 4.00% 15/05/2026 EUR 120,000 120,626 0.11Cheniere Energy Partners LP 5.25%01/10/2025 USD 201,000 200,337 0.18Cheniere Energy Partners LP 5.63%01/10/2026 USD 449,000 446,755 0.40Cheniere Energy Partners LP 4.50%01/10/2029 USD 217,000 210,208 0.19Cheniere Energy, Inc. CVB 4.88%28/05/2021 USD 245,000 247,377 0.22Churchill Downs, Inc. 5.50% 01/04/2027 USD 317,000 310,280 0.28Churchill Downs, Inc. 4.75% 15/01/2028 USD 187,000 180,455 0.16Cielo USA, Inc. 3.75% 16/11/2022 USD 192,000 192,002 0.17Cincinnati Bell, Inc. 7.00% 15/07/2024 USD 250,000 255,000 0.23Cincinnati Bell, Inc. 8.00% 15/10/2025 USD 124,000 129,425 0.12Clean Harbors, Inc. 4.88% 15/07/2027 USD 170,000 174,675 0.16Clean Harbors, Inc. 5.13% 15/07/2029 USD 164,000 170,094 0.15CNX Midstream Partners LP / CNXMidstream Finance Corp. 6.50%15/03/2026 USD 180,000 165,600 0.15Cogent Communications Group, Inc.5.38% 01/03/2022 USD 192,000 197,520 0.18Commercial Metals Co. 4.88%15/05/2023 USD 52,000 52,390 0.05Compass Group Diversified Holdings LLC8.00% 01/05/2026 USD 180,000 183,047 0.16Compass Minerals International, Inc.6.75% 01/12/2027 USD 207,000 217,350 0.20Comstock Resources, Inc. 7.50%15/05/2025 USD 216,000 195,750 0.18Comstock Resources, Inc. 9.75%15/08/2026 USD 226,000 211,310 0.19Consolidated Communications, Inc.6.50% 01/10/2022 USD 375,000 344,925 0.31Cooper-Standard Automotive, Inc. 5.63%15/11/2026 USD 194,000 124,160 0.11CoreCivic, Inc. 4.75% 15/10/2027 USD 106,000 87,980 0.08Cott Holdings, Inc. 5.50% 01/04/2025 USD 158,000 158,804 0.14Credit Acceptance Corp. 5.13%31/12/2024 USD 134,000 129,404 0.12CTR Partnership LP / CareTrust CapitalCorp. 5.25% 01/06/2025 USD 142,000 143,420 0.13Curo Group Holdings Corp. 8.25%01/09/2025 USD 256,000 204,723 0.18Darling Ingredients, Inc. 5.25%15/04/2027 USD 100,000 102,778 0.09Denbury Resources, Inc. 9.25%31/03/2022 USD 150,000 60,000 0.05Denbury Resources, Inc. 7.75%15/02/2024 USD 197,000 74,860 0.07Diebold Nixdorf, Inc. 8.50% 15/04/2024 USD 150,000 118,875 0.11DISH DBS Corp. 5.88% 15/07/2022 USD 126,000 128,117 0.12DISH DBS Corp. 5.00% 15/03/2023 USD 327,000 326,215 0.29DISH DBS Corp. 7.75% 01/07/2026 USD 693,000 734,580 0.66Edgewell Personal Care Co. 4.70%24/05/2022 USD 84,000 86,942 0.08Edgewell Personal Care Co. 5.50%01/06/2028 USD 238,000 244,545 0.22Encompass Health Corp. 5.13%15/03/2023 USD 198,000 198,990 0.18Encompass Health Corp. 5.75%01/11/2024 USD 539,000 539,000 0.49Encompass Health Corp. 5.75%15/09/2025 USD 50,000 51,000 0.05Encompass Health Corp. 4.50%01/02/2028 USD 229,000 219,638 0.20Encompass Health Corp. 4.75%01/02/2030 USD 109,000 104,095 0.09Energy Ventures Gom LLC / EnVenFinance Corp. 11.00% 15/02/2023 USD 87,000 72,645 0.07EnerSys 5.00% 30/04/2023 USD 100,000 102,500 0.09EnerSys 4.38% 15/12/2027 USD 70,000 69,300 0.06Enova International, Inc. 8.50%15/09/2025 USD 210,000 189,525 0.17EnPro Industries, Inc. 5.75% 15/10/2026 USD 189,000 189,000 0.17Entegris, Inc. 4.63% 10/02/2026 USD 250,000 253,750 0.23ESH Hospitality, Inc. 5.25% 01/05/2025 USD 380,000 364,800 0.33ESH Hospitality, Inc. 4.63% 01/10/2027 USD 240,000 224,700 0.20Everi Payments, Inc. 7.50% 15/12/2025 USD 150,000 143,625 0.13Exterran Energy Solutions LP / EESFinance Corp. 8.13% 01/05/2025 USD 323,000 267,282 0.24Fair Isaac Corp. 5.25% 15/05/2026 USD 56,000 61,040 0.06Fair Isaac Corp. 4.00% 15/06/2028 USD 104,000 104,260 0.09FirstCash, Inc. 5.38% 01/06/2024 USD 209,000 210,045 0.19Forestar Group, Inc. 8.00% 15/04/2024 USD 184,000 190,440 0.17
Fortress Transportation & InfrastructureInvestors LLC 6.75% 15/03/2022 USD 150,000 144,069 0.13Fortress Transportation & InfrastructureInvestors LLC 6.50% 01/10/2025 USD 110,000 99,023 0.09Gates Global LLC / Gates Corp. 6.25%15/01/2026 USD 176,000 172,920 0.16Genworth Holdings, Inc. 7.63%24/09/2021 USD 269,000 251,878 0.23Genworth Holdings, Inc. 4.90%15/08/2023 USD 289,000 231,200 0.21Genworth Holdings, Inc. 4.80%15/02/2024 USD 134,000 106,865 0.10Genworth Holdings, Inc. 6.50%15/06/2034 USD 100,000 72,500 0.07GEO Group, Inc. (The) 5.13% 01/04/2023 USD 201,000 173,865 0.16GEO Group, Inc. (The) 6.00% 15/04/2026 USD 133,000 102,236 0.09Global Partners LP / GLP Finance Corp.7.00% 15/06/2023 USD 50,000 48,062 0.04Global Partners LP / GLP Finance Corp.7.00% 01/08/2027 USD 65,000 60,125 0.05Gogo Intermediate Holdings LLC / GogoFinance Co., Inc. 9.88% 01/05/2024 USD 448,000 380,800 0.34Graham Holdings Co. 5.75% 01/06/2026 USD 193,000 199,587 0.18Great Lakes Dredge & Dock Corp. 8.00%15/05/2022 USD 157,000 160,925 0.15Greif, Inc. 6.50% 01/03/2027 USD 204,000 207,645 0.19GrubHub Holdings, Inc. 5.50%01/07/2027 USD 171,000 175,061 0.16HC2 Holdings, Inc. 11.50% 01/12/2021 USD 130,000 123,825 0.11HD Supply, Inc. 5.38% 15/10/2026 USD 273,000 278,801 0.25Hess Midstream Operations LP 5.63%15/02/2026 USD 413,000 408,659 0.37Hill-Rom Holdings, Inc. 5.00%15/02/2025 USD 58,000 59,752 0.05Hill-Rom Holdings, Inc. 4.38%15/09/2027 USD 310,000 317,362 0.29Hilton Domestic Operating Co., Inc.4.25% 01/09/2024 USD 90,000 87,318 0.08Hilton Domestic Operating Co., Inc. 5.13%01/05/2026 USD 439,000 437,082 0.39Hilton Domestic Operating Co., Inc.4.88% 15/01/2030 USD 245,000 241,325 0.22Hilton Grand Vacations Borrower LLC /Hilton Grand Vacations Borrower, Inc.6.13% 01/12/2024 USD 150,000 150,750 0.14Hilton Worldwide Finance LLC / HiltonWorldwide Finance Corp. 4.88%01/04/2027 USD 252,000 246,015 0.22HLF Financing Sarl LLC / HerbalifeInternational, Inc. 7.25% 15/08/2026 USD 191,000 191,955 0.17Holly Energy Partners LP / Holly EnergyFinance Corp. 5.00% 01/02/2028 USD 155,000 147,638 0.13Hologic, Inc. 4.38% 15/10/2025 USD 419,000 423,102 0.38Hologic, Inc. 4.63% 01/02/2028 USD 50,000 51,875 0.05Horizon Therapeutics USA, Inc. 5.50%01/08/2027 USD 219,000 227,841 0.21Houghton Mifflin Harcourt Publishers,Inc. 9.00% 15/02/2025 USD 130,000 125,450 0.11Hughes Satellite Systems Corp. 7.63%15/06/2021 USD 50,000 51,500 0.05Hughes Satellite Systems Corp. 5.25%01/08/2026 USD 199,000 205,806 0.19Hughes Satellite Systems Corp. 6.63%01/08/2026 USD 381,000 395,432 0.36IAA, Inc. 5.50% 15/06/2027 USD 202,000 208,387 0.19IQVIA, Inc. 3.50% 15/10/2024 EUR 154,000 175,674 0.16IQVIA, Inc. 3.25% 15/03/2025 EUR 453,000 512,320 0.46IQVIA, Inc. 2.88% 15/09/2025 EUR 130,000 146,448 0.13Itron, Inc. 5.00% 15/01/2026 USD 322,000 320,792 0.29j2 Cloud Services LLC / j2 CloudCo.-Obligor, Inc. 6.00% 15/07/2025 USD 277,000 281,847 0.25Kaiser Aluminum Corp. 4.63%01/03/2028 USD 115,000 109,977 0.10KFC Holding Co./Pizza Hut HoldingsLLC/Taco Bell of America LLC 5.00%01/06/2024 USD 430,000 438,062 0.39KFC Holding Co./Pizza Hut HoldingsLLC/Taco Bell of America LLC 5.25%01/06/2026 USD 259,000 265,475 0.24KFC Holding Co./Pizza Hut HoldingsLLC/Taco Bell of America LLC 4.75%01/06/2027 USD 50,000 51,250 0.05Korn Ferry 4.63% 15/12/2027 USD 120,000 116,400 0.10Kronos International, Inc. 3.75%15/09/2025 EUR 296,000 324,746 0.29L Brands, Inc. 6.88% 01/11/2035 USD 170,000 141,423 0.13L Brands, Inc. 6.75% 01/07/2036 USD 138,000 113,160 0.10L Brands, Inc. 7.60% 15/07/2037 USD 451,000 306,680 0.28Lamar Media Corp. 5.75% 01/02/2026 USD 197,000 203,229 0.18Lamar Media Corp. 3.75% 15/02/2028 USD 67,000 63,168 0.06Lamar Media Corp. 4.00% 15/02/2030 USD 121,000 115,821 0.10
111
JPMorgan ETFs (Ireland) ICAV - Global High Yield Corporate Bond Multi-Factor UCITS ETFSchedule of Investments (continued)As at 30 June 2020
Investments Currency
Quantity/Nominal
Value
FairValue
USD
% ofNet
Assets Investments Currency
Quantity/Nominal
Value
FairValue
USD
% ofNet
Assets

Lamb Weston Holdings, Inc. 4.63%01/11/2024 USD 292,000 302,950 0.27Lamb Weston Holdings, Inc. 4.88%01/11/2026 USD 335,000 346,725 0.31Levi Strauss & Co. 5.00% 01/05/2025 USD 321,000 322,207 0.29Levi Strauss & Co. 3.38% 15/03/2027 EUR 100,000 113,171 0.10LGI Homes, Inc. 6.88% 15/07/2026 USD 130,000 132,275 0.12Louisiana-Pacific Corp. 4.88%15/09/2024 USD 225,000 226,735 0.20LPL Holdings, Inc. 5.75% 15/09/2025 USD 374,000 378,675 0.34Magellan Health, Inc. 4.90% 22/09/2024 USD 145,000 146,740 0.13Magnolia Oil & Gas Operating LLC /Magnolia Oil & Gas Finance Corp. 6.00%01/08/2026 USD 106,000 99,640 0.09Manitowoc Co., Inc. (The) 9.00%01/04/2026 USD 108,000 106,920 0.10Match Group, Inc. 5.00% 15/12/2027 USD 289,000 300,719 0.27Matthews International Corp. 5.25%01/12/2025 USD 286,000 257,400 0.23MDC Holdings, Inc. 5.50% 15/01/2024 USD 151,000 161,570 0.15MDC Holdings, Inc. 6.00% 15/01/2043 USD 135,000 142,087 0.13MEDNAX, Inc. 5.25% 01/12/2023 USD 324,000 322,380 0.29MEDNAX, Inc. 6.25% 15/01/2027 USD 218,000 218,000 0.20Meritor, Inc. 6.25% 15/02/2024 USD 231,000 232,732 0.21Mobile Mini, Inc. 5.88% 01/07/2024 USD 80,000 82,344 0.07Molina Healthcare, Inc. 5.38% 15/11/2022 USD 269,000 274,380 0.25Montage Resources Corp. 8.88%15/07/2023 USD 170,000 134,300 0.12Moss Creek Resources Holdings, Inc.7.50% 15/01/2026 USD 573,000 286,500 0.26MPT Operating Partnership LP / MPTFinance Corp. 5.25% 01/08/2026 USD 144,000 149,400 0.13MPT Operating Partnership LP / MPTFinance Corp. 5.00% 15/10/2027 USD 409,000 420,247 0.38MPT Operating Partnership LP / MPTFinance Corp. 4.63% 01/08/2029 USD 206,000 207,030 0.19MSCI, Inc. 4.75% 01/08/2026 USD 269,000 278,278 0.25MSCI, Inc. 5.38% 15/05/2027 USD 221,000 234,536 0.21MSCI, Inc. 4.00% 15/11/2029 USD 250,000 255,000 0.23MSCI, Inc. 3.63% 01/09/2030 USD 153,000 152,235 0.14MSCI, Inc. 3.88% 15/02/2031 USD 100,000 102,000 0.09Mueller Water Products, Inc. 5.50%15/06/2026 USD 194,000 200,790 0.18Murphy Oil USA, Inc. 4.75% 15/09/2029 USD 213,000 217,793 0.20Natural Resource Partners LP / NRPFinance Corp. 9.13% 30/06/2025 USD 53,000 43,990 0.04Navistar International Corp. 6.63%01/11/2025 USD 142,000 134,545 0.12Netflix, Inc. 5.50% 15/02/2022 USD 262,000 273,201 0.25Netflix, Inc. 5.75% 01/03/2024 USD 69,000 74,693 0.07Netflix, Inc. 5.88% 15/02/2025 USD 278,000 307,190 0.28Netflix, Inc. 4.38% 15/11/2026 USD 210,000 218,436 0.20Netflix, Inc. 3.63% 15/05/2027 EUR 390,000 455,480 0.41Netflix, Inc. 4.88% 15/04/2028 USD 353,000 377,452 0.34Netflix, Inc. 4.63% 15/05/2029 EUR 137,000 170,534 0.15Netflix, Inc. 4.88% 15/06/2030 USD 175,000 187,688 0.17Nine Energy Service, Inc. 8.75%01/11/2023 USD 257,000 125,288 0.11Oceaneering International, Inc. 6.00%01/02/2028 USD 258,000 180,600 0.16Par Pharmaceutical, Inc. 7.50%01/04/2027 USD 581,000 596,222 0.54Patrick Industries, Inc. 7.50% 15/10/2027 USD 120,000 123,600 0.11PBF Logistics LP / PBF Logistics FinanceCorp. 6.88% 15/05/2023 USD 295,000 280,988 0.25PDC Energy, Inc. 5.75% 15/05/2026 USD 125,000 113,750 0.10Peabody Energy Corp. 6.00% 31/03/2022 USD 291,000 189,150 0.17Peabody Energy Corp. 6.38% 31/03/2025 USD 149,000 78,970 0.07PGT Innovations, Inc. 6.75% 01/08/2026 USD 96,000 96,960 0.09Pilgrim’s Pride Corp. 5.75% 15/03/2025 USD 431,000 429,741 0.39Pilgrim’s Pride Corp. 5.88% 30/09/2027 USD 351,000 351,070 0.32Prestige Brands, Inc. 5.13% 15/01/2028 USD 161,000 158,585 0.14PulteGroup, Inc. 5.50% 01/03/2026 USD 214,000 233,388 0.21PulteGroup, Inc. 5.00% 15/01/2027 USD 331,000 354,170 0.32PulteGroup, Inc. 7.88% 15/06/2032 USD 306,000 391,007 0.35PulteGroup, Inc. 6.38% 15/05/2033 USD 78,000 91,260 0.08Qorvo, Inc. 5.50% 15/07/2026 USD 203,000 211,120 0.19Qorvo, Inc. 4.38% 15/10/2029 USD 50,000 51,204 0.05Radian Group, Inc. 4.50% 01/10/2024 USD 63,000 60,795 0.05Radian Group, Inc. 4.88% 15/03/2027 USD 109,000 102,460 0.09RBS Global, Inc. / Rexnord LLC 4.88%15/12/2025 USD 276,000 277,380 0.25Resideo Funding, Inc. 6.13% 01/11/2026 USD 172,000 168,130 0.15Rite Aid Corp. 6.13% 01/04/2023 USD 50,000 48,625 0.04Sally Holdings LLC / Sally Capital, Inc.5.63% 01/12/2025 USD 280,000 272,059 0.25SBA Communications Corp. 3.88%15/02/2027 USD 393,000 391,526 0.35Schweitzer-Mauduit International, Inc.6.88% 01/10/2026 USD 100,000 102,250 0.09
Scotts Miracle-Gro Co. (The) 5.25%15/12/2026 USD 150,000 155,813 0.14Scotts Miracle-Gro Co. (The) 4.50%15/10/2029 USD 50,000 51,438 0.05Sealed Air Corp. 4.50% 15/09/2023 EUR 129,000 154,016 0.14Sealed Air Corp. 5.50% 15/09/2025 USD 180,000 193,500 0.17Sealed Air Corp. 6.88% 15/07/2033 USD 130,000 153,725 0.14Service Corp. International 5.38%15/05/2024 USD 205,000 208,844 0.19Service Corp. International 4.63%15/12/2027 USD 256,000 266,880 0.24Service Corp. International 5.13%01/06/2029 USD 200,000 215,200 0.19Silgan Holdings, Inc. 3.25% 15/03/2025 EUR 110,000 124,154 0.11Silgan Holdings, Inc. 4.75% 15/03/2025 USD 110,000 111,398 0.10Silgan Holdings, Inc. 2.25% 01/06/2028 EUR 351,000 378,220 0.34Sirius XM Radio, Inc. 3.88% 01/08/2022 USD 344,000 346,618 0.31Sirius XM Radio, Inc. 4.63% 15/05/2023 USD 135,000 135,743 0.12Sirius XM Radio, Inc. 5.38% 15/07/2026 USD 668,000 689,870 0.62Six Flags Entertainment Corp. 4.88%31/07/2024 USD 319,000 285,505 0.26Six Flags Entertainment Corp. 5.50%15/04/2027 USD 240,000 214,500 0.19Southwestern Energy Co. 6.20%23/01/2025 USD 255,000 218,344 0.20Southwestern Energy Co. 7.50%01/04/2026 USD 173,000 151,427 0.14Southwestern Energy Co. 7.75%01/10/2027 USD 211,000 183,570 0.17Speedway Motorsports LLC / SpeedwayFunding II, Inc. 4.88% 01/11/2027 USD 87,000 79,170 0.07Sprint Communications, Inc. 6.00%15/11/2022 USD 225,000 237,314 0.21Sprint Corp. 7.88% 15/09/2023 USD 675,000 760,219 0.69SPX FLOW, Inc. 5.88% 15/08/2026 USD 203,000 207,568 0.19Stericycle, Inc. 5.38% 15/07/2024 USD 100,000 102,500 0.09Stillwater Mining Co. 7.13% 27/06/2025 USD 279,000 292,731 0.26Suburban Propane Partners LP/SuburbanEnergy Finance Corp. 5.50% 01/06/2024 USD 170,000 168,300 0.15Suburban Propane Partners LP/SuburbanEnergy Finance Corp. 5.75% 01/03/2025 USD 333,000 333,000 0.30Suburban Propane Partners LP/SuburbanEnergy Finance Corp. 5.88% 01/03/2027 USD 63,000 62,370 0.06Sunoco LP / Sunoco Finance Corp. 5.50%15/02/2026 USD 118,000 114,460 0.10Sunoco LP / Sunoco Finance Corp. 5.88%15/03/2028 USD 200,000 198,532 0.18Surgery Center Holdings, Inc. 6.75%01/07/2025 USD 75,000 67,688 0.06Surgery Center Holdings, Inc. 10.00%15/04/2027 USD 30,000 30,000 0.03Teleflex, Inc. 4.88% 01/06/2026 USD 251,000 258,530 0.23Teleflex, Inc. 4.63% 15/11/2027 USD 160,000 169,154 0.15Tempur Sealy International, Inc. 5.50%15/06/2026 USD 50,000 50,500 0.05Tennant Co. 5.63% 01/05/2025 USD 359,000 362,590 0.33Terex Corp. 5.63% 01/02/2025 USD 262,000 238,420 0.21Tesla, Inc. 5.30% 15/08/2025 USD 683,000 683,000 0.62T-Mobile USA, Inc. 4.00% 15/04/2022 USD 106,000 108,546 0.10TopBuild Corp. 5.63% 01/05/2026 USD 235,000 237,350 0.21Trilogy International Partners LLC /Trilogy International Finance, Inc. 8.88%01/05/2022 USD 150,000 132,750 0.12TriMas Corp. 4.88% 15/10/2025 USD 101,000 101,222 0.09Twin River Worldwide Holdings, Inc.6.75% 01/06/2027 USD 162,000 153,900 0.14UGI International LLC 3.25% 01/11/2025 EUR 100,000 110,069 0.10United Airlines Holdings, Inc. 4.25%01/10/2022 USD 210,000 178,500 0.16United Airlines Holdings, Inc. 5.00%01/02/2024 USD 100,000 81,375 0.07United States Cellular Corp. 6.70%15/12/2033 USD 150,000 174,377 0.16Uniti Group LP / Uniti Fiber Holdings, Inc./ CSL Capital LLC 7.88% 15/02/2025 USD 696,000 705,236 0.64Uniti Group LP / Uniti Group Finance, Inc./ CSL Capital LLC 6.00% 15/04/2023 USD 244,000 237,900 0.21Urban One, Inc. 7.38% 15/04/2022 USD 114,000 101,460 0.09US Foods, Inc. 5.88% 15/06/2024 USD 196,000 186,200 0.17Valvoline, Inc. 4.38% 15/08/2025 USD 174,000 174,870 0.16Valvoline, Inc. 4.25% 15/02/2030 USD 118,000 116,230 0.10Vector Group Ltd. 6.13% 01/02/2025 USD 292,000 280,320 0.25Vector Group Ltd. 10.50% 01/11/2026 USD 263,000 264,084 0.24VeriSign, Inc. 4.63% 01/05/2023 USD 338,000 340,113 0.31VeriSign, Inc. 5.25% 01/04/2025 USD 50,000 55,375 0.05VeriSign, Inc. 4.75% 15/07/2027 USD 400,000 420,196 0.38VICI Properties LP / VICI Note Co., Inc.4.63% 01/12/2029 USD 200,000 195,000 0.18VICI Properties LP / VICI Note Co., Inc.4.13% 15/08/2030 USD 260,000 247,975 0.22Vista Outdoor, Inc. 5.88% 01/10/2023 USD 230,000 224,825 0.20
112
JPMorgan ETFs (Ireland) ICAV - Global High Yield Corporate Bond Multi-Factor UCITS ETFSchedule of Investments (continued)As at 30 June 2020
Investments Currency
Quantity/Nominal
Value
FairValue
USD
% ofNet
Assets Investments Currency
Quantity/Nominal
Value
FairValue
USD
% ofNet
Assets

Vistra Operations Co. LLC 5.00%31/07/2027 USD 220,000 222,475 0.20W&T Offshore, Inc. 9.75% 01/11/2023 USD 317,000 198,442 0.18Wabash National Corp. 5.50%01/10/2025 USD 130,000 119,275 0.11Warrior Met Coal, Inc. 8.00% 01/11/2024 USD 140,000 136,500 0.12William Carter Co. (The) 5.63%15/03/2027 USD 196,000 201,880 0.18WMG Acquisition Corp. 3.63% 15/10/2026 EUR 218,000 252,577 0.23WR Grace & Co.-Conn 5.13% 01/10/2021 USD 303,000 319,150 0.29WR Grace & Co.-Conn 5.63% 01/10/2024 USD 75,000 78,937 0.07Xerox Corp. 4.07% 17/03/2022 USD 240,000 238,200 0.21Xerox Corp. 4.13% 15/03/2023 USD 52,000 51,922 0.05Xerox Corp. 4.80% 01/03/2035 USD 50,000 46,615 0.04Xerox Corp. 6.75% 15/12/2039 USD 125,000 129,563 0.12XPO CNW, Inc. 6.70% 01/05/2034 USD 136,000 139,767 0.13XPO Logistics, Inc. 6.50% 15/06/2022 USD 77,000 77,096 0.07Yum! Brands, Inc. 3.75% 01/11/2021 USD 50,000 50,375 0.05Yum! Brands, Inc. 3.88% 01/11/2023 USD 56,000 57,344 0.05Yum! Brands, Inc. 6.88% 15/11/2037 USD 227,000 244,025 0.22Zayo Group LLC / Zayo Capital, Inc.6.38% 15/05/2025 USD 170,000 164,900 0.15
United States total 62,433,079 56.27
Total investments in Corporate Debt Securities 108,752,347 98.02
Total Bonds 108,752,347 98.02
113
JPMorgan ETFs (Ireland) ICAV - Global High Yield Corporate Bond Multi-Factor UCITS ETFSchedule of Investments (continued)As at 30 June 2020
Investments Currency
Quantity/Nominal
Value
FairValue
USD
% ofNet
Assets Investments Currency
Quantity/Nominal
Value
FairValue
USD
% ofNet
Assets

JPMorgan ETFs (Ireland) ICAV - Global High Yield Corporate Bond Multi-Factor UCITS ETF
Schedule of Investments (continued)
As at 30 June 2020
Forward Currency Contracts
CurrencyPurchased
AmountPurchased Currency Sold Amount Sold
MaturityDate Counterparty
FairValue
USD
% ofNet
Assets
Class GBP Hedged (dist)*EUR 69,041 GBP 62,047 06/07/2020 Standard Chartered 883 -GBP 146,281 USD 178,033 06/07/2020 Bank of America Merrill Lynch 2,715 -GBP 33,892,654 USD 41,579,989 05/08/2020 Standard Chartered 307,422 0.28GBP 185,356 USD 228,261 06/07/2020 State Street 769 -USD 321,660 GBP 255,500 06/07/2020 BNP Paribas 5,957 0.01USD 114,185 GBP 90,048 06/07/2020 BNP Paribas 2,919 -USD 163,792 GBP 131,747 05/08/2020 Citibank NA 968 -USD 101,876 GBP 82,230 05/08/2020 Citibank NA 249 -
Class MXN Hedged (acc)*EUR 935 MXN 23,675 06/07/2020 Bank of America Merrill Lynch 26 -MXN 12,237,763 USD 525,743 05/08/2020 State Street 1,326 -USD 1,519 MXN 33,799 06/07/2020 Citibank NA 57 -USD 2,053 MXN 47,095 05/08/2020 Goldman Sachs 25 -USD 4,297 MXN 96,137 06/07/2020 State Street 138 -USD 1,231 MXN 28,483 05/08/2020 State Street 5 -
Class USD Hedged (acc)*USD 1,509 EUR 1,336 06/07/2020 State Street 9 -USD 1,378 EUR 1,220 06/07/2020 State Street 7 -
Total unrealised gain on Forward Currency Contracts 323,475 0.29
Class GBP Hedged (dist)*EUR 5,655,700 USD 6,352,754 06/07/2020 Goldman Sachs (55) -GBP 260,186 USD 330,214 06/07/2020 Bank of America Merrill Lynch (8,721) (0.01)GBP 146,279 USD 183,602 06/07/2020 BNP Paribas (2,856) -GBP 189,948 USD 238,566 06/07/2020 BNP Paribas (3,861) -GBP 911,678 USD 1,143,351 06/07/2020 Citibank NA (16,859) (0.02)GBP 887,917 USD 1,097,909 06/07/2020 Goldman Sachs (777) -GBP 30,616,215 USD 37,858,572 06/07/2020 Goldman Sachs (28,410) (0.03)GBP 908,473 USD 1,127,246 05/08/2020 Goldman Sachs (4,478) (0.01)GBP 121,313 USD 152,657 06/07/2020 State Street (2,760) -GBP 85,925 USD 109,202 06/07/2020 State Street (3,032) -GBP 191,005 USD 240,096 06/07/2020 State Street (4,086) -GBP 85,425 EUR 95,125 06/07/2020 Bank of America Merrill Lynch (1,295) -GBP 107,114 EUR 120,317 06/07/2020 Bank of America Merrill Lynch (2,793) -GBP 58,578 EUR 65,018 06/07/2020 Citibank NA (650) -GBP 151,092 EUR 168,784 06/07/2020 Citibank NA (2,891) -GBP 155,938 EUR 173,236 06/07/2020 Goldman Sachs (1,904) -USD 5,679,088 EUR 5,102,262 06/07/2020 Goldman Sachs (51,968) (0.05)USD 6,356,509 EUR 5,655,700 05/08/2020 Goldman Sachs (653) -GBP 134,694 EUR 148,919 05/08/2020 Goldman Sachs (923) -USD 119,672 GBP 97,519 05/08/2020 Bank of America Merrill Lynch (850) -USD 41,572,506 GBP 33,892,654 06/07/2020 Standard Chartered (306,106) (0.28)
Class MXN Hedged (acc)*EUR 76,135 USD 85,519 06/07/2020 Goldman Sachs (1) -MXN 10,297,476 USD 474,752 06/07/2020 Citibank NA (29,331) (0.03)MXN 31,755 USD 1,450 06/07/2020 Goldman Sachs (77) -MXN 70,542 USD 3,161 06/07/2020 Goldman Sachs (109) -MXN 35,738 USD 1,637 06/07/2020 Standard Chartered (91) -MXN 77,840 USD 3,602 06/07/2020 Standard Chartered (235) -MXN 1,823,044 EUR 74,858 06/07/2020 Citibank NA (5,227) (0.01)USD 85,570 EUR 76,135 05/08/2020 Goldman Sachs (9) -MXN 32,486 EUR 1,290 06/07/2020 Standard Chartered (43) -MXN 22,493 EUR 923 06/07/2020 Standard Chartered (64) -USD 527,864 MXN 12,237,763 06/07/2020 State Street (1,484) -USD 1,509 MXN 35,106 05/08/2020 State Street (3) -
Class USD Hedged (acc)*EUR 198,162 USD 222,585 06/07/2020 Goldman Sachs (2) -EUR 872 USD 986 06/07/2020 Standard Chartered (7) -USD 142,678 EUR 127,349 06/07/2020 Goldman Sachs (365) -USD 75,973 EUR 68,256 06/07/2020 Goldman Sachs (695) -USD 222,716 EUR 198,162 05/08/2020 Goldman Sachs (23) -USD 968 EUR 873 06/07/2020 Standard Chartered (12) -
Total unrealised loss on Forward Currency Contracts (483,706) (0.44)
*Contracts entered into for share class currency hedging purpose.
114

JPMorgan ETFs (Ireland) ICAV - Global High Yield Corporate Bond Multi-Factor UCITS ETF
Schedule of Investments (continued)
As at 30 June 2020
FairValue
USD
% ofNet
Assets
Total financial assets at fair value through profit or loss 109,075,822 98.31Total financial liabilities at fair value through profit or loss (483,706) (0.44)Cash 1,810,006 1.63Other assets and liabilities 552,510 0.50
Net asset value attributable to holders of redeemable participating shares 110,954,632 100.00
Analysis of total assets
% ofTotal
Assets
Transferable securities and money market instruments admitted to official stock exchange listing 43.21Transferable securities and money market instruments dealt in on another regulated market 48.27Financial derivative instruments dealt in on a regulated market 0.27Other assets 8.25
Total Assets 100.00
115

116
Equities (31 December 2019: 97.71%)
Argentina (31 December 2019: 0.06%)MercadoLibre, Inc. USD 68 67,032 0.10
Argentina total 67,032 0.10
Australia (31 December 2019: 1.96%)AGL Energy Ltd. AUD 608 7,137 0.01Ampol Ltd. AUD 468 9,448 0.01APA Group AUD 1,706 13,073 0.02Aristocrat Leisure Ltd. AUD 364 6,391 0.01Aurizon Holdings Ltd. AUD 4,383 14,847 0.02Australia & New Zealand Banking GroupLtd. AUD 5,057 64,900 0.09BHP Group Ltd. AUD 4,352 107,329 0.15BHP Group plc GBP 5,877 120,136 0.17Brambles Ltd. AUD 2,355 17,625 0.03Coca-Cola Amatil Ltd. AUD 1,754 10,458 0.02Cochlear Ltd. AUD 145 18,861 0.03Coles Group Ltd. AUD 1,480 17,496 0.03Commonwealth Bank of Australia AUD 2,077 99,272 0.14Computershare Ltd. AUD 1,054 9,615 0.01CSL Ltd. AUD 650 128,440 0.18Fortescue Metals Group Ltd. AUD 1,524 14,533 0.02Goodman Group, REIT AUD 2,793 28,556 0.04GPT Group (The), REIT AUD 8,659 24,860 0.04Insurance Australia Group Ltd. AUD 2,187 8,688 0.01Lendlease Group AUD 714 6,081 0.01Macquarie Group Ltd. AUD 468 38,215 0.05Mirvac Group, REIT AUD 18,084 27,018 0.04National Australia Bank Ltd. AUD 3,070 38,512 0.05Newcrest Mining Ltd. AUD 1,131 24,552 0.04Oil Search Ltd. AUD 2,263 4,939 0.01Orica Ltd. AUD 753 8,627 0.01Origin Energy Ltd. AUD 2,092 8,412 0.01QBE Insurance Group Ltd. AUD 3,340 20,374 0.03Ramsay Health Care Ltd. AUD 207 9,480 0.01REA Group Ltd. AUD 114 8,467 0.01Santos Ltd. AUD 2,316 8,451 0.01Sonic Healthcare Ltd. AUD 327 6,851 0.01South32 Ltd. AUD 8,622 12,110 0.02Stockland, REIT AUD 3,512 8,004 0.01Suncorp Group Ltd. AUD 3,000 19,065 0.03Sydney Airport AUD 2,119 8,272 0.01TABCORP Holdings Ltd. AUD 3,223 7,500 0.01Telstra Corp. Ltd. AUD 2,025 4,364 0.01TPG Corp. Ltd. AUD 1,323 8,134 0.01Transurban Group AUD 3,214 31,267 0.04Treasury Wine Estates Ltd. AUD 598 4,315 0.01Wesfarmers Ltd. AUD 1,480 45,681 0.07Westpac Banking Corp. AUD 5,238 64,734 0.09Woodside Petroleum Ltd. AUD 1,026 15,294 0.02Woolworths Group Ltd. AUD 1,974 50,667 0.07
Australia total 1,211,051 1.72
Austria (31 December 2019: 0.16%)Erste Group Bank AG EUR 2,799 65,860 0.09
Austria total 65,860 0.09
Belgium (31 December 2019: 0.24%)Anheuser-Busch InBev SA/NV EUR 976 48,085 0.07
Belgium total 48,085 0.07
Bermuda (31 December 2019: 0.01%)Arch Capital Group Ltd. USD 3,226 92,425 0.13RenaissanceRe Holdings Ltd. USD 95 16,248 0.02
Bermuda total 108,673 0.15
Canada (31 December 2019: 3.24%)Agnico Eagle Mines Ltd. CAD 457 29,168 0.04Alimentation Couche-Tard, Inc. ‘B’ CAD 1,680 52,509 0.07Bank of Montreal CAD 1,052 55,813 0.08Bank of Nova Scotia (The) CAD 2,000 82,496 0.12Barrick Gold Corp. CAD 3,512 94,195 0.13BCE, Inc. CAD 311 12,929 0.02Brookfield Asset Management, Inc. ‘A’ CAD 2,571 84,341 0.12Cameco Corp. CAD 688 7,031 0.01Canadian Imperial Bank of Commerce CAD 729 48,568 0.07Canadian National Railway Co. CAD 1,328 117,112 0.17Canadian Natural Resources Ltd. CAD 2,325 40,201 0.06Canadian Pacific Railway Ltd. CAD 259 65,667 0.09Cenovus Energy, Inc. CAD 2,026 9,446 0.01CGI, Inc. ‘A’ CAD 471 29,578 0.04CI Financial Corp. CAD 445 5,643 0.01Constellation Software, Inc. CAD 39 43,893 0.06Dollarama, Inc. CAD 572 18,966 0.03
Emera, Inc. CAD 467 18,316 0.03Enbridge, Inc. CAD 3,547 107,504 0.15Fairfax Financial Holdings Ltd. CAD 53 16,321 0.02Fortis, Inc. CAD 834 31,615 0.04Franco-Nevada Corp. CAD 366 50,963 0.07Great-West Lifeco, Inc. CAD 533 9,314 0.01IGM Financial, Inc. CAD 159 3,851 0.01Imperial Oil Ltd. CAD 531 8,515 0.01Intact Financial Corp. CAD 274 25,994 0.04Inter Pipeline Ltd. CAD 716 6,645 0.01Keyera Corp. CAD 366 5,554 0.01Kirkland Lake Gold Ltd. CAD 393 16,130 0.02Loblaw Cos. Ltd. CAD 363 17,620 0.03Magna International, Inc. CAD 583 25,880 0.04Manulife Financial Corp. CAD 3,784 51,315 0.07Metro, Inc. CAD 494 20,311 0.03National Bank of Canada CAD 548 24,752 0.04Nutrien Ltd. CAD 1,158 37,087 0.05Open Text Corp. CAD 520 22,010 0.03Pembina Pipeline Corp. CAD 886 22,078 0.03Power Corp. of Canada CAD 600 10,520 0.01Restaurant Brands International, Inc. CAD 480 26,040 0.04Rogers Communications, Inc. ‘B’ CAD 692 27,716 0.04Royal Bank of Canada CAD 2,343 158,454 0.23Shaw Communications, Inc. ‘B’ CAD 898 14,597 0.02Shopify, Inc. ‘A’ CAD 154 145,833 0.21Sun Life Financial, Inc. CAD 1,134 41,538 0.06Suncor Energy, Inc. CAD 3,045 51,175 0.07TC Energy Corp. CAD 1,614 68,731 0.10Teck Resources Ltd. ‘B’ CAD 1,002 10,461 0.01Thomson Reuters Corp. CAD 390 26,412 0.04Toronto-Dominion Bank (The) CAD 2,979 132,524 0.19Wheaton Precious Metals Corp. CAD 896 39,281 0.06
Canada total 2,072,613 2.95
Denmark (31 December 2019: 0.83%)Carlsberg A/S ‘B’ DKK 932 123,116 0.18Novo Nordisk A/S ‘B’ DKK 4,358 281,998 0.40Novozymes A/S ‘B’ DKK 1,625 93,911 0.13Orsted A/S DKK 858 98,963 0.14
Denmark total 597,988 0.85
Finland (31 December 2019: 0.29%)Elisa OYJ EUR 768 46,700 0.07UPM-Kymmene OYJ EUR 3,709 107,144 0.15
Finland total 153,844 0.22
France (31 December 2019: 3.83%)Accor SA EUR 2,604 70,807 0.10Air Liquide SA EUR 952 137,290 0.20Alstom SA EUR 1,942 90,322 0.13Arkema SA EUR 730 69,806 0.10AXA SA EUR 5,268 110,123 0.16BioMerieux EUR 430 59,065 0.08BNP Paribas SA EUR 3,496 138,881 0.20Capgemini SE EUR 1,026 117,482 0.17Danone SA EUR 901 62,296 0.09Dassault Systemes SE EUR 484 83,498 0.12Eiffage SA EUR 550 50,283 0.07EssilorLuxottica SA EUR 352 45,169 0.06Kering SA EUR 221 120,199 0.17Legrand SA EUR 524 39,796 0.06L’Oreal SA EUR 341 109,421 0.16LVMH Moet Hennessy Louis Vuitton SE EUR 596 261,400 0.37Orange SA EUR 7,891 94,344 0.13Pernod Ricard SA EUR 270 42,470 0.06Peugeot SA EUR 3,925 63,833 0.09Sanofi EUR 1,740 177,156 0.25Schneider Electric SE EUR 1,661 184,466 0.26TOTAL SA EUR 4,471 170,609 0.24Vinci SA EUR 1,338 123,228 0.18Vivendi SA EUR 660 16,931 0.02
France total 2,438,875 3.47
Germany (31 December 2019: 3.02%)adidas AG EUR 517 135,644 0.19Allianz SE EUR 914 186,587 0.26BASF SE EUR 975 54,622 0.08Daimler AG EUR 2,509 101,856 0.14Deutsche Boerse AG EUR 236 42,688 0.06Deutsche Post AG EUR 3,822 139,727 0.20Deutsche Telekom AG EUR 10,377 174,183 0.25Henkel AG & Co. KGaA, Preference EUR 251 23,365 0.03Infineon Technologies AG EUR 5,873 137,697 0.20Merck KGaA EUR 1,012 117,414 0.17
JPMorgan ETFs (Ireland) ICAV - Global Research Enhanced Index Equity (ESG) UCITS ETFSchedule of InvestmentsAs at 30 June 2020
Investments Currency
Quantity/Nominal
Value
FairValue
USD
% ofNet
Assets Investments Currency
Quantity/Nominal
Value
FairValue
USD
% ofNet
Assets

MTU Aero Engines AG EUR 492 85,182 0.12MuenchenerRueckversicherungs-Gesellschaft AG inMuenchen EUR 432 112,275 0.16RWE AG EUR 2,201 76,905 0.11SAP SE EUR 2,195 306,488 0.44Siemens AG EUR 2,134 251,089 0.36Volkswagen AG, Preference EUR 978 148,224 0.21Vonovia SE EUR 833 51,064 0.07
Germany total 2,145,010 3.05
Hong Kong (31 December 2019: 0.90%)AIA Group Ltd. HKD 15,600 145,524 0.21ASM Pacific Technology Ltd. HKD 300 3,149 0.00BOC Hong Kong Holdings Ltd. HKD 8,000 25,444 0.04CK Asset Holdings Ltd. HKD 2,500 14,902 0.02CK Hutchison Holdings Ltd. HKD 5,500 35,340 0.05CK Infrastructure Holdings Ltd. HKD 1,500 7,722 0.01CLP Holdings Ltd. HKD 2,500 24,515 0.03Galaxy Entertainment Group Ltd. HKD 3,000 20,418 0.03Hang Seng Bank Ltd. HKD 1,200 20,143 0.03Henderson Land Development Co. Ltd. HKD 1,100 4,173 0.01HKT Trust & HKT Ltd. HKD 3,000 4,389 0.01Hong Kong & China Gas Co. Ltd. HKD 12,980 20,097 0.03Hong Kong Exchanges & Clearing Ltd. HKD 2,400 102,188 0.15Hongkong Land Holdings Ltd. USD 1,300 5,369 0.01Jardine Matheson Holdings Ltd. USD 100 4,174 0.01Kerry Properties Ltd. HKD 1,500 3,871 0.01Link REIT HKD 1,600 13,078 0.02MTR Corp. Ltd. HKD 500 2,590 0.00New World Development Co. Ltd. HKD 750 3,561 0.00NWS Holdings Ltd. HKD 3,000 2,590 0.00Power Assets Holdings Ltd. HKD 2,500 13,596 0.02Sino Land Co. Ltd. HKD 6,000 7,548 0.01Sun Hung Kai Properties Ltd. HKD 2,500 31,917 0.04Swire Pacific Ltd. ‘A’ HKD 500 2,651 0.00Techtronic Industries Co. Ltd. HKD 1,500 14,670 0.02WH Group Ltd. HKD 6,500 5,569 0.01Wharf Real Estate Investment Co. Ltd. HKD 1,000 4,774 0.01Wheelock & Co. Ltd. HKD 1,000 8,356 0.01
Hong Kong total 552,318 0.79
Ireland (31 December 2019: 1.55%)Accenture plc ‘A’ USD 1,525 327,448 0.47CRH plc EUR 2,886 98,863 0.14DCC plc GBP 247 20,540 0.03James Hardie Industries plc CDI AUD 768 14,552 0.02Kerry Group plc ‘A’ EUR 758 93,733 0.13Kingspan Group plc EUR 1,145 73,302 0.10Medtronic plc USD 4,109 376,795 0.54Ryanair Holdings plc EUR 3,824 45,483 0.07Trane Technologies plc USD 2,222 197,714 0.28
Ireland total 1,248,430 1.78
Italy (31 December 2019: 0.66%)Davide Campari-Milano SpA EUR 4,248 35,783 0.05Enel SpA EUR 19,876 171,401 0.25FinecoBank Banca Fineco SpA EUR 5,685 76,717 0.11Snam SpA EUR 17,097 83,224 0.12UniCredit SpA EUR 9,425 86,676 0.12
Italy total 453,801 0.65
Japan (31 December 2019: 7.05%)Aeon Co. Ltd. JPY 200 4,644 0.01Alfresa Holdings Corp. JPY 400 8,346 0.01Amada Co. Ltd. JPY 1,900 15,516 0.02Asahi Group Holdings Ltd. JPY 1,100 38,500 0.05Asahi Kasei Corp. JPY 4,000 32,464 0.05Astellas Pharma, Inc. JPY 2,800 46,703 0.07Bandai Namco Holdings, Inc. JPY 200 10,506 0.01Bridgestone Corp. JPY 600 19,293 0.03Canon, Inc. JPY 1,300 25,720 0.04Casio Computer Co. Ltd. JPY 800 13,867 0.02Central Japan Railway Co. JPY 400 61,881 0.09Chubu Electric Power Co., Inc. JPY 1,700 21,304 0.03Chugai Pharmaceutical Co. Ltd. JPY 600 32,062 0.05Chugoku Electric Power Co., Inc. (The) JPY 200 2,671 0.00CyberAgent, Inc. JPY 200 9,807 0.01Dai Nippon Printing Co. Ltd. JPY 200 4,577 0.01Dai-ichi Life Holdings, Inc. JPY 1,300 15,460 0.02Daiichi Sankyo Co. Ltd. JPY 1,300 106,111 0.15Daito Trust Construction Co. Ltd. JPY 200 18,370 0.03Daiwa House Industry Co. Ltd. JPY 1,500 35,343 0.05Daiwa House REIT Investment Corp. JPY 2 4,709 0.01Denso Corp. JPY 1,300 50,670 0.07Dentsu Group, Inc. JPY 600 14,210 0.02
East Japan Railway Co. JPY 600 41,566 0.06Eisai Co. Ltd. JPY 400 31,686 0.04Electric Power Development Co. Ltd. JPY 1,300 24,642 0.03ENEOS Holdings, Inc. JPY 9,600 33,992 0.05FANUC Corp. JPY 200 35,705 0.05FUJIFILM Holdings Corp. JPY 800 34,185 0.05Fujitsu Ltd. JPY 400 46,791 0.07Fukuoka Financial Group, Inc. JPY 1,100 17,343 0.02Hankyu Hanshin Holdings, Inc. JPY 200 6,757 0.01Hitachi Ltd. JPY 3,000 94,628 0.13Honda Motor Co. Ltd. JPY 3,400 86,840 0.12Hoya Corp. JPY 800 76,081 0.11Inpex Corp. JPY 600 3,709 0.00Isuzu Motors Ltd. JPY 1,500 13,532 0.02ITOCHU Corp. JPY 3,400 73,162 0.10Japan Airlines Co. Ltd. JPY 1,100 19,801 0.03Japan Exchange Group, Inc. JPY 600 13,859 0.02Japan Post Holdings Co. Ltd. JPY 600 4,264 0.01Japan Prime Realty Investment Corp., REIT JPY 2 5,858 0.01Japan Real Estate Investment Corp., REIT JPY 2 10,252 0.01Japan Retail Fund Investment Corp., REIT JPY 4 4,987 0.01JTEKT Corp. JPY 400 3,103 0.00Kajima Corp. JPY 2,800 33,324 0.05KAO Corp. JPY 1,300 102,906 0.15KDDI Corp. JPY 3,000 89,929 0.13Keikyu Corp. JPY 400 6,121 0.01Keyence Corp. JPY 400 166,956 0.24Kikkoman Corp. JPY 400 19,243 0.03Kintetsu Group Holdings Co. Ltd. JPY 200 8,982 0.01Kirin Holdings Co. Ltd. JPY 2,500 52,707 0.07Konami Holdings Corp. JPY 600 19,966 0.03Kubota Corp. JPY 4,900 73,033 0.10Kuraray Co. Ltd. JPY 1,300 13,556 0.02Kurita Water Industries Ltd. JPY 200 5,545 0.01Kyocera Corp. JPY 600 32,618 0.05Kyowa Kirin Co. Ltd. JPY 1,700 44,578 0.06M3, Inc. JPY 1,100 46,749 0.07Marui Group Co. Ltd. JPY 1,500 27,057 0.04MEIJI Holdings Co. Ltd. JPY 200 15,906 0.02MINEBEA MITSUMI, Inc. JPY 800 14,482 0.02MISUMI Group, Inc. JPY 200 4,994 0.01Mitsubishi Corp. JPY 3,200 67,331 0.10Mitsubishi Estate Co. Ltd. JPY 2,800 41,591 0.06Mitsubishi UFJ Financial Group, Inc. JPY 24,600 96,133 0.14Mitsui & Co. Ltd. JPY 2,300 33,993 0.05Mitsui Chemicals, Inc. JPY 1,300 27,076 0.04Mitsui Fudosan Co. Ltd. JPY 2,300 40,709 0.06Mizuho Financial Group, Inc. JPY 22,300 27,326 0.04MS&AD Insurance Group Holdings, Inc. JPY 200 5,489 0.01Murata Manufacturing Co. Ltd. JPY 1,300 76,107 0.11Nabtesco Corp. JPY 1,300 40,006 0.06Nexon Co. Ltd. JPY 600 13,553 0.02NGK Spark Plug Co. Ltd. JPY 1,100 15,743 0.02NH Foods Ltd. JPY 400 16,036 0.02Nidec Corp. JPY 1,100 73,371 0.10Nihon M&A Center, Inc. JPY 200 9,028 0.01Nintendo Co. Ltd. JPY 200 89,002 0.13Nippon Building Fund, Inc., REIT JPY 2 11,382 0.02Nippon Express Co. Ltd. JPY 400 20,689 0.03Nippon Prologis REIT, Inc. JPY 2 6,081 0.01Nippon Steel Corp. JPY 1,700 15,970 0.02Nippon Telegraph & Telephone Corp. JPY 3,400 79,276 0.11Nippon Yusen KK JPY 800 11,242 0.02Nissan Motor Co. Ltd. JPY 3,400 12,581 0.02Nisshin Seifun Group, Inc. JPY 400 5,966 0.01Nissin Foods Holdings Co. Ltd. JPY 400 35,408 0.05Nitori Holdings Co. Ltd. JPY 200 39,162 0.06Nomura Holdings, Inc. JPY 2,300 10,284 0.01Nomura Real Estate Master Fund, Inc.,REIT JPY 6 7,197 0.01Nomura Research Institute Ltd. JPY 1,700 46,122 0.07NTT DOCOMO, Inc. JPY 1,700 45,413 0.06Olympus Corp. JPY 2,300 44,248 0.06Omron Corp. JPY 200 13,385 0.02Ono Pharmaceutical Co. Ltd. JPY 1,500 43,616 0.06Oriental Land Co. Ltd. JPY 200 26,398 0.04ORIX Corp. JPY 3,400 41,868 0.06Osaka Gas Co. Ltd. JPY 200 3,945 0.01Otsuka Corp. JPY 800 42,119 0.06Otsuka Holdings Co. Ltd. JPY 1,100 47,911 0.07Pan Pacific International Holdings Corp. JPY 800 17,567 0.02Panasonic Corp. JPY 2,100 18,289 0.03Rakuten, Inc. JPY 600 5,272 0.01Recruit Holdings Co. Ltd. JPY 2,500 85,322 0.12Resona Holdings, Inc. JPY 5,900 20,114 0.03Rinnai Corp. JPY 200 16,684 0.02Rohm Co. Ltd. JPY 400 26,473 0.04
117
JPMorgan ETFs (Ireland) ICAV - Global Research Enhanced Index Equity (ESG) UCITS ETFSchedule of Investments (continued)As at 30 June 2020
Investments Currency
Quantity/Nominal
Value
FairValue
USD
% ofNet
Assets Investments Currency
Quantity/Nominal
Value
FairValue
USD
% ofNet
Assets

Ryohin Keikaku Co. Ltd. JPY 1,100 15,549 0.02Santen Pharmaceutical Co. Ltd. JPY 400 7,352 0.01SBI Holdings, Inc. JPY 800 17,263 0.02SCSK Corp. JPY 200 9,714 0.01Secom Co. Ltd. JPY 200 17,469 0.02Sega Sammy Holdings, Inc. JPY 1,100 13,153 0.02Seibu Holdings, Inc. JPY 1,900 20,623 0.03Sekisui House Ltd. JPY 400 7,610 0.01Seven & i Holdings Co. Ltd. JPY 1,700 55,466 0.08Shimadzu Corp. JPY 800 21,267 0.03Shimano, Inc. JPY 200 38,467 0.05Shin-Etsu Chemical Co. Ltd. JPY 800 93,396 0.13Shionogi & Co. Ltd. JPY 200 12,513 0.02Shiseido Co. Ltd. JPY 1,100 69,690 0.10SMC Corp. JPY 200 102,294 0.14Softbank Corp. JPY 1,700 21,667 0.03SoftBank Group Corp. JPY 2,500 126,292 0.18Sompo Holdings, Inc. JPY 800 27,488 0.04Sony Corp. JPY 2,300 157,419 0.22Square Enix Holdings Co. Ltd. JPY 400 20,170 0.03Stanley Electric Co. Ltd. JPY 200 4,811 0.01Sumitomo Electric Industries Ltd. JPY 1,900 21,829 0.03Sumitomo Metal Mining Co. Ltd. JPY 400 11,156 0.02Sumitomo Mitsui Financial Group, Inc. JPY 2,800 78,691 0.11Sumitomo Mitsui Trust Holdings, Inc. JPY 800 22,431 0.03Sumitomo Realty & Development Co. Ltd. JPY 800 21,971 0.03Sundrug Co. Ltd. JPY 400 13,236 0.02Suntory Beverage & Food Ltd. JPY 200 7,795 0.01Suzuken Co. Ltd. JPY 200 7,452 0.01Suzuki Motor Corp. JPY 1,100 37,287 0.05Sysmex Corp. JPY 200 15,257 0.02T&D Holdings, Inc. JPY 2,500 21,342 0.03Taiheiyo Cement Corp. JPY 1,100 25,408 0.04Taisei Corp. JPY 600 21,801 0.03Takeda Pharmaceutical Co. Ltd. JPY 2,684 95,732 0.14TDK Corp. JPY 200 19,799 0.03Terumo Corp. JPY 1,300 49,175 0.07Tohoku Electric Power Co., Inc. JPY 1,100 10,461 0.01Tokio Marine Holdings, Inc. JPY 1,700 74,029 0.10Tokyo Electron Ltd. JPY 400 98,030 0.14Tokyo Gas Co. Ltd. JPY 1,100 26,306 0.04Tokyu Corp. JPY 2,300 32,341 0.05Toppan Printing Co. Ltd. JPY 400 6,663 0.01Toray Industries, Inc. JPY 1,700 7,997 0.01Toshiba Corp. JPY 600 19,104 0.03Toyota Industries Corp. JPY 200 10,585 0.01Toyota Motor Corp. JPY 4,000 250,711 0.36Toyota Tsusho Corp. JPY 200 5,059 0.01Trend Micro, Inc. JPY 200 11,160 0.02Unicharm Corp. JPY 400 16,388 0.02United Urban Investment Corp., REIT JPY 4 4,293 0.01Yamaha Corp. JPY 200 9,399 0.01Yamato Holdings Co. Ltd. JPY 400 8,639 0.01Yaskawa Electric Corp. JPY 200 6,905 0.01Z Holdings Corp. JPY 5,700 27,791 0.04
Japan total 5,482,503 7.80
Macau (31 December 2019: 0.04%)Sands China Ltd. HKD 4,400 17,258 0.02Wynn Macau Ltd. HKD 4,000 6,885 0.01
Macau total 24,143 0.03
Netherlands (31 December 2019: 2.20%)Akzo Nobel NV EUR 1,547 138,549 0.20ASML Holding NV EUR 913 335,215 0.48Heineken NV EUR 979 90,230 0.13ING Groep NV EUR 15,263 106,250 0.15Koninklijke Ahold Delhaize NV EUR 3,964 108,009 0.15Koninklijke KPN NV EUR 23,998 63,610 0.09Koninklijke Philips NV EUR 1,625 75,779 0.11NN Group NV EUR 2,221 74,586 0.11NXP Semiconductors NV USD 366 41,739 0.06Prosus NV EUR 909 84,473 0.12Randstad NV EUR 928 41,337 0.06Royal Dutch Shell plc ‘A’ GBP 8,650 137,554 0.19Royal Dutch Shell plc ‘B’ GBP 5,852 88,504 0.12Wolters Kluwer NV EUR 1,248 97,446 0.14
Netherlands total 1,483,281 2.11
New Zealand (31 December 2019: 0.06%)Auckland International Airport Ltd. NZD 2,239 9,470 0.01Ryman Healthcare Ltd. NZD 887 7,469 0.01Spark New Zealand Ltd. NZD 4,120 12,094 0.02
New Zealand total 29,033 0.04
Norway (31 December 2019: 0.13%)Telenor ASA NOK 4,887 70,972 0.10
Norway total 70,972 0.10
Portugal (31 December 2019: 0.00%)Galp Energia SGPS SA EUR 1,160 13,413 0.02
Portugal total 13,413 0.02
Singapore (31 December 2019: 0.34%)Ascendas Real Estate Investment Trust,REIT SGD 2,800 6,363 0.01CapitaLand Ltd. SGD 6,500 13,605 0.02CapitaLand Mall Trust, REIT SGD 3,900 5,479 0.01DBS Group Holdings Ltd. SGD 3,600 53,675 0.08Genting Singapore Ltd. SGD 7,500 4,086 0.01Keppel Corp. Ltd. SGD 2,500 10,681 0.01Oversea-Chinese Banking Corp. Ltd. SGD 7,500 48,385 0.07Singapore Airlines Ltd. SGD 1,000 2,674 0.00Singapore Telecommunications Ltd. SGD 16,900 29,801 0.04United Overseas Bank Ltd. SGD 500 7,251 0.01Wilmar International Ltd. SGD 5,000 14,659 0.02
Singapore total 196,659 0.28
Spain (31 December 2019: 0.70%)Banco Bilbao Vizcaya Argentaria SA EUR 5,472 18,831 0.03Banco Santander SA EUR 27,368 66,841 0.09Endesa SA EUR 1,415 34,852 0.05Iberdrola SA EUR 17,937 207,906 0.30Industria de Diseno Textil SA EUR 2,441 64,620 0.09Naturgy Energy Group SA EUR 1,778 33,080 0.05
Spain total 426,130 0.61
Sweden (31 December 2019: 0.76%)Alfa Laval AB SEK 1,627 35,695 0.05Atlas Copco AB ‘A’ SEK 3,767 159,549 0.23Boliden AB SEK 1,977 44,986 0.06Essity AB ‘B’ SEK 1,170 37,813 0.05Lundin Energy AB SEK 895 21,576 0.03Sandvik AB SEK 7,632 142,619 0.20SKF AB ‘B’ SEK 2,810 52,224 0.08Svenska Handelsbanken AB ‘A’ SEK 11,477 108,947 0.16
Sweden total 603,409 0.86
Switzerland (31 December 2019: 3.30%)ABB Ltd. CHF 2,820 63,480 0.09Adecco Group AG CHF 585 27,449 0.04Chubb Ltd. USD 133 16,840 0.02Credit Suisse Group AG CHF 8,097 83,726 0.12Givaudan SA CHF 6 22,340 0.03LafargeHolcim Ltd. CHF 2,337 102,379 0.15Lonza Group AG CHF 317 167,340 0.24Nestle SA CHF 5,677 627,523 0.89Novartis AG CHF 4,728 411,252 0.59Roche Holding AG CHF 1,441 499,343 0.71Swiss Re AG CHF 523 40,325 0.06TE Connectivity Ltd. USD 1,042 84,975 0.12UBS Group AG CHF 6,215 71,526 0.10Zurich Insurance Group AG CHF 101 35,623 0.05
Switzerland total 2,254,121 3.21
United Kingdom (31 December 2019: 4.90%)3i Group plc GBP 8,229 84,657 0.12Aon plc ‘A’ USD 391 75,307 0.11AstraZeneca plc GBP 2,242 233,280 0.33Barclays plc GBP 53,300 75,354 0.11Beazley plc GBP 12,140 61,501 0.09BP plc GBP 48,141 182,732 0.26Burberry Group plc GBP 3,806 75,219 0.11Compass Group plc GBP 4,275 58,738 0.08Diageo plc GBP 5,798 192,103 0.27GlaxoSmithKline plc GBP 7,095 143,474 0.20HSBC Holdings plc GBP 21,281 99,552 0.14IHS Markit Ltd. USD 128 9,664 0.01InterContinental Hotels Group plc GBP 1,795 79,112 0.11Intertek Group plc GBP 822 55,252 0.08ITV plc GBP 21,285 19,641 0.03Liberty Global plc ‘C’ USD 304 6,539 0.01Linde plc USD 727 154,204 0.22Lloyds Banking Group plc GBP 209,951 80,873 0.12London Stock Exchange Group plc GBP 899 92,841 0.13M&G plc GBP 25,699 53,203 0.08Next plc GBP 323 19,532 0.03Persimmon plc GBP 1,765 49,854 0.07Prudential plc GBP 7,581 114,138 0.16Reckitt Benckiser Group plc GBP 1,644 150,968 0.22
118
JPMorgan ETFs (Ireland) ICAV - Global Research Enhanced Index Equity (ESG) UCITS ETFSchedule of Investments (continued)As at 30 June 2020
Investments Currency
Quantity/Nominal
Value
FairValue
USD
% ofNet
Assets Investments Currency
Quantity/Nominal
Value
FairValue
USD
% ofNet
Assets

RELX plc GBP 5,697 131,633 0.19Rio Tinto Ltd. AUD 715 48,223 0.07Rio Tinto plc GBP 3,171 178,234 0.25Severn Trent plc GBP 829 25,393 0.04SSE plc GBP 1,031 17,382 0.02Standard Chartered plc GBP 14,589 79,333 0.11Taylor Wimpey plc GBP 40,091 70,639 0.10Tesco plc GBP 30,355 85,553 0.12Unilever plc GBP 5,190 279,276 0.40Vodafone Group plc GBP 8,065 12,841 0.02
United Kingdom total 3,096,245 4.41
United States (31 December 2019: 61.48%)3M Co. USD 355 55,376 0.08A O Smith Corp. USD 401 18,895 0.03Abbott Laboratories USD 846 77,350 0.11AbbVie, Inc. USD 4,964 487,366 0.69ABIOMED, Inc. USD 51 12,320 0.02Acuity Brands, Inc. USD 270 25,850 0.04Adobe, Inc. USD 551 239,856 0.34Advance Auto Parts, Inc. USD 118 16,809 0.02Advanced Micro Devices, Inc. USD 2,104 110,691 0.16Air Products & Chemicals, Inc. USD 416 100,447 0.14Akamai Technologies, Inc. USD 169 18,098 0.03Alexion Pharmaceuticals, Inc. USD 1,117 125,372 0.18Align Technology, Inc. USD 76 20,857 0.03Allstate Corp. (The) USD 2,224 215,706 0.31Ally Financial, Inc. USD 573 11,363 0.02Alphabet, Inc. ‘A’ USD 547 775,673 1.10Alphabet, Inc. ‘C’ USD 584 825,548 1.17Altice USA, Inc. ‘A’ USD 835 18,821 0.03Amazon.com, Inc. USD 791 2,182,227 3.11Ameren Corp. USD 742 52,207 0.07American Electric Power Co., Inc. USD 829 66,022 0.09American Express Co. USD 2,252 214,390 0.30American International Group, Inc. USD 862 26,877 0.04American Tower Corp., REIT USD 315 81,440 0.12Ameriprise Financial, Inc. USD 69 10,353 0.01Amgen, Inc. USD 419 98,825 0.14Analog Devices, Inc. USD 2,325 285,138 0.41Anthem, Inc. USD 817 214,855 0.31Apple, Inc. USD 7,888 2,877,542 4.10Applied Materials, Inc. USD 1,445 87,350 0.12Aramark USD 429 9,683 0.01Arrow Electronics, Inc. USD 168 11,540 0.02Arthur J Gallagher & Co. USD 290 28,272 0.04AT&T, Inc. USD 5,017 151,664 0.22Autodesk, Inc. USD 119 28,464 0.04Automatic Data Processing, Inc. USD 1,418 211,126 0.30AutoZone, Inc. USD 133 150,040 0.21AvalonBay Communities, Inc., REIT USD 236 36,495 0.05Avery Dennison Corp. USD 985 112,379 0.16Bank of America Corp. USD 14,974 355,632 0.51Bausch Health Cos., Inc. CAD 586 10,687 0.02Baxter International, Inc. USD 2,524 217,316 0.31Becton Dickinson & Co. USD 291 69,628 0.10Berkshire Hathaway, Inc. ‘B’ USD 2,874 513,038 0.73Best Buy Co., Inc. USD 2,571 224,371 0.32Biogen, Inc. USD 378 101,134 0.14BlackRock, Inc. ‘A’ USD 539 293,265 0.42Booking Holdings, Inc. USD 106 168,788 0.24Booz Allen Hamilton Holding Corp. ‘A’ USD 768 59,743 0.08BorgWarner, Inc. USD 521 18,391 0.03Boston Scientific Corp. USD 3,888 136,508 0.19Bristol-Myers Squibb Co. USD 6,953 408,836 0.58Broadcom, Inc. USD 227 71,643 0.10Cabot Oil & Gas Corp. USD 622 10,686 0.02Cadence Design Systems, Inc. USD 471 45,197 0.06Camden Property Trust, REIT USD 119 10,855 0.02Capital One Financial Corp. USD 1,720 107,655 0.15Cardinal Health, Inc. USD 479 24,999 0.04Carrier Global Corp. USD 2,695 59,883 0.09Caterpillar, Inc. USD 725 91,712 0.13CBRE Group, Inc. ‘A’ USD 561 25,368 0.04CDW Corp. USD 381 44,265 0.06Celanese Corp. ‘A’ USD 1,469 126,833 0.18Cerner Corp. USD 534 36,606 0.05Charles Schwab Corp. (The) USD 2,626 88,601 0.13Charter Communications, Inc. ‘A’ USD 661 337,136 0.48Cheniere Energy, Inc. USD 874 42,232 0.06Chevron Corp. USD 3,676 328,009 0.47Cigna Corp. USD 705 132,293 0.19Cincinnati Financial Corp. USD 278 17,800 0.03Cintas Corp. USD 79 21,042 0.03Cisco Systems, Inc. USD 4,199 195,841 0.28Citigroup, Inc. USD 7,492 382,841 0.54Citizens Financial Group, Inc. USD 3,096 78,143 0.11
CME Group, Inc. ‘A’ USD 600 97,524 0.14CMS Energy Corp. USD 1,628 95,108 0.14Coca-Cola Co. (The) USD 8,724 389,788 0.55Cognizant Technology Solutions Corp. ‘A’ USD 562 31,933 0.05Comcast Corp. ‘A’ USD 9,392 366,100 0.52Conagra Brands, Inc. USD 887 31,196 0.04Concho Resources, Inc. USD 362 18,643 0.03ConocoPhillips USD 990 41,600 0.06Constellation Brands, Inc. ‘A’ USD 1,106 193,495 0.28Cooper Cos., Inc. (The) USD 66 18,720 0.03Corteva, Inc. USD 780 20,896 0.03Costco Wholesale Corp. USD 1,195 362,336 0.52Coupa Software, Inc. USD 103 28,535 0.04Crown Holdings, Inc. USD 1,512 98,477 0.14CSX Corp. USD 3,047 212,498 0.30Cummins, Inc. USD 1,315 227,837 0.32CVS Health Corp. USD 677 43,985 0.06DaVita, Inc. USD 232 18,360 0.03Deere & Co. USD 868 136,406 0.19Delta Air Lines, Inc. USD 2,110 59,185 0.08DexCom, Inc. USD 147 59,594 0.08Diamondback Energy, Inc. USD 1,210 50,602 0.07Discovery, Inc. ‘A’ USD 2,746 57,941 0.08Discovery, Inc. ‘C’ USD 3,342 64,367 0.09DocuSign, Inc. ‘A’ USD 282 48,563 0.07Dollar Tree, Inc. USD 420 38,926 0.06Dow, Inc. USD 2,015 82,131 0.12DR Horton, Inc. USD 583 32,327 0.05Dropbox, Inc. ‘A’ USD 407 8,860 0.01DTE Energy Co. USD 454 48,805 0.07Duke Energy Corp. USD 2,056 164,254 0.23DuPont de Nemours, Inc. USD 1,675 88,993 0.13Eastman Chemical Co. USD 1,668 116,160 0.17Eaton Corp. plc USD 3,351 293,145 0.42Edison International USD 973 52,844 0.08Edwards Lifesciences Corp. USD 989 68,350 0.10Electronic Arts, Inc. USD 673 88,870 0.13Eli Lilly & Co. USD 2,539 416,853 0.59Emerson Electric Co. USD 1,560 96,767 0.14Entergy Corp. USD 1,722 161,541 0.23EOG Resources, Inc. USD 3,290 166,671 0.24Equinix, Inc., REIT USD 276 193,835 0.28Equity Residential, REIT USD 1,914 112,581 0.16Essex Property Trust, Inc., REIT USD 336 77,001 0.11Estee Lauder Cos., Inc. (The) ‘A’ USD 244 46,038 0.07Exxon Mobil Corp. USD 3,915 175,079 0.25F5 Networks, Inc. USD 91 12,693 0.02Facebook, Inc. ‘A’ USD 4,030 915,092 1.30Federal Realty Investment Trust, REIT USD 611 52,063 0.07Fidelity National Financial, Inc. USD 182 5,580 0.01Fifth Third Bancorp USD 2,992 57,686 0.08FirstEnergy Corp. USD 1,426 55,300 0.08Fiserv, Inc. USD 961 93,813 0.13FleetCor Technologies, Inc. USD 283 71,183 0.10FLIR Systems, Inc. USD 1,065 43,207 0.06Ford Motor Co. USD 7,175 43,624 0.06Fortinet, Inc. USD 443 60,811 0.09General Electric Co. USD 7,018 47,933 0.07General Mills, Inc. USD 1,998 123,177 0.18General Motors Co. USD 2,999 75,875 0.11Gilead Sciences, Inc. USD 1,107 85,173 0.12Goldman Sachs Group, Inc. (The) USD 700 138,334 0.20Hartford Financial Services Group, Inc.(The) USD 743 28,643 0.04HD Supply Holdings, Inc. USD 1,702 58,974 0.08Healthpeak Properties, Inc., REIT USD 348 9,591 0.01Hilton Worldwide Holdings, Inc. USD 1,220 89,609 0.13Hologic, Inc. USD 470 26,790 0.04Home Depot, Inc. (The) USD 1,852 463,945 0.66HP, Inc. USD 6,848 119,361 0.17Humana, Inc. USD 159 61,652 0.09IDEXX Laboratories, Inc. USD 132 43,581 0.06Illumina, Inc. USD 224 82,958 0.12Insulet Corp. USD 94 18,260 0.03Intel Corp. USD 4,288 256,551 0.37International Business Machines Corp. USD 1,990 240,332 0.34Intuit, Inc. USD 1,080 319,885 0.46Intuitive Surgical, Inc. USD 183 104,279 0.15Invitation Homes, Inc., REIT USD 2,132 58,694 0.08Johnson & Johnson USD 3,486 490,236 0.70Kansas City Southern USD 661 98,681 0.14KeyCorp USD 8,322 101,362 0.14Kimberly-Clark Corp. USD 1,768 249,907 0.36Kroger Co. (The) USD 1,388 46,984 0.07Lam Research Corp. USD 532 172,081 0.24Lamb Weston Holdings, Inc. USD 250 15,982 0.02Las Vegas Sands Corp. USD 534 24,318 0.03
119
JPMorgan ETFs (Ireland) ICAV - Global Research Enhanced Index Equity (ESG) UCITS ETFSchedule of Investments (continued)As at 30 June 2020
Investments Currency
Quantity/Nominal
Value
FairValue
USD
% ofNet
Assets Investments Currency
Quantity/Nominal
Value
FairValue
USD
% ofNet
Assets

Lear Corp. USD 77 8,395 0.01Lennar Corp. ‘A’ USD 2,446 150,723 0.21Liberty Broadband Corp. ‘C’ USD 89 11,032 0.02Lowe’s Cos., Inc. USD 2,454 331,584 0.47LyondellBasell Industries NV ‘A’ USD 479 31,480 0.04Marathon Petroleum Corp. USD 2,336 87,320 0.12MarketAxess Holdings, Inc. USD 106 53,098 0.08Marsh & McLennan Cos., Inc. USD 834 89,547 0.13Masco Corp. USD 3,054 153,341 0.22Mastercard, Inc. ‘A’ USD 2,277 673,309 0.96McDonald’s Corp. USD 545 100,536 0.14McKesson Corp. USD 1,264 193,923 0.28Merck & Co., Inc. USD 6,423 496,691 0.71MetLife, Inc. USD 2,500 91,300 0.13Microchip Technology, Inc. USD 647 68,136 0.10Micron Technology, Inc. USD 2,553 131,531 0.19Microsoft Corp. USD 13,383 2,723,574 3.88Mid-America Apartment Communities,Inc., REIT USD 379 43,460 0.06Moderna, Inc. USD 325 20,868 0.03Mohawk Industries, Inc. USD 89 9,057 0.01Molson Coors Beverage Co. ‘B’ USD 143 4,913 0.01Mondelez International, Inc. ‘A’ USD 5,408 276,511 0.39Monster Beverage Corp. USD 1,301 90,185 0.13Morgan Stanley USD 6,023 290,911 0.41Motorola Solutions, Inc. USD 196 27,465 0.04MSCI, Inc. ‘A’ USD 136 45,400 0.06National Retail Properties, Inc., REIT USD 209 7,415 0.01Netflix, Inc. USD 1,055 480,067 0.68Newell Brands, Inc. USD 797 12,656 0.02Newmont Corp. USD 1,365 84,275 0.12NextEra Energy, Inc. USD 1,536 368,901 0.52NIKE, Inc. ‘B’ USD 2,378 233,163 0.33Norfolk Southern Corp. USD 1,661 291,622 0.41Nucor Corp. USD 637 26,378 0.04NVIDIA Corp. USD 954 362,434 0.52ON Semiconductor Corp. USD 4,071 80,687 0.11ONEOK, Inc. USD 2,357 78,300 0.11Oracle Corp. USD 1,876 103,687 0.15O’Reilly Automotive, Inc. USD 119 50,179 0.07Otis Worldwide Corp. USD 1,354 76,988 0.11Owens Corning USD 169 9,423 0.01PACCAR, Inc. USD 675 50,524 0.07Packaging Corp. of America USD 739 73,752 0.10Palo Alto Networks, Inc. USD 131 30,087 0.04Parker-Hannifin Corp. USD 1,583 290,116 0.41PayPal Holdings, Inc. USD 3,133 545,863 0.78PepsiCo, Inc. USD 2,038 269,546 0.38Pfizer, Inc. USD 6,101 199,503 0.28Phillips 66 USD 771 55,435 0.08Pinnacle West Capital Corp. USD 212 15,537 0.02Pioneer Natural Resources Co. USD 1,519 148,406 0.21PPG Industries, Inc. USD 209 22,167 0.03Principal Financial Group, Inc. USD 466 19,358 0.03Procter & Gamble Co. (The) USD 5,773 690,278 0.98Progressive Corp. (The) USD 1,616 129,458 0.18Prologis, Inc., REIT USD 2,096 195,620 0.28PulteGroup, Inc. USD 390 13,272 0.02Qorvo, Inc. USD 446 49,296 0.07QUALCOMM, Inc. USD 1,224 111,641 0.16Ralph Lauren Corp. ‘A’ USD 354 25,672 0.04Realty Income Corp., REIT USD 550 32,725 0.05Regeneron Pharmaceuticals, Inc. USD 273 170,256 0.24Regions Financial Corp. USD 7,765 86,347 0.12Roku, Inc. ‘A’ USD 157 18,295 0.03Rollins, Inc. USD 296 12,547 0.02Roper Technologies, Inc. USD 142 55,133 0.08Ross Stores, Inc. USD 1,159 98,793 0.14Royal Caribbean Cruises Ltd. USD 311 15,643 0.02S&P Global, Inc. USD 805 265,231 0.38salesforce.com, Inc. USD 2,524 472,821 0.67SBA Communications Corp., REIT ‘A’ USD 193 57,499 0.08SEI Investments Co. USD 364 20,013 0.03Sempra Energy USD 638 74,793 0.11ServiceNow, Inc. USD 298 120,708 0.17Slack Technologies, Inc. ‘A’ USD 555 17,255 0.02Snap, Inc. ‘A’ USD 1,299 30,514 0.04Snap-on, Inc. USD 1,159 160,533 0.23Southern Co. (The) USD 959 49,724 0.07Square, Inc. ‘A’ USD 510 53,519 0.08Stanley Black & Decker, Inc. USD 1,133 157,918 0.22State Street Corp. USD 2,167 137,713 0.20Steel Dynamics, Inc. USD 363 9,471 0.01Sun Communities, Inc., REIT USD 299 40,568 0.06T Rowe Price Group, Inc. USD 181 22,353 0.03Target Corp. USD 1,572 188,530 0.27TD Ameritrade Holding Corp. USD 976 35,507 0.05
Teladoc Health, Inc. USD 54 10,305 0.01Teradyne, Inc. USD 967 81,721 0.12Tesla, Inc. USD 225 242,957 0.35Texas Instruments, Inc. USD 3,293 418,112 0.59Thermo Fisher Scientific, Inc. USD 1,118 405,096 0.58TJX Cos., Inc. (The) USD 3,173 160,427 0.23T-Mobile US, Inc. USD 1,824 189,970 0.27T-Mobile US, Inc., Rights USD 1,824 306 0.00Truist Financial Corp. USD 1,707 64,098 0.09Tyson Foods, Inc. ‘A’ USD 521 31,109 0.04Uber Technologies, Inc. USD 2,216 68,873 0.10UDR, Inc., REIT USD 549 20,522 0.03Ulta Beauty, Inc. USD 90 18,308 0.03Union Pacific Corp. USD 1,080 182,596 0.26United Parcel Service, Inc. ‘B’ USD 989 109,957 0.16UnitedHealth Group, Inc. USD 2,108 621,755 0.88US Bancorp USD 1,328 48,897 0.07Ventas, Inc., REIT USD 1,145 41,930 0.06VEREIT, Inc., REIT USD 1,846 11,870 0.02Verisk Analytics, Inc. ‘A’ USD 261 44,422 0.06Verizon Communications, Inc. USD 9,105 501,959 0.71Vertex Pharmaceuticals, Inc. USD 739 214,539 0.31VICI Properties, Inc., REIT USD 2,145 43,308 0.06Visa, Inc. ‘A’ USD 2,890 558,261 0.79Voya Financial, Inc. USD 2,442 113,919 0.16Walgreens Boots Alliance, Inc. USD 285 12,081 0.02Walmart, Inc. USD 910 109,000 0.15Walt Disney Co. (The) USD 1,271 141,729 0.20Waste Management, Inc. USD 977 103,474 0.15Wells Fargo & Co. USD 6,927 177,331 0.25Weyerhaeuser Co., REIT USD 740 16,620 0.02Williams Cos., Inc. (The) USD 2,000 38,040 0.05Workday, Inc. ‘A’ USD 444 83,188 0.12WW Grainger, Inc. USD 77 24,190 0.03Xcel Energy, Inc. USD 2,199 137,438 0.20Xilinx, Inc. USD 143 14,070 0.02Yum! Brands, Inc. USD 1,878 163,217 0.23Zimmer Biomet Holdings, Inc. USD 1,623 193,721 0.28
United States total 44,547,905 63.41
Total investments in Equities 69,391,394 98.77
120
JPMorgan ETFs (Ireland) ICAV - Global Research Enhanced Index Equity (ESG) UCITS ETFSchedule of Investments (continued)As at 30 June 2020
Investments Currency
Quantity/Nominal
Value
FairValue
USD
% ofNet
Assets Investments Currency
Quantity/Nominal
Value
FairValue
USD
% ofNet
Assets

JPMorgan ETFs (Ireland) ICAV - Global Research Enhanced Index Equity (ESG) UCITS ETF
Schedule of Investments (continued)
As at 30 June 2020
Financial Futures Contracts
Security DescriptionNo. of
Contracts Currency
UnderlyingExposure
USD Counterparty
FairValue
USD
% ofNet
Assets
Australia (31 December 2019: 0.00%)SPI 200 Index, 17/09/2020 2 AUD 202,006 Goldman Sachs 826 -
Australia total 826 -
Total unrealised gain on Financial Futures Contracts (31 December 2019: 0.00%) 826 -
FairValue
USD
% ofNet
Assets
Total financial assets at fair value through profit or loss 69,392,220 98.77Cash and margin cash 313,694 0.45
Cash equivalents
Currency
Quantity/Nominal
ValueUndertaking for collective investment schemes (31 December 2019: 1.56%)JPMorgan Liquidity Funds - USD Liquidity LVNAV Fund - Class X (dist.)1 USD 510,015 510,015 0.73
Total Cash equivalents 510,015 0.73Other assets and liabilities 41,688 0.05
Net asset value attributable to holders of redeemable participating shares 70,257,617 100.00
Analysis of total assets
% ofTotal
Assets
Transferable securities and money market instruments admitted to official stock exchange listing 98.43Transferable securities and money market instruments dealt in on another regulated market 0.31Collective investment schemes 0.73Financial derivative instruments dealt in on a regulated market -Other assets 0.53
Total Assets 100.00
1A related party to the Fund.
121

Bonds
Corporate Debt Securities (31 December 2019: 6.97%)
France (31 December 2019: 0.00%)Dexia Credit Local SA 2.50% 25/01/2021 USD 4,200,000 4,249,461 4.82
France total 4,249,461 4.82
Supranational (31 December 2019: 0.00%)International Bank for Reconstruction &Development 1.63% 09/03/2021 USD 5,220,000 5,272,350 5.99
Supranational total 5,272,350 5.99
Total investments in Corporate Debt Securities 9,521,811 10.81
Government Debt Securities (31 December 2019: 60.47%)
France (31 December 2019: 0.00%)Agence Francaise de Developpement EPIC1.88% 14/09/2020 USD 2,000,000 2,006,202 2.28
France total 2,006,202 2.28
Netherlands (31 December 2019: 0.00%)BNG Bank NV 2.50% 16/02/2021 USD 6,904,000 6,997,694 7.94
Netherlands total 6,997,694 7.94
United States (31 December 2019: 53.53%)US Treasury Bill 0.00% 16/07/2020 USD 4,630,200 4,626,842 5.25US Treasury Bill 0.00% 13/08/2020 USD 4,622,900 4,613,324 5.24US Treasury Bill 0.00% 10/09/2020 USD 5,197,600 5,196,319 5.90US Treasury Bill 0.00% 08/10/2020 USD 7,000,000 6,997,209 7.94US Treasury Bill 0.00% 17/12/2020 USD 1,157,800 1,157,032 1.31US Treasury Bill 0.00% 31/12/2020 USD 6,577,600 6,572,083 7.46US Treasury Bill 0.00% 28/01/2021 USD 6,635,000 6,628,972 7.52US Treasury Bill 0.00% 25/02/2021 USD 6,582,800 6,576,245 7.46US Treasury Bill 0.00% 25/03/2021 USD 4,693,800 4,688,404 5.32US Treasury Bill 0.00% 22/04/2021 USD 6,585,900 6,577,535 7.46
United States total 53,633,965 60.86
Total investments in Government Debt Securities 62,637,861 71.08
Total Bonds 72,159,672 81.89
122
JPMorgan ETFs (Ireland) ICAV - Managed Futures UCITS ETFSchedule of InvestmentsAs at 30 June 2020
Investments Currency
Quantity/Nominal
Value
FairValue
USD
% ofNet
Assets Investments Currency
Quantity/Nominal
Value
FairValue
USD
% ofNet
Assets
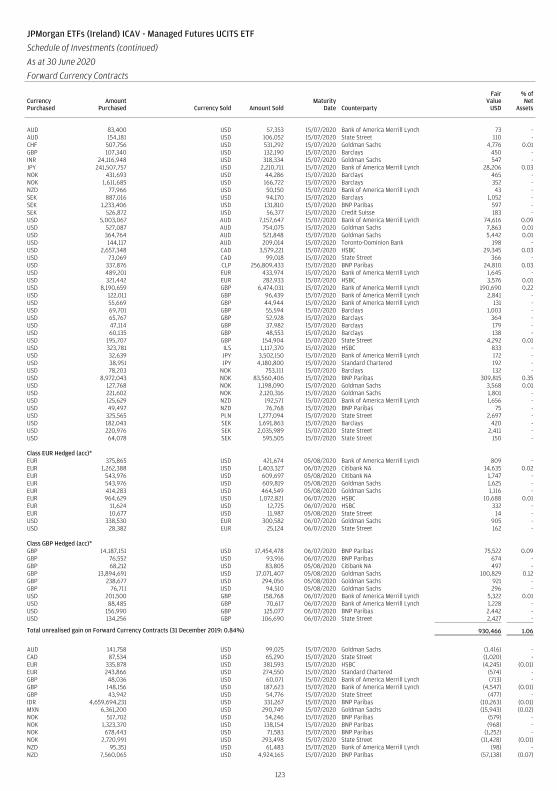
JPMorgan ETFs (Ireland) ICAV - Managed Futures UCITS ETF
Schedule of Investments (continued)
As at 30 June 2020
Forward Currency Contracts (continued)
CurrencyPurchased
AmountPurchased Currency Sold Amount Sold
MaturityDate Counterparty
FairValue
USD
% ofNet
Assets
AUD 83,400 USD 57,353 15/07/2020 Bank of America Merrill Lynch 73 -AUD 154,181 USD 106,052 15/07/2020 State Street 110 -CHF 507,756 USD 531,292 15/07/2020 Goldman Sachs 4,776 0.01GBP 107,340 USD 132,190 15/07/2020 Barclays 450 -INR 24,116,948 USD 318,334 15/07/2020 Goldman Sachs 547 -JPY 241,507,757 USD 2,210,711 15/07/2020 Bank of America Merrill Lynch 28,206 0.03NOK 431,693 USD 44,286 15/07/2020 Barclays 465 -NOK 1,611,685 USD 166,722 15/07/2020 Barclays 352 -NZD 77,966 USD 50,150 15/07/2020 Bank of America Merrill Lynch 43 -SEK 887,016 USD 94,170 15/07/2020 Barclays 1,052 -SEK 1,233,406 USD 131,810 15/07/2020 BNP Paribas 597 -SEK 526,872 USD 56,377 15/07/2020 Credit Suisse 183 -USD 5,003,067 AUD 7,157,647 15/07/2020 Bank of America Merrill Lynch 74,616 0.09USD 527,087 AUD 754,075 15/07/2020 Goldman Sachs 7,863 0.01USD 364,764 AUD 521,848 15/07/2020 Goldman Sachs 5,442 0.01USD 144,117 AUD 209,014 15/07/2020 Toronto-Dominion Bank 198 -USD 2,657,348 CAD 3,579,221 15/07/2020 HSBC 29,345 0.03USD 73,069 CAD 99,018 15/07/2020 State Street 366 -USD 337,876 CLP 256,809,433 15/07/2020 BNP Paribas 24,810 0.03USD 489,201 EUR 433,974 15/07/2020 Bank of America Merrill Lynch 1,645 -USD 321,442 EUR 282,933 15/07/2020 HSBC 3,576 0.01USD 8,190,659 GBP 6,474,031 15/07/2020 Bank of America Merrill Lynch 190,690 0.22USD 122,011 GBP 96,439 15/07/2020 Bank of America Merrill Lynch 2,841 -USD 55,669 GBP 44,944 15/07/2020 Bank of America Merrill Lynch 131 -USD 69,701 GBP 55,594 15/07/2020 Barclays 1,003 -USD 65,767 GBP 52,928 15/07/2020 Barclays 364 -USD 47,114 GBP 37,982 15/07/2020 Barclays 179 -USD 60,135 GBP 48,553 15/07/2020 Barclays 138 -USD 195,707 GBP 154,904 15/07/2020 State Street 4,292 0.01USD 323,781 ILS 1,117,370 15/07/2020 HSBC 833 -USD 32,639 JPY 3,502,150 15/07/2020 Bank of America Merrill Lynch 172 -USD 38,951 JPY 4,180,800 15/07/2020 Standard Chartered 192 -USD 78,203 NOK 753,111 15/07/2020 Barclays 132 -USD 8,972,043 NOK 83,560,406 15/07/2020 BNP Paribas 309,815 0.35USD 127,768 NOK 1,198,090 15/07/2020 Goldman Sachs 3,568 0.01USD 221,602 NOK 2,120,316 15/07/2020 Goldman Sachs 1,801 -USD 125,629 NZD 192,571 15/07/2020 Bank of America Merrill Lynch 1,656 -USD 49,497 NZD 76,768 15/07/2020 BNP Paribas 75 -USD 325,565 PLN 1,277,094 15/07/2020 State Street 2,697 -USD 182,043 SEK 1,691,863 15/07/2020 Barclays 420 -USD 220,976 SEK 2,035,989 15/07/2020 State Street 2,411 -USD 64,078 SEK 595,505 15/07/2020 State Street 150 -
Class EUR Hedged (acc)*EUR 375,865 USD 421,674 05/08/2020 Bank of America Merrill Lynch 809 -EUR 1,262,388 USD 1,403,327 06/07/2020 Citibank NA 14,635 0.02EUR 543,976 USD 609,697 05/08/2020 Citibank NA 1,747 -EUR 543,976 USD 609,819 05/08/2020 Goldman Sachs 1,625 -EUR 414,283 USD 464,549 05/08/2020 Goldman Sachs 1,116 -EUR 964,629 USD 1,072,821 06/07/2020 HSBC 10,688 0.01EUR 11,624 USD 12,725 06/07/2020 HSBC 332 -EUR 10,677 USD 11,987 05/08/2020 State Street 14 -USD 338,530 EUR 300,582 06/07/2020 Goldman Sachs 905 -USD 28,382 EUR 25,124 06/07/2020 State Street 162 -
Class GBP Hedged (acc)*GBP 14,187,151 USD 17,454,478 06/07/2020 BNP Paribas 75,522 0.09GBP 76,552 USD 93,916 06/07/2020 BNP Paribas 674 -GBP 68,212 USD 83,805 05/08/2020 Citibank NA 497 -GBP 13,894,691 USD 17,071,407 05/08/2020 Goldman Sachs 100,829 0.12GBP 238,677 USD 294,056 05/08/2020 Goldman Sachs 921 -GBP 76,711 USD 94,510 05/08/2020 Goldman Sachs 296 -USD 201,500 GBP 158,768 06/07/2020 Bank of America Merrill Lynch 5,322 0.01USD 88,485 GBP 70,617 06/07/2020 Bank of America Merrill Lynch 1,228 -USD 156,990 GBP 125,077 06/07/2020 BNP Paribas 2,442 -USD 134,256 GBP 106,690 06/07/2020 State Street 2,427 -
Total unrealised gain on Forward Currency Contracts (31 December 2019: 0.84%) 930,466 1.06
AUD 141,758 USD 99,025 15/07/2020 Goldman Sachs (1,416) -CAD 87,534 USD 65,290 15/07/2020 State Street (1,020) -EUR 335,878 USD 381,593 15/07/2020 HSBC (4,245) (0.01)EUR 243,866 USD 274,550 15/07/2020 Standard Chartered (574) -GBP 48,036 USD 60,071 15/07/2020 Bank of America Merrill Lynch (713) -GBP 148,156 USD 187,623 15/07/2020 Bank of America Merrill Lynch (4,547) (0.01)GBP 43,942 USD 54,776 15/07/2020 State Street (477) -IDR 4,659,694,231 USD 331,267 15/07/2020 BNP Paribas (10,263) (0.01)MXN 6,361,200 USD 290,749 15/07/2020 Goldman Sachs (15,943) (0.02)NOK 517,702 USD 54,246 15/07/2020 BNP Paribas (579) -NOK 1,323,370 USD 138,154 15/07/2020 BNP Paribas (968) -NOK 678,443 USD 71,583 15/07/2020 BNP Paribas (1,252) -NOK 2,720,991 USD 293,498 15/07/2020 State Street (11,428) (0.01)NZD 95,351 USD 61,483 15/07/2020 Bank of America Merrill Lynch (98) -NZD 7,560,065 USD 4,924,165 15/07/2020 BNP Paribas (57,138) (0.07)
123

JPMorgan ETFs (Ireland) ICAV - Managed Futures UCITS ETF
Schedule of Investments (continued)
As at 30 June 2020
Forward Currency Contracts (continued)
CurrencyPurchased
AmountPurchased Currency Sold Amount Sold
MaturityDate Counterparty
FairValue
USD
% ofNet
Assets
NZD 166,800 USD 107,756 15/07/2020 Goldman Sachs (373) -RUB 19,626,781 USD 284,784 15/07/2020 Goldman Sachs (9,747) (0.01)SEK 628,331 USD 68,218 15/07/2020 Bank of America Merrill Lynch (766) -SEK 493,537 USD 53,002 15/07/2020 Barclays (20) -SEK 736,653 USD 79,377 15/07/2020 Goldman Sachs (296) -SEK 463,732 USD 50,139 15/07/2020 Goldman Sachs (357) -SEK 81,899,778 USD 8,908,571 15/07/2020 Toronto-Dominion Bank (116,526) (0.13)USD 59,648 AUD 86,639 15/07/2020 Bank of America Merrill Lynch (8) -USD 45,700 AUD 67,064 15/07/2020 Bank of America Merrill Lynch (478) -USD 49,342 JPY 5,328,457 15/07/2020 Citibank NA (55) -USD 327,043 KRW 394,989,620 15/07/2020 BNP Paribas (2,257) -USD 130,189 NOK 1,260,924 15/07/2020 Barclays (523) -USD 127,322 NOK 1,231,081 15/07/2020 Goldman Sachs (297) -USD 144,258 NOK 1,401,783 15/07/2020 Goldman Sachs (1,057) -USD 105,337 NZD 163,717 15/07/2020 Barclays (61) -USD 123,342 SEK 1,150,447 15/07/2020 Barclays (160) -USD 50,779 SEK 475,895 15/07/2020 Standard Chartered (309) -USD 322,722 TWD 9,576,134 15/07/2020 Goldman Sachs (3,672) (0.01)ZAR 4,868,819 USD 288,556 15/07/2020 State Street (8,763) (0.01)
Class EUR Hedged (acc)*EUR 25,284 USD 28,585 06/07/2020 BNP Paribas (186) -EUR 12,362 USD 14,045 06/07/2020 Goldman Sachs (159) -EUR 300,582 USD 338,753 05/08/2020 Goldman Sachs (890) -USD 421,404 EUR 375,865 06/07/2020 Bank of America Merrill Lynch (782) -USD 25,971 EUR 23,652 06/07/2020 BNP Paribas (596) -USD 609,308 EUR 543,976 06/07/2020 Citibank NA (1,707) -USD 464,246 EUR 414,283 06/07/2020 Goldman Sachs (1,093) -USD 609,431 EUR 543,976 06/07/2020 Goldman Sachs (1,584) -USD 95,212 EUR 84,929 05/08/2020 Goldman Sachs (250) -USD 23,404 EUR 20,949 06/07/2020 HSBC (127) -USD 12,405 EUR 11,064 06/07/2020 State Street (22) -USD 18,864 EUR 16,816 06/07/2020 State Street (25) -
Class GBP Hedged (acc)*GBP 78,568 USD 99,525 06/07/2020 Bank of America Merrill Lynch (2,444) -GBP 163,608 USD 206,064 06/07/2020 Bank of America Merrill Lynch (3,906) (0.01)USD 184,526 GBP 150,036 06/07/2020 Bank of America Merrill Lynch (863) -USD 17,068,288 GBP 13,894,691 06/07/2020 Goldman Sachs (100,341) (0.12)USD 2,156,783 GBP 1,750,600 05/08/2020 Goldman Sachs (6,757) (0.01)USD 4,081 GBP 3,326 05/08/2020 State Street (30) -
Total unrealised loss on Forward Currency Contracts (31 December 2019: (1.14)%) (378,148) (0.43)
*Contracts entered into for share class currency hedging purpose.
JPMorgan ETFs (Ireland) ICAV - Managed Futures UCITS ETF
Schedule of Investments (continued)
As at 30 June 2020
Financial Futures Contracts (continued)
Security DescriptionNo. of
Contracts Currency
UnderlyingExposure
USD Counterparty
FairValue
USD
% ofNet
Assets
Australia (31 December 2019: 0.00%)Australia 10-Year Bond, 15/09/2020 106 AUD 10,752,740 Goldman Sachs 105,983 0.12Australia 3-Year Bond, 15/09/2020 247 AUD 19,899,223 Goldman Sachs 7,909 0.01SPI 200 Index, 17/09/2020 2 AUD 198,477 Goldman Sachs 4,355 -
Australia total 118,247 0.13
Canada (31 December 2019: 0.12%)Canada 10-Year Bond, 21/09/2020 122 CAD 13,759,141 Goldman Sachs 19,156 0.02S&P/TSX 60 Index, 17/09/2020 1 CAD 133,510 Goldman Sachs 2,834 0.01
Canada total 21,990 0.03
France (31 December 2019: 0.01%)CAC 40 Index, 17/07/2020 1 EUR 52,586 Goldman Sachs 2,600 -
France total 2,600 -
124

JPMorgan ETFs (Ireland) ICAV - Managed Futures UCITS ETF
Schedule of Investments (continued)
As at 30 June 2020
Financial Futures Contracts (continued)
Security DescriptionNo. of
Contracts Currency
UnderlyingExposure
USD Counterparty
FairValue
USD
% ofNet
Assets
Germany (31 December 2019: 0.07%)DAX Index, 18/09/2020 1 EUR 326,809 Goldman Sachs 19,276 0.02EURO STOXX 50 Index, 18/09/2020 6 EUR 216,858 Goldman Sachs 337 -Euro-Bobl, 08/09/2020 32 EUR 4,840,507 Goldman Sachs 10,782 0.01Euro-Bund, 08/09/2020 9 EUR 1,776,643 Goldman Sachs 7,683 0.01Euro-Buxl 30-Year Bond, 08/09/2020 6 EUR 1,468,204 Goldman Sachs 14,084 0.02
Germany total 52,162 0.06
Hong Kong (31 December 2019: 0.00%)Hang Seng China Enterprises Index, 30/07/2020 (1) HKD (62,642) Goldman Sachs 400 -
Hong Kong total 400 -
Singapore (31 December 2019: 0.00%)MSCI Singapore Index, 29/07/2020 (3) SGD (63,969) Goldman Sachs 348 -
Singapore total 348 -
Spain (31 December 2019: 0.00%)IBEX 35 Index, 17/07/2020 (1) EUR (81,035) Goldman Sachs 58 -
Spain total 58 -
Sweden (31 December 2019: 0.00%)OMX Stockholm 30 Index, 17/07/2020 40 SEK 677,891 Goldman Sachs 37,495 0.04
Sweden total 37,495 0.04
United Kingdom (31 December 2019: 0.00%)FTSE 100 Index, 18/09/2020 1 GBP 73,376 Goldman Sachs 2,582 -Long Gilt, 28/09/2020 62 GBP 10,522,814 Goldman Sachs 21,401 0.03
United Kingdom total 23,983 0.03
United States (31 December 2019: 0.04%)MSCI EAFE Index, 18/09/2020 3 USD 262,385 Goldman Sachs 4,375 -MSCI Emerging Markets Index, 18/09/2020 4 USD 193,985 Goldman Sachs 3,155 -NASDAQ E-Mini 100 Index, 18/09/2020 10 USD 1,908,265 Goldman Sachs 121,185 0.14S&P 500 E-Mini Index, 18/09/2020 11 USD 1,663,375 Goldman Sachs 36,263 0.04S&P MidCap 400 Index, 18/09/2020 1 USD 171,930 Goldman Sachs 5,980 0.01US 10-Year Note, 21/09/2020 134 USD 18,608,844 Goldman Sachs 40,187 0.05US 5-Year Note, 30/09/2020 94 USD 11,793,750 Goldman Sachs 26,016 0.03US Long Bond, 21/09/2020 2 USD 354,687 Goldman Sachs 2,437 -
United States total 239,598 0.27
Total unrealised gain on Financial Futures Contracts (31 December 2019: 0.24%) 496,881 0.56
Germany (31 December 2019: (0.05)%)Euro-Bund, 08/09/2020 (52) EUR (10,185,623) Goldman Sachs (123,816) (0.14)Euro-Schatz, 08/09/2020 (532) EUR (66,993,307) Goldman Sachs (12,113) (0.01)
Germany total (135,929) (0.15)
Japan (31 December 2019: (0.00)%)1
TOPIX Index, 10/09/2020 6 JPY 906,808 Goldman Sachs (40,052) (0.05)
Japan total (40,052) (0.05)
United Kingdom (31 December 2019: (0.00)%)Long Gilt, 28/09/2020 (22) GBP (3,720,688) Goldman Sachs (20,807) (0.02)
United Kingdom total (20,807) (0.02)
Total unrealised loss on Financial Futures Contracts (31 December 2019: (0.62)%) (196,788) (0.22)
125

JPMorgan ETFs (Ireland) ICAV - Managed Futures UCITS ETF
Schedule of Investments (continued)
As at 30 June 2020
Commodity Index Swap Contracts
NotionalAmount Currency Counterparty Security Description
MaturityDate Fixed Rate
Fair Value/Underlying Exposure
USD
% ofNet
Assets
(14,770,747) USD Goldman Sachs S&P GSCI Equal Weight Select ER 25/09/2020 0.71% 35,048 0.0420,971,541 USD Goldman Sachs S&P GSCI Roll Weight Select ER 02/07/2020 0.88% 1,322,821 1.5015,100,434 USD Goldman Sachs S&P GSCI Roll Weight Select ER 25/09/2020 0.93% 18,783 0.02
Total unrealised gain on Commodity Index Swap Contracts (31 December 2019: 0.66%) 1,376,652 1.56
(52,328) USD Goldman Sachs Bloomberg Commodity Index 29/07/2020 0.61% (3,617) -(301,114) USD Goldman Sachs Bloomberg Commodity Index 02/10/2020 0.63% (8,368) (0.01)
(21,685,944) USD Goldman Sachs S&P GSCI Equal Weight Select ER 02/07/2020 0.65% (1,854,440) (2.11)
Total unrealised loss on Commodity Index Swap Contracts (31 December 2019: (0.71)%) (1,866,425) (2.12)
FairValue
USD
% ofNet
Assets
Total financial assets at fair value through profit or loss 74,963,671 85.07Total financial liabilities at fair value through profit or loss (2,441,361) (2.77)Cash and margin cash 7,579,418 8.60
Cash equivalents
Currency
Quantity/Nominal
ValueUndertaking for collective investment schemes (31 December 2019: 9.61%)JPMorgan Liquidity Funds - USD Liquidity LVNAV Fund - Class X (dist.)2 USD 8,535,193 8,535,193 9.69Time Deposits (31 December 2019: 16.85%)BRED Banque Populaire SA, 0.08%, 01/07/2020 USD 1,000,000 1,000,000 1.13
Total Cash equivalents 9,535,193 10.82Other assets and liabilities (1,517,045) (1.72)
Net asset value attributable to holders of redeemable participating shares 88,119,876 100.00
Analysis of total assets
% ofTotal
Assets
Transferable securities and money market instruments admitted to official stock exchange listing 77.74Collective investment schemes 9.20Time deposits 1.08Financial derivative instruments dealt in on a regulated market 0.53OTC financial derivative instruments 2.49Other assets 8.96
Total Assets 100.00
1 Prior year percentage of net asset value rounds to 0.00%.2 A related party to the Fund.
126

127
Equities (31 December 2019: 99.68%)
Bermuda (31 December 2019: 0.12%)Arch Capital Group Ltd. USD 334 9,569 0.09
Bermuda total 9,569 0.09
Canada (31 December 2019: 0.40%)Lululemon Athletica, Inc. USD 141 43,994 0.42
Canada total 43,994 0.42
China (31 December 2019: 0.10%)Yum China Holdings, Inc. USD 265 12,739 0.12
China total 12,739 0.12
Ireland (31 December 2019: 0.76%)Accenture plc ‘A’ USD 210 45,091 0.43Medtronic plc USD 428 39,248 0.37Trane Technologies plc USD 231 20,554 0.19
Ireland total 104,893 0.99
Israel (31 December 2019: 0.00%)SolarEdge Technologies, Inc. USD 223 30,948 0.29
Israel total 30,948 0.29
Panama (31 December 2019: 0.11%)Copa Holdings SA ‘A’ USD 122 6,168 0.06
Panama total 6,168 0.06
Peru (31 December 2019: 0.42%)Southern Copper Corp. USD 1,161 46,173 0.44
Peru total 46,173 0.44
Puerto Rico (31 December 2019: 0.11%)Popular, Inc. USD 230 8,549 0.08
Puerto Rico total 8,549 0.08
Switzerland (31 December 2019: 0.55%)Chubb Ltd. USD 123 15,574 0.15Garmin Ltd. USD 468 45,630 0.43
Switzerland total 61,204 0.58
United Kingdom (31 December 2019: 0.68%)Aon plc ‘A’ USD 160 30,816 0.29Linde plc USD 209 44,331 0.42
United Kingdom total 75,147 0.71
United States (31 December 2019: 96.43%)A O Smith Corp. USD 588 27,707 0.26Abbott Laboratories USD 446 40,778 0.39AbbVie, Inc. USD 343 33,676 0.32Activision Blizzard, Inc. USD 352 26,717 0.25Adobe, Inc. USD 110 47,884 0.45AES Corp. (The) USD 2,517 36,471 0.35Aflac, Inc. USD 551 19,853 0.19Air Products & Chemicals, Inc. USD 175 42,255 0.40Alaska Air Group, Inc. USD 45 1,632 0.02Albemarle Corp. USD 414 31,965 0.30Alexandria Real Estate Equities, Inc., REIT USD 108 17,523 0.17Alliant Energy Corp. USD 641 30,665 0.29Allstate Corp. (The) USD 149 14,452 0.14Ally Financial, Inc. USD 1,293 25,640 0.24Alphabet, Inc. ‘A’ USD 24 34,033 0.32Altria Group, Inc. USD 575 22,569 0.21Ameren Corp. USD 556 39,120 0.37American Electric Power Co., Inc. USD 492 39,183 0.37American Express Co. USD 161 15,327 0.15American Tower Corp., REIT USD 107 27,664 0.26American Water Works Co., Inc. USD 332 42,715 0.40Ameriprise Financial, Inc. USD 68 10,203 0.10AmerisourceBergen Corp. ‘A’ USD 238 23,983 0.23AMETEK, Inc. USD 214 19,125 0.18Amgen, Inc. USD 184 43,398 0.41Amphenol Corp. ‘A’ USD 260 24,911 0.24Analog Devices, Inc. USD 292 35,811 0.34Anthem, Inc. USD 144 37,869 0.36Apartment Investment & ManagementCo., REIT ‘A’ USD 370 13,927 0.13Apple, Inc. USD 136 49,613 0.47Applied Materials, Inc. USD 363 21,943 0.21Ashland Global Holdings, Inc. USD 515 35,586 0.34Assurant, Inc. USD 159 16,423 0.16AT&T, Inc. USD 1,247 37,697 0.36Automatic Data Processing, Inc. USD 122 18,165 0.17
AutoZone, Inc. USD 31 34,972 0.33AvalonBay Communities, Inc., REIT USD 89 13,763 0.13Avangrid, Inc. USD 390 16,372 0.15Avery Dennison Corp. USD 365 41,643 0.39Axalta Coating Systems Ltd. USD 1,205 27,173 0.26Baker Hughes Co. ‘A’ USD 1,915 29,472 0.28Ball Corp. USD 27 1,876 0.02Bank of America Corp. USD 392 9,310 0.09Bank of Hawaii Corp. USD 126 7,738 0.07Baxter International, Inc. USD 469 40,381 0.38Becton Dickinson & Co. USD 120 28,712 0.27Best Buy Co., Inc. USD 443 38,661 0.37Biogen, Inc. USD 103 27,558 0.26Bio-Rad Laboratories, Inc. ‘A’ USD 64 28,895 0.27Bio-Techne Corp. USD 120 31,688 0.30Booking Holdings, Inc. USD 10 15,923 0.15Booz Allen Hamilton Holding Corp. ‘A’ USD 364 28,316 0.27Bristol-Myers Squibb Co. USD 619 36,397 0.34Broadcom, Inc. USD 84 26,511 0.25Broadridge Financial Solutions, Inc. USD 289 36,469 0.35Brown-Forman Corp. ‘B’ USD 612 38,960 0.37Burlington Stores, Inc. USD 36 7,089 0.07Cable One, Inc. USD 1 1,775 0.02Cabot Corp. USD 552 20,452 0.19Cabot Oil & Gas Corp. USD 1,981 34,034 0.32Cadence Design Systems, Inc. USD 462 44,334 0.42Camden Property Trust, REIT USD 20 1,824 0.02Campbell Soup Co. USD 619 30,721 0.29Capital One Financial Corp. USD 135 8,450 0.08Carlisle Cos., Inc. USD 169 20,224 0.19Carrier Global Corp. USD 174 3,866 0.04Carter’s, Inc. USD 249 20,094 0.19Caterpillar, Inc. USD 105 13,282 0.13CBRE Group, Inc. ‘A’ USD 117 5,291 0.05Celanese Corp. ‘A’ USD 460 39,716 0.38CenturyLink, Inc. USD 3,570 35,807 0.34CF Industries Holdings, Inc. USD 1,169 32,896 0.31CH Robinson Worldwide, Inc. USD 189 14,942 0.14Chemed Corp. USD 40 18,043 0.17Chevron Corp. USD 406 36,227 0.34Church & Dwight Co., Inc. USD 558 43,133 0.41Cigna Corp. USD 214 40,157 0.38Cintas Corp. USD 162 43,150 0.41Cirrus Logic, Inc. USD 252 15,569 0.15Cisco Systems, Inc. USD 736 34,327 0.33Citizens Financial Group, Inc. USD 198 4,998 0.05Citrix Systems, Inc. USD 285 42,154 0.40Clorox Co. (The) USD 205 44,971 0.43CMS Energy Corp. USD 717 41,887 0.40Coca-Cola Co. (The) USD 821 36,682 0.35Cognizant Technology Solutions Corp. ‘A’ USD 390 22,160 0.21Colgate-Palmolive Co. USD 227 16,630 0.16Comcast Corp. ‘A’ USD 733 28,572 0.27ConocoPhillips USD 795 33,406 0.32Consolidated Edison, Inc. USD 557 40,065 0.38Costco Wholesale Corp. USD 137 41,540 0.39Crane Co. USD 36 2,141 0.02Crown Castle International Corp., REIT USD 113 18,911 0.18CSX Corp. USD 180 12,553 0.12Cummins, Inc. USD 249 43,142 0.41Curtiss-Wright Corp. USD 144 12,856 0.12Danaher Corp. USD 224 39,610 0.38Darden Restaurants, Inc. USD 375 28,414 0.27DaVita, Inc. USD 391 30,944 0.29Delta Air Lines, Inc. USD 245 6,872 0.06Devon Energy Corp. USD 1,026 11,635 0.11Dick’s Sporting Goods, Inc. USD 934 38,537 0.37Discover Financial Services USD 222 11,120 0.11DISH Network Corp. ‘A’ USD 63 2,174 0.02Dollar General Corp. USD 220 41,912 0.40Dollar Tree, Inc. USD 149 13,809 0.13Dominion Energy, Inc. USD 497 40,346 0.38Dover Corp. USD 190 18,346 0.17Dow, Inc. USD 820 33,423 0.32DR Horton, Inc. USD 595 32,993 0.31DTE Energy Co. USD 350 37,625 0.36Duke Energy Corp. USD 479 38,267 0.36Duke Realty Corp., REIT USD 54 1,911 0.02Dunkin’ Brands Group, Inc. USD 270 17,612 0.17Eastman Chemical Co. USD 607 42,271 0.40Eaton Corp. plc USD 484 42,340 0.40eBay, Inc. USD 926 48,569 0.46Ecolab, Inc. USD 199 39,591 0.38Edwards Lifesciences Corp. USD 477 32,965 0.31Electronic Arts, Inc. USD 214 28,259 0.27Element Solutions, Inc. USD 763 8,279 0.08Eli Lilly & Co. USD 276 45,314 0.43
JPMorgan ETFs (Ireland) ICAV - US Equity Multi-Factor UCITS ETFSchedule of InvestmentsAs at 30 June 2020
Investments Currency
Quantity/Nominal
Value
FairValue
USD
% ofNet
Assets Investments Currency
Quantity/Nominal
Value
FairValue
USD
% ofNet
Assets

Emerson Electric Co. USD 173 10,731 0.10Enphase Energy, Inc. USD 544 25,878 0.25Entergy Corp. USD 369 34,616 0.33EOG Resources, Inc. USD 579 29,332 0.28EQT Corp. USD 1,254 14,923 0.14Equity Residential, REIT USD 231 13,587 0.13Essential Utilities, Inc. USD 236 9,969 0.09Estee Lauder Cos., Inc. (The) ‘A’ USD 214 40,378 0.38Evergy, Inc. USD 671 39,784 0.38Eversource Energy USD 504 41,968 0.40Exelon Corp. USD 1,019 36,980 0.35Exxon Mobil Corp. USD 508 22,718 0.22Facebook, Inc. ‘A’ USD 134 30,427 0.29FactSet Research Systems, Inc. USD 137 45,000 0.43Fastenal Co. USD 767 32,858 0.31Fidelity National Financial, Inc. USD 836 25,632 0.24Fidelity National Information Services, Inc. USD 304 40,763 0.39Fifth Third Bancorp USD 1,101 21,227 0.20FirstEnergy Corp. USD 987 38,276 0.36Fiserv, Inc. USD 274 26,748 0.25Flowers Foods, Inc. USD 1,243 27,793 0.26FMC Corp. USD 347 34,568 0.33Foot Locker, Inc. USD 681 19,858 0.19Ford Motor Co. USD 2,784 16,927 0.16Fortune Brands Home & Security, Inc. USD 273 17,453 0.17Fox Corp. ‘A’ USD 288 7,724 0.07Gaming & Leisure Properties, Inc., REIT USD 366 12,664 0.12Gap, Inc. (The) USD 270 3,407 0.03GCI Liberty, Inc. ‘A’ USD 56 3,983 0.04General Mills, Inc. USD 670 41,305 0.39Gentex Corp. USD 1,586 40,871 0.39Genuine Parts Co. USD 154 13,392 0.13Gilead Sciences, Inc. USD 414 31,853 0.30Global Payments, Inc. USD 234 39,691 0.38Globe Life, Inc. USD 301 22,343 0.21H&R Block, Inc. USD 561 8,011 0.08Hanesbrands, Inc. USD 738 8,332 0.08Hanover Insurance Group, Inc. (The) USD 83 8,410 0.08Harley-Davidson, Inc. USD 776 18,446 0.17Hartford Financial Services Group, Inc.(The) USD 681 26,253 0.25Hasbro, Inc. USD 410 30,730 0.29Hawaiian Electric Industries, Inc. USD 754 27,189 0.26HCA Healthcare, Inc. USD 283 27,468 0.26Healthpeak Properties, Inc., REIT USD 1,303 35,911 0.34Helmerich & Payne, Inc. USD 915 17,852 0.17Hershey Co. (The) USD 305 39,534 0.37Hess Corp. USD 478 24,765 0.23Hewlett Packard Enterprise Co. USD 288 2,802 0.03Hexcel Corp. USD 632 28,579 0.27Hill-Rom Holdings, Inc. USD 413 45,339 0.43Hilton Worldwide Holdings, Inc. USD 368 27,030 0.26HollyFrontier Corp. USD 1,006 29,375 0.28Home Depot, Inc. (The) USD 171 42,837 0.41Honeywell International, Inc. USD 163 23,568 0.22Hormel Foods Corp. USD 864 41,705 0.40Howmet Aerospace, Inc. USD 1,101 17,451 0.17HP, Inc. USD 1,239 21,596 0.20Hubbell, Inc. ‘B’ USD 134 16,798 0.16Humana, Inc. USD 103 39,938 0.38Huntington Bancshares, Inc. USD 2,874 25,967 0.25Huntsman Corp. USD 2,315 41,601 0.39IAC/interactivecorp USD 156 50,450 0.48IDACORP, Inc. USD 402 35,123 0.33IDEX Corp. USD 103 16,278 0.15IDEXX Laboratories, Inc. USD 137 45,232 0.43Illinois Tool Works, Inc. USD 184 32,172 0.30Illumina, Inc. USD 16 5,926 0.06Intel Corp. USD 506 30,274 0.29Intercontinental Exchange, Inc. USD 207 18,961 0.18International Business Machines Corp. USD 168 20,289 0.19International Flavors & Fragrances, Inc. USD 238 29,145 0.28International Paper Co. USD 1,187 41,794 0.40Interpublic Group of Cos., Inc. (The) USD 910 15,616 0.15Intuit, Inc. USD 146 43,244 0.41IQVIA Holdings, Inc. USD 282 40,010 0.38ITT, Inc. USD 506 29,722 0.28JM Smucker Co. (The) USD 126 13,332 0.13John Wiley & Sons, Inc. ‘A’ USD 117 4,563 0.04Johnson & Johnson USD 286 40,220 0.38Juniper Networks, Inc. USD 737 16,848 0.16Kansas City Southern USD 68 10,152 0.10Kellogg Co. USD 521 34,417 0.33Keurig Dr Pepper, Inc. USD 863 24,509 0.23KeyCorp USD 423 5,152 0.05Kimberly-Clark Corp. USD 299 42,264 0.40Kinder Morgan, Inc. USD 2,248 34,102 0.32
KLA Corp. USD 198 38,507 0.36Kohl’s Corp. USD 654 13,584 0.13Kroger Co. (The) USD 402 13,608 0.13L3Harris Technologies, Inc. USD 214 36,309 0.34Laboratory Corp. of America Holdings USD 241 40,033 0.38Lam Research Corp. USD 147 47,549 0.45Lamb Weston Holdings, Inc. USD 63 4,028 0.04Las Vegas Sands Corp. USD 409 18,626 0.18Lear Corp. USD 159 17,334 0.16Leggett & Platt, Inc. USD 802 28,190 0.27Leidos Holdings, Inc. USD 401 37,562 0.36Lennar Corp. ‘A’ USD 548 33,768 0.32Liberty Media Corp.-Liberty SiriusXM ‘A’ USD 160 5,523 0.05Lockheed Martin Corp. USD 109 39,776 0.38Lowe’s Cos., Inc. USD 322 43,509 0.41Lumentum Holdings, Inc. USD 432 35,178 0.33LyondellBasell Industries NV ‘A’ USD 615 40,418 0.38Marathon Oil Corp. USD 2,448 14,982 0.14Marathon Petroleum Corp. USD 791 29,568 0.28Marriott International, Inc. ‘A’ USD 232 19,889 0.19Marsh & McLennan Cos., Inc. USD 236 25,339 0.24Masco Corp. USD 678 34,042 0.32Mastercard, Inc. ‘A’ USD 108 31,936 0.30Maxim Integrated Products, Inc. USD 408 24,729 0.23McCormick & Co., Inc. USD 241 43,238 0.41McDonald’s Corp. USD 212 39,108 0.37McKesson Corp. USD 108 16,569 0.16Medical Properties Trust, Inc., REIT USD 2,078 39,066 0.37Merck & Co., Inc. USD 414 32,015 0.30MetLife, Inc. USD 153 5,588 0.05Micron Technology, Inc. USD 385 19,835 0.19Microsoft Corp. USD 237 48,232 0.46Molson Coors Beverage Co. ‘B’ USD 499 17,146 0.16Mondelez International, Inc. ‘A’ USD 805 41,160 0.39Monster Beverage Corp. USD 128 8,873 0.08Moody’s Corp. USD 50 13,737 0.13Morgan Stanley USD 144 6,955 0.07Motorola Solutions, Inc. USD 236 33,071 0.31MSC Industrial Direct Co., Inc. ‘A’ USD 177 12,887 0.12Murphy Oil Corp. USD 1,292 17,830 0.17Nasdaq, Inc. USD 88 10,513 0.10National Fuel Gas Co. USD 857 35,934 0.34NetApp, Inc. USD 249 11,048 0.10NewMarket Corp. USD 79 31,638 0.30Newmont Corp. USD 722 44,576 0.42Nexstar Media Group, Inc. ‘A’ USD 179 14,981 0.14NextEra Energy, Inc. USD 165 39,628 0.38NIKE, Inc. ‘B’ USD 429 42,063 0.40Noble Energy, Inc. USD 1,540 13,798 0.13Nordstrom, Inc. USD 189 2,928 0.03Norfolk Southern Corp. USD 117 20,542 0.19Northrop Grumman Corp. USD 2 615 0.01NRG Energy, Inc. USD 877 28,555 0.27Nu Skin Enterprises, Inc. ‘A’ USD 99 3,785 0.04Nucor Corp. USD 844 34,950 0.33NVIDIA Corp. USD 90 34,192 0.32NVR, Inc. USD 12 39,105 0.37OGE Energy Corp. USD 1,131 34,337 0.33Olin Corp. USD 61 701 0.01Omnicom Group, Inc. USD 379 20,693 0.20ONEOK, Inc. USD 532 17,673 0.17Oracle Corp. USD 461 25,479 0.24Otis Worldwide Corp. USD 87 4,947 0.05PACCAR, Inc. USD 172 12,874 0.12Packaging Corp. of America USD 235 23,453 0.22Parker-Hannifin Corp. USD 85 15,578 0.15Paychex, Inc. USD 305 23,104 0.22PayPal Holdings, Inc. USD 159 27,703 0.26People’s United Financial, Inc. USD 761 8,805 0.08PepsiCo, Inc. USD 322 42,588 0.40Pfizer, Inc. USD 976 31,915 0.30Philip Morris International, Inc. USD 413 28,935 0.27Phillips 66 USD 411 29,551 0.28Pinnacle West Capital Corp. USD 491 35,985 0.34Pioneer Natural Resources Co. USD 263 25,695 0.24PPG Industries, Inc. USD 370 39,242 0.37PPL Corp. USD 1,464 37,830 0.36Principal Financial Group, Inc. USD 206 8,557 0.08Procter & Gamble Co. (The) USD 366 43,763 0.41Progressive Corp. (The) USD 537 43,019 0.41Prologis, Inc., REIT USD 198 18,479 0.17Prudential Financial, Inc. USD 81 4,933 0.05Public Service Enterprise Group, Inc. USD 825 40,557 0.38PulteGroup, Inc. USD 1,072 36,480 0.35PVH Corp. USD 153 7,352 0.07Quest Diagnostics, Inc. USD 357 40,684 0.39Quidel Corp. USD 181 40,497 0.38
128
JPMorgan ETFs (Ireland) ICAV - US Equity Multi-Factor UCITS ETFSchedule of Investments (continued)As at 30 June 2020
Investments Currency
Quantity/Nominal
Value
FairValue
USD
% ofNet
Assets Investments Currency
Quantity/Nominal
Value
FairValue
USD
% ofNet
Assets

Ralph Lauren Corp. ‘A’ USD 303 21,974 0.21Raymond James Financial, Inc. USD 107 7,365 0.07Raytheon Technologies Corp. USD 548 33,768 0.32Regeneron Pharmaceuticals, Inc. USD 52 32,430 0.31Regions Financial Corp. USD 477 5,304 0.05Reliance Steel & Aluminum Co. USD 429 40,725 0.39Republic Services, Inc. ‘A’ USD 486 39,876 0.38Robert Half International, Inc. USD 531 28,053 0.27Rockwell Automation, Inc. USD 147 31,311 0.30Roper Technologies, Inc. USD 83 32,226 0.31Royal Gold, Inc. USD 317 39,409 0.37RPM International, Inc. USD 564 42,334 0.40S&P Global, Inc. USD 86 28,335 0.27Santander Consumer USA Holdings, Inc. USD 1,766 32,512 0.31Schlumberger Ltd. USD 378 6,951 0.07Schneider National, Inc. ‘B’ USD 233 5,748 0.05Scotts Miracle-Gro Co. (The) USD 296 39,803 0.38Sempra Energy USD 314 36,810 0.35Sherwin-Williams Co. (The) USD 53 30,626 0.29Skyworks Solutions, Inc. USD 267 34,139 0.32Sonoco Products Co. USD 22 1,150 0.01Southern Co. (The) USD 728 37,747 0.36Southwest Airlines Co. USD 627 21,431 0.20Spirit Realty Capital, Inc., REIT USD 500 17,430 0.16Starbucks Corp. USD 469 34,514 0.33Starwood Property Trust, Inc., REIT USD 1,627 24,340 0.23Steel Dynamics, Inc. USD 1,502 39,187 0.37STERIS plc USD 191 29,307 0.28Stryker Corp. USD 206 37,119 0.35Synchrony Financial USD 1,281 28,387 0.27Sysco Corp. USD 446 24,378 0.23Take-Two Interactive Software, Inc. USD 169 23,587 0.22Tapestry, Inc. USD 839 11,142 0.11Targa Resources Corp. USD 297 5,961 0.06Target Corp. USD 345 41,376 0.39Telephone & Data Systems, Inc. USD 805 16,003 0.15Teradyne, Inc. USD 472 39,889 0.38Texas Instruments, Inc. USD 228 28,949 0.27Thermo Fisher Scientific, Inc. USD 121 43,843 0.42T-Mobile US, Inc. USD 422 43,951 0.42T-Mobile US, Inc., Rights USD 633 106 0.00Toll Brothers, Inc. USD 673 21,933 0.21Tractor Supply Co. USD 346 45,599 0.43Truist Financial Corp. USD 639 23,994 0.23Tyson Foods, Inc. ‘A’ USD 487 29,079 0.28UGI Corp. USD 214 6,805 0.06Union Pacific Corp. USD 153 25,868 0.24United States Cellular Corp. USD 231 7,131 0.07United Therapeutics Corp. USD 237 28,677 0.27UnitedHealth Group, Inc. USD 139 40,998 0.39Universal Health Services, Inc. ‘B’ USD 314 29,167 0.28US Bancorp USD 252 9,279 0.09Valero Energy Corp. USD 521 30,645 0.29Valvoline, Inc. USD 587 11,347 0.11Varian Medical Systems, Inc. USD 122 14,947 0.14VEREIT, Inc., REIT USD 4,025 25,881 0.25VeriSign, Inc. USD 193 39,918 0.38Verisk Analytics, Inc. ‘A’ USD 40 6,808 0.06Verizon Communications, Inc. USD 739 40,741 0.39Vertex Pharmaceuticals, Inc. USD 66 19,160 0.18VICI Properties, Inc., REIT USD 1,679 33,899 0.32Visa, Inc. ‘A’ USD 138 26,657 0.25Vistra Energy Corp. USD 2,063 38,413 0.36Vornado Realty Trust, REIT USD 45 1,719 0.02W R Berkley Corp. USD 333 19,078 0.18W R Grace & Co. USD 106 5,386 0.05Walgreens Boots Alliance, Inc. USD 388 16,447 0.16Walmart, Inc. USD 341 40,845 0.39Waste Management, Inc. USD 381 40,352 0.38WEC Energy Group, Inc. USD 458 40,144 0.38Weingarten Realty Investors, REIT USD 135 2,556 0.02Wells Fargo & Co. USD 234 5,990 0.06West Pharmaceutical Services, Inc. USD 147 33,394 0.32Western Union Co. (The) USD 1,766 38,181 0.36Westlake Chemical Corp. USD 383 20,548 0.19Whirlpool Corp. USD 58 7,513 0.07Williams Cos., Inc. (The) USD 1,585 30,147 0.29Williams-Sonoma, Inc. USD 271 22,225 0.21WP Carey, Inc., REIT USD 505 34,163 0.32WPX Energy, Inc. USD 2,388 15,235 0.14WW Grainger, Inc. USD 108 33,929 0.32Wyndham Destinations, Inc. USD 465 13,104 0.12Xcel Energy, Inc. USD 649 40,563 0.38Xerox Holdings Corp. USD 1,338 20,458 0.19Xilinx, Inc. USD 275 27,057 0.26Yum! Brands, Inc. USD 388 33,721 0.32
Zimmer Biomet Holdings, Inc. USD 274 32,705 0.31Zoetis, Inc. ‘A’ USD 303 41,523 0.39
United States total 10,124,373 95.98
Total investments in Equities 10,523,757 99.76
129
JPMorgan ETFs (Ireland) ICAV - US Equity Multi-Factor UCITS ETFSchedule of Investments (continued)As at 30 June 2020
Investments Currency
Quantity/Nominal
Value
FairValue
USD
% ofNet
Assets Investments Currency
Quantity/Nominal
Value
FairValue
USD
% ofNet
Assets

JPMorgan ETFs (Ireland) ICAV - US Equity Multi-Factor UCITS ETF
Schedule of Investments (continued)
As at 30 June 2020
Financial Futures Contracts
Security DescriptionNo. of
Contracts Currency
UnderlyingExposure
USD Counterparty
FairValue
USD
% ofNet
Assets
United States (31 December 2019: 0.01%)S&P 500 Micro E-Mini Index, 18/09/2020 2 USD 30,238 Citibank NA 665 0.01
United States total 665 0.01
Total unrealised gain on Financial Futures Contracts (31 December 2019: 0.01%) 665 0.01
FairValue
USD
% ofNet
Assets
Total financial assets at fair value through profit or loss 10,524,422 99.77Cash and margin cash 13,504 0.13Other assets and liabilities 10,927 0.10
Net asset value attributable to holders of redeemable participating shares 10,548,853 100.00
Analysis of total assets
% ofTotal
Assets
Transferable securities and money market instruments admitted to official stock exchange listing 99.73Financial derivative instruments dealt in on a regulated market 0.01Other assets 0.26
Total Assets 100.00
130

131
Equities (31 December 2019: 99.44%)
Bermuda (31 December 2019: 0.00%)Arch Capital Group Ltd. USD 6,423 184,019 0.08RenaissanceRe Holdings Ltd. USD 1,048 179,239 0.07
Bermuda total 363,258 0.15
Canada (31 December 2019: 0.00%)Magna International, Inc. USD 7,133 317,632 0.13
Canada total 317,632 0.13
Ireland (31 December 2019: 1.56%)Accenture plc ‘A’ USD 7,050 1,513,776 0.63Medtronic plc USD 21,858 2,004,379 0.83Trane Technologies plc USD 11,547 1,027,452 0.42
Ireland total 4,545,607 1.88
Netherlands (31 December 2019: 0.35%)NXP Semiconductors NV USD 6,891 785,850 0.33
Netherlands total 785,850 0.33
Switzerland (31 December 2019: 0.31%)Chubb Ltd. USD 131 16,587 0.00TE Connectivity Ltd. USD 7,923 646,121 0.27
Switzerland total 662,708 0.27
United Kingdom (31 December 2019: 0.45%)Aon plc ‘A’ USD 2,325 447,795 0.19IHS Markit Ltd. USD 678 51,189 0.02Linde plc USD 4,205 891,923 0.37
United Kingdom total 1,390,907 0.58
United States (31 December 2019: 96.77%)3M Co. USD 1,489 232,269 0.10A O Smith Corp. USD 3,163 149,041 0.06Abbott Laboratories USD 5,468 499,939 0.21AbbVie, Inc. USD 26,965 2,647,424 1.10ABIOMED, Inc. USD 328 79,232 0.03Adobe, Inc. USD 2,942 1,280,682 0.53Advance Auto Parts, Inc. USD 657 93,590 0.04Advanced Micro Devices, Inc. USD 10,907 573,817 0.24Air Products & Chemicals, Inc. USD 2,195 530,005 0.22Alexion Pharmaceuticals, Inc. USD 5,362 601,831 0.25Align Technology, Inc. USD 392 107,580 0.04Allstate Corp. (The) USD 11,319 1,097,830 0.45Alphabet, Inc. ‘A’ USD 3,052 4,327,889 1.79Alphabet, Inc. ‘C’ USD 3,082 4,356,746 1.80Amazon.com, Inc. USD 4,245 11,711,191 4.85Ameren Corp. USD 3,824 269,057 0.11American Electric Power Co., Inc. USD 4,796 381,953 0.16American Express Co. USD 12,132 1,154,966 0.48American International Group, Inc. USD 1,973 61,518 0.03American Tower Corp., REIT USD 1,344 347,478 0.14Ameriprise Financial, Inc. USD 295 44,262 0.02Amgen, Inc. USD 2,427 572,432 0.24Analog Devices, Inc. USD 12,470 1,529,321 0.63Anthem, Inc. USD 4,211 1,107,409 0.46Apple, Inc. USD 41,436 15,115,853 6.26Applied Materials, Inc. USD 8,468 511,891 0.21Arthur J Gallagher & Co. USD 2,795 272,485 0.11AT&T, Inc. USD 29,887 903,484 0.37Automatic Data Processing, Inc. USD 6,798 1,012,154 0.42AutoZone, Inc. USD 626 706,203 0.29AvalonBay Communities, Inc., REIT USD 1,258 194,537 0.08Avery Dennison Corp. USD 5,553 633,542 0.26Bank of America Corp. USD 83,185 1,975,644 0.82Baxter International, Inc. USD 13,509 1,163,125 0.48Becton Dickinson & Co. USD 1,321 316,076 0.13Berkshire Hathaway, Inc. ‘B’ USD 21,261 3,795,301 1.57Best Buy Co., Inc. USD 13,308 1,161,389 0.48Biogen, Inc. USD 2,147 574,430 0.24BlackRock, Inc. ‘A’ USD 2,636 1,434,221 0.59Booking Holdings, Inc. USD 499 794,578 0.33BorgWarner, Inc. USD 1,952 68,906 0.03Boston Scientific Corp. USD 21,986 771,928 0.32Bristol-Myers Squibb Co. USD 37,795 2,222,346 0.92Broadcom, Inc. USD 1,261 397,984 0.16Cabot Oil & Gas Corp. USD 4,417 75,884 0.03Capital One Financial Corp. USD 9,330 583,965 0.24Cardinal Health, Inc. USD 2,771 144,619 0.06Carrier Global Corp. USD 29,343 652,001 0.27Carter’s, Inc. USD 1,382 111,527 0.05Caterpillar, Inc. USD 4,529 572,919 0.24Cboe Global Markets, Inc. USD 999 93,187 0.04Celanese Corp. ‘A’ USD 7,163 618,453 0.26
Cerner Corp. USD 655 44,900 0.02Charles Schwab Corp. (The) USD 10,787 363,953 0.15Charter Communications, Inc. ‘A’ USD 3,400 1,734,136 0.72Cheniere Energy, Inc. USD 2,105 101,714 0.04Chevron Corp. USD 21,092 1,882,039 0.78Cigna Corp. USD 4,476 839,921 0.35Cincinnati Financial Corp. USD 1,572 100,655 0.04Cintas Corp. USD 418 111,338 0.05Cisco Systems, Inc. USD 23,288 1,086,152 0.45Citigroup, Inc. USD 42,956 2,195,052 0.91Citizens Financial Group, Inc. USD 11,054 279,003 0.12CME Group, Inc. ‘A’ USD 3,359 545,972 0.23CMS Energy Corp. USD 9,383 548,155 0.23Coca-Cola Co. (The) USD 47,554 2,124,713 0.88Cognizant Technology Solutions Corp. ‘A’ USD 2,994 170,119 0.07Comcast Corp. ‘A’ USD 51,809 2,019,515 0.84Conagra Brands, Inc. USD 11,503 404,561 0.17Concho Resources, Inc. USD 1,135 58,453 0.02ConocoPhillips USD 7,296 306,578 0.13Constellation Brands, Inc. ‘A’ USD 7,435 1,300,753 0.54Corteva, Inc. USD 3,058 81,924 0.03Costco Wholesale Corp. USD 6,415 1,945,092 0.81Crown Holdings, Inc. USD 7,010 456,561 0.19CSX Corp. USD 17,553 1,224,146 0.51Cummins, Inc. USD 6,824 1,182,326 0.49CVS Health Corp. USD 3,889 252,668 0.10Danaher Corp. USD 106 18,744 0.01DaVita, Inc. USD 965 76,370 0.03Deere & Co. USD 4,179 656,730 0.27Delta Air Lines, Inc. USD 14,157 397,104 0.16DexCom, Inc. USD 752 304,861 0.13Diamondback Energy, Inc. USD 7,389 309,008 0.13Discovery, Inc. ‘A’ USD 14,340 302,574 0.13Discovery, Inc. ‘C’ USD 17,733 341,538 0.14Dollar Tree, Inc. USD 2,224 206,120 0.09Dow, Inc. USD 9,841 401,119 0.17DR Horton, Inc. USD 3,054 169,344 0.07DTE Energy Co. USD 1,956 210,270 0.09Duke Energy Corp. USD 11,869 948,214 0.39DuPont de Nemours, Inc. USD 9,039 480,242 0.20Eastman Chemical Co. USD 8,892 619,239 0.26Eaton Corp. plc USD 16,853 1,474,300 0.61Edison International USD 4,634 251,673 0.10Edwards Lifesciences Corp. USD 5,682 392,683 0.16Electronic Arts, Inc. USD 2,966 391,660 0.16Eli Lilly & Co. USD 13,679 2,245,818 0.93Emerson Electric Co. USD 8,497 527,069 0.22Entergy Corp. USD 9,108 854,421 0.35EOG Resources, Inc. USD 17,689 896,125 0.37Equinix, Inc., REIT USD 1,444 1,014,121 0.42Equity Residential, REIT USD 8,577 504,499 0.21Essex Property Trust, Inc., REIT USD 1,219 279,358 0.12Estee Lauder Cos., Inc. (The) ‘A’ USD 1,287 242,831 0.10Expedia Group, Inc. USD 1,288 105,874 0.04Exxon Mobil Corp. USD 21,605 966,176 0.40F5 Networks, Inc. USD 591 82,433 0.03Facebook, Inc. ‘A’ USD 22,375 5,080,691 2.10Federal Realty Investment Trust, REIT USD 2,974 253,415 0.11FedEx Corp. USD 14 1,963 0.00Fifth Third Bancorp USD 16,389 315,980 0.13FirstEnergy Corp. USD 7,407 287,243 0.12Fiserv, Inc. USD 7,039 687,147 0.28FleetCor Technologies, Inc. USD 763 191,917 0.08FLIR Systems, Inc. USD 6,697 271,697 0.11Fortinet, Inc. USD 1,333 182,981 0.08General Electric Co. USD 53,934 368,369 0.15General Mills, Inc. USD 4,736 291,974 0.12General Motors Co. USD 17,377 439,638 0.18Gilead Sciences, Inc. USD 5,633 433,403 0.18Goldman Sachs Group, Inc. (The) USD 4,117 813,602 0.34Hartford Financial Services Group, Inc.(The) USD 5,576 214,955 0.09Hilton Worldwide Holdings, Inc. USD 7,163 526,122 0.22Hologic, Inc. USD 1,788 101,916 0.04Home Depot, Inc. (The) USD 10,109 2,532,406 1.05HP, Inc. USD 32,189 561,054 0.23Humana, Inc. USD 759 294,302 0.12IDEXX Laboratories, Inc. USD 1,116 368,459 0.15Illumina, Inc. USD 1,346 498,491 0.21Intel Corp. USD 24,210 1,448,484 0.60International Business Machines Corp. USD 10,929 1,319,895 0.55Intuit, Inc. USD 5,266 1,559,737 0.65Intuitive Surgical, Inc. USD 1,010 575,528 0.24Invitation Homes, Inc., REIT USD 4,003 110,203 0.05Johnson & Johnson USD 18,888 2,656,219 1.10Kansas City Southern USD 2,620 391,140 0.16KeyCorp USD 39,638 482,791 0.20
JPMorgan ETFs (Ireland) ICAV - US Research Enhanced Index Equity (ESG) UCITS ETFSchedule of InvestmentsAs at 30 June 2020
Investments Currency
Quantity/Nominal
Value
FairValue
USD
% ofNet
Assets Investments Currency
Quantity/Nominal
Value
FairValue
USD
% ofNet
Assets

Kimberly-Clark Corp. USD 8,362 1,181,969 0.49Kroger Co. (The) USD 7,359 249,102 0.10Lam Research Corp. USD 2,421 783,097 0.32Lamb Weston Holdings, Inc. USD 1,444 92,315 0.04Lennar Corp. ‘A’ USD 13,999 862,618 0.36Lowe’s Cos., Inc. USD 12,927 1,746,696 0.72Lyft, Inc. ‘A’ USD 1,845 60,903 0.03LyondellBasell Industries NV ‘A’ USD 2,698 177,313 0.07Marathon Petroleum Corp. USD 14,467 540,776 0.22MarketAxess Holdings, Inc. USD 599 300,051 0.12Marsh & McLennan Cos., Inc. USD 4,753 510,330 0.21Masco Corp. USD 13,623 684,011 0.28Mastercard, Inc. ‘A’ USD 12,460 3,684,422 1.52McDonald’s Corp. USD 3,253 600,081 0.25McKesson Corp. USD 6,572 1,008,276 0.42Merck & Co., Inc. USD 35,568 2,750,473 1.14MetLife, Inc. USD 11,978 437,437 0.18Microchip Technology, Inc. USD 3,636 382,907 0.16Micron Technology, Inc. USD 13,867 714,428 0.30Microsoft Corp. USD 77,349 15,741,295 6.51Mid-America Apartment Communities,Inc., REIT USD 1,070 122,697 0.05Mohawk Industries, Inc. USD 223 22,692 0.01Molson Coors Beverage Co. ‘B’ USD 2,975 102,221 0.04Mondelez International, Inc. ‘A’ USD 26,940 1,377,442 0.57Monster Beverage Corp. USD 4,239 293,847 0.12Morgan Stanley USD 29,247 1,412,630 0.58Motorola Solutions, Inc. USD 1,106 154,984 0.06MSCI, Inc. ‘A’ USD 749 250,031 0.10Netflix, Inc. USD 5,556 2,528,202 1.05Newell Brands, Inc. USD 14,413 228,878 0.09Newmont Corp. USD 8,118 501,205 0.21NextEra Energy, Inc. USD 8,266 1,985,245 0.82NIKE, Inc. ‘B’ USD 13,107 1,285,141 0.53Norfolk Southern Corp. USD 8,889 1,560,642 0.65Nucor Corp. USD 2,805 116,155 0.05NVIDIA Corp. USD 5,295 2,011,623 0.83ON Semiconductor Corp. USD 9,971 197,625 0.08ONEOK, Inc. USD 9,939 330,174 0.14Oracle Corp. USD 7,145 394,904 0.16O’Reilly Automotive, Inc. USD 694 292,639 0.12Otis Worldwide Corp. USD 3,968 225,620 0.09PACCAR, Inc. USD 8,010 599,549 0.25Packaging Corp. of America USD 2,369 236,426 0.10Parker-Hannifin Corp. USD 7,375 1,351,616 0.56PayPal Holdings, Inc. USD 17,371 3,026,549 1.25PepsiCo, Inc. USD 11,777 1,557,626 0.64Pfizer, Inc. USD 24,465 800,006 0.33Phillips 66 USD 5,531 397,679 0.16Pinnacle West Capital Corp. USD 1,116 81,792 0.03Pioneer Natural Resources Co. USD 8,708 850,772 0.35PPG Industries, Inc. USD 1,138 120,696 0.05Procter & Gamble Co. (The) USD 31,227 3,733,812 1.55Progressive Corp. (The) USD 8,870 710,576 0.29Prologis, Inc., REIT USD 11,498 1,073,108 0.44PulteGroup, Inc. USD 2,329 79,256 0.03Qorvo, Inc. USD 4,166 460,468 0.19QUALCOMM, Inc. USD 6,167 562,492 0.23Quanta Services, Inc. USD 666 26,127 0.01Ralph Lauren Corp. ‘A’ USD 2,571 186,449 0.08Realty Income Corp., REIT USD 3,345 199,028 0.08Regeneron Pharmaceuticals, Inc. USD 1,410 879,347 0.36Regions Financial Corp. USD 35,583 395,683 0.16Roper Technologies, Inc. USD 808 313,714 0.13Ross Stores, Inc. USD 6,223 530,449 0.22Royal Caribbean Cruises Ltd. USD 3,919 197,126 0.08S&P Global, Inc. USD 4,371 1,440,157 0.60salesforce.com, Inc. USD 13,329 2,496,922 1.03SBA Communications Corp., REIT ‘A’ USD 875 260,680 0.11Sempra Energy USD 3,670 430,234 0.18ServiceNow, Inc. USD 782 316,757 0.13Snap-on, Inc. USD 5,569 771,362 0.32Southern Co. (The) USD 6,853 355,328 0.15Southwest Airlines Co. USD 6,071 207,507 0.09Stanley Black & Decker, Inc. USD 6,046 842,691 0.35State Street Corp. USD 7,923 503,507 0.21Sun Communities, Inc., REIT USD 2,020 274,074 0.11T Rowe Price Group, Inc. USD 966 119,301 0.05Target Corp. USD 9,006 1,080,090 0.45TD Ameritrade Holding Corp. USD 4,908 178,553 0.07Teradyne, Inc. USD 3,646 308,123 0.13Texas Instruments, Inc. USD 17,598 2,234,418 0.92Thermo Fisher Scientific, Inc. USD 6,168 2,234,913 0.93TJX Cos., Inc. (The) USD 17,915 905,782 0.37T-Mobile US, Inc. USD 11,543 1,202,203 0.50T-Mobile US, Inc., Rights USD 11,741 1,973 0.00Truist Financial Corp. USD 9,927 372,759 0.15
UDR, Inc., REIT USD 2,789 104,253 0.04Ulta Beauty, Inc. USD 200 40,684 0.02Union Pacific Corp. USD 5,585 944,256 0.39United Parcel Service, Inc. ‘B’ USD 4,231 470,403 0.19United Rentals, Inc. USD 565 84,208 0.03UnitedHealth Group, Inc. USD 11,516 3,396,644 1.41US Bancorp USD 6,813 250,855 0.10Ventas, Inc., REIT USD 6,267 229,498 0.10Verisk Analytics, Inc. ‘A’ USD 736 125,267 0.05Verizon Communications, Inc. USD 49,365 2,721,492 1.13Vertex Pharmaceuticals, Inc. USD 3,479 1,009,989 0.42VICI Properties, Inc., REIT USD 8,461 170,828 0.07Visa, Inc. ‘A’ USD 14,658 2,831,486 1.17Voya Financial, Inc. USD 8,156 380,477 0.16Walgreens Boots Alliance, Inc. USD 1,934 81,982 0.03Walmart, Inc. USD 4,780 572,548 0.24Walt Disney Co. (The) USD 6,711 748,344 0.31Waste Management, Inc. USD 5,242 555,180 0.23Wells Fargo & Co. USD 49,759 1,273,830 0.53Weyerhaeuser Co., REIT USD 3,452 77,532 0.03Williams Cos., Inc. (The) USD 11,682 222,192 0.09Workday, Inc. ‘A’ USD 1,664 311,767 0.13WW Grainger, Inc. USD 1,132 355,629 0.15Xcel Energy, Inc. USD 10,208 638,000 0.26Yum! Brands, Inc. USD 9,054 786,883 0.33Zimmer Biomet Holdings, Inc. USD 8,472 1,011,218 0.42
United States total 233,134,955 96.48
Total investments in Equities 241,200,917 99.82
132
JPMorgan ETFs (Ireland) ICAV - US Research Enhanced Index Equity (ESG) UCITS ETFSchedule of Investments (continued)As at 30 June 2020
Investments Currency
Quantity/Nominal
Value
FairValue
USD
% ofNet
Assets Investments Currency
Quantity/Nominal
Value
FairValue
USD
% ofNet
Assets

JPMorgan ETFs (Ireland) ICAV - US Research Enhanced Index Equity (ESG) UCITS ETF
Schedule of Investments (continued)
As at 30 June 2020
Financial Futures Contracts
Security DescriptionNo. of
Contracts Currency
UnderlyingExposure
USD Counterparty
FairValue
USD
% ofNet
Assets
United States (31 December 2019: 0.01%)S&P 500 E-Mini Index, 18/09/2020 2 USD 304,293 Goldman Sachs 4,732 -
United States total 4,732 -
Total unrealised gain on Financial Futures Contracts (31 December 2019: 0.01%) 4,732 -
FairValue
USD
% ofNet
Assets
Total financial assets at fair value through profit or loss 241,205,649 99.82Cash and margin cash 86,819 0.04
Cash equivalents
Currency
Quantity/Nominal
ValueUndertaking for collective investment schemes (31 December 2019: 0.49%)JPMorgan Liquidity Funds - USD Liquidity LVNAV Fund - Class X (dist.)1 USD 402,826 402,826 0.17
Total Cash equivalents 402,826 0.17Other assets (51,197) (0.03)
Net asset value attributable to holders of redeemable participating shares 241,644,097 100.00
Analysis of total assets
% ofTotal
Assets
Transferable securities and money market instruments admitted to official stock exchange listing 98.07Collective investment schemes 0.17Financial derivative instruments dealt in on a regulated market -Other assets 1.76
Total Assets 100.00
1A related party to the Fund.
133

134
Bonds
Corporate Debt Securities (31 December 2019: 97.47%)
Australia (31 December 2019: 0.80%)Newcrest Finance Pty. Ltd. 3.25%13/05/2030 USD 140,000 150,328 0.12Westpac Banking Corp. 2.75% 11/01/2023 USD 183,000 192,730 0.16Westpac Banking Corp. 2.85%13/05/2026 USD 615,000 675,106 0.55
Australia total 1,018,164 0.83
Canada (31 December 2019: 1.37%)Air Canada 2017-1 Class AA Pass ThroughTrust 3.30% 15/01/2030 USD 27,696 24,480 0.02Bank of Nova Scotia (The) 2.70%07/03/2022 USD 198,000 205,354 0.17Bank of Nova Scotia (The) 2.20%03/02/2025 USD 240,000 252,177 0.21Enbridge, Inc. 4.25% 01/12/2026 USD 122,000 138,451 0.11Fortis, Inc. 3.06% 04/10/2026 USD 287,000 309,454 0.25Rogers Communications, Inc. 3.70%15/11/2049 USD 220,000 243,998 0.20TransCanada PipeLines Ltd. 4.63%01/03/2034 USD 282,000 325,302 0.27
Canada total 1,499,216 1.23
Cayman Islands (31 December 2019: 0.00%)Vale Overseas Ltd. 6.25% 10/08/2026 USD 380,000 447,028 0.37
Cayman Islands total 447,028 0.37
France (31 December 2019: 0.33%)Total Capital International SA 2.43%10/01/2025 USD 420,000 445,889 0.36Total Capital International SA 2.83%10/01/2030 USD 210,000 228,101 0.19Total Capital International SA 3.46%12/07/2049 USD 80,000 86,944 0.07
France total 760,934 0.62
Ireland (31 December 2019: 2.60%)GE Capital International Funding Co.Unlimited Co. 2.34% 15/11/2020 USD 200,000 201,262 0.16GE Capital International Funding Co.Unlimited Co. 3.37% 15/11/2025 USD 245,000 255,428 0.21Shire Acquisitions Investments IrelandDAC 2.40% 23/09/2021 USD 823,000 838,842 0.69Shire Acquisitions Investments IrelandDAC 2.88% 23/09/2023 USD 122,000 129,285 0.10Shire Acquisitions Investments IrelandDAC 3.20% 23/09/2026 USD 804,000 893,034 0.73
Ireland total 2,317,851 1.89
Japan (31 December 2019: 1.78%)Mitsubishi UFJ Financial Group, Inc.2.67% 25/07/2022 USD 523,000 543,579 0.44Mitsubishi UFJ Financial Group, Inc.3.76% 26/07/2023 USD 516,000 559,893 0.46Mitsubishi UFJ Financial Group, Inc.3.68% 22/02/2027 USD 85,000 94,209 0.08Mitsubishi UFJ Financial Group, Inc.3.96% 02/03/2028 USD 41,000 47,088 0.04Mitsubishi UFJ Financial Group, Inc.3.74% 07/03/2029 USD 200,000 226,834 0.19Sumitomo Mitsui Financial Group, Inc.2.78% 12/07/2022 USD 202,000 210,365 0.17Sumitomo Mitsui Financial Group, Inc.2.63% 14/07/2026 USD 440,000 468,936 0.38Sumitomo Mitsui Financial Group, Inc.3.36% 12/07/2027 USD 112,000 123,242 0.10
Japan total 2,274,146 1.86
Luxembourg (31 December 2019: 0.45%)DH Europe Finance II Sarl 3.25%15/11/2039 USD 230,000 253,689 0.21
Luxembourg total 253,689 0.21
Multinational (31 December 2019: 0.00%)NXP BV / NXP Funding LLC / NXP USA,Inc. 4.30% 18/06/2029 USD 100,000 113,776 0.09
Multinational total 113,776 0.09
Netherlands (31 December 2019: 0.74%)Cooperatieve Rabobank UA 3.88%08/02/2022 USD 121,000 127,690 0.10Cooperatieve Rabobank UA 5.25%24/05/2041 USD 61,000 87,047 0.07
Shell International Finance BV 2.38%06/04/2025 USD 120,000 127,444 0.10Shell International Finance BV 3.25%11/05/2025 USD 53,000 58,691 0.05Shell International Finance BV 2.88%10/05/2026 USD 190,000 208,680 0.17Shell International Finance BV 4.13%11/05/2035 USD 479,000 580,610 0.48Shell International Finance BV 4.00%10/05/2046 USD 120,000 141,058 0.12
Netherlands total 1,331,220 1.09
Switzerland (31 December 2019: 0.32%)Credit Suisse AG 2.80% 08/04/2022 USD 275,000 285,244 0.23Credit Suisse AG 2.95% 09/04/2025 USD 500,000 542,082 0.45Credit Suisse Group AG, FRN 4.21%12/06/2024 USD 570,000 614,661 0.50
Switzerland total 1,441,987 1.18
United Kingdom (31 December 2019: 4.80%)AstraZeneca plc 4.00% 17/01/2029 USD 230,000 274,628 0.22AstraZeneca plc 4.38% 16/11/2045 USD 75,000 97,308 0.08BAE Systems plc 3.40% 15/04/2030 USD 100,000 108,966 0.09BP Capital Markets plc 3.28% 19/09/2027 USD 263,000 286,916 0.23HSBC Holdings plc 4.00% 30/03/2022 USD 332,000 350,616 0.29HSBC Holdings plc, FRN 2.63%07/11/2025 USD 540,000 558,976 0.46HSBC Holdings plc, FRN 3.97%22/05/2030 USD 200,000 222,160 0.18Nationwide Building Society, FRN 3.62%26/04/2023 USD 220,000 228,794 0.19Royal Bank of Scotland Group plc 6.13%15/12/2022 USD 1,102,000 1,201,749 0.98Royal Bank of Scotland Group plc 6.00%19/12/2023 USD 469,000 525,361 0.43Royal Bank of Scotland Group plc 5.13%28/05/2024 USD 125,000 136,401 0.11Vodafone Group plc 3.75% 16/01/2024 USD 343,000 375,523 0.31Vodafone Group plc 5.25% 30/05/2048 USD 223,000 289,237 0.24Vodafone Group plc 4.25% 17/09/2050 USD 230,000 268,023 0.22
United Kingdom total 4,924,658 4.03
United States (31 December 2019: 83.52%)Abbott Laboratories 3.75% 30/11/2026 USD 201,000 233,855 0.19AbbVie, Inc. 3.45% 15/03/2022 USD 110,000 114,399 0.09AbbVie, Inc. 2.90% 06/11/2022 USD 578,000 606,101 0.50AbbVie, Inc. 2.60% 21/11/2024 USD 190,000 201,597 0.16AbbVie, Inc. 3.60% 14/05/2025 USD 110,000 121,612 0.10AbbVie, Inc. 2.95% 21/11/2026 USD 100,000 108,707 0.09AbbVie, Inc. 4.25% 14/11/2028 USD 165,000 194,649 0.16AbbVie, Inc. 4.05% 21/11/2039 USD 360,000 420,901 0.34AbbVie, Inc. 4.70% 14/05/2045 USD 200,000 249,091 0.20AbbVie, Inc. 4.25% 21/11/2049 USD 210,000 254,191 0.21Adobe, Inc. 2.30% 01/02/2030 USD 110,000 118,634 0.10Aetna, Inc. 2.80% 15/06/2023 USD 388,000 408,316 0.33Aetna, Inc. 3.88% 15/08/2047 USD 156,000 175,518 0.14Aflac, Inc. 3.60% 01/04/2030 USD 130,000 151,274 0.12Air Lease Corp. 3.00% 15/09/2023 USD 432,000 426,970 0.35Air Lease Corp. 3.75% 01/06/2026 USD 512,000 516,615 0.42Alexandria Real Estate Equities, Inc.2.75% 15/12/2029 USD 185,000 196,360 0.16Alexandria Real Estate Equities, Inc.4.90% 15/12/2030 USD 110,000 137,771 0.11Altria Group, Inc. 2.85% 09/08/2022 USD 280,000 291,664 0.24Altria Group, Inc. 4.80% 14/02/2029 USD 187,000 218,210 0.18Altria Group, Inc. 5.80% 14/02/2039 USD 25,000 31,064 0.03Altria Group, Inc. 5.38% 31/01/2044 USD 254,000 305,458 0.25Altria Group, Inc. 5.95% 14/02/2049 USD 50,000 65,196 0.05Altria Group, Inc. 4.45% 06/05/2050 USD 140,000 153,048 0.13Amazon.com, Inc. 2.80% 22/08/2024 USD 130,000 141,322 0.12Amazon.com, Inc. 3.88% 22/08/2037 USD 593,000 727,959 0.60Amazon.com, Inc. 4.05% 22/08/2047 USD 42,000 54,620 0.04Ameren Corp. 2.50% 15/09/2024 USD 321,000 340,628 0.28American Airlines 2019-1 Class AA PassThrough Trust 3.15% 15/02/2032 USD 39,384 36,299 0.03American Express Co. 3.70% 03/08/2023 USD 411,000 446,783 0.37American Express Credit Corp. 3.30%03/05/2027 USD 112,000 127,279 0.10American International Group, Inc. 3.90%01/04/2026 USD 34,000 38,348 0.03American International Group, Inc. 4.50%16/07/2044 USD 140,000 161,157 0.13American Tower Corp. 3.38% 15/10/2026 USD 728,000 806,840 0.66American Tower Corp. 3.55% 15/07/2027 USD 213,000 236,164 0.19American Tower Corp. 3.80%15/08/2029 USD 100,000 113,317 0.09American Tower Corp. 2.10% 15/06/2030 USD 140,000 140,467 0.11
JPMorgan ETFs (Ireland) ICAV - USD Corporate Bond Research Enhanced Index UCITS ETFSchedule of InvestmentsAs at 30 June 2020
Investments Currency
Quantity/Nominal
Value
FairValue
USD
% ofNet
Assets Investments Currency
Quantity/Nominal
Value
FairValue
USD
% ofNet
Assets

American Water Capital Corp. 2.80%01/05/2030 USD 125,000 136,464 0.11Amgen, Inc. 2.20% 21/02/2027 USD 145,000 152,406 0.12Amgen, Inc. 2.45% 21/02/2030 USD 115,000 121,585 0.10Amgen, Inc. 3.15% 21/02/2040 USD 70,000 75,073 0.06Amgen, Inc. 3.38% 21/02/2050 USD 60,000 66,333 0.05Analog Devices, Inc. 3.50% 05/12/2026 USD 297,000 334,244 0.27Anheuser-Busch Cos. LLC /Anheuser-Busch InBev Worldwide, Inc.3.65% 01/02/2026 USD 410,000 459,660 0.38Anheuser-Busch Cos. LLC /Anheuser-Busch InBev Worldwide, Inc.4.90% 01/02/2046 USD 322,000 390,464 0.32Anheuser-Busch InBev Worldwide, Inc.4.00% 13/04/2028 USD 102,000 117,720 0.10Anheuser-Busch InBev Worldwide, Inc.4.90% 23/01/2031 USD 197,000 246,702 0.20Anheuser-Busch InBev Worldwide, Inc.4.60% 15/04/2048 USD 352,000 411,476 0.34Anheuser-Busch InBev Worldwide, Inc.4.44% 06/10/2048 USD 100,000 115,182 0.09Anthem, Inc. 4.65% 15/08/2044 USD 216,000 273,496 0.22Apple, Inc. 3.25% 23/02/2026 USD 433,000 485,877 0.40Apple, Inc. 2.90% 12/09/2027 USD 67,000 74,939 0.06Apple, Inc. 2.20% 11/09/2029 USD 230,000 246,710 0.20Apple, Inc. 3.85% 04/05/2043 USD 50,000 61,703 0.05Apple, Inc. 3.45% 09/02/2045 USD 280,000 325,844 0.27Apple, Inc. 3.75% 12/09/2047 USD 284,000 347,613 0.28AT&T, Inc. 3.00% 30/06/2022 USD 121,000 126,449 0.10AT&T, Inc. 3.40% 15/05/2025 USD 332,000 364,356 0.30AT&T, Inc. 4.30% 15/02/2030 USD 364,000 426,282 0.35AT&T, Inc. 4.50% 15/05/2035 USD 490,000 577,939 0.47AT&T, Inc. 4.50% 09/03/2048 USD 607,000 707,126 0.58Atmos Energy Corp. 4.13% 15/10/2044 USD 38,000 46,662 0.04Atmos Energy Corp. 3.38% 15/09/2049 USD 80,000 89,903 0.07Bank of America Corp., FRN 2.37%21/07/2021 USD 777,000 777,715 0.64Bank of America Corp., FRN 3.00%20/12/2023 USD 1,307,000 1,372,269 1.12Bank of America Corp., FRN 3.55%05/03/2024 USD 260,000 277,586 0.23Bank of America Corp., FRN 3.86%23/07/2024 USD 310,000 336,472 0.28Bank of America Corp., FRN 3.82%20/01/2028 USD 375,000 424,563 0.35Bank of America Corp., FRN 3.42%20/12/2028 USD 690,000 768,332 0.63Bank of America Corp., FRN 2.50%13/02/2031 USD 240,000 251,846 0.21Bank of America Corp., FRN 4.24%24/04/2038 USD 287,000 350,070 0.29Bank of America Corp., FRN 3.95%23/01/2049 USD 110,000 132,987 0.11Bank of America Corp., FRN 4.08%20/03/2051 USD 90,000 111,317 0.09Bank of New York Mellon Corp. (The)2.20% 16/08/2023 USD 333,000 348,089 0.28Bank of New York Mellon Corp. (The),FRN 3.44% 07/02/2028 USD 259,000 292,389 0.24BAT Capital Corp. 4.39% 15/08/2037 USD 436,000 475,549 0.39BAT Capital Corp. 4.54% 15/08/2047 USD 200,000 216,787 0.18Becton Dickinson & Co. 2.89%06/06/2022 USD 281,000 290,878 0.24Becton Dickinson & Co. 3.36%06/06/2024 USD 250,000 269,075 0.22Becton Dickinson & Co. 3.70%06/06/2027 USD 103,000 114,987 0.09Becton Dickinson & Co. 4.69%15/12/2044 USD 121,000 148,828 0.12Becton Dickinson & Co. 4.67%06/06/2047 USD 120,000 148,106 0.12Berkshire Hathaway Energy Co. 4.05%15/04/2025 USD 210,000 240,214 0.20Berkshire Hathaway Energy Co. 4.50%01/02/2045 USD 334,000 419,861 0.34Berkshire Hathaway Energy Co. 3.80%15/07/2048 USD 118,000 137,440 0.11Berkshire Hathaway Energy Co. 4.45%15/01/2049 USD 58,000 74,291 0.06Berkshire Hathaway Finance Corp. 4.20%15/08/2048 USD 244,000 308,826 0.25Berkshire Hathaway, Inc. 3.13%15/03/2026 USD 246,000 275,168 0.23Boeing Co. (The) 4.51% 01/05/2023 USD 400,000 422,713 0.35Boeing Co. (The) 4.88% 01/05/2025 USD 405,000 441,512 0.36Boeing Co. (The) 5.04% 01/05/2027 USD 381,000 420,215 0.34Boeing Co. (The) 5.15% 01/05/2030 USD 70,000 77,999 0.06Boeing Co. (The) 3.60% 01/05/2034 USD 273,000 257,637 0.21Boeing Co. (The) 5.71% 01/05/2040 USD 95,000 107,451 0.09Boston Properties LP 4.50% 01/12/2028 USD 49,000 58,568 0.05
BP Capital Markets America, Inc. 2.75%10/05/2023 USD 61,000 64,403 0.05BP Capital Markets America, Inc. 4.23%06/11/2028 USD 420,000 489,504 0.40BP Capital Markets America, Inc. 3.00%24/02/2050 USD 225,000 220,482 0.18Bristol-Myers Squibb Co. 2.90%26/07/2024 USD 357,000 385,537 0.32Bristol-Myers Squibb Co. 3.20%15/06/2026 USD 350,000 392,488 0.32Bristol-Myers Squibb Co. 3.40%26/07/2029 USD 190,000 219,383 0.18Bristol-Myers Squibb Co. 4.35%15/11/2047 USD 210,000 276,364 0.23Bristol-Myers Squibb Co. 4.25%26/10/2049 USD 75,000 98,875 0.08Broadcom Corp. / Broadcom CaymanFinance Ltd. 3.88% 15/01/2027 USD 586,000 632,915 0.52Broadcom, Inc. 3.15% 15/11/2025 USD 221,000 235,252 0.19Broadcom, Inc. 4.75% 15/04/2029 USD 140,000 158,889 0.13Broadcom, Inc. 4.15% 15/11/2030 USD 130,000 141,376 0.12Burlington Northern Santa Fe LLC 4.90%01/04/2044 USD 43,000 58,532 0.05Burlington Northern Santa Fe LLC 4.55%01/09/2044 USD 115,000 148,709 0.12Burlington Northern Santa Fe LLC 4.15%01/04/2045 USD 193,000 238,415 0.19Burlington Northern Santa Fe LLC 4.15%15/12/2048 USD 40,000 50,277 0.04Burlington Northern Santa Fe LLC 3.55%15/02/2050 USD 100,000 116,779 0.10Cameron LNG LLC 2.90% 15/07/2031 USD 80,000 85,476 0.07Cameron LNG LLC 3.30% 15/01/2035 USD 65,000 71,548 0.06Cameron LNG LLC 3.70% 15/01/2039 USD 10,000 10,797 0.01Capital One Financial Corp. 3.30%30/10/2024 USD 282,000 303,354 0.25Capital One Financial Corp. 3.80%31/01/2028 USD 433,000 479,886 0.39Caterpillar Financial Services Corp. 2.15%08/11/2024 USD 220,000 232,939 0.19Caterpillar, Inc. 3.80% 15/08/2042 USD 152,000 180,060 0.15Caterpillar, Inc. 3.25% 19/09/2049 USD 110,000 122,348 0.10Charter Communications Operating LLC /Charter Communications OperatingCapital 4.46% 23/07/2022 USD 646,000 689,107 0.56Charter Communications Operating LLC /Charter Communications OperatingCapital 2.80% 01/04/2031 USD 100,000 101,525 0.08Charter Communications Operating LLC /Charter Communications OperatingCapital 6.48% 23/10/2045 USD 147,000 194,968 0.16Charter Communications Operating LLC /Charter Communications OperatingCapital 5.38% 01/05/2047 USD 50,000 59,361 0.05Charter Communications Operating LLC /Charter Communications OperatingCapital 4.80% 01/03/2050 USD 210,000 237,147 0.19Charter Communications Operating LLC /Charter Communications OperatingCapital 3.70% 01/04/2051 USD 60,000 59,013 0.05Chevron Corp. 1.55% 11/05/2025 USD 230,000 236,552 0.19Chevron Corp. 2.95% 16/05/2026 USD 190,000 210,634 0.17Cigna Corp. 4.38% 15/10/2028 USD 90,000 106,581 0.09Cigna Corp. 2.40% 15/03/2030 USD 185,000 192,018 0.16Cigna Corp. 4.80% 15/08/2038 USD 94,000 119,097 0.10Cigna Corp. 4.90% 15/12/2048 USD 79,000 104,142 0.09Citigroup, Inc., FRN 2.88% 24/07/2023 USD 833,000 866,633 0.71Citigroup, Inc., FRN 3.11% 08/04/2026 USD 230,000 247,250 0.20Citigroup, Inc. 3.20% 21/10/2026 USD 582,000 638,531 0.52Citigroup, Inc., FRN 3.67% 24/07/2028 USD 313,000 349,448 0.29Citigroup, Inc., FRN 2.98% 05/11/2030 USD 190,000 201,877 0.17Citigroup, Inc., FRN 2.67% 29/01/2031 USD 140,000 144,979 0.12Citigroup, Inc., FRN 4.41% 31/03/2031 USD 110,000 130,521 0.11Citigroup, Inc., FRN 3.88% 24/01/2039 USD 182,000 210,715 0.17Citigroup, Inc. 4.65% 23/07/2048 USD 178,000 232,771 0.19Citizens Financial Group, Inc. 4.30%03/12/2025 USD 493,000 547,801 0.45CME Group, Inc. 3.00% 15/03/2025 USD 270,000 297,658 0.24Columbia Pipeline Group, Inc. 4.50%01/06/2025 USD 121,000 137,889 0.11Comcast Corp. 3.70% 15/04/2024 USD 182,000 201,561 0.16Comcast Corp. 3.95% 15/10/2025 USD 263,000 301,193 0.25Comcast Corp. 3.15% 01/03/2026 USD 320,000 355,771 0.29Comcast Corp. 4.15% 15/10/2028 USD 190,000 227,641 0.19Comcast Corp. 3.40% 01/04/2030 USD 125,000 143,132 0.12Comcast Corp. 4.25% 15/01/2033 USD 320,000 393,835 0.32Comcast Corp. 3.90% 01/03/2038 USD 151,000 179,333 0.15Comcast Corp. 4.60% 15/10/2038 USD 489,000 620,442 0.51Comcast Corp. 4.70% 15/10/2048 USD 76,000 101,668 0.08Comcast Corp. 4.00% 01/11/2049 USD 40,000 48,592 0.04Comcast Corp. 3.45% 01/02/2050 USD 190,000 215,338 0.18
135
JPMorgan ETFs (Ireland) ICAV - USD Corporate Bond Research Enhanced Index UCITS ETFSchedule of Investments (continued)As at 30 June 2020
Investments Currency
Quantity/Nominal
Value
FairValue
USD
% ofNet
Assets Investments Currency
Quantity/Nominal
Value
FairValue
USD
% ofNet
Assets

Commonwealth Edison Co. 3.00%01/03/2050 USD 260,000 274,688 0.22Concho Resources, Inc. 4.30%15/08/2028 USD 160,000 175,566 0.14Connecticut Light & Power Co. (The)4.00% 01/04/2048 USD 170,000 208,483 0.17Corning, Inc. 4.38% 15/11/2057 USD 116,000 133,896 0.11Corning, Inc. 5.45% 15/11/2079 USD 40,000 47,781 0.04Crown Castle International Corp. 3.80%15/02/2028 USD 150,000 168,645 0.14Crown Castle International Corp. 3.30%01/07/2030 USD 245,000 269,482 0.22Crown Castle International Corp. 2.25%15/01/2031 USD 130,000 131,155 0.11CSX Corp. 3.25% 01/06/2027 USD 317,000 355,393 0.29CSX Corp. 4.30% 01/03/2048 USD 287,000 358,343 0.29CSX Corp. 3.80% 15/04/2050 USD 20,000 23,783 0.02CVS Health Corp. 3.70% 09/03/2023 USD 510,000 547,418 0.45CVS Health Corp. 2.63% 15/08/2024 USD 50,000 53,171 0.04CVS Health Corp. 4.30% 25/03/2028 USD 232,000 270,752 0.22CVS Health Corp. 3.25% 15/08/2029 USD 200,000 220,665 0.18CVS Health Corp. 5.05% 25/03/2048 USD 282,000 368,630 0.30Deere & Co. 2.75% 15/04/2025 USD 60,000 65,347 0.05Deere & Co. 3.10% 15/04/2030 USD 125,000 141,721 0.12Deere & Co. 3.75% 15/04/2050 USD 205,000 251,591 0.21Dell International LLC / EMC Corp. 5.45%15/06/2023 USD 230,000 251,650 0.21Dell International LLC / EMC Corp. 6.02%15/06/2026 USD 280,000 320,335 0.26Dell International LLC / EMC Corp. 5.30%01/10/2029 USD 100,000 110,496 0.09Discovery Communications LLC 4.65%15/05/2050 USD 288,000 326,952 0.27Dominion Energy, Inc. 3.90% 01/10/2025 USD 21,000 23,707 0.02Duke Energy Corp. 3.75% 15/04/2024 USD 489,000 535,690 0.44Duke Energy Corp. 2.65% 01/09/2026 USD 18,000 19,536 0.02Duke Energy Corp. 3.75% 01/09/2046 USD 170,000 192,369 0.16Duke Energy Indiana LLC 2.75%01/04/2050 USD 200,000 202,455 0.17DuPont de Nemours, Inc. 4.21%15/11/2023 USD 443,000 485,840 0.40DuPont de Nemours, Inc. 4.73%15/11/2028 USD 365,000 439,139 0.36Edison International 3.13% 15/11/2022 USD 145,000 149,183 0.12Edison International 2.95% 15/03/2023 USD 280,000 286,397 0.23Edison International 4.13% 15/03/2028 USD 70,000 73,490 0.06Eli Lilly & Co. 2.25% 15/05/2050 USD 340,000 325,469 0.27Emera US Finance LP 4.75% 15/06/2046 USD 373,000 443,519 0.36Energy Transfer Operating LP 4.25%15/03/2023 USD 200,000 210,488 0.17Energy Transfer Operating LP 4.75%15/01/2026 USD 32,000 34,919 0.03Energy Transfer Operating LP 4.95%15/06/2028 USD 48,000 51,703 0.04Entergy Louisiana LLC 4.00%15/03/2033 USD 637,000 783,287 0.64Entergy Louisiana LLC 2.90% 15/03/2051 USD 15,000 15,491 0.01Enterprise Products Operating LLC 3.13%31/07/2029 USD 45,000 48,261 0.04Enterprise Products Operating LLC 5.10%15/02/2045 USD 108,000 128,164 0.10Enterprise Products Operating LLC4.20% 31/01/2050 USD 195,000 217,522 0.18Evergy, Inc. 2.45% 15/09/2024 USD 280,000 296,210 0.24Evergy, Inc. 2.90% 15/09/2029 USD 80,000 85,821 0.07Exxon Mobil Corp. 2.99% 19/03/2025 USD 160,000 173,808 0.14Exxon Mobil Corp. 2.61% 15/10/2030 USD 485,000 519,664 0.42Exxon Mobil Corp. 3.00% 16/08/2039 USD 400,000 420,568 0.34Exxon Mobil Corp. 3.45% 15/04/2051 USD 60,000 66,407 0.05Fidelity National Information Services,Inc. 3.00% 15/08/2026 USD 460,000 508,913 0.42FirstEnergy Corp. 3.90% 15/07/2027 USD 488,000 552,618 0.45FirstEnergy Corp. 2.65% 01/03/2030 USD 95,000 99,364 0.08FirstEnergy Corp. 3.40% 01/03/2050 USD 220,000 234,395 0.19Fiserv, Inc. 4.40% 01/07/2049 USD 60,000 72,691 0.06Florida Power & Light Co. 3.95%01/03/2048 USD 80,000 100,600 0.08Florida Power & Light Co. 3.15%01/10/2049 USD 140,000 158,696 0.13General Electric Co. 4.38% 16/09/2020 USD 200,000 201,525 0.16General Electric Co. 2.70% 09/10/2022 USD 398,000 413,689 0.34General Electric Co. 6.75% 15/03/2032 USD 60,000 73,068 0.06General Electric Co. 5.88% 14/01/2038 USD 424,000 475,260 0.39General Electric Co. 4.13% 09/10/2042 USD 22,000 20,928 0.02General Motors Financial Co., Inc. 3.20%06/07/2021 USD 475,000 480,289 0.39General Motors Financial Co., Inc. 5.10%17/01/2024 USD 332,000 355,655 0.29Gilead Sciences, Inc. 4.00% 01/09/2036 USD 210,000 259,421 0.21Gilead Sciences, Inc. 4.15% 01/03/2047 USD 357,000 455,537 0.37
Glencore Funding LLC 4.13% 30/05/2023 USD 250,000 266,847 0.22Global Payments, Inc. 3.20% 15/08/2029 USD 280,000 299,872 0.25Global Payments, Inc. 4.15% 15/08/2049 USD 180,000 206,602 0.17Goldman Sachs Group, Inc. (The) 2.35%15/11/2021 USD 394,000 396,420 0.32Goldman Sachs Group, Inc. (The), FRN2.88% 31/10/2022 USD 950,000 974,492 0.80Goldman Sachs Group, Inc. (The) 4.00%03/03/2024 USD 470,000 519,329 0.42Goldman Sachs Group, Inc. (The) 3.50%01/04/2025 USD 220,000 241,271 0.20Goldman Sachs Group, Inc. (The) 3.85%26/01/2027 USD 425,000 477,637 0.39Goldman Sachs Group, Inc. (The), FRN4.22% 01/05/2029 USD 293,000 339,747 0.28Goldman Sachs Group, Inc. (The) 2.60%07/02/2030 USD 270,000 283,106 0.23Goldman Sachs Group, Inc. (The), FRN4.02% 31/10/2038 USD 340,000 393,048 0.32HCA, Inc. 5.00% 15/03/2024 USD 320,000 355,451 0.29HCA, Inc. 4.50% 15/02/2027 USD 272,000 302,890 0.25HCA, Inc. 5.13% 15/06/2039 USD 150,000 174,624 0.14HCA, Inc. 5.25% 15/06/2049 USD 271,000 324,723 0.27Healthpeak Properties, Inc. 4.00%01/06/2025 USD 716,000 792,741 0.65Healthpeak Properties, Inc. 3.00%15/01/2030 USD 120,000 125,390 0.10Healthpeak Properties, Inc. 2.88%15/01/2031 USD 70,000 71,725 0.06Hess Corp. 4.30% 01/04/2027 USD 140,000 144,972 0.12Home Depot, Inc. (The) 2.95%15/06/2029 USD 10,000 11,224 0.01Home Depot, Inc. (The) 2.70%15/04/2030 USD 90,000 98,937 0.08Home Depot, Inc. (The) 3.30%15/04/2040 USD 70,000 79,207 0.06Home Depot, Inc. (The) 4.20%01/04/2043 USD 70,000 86,433 0.07Home Depot, Inc. (The) 4.25%01/04/2046 USD 15,000 18,948 0.02Home Depot, Inc. (The) 3.13% 15/12/2049 USD 250,000 273,815 0.22Home Depot, Inc. (The) 3.50%15/09/2056 USD 25,000 28,990 0.02Honeywell International, Inc. 2.50%01/11/2026 USD 60,000 66,036 0.05Huntington Bancshares, Inc. 2.30%14/01/2022 USD 457,000 469,295 0.38Huntington Bancshares, Inc. 2.63%06/08/2024 USD 60,000 63,469 0.05Huntsman International LLC 4.50%01/05/2029 USD 150,000 157,890 0.13Intel Corp. 3.73% 08/12/2047 USD 80,000 95,769 0.08Intel Corp. 3.25% 15/11/2049 USD 130,000 147,592 0.12International Business Machines Corp.3.00% 15/05/2024 USD 490,000 529,868 0.43International Business Machines Corp.3.30% 15/05/2026 USD 120,000 134,890 0.11International Business Machines Corp.3.50% 15/05/2029 USD 100,000 115,335 0.09International Business Machines Corp.4.25% 15/05/2049 USD 100,000 124,210 0.10International Paper Co. 4.40%15/08/2047 USD 260,000 305,581 0.25International Paper Co. 4.35%15/08/2048 USD 60,000 70,450 0.06John Deere Capital Corp. 1.20%06/04/2023 USD 50,000 50,933 0.04John Deere Capital Corp. 3.45%13/03/2025 USD 246,000 275,982 0.23Keurig Dr Pepper, Inc. 4.06%25/05/2023 USD 118,000 128,528 0.11Keurig Dr Pepper, Inc. 4.60%25/05/2028 USD 119,000 142,729 0.12Keurig Dr Pepper, Inc. 3.80%01/05/2050 USD 60,000 67,890 0.06Kinder Morgan, Inc. 4.30% 01/06/2025 USD 41,000 46,061 0.04Kinder Morgan, Inc. 5.55% 01/06/2045 USD 216,000 263,670 0.22Kroger Co. (The) 4.45% 01/02/2047 USD 141,000 172,538 0.14L3Harris Technologies, Inc. 4.40%15/06/2028 USD 401,000 476,419 0.39Lowe’s Cos., Inc. 3.10% 03/05/2027 USD 102,000 113,521 0.09Lowe’s Cos., Inc. 3.65% 05/04/2029 USD 91,000 104,214 0.09Lowe’s Cos., Inc. 3.70% 15/04/2046 USD 276,000 308,760 0.25Lowe’s Cos., Inc. 4.05% 03/05/2047 USD 197,000 231,489 0.19Marathon Petroleum Corp. 4.75%15/09/2044 USD 46,000 48,572 0.04Marsh & McLennan Cos., Inc. 4.38%15/03/2029 USD 137,000 164,835 0.13Mastercard, Inc. 2.95% 01/06/2029 USD 95,000 106,675 0.09Mastercard, Inc. 3.35% 26/03/2030 USD 130,000 150,647 0.12McDonald’s Corp. 2.13% 01/03/2030 USD 40,000 41,065 0.03McDonald’s Corp. 3.63% 01/09/2049 USD 330,000 365,672 0.30
136
JPMorgan ETFs (Ireland) ICAV - USD Corporate Bond Research Enhanced Index UCITS ETFSchedule of Investments (continued)As at 30 June 2020
Investments Currency
Quantity/Nominal
Value
FairValue
USD
% ofNet
Assets Investments Currency
Quantity/Nominal
Value
FairValue
USD
% ofNet
Assets

Medtronic, Inc. 3.50% 15/03/2025 USD 330,000 372,038 0.30Merck & Co., Inc. 2.75% 10/02/2025 USD 137,000 148,726 0.12Merck & Co., Inc. 3.40% 07/03/2029 USD 37,000 42,791 0.03Merck & Co., Inc. 3.70% 10/02/2045 USD 80,000 96,756 0.08Microsoft Corp. 3.30% 06/02/2027 USD 112,000 128,056 0.10Microsoft Corp. 3.45% 08/08/2036 USD 220,000 265,072 0.22Microsoft Corp. 4.10% 06/02/2037 USD 267,000 344,878 0.28Microsoft Corp. 3.70% 08/08/2046 USD 353,000 441,372 0.36Microsoft Corp. 2.53% 01/06/2050 USD 109,000 113,675 0.09MidAmerican Energy Co. 3.65%15/04/2029 USD 240,000 286,224 0.23Morgan Stanley 2.75% 19/05/2022 USD 446,000 463,030 0.38Morgan Stanley, FRN 3.74% 24/04/2024 USD 122,000 131,448 0.11Morgan Stanley 3.70% 23/10/2024 USD 263,000 291,412 0.24Morgan Stanley 3.63% 20/01/2027 USD 318,000 358,193 0.29Morgan Stanley, FRN 3.77% 24/01/2029 USD 391,000 445,132 0.36Morgan Stanley, FRN 2.70% 22/01/2031 USD 250,000 265,352 0.22Morgan Stanley, FRN 3.62% 01/04/2031 USD 170,000 194,317 0.16Morgan Stanley 4.30% 27/01/2045 USD 270,000 339,306 0.28MPLX LP 4.25% 01/12/2027 USD 36,000 39,165 0.03MPLX LP 4.00% 15/03/2028 USD 86,000 90,907 0.07MPLX LP 4.50% 15/04/2038 USD 182,000 181,832 0.15MPLX LP 5.50% 15/02/2049 USD 50,000 55,389 0.05New York Life Global Funding 2.88%10/04/2024 USD 125,000 134,639 0.11NextEra Energy Capital Holdings, Inc.3.15% 01/04/2024 USD 115,000 124,877 0.10NextEra Energy Capital Holdings, Inc.2.75% 01/11/2029 USD 250,000 269,642 0.22NIKE, Inc. 2.85% 27/03/2030 USD 110,000 122,452 0.10NiSource, Inc. 3.49% 15/05/2027 USD 110,000 124,162 0.10NiSource, Inc. 3.60% 01/05/2030 USD 120,000 137,490 0.11Norfolk Southern Corp. 4.15%28/02/2048 USD 348,000 421,718 0.34Northwestern Mutual Life Insurance Co.(The) 3.85% 30/09/2047 USD 40,000 45,989 0.04Novartis Capital Corp. 2.75% 14/08/2050 USD 230,000 243,008 0.20Oracle Corp. 2.50% 01/04/2025 USD 330,000 353,777 0.29Oracle Corp. 3.25% 15/11/2027 USD 115,000 128,866 0.11Oracle Corp. 2.95% 01/04/2030 USD 260,000 289,566 0.24Oracle Corp. 3.80% 15/11/2037 USD 122,000 141,257 0.12Oracle Corp. 3.60% 01/04/2040 USD 270,000 305,180 0.25Oracle Corp. 4.00% 15/07/2046 USD 213,000 250,638 0.20Oracle Corp. 3.60% 01/04/2050 USD 195,000 218,655 0.18O’Reilly Automotive, Inc. 3.60%01/09/2027 USD 770,000 863,385 0.71Otis Worldwide Corp. 2.06% 05/04/2025 USD 100,000 104,852 0.09Otis Worldwide Corp. 2.57% 15/02/2030 USD 105,000 110,272 0.09Otis Worldwide Corp. 3.36% 15/02/2050 USD 45,000 47,415 0.04PacifiCorp 2.70% 15/09/2030 USD 120,000 130,916 0.11PepsiCo, Inc. 2.75% 19/03/2030 USD 110,000 122,611 0.10PepsiCo, Inc. 3.45% 06/10/2046 USD 182,000 211,056 0.17PepsiCo, Inc. 3.63% 19/03/2050 USD 50,000 60,872 0.05Pfizer, Inc. 3.00% 15/12/2026 USD 245,000 276,659 0.23Pfizer, Inc. 2.63% 01/04/2030 USD 50,000 55,025 0.05Pfizer, Inc. 4.00% 15/12/2036 USD 105,000 128,644 0.11Pfizer, Inc. 2.55% 28/05/2040 USD 80,000 82,760 0.07Pfizer, Inc. 4.40% 15/05/2044 USD 37,000 48,430 0.04Pfizer, Inc. 4.13% 15/12/2046 USD 158,000 203,374 0.17Pfizer, Inc. 4.00% 15/03/2049 USD 162,000 206,849 0.17Philip Morris International, Inc. 3.88%21/08/2042 USD 127,000 144,207 0.12PNC Financial Services Group, Inc. (The)3.90% 29/04/2024 USD 22,000 24,256 0.02PNC Financial Services Group, Inc. (The)2.60% 23/07/2026 USD 468,000 507,496 0.41PNC Financial Services Group, Inc. (The)3.45% 23/04/2029 USD 170,000 194,981 0.16PPL Electric Utilities Corp. 3.00%01/10/2049 USD 30,000 31,818 0.03Precision Castparts Corp. 3.25%15/06/2025 USD 108,000 119,773 0.10Prologis LP 3.75% 01/11/2025 USD 400,000 459,172 0.38Prudential Financial, Inc. 3.91%07/12/2047 USD 116,000 132,374 0.11Prudential Financial, Inc. 3.70%13/03/2051 USD 60,000 65,847 0.05QUALCOMM, Inc. 3.25% 20/05/2027 USD 180,000 204,062 0.17Raytheon Technologies Corp. 3.50%15/03/2027 USD 251,000 282,654 0.23Raytheon Technologies Corp. 3.13%04/05/2027 USD 160,000 177,914 0.15Raytheon Technologies Corp. 4.13%16/11/2028 USD 260,000 306,017 0.25Raytheon Technologies Corp. 4.45%16/11/2038 USD 102,000 124,567 0.10Raytheon Technologies Corp. 3.75%01/11/2046 USD 255,000 289,603 0.24Republic Services, Inc. 3.95% 15/05/2028 USD 24,000 28,052 0.02
Reynolds American, Inc. 4.00%12/06/2022 USD 274,000 289,255 0.24Reynolds American, Inc. 4.45%12/06/2025 USD 351,000 395,537 0.32Roper Technologies, Inc. 4.20%15/09/2028 USD 267,000 312,462 0.26Roper Technologies, Inc. 2.00%30/06/2030 USD 270,000 270,140 0.22Sabine Pass Liquefaction LLC 5.63%01/03/2025 USD 260,000 297,783 0.24San Diego Gas & Electric Co. 4.10%15/06/2049 USD 65,000 80,355 0.07Sempra Energy 3.25% 15/06/2027 USD 120,000 131,728 0.11Sempra Energy 3.80% 01/02/2038 USD 97,000 104,822 0.09Sempra Energy 4.00% 01/02/2048 USD 230,000 260,847 0.21Sherwin-Williams Co. (The) 2.75%01/06/2022 USD 11,000 11,327 0.01Sherwin-Williams Co. (The) 4.50%01/06/2047 USD 40,000 48,543 0.04Simon Property Group LP 3.38%01/10/2024 USD 276,000 296,764 0.24Simon Property Group LP 2.45%13/09/2029 USD 220,000 216,519 0.18Simon Property Group LP 3.25%13/09/2049 USD 10,000 9,138 0.01Southern California Edison Co. 3.70%01/08/2025 USD 210,000 232,042 0.19Southern California Edison Co. 2.25%01/06/2030 USD 24,000 24,330 0.02Southern California Edison Co. 3.90%15/03/2043 USD 9,000 9,978 0.01Southern California Edison Co. 3.60%01/02/2045 USD 229,000 246,951 0.20Southern California Edison Co. 4.00%01/04/2047 USD 90,000 103,044 0.08Southern California Edison Co. 4.13%01/03/2048 USD 40,000 46,481 0.04Southern California Edison Co. 3.65%01/02/2050 USD 21,000 23,181 0.02Southern Co. (The) 2.35% 01/07/2021 USD 108,000 109,853 0.09Southern Co. (The) 4.40% 01/07/2046 USD 198,000 236,344 0.19Southern Co. Gas Capital Corp. 2.45%01/10/2023 USD 420,000 440,422 0.36Starbucks Corp. 3.50% 15/11/2050 USD 250,000 263,355 0.22Sunoco Logistics Partners Operations LP5.40% 01/10/2047 USD 456,000 447,652 0.37Target Corp. 3.90% 15/11/2047 USD 40,000 51,005 0.04Thermo Fisher Scientific, Inc. 2.95%19/09/2026 USD 170,000 187,821 0.15Thermo Fisher Scientific, Inc. 4.10%15/08/2047 USD 290,000 360,303 0.29T-Mobile USA, Inc. 3.50% 15/04/2025 USD 450,000 490,424 0.40T-Mobile USA, Inc. 3.75% 15/04/2027 USD 330,000 365,843 0.30T-Mobile USA, Inc. 3.88% 15/04/2030 USD 120,000 133,566 0.11T-Mobile USA, Inc. 4.38% 15/04/2040 USD 75,000 86,829 0.07T-Mobile USA, Inc. 4.50% 15/04/2050 USD 185,000 217,958 0.18Truist Bank 2.80% 17/05/2022 USD 230,000 239,346 0.20Truist Bank 3.20% 01/04/2024 USD 180,000 195,696 0.16UDR, Inc. 3.00% 15/08/2031 USD 110,000 117,316 0.10Union Pacific Corp. 3.95% 10/09/2028 USD 50,000 59,332 0.05Union Pacific Corp. 3.70% 01/03/2029 USD 61,000 71,251 0.06Union Pacific Corp. 4.38% 10/09/2038 USD 168,000 206,933 0.17Union Pacific Corp. 4.30% 01/03/2049 USD 152,000 194,040 0.16Union Pacific Corp. 3.25% 05/02/2050 USD 175,000 191,873 0.16United Airlines 2019-2 Class AA PassThrough Trust 2.70% 01/05/2032 USD 40,000 36,027 0.03UnitedHealth Group, Inc. 3.75%15/07/2025 USD 187,000 213,317 0.17UnitedHealth Group, Inc. 4.63%15/07/2035 USD 50,000 65,116 0.05UnitedHealth Group, Inc. 3.50%15/08/2039 USD 160,000 186,040 0.15UnitedHealth Group, Inc. 2.75%15/05/2040 USD 450,000 481,729 0.39UnitedHealth Group, Inc. 4.25%15/06/2048 USD 40,000 51,297 0.04University of Chicago (The) 2.76%01/04/2045 USD 30,000 30,825 0.03Upjohn, Inc. 1.13% 22/06/2022 USD 250,000 251,491 0.21Upjohn, Inc. 1.65% 22/06/2025 USD 60,000 61,143 0.05Upjohn, Inc. 2.30% 22/06/2027 USD 40,000 41,314 0.03Upjohn, Inc. 2.70% 22/06/2030 USD 80,000 82,217 0.07Upjohn, Inc. 3.85% 22/06/2040 USD 40,000 42,977 0.04Upjohn, Inc. 4.00% 22/06/2050 USD 70,000 74,919 0.06US Bancorp 2.38% 22/07/2026 USD 429,000 464,539 0.38Verizon Communications, Inc. 5.15%15/09/2023 USD 230,000 262,350 0.21Verizon Communications, Inc. 3.38%15/02/2025 USD 65,000 72,338 0.06Verizon Communications, Inc. 4.33%21/09/2028 USD 108,000 130,215 0.11
137
JPMorgan ETFs (Ireland) ICAV - USD Corporate Bond Research Enhanced Index UCITS ETFSchedule of Investments (continued)As at 30 June 2020
Investments Currency
Quantity/Nominal
Value
FairValue
USD
% ofNet
Assets Investments Currency
Quantity/Nominal
Value
FairValue
USD
% ofNet
Assets

Verizon Communications, Inc. 4.02%03/12/2029 USD 628,000 750,815 0.61Verizon Communications, Inc. 4.40%01/11/2034 USD 52,000 64,472 0.05Verizon Communications, Inc. 4.27%15/01/2036 USD 726,000 895,529 0.73ViacomCBS, Inc. 4.95% 19/05/2050 USD 350,000 389,189 0.32Virginia Electric & Power Co. 3.15%15/01/2026 USD 22,000 24,498 0.02Virginia Electric & Power Co. 3.50%15/03/2027 USD 105,000 119,275 0.10Virginia Electric & Power Co. 4.60%01/12/2048 USD 57,000 75,066 0.06Visa, Inc. 3.15% 14/12/2025 USD 200,000 223,103 0.18Visa, Inc. 3.65% 15/09/2047 USD 40,000 48,798 0.04Walmart, Inc. 3.40% 26/06/2023 USD 316,000 343,597 0.28Walmart, Inc. 3.05% 08/07/2026 USD 83,000 93,646 0.08Walmart, Inc. 3.70% 26/06/2028 USD 33,000 38,992 0.03Walmart, Inc. 4.05% 29/06/2048 USD 142,000 186,354 0.15Walt Disney Co. (The) 2.75% 01/09/2049 USD 70,000 67,568 0.06Waste Management, Inc. 2.95%15/06/2024 USD 240,000 245,269 0.20Waste Management, Inc. 3.45%15/06/2029 USD 250,000 256,737 0.21Waste Management, Inc. 4.15%15/07/2049 USD 190,000 237,702 0.19Wells Fargo & Co. 2.10% 26/07/2021 USD 255,000 259,143 0.21Wells Fargo & Co. 2.63% 22/07/2022 USD 637,000 662,788 0.54Wells Fargo & Co. 3.75% 24/01/2024 USD 292,000 319,075 0.26Wells Fargo & Co., FRN 2.41%30/10/2025 USD 240,000 249,780 0.20Wells Fargo & Co. 3.00% 23/10/2026 USD 496,000 541,851 0.44Wells Fargo & Co. 4.30% 22/07/2027 USD 187,000 213,911 0.17Wells Fargo & Co., FRN 3.58%22/05/2028 USD 378,000 419,458 0.34Wells Fargo & Co., FRN 2.88%30/10/2030 USD 473,000 504,929 0.41Wells Fargo & Co., FRN 3.07%30/04/2041 USD 80,000 83,500 0.07Wells Fargo & Co. 3.90% 01/05/2045 USD 230,000 269,198 0.22Wells Fargo & Co. 4.75% 07/12/2046 USD 107,000 137,111 0.11Welltower, Inc. 3.63% 15/03/2024 USD 269,000 287,237 0.23Welltower, Inc. 4.00% 01/06/2025 USD 779,000 860,283 0.70Welltower, Inc. 3.10% 15/01/2030 USD 130,000 134,586 0.11William Marsh Rice University 2.60%15/05/2050 USD 40,000 39,972 0.03Zoetis, Inc. 3.00% 12/09/2027 USD 276,000 304,591 0.25Zoetis, Inc. 4.70% 01/02/2043 USD 102,000 134,284 0.11Zoetis, Inc. 3.00% 15/05/2050 USD 60,000 63,298 0.05
United States total 103,645,117 84.74
Total investments in Corporate Debt Securities 120,027,786 98.14
Government Debt Securities (31 December 2019: 0.37%)
United States (31 December 2019: 0.37%)US Treasury Bond 2.00% 15/02/2050 USD 399,000 456,980 0.37
United States total 456,980 0.37
Total investments in Government Debt Securities 456,980 0.37
Total Bonds 120,484,766 98.51
138
JPMorgan ETFs (Ireland) ICAV - USD Corporate Bond Research Enhanced Index UCITS ETFSchedule of Investments (continued)As at 30 June 2020
Investments Currency
Quantity/Nominal
Value
FairValue
USD
% ofNet
Assets Investments Currency
Quantity/Nominal
Value
FairValue
USD
% ofNet
Assets

JPMorgan ETFs (Ireland) ICAV - USD Corporate Bond Research Enhanced Index UCITS ETF
Schedule of Investments (continued)
As at 30 June 2020
Financial Futures Contracts
Security DescriptionNo. of
Contracts Currency
UnderlyingExposure
USD Counterparty
FairValue
USD
% ofNet
Assets
United States (31 December 2019: 0.04%)US 2-Year Note, 30/09/2020 9 USD 1,987,313 Goldman Sachs 141 -US Long Bond, 21/09/2020 49 USD 8,694,781 Goldman Sachs 54,781 0.05
United States total 54,922 0.05
Total unrealised gain on Financial Futures Contracts (31 December 2019: 0.04%) 54,922 0.05
United States (31 December 2019: (0.06)%)US 10-Year Note, 21/09/2020 (15) USD (2,083,258) Goldman Sachs (4,320) (0.01)US 10-Year Ultra Note, 21/09/2020 (31) USD (4,856,476) Goldman Sachs (25,539) (0.02)US 5-Year Note, 30/09/2020 (16) USD (2,008,180) Goldman Sachs (3,695) -US Ultra Bond, 21/09/2020 (5) USD (1,087,344) Goldman Sachs (3,438) -
United States total (36,992) (0.03)
Total unrealised loss on Financial Futures Contracts (31 December 2019: (0.06)%) (36,992) (0.03)
FairValue
USD
% ofNet
Assets
Total financial assets at fair value through profit or loss 120,539,688 98.56Total financial liabilities at fair value through profit or loss (36,992) (0.03)Cash and margin cash 107,585 0.09
Cash equivalents
Currency
Quantity/Nominal
ValueUndertaking for collective investment schemes (31 December 2019: 1.18%)JPMorgan Liquidity Funds - USD Liquidity LVNAV Fund - Class X (dist.)1 USD 736,263 736,263 0.60
Total Cash equivalents 736,263 0.60Other assets and liabilities 955,234 0.78
Net asset value attributable to holders of redeemable participating shares 122,301,778 100.00
Analysis of total assets
% ofTotal
Assets
Transferable securities and money market instruments admitted to official stock exchange listing 66.29Transferable securities and money market instruments dealt in on another regulated market 32.16Collective investment schemes 0.60Financial derivative instruments dealt in on a regulated market 0.05Other assets 0.90
Total Assets 100.00
1A related party to the Fund.
139

140
Bonds
Corporate Debt Securities (31 December 2019: 15.49%)
Australia (31 December 2019: 0.06%)CNOOC Curtis Funding No 1 Pty. Ltd.4.50% 03/10/2023 USD 300,000 328,969 0.07CNOOC Curtis Funding No 1 Pty. Ltd.,144A 4.50% 03/10/2023 USD 200,000 219,312 0.04
Australia total 548,281 0.11
Azerbaijan (31 December 2019: 1.05%)Southern Gas Corridor CJSC 6.88%24/03/2026 USD 3,331,000 3,821,885 0.74Southern Gas Corridor CJSC, 144A 6.88%24/03/2026 USD 1,127,000 1,293,085 0.25State Oil Co. of the Azerbaijan Republic4.75% 13/03/2023 USD 2,104,000 2,184,215 0.43
Azerbaijan total 7,299,185 1.42
Bahrain (31 December 2019: 1.43%)CBB International Sukuk Co. 5 SPC 5.62%12/02/2024 USD 420,000 437,194 0.09CBB International Sukuk Co. 5 SPC, 144A5.62% 12/02/2024 USD 2,396,000 2,494,086 0.48CBB International Sukuk Co. 7 SPC 6.88%05/10/2025 USD 847,000 942,287 0.18CBB International Sukuk Programme Co.SPC 6.25% 14/11/2024 USD 250,000 264,687 0.05CBB International Sukuk Programme Co.SPC 4.50% 30/03/2027 USD 2,408,000 2,483,250 0.48Oil & Gas Holding Co. BSCC (The) 7.50%25/10/2027 USD 1,205,000 1,290,480 0.25Oil & Gas Holding Co. BSCC (The), 144A7.50% 25/10/2027 USD 899,000 962,773 0.19
Bahrain total 8,874,757 1.72
British Virgin Islands (31 December 2019: 1.35%)1MDB Global Investments Ltd. 4.40%09/03/2023 USD 1,000,000 940,312 0.18Sinopec Group Overseas Development2012 Ltd. 4.88% 17/05/2042 USD 200,000 256,813 0.05Sinopec Group Overseas Development2013 Ltd. 4.38% 17/10/2023 USD 1,400,000 1,530,270 0.30Sinopec Group Overseas Development2015 Ltd. 3.25% 28/04/2025 USD 268,000 288,435 0.06Sinopec Group Overseas Development2017 Ltd. 2.50% 13/09/2022 USD 500,000 510,781 0.10Sinopec Group Overseas Development2018 Ltd. 2.70% 13/05/2030 USD 350,000 360,616 0.07State Grid Overseas Investment 2016 Ltd.2.75% 04/05/2022 USD 210,000 215,381 0.04State Grid Overseas Investment 2016 Ltd.3.50% 04/05/2027 USD 700,000 771,400 0.15
British Virgin Islands total 4,874,008 0.95
Cayman Islands (31 December 2019: 1.25%)Brazil Minas SPE via State of MinasGerais 5.33% 15/02/2028 USD 1,156,800 1,170,537 0.23Brazil Minas SPE via State of MinasGerais, 144A 5.33% 15/02/2028 USD 221,600 224,231 0.04KSA Sukuk Ltd. 3.63% 20/04/2027 USD 200,000 218,500 0.04KSA Sukuk Ltd. 4.30% 19/01/2029 USD 290,000 334,297 0.07KSA Sukuk Ltd. 2.97% 29/10/2029 USD 643,000 675,954 0.13Sharjah Sukuk Program Ltd. 4.23%14/03/2028 USD 772,000 832,313 0.16Three Gorges Finance I Cayman IslandsLtd. 3.15% 02/06/2026 USD 475,000 511,961 0.10
Cayman Islands total 3,967,793 0.77
Chile (31 December 2019: 0.70%)Corp. Nacional del Cobre de Chile 4.50%16/09/2025 USD 400,000 446,875 0.09Corp. Nacional del Cobre de Chile 3.63%01/08/2027 USD 714,000 764,203 0.15Corp. Nacional del Cobre de Chile, 144A3.63% 01/08/2027 USD 303,000 324,305 0.06Corp. Nacional del Cobre de Chile 3.00%30/09/2029 USD 827,000 851,293 0.17Corp. Nacional del Cobre de Chile 4.50%01/08/2047 USD 200,000 228,813 0.04Corp. Nacional del Cobre de Chile 4.38%05/02/2049 USD 1,046,000 1,179,365 0.23Corp. Nacional del Cobre de Chile, 144A4.38% 05/02/2049 USD 207,000 233,392 0.05
Corp. Nacional del Cobre de Chile 3.70%30/01/2050 USD 618,000 627,656 0.12Empresa de Transporte de PasajerosMetro SA 4.70% 07/05/2050 USD 200,000 228,400 0.04
Chile total 4,884,302 0.95
China (31 December 2019: 0.05%)China Minmetals Corp., FRN 3.75%31/12/2049 USD 600,000 605,438 0.12
China total 605,438 0.12
Hong Kong (31 December 2019: 0.37%)CNAC HK Finbridge Co. Ltd. 3.50%19/07/2022 USD 312,000 320,385 0.06CNAC HK Finbridge Co. Ltd. 4.13%19/07/2027 USD 385,000 416,883 0.08CNAC HK Finbridge Co. Ltd. 5.13%14/03/2028 USD 800,000 926,000 0.18
Hong Kong total 1,663,268 0.32
Indonesia (31 December 2019: 0.79%)Indonesia Asahan Aluminium Persero PT6.53% 15/11/2028 USD 307,000 362,260 0.07Pertamina Persero PT 4.30% 20/05/2023 USD 967,000 1,018,976 0.20Pertamina Persero PT 4.18% 21/01/2050 USD 793,000 795,490 0.15Perusahaan Perseroan Persero PTPerusahaan Listrik Negara 5.25%24/10/2042 USD 208,000 236,145 0.05Perusahaan Perseroan Persero PTPerusahaan Listrik Negara 6.15%21/05/2048 USD 460,000 572,988 0.11
Indonesia total 2,985,859 0.58
Ireland (31 December 2019: 0.20%)Vnesheconombank Via VEB Finance plc6.80% 22/11/2025 USD 760,000 904,875 0.18
Ireland total 904,875 0.18
Kazakhstan (31 December 2019: 0.88%)Development Bank of Kazakhstan JSC4.13% 10/12/2022 USD 395,000 411,787 0.08KazMunayGas National Co. JSC 4.75%19/04/2027 USD 200,000 217,063 0.04KazMunayGas National Co. JSC 5.38%24/04/2030 USD 677,000 765,010 0.15KazMunayGas National Co. JSC, 144A5.38% 24/04/2030 USD 268,000 302,840 0.06KazMunayGas National Co. JSC 5.75%19/04/2047 USD 1,169,000 1,361,885 0.26KazMunayGas National Co. JSC, 144A5.75% 19/04/2047 USD 740,000 862,100 0.17KazMunayGas National Co. JSC 6.38%24/10/2048 USD 200,000 252,438 0.05
Kazakhstan total 4,173,123 0.81
Malaysia (31 December 2019: 0.89%)Malaysia Sovereign Sukuk Bhd. 3.04%22/04/2025 USD 293,000 313,693 0.06Petronas Capital Ltd. 3.50% 18/03/2025 USD 830,000 904,441 0.18Petronas Capital Ltd. 4.50% 18/03/2045 USD 1,400,000 1,743,000 0.34Petronas Capital Ltd., 144A 4.50%18/03/2045 USD 200,000 249,000 0.05Petronas Capital Ltd. 4.55% 21/04/2050 USD 300,000 381,267 0.07
Malaysia total 3,591,401 0.70
Mexico (31 December 2019: 2.02%)Banco Nacional de Comercio Exterior SNC4.38% 14/10/2025 USD 200,000 206,250 0.04Comision Federal de Electricidad 4.88%15/01/2024 USD 200,000 210,625 0.04Mexico City Airport Trust 5.50%31/07/2047 USD 200,000 176,300 0.03Petroleos Mexicanos 4.88% 18/01/2024 USD 80,000 76,925 0.02Petroleos Mexicanos 4.50% 23/01/2026 USD 134,000 116,915 0.02Petroleos Mexicanos 6.88% 04/08/2026 USD 360,000 340,110 0.07Petroleos Mexicanos 6.49% 23/01/2027 USD 100,000 91,289 0.02Petroleos Mexicanos, 144A 6.49%23/01/2027 USD 50,000 45,644 0.01Petroleos Mexicanos 6.50% 13/03/2027 USD 128,000 115,994 0.02Petroleos Mexicanos 5.35% 12/02/2028 USD 991,000 830,210 0.16Petroleos Mexicanos 6.50% 23/01/2029 USD 1,964,000 1,706,520 0.33Petroleos Mexicanos 6.84% 23/01/2030 USD 240,000 210,262 0.04
JPMorgan ETFs (Ireland) ICAV - USD Emerging Markets Sovereign Bond UCITS ETFSchedule of InvestmentsAs at 30 June 2020
Investments Currency
Quantity/Nominal
Value
FairValue
USD
% ofNet
Assets Investments Currency
Quantity/Nominal
Value
FairValue
USD
% ofNet
Assets

Petroleos Mexicanos 5.95% 28/01/2031 USD 200,000 164,320 0.03Petroleos Mexicanos, 144A 5.95%28/01/2031 USD 895,000 735,332 0.14Petroleos Mexicanos 6.63% 15/06/2035 USD 1,171,000 948,634 0.18Petroleos Mexicanos 6.38% 23/01/2045 USD 100,000 74,219 0.02Petroleos Mexicanos 6.75% 21/09/2047 USD 277,000 212,667 0.04Petroleos Mexicanos 7.69% 23/01/2050 USD 100,000 83,425 0.02Petroleos Mexicanos, 144A 7.69%23/01/2050 USD 219,000 182,701 0.04Petroleos Mexicanos 6.95% 28/01/2060 USD 200,000 153,550 0.03Petroleos Mexicanos, 144A 6.95%28/01/2060 USD 632,000 485,218 0.09
Mexico total 7,167,110 1.39
Netherlands (31 December 2019: 0.41%)MDGH - GMTN BV 3.70% 07/11/2049 USD 1,055,000 1,115,992 0.22
Netherlands total 1,115,992 0.22
Pakistan (31 December 2019: 0.62%)Third Pakistan International Sukuk Co.Ltd. (The) 5.63% 05/12/2022 USD 3,000,000 2,919,375 0.57
Pakistan total 2,919,375 0.57
Peru (31 December 2019: 0.26%)Petroleos del Peru SA 4.75% 19/06/2032 USD 200,000 220,000 0.04Petroleos del Peru SA 5.63% 19/06/2047 USD 575,000 676,703 0.13
Peru total 896,703 0.17
Philippines (31 December 2019: 0.12%)Power Sector Assets & LiabilitiesManagement Corp. 7.39% 02/12/2024 USD 413,000 505,409 0.10
Philippines total 505,409 0.10
South Africa (31 December 2019: 0.90%)Eskom Holdings SOC Ltd. 6.75%06/08/2023 USD 965,000 911,925 0.18Eskom Holdings SOC Ltd., 144A 6.75%06/08/2023 USD 343,000 324,135 0.06Eskom Holdings SOC Ltd. 7.13%11/02/2025 USD 1,029,000 952,147 0.18Eskom Holdings SOC Ltd., 144A 7.13%11/02/2025 USD 493,000 456,179 0.09Eskom Holdings SOC Ltd. 6.35%10/08/2028 USD 1,292,000 1,287,962 0.25Eskom Holdings SOC Ltd., 144A 6.35%10/08/2028 USD 450,000 448,594 0.09
South Africa total 4,380,942 0.85
Turkey (31 December 2019: 0.54%)Hazine Mustesarligi Varlik Kiralama A/S5.00% 06/04/2023 USD 580,000 574,019 0.11Hazine Mustesarligi Varlik Kiralama A/S4.49% 25/11/2024 USD 745,000 710,078 0.14Hazine Mustesarligi Varlik Kiralama A/S,144A 4.49% 25/11/2024 USD 300,000 285,937 0.05
Turkey total 1,570,034 0.30
United Arab Emirates (31 December 2019: 0.20%)Abu Dhabi Crude Oil Pipeline LLC 4.60%02/11/2047 USD 678,000 803,642 0.16
United Arab Emirates total 803,642 0.16
Total investments in Corporate Debt Securities 63,731,497 12.39
Government Debt Securities (31 December 2019: 81.99%)
Azerbaijan (31 December 2019: 0.83%)Azerbaijan Government Bond 4.75%18/03/2024 USD 2,830,000 3,017,487 0.59Azerbaijan Government Bond 3.50%01/09/2032 USD 2,492,000 2,432,815 0.47
Azerbaijan total 5,450,302 1.06
Bahrain (31 December 2019: 2.72%)Bahrain Government Bond 6.13%05/07/2022 USD 1,000,000 1,043,125 0.20Bahrain Government Bond 6.13%01/08/2023 USD 1,750,000 1,850,625 0.36Bahrain Government Bond, 144A 6.13%01/08/2023 USD 1,062,000 1,123,065 0.22Bahrain Government Bond 7.00%26/01/2026 USD 2,590,000 2,879,756 0.56Bahrain Government Bond, 144A 7.00%26/01/2026 USD 333,000 370,254 0.07Bahrain Government Bond 7.00%12/10/2028 USD 1,850,000 2,063,906 0.40
Bahrain Government Bond, 144A 7.00%12/10/2028 USD 2,576,000 2,873,850 0.56Bahrain Government Bond 6.75%20/09/2029 USD 2,000,000 2,186,250 0.43Bahrain Government Bond, 144A 6.75%20/09/2029 USD 972,000 1,062,518 0.21Bahrain Government Bond 7.38%14/05/2030 USD 2,250,000 2,542,500 0.49Bahrain Government Bond 5.63%30/09/2031 USD 2,247,000 2,265,257 0.44Bahrain Government Bond, 144A 5.63%30/09/2031 USD 200,000 201,625 0.04Bahrain Government Bond 6.00%19/09/2044 USD 1,265,000 1,248,002 0.24Bahrain Government Bond, 144A 6.00%19/09/2044 USD 1,116,000 1,101,004 0.21
Bahrain total 22,811,737 4.43
Bolivia (31 December 2019: 0.29%)Bolivia Government Bond 4.50%20/03/2028 USD 1,795,000 1,525,750 0.30Bolivia Government Bond, 144A 4.50%20/03/2028 USD 455,000 386,750 0.07
Bolivia total 1,912,500 0.37
Brazil (31 December 2019: 5.95%)Banco Nacional de DesenvolvimentoEconomico e Social 5.75% 26/09/2023 USD 1,250,000 1,350,391 0.26Banco Nacional de DesenvolvimentoEconomico e Social, 144A 5.75%26/09/2023 USD 400,000 432,125 0.08Brazil Government Bond 2.63%05/01/2023 USD 2,257,000 2,308,488 0.45Brazil Government Bond 8.88%15/04/2024 USD 1,425,000 1,760,766 0.34Brazil Government Bond 4.25%07/01/2025 USD 5,144,000 5,425,312 1.05Brazil Government Bond 2.88%06/06/2025 USD 450,000 443,700 0.09Brazil Government Bond 6.00%07/04/2026 USD 1,977,000 2,241,424 0.44Brazil Government Bond 4.63%13/01/2028 USD 3,317,000 3,482,850 0.68Brazil Government Bond 4.50%30/05/2029 USD 3,620,000 3,722,944 0.72Brazil Government Bond 8.25%20/01/2034 USD 1,413,000 1,832,043 0.36Brazil Government Bond 7.13%20/01/2037 USD 1,600,000 1,923,500 0.37Brazil Government Bond 5.63%07/01/2041 USD 3,124,000 3,246,031 0.63Brazil Government Bond 5.00%27/01/2045 USD 2,935,000 2,820,352 0.55Brazil Government Bond 5.63%21/02/2047 USD 3,588,000 3,742,732 0.73Brazil Government Bond 4.75%14/01/2050 USD 3,164,000 2,991,957 0.58
Brazil total 37,724,615 7.33
Chile (31 December 2019: 0.58%)Chile Government Bond 3.24%06/02/2028 USD 1,027,000 1,129,058 0.22Chile Government Bond 2.45%31/01/2031 USD 450,000 467,213 0.09Chile Government Bond 3.86%21/06/2047 USD 741,000 877,390 0.17Chile Government Bond 3.50%25/01/2050 USD 1,105,000 1,244,506 0.24
Chile total 3,718,167 0.72
China (31 December 2019: 0.61%)China Government Bond 3.25%19/10/2023 USD 603,000 651,051 0.13China Government Bond 2.63%02/11/2027 USD 856,000 927,690 0.18China Government Bond 3.50%19/10/2028 USD 500,000 580,156 0.11China Government Bond 2.13%03/12/2029 USD 507,000 539,480 0.10Export-Import Bank of China (The) 2.88%26/04/2026 USD 611,000 657,398 0.13
China total 3,355,775 0.65
Colombia (31 December 2019: 2.27%)Colombia Government Bond 2.63%15/03/2023 USD 639,000 647,187 0.13Colombia Government Bond 4.00%26/02/2024 USD 400,000 421,500 0.08Colombia Government Bond 8.13%21/05/2024 USD 419,000 502,931 0.10
141
JPMorgan ETFs (Ireland) ICAV - USD Emerging Markets Sovereign Bond UCITS ETFSchedule of Investments (continued)As at 30 June 2020
Investments Currency
Quantity/Nominal
Value
FairValue
USD
% ofNet
Assets Investments Currency
Quantity/Nominal
Value
FairValue
USD
% ofNet
Assets

Colombia Government Bond 3.88%25/04/2027 USD 1,536,000 1,627,680 0.32Colombia Government Bond 4.50%15/03/2029 USD 679,000 743,081 0.14Colombia Government Bond 3.00%30/01/2030 USD 400,000 395,250 0.08Colombia Government Bond 7.38%18/09/2037 USD 349,000 478,828 0.09Colombia Government Bond 6.13%18/01/2041 USD 1,533,000 1,911,938 0.37Colombia Government Bond 5.63%26/02/2044 USD 550,000 660,550 0.13Colombia Government Bond 5.00%15/06/2045 USD 1,477,000 1,660,471 0.32Colombia Government Bond 5.20%15/05/2049 USD 663,000 776,373 0.15Colombia Government Bond 4.13%15/05/2051 USD 350,000 352,188 0.07
Colombia total 10,177,977 1.98
Croatia (31 December 2019: 0.45%)Croatia Government Bond 5.50%04/04/2023 USD 400,000 440,125 0.09Croatia Government Bond 6.00%26/01/2024 USD 1,043,000 1,193,257 0.23Croatia Government Bond, 144A 6.00%26/01/2024 USD 360,000 411,863 0.08
Croatia total 2,045,245 0.40
Dominican Republic (31 December 2019: 4.40%)Dominican Republic Government Bond5.88% 18/04/2024 USD 1,622,000 1,663,057 0.32Dominican Republic Government Bond,144A 5.88% 18/04/2024 USD 650,000 666,453 0.13Dominican Republic Government Bond5.50% 27/01/2025 USD 3,481,000 3,517,986 0.68Dominican Republic Government Bond6.88% 29/01/2026 USD 2,948,000 3,090,794 0.60Dominican Republic Government Bond,144A 6.88% 29/01/2026 USD 193,000 202,348 0.04Dominican Republic Government Bond5.95% 25/01/2027 USD 3,225,000 3,244,148 0.63Dominican Republic Government Bond6.00% 19/07/2028 USD 2,261,000 2,273,012 0.44Dominican Republic Government Bond,144A 6.00% 19/07/2028 USD 748,000 751,974 0.15Dominican Republic Government Bond4.50% 30/01/2030 USD 2,538,000 2,296,097 0.45Dominican Republic Government Bond7.45% 30/04/2044 USD 3,592,000 3,690,780 0.72Dominican Republic Government Bond,144A 7.45% 30/04/2044 USD 444,000 456,210 0.09Dominican Republic Government Bond6.85% 27/01/2045 USD 2,787,000 2,669,423 0.52Dominican Republic Government Bond,144A 6.85% 27/01/2045 USD 284,000 272,019 0.05Dominican Republic Government Bond6.50% 15/02/2048 USD 1,594,000 1,466,978 0.28Dominican Republic Government Bond,144A 6.50% 15/02/2048 USD 601,000 553,108 0.11Dominican Republic Government Bond6.40% 05/06/2049 USD 3,517,000 3,219,154 0.63Dominican Republic Government Bond5.88% 30/01/2060 USD 3,319,000 2,851,228 0.55
Dominican Republic total 32,884,769 6.39
Egypt (31 December 2019: 1.72%)Egypt Government Bond 5.58%21/02/2023 USD 2,600,000 2,656,062 0.52Egypt Government Bond 5.88%11/06/2025 USD 2,000,000 2,017,500 0.39Egypt Government Bond, 144A 5.88%11/06/2025 USD 764,000 770,685 0.15Egypt Government Bond 7.50%31/01/2027 USD 2,310,000 2,416,116 0.47Egypt Government Bond, 144A 7.50%31/01/2027 USD 305,000 319,011 0.06Egypt Government Bond 6.59%21/02/2028 USD 5,300,000 5,232,094 1.02Egypt Government Bond 7.60%01/03/2029 USD 2,603,000 2,650,179 0.52Egypt Government Bond 7.05%15/01/2032 USD 2,213,000 2,102,350 0.41Egypt Government Bond 7.63%29/05/2032 USD 1,000,000 976,563 0.19Egypt Government Bond 8.50%31/01/2047 USD 5,476,000 5,352,790 1.04Egypt Government Bond 7.90%21/02/2048 USD 1,350,000 1,248,328 0.24
Egypt Government Bond, 144A 7.90%21/02/2048 USD 744,000 687,967 0.13Egypt Government Bond 8.70%01/03/2049 USD 4,116,000 4,032,394 0.78Egypt Government Bond 8.88%29/05/2050 USD 1,200,000 1,185,000 0.23
Egypt total 31,647,039 6.15
Ethiopia (31 December 2019: 0.38%)Ethiopia Government Bond 6.63%11/12/2024 USD 2,212,000 2,207,161 0.43
Ethiopia total 2,207,161 0.43
Hungary (31 December 2019: 1.07%)Hungary Government Bond 5.38%21/02/2023 USD 668,000 732,504 0.14Hungary Government Bond 5.75%22/11/2023 USD 740,000 841,056 0.16Hungary Government Bond 5.38%25/03/2024 USD 1,526,000 1,732,010 0.34Hungary Government Bond 7.63%29/03/2041 USD 594,000 996,435 0.20
Hungary total 4,302,005 0.84
India (31 December 2019: 0.22%)Export-Import Bank of India 3.38%05/08/2026 USD 1,057,000 1,095,977 0.21Export-Import Bank of India 3.88%01/02/2028 USD 200,000 208,284 0.04Export-Import Bank of India 3.25%15/01/2030 USD 450,000 444,466 0.09
India total 1,748,727 0.34
Indonesia (31 December 2019: 2.53%)Indonesia Government Bond 3.38%15/04/2023 USD 296,000 308,302 0.06Indonesia Government Bond 5.88%15/01/2024 USD 100,000 113,281 0.02Indonesia Government Bond 4.75%08/01/2026 USD 1,229,000 1,386,082 0.27Indonesia Government Bond, 144A 4.75%08/01/2026 USD 280,000 315,787 0.06Indonesia Government Bond 3.50%11/01/2028 USD 504,000 536,445 0.10Indonesia Government Bond 4.10%24/04/2028 USD 611,000 677,637 0.13Indonesia Government Bond 2.85%14/02/2030 USD 635,000 646,906 0.13Indonesia Government Bond 8.50%12/10/2035 USD 130,000 202,759 0.04Indonesia Government Bond 6.63%17/02/2037 USD 103,000 141,046 0.03Indonesia Government Bond 7.75%17/01/2038 USD 913,000 1,372,924 0.27Indonesia Government Bond 4.63%15/04/2043 USD 948,000 1,086,645 0.21Indonesia Government Bond 6.75%15/01/2044 USD 253,000 368,798 0.07Indonesia Government Bond, 144A 6.75%15/01/2044 USD 350,000 510,195 0.10Indonesia Government Bond 5.13%15/01/2045 USD 200,000 244,020 0.05Indonesia Government Bond 5.95%08/01/2046 USD 227,000 308,829 0.06Indonesia Government Bond 4.35%11/01/2048 USD 490,000 551,250 0.11Indonesia Government Bond 4.45%15/04/2070 USD 462,000 528,990 0.10Perusahaan Penerbit SBSN Indonesia III3.30% 21/11/2022 USD 200,000 206,437 0.04Perusahaan Penerbit SBSN Indonesia III4.35% 10/09/2024 USD 451,000 490,886 0.09Perusahaan Penerbit SBSN Indonesia III,144A 4.35% 10/09/2024 USD 400,000 435,375 0.09Perusahaan Penerbit SBSN Indonesia III4.33% 28/05/2025 USD 200,000 219,500 0.04Perusahaan Penerbit SBSN Indonesia III4.40% 01/03/2028 USD 344,000 381,947 0.07Perusahaan Penerbit SBSN Indonesia III4.45% 20/02/2029 USD 300,000 336,188 0.07Perusahaan Penerbit SBSN Indonesia III,144A 4.45% 20/02/2029 USD 200,000 224,125 0.04
Indonesia total 11,594,354 2.25
Iraq (31 December 2019: 1.19%)Iraq Government Bond 6.75%09/03/2023 USD 2,994,000 2,760,094 0.54Iraq Government Bond 5.80%15/01/2028 USD 4,024,000 3,617,827 0.70
142
JPMorgan ETFs (Ireland) ICAV - USD Emerging Markets Sovereign Bond UCITS ETFSchedule of Investments (continued)As at 30 June 2020
Investments Currency
Quantity/Nominal
Value
FairValue
USD
% ofNet
Assets Investments Currency
Quantity/Nominal
Value
FairValue
USD
% ofNet
Assets

Iraq Government Bond, 144A 5.80%15/01/2028 USD 1,083,000 973,685 0.19
Iraq total 7,351,606 1.43
Ivory Coast (31 December 2019: 1.35%)Ivory Coast Government Bond 6.38%03/03/2028 USD 2,286,000 2,336,721 0.45Ivory Coast Government Bond, STEP5.75% 31/12/2032 USD 2,441,030 2,399,837 0.47Ivory Coast Government Bond 6.13%15/06/2033 USD 2,864,000 2,852,365 0.55
Ivory Coast total 7,588,923 1.47
Jamaica (31 December 2019: 1.93%)Jamaica Government Bond 6.75%28/04/2028 USD 211,000 237,639 0.05Jamaica Government Bond 8.00%15/03/2039 USD 729,000 899,176 0.17Jamaica Government Bond 7.88%28/07/2045 USD 200,000 244,250 0.05
Jamaica total 1,381,065 0.27
Jordan (31 December 2019: 1.00%)Jordan Government Bond 6.13%29/01/2026 USD 1,863,000 1,960,225 0.38Jordan Government Bond 5.75%31/01/2027 USD 2,260,000 2,338,394 0.45Jordan Government Bond, 144A 5.75%31/01/2027 USD 206,000 213,145 0.04Jordan Government Bond 7.38%10/10/2047 USD 2,085,000 2,144,944 0.42Jordan Government Bond, 144A 7.38%10/10/2047 USD 200,000 205,750 0.04
Jordan total 6,862,458 1.33
Kazakhstan (31 December 2019: 0.92%)Kazakhstan Government Bond 3.88%14/10/2024 USD 1,122,000 1,220,736 0.24Kazakhstan Government Bond 5.13%21/07/2025 USD 1,625,000 1,880,531 0.37Kazakhstan Government Bond 4.88%14/10/2044 USD 417,000 528,938 0.10Kazakhstan Government Bond 6.50%21/07/2045 USD 400,000 590,375 0.11Kazakhstan Government Bond, 144A6.50% 21/07/2045 USD 200,000 295,188 0.06
Kazakhstan total 4,515,768 0.88
Kenya (31 December 2019: 1.81%)Kenya Government Bond 6.88%24/06/2024 USD 4,408,000 4,469,988 0.87Kenya Government Bond 7.25%28/02/2028 USD 1,539,000 1,520,243 0.29Kenya Government Bond, 144A 7.25%28/02/2028 USD 815,000 805,067 0.16Kenya Government Bond 8.00%22/05/2032 USD 2,875,000 2,830,977 0.55Kenya Government Bond 8.25%28/02/2048 USD 1,649,000 1,624,780 0.31Kenya Government Bond, 144A 8.25%28/02/2048 USD 455,000 448,317 0.09
Kenya total 11,699,372 2.27
Kuwait (31 December 2019: 0.58%)Kuwait Government Bond 3.50%20/03/2027 USD 2,406,000 2,683,442 0.52
Kuwait total 2,683,442 0.52
Mexico (31 December 2019: 1.67%)Mexico Government Bond 4.00%02/10/2023 USD 647,000 688,853 0.13Mexico Government Bond 4.13%21/01/2026 USD 925,000 999,000 0.19Mexico Government Bond 4.15%28/03/2027 USD 910,000 976,430 0.19Mexico Government Bond 4.50%22/04/2029 USD 200,000 216,687 0.04Mexico Government Bond 3.25%16/04/2030 USD 200,000 198,300 0.04Mexico Government Bond 8.30%15/08/2031 USD 100,000 144,700 0.03Mexico Government Bond 4.75%27/04/2032 USD 200,000 220,300 0.04Mexico Government Bond 6.05%11/01/2040 USD 358,000 436,872 0.09
Mexico Government Bond 4.75%08/03/2044 USD 900,000 946,969 0.18Mexico Government Bond 5.55%21/01/2045 USD 817,000 960,996 0.19Mexico Government Bond 4.60%23/01/2046 USD 200,000 206,500 0.04Mexico Government Bond 4.35%15/01/2047 USD 1,231,000 1,231,000 0.24Mexico Government Bond 5.75%12/10/2110 USD 758,000 841,854 0.17
Mexico total 8,068,461 1.57
Mongolia (31 December 2019: 0.30%)Mongolia Government Bond 5.13%05/12/2022 USD 1,615,000 1,600,869 0.31Mongolia Government Bond, 144A 5.13%05/12/2022 USD 441,000 437,141 0.09
Mongolia total 2,038,010 0.40
Morocco (31 December 2019: 0.18%)Morocco Government Bond 4.25%11/12/2022 USD 729,000 768,184 0.15
Morocco total 768,184 0.15
Oman (31 December 2019: 4.01%)Oman Government Bond 4.13%17/01/2023 USD 2,624,000 2,573,160 0.50Oman Government Bond 4.75%15/06/2026 USD 3,355,000 3,102,327 0.60Oman Government Bond, 144A 4.75%15/06/2026 USD 1,042,000 963,524 0.19Oman Government Bond 5.38%08/03/2027 USD 3,457,000 3,215,010 0.63Oman Government Bond, 144A 5.38%08/03/2027 USD 473,000 439,890 0.09Oman Government Bond 5.63%17/01/2028 USD 4,208,000 3,923,960 0.76Oman Government Bond, 144A 5.63%17/01/2028 USD 514,000 479,305 0.09Oman Government Bond 6.00%01/08/2029 USD 4,097,000 3,817,892 0.74Oman Government Bond 6.50%08/03/2047 USD 3,720,000 3,206,175 0.62Oman Government Bond, 144A 6.50%08/03/2047 USD 408,000 351,645 0.07Oman Government Bond 6.75%17/01/2048 USD 3,901,000 3,360,955 0.65Oman Government Bond, 144A 6.75%17/01/2048 USD 887,000 764,206 0.15Oman Sovereign Sukuk SAOC 4.40%01/06/2024 USD 2,676,000 2,605,755 0.51Oman Sovereign Sukuk SAOC, 144A4.40% 01/06/2024 USD 485,000 472,269 0.09Oman Sovereign Sukuk SAOC 5.93%31/10/2025 USD 2,551,000 2,624,341 0.51Oman Sovereign Sukuk SAOC, 144A5.93% 31/10/2025 USD 601,000 618,279 0.12
Oman total 32,518,693 6.32
Pakistan (31 December 2019: 0.61%)Pakistan Government Bond 8.25%15/04/2024 USD 850,000 885,594 0.17Pakistan Government Bond, 144A 8.25%15/04/2024 USD 200,000 208,375 0.04Pakistan Government Bond 6.88%05/12/2027 USD 3,570,000 3,512,327 0.69Pakistan Government Bond, 144A 6.88%05/12/2027 USD 525,000 516,518 0.10
Pakistan total 5,122,814 1.00
Panama (31 December 2019: 1.41%)Panama Government Bond 3.75%16/03/2025 USD 377,000 408,338 0.08Panama Government Bond 3.88%17/03/2028 USD 1,588,000 1,784,516 0.35Panama Government Bond 3.16%23/01/2030 USD 870,000 936,881 0.18Panama Government Bond 6.70%26/01/2036 USD 1,320,000 1,899,562 0.37Panama Government Bond 4.50%16/04/2050 USD 800,000 976,750 0.19Panama Government Bond 4.30%29/04/2053 USD 2,347,000 2,806,132 0.54Panama Government Bond 4.50%01/04/2056 USD 400,000 491,000 0.10
Panama total 9,303,179 1.81
143
JPMorgan ETFs (Ireland) ICAV - USD Emerging Markets Sovereign Bond UCITS ETFSchedule of Investments (continued)As at 30 June 2020
Investments Currency
Quantity/Nominal
Value
FairValue
USD
% ofNet
Assets Investments Currency
Quantity/Nominal
Value
FairValue
USD
% ofNet
Assets

Peru (31 December 2019: 1.52%)Peru Government Bond 7.35%21/07/2025 USD 503,000 641,168 0.12Peru Government Bond 4.13%25/08/2027 USD 1,658,000 1,903,591 0.37Peru Government Bond 2.78%23/01/2031 USD 401,000 427,767 0.08Peru Government Bond 8.75%21/11/2033 USD 941,000 1,567,706 0.31Peru Government Bond 6.55%14/03/2037 USD 524,000 796,971 0.16Peru Government Bond 5.63%18/11/2050 USD 1,146,000 1,806,383 0.35
Peru total 7,143,586 1.39
Philippines (31 December 2019: 2.27%)Philippines Government Bond 4.20%21/01/2024 USD 655,000 712,722 0.14Philippines Government Bond 10.63%16/03/2025 USD 206,000 288,271 0.06Philippines Government Bond 5.50%30/03/2026 USD 1,055,000 1,266,659 0.25Philippines Government Bond 3.00%01/02/2028 USD 450,000 485,334 0.09Philippines Government Bond 3.75%14/01/2029 USD 684,000 781,043 0.15Philippines Government Bond 2.46%05/05/2030 USD 600,000 630,000 0.12Philippines Government Bond 7.75%14/01/2031 USD 100,000 149,563 0.03Philippines Government Bond 6.38%15/01/2032 USD 896,000 1,236,760 0.24Philippines Government Bond 6.38%23/10/2034 USD 1,503,000 2,162,911 0.42Philippines Government Bond 3.95%20/01/2040 USD 1,013,000 1,177,296 0.23Philippines Government Bond 3.70%02/02/2042 USD 903,000 1,034,499 0.20Philippines Government Bond 2.95%05/05/2045 USD 500,000 518,750 0.10
Philippines total 10,443,808 2.03
Poland (31 December 2019: 1.14%)Poland Government Bond 3.00%17/03/2023 USD 1,815,000 1,918,795 0.37Poland Government Bond 3.25%06/04/2026 USD 1,153,000 1,294,963 0.25
Poland total 3,213,758 0.62
Qatar (31 December 2019: 2.58%)Qatar Government Bond 3.88%23/04/2023 USD 200,000 214,750 0.04Qatar Government Bond, 144A 3.88%23/04/2023 USD 827,000 887,991 0.17Qatar Government Bond 3.38%14/03/2024 USD 763,000 816,887 0.16Qatar Government Bond 3.25%02/06/2026 USD 782,000 848,470 0.17Qatar Government Bond 4.50%23/04/2028 USD 450,000 530,438 0.10Qatar Government Bond 4.00%14/03/2029 USD 1,706,000 1,961,900 0.38Qatar Government Bond 3.75%16/04/2030 USD 450,000 513,422 0.10Qatar Government Bond 9.75%15/06/2030 USD 100,000 165,844 0.03Qatar Government Bond, 144A 9.75%15/06/2030 USD 161,000 267,008 0.05Qatar Government Bond 6.40%20/01/2040 USD 100,000 151,781 0.03Qatar Government Bond 5.75%20/01/2042 USD 212,000 304,286 0.06Qatar Government Bond 4.63%02/06/2046 USD 276,000 355,609 0.07Qatar Government Bond 5.10%23/04/2048 USD 850,000 1,155,734 0.23Qatar Government Bond, 144A 5.10%23/04/2048 USD 1,215,000 1,652,020 0.32Qatar Government Bond 4.82%14/03/2049 USD 1,056,000 1,390,620 0.27Qatar Government Bond, 144A 4.82%14/03/2049 USD 404,000 532,018 0.11Qatar Government Bond 4.40%16/04/2050 USD 300,000 371,625 0.07
Qatar total 12,120,403 2.36
Romania (31 December 2019: 0.94%)Romania Government Bond 4.38%22/08/2023 USD 1,070,000 1,138,213 0.23Romania Government Bond, 144A 4.38%22/08/2023 USD 114,000 121,267 0.02Romania Government Bond 4.88%22/01/2024 USD 282,000 306,322 0.06Romania Government Bond 6.13%22/01/2044 USD 100,000 131,094 0.02Romania Government Bond 5.13%15/06/2048 USD 1,172,000 1,384,425 0.27
Romania total 3,081,321 0.60
Russia (31 December 2019: 2.51%)Russian Foreign Bond - Eurobond 4.50%04/04/2022 USD 200,000 211,375 0.04Russian Foreign Bond - Eurobond 4.88%16/09/2023 USD 400,000 444,375 0.09Russian Foreign Bond - Eurobond, 144A4.88% 16/09/2023 USD 400,000 444,375 0.09Russian Foreign Bond - Eurobond 4.25%23/06/2027 USD 600,000 669,600 0.13Russian Foreign Bond - Eurobond, 144A4.25% 23/06/2027 USD 200,000 223,200 0.04Russian Foreign Bond - Eurobond 12.75%24/06/2028 USD 556,000 956,320 0.19Russian Foreign Bond - Eurobond 4.38%21/03/2029 USD 2,200,000 2,497,000 0.49Russian Foreign Bond - Eurobond, STEP7.50% 31/03/2030 USD 1,040,045 1,199,691 0.24Russian Foreign Bond - Eurobond 5.63%04/04/2042 USD 800,000 1,084,750 0.21Russian Foreign Bond - Eurobond 5.88%16/09/2043 USD 200,000 281,375 0.05Russian Foreign Bond - Eurobond, 144A5.88% 16/09/2043 USD 200,000 281,375 0.05Russian Foreign Bond - Eurobond 5.25%23/06/2047 USD 1,600,000 2,113,600 0.41Russian Foreign Bond - Eurobond, 144A5.25% 23/06/2047 USD 600,000 792,600 0.15
Russia total 11,199,636 2.18
Saudi Arabia (31 December 2019: 2.14%)Saudi Government Bond 2.88%04/03/2023 USD 200,000 208,850 0.04Saudi Government Bond, 144A 2.88%04/03/2023 USD 235,000 245,399 0.05Saudi Government Bond 4.00%17/04/2025 USD 850,000 942,225 0.18Saudi Government Bond 3.25%26/10/2026 USD 1,723,000 1,860,840 0.36Saudi Government Bond 2.50%03/02/2027 USD 400,000 411,000 0.08Saudi Government Bond 3.63%04/03/2028 USD 1,150,000 1,264,281 0.25Saudi Government Bond 4.38%16/04/2029 USD 598,000 696,483 0.13Saudi Government Bond 4.50%17/04/2030 USD 1,171,000 1,380,609 0.27Saudi Government Bond 4.50%26/10/2046 USD 1,480,000 1,700,520 0.33Saudi Government Bond, 144A 4.50%26/10/2046 USD 538,000 618,162 0.12Saudi Government Bond 5.00%17/04/2049 USD 400,000 496,000 0.10Saudi Government Bond, 144A 5.00%17/04/2049 USD 200,000 248,000 0.05Saudi Government Bond 5.25%16/01/2050 USD 571,000 734,092 0.14Saudi Government Bond 3.75%21/01/2055 USD 1,100,000 1,119,938 0.22
Saudi Arabia total 11,926,399 2.32
South Africa (31 December 2019: 4.09%)South Africa Government Bond 4.67%17/01/2024 USD 3,006,000 3,065,181 0.60South Africa Government Bond 5.88%16/09/2025 USD 2,143,000 2,268,231 0.44South Africa Government Bond 4.88%14/04/2026 USD 1,572,000 1,568,070 0.30South Africa Government Bond 4.85%27/09/2027 USD 1,492,000 1,456,565 0.28South Africa Government Bond 4.30%12/10/2028 USD 2,277,000 2,114,764 0.41South Africa Government Bond 4.85%30/09/2029 USD 1,350,000 1,272,375 0.25South Africa Government Bond 5.88%22/06/2030 USD 4,050,000 4,105,688 0.80
144
JPMorgan ETFs (Ireland) ICAV - USD Emerging Markets Sovereign Bond UCITS ETFSchedule of Investments (continued)As at 30 June 2020
Investments Currency
Quantity/Nominal
Value
FairValue
USD
% ofNet
Assets Investments Currency
Quantity/Nominal
Value
FairValue
USD
% ofNet
Assets

South Africa Government Bond 5.38%24/07/2044 USD 1,044,000 910,564 0.18South Africa Government Bond 5.00%12/10/2046 USD 2,091,000 1,716,580 0.33South Africa Government Bond 5.65%27/09/2047 USD 1,638,000 1,418,917 0.28South Africa Government Bond 5.75%30/09/2049 USD 4,319,000 3,733,236 0.72
South Africa total 23,630,171 4.59
Trinidad and Tobago (31 December 2019: 0.36%)Trinidad and Tobago Government Bond4.50% 04/08/2026 USD 1,637,000 1,658,486 0.32Trinidad and Tobago Government Bond,144A 4.50% 04/08/2026 USD 420,000 425,512 0.09
Trinidad and Tobago total 2,083,998 0.41
Tunisia (31 December 2019: 0.29%)Banque Centrale de Tunisie InternationalBond 5.75% 30/01/2025 USD 2,183,000 2,022,686 0.39
Tunisia total 2,022,686 0.39
Turkey (31 December 2019: 6.56%)Turkey Government Bond 6.25%26/09/2022 USD 1,925,000 1,949,062 0.38Turkey Government Bond 3.25%23/03/2023 USD 1,511,000 1,428,367 0.28Turkey Government Bond 7.25%23/12/2023 USD 1,569,000 1,629,308 0.32Turkey Government Bond 5.75%22/03/2024 USD 1,185,000 1,177,594 0.23Turkey Government Bond 6.35%10/08/2024 USD 2,400,000 2,427,750 0.47Turkey Government Bond 5.60%14/11/2024 USD 450,000 443,109 0.09Turkey Government Bond 7.38%05/02/2025 USD 1,465,000 1,542,828 0.30Turkey Government Bond 4.25%13/03/2025 USD 250,000 232,969 0.05Turkey Government Bond 4.25%14/04/2026 USD 2,442,000 2,222,983 0.43Turkey Government Bond 4.88%09/10/2026 USD 1,057,000 980,698 0.19Turkey Government Bond 6.00%25/03/2027 USD 3,421,000 3,334,406 0.65Turkey Government Bond 5.13%17/02/2028 USD 2,958,000 2,728,755 0.53Turkey Government Bond 6.13%24/10/2028 USD 1,507,000 1,464,616 0.28Turkey Government Bond 7.63%26/04/2029 USD 1,217,000 1,279,371 0.25Turkey Government Bond 11.88%15/01/2030 USD 1,330,000 1,802,150 0.35Turkey Government Bond 5.25%13/03/2030 USD 1,182,000 1,058,259 0.21Turkey Government Bond 8.00%14/02/2034 USD 1,213,000 1,311,556 0.25Turkey Government Bond 6.88%17/03/2036 USD 1,438,000 1,398,455 0.27Turkey Government Bond 7.25%05/03/2038 USD 1,750,000 1,754,375 0.34Turkey Government Bond 6.75%30/05/2040 USD 377,000 355,558 0.07Turkey Government Bond 6.00%14/01/2041 USD 2,397,000 2,069,660 0.40Turkey Government Bond 4.88%16/04/2043 USD 2,110,000 1,630,635 0.31Turkey Government Bond 6.63%17/02/2045 USD 1,745,000 1,574,863 0.31Turkey Government Bond 5.75%11/05/2047 USD 2,452,000 2,007,575 0.39
Turkey total 37,804,902 7.35
Ukraine (31 December 2019: 4.32%)Ukraine Government Bond 7.75%01/09/2022 USD 2,967,000 3,093,098 0.60Ukraine Government Bond, 144A 7.75%01/09/2022 USD 675,000 703,687 0.14Ukraine Government Bond 7.75%01/09/2023 USD 2,565,000 2,686,838 0.52Ukraine Government Bond, 144A 7.75%01/09/2023 USD 209,000 218,927 0.04Ukraine Government Bond 7.75%01/09/2024 USD 2,282,000 2,378,985 0.46Ukraine Government Bond 7.75%01/09/2025 USD 1,941,000 2,023,493 0.39Ukraine Government Bond 7.75%01/09/2026 USD 2,196,000 2,289,330 0.44Ukraine Government Bond, 144A 7.75%01/09/2026 USD 669,000 697,432 0.14
Ukraine Government Bond 7.75%01/09/2027 USD 5,330,000 5,544,866 1.08Ukraine Government Bond, 144A 7.75%01/09/2027 USD 490,000 509,753 0.10Ukraine Government Bond 9.75%01/11/2028 USD 2,424,000 2,769,420 0.54Ukraine Government Bond, 144A 9.75%01/11/2028 USD 421,000 480,993 0.09Ukraine Government Bond 7.38%25/09/2032 USD 5,686,000 5,710,876 1.11Ukraine Government Bond, 144A 7.38%25/09/2032 USD 545,000 547,384 0.11
Ukraine total 29,655,082 5.76
United Arab Emirates (31 December 2019: 1.40%)Abu Dhabi Government Bond 2.50%11/10/2022 USD 800,000 828,000 0.16Abu Dhabi Government Bond, 144A2.50% 11/10/2022 USD 390,000 403,650 0.08Abu Dhabi Government Bond 3.13%03/05/2026 USD 1,815,000 1,972,678 0.38Abu Dhabi Government Bond 3.13%11/10/2027 USD 1,150,000 1,256,375 0.24Abu Dhabi Government Bond 2.50%30/09/2029 USD 450,000 471,375 0.09Abu Dhabi Government Bond, 144A2.50% 30/09/2029 USD 570,000 597,075 0.12Abu Dhabi Government Bond 4.13%11/10/2047 USD 827,000 1,007,906 0.20Abu Dhabi Government Bond 3.13%30/09/2049 USD 602,000 626,833 0.12Abu Dhabi Government Bond, 144A3.13% 30/09/2049 USD 328,000 341,530 0.07
United Arab Emirates total 7,505,422 1.46
Uruguay (31 December 2019: 1.60%)Uruguay Government Bond 4.38%27/10/2027 USD 1,315,000 1,504,853 0.29Uruguay Government Bond 4.38%23/01/2031 USD 908,000 1,060,658 0.21Uruguay Government Bond 7.63%21/03/2036 USD 426,000 645,922 0.12Uruguay Government Bond 5.10%18/06/2050 USD 2,422,028 3,122,902 0.61Uruguay Government Bond 4.98%20/04/2055 USD 1,047,000 1,337,870 0.26
Uruguay total 7,672,205 1.49
Vietnam (31 December 2019: 0.37%)Vietnam Government Bond 4.80%19/11/2024 USD 2,193,000 2,389,763 0.46
Vietnam total 2,389,763 0.46
Total investments in Government Debt Securities 443,375,488 86.17
Total Bonds 507,106,985 98.56
145
JPMorgan ETFs (Ireland) ICAV - USD Emerging Markets Sovereign Bond UCITS ETFSchedule of Investments (continued)As at 30 June 2020
Investments Currency
Quantity/Nominal
Value
FairValue
USD
% ofNet
Assets Investments Currency
Quantity/Nominal
Value
FairValue
USD
% ofNet
Assets

JPMorgan ETFs (Ireland) ICAV - USD Emerging Markets Sovereign Bond UCITS ETF
Schedule of Investments (continued)
As at 30 June 2020
Forward Currency Contracts
CurrencyPurchased
AmountPurchased Currency Sold Amount Sold
MaturityDate Counterparty
FairValue
USD
% ofNet
Assets
Class CHF Hedged (acc)*CHF 4,208 USD 4,440 02/07/2020 Citibank NA 1 -CHF 280,947 USD 293,797 02/07/2020 Goldman Sachs 2,701 -CHF 289,278 USD 303,824 02/07/2020 Goldman Sachs 1,467 -CHF 12,195,118 USD 12,607,638 02/07/2020 Standard Chartered 262,520 0.05CHF 135,899 USD 140,867 02/07/2020 Standard Chartered 2,555 -CHF 144,319 USD 150,089 02/07/2020 Standard Chartered 2,218 -CHF 145,790 USD 151,729 02/07/2020 Standard Chartered 2,131 -CHF 4,722 USD 4,941 02/07/2020 Standard Chartered 42 -CHF 197,682 USD 206,974 02/07/2020 State Street 1,651 -USD 13,215,513 CHF 12,501,529 02/07/2020 Barclays 21,983 0.01
Class EUR Hedged (acc)*EUR 238,530,320 USD 262,853,257 02/07/2020 Bank of America Merrill Lynch 5,052,080 0.98EUR 2,646,214 USD 2,904,326 02/07/2020 BNP Paribas 67,770 0.01EUR 2,851,328 USD 3,198,133 02/07/2020 BNP Paribas 4,336 -EUR 2,832,658 USD 3,175,696 02/07/2020 State Street 5,804 -USD 7,507,834 EUR 6,608,980 02/07/2020 Goldman Sachs 84,958 0.02USD 4,536,984 EUR 3,993,807 02/07/2020 Goldman Sachs 51,340 0.01USD 4,687,430 EUR 4,135,429 02/07/2020 Goldman Sachs 42,723 0.01USD 2,630,860 EUR 2,324,350 02/07/2020 Goldman Sachs 20,266 0.01USD 19,211 EUR 17,000 02/07/2020 Goldman Sachs 117 -USD 39,409 EUR 34,704 02/07/2020 State Street 431 -USD 304,264,904 EUR 270,154,159 02/07/2020 Toronto-Dominion Bank 841,252 0.16
Class GBP Hedged (dist)*GBP 28,768 USD 35,104 02/07/2020 Barclays 441 -GBP 1,828,147 USD 2,244,109 02/07/2020 Toronto-Dominion Bank 14,751 -USD 987,992 GBP 797,985 02/07/2020 Barclays 2,001 -USD 13,075 GBP 10,381 02/07/2020 Barclays 248 -USD 1,122,879 GBP 880,285 02/07/2020 Goldman Sachs 35,198 0.01USD 299,644 GBP 237,650 02/07/2020 Goldman Sachs 6,003 -USD 1,275 GBP 1,005 02/07/2020 Goldman Sachs 33 -
Class MXN Hedged (acc)*USD 237,379 MXN 5,459,294 02/07/2020 Goldman Sachs 1,117 -USD 2,449 MXN 55,534 02/07/2020 Standard Chartered 45 -
Total unrealised gain on Forward Currency Contracts (31 December 2019: 1.28%) 6,528,183 1.27
GBP 2,821 USD 3,569 06/07/2020 Citibank NA (83) -
Class CHF Hedged (acc)*CHF 12,501,529 USD 13,227,922 04/08/2020 Barclays (20,914) (0.01)USD 137,303 CHF 130,858 02/07/2020 Goldman Sachs (799) -USD 806,294 CHF 765,576 02/07/2020 Goldman Sachs (1,659) -
Class EUR Hedged (acc)*EUR 3,796,765 USD 4,277,663 02/07/2020 Credit Suisse (13,327) -EUR 3,566,243 USD 4,025,754 02/07/2020 Goldman Sachs (20,327) (0.01)EUR 4,720,700 USD 5,362,739 02/07/2020 Goldman Sachs (60,684) (0.01)EUR 28,324,200 USD 32,177,339 02/07/2020 Goldman Sachs (365,013) (0.07)EUR 270,154,159 USD 304,480,217 04/08/2020 Toronto-Dominion Bank (826,015) (0.16)
Class GBP Hedged (dist)*GBP 21,830 USD 27,353 02/07/2020 Barclays (380) -GBP 22,846 USD 28,748 02/07/2020 Barclays (519) -GBP 25,715 USD 32,599 02/07/2020 Barclays (825) -GBP 797,985 USD 988,170 04/08/2020 Barclays (1,958) -
Class MXN Hedged (acc)*MXN 44,765 USD 2,045 02/07/2020 Goldman Sachs (108) -MXN 5,409,800 USD 249,523 02/07/2020 Goldman Sachs (15,403) -MXN 5,459,294 USD 236,334 04/08/2020 Goldman Sachs (1,177) -MXN 60,263 USD 2,790 02/07/2020 Standard Chartered (182) -
Total unrealised loss on Forward Currency Contracts (31 December 2019: (0.20)%) (1,329,373) (0.26)
*Contracts entered into for share class currency hedging purpose.
146

JPMorgan ETFs (Ireland) ICAV - USD Emerging Markets Sovereign Bond UCITS ETF
Schedule of Investments (continued)
As at 30 June 2020
FairValue
USD
% ofNet
Assets
Total financial assets at fair value through profit or loss 513,635,168 99.83Total financial liabilities at fair value through profit or loss (1,329,373) (0.26)Cash 440,589 0.09
Cash equivalents
Currency
Quantity/Nominal
ValueUndertaking for collective investment schemes (31 December 2019: 0.31%)JPMorgan Liquidity Funds - USD Liquidity LVNAV Fund - Class X (dist.)1 USD 2,114,561 2,114,561 0.41
Total Cash equivalents 2,114,561 0.41Other assets and liabilities (347,369) (0.07)
Net asset value attributable to holders of redeemable participating shares 514,513,576 100.00
Analysis of total assets
% ofTotal
Assets
Transferable securities and money market instruments admitted to official stock exchange listing 91.89Transferable securities and money market instruments dealt in on another regulated market 3.08Transferable securities and money market instruments other than those admitted to an official stock exchange listing or dealt in on another regulated market 0.69Collective investment schemes 0.40OTC financial derivative instruments 1.23Other assets 2.71
Total Assets 100.00
1A related party to the Fund.
147

148
Bonds
Asset-Backed Securities (31 December 2019: 7.90%)
Cayman Islands (31 December 2019: 6.08%)CIFC Funding 2012-II-R Ltd. ‘A1’, FRN1.94% 20/01/2028 USD 990,382 977,231 0.61Galaxy XX CLO Ltd. ‘X’, FRN 1.74%20/04/2031 USD 166,667 166,643 0.10GoldenTree Loan Opportunities IX Ltd.‘XR2’, FRN 1.44% 29/10/2029 USD 126,506 126,503 0.08LCM XVII LP ‘XR’, FRN 1.82% 15/10/2031 USD 125,000 124,985 0.08Neuberger Berman CLO XIX Ltd. ‘A1R2’,FRN 2.02% 15/07/2027 USD 657,754 650,939 0.40OCP CLO 2015-9 Ltd. ‘A1R’, FRN 2.02%15/07/2027 USD 715,870 711,031 0.44Octagon Investment Partners 28 Ltd.‘XR’, FRN 1.67% 24/10/2030 USD 128,333 128,331 0.08Shackleton 2014-VI-R CLO Ltd. ‘A’, FRN2.15% 17/07/2028 USD 737,203 727,076 0.45Shackleton 2015-VIII CLO Ltd. ‘A1R’, FRN2.06% 20/10/2027 USD 569,299 562,891 0.35Voya CLO 2015-2 Ltd. ‘AR’, FRN 2.01%23/07/2027 USD 1,020,000 1,006,543 0.62
Cayman Islands total 5,182,173 3.21
United States (31 December 2019: 1.82%)Americredit Automobile ReceivablesTrust 2018-3 ‘A2A’ 3.11% 18/01/2022 USD 3,720 3,720 0.00Ford Credit Auto Owner Trust 2016-REV1‘A’ 2.31% 15/08/2027 USD 859,000 866,971 0.54Verizon Owner Trust 2018-1 ‘A1A’ 2.82%20/09/2022 USD 737,123 743,570 0.46
United States total 1,614,261 1.00
Total investments in Asset-Backed Securities 6,796,434 4.21
Corporate Debt Securities (31 December 2019: 79.08%)
Australia (31 December 2019: 3.47%)Australia & New Zealand Banking GroupLtd., FRN 0.77% 09/11/2020 USD 500,000 500,404 0.31Macquarie Bank Ltd. 2.85% 15/01/2021 USD 397,000 401,659 0.25Macquarie Bank Ltd., FRN 0.95%06/08/2021 USD 1,686,000 1,688,492 1.05Macquarie Bank Ltd. 2.30% 22/01/2025 USD 166,000 173,834 0.11National Australia Bank Ltd., FRN 1.27%04/11/2021 USD 600,000 604,508 0.37Scentre Group Trust 1 / Scentre GroupTrust 2 2.38% 28/04/2021 USD 1,400,000 1,406,593 0.87
Australia total 4,775,490 2.96
British Virgin Islands (31 December 2019: 0.22%)Eastern Creation II Investment HoldingsLtd. 2.75% 26/09/2020 USD 1,700,000 1,703,145 1.05
British Virgin Islands total 1,703,145 1.05
Canada (31 December 2019: 2.01%)Bank of Montreal, FRN 0.71% 10/09/2021 USD 854,000 856,260 0.53Bank of Montreal, FRN 0.85%26/03/2022 USD 1,000,000 1,004,646 0.62Bank of Nova Scotia (The) 3.40%11/02/2024 USD 894,000 969,167 0.60Bank of Nova Scotia (The) 1.30%11/06/2025 USD 400,000 402,679 0.25Brookfield Asset Management, Inc.4.00% 15/01/2025 USD 400,000 440,448 0.27Canadian Imperial Bank of Commerce0.95% 23/06/2023 USD 148,000 148,498 0.09Canadian Imperial Bank of Commerce,FRN 2.61% 22/07/2023 USD 1,800,000 1,860,540 1.16Federation des Caisses Desjardins duQuebec 2.05% 10/02/2025 USD 200,000 205,815 0.13National Bank of Canada, FRN 0.71%21/03/2021 USD 1,100,000 1,100,374 0.68National Bank of Canada 2.15%07/10/2022 USD 250,000 256,946 0.16Rogers Communications, Inc., FRN 0.91%22/03/2022 USD 881,000 885,110 0.55Toronto-Dominion Bank (The), FRN0.54% 27/01/2023 USD 791,000 785,905 0.49Toronto-Dominion Bank (The) 0.75%12/06/2023 USD 485,000 487,787 0.30Toronto-Dominion Bank (The) 1.15%12/06/2025 USD 300,000 303,596 0.19
Canada total 9,707,771 6.02
Cayman Islands (31 December 2019: 0.33%)Avolon Holdings Funding Ltd. 3.63%01/05/2022 USD 433,000 408,165 0.25
Cayman Islands total 408,165 0.25
Curacao (31 December 2019: 0.00%)First Abu Dhabi Bank USA NV, FRN 1.31%21/01/2021 USD 407,000 406,888 0.25
Curacao total 406,888 0.25
Finland (31 December 2019: 1.15%)Nordea Bank Abp 4.88% 14/01/2021 USD 200,000 204,752 0.13Nordea Bank Abp, FRN 1.12% 28/01/2022 USD 1,199,000 1,196,751 0.74Nordea Bank Abp 1.00% 09/06/2023 USD 200,000 201,943 0.12Nordea Bank Abp 3.75% 30/08/2023 USD 600,000 643,341 0.40
Finland total 2,246,787 1.39
France (31 December 2019: 5.69%)Banque Federative du Credit Mutuel SA1.96% 21/07/2021 USD 293,000 297,678 0.18Banque Federative du Credit Mutuel SA3.75% 20/07/2023 USD 383,000 413,956 0.26Banque Federative du Credit Mutuel SA2.38% 21/11/2024 USD 800,000 843,112 0.52BNP Paribas SA 5.00% 15/01/2021 USD 735,000 752,759 0.47BNP Paribas SA, FRN 0.86% 07/08/2021 USD 822,000 823,881 0.51BNP Paribas SA 3.50% 01/03/2023 USD 452,000 478,430 0.30BNP Paribas SA, FRN 4.71% 10/01/2025 USD 290,000 320,974 0.20BPCE SA, FRN 1.61% 14/01/2022 USD 2,498,000 2,485,950 1.54Credit Agricole Corporate & InvestmentBank, FRN 0.64% 09/08/2021 USD 822,000 822,091 0.51Credit Agricole Corporate & InvestmentBank SA, FRN 2.06% 03/10/2021 USD 2,000,000 2,002,458 1.24Societe Generale SA 2.63% 16/09/2020 USD 1,213,000 1,218,687 0.76Societe Generale SA 2.50% 08/04/2021 USD 343,000 346,601 0.21
France total 10,806,577 6.70
Guernsey (31 December 2019: 0.48%)Credit Suisse Group Funding GuernseyLtd. 3.13% 10/12/2020 USD 1,069,000 1,081,248 0.67Credit Suisse Group Funding GuernseyLtd., FRN 3.43% 16/04/2021 USD 250,000 253,896 0.16
Guernsey total 1,335,144 0.83
Ireland (31 December 2019: 0.00%)Shire Acquisitions Investments IrelandDAC 2.40% 23/09/2021 USD 172,000 175,350 0.11
Ireland total 175,350 0.11
Japan (31 December 2019: 2.64%)Mitsubishi UFJ Financial Group, Inc.2.95% 01/03/2021 USD 291,000 295,676 0.18Mitsubishi UFJ Financial Group, Inc.2.62% 18/07/2022 USD 1,511,000 1,569,444 0.97Mitsubishi UFJ Financial Group, Inc.2.67% 25/07/2022 USD 197,000 204,770 0.13Mizuho Financial Group, Inc., FRN 1.31%28/02/2022 USD 200,000 201,247 0.12Mizuho Financial Group, Inc. 2.60%11/09/2022 USD 200,000 207,832 0.13Mizuho Financial Group, Inc., FRN 2.72%16/07/2023 USD 1,296,000 1,339,622 0.83Sumitomo Mitsui Banking Corp., FRN0.68% 22/11/2021 USD 1,020,000 1,019,574 0.63Sumitomo Mitsui Financial Group, Inc.,FRN 2.42% 14/07/2021 USD 300,000 302,332 0.19Sumitomo Mitsui Financial Group, Inc.2.44% 19/10/2021 USD 1,177,000 1,205,424 0.75Sumitomo Mitsui Financial Group, Inc.,FRN 2.28% 11/01/2022 USD 860,000 864,085 0.54
Japan total 7,210,006 4.47
Luxembourg (31 December 2019: 0.00%)DH Europe Finance II Sarl 2.05%15/11/2022 USD 250,000 258,193 0.16DH Europe Finance II Sarl 2.20%15/11/2024 USD 900,000 945,920 0.59
Luxembourg total 1,204,113 0.75
Netherlands (31 December 2019: 2.60%)ABN AMRO Bank NV, FRN 1.55%19/01/2021 USD 750,000 751,399 0.47Cooperatieve Rabobank UA 4.50%11/01/2021 USD 365,000 373,138 0.23
JPMorgan ETFs (Ireland) ICAV - USD Ultra-Short Income UCITS ETFSchedule of InvestmentsAs at 30 June 2020
Investments Currency
Quantity/Nominal
Value
FairValue
USD
% ofNet
Assets Investments Currency
Quantity/Nominal
Value
FairValue
USD
% ofNet
Assets

ING Groep NV, FRN 1.46% 29/03/2022 USD 856,000 862,192 0.53
Netherlands total 1,986,729 1.23
New Zealand (31 December 2019: 1.24%)ANZ New Zealand Int’l Ltd. 2.85%06/08/2020 USD 671,000 672,606 0.42BNZ International Funding Ltd., FRN1.29% 14/09/2021 USD 250,000 251,526 0.15
New Zealand total 924,132 0.57
Norway (31 December 2019: 1.13%)DNB Bank ASA 2.13% 02/10/2020 USD 1,598,000 1,605,171 0.99DNB Bank ASA 2.38% 02/06/2021 USD 587,000 597,729 0.37
Norway total 2,202,900 1.36
Singapore (31 December 2019: 0.98%)BOC Aviation Ltd., 144A, FRN 1.61%02/05/2021, USD 1,253,000 1,241,335 0.77BOC Aviation Ltd., FRN 1.61% 02/05/2021 USD 320,000 317,021 0.20BOC Aviation Ltd. 2.38% 15/09/2021 USD 1,200,000 1,199,484 0.74DBS Group Holdings Ltd. 2.85%16/04/2022 USD 683,000 707,223 0.44
Singapore total 3,465,063 2.15
Sweden (31 December 2019: 1.50%)Svenska Handelsbanken AB 0.63%30/06/2023 USD 704,000 703,457 0.44
Sweden total 703,457 0.44
Switzerland (31 December 2019: 1.59%)Credit Suisse AG 2.80% 08/04/2022 USD 264,000 273,892 0.17Credit Suisse AG 1.00% 05/05/2023 USD 418,000 420,272 0.26UBS AG 2.45% 01/12/2020 USD 729,000 733,667 0.46UBS AG 1.75% 21/04/2022 USD 767,000 781,666 0.48UBS Group AG 3.00% 15/04/2021 USD 476,000 485,403 0.30UBS Group AG, FRN 2.22% 01/02/2022 USD 400,000 407,356 0.25
Switzerland total 3,102,256 1.92
United Kingdom (31 December 2019: 4.16%)Barclays Bank plc, FRN 1.12%07/08/2020 USD 500,000 500,298 0.31Barclays Bank plc 1.70% 12/05/2022 USD 221,000 224,969 0.14Barclays plc 3.20% 10/08/2021 USD 1,200,000 1,226,688 0.76BG Energy Capital plc 4.00% 09/12/2020 USD 100,000 101,334 0.06BP Capital Markets plc, FRN 0.61%24/11/2020 USD 1,103,000 1,103,361 0.68GlaxoSmithKline Capital plc, FRN 0.77%14/05/2021 USD 488,000 488,816 0.30HSBC Holdings plc, FRN 2.02%25/05/2021 USD 284,000 287,166 0.18HSBC Holdings plc, FRN 0.97%11/09/2021 USD 585,000 585,273 0.36HSBC Holdings plc, FRN 2.87%05/01/2022 USD 500,000 507,186 0.32HSBC Holdings plc 4.00% 30/03/2022 USD 556,000 586,753 0.36KEB Hana Bank 0.00% 05/08/2020 USD 3,000,000 2,999,580 1.86Lloyds Banking Group plc 3.00%11/01/2022 USD 200,000 206,798 0.13Lloyds Banking Group plc, FRN 2.91%07/11/2023 USD 1,140,000 1,186,353 0.74Reckitt Benckiser Treasury Services plc2.38% 24/06/2022 USD 507,000 522,357 0.32Santander UK Group Holdings plc 2.88%16/10/2020 USD 1,271,000 1,279,800 0.79Santander UK plc 2.10% 13/01/2023 USD 600,000 620,365 0.39Santander UK plc 2.88% 18/06/2024 USD 439,000 468,100 0.29Standard Chartered plc 3.05%15/01/2021 USD 1,060,000 1,072,665 0.67Standard Chartered plc, FRN 4.25%20/01/2023 USD 500,000 519,050 0.32
United Kingdom total 14,486,912 8.98
United States (31 December 2019: 49.14%)AbbVie, Inc. 2.30% 14/05/2021 USD 433,000 438,823 0.27AbbVie, Inc. 2.15% 19/11/2021 USD 350,000 356,655 0.22AIG Global Funding, FRN 1.93%02/07/2020 USD 188,000 188,000 0.12AIG Global Funding 2.15% 02/07/2020 USD 269,000 269,000 0.17AIG Global Funding, FRN 1.75%22/01/2021 USD 546,000 546,616 0.34AIG Global Funding 2.30% 01/07/2022 USD 294,000 302,856 0.19Amazon.com, Inc. 0.80% 03/06/2025 USD 324,000 326,834 0.20American Electric Power Co., Inc. 2.15%13/11/2020 USD 1,311,000 1,319,230 0.82American Express Co. 2.20% 30/10/2020 USD 1,129,000 1,134,184 0.70American Express Co., FRN 1.14%05/11/2021 USD 500,000 501,606 0.31
American Express Co. 3.40% 22/02/2024 USD 67,000 72,874 0.05American International Group, Inc. 3.30%01/03/2021 USD 543,000 552,143 0.34Apple, Inc. 2.75% 13/01/2025 USD 255,000 276,793 0.17AstraZenecaáplc 0.00% 16/10/2020 USD 1,000,000 998,488 0.62AT&T, Inc., FRN 1.10% 01/06/2021 USD 300,000 301,519 0.19Athene Global Funding 4.00%25/01/2022 USD 260,000 269,083 0.17Aviation Capital Group LLC, FRN 1.30%01/06/2021 USD 450,000 428,015 0.27Aviation Capital Group LLC, FRN 1.43%30/07/2021 USD 303,000 285,697 0.18Aviation Capital Group LLC 2.88%20/01/2022 USD 419,000 400,440 0.25Bank of America Corp., FRN 1.77%21/07/2021 USD 737,000 737,171 0.46Bank of America Corp., FRN 2.37%21/07/2021 USD 629,000 629,581 0.39Bank of America Corp., FRN 3.46%15/03/2025 USD 57,000 61,825 0.04Bank of New York Mellon Corp. (The)1.60% 24/04/2025 USD 350,000 362,271 0.22BAT Capital Corp., FRN 1.01%14/08/2020 USD 750,000 750,054 0.46BBVA USA, FRN 1.04% 11/06/2021 USD 250,000 248,083 0.15BBVA USA 3.50% 11/06/2021 USD 700,000 715,215 0.44BMW US Capital LLC 3.25% 14/08/2020 USD 279,000 279,929 0.17BMW US Capital LLC, FRN 0.93%13/08/2021 USD 53,000 52,723 0.03Boeing Co. (The) 4.51% 01/05/2023 USD 376,000 397,217 0.25BP Capital Markets America, Inc. 4.74%11/03/2021 USD 237,000 244,191 0.15Bristol-Myers Squibb Co., FRN 0.59%16/11/2020 USD 503,000 503,348 0.31Capital One Financial Corp. 3.45%30/04/2021 USD 516,000 526,800 0.33Capital One Financial Corp., FRN 1.26%09/03/2022 USD 928,000 926,731 0.57Capital One NA 2.15% 06/09/2022 USD 500,000 513,632 0.32Cargill, Inc. 1.38% 23/07/2023 USD 265,000 269,573 0.17Caterpillar Financial Services Corp., FRN0.62% 08/03/2021 USD 1,034,000 1,034,519 0.64CenterPoint Energy, Inc. 3.60%01/11/2021 USD 1,271,000 1,319,688 0.82Charles Schwab Corp. (The), FRN 0.69%21/05/2021 USD 406,000 406,465 0.25Chevron Corp. 1.55% 11/05/2025 USD 337,000 346,553 0.21Cigna Corp. 3.20% 17/09/2020 USD 774,000 778,325 0.48Citibank NA, FRN 1.61% 23/07/2021 USD 376,000 377,754 0.23Citibank NA, FRN 0.91% 19/02/2022 USD 1,000,000 1,000,575 0.62Citigroup, Inc., FRN 1.75% 02/08/2021 USD 400,000 403,737 0.25Citigroup, Inc., FRN 2.88% 24/07/2023 USD 473,000 492,267 0.31Citizens Bank NA/Providence RI 2.25%30/10/2020 USD 600,000 602,621 0.37Citizens Bank NA/Providence RI 2.55%13/05/2021 USD 250,000 254,090 0.16Citizens Bank NA/Providence RI, FRN1.14% 14/02/2022 USD 491,000 491,047 0.30Comcast Corp., FRN 0.63% 01/10/2020 USD 673,000 673,519 0.42Comerica, Inc. 3.70% 31/07/2023 USD 771,000 830,668 0.51Constellation Brands, Inc., FRN 1.09%15/11/2021 USD 300,000 299,976 0.19Credit Suisse AG, New York Branch 1.86%09/10/2020 USD 1,090,000 1,094,701 0.68CVS Health Corp. 2.13% 01/06/2021 USD 482,000 488,350 0.30Daimler Finance North America LLC2.20% 30/10/2021 USD 521,000 528,033 0.33Daimler Finance North America LLC, FRN1.29% 15/02/2022 USD 803,000 793,464 0.49Daimler Finance North America LLC, FRN1.24% 22/02/2022 USD 1,000,000 989,709 0.61Dominion Energy, Inc., STEP 2.72%15/08/2021 USD 786,000 803,273 0.50Duke Energy Corp., FRN 0.92%14/05/2021 USD 336,000 336,710 0.21DuPont de Nemours, Inc., FRN 1.10%15/11/2020 USD 269,000 269,432 0.17Enbridge (US), Inc. 0.00% 14/09/2020 USD 405,000 404,567 0.25Eni Finance USA, Inc. 0.00% 06/07/2020 USD 600,000 599,978 0.37Eni Finance USA, Inc. 0.00% 08/07/2020 USD 200,000 199,990 0.12Eni Finance USA, Inc. 0.00% 09/07/2020 USD 500,000 499,968 0.31Enterprise Products Operating LLC 2.80%15/02/2021 USD 1,271,000 1,288,576 0.80Eversource Energy 2.50% 15/03/2021 USD 1,271,000 1,286,984 0.80Exelon Corp. 5.15% 01/12/2020 USD 104,000 104,753 0.07Express Scripts Holding Co. 2.60%30/11/2020 USD 802,000 809,202 0.50Fifth Third Bancorp 2.88% 27/07/2020 USD 1,361,000 1,361,000 0.84Fifth Third Bancorp 1.63% 05/05/2023 USD 336,000 344,638 0.21General Mills, Inc., FRN 1.72% 16/04/2021 USD 252,000 252,522 0.16General Mills, Inc. 3.20% 16/04/2021 USD 1,019,000 1,040,872 0.65
149
JPMorgan ETFs (Ireland) ICAV - USD Ultra-Short Income UCITS ETFSchedule of Investments (continued)As at 30 June 2020
Investments Currency
Quantity/Nominal
Value
FairValue
USD
% ofNet
Assets Investments Currency
Quantity/Nominal
Value
FairValue
USD
% ofNet
Assets

Glencore Funding LLC 0.00%08/07/2020 USD 300,000 299,960 0.19Glencore Funding LLC 0.00%08/09/2020 USD 500,000 498,483 0.31Goldman Sachs Group, Inc. (The) 2.88%25/02/2021 USD 271,000 274,655 0.17Goldman Sachs Group, Inc. (The), FRN1.56% 15/11/2021 USD 148,000 148,442 0.09Goldman Sachs Group, Inc. (The) 5.75%24/01/2022 USD 750,000 809,130 0.50Guardian Life Global Funding 1.95%27/10/2021 USD 1,255,000 1,280,919 0.79Huntington Bancshares, Inc. 2.63%06/08/2024 USD 926,000 980,505 0.61Huntington National Bank (The), FRN1.09% 05/02/2021 USD 289,000 289,811 0.18Hyundai CapitaláAmerica 0.00%20/07/2020 USD 500,000 499,830 0.31International Lease Finance Corp. 8.25%15/12/2020 USD 1,200,000 1,228,153 0.76Jackson National Life Global Funding,FRN 0.63% 16/03/2021 USD 732,000 732,247 0.45Jackson National Life Global Funding,FRN 0.65% 06/01/2023 USD 1,353,000 1,335,036 0.83Jackson National Life Global Funding3.25% 30/01/2024 USD 200,000 213,526 0.13John Deere Capital Corp. 0.70%05/07/2023 USD 707,000 709,496 0.44Keurig Dr Pepper, Inc. 3.55% 25/05/2021 USD 587,000 603,313 0.37Leidos, Inc. 2.95% 15/05/2023 USD 312,000 325,010 0.20Lloyds Bank Commercial Banking 0.61%17/06/2021 USD 1,000,000 1,000,183 0.62Marathon Petroleum Corp. 5.13%01/03/2021 USD 991,000 1,018,517 0.63MassMutual Global Funding II 0.85%09/06/2023 USD 626,000 628,650 0.39McKesson Corp. 3.65% 30/11/2020 USD 1,017,000 1,030,075 0.64Metropolitan Life Global Funding I, FRN1.58% 08/01/2021 USD 268,000 268,269 0.17Metropolitan Life Global Funding I 0.90%08/06/2023 USD 267,000 268,506 0.17Mondelez International, Inc. 0.00%01/07/2022 USD 110,000 109,985 0.07Mondelez International, Inc. 1.50%04/05/2025 USD 268,000 273,371 0.17Morgan Stanley 5.75% 25/01/2021 USD 1,041,000 1,072,086 0.66Morgan Stanley, FRN 2.51% 21/04/2021 USD 245,000 247,137 0.15Morgan Stanley 3.88% 29/04/2024 USD 506,000 559,523 0.35MPLX LP, FRN 1.21% 09/09/2021 USD 280,000 277,780 0.17MUFG Union Bank NA, FRN 0.79%09/12/2022 USD 250,000 248,857 0.15National Rural Utilities CooperativeFinance Corp., FRN 0.68% 30/06/2021 USD 431,000 431,567 0.27Natixis SA 1.93% 13/11/2020 USD 135,000 135,846 0.08NatWest Markets plc 0.00% 29/07/2020 USD 1,200,000 1,199,544 0.74New York Life Global Funding 1.10%05/05/2023 USD 122,000 124,556 0.08New York Life Global Funding 0.95%24/06/2025 USD 509,000 510,239 0.32Newmont Corp. 3.63% 09/06/2021 USD 450,000 459,325 0.28NextEra Energy Capital Holdings, Inc.2.40% 01/09/2021 USD 320,000 327,228 0.20NextEra Energy Capital Holdings, Inc.,FRN 1.08% 25/02/2022 USD 1,298,000 1,305,086 0.81Oracle Corp. 2.50% 01/04/2025 USD 1,000,000 1,071,022 0.66PACCAR Financial Corp. 0.80%08/06/2023 USD 116,000 116,445 0.07Penske Truck Leasing Co. LP / PTLFinance Corp. 3.65% 29/07/2021 USD 1,000,000 1,023,533 0.63Pfizer, Inc. 0.80% 28/05/2025 USD 708,000 707,708 0.44Philip Morris International, Inc. 1.13%01/05/2023 USD 208,000 211,516 0.13Phillips 66, FRN 0.96% 26/02/2021 USD 500,000 499,253 0.31Pinnacle West Capital Corp. 1.30%15/06/2025 USD 714,000 722,772 0.45Principal Life Global Funding II, FRN0.67% 02/03/2021 USD 382,000 382,240 0.24Principal Life Global Funding II 1.25%11/05/2023 USD 1,445,000 1,446,000 0.90Protective Life Global Funding, FRN1.68% 13/07/2020 USD 700,000 700,237 0.43Protective Life Global Funding 2.70%25/11/2020 USD 289,000 291,668 0.18Protective Life Global Funding 1.08%09/06/2023 USD 205,000 206,647 0.13Reliance Standard Life Global Funding II3.05% 20/01/2021 USD 663,000 669,751 0.42Reliance Standard Life Global Funding II2.15% 21/01/2023 USD 138,000 140,739 0.09Ryder System, Inc. 2.88% 01/09/2020 USD 473,000 473,616 0.29Ryder System, Inc. 2.88% 01/06/2022 USD 709,000 733,626 0.45
Shell International Finance BV 0.00%29/03/2021 USD 660,000 657,447 0.41Standard Chartered Bank 1.78%26/10/2020 USD 1,216,000 1,221,884 0.76Starbucks Corp. 1.30% 07/05/2022 USD 176,000 178,504 0.11State Street Corp., FRN 2.83%30/03/2023 USD 107,000 111,022 0.07Tampa Electric Co. 5.40% 15/05/2021 USD 326,000 338,295 0.21Toyota Motor Credit Corp., FRN 0.48%23/10/2020 USD 668,000 667,993 0.41Toyota Motor Credit Corp., FRN 0.56%13/08/2021 USD 349,000 348,492 0.22Truist Bank, FRN 1.49% 26/10/2021 USD 650,000 651,100 0.40Truist Financial Corp. 3.75% 06/12/2023 USD 273,000 298,992 0.19Upjohn, Inc. 1.13% 22/06/2022 USD 238,000 239,431 0.15US Bancorp 1.45% 12/05/2025 USD 500,000 514,994 0.32US Bank NA, FRN 1.31% 26/04/2021 USD 178,000 178,369 0.11US Bank NA, FRN 1.29% 21/01/2022 USD 499,000 498,875 0.31Verizon Communications, Inc., FRN 1.32%16/03/2022 USD 969,000 982,021 0.61ViacomCBS, Inc. 3.88% 01/04/2024 USD 1,300,000 1,398,833 0.87Volkswagen Group of America FinanceLLC, FRN 1.16% 24/09/2021 USD 808,000 805,130 0.50Volkswagen Group of America FinanceLLC 2.90% 13/05/2022 USD 200,000 206,476 0.13Volkswagen Group of America FinanceLLC 3.13% 12/05/2023 USD 260,000 273,452 0.17Walt Disney Co. (The), FRN 0.60%01/09/2021 USD 239,000 238,645 0.15WEA Finance LLC / Westfield UK &Europe Finance plc 3.25% 05/10/2020 USD 1,159,000 1,160,483 0.72Wells Fargo & Co., FRN 1.67%04/03/2021 USD 278,000 280,026 0.17Wells Fargo & Co., FRN 2.02%26/07/2021 USD 1,000,000 1,007,709 0.62Wells Fargo & Co., FRN 1.65%02/06/2024 USD 400,000 406,324 0.25Wells Fargo Bank NA, FRN 3.33%23/07/2021 USD 600,000 600,977 0.37Wells Fargo Bank NA, FRN 1.61%22/10/2021 USD 850,000 852,630 0.53Zimmer Biomet Holdings, Inc., FRN 1.07%19/03/2021 USD 500,000 499,913 0.31Zoetis, Inc. 3.45% 13/11/2020 USD 133,000 134,153 0.08Zoetis, Inc., FRN 0.82% 20/08/2021 USD 842,000 843,255 0.52
United States total 85,712,770 53.11
Total investments in Corporate Debt Securities 152,563,655 94.54
Total Bonds 159,360,089 98.75
150
JPMorgan ETFs (Ireland) ICAV - USD Ultra-Short Income UCITS ETFSchedule of Investments (continued)As at 30 June 2020
Investments Currency
Quantity/Nominal
Value
FairValue
USD
% ofNet
Assets Investments Currency
Quantity/Nominal
Value
FairValue
USD
% ofNet
Assets

JPMorgan ETFs (Ireland) ICAV - USD Ultra-Short Income UCITS ETFSchedule of Investments (continued)As at 30 June 2020
Fair ValueUSD
% ofNet
Assets
Total financial assets at fair value through profit or loss 159,360,089 98.75Cash 66 -
Cash equivalents
Currency
Quantity/Nominal
ValueUndertaking for collective investment schemes (31 December 2019: 7.70%)JPMorgan Liquidity Funds - USD Liquidity LVNAV Fund - Class X (dist.)1 USD 4,979,714 4,979,714 3.09
Total Cash equivalents 4,979,714 3.09Other assets and liabilities (2,968,157) (1.84)
Net asset value attributable to holders of redeemable participating shares 161,371,712 100.00
Analysis of total assets
% ofTotal
Assets
Transferable securities and money market instruments admitted to official stock exchange listing 33.17Transferable securities and money market instruments dealt in on another regulated market 53.79Transferable securities and money market instruments other than those admitted to an official stock exchange listing or dealt in on another regulated market 9.54Collective investment schemes 3.02Other assets 0.48
Total Assets 100.00
1A related party to the Fund.
151

1. Statement of Significant Portfolio ChangesJPMorgan ETFs (Ireland) ICAV - BetaBuilders EUR Govt Bond 1-3 yr UCITS ETF
Purchases
Nominal Holdingor Shares Description
CostEUR
3,671,000 France Government Bond OAT 3,731,8052,962,000 France Government Bond OAT 3,167,5712,359,000 Italy Buoni Poliennali Del Tesoro 2,342,0721,987,000 Bundesobligation 2,029,8421,596,000 Spain Government Bond 1,871,0601,679,000 Italy Buoni Poliennali Del Tesoro 1,865,7651,509,000 Italy Buoni Poliennali Del Tesoro 1,543,4851,490,000 Spain Government Bond 1,499,2911,232,000 Bundesrepublik Deutschland Bundesanleihe 1,311,7831,159,000 Bundesrepublik Deutschland Bundesanleihe 1,239,3411,181,000 France Government Bond OAT 1,200,619930,000 France Government Bond OAT 1,176,1621,039,000 Netherlands Government Bond 1,174,3211,160,000 Italy Buoni Poliennali Del Tesoro 1,172,1921,019,000 Belgium Government Bond 1,106,369840,000 Bundesobligation 847,054795,000 Bundesobligation 810,858685,000 Ireland Government Bond 692,711595,000 Italy Buoni Poliennali Del Tesoro 605,310597,000 Netherlands Government Bond 603,271572,000 Italy Buoni Poliennali Del Tesoro 593,626543,000 Spain Government Bond 552,582456,000 Italy Buoni Poliennali Del Tesoro 492,886465,000 France Government Bond OAT 471,022439,000 Spain Government Bond 441,033383,000 France Government Bond OAT 405,383396,000 Bundesobligation 402,571370,000 Finland Government Bond 393,043
Sales
Nominal Holdingor Shares Description
ProceedEUR
2,663,000 France Government Bond OAT 2,680,3362,420,000 France Government Bond OAT 2,532,6492,427,000 France Government Bond OAT 2,441,0361,901,000 Spain Government Bond 2,018,1811,753,000 Italy Buoni Poliennali Del Tesoro 1,822,3191,778,000 Bundesschatzanweisungen 1,789,6661,672,000 Spain Government Bond 1,694,6441,685,000 Italy Buoni Poliennali Del Tesoro 1,688,9931,361,000 Italy Buoni Poliennali Del Tesoro 1,408,4691,239,000 Netherlands Government Bond 1,289,0581,234,000 Bundesobligation 1,241,6401,229,000 Bundesschatzanweisungen 1,238,719953,000 Italy Buoni Poliennali Del Tesoro 969,967690,000 Italy Buoni Poliennali Del Tesoro 759,572660,000 Portugal Obrigacoes do Tesouro OT 688,508532,000 Italy Buoni Poliennali Del Tesoro 531,165443,000 Finland Government Bond 461,420403,000 Belgium Government Bond 439,760387,000 France Government Bond OAT 392,797306,000 Netherlands Government Bond 325,021
152
JPMorgan ETFs (Ireland) ICAVUnaudited Appendix

1. Statement of Significant Portfolio Changes (continued)JPMorgan ETFs (Ireland) ICAV - BetaBuilders EUR Govt Bond UCITS ETF
Purchases
Nominal Holdingor Shares Description
CostEUR
320,000 France Government Bond OAT 343,960220,000 Italy Buoni Poliennali Del Tesoro 253,717154,000 Spain Government Bond 215,792191,000 France Government Bond OAT 213,271166,000 Italy Buoni Poliennali Del Tesoro 210,570155,000 Italy Buoni Poliennali Del Tesoro 188,419155,000 Italy Buoni Poliennali Del Tesoro 174,683152,000 Spain Government Bond 153,636138,000 Bundesobligation 141,901130,000 France Government Bond OAT 137,258134,000 France Government Bond OAT 135,909131,000 Bundesobligation 135,326107,000 Bundesrepublik Deutschland Bundesanleihe 134,758122,000 France Government Bond OAT 126,971101,000 France Government Bond OAT 123,637107,000 France Government Bond OAT 121,39462,000 Spain Government Bond 115,530105,000 Bundesrepublik Deutschland Bundesanleihe 109,97667,000 France Government Bond OAT 108,528107,000 Italy Buoni Poliennali Del Tesoro 104,77189,000 Spain Government Bond 103,92060,000 Bundesrepublik Deutschland Bundesanleihe 103,881
Sales
Nominal Holdingor Shares Description
ProceedEUR
198,000 France Government Bond OAT 202,671102,000 Italy Buoni Poliennali Del Tesoro 134,247120,000 Spain Government Bond 130,670124,000 France Government Bond OAT 125,694109,000 Italy Buoni Poliennali Del Tesoro 113,20398,000 France Government Bond OAT 106,48371,000 Spain Government Bond 101,02655,000 Bundesrepublik Deutschland Bundesanleihe 95,93962,000 Italy Buoni Poliennali Del Tesoro 95,23943,000 France Government Bond OAT 87,19781,000 France Government Bond OAT 82,24158,000 Italy Buoni Poliennali Del Tesoro 79,30175,000 Bundesrepublik Deutschland Bundesanleihe 78,43477,000 Spain Government Bond 78,40376,000 Bundesschatzanweisungen 76,49454,000 Austria Government Bond 72,08139,000 France Government Bond OAT 71,24964,000 Bundesrepublik Deutschland Bundesanleihe 70,68165,000 Bundesrepublik Deutschland Bundesanleihe 68,34957,000 France Government Bond OAT 67,89057,000 Italy Buoni Poliennali Del Tesoro 64,85940,000 Spain Government Bond 62,56453,000 Italy Buoni Poliennali Del Tesoro 61,87549,000 Belgium Government Bond 61,33250,000 Italy Buoni Poliennali Del Tesoro 61,16855,000 France Government Bond OAT 55,43051,000 Italy Buoni Poliennali Del Tesoro 51,08527,000 Spain Government Bond 50,837
153
JPMorgan ETFs (Ireland) ICAVUnaudited Appendix (continued)

1. Statement of Significant Portfolio Changes (continued)JPMorgan ETFs (Ireland) ICAV - BetaBuilders UK Gilt 1-5 yr UCITS ETF
Purchases
Nominal Holdingor Shares Description
CostGBP
2,338,400 UK Gilt 2,891,2952,332,000 UK Gilt 2,410,7051,087,300 UK Gilt 1,090,053558,100 UK Gilt 569,952479,500 UK Gilt 495,572405,300 UK Gilt 452,541311,500 UK Gilt 334,211311,600 UK Gilt 328,171297,300 UK Gilt 299,083219,700 UK Gilt 228,519192,050 UK Gilt 210,447144,700 UK Gilt 155,450
Sales
Nominal Holdingor Shares Description
ProceedGBP
1,727,000 UK Gilt 1,872,055987,800 UK Gilt 1,058,959975,700 UK Gilt 997,413941,600 UK Gilt 987,901967,800 UK Gilt 977,589880,700 UK Gilt 915,203667,500 UK Gilt 714,845628,100 UK Gilt 650,389551,900 UK Gilt 614,932408,700 UK Gilt 505,597
154
JPMorgan ETFs (Ireland) ICAVUnaudited Appendix (continued)

1. Statement of Significant Portfolio Changes (continued)JPMorgan ETFs (Ireland) ICAV - BetaBuilders US Equity UCITS ETF
Purchases
Nominal Holdingor Shares Description
CostUSD
796 Microsoft Corp. 148,144430 Apple, Inc. 138,99545 Amazon.com, Inc. 98,08590,309 JPMorgan Liquidity Funds - USD Liquidity LVNAV Fund - Class X (dist.) 90,309255 Facebook, Inc. ‘A’ 55,04332 Alphabet, Inc. ‘A’ 48,50331 Alphabet, Inc. ‘C’ 47,238204 Berkshire Hathaway, Inc. ‘B’ 46,238322 JPMorgan Chase & Co. 44,025282 Johnson & Johnson 42,108176 Visa, Inc. ‘A’ 37,125259 Procter & Gamble Co. (The) 32,53593 Mastercard, Inc. ‘A’ 31,587101 UnitedHealth Group, Inc. 30,435447 Intel Corp. 29,947833 Bank of America Corp. 28,779752 AT&T, Inc. 28,725112 Home Depot, Inc. (The) 27,278194 Walt Disney Co. (The) 26,914449 Exxon Mobil Corp. 26,803
Sales
Nominal Holdingor Shares Description
ProceedUSD
83,324 JPMorgan Liquidity Funds - USD Liquidity LVNAV Fund - Class X (dist.) 83,324117 Allergan plc 22,58398 Raytheon Co. 11,46222 Apple, Inc. 7,694143 Otis Worldwide Corp. 6,767287 Carrier Global Corp. 4,85675 Ingersoll Rand, Inc. 2,395138 American Airlines Group, Inc. 2,20820 JPMorgan Chase & Co. 1,95674 Bank of America Corp. 1,86983 Targa Resources Corp. 1,71134 eBay, Inc. 1,64226 Intel Corp. 1,55028 Citigroup, Inc. 1,482128 Hanesbrands, Inc. 1,45321 Ashland Global Holdings, Inc. 1,4441 Alphabet, Inc. ‘C’ 1,43276 Norwegian Cruise Line Holdings Ltd. 1,38555 Harley-Davidson, Inc. 1,3655 Biogen, Inc. 1,355
155
JPMorgan ETFs (Ireland) ICAVUnaudited Appendix (continued)

1. Statement of Significant Portfolio Changes (continued)JPMorgan ETFs (Ireland) ICAV - BetaBuilders US Treasury Bond 0-1 yr UCITS ETF
Purchases
Nominal Holdingor Shares Description
CostUSD
91,951,000 US Treasury Bill 91,937,24273,697,000 US Treasury Bill 73,692,45559,916,000 US Treasury Bill 59,911,80348,716,000 US Cash Management Bill 48,702,29937,713,000 US Cash Management Bill 37,700,36736,968,000 US Treasury Bill 36,951,00934,673,000 US Treasury Bill 34,601,61433,010,000 US Treasury Bill 33,002,69332,300,000 US Treasury Note 32,346,84130,741,000 US Treasury Bill 30,718,64928,975,000 US Treasury Bill 28,952,67427,216,000 US Treasury Bill 27,212,02426,968,000 US Treasury Bill 26,958,07425,808,000 US Treasury Bill 25,777,51124,734,000 US Treasury Bill 24,705,80724,477,000 US Treasury Bill 24,460,52624,434,000 US Treasury Bill 24,417,59022,140,000 US Treasury Bill 22,124,14721,554,000 US Treasury Bill 21,546,56421,528,000 US Treasury Bill 21,526,45321,262,000 US Treasury Bill 21,255,59020,886,000 US Treasury Note 20,983,48719,972,000 US Treasury Note 20,414,12720,237,000 US Treasury Bill 20,188,21319,869,000 US Treasury Bill 19,863,49319,352,000 US Treasury Note 19,582,69318,767,000 US Treasury Bill 18,765,79317,053,000 US Treasury Bill 17,043,17917,025,000 US Treasury Bill 17,014,30216,999,000 US Treasury Bill 16,971,02216,614,000 US Treasury Bill 16,613,58516,456,000 US Treasury Bill 16,442,71915,648,000 US Treasury Note 15,748,62715,657,000 US Treasury Bill 15,655,30015,094,000 US Treasury Note 15,232,212
Sales
Nominal Holdingor Shares Description
ProceedUSD
51,580,000 US Treasury Bill 51,576,59722,572,000 US Treasury Note 22,823,56321,573,000 US Treasury Bill 21,564,05815,486,200 US Treasury Bill 15,468,82215,094,000 US Treasury Note 15,190,69613,982,000 US Treasury Bill 13,978,52613,821,000 US Treasury Note 13,913,54013,729,600 US Treasury Note 13,769,18212,496,000 US Treasury Bill 12,495,30612,391,000 US Treasury Note 12,441,82211,113,000 US Treasury Note 11,306,17510,962,000 US Treasury Bill 10,939,29010,859,000 US Treasury Bill 10,791,59310,271,000 US Treasury Bill 10,263,21410,039,000 US Treasury Note 10,117,7699,874,000 US Treasury Note 9,988,8528,661,000 US Treasury Bill 8,658,8208,528,000 US Treasury Note 8,585,6668,223,000 US Treasury Note 8,244,5117,864,000 US Treasury Note 7,985,9537,280,000 US Treasury Bill 7,202,4567,183,000 US Treasury Note 7,192,7026,648,600 US Treasury Bill 6,642,5256,535,000 US Treasury Note 6,531,8256,140,000 US Treasury Note 6,143,1186,112,000 US Treasury Bill 6,102,4996,033,000 US Treasury Bill 6,013,2465,463,600 US Treasury Bill 5,459,1155,389,000 US Treasury Bill 5,362,4955,016,000 US Treasury Bill 5,013,8985,000,000 US Treasury Bill 4,997,3304,915,000 US Treasury Note 4,919,1554,633,000 US Treasury Note 4,663,3404,530,000 US Treasury Note 4,532,5254,535,000 US Treasury Bill 4,514,313
156
JPMorgan ETFs (Ireland) ICAVUnaudited Appendix (continued)

1. Statement of Significant Portfolio Changes (continued)JPMorgan ETFs (Ireland) ICAV - BetaBuilders US Treasury Bond 1-3 yr UCITS ETF
Purchases
Nominal Holdingor Shares Description
CostUSD
12,500,000 US Treasury Note 12,515,0694,494,000 US Treasury Note 4,658,5924,400,000 US Treasury Note 4,497,9511,913,000 US Treasury Note 1,966,2351,902,000 US Treasury Note 1,899,6971,750,000 US Treasury Note 1,763,9451,500,000 US Treasury Note 1,525,7321,500,000 US Treasury Note 1,520,5961,315,000 US Treasury Note 1,326,8361,250,000 US Treasury Note 1,308,5061,269,000 US Treasury Note 1,306,4191,247,000 US Treasury Note 1,281,2161,250,000 US Treasury Note 1,277,4711,248,000 US Treasury Note 1,275,3281,247,000 US Treasury Note 1,270,2571,250,000 US Treasury Note 1,268,4281,250,000 US Treasury Note 1,268,1351,250,000 US Treasury Note 1,268,0571,250,000 US Treasury Note 1,263,1451,250,000 US Treasury Note 1,258,9261,250,000 US Treasury Note 1,256,8261,250,000 US Treasury Note 1,256,7771,232,000 US Treasury Note 1,256,4181,250,000 US Treasury Note 1,256,0061,250,000 US Treasury Note 1,250,4791,250,000 US Treasury Note 1,241,5821,151,000 US Treasury Note 1,172,1051,145,000 US Treasury Note 1,166,2081,106,000 US Treasury Note 1,127,7721,083,000 US Treasury Note 1,106,918
157
JPMorgan ETFs (Ireland) ICAVUnaudited Appendix (continued)

1. Statement of Significant Portfolio Changes (continued)JPMorgan ETFs (Ireland) ICAV - BetaBuilders US Treasury Bond 1-3 yr UCITS ETF (continued)
Sales
Nominal Holdingor Shares Description
ProceedUSD
3,295,900 US Treasury Note 3,331,9662,402,000 US Treasury Note 2,458,1902,375,000 US Treasury Note 2,440,9372,372,400 US Treasury Note 2,415,5442,379,400 US Treasury Note 2,400,7332,047,700 US Treasury Note 2,058,3982,003,900 US Treasury Note 2,035,4741,962,000 US Treasury Note 1,975,0191,751,000 US Treasury Note 1,784,4571,750,000 US Treasury Note 1,771,8071,719,000 US Treasury Note 1,750,4331,475,000 US Treasury Note 1,483,7221,373,200 US Treasury Note 1,381,5251,333,200 US Treasury Note 1,353,6561,312,000 US Treasury Note 1,341,5851,250,000 US Treasury Note 1,286,2891,250,000 US Treasury Note 1,276,3571,250,000 US Treasury Note 1,274,9221,250,000 US Treasury Note 1,273,7601,250,000 US Treasury Note 1,272,5291,250,000 US Treasury Note 1,258,3501,250,000 US Treasury Note 1,257,6761,250,000 US Treasury Note 1,257,0701,227,000 US Treasury Note 1,252,1521,217,900 US Treasury Note 1,229,6711,179,000 US Treasury Note 1,197,2761,061,000 US Treasury Note 1,071,7211,051,000 US Treasury Note 1,062,3721,002,000 US Treasury Note 1,027,6191,000,000 US Treasury Note 1,018,8181,000,000 US Treasury Note 1,012,6951,000,000 US Treasury Note 1,011,914950,000 US Treasury Note 982,742948,400 US Treasury Note 953,090881,000 US Treasury Note 901,438
158
JPMorgan ETFs (Ireland) ICAVUnaudited Appendix (continued)

1. Statement of Significant Portfolio Changes (continued)JPMorgan ETFs (Ireland) ICAV - BetaBuilders US Treasury Bond UCITS ETF
Purchases
Nominal Holdingor Shares Description
CostUSD
8,304,421 JPMorgan Liquidity Funds - USD Liquidity LVNAV Fund - Class X (dist.) 8,304,4211,420,000 US Treasury Note 1,419,2511,343,000 US Treasury Note 1,344,1241,153,000 US Treasury Note 1,240,5231,001,000 US Treasury Note 1,114,542894,000 US Treasury Bond 1,057,3551,033,000 US Treasury Note 1,040,539500,000 US Treasury Bond 827,246822,000 US Treasury Note 822,477750,000 US Treasury Note 763,877740,000 US Treasury Note 763,429728,000 US Treasury Note 746,256718,000 US Treasury Note 729,435728,000 US Treasury Note 727,065620,000 US Treasury Note 642,743440,000 US Treasury Bond 586,386501,000 US Treasury Note 555,884496,000 US Treasury Note 528,686500,000 US Treasury Note 520,508501,000 US Treasury Note 516,906500,000 US Treasury Note 515,605500,000 US Treasury Note 501,543500,000 US Treasury Note 501,113500,000 US Treasury Note 496,191491,000 US Treasury Note 489,554482,000 US Treasury Note 485,840462,000 US Treasury Note 465,664417,000 US Treasury Bond 461,827430,000 US Treasury Note 443,236364,000 US Treasury Bond 443,082279,000 US Treasury Bond 429,261397,000 US Treasury Note 408,546392,000 US Treasury Note 387,695
Sales
Nominal Holdingor Shares Description
ProceedUSD
8,333,883 JPMorgan Liquidity Funds - USD Liquidity LVNAV Fund - Class X (dist.) 8,333,8831,067,000 US Treasury Note 1,101,972771,000 US Treasury Note 790,331718,000 US Treasury Note 727,143562,000 US Treasury Bond 720,821663,000 US Treasury Note 673,880624,000 US Treasury Note 628,160498,000 US Treasury Bond 620,982601,000 US Treasury Note 615,462532,000 US Treasury Bond 595,333554,000 US Treasury Note 584,018550,000 US Treasury Note 566,244550,000 US Treasury Note 559,515548,000 US Treasury Note 551,898525,000 US Treasury Note 547,559483,000 US Treasury Note 519,976500,000 US Treasury Note 519,043504,000 US Treasury Note 515,064503,000 US Treasury Note 507,336482,000 US Treasury Note 487,047470,000 US Treasury Note 478,372447,000 US Treasury Note 458,625446,000 US Treasury Note 455,368437,000 US Treasury Note 450,366297,000 US Treasury Bond 419,697393,000 US Treasury Note 395,426352,000 US Treasury Note 355,804304,000 US Treasury Bond 340,437311,000 US Treasury Note 336,706313,000 US Treasury Note 324,065204,000 US Treasury Bond 322,830
159
JPMorgan ETFs (Ireland) ICAVUnaudited Appendix (continued)

1. Statement of Significant Portfolio Changes (continued)JPMorgan ETFs (Ireland) ICAV - Equity Long-Short UCITS ETF*
Purchases
Nominal Holdingor Shares Description
CostUSD
1,398,063 JPMorgan Liquidity Funds - USD Liquidity LVNAV Fund - Class X (dist.) 1,398,0631,200,000 US Treasury Bill 1,199,7341,010,000 US Treasury Bill 1,009,8451,010,000 US Treasury Bill 1,009,8191,010,000 US Treasury Bill 1,009,7951,010,000 US Treasury Bill 1,009,7931,010,000 US Treasury Bill 1,009,781400,000 Agence Francaise de Developpement 402,348166,000 US Treasury Bill 165,8515,888 Equitable Holdings, Inc. 113,5984,325 US Foods Holding Corp. 108,4002,062 MasTec, Inc. 106,4027,408 First Horizon National Corp. 103,6645,762 Manulife Financial Corp. 101,8554,064 PolyOne Corp. 97,1715,416 Valvoline, Inc. 95,4647,453 PBF Energy, Inc. ‘A’ 95,3386,774 JetBlue Airways Corp. 94,9152,319 Delta Air Lines, Inc. 94,4762,901 Jabil, Inc. 91,053
Sales
Nominal Holdingor Shares Description
ProceedUSD
3,465,191 JPMorgan Liquidity Funds - USD Liquidity LVNAV Fund - Class X (dist.) 3,465,1912,400,000 US Treasury Bill 2,399,5942,020,000 US Treasury Bill 2,019,8132,020,000 US Treasury Bill 2,019,8002,020,000 US Treasury Bill 2,019,7142,020,000 US Treasury Bill 2,019,6531,150,000 US Treasury Bill 1,149,6401,010,000 US Treasury Bill 1,009,874400,000 Agence Francaise de Developpement 401,437332,000 US Treasury Bill 331,7293,991 Horizon Therapeutics plc 167,7646,191 Suncor Energy, Inc. 133,18010,041 Parex Resources, Inc. 132,8332,620 ConocoPhillips 128,8076,899 Imperial Oil Ltd. 126,2295,888 Equitable Holdings, Inc. 126,0344,168 KB Home 125,5335,229 Renewable Energy Group, Inc. 121,4761,159 Medifast, Inc. 119,9222,937 Aaron’s, Inc. 119,134
*Sub-Fund liquidated on 19 June 2020. See Note 17e.
160
JPMorgan ETFs (Ireland) ICAVUnaudited Appendix (continued)

1. Statement of Significant Portfolio Changes (continued)JPMorgan ETFs (Ireland) ICAV - EUR Corporate Bond 1-5 yr Research Enhanced Index UCITS ETF
Purchases
Nominal Holdingor Shares Description
CostEUR
365,000 Pfizer, Inc. 366,167300,000 Diageo Finance plc 312,542310,000 Svenska Handelsbanken AB 311,215300,000 Air Liquide Finance SA 307,980250,000 Santander UK plc 260,183250,000 Royal Bank of Scotland Group plc, FRN 250,585200,000 Daimler AG 211,889210,000 Medtronic Global Holdings SCA 210,775200,000 Verizon Communications, Inc. 209,447200,000 Credit Agricole SA 208,249200,000 Honeywell International, Inc. 206,380200,000 Vonovia Finance BV 204,690200,000 Citigroup, Inc. 202,892200,000 Iberdrola Finanzas SA 202,726200,000 UBS Group AG, FRN 201,630200,000 Siemens Financieringsmaatschappij NV 201,508200,000 Credit Agricole SA 198,302200,000 Volkswagen International Finance NV 197,974200,000 E.ON SE 197,707200,000 Honeywell International, Inc. 193,297150,000 Linde Finance BV 161,643150,000 Airbus SE 154,935130,000 Bayer Capital Corp. BV 132,536
Sales
Nominal Holdingor Shares Description
ProceedEUR
300,000 Holding d’Infrastructures de Transport SASU 299,670280,000 Bayer Capital Corp. BV 289,251280,000 Standard Chartered plc 281,512208,000 Prologis LP 211,257200,000 ABN AMRO Bank NV 209,504200,000 BHP Billiton Finance Ltd., FRN 204,520210,000 Daimler International Finance BV 204,475202,000 AT&T, Inc. 203,301200,000 DH Europe Finance Sarl 203,134200,000 Thales S.A. 202,396200,000 Zimmer Biomet Holdings, Inc. 197,320200,000 Bank of Ireland Group plc 193,706133,000 Bayer AG 135,075124,000 General Motors Financial Co., Inc. 119,972100,000 Prologis LP 112,898103,000 ENI SpA 105,082100,000 Cie de Saint-Gobain 105,045100,000 CNP Assurances 104,896100,000 Volkswagen International Finance NV, FRN 103,000100,000 Merck & Co., Inc. 101,956100,000 HSBC Holdings plc 101,868100,000 Deutsche Bank AG 101,493100,000 Eastman Chemical Co. 101,093100,000 Skandinaviska Enskilda Banken AB, FRN 100,905100,000 Commonwealth Bank of Australia 100,764100,000 Deutsche Bank AG 100,594100,000 Banco Santander SA 100,481100,000 Westpac Banking Corp. 100,307100,000 Societe Generale SA 99,991100,000 Societe Generale SA 99,964100,000 AT&T, Inc. 99,907100,000 Veolia Environnement SA 99,470100,000 VF Corp. 98,150100,000 Klepierre SA 97,279100,000 General Motors Financial Co., Inc. 89,600
161
JPMorgan ETFs (Ireland) ICAVUnaudited Appendix (continued)
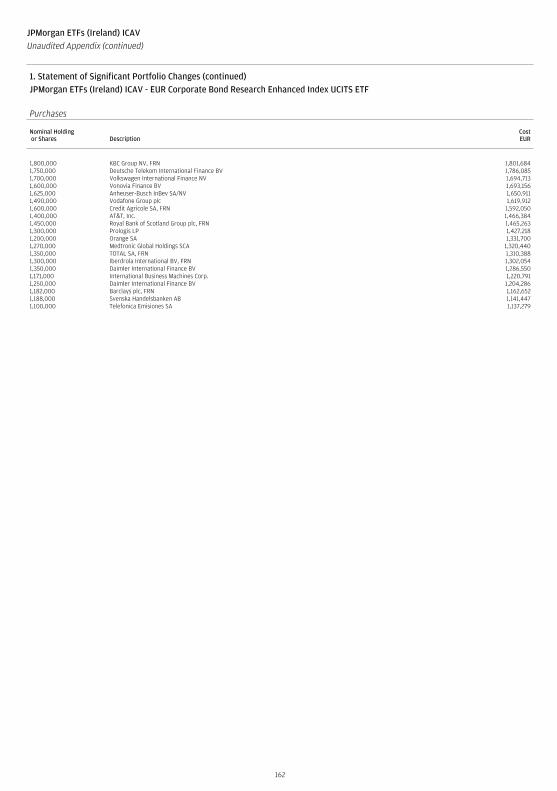
1. Statement of Significant Portfolio Changes (continued)JPMorgan ETFs (Ireland) ICAV - EUR Corporate Bond Research Enhanced Index UCITS ETF
Purchases
Nominal Holdingor Shares Description
CostEUR
1,800,000 KBC Group NV, FRN 1,801,6841,750,000 Deutsche Telekom International Finance BV 1,786,0851,700,000 Volkswagen International Finance NV 1,694,7131,600,000 Vonovia Finance BV 1,693,1561,625,000 Anheuser-Busch InBev SA/NV 1,650,9111,490,000 Vodafone Group plc 1,619,9121,600,000 Credit Agricole SA, FRN 1,592,0501,400,000 AT&T, Inc. 1,466,3841,450,000 Royal Bank of Scotland Group plc, FRN 1,465,2631,300,000 Prologis LP 1,427,2181,200,000 Orange SA 1,331,7001,270,000 Medtronic Global Holdings SCA 1,320,4401,350,000 TOTAL SA, FRN 1,310,3881,300,000 Iberdrola International BV, FRN 1,302,0541,350,000 Daimler International Finance BV 1,286,5501,171,000 International Business Machines Corp. 1,220,7911,250,000 Daimler International Finance BV 1,204,2861,182,000 Barclays plc, FRN 1,162,6521,188,000 Svenska Handelsbanken AB 1,141,4471,100,000 Telefonica Emisiones SA 1,137,279
162
JPMorgan ETFs (Ireland) ICAVUnaudited Appendix (continued)

1. Statement of Significant Portfolio Changes (continued)JPMorgan ETFs (Ireland) ICAV - EUR Corporate Bond Research Enhanced Index UCITS ETF (continued)
Sales
Nominal Holdingor Shares Description
ProceedEUR
900,000 Bayer Capital Corp. BV 951,453400,000 Alstom SA 386,663350,000 AT&T, Inc. 364,242400,000 General Motors Financial Co., Inc. 341,271300,000 Unibail-Rodamco-Westfield SE 300,534300,000 Deutsche Bank AG 286,500266,000 Standard Chartered plc 269,751275,000 Daimler International Finance BV 257,290250,000 Barclays plc 253,722250,000 UniCredit SpA 236,188200,000 Merck & Co., Inc. 224,084225,000 American Honda Finance Corp. 216,320200,000 Abbott Ireland Financing DAC 216,236200,000 Holding d’Infrastructures de Transport SASU 212,282200,000 BHP Billiton Finance Ltd., FRN 204,520200,000 Kraft Heinz Foods Co. 202,278200,000 Zimmer Biomet Holdings, Inc. 202,220200,000 Indigo Group SAS 189,730200,000 AT&T, Inc. 185,028154,000 HSBC Holdings plc 175,100175,000 RCI Banque SA 152,338150,000 ANZ New Zealand Int’l Ltd. 151,340137,000 Hammerson plc 142,753100,000 Microsoft Corp. 125,959122,000 Takeda Pharmaceutical Co. Ltd. 125,680145,000 Daimler AG 125,666100,000 Philip Morris International, Inc. 117,887100,000 BP Capital Markets plc 116,947100,000 GE Capital European Funding Unlimited Co. 115,151110,000 AT&T, Inc. 113,807100,000 Vodafone Group plc 112,574100,000 Total Capital International SA 112,096100,000 Credit Agricole SA 112,062100,000 Takeda Pharmaceutical Co. Ltd. 111,854100,000 XLIT Ltd., FRN 111,280101,000 CRH Finance DAC 109,172100,000 American Tower Corp. 108,816100,000 Credit Agricole SA 108,694100,000 Bank of America Corp., FRN 108,033100,000 American International Group, Inc. 107,617100,000 EDP Finance BV 107,341100,000 Hannover Rueck SE 106,577100,000 Ferrovial Emisiones SA 105,898100,000 Medtronic Global Holdings SCA 105,659100,000 Iberdrola Finanzas SA 104,827100,000 Glencore Finance Europe Ltd. 104,146100,000 Banco Santander SA 102,900100,000 Procter & Gamble Co. (The) 102,664100,000 Naturgy Capital Markets SA 102,140100,000 ASB Finance Ltd. 101,538100,000 General Mills, Inc. 100,817100,000 Societe Generale SA 100,612100,000 Societe Generale SA 99,749100,000 Thales SA 98,589
163
JPMorgan ETFs (Ireland) ICAVUnaudited Appendix (continued)

1. Statement of Significant Portfolio Changes (continued)JPMorgan ETFs (Ireland) ICAV - EUR Ultra-Short Income UCITS ETF
Purchases
Nominal Holdingor Shares Description
CostEUR
34,267 JPMorgan Liquidity Funds - EUR Liquidity LVNAV Fund - Class X (flex dist.) 341,125,79017,000,000 LMA SA 17,000,24117,000,000 LMA SA 17,000,24115,000,000 Kreditanstalt fuer Wiederaufbau 15,357,16015,000,000 LMA SA 15,000,63815,000,000 LMA SA 15,000,21315,000,000 LMA SA 15,000,21314,500,000 Exxon Mobil Corp. 14,500,00013,500,000 LMA SA 13,500,19113,500,000 LMA SA 13,500,19112,500,000 LMA SA 12,500,53112,500,000 LMA SA 12,500,17712,000,000 LMA SA 12,000,85012,000,000 LMA SA 12,000,17012,000,000 LMA SA 12,000,17012,000,000 LMA SA 12,000,17012,000,000 LMA SA 12,000,17012,000,000 LMA SA 12,000,17011,500,000 LMA SA 11,500,48911,500,000 LMA SA 11,500,48911,500,000 LMA SA 11,500,16311,500,000 LMA SA 11,500,16311,500,000 LMA SA 11,500,16311,500,000 LMA SA 11,500,16311,500,000 LMA SA 11,500,16311,500,000 LMA SA 11,500,163
Sales
Nominal Holdingor Shares Description
ProceedEUR
34,073 JPMorgan Liquidity Funds - EUR Liquidity LVNAV Fund - Class X (flex dist.) 339,235,38015,000,000 Kreditanstalt fuer Wiederaufbau 15,213,00010,000,000 Kreditanstalt fuer Wiederaufbau 10,078,0008,000,000 Kreditanstalt fuer Wiederaufbau 8,667,2008,000,000 Macquarie Bank Ltd. 8,077,2807,000,000 Booking Holdings, Inc. 7,120,0507,000,000 Siemens Financieringsmaatschappij NV 6,940,5007,500,000 Barclays Bank plc 6,687,4386,500,000 Credit Suisse AG, FRN 6,445,7006,000,000 Heathrow Funding Ltd. 6,210,5406,000,000 HSBC Holdings plc 6,172,0506,000,000 Kreditanstalt fuer Wiederaufbau 6,079,2006,000,000 Banque Federative du Credit Mutuel SA 6,020,4606,000,000 Opusalpha Funding Ltd. 6,000,6335,800,000 Toyota Motor Credit Corp. 5,769,6665,000,000 Orange SA 5,368,3505,350,000 American Express Credit Corp. 5,256,3755,000,000 Linde Finance BV 5,200,9505,092,000 Novartis Finance SA 5,066,5405,000,000 ASB Finance Ltd. 5,066,000
164
JPMorgan ETFs (Ireland) ICAVUnaudited Appendix (continued)

1. Statement of Significant Portfolio Changes (continued)JPMorgan ETFs (Ireland) ICAV - Europe Research Enhanced Index Equity (ESG) UCITS ETF
Purchases
Nominal Holdingor Shares Description
CostEUR
58,347 Nestle SA 5,743,066502 JPMorgan Liquidity Funds - EUR Liquidity LVNAV Fund - Class X (flex dist.) 5,000,00414,587 Roche Holding AG 4,407,64748,639 Novartis AG 3,859,26752,750 Unilever plc 2,528,12445,702 Novo Nordisk A/S ‘B’ 2,525,8889,604 ASML Holding NV 2,476,67222,495 SAP SE 2,403,1875,936 LVMH Moet Hennessy Louis Vuitton SE 2,095,47069,299 Diageo plc 2,091,02324,364 AstraZeneca plc 2,049,196468,139 BP plc 1,890,676197,846 Iberdrola SA 1,836,75721,102 Siemens AG 1,824,36710,040 Allianz SE 1,718,23789,077 Royal Dutch Shell plc ‘A’ 1,589,03544,488 TOTAL SA 1,579,32817,738 Sanofi 1,515,66217,276 Schneider Electric SE 1,456,958220,239 Enel SpA 1,450,44818,778 Vinci SA 1,423,53931,697 Rio Tinto plc 1,381,15918,577 Reckitt Benckiser Group plc 1,360,600268,672 HSBC Holdings plc 1,349,32850,297 Deutsche Post AG 1,337,5473,436 Lonza Group AG 1,329,017
Sales
Nominal Holdingor Shares Description
ProceedEUR
524 JPMorgan Liquidity Funds - EUR Liquidity LVNAV Fund - Class X (flex dist.) 5,210,6827,548 Pernod Ricard SA 1,081,28852,675 SSE plc 779,4866,421 Nestle SA 630,28355,408 St James’s Place plc 570,88618,089 Diageo plc 541,9956,812 Vinci SA 515,3798,639 KBC Group NV 430,2717,630 Novo Nordisk A/S ‘B’ 427,81714,003 Deutsche Post AG 400,68185,047 HSBC Holdings plc 384,1193,314 BioMerieux 379,4521,182 Roche Holding AG 371,8276,261 Cie Financiere Richemont SA 344,14711,589 CRH plc 340,54743,395 Davide Campari-Milano SpA 316,9103,890 Novartis AG 304,5456,634 Anheuser-Busch InBev SA/NV 301,2946,406 Amadeus IT Group SA 301,059198,733 Vodafone Group plc 288,2911,742 Allianz SE 271,9706,500 Alstom SA 269,197639 Lonza Group AG 251,947815 ASML Holding NV 247,67310,903 Vivendi SA 237,845122,876 Taylor Wimpey plc 230,87737,856 Enel SpA 229,88524,785 Iberdrola SA 228,77717,037 Telenor ASA 226,774
165
JPMorgan ETFs (Ireland) ICAVUnaudited Appendix (continued)

1. Statement of Significant Portfolio Changes (continued)JPMorgan ETFs (Ireland) ICAV - GBP Ultra-Short Income UCITS ETF
Purchases
Nominal Holdingor Shares Description
CostGBP
36,134,159 JPMorgan Liquidity Funds - GBP Liquidity LVNAV Fund - Class X (dist.) 36,134,1593,547,000 UK Treasury Bill 3,545,9543,500,000 Exxon Mobil Corp. 3,167,2993,000,000 KFW 3,028,5422,400,000 UK Treasury Bill 2,395,0562,250,000 CPPIB Capital, Inc. 2,243,6782,000,000 LMA SA 1,999,0471,500,000 OP Corporate Bank plc 1,551,3001,500,000 Antalis SA 1,499,7781,500,000 Volvo Treasury AB 1,342,3691,280,000 Scentre Group Trust 1 / Scentre Group Trust 2 1,314,1881,300,000 LVMH Moet Hennessy Louis Vuitton SE 1,299,5971,000,000 Svenska Handelsbanken AB 1,021,1701,000,000 Henkel AG & Co. KGaA 1,009,2201,000,000 KFW 1,008,9991,000,000 Nestle Holdings, Inc. 1,006,7401,000,000 BNP Paribas SA 1,000,6761,000,000 Matchpoint Finance plc 999,8031,000,000 Lloyds Bank Corporate Markets plc 998,7101,000,000 Matchpoint Finance plc 998,6601,000,000 Matchpoint Finance plc 998,5901,000,000 Siemens Financieringsmaatschappij NV 996,8101,000,000 HSBC UK Bank plc 996,0271,250,000 Apidos CLO XXI ‘A1R’, FRN 982,654
Sales
Nominal Holdingor Shares Description
ProceedGBP
30,885,391 JPMorgan Liquidity Funds - GBP Liquidity LVNAV Fund - Class X (dist.) 30,885,3913,000,000 KFW 3,016,3502,600,000 Svenska Handelsbanken AB 2,642,1202,200,000 Royal Bank of Canada 2,210,6261,500,000 Exxon Mobil Corp. 1,359,0111,300,000 LVMH Moet Hennessy Louis Vuitton SE 1,293,3441,200,000 Henkel AG & Co. KGaA 1,205,4021,200,000 BMW International Investment BV 1,194,9361,200,000 Heathrow Funding Ltd. 1,079,6011,000,000 KFW 1,006,0001,000,000 Toronto-Dominion Bank (The), FRN 1,003,5201,000,000 UBS AG 1,002,5101,000,000 CPPIB Capital, Inc. 999,59010,013 JPMorgan ETFs (Ireland) ICAV - EUR Ultra-Short Income UCITS ETF 852,632900,000 VCL Multi-Compartment SA, ‘A’, FRN 827,848100,000,000 Central Nippon Expressway Company Ltd. 762,700750,000 National Australia Bank Ltd., FRN 749,820700,000 Nestle Holdings, Inc. 701,407700,000 IXIS Corporate & Investment Bank SA 701,386700,000 Cooperatieve Rabobank UA, FRN 701,162900,000 Barings CLO Ltd. 2013-IX ‘AR’, FRN 683,120860,000 GoldenTree Loan Management US CLO 1 Ltd. 2017-1X ‘A’, FRN 664,016
166
JPMorgan ETFs (Ireland) ICAVUnaudited Appendix (continued)

1. Statement of Significant Portfolio Changes (continued)JPMorgan ETFs (Ireland) ICAV - Global Emerging Markets Research Enhanced Index Equity (ESG) UCITS ETF
Purchases
Nominal Holdingor Shares Description
CostUSD
11,884,876 JPMorgan Liquidity Funds - USD Liquidity LVNAV Fund - Class X (dist.) 11,884,876100,218 Housing Development Finance Corp. Ltd. 2,949,05513,955 Alibaba Group Holding Ltd. ADR 2,896,210122,900 Meituan Dianping ‘B’ 2,302,53832,400 Tencent Holdings Ltd. 1,801,92597,115 Reliance Industries Ltd. 1,788,68459,736 Tata Consultancy Services Ltd. 1,750,024149,824 Axis Bank Ltd. 1,452,99344,986 Hindustan Unilever Ltd. 1,336,00224,590 Taiwan Semiconductor Manufacturing Co. Ltd. ADR 1,245,28910,484 New Oriental Education & Technology Group, Inc. ADR 1,220,32619,459 JD.com, Inc. ADR 1,140,78513,876 Maruti Suzuki India Ltd. 1,128,71926,685 Samsung Electronics Co. Ltd. 1,082,87915,878 UltraTech Cement Ltd. 909,986114,070 HCL Technologies Ltd. 877,098616,000 CNOOC Ltd. 875,95314,211 Tatneft PJSC ADR 822,026301,955 Power Grid Corp. of India Ltd. 794,446275,190 Itausa SA, Preference 783,107
Sales
Nominal Holdingor Shares Description
ProceedUSD
928,112 Lyxor MSCI India UCITS ETF 16,544,49310,116,120 JPMorgan Liquidity Funds - USD Liquidity LVNAV Fund - Class X (dist.) 10,116,1201,731,000 CTBC Financial Holding Co. Ltd. 1,139,14019,000 Tencent Holdings Ltd. 981,505172,690 Yonyou Network Technology Co. Ltd. ‘A’ 949,39833,151 KB Financial Group, Inc. 904,0383,144 Samsung SDI Co. Ltd. 896,70110,865 Prosus NV 841,4381,084,000 Industrial & Commercial Bank of China Ltd. ‘H’ 717,0757,282 Hyundai Motor Co. 705,54427,156 Bank Polska Kasa Opieki SA 705,20512,002 Taiwan Semiconductor Manufacturing Co. Ltd. ADR 595,744671,000 Inventec Corp. 512,683201,800 SAIC Motor Corp. Ltd. ‘A’ 509,6021,359,000 Bank of China Ltd. ‘H’ 503,786131,781 Gerdau SA, Preference 496,22551,100 Zhejiang Supor Co. Ltd. ‘A’ 479,07047,000 Hiwin Technologies Corp. 470,4522,436 Alibaba Group Holding Ltd. ADR 467,732283,100 Zhejiang Weixing New Building Materials Co. Ltd. ‘A’ 461,012
167
JPMorgan ETFs (Ireland) ICAVUnaudited Appendix (continued)

1. Statement of Significant Portfolio Changes (continued)JPMorgan ETFs (Ireland) ICAV - Global Equity Multi-Factor UCITS ETF
Purchases
Nominal Holdingor Shares Description
CostUSD
1,029 CVS Health Corp. 57,117576 QUALCOMM, Inc. 51,155829 Applied Materials, Inc. 50,528393 Skyworks Solutions, Inc. 50,049445 Qorvo, Inc. 49,75176 Regeneron Pharmaceuticals, Inc. 48,938131 NVIDIA Corp. 48,529280 Danaher Corp. 48,426998 Masco Corp. 48,393162 Vertex Pharmaceuticals, Inc. 47,510178 Zebra Technologies Corp. ‘A’ 47,065388 Alexion Pharmaceuticals, Inc. 46,308431 Keysight Technologies, Inc. 45,876852 Cardinal Health, Inc. 45,8462,587 NortonLifeLock, Inc. 44,984241 Synopsys, Inc. 44,265622 Edwards Lifesciences Corp. 43,6892,366 Western Union Co. (The) 43,577113 Humana, Inc. 43,0264,209 AGNC Investment Corp., REIT 42,240
Sales
Nominal Holdingor Shares Description
ProceedUSD
412 Safran S.A. 43,487549 Swiss Re AG 42,478752 Newmont Corp. 37,3404,122 Fortescue Metals Group Ltd. 36,9314,361 Telefonaktiebolaget LM Ericsson ‘B’ 36,472800 FUJIFILM Holdings Corp. 36,382392 Travelers Cos., Inc. (The) 35,088330 VMware, Inc. ‘A’ 34,888400 Daiichi Sankyo Co. Ltd. 33,3241,574 Barrick Gold Corp. 32,432268 Franco-Nevada Corp. 31,756966 Sampo OYJ ‘A’ 30,920212 Citrix Systems, Inc. 30,5041,140 Aflac, Inc. 30,472101 Lululemon Athletica, Inc. 30,035195 Eli Lilly & Co. 28,1482,129 H&R Block, Inc. 27,847500 Shionogi & Co. Ltd. 27,606544 InterContinental Hotels Group plc 26,870410 Liberty Property Trust, REIT 25,400399 Cincinnati Financial Corp. 25,2051,455 Burberry Group plc 23,948378 General Mills, Inc. 23,277382 KT&G Corp. 23,004359 VF Corp. 22,721121 Dollar General Corp. 22,55072 Apple, Inc. 22,168128 Microsoft Corp. 21,627990 Foot Locker, Inc. 20,018308 Raytheon Technologies Corp. 19,986
168
JPMorgan ETFs (Ireland) ICAVUnaudited Appendix (continued)

1. Statement of Significant Portfolio Changes (continued)JPMorgan ETFs (Ireland) ICAV - Global High Yield Corporate Bond Multi-Factor UCITS ETF
Purchases
Nominal Holdingor Shares Description
CostUSD
675,000 Sprint Corp. 761,078718,000 Sirius XM Radio, Inc. 753,764693,000 DISH DBS Corp. 736,146714,000 Fiat Chrysler Automobiles NV 720,839696,000 Uniti Group LP / Uniti Fiber Holdings, Inc. / CSL Capital LLC 701,541683,000 Tesla, Inc. 688,520627,000 Cemig Geracao e Transmissao SA 687,275581,000 Par Pharmaceutical, Inc. 596,795625,000 Turk Telekomunikasyon A/S 595,679605,000 MTN Mauritius Investments Ltd. 586,591514,000 Videotron Ltd. 544,125539,000 Encompass Health Corp. 543,676490,000 Polyus Finance plc 518,978453,000 IQVIA, Inc. 513,769476,000 Evraz plc 508,426489,000 Telefonaktiebolaget LM Ericsson 505,697520,000 Tupras Turkiye Petrol Rafinerileri A/S 484,058448,500 Intrum AB 482,343582,000 MDC Partners, Inc. 472,356390,000 Netflix, Inc. 469,874
Sales
Nominal Holdingor Shares Description
ProceedUSD
448,500 Intrum AB 483,720335,000 HCA, Inc. 385,250349,000 HCA, Inc. 385,062354,000 Telecom Italia Capital SA 381,435375,000 Summit Properties Ltd. 378,503355,000 Hughes Satellite Systems Corp. 365,686411,000 Triumph Group, Inc. 349,350271,000 Telecom Italia Capital SA 327,910322,000 Performance Food Group, Inc. 322,805309,000 Avon Products, Inc. 305,233280,000 Frontier Communications Corp. 285,516313,000 PBF Holding Co. LLC / PBF Finance Corp. 282,899274,000 Avon International Capital plc 268,406275,000 Garda World Security Corp. 267,575350,000 Endo Dac / Endo Finance LLC / Endo Finco, Inc. 263,410235,000 LKQ European Holdings BV 261,765290,000 Credito Real SAB de CV SOFOM ER 256,824270,000 Mattel, Inc. 254,297250,000 Ultrapar International SA 246,250244,000 Turk Telekomunikasyon A/S 235,167200,000 Ypso Finance Bis SA 228,262230,000 MTN Mauritius Investments Ltd. 224,469190,000 Petrobras Global Finance BV 223,322278,000 PBF Holding Co. LLC / PBF Finance Corp. 221,528200,000 Cemig Geracao e Transmissao SA 215,000200,000 Telecom Italia SpA 211,000254,000 Ladder Capital Finance Holdings LLLP / Ladder Capital Finance Corp. 209,974204,000 Vistra Operations Co. LLC 205,552201,000 Ronshine China Holdings Ltd. 204,769200,000 Polyus Finance plc 204,040
169
JPMorgan ETFs (Ireland) ICAVUnaudited Appendix (continued)

1. Statement of Significant Portfolio Changes (continued)JPMorgan ETFs (Ireland) ICAV - Global Research Enhanced Index Equity (ESG) UCITS ETF
Purchases
Nominal Holdingor Shares Description
CostUSD
10,961,440 JPMorgan Liquidity Funds - USD Liquidity LVNAV Fund - Class X (dist.) 10,961,4403,653 Apple, Inc. 1,254,0556,437 Microsoft Corp. 1,220,685378 Amazon.com, Inc. 958,3582,276 Facebook, Inc. ‘A’ 517,1763,685 Procter & Gamble Co. (The) 439,501281 Alphabet, Inc. ‘C’ 409,468260 Alphabet, Inc. ‘A’ 379,4331,195 Costco Wholesale Corp. 365,7001,112 Mastercard, Inc. ‘A’ 346,4101,011 UnitedHealth Group, Inc. 304,6432,726 Nestle SA 302,9965,136 Verizon Communications, Inc. 295,4155,946 Coca-Cola Co. (The) 287,9121,444 Berkshire Hathaway, Inc. ‘B’ 279,2291,366 Visa, Inc. ‘A’ 272,006831 S&P Global, Inc. 261,2253,235 Merck & Co., Inc. 260,1321,839 Kimberly-Clark Corp. 255,9071,663 Johnson & Johnson 242,764
Sales
Nominal Holdingor Shares Description
ProceedUSD
11,073,444 JPMorgan Liquidity Funds - USD Liquidity LVNAV Fund - Class X (dist.) 11,073,4441,747 Intercontinental Exchange, Inc. 164,8992,758 General Mills, Inc. 157,9162,500 Coca-Cola Co. (The) 134,4161,298 Waste Management, Inc. 124,1151,595 Teradyne, Inc. 114,741492 Cigna Corp. 109,5002,216 American International Group, Inc. 107,0881,683 Southern Co. (The) 104,9391,107 Waste Connections, Inc. 103,250642 Kansas City Southern 89,8491,039 Expedia Group, Inc. 85,243348 Home Depot, Inc. (The) 84,0733,105 Bank of America Corp. 82,184471 Pernod Ricard SA 76,414319 Becton Dickinson & Co. 75,4441,524 Advanced Micro Devices, Inc. 74,714244 NVIDIA Corp. 71,167609 Walmart, Inc. 69,487305 Berkshire Hathaway, Inc. ‘B’ 68,927
170
JPMorgan ETFs (Ireland) ICAVUnaudited Appendix (continued)

1. Statement of Significant Portfolio Changes (continued)JPMorgan ETFs (Ireland) ICAV - Managed Futures UCITS ETF
Purchases
Nominal Holdingor Shares Description
CostUSD
6,904,000 BNG Bank NV 7,008,9417,000,000 US Treasury Bill 6,999,0726,635,000 US Treasury Bill 6,632,4296,635,000 US Treasury Bill 6,619,8046,585,900 US Treasury Bill 6,577,1416,582,800 US Treasury Bill 6,576,0146,577,600 US Treasury Bill 6,573,0215,220,000 International Bank for Reconstruction & Development 5,273,2444,693,800 US Treasury Bill 4,687,9854,200,000 Dexia Credit Local SA 4,232,5502,790,472 JPMorgan Liquidity Funds - USD Liquidity LVNAV Fund - Class X (dist.) 2,790,4722,000,000 Agence Francaise de Developpement EPIC 2,011,7401,157,800 US Treasury Bill 1,156,761
Sales
Nominal Holdingor Shares Description
ProceedUSD
3,835,769 JPMorgan Liquidity Funds - USD Liquidity LVNAV Fund - Class X (dist.) 3,835,769
171
JPMorgan ETFs (Ireland) ICAVUnaudited Appendix (continued)

1. Statement of Significant Portfolio Changes (continued)JPMorgan ETFs (Ireland) ICAV - US Equity Multi-Factor UCITS ETF
Purchases
Nominal Holdingor Shares Description
CostUSD
181 Quidel Corp. 40,001118 Lockheed Martin Corp. 34,54590 NVIDIA Corp. 32,958432 Lumentum Holdings, Inc. 32,888678 Masco Corp. 32,747147 West Pharmaceutical Services, Inc. 32,70052 Regeneron Pharmaceuticals, Inc. 31,791414 Albemarle Corp. 30,901120 Bio-Techne Corp. 30,774391 DaVita, Inc. 29,544223 SolarEdge Technologies, Inc. 28,885237 United Therapeutics Corp. 28,383619 Campbell Soup Co. 28,041632 Hexcel Corp. 27,80864 Bio-Rad Laboratories, Inc. ‘A’ 27,683588 A O Smith Corp. 26,137238 International Flavors & Fragrances, Inc. 25,389544 Enphase Energy, Inc. 24,643820 Dow, Inc. 22,748347 FMC Corp. 22,666235 Packaging Corp. of America 22,4851,679 VICI Properties, Inc., REIT 20,669886 Axalta Coating Systems Ltd. 18,98740 Chemed Corp. 17,786256 Eaton Corp. plc 16,807524 NRG Energy, Inc. 16,543263 Pioneer Natural Resources Co. 16,24356 Vertex Pharmaceuticals, Inc. 15,995121 Skyworks Solutions, Inc. 14,863252 Cirrus Logic, Inc. 14,7471,101 Arconic, Inc. 14,588266 Westlake Chemical Corp. 14,013177 MSC Industrial Direct Co., Inc. ‘A’ 12,321
Sales
Nominal Holdingor Shares Description
ProceedUSD
765 TJX Cos., Inc. (The) 37,363314 Walt Disney Co. (The) 34,257185 Waters Corp. 32,090314 T-Mobile US, Inc. 29,87670 Intuitive Surgical, Inc. 27,593308 Ross Stores, Inc. 25,795505 Newmont Corp. 25,215380 VF Corp. 21,713207 Varian Medical Systems, Inc. 20,6012,193 Chimera Investment Corp., REIT 20,4611,651 Olin Corp. 19,383291 Agilent Technologies, Inc. 19,3402,702 New Residential Investment Corp., REIT 19,292964 Domtar Corp. 18,962801 STORE Capital Corp., REIT 18,936167 Scotts Miracle-Gro Co. (The) 18,837301 Cincinnati Financial Corp. 18,66267 Lululemon Athletica, Inc. 18,153171 VMware, Inc. ‘A’ 18,078700 NRG Energy, Inc. 16,317277 Genuine Parts Co. 15,332130 Royal Gold, Inc. 15,275898 Sinclair Broadcast Group, Inc. ‘A’ 14,86563 Clorox Co. (The) 13,56468 Dollar General Corp. 12,879216 General Mills, Inc. 12,789113 Travelers Cos., Inc. (The) 12,543871 H&R Block, Inc. 11,75973 Eli Lilly & Co. 11,60472 Microsoft Corp. 11,6003,087 Patterson-UTI Energy, Inc. 11,02176 Citrix Systems, Inc. 10,851801 KAR Auction Services, Inc. 10,78983 Tractor Supply Co. 10,788
172
JPMorgan ETFs (Ireland) ICAVUnaudited Appendix (continued)

1. Statement of Significant Portfolio Changes (continued)JPMorgan ETFs (Ireland) ICAV - US Research Enhanced Index Equity (ESG) UCITS ETF
Purchases
Nominal Holdingor Shares Description
CostUSD
5,919,320 JPMorgan Liquidity Funds - USD Liquidity LVNAV Fund - Class X (dist.) 5,919,32013,566 Microsoft Corp. 2,373,3607,596 Apple, Inc. 2,326,7776,568 Costco Wholesale Corp. 1,975,76115,042 Procter & Gamble Co. (The) 1,760,701708 Amazon.com, Inc. 1,509,1307,213 Facebook, Inc. ‘A’ 1,442,25115,062 Baxter International, Inc. 1,337,29816,076 State Street Corp. 1,274,90515,210 TE Connectivity Ltd. 1,273,4154,201 S&P Global, Inc. 1,230,49324,168 Coca-Cola Co. (The) 1,175,67515,535 PACCAR, Inc. 1,175,13619,756 Verizon Communications, Inc. 1,136,68215,403 CSX Corp. 1,117,3329,578 United Parcel Service, Inc. ‘B’ 1,103,5164,612 Goldman Sachs Group, Inc. (The) 1,077,77715,726 Booz Allen Hamilton Holding Corp. ‘A’ 1,069,48312,598 Duke Energy Corp. 1,058,8337,477 Kimberly-Clark Corp. 1,035,117
Sales
Nominal Holdingor Shares Description
ProceedUSD
6,636,428 JPMorgan Liquidity Funds - USD Liquidity LVNAV Fund - Class X (dist.) 6,636,42813,709 Waste Management, Inc. 1,629,63129,010 Coca-Cola Co. (The) 1,578,59830,241 General Mills, Inc. 1,578,26415,961 Intercontinental Exchange, Inc. 1,505,3744,240 Apple, Inc. 1,271,2067,209 Microsoft Corp. 1,263,95415,726 Booz Allen Hamilton Holding Corp. ‘A’ 1,197,5614,594 Cigna Corp. 1,006,61415,757 Southern Co. (The) 965,89813,875 Teradyne, Inc. 953,7366,860 Kansas City Southern 951,8864,556 Berkshire Hathaway, Inc. ‘B’ 938,644402 Amazon.com, Inc. 911,05411,491 TE Connectivity Ltd. 907,09012,208 Monster Beverage Corp. 818,7295,151 Automatic Data Processing, Inc. 801,6526,210 PayPal Holdings, Inc. 782,99612,236 AGCO Corp. 777,4112,534 NVIDIA Corp. 761,969
173
JPMorgan ETFs (Ireland) ICAVUnaudited Appendix (continued)

1. Statement of Significant Portfolio Changes (continued)JPMorgan ETFs (Ireland) ICAV - USD Corporate Bond Research Enhanced Index UCITS ETF
Purchases
Nominal Holdingor Shares Description
CostUSD
18,262,695 JPMorgan Liquidity Funds - USD Liquidity LVNAV Fund - Class X (dist.) 18,262,695760,000 Goldman Sachs Group, Inc. (The), FRN 773,612710,000 Berkshire Hathaway, Inc. 722,730650,000 O’Reilly Automotive, Inc. 707,961600,000 Fidelity National Information Services, Inc. 637,212529,000 US Treasury Bond 614,840500,000 Verizon Communications, Inc. 561,360490,000 AT&T, Inc. 549,062500,000 Credit Suisse AG 514,143470,000 Royal Bank of Scotland Group plc 513,198482,000 Shire Acquisitions Investments Ireland DAC 500,590485,000 Exxon Mobil Corp. 494,578490,000 Broadcom Corp. / Broadcom Cayman Finance Ltd. 489,869468,000 PNC Financial Services Group, Inc. (The) 457,830450,000 Charter Communications Operating LLC / Charter Communications Operating Capital 455,495450,000 UnitedHealth Group, Inc. 454,480450,000 T-Mobile USA, Inc. 449,897400,000 Prologis LP 441,840440,000 Wells Fargo & Co. 433,809405,000 Boeing Co. (The) 422,358
Sales
Nominal Holdingor Shares Description
ProceedUSD
18,513,698 JPMorgan Liquidity Funds - USD Liquidity LVNAV Fund - Class X (dist.) 18,513,698964,000 Morgan Stanley 980,550710,000 Berkshire Hathaway, Inc. 751,450570,500 US Treasury Bond 702,937522,000 Goldman Sachs Group, Inc. (The) 558,587390,000 Sherwin-Williams Co. (The) 434,628350,000 US Treasury Bond 421,539400,000 Nordea Bank Abp 413,656340,000 Duke Energy Corp. 373,612349,000 Simon Property Group LP 372,495310,000 Medtronic, Inc. 371,120335,000 McDonald’s Corp. 370,628345,000 Apple, Inc. 364,586335,000 Discovery Communications LLC 353,261276,000 American International Group, Inc. 333,394302,000 Discover Financial Services 330,183251,000 Eli Lilly & Co. 312,384449,000 Occidental Petroleum Corp. 312,055300,000 Shire Acquisitions Investments Ireland DAC 304,050316,000 EQM Midstream Partners LP 301,960
174
JPMorgan ETFs (Ireland) ICAVUnaudited Appendix (continued)

1. Statement of Significant Portfolio Changes (continued)JPMorgan ETFs (Ireland) ICAV - USD Emerging Markets Sovereign Bond UCITS ETF
Purchases
Nominal Holdingor Shares Description
CostUSD
28,331,663 JPMorgan Liquidity Funds - USD Liquidity LVNAV Fund - Class X (dist.) 28,331,6636,476,000 Egypt Government Bond 5,946,1115,600,000 Egypt Government Bond 5,244,1883,691,000 Egypt Government Bond 3,734,6263,700,000 Egypt Government Bond 3,668,8773,457,000 Ukraine Government Bond 3,283,6052,968,000 Dominican Republic Government Bond 3,282,5943,024,000 Ukraine Government Bond 3,270,2762,994,000 Brazil Government Bond 3,143,2113,095,000 Pakistan Government Bond 3,065,6983,640,000 Oman Government Bond 2,978,3333,903,000 Ecuador Government Bond 2,892,4583,047,000 Oman Government Bond 2,817,0603,289,000 Iraq Government Bond 2,815,9962,778,000 Kenya Government Bond 2,812,4703,319,000 Dominican Republic Government Bond 2,789,0062,452,000 Southern Gas Corridor CJSC 2,784,3612,744,000 Dominican Republic Government Bond 2,705,4792,750,000 Bahrain Government Bond 2,704,5992,347,000 Panama Government Bond 2,689,592
Sales
Nominal Holdingor Shares Description
ProceedUSD
27,329,700 JPMorgan Liquidity Funds - USD Liquidity LVNAV Fund - Class X (dist.) 27,329,7003,157,000 Jamaica Government Bond 3,310,4752,774,000 Jamaica Government Bond 2,806,5912,318,000 Jamaica Government Bond 2,548,2721,856,000 Poland Government Bond 2,028,1911,726,000 Bahrain Government Bond 1,801,5132,827,000 Sri Lanka Government Bond 1,769,0641,486,000 Qatar Government Bond 1,765,4292,098,000 Ecuador Government Bond 1,734,8993,250,000 Sri Lanka Government Bond 1,694,6005,216,000 Ecuador Government Bond 1,419,8701,257,000 Peru Government Bond 1,402,9161,242,000 Hungary Government Bond 1,388,8412,000,000 Gabon Government Bond 1,383,0751,400,000 Egypt Government Bond 1,381,1251,301,000 Saudi Government Bond 1,351,1021,265,000 Poland Government Bond 1,325,9481,274,000 Petronas Capital Ltd. 1,325,4351,792,000 Gabon Government Bond 1,319,8081,372,000 Indonesia Government Bond 1,315,274
175
JPMorgan ETFs (Ireland) ICAVUnaudited Appendix (continued)

1. Statement of Significant Portfolio Changes (continued)JPMorgan ETFs (Ireland) ICAV - USD Ultra-Short Income UCITS ETF
Purchases
Nominal Holdingor Shares Description
CostUSD
73,238,632 JPMorgan Liquidity Funds - USD Liquidity LVNAV Fund - Class X (dist.) 73,238,6324,400,000 Industrial & Commercial Bank of China Ltd. 4,379,5642,998,000 BPCE SA, FRN 2,998,0003,000,000 KEB Hana Bank 2,991,5903,000,000 KEB Hana Bank 2,983,6842,600,000 Tokyo Metropolitan Government 2,602,1582,210,000 US Bank NA, FRN 2,210,0002,200,000 Eastern Creation II Investment Holdings Ltd. 2,206,4242,086,000 Standard Chartered Bank 2,086,0002,000,000 Cargill, Inc. 1,999,9581,800,000 Canadian Imperial Bank of Commerce, FRN 1,811,3221,800,000 Sumitomo Corp. 1,790,6411,598,000 DNB Bank ASA 1,598,4571,550,000 Lloyds Bank Commercial Banking 1,550,3701,511,000 Mitsubishi UFJ Financial Group, Inc. 1,516,0171,445,000 Principal Life Global Funding II 1,443,7001,300,000 ViacomCBS, Inc. 1,386,9051,369,000 State Grid Overseas Investment 2016 Ltd. 1,369,4111,336,000 Svenska Handelsbanken AB 1,354,2761,300,000 International Business Machines Corp. 1,353,313
Sales
Nominal Holdingor Shares Description
ProceedUSD
89,541,769 JPMorgan Liquidity Funds - USD Liquidity LVNAV Fund - Class X (dist.) 89,541,7695,500,000 US Treasury Note 5,602,8202,868,000 Industrial & Commercial Bank of China Ltd., New York Branch 2,860,5402,700,000 US Treasury Note 2,734,2662,600,000 Tokyo Metropolitan Government 2,600,7802,140,000 US Treasury Note 2,170,0232,104,000 Banque Federative du Credit Mutuel SA 2,109,9622,070,000 Skandinaviska Enskilda Banken AB 2,071,3252,000,000 BPCE SA 2,013,6602,000,000 Barclays Bank plc, New York Branch 2,004,0302,000,000 MUFG Bank Ltd. 2,002,6512,000,000 Suncor Energy, Inc. 1,998,5421,865,000 Principal Life Global Funding II 1,892,0871,796,000 Swire Properties MTN Financing Ltd. 1,796,6651,757,000 Cooperatieve Rabobank UA 1,775,0741,738,000 Federation des Caisses Desjardins du Quebec 1,746,5291,733,187 Voya CLO 2014-3 Ltd. ‘A1R’, FRN 1,704,5891,711,000 US Bank NA, FRN 1,702,2741,696,000 Commonwealth Bank of Australia 1,696,9331,791,000 Air Lease Corp., FRN 1,696,476
The CBI requires a schedule of material changes in the composition of the portfolio during the period. These are defined as aggregate purchases of a securityexceeding one per cent of the total value of purchases for the period and aggregate disposals greater than one per cent of the total value of sales. At aminimum the largest 20 purchases and 20 sales must be given or all purchases and sales if less than 20. A full listing of the portfolio changes for the period isavailable, upon request, at no extra cost from the Administrator.
176
JPMorgan ETFs (Ireland) ICAVUnaudited Appendix (continued)

Sub-Funds Actual TER (net of waiver fees) Maximum TER as per Prospectus
BetaBuilders EUR Govt Bond 1-3 yr UCITS ETFClass EUR (acc) 0.10% 0.10%
BetaBuilders EUR Govt Bond UCITS ETFClass EUR (acc) 0.10% 0.10%
BetaBuilders UK Gilt 1-5 yr UCITS ETFClass GBP (dist) 0.10% 0.10%
BetaBuilders US Equity UCITS ETFClass USD (acc) 0.04% 0.04%Class USD (dist) 0.04% 0.04%
BetaBuilders US Treasury Bond 0-1 yr UCITS ETFClass MXN Hedged (acc) 0.12% 0.12%Class USD (acc) 0.10% 0.10%
BetaBuilders US Treasury Bond 1-3 yr UCITS ETFClass USD (acc) 0.10% 0.10%
BetaBuilders US Treasury Bond UCITS ETFClass GBP Hedged (acc) 0.10% 0.10%Class USD (acc) 0.10% 0.10%
Equity Long-Short UCITS ETF#
Class EUR Hedged (acc) 0.64% 0.67%Class GBP Hedged (acc) 0.67% 0.67%Class USD (acc) 0.63% 0.67%
EUR Corporate Bond 1-5 yr Research Enhanced Index UCITS ETFClass EUR (acc) 0.19% 0.19%
EUR Corporate Bond Research Enhanced Index UCITS ETFClass EUR (acc) 0.19% 0.19%
EUR Ultra-Short Income UCITS ETFClass EUR (acc) 0.08% 0.18%*
Europe Research Enhanced Index Equity (ESG) UCITS ETFClass EUR (acc) 0.25% 0.25%
GBP Ultra-Short Income UCITS ETFClass GBP (acc) 0.14% 0.18%**Class GBP (dist) 0.14% 0.18%**
Global Emerging Markets Research Enhanced Index Equity (ESG) UCITS ETFClass USD (acc) 0.30% 0.30%
Global Equity Multi-Factor UCITS ETFClass USD (acc) 0.19% 0.19%
Global High Yield Corporate Bond Multi-Factor UCITS ETFClass GBP Hedged (dist) 0.35% 0.35%Class MXN Hedged (acc) 0.35% 0.35%Class USD (acc) 0.35% 0.35%Class USD Hedged (acc) 0.35% 0.35%
Global Research Enhanced Index Equity (ESG) UCITS ETFClass USD (acc) 0.25% 0.25%
177
JPMorgan ETFs (Ireland) ICAVUnaudited Appendix (continued)
2. Total Expense Ratios

Sub-Funds Actual TER (net of waiver fees) Maximum TER as per Prospectus
Managed Futures UCITS ETFClass EUR Hedged (acc) 0.57% 0.57%Class GBP Hedged (acc) 0.57% 0.57%Class USD (acc) 0.57% 0.57%
US Equity Multi-Factor UCITS ETFClass USD (acc) 0.19% 0.19%
US Research Enhanced Index Equity (ESG) UCITS ETFClass USD (acc) 0.20% 0.25%^Class USD (dist) 0.20% 0.25%^
USD Corporate Bond Research Enhanced Index UCITS ETFClass USD (acc) 0.19% 0.19%
USD Emerging Markets Sovereign Bond UCITS ETFClass CHF Hedged (acc) 0.39% 0.39%Class EUR Hedged (acc) 0.39% 0.39%Class GBP Hedged (dist) 0.39% 0.39%Class MXN Hedged (acc) 0.39% 0.39%Class USD (acc) 0.39% 0.39%Class USD (dist) 0.39% 0.39%
USD Ultra-Short Income UCITS ETFClass USD (acc) 0.18% 0.18%Class USD (dist) 0.18% 0.18%
# Sub-Fund liquidated on 19 June 2020. See Note 17e.* With effect from 9 May 2019 to 1 June 2020, the TER was waived by 0.10% per annum. The Management Company has decided to extend this fee waiver until 31 May 2021. From 1 June 2021, theTER will revert to up to 0.18% per annum.** With effect from 1 April 2020, the TER is waived by the Management Company by 0.08% per annum until 31 March 2021. From 1 April 2021, the TER will revert to up to 0.18% per annum.^ The TER is waived by the Management Company by 0.05% per annum until 30 June 2020.
178
JPMorgan ETFs (Ireland) ICAVUnaudited Appendix (continued)
2. Total Expense Ratios (continued)

The ICAV engages in Securities Financing Transactions (as defined in Article 3 of Regulation (EU) 2015/2365, Securities Financing Transactions includerepurchase transactions, securities or commodities lending and securities or commodities borrowing, buy-sell back transactions or sell-buy backtransactions and margin lending transactions) through its exposure on securities lending transactions and contracts for differences during the period. Inaccordance with Article 13 of the Regulation, the information on securities lending transactions are detailed below.
Collateral received or granted with respect to Securities Financing Transactions are disclosed on a trade date basis of accounting.
Global Data
Amount of securities on loan
The total value of securities on loan as a proportion of the Sub-Funds’ total lendable assets as at the reporting date is detailed below. Total lendable assetsrepresent the aggregate value of asset types forming part of the Sub-Funds’ securities lending programme.
Sub-Fund % of Total Lendable Assets
JPMorgan ETFs (Ireland) ICAV - BetaBuilders US Equity UCITS ETF 0.46
JPMorgan ETFs (Ireland) ICAV - Global Equity Multi-Factor UCITS ETF 0.33
JPMorgan ETFs (Ireland) ICAV - US Equity Multi-Factor UCITS ETF 0.33
Amount of assets engaged in securities lending transactions and contracts for differences
Securities lending transactionsThe following table represents the total value of assets engaged in securities lending transactions as at the reporting date:
Sub-Fund Sub-Fund CurrencyMarket Value of Securities on Loan
(in Sub-Fund Currency) % of AUM
JPMorgan ETFs (Ireland) ICAV - BetaBuilders US Equity UCITS ETF USD 38,927 0.40
JPMorgan ETFs (Ireland) ICAV - Global Equity Multi-Factor UCITS ETF USD 67,825 0.29
JPMorgan ETFs (Ireland) ICAV - US Equity Multi-Factor UCITS ETF USD 34,648 0.33
Contracts for differencesThe following table represents the total value of assets engaged in contracts for differences as at the reporting date:
JPMorgan ETFs (Ireland) ICAV - Equity Long-Short UCITS ETF*
Sub-FundAmount
USD % of AUM
Contracts for differences - Assets - -
Contracts for differences - Liabilities (84) -
*Sub-Fund liquidated on 19 June 2020. See Note 17e.
Concentration Data
Ten largest collateral issuers
Securities lending transactionsThe following table lists the ten largest issuers by value of non-cash collaterals received by the Sub-Funds across securities lending transactions as at thereporting date:
JPMorgan ETFs (Ireland) ICAV - BetaBuilders US Equity UCITS ETF JPMorgan ETFs (Ireland) ICAV - Global Equity Multi-Factor UCITS ETF
IssuerNon-Cash Collateral Value
USD IssuerNon-Cash Collateral Value
USD
France Government 46 France Government 80
Netherlands Government 4,368 Netherlands Government 7,612
UK Treasury 718 UK Treasury 1,251
US Treasury 35,747 US Treasury 62,285
JPMorgan ETFs (Ireland) ICAV - US Equity Multi-Factor UCITS ETF
IssuerNon-Cash Collateral Value
USD
France Government 41
Netherlands Government 3,888
UK Treasury 639
US Treasury 31,818
Contracts for differencesThere is no collateral received in respect of contracts for differences as at the reporting date.
179
JPMorgan ETFs (Ireland) ICAVUnaudited Appendix (continued)
3. Securities Financing Transactions

Top ten counterparties
Securities lending transactionsThe following table lists the top ten counterparties across securities lending transactions as at the reporting date:
JPMorgan ETFs (Ireland) ICAV - BetaBuilders US Equity UCITS ETF
AmountUSD % of AUM
Citibank NA 2,484 0.03
UBS 36,443 0.37
JPMorgan ETFs (Ireland) ICAV - Global Equity Multi-Factor UCITS ETF
AmountUSD % of AUM
Credit Suisse 67,825 0.29
JPMorgan ETFs (Ireland) ICAV - US Equity Multi-Factor UCITS ETF
AmountUSD % of AUM
Credit Suisse 15,269 0.15
UBS 19,379 0.18
Contracts for differencesThe following table lists the top ten counterparties across contracts for differences as at the reporting date:
JPMorgan ETFs (Ireland) ICAV - Equity Long-Short UCITS ETF*
AmountUSD % of AUM
Bank of America Merrill Lynch (84) -
Aggregate Transaction Data
Type and quality of collateral
Securities lending transactionsCollaterals received by the Sub-Funds in respect of securities lending transactions as at the reporting date are in the form of debt securities havinginvestment grade credit rating.
Sub-Fund Sub-Fund CurrencyNon-Cash Collateral Value
(in Sub-Fund Currency)% of Non-Cash Collateral
deemed Investment Grade
BetaBuilders US Equity UCITS ETF USD 40,879 100.00%
Global Equity Multi-Factor UCITS ETF USD 71,228 100.00%
US Equity Multi-Factor UCITS ETF USD 36,386 100.00%
Contracts for differencesThere is no collateral received in respect of contracts for differences as at the reporting date.
Maturity tenor of collateral
Securities lending transactionsThe following table provides an analysis of the maturity tenor of collaterals received in relation to securities lending transactions as at the reporting date.
Collateral Value
BetaBuilders US Equity UCITS ETF Global Equity Multi-Factor UCITS ETF US Equity Multi-Factor UCITS ETF
Maturity USD USD USD
Cash
less than 1 day - - -
Non-Cash
1 to 7 days - - -
1 to 4 weeks - - -
1 to 3 months - - -
3 to 12 months - - -
more than 1 year 40,879 71,228 36,386
Contracts for differencesThere is no collateral received in relation to contracts for differences as at the reporting date.
180
JPMorgan ETFs (Ireland) ICAVUnaudited Appendix (continued)
3. Securities Financing Transactions (continued)

Currency of collateral
Securities lending transactionsThe following table provides currency of collaterals received in relation to securities lending transactions as at the reporting date.
Collateral Value (in Sub-Fund Currency)
Sub-Fund Sub-Fund Currency EUR GBP USD Total
BetaBuilders US Equity UCITS ETF USD 4,414 718 35,747 40,879
Global Equity Multi-Factor UCITS ETF USD 7,692 1,251 62,285 71,228
US Equity Multi-Factor UCITS ETF USD 3,929 639 31,818 36,386
Contracts for differencesThere is no collateral received in relation to contracts for differences as at the reporting date.
Maturity tenor of securities lending agreements and contracts for differences
Securities lending transactionsThe ICAV’s securities lending transactions have open maturity.
Contracts for differencesThe contracts for differences have open maturity.
Country in which counterparties are established
Securities lending transactionsThe following table provides details of the country of incorporation of counterparties across securities lending transactions:
Counterparty Country of Incorporation
Citibank NA United States of America
Credit Suisse Switzerland
UBS Switzerland
Contracts for differencesThe following table provides details of the country of incorporation of counterparties across contracts for differences:
Counterparty Country of Incorporation
Bank of America Merrill Lynch United States of America
Settlement and clearing
All Sub-Funds engaged in securities lending agreements utilise bi-lateral settlement and clearing with their respective counterparty.
Reuse of collateral
Share of collateral received that is reused and reinvestment return
Non-cash collateral received by way of title transfer collateral arrangement in relation to securities lending transactions, reverse repurchase agreementsand OTC derivative transactions, cannot be sold, reinvested or pledged.
Securities lending transactionsAs at the reporting date, the Fund did not receive any cash collateral in relation to securities lending transactions.
Contracts for differencesAs at the reporting date, the Fund did not receive any cash collateral in relation to contracts for differences.
Safekeeping of Collateral
Collateral received
Securities lending transactionsAll collateral received, if any, is held at the Sub-Funds custodian, Brown Brothers Harriman Trustee Services (Ireland) Limited, as at the reporting date.
Contracts for differencesAll collateral received, if any, is held at the Sub-Funds custodian, Brown Brothers Harriman Trustee Services (Ireland) Limited, as at the reporting date.
Collateral granted
Securities lending transactionsAs at the reporting date, there was no collateral granted with respect to securities lending transactions.
Contracts for differencesAs at the reporting date, there was no collateral granted with respect to contracts for differences.
181
JPMorgan ETFs (Ireland) ICAVUnaudited Appendix (continued)
3. Securities Financing Transactions (continued)

Return and cost
Securities lending transactionsThe total income earned from securities lending transactions is split between the relevant Sub-Funds and the securities lending agent. Detail of this split isdisclosed in Note 16 to the Financial Statements.
Contracts for differencesAll returns from contracts for differences will accrue to the Sub-Funds and are not subject to any returns sharing arrangements with the Investment Manageror any other third parties.
Returns and costs of contracts for differences for the six month period ended 30 June 2020 are as follows:
ReturnUSD
Transaction costsUSD
JPMorgan ETFs (Ireland) ICAV - Equity Long-Short UCITS ETF* (2,962,180) (29,755)
*Sub-Fund liquidated on 19 June 2020. See Note 17e.
182
JPMorgan ETFs (Ireland) ICAVUnaudited Appendix (continued)
3. Securities Financing Transactions (continued)

Standalone / Sub-Fund name
Standalone /Sub-Fundnumber Launch date
Indextracking?
Expectedtracking errors
Semi-Annualtrackingerror % Comments
JPMorgan ETFs (Ireland) ICAV - BetaBuilders EURGovt Bond 1-3 yr UCITS ETF
C175317 15/02/2018 Yes up to 1.00% 0.01% The performance of the Sub-Fund has been consistently inline with that of the index and within our tolerance levels
JPMorgan ETFs (Ireland) ICAV - BetaBuilders EURGovt Bond UCITS ETF
C182003 25/04/2019 Yes up to 1.00% 0.03% The performance of the Sub-Fund has been consistently inline with that of the index and within our tolerance levels
JPMorgan ETFs (Ireland) ICAV - BetaBuilders UKGilt 1-5 yr UCITS ETF
C178895 06/06/2018 Yes up to 1.00% 0.01% The performance of the Sub-Fund has been consistently inline with that of the index and within our tolerance levels
JPMorgan ETFs (Ireland) ICAV - BetaBuilders USEquity UCITS ETF
C187895 03/04/2019 Yes up to 1.00% 0.10% The performance of the Sub-Fund has been consistently inline with that of the index and within our tolerance levels
JPMorgan ETFs (Ireland) ICAV - BetaBuilders USTreasury Bond 0-1 yr UCITS ETF
C190324 09/07/2019 Yes up to 1.00% 0.00% The performance of the Sub-Fund has been consistently inline with that of the index and within our tolerance levels
JPMorgan ETFs (Ireland) ICAV - BetaBuilders USTreasury Bond 1-3 yr UCITS ETF
C178896 06/06/2018 Yes up to 1.00% 0.00% The performance of the Sub-Fund has been consistently inline with that of the index and within our tolerance levels
JPMorgan ETFs (Ireland) ICAV - BetaBuilders USTreasury Bond UCITS ETF
C182016 25/04/2019 Yes up to 1.00% 0.03% The performance of the Sub-Fund has been consistently inline with that of the index and within our tolerance levels
JPMorgan ETFs (Ireland) ICAV - Global EquityMulti-Factor UCITS ETF
C190300 09/07/2019 Yes up to 1.00% 0.12% The performance of the Sub-Fund has been consistently inline with that of the index and within our tolerance levels
JPMorgan ETFs (Ireland) ICAV - US EquityMulti-Factor UCITS ETF
C190297 09/07/2019 Yes up to 1.00% 0.18% The performance of the Sub-Fund has been consistently inline with that of the index and within our tolerance levels
JPMorgan ETFs (Ireland) ICAV - USD EmergingMarkets Sovereign Bond UCITS ETF
C174035 15/02/2018 Yes up to 2.00% 0.07% The performance of the Sub-Fund has been consistently inline with that of the index and within our tolerance levels
JPMorgan ETFs (Ireland) ICAV - Global High Yield Corporate Bond Multi-Factor UCITS ETF is also an Index Tracking Sub-Fund, it was launched in April 2020.As at 30 June 2020, the above Sub-Fund was not active for more than 6 months and therefore there is no sufficient meaningful data available to calculate for the period's tracking error %.
183
JPMorgan ETFs (Ireland) ICAVUnaudited Appendix (continued)
4. Sub-Fund Tracking Errors

JPMorgan Asset Management (Europe) S.à.r.l. (the “Management Company”) is the authorised manager of JPMorgan ETFs (Ireland) ICAV (the “Fund”) and ispart of the J.P. Morgan Chase & Co. group of companies. In this section, the terms “J.P. Morgan” or “Firm” refer to that group, and each of the entities in thatgroup globally, unless otherwise specified.
This section of the semi-annual report has been prepared in accordance with the Undertakings for Collective Investment in Transferable Securities (the“UCITS Directive”) and the ‘Guidelines on sound remuneration policies’ issued by the European Securities and Markets Authority under the UCITS Directive.The information in this section is in respect of the most recent complete remuneration period (“Performance Year”) as at the reporting date.
Remuneration Policy
A summary of the Remuneration Policy applying to the Management Company (the “Remuneration Policy”) can be found athttps://am.jpmorgan.com/lu/en/asset-management/adv/funds/policies/ (the “Remuneration Policy Statement”). This Remuneration Policy Statementincludes details of how remuneration and benefits are calculated, including the financial and non-financial criteria used to evaluate performance, theresponsibilities and composition of the Firm’s Compensation and Management Development Committee, and the measures adopted to avoid or manageconflicts of interest. A copy of this policy can be requested free of charge from the Management Company.
The Remuneration Policy applies to all employees of the Management Company, including individuals whose professional activities may have a materialimpact on the risk profile of the Management Company or the UCITS Funds it manages (“UCITS Identified Staff”). The UCITS Identified Staff include membersof the Board of the Management Company (the “Board”), senior management, the heads of relevant Control Functions, and holders of other key functions.Individuals are notified of their identification and the implications of this status on at least an annual basis.
The Board reviews and adopts the Remuneration Policy on an annual basis, and oversees its implementation, including the classification of UCITS IdentifiedStaff. The Board last reviewed and adopted the Remuneration Policy that applied to the 2019 Performance Year in June 2019 which was updated to reflectthe establishment of the JPMAMIL Remuneration Committee and was satisfied with its implementation.
Quantitative Disclosures
The table below provides an overview of the aggregate total remuneration paid to staff of the Management Company in respect of the 2019 PerformanceYear and the number of beneficiaries.
Due to the Firm’s structure, the information needed to provide a further breakdown of remuneration attributable to the Company is not readily available andwould not be relevant or reliable. However, for context, the Management Company manages 16 Alternative Investment Funds (with 20 sub-funds) and 7UCITS (with 165 sub-funds) As at 31 December 2019, with a combined AUM as at that date of USD 4,249m and USD 355,185m respectively.
Fixed remuneration Variable remuneration Total remuneration Number of beneficiaries
All staff (USD ‘000s) 46,254 19,497 65,751 347
The aggregate total remuneration paid to UCITS Identified Staff in respect of the 2019 Performance Year was USD 113,802k, of which USD 6,335k relates toSenior Management and USD 107,467k relates to other UCITS Identified Staff1.
1Since 2017, the UCITS Identified Staff disclosures includes employees of companies to which portfolio management has been formally delegated, in line with the latest ESMA guidance.
184
JPMorgan ETFs (Ireland) ICAVUnaudited Appendix (continued)
5. UCITS Remuneration Disclosures

Language Disclaimer Annual

JPMorgan Asset Management (Europe) S.à r.l.Postal Address: L-2633 LuxembourgTel No: (352) 34 101 Fax No: (352) 3410 8000E-mail: [email protected]
Internet: www.jpmorganassetmanagement.ie
For further information concerning JPMorgan ETFs (Ireland) ICAV, please contact the Management Company: