Legal & General UCITS ETF Plc - Fund Communication Solutions
647
Legal & General Investment Management Limited One Coleman Street London EC2R 5AA Legal & General UCITS ETF Plc Interim Report and Unaudited Financial Statements for the Financial Period Ended 31 December 2021
-
Upload
khangminh22 -
Category
Documents
-
view
0 -
download
0
Transcript of Legal & General UCITS ETF Plc - Fund Communication Solutions

Legal & General Investment Management Limited
One Coleman Street
London EC2R 5AA
Legal & General UCITS ETF Plc
Interim Report and Unaudited Financial Statements
for the Financial Period Ended 31 December 2021

December 2021 Legal & General UCITS ETF Plc
1
Contents Legal & General UCITS ETF Plc Interim Report and Unaudited Financial Statements
Table of contents 1
Directors and other information 2
Company information 4
Fund review 10
Unaudited Financial Statements of the Company
Company Total Statement of financial position 17
Company Total Statement of comprehensive income 18
Company Total Statement of changes in net assets attributable to redeemable participating shareholders 19
Company Total Statement of cash flows 20
Unaudited Financial Statements of the Funds
Statement of financial position
as at 31 December 2021 21
Comparatives as at 30 June 2021 28
Statement of comprehensive income
for the financial period ended 31 December 2021 34
Comparatives for the financial period ended 31 December 2020 41
Statement of changes in net assets attributable to redeemable participating shareholders
for the financial period ended 31 December 2021 46
Comparatives for the financial period ended December 2020 50
Notes to the financial statements 53
Other Information - Unaudited
Schedule of investments 113
Additional information 554
Securities financing transactions regulation 556
Statement of significant purchases and sales 564

December 2021 Legal & General UCITS ETF Plc
2
Directors and other information
Board of Directors: Feargal Dempsey (IRE)
(1), (2)
Howie Li (UK) Patrizia Libotte (IRE)
David Fagan (IRE) (1)
Donard McClean (IRE)
(1)
All Directors are non-executive (1)
Independent Director (2)
Chairman
Manager: LGIM Managers (Europe) Limited 70 Sir John Rogerson’s Quay Dublin 2 D02 R296 Ireland
Investment Managers: GO ETF Solutions LLP (until 1 November 2021) One Coleman Street London, EC2R 5AA United Kingdom Legal & General Investment Management Limited One Coleman Street London, EC2R 5AA United Kingdom
Sub-Investment Manager: E Fund Management (Hong Kong) Co., Limited Suites 3501-02, 35/F Two International Finance Centre 8 Finance Street Central Hong Kong
Depositary: The Bank of New York Mellon SA/NV, Dublin Branch Riverside II, Sir John Rogerson’s Quay Grand Canal Dock Dublin 2 D02 KV60 Ireland
UK Listing Sponsor: J&E Davy Davy House 49 Dawson Street Dublin 2 D02 PY05 Ireland
Registered Office: 70 Sir John Rogerson's Quay Dublin 2 D02 R296 Ireland
Administrator, Transfer Agent and Registrar: BNY Mellon Fund Services (Ireland) Designated Activity Company One Dockland Central Guild Street International Financial Services Centre Dublin 1 D01 E4X0 Ireland
Secretary: Matsack Trust Limited 70 Sir John Rogerson's Quay Dublin 2 D02 R296 Ireland
Independent Auditors: Ernst & Young Chartered Accountants & Registered Auditors Harcourt Centre Harcourt Street Dublin 2 D02 YA40 Ireland

December 2021 Legal & General UCITS ETF Plc
3
Directors and other information (continued)
Legal Advisers in Ireland: William Fry 2 Grand Canal Square Dublin 2 D02 A342 Ireland
Distributor: Legal & General Investment Management Limited One Coleman Street London, EC2R 5AA United Kingdom
Collateral Manager: The Bank of New York Mellon One Canada Square Canary Wharf London, E14 5AL United Kingdom
Swiss Local Paying Agent and Representative: State Street Bank International GmbH Munich, Zurich Branch Beethovenstrasse 19 CH-8027 Zürich
Registration Number: 459936
This interim report and unaudited financial statements (the “Report and Financial Statements”) may be translated into other languages. Any such translation shall only contain the same information and have the same meaning as the English language Report and Financial Statements. To the extent that there is any inconsistency between the English language Report and Financial Statements and the Report and Financial Statements in another language, the English language Report and Financial Statements will prevail, except to the extent (and only to the extent) that it is required by law of any jurisdiction where the shares are sold, that in an action based upon disclosure in a Report and Financial Statements in a language other than English, the language of the Report and Financial Statements on which such action is based shall prevail. Any disputes as to the terms of the Reports and Financial Statements regardless of the language of the Report and Financial Statements, shall be governed by and construed in accordance with the Laws of Ireland.
December 2021 Legal & General UCITS ETF Plc
4
Company information
Legal & General UCITS ETF Plc (the “Company”) is organised as an open-ended investment company with variable capital. The Company has segregated liability between its sub-funds and is organised under the laws of Ireland as a public limited company pursuant to the Companies Act 2014 (the “Companies Act”). The Company is subject to the European Communities (Undertakings for Collective Investment in Transferable Securities) Regulations, 2011 (as amended) (the “UCITS Regulations”) and the Central Bank (Supervision and Enforcement) Act 2013 (Section 48(1)) (Undertakings for Collective Investment in Transferable Securities) Regulations 2019 (the “Central Bank UCITS Regulations”).
The objective of the Company is the collective investment in transferable securities and other liquid financial assets of capital raised from the public, operating on the principle of risk spreading in accordance with the UCITS Regulations.
The Company is structured as an umbrella fund with segregated liability between sub-funds and comprises separate sub-funds (each a "Fund" and together the "Funds"), in that the Directors may from time to time, with the prior approval of the Central Bank of Ireland (the "Central Bank"), issue different series of shares representing separate portfolios of assets. The assets of each Fund will be invested in accordance with the investment objective and policies applicable to such Fund as disclosed in the prospectus of the Company (the “Prospectus”) and the relevant Fund supplement (the “Supplement”).
As at 31 December 2021, the following 55 Funds (30 June 2021: 55 Funds) of the Company were approved by the Central Bank, 44 (30 June 2021: 41 Funds) of which were open for subscriptions and operational at the financial period end. The corresponding indices tracked/replicated by each Fund are also shown below:
Fund name Fund type Index name Investment Manager / Sub-Investment Manager
L&G E Fund MSCI China A UCITS ETF
Physically-Replicating Fund
MSCI China A Onshore Index E Fund Management (Hong Kong) Co., Limited
L&G Russell 2000 US Small Cap Quality UCITS ETF
" Russell 2000® Index Legal & General Investment Management Limited
L&G Gold Mining UCITS ETF " DAXglobal® Gold Miners Index Legal & General Investment Management Limited
L&G ROBO Global® Robotics and Automation UCITS ETF
" ROBO Global Robotics and Automation UCITS Index Legal & General Investment Management Limited
L&G Cyber Security UCITS ETF " ISE Cyber Security® UCITS Index Net Total Return Legal & General Investment Management Limited
L&G Battery Value-Chain UCITS ETF " Solactive Battery Value-Chain Index Net Total Return Legal & General Investment Management Limited
L&G Pharma Breakthrough UCITS ETF
“ Solactive Pharma Breakthrough Value Index Net Total Return
Legal & General Investment Management Limited
L&G Ecommerce Logistics UCITS ETF
" Solactive eCommerce Logistics Index Net Total Return
Legal & General Investment Management Limited
L&G US Equity UCITS ETF " Solactive Core United States Large & Mid Cap Index NTR
Legal & General Investment Management Limited
L&G UK Equity UCITS ETF " Solactive Core United Kingdom Large & Mid Cap Index NTR
Legal & General Investment Management Limited
L&G Japan Equity UCITS ETF " Solactive Core Japan Large & Mid Cap USD Index NTR
Legal & General Investment Management Limited
L&G Global Equity UCITS ETF " Solactive Core Developed Markets Large & Mid Cap USD Index NTR
Legal & General Investment Management Limited
L&G Europe ex UK Equity UCITS ETF
" Solactive Core Developed Markets Europe ex UK Large & Mid Cap EUR Index NTR
Legal & General Investment Management Limited
L&G Asia Pacific ex Japan Equity UCITS ETF
" Solactive Core Developed Markets Pacific ex Japan Large & Mid Cap USD Index NTR
Legal & General Investment Management Limited
L&G Emerging Markets Equity UCITS ETF
1
" Solactive Core Emerging Markets Large & Mid Cap USD Index NTR
Legal & General Investment Management Limited
1 This Fund was approved by the Central Bank on 15 October 2019. No shares of the Fund have been issued as at the date of the Financial Statements.

December 2021 Legal & General UCITS ETF Plc
5
Company information (continued)
Fund name Fund type Index name Investment Manager / Sub-Investment Manager
L&G Germany Equity UCITS ETF2 " Solactive Core Germany Large & Mid Cap Index NTR Legal & General Investment
Management Limited
L&G Italy Equity UCITS ETF2 " Solactive Core Italy Large & Mid Cap Index NTR Legal & General Investment
Management Limited
L&G Switzerland Equity UCITS ETF2 " Solactive Core Switzerland Large & Mid Cap CHF
Index NTR
Legal & General Investment Management Limited
L&G Clean Water UCITS ETF " Solactive Clean Water Index NTR Legal & General Investment Management Limited
L&G Artificial Intelligence UCITS ETF " ROBO Global® Artificial Intelligence Index Legal & General Investment Management Limited
L&G Healthcare Breakthrough UCITS ETF
" ROBO Global® Healthcare Technology and Innovation Index TR
Legal & General Investment Management Limited
L&G Europe Equity (Responsible Exclusions) UCITS ETF
" Foxberry Sustainability Consensus Europe TR Index Legal & General Investment Management Limited
L&G US Equity (Responsible Exclusions) UCITS ETF
" Foxberry Sustainability Consensus US TR Index Legal & General Investment Management Limited
L&G Clean Energy UCITS ETF " Solactive Clean Energy Index NTR Legal & General Investment Management Limited
L&G ESG GBP Corporate Bond 0-5 Year UCITS ETF
" J.P. Morgan Global Credit Index (GCI) ESG Investment Grade GBP Short-Term Custom Maturity Index
Legal & General Investment Management Limited
L&G ESG GBP Corporate Bond UCITS ETF
" J.P. Morgan Global Credit Index (GCI) ESG Investment Grade GBP Custom Maturity Index
Legal & General Investment Management Limited
L&G ESG Emerging Markets Government Bond (USD) 0-5 Year UCITS ETF
" J.P. Morgan ESG Emerging Market Bond Index (EMBI) Global Diversified Short-Term Custom Maturity Index
Legal & General Investment Management Limited
L&G ESG China CNY Bond UCITS ETF
" J.P. Morgan China Custom Liquid ESG Capped Index Legal & General Investment Management Limited
L&G UK Gilt 0-5 Year UCITS ETF " J.P. Morgan Government Bond Index (GBI) United Kingdom Short-term Custom Maturity Index
Legal & General Investment Management Limited
L&G ESG USD Corporate Bond UCITS ETF
" J.P. Morgan Global Credit Index (GCI) ESG Investment Grade USD Custom Maturity Index
Legal & General Investment Management Limited
L&G ESG USD Corporate Bond 0-5 Year UCITS ETF
3
" J.P. Morgan Global Credit Index (GCI) ESG Investment Grade USD Short-Term Custom Maturity Index
Legal & General Investment Management Limited
L&G ESG EUR Corporate Bond 0-5 Year UCITS ETF
3
" J.P. Morgan Global Credit Index (GCI) ESG Investment Grade EUR Short-Term Custom Maturity Index
Legal & General Investment Management Limited
L&G ESG EUR Corporate Bond UCITS ETF
3
" J.P. Morgan Global Credit Index (GCI) ESG Investment Grade EUR Custom Maturity Index
Legal & General Investment Management Limited
L&G ESG Emerging Markets Corporate Bond (USD) UCITS ETF
" J.P. Morgan ESG Corporate Emerging Market Bond Index (CEMBI) Broad Diversified Custom Maturity Index
Legal & General Investment Management Limited
L&G Hydrogen Economy UCITS ETF " Solactive Hydrogen Economy Index NTR Legal & General Investment Management Limited
L&G ESG Green Bond UCITS ETF " J.P. Morgan ESG Green Bond Focus Index Legal & General Investment Management Limited
2 These Funds were approved by the Central Bank on 25 January 2019. No shares of the Funds have been issued as at the date of the Financial Statements.
3 These Funds were approved by the Central Bank on 22 October 2020. No shares of the Funds have been issued as at the date of the Financial Statements.
December 2021 Legal & General UCITS ETF Plc
6
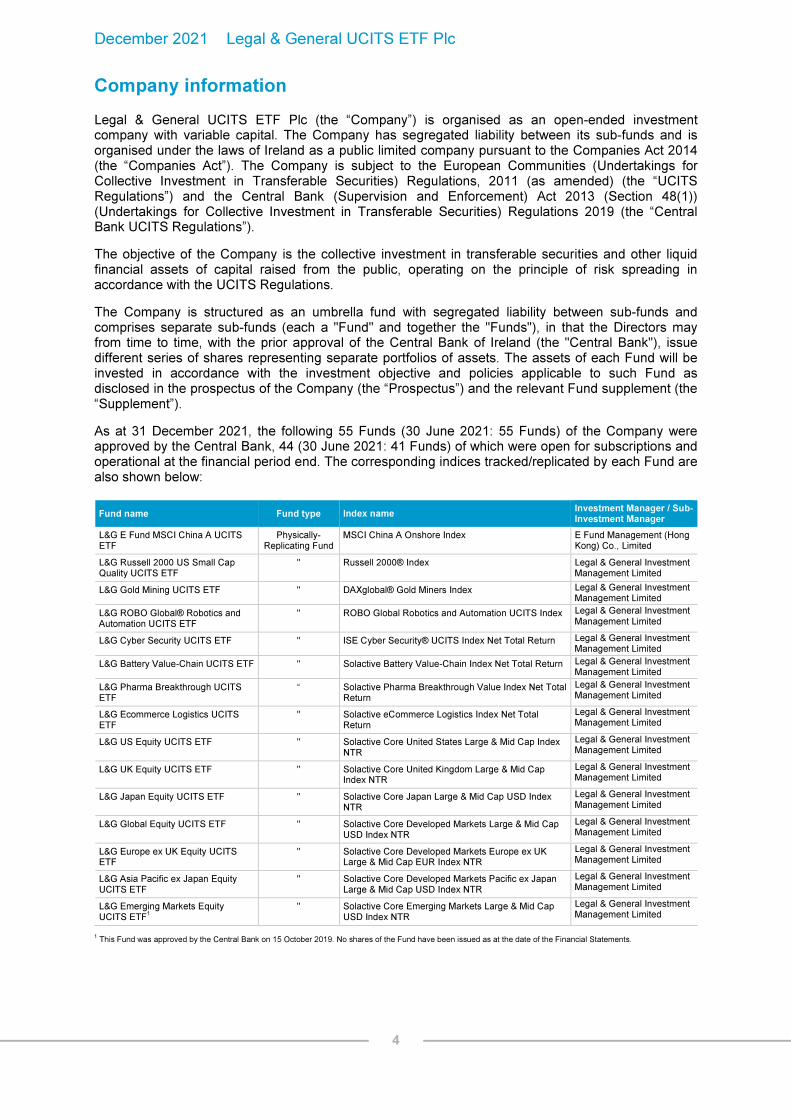
Company information (continued)
Fund name Fund type Index name Investment Manager / Sub-Investment Manager
L&G Quality Equity Dividends ESG Exclusions UK UCITS ETF
" FTSE All Share ex IT ex CW ex TC ex REITS Dividend Growth with Quality Net Tax Index
Legal & General Investment Management Limited
L&G Quality Equity Dividends ESG Exclusions Europe ex-UK UCITS ETF
" FTSE Developed Europe ex UK All Cap ex CW ex TC ex REITS Dividend Growth with Quality Net Tax Index
Legal & General Investment Management Limited
L&G Quality Equity Dividends ESG Exclusions Emerging Markets UCITS ETF
4
" FTSE Emerging All Cap ex CW ex TC ex REITS Dividend Growth with Quality Net Tax Index
Legal & General Investment Management Limited
L&G Quality Equity Dividends ESG Exclusions Asia Pacific ex-Japan UCITS ETF
" FTSE Developed Asia Pacific ex Japan All Cap ex CW ex TC ex REITS Dividend Growth with Quality Net Tax Index
Legal & General Investment Management Limited
L&G Digital Payments UCITS ETF " Solactive Digital Payments Index NTR Legal & General Investment Management Limited
L&G India INR Government Bond UCITS ETF
5
" J.P. Morgan India Government Fully Accessible Route (FAR) Bonds Index
Legal & General Investment Management Limited
L&G DAX® Daily 2x Long UCITS ETF Synthetically-Replicating Fund
LevDAX® x2 Index Legal & General Investment Management Limited
L&G DAX® Daily 2x Short UCITS ETF " ShortDAX® x2 Index Legal & General Investment Management Limited
L&G Longer Dated All Commodities UCITS ETF
" Bloomberg Commodity Index 3 Month Forward Total Return
Legal & General Investment Management Limited
L&G FTSE 100® Leveraged (Daily 2x) UCITS ETF
" FTSE 100® Daily Leveraged Index Legal & General Investment Management Limited
L&G FTSE 100® Super Short Strategy (Daily 2x) UCITS ETF
" FTSE 100® Daily Super Short Strategy Index Legal & General Investment Management Limited
L&G US Energy Infrastructure MLP UCITS ETF
" Solactive US Energy Infrastructure MLP Index TR Legal & General Investment Management Limited
L&G All Commodities UCITS ETF " Bloomberg Commodity Index Total Return Legal & General Investment Management Limited
L&G Foxberry US Large Cap Floored UCITS ETF
6
" Foxberry Floored Beta US Large Cap @80% TR Index
Legal & General Investment Management Limited
L&G Foxberry EU Large Cap Floored UCITS ETF
6
" Foxberry Floored Beta EU Large Cap @80% TR Index
Legal & General Investment Management Limited
L&G Foxberry Germany Large Cap Floored UCITS ETF
6
" Foxberry Floored Beta Germany Large Cap @80% TR Index
Legal & General Investment Management Limited
L&G Foxberry Emerging Markets Floored UCITS ETF
6
" Foxberry Floored Beta Emerging Markets @80% TR Index
Legal & General Investment Management Limited
L&G Longer Dated All Commodities ex-Agriculture and Livestock UCITS ETF
" Bloomberg ex-Agriculture and Livestock 15/30 Capped 3 Month Forward Total Return Index
Legal & General Investment Management Limited
L&G Multi-Strategy Enhanced Commodities UCITS ETF
7
" Barclays Backwardation Tilt Multi-Strategy Capped Total Return Index
Legal & General Investment Management Limited
4 This Fund was approved by the Central Bank on 4 January 2021. The Fund launched on 12 July 2021.
5 This Fund was approved by the Central Bank on 14 June 2021. The Fund launched on 26 October 2021.
6 These Funds were approved by the Central Bank on 23 February 2017. No shares of the Funds have been issued as at the date of the Financial Statements.
7 This Fund was approved by the Central Bank on 24 April 2019. The Fund launched on 2 July 2021.

December 2021 Legal & General UCITS ETF Plc
7
Company information (continued)
Investment objective and policy of the Funds
Each of the Funds, unless otherwise stated, seeks to provide a return equivalent to the return of a financial index.
Depending on the nature of the relevant index tracked/replicated by each Fund, the Investment Managers (or relevant Sub-Investment Manager) may employ alternative techniques in order to gain exposure to the index, including (but not limited to):
entering into financial derivative instruments (in particular, total return swaps) with one or more counterparties;
investing directly in the portfolio of transferable securities or other relevant assets which comprise the constituents of the relevant index; and/or
investing directly in an optimised/representative sample of the index constituents together with other eligible assets which may be unrelated to the index constituents.
The actual method used by a Fund to track its index is as set out in the investment policy of that Fund in the Fund specific Supplement to the Company’s Prospectus.
For the avoidance of doubt, total return swaps are only entered into with eligible financial counterparties that are subject to prudential supervision and belonging to categories approved by the Central Bank. Please refer to the section entitled “Counterparty Eligibility” in the Company’s Prospectus for further details of the eligibility criteria for financial counterparties.
The table below shows which stock exchanges each Fund (or share class thereof where the relevant Fund is comprised of more than one share class) was listed on as at 31 December 2021.
Fund/Share Class Fra
nkfu
rt
Sto
ck
Exch
an
ge
Eu
ron
ex
t A
mste
rdam
Bo
rsa
It
ali
an
a
Lo
nd
on
S
toc
k
Exch
an
ge
SIX
Sw
iss
Exch
an
ge
Eu
ron
ex
t P
ari
s
L&G E Fund MSCI China A UCITS ETF X
L&G DAX® Daily 2x Long UCITS ETF X X X
L&G DAX® Daily 2x Short UCITS ETF X X X
L&G Longer Dated All Commodities UCITS ETF X
L&G FTSE 100® Leveraged (Daily 2x) UCITS ETF X X X X X
L&G FTSE 100® Super Short Strategy (Daily 2x) UCITS ETF X X X X X
L&G Russell 2000 US Small Cap Quality UCITS ETF X X
L&G Gold Mining UCITS ETF X
L&G US Energy Infrastructure MLP UCITS ETF X X
L&G ROBO Global® Robotics and Automation UCITS ETF X
L&G Cyber Security UCITS ETF X
L&G All Commodities UCITS ETF X X X X
L&G Longer Dated All Commodities ex-Agriculture and Livestock UCITS ETF X X X X
L&G Battery Value-Chain UCITS ETF X

December 2021 Legal & General UCITS ETF Plc
8
Company information (continued)
Fund/Share Class Fra
nkfu
rt
Sto
ck
Exch
an
ge
Eu
ron
ex
t A
mste
rdam
Bo
rsa
It
ali
an
a
Lo
nd
on
S
toc
k
Exch
an
ge
SIX
Sw
iss
Exch
an
ge
Eu
ron
ex
t P
ari
s
L&G Pharma Breakthrough UCITS ETF X
L&G Ecommerce Logistics UCITS ETF X
L&G US Equity UCITS ETF X X
L&G UK Equity UCITS ETF X X X X X
L&G Japan Equity UCITS ETF X X
L&G Global Equity UCITS ETF X X
L&G Europe ex UK Equity UCITS ETF X X
L&G Asia Pacific ex Japan Equity UCITS ETF X X
L&G Clean Water UCITS ETF X X
L&G Artificial Intelligence UCITS ETF X X
L&G Healthcare Breakthrough UCITS ETF X X
L&G Europe Equity (Responsible Exclusions) UCITS ETF X X X
L&G US Equity (Responsible Exclusions) UCITS ETF X X X
L&G Clean Energy UCITS ETF X X
L&G ESG GBP Corporate Bond 0-5 Year UCITS ETF X X X X
L&G ESG GBP Corporate Bond UCITS ETF X X X X
L&G ESG Emerging Markets Government Bond (USD) 0-5 Year UCITS ETF X X
L&G ESG China CNY Bond UCITS ETF - USD Distributing ETF X X
L&G ESG China CNY Bond UCITS ETF - EUR Hedged Distributing ETF1 X X X X X
L&G UK Gilt 0-5 Year UCITS ETF X X X X X
L&G ESG USD Corporate Bond UCITS ETF X X L&G ESG Emerging Markets Corporate Bond (USD) UCITS ETF - USD Distributing ETF X X L&G ESG Emerging Markets Corporate Bond (USD) UCITS ETF - USD Accumulating ETF X X X X
L&G ESG Emerging Markets Corporate Bond (USD) UCITS ETF - CHF Hedged Accumulating ETF
2 X X X X X X
L&G ESG Emerging Markets Corporate Bond (USD) UCITS ETF - EUR Hedged Accumulating ETF
2 X X X X X X
L&G ESG Emerging Markets Corporate Bond (USD) UCITS ETF - GBP Hedged Distributing ETF
2 X X X X X X
L&G Hydrogen Economy UCITS ETF X X
L&G ESG Green Bond UCITS ETF X X
L&G Quality Equity Dividends ESG Exclusions UK UCITS ETF X X X X X
L&G Quality Equity Dividends ESG Exclusions Europe ex-UK UCITS ETF X X X L&G Quality Equity Dividends ESG Exclusions Asia Pacific ex-Japan UCITS ETF X X X
L&G Digital Payments UCITS ETF X X 1 The share class launched on 20 July 2021.
2 The share class launched on 20 August 2021.

December 2021 Legal & General UCITS ETF Plc
9
Company information (continued)
Fund/Share Class Fra
nkfu
rt
Sto
ck
Exch
an
ge
Eu
ron
ex
t A
mste
rdam
Bo
rsa
It
ali
an
a
Lo
nd
on
S
toc
k
Exch
an
ge
SIX
Sw
iss
Exch
an
ge
Eu
ron
ex
t P
ari
s
L&G Quality Equity Dividends ESG Exclusions Emerging Markets UCITS ETF
1 X X X X X
L&G India INR Government Bond UCITS ETF2 X X
L&G Multi-Strategy Enhanced Commodities UCITS ETF3 X X
1 This Fund was approved by the Central Bank on 4 January 2021. The Fund launched on 12 July 2021.
2 This Fund was approved by the Central Bank on 14 June 2021. The Fund launched on 26 October 2021.
3 This Fund was approved by the Central Bank on 24 April 2019. The Fund launched on 2 July 2021.
Each Fund may have more than one share class allocated to it. The shares of each share class within a Fund will rank pari passu with each other in all respects except that the share classes within a Fund may differ as follows or as the Directors may otherwise determine:
Currency of denomination of the shares
Dividend policy
Total expense ratio
Minimum subscription and redemption size
Currency hedging policy
The term “Fund” means a Fund of the Company, or if the context so requires, the Company or the Manager (or its delegate) for the account of the relevant Fund.
The term “NAV” is used to represent Net Asset Value.
The term “Manager” means LGIM Managers (Europe) Limited.
The term “Distributor” means Legal & General Investment Management Limited.
The term “Investment Managers” means GO ETF Solutions LLP or Legal & General Investment Management Limited, as the context requires.
The term “Sub-Investment Manager” means E Fund Management (Hong Kong) Co., Limited.
The term "LGIMH" means Legal & General Investment Management (Holdings) Limited.
The term "L&G Group" means subsidiaries of Legal & General Group plc.
The term “for the financial period ended 31 December 2021” means the six month period which began on 01 July 2021 and ended on 31 December 2021.
The term "equity" or "equities" also refers to common stock.
The term “Administrator” means BNY Mellon Fund Services (Ireland) Designated Activity Company.
The term "Depositary" means The Bank of New York Mellon SA/NV, Dublin Branch.
December 2021 Legal & General UCITS ETF Plc
10
Fund review
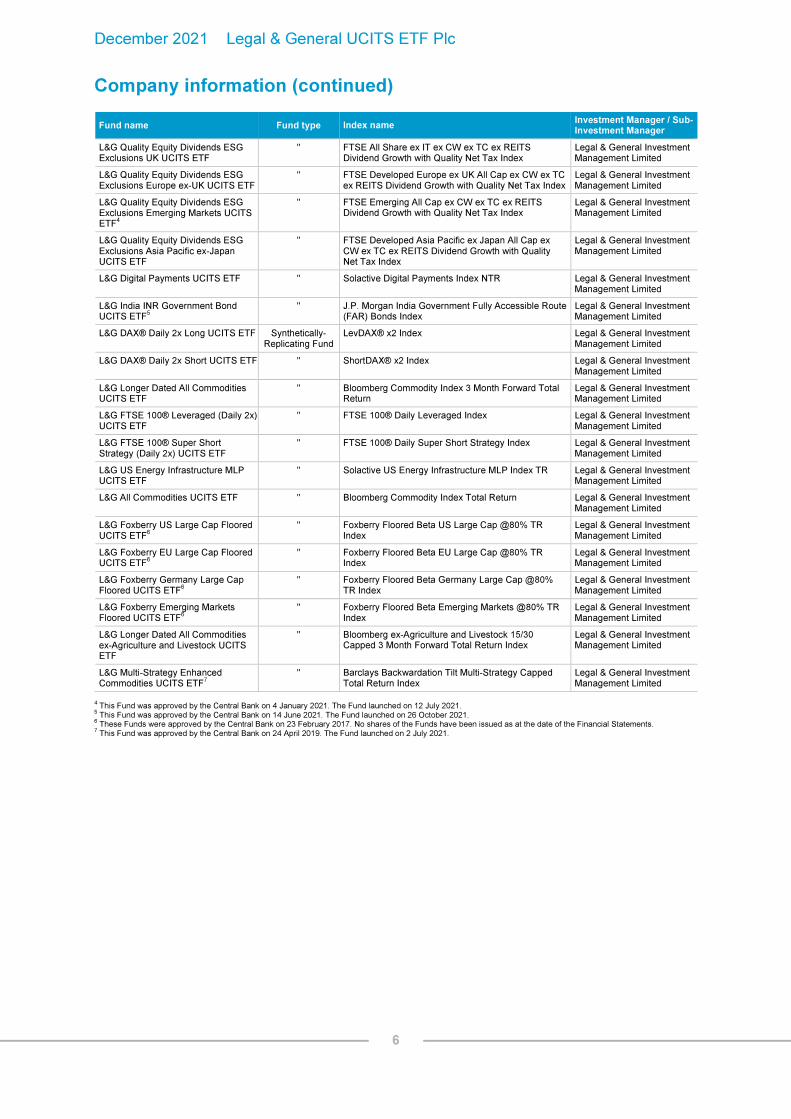
The performance of the Funds during the financial period under review is as set out below:
The performance returns disclosed are the performance returns for the primary share class for each Fund, net of fees, which have been selected as a representative share class. The primary share class represents the class of share invested into by the majority of investors in the Fund, or the class of share where the relevant Fund is comprised of only one share class. Performance returns for any other share class can be made available on request.
Share Class Currency Launch
date TER
NAV as at 31/12/2021
In Aggregate
NAV as at 31/12/2021 Per share
Performance for the
financial period ended
31/12/2021 NAV/share % Change
Performance for the
financial period ended
31/12/2021 Index
% Change
Tracking difference
%
Anticipated tracking
error4
Realised tracking
error4
Difference between
anticipated tracking error
minus realised
tracking error in basis
points
L&G E Fund MSCI China A UCITS ETF - USD Accumulating ETF USD 14/05/2014 0.88% 33,746,324 22.0564 -0.50% -0.74% 0.24% 0.70% 0.50% 19.56
L&G DAX® Daily 2x Long UCITS ETF - EUR Accumulating ETF EUR 18/06/2009 0.40% 28,004,199 396.6094 2.93% 3.68% -0.75% 0.20% 0.05% 14.88
L&G DAX® Daily 2x Short UCITS ETF - EUR Accumulating ETF EUR 18/06/2009 0.60% 33,321,672 1.5917 -8.71% -8.42% -0.29% 0.20% 0.06% 14.23
L&G Longer Dated All Commodities UCITS ETF - USD Accumulating ETF USD 15/03/2010 0.30% 738,880,219 19.4947 8.72% 8.90% -0.18% 0.20% 0.13% 7.00
L&G FTSE 100® Leveraged (Daily 2x) UCITS ETF - GBP Accumulating ETF GBP 18/06/2009 0.50% 17,270,210 319.9549 11.88% 13.09% -1.21% 0.20% 0.06% 13.82
L&G FTSE 100® Super Short Strategy (Daily 2x) UCITS ETF - GBP Accumulating ETF GBP 18/06/2009 0.60% 12,718,514 4.3532 -14.76% -14.31% -0.44% 0.20% 0.04% 16.35
L&G Russell 2000 US Small Cap Quality UCITS ETF - USD Accumulating ETF USD 11/09/2008 0.30% 40,748,955 99.9319 1.09% 1.27% -0.18% 0.30% 0.09% 21.20
L&G Gold Mining UCITS ETF - USD Accumulating ETF USD 11/09/2008 0.65% 162,227,884 33.0935 -1.41% -1.26% -0.15% 0.35% 0.16% 19.02
L&G US Energy Infrastructure MLP UCITS ETF - USD Distributing ETF2 USD 12/05/2014 0.25% 30,690,421 4.4093 -5.24% -4.81% -0.43% 0.20% 0.06% 13.77
L&G ROBO Global® Robotics and Automation UCITS ETF - USD Accumulating ETF USD 23/10/2014 0.80% 1,373,376,507 27.8996 7.67% 8.01% -0.35% 0.45% 0.23% 22.37
L&G Cyber Security UCITS ETF - USD Accumulating ETF3 USD 22/09/2015 0.75% 3,068,047,709 25.3491 -0.24% 0.18% -0.42% 0.45% 0.47% -1.66
L&G All Commodities UCITS ETF - USD Accumulating ETF USD 05/07/2017 0.15% 83,570,238 12.4232 4.84% 4.92% -0.08% 0.20% 0.01% 19.37
L&G Longer Dated All Commodities ex-Agriculture and Livestock UCITS ETF - USD Accumulating ETF USD 05/07/2017 0.30% 1,458,995 15.3431 10.42% 10.62% -0.20% 0.20% 0.04% 15.70
L&G Battery Value-Chain UCITS ETF - USD Accumulating ETF3 USD 18/01/2018 0.49% 955,511,075 18.4997 0.80% 0.97% -0.17% 0.45% 0.45% -0.47
L&G Pharma Breakthrough UCITS ETF - USD Accumulating ETF USD 18/01/2018 0.49% 33,377,632 12.5953 -4.61% -4.45% -0.16% 0.35% 0.11% 24.50
L&G Ecommerce Logistics UCITS ETF - USD Accumulating ETF USD 18/01/2018 0.49% 514,171,024 17.3513 -3.00% -2.73% -0.26% 0.45% 0.28% 17.36
L&G US Equity UCITS ETF - USD Accumulating ETF USD 07/11/2018 0.05% 319,154,854 18.3387 10.50% 10.43% 0.07% 0.30% 0.02% 27.67
L&G UK Equity UCITS ETF - GBP Accumulating ETF GBP 07/11/2018 0.05% 18,899,495 11.5240 6.51% 6.44% 0.07% 0.30% 0.09% 21.11

December 2021 Legal & General UCITS ETF Plc
11
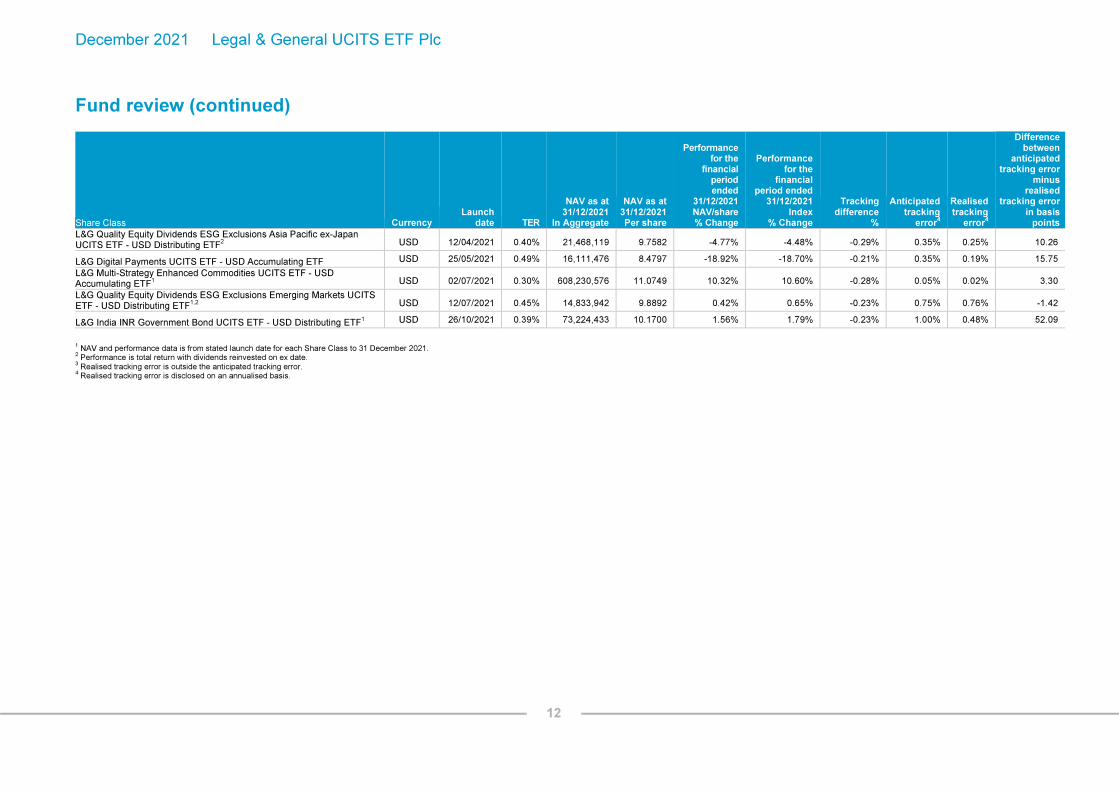
Fund review (continued)
Share Class Currency Launch
date TER
NAV as at 31/12/2021
In Aggregate
NAV as at 31/12/2021 Per share
Performance for the
financial period ended
31/12/2021 NAV/share % Change
Performance for the
financial period ended
31/12/2021 Index
% Change
Tracking difference
%
Anticipated tracking
error4
Realised tracking
error4
Difference between
anticipated tracking error
minus realised
tracking error in basis
points
L&G Japan Equity UCITS ETF - USD Accumulating ETF USD 07/11/2018 0.10% 253,282,728 13.0255 0.22% 0.18% 0.03% 0.30% 0.05% 24.86
L&G Global Equity UCITS ETF - USD Accumulating ETF USD 07/11/2018 0.10% 63,752,038 16.7768 7.73% 7.63% 0.09% 0.30% 0.19% 10.87
L&G Europe ex UK Equity UCITS ETF - EUR Accumulating ETF EUR 07/11/2018 0.10% 123,882,897 14.9599 8.22% 8.19% 0.03% 0.30% 0.12% 17.53
L&G Asia Pacific ex Japan Equity UCITS ETF - USD Accumulating ETF USD 07/11/2018 0.10% 235,857,311 12.9912 -5.15% -5.11% -0.03% 0.30% 0.07% 22.78
L&G Clean Water UCITS ETF - USD Accumulating ETF USD 25/06/2019 0.49% 363,699,384 16.9556 6.99% 7.32% -0.34% 0.45% 0.19% 25.58
L&G Artificial Intelligence UCITS ETF - USD Accumulating ETF USD 26/06/2019 0.49% 333,065,284 19.1049 1.52% 1.71% -0.19% 0.45% 0.04% 41.06
L&G Healthcare Breakthrough UCITS ETF - USD Accumulating ETF USD 26/06/2019 0.49% 212,918,240 17.8922 -9.05% -9.06% 0.01% 0.45% 0.23% 21.91
L&G Europe Equity (Responsible Exclusions) UCITS ETF - EUR Accumulating ETF EUR 30/08/2019 0.16% 130,347,882 14.1013 8.27% 8.28% -0.01% 0.30% 0.08% 21.66
L&G US Equity (Responsible Exclusions) UCITS ETF - USD Accumulating ETF USD 26/11/2019 0.12% 1,796,355,192 16.5360 10.97% 10.95% 0.02% 0.30% 0.03% 26.86
L&G Clean Energy UCITS ETF - USD Accumulating ETF USD 05/11/2020 0.49% 130,339,313 12.6543 -5.57% -5.36% -0.21% 0.35% 0.10% 24.52
L&G ESG GBP Corporate Bond 0-5 Year UCITS ETF - GBP Distributing ETF
2 GBP 03/12/2020 0.09% 68,711,956 9.9151 -0.76% -0.71% -0.05% 1.00% 0.06% 94.17
L&G ESG GBP Corporate Bond UCITS ETF - GBP Distributing ETF2 GBP 03/12/2020 0.09% 79,018,853 9.7554 -0.73% -0.61% -0.11% 1.00% 0.15% 84.55
L&G ESG Emerging Markets Government Bond (USD) 0-5 Year UCITS ETF - USD Distributing ETF
2 USD 03/12/2020 0.25% 52,124,300 9.8963 -1.63% -1.37% -0.26% 1.00% 0.35% 64.86
L&G ESG China CNY Bond UCITS ETF - USD Distributing ETF2 USD 03/12/2020 0.30% 234,220,860 10.6741 4.19% 4.36% -0.17% 1.00% 0.13% 87.25
L&G UK Gilt 0-5 Year UCITS ETF - GBP Distributing ETF GBP 03/12/2020 0.06% 27,584,292 9.8515 -0.98% -0.95% -0.04% 0.50% 0.03% 46.84
L&G ESG USD Corporate Bond UCITS ETF - USD Distributing ETF2 USD 15/01/2021 0.09% 92,962,677 9.8896 -0.08% 0.00% -0.07% 1.00% 0.09% 90.87
L&G ESG Emerging Markets Corporate Bond (USD) UCITS ETF - USD Distributing ETF
2 USD 15/01/2021 0.35% 222,858,119 9.9146 -0.71% -0.55% -0.15% 1.00% 0.17% 82.73
L&G Hydrogen Economy UCITS ETF - USD Accumulating ETF USD 01/02/2021 0.49% 560,752,503 7.8262 -11.65% -11.57% -0.08% 0.45% 0.20% 24.80
L&G ESG Green Bond UCITS ETF - EUR Distributing ETF2 EUR 11/02/2021 0.25% 23,256,957 9.8965 0.44% 0.44% 0.00% 1.00% 0.13% 87.15
L&G Quality Equity Dividends ESG Exclusions UK UCITS ETF - GBP Distributing ETF
2 GBP 12/04/2021 0.25% 33,560,967 10.1699 3.56% 3.81% -0.25% 0.35% 0.15% 19.95
L&G Quality Equity Dividends ESG Exclusions Europe ex-UK UCITS ETF - EUR Distributing ETF
2 EUR 12/04/2021 0.25% 21,575,955 10.6072 8.04% 8.08% -0.04% 0.35% 0.13% 21.84
December 2021 Legal & General UCITS ETF Plc
12
Fund review (continued)
Share Class Currency Launch
date TER
NAV as at 31/12/2021
In Aggregate
NAV as at 31/12/2021 Per share
Performance for the
financial period ended
31/12/2021 NAV/share % Change
Performance for the
financial period ended
31/12/2021 Index
% Change
Tracking difference
%
Anticipated tracking
error4
Realised tracking
error4
Difference between
anticipated tracking error
minus realised
tracking error in basis
points
L&G Quality Equity Dividends ESG Exclusions Asia Pacific ex-Japan UCITS ETF - USD Distributing ETF
2 USD 12/04/2021 0.40% 21,468,119 9.7582 -4.77% -4.48% -0.29% 0.35% 0.25% 10.26
L&G Digital Payments UCITS ETF - USD Accumulating ETF USD 25/05/2021 0.49% 16,111,476 8.4797 -18.92% -18.70% -0.21% 0.35% 0.19% 15.75
L&G Multi-Strategy Enhanced Commodities UCITS ETF - USD Accumulating ETF
1 USD 02/07/2021 0.30% 608,230,576 11.0749 10.32% 10.60% -0.28% 0.05% 0.02% 3.30
L&G Quality Equity Dividends ESG Exclusions Emerging Markets UCITS ETF - USD Distributing ETF
1,2 USD 12/07/2021 0.45% 14,833,942 9.8892 0.42% 0.65% -0.23% 0.75% 0.76% -1.42
L&G India INR Government Bond UCITS ETF - USD Distributing ETF1 USD 26/10/2021 0.39% 73,224,433 10.1700 1.56% 1.79% -0.23% 1.00% 0.48% 52.09
1 NAV and performance data is from stated launch date for each Share Class to 31 December 2021.
2 Performance is total return with dividends reinvested on ex date.
3 Realised tracking error is outside the anticipated tracking error.
4 Realised tracking error is disclosed on an annualised basis.

December 2021 Legal & General UCITS ETF Plc
13
Fund review (continued)
Synthetically-Replicating Funds: Tracking difference (i.e. the difference between the performance of each Fund and the performance of its corresponding index) can be attributed to the portfolio transaction costs deducted from the Fund associated with the Over The Counter (OTC) swap transactions entered into with counterparties to track the performance of the corresponding indices as well as the Total Expense Ratio (TER) which is deducted from the Fund and paid to the Manager. The respective indices tracked by the Funds do not incur any of the foregoing costs or charges, therefore each Fund will always be expected to deviate from its corresponding index in this respect. Each Fund has a different management fee and swap spread which is why the tracking difference figures vary between Funds. For example, the 2x short and 2x leveraged Funds will typically have higher swap spreads and, therefore, higher tracking difference figures. Tracking Error (i.e. the volatility of the differences between the return of the Fund and the return of the corresponding index) in these Funds can be attributed to the over/under exposure of the swap contract, which can only be adjusted when trading occurs or at the monthly reset dates, and the swap accruals, which are set at the monthly reset date and not updated throughout that month for changes in Fund NAV. The Anticipated Tracking Error levels per the Company's Prospectus are the anticipated levels 'under normal market conditions'. Due to increased volatility in markets since February 2020, the factors mentioned above have been more material and in some instances the Funds have realised Tracking Errors that are greater than the anticipated levels per the Company's Prospectus. Physically-Replicating Funds: Tracking difference (i.e. the difference between the performance of each Fund and the performance of its corresponding index) can be attributed to the portfolio transaction costs deducted from the Fund associated with buying and selling investments as part of the index replication strategy as well as the Total Expense Ratio (TER) which is deducted from the Fund and paid to the Manager. The respective indices tracked by the Funds do not incur any of the foregoing costs or charges, therefore each Fund will always be expected to deviate from its corresponding index in this respect. Additionally, some of the Funds employ an optimised / representative sampling strategy which means that they do not hold all of the underlying constituents of their respective indices. Accordingly, the strategy can cause a Fund to either outperform or underperform its corresponding index over the given period. Tracking Error (i.e. the volatility of the differences between the return of the Fund and the return of the corresponding index) in these Funds can be attributed to the differing taxation fee treatments between the Funds and the corresponding index, and replication differences, where the Fund does not exactly match the composition of the corresponding index. The Anticipated Tracking Error levels per the Company's Prospectus are the anticipated levels 'under normal market conditions'. Due to increased volatility in markets since February 2020, the impact of replication differences have increased and has led to some Funds having realised Tracking Errors greater than the anticipated levels per the Company's Prospectus.

December 2021 Legal & General UCITS ETF Plc
14
Fund review (continued)
Market commentary – December 2021
Economic overview
Over the past six months, while the twin forces of continued support from central banks and increasingly successful vaccination rollouts across developed markets have been a key driver of markets, inflationary pressures have steadily mounted over the period.
The monetary and fiscal support put in place in the immediate aftermath of the pandemic has remained in force, with interest rates stuck at historic lows across the UK, Europe and US. However, December saw the Bank of England blink first among developed market policymakers, raising rates for the first time in three years. The US doesn’t seem far behind with the Federal Reserve admitting that inflationary forces are no longer transitory – it is expected to raise rates three times in 2022. Meanwhile, President Biden’s wider-ranging spending plans have triggered investor optimism as various sectors of the economy stand to benefit from the spending. Indeed, August saw Biden’s US$1tn infrastructure plan passed into law by the US Senate, the bill will provide billions of dollars to upgrade the country’s-tired transport system.
The central banks of the UK and Europe continue to make large monthly asset purchases, with Europe planning to buy as much as €1.85 trillion of bonds until at least the end of March 2022. The US, in contrast, has started to taper its own emergency asset-purchasing programme. For now, however, the pillar of support from central banks remains largely in place. In Europe, tweaking of monetary policy guidance in July gave the central bank leeway to maintain ultra-loose policy even as inflation creeps up, signalling a ‘lower for longer’ interest rate environment. For how long this stance continues, remains to be seen.
Against this supportive backdrop, the development and deployment of highly effective vaccines gave markets a second leg of gains, despite the emergence of increasingly virulent strains of COVID-19. Economic indicators for the US, UK and Europe reflect the success of the vaccine rollouts in these countries, with these economies increasingly open for business.
However, concerns over higher inflation and a subsequent rise in rates remained front and centre for investors, while the emergence of a new Covid-19 variant, Omicron, late in the period prompted initial market jitters at the prospect of further economic restrictions amid fears over the efficacy of vaccines on the variant. However, these concerns had largely subsided by year end.
Equities
Global equity markets rose strongly over the six months to the end of December but endured
something of a hiccup towards the end of the period, amid soaring inflation, heightened rate-rise
expectations and the emergence of a new Covid-19 variant, Omicron.
The first half of period was characterised by ongoing economic optimism as vaccination rollouts
allowed businesses to reopen. US economic growth led the way, with rising demand from US
consumers energising the world’s exporters.
US equities recorded strong gains over the past six months. Just as decisive action from the country's
central bank shortly after the pandemic hit hailed a rapid rebound in US markets, the country’s ability
to act without hesitation on promising clinical trials of vaccines helped support the stock market surge
that still endures.

December 2021 Legal & General UCITS ETF Plc
15
Fund review (continued)
Market commentary – December 2021
Equities (continued)
Rising Treasury yields for much of the period, a result of increasing expectations of inflation (and an
eventual increase in interest rates) as the economy bounced back, had a pronounced effect on which
sectors of the equity market found favour with investors. At the sector level, all areas of the US market
made gains, led by the technology and real estate sectors. Energy has also been notably strong while
the consumer staples sector has rebounded strongly from its pandemic weakness.
UK equities finished the six-month period in positive territory but underperformed the US and the
global average. Large caps led the way, while mid-caps also posted positive returns for the period. By
contrast, small caps ended the period in the red. Inflation dominated proceedings over the period and
the Bank of England finally acted late in the review period, lifting rates from 0.1% to 0.25%.
European equity markets rose over the six months to the end of December, despite a Covid-19 related
blip towards the end of the period, keeping pace with the UK but underperforming the US and the
global average. At the sector level, general industrials, healthcare, financials, and consumer staples all
enjoyed decent performance, however, a number of sectors lost ground over the review period.
Notable among them were the beleaguered travel and leisure sector, a pandemic-era victim of
restrictions and travel uncertainty, while utilities and telecoms also struggled.
Asia Pacific equity markets lost ground over the past six months, underperforming global equities.
While China propelled the region in the previous six months because of its extremely rapid and strong
rebound from the immediate impact of the pandemic, during the review period it dragged down the
region. Data points to an overheating Chinese economy which, together with comparatively modest
official Gross Domestic Product (“GDP”) numbers, suggest that monetary tightening in China is likely.
This was compounded by tighter government regulations in a number of sectors in the closing months
of the review period and fears of a high-profile default in the real estate sector leading to a significant
decline in Chinese equities as investors braced for the possibility of further regulatory pressure in the
months ahead.
Emerging markets delivered a negative return over the past six months, dragged down by China and
Brazil. Despite the positives of higher oil and industrial metals prices, US dollar strength and fears
over new strains of COVID-19 saw emerging markets as a whole fall out of favour. The decline was
particularly evident in July, when the general ‘risk-off’ market mood led to a significant decline in
emerging market indices. India was the top performer over the period.

December 2021 Legal & General UCITS ETF Plc
16
Fund review (continued)
Market commentary – December 2021
Bonds
Benchmark government bond yields fell during the first few months of the reporting period as fears
around inflation and COVID-19 variants increased the appeal of safe-haven investments. Yields
moved higher over the second half of the period and rose marginally over the six months.
Spreads on US, UK and European investment grade bonds widened marginally, leading to an
increasing correlation between corporate debt and underlying government bond yields, with little
cushion available to prevent a rise in corporate yields when Treasuries moved higher. High yield bond
yield spreads widened over the period.
UK gilt yields (both conventional and index-linked) and European government bond yields moved
broadly in line with their US counterparts.
Property
The UK commercial property market continues to see signs of recovery. The past year has seen
steady growth in office leasing, while investment volumes seem to be picking up. Meanwhile, retail
yields remain stable as the economic recovery continues to gather pace. Finally, the UK residential
property market continues to be robust despite the removal of government support, owing much to
ongoing supply-side pressures.
January 2022

December 2021 Legal & General UCITS ETF Plc
17
Company Statement of Financial Position
As at
31 December 2021 As at
30 June 2021 Total Total Notes $ $
Assets
Cash and cash equivalents 4 28,305,313 57,108,588
Cash for margin calls to counterparties 5 4,251,975 2,450,601
Financial assets at fair value through profit or loss
- Transferable securities 11 12,128,756,340 11,398,035,050
- Money market instruments 11 178,995,678 124,998,774
- Collective investment schemes 46,883 –
- Financial derivative instruments 11 67,946,526 41,722,568
- Reverse repurchase agreements 5,11 1,419,253,792 1,354,803,398
Securities sold receivable 10,586,287 24,317,057
Capital shares receivable 6,974,637 18,709,827
Other assets 21,560,099 22,251,150
Total assets 13,866,677,530 13,044,397,013
Liabilities
Financial liabilities at fair value through profit or loss
- Financial derivative instruments 11 (4,277,699) (1,319,868)
Bank overdraft 4 (1,649,309) (1,077,871)
Cash for margin calls by counterparties 5 (77,271,712) (22,876,918)
Securities purchased payable (30,670,620) (33,794,319)
Capital shares payable (12,550,862) (41,650,058)
Other liabilities (6,782,761) (4,772,465)
Total liabilities (excluding net assets attributable to holders of redeemable participating shares) (133,202,963) (105,491,499)
Net assets attributable to holders of redeemable participating shares 13,733,474,567 12,938,905,514
The accompanying notes form an integral part of these financial statements.

December 2021 Legal & General UCITS ETF Plc
18
Company Statement of Comprehensive Income
Financial Period ended
31 December 2021
Financial Period ended
31 December 2020 Total Total Notes $ $
Revenue
Interest income 5,791 4,655
Dividend income 89,228,576 29,182,282
Interest income on debt securities and money market instruments 18,145,238 171,599
Income on reverse repurchase agreements 1,308,965 764,295
Net gain on financial assets and liabilities at fair value through profit or loss 2 277,197,995 1,523,977,562
Total revenue 385,886,565 1,554,100,393
Expenses
Management fees 8 (30,022,508) (15,627,735)
Custody out-of-pocket expenses (50,175) (38,844)
Total expenses (30,072,683) (15,666,579)
Net revenue 355,813,882 1,538,433,814
Finance Costs
Distributions to holders of redeemable participating shares 12 (17,355,725) (830,157)
Interest expense (93,770) (26,892)
Interest expense on reverse repurchase agreements (223,813) -
Total finance costs (17,673,308) (857,049)
Increase in net assets attributable to holders of redeemable participating shares from operations before tax 338,140,574 1,537,576,765
Dividend withholding tax (11,065,326) (3,681,933)
Increase in net assets attributable to holders of redeemable participating shares from operations 327,075,248 1,533,894,832
Other comprehensive income
Translation adjustment (26,504,107) 40,707,575
Increase in net assets attributable to holders of redeemable participating shares from operations 300,571,141 1,574,602,407
The accompanying notes form an integral part of these financial statements.

December 2021 Legal & General UCITS ETF Plc
19
Company Statement of Changes in Net Assets Attributable to Redeemable Participating Shareholders
Financial Period ended
31 December 2021
Financial Period ended
31 December 2020 Total Total Note $ $
Net assets attributable to holders of redeemable participating shares at beginning of the financial period 12,938,905,514 4,877,173,558
Increase in net assets attributable to holders of redeemable participating shares from operations after tax 300,571,141 1,574,602,407
Proceeds from redeemable participating shares issued 6 3,184,133,145 2,470,058,678
Value of redeemable participating shares redeemed 6 (2,690,135,233) (456,877,114)
Net increase in net assets from share transactions 493,997,912 2,013,181,564
Net assets attributable to holders of redeemable participating shares at end of the financial period 13,733,474,567 8,464,957,529
The accompanying notes form an integral part of these financial statements.

December 2021 Legal & General UCITS ETF Plc
20
Company Statement of Cash Flows
Financial Period ended
31 December 2021
Financial Period ended
31 December 2020 Total Total Note $ $
Cash flows used in operating activities
Profit after tax 327,075,248 1,533,894,832
Adjustment for:
Interest income (19,459,994) (940,549)
Interest expense 317,583 26,892
Distribution to holders of redeemable participating shares 17,355,725 830,157
Dividend income (89,228,576) (29,182,282)
Withholding taxes 11,065,326 3,681,933
(Increase)/decrease in assets:
Cash for margin calls to counterparties (1,801,374) (299,402)
Financial assets at fair value through profit or loss (864,832,358) (3,601,446,261)
Due from brokers (73,017) (83,306)
Other receivables (126,139) (7,426)
Increase/(decrease) in liabilities:
Cash for margin calls by counterparties 54,394,794 (3,234,791)
Financial liabilities at fair value through profit or loss 2,957,831 85,425,358
Due to brokers (73) 3,176
Accrued expenses 2,010,369 4,032,072
Cash used in operations (560,344,655) (2,007,299,597)
Interest paid 20,622,380 (1,973,987)
Interest received (317,583) (26,892)
Dividend received 77,891,071 23,531,856
Net cash used in operating activities (462,148,787) (1,985,768,620)
Cash flows provided by financing activities
Distributions paid to holders of redeemable participating shares (17,355,725) (830,157)
Proceeds from redeemable participating shares issued* 6 3,195,868,335 2,414,729,894
Redemptions of redeemable participating shares* 6 (2,719,234,429) (484,511,863)
Net cash provided by financing activities 459,278,181 1,929,387,874
Net decrease in cash and cash equivalents (2,870,606) (56,380,746)
Cash and cash equivalents at beginning of financial period 56,030,717 31,929,666
Translation adjustment (26,504,107) 40,707,575
Cash and cash equivalents at end of financial period 26,656,004 16,256,495
* Please refer to Note 6 for the disclosure of changes during the financial period in the redeemable participating shares classified as financial liabilities.
The accompanying notes form an integral part of these financial statements.
December 2021 Legal & General UCITS ETF Plc
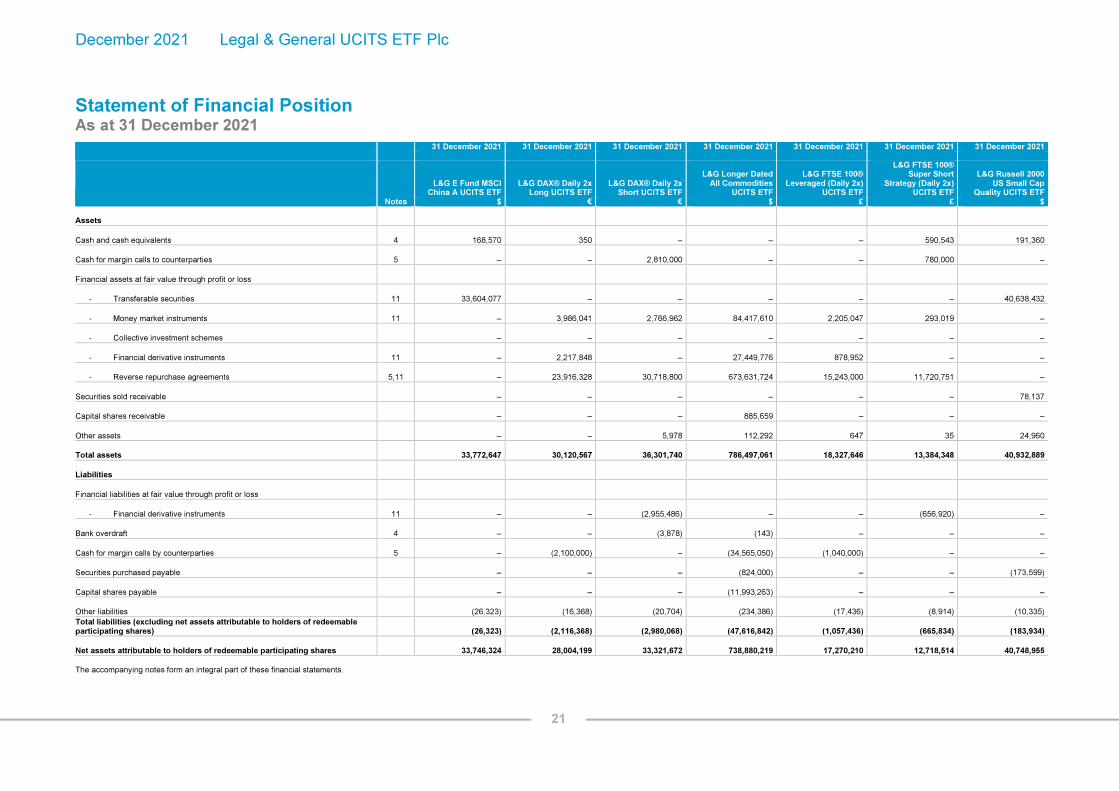
21
Statement of Financial Position As at 31 December 2021
31 December 2021 31 December 2021 31 December 2021 31 December 2021 31 December 2021 31 December 2021 31 December 2021
L&G E Fund MSCI
China A UCITS ETF L&G DAX® Daily 2x
Long UCITS ETF L&G DAX® Daily 2x
Short UCITS ETF
L&G Longer Dated All Commodities
UCITS ETF
L&G FTSE 100® Leveraged (Daily 2x)
UCITS ETF
L&G FTSE 100® Super Short
Strategy (Daily 2x) UCITS ETF
L&G Russell 2000 US Small Cap
Quality UCITS ETF Notes $ € € $ £ £ $
Assets
Cash and cash equivalents 4 168,570 350 – – – 590,543 191,360
Cash for margin calls to counterparties 5 – – 2,810,000 – – 780,000 –
Financial assets at fair value through profit or loss
- Transferable securities 11 33,604,077 – – – – – 40,638,432
- Money market instruments 11 – 3,986,041 2,766,962 84,417,610 2,205,047 293,019 –
- Collective investment schemes – – – – – – –
- Financial derivative instruments 11 – 2,217,848 – 27,449,776 878,952 – –
- Reverse repurchase agreements 5,11 – 23,916,328 30,718,800 673,631,724 15,243,000 11,720,751 –
Securities sold receivable – – – – – – 78,137
Capital shares receivable – – – 885,659 – – –
Other assets – – 5,978 112,292 647 35 24,960
Total assets 33,772,647 30,120,567 36,301,740 786,497,061 18,327,646 13,384,348 40,932,889
Liabilities
Financial liabilities at fair value through profit or loss
- Financial derivative instruments 11 – – (2,955,486) – – (656,920) –
Bank overdraft 4 – – (3,878) (143) – – –
Cash for margin calls by counterparties 5 – (2,100,000) – (34,565,050) (1,040,000) – –
Securities purchased payable – – – (824,000) – – (173,599)
Capital shares payable – – – (11,993,263) – – –
Other liabilities (26,323) (16,368) (20,704) (234,386) (17,436) (8,914) (10,335)
Total liabilities (excluding net assets attributable to holders of redeemable participating shares) (26,323) (2,116,368) (2,980,068) (47,616,842) (1,057,436) (665,834) (183,934)
Net assets attributable to holders of redeemable participating shares 33,746,324 28,004,199 33,321,672 738,880,219 17,270,210 12,718,514 40,748,955
The accompanying notes form an integral part of these financial statements.

December 2021 Legal & General UCITS ETF Plc
22
Statement of Financial Position (continued) As at 31 December 2021
31 December 2021 31 December 2021 31 December 2021 31 December 2021 31 December 2021 31 December 2021 31 December 2021
L&G Gold Mining
UCITS ETF
L&G US Energy Infrastructure MLP
UCITS ETF
L&G ROBO Global®
Robotics and Automation UCITS ETF
L&G Cyber Security UCITS ETF
L&G All Commodities
UCITS ETF
L&G Longer Dated All Commodities ex-
Agriculture and Livestock
UCITS ETF L&G Battery Value-
Chain UCITS ETF Notes $ $ $ $ $ $ $
Assets
Cash and cash equivalents 4 322,285 475 655,628 17,808,162 – – 1,637,590
Cash for margin calls to counterparties 5 – – – – – – –
Financial assets at fair value through profit or loss
- Transferable securities 11 161,829,914 – 1,373,276,925 3,061,927,289 – – 953,726,159
- Money market instruments 11 – 3,844,914 – – 8,397,429 98,438 –
- Collective investment schemes – – – – – – –
- Financial derivative instruments 11 – 2,196,343 – – 3,194,997 61,387 –
- Reverse repurchase agreements 5,11 – 26,448,923 – – 76,038,070 1,299,553 –
Securities sold receivable – – – 2,024,058 – – –
Capital shares receivable – – – – – – –
Other assets 161,203 603 360,094 1,928,758 3,785 64 536,551
Total assets 162,313,402 32,491,258 1,374,292,647 3,083,688,267 87,634,281 1,459,442 955,900,300
Liabilities
Financial liabilities at fair value through profit or loss
- Financial derivative instruments 11 – – – – – – –
Bank overdraft 4 – – – – – (5) –
Cash for margin calls by counterparties 5 – (1,789,935) – – (4,050,000) – –
Securities purchased payable – – – (13,901,151) – – –
Capital shares payable – – – – – – –
Other liabilities (85,518) (10,902) (916,140) (1,739,407) (14,043) (442) (389,225)
Total liabilities (excluding net assets attributable to holders of redeemable participating shares) (85,518) (1,800,837) (916,140) (15,640,558) (4,064,043) (447) (389,225)
Net assets attributable to holders of redeemable participating shares 162,227,884 30,690,421 1,373,376,507 3,068,047,709 83,570,238 1,458,995 955,511,075
The accompanying notes form an integral part of these financial statements.

December 2021 Legal & General UCITS ETF Plc
23
Statement of Financial Position (continued) As at 31 December 2021
31 December 2021 31 December 2021 31 December 2021 31 December 2021 31 December 2021 31 December 2021 31 December 2021
L&G Pharma Breakthrough
UCITS ETF
L&G Ecommerce Logistics
UCITS ETF L&G US Equity
UCITS ETF L&G UK Equity
UCITS ETF L&G Japan Equity
UCITS ETF L&G Global Equity
UCITS ETF L&G Europe ex UK Equity UCITS ETF
Notes $ $ $ £ $ $ €
Assets
Cash and cash equivalents 4 47,689 818,741 605,861 9,355 124,443 71,246 50,688
Cash for margin calls to counterparties 5 – – – – – – –
Financial assets at fair value through profit or loss
- Transferable securities 11 33,337,899 513,448,755 318,401,634 18,842,036 252,907,773 63,645,496 123,836,284
- Money market instruments 11 – – – – – – –
- Collective investment schemes – – – – – – –
- Financial derivative instruments 11 – – – – – – –
- Reverse repurchase agreements 5,11 – – – – – – –
Securities sold receivable – – – – 705 16,990 68,032
Capital shares receivable – – – – – – –
Other assets 5,804 114,960 160,607 48,894 271,269 40,538 5,896
Total assets 33,391,392 514,382,456 319,168,102 18,900,285 253,304,190 63,774,270 123,960,900
Liabilities
Financial liabilities at fair value through profit or loss
- Financial derivative instruments 11 – – – – – – –
Bank overdraft 4 – – – – – – –
Cash for margin calls by counterparties 5 – – – – – – –
Securities purchased payable – – – – – (16,981) (67,747)
Capital shares payable – – – – – – –
Other liabilities (13,760) (211,432) (13,248) (790) (21,462) (5,251) (10,256)
Total liabilities (excluding net assets attributable to holders of redeemable participating shares) (13,760) (211,432) (13,248) (790) (21,462) (22,232) (78,003)
Net assets attributable to holders of redeemable participating shares 33,377,632 514,171,024 319,154,854 18,899,495 253,282,728 63,752,038 123,882,897
The accompanying notes form an integral part of these financial statements.

December 2021 Legal & General UCITS ETF Plc
24
Statement of Financial Position (continued) As at 31 December 2021
31 December 2021 31 December 2021 31 December 2021 31 December 2021 31 December 2021 31 December 2021 31 December 2021
L&G Asia Pacific ex Japan Equity
UCITS ETF L&G Clean Water
UCITS ETF
L&G Artificial Intelligence UCITS ETF
L&G Healthcare Breakthrough
UCITS ETF
L&G Europe Equity (Responsible
Exclusions) UCITS ETF
L&G US Equity (Responsible
Exclusions) UCITS ETF
L&G Clean Energy UCITS ETF
Notes $ $ $ $ € $ $
Assets
Cash and cash equivalents 4 34,532 2,127,928 – 40,742 168,724 769,252 201,716
Cash for margin calls to counterparties 5 – – – – – – –
Financial assets at fair value through profit or loss
- Transferable securities 11 235,612,447 363,210,695 333,153,024 212,948,553 130,108,677 1,795,040,945 130,147,931
- Money market instruments 11 – – – – – – –
- Collective investment schemes – – – – – – –
- Financial derivative instruments 11 – – – – – – –
- Reverse repurchase agreements 5,11 – – – – – – –
Securities sold receivable 2,498,700 703,850 182,794 – – – –
Capital shares receivable 2,608,660 843,646 – – – – –
Other assets 179,803 353,001 28,301 17,455 87,720 724,951 43,237
Total assets 240,934,142 367,239,120 333,364,119 213,006,750 130,365,121 1,796,535,148 130,392,884
Liabilities
Financial liabilities at fair value through profit or loss
- Financial derivative instruments 11 – – – – – – –
Bank overdraft 4 – – (161,024) – – – –
Cash for margin calls by counterparties 5 – – – – – – –
Securities purchased payable (5,057,613) (3,393,066) – – – – –
Capital shares payable – – – – – – –
Other liabilities (19,218) (146,670) (137,811) (88,510) (17,239) (179,956) (53,571)
Total liabilities (excluding net assets attributable to holders of redeemable participating shares) (5,076,831) (3,539,736) (298,835) (88,510) (17,239) (179,956) (53,571)
Net assets attributable to holders of redeemable participating shares 235,857,311 363,699,384 333,065,284 212,918,240 130,347,882 1,796,355,192 130,339,313
The accompanying notes form an integral part of these financial statements.
December 2021 Legal & General UCITS ETF Plc
25
Statement of Financial Position (continued) As at 31 December 2021
31 December 2021 31 December 2021 31 December 2021 31 December 2021 31 December 2021 31 December 2021 31 December 2021
L&G ESG GBP Corporate Bond 0-5
Year UCITS ETF
L&G ESG GBP Corporate Bond
UCITS ETF
L&G ESG Emerging
Markets Government Bond
(USD) 0-5 Year UCITS ETF
L&G ESG China CNY Bond UCITS
ETF L&G UK Gilt 0-5 Year UCITS ETF
L&G ESG USD Corporate Bond
UCITS ETF
L&G ESG Emerging Markets Corporate Bond (USD) UCITS
ETF Notes £ £ $ $ £ $ $
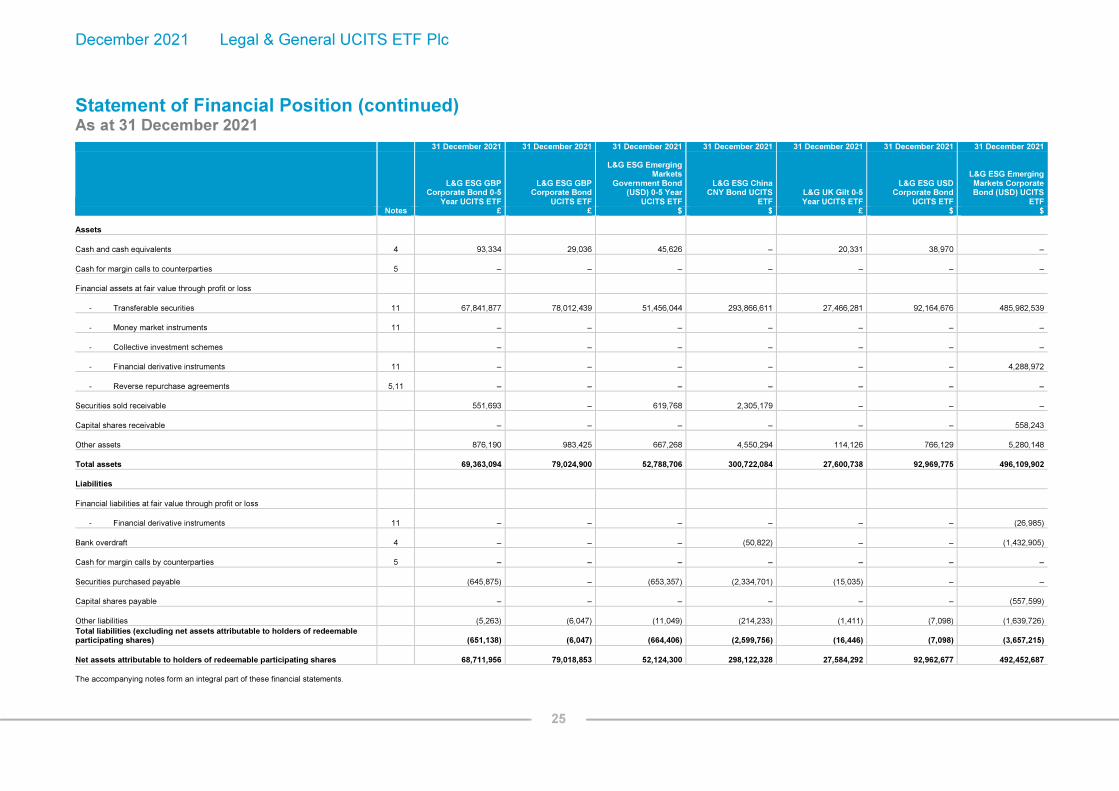
Assets
Cash and cash equivalents 4 93,334 29,036 45,626 – 20,331 38,970 –
Cash for margin calls to counterparties 5 – – – – – – –
Financial assets at fair value through profit or loss
- Transferable securities 11 67,841,877 78,012,439 51,456,044 293,866,611 27,466,281 92,164,676 485,982,539
- Money market instruments 11 – – – – – – –
- Collective investment schemes – – – – – – –
- Financial derivative instruments 11 – – – – – – 4,288,972
- Reverse repurchase agreements 5,11 – – – – – – –
Securities sold receivable 551,693 – 619,768 2,305,179 – – –
Capital shares receivable – – – – – – 558,243
Other assets 876,190 983,425 667,268 4,550,294 114,126 766,129 5,280,148
Total assets 69,363,094 79,024,900 52,788,706 300,722,084 27,600,738 92,969,775 496,109,902
Liabilities
Financial liabilities at fair value through profit or loss
- Financial derivative instruments 11 – – – – – – (26,985)
Bank overdraft 4 – – – (50,822) – – (1,432,905)
Cash for margin calls by counterparties 5 – – – – – – –
Securities purchased payable (645,875) – (653,357) (2,334,701) (15,035) – –
Capital shares payable – – – – – – (557,599)
Other liabilities (5,263) (6,047) (11,049) (214,233) (1,411) (7,098) (1,639,726)
Total liabilities (excluding net assets attributable to holders of redeemable participating shares) (651,138) (6,047) (664,406) (2,599,756) (16,446) (7,098) (3,657,215)
Net assets attributable to holders of redeemable participating shares 68,711,956 79,018,853 52,124,300 298,122,328 27,584,292 92,962,677 492,452,687
The accompanying notes form an integral part of these financial statements.
December 2021 Legal & General UCITS ETF Plc
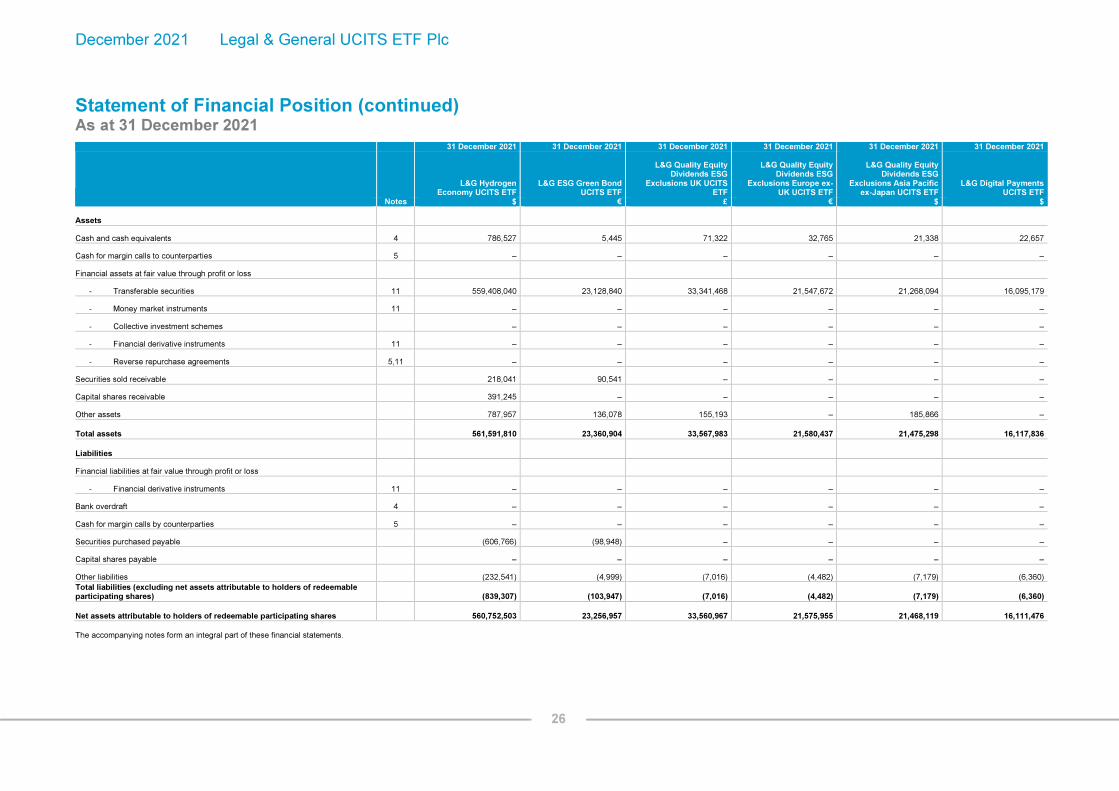
26
Statement of Financial Position (continued) As at 31 December 2021
31 December 2021 31 December 2021 31 December 2021 31 December 2021 31 December 2021 31 December 2021
L&G Hydrogen
Economy UCITS ETF L&G ESG Green Bond
UCITS ETF
L&G Quality Equity Dividends ESG
Exclusions UK UCITS ETF
L&G Quality Equity Dividends ESG
Exclusions Europe ex-UK UCITS ETF
L&G Quality Equity
Dividends ESG Exclusions Asia Pacific
ex-Japan UCITS ETF L&G Digital Payments
UCITS ETF Notes $ € £ € $ $
Assets
Cash and cash equivalents 4 786,527 5,445 71,322 32,765 21,338 22,657
Cash for margin calls to counterparties 5 – – – – – –
Financial assets at fair value through profit or loss
- Transferable securities 11 559,408,040 23,128,840 33,341,468 21,547,672 21,268,094 16,095,179
- Money market instruments 11 – – – – – –
- Collective investment schemes – – – – – –
- Financial derivative instruments 11 – – – – – –
- Reverse repurchase agreements 5,11 – – – – – –
Securities sold receivable 218,041 90,541 – – – –
Capital shares receivable 391,245 – – – – –
Other assets 787,957 136,078 155,193 – 185,866 –
Total assets 561,591,810 23,360,904 33,567,983 21,580,437 21,475,298 16,117,836
Liabilities
Financial liabilities at fair value through profit or loss
- Financial derivative instruments 11 – – – – – –
Bank overdraft 4 – – – – – –
Cash for margin calls by counterparties 5 – – – – – –
Securities purchased payable (606,766) (98,948) – – – –
Capital shares payable – – – – – –
Other liabilities (232,541) (4,999) (7,016) (4,482) (7,179) (6,360)
Total liabilities (excluding net assets attributable to holders of redeemable participating shares) (839,307) (103,947) (7,016) (4,482) (7,179) (6,360)
Net assets attributable to holders of redeemable participating shares 560,752,503 23,256,957 33,560,967 21,575,955 21,468,119 16,111,476
The accompanying notes form an integral part of these financial statements.

December 2021 Legal & General UCITS ETF Plc
27
Statement of Financial Position (continued) As at 31 December 2021
31 December 2021 31 December 2021 31 December 2021
L&G Multi-Strategy Enhanced
Commodities UCITS ETF
1
L&G Quality Equity Dividends ESG
Exclusions Emerging Markets
UCITS ETF2
L&G India INR Government Bond
UCITS ETF3
Notes $ $ $
Assets
Cash and cash equivalents 4 10,258 54,694 303,245
Cash for margin calls to counterparties 5 – – –
Financial assets at fair value through profit or loss
- Transferable securities 11 – 14,715,704 71,918,160
- Money market instruments 11 71,174,335 – –
- Collective investment schemes – 46,883 –
- Financial derivative instruments 11 27,042,440 – –
- Reverse repurchase agreements 5,11 543,183,955 – –
Securities sold receivable – 4,106 1,006,391
Capital shares receivable 671,154 – 1,016,030
Other assets 22,177 20,089 993,248
Total assets 642,104,319 14,841,476 75,237,074
Liabilities
Financial liabilities at fair value through profit or loss
- Financial derivative instruments 11 – – –
Bank overdraft 4 – – –
Cash for margin calls by counterparties 5 (33,070,000) – –
Securities purchased payable (624,000) (1,945) (1,998,707)
Capital shares payable – – –
Other liabilities (179,743) (5,589) (13,934)
Total liabilities (excluding net assets attributable to holders of redeemable participating shares) (33,873,743) (7,534) (2,012,641)
Net assets attributable to holders of redeemable participating shares 608,230,576 14,833,942 73,224,433
1 This Fund was approved by the Central Bank on 4 January 2021. The Fund launched on 2 July 2021.
2 This Fund was approved by the Central Bank on 14 June 2021. The Fund launched on 12 July 2021.
3 This Fund was approved by the Central Bank on 24 April 2019. The Fund launched on 26 October 2021.
The accompanying notes form an integral part of these financial statements.

December 2021 Legal & General UCITS ETF Plc
28
Statement of Financial Position As at 30 June 2021
30 June 2021 30 June 2021 30 June 2021 30 June 2021 30 June 2021 30 June 2021 30 June 2021
L&G E Fund MSCI
China A UCITS ETF L&G DAX® Daily 2x
Long UCITS ETF L&G DAX® Daily 2x
Short UCITS ETF
L&G Longer Dated All Commodities
UCITS ETF
L&G FTSE 100® Leveraged (Daily 2x)
UCITS ETF
L&G FTSE 100® Super Short
Strategy (Daily 2x) UCITS ETF
L&G Russell 2000 US Small Cap
Quality UCITS ETF Notes $ € € $ £ £ $
Assets
Cash and cash equivalents 4 32,408,896 290,108 224 1,489,420 91 – 102,373
Cash for margin calls to counterparties 5 – – 580,000 – – 60,000 –
Financial assets at fair value through profit or loss
- Transferable securities 11 42,347,972 – – – – – 38,710,047
- Money market instruments 11 – 1,813,614 2,805,266 103,571,225 1,823,332 598,160 –
- Financial derivative instruments 11 – – 366,869 37,901,189 – 53,803 –
- Reverse repurchase agreements 5,11 – 24,266,328 44,148,270 1,103,956,000 17,820,000 10,588,751 –
Securities sold receivable – – – – – – –
Capital shares receivable – – – 1,857,377 – 1,225,632 –
Other assets – – 3,357 47,859 167 100 23,813
Total assets 74,756,868 26,370,050 47,903,986 1,248,823,070 19,643,590 12,526,446 38,836,233
Liabilities
Financial liabilities at fair value through profit or loss
- Financial derivative instruments 11 – (247,816) – – (133,209) – –
Bank overdraft 4 – – – – – – –
Cash for margin calls by counterparties 5 – (290,000) – (20,500,000) (270,000) – –
Securities purchased payable – – – (1,728,000) – – –
Capital shares payable (30,814,420) – – (1,481,924) – – –
Other liabilities (53,114) (12,919) (23,295) (356,066) (14,140) (6,370) (9,520)
Total liabilities (excluding net assets attributable to holders of redeemable participating shares) (30,867,534) (550,735) (23,295) (24,065,990) (417,349) (6,370) (9,520)
Net assets attributable to holders of redeemable participating shares 43,889,334 25,819,315 47,880,691 1,224,757,080 19,226,241 12,520,076 38,826,713
The accompanying notes form an integral part of these financial statements.

December 2021 Legal & General UCITS ETF Plc
29
Statement of Financial Position (continued) As at 30 June 2021
30 June 2021 30 June 2021 30 June 2021 30 June 2021 30 June 2021 30 June 2021 30 June 2021
L&G Gold Mining
UCITS ETF
L&G US Energy Infrastructure MLP
UCITS ETF
L&G ROBO Global®
Robotics and Automation UCITS ETF
L&G Cyber Security UCITS ETF
L&G All Commodities
UCITS ETF
L&G Longer Dated All Commodities ex-
Agriculture and Livestock
UCITS ETF L&G Battery Value-
Chain UCITS ETF Notes $ $ $ $ $ $ $
Assets
Cash and cash equivalents 4 320,046 – 2,212,912 5,246,345 – – 1,430,002
Cash for margin calls to counterparties 5 – 1,679,894 – – – – –
Financial assets at fair value through profit or loss
- Transferable securities 11 155,213,214 – 1,252,893,177 2,788,358,945 – – 832,509,597
- Money market instruments 11 – 2,926,984 – – 8,543,256 1,134,629 –
- Financial derivative instruments 11 – – – – 2,961,381 350,603 –
- Reverse repurchase agreements 5,11 – 36,548,923 – – 83,859,070 10,061,553 –
Securities sold receivable – – – 415,294 – – 764,308
Capital shares receivable – – – 1,283,020 – – 6,422,250
Other assets 51,048 12 605,895 215,388 3,683 422 528,272
Total assets 155,584,308 41,155,813 1,255,711,984 2,795,518,992 95,367,390 11,547,207 841,654,429
Liabilities
Financial liabilities at fair value through profit or loss
- Financial derivative instruments 11 – (841,962) – – – – –
Bank overdraft 4 – – – – (2,731) – –
Cash for margin calls by counterparties 5 – – – – (1,500,000) (160,017) –
Securities purchased payable – – – (1,698,124) – – (7,167,345)
Capital shares payable – – – – – – –
Other liabilities (94,812) (12,427) (846,569) (1,674,498) (14,929) (3,243) (332,965)
Total liabilities (excluding net assets attributable to holders of redeemable participating shares) (94,812) (854,389) (846,569) (3,372,622) (1,517,660) (163,260) (7,500,310)
Net assets attributable to holders of redeemable participating shares 155,489,496 40,301,424 1,254,865,415 2,792,146,370 93,849,730 11,383,947 834,154,119
The accompanying notes form an integral part of these financial statements.

December 2021 Legal & General UCITS ETF Plc
30
Statement of Financial Position (continued) As at 30 June 2021
30 June 2021 30 June 2021 30 June 2021 30 June 2021 30 June 2021 30 June 2021 30 June 2021
L&G Pharma Breakthrough
UCITS ETF
L&G Ecommerce Logistics
UCITS ETF L&G US Equity
UCITS ETF L&G UK Equity
UCITS ETF L&G Japan Equity
UCITS ETF L&G Global Equity
UCITS ETF L&G Europe ex UK Equity UCITS ETF
Notes $ $ $ £ $ $ €
Assets
Cash and cash equivalents 4 58,645 999,247 173,102 13,302 1,398,999 108,763 162,990
Cash for margin calls to counterparties 5 – – – – – – –
Financial assets at fair value through profit or loss
- Transferable securities 11 34,270,643 610,390,357 295,165,887 16,601,989 251,110,148 51,244,821 112,865,476
- Money market instruments 11 – – – – – – –
- Financial derivative instruments 11 – – – – – – –
- Reverse repurchase agreements 5,11 – – – – – – –
Securities sold receivable – – – – 746 – –
Capital shares receivable – 5,366,220 – – – – –
Other assets 15,111 1,172,177 144,258 48,111 241,706 43,408 68,008
Total assets 34,344,399 617,928,001 295,483,247 16,663,402 252,751,599 51,396,992 113,096,474
Liabilities
Financial liabilities at fair value through profit or loss
- Financial derivative instruments 11 – – – – – – –
Bank overdraft 4 – – – – – – –
Cash for margin calls by counterparties 5 – – – – – – –
Securities purchased payable – (5,365,911) – – – – –
Capital shares payable – – – – – – –
Other liabilities (12,898) (226,067) (11,831) (690) (21,204) (4,196) (9,314)
Total liabilities (excluding net assets attributable to holders of redeemable participating shares) (12,898) (5,591,978) (11,831) (690) (21,204) (4,196) (9,314)
Net assets attributable to holders of redeemable participating shares 34,331,501 612,336,023 295,471,416 16,662,712 252,730,395 51,392,796 113,087,160
The accompanying notes form an integral part of these financial statements.

December 2021 Legal & General UCITS ETF Plc
31
Statement of Financial Position (continued) As at 30 June 2021
30 June 2021 30 June 2021 30 June 2021 30 June 2021 30 June 2021 30 June 2021 30 June 2021
L&G Asia Pacific ex Japan Equity
UCITS ETF L&G Clean Water
UCITS ETF
L&G Artificial Intelligence UCITS ETF
L&G Healthcare Breakthrough
UCITS ETF
L&G Europe Equity (Responsible
Exclusions) UCITS ETF
L&G US Equity (Responsible
Exclusions) UCITS ETF
L&G Clean Energy UCITS ETF
Notes $ $ $ $ € $ $
Assets
Cash and cash equivalents 4 700,739 117,454 13,743 374,745 151,838 2,221,125 136,209
Cash for margin calls to counterparties 5 – – – – – – –
Financial assets at fair value through profit or loss
- Transferable securities 11 172,688,495 231,554,039 255,249,690 219,066,567 233,621,909 1,703,516,278 115,077,930
- Money market instruments 11 – – – – – – –
- Financial derivative instruments 11 – – – – – – –
- Reverse repurchase agreements 5,11 – – – – – – –
Securities sold receivable 822 – 2,604,111 – 2,936 7,446,266 –
Capital shares receivable – – – – – – –
Other assets 515,991 599,288 27,424 14,855 243,048 651,331 72,581
Total assets 173,906,047 232,270,781 257,894,968 219,456,167 234,019,731 1,713,835,000 115,286,720
Liabilities
Financial liabilities at fair value through profit or loss
- Financial derivative instruments 11 – – – – – – –
Bank overdraft 4 – – – – – – –
Cash for margin calls by counterparties 5 – – – – – – –
Securities purchased payable – – (263,711) (25,191) – – –
Capital shares payable – – (1,900,964) – – (7,452,750) –
Other liabilities (14,372) (90,155) (99,888) (74,440) (30,842) (169,326) (43,358)
Total liabilities (excluding net assets attributable to holders of redeemable participating shares) (14,372) (90,155) (2,264,563) (99,631) (30,842) (7,622,076) (43,358)
Net assets attributable to holders of redeemable participating shares 173,891,675 232,180,626 255,630,405 219,356,536 233,988,889 1,706,212,924 115,243,362
The accompanying notes form an integral part of these financial statements.
December 2021 Legal & General UCITS ETF Plc
32
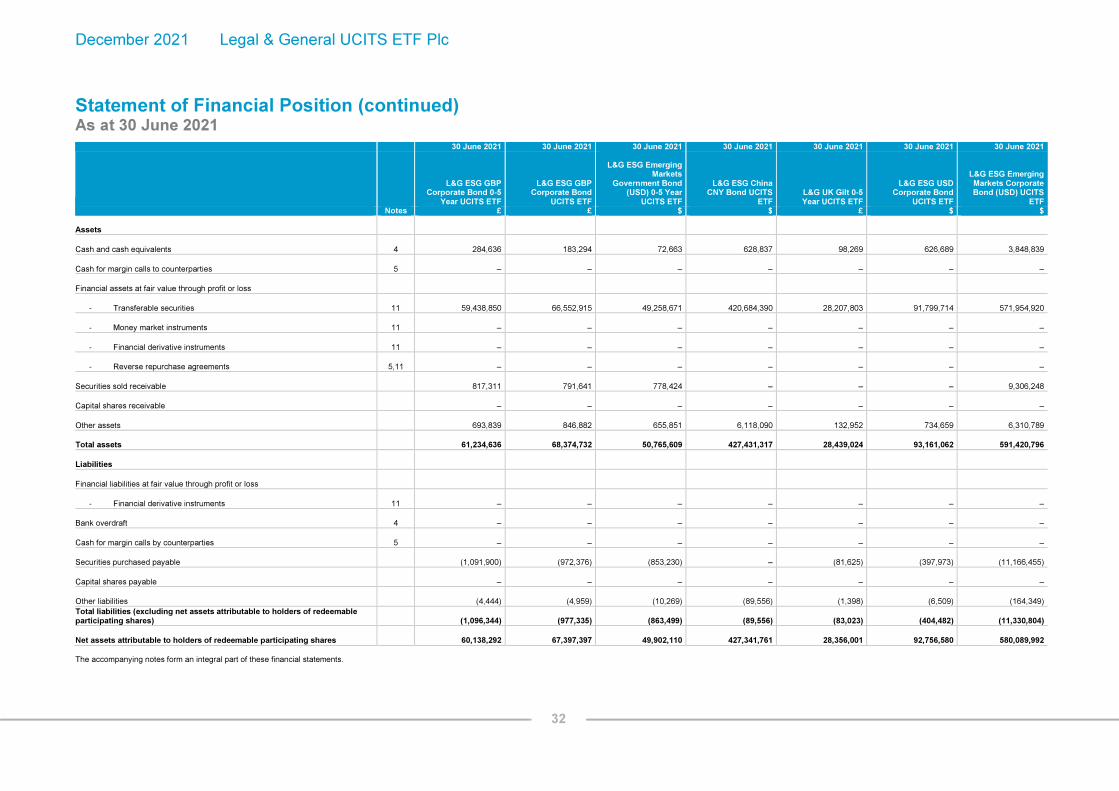
Statement of Financial Position (continued) As at 30 June 2021
30 June 2021 30 June 2021 30 June 2021 30 June 2021 30 June 2021 30 June 2021 30 June 2021
L&G ESG GBP Corporate Bond 0-5
Year UCITS ETF
L&G ESG GBP Corporate Bond
UCITS ETF
L&G ESG Emerging
Markets Government Bond
(USD) 0-5 Year UCITS ETF
L&G ESG China CNY Bond UCITS
ETF L&G UK Gilt 0-5 Year UCITS ETF
L&G ESG USD Corporate Bond
UCITS ETF
L&G ESG Emerging Markets Corporate Bond (USD) UCITS
ETF Notes £ £ $ $ £ $ $
Assets
Cash and cash equivalents 4 284,636 183,294 72,663 628,837 98,269 626,689 3,848,839
Cash for margin calls to counterparties 5 – – – – – – –
Financial assets at fair value through profit or loss
- Transferable securities 11 59,438,850 66,552,915 49,258,671 420,684,390 28,207,803 91,799,714 571,954,920
- Money market instruments 11 – – – – – – –
- Financial derivative instruments 11 – – – – – – –
- Reverse repurchase agreements 5,11 – – – – – – –
Securities sold receivable 817,311 791,641 778,424 – – – 9,306,248
Capital shares receivable – – – – – – –
Other assets 693,839 846,882 655,851 6,118,090 132,952 734,659 6,310,789
Total assets 61,234,636 68,374,732 50,765,609 427,431,317 28,439,024 93,161,062 591,420,796
Liabilities
Financial liabilities at fair value through profit or loss
- Financial derivative instruments 11 – – – – – – –
Bank overdraft 4 – – – – – – –
Cash for margin calls by counterparties 5 – – – – – – –
Securities purchased payable (1,091,900) (972,376) (853,230) – (81,625) (397,973) (11,166,455)
Capital shares payable – – – – – – –
Other liabilities (4,444) (4,959) (10,269) (89,556) (1,398) (6,509) (164,349)
Total liabilities (excluding net assets attributable to holders of redeemable participating shares) (1,096,344) (977,335) (863,499) (89,556) (83,023) (404,482) (11,330,804)
Net assets attributable to holders of redeemable participating shares 60,138,292 67,397,397 49,902,110 427,341,761 28,356,001 92,756,580 580,089,992
The accompanying notes form an integral part of these financial statements.

December 2021 Legal & General UCITS ETF Plc
33
Statement of Financial Position (continued) As at 30 June 2021
30 June 2021 30 June 2021 30 June 2021 30 June 2021 30 June 2021 30 June 2021
L&G Hydrogen Economy UCITS
ETF L&G ESG Green
Bond UCITS ETF
L&G Quality Equity Dividends ESG Exclusions UK
UCITS ETF
L&G Quality Equity Dividends ESG
Exclusions Europe ex-UK UCITS ETF
L&G Quality Equity
Dividends ESG Exclusions Asia Pacific ex-Japan
UCITS ETF
L&G Digital Payments
UCITS ETF Notes $ € £ € $ $
Assets
Cash and cash equivalents 4 636,112 144,608 29,965 – 40,725 10,739
Cash for margin calls to counterparties 5 – – – – – –
Financial assets at fair value through profit or loss
- Transferable securities 11 459,443,397 22,984,312 26,267,797 16,171,246 19,686,569 6,265,782
- Money market instruments 11 – – – – – –
- Financial derivative instruments 11 – – – – – –
- Reverse repurchase agreements 5,11 – – – – – –
Securities sold receivable – 653,236 – – – –
Capital shares receivable 895,090 – – 1,005,755 – –
Other assets 267,855 97,875 160,550 28,115 66,393 –
Total assets 461,242,454 23,880,031 26,458,312 17,205,116 19,793,687 6,276,521
Liabilities
Financial liabilities at fair value through profit or loss
- Financial derivative instruments 11 – – – – – –
Bank overdraft 4 – – – (906,606) – –
Cash for margin calls by counterparties 5 – – – – – –
Securities purchased payable (1,340,067) (694,713) – – – –
Capital shares payable – – – – – –
Other liabilities (175,939) (4,735) (5,476) (3,216) (6,512) (1,685)
Total liabilities (excluding net assets attributable to holders of redeemable participating shares) (1,516,006) (699,448) (5,476) (909,822) (6,512) (1,685)
Net assets attributable to holders of redeemable participating shares 459,726,448 23,180,583 26,452,836 16,295,294 19,787,175 6,274,836
The accompanying notes form an integral part of these financial statements.

December 2021 Legal & General UCITS ETF Plc
34
Statement of Comprehensive Income For the financial period ended 31 December 2021
Financial Period ended
31 December 2021
Financial Period ended
31 December 2021
Financial Period ended
31 December 2021
Financial Period ended
31 December 2021
Financial Period ended
31 December 2021
Financial Period ended
31 December 2021
Financial Period ended
31 December 2021
L&G E Fund MSCI China A
UCITS ETF
L&G DAX® Daily 2x Long
UCITS ETF
L&G DAX® Daily 2x Short
UCITS ETF
L&G Longer Dated All Commodities
UCITS ETF
L&G FTSE 100® Leveraged (Daily 2x)
UCITS ETF
L&G FTSE 100® Super Short
Strategy (Daily 2x) UCITS ETF
L&G Russell 2000 US Small Cap
Quality UCITS ETF Notes $ € € $ £ £ $
Revenue
Interest income 2,099 – 34 88 – – 2
Dividend income 341,660 – – – – – 269,567
Interest income on debt securities and money market instruments – 1,511 (3,385) (5,597) (122) 74 –
Income on reverse repurchase agreements – – – 1,110,225 4,877 3,409 –
Net (loss)/gain on financial assets and liabilities at fair value through profit or loss 2 (379,394) 1,538,097 (2,447,654) 73,980,784 2,796,390 (1,637,179) 146,337
Total revenue (35,635) 1,539,608 (2,451,005) 75,085,500 2,801,145 (1,633,696) 415,906
Expenses
Management fees 8 (174,956) (52,145) (142,544) (1,619,843) (47,761) (38,141) (59,229)
Custody out-of-pocket expenses – (2,004) (2,244) (5,058) (1,596) (900) (3,390)
Total expenses (174,956) (54,149) (144,788) (1,624,901) (49,357) (39,041) (62,619)
Net (expense)/revenue (210,591) 1,485,459 (2,595,793) 73,460,599 2,751,788 (1,672,737) 353,287
Finance costs
Distributions to holders of redeemable participating shares 12 – – – – – – –
Interest expense (214) (954) (2,353) (1) (146) (286) (76)
Interest expense on reverse repurchase agreements – (67,216) (125,575) – – – –
Total finance costs (214) (68,170) (127,928) (1) (146) (286) (76)
(Decrease)/increase in net assets attributable to holders of redeemable participating shares from operations before tax (210,805) 1,417,289 (2,723,721) 73,460,598 2,751,642 (1,673,023) 353,211
Dividend withholding tax (34,266) – – – – – (40,449)
(Decrease)/increase in net assets attributable to holders of redeemable participating shares from operations (245,071) 1,417,289 (2,723,721) 73,460,598 2,751,642 (1,673,023) 312,762
The accompanying notes form an integral part of these financial statements.

December 2021 Legal & General UCITS ETF Plc
35
Statement of Comprehensive Income (continued) For the financial period ended 31 December 2021
Financial Period ended
31 December 2021
Financial Period ended
31 December 2021
Financial Period ended
31 December 2021
Financial Period ended
31 December 2021
Financial Period ended
31 December 2021
Financial Period ended
31 December 2021
Financial Period ended
31 December 2021
L&G Gold Mining
UCITS ETF
L&G US Energy Infrastructure MLP
UCITS ETF
L&G ROBO Global® Robotics and
Automation UCITS ETF
L&G Cyber Security UCITS ETF
L&G All Commodities
UCITS ETF
L&G Longer Dated All Commodities ex-
Agriculture and Livestock
UCITS ETF L&G Battery Value-
Chain UCITS ETF Notes $ $ $ $ $ $ $
Revenue
Interest income 8 2 71 289 1 – 46
Dividend income 1,867,635 – 3,506,058 39,021,936 – – 4,592,695
Interest income on debt securities and money market instruments – 89 – – 2,330 (17) –
Income on reverse repurchase agreements – 14,433 – – 98,707 3,135 –
Net (loss)/gain on financial assets and liabilities at fair value through profit or loss 2 (3,007,041) (2,269,972) 95,859,639 (36,066,062) 6,653,972 423,307 2,700,310
Total revenue (1,139,398) (2,255,448) 99,365,768 2,956,163 6,755,010 426,425 7,293,051
Expenses
Management fees 8 (508,606) (43,136) (5,170,427) (10,833,397) (73,466) (4,506) (2,163,936)
Custody out-of-pocket expenses (273) (2,776) (2,378) (692) (3,080) (823) (587)
Total expenses (508,879) (45,912) (5,172,805) (10,834,089) (76,546) (5,329) (2,164,523)
Net (expense)/revenue (1,648,277) (2,301,360) 94,192,963 (7,877,926) 6,678,464 421,096 5,128,528
Finance costs
Distributions to holders of redeemable participating shares 12 – (1,225,317) – – – – –
Interest expense (608) (10) (7,320) (17,090) – – (2,459)
Interest expense on reverse repurchase agreements – – – – – – –
Total finance costs (608) (1,225,327) (7,320) (17,090) – – (2,459)
(Decrease)/increase in net assets attributable to holders of redeemable participating shares from operations before tax (1,648,885) (3,526,687) 94,185,643 (7,895,016) 6,678,464 421,096 5,126,069
Dividend withholding tax (192,711) – (535,601) (5,585,097) – – (617,028)
(Decrease)/increase in net assets attributable to holders of redeemable participating shares from operations (1,841,596) (3,526,687) 93,650,042 (13,480,113) 6,678,464 421,096 4,509,041
The accompanying notes form an integral part of these financial statements.
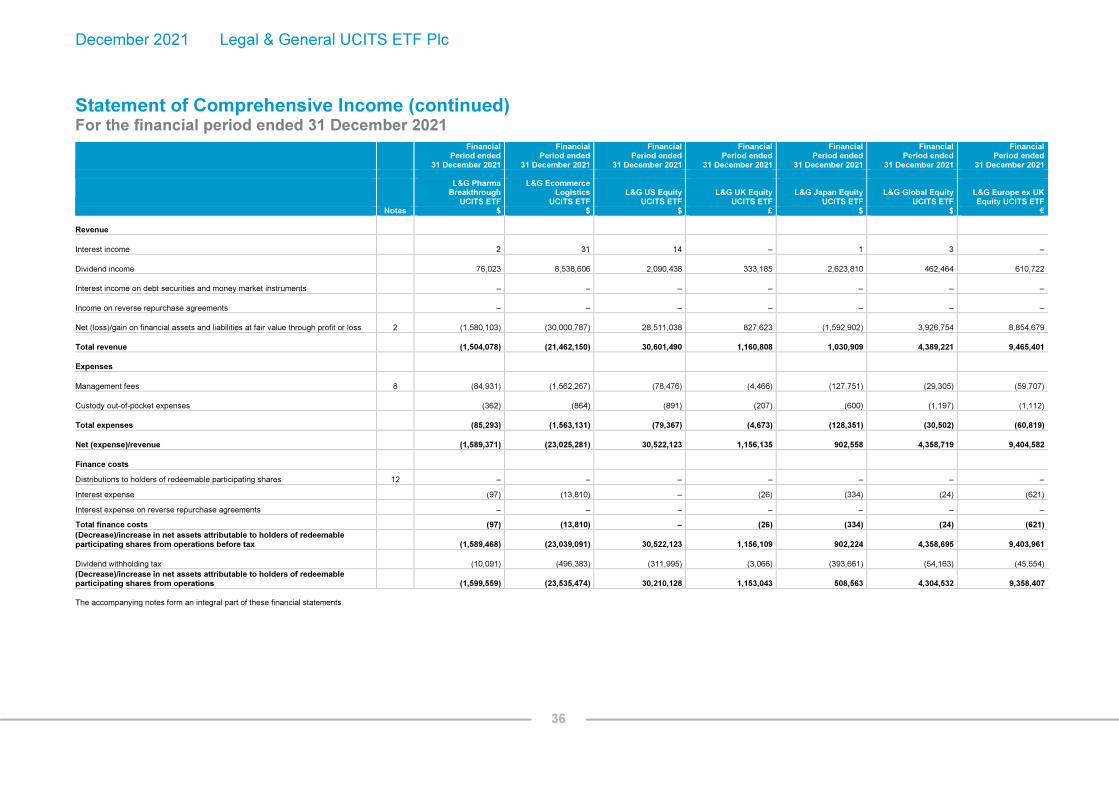
December 2021 Legal & General UCITS ETF Plc
36
Statement of Comprehensive Income (continued) For the financial period ended 31 December 2021
Financial Period ended
31 December 2021
Financial Period ended
31 December 2021
Financial Period ended
31 December 2021
Financial Period ended
31 December 2021
Financial Period ended
31 December 2021
Financial Period ended
31 December 2021
Financial Period ended
31 December 2021
L&G Pharma Breakthrough
UCITS ETF
L&G Ecommerce Logistics
UCITS ETF L&G US Equity
UCITS ETF L&G UK Equity
UCITS ETF L&G Japan Equity
UCITS ETF L&G Global Equity
UCITS ETF L&G Europe ex UK Equity UCITS ETF
Notes $ $ $ £ $ $ €
Revenue
Interest income 2 31 14 – 1 3 –
Dividend income 76,023 8,538,606 2,090,438 333,185 2,623,810 462,464 610,722
Interest income on debt securities and money market instruments – – – – – – –
Income on reverse repurchase agreements – – – – – – –
Net (loss)/gain on financial assets and liabilities at fair value through profit or loss 2 (1,580,103) (30,000,787) 28,511,038 827,623 (1,592,902) 3,926,754 8,854,679
Total revenue (1,504,078) (21,462,150) 30,601,490 1,160,808 1,030,909 4,389,221 9,465,401
Expenses
Management fees 8 (84,931) (1,562,267) (78,476) (4,466) (127,751) (29,305) (59,707)
Custody out-of-pocket expenses (362) (864) (891) (207) (600) (1,197) (1,112)
Total expenses (85,293) (1,563,131) (79,367) (4,673) (128,351) (30,502) (60,819)
Net (expense)/revenue (1,589,371) (23,025,281) 30,522,123 1,156,135 902,558 4,358,719 9,404,582
Finance costs
Distributions to holders of redeemable participating shares 12 – – – – – – –
Interest expense (97) (13,810) – (26) (334) (24) (621)
Interest expense on reverse repurchase agreements – – – – – – –
Total finance costs (97) (13,810) – (26) (334) (24) (621)
(Decrease)/increase in net assets attributable to holders of redeemable participating shares from operations before tax (1,589,468) (23,039,091) 30,522,123 1,156,109 902,224 4,358,695 9,403,961
Dividend withholding tax (10,091) (496,383) (311,995) (3,066) (393,661) (54,163) (45,554)
(Decrease)/increase in net assets attributable to holders of redeemable participating shares from operations (1,599,559) (23,535,474) 30,210,128 1,153,043 508,563 4,304,532 9,358,407
The accompanying notes form an integral part of these financial statements.
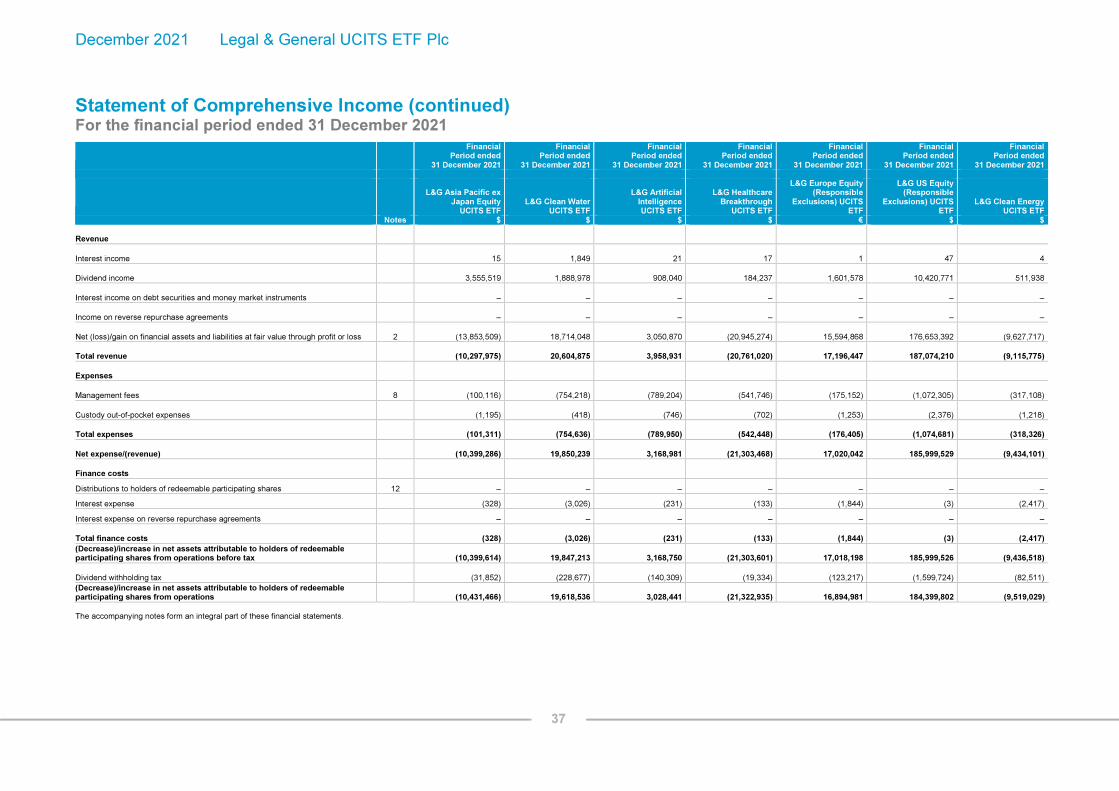
December 2021 Legal & General UCITS ETF Plc
37
Statement of Comprehensive Income (continued) For the financial period ended 31 December 2021
Financial Period ended
31 December 2021
Financial Period ended
31 December 2021
Financial Period ended
31 December 2021
Financial Period ended
31 December 2021
Financial Period ended
31 December 2021
Financial Period ended
31 December 2021
Financial Period ended
31 December 2021
L&G Asia Pacific ex Japan Equity
UCITS ETF L&G Clean Water
UCITS ETF
L&G Artificial Intelligence UCITS ETF
L&G Healthcare Breakthrough
UCITS ETF
L&G Europe Equity (Responsible
Exclusions) UCITS ETF
L&G US Equity (Responsible
Exclusions) UCITS ETF
L&G Clean Energy UCITS ETF
Notes $ $ $ $ € $ $
Revenue
Interest income 15 1,849 21 17 1 47 4
Dividend income 3,555,519 1,888,978 908,040 184,237 1,601,578 10,420,771 511,938
Interest income on debt securities and money market instruments – – – – – – –
Income on reverse repurchase agreements – – – – – – –
Net (loss)/gain on financial assets and liabilities at fair value through profit or loss 2 (13,853,509) 18,714,048 3,050,870 (20,945,274) 15,594,868 176,653,392 (9,627,717)
Total revenue (10,297,975) 20,604,875 3,958,931 (20,761,020) 17,196,447 187,074,210 (9,115,775)
Expenses
Management fees 8 (100,116) (754,218) (789,204) (541,746) (175,152) (1,072,305) (317,108)
Custody out-of-pocket expenses (1,195) (418) (746) (702) (1,253) (2,376) (1,218)
Total expenses (101,311) (754,636) (789,950) (542,448) (176,405) (1,074,681) (318,326)
Net expense/(revenue) (10,399,286) 19,850,239 3,168,981 (21,303,468) 17,020,042 185,999,529 (9,434,101)
Finance costs
Distributions to holders of redeemable participating shares 12 – – – – – – –
Interest expense (328) (3,026) (231) (133) (1,844) (3) (2,417)
Interest expense on reverse repurchase agreements – – – – – – –
Total finance costs (328) (3,026) (231) (133) (1,844) (3) (2,417)
(Decrease)/increase in net assets attributable to holders of redeemable participating shares from operations before tax (10,399,614) 19,847,213 3,168,750 (21,303,601) 17,018,198 185,999,526 (9,436,518)
Dividend withholding tax (31,852) (228,677) (140,309) (19,334) (123,217) (1,599,724) (82,511)
(Decrease)/increase in net assets attributable to holders of redeemable participating shares from operations (10,431,466) 19,618,536 3,028,441 (21,322,935) 16,894,981 184,399,802 (9,519,029)
The accompanying notes form an integral part of these financial statements.

December 2021 Legal & General UCITS ETF Plc
38
Statement of Comprehensive Income (continued) For the financial period ended 31 December 2021
Financial Period ended
31 December 2021
Financial Period ended
31 December 2021
Financial Period ended
31 December 2021
Financial Period ended
31 December 2021
Financial Period ended
31 December 2021
Financial Period ended
31 December 2021
Financial Period ended
31 December 2021
L&G ESG GBP Corporate Bond 0-5
Year UCITS ETF
L&G ESG GBP Corporate Bond
UCITS ETF
L&G ESG Emerging Markets Government Bond (USD) 0-5 Year
UCITS ETF
L&G ESG China CNY Bond UCITS
ETF
L&G UK Gilt 0-5 Year UCITS ETF
L&G ESG USD Corporate Bond
UCITS ETF
L&G ESG Emerging Markets Corporate Bond (USD) UCITS
ETF Notes £ £ $ $ £ $ $
Revenue
Interest income – – 5 1,050 – 4 31
Dividend income – – – – – – –
Interest income on debt securities and money market instruments 284,890 604,377 670,485 6,766,712 4,073 901,063 8,279,607
Income on reverse repurchase agreements – – – – – – –
Net (loss)/gain on financial assets and liabilities at fair value through profit or loss 2 (761,782) (1,162,525) (1,451,987) 12,559,652 (266,694) (901,772) (15,288,059)
Total revenue (476,892) (558,148) (781,497) 19,327,414 (262,621) (705) (7,008,421)
Expenses
Management fees 8 (28,546) (31,754) (63,913) (678,006) (8,374) (40,937) (757,399)
Custody out-of-pocket expenses – – – – – – –
Total expenses (28,546) (31,754) (63,913) (678,006) (8,374) (40,937) (757,399)
Net (expense)/revenue (505,438) (589,902) (845,410) 18,649,408 (270,995) (41,642) (7,765,820)
Finance costs
Distributions to holders of redeemable participating shares 12 (192,600) (577,320) (575,299) (6,611,540) – (692,100) (4,809,357)
Interest expense (48) (56) (53) (8,605) (84) (140) (11,813)
Interest expense on reverse repurchase agreements – – – – – – –
Total finance costs (192,648) (577,376) (575,352) (6,620,145) (84) (692,240) (4,821,170)
(Decrease)/increase in net assets attributable to holders of redeemable participating shares from operations before tax (698,086) (1,167,278) (1,420,762) 12,029,263 (271,079) (733,882) (12,586,990)
Dividend withholding tax 12,419 503 (4,127) – – (791) 38,651
(Decrease)/increase in net assets attributable to holders of redeemable participating shares from operations (685,667) (1,166,775) (1,424,889) 12,029,263 (271,079) (734,673) (12,548,339)
The accompanying notes form an integral part of these financial statements.

December 2021 Legal & General UCITS ETF Plc
39
Statement of Comprehensive Income (continued) For the financial period ended 31 December 2021
Financial Period ended
31 December 2021
Financial Period ended
31 December 2021 Financial
Period ended 31 December 2021
Financial Period ended
31 December 2021 Financial
Period ended 31 December 2021
Financial Period ended
31 December 2021
L&G Hydrogen
Economy UCITS ETF L&G ESG Green Bond
UCITS ETF
L&G Quality Equity Dividends ESG
Exclusions UK UCITS ETF
L&G Quality Equity Dividends ESG
Exclusions Europe ex-UK UCITS ETF
L&G Quality Equity
Dividends ESG Exclusions Asia Pacific
ex-Japan UCITS ETF L&G Digital Payments
UCITS ETF Notes $ € £ € $ $
Revenue
Interest income 42 – – – 2 3
Dividend income 2,645,869 – 1,049,612 307,648 559,055 28,245
Interest income on debt securities and money market instruments – 75,007 – – – –
Income on reverse repurchase agreements – – – – – –
Net (loss)/gain on financial assets and liabilities at fair value through profit or loss 2 (64,611,407) 57,337 242,446 1,218,886 (1,442,237) (2,836,488)
Total revenue (61,965,496) 132,344 1,292,058 1,526,534 (883,180) (2,808,240)
Expenses
Management fees 8 (1,256,410) (29,539) (38,021) (24,060) (40,940) (30,236)
Custody out-of-pocket expenses (1,125) – (194) (968) (1,188) (165)
Total expenses (1,257,535) (29,539) (38,215) (25,028) (42,128) (30,401)
Net (expense)/revenue (63,223,031) 102,805 1,253,843 1,501,506 (925,308) (2,838,641)
Finance costs
Distributions to holders of redeemable participating shares 12 – (25,850) (1,058,400) (309,927) (334,640) –
Interest expense (14,915) (13) (80) (149) (9) (142)
Interest expense on reverse repurchase agreements – – – – – –
Total finance costs (14,915) (25,863) (1,058,480) (310,076) (334,649) (142)
(Decrease)/increase in net assets attributable to holders of redeemable participating shares from operations before tax (63,237,946) 76,942 195,363 1,191,430 (1,259,957) (2,838,783)
Dividend withholding tax (373,879) (568) (11,042) (44,889) (52,669) (2,529)
(Decrease)/increase in net assets attributable to holders of redeemable participating shares from operations (63,611,825) 76,374 184,321 1,146,541 (1,312,626) (2,841,312)
The accompanying notes form an integral part of these financial statements.

December 2021 Legal & General UCITS ETF Plc
40
Statement of Comprehensive Income (continued) For the financial period ended 31 December 2021
Financial Period ended
31 December 2021
Financial Period ended
31 December 2021
Financial Period ended
31 December 2021
L&G Multi-Strategy Enhanced
Commodities UCITS ETF
1
L&G Quality Equity Dividends ESG
Exclusions Emerging Markets
UCITS ETF2
L&G India INR Government Bond
UCITS ETF3
Notes $ $ $
Revenue
Interest income 1 2 –
Dividend income – 325,144 –
Interest income on debt securities and money market instruments (143) – 228,439
Income on reverse repurchase agreements 71,173 – –
Net gain/(loss) on financial assets and liabilities at fair value through profit or loss 2 30,457,641 (165,051) 718,521
Total revenue 30,528,672 160,095 946,960
Expenses
Management fees 8 (168,594) (30,886) (16,814)
Custody out-of-pocket expenses (1,832) (3,490) –
Total expenses (170,426) (34,376) (16,814)
Net revenue/(expense) 30,358,246 125,719 930,146
Finance costs
Distributions to holders of redeemable participating shares 12 – (226,050) –
Interest expense (748) (1,273) (13)
Interest expense on reverse repurchase agreements – – –
Total finance costs (748) (227,323) (13)
Increase/(decrease) in net assets attributable to holders of redeemable participating shares from operations before tax 30,357,498 (101,604) 930,133
Dividend withholding tax – (45,814) –
Increase/(decrease ) in net assets attributable to holders of redeemable participating shares from operations 30,357,498 (147,418) 930,133 1 This Fund was approved by the Central Bank on 4 January 2021. The Fund launched on 2 July 2021.
2 This Fund was approved by the Central Bank on 14 June 2021. The Fund launched on 12 July 2021.
3 This Fund was approved by the Central Bank on 24 April 2019. The Fund launched on 26 October 2021.
The accompanying notes form an integral part of these financial statements.

December 2021 Legal & General UCITS ETF Plc
41
Statement of Comprehensive Income For the financial period ended 31 December 2020
Financial Period ended
31 December 2020
Financial Period ended
31 December 2020
Financial Period ended
31 December 2020
Financial Period ended
31 December 2020
Financial Period ended
31 December 2020
Financial Period ended
31 December 2020
Financial Period ended
31 December 2020
L&G E Fund MSCI China A
UCITS ETF
L&G DAX® Daily 2x Long
UCITS ETF
L&G DAX® Daily 2x Short
UCITS ETF
L&G Longer Dated All Commodities
UCITS ETF
L&G FTSE 100® Leveraged (Daily 2x)
UCITS ETF
L&G FTSE 100® Super Short
Strategy (Daily 2x) UCITS ETF
L&G Russell 2000 US Small Cap
Quality UCITS ETF Notes $ € € $ £ £ $
Revenue
Interest income 618 – – 34 110 20 2
Dividend income 256,374 – – – – – –
Interest income on debt securities and money market instruments – 2,721 (6,565) 15,289 (9) 170 1,472
Income on reverse repurchase agreements – (71,096) (156,120) 725,026 3,361 5,677 25,116
Net gain/(loss) on financial assets and liabilities at fair value through profit or loss 2 8,518,379 6,739,936 (15,340,044) 97,711,409 1,838,577 (1,727,209) 10,643,608
Total revenue 8,775,371 6,671,561 (15,502,729) 98,451,758 1,842,039 (1,721,342) 10,670,198
Expenses
Management fees 8 (133,177) (56,792) (183,129) (799,477) (34,142) (63,496) (72,519)
Custody out-of-pocket expenses – (2,109) (2,280) (3,642) (1,510) (1,958) (2,158)
Total expenses (133,177) (58,901) (185,409) (803,119) (35,652) (65,454) (74,677)
Net revenue/(expense) 8,642,194 6,612,660 (15,688,138) 97,648,639 1,806,387 (1,786,796) 10,595,521
Finance costs
Distributions to holders of redeemable participating shares 12 – – – – – – –
Interest expense (64) (1,828) (4,734) (458) (122) (317) (12)
Total finance costs (64) (1,828) (4,734) (458) (122) (317) (12)
Increase/(decrease) in net assets attributable to holders of redeemable participating shares from operations before tax 8,642,130 6,610,832 (15,692,872) 97,648,181 1,806,265 (1,787,113) 10,595,509
Dividend withholding tax (25,733) – – – – – –
Increase/(decrease) in net assets attributable to holders of redeemable participating shares from operations 8,616,397 6,610,832 (15,692,872) 97,648,181 1,806,265 (1,787,113) 10,595,509
The accompanying notes form an integral part of these financial statements.

December 2021 Legal & General UCITS ETF Plc
42
Statement of Comprehensive Income (continued) For the financial period ended 31 December 2020
Financial Period ended
31 December 2020
Financial Period ended
31 December 2020
Financial Period ended
31 December 2020
Financial Period ended
31 December 2020
Financial Period ended
31 December 2020
Financial Period ended
31 December 2020
Financial Period ended
31 December 2020
L&G Gold Mining
UCITS ETF
L&G US Energy Infrastructure MLP
UCITS ETF
L&G ROBO Global® Robotics and
Automation UCITS ETF
L&G Cyber Security UCITS ETF
L&G All Commodities
UCITS ETF
L&G Longer Dated All Commodities ex-
Agriculture and Livestock
UCITS ETF L&G Battery Value-
Chain UCITS ETF Notes $ $ $ $ $ $ $
Revenue
Interest income 26 4 3,527 175 2 – 22
Dividend income – – 4,262,179 7,689,223 – – 1,306,453
Interest income on debt securities and money market instruments 10,550 699 – – 1,668 287 –
Income on reverse repurchase agreements 170,504 10,638 – – 77,436 11,937 –
Net gain on financial assets and liabilities at fair value through profit or loss 2 18,080,505 3,383,868 342,425,700 434,727,426 10,264,868 1,271,424 134,851,239
Total revenue 18,261,585 3,395,209 346,691,406 442,416,824 10,343,974 1,283,648 136,157,714
Expenses
Management fees 8 (717,651) (18,090) (3,890,225) (6,863,488) (42,492) (13,554) (563,267)
Custody out-of-pocket expenses (3,057) (1,630) (1,732) (1,217) (2,315) (629) (278)
Total expenses (720,708) (19,720) (3,891,957) (6,864,705) (44,807) (14,183) (563,545)
Net revenue 17,540,877 3,375,489 342,799,449 435,552,119 10,299,167 1,269,465 135,594,169
Finance costs
Distributions to holders of redeemable participating shares 12 – (830,157) – – – – –
Interest expense (495) (44) (2,578) (8,934) (24) – (1,176)
Total finance costs (495) (830,201) (2,578) (8,934) (24) – (1,176)
Increase in net assets attributable to holders of redeemable participating shares from operations before tax 17,540,382 2,545,288 342,796,871 435,543,185 10,299,143 1,269,465 135,592,993
Dividend withholding tax (50,098) – (624,435) (796,605) – – (164,079)
Increase in net assets attributable to holders of redeemable participating shares from operations 17,490,284 2,545,288 342,172,436 434,746,580 10,299,143 1,269,465 135,428,914
The accompanying notes form an integral part of these financial statements.
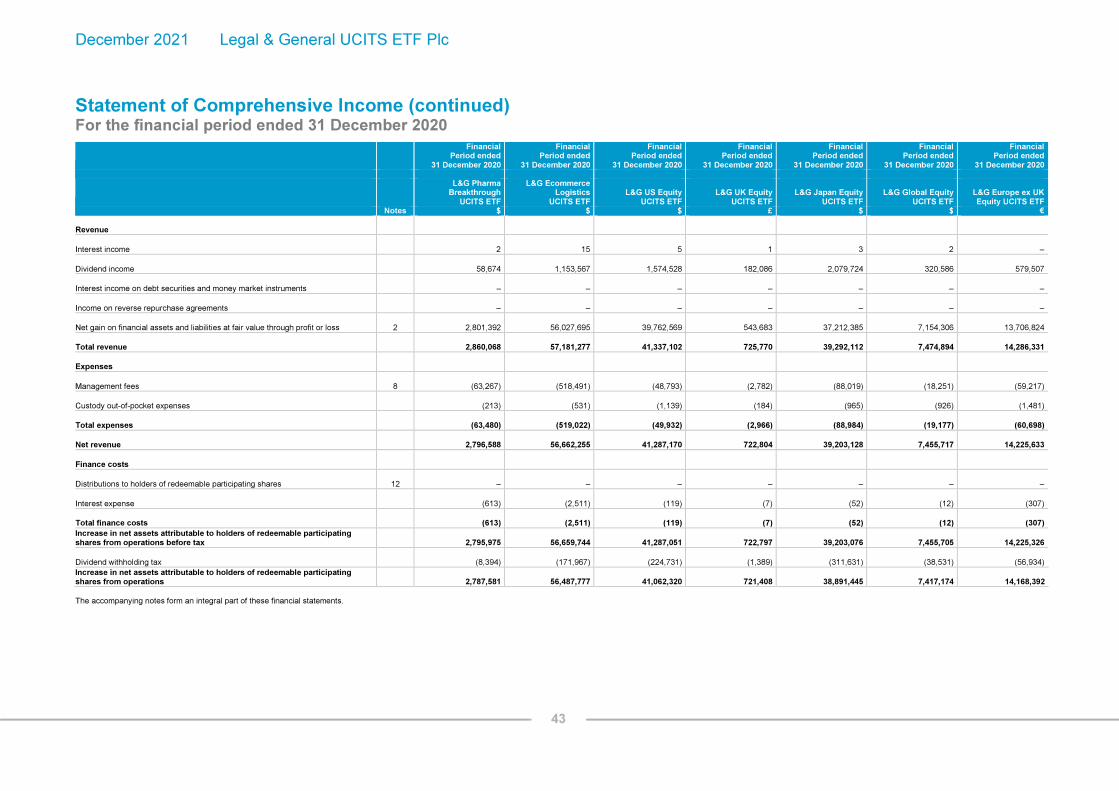
December 2021 Legal & General UCITS ETF Plc
43
Statement of Comprehensive Income (continued) For the financial period ended 31 December 2020
Financial Period ended
31 December 2020
Financial Period ended
31 December 2020
Financial Period ended
31 December 2020
Financial Period ended
31 December 2020
Financial Period ended
31 December 2020
Financial Period ended
31 December 2020
Financial Period ended
31 December 2020
L&G Pharma Breakthrough
UCITS ETF
L&G Ecommerce Logistics
UCITS ETF L&G US Equity
UCITS ETF L&G UK Equity
UCITS ETF L&G Japan Equity
UCITS ETF L&G Global Equity
UCITS ETF L&G Europe ex UK Equity UCITS ETF
Notes $ $ $ £ $ $ €
Revenue
Interest income 2 15 5 1 3 2 –
Dividend income 58,674 1,153,567 1,574,528 182,086 2,079,724 320,586 579,507
Interest income on debt securities and money market instruments – – – – – – –
Income on reverse repurchase agreements – – – – – – –
Net gain on financial assets and liabilities at fair value through profit or loss 2 2,801,392 56,027,695 39,762,569 543,683 37,212,385 7,154,306 13,706,824
Total revenue 2,860,068 57,181,277 41,337,102 725,770 39,292,112 7,474,894 14,286,331
Expenses
Management fees 8 (63,267) (518,491) (48,793) (2,782) (88,019) (18,251) (59,217)
Custody out-of-pocket expenses (213) (531) (1,139) (184) (965) (926) (1,481)
Total expenses (63,480) (519,022) (49,932) (2,966) (88,984) (19,177) (60,698)
Net revenue 2,796,588 56,662,255 41,287,170 722,804 39,203,128 7,455,717 14,225,633
Finance costs
Distributions to holders of redeemable participating shares 12 – – – – – – –
Interest expense (613) (2,511) (119) (7) (52) (12) (307)
Total finance costs (613) (2,511) (119) (7) (52) (12) (307)
Increase in net assets attributable to holders of redeemable participating shares from operations before tax 2,795,975 56,659,744 41,287,051 722,797 39,203,076 7,455,705 14,225,326
Dividend withholding tax (8,394) (171,967) (224,731) (1,389) (311,631) (38,531) (56,934)
Increase in net assets attributable to holders of redeemable participating shares from operations 2,787,581 56,487,777 41,062,320 721,408 38,891,445 7,417,174 14,168,392
The accompanying notes form an integral part of these financial statements.

December 2021 Legal & General UCITS ETF Plc
44
Statement of Comprehensive Income (continued) For the financial period ended 31 December 2020
Financial Period ended
31 December 2020
Financial Period ended
31 December 2020 Financial
Period ended 31 December 2020
Financial Period ended
31 December 2020 Financial
Period ended 31 December 2020
Financial Period ended
31 December 2020
Financial Period ended
31 December 2020
L&G Asia Pacific ex Japan Equity
UCITS ETF L&G Clean Water
UCITS ETF
L&G Artificial Intelligence UCITS ETF
L&G Healthcare Breakthrough
UCITS ETF
L&G Europe Equity (Responsible
Exclusions) UCITS ETF
L&G US Equity (Responsible
Exclusions) UCITS ETF
L&G Clean Energy UCITS ETF
Notes $ $ $ $ € $ $
Revenue
Interest income 6 2 9 7 – 23 –
Dividend income 918,803 139,638 235,969 43,097 658,028 7,436,237 8,951
Interest income on debt securities and money market instruments – – – – – – –
Income on reverse repurchase agreements – – – – – – –
Net gain on financial assets and liabilities at fair value through profit or loss 2 14,922,136 6,229,506 44,036,420 21,282,859 10,968,446 210,319,388 1,182,290
Total revenue 15,840,945 6,369,146 44,272,398 21,325,963 11,626,474 217,755,648 1,191,241
Expenses
Management fees 8 (36,232) (55,740) (329,672) (138,722) (81,787) (615,188) (3,418)
Custody out-of-pocket expenses (1,300) (277) (619) (677) (1,852) (1,491) (166)
Total expenses (37,532) (56,017) (330,291) (139,399) (83,639) (616,679) (3,584)
Net revenue 15,803,413 6,313,129 43,942,107 21,186,564 11,542,835 217,138,969 1,187,657
Finance costs
Distributions to holders of redeemable participating shares 12 – – – – – – –
Interest expense (187) (36) (198) (326) (277) (25) (12)
Total finance costs (187) (36) (198) (326) (277) (25) (12)
Increase in net assets attributable to holders of redeemable participating shares from operations before tax 15,803,226 6,313,093 43,941,909 21,186,238 11,542,558 217,138,944 1,187,645
Dividend withholding tax 20,852) (16,078) (34,335) (4,831) (17,379) (1,068,125) (1,631)
Increase in net assets attributable to holders of redeemable participating shares from operations 15,782,374 6,297,015 43,907,574 21,181,407 11,525,179 216,070,819 1,186,014
The accompanying notes form an integral part of these financial statements.

December 2021 Legal & General UCITS ETF Plc
45
Statement of Comprehensive Income (continued) For the financial period ended 31 December 2020
Financial Period ended
31 December 2020
Financial Period ended
31 December 2020 Financial
Period ended 31 December 2020
Financial Period ended
31 December 2020 Financial
Period ended 31 December 2020
L&G ESG GBP Corporate Bond 0-5
Year UCITS ETF
L&G ESG GBP Corporate Bond
UCITS ETF
L&G ESG Emerging Markets
Government Bond (USD) 0-5 Year
UCITS ETF
L&G ESG China CNY Bond UCITS
ETF L&G UK Gilt 0-5 Year UCITS ETF
Notes € € $ $ €
Revenue
Interest income – – – – –
Dividend income – – – – –
Interest income on debt securities and money market instruments 12,076 40,552 54,894 21,945 (1,174)
Income on reverse repurchase agreements – – – – –
Net gain on financial assets and liabilities at fair value through profit or loss 2 120,034 666,231 143,634 74,004 49,909
Total revenue 132,110 706,783 198,528 95,949 48,735
Expenses
Management fees 8 (2,310) (2,887) (6,631) (2,673) (773)
Custody out-of-pocket expenses – – – – –
Total expenses (2,310) (2,887) (6,631) (2,673) (773)
Net revenue 129,800 703,896 191,897 93,276 47,962
Finance costs
Distributions to holders of redeemable participating shares 12 – – – – –
Interest expense – – – – –
Total finance costs – – – – –
Increase in net assets attributable to holders of redeemable participating shares from operations before tax 129,800 703,896 191,897 93,276 47,962
Dividend withholding tax (6,643) (2,907) (17,530) – –
Increase in net assets attributable to holders of redeemable participating shares from operations 123,157 700,989 174,367 93,276 47,962
The accompanying notes form an integral part of these financial statements.

December 2021 Legal & General UCITS ETF Plc
46
Statement of Changes in Net Assets Attributable to Redeemable Participating Shareholders For the financial period ended 31 December 2021
Financial Period ended
31 December 2021
Financial Period ended
31 December 2021
Financial Period ended
31 December 2021
Financial Period ended
31 December 2021
Financial Period ended
31 December 2021
Financial Period ended
31 December 2021
Financial Period ended
31 December 2021
L&G E Fund MSCI China A
UCITS ETF
L&G DAX® Daily 2x Long
UCITS ETF
L&G DAX® Daily 2x Short
UCITS ETF
L&G Longer Dated All Commodities
UCITS ETF
L&G FTSE 100® Leveraged (Daily 2x)
UCITS ETF
L&G FTSE 100® Super Short
Strategy (Daily 2x) UCITS ETF
L&G Russell 2000 US Small Cap
Quality UCITS ETF Note $ € € $ £ £ $ Net assets attributable to holders of redeemable participating shares at beginning of the financial period 43,889,334 25,819,315 47,880,691 1,224,757,080 19,226,241 12,520,076 38,826,713
(Decrease)/increase in net assets attributable to holders of redeemable participating shares from operations (245,071) 1,417,289 (2,723,721) 73,460,598 2,751,642 (1,673,023) 312,762
Proceeds from redeemable participating shares issued 6 – 9,976,975 17,455,992 299,292,561 27,985,236 11,070,971 4,516,609
Value of redeemable participating shares redeemed 6 (9,897,939) (9,209,380) (29,291,290) (858,630,020) (32,692,909) (9,199,510) (2,907,129)
Net (decrease)/increase in net assets from share transactions (9,897,939) 767,595 (11,835,298) (559,337,459) (4,707,673) 1,871,461 1,609,480
Net assets attributable to holders of redeemable participating shares at end of the financial period 33,746,324 28,004,199 33,321,672 738,880,219 17,270,210 12,718,514 40,748,955
Financial Period ended
31 December 2021
Financial Period ended
31 December 2021
Financial Period ended
31 December 2021
Financial Period ended
31 December 2021
Financial Period ended
31 December 2021
Financial Period ended
31 December 2021
Financial Period ended
31 December 2021
L&G Gold Mining
UCITS ETF
L&G US Energy Infrastructure MLP
UCITS ETF
L&G ROBO Global® Robotics and
Automation UCITS ETF
L&G Cyber Security UCITS ETF
L&G All Commodities
UCITS ETF
L&G Longer Dated All Commodities ex-
Agriculture and Livestock
UCITS ETF L&G Battery Value-
Chain UCITS ETF Note $ $ $ $ $ $ $ Net assets attributable to holders of redeemable participating shares at beginning of the financial period 155,489,496 40,301,424 1,254,865,415 2,792,146,370 93,849,730 11,383,947 834,154,119
(Decrease)/increase in net assets attributable to holders of redeemable participating shares from operations (1,841,596) (3,526,687) 93,650,042 (13,480,113) 6,678,464 421,096 4,509,041
Proceeds from redeemable participating shares issued 6 10,888,557 – 116,386,000 330,122,952 27,742,116 1,798,502 162,018,705
Value of redeemable participating shares redeemed 6 (2,308,573) (6,084,316) (91,524,950) (40,741,500) (44,700,072) (12,144,550) (45,170,790)
Net increase/(decrease) in net assets from share transactions 8,579,984 (6,084,316) 24,861,050 289,381,452 (16,957,956) (10,346,048) 116,847,915
Net assets attributable to holders of redeemable participating shares at end of the financial period 162,227,884 30,690,421 1,373,376,507 3,068,047,709 83,570,238 1,458,995 955,511,075
The accompanying notes form an integral part of these financial statements.

December 2021 Legal & General UCITS ETF Plc
47
Statement of Changes in Net Assets Attributable to Redeemable Participating Shareholders (continued) For the financial period ended 31 December 2021
Financial Period ended
31 December 2021
Financial Period ended
31 December 2021
Financial Period ended
31 December 2021
Financial Period ended
31 December 2021
Financial Period ended
31 December 2021
Financial Period ended
31 December 2021
Financial Period ended
31 December 2021
L&G Pharma Breakthrough
UCITS ETF
L&G Ecommerce Logistics
UCITS ETF L&G US Equity
UCITS ETF L&G UK Equity
UCITS ETF L&G Japan Equity
UCITS ETF L&G Global Equity
UCITS ETF L&G Europe ex UK Equity UCITS ETF
Note $ $ $ £ $ $ € Net assets attributable to holders of redeemable participating shares at beginning of the financial period 34,331,501 612,336,023 295,471,416 16,662,712 252,730,395 51,392,796 113,087,160
(Decrease)/increase in net assets attributable to holders of redeemable participating shares from operations (1,599,559) (23,535,474) 30,210,128 1,153,043 508,563 4,304,532 9,358,407
Proceeds from redeemable participating shares issued 6 1,965,990 169,473,000 23,983,330 1,083,740 5,259,330 8,054,710 1,437,330
Value of redeemable participating shares redeemed 6 (1,320,300) (244,102,525) (30,510,020) – (5,215,560) – –
Net increase/(decrease) in net assets from share transactions 645,690 (74,629,525) (6,526,690) 1,083,740 43,770 8,054,710 1,437,330
Net assets attributable to holders of redeemable participating shares at end of the financial period 33,377,632 514,171,024 319,154,854 18,899,495 253,282,728 63,752,038 123,882,897
Financial Period ended
31 December 2021
Financial Period ended
31 December 2021
Financial Period ended
31 December 2021
Financial Period ended
31 December 2021
Financial Period ended
31 December 2021
Financial Period ended
31 December 2021
Financial Period ended
31 December 2021
L&G Asia Pacific ex Japan Equity
UCITS ETF L&G Clean Water
UCITS ETF
L&G Artificial Intelligence UCITS ETF
L&G Healthcare Breakthrough
UCITS ETF
L&G Europe Equity (Responsible
Exclusions) UCITS ETF
L&G US Equity (Responsible
Exclusions) UCITS ETF
L&G Clean Energy UCITS ETF
Note $ $ $ $ € $ $ Net assets attributable to holders of redeemable participating shares at beginning of the financial periodr 173,891,675 232,180,626 255,630,405 219,356,536 233,988,889 1,706,212,924 115,243,362
(Decrease)/increase in net assets attributable to holders of redeemable participating shares from operations (10,431,466) 19,618,536 3,028,441 (21,322,935) 16,894,981 184,399,802 (9,519,029)
Proceeds from redeemable participating shares issued 6 72,397,102 118,312,776 107,236,057 32,245,447 6,624,052 40,336,800 50,179,631
Value of redeemable participating shares redeemed 6 – (6,412,554) (32,829,619) (17,360,808) (127,160,040) (134,594,334) (25,564,651)
Net increase/(decrease) in net assets from share transactions 72,397,102 111,900,222 74,406,438 14,884,639 (120,535,988) (94,257,534) 24,614,980
Net assets attributable to holders of redeemable participating shares at end of the financial period 235,857,311 363,699,384 333,065,284 212,918,240 130,347,882 1,796,355,192 130,339,313
The accompanying notes form an integral part of these financial statements.

December 2021 Legal & General UCITS ETF Plc
48
Statement of Changes in Net Assets Attributable to Redeemable Participating Shareholders (continued) For the financial period ended 31 December 2021
Financial Period ended
31 December 2021
Financial Period ended
31 December 2021
Financial Period ended
31 December 2021
Financial Period ended
31 December 2021
Financial Period ended
31 December 2021
Financial Period ended
31 December 2021
Financial Period ended
31 December 2021
L&G ESG GBP Corporate Bond 0-5
Year UCITS ETF
L&G ESG GBP Corporate Bond
UCITS ETF
L&G ESG Emerging Markets
Government Bond (USD) 0-5 Year
UCITS ETF
L&G ESG China CNY Bond UCITS
ETF L&G UK Gilt 0-5 Year UCITS ETF
L&G ESG USD Corporate Bond
UCITS ETF
L&G ESG Emerging Markets Corporate Bond (USD) UCITS
ETF Note £ £ $ $ £ $ $ Net assets attributable to holders of redeemable participating shares at beginning of the financial period 60,138,292 67,397,397 49,902,110 427,341,761 28,356,001 92,756,580 580,089,992
(Decrease)/increase in net assets attributable to holders of redeemable participating shares from operations (685,667) (1,166,775) (1,424,889) 12,029,263 (271,079) (734,673) (12,548,339)
Proceeds from redeemable participating shares issued 6 9,259,331 12,788,231 6,222,771 137,541,060 495,420 7,951,760 443,667,134
Value of redeemable participating shares redeemed 6 – – (2,575,692) (278,789,756) (996,050) (7,010,990) (518,756,100)
Net increase/(decrease) in net assets from share transactions 9,259,331 12,788,231 3,647,079 (141,248,696) (500,630) 940,770 (75,088,966)
Net assets attributable to holders of redeemable participating shares at end of the financial period 68,711,956 79,018,853 52,124,300 298,122,328 27,584,292 92,962,677 492,452,687
Financial Period ended
31 December 2021
Financial Period ended
31 December 2021
Financial Period ended
31 December 2021
Financial Period ended
31 December 2021
Financial Period ended
31 December 2021
Financial Period ended
31 December 2021
Financial Period ended
31 December 2021
L&G Hydrogen Economy UCITS
ETF L&G ESG Green
Bond UCITS ETF
L&G Quality Equity Dividends ESG Exclusions UK
UCITS ETF
L&G Quality Equity Dividends ESG
Exclusions Europe ex-UK UCITS ETF
L&G Quality Equity
Dividends ESG Exclusions Asia Pacific ex-Japan
UCITS ETF L&G Digital
Payments UCITS ETF
L&G Multi-Strategy Enhanced
Commodities UCITS ETF
1
Note $ € £ € $ $ $ Net assets attributable to holders of redeemable participating shares at beginning of the financial period 459,726,448 23,180,583 26,452,836 16,295,294 19,787,175 6,274,836 –
(Decrease)/increase in net assets attributable to holders of redeemable participating shares from operations (63,611,825) 76,374 184,321 1,146,541 (1,312,626) (2,841,312) 30,357,498
Proceeds from redeemable participating shares issued 6 171,217,080 497,288 6,923,810 4,134,120 2,993,570 12,677,952 590,934,343
Value of redeemable participating shares redeemed 6 (6,579,200) (497,288) – – – – (13,061,265)
Net increase in net assets from share transactions 164,637,880 – 6,923,810 4,134,120 2,993,570 12,677,952 577,873,078
Net assets attributable to holders of redeemable participating shares at end of the financial period 560,752,503 23,256,957 33,560,967 21,575,955 21,468,119 16,111,476 608,230,576
1 This Fund was approved by the Central Bank on 4 January 2021. The Fund launched on 2 July 2021.
The accompanying notes form an integral part of these financial statements.
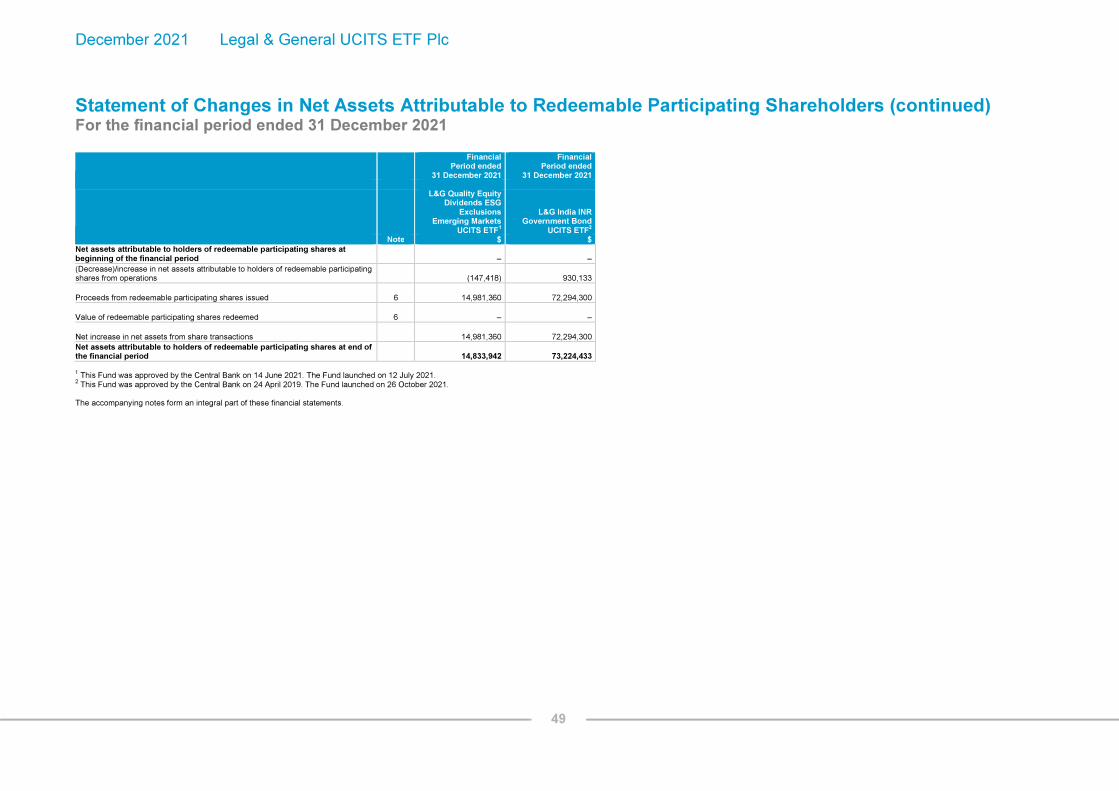
December 2021 Legal & General UCITS ETF Plc
49
Statement of Changes in Net Assets Attributable to Redeemable Participating Shareholders (continued) For the financial period ended 31 December 2021
Financial Period ended
31 December 2021
Financial Period ended
31 December 2021
L&G Quality Equity Dividends ESG
Exclusions Emerging Markets
UCITS ETF1
L&G India INR Government Bond
UCITS ETF2
Note $ $
Net assets attributable to holders of redeemable participating shares at beginning of the financial period – –
(Decrease)/increase in net assets attributable to holders of redeemable participating shares from operations (147,418) 930,133
Proceeds from redeemable participating shares issued 6 14,981,360 72,294,300
Value of redeemable participating shares redeemed 6 – –
Net increase in net assets from share transactions 14,981,360 72,294,300
Net assets attributable to holders of redeemable participating shares at end of the financial period 14,833,942 73,224,433
1 This Fund was approved by the Central Bank on 14 June 2021. The Fund launched on 12 July 2021.
2 This Fund was approved by the Central Bank on 24 April 2019. The Fund launched on 26 October 2021.
The accompanying notes form an integral part of these financial statements.

December 2021 Legal & General UCITS ETF Plc
50
Statement of Changes in Net Assets Attributable to Redeemable Participating Shareholders For the financial period ended 31 December 2020
Financial Period ended
31 December 2020
Financial Period ended
31 December 2020
Financial Period ended
31 December 2020
Financial Period ended
31 December 2020
Financial Period ended
31 December 2020
Financial Period ended
31 December 2020
Financial Period ended
31 December 2020
L&G E Fund MSCI China A
UCITS ETF
L&G DAX® Daily 2x Long
UCITS ETF
L&G DAX® Daily 2x Short
UCITS ETF
L&G Longer Dated All Commodities
UCITS ETF
L&G FTSE 100® Leveraged (Daily 2x)
UCITS ETF
L&G FTSE 100® Super Short
Strategy (Daily 2x) UCITS ETF
L&G Russell 2000 US Small Cap
Quality UCITS ETF Note $ € € $ £ £ $ Net assets attributable to holders of redeemable participating shares at beginning of the financial period 27,517,011 30,354,290 67,772,133 439,243,546 12,487,709 26,073,456 48,856,605
Increase/(decrease) in net assets attributable to holders of redeemable participating shares from operations 8,616,397 6,610,832 (15,692,872) 97,648,181 1,806,265 (1,787,113) 10,595,509
Proceeds from redeemable participating shares issued 6 5,878,491 8,839,344 19,885,606 129,790,488 12,940,830 2,916,024 970,561
Value of redeemable participating shares redeemed 6 (5,285,970) (18,584,468) (23,347,171) (85,787,786) (8,633,685) (12,836,539) (30,100,366)
Net increase/(decrease) in net assets from share transactions 592,521 (9,745,124) (3,461,565) 44,002,702 4,307,145 (9,920,515) (29,129,805)
Net assets attributable to holders of redeemable participating shares at end of the financial period 36,725,929 27,219,998 48,617,696 580,894,429 18,601,119 14,365,828 30,322,309
Financial Period ended
31 December 2020
Financial Period ended
31 December 2020
Financial Period ended
31 December 2020
Financial Period ended
31 December 2020
Financial Period ended
31 December 2020
Financial Period ended
31 December 2020
Financial Period ended
31 December 2020
L&G Gold Mining
UCITS ETF
L&G US Energy Infrastructure MLP
UCITS ETF
L&G ROBO Global® Robotics and
Automation UCITS ETF
L&G Cyber Security UCITS ETF
L&G All Commodities
UCITS ETF
L&G Longer Dated All Commodities ex-
Agriculture and Livestock
UCITS ETF L&G Battery Value-
Chain UCITS ETF Note $ $ $ $ $ $ $ Net assets attributable to holders of redeemable participating shares at beginning of the financial period 273,800,641 13,578,782 816,606,435 1,547,753,663 50,460,470 7,801,655 111,264,445
Increase in net assets attributable to holders of redeemable participating shares from operations 17,490,284 2,545,288 342,172,436 434,746,580 10,299,143 1,269,465 135,428,914
Proceeds from redeemable participating shares issued 6 1,166,829 1,103,717 155,210,940 345,274,083 7,254,889 2,670,546 236,315,045
Value of redeemable participating shares redeemed 6 (110,450,892) – (41,569,120) (11,448,670) (4,689,035) (2,313,937) (11,526,420)
Net (decrease)/increase in net assets from share transactions (109,284,063) 1,103,717 113,641,820 333,825,413 2,565,854 356,609 224,788,625
Net assets attributable to holders of redeemable participating shares at end of the financial period 182,006,862 17,227,787 1,272,420,691 2,316,325,656 63,325,467 9,427,729 471,481,984
The accompanying notes form an integral part of these financial statements.

December 2021 Legal & General UCITS ETF Plc
51
Statement of Changes in Net Assets Attributable to Redeemable Participating Shareholders (continued) For the financial period ended 31 December 2020
Financial Period ended
31 December 2020
Financial Period ended
31 December 2020
Financial Period ended
31 December 2020
Financial Period ended
31 December 2020
Financial Period ended
31 December 2020
Financial Period ended
31 December 2020
Financial Period ended
31 December 2020
L&G Pharma Breakthrough
UCITS ETF
L&G Ecommerce Logistics
UCITS ETF L&G US Equity
UCITS ETF L&G UK Equity
UCITS ETF L&G Japan Equity
UCITS ETF L&G Global Equity
UCITS ETF L&G Europe ex UK Equity UCITS ETF
Note $ $ $ £ $ $ € Net assets attributable to holders of redeemable participating shares at beginning of the financial period 25,643,912 58,987,801 137,286,308 10,962,695 116,469,371 32,552,079 99,876,259
Increase in net assets attributable to holders of redeemable participating shares from operations 2,787,581 56,487,777 41,062,320 721,408 38,891,445 7,417,174 14,168,392
Proceeds from redeemable participating shares issued 6 14,024,176 242,040,735 74,408,468 2,193,970 109,962,626 1,332,330 27,736,150
Value of redeemable participating shares redeemed 6 (13,636,980) (16,838,315) – – (2,381,160) – –
Net increase in net assets from share transactions 387,196 225,202,420 74,408,468 2,193,970 107,581,466 1,332,330 27,736,150
Net assets attributable to holders of redeemable participating shares at end of the financial period 28,818,689 340,677,998 252,757,096 13,878,073 262,942,282 41,301,583 141,780,801
Financial Period ended
31 December 2020
Financial Period ended
31 December 2020
Financial Period ended
31 December 2020
Financial Period ended
31 December 2020
Financial Period ended
31 December 2020
Financial Period ended
31 December 2020
Financial Period ended
31 December 2020
L&G Asia Pacific ex Japan Equity
UCITS ETF L&G Clean Water
UCITS ETF
L&G Artificial Intelligence UCITS ETF
L&G Healthcare Breakthrough
UCITS ETF
L&G Europe Equity (Responsible
Exclusions) UCITS ETF
L&G US Equity (Responsible
Exclusions) UCITS ETF
L&G Clean Energy UCITS ETF
Note $ $ $ $ € $ $
Net assets attributable to holders of redeemable participating shares at beginning of the financial period 47,377,214 15,520,613 82,834,267 33,256,148 92,898,894 602,438,807 –
Increase in net assets attributable to holders of redeemable participating shares from operations 15,782,374 6,297,015 43,907,574 21,181,407 11,525,179 216,070,819 1,186,014
Proceeds from redeemable participating shares issued 6 57,136,691 17,949,029 78,110,778 53,929,700 10,667,266 557,232,236 8,270,084
Value of redeemable participating shares redeemed 6 (3,189,720) (5,555,698) (2,801,869) (10,996,923) – (20,784,901) –
Net Increase in net assets from share transactions 53,946,971 12,393,331 75,308,909 42,932,777 10,667,266 536,447,335 8,270,084
Net assets attributable to holders of redeemable participating shares at end of the financial period 117,106,559 34,210,959 202,050,750 97,370,332 115,091,339 1,354,956,961 9,456,098
The accompanying notes form an integral part of these financial statements.
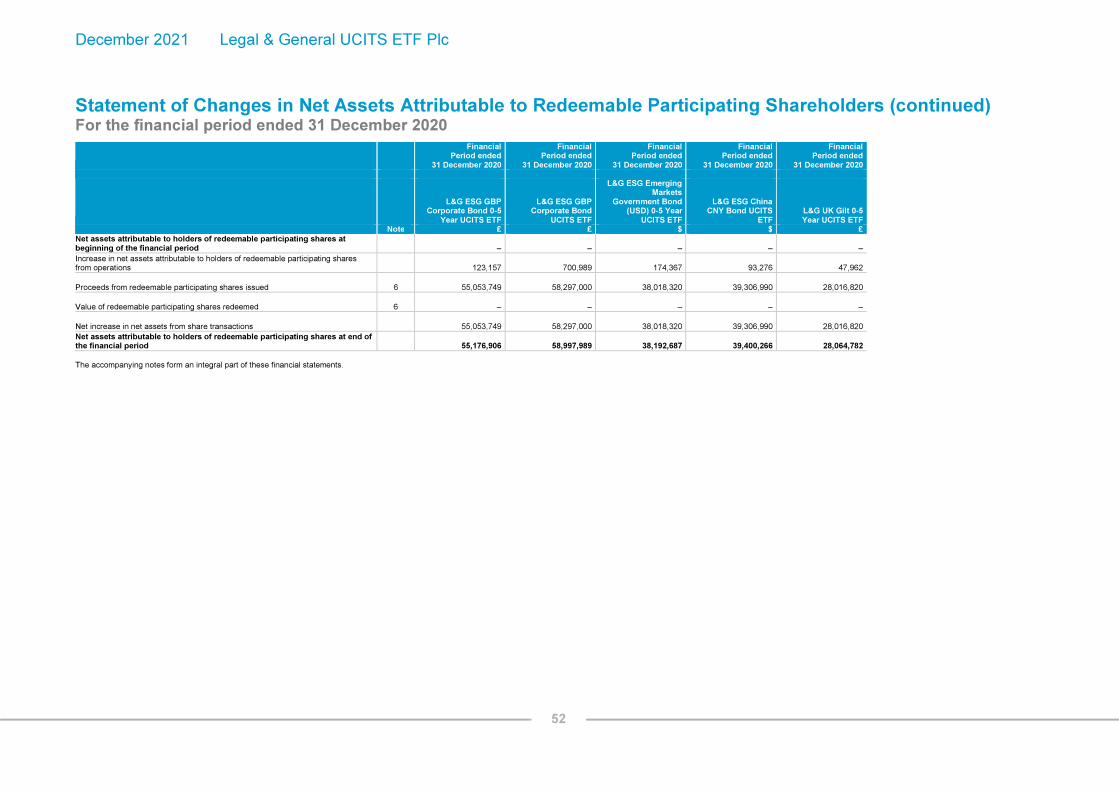
December 2021 Legal & General UCITS ETF Plc
52
Statement of Changes in Net Assets Attributable to Redeemable Participating Shareholders (continued) For the financial period ended 31 December 2020
Financial Period ended
31 December 2020
Financial Period ended
31 December 2020
Financial Period ended
31 December 2020
Financial Period ended
31 December 2020
Financial Period ended
31 December 2020
L&G ESG GBP Corporate Bond 0-5
Year UCITS ETF
L&G ESG GBP Corporate Bond
UCITS ETF
L&G ESG Emerging Markets
Government Bond (USD) 0-5 Year
UCITS ETF
L&G ESG China CNY Bond UCITS
ETF L&G UK Gilt 0-5 Year UCITS ETF
Note £ £ $ $ £ Net assets attributable to holders of redeemable participating shares at beginning of the financial period – – – – –
Increase in net assets attributable to holders of redeemable participating shares from operations 123,157 700,989 174,367 93,276 47,962
Proceeds from redeemable participating shares issued 6 55,053,749 58,297,000 38,018,320 39,306,990 28,016,820
Value of redeemable participating shares redeemed 6 – – – – –
Net increase in net assets from share transactions 55,053,749 58,297,000 38,018,320 39,306,990 28,016,820
Net assets attributable to holders of redeemable participating shares at end of the financial period 55,176,906 58,997,989 38,192,687 39,400,266 28,064,782
The accompanying notes form an integral part of these financial statements.

December 2021 Legal & General UCITS ETF Plc
Notes to the Financial Statements
For the financial period ended 31 December 2021
53
1. Significant Accounting Policies
A. Basis of Preparation and Statement of Compliance
The unaudited financial statements for the financial period ended 31 December 2021 have been prepared in accordance with International Accounting Standard (“IAS”) 34, Interim Financial Reporting and Irish Statute comprising the European Communities (Undertakings for Collective Investment in Transferable Securities) Regulations, 2011 (as amended) (the “UCITS Regulations”) and the Central Bank (Supervision and Enforcement) Act 2013 (Section 48(1)) (Undertakings for Collective Investment in Transferable Securities) Regulations 2019 (the “Central Bank UCITS Regulations”). The condensed unaudited financial statements should be read in conjunction with the annual report and audited financial statements for the financial year ended 30 June 2021, which have been prepared in accordance with International Financial Reporting Standards as adopted by the European Union (“EU IFRS”) and Irish Statute comprising the Companies Act 2014, the UCITS Regulations and the Central Bank UCITS Regulations.
The same accounting policies, presentation and methods of computation have been followed in these unaudited financial statements as were applied in the preparation of the Company’s annual report and audited financial statements for the financial year ended 30 June 2021.
B. New Standards, Amendments and Interpretations effective from 1 July 2021
Amendment to IFRS 7, IFRS 9 and IAS 39 (Phase 2) The amendments address issues that might affect financial reporting during the reform of an interest rate benchmark, including the effects of changes to contractual cash flows or hedging relationships arising from the replacement of an interest rate benchmark with an alternative benchmark rate (replacement issues). The amended requirements in IFRS 7, IFRS 9 and IAS 39 relates to:
changes in the basis for determining contractual cash flows of financial assets and financial liabilities,
hedge accounting, and
disclosures. The Phase 2 amendments apply only to changes required by the interest rate benchmark reform to financial instruments and hedging relationships. The amendments apply retrospectively with earlier application permitted. Hedging relationships previously discontinued solely because of changes resulting from the reform will be reinstated if certain conditions are met. The amendment is effective for annual reporting periods beginning on or after 1 January 2021. The adoption of the amendment did not have a significant impact on the Company's financial statements.
There are no other standards, amendments to standards or interpretations that are effective from 1 July 2021 that have a material effect on the Company’s financial statements.

December 2021 Legal & General UCITS ETF Plc
Notes to the Financial Statements
For the financial period ended 31 December 2021
54
1. Significant Accounting Policies (continued)
C. New Standards, Amendments and Interpretations issued but not yet effective from 1 July 2021 and not early adopted
Onerous Contracts - Cost of Fulfilling a Contract (Amendments to IAS 37) IAS 37 Provisions Contingent Liabilities and Contingent Assets did not specify which costs to include in estimating the cost of fulfilling a contract for the purpose of assessing whether that contract is onerous. Research conducted by the IFRS Interpretations Committee indicated that differing views on which costs to include could lead to material differences in the financial statements of entities that enter into some types of contracts. In this project, the IASB developed amendments to IAS 37 to clarify that for the purpose of assessing whether a contract is onerous, the cost of fulfilling the contract includes both the incremental costs of fulfilling that contract and an allocation of other costs that relate directly to fulfilling contracts. The IASB issued the amendments in May 2020.
The amendments are effective for contracts for which an entity has not yet fulfilled all its obligations on or after 1 January 2022 with earlier application permitted. The Company is currently evaluating the impact, if any, that this amendment will have on its financial statements.
Classification of Liabilities as Current or Non-current (Amendments to IAS 1) The amendments clarify a criterion in IAS 1 for classifying a liability as non-current: the requirement for an entity to have the right to defer settlement of the liability for at least 12 months after the reporting period.
The amendments:
specify that an entity’s right to defer settlement must exist at the end of the reporting period;
clarify that classification is unaffected by management’s intentions or expectations about whether the entity will exercise its right to defer settlement;
clarify how lending conditions affect classification; and
clarify requirements for classifying liabilities an entity will or may settle by issuing its own equity instruments.
In its Primary Financial Statements project, the IASB is developing proposals to improve the way information is communicated in financial statements. The IASB proposes to issue requirements in a new IFRS Standard that would replace IAS 1. The amendments apply retrospectively for annual reporting periods beginning on or after 1 January 2023 with earlier application permitted. The Company is currently evaluating the impact, if any, that this amendment will have on its financial statements.
There are no other standards, amendments to existing standards and interpretations that are not yet effective that would be expected to have a significant impact on the Company.

December 2021 Legal & General UCITS ETF Plc
Notes to the Financial Statements (continued)
For the financial period ended 31 December 2021 (continued)
55
2. Net Gain/(Loss) on Financial Assets and Liabilities at Fair Value through Profit or Loss
Financial period ended
31 December 2021
Financial period ended
31 December 2021
Financial period ended
31 December 2021
Financial period ended
31 December 2021
Financial period ended
31 December 2021
Financial period ended
31 December 2021
Financial period ended
31 December 2021
Financial period ended
31 December 2021
Company Total L&G E Fund MSCI
China A UCITS ETF L&G DAX® Daily 2x
Long UCITS ETF L&G DAX® Daily 2x
Short UCITS ETF
L&G Longer Dated All
Commodities UCITS ETF
L&G FTSE 100® Leveraged (Daily 2x)
UCITS ETF
L&G FTSE 100® Super Short Strategy (Daily
2x) UCITS ETF
L&G Russell 2000 US Small Cap Quality
UCITS ETF
$ $ € € $ £ £ $
Net realised investment gain/(loss) 474,414,867 1,339,713 (7,342) (10,493) (2) 10 (8) 328,489
Net realised gain/(loss) on derivatives 85,273,153 (10,468) (919,525) 885,258 84,432,199 1,784,219 (926,448) –
Net realised gain/(loss) on foreign currency 2,543,088 9,305 – – – – – –
Net change in unrealised investment gain/(loss) (310,878,970) (1,725,615) (700) (64) – – – (182,152)
Net change in unrealised gain/(loss) on derivatives 21,726,869 – 2,465,664 (3,322,355) (10,451,413) 1,012,161 (710,723) –
Net change in unrealised gain/(loss) on foreign currency 4,118,988 7,671 – – – – – –
277,197,995 (379,394) 1,538,097 (2,447,654) 73,980,784 2,796,390 (1,637,179) 146,337
Financial period ended
31 December 2021
Financial period ended
31 December 2021
Financial period ended
31 December 2021
Financial period ended
31 December 2021
Financial period ended
31 December 2021
Financial period ended
31 December 2021
Financial period ended
31 December 2021
Financial period ended
31 December 2021
L&G Gold Mining
UCITS ETF
L&G US Energy Infrastructure MLP
UCITS ETF
L&G ROBO Global® Robotics and
Automation UCITS ETF
L&G Cyber Security UCITS ETF
L&G All Commodities UCITS ETF
L&G Longer Dated All
Commodities ex-Agriculture and
Livestock UCITS ETF L&G Battery Value-
Chain UCITS ETF
L&G Pharma Breakthrough UCITS
ETF
$ $ $ $ $ $ $ $
Net realised investment gain/(loss) (869,442) – 89,050,133 167,254,121 – – 69,416,331 1,822,837
Net realised gain/(loss) on derivatives 11,562 (5,308,278) (17,567) (12,824) 6,420,356 712,523 (673) –
Net realised gain/(loss) on foreign currency (14,698) – (149,635) (125,465) – – (31,773) (826)
Net change in unrealised investment gain/(loss) (2,133,622) – 6,974,086 (203,177,901) – – (66,683,374) (3,402,118)
Net change in unrealised gain/(loss) on derivatives – 3,038,306 – – 233,616 (289,216) – –
Net change in unrealised gain/(loss) on foreign currency (841) – 2,622 (3,993) – – (201) 4
(3,007,041) (2,269,972) 95,859,639 (36,066,062) 6,653,972 423,307 2,700,310 (1,580,103)

December 2021 Legal & General UCITS ETF Plc
Notes to the Financial Statements (continued)
For the financial period ended 31 December 2021 (continued)
56
2. Net Gain/(Loss) on Financial Assets and Liabilities at Fair Value through Profit or Loss (continued)
Financial period ended
31 December 2021
Financial period ended
31 December 2021
Financial period ended
31 December 2021
Financial period ended
31 December 2021
Financial period ended
31 December 2021
Financial period ended
31 December 2021
Financial period ended
31 December 2021
Financial period ended
31 December 2021
L&G Ecommerce
Logistics UCITS ETF L&G US Equity
UCITS ETF L&G UK Equity
UCITS ETF L&G Japan Equity
UCITS ETF L&G Global Equity
UCITS ETF L&G Europe ex UK Equity UCITS ETF
L&G Asia Pacific ex
Japan Equity UCITS ETF
L&G Clean Water UCITS ETF
$ $ £ $ $ € $ $
Net realised investment gain/(loss) 48,057,253 11,625,039 64,459 526,113 435,027 983,595 809,102 6,296,804
Net realised gain/(loss) on derivatives 3,279 – – – – – – (1,648)
Net realised gain/(loss) on foreign currency (51,431) (222) (232) (32,358) (1,047) (559) (85,691) (22,194)
Net change in unrealised investment gain/(loss) (78,020,846) 16,886,221 763,394 (2,089,621) 3,491,640 7,871,558 (14,589,922) 12,432,741
Net change in unrealised gain/(loss) on derivatives – – – – – – – 78
Net change in unrealised gain/(loss) on foreign currency 10,958 – 2 2,964 1,134 85 13,002 8,267
(30,000,787) 28,511,038 827,623 (1,592,902) 3,926,754 8,854,679 (13,853,509) 18,714,048
Financial period ended
31 December 2021
Financial period ended
31 December 2021
Financial period ended
31 December 2021
Financial period ended
31 December 2021
Financial period ended
31 December 2021
Financial period ended
31 December 2021
Financial period ended
31 December 2021
Financial period ended
31 December 2021
L&G Artificial Intelligence UCITS
ETF
L&G Healthcare Breakthrough UCITS
ETF
L&G Europe Equity (Responsible
Exclusions) UCITS ETF
L&G US Equity
(Responsible Exclusions) UCITS
ETF
L&G Clean Energy UCITS ETF
L&G ESG GBP Corporate Bond 0-5
Year UCITS ETF
L&G ESG GBP Corporate Bond UCITS
ETF
L&G ESG Emerging Markets Government Bond (USD) 0-5 Year
UCITS ETF
$ $ € $ $ £ £ $
Net realised investment gain/(loss) 21,104,518 8,687,365 22,708,370 36,999,886 (408,457) (28,424) (149,567) 6,963
Net realised gain/(loss) on derivatives 287 53 – – (400) – – –
Net realised gain/(loss) on foreign currency (21,644) (2,617) (21,593) 8,414 (16,485) – – –
Net change in unrealised investment gain/(loss) (18,032,484) (29,630,079) (7,092,147) 139,633,690 (9,202,645) (733,358) (1,012,958) (1,458,950)
Net change in unrealised gain/(loss) on derivatives – – – – – – – –
Net change in unrealised gain/(loss) on foreign currency 193 4 238 11,402 270 – – –
3,050,870 (20,945,274) 15,594,868 176,653,392 (9,627,717) (761,782) (1,162,525) (1,451,987)

December 2021 Legal & General UCITS ETF Plc
Notes to the Financial Statements (continued)
For the financial period ended 31 December 2021 (continued)
57
2. Net Gain/(Loss) on Financial Assets and Liabilities at Fair Value through Profit or Loss (continued)
Financial period ended
31 December 2021
Financial period ended
31 December 2021
Financial period ended
31 December 2021
Financial period ended
31 December 2021
Financial period ended
31 December 2021
Financial period ended
31 December 2021
Financial period ended
31 December 2021
Financial period ended
31 December 2021
L&G ESG China CNY
Bond UCITS ETF L&G UK Gilt 0-5 Year
UCITS ETF
L&G ESG USD Corporate Bond UCITS
ETF
L&G ESG Emerging Markets Corporate Bond (USD) UCITS
ETF L&G Hydrogen
Economy UCITS ETF L&G ESG Green Bond
UCITS ETF
L&G Quality Equity Dividends ESG
Exclusions UK UCITS ETF
L&G Quality Equity
Dividends ESG Exclusions Europe ex-
UK UCITS ETF
$ £ $ $ $ € £ €
Net realised investment gain/(loss) 3,281,520 (33,544) 83,408 (5,059,278) (13,533,711) (39,982) (199,870) 25,716
Net realised gain/(loss) on derivatives (87) – – (5,489,544) 2,205 (2,460) – –
Net realised gain/(loss) on foreign currency 4,111,999 – – (943,762) 46,499 32,533 28 (1,310)
Net change in unrealised investment gain/(loss) 2,424,961 (233,150) (985,180) (6,532,292) (51,132,164) (117,947) 441,600 1,194,481
Net change in unrealised gain/(loss) on derivatives – – – 2,736,817 (17) – – –
Net change in unrealised gain/(loss) on foreign currency 2,741,259 – – – 5,781 185,193 688 (1)
12,559,652 (266,694) (901,772) (15,288,059) (64,611,407) 57,337 242,446 1,218,886
Financial period ended
31 December 2021
Financial period ended
31 December 2021
Financial period ended
31 December 2021
Financial period ended
31 December 2021
Financial period ended
31 December 2021
L&G Quality Equity
Dividends ESG Exclusions Asia Pacific ex-Japan
UCITS ETF L&G Digital Payments
UCITS ETF
L&G Multi-Strategy Enhanced
Commodities UCITS ETF
1
L&G Quality Equity Dividends ESG
Exclusions Emerging Markets UCITS ETF
2
L&G India INR Government Bond
UCITS ETF3
$ $ $ $ $
Net realised investment gain/(loss) (301,346) 152,370 – 124,607 191,404
Net realised gain/(loss) on derivatives – 97 3,415,201 (9,444) –
Net realised gain/(loss) on foreign currency (4,894) (1,260) – (22,655) (114,725)
Net change in unrealised investment gain/(loss) (1,136,494) (2,987,748) – (257,555) (459,798)
Net change in unrealised gain/(loss) on derivatives – – 27,042,440 – –
Net change in unrealised gain/(loss) on foreign currency 497 53 – (4) 1,101,640
(1,442,237) (2,836,488) 30,457,641 (165,051) 718,521
1 This Fund was approved by the Central Bank on 4 January 2021. The Fund launched on 2 July 2021.
2 This Fund was approved by the Central Bank on 14 June 2021. The Fund launched on 12 July 2021.
3 This Fund was approved by the Central Bank on 24 April 2019. The Fund launched on 26 October 2021.

December 2021 Legal & General UCITS ETF Plc
Notes to the Financial Statements (continued)
For the financial period ended 31 December 2021 (continued)
58
2. Net Gain/(Loss) on Financial Assets and Liabilities at Fair Value through Profit or Loss (continued)
Financial Period ended
31 December 2020
Financial Period ended
31 December 2020
Financial Period ended
31 December 2020
Financial Period ended
31 December 2020
Financial Period ended
31 December 2020
Financial Period ended
31 December 2020
Financial Period ended
31 December 2020
Financial Period ended
31 December 2020
Company Total L&G E Fund MSCI
China A UCITS ETF L&G DAX® Daily 2x
Long UCITS ETF L&G DAX® Daily 2x
Short UCITS ETF
L&G Longer Dated All
Commodities UCITS ETF
L&G FTSE 100® Leveraged (Daily 2x)
UCITS ETF
L&G FTSE 100® Super Short Strategy (Daily
2x) UCITS ETF L&G Russell 2000 US Small Cap UCITS ETF
$ $ € € $ £ £ $
Net realised investment gain/(loss) 253,658,370 1,619,919 (7,820) (11,960) – – – –
Net realised gain/(loss) on derivatives 142,037,115 – 5,096,393 (12,641,260) 93,018,789 1,546,899 (1,037,923) 10,847,789
Net realised gain/(loss) on foreign currency 19,379 1,439 – – – – – –
Net change in unrealised investment gain/(loss) 1,138,727,913 6,897,035 (317) (248) – – – –
Net change in unrealised gain/(loss) on derivatives (10,440,679) – 1,651,680 (2,686,576) 4,692,620 291,678 (689,286) (204,181)
Net change in unrealised gain/(loss) on foreign currency (24,536) (14) – – – – – –
1,523,977,562 8,518,379 6,739,936 (15,340,044) 97,711,409 1,838,577 (1,727,209) 10,643,608
Financial Period ended
31 December 2020
Financial Period ended
31 December 2020
Financial Period ended
31 December 2020
Financial Period ended
31 December 2020
Financial Period ended
31 December 2020
Financial Period ended
31 December 2020
Financial Period ended
31 December 2020
Financial Period ended
31 December 2020
L&G Gold Mining
UCITS ETF
L&G US Energy Infrastructure MLP
UCITS ETF
L&G ROBO Global® Robotics and
Automation UCITS ETF
L&G Cyber Security UCITS ETF
L&G All Commodities UCITS ETF
L&G Longer Dated All
Commodities ex-Agriculture and
Livestock UCITS ETF L&G Battery Value-
Chain UCITS ETF
L&G Pharma Breakthrough UCITS
ETF
$ $ $ $ $ $ $ $
Net realised investment gain/(loss) – – 59,466,587 135,205,032 – – 22,340,219 1,847,741
Net realised gain/(loss) on derivatives 31,681,374 3,597,789 37 231,862 9,488,073 1,421,669 (10) –
Net realised gain/(loss) on foreign currency – – (99,434) 169,910 – – (25,828) (833)
Net change in unrealised investment gain/(loss) – – 283,052,012 299,116,295 – – 112,536,869 954,405
Net change in unrealised gain/(loss) on derivatives (13,600,869) (213,921) – – 776,795 (150,245) (170) –
Net change in unrealised gain/(loss) on foreign currency – – 6,498 4,327 – – 159 79
18,080,505 3,383,868 342,425,700 434,727,426 10,264,868 1,271,424 134,851,239 2,801,392

December 2021 Legal & General UCITS ETF Plc
Notes to the Financial Statements (continued)
For the financial period ended 31 December 2021 (continued)
59
2. Net Gain/(Loss) on Financial Assets and Liabilities at Fair Value through Profit or Loss (continued)
Financial period ended
31 December 2020
Financial period ended
31 December 2020
Financial period ended
31 December 2020
Financial period ended
31 December 2020
Financial period ended
31 December 2020
Financial period ended
31 December 2020
Financial period ended
31 December 2020
Financial period ended
31 December 2020
L&G Ecommerce
Logistics UCITS ETF L&G US Equity
UCITS ETF L&G UK Equity
UCITS ETF L&G Japan Equity
UCITS ETF L&G Global Equity
UCITS ETF L&G Europe ex UK Equity UCITS ETF
L&G Asia Pacific ex
Japan Equity UCITS ETF
L&G Clean Water UCITS ETF
$ $ £ $ $ € $ $
Net realised investment gain/(loss) 5,939,416 619,843 (173,320) 982,561 (34,816) (176,926) (65,106) 612,415
Net realised gain/(loss) on derivatives (7,997) – – 23 – – (63) –
Net realised gain/(loss) on foreign currency (35,290) – 854 5,150 1,385 (1,941) (4,430) (242)
Net change in unrealised investment gain/(loss) 50,131,958 39,142,726 716,285 36,222,646 7,187,481 13,885,563 14,991,673 5,617,000
Net change in unrealised gain/(loss) on derivatives – – – – – – (91) –
Net change in unrealised gain/(loss) on foreign currency (392) – (136) 2,005 256 128 153 333
56,027,695 39,762,569 543,683 37,212,385 7,154,306 13,706,824 14,922,136 6,229,506
Financial period ended
31 December 2020
Financial period ended
31 December 2020
Financial period ended
31 December 2020
Financial period ended
31 December 2020
Financial period ended
31 December 2020
Financial period ended
31 December 2020
Financial period ended
31 December 2020
Financial period ended
31 December 2020
L&G Artificial Intelligence UCITS
ETF
L&G Healthcare Breakthrough UCITS
ETF
L&G Europe Equity (Responsible
Exclusions) UCITS ETF
L&G US Equity
(Responsible Exclusions) UCITS
ETF
L&G Clean Energy UCITS ETF
L&G ESG GBP
Corporate Bond 0-5 Year UCITS ETF
L&G ESG GBP
Corporate Bond UCITS ETF
L&G ESG Emerging
Markets Government Bond (USD) 0-5 Year
UCITS ETF
$ $ € $ $ € € $
Net realised investment gain/(loss) 9,072,296 7,435,701 9,781 8,889,881 21,759 (2,545) (19,056) 146,509
Net realised gain/(loss) on derivatives 75 (7) 73 – (2,375) – – –
Net realised gain/(loss) on foreign currency (3,906) (1,673) (3,550) – 1,087 – – –
Net change in unrealised investment gain/(loss) 34,968,002 13,848,892 10,961,376 201,429,507 1,162,567 122,579 685,287 (2,875)
Net change in unrealised gain/(loss) on derivatives (50) (5) – – (57) – – –
Net change in unrealised gain/(loss) on foreign currency 3 (49) 766 – (691) – – –
44,036,420 21,282,859 10,968,446 210,319,388 1,182,290 120,034 666,231 143,634
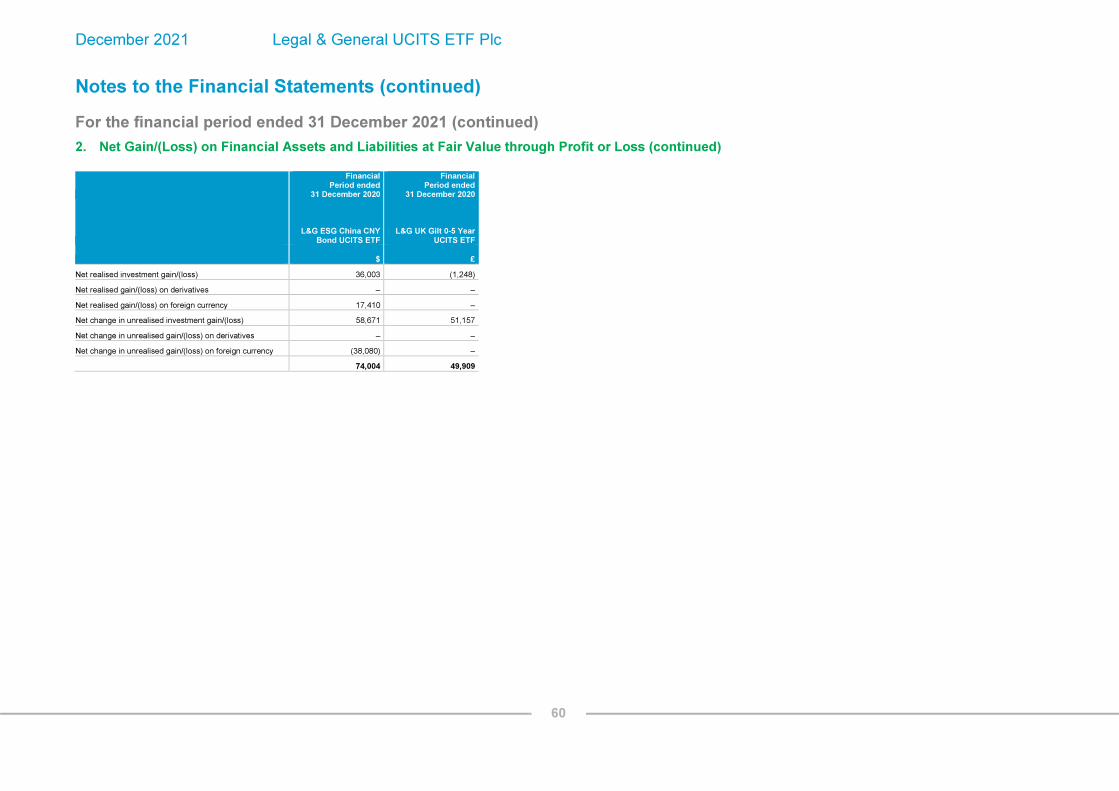
December 2021 Legal & General UCITS ETF Plc
Notes to the Financial Statements (continued)
For the financial period ended 31 December 2021 (continued)
60
2. Net Gain/(Loss) on Financial Assets and Liabilities at Fair Value through Profit or Loss (continued)
Financial Period ended
31 December 2020
Financial Period ended
31 December 2020
Financial Period ended
31 December 2020
Financial Period ended
31 December 2020
Financial Period ended
31 December 2020
L&G ESG China CNY
Bond UCITS ETF L&G UK Gilt 0-5 Year
UCITS ETF
L&G Healthcare Breakthrough UCITS
ETF
L&G Europe Equity (Responsible
Exclusions) UCITS ETF
1
L&G US Equity
(Responsible Exclusions) UCITS
ETF2
$ £ $ € $
Net realised investment gain/(loss) 36,003 (1,248)
Net realised gain/(loss) on derivatives – –
Net realised gain/(loss) on foreign currency 17,410 –
Net change in unrealised investment gain/(loss) 58,671 51,157
Net change in unrealised gain/(loss) on derivatives – –
Net change in unrealised gain/(loss) on foreign currency (38,080) –
74,004 49,909

December 2021 Legal & General UCITS ETF Plc
Notes to the Financial Statements (continued)
For the financial period ended 31 December 2021 (continued)
61
3. Taxation
The Company is an investment undertaking as defined in Section 739B of the Taxes Consolidation Act, 1997. Therefore, the Company will not be liable to Irish tax in respect of its income and gains, other than on the occurrence of a chargeable event.
Generally a chargeable event arises on any distribution, redemption, repurchase, cancellation, transfer of shares or the ending of a ‘Relevant Period’. A ‘Relevant Period’ is an eight year period beginning with the acquisition of the shares by the shareholder and each subsequent period of eight years beginning immediately after the preceding Relevant Period.
A gain on a chargeable event does not arise in respect of:
a) a shareholder who is not an Irish resident and not ordinarily resident in Ireland at the time of the chargeable event, provided the necessary signed statutory declarations are held by the Company;
b) certain exempted Irish tax resident Investors who have provided the Company with the necessary signed statutory declarations;
c) an exchange of shares arising on a qualifying amalgamation or reconstruction of the Company with another fund;
d) any transactions in relation to shares held in a recognised clearing system as designated by order of the Revenue Commissioners of Ireland;
e) certain exchanges of shares between spouses and former spouses on the occasion of judicial separation and/or divorce;
f) an exchange by a shareholder, effected by way of an arm’s length bargain where no payment is made to the shareholder of shares in the Company for other shares in the Company.
In the absence of an appropriate declaration, the Company will be liable for Irish tax on the occurrence of a chargeable event, and the Company reserves its right to withhold such taxes from the relevant shareholders.
Other Countries:
Interest and capital gains (if any) received on investments made by the Company may be subject to withholding taxes imposed by the country from which the investment income/gains are received and such taxes may not be recoverable by the Company or its shareholders.
4. Cash, Cash Equivalents and Bank Overdrafts
Cash and cash equivalents comprises of current deposits and overdrafts held with the Bank of New York Mellon SA/NV, plus holdings in sub-funds of LGIM Liquidity Funds Plc (LGIM Sterling Liquidity Fund, LGIM US Dollar Liquidity Fund and LGIM Euro Liquidity Fund).
The Company may also hold cash in the base currency of the Funds, or the currency in which the assets are denominated. For example, L&G E Fund MSCI China A UCITS ETF may hold cash in US Dollars or Chinese Renminbi or both. Included in the cash balance of L&G E Fund MSCI China A UCITS ETF is a restricted cash amount of $8,042 (30 June 2021: $16,464) which is held with HSBC Securities Services as a minimum reserve contribution with the China Securities Depositary and Clearing Corp in order to trade in the China A share market.

December 2021 Legal & General UCITS ETF Plc
Notes to the Financial Statements (continued)
For the financial period ended 31 December 2021 (continued)
62
4. Cash, Cash Equivalents and Bank Overdrafts (continued)
The Company operates umbrella “collection accounts” which are subscription and redemption accounts in the name of the Company operated at umbrella level through which subscription, redemption and dividend monies and Fund liquidation proceeds are paid. Subscription and redemption accounts have not been established at Fund level. But a number of collection accounts have been established, one for each of the dealing currencies used by the Funds of the Company. All subscription monies, redemption proceeds, dividend payments and Fund liquidation payments are paid through the collection accounts. The balances on these cash collection accounts as at 31 December 2021 and 30 June 2021 are deemed immaterial in respect of the relevant Fund to which they are due, with the exception of L&G ESG Emerging Markets Corporate Bond (USD) UCITS ETF which have been adjusted in "Cash and cash equivalents" in the statement of financial position as at 31 December 2021 (L&G Longer Dated All Commodities UCITS ETF and L&G Quality Equity Dividends ESG Exclusions Europe ex-UK UCITS ETF as at 30 June 2021).
5. Collateral
In connection with their investments in OTC swaps, the Synthetically–Replicating Funds may enter into reverse repurchase agreements or receive collateral either in the form of cash or securities.
(i) Collateral received for reverse repurchase agreements
The tables below show the amounts representing collateral received by the Synthetically–Replicating Funds in respect of reverse repurchase agreements, the counterparty and the fair value of the corresponding reverse repurchase agreements as at 31 December 2021 and 30 June 2021:
Fund Counterparty
Reverse Repurchase Agreement Fair Value as at
31 December 2021
Collateral Fair Value as at
31 December 2021* % of Position
L&G DAX® Daily 2x Long UCITS ETF Merrill Lynch International €23,916,328 €23,592,483 99%
L&G DAX® Daily 2x Short UCITS ETF Merrill Lynch International €30,718,800 €30,417,725 99%
L&G Longer Dated All Commodities UCITS ETF Barclays Bank Plc $673,631,724 $707,867,110 105%
L&G FTSE 100® Leveraged (Daily 2x) UCITS ETF Merrill Lynch International £15,243,000 £14,952,890 98%
L&G FTSE 100® Super Short Strategy (Daily 2x) UCITS ETF Merrill Lynch International £11,720,751 £11,637,953 99%
L&G US Energy Infrastructure MLP UCITS ETF Citigroup Global Markets Limited $26,448,923 $29,031,455 110%
L&G All Commodities UCITS ETF Barclays Bank Plc $76,038,070 $80,154,937 105%
L&G Longer Dated All Commodities ex–Agriculture and Livestock UCITS ETF Barclays Bank Plc $1,299,553 $1,364,599 105%
L&G Multi-Strategy Enhanced Commodities UCITS ETF1 Barclays Bank Plc $543,183,955 $571,263,953 105%
Company Total $1,419,253,792 $1,487,117,883
1 The Fund launched on 2 July 2021.
* Collateral received pursuant to the reverse repurchase agreements is comprised of equities, government bonds and supranational bonds.

December 2021 Legal & General UCITS ETF Plc
Notes to the Financial Statements (continued)
For the financial period ended 31 December 2021 (continued)
63
5. Collateral (continued)
(i) Collateral received for reverse repurchase agreements (continued)
Fund Counterparty
Reverse Repurchase Agreement Fair Value as at
30 June 2021
Collateral Fair Value as at
30 June 2021* % of Position
L&G DAX® Daily 2x Long UCITS ETF Merrill Lynch International €24,266,328 €24,300,632 100%
L&G DAX® Daily 2x Short UCITS ETF Merrill Lynch International €44,148,270 €43,641,515 99%
L&G Longer Dated All Commodities UCITS ETF Barclays Bank Plc $1,103,956,000 $1,164,898,891 106%
L&G FTSE 100® Leveraged (Daily 2x) UCITS ETF Merrill Lynch International £17,820,000 £17,835,812 100%
L&G FTSE 100® Super Short Strategy (Daily 2x) UCITS ETF Merrill Lynch International £10,588,751 £10,567,630 100%
L&G US Energy Infrastructure MLP UCITS ETF Citigroup Global Markets Limited $36,548,923 $40,203,818 110%
L&G All Commodities UCITS ETF Barclays Bank Plc $83,859,070 $90,371,233 108%
L&G Longer Dated All Commodities ex–Agriculture and Livestock UCITS ETF Barclays Bank Plc $10,061,553 $10,908,414 108%
Company Total $1,354,803,398 $1,426,192,597
* Collateral received pursuant to the reverse repurchase agreements is comprised of equities, government bonds and supranational bonds.
(ii) Cash collateral pledged by swap counterparties
Merrill Lynch International
Citigroup Global Markets Limited
Barclays Bank Plc Company Total
Cash collateral pledged by swap counterparties
As at 31 December
2021
As at 31 December
2021
As at 31 December
2021
As at 31 December
2021
L&G DAX® Daily 2x Long UCITS ETF €2,810,000 – – €2,810,000
L&G FTSE 100® Leveraged (Daily 2x) UCITS ETF £780,000 – – £780,000
Company Total $4,251,975 – – $4,251,975
Merrill Lynch International
Citigroup Global Markets Limited
Barclays Bank Plc Company Total
Cash collateral pledged by swap counterparties
As at 30 June
2021
As at 30 June
2021
As at 30 June
2021
As at 30 June
2021
L&G DAX® Daily 2x Short UCITS ETF €580,000 – – €580,000
L&G FTSE 100® Super Short Strategy (Daily 2x) UCITS ETF £60,000 – – £60,000
L&G US Energy Infrastructure MLP UCITS ETF – $1,679,894 – $1,679,894
Company Total $770,707 $1,679,894 – $2,450,601

December 2021 Legal & General UCITS ETF Plc
Notes to the Financial Statements (continued)
For the financial period ended 31 December 2021 (continued)
64
5. Collateral (continued)
(iii) Cash collateral pledged to swap counterparties
Merrill Lynch International
Citigroup Global Markets Limited
Barclays Bank Plc Company Total
Cash collateral pledged to swap counterparties
As at 31 December
2021
As at 31 December
2021
As at 31 December
2021
As at 31 December
2021
L&G DAX® Daily 2x Long UCITS ETF €2,100,000 – – €2,100,000
L&G Longer Dated All Commodities UCITS ETF – – $34,565,050 $34,565,050
L&G FTSE 100® Leveraged (Daily 2x) UCITS ETF £1,040,000 – – £1,040,000
L&G US Energy Infrastructure MLP UCITS ETF – $1,789,935 – $1,789,935
L&G All Commodities UCITS ETF – – $4,050,000 $4,050,000
L&G Multi-Strategy Enhanced Commodities UCITS ETF1 – – $33,070,000 $33,070,000
Company Total $3,796,727 $1,789,935 $71,685,050 $77,271,712
1 The Fund launched on 2 July 2021.
Merrill Lynch International
Citigroup Global Markets Limited
Barclays Bank Plc Company Total
Cash collateral pledged to swap counterparties
As at 30 June
2021
As at 30 June
2021
As at 30 June
2021
As at 30 June
2021
L&G DAX® Daily 2x Long UCITS ETF €290,000 – – €290,000
L&G Longer Dated All Commodities UCITS ETF – – $20,500,000 $20,500,000
L&G FTSE 100® Leveraged (Daily 2x) UCITS ETF £270,000 – – £270,000
L&G All Commodities UCITS ETF – – $1,500,000 $1,500,000
L&G Longer Dated All Commodities ex-Agriculture and Livestock UCITS ETF – – $160,017 $160,017
Company Total $716,901 – $22,160,017 $22,876,918
Cash collateral pledged by/to swap counterparties are included as cash for margin calls to/by counterparties in the statement of financial position.
6. Share Capital
On incorporation, the authorised and fully paid share capital of the Company was $2.00 divided into two "subscriber shares" of $1.00 each and 500,000,000,000,000,000,000 participating shares of no par value. The subscriber shares do not form part of the Company’s Net Asset Value ("NAV") when determining the NAV per Fund. They are thus disclosed in the financial statements by way of this note only. The subscriber shares are held by LGIMH and the Manager.
The subscriber shares entitle the holders to one vote per subscriber share, on a poll, and do not entitle the holders to any dividends and on winding up entitle the holders to receive the amount paid up thereon but not otherwise participate in the net assets of the Company. Each of the participating shares of the Company entitles the holder to one vote per share, dividends as the Directors may from time to time declare and, in the event of a winding up or dissolution of the Company, be entitled, in priority to the holders of the subscriber shares, firstly to an amount equal to the NAV of the shares of each class or series held at the date of winding up and, after payment to the holders of the subscriber shares of the nominal amount paid up thereon, to participate in surplus assets of the Company (if any).
The issued and fully paid redeemable participating share capital is at all times equal to the NAV of the Company. Redeemable participating shares are redeemable at the shareholder’s option and are classified as financial liabilities.

December 2021 Legal & General UCITS ETF Plc
Notes to the Financial Statements (continued)
For the financial period ended 31 December 2021 (continued)
65
7. Efficient Portfolio Management
The Company may, on behalf of each Fund and subject to the conditions and within the limits laid down by the Central Bank, employ techniques and instruments relating to transferable securities for efficient portfolio management purposes. Transactions for the purposes of efficient portfolio management may be undertaken with a view to achieving a reduction in risk, a reduction in costs or an increase in capital or income returns to a Fund and may not be speculative in nature.
These techniques and instruments may include investments in repurchase agreements, reverse repurchase agreements and stocklending. Such techniques and instruments will be utilised in accordance with the requirements of the Central Bank. New techniques and instruments may be developed which may be suitable for use by the Company and the Company (subject as aforesaid) may employ such techniques. A Fund may enter into repurchase and/or reverse repurchase agreements for the purposes of efficient portfolio management in accordance with the requirements of the Central Bank. The Funds enter into these agreements as a cash management strategy with the intention to achieve greater returns than holding deposits. The three counterparties of the Company for reverse repurchase transactions are Barclays Bank Plc, Citigroup Global Markets Limited and Merrill Lynch International. Please refer to Note 5 ("Collateral") for the fair value of reverse repurchase agreements and the type and amount of the collateral received. There are no transaction costs associated on the purchase and sale of reverse repurchase agreements for the financial periods ended 31 December 2021 and 31 December 2020.
Please refer to the description “Income on reverse repurchase agreements” in the statement of comprehensive income for details on the revenue earned from reverse repurchase agreements during the financial periods ended 31 December 2021 and 31 December 2020.
The Funds, where applicable, may enter into forward currency contracts to purchase or sell a specific currency at a future date at a price set at the time of the contract. A Fund may enter into these contracts to hedge against fluctuations in currency exchange rates. The Funds may use one currency (or a basket of currencies) to hedge against adverse fluctuations in the value of another currency (or a basket of currencies) when exchange rates between the two currencies are positively correlated.
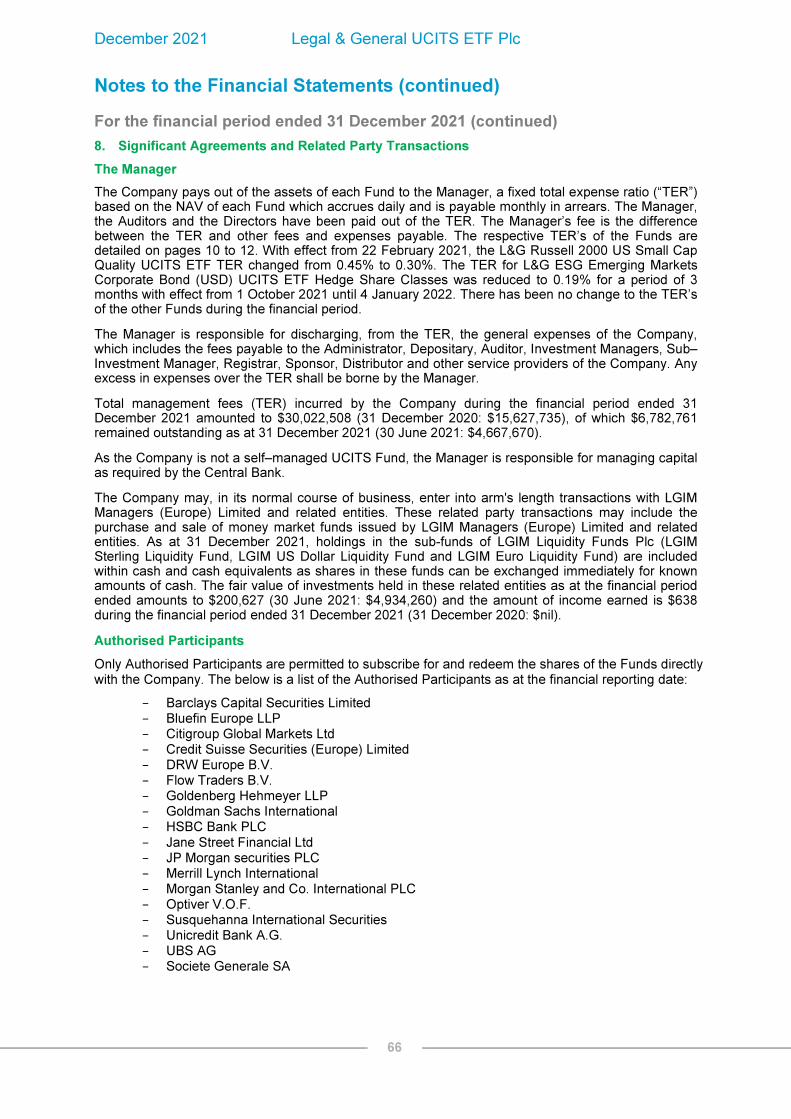
December 2021 Legal & General UCITS ETF Plc
Notes to the Financial Statements (continued)
For the financial period ended 31 December 2021 (continued)
66
8. Significant Agreements and Related Party Transactions
The Manager
The Company pays out of the assets of each Fund to the Manager, a fixed total expense ratio (“TER”) based on the NAV of each Fund which accrues daily and is payable monthly in arrears. The Manager, the Auditors and the Directors have been paid out of the TER. The Manager’s fee is the difference between the TER and other fees and expenses payable. The respective TER’s of the Funds are detailed on pages 10 to 12. With effect from 22 February 2021, the L&G Russell 2000 US Small Cap Quality UCITS ETF TER changed from 0.45% to 0.30%. The TER for L&G ESG Emerging Markets Corporate Bond (USD) UCITS ETF Hedge Share Classes was reduced to 0.19% for a period of 3 months with effect from 1 October 2021 until 4 January 2022. There has been no change to the TER’s of the other Funds during the financial period.
The Manager is responsible for discharging, from the TER, the general expenses of the Company, which includes the fees payable to the Administrator, Depositary, Auditor, Investment Managers, Sub–Investment Manager, Registrar, Sponsor, Distributor and other service providers of the Company. Any excess in expenses over the TER shall be borne by the Manager.
Total management fees (TER) incurred by the Company during the financial period ended 31 December 2021 amounted to $30,022,508 (31 December 2020: $15,627,735), of which $6,782,761 remained outstanding as at 31 December 2021 (30 June 2021: $4,667,670).
As the Company is not a self–managed UCITS Fund, the Manager is responsible for managing capital as required by the Central Bank.
The Company may, in its normal course of business, enter into arm's length transactions with LGIM Managers (Europe) Limited and related entities. These related party transactions may include the purchase and sale of money market funds issued by LGIM Managers (Europe) Limited and related entities. As at 31 December 2021, holdings in the sub-funds of LGIM Liquidity Funds Plc (LGIM Sterling Liquidity Fund, LGIM US Dollar Liquidity Fund and LGIM Euro Liquidity Fund) are included within cash and cash equivalents as shares in these funds can be exchanged immediately for known amounts of cash. The fair value of investments held in these related entities as at the financial period ended amounts to $200,627 (30 June 2021: $4,934,260) and the amount of income earned is $638 during the financial period ended 31 December 2021 (31 December 2020: $nil).
Authorised Participants
Only Authorised Participants are permitted to subscribe for and redeem the shares of the Funds directly with the Company. The below is a list of the Authorised Participants as at the financial reporting date:
− Barclays Capital Securities Limited − Bluefin Europe LLP − Citigroup Global Markets Ltd − Credit Suisse Securities (Europe) Limited − DRW Europe B.V. − Flow Traders B.V. − Goldenberg Hehmeyer LLP − Goldman Sachs International − HSBC Bank PLC − Jane Street Financial Ltd − JP Morgan securities PLC − Merrill Lynch International − Morgan Stanley and Co. International PLC − Optiver V.O.F. − Susquehanna International Securities − Unicredit Bank A.G. − UBS AG − Societe Generale SA

December 2021 Legal & General UCITS ETF Plc
Notes to the Financial Statements (continued)
For the financial period ended 31 December 2021 (continued)
67
8. Significant Agreements and Related Party Transactions (continued)
Director Relationships
Mr. Feargal Dempsey, Mr. David Fagan and Mr. Donard McClean (appointed 15 March 2021) are all independent non-executive Director's and each earned fees of €22,500, €22,500 and €20,000, respectively for services to the Company for the financial period ended 31 December 2021 (31 December 2020: €22,500, €20,000 and €nil, respectively).
Mr. Howie Li and Ms. Patrizia Libotte are non-executive Directors of the Manager and the Company.
Other than Mr Fergal Dempsey, Mr David Fagan and Mr. Donard McClean, none of the other Directors receive any remuneration for holding the role of Director of the Company.
On 31 March 2021, Mr. Adrian Waters and Ms. Eimear Cowhey resigned as independent non-executive Directors of the Company. Mr. Adrian Waters and Ms. Eimear Cowhey each earned fees of €22,500 and €20,000, respectively, for services to the Company for the financial period ended 31 December 2020. This note is only included for comparative purposes.
The Directors and the Secretary who held office as at 31 December 2021 had no interest in the shares of the Company at that date or at any time during the financial period and their families had no interests in the shares of the Company as at 31 December 2021 or at any time during the financial period.
The subscriber shares are held by LGIMH and the Manager.
Connected Persons In accordance with the requirements of Chapter 10 of the Central Bank UCITS Regulations, all transactions carried out with the Company by the Manager, Depositary, Investment Managers and their respective associated and/or group companies (together the “Connected Persons”) must be carried out as if negotiated on an arm’s length basis and be in the best interest of shareholders.
The Directors are satisfied that there are arrangements in place to ensure that the obligations set out above are applied to all transactions with Connected Persons and transactions with Connected Persons entered into during the current and prior financial periods complied with the obligations set out above.
9. Operating Expenses
Pursuant to the depositary agreement between the Company, the Manager and the Depositary, the Depositary provides various custodial services and ancillary services to the Company. In connection with the provision of the services, various fees are levied. The fees relate to any transfers including both cash transfers and securities settlement. On top of fees relating to transfers, depositary fees (as a percentage of assets under management) are also applied. Although the Depositary has been appointed directly by the Company, its fees (other than portfolio transactions charges, which are charged to each relevant Fund) are paid by the Manager out of the TER that it receives from the Company.

December 2021 Legal & General UCITS ETF Plc
Notes to the Financial Statements (continued)
For the financial period ended 31 December 2021 (continued)
68
9. Operating Expenses (continued)
In relation to the Synthetically–Replicating Funds, the Company has entered into tri–party agreements with The Bank of New York Mellon (the “Collateral Manager”) and each of Barclays Bank Plc, Citigroup Global Markets Limited and Merrill Lynch International (the “Repo Counterparties”) pursuant to which The Bank of New York Mellon acts as Collateral Manager with respect to all collateral transferred to the Company pursuant to the reverse repurchase agreements entered into between the Company and the Repo Counterparties. As is common with respect to tri–party collateral management arrangements, the collateral receiver (i.e. the Company) does not pay any fees with respect to the collateral management services. Any fees associated therewith are paid by the relevant collateral provider (i.e. the relevant Repo Counterparty).
With respect to L&G E Fund MSCI China A UCITS ETF, the Fund’s cash (received from subscriptions) is converted from US Dollar (USD) into Chinese Yuan Renminbi (RMB) for the purpose of purchasing Chinese domestic equities. Conversely, when there is a redemption, a proportion of the Chinese equities are sold and the proceeds are converted back from RMB into USD. Any excess pre–funding amount associated with a subscription also needs to be converted back from RMB to USD for repayment to the relevant Authorised Participant. The FX transactions are entered into with The Bank of New York Mellon (an affiliate of the Depositary and the Administrator) and are instructed by the Sub–Investment Manager on behalf of the Fund.
The Manager has appointed BNY Mellon Fund Services (Ireland) Designated Activity Company (the “Administrator”) to act as Administrator, Transfer Agent and Registrar of the Company with responsibility for performing the day-to-day administration of the Company, including the calculation of the NAV and the NAV per share of each Fund. The Administrator’s fee is paid by the Manager out of the TER that it receives from the Company.
The Investment Managers fee and Sub–Investment Manager's fees are paid by the Manager out of the TER that it receives from the Company.
Dealing/Transaction Fees
Since the launch of the Company, primary market transaction costs (defined as “Duties and Charges” in the Prospectus) relating to ETF trades have been excluded from NAV calculations. These fees correspond to what Authorised Participants are charged on top of the NAV per share price when subscribing or redeeming shares to reflect the costs incurred by the Company in acquiring or disposing of investments on foot of the relevant subscription/redemption. They form no part of ongoing charges and are therefore not disclosed in the financial statements.

December 2021 Legal & General UCITS ETF Plc
Notes to the Financial Statements (continued)
For the financial period ended 31 December 2021 (continued)
69
10. Swap Fees
Swap fees are charged to net gain/(loss) on financial assets and liabilities at fair value through profit or loss and relate to the finance costs and fees associated with the swap contracts entered into with the swap counterparties. The swap interest is linked to the relevant Libor/Euribor/SONIA (from August 2021), plus a spread reflecting the fees charged by the swap counterparties. The following table shows the swap interest (including the spread) in respect of each of the applicable Funds for the financial periods ended 31 December 2021 and 31 December 2020.
Fund
Financial period ended
31 December 2021
Financial period ended
31 December 2020
L&G DAX® Daily 2x Long UCITS ETF €(60,454) €(48,491)
L&G DAX® Daily 2x Short UCITS ETF €128,207 €181,069
L&G Longer Dated All Commodities UCITS ETF $(1,244,828) $(804,017)
L&G FTSE 100® Leveraged (Daily 2x) UCITS ETF £(152,538) £(101,698)
L&G FTSE 100® Super Short Strategy (Daily 2x) UCITS ETF £(31,515) £(36,537)
L&G Russell 2000 US Small Cap Quality UCITS ETF2 n/a $26,511
L&G Gold Mining UCITS ETF2 n/a $(747,729)
L&G US Energy Infrastructure MLP UCITS ETF $(121,016) $(53,285)
L&G All Commodities UCITS ETF $(97,003) $(76,923)
L&G Longer Dated All Commodities ex–Agriculture and Livestock UCITS ETF $(3,557) $(13,198)
L&G Multi-Strategy Enhanced Commodities UCITS ETF1 $(174,942) n/a
Company Total $(1,813,517) $(1,692,649)
1 The Fund launched on 2 July 2021.
2 These Funds changed from synthetic to a physical index tracking strategy on 22 February 2021.
11. Financial Instruments and Associated Risks
1. Management of Risk
The Company’s activities expose it to a variety of financial risks – market risk (including price risk, currency risk and interest rate risk), credit risk and liquidity risk, which are discussed in this note.
Global exposure is calculated using the commitment approach in the context of the Physically-Replicating Funds and using the relative value at risk approach for the Synthetically-Replicating Funds as detailed in Note 11.5 (Global Exposure).
The Manager has delegated investment management activities (i.e. the investment and re–investment of the Company’s assets) to the Investment Managers pursuant to an investment management agreement. While the Directors of the Company are ultimately responsible for monitoring the risks associated with the Company and its Funds, including the overall supervision of investment performance risk monitoring, the day–to–day management of investment risk has been delegated to the Investment Managers by the Manager. In the context of L&G E Fund MSCI China A UCITS ETF, the Investment Manager has sub–delegated the investment management activities (i.e. the investment and re–investment of the Fund's assets) to the relevant Sub–Investment Manager.
The Investment Managers are responsible to the Manager, and ultimately the Company’s Directors, in regard to the investment management of the assets of the Company.
December 2021 Legal & General UCITS ETF Plc
Notes to the Financial Statements (continued)
For the financial period ended 31 December 2021 (continued)
70
11. Financial Instruments and Associated Risks (continued)
1. Management of Risk (continued)
The investments of the Company are subject to normal market fluctuations and other risks inherent in investing in securities and other financial instruments. There can be no assurance that any appreciation in the value of investments will occur, and the capital value of an investor’s original investment is not guaranteed. The value of investments may go down as well as up, and an investor may not get back the original amount invested.
The information provided below is not intended to be a comprehensive summary of all the risks associated with the Company’s investments and investors should refer to the Company’s Prospectus and any Fund specific Supplements (under the headings “Risk Factors”) for a detailed summary of the risks inherent in investing in the Company’s Funds.
In addition to identifying risks during their consideration of creating new Funds, the Manager, on a quarterly basis, undertakes a review of the investment management and operation of the Funds as well as a list of financial counterparties and Authorised Participants. In addition, the Directors receive periodic compliance and risk reports from the Investment Managers, which are designed to identify any significant risk issues. The Directors may seek additional information from other parties such as the money laundering reporting officer (MLRO), Manager, Administrator or Depositary.
The Manager has implemented a detailed business plan for the Company’s business which sets out the material risks pertaining to the management of the Company and the methods used to monitor and measure these risks. The Company’s Prospectus further sets out the risks related to the management of and investment in the Funds.
The investment objective of L&G E Fund MSCI China A UCITS ETF is to provide exposure to the equity markets in China. In order to achieve this investment objective, L&G E Fund MSCI China A UCITS ETF aims to track the performance of the MSCI China A Onshore Index by investing primarily in an optimised portfolio of A Shares that, as far as possible and practicable, consists of the component securities of the MSCI China A Onshore Index. The component securities of the MSCI China A Onshore Index are equity securities, referred to as “A Shares”, issued by companies incorporated in mainland China and denominated and traded in RMB on the Shenzhen and Shanghai stock exchanges.
In addition, the Investment Managers employ a risk management programme in the daily management of the Company’s investment in financial derivative instruments. In the context of L&G E Fund MSCI China A UCITS ETF, the Sub–Investment Manager employs a risk management programme with respect to any investment by the Company in exchange–traded futures. As at the financial period ended 31 December 2021 and the financial year ended 30 June 2021, L&G E Fund MSCI China A UCITS ETF did not hold any investment in futures. The foregoing risk management programmes are utilised by the Investment Managers and the Sub–Investment Manager to manage and monitor the risks associated with investment by the Funds in the relevant types of financial derivative instruments.

December 2021 Legal & General UCITS ETF Plc
Notes to the Financial Statements (continued)
For the financial period ended 31 December 2021 (continued)
71
11. Financial Instruments and Associated Risks (continued)
2. Physically–Replicating Funds
A. Market Risk
Market risk is the risk that the value of instruments held will fluctuate due to changes in market prices resulting from price risk, currency risk and interest rate risk.
(i) Price Risk
Price risk arises when the fair value or future cash flows of an investment will fluctuate because of changes in market prices, other than those arising from interest rate risk or currency risk, whether those changes are caused by factors specific to the individual financial instrument or its issuer, or factors affecting similar financial instruments traded in the market.
Several of the Company’s Funds are either “thematic”, sector specific, country specific or focused on a single commodity or commodity industry. The prices of commodities are influenced by factors such as, but not limited to, changes in supply and demand for commodities, technological changes which can influence the level of production of commodities, trade protectionism or liberalisation, environmental changes, agricultural, fiscal, monetary, and exchange control programmes and policies of governments (including government intervention in certain markets).
(ii) Currency Risk
Currency risk is the risk that the value of a Fund’s net assets as denominated in the Fund's functional currency will fluctuate due to changes in foreign currency rates.
The Physically–Replicating Funds hold assets denominated in currencies other than the Fund's functional currency. They can therefore be exposed to currency risk as the value of the securities denominated in other currencies will fluctuate due to changes in exchange rates.
(iii) Interest Rate Risk
Interest rate risk is the risk that the value of a financial instrument will fluctuate due to changes in market interest rates.
Each Fund’s interest rate risk is managed by the Investment Managers or Sub–Investment Manager in accordance with the objectives and policies and procedures in place as given in the Company information section. The Investment Managers are of the view that there is minimal exposure to interest rate risk for the Physically-Replicating Funds, with the exception of bond Funds, as the exposure is limited to cash and cash equivalents. Debt securities are subject to interest rate risk. In general, if prevailing interest rates rise, the values of debt securities will tend to fall, and if interest rates fall, the values of debt securities will tend to rise. Changes in the value of a debt security usually will not affect the amount of income a Fund receives from it or the ability of a Fund to realise the par value of the security upon its maturity but may affect the value of a Fund’s shares prior to the maturity of those securities owned by a Fund and issued in a lower prevailing interest rate environment. Interest rate risk is generally greater for debt securities with longer maturities or durations. L&G ESG GBP Corporate Bond 0-5 Year UCITS ETF, L&G ESG GBP Corporate Bond UCITS ETF, L&G ESG Emerging Markets Government Bond (USD) 0-5 Year UCITS ETF, L&G ESG China CNY Bond UCITS ETF, L&G UK Gilt 0-5 Year UCITS ETF, L&G ESG USD Corporate Bond UCITS ETF, L&G ESG Emerging Markets Corporate Bond (USD) UCITS ETF, L&G ESG Green Bond UCITS ETF and L&G India INR Government Bond UCITS ETF invest in both fixed and floating rate securities. Any change to the interest rates may result in income either increasing or decreasing, or the Investment Managers being unable to secure similar returns on the expiry of contracts or the sale of securities.

December 2021 Legal & General UCITS ETF Plc
Notes to the Financial Statements (continued)
For the financial period ended 31 December 2021 (continued)
72
11. Financial Instruments and Associated Risks (continued)
2. Physically–Replicating Funds (continued)
A. Market Risk (continued)
(iii) Interest Rate Risk (continued)
For those Funds holding primarily interest bearing securities and as such exposed to the risk of fluctuations in the prevailing levels of market interest rates, the Investment Managers monitor the Funds’ exposure to interest fluctuations on a daily basis. Whilst primarily an investment decision, the Investment Managers employ proprietary systems and processes to best position the Funds to benefit from, or limit the risk of, any fluctuations in the prevailing market levels of market interest rates.
B. Credit Risk
Credit risk is the risk that the counterparty to a financial instrument will fail to discharge an obligation or commitment that it has entered into with the Company’s Funds.
In addition to the processes employed by the Investment Managers as part of the day-to-day oversight of transactions with the counterparties, the Investment Managers review the list of counterparties on an ongoing basis to ensure no significant issues which could affect the ability of the counterparties to meet their obligations are identified.
L&G ESG GBP Corporate Bond 0-5 Year UCITS ETF, L&G ESG GBP Corporate Bond UCITS ETF, L&G ESG Emerging Markets Government Bond (USD) 0-5 Year UCITS ETF, L&G ESG China CNY Bond UCITS ETF, L&G UK Gilt 0-5 Year UCITS ETF, L&G ESG USD Corporate Bond UCITS ETF, L&G ESG Emerging Markets Corporate Bond (USD) UCITS ETF, L&G ESG Green Bond UCITS ETF and L&G India INR Government Bond UCITS ETF are primarily exposed to credit risk from investments in debt instruments which have an investment grade as rated by Standard & Poor's and Moody's. Such credit risk is managed by the Investment Managers as required by the investment objectives for the Funds.
Debt securities are subject to both actual and perceived measures of creditworthiness. The amount of credit risk may be assessed using the issuer's credit rating which is assigned by one or more independent rating agencies. This does not amount to a guarantee of the issuer's creditworthiness but provides an indicator of the likelihood of default. Securities which have a lower credit rating are generally considered to have a higher credit risk and a greater possibility of default than more highly rated securities. Companies often issue securities which are ranked in order of seniority which in the event of default would be reflected in the priority in which investors might be paid back. The "downgrading" of an investment grade rated debt security or adverse publicity and investor perception, which may not be based on fundamental analysis, could decrease the value and liquidity of the security, particularly in a thinly traded market.
(i) Transactions with Authorised Participants
Credit risk arising on subscriptions and redemptions with Authorised Participants relates to transaction settlement risk. In the event that (i) in respect of a cash subscription, an Authorised Participant fails to deliver the required cash within the settlement time specified in the relevant Fund Supplement, or (ii) in respect of a cash subscription resulting in a Directed Transaction, an Authorised Participant fails to deliver the required cash within the settlement time specified in the relevant Fund Supplement or the Authorised Participant Designated Broker fails to transfer to the Company (via the Depositary) the relevant underlying investments (or part thereof) within the settlement time prescribed by the Manager (or its appointed delegate), the Company and/or the Manager (or its appointed delegate) reserves the right to cancel the relevant subscription application.
With respect to the Physically–Replicating Funds (other than L&G E Fund MSCI China A UCITS ETF), risk relating to unsettled transactions is limited given that subscriptions and redemptions are all settled on a “delivery versus payment” basis in the relevant settlement system.

December 2021 Legal & General UCITS ETF Plc
Notes to the Financial Statements (continued)
For the financial period ended 31 December 2021 (continued)
73
11. Financial Instruments and Associated Risks (continued)
2. Physically–Replicating Funds (continued)
B. Credit Risk (continued)
(i) Transactions with Authorised Participants (continued)
With respect to the Physically–Replicating Funds (other than L&G E Fund MSCI China A UCITS ETF), the Company may, at the discretion of the Sub–Investment Manager, enter into transactions for the purchase and sale of investments with the relevant Authorised Participant (or a broker designated by it) in connection with any subscription and redemption application (“Directed Transactions”). The sections entitled “Failure to settle” within the “dealing” section of the Company’s Prospectus set out the recourse arrangements pursuant to which the Company shall be entitled to indemnification by the relevant Authorised Participant for any failure by it (or its designated broker) with respect to the timely completion of any such Directed Transactions.
With respect to L&G E Fund MSCI China A UCITS ETF, subscriptions are settled on a “free of payment” basis, however, the risk associated with settlement lies with the relevant Authorised Participant given the fact that all subscriptions must be “pre–funded” by Authorised Participants in accordance with the terms and conditions of the Fund specific Supplement to the Prospectus of the Company. Redemptions are settled on a “delivery versus payment” basis.
(ii) Counterparty risk to the Paying Agent - dividend and fund liquidation monies
The Paying Agent (“The Bank of New York Mellon, London Branch”) for the Funds is responsible for arranging payments to participants relating to dividend monies and the proceeds of any compulsory redemptions of ETF Shares on the relevant payment dates.
Prior to the relevant payment date, monies for distribution to participants as dividends will be transferred from the Company’s cash accounts with the Depositary to the Paying Agent. During the interim period, dividend monies are held with the Paying Agent (or its associated depositary bank) in the form of cash and the Company will have credit risk exposure, in respect of such cash, to the Paying Agent and its associated depositary bank. Cash held by the Paying Agent will not be segregated in practice but will be a debt owing from the Paying Agent (or its associated depositary bank) to the Company as a depositor. In the event of the insolvency of the Paying Agent (or its associated depositary bank) during the interim period, the Company will be treated as a general unsecured creditor of the Paying Agent (or its associated depositary bank) in relation to the cash. The Company may face difficulties and/or encounter delays in recovering such debt, or may not be able to recover it in full or at all, in which case the Company may lose some or all of the dividend monies being distributed by the Paying Agent resulting in a reduction in the value of a Fund.
C. Liquidity Risk
Liquidity risk is the risk that the Company will encounter difficulty in meeting obligations associated with financial liabilities. The main liquidity risk to the Company arises from the redemption requests of investors (in the Company’s case, the Authorised Participants). The Company’s shareholders may redeem their shares on any business day for cash equal to a proportionate share of a Fund’s NAV, and it is therefore exposed to the liquidity risk of meeting daily redemptions by its shareholders.
The Funds provide for the subscription and redemption of shares and, therefore are, exposed to the liquidity risk associated with shareholder redemptions in accordance with the terms of the Prospectus. These terms include the discretion to pay redemption distributions in cash or in kind or to limit redemptions to 10% of the NAV of the relevant Fund on any dealing day. The portfolios are managed to include liquid investments sufficient to meet normal liquidity needs although substantial redemptions of shares in the Funds could require the Funds to liquidate investments more rapidly than otherwise desirable in order to raise cash for redemptions. These factors could adversely affect the value of the shares redeemed and the valuation of the shares that remain outstanding and the liquidity of remaining assets if more liquid assets have been sold to meet redemptions.
The Company may suspend calculation of the NAV and the subscription and redemption of shares of one or more Funds under certain circumstances.

December 2021 Legal & General UCITS ETF Plc
Notes to the Financial Statements (continued)
For the financial period ended 31 December 2021 (continued)
74
11. Financial Instruments and Associated Risks (continued)
2. Physically–Replicating Funds (continued)
C. Liquidity Risk (continued)
The Directors may, subject to the rules of any relevant central securities depositories, and/or the rules of a relevant exchange, declare a temporary suspension of the determination of the NAV of any particular class, and of the issue and redemption of any particular class, of shares:
I. during the whole or any part of any period when any of the principal markets on which any significant portion of the constituents of the Index relating to the relevant Fund or the investments of the relevant Fund, as the case may be, from time to time are quoted, listed, traded or dealt in, or when the foreign exchange markets corresponding to the base currency of the Fund or the currency in which a considerable portion of the constituents of the Index relating to the relevant Fund or the Fund’s investments (as the case may be) are denominated, is closed (otherwise than for customary weekend or ordinary holidays) or during which dealings therein are restricted or suspended or trading on any relevant futures exchange or market is restricted or suspended;
II. during the whole or any part of any period when, as a result of political, economic, military or monetary events or any other circumstances outside the control, responsibility and power of the Directors, any disposal or valuation of investments of the relevant Fund is not, in the opinion of the Directors, reasonably practicable without this being detrimental to the interests of owners of shares in general or the owners of shares of the relevant Fund or if, in the opinion of the Directors, the NAV cannot fairly be calculated or such disposal would be materially prejudicial to the owners of shares in general or the owners of shares of the relevant Fund;
III. during the whole or any part of any period during which any breakdown occurs in the means of communication normally employed in determining the value of any of the investments of the Company or when for any other reason the value of any of the investments or other assets of the relevant Fund cannot reasonably or fairly be ascertained;
IV. during the whole or any part of any period when the Company is unable to repatriate funds required for the purpose of making redemption payments or when such payments cannot, in the opinion of the Directors, be effected at normal prices or normal rates of exchange or during which there are difficulties or it is envisaged that there will be difficulties, in the transfer of monies or assets required for subscriptions, redemptions or trading;
V. at the discretion of the Directors in circumstances where the Directors consider such a suspension to be in the best interest of the Company, or the Fund or the investors of the Fund as a whole;
VI. upon the publication of a notice convening a general shareholder meeting for the purpose of resolving to wind up the Company or terminate any Fund;
VII. when dealings of the shares on any relevant stock exchange are listed are restricted or suspended;
VIII. when settlement or clearing of securities in a recognised clearing and settlement system is disrupted;
IX. any period when the dealing of shares is suspended pursuant to any order or direction issued by a relevant regulatory authority; or
X. any period when an Index is not compiled or published.

December 2021 Legal & General UCITS ETF Plc
Notes to the Financial Statements (continued)
For the financial period ended 31 December 2021 (continued)
75
11. Financial Instruments and Associated Risks (continued)
2. Physically–Replicating Funds (continued)
C. Liquidity Risk (continued)
Notice of the beginning and end of any period of suspension will be communicated immediately (and in any event during the business days on which the suspension takes place/ends) to the central bank and relevant stock exchanges and, to the extent required by the law or practices of the country concerned, to any other competent authority in a member state or other country in which shares are registered for marketing. Such notice shall also be published in such publication(s) as the Board of Directors may determine and, in any event, shall be communicated through the media by which share prices are published.
Notice will likewise be given to any person applying to subscribe or redeem shares in the Fund’s concerned. Any applications for shares received during any period of suspension will normally be held over until the next dealing day.
The Company, where possible, will take all necessary steps to bring any period of suspension to an end as soon as possible.
If total requests for redemption on any dealing day for any Fund represent 10% or more of the NAV of that Fund, each redemption request in respect of shares in such Fund may, at the discretion of the Manager, be reduced rateably so that the total number of shares of such Fund for redemption on that dealing day shall not exceed 10% of the NAV of such Fund. Any part of a redemption request to which effect is not given by reason of the exercise of this power by the Manager shall be treated as if a request had been made in respect of the next dealing day and each succeeding dealing day (in relation to which the Manager shall have the same power) until the original requests have been satisfied in full.
During such suspension, it may be difficult for investors to buy or sell shares on the secondary market and the secondary market price may not reflect the NAV per share. In the event that the Company has to suspend the subscription and/or redemption of shares of a Fund, or if a stock exchange on which a Fund’s underlying investments are traded is closed, it is expected that larger discounts or premiums could arise.
3. Synthetically–Replicating Funds
A. Risks Associated With Usage of OTC Swaps
There are various risks associated with the use of OTC Swaps, including no assurance that a Fund will achieve its stated investment objective. Additionally, a Fund may not receive the desired return from a counterparty for a number of reasons which may include:
a material increase in the counterparty’s costs of hedging its exposure to a Fund under the OTC Swap (e.g. holding a physical position in an index’s underlying securities) or a material change or impediment to maintaining such hedging, resulting in an amendment to the terms of the OTC Swap, an increase in the fees payable to the counterparty by a Fund, a postponed or reduced payment of return under the OTC Swaps, the payment of return under the OTC Swaps in the currency of the hedge, or physical settlement or termination of the OTC Swaps;

December 2021 Legal & General UCITS ETF Plc
Notes to the Financial Statements (continued)
For the financial period ended 31 December 2021 (continued)
76
11. Financial Instruments and Associated Risks (continued)
3. Synthetically–Replicating Funds (continued)
A. Risks Associated With Usage of OTC Swaps (continued)
an increase or decrease in a Fund’s exposure to an index through the OTC Swap as a result of the issue or redemption of shares in a Fund. The cost and method of doing this with the counterparty may mean that the price at which the Fund issues or redeems shares will not correspond exactly to the price at which the Fund may have issued or redeemed such shares if the Fund had invested directly in the relevant index constituents;
the termination of an OTC Swap earlier than its anticipated term, for reasons such as modification or cancellation of the relevant index or reference assets for the relevant Fund, illegality, material impediment to the counterparty to maintain or effect its hedge, default or market disruption. Where an OTC Swap terminates early, a termination payment may be payable to the counterparty by the relevant Fund and this would reduce both the exposure of the Fund to the relevant index and the return to shareholders in the Fund;
at the end of the term of an OTC Swap, the Company will need to enter into another OTC Swap. It may not be possible to enter into an OTC Swap with similar arrangements and terms to the original OTC Swap;
the delivery to the Fund of a return at the end of the anticipated term of the OTC Swap is based on the performance of an index at a particular point in time as determined by the counterparty. The method of determining that value can involve delays and may mean that the price at which shares are redeemed at the end of an OTC Swap may not correspond exactly to the value of the index;
the valuation of an index may be impaired or delayed as a result of market disruption events specified in the relevant OTC Swap;
exposure to credit risk through the insolvency or inability of a counterparty to an OTC Swap to meet its obligations under the OTC Swap, resulting in a loss to a Fund and a potentially significant impact on the investment performance of the Funds. Please note that the foregoing counterparty risk is mitigated by the fact that, on a daily basis, the relevant profit/loss on the index swap is collateralised by the parties in the form of cash (in the base currency of the relevant Fund). In order to avoid daily transfers of immaterial amounts of cash, transfers of cash collateral are made only to the extent that the relevant profit/loss amount on any given day exceeds the agreed minimum transfer amount for the relevant Fund (such minimum transfer amounts which are set in accordance with the limits prescribed by EMIR);
changes in the rates of exchange between the base currency of a Fund and the currency of denomination may cause the value of the OTC Swap to rise or fall due to the impact of currency exchange rates on the constituents of the index;

December 2021 Legal & General UCITS ETF Plc
Notes to the Financial Statements (continued)
For the financial period ended 31 December 2021 (continued)
77
11. Financial Instruments and Associated Risks (continued)
3. Synthetically–Replicating Funds (continued)
A. Risks Associated With Usage of OTC Swaps (continued)
state intervention at the European, International and National level, including any new legislation affecting the relevant products and markets, which may include, but shall not be limited to, EMIR and the Dodd–Frank Act, which may affect the future ability of the Company to enter into or continue such OTC Swap transactions and/or increase the costs thereof;
in certain circumstances, valuations of OTC Swaps and/or indices may only be available from a limited number of market participants who may also act as counterparties to these transactions. The valuation or close out position of an OTC Swap used to track or replicate an index in such circumstances may be calculated by reference to an adjusted value of the index or to the hedging positions entered into by the counterparty to the OTC Swaps to track or replicate such index, rather than by reference to the actual value of the index, and there could be a material difference between such values. Valuations received from such market participants may therefore be subjective and there may be substantial differences between any available valuations; and/or
the charging structure of the Fund which may mean that there may be variations used in the formulae which are used to calculate returns to a Fund under the relevant OTC Swap causing changes (including possible reductions) to the anticipated returns to investors.
B. Market Risk
Market risk is the risk that the value of instruments held will fluctuate due to changes in market prices resulting from price risk, currency risk and interest rate risk.
(i) Price Risk
Price risk arises when the fair value or future cash flows of an investment will fluctuate because of changes in market prices, other than those arising from interest rate risk or currency risk, whether those changes are caused by factors specific to the individual financial instrument or its issuer, or factors affecting similar financial instruments traded in the market.
Several of the Synthetically–Replicating Funds seek to achieve a leveraged return or a leveraged inverse (i.e. short) return against the performance of a globally–recognised benchmark index (i.e. either the DAX 30 or FTSE 100) (each, the “Underlying Index”).
Leveraged Funds In order to achieve a leveraged return against an Underlying Index, a Fund will track a leveraged version of the relevant Underlying Index (each, a “Leveraged Index”) which aims to provide twice the daily percentage change in the level of the Underlying Index less an implied amount reflecting the cost of borrowing additional capital to invest in the index portfolio to create the leveraged position which is comprised of an overnight interest rate and a liquidity spread cost reflecting the cost of sourcing long term liquidity to finance the leveraged position (the “Financing Cost”).
December 2021 Legal & General UCITS ETF Plc
Notes to the Financial Statements (continued)
For the financial period ended 31 December 2021 (continued)
78
11. Financial Instruments and Associated Risks (continued)
3. Synthetically–Replicating Funds (continued)
B. Market Risk (continued)
(i) Price Risk (continued)
Leveraged Funds (continued) This means that the Fund will seek to deliver a leveraged return to shareholders which corresponds to twice the daily percentage change in the level of the Underlying Index on that day less the Financing Cost built into the leveraged methodology and fees and expenses levied at Fund–level.
In the event that the index produces a positive return on a particular day, the Fund should record a positive return equivalent to twice the percentage change in the level of the Underlying Index on that day (before adjustment reflecting the Financing Cost built into the leveraged methodology and fees and expenses applied at Fund–level).
Conversely, in the event the index produces a negative return on a particular day, the Fund should record a negative return equivalent to twice the percentage change in the level of the Underlying Index on that day (before adjustment reflecting the Financing Cost built into the leveraged methodology and fees and expenses applied at Fund–level).
Accordingly, a Leveraged Fund’s exposure to market risk is linked directly to the fluctuation of the value of the Underlying Index and its constituents.
Leveraged Inverse Funds In order to achieve a leveraged inverse return against an Underlying Index, a Fund will track a leveraged inverse version of the relevant Underlying Index (each, a “Leveraged Inverse Index”) which aims to provide twice the daily percentage change in the level of the Underlying Index on an inverse basis plus an implied amount reflecting the interest accruing on the cash proceeds earned from the sale of the index portfolio (the “Overnight Interest Rate”) less an implied amount reflecting the cost of borrowing the index portfolio to maintain the leveraged short exposure (the “Borrowing Cost ”).
This means that the Fund will seek to deliver an inverse return to Shareholders which corresponds to twice the daily percentage change in the level of the Underlying Index on an inverse basis on that day plus the Overnight Interest Rate and less the Borrowing Cost (both of which are built into the leveraged methodology) and fees and expenses levied at Fund–level.
In the event that the index produces a positive return on a particular day, the Fund should record a positive return equivalent to twice the daily percentage change in the level of the Underlying Index on an inverse basis on that day (before adjustment reflecting the Overnight Interest Rate and Borrowing Cost built into the leveraged methodology and fees and expenses applied at Fund–level).

December 2021 Legal & General UCITS ETF Plc
Notes to the Financial Statements (continued)
For the financial period ended 31 December 2021 (continued)
79
11. Financial Instruments and Associated Risks (continued)
3. Synthetically–Replicating Funds (continued)
B. Market Risk (continued)
(i) Price Risk (continued)
Leveraged Inverse Funds (continued) Conversely, in the event the index produces a negative return on a particular day, the Fund will record a negative return equivalent to twice the percentage change in the level of the Underlying Index on an inverse basis on that day (before adjustment reflecting the Overnight Interest Rate and Borrowing Cost built into the leveraged methodology and fees and expenses applied at Fund–level).
Accordingly, a Leveraged Inverse Fund’s exposure to market risk is linked directly to the fluctuation of the value of the Underlying Index and its constituents.
A Fund tracking a Leveraged Inverse Index may not be suitable for investment over extended periods of time. Due to the daily rebalancing of the Index, the actual change in the value of the Fund may differ significantly from the change in the inverse return of the Underlying Index multiplied by a leverage factor of two (the “Unbalanced Leveraged Return”).
Price volatility may also result in long–term returns of the Fund being significantly different from the Unbalanced Leveraged Return. The daily rebalancing of the index may result in the index being under– leveraged or over–leveraged relative to the Unbalanced Leveraged Return on the day following such rebalancing. Accordingly, this may result in the underperformance of the Fund compared to the performance arising from the Unbalanced Leveraged Return. Even after taking into account the Overnight Interest Rate and Borrowing Cost built into the leverage methodology and the fees and expenses applied at Fund–level, investors should not expect the actual percentage return for shares in the Fund to be equal to the percentage change in the Unbalanced Leveraged Return for periods of longer than one day.
The table below lists the Funds tracking Leveraged Indices or Leveraged Inverse Indices and the corresponding Underlying Index for each:
Fund Name Leveraged Index Underlying Index
L&G DAX® Daily 2x Long UCITS ETF LevDAX® x2 Index DAX® Index
L&G FTSE 100® Leveraged (Daily 2x) UCITS ETF FTSE 100® Daily Leveraged Index FTSE 100® Net Dividend Total Return Index
Fund Name Leveraged Inverse Index Underlying Index
L&G DAX® Daily 2x Short UCITS ETF ShortDAX® x2 Index DAX® Index
L&G FTSE 100® Super Short Strategy (Daily 2x) UCITS ETF FTSE 100® Daily Super Short Strategy Index FTSE 100® Total Return Declared Dividend Index

December 2021 Legal & General UCITS ETF Plc
Notes to the Financial Statements (continued)
For the financial period ended 31 December 2021 (continued)
80
11. Financial Instruments and Associated Risks (continued)
3. Synthetically–Replicating Funds (continued)
B. Market Risk (continued)
(i) Price Risk (continued)
An investment in a Fund tracking a Leveraged Index or a Leveraged Inverse Index exposes an investor to the market risks associated with fluctuations in the Underlying Index and the value of securities comprised in the Underlying Index. Due to the leverage inherent in the Leveraged Index or Leveraged Inverse Index, the market risk is greater than that for the Underlying Index.
For further information, please refer to the Fund–specific risk factors contained in the Fund specific Supplements to the Company’s Prospectus and the section of the Company’s Prospectus entitled “Leveraged Return and Inverse Return” which contain further information on the risks associated with Funds tracking Leveraged Indices and Leveraged Inverse Indices.
(ii) Currency Risk
Currency risk is the risk that the value of a Fund’s net assets as denominated in the Fund's functional currency will fluctuate due to changes in foreign currency rates.
The Synthetically–Replicating Funds held OTC Swaps during the financial period, which were issued in the functional currency of the relevant Funds, and all other assets and liabilities were denominated in each Fund’s functional currency.
(iii) Interest Rate Risk
Interest rate risk is the risk that the value of a financial instrument will fluctuate due to changes in market interest rates. All of the Company’s Synthetically–Replicating Funds primarily hold swaps, the interest of which is wholly or partially offset by the return on reverse repurchase agreements held. The Investment Managers are of the view that there is minimal exposure to interest rate risk, as the exposure is limited to cash holdings which are swept into short term investment funds. These amounts are classified as money market instruments on the statement of financial position of each Fund.
Each Fund’s interest rate risk is managed by the Investment Managers or Sub–Investment Manager in accordance with the objectives and policies and procedures in place as given in the Company information section.

December 2021 Legal & General UCITS ETF Plc
Notes to the Financial Statements (continued)
For the financial period ended 31 December 2021 (continued)
81
11. Financial Instruments and Associated Risks (continued)
3. Synthetically–Replicating Funds (continued)
C. Credit Risk
Credit risk is the risk that the counterparty to a financial instrument will fail to discharge an obligation or commitment that it has entered into with the Company’s Funds. As the Synthetically–Replicating Funds each primarily enter into OTC Swaps and reverse repurchase agreements, there is exposure to credit risk from the parties with which these arrangements are made and these are disclosed in Note 5 ("Collateral").
(i) OTC Swaps and Reverse Repurchase Agreements
The Synthetically–Replicating Funds use total return index swaps entered into with one or more OTC swap counterparties (during the current financial period and prior financial year, these were Barclays Bank Plc, Citigroup Global Markets Limited and Merrill Lynch International) to track the performance of the relevant index.
As the OTC Swaps used are all “unfunded” swaps, the cash received by a Fund from subscriptions is retained by the Fund (i.e. it is not transferred to the swap counterparties as would be the case with a “funded” swap). The retained cash is then managed by the Investment Managers in accordance with the Company’s efficient portfolio (cash) management policy by investing:
the majority of the cash into reverse repurchase agreements with Repo Counterparties pursuant to which the Company (for the account of the relevant Fund) exchanges the cash for securities which are transferred to it by the Repo Counterparty (full legal title transfer) subject to an obligation by the counterparty to repurchase the securities from the Company on demand (“Reverse Repurchase Arrangements”). The Reverse Repurchase Arrangements are documented by way of a collateral management master agreement between the Company (for the account of each relevant Fund) and The Bank of New York Mellon (the “Collateral Manager”) to whom the establishment and maintenance of the collateral accounts has been delegated by the Depositary.
The securities transferred to the Company (for the account of the relevant Fund) must satisfy certain eligibility criteria. On a daily basis, the collateral securities are valued (i.e. “marked–to–market”) and, to the extent that their value is less than the notional cash value of the Reverse Repurchase Arrangements (i.e. the value of the cash transferred to the Repo Counterparty), the Repo Counterparty will be required to transfer additional collateral securities to the Company (for the account of the relevant Fund) to match the notional cash value of the Reverse Repurchase Arrangements. Conversely, to the extent that the value of the collateral securities is greater than the notional cash value of the Reverse Repurchase Arrangements, the Company will transfer a proportion of the securities (equivalent to the excess) back to the Repo Counterparty.
a small proportion of the cash into UCITS AAA money market funds which are not managed or otherwise connected with the Company, the Manager or the ETF Securities group (Short–Term Investment Funds (“STIFs”)). The STIFs are used because they have daily liquidity and therefore, where there is a margin call on the swap (see paragraph below), a proportion of the cash held in the STIF can be quickly unwound and transferred to the swap counterparty.

December 2021 Legal & General UCITS ETF Plc
Notes to the Financial Statements (continued)
For the financial period ended 31 December 2021 (continued)
82
11. Financial Instruments and Associated Risks (continued)
3. Synthetically–Replicating Funds (continued)
C. Credit Risk (continued)
(i) OTC Swaps and Reverse Repurchase Agreements (continued)
As the value of the relevant index tracked by a Fund increases or decreases, the total return index swaps entered into with a swap counterparty records either a gain or loss for the Fund. The profit or loss on the swap is settled between the Company (for the account of the relevant Fund) and the swap counterparty on a monthly basis. However, on an intra–month basis, the Company (for the account of the relevant Fund) and the swap counterparty transfers cash collateral (in the base currency of the Fund only) back and forth in amounts matching the daily profit/loss on the index swap to the extent that the relevant profit/loss exceeds an agreed threshold amount. In order to avoid daily transfers of immaterial amounts of cash, transfers of cash collateral are made only to the extent that the relevant profit/loss amount on any given day exceeds the agreed minimum transfer amount for the relevant Fund which is set in accordance with the limits prescribed by the Central Bank UCITS Regulations and EMIR.
Any cash transferred to the Company (for the account of the relevant Fund) by the swap counterparty as collateral on the swap is invested in the Reverse Repurchase Arrangements and the STIFs (as described above) in proportions determined by the Investment Managers. Conversely, where the Company (for the account of the relevant Fund) is required to transfer cash collateral to the swap counterparty under the swap, it unwinds a proportion of the Reverse Repurchase Arrangements / STIFs to cover the relevant amount.
As at the statement of financial position date, all of the cash collateral received in respect of OTC derivative transactions was re–invested in money market funds. Non–cash collateral received by way of title transfer collateral arrangements in relation to OTC derivative transactions, cannot be sold, re–invested or pledged. Income earned by the Funds from the reinvestment of cash collateral in money market funds, net of any interest payable to the relevant counterparty, amounted to ($5,579) for the financial period ended 31 December 2021 (31 December 2020: $25,638) and is disclosed in the statement of comprehensive income.
The Investment Managers employ internal procedures to determine a counterparty’s creditworthiness in accordance with the Central Bank UCITS requirements and that the OTC Swaps are issued under the International Swaps and Derivatives Association Master Agreement (“ISDA”) and ancillary industry-standard confirmation agreements.
As at 31 December 2021 and 30 June 2021, the Synthetically-Replicating Funds held OTC Swaps issued by Barclays Bank Plc, Citigroup Global Markets Limited and Merrill Lynch International. All reverse repurchase agreements entered into by the Company on behalf of the Synthetically-Replicating Funds are contracted with Barclays Bank Plc, Citigroup Global Markets Limited and Merrill Lynch International.
In addition to the processes employed by the Investment Managers as part of the day-to-day oversight of transactions with the counterparties, the Investment Managers review the list of counterparties on an ongoing basis to ensure no significant issues which could affect the ability of the counterparties to meet their obligations are identified.
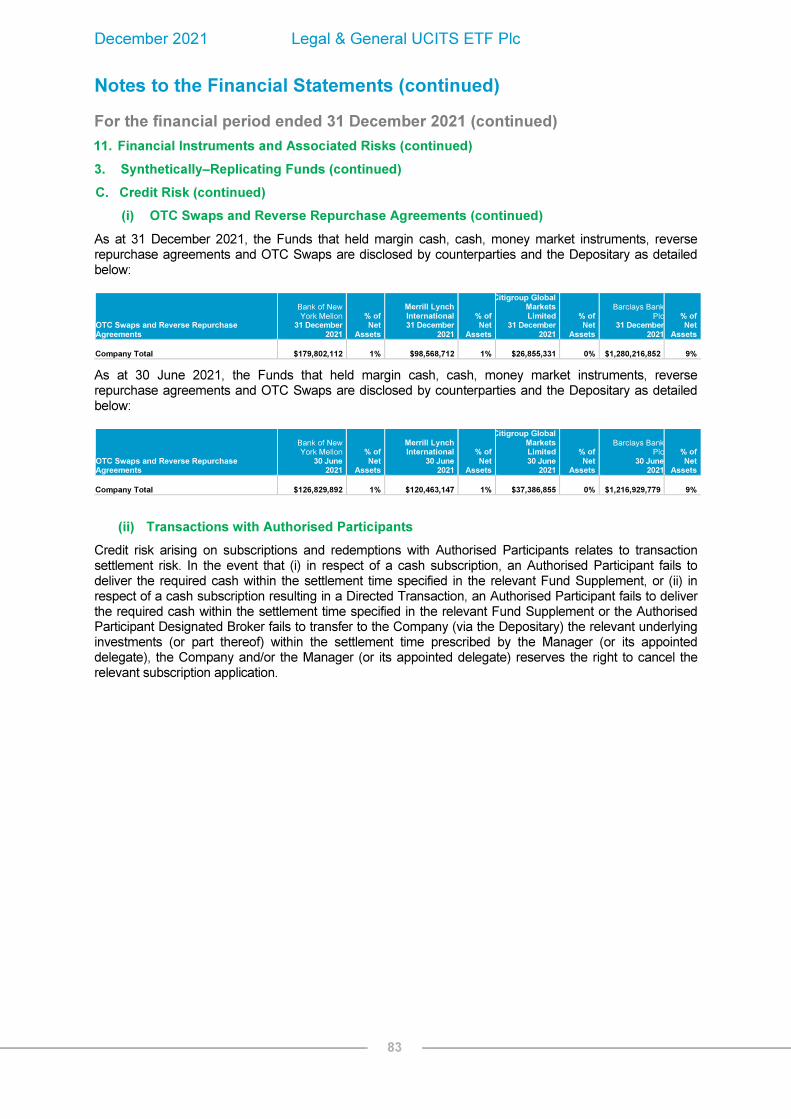
December 2021 Legal & General UCITS ETF Plc
Notes to the Financial Statements (continued)
For the financial period ended 31 December 2021 (continued)
83
11. Financial Instruments and Associated Risks (continued)
3. Synthetically–Replicating Funds (continued)
C. Credit Risk (continued)
(i) OTC Swaps and Reverse Repurchase Agreements (continued)
As at 31 December 2021, the Funds that held margin cash, cash, money market instruments, reverse repurchase agreements and OTC Swaps are disclosed by counterparties and the Depositary as detailed below:
OTC Swaps and Reverse Repurchase Agreements
Bank of New York Mellon
31 December 2021
% of Net
Assets
Merrill Lynch International 31 December
2021
% of Net
Assets
Citigroup Global Markets Limited
31 December 2021
% of Net
Assets
Barclays BankPlc
31 December2021
% of Net
Assets
Company Total $179,802,112 1% $98,568,712 1% $26,855,331 0% $1,280,216,852 9%
As at 30 June 2021, the Funds that held margin cash, cash, money market instruments, reverse repurchase agreements and OTC Swaps are disclosed by counterparties and the Depositary as detailed below:
OTC Swaps and Reverse Repurchase Agreements
Bank of New York Mellon
30 June 2021
% of Net
Assets
Merrill Lynch International
30 June 2021
% of Net
Assets
Citigroup Global Markets Limited 30 June
2021
% of Net
Assets
Barclays BankPlc
30 June2021
% of Net
Assets
Company Total $126,829,892 1% $120,463,147 1% $37,386,855 0% $1,216,929,779 9%
(ii) Transactions with Authorised Participants
Credit risk arising on subscriptions and redemptions with Authorised Participants relates to transaction settlement risk. In the event that (i) in respect of a cash subscription, an Authorised Participant fails to deliver the required cash within the settlement time specified in the relevant Fund Supplement, or (ii) in respect of a cash subscription resulting in a Directed Transaction, an Authorised Participant fails to deliver the required cash within the settlement time specified in the relevant Fund Supplement or the Authorised Participant Designated Broker fails to transfer to the Company (via the Depositary) the relevant underlying investments (or part thereof) within the settlement time prescribed by the Manager (or its appointed delegate), the Company and/or the Manager (or its appointed delegate) reserves the right to cancel the relevant subscription application.

December 2021 Legal & General UCITS ETF Plc
Notes to the Financial Statements (continued)
For the financial period ended 31 December 2021 (continued)
84
11. Financial Instruments and Associated Risks (continued)
3. Synthetically–Replicating Funds (continued)
C. Credit Risk (continued)
(iii) Counterparty risk to the Paying Agent - dividend and fund liquidation monies
The Paying Agent for the Funds is responsible for arranging payments to participants relating to dividend monies and the proceeds of any compulsory redemptions of ETF Shares on the relevant payment dates.
Prior to the relevant payment date, monies for distribution to participants as dividends will be transferred from the Company’s cash accounts with the Depositary to the Paying Agent. During the interim period, dividend monies are held with the Paying Agent (or its associated depositary bank) in the form of cash and the Company will have credit risk exposure, in respect of such cash, to the Paying Agent and its associated depositary bank. Cash held by the Paying Agent will not be segregated in practice but will be a debt owing from the Paying Agent (or its associated depositary bank) to the Company as a depositor. In the event of the insolvency of the Paying Agent (or its associated depositary bank) during the interim period, the Company will be treated as a general unsecured creditor of the Paying Agent (or its associated depositary bank) in relation to the cash. The Company may face difficulties and/or encounter delays in recovering such debt, or may not be able to recover it in full or at all, in which case the Company may lose some or all of the dividend monies being distributed by the Paying Agent resulting in a reduction in the value of a Fund.
With respect to the Synthetically–Replicating Funds, risk relating to unsettled transactions is limited given that subscriptions and redemptions are all settled on a “delivery versus payment” basis in the relevant settlement system.
D. Liquidity Risk
Liquidity risk is the risk that the Company will encounter difficulty in meeting obligations associated with financial liabilities. The main liquidity risk to the Company arises from the redemption requests of investors (in the Company’s case, the Authorised Participants). The Company’s shareholders may redeem their shares on any business day for cash equal to a proportionate share of a Fund’s NAV, and it is therefore exposed to the liquidity risk of meeting daily redemptions by its shareholders.
The Funds provide for the subscription and redemption of shares and, therefore are, exposed to the liquidity risk associated with shareholder redemptions in accordance with the terms of the Prospectus. These terms include the discretion to pay redemption distributions in cash or in kind or to limit redemptions to 10% of the NAV of the relevant Fund on any dealing day. The portfolios are managed to include liquid investments sufficient to meet normal liquidity needs although substantial redemptions of shares in the Funds could require the Funds to liquidate investments more rapidly than otherwise desirable in order to raise cash for redemptions. These factors could adversely affect the value of the shares redeemed and the valuation of the shares that remain outstanding and the liquidity of remaining assets if more liquid assets have been sold to meet redemptions.

December 2021 Legal & General UCITS ETF Plc
Notes to the Financial Statements (continued)
For the financial period ended 31 December 2021 (continued)
85
11. Financial Instruments and Associated Risks (continued)
3. Synthetically–Replicating Funds (continued)
D. Liquidity Risk (continued)
The Company may suspend calculation of the NAV and the subscription and redemption of shares of one or more Funds under certain circumstances.
The Directors may, subject to the rules of any relevant central securities depositories, and/or the rules of a relevant exchange, declare a temporary suspension of the determination of the NAV of any particular class, and of the issue and redemption of any particular class, of shares:
I. during the whole or any part of any period when any of the principal markets on which any significant portion of the constituents of the Index relating to the relevant Fund or the investments of the relevant Fund, as the case may be, from time to time are quoted, listed, traded or dealt in, or when the foreign exchange markets corresponding to the base currency of the Fund or the currency in which a considerable portion of the constituents of the Index relating to the relevant Fund or the Fund’s investments (as the case may be) are denominated, is closed (otherwise than for customary weekend or ordinary holidays) or during which dealings therein are restricted or suspended or trading on any relevant futures exchange or market is restricted or suspended;
II. during the whole or any part of any period when, as a result of political, economic, military or monetary events or any other circumstances outside the control, responsibility and power of the Directors, any disposal or valuation of investments of the relevant Fund is not, in the opinion of the Directors, reasonably practicable without this being detrimental to the interests of owners of shares in general or the owners of shares of the relevant Fund or if, in the opinion of the Directors, the NAV cannot fairly be calculated or such disposal would be materially prejudicial to the owners of shares in general or the owners of shares of the relevant Fund;
III. during the whole or any part of any period during which any breakdown occurs in the means of communication normally employed in determining the value of any of the investments of the Company or when for any other reason the value of any of the investments or other assets of the relevant Fund cannot reasonably or fairly be ascertained;
IV. during the whole or any part of any period when the Company is unable to repatriate funds required for the purpose of making redemption payments or when such payments cannot, in the opinion of the Directors, be effected at normal prices or normal rates of exchange or during which there are difficulties or it is envisaged that there will be difficulties, in the transfer of monies or assets required for subscriptions, redemptions or trading;

December 2021 Legal & General UCITS ETF Plc
Notes to the Financial Statements (continued)
For the financial period ended 31 December 2021 (continued)
86
11. Financial Instruments and Associated Risks (continued)
3. Synthetically–Replicating Funds (continued)
D. Liquidity Risk (continued)
V. at the discretion of the Directors in circumstances where the Directors consider such a suspension to be in the best interest of the Company, or the Fund or the investors of the Fund as a whole;
VI. upon the publication of a notice convening a general shareholder meeting for the purpose of resolving to wind up the Company or terminate any Fund;
VII. when dealings of the shares on any relevant stock exchange are listed are restricted or suspended;
VIII. when settlement or clearing of securities in a recognised clearing and settlement system is disrupted;
IX. any period when the dealing of shares is suspended pursuant to any order or direction issued by a relevant regulatory authority; or
X. any period when an Index is not compiled or published.
Notice of the beginning and end of any period of suspension will be communicated immediately (and in any event during the business days on which the suspension takes place/ends) to the central bank and relevant stock exchanges and, to the extent required by the law or practices of the country concerned, to any other competent authority in a member state or other country in which shares are registered for marketing. Such notice shall also be published in such publication(s) as the Board of Directors may determine and, in any event, shall be communicated through the media by which share prices are published.
Notice will likewise be given to any person applying to subscribe or redeem shares in the Fund’s concerned. Any applications for shares received during any period of suspension will normally be held over until the next dealing day.
The Company, where possible, will take all necessary steps to bring any period of suspension to an end as soon as possible.
If total requests for redemption on any dealing day for any Fund represent 10% or more of the NAV of that Fund, each redemption request in respect of shares in such Fund may, at the discretion of the Manager, be reduced rateably so that the total number of shares of such Fund for redemption on that dealing day shall not exceed 10% of the NAV of such Fund. Any part of a redemption request to which effect is not given by reason of the exercise of this power by the Manager shall be treated as if a request had been made in respect of the next dealing day and each succeeding dealing day (in relation to which the Manager shall have the same power) until the original requests have been satisfied in full.

December 2021 Legal & General UCITS ETF Plc
Notes to the Financial Statements (continued)
For the financial period ended 31 December 2021 (continued)
87
11. Financial Instruments and Associated Risks (continued)
3. Synthetically–Replicating Funds (continued)
D. Liquidity Risk (continued)
During such suspension, it may be difficult for investors to buy or sell shares on the secondary market and the secondary market price may not reflect the NAV per share. In the event that the Company has to suspend the subscription and/or redemption of shares of a Fund, or if a stock exchange on which a Fund’s underlying investments are traded is closed, it is expected that larger discounts or premiums could arise
For OTC swaps, the values in the statement of financial position represent the fair value as at the current and prior financial periods and at the time of payment, the fair value might change based on the market movement. The notional amounts of these OTC swaps are disclosed in the schedule of investments.
4. Fair Value
The Company’s accounting policy on fair value measurement requires a fair value hierarchy when financial instruments are recognised at fair value, based on the following levels:
Level 1 – Unadjusted quoted prices in active markets that are accessible at the measurement date for identical unrestricted assets or liabilities;
Level 2 – Inputs other than quoted prices included in level 1 that are observable for the asset or liability, either directly (as prices) or indirectly (derived from prices); and
Level 3 – Inputs for the asset or liability that are not based on observable market data (unobservable inputs).
The level in the fair value hierarchy within which the fair value of a financial instrument is categorised in its entirety shall be determined on the basis of the lowest level input that is significant to the fair value measurement. For this purpose, the significance of an input is assessed against the fair value measurement in its entirety. If a fair value measurement uses observable inputs that require significant adjustment based on unobservable inputs, that measure is considered a level 3 measurement. Assessing the significance of a particular input to the overall fair value measurement of a financial instrument requires judgement, considering factors specific to the particular asset or liability.
The financial instruments not measured at fair value through profit or loss are short–term financial assets and financial liabilities whose carrying amounts approximate fair value. These include the following:
(i) cash and cash equivalents and balances due from/to brokers. These are short–term financial assets and financial liabilities whose carrying amounts approximate fair value, because of their short term nature and the high credit quality of counterparties. The cash and cash equivalents and balances due from/to brokers are categorised into level 2 of the fair value hierarchy; and
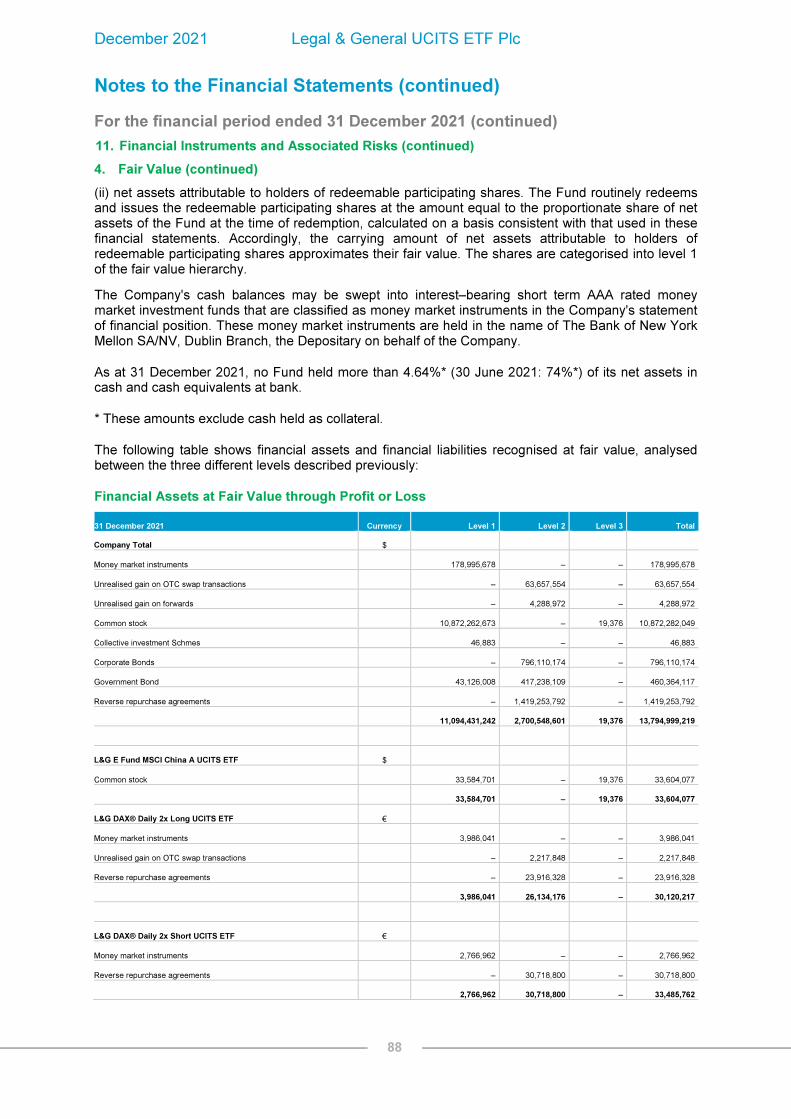
December 2021 Legal & General UCITS ETF Plc
Notes to the Financial Statements (continued)
For the financial period ended 31 December 2021 (continued)
88
11. Financial Instruments and Associated Risks (continued)
4. Fair Value (continued)
(ii) net assets attributable to holders of redeemable participating shares. The Fund routinely redeems and issues the redeemable participating shares at the amount equal to the proportionate share of net assets of the Fund at the time of redemption, calculated on a basis consistent with that used in these financial statements. Accordingly, the carrying amount of net assets attributable to holders of redeemable participating shares approximates their fair value. The shares are categorised into level 1 of the fair value hierarchy.
The Company's cash balances may be swept into interest–bearing short term AAA rated money market investment funds that are classified as money market instruments in the Company's statement of financial position. These money market instruments are held in the name of The Bank of New York Mellon SA/NV, Dublin Branch, the Depositary on behalf of the Company.
As at 31 December 2021, no Fund held more than 4.64%* (30 June 2021: 74%*) of its net assets in cash and cash equivalents at bank.
* These amounts exclude cash held as collateral.
The following table shows financial assets and financial liabilities recognised at fair value, analysed between the three different levels described previously:
Financial Assets at Fair Value through Profit or Loss
31 December 2021 Currency Level 1 Level 2 Level 3 Total
Company Total $
Money market instruments 178,995,678 – – 178,995,678
Unrealised gain on OTC swap transactions – 63,657,554 – 63,657,554
Unrealised gain on forwards – 4,288,972 – 4,288,972
Common stock 10,872,262,673 – 19,376 10,872,282,049
Collective investment Schmes 46,883 – – 46,883
Corporate Bonds – 796,110,174 – 796,110,174
Government Bond 43,126,008 417,238,109 – 460,364,117
Reverse repurchase agreements – 1,419,253,792 – 1,419,253,792
11,094,431,242 2,700,548,601 19,376 13,794,999,219
L&G E Fund MSCI China A UCITS ETF $
Common stock 33,584,701 – 19,376 33,604,077
33,584,701 – 19,376 33,604,077
L&G DAX® Daily 2x Long UCITS ETF €
Money market instruments 3,986,041 – – 3,986,041
Unrealised gain on OTC swap transactions – 2,217,848 – 2,217,848
Reverse repurchase agreements – 23,916,328 – 23,916,328
3,986,041 26,134,176 – 30,120,217
L&G DAX® Daily 2x Short UCITS ETF €
Money market instruments 2,766,962 – – 2,766,962
Reverse repurchase agreements – 30,718,800 – 30,718,800
2,766,962 30,718,800 – 33,485,762

December 2021 Legal & General UCITS ETF Plc
Notes to the Financial Statements (continued)
For the financial period ended 31 December 2021 (continued)
89
11. Financial Instruments and Associated Risks (continued)
4. Fair Value (continued)
Financial Assets at Fair Value through Profit or Loss (continued)
31 December 2021 Currency Level 1 Level 2 Level 3 Total
L&G Longer Dated All Commodities UCITS ETF $
Money market instruments 84,417,610 – – 84,417,610
Unrealised gain on OTC swap transactions – 27,449,776 – 27,449,776
Reverse repurchase agreements – 673,631,724 – 673,631,724
84,417,610 701,081,500 – 785,499,110
L&G FTSE 100® Leveraged (Daily 2x) UCITS ETF £
Money market instruments 2,205,047 – – 2,205,047
Unrealised gain on OTC swap transactions – 878,952 – 878,952
Reverse repurchase agreements – 15,243,000 – 15,243,000
2,205,047 16,121,952 – 18,326,999
L&G FTSE 100® Super Short Strategy (Daily 2x) UCITS ETF £
Money market instruments 293,019 – – 293,019
Reverse repurchase agreements – 11,720,751 – 11,720,751
293,019 11,720,751 – 12,013,770
L&G Russell 2000 US Small Cap Quality UCITS ETF $
Common stock 40,638,432 – – 40,638,432
40,638,432 – – 40,638,432
L&G Gold Mining UCITS ETF $
Common stock 161,829,914 – – 161,829,914
161,829,914 – – 161,829,914
L&G US Energy Infrastructure MLP UCITS ETF $
Money market instruments 3,844,914 – – 3,844,914
Unrealised gain on OTC swap transactions – 2,196,343 – 2,196,343
Reverse repurchase agreements – 26,448,923 – 26,448,923
3,844,914 28,645,266 – 32,490,180
L&G ROBO Global® Robotics and Automation UCITS ETF $
Common stock 1,373,276,925 – – 1,373,276,925
1,373,276,925 – – 1,373,276,925

December 2021 Legal & General UCITS ETF Plc
Notes to the Financial Statements (continued)
For the financial period ended 31 December 2021 (continued)
90
11. Financial Instruments and Associated Risks (continued)
4. Fair Value (continued)
Financial Assets at Fair Value through Profit or Loss (continued)
31 December 2021 Currency Level 1 Level 2 Level 3 Total
L&G Cyber Security UCITS ETF $
Common stock 3,061,927,289 – – 3,061,927,289
3,061,927,289 – – 3,061,927,289
L&G All Commodities UCITS ETF $
Money market instruments 8,397,429 – – 8,397,429
Unrealised gain on OTC swap transactions – 3,194,997 – 3,194,997
Reverse repurchase agreements – 76,038,070 – 76,038,070
8,397,429 79,233,067 – 87,630,496
L&G Longer Dated All Commodities ex–Agriculture and Livestock UCITS ETF $
Money market instruments 98,438 – – 98,438
Unrealised gain on OTC swap transactions – 61,387 – 61,387
Reverse repurchase agreements – 1,299,553 – 1,299,553
98,438 1,360,940 – 1,459,378
L&G Battery Value–Chain UCITS ETF $
Common stock 953,726,159 – – 953,726,159
953,726,159 – – 953,726,159
L&G Pharma Breakthrough UCITS ETF $
Common stock 33,337,899 – – 33,337,899
33,337,899 – – 33,337,899
L&G Ecommerce Logistics UCITS ETF $
Common stock 513,448,755 – – 513,448,755
513,448,755 – – 513,448,755
L&G US Equity UCITS ETF $
Common stock 318,401,634 – – 318,401,634
318,401,634 – – 318,401,634
L&G UK Equity UCITS ETF £
Common stock 18,842,036 – – 18,842,036
18,842,036 – – 18,842,036

December 2021 Legal & General UCITS ETF Plc
Notes to the Financial Statements (continued)
For the financial period ended 31 December 2021 (continued)
91
11. Financial Instruments and Associated Risks (continued)
4. Fair Value (continued)
Financial Assets at Fair Value through Profit or Loss (continued)
31 December 2021 Currency Level 1 Level 2 Level 3 Total
L&G Japan Equity UCITS ETF $
Common stock 252,907,773 – – 252,907,773
252,907,773 – – 252,907,773
L&G Global Equity UCITS ETF $
Common stock 63,645,496 – – 63,645,496
63,645,496 – – 63,645,496
L&G Europe ex UK Equity UCITS ETF €
Common stock 123,836,284 – – 123,836,284
123,836,284 – – 123,836,284
L&G Asia Pacific ex Japan Equity UCITS ETF $
Common stock 235,582,151 – – 235,582,151
Corporate Bonds – 30,296 – 30,296
235,582,151 30,296 – 235,612,447
L&G Clean Water UCITS ETF $
Common stock 363,210,695 – – 363,210,695
363,210,695 – – 363,210,695
L&G Artificial Intelligence UCITS ETF $
Common stock 333,153,024 – – 333,153,024
333,153,024 – – 333,153,024
L&G Healthcare Breakthrough UCITS ETF $
Common stock 212,948,553 – – 212,948,553
212,948,553 – – 212,948,553
L&G Europe Equity (Responsible Exclusions) UCITS ETF
€
Common stock 130,108,677 – – 130,108,677
130,108,677 – – 130,108,677
L&G US Equity (Responsible Exclusions) UCITS ETF
$
Common stock 1,795,040,945 – – 1,795,040,945
1,795,040,945 – – 1,795,040,945

December 2021 Legal & General UCITS ETF Plc
Notes to the Financial Statements (continued)
For the financial period ended 31 December 2021 (continued)
92
11. Financial Instruments and Associated Risks (continued)
4. Fair Value (continued)
Financial Assets at Fair Value through Profit or Loss (continued)
31 December 2021 Currency Level 1 Level 2 Level 3 Total
L&G Clean Energy UCITS ETF $
Common Stock 130,147,931 – – 130,147,931
130,147,931 – – 130,147,931
L&G ESG GBP Corporate Bond 0-5 Year UCITS ETF £
Corporate Bonds – 67,625,731 – 67,625,731
Government Bond 216,146 – – 216,146
216,146 67,625,731 – 67,841,877
L&G ESG GBP Corporate Bond UCITS ETF £
Corporate Bonds – 77,914,852 – 77,914,852
Government Bond 97,587 – – 97,587
97,587 77,914,852 – 78,012,439
L&G ESG Emerging Markets Government Bond (USD) 0-5 Year UCITS ETF $
Corporate Bonds – 7,959,885 – 7,959,885
Government Bond – 43,496,159 – 43,496,159
– 51,456,044 – 51,456,044
L&G ESG China CNY Bond UCITS ETF $
Government Bond – 293,866,611 – 293,866,611
– 293,866,611 – 293,866,611
L&G UK Gilt 0-5 Year UCITS ETF £
Government Bond 27,466,281 – – 27,466,281
27,466,281 – – 27,466,281
L&G ESG USD Corporate Bond UCITS ETF $
Corporate Bonds – 92,164,676 – 92,164,676
– 92,164,676 – 92,164,676
L&G ESG Emerging Markets Corporate Bond (USD) UCITS ETF $
Unrealised gain on forwards – 4,288,972 – 4,288,972
Corporate Bonds – 482,111,558 – 482,111,558
Government Bond – 3,870,981 – 3,870,981
– 490,271,511 – 490,271,511
L&G Hydrogen Economy UCITS ETF $
Common stock 559,408,040 – – 559,408,040
559,408,040 – – 559,408,040

December 2021 Legal & General UCITS ETF Plc
Notes to the Financial Statements (continued)
For the financial period ended 31 December 2021 (continued)
93
11. Financial Instruments and Associated Risks (continued)
4. Fair Value (continued)
Financial Assets at Fair Value through Profit or Loss (continued)
31 December 2021 Currency Level 1 Level 2 Level 3 Total
L&G ESG Green Bond UCITS ETF
€
Corporate Bonds – 14,699,670 – 14,699,670
Government Bond 4,835,928 3,593,242 – 8,429,170
4,835,928 18,292,912 – 23,128,840
L&G Quality Equity Dividends ESG Exclusions UK UCITS ETF £
Common stock 33,341,468 – – 33,341,468
33,341,468 – – 33,341,468
L&G Quality Equity Dividends ESG Exclusions Europe ex-UK UCITS ETF €
Common stock 21,547,672 – – 21,547,672
21,547,672 – – 21,547,672
L&G Quality Equity Dividends ESG Exclusions Asia Pacific ex-Japan UCITS ETF $
Common stock 21,268,094 – – 21,268,094
21,268,094 – – 21,268,094
L&G Digital Payments UCITS ETF $
Common stock 16,095,179 – – 16,095,179
16,095,179 – – 16,095,179
L&G Multi-Strategy Enhanced Commodities UCITS ETF1 $
Money market instruments 71,174,335 – – 71,174,335
Unrealised gain on OTC swap transactions – 27,042,440 – 27,042,440
Reverse repurchase agreements – 543,183,955 – 543,183,955
71,174,335 570,226,395 – 641,400,730
L&G Quality Equity Dividends ESG Exclusions Emerging Markets UCITS ETF
2 $
Common stock 14,715,704 – – 14,715,704
Collective investment Schmes 46,883 – – 46,883
14,762,587 – – 14,762,587
L&G India INR Government Bond UCITS ETF3 $
Government Bond – 71,918,160 – 71,918,160
– 71,918,160 – 71,918,160
1 The Fund launched on 2 July 2021.
2 The Fund launched on 12 July 2021.
3 The Fund launched on 26 October 2021.

December 2021 Legal & General UCITS ETF Plc
Notes to the Financial Statements (continued)
For the financial period ended 31 December 2021 (continued)
94
11. Financial Instruments and Associated Risks (continued)
4. Fair Value (continued)
Financial Assets at Fair Value through Profit or Loss
30 June 2021 Currency Level 1 Level 2 Level 3 Total
Company Total $
Money market instruments 124,998,774 – – 124,998,774
Unrealised gain on OTC swap transactions – 41,722,568 – 41,722,568
Common stock 10,023,971,107 – 43,875 10,024,014,982
Right 15,224 – – 15,224
Corporate Bonds – 859,481,634 - 859,481,634
Government Bond – 514,523,210 - 514,523,210
Reverse repurchase agreements – 1,354,803,398 – 1,354,803,398
10,148,985,105 2,770,530,810 43,875 12,919,559,790
L&G E Fund MSCI China A UCITS ETF $
Common stock 42,304,097 – 43,875 42,347,972
42,304,097 – 43,875 42,347,972
L&G DAX® Daily 2x Long UCITS ETF €
Money market instruments 1,813,614 – – 1,813,614
Reverse repurchase agreements – 24,266,328 – 24,266,328
1,813,614 24,266,328 – 26,079,942
L&G DAX® Daily 2x Short UCITS ETF €
Money market instruments 2,805,266 – – 2,805,266
Unrealised gain on OTC swap transactions – 366,869 – 366,869
Reverse repurchase agreements – 44,148,270 – 44,148,270
2,805,266 44,515,139 – 47,320,405

December 2021 Legal & General UCITS ETF Plc
Notes to the Financial Statements (continued)
For the financial period ended 31 December 2021 (continued)
95
11. Financial Instruments and Associated Risks (continued)
4. Fair Value (continued)
Financial Assets at Fair Value through Profit or Loss (continued)
30 June 2021 Currency Level 1 Level 2 Level 3 Total
L&G Longer Dated All Commodities UCITS ETF $
Money market instruments 103,571,225 – – 103,571,225
Unrealised gain on OTC swap transactions – 37,901,189 – 37,901,189
Reverse repurchase agreements – 1,103,956,000 – 1,103,956,000
103,571,225 1,141,857,189 – 1,245,428,414
L&G FTSE 100® Leveraged (Daily 2x) UCITS ETF £
Money market instruments 1,823,332 – – 1,823,332
Reverse repurchase agreements – 17,820,000 – 17,820,000
1,823,332 17,820,000 – 19,643,332
L&G FTSE 100® Super Short Strategy (Daily 2x) UCITS ETF £
Money market instruments 598,160 – – 598,160
Unrealised gain on OTC swap transactions – 53,803 – 53,803
Reverse repurchase agreements – 10,588,751 – 10,588,751
598,160 10,642,554 – 11,240,714
L&G Russell 2000 US Small Cap Quality UCITS ETF $
Common stock 38,710,047 – – 38,710,047
38,710,047 – – 38,710,047
L&G Gold Mining UCITS ETF $
Common stock 155,213,214 – – 155,213,214
155,213,214 – – 155,213,214
L&G US Energy Infrastructure MLP UCITS ETF $
Money market instruments 2,926,984 – – 2,926,984
Reverse repurchase agreements – 36,548,923 – 36,548,923
2,926,984 36,548,923 – 39,475,907
L&G ROBO Global® Robotics and Automation UCITS ETF $
Common stock 1,252,893,177 – – 1,252,893,177
1,252,893,177 – – 1,252,893,177

December 2021 Legal & General UCITS ETF Plc
Notes to the Financial Statements (continued)
For the financial period ended 31 December 2021 (continued)
96
11. Financial Instruments and Associated Risks (continued)
4. Fair Value (continued)
Financial Assets at Fair Value through Profit or Loss (continued)
30 June 2021 Currency Level 1 Level 2 Level 3 Total
L&G Cyber Security UCITS ETF $
Common stock 2,788,358,945 – – 2,788,358,945
2,788,358,945 – – 2,788,358,945
L&G All Commodities UCITS ETF $
Money market instruments 8,543,256 – – 8,543,256
Unrealised gain on OTC swap transactions – 2,961,381 – 2,961,381
Reverse repurchase agreements – 83,859,070 – 83,859,070
8,543,256 86,820,451 – 95,363,707
L&G Longer Dated All Commodities ex–Agriculture and Livestock UCITS ETF $
Money market instruments 1,134,629 – – 1,134,629
Unrealised gain on OTC swap transactions – 350,603 – 350,603
Reverse repurchase agreements – 10,061,553 – 10,061,553
1,134,629 10,412,156 – 11,546,785
L&G Battery Value–Chain UCITS ETF $
Common stock 832,509,597 – – 832,509,597
832,509,597 – – 832,509,597
L&G Pharma Breakthrough UCITS ETF $
Common stock 34,270,643 – – 34,270,643
34,270,643 – – 34,270,643
L&G Ecommerce Logistics UCITS ETF $
Common stock 610,390,357 – – 610,390,357
610,390,357 – – 610,390,357
L&G US Equity UCITS ETF $
Common stock 295,165,887 – – 295,165,887
295,165,887 – – 295,165,887
L&G UK Equity UCITS ETF £
Common stock 16,601,989 – – 16,601,989
16,601,989 – – 16,601,989

December 2021 Legal & General UCITS ETF Plc
Notes to the Financial Statements (continued)
For the financial period ended 31 December 2021 (continued)
97
11. Financial Instruments and Associated Risks (continued)
4. Fair Value (continued)
Financial Assets at Fair Value through Profit or Loss (continued)
30 June 2021 Currency Level 1 Level 2 Level 3 Total
L&G Japan Equity UCITS ETF $
Common stock 251,110,148 – – 251,110,148
251,110,148 – – 251,110,148
L&G Global Equity UCITS ETF $
Common stock 51,244,631 – – 51,244,631
Right 190 – – 190
51,244,821 – – 51,244,821
L&G Europe ex UK Equity UCITS ETF €
Common stock 112,861,207 – – 112,861,207
Right 4,269 – – 4,269
112,865,476 – – 112,865,476
L&G Asia Pacific ex Japan Equity UCITS ETF $
Common stock 172,655,619 – – 172,655,619
Right 1,718 – – 1,718
Corporate Bonds – 31,158 – 31,158
172,657,337 31,158 – 172,688,495
L&G Clean Water UCITS ETF $
Common stock 231,554,039 – – 231,554,039
231,554,039 – – 231,554,039
L&G Artificial Intelligence UCITS ETF $
Common stock 255,249,690 – – 255,249,690
255,249,690 – – 255,249,690
L&G Healthcare Breakthrough UCITS ETF $
Common stock 219,066,567 – – 219,066,567
219,066,567 – – 219,066,567
L&G Europe Equity (Responsible Exclusions) UCITS ETF
€
Common stock 233,614,949 – – 233,614,949
Right 6,960 – – 6,960
233,621,909 – – 233,621,909
L&G US Equity (Responsible Exclusions) UCITS ETF
$
Common stock 1,703,516,278 – – 1,703,516,278
1,703,516,278 – – 1,703,516,278

December 2021 Legal & General UCITS ETF Plc
Notes to the Financial Statements (continued)
For the financial period ended 31 December 2021 (continued)
98
11. Financial Instruments and Associated Risks (continued)
4. Fair Value (continued)
Financial Assets at Fair Value through Profit or Loss
30 June 2021 Currency Level 1 Level 2 Level 3 Total
L&G Clean Energy UCITS ETF $
Common Stock 115,077,930 – – 115,077,930
115,077,930 – – 115,077,930
L&G ESG GBP Corporate Bond 0-5 Year UCITS ETF £
Corporate Bonds – 59,438,850 – 59,438,850
– 59,438,850 – 59,438,850
L&G ESG GBP Corporate Bond UCITS ETF £
Corporate Bonds – 66,552,915 – 66,552,915
– 66,552,915 – 66,552,915
L&G ESG Emerging Markets Government Bond (USD) 0-5 Year UCITS ETF $
Corporate Bonds – 6,773,065 – 6,773,065
Government Bond – 42,485,606 – 42,485,606
– 49,258,671 – 49,258,671
L&G ESG China CNY Bond UCITS ETF $
Government Bond – 420,684,390 - 420,684,390
– 420,684,390 - 420,684,390
L&G UK Gilt 0-5 Year UCITS ETF £
Government Bond – 28,207,803 – 28,207,803
– 28,207,803 – 28,207,803
L&G ESG USD Corporate Bond UCITS ETF $
Corporate Bonds – 91,799,714 - 91,799,714
– 91,799,714 - 91,799,714

December 2021 Legal & General UCITS ETF Plc
Notes to the Financial Statements (continued)
For the financial period ended 31 December 2021 (continued)
99
11. Financial Instruments and Associated Risks (continued)
4. Fair Value (continued)
Financial Assets at Fair Value through Profit or Loss (continued)
30 June 2021 Currency Level 1 Level 2 Level 3 Total
L&G ESG Emerging Markets Corporate Bond (USD) UCITS ETF $
Corporate Bonds – 568,697,420 – 568,697,420
Government Bond – 3,257,500 – 3,257,500
– 571,954,920 – 571,954,920
L&G Hydrogen Economy UCITS ETF $
Common stock 459,443,397 – – 459,443,397
459,443,397 – – 459,443,397
L&G ESG Green Bond UCITS ETF
€
Corporate Bonds – 15,287,139 – 15,287,139
Government Bond – 7,697,173 – 7,697,173
– 22,984,312 – 22,984,312
L&G Quality Equity Dividends ESG Exclusions UK UCITS ETF £
Common stock 26,267,797 – – 26,267,797
26,267,797 – – 26,267,797
L&G Quality Equity Dividends ESG Exclusions Europe ex-UK UCITS ETF €
Common stock 16,171,246 – – 16,171,246
16,171,246 – – 16,171,246
L&G Quality Equity Dividends ESG Exclusions Asia Pacific ex-Japan UCITS ETF $
Common stock 19,686,569 – – 19,686,569
19,686,569 – – 19,686,569
L&G Digital Payments UCITS ETF $
Common stock 6,265,782 – – 6,265,782
6,265,782 – – 6,265,782

December 2021 Legal & General UCITS ETF Plc
Notes to the Financial Statements (continued)
For the financial period ended 31 December 2021 (continued)
100
11. Financial Instruments and Associated Risks (continued)
4. Fair Value (continued)
Financial Liabilities at Fair Value through Profit or Loss
31 December 2021 Currency Level 1 Level 2 Level 3 Total
Company Total $
Unrealised loss on OTC swap transactions – (4,250,714) – (4,250,714)
Unrealised loss on forwards – (26,985) – (26,985)
– (4,277,699) – (4,277,699)
L&G DAX® Daily 2x Short UCITS ETF €
Unrealised loss on OTC swap transactions – (2,955,486) – (2,955,486)
– (2,955,486) – (2,955,486)
L&G FTSE 100® Super Short Strategy (Daily 2x) UCITS ETF £
Unrealised loss on OTC swap transactions – (656,920) – (656,920)
– (656,920) – (656,920)
L&G ESG Emerging Markets Corporate Bond (USD) UCITS ETF $
Unrealised loss on forwards – (26,985) – (26,985)
– (26,985) – (26,985)
30 June 2021 Currency Level 1 Level 2 Level 3 Total
Company Total $
Unrealised loss on OTC swap transactions – (1,319,868) – (1,319,868)
– (1,319,868) – (1,319,868)
L&G DAX® Daily 2x Long UCITS ETF €
Unrealised loss on OTC swap transactions – (247,816) – (247,816)
– (247,816) – (247,816)
L&G FTSE 100® Leveraged (Daily 2x) UCITS ETF £
Unrealised loss on OTC swap transactions – (133,209) – (133,209)
– (133,209) – (133,209)
L&G US Energy Infrastructure MLP UCITS ETF $
Unrealised loss on OTC swap transactions – (841,962) – (841,962)
– (841,962) – (841,962)

December 2021 Legal & General UCITS ETF Plc
Notes to the Financial Statements (continued)
For the financial period ended 31 December 2021 (continued)
101
11. Financial Instruments and Associated Risks (continued)
4. Fair Value (continued)
Reconciliations of movements in the fair value of financial investments categorised within level 3 between the beginning and end of the financial period are presented below. In determining the amount of transfers into and out of levels of the fair value hierarchy, transfers are deemed to have occurred at the beginning of the financial period. L&G E Fund MSCI China A UCITS ETF 31 December 2021
Common Stock $
Total $
Opening Balance 43,875 43,875
Transfers into Level 3 from Level 1 35,242 35,242
Transfers into Level 1 from Level 3 (43,875) (43,875)
Purchases - -
Sales (19,120) (19,120)
Realised gain (426) (426)
Change in unrealised loss 3,680 3,680
Closing Balance 19,376 19,376
L&G E Fund MSCI China A UCITS ETF 30 June 2021
Common Stock $
Total $
Opening Balance 41,222 41,222
Transfers into Level 3 from Level 1 43,657 43,657
Transfers into Level 1 from Level 3 (41,222) (41,222)
Purchases 27,357 27,357
Sales (14,227) (14,227)
Realised gain 412 412
Change in unrealised loss (13,324) (13,324)
Closing Balance 43,875 43,875

December 2021 Legal & General UCITS ETF Plc
Notes to the Financial Statements (continued)
For the financial period ended 31 December 2021 (continued)
102
11. Financial Instruments and Associated Risks (continued)
4. Fair Value (continued)
L&G UK Equity UCITS ETF 30 June 2021
Common Stock £
Total £
Opening Balance 6,175 6,175
Transfers into Level 1 from Level 3 - -
Purchases - - Sales - - Realised loss - - Change in unrealised loss (6,175) (6,175)
Closing Balance - - L&G Global Equity UCITS ETF 30 June 2021
Common Stock $
Total $
Opening Balance 17,662 17,662
Transfers into Level 1 from Level 3 (15,818) (15,818)
Purchases - - Sales - - Realised loss - - Change in unrealised loss (1,844) (1,844)
Closing Balance - -
L&G Asia Pacific ex Japan Equity UCITS ETF 30 June 2021
Common Stock $
Corporate Bonds $
Total $
Opening Balance 125,915 29,799 155,714
Transfers into Level 1 from Level 3 (125,915) (29,799) (155,714)
Purchases - - -
Sales - - -
Realised loss - - -
Change in unrealised gain/(loss) - - -
Closing Balance - - -
L&G Europe Equity (Responsible Exclusions) UCITS ETF 30 June 2021
Common Stock €
Total €
Opening Balance 24,797 24,797
Transfers into Level 1 from Level 3 - -
Purchases - -
Sales - -
Realised loss - -
Change in unrealised loss (24,797) (24,797)
Closing Balance - -
All realised and unrealised gains and losses are disclosed in the statement of comprehensive income.

December 2021 Legal & General UCITS ETF Plc
Notes to the Financial Statements (continued)
For the financial period ended 31 December 2021 (continued)
103
11. Financial Instruments and Associated Risks (continued)
4. Fair Value (continued)
As at 31 December 2021 and 30 June 2021, there were level 3 securities held which suspended trading of their shares prior to the reporting date. However, the fair value measurement objective remains the same, i.e. an exit price from the perspective of a market participant that holds the asset or owes the liability. For each of the suspended securities, in the judgement of the competent person, there is no evidence to suggest that an adjustment should be made to the last traded price; and that the last traded price remains the best measure of the fair value of the suspended securities. As judgement is used by the competent person to determine an appropriate fair value for the suspended securities, this is considered to be a significant unobservable input.
There were Level 3 securities recorded at fair value of zero as at 31 December 2021 for L&G UK Equity UCITS ETF, L&G Global Equity UCITS ETF, L&G Europe ex UK Equity UCITS ETF and L&G Europe Equity (Responsible Exclusions) UCITS ETF.
There was a Level 3 security recorded at fair value of zero as at 30 June 2021 for L&G UK Equity UCITS ETF, L&G Global Equity UCITS ETF and L&G Europe Equity (Responsible Exclusions) UCITS ETF.
During the financial period ended 31 December 2021 and the financial year ended 30 June 2021, there were transfers between level 1 and level 3 of the fair value hierarchy for financial assets and financial liabilities which were recorded at fair value. Transfers into Level 3 are a result of suspended trading or manager prices based on unobservable inputs. Transfers out of Level 3 occur when those securities are no longer suspended or manager priced based on unobservable inputs.
The following table sets out information about the significant unobservable inputs used in the Company’s valuation of investments and financial instruments that are categorised within level 3 of the fair value hierarchy as at 31 December 2021 and 30 June 2021.
This table also sets out sensitivity to changes in the significant unobservable inputs, and demonstrate the effect of a 10% discount on the value of investments and the effect on the NAV of the Fund. Management have chosen to apply a 10% discount to perform sensitivity analysis, as this could be considered appropriate as an adjusted exit price for illiquid securities.
L&G E Fund MSCI China A UCITS ETF
31 December 2021
Investment Common stock
Fair value ($) 19,376
Principal valuation techniques Last traded price
Value applying sensitivity discount to significant unobservable inputs* ($) 1,017,527
NAV per share before applying sensitivity discount to significant unobservable inputs ($) 4.7259
NAV per share after applying sensitivity discount to significant unobservable inputs ($) 4.7236
Effect of applying discount to significant unobservable inputs on NAV per share (0.0500)%
L&G E Fund MSCI China A UCITS ETF
30 June 2021
Investment Common stock
Fair value ($) 43,875
Principal valuation techniques Last traded price
Value applying sensitivity discount to significant unobservable inputs* ($) 1,069,544
NAV per share before applying sensitivity discount to significant unobservable inputs ($) 0.8651
NAV per share after applying sensitivity discount to significant unobservable inputs ($) 0.8650
Effect of applying discount to significant unobservable inputs on NAV per share (0.0104)%
* Sensitivity discount of 10% applied to the last traded price of those securities which suspended trading of their shares prior to the reporting date.

December 2021 Legal & General UCITS ETF Plc
Notes to the Financial Statements (continued)
For the financial period ended 31 December 2021 (continued)
104
11. Financial Instruments and Associated Risks (continued)
5. Exposure to Derivatives
A. Global Exposure
In the context of the Physically-Replicating Funds, global exposure has been calculated using the commitment approach. The commitment approach is an integral part of the ongoing monitoring and management of the Funds’ market risk. The reason the commitment approach is suitable is because, as per the Central Bank UCITS Regulations, these thirty five Funds will not use financial derivative instruments as part of a complex investment strategy. Each Fund’s global exposure, being the incremental exposure and leverage generated by the Fund through its use of futures shall be calculated on at least a daily basis (where futures are held) and may at no time exceed 100% of the Fund’s NAV.
B. Value–at–risk ("VaR")
During the financial period ended 31 December 2021 and the financial year ended 30 June 2021, the Investment Managers applied the relative value–at–risk ("relative VaR") approach with respect to the determination of the global exposure for the remaining Funds. The Funds track indices (for a daily leveraged index, the non–leveraged index, is used as the benchmark for relative VaR as per the Central Bank UCITS Regulations) and are based on a confidence level of 99%. The relative VaR is reported monthly. The leverage is calculated using the sum of the notionals, which converts the swap into the underlying assets. The leverage is monitored and targeted at 100% relative to the NAV value. The 100% target is to the nearest percentile and was maintained throughout the financial year. Effectively this shows the Fund is tracking the underlying index on a one–to–one basis less fees and accruals. The one–tailed confidence level of the Fund shall be 99% and the holding period shall be one day. The historical observation period will not be less than one year, however, a shorter observation period may be used when appropriate. The Funds employ no leverage directly, the only leverage applicable to the 2x short and 2x leveraged Synthetically–Replicating Funds is built into the relevant tracked index by each Fund, not at Fund level. The Funds look at relative VaR which is always 1 with the exception of the 2x short and 2x leveraged Funds which have a relative VaR of 2. This is because the VaR of the Fund is measured against the VaR of the non–leveraged index rather than the VaR of the directly tracked index which has leverage built in. ETF VaR 1D represents the daily volatility of the Fund’s NAV over the course of the financial period, equating to the standard deviation of daily returns, assuming a normal distribution with a 99% confidence level.

December 2021 Legal & General UCITS ETF Plc
Notes to the Financial Statements (continued)
For the financial period ended 31 December 2021 (continued)
105
12. Distributions to Redeemable Participating Shareholders
Each Fund has been approved (or, unless otherwise indicated, shall be approved within a reasonable period following its approval by the Central Bank) as a reporting fund under the United Kingdom offshore fund rules. As reporting Funds, the Company will not ordinarily, but may at the Directors' discretion, declare dividends at a specified date. The Directors may establish share classes with different distribution policies from time to time. Dividends, if paid, will (unless otherwise stated in a relevant Fund Supplement) be declared in the base currency of the applicable Fund.
During the financial periods ended 31 December 2021 and 31 December 2020, the following Funds paid the below distributions:
For the Period ended
31 December 2021 For the Period ended
31 December 2020
Fund Ex-date Dividend rate Ex-date Dividend rate
L&G US Energy Infrastructure MLP UCITS ETF
USD Distributing ETF 9 September 2021 $0.0787 17 September 2020 $0.1420
9 December 2021 $0.0819 17 December 2020 $0.0240
L&G ESG GBP Corporate Bond 0-5 Year UCITS ETF
GBP Distributing ETF 15 July 2021 £0.0321
L&G ESG GBP Corporate Bond UCITS ETF
GBP Distributing ETF 15 July 2021 £0.0849
L&G ESG Emerging Markets Government Bond (USD) 0-5 Year UCITS ETF
USD Distributing ETF 15 July 2021 $0.1238
L&G ESG China CNY Bond UCITS ETF
USD Distributing ETF 15 July 2021 $0.1534
L&G ESG USD Corporate Bond UCITS ETF
USD Distributing ETF 15 July 2021 $0.0769
L&G ESG Emerging Markets Corporate Bond (USD) UCITS ETF
USD Distributing ETF 15 July 2021 $0.1168
L&G ESG Green Bond UCITS ETF
EUR Distributing ETF 15 July 2021 €0.0110
L&G Quality Equity Dividends ESG Exclusions UK UCITS ETF
GBP Distributing ETF 9 September 2021 £0.2790
9 December 2021 £0.0840
L&G Quality Equity Dividends ESG Exclusions Europe ex-UK UCITS ETF
EUR Distributing ETF 9 September 2021 €0.0626
9 December 2021 €0.0990

December 2021 Legal & General UCITS ETF Plc
Notes to the Financial Statements (continued)
For the financial period ended 31 December 2021 (continued)
106
12. Distributions to Redeemable Participating Shareholders (continued)
For the Period ended
31 December 2021
Fund Ex-date Dividend rate
L&G Quality Equity Dividends ESG Exclusions Asia Pacific ex-Japan UCITS ETF
USD Distributing ETF 9 September 2021 $0.0945
9 December 2021 $0.0662
L&G Quality Equity Dividends ESG Exclusions Emerging Markets UCITS ETF
USD Distributing ETF 9 September 2021 $0.1073
9 December 2021 $0.0434
13. Segregated Liability
The Company is structured as an umbrella fund with segregated liability between its Funds. As a matter of Irish law, the assets of one Fund will not be available to meet the liabilities of another (a provision which also applies in insolvency and is also generally binding upon creditors). Furthermore, and by operation of Irish law, any contract entered into by the Company in respect of a Fund (or Funds) shall include an implied term to the effect that recourse by the contract counterparty may not be had to assets of Funds other than the Fund or Funds in respect of which the contract was entered into. The index–based OTC swaps which the Funds will enter into from time to time will also contain express provisions entrenching such Irish law segregated liability principle.
However, as the Company is a single legal entity that may operate or have assets held on its behalf or be subject to claims in other jurisdictions that may not necessarily recognise such segregation, in the event an action to enforce a debt or liability of a Fund was brought against the Company in a venue other than Ireland, there remains a risk that a creditor may seek to seize or attach assets of one Fund in satisfaction of a debt or liability owed by another Fund and the jurisdiction in which the claim is being heard may not recognise the principle of segregated liability between the Funds.
14. Net Asset Value
The following table summarises the NAV, shares outstanding and the NAV per share as at the financial period ended 31 December 2021 and the financial year ended 30 June 2021.
Fund/Share Class Currency NAV as at
31 December 2021 Shares
Outstanding
NAV Per Share as at
31 December 2021
L&G E Fund MSCI China A UCITS ETF USD 33,746,324 1,530,000 22.0564
L&G DAX® Daily 2x Long UCITS ETF EUR 28,004,199 70,609 396.6094
L&G DAX® Daily 2x Short UCITS ETF EUR 33,321,672 20,933,366 1.5917
L&G Longer Dated All Commodities UCITS ETF USD 738,880,219 37,901,581 19.4947
L&G FTSE 100® Leveraged (Daily 2x) UCITS ETF GBP 17,270,210 53,977 319.9549
L&G FTSE 100® Super Short Strategy (Daily 2x) UCITS ETF GBP 12,718,514 2,921,608 4.3532
L&G Russell 2000 US Small Cap Quality UCITS ETF USD 40,748,955 407,767 99.9319
L&G Gold Mining UCITS ETF USD 162,227,884 4,902,093 33.0935
L&G US Energy Infrastructure MLP UCITS ETF USD 30,690,421 6,960,239 4.4093
L&G ROBO Global® Robotics and Automation UCITS ETF USD 1,373,376,507 49,225,616 27.8996
L&G Cyber Security UCITS ETF USD 3,068,047,709 121,031,776 25.3491
L&G All Commodities UCITS ETF USD 83,570,238 6,726,910 12.4232
L&G Longer Dated All Commodities ex-Agriculture and Livestock UCITS ETF USD 1,458,995 95,091 15.3431
L&G Battery Value-Chain UCITS ETF USD 955,511,075 51,650,000 18.4997
L&G Pharma Breakthrough UCITS ETF USD 33,377,632 2,650,000 12.5953

December 2021 Legal & General UCITS ETF Plc
Notes to the Financial Statements (continued)
For the financial period ended 31 December 2021 (continued)
107
14. Net Asset Value (continued)
Fund/Share Class Currency NAV as at
31 December 2021 Shares
Outstanding
NAV Per Share as at
31 December 2021
L&G Ecommerce Logistics UCITS ETF USD 514,171,024 29,632,900 17.3513
L&G US Equity UCITS ETF USD 319,154,854 17,403,271 18.3387
L&G UK Equity UCITS ETF GBP 18,899,495 1,640,000 11.5240
L&G Japan Equity UCITS ETF USD 253,282,728 19,445,000 13.0255
L&G Global Equity UCITS ETF USD 63,752,038 3,800,000 16.7768
L&G Europe ex UK Equity UCITS ETF EUR 123,882,897 8,280,988 14.9599
L&G Asia Pacific ex Japan Equity UCITS ETF USD 235,857,311 18,155,064 12.9912
L&G Clean Water UCITS ETF USD 363,699,384 21,450,000 16.9556
L&G Artificial Intelligence UCITS ETF USD 333,065,284 17,433,500 19.1049
L&G Healthcare Innovation UCITS ETF USD 212,918,240 11,900,000 17.8922
L&G Europe Equity (Responsible Exclusions) UCITS ETF EUR 130,347,882 9,243,647 14.1013
L&G US Equity (Responsible Exclusions) UCITS ETF USD 1,796,355,192 108,632,915 16.5360
L&G Clean Energy UCITS ETF USD 130,339,313 10,300,000 12.6543
L&G ESG GBP Corporate Bond 0-5 Year UCITS ETF GBP 68,711,956 6,930,000 9.9151
L&G ESG GBP Corporate Bond UCITS ETF GBP 79,018,853 8,100,000 9.7554
L&G ESG Emerging Markets Government Bond (USD) 0-5 Year UCITS ETF USD 52,124,300 5,267,000 9.8963
L&G ESG China CNY Bond UCITS ETF- EUR Hedged Distributing ETF1 EUR 56,192,435 5,222,546 10.7595
L&G ESG China CNY Bond UCITS ETF- USD Distributing ETF USD 234,220,860 21,942,800 10.6741
L&G UK Gilt 0-5 Year UCITS ETF GBP 27,584,292 2,800,000 9.8515
L&G ESG USD Corporate Bond UCITS ETF USD 92,962,677 9,400,000 9.8896
L&G ESG Emerging Markets Corporate Bond (USD) UCITS ETF- CHF Hedged Accumulating ETF
2 CHF 171,389,669 17,476,673 9.8067
L&G ESG Emerging Markets Corporate Bond (USD) UCITS ETF- EUR Hedged Accumulating ETF
2 EUR 70,844,554 7,221,082 9.8107
L&G ESG Emerging Markets Corporate Bond (USD) UCITS ETF- GBP Hedged Distributing ETF
2 GBP 299,852 30,000 9.9950
L&G ESG Emerging Markets Corporate Bond (USD) UCITS ETF- USD Distributing ETF USD 222,858,119 22,477,636 9.9146
L&G ESG Emerging Markets Corporate Bond (USD) UCITS ETF- USD Accumulating ETF USD 521,056 52,048 10.0110
L&G Hydrogen Economy UCITS ETF USD 560,752,503 71,650,000 7.8262
L&G ESG Green Bond UCITS ETF EUR 23,256,957 2,350,000 9.8965
L&G Quality Equity Dividends ESG Exclusions UK UCITS ETF GBP 33,560,967 3,300,000 10.1699
L&G Quality Equity Dividends ESG Exclusions Europe ex-UK UCITS ETF EUR 21,575,955 2,034,080 10.6072
L&G Quality Equity Dividends ESG Exclusions Asia Pacific ex-Japan UCITS ETF USD 21,468,119 2,200,000 9.7582
L&G Digital Payments UCITS ETF USD 16,111,476 1,900,000 8.4797
L&G Multi-Strategy Enhanced Commodities UCITS ETF3 USD 608,230,576 54,919,282 11.0749
L&G Quality Equity Dividends ESG Exclusions Emerging Markets UCITS ETF4 USD 14,833,942 1,500,000 9.8892
L&G India INR Government Bond UCITS ETF5 USD 73,224,433 7,200,000 10.1700
1 The share class launched on 20 July 2021.
2 The share class launched on 20 August 2021.
3 The Fund launched on 2 July 2021.
4 The Fund launched on 12 July 2021.
5 The Fund launched on 26 October 2021.

December 2021 Legal & General UCITS ETF Plc
Notes to the Financial Statements (continued)
For the financial period ended 31 December 2021 (continued)
108
14. Net Asset Value (continued)
Fund/Share Class Currency NAV as at
30 June 2021 Shares
Outstanding
NAV Per Share as at
30 June 2021
L&G E Fund MSCI China A UCITS ETF USD 43,889,334 1,980,000 22.1663
L&G DAX® Daily 2x Long UCITS ETF EUR 25,819,315 67,009 385.3111
L&G DAX® Daily 2x Short UCITS ETF EUR 47,880,691 27,458,366 1.7437
L&G Longer Dated All Commodities UCITS ETF USD 1,224,757,080 68,302,602 17.9313
L&G FTSE 100® Leveraged (Daily 2x) UCITS ETF GBP 19,226,241 67,231 285.9728
L&G FTSE 100® Super Short Strategy (Daily 2x) UCITS ETF GBP 12,520,076 2,451,608 5.1068
L&G Russell 2000 US Small Cap Quality UCITS ETF USD 38,826,713 392,767 98.8543
L&G Gold Mining UCITS ETF USD 155,489,496 4,632,093 33.5678
L&G US Energy Infrastructure MLP UCITS ETF USD 40,301,424 8,345,239 4.8292
L&G ROBO Global® Robotics and Automation UCITS ETF USD 1,254,865,415 48,425,616 25.9132
L&G Cyber Security UCITS ETF USD 2,792,146,370 109,881,776 25.4104
L&G All Commodities UCITS ETF USD 93,849,730 7,920,310 11.8492
L&G Longer Dated All Commodities ex-Agriculture and Livestock UCITS ETF USD 11,383,947 819,278 13.8950
L&G Battery Value-Chain UCITS ETF USD 834,154,119 45,450,000 18.3532
L&G Pharma Breakthrough UCITS ETF USD 34,331,501 2,600,000 13.2044
L&G Ecommerce Logistics UCITS ETF USD 612,336,023 34,232,900 17.8873
L&G US Equity UCITS ETF USD 295,471,416 17,803,271 16.5964
L&G UK Equity UCITS ETF GBP 16,662,712 1,540,000 10.8199
L&G Japan Equity UCITS ETF USD 252,730,395 19,445,000 12.9971
L&G Global Equity UCITS ETF USD 51,392,796 3,300,000 15.5735
L&G Europe ex UK Equity UCITS ETF EUR 113,087,160 8,180,988 13.8231
L&G Asia Pacific ex Japan Equity UCITS ETF USD 173,891,675 12,696,064 13.6965
L&G Clean Water UCITS ETF USD 232,180,626 14,650,000 15.8485
L&G Artificial Intelligence UCITS ETF USD 255,630,405 13,583,500 18.8191
L&G Healthcare Breakthrough UCITS ETF USD 219,356,536 11,150,000 19.6732
L&G Europe Equity (Responsible Exclusions) UCITS ETF EUR 233,988,889 17,965,798 13.0241
L&G US Equity (Responsible Exclusions) UCITS ETF USD 1,706,212,924 114,500,000 14.9014

December 2021 Legal & General UCITS ETF Plc
Notes to the Financial Statements (continued)
For the financial period ended 31 December 2021 (continued)
109
14. Net Asset Value (continued)
Fund/Share Class Currency NAV as at
30 June 2021 Shares
Outstanding
NAV Per Share as at
30 June 2021
L&G Clean Energy UCITS ETF USD 115,243,362 8,600,000 13.4003
L&G ESG GBP Corporate Bond 0-5 Year UCITS ETF GBP 60,138,292 6,000,000 10.0230
L&G ESG GBP Corporate Bond UCITS ETF GBP 67,397,397 6,800,000 9.9113
L&G ESG Emerging Markets Government Bond (USD) 0-5 Year UCITS ETF USD 49,902,110 4,900,000 10.1841
L&G ESG China CNY Bond UCITS ETF USD 427,341,761 41,100,000 10.3976
L&G UK Gilt 0-5 Year UCITS ETF GBP 28,356,001 2,850,000 9.9494
L&G ESG USD Corporate Bond UCITS ETF USD 92,756,580 9,300,000 9.9738
L&G ESG Emerging Markets Corporate Bond (USD) UCITS ETF- USD Distributing ETF USD 579,585,871 57,376,000 10.1015
L&G ESG Emerging Markets Corporate Bond (USD) UCITS ETF- USD Accumulating ETF USD 504,121 50,000 10.0824
L&G Hydrogen Economy UCITS ETF USD 459,726,448 51,900,000 8.8579
L&G ESG Green Bond UCITS ETF USD 23,180,583 2,350,000 9.8640
L&G Quality Equity Dividends ESG Exclusions UK UCITS ETF EUR 26,452,836 2,600,000 10.1741
L&G Quality Equity Dividends ESG Exclusions Europe ex-UK UCITS ETF GBP 16,295,294 1,634,080 9.9721
L&G Quality Equity Dividends ESG Exclusions Asia Pacific ex-Japan UCITS ETF USD 19,787,175 1,900,000 10.4143
L&G Digital Payments UCITS ETF USD 6,274,836 600,000 10.4580

December 2021 Legal & General UCITS ETF Plc
Notes to the Financial Statements (continued)
For the financial period ended 31 December 2021 (continued)
110
15. Segment Reporting
An operating segment is a component of the Company that engages in business activities from which it may earn revenues and incur expenses, including revenues and expenses that relates to transactions with any of the Company's other components, whose operating results are reviewed regularly to make decisions about resources allocated to the segment and assess its performance, and for which discrete financial information is available.
Segment results that are reported include items directly attributable to a segment.
It is considered that each Fund is an operating segment which is investing in line with its investment objective. The segment information provided to the Board of the Company is the same as that disclosed in the statement of comprehensive income and the statement of financial position for each Fund. The chief operating decision maker, who is responsible for allocating resources and assessing performance of the operating segments, has been identified as the Directors.
Geographic Information
The Investment Managers' asset allocation decisions are based on a single, integrated investment strategy, to deliver the performance of the relevant index of each Fund, and each Fund's performance is evaluated by reference to the relevant index. The revenue attributable to each Fund is derived from geographical locations (i.e. country of incorporation of the issuer of the instruments) in line with those outlined in the schedule of investments for the Physically-Replicating Funds. The daily asset allocation decisions are made by the Investment Managers for each Fund. For the Synthetically-Replicating Funds, the revenue attributable for the reverse repurchase agreements and the money market instruments is derived from the country of incorporation of the issuer of these instruments and for the swap contracts there is no specific country allocation.
The Company is domiciled in Ireland. All of the Company’s income from investments is primarily from entities incorporated in countries other than Ireland. The breakdown of the major components of income from other countries is disclosed below.
United Kingdom Rest of Europe United States Japan Rest of World Company Total
$ $ $ $ $ $
For the financial period ended 31 December 2021
Segmental net income* 12,644,472 (11,442,167) 453,849,934 29,415,959 (98,899,216) 385,568,982
United Kingdom Rest of Europe United States Japan Rest of World Company Total
$ $ $ $ $ $
For the financial period ended 31 December 2020
Segmental net income* 38,588,485 1,199,792,691 14,624,131 137,905,570 163,162,624 1,554,073,501
* Represents total revenue less interest expense

December 2021 Legal & General UCITS ETF Plc
Notes to the Financial Statements (continued)
For the financial period ended 31 December 2021 (continued)
111
15. Segment Reporting (continued)
Major Customers
The Company does not regard the holders of redeemable participating shares of its Funds as clients or customers as it does not deal directly with investors other than Authorised Participants (i.e. the Company does not permit subscriptions and redemptions with investors other than Authorised Participants). However, strictly for the purposes of satisfying the disclosure requirements regarding “major customers” pursuant to IFRS 8.34, the Company shall treat the holders of redeemable participating shares of its Funds as customers as it relies on the TER deducted from the assets of each Fund for the purposes of funding the operations of each Fund.
On 20 April 2020, the Company transitioned to the International Central Securities Depositary (the “ICSD”) settlement model. Under the ICSD settlement model, all holdings in the Company are registered in the Company’s register of members in the name of a single legal shareholder, namely The Bank of New York Depository (Nominees) Limited as the entity appointed as the Common Depository's Nominee. Therefore, The Bank of New York Depository (Nominees) Limited is a major customer, holding legal, but not beneficial, title to 100% of the issued share capital of the Company.
In order to identify beneficial holders of shares in the Company, the Company receives participant reports from the ICSD evidencing beneficial title to shares in the Company held through the ICSD settlement model (the “Participant Report”). However, end–investors who purchase and sell shares on stock exchanges (i.e. the ultimate beneficial holders) typically do not appear on the Participant Report. This is because they typically hold their units via an intermediary (broker/nominee or local common depositary) which appears on the Participant Report on their behalf.
For end–investors who purchase and sell their shares on exchanges which use local clearing and settlement systems (e.g. Borsa Italiana), end–investors will be a further step removed from the Participant Report. This is because the relevant clearing and settlement system used by a particular stock exchange (e.g. Monte Titoli for transactions executed on Borsa Italiana) will usually appear on the Participant Report in respect of all investments made on the relevant foreign exchange. The foreign settlement system will in turn have its own records as to the local intermediaries (brokers/nominees) who hold on behalf of end–investors.
It is therefore impossible for the Company to identify all end–investors (i.e. beneficial holders) who hold an interest in its shares. It is also impossible for the Company to quantify exactly how many end– investors there are for a given share class of the Company. Accordingly, it is only possible for the Company to identify the single legal shareholder of the Company, The Bank of New York Depository (Nominees) Limited.
16. Significant Events During the Financial Period
On 22 February 2021, the L&G Russell 2000 US Small Cap Quality UCITS ETF TER was reduced from 0.45% to 0.30%.
On 2 July 2021, L&G Multi-Strategy Enhanced Commodities UCITS ETF was launched.
December 2021 Legal & General UCITS ETF Plc
Notes to the Financial Statements (continued)
For the financial period ended 31 December 2021 (continued)
112
16. Significant Events During the Financial Period (continued)
On 12 July 2021, L&G Quality Equity Dividends ESG Exclusions Emerging Markets UCITS ETF was launched.
On 20 August 2021, EUR Hedged Accumulating ETF, GBP Hedged Distributing ETF and CHF Hedged Accumulating ETF Share Classes of L&G ESG Emerging Markets Corporate Bond (USD) UCITS ETF (the “EM Corporate Bond Hedged Share Classes”) were launched. These are the first hedged Share Classes launched since the Company was acquired by the LGIM Group.
On 1 October 2021, the TER for the EM Corporate Bond Hedged Share Classes was reduced to 0.19% for a period of 3 months until 4 January 2022.
On 26 October 2021, L&G India INR Government Bond UCITS ETF was launched.
On 28 October 2021, L&G India INR Government Bond UCITS ETF was cross listed on the London Stock Exchange ("LSE"), Borsa Italiana and Deutsche Boerse.
On 1 November 2021, Legal & General Investment Management Limited replaced GO ETF Solutions LLP as Investment Manager of the equity and commodity Funds of the Company. A shareholder notification was issued to the registered shareholder of the equity and commodity Funds, The Bank of New York Depository (Nominees) Limited, for onward transmission to the underlying shareholders of these Funds on 14 October 2021. The purpose of this notification was to advise the underlying shareholders of the change in Investment Manager.
On 17 November 2021, L&G Digital Payments UCITS ETF, L&G ESG Emerging Markets Corporate Bond (USD) UCITS ETF – USD Accumulating ETF Share Class, L&G Multi-Strategy Enhanced Commodities UCITS ETF and L&G India INR Government Bond UCITS ETF were cross listed in Switzerland.
On 29 November 2021, L&G ESG Emerging Markets Corporate Bond (USD) UCITS ETF – GBP Hedged Distributing ETF Share Class was registered for distribution in the UK.
On 3 December 2021, a notification was issued to the registered shareholder of L&G Longer Dated All Commodities ex-Agriculture and Livestock UCITS ETF, The Bank of New York Depository (Nominees) Limited, for onward transmission to the underlying shareholders (the “Shareholders”). The purpose of the shareholder notification was to advise the Shareholders that after careful consideration and with the long-term interests of the Shareholders in mind, the Directors of the Company resolved to close and wind-up the L&G Longer Dated All Commodities ex-Agriculture and Livestock UCITS ETF by way of compulsory redemption of all shares in accordance with the applicable provisions of the Constitution and the Prospectus of the Company. The Fund has been successfully compulsorily redeemed and we will proceed to seek revocation of the Central Bank’s authorisation.
On 15 December 2021, L&G ESG Emerging Markets Corporate Bond (USD) UCITS ETF – GBP Hedged Distributing ETF Share Class was cross listed on the LSE.
17. Significant Events After the Financial Period End
On 4 January 2022, the TER for the EM Corporate Bond Hedged Share Classes was returned to 0.38%.
On 14 January 2022, L&G Longer Dated All Commodities ex-Agriculture and Livestock UCITS ETF closed.
In response to recent events in Eastern Europe, the Board of Directors is closely monitoring financial markets and any potential liquidity and volatility risks which may have impact on the Funds of the Company.
18. Approval of the Financial Statements
The Directors approved the unaudited financial statements on 24 February 2022.

December 2021 Legal & General UCITS ETF Plc
L&G E Fund MSCI China A UCITS ETF
Schedule of Investments
As at 31 December 2021
113
Nominal Description
Value
$
% of Net
Assets
Common Stock (30 June 2021: 96.49%)
Cayman Islands (30 June 2021: 0.16%)
3,200 China Resources Microelectronics Ltd 'A' 32,435 0.10
Total Cayman Islands 32,435 0.10
China (30 June 2021: 96.33%)
12,200 360 Security Technology Inc 'A' 24,349 0.07
300 3peak Inc 'A' 36,150 0.11
3,300 Accelink Technologies Co Ltd 'A' 12,059 0.04
9,800 Addsino Co Ltd 'A' 25,679 0.08
13,400 AECC Aero-Engine Control Co Ltd 'A' 63,664 0.19
19,500 AECC Aviation Power Co Ltd 'A' 194,163 0.58
190,515 Agricultural Bank of China Ltd 'A' 87,884 0.26
19,474 Aier Eye Hospital Group Co Ltd 'A' 129,188 0.38
8,800 Air China Ltd 'A' 12,606 0.04
7,100 Aisino Corp 'A' 14,917 0.04
51,100 Aluminum Corp of China Ltd 'A' 48,828 0.14
1,700 Amlogic Shanghai Co Ltd 'A' 34,729 0.10
4,600 Angel Yeast Co Ltd 'A' 43,565 0.13
5,840 Anhui Anke Biotechnology Group Co Ltd 'A' 11,995 0.04
17,163 Anhui Conch Cement Co Ltd 'A' 108,525 0.32
1,300 Anhui Gujing Distillery Co Ltd 'A' 49,770 0.15
2,800 Anhui Honglu Steel Construction Group Co Ltd 'A' 23,522 0.07
14,548 Anhui Jianghuai Automobile Group Corp Ltd 'A' 39,718 0.12
2,700 Anhui Kouzi Distillery Co Ltd 'A' 30,023 0.09
4,100 Anhui Yingjia Distillery Co Ltd 'A' 44,677 0.13
7,612 Anhui Zhongding Sealing Parts Co Ltd 'A' 26,049 0.08
5,500 Apeloa Pharmaceutical Co Ltd 'A' 30,282 0.09
500 Arctech Solar Holding Co Ltd 'A' 13,847 0.04
1,000 Asymchem Laboratories Tianjin Co Ltd 'A' 68,253 0.20
1,600 Autel Intelligent Technology Corp Ltd 'A' 19,933 0.06

December 2021 Legal & General UCITS ETF Plc
L&G E Fund MSCI China A UCITS ETF
Schedule of Investments (continued)
As at 31 December 2021
114
Nominal Description
Value
$
% of Net
Assets
Common Stock (30 June 2021: 96.49%) (continued)
China (30 June 2021: 96.33%) (continued)
3,200 Autobio Diagnostics Co Ltd 'A' 27,645 0.08
4,900 Avary Holding Shenzhen Co Ltd 'A' 32,621 0.10
24,575 AVIC Electromechanical Systems Co Ltd 'A' 70,100 0.21
44,400 AVIC Industry-Finance Holdings Co Ltd 'A' 27,657 0.08
6,397 AVICOPTER Plc 'A' 80,598 0.24
10,000 BAIC BluePark New Energy Technology Co Ltd 'A' 15,722 0.05
110,544 Bank of Beijing Co Ltd 'A' 77,010 0.23
17,600 Bank of Changsha Co Ltd 'A' 21,567 0.06
9,100 Bank of Chengdu Co Ltd 'A' 17,134 0.05
83,700 Bank of China Ltd 'A' 40,055 0.12
164,960 Bank of Communications Co Ltd 'A' 119,319 0.35
9,420 Bank of Guiyang Co Ltd 'A' 9,622 0.03
19,200 Bank of Hangzhou Co Ltd 'A' 38,621 0.11
109,500 Bank of Jiangsu Co Ltd 'A' 100,165 0.30
42,823 Bank of Nanjing Co Ltd 'A' 60,203 0.18
23,640 Bank of Ningbo Co Ltd 'A' 141,988 0.42
71,660 Bank of Shanghai Co Ltd 'A' 80,167 0.24
7,000 Bank of Suzhou Co Ltd 'A' 7,436 0.02
39,380 Bank of Zhengzhou Co Ltd 'A' 19,525 0.06
50,029 Baoshan Iron & Steel Co Ltd 'A' 56,204 0.17
29,300 BBMG Corp 'A' 13,056 0.04
2,000 Beijing BDStar Navigation Co Ltd 'A' 12,317 0.04
4,893 Beijing Capital Development Co Ltd 'A' 4,345 0.01
14,190 Beijing Capital Eco-Environment Protection Group Co Ltd 'A' 7,592 0.02
22,446 Beijing Dabeinong Technology Group Co Ltd 'A' 36,944 0.11
2,000 Beijing Easpring Material Technology Co Ltd 'A' 27,260 0.08
4,752 Beijing E-Hualu Information Technology Co Ltd 'A' 26,357 0.08

December 2021 Legal & General UCITS ETF Plc
L&G E Fund MSCI China A UCITS ETF
Schedule of Investments (continued)
As at 31 December 2021
115
Nominal Description
Value
$
% of Net
Assets
Common Stock (30 June 2021: 96.49%) (continued)
China (30 June 2021: 96.33%) (continued)
8,300 Beijing Enlight Media Co Ltd 'A' 16,735 0.05
10,500 Beijing Jingyuntong Technology Co Ltd 'A' 15,107 0.04
800 Beijing Kingsoft Office Software Inc 'A' 33,263 0.10
7,000 Beijing New Building Materials Plc 'A' 39,353 0.12
14,080 Beijing Oriental Yuhong Waterproof Technology Co Ltd 'A' 116,380 0.34
12,300 Beijing Originwater Technology Co Ltd 'A' 13,876 0.04
200 Beijing Roborock Technology Co Ltd 'A' 25,512 0.08
12,000 Beijing Sanju Environmental Protection and New Material Co Ltd 'A' 14,931 0.04
3,500 Beijing Shiji Information Technology Co Ltd 'A' 15,783 0.05
6,010 Beijing Shunxin Agriculture Co Ltd 'A' 36,003 0.11
12,800 Beijing Sinnet Technology Co Ltd 'A' 29,804 0.09
4,780 Beijing Tiantan Biological Products Corp Ltd 'A' 21,720 0.06
4,900 Beijing Tongrentang Co Ltd 'A' 34,582 0.10
1,650 Beijing United Information Technology Co Ltd 'A' 27,831 0.08
900 Beijing Wantai Biological Pharmacy Enterprise Co Ltd 'A' 31,279 0.09
5,910 Beijing Yanjing Brewery Co Ltd 'A' 7,854 0.02
1,300 Beijing Yuanliu Hongyuan Electronic Technology Co Ltd 'A' 36,601 0.11
89,800 Beijing-Shanghai High Speed Railway Co Ltd 'A' 68,054 0.20
46,500 Beiqi Foton Motor Co Ltd 'A' 25,098 0.07
2,800 Betta Pharmaceuticals Co Ltd 'A' 35,072 0.10
1,600 BGI Genomics Co Ltd 'A' 22,042 0.07
800 Bloomage Biotechnology Corp Ltd 'A' 19,494 0.06
2,800 Blue Sail Medical Co Ltd 'A' 7,157 0.02
1,900 BOC International China Co Ltd 'A' 4,010 0.01
245,256 BOE Technology Group Co Ltd 'A' 194,331 0.58
7,600 Bright Dairy & Food Co Ltd 'A' 17,315 0.05
5,600 BTG Hotels Group Co Ltd 'A' 22,959 0.07
6,907 BYD Co Ltd 'A' 290,570 0.86

December 2021 Legal & General UCITS ETF Plc
L&G E Fund MSCI China A UCITS ETF
Schedule of Investments (continued)
As at 31 December 2021
116
Nominal Description
Value
$
% of Net
Assets
Common Stock (30 June 2021: 96.49%) (continued)
China (30 June 2021: 96.33%) (continued)
3,600 By-health Co Ltd 'A' 15,228 0.05
4,500 C&S Paper Co Ltd 'A' 11,798 0.03
20,600 Caitong Securities Co Ltd 'A' 35,942 0.11
1,200 Cambricon Technologies Corp Ltd 'A' 17,906 0.05
300 CanSino Biologics Inc 'A' 14,100 0.04
13,700 CECEP Solar Energy Co Ltd 'A' 24,075 0.07
19,000 CECEP Wind-Power Corp 'A' 19,407 0.06
6,800 Central China Securities Co Ltd 'A' 5,239 0.02
13,200 Centre Testing International Group Co Ltd 'A' 55,651 0.16
2,900 Chacha Food Co Ltd 'A' 27,920 0.08
2,250 Changchun High & New Technology Industry Group Inc 'A' 95,813 0.28
29,200 Changjiang Securities Co Ltd 'A' 34,545 0.10
1,100 Changzhou Xingyu Automotive Lighting Systems Co Ltd 'A' 35,252 0.10
9,500 Chaozhou Three-Circle Group Co Ltd 'A' 66,480 0.20
12,636 Chengdu Xingrong Environment Co Ltd 'A' 12,530 0.04
16,100 Chengtun Mining Group Co Ltd 'A' 27,105 0.08
4,700 Chengxin Lithium Group Co Ltd 'A' 42,735 0.13
11,600 Chifeng Jilong Gold Mining Co Ltd 'A' 27,119 0.08
17,128 China Baoan Group Co Ltd 'A' 38,780 0.11
59,160 China Construction Bank Corp 'A' 54,395 0.16
13,800 China CSSC Holdings Ltd 'A' 53,677 0.16
33,128 China Eastern Airlines Corp Ltd 'A' 26,821 0.08
124,587 China Energy Engineering Corp Ltd 'A' 53,366 0.16
119,400 China Everbright Bank Co Ltd 'A' 62,198 0.18
6,300 China Film Co Ltd 'A' 12,663 0.04
44,000 China First Heavy Industries 'A' 24,025 0.07

December 2021 Legal & General UCITS ETF Plc
L&G E Fund MSCI China A UCITS ETF
Schedule of Investments (continued)
As at 31 December 2021
117
Nominal Description
Value
$
% of Net
Assets
Common Stock (30 June 2021: 96.49%) (continued)
China (30 June 2021: 96.33%) (continued)
4,596 China Fortune Land Development Co Ltd 'A' 2,596 0.01
6,700 China Galaxy Securities Co Ltd 'A' 11,763 0.03
22,300 China Grand Automotive Services Group Co Ltd 'A' 9,342 0.03
7,000 China Great Wall Securities Co Ltd 'A' 14,223 0.04
14,849 China Greatwall Technology Group Co Ltd 'A' 32,991 0.10
27,700 China Hainan Rubber Industry Group Co Ltd 'A' 22,948 0.07
2,200 China International Capital Corp Ltd 'A' 16,925 0.05
11,165 China International Marine Containers Group Co Ltd 'A' 30,061 0.09
23,221 China Jushi Co Ltd 'A' 66,311 0.20
6,306 China Life Insurance Co Ltd 'A' 29,772 0.09
104,027 China Merchants Bank Co Ltd 'A' 795,052 2.36
7,711 China Merchants Energy Shipping Co Ltd 'A' 4,961 0.01
21,743 China Merchants Securities Co Ltd 'A' 60,214 0.18
20,112 China Merchants Shekou Industrial Zone Holdings Co Ltd 'A' 42,096 0.12
5,900 China Minmetals Rare Earth Co Ltd 'A' 36,122 0.11
157,046 China Minsheng Banking Corp Ltd 'A' 96,100 0.28
47,500 China Molybdenum Co Ltd 'A' 41,587 0.12
2,024 China National Medicines Corp Ltd 'A' 10,013 0.03
2,600 China National Software & Service Co Ltd 'A' 20,369 0.06
15,702 China Northern Rare Earth Group High-Tech Co Ltd 'A' 112,837 0.33
23,865 China Pacific Insurance Group Co Ltd 'A' 101,551 0.30
97,809 China Petroleum & Chemical Corp 'A' 64,916 0.19
77,000 China Railway Group Ltd 'A' 69,952 0.21
3,000 China Railway Hi-tech Industry Co Ltd 'A' 3,865 0.01
427,400 China Railway Signal & Communication Corp Ltd 'A' 333,961 0.99
2,500 China Resources Sanjiu Medical & Pharmaceutical Co Ltd 'A' 13,431 0.04
13,114 China Shenhua Energy Co Ltd 'A' 46,338 0.14
31,197 China Southern Airlines Co Ltd 'A' 33,334 0.10

December 2021 Legal & General UCITS ETF Plc
L&G E Fund MSCI China A UCITS ETF
Schedule of Investments (continued)
As at 31 December 2021
118
Nominal Description
Value
$
% of Net
Assets
Common Stock (30 June 2021: 96.49%) (continued)
China (30 June 2021: 96.33%) (continued)
15,500 China Southern Power Grid Energy Efficiency&Clean Energy Co Ltd 'A' 20,161 0.06
148,700 China State Construction Engineering Corp Ltd 'A' 116,657 0.35
47,700 China Three Gorges Renewables Group Co Ltd 'A' 56,207 0.17
7,458 China Tourism Group Duty Free Corp Ltd 'A' 256,750 0.76
4,500 China TransInfo Technology Co Ltd 'A' 10,556 0.03
52,661 China Vanke Co Ltd 'A' 163,270 0.48
1,640 China Wafer Level CSP Co Ltd 'A' 14,176 0.04
19,200 China XD Electric Co Ltd 'A' 16,720 0.05
70,584 China Yangtze Power Co Ltd 'A' 251,399 0.74
2,300 China Zhenhua Group Science & Technology Co Ltd 'A' 44,850 0.13
50,700 China Zheshang Bank Co Ltd 'A' 27,842 0.08
1,600 Chongqing Brewery Co Ltd 'A' 37,988 0.11
29,694 Chongqing Changan Automobile Co Ltd 'A' 70,771 0.21
3,300 Chongqing Fuling Zhacai Group Co Ltd 'A' 19,572 0.06
49,600 Chongqing Iron & Steel Co Ltd 'A' 16,265 0.05
43,700 Chongqing Rural Commercial Bank Co Ltd 'A' 26,398 0.08
3,600 Chongqing Sokon Industry Group Co Ltd 'A' 33,637 0.10
5,500 Chongqing Zhifei Biological Products Co Ltd 'A' 107,526 0.32
28,000 CITIC Heavy Industries Co Ltd 'A' 19,594 0.06
60,419 CITIC Securities Co Ltd 'A' 250,365 0.74
7,700 CNHTC Jinan Truck Co Ltd 'A' 20,406 0.06
12,400 CNOOC Energy Technology & Services Ltd 'A' 5,701 0.02
6,200 COFCO Biotechnology Co Ltd 'A' 10,574 0.03
900 COFCO Sugar Holding Co Ltd 'A' 1,327 0.00
8,800 Contemporary Amperex Technology Co Ltd 'A' 811,879 2.41
27,880 COSCO SHIPPING Development Co Ltd 'A' 14,217 0.04
18,700 COSCO SHIPPING Energy Transportation Co Ltd 'A' 17,370 0.05
40,043 COSCO SHIPPING Holdings Co Ltd 'A' 117,427 0.35

December 2021 Legal & General UCITS ETF Plc
L&G E Fund MSCI China A UCITS ETF
Schedule of Investments (continued)
As at 31 December 2021
119
Nominal Description
Value
$
% of Net
Assets
Common Stock (30 June 2021: 96.49%) (continued)
China (30 June 2021: 96.33%) (continued)
11,900 CSC Financial Co Ltd 'A' 54,614 0.16
9,000 CSG Holding Co Ltd 'A' 14,022 0.04
10,112 Daan Gene Co Ltd 'A' 31,827 0.09
48,834 Daqin Railway Co Ltd 'A' 49,038 0.15
1,080 DaShenLin Pharmaceutical Group Co Ltd 'A' 7,136 0.02
100 DBAPP Security Ltd 'A' 3,934 0.01
17,868 DHC Software Co Ltd 'A' 21,868 0.06
3,900 Dian Diagnostics Group Co Ltd 'A' 20,542 0.06
5,000 Do-Fluoride New Materials Co Ltd 'A' 35,295 0.10
3,227 Dong-E-E-Jiao Co Ltd 'A' 24,683 0.07
5,800 Dongfang Electric Corp Ltd 'A' 19,493 0.06
14,800 Dongxing Securities Co Ltd 'A' 27,068 0.08
64,480 East Money Information Co Ltd 'A' 375,446 1.11
1,000 Ecovacs Robotics Co Ltd 'A' 23,685 0.07
6,800 ENN Natural Gas Co Ltd 'A' 19,589 0.06
4,621 Eoptolink Technology Inc Ltd 'A' 28,407 0.08
3,000 Estun Automation Co Ltd 'A' 12,215 0.04
10,424 Eve Energy Co Ltd 'A' 193,290 0.57
15,300 Everbright Securities Co Ltd 'A' 35,841 0.11
500 Eyebright Medical Technology Beijing Co Ltd 'A' 16,493 0.05
24,050 Fangda Carbon New Material Co Ltd 'A' 40,829 0.12
15,198 Fangda Special Steel Technology Co Ltd 'A' 18,600 0.06
3,200 Farasis Energy Gan Zhou Co Ltd 'A' 16,895 0.05
5,901 FAW Jiefang Group Co Ltd 'A' 9,527 0.03
3,829 Fiberhome Telecommunication Technologies Co Ltd 'A' 10,802 0.03
7,900 Financial Street Holdings Co Ltd 'A' 7,016 0.02
20,000 First Capital Securities Co Ltd 'A' 22,971 0.07
6,100 Flat Glass Group Co Ltd 'A' 55,455 0.16

December 2021 Legal & General UCITS ETF Plc
L&G E Fund MSCI China A UCITS ETF
Schedule of Investments (continued)
As at 31 December 2021
120
Nominal Description
Value
$
% of Net
Assets
Common Stock (30 June 2021: 96.49%) (continued)
China (30 June 2021: 96.33%) (continued)
88,180 Focus Media Information Technology Co Ltd 'A' 113,314 0.34
8,378 Foshan Haitian Flavouring & Food Co Ltd 'A' 138,171 0.41
28,265 Founder Securities Co Ltd 'A' 34,769 0.10
17,100 Foxconn Industrial Internet Co Ltd 'A' 31,982 0.09
800 Fu Jian Anjoy Foods Co Ltd 'A' 21,437 0.06
2,400 Fujian Sunner Development Co Ltd 'A' 9,102 0.03
11,200 Fushun Special Steel Co Ltd 'A' 43,529 0.13
14,017 Fuyao Glass Industry Group Co Ltd 'A' 103,675 0.31
6,850 Ganfeng Lithium Co Ltd 'A' 153,533 0.45
200 G-bits Network Technology Xiamen Co Ltd 'A' 13,238 0.04
25,300 GCL System Integration Technology Co Ltd 'A' 15,085 0.04
98,863 GD Power Development Co Ltd 'A' 49,173 0.15
37,220 GEM Co Ltd 'A' 60,443 0.18
12,938 Gemdale Corp 'A' 26,329 0.08
18,000 GF Securities Co Ltd 'A' 69,448 0.21
8,000 Giant Network Group Co Ltd 'A' 15,025 0.04
3,856 Gigadevice Semiconductor Beijing Inc 'A' 106,392 0.32
500 Ginlong Technologies Co Ltd 'A' 18,165 0.05
7,208 Glodon Co Ltd 'A' 72,359 0.21
19,570 GoerTek Inc 'A' 166,119 0.49
7,500 Gotion High-tech Co Ltd 'A' 60,310 0.18
7,100 Grandblue Environment Co Ltd 'A' 23,372 0.07
5,100 Great Wall Motor Co Ltd 'A' 38,842 0.12
35,172 Gree Electric Appliances Inc of Zhuhai 'A' 204,354 0.61
15,750 Greenland Holdings Corp Ltd 'A' 10,725 0.03
2,600 GRG Banking Equipment Co Ltd 'A' 4,855 0.01
8,900 Guangdong Fenghua Advanced Technology Holding Co Ltd 'A' 41,614 0.12
6,900 Guangdong Haid Group Co Ltd 'A' 79,357 0.24
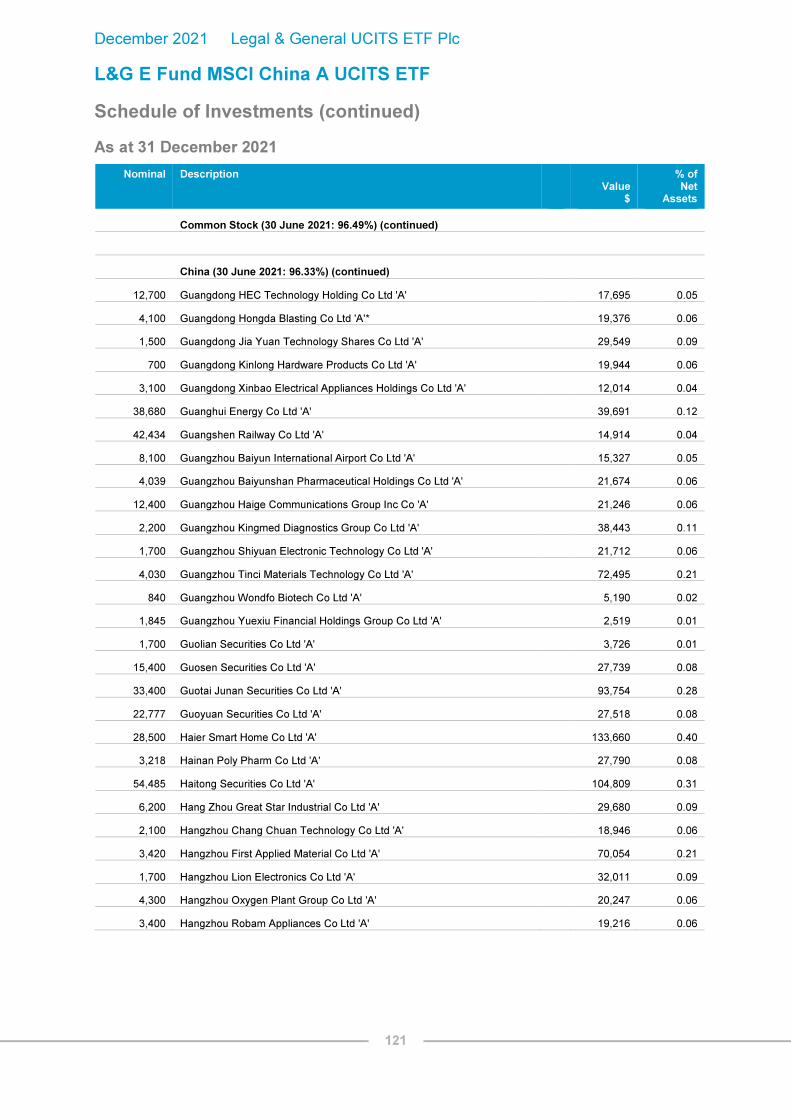
December 2021 Legal & General UCITS ETF Plc
L&G E Fund MSCI China A UCITS ETF
Schedule of Investments (continued)
As at 31 December 2021
121
Nominal Description
Value
$
% of Net
Assets
Common Stock (30 June 2021: 96.49%) (continued)
China (30 June 2021: 96.33%) (continued)
12,700 Guangdong HEC Technology Holding Co Ltd 'A' 17,695 0.05
4,100 Guangdong Hongda Blasting Co Ltd 'A'* 19,376 0.06
1,500 Guangdong Jia Yuan Technology Shares Co Ltd 'A' 29,549 0.09
700 Guangdong Kinlong Hardware Products Co Ltd 'A' 19,944 0.06
3,100 Guangdong Xinbao Electrical Appliances Holdings Co Ltd 'A' 12,014 0.04
38,680 Guanghui Energy Co Ltd 'A' 39,691 0.12
42,434 Guangshen Railway Co Ltd 'A' 14,914 0.04
8,100 Guangzhou Baiyun International Airport Co Ltd 'A' 15,327 0.05
4,039 Guangzhou Baiyunshan Pharmaceutical Holdings Co Ltd 'A' 21,674 0.06
12,400 Guangzhou Haige Communications Group Inc Co 'A' 21,246 0.06
2,200 Guangzhou Kingmed Diagnostics Group Co Ltd 'A' 38,443 0.11
1,700 Guangzhou Shiyuan Electronic Technology Co Ltd 'A' 21,712 0.06
4,030 Guangzhou Tinci Materials Technology Co Ltd 'A' 72,495 0.21
840 Guangzhou Wondfo Biotech Co Ltd 'A' 5,190 0.02
1,845 Guangzhou Yuexiu Financial Holdings Group Co Ltd 'A' 2,519 0.01
1,700 Guolian Securities Co Ltd 'A' 3,726 0.01
15,400 Guosen Securities Co Ltd 'A' 27,739 0.08
33,400 Guotai Junan Securities Co Ltd 'A' 93,754 0.28
22,777 Guoyuan Securities Co Ltd 'A' 27,518 0.08
28,500 Haier Smart Home Co Ltd 'A' 133,660 0.40
3,218 Hainan Poly Pharm Co Ltd 'A' 27,790 0.08
54,485 Haitong Securities Co Ltd 'A' 104,809 0.31
6,200 Hang Zhou Great Star Industrial Co Ltd 'A' 29,680 0.09
2,100 Hangzhou Chang Chuan Technology Co Ltd 'A' 18,946 0.06
3,420 Hangzhou First Applied Material Co Ltd 'A' 70,054 0.21
1,700 Hangzhou Lion Electronics Co Ltd 'A' 32,011 0.09
4,300 Hangzhou Oxygen Plant Group Co Ltd 'A' 20,247 0.06
3,400 Hangzhou Robam Appliances Co Ltd 'A' 19,216 0.06

December 2021 Legal & General UCITS ETF Plc
L&G E Fund MSCI China A UCITS ETF
Schedule of Investments (continued)
As at 31 December 2021
122
Nominal Description
Value
$
% of Net
Assets
Common Stock (30 June 2021: 96.49%) (continued)
China (30 June 2021: 96.33%) (continued)
6,700 Hangzhou Silan Microelectronics Co Ltd 'A' 56,978 0.17
4,250 Hangzhou Tigermed Consulting Co Ltd 'A' 85,222 0.25
6,805 Han's Laser Technology Industry Group Co Ltd 'A' 57,657 0.17
2,200 Hebei Hengshui Laobaigan Liquor Co Ltd 'A' 9,645 0.03
3,280 Hebei Yangyuan Zhihui Beverage Co Ltd 'A' 14,621 0.04
2,700 Hefei Meiya Optoelectronic Technology Inc 'A' 15,869 0.05
7,000 Heilongjiang Agriculture Co Ltd 'A' 15,992 0.05
15,400 Henan Shenhuo Coal & Power Co Ltd 'A' 21,964 0.07
6,717 Henan Shuanghui Investment & Development Co Ltd 'A' 33,251 0.10
6,700 Hengdian Group DMEGC Magnetics Co Ltd 'A' 19,837 0.06
17,440 Hengli Petrochemical Co Ltd 'A' 62,855 0.19
15,980 Hengtong Optic-electric Co Ltd 'A' 37,911 0.11
17,260 Hengyi Petrochemical Co Ltd 'A' 28,761 0.09
35,172 Hesteel Co Ltd 'A' 13,576 0.04
14,000 Hisense Visual Technology Co Ltd 'A' 29,545 0.09
1,900 Hithink RoyalFlush Information Network Co Ltd 'A' 43,102 0.13
3,800 Hongfa Technology Co Ltd 'A' 44,503 0.13
800 Hoshine Silicon Industry Co Ltd 'A' 16,565 0.05
13,200 Huaan Securities Co Ltd 'A' 11,205 0.03
39,200 Huadian Power International Corp Ltd 'A' 32,906 0.10
4,158 Huadong Medicine Co Ltd 'A' 26,227 0.08
12,700 Huafon Chemical Co Ltd 'A' 20,803 0.06
5,856 Huagong Tech Co Ltd 'A' 25,598 0.08
8,465 Hualan Biological Engineering Inc 'A' 38,703 0.11
25,200 Huaneng Power International Inc 'A' 38,314 0.11
41,467 Huatai Securities Co Ltd 'A' 115,552 0.34
4,400 Huaxi Securities Co Ltd 'A' 6,800 0.02
34,392 Huaxia Bank Co Ltd 'A' 30,219 0.09

December 2021 Legal & General UCITS ETF Plc
L&G E Fund MSCI China A UCITS ETF
Schedule of Investments (continued)
As at 31 December 2021
123
Nominal Description
Value
$
% of Net
Assets
Common Stock (30 June 2021: 96.49%) (continued)
China (30 June 2021: 96.33%) (continued)
4,900 Huaxin Cement Co Ltd 'A' 14,838 0.04
12,281 Huayu Automotive Systems Co Ltd 'A' 54,532 0.16
26,400 Hubei Energy Group Co Ltd 'A' 21,705 0.06
2,900 Hubei Xingfa Chemicals Group Co Ltd 'A' 17,236 0.05
5,100 Hubei Yihua Chemical Industry Co Ltd 'A' 17,052 0.05
700 Huizhou Desay Sv Automotive Co Ltd 'A' 15,542 0.05
4,770 Humanwell Healthcare Group Co Ltd 'A' 16,855 0.05
24,620 Hunan Valin Steel Co Ltd 'A' 19,740 0.06
7,882 Hundsun Technologies Inc 'A' 76,862 0.23
14,511 Iflytek Co Ltd 'A' 119,556 0.35
540 Imeik Technology Development Co Ltd 'A' 45,423 0.13
149,968 Industrial & Commercial Bank of China Ltd 'A' 108,946 0.32
120,535 Industrial Bank Co Ltd 'A' 360,090 1.07
36,764 Industrial Securities Co Ltd 'A' 56,992 0.17
1,700 Ingenic Semiconductor Co Ltd 'A' 35,743 0.11
193,333 Inner Mongolia BaoTou Steel Union Co Ltd 'A' 84,633 0.25
6,900 Inner Mongolia Dian Tou Energy Corp Ltd 'A' 16,077 0.05
18,600 Inner Mongolia Junzheng Energy & Chemical Industry Group Co Ltd 'A' 15,263 0.05
30,300 Inner Mongolia MengDian HuaNeng Thermal Power Corp Ltd 'A' 18,731 0.06
43,906 Inner Mongolia Yili Industrial Group Co Ltd 'A' 285,617 0.85
13,800 Inspur Electronic Information Industry Co Ltd 'A' 77,581 0.23
2,700 Intco Medical Technology Co Ltd 'A' 24,503 0.07
16,200 IRICO Display Devices Co Ltd 'A' 17,335 0.05
5,400 JA Solar Technology Co Ltd 'A' 78,543 0.23
3,220 Jafron Biomedical Co Ltd 'A' 26,929 0.08
2,000 Jason Furniture Hangzhou Co Ltd 'A' 24,213 0.07
8,700 JCET Group Co Ltd 'A' 42,344 0.13
20,100 Jiangsu Changshu Rural Commercial Bank Co Ltd 'A' 20,846 0.06

December 2021 Legal & General UCITS ETF Plc
L&G E Fund MSCI China A UCITS ETF
Schedule of Investments (continued)
As at 31 December 2021
124
Nominal Description
Value
$
% of Net
Assets
Common Stock (30 June 2021: 96.49%) (continued)
China (30 June 2021: 96.33%) (continued)
800 Jiangsu Cnano Technology Co Ltd 'A' 18,739 0.06
7,900 Jiangsu Eastern Shenghong Co Ltd 'A' 23,973 0.07
300 Jiangsu GoodWe Power Supply Technology Co Ltd 'A' 21,633 0.06
2,740 Jiangsu Hengli Hydraulic Co Ltd 'A' 35,167 0.10
26,839 Jiangsu Hengrui Medicine Co Ltd 'A' 213,546 0.63
6,600 Jiangsu Hengshun Vinegar Industry Co Ltd 'A' 16,517 0.05
4,300 Jiangsu Hoperun Software Co Ltd 'A' 15,363 0.05
3,800 Jiangsu King's Luck Brewery JSC Ltd 'A' 32,435 0.10
8,600 Jiangsu Nhwa Pharmaceutical Co Ltd 'A' 21,118 0.06
12,000 Jiangsu Shagang Co Ltd 'A' 10,977 0.03
4,500 Jiangsu Shuangxing Color Plastic New Materials Co Ltd 'A' 19,120 0.06
4,900 Jiangsu Yanghe Brewery Joint-Stock Co Ltd 'A' 126,649 0.38
1,000 Jiangsu Yangnong Chemical Co Ltd 'A' 20,586 0.06
2,500 Jiangsu Yoke Technology Co Ltd 'A' 31,840 0.09
5,200 Jiangsu Yuyue Medical Equipment & Supply Co Ltd 'A' 30,841 0.09
23,600 Jiangsu Zhongnan Construction Group Co Ltd 'A' 15,330 0.05
20,750 Jiangsu Zhongtian Technology Co Ltd 'A' 55,217 0.16
9,400 Jiangxi Copper Co Ltd 'A' 32,934 0.10
10,100 Jiangxi Special Electric Motor Co Ltd 'A' 32,899 0.10
9,700 Jiangxi Zhengbang Technology Co Ltd 'A' 14,702 0.04
7,157 Jilin Aodong Pharmaceutical Group Co Ltd 'A' 20,741 0.06
16,300 Jinke Properties Group Co Ltd 'A' 11,458 0.03
7,129 Jinyu Bio-Technology Co Ltd 'A' 18,289 0.05
2,100 JiuGui Liquor Co Ltd 'A' 70,018 0.21
2,400 JL Mag Rare-Earth Co Ltd 'A' 16,904 0.05
5,100 Joincare Pharmaceutical Group Industry Co Ltd 'A' 10,275 0.03
1,380 Joinn Laboratories China Co Ltd 'A' 24,994 0.07
7,100 Jointown Pharmaceutical Group Co Ltd 'A' 16,398 0.05
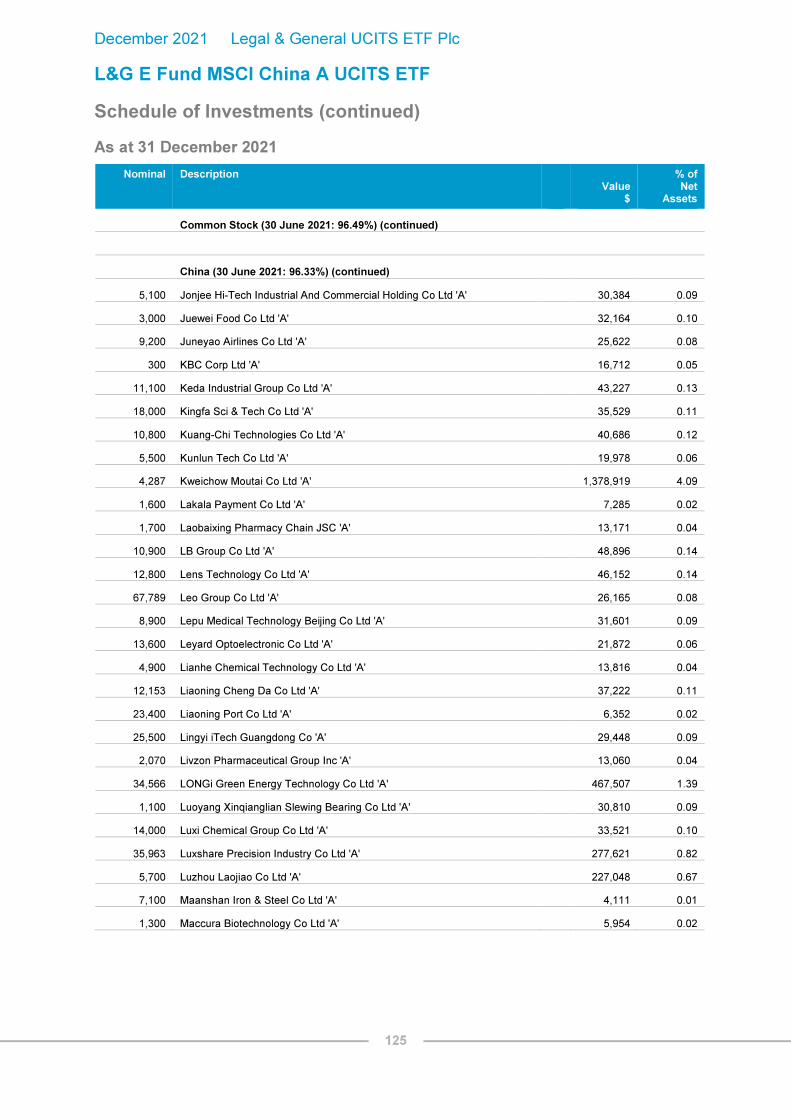
December 2021 Legal & General UCITS ETF Plc
L&G E Fund MSCI China A UCITS ETF
Schedule of Investments (continued)
As at 31 December 2021
125
Nominal Description
Value
$
% of Net
Assets
Common Stock (30 June 2021: 96.49%) (continued)
China (30 June 2021: 96.33%) (continued)
5,100 Jonjee Hi-Tech Industrial And Commercial Holding Co Ltd 'A' 30,384 0.09
3,000 Juewei Food Co Ltd 'A' 32,164 0.10
9,200 Juneyao Airlines Co Ltd 'A' 25,622 0.08
300 KBC Corp Ltd 'A' 16,712 0.05
11,100 Keda Industrial Group Co Ltd 'A' 43,227 0.13
18,000 Kingfa Sci & Tech Co Ltd 'A' 35,529 0.11
10,800 Kuang-Chi Technologies Co Ltd 'A' 40,686 0.12
5,500 Kunlun Tech Co Ltd 'A' 19,978 0.06
4,287 Kweichow Moutai Co Ltd 'A' 1,378,919 4.09
1,600 Lakala Payment Co Ltd 'A' 7,285 0.02
1,700 Laobaixing Pharmacy Chain JSC 'A' 13,171 0.04
10,900 LB Group Co Ltd 'A' 48,896 0.14
12,800 Lens Technology Co Ltd 'A' 46,152 0.14
67,789 Leo Group Co Ltd 'A' 26,165 0.08
8,900 Lepu Medical Technology Beijing Co Ltd 'A' 31,601 0.09
13,600 Leyard Optoelectronic Co Ltd 'A' 21,872 0.06
4,900 Lianhe Chemical Technology Co Ltd 'A' 13,816 0.04
12,153 Liaoning Cheng Da Co Ltd 'A' 37,222 0.11
23,400 Liaoning Port Co Ltd 'A' 6,352 0.02
25,500 Lingyi iTech Guangdong Co 'A' 29,448 0.09
2,070 Livzon Pharmaceutical Group Inc 'A' 13,060 0.04
34,566 LONGi Green Energy Technology Co Ltd 'A' 467,507 1.39
1,100 Luoyang Xinqianglian Slewing Bearing Co Ltd 'A' 30,810 0.09
14,000 Luxi Chemical Group Co Ltd 'A' 33,521 0.10
35,963 Luxshare Precision Industry Co Ltd 'A' 277,621 0.82
5,700 Luzhou Laojiao Co Ltd 'A' 227,048 0.67
7,100 Maanshan Iron & Steel Co Ltd 'A' 4,111 0.01
1,300 Maccura Biotechnology Co Ltd 'A' 5,954 0.02

December 2021 Legal & General UCITS ETF Plc
L&G E Fund MSCI China A UCITS ETF
Schedule of Investments (continued)
As at 31 December 2021
126
Nominal Description
Value
$
% of Net
Assets
Common Stock (30 June 2021: 96.49%) (continued)
China (30 June 2021: 96.33%) (continued)
5,300 Mango Excellent Media Co Ltd 'A' 47,583 0.14
1,572 Maxscend Microelectronics Co Ltd 'A' 80,606 0.24
16,872 Meihua Holdings Group Co Ltd 'A' 20,305 0.06
22,060 Meinian Onehealth Healthcare Holdings Co Ltd 'A' 27,171 0.08
82,100 Metallurgical Corp of China Ltd 'A' 49,337 0.15
3,300 Mianyang Fulin Precision Co Ltd 'A' 15,223 0.05
700 Micro-Tech Nanjing Co Ltd 'A' 23,358 0.07
35,742 Midea Group Co Ltd 'A' 413,929 1.23
6,900 Ming Yang Smart Energy Group Ltd 'A' 28,257 0.08
1,100 Minmetals Capital Co Ltd 'A' 918 0.00
4,200 MLS Co Ltd 'A' 9,971 0.03
2,200 Montage Technology Co Ltd 'A' 28,951 0.09
18,266 Muyuan Foods Co Ltd 'A' 152,929 0.45
12,200 NanJi E-Commerce Co Ltd 'A' 13,208 0.04
1,200 Nanjing Hanrui Cobalt Co Ltd 'A' 15,097 0.04
35,900 Nanjing Iron & Steel Co Ltd 'A' 20,841 0.06
4,225 Nanjing King-Friend Biochemical Pharmaceutical Co Ltd 'A' 27,842 0.08
18,700 Nanjing Securities Co Ltd 'A' 29,077 0.09
17,386 NARI Technology Co Ltd 'A' 109,199 0.32
9,000 National Silicon Industry Group Co Ltd 'A' 36,461 0.11
1,700 NAURA Technology Group Co Ltd 'A' 92,562 0.27
9,825 NavInfo Co Ltd 'A' 24,542 0.07
4,277 New China Life Insurance Co Ltd 'A' 26,091 0.08
12,600 New Hope Liuhe Co Ltd 'A' 30,070 0.09
4,000 Newland Digital Technology Co Ltd 'A' 11,372 0.03
4,100 Ninestar Corp 'A' 30,724 0.09
800 Ningbo Deye Technology Co Ltd 'A' 34,367 0.10
8,640 Ningbo Joyson Electronic Corp 'A' 29,783 0.09

December 2021 Legal & General UCITS ETF Plc
L&G E Fund MSCI China A UCITS ETF
Schedule of Investments (continued)
As at 31 December 2021
127
Nominal Description
Value
$
% of Net
Assets
Common Stock (30 June 2021: 96.49%) (continued)
China (30 June 2021: 96.33%) (continued)
1,300 Ningbo Ronbay New Energy Technology Co Ltd 'A' 23,575 0.07
10,680 Ningbo Shanshan Co Ltd 'A' 54,914 0.16
4,300 Ningbo Tuopu Group Co Ltd 'A' 35,758 0.11
17,100 Ningxia Baofeng Energy Group Co Ltd 'A' 46,578 0.14
8,000 North China Pharmaceutical Co Ltd 'A' 14,962 0.04
5,582 Northeast Securities Co Ltd 'A' 7,690 0.02
11,000 Nuode Investment Co Ltd 'A' 27,529 0.08
20,491 Offshore Oil Engineering Co Ltd 'A' 14,822 0.04
19,916 OFILM Group Co Ltd 'A' 30,311 0.09
1,580 Oppein Home Group Inc 'A' 36,566 0.11
24,100 Orient Securities Co Ltd/China 'A' 55,737 0.17
15,400 Oriental Energy Co Ltd 'A' 30,421 0.09
11,393 Oriental Pearl Group Co Ltd 'A' 16,893 0.05
3,000 Ovctek China Inc 'A' 27,005 0.08
54,537 Pacific Securities Co Ltd/The/China 'A' 28,067 0.08
900 Pacific Shuanglin Bio-pharmacy Co Ltd 'A' 3,958 0.01
72,600 Pang Da Automobile Trade Co Ltd 'A' 18,682 0.06
41,000 Pangang Group Vanadium Titanium & Resources Co Ltd 'A' 25,024 0.07
26,600 People's Insurance Co Group of China Ltd/The 'A' 19,616 0.06
11,400 Perfect World Co Ltd/China 'A' 36,328 0.11
51,383 PetroChina Co Ltd 'A' 39,585 0.12
900 PharmaBlock Sciences Nanjing Inc 'A' 20,076 0.06
2,400 Pharmaron Beijing Co Ltd 'A' 53,198 0.16
63,200 Ping An Bank Co Ltd 'A' 163,420 0.48
73,298 Ping An Insurance Group Co of China Ltd 'A' 579,749 1.72
12,300 Polaris Bay Group Co Ltd 'A' 19,222 0.06
54,659 Poly Developments and Holdings Group Co Ltd 'A' 134,045 0.40
3,100 Porton Pharma Solutions Ltd 'A' 43,508 0.13
60,800 Postal Savings Bank of China Co Ltd 'A' 48,653 0.14

December 2021 Legal & General UCITS ETF Plc
L&G E Fund MSCI China A UCITS ETF
Schedule of Investments (continued)
As at 31 December 2021
128
Nominal Description
Value
$
% of Net
Assets
Common Stock (30 June 2021: 96.49%) (continued)
China (30 June 2021: 96.33%) (continued)
52,284 Power Construction Corp of China Ltd 'A' 66,284 0.20
700 Proya Cosmetics Co Ltd 'A' 22,879 0.07
4,320 Qianhe Condiment and Food Co Ltd 'A' 16,322 0.05
35,100 Qingdao Rural Commercial Bank Corp 'A' 21,258 0.06
5,800 Qingdao TGOOD Electric Co Ltd 'A' 22,633 0.07
700 Quectel Wireless Solutions Co Ltd 'A' 22,395 0.07
2,600 Raytron Technology Co Ltd 'A' 32,052 0.09
21,700 RiseSun Real Estate Development Co Ltd 'A' 14,811 0.04
3,500 Riyue Heavy Industry Co Ltd 'A' 18,095 0.05
28,500 Rongsheng Petrochemical Co Ltd 'A' 81,207 0.24
21,147 SAIC Motor Corp Ltd 'A' 68,451 0.20
9,400 Sailun Group Co Ltd 'A' 21,814 0.06
21,381 Sanan Optoelectronics Co Ltd 'A' 126,004 0.37
1,600 Sangfor Technologies Inc 'A' 47,950 0.14
6,150 Sansteel Minguang Co Ltd Fujian 'A' 6,562 0.02
53,382 Sany Heavy Industry Co Ltd 'A' 190,968 0.57
7,220 Satellite Chemical Co Ltd 'A' 45,348 0.13
11,636 SDIC Capital Co Ltd 'A' 15,007 0.04
20,847 SDIC Power Holdings Co Ltd 'A' 37,518 0.11
39,950 Sealand Securities Co Ltd 'A' 25,763 0.08
4,900 Seazen Holdings Co Ltd 'A' 22,396 0.07
12,400 SF Holding Co Ltd 'A' 134,091 0.40
1,200 SG Micro Corp 'A' 58,180 0.17
27,200 Shaanxi Coal Industry Co Ltd 'A' 52,067 0.15
9,595 Shan Xi Hua Yang Group New Energy Co Ltd 'A' 17,840 0.05
6,600 Shandong Buchang Pharmaceuticals Co Ltd 'A' 21,840 0.06
12,354 Shandong Gold Mining Co Ltd 'A' 36,480 0.11
6,800 Shandong Himile Mechanical Science & Technology Co Ltd 'A' 29,618 0.09

December 2021 Legal & General UCITS ETF Plc
L&G E Fund MSCI China A UCITS ETF
Schedule of Investments (continued)
As at 31 December 2021
129
Nominal Description
Value
$
% of Net
Assets
Common Stock (30 June 2021: 96.49%) (continued)
China (30 June 2021: 96.33%) (continued)
11,136 Shandong Hualu Hengsheng Chemical Co Ltd 'A' 54,690 0.16
65,600 Shandong Iron and Steel Co Ltd 'A' 18,424 0.05
3,900 Shandong Linglong Tyre Co Ltd 'A' 22,366 0.07
57,788 Shandong Nanshan Aluminum Co Ltd 'A' 42,706 0.13
4,000 Shandong Pharmaceutical Glass Co Ltd 'A' 27,552 0.08
1,200 Shandong Shida Shenghua Chemical Group Co Ltd 'A' 37,278 0.11
7,500 Shandong Sinocera Functional Material Co Ltd 'A' 50,095 0.15
12,200 Shandong Sun Paper Industry JSC Ltd 'A' 21,994 0.07
5,200 Shanghai Aiko Solar Energy Co Ltd 'A' 19,059 0.06
9,129 Shanghai Bailian Group Co Ltd 'A' 19,093 0.06
2,380 Shanghai Bairun Investment Holding Group Co Ltd 'A' 22,342 0.07
3,170 Shanghai Baosight Software Co Ltd 'A' 30,256 0.09
800 Shanghai Chinafortune Co Ltd 'A' 1,737 0.01
44,474 Shanghai Construction Group Co Ltd 'A' 25,121 0.07
16,200 Shanghai Electric Group Co Ltd 'A' 12,353 0.04
9,900 Shanghai Fosun Pharmaceutical Group Co Ltd 'A' 76,020 0.23
100 Shanghai Friendess Electronic Technology Corp Ltd 'A' 6,048 0.02
7,278 Shanghai International Airport Co Ltd 'A' 53,317 0.16
28,884 Shanghai International Port Group Co Ltd 'A' 24,835 0.07
3,584 Shanghai Jahwa United Co Ltd 'A' 22,724 0.07
3,000 Shanghai Jinjiang International Hotels Co Ltd 'A' 27,584 0.08
2,300 Shanghai Junshi Biosciences Co Ltd 'A' 24,172 0.07
8,520 Shanghai Lingang Holdings Corp Ltd 'A' 19,878 0.06
2,503 Shanghai M&G Stationery Inc 'A' 25,335 0.07
2,000 Shanghai Milkground Food Tech Co Ltd 'A' 17,573 0.05
9,230 Shanghai Pharmaceuticals Holding Co Ltd 'A' 28,776 0.09
131,433 Shanghai Pudong Development Bank Co Ltd 'A' 175,908 0.52
2,420 Shanghai Putailai New Energy Technology Co Ltd 'A' 60,984 0.18

December 2021 Legal & General UCITS ETF Plc
L&G E Fund MSCI China A UCITS ETF
Schedule of Investments (continued)
As at 31 December 2021
130
Nominal Description
Value
$
% of Net
Assets
Common Stock (30 June 2021: 96.49%) (continued)
China (30 June 2021: 96.33%) (continued)
8,900 Shanghai RAAS Blood Products Co Ltd 'A' 9,524 0.03
26,080 Shanghai Tunnel Engineering Co Ltd 'A' 22,015 0.07
3,100 Shanghai Wanye Enterprises Co Ltd 'A' 16,183 0.05
6,900 Shanghai Yuyuan Tourist Mart Group Co Ltd 'A' 11,151 0.03
9,500 Shanghai Zhangjiang High-Tech Park Development Co Ltd 'A' 22,448 0.07
8,711 Shanghai Zhenhua Heavy Industries Co Ltd 'A' 5,153 0.02
12,200 Shanxi Coal International Energy Group Co Ltd 'A' 15,716 0.05
15,671 Shanxi Coking Coal Energy Group Co Ltd 'A' 20,335 0.06
8,600 Shanxi Lu'an Environmental Energy Development Co Ltd 'A' 15,261 0.05
13,100 Shanxi Meijin Energy Co Ltd 'A' 33,360 0.10
8,900 Shanxi Securities Co Ltd 'A' 9,217 0.03
9,800 Shanxi Taigang Stainless Steel Co Ltd 'A' 10,825 0.03
3,800 Shanxi Xinghuacun Fen Wine Factory Co Ltd 'A' 188,278 0.56
34,600 Shanying International Holding Co Ltd 'A' 17,861 0.05
1,600 Shede Spirits Co Ltd 'A' 57,063 0.17
6,200 Shenergy Co Ltd 'A' 7,170 0.02
11,400 Shenghe Resources Holding Co Ltd 'A' 35,094 0.10
13,304 Shengyi Technology Co Ltd 'A' 49,159 0.15
1,904 Shennan Circuits Co Ltd 'A' 36,393 0.11
62,100 Shenwan Hongyuan Group Co Ltd 'A' 49,888 0.15
4,400 Shenzhen Airport Co Ltd 'A' 5,054 0.01
2,900 Shenzhen Capchem Technology Co Ltd 'A' 51,417 0.15
400 Shenzhen Dynanonic Co Ltd 'A' 30,826 0.09
5,600 Shenzhen Energy Group Co Ltd 'A' 7,117 0.02
5,520 Shenzhen Everwin Precision Technology Co Ltd 'A' 17,184 0.05
6,200 Shenzhen Fastprint Circuit Tech Co Ltd 'A' 13,619 0.04
1,600 Shenzhen Goodix Technology Co Ltd 'A' 27,055 0.08
12,150 Shenzhen Inovance Technology Co Ltd 'A' 130,777 0.39

December 2021 Legal & General UCITS ETF Plc
L&G E Fund MSCI China A UCITS ETF
Schedule of Investments (continued)
As at 31 December 2021
131
Nominal Description
Value
$
% of Net
Assets
Common Stock (30 June 2021: 96.49%) (continued)
China (30 June 2021: 96.33%) (continued)
9,700 Shenzhen Jinjia Group Co Ltd 'A' 23,027 0.07
7,700 Shenzhen Kaifa Technology Co Ltd 'A' 19,137 0.06
2,500 Shenzhen Kangtai Biological Products Co Ltd 'A' 38,653 0.11
1,400 Shenzhen Kedali Industry Co Ltd 'A' 35,221 0.10
3,600 Shenzhen Mindray Bio-Medical Electronics Co Ltd 'A' 215,095 0.64
34,500 Shenzhen MTC Co Ltd 'A' 26,308 0.08
34,426 Shenzhen Overseas Chinese Town Co Ltd 'A' 38,027 0.11
2,900 Shenzhen Salubris Pharmaceuticals Co Ltd 'A' 12,431 0.04
1,700 Shenzhen SC New Energy Technology Corp 'A' 30,488 0.09
5,200 Shenzhen Senior Technology Material Co Ltd 'A' 29,968 0.09
6,800 Shenzhen Sunlord Electronics Co Ltd 'A' 40,736 0.12
5,800 Shenzhen Sunway Communication Co Ltd 'A' 23,042 0.07
1,900 Shenzhen Transsion Holdings Co Ltd 'A' 46,774 0.14
11,043 Shenzhen Zhongjin Lingnan Nonfemet Co Ltd 'A' 8,507 0.03
4,620 Shijiazhuang Yiling Pharmaceutical Co Ltd 'A' 14,208 0.04
9,900 Siasun Robot & Automation Co Ltd 'A' 17,351 0.05
10,524 Sichuan Chuantou Energy Co Ltd 'A' 20,641 0.06
46,600 Sichuan Hebang Biotechnology Co Ltd 'A' 24,933 0.07
8,604 Sichuan Kelun Pharmaceutical Co Ltd 'A' 25,555 0.08
8,100 Sichuan New Energy Power Co Ltd 'A' 33,717 0.10
20,532 Sichuan Road & Bridge Co Ltd 'A' 38,787 0.11
1,500 Sichuan Swellfun Co Ltd 'A' 28,240 0.08
11,000 Sichuan Yahua Industrial Group Co Ltd 'A' 49,465 0.15
4,400 Sieyuan Electric Co Ltd 'A' 33,973 0.10
6,400 Sinocare Inc 'A' 30,035 0.09
15,885 Sinolink Securities Co Ltd 'A' 28,239 0.08
12,400 Sinoma International Engineering Co 'A' 22,238 0.07
4,300 Sinoma Science & Technology Co Ltd 'A' 22,953 0.07

December 2021 Legal & General UCITS ETF Plc
L&G E Fund MSCI China A UCITS ETF
Schedule of Investments (continued)
As at 31 December 2021
132
Nominal Description
Value
$
% of Net
Assets
Common Stock (30 June 2021: 96.49%) (continued)
China (30 June 2021: 96.33%) (continued)
13,800 Sinopec Shanghai Petrochemical Co Ltd 'A' 9,029 0.03
1,200 Sinosoft Co Ltd 'A' 5,151 0.02
21,000 Sinotrans Ltd 'A' 14,761 0.04
1,500 Skshu Paint Co Ltd 'A' 32,750 0.10
13,860 Songcheng Performance Development Co Ltd 'A' 31,141 0.09
19,023 SooChow Securities Co Ltd 'A' 26,445 0.08
34,900 Southwest Securities Co Ltd 'A' 28,968 0.09
2,900 Spring Airlines Co Ltd 'A' 25,845 0.08
400 StarPower Semiconductor Ltd 'A' 23,912 0.07
7,700 Sungrow Power Supply Co Ltd 'A' 176,149 0.52
21,715 Suning.com Co Ltd 'A' 14,037 0.04
9,400 Sunwoda Electronic Co Ltd 'A' 62,181 0.18
4,800 Suofeiya Home Collection Co Ltd 'A' 16,720 0.05
10,500 Suzhou Dongshan Precision Manufacturing Co Ltd 'A' 44,647 0.13
16,588 Suzhou Gold Mantis Construction Decoration Co Ltd 'A' 15,824 0.05
320 Suzhou Maxwell Technologies Co Ltd 'A' 32,249 0.10
2,400 Suzhou TA&A Ultra Clean Technology Co Ltd 'A' 30,502 0.09
2,100 Taiji Computer Corp Ltd 'A' 9,074 0.03
10,500 Tangshan Jidong Cement Co Ltd 'A' 19,704 0.06
50,500 TangShan Port Group Co Ltd 'A' 21,790 0.06
10,200 Tangshan Sanyou Chemical Industries Co Ltd 'A' 13,924 0.04
5,925 Tasly Pharmaceutical Group Co Ltd 'A' 14,735 0.04
22,938 TBEA Co Ltd 'A' 76,192 0.23
102,637 TCL Technology Group Corp 'A' 99,362 0.29
1,900 Thunder Software Technology Co Ltd 'A' 41,265 0.12
38,300 Tianfeng Securities Co Ltd 'A' 24,338 0.07
2,400 Tianjin 712 Communication & Broadcasting Co Ltd 'A' 16,305 0.05
15,600 Tianjin Zhonghuan Semiconductor Co Ltd 'A' 102,191 0.30

December 2021 Legal & General UCITS ETF Plc
L&G E Fund MSCI China A UCITS ETF
Schedule of Investments (continued)
As at 31 December 2021
133
Nominal Description
Value
$
% of Net
Assets
Common Stock (30 June 2021: 96.49%) (continued)
China (30 June 2021: 96.33%) (continued)
6,400 Tianma Microelectronics Co Ltd 'A' 13,074 0.04
8,360 Tianqi Lithium Corp 'A' 140,353 0.42
16,489 Tianshui Huatian Technology Co Ltd 'A' 32,883 0.10
3,900 Tibet Mineral Development Co 'A' 32,511 0.10
3,200 Tibet Summit Resources Co Ltd 'A' 18,909 0.06
3,780 Toly Bread Co Ltd 'A' 16,844 0.05
5,000 TongFu Microelectronics Co Ltd 'A' 15,243 0.05
8,000 Tonghua Dongbao Pharmaceutical Co Ltd 'A' 13,757 0.04
14,880 Tongkun Group Co Ltd 'A' 49,449 0.15
49,000 Tongling Nonferrous Metals Group Co Ltd 'A' 26,755 0.08
22,200 Tongwei Co Ltd 'A' 156,607 0.46
1,600 Topchoice Medical Corp 'A' 49,958 0.15
3,600 Topsec Technologies Group Inc 'A' 10,828 0.03
10,600 Transfar Zhilian Co Ltd 'A' 14,470 0.04
4,700 Trina Solar Co Ltd 'A' 58,184 0.17
24,450 Tsinghua Tongfang Co Ltd 'A' 23,133 0.07
2,000 Tsingtao Brewery Co Ltd 'A' 31,067 0.09
3,600 Unigroup Guoxin Microelectronics Co Ltd 'A' 127,091 0.38
11,886 Unisplendour Corp Ltd 'A' 42,614 0.13
900 Universal Scientific Industrial Shanghai Co Ltd 'A' 2,268 0.01
6,900 Venustech Group Inc 'A' 30,887 0.09
1,500 Verisilicon Microelectronics Shanghai Co Ltd 'A' 18,207 0.05
10,500 Walvax Biotechnology Co Ltd 'A' 92,589 0.27
12,100 Wanda Film Holding Co Ltd 'A' 29,389 0.09
2,300 Wangfujing Group Co Ltd 'A' 9,744 0.03
9,400 Wangsu Science & Technology Co Ltd 'A' 9,867 0.03
10,900 Wanhua Chemical Group Co Ltd 'A' 172,735 0.51
11,214 Wanxiang Qianchao Co Ltd 'A' 11,208 0.03

December 2021 Legal & General UCITS ETF Plc
L&G E Fund MSCI China A UCITS ETF
Schedule of Investments (continued)
As at 31 December 2021
134
Nominal Description
Value
$
% of Net
Assets
Common Stock (30 June 2021: 96.49%) (continued)
China (30 June 2021: 96.33%) (continued)
40,300 Weichai Power Co Ltd 'A' 113,122 0.34
900 Weifu High-Technology Group Co Ltd 'A' 3,042 0.01
1,900 Weihai Guangwei Composites Co Ltd 'A' 25,185 0.07
37,820 Wens Foodstuffs Group Co Ltd 'A' 114,290 0.34
15,932 Western Mining Co Ltd 'A' 34,022 0.10
14,334 Western Securities Co Ltd 'A' 18,150 0.05
1,500 Western Superconducting Technologies Co Ltd 'A' 22,815 0.07
5,440 Westone Information Industry Inc 'A' 47,748 0.14
3,000 Will Semiconductor Co Ltd Shanghai 'A' 146,282 0.43
4,800 Wingtech Technology Co Ltd 'A' 97,380 0.29
10,690 Winning Health Technology Group Co Ltd 'A' 28,111 0.08
134,000 Wintime Energy Co Ltd 'A' 38,266 0.11
15,100 Wonders Information Co Ltd 'A' 30,847 0.09
11,075 Wuchan Zhongda Group Co Ltd 'A' 10,287 0.03
6,172 Wuhan Guide Infrared Co Ltd 'A' 23,445 0.07
900 Wuhan Jingce Electronic Group Co Ltd 'A' 10,228 0.03
2,200 Wuhan Raycus Fiber Laser Technologies Co Ltd 'A' 20,404 0.06
7,700 Wuhu Sanqi Interactive Entertainment Network Technology Group Co Ltd 'A' 32,644 0.10
18,100 Wuhu Token Science Co Ltd 'A' 37,714 0.11
14,925 Wuliangye Yibin Co Ltd 'A' 521,420 1.55
9,630 WUS Printed Circuit Kunshan Co Ltd 'A' 25,052 0.07
14,856 WuXi AppTec Co Ltd 'A' 276,404 0.82
7,600 Wuxi Lead Intelligent Equipment Co Ltd 'A' 88,683 0.26
1,000 Wuxi Shangji Automation Co Ltd 'A' 26,200 0.08
16,500 Wuxi Taiji Industry Co Ltd 'A' 20,918 0.06
65,120 XCMG Construction Machinery Co Ltd 'A' 61,203 0.18
9,157 Xiamen C & D Inc 'A' 13,031 0.04
1,200 Xiamen Faratronic Co Ltd 'A' 43,757 0.13

December 2021 Legal & General UCITS ETF Plc
L&G E Fund MSCI China A UCITS ETF
Schedule of Investments (continued)
As at 31 December 2021
135
Nominal Description
Value
$
% of Net
Assets
Common Stock (30 June 2021: 96.49%) (continued)
China (30 June 2021: 96.33%) (continued)
18,800 Xiamen ITG Group Corp Ltd 'A' 21,268 0.06
1,500 Xiamen Kingdomway Group Co 'A' 7,374 0.02
6,100 Xiamen Tungsten Co Ltd 'A' 21,659 0.06
13,600 Xian International Medical Investment Co Ltd 'A' 23,537 0.07
23,728 Xinhu Zhongbao Co Ltd 'A' 11,095 0.03
19,518 Xinjiang Goldwind Science & Technology Co Ltd 'A' 50,438 0.15
17,700 Xinjiang Zhongtai Chemical Co Ltd 'A' 26,494 0.08
8,169 Xinxing Ductile Iron Pipes Co Ltd 'A' 5,550 0.02
2,700 Xinyangfeng Agricultural Technology Co Ltd 'A' 7,155 0.02
22,900 Xinyu Iron & Steel Co Ltd 'A' 18,971 0.06
7,299 Xuji Electric Co Ltd 'A' 29,891 0.09
21,800 Yango Group Co Ltd 'A' 10,330 0.03
3,200 Yangzhou Yangjie Electronic Technology Co Ltd 'A' 33,730 0.10
5,400 Yankuang Energy Group Co Ltd 'A' 19,936 0.06
2,820 Yantai Eddie Precision Machinery Co Ltd 'A' 14,124 0.04
4,460 Yantai Jereh Oilfield Services Group Co Ltd 'A' 27,992 0.08
3,050 Yealink Network Technology Corp Ltd 'A' 38,978 0.12
2,700 Yifan Pharmaceutical Co Ltd 'A' 7,465 0.02
3,790 Yifeng Pharmacy Chain Co Ltd 'A' 32,772 0.10
3,000 Yihai Kerry Arawana Holdings Co Ltd 'A' 29,622 0.09
724 Yintai Gold Co Ltd 'A' 997 0.00
3,200 Yixintang Pharmaceutical Group Co Ltd 'A' 19,335 0.06
39,894 Yonghui Superstores Co Ltd 'A' 25,351 0.08
800 YongXing Special Materials Technology Co Ltd 'A' 18,580 0.05
10,570 Yonyou Network Technology Co Ltd 'A' 59,506 0.18
24,920 Youngor Group Co Ltd 'A' 26,940 0.08
1,700 Youngy Co Ltd 'A' 34,716 0.10
7,200 YTO Express Group Co Ltd 'A' 18,843 0.06

December 2021 Legal & General UCITS ETF Plc
L&G E Fund MSCI China A UCITS ETF
Schedule of Investments (continued)
As at 31 December 2021
136
Nominal Description
Value
$
% of Net
Assets
Common Stock (30 June 2021: 96.49%) (continued)
China (30 June 2021: 96.33%) (continued)
10,190 Yuan Longping High-tech Agriculture Co Ltd 'A' 37,189 0.11
9,610 Yunda Holding Co Ltd 'A' 30,850 0.09
20,600 Yunnan Aluminium Co Ltd 'A' 36,104 0.11
3,526 Yunnan Baiyao Group Co Ltd 'A' 57,897 0.17
22,700 Yunnan Chihong Zinc&Germanium Co Ltd 'A' 17,773 0.05
4,336 Yunnan Copper Co Ltd 'A' 9,096 0.03
3,300 Yunnan Energy New Material Co Ltd 'A' 129,652 0.38
4,696 Yunnan Tin Co Ltd 'A' 14,390 0.04
4,700 Yunnan Yuntianhua Co Ltd 'A' 14,469 0.04
12,876 Yutong Bus Co Ltd 'A' 22,264 0.07
4,300 Zangge Mining Co Ltd 'A' 27,662 0.08
1,700 Zhangzhou Pientzehuang Pharmaceutical Co Ltd 'A' 116,603 0.35
29,300 Zhefu Holding Group Co Ltd 'A' 32,732 0.10
20,800 Zhejiang Century Huatong Group Co Ltd 'A' 27,381 0.08
900 Zhejiang Cfmoto Power Co Ltd 'A' 24,430 0.07
14,000 Zhejiang China Commodities City Group Co Ltd 'A' 10,654 0.03
8,200 Zhejiang Chint Electrics Co Ltd 'A' 69,335 0.21
7,200 Zhejiang Crystal-Optech Co Ltd 'A' 19,646 0.06
2,240 Zhejiang Dingli Machinery Co Ltd 'A' 28,208 0.08
4,500 Zhejiang Hailiang Co Ltd 'A' 8,776 0.03
1,200 Zhejiang HangKe Technology Inc Co 'A' 20,256 0.06
4,580 Zhejiang Huahai Pharmaceutical Co Ltd 'A' 15,565 0.05
7,252 Zhejiang Huayou Cobalt Co Ltd 'A' 125,517 0.37
13,800 Zhejiang Jiahua Energy Chemical Industry Co Ltd 'A' 25,052 0.07
5,400 Zhejiang Jingsheng Mechanical & Electrical Co Ltd 'A' 58,886 0.17
3,300 Zhejiang Jiuzhou Pharmaceutical Co Ltd 'A' 29,130 0.09
14,156 Zhejiang Juhua Co Ltd 'A' 28,675 0.08
20,300 Zhejiang Longsheng Group Co Ltd 'A' 40,228 0.12

December 2021 Legal & General UCITS ETF Plc
L&G E Fund MSCI China A UCITS ETF
Schedule of Investments (continued)
As at 31 December 2021
137
Nominal Description
Value
$
% of Net
Assets
Common Stock (30 June 2021: 96.49%) (continued)
China (30 June 2021: 96.33%) (continued)
3,868 Zhejiang Medicine Co Ltd 'A' 10,366 0.03
11,718 Zhejiang NHU Co Ltd 'A' 57,217 0.17
13,012 Zhejiang Sanhua Intelligent Controls Co Ltd 'A' 51,653 0.15
14,700 Zhejiang Semir Garment Co Ltd 'A' 17,829 0.05
2,400 Zhejiang Supor Co Ltd 'A' 23,438 0.07
1,600 Zhejiang Weiming Environment Protection Co Ltd 'A' 9,171 0.03
6,600 Zhejiang Weixing New Building Materials Co Ltd 'A' 25,185 0.07
1,200 Zhejiang Wolwo Bio-Pharmaceutical Co Ltd 'A' 10,789 0.03
3,900 Zhejiang Yongtai Technology Co Ltd 'A' 31,337 0.09
24,400 Zhejiang Zheneng Electric Power Co Ltd 'A' 15,467 0.05
9,100 Zhengzhou Coal Mining Machinery Group Co Ltd 'A' 16,548 0.05
10,400 Zheshang Securities Co Ltd 'A' 21,507 0.06
3,700 Zhongji Innolight Co Ltd 'A' 24,673 0.07
19,171 Zhongjin Gold Corp Ltd 'A' 24,756 0.07
12,600 Zhongtai Securities Co Ltd 'A' 19,710 0.06
2,600 Zhongtian Financial Group Co Ltd 'A' 1,077 0.00
800 Zhuzhou Hongda Electronics Corp Ltd 'A' 12,560 0.04
13,900 Zhuzhou Kibing Group Co Ltd 'A' 37,294 0.11
106,036 Zijin Mining Group Co Ltd 'A' 161,383 0.48
54,686 Zoomlion Heavy Industry Science and Technology Co Ltd 'A' 61,521 0.18
23,600 ZTE Corp 'A' 124,048 0.37
Total China 33,571,642 99.48
Total Common Stock 33,604,077 99.58

December 2021 Legal & General UCITS ETF Plc
L&G E Fund MSCI China A UCITS ETF
Schedule of Investments (continued)
As at 31 December 2021
138
Total Investments
Common Stock 33,604,077 99.58
Other Assets and Liabilities 142,247
0.42
Net Assets Attributable to Holders of Redeemable Participating Shares 33,746,324 100.00
Analysis of Total Assets
% of Total
Assets
Transferable securities admitted to an official stock exchange listing 99.50
Other assets 0.50
100.00
Analysis of Total Assets rather than Net Assets is required under Schedule 12 of the UCITS Regulations.
* This security has been suspended.

December 2021 Legal & General UCITS ETF Plc
L&G DAX® Daily 2x Long UCITS ETF
Schedule of Investments
As at 31 December 2021
139
Nominal Description
Coupon Rate
Maturity Date
Value €
% of Net
Assets
Reverse Repurchase Agreements (30 June 2021: 93.99%)
1,765,000 Merrill Lynch International (0.63)% 24/01/2022 1,765,000 6.30
22,151,328 Merrill Lynch International (0.63)% 24/01/2022 22,151,328 79.10
Total Reverse Repurchase Agreements 23,916,328 85.40
Nominal Amount
Description
Unrealised gain
€
% of Net
Assets
Swap Contracts (30 June 2021: (0.96)%
25,770,311 LevDAX® x2 Index1 20/01/2022 2,217,848 7.92
Unrealised Gain on Swap Contracts 2,217,848 7.92
Nominal Description
Value
€
% of Net
Assets
Money Market Instruments (30 June 2021: 7.02%)
40,485 BlackRock Institutional Euro Cash Plus Fund 3,986,041 14.23
Total Money Market Instruments 3,986,041 14.23
Total Investments
Reverse Repurchase Agreements 23,916,328 85.40
Money Market Instruments 3,986,041 14.23
Unrealised Gain on Swap Contracts 2,217,848 7.92
Other Assets and Liabilities (2,116,018)
(7.55)
Net Assets Attributable to Holders of Redeemable Participating Shares 28,004,199 100.00
Analysis of Total Assets
% of Total
Assets
Transferable securities and money market instruments other than those admitted to an official stock exchange listing or dealt on a regulated market 13.23
Deposits with credit institutions 79.40
OTC financial derivative instruments 7.36
Other assets 0.01
100.00
Analysis of Total Assets rather than Net Assets is required under Schedule 12 of the UCITS Regulations.
1 The counterparty for the swap contracts was Merrill Lynch International.

December 2021 Legal & General UCITS ETF Plc
L&G DAX® Daily 2x Short UCITS ETF
Schedule of Investments
As at 31 December 2021
140
Nominal Description Coupon
Rate Maturity
Date Value
€
% of Net
Assets
Reverse Repurchase Agreements (30 June 2021: 92.20%)
30,718,800 Merrill Lynch International (0.63)% 24/01/2022 30,718,800 92.19
Total Reverse Repurchase Agreements 30,718,800 92.19
Nominal Amount
Description
Unrealised Loss
€
% of Net
Assets
Swap Contracts (30 June 2021: 0.77%)
36,231,248 ShortDAX® x2 Index1 20/01/2022 (2,955,486)
(8.87)
Unrealised Loss on Swap Contracts (2,955,486) (8.87)
Nominal Description
Value
€
% of Net
Assets
Money Market Instruments (30 June 2021: 5.86%)
28,103 BlackRock Institutional Euro Cash Plus Fund 2,766,962 8.30
Total Money Market Instruments 2,766,962 8.30
Total Investments
Reverse Repurchase Agreements 30,718,800 92.19
Money Market Instruments 2,766,962 8.30
Unrealised Loss on Swap Contracts (2,955,486)
(8.87)
Other Assets and Liabilities 2,791,396 8.38
Net Assets Attributable to Holders of Redeemable Participating Shares 33,321,672 100.00
Analysis of Total Assets
% of Total
Assets
Transferable securities and money market instruments other than those admitted to an official stock exchange listing or dealt on a regulated market 7.62
Deposits with credit institutions
84.62
Other assets 7.76
100.00
Analysis of Total Assets rather than Net Assets is required under Schedule 12 of the UCITS Regulations.
1The counterparty for the swap contracts was Merrill Lynch International.
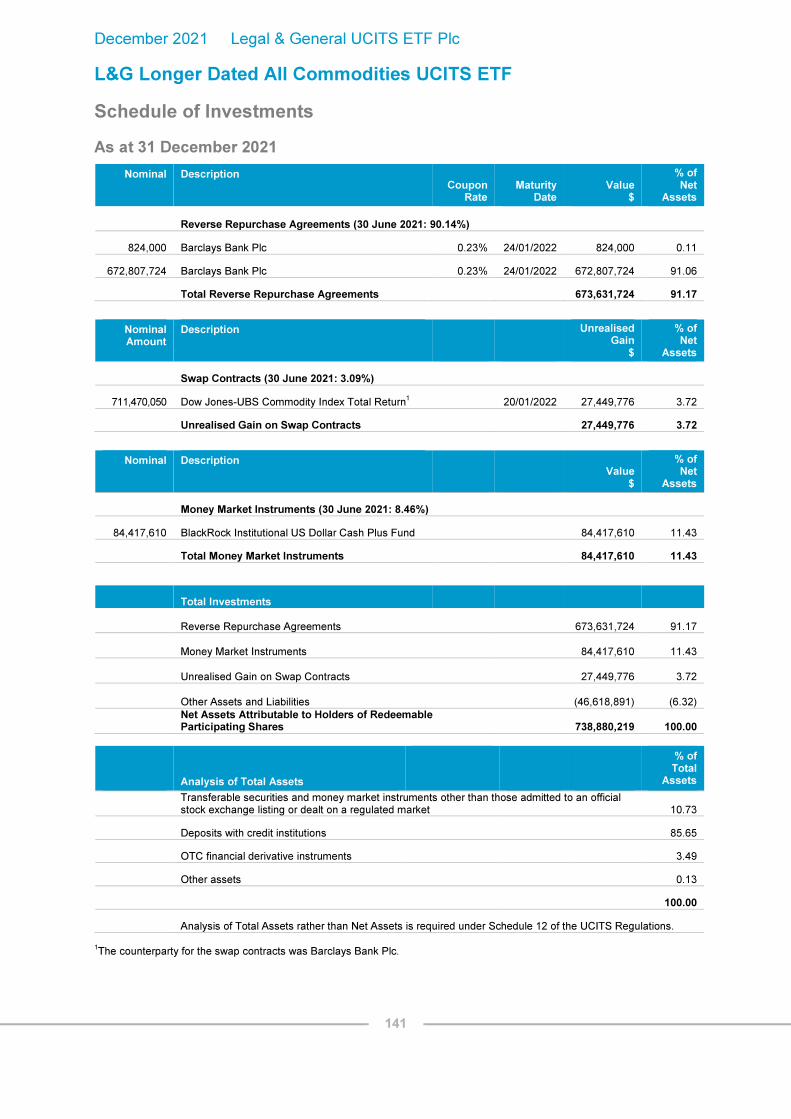
December 2021 Legal & General UCITS ETF Plc
L&G Longer Dated All Commodities UCITS ETF
Schedule of Investments
As at 31 December 2021
141
Nominal Description Coupon
Rate Maturity
Date Value
$
% of Net
Assets
Reverse Repurchase Agreements (30 June 2021: 90.14%)
824,000 Barclays Bank Plc 0.23% 24/01/2022 824,000 0.11
672,807,724 Barclays Bank Plc 0.23% 24/01/2022 672,807,724 91.06
Total Reverse Repurchase Agreements 673,631,724 91.17
Nominal Amount
Description
Unrealised Gain
$
% of Net
Assets
Swap Contracts (30 June 2021: 3.09%)
711,470,050 Dow Jones-UBS Commodity Index Total Return1 20/01/2022 27,449,776 3.72
Unrealised Gain on Swap Contracts 27,449,776 3.72
Nominal Description
Value
$
% of Net
Assets
Money Market Instruments (30 June 2021: 8.46%)
84,417,610 BlackRock Institutional US Dollar Cash Plus Fund 84,417,610 11.43
Total Money Market Instruments 84,417,610 11.43
Total Investments
Reverse Repurchase Agreements 673,631,724
91.17
Money Market Instruments 84,417,610
11.43
Unrealised Gain on Swap Contracts 27,449,776
3.72
Other Assets and Liabilities (46,618,891)
(6.32)
Net Assets Attributable to Holders of Redeemable Participating Shares 738,880,219 100.00
Analysis of Total Assets
% of Total
Assets
Transferable securities and money market instruments other than those admitted to an official stock exchange listing or dealt on a regulated market 10.73
Deposits with credit institutions 85.65
OTC financial derivative instruments 3.49
Other assets 0.13
100.00
Analysis of Total Assets rather than Net Assets is required under Schedule 12 of the UCITS Regulations.
1The counterparty for the swap contracts was Barclays Bank Plc.

December 2021 Legal & General UCITS ETF Plc
L&G FTSE 100® Leveraged (Daily 2x) UCITS ETF
Schedule of Investments
As at 31 December 2021
142
Nominal Description
Coupon Rate
Maturity Date
Value £
% of Net
Assets
Reverse Repurchase Agreements (30 June 2021: 92.69%)
15,243,000 Merrill Lynch International 0.19% 24/01/2022 15,243,000 88.26
Total Reverse Repurchase Agreements 15,243,000 88.26
Nominal Amount
Description
Unrealised Gain
£
% of Net
Assets
Swap Contracts (30 June 2021: (0.69)%)
16,361,344 FTSE 100® Leveraged Index1 20/01/2022 878,952 5.09
Unrealised Gain on Swap Contracts 878,952 5.09
Nominal Description
Value
£
% of Net
Assets
Money Market Instruments (30 June 2021: 9.48%)
2,205,047 BlackRock Institutional Sterling Cash Plus Fund 2,205,047 12.77
Total Money Market Instruments 2,205,047 12.77
Total Investments
Reverse Repurchase Agreements 15,243,000 88.26
Money Market Instruments 2,205,047 12.77
Unrealised Gain on Swap Contracts 878,952 5.09
Other Assets and Liabilities (1,056,789) (6.12)
Net Assets Attributable to Holders of Redeemable Participating Shares 17,270,210 100.00

December 2021 Legal & General UCITS ETF Plc
L&G FTSE 100® Leveraged (Daily 2x) UCITS ETF
Schedule of Investments (continued)
As at 31 December 2021
143
Analysis of Total Assets
% of Total
Assets
Transferable securities and money market instruments other than those admitted to an official stock exchange listing or dealt on a regulated market 12.03
Deposits with credit institutions 83.17
OTC financial derivative instruments 4.80
Other assets –
100.00
Analysis of Total Assets rather than Net Assets is required under Schedule 12 of the UCITS Regulations.
1The counterparty for the swap contracts was Merrill Lynch International.

December 2021 Legal & General UCITS ETF Plc
L&G FTSE 100® Super Short Strategy (Daily 2x) UCITS ETF
Schedule of Investments
As at 31 December 2021
144
Nominal Description
Coupon Rate
Maturity Date
Value £
% of Net
Assets
Reverse Repurchase Agreements (30 June 2021: 84.57%)
944,000 Merrill Lynch International 0.19% 24/01/2022 944,000 7.42
10,776,751 Merrill Lynch International 0.19% 24/01/2022 10,776,751 84.74
Total Reverse Repurchase Agreements 11,720,751 92.16
Nominal Amount
Description
Unrealised Loss
£
% of Net
Assets
Swap Contracts (30 June 2021: 0.43%)
13,361,608 FTSE 100® Daily Super Short Strategy Index1 20/01/2022 (656,920) (5.17)
Unrealised Loss on Swap Contracts (656,920) (5.17)
Nominal Description
Value
£
% of Net
Assets
Money Market Instruments (30 June 2021: 4.78%)
293,019 BlackRock Institutional Sterling Cash Plus Fund 293,019 2.30
Total Money Market Instruments 293,019 2.30
Total Investments
Reverse Repurchase Agreements 11,720,751 92.16
Money Market Instruments 293,019 2.30
Unrealised Loss on Swap Contracts (656,920)
(5.17)
Other Assets and Liabilities 1,361,664 10.71
Net Assets Attributable to Holders of Redeemable Participating Shares 12,718,514 100.00
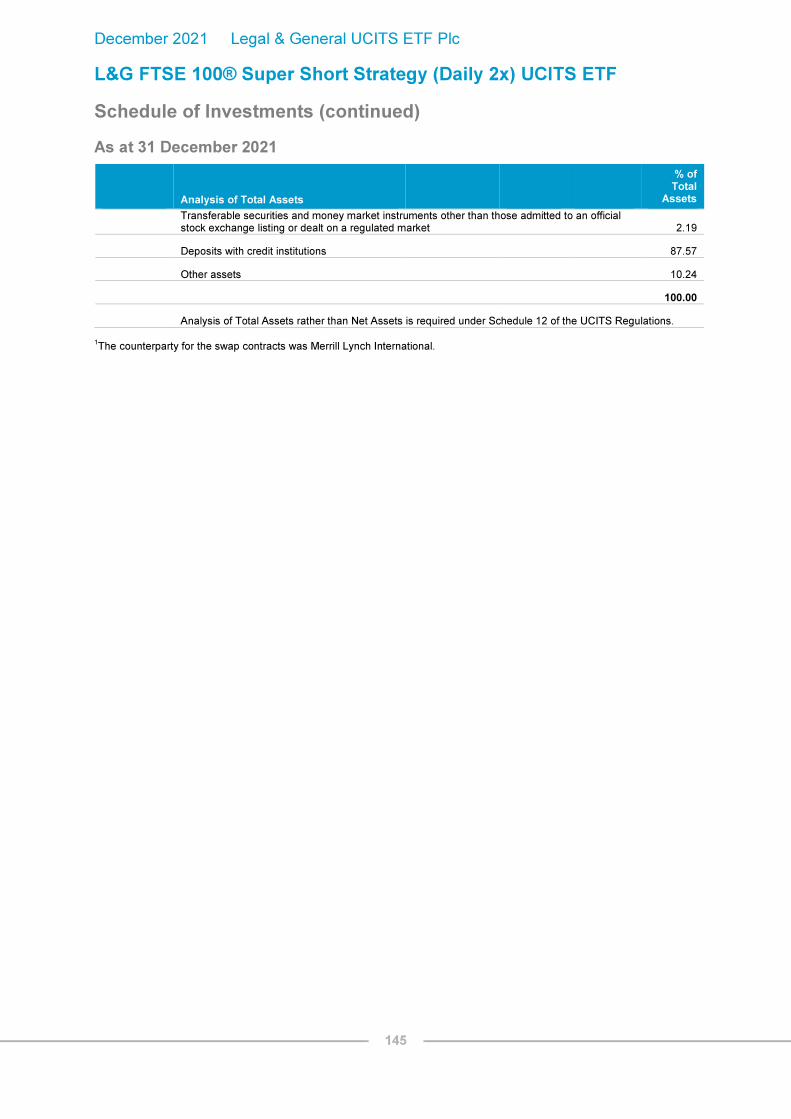
December 2021 Legal & General UCITS ETF Plc
L&G FTSE 100® Super Short Strategy (Daily 2x) UCITS ETF
Schedule of Investments (continued)
As at 31 December 2021
145
Analysis of Total Assets
% of Total
Assets
Transferable securities and money market instruments other than those admitted to an official stock exchange listing or dealt on a regulated market 2.19
Deposits with credit institutions 87.57
Other assets 10.24
100.00
Analysis of Total Assets rather than Net Assets is required under Schedule 12 of the UCITS Regulations.
1The counterparty for the swap contracts was Merrill Lynch International.

December 2021 Legal & General UCITS ETF Plc
L&G Russell 2000 US Small Cap Quality UCITS ETF
Schedule of Investments
As at 31 December 2021
146
Nominal Description
Value
$
% of Net
Assets
Common Stock (30 June 2021: 99.70%)
Bermuda (30 June 2021: 1.52%)
285 Alpha & Omega Semiconductor Ltd 17,260 0.04
328 Argo Group International Holdings Ltd 19,060 0.05
597 Bank of NT Butterfield & Son Ltd/The 22,752 0.06
323 Enstar Group Ltd 79,972 0.20
2,583 Essent Group Ltd 117,604 0.29
1,949 Frontline Ltd/Bermuda 13,779 0.03
1,461 Golar LNG Ltd 18,102 0.04
545 Helen of Troy Ltd 133,236 0.33
633 James River Group Holdings Ltd 18,237 0.04
2,256 Liberty Latin America Ltd 25,718 0.06
106 Nabors Industries Ltd 8,596 0.02
1,414 SFL Corp Ltd 11,524 0.03
864 Signet Jewelers Ltd 75,194 0.18
1,478 SiriusPoint Ltd 12,016 0.03
643 Textainer Group Holdings Ltd 22,961 0.06
993 Triton International Ltd 59,808 0.15
Total Bermuda 655,819 1.61
British Virgin Islands (30 June 2021: 0.10%)
408 Biohaven Pharmaceutical Holding Co Ltd 56,226 0.14
Total British Virgin Islands 56,226 0.14
Canada (30 June 2021: 0.78%)
680 Brookfield Infrastructure Corp - Class A
46,417 0.11
1,984 Energy Fuels Inc/Canada
15,138 0.04
454 IMAX Corp
8,099 0.02
2,500 Lions Gate Entertainment Corp
38,475 0.09
391 Masonite International Corp
46,118 0.11
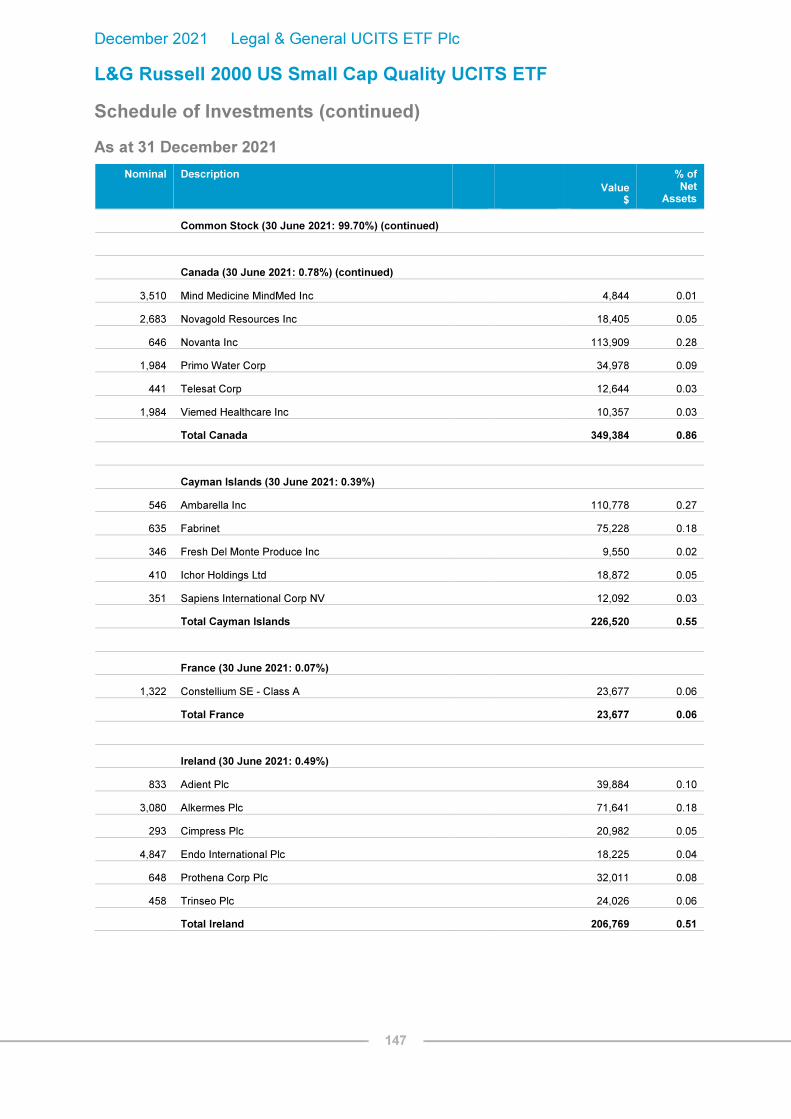
December 2021 Legal & General UCITS ETF Plc
L&G Russell 2000 US Small Cap Quality UCITS ETF
Schedule of Investments (continued)
As at 31 December 2021
147
Nominal Description
Value
$
% of Net
Assets
Common Stock (30 June 2021: 99.70%) (continued)
Canada (30 June 2021: 0.78%) (continued)
3,510 Mind Medicine MindMed Inc 4,844 0.01
2,683 Novagold Resources Inc 18,405 0.05
646 Novanta Inc 113,909 0.28
1,984 Primo Water Corp 34,978 0.09
441 Telesat Corp 12,644 0.03
1,984 Viemed Healthcare Inc 10,357 0.03
Total Canada 349,384 0.86
Cayman Islands (30 June 2021: 0.39%)
546 Ambarella Inc 110,778 0.27
635 Fabrinet 75,228 0.18
346 Fresh Del Monte Produce Inc 9,550 0.02
410 Ichor Holdings Ltd 18,872 0.05
351 Sapiens International Corp NV 12,092 0.03
Total Cayman Islands 226,520 0.55
France (30 June 2021: 0.07%)
1,322 Constellium SE - Class A
23,677 0.06
Total France
23,677 0.06
Ireland (30 June 2021: 0.49%)
833 Adient Plc
39,884 0.10
3,080 Alkermes Plc
71,641 0.18
293 Cimpress Plc
20,982 0.05
4,847 Endo International Plc
18,225 0.04
648 Prothena Corp Plc
32,011 0.08
458 Trinseo Plc
24,026 0.06
Total Ireland
206,769 0.51

December 2021 Legal & General UCITS ETF Plc
L&G Russell 2000 US Small Cap Quality UCITS ETF
Schedule of Investments (continued)
As at 31 December 2021
148
Nominal Description
Value
$
% of Net
Assets
Common Stock (30 June 2021: 99.70%) (continued)
Israel (30 June 2021: 0.03%)
289 JFrog Ltd 8,583 0.02
Total Israel 8,583 0.02
Jersey (30 June 2021: 0.13%)
1,143 Mimecast Ltd 90,949 0.22
Total Jersey 90,949 0.22
Luxembourg (30 June 2021: 0.09%)
588 Orion Engineered Carbons SA 10,796 0.03
Total Luxembourg 10,796 0.03
Marshall Islands (30 June 2021: 0.08%)
3,346 DHT Holdings Inc 17,366 0.04
761 Scorpio Tankers Inc 9,748 0.03
Total Marshall Islands 27,114 0.07
Netherlands (30 June 2021: 0.03%)
622 Expro Group Holdings NV 8,926 0.02
Total Netherlands 8,926 0.02
Puerto Rico (30 June 2021: 0.26%)
1,091 EVERTEC Inc 54,528 0.13
2,473 First BanCorp/Puerto Rico 34,078 0.08
573 OFG Bancorp 15,219 0.04
802 Triple-S Management Corp - Class B 28,615 0.07
Total Puerto Rico 132,440 0.32
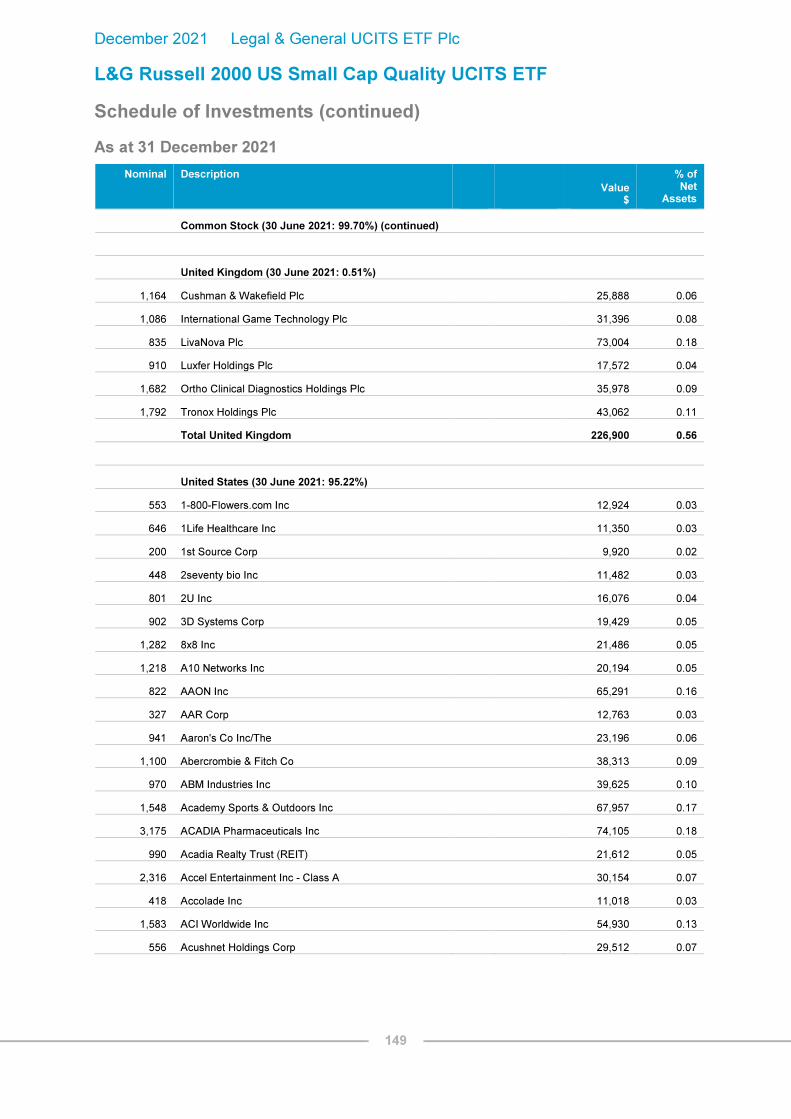
December 2021 Legal & General UCITS ETF Plc
L&G Russell 2000 US Small Cap Quality UCITS ETF
Schedule of Investments (continued)
As at 31 December 2021
149
Nominal Description
Value
$
% of Net
Assets
Common Stock (30 June 2021: 99.70%) (continued)
United Kingdom (30 June 2021: 0.51%)
1,164 Cushman & Wakefield Plc 25,888 0.06
1,086 International Game Technology Plc 31,396 0.08
835 LivaNova Plc 73,004 0.18
910 Luxfer Holdings Plc 17,572 0.04
1,682 Ortho Clinical Diagnostics Holdings Plc 35,978 0.09
1,792 Tronox Holdings Plc 43,062 0.11
Total United Kingdom
226,900 0.56
United States (30 June 2021: 95.22%)
553 1-800-Flowers.com Inc
12,924 0.03
646 1Life Healthcare Inc
11,350 0.03
200 1st Source Corp
9,920 0.02
448 2seventy bio Inc
11,482 0.03
801 2U Inc
16,076 0.04
902 3D Systems Corp
19,429 0.05
1,282 8x8 Inc
21,486 0.05
1,218 A10 Networks Inc
20,194 0.05
822 AAON Inc
65,291 0.16
327 AAR Corp
12,763 0.03
941 Aaron's Co Inc/The
23,196 0.06
1,100 Abercrombie & Fitch Co
38,313 0.09
970 ABM Industries Inc
39,625 0.10
1,548 Academy Sports & Outdoors Inc
67,957 0.17
3,175 ACADIA Pharmaceuticals Inc
74,105 0.18
990 Acadia Realty Trust (REIT)
21,612 0.05
2,316 Accel Entertainment Inc - Class A
30,154 0.07
418 Accolade Inc
11,018 0.03
1,583 ACI Worldwide Inc
54,930 0.13
556 Acushnet Holdings Corp
29,512 0.07
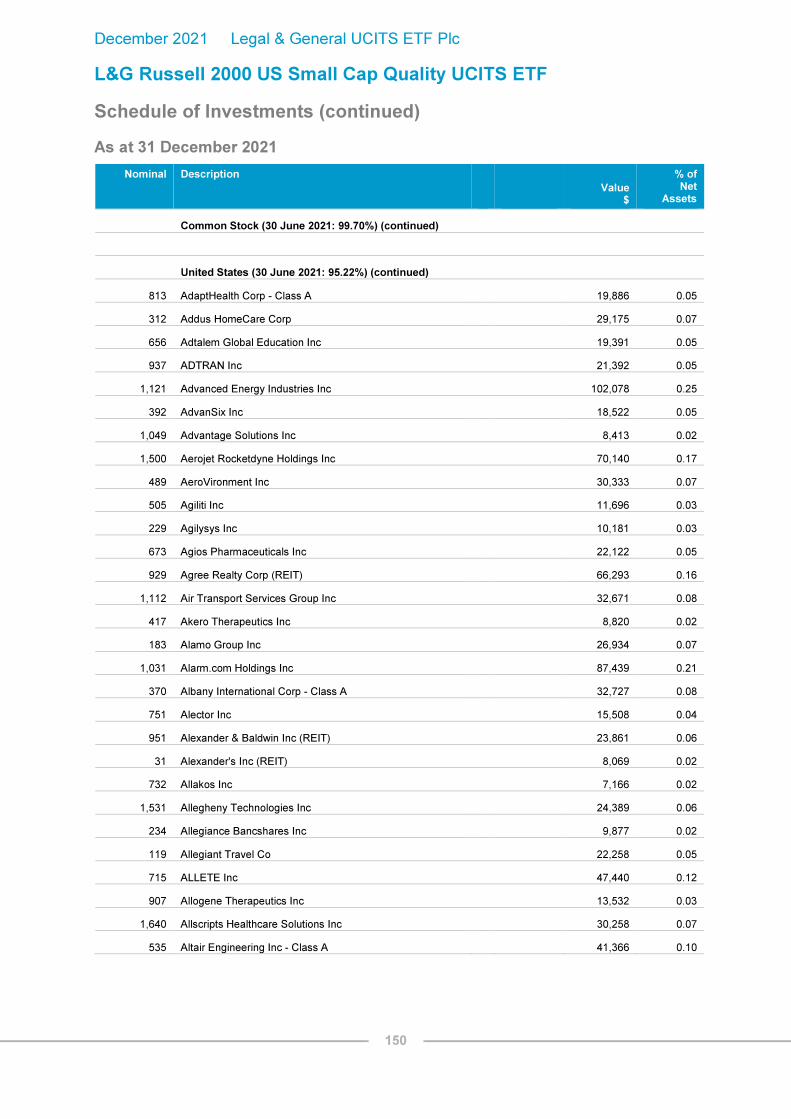
December 2021 Legal & General UCITS ETF Plc
L&G Russell 2000 US Small Cap Quality UCITS ETF
Schedule of Investments (continued)
As at 31 December 2021
150
Nominal Description
Value
$
% of Net
Assets
Common Stock (30 June 2021: 99.70%) (continued)
United States (30 June 2021: 95.22%) (continued)
813 AdaptHealth Corp - Class A 19,886 0.05
312 Addus HomeCare Corp 29,175 0.07
656 Adtalem Global Education Inc 19,391 0.05
937 ADTRAN Inc 21,392 0.05
1,121 Advanced Energy Industries Inc 102,078 0.25
392 AdvanSix Inc 18,522 0.05
1,049 Advantage Solutions Inc 8,413 0.02
1,500 Aerojet Rocketdyne Holdings Inc 70,140 0.17
489 AeroVironment Inc 30,333 0.07
505 Agiliti Inc 11,696 0.03
229 Agilysys Inc 10,181 0.03
673 Agios Pharmaceuticals Inc 22,122 0.05
929 Agree Realty Corp (REIT) 66,293 0.16
1,112 Air Transport Services Group Inc 32,671 0.08
417 Akero Therapeutics Inc 8,820 0.02
183 Alamo Group Inc 26,934 0.07
1,031 Alarm.com Holdings Inc 87,439 0.21
370 Albany International Corp - Class A 32,727 0.08
751 Alector Inc 15,508 0.04
951 Alexander & Baldwin Inc (REIT) 23,861 0.06
31 Alexander's Inc (REIT) 8,069 0.02
732 Allakos Inc 7,166 0.02
1,531 Allegheny Technologies Inc 24,389 0.06
234 Allegiance Bancshares Inc 9,877 0.02
119 Allegiant Travel Co 22,258 0.05
715 ALLETE Inc 47,440 0.12
907 Allogene Therapeutics Inc 13,532 0.03
1,640 Allscripts Healthcare Solutions Inc 30,258 0.07
535 Altair Engineering Inc - Class A 41,366 0.10
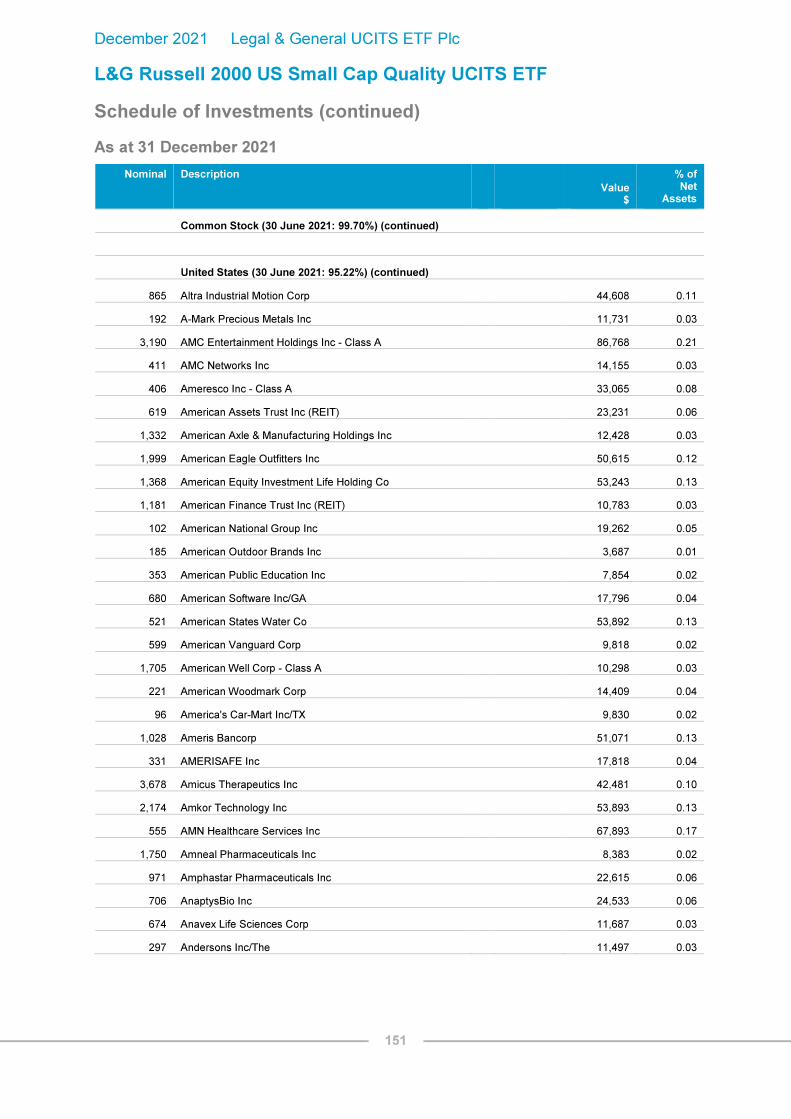
December 2021 Legal & General UCITS ETF Plc
L&G Russell 2000 US Small Cap Quality UCITS ETF
Schedule of Investments (continued)
As at 31 December 2021
151
Nominal Description
Value
$
% of Net
Assets
Common Stock (30 June 2021: 99.70%) (continued)
United States (30 June 2021: 95.22%) (continued)
865 Altra Industrial Motion Corp 44,608 0.11
192 A-Mark Precious Metals Inc 11,731 0.03
3,190 AMC Entertainment Holdings Inc - Class A 86,768 0.21
411 AMC Networks Inc 14,155 0.03
406 Ameresco Inc - Class A 33,065 0.08
619 American Assets Trust Inc (REIT) 23,231 0.06
1,332 American Axle & Manufacturing Holdings Inc 12,428 0.03
1,999 American Eagle Outfitters Inc 50,615 0.12
1,368 American Equity Investment Life Holding Co 53,243 0.13
1,181 American Finance Trust Inc (REIT) 10,783 0.03
102 American National Group Inc 19,262 0.05
185 American Outdoor Brands Inc 3,687 0.01
353 American Public Education Inc 7,854 0.02
680 American Software Inc/GA 17,796 0.04
521 American States Water Co 53,892 0.13
599 American Vanguard Corp 9,818 0.02
1,705 American Well Corp - Class A 10,298 0.03
221 American Woodmark Corp 14,409 0.04
96 America's Car-Mart Inc/TX 9,830 0.02
1,028 Ameris Bancorp 51,071 0.13
331 AMERISAFE Inc 17,818 0.04
3,678 Amicus Therapeutics Inc 42,481 0.10
2,174 Amkor Technology Inc 53,893 0.13
555 AMN Healthcare Services Inc 67,893 0.17
1,750 Amneal Pharmaceuticals Inc 8,383 0.02
971 Amphastar Pharmaceuticals Inc 22,615 0.06
706 AnaptysBio Inc 24,533 0.06
674 Anavex Life Sciences Corp 11,687 0.03
297 Andersons Inc/The 11,497 0.03

December 2021 Legal & General UCITS ETF Plc
L&G Russell 2000 US Small Cap Quality UCITS ETF
Schedule of Investments (continued)
As at 31 December 2021
152
Nominal Description
Value
$
% of Net
Assets
Common Stock (30 June 2021: 99.70%) (continued)
United States (30 June 2021: 95.22%) (continued)
525 AngioDynamics Inc 14,480 0.04
322 Anika Therapeutics Inc 11,537 0.03
4,869 Antares Pharma Inc 17,382 0.04
224 Anterix Inc 13,162 0.03
4,415 Antero Resources Corp 77,262 0.19
1,797 Apartment Investment and Management Co (REIT) 13,873 0.03
796 Apellis Pharmaceuticals Inc 37,635 0.09
2,427 API Group Corp 62,544 0.15
493 Apogee Enterprises Inc 23,738 0.06
2,981 Apollo Commercial Real Estate Finance Inc (REIT) 39,230 0.10
1,018 Apollo Medical Holdings Inc 74,803 0.18
399 Appfolio Inc 48,303 0.12
954 AppHarvest Inc 3,711 0.01
408 Appian Corp - Class A 26,606 0.07
1,912 Apple Hospitality REIT Inc (REIT) 30,879 0.08
586 Applied Industrial Technologies Inc 60,182 0.15
1,667 Arbor Realty Trust Inc (REIT) 30,539 0.07
367 ArcBest Corp 43,985 0.11
2,192 Archrock Inc 16,396 0.04
941 Arconic Corp 31,062 0.08
1,068 Arcosa Inc 56,284 0.14
630 Arcus Biosciences Inc 25,496 0.06
470 Argan Inc 18,184 0.04
1,407 Arlo Technologies Inc 14,759 0.04
1,204 Armada Hoffler Properties Inc (REIT) 18,325 0.04
4,884 Array Technologies Inc 76,630 0.19
854 Arrowhead Pharmaceuticals Inc 56,620 0.14
3,590 Artisan Partners Asset Management Inc - Class A 171,028 0.42
194 Arvinas Inc 15,935 0.04

December 2021 Legal & General UCITS ETF Plc
L&G Russell 2000 US Small Cap Quality UCITS ETF
Schedule of Investments (continued)
As at 31 December 2021
153
Nominal Description
Value
$
% of Net
Assets
Common Stock (30 June 2021: 99.70%) (continued)
United States (30 June 2021: 95.22%) (continued)
377 Asana Inc 28,105 0.07
142 Asbury Automotive Group Inc 24,528 0.06
678 ASGN Inc 83,665 0.21
2,246 Associated Banc-Corp 50,737 0.12
327 Astec Industries Inc 22,651 0.06
2,772 Atea Pharmaceuticals Inc 24,782 0.06
582 Atkore Inc 64,713 0.16
906 Atlantic Union Bankshares Corp 33,785 0.08
482 Atlas Air Worldwide Holdings Inc 45,366 0.11
234 ATN International Inc 9,348 0.02
2,116 Atossa Therapeutics Inc 3,386 0.01
484 AtriCure Inc 33,653 0.08
44 Atrion Corp 31,016 0.08
1,589 Avanos Medical Inc 55,091 0.14
1,050 Avaya Holdings Corp 20,790 0.05
1,436 Aveanna Healthcare Holdings Inc 10,626 0.03
1,731 Avid Bioservices Inc 50,511 0.12
375 Avid Technology Inc 12,214 0.03
955 Avient Corp 53,432 0.13
595 Avis Budget Group Inc 123,385 0.30
952 Avista Corp 40,450 0.10
750 Axcelis Technologies Inc 55,920 0.14
523 Axogen Inc 4,901 0.01
212 Axonics Inc 11,872 0.03
744 Axos Financial Inc 41,597 0.10
311 AZZ Inc 17,195 0.04
416 B Riley Financial Inc 36,966 0.09
816 B&G Foods Inc 25,076 0.06
539 Badger Meter Inc 57,436 0.14

December 2021 Legal & General UCITS ETF Plc
L&G Russell 2000 US Small Cap Quality UCITS ETF
Schedule of Investments (continued)
As at 31 December 2021
154
Nominal Description
Value
$
% of Net
Assets
Common Stock (30 June 2021: 99.70%) (continued)
United States (30 June 2021: 95.22%) (continued)
683 Balchem Corp 115,154 0.28
242 Bally's Corp 9,211 0.02
223 BancFirst Corp 15,735 0.04
590 Bancorp Inc/The 14,933 0.04
119 Bandwidth Inc - Class A 8,539 0.02
1,268 BankUnited Inc 53,649 0.13
407 Banner Corp 24,693 0.06
551 Barnes Group Inc 25,671 0.06
682 Beacon Roofing Supply Inc 39,113 0.10
908 Beauty Health Co/The 21,937 0.05
464 Beazer Homes USA Inc 10,774 0.03
1,541 Bed Bath & Beyond Inc 22,468 0.06
655 Belden Inc 43,053 0.11
1,235 BellRing Brands Inc 35,235 0.09
533 Benchmark Electronics Inc 14,444 0.04
469 Berkshire Hills Bancorp Inc 13,334 0.03
4,150 BGC Partners Inc - Class A 19,297 0.05
423 Big 5 Sporting Goods Corp 8,041 0.02
652 Big Lots Inc 29,373 0.07
189 BigCommerce Holdings Inc 6,685 0.02
1,764 BioCryst Pharmaceuticals Inc 24,431 0.06
2,439 BioDelivery Sciences International Inc 7,561 0.02
408 BioLife Solutions Inc 15,206 0.04
189 BJ's Restaurants Inc 6,530 0.02
3,717 BJ's Wholesale Club Holdings Inc 248,927 0.61
919 Black Hills Corp 64,854 0.16
789 Blackbaud Inc 62,315 0.15
896 Blackline Inc 92,772 0.23
1,614 Blackstone Mortgage Trust Inc (REIT) - Class A 49,421 0.12

December 2021 Legal & General UCITS ETF Plc
L&G Russell 2000 US Small Cap Quality UCITS ETF
Schedule of Investments (continued)
As at 31 December 2021
155
Nominal Description
Value
$
% of Net
Assets
Common Stock (30 June 2021: 99.70%) (continued)
United States (30 June 2021: 95.22%) (continued)
1,444 Bloom Energy Corp 31,667 0.08
891 Bloomin' Brands Inc 18,693 0.05
1,292 Bluebird Bio Inc 12,907 0.03
2,621 Blueprint Medicines Corp 280,735 0.69
819 Boise Cascade Co 58,313 0.14
532 Boot Barn Holdings Inc 65,463 0.16
643 Bottomline Technologies DE Inc 36,310 0.09
1,987 Box Inc 52,040 0.13
888 Brady Corp - Class A 47,863 0.12
4,146 Brandywine Realty Trust (REIT) 55,639 0.14
958 Bridgebio Pharma Inc 15,979 0.04
774 Brigham Minerals Inc - Class A 16,324 0.04
680 Brightcove Inc 6,950 0.02
3,305 Brightsphere Investment Group Inc 84,608 0.21
468 BrightView Holdings Inc 6,589 0.02
213 Brinker International Inc 7,794 0.02
534 Brink's Co/The 35,014 0.09
2,414 Broadmark Realty Capital Inc (REIT) 22,764 0.06
1,855 Broadstone Net Lease Inc (REIT) 46,041 0.11
3,381 Brookdale Senior Living Inc 17,446 0.04
882 Brookline Bancorp Inc 14,280 0.04
672 BRP Group Inc - Class A 24,266 0.06
799 BTRS Holdings Inc 6,248 0.02
730 Buckle Inc/The 30,886 0.08
1,087 Butterfly Network Inc 7,272 0.02
640 Cabot Corp 35,968 0.09
834 Cactus Inc 31,800 0.08
2,229 Cadence Bank 66,402 0.16
429 Caleres Inc 9,730 0.02

December 2021 Legal & General UCITS ETF Plc
L&G Russell 2000 US Small Cap Quality UCITS ETF
Schedule of Investments (continued)
As at 31 December 2021
156
Nominal Description
Value
$
% of Net
Assets
Common Stock (30 June 2021: 99.70%) (continued)
United States (30 June 2021: 95.22%) (continued)
2,316 California Resources Corp 98,916 0.24
663 California Water Service Group 47,643 0.12
936 Calix Inc 74,852 0.18
1,549 Callaway Golf Co 42,505 0.10
619 Callon Petroleum Co 29,248 0.07
641 Cal-Maine Foods Inc 23,711 0.06
848 Camping World Holdings Inc - Class A 34,259 0.08
5,320 Cannae Holdings Inc 186,998 0.46
1,350 Capitol Federal Financial Inc 15,295 0.04
1,751 Cara Therapeutics Inc 21,327 0.05
299 Cardiovascular Systems Inc 5,615 0.01
267 Cardlytics Inc 17,646 0.04
641 CareDx Inc 29,153 0.07
1,736 CareTrust REIT Inc (REIT) 39,633 0.10
1,071 Cargurus Inc 36,028 0.09
806 Carpenter Technology Corp 23,527 0.06
215 Carriage Services Inc - Class A 13,855 0.03
1,028 Cars.com Inc 16,541 0.04
612 Casella Waste Systems Inc - Class A 52,277 0.13
189 Cass Information Systems Inc 7,431 0.02
994 Cassava Sciences Inc 43,438 0.11
367 Castle Biosciences Inc 15,733 0.04
3,969 Castlight Health Inc 6,112 0.02
3,345 Catalyst Pharmaceuticals Inc 22,646 0.06
1,141 Cathay General Bancorp 49,052 0.12
190 Cavco Industries Inc 60,354 0.15
870 CBIZ Inc 34,034 0.08
474 Celldex Therapeutics Inc 18,315 0.04
780 Celsius Holdings Inc 58,165 0.14

December 2021 Legal & General UCITS ETF Plc
L&G Russell 2000 US Small Cap Quality UCITS ETF
Schedule of Investments (continued)
As at 31 December 2021
157
Nominal Description
Value
$
% of Net
Assets
Common Stock (30 June 2021: 99.70%) (continued)
United States (30 June 2021: 95.22%) (continued)
2,495 Centennial Resource Development Inc/DE - Class A 14,920 0.04
215 Centerspace (REIT) 23,844 0.06
573 Central Garden & Pet Co - Class A 27,418 0.07
531 Century Communities Inc 43,430 0.11
677 Cerence Inc 51,885 0.13
1,168 Cerevel Therapeutics Holdings Inc 37,867 0.09
473 CEVA Inc 20,453 0.05
1,965 ChampionX Corp 39,713 0.10
493 ChannelAdvisor Corp 12,167 0.03
558 Chart Industries Inc 88,995 0.22
225 Chase Corp 22,401 0.05
437 Cheesecake Factory Inc/The 17,109 0.04
1,965 Chesapeake Energy Corp 126,782 0.31
268 Chesapeake Utilities Corp 39,077 0.10
137 Children's Place Inc/The 10,863 0.03
2,589 Chimera Investment Corp (REIT) 39,042 0.10
1,898 Chimerix Inc 12,204 0.03
254 Chuy's Holdings Inc 7,650 0.02
685 Cinemark Holdings Inc 11,042 0.03
173 Citi Trends Inc 16,392 0.04
179 City Holding Co 14,640 0.04
918 Civitas Resources Inc 44,954 0.11
2,233 Clean Energy Fuels Corp 13,688 0.03
3,988 Clear Channel Outdoor Holdings Inc 13,200 0.03
227 Clearfield Inc 19,163 0.05
1,629 Clearway Energy Inc - Class A 54,539 0.13
435 CMC Materials Inc 83,385 0.20
1,643 CNO Financial Group Inc 39,169 0.10
3,389 CNX Resources Corp 46,599 0.11

December 2021 Legal & General UCITS ETF Plc
L&G Russell 2000 US Small Cap Quality UCITS ETF
Schedule of Investments (continued)
As at 31 December 2021
158
Nominal Description
Value
$
% of Net
Assets
Common Stock (30 June 2021: 99.70%) (continued)
United States (30 June 2021: 95.22%) (continued)
82 Coca-Cola Consolidated Inc 50,774 0.12
1,133 Codexis Inc 35,429 0.09
4,219 Coeur Mining Inc 21,264 0.05
627 Cogent Communications Holdings Inc 45,884 0.11
1,320 Cohen & Steers Inc 122,113 0.30
1,591 Coherus Biosciences Inc 25,392 0.06
631 Cohu Inc (Units) 24,035 0.06
833 Columbia Banking System Inc 27,256 0.07
322 Columbus McKinnon Corp/NY 14,896 0.04
580 Comfort Systems USA Inc 57,385 0.14
1,921 Commercial Metals Co 69,713 0.17
664 Community Bank System Inc 49,455 0.12
2,363 Community Health Systems Inc 31,452 0.08
460 Community Healthcare Trust Inc (REIT) 21,744 0.05
747 CommVault Systems Inc 51,483 0.13
506 Compass Minerals International Inc 25,846 0.06
348 Computer Programs and Systems Inc 10,196 0.03
4,000 Conduent Inc 21,360 0.05
644 CONMED Corp 91,293 0.22
453 ConnectOne Bancorp Inc 14,818 0.04
326 Conn's Inc 7,668 0.02
190 Consensus Cloud Solutions Inc 10,995 0.03
1,114 Consolidated Communications Holdings Inc 8,333 0.02
435 Construction Partners Inc - Class A 12,793 0.03
598 Container Store Group Inc/The 5,968 0.01
2,726 Corcept Therapeutics Inc 53,975 0.13
1,989 CoreCivic Inc 19,830 0.05
711 Cornerstone Building Brands Inc 12,400 0.03
1,629 Corporate Office Properties Trust (REIT) 45,563 0.11

December 2021 Legal & General UCITS ETF Plc
L&G Russell 2000 US Small Cap Quality UCITS ETF
Schedule of Investments (continued)
As at 31 December 2021
159
Nominal Description
Value
$
% of Net
Assets
Common Stock (30 June 2021: 99.70%) (continued)
United States (30 June 2021: 95.22%) (continued)
546 Corsair Gaming Inc 11,471 0.03
449 Cortexyme Inc 5,666 0.01
256 CorVel Corp 53,248 0.13
1,285 Covetrus Inc 25,661 0.06
382 Cowen Inc - Class A 13,790 0.03
147 CRA International Inc 13,724 0.03
151 Cracker Barrel Old Country Store Inc 19,425 0.05
677 Crescent Energy Inc 8,584 0.02
655 Crinetics Pharmaceuticals Inc 18,609 0.05
1,899 Crocs Inc 243,490 0.60
673 Cross Country Healthcare Inc 18,682 0.05
584 CryoLife Inc 11,884 0.03
213 CryoPort Inc 12,603 0.03
531 CSG Systems International Inc 30,596 0.08
722 CTS Corp 26,512 0.07
529 Cullinan Oncology Inc 8,162 0.02
887 CuriosityStream Inc 5,260 0.01
425 Customers Bancorp Inc 27,782 0.07
1,527 CVB Financial Corp 32,693 0.08
776 Cytokinetics Inc 35,370 0.09
1,811 CytomX Therapeutics Inc 7,842 0.02
1,503 Dana Inc 34,298 0.08
877 Danimer Scientific Inc 7,472 0.02
286 Dave & Buster's Entertainment Inc 10,982 0.03
573 Deciphera Pharmaceuticals Inc 5,598 0.01
1,093 Delek US Holdings Inc 16,384 0.04
536 Deluxe Corp 17,211 0.04
2,747 Denali Therapeutics Inc 122,516 0.30
983 Denbury Inc 75,288 0.18

December 2021 Legal & General UCITS ETF Plc
L&G Russell 2000 US Small Cap Quality UCITS ETF
Schedule of Investments (continued)
As at 31 December 2021
160
Nominal Description
Value
$
% of Net
Assets
Common Stock (30 June 2021: 99.70%) (continued)
United States (30 June 2021: 95.22%) (continued)
107 Diamond Hill Investment Group Inc 20,783 0.05
1,053 DiamondRock Hospitality Co (REIT) 10,119 0.02
996 Diebold Nixdorf Inc 9,014 0.02
3,059 Digital Turbine Inc 186,568 0.46
2,104 DigitalBridge Group Inc (REIT) 17,526 0.04
56 Dillard's Inc 13,721 0.03
509 Dime Community Bancshares Inc 17,896 0.04
234 Dine Brands Global Inc 17,740 0.04
592 Diodes Inc 65,008 0.16
2,198 Diversified Healthcare Trust (REIT) 6,792 0.02
170 DMC Global Inc 6,734 0.02
260 Domo Inc 12,896 0.03
525 Donnelley Financial Solutions Inc 24,748 0.06
516 Dorman Products Inc 58,313 0.14
338 Douglas Dynamics Inc 13,202 0.03
1,195 Douglas Elliman Inc 13,743 0.03
605 Dycom Industries Inc 56,725 0.14
480 Dynex Capital Inc (REIT) 8,021 0.02
392 Eagle Bancorp Inc 22,869 0.06
281 Eagle Pharmaceuticals Inc/DE 14,309 0.04
1,121 Easterly Government Properties Inc (REIT) - Class A 25,693 0.06
2,043 Eastern Bankshares Inc 41,207 0.10
642 EastGroup Properties Inc (REIT) 146,280 0.36
376 Ebix Inc 11,430 0.03
593 EchoStar Corp 15,626 0.04
496 Ecovyst Inc 5,079 0.01
692 Edgewell Personal Care Co 31,631 0.08
566 Edgewise Therapeutics Inc 8,648 0.02
1,137 Editas Medicine Inc - Class A 30,187 0.07

December 2021 Legal & General UCITS ETF Plc
L&G Russell 2000 US Small Cap Quality UCITS ETF
Schedule of Investments (continued)
As at 31 December 2021
161
Nominal Description
Value
$
% of Net
Assets
Common Stock (30 June 2021: 99.70%) (continued)
United States (30 June 2021: 95.22%) (continued)
406 eHealth Inc 10,353 0.03
602 elf Beauty Inc 19,992 0.05
929 EMCOR Group Inc 118,345 0.29
1,548 Emergent BioSolutions Inc 67,292 0.17
1,698 Empire State Realty Trust Inc (REIT) 15,112 0.04
418 Employers Holdings Inc 17,297 0.04
535 Enanta Pharmaceuticals Inc 40,007 0.10
789 Encore Capital Group Inc 49,005 0.12
344 Encore Wire Corp 49,226 0.12
967 Energizer Holdings Inc 38,777 0.10
1,161 Energy Recovery Inc 24,950 0.06
683 Enerpac Tool Group Corp - Class A 13,851 0.03
553 EnerSys 43,720 0.11
2,009 Enova International Inc 82,289 0.20
255 EnPro Industries Inc 28,068 0.07
1,906 Ensign Group Inc/The 160,028 0.39
301 Enterprise Financial Services Corp 14,174 0.03
850 Envestnet Inc 67,439 0.17
346 ePlus Inc 18,642 0.05
8,700 Equitrans Midstream Corp 89,958 0.22
4,324 Equity Commonwealth (REIT) 111,992 0.27
392 ESCO Technologies Inc 35,276 0.09
448 Esperion Therapeutics Inc 2,240 0.01
1,613 Essential Properties Realty Trust Inc (REIT) 46,503 0.11
784 Everi Holdings Inc 16,738 0.04
620 Evo Payments Inc - Class A 15,872 0.04
1,870 Evolent Health Inc - Class A 51,743 0.13
1,578 Evoqua Water Technologies Corp 73,771 0.18
998 EW Scripps Co/The - Class A 19,311 0.05

December 2021 Legal & General UCITS ETF Plc
L&G Russell 2000 US Small Cap Quality UCITS ETF
Schedule of Investments (continued)
As at 31 December 2021
162
Nominal Description
Value
$
% of Net
Assets
Common Stock (30 June 2021: 99.70%) (continued)
United States (30 June 2021: 95.22%) (continued)
578 ExlService Holdings Inc 83,677 0.21
3,046 eXp World Holdings Inc 102,620 0.25
1,097 Exponent Inc 128,053 0.31
1,092 Extreme Networks Inc 17,144 0.04
268 FARO Technologies Inc 18,765 0.05
1,424 Fate Therapeutics Inc 83,318 0.20
491 FB Financial Corp 21,516 0.05
90 Federal Agricultural Mortgage Corp 11,154 0.03
925 Federal Signal Corp 40,089 0.10
3,631 Federated Hermes Inc 136,453 0.33
966 Ferro Corp 21,088 0.05
3,147 FibroGen Inc 44,373 0.11
347 First Bancorp/Southern Pines NC 15,865 0.04
272 First Bancshares Inc/The 10,505 0.03
567 First Busey Corp 15,377 0.04
1,171 First Commonwealth Financial Corp 18,841 0.05
1,121 First Financial Bancorp 27,330 0.07
1,757 First Financial Bankshares Inc 89,326 0.22
455 First Foundation Inc 11,311 0.03
468 First Interstate BancSystem Inc 19,034 0.05
621 First Merchants Corp 26,014 0.06
1,310 First Midwest Bancorp Inc/IL 26,829 0.07
638 FirstCash Holdings Inc 47,729 0.12
2,734 Fisker Inc 43,006 0.11
704 Flagstar Bancorp Inc 33,750 0.08
2,976 Fluor Corp 73,716 0.18
541 Focus Financial Partners Inc - Class A 32,309 0.08
786 Forian Inc 7,090 0.02
1,431 FormFactor Inc 65,425 0.16

December 2021 Legal & General UCITS ETF Plc
L&G Russell 2000 US Small Cap Quality UCITS ETF
Schedule of Investments (continued)
As at 31 December 2021
163
Nominal Description
Value
$
% of Net
Assets
Common Stock (30 June 2021: 99.70%) (continued)
United States (30 June 2021: 95.22%) (continued)
448 Forterra Inc 10,653 0.03
329 Forward Air Corp 39,839 0.10
1,516 Four Corners Property Trust Inc (REIT) 44,586 0.11
356 Fox Factory Holding Corp 60,556 0.15
760 Franchise Group Inc 39,642 0.10
805 Franklin Electric Co Inc 76,121 0.19
4,360 FuelCell Energy Inc 22,672 0.06
732 Fulgent Genetics Inc 73,632 0.18
1,808 Fulton Financial Corp 30,736 0.08
437 GAMCO Investors Inc 10,916 0.03
3,214 Gannett Co Inc 17,131 0.04
578 Gatos Silver Inc 6,000 0.01
445 GATX Corp 46,365 0.11
553 GCP Applied Technologies Inc 17,508 0.04
681 Gemini Therapeutics Inc 1,982 0.00
216 Genesco Inc 13,861 0.03
319 Gentherm Inc 27,721 0.07
8,229 Genworth Financial Inc - Class A 33,327 0.08
1,745 GEO Group Inc/The (REIT) 13,524 0.03
289 German American Bancorp Inc 11,265 0.03
749 Getty Realty Corp (REIT) 24,035 0.06
407 Gibraltar Industries Inc 27,139 0.07
370 G-III Apparel Group Ltd 10,227 0.03
1,473 Glacier Bancorp Inc 83,519 0.20
1,972 Gladstone Commercial Corp (REIT) 50,818 0.12
695 Glatfelter Corp 11,954 0.03
660 Glaukos Corp 29,330 0.07
847 Global Blood Therapeutics Inc 24,792 0.06
998 Global Industrial Co 40,818 0.10

December 2021 Legal & General UCITS ETF Plc
L&G Russell 2000 US Small Cap Quality UCITS ETF
Schedule of Investments (continued)
As at 31 December 2021
164
Nominal Description
Value
$
% of Net
Assets
Common Stock (30 June 2021: 99.70%) (continued)
United States (30 June 2021: 95.22%) (continued)
547 Global Medical REIT Inc (REIT) 9,709 0.02
1,824 Global Net Lease Inc (REIT) 27,871 0.07
7,373 Globalstar Inc 8,553 0.02
614 GMS Inc 36,908 0.09
680 Gogo Inc 9,200 0.02
1,239 Golden Nugget Online Gaming Inc 12,328 0.03
3,309 Goodyear Tire & Rubber Co/The 70,548 0.17
493 Goosehead Insurance Inc 64,129 0.16
1,294 GoPro Inc - Class A 13,341 0.03
364 Gorman-Rupp Co/The 16,216 0.04
2,112 GrafTech International Ltd 24,985 0.06
51 Graham Holdings Co 32,121 0.08
913 Granite Construction Inc 35,333 0.09
1,901 Gray Television Inc 38,324 0.09
1,070 Great Lakes Dredge & Dock Corp 16,820 0.04
481 Great Western Bancorp Inc 16,335 0.04
489 Green Brick Partners Inc 14,831 0.04
810 Green Dot Corp - Class A 29,354 0.07
490 Green Plains Inc 17,032 0.04
426 Greenbrier Cos Inc/The 19,549 0.05
361 Greif Inc 21,794 0.05
1,735 Grid Dynamics Holdings Inc 65,878 0.16
551 Griffon Corp 15,692 0.04
253 Group 1 Automotive Inc 49,391 0.12
423 Guess? Inc 10,017 0.02
415 H&E Equipment Services Inc 18,372 0.05
542 Haemonetics Corp 28,748 0.07
4,396 Halozyme Therapeutics Inc 176,763 0.43
1,335 Hamilton Lane Inc - Class A 138,333 0.34

December 2021 Legal & General UCITS ETF Plc
L&G Russell 2000 US Small Cap Quality UCITS ETF
Schedule of Investments (continued)
As at 31 December 2021
165
Nominal Description
Value
$
% of Net
Assets
Common Stock (30 June 2021: 99.70%) (continued)
United States (30 June 2021: 95.22%) (continued)
975 Hancock Whitney Corp 48,769 0.12
1,268 Hanger Inc 22,989 0.06
1,325 Hannon Armstrong Sustainable Infrastructure Capital Inc (REIT) 70,384 0.17
1,155 Harmonic Inc 13,583 0.03
1,010 Harsco Corp 16,877 0.04
262 Haverty Furniture Cos Inc 8,009 0.02
315 Hawkins Inc 12,427 0.03
668 HB Fuller Co 54,108 0.13
449 Health Catalyst Inc 17,789 0.04
1,974 Healthcare Realty Trust Inc (REIT) 62,457 0.15
1,995 Healthcare Services Group Inc 35,491 0.09
1,869 HealthEquity Inc 82,685 0.20
651 HealthStream Inc 17,160 0.04
958 Heartland Express Inc 16,114 0.04
689 Heartland Financial USA Inc 34,870 0.09
10,452 Hecla Mining Co (Units) 54,559 0.13
362 Heidrick & Struggles International Inc 15,830 0.04
423 Helios Technologies Inc 44,487 0.11
2,086 Helix Energy Solutions Group Inc 6,508 0.02
2,037 Helmerich & Payne Inc 48,277 0.12
391 Herc Holdings Inc 61,211 0.15
904 Heritage Financial Corp/WA 22,094 0.05
285 Heritage-Crystal Clean Inc 9,126 0.02
117 Heska Corp 21,351 0.05
470 Hibbett Inc 33,807 0.08
709 Hillenbrand Inc 36,861 0.09
831 Hilltop Holdings Inc 29,201 0.07
770 Hilton Grand Vacations Inc 40,125 0.10
753 HNI Corp 31,664 0.08

December 2021 Legal & General UCITS ETF Plc
L&G Russell 2000 US Small Cap Quality UCITS ETF
Schedule of Investments (continued)
As at 31 December 2021
166
Nominal Description
Value
$
% of Net
Assets
Common Stock (30 June 2021: 99.70%) (continued)
United States (30 June 2021: 95.22%) (continued)
2,537 Home BancShares Inc/AR 61,776 0.15
227 HomeStreet Inc 11,804 0.03
1,233 Homology Medicines Inc 4,488 0.01
551 Honest Co Inc/The 4,458 0.01
250 Hooker Furnishings Corp 5,820 0.01
1,345 Hope Bancorp Inc 19,785 0.05
477 Horace Mann Educators Corp 18,460 0.05
545 Horizon Bancorp Inc/IN 11,363 0.03
1,685 Hostess Brands Inc - Class A 34,408 0.08
1,414 Houghton Mifflin Harcourt Co 22,765 0.06
1,895 Houlihan Lokey Inc - Class A 196,170 0.48
94 Hovnanian Enterprises Inc - Class A 11,965 0.03
401 Hub Group Inc - Class A 33,780 0.08
587 Humanigen Inc 2,184 0.01
367 Huron Consulting Group Inc 18,313 0.04
257 ICF International Inc 26,355 0.06
527 Ideaya Biosciences Inc 12,458 0.03
453 IDT Corp 20,004 0.05
188 IGM Biosciences Inc 5,514 0.01
1,278 iHeartMedia Inc 26,889 0.07
816 II-VI Inc 55,757 0.14
824 ImmunityBio Inc 5,010 0.01
256 Inari Medical Inc 23,365 0.06
1,260 Independence Realty Trust Inc (REIT) 32,546 0.08
730 Independent Bank Corp 59,517 0.15
545 Independent Bank Group Inc 39,322 0.10
1,286 Industrial Logistics Properties Trust (REIT) 32,214 0.08
1,956 Infinera Corp 18,758 0.05
551 InfuSystem Holdings Inc 9,384 0.02
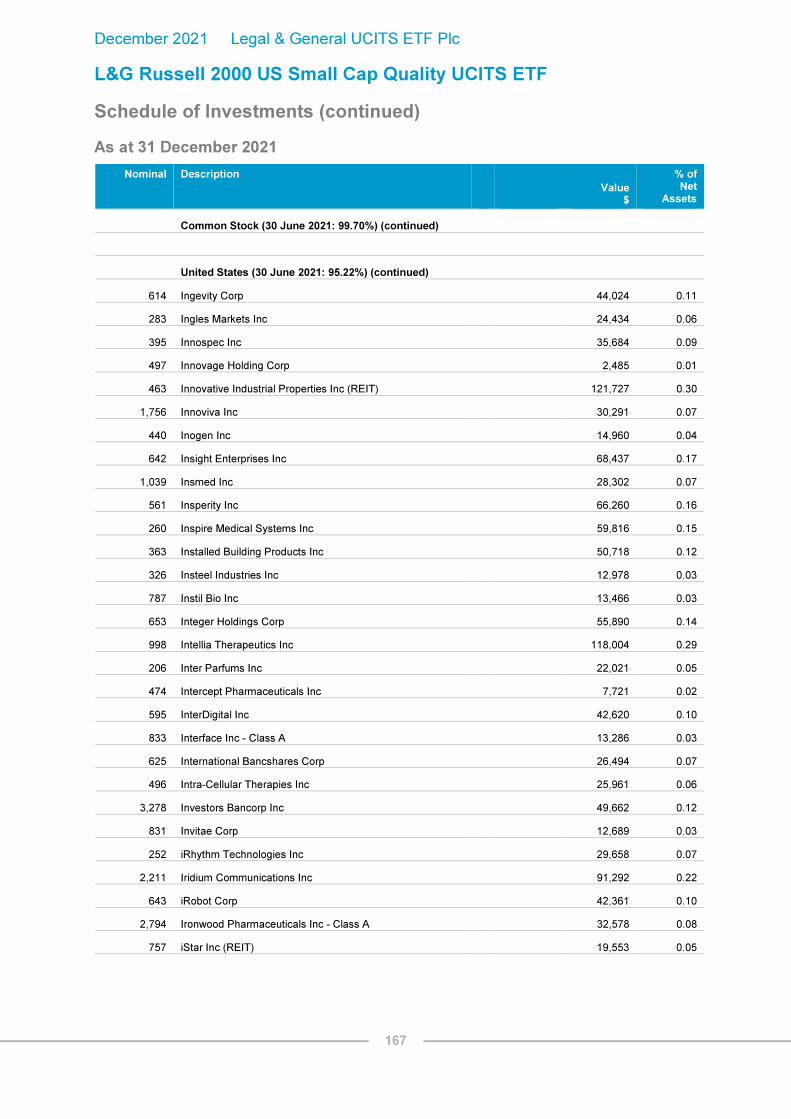
December 2021 Legal & General UCITS ETF Plc
L&G Russell 2000 US Small Cap Quality UCITS ETF
Schedule of Investments (continued)
As at 31 December 2021
167
Nominal Description
Value
$
% of Net
Assets
Common Stock (30 June 2021: 99.70%) (continued)
United States (30 June 2021: 95.22%) (continued)
614 Ingevity Corp 44,024 0.11
283 Ingles Markets Inc 24,434 0.06
395 Innospec Inc 35,684 0.09
497 Innovage Holding Corp 2,485 0.01
463 Innovative Industrial Properties Inc (REIT) 121,727 0.30
1,756 Innoviva Inc 30,291 0.07
440 Inogen Inc 14,960 0.04
642 Insight Enterprises Inc 68,437 0.17
1,039 Insmed Inc 28,302 0.07
561 Insperity Inc 66,260 0.16
260 Inspire Medical Systems Inc 59,816 0.15
363 Installed Building Products Inc 50,718 0.12
326 Insteel Industries Inc 12,978 0.03
787 Instil Bio Inc 13,466 0.03
653 Integer Holdings Corp 55,890 0.14
998 Intellia Therapeutics Inc 118,004 0.29
206 Inter Parfums Inc 22,021 0.05
474 Intercept Pharmaceuticals Inc 7,721 0.02
595 InterDigital Inc 42,620 0.10
833 Interface Inc - Class A 13,286 0.03
625 International Bancshares Corp 26,494 0.07
496 Intra-Cellular Therapies Inc 25,961 0.06
3,278 Investors Bancorp Inc 49,662 0.12
831 Invitae Corp 12,689 0.03
252 iRhythm Technologies Inc 29,658 0.07
2,211 Iridium Communications Inc 91,292 0.22
643 iRobot Corp 42,361 0.10
2,794 Ironwood Pharmaceuticals Inc - Class A 32,578 0.08
757 iStar Inc (REIT) 19,553 0.05

December 2021 Legal & General UCITS ETF Plc
L&G Russell 2000 US Small Cap Quality UCITS ETF
Schedule of Investments (continued)
As at 31 December 2021
168
Nominal Description
Value
$
% of Net
Assets
Common Stock (30 June 2021: 99.70%) (continued)
United States (30 June 2021: 95.22%) (continued)
503 Itron Inc
34,466 0.08
192 J & J Snack Foods Corp
30,328 0.07
312 Jack in the Box Inc
27,294 0.07
966 JELD-WEN Holding Inc
25,464 0.06
186 John B Sanfilippo & Son Inc
16,770 0.04
465 John Bean Technologies Corp
71,405 0.18
602 John Wiley & Sons Inc
34,477 0.08
99 Johnson Outdoors Inc
9,275 0.02
431 Joint Corp/The
28,312 0.07
163 Kadant Inc
37,568 0.09
213 Kaiser Aluminum Corp
20,009 0.05
368 KalVista Pharmaceuticals Inc
4,869 0.01
316 Kaman Corp
13,635 0.03
2,127 KAR Auction Services Inc
33,224 0.08
388 Karuna Therapeutics Inc
50,828 0.12
1,109 KB Home
49,606 0.12
1,732 KBR Inc
82,478 0.20
755 Kearny Financial Corp/MD
10,004 0.02
479 Kelly Services Inc - Class A
8,033 0.02
914 Kennametal Inc
32,822 0.08
1,636 Kennedy-Wilson Holdings Inc
39,068 0.10
230 Kforce Inc
17,301 0.04
415 Kinsale Capital Group Inc
98,724 0.24
2,700 Kite Realty Group Trust (REIT)
58,806 0.14
1,278 Knowles Corp
29,841 0.07
1,026 Kodiak Sciences Inc
86,984 0.21
525 Kontoor Brands Inc
26,906 0.07
1,732 Kopin Corp
7,084 0.02
775 Korn Ferry
58,691 0.14

December 2021 Legal & General UCITS ETF Plc
L&G Russell 2000 US Small Cap Quality UCITS ETF
Schedule of Investments (continued)
As at 31 December 2021
169
Nominal Description
Value
$
% of Net
Assets
Common Stock (30 June 2021: 99.70%) (continued)
United States (30 June 2021: 95.22%) (continued)
4,909 Kosmos Energy Ltd 16,985 0.04
383 Kraton Corp 17,741 0.04
1,331 Kratos Defense & Security Solutions Inc 25,821 0.06
402 Krystal Biotech Inc 28,120 0.07
1,095 Kulicke & Soffa Industries Inc 66,291 0.16
307 Kymera Therapeutics Inc 19,491 0.05
1,379 Ladder Capital Corp (REIT) - Class A 16,534 0.04
469 Lakeland Bancorp Inc 8,906 0.02
285 Lakeland Financial Corp 22,840 0.06
323 Lancaster Colony Corp 53,489 0.13
192 Laredo Petroleum Inc 11,545 0.03
311 Latham Group Inc 7,784 0.02
2,529 Lattice Semiconductor Corp 194,885 0.48
1,231 Laureate Education Inc - Class A 15,067 0.04
541 La-Z-Boy Inc 19,644 0.05
348 LCI Industries 54,243 0.13
439 LeMaitre Vascular Inc 22,051 0.05
88 LendingTree Inc 10,789 0.03
445 LGI Homes Inc 68,744 0.17
870 LHC Group Inc 119,390 0.29
350 Ligand Pharmaceuticals Inc (Units) 54,061 0.13
148 Lindsay Corp 22,496 0.06
440 Liquidity Services Inc 9,715 0.02
393 Live Oak Bancshares Inc 34,305 0.08
1,774 Livent Corp 43,250 0.11
765 LivePerson Inc 27,326 0.07
1,016 LiveRamp Holdings Inc 48,717 0.12
525 LL Flooring Holdings Inc 8,962 0.02
278 Lovesac Co/The 18,420 0.05

December 2021 Legal & General UCITS ETF Plc
L&G Russell 2000 US Small Cap Quality UCITS ETF
Schedule of Investments (continued)
As at 31 December 2021
170
Nominal Description
Value
$
% of Net
Assets
Common Stock (30 June 2021: 99.70%) (continued)
United States (30 June 2021: 95.22%) (continued)
736 LTC Properties Inc (REIT) 25,127 0.06
4,996 LXP Industrial Trust (REIT) 78,038 0.19
444 M/I Homes Inc 27,608 0.07
1,949 Macerich Co/The (REIT) 33,679 0.08
762 MACOM Technology Solutions Holdings Inc 59,665 0.15
1,057 MacroGenics Inc 16,965 0.04
3,599 Macy's Inc 94,222 0.23
365 Madison Square Garden Entertainment Corp 25,674 0.06
390 Madrigal Pharmaceuticals Inc 33,049 0.08
976 Magnite Inc 17,080 0.04
3,888 Magnolia Oil & Gas Corp - Class A 73,367 0.18
297 Malibu Boats Inc - Class A 20,413 0.05
587 ManTech International Corp/VA - Class A 42,810 0.11
644 Marathon Digital Holdings Inc 21,162 0.05
435 Marcus & Millichap Inc 22,385 0.05
687 MarineMax Inc 40,560 0.10
1,178 Marten Transport Ltd 20,214 0.05
1,600 Matador Resources Co 59,072 0.14
240 Materion Corp 22,066 0.05
709 Matson Inc 63,831 0.16
482 Matthews International Corp 17,675 0.04
953 Maxar Technologies Inc 28,142 0.07
1,487 Maximus Inc 118,469 0.29
897 MaxLinear Inc 67,625 0.17
589 McGrath RentCorp 47,273 0.12
780 MDC Holdings Inc 43,547 0.11
314 Medifast Inc 65,761 0.16
1,089 MEDNAX Inc 29,632 0.07
931 Medpace Holdings Inc 202,623 0.50

December 2021 Legal & General UCITS ETF Plc
L&G Russell 2000 US Small Cap Quality UCITS ETF
Schedule of Investments (continued)
As at 31 December 2021
171
Nominal Description
Value
$
% of Net
Assets
Common Stock (30 June 2021: 99.70%) (continued)
United States (30 June 2021: 95.22%) (continued)
1,090 Meridian Bioscience Inc 22,236 0.05
1,253 Merit Medical Systems Inc 78,062 0.19
742 Meritage Homes Corp 90,569 0.22
555 Meritor Inc 13,753 0.03
62 Mesa Laboratories Inc 20,342 0.05
392 Meta Financial Group Inc 23,387 0.06
561 Methode Electronics Inc 27,584 0.07
2,948 MFA Financial Inc (REIT) 13,443 0.03
533 MGE Energy Inc 43,839 0.11
253 MGP Ingredients Inc 21,502 0.05
54 MicroStrategy Inc - Class A 29,402 0.07
269 Middlesex Water Co 32,361 0.08
721 MillerKnoll Inc 28,256 0.07
496 Minerals Technologies Inc 36,282 0.09
404 Mission Produce Inc 6,343 0.02
611 Mitek Systems Inc 10,845 0.03
314 Model N Inc 9,429 0.02
648 Modine Manufacturing Co 6,538 0.02
142 ModivCare Inc 21,057 0.05
3,506 Moelis & Co - Class A 219,160 0.54
1,595 Momentive Global Inc 33,734 0.08
170 Monarch Casino & Resort Inc 12,572 0.03
1,081 Monmouth Real Estate Investment Corp (REIT) 22,712 0.06
409 Monro Inc 23,832 0.06
390 Moog Inc - Class A 31,578 0.08
503 Morphic Holding Inc 23,832 0.06
832 MP Materials Corp 37,789 0.09
917 Mr Cooper Group Inc 38,156 0.09
1,072 MRC Global Inc 7,375 0.02

December 2021 Legal & General UCITS ETF Plc
L&G Russell 2000 US Small Cap Quality UCITS ETF
Schedule of Investments (continued)
As at 31 December 2021
172
Nominal Description
Value
$
% of Net
Assets
Common Stock (30 June 2021: 99.70%) (continued)
United States (30 June 2021: 95.22%) (continued)
1,014 Mueller Industries Inc 60,191 0.15
2,164 Mueller Water Products Inc - Class A 31,162 0.08
4,608 Multiplan Corp 20,413 0.05
2,157 Murphy Oil Corp 56,319 0.14
190 Murphy USA Inc 37,856 0.09
381 MYR Group Inc 42,120 0.10
1,089 Myriad Genetics Inc 30,056 0.07
537 NanoString Technologies Inc 22,678 0.06
347 National Bank Holdings Corp 15,247 0.04
273 National Beverage Corp 12,375 0.03
944 National Health Investors Inc (REIT) 54,252 0.13
359 National HealthCare Corp 24,390 0.06
117 National Presto Industries Inc 9,598 0.02
447 National Research Corp 18,559 0.05
936 National Storage Affiliates Trust (REIT) 64,771 0.16
1,334 National Vision Holdings Inc 64,019 0.16
838 Natus Medical Inc 19,886 0.05
1,474 Nautilus Inc 9,036 0.02
2,081 Navient Corp 44,159 0.11
478 NBT Bancorp Inc 18,413 0.05
275 Neenah Inc 12,727 0.03
310 Nelnet Inc 30,281 0.07
2,842 Neogen Corp 129,055 0.32
1,651 NeoGenomics Inc 56,332 0.14
1,107 NeoPhotonics Corp 17,015 0.04
1,491 NETGEAR Inc 43,552 0.11
1,107 NetScout Systems Inc 36,620 0.09
510 NETSTREIT Corp (REIT) 11,679 0.03
270 Nevro Corp 21,889 0.05

December 2021 Legal & General UCITS ETF Plc
L&G Russell 2000 US Small Cap Quality UCITS ETF
Schedule of Investments (continued)
As at 31 December 2021
173
Nominal Description
Value
$
% of Net
Assets
Common Stock (30 June 2021: 99.70%) (continued)
United States (30 June 2021: 95.22%) (continued)
959 New Jersey Resources Corp 39,377 0.10
4,229 New York Mortgage Trust Inc (REIT) 15,732 0.04
2,281 Newmark Group Inc 42,655 0.10
408 NexPoint Residential Trust Inc (REIT) 34,203 0.08
1,581 NextGen Healthcare Inc 28,126 0.07
2,333 NexTier Oilfield Solutions Inc 8,282 0.02
527 NGM Biopharmaceuticals Inc 9,333 0.02
684 nLight Inc 16,382 0.04
1,973 NMI Holdings Inc - Class A 43,110 0.11
531 Northern Oil and Gas Inc 10,928 0.03
1,197 Northwest Bancshares Inc 16,950 0.04
482 Northwest Natural Holding Co 23,512 0.06
662 NorthWestern Corp 37,840 0.09
1,771 NOW Inc 15,124 0.04
983 Nu Skin Enterprises Inc - Class A 49,887 0.12
1,000 NuVasive Inc 52,480 0.13
1,185 Nuvation Bio Inc 10,073 0.02
225 NV5 Global Inc 31,077 0.08
298 Oasis Petroleum Inc 37,545 0.09
2,677 Oceaneering International Inc 30,277 0.07
658 OceanFirst Financial Corp 14,608 0.04
1,549 ODP Corp/The 60,845 0.15
980 Office Properties Income Trust (REIT) 24,343 0.06
2,151 O-I Glass Inc 25,877 0.06
1,946 Old National Bancorp/IN 35,262 0.09
903 Omnicell Inc 162,937 0.40
774 ONE Gas Inc 60,055 0.15
535 OneSpan Inc 9,058 0.02
328 OneWater Marine Inc - Class A 19,998 0.05

December 2021 Legal & General UCITS ETF Plc
L&G Russell 2000 US Small Cap Quality UCITS ETF
Schedule of Investments (continued)
As at 31 December 2021
174
Nominal Description
Value
$
% of Net
Assets
Common Stock (30 June 2021: 99.70%) (continued)
United States (30 June 2021: 95.22%) (continued)
1,064 Onto Innovation Inc
107,709 0.26
439 Ooma Inc
8,973 0.02
9,670 OPKO Health Inc
46,513 0.11
503 OptimizeRx Corp
31,241 0.08
3,379 Option Care Health Inc
96,099 0.24
1,681 OraSure Technologies Inc
14,608 0.04
1,098 Organogenesis Holdings Inc - Class A
10,146 0.02
262 Origin Bancorp Inc
11,245 0.03
597 Ormat Technologies Inc
47,342 0.12
467 Orthofix Medical Inc
14,519 0.04
252 OSI Systems Inc
23,486 0.06
697 Otter Tail Corp
49,780 0.12
1,699 Outfront Media Inc (REIT)
45,567 0.11
744 Overstock.com Inc
43,903 0.11
3,983 Ovintiv Inc
134,227 0.33
1,571 Owens & Minor Inc
68,338 0.17
226 Oxford Industries Inc
22,944 0.06
1,837 Pacific Biosciences of California Inc
37,585 0.09
1,328 Pacific Premier Bancorp Inc
53,160 0.13
708 Pacira BioSciences Inc
42,600 0.10
646 Pactiv Evergreen Inc
8,191 0.02
2,406 PAE Inc
23,892 0.06
906 PagerDuty Inc
31,483 0.08
280 Palomar Holdings Inc
18,136 0.04
501 Papa John's International Inc
66,868 0.16
160 PAR Technology Corp
8,443 0.02
2,275 Paramount Group Inc (REIT)
18,974 0.05
236 Park National Corp
32,405 0.08
373 Parsons Corp
12,551 0.03

December 2021 Legal & General UCITS ETF Plc
L&G Russell 2000 US Small Cap Quality UCITS ETF
Schedule of Investments (continued)
As at 31 December 2021
175
Nominal Description
Value
$
% of Net
Assets
Common Stock (30 June 2021: 99.70%) (continued)
United States (30 June 2021: 95.22%) (continued)
1,295 Party City Holdco Inc 7,213 0.02
231 Patrick Industries Inc 18,639 0.05
2,272 Patterson Cos Inc 66,683 0.16
2,176 Patterson-UTI Energy Inc 18,387 0.05
2,873 Paya Holdings Inc 18,215 0.04
1,235 PDC Energy Inc 60,243 0.15
992 Pebblebrook Hotel Trust (REIT) 22,191 0.05
703 Pennant Group Inc/The 16,225 0.04
726 PennyMac Financial Services Inc 50,660 0.12
1,262 PennyMac Mortgage Investment Trust (REIT) 21,870 0.05
1,246 Perdoceo Education Corp 14,653 0.04
445 Perficient Inc 57,534 0.14
1,005 Performance Food Group Co 46,119 0.11
494 Personalis Inc 7,049 0.02
296 PetIQ Inc - Class A 6,722 0.02
325 PetMed Express Inc 8,210 0.02
835 PGT Innovations Inc 18,779 0.05
309 Phibro Animal Health Corp 6,310 0.02
1,232 Photronics Inc 23,223 0.06
404 Phreesia Inc 16,831 0.04
2,923 Physicians Realty Trust (REIT) 55,040 0.14
2,477 Piedmont Office Realty Trust Inc (REIT) 45,527 0.11
542 Ping Identity Holding Corp 12,401 0.03
236 Piper Sandler Cos 42,128 0.10
2,379 Pitney Bowes Inc 15,773 0.04
639 PJT Partners Inc 47,344 0.12
605 Plantronics Inc 17,751 0.04
404 Plexus Corp 38,740 0.10
354 PMV Pharmaceuticals Inc 8,177 0.02

December 2021 Legal & General UCITS ETF Plc
L&G Russell 2000 US Small Cap Quality UCITS ETF
Schedule of Investments (continued)
As at 31 December 2021
176
Nominal Description
Value
$
% of Net
Assets
Common Stock (30 June 2021: 99.70%) (continued)
United States (30 June 2021: 95.22%) (continued)
1,123 PNM Resources Inc 51,220 0.13
1,311 Portland General Electric Co 69,378 0.17
1,429 PotlatchDeltic Corp (REIT) 86,054 0.21
1,182 Power Integrations Inc 109,796 0.27
725 PRA Group Inc 36,402 0.09
182 Preferred Bank/Los Angeles CA 13,066 0.03
425 Premier Financial Corp 13,137 0.03
1,041 Prestige Consumer Healthcare Inc 63,137 0.15
299 PriceSmart Inc 21,878 0.05
1,173 Primoris Services Corp 28,129 0.07
377 Privia Health Group Inc 9,753 0.02
552 ProAssurance Corp 13,966 0.03
3,146 PROG Holdings Inc 141,916 0.35
618 Progress Software Corp 29,831 0.07
1,445 Progyny Inc 72,756 0.18
398 PROS Holdings Inc 13,727 0.03
585 Protagonist Therapeutics Inc 20,007 0.05
441 Proto Labs Inc 22,645 0.06
958 Provident Financial Services Inc 23,203 0.06
474 PS Business Parks Inc (REIT) 87,297 0.21
906 PTC Therapeutics Inc 36,086 0.09
542 Q2 Holdings Inc 43,056 0.11
220 Quaker Chemical Corp 50,772 0.12
748 Qualys Inc 102,641 0.25
505 Quanex Building Products Corp 12,514 0.03
234 Quanterix Corp 9,922 0.02
752 QuinStreet Inc 13,679 0.03
1,457 Quotient Technology Inc 10,811 0.03
2,308 R1 RCM Inc 58,831 0.14

December 2021 Legal & General UCITS ETF Plc
L&G Russell 2000 US Small Cap Quality UCITS ETF
Schedule of Investments (continued)
As at 31 December 2021
177
Nominal Description
Value
$
% of Net
Assets
Common Stock (30 June 2021: 99.70%) (continued)
United States (30 June 2021: 95.22%) (continued)
598 Rackspace Technology Inc 8,055 0.02
3,540 Radian Group Inc 74,800 0.18
987 Radius Health Inc 6,830 0.02
858 RadNet Inc 25,834 0.06
2,056 Rambus Inc 60,426 0.15
3,714 Range Resources Corp 66,221 0.16
476 Ranpak Holdings Corp - Class A 17,888 0.04
545 Rapid7 Inc 64,141 0.16
496 RBC Bearings Inc 100,177 0.25
327 RE/MAX Holdings Inc - Class A 9,970 0.02
711 Ready Capital Corp (REIT) 11,113 0.03
1,012 Realogy Holdings Corp 17,012 0.04
624 RealReal Inc/The 7,245 0.02
632 Red Rock Resorts Inc 34,766 0.09
1,114 Redfin Corp 42,766 0.10
1,278 Redwood Trust Inc (REIT) 16,857 0.04
1,699 REGENXBIO Inc 55,557 0.14
751 Relay Therapeutics Inc 23,063 0.06
616 Renasant Corp 23,377 0.06
1,217 Renewable Energy Group Inc 51,649 0.13
1,270 Rent-A-Center Inc/TX 61,011 0.15
937 Repay Holdings Corp - Class A 17,119 0.04
1,879 Resideo Technologies Inc 48,910 0.12
1,377 Retail Opportunity Investments Corp (REIT) 26,989 0.07
507 Revance Therapeutics Inc 8,274 0.02
344 Revolve Group Inc 19,278 0.05
88 REX American Resources Corp 8,448 0.02
1,016 Rhythm Pharmaceuticals Inc 10,140 0.02
6,623 Rigel Pharmaceuticals Inc 17,551 0.04

December 2021 Legal & General UCITS ETF Plc
L&G Russell 2000 US Small Cap Quality UCITS ETF
Schedule of Investments (continued)
As at 31 December 2021
178
Nominal Description
Value
$
% of Net
Assets
Common Stock (30 June 2021: 99.70%) (continued)
United States (30 June 2021: 95.22%) (continued)
518 Riot Blockchain Inc 11,567 0.03
865 Rite Aid Corp 12,707 0.03
618 RLI Corp 69,278 0.17
1,426 RLJ Lodging Trust (REIT) 19,864 0.05
251 RMR Group Inc/The - Class A 8,705 0.02
290 Rocket Pharmaceuticals Inc 6,331 0.02
302 Rogers Corp 82,446 0.20
991 RPT Realty (REIT) 13,260 0.03
563 Rush Enterprises Inc - Class A 31,325 0.08
840 Rush Street Interactive Inc 13,860 0.03
288 Ryman Hospitality Properties Inc (REIT) 26,484 0.07
452 S&T Bancorp Inc 14,247 0.03
3,113 Sabra Health Care REIT Inc (REIT) 42,150 0.10
264 Safehold Inc (REIT) 21,080 0.05
233 Safety Insurance Group Inc 19,812 0.05
457 Saia Inc 154,023 0.38
1,474 Sailpoint Technologies Holdings Inc 71,253 0.17
989 Sally Beauty Holdings Inc 18,257 0.04
662 Sana Biotechnology Inc 10,248 0.03
318 Sanderson Farms Inc 60,763 0.15
529 Sandy Spring Bancorp Inc 25,434 0.06
2,464 Sangamo Therapeutics Inc 18,480 0.05
782 Sanmina Corp 32,422 0.08
437 ScanSource Inc 15,330 0.04
540 Schnitzer Steel Industries Inc 28,037 0.07
300 Scholastic Corp 11,988 0.03
168 Schrodinger Inc/United States 5,851 0.01
478 Schweitzer-Mauduit International Inc 14,292 0.04
1,290 Scientific Games Corp 86,211 0.21

December 2021 Legal & General UCITS ETF Plc
L&G Russell 2000 US Small Cap Quality UCITS ETF
Schedule of Investments (continued)
As at 31 December 2021
179
Nominal Description
Value
$
% of Net
Assets
Common Stock (30 June 2021: 99.70%) (continued)
United States (30 June 2021: 95.22%) (continued)
696 Sculptor Capital Management Inc - Class A 14,860 0.04
788 Seacoast Banking Corp of Florida 27,887 0.07
385 SeaWorld Entertainment Inc 24,971 0.06
2,852 Select Medical Holdings Corp 83,849 0.21
2,123 Selecta Biosciences Inc 6,921 0.02
829 Selective Insurance Group Inc 67,928 0.17
1,290 Selectquote Inc 11,687 0.03
1,058 Semtech Corp 94,088 0.23
3,595 Senseonics Holdings Inc 9,599 0.02
726 Sensient Technologies Corp 72,644 0.18
1,526 Service Properties Trust (REIT) 13,414 0.03
717 ServisFirst Bancshares Inc 60,902 0.15
3,737 Sesen Bio Inc 3,046 0.01
445 Shake Shack Inc - Class A 32,111 0.08
712 Shenandoah Telecommunications Co 18,156 0.04
91 Shockwave Medical Inc 16,228 0.04
286 Shoe Carnival Inc 11,177 0.03
453 Shutterstock Inc 50,229 0.12
752 Shyft Group Inc/The 36,946 0.09
2,917 SIGA Technologies Inc 21,936 0.05
571 Silicon Laboratories Inc 117,866 0.29
300 Silk Road Medical Inc 12,783 0.03
330 Silvergate Capital Corp - Class A 48,906 0.12
1,560 Simmons First National Corp - Class A 46,145 0.11
726 Simply Good Foods Co/The 30,180 0.07
1,013 Simpson Manufacturing Co Inc 140,878 0.35
731 Sinclair Broadcast Group Inc - Class A 19,320 0.05
2,725 SITE Centers Corp (REIT) 43,137 0.11
233 SiTime Corp 68,162 0.17

December 2021 Legal & General UCITS ETF Plc
L&G Russell 2000 US Small Cap Quality UCITS ETF
Schedule of Investments (continued)
As at 31 December 2021
180
Nominal Description
Value
$
% of Net
Assets
Common Stock (30 June 2021: 99.70%) (continued)
United States (30 June 2021: 95.22%) (continued)
374 SJW Group 27,377 0.07
921 Skyline Champion Corp 72,741 0.18
619 SkyWest Inc 24,327 0.06
760 Sleep Number Corp 58,216 0.14
2,184 SM Energy Co 64,384 0.16
915 Smith & Wesson Brands Inc 16,287 0.04
3,514 SOC Telemed Inc - Class A 4,498 0.01
306 Sonic Automotive Inc - Class A 15,132 0.04
2,465 Sonos Inc 73,457 0.18
2,847 Sorrento Therapeutics Inc 13,239 0.03
1,310 South Jersey Industries Inc 34,217 0.08
334 Southside Bancshares Inc 13,968 0.03
864 SouthState Corp 69,215 0.17
867 Southwest Gas Holdings Inc 60,733 0.15
7,748 Southwestern Energy Co 36,106 0.09
843 SpartanNash Co 21,716 0.05
662 Spire Inc 43,176 0.11
723 Spirit Airlines Inc 15,798 0.04
1,769 Sportsman's Warehouse Holdings Inc 20,874 0.05
615 Sprout Social Inc - Class A 55,774 0.14
3,013 Sprouts Farmers Market Inc 89,426 0.22
645 SPS Commerce Inc 91,816 0.23
552 SPX Corp 32,943 0.08
576 SPX FLOW Inc 49,812 0.12
560 St Joe Co/The 29,148 0.07
1,262 STAAR Surgical Co 115,221 0.28
2,747 STAG Industrial Inc (REIT) 131,746 0.32
336 Standard Motor Products Inc 17,603 0.04
159 Standex International Corp 17,595 0.04

December 2021 Legal & General UCITS ETF Plc
L&G Russell 2000 US Small Cap Quality UCITS ETF
Schedule of Investments (continued)
As at 31 December 2021
181
Nominal Description
Value
$
% of Net
Assets
Common Stock (30 June 2021: 99.70%) (continued)
United States (30 June 2021: 95.22%) (continued)
736 Steelcase Inc 8,626 0.02
415 Stepan Co 51,580 0.13
2,290 StepStone Group Inc - Class A 95,195 0.23
590 Sterling Construction Co Inc 15,517 0.04
1,187 Steven Madden Ltd 55,160 0.14
581 Stewart Information Services Corp 46,323 0.11
513 Stitch Fix Inc 9,706 0.02
384 Stock Yards Bancorp Inc 24,530 0.06
406 Stoke Therapeutics Inc 9,740 0.02
187 StoneX Group Inc 11,454 0.03
318 Strategic Education Inc 18,393 0.05
420 Stride Inc 13,999 0.03
719 Sturm Ruger & Co Inc 48,906 0.12
1,947 Summit Materials Inc - Class A 78,153 0.19
1,551 SunCoke Energy Inc 10,221 0.03
868 Sunnova Energy International Inc 24,235 0.06
968 SunPower Corp 20,202 0.05
1,091 Sunstone Hotel Investors Inc (REIT) 12,797 0.03
1,152 Supernus Pharmaceuticals Inc 33,592 0.08
2,760 Surface Oncology Inc 13,193 0.03
609 Surgery Partners Inc 32,527 0.08
329 Surmodics Inc 15,841 0.04
494 Synaptics Inc 143,018 0.35
348 Tabula Rasa HealthCare Inc 5,220 0.01
577 Tactile Systems Technology Inc 10,980 0.03
1,297 Tanger Factory Outlet Centers Inc (REIT) 25,006 0.06
486 Tattooed Chef Inc 7,552 0.02
1,480 Taylor Morrison Home Corp - Class A 51,741 0.13
246 TechTarget Inc 23,532 0.06
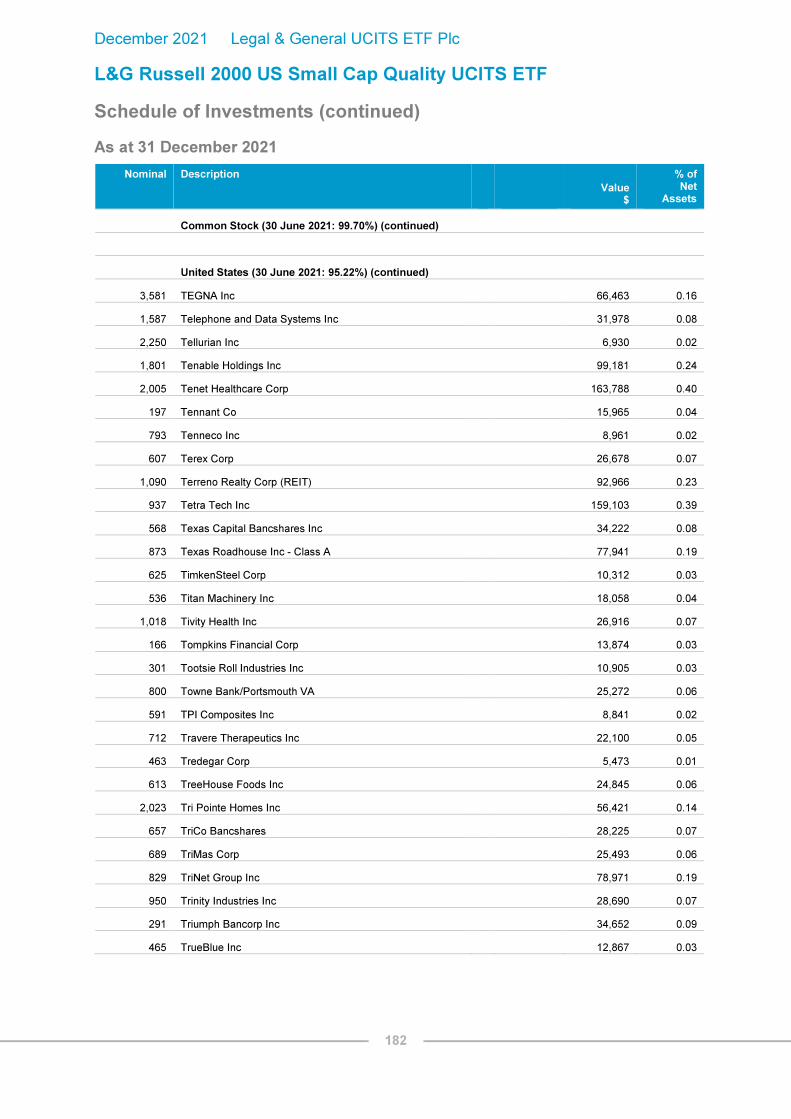
December 2021 Legal & General UCITS ETF Plc
L&G Russell 2000 US Small Cap Quality UCITS ETF
Schedule of Investments (continued)
As at 31 December 2021
182
Nominal Description
Value
$
% of Net
Assets
Common Stock (30 June 2021: 99.70%) (continued)
United States (30 June 2021: 95.22%) (continued)
3,581 TEGNA Inc 66,463 0.16
1,587 Telephone and Data Systems Inc 31,978 0.08
2,250 Tellurian Inc 6,930 0.02
1,801 Tenable Holdings Inc 99,181 0.24
2,005 Tenet Healthcare Corp 163,788 0.40
197 Tennant Co 15,965 0.04
793 Tenneco Inc 8,961 0.02
607 Terex Corp 26,678 0.07
1,090 Terreno Realty Corp (REIT) 92,966 0.23
937 Tetra Tech Inc 159,103 0.39
568 Texas Capital Bancshares Inc 34,222 0.08
873 Texas Roadhouse Inc - Class A 77,941 0.19
625 TimkenSteel Corp 10,312 0.03
536 Titan Machinery Inc 18,058 0.04
1,018 Tivity Health Inc 26,916 0.07
166 Tompkins Financial Corp 13,874 0.03
301 Tootsie Roll Industries Inc 10,905 0.03
800 Towne Bank/Portsmouth VA 25,272 0.06
591 TPI Composites Inc 8,841 0.02
712 Travere Therapeutics Inc 22,100 0.05
463 Tredegar Corp 5,473 0.01
613 TreeHouse Foods Inc 24,845 0.06
2,023 Tri Pointe Homes Inc 56,421 0.14
657 TriCo Bancshares 28,225 0.07
689 TriMas Corp 25,493 0.06
829 TriNet Group Inc 78,971 0.19
950 Trinity Industries Inc 28,690 0.07
291 Triumph Bancorp Inc 34,652 0.09
465 TrueBlue Inc 12,867 0.03

December 2021 Legal & General UCITS ETF Plc
L&G Russell 2000 US Small Cap Quality UCITS ETF
Schedule of Investments (continued)
As at 31 December 2021
183
Nominal Description
Value
$
% of Net
Assets
Common Stock (30 June 2021: 99.70%) (continued)
United States (30 June 2021: 95.22%) (continued)
1,972 TrueCar Inc 6,705 0.02
405 Trupanion Inc 53,472 0.13
718 Trustmark Corp 23,306 0.06
358 TTEC Holdings Inc 32,417 0.08
1,235 TTM Technologies Inc 18,402 0.05
721 Tupperware Brands Corp 11,024 0.03
794 Turning Point Therapeutics Inc 37,874 0.09
303 Turtle Beach Corp 6,745 0.02
1,631 Tutor Perini Corp 20,175 0.05
1,995 Two Harbors Investment Corp (REIT) 11,511 0.03
1,099 UFP Industries Inc 101,119 0.25
150 UFP Technologies Inc 10,539 0.03
831 Ultra Clean Holdings Inc 47,666 0.12
597 UMB Financial Corp 63,348 0.16
505 UMH Properties Inc (REIT) 13,802 0.03
284 UniFirst Corp/MA 59,754 0.15
1,787 United Bankshares Inc/WV 64,832 0.16
1,231 United Community Banks Inc/GA 44,242 0.11
1,417 United Natural Foods Inc 69,546 0.17
214 United States Cellular Corp 6,745 0.02
222 Unitil Corp 10,210 0.03
322 Universal Corp/VA 17,684 0.04
211 Universal Electronics Inc 8,598 0.02
202 Universal Health Realty Income Trust (REIT) 12,013 0.03
359 Univest Financial Corp 10,741 0.03
594 Upland Software Inc 10,656 0.03
2,306 Upwork Inc 78,773 0.19
2,034 Urban Edge Properties (REIT) 38,646 0.09
937 Urban Outfitters Inc 27,510 0.07

December 2021 Legal & General UCITS ETF Plc
L&G Russell 2000 US Small Cap Quality UCITS ETF
Schedule of Investments (continued)
As at 31 December 2021
184
Nominal Description
Value
$
% of Net
Assets
Common Stock (30 June 2021: 99.70%) (continued)
United States (30 June 2021: 95.22%) (continued)
572 US Ecology Inc 18,270 0.04
309 US Physical Therapy Inc 29,525 0.07
186 USANA Health Sciences Inc 18,823 0.05
89 Utah Medical Products Inc 8,900 0.02
599 Utz Brands Inc 9,554 0.02
5,411 Valley National Bancorp 74,401 0.18
1,686 Vanda Pharmaceuticals Inc 26,453 0.06
604 Varex Imaging Corp 19,056 0.05
879 Varonis Systems Inc - Class B 42,878 0.11
2,390 Vector Group Ltd 27,437 0.07
561 Veeco Instruments Inc 15,972 0.04
960 Vericel Corp 37,728 0.09
941 Verint Systems Inc 49,412 0.12
993 Veris Residential Inc (REIT) 18,251 0.04
584 Veritex Holdings Inc 23,232 0.06
158 Veritiv Corp 19,366 0.05
1,602 Verra Mobility Corp - Class A 24,719 0.06
3,876 Viavi Solutions Inc 68,295 0.17
252 Vicor Corp 31,999 0.08
1,827 View Inc 7,144 0.02
1,858 Viking Therapeutics Inc 8,547 0.02
3,419 VirnetX Holding Corp 8,889 0.02
101 Virtus Investment Partners Inc 30,007 0.07
2,016 Vishay Intertechnology Inc 44,090 0.11
1,076 Vista Outdoor Inc 49,571 0.12
344 Visteon Corp 38,232 0.09
4,425 Vivint Smart Home Inc 43,276 0.11
485 Vocera Communications Inc 31,447 0.08
3,511 Vonage Holdings Corp 72,994 0.18

December 2021 Legal & General UCITS ETF Plc
L&G Russell 2000 US Small Cap Quality UCITS ETF
Schedule of Investments (continued)
As at 31 December 2021
185
Nominal Description
Value
$
% of Net
Assets
Common Stock (30 June 2021: 99.70%) (continued)
United States (30 June 2021: 95.22%) (continued)
604 Vuzix Corp 5,237 0.01
561 Walker & Dunlop Inc 84,644 0.21
849 Washington Federal Inc 28,340 0.07
961 Washington Real Estate Investment Trust (REIT) 24,842 0.06
194 Washington Trust Bancorp Inc 10,936 0.03
468 Watts Water Technologies Inc - Class A 90,872 0.22
181 WD-40 Co 44,280 0.11
352 Weis Markets Inc 23,190 0.06
1,299 Welbilt Inc 30,877 0.08
1,099 Werner Enterprises Inc 52,378 0.13
710 WesBanco Inc 24,843 0.06
249 WESCO International Inc 32,766 0.08
292 Westamerica BanCorp 16,857 0.04
502 Whiting Petroleum Corp 32,469 0.08
693 Whole Earth Brands Inc 7,443 0.02
747 WideOpenWest Inc 16,075 0.04
1,484 WillScot Mobile Mini Holdings Corp 60,607 0.15
963 Wingstop Inc 166,406 0.41
242 Winmark Corp 60,086 0.15
306 Winnebago Industries Inc 22,926 0.06
1,149 Wolverine World Wide Inc 33,103 0.08
1,002 Workhorse Group Inc 4,369 0.01
453 Workiva Inc - Class A 59,112 0.15
99 World Acceptance Corp 24,298 0.06
609 World Fuel Services Corp 16,120 0.04
441 Worthington Industries Inc 24,105 0.06
573 WSFS Financial Corp 28,719 0.07
633 WW International Inc 10,210 0.03
1,501 Xencor Inc 60,220 0.15

December 2021 Legal & General UCITS ETF Plc
L&G Russell 2000 US Small Cap Quality UCITS ETF
Schedule of Investments (continued)
As at 31 December 2021
186
Nominal Description
Value
$
% of Net
Assets
Common Stock (30 June 2021: 99.70%) (continued)
United States (30 June 2021: 95.22%) (continued)
938 Xenia Hotels & Resorts Inc (REIT)
16,987 0.04
201 XPEL Inc
13,724 0.03
1,222 Xperi Holding Corp
23,108 0.06
1,238 Yelp Inc - Class A
44,865 0.11
1,578 Yext Inc
15,654 0.04
422 Y-mAbs Therapeutics Inc
6,841 0.02
202 York Water Co/The
10,056 0.02
253 Zentalis Pharmaceuticals Inc
21,267 0.05
685 Ziff Davis Inc
75,939 0.19
345 Zumiez Inc
16,557 0.04
1,589 Zuora Inc
29,683 0.07
1,481 Zurn Water Solutions Corp
53,908 0.13
Total United States
38,614,329 94.76
Total Common Stock 40,638,432 99.73
Total Investments
Common Stock 40,638,432 99.73
Other Assets and Liabilities 110,523 0.27
Net Assets Attributable to Holders of Redeemable Participating Shares 40,748,955 100.00
Analysis of Total Assets
% of Total
Assets
Transferable securities admitted to an official stock exchange listing 99.28
Other assets
0.72
100.00
Analysis of Total Assets rather than Net Assets is required under Schedule 12 of the UCITS Regulations.

December 2021 Legal & General UCITS ETF Plc
L&G Gold Mining UCITS ETF
Schedule of Investments
As at 31 December 2021
187
Nominal Description
Value
$
% of Net
Assets
Common Stock (30 June 2021: 99.82%)
Australia (30 June 2021: 14.64%)
1,296,124 Evolution Mining Ltd
3,825,906 2.36
603,033 Newcrest Mining Ltd
10,732,830 6.61
613,602 Northern Star Resources Ltd
4,197,959 2.59
962,562 Ramelius Resources Ltd
1,098,728 0.68
1,185,406 Regis Resources Ltd
1,680,597 1.03
1,044,713 Silver Lake Resources Ltd
1,348,209 0.83
1,672,843 St Barbara Ltd
1,781,782 1.10
Total Australia
24,666,011 15.20
Canada (30 June 2021: 46.14%)
160,913 Agnico Eagle Mines Ltd (Units)
8,559,219 5.28
257,400 Alamos Gold Inc - Class A
1,982,712 1.22
316,100 Argonaut Gold Inc
600,584 0.37
1,216,626 Barrick Gold Corp
23,163,838 14.28
503,500 Centerra Gold Inc
3,886,355 2.40
215,900 Dundee Precious Metals Inc (Units)
1,336,588 0.82
298,400 Equinox Gold Corp
2,022,139 1.25
1,042,100 IAMGOLD Corp
3,250,454 2.00
1,840,910 Kinross Gold Corp
10,697,122 6.59
160,300 Kirkland Lake Gold Ltd
6,727,128 4.15
127,500 Lundin Gold Inc
1,051,759 0.65
961,100 New Gold Inc
1,438,033 0.89
99,095 Pan American Silver Corp
2,474,402 1.52
125,100 Pretium Resources Inc
1,764,832 1.09
178,200 Torex Gold Resources Inc
1,855,119 1.14
915,700 Yamana Gold Inc (Units)
3,856,588 2.38
Total Canada
74,666,872 46.03

December 2021 Legal & General UCITS ETF Plc
L&G Gold Mining UCITS ETF
Schedule of Investments (continued)
As at 31 December 2021
188
Nominal Description
Value
$
% of Net
Assets
Common Stock (30 June 2021: 99.82%) (continued)
Jersey (30 June 2021: 4.48%)
365,276 Polymetal International Plc 6,488,621 4.00
Total Jersey 6,488,621 4.00
South Africa (30 June 2021: 14.98%)
742,832 AngloGold Ashanti Ltd 15,298,818 9.43
1,111,181 Gold Fields Ltd 12,124,139 7.47
Total South Africa 27,422,957 16.90
United States (30 June 2021: 17.37%)
260,398 Coeur Mining Inc 1,312,406 0.81
439,746 Newmont Corp 27,273,047 16.81
Total United States 28,585,453 17.62
Total Common Stock 161,829,914 99.75
Total Investments
Common Stock
161,829,914
99.75
Other Assets and Liabilities
397,970
0.25
Net Assets Attributable to Holders of Redeemable Participating Shares
162,227,884 100.00
Analysis of Total Assets
% of Total
Assets
Transferable securities admitted to an official stock exchange listing 99.70
Other assets
0.30
100.00
Analysis of Total Assets rather than Net Assets is required under Schedule 12 of the UCITS Regulations.
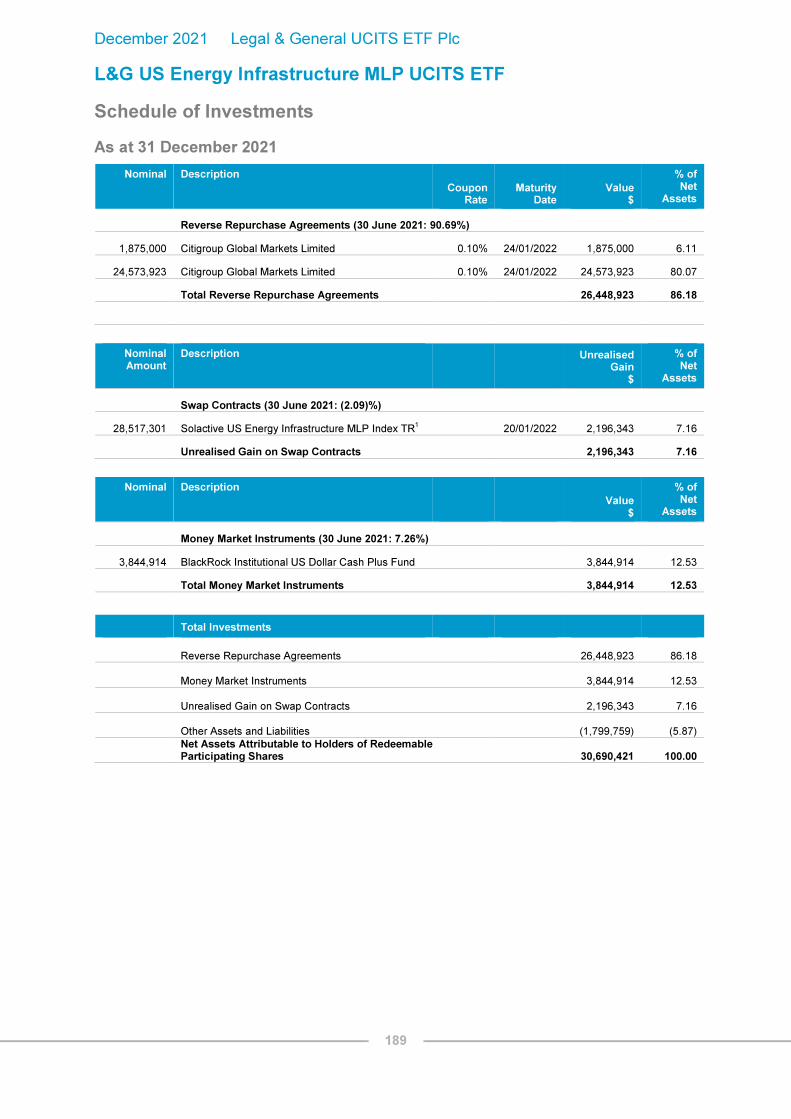
December 2021 Legal & General UCITS ETF Plc
L&G US Energy Infrastructure MLP UCITS ETF
Schedule of Investments
As at 31 December 2021
189
Nominal Description
Coupon Rate
Maturity Date
Value $
% of Net
Assets
Reverse Repurchase Agreements (30 June 2021: 90.69%)
1,875,000 Citigroup Global Markets Limited 0.10% 24/01/2022 1,875,000 6.11
24,573,923 Citigroup Global Markets Limited 0.10% 24/01/2022 24,573,923 80.07
Total Reverse Repurchase Agreements 26,448,923 86.18
Nominal Amount
Description
Unrealised Gain
$
% of Net
Assets
Swap Contracts (30 June 2021: (2.09)%)
28,517,301 Solactive US Energy Infrastructure MLP Index TR1 20/01/2022 2,196,343 7.16
Unrealised Gain on Swap Contracts 2,196,343 7.16
Nominal Description
Value
$
% of Net
Assets
Money Market Instruments (30 June 2021: 7.26%)
3,844,914 BlackRock Institutional US Dollar Cash Plus Fund 3,844,914 12.53
Total Money Market Instruments 3,844,914 12.53
Total Investments
Reverse Repurchase Agreements 26,448,923
86.18
Money Market Instruments 3,844,914
12.53
Unrealised Gain on Swap Contracts 2,196,343
7.16
Other Assets and Liabilities (1,799,759)
(5.87)
Net Assets Attributable to Holders of Redeemable Participating Shares 30,690,421 100.00
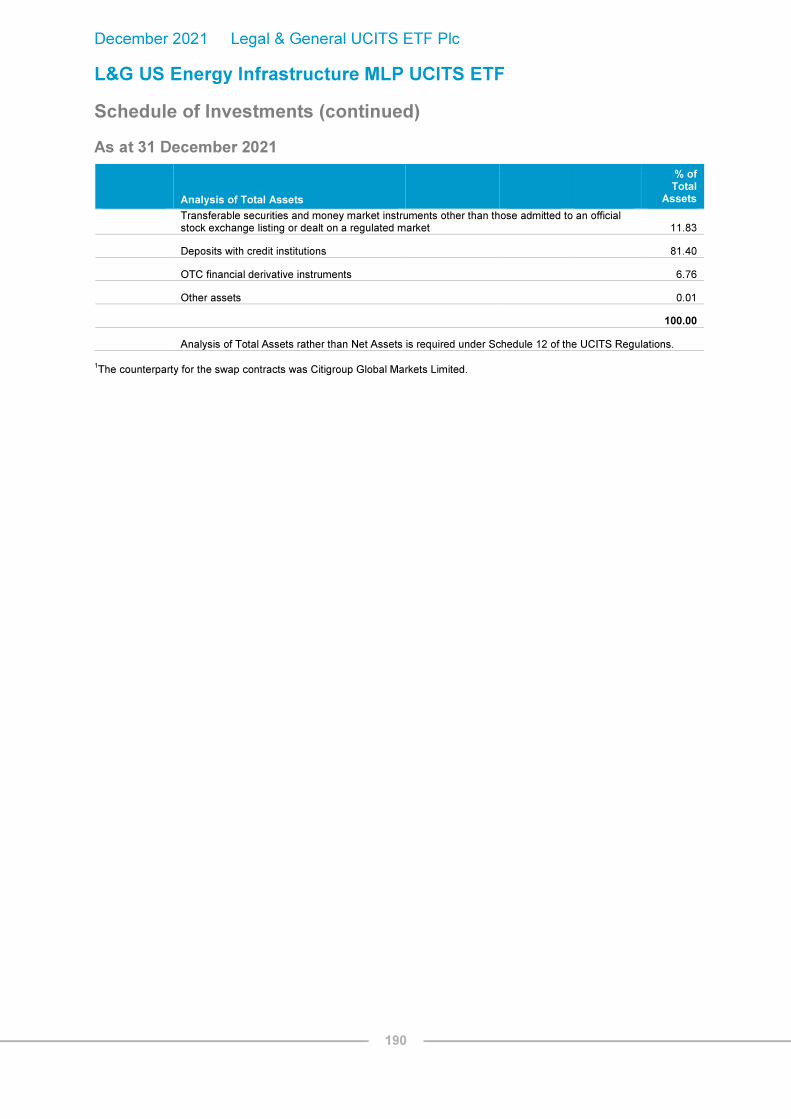
December 2021 Legal & General UCITS ETF Plc
L&G US Energy Infrastructure MLP UCITS ETF
Schedule of Investments (continued)
As at 31 December 2021
190
Analysis of Total Assets
% of Total
Assets
Transferable securities and money market instruments other than those admitted to an official stock exchange listing or dealt on a regulated market 11.83
Deposits with credit institutions 81.40
OTC financial derivative instruments 6.76
Other assets 0.01
100.00
Analysis of Total Assets rather than Net Assets is required under Schedule 12 of the UCITS Regulations.
1The counterparty for the swap contracts was Citigroup Global Markets Limited.

December 2021 Legal & General UCITS ETF Plc
L&G ROBO Global® Robotics and Automation UCITS ETF
Schedule of investments
As at 31 December 2021
191
Nominal Description
Value $
% of Net
Assets
Common Stock (30 June 2021: 99.84%)
Belgium (30 June 2021: 1.18%)
876,637 Materialise NV ADR 20,925,325 1.52
Total Belgium 20,925,325 1.52
Bermuda (30 June 2021: –%)
3,615,593 AutoStore Holdings Ltd 14,262,201 1.04
Total Bermuda 14,262,201 1.04
Canada (30 June 2021: 2.78%)
490,933 ATS Automation Tooling Systems Inc 19,525,862 1.42
113,010 Novanta Inc 19,927,053 1.45
Total Canada 39,452,915 2.87
Cayman Islands (30 June 2021: 2.84%)
640,795 Airtac International Group 23,624,217 1.72
82,839 Ambarella Inc 16,807,205 1.22
Total Cayman Islands 40,431,422 2.94
China (30 June 2021: 1.79%)
680,095 Han's Laser Technology Industry Group Co Ltd 'A' 5,775,264 0.42
603,317 Iflytek Co Ltd 'A' 4,981,913 0.36
341,369 Shenzhen Inovance Technology Co Ltd 'A' 3,682,619 0.27
2,460,404 Siasun Robot & Automation Co Ltd 'A' 4,321,834 0.32
Total China 18,761,630 1.37

December 2021 Legal & General UCITS ETF Plc
L&G ROBO Global® Robotics and Automation UCITS ETF
Schedule of investments (continued)
As at 31 December 2021
192
Nominal Description
Value $
% of Net
Assets
Common Stock (30 June 2021: 99.84%) (continued)
Finland (30 June 2021: 0.96%)
308,002 Cargotec Oyj - Class B 15,355,256 1.12
Total Finland 15,355,256 1.12
France (30 June 2021: 2.10%)
271,418 Dassault Systemes SE 16,145,681 1.18
67,960 Schneider Electric SE 13,328,299 0.97
Total France 29,473,980 2.15
Germany (30 June 2021: 6.21%)
363,648 Duerr AG 16,591,097 1.21
382,757 GEA Group AG 20,932,008 1.52
382,319 Jenoptik AG 16,147,332 1.18
104,300 KION Group AG 11,443,387 0.83
166,362 Krones AG 18,142,859 1.32
81,076 Siemens AG 14,076,914 1.03
Total Germany 97,333,597 7.09
Israel (30 June 2021: 1.57%)
794,481 Stratasys Ltd 19,456,840 1.42
Total Israel 19,456,840 1.42
Japan (30 June 2021: 19.10%)
532,515 Amano Corp 12,240,607 0.89
236,463 Daifuku Co Ltd 19,302,263 1.41
297,548 Daihen Corp 12,338,080 0.90
106,010 FANUC Corp 22,443,868 1.63
827,946 Fuji Corp/Aichi 18,564,165 1.35
549,769 Harmonic Drive Systems Inc 23,202,442 1.69
33,298 Keyence Corp 20,900,345 1.52
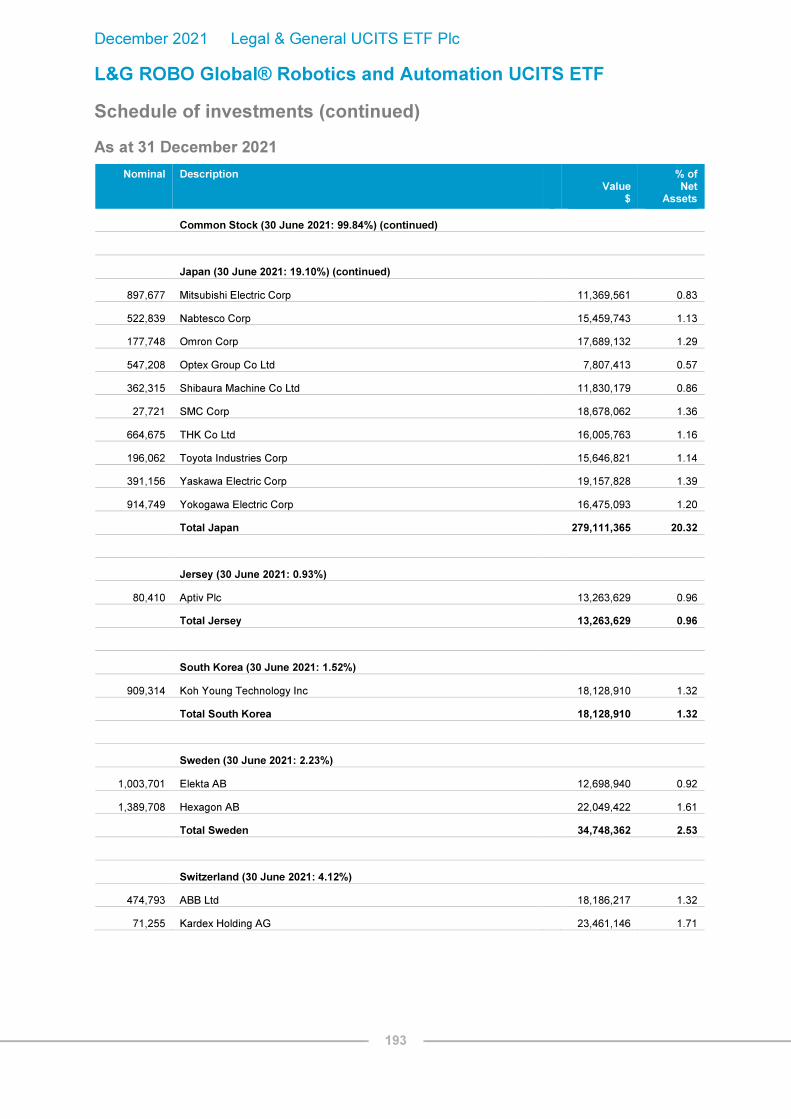
December 2021 Legal & General UCITS ETF Plc
L&G ROBO Global® Robotics and Automation UCITS ETF
Schedule of investments (continued)
As at 31 December 2021
193
Nominal Description
Value $
% of Net
Assets
Common Stock (30 June 2021: 99.84%) (continued)
Japan (30 June 2021: 19.10%) (continued)
897,677 Mitsubishi Electric Corp
11,369,561 0.83
522,839 Nabtesco Corp
15,459,743 1.13
177,748 Omron Corp
17,689,132 1.29
547,208 Optex Group Co Ltd
7,807,413 0.57
362,315 Shibaura Machine Co Ltd
11,830,179 0.86
27,721 SMC Corp
18,678,062 1.36
664,675 THK Co Ltd
16,005,763 1.16
196,062 Toyota Industries Corp
15,646,821 1.14
391,156 Yaskawa Electric Corp
19,157,828 1.39
914,749 Yokogawa Electric Corp
16,475,093 1.20
Total Japan
279,111,365 20.32
Jersey (30 June 2021: 0.93%)
80,410 Aptiv Plc
13,263,629 0.96
Total Jersey
13,263,629 0.96
South Korea (30 June 2021: 1.52%)
909,314 Koh Young Technology Inc
18,128,910 1.32
Total South Korea
18,128,910 1.32
Sweden (30 June 2021: 2.23%)
1,003,701 Elekta AB
12,698,940 0.92
1,389,708 Hexagon AB
22,049,422 1.61
Total Sweden
34,748,362 2.53
Switzerland (30 June 2021: 4.12%)
474,793 ABB Ltd
18,186,217 1.32
71,255 Kardex Holding AG
23,461,146 1.71

December 2021 Legal & General UCITS ETF Plc
L&G ROBO Global® Robotics and Automation UCITS ETF
Schedule of investments (continued)
As at 31 December 2021
194
Nominal Description
Value $
% of Net
Assets
Common Stock (30 June 2021: 99.84%) (continued)
Switzerland (30 June 2021: 4.12%) (continued)
31,538 Tecan Group AG 19,227,855 1.40
Total Switzerland 60,875,218 4.43
Taiwan (30 June 2021: 4.53%)
1,147,482 Advantech Co Ltd 16,444,747 1.20
1,374,003 Delta Electronics Inc 13,657,101 0.99
530,541 Global Unichip Corp 11,237,112 0.82
1,846,051 Hiwin Technologies Corp 20,450,895 1.49
Total Taiwan 61,789,855 4.50
United Kingdom (30 June 2021: 3.48%)
735,132 Ocado Group Plc 16,707,838 1.22
290,493 Renishaw Plc 18,807,304 1.37
Total United Kingdom 35,515,142 2.59
United States (30 June 2021: 43.39%)
771,533 3D Systems Corp 16,618,821 1.21
1,095,599 AppHarvest Inc 4,261,880 0.31
53,960 Autodesk Inc 15,173,012 1.10
210,033 Azenta Inc 21,656,503 1.58
92,769 Cadence Design Systems Inc 17,287,503 1.26
286,296 Cognex Corp 22,262,377 1.62
45,236 Deere & Co 15,510,972 1.13
270,856 FARO Technologies Inc 18,965,337 1.38
190,801 Globus Medical Inc 13,775,832 1.00
143,170 GXO Logistics Inc 13,004,131 0.95
59,409 Illumina Inc 22,601,560 1.65
71,208 Intuitive Surgical Inc 25,585,034 1.86
130,868 IPG Photonics Corp 22,527,618 1.64
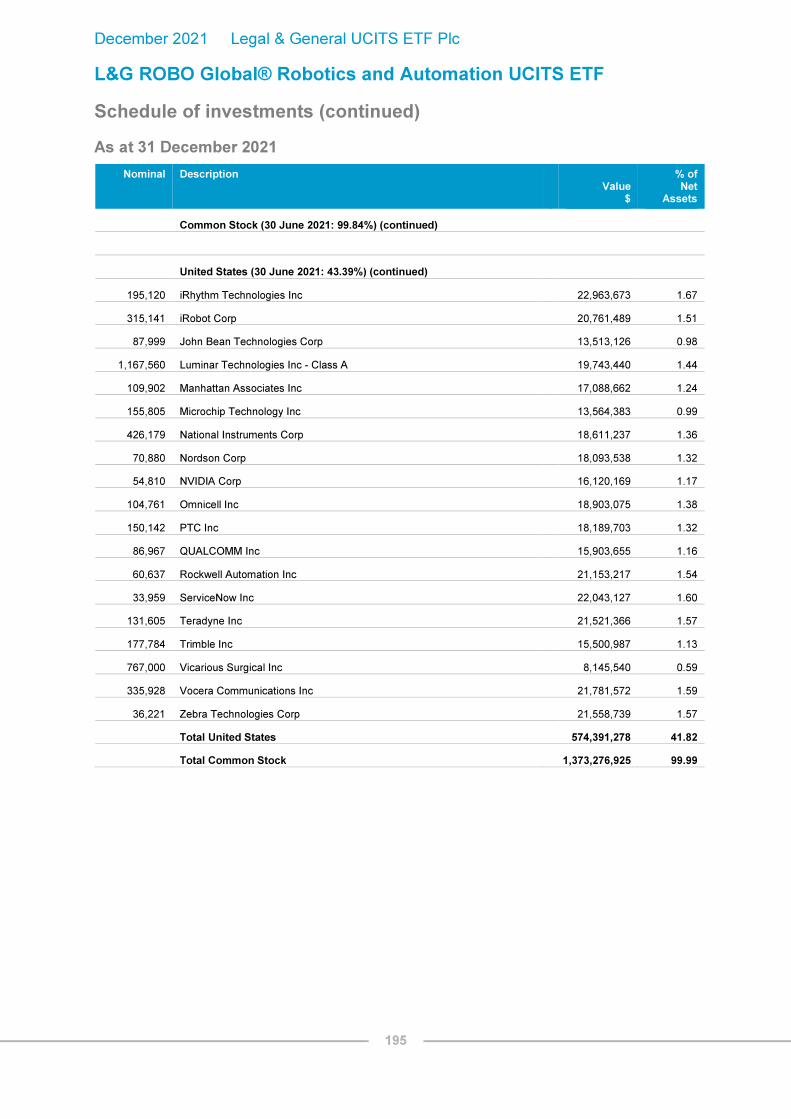
December 2021 Legal & General UCITS ETF Plc
L&G ROBO Global® Robotics and Automation UCITS ETF
Schedule of investments (continued)
As at 31 December 2021
195
Nominal Description
Value $
% of Net
Assets
Common Stock (30 June 2021: 99.84%) (continued)
United States (30 June 2021: 43.39%) (continued)
195,120 iRhythm Technologies Inc
22,963,673 1.67
315,141 iRobot Corp
20,761,489 1.51
87,999 John Bean Technologies Corp
13,513,126 0.98
1,167,560 Luminar Technologies Inc - Class A
19,743,440 1.44
109,902 Manhattan Associates Inc
17,088,662 1.24
155,805 Microchip Technology Inc
13,564,383 0.99
426,179 National Instruments Corp
18,611,237 1.36
70,880 Nordson Corp
18,093,538 1.32
54,810 NVIDIA Corp
16,120,169 1.17
104,761 Omnicell Inc
18,903,075 1.38
150,142 PTC Inc
18,189,703 1.32
86,967 QUALCOMM Inc
15,903,655 1.16
60,637 Rockwell Automation Inc
21,153,217 1.54
33,959 ServiceNow Inc
22,043,127 1.60
131,605 Teradyne Inc
21,521,366 1.57
177,784 Trimble Inc
15,500,987 1.13
767,000 Vicarious Surgical Inc
8,145,540 0.59
335,928 Vocera Communications Inc
21,781,572 1.59
36,221 Zebra Technologies Corp
21,558,739 1.57
Total United States
574,391,278 41.82
Total Common Stock 1,373,276,925 99.99

December 2021 Legal & General UCITS ETF Plc
L&G ROBO Global® Robotics and Automation UCITS ETF
Schedule of investments (continued)
As at 31 December 2021
196
Total Investments
Value $
% of Net
Assets
Common Stock 1,373,276,925
99.99
Other Assets and Liabilities 99,582
0.01
Net Assets Attributable to Holders of Redeemable Participating Shares 1,373,376,507 100.00
Analysis of Total Assets
% of Total
Assets
Transferable securities admitted to an official stock exchange listing 99.93
Other assets 0.07
100.00
Analysis of Total Assets rather than Net Assets is required under Schedule 12 of the UCITS Regulations.

December 2021 Legal & General UCITS ETF Plc
L&G Cyber Security UCITS ETF
Schedule of Investments
As at 31 December 2021
197
Nominal Description
Value $
% of Net
Assets
Common Stock (30 June 2021: 99.86%)
Canada (30 June 2021: 4.92%)
3,357,602 Absolute Software Corp 31,524,794 1.03
8,301,630 BlackBerry Ltd 77,681,786 2.53
Total Canada 109,206,580 3.56
France (30 June 2021: 1.74%)
601,138 Atos SE 25,560,105 0.83
329,641 Thales SA 28,039,857 0.92
Total France 53,599,962 1.75
Israel (30 June 2021: 9.13%)
1,728,507 Allot Ltd 20,534,663 0.67
714,775 Check Point Software Technologies Ltd 83,314,174 2.72
3,931,785 Cognyte Software Ltd 61,611,071 2.01
511,964 CyberArk Software Ltd 88,713,122 2.89
2,396,149 Radware Ltd 99,775,645 3.25
1,885,664 Tufin Software Technologies Ltd 19,893,755 0.65
Total Israel 373,842,430 12.19
Japan (30 June 2021: 4.37%)
705,302 Digital Arts Inc 51,693,357 1.69
1,449,321 Trend Micro Inc/Japan 80,423,434 2.62
Total Japan 132,116,791 4.31
Jersey (30 June 2021: 1.28%)
505,538 Mimecast Ltd 40,225,659 1.31
Total Jersey 40,225,659 1.31

December 2021 Legal & General UCITS ETF Plc
L&G Cyber Security UCITS ETF
Schedule of Investments (continued)
As at 31 December 2021
198
Nominal Description
Value $
% of Net
Assets
Common Stock (30 June 2021: 99.86%) (continued)
South Korea (30 June 2021: 1.12%)
506,889 Ahnlab Inc 42,171,459 1.37
Total South Korea 42,171,459 1.37
Sweden (30 June 2021: 2.70%)
18,319,724 Fingerprint Cards AB - Class B 41,844,413 1.36
Total Sweden 41,844,413 1.36
United Kingdom (30 June 2021: 5.70%)
10,553,670 Avast Plc '144A' 86,795,708 2.83
4,218,962 BAE Systems Plc 31,417,623 1.02
7,307,773 Darktrace Plc 41,591,451 1.36
7,355,205 QinetiQ Group Plc 26,499,605 0.86
Total United Kingdom 186,304,387 6.07
United States (30 June 2021: 68.90%)
2,385,177 A10 Networks Inc 39,546,235 1.29
772,523 Akamai Technologies Inc 90,416,092 2.95
405,194 Booz Allen Hamilton Holding Corp - Class A 34,356,399 1.12
122,671 CACI International Inc - Class A 33,024,260 1.08
1,484,442 Cisco Systems Inc/Delaware 94,069,090 3.07
717,250 Cloudflare Inc 94,318,375 3.07
328,742 Crowdstrike Holdings Inc 67,309,925 2.19
161,748 F5 Inc 39,581,353 1.29
1,997,976 Fastly Inc 70,828,249 2.31
276,668 Fortinet Inc 99,434,479 3.24
242,603 Jacobs Engineering Group Inc 33,777,616 1.10
2,935,980 Juniper Networks Inc 104,843,846 3.42
334,466 Leidos Holdings Inc 29,734,027 0.97
4,539,223 Mandiant Inc 79,617,971 2.60

December 2021 Legal & General UCITS ETF Plc
L&G Cyber Security UCITS ETF
Schedule of Investments (continued)
As at 31 December 2021
199
Nominal Description
Value $
% of Net
Assets
Common Stock (30 June 2021: 99.86%) (continued)
United States (30 June 2021: 68.90%) (continued)
423,500 ManTech International Corp/VA - Class A 30,885,855 1.01
3,654,372 McAfee Corp - Class A 94,246,254 3.07
2,950,335 Mitek Systems Inc 52,368,446 1.71
2,998,077 NetScout Systems Inc 99,176,387 3.23
3,193,604 NortonLifeLock Inc 82,969,832 2.70
135,468 Okta Inc 30,367,862 0.99
2,207,417 OneSpan Inc 37,371,570 1.22
168,681 Palo Alto Networks Inc 93,914,834 3.06
952,375 Parsons Corp 32,047,419 1.04
3,288,488 Ping Identity Holding Corp 75,240,605 2.45
726,014 Qualys Inc 99,623,641 3.25
2,261,053 Rackspace Technology Inc 30,456,384 0.99
284,482 Rapid7 Inc 33,480,687 1.09
749,818 Sailpoint Technologies Holdings Inc 36,246,202 1.18
375,785 Science Applications International Corp 31,411,868 1.02
1,921,828 SolarWinds Corp 27,270,739 0.89
558,345 Splunk Inc 64,611,683 2.11
1,994,552 Sumo Logic Inc 27,046,125 0.88
1,131,322 Telos Corp 17,444,985 0.57
696,840 Tenable Holdings Inc 38,374,979 1.25
528,385 Varonis Systems Inc - Class B 25,774,620 0.84
621,564 VMware Inc 72,026,836 2.35
122,615 Zscaler Inc 39,399,878 1.28
Total United States 2,082,615,608 67.88
Total Common Stock 3,061,927,289 99.80

December 2021 Legal & General UCITS ETF Plc
L&G Cyber Security UCITS ETF
Schedule of Investments (continued)
As at 31 December 2021
200
Total Investments
Common Stock 3,061,927,289 99.80
Other Assets and Liabilities 6,120,420 0.20
Net Assets Attributable to Holders of Redeemable Participating Shares 3,068,047,709 100.00
Analysis of Total Assets
% of Total
Assets
Transferable securities admitted to an official stock exchange listing 99.29
Other assets 0.71
100.00
Analysis of Total Assets rather than Net Assets is required under Schedule 12 of the UCITS Regulations.

December 2021 Legal & General UCITS ETF Plc
L&G All Commodities UCITS ETF
Schedule of Investments
As at 31 December 2021
201
Nominal Description
Coupon Rate
Maturity Date
Value $
% of Net
Assets
Reverse Repurchase Agreements (30 June 2021: 89.35%)
6,230,000 Barclays Bank Plc 0.23% 24/01/2022 6,230,000 7.46
69,808,070 Barclays Bank Plc 0.23% 24/01/2022 69,808,070 83.53
Total Reverse Repurchase Agreements 76,038,070 90.99
Nominal Amount
Description
Unrealised Gain
$
% of Net
Assets
Swap Contracts (30 June 2021: 3.16%)
80,382,585 Bloomberg Commodity Index Total Return1 20/01/2022 3,194,997 3.82
Unrealised Gain on Swap Contracts 3,194,997 3.82
Nominal Description
Value
$
% of Net
Assets
Money Market Instruments (30 June 2021: 9.10%)
8,397,429 BlackRock Institutional US Dollar Cash Plus Fund 8,397,429 10.05
Total Money Market Instruments 8,397,429 10.05
Total Investments
Reverse Repurchase Agreements 76,038,070 90.99
Money Market Instruments 8,397,429 10.05
Unrealised Gain on Swap Contracts 3,194,997 3.82
Other Assets and Liabilities (4,060,258)
(4.86)
Net Assets Attributable to Holders of Redeemable Participating Shares 83,570,238 100.00

December 2021 Legal & General UCITS ETF Plc
L&G All Commodities UCITS ETF
Schedule of Investments (continued)
As at 31 December 2021
202
Analysis of Total Assets
% of Total
Assets
Transferable securities and money market instruments other than those admitted to an official stock exchange listing or dealt on a regulated market 9.58
Deposits with credit institutions
86.77
OTC financial derivative instruments
3.65
Other assets
0.00
100.00
Analysis of Total Assets rather than Net Assets is required under Schedule 12 of the UCITS Regulations.
1 The counterparty for the swap contracts was Barclays Bank Plc.

December 2021 Legal & General UCITS ETF Plc
L&G Longer Dated All Commodities ex-Agriculture and Livestock UCITS ETF
Schedule of Investments
As at 31 December 2021
203
Nominal Description
Coupon Rate
Maturity Date
Value $
% of Net
Assets
Reverse Repurchase Agreements (30 June 2021: 88.38%)
1,299,553 Barclays Bank Plc 0.22% 24/01/2022 1,299,553 89.07
Total Reverse Repurchase Agreements 1,299,553 89.07
Nominal Amount
Description
Unrealised Gain
$
% of Net
Assets
Swap Contracts (30 June 2021: 3.08%)
1,397,423 Bloomberg ex-Agriculture and Livestock 15/30 Capped 3 Month Forward Total Return
1 20/01/2022 61,387 4.21
Unrealised Gain on Swap Contracts 61,387 4.21
Nominal Description
Value
$
% of Net
Assets
Money Market Instruments (30 June 2021: 9.97%)
98,438 BlackRock Institutional US Dollar Cash Plus Fund 98,438 6.75
Total Money Market Instruments 98,438 6.75
Total Investments
Reverse Repurchase Agreements 1,299,553 89.07
Money Market Instruments 98,438 6.75
Unrealised Gain on Swap Contracts 61,387 4.21
Other Assets and Liabilities (383)
(0.03)
Net Assets Attributable to Holders of Redeemable Participating Shares 1,458,995 100.00

December 2021 Legal & General UCITS ETF Plc
L&G Longer Dated All Commodities ex-Agriculture and Livestock UCITS ETF
Schedule of Investments (continued)
As at 31 December 2021
204
Analysis of Total Assets
% of Total
Assets
Transferable securities and money market instruments other than those admitted to an official stock exchange listing or dealt on a regulated market 6.74
Deposits with credit institutions 89.04
OTC financial derivative instruments 4.21
Other assets 0.01
100.00
Analysis of Total Assets rather than Net Assets is required under Schedule 12 of the UCITS Regulations.
1The counterparty for the swap contracts was Barclays Bank Plc.
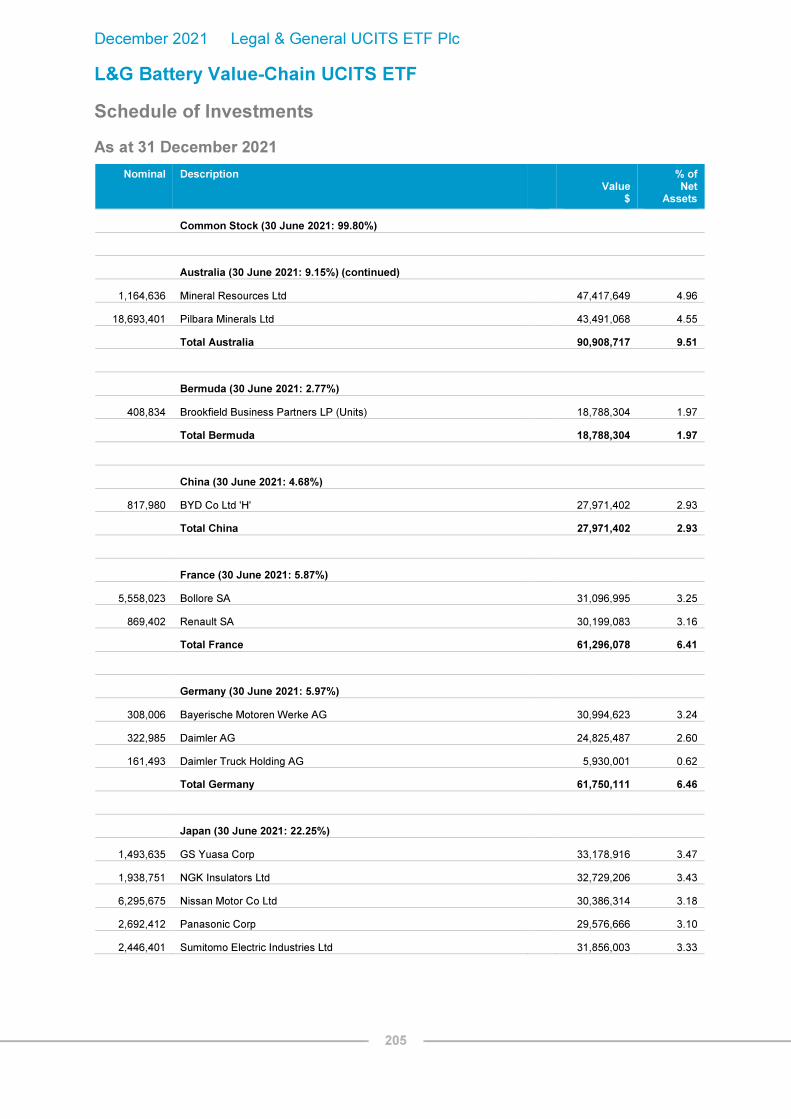
December 2021 Legal & General UCITS ETF Plc
L&G Battery Value-Chain UCITS ETF
Schedule of Investments
As at 31 December 2021
205
Nominal Description
Value $
% of Net
Assets
Common Stock (30 June 2021: 99.80%)
Australia (30 June 2021: 9.15%) (continued)
1,164,636 Mineral Resources Ltd 47,417,649 4.96
18,693,401 Pilbara Minerals Ltd 43,491,068 4.55
Total Australia 90,908,717 9.51
Bermuda (30 June 2021: 2.77%)
408,834 Brookfield Business Partners LP (Units) 18,788,304 1.97
Total Bermuda 18,788,304 1.97
China (30 June 2021: 4.68%)
817,980 BYD Co Ltd 'H' 27,971,402 2.93
Total China 27,971,402 2.93
France (30 June 2021: 5.87%)
5,558,023 Bollore SA 31,096,995 3.25
869,402 Renault SA 30,199,083 3.16
Total France 61,296,078 6.41
Germany (30 June 2021: 5.97%)
308,006 Bayerische Motoren Werke AG 30,994,623 3.24
322,985 Daimler AG 24,825,487 2.60
161,493 Daimler Truck Holding AG 5,930,001 0.62
Total Germany 61,750,111 6.46
Japan (30 June 2021: 22.25%)
1,493,635 GS Yuasa Corp 33,178,916 3.47
1,938,751 NGK Insulators Ltd 32,729,206 3.43
6,295,675 Nissan Motor Co Ltd 30,386,314 3.18
2,692,412 Panasonic Corp 29,576,666 3.10
2,446,401 Sumitomo Electric Industries Ltd 31,856,003 3.33

December 2021 Legal & General UCITS ETF Plc
L&G Battery Value-Chain UCITS ETF
Schedule of Investments (continued)
As at 31 December 2021
206
Nominal Description
Value $
% of Net
Assets
Common Stock (30 June 2021: 99.80%) (continued)
Japan (30 June 2021: 22.25%) (continued)
828,822 TDK Corp 32,316,535 3.38
723,944 Toshiba Corp 29,736,050 3.11
Total Japan 219,779,690 23.00
Netherlands (30 June 2021: 2.63%)
1,109,425 AMG Advanced Metallurgical Group NV 35,552,645 3.72
Total Netherlands 35,552,645 3.72
South Korea (30 June 2021: 11.83%)
1,717,972 Hyundai Electric & Energy System Co Ltd 28,759,321 3.01
49,289 LG Chem Ltd 25,499,672 2.67
51,311 Samsung SDI Co Ltd 28,272,307 2.96
484,859 Sebang Global Battery Co Ltd 30,957,558 3.24
Total South Korea 113,488,858 11.88
Switzerland (30 June 2021: 2.93%)
947,995 ABB Ltd 36,311,492 3.80
Total Switzerland 36,311,492 3.80
Taiwan (30 June 2021: 3.02%)
3,478,460 Delta Electronics Inc 34,574,654 3.62
Total Taiwan 34,574,654 3.62
United Kingdom (30 June 2021: 2.67%)
16,952,101 Rolls-Royce Holdings Plc 28,214,198 2.95
Total United Kingdom 28,214,198 2.95
United States (30 June 2021: 26.03%)
382,361 EnerSys 30,229,461 3.16
2,895,311 Eos Energy Enterprises Inc 21,772,739 2.28
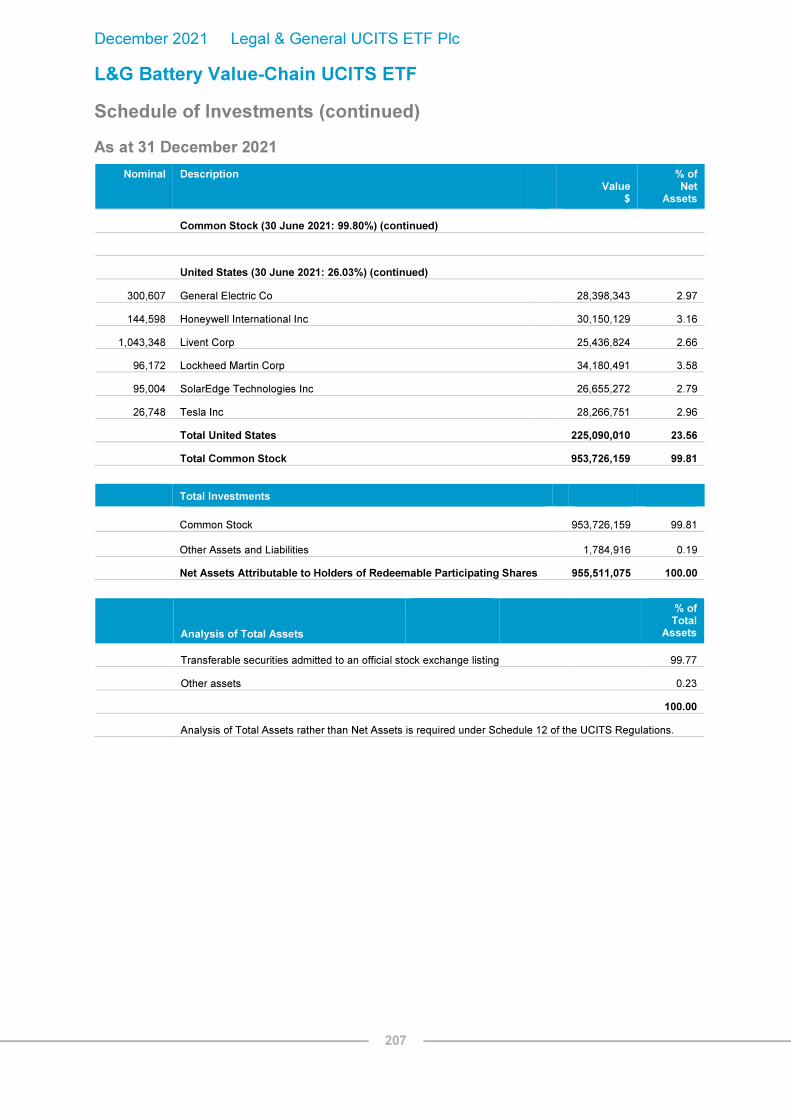
December 2021 Legal & General UCITS ETF Plc
L&G Battery Value-Chain UCITS ETF
Schedule of Investments (continued)
As at 31 December 2021
207
Nominal Description
Value $
% of Net
Assets
Common Stock (30 June 2021: 99.80%) (continued)
United States (30 June 2021: 26.03%) (continued)
300,607 General Electric Co 28,398,343 2.97
144,598 Honeywell International Inc 30,150,129 3.16
1,043,348 Livent Corp 25,436,824 2.66
96,172 Lockheed Martin Corp 34,180,491 3.58
95,004 SolarEdge Technologies Inc 26,655,272 2.79
26,748 Tesla Inc 28,266,751 2.96
Total United States 225,090,010 23.56
Total Common Stock 953,726,159 99.81
Total Investments
Common Stock 953,726,159
99.81
Other Assets and Liabilities 1,784,916
0.19
Net Assets Attributable to Holders of Redeemable Participating Shares 955,511,075 100.00
Analysis of Total Assets
% of Total
Assets
Transferable securities admitted to an official stock exchange listing 99.77
Other assets 0.23
100.00
Analysis of Total Assets rather than Net Assets is required under Schedule 12 of the UCITS Regulations.

December 2021 Legal & General UCITS ETF Plc
L&G Pharma Breakthrough UCITS ETF
Schedule of Investments
As at 31 December 2021
208
Nominal Description
Value $
% of Net
Assets
Common Stock (30 June 2021: 99.82%)
Australia (30 June 2021: 3.09%)
23,915 Clinuvel Pharmaceuticals Ltd
473,109 1.42
5,342 CSL Ltd
1,129,121 3.38
Total Australia
1,602,230 4.80
Cayman Islands (30 June 2021: 5.67%)
1,377,003 Sino Biopharmaceutical Ltd 964,359 2.89
8,302 Zai Lab Ltd ADR 521,781 1.56
Total Cayman Islands 1,486,140 4.45
Denmark (30 June 2021: 3.70%)
2,470 Genmab A/S 993,248 2.98
Total Denmark 993,248 2.98
France (30 June 2021: 6.56%)
11,579 Sanofi 1,166,379 3.49
Total France 1,166,379 3.49
Ireland (30 June 2021: 5.88%)
562,106 Endo International Plc 2,113,519 6.33
Total Ireland 2,113,519 6.33
Japan (30 June 2021: 13.22%)
30,030 Chugai Pharmaceutical Co Ltd 974,009 2.92
14,308 Eisai Co Ltd 811,476 2.43
34,185 Kyowa Kirin Co Ltd 930,659 2.79
Total Japan 2,716,144 8.14
Spain (30 June 2021: 5.19%)
48,623 Grifols SA 933,079 2.80
Total Spain 933,079 2.80

December 2021 Legal & General UCITS ETF Plc
L&G Pharma Breakthrough UCITS ETF
Schedule of Investments (continued)
As at 31 December 2021
209
Nominal Description
Value $
% of Net
Assets
Common Stock (30 June 2021: 99.82%) (continued)
Sweden (30 June 2021: 3.09%)
42,498 Swedish Orphan Biovitrum AB 868,846 2.60
Total Sweden 868,846 2.60
Switzerland (30 June 2021: 6.29%)
13,242 Novartis AG 1,166,738 3.50
3,027 Roche Holding AG 1,259,444 3.77
Total Switzerland 2,426,182 7.27
United Kingdom (30 June 2021: 2.41%)
17,140 Oxford Biomedica Plc 285,548 0.86
Total United Kingdom 285,548 0.86
United States (30 June 2021: 44.72%)
10,827 AbbVie Inc 1,465,976 4.39
6,120 Alnylam Pharmaceuticals Inc 1,037,830 3.11
14,226 BioMarin Pharmaceutical Inc 1,256,867 3.77
18,420 Bristol-Myers Squibb Co 1,148,487 3.44
19,120 Emergent BioSolutions Inc 831,146 2.49
28,624 Halozyme Therapeutics Inc 1,150,971 3.45
15,883 Incyte Corp 1,165,812 3.49
30,580 Ionis Pharmaceuticals Inc 930,549 2.79
6,905 Johnson & Johnson 1,181,238 3.54
27,373 PTC Therapeutics Inc 1,090,267 3.27
15,011 Sarepta Therapeutics Inc 1,351,741 4.05
44,010 Supernus Pharmaceuticals Inc 1,283,332 3.84
11,802 Ultragenyx Pharmaceutical Inc 992,430 2.97
5,733 United Therapeutics Corp 1,238,787 3.71

December 2021 Legal & General UCITS ETF Plc
L&G Pharma Breakthrough UCITS ETF
Schedule of Investments (continued)
As at 31 December 2021
210
Nominal Description
Value $
% of Net
Assets
Common Stock (30 June 2021: 99.82%) (continued)
United States (30 June 2021: 44.72%) (continued)
6,102 Vertex Pharmaceuticals Inc 1,339,999 4.01
31,933 Xencor Inc 1,281,152 3.84
Total United States
18,746,584 56.16
Total Common Stock
33,337,899 99.88
Total Investments
Common Stock 33,337,899
99.88
Other Assets and Liabilities 39,733
0.12
Net Assets Attributable to Holders of Redeemable Participating Shares 33,377,632 100.00
Analysis of Total Assets
% of Total
Assets
Transferable securities admitted to an official stock exchange listing 99.84
Other assets 0.16
100.00
Analysis of Total Assets rather than Net Assets is required under Schedule 12 of the UCITS Regulations.

December 2021 Legal & General UCITS ETF Plc
L&G Ecommerce Logistics UCITS ETF
Schedule of Investments
As at 31 December 2021
211
Nominal Description
Value $
% of Net
Assets
Common Stock (30 June 2021: 99.68%)
Belgium (30 June 2021: 2.70%)
1,391,660 bpost SA 12,138,401 2.36
Total Belgium 12,138,401 2.36
Bermuda (30 June 2021: 2.17%)
5,732,111 Kerry Logistics Network Ltd 14,013,573 2.73
Total Bermuda 14,013,573 2.73
Canada (30 June 2021: 5.24%)
152,292 Descartes Systems Group Inc/The 12,613,341 2.45
9,172 Shopify Inc - Class A 12,646,585 2.46
Total Canada 25,259,926 4.91
Cayman Islands (30 June 2021: 5.72%)
85,055 Alibaba Group Holding Ltd ADR 10,103,683 1.97
175,167 JD.com Inc ADR 12,273,952 2.39
1,123,184 Vipshop Holdings Ltd ADR 9,434,746 1.83
Total Cayman Islands 31,812,381 6.19
China (30 June 2021: 2.30%)
26,006,547 Sinotrans Ltd 'H' 8,339,386 1.62
Total China 8,339,386 1.62
Denmark (30 June 2021: 5.29%)
4,554 AP Moller - Maersk A/S - Class B 16,328,305 3.18
51,852 DSV A/S 12,110,218 2.35
163,192 NTG Nordic Transport Group A/S 13,324,330 2.59
Total Denmark 41,762,853 8.12

December 2021 Legal & General UCITS ETF Plc
L&G Ecommerce Logistics UCITS ETF
Schedule of Investments (continued)
As at 31 December 2021
212
Nominal Description
Value $
% of Net
Assets
Common Stock (30 June 2021: 99.68%) (continued)
France (30 June 2021: 2.43%)
2,128,091 Bollore SA 11,906,614 2.31
15,739 ID Logistics Group 6,577,600 1.28
Total France 18,484,214 3.59
Germany (30 June 2021: 7.80%)
195,393 Deutsche Post AG 12,563,128 2.44
90,972 SAP SE 12,921,210 2.51
136,932 Zalando SE '144A' 11,077,756 2.16
Total Germany 36,562,094 7.11
Japan (30 June 2021: 16.57%)
278,983 Hitachi Transport System Ltd 13,082,438 2.54
1,464,154 Japan Post Holdings Co Ltd 11,402,485 2.22
494,494 Kintetsu World Express Inc 12,839,538 2.50
180,519 Nippon Express Co Ltd 10,832,237 2.11
163,906 Nippon Yusen KK 12,468,555 2.42
1,219,536 Rakuten Group Inc 12,221,306 2.38
1,348,714 Senko Group Holdings Co Ltd 10,857,173 2.11
Total Japan 83,703,732 16.28
New Zealand (30 June 2021: 2.00%)
184,513 Mainfreight Ltd 11,862,149 2.31
Total New Zealand 11,862,149 2.31
South Korea (30 June 2021: 2.13%)
96,879 CJ Logistics Corp 10,268,563 2.00
Total South Korea 10,268,563 2.00

December 2021 Legal & General UCITS ETF Plc
L&G Ecommerce Logistics UCITS ETF
Schedule of Investments (continued)
As at 31 December 2021
213
Nominal Description
Value $
% of Net
Assets
Common Stock (30 June 2021: 99.68%) (continued)
Spain (30 June 2021: 2.24%)
584,021 Cia de Distribucion Integral Logista Holdings SA 11,642,423 2.26
Total Spain 11,642,423 2.26
Switzerland (30 June 2021: 2.58%)
36,472 Kuehne + Nagel International AG 11,784,469 2.29
Total Switzerland 11,784,469 2.29
Taiwan (30 June 2021: 3.72%)
3,732,490 Dimerco Express Corp 14,232,764 2.77
Total Taiwan 14,232,764 2.77
United Kingdom (30 June 2021: 6.00%)
525,717 Clipper Logistics Plc 5,169,537 1.01
550,707 Ocado Group Plc 12,516,287 2.43
Total United Kingdom 17,685,824 3.44
United States (30 June 2021: 30.79%)
3,735 Amazon.com Inc 12,453,760 2.42
67,059 Concentrix Corp 11,978,079 2.33
175,443 eBay Inc 11,666,959 2.27
105,589 Expeditors International of Washington Inc 14,179,547 2.76
55,117 FedEx Corp 14,255,461 2.77
78,780 Manhattan Associates Inc 12,249,502 2.38
136,674 Oracle Corp 11,919,339 2.32
147,329 Ryder System Inc 12,144,329 2.36
74,996 SPS Commerce Inc 10,675,681 2.08
115,360 TD SYNNEX Corp 13,192,570 2.57
67,582 United Parcel Service Inc - Class B 14,485,526 2.82
89,494 Walmart Inc 12,948,887 2.52

December 2021 Legal & General UCITS ETF Plc
L&G Ecommerce Logistics UCITS ETF
Schedule of Investments (continued)
As at 31 December 2021
214
Nominal Description
Value $
% of Net
Assets
Common Stock (30 June 2021: 99.68%) (continued)
United States (30 June 2021: 30.79%) (continued)
151,703 XPO Logistics Inc
11,746,363 2.28
Total United States
163,896,003 31.88
Total Common Stock
513,448,755 99.86
Total Investments
Value $
% of Net
Assets
Common Stock 513,448,755 99.86
Other Assets and Liabilities 722,269 0.14
Net Assets Attributable to Holders of Redeemable Participating Shares 514,171,024 100.00
Analysis of Total Assets
% of Total
Assets
Transferable securities admitted to an official stock exchange listing 99.82
Other assets 0.18
100.00
Analysis of Total Assets rather than Net Assets is required under Schedule 12 of the UCITS Regulations.

December 2021 Legal & General UCITS ETF Plc
L&G US Equity UCITS ETF
Schedule of Investments
As at 31 December 2021
215
Nominal Description
Value $
% of Net
Assets
Common Stock (30 June 2021: 99.90%)
Bermuda (30 June 2021: 0.18%)
3,051 Arch Capital Group Ltd 135,617 0.04
305 Everest Re Group Ltd 83,545 0.03
2,638 IHS Markit Ltd 350,643 0.11
Total Bermuda 569,805 0.18
Curacao (30 June 2021: 0.13%)
10,884 Schlumberger NV 325,976 0.10
Total Curacao 325,976 0.10
Guernsey (30 June 2021: 0.03%)
960 Amdocs Ltd 71,846 0.02
Total Guernsey 71,846 0.02
Ireland (30 June 2021: 2.07%)
4,898 Accenture Plc - Class A 2,030,466 0.64
1,644 Aon Plc 494,121 0.15
3,027 Eaton Corp Plc 523,126 0.16
1,688 Horizon Therapeutics Plc 181,899 0.06
461 Jazz Pharmaceuticals Plc 58,731 0.02
5,494 Johnson Controls International plc 446,717 0.14
3,946 Linde Plc 1,367,013 0.43
10,404 Medtronic Plc 1,076,294 0.34
1,648 Seagate Technology Holdings Plc 186,191 0.06
1,821 Trane Technologies Plc 367,897 0.11
997 Willis Towers Watson Plc 236,777 0.07
Total Ireland 6,969,232 2.18
Jersey (30 June 2021: 0.16%)
11,505 Amcor Plc 138,175 0.04
2,013 Aptiv Plc 332,044 0.11
Total Jersey 470,219 0.15

December 2021 Legal & General UCITS ETF Plc
L&G US Equity UCITS ETF
Schedule of Investments (continued)
As at 31 December 2021
216
Nominal Description
Value $
% of Net
Assets
Common Stock (30 June 2021: 99.90%) (continued)
Liberia (30 June 2021: 0.05%)
1,692 Royal Caribbean Cruises Ltd 130,115 0.04
Total Liberia 130,115 0.04
Luxembourg (30 June 2021: 0.09%)
899 Spotify Technology SA 210,393 0.07
Total Luxembourg 210,393 0.07
Netherlands (30 June 2021: 0.07%)
2,061 LyondellBasell Industries NV 190,086 0.06
Total Netherlands 190,086 0.06
Panama (30 June 2021: 0.06%)
6,682 Carnival Corp 134,442 0.04
Total Panama 134,442 0.04
Switzerland (30 June 2021: 0.35%)
2,869 Chubb Ltd 554,607 0.17
1,190 Garmin Ltd 162,042 0.05
2,506 TE Connectivity Ltd 404,318 0.13
Total Switzerland 1,120,967 0.35
United Kingdom (30 June 2021: 0.12%)
1,042 Atlassian Corp Plc 397,304 0.13
2,592 Royalty Pharma Plc - Class A 103,291 0.03
Total United Kingdom 500,595 0.16
United States (30 June 2021: 96.54%)
614 10X Genomics Inc (Units) 91,461 0.03
4,362 3M Co 774,822 0.24

December 2021 Legal & General UCITS ETF Plc
L&G US Equity UCITS ETF
Schedule of Investments (continued)
As at 31 December 2021
217
Nominal Description
Value $
% of Net
Assets
Common Stock (30 June 2021: 99.90%) (continued)
United States (30 June 2021: 96.54%) (continued)
1,058 A O Smith Corp 90,829 0.03
13,578 Abbott Laboratories 1,910,968 0.60
13,433 AbbVie Inc 1,818,828 0.57
346 ABIOMED Inc 124,273 0.04
5,858 Activision Blizzard Inc 389,733 0.12
3,660 Adobe Inc 2,075,440 0.65
496 Advance Auto Parts Inc 118,980 0.04
9,313 Advanced Micro Devices Inc 1,340,141 0.42
1,224 Affirm Holdings Inc 123,085 0.04
4,584 Aflac Inc 267,660 0.08
2,278 Agilent Technologies Inc 363,683 0.11
1,708 Air Products & Chemicals Inc 519,676 0.16
2,280 Airbnb Inc 379,597 0.12
1,251 Akamai Technologies Inc 146,417 0.05
913 Albemarle Corp 213,432 0.07
1,118 Alexandria Real Estate Equities Inc (REIT) 249,269 0.08
560 Align Technology Inc 368,021 0.12
99 Alleghany Corp 66,091 0.02
1,916 Alliant Energy Corp 117,777 0.04
2,188 Allstate Corp/The 257,418 0.08
2,639 Ally Financial Inc 125,643 0.04
896 Alnylam Pharmaceuticals Inc 151,944 0.05
2,102 Alphabet Inc 6,082,326 1.91
2,304 Alphabet Inc - Class A 6,674,780 2.09
1,725 Altice USA Inc 27,910 0.01
14,085 Altria Group Inc
667,488 0.21
3,353 Amazon.com Inc
11,180,042 3.50
1,981 Ameren Corp 176,329 0.06
3,890 American Electric Power Co Inc 346,093 0.11

December 2021 Legal & General UCITS ETF Plc
L&G US Equity UCITS ETF
Schedule of Investments (continued)
As at 31 December 2021
218
Nominal Description
Value $
% of Net
Assets
Common Stock (30 June 2021: 99.90%) (continued)
United States (30 June 2021: 96.54%) (continued)
4,599 American Express Co 752,396 0.24
6,749 American International Group Inc 383,748 0.12
3,512 American Tower Corp (REIT) 1,027,260 0.32
1,444 American Water Works Co Inc 272,714 0.09
897 Ameriprise Financial Inc 270,589 0.08
1,148 AmerisourceBergen Corp - Class A 152,558 0.05
1,725 AMETEK Inc 253,644 0.08
4,323 Amgen Inc 972,545 0.30
4,514 Amphenol Corp - Class A 394,794 0.12
4,105 Analog Devices Inc 721,536 0.23
11,695 Annaly Capital Management Inc (REIT) 91,455 0.03
663 ANSYS Inc 265,943 0.08
1,888 Anthem Inc 875,164 0.27
1,626 Apollo Global Management Inc - Class A 117,771 0.04
127,357 Apple Inc 22,614,782 7.09
6,943 Applied Materials Inc 1,092,550 0.34
697 AppLovin Corp - Class A 65,699 0.02
4,258 Archer-Daniels-Midland Co 287,798 0.09
1,759 Arista Networks Inc 252,856 0.08
1,570 Arthur J Gallagher & Co 266,382 0.08
54,749 AT&T Inc 1,346,825 0.42
992 Atmos Energy Corp 103,932 0.03
1,702 Autodesk Inc 478,585 0.15
3,257 Automatic Data Processing Inc 803,111 0.25
167 AutoZone Inc 350,097 0.11
1,074 AvalonBay Communities Inc (REIT) 271,282 0.09
535 Avangrid Inc 26,686 0.01
3,960 Avantor Inc 166,874 0.05
5,768 Baker Hughes Co - Class A 138,778 0.04

December 2021 Legal & General UCITS ETF Plc
L&G US Equity UCITS ETF
Schedule of Investments (continued)
As at 31 December 2021
219
Nominal Description
Value $
% of Net
Assets
Common Stock (30 June 2021: 99.90%) (continued)
United States (30 June 2021: 96.54%) (continued)
2,548 Ball Corp 245,296 0.08
57,052 Bank of America Corp 2,538,243 0.80
6,161 Bank of New York Mellon Corp/The 357,831 0.11
3,762 Baxter International Inc 322,930 0.10
2,177 Becton Dickinson and Co 547,472 0.17
9,804 Berkshire Hathaway Inc - Class B 2,931,396 0.92
1,656 Best Buy Co Inc 168,250 0.05
707 Bill.com Holdings Inc 176,149 0.06
1,139 Biogen Inc 273,269 0.09
1,392 BioMarin Pharmaceutical Inc 122,983 0.04
1,080 BlackRock Inc 988,805 0.31
5,320 Blackstone Inc 688,355 0.22
3,049 Block Inc 492,444 0.15
4,531 Boeing Co/The 912,181 0.29
316 Booking Holdings Inc 758,157 0.24
1,116 Boston Properties Inc (REIT) 128,541 0.04
10,793 Boston Scientific Corp 458,487 0.14
16,712 Bristol-Myers Squibb Co 1,041,993 0.33
3,042 Broadcom Inc 2,024,177 0.63
890 Broadridge Financial Solutions Inc 162,710 0.05
2,432 Brown-Forman Corp 177,196 0.06
202 Brown-Forman Corp 13,694 0.00
520 Burlington Stores Inc 151,585 0.05
2,057 Cadence Design Systems Inc 383,322 0.12
1,527 Caesars Entertainment Inc 142,820 0.04
1,522 Campbell Soup Co 66,146 0.02
3,443 Capital One Financial Corp 499,545 0.16
2,246 Cardinal Health Inc 115,647 0.04
1,275 CarMax Inc 166,043 0.05

December 2021 Legal & General UCITS ETF Plc
L&G US Equity UCITS ETF
Schedule of Investments (continued)
As at 31 December 2021
220
Nominal Description
Value $
% of Net
Assets
Common Stock (30 June 2021: 99.90%) (continued)
United States (30 June 2021: 96.54%) (continued)
6,727 Carrier Global Corp 364,872 0.11
627 Carvana Co - Class A 145,332 0.05
1,299 Catalent Inc 166,311 0.05
4,249 Caterpillar Inc 878,438 0.28
825 Cboe Global Markets Inc 107,580 0.03
2,495 CBRE Group Inc - Class A 270,732 0.08
1,003 CDW Corp/DE 205,394 0.06
884 Celanese Corp - Class A 148,565 0.05
4,452 Centene Corp 366,845 0.12
4,496 CenterPoint Energy Inc 125,483 0.04
2,255 Cerner Corp 209,422 0.07
989 CH Robinson Worldwide Inc 106,446 0.03
11,698 Charles Schwab Corp/The 983,802 0.31
909 Charter Communications Inc 592,641 0.19
1,840 Cheniere Energy Inc 186,613 0.06
14,658 Chevron Corp 1,720,116 0.54
635 Chewy Inc - Class A 37,446 0.01
201 Chipotle Mexican Grill Inc - Class A 351,398 0.11
1,792 Church & Dwight Co Inc 183,680 0.06
2,583 Cigna Corp 593,134 0.19
1,213 Cincinnati Financial Corp 138,197 0.04
655 Cintas Corp 290,276 0.09
29,998 Cisco Systems Inc/Delaware 1,900,973 0.60
15,574 Citigroup Inc 940,514 0.29
3,282 Citizens Financial Group Inc 155,075 0.05
956 Citrix Systems Inc 90,428 0.03
953 Clorox Co/The 166,165 0.05
1,817 Cloudflare Inc 238,936 0.07
2,694 CME Group Inc 615,471 0.19
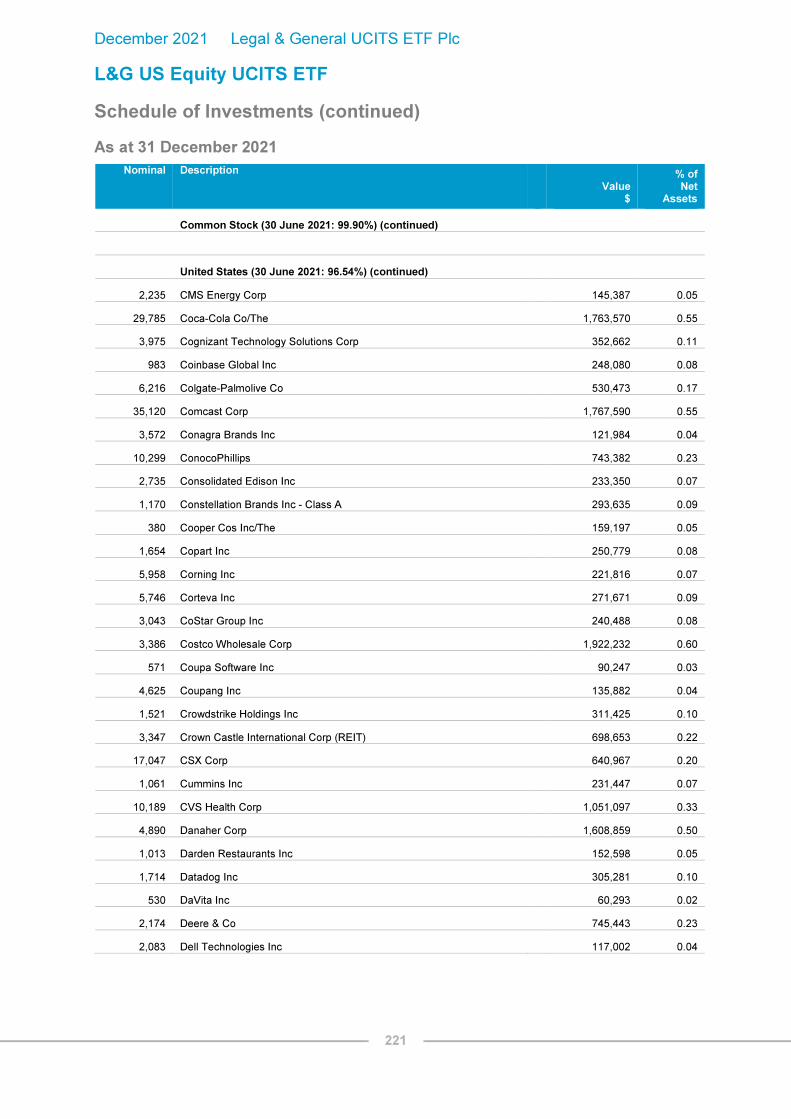
December 2021 Legal & General UCITS ETF Plc
L&G US Equity UCITS ETF
Schedule of Investments (continued)
As at 31 December 2021
221
Nominal Description
Value $
% of Net
Assets
Common Stock (30 June 2021: 99.90%) (continued)
United States (30 June 2021: 96.54%) (continued)
2,235 CMS Energy Corp 145,387 0.05
29,785 Coca-Cola Co/The 1,763,570 0.55
3,975 Cognizant Technology Solutions Corp 352,662 0.11
983 Coinbase Global Inc 248,080 0.08
6,216 Colgate-Palmolive Co 530,473 0.17
35,120 Comcast Corp 1,767,590 0.55
3,572 Conagra Brands Inc 121,984 0.04
10,299 ConocoPhillips 743,382 0.23
2,735 Consolidated Edison Inc 233,350 0.07
1,170 Constellation Brands Inc - Class A 293,635 0.09
380 Cooper Cos Inc/The 159,197 0.05
1,654 Copart Inc 250,779 0.08
5,958 Corning Inc 221,816 0.07
5,746 Corteva Inc 271,671 0.09
3,043 CoStar Group Inc 240,488 0.08
3,386 Costco Wholesale Corp 1,922,232 0.60
571 Coupa Software Inc 90,247 0.03
4,625 Coupang Inc 135,882 0.04
1,521 Crowdstrike Holdings Inc 311,425 0.10
3,347 Crown Castle International Corp (REIT) 698,653 0.22
17,047 CSX Corp 640,967 0.20
1,061 Cummins Inc 231,447 0.07
10,189 CVS Health Corp 1,051,097 0.33
4,890 Danaher Corp 1,608,859 0.50
1,013 Darden Restaurants Inc 152,598 0.05
1,714 Datadog Inc 305,281 0.10
530 DaVita Inc 60,293 0.02
2,174 Deere & Co 745,443 0.23
2,083 Dell Technologies Inc 117,002 0.04

December 2021 Legal & General UCITS ETF Plc
L&G US Equity UCITS ETF
Schedule of Investments (continued)
As at 31 December 2021
222
Nominal Description
Value $
% of Net
Assets
Common Stock (30 June 2021: 99.90%) (continued)
United States (30 June 2021: 96.54%) (continued)
4,895 Delta Air Lines Inc 191,297 0.06
1,682 DENTSPLY SIRONA Inc 93,839 0.03
5,049 Devon Energy Corp 222,408 0.07
733 Dexcom Inc 393,584 0.12
2,209 Digital Realty Trust Inc (REIT) 390,706 0.12
2,222 Discover Financial Services 256,774 0.08
2,491 Discovery Inc 57,044 0.02
1,238 Discovery Inc 29,143 0.01
1,961 DISH Network Corp - Class A 63,615 0.02
1,474 DocuSign Inc - Class A 224,505 0.07
1,763 Dollar General Corp 415,768 0.13
1,730 Dollar Tree Inc 243,100 0.08
6,305 Dominion Energy Inc 495,321 0.16
270 Domino's Pizza Inc 152,369 0.05
1,281 DoorDash Inc 190,741 0.06
1,114 Dover Corp 202,302 0.06
5,818 Dow Inc 329,997 0.10
2,621 DR Horton Inc 284,247 0.09
2,193 DraftKings Inc - Class A 60,242 0.02
2,255 Dropbox Inc 55,338 0.02
1,484 DTE Energy Co 177,397 0.06
5,841 Duke Energy Corp 612,721 0.19
2,890 Duke Realty Corp (REIT) 189,700 0.06
3,937 DuPont de Nemours Inc 318,031 0.10
1,065 Eastman Chemical Co 128,769 0.04
4,742 eBay Inc 315,343 0.10
1,903 Ecolab Inc 446,425 0.14
2,953 Edison International 201,542 0.06
4,801 Edwards Lifesciences Corp 621,970 0.19

December 2021 Legal & General UCITS ETF Plc
L&G US Equity UCITS ETF
Schedule of Investments (continued)
As at 31 December 2021
223
Nominal Description
Value $
% of Net
Assets
Common Stock (30 June 2021: 99.90%) (continued)
United States (30 June 2021: 96.54%) (continued)
3,454 Elanco Animal Health Inc 98,025 0.03
2,142 Electronic Arts Inc 282,530 0.09
6,532 Eli Lilly & Co 1,804,269 0.57
4,521 Emerson Electric Co 420,317 0.13
966 Enphase Energy Inc 176,720 0.06
1,577 Entergy Corp 177,649 0.06
4,531 EOG Resources Inc 402,489 0.13
429 EPAM Systems Inc 286,765 0.09
947 Equifax Inc 277,272 0.09
695 Equinix Inc (REIT) 587,859 0.18
2,786 Equity Residential (REIT) 252,133 0.08
502 Essex Property Trust Inc (REIT) 176,819 0.06
1,654 Estee Lauder Cos Inc/The - Class A 612,311 0.19
986 Etsy Inc 215,875 0.07
1,725 Evergy Inc 118,352 0.04
2,671 Eversource Energy 243,008 0.08
1,333 Exact Sciences Corp 103,747 0.03
7,491 Exelon Corp 432,680 0.14
1,085 Expedia Group Inc 196,081 0.06
1,309 Expeditors International of Washington Inc 175,786 0.06
1,030 Extra Space Storage Inc (REIT) 233,532 0.07
32,498 Exxon Mobil Corp 1,988,553 0.62
460 F5 Inc 112,567 0.04
4,440 Fastenal Co 284,426 0.09
1,899 FedEx Corp 491,157 0.15
2,141 Fidelity National Financial Inc 111,717 0.04
4,704 Fidelity National Information Services Inc 513,442 0.16
4,919 Fifth Third Bancorp 214,222 0.07
1,355 First Republic Bank/CA 279,821 0.09
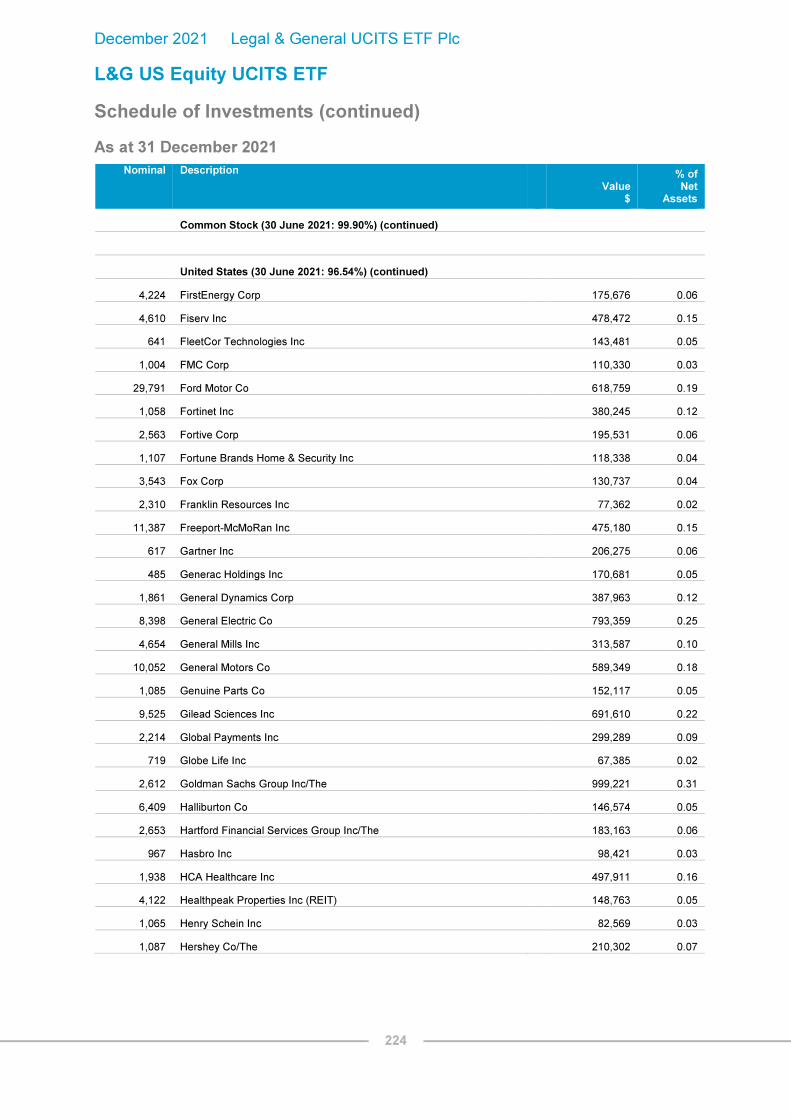
December 2021 Legal & General UCITS ETF Plc
L&G US Equity UCITS ETF
Schedule of Investments (continued)
As at 31 December 2021
224
Nominal Description
Value $
% of Net
Assets
Common Stock (30 June 2021: 99.90%) (continued)
United States (30 June 2021: 96.54%) (continued)
4,224 FirstEnergy Corp 175,676 0.06
4,610 Fiserv Inc 478,472 0.15
641 FleetCor Technologies Inc 143,481 0.05
1,004 FMC Corp 110,330 0.03
29,791 Ford Motor Co 618,759 0.19
1,058 Fortinet Inc 380,245 0.12
2,563 Fortive Corp 195,531 0.06
1,107 Fortune Brands Home & Security Inc 118,338 0.04
3,543 Fox Corp 130,737 0.04
2,310 Franklin Resources Inc 77,362 0.02
11,387 Freeport-McMoRan Inc 475,180 0.15
617 Gartner Inc 206,275 0.06
485 Generac Holdings Inc 170,681 0.05
1,861 General Dynamics Corp 387,963 0.12
8,398 General Electric Co 793,359 0.25
4,654 General Mills Inc 313,587 0.10
10,052 General Motors Co 589,349 0.18
1,085 Genuine Parts Co 152,117 0.05
9,525 Gilead Sciences Inc 691,610 0.22
2,214 Global Payments Inc 299,289 0.09
719 Globe Life Inc 67,385 0.02
2,612 Goldman Sachs Group Inc/The 999,221 0.31
6,409 Halliburton Co 146,574 0.05
2,653 Hartford Financial Services Group Inc/The 183,163 0.06
967 Hasbro Inc 98,421 0.03
1,938 HCA Healthcare Inc 497,911 0.16
4,122 Healthpeak Properties Inc (REIT) 148,763 0.05
1,065 Henry Schein Inc 82,569 0.03
1,087 Hershey Co/The 210,302 0.07

December 2021 Legal & General UCITS ETF Plc
L&G US Equity UCITS ETF
Schedule of Investments (continued)
As at 31 December 2021
225
Nominal Description
Value $
% of Net
Assets
Common Stock (30 June 2021: 99.90%) (continued)
United States (30 June 2021: 96.54%) (continued)
2,206 Hess Corp 163,310 0.05
10,105 Hewlett Packard Enterprise Co 159,356 0.05
2,126 Hilton Worldwide Holdings Inc 331,635 0.10
1,971 Hologic Inc 150,900 0.05
8,139 Home Depot Inc/The 3,377,766 1.06
5,225 Honeywell International Inc 1,089,465 0.34
2,113 Hormel Foods Corp 103,136 0.03
5,516 Host Hotels & Resorts Inc (REIT) 95,923 0.03
8,887 HP Inc 334,773 0.10
345 HubSpot Inc 227,407 0.07
962 Humana Inc 446,233 0.14
11,228 Huntington Bancshares Inc/OH 173,136 0.05
591 IAC/InterActiveCorp 77,250 0.02
640 IDEXX Laboratories Inc 421,414 0.13
2,116 Illinois Tool Works Inc 522,229 0.16
1,190 Illumina Inc 452,724 0.14
1,411 Incyte Corp 103,567 0.03
3,291 Ingersoll Rand Inc 203,614 0.06
31,265 Intel Corp 1,610,147 0.50
596 Interactive Brokers Group Inc 47,334 0.01
4,265 Intercontinental Exchange Inc 583,324 0.18
6,921 International Business Machines Corp 925,061 0.29
1,940 International Flavors & Fragrances Inc 292,261 0.09
2,987 International Paper Co 140,329 0.04
2,046 Intuit Inc 1,316,028 0.41
2,734 Intuitive Surgical Inc 982,326 0.31
4,392 Invitation Homes Inc (REIT) 199,133 0.06
1,456 IQVIA Holdings Inc 410,796 0.13
2,247 Iron Mountain Inc (REIT) 117,586 0.04

December 2021 Legal & General UCITS ETF Plc
L&G US Equity UCITS ETF
Schedule of Investments (continued)
As at 31 December 2021
226
Nominal Description
Value $
% of Net
Assets
Common Stock (30 June 2021: 99.90%) (continued)
United States (30 June 2021: 96.54%) (continued)
790 J M Smucker Co/The 107,298 0.03
657 JB Hunt Transport Services Inc 134,291 0.04
20,236 Johnson & Johnson 3,461,773 1.08
22,815 JPMorgan Chase & Co 3,612,755 1.13
1,921 Kellogg Co 123,751 0.04
6,172 Keurig Dr Pepper Inc 227,500 0.07
7,417 KeyCorp 171,555 0.05
1,414 Keysight Technologies Inc 292,005 0.09
2,570 Kimberly-Clark Corp 367,304 0.12
15,395 Kinder Morgan Inc 244,165 0.08
4,353 KKR & Co Inc 324,299 0.10
1,169 KLA Corp 502,799 0.16
5,028 Kraft Heinz Co/The 180,505 0.06
5,040 Kroger Co/The 228,110 0.07
1,391 Kyndryl Holdings Inc 25,177 0.01
1,535 L3Harris Technologies Inc 327,323 0.10
718 Laboratory Corp of America Holdings 225,603 0.07
1,083 Lam Research Corp 778,839 0.24
3,241 Las Vegas Sands Corp 121,991 0.04
1,095 Leidos Holdings Inc 97,346 0.03
2,058 Lennar Corp 239,057 0.07
114 Lennar Corp 10,901 0.00
1,243 Liberty Broadband Corp 200,247 0.06
491 Liberty Media Corp-Liberty SiriusXM 24,967 0.01
1,300 Liberty Media Corp-Liberty SiriusXM 66,105 0.02
1,086 Live Nation Entertainment Inc 129,983 0.04
2,038 LKQ Corp 122,341 0.04
1,796 Lockheed Martin Corp 638,316 0.20
1,764 Loews Corp 101,889 0.03

December 2021 Legal & General UCITS ETF Plc
L&G US Equity UCITS ETF
Schedule of Investments (continued)
As at 31 December 2021
227
Nominal Description
Value $
% of Net
Assets
Common Stock (30 June 2021: 99.90%) (continued)
United States (30 June 2021: 96.54%) (continued)
5,332 Lowe's Cos Inc 1,378,215 0.43
4,019 Lucid Group Inc 152,923 0.05
906 Lululemon Athletica Inc 354,654 0.11
8,503 Lumen Technologies Inc 106,713 0.03
2,060 Lyft Inc 88,024 0.03
988 M&T Bank Corp 151,737 0.05
4,703 Marathon Petroleum Corp 300,945 0.09
104 Markel Corp 128,336 0.04
2,043 Marriott International Inc/MD 337,585 0.11
3,816 Marsh & McLennan Cos Inc 663,297 0.21
484 Martin Marietta Materials Inc 213,212 0.07
6,365 Marvell Technology Inc 556,874 0.17
2,006 Masco Corp 140,861 0.04
6,700 Mastercard Inc 2,407,444 0.75
2,009 Match Group Inc 265,690 0.08
1,858 McCormick & Co Inc/MD 179,501 0.06
5,735 McDonald's Corp 1,537,381 0.48
1,192 McKesson Corp 296,295 0.09
361 MercadoLibre Inc 486,772 0.15
19,423 Merck & Co Inc 1,488,579 0.47
18,300 Meta Platforms Inc - Class A 6,155,205 1.93
5,272 MetLife Inc 329,447 0.10
172 Mettler-Toledo International Inc 291,920 0.09
3,199 MGM Resorts International 143,571 0.05
4,190 Microchip Technology Inc 364,781 0.11
8,664 Micron Technology Inc 807,052 0.25
57,114 Microsoft Corp 19,208,580 6.02
878 Mid-America Apartment Communities Inc (REIT) 201,448 0.06
2,661 Moderna Inc 675,841 0.21

December 2021 Legal & General UCITS ETF Plc
L&G US Equity UCITS ETF
Schedule of Investments (continued)
As at 31 December 2021
228
Nominal Description
Value $
% of Net
Assets
Common Stock (30 June 2021: 99.90%) (continued)
United States (30 June 2021: 96.54%) (continued)
458 Mohawk Industries Inc 83,438 0.03
1,475 Molson Coors Beverage Co - Class B 68,366 0.02
10,384 Mondelez International Inc 688,563 0.22
472 MongoDB Inc - Class A 249,853 0.08
2,909 Monster Beverage Corp 279,380 0.09
1,228 Moody's Corp 479,632 0.15
11,138 Morgan Stanley 1,093,306 0.34
1,314 Motorola Solutions Inc 357,014 0.11
611 MSCI Inc - Class A 374,354 0.12
857 Nasdaq Inc 179,979 0.06
1,713 NetApp Inc 157,579 0.05
3,359 Netflix Inc 2,023,596 0.63
3,071 Newell Brands Inc 67,071 0.02
6,214 Newmont Corp 385,392 0.12
15,113 NextEra Energy Inc 1,410,950 0.44
9,733 NIKE Inc 1,622,199 0.51
2,824 NiSource Inc 77,971 0.02
1,893 Norfolk Southern Corp 563,565 0.18
1,520 Northern Trust Corp 181,807 0.06
1,095 Northrop Grumman Corp 423,842 0.13
4,314 NortonLifeLock Inc 112,078 0.04
2,277 Nucor Corp 259,920 0.08
18,492 NVIDIA Corp 5,438,682 1.70
27 NVR Inc 159,539 0.05
6,808 Occidental Petroleum Corp 197,364 0.06
1,117 Okta Inc 250,398 0.08
807 Old Dominion Freight Line Inc 289,213 0.09
1,596 Omnicom Group Inc 116,939 0.04
3,444 ONEOK Inc 202,369 0.06
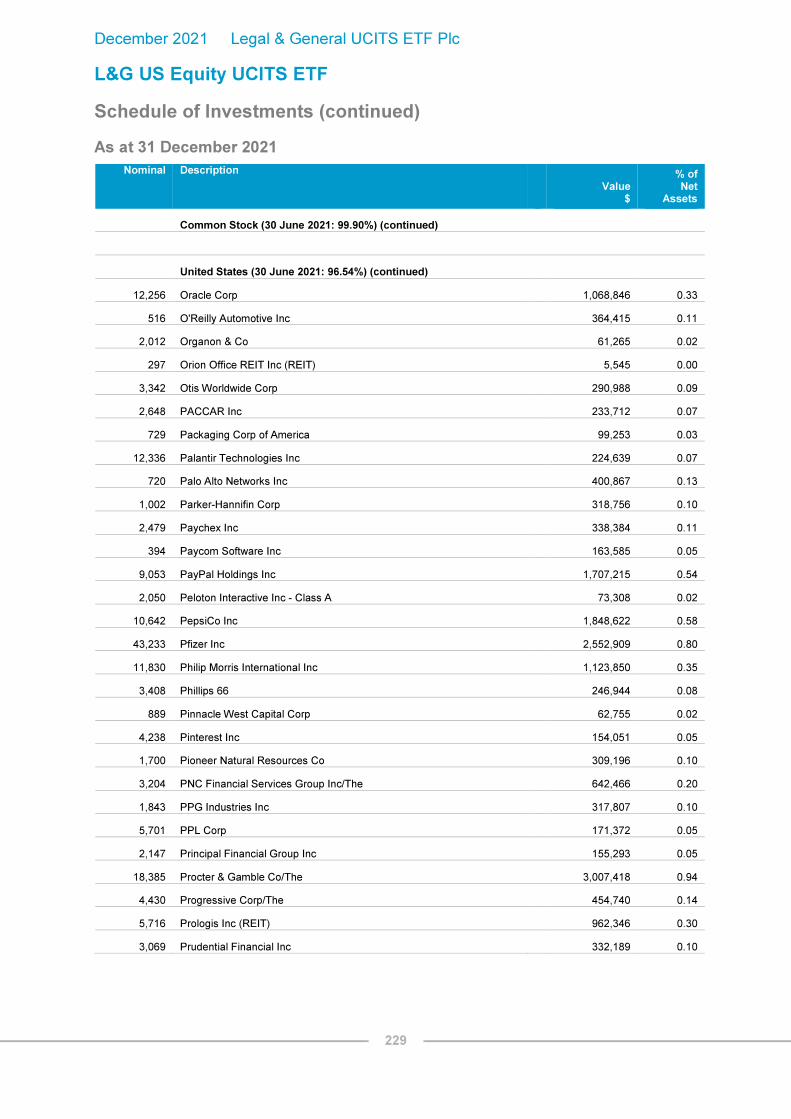
December 2021 Legal & General UCITS ETF Plc
L&G US Equity UCITS ETF
Schedule of Investments (continued)
As at 31 December 2021
229
Nominal Description
Value $
% of Net
Assets
Common Stock (30 June 2021: 99.90%) (continued)
United States (30 June 2021: 96.54%) (continued)
12,256 Oracle Corp 1,068,846 0.33
516 O'Reilly Automotive Inc 364,415 0.11
2,012 Organon & Co 61,265 0.02
297 Orion Office REIT Inc (REIT) 5,545 0.00
3,342 Otis Worldwide Corp 290,988 0.09
2,648 PACCAR Inc 233,712 0.07
729 Packaging Corp of America 99,253 0.03
12,336 Palantir Technologies Inc 224,639 0.07
720 Palo Alto Networks Inc 400,867 0.13
1,002 Parker-Hannifin Corp 318,756 0.10
2,479 Paychex Inc 338,384 0.11
394 Paycom Software Inc 163,585 0.05
9,053 PayPal Holdings Inc 1,707,215 0.54
2,050 Peloton Interactive Inc - Class A 73,308 0.02
10,642 PepsiCo Inc 1,848,622 0.58
43,233 Pfizer Inc 2,552,909 0.80
11,830 Philip Morris International Inc 1,123,850 0.35
3,408 Phillips 66 246,944 0.08
889 Pinnacle West Capital Corp 62,755 0.02
4,238 Pinterest Inc 154,051 0.05
1,700 Pioneer Natural Resources Co 309,196 0.10
3,204 PNC Financial Services Group Inc/The 642,466 0.20
1,843 PPG Industries Inc 317,807 0.10
5,701 PPL Corp 171,372 0.05
2,147 Principal Financial Group Inc 155,293 0.05
18,385 Procter & Gamble Co/The 3,007,418 0.94
4,430 Progressive Corp/The 454,740 0.14
5,716 Prologis Inc (REIT) 962,346 0.30
3,069 Prudential Financial Inc 332,189 0.10

December 2021 Legal & General UCITS ETF Plc
L&G US Equity UCITS ETF
Schedule of Investments (continued)
As at 31 December 2021
230
Nominal Description
Value $
% of Net
Assets
Common Stock (30 June 2021: 99.90%) (continued)
United States (30 June 2021: 96.54%) (continued)
3,953 Public Service Enterprise Group Inc 263,784 0.08
1,161 Public Storage (REIT) 434,864 0.14
2,039 PulteGroup Inc 116,549 0.04
859 Qorvo Inc 134,339 0.04
8,686 QUALCOMM Inc 1,588,409 0.50
481 Qualtrics International Inc - Class A 17,027 0.01
887 Quest Diagnostics Inc 153,460 0.05
1,413 Raymond James Financial Inc 141,865 0.04
11,696 Raytheon Technologies Corp 1,006,558 0.32
2,970 Realty Income Corp (REIT) 212,622 0.07
776 Regeneron Pharmaceuticals Inc 490,060 0.15
7,387 Regions Financial Corp 161,037 0.05
1,615 Republic Services Inc - Class A 225,212 0.07
1,123 ResMed Inc 292,519 0.09
621 RingCentral Inc - Class A 116,344 0.04
555 Robinhood Markets Inc 9,857 0.00
2,037 ROBLOX Corp 210,137 0.07
945 Rocket Cos Inc 13,230 0.00
895 Rockwell Automation Inc 312,221 0.10
898 Roku Inc 204,924 0.06
1,884 Rollins Inc 64,452 0.02
808 Roper Technologies Inc 397,423 0.12
2,619 Ross Stores Inc 299,299 0.09
1,844 S&P Global Inc 870,239 0.27
7,299 salesforce.com Inc 1,854,895 0.58
845 SBA Communications Corp (REIT) - Class A 328,722 0.10
1,028 Seagen Inc 158,929 0.05
953 SEI Investments Co 58,076 0.02
2,481 Sempra Energy 328,187 0.10

December 2021 Legal & General UCITS ETF Plc
L&G US Equity UCITS ETF
Schedule of Investments (continued)
As at 31 December 2021
231
Nominal Description
Value $
% of Net
Assets
Common Stock (30 June 2021: 99.90%) (continued)
United States (30 June 2021: 96.54%) (continued)
1,524 ServiceNow Inc 989,244 0.31
1,839 Sherwin-Williams Co/The 647,622 0.20
2,547 Simon Property Group Inc (REIT) 406,934 0.13
6,420 Sirius XM Holdings Inc 40,767 0.01
1,278 Skyworks Solutions Inc 198,269 0.06
9,104 Snap Inc 428,161 0.13
407 Snap-on Inc 87,660 0.03
2,030 Snowflake Inc 687,662 0.22
7,929 Southern Co/The (Units) 543,771 0.17
4,547 Southwest Airlines Co 194,793 0.06
1,199 Splunk Inc 138,748 0.04
1,660 SS&C Technologies Holdings Inc 136,087 0.04
1,261 Stanley Black & Decker Inc 237,850 0.07
9,059 Starbucks Corp 1,059,631 0.33
2,732 State Street Corp 254,076 0.08
2,567 Stryker Corp 686,467 0.22
436 SVB Financial Group 295,713 0.09
4,256 Synchrony Financial 197,436 0.06
1,141 Synopsys Inc 420,458 0.13
3,700 Sysco Corp 290,635 0.09
1,741 T Rowe Price Group Inc 342,350 0.11
884 Take-Two Interactive Software Inc 157,104 0.05
3,770 Target Corp 872,529 0.27
1,083 Teladoc Health Inc 99,441 0.03
363 Teleflex Inc 119,238 0.04
1,297 Teradyne Inc 212,098 0.07
6,278 Tesla Inc 6,634,465 2.08
7,093 Texas Instruments Inc 1,336,818 0.42
1,769 Textron Inc 136,567 0.04

December 2021 Legal & General UCITS ETF Plc
L&G US Equity UCITS ETF
Schedule of Investments (continued)
As at 31 December 2021
232
Nominal Description
Value $
% of Net
Assets
Common Stock (30 June 2021: 99.90%) (continued)
United States (30 June 2021: 96.54%) (continued)
3,033 Thermo Fisher Scientific Inc 2,023,739 0.63
8,617 TJX Cos Inc/The 654,203 0.21
4,445 T-Mobile US Inc 515,531 0.16
898 Tractor Supply Co 214,263 0.07
3,345 Trade Desk Inc/The - Class A 306,536 0.10
406 TransDigm Group Inc 258,330 0.08
1,480 TransUnion 175,498 0.06
1,859 Travelers Cos Inc/The 290,803 0.09
1,944 Trimble Inc 169,497 0.05
10,234 Truist Financial Corp 599,201 0.19
1,251 Twilio Inc - Class A 329,438 0.10
6,045 Twitter Inc 261,265 0.08
2,240 Tyson Foods Inc - Class A 195,238 0.06
10,966 Uber Technologies Inc 459,804 0.14
2,198 UDR Inc (REIT) 131,858 0.04
1,773 UiPath Inc 76,469 0.02
416 Ulta Beauty Inc 171,533 0.05
5,001 Union Pacific Corp 1,259,902 0.39
2,497 United Airlines Holdings Inc 109,319 0.03
5,626 United Parcel Service Inc - Class B 1,205,877 0.38
571 United Rentals Inc 189,738 0.06
7,248 UnitedHealth Group Inc 3,639,511 1.14
1,179 Unity Software Inc 168,585 0.05
607 Universal Health Services Inc 78,704 0.02
383 Upstart Holdings Inc 57,948 0.02
10,052 US Bancorp 564,621 0.18
305 Vail Resorts Inc 100,009 0.03
3,186 Valero Energy Corp 239,300 0.08
1,062 Veeva Systems Inc - Class A 271,320 0.09

December 2021 Legal & General UCITS ETF Plc
L&G US Equity UCITS ETF
Schedule of Investments (continued)
As at 31 December 2021
233
Nominal Description
Value $
% of Net
Assets
Common Stock (30 June 2021: 99.90%) (continued)
United States (30 June 2021: 96.54%) (continued)
2,910 Ventas Inc (REIT) 148,759 0.05
774 VeriSign Inc 196,457 0.06
1,242 Verisk Analytics Inc - Class A 284,083 0.09
30,389 Verizon Communications Inc 1,579,012 0.49
2,007 Vertex Pharmaceuticals Inc 440,737 0.14
2,771 VF Corp 202,893 0.06
227 ViacomCBS Inc 7,575 0.00
4,293 ViacomCBS Inc - Class B 129,563 0.04
9,503 Viatris Inc 128,576 0.04
12,959 Visa Inc - Class A 2,808,345 0.88
1,579 VMware Inc 182,975 0.06
913 Vulcan Materials Co 189,521 0.06
991 W R Berkley Corp 81,648 0.03
5,544 Walgreens Boots Alliance Inc 289,175 0.09
11,178 Walmart Inc 1,617,345 0.51
14,009 Walt Disney Co/The 2,169,854 0.68
772 Warner Music Group Corp - Class A 33,335 0.01
3,269 Waste Management Inc 545,596 0.17
479 Waters Corp 178,475 0.06
578 Wayfair Inc 109,803 0.03
2,473 WEC Energy Group Inc 240,054 0.08
3,270 Welltower Inc (REIT) 280,468 0.09
572 West Pharmaceutical Services Inc 268,274 0.08
2,348 Western Digital Corp 153,113 0.05
3,129 Western Union Co/The 55,821 0.02
1,384 Westinghouse Air Brake Technologies Corp 127,480 0.04
2,102 Westrock Co 93,245 0.03
5,823 Weyerhaeuser Co (REIT) 239,791 0.08
497 Whirlpool Corp 116,626 0.04

December 2021 Legal & General UCITS ETF Plc
L&G US Equity UCITS ETF
Schedule of Investments (continued)
As at 31 December 2021
234
Nominal Description
Value $
% of Net
Assets
Common Stock (30 June 2021: 99.90%) (continued)
United States (30 June 2021: 96.54%) (continued)
9,226 Williams Cos Inc/The 240,245 0.08
1,451 Workday Inc - Class A 396,384 0.12
1,399 WP Carey Inc (REIT) 114,788 0.04
340 WW Grainger Inc 176,202 0.06
833 Wynn Resorts Ltd 70,838 0.02
4,188 Xcel Energy Inc 283,528 0.09
1,918 Xilinx Inc 406,674 0.13
1,397 Xylem Inc/NY 167,528 0.05
3,004 Yum China Holdings Inc 149,719 0.05
2,207 Yum! Brands Inc 306,464 0.10
417 Zebra Technologies Corp 248,198 0.08
1,363 Zillow Group Inc 87,028 0.03
241 Zillow Group Inc - Class A 14,995 0.00
1,620 Zimmer Biomet Holdings Inc 205,805 0.06
3,599 Zoetis Inc 878,264 0.28
1,560 Zoom Video Communications Inc - Class A 286,900 0.09
1,768 ZoomInfo Technologies Inc - Class A 113,506 0.04
601 Zscaler Inc 193,119 0.06
Total United States 307,707,958 96.41
Total Common Stock 318,401,634 99.76

December 2021 Legal & General UCITS ETF Plc
L&G US Equity UCITS ETF
Schedule of Investments (continued)
As at 31 December 2021
235
Total Investments
Value $
% of Net
Assets
Common Stock 318,401,634 99.76
Other Assets and Liabilities 753,220 0.24
Net Assets Attributable to Holders of Redeemable Participating Shares 319,154,854 100.00
Analysis of Total Assets
% of Total
Assets
Transferable securities admitted to an official stock exchange listing 99.76
Other assets
0.24
100.00
Analysis of Total Assets rather than Net Assets is required under Schedule 12 of the UCITS Regulations.

December 2021 Legal & General UCITS ETF Plc
L&G UK Equity UCITS ETF
Schedule of Investments
As at 31 December 2021
236
Nominal Description
Value
£
% of Net
Assets
Common Stock (30 June 2021: 99.64%)
Cayman Islands (30 June 2021: 0.48%)
2,744 Farfetch Ltd 67,726 0.36
Total Cayman Islands 67,726 0.36
Ireland (30 June 2021: 0.29%)
803 DCC Plc 48,581 0.26
Total Ireland 48,581 0.26
Isle of Man (30 June 2021: 0.56%)
5,802 Entain Plc 97,648 0.52
Total Isle of Man 97,648 0.52
Jersey (30 June 2021: 5.63%)
8,909 Experian Plc 323,575 1.71
2,138 Ferguson Plc 280,185 1.48
100,392 Glencore Plc 376,420 1.99
9,744 WPP Plc 109,084 0.58
Total Jersey 1,089,264 5.76
Luxembourg (30 June 2021: –%)
6,781 B&M European Value Retail SA 42,992 0.23
Total Luxembourg 42,992 0.23
Netherlands (30 June 2021: 0.64%)
9,960 CNH Industrial NV 142,746 0.75
Total Netherlands 142,746 0.75
Spain (30 June 2021: 0.37%)
35,213 International Consolidated Airlines Group SA 50,171 0.27
Total Spain 50,171 0.27

December 2021 Legal & General UCITS ETF Plc
L&G UK Equity UCITS ETF
Schedule of Investments (continued)
As at 31 December 2021
237
Nominal Description
Value
£
% of Net
Assets
Common Stock (30 June 2021: 99.64%) (continued)
United Kingdom (30 June 2021: 91.66%)
9,465 3i Group Plc 137,148 0.73
20,366 abrdn plc 49,062 0.26
2,487 Admiral Group Plc 78,515 0.42
3,107 Allfunds Group Plc 45,119 0.24
11,328 Anglo American Plc 341,652 1.81
3,649 Antofagasta Plc 48,842 0.26
4,332 Ashtead Group Plc 257,407 1.36
606 ASOS Plc 14,489 0.08
3,306 Associated British Foods Plc 66,384 0.35
14,167 AstraZeneca Plc 1,229,412 6.51
8,194 Auto Trader Group Plc '144A' 60,636 0.32
7,317 Avast Plc '144A' 44,429 0.24
1,029 AVEVA Group Plc 35,027 0.19
38,830 Aviva Plc 159,358 0.84
31,442 BAE Systems Plc 172,868 0.91
164,883 Barclays Plc 308,331 1.63
10,964 Barratt Developments Plc 82,011 0.43
1,149 Berkeley Group Holdings Plc 54,865 0.29
20,030 BHP Group Plc 440,560 2.33
170,917 BP Plc 564,881 2.99
21,921 British American Tobacco Plc 599,211 3.17
7,143 British Land Co Plc/The (REIT) 37,929 0.20
72,444 BT Group Plc 122,829 0.65
3,374 Bunzl Plc 97,340 0.52
3,839 Burberry Group Plc 69,774 0.37
1,840 Carnival Plc 25,458 0.13
1,288 Coca-Cola Europacific Partners Plc 53,186 0.28
17,440 Compass Group Plc 287,934 1.52
13,508 ConvaTec Group Plc '144A' 26,091 0.14
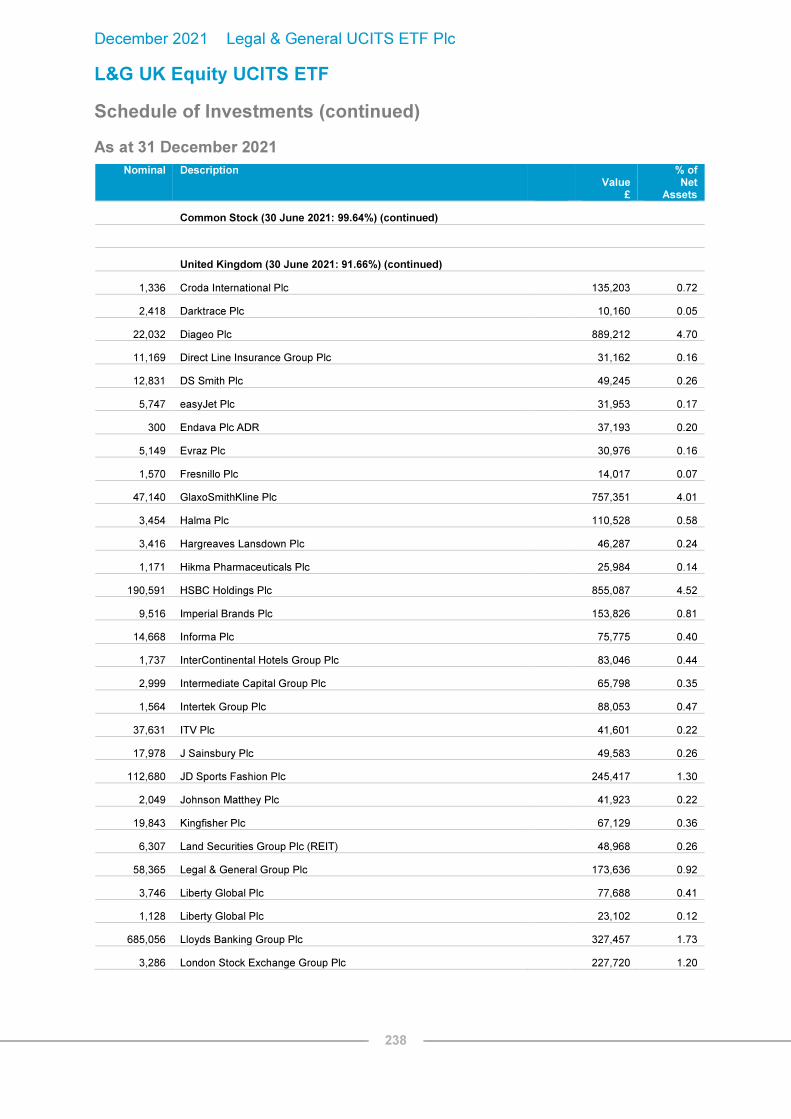
December 2021 Legal & General UCITS ETF Plc
L&G UK Equity UCITS ETF
Schedule of Investments (continued)
As at 31 December 2021
238
Nominal Description
Value
£
% of Net
Assets
Common Stock (30 June 2021: 99.64%) (continued)
United Kingdom (30 June 2021: 91.66%) (continued)
1,336 Croda International Plc 135,203 0.72
2,418 Darktrace Plc 10,160 0.05
22,032 Diageo Plc 889,212 4.70
11,169 Direct Line Insurance Group Plc 31,162 0.16
12,831 DS Smith Plc 49,245 0.26
5,747 easyJet Plc 31,953 0.17
300 Endava Plc ADR 37,193 0.20
5,149 Evraz Plc 30,976 0.16
1,570 Fresnillo Plc 14,017 0.07
47,140 GlaxoSmithKline Plc 757,351 4.01
3,454 Halma Plc 110,528 0.58
3,416 Hargreaves Lansdown Plc 46,287 0.24
1,171 Hikma Pharmaceuticals Plc 25,984 0.14
190,591 HSBC Holdings Plc 855,087 4.52
9,516 Imperial Brands Plc 153,826 0.81
14,668 Informa Plc 75,775 0.40
1,737 InterContinental Hotels Group Plc 83,046 0.44
2,999 Intermediate Capital Group Plc 65,798 0.35
1,564 Intertek Group Plc 88,053 0.47
37,631 ITV Plc 41,601 0.22
17,978 J Sainsbury Plc 49,583 0.26
112,680 JD Sports Fashion Plc 245,417 1.30
2,049 Johnson Matthey Plc 41,923 0.22
19,843 Kingfisher Plc 67,129 0.36
6,307 Land Securities Group Plc (REIT) 48,968 0.26
58,365 Legal & General Group Plc 173,636 0.92
3,746 Liberty Global Plc 77,688 0.41
1,128 Liberty Global Plc 23,102 0.12
685,056 Lloyds Banking Group Plc 327,457 1.73
3,286 London Stock Exchange Group Plc 227,720 1.20

December 2021 Legal & General UCITS ETF Plc
L&G UK Equity UCITS ETF
Schedule of Investments (continued)
As at 31 December 2021
239
Nominal Description
Value
£
% of Net
Assets
Common Stock (30 June 2021: 99.64%) (continued)
United Kingdom (30 June 2021: 91.66%) (continued)
23,092 M&G Plc 46,069 0.24
6,589 Meggitt Plc 48,627 0.26
40,154 Melrose Industries Plc 64,206 0.34
4,432 Mondi Plc 80,928 0.43
34,075 National Grid Plc 361,127 1.91
51,647 NatWest Group Plc 116,567 0.62
1,122 Next Plc 91,443 0.48
658 NMC Health Plc* – –
5,014 Ocado Group Plc 84,135 0.45
7,277 Pearson Plc 44,623 0.24
3,224 Persimmon Plc 92,077 0.49
6,233 Phoenix Group Holdings Plc 40,714 0.22
25,659 Prudential Plc 327,024 1.73
6,677 Reckitt Benckiser Group Plc 423,455 2.24
18,643 RELX Plc 447,805 2.37
17,021 Rentokil Initial Plc 99,403 0.53
8,273 Rightmove Plc 65,770 0.35
10,337 Rio Tinto Plc 505,686 2.68
76,774 Rolls-Royce Holdings Plc 94,340 0.50
43,220 Royal Dutch Shell Plc 700,942 3.71
30,098 Royal Dutch Shell Plc 488,310 2.58
9,920 Sage Group Plc/The 84,578 0.45
1,086 Schroders Plc 38,662 0.20
11,983 Segro Plc (REIT) 172,136 0.91
2,362 Severn Trent Plc 69,608 0.37
8,697 Smith & Nephew Plc 112,496 0.60
3,978 Smiths Group Plc 62,833 0.33
675 Spirax-Sarco Engineering Plc 108,338 0.57
10,080 SSE Plc 166,219 0.88
4,858 St James's Place Plc 81,784 0.43

December 2021 Legal & General UCITS ETF Plc
L&G UK Equity UCITS ETF
Schedule of Investments (continued)
As at 31 December 2021
240
Nominal Description
Value
£
% of Net
Assets
Common Stock (30 June 2021: 99.64%) (continued)
United Kingdom (30 June 2021: 91.66%) (continued)
30,739 Standard Chartered Plc 137,834 0.73
37,444 Taylor Wimpey Plc 65,714 0.35
69,552 Tesco Plc 201,631 1.07
6,624 THG Plc - Class B 15,182 0.08
23,970 Unilever Plc 945,736 5.00
6,571 United Utilities Group Plc 71,558 0.38
267,821 Vodafone Group Plc 300,656 1.59
2,424 Weir Group Plc/The 41,487 0.22
1,734 Whitbread Plc 51,933 0.27
3,363 Wise Plc - Class A 25,444 0.13
Total United Kingdom 17,302,908 91.55
Total Common Stock 18,842,036 99.70
Total Investments
Common Stock 18,842,036 99.70
Other Assets and Liabilities 57,459 0.30
Net Assets Attributable to Holders of Redeemable Participating Shares 18,899,495 100.00
Analysis of Total Assets
% of Total
Assets
Transferable securities admitted to an official stock exchange listing 99.69
Other assets
0.31
100.00
Analysis of Total Assets rather than Net Assets is required under Schedule 12 of the UCITS Regulations.
*Security is valued at zero.

December 2021 Legal & General UCITS ETF Plc
L&G Japan Equity UCITS ETF
Schedule of Investments
As at 31 December 2021
241
Nominal Description
Value $
% of Net
Assets
Common Stock (30 June 2021: 99.36%)
Japan (30 June 2021: 99.36%)
2,100 ABC-Mart Inc 89,905 0.04
18,600 Acom Co Ltd 53,464 0.02
11,600 Advantest Corp 1,097,998 0.43
40,300 Aeon Co Ltd 948,050 0.37
8,300 AEON Financial Service Co Ltd 89,519 0.04
4,800 Aeon Mall Co Ltd 68,402 0.03
11,600 AGC Inc 553,028 0.22
11,700 Air Water Inc 180,445 0.07
9,000 Aisin Corp 344,666 0.14
32,600 Ajinomoto Co Inc 989,989 0.39
10,600 Alfresa Holdings Corp 141,112 0.06
22,100 Amada Co Ltd 218,591 0.09
26,000 ANA Holdings Inc 542,894 0.21
26,500 Asahi Group Holdings Ltd 1,029,577 0.41
12,500 Asahi Intecc Co Ltd 268,225 0.11
78,900 Asahi Kasei Corp 740,662 0.29
111,800 Astellas Pharma Inc 1,816,004 0.72
8,722 Azbil Corp 396,885 0.16
11,800 Bandai Namco Holdings Inc 921,620 0.36
810 BayCurrent Consulting Inc 313,013 0.12
4,679 Benefit One Inc 200,520 0.08
4,300 Benesse Holdings Inc 84,353 0.03
34,900 Bridgestone Corp 1,499,892 0.59
15,000 Brother Industries Ltd 288,003 0.11
4,700 Calbee Inc 108,934 0.04
62,000 Canon Inc 1,508,072 0.60
9,978 Capcom Co Ltd 234,644 0.09
12,900 Casio Computer Co Ltd 165,682 0.07

December 2021 Legal & General UCITS ETF Plc
L&G Japan Equity UCITS ETF
Schedule of Investments (continued)
As at 31 December 2021
242
Nominal Description
Value $
% of Net
Assets
Common Stock (30 June 2021: 99.36%) (continued)
Japan (30 June 2021: 99.36%) (continued)
10,300 Central Japan Railway Co 1,372,528 0.54
37,900 Chiba Bank Ltd/The 216,891 0.09
42,400 Chubu Electric Power Co Inc 446,258 0.18
38,300 Chugai Pharmaceutical Co Ltd 1,242,243 0.49
19,900 Chugoku Electric Power Co Inc/The 160,887 0.06
7,500 Coca-Cola Bottlers Japan Holdings Inc 85,971 0.03
58,900 Concordia Financial Group Ltd 213,800 0.08
1,100 Cosmos Pharmaceutical Corp 161,721 0.06
25,200 CyberAgent Inc 418,851 0.17
13,700 Dai Nippon Printing Co Ltd 344,180 0.14
14,200 Daicel Corp 98,033 0.04
6,900 Daifuku Co Ltd 563,241 0.22
62,400 Dai-ichi Life Holdings Inc 1,260,138 0.50
114,700 Daiichi Sankyo Co Ltd 2,913,443 1.15
16,000 Daikin Industries Ltd 3,625,027 1.43
3,800 Daito Trust Construction Co Ltd 434,597 0.17
36,800 Daiwa House Industry Co Ltd 1,057,135 0.42
130 Daiwa House REIT Investment Corp (REIT) 393,426 0.16
87,800 Daiwa Securities Group Inc 494,602 0.20
26,300 Denso Corp 2,176,307 0.86
12,900 Dentsu Group Inc 459,294 0.18
4,200 DIC Corp 105,625 0.04
1,700 Disco Corp 518,909 0.20
19,800 East Japan Railway Co 1,216,147 0.48
5,700 Ebara Corp 316,295 0.12
16,500 Eisai Co Ltd 935,795 0.37
10,100 Electric Power Development Co Ltd 133,930 0.05
183,400 ENEOS Holdings Inc 685,311 0.27
5,500 Ezaki Glico Co Ltd 174,808 0.07
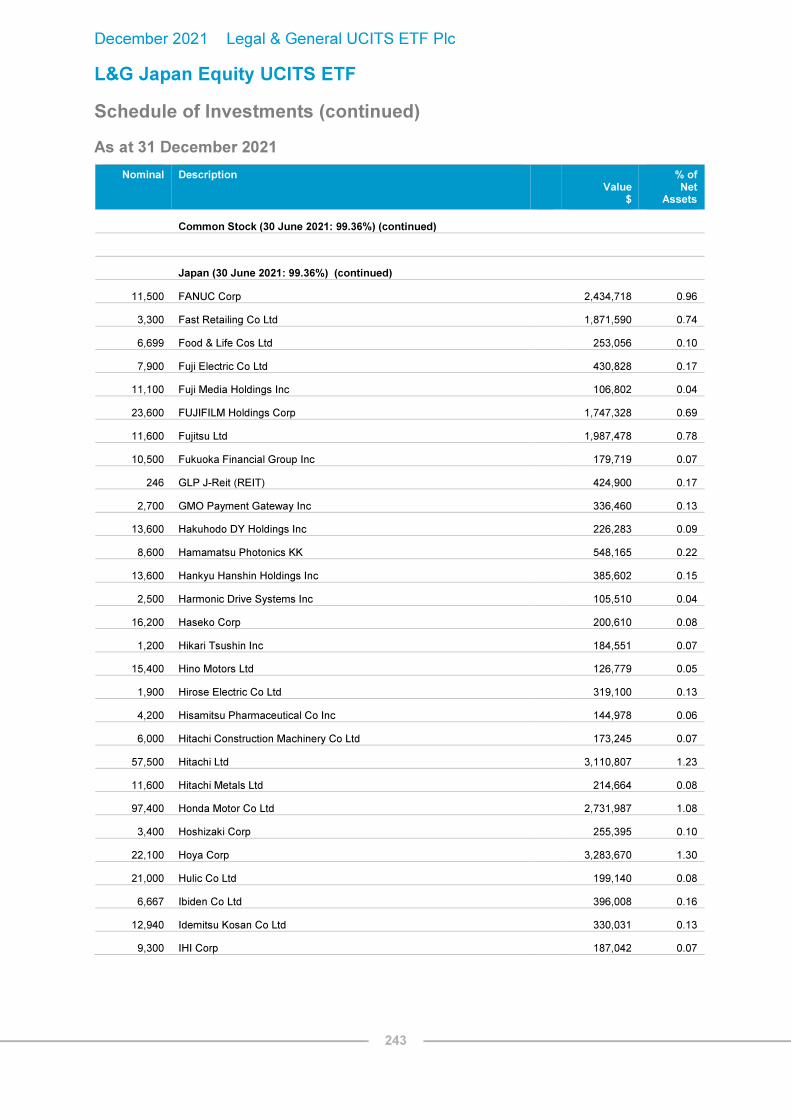
December 2021 Legal & General UCITS ETF Plc
L&G Japan Equity UCITS ETF
Schedule of Investments (continued)
As at 31 December 2021
243
Nominal Description
Value $
% of Net
Assets
Common Stock (30 June 2021: 99.36%) (continued)
Japan (30 June 2021: 99.36%) (continued)
11,500 FANUC Corp 2,434,718 0.96
3,300 Fast Retailing Co Ltd 1,871,590 0.74
6,699 Food & Life Cos Ltd 253,056 0.10
7,900 Fuji Electric Co Ltd 430,828 0.17
11,100 Fuji Media Holdings Inc 106,802 0.04
23,600 FUJIFILM Holdings Corp 1,747,328 0.69
11,600 Fujitsu Ltd 1,987,478 0.78
10,500 Fukuoka Financial Group Inc 179,719 0.07
246 GLP J-Reit (REIT) 424,900 0.17
2,700 GMO Payment Gateway Inc 336,460 0.13
13,600 Hakuhodo DY Holdings Inc 226,283 0.09
8,600 Hamamatsu Photonics KK 548,165 0.22
13,600 Hankyu Hanshin Holdings Inc 385,602 0.15
2,500 Harmonic Drive Systems Inc 105,510 0.04
16,200 Haseko Corp 200,610 0.08
1,200 Hikari Tsushin Inc 184,551 0.07
15,400 Hino Motors Ltd 126,779 0.05
1,900 Hirose Electric Co Ltd 319,100 0.13
4,200 Hisamitsu Pharmaceutical Co Inc 144,978 0.06
6,000 Hitachi Construction Machinery Co Ltd 173,245 0.07
57,500 Hitachi Ltd 3,110,807 1.23
11,600 Hitachi Metals Ltd 214,664 0.08
97,400 Honda Motor Co Ltd 2,731,987 1.08
3,400 Hoshizaki Corp 255,395 0.10
22,100 Hoya Corp 3,283,670 1.30
21,000 Hulic Co Ltd 199,140 0.08
6,667 Ibiden Co Ltd 396,008 0.16
12,940 Idemitsu Kosan Co Ltd 330,031 0.13
9,300 IHI Corp 187,042 0.07

December 2021 Legal & General UCITS ETF Plc
L&G Japan Equity UCITS ETF
Schedule of Investments (continued)
As at 31 December 2021
244
Nominal Description
Value $
% of Net
Assets
Common Stock (30 June 2021: 99.36%) (continued)
Japan (30 June 2021: 99.36%) (continued)
10,400 Iida Group Holdings Co Ltd 241,678 0.10
62,300 Inpex Corp 542,092 0.21
19,000 Isetan Mitsukoshi Holdings Ltd 140,246 0.06
36,300 Isuzu Motors Ltd 451,090 0.18
3,400 Ito En Ltd 178,334 0.07
89,400 ITOCHU Corp 2,731,181 1.08
5,800 Itochu Techno-Solutions Corp 186,357 0.07
1,900 Izumi Co Ltd 53,211 0.02
15,100 J Front Retailing Co Ltd 137,291 0.05
25,000 Japan Airlines Co Ltd 476,749 0.19
32,100 Japan Exchange Group Inc 701,904 0.28
400 Japan Metropolitan Fund Invest (REIT) 344,232 0.14
30,598 Japan Post Bank Co Ltd 280,326 0.11
85,400 Japan Post Holdings Co Ltd 665,075 0.26
10,000 Japan Post Insurance Co Ltd 160,653 0.06
72 Japan Real Estate Investment Corp (REIT) 408,284 0.16
65,200 Japan Tobacco Inc 1,314,984 0.52
28,700 JFE Holdings Inc 365,619 0.14
12,600 JGC Holdings Corp 105,150 0.04
11,900 JSR Corp 452,108 0.18
14,600 JTEKT Corp 127,420 0.05
26,100 Kajima Corp 299,406 0.12
7,900 Kakaku.com Inc 210,612 0.08
44,800 Kansai Electric Power Co Inc/The 417,830 0.16
13,600 Kansai Paint Co Ltd 295,254 0.12
28,400 Kao Corp 1,484,430 0.59
8,800 Kawasaki Heavy Industries Ltd 158,798 0.06
93,200 KDDI Corp 2,721,014 1.07
6,100 Keihan Holdings Co Ltd 140,164 0.06
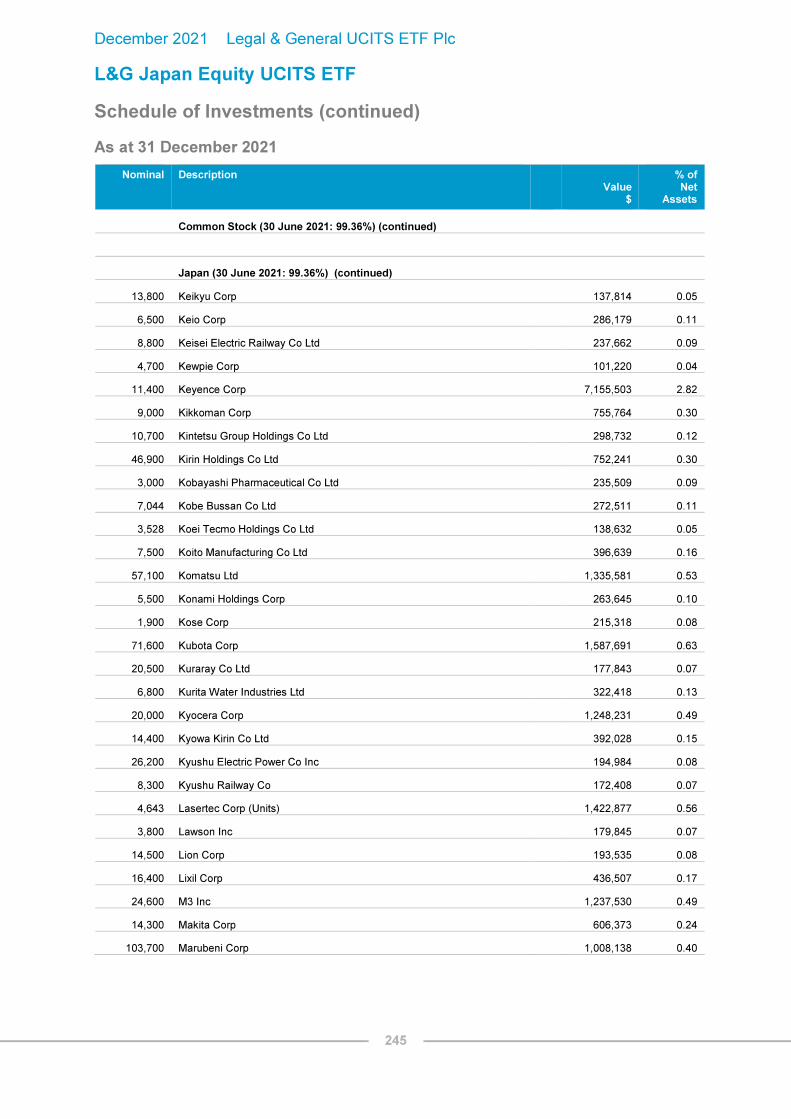
December 2021 Legal & General UCITS ETF Plc
L&G Japan Equity UCITS ETF
Schedule of Investments (continued)
As at 31 December 2021
245
Nominal Description
Value $
% of Net
Assets
Common Stock (30 June 2021: 99.36%) (continued)
Japan (30 June 2021: 99.36%) (continued)
13,800 Keikyu Corp 137,814 0.05
6,500 Keio Corp 286,179 0.11
8,800 Keisei Electric Railway Co Ltd 237,662 0.09
4,700 Kewpie Corp 101,220 0.04
11,400 Keyence Corp 7,155,503 2.82
9,000 Kikkoman Corp 755,764 0.30
10,700 Kintetsu Group Holdings Co Ltd 298,732 0.12
46,900 Kirin Holdings Co Ltd 752,241 0.30
3,000 Kobayashi Pharmaceutical Co Ltd 235,509 0.09
7,044 Kobe Bussan Co Ltd 272,511 0.11
3,528 Koei Tecmo Holdings Co Ltd 138,632 0.05
7,500 Koito Manufacturing Co Ltd 396,639 0.16
57,100 Komatsu Ltd 1,335,581 0.53
5,500 Konami Holdings Corp 263,645 0.10
1,900 Kose Corp 215,318 0.08
71,600 Kubota Corp 1,587,691 0.63
20,500 Kuraray Co Ltd 177,843 0.07
6,800 Kurita Water Industries Ltd 322,418 0.13
20,000 Kyocera Corp 1,248,231 0.49
14,400 Kyowa Kirin Co Ltd 392,028 0.15
26,200 Kyushu Electric Power Co Inc 194,984 0.08
8,300 Kyushu Railway Co 172,408 0.07
4,643 Lasertec Corp (Units) 1,422,877 0.56
3,800 Lawson Inc 179,845 0.07
14,500 Lion Corp 193,535 0.08
16,400 Lixil Corp 436,507 0.17
24,600 M3 Inc 1,237,530 0.49
14,300 Makita Corp 606,373 0.24
103,700 Marubeni Corp 1,008,138 0.40

December 2021 Legal & General UCITS ETF Plc
L&G Japan Equity UCITS ETF
Schedule of Investments (continued)
As at 31 December 2021
246
Nominal Description
Value $
% of Net
Assets
Common Stock (30 June 2021: 99.36%) (continued)
Japan (30 June 2021: 99.36%) (continued)
12,000 Marui Group Co Ltd 225,609 0.09
36,200 Mazda Motor Corp 278,208 0.11
5,400 McDonald's Holdings Co Japan Ltd 238,687 0.09
64,200 Mebuki Financial Group Inc 132,130 0.05
9,900 Medipal Holdings Corp 185,268 0.07
7,500 MEIJI Holdings Co Ltd 446,789 0.18
6,100 Mercari Inc 310,416 0.12
23,500 MINEBEA MITSUMI Inc 666,298 0.26
17,100 MISUMI Group Inc 700,899 0.28
85,500 Mitsubishi Chemical Holdings Corp 632,591 0.25
82,300 Mitsubishi Corp 2,610,044 1.03
119,300 Mitsubishi Electric Corp 1,510,999 0.60
71,400 Mitsubishi Estate Co Ltd 988,644 0.39
12,200 Mitsubishi Gas Chemical Co Inc 206,379 0.08
36,500 Mitsubishi HC Capital Inc 180,353 0.07
18,000 Mitsubishi Heavy Industries Ltd 415,631 0.16
7,200 Mitsubishi Materials Corp 123,486 0.05
38,794 Mitsubishi Motors Corp 108,140 0.04
703,200 Mitsubishi UFJ Financial Group Inc 3,815,984 1.51
91,400 Mitsui & Co Ltd 2,161,677 0.85
11,400 Mitsui Chemicals Inc 305,901 0.12
54,600 Mitsui Fudosan Co Ltd 1,080,336 0.43
6,900 Mitsui OSK Lines Ltd 511,710 0.20
5,694 Miura Co Ltd 195,808 0.08
141,460 Mizuho Financial Group Inc 1,797,195 0.71
14,400 MonotaRO Co Ltd 259,226 0.10
27,900 MS&AD Insurance Group Holdings Inc 859,859 0.34
38,000 Murata Manufacturing Co Ltd 3,021,718 1.19
7,200 Nabtesco Corp 212,896 0.08

December 2021 Legal & General UCITS ETF Plc
L&G Japan Equity UCITS ETF
Schedule of Investments (continued)
As at 31 December 2021
247
Nominal Description
Value $
% of Net
Assets
Common Stock (30 June 2021: 99.36%) (continued)
Japan (30 June 2021: 99.36%) (continued)
11,400 Nagoya Railroad Co Ltd 173,245 0.07
14,800 NEC Corp 682,454 0.27
27,900 Nexon Co Ltd 538,835 0.21
17,800 NGK Insulators Ltd 300,492 0.12
11,500 NGK Spark Plug Co Ltd 200,030 0.08
8,200 NH Foods Ltd 294,803 0.12
6,300 Nichirei Corp 145,690 0.06
30,700 Nidec Corp 3,604,394 1.42
17,500 Nihon M&A Center Holdings Inc 428,705 0.17
18,900 Nikon Corp 203,517 0.08
7,000 Nintendo Co Ltd 3,261,256 1.29
97 Nippon Building Fund Inc (REIT) 564,370 0.22
5,100 Nippon Express Co Ltd 306,031 0.12
53,200 Nippon Paint Holdings Co Ltd 579,330 0.23
123 Nippon Prologis REIT Inc (REIT) 434,727 0.17
10,300 Nippon Sanso Holdings Corp 224,774 0.09
3,700 Nippon Shinyaku Co Ltd 257,366 0.10
52,100 Nippon Steel Corp 849,897 0.34
136,100 Nippon Telegraph & Telephone Corp 3,722,938 1.47
7,200 Nippon Television Holdings Inc 73,028 0.03
9,900 Nippon Yusen KK 753,107 0.30
7,700 Nissan Chemical Corp 446,667 0.18
130,400 Nissan Motor Co Ltd 629,381 0.25
20,000 Nisshin Seifun Group Inc 287,960 0.11
4,800 Nissin Foods Holdings Co Ltd 349,720 0.14
5,000 Nitori Holdings Co Ltd 747,905 0.30
8,800 Nitto Denko Corp 679,363 0.27
185,600 Nomura Holdings Inc 808,610 0.32
5,700 Nomura Real Estate Holdings Inc 131,022 0.05

December 2021 Legal & General UCITS ETF Plc
L&G Japan Equity UCITS ETF
Schedule of Investments (continued)
As at 31 December 2021
248
Nominal Description
Value $
% of Net
Assets
Common Stock (30 June 2021: 99.36%) (continued)
Japan (30 June 2021: 99.36%) (continued)
252 Nomura Real Estate Master Fund Inc (REIT) 354,076 0.14
22,400 Nomura Research Institute Ltd 959,958 0.38
28,400 NSK Ltd 182,009 0.07
38,600 NTT Data Corp 826,604 0.33
37,400 Obayashi Corp 289,054 0.11
1,600 OBIC Business Consultants Co Ltd 67,387 0.03
3,800 Obic Co Ltd 712,778 0.28
20,100 Odakyu Electric Railway Co Ltd 372,833 0.15
51,200 Oji Holdings Corp 247,652 0.10
72,800 Olympus Corp 1,674,991 0.66
11,700 Omron Corp 1,164,361 0.46
23,500 Ono Pharmaceutical Co Ltd 582,832 0.23
4,505 Open House Group Co Ltd 235,509 0.09
2,000 Oracle Corp Japan 151,795 0.06
12,000 Oriental Land Co Ltd/Japan 2,021,102 0.80
72,500 ORIX Corp 1,477,954 0.58
162 Orix JREIT Inc (REIT) 252,943 0.10
23,800 Osaka Gas Co Ltd 392,895 0.15
6,200 Otsuka Corp 295,584 0.12
23,800 Otsuka Holdings Co Ltd 861,640 0.34
22,500 Pan Pacific International Holdings Corp 310,082 0.12
130,300 Panasonic Corp 1,431,371 0.56
5,700 Park24 Co Ltd 78,010 0.03
6,200 PeptiDream Inc 137,024 0.05
11,200 Persol Holdings Co Ltd 324,849 0.13
6,500 Pigeon Corp 124,068 0.05
4,400 Pola Orbis Holdings Inc 73,247 0.03
4,374 Rakus Co Ltd 117,749 0.05
51,500 Rakuten Group Inc 516,096 0.20

December 2021 Legal & General UCITS ETF Plc
L&G Japan Equity UCITS ETF
Schedule of Investments (continued)
As at 31 December 2021
249
Nominal Description
Value $
% of Net
Assets
Common Stock (30 June 2021: 99.36%) (continued)
Japan (30 June 2021: 99.36%) (continued)
82,500 Recruit Holdings Co Ltd 4,994,920 1.97
68,700 Renesas Electronics Corp 848,944 0.33
141,900 Resona Holdings Inc 551,310 0.22
38,000 Ricoh Co Ltd 353,419 0.14
2,100 Rinnai Corp 189,293 0.07
5,000 Rohm Co Ltd 454,605 0.18
14,600 Ryohin Keikaku Co Ltd 222,382 0.09
22,700 Santen Pharmaceutical Co Ltd 277,356 0.11
14,300 SBI Holdings Inc/Japan 389,306 0.15
2,500 SCREEN Holdings Co Ltd 268,551 0.11
8,400 SCSK Corp 166,971 0.07
14,400 Secom Co Ltd 998,640 0.39
10,800 Sega Sammy Holdings Inc 169,472 0.07
13,300 Seibu Holdings Inc 124,274 0.05
17,800 Seiko Epson Corp 320,123 0.13
25,400 Sekisui Chemical Co Ltd 423,940 0.17
35,700 Sekisui House Ltd 765,432 0.30
45,300 Seven & i Holdings Co Ltd 1,988,943 0.79
22,400 Seven Bank Ltd 46,296 0.02
24,700 SG Holdings Co Ltd 577,631 0.23
17,100 Sharp Corp/Japan 196,163 0.08
17,200 Shimadzu Corp 725,162 0.29
1,400 Shimamura Co Ltd 117,442 0.05
4,800 Shimano Inc 1,277,999 0.50
31,600 Shimizu Corp 195,656 0.08
24,700 Shin-Etsu Chemical Co Ltd 4,272,710 1.69
13,100 Shinsei Bank Ltd 213,072 0.08
18,100 Shionogi & Co Ltd 1,277,083 0.50
24,000 Shiseido Co Ltd 1,336,772 0.53
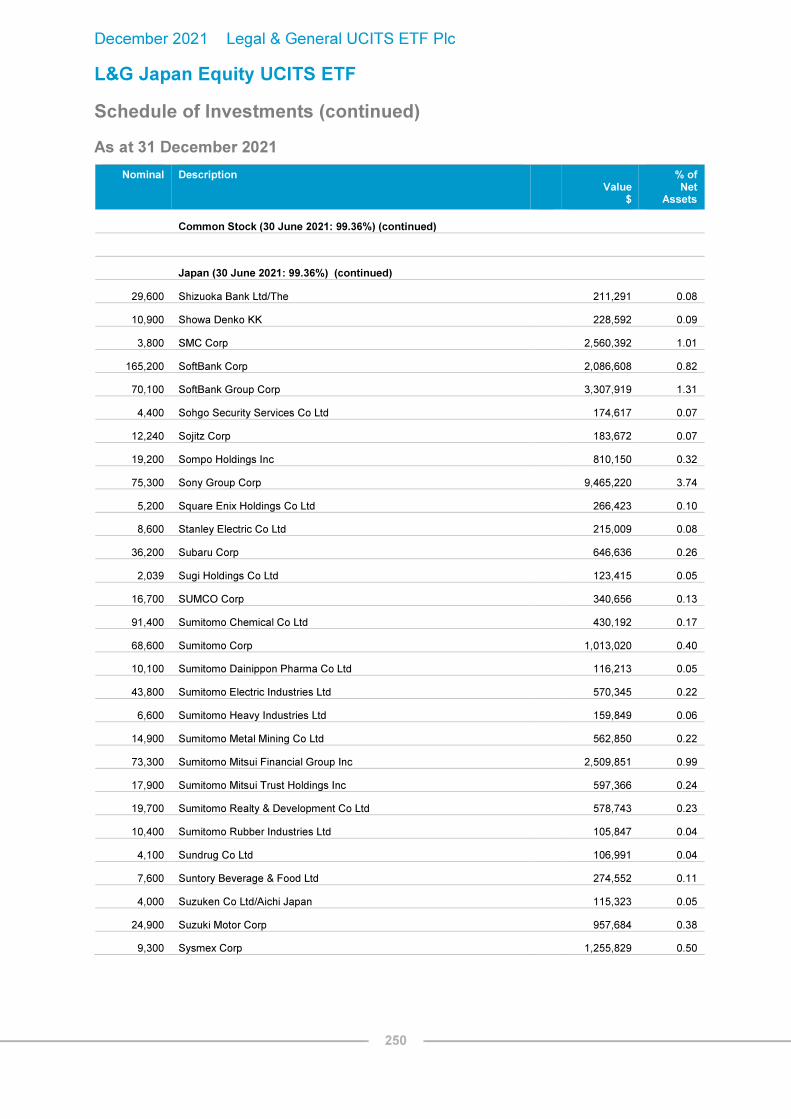
December 2021 Legal & General UCITS ETF Plc
L&G Japan Equity UCITS ETF
Schedule of Investments (continued)
As at 31 December 2021
250
Nominal Description
Value $
% of Net
Assets
Common Stock (30 June 2021: 99.36%) (continued)
Japan (30 June 2021: 99.36%) (continued)
29,600 Shizuoka Bank Ltd/The 211,291 0.08
10,900 Showa Denko KK 228,592 0.09
3,800 SMC Corp 2,560,392 1.01
165,200 SoftBank Corp 2,086,608 0.82
70,100 SoftBank Group Corp 3,307,919 1.31
4,400 Sohgo Security Services Co Ltd 174,617 0.07
12,240 Sojitz Corp 183,672 0.07
19,200 Sompo Holdings Inc 810,150 0.32
75,300 Sony Group Corp 9,465,220 3.74
5,200 Square Enix Holdings Co Ltd 266,423 0.10
8,600 Stanley Electric Co Ltd 215,009 0.08
36,200 Subaru Corp 646,636 0.26
2,039 Sugi Holdings Co Ltd 123,415 0.05
16,700 SUMCO Corp 340,656 0.13
91,400 Sumitomo Chemical Co Ltd 430,192 0.17
68,600 Sumitomo Corp 1,013,020 0.40
10,100 Sumitomo Dainippon Pharma Co Ltd 116,213 0.05
43,800 Sumitomo Electric Industries Ltd 570,345 0.22
6,600 Sumitomo Heavy Industries Ltd 159,849 0.06
14,900 Sumitomo Metal Mining Co Ltd 562,850 0.22
73,300 Sumitomo Mitsui Financial Group Inc 2,509,851 0.99
17,900 Sumitomo Mitsui Trust Holdings Inc 597,366 0.24
19,700 Sumitomo Realty & Development Co Ltd 578,743 0.23
10,400 Sumitomo Rubber Industries Ltd 105,847 0.04
4,100 Sundrug Co Ltd 106,991 0.04
7,600 Suntory Beverage & Food Ltd 274,552 0.11
4,000 Suzuken Co Ltd/Aichi Japan 115,323 0.05
24,900 Suzuki Motor Corp 957,684 0.38
9,300 Sysmex Corp 1,255,829 0.50

December 2021 Legal & General UCITS ETF Plc
L&G Japan Equity UCITS ETF
Schedule of Investments (continued)
As at 31 December 2021
251
Nominal Description
Value $
% of Net
Assets
Common Stock (30 June 2021: 99.36%) (continued)
Japan (30 June 2021: 99.36%) (continued)
29,500 T&D Holdings Inc 377,092 0.15
6,600 Taiheiyo Cement Corp 130,275 0.05
11,300 Taisei Corp 342,959 0.14
2,300 Taisho Pharmaceutical Holdings Co Ltd 105,658 0.04
7,290 Taiyo Yuden Co Ltd 419,086 0.17
95,100 Takeda Pharmaceutical Co Ltd 2,590,671 1.02
5,500 TBS Holdings Inc 79,714 0.03
23,200 TDK Corp 904,589 0.36
9,000 Teijin Ltd 110,590 0.04
43,100 Terumo Corp 1,818,992 0.72
8,100 THK Co Ltd 195,053 0.08
14,149 TIS Inc 420,827 0.17
11,600 Tobu Railway Co Ltd 264,124 0.10
391 Toei Animation Co Ltd 38,878 0.02
6,300 Toho Co Ltd/Tokyo 269,441 0.11
5,500 Toho Gas Co Ltd 139,894 0.05
28,100 Tohoku Electric Power Co Inc 199,119 0.08
38,900 Tokio Marine Holdings Inc 2,159,253 0.85
2,500 Tokyo Century Corp 121,141 0.05
9,000 Tokyo Electron Ltd 5,180,148 2.04
25,500 Tokyo Gas Co Ltd 456,611 0.18
34,400 Tokyu Corp 456,456 0.18
37,300 Tokyu Fudosan Holdings Corp 208,275 0.08
15,800 TOPPAN INC 295,817 0.12
87,800 Toray Industries Inc 519,839 0.20
16,000 Tosoh Corp 237,037 0.09
9,400 TOTO Ltd 431,818 0.17
5,200 Toyo Suisan Kaisha Ltd 220,138 0.09
4,300 Toyoda Gosei Co Ltd 93,427 0.04

December 2021 Legal & General UCITS ETF Plc
L&G Japan Equity UCITS ETF
Schedule of Investments (continued)
As at 31 December 2021
252
Nominal Description
Value $
% of Net
Assets
Common Stock (30 June 2021: 99.36%) (continued)
Japan (30 June 2021: 99.36%) (continued)
3,400 Toyota Boshoku Corp 66,609 0.03
9,200 Toyota Industries Corp 734,210 0.29
666,500 Toyota Motor Corp 12,186,320 4.81
13,700 Toyota Tsusho Corp 630,541 0.25
8,100 Trend Micro Inc/Japan 449,472 0.18
2,200 Tsuruha Holdings Inc 210,916 0.08
23,800 Unicharm Corp 1,033,183 0.41
178 United Urban Investment Corp (REIT) 208,984 0.08
10,700 USS Co Ltd 166,881 0.07
5,700 Welcia Holdings Co Ltd 177,700 0.07
13,000 West Japan Railway Co 543,007 0.21
1,202 Workman Co Ltd 57,410 0.02
7,300 Yakult Honsha Co Ltd 380,357 0.15
41,400 Yamada Holdings Co Ltd 141,290 0.06
9,600 Yamaha Corp 472,685 0.19
19,500 Yamaha Motor Co Ltd 467,201 0.18
19,500 Yamato Holdings Co Ltd 457,718 0.18
7,100 Yamazaki Baking Co Ltd 94,210 0.04
15,200 Yaskawa Electric Corp 744,457 0.29
16,400 Yokogawa Electric Corp 295,372 0.12
6,800 Yokohama Rubber Co Ltd/The 108,831 0.04
156,700 Z Holdings Corp 908,181 0.36
6,300 ZOZO Inc 196,405 0.08
Total Japan 252,907,773 99.85
Total Common Stock 252,907,773 99.85

December 2021 Legal & General UCITS ETF Plc
L&G Japan Equity UCITS ETF
Schedule of Investments (continued)
As at 31 December 2021
253
Total Investments
Value $
% of Net
Assets
Common Stock 252,907,773
99.85
Other Assets and Liabilities 374,955
0.15
Net Assets Attributable to Holders of Redeemable Participating Shares 253,282,728 100.00
Analysis of Total Assets
% of Total
Assets
Transferable securities admitted to an official stock exchange listing 99.84
Other assets 0.16
100.00
Analysis of Total Assets rather than Net Assets is required under Schedule 12 of the UCITS Regulations.

December 2021 Legal & General UCITS ETF Plc
L&G Global Equity UCITS ETF
Schedule of Investments
As at 31 December 2021
254
Nominal Description
Value $
% of Net
Assets
Common Stock (30 June 2021: 99.71%)
Australia (30 June 2021: 2.11%)
175 Afterpay Ltd 10,562 0.02
387 AGL Energy Ltd 1,728 0.00
718 APA Group 5,251 0.01
1,242 Aristocrat Leisure Ltd 39,343 0.06
184 ASX Ltd 12,428 0.02
5,832 Aurizon Holdings Ltd 14,798 0.02
3,454 Australia & New Zealand Banking Group Ltd 69,084 0.11
3,274 BHP Group Ltd 98,784 0.15
492 BlueScope Steel Ltd 7,476 0.01
660 Brambles Ltd 5,101 0.01
40 Cochlear Ltd 6,285 0.01
2,648 Coles Group Ltd 34,538 0.05
1,959 Commonwealth Bank of Australia 143,853 0.23
347 Computershare Ltd 5,046 0.01
435 CSL Ltd 91,944 0.14
717 Dexus (REIT) 5,797 0.01
1,178 Endeavour Group Ltd/Australia 5,773 0.01
2,300 Fortescue Metals Group Ltd 32,123 0.05
2,601 Goodman Group (REIT) 50,113 0.08
1,363 GPT Group/The (REIT) 5,371 0.01
1,010 Insurance Australia Group Ltd 3,128 0.00
404 Lendlease Corp Ltd 3,140 0.00
488 Macquarie Group Ltd 72,876 0.11
245 Mineral Resources Ltd 9,975 0.02
4,040 Mirvac Group (Units) (REIT) 8,547 0.01
4,445 National Australia Bank Ltd 93,203 0.15

December 2021 Legal & General UCITS ETF Plc
L&G Global Equity UCITS ETF
Schedule of Investments (continued)
As at 31 December 2021
255
Nominal Description
Value $
% of Net
Assets
Common Stock (30 June 2021: 99.71%) (continued)
Australia (30 June 2021: 2.11%) (continued)
335 Newcrest Mining Ltd 5,962 0.01
1,903 Northern Star Resources Ltd 13,019 0.02
968 Origin Energy Ltd 3,688 0.01
1,243 Qantas Airways Ltd 4,528 0.01
615 QBE Insurance Group Ltd 5,075 0.01
382 Ramsay Health Care Ltd 19,858 0.03
331 Rio Tinto Ltd 24,092 0.04
1,665 Santos Ltd 7,638 0.01
1,963 Scentre Group (REIT) 4,510 0.01
308 Sonic Healthcare Ltd 10,442 0.02
1,956 South32 Ltd 5,703 0.01
542 Suncorp Group Ltd 4,362 0.01
2,827 Sydney Airport 17,840 0.03
1,499 Tabcorp Holdings Ltd 5,471 0.01
18,752 Telstra Corp Ltd 56,988 0.09
5,252 Transurban Group 52,771 0.08
448 Treasury Wine Estates Ltd 4,032 0.01
956 Wesfarmers Ltd 41,217 0.06
4,424 Westpac Banking Corp 68,671 0.11
984 Woodside Petroleum Ltd 15,689 0.02
1,178 Woolworths Group Ltd 32,554 0.05
Total Australia 1,240,377 1.95
Austria (30 June 2021: 0.02%)
165 Erste Group Bank AG 7,759 0.01
107 OMV AG 6,078 0.01
Total Austria 13,837 0.02

December 2021 Legal & General UCITS ETF Plc
L&G Global Equity UCITS ETF
Schedule of Investments (continued)
As at 31 December 2021
256
Nominal Description
Value $
% of Net
Assets
Common Stock (30 June 2021: 99.71%) (continued)
Belgium (30 June 2021: 0.28%)
99 Ageas SA/NV 5,128 0.01
962 Anheuser-Busch InBev SA/NV 58,167 0.09
269 Etablissements Franz Colruyt NV 11,398 0.02
209 Groupe Bruxelles Lambert SA 23,330 0.03
314 KBC Group NV 26,945 0.04
43 Solvay SA 4,997 0.01
168 Telenet Group Holding NV 6,125 0.01
60 UCB SA 6,847 0.01
104 Umicore SA 4,228 0.01
Total Belgium 147,165 0.23
Bermuda (30 June 2021: 0.20%)
6,000 Alibaba Health Information Technology Ltd 5,072 0.01
431 Arch Capital Group Ltd 19,158 0.03
1,600 China Gas Holdings Ltd 3,325 0.00
25 Everest Re Group Ltd 6,848 0.01
38 HAL Trust 6,300 0.01
800 Hongkong Land Holdings Ltd 4,160 0.01
382 IHS Markit Ltd 50,775 0.08
700 Jardine Matheson Holdings Ltd 38,507 0.06
Total Bermuda 134,145 0.21
Canada (30 June 2021: 3.57%)
100 Agnico Eagle Mines Ltd (Units) 5,319 0.01
400 Air Canada 6,691 0.01
1,300 Algonquin Power & Utilities Corp 18,803 0.03
800 Alimentation Couche-Tard Inc 33,566 0.05
421 Atco Ltd/Canada 14,231 0.02

December 2021 Legal & General UCITS ETF Plc
L&G Global Equity UCITS ETF
Schedule of Investments (continued)
As at 31 December 2021
257
Nominal Description
Value $
% of Net
Assets
Common Stock (30 June 2021: 99.71%) (continued)
Canada (30 June 2021: 3.57%) (continued)
723 Bank of Montreal 77,951 0.12
1,384 Bank of Nova Scotia/The 98,116 0.15
2,592 Barrick Gold Corp 49,350 0.08
600 BCE Inc 31,260 0.05
1,492 Brookfield Asset Management Inc - Class A 90,229 0.14
549 CAE Inc 13,869 0.02
510 Cameco Corp 11,135 0.02
501 Canadian Apartment Properties REIT (Units) (REIT) 23,781 0.04
300 Canadian Imperial Bank of Commerce 35,019 0.06
799 Canadian National Railway Co 98,283 0.15
1,000 Canadian Natural Resources Ltd 42,314 0.07
995 Canadian Pacific Railway Ltd 71,665 0.11
97 Canadian Tire Corp Ltd 13,933 0.02
744 Canadian Utilities Ltd 21,610 0.03
100 Canopy Growth Corp 874 0.00
100 CCL Industries Inc - Class B 5,370 0.01
2,032 Cenovus Energy Inc 24,950 0.04
100 CGI Inc 8,855 0.01
1,099 Choice Properties Real Estate Investment Trust (Units) (REIT) 13,216 0.02
29 Constellation Software Inc/Canada 53,881 0.08
200 Dollarama Inc 10,024 0.02
208 Emera Inc 10,410 0.02
1,900 Enbridge Inc 74,320 0.12
57 Fairfax Financial Holdings Ltd 28,078 0.04
471 First Quantum Minerals Ltd 11,287 0.02
202 Fortis Inc/Canada 9,760 0.02
232 Franco-Nevada Corp 32,130 0.05

December 2021 Legal & General UCITS ETF Plc
L&G Global Equity UCITS ETF
Schedule of Investments (continued)
As at 31 December 2021
258
Nominal Description
Value $
% of Net
Assets
Common Stock (30 June 2021: 99.71%) (continued)
Canada (30 June 2021: 3.57%) (continued)
82 George Weston Ltd 9,521 0.02
200 Gildan Activewear Inc 8,491 0.01
200 Great-West Lifeco Inc 6,010 0.01
1,218 Hydro One Ltd '144A' 31,733 0.05
200 Imperial Oil Ltd 7,223 0.01
100 Intact Financial Corp 13,017 0.02
500 Keyera Corp 11,293 0.02
1,500 Kinross Gold Corp 8,716 0.01
484 Kirkland Lake Gold Ltd 20,312 0.03
154 Lightspeed Commerce Inc 6,227 0.01
100 Loblaw Cos Ltd 8,205 0.01
300 Magna International Inc (Units) 24,308 0.04
2,745 Manulife Financial Corp 52,394 0.08
200 Metro Inc/CN 10,659 0.02
300 National Bank of Canada 22,904 0.04
500 Nutrien Ltd 37,636 0.06
56 Nuvei Corp '144A' 3,635 0.01
100 Onex Corp 7,860 0.01
200 Open Text Corp 9,506 0.01
500 Pembina Pipeline Corp 15,188 0.02
390 Power Corp of Canada 12,906 0.02
427 Restaurant Brands International Inc 25,928 0.04
1,000 RioCan Real Estate Investment Trust (Units) (REIT) 18,161 0.03
229 Ritchie Bros Auctioneers Inc 14,034 0.02
300 Rogers Communications Inc 14,305 0.02
1,532 Royal Bank of Canada 162,821 0.26
200 Saputo Inc 4,512 0.01
300 Shaw Communications Inc 9,118 0.01

December 2021 Legal & General UCITS ETF Plc
L&G Global Equity UCITS ETF
Schedule of Investments (continued)
As at 31 December 2021
259
Nominal Description
Value $
% of Net
Assets
Common Stock (30 June 2021: 99.71%) (continued)
Canada (30 June 2021: 3.57%) (continued)
121 Shopify Inc - Class A 166,838 0.26
600 Sun Life Financial Inc 33,444 0.05
1,200 Suncor Energy Inc 30,067 0.05
1,431 TC Energy Corp 66,646 0.10
828 Teck Resources Ltd 23,880 0.04
1,036 TELUS Corp 24,433 0.04
99 TFI International Inc 11,119 0.02
90 Thomson Reuters Corp 10,778 0.02
1,800 Toronto-Dominion Bank/The 138,195 0.22
370 Tourmaline Oil Corp 11,963 0.02
200 Waste Connections Inc 27,296 0.04
199 West Fraser Timber Co Ltd (Units) 19,012 0.03
302 Wheaton Precious Metals Corp 12,977 0.02
205 WSP Global Inc 29,801 0.05
Total Canada 2,223,352 3.49
Cayman Islands (30 June 2021: 0.24%)
2,000 CK Asset Holdings Ltd 12,609 0.02
2,500 CK Hutchison Holdings Ltd 16,129 0.03
402 Farfetch Ltd 13,439 0.02
7,448 Geely Automobile Holdings Ltd 20,348 0.03
278 Melco Resorts & Entertainment Ltd ADR 2,830 0.00
1,200 Sands China Ltd 2,795 0.00
75 Sea Ltd ADR 16,778 0.03
7,500 Sino Biopharmaceutical Ltd 5,253 0.01
7,000 WH Group Ltd '144A' 4,391 0.01
3,000 Wharf Real Estate Investment Co Ltd 15,238 0.02
Total Cayman Islands 109,810 0.17

December 2021 Legal & General UCITS ETF Plc
L&G Global Equity UCITS ETF
Schedule of Investments (continued)
As at 31 December 2021
260
Nominal Description
Value $
% of Net
Assets
Common Stock (30 June 2021: 99.71%) (continued)
Curacao (30 June 2021: 0.06%)
987 Schlumberger NV 29,561 0.05
Total Curacao 29,561 0.05
Denmark (30 June 2021: 0.73%)
4 AP Moller - Maersk A/S - Class B 14,342 0.02
192 Carlsberg AS 33,158 0.05
48 Chr Hansen Holding A/S 3,783 0.01
149 Coloplast A/S 26,222 0.04
273 Danske Bank A/S 4,715 0.01
262 DSV A/S 61,191 0.10
70 Genmab A/S 28,149 0.04
252 GN Store Nord AS 15,848 0.02
1,662 Novo Nordisk A/S 186,777 0.29
101 Novozymes A/S 8,296 0.01
180 Orsted AS '144A' 22,986 0.04
133 Pandora A/S 16,582 0.03
1,009 Tryg A/S 24,915 0.04
1,320 Vestas Wind Systems A/S 40,365 0.06
Total Denmark 487,329 0.76
Finland (30 June 2021: 0.38%)
116 Elisa Oyj 7,139 0.01
231 Fortum Oyj 7,090 0.01
729 Kesko Oyj 24,323 0.04
550 Kone Oyj - Class B 39,429 0.06
697 Neste Oyj 34,368 0.06
5,344 Nokia Oyj 33,874 0.05
2,231 Nordea Bank Abp 27,365 0.04
390 Sampo Oyj - Class A 19,541 0.03

December 2021 Legal & General UCITS ETF Plc
L&G Global Equity UCITS ETF
Schedule of Investments (continued)
As at 31 December 2021
261
Nominal Description
Value $
% of Net
Assets
Common Stock (30 June 2021: 99.71%) (continued)
Finland (30 June 2021: 0.38%) (continued)
333 Stora Enso Oyj 6,112 0.01
538 UPM-Kymmene Oyj 20,471 0.03
282 Wartsila OYJ Abp 3,964 0.01
Total Finland 223,676 0.35
France (30 June 2021: 2.79%)
24 Aeroports de Paris 3,092 0.00
560 Air Liquide SA 97,638 0.15
515 Alstom SA 18,284 0.03
120 Amundi SA '144A' 9,900 0.02
2,523 AXA SA 75,128 0.12
1,425 BNP Paribas SA 98,478 0.15
2,517 Bollore SA 14,083 0.02
132 Bouygues SA 4,727 0.01
145 Capgemini SE 35,534 0.06
252 Carrefour SA 4,615 0.01
725 Cie de Saint-Gobain 51,010 0.08
133 Cie Generale des Etablissements Michelin SCA 21,802 0.03
516 Credit Agricole SA 7,364 0.01
803 Danone SA 49,850 0.08
515 Dassault Systemes SE 30,636 0.05
299 Electricite de France SA 3,512 0.01
1,375 Engie SA 20,349 0.03
342 EssilorLuxottica SA 72,821 0.11
40 Hermes International 69,869 0.11
80 Kering SA 64,310 0.10
369 Legrand SA 43,179 0.07
244 L'Oreal SA 115,693 0.18

December 2021 Legal & General UCITS ETF Plc
L&G Global Equity UCITS ETF
Schedule of Investments (continued)
As at 31 December 2021
262
Nominal Description
Value $
% of Net
Assets
Common Stock (30 June 2021: 99.71%) (continued)
France (30 June 2021: 2.79%) (continued)
262 LVMH Moet Hennessy Louis Vuitton SE 216,605 0.34
1,621 Orange SA 17,352 0.03
136 Pernod Ricard SA 32,710 0.05
490 Safran SA 59,991 0.09
1,033 Sanofi 104,056 0.16
22 Sartorius Stedim Biotech 12,069 0.02
554 Schneider Electric SE 108,650 0.17
657 Societe Generale SA 22,567 0.03
51 Sodexo SA 4,469 0.01
91 Teleperformance 40,566 0.06
45 Thales SA 3,828 0.01
2,748 TotalEnergies SE 139,469 0.22
594 Vinci SA 62,760 0.10
840 Vivendi SE 11,358 0.02
366 Worldline SA/France '144A' 20,399 0.03
Total France 1,768,723 2.77
Germany (30 June 2021: 2.59%)
175 adidas AG 50,389 0.08
396 Allianz SE 93,510 0.15
1,058 BASF SE 74,330 0.12
952 Bayer AG 50,882 0.08
448 Bayerische Motoren Werke AG 45,082 0.07
45 Bayerische Motoren Werke AG - Preference 3,751 0.00
48 Beiersdorf AG 4,933 0.01
89 BioNTech SE ADR 21,689 0.03
42 Continental AG 4,447 0.01
75 Covestro AG '144A' 4,623 0.01

December 2021 Legal & General UCITS ETF Plc
L&G Global Equity UCITS ETF
Schedule of Investments (continued)
As at 31 December 2021
263
Nominal Description
Value $
% of Net
Assets
Common Stock (30 June 2021: 99.71%) (continued)
Germany (30 June 2021: 2.59%) (continued)
896 Daimler AG 68,869 0.11
448 Daimler Truck Holding AG 16,451 0.02
108 Delivery Hero SE '144A' 12,036 0.02
2,854 Deutsche Bank AG 35,759 0.05
143 Deutsche Boerse AG 23,921 0.04
794 Deutsche Post AG 51,052 0.08
3,543 Deutsche Telekom AG 65,674 0.10
1,972 E.ON SE 27,341 0.04
568 Evonik Industries AG 18,389 0.03
294 Fresenius Medical Care AG & Co KGaA 19,104 0.03
310 Fresenius SE & Co KGaA 12,480 0.02
37 Hannover Rueck SE 7,033 0.01
73 HeidelbergCement AG 4,941 0.01
169 Henkel AG & Co KGaA 13,203 0.02
57 Henkel AG & Co KGaA - Preference 4,611 0.01
1,370 Infineon Technologies AG 63,502 0.10
190 Knorr-Bremse AG 18,776 0.03
167 Merck KGaA 43,110 0.07
85 MTU Aero Engines AG 17,341 0.03
118 Muenchener Rueckversicherungs-Gesellschaft AG in Muenchen 34,956 0.05
75 Porsche Automobil Holding SE - Preference 7,117 0.01
583 RWE AG 23,682 0.04
1,030 SAP SE 146,296 0.23
37 Sartorius AG - Preference 25,044 0.04
792 Siemens AG 137,512 0.21
654 Siemens Energy AG 16,726 0.03
368 Siemens Healthineers AG '144A' 27,545 0.04
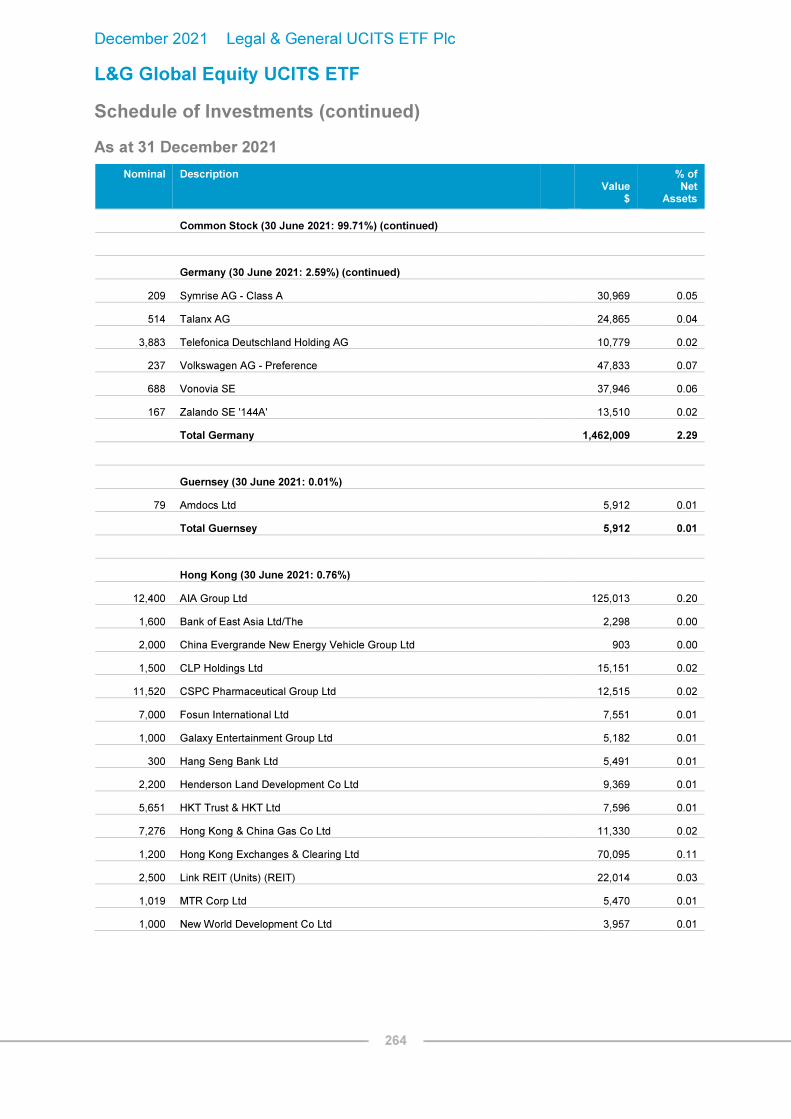
December 2021 Legal & General UCITS ETF Plc
L&G Global Equity UCITS ETF
Schedule of Investments (continued)
As at 31 December 2021
264
Nominal Description
Value $
% of Net
Assets
Common Stock (30 June 2021: 99.71%) (continued)
Germany (30 June 2021: 2.59%) (continued)
209 Symrise AG - Class A 30,969 0.05
514 Talanx AG 24,865 0.04
3,883 Telefonica Deutschland Holding AG 10,779 0.02
237 Volkswagen AG - Preference 47,833 0.07
688 Vonovia SE 37,946 0.06
167 Zalando SE '144A' 13,510 0.02
Total Germany 1,462,009 2.29
Guernsey (30 June 2021: 0.01%)
79 Amdocs Ltd 5,912 0.01
Total Guernsey 5,912 0.01
Hong Kong (30 June 2021: 0.76%)
12,400 AIA Group Ltd 125,013 0.20
1,600 Bank of East Asia Ltd/The 2,298 0.00
2,000 China Evergrande New Energy Vehicle Group Ltd 903 0.00
1,500 CLP Holdings Ltd 15,151 0.02
11,520 CSPC Pharmaceutical Group Ltd 12,515 0.02
7,000 Fosun International Ltd 7,551 0.01
1,000 Galaxy Entertainment Group Ltd 5,182 0.01
300 Hang Seng Bank Ltd 5,491 0.01
2,200 Henderson Land Development Co Ltd 9,369 0.01
5,651 HKT Trust & HKT Ltd 7,596 0.01
7,276 Hong Kong & China Gas Co Ltd 11,330 0.02
1,200 Hong Kong Exchanges & Clearing Ltd 70,095 0.11
2,500 Link REIT (Units) (REIT) 22,014 0.03
1,019 MTR Corp Ltd 5,470 0.01
1,000 New World Development Co Ltd 3,957 0.01

December 2021 Legal & General UCITS ETF Plc
L&G Global Equity UCITS ETF
Schedule of Investments (continued)
As at 31 December 2021
265
Nominal Description
Value $
% of Net
Assets
Common Stock (30 June 2021: 99.71%) (continued)
Hong Kong (30 June 2021: 0.76%) (continued)
1,000 Power Assets Holdings Ltd 6,234 0.01
8,000 Sino Land Co Ltd 9,964 0.02
1,500 Sun Hung Kai Properties Ltd 18,201 0.03
500 Swire Pacific Ltd 2,844 0.00
1,500 Techtronic Industries Co Ltd 29,860 0.05
2,000 Wharf Holdings Ltd/The 6,144 0.01
Total Hong Kong 377,182 0.59
Ireland (30 June 2021: 1.68%)
644 Accenture Plc - Class A 266,970 0.42
213 Aon Plc 64,019 0.10
723 CRH Plc 38,248 0.06
59 DCC Plc 4,835 0.01
360 Eaton Corp Plc 62,215 0.10
204 Flutter Entertainment Plc 32,246 0.05
216 Horizon Therapeutics Plc 23,276 0.04
93 ICON Plc 28,802 0.04
535 James Hardie Industries Plc CDI 21,510 0.03
31 Jazz Pharmaceuticals Plc 3,950 0.01
706 Johnson Controls International plc 57,405 0.09
136 Kerry Group Plc 17,515 0.03
112 Kingspan Group Plc 13,374 0.02
523 Linde Plc 181,183 0.28
1,397 Medtronic Plc 144,520 0.23
1,395 Ryanair Holdings Plc 24,192 0.04
266 Seagate Technology Holdings Plc 30,053 0.05
154 Smurfit Kappa Group Plc 8,483 0.01
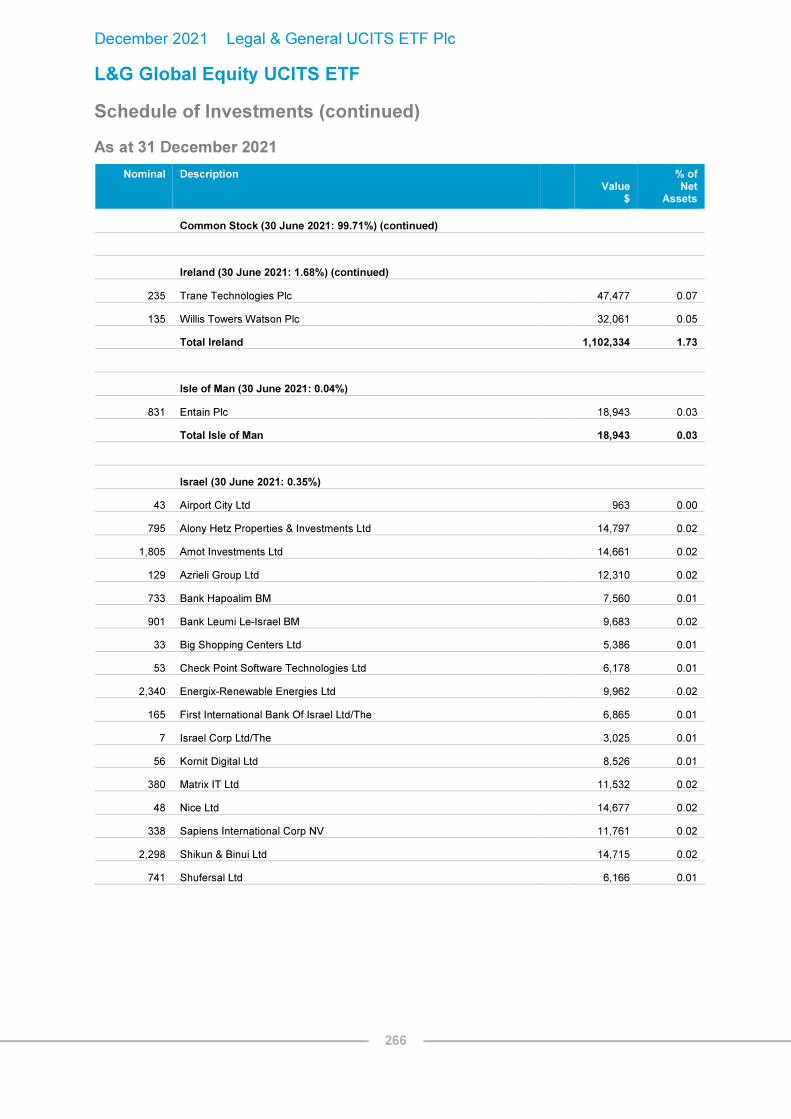
December 2021 Legal & General UCITS ETF Plc
L&G Global Equity UCITS ETF
Schedule of Investments (continued)
As at 31 December 2021
266
Nominal Description
Value $
% of Net
Assets
Common Stock (30 June 2021: 99.71%) (continued)
Ireland (30 June 2021: 1.68%) (continued)
235 Trane Technologies Plc 47,477 0.07
135 Willis Towers Watson Plc 32,061 0.05
Total Ireland 1,102,334 1.73
Isle of Man (30 June 2021: 0.04%)
831 Entain Plc 18,943 0.03
Total Isle of Man 18,943 0.03
Israel (30 June 2021: 0.35%)
43 Airport City Ltd 963 0.00
795 Alony Hetz Properties & Investments Ltd 14,797 0.02
1,805 Amot Investments Ltd 14,661 0.02
129 Azrieli Group Ltd 12,310 0.02
733 Bank Hapoalim BM 7,560 0.01
901 Bank Leumi Le-Israel BM 9,683 0.02
33 Big Shopping Centers Ltd 5,386 0.01
53 Check Point Software Technologies Ltd 6,178 0.01
2,340 Energix-Renewable Energies Ltd 9,962 0.02
165 First International Bank Of Israel Ltd/The 6,865 0.01
7 Israel Corp Ltd/The 3,025 0.01
56 Kornit Digital Ltd 8,526 0.01
380 Matrix IT Ltd 11,532 0.02
48 Nice Ltd 14,677 0.02
338 Sapiens International Corp NV 11,761 0.02
2,298 Shikun & Binui Ltd 14,715 0.02
741 Shufersal Ltd 6,166 0.01

December 2021 Legal & General UCITS ETF Plc
L&G Global Equity UCITS ETF
Schedule of Investments (continued)
As at 31 December 2021
267
Nominal Description
Value $
% of Net
Assets
Common Stock (30 June 2021: 99.71%) (continued)
Israel (30 June 2021: 0.35%) (continued)
20 Strauss Group Ltd 623 0.00
1,205 Teva Pharmaceutical Industries Ltd 10,434 0.02
89 Wix.com Ltd 14,043 0.02
Total Israel 183,867 0.29
Italy (30 June 2021: 0.67%)
4,627 A2A SpA 9,050 0.01
1,349 Assicurazioni Generali SpA 28,580 0.05
248 Atlantia SpA 4,923 0.01
700 Banca Mediolanum SpA 6,909 0.01
454 Buzzi Unicem SpA 9,796 0.02
9,274 Enel SpA 74,309 0.12
1,911 Eni SpA 26,556 0.04
1,553 FinecoBank Banca Fineco SpA 27,259 0.04
3,767 Hera SpA 15,683 0.02
25,610 Intesa Sanpaolo SpA 66,227 0.10
559 Mediobanca Banca di Credito Finanziario SpA 6,427 0.01
137 Moncler SpA 9,974 0.02
1,559 Nexi SpA '144A' 24,803 0.04
2,877 Pirelli & C SpA '144A' 19,983 0.03
739 Prysmian SpA 27,825 0.04
1,184 Snam SpA 7,136 0.01
8,192 Telecom Italia SpA/Milano 4,045 0.01
955 Terna - Rete Elettrica Nazionale 7,726 0.01
2,006 UniCredit SpA 30,897 0.05
Total Italy 408,108 0.64
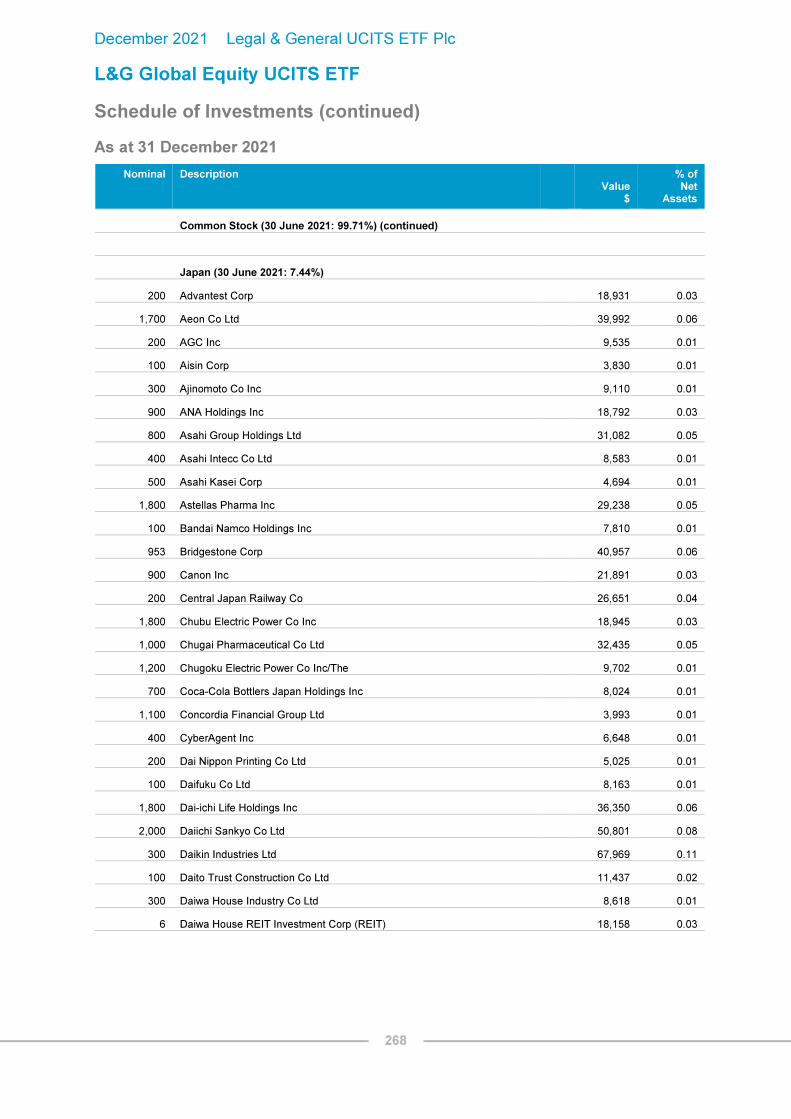
December 2021 Legal & General UCITS ETF Plc
L&G Global Equity UCITS ETF
Schedule of Investments (continued)
As at 31 December 2021
268
Nominal Description
Value $
% of Net
Assets
Common Stock (30 June 2021: 99.71%) (continued)
Japan (30 June 2021: 7.44%)
200 Advantest Corp 18,931 0.03
1,700 Aeon Co Ltd 39,992 0.06
200 AGC Inc 9,535 0.01
100 Aisin Corp 3,830 0.01
300 Ajinomoto Co Inc 9,110 0.01
900 ANA Holdings Inc 18,792 0.03
800 Asahi Group Holdings Ltd 31,082 0.05
400 Asahi Intecc Co Ltd 8,583 0.01
500 Asahi Kasei Corp 4,694 0.01
1,800 Astellas Pharma Inc 29,238 0.05
100 Bandai Namco Holdings Inc 7,810 0.01
953 Bridgestone Corp 40,957 0.06
900 Canon Inc 21,891 0.03
200 Central Japan Railway Co 26,651 0.04
1,800 Chubu Electric Power Co Inc 18,945 0.03
1,000 Chugai Pharmaceutical Co Ltd 32,435 0.05
1,200 Chugoku Electric Power Co Inc/The 9,702 0.01
700 Coca-Cola Bottlers Japan Holdings Inc 8,024 0.01
1,100 Concordia Financial Group Ltd 3,993 0.01
400 CyberAgent Inc 6,648 0.01
200 Dai Nippon Printing Co Ltd 5,025 0.01
100 Daifuku Co Ltd 8,163 0.01
1,800 Dai-ichi Life Holdings Inc 36,350 0.06
2,000 Daiichi Sankyo Co Ltd 50,801 0.08
300 Daikin Industries Ltd 67,969 0.11
100 Daito Trust Construction Co Ltd 11,437 0.02
300 Daiwa House Industry Co Ltd 8,618 0.01
6 Daiwa House REIT Investment Corp (REIT) 18,158 0.03

December 2021 Legal & General UCITS ETF Plc
L&G Global Equity UCITS ETF
Schedule of Investments (continued)
As at 31 December 2021
269
Nominal Description
Value $
% of Net
Assets
Common Stock (30 June 2021: 99.71%) (continued)
Japan (30 June 2021: 7.44%) (continued)
900 Daiwa Securities Group Inc 5,070 0.01
600 Denso Corp 49,650 0.08
100 Dentsu Group Inc 3,560 0.01
200 East Japan Railway Co 12,284 0.02
300 Eisai Co Ltd 17,014 0.03
1,400 ENEOS Holdings Inc 5,231 0.01
200 FANUC Corp 42,343 0.07
79 Fast Retailing Co Ltd 44,805 0.07
500 FUJIFILM Holdings Corp 37,020 0.06
200 Fujitsu Ltd 34,267 0.05
10 GLP J-Reit (REIT) 17,272 0.03
1,500 Hakuhodo DY Holdings Inc 24,958 0.04
200 Hankyu Hanshin Holdings Inc 5,671 0.01
1,300 Hitachi Ltd 70,331 0.11
300 Hitachi Metals Ltd 5,552 0.01
2,200 Honda Motor Co Ltd 61,708 0.10
400 Hoya Corp 59,433 0.09
600 Idemitsu Kosan Co Ltd 15,303 0.02
1,900 Inpex Corp 16,532 0.03
400 Isuzu Motors Ltd 4,971 0.01
1,200 ITOCHU Corp 36,660 0.06
700 Itochu Techno-Solutions Corp 22,491 0.03
400 Izumi Co Ltd 11,202 0.02
1,472 J Front Retailing Co Ltd 13,384 0.02
500 Japan Airlines Co Ltd 9,535 0.01
300 Japan Exchange Group Inc 6,560 0.01
6 Japan Metropolitan Fund Invest (REIT) 5,163 0.01
600 Japan Post Holdings Co Ltd 4,673 0.01

December 2021 Legal & General UCITS ETF Plc
L&G Global Equity UCITS ETF
Schedule of Investments (continued)
As at 31 December 2021
270
Nominal Description
Value $
% of Net
Assets
Common Stock (30 June 2021: 99.71%) (continued)
Japan (30 June 2021: 7.44%) (continued)
1,400 Japan Tobacco Inc 28,236 0.04
300 JFE Holdings Inc 3,822 0.01
400 Kajima Corp 4,589 0.01
1,400 Kansai Electric Power Co Inc/The 13,057 0.02
400 Kao Corp 20,907 0.03
2,000 KDDI Corp 58,391 0.09
600 Keikyu Corp 5,992 0.01
100 Keio Corp 4,403 0.01
500 Keisei Electric Railway Co Ltd 13,504 0.02
199 Keyence Corp 124,907 0.20
100 Kikkoman Corp 8,397 0.01
100 Kintetsu Group Holdings Co Ltd 2,792 0.00
400 Kirin Holdings Co Ltd 6,416 0.01
300 Kobe Bussan Co Ltd 11,606 0.02
100 Koito Manufacturing Co Ltd 5,289 0.01
900 Komatsu Ltd 21,051 0.03
1,000 Kubota Corp 22,174 0.03
400 Kuraray Co Ltd 3,470 0.01
300 Kyocera Corp 18,723 0.03
800 Kyowa Kirin Co Ltd 21,779 0.03
2,400 Kyushu Electric Power Co Inc 17,861 0.03
300 Kyushu Railway Co 6,232 0.01
100 Lasertec Corp (Units) 30,646 0.05
300 Lawson Inc 14,198 0.02
400 Lion Corp 5,339 0.01
300 M3 Inc 15,092 0.02
400 Makita Corp 16,961 0.03
800 Marubeni Corp 7,777 0.01

December 2021 Legal & General UCITS ETF Plc
L&G Global Equity UCITS ETF
Schedule of Investments (continued)
As at 31 December 2021
271
Nominal Description
Value $
% of Net
Assets
Common Stock (30 June 2021: 99.71%) (continued)
Japan (30 June 2021: 7.44%) (continued)
1,800 Mazda Motor Corp 13,834 0.02
100 MEIJI Holdings Co Ltd 5,957 0.01
300 MINEBEA MITSUMI Inc 8,506 0.01
200 MISUMI Group Inc 8,198 0.01
600 Mitsubishi Chemical Holdings Corp 4,439 0.01
1,971 Mitsubishi Corp 62,508 0.10
1,600 Mitsubishi Electric Corp 20,265 0.03
600 Mitsubishi Estate Co Ltd 8,308 0.01
100 Mitsubishi Heavy Industries Ltd 2,309 0.00
14,400 Mitsubishi UFJ Financial Group Inc 78,143 0.12
2,413 Mitsui & Co Ltd 57,069 0.09
1,000 Mitsui Fudosan Co Ltd 19,786 0.03
200 Mitsui OSK Lines Ltd 14,832 0.02
1,860 Mizuho Financial Group Inc 23,631 0.04
500 MonotaRO Co Ltd 9,001 0.01
200 MS&AD Insurance Group Holdings Inc 6,164 0.01
900 Murata Manufacturing Co Ltd 71,567 0.11
700 Nagoya Railroad Co Ltd 10,638 0.02
200 NEC Corp 9,222 0.01
400 Nexon Co Ltd 7,725 0.01
700 Nidec Corp 82,185 0.13
600 Nihon M&A Center Holdings Inc 14,698 0.02
300 Nikon Corp 3,230 0.00
100 Nintendo Co Ltd 46,589 0.07
4 Nippon Building Fund Inc (REIT) 23,273 0.04
1,000 Nippon Paint Holdings Co Ltd 10,890 0.02
400 Nippon Steel Corp 6,525 0.01
2,800 Nippon Telegraph & Telephone Corp 76,592 0.12
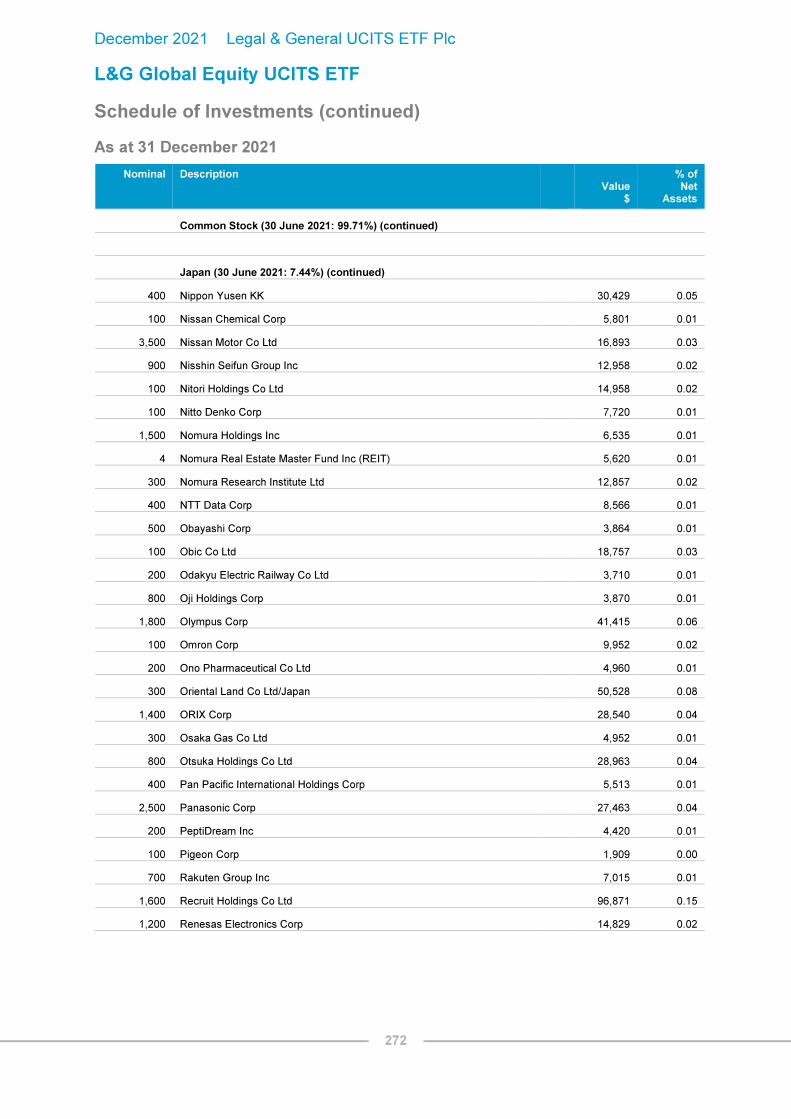
December 2021 Legal & General UCITS ETF Plc
L&G Global Equity UCITS ETF
Schedule of Investments (continued)
As at 31 December 2021
272
Nominal Description
Value $
% of Net
Assets
Common Stock (30 June 2021: 99.71%) (continued)
Japan (30 June 2021: 7.44%) (continued)
400 Nippon Yusen KK 30,429 0.05
100 Nissan Chemical Corp 5,801 0.01
3,500 Nissan Motor Co Ltd 16,893 0.03
900 Nisshin Seifun Group Inc 12,958 0.02
100 Nitori Holdings Co Ltd 14,958 0.02
100 Nitto Denko Corp 7,720 0.01
1,500 Nomura Holdings Inc 6,535 0.01
4 Nomura Real Estate Master Fund Inc (REIT) 5,620 0.01
300 Nomura Research Institute Ltd 12,857 0.02
400 NTT Data Corp 8,566 0.01
500 Obayashi Corp 3,864 0.01
100 Obic Co Ltd 18,757 0.03
200 Odakyu Electric Railway Co Ltd 3,710 0.01
800 Oji Holdings Corp 3,870 0.01
1,800 Olympus Corp 41,415 0.06
100 Omron Corp 9,952 0.02
200 Ono Pharmaceutical Co Ltd 4,960 0.01
300 Oriental Land Co Ltd/Japan 50,528 0.08
1,400 ORIX Corp 28,540 0.04
300 Osaka Gas Co Ltd 4,952 0.01
800 Otsuka Holdings Co Ltd 28,963 0.04
400 Pan Pacific International Holdings Corp 5,513 0.01
2,500 Panasonic Corp 27,463 0.04
200 PeptiDream Inc 4,420 0.01
100 Pigeon Corp 1,909 0.00
700 Rakuten Group Inc 7,015 0.01
1,600 Recruit Holdings Co Ltd 96,871 0.15
1,200 Renesas Electronics Corp 14,829 0.02
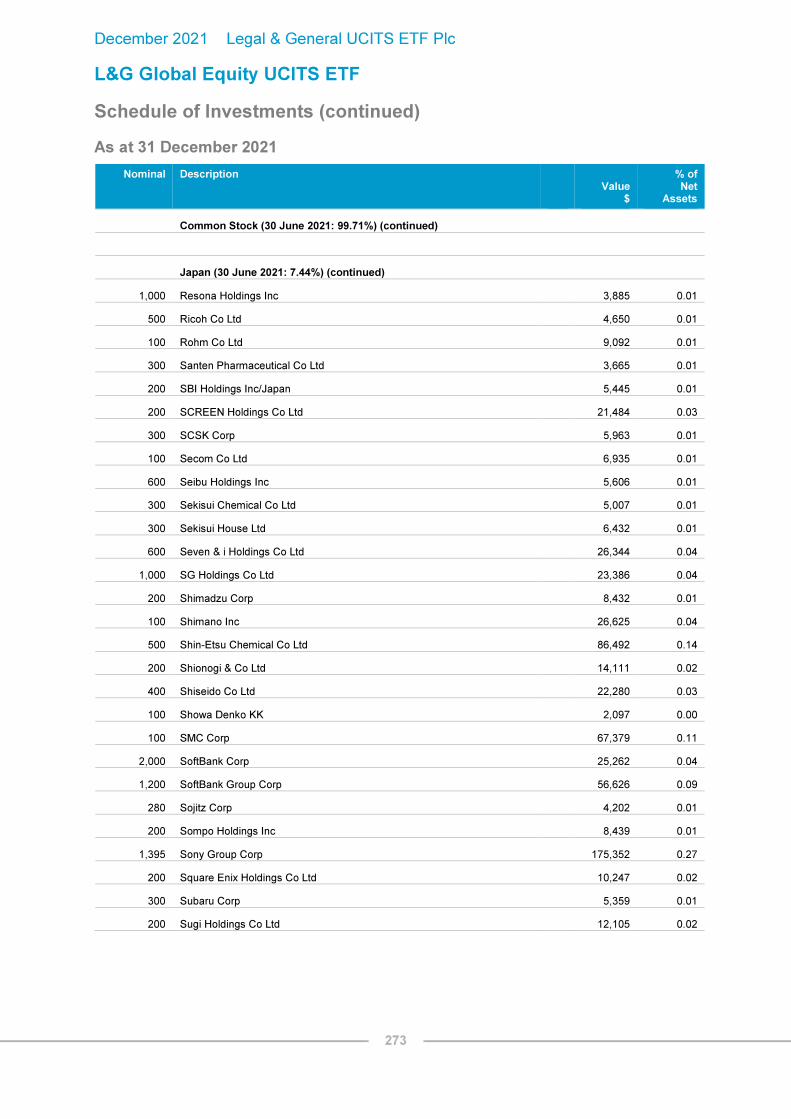
December 2021 Legal & General UCITS ETF Plc
L&G Global Equity UCITS ETF
Schedule of Investments (continued)
As at 31 December 2021
273
Nominal Description
Value $
% of Net
Assets
Common Stock (30 June 2021: 99.71%) (continued)
Japan (30 June 2021: 7.44%) (continued)
1,000 Resona Holdings Inc 3,885 0.01
500 Ricoh Co Ltd 4,650 0.01
100 Rohm Co Ltd 9,092 0.01
300 Santen Pharmaceutical Co Ltd 3,665 0.01
200 SBI Holdings Inc/Japan 5,445 0.01
200 SCREEN Holdings Co Ltd 21,484 0.03
300 SCSK Corp 5,963 0.01
100 Secom Co Ltd 6,935 0.01
600 Seibu Holdings Inc 5,606 0.01
300 Sekisui Chemical Co Ltd 5,007 0.01
300 Sekisui House Ltd 6,432 0.01
600 Seven & i Holdings Co Ltd 26,344 0.04
1,000 SG Holdings Co Ltd 23,386 0.04
200 Shimadzu Corp 8,432 0.01
100 Shimano Inc 26,625 0.04
500 Shin-Etsu Chemical Co Ltd 86,492 0.14
200 Shionogi & Co Ltd 14,111 0.02
400 Shiseido Co Ltd 22,280 0.03
100 Showa Denko KK 2,097 0.00
100 SMC Corp 67,379 0.11
2,000 SoftBank Corp 25,262 0.04
1,200 SoftBank Group Corp 56,626 0.09
280 Sojitz Corp 4,202 0.01
200 Sompo Holdings Inc 8,439 0.01
1,395 Sony Group Corp 175,352 0.27
200 Square Enix Holdings Co Ltd 10,247 0.02
300 Subaru Corp 5,359 0.01
200 Sugi Holdings Co Ltd 12,105 0.02

December 2021 Legal & General UCITS ETF Plc
L&G Global Equity UCITS ETF
Schedule of Investments (continued)
As at 31 December 2021
274
Nominal Description
Value $
% of Net
Assets
Common Stock (30 June 2021: 99.71%) (continued)
Japan (30 June 2021: 7.44%) (continued)
1,000 Sumitomo Chemical Co Ltd 4,707 0.01
1,300 Sumitomo Corp 19,197 0.03
400 Sumitomo Electric Industries Ltd 5,209 0.01
200 Sumitomo Metal Mining Co Ltd 7,555 0.01
1,000 Sumitomo Mitsui Financial Group Inc 34,241 0.05
200 Sumitomo Mitsui Trust Holdings Inc 6,674 0.01
200 Sumitomo Realty & Development Co Ltd 5,876 0.01
1,525 Sumitomo Rubber Industries Ltd 15,521 0.02
300 Sundrug Co Ltd 7,829 0.01
100 Suntory Beverage & Food Ltd 3,612 0.01
200 Suzuki Motor Corp 7,692 0.01
100 Sysmex Corp 13,504 0.02
300 T&D Holdings Inc 3,835 0.01
100 Taisei Corp 3,035 0.00
300 Taisho Pharmaceutical Holdings Co Ltd 13,781 0.02
1,400 Takeda Pharmaceutical Co Ltd 38,138 0.06
300 TDK Corp 11,697 0.02
600 Terumo Corp 25,322 0.04
200 Tobu Railway Co Ltd 4,554 0.01
100 Toho Gas Co Ltd 2,544 0.00
2,300 Tohoku Electric Power Co Inc 16,298 0.03
600 Tokio Marine Holdings Inc 33,305 0.05
200 Tokyo Electron Ltd 115,114 0.18
200 Tokyo Gas Co Ltd 3,581 0.01
300 Tokyu Corp 3,981 0.01
700 Toray Industries Inc 4,144 0.01
100 TOTO Ltd 4,594 0.01

December 2021 Legal & General UCITS ETF Plc
L&G Global Equity UCITS ETF
Schedule of Investments (continued)
As at 31 December 2021
275
Nominal Description
Value $
% of Net
Assets
Common Stock (30 June 2021: 99.71%) (continued)
Japan (30 June 2021: 7.44%) (continued)
1,001 Toyota Boshoku Corp 19,611 0.03
100 Toyota Industries Corp 7,981 0.01
11,800 Toyota Motor Corp 215,752 0.34
100 Toyota Tsusho Corp 4,602 0.01
100 Trend Micro Inc/Japan 5,549 0.01
700 Unicharm Corp 30,388 0.05
500 USS Co Ltd 7,798 0.01
100 West Japan Railway Co 4,177 0.01
100 Yakult Honsha Co Ltd 5,210 0.01
100 Yamaha Corp 4,924 0.01
300 Yamaha Motor Co Ltd 7,188 0.01
200 Yamato Holdings Co Ltd 4,695 0.01
200 Yaskawa Electric Corp 9,795 0.01
1,700 Z Holdings Corp 9,853 0.02
Total Japan 4,305,535 6.75
Jersey (30 June 2021: 0.34%)
1,784 Amcor Plc 21,426 0.03
281 Aptiv Plc 46,351 0.07
863 Experian Plc 42,454 0.07
178 Ferguson Plc 31,595 0.05
13,299 Glencore Plc 67,539 0.11
444 WPP Plc 6,733 0.01
Total Jersey 216,098 0.34
Liberia (30 June 2021: 0.02%)
144 Royal Caribbean Cruises Ltd 11,074 0.02
Total Liberia 11,074 0.02

December 2021 Legal & General UCITS ETF Plc
L&G Global Equity UCITS ETF
Schedule of Investments (continued)
As at 31 December 2021
276
Nominal Description
Value $
% of Net
Assets
Common Stock (30 June 2021: 99.71%) (continued)
Luxembourg (30 June 2021: 0.17%)
653 ArcelorMittal SA 20,900 0.03
163 Eurofins Scientific SE 20,167 0.03
88 Millicom International Cellular SA SDR 2,501 0.00
149 Spotify Technology SA 34,871 0.06
326 Tenaris SA 3,414 0.01
Total Luxembourg 81,853 0.13
Netherlands (30 June 2021: 1.63%)
196 ABN AMRO Bank NV Dutch Cert '144A' 2,879 0.00
26 Adyen NV '144A' 68,344 0.11
102 AerCap Holdings NV 6,673 0.01
595 Airbus SE 76,026 0.12
86 Akzo Nobel NV 9,437 0.02
64 ASM International NV 28,290 0.04
429 ASML Holding NV 344,767 0.54
474 CNH Industrial NV 9,201 0.01
86 EXOR NV 7,722 0.01
118 Ferrari NV 30,528 0.05
57 Heineken Holding NV 5,260 0.01
245 Heineken NV 27,543 0.04
4,371 ING Groep NV 60,851 0.10
233 JDE Peet's NV 7,181 0.01
198 Just Eat Takeaway.com NV '144A' 10,914 0.02
790 Koninklijke Ahold Delhaize NV 27,073 0.04
254 Koninklijke DSM NV 57,192 0.09
1,850 Koninklijke KPN NV 5,743 0.01
1,226 Koninklijke Philips NV 45,681 0.07
253 LyondellBasell Industries NV 23,334 0.04

December 2021 Legal & General UCITS ETF Plc
L&G Global Equity UCITS ETF
Schedule of Investments (continued)
As at 31 December 2021
277
Nominal Description
Value $
% of Net
Assets
Common Stock (30 June 2021: 99.71%) (continued)
Netherlands (30 June 2021: 1.63%) (continued)
131 NN Group NV 7,093 0.01
262 NXP Semiconductors NV 59,678 0.09
1,019 Prosus NV 85,206 0.13
102 Randstad NV 6,964 0.01
2,235 Stellantis NV 42,409 0.07
886 STMicroelectronics NV 44,090 0.07
417 Wolters Kluwer NV 49,128 0.08
Total Netherlands 1,149,207 1.80
New Zealand (30 June 2021: 0.18%)
802 a2 Milk Co Ltd/The 3,256 0.00
1,041 Auckland International Airport Ltd 5,488 0.01
3,121 Chorus Ltd 15,321 0.02
546 Fisher & Paykel Healthcare Corp Ltd 12,246 0.02
4,457 Fletcher Building Ltd 22,368 0.03
2,145 Infratil Ltd 11,749 0.02
1,884 Spark New Zealand Ltd 5,830 0.01
280 Xero Ltd 28,793 0.05
Total New Zealand 105,051 0.16
Norway (30 June 2021: 0.20%)
1,440 DNB Bank ASA 32,986 0.05
1,298 Equinor ASA 34,723 0.06
202 Mowi ASA 4,781 0.01
925 Norsk Hydro ASA 7,292 0.01
587 Orkla ASA 5,882 0.01
374 Schibsted ASA 14,424 0.02
151 Schibsted ASA - Class B 5,086 0.01

December 2021 Legal & General UCITS ETF Plc
L&G Global Equity UCITS ETF
Schedule of Investments (continued)
As at 31 December 2021
278
Nominal Description
Value $
% of Net
Assets
Common Stock (30 June 2021: 99.71%) (continued)
Norway (30 June 2021: 0.20%) (continued)
296 Telenor ASA 4,652 0.01
300 TOMRA Systems ASA 21,467 0.03
113 Yara International ASA 5,702 0.01
Total Norway 136,995 0.22
Panama (30 June 2021: 0.05%)
965 Carnival Corp 19,416 0.03
Total Panama 19,416 0.03
Poland (30 June 2021: 0.08%)
1,956 Cyfrowy Polsat SA 16,850 0.03
73 mBank SA 7,847 0.01
182 Santander Bank Polska SA 15,737 0.02
Total Poland 40,434 0.06
Portugal (30 June 2021: 0.02%)
1,417 EDP - Energias de Portugal SA 7,786 0.01
292 Galp Energia SGPS SA 2,829 0.01
Total Portugal 10,615 0.02
Singapore (30 June 2021: 0.32%)
12,040 CapitaLand Integrated Commercial Trust (Units) (REIT) 18,219 0.03
4,363 City Developments Ltd 22,039 0.03
2,100 DBS Group Holdings Ltd 50,874 0.08
1,100 Keppel Corp Ltd 4,178 0.01
11,645 Mapletree Commercial Trust (REIT) 17,275 0.03
4,753 Oversea-Chinese Banking Corp Ltd 40,192 0.06

December 2021 Legal & General UCITS ETF Plc
L&G Global Equity UCITS ETF
Schedule of Investments (continued)
As at 31 December 2021
279
Nominal Description
Value $
% of Net
Assets
Common Stock (30 June 2021: 99.71%) (continued)
Singapore (30 June 2021: 0.32%) (continued)
2,900 Singapore Exchange Ltd 20,005 0.03
3,700 Singapore Telecommunications Ltd 6,367 0.01
1,500 United Overseas Bank Ltd 29,930 0.05
1,200 UOL Group Ltd 6,311 0.01
Total Singapore 215,390 0.34
Spain (30 June 2021: 0.71%)
136 ACS Actividades de Construccion y Servicios SA 3,645 0.00
32 Aena SME SA '144A' 5,051 0.01
605 Amadeus IT Group SA 41,032 0.06
7,349 Banco Bilbao Vizcaya Argentaria SA 43,875 0.07
17,744 Banco Santander SA 59,334 0.09
1,404 CaixaBank SA 3,854 0.01
671 Cellnex Telecom SA '144A' 39,053 0.06
235 Endesa SA 5,398 0.01
252 Ferrovial SA 7,898 0.01
194 Grifols SA 3,723 0.01
694 Grifols SA - Preference 7,979 0.01
6,905 Iberdrola SA 81,743 0.13
1,210 Industria de Diseno Textil SA 39,257 0.06
5,518 International Consolidated Airlines Group SA 10,649 0.02
5,351 Mapfre SA 10,987 0.02
569 Naturgy Energy Group SA 18,525 0.03
240 Red Electrica Corp SA 5,193 0.01
1,264 Repsol SA 15,001 0.02
393 Siemens Gamesa Renewable Energy SA 9,417 0.01
3,948 Telefonica SA 17,294 0.03
Total Spain 428,908 0.67
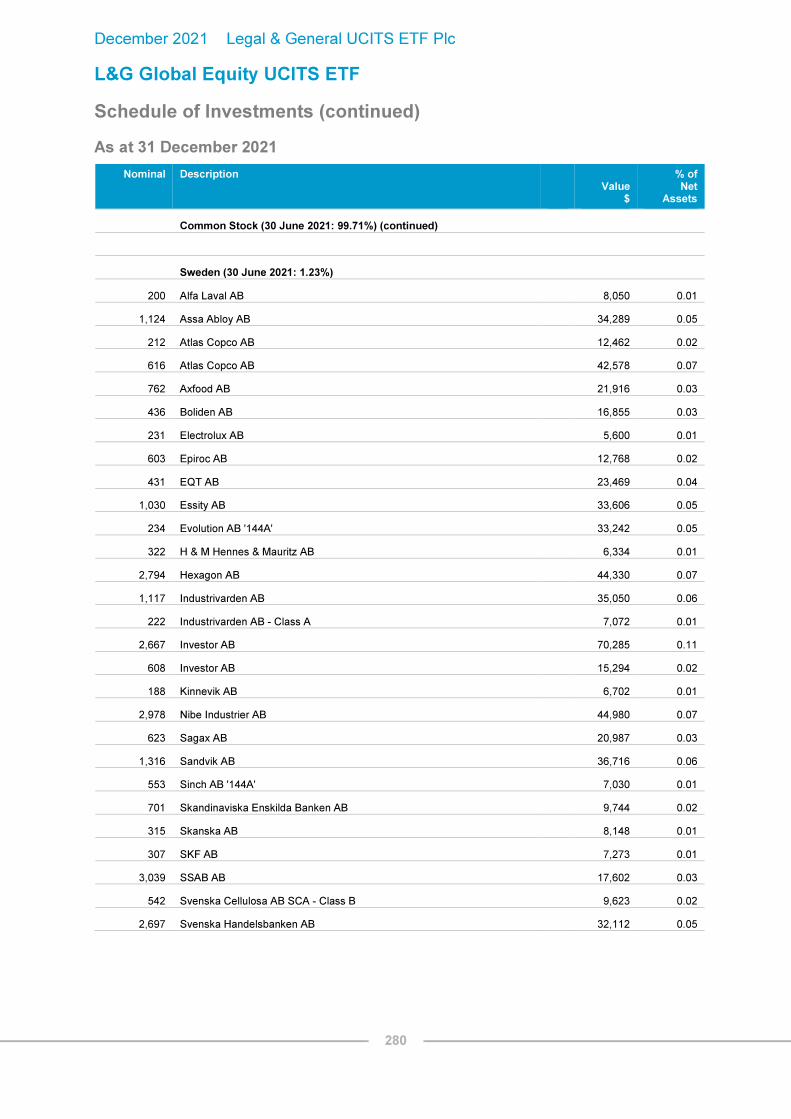
December 2021 Legal & General UCITS ETF Plc
L&G Global Equity UCITS ETF
Schedule of Investments (continued)
As at 31 December 2021
280
Nominal Description
Value $
% of Net
Assets
Common Stock (30 June 2021: 99.71%) (continued)
Sweden (30 June 2021: 1.23%)
200 Alfa Laval AB 8,050 0.01
1,124 Assa Abloy AB 34,289 0.05
212 Atlas Copco AB 12,462 0.02
616 Atlas Copco AB 42,578 0.07
762 Axfood AB 21,916 0.03
436 Boliden AB 16,855 0.03
231 Electrolux AB 5,600 0.01
603 Epiroc AB 12,768 0.02
431 EQT AB 23,469 0.04
1,030 Essity AB 33,606 0.05
234 Evolution AB '144A' 33,242 0.05
322 H & M Hennes & Mauritz AB 6,334 0.01
2,794 Hexagon AB 44,330 0.07
1,117 Industrivarden AB 35,050 0.06
222 Industrivarden AB - Class A 7,072 0.01
2,667 Investor AB 70,285 0.11
608 Investor AB 15,294 0.02
188 Kinnevik AB 6,702 0.01
2,978 Nibe Industrier AB 44,980 0.07
623 Sagax AB 20,987 0.03
1,316 Sandvik AB 36,716 0.06
553 Sinch AB '144A' 7,030 0.01
701 Skandinaviska Enskilda Banken AB 9,744 0.02
315 Skanska AB 8,148 0.01
307 SKF AB 7,273 0.01
3,039 SSAB AB 17,602 0.03
542 Svenska Cellulosa AB SCA - Class B 9,623 0.02
2,697 Svenska Handelsbanken AB 32,112 0.05

December 2021 Legal & General UCITS ETF Plc
L&G Global Equity UCITS ETF
Schedule of Investments (continued)
As at 31 December 2021
281
Nominal Description
Value $
% of Net
Assets
Common Stock (30 June 2021: 99.71%) (continued)
Sweden (30 June 2021: 1.23%) (continued)
581 Svenska Handelsbanken AB 6,280 0.01
845 Swedbank AB 16,996 0.03
970 Swedish Match AB 7,716 0.01
2,390 Telefonaktiebolaget LM Ericsson - Class B 26,342 0.04
1,076 Telia Co AB 4,208 0.01
2,503 Volvo AB 57,959 0.09
Total Sweden 743,618 1.17
Switzerland (30 June 2021: 2.74%)
1,614 ABB Ltd 61,822 0.10
524 Alcon Inc 46,434 0.07
377 Chubb Ltd 72,878 0.12
434 Cie Financiere Richemont SA 65,233 0.10
2,225 Credit Suisse Group AG 21,665 0.03
162 Garmin Ltd 22,059 0.04
54 Geberit AG 44,165 0.07
7 Givaudan SA 36,815 0.06
848 Holcim Ltd 43,287 0.07
37 Kuehne + Nagel International AG 11,955 0.02
69 Lonza Group AG 57,675 0.09
2,917 Nestle SA 407,995 0.64
2,383 Novartis AG 209,964 0.33
25 Partners Group Holding AG 41,500 0.07
678 Roche Holding AG 282,095 0.44
60 Roche Holding AG 26,920 0.04
37 Schindler Holding AG 9,925 0.02
25 Schindler Holding AG 6,736 0.01
2 SGS SA 6,688 0.01

December 2021 Legal & General UCITS ETF Plc
L&G Global Equity UCITS ETF
Schedule of Investments (continued)
As at 31 December 2021
282
Nominal Description
Value $
% of Net
Assets
Common Stock (30 June 2021: 99.71%) (continued)
Switzerland (30 June 2021: 2.74%) (continued)
141 Sika AG 58,836 0.09
15 Straumann Holding AG 31,888 0.05
447 Swatch Group AG/The 26,222 0.04
15 Swatch Group AG/The 4,593 0.01
276 Swiss Re AG 27,341 0.04
11 Swisscom AG 6,213 0.01
279 TE Connectivity Ltd 45,014 0.07
4,371 UBS Group AG 78,771 0.12
150 Zurich Insurance Group AG 65,917 0.10
Total Switzerland 1,820,606 2.86
United Kingdom (30 June 2021: 4.41%)
446 3i Group Plc 8,753 0.01
1,420 abrdn plc 4,633 0.01
471 Admiral Group Plc 20,140 0.03
1,042 Anglo American Plc 42,566 0.07
1,332 Antofagasta Plc 24,148 0.04
654 Ashtead Group Plc 52,635 0.08
161 Associated British Foods Plc 4,379 0.01
1,552 AstraZeneca Plc 182,421 0.29
142 Atlassian Corp Plc 54,143 0.08
1,775 Auto Trader Group Plc '144A' 17,791 0.03
3,556 Aviva Plc 19,767 0.03
2,777 BAE Systems Plc 20,680 0.03
24,030 Barclays Plc 60,864 0.09
715 Barratt Developments Plc 7,244 0.01
138 Berkeley Group Holdings Plc 8,925 0.01
2,141 BHP Group Plc 63,783 0.10

December 2021 Legal & General UCITS ETF Plc
L&G Global Equity UCITS ETF
Schedule of Investments (continued)
As at 31 December 2021
283
Nominal Description
Value $
% of Net
Assets
Common Stock (30 June 2021: 99.71%) (continued)
United Kingdom (30 June 2021: 4.41%) (continued)
18,914 BP Plc 84,668 0.13
2,546 British American Tobacco Plc 94,263 0.15
637 British Land Co Plc/The (REIT) 4,581 0.01
6,391 BT Group Plc 14,677 0.02
171 Bunzl Plc 6,682 0.01
213 Burberry Group Plc 5,243 0.01
90 Carnival Plc 1,687 0.00
108 Coca-Cola Europacific Partners Plc 6,040 0.01
2,166 Compass Group Plc 48,436 0.08
78 Croda International Plc 10,691 0.02
2,390 Diageo Plc 130,651 0.20
4,112 Direct Line Insurance Group Plc 15,539 0.02
577 easyJet Plc 4,345 0.01
4,865 GlaxoSmithKline Plc 105,865 0.17
647 Halma Plc 28,043 0.04
541 Hargreaves Lansdown Plc 9,929 0.02
22,161 HSBC Holdings Plc 134,667 0.21
750 Imperial Brands Plc 16,421 0.03
545 Informa Plc 3,813 0.01
89 InterContinental Hotels Group Plc 5,763 0.01
630 Intermediate Capital Group Plc 18,721 0.03
82 Intertek Group Plc 6,253 0.01
2,481 ITV Plc 3,715 0.01
1,226 J Sainsbury Plc 4,580 0.01
15,935 JD Sports Fashion Plc 47,008 0.07
128 Johnson Matthey Plc 3,547 0.01
1,509 Kingfisher Plc 6,914 0.01
448 Land Securities Group Plc (REIT) 4,711 0.01

December 2021 Legal & General UCITS ETF Plc
L&G Global Equity UCITS ETF
Schedule of Investments (continued)
As at 31 December 2021
284
Nominal Description
Value $
% of Net
Assets
Common Stock (30 June 2021: 99.71%) (continued)
United Kingdom (30 June 2021: 4.41%) (continued)
5,418 Legal & General Group Plc 21,832 0.03
264 Liberty Global Plc 7,416 0.01
82,240 Lloyds Banking Group Plc 53,244 0.08
455 London Stock Exchange Group Plc 42,708 0.07
1,854 M&G Plc 5,010 0.01
1,565 Meggitt Plc 15,643 0.02
2,009 Melrose Industries Plc 4,351 0.01
210 Mondi Plc 5,194 0.01
3,931 National Grid Plc 56,427 0.09
7,203 NatWest Group Plc 22,020 0.03
73 Next Plc 8,058 0.01
159 NMC Health Plc* – –
512 Ocado Group Plc 11,637 0.02
423 Pearson Plc 3,513 0.00
162 Persimmon Plc 6,267 0.01
4,015 Phoenix Group Holdings Plc 35,522 0.06
3,131 Prudential Plc 54,049 0.08
885 Reckitt Benckiser Group Plc 76,021 0.12
2,487 RELX Plc 80,912 0.13
1,251 Rentokil Initial Plc 9,895 0.01
2,231 Rightmove Plc 24,023 0.04
1,150 Rio Tinto Plc 76,199 0.12
6,965 Rolls-Royce Holdings Plc 11,592 0.02
1,168 Royal Dutch Shell Plc 25,666 0.04
6,813 Royal Dutch Shell Plc 149,658 0.23
522 Royalty Pharma Plc - Class A 20,802 0.03
692 Sage Group Plc/The 7,991 0.01
146 Schroders Plc 7,040 0.01

December 2021 Legal & General UCITS ETF Plc
L&G Global Equity UCITS ETF
Schedule of Investments (continued)
As at 31 December 2021
285
Nominal Description
Value $
% of Net
Assets
Common Stock (30 June 2021: 99.71%) (continued)
United Kingdom (30 June 2021: 4.41%) (continued)
624 Segro Plc (REIT) 12,141 0.02
473 Severn Trent Plc 18,880 0.03
1,466 Smith & Nephew Plc 25,684 0.04
285 Smiths Group Plc 6,097 0.01
82 Spirax-Sarco Engineering Plc 17,826 0.03
1,064 SSE Plc 23,764 0.04
378 St James's Place Plc 8,619 0.01
2,903 Standard Chartered Plc 17,631 0.03
2,325 Taylor Wimpey Plc 5,527 0.01
10,586 Tesco Plc 41,566 0.06
2,580 Unilever Plc 137,875 0.22
517 United Utilities Group Plc 7,626 0.01
36,293 Vodafone Group Plc 55,184 0.09
554 Weir Group Plc/The 12,842 0.02
94 Whitbread Plc 3,813 0.01
Total United Kingdom 2,658,090 4.17
United States (30 June 2021: 63.69%)
77 10X Genomics Inc (Units) 11,470 0.02
593 3M Co 105,335 0.17
303 A O Smith Corp 26,013 0.04
1,791 Abbott Laboratories 252,065 0.40
1,804 AbbVie Inc 244,262 0.38
44 ABIOMED Inc 15,803 0.02
893 Activision Blizzard Inc 59,411 0.09
491 Adobe Inc 278,426 0.44
30 Advance Auto Parts Inc 7,196 0.01
1,266 Advanced Micro Devices Inc 182,177 0.29
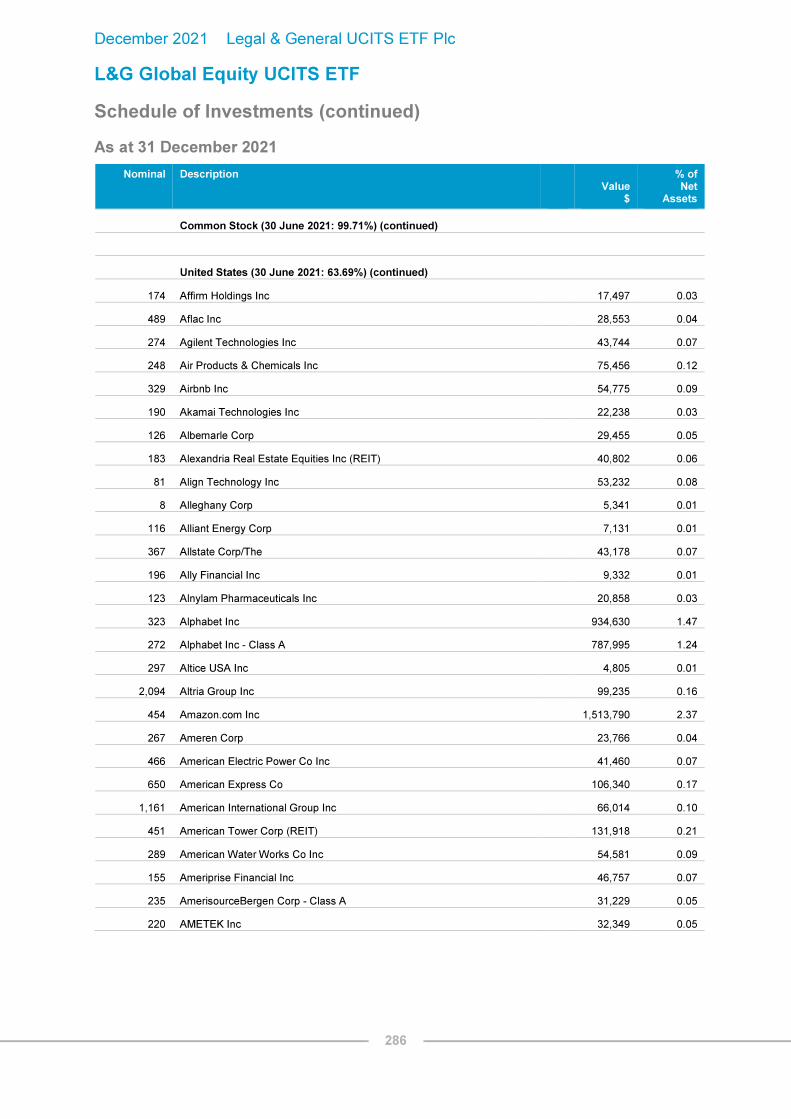
December 2021 Legal & General UCITS ETF Plc
L&G Global Equity UCITS ETF
Schedule of Investments (continued)
As at 31 December 2021
286
Nominal Description
Value $
% of Net
Assets
Common Stock (30 June 2021: 99.71%) (continued)
United States (30 June 2021: 63.69%) (continued)
174 Affirm Holdings Inc 17,497 0.03
489 Aflac Inc 28,553 0.04
274 Agilent Technologies Inc 43,744 0.07
248 Air Products & Chemicals Inc 75,456 0.12
329 Airbnb Inc 54,775 0.09
190 Akamai Technologies Inc 22,238 0.03
126 Albemarle Corp 29,455 0.05
183 Alexandria Real Estate Equities Inc (REIT) 40,802 0.06
81 Align Technology Inc 53,232 0.08
8 Alleghany Corp 5,341 0.01
116 Alliant Energy Corp 7,131 0.01
367 Allstate Corp/The 43,178 0.07
196 Ally Financial Inc 9,332 0.01
123 Alnylam Pharmaceuticals Inc 20,858 0.03
323 Alphabet Inc 934,630 1.47
272 Alphabet Inc - Class A 787,995 1.24
297 Altice USA Inc 4,805 0.01
2,094 Altria Group Inc 99,235 0.16
454 Amazon.com Inc 1,513,790 2.37
267 Ameren Corp 23,766 0.04
466 American Electric Power Co Inc 41,460 0.07
650 American Express Co 106,340 0.17
1,161 American International Group Inc 66,014 0.10
451 American Tower Corp (REIT) 131,918 0.21
289 American Water Works Co Inc 54,581 0.09
155 Ameriprise Financial Inc 46,757 0.07
235 AmerisourceBergen Corp - Class A 31,229 0.05
220 AMETEK Inc 32,349 0.05

December 2021 Legal & General UCITS ETF Plc
L&G Global Equity UCITS ETF
Schedule of Investments (continued)
As at 31 December 2021
287
Nominal Description
Value $
% of Net
Assets
Common Stock (30 June 2021: 99.71%) (continued)
United States (30 June 2021: 63.69%) (continued)
569 Amgen Inc 128,008 0.20
472 Amphenol Corp - Class A 41,281 0.06
536 Analog Devices Inc 94,213 0.15
509 Annaly Capital Management Inc (REIT) 3,980 0.01
95 ANSYS Inc 38,106 0.06
261 Anthem Inc 120,984 0.19
202 Apollo Global Management Inc - Class A 14,631 0.02
17,206 Apple Inc 3,055,269 4.79
903 Applied Materials Inc 142,096 0.22
96 AppLovin Corp - Class A 9,049 0.01
628 Archer-Daniels-Midland Co 42,447 0.07
228 Arista Networks Inc 32,775 0.05
193 Arthur J Gallagher & Co 32,746 0.05
7,763 AT&T Inc 190,970 0.30
207 Atmos Energy Corp 21,687 0.03
227 Autodesk Inc 63,830 0.10
417 Automatic Data Processing Inc 102,824 0.16
20 AutoZone Inc 41,928 0.07
110 AvalonBay Communities Inc (REIT) 27,785 0.04
245 Avangrid Inc 12,221 0.02
508 Avantor Inc 21,407 0.03
1,345 Baker Hughes Co - Class A 32,361 0.05
424 Ball Corp 40,818 0.06
7,410 Bank of America Corp 329,671 0.52
780 Bank of New York Mellon Corp/The 45,302 0.07
610 Baxter International Inc 52,362 0.08
290 Becton Dickinson and Co 72,929 0.11
1,274 Berkshire Hathaway Inc - Class B 380,926 0.60
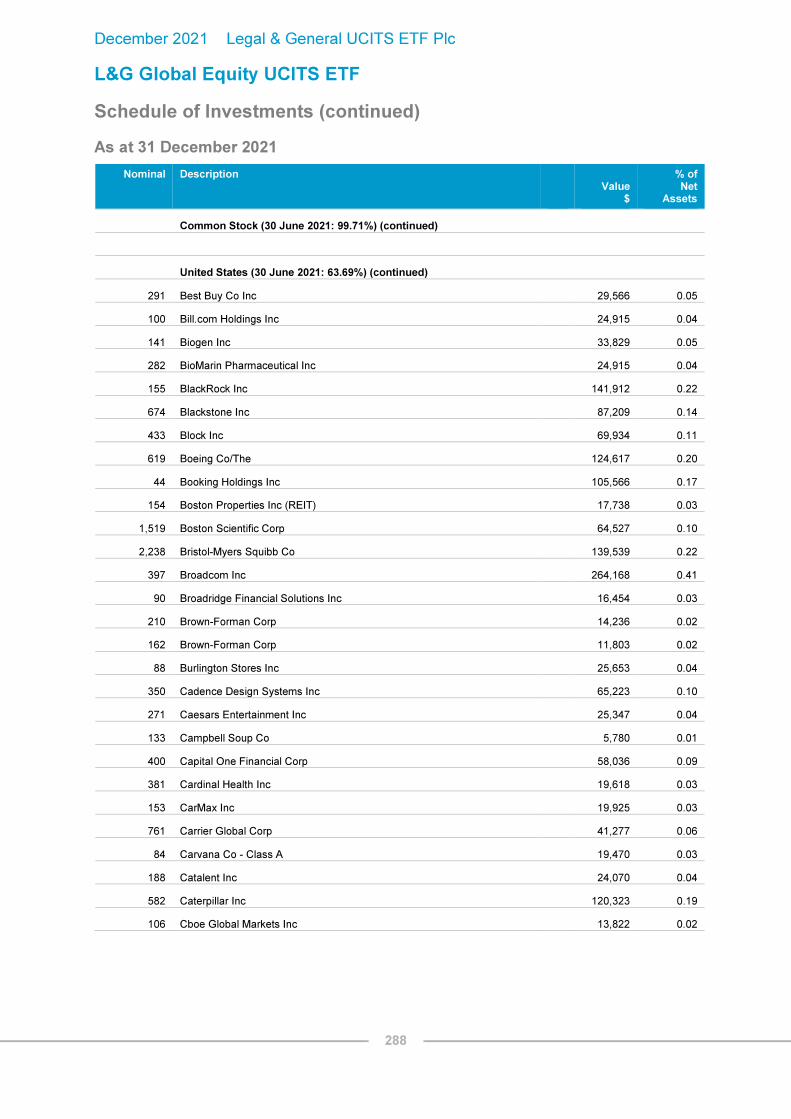
December 2021 Legal & General UCITS ETF Plc
L&G Global Equity UCITS ETF
Schedule of Investments (continued)
As at 31 December 2021
288
Nominal Description
Value $
% of Net
Assets
Common Stock (30 June 2021: 99.71%) (continued)
United States (30 June 2021: 63.69%) (continued)
291 Best Buy Co Inc 29,566 0.05
100 Bill.com Holdings Inc 24,915 0.04
141 Biogen Inc 33,829 0.05
282 BioMarin Pharmaceutical Inc 24,915 0.04
155 BlackRock Inc 141,912 0.22
674 Blackstone Inc 87,209 0.14
433 Block Inc 69,934 0.11
619 Boeing Co/The 124,617 0.20
44 Booking Holdings Inc 105,566 0.17
154 Boston Properties Inc (REIT) 17,738 0.03
1,519 Boston Scientific Corp 64,527 0.10
2,238 Bristol-Myers Squibb Co 139,539 0.22
397 Broadcom Inc 264,168 0.41
90 Broadridge Financial Solutions Inc 16,454 0.03
210 Brown-Forman Corp 14,236 0.02
162 Brown-Forman Corp 11,803 0.02
88 Burlington Stores Inc 25,653 0.04
350 Cadence Design Systems Inc 65,223 0.10
271 Caesars Entertainment Inc 25,347 0.04
133 Campbell Soup Co 5,780 0.01
400 Capital One Financial Corp 58,036 0.09
381 Cardinal Health Inc 19,618 0.03
153 CarMax Inc 19,925 0.03
761 Carrier Global Corp 41,277 0.06
84 Carvana Co - Class A 19,470 0.03
188 Catalent Inc 24,070 0.04
582 Caterpillar Inc 120,323 0.19
106 Cboe Global Markets Inc 13,822 0.02

December 2021 Legal & General UCITS ETF Plc
L&G Global Equity UCITS ETF
Schedule of Investments (continued)
As at 31 December 2021
289
Nominal Description
Value $
% of Net
Assets
Common Stock (30 June 2021: 99.71%) (continued)
United States (30 June 2021: 63.69%) (continued)
460 CBRE Group Inc - Class A 49,915 0.08
159 CDW Corp/DE 32,560 0.05
145 Celanese Corp - Class A 24,369 0.04
602 Centene Corp 49,605 0.08
751 CenterPoint Energy Inc 20,960 0.03
295 Cerner Corp 27,397 0.04
57 CH Robinson Worldwide Inc 6,135 0.01
1,608 Charles Schwab Corp/The 135,233 0.21
121 Charter Communications Inc 78,888 0.12
342 Cheniere Energy Inc 34,686 0.05
1,952 Chevron Corp 229,067 0.36
31 Chipotle Mexican Grill Inc - Class A 54,196 0.08
308 Church & Dwight Co Inc 31,570 0.05
358 Cigna Corp 82,208 0.13
157 Cincinnati Financial Corp 17,887 0.03
104 Cintas Corp 46,090 0.07
3,992 Cisco Systems Inc/Delaware 252,973 0.40
2,178 Citigroup Inc 131,529 0.21
413 Citizens Financial Group Inc 19,514 0.03
153 Citrix Systems Inc 14,472 0.02
133 Clorox Co/The 23,190 0.04
247 Cloudflare Inc 32,481 0.05
335 CME Group Inc 76,534 0.12
476 CMS Energy Corp 30,964 0.05
4,124 Coca-Cola Co/The 244,182 0.38
553 Cognizant Technology Solutions Corp 49,062 0.08
143 Coinbase Global Inc 36,089 0.06
946 Colgate-Palmolive Co 80,732 0.13

December 2021 Legal & General UCITS ETF Plc
L&G Global Equity UCITS ETF
Schedule of Investments (continued)
As at 31 December 2021
290
Nominal Description
Value $
% of Net
Assets
Common Stock (30 June 2021: 99.71%) (continued)
United States (30 June 2021: 63.69%) (continued)
4,793 Comcast Corp 241,232 0.38
505 Conagra Brands Inc 17,246 0.03
1,358 ConocoPhillips 98,020 0.15
268 Consolidated Edison Inc 22,866 0.04
177 Constellation Brands Inc - Class A 44,422 0.07
60 Cooper Cos Inc/The 25,136 0.04
217 Copart Inc 32,902 0.05
617 Corning Inc 22,971 0.04
873 Corteva Inc 41,275 0.06
320 CoStar Group Inc 25,290 0.04
450 Costco Wholesale Corp 255,465 0.40
60 Coupa Software Inc 9,483 0.01
822 Coupang Inc 24,150 0.04
220 Crowdstrike Holdings Inc 45,045 0.07
492 Crown Castle International Corp (REIT) 102,700 0.16
2,186 CSX Corp 82,194 0.13
141 Cummins Inc 30,758 0.05
1,349 CVS Health Corp 139,163 0.22
644 Danaher Corp 211,882 0.33
146 Darden Restaurants Inc 21,993 0.03
210 Datadog Inc 37,403 0.06
73 DaVita Inc 8,304 0.01
303 Deere & Co 103,896 0.16
204 Dell Technologies Inc 11,459 0.02
505 Delta Air Lines Inc 19,735 0.03
143 DENTSPLY SIRONA Inc 7,978 0.01
927 Devon Energy Corp 40,834 0.06
95 Dexcom Inc 51,010 0.08
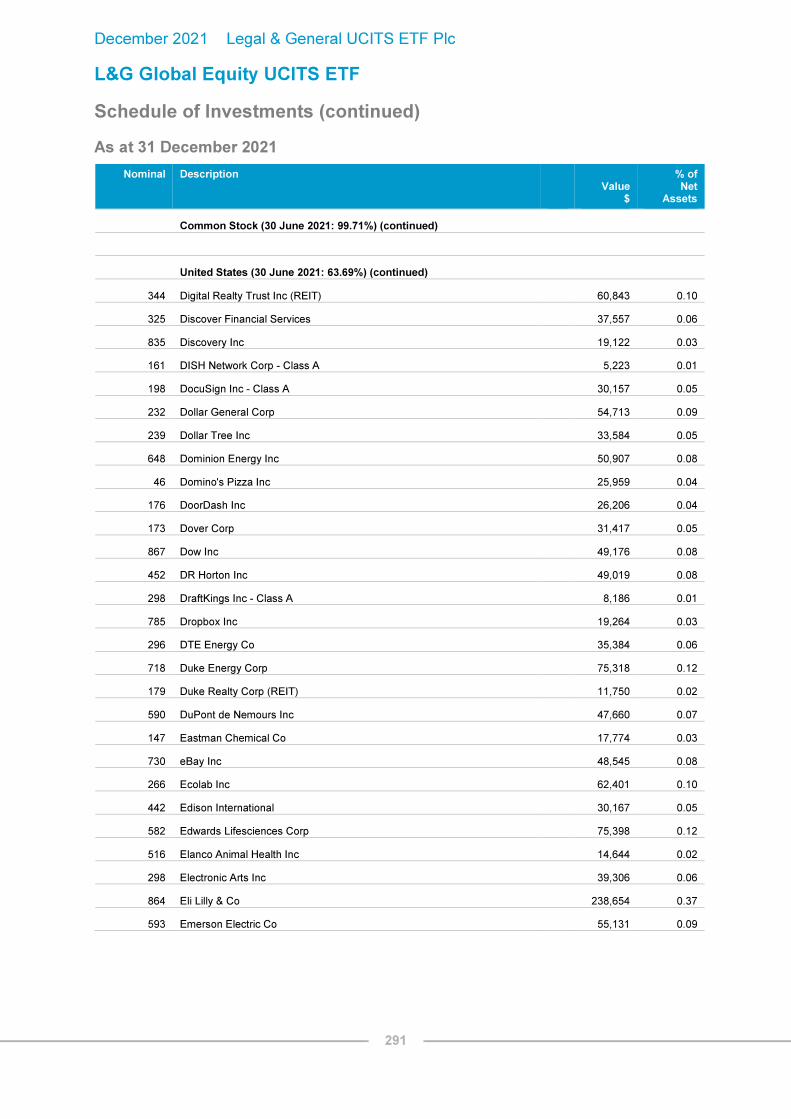
December 2021 Legal & General UCITS ETF Plc
L&G Global Equity UCITS ETF
Schedule of Investments (continued)
As at 31 December 2021
291
Nominal Description
Value $
% of Net
Assets
Common Stock (30 June 2021: 99.71%) (continued)
United States (30 June 2021: 63.69%) (continued)
344 Digital Realty Trust Inc (REIT) 60,843 0.10
325 Discover Financial Services 37,557 0.06
835 Discovery Inc 19,122 0.03
161 DISH Network Corp - Class A 5,223 0.01
198 DocuSign Inc - Class A 30,157 0.05
232 Dollar General Corp 54,713 0.09
239 Dollar Tree Inc 33,584 0.05
648 Dominion Energy Inc 50,907 0.08
46 Domino's Pizza Inc 25,959 0.04
176 DoorDash Inc 26,206 0.04
173 Dover Corp 31,417 0.05
867 Dow Inc 49,176 0.08
452 DR Horton Inc 49,019 0.08
298 DraftKings Inc - Class A 8,186 0.01
785 Dropbox Inc 19,264 0.03
296 DTE Energy Co 35,384 0.06
718 Duke Energy Corp 75,318 0.12
179 Duke Realty Corp (REIT) 11,750 0.02
590 DuPont de Nemours Inc 47,660 0.07
147 Eastman Chemical Co 17,774 0.03
730 eBay Inc 48,545 0.08
266 Ecolab Inc 62,401 0.10
442 Edison International 30,167 0.05
582 Edwards Lifesciences Corp 75,398 0.12
516 Elanco Animal Health Inc 14,644 0.02
298 Electronic Arts Inc 39,306 0.06
864 Eli Lilly & Co 238,654 0.37
593 Emerson Electric Co 55,131 0.09

December 2021 Legal & General UCITS ETF Plc
L&G Global Equity UCITS ETF
Schedule of Investments (continued)
As at 31 December 2021
292
Nominal Description
Value $
% of Net
Assets
Common Stock (30 June 2021: 99.71%) (continued)
United States (30 June 2021: 63.69%) (continued)
194 Enphase Energy Inc 35,490 0.06
352 Entergy Corp 39,653 0.06
595 EOG Resources Inc 52,854 0.08
60 EPAM Systems Inc 40,107 0.06
145 Equifax Inc 42,455 0.07
86 Equinix Inc (REIT) 72,742 0.11
289 Equity Residential (REIT) 26,154 0.04
46 Essex Property Trust Inc (REIT) 16,203 0.03
212 Estee Lauder Cos Inc/The - Class A 78,482 0.12
164 Etsy Inc 35,906 0.06
102 Evergy Inc 6,998 0.01
259 Eversource Energy 23,564 0.04
237 Exact Sciences Corp 18,446 0.03
903 Exelon Corp 52,157 0.08
202 Expedia Group Inc 36,505 0.06
179 Expeditors International of Washington Inc 24,038 0.04
116 Extra Space Storage Inc (REIT) 26,301 0.04
4,444 Exxon Mobil Corp 271,928 0.43
28 F5 Inc 6,852 0.01
490 Fastenal Co 31,389 0.05
261 FedEx Corp 67,505 0.11
152 Fidelity National Financial Inc 7,931 0.01
617 Fidelity National Information Services Inc 67,346 0.11
1,121 Fifth Third Bancorp 48,820 0.08
239 First Republic Bank/CA 49,356 0.08
481 FirstEnergy Corp 20,005 0.03
618 Fiserv Inc 64,142 0.10
92 FleetCor Technologies Inc 20,593 0.03

December 2021 Legal & General UCITS ETF Plc
L&G Global Equity UCITS ETF
Schedule of Investments (continued)
As at 31 December 2021
293
Nominal Description
Value $
% of Net
Assets
Common Stock (30 June 2021: 99.71%) (continued)
United States (30 June 2021: 63.69%) (continued)
182 FMC Corp 20,000 0.03
4,270 Ford Motor Co 88,688 0.14
175 Fortinet Inc 62,895 0.10
366 Fortive Corp 27,922 0.04
230 Fortune Brands Home & Security Inc 24,587 0.04
255 Fox Corp 8,739 0.01
140 Fox Corp 5,166 0.01
162 Franklin Resources Inc 5,425 0.01
1,791 Freeport-McMoRan Inc 74,738 0.12
84 Gartner Inc 28,083 0.04
72 Generac Holdings Inc 25,338 0.04
257 General Dynamics Corp 53,577 0.08
1,063 General Electric Co 100,422 0.16
785 General Mills Inc 52,893 0.08
1,409 General Motors Co 82,610 0.13
119 Genuine Parts Co 16,684 0.03
1,414 Gilead Sciences Inc 102,671 0.16
317 Global Payments Inc 42,852 0.07
58 Globe Life Inc 5,436 0.01
352 Goldman Sachs Group Inc/The 134,658 0.21
1,550 Halliburton Co 35,449 0.06
560 Hartford Financial Services Group Inc/The 38,662 0.06
153 Hasbro Inc 15,572 0.02
269 HCA Healthcare Inc 69,111 0.11
602 Healthpeak Properties Inc (REIT) 21,726 0.03
203 Henry Schein Inc 15,739 0.02
185 Hershey Co/The 35,792 0.06
417 Hess Corp 30,871 0.05

December 2021 Legal & General UCITS ETF Plc
L&G Global Equity UCITS ETF
Schedule of Investments (continued)
As at 31 December 2021
294
Nominal Description
Value $
% of Net
Assets
Common Stock (30 June 2021: 99.71%) (continued)
United States (30 June 2021: 63.69%) (continued)
1,207 Hewlett Packard Enterprise Co 19,034 0.03
298 Hilton Worldwide Holdings Inc 46,485 0.07
275 Hologic Inc 21,054 0.03
1,077 Home Depot Inc/The 446,966 0.70
700 Honeywell International Inc 145,957 0.23
304 Hormel Foods Corp 14,838 0.02
1,541 Host Hotels & Resorts Inc (REIT) 26,798 0.04
1,221 HP Inc 45,995 0.07
49 HubSpot Inc 32,298 0.05
136 Humana Inc 63,085 0.10
1,783 Huntington Bancshares Inc/OH 27,494 0.04
65 IAC/InterActiveCorp 8,496 0.01
90 IDEXX Laboratories Inc 59,261 0.09
327 Illinois Tool Works Inc 80,704 0.13
173 Illumina Inc 65,816 0.10
263 Incyte Corp 19,304 0.03
489 Ingersoll Rand Inc 30,254 0.05
4,060 Intel Corp 209,090 0.33
142 Interactive Brokers Group Inc 11,278 0.02
563 Intercontinental Exchange Inc 77,002 0.12
886 International Business Machines Corp 118,423 0.19
329 International Flavors & Fragrances Inc 49,564 0.08
359 International Paper Co 16,866 0.03
291 Intuit Inc 187,177 0.29
377 Intuitive Surgical Inc 135,456 0.21
606 Invitation Homes Inc (REIT) 27,476 0.04
162 IQVIA Holdings Inc 45,707 0.07
158 Iron Mountain Inc (REIT) 8,268 0.01
122 J M Smucker Co/The 16,570 0.03

December 2021 Legal & General UCITS ETF Plc
L&G Global Equity UCITS ETF
Schedule of Investments (continued)
As at 31 December 2021
295
Nominal Description
Value $
% of Net
Assets
Common Stock (30 June 2021: 99.71%) (continued)
United States (30 June 2021: 63.69%) (continued)
46 JB Hunt Transport Services Inc 9,402 0.01
2,753 Johnson & Johnson 470,956 0.74
3,022 JPMorgan Chase & Co 478,534 0.75
313 Kellogg Co 20,163 0.03
825 Keurig Dr Pepper Inc 30,410 0.05
1,082 KeyCorp 25,027 0.04
187 Keysight Technologies Inc 38,617 0.06
364 Kimberly-Clark Corp 52,023 0.08
2,150 Kinder Morgan Inc 34,099 0.05
677 KKR & Co Inc 50,437 0.08
183 KLA Corp 78,710 0.12
886 Kraft Heinz Co/The 31,807 0.05
596 Kroger Co/The 26,975 0.04
177 Kyndryl Holdings Inc 3,204 0.00
208 L3Harris Technologies Inc 44,354 0.07
148 Laboratory Corp of America Holdings 46,503 0.07
138 Lam Research Corp 99,243 0.16
321 Las Vegas Sands Corp 12,082 0.02
80 Leidos Holdings Inc 7,112 0.01
370 Lennar Corp 35,379 0.06
28 Lennar Corp 3,252 0.01
109 Liberty Broadband Corp 17,538 0.03
60 Liberty Broadband Corp 9,666 0.02
187 Liberty Media Corp-Liberty SiriusXM 9,509 0.01
123 Liberty Media Corp-Liberty SiriusXM 6,255 0.01
216 Live Nation Entertainment Inc 25,853 0.04
180 LKQ Corp 10,805 0.02
246 Lockheed Martin Corp 87,431 0.14

December 2021 Legal & General UCITS ETF Plc
L&G Global Equity UCITS ETF
Schedule of Investments (continued)
As at 31 December 2021
296
Nominal Description
Value $
% of Net
Assets
Common Stock (30 June 2021: 99.71%) (continued)
United States (30 June 2021: 63.69%) (continued)
103 Loews Corp 5,949 0.01
688 Lowe's Cos Inc 177,834 0.28
596 Lucid Group Inc 22,678 0.04
126 Lululemon Athletica Inc 49,323 0.08
1,099 Lumen Technologies Inc 13,792 0.02
186 Lyft Inc 7,948 0.01
106 M&T Bank Corp 16,279 0.03
668 Marathon Petroleum Corp 42,745 0.07
13 Markel Corp 16,042 0.03
211 Marriott International Inc/MD 34,866 0.05
520 Marsh & McLennan Cos Inc 90,386 0.14
61 Martin Marietta Materials Inc 26,872 0.04
992 Marvell Technology Inc 86,790 0.14
159 Masco Corp 11,165 0.02
880 Mastercard Inc 316,202 0.50
325 Match Group Inc 42,981 0.07
328 McCormick & Co Inc/MD 31,688 0.05
771 McDonald's Corp 206,682 0.32
149 McKesson Corp 37,037 0.06
45 MercadoLibre Inc 60,678 0.10
2,615 Merck & Co Inc 200,414 0.31
2,486 Meta Platforms Inc - Class A 836,166 1.31
703 MetLife Inc 43,930 0.07
26 Mettler-Toledo International Inc 44,127 0.07
572 MGM Resorts International 25,671 0.04
583 Microchip Technology Inc 50,756 0.08
1,226 Micron Technology Inc 114,202 0.18
7,688 Microsoft Corp 2,585,628 4.06

December 2021 Legal & General UCITS ETF Plc
L&G Global Equity UCITS ETF
Schedule of Investments (continued)
As at 31 December 2021
297
Nominal Description
Value $
% of Net
Assets
Common Stock (30 June 2021: 99.71%) (continued)
United States (30 June 2021: 63.69%) (continued)
145 Mid-America Apartment Communities Inc (REIT) 33,269 0.05
355 Moderna Inc 90,163 0.14
39 Mohawk Industries Inc 7,105 0.01
79 Molson Coors Beverage Co - Class B 3,662 0.01
1,386 Mondelez International Inc 91,906 0.14
68 MongoDB Inc - Class A 35,996 0.06
353 Monster Beverage Corp 33,902 0.05
156 Moody's Corp 60,930 0.10
1,481 Morgan Stanley 145,375 0.23
187 Motorola Solutions Inc 50,808 0.08
94 MSCI Inc - Class A 57,593 0.09
87 Nasdaq Inc 18,271 0.03
209 NetApp Inc 19,226 0.03
451 Netflix Inc 271,700 0.43
250 Newell Brands Inc 5,460 0.01
831 Newmont Corp 51,539 0.08
2,031 NextEra Energy Inc 189,614 0.30
1,288 NIKE Inc 214,671 0.34
193 NiSource Inc 5,329 0.01
233 Norfolk Southern Corp 69,366 0.11
196 Northern Trust Corp 23,444 0.04
154 Northrop Grumman Corp 59,609 0.09
566 NortonLifeLock Inc 14,705 0.02
296 Nucor Corp 33,788 0.05
2,491 NVIDIA Corp 732,628 1.15
4 NVR Inc 23,635 0.04
682 Occidental Petroleum Corp 19,771 0.03
137 Okta Inc 30,711 0.05

December 2021 Legal & General UCITS ETF Plc
L&G Global Equity UCITS ETF
Schedule of Investments (continued)
As at 31 December 2021
298
Nominal Description
Value $
% of Net
Assets
Common Stock (30 June 2021: 99.71%) (continued)
United States (30 June 2021: 63.69%) (continued)
128 Old Dominion Freight Line Inc 45,873 0.07
224 Omnicom Group Inc 16,412 0.03
368 ONEOK Inc 21,624 0.03
1,640 Oracle Corp 143,024 0.22
62 O'Reilly Automotive Inc 43,786 0.07
217 Organon & Co 6,608 0.01
28 Orion Office REIT Inc (REIT) 523 0.00
448 Otis Worldwide Corp 39,007 0.06
452 PACCAR Inc 39,894 0.06
52 Packaging Corp of America 7,080 0.01
1,500 Palantir Technologies Inc 27,315 0.04
94 Palo Alto Networks Inc 52,335 0.08
132 Parker-Hannifin Corp 41,992 0.07
325 Paychex Inc 44,363 0.07
58 Paycom Software Inc 24,081 0.04
1,215 PayPal Holdings Inc 229,125 0.36
261 Peloton Interactive Inc - Class A 9,333 0.01
1,391 PepsiCo Inc 241,631 0.38
5,980 Pfizer Inc 353,119 0.55
1,748 Philip Morris International Inc 166,060 0.26
481 Phillips 66 34,853 0.05
60 Pinnacle West Capital Corp 4,235 0.01
476 Pinterest Inc 17,303 0.03
221 Pioneer Natural Resources Co 40,195 0.06
396 PNC Financial Services Group Inc/The 79,406 0.12
264 PPG Industries Inc 45,524 0.07
569 PPL Corp 17,104 0.03
282 Principal Financial Group Inc 20,397 0.03

December 2021 Legal & General UCITS ETF Plc
L&G Global Equity UCITS ETF
Schedule of Investments (continued)
As at 31 December 2021
299
Nominal Description
Value $
% of Net
Assets
Common Stock (30 June 2021: 99.71%) (continued)
United States (30 June 2021: 63.69%) (continued)
2,387 Procter & Gamble Co/The 390,465 0.61
551 Progressive Corp/The 56,560 0.09
770 Prologis Inc (REIT) 129,637 0.20
547 Prudential Financial Inc 59,207 0.09
364 Public Service Enterprise Group Inc 24,290 0.04
146 Public Storage (REIT) 54,686 0.09
202 PulteGroup Inc 11,546 0.02
72 Qorvo Inc 11,260 0.02
1,171 QUALCOMM Inc 214,141 0.34
140 Quest Diagnostics Inc 24,221 0.04
94 Raymond James Financial Inc 9,438 0.01
1,605 Raytheon Technologies Corp 138,126 0.22
284 Realty Income Corp (REIT) 20,332 0.03
112 Regeneron Pharmaceuticals Inc 70,730 0.11
1,244 Regions Financial Corp 27,119 0.04
198 Republic Services Inc - Class A 27,611 0.04
180 ResMed Inc 46,886 0.07
77 RingCentral Inc - Class A 14,426 0.02
315 ROBLOX Corp 32,495 0.05
125 Rockwell Automation Inc 43,606 0.07
100 Roku Inc 22,820 0.04
535 Rollins Inc 18,302 0.03
114 Roper Technologies Inc 56,072 0.09
409 Ross Stores Inc 46,741 0.07
230 S&P Global Inc 108,544 0.17
984 salesforce.com Inc 250,064 0.39
142 SBA Communications Corp (REIT) - Class A 55,241 0.09
139 Seagen Inc 21,489 0.03

December 2021 Legal & General UCITS ETF Plc
L&G Global Equity UCITS ETF
Schedule of Investments (continued)
As at 31 December 2021
300
Nominal Description
Value $
% of Net
Assets
Common Stock (30 June 2021: 99.71%) (continued)
United States (30 June 2021: 63.69%) (continued)
93 SEI Investments Co 5,667 0.01
445 Sempra Energy 58,865 0.09
199 ServiceNow Inc 129,173 0.20
252 Sherwin-Williams Co/The 88,744 0.14
363 Simon Property Group Inc (REIT) 57,997 0.09
818 Sirius XM Holdings Inc 5,194 0.01
164 Skyworks Solutions Inc 25,443 0.04
1,280 Snap Inc 60,198 0.09
32 Snap-on Inc 6,892 0.01
266 Snowflake Inc 90,108 0.14
959 Southern Co/The (Units) 65,768 0.10
760 Southwest Airlines Co 32,558 0.05
160 Splunk Inc 18,515 0.03
344 SS&C Technologies Holdings Inc 28,201 0.04
186 Stanley Black & Decker Inc 35,083 0.06
1,187 Starbucks Corp 138,843 0.22
263 State Street Corp 24,459 0.04
319 Stryker Corp 85,307 0.13
63 SVB Financial Group 42,729 0.07
647 Synchrony Financial 30,014 0.05
201 Synopsys Inc 74,069 0.12
537 Sysco Corp 42,181 0.07
222 T Rowe Price Group Inc 43,654 0.07
155 Take-Two Interactive Software Inc 27,547 0.04
501 Target Corp 115,951 0.18
173 Teladoc Health Inc 15,885 0.02
75 Teleflex Inc 24,636 0.04
186 Teradyne Inc 30,417 0.05

December 2021 Legal & General UCITS ETF Plc
L&G Global Equity UCITS ETF
Schedule of Investments (continued)
As at 31 December 2021
301
Nominal Description
Value $
% of Net
Assets
Common Stock (30 June 2021: 99.71%) (continued)
United States (30 June 2021: 63.69%) (continued)
848 Tesla Inc 896,149 1.41
968 Texas Instruments Inc 182,439 0.29
226 Textron Inc 17,447 0.03
396 Thermo Fisher Scientific Inc 264,227 0.41
1,213 TJX Cos Inc/The 92,091 0.14
614 T-Mobile US Inc 71,212 0.11
145 Tractor Supply Co 34,597 0.05
400 Trade Desk Inc/The - Class A 36,656 0.06
49 TransDigm Group Inc 31,178 0.05
223 TransUnion 26,443 0.04
308 Travelers Cos Inc/The 48,180 0.08
284 Trimble Inc 24,762 0.04
1,349 Truist Financial Corp 78,984 0.12
181 Twilio Inc - Class A 47,665 0.07
747 Twitter Inc 32,285 0.05
241 Tyson Foods Inc - Class A 21,006 0.03
1,362 Uber Technologies Inc 57,109 0.09
126 UDR Inc (REIT) 7,559 0.01
250 UiPath Inc 10,782 0.02
59 Ulta Beauty Inc 24,328 0.04
646 Union Pacific Corp 162,747 0.26
218 United Airlines Holdings Inc 9,544 0.01
747 United Parcel Service Inc - Class B 160,112 0.25
69 United Rentals Inc 22,928 0.04
969 UnitedHealth Group Inc 486,574 0.76
229 Unity Software Inc 32,745 0.05
40 Universal Health Services Inc 5,186 0.01
54 Upstart Holdings Inc 8,170 0.01

December 2021 Legal & General UCITS ETF Plc
L&G Global Equity UCITS ETF
Schedule of Investments (continued)
As at 31 December 2021
302
Nominal Description
Value $
% of Net
Assets
Common Stock (30 June 2021: 99.71%) (continued)
United States (30 June 2021: 63.69%) (continued)
1,381 US Bancorp 77,571 0.12
20 Vail Resorts Inc 6,558 0.01
459 Valero Energy Corp 34,475 0.05
139 Veeva Systems Inc - Class A 35,512 0.06
514 Ventas Inc (REIT) 26,276 0.04
150 VeriSign Inc 38,073 0.06
167 Verisk Analytics Inc - Class A 38,198 0.06
4,286 Verizon Communications Inc 222,701 0.35
253 Vertex Pharmaceuticals Inc 55,559 0.09
407 VF Corp 29,801 0.05
454 ViacomCBS Inc - Class B 13,702 0.02
1,150 Viatris Inc 15,560 0.02
1,766 Visa Inc - Class A 382,710 0.60
225 VMware Inc 26,073 0.04
206 Vulcan Materials Co 42,761 0.07
97 W R Berkley Corp 7,992 0.01
740 Walgreens Boots Alliance Inc 38,598 0.06
1,510 Walmart Inc 218,482 0.34
1,928 Walt Disney Co/The 298,628 0.47
384 Waste Management Inc 64,090 0.10
61 Waters Corp 22,729 0.04
72 Wayfair Inc 13,678 0.02
252 WEC Energy Group Inc 24,462 0.04
432 Welltower Inc (REIT) 37,053 0.06
101 West Pharmaceutical Services Inc 47,370 0.07
255 Western Digital Corp 16,629 0.03
271 Western Union Co/The 4,835 0.01
89 Westinghouse Air Brake Technologies Corp 8,198 0.01

December 2021 Legal & General UCITS ETF Plc
L&G Global Equity UCITS ETF
Schedule of Investments (continued)
As at 31 December 2021
303
Nominal Description
Value $
% of Net
Assets
Common Stock (30 June 2021: 99.71%) (continued)
United States (30 June 2021: 63.69%) (continued)
460 Westrock Co 20,406 0.03
651 Weyerhaeuser Co (REIT) 26,808 0.04
43 Whirlpool Corp 10,090 0.02
1,198 Williams Cos Inc/The 31,196 0.05
223 Workday Inc - Class A 60,919 0.10
207 WP Carey Inc (REIT) 16,984 0.03
41 WW Grainger Inc 21,248 0.03
159 Wynn Resorts Ltd 13,521 0.02
401 Xcel Energy Inc 27,148 0.04
241 Xilinx Inc 51,099 0.08
238 Xylem Inc/NY 28,541 0.04
624 Yum China Holdings Inc 31,100 0.05
268 Yum! Brands Inc 37,214 0.06
57 Zebra Technologies Corp 33,926 0.05
210 Zillow Group Inc 13,409 0.02
176 Zimmer Biomet Holdings Inc 22,359 0.04
476 Zoetis Inc 116,158 0.18
217 Zoom Video Communications Inc - Class A 39,908 0.06
236 ZoomInfo Technologies Inc - Class A 15,151 0.02
89 Zscaler Inc 28,598 0.04
Total United States 41,766,276 65.51
Total Common Stock 63,645,496 99.83
Total Investments
Common Stock 63,645,496 99.83
Other Assets and Liabilities 106,542 0.17
Net Assets Attributable to Holders of Redeemable Participating Shares 63,752,038 100.00

December 2021 Legal & General UCITS ETF Plc
L&G Global Equity UCITS ETF
Schedule of Investments (continued)
As at 31 December 2021
304
Analysis of Total Assets
% of Total
Assets
Transferable securities admitted to an official stock exchange listing 99.80
Other assets
0.20
100.00
Analysis of Total Assets rather than Net Assets is required under Schedule 12 of the UCITS Regulations.
*Security is valued at zero.

December 2021 Legal & General UCITS ETF Plc
L&G Europe ex UK Equity UCITS ETF
Schedule of Investments
As at 31 December 2021
305
Nominal Description
Value €
% of Net
Assets
Common Stock (30 June 2021: 99.80%)
Austria (30 June 2021: 0.72%)
4,107 ams AG 65,778 0.05
1,118 ANDRITZ AG 50,735 0.04
1,363 BAWAG Group AG '144A' 73,875 0.06
708 CA Immobilien Anlagen AG 23,364 0.02
4,579 Erste Group Bank AG 189,342 0.15
737 EVN AG 19,604 0.02
210 Mayr Melnhof Karton AG 37,086 0.03
2,258 OMV AG 112,787 0.09
2,066 Raiffeisen Bank International AG 53,468 0.04
1,037 Verbund AG 102,559 0.08
509 Vienna Insurance Group AG Wiener Versicherung Gruppe 12,674 0.01
1,751 voestalpine AG 56,032 0.05
1,739 Wienerberger AG 56,239 0.05
Total Austria 853,543 0.69
Belgium (30 June 2021: 2.05%)
332 Ackermans & van Haaren NV
56,008 0.05
2,837 Ageas SA/NV
129,225 0.10
14,563 Anheuser-Busch InBev SA/NV
774,315 0.63
331 D'ieteren Group
56,800 0.05
459 Elia Group SA/NV
53,106 0.04
821 Etablissements Franz Colruyt NV
30,590 0.02
2,106 Groupe Bruxelles Lambert SA
206,725 0.17
4,611 KBC Group NV
347,946 0.28
2,220 Proximus SADP
38,051 0.03
232 Sofina SA
100,224 0.08
1,123 Solvay SA
114,771 0.09
643 Telenet Group Holding NV
20,615 0.02

December 2021 Legal & General UCITS ETF Plc
L&G Europe ex UK Equity UCITS ETF
Schedule of Investments (continued)
As at 31 December 2021
306
Nominal Description
Value €
% of Net
Assets
Common Stock (30 June 2021: 99.80%) (continued)
Belgium (30 June 2021: 2.05%) (continued)
1,887 UCB SA
189,360 0.15
3,049 Umicore SA
109,002 0.09
2,074 Warehouses De Pauw CVA (REIT)
87,481 0.07
Total Belgium 2,314,219 1.87
Bermuda (30 June 2021: 0.18%)
1,345 HAL Trust 196,101 0.16
Total Bermuda 196,101 0.16
Denmark (30 June 2021: 5.05%)
2,880 Ambu A/S - Class B 66,990 0.05
36 AP Moller - Maersk A/S - Class A 105,422 0.08
66 AP Moller - Maersk A/S - Class B 208,094 0.17
1,532 Carlsberg AS 232,658 0.19
1,604 Chr Hansen Holding A/S 111,153 0.09
1,935 Coloplast A/S 299,453 0.24
10,601 Danske Bank A/S 160,992 0.13
1,555 Demant A/S 70,061 0.06
3,210 DSV A/S 659,263 0.53
1,111 Genmab A/S 392,864 0.32
2,021 GN Store Nord AS 111,763 0.09
26,799 Novo Nordisk A/S 2,648,367 2.14
3,448 Novozymes A/S 249,044 0.20
2,960 Orsted AS '144A' 332,395 0.27
1,614 Pandora A/S 176,948 0.14
8,474 Tryg A/S 184,006 0.15
15,828 Vestas Wind Systems A/S 425,626 0.34
Total Denmark 6,435,099 5.19

December 2021 Legal & General UCITS ETF Plc
L&G Europe ex UK Equity UCITS ETF
Schedule of Investments (continued)
As at 31 December 2021
307
Nominal Description
Value €
% of Net
Assets
Common Stock (30 June 2021: 99.80%) (continued)
Faroe Islands (30 June 2021: 0.05%)
782 Bakkafrost P/F 45,510 0.04
Total Faroe Islands
45,510 0.04
Finland (30 June 2021: 2.75%)
2,218 Elisa Oyj 120,038 0.10
6,621 Fortum Oyj 178,701 0.14
1,339 Huhtamaki Oyj 52,074 0.04
235 Kesko Oyj 6,895 0.01
6,051 Kesko Oyj 164,284 0.13
6,076 Kone Oyj - Class B 383,031 0.31
12,505 Metso Outotec Oyj 116,897 0.09
8,025 Neste Oyj 347,964 0.28
85,937 Nokia Oyj 479,013 0.39
52,980 Nordea Bank Abp 571,442 0.46
1,519 Orion Oyj 55,474 0.04
7,228 Sampo Oyj - Class A 318,466 0.26
8,835 Stora Enso Oyj 142,597 0.12
8,900 UPM-Kymmene Oyj 297,794 0.24
8,373 Wartsila OYJ Abp 103,490 0.08
Total Finland 3,338,160 2.69
France (30 June 2021: 19.41%)
516 Aeroports de Paris 58,463 0.05
7,759 Air Liquide SA 1,189,610 0.96
5,918 Alstom SA 184,760 0.15
948 Amundi SA '144A' 68,777 0.06
37,742 AXA SA 988,274 0.80
635 BioMerieux 79,312 0.06
18,867 BNP Paribas SA 1,146,548 0.93
14,095 Bollore SA 69,347 0.06

December 2021 Legal & General UCITS ETF Plc
L&G Europe ex UK Equity UCITS ETF
Schedule of Investments (continued)
As at 31 December 2021
308
Nominal Description
Value €
% of Net
Assets
Common Stock (30 June 2021: 99.80%) (continued)
France (30 June 2021: 19.41%) (continued)
4,722 Bouygues SA 148,696 0.12
2,620 Capgemini SE 564,610 0.46
9,763 Carrefour SA 157,233 0.13
7,652 Cie de Saint-Gobain 473,429 0.38
2,692 Cie Generale des Etablissements Michelin SCA 388,052 0.31
24,570 Credit Agricole SA 308,354 0.25
10,967 Danone SA 598,689 0.48
11,345 Dassault Systemes SE 593,457 0.48
10,054 Electricite de France SA 103,858 0.08
28,506 Engie SA 370,977 0.30
4,980 EssilorLuxottica SA 932,455 0.75
546 Hermes International 838,656 0.68
1,199 Kering SA 847,573 0.68
4,133 Legrand SA 425,286 0.34
3,422 L'Oreal SA 1,426,803 1.15
4,297 LVMH Moet Hennessy Louis Vuitton SE 3,123,919 2.52
33,968 Orange SA 319,741 0.26
2,889 Pernod Ricard SA 611,023 0.49
6,192 Safran SA 666,631 0.54
17,829 Sanofi 1,579,293 1.27
373 Sartorius Stedim Biotech 179,935 0.15
8,898 Schneider Electric SE 1,534,549 1.24
13,707 Societe Generale SA 414,020 0.33
1,225 Sodexo SA 94,398 0.08
906 Teleperformance 355,152 0.29
1,644 Thales SA 122,971 0.10
43,364 TotalEnergies SE 1,935,335 1.56
9,085 Vinci SA 844,087 0.68

December 2021 Legal & General UCITS ETF Plc
L&G Europe ex UK Equity UCITS ETF
Schedule of Investments (continued)
As at 31 December 2021
309
Nominal Description
Value €
% of Net
Assets
Common Stock (30 June 2021: 99.80%) (continued)
France (30 June 2021: 19.41%) (continued)
10,946 Vivendi SE 130,148 0.10
3,561 Worldline SA/France '144A' 174,525 0.14
Total France
24,048,946 19.41
Germany (30 June 2021: 17.75%)
2,850 adidas AG 721,620 0.58
6,812 Allianz SE 1,414,512 1.14
15,214 BASF SE 939,921 0.76
16,346 Bayer AG 768,262 0.62
5,497 Bayerische Motoren Werke AG 486,430 0.39
939 Bayerische Motoren Werke AG - Preference 68,829 0.06
1,529 Beiersdorf AG 138,191 0.11
1,425 BioNTech SE ADR 305,378 0.25
604 Carl Zeiss Meditec AG 111,649 0.09
1,698 Continental AG 158,101 0.13
2,944 Covestro AG '144A' 159,565 0.13
13,774 Daimler AG 930,985 0.75
6,887 Daimler Truck Holding AG 222,381 0.18
2,518 Delivery Hero SE '144A' 246,764 0.20
30,129 Deutsche Bank AG 331,961 0.27
2,881 Deutsche Boerse AG 423,795 0.34
16,556 Deutsche Post AG 936,076 0.76
53,310 Deutsche Telekom AG 868,953 0.70
35,564 E.ON SE 433,596 0.35
3,001 Evonik Industries AG 85,438 0.07
3,110 Fresenius Medical Care AG & Co KGaA 177,705 0.14
6,375 Fresenius SE & Co KGaA 225,675 0.18
944 Hannover Rueck SE 157,790 0.13
381 Hapag-Lloyd AG '144A' 105,537 0.09

December 2021 Legal & General UCITS ETF Plc
L&G Europe ex UK Equity UCITS ETF
Schedule of Investments (continued)
As at 31 December 2021
310
Nominal Description
Value €
% of Net
Assets
Common Stock (30 June 2021: 99.80%) (continued)
Germany (30 June 2021: 17.75%) (continued)
2,318 HeidelbergCement AG 137,967 0.11
1,403 Henkel AG & Co KGaA 96,386 0.08
3,182 Henkel AG & Co KGaA - Preference 226,367 0.18
19,623 Infineon Technologies AG 799,834 0.65
1,018 Knorr-Bremse AG 88,464 0.07
2,168 Merck KGaA 492,136 0.40
838 MTU Aero Engines AG 150,337 0.12
2,395 Muenchener Rueckversicherungs-Gesellschaft AG in Muenchen 623,898 0.50
2,412 Porsche Automobil Holding SE - Preference 201,257 0.16
1,616 Puma SE 173,720 0.14
10,851 RWE AG 387,598 0.31
16,587 SAP SE 2,071,716 1.67
62 Sartorius AG 30,938 0.02
536 Sartorius AG - Preference 319,027 0.26
13,281 Siemens AG 2,027,743 1.64
7,672 Siemens Energy AG 172,543 0.14
4,623 Siemens Healthineers AG '144A' 304,286 0.25
1,941 Symrise AG - Class A 252,912 0.20
818 Talanx AG 34,798 0.03
11,909 Telefonica Deutschland Holding AG 29,070 0.02
358 Volkswagen AG 92,507 0.07
3,224 Volkswagen AG - Preference 572,196 0.46
12,562 Vonovia SE 609,257 0.49
3,755 Zalando SE '144A' 267,131 0.22
Total Germany 20,581,202 16.61
Ireland (30 June 2021: 2.01%)
11,985 AIB Group Plc 25,648 0.02
12,947 CRH Plc 602,294 0.49
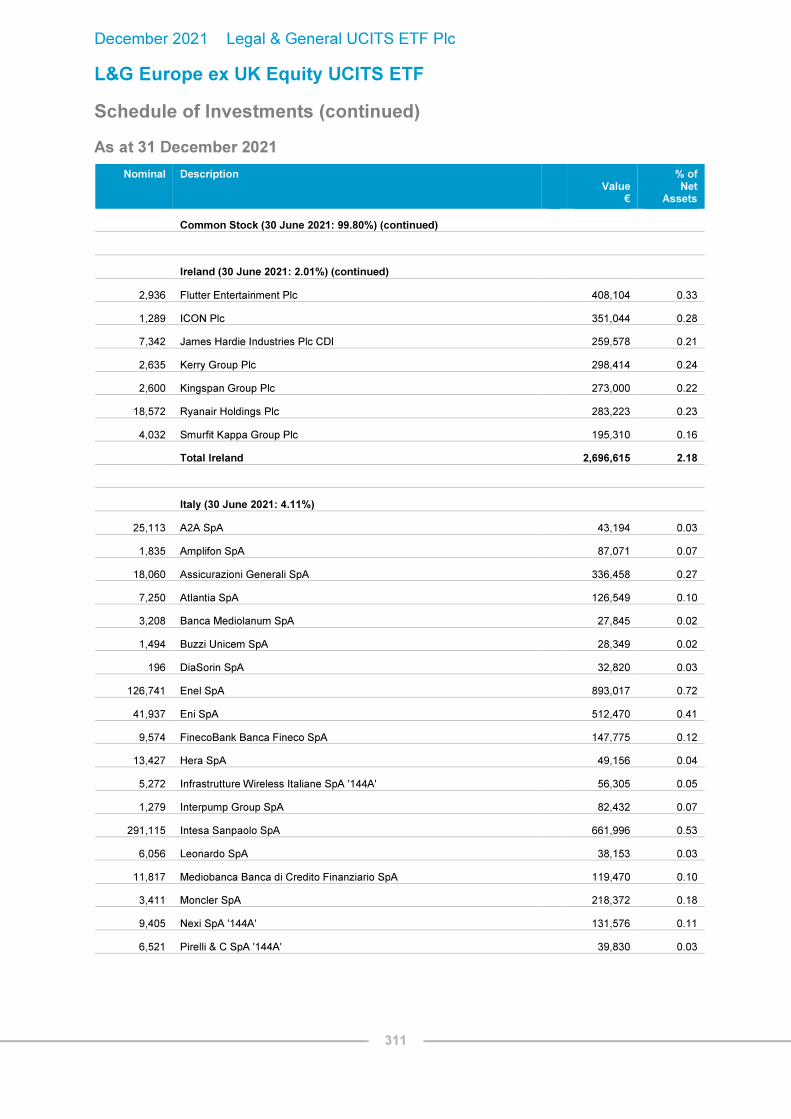
December 2021 Legal & General UCITS ETF Plc
L&G Europe ex UK Equity UCITS ETF
Schedule of Investments (continued)
As at 31 December 2021
311
Nominal Description
Value €
% of Net
Assets
Common Stock (30 June 2021: 99.80%) (continued)
Ireland (30 June 2021: 2.01%) (continued)
2,936 Flutter Entertainment Plc 408,104 0.33
1,289 ICON Plc 351,044 0.28
7,342 James Hardie Industries Plc CDI 259,578 0.21
2,635 Kerry Group Plc 298,414 0.24
2,600 Kingspan Group Plc 273,000 0.22
18,572 Ryanair Holdings Plc 283,223 0.23
4,032 Smurfit Kappa Group Plc 195,310 0.16
Total Ireland 2,696,615 2.18
Italy (30 June 2021: 4.11%)
25,113 A2A SpA 43,194 0.03
1,835 Amplifon SpA 87,071 0.07
18,060 Assicurazioni Generali SpA 336,458 0.27
7,250 Atlantia SpA 126,549 0.10
3,208 Banca Mediolanum SpA 27,845 0.02
1,494 Buzzi Unicem SpA 28,349 0.02
196 DiaSorin SpA 32,820 0.03
126,741 Enel SpA 893,017 0.72
41,937 Eni SpA 512,470 0.41
9,574 FinecoBank Banca Fineco SpA 147,775 0.12
13,427 Hera SpA 49,156 0.04
5,272 Infrastrutture Wireless Italiane SpA '144A' 56,305 0.05
1,279 Interpump Group SpA 82,432 0.07
291,115 Intesa Sanpaolo SpA 661,996 0.53
6,056 Leonardo SpA 38,153 0.03
11,817 Mediobanca Banca di Credito Finanziario SpA 119,470 0.10
3,411 Moncler SpA 218,372 0.18
9,405 Nexi SpA '144A' 131,576 0.11
6,521 Pirelli & C SpA '144A' 39,830 0.03

December 2021 Legal & General UCITS ETF Plc
L&G Europe ex UK Equity UCITS ETF
Schedule of Investments (continued)
As at 31 December 2021
312
Nominal Description
Value €
% of Net
Assets
Common Stock (30 June 2021: 99.80%) (continued)
Italy (30 June 2021: 4.11% ) (continued)
7,322 Poste Italiane SpA '144A' 84,496 0.07
8,000 PRADA SpA 45,027 0.04
3,719 Prysmian SpA 123,136 0.10
1,496 Recordati Industria Chimica e Farmaceutica SpA 84,524 0.07
30,829 Snam SpA 163,394 0.13
239 Stevanato Group SpA 4,718 0.00
74,807 Telecom Italia SpA/Milano 31,254 0.03
179,548 Telecom Italia SpA/Milano 77,960 0.06
22,197 Terna - Rete Elettrica Nazionale 157,909 0.13
33,491 UniCredit SpA 453,602 0.37
6,326 UnipolSai Assicurazioni SpA 15,688 0.01
Total Italy 4,874,546 3.94
Luxembourg (30 June 2021: 0.65%)
6,288 Allegro.eu SA '144A' 53,313 0.04
9,910 ArcelorMittal SA 278,917 0.23
1,986 Eurofins Scientific SE 216,077 0.17
3,281 InPost SA 34,772 0.03
1,588 Millicom International Cellular SA SDR 39,685 0.03
7,359 Tenaris SA 67,776 0.06
Total Luxembourg 690,540 0.56
Netherlands (30 June 2021: 11.32%)
6,896 ABN AMRO Bank NV Dutch Cert '144A' 89,069 0.07
425 Adyen NV '144A' 982,387 0.79
1,964 AerCap Holdings NV 112,984 0.09
9,555 Airbus SE 1,073,600 0.87
2,710 Akzo Nobel NV 261,515 0.21
738 ASM International NV 286,861 0.23

December 2021 Legal & General UCITS ETF Plc
L&G Europe ex UK Equity UCITS ETF
Schedule of Investments (continued)
As at 31 December 2021
313
Nominal Description
Value €
% of Net
Assets
Common Stock (30 June 2021: 99.80%) (continued)
Netherlands (30 June 2021: 11.32%) (continued)
6,684 ASML Holding NV 4,723,583 3.81
8,373 Davide Campari-Milano NV 107,635 0.09
1,633 EXOR NV 128,942 0.10
1,904 Ferrari NV 433,160 0.35
1,575 Heineken Holding NV 127,811 0.10
3,937 Heineken NV 389,212 0.31
64,389 ING Groep NV 788,250 0.64
1,551 JDE Peet's NV 42,032 0.03
3,231 Just Eat Takeaway.com NV '144A' 156,607 0.13
17,641 Koninklijke Ahold Delhaize NV 531,611 0.43
2,935 Koninklijke DSM NV 581,130 0.47
54,048 Koninklijke KPN NV 147,551 0.12
15,066 Koninklijke Philips NV 493,637 0.40
4,401 NN Group NV 209,532 0.17
4,333 NXP Semiconductors NV 867,903 0.70
14,119 Prosus NV 1,038,170 0.84
1,865 Randstad NV 111,975 0.09
34,783 Stellantis NV 580,389 0.47
11,025 STMicroelectronics NV 482,454 0.39
4,131 Wolters Kluwer NV 427,972 0.35
Total Netherlands 15,175,972 12.25
Norway (30 June 2021: 1.79%)
4,374 Adevinta ASA 51,163 0.04
356 Aker ASA 29,288 0.02
1,722 Aker BP ASA 46,638 0.04
1,360 Austevoll Seafood ASA 14,430 0.01
14,478 DNB Bank ASA 291,637 0.24
1,157 Entra ASA '144A' 22,879 0.02

December 2021 Legal & General UCITS ETF Plc
L&G Europe ex UK Equity UCITS ETF
Schedule of Investments (continued)
As at 31 December 2021
314
Nominal Description
Value €
% of Net
Assets
Common Stock (30 June 2021: 99.80%) (continued)
Norway (30 June 2021: 1.79%) (continued)
17,566 Equinor ASA 413,221 0.33
2,916 Gjensidige Forsikring ASA 62,228 0.05
7,283 Kahoot! ASA 33,844 0.03
1,352 Kongsberg Gruppen ASA 38,559 0.03
4,428 Leroy Seafood Group ASA 30,450 0.03
8,197 Mowi ASA 170,592 0.14
22,109 NEL ASA 33,534 0.03
2,990 Nordic Semiconductor ASA 88,733 0.07
20,889 Norsk Hydro ASA 144,814 0.12
11,519 Orkla ASA 101,497 0.08
812 Salmar ASA 49,231 0.04
1,786 Scatec ASA '144A' 27,205 0.02
291 Schibsted ASA 9,869 0.01
2,938 Schibsted ASA - Class B 87,014 0.07
2,831 SpareBank 1 SR-Bank ASA 37,603 0.03
7,269 Storebrand ASA 64,165 0.05
9,959 Telenor ASA 137,645 0.11
1,843 TOMRA Systems ASA 115,968 0.09
2,588 Yara International ASA 114,843 0.09
Total Norway 2,217,050 1.79
Poland (30 June 2021: 0.56%)
2,558 Bank Polska Kasa Opieki SA 68,090 0.05
1,078 CD Projekt SA 45,370 0.04
2,966 Cyfrowy Polsat SA 22,468 0.02
757 Dino Polska SA '144A' 60,665 0.05
2,154 KGHM Polska Miedz SA 65,513 0.05
213 mBank SA 20,132 0.02
12,778 PGE Polska Grupa Energetyczna SA 22,476 0.02

December 2021 Legal & General UCITS ETF Plc
L&G Europe ex UK Equity UCITS ETF
Schedule of Investments (continued)
As at 31 December 2021
315
Nominal Description
Value €
% of Net
Assets
Common Stock (30 June 2021: 99.80%) (continued)
Poland (30 June 2021: 0.56%) (continued)
4,854 Polski Koncern Naftowy ORLEN SA 78,731 0.06
25,267 Polskie Gornictwo Naftowe i Gazownictwo SA 34,731 0.03
13,891 Powszechna Kasa Oszczednosci Bank Polski SA 136,173 0.11
8,959 Powszechny Zaklad Ubezpieczen SA 69,099 0.06
538 Santander Bank Polska SA 40,908 0.03
Total Poland 664,356 0.54
Portugal (30 June 2021: 0.28%)
122,406 Banco Comercial Portugues SA 17,247 0.02
49,420 EDP - Energias de Portugal SA 238,798 0.19
7,683 Galp Energia SGPS SA 65,459 0.05
3,739 Jeronimo Martins SGPS SA 75,154 0.06
Total Portugal 396,658 0.32
Spain (30 June 2021: 5.02%)
3,618 ACS Actividades de Construccion y Servicios SA 85,276 0.07
1,067 Aena SME SA '144A' 148,100 0.12
7,395 Amadeus IT Group SA 441,038 0.36
109,443 Banco Bilbao Vizcaya Argentaria SA 574,576 0.46
283,238 Banco Santander SA 832,861 0.67
66,402 CaixaBank SA 160,294 0.13
9,365 Cellnex Telecom SA '144A' 479,301 0.39
4,170 EDP Renovaveis SA 91,323 0.07
4,975 Endesa SA 100,495 0.08
7,755 Ferrovial SA 213,728 0.17
4,840 Grifols SA 81,675 0.07
3,617 Grifols SA - Preference 36,568 0.03

December 2021 Legal & General UCITS ETF Plc
L&G Europe ex UK Equity UCITS ETF
Schedule of Investments (continued)
As at 31 December 2021
316
Nominal Description
Value €
% of Net
Assets
Common Stock (30 June 2021: 99.80%) (continued)
Spain (30 June 2021: 5.02%) (continued)
102,593 Iberdrola SA 1,067,993 0.86
18,773 Industria de Diseno Textil SA 535,594 0.43
14,767 Mapfre SA 26,662 0.02
7,544 Naturgy Energy Group SA 215,985 0.17
6,565 Red Electrica Corp SA 124,899 0.10
21,266 Repsol SA 221,932 0.18
3,501 Siemens Gamesa Renewable Energy SA 73,766 0.06
85,314 Telefonica SA 328,629 0.27
Total Spain 5,840,695 4.71
Sweden (30 June 2021: 8.34%)
2,710 AAK AB 51,405 0.04
4,110 AddTech AB 86,224 0.07
4,669 Alfa Laval AB 165,248 0.13
15,745 Assa Abloy AB 422,378 0.34
6,085 Atlas Copco AB 314,536 0.25
10,476 Atlas Copco AB 636,746 0.51
2,138 Avanza Bank Holding AB 68,983 0.06
1,543 Axfood AB 39,025 0.03
4,054 Beijer Ref AB - Class B 77,923 0.06
4,234 Boliden AB 143,931 0.12
3,825 Castellum AB 90,573 0.07
3,944 Electrolux AB 84,083 0.07
5,672 Elekta AB 63,105 0.05
9,249 Embracer Group AB - Class B 86,697 0.07
12,184 Epiroc AB 226,854 0.18
5,467 Epiroc AB 121,702 0.10
5,603 EQT AB 268,289 0.22
9,514 Essity AB 272,966 0.22

December 2021 Legal & General UCITS ETF Plc
L&G Europe ex UK Equity UCITS ETF
Schedule of Investments (continued)
As at 31 December 2021
317
Nominal Description
Value €
% of Net
Assets
Common Stock (30 June 2021: 99.80%) (continued)
Sweden (30 June 2021: 8.34%) (continued)
2,897 Evolution AB '144A' 361,903 0.29
4,161 Fabege AB 61,248 0.05
1,808 Fastighets AB Balder - Class B 114,458 0.09
2,895 Getinge AB 111,094 0.09
11,642 H & M Hennes & Mauritz AB 201,362 0.16
32,749 Hexagon AB 456,918 0.37
1,370 Holmen AB 57,842 0.05
6,220 Husqvarna AB 87,507 0.07
741 Industrivarden AB 20,447 0.02
4,363 Industrivarden AB - Class A 122,212 0.10
3,978 Indutrade AB 107,101 0.09
1,667 Investment AB Latour 59,696 0.05
35,159 Investor AB 777,732 0.63
2,220 Investor AB 51,447 0.04
3,800 Kinnevik AB 119,120 0.10
1,170 L E Lundbergforetagen AB 57,728 0.05
3,535 Lifco AB 92,942 0.07
2,770 Lundin Energy AB 87,303 0.07
26,676 Nibe Industrier AB 354,310 0.29
1,189 Saab AB 26,596 0.02
1,154 Sagax AB 34,185 0.03
42,406 Samhallsbyggnadsbolaget i Norden AB 132,376 0.11
16,794 Sandvik AB 412,024 0.33
4,843 Securitas AB 58,633 0.05
8,285 Sinch AB '144A' 92,620 0.07
23,925 Skandinaviska Enskilda Banken AB 292,442 0.24
5,811 Skanska AB 132,182 0.11
6,675 SKF AB 139,064 0.11
3,505 SSAB AB 17,852 0.01

December 2021 Legal & General UCITS ETF Plc
L&G Europe ex UK Equity UCITS ETF
Schedule of Investments (continued)
As at 31 December 2021
318
Nominal Description
Value €
% of Net
Assets
Common Stock (30 June 2021: 99.80%) (continued)
Sweden (30 June 2021: 8.34%) (continued)
8,172 SSAB AB - Class B 36,201 0.03
8,879 Svenska Cellulosa AB SCA - Class B 138,628 0.11
1,962 Svenska Handelsbanken AB 20,543 0.02
22,840 Svenska Handelsbanken AB 217,088 0.17
3,118 Sweco AB 51,543 0.04
18,011 Swedbank AB 318,554 0.26
24,590 Swedish Match AB 172,007 0.14
2,654 Swedish Orphan Biovitrum AB 47,714 0.04
6,997 Tele2 AB 87,735 0.07
48,207 Telefonaktiebolaget LM Ericsson - Class B 467,232 0.38
43,249 Telia Co AB 148,722 0.12
1,677 Thule Group AB '144A' 89,258 0.07
3,809 Trelleborg AB 87,975 0.07
1,109 Vitrolife AB 60,319 0.05
25,850 Volvo AB 526,369 0.42
2,489 Volvo AB 51,395 0.04
2,310 Wallenstam AB 37,693 0.03
Total Sweden 10,419,988 8.41
Switzerland (30 June 2021: 17.76%)
27,754 ABB Ltd 934,826 0.75
8,209 Alcon Inc 639,674 0.52
7,521 Cie Financiere Richemont SA 994,071 0.80
40,887 Credit Suisse Group AG 350,095 0.28
561 Geberit AG 403,474 0.33
131 Givaudan SA 605,854 0.49
8,728 Holcim Ltd 391,778 0.32
890 Kuehne + Nagel International AG 252,876 0.20
1,239 Lonza Group AG 910,705 0.73

December 2021 Legal & General UCITS ETF Plc
L&G Europe ex UK Equity UCITS ETF
Schedule of Investments (continued)
As at 31 December 2021
319
Nominal Description
Value €
% of Net
Assets
Common Stock (30 June 2021: 99.80%) (continued)
Switzerland (30 June 2021: 17.76%) (continued)
43,605 Nestle SA 5,363,172 4.33
38,514 Novartis AG 2,984,047 2.41
374 Partners Group Holding AG 545,942 0.44
527 Roche Holding AG 207,922 0.17
11,432 Roche Holding AG 4,182,690 3.38
432 Schindler Holding AG 101,898 0.08
549 Schindler Holding AG 130,078 0.10
83 SGS SA 244,079 0.20
2,257 Sika AG 828,177 0.67
166 Straumann Holding AG 310,325 0.25
867 Swatch Group AG/The 44,724 0.04
457 Swatch Group AG/The 123,055 0.10
4,707 Swiss Re AG 410,033 0.33
411 Swisscom AG 204,123 0.16
56,792 UBS Group AG 899,995 0.73
2,545 Zurich Insurance Group AG 983,471 0.79
Total Switzerland 23,047,084 18.60
Total Common Stock 123,836,284 99.96
Austria (30 June 2021: –%)
1,010 CA Immobilien Anlagen AG (Right) 22/07/2022* – –
Total Austria – –
Total Right – –

December 2021 Legal & General UCITS ETF Plc
L&G Europe ex UK Equity UCITS ETF
Schedule of Investments (continued)
As at 31 December 2021
320
Total Investments
Common Stock 123,836,284 99.96
Other Assets and Liabilities 46,613 0.04
Net Assets Attributable to Holders of Redeemable Participating Shares 123,882,897 100.00
Analysis of Total Assets
% of Total
Assets
Transferable securities admitted to an official stock exchange listing 99.90
Other assets 0.10
100.00
Analysis of Total Assets rather than Net Assets is required under Schedule 12 of the UCITS Regulations.
*Security is valued at zero.

December 2021 Legal & General UCITS ETF Plc
L&G Asia Pacific ex Japan Equity UCITS ETF
Schedule of Investments
As at 31 December 2021
321
Nominal Description
Value $
% of Net
Assets
Common Stock (30 June 2021: 99.29%)
Australia (30 June 2021: 57.34%)
25,539 Afterpay Ltd 1,541,332 0.65
73,980 AGL Energy Ltd 330,251 0.14
284,346 Alumina Ltd 385,556 0.16
355,800 AMP Ltd 261,270 0.11
26,375 Ampol Ltd 568,755 0.24
131,983 APA Group 965,334 0.41
71,454 Aristocrat Leisure Ltd 2,263,476 0.96
21,814 ASX Ltd 1,473,373 0.62
205,143 Aurizon Holdings Ltd 520,528 0.22
207,459 AusNet Services Ltd 387,639 0.16
303,054 Australia & New Zealand Banking Group Ltd 6,061,392 2.57
335,374 BHP Group Ltd 10,119,039 4.29
57,450 BlueScope Steel Ltd 872,968 0.37
40,028 Boral Ltd 177,523 0.08
164,574 Brambles Ltd 1,271,910 0.54
28,973 carsales.com Ltd 528,513 0.22
52,278 Charter Hall Group (REIT) 782,215 0.33
6,703 CIMIC Group Ltd 82,360 0.03
7,458 Cochlear Ltd 1,171,869 0.50
143,331 Coles Group Ltd 1,869,495 0.79
192,625 Commonwealth Bank of Australia 14,144,767 6.00
62,496 Computershare Ltd 908,749 0.39
50,126 Crown Resorts Ltd 435,869 0.18
51,621 CSL Ltd 10,910,964 4.63
122,720 Dexus (REIT) 992,160 0.42
6,631 Domino's Pizza Enterprises Ltd 569,027 0.24
150,999 Endeavour Group Ltd/Australia 739,939 0.31
199,002 Evolution Mining Ltd 587,415 0.25
200,199 Fortescue Metals Group Ltd 2,796,089 1.19
206,406 Goodman Group (REIT) 3,976,765 1.69
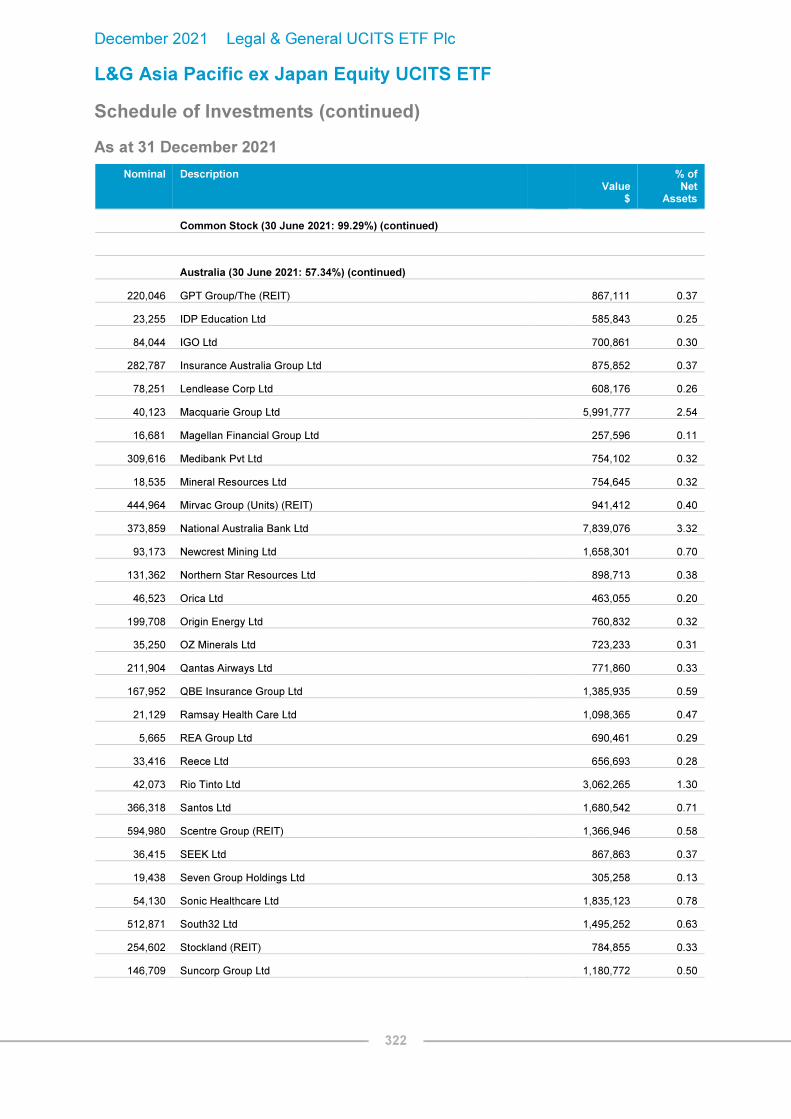
December 2021 Legal & General UCITS ETF Plc
L&G Asia Pacific ex Japan Equity UCITS ETF
Schedule of Investments (continued)
As at 31 December 2021
322
Nominal Description
Value $
% of Net
Assets
Common Stock (30 June 2021: 99.29%) (continued)
Australia (30 June 2021: 57.34%) (continued)
220,046 GPT Group/The (REIT) 867,111 0.37
23,255 IDP Education Ltd 585,843 0.25
84,044 IGO Ltd 700,861 0.30
282,787 Insurance Australia Group Ltd 875,852 0.37
78,251 Lendlease Corp Ltd 608,176 0.26
40,123 Macquarie Group Ltd 5,991,777 2.54
16,681 Magellan Financial Group Ltd 257,596 0.11
309,616 Medibank Pvt Ltd 754,102 0.32
18,535 Mineral Resources Ltd 754,645 0.32
444,964 Mirvac Group (Units) (REIT) 941,412 0.40
373,859 National Australia Bank Ltd 7,839,076 3.32
93,173 Newcrest Mining Ltd 1,658,301 0.70
131,362 Northern Star Resources Ltd 898,713 0.38
46,523 Orica Ltd 463,055 0.20
199,708 Origin Energy Ltd 760,832 0.32
35,250 OZ Minerals Ltd 723,233 0.31
211,904 Qantas Airways Ltd 771,860 0.33
167,952 QBE Insurance Group Ltd 1,385,935 0.59
21,129 Ramsay Health Care Ltd 1,098,365 0.47
5,665 REA Group Ltd 690,461 0.29
33,416 Reece Ltd 656,693 0.28
42,073 Rio Tinto Ltd 3,062,265 1.30
366,318 Santos Ltd 1,680,542 0.71
594,980 Scentre Group (REIT) 1,366,946 0.58
36,415 SEEK Ltd 867,863 0.37
19,438 Seven Group Holdings Ltd 305,258 0.13
54,130 Sonic Healthcare Ltd 1,835,123 0.78
512,871 South32 Ltd 1,495,252 0.63
254,602 Stockland (REIT) 784,855 0.33
146,709 Suncorp Group Ltd 1,180,772 0.50

December 2021 Legal & General UCITS ETF Plc
L&G Asia Pacific ex Japan Equity UCITS ETF
Schedule of Investments (continued)
As at 31 December 2021
323
Nominal Description
Value $
% of Net
Assets
Common Stock (30 June 2021: 99.29%) (continued)
Australia (30 June 2021: 57.34%) (continued)
306,417 Sydney Airport 1,933,723 0.82
253,302 Tabcorp Holdings Ltd 924,494 0.39
1,340,952 Telstra Corp Ltd 4,075,222 1.73
41,860 TPG Telecom Ltd 179,257 0.08
341,041 Transurban Group 3,426,703 1.45
82,560 Treasury Wine Estates Ltd 743,108 0.32
438,163 Vicinity Centres (REIT) 538,374 0.23
129,013 Wesfarmers Ltd 5,562,243 2.36
409,283 Westpac Banking Corp 6,353,066 2.69
16,907 WiseTech Global Ltd 720,075 0.31
109,997 Woodside Petroleum Ltd 1,753,805 0.74
143,697 Woolworths Group Ltd 3,971,068 1.68
Total Australia 139,740,455 59.25
Bermuda (30 June 2021: 1.89%)
467,805 Alibaba Health Information Technology Ltd 395,423 0.17
247,171 China Gas Holdings Ltd 513,599 0.22
67,308 CK Infrastructure Holdings Ltd 428,644 0.18
29,886 Dairy Farm International Holdings Ltd 85,474 0.04
132,753 Hongkong Land Holdings Ltd 690,316 0.29
76,084 Jardine Matheson Holdings Ltd 4,185,381 1.77
Total Bermuda 6,298,837 2.67
Cayman Islands (30 June 2021: 6.25%)
34,680 ASM Pacific Technology Ltd 374,766 0.16
191,000 Budweiser Brewing Co APAC Ltd '144A' 501,001 0.21
196,485 Chow Tai Fook Jewellery Group Ltd 353,337 0.15
224,042 CK Asset Holdings Ltd 1,412,422 0.60
300,759 CK Hutchison Holdings Ltd 1,940,430 0.82
193,800 ESR Cayman Ltd '144A' 655,007 0.28

December 2021 Legal & General UCITS ETF Plc
L&G Asia Pacific ex Japan Equity UCITS ETF
Schedule of Investments (continued)
As at 31 December 2021
324
Nominal Description
Value $
% of Net
Assets
Common Stock (30 June 2021: 99.29%) (continued)
Cayman Islands (30 June 2021: 6.25%) (continued)
8,771 Futu Holdings Ltd ADR 379,784 0.16
656,623 Geely Automobile Holdings Ltd 1,793,937 0.76
5,499 JOYY Inc ADR 249,820 0.11
90,236 JS Global Lifestyle Co Ltd '144A' 152,085 0.06
52,624 Melco Resorts & Entertainment Ltd ADR 535,712 0.23
277,953 Sands China Ltd 647,439 0.27
8,109 Sea Ltd ADR 1,814,064 0.77
131,264 Shimao Group Holdings Ltd 85,867 0.04
1,130,350 Sino Biopharmaceutical Ltd 791,620 0.34
845,765 WH Group Ltd '144A' 530,481 0.23
169,148 Wharf Real Estate Investment Co Ltd 859,159 0.36
178,663 Wynn Macau Ltd 145,977 0.06
188,986 Xinyi Glass Holdings Ltd 472,689 0.20
Total Cayman Islands 13,695,597 5.81
Hong Kong (30 June 2021: 20.83%)
1,377,895 AIA Group Ltd 13,891,530 5.89
147,792 Bank of East Asia Ltd/The 212,315 0.09
74,500 BYD Electronic International Co Ltd 272,818 0.12
99,000 Cathay Pacific Airways Ltd 81,142 0.03
369,000 China Evergrande New Energy Vehicle Group Ltd 166,602 0.07
213,907 CLP Holdings Ltd 2,160,663 0.92
966,526 CSPC Pharmaceutical Group Ltd 1,050,046 0.44
253,994 Fosun International Ltd 273,988 0.12
245,357 Galaxy Entertainment Group Ltd 1,271,426 0.54
203,839 Hang Lung Properties Ltd 419,375 0.18
82,039 Hang Seng Bank Ltd 1,501,605 0.64
152,136 Henderson Land Development Co Ltd 647,860 0.27
258,199 HK Electric Investments & HK Electric Investments Ltd 253,354 0.11
387,342 HKT Trust & HKT Ltd 520,676 0.22

December 2021 Legal & General UCITS ETF Plc
L&G Asia Pacific ex Japan Equity UCITS ETF
Schedule of Investments (continued)
As at 31 December 2021
325
Nominal Description
Value $
% of Net
Assets
Common Stock (30 June 2021: 99.29%) (continued)
Hong Kong (30 June 2021: 20.83%) (continued)
1,227,595 Hong Kong & China Gas Co Ltd 1,911,548 0.81
144,415 Hong Kong Exchanges & Clearing Ltd 8,435,615 3.58
237,529 Link REIT (Units) (REIT) 2,091,552 0.89
173,862 MTR Corp Ltd 933,279 0.40
158,211 New World Development Co Ltd 626,042 0.26
157,182 Power Assets Holdings Ltd 979,829 0.41
361,832 Sino Land Co Ltd 450,648 0.19
196,463 Sun Art Retail Group Ltd 78,874 0.03
163,591 Sun Hung Kai Properties Ltd 1,985,007 0.84
52,090 Swire Pacific Ltd 296,319 0.12
124,405 Swire Properties Ltd 311,798 0.13
156,077 Techtronic Industries Co Ltd 3,107,005 1.32
150,769 Wharf Holdings Ltd/The 463,158 0.20
Total Hong Kong 44,394,074 18.82
New Zealand (30 June 2021: 3.49%)
83,260 a2 Milk Co Ltd/The 338,035 0.14
134,740 Auckland International Airport Ltd 710,327 0.30
50,154 Chorus Ltd 246,204 0.10
87,671 Contact Energy Ltd 486,197 0.21
13,314 EBOS Group Ltd 375,558 0.16
65,599 Fisher & Paykel Healthcare Corp Ltd 1,471,336 0.62
87,757 Fletcher Building Ltd 440,409 0.19
51,521 Genesis Energy Ltd 100,884 0.04
120,303 Goodman Property Trust (Units) (REIT) 212,504 0.09
82,980 Infratil Ltd 454,500 0.19
9,431 Mainfreight Ltd 606,309 0.26
66,277 Mercury NZ Ltd 277,706 0.12
127,489 Meridian Energy Ltd 423,336 0.18
43,841 Ryman Healthcare Ltd 367,695 0.15

December 2021 Legal & General UCITS ETF Plc
L&G Asia Pacific ex Japan Equity UCITS ETF
Schedule of Investments (continued)
As at 31 December 2021
326
Nominal Description
Value $
% of Net
Assets
Common Stock (30 June 2021: 99.29%) (continued)
New Zealand (30 June 2021: 3.49%) (continued)
204,353 Spark New Zealand Ltd 632,398 0.27
14,847 Xero Ltd 1,526,767 0.65
Total New Zealand 8,670,165 3.67
Singapore (30 June 2021: 9.24%)
384,513 Ascendas Real Estate Investment Trust (Units) (REIT) 841,386 0.36
516,790 CapitaLand Integrated Commercial Trust (Units) (REIT) 781,999 0.33
65,076 City Developments Ltd 328,723 0.14
249,229 ComfortDelGro Corp Ltd 258,815 0.11
204,696 DBS Group Holdings Ltd 4,958,927 2.10
306,500 Frasers Logistics & Commercial Trust (Units) (REIT) 345,570 0.15
618,145 Genting Singapore Ltd 355,348 0.15
10,720 Jardine Cycle & Carriage Ltd 163,804 0.07
165,456 Keppel Corp Ltd 628,369 0.27
149,386 Keppel DC REIT (Units) (REIT) 273,696 0.12
225,365 Mapletree Commercial Trust (REIT) 334,333 0.14
226,655 Mapletree Industrial Trust (Units) (REIT) 455,614 0.19
341,683 Mapletree Logistics Trust (Units) (REIT) 481,548 0.20
133,964 Olam International Ltd 173,895 0.07
454,337 Oversea-Chinese Banking Corp Ltd 3,841,892 1.63
85,191 SATS Ltd 245,813 0.11
147,130 Singapore Airlines Ltd 544,583 0.23
92,945 Singapore Exchange Ltd 641,167 0.27
179,874 Singapore Technologies Engineering Ltd 501,670 0.21
909,836 Singapore Telecommunications Ltd 1,565,717 0.66
146,391 Suntec Real Estate Investment Trust (Units) (REIT) 163,966 0.07
162,232 United Overseas Bank Ltd 3,237,062 1.37
58,880 UOL Group Ltd 309,654 0.13
30,580 Venture Corp Ltd 415,325 0.18
203,392 Wilmar International Ltd (Units) 624,592 0.27
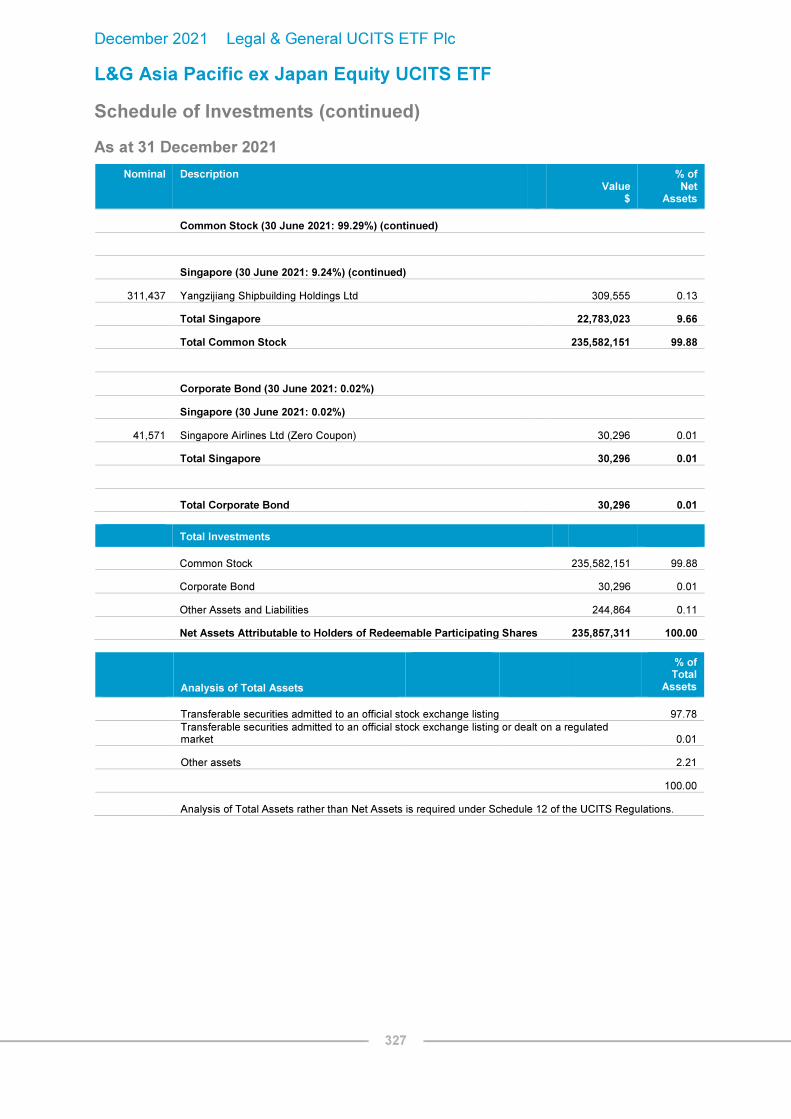
December 2021 Legal & General UCITS ETF Plc
L&G Asia Pacific ex Japan Equity UCITS ETF
Schedule of Investments (continued)
As at 31 December 2021
327
Nominal Description
Value $
% of Net
Assets
Common Stock (30 June 2021: 99.29%) (continued)
Singapore (30 June 2021: 9.24%) (continued)
311,437 Yangzijiang Shipbuilding Holdings Ltd 309,555 0.13
Total Singapore 22,783,023 9.66
Total Common Stock 235,582,151 99.88
Corporate Bond (30 June 2021: 0.02%)
Singapore (30 June 2021: 0.02%)
41,571 Singapore Airlines Ltd (Zero Coupon) 30,296 0.01
Total Singapore 30,296 0.01
Total Corporate Bond 30,296 0.01
Total Investments
Common Stock 235,582,151 99.88
Corporate Bond 30,296 0.01
Other Assets and Liabilities 244,864 0.11
Net Assets Attributable to Holders of Redeemable Participating Shares 235,857,311 100.00
Analysis of Total Assets
% of Total
Assets
Transferable securities admitted to an official stock exchange listing 97.78
Transferable securities admitted to an official stock exchange listing or dealt on a regulated market 0.01
Other assets 2.21
100.00
Analysis of Total Assets rather than Net Assets is required under Schedule 12 of the UCITS Regulations.

December 2021 Legal & General UCITS ETF Plc
L&G Clean Water UCITS ETF
Schedule of Investments
As at 31 December 2021
328
Nominal Description
Value $
% of Net
Assets
Common Stock
Bermuda (30 June 2021: 2.58%)
16,001,984 Beijing Enterprises Water Group Ltd 6,219,105 1.71
3,415,472 China Water Affairs Group Ltd 4,897,832 1.35
Total Bermuda 11,116,937 3.06
Brazil (30 June 2021: 1.96%)
992,264 Cia de Saneamento Basico do Estado de Sao Paulo ADR 7,283,218 2.00
Total Brazil 7,283,218 2.00
Canada (30 June 2021: 1.93%)
207,613 Primo Water Corp 3,660,217 1.01
Total Canada 3,660,217 1.01
Cayman Islands (30 June 2021: 3.07%)
3,370,935 China Lesso Group Holdings Ltd 4,842,614 1.33
305,233 Consolidated Water Co Ltd 3,247,679 0.90
Total Cayman Islands 8,090,293 2.23
Finland (30 June 2021: 4.17%)
398,498 Kemira Oyj 6,040,728 1.66
620,612 Metso Outotec Oyj 6,597,386 1.81
114,266 Uponor Oyj 2,720,988 0.75
Total Finland 15,359,102 4.22
Germany (30 June 2021: 1.83%)
72,647 Norma Group SE 2,798,943 0.77
Total Germany 2,798,943 0.77
Hong Kong (30 June 2021: 1.47%)
4,625,907 Guangdong Investment Ltd 5,880,063 1.62
Total Hong Kong 5,880,063 1.62

December 2021 Legal & General UCITS ETF Plc
L&G Clean Water UCITS ETF
Schedule of Investments (continued)
As at 31 December 2021
329
Nominal Description
Value $
% of Net
Assets
Common Stock
Ireland (30 June 2021: 2.06%)
87,796 Pentair Plc 6,411,742 1.76
Total Ireland 6,411,742 1.76
Japan (30 June 2021: 6.60%)
484,185 Kitz Corp 2,993,701 0.82
139,841 Kurita Water Industries Ltd 6,630,470 1.82
213,958 METAWATER Co Ltd 3,758,734 1.04
61,318 Organo Corp 4,605,972 1.27
Total Japan 17,988,877 4.95
Netherlands (30 June 2021: 2.02%)
105,467 Aalberts NV 6,987,472 1.92
Total Netherlands 6,987,472 1.92
Sweden (30 June 2021: 1.97%)
166,150 Alfa Laval AB 6,687,237 1.84
Total Sweden 6,687,237 1.84
Switzerland (30 June 2021: 4.43%)
8,184 Geberit AG 6,693,466 1.84
44,960 Medmix AG '144A' 2,228,399 0.61
44,960 Sulzer AG 4,433,605 1.22
Total Switzerland 13,355,470 3.67
United Kingdom (30 June 2021: 9.54%)
640,054 Genuit Group Plc 5,080,158 1.40
391,144 Pennon Group Plc 6,182,591 1.70
1,444,436 Rotork Plc 6,988,319 1.92
175,889 Severn Trent Plc 7,020,722 1.93
466,707 United Utilities Group Plc 6,883,910 1.89
Total United Kingdom 32,155,700 8.84

December 2021 Legal & General UCITS ETF Plc
L&G Clean Water UCITS ETF
Schedule of Investments (continued)
As at 31 December 2021
330
Nominal Description
Value $
% of Net
Assets
Common Stock
United States (30 June 2021: 56.10%)
93,347 A O Smith Corp
8,013,840 2.20
58,724 Advanced Drainage Systems Inc
7,994,098 2.20
73,253 American States Water Co
7,577,290 2.08
36,925 American Water Works Co Inc
6,973,656 1.92
93,893 Artesian Resources Corp - Class A
4,350,063 1.20
64,723 Badger Meter Inc
6,896,883 1.90
101,767 Bentley Systems Inc - Class B
4,918,399 1.35
510,583 Cadiz Inc
1,970,850 0.54
106,011 California Water Service Group
7,617,951 2.09
20,566 Danaher Corp
6,766,420 1.86
30,367 Ecolab Inc
7,123,795 1.96
296,861 Energy Recovery Inc
6,379,543 1.75
177,025 Evoqua Water Technologies Corp
8,275,919 2.28
288,590 Forterra Inc
6,862,670 1.89
80,149 Franklin Electric Co Inc
7,578,889 2.08
192,420 Gorman-Rupp Co/The
8,572,311 2.36
30,717 IDEX Corp
7,259,041 2.00
86,761 Ingevity Corp
6,220,764 1.71
83,547 Itron Inc
5,724,640 1.57
31,786 Kadant Inc
7,326,037 2.01
41,910 Lindsay Corp
6,370,320 1.75
4,340 Mettler-Toledo International Inc
7,365,891 2.03
60,723 Middlesex Water Co
7,304,977 2.01
422,018 Mueller Water Products Inc - Class A
6,077,059 1.67
143,248 Northwest Pipe Co
4,555,286 1.25
24,108 Regal Rexnord Corp
4,102,699 1.13
14,061 Roper Technologies Inc
6,916,044 1.90
97,667 SJW Group
7,149,224 1.97
45,091 Tetra Tech Inc
7,656,452 2.10
2,123,199 TETRA Technologies Inc
6,029,885 1.66

December 2021 Legal & General UCITS ETF Plc
L&G Clean Water UCITS ETF
Schedule of Investments (continued)
As at 31 December 2021
331
Nominal Description
Value $
% of Net
Assets
Common Stock
United States (30 June 2021: 56.10%) (continued)
72,072 Trimble Inc
6,283,958 1.73
40,399 Watts Water Technologies Inc - Class A
7,844,274 2.16
49,812 Xylem Inc/NY
5,973,455 1.64
69,649 York Water Co/The
3,467,127 0.95
108,124 Zurn Water Solutions Corp
3,935,714 1.08
Total United States
225,435,424 61.98
Total Common Stock
363,210,695 99.87
Total Investments
Common Stock 363,210,695 99.87
Other Assets and Liabilities 488,689 0.13
Net Assets Attributable to Holders of Redeemable Participating Shares 363,699,384 100.00
Analysis of Total Assets
% of Total
Assets
Transferable securities admitted to an official stock exchange listing 98.90
Other assets 1.10
100.00
Analysis of Total Assets rather than Net Assets is required under Schedule 12 of the UCITS Regulations.

December 2021 Legal & General UCITS ETF Plc
L&G Artificial Intelligence UCITS ETF
Schedule of Investments
As at 31 December 2021
332
Nominal Description
Value $
% of Net
Assets
Common Stock (30 June 2021: 99.85%)
Australia (30 June 2021: 1.39%)
589,975 Appen Ltd 4,786,958 1.44
Total Australia 4,786,958 1.44
Canada (30 June 2021: 1.41%)
2,940 Shopify Inc 4,049,527 1.22
Total Canada 4,049,527 1.22
Cayman Islands (30 June 2021: 6.63%)
46,654 Alibaba Group Holding Ltd ADR 5,542,029 1.66
39,603 Baidu Inc ADR 5,892,530 1.77
55,976 JD.com Inc ADR 3,922,238 1.18
987,532 Kingdee International Software Group Co Ltd 3,040,002 0.91
91,838 Tencent Holdings Ltd 5,380,962 1.62
Total Cayman Islands 23,777,761 7.14
China (30 June 2021: 0.38%)
141,273 Iflytek Co Ltd 'A' 1,166,567 0.35
Total China 1,166,567 0.35
France (30 June 2021: 1.50%)
86,160 Dassault Systemes SE 5,125,348 1.54
Total France 5,125,348 1.54
Germany (30 June 2021: 1.18%)
93,912 Infineon Technologies AG 4,352,996 1.31
Total Germany 4,352,996 1.31
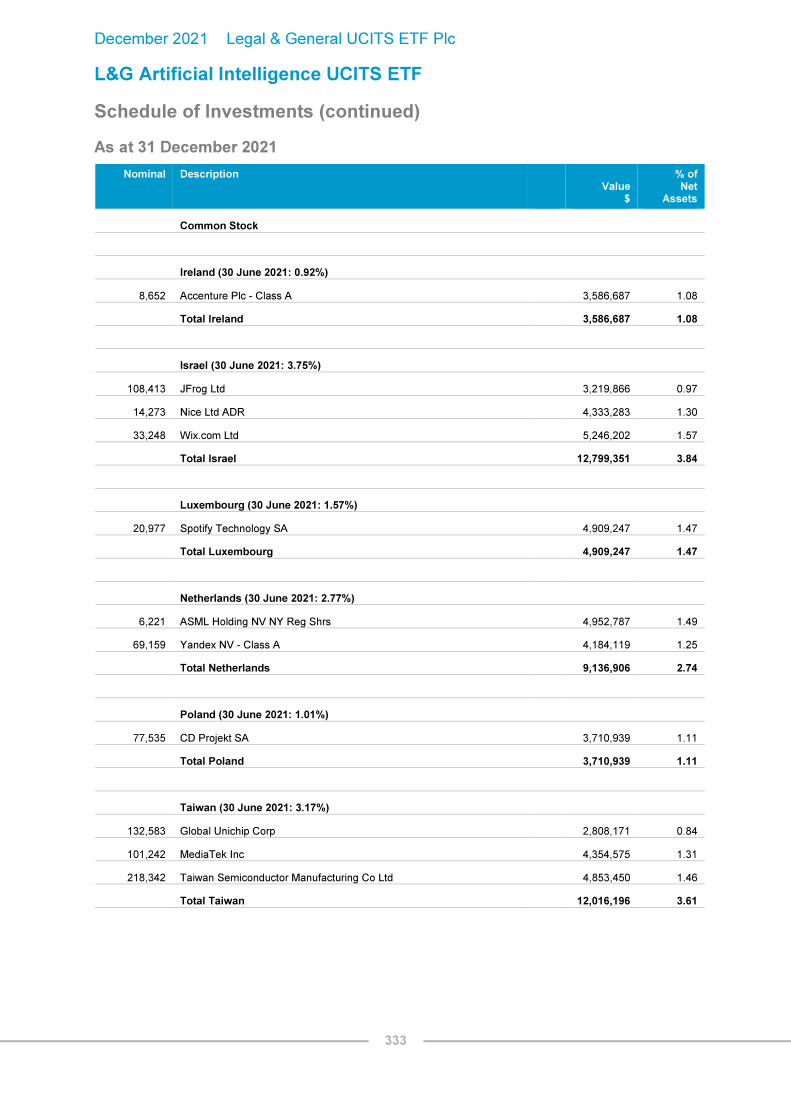
December 2021 Legal & General UCITS ETF Plc
L&G Artificial Intelligence UCITS ETF
Schedule of Investments (continued)
As at 31 December 2021
333
Nominal Description
Value $
% of Net
Assets
Common Stock
Ireland (30 June 2021: 0.92%)
8,652 Accenture Plc - Class A 3,586,687 1.08
Total Ireland 3,586,687 1.08
Israel (30 June 2021: 3.75%)
108,413 JFrog Ltd 3,219,866 0.97
14,273 Nice Ltd ADR 4,333,283 1.30
33,248 Wix.com Ltd 5,246,202 1.57
Total Israel 12,799,351 3.84
Luxembourg (30 June 2021: 1.57%)
20,977 Spotify Technology SA 4,909,247 1.47
Total Luxembourg 4,909,247 1.47
Netherlands (30 June 2021: 2.77%)
6,221 ASML Holding NV NY Reg Shrs 4,952,787 1.49
69,159 Yandex NV - Class A 4,184,119 1.25
Total Netherlands 9,136,906 2.74
Poland (30 June 2021: 1.01%)
77,535 CD Projekt SA 3,710,939 1.11
Total Poland 3,710,939 1.11
Taiwan (30 June 2021: 3.17%)
132,583 Global Unichip Corp 2,808,171 0.84
101,242 MediaTek Inc 4,354,575 1.31
218,342 Taiwan Semiconductor Manufacturing Co Ltd 4,853,450 1.46
Total Taiwan 12,016,196 3.61
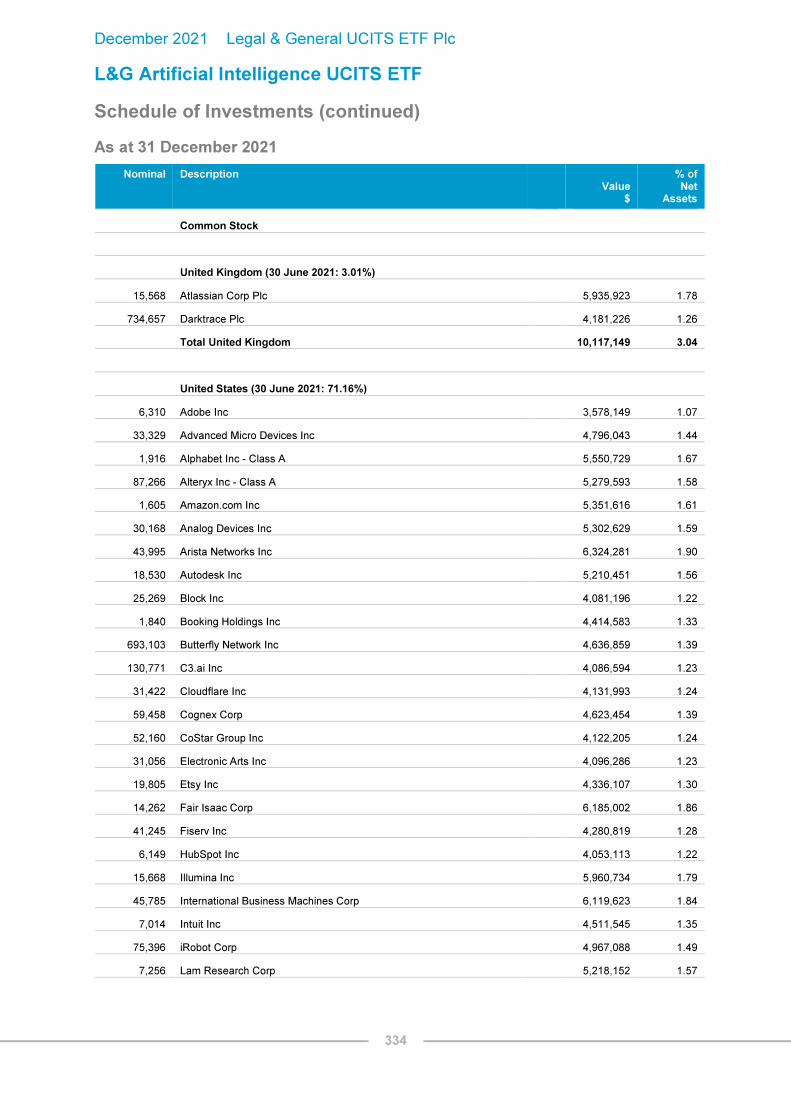
December 2021 Legal & General UCITS ETF Plc
L&G Artificial Intelligence UCITS ETF
Schedule of Investments (continued)
As at 31 December 2021
334
Nominal Description
Value $
% of Net
Assets
Common Stock
United Kingdom (30 June 2021: 3.01%)
15,568 Atlassian Corp Plc 5,935,923 1.78
734,657 Darktrace Plc 4,181,226 1.26
Total United Kingdom 10,117,149 3.04
United States (30 June 2021: 71.16%)
6,310 Adobe Inc 3,578,149 1.07
33,329 Advanced Micro Devices Inc 4,796,043 1.44
1,916 Alphabet Inc - Class A 5,550,729 1.67
87,266 Alteryx Inc - Class A 5,279,593 1.58
1,605 Amazon.com Inc 5,351,616 1.61
30,168 Analog Devices Inc 5,302,629 1.59
43,995 Arista Networks Inc 6,324,281 1.90
18,530 Autodesk Inc 5,210,451 1.56
25,269 Block Inc 4,081,196 1.22
1,840 Booking Holdings Inc 4,414,583 1.33
693,103 Butterfly Network Inc 4,636,859 1.39
130,771 C3.ai Inc 4,086,594 1.23
31,422 Cloudflare Inc 4,131,993 1.24
59,458 Cognex Corp 4,623,454 1.39
52,160 CoStar Group Inc 4,122,205 1.24
31,056 Electronic Arts Inc 4,096,286 1.23
19,805 Etsy Inc 4,336,107 1.30
14,262 Fair Isaac Corp 6,185,002 1.86
41,245 Fiserv Inc 4,280,819 1.28
6,149 HubSpot Inc 4,053,113 1.22
15,668 Illumina Inc 5,960,734 1.79
45,785 International Business Machines Corp 6,119,623 1.84
7,014 Intuit Inc 4,511,545 1.35
75,396 iRobot Corp 4,967,088 1.49
7,256 Lam Research Corp 5,218,152 1.57

December 2021 Legal & General UCITS ETF Plc
L&G Artificial Intelligence UCITS ETF
Schedule of Investments (continued)
As at 31 December 2021
335
Nominal Description
Value $
% of Net
Assets
Common Stock
United States (30 June 2021: 71.16%) (continued)
85,823 Lemonade Inc 3,614,007 1.08
4,547 MercadoLibre Inc 6,131,175 1.84
16,845 Microsoft Corp 5,665,310 1.70
7,915 MongoDB Inc - Class A 4,189,805 1.26
7,971 Netflix Inc 4,802,049 1.44
44,369 New Relic Inc 4,878,815 1.46
134,105 NortonLifeLock Inc 3,484,048 1.05
17,415 NVIDIA Corp 5,121,926 1.54
7,888 Palo Alto Networks Inc 4,391,723 1.32
102,403 Pure Storage Inc 3,333,218 1.00
42,942 Rapid7 Inc 5,053,844 1.52
20,692 salesforce.com Inc 5,258,458 1.58
7,828 ServiceNow Inc 5,081,233 1.53
47,641 Splunk Inc 5,513,017 1.65
25,840 Teradyne Inc 4,225,615 1.27
4,084 Tesla Inc 4,315,889 1.30
18,314 Twilio Inc - Class A 4,822,809 1.45
20,766 Upstart Holdings Inc 3,141,896 0.94
99,785 Varonis Systems Inc - Class B 4,867,512 1.46
18,217 Veeva Systems Inc - Class A 4,654,079 1.40
125,934 Veracyte Inc 5,188,481 1.56
21,654 Verisk Analytics Inc - Class A 4,952,919 1.49
458,063 Yext Inc 4,543,985 1.36
49,542 Zendesk Inc 5,166,735 1.55
Total United States 233,617,392 70.14
Total Common Stock 333,153,024 100.03
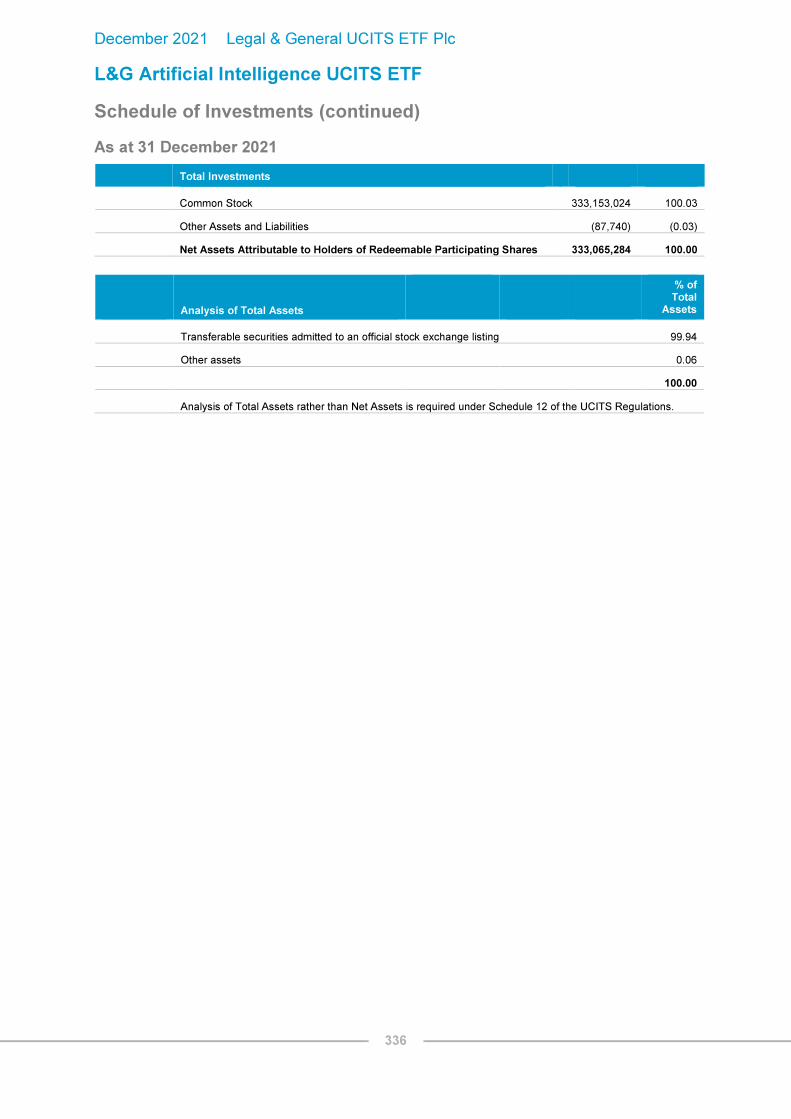
December 2021 Legal & General UCITS ETF Plc
L&G Artificial Intelligence UCITS ETF
Schedule of Investments (continued)
As at 31 December 2021
336
Total Investments
Common Stock 333,153,024 100.03
Other Assets and Liabilities (87,740) (0.03)
Net Assets Attributable to Holders of Redeemable Participating Shares 333,065,284 100.00
Analysis of Total Assets
% of Total
Assets
Transferable securities admitted to an official stock exchange listing 99.94
Other assets 0.06
100.00
Analysis of Total Assets rather than Net Assets is required under Schedule 12 of the UCITS Regulations.

December 2021 Legal & General UCITS ETF Plc
L&G Healthcare Breakthrough UCITS ETF
Schedule of Investments
As at 31 December 2021
337
Nominal Description
Value $
% of Net
Assets
Common Stock (30 June 2021: 99.87%)
Australia (30 June 2021: 0.97%)
9,993 CSL Ltd
2,112,188 0.99
Total Australia
2,112,188 0.99
Belgium (30 June 2021: 0.67%)
73,491 Materialise NV ADR
1,754,230 0.82
Total Belgium
1,754,230 0.82
Bermuda (30 June 2021: 0.95%)
2,387,956 Alibaba Health Information Technology Ltd
2,018,474 0.95
Total Bermuda
2,018,474 0.95
Canada (30 June 2021: 0.76%)
9,892 Novanta Inc
1,744,256 0.82
Total Canada
1,744,256 0.82
Cayman Islands (30 June 2021: 2.56%)
258,666 JD Health International Inc '144A'
2,038,791 0.96
766,392 Ping An Healthcare and Technology Co Ltd '144A'
2,786,862 1.31
Total Cayman Islands
4,825,653 2.27
Denmark (30 June 2021: 0.84%)
29,694 GN Store Nord AS
1,867,380 0.88
Total Denmark
1,867,380 0.88
France (30 June 2021: 1.45%)
337,201 Cellectis SA ADR
2,738,072 1.29
Total France
2,738,072 1.29
Germany (30 June 2021: 1.41%)
37,213 Siemens Healthineers AG '144A'
2,785,387 1.31
Total Germany
2,785,387 1.31

December 2021 Legal & General UCITS ETF Plc
L&G Healthcare Breakthrough UCITS ETF
Schedule of Investments (continued)
As at 31 December 2021
338
Nominal Description
Value $
% of Net
Assets
Common Stock (30 June 2021: 99.87%) (continued)
Italy (30 June 2021: 1.44%)
13,432 DiaSorin SpA 2,557,754 1.20
Total Italy 2,557,754 1.20
Japan (30 June 2021: 0.74%)
34,774 Terumo Corp 1,467,601 0.69
Total Japan 1,467,601 0.69
Jersey (30 June 2021: 0.74%)
33,860 Novocure Ltd 2,542,209 1.19
Total Jersey 2,542,209 1.19
Luxembourg (30 June 2021: 1.19%)
18,262 Eurofins Scientific SE 2,259,489 1.06
Total Luxembourg 2,259,489 1.06
Netherlands (30 June 2021: 1.02%)
69,598 Koninklijke Philips NV 2,593,223 1.22
Total Netherlands 2,593,223 1.22
Spain (30 June 2021: –%)
112,636 Grifols SA 2,161,494 1.01
Total Spain 2,161,494 1.01
Switzerland (30 June 2021: 3.67%)
3,126 Lonza Group AG 2,612,935 1.23
5,632 Roche Holding AG 2,343,306 1.10
4,359 Tecan Group AG 2,657,563 1.25
Total Switzerland 7,613,804 3.58

December 2021 Legal & General UCITS ETF Plc
L&G Healthcare Breakthrough UCITS ETF
Schedule of Investments (continued)
As at 31 December 2021
339
Nominal Description
Value $
% of Net
Assets
Common Stock (30 June 2021: 99.87%) (continued)
United Kingdom (30 June 2021: 1.62%)
85,951 EMIS Group Plc 1,583,262 0.74
119,198 Smith & Nephew Plc 2,088,327 0.98
Total United Kingdom 3,671,589 1.72
United States (30 June 2021: 79.84%)
161,961 1Life Healthcare Inc 2,845,655 1.34
80,788 3D Systems Corp 1,740,173 0.82
13,915 Abbott Laboratories 1,958,397 0.92
9,242 ABIOMED Inc 3,319,449 1.56
14,941 Agilent Technologies Inc 2,385,331 1.12
201,506 Akoya Biosciences Inc 3,085,057 1.45
3,644 Align Technology Inc 2,394,764 1.12
8,138 Alnylam Pharmaceuticals Inc 1,380,042 0.65
20,658 Arrowhead Pharmaceuticals Inc 1,369,625 0.64
56,771 Avanos Medical Inc 1,968,251 0.92
290,642 Axogen Inc 2,723,315 1.28
26,131 Azenta Inc 2,694,367 1.26
22,689 Baxter International Inc 1,947,624 0.91
6,283 Becton Dickinson and Co 1,580,049 0.74
22,861 BioMarin Pharmaceutical Inc 2,019,769 0.95
3,235 Bio-Rad Laboratories Inc 2,444,269 1.15
70,414 Boston Scientific Corp 2,991,187 1.40
30,453 Bristol-Myers Squibb Co 1,898,745 0.89
416,781 Butterfly Network Inc 2,788,265 1.31
139,000 Cardiovascular Systems Inc 2,610,420 1.23
61,629 CareDx Inc 2,802,887 1.32
20,986 Catalent Inc 2,686,838 1.26
245,702 Cerus Corp 1,673,231 0.79
7,775 Charles River Laboratories International Inc 2,929,464 1.38

December 2021 Legal & General UCITS ETF Plc
L&G Healthcare Breakthrough UCITS ETF
Schedule of Investments (continued)
As at 31 December 2021
340
Nominal Description
Value $
% of Net
Assets
Common Stock (30 June 2021: 99.87%) (continued)
United States (30 June 2021: 79.84%) (continued)
65,096 Codexis Inc 2,035,552 0.96
13,113 CONMED Corp 1,858,899 0.87
8,657 Danaher Corp 2,848,240 1.34
5,349 Dexcom Inc 2,872,145 1.35
50,304 Editas Medicine Inc - Class A 1,335,571 0.63
18,826 Edwards Lifesciences Corp 2,438,908 1.14
33,376 Exact Sciences Corp 2,597,654 1.22
29,051 Fate Therapeutics Inc 1,699,774 0.80
31,250 Fulgent Genetics Inc 3,143,437 1.48
68,998 Glaukos Corp 3,066,271 1.44
23,221 Globus Medical Inc 1,676,556 0.79
28,184 Guardant Health Inc 2,818,964 1.32
67,142 Health Catalyst Inc 2,660,166 1.25
28,665 Hologic Inc 2,194,592 1.03
8,001 Illumina Inc 3,043,900 1.43
38,861 Incyte Corp 2,852,397 1.34
10,558 Insulet Corp 2,809,167 1.32
44,322 Integra LifeSciences Holdings Corp 2,969,131 1.39
8,639 Intuitive Surgical Inc 3,103,993 1.46
9,662 IQVIA Holdings Inc 2,726,037 1.28
27,202 iRhythm Technologies Inc 3,201,403 1.50
7,401 Masimo Corp 2,166,865 1.02
10,823 Medpace Holdings Inc 2,355,518 1.11
8,365 Moderna Inc 2,124,543 1.00
56,747 NanoString Technologies Inc 2,396,426 1.13
32,100 Natera Inc 2,997,819 1.41
83,839 NeoGenomics Inc 2,860,587 1.34
26,834 Nevro Corp 2,175,432 1.02
14,296 Omnicell Inc 2,579,570 1.21
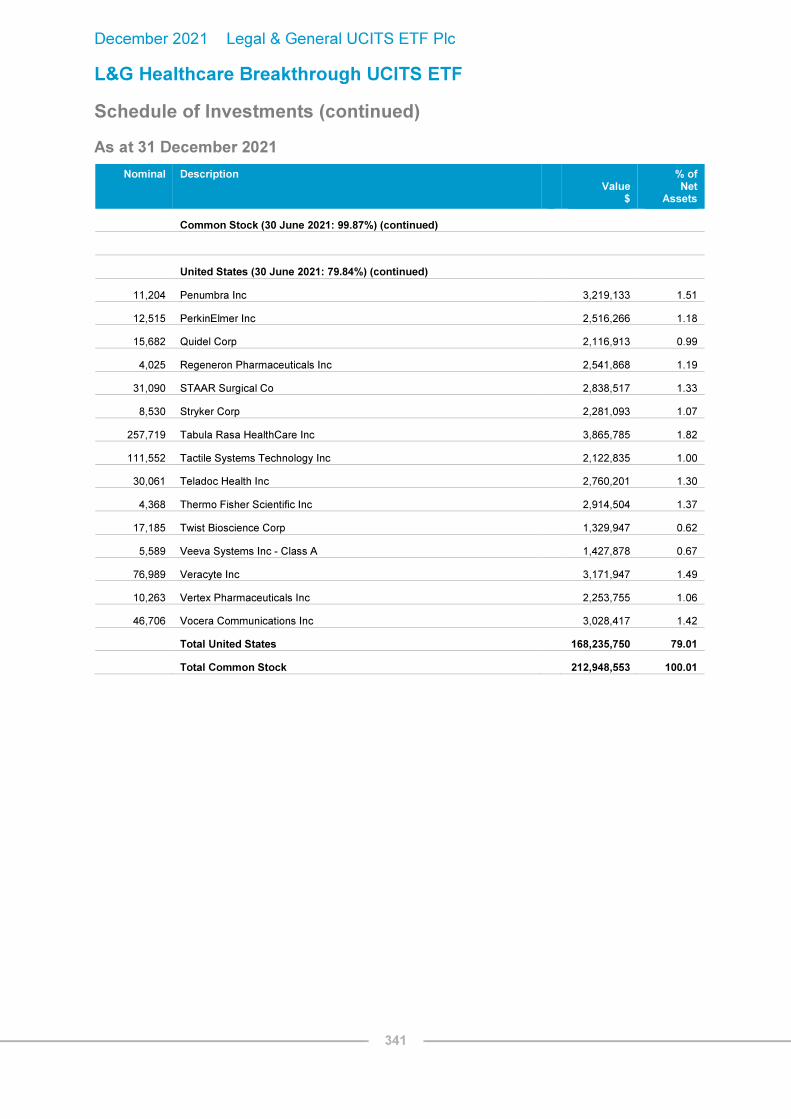
December 2021 Legal & General UCITS ETF Plc
L&G Healthcare Breakthrough UCITS ETF
Schedule of Investments (continued)
As at 31 December 2021
341
Nominal Description
Value $
% of Net
Assets
Common Stock (30 June 2021: 99.87%) (continued)
United States (30 June 2021: 79.84%) (continued)
11,204 Penumbra Inc 3,219,133 1.51
12,515 PerkinElmer Inc 2,516,266 1.18
15,682 Quidel Corp 2,116,913 0.99
4,025 Regeneron Pharmaceuticals Inc 2,541,868 1.19
31,090 STAAR Surgical Co 2,838,517 1.33
8,530 Stryker Corp 2,281,093 1.07
257,719 Tabula Rasa HealthCare Inc 3,865,785 1.82
111,552 Tactile Systems Technology Inc 2,122,835 1.00
30,061 Teladoc Health Inc 2,760,201 1.30
4,368 Thermo Fisher Scientific Inc 2,914,504 1.37
17,185 Twist Bioscience Corp 1,329,947 0.62
5,589 Veeva Systems Inc - Class A 1,427,878 0.67
76,989 Veracyte Inc 3,171,947 1.49
10,263 Vertex Pharmaceuticals Inc 2,253,755 1.06
46,706 Vocera Communications Inc 3,028,417 1.42
Total United States 168,235,750 79.01
Total Common Stock 212,948,553 100.01

December 2021 Legal & General UCITS ETF Plc
L&G Healthcare Breakthrough UCITS ETF
Schedule of Investments (continued)
As at 31 December 2021
342
Total Investments
Common Stock 212,948,553 100.01
Other Assets and Liabilities (30,313) (0.01)
Net Assets Attributable to Holders of Redeemable Participating Shares 212,918,240 100.00
Analysis of Total Assets
% of Total
Assets
Transferable securities admitted to an official stock exchange listing 99.97
Other assets 0.03
100.00
Analysis of Total Assets rather than Net Assets is required under Schedule 12 of the UCITS Regulations.
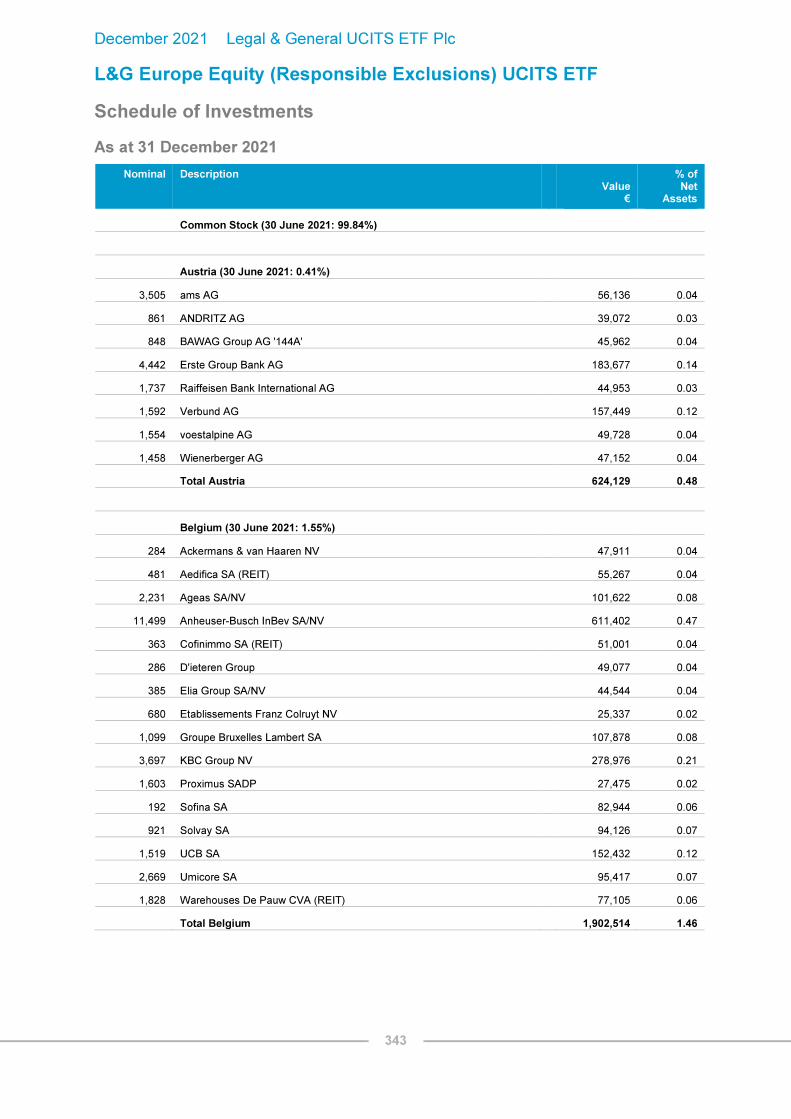
December 2021 Legal & General UCITS ETF Plc
L&G Europe Equity (Responsible Exclusions) UCITS ETF
Schedule of Investments
As at 31 December 2021
343
Nominal Description
Value €
% of Net
Assets
Common Stock (30 June 2021: 99.84%)
Austria (30 June 2021: 0.41%)
3,505 ams AG 56,136 0.04
861 ANDRITZ AG 39,072 0.03
848 BAWAG Group AG '144A' 45,962 0.04
4,442 Erste Group Bank AG 183,677 0.14
1,737 Raiffeisen Bank International AG 44,953 0.03
1,592 Verbund AG 157,449 0.12
1,554 voestalpine AG 49,728 0.04
1,458 Wienerberger AG 47,152 0.04
Total Austria 624,129 0.48
Belgium (30 June 2021: 1.55%)
284 Ackermans & van Haaren NV 47,911 0.04
481 Aedifica SA (REIT) 55,267 0.04
2,231 Ageas SA/NV 101,622 0.08
11,499 Anheuser-Busch InBev SA/NV 611,402 0.47
363 Cofinimmo SA (REIT) 51,001 0.04
286 D'ieteren Group 49,077 0.04
385 Elia Group SA/NV 44,544 0.04
680 Etablissements Franz Colruyt NV 25,337 0.02
1,099 Groupe Bruxelles Lambert SA 107,878 0.08
3,697 KBC Group NV 278,976 0.21
1,603 Proximus SADP 27,475 0.02
192 Sofina SA 82,944 0.06
921 Solvay SA 94,126 0.07
1,519 UCB SA 152,432 0.12
2,669 Umicore SA 95,417 0.07
1,828 Warehouses De Pauw CVA (REIT) 77,105 0.06
Total Belgium 1,902,514 1.46
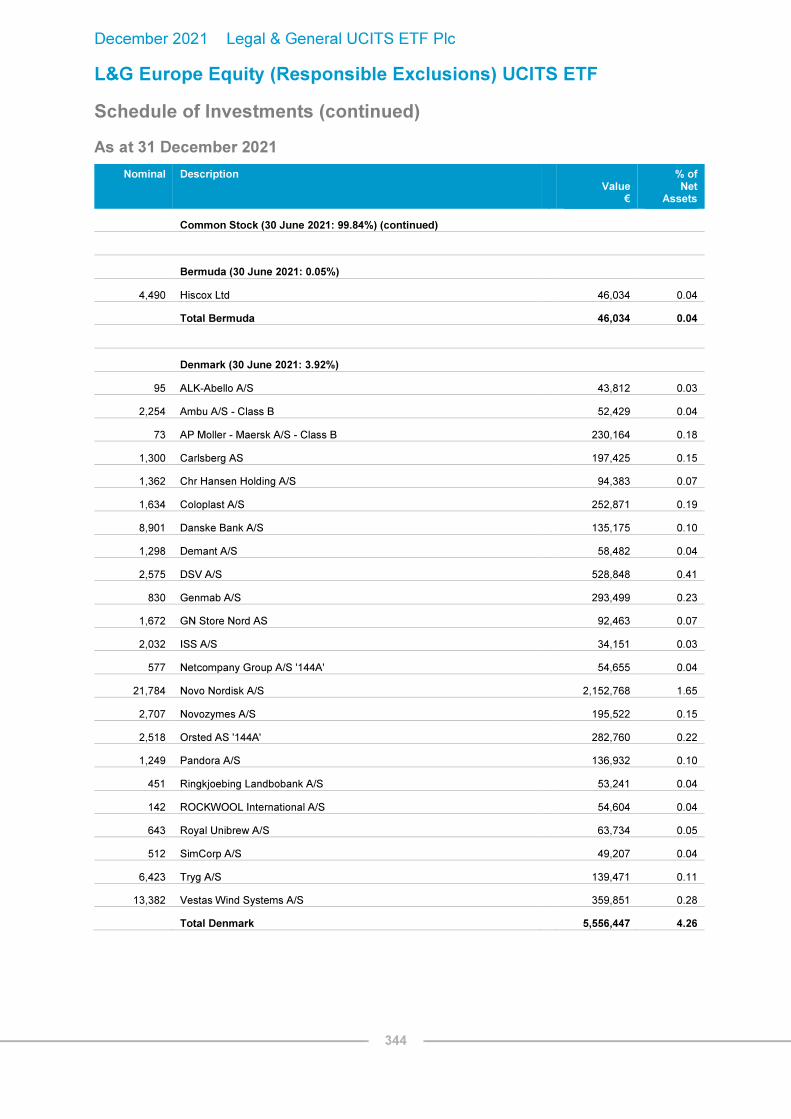
December 2021 Legal & General UCITS ETF Plc
L&G Europe Equity (Responsible Exclusions) UCITS ETF
Schedule of Investments (continued)
As at 31 December 2021
344
Nominal Description
Value €
% of Net
Assets
Common Stock (30 June 2021: 99.84%) (continued)
Bermuda (30 June 2021: 0.05%)
4,490 Hiscox Ltd 46,034 0.04
Total Bermuda 46,034 0.04
Denmark (30 June 2021: 3.92%)
95 ALK-Abello A/S 43,812 0.03
2,254 Ambu A/S - Class B 52,429 0.04
73 AP Moller - Maersk A/S - Class B 230,164 0.18
1,300 Carlsberg AS 197,425 0.15
1,362 Chr Hansen Holding A/S 94,383 0.07
1,634 Coloplast A/S 252,871 0.19
8,901 Danske Bank A/S 135,175 0.10
1,298 Demant A/S 58,482 0.04
2,575 DSV A/S 528,848 0.41
830 Genmab A/S 293,499 0.23
1,672 GN Store Nord AS 92,463 0.07
2,032 ISS A/S 34,151 0.03
577 Netcompany Group A/S '144A' 54,655 0.04
21,784 Novo Nordisk A/S 2,152,768 1.65
2,707 Novozymes A/S 195,522 0.15
2,518 Orsted AS '144A' 282,760 0.22
1,249 Pandora A/S 136,932 0.10
451 Ringkjoebing Landbobank A/S 53,241 0.04
142 ROCKWOOL International A/S 54,604 0.04
643 Royal Unibrew A/S 63,734 0.05
512 SimCorp A/S 49,207 0.04
6,423 Tryg A/S 139,471 0.11
13,382 Vestas Wind Systems A/S 359,851 0.28
Total Denmark 5,556,447 4.26

December 2021 Legal & General UCITS ETF Plc
L&G Europe Equity (Responsible Exclusions) UCITS ETF
Schedule of Investments (continued)
As at 31 December 2021
345
Nominal Description
Value €
% of Net
Assets
Common Stock (30 June 2021: 99.84%) (continued)
Faroe Islands (30 June 2021: 0.03%)
656 Bakkafrost P/F 38,177 0.03
Total Faroe Islands 38,177 0.03
Finland (30 June 2021: 2.19%)
1,755 Elisa Oyj 94,981 0.07
1,325 Huhtamaki Oyj 51,529 0.04
3,546 Kesko Oyj 104,040 0.08
2,099 Kojamo Oyj 44,583 0.03
4,219 Kone Oyj - Class B 265,966 0.20
9,152 Metso Outotec Oyj 85,553 0.07
5,510 Neste Oyj 238,914 0.18
70,943 Nokia Oyj 395,436 0.30
1,541 Nokian Renkaat Oyj 51,315 0.04
55,160 Nordea Bank Abp 594,956 0.46
1,286 Orion Oyj 46,965 0.04
216 QT Group Oyj 28,857 0.02
6,617 Sampo Oyj - Class A 291,545 0.22
7,873 Stora Enso Oyj 127,070 0.10
6,872 UPM-Kymmene Oyj 229,937 0.18
1,680 Valmet Oyj 63,370 0.05
5,993 Wartsila OYJ Abp 74,073 0.06
Total Finland 2,789,090 2.14
France (30 June 2021: 15.44%)
2,537 Accor SA 72,178 0.06
351 Aeroports de Paris 39,768 0.03
6,253 Air Liquide SA 958,710 0.74
4,816 Alstom SA 150,356 0.12
344 Alten SA 54,524 0.04

December 2021 Legal & General UCITS ETF Plc
L&G Europe Equity (Responsible Exclusions) UCITS ETF
Schedule of Investments (continued)
As at 31 December 2021
346
Nominal Description
Value €
% of Net
Assets
Common Stock (30 June 2021: 99.84%) (continued)
France (30 June 2021: 15.44%) (continued)
780 Amundi SA '144A' 56,589 0.04
875 Arkema SA 108,369 0.08
1,316 Atos SE 49,205 0.04
25,706 AXA SA 673,112 0.52
551 BioMerieux 68,820 0.05
15,002 BNP Paribas SA 911,672 0.70
11,528 Bollore SA 56,718 0.04
2,951 Bouygues SA 92,927 0.07
3,702 Bureau Veritas SA 108,024 0.08
2,082 Capgemini SE 448,671 0.34
7,955 Carrefour SA 128,115 0.10
6,391 Cie de Saint-Gobain 395,411 0.30
2,207 Cie Generale des Etablissements Michelin SCA 318,139 0.24
1,973 CNP Assurances 42,913 0.03
799 Covivio (REIT) 57,688 0.04
16,104 Credit Agricole SA 202,105 0.16
8,648 Danone SA 472,094 0.36
9,165 Dassault Systemes SE 479,421 0.37
3,328 Edenred 135,017 0.10
1,107 Eiffage SA 100,139 0.08
6,281 Electricite de France SA 64,883 0.05
2,752 Elis SA 41,885 0.03
23,274 Engie SA 302,888 0.23
3,843 EssilorLuxottica SA 719,563 0.55
542 Eurazeo SE 41,626 0.03
1,657 Faurecia SE 69,312 0.05
678 Gecina SA (REIT) 83,326 0.06
5,496 Getlink SE 80,022 0.06
464 Hermes International 712,704 0.55

December 2021 Legal & General UCITS ETF Plc
L&G Europe Equity (Responsible Exclusions) UCITS ETF
Schedule of Investments (continued)
As at 31 December 2021
347
Nominal Description
Value €
% of Net
Assets
Common Stock (30 June 2021: 99.84%) (continued)
France (30 June 2021: 15.44%) (continued)
457 Ipsen SA 36,789 0.03
968 Kering SA 684,279 0.53
2,877 Klepierre SA (REIT) 59,985 0.05
1,160 La Francaise des Jeux SAEM '144A' 45,170 0.04
3,409 Legrand SA 350,786 0.27
3,160 L'Oreal SA 1,317,562 1.01
3,560 LVMH Moet Hennessy Louis Vuitton SE 2,588,120 1.99
27,808 Orange SA 261,757 0.20
811 Orpea SA 71,449 0.06
2,642 Pernod Ricard SA 558,783 0.43
2,964 Publicis Groupe SA 175,469 0.13
271 Remy Cointreau SA 57,994 0.04
2,452 Renault SA 74,896 0.06
3,187 Rexel SA 56,824 0.04
1,287 Rubis SCA 33,797 0.03
15,107 Sanofi 1,338,178 1.03
323 Sartorius Stedim Biotech 155,815 0.12
7,336 Schneider Electric SE 1,265,167 0.97
2,060 SCOR SE 56,526 0.04
363 SEB SA 49,695 0.04
10,621 Societe Generale SA 320,807 0.25
1,072 Sodexo SA 82,608 0.06
359 SOITEC 77,257 0.06
192 Sopra Steria Group SACA 30,240 0.02
1,771 SPIE SA 40,237 0.03
4,581 Suez SA 90,750 0.07
767 Teleperformance 300,664 0.23
1,419 Ubisoft Entertainment SA 61,116 0.05
1,485 Unibail-Rodamco-Westfield (REIT) 91,506 0.07

December 2021 Legal & General UCITS ETF Plc
L&G Europe Equity (Responsible Exclusions) UCITS ETF
Schedule of Investments (continued)
As at 31 December 2021
348
Nominal Description
Value €
% of Net
Assets
Common Stock (30 June 2021: 99.84%) (continued)
France (30 June 2021: 15.44%) (continued)
2,905 Valeo 77,215 0.06
8,595 Veolia Environnement SA 277,275 0.21
6,950 Vinci SA 645,725 0.50
9,461 Vivendi SE 112,491 0.09
327 Wendel SE 34,466 0.03
3,244 Worldline SA/France '144A' 158,988 0.12
Total France 19,937,280 15.30
Germany (30 June 2021: 14.71%)
2,322 adidas AG 587,930 0.45
5,579 Allianz SE 1,158,479 0.89
2,207 alstria office REIT-AG (REIT) 43,103 0.03
1,293 Auto1 Group SE '144A' 25,136 0.02
12,758 BASF SE 788,189 0.60
13,446 Bayer AG 631,962 0.48
4,270 Bayerische Motoren Werke AG 377,852 0.29
1,103 Bechtle AG 69,423 0.05
1,280 Beiersdorf AG 115,686 0.09
2,068 Brenntag SE 164,571 0.13
479 Carl Zeiss Meditec AG 88,543 0.07
14,206 Commerzbank AG 95,024 0.07
1,424 Continental AG 132,589 0.10
2,489 Covestro AG '144A' 134,904 0.10
769 CTS Eventim AG & Co KGaA 49,493 0.04
11,852 Daimler AG 801,077 0.61
2,206 Delivery Hero SE '144A' 216,188 0.17
25,564 Deutsche Bank AG 281,664 0.22
2,411 Deutsche Boerse AG 354,658 0.27
11,500 Deutsche Lufthansa AG 71,070 0.05

December 2021 Legal & General UCITS ETF Plc
L&G Europe Equity (Responsible Exclusions) UCITS ETF
Schedule of Investments (continued)
As at 31 December 2021
349
Nominal Description
Value €
% of Net
Assets
Common Stock (30 June 2021: 99.84%) (continued)
Germany (30 June 2021: 14.71%) (continued)
13,545 Deutsche Post AG 765,834 0.59
55,543 Deutsche Telekom AG 905,351 0.69
29,137 E.ON SE 355,238 0.27
2,507 Evonik Industries AG 71,374 0.05
1,917 Evotec SE 81,472 0.06
1,509 Freenet AG 35,114 0.03
2,644 Fresenius Medical Care AG & Co KGaA 151,078 0.12
5,457 Fresenius SE & Co KGaA 193,178 0.15
1,203 FUCHS PETROLUB SE - Preference 48,024 0.04
2,085 GEA Group AG 100,268 0.08
411 Gerresheimer AG 34,812 0.03
787 Hannover Rueck SE 131,547 0.10
2,130 HelloFresh SE 143,860 0.11
2,257 Henkel AG & Co KGaA - Preference 160,563 0.12
17,848 Infineon Technologies AG 727,484 0.56
931 KION Group AG 89,823 0.07
637 Knorr-Bremse AG 55,355 0.04
1,114 LANXESS AG 60,713 0.05
831 LEG Immobilien SE 101,964 0.08
1,716 Merck KGaA 389,532 0.30
633 MTU Aero Engines AG 113,560 0.09
1,861 Muenchener Rueckversicherungs-Gesellschaft AG in Muenchen 484,791 0.37
735 Nemetschek SE 82,908 0.06
2,065 Porsche Automobil Holding SE - Preference 172,304 0.13
2,134 ProSiebenSat.1 Media SE 29,897 0.02
1,213 Puma SE 130,398 0.10
63 Rational AG 56,725 0.04
550 Rheinmetall AG 45,683 0.04
14,160 SAP SE 1,768,584 1.36

December 2021 Legal & General UCITS ETF Plc
L&G Europe Equity (Responsible Exclusions) UCITS ETF
Schedule of Investments (continued)
As at 31 December 2021
350
Nominal Description
Value €
% of Net
Assets
Common Stock (30 June 2021: 99.84%) (continued)
Germany (30 June 2021: 14.71%) (continued)
328 Sartorius AG - Preference 195,226 0.15
1,014 Scout24 SE '144A' 62,280 0.05
10,176 Siemens AG 1,553,672 1.19
5,666 Siemens Energy AG 127,428 0.10
3,667 Siemens Healthineers AG '144A' 241,362 0.19
1,683 Symrise AG - Class A 219,295 0.17
1,816 TAG Immobilien AG 44,692 0.03
4,963 thyssenkrupp AG 48,062 0.04
14,033 TUI AG 38,676 0.03
4,075 TUI AG 11,007 0.01
1,146 Uniper SE 47,903 0.04
1,100 United Internet AG 38,434 0.03
2,754 Volkswagen AG - Preference 488,780 0.37
10,757 Vonovia SE 521,715 0.40
2,952 Zalando SE '144A' 210,005 0.16
Total Germany 17,523,512 13.44
Ireland (30 June 2021: 2.70%)
12,515 Bank of Ireland Group Plc 62,400 0.05
1,329 DCC Plc 95,766 0.07
2,265 Flutter Entertainment Plc 314,835 0.24
2,468 Glanbia Plc 30,356 0.02
2,999 Grafton Group Plc 44,042 0.04
2,034 Kerry Group Plc 230,351 0.18
2,029 Kingspan Group Plc 213,045 0.16
6,847 Linde Plc 2,095,182 1.61
3,428 Smurfit Kappa Group Plc 166,052 0.13
Total Ireland 3,252,029 2.50

December 2021 Legal & General UCITS ETF Plc
L&G Europe Equity (Responsible Exclusions) UCITS ETF
Schedule of Investments (continued)
As at 31 December 2021
351
Nominal Description
Value €
% of Net
Assets
Common Stock (30 June 2021: 99.84%) (continued)
Isle of Man (30 June 2021: 0.14%)
7,615 Entain Plc 152,645 0.12
Total Isle of Man 152,645 0.12
Italy (30 June 2021: 2.83%)
20,533 A2A SpA 35,317 0.03
1,635 Amplifon SpA 77,581 0.06
18,149 Assicurazioni Generali SpA 338,116 0.26
7,480 Atlantia SpA 130,563 0.10
18,719 Banco BPM SpA 49,418 0.04
300 DiaSorin SpA 50,235 0.04
103,614 Enel SpA 730,064 0.56
7,912 FinecoBank Banca Fineco SpA 122,122 0.09
10,096 Hera SpA 36,961 0.03
3,903 Infrastrutture Wireless Italiane SpA '144A' 41,684 0.03
890 Interpump Group SpA 57,360 0.04
245,544 Intesa Sanpaolo SpA 558,367 0.43
6,431 Italgas SpA 38,920 0.03
8,586 Mediobanca Banca di Credito Finanziario SpA 86,804 0.07
2,752 Moncler SpA 176,183 0.14
10,597 Nexi SpA '144A' 148,252 0.11
5,614 Poste Italiane SpA '144A' 64,786 0.05
3,408 Prysmian SpA 112,839 0.09
1,263 Recordati Industria Chimica e Farmaceutica SpA 71,360 0.05
297 Reply SpA 53,074 0.04
27,696 Snam SpA 146,789 0.11
125,025 Telecom Italia SpA/Milano 54,286 0.04
18,737 Terna - Rete Elettrica Nazionale 133,295 0.10
26,125 UniCredit SpA 353,837 0.27
Total Italy 3,668,213 2.81

December 2021 Legal & General UCITS ETF Plc
L&G Europe Equity (Responsible Exclusions) UCITS ETF
Schedule of Investments (continued)
As at 31 December 2021
352
Nominal Description
Value €
% of Net
Assets
Common Stock (30 June 2021: 99.84%) (continued)
Jersey (30 June 2021: 0.94%)
12,252 Experian Plc 530,008 0.41
2,957 Ferguson Plc 461,550 0.35
9,639 IWG Plc 33,408 0.02
18,132 Man Group Plc/Jersey 49,110 0.04
4,374 Polymetal International Plc 68,325 0.05
934 Wizz Air Holdings Plc '144A' 46,589 0.04
15,573 WPP Plc 207,647 0.16
Total Jersey 1,396,637 1.07
Luxembourg (30 June 2021: 0.50%)
4,902 Allegro.eu SA '144A' 41,562 0.03
15,695 Aroundtown SA 83,497 0.07
11,834 B&M European Value Retail SA 89,362 0.07
1,691 Eurofins Scientific SE 183,981 0.14
2,808 InPost SA 29,759 0.02
1,216 Millicom International Cellular SA SDR 30,388 0.02
4,180 SES SA Receipt - Class A 29,143 0.02
6,656 Tenaris SA 61,302 0.05
Total Luxembourg 548,994 0.42
Malta (30 June 2021: 0.03%)
2,855 Kindred Group Plc SDR 29,865 0.02
Total Malta 29,865 0.02
Netherlands (30 June 2021: 8.61%)
1,219 Aalberts NV 71,019 0.05
5,737 ABN AMRO Bank NV Dutch Cert '144A' 74,099 0.06
322 Adyen NV '144A' 744,303 0.57
23,920 Aegon NV 105,081 0.08
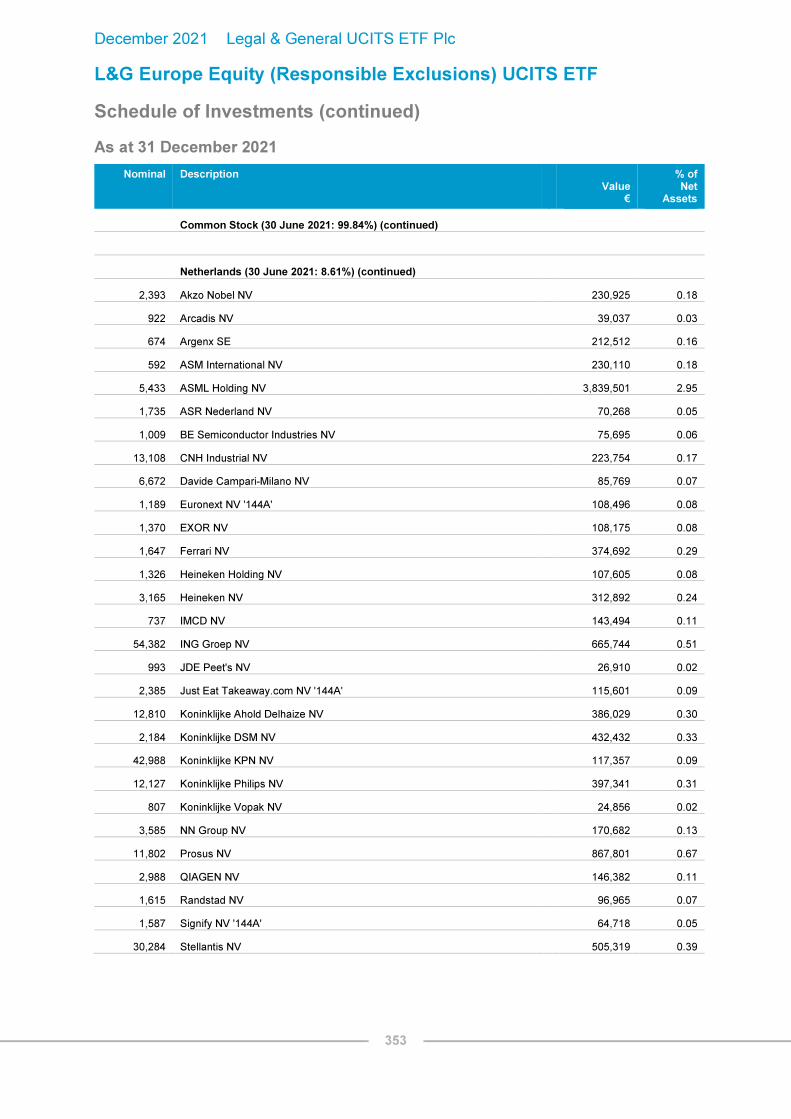
December 2021 Legal & General UCITS ETF Plc
L&G Europe Equity (Responsible Exclusions) UCITS ETF
Schedule of Investments (continued)
As at 31 December 2021
353
Nominal Description
Value €
% of Net
Assets
Common Stock (30 June 2021: 99.84%) (continued)
Netherlands (30 June 2021: 8.61%) (continued)
2,393 Akzo Nobel NV 230,925 0.18
922 Arcadis NV 39,037 0.03
674 Argenx SE 212,512 0.16
592 ASM International NV 230,110 0.18
5,433 ASML Holding NV 3,839,501 2.95
1,735 ASR Nederland NV 70,268 0.05
1,009 BE Semiconductor Industries NV 75,695 0.06
13,108 CNH Industrial NV 223,754 0.17
6,672 Davide Campari-Milano NV 85,769 0.07
1,189 Euronext NV '144A' 108,496 0.08
1,370 EXOR NV 108,175 0.08
1,647 Ferrari NV 374,692 0.29
1,326 Heineken Holding NV 107,605 0.08
3,165 Heineken NV 312,892 0.24
737 IMCD NV 143,494 0.11
54,382 ING Groep NV 665,744 0.51
993 JDE Peet's NV 26,910 0.02
2,385 Just Eat Takeaway.com NV '144A' 115,601 0.09
12,810 Koninklijke Ahold Delhaize NV 386,029 0.30
2,184 Koninklijke DSM NV 432,432 0.33
42,988 Koninklijke KPN NV 117,357 0.09
12,127 Koninklijke Philips NV 397,341 0.31
807 Koninklijke Vopak NV 24,856 0.02
3,585 NN Group NV 170,682 0.13
11,802 Prosus NV 867,801 0.67
2,988 QIAGEN NV 146,382 0.11
1,615 Randstad NV 96,965 0.07
1,587 Signify NV '144A' 64,718 0.05
30,284 Stellantis NV 505,319 0.39

December 2021 Legal & General UCITS ETF Plc
L&G Europe Equity (Responsible Exclusions) UCITS ETF
Schedule of Investments (continued)
As at 31 December 2021
354
Nominal Description
Value €
% of Net
Assets
Common Stock (30 June 2021: 99.84%) (continued)
Netherlands (30 June 2021: 8.61%) (continued)
8,679 STMicroelectronics NV 379,793 0.29
13,065 Universal Music Group NV 323,751 0.25
3,433 Wolters Kluwer NV 355,659 0.27
Total Netherlands 12,234,767 9.39
Norway (30 June 2021: 0.96%)
6,753 Adevinta ASA 78,991 0.06
11,830 DNB Bank ASA 238,297 0.18
2,339 Gjensidige Forsikring ASA 49,914 0.04
5,818 Mowi ASA 121,082 0.09
2,204 Nordic Semiconductor ASA 65,407 0.05
17,847 Norsk Hydro ASA 123,725 0.10
11,977 Orkla ASA 105,532 0.08
720 Salmar ASA 43,653 0.03
929 Schibsted ASA 31,507 0.02
6,117 Storebrand ASA 53,996 0.04
8,290 Telenor ASA 114,578 0.09
1,951 TOMRA Systems ASA 122,763 0.10
Total Norway 1,149,445 0.88
Poland (30 June 2021: 0.29%)
2,311 Bank Polska Kasa Opieki SA 61,515 0.05
933 CD Projekt SA 39,268 0.03
644 Dino Polska SA '144A' 51,609 0.04
11 LPP SA 41,280 0.03
3,926 Polski Koncern Naftowy ORLEN SA 63,679 0.05
11,362 Powszechna Kasa Oszczednosci Bank Polski SA 111,381 0.08
7,822 Powszechny Zaklad Ubezpieczen SA 60,329 0.05
Total Poland 429,061 0.33

December 2021 Legal & General UCITS ETF Plc
L&G Europe Equity (Responsible Exclusions) UCITS ETF
Schedule of Investments (continued)
As at 31 December 2021
355
Nominal Description
Value €
% of Net
Assets
Common Stock (30 June 2021: 99.84%) (continued)
Portugal (30 June 2021: 0.18%)
37,440 EDP - Energias de Portugal SA 180,910 0.14
3,260 Jeronimo Martins SGPS SA 65,526 0.05
Total Portugal 246,436 0.19
Spain (30 June 2021: 3.97%)
313 Acciona SA 52,615 0.04
2,985 ACS Actividades de Construccion y Servicios SA 70,356 0.05
973 Aena SME SA '144A' 135,052 0.10
5,993 Amadeus IT Group SA 357,423 0.27
88,387 Banco Bilbao Vizcaya Argentaria SA 464,032 0.36
75,296 Banco de Sabadell SA 44,560 0.03
239,706 Banco Santander SA 704,856 0.54
7,826 Bankinter SA 35,287 0.03
57,067 CaixaBank SA 137,760 0.11
7,888 Cellnex Telecom SA '144A' 403,708 0.31
3,309 EDP Renovaveis SA 72,467 0.06
2,665 Enagas SA 54,366 0.04
4,152 Endesa SA 83,870 0.06
6,292 Ferrovial SA 173,408 0.13
922 Fluidra SA 32,454 0.03
3,874 Grifols SA 65,374 0.05
83,016 Iberdrola SA 864,197 0.66
14,697 Industria de Diseno Textil SA 419,305 0.32
5,258 Inmobiliaria Colonial Socimi SA (REIT) 43,379 0.03
49,487 International Consolidated Airlines Group SA 83,980 0.07
4,133 Merlin Properties Socimi SA (REIT) 39,553 0.03
4,546 Naturgy Energy Group SA 130,152 0.10
5,517 Red Electrica Corp SA 104,961 0.08
2,986 Siemens Gamesa Renewable Energy SA 62,915 0.05
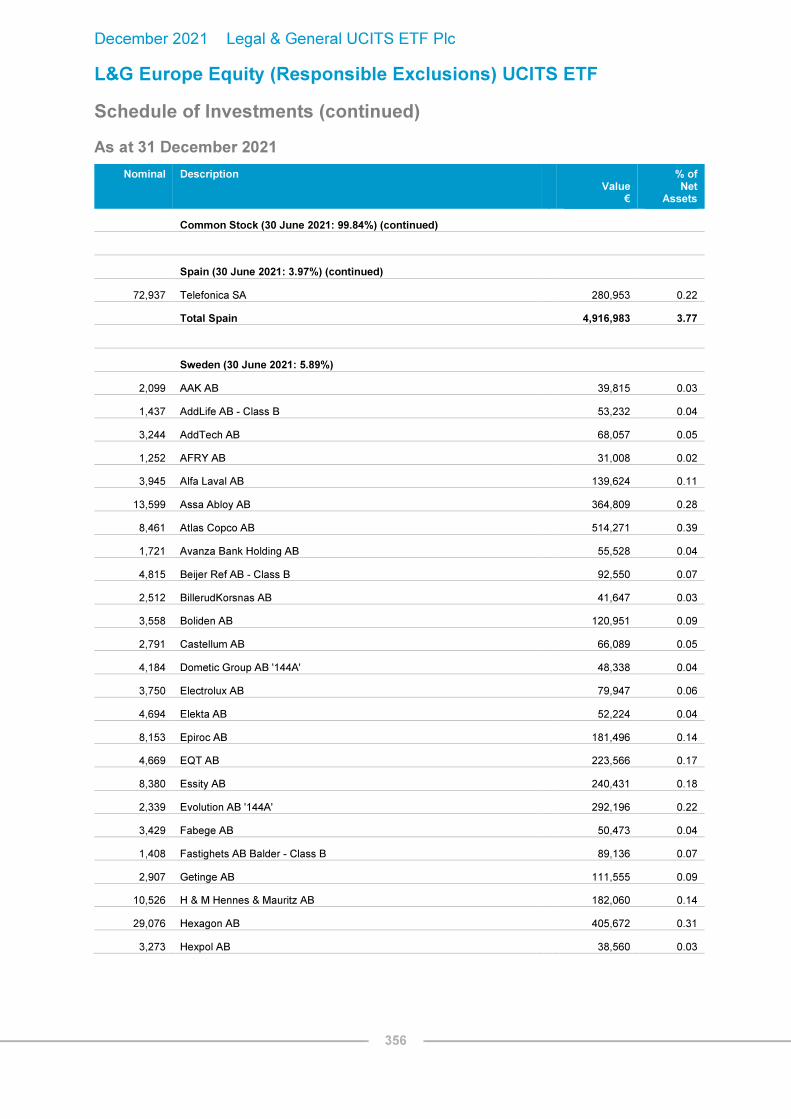
December 2021 Legal & General UCITS ETF Plc
L&G Europe Equity (Responsible Exclusions) UCITS ETF
Schedule of Investments (continued)
As at 31 December 2021
356
Nominal Description
Value €
% of Net
Assets
Common Stock (30 June 2021: 99.84%) (continued)
Spain (30 June 2021: 3.97%) (continued)
72,937 Telefonica SA 280,953 0.22
Total Spain 4,916,983 3.77
Sweden (30 June 2021: 5.89%)
2,099 AAK AB 39,815 0.03
1,437 AddLife AB - Class B 53,232 0.04
3,244 AddTech AB 68,057 0.05
1,252 AFRY AB 31,008 0.02
3,945 Alfa Laval AB 139,624 0.11
13,599 Assa Abloy AB 364,809 0.28
8,461 Atlas Copco AB 514,271 0.39
1,721 Avanza Bank Holding AB 55,528 0.04
4,815 Beijer Ref AB - Class B 92,550 0.07
2,512 BillerudKorsnas AB 41,647 0.03
3,558 Boliden AB 120,951 0.09
2,791 Castellum AB 66,089 0.05
4,184 Dometic Group AB '144A' 48,338 0.04
3,750 Electrolux AB 79,947 0.06
4,694 Elekta AB 52,224 0.04
8,153 Epiroc AB 181,496 0.14
4,669 EQT AB 223,566 0.17
8,380 Essity AB 240,431 0.18
2,339 Evolution AB '144A' 292,196 0.22
3,429 Fabege AB 50,473 0.04
1,408 Fastighets AB Balder - Class B 89,136 0.07
2,907 Getinge AB 111,555 0.09
10,526 H & M Hennes & Mauritz AB 182,060 0.14
29,076 Hexagon AB 405,672 0.31
3,273 Hexpol AB 38,560 0.03

December 2021 Legal & General UCITS ETF Plc
L&G Europe Equity (Responsible Exclusions) UCITS ETF
Schedule of Investments (continued)
As at 31 December 2021
357
Nominal Description
Value €
% of Net
Assets
Common Stock (30 June 2021: 99.84%) (continued)
Sweden (30 June 2021: 5.89%) (continued)
1,235 Holmen AB 52,142 0.04
5,409 Husqvarna AB 76,098 0.06
1,952 Industrivarden AB - Class A 54,678 0.04
3,578 Indutrade AB 96,332 0.07
1,820 Investment AB Latour 65,175 0.05
24,302 Investor AB 537,571 0.41
3,251 Kinnevik AB 101,910 0.08
965 L E Lundbergforetagen AB 47,613 0.04
2,981 Lifco AB 78,376 0.06
405 MIPS AB 46,692 0.04
20,472 Nibe Industrier AB 271,908 0.21
1,054 Nordic Entertainment Group AB - Class B 48,032 0.04
2,060 Sagax AB 61,024 0.05
12,015 Samhallsbyggnadsbolaget i Norden AB 77,510 0.06
16,304 Sandvik AB 400,002 0.31
3,653 Securitas AB 44,226 0.03
6,915 Sinch AB '144A' 77,304 0.06
20,970 Skandinaviska Enskilda Banken AB 256,322 0.20
4,852 Skanska AB 110,368 0.09
5,700 SKF AB 118,751 0.09
19,944 Storskogen Group AB 118,065 0.09
8,522 Svenska Cellulosa AB SCA - Class B 133,054 0.10
23,081 Svenska Handelsbanken AB 219,379 0.17
2,719 Sweco AB 44,947 0.03
12,120 Swedbank AB 214,362 0.16
2,362 Swedish Orphan Biovitrum AB 42,464 0.03
6,547 Tele2 AB 82,093 0.06
39,227 Telefonaktiebolaget LM Ericsson - Class B 380,196 0.29
31,134 Telia Co AB 107,062 0.08

December 2021 Legal & General UCITS ETF Plc
L&G Europe Equity (Responsible Exclusions) UCITS ETF
Schedule of Investments (continued)
As at 31 December 2021
358
Nominal Description
Value €
% of Net
Assets
Common Stock (30 June 2021: 99.84%) (continued)
Sweden (30 June 2021: 5.89%) (continued)
1,358 Thule Group AB '144A' 72,280 0.06
3,152 Trelleborg AB 72,800 0.06
861 Vitrolife AB 46,830 0.04
20,142 Volvo AB 410,140 0.31
7,783 Volvo Car AB 58,222 0.05
2,399 Wallenstam AB 39,145 0.03
1,778 Wihlborgs Fastigheter AB 35,471 0.03
Total Sweden 8,281,779 6.35
Switzerland (30 June 2021: 15.31%)
23,953 ABB Ltd 806,798 0.62
2,114 Adecco Group AG 95,076 0.07
6,491 Alcon Inc 505,801 0.39
172 Allreal Holding AG 33,532 0.02
81 Bachem Holding AG 55,973 0.04
528 Baloise Holding AG 75,979 0.06
52 Barry Callebaut AG 111,212 0.08
131 Belimo Holding AG 73,330 0.06
80 Bucher Industries AG 34,821 0.03
1 Chocoladefabriken Lindt & Spruengli AG 117,937 0.09
6,896 Cie Financiere Richemont SA 911,463 0.70
2,622 Clariant AG 48,080 0.04
2,619 Coca-Cola HBC AG 79,700 0.06
32,126 Credit Suisse Group AG 275,079 0.21
995 Dufry AG 43,357 0.03
89 EMS-Chemie Holding AG 87,699 0.07
234 Flughafen Zurich AG 37,060 0.03
565 Galenica AG '144A' 37,380 0.03
458 Geberit AG 329,396 0.25

December 2021 Legal & General UCITS ETF Plc
L&G Europe Equity (Responsible Exclusions) UCITS ETF
Schedule of Investments (continued)
As at 31 December 2021
359
Nominal Description
Value €
% of Net
Assets
Common Stock (30 June 2021: 99.84%) (continued)
Switzerland (30 June 2021: 15.31%) (continued)
52 Georg Fischer AG 69,508 0.05
106 Givaudan SA 490,233 0.38
442 Helvetia Holding AG 45,815 0.03
2,840 Julius Baer Group Ltd 167,690 0.13
670 Kuehne + Nagel International AG 190,367 0.15
2,229 Logitech International SA 165,388 0.13
1,020 Lonza Group AG 749,733 0.57
36,847 Nestle SA 4,531,975 3.48
28,294 Novartis AG 2,192,206 1.68
290 Partners Group Holding AG 423,324 0.32
568 PSP Swiss Property AG 62,329 0.05
9,343 Roche Holding AG 3,418,376 2.62
531 Schindler Holding AG 125,813 0.10
79 SGS SA 232,316 0.18
50 Siegfried Holding AG 42,924 0.03
4,244 SIG Combibloc Group AG 104,283 0.08
1,817 Sika AG 666,725 0.51
705 Sonova Holding AG 243,450 0.19
137 Straumann Holding AG 256,112 0.20
371 Swatch Group AG/The 99,898 0.08
401 Swiss Life Holding AG 216,339 0.17
955 Swiss Prime Site AG 82,629 0.06
3,816 Swiss Re AG 332,417 0.25
333 Swisscom AG 165,384 0.13
168 Tecan Group AG 90,069 0.07
855 Temenos AG 104,013 0.08
47,636 UBS Group AG 754,898 0.58
358 VAT Group AG '144A' 157,000 0.12
609 Vifor Pharma AG 95,363 0.07

December 2021 Legal & General UCITS ETF Plc
L&G Europe Equity (Responsible Exclusions) UCITS ETF
Schedule of Investments (continued)
As at 31 December 2021
360
Nominal Description
Value €
% of Net
Assets
Common Stock (30 June 2021: 99.84%) (continued)
Switzerland (30 June 2021: 15.31%) (continued)
123 Zur Rose Group AG 27,956 0.02
2,060 Zurich Insurance Group AG 796,051 0.61
Total Switzerland 20,860,257 16.00
United Kingdom (30 June 2021: 19.19%)
12,417 3i Group Plc 214,297 0.16
28,163 abrdn plc 80,806 0.06
2,783 Admiral Group Plc 104,645 0.08
3,836 Allfunds Group Plc 66,347 0.05
4,418 Antofagasta Plc 70,433 0.05
5,900 Ashtead Group Plc 417,556 0.32
4,621 Associated British Foods Plc 110,517 0.08
34,772 Assura Plc (REIT) 28,908 0.02
20,149 AstraZeneca Plc 2,082,587 1.60
12,121 Auto Trader Group Plc '144A' 106,832 0.08
8,079 Avast Plc '144A' 58,428 0.04
1,468 AVEVA Group Plc 59,518 0.05
52,408 Aviva Plc 256,174 0.20
224,558 Barclays Plc 500,150 0.38
13,588 Barratt Developments Plc 121,056 0.09
1,663 Bellway Plc 66,077 0.05
1,569 Berkeley Group Holdings Plc 89,233 0.07
2,298 Big Yellow Group Plc (REIT) 46,721 0.04
7,939 Bridgepoint Group Plc '144A' 46,617 0.04
12,353 British Land Co Plc/The (REIT) 78,126 0.06
3,492 Britvic Plc 38,264 0.03
99,183 BT Group Plc 200,293 0.15
4,436 Bunzl Plc 152,429 0.12
5,423 Burberry Group Plc 117,394 0.09
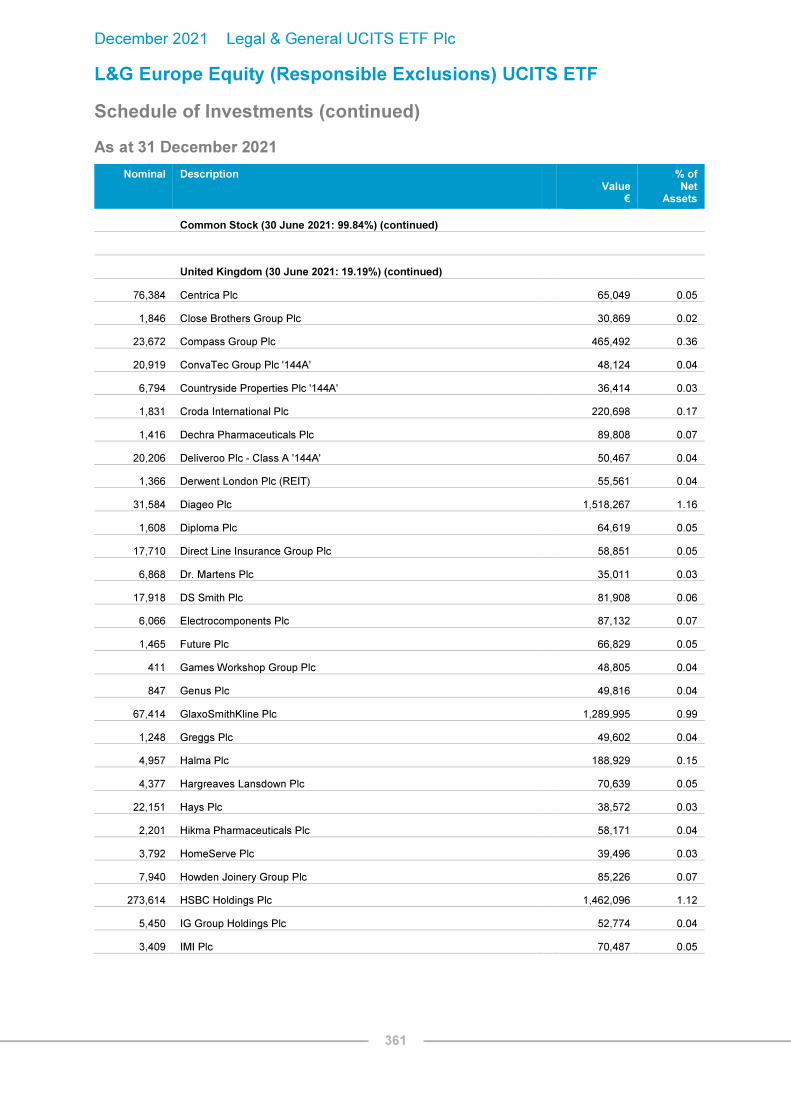
December 2021 Legal & General UCITS ETF Plc
L&G Europe Equity (Responsible Exclusions) UCITS ETF
Schedule of Investments (continued)
As at 31 December 2021
361
Nominal Description
Value €
% of Net
Assets
Common Stock (30 June 2021: 99.84%) (continued)
United Kingdom (30 June 2021: 19.19%) (continued)
76,384 Centrica Plc 65,049 0.05
1,846 Close Brothers Group Plc 30,869 0.02
23,672 Compass Group Plc 465,492 0.36
20,919 ConvaTec Group Plc '144A' 48,124 0.04
6,794 Countryside Properties Plc '144A' 36,414 0.03
1,831 Croda International Plc 220,698 0.17
1,416 Dechra Pharmaceuticals Plc 89,808 0.07
20,206 Deliveroo Plc - Class A '144A' 50,467 0.04
1,366 Derwent London Plc (REIT) 55,561 0.04
31,584 Diageo Plc 1,518,267 1.16
1,608 Diploma Plc 64,619 0.05
17,710 Direct Line Insurance Group Plc 58,851 0.05
6,868 Dr. Martens Plc 35,011 0.03
17,918 DS Smith Plc 81,908 0.06
6,066 Electrocomponents Plc 87,132 0.07
1,465 Future Plc 66,829 0.05
411 Games Workshop Group Plc 48,805 0.04
847 Genus Plc 49,816 0.04
67,414 GlaxoSmithKline Plc 1,289,995 0.99
1,248 Greggs Plc 49,602 0.04
4,957 Halma Plc 188,929 0.15
4,377 Hargreaves Lansdown Plc 70,639 0.05
22,151 Hays Plc 38,572 0.03
2,201 Hikma Pharmaceuticals Plc 58,171 0.04
3,792 HomeServe Plc 39,496 0.03
7,940 Howden Joinery Group Plc 85,226 0.07
273,614 HSBC Holdings Plc 1,462,096 1.12
5,450 IG Group Holdings Plc 52,774 0.04
3,409 IMI Plc 70,487 0.05

December 2021 Legal & General UCITS ETF Plc
L&G Europe Equity (Responsible Exclusions) UCITS ETF
Schedule of Investments (continued)
As at 31 December 2021
362
Nominal Description
Value €
% of Net
Assets
Common Stock (30 June 2021: 99.84%) (continued)
United Kingdom (30 June 2021: 19.19%) (continued)
4,689 Inchcape Plc 50,794 0.04
20,025 Informa Plc 123,213 0.09
2,339 InterContinental Hotels Group Plc 133,192 0.10
3,675 Intermediate Capital Group Plc 96,034 0.07
2,128 Intertek Group Plc 142,695 0.11
47,192 ITV Plc 62,138 0.05
30,571 J Sainsbury Plc 100,423 0.08
32,345 JD Sports Fashion Plc 83,906 0.06
2,562 Johnson Matthey Plc 62,433 0.05
27,937 Kingfisher Plc 112,567 0.09
9,839 Land Securities Group Plc (REIT) 90,984 0.07
77,946 Legal & General Group Plc 276,192 0.21
941,059 Lloyds Banking Group Plc 535,766 0.41
4,330 London Stock Exchange Group Plc 357,397 0.27
11,006 LondonMetric Property Plc (REIT) 37,150 0.03
34,063 M&G Plc 80,939 0.06
25,741 Marks & Spencer Group Plc 70,945 0.05
10,182 Meggitt Plc 89,499 0.07
58,015 Melrose Industries Plc 110,489 0.08
6,391 Mondi Plc 138,995 0.11
48,635 National Grid Plc 613,907 0.47
68,590 NatWest Group Plc 184,384 0.14
1,654 Next Plc 160,555 0.12
2,402 NMC Health Plc* – –
6,400 Ocado Group Plc 127,909 0.10
4,964 Oxford Nanopore Technologies Plc 41,268 0.03
9,971 Pearson Plc 72,823 0.06
3,607 Pennon Group Plc 50,136 0.04
4,083 Persimmon Plc 138,889 0.11

December 2021 Legal & General UCITS ETF Plc
L&G Europe Equity (Responsible Exclusions) UCITS ETF
Schedule of Investments (continued)
As at 31 December 2021
363
Nominal Description
Value €
% of Net
Assets
Common Stock (30 June 2021: 99.84%) (continued)
United Kingdom (30 June 2021: 19.19%) (continued)
10,636 Phoenix Group Holdings Plc 82,747 0.06
16,399 Primary Health Properties Plc (REIT) 29,572 0.02
37,431 Prudential Plc 568,200 0.44
19,773 Quilter Plc '144A' 34,973 0.03
9,625 Reckitt Benckiser Group Plc 727,038 0.56
26,233 RELX Plc 750,500 0.58
24,190 Rentokil Initial Plc 168,259 0.13
10,718 Rightmove Plc 101,487 0.08
14,539 Rio Tinto Plc 847,132 0.65
111,228 Rolls-Royce Holdings Plc 162,789 0.12
11,293 Rotork Plc 48,045 0.04
13,115 Royal Mail Plc 79,040 0.06
4,724 S4 Capital Plc 35,672 0.03
4,002 Safestore Holdings Plc (REIT) 67,161 0.05
13,551 Sage Group Plc/The 137,609 0.11
1,526 Schroders Plc 64,705 0.05
15,481 Segro Plc (REIT) 264,871 0.20
3,334 Severn Trent Plc 117,024 0.09
11,587 Smith & Nephew Plc 178,512 0.14
5,271 Smiths Group Plc 99,161 0.08
1,678 Softcat Plc 36,054 0.03
1,470 Spectris Plc 64,046 0.05
962 Spirax-Sarco Engineering Plc 183,899 0.14
13,812 SSE Plc 271,273 0.21
6,903 St James's Place Plc 138,414 0.11
41,004 Standard Chartered Plc 218,989 0.17
5,433 Tate & Lyle Plc 42,799 0.03
48,530 Taylor Wimpey Plc 101,442 0.08
5,637 TechnipFMC Plc 29,504 0.02

December 2021 Legal & General UCITS ETF Plc
L&G Europe Equity (Responsible Exclusions) UCITS ETF
Schedule of Investments (continued)
As at 31 December 2021
364
Nominal Description
Value €
% of Net
Assets
Common Stock (30 June 2021: 99.84%) (continued)
United Kingdom (30 June 2021: 19.19%) (continued)
100,409 Tesco Plc 346,698 0.27
2,986 Travis Perkins Plc 55,285 0.04
22,319 Tritax Big Box REIT Plc (REIT) 66,192 0.05
33,765 Unilever Plc 1,586,715 1.22
5,347 UNITE Group Plc/The (REIT) 70,723 0.05
9,040 United Utilities Group Plc 117,254 0.09
1,055 Victrex Plc 30,710 0.02
16,169 Virgin Money UK Plc 34,241 0.03
3,030 Vistry Group Plc 42,729 0.03
366,273 Vodafone Group Plc 489,734 0.38
3,239 Watches of Switzerland Group Plc '144A' 54,781 0.04
3,438 Weir Group Plc/The 70,083 0.05
2,708 Whitbread Plc 96,600 0.07
8,099 Wise Plc - Class A 72,984 0.06
Total United Kingdom 24,524,383 18.82
Total Common Stock 130,108,677 99.82

December 2021 Legal & General UCITS ETF Plc
L&G Europe Equity (Responsible Exclusions) UCITS ETF
Schedule of Investments (continued)
As at 31 December 2021
365
Total Investments
Common Stock 130,108,677 99.82
Other Assets and Liabilities 239,205 0.18
Net Assets Attributable to Holders of Redeemable Participating Shares 130,347,882 100.00
Analysis of Total Assets
% of Total
Assets
Transferable securities admitted to an official stock exchange listing 99.80
Other assets 0.20
100.00
Analysis of Total Assets rather than Net Assets is required under Schedule 12 of the UCITS Regulations.
*Security is valued at zero.

December 2021 Legal & General UCITS ETF Plc
L&G US Equity (Responsible Exclusions) UCITS ETF
Schedule of Investments
As at 31 December 2021
366
Nominal Description
Value $
% of Net
Assets
Common Stock (30 June 2021: 99.84%)
Bermuda (30 June 2021: 0.17%)
8,834 Athene Holding Ltd - Class A
736,137 0.04
16,839 IHS Markit Ltd
2,238,240 0.12
Total Bermuda
2,974,377 0.16
Curacao (30 June 2021: 0.13%)
63,830 Schlumberger NV
1,911,709 0.11
Total Curacao
1,911,709 0.11
Ireland (30 June 2021: 2.25%)
30,156 Accenture Plc - Class A
12,501,170 0.70
9,918 Aon Plc
2,980,954 0.17
18,081 Eaton Corp Plc
3,124,758 0.17
9,972 Horizon Therapeutics Plc
1,074,583 0.06
32,543 Johnson Controls International plc
2,646,071 0.15
23,422 Linde Plc
8,114,083 0.45
61,129 Medtronic Plc
6,323,795 0.35
10,276 Seagate Technology Holdings Plc
1,160,983 0.07
4,507 STERIS Plc
1,097,049 0.06
10,824 Trane Technologies Plc
2,186,773 0.12
5,625 Willis Towers Watson Plc
1,335,881 0.07
Total Ireland
42,546,100 2.37
Israel (30 June 2021: –%)
1,183 Monday.com Ltd
365,216 0.02
Total Israel
365,216 0.02
Jersey (30 June 2021: 0.22%)
69,599 Amcor Plc
835,884 0.05
12,111 Aptiv Plc
1,997,709 0.11
Total Jersey
2,833,593 0.16

December 2021 Legal & General UCITS ETF Plc
L&G US Equity (Responsible Exclusions) UCITS ETF
Schedule of Investments (continued)
As at 31 December 2021
367
Nominal Description
Value $
% of Net
Assets
Common Stock (30 June 2021: 99.84%) (continued)
Liberia (30 June 2021: 0.05%)
9,895 Royal Caribbean Cruises Ltd 760,926 0.04
Total Liberia 760,926 0.04
Luxembourg (30 June 2021: 0.10%)
6,198 Spotify Technology SA 1,450,518 0.08
Total Luxembourg 1,450,518 0.08
Netherlands (30 June 2021: 0.08%)
12,031 LyondellBasell Industries NV 1,109,619 0.06
Total Netherlands 1,109,619 0.06
Panama (30 June 2021: 0.07%)
40,920 Carnival Corp 823,310 0.05
Total Panama 823,310 0.05
Switzerland (30 June 2021: 0.38%)
19,647 Chubb Ltd 3,797,962 0.21
6,890 Garmin Ltd 938,211 0.05
14,858 TE Connectivity Ltd 2,397,190 0.14
Total Switzerland 7,133,363 0.40
United Kingdom (30 June 2021: 0.13%)
6,405 Atlassian Corp Plc 2,442,162 0.14
15,820 Royalty Pharma Plc - Class A 630,427 0.03
Total United Kingdom 3,072,589 0.17
United States (30 June 2021: 95.99%)
25,893 3M Co 4,599,374 0.26
80,034 Abbott Laboratories 11,263,985 0.63

December 2021 Legal & General UCITS ETF Plc
L&G US Equity (Responsible Exclusions) UCITS ETF
Schedule of Investments (continued)
As at 31 December 2021
368
Nominal Description
Value $
% of Net
Assets
Common Stock (30 June 2021: 99.84%) (continued)
United States (30 June 2021: 95.99%) (continued)
80,637 AbbVie Inc 10,918,250 0.61
35,059 Activision Blizzard Inc 2,332,475 0.13
21,686 Adobe Inc 12,297,263 0.68
54,873 Advanced Micro Devices Inc 7,896,225 0.44
8,961 Affirm Holdings Inc 901,118 0.05
27,653 Aflac Inc 1,614,659 0.09
13,638 Agilent Technologies Inc 2,177,307 0.12
15,733 Airbnb Inc 2,619,387 0.15
7,308 Akamai Technologies Inc 855,328 0.05
5,315 Albemarle Corp 1,242,488 0.07
11,450 Albertsons Cos Inc 345,675 0.02
6,784 Alexandria Real Estate Equities Inc (REIT) 1,512,561 0.08
3,353 Align Technology Inc 2,203,525 0.12
12,897 Allstate Corp/The 1,517,332 0.08
16,153 Ally Financial Inc 769,044 0.04
5,370 Alnylam Pharmaceuticals Inc 910,645 0.05
12,824 Alphabet Inc 37,107,398 2.07
13,670 Alphabet Inc - Class A 39,602,537 2.20
20,087 Amazon.com Inc 66,976,888 3.73
23,315 AMC Entertainment Holdings Inc - Class A 634,168 0.04
11,534 Ameren Corp 1,026,641 0.06
36,080 American Express Co 5,902,688 0.33
39,306 American International Group Inc 2,234,939 0.12
20,862 American Tower Corp (REIT) 6,102,135 0.34
8,659 American Water Works Co Inc 1,635,339 0.09
5,155 Ameriprise Financial Inc 1,555,057 0.09
6,809 AmerisourceBergen Corp - Class A 904,848 0.05
10,313 AMETEK Inc 1,516,424 0.08
25,581 Amgen Inc 5,754,958 0.32
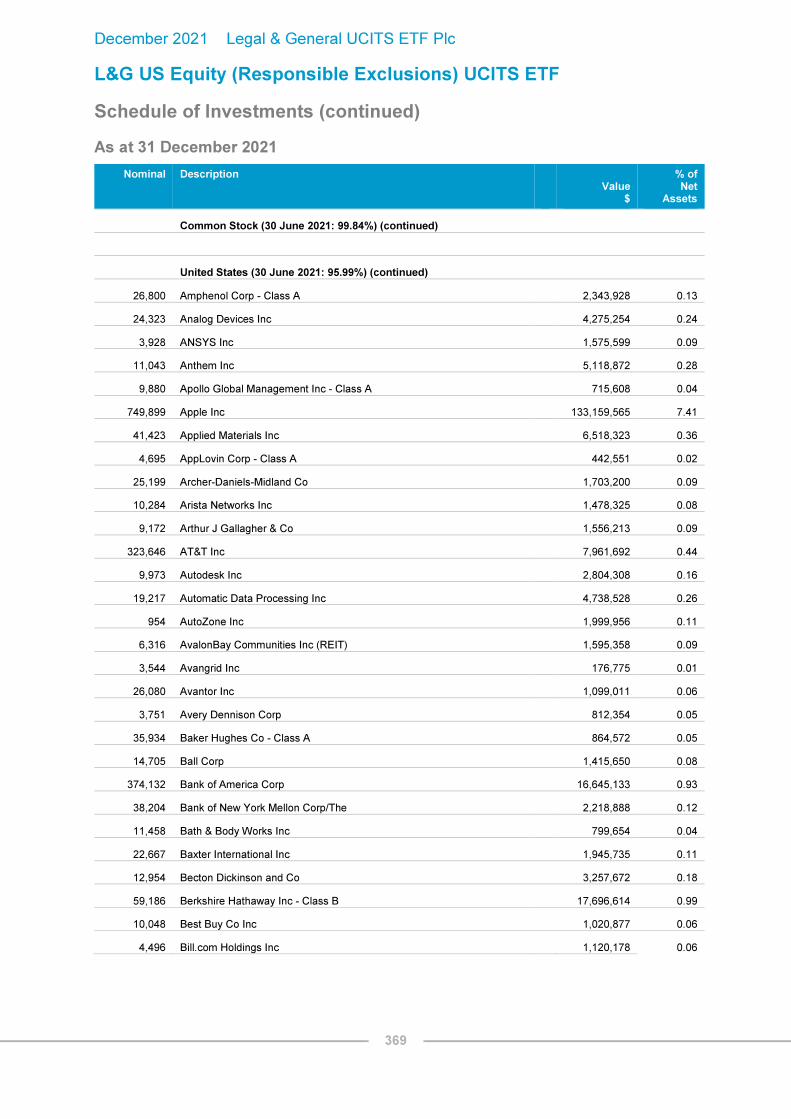
December 2021 Legal & General UCITS ETF Plc
L&G US Equity (Responsible Exclusions) UCITS ETF
Schedule of Investments (continued)
As at 31 December 2021
369
Nominal Description
Value $
% of Net
Assets
Common Stock (30 June 2021: 99.84%) (continued)
United States (30 June 2021: 95.99%) (continued)
26,800 Amphenol Corp - Class A 2,343,928 0.13
24,323 Analog Devices Inc 4,275,254 0.24
3,928 ANSYS Inc 1,575,599 0.09
11,043 Anthem Inc 5,118,872 0.28
9,880 Apollo Global Management Inc - Class A 715,608 0.04
749,899 Apple Inc 133,159,565 7.41
41,423 Applied Materials Inc 6,518,323 0.36
4,695 AppLovin Corp - Class A 442,551 0.02
25,199 Archer-Daniels-Midland Co 1,703,200 0.09
10,284 Arista Networks Inc 1,478,325 0.08
9,172 Arthur J Gallagher & Co 1,556,213 0.09
323,646 AT&T Inc 7,961,692 0.44
9,973 Autodesk Inc 2,804,308 0.16
19,217 Automatic Data Processing Inc 4,738,528 0.26
954 AutoZone Inc 1,999,956 0.11
6,316 AvalonBay Communities Inc (REIT) 1,595,358 0.09
3,544 Avangrid Inc 176,775 0.01
26,080 Avantor Inc 1,099,011 0.06
3,751 Avery Dennison Corp 812,354 0.05
35,934 Baker Hughes Co - Class A 864,572 0.05
14,705 Ball Corp 1,415,650 0.08
374,132 Bank of America Corp 16,645,133 0.93
38,204 Bank of New York Mellon Corp/The 2,218,888 0.12
11,458 Bath & Body Works Inc 799,654 0.04
22,667 Baxter International Inc 1,945,735 0.11
12,954 Becton Dickinson and Co 3,257,672 0.18
59,186 Berkshire Hathaway Inc - Class B 17,696,614 0.99
10,048 Best Buy Co Inc 1,020,877 0.06
4,496 Bill.com Holdings Inc 1,120,178 0.06

December 2021 Legal & General UCITS ETF Plc
L&G US Equity (Responsible Exclusions) UCITS ETF
Schedule of Investments (continued)
As at 31 December 2021
370
Nominal Description
Value $
% of Net
Assets
Common Stock (30 June 2021: 99.84%) (continued)
United States (30 June 2021: 95.99%) (continued)
6,714 Biogen Inc 1,610,823 0.09
8,331 BioMarin Pharmaceutical Inc 736,044 0.04
971 Bio-Rad Laboratories Inc 733,658 0.04
1,764 Bio-Techne Corp 912,588 0.05
31,394 Blackstone Inc 4,062,070 0.23
18,144 Block Inc 2,930,437 0.16
1,862 Booking Holdings Inc 4,467,366 0.25
7,180 Boston Properties Inc (REIT) 826,992 0.05
64,668 Boston Scientific Corp 2,747,097 0.15
102,667 Bristol-Myers Squibb Co 6,401,287 0.36
18,362 Broadcom Inc 12,218,258 0.68
5,270 Broadridge Financial Solutions Inc 963,461 0.05
10,375 Brown & Brown Inc 729,155 0.04
4,262 Brown-Forman Corp 310,529 0.02
12,786 Brown-Forman Corp 866,763 0.05
3,043 Burlington Stores Inc 887,065 0.05
12,373 Cadence Design Systems Inc 2,305,709 0.13
9,307 Caesars Entertainment Inc 870,484 0.05
4,632 Camden Property Trust (REIT) 827,646 0.05
19,407 Capital One Financial Corp 2,815,762 0.16
10,032 Carlyle Group Inc/The (Units) 550,757 0.03
7,400 CarMax Inc 963,702 0.05
39,791 Carrier Global Corp 2,158,264 0.12
3,743 Carvana Co - Class A 867,590 0.05
7,645 Catalent Inc 978,789 0.05
24,921 Caterpillar Inc 5,152,168 0.29
15,306 CBRE Group Inc - Class A 1,660,854 0.09
6,167 CDW Corp/DE 1,262,878 0.07
5,082 Celanese Corp - Class A 854,081 0.05

December 2021 Legal & General UCITS ETF Plc
L&G US Equity (Responsible Exclusions) UCITS ETF
Schedule of Investments (continued)
As at 31 December 2021
371
Nominal Description
Value $
% of Net
Assets
Common Stock (30 June 2021: 99.84%) (continued)
United States (30 June 2021: 95.99%) (continued)
26,311 Centene Corp 2,168,026 0.12
30,112 CenterPoint Energy Inc 840,426 0.05
6,651 Ceridian HCM Holding Inc 694,763 0.04
14,051 Cerner Corp 1,304,916 0.07
2,246 Charles River Laboratories International Inc 846,248 0.05
77,299 Charles Schwab Corp/The 6,500,846 0.36
5,528 Charter Communications Inc 3,604,090 0.20
11,251 Cheniere Energy Inc 1,141,076 0.06
1,370 Chipotle Mexican Grill Inc - Class A 2,395,103 0.13
11,326 Church & Dwight Co Inc 1,160,915 0.06
15,121 Cigna Corp 3,472,235 0.19
6,887 Cincinnati Financial Corp 784,636 0.04
3,997 Cintas Corp 1,771,350 0.10
193,475 Cisco Systems Inc/Delaware 12,260,511 0.68
90,277 Citigroup Inc 5,451,828 0.30
19,303 Citizens Financial Group Inc 912,067 0.05
5,419 Clorox Co/The 944,857 0.05
11,670 Cloudflare Inc 1,534,605 0.09
16,210 CME Group Inc 3,703,337 0.21
12,974 CMS Energy Corp 843,959 0.05
196,205 Coca-Cola Co/The 11,617,298 0.65
23,863 Cognizant Technology Solutions Corp 2,117,125 0.12
7,026 Coinbase Global Inc 1,773,152 0.10
37,793 Colgate-Palmolive Co 3,225,255 0.18
206,872 Comcast Corp 10,411,868 0.58
16,061 Consolidated Edison Inc 1,370,325 0.08
7,220 Constellation Brands Inc - Class A 1,812,003 0.10
2,233 Cooper Cos Inc/The 935,493 0.05
9,607 Copart Inc 1,456,613 0.08

December 2021 Legal & General UCITS ETF Plc
L&G US Equity (Responsible Exclusions) UCITS ETF
Schedule of Investments (continued)
As at 31 December 2021
372
Nominal Description
Value $
% of Net
Assets
Common Stock (30 June 2021: 99.84%) (continued)
United States (30 June 2021: 95.99%) (continued)
34,905 Corning Inc 1,299,513 0.07
33,498 Corteva Inc 1,583,785 0.09
17,719 CoStar Group Inc 1,400,333 0.08
20,179 Costco Wholesale Corp 11,455,618 0.64
69,247 Coupang Inc 2,034,477 0.11
9,193 Crowdstrike Holdings Inc 1,882,267 0.10
19,850 Crown Castle International Corp (REIT) 4,143,489 0.23
100,574 CSX Corp 3,781,582 0.21
6,477 Cummins Inc 1,412,893 0.08
60,665 CVS Health Corp 6,258,201 0.35
29,040 Danaher Corp 9,554,450 0.53
5,890 Darden Restaurants Inc 887,270 0.05
10,790 Datadog Inc 1,921,807 0.11
14,260 Deere & Co 4,889,611 0.27
12,978 Dell Technologies Inc 728,974 0.04
27,396 Delta Air Lines Inc 1,070,636 0.06
4,375 Dexcom Inc 2,349,156 0.13
13,159 Digital Realty Trust Inc (REIT) 2,327,432 0.13
13,317 Discover Financial Services 1,538,913 0.09
8,728 DocuSign Inc - Class A 1,329,362 0.07
10,572 Dollar General Corp 2,493,195 0.14
10,124 Dollar Tree Inc 1,422,624 0.08
37,735 Dominion Energy Inc 2,964,462 0.17
1,662 Domino's Pizza Inc 937,916 0.05
14,210 DoorDash Inc 2,115,869 0.12
6,433 Dover Corp 1,168,233 0.07
33,979 Dow Inc 1,927,289 0.11
14,806 DR Horton Inc 1,605,711 0.09
17,266 Duke Realty Corp (REIT) 1,133,340 0.06

December 2021 Legal & General UCITS ETF Plc
L&G US Equity (Responsible Exclusions) UCITS ETF
Schedule of Investments (continued)
As at 31 December 2021
373
Nominal Description
Value $
% of Net
Assets
Common Stock (30 June 2021: 99.84%) (continued)
United States (30 June 2021: 95.99%) (continued)
23,847 DuPont de Nemours Inc 1,926,361 0.11
8,572 Dynatrace Inc 517,320 0.03
27,237 eBay Inc 1,811,261 0.10
12,889 Ecolab Inc 3,023,631 0.17
17,320 Edison International 1,182,090 0.07
28,171 Edwards Lifesciences Corp 3,649,553 0.20
12,812 Electronic Arts Inc 1,689,903 0.09
43,670 Eli Lilly & Co 12,062,527 0.67
26,988 Emerson Electric Co 2,509,074 0.14
6,090 Enphase Energy Inc 1,114,105 0.06
6,140 Entegris Inc 850,881 0.05
2,490 EPAM Systems Inc 1,664,440 0.09
5,526 Equifax Inc 1,617,958 0.09
4,132 Equinix Inc (REIT) 3,495,011 0.19
16,828 Equity Residential (REIT) 1,522,934 0.08
2,941 Essex Property Trust Inc (REIT) 1,035,908 0.06
10,540 Estee Lauder Cos Inc/The - Class A 3,901,908 0.22
5,706 Etsy Inc 1,249,272 0.07
15,538 Eversource Energy 1,413,647 0.08
44,555 Exelon Corp 2,573,497 0.14
6,300 Expedia Group Inc 1,138,536 0.06
7,603 Expeditors International of Washington Inc 1,021,007 0.06
5,932 Extra Space Storage Inc (REIT) 1,344,962 0.07
1,645 FactSet Research Systems Inc 799,486 0.04
26,225 Fastenal Co 1,679,973 0.09
11,235 FedEx Corp 2,905,820 0.16
27,978 Fidelity National Information Services Inc 3,053,799 0.17
30,083 Fifth Third Bancorp 1,310,115 0.07
7,953 First Republic Bank/CA 1,642,374 0.09

December 2021 Legal & General UCITS ETF Plc
L&G US Equity (Responsible Exclusions) UCITS ETF
Schedule of Investments (continued)
As at 31 December 2021
374
Nominal Description
Value $
% of Net
Assets
Common Stock (30 June 2021: 99.84%) (continued)
United States (30 June 2021: 95.99%) (continued)
24,791 FirstEnergy Corp 1,031,058 0.06
27,658 Fiserv Inc 2,870,624 0.16
3,691 FleetCor Technologies Inc 826,193 0.05
177,446 Ford Motor Co 3,685,553 0.21
6,083 Fortinet Inc 2,186,230 0.12
15,789 Fortive Corp 1,204,543 0.07
17,213 Fox Corp 635,160 0.04
3,657 Fox Corp 125,325 0.01
13,186 Franklin Resources Inc 441,599 0.02
66,729 Freeport-McMoRan Inc 2,784,601 0.15
3,707 Gartner Inc 1,239,324 0.07
2,831 Generac Holdings Inc 996,286 0.06
49,864 General Electric Co 4,710,652 0.26
27,170 General Mills Inc 1,830,715 0.10
62,548 General Motors Co 3,667,189 0.20
6,396 Genuine Parts Co 896,719 0.05
57,617 Gilead Sciences Inc 4,183,570 0.23
13,282 Global Payments Inc 1,795,461 0.10
15,313 Goldman Sachs Group Inc/The 5,857,988 0.33
40,613 Halliburton Co 928,819 0.05
15,689 Hartford Financial Services Group Inc/The 1,083,169 0.06
11,122 HCA Healthcare Inc 2,857,464 0.16
24,496 Healthpeak Properties Inc (REIT) 884,061 0.05
6,125 HEICO Corp - Class A 787,185 0.04
6,540 Hershey Co/The 1,265,294 0.07
59,621 Hewlett Packard Enterprise Co 940,223 0.05
12,450 Hilton Worldwide Holdings Inc 1,942,076 0.11
11,475 Hologic Inc 878,526 0.05
47,763 Home Depot Inc/The 19,822,123 1.10

December 2021 Legal & General UCITS ETF Plc
L&G US Equity (Responsible Exclusions) UCITS ETF
Schedule of Investments (continued)
As at 31 December 2021
375
Nominal Description
Value $
% of Net
Assets
Common Stock (30 June 2021: 99.84%) (continued)
United States (30 June 2021: 95.99%) (continued)
12,659 Hormel Foods Corp 617,886 0.03
52,832 HP Inc 1,990,181 0.11
2,026 HubSpot Inc 1,335,438 0.07
5,833 Humana Inc 2,705,695 0.15
62,966 Huntington Bancshares Inc/OH 970,936 0.05
3,460 IDEX Corp 817,667 0.05
3,835 IDEXX Laboratories Inc 2,525,194 0.14
14,305 Illinois Tool Works Inc 3,530,474 0.20
7,138 Illumina Inc 2,715,581 0.15
19,131 Ingersoll Rand Inc 1,183,635 0.07
3,136 Insulet Corp 834,396 0.05
185,618 Intel Corp 9,559,327 0.53
25,086 Intercontinental Exchange Inc 3,431,012 0.19
40,752 International Business Machines Corp 5,446,912 0.30
11,588 International Flavors & Fragrances Inc 1,745,732 0.10
17,770 International Paper Co 834,835 0.05
12,584 Intuit Inc 8,094,280 0.45
16,079 Intuitive Surgical Inc 5,777,185 0.32
25,480 Invitation Homes Inc (REIT) 1,155,263 0.06
8,602 IQVIA Holdings Inc 2,426,968 0.14
3,825 JB Hunt Transport Services Inc 781,830 0.04
120,321 Johnson & Johnson 20,583,313 1.15
133,658 JPMorgan Chase & Co 21,164,744 1.18
15,529 Kellogg Co 1,000,378 0.06
35,525 Keurig Dr Pepper Inc 1,309,452 0.07
40,476 KeyCorp 936,210 0.05
8,283 Keysight Technologies Inc 1,710,522 0.10
14,970 Kimberly-Clark Corp 2,139,512 0.12
97,613 Kinder Morgan Inc 1,548,142 0.09
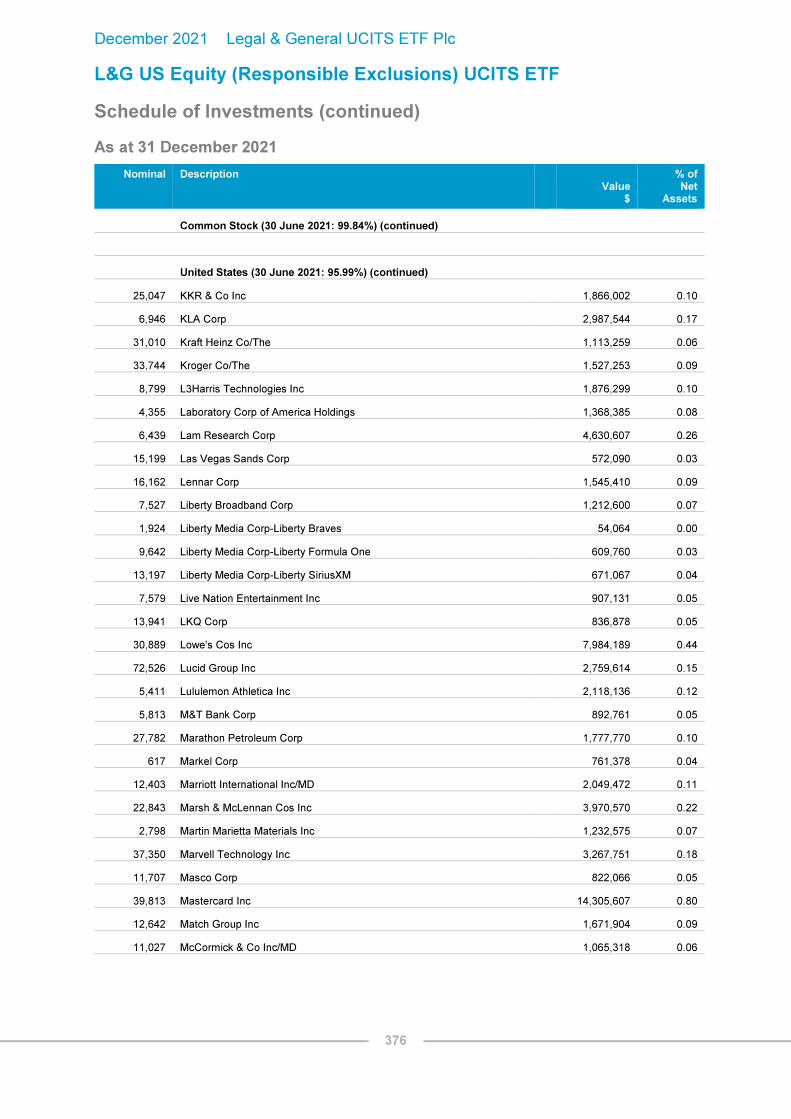
December 2021 Legal & General UCITS ETF Plc
L&G US Equity (Responsible Exclusions) UCITS ETF
Schedule of Investments (continued)
As at 31 December 2021
376
Nominal Description
Value $
% of Net
Assets
Common Stock (30 June 2021: 99.84%) (continued)
United States (30 June 2021: 95.99%) (continued)
25,047 KKR & Co Inc 1,866,002 0.10
6,946 KLA Corp 2,987,544 0.17
31,010 Kraft Heinz Co/The 1,113,259 0.06
33,744 Kroger Co/The 1,527,253 0.09
8,799 L3Harris Technologies Inc 1,876,299 0.10
4,355 Laboratory Corp of America Holdings 1,368,385 0.08
6,439 Lam Research Corp 4,630,607 0.26
15,199 Las Vegas Sands Corp 572,090 0.03
16,162 Lennar Corp 1,545,410 0.09
7,527 Liberty Broadband Corp 1,212,600 0.07
1,924 Liberty Media Corp-Liberty Braves 54,064 0.00
9,642 Liberty Media Corp-Liberty Formula One 609,760 0.03
13,197 Liberty Media Corp-Liberty SiriusXM 671,067 0.04
7,579 Live Nation Entertainment Inc 907,131 0.05
13,941 LKQ Corp 836,878 0.05
30,889 Lowe's Cos Inc 7,984,189 0.44
72,526 Lucid Group Inc 2,759,614 0.15
5,411 Lululemon Athletica Inc 2,118,136 0.12
5,813 M&T Bank Corp 892,761 0.05
27,782 Marathon Petroleum Corp 1,777,770 0.10
617 Markel Corp 761,378 0.04
12,403 Marriott International Inc/MD 2,049,472 0.11
22,843 Marsh & McLennan Cos Inc 3,970,570 0.22
2,798 Martin Marietta Materials Inc 1,232,575 0.07
37,350 Marvell Technology Inc 3,267,751 0.18
11,707 Masco Corp 822,066 0.05
39,813 Mastercard Inc 14,305,607 0.80
12,642 Match Group Inc 1,671,904 0.09
11,027 McCormick & Co Inc/MD 1,065,318 0.06

December 2021 Legal & General UCITS ETF Plc
L&G US Equity (Responsible Exclusions) UCITS ETF
Schedule of Investments (continued)
As at 31 December 2021
377
Nominal Description
Value $
% of Net
Assets
Common Stock (30 June 2021: 99.84%) (continued)
United States (30 June 2021: 95.99%) (continued)
34,026 McDonald's Corp 9,121,350 0.51
7,045 McKesson Corp 1,751,176 0.10
2,117 MercadoLibre Inc 2,854,563 0.16
115,218 Merck & Co Inc 8,830,308 0.49
107,541 Meta Platforms Inc - Class A 36,171,415 2.01
33,450 MetLife Inc 2,090,291 0.12
1,039 Mettler-Toledo International Inc 1,763,401 0.10
18,685 MGM Resorts International 838,583 0.05
25,236 Microchip Technology Inc 2,197,046 0.12
51,153 Micron Technology Inc 4,764,902 0.27
343,593 Microsoft Corp 115,557,198 6.43
5,210 Mid-America Apartment Communities Inc (REIT) 1,195,382 0.07
16,802 Moderna Inc 4,267,372 0.24
2,664 Molina Healthcare Inc 847,365 0.05
64,783 Mondelez International Inc 4,295,761 0.24
2,843 MongoDB Inc - Class A 1,504,942 0.08
2,030 Monolithic Power Systems Inc 1,001,460 0.06
17,177 Monster Beverage Corp 1,649,679 0.09
8,434 Moody's Corp 3,294,152 0.18
65,026 Morgan Stanley 6,382,952 0.36
7,670 Motorola Solutions Inc 2,083,939 0.12
3,647 MSCI Inc - Class A 2,234,480 0.12
5,226 Nasdaq Inc 1,097,512 0.06
10,070 NetApp Inc 926,339 0.05
19,953 Netflix Inc 12,020,485 0.67
36,254 Newmont Corp 2,248,473 0.13
57,689 NIKE Inc 9,615,026 0.54
11,020 Norfolk Southern Corp 3,280,764 0.18
9,503 Northern Trust Corp 1,136,654 0.06

December 2021 Legal & General UCITS ETF Plc
L&G US Equity (Responsible Exclusions) UCITS ETF
Schedule of Investments (continued)
As at 31 December 2021
378
Nominal Description
Value $
% of Net
Assets
Common Stock (30 June 2021: 99.84%) (continued)
United States (30 June 2021: 95.99%) (continued)
3,364 Novavax Inc 481,287 0.03
14,063 Nuance Communications Inc 777,965 0.04
13,415 Nucor Corp 1,531,322 0.09
109,756 NVIDIA Corp 32,280,337 1.80
154 NVR Inc 909,966 0.05
6,684 Okta Inc 1,498,352 0.08
4,609 Old Dominion Freight Line Inc 1,651,773 0.09
19,428 ON Semiconductor Corp 1,319,550 0.07
19,959 ONEOK Inc 1,172,791 0.07
72,639 Oracle Corp 6,334,847 0.35
3,040 O'Reilly Automotive Inc 2,146,939 0.12
19,383 Otis Worldwide Corp 1,687,678 0.09
15,540 PACCAR Inc 1,371,560 0.08
76,203 Palantir Technologies Inc 1,387,657 0.08
4,416 Palo Alto Networks Inc 2,458,652 0.14
5,873 Parker-Hannifin Corp 1,868,319 0.10
14,568 Paychex Inc 1,988,532 0.11
2,283 Paycom Software Inc 947,879 0.05
53,819 PayPal Holdings Inc 10,149,187 0.56
63,325 PepsiCo Inc 11,000,186 0.61
5,743 PerkinElmer Inc 1,154,688 0.06
256,626 Pfizer Inc 15,153,765 0.84
19,815 Phillips 66 1,435,795 0.08
25,057 Pinterest Inc 910,822 0.05
24,086 Plug Power Inc 679,948 0.04
19,200 PNC Financial Services Group Inc/The 3,849,984 0.21
1,774 Pool Corp 1,004,084 0.06
10,746 PPG Industries Inc 1,853,040 0.10
12,285 Principal Financial Group Inc 888,574 0.05

December 2021 Legal & General UCITS ETF Plc
L&G US Equity (Responsible Exclusions) UCITS ETF
Schedule of Investments (continued)
As at 31 December 2021
379
Nominal Description
Value $
% of Net
Assets
Common Stock (30 June 2021: 99.84%) (continued)
United States (30 June 2021: 95.99%) (continued)
110,040 Procter & Gamble Co/The 18,000,343 1.00
26,396 Progressive Corp/The 2,709,549 0.15
33,862 Prologis Inc (REIT) 5,701,006 0.32
17,947 Prudential Financial Inc 1,942,583 0.11
22,994 Public Service Enterprise Group Inc 1,534,390 0.09
6,863 Public Storage (REIT) 2,570,605 0.14
4,979 Qorvo Inc 778,666 0.04
51,263 QUALCOMM Inc 9,374,465 0.52
6,924 Quanta Services Inc 793,906 0.04
5,506 Quest Diagnostics Inc 952,593 0.05
8,456 Raymond James Financial Inc 848,982 0.05
24,992 Realty Income Corp (REIT) 1,789,177 0.10
4,633 Regeneron Pharmaceuticals Inc 2,925,832 0.16
42,664 Regions Financial Corp 930,075 0.05
2,425 Repligen Corp 642,237 0.04
14,468 Republic Services Inc - Class A 2,017,563 0.11
6,545 ResMed Inc 1,704,842 0.09
3,661 RingCentral Inc - Class A 685,888 0.04
30,936 Robinhood Markets Inc 549,423 0.03
23,199 ROBLOX Corp 2,393,209 0.13
5,247 Rockwell Automation Inc 1,830,416 0.10
5,282 Roku Inc 1,205,352 0.07
9,689 Rollins Inc 331,461 0.02
4,724 Roper Technologies Inc 2,323,547 0.13
15,792 Ross Stores Inc 1,804,710 0.10
10,932 S&P Global Inc 5,159,139 0.29
43,220 salesforce.com Inc 10,983,499 0.61
4,979 SBA Communications Corp (REIT) - Class A 1,936,931 0.11
8,191 Seagen Inc 1,266,329 0.07

December 2021 Legal & General UCITS ETF Plc
L&G US Equity (Responsible Exclusions) UCITS ETF
Schedule of Investments (continued)
As at 31 December 2021
380
Nominal Description
Value $
% of Net
Assets
Common Stock (30 June 2021: 99.84%) (continued)
United States (30 June 2021: 95.99%) (continued)
14,590 Sempra Energy 1,929,965 0.11
9,054 ServiceNow Inc 5,877,042 0.33
10,910 Sherwin-Williams Co/The 3,842,066 0.21
2,751 Signature Bank/New York NY 889,866 0.05
14,908 Simon Property Group Inc (REIT) 2,381,851 0.13
29,947 Sirius XM Holdings Inc 190,163 0.01
7,460 Skyworks Solutions Inc 1,157,344 0.06
12,999 Snowflake Inc 4,403,411 0.25
2,423 SolarEdge Technologies Inc 679,821 0.04
26,401 Southwest Airlines Co 1,131,019 0.06
7,274 Splunk Inc 841,747 0.05
9,918 SS&C Technologies Holdings Inc 813,078 0.05
7,402 Stanley Black & Decker Inc 1,396,165 0.08
53,481 Starbucks Corp 6,255,673 0.35
17,164 State Street Corp 1,596,252 0.09
15,926 Stryker Corp 4,258,931 0.24
5,113 Sun Communities Inc (REIT) 1,073,577 0.06
2,699 SVB Financial Group 1,830,570 0.10
24,993 Synchrony Financial 1,159,425 0.06
6,859 Synopsys Inc 2,527,541 0.14
23,077 Sysco Corp 1,812,698 0.10
5,195 Take-Two Interactive Software Inc 923,255 0.05
21,914 Target Corp 5,071,776 0.28
6,766 Teladoc Health Inc 621,254 0.03
2,078 Teledyne Technologies Inc 907,857 0.05
7,491 Teradyne Inc 1,225,003 0.07
36,992 Tesla Inc 39,092,406 2.18
42,178 Texas Instruments Inc 7,949,288 0.44
17,998 Thermo Fisher Scientific Inc 12,008,986 0.67
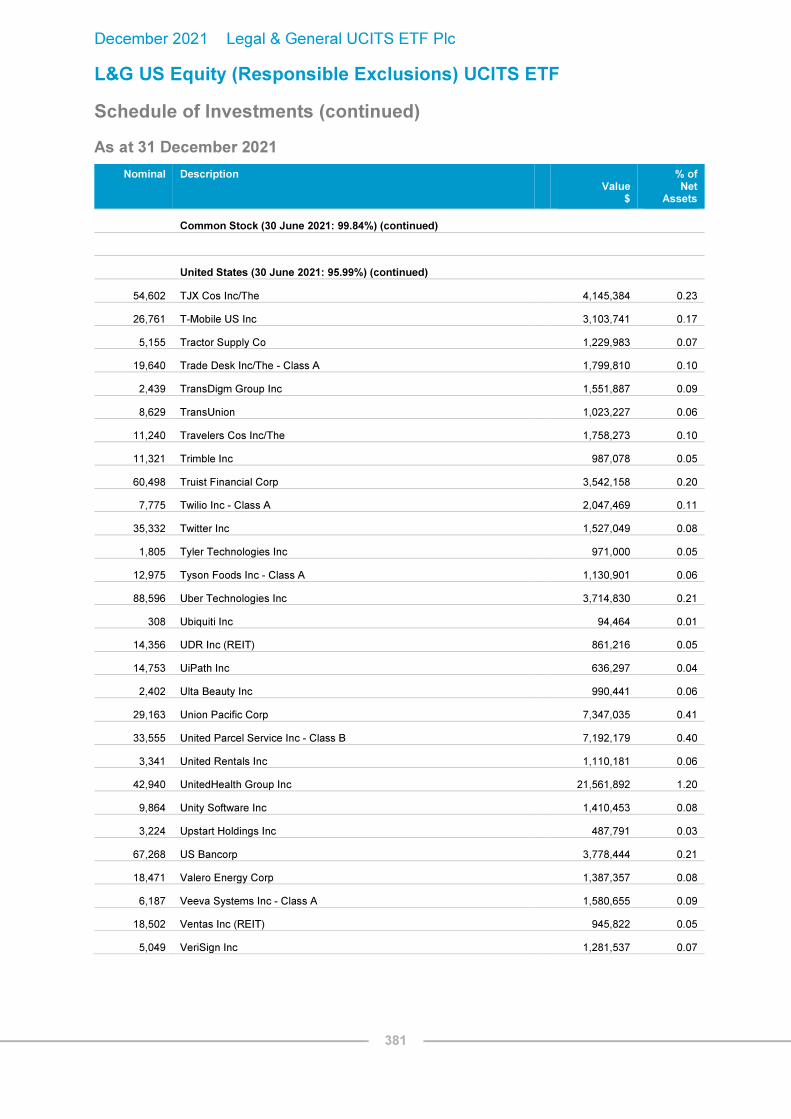
December 2021 Legal & General UCITS ETF Plc
L&G US Equity (Responsible Exclusions) UCITS ETF
Schedule of Investments (continued)
As at 31 December 2021
381
Nominal Description
Value $
% of Net
Assets
Common Stock (30 June 2021: 99.84%) (continued)
United States (30 June 2021: 95.99%) (continued)
54,602 TJX Cos Inc/The 4,145,384 0.23
26,761 T-Mobile US Inc 3,103,741 0.17
5,155 Tractor Supply Co 1,229,983 0.07
19,640 Trade Desk Inc/The - Class A 1,799,810 0.10
2,439 TransDigm Group Inc 1,551,887 0.09
8,629 TransUnion 1,023,227 0.06
11,240 Travelers Cos Inc/The 1,758,273 0.10
11,321 Trimble Inc 987,078 0.05
60,498 Truist Financial Corp 3,542,158 0.20
7,775 Twilio Inc - Class A 2,047,469 0.11
35,332 Twitter Inc 1,527,049 0.08
1,805 Tyler Technologies Inc 971,000 0.05
12,975 Tyson Foods Inc - Class A 1,130,901 0.06
88,596 Uber Technologies Inc 3,714,830 0.21
308 Ubiquiti Inc 94,464 0.01
14,356 UDR Inc (REIT) 861,216 0.05
14,753 UiPath Inc 636,297 0.04
2,402 Ulta Beauty Inc 990,441 0.06
29,163 Union Pacific Corp 7,347,035 0.41
33,555 United Parcel Service Inc - Class B 7,192,179 0.40
3,341 United Rentals Inc 1,110,181 0.06
42,940 UnitedHealth Group Inc 21,561,892 1.20
9,864 Unity Software Inc 1,410,453 0.08
3,224 Upstart Holdings Inc 487,791 0.03
67,268 US Bancorp 3,778,444 0.21
18,471 Valero Energy Corp 1,387,357 0.08
6,187 Veeva Systems Inc - Class A 1,580,655 0.09
18,502 Ventas Inc (REIT) 945,822 0.05
5,049 VeriSign Inc 1,281,537 0.07

December 2021 Legal & General UCITS ETF Plc
L&G US Equity (Responsible Exclusions) UCITS ETF
Schedule of Investments (continued)
As at 31 December 2021
382
Nominal Description
Value $
% of Net
Assets
Common Stock (30 June 2021: 99.84%) (continued)
United States (30 June 2021: 95.99%) (continued)
7,190 Verisk Analytics Inc - Class A 1,644,569 0.09
189,974 Verizon Communications Inc 9,871,049 0.55
11,531 Vertex Pharmaceuticals Inc 2,532,208 0.14
17,897 VF Corp 1,310,418 0.07
1 ViacomCBS Inc 33 0.00
27,342 ViacomCBS Inc - Class B 825,182 0.05
29,114 VICI Properties Inc (REIT) 876,623 0.05
76,342 Visa Inc - Class A 16,544,075 0.92
9,293 VMware Inc 1,076,873 0.06
5,994 Vulcan Materials Co 1,244,235 0.07
32,529 Walgreens Boots Alliance Inc 1,696,713 0.09
63,358 Walmart Inc 9,167,269 0.51
83,069 Walt Disney Co/The 12,866,557 0.72
19,156 Waste Management Inc 3,197,136 0.18
2,776 Waters Corp 1,034,338 0.06
3,275 Wayfair Inc 622,152 0.03
20,208 Welltower Inc (REIT) 1,733,240 0.10
3,330 West Pharmaceutical Services Inc 1,561,803 0.09
14,013 Western Digital Corp 913,788 0.05
8,260 Westinghouse Air Brake Technologies Corp 760,829 0.04
34,948 Weyerhaeuser Co (REIT) 1,439,159 0.08
54,379 Williams Cos Inc/The 1,416,029 0.08
8,562 Workday Inc - Class A 2,338,967 0.13
2,071 WW Grainger Inc 1,073,275 0.06
11,267 Xilinx Inc 2,388,942 0.13
8,038 Xylem Inc/NY 963,917 0.05
18,200 Yum China Holdings Inc 907,088 0.05
13,328 Yum! Brands Inc 1,850,726 0.10
2,414 Zebra Technologies Corp 1,436,813 0.08
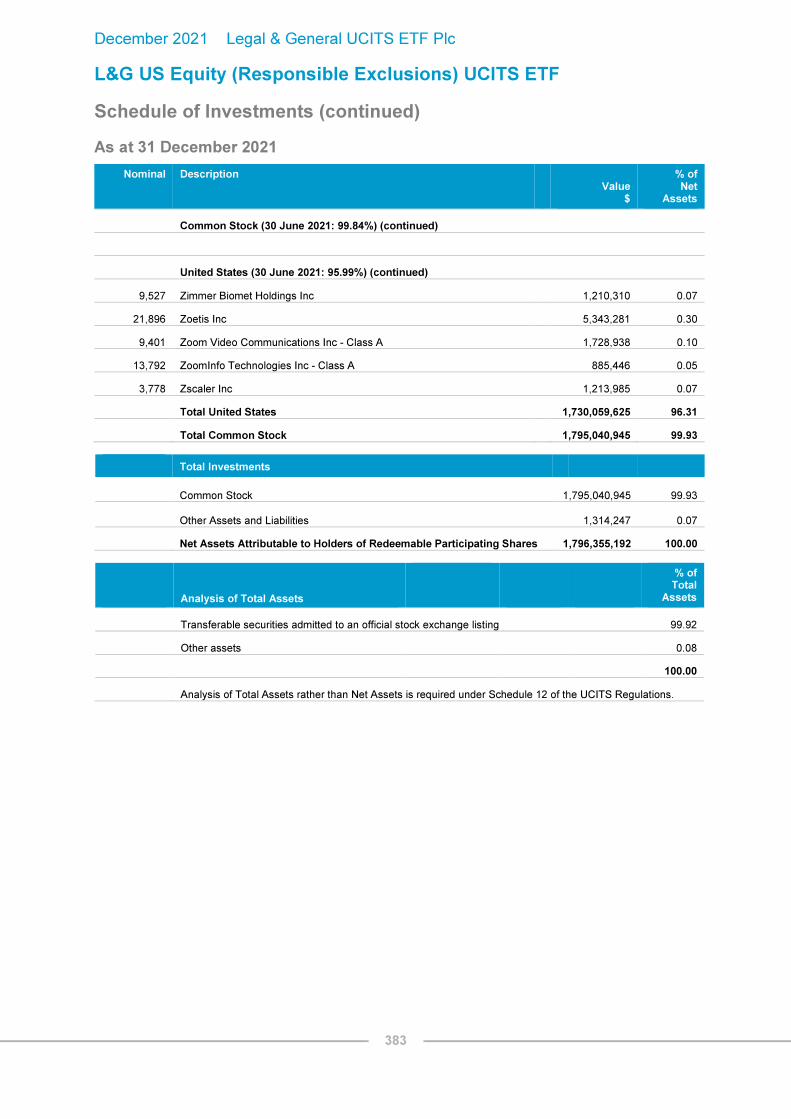
December 2021 Legal & General UCITS ETF Plc
L&G US Equity (Responsible Exclusions) UCITS ETF
Schedule of Investments (continued)
As at 31 December 2021
383
Nominal Description
Value $
% of Net
Assets
Common Stock (30 June 2021: 99.84%) (continued)
United States (30 June 2021: 95.99%) (continued)
9,527 Zimmer Biomet Holdings Inc 1,210,310 0.07
21,896 Zoetis Inc 5,343,281 0.30
9,401 Zoom Video Communications Inc - Class A 1,728,938 0.10
13,792 ZoomInfo Technologies Inc - Class A 885,446 0.05
3,778 Zscaler Inc 1,213,985 0.07
Total United States 1,730,059,625 96.31
Total Common Stock 1,795,040,945 99.93
Total Investments
Common Stock 1,795,040,945
99.93
Other Assets and Liabilities 1,314,247
0.07
Net Assets Attributable to Holders of Redeemable Participating Shares 1,796,355,192 100.00
Analysis of Total Assets
% of Total
Assets
Transferable securities admitted to an official stock exchange listing 99.92
Other assets 0.08
100.00
Analysis of Total Assets rather than Net Assets is required under Schedule 12 of the UCITS Regulations.

December 2021 Legal & General UCITS ETF Plc
L&G Clean Energy UCITS ETF
Schedule of Investments
As at 31 December 2021
384
Nominal Description
Value $
% of Net
Assets
Common Stock (30 June 2021: 99.86%)
Australia (30 June 2021: 3.61%)
499,046 Downer EDI Ltd 2,162,463 1.66
306,050 Worley Ltd 2,365,306 1.81
Total Australia 4,527,769 3.47
Austria (30 June 2021: 2.05%)
40,839 ANDRITZ AG 2,107,524 1.62
Total Austria 2,107,524 1.62
Canada (30 June 2021: 7.31%)
75,115 Boralex Inc 2,062,263 1.58
64,755 Canadian Solar Inc 2,026,184 1.56
59,964 Enbridge Inc 2,345,545 1.80
70,688 Northland Power Inc 2,123,713 1.63
18,400 WSP Global Inc 2,674,853 2.05
Total Canada 11,232,558 8.62
Denmark (30 June 2021: 3.60%)
15,211 Orsted AS '144A' 1,942,466 1.49
56,662 Vestas Wind Systems A/S 1,732,715 1.33
Total Denmark 3,675,181 2.82
Finland (30 June 2021: 4.03%)
57,590 Valmet Oyj 2,470,312 1.89
Total Finland 2,470,312 1.89
France (30 June 2021: 5.29%)
168,680 Engie SA 2,496,361 1.91
55,826 Neoen SA '144A' 2,422,578 1.86
13,148 Schneider Electric SE 2,578,583 1.98
Total France 7,497,522 5.75

December 2021 Legal & General UCITS ETF Plc
L&G Clean Energy UCITS ETF
Schedule of Investments (continued)
As at 31 December 2021
385
Nominal Description
Value $
% of Net
Assets
Common Stock (30 June 2021: 99.86%) (continued)
Germany (30 June 2021: 8.92%)
181,905 E.ON SE 2,522,044 1.93
129,440 Encavis AG 2,290,399 1.76
123,287 Nordex SE 1,950,192 1.50
48,354 SMA Solar Technology AG 2,055,439 1.58
Total Germany 8,818,074 6.77
Italy (30 June 2021: 1.45%)
78,906 ERG SpA 2,551,953 1.96
279,055 Falck Renewables SpA 2,748,151 2.11
1,023,600 Saipem SpA 2,147,631 1.64
Total Italy 7,447,735 5.71
Japan (30 June 2021: 14.35%)
53,677 Fuji Electric Co Ltd 2,927,285 2.25
100,434 GS Yuasa Corp 2,230,995 1.71
318,397 Hitachi Zosen Corp 2,206,424 1.69
172,208 Mitsubishi Electric Corp 2,181,107 1.67
176,485 Sumitomo Electric Industries Ltd 2,298,113 1.76
86,572 Sumitomo Heavy Industries Ltd 2,096,733 1.61
142,435 Yokogawa Electric Corp 2,565,327 1.97
Total Japan 16,505,984 12.66
Luxembourg (30 June 2021: –%)
309,314 Subsea 7 SA 2,216,125 1.70
Total Luxembourg 2,216,125 1.70
Mauritius (30 June 2021: 1.68%)
110,414 Azure Power Global Ltd 2,004,014 1.54
Total Mauritius 2,004,014 1.54

December 2021 Legal & General UCITS ETF Plc
L&G Clean Energy UCITS ETF
Schedule of Investments (continued)
As at 31 December 2021
386
Nominal Description
Value $
% of Net
Assets
Common Stock (30 June 2021: 99.86%) (continued)
Netherlands (30 June 2021: 3.54%)
21,754 Alfen Beheer BV '144A' 2,183,166 1.68
227,115 Fugro NV 1,778,209 1.36
Total Netherlands 3,961,375 3.04
Norway (30 June 2021: 1.56%)
1,269,677 Aker Solutions ASA 3,366,299 2.58
114,637 Scatec ASA '144A' 1,985,734 1.53
Total Norway 5,352,033 4.11
South Korea (30 June 2021: 4.52%)
35,383 CS Wind Corp 1,955,553 1.50
50,565 Hyundai Engineering & Construction Co Ltd 1,890,737 1.45
Total South Korea 3,846,290 2.95
Spain (30 June 2021: 4.22%)
191,677 Iberdrola SA 2,269,100 1.74
78,844 Siemens Gamesa Renewable Energy SA 1,889,149 1.45
Total Spain 4,158,249 3.19
Sweden (30 June 2021: 3.63%)
34,771 Atlas Copco AB 2,403,371 1.84
66,983 Eolus Vind AB 915,171 0.70
203,130 Peab AB 2,562,171 1.97
Total Sweden 5,880,713 4.51
Taiwan (30 June 2021: 5.46%)
1,068,676 CTCI Corp 1,436,902 1.10
244,863 Delta Electronics Inc 2,433,851 1.87
2,128,539 Teco Electric and Machinery Co Ltd 2,434,969 1.87
Total Taiwan 6,305,722 4.84

December 2021 Legal & General UCITS ETF Plc
L&G Clean Energy UCITS ETF
Schedule of Investments (continued)
As at 31 December 2021
387
Nominal Description
Value $
% of Net
Assets
Common Stock (30 June 2021: 99.86%) (continued)
United Kingdom (30 June 2021: 1.66%)
3,238,824 Centrica Plc 3,136,580 2.41
Total United Kingdom 3,136,580 2.41
United States (30 June 2021: 22.98%)
33,348 Ameresco Inc - Class A 2,715,861 2.08
169,633 American Superconductor Corp 1,845,607 1.41
123,266 Array Technologies Inc 1,934,044 1.48
333,847 Babcock & Wilcox Enterprises Inc 3,011,300 2.31
13,819 Enphase Energy Inc 2,528,048 1.94
25,555 First Solar Inc 2,227,374 1.71
182,375 Infrastructure and Energy Alternatives Inc 1,677,850 1.29
28,051 NextEra Energy Inc 2,618,841 2.01
33,469 Ormat Technologies Inc 2,654,092 2.04
8,411 SolarEdge Technologies Inc 2,359,874 1.81
327,926 Sunworks Inc (Units) 1,006,733 0.77
3,277 Tesla Inc 3,463,068 2.66
64,270 TPI Composites Inc 961,479 0.74
Total United States 29,004,171 22.25
Total Common Stock 130,147,931 99.85
Total Investments
Value $
% of Net
Assets
Common Stock 130,147,931 99.85
Other Assets and Liabilities 191,382 0.15
Net Assets Attributable to Holders of Redeemable Participating Shares 130,339,313 100.00

December 2021 Legal & General UCITS ETF Plc
L&G Clean Energy UCITS ETF
Schedule of Investments (continued)
As at 31 December 2021
388
Analysis of Total Assets
% of Total
Assets
Transferable securities admitted to an official stock exchange listing 99.81
Other assets 0.19
100.00
Analysis of Total Assets rather than Net Assets is required under Schedule 12 of the UCITS Regulations.

December 2021 Legal & General UCITS ETF Plc
L&G ESG GBP Corporate Bond 0-5 Year UCITS ETF
Schedule of Investments
As at 31 December 2021
389
Nominal Description
Coupon Rate
Maturity Date
Value £
% of Net
Assets
Corporate Bond (30 June 2021: 98.84%)
Australia (30 June 2021: 2.70%)
300,000 APT Pipelines Ltd 'EMTN' 4.25% 26/11/2024 322,720 0.47
300,000 Macquarie Bank Ltd 'EMTN' 1.13% 15/12/2025 295,545 0.43
450,000 Scentre Group Trust 1 / Scentre Group Trust 2 'EMTN' 2.38% 08/04/2022 450,126 0.65
300,000 Westfield America Management Ltd 2.13% 30/03/2025 301,093 0.44
Total Australia 1,369,484 1.99
Belgium (30 June 2021: 1.57%)
100,000 Anheuser-Busch InBev SA/NV 'EMTN' 9.75% 30/07/2024 121,357 0.17
350,000 Anheuser-Busch InBev SA/NV 'EMTN' 4.00% 24/09/2025 384,084 0.56
Total Belgium 505,441 0.73
Canada (30 June 2021: 2.36%)
430,000 Bank of Montreal 'EMTN' 1.50% 18/12/2024 430,658 0.63
850,000 Bank of Montreal 'EMTN' 1.00% 09/09/2026 828,813 1.21
200,000 Royal Bank of Canada 'EMTN' 1.38% 09/12/2024 199,672 0.29
400,000 Royal Bank of Canada 'EMTN' 1.13% 15/12/2025 394,617 0.57
830,000 Royal Bank of Canada 'EMTN' 1.00% 09/09/2026 811,933 1.18
Total Canada 2,665,693 3.88
Cayman Islands (30 June 2021: 0.72%)
350,000 Southern Water Services Finance Ltd 6.64% 31/03/2026 419,911 0.61
Total Cayman Islands 419,911 0.61
Finland (30 June 2021: –%)
400,000 OP Corporate Bank plc 'GMTN' 1.38% 04/09/2026 396,348 0.58
Total Finland 396,348 0.58
France (30 June 2021: 8.77%)
600,000 Banque Federative du Credit Mutuel SA 1.25% 05/12/2025 594,169 0.86
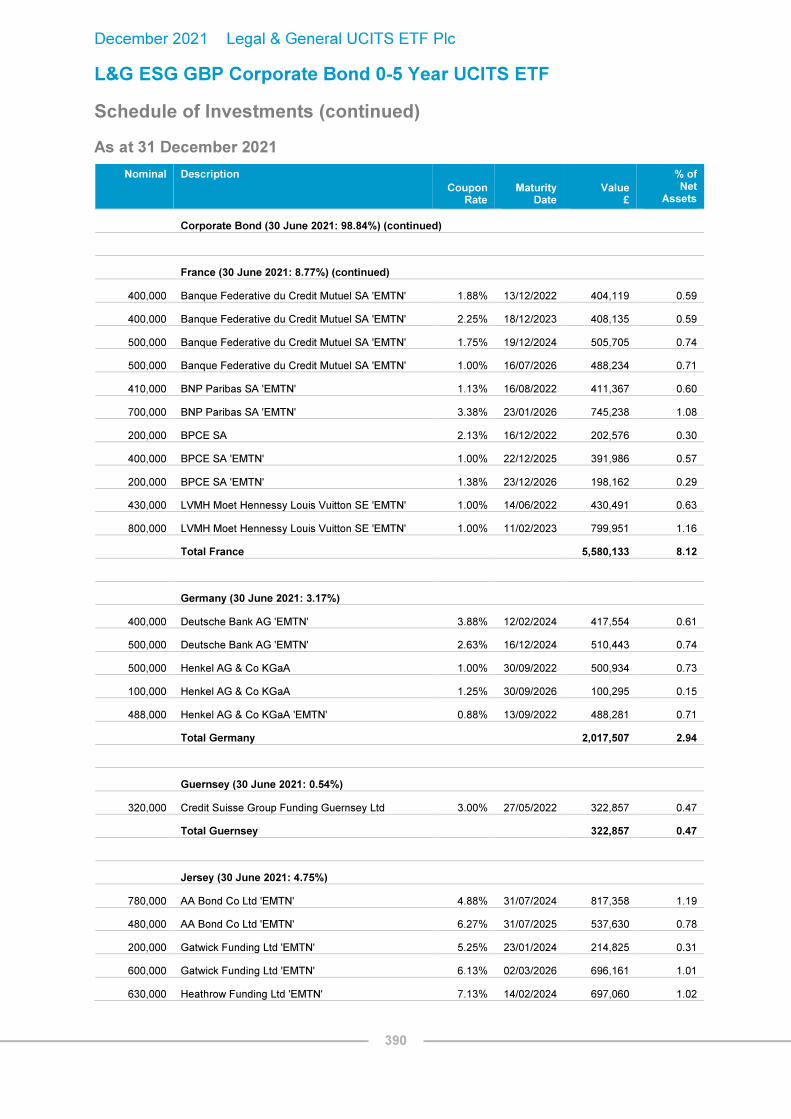
December 2021 Legal & General UCITS ETF Plc
L&G ESG GBP Corporate Bond 0-5 Year UCITS ETF
Schedule of Investments (continued)
As at 31 December 2021
390
Nominal Description
Coupon Rate
Maturity Date
Value £
% of Net
Assets
Corporate Bond (30 June 2021: 98.84%) (continued)
France (30 June 2021: 8.77%) (continued)
400,000 Banque Federative du Credit Mutuel SA 'EMTN' 1.88% 13/12/2022 404,119 0.59
400,000 Banque Federative du Credit Mutuel SA 'EMTN' 2.25% 18/12/2023 408,135 0.59
500,000 Banque Federative du Credit Mutuel SA 'EMTN' 1.75% 19/12/2024 505,705 0.74
500,000 Banque Federative du Credit Mutuel SA 'EMTN' 1.00% 16/07/2026 488,234 0.71
410,000 BNP Paribas SA 'EMTN' 1.13% 16/08/2022 411,367 0.60
700,000 BNP Paribas SA 'EMTN' 3.38% 23/01/2026 745,238 1.08
200,000 BPCE SA 2.13% 16/12/2022 202,576 0.30
400,000 BPCE SA 'EMTN' 1.00% 22/12/2025 391,986 0.57
200,000 BPCE SA 'EMTN' 1.38% 23/12/2026 198,162 0.29
430,000 LVMH Moet Hennessy Louis Vuitton SE 'EMTN' 1.00% 14/06/2022 430,491 0.63
800,000 LVMH Moet Hennessy Louis Vuitton SE 'EMTN' 1.00% 11/02/2023 799,951 1.16
Total France 5,580,133 8.12
Germany (30 June 2021: 3.17%)
400,000 Deutsche Bank AG 'EMTN' 3.88% 12/02/2024 417,554 0.61
500,000 Deutsche Bank AG 'EMTN' 2.63% 16/12/2024 510,443 0.74
500,000 Henkel AG & Co KGaA 1.00% 30/09/2022 500,934 0.73
100,000 Henkel AG & Co KGaA 1.25% 30/09/2026 100,295 0.15
488,000 Henkel AG & Co KGaA 'EMTN' 0.88% 13/09/2022 488,281 0.71
Total Germany 2,017,507 2.94
Guernsey (30 June 2021: 0.54%)
320,000 Credit Suisse Group Funding Guernsey Ltd 3.00% 27/05/2022 322,857 0.47
Total Guernsey 322,857 0.47
Jersey (30 June 2021: 4.75%)
780,000 AA Bond Co Ltd 'EMTN' 4.88% 31/07/2024 817,358 1.19
480,000 AA Bond Co Ltd 'EMTN' 6.27% 31/07/2025 537,630 0.78
200,000 Gatwick Funding Ltd 'EMTN' 5.25% 23/01/2024 214,825 0.31
600,000 Gatwick Funding Ltd 'EMTN' 6.13% 02/03/2026 696,161 1.01
630,000 Heathrow Funding Ltd 'EMTN' 7.13% 14/02/2024 697,060 1.02

December 2021 Legal & General UCITS ETF Plc
L&G ESG GBP Corporate Bond 0-5 Year UCITS ETF
Schedule of Investments (continued)
As at 31 December 2021
391
Nominal Description
Coupon Rate
Maturity Date
Value £
% of Net
Assets
Corporate Bond (30 June 2021: 98.84%) (continued)
Jersey (30 June 2021: 4.75%) (continued)
590,000 Heathrow Funding Ltd 'REGS' 5.23% 15/02/2023 615,364 0.90
Total Jersey 3,578,398 5.21
Luxembourg (30 June 2021: –%)
200,000 Blackstone Property Partners Europe Holdings Sarl 'EMTN' 2.00% 20/10/2025 199,105 0.29
200,000 Nestle Finance International Ltd 'EMTN' 2.25% 30/11/2023 205,469 0.30
Total Luxembourg 404,574 0.59
Mexico (30 June 2021: –%)
200,000 America Movil SAB de CV 5.00% 27/10/2026 230,659 0.34
Total Mexico 230,659 0.34
Netherlands (30 June 2021: 12.49%)
100,000 ABN AMRO Bank NV 'EMTN' 1.38% 07/06/2022 100,418 0.15
300,000 ABN AMRO Bank NV 'EMTN' 1.38% 16/01/2025 300,051 0.44
470,000 BMW Finance NV 'EMTN' 0.88% 16/08/2022 470,962 0.69
180,000 BMW International Investment BV 'EMTN' 1.25% 11/07/2022 180,649 0.26
280,000 BMW International Investment BV 'EMTN' 1.88% 11/09/2023 283,837 0.41
380,000 BMW International Investment BV 'EMTN' 0.75% 08/03/2024 376,537 0.55
470,000 Cooperatieve Rabobank UA 4.00% 19/09/2022 480,877 0.70
700,000 Cooperatieve Rabobank UA 'GMTN' 2.25% 23/03/2022 702,859 1.02
300,000 Cooperatieve Rabobank UA 'GMTN' 1.25% 14/01/2025 297,903 0.43
240,000 Daimler International Finance BV 'EMTN' 2.13% 07/06/2022 241,626 0.35
400,000 Daimler International Finance BV 'EMTN' 2.00% 04/09/2023 405,167 0.59
320,000 Deutsche Telekom International Finance BV 'EMTN' 1.25% 06/10/2023 320,884 0.47
420,000 Deutsche Telekom International Finance BV 'EMTN' 2.50% 10/10/2025 437,658 0.64
700,000 ING Groep NV 'EMTN' 3.00% 18/02/2026 737,630 1.07
300,000 Siemens Financieringsmaatschappij NV 'EMTN' 0.88% 05/06/2023 299,784 0.44
500,000 Siemens Financieringsmaatschappij NV 'EMTN' 1.00% 20/02/2025 496,998 0.72
300,000 Siemens Financieringsmaatschappij NV 'EMTN' 2.75% 10/09/2025 316,484 0.46
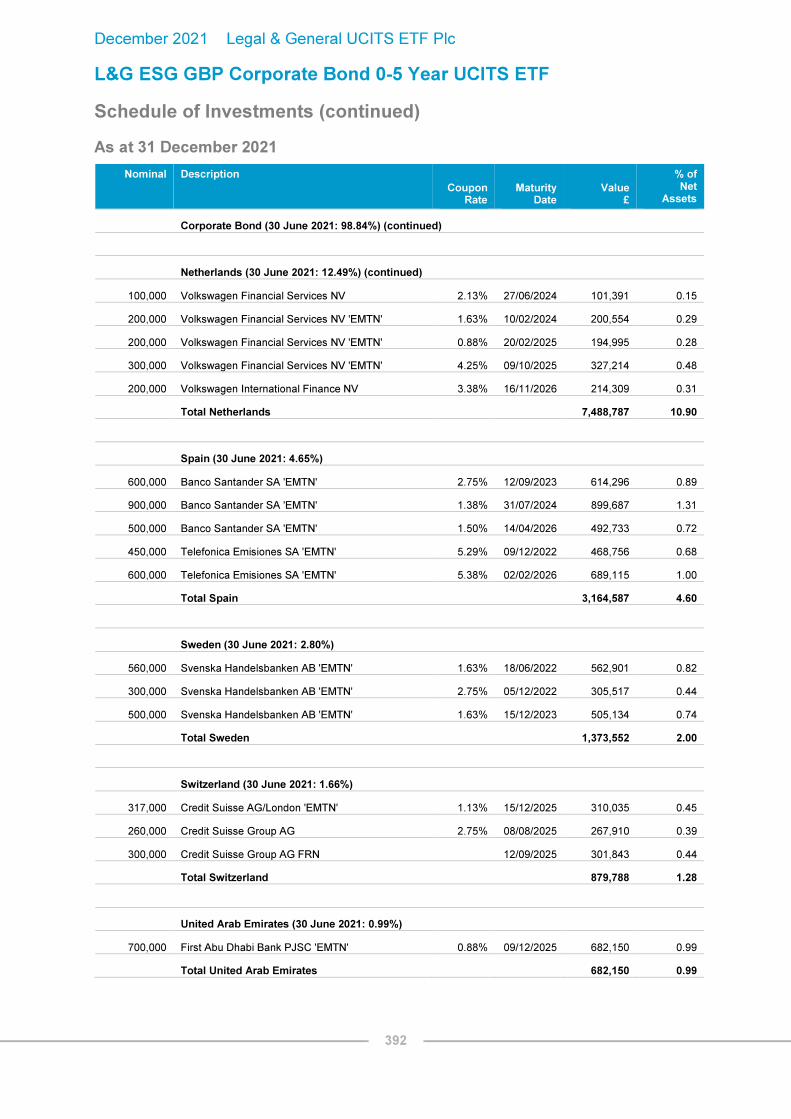
December 2021 Legal & General UCITS ETF Plc
L&G ESG GBP Corporate Bond 0-5 Year UCITS ETF
Schedule of Investments (continued)
As at 31 December 2021
392
Nominal Description
Coupon Rate
Maturity Date
Value £
% of Net
Assets
Corporate Bond (30 June 2021: 98.84%) (continued)
Netherlands (30 June 2021: 12.49%) (continued)
100,000 Volkswagen Financial Services NV 2.13% 27/06/2024 101,391 0.15
200,000 Volkswagen Financial Services NV 'EMTN' 1.63% 10/02/2024 200,554 0.29
200,000 Volkswagen Financial Services NV 'EMTN' 0.88% 20/02/2025 194,995 0.28
300,000 Volkswagen Financial Services NV 'EMTN' 4.25% 09/10/2025 327,214 0.48
200,000 Volkswagen International Finance NV 3.38% 16/11/2026 214,309 0.31
Total Netherlands 7,488,787 10.90
Spain (30 June 2021: 4.65%)
600,000 Banco Santander SA 'EMTN' 2.75% 12/09/2023 614,296 0.89
900,000 Banco Santander SA 'EMTN' 1.38% 31/07/2024 899,687 1.31
500,000 Banco Santander SA 'EMTN' 1.50% 14/04/2026 492,733 0.72
450,000 Telefonica Emisiones SA 'EMTN' 5.29% 09/12/2022 468,756 0.68
600,000 Telefonica Emisiones SA 'EMTN' 5.38% 02/02/2026 689,115 1.00
Total Spain 3,164,587 4.60
Sweden (30 June 2021: 2.80%)
560,000 Svenska Handelsbanken AB 'EMTN' 1.63% 18/06/2022 562,901 0.82
300,000 Svenska Handelsbanken AB 'EMTN' 2.75% 05/12/2022 305,517 0.44
500,000 Svenska Handelsbanken AB 'EMTN' 1.63% 15/12/2023 505,134 0.74
Total Sweden 1,373,552 2.00
Switzerland (30 June 2021: 1.66%)
317,000 Credit Suisse AG/London 'EMTN' 1.13% 15/12/2025 310,035 0.45
260,000 Credit Suisse Group AG 2.75% 08/08/2025 267,910 0.39
300,000 Credit Suisse Group AG FRN 12/09/2025 301,843 0.44
Total Switzerland 879,788 1.28
United Arab Emirates (30 June 2021: 0.99%)
700,000 First Abu Dhabi Bank PJSC 'EMTN' 0.88% 09/12/2025 682,150 0.99
Total United Arab Emirates 682,150 0.99

December 2021 Legal & General UCITS ETF Plc
L&G ESG GBP Corporate Bond 0-5 Year UCITS ETF
Schedule of Investments (continued)
As at 31 December 2021
393
Nominal Description
Coupon Rate
Maturity Date
Value £
% of Net
Assets
Corporate Bond (30 June 2021: 98.84%) (continued)
United Kingdom (30 June 2021: 35.62%)
500,000 Annington Funding Plc 'EMTN' 2.65% 12/07/2025 516,184 0.75
460,000 Barclays Plc 'EMTN' 3.13% 17/01/2024 474,552 0.69
500,000 Barclays Plc 'EMTN' 3.00% 08/05/2026 521,566 0.76
1,030,000 Barclays Plc FRN 06/10/2023 1,040,397 1.51
300,000 Barclays Plc FRN 03/11/2026 298,487 0.43
400,000 BUPA Finance Plc 2.00% 05/04/2024 406,572 0.59
300,000 BUPA Finance Plc 5.00% 08/12/2026 339,544 0.49
220,000 Coventry Building Society 'EMTN' 5.88% 28/09/2022 228,081 0.33
570,000 Coventry Building Society 'EMTN' 1.50% 23/01/2023 572,363 0.83
360,000 Coventry Building Society 'EMTN' 1.88% 24/10/2023 364,448 0.53
280,000 Coventry Building Society 'EMTN' 1.00% 21/09/2025 275,106 0.40
300,000 Diageo Finance Plc 'EMTN' 1.75% 12/10/2026 306,989 0.45
310,000 Eastern Power Networks Plc 'EMTN' 5.75% 08/03/2024 340,003 0.50
350,000 Electricity North West Ltd 8.88% 25/03/2026 455,053 0.66
330,000 Experian Finance Plc 'EMTN' 2.13% 27/09/2024 336,376 0.49
530,000 Experian Finance Plc 'EMTN' 0.74% 29/10/2025 517,196 0.75
400,000 Friends Life Holdings Plc 8.25% 21/04/2022 408,716 0.60
240,000 HSBC Bank Plc 'EMTN' 6.50% 07/07/2023 257,899 0.38
517,000 HSBC Holdings Plc 'EMTN' 6.50% 20/05/2024 576,964 0.84
760,000 HSBC Holdings Plc FRN 27/06/2023 765,197 1.11
200,000 HSBC Holdings Plc FRN 13/11/2026 202,372 0.29
309,000 InterContinental Hotels Group Plc 'EMTN' 2.13% 24/08/2026 308,902 0.45
300,000 Land Securities Capital Markets Plc 'EMTN' 1.97% 08/02/2024 304,526 0.44
280,000 Lloyds Bank Corporate Markets Plc 'EMTN' 1.50% 23/06/2023 281,961 0.41
330,000 Lloyds Bank Corporate Markets Plc 'EMTN' 1.75% 11/07/2024 333,133 0.49
410,000 Lloyds Bank Plc 'EMTN' 7.50% 15/04/2024 466,573 0.68
700,000 Lloyds Bank Plc 'EMTN' 7.63% 22/04/2025 830,879 1.21
650,000 Lloyds Banking Group Plc 'EMTN' 2.25% 16/10/2024 662,854 0.97
400,000 Lloyds Banking Group Plc FRN 15/01/2026 403,181 0.59

December 2021 Legal & General UCITS ETF Plc
L&G ESG GBP Corporate Bond 0-5 Year UCITS ETF
Schedule of Investments (continued)
As at 31 December 2021
394
Nominal Description
Coupon Rate
Maturity Date
Value £
% of Net
Assets
Corporate Bond (30 June 2021: 98.84%) (continued)
United Kingdom (30 June 2021: 35.62%) (continued)
200,000 London & Quadrant Housing Trust 2.63% 05/05/2026 210,276 0.31
200,000 Manchester Airport Group Funding Plc 'EMTN' 4.13% 02/04/2024 211,440 0.31
200,000 National Grid Electricity Transmission Plc 'EMTN' 1.38% 16/09/2026 198,340 0.29
480,000 Nationwide Building Society 1.00% 24/01/2023 480,065 0.70
400,000 NatWest Group Plc 'EMTN' FRN 19/09/2026 414,722 0.60
270,000 Northumbrian Water Finance Plc 6.88% 06/02/2023 286,581 0.42
425,000 Pension Insurance Corp Plc 6.50% 03/07/2024 471,321 0.69
410,000 Phoenix Group Holdings Plc 6.63% 18/12/2025 475,749 0.69
650,000 Phoenix Group Holdings Plc 'EMTN' 4.13% 20/07/2022 660,707 0.96
813,000 RAC Bond Co Plc 'EMTN' 4.87% 06/05/2026 878,465 1.28
564,000 Rothesay Life Plc 3.38% 12/07/2026 589,928 0.86
600,000 Santander UK Group Holdings Plc 'EMTN' 3.63% 14/01/2026 642,505 0.94
600,000 Santander UK Group Holdings Plc 'EMTN' FRN 08/05/2026 620,660 0.90
720,000 Scottish Widows Ltd 5.50% 16/06/2023 759,371 1.11
300,000 Severn Trent Utilities Finance Plc 6.13% 26/02/2024 331,293 0.48
480,000 Severn Trent Utilities Finance Plc 'EMTN' 3.63% 16/01/2026 522,808 0.76
200,000 Southern Gas Networks Plc 'EMTN' 4.88% 05/10/2023 212,428 0.31
200,000 Southern Gas Networks Plc 'EMTN' 2.50% 03/02/2025 206,933 0.30
210,000 Tesco Corporate Treasury Services Plc 'EMTN' 2.50% 02/05/2025 216,110 0.31
757,000 Thames Water Utilities Finance Plc 'EMTN' 4.00% 19/06/2025 822,791 1.20
470,000 United Utilities Water Finance Plc 'EMTN' 2.00% 14/02/2025 480,394 0.70
500,000 Virgin Money UK Plc 'EMTN' FRN 25/09/2026 530,700 0.77
100,000 Virgin Money UK Plc 'EMTN' FRN 19/08/2031 98,953 0.14
300,000 Virgin Money UK Plc 'GMTN' FRN 22/06/2025 308,667 0.45
300,000 Virgin Money UK Plc 'GMTN' FRN 24/04/2026 310,106 0.45
400,000 Western Power Distribution Plc 3.63% 06/11/2023 416,475 0.61
300,000 Western Power Distribution Plc 3.50% 16/10/2026 324,044 0.47
300,000 Western Power Distribution West Midlands Plc 'EMTN' 3.88% 17/10/2024 318,398 0.46
280,000 Whitbread Group Plc 3.38% 16/10/2025 290,451 0.42
Total United Kingdom 25,086,755 36.51
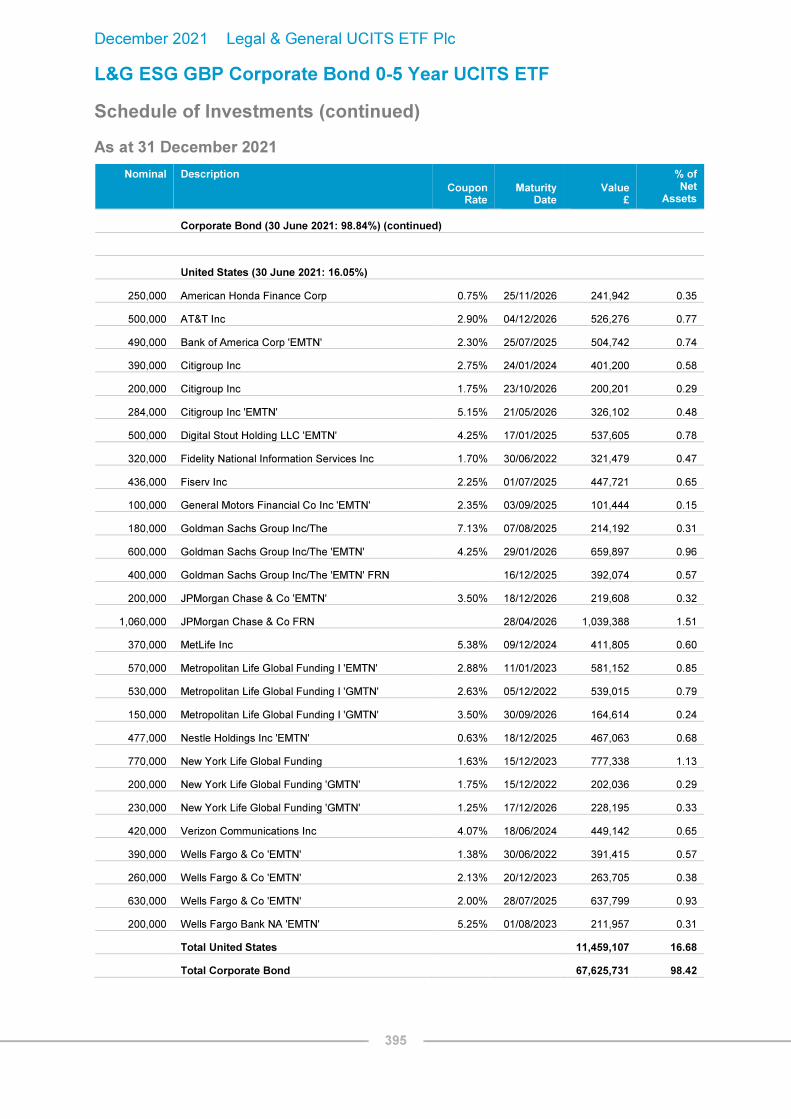
December 2021 Legal & General UCITS ETF Plc
L&G ESG GBP Corporate Bond 0-5 Year UCITS ETF
Schedule of Investments (continued)
As at 31 December 2021
395
Nominal Description
Coupon Rate
Maturity Date
Value £
% of Net
Assets
Corporate Bond (30 June 2021: 98.84%) (continued)
United States (30 June 2021: 16.05%)
250,000 American Honda Finance Corp 0.75% 25/11/2026 241,942 0.35
500,000 AT&T Inc 2.90% 04/12/2026 526,276 0.77
490,000 Bank of America Corp 'EMTN' 2.30% 25/07/2025 504,742 0.74
390,000 Citigroup Inc 2.75% 24/01/2024 401,200 0.58
200,000 Citigroup Inc 1.75% 23/10/2026 200,201 0.29
284,000 Citigroup Inc 'EMTN' 5.15% 21/05/2026 326,102 0.48
500,000 Digital Stout Holding LLC 'EMTN' 4.25% 17/01/2025 537,605 0.78
320,000 Fidelity National Information Services Inc 1.70% 30/06/2022 321,479 0.47
436,000 Fiserv Inc 2.25% 01/07/2025 447,721 0.65
100,000 General Motors Financial Co Inc 'EMTN' 2.35% 03/09/2025 101,444 0.15
180,000 Goldman Sachs Group Inc/The 7.13% 07/08/2025 214,192 0.31
600,000 Goldman Sachs Group Inc/The 'EMTN' 4.25% 29/01/2026 659,897 0.96
400,000 Goldman Sachs Group Inc/The 'EMTN' FRN 16/12/2025 392,074 0.57
200,000 JPMorgan Chase & Co 'EMTN' 3.50% 18/12/2026 219,608 0.32
1,060,000 JPMorgan Chase & Co FRN 28/04/2026 1,039,388 1.51
370,000 MetLife Inc 5.38% 09/12/2024 411,805 0.60
570,000 Metropolitan Life Global Funding I 'EMTN' 2.88% 11/01/2023 581,152 0.85
530,000 Metropolitan Life Global Funding I 'GMTN' 2.63% 05/12/2022 539,015 0.79
150,000 Metropolitan Life Global Funding I 'GMTN' 3.50% 30/09/2026 164,614 0.24
477,000 Nestle Holdings Inc 'EMTN' 0.63% 18/12/2025 467,063 0.68
770,000 New York Life Global Funding 1.63% 15/12/2023 777,338 1.13
200,000 New York Life Global Funding 'GMTN' 1.75% 15/12/2022 202,036 0.29
230,000 New York Life Global Funding 'GMTN' 1.25% 17/12/2026 228,195 0.33
420,000 Verizon Communications Inc 4.07% 18/06/2024 449,142 0.65
390,000 Wells Fargo & Co 'EMTN' 1.38% 30/06/2022 391,415 0.57
260,000 Wells Fargo & Co 'EMTN' 2.13% 20/12/2023 263,705 0.38
630,000 Wells Fargo & Co 'EMTN' 2.00% 28/07/2025 637,799 0.93
200,000 Wells Fargo Bank NA 'EMTN' 5.25% 01/08/2023 211,957 0.31
Total United States 11,459,107 16.68
Total Corporate Bond 67,625,731 98.42

December 2021 Legal & General UCITS ETF Plc
L&G ESG GBP Corporate Bond 0-5 Year UCITS ETF
Schedule of Investments (continued)
As at 31 December 2021
396
Nominal Description
Coupon Rate
Maturity Date
Value £
% of Net
Assets
Government Bond (30 June 2021: –%)
United Kingdom (30 June 2021: –%)
205,000 United Kingdom Gilt 2.75% 07/09/2024 216,146 0.31
Total United Kingdom 216,146 0.31
Total Government Bond 216,146 0.31
Total Investments
Corporate Bond 67,625,731
98.42
Government Bond 216,146
0.31
Other Assets and Liabilities* 870,079
1.27
Net Assets Attributable to Holders of Redeemable Participating Shares 68,711,956 100.00
Analysis of Total Assets
% of Total
Assets
Transferable securities admitted to an official stock exchange listing or dealt on a regulated market 97.81
Other assets
2.19
100.00
Analysis of Total Assets rather than Net Assets is required under Schedule 12 of the UCITS Regulations.
*Included within other assets are holdings in LGIM Sterling Liquidity Fund with a value of £93,336. These are shown as "Cash and cash equivalents" within the Fund's Statement of Financial Position.

December 2021 Legal & General UCITS ETF Plc
L&G ESG GBP Corporate Bond UCITS ETF
Schedule of Investments
As at 31 December 2021
397
Nominal Description
Coupon Rate
Maturity Date
Value £
% of Net
Assets
Corporate Bond (30 June 2021: 98.75%)
Australia (30 June 2021: 1.66%)
220,000 APT Pipelines Ltd 3.13% 18/07/2031 233,417 0.30
100,000 APT Pipelines Ltd 'EMTN' 4.25% 26/11/2024 107,573 0.14
150,000 APT Pipelines Ltd 'EMTN' 3.50% 22/03/2030 163,396 0.21
100,000 Macquarie Bank Ltd 'EMTN' 1.13% 15/12/2025 98,515 0.12
100,000 Macquarie Group Ltd 'EMTN' 2.13% 01/10/2031 98,990 0.12
110,000 Scentre Group Trust 1 / Scentre Group Trust 2 'EMTN' 2.38% 08/04/2022 110,031 0.14
100,000 Westfield America Management Ltd 2.13% 30/03/2025 100,364 0.13
200,000 Westfield America Management Ltd 2.63% 30/03/2029 201,309 0.25
Total Australia 1,113,595 1.41
Belgium (30 June 2021: 0.99%)
100,000 Anheuser-Busch InBev SA/NV 'EMTN' 9.75% 30/07/2024 121,357 0.15
100,000 Anheuser-Busch InBev SA/NV 'EMTN' 4.00% 24/09/2025 109,738 0.14
200,000 Anheuser-Busch InBev SA/NV 'EMTN' 2.25% 24/05/2029 206,976 0.26
200,000 Anheuser-Busch InBev SA/NV 'EMTN' 2.85% 25/05/2037 213,450 0.27
Total Belgium 651,521 0.82
Canada (30 June 2021: 0.45%)
100,000 Bank of Montreal 'EMTN' 1.50% 18/12/2024 100,153 0.13
600,000 Bank of Montreal 'EMTN' 1.00% 09/09/2026 585,044 0.74
200,000 Royal Bank of Canada 'EMTN' 1.13% 15/12/2025 197,309 0.25
Total Canada 882,506 1.12
Cayman Islands (30 June 2021: 0.76%)
140,000 Southern Water Services Finance Ltd 6.64% 31/03/2026 167,964 0.21
200,000 Southern Water Services Finance Ltd 'EMTN' 2.38% 28/05/2028 205,752 0.26
120,000 Southern Water Services Finance Ltd 'EMTN' 3.00% 28/05/2037 130,215 0.17
Total Cayman Islands 503,931 0.64

December 2021 Legal & General UCITS ETF Plc
L&G ESG GBP Corporate Bond UCITS ETF
Schedule of Investments (continued)
As at 31 December 2021
398
Nominal Description
Coupon Rate
Maturity Date
Value £
% of Net
Assets
Corporate Bond (30 June 2021: 98.75%) (continued)
Denmark (30 June 2021: 0.51%)
100,000 Orsted AS 'EMTN' 2.13% 17/05/2027 103,694 0.13
100,000 Orsted AS 'EMTN' 2.50% 16/05/2033 107,428 0.14
130,000 Orsted AS FRN 18/02/3021 127,400 0.16
Total Denmark 338,522 0.43
Finland (30 June 2021: –%)
100,000 Nordea Bank Abp 'EMTN' FRN 09/12/2032 96,215 0.12
100,000 OP Corporate Bank plc 'GMTN' 1.38% 04/09/2026 99,087 0.13
Total Finland 195,302 0.25
France (30 June 2021: 6.39%)
200,000 AXA SA 'EMTN' FRN 16/01/2054 245,558 0.31
250,000 AXA SA 'EMTN' FRN (Perpetual) 04/03/2026 282,500 0.36
100,000 AXA SA 'EMTN' FRN (Perpetual) 06/07/2026 119,750 0.15
200,000 Banque Federative du Credit Mutuel SA 1.25% 05/12/2025 198,056 0.25
100,000 Banque Federative du Credit Mutuel SA 'EMTN' 1.88% 13/12/2022 101,030 0.13
100,000 Banque Federative du Credit Mutuel SA 'EMTN' 2.25% 18/12/2023 102,034 0.13
300,000 Banque Federative du Credit Mutuel SA 'EMTN' 1.75% 19/12/2024 303,423 0.38
200,000 Banque Federative du Credit Mutuel SA 'EMTN' 1.00% 16/07/2026 195,293 0.25
200,000 Banque Federative du Credit Mutuel SA 'EMTN' 0.88% 07/12/2027 192,139 0.24
100,000 BNP Paribas SA 1.88% 14/12/2027 100,220 0.13
100,000 BNP Paribas SA 'EMTN' 1.13% 16/08/2022 100,333 0.13
200,000 BNP Paribas SA 'EMTN' 3.38% 23/01/2026 212,925 0.27
200,000 BNP Paribas SA 'EMTN' 1.25% 13/07/2031 185,821 0.24
200,000 BNP Paribas SA 'EMTN' 2.00% 13/09/2036 191,554 0.24
200,000 BNP Paribas SA 'EMTN' FRN 24/05/2031 197,132 0.25
100,000 BPCE SA 2.13% 16/12/2022 101,288 0.13
200,000 BPCE SA 5.25% 16/04/2029 239,511 0.30
100,000 BPCE SA 'EMTN' 1.00% 22/12/2025 97,997 0.12

December 2021 Legal & General UCITS ETF Plc
L&G ESG GBP Corporate Bond UCITS ETF
Schedule of Investments (continued)
As at 31 December 2021
399
Nominal Description
Coupon Rate
Maturity Date
Value £
% of Net
Assets
Corporate Bond (30 June 2021: 98.75%) (continued)
France (30 June 2021: 6.39%) (continued)
100,000 BPCE SA 'EMTN' 1.38% 23/12/2026 99,081 0.13
100,000 BPCE SA FRN 30/11/2032 99,982 0.13
100,000 Credit Agricole SA FRN 09/12/2031 97,849 0.12
100,000 Credit Agricole SA 'GMTN' 7.38% 18/12/2023 111,161 0.14
180,000 LVMH Moet Hennessy Louis Vuitton SE 'EMTN' 1.00% 14/06/2022 180,206 0.23
100,000 LVMH Moet Hennessy Louis Vuitton SE 'EMTN' 1.00% 11/02/2023 99,994 0.13
300,000 LVMH Moet Hennessy Louis Vuitton SE 'EMTN' 1.13% 11/02/2027 296,828 0.38
405,000 Orange SA 'EMTN' 8.13% 20/11/2028 572,967 0.72
300,000 Orange SA 'EMTN' 3.25% 15/01/2032 334,429 0.42
100,000 Orange SA 'EMTN' 5.63% 23/01/2034 138,078 0.17
150,000 Orange SA 'EMTN' 5.38% 22/11/2050 244,070 0.31
100,000 Orange SA 'EMTN' FRN (Perpetual) 01/04/2023 104,984 0.13
200,000 Vinci SA 'EMTN' 2.75% 15/09/2034 221,040 0.28
Total France 5,767,233 7.30
Germany (30 June 2021: 1.24%)
100,000 Deutsche Bank AG 'EMTN' 3.88% 12/02/2024 104,389 0.13
200,000 Deutsche Bank AG 'EMTN' 2.63% 16/12/2024 204,177 0.26
100,000 Deutsche Bank AG 'EMTN' FRN 22/12/2028 97,567 0.12
100,000 Deutsche Telekom AG 'EMTN' 3.13% 06/02/2034 111,941 0.14
100,000 Henkel AG & Co KGaA 1.00% 30/09/2022 100,187 0.13
200,000 Henkel AG & Co KGaA 1.25% 30/09/2026 200,590 0.25
Total Germany 818,851 1.03
Jersey (30 June 2021: 4.29%)
500,000 AA Bond Co Ltd 'EMTN' 4.88% 31/07/2024 523,947 0.66
100,000 AA Bond Co Ltd 'EMTN' 6.27% 31/07/2025 112,006 0.14
100,000 Gatwick Funding Ltd 'EMTN' 5.25% 23/01/2024 107,412 0.14
125,000 Gatwick Funding Ltd 'EMTN' 6.13% 02/03/2026 145,034 0.18
100,000 Gatwick Funding Ltd 'EMTN' 4.63% 27/03/2034 117,996 0.15

December 2021 Legal & General UCITS ETF Plc
L&G ESG GBP Corporate Bond UCITS ETF
Schedule of Investments (continued)
As at 31 December 2021
400
Nominal Description
Coupon Rate
Maturity Date
Value £
% of Net
Assets
Corporate Bond (30 June 2021: 98.75%) (continued)
Jersey (30 June 2021: 4.29%) (continued)
125,000 Gatwick Funding Ltd 'EMTN' 5.75% 23/01/2037 165,716 0.21
200,000 Gatwick Funding Ltd 'EMTN' 3.13% 28/09/2039 203,063 0.26
200,000 Gatwick Funding Ltd 'EMTN' 2.63% 07/10/2046 185,766 0.24
130,000 Gatwick Funding Ltd 'EMTN' 3.25% 26/02/2048 135,421 0.17
100,000 Heathrow Funding Ltd 2.63% 16/03/2028 99,348 0.13
230,000 Heathrow Funding Ltd 'EMTN' 7.13% 14/02/2024 254,482 0.32
200,000 Heathrow Funding Ltd 'EMTN' 6.75% 03/12/2026 243,176 0.31
200,000 Heathrow Funding Ltd 'EMTN' 2.75% 13/10/2029 204,926 0.26
260,000 Heathrow Funding Ltd 'EMTN' 5.88% 13/05/2041 373,963 0.47
225,000 Heathrow Funding Ltd 'EMTN' 4.63% 31/10/2046 293,884 0.37
200,000 Heathrow Funding Ltd 'EMTN' 2.75% 09/08/2049 196,773 0.25
200,000 Heathrow Funding Ltd 'REGS' 5.23% 15/02/2023 208,598 0.26
240,000 Heathrow Funding Ltd 'REGS' 6.45% 10/12/2031 321,563 0.41
Total Jersey 3,893,074 4.93
Luxembourg (30 June 2021: 1.14%)
200,000 Aroundtown SA 'EMTN' 3.00% 16/10/2029 208,591 0.26
210,000 Aroundtown SA 'EMTN' 3.63% 10/04/2031 228,446 0.29
110,000 Aroundtown SA 'EMTN' FRN (Perpetual) 25/06/2024 114,558 0.15
100,000 Blackstone Property Partners Europe Holdings Sarl 'EMTN' 2.00% 20/10/2025 99,553 0.13
120,000 Blackstone Property Partners Europe Holdings Sarl 'EMTN' 2.63% 20/10/2028 120,733 0.15
200,000 CK Hutchison Group Telecom Finance SA 2.00% 17/10/2027 199,747 0.25
Total Luxembourg 971,628 1.23
Mexico (30 June 2021: 0.56%)
100,000 America Movil SAB de CV 5.00% 27/10/2026 115,330 0.15
60,000 America Movil SAB de CV 5.75% 28/06/2030 77,316 0.10
100,000 America Movil SAB de CV 4.38% 07/08/2041 129,157 0.16
200,000 America Movil SAB de CV 'EMTN' 4.95% 22/07/2033 255,807 0.32
Total Mexico 577,610 0.73
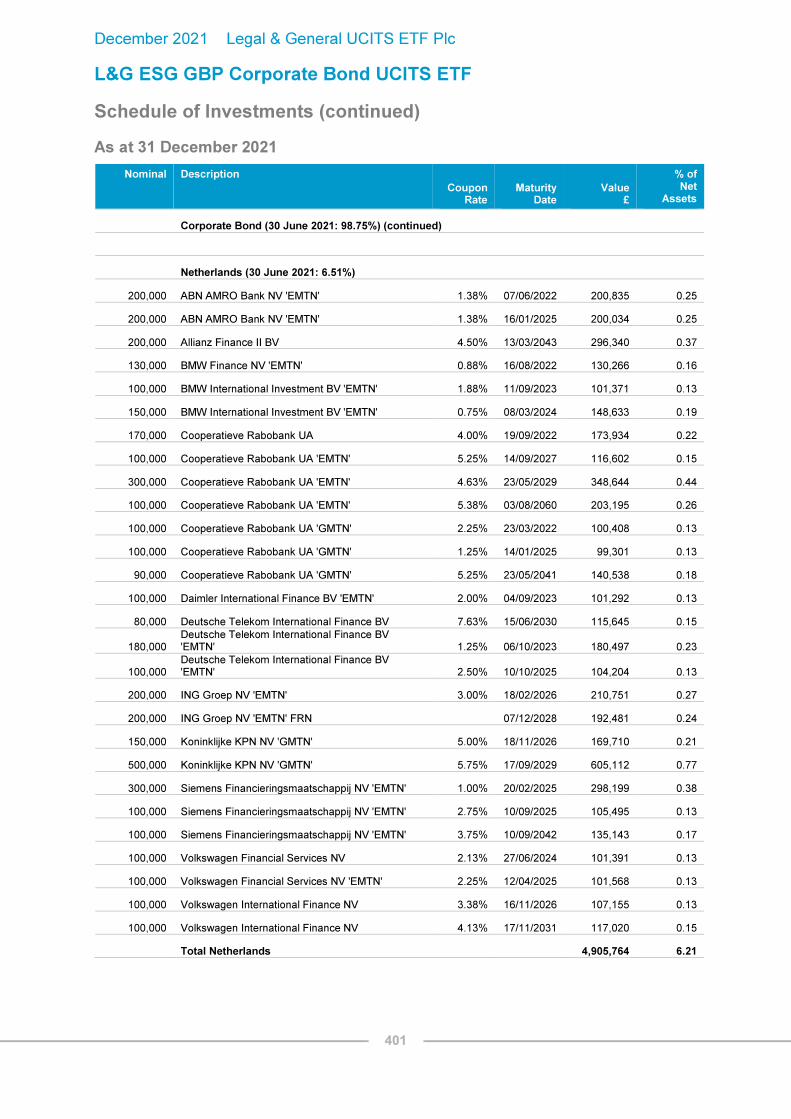
December 2021 Legal & General UCITS ETF Plc
L&G ESG GBP Corporate Bond UCITS ETF
Schedule of Investments (continued)
As at 31 December 2021
401
Nominal Description
Coupon Rate
Maturity Date
Value £
% of Net
Assets
Corporate Bond (30 June 2021: 98.75%) (continued)
Netherlands (30 June 2021: 6.51%)
200,000 ABN AMRO Bank NV 'EMTN' 1.38% 07/06/2022 200,835 0.25
200,000 ABN AMRO Bank NV 'EMTN' 1.38% 16/01/2025 200,034 0.25
200,000 Allianz Finance II BV 4.50% 13/03/2043 296,340 0.37
130,000 BMW Finance NV 'EMTN' 0.88% 16/08/2022 130,266 0.16
100,000 BMW International Investment BV 'EMTN' 1.88% 11/09/2023 101,371 0.13
150,000 BMW International Investment BV 'EMTN' 0.75% 08/03/2024 148,633 0.19
170,000 Cooperatieve Rabobank UA 4.00% 19/09/2022 173,934 0.22
100,000 Cooperatieve Rabobank UA 'EMTN' 5.25% 14/09/2027 116,602 0.15
300,000 Cooperatieve Rabobank UA 'EMTN' 4.63% 23/05/2029 348,644 0.44
100,000 Cooperatieve Rabobank UA 'EMTN' 5.38% 03/08/2060 203,195 0.26
100,000 Cooperatieve Rabobank UA 'GMTN' 2.25% 23/03/2022 100,408 0.13
100,000 Cooperatieve Rabobank UA 'GMTN' 1.25% 14/01/2025 99,301 0.13
90,000 Cooperatieve Rabobank UA 'GMTN' 5.25% 23/05/2041 140,538 0.18
100,000 Daimler International Finance BV 'EMTN' 2.00% 04/09/2023 101,292 0.13
80,000 Deutsche Telekom International Finance BV 7.63% 15/06/2030 115,645 0.15
180,000 Deutsche Telekom International Finance BV 'EMTN' 1.25% 06/10/2023 180,497 0.23
100,000 Deutsche Telekom International Finance BV 'EMTN' 2.50% 10/10/2025 104,204 0.13
200,000 ING Groep NV 'EMTN' 3.00% 18/02/2026 210,751 0.27
200,000 ING Groep NV 'EMTN' FRN 07/12/2028 192,481 0.24
150,000 Koninklijke KPN NV 'GMTN' 5.00% 18/11/2026 169,710 0.21
500,000 Koninklijke KPN NV 'GMTN' 5.75% 17/09/2029 605,112 0.77
300,000 Siemens Financieringsmaatschappij NV 'EMTN' 1.00% 20/02/2025 298,199 0.38
100,000 Siemens Financieringsmaatschappij NV 'EMTN' 2.75% 10/09/2025 105,495 0.13
100,000 Siemens Financieringsmaatschappij NV 'EMTN' 3.75% 10/09/2042 135,143 0.17
100,000 Volkswagen Financial Services NV 2.13% 27/06/2024 101,391 0.13
100,000 Volkswagen Financial Services NV 'EMTN' 2.25% 12/04/2025 101,568 0.13
100,000 Volkswagen International Finance NV 3.38% 16/11/2026 107,155 0.13
100,000 Volkswagen International Finance NV 4.13% 17/11/2031 117,020 0.15
Total Netherlands 4,905,764 6.21

December 2021 Legal & General UCITS ETF Plc
L&G ESG GBP Corporate Bond UCITS ETF
Schedule of Investments (continued)
As at 31 December 2021
402
Nominal Description
Coupon Rate
Maturity Date
Value £
% of Net
Assets
Corporate Bond (30 June 2021: 98.75%) (continued)
Norway (30 June 2021: 0.48%)
220,000 Equinor ASA 'EMTN' 6.88% 11/03/2031 316,568 0.40
Total Norway 316,568 0.40
Spain (30 June 2021: 1.91%)
200,000 Banco Santander SA 'EMTN' 2.75% 12/09/2023 204,765 0.26
100,000 Banco Santander SA 'EMTN' 1.38% 31/07/2024 99,965 0.13
300,000 Banco Santander SA 'EMTN' 1.50% 14/04/2026 295,640 0.37
200,000 Banco Santander SA 'EMTN' 1.75% 17/02/2027 198,357 0.25
200,000 Banco Santander SA 'EMTN' FRN 04/10/2032 196,858 0.25
150,000 Telefonica Emisiones SA 'EMTN' 5.29% 09/12/2022 156,252 0.20
100,000 Telefonica Emisiones SA 'EMTN' 5.38% 02/02/2026 114,853 0.14
150,000 Telefonica Emisiones SA 'EMTN' 5.45% 08/10/2029 187,192 0.24
Total Spain 1,453,882 1.84
Sweden (30 June 2021: 0.50%)
130,000 Svenska Handelsbanken AB 'EMTN' 1.63% 18/06/2022 130,673 0.16
100,000 Svenska Handelsbanken AB 'EMTN' 2.75% 05/12/2022 101,839 0.13
100,000 Svenska Handelsbanken AB 'EMTN' 1.63% 15/12/2023 101,027 0.13
Total Sweden 333,539 0.42
Switzerland (30 June 2021: 0.62%)
211,000 Credit Suisse AG/London 'EMTN' 1.13% 15/12/2025 206,364 0.26
100,000 Credit Suisse Group AG 'EMTN' FRN 09/06/2028 100,141 0.13
200,000 Credit Suisse Group AG FRN 12/09/2025 201,229 0.25
Total Switzerland
507,734 0.64
United Arab Emirates (30 June 2021: 0.29%)
300,000 First Abu Dhabi Bank PJSC 'EMTN' 0.88% 09/12/2025 292,350 0.37
Total United Arab Emirates 292,350 0.37
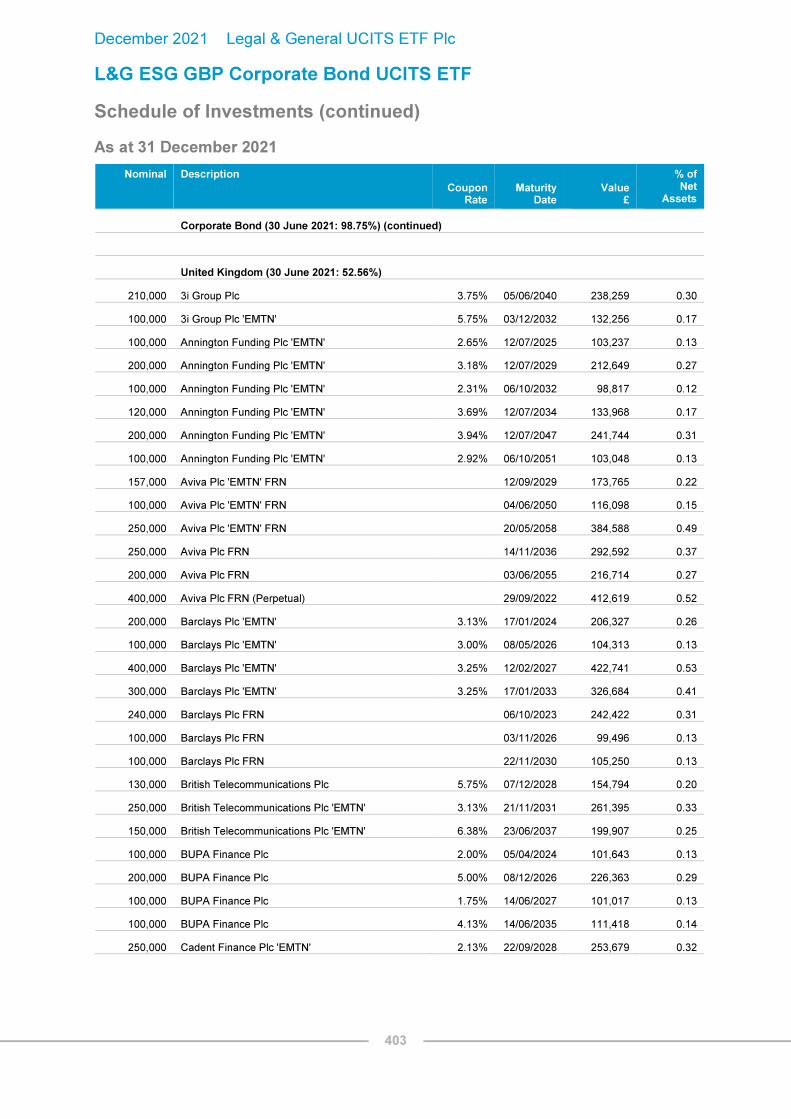
December 2021 Legal & General UCITS ETF Plc
L&G ESG GBP Corporate Bond UCITS ETF
Schedule of Investments (continued)
As at 31 December 2021
403
Nominal Description
Coupon Rate
Maturity Date
Value £
% of Net
Assets
Corporate Bond (30 June 2021: 98.75%) (continued)
United Kingdom (30 June 2021: 52.56%)
210,000 3i Group Plc 3.75% 05/06/2040 238,259 0.30
100,000 3i Group Plc 'EMTN' 5.75% 03/12/2032 132,256 0.17
100,000 Annington Funding Plc 'EMTN' 2.65% 12/07/2025 103,237 0.13
200,000 Annington Funding Plc 'EMTN' 3.18% 12/07/2029 212,649 0.27
100,000 Annington Funding Plc 'EMTN' 2.31% 06/10/2032 98,817 0.12
120,000 Annington Funding Plc 'EMTN' 3.69% 12/07/2034 133,968 0.17
200,000 Annington Funding Plc 'EMTN' 3.94% 12/07/2047 241,744 0.31
100,000 Annington Funding Plc 'EMTN' 2.92% 06/10/2051 103,048 0.13
157,000 Aviva Plc 'EMTN' FRN 12/09/2029 173,765 0.22
100,000 Aviva Plc 'EMTN' FRN 04/06/2050 116,098 0.15
250,000 Aviva Plc 'EMTN' FRN 20/05/2058 384,588 0.49
250,000 Aviva Plc FRN 14/11/2036 292,592 0.37
200,000 Aviva Plc FRN 03/06/2055 216,714 0.27
400,000 Aviva Plc FRN (Perpetual) 29/09/2022 412,619 0.52
200,000 Barclays Plc 'EMTN' 3.13% 17/01/2024 206,327 0.26
100,000 Barclays Plc 'EMTN' 3.00% 08/05/2026 104,313 0.13
400,000 Barclays Plc 'EMTN' 3.25% 12/02/2027 422,741 0.53
300,000 Barclays Plc 'EMTN' 3.25% 17/01/2033 326,684 0.41
240,000 Barclays Plc FRN 06/10/2023 242,422 0.31
100,000 Barclays Plc FRN 03/11/2026 99,496 0.13
100,000 Barclays Plc FRN 22/11/2030 105,250 0.13
130,000 British Telecommunications Plc 5.75% 07/12/2028 154,794 0.20
250,000 British Telecommunications Plc 'EMTN' 3.13% 21/11/2031 261,395 0.33
150,000 British Telecommunications Plc 'EMTN' 6.38% 23/06/2037 199,907 0.25
100,000 BUPA Finance Plc 2.00% 05/04/2024 101,643 0.13
200,000 BUPA Finance Plc 5.00% 08/12/2026 226,363 0.29
100,000 BUPA Finance Plc 1.75% 14/06/2027 101,017 0.13
100,000 BUPA Finance Plc 4.13% 14/06/2035 111,418 0.14
250,000 Cadent Finance Plc 'EMTN' 2.13% 22/09/2028 253,679 0.32

December 2021 Legal & General UCITS ETF Plc
L&G ESG GBP Corporate Bond UCITS ETF
Schedule of Investments (continued)
As at 31 December 2021
404
Nominal Description
Coupon Rate
Maturity Date
Value £
% of Net
Assets
Corporate Bond (30 June 2021: 98.75%) (continued)
United Kingdom (30 June 2021: 52.56%) (continued)
200,000 Cadent Finance Plc 'EMTN' 2.25% 10/10/2035 194,996 0.25
150,000 Cadent Finance Plc 'EMTN' 2.63% 22/09/2038 152,316 0.19
150,000 Cadent Finance Plc 'EMTN' 3.13% 21/03/2040 161,719 0.20
210,000 Cadent Finance Plc 'EMTN' 2.75% 22/09/2046 215,392 0.27
150,000 Centrica Plc 'EMTN' 4.38% 13/03/2029 173,514 0.22
591,000 Centrica Plc 'EMTN' 7.00% 19/09/2033 868,183 1.10
200,000 Centrica Plc 'EMTN' 4.25% 12/09/2044 251,408 0.32
100,000 Clarion Funding Plc 'EMTN' 2.63% 18/01/2029 106,790 0.14
120,000 Clarion Funding Plc 'EMTN' 1.25% 13/11/2032 113,784 0.14
130,000 Clarion Funding Plc 'EMTN' 1.88% 22/01/2035 128,789 0.16
336,000 Clarion Funding Plc 'EMTN' 3.13% 19/04/2048 405,673 0.51
312,219 Connect Plus M25 Issuer Plc 2.61% 31/03/2039 340,374 0.43
100,000 Coventry Building Society 'EMTN' 1.50% 23/01/2023 100,415 0.13
200,000 Coventry Building Society 'EMTN' 1.88% 24/10/2023 202,471 0.26
170,000 Coventry Building Society 'EMTN' 1.00% 21/09/2025 167,029 0.21
100,000 Diageo Finance Plc 2.88% 27/03/2029 110,008 0.14
100,000 Diageo Finance Plc 'EMTN' 1.75% 12/10/2026 102,330 0.13
100,000 Diageo Finance Plc 'EMTN' 1.25% 28/03/2033 95,641 0.12
50,000 Eastern Power Networks Plc 'EMTN' 5.75% 08/03/2024 54,839 0.07
200,000 Eastern Power Networks Plc 'EMTN' 1.88% 01/06/2035 195,891 0.25
100,000 Eastern Power Networks Plc 'EMTN' 6.25% 12/11/2036 153,647 0.19
100,000 Electricity North West Ltd 8.88% 25/03/2026 130,015 0.16
100,000 ENW Finance Plc 1.42% 30/07/2030 96,473 0.12
96,429 Eversholt Funding Plc 'EMTN' 6.70% 22/02/2035 122,854 0.16
204,615 Eversholt Funding Plc 'EMTN' 2.74% 30/06/2040 211,993 0.27
100,000 Eversholt Funding Plc 'EMTN' 3.53% 07/08/2042 111,692 0.14
110,000 Experian Finance Plc 'EMTN' 2.13% 27/09/2024 112,125 0.14
100,000 Experian Finance Plc 'EMTN' 0.74% 29/10/2025 97,584 0.12
210,000 Experian Finance Plc 'EMTN' 3.25% 07/04/2032 234,714 0.30
130,000 GlaxoSmithKline Capital Plc 'EMTN' 3.38% 20/12/2027 144,166 0.18

December 2021 Legal & General UCITS ETF Plc
L&G ESG GBP Corporate Bond UCITS ETF
Schedule of Investments (continued)
As at 31 December 2021
405
Nominal Description
Coupon Rate
Maturity Date
Value £
% of Net
Assets
Corporate Bond (30 June 2021: 98.75%) (continued)
United Kingdom (30 June 2021: 52.56%) (continued)
120,000 GlaxoSmithKline Capital Plc 'EMTN' 1.25% 12/10/2028 118,271 0.15
235,000 GlaxoSmithKline Capital Plc 'EMTN' 5.25% 19/12/2033 321,607 0.41
200,000 GlaxoSmithKline Capital Plc 'EMTN' 1.63% 12/05/2035 192,519 0.24
150,000 GlaxoSmithKline Capital Plc 'EMTN' 6.38% 09/03/2039 245,801 0.31
300,000 GlaxoSmithKline Capital Plc 'EMTN' 5.25% 10/04/2042 461,485 0.58
100,000 GlaxoSmithKline Capital Plc 'EMTN' 4.25% 18/12/2045 141,662 0.18
120,000 HSBC Bank Plc 'EMTN' 6.50% 07/07/2023 128,949 0.16
230,000 HSBC Bank Plc 'EMTN' 5.38% 22/08/2033 300,107 0.38
360,000 HSBC Bank Plc 'EMTN' 4.75% 24/03/2046 481,768 0.61
300,000 HSBC Holdings Plc 2.63% 16/08/2028 310,364 0.39
250,000 HSBC Holdings Plc 6.75% 11/09/2028 315,520 0.40
200,000 HSBC Holdings Plc 'EMTN' 6.50% 20/05/2024 223,197 0.28
200,000 HSBC Holdings Plc 'EMTN' 5.75% 20/12/2027 235,967 0.30
150,000 HSBC Holdings Plc 'EMTN' 7.00% 07/04/2038 223,450 0.28
200,000 HSBC Holdings Plc 'EMTN' 6.00% 29/03/2040 277,622 0.35
210,000 HSBC Holdings Plc FRN 27/06/2023 211,436 0.27
200,000 HSBC Holdings Plc FRN 13/11/2026 202,372 0.26
210,000 HSBC Holdings Plc FRN 24/07/2027 207,462 0.26
200,000 HSBC Holdings Plc FRN 22/07/2028 209,083 0.26
100,000 HSBC Holdings Plc FRN 29/05/2030 105,250 0.13
100,000 Hyde Housing Association Ltd 1.75% 18/08/2055 93,256 0.12
100,000 InterContinental Hotels Group Plc 'EMTN' 2.13% 24/08/2026 99,968 0.13
100,000 InterContinental Hotels Group Plc 'EMTN' 3.38% 08/10/2028 105,100 0.13
100,000 Land Securities Capital Markets Plc 'EMTN' 1.97% 08/02/2024 101,509 0.13
130,000 Land Securities Capital Markets Plc 'EMTN' 2.38% 29/03/2027 135,064 0.17
100,000 Land Securities Capital Markets Plc 'EMTN' 2.40% 08/02/2029 104,627 0.13
110,000 Land Securities Capital Markets Plc 'EMTN' 2.63% 22/09/2037 118,287 0.15
300,000 Land Securities Capital Markets Plc 'EMTN' 2.75% 22/09/2057 352,415 0.45
204,000 Legal & General Finance Plc 'EMTN' 5.88% 11/12/2031 280,751 0.36

December 2021 Legal & General UCITS ETF Plc
L&G ESG GBP Corporate Bond UCITS ETF
Schedule of Investments (continued)
As at 31 December 2021
406
Nominal Description
Coupon Rate
Maturity Date
Value £
% of Net
Assets
Corporate Bond (30 June 2021: 98.75%) (continued)
United Kingdom (30 June 2021: 52.56%) (continued)
100,000 Legal & General Group Plc 'EMTN' FRN 27/06/2064 128,325 0.16
200,000 Legal & General Group Plc FRN 14/11/2048 228,704 0.29
400,000 Legal & General Group Plc FRN 01/11/2050 442,304 0.56
100,000 Lloyds Bank Corporate Markets Plc 'EMTN' 1.50% 23/06/2023 100,700 0.13
200,000 Lloyds Bank Plc 'EMTN' 7.50% 15/04/2024 227,596 0.29
240,000 Lloyds Bank Plc 'EMTN' 7.63% 22/04/2025 284,873 0.36
180,000 Lloyds Bank Plc 'EMTN' 6.50% 17/09/2040 302,178 0.38
300,000 Lloyds Banking Group Plc 'EMTN' 2.25% 16/10/2024 305,932 0.39
200,000 Lloyds Banking Group Plc FRN 15/01/2026 201,591 0.26
140,000 Lloyds Banking Group Plc FRN 15/12/2031 137,836 0.17
350,000 Lloyds Banking Group Plc FRN 03/12/2035 349,384 0.44
100,000 London & Quadrant Housing Trust 2.63% 05/05/2026 105,138 0.13
110,000 London & Quadrant Housing Trust 5.50% 27/01/2040 165,653 0.21
100,000 London Power Networks Plc 'EMTN' 6.13% 07/06/2027 124,011 0.16
200,000 M&G Plc 'EMTN' FRN 20/07/2055 233,378 0.30
150,000 M&G Plc 'EMTN' FRN 19/12/2063 189,737 0.24
100,000 M&G Plc FRN 20/07/2024 103,665 0.13
260,000 M&G Plc FRN 20/10/2051 300,827 0.38
400,000 M&G Plc FRN 20/10/2068 510,174 0.65
100,000 Manchester Airport Group Funding Plc 'EMTN' 4.13% 02/04/2024 105,720 0.13
200,000 Manchester Airport Group Funding Plc 'EMTN' 4.75% 31/03/2034 243,160 0.31
100,000 Manchester Airport Group Funding Plc 'EMTN' 2.88% 30/09/2044 99,369 0.13
100,000 Martlet Homes Ltd 3.00% 09/05/2052 120,822 0.15
200,000 National Grid Electricity Transmission Plc 'EMTN' 4.00% 08/06/2027 223,781 0.28
220,000 National Grid Electricity Transmission Plc 'EMTN' 1.13% 07/07/2028 211,614 0.27
200,000 National Grid Electricity Transmission Plc 'EMTN' 2.00% 17/04/2040 193,236 0.24
100,000 Nationwide Building Society 1.00% 24/01/2023 100,014 0.13
110,000 Nationwide Building Society 'EMTN' 3.25% 20/01/2028 121,294 0.15
150,000 NatWest Group Plc 'EMTN' FRN 19/09/2026 155,521 0.20

December 2021 Legal & General UCITS ETF Plc
L&G ESG GBP Corporate Bond UCITS ETF
Schedule of Investments (continued)
As at 31 December 2021
407
Nominal Description
Coupon Rate
Maturity Date
Value £
% of Net
Assets
Corporate Bond (30 June 2021: 98.75%) (continued)
United Kingdom (30 June 2021: 52.56%) (continued)
150,000 NatWest Group Plc 'EMTN' FRN 28/03/2027 157,511 0.20
300,000 NatWest Group Plc 'EMTN' FRN 28/11/2031 295,253 0.37
300,000 NatWest Group Plc FRN 14/08/2030 312,390 0.40
100,000 NatWest Group Plc FRN 09/11/2028 100,534 0.13
50,000 Northumbrian Water Finance Plc 6.88% 06/02/2023 53,071 0.07
100,000 Northumbrian Water Finance Plc 1.63% 11/10/2026 100,783 0.13
30,000 Northumbrian Water Finance Plc 5.63% 29/04/2033 41,240 0.05
100,000 Northumbrian Water Finance Plc 5.13% 23/01/2042 148,138 0.19
100,000 Notting Hill Genesis 3.75% 20/12/2032 118,201 0.15
100,000 Notting Hill Genesis 5.25% 07/07/2042 150,458 0.19
250,000 Notting Hill Genesis 3.25% 12/10/2048 303,743 0.38
100,000 Peabody Capital No 2 Plc 4.63% 12/12/2053 156,898 0.20
100,000 Pension Insurance Corp Plc 6.50% 03/07/2024 110,899 0.14
300,000 Pension Insurance Corp Plc 5.63% 20/09/2030 356,906 0.45
200,000 Pension Insurance Corp Plc 3.63% 21/10/2032 204,447 0.26
100,000 Phoenix Group Holdings Plc 6.63% 18/12/2025 116,036 0.15
210,000 Phoenix Group Holdings Plc 5.87% 13/06/2029 250,883 0.32
100,000 Phoenix Group Holdings Plc 'EMTN' 4.13% 20/07/2022 101,647 0.13
200,000 Phoenix Group Holdings Plc 'EMTN' 5.63% 28/04/2031 236,460 0.30
200,000 Phoenix Group Holdings Plc FRN (Perpetual) 26/04/2028 213,500 0.27
400,000 RAC Bond Co Plc 'EMTN' 4.87% 06/05/2026 432,209 0.55
200,000 Rl Finance Bonds No 3 Plc 6.13% 13/11/2028 240,933 0.30
150,000 RL Finance Bonds NO 4 Plc FRN 04/07/2039 168,559 0.21
484,000 Rothesay Life Plc 3.38% 12/07/2026 506,251 0.64
120,000 Rothesay Life Plc FRN 17/09/2029 129,893 0.16
200,000 Rothesay Life Plc FRN (Perpetual) 12/09/2028 227,000 0.29
110,000 Sanctuary Capital Plc 6.70% 23/03/2039 186,497 0.24
100,000 Sanctuary Capital Plc 2.38% 14/04/2050 108,113 0.14
100,000 Sanctuary Capital Plc 'EMTN' 5.00% 26/04/2047 159,212 0.20

December 2021 Legal & General UCITS ETF Plc
L&G ESG GBP Corporate Bond UCITS ETF
Schedule of Investments (continued)
As at 31 December 2021
408
Nominal Description
Coupon Rate
Maturity Date
Value £
% of Net
Assets
Corporate Bond (30 June 2021: 98.75%) (continued)
United Kingdom (30 June 2021: 52.56%) (continued)
200,000 Santander UK Group Holdings Plc 'EMTN' 3.63% 14/01/2026 214,168 0.27
150,000 Santander UK Group Holdings Plc 'EMTN' FRN 08/05/2026 155,165 0.20
100,000 Santander UK Plc 'EMTN' 3.88% 15/10/2029 117,073 0.15
200,000 Scottish Hydro Electric Transmission Plc 'EMTN' 2.25% 27/09/2035 199,899 0.25
250,000 Scottish Widows Ltd 5.50% 16/06/2023 263,671 0.33
200,000 Scottish Widows Ltd 7.00% 16/06/2043 308,633 0.39
220,000 Segro Plc 2.38% 11/10/2029 233,151 0.30
100,000 Segro Plc 2.88% 11/10/2037 112,001 0.14
60,000 Severn Trent Utilities Finance Plc 6.13% 26/02/2024 66,259 0.08
90,000 Severn Trent Utilities Finance Plc 6.25% 07/06/2029 118,592 0.15
200,000 Severn Trent Utilities Finance Plc 'EMTN' 3.63% 16/01/2026 217,837 0.28
100,000 Severn Trent Utilities Finance Plc 'EMTN' 2.75% 05/12/2031 108,562 0.14
100,000 Severn Trent Utilities Finance Plc 'EMTN' 2.00% 02/06/2040 98,094 0.12
100,000 Severn Trent Utilities Finance Plc 'EMTN' 4.88% 24/01/2042 144,104 0.18
100,000 Sky Ltd 'EMTN' 6.00% 21/05/2027 123,111 0.16
100,000 Society of Lloyd's 4.75% 30/10/2024 107,260 0.14
100,000 Society of Lloyd's FRN 07/02/2047 111,671 0.14
100,000 South Eastern Power Networks Plc 'EMTN' 5.63% 30/09/2030 130,893 0.17
100,000 South Eastern Power Networks Plc 'EMTN' 6.38% 12/11/2031 140,352 0.18
100,000 Southern Gas Networks Plc 'EMTN' 4.88% 05/10/2023 106,214 0.13
100,000 Southern Gas Networks Plc 'EMTN' 2.50% 03/02/2025 103,467 0.13
290,000 Southern Gas Networks Plc 'EMTN' 3.10% 15/09/2036 309,598 0.39
100,000 Standard Chartered Plc 'EMTN' 5.13% 06/06/2034 123,285 0.16
100,000 Standard Chartered Plc 'EMTN' 4.38% 18/01/2038 130,292 0.16
100,000 Tesco Corporate Treasury Services Plc 'EMTN' 2.50% 02/05/2025 102,909 0.13
50,000 Tesco Plc 'EMTN' 6.13% 24/02/2022 50,389 0.06
457,000 Thames Water Utilities Finance Plc 'EMTN' 4.00% 19/06/2025 496,718 0.63
100,000 Thames Water Utilities Finance Plc 'EMTN' 3.50% 25/02/2028 109,269 0.14
70,000 Thames Water Utilities Finance Plc 'EMTN' 6.75% 16/11/2028 91,487 0.12

December 2021 Legal & General UCITS ETF Plc
L&G ESG GBP Corporate Bond UCITS ETF
Schedule of Investments (continued)
As at 31 December 2021
409
Nominal Description
Coupon Rate
Maturity Date
Value £
% of Net
Assets
Corporate Bond (30 June 2021: 98.75%) (continued)
United Kingdom (30 June 2021: 52.56%) (continued)
100,000 Thames Water Utilities Finance Plc 'EMTN' 4.38% 03/07/2034 123,023 0.16
100,000 Thames Water Utilities Finance Plc 'EMTN' 5.13% 28/09/2037 135,733 0.17
150,000 Thames Water Utilities Finance Plc 'EMTN' 2.38% 22/04/2040 148,801 0.19
100,000 Thames Water Utilities Finance Plc 'EMTN' 5.50% 11/02/2041 145,881 0.18
100,000 Thames Water Utilities Finance Plc 'EMTN' 7.74% 09/04/2058 225,126 0.28
200,000 THFC Funding No 3 Plc 'EMTN' 5.20% 11/10/2043 304,712 0.39
200,000 Unilever Plc 1.50% 22/07/2026 204,059 0.26
200,000 United Utilities Water Finance Plc 'EMTN' 2.00% 14/02/2025 204,423 0.26
200,000 United Utilities Water Finance Plc 'EMTN' 0.88% 28/10/2029 190,143 0.24
100,000 United Utilities Water Finance Plc 'EMTN' 2.63% 12/02/2031 107,347 0.14
100,000 United Utilities Water Finance Plc 'EMTN' 2.00% 03/07/2033 101,984 0.13
100,000 United Utilities Water Finance Plc 'EMTN' 1.88% 03/06/2042 97,274 0.12
80,000 United Utilities Water Ltd 'EMTN' 5.63% 20/12/2027 98,828 0.13
100,000 Virgin Money UK Plc 'EMTN' FRN 25/09/2026 106,140 0.13
100,000 Virgin Money UK Plc 'EMTN' FRN 19/08/2031 98,953 0.13
150,000 Virgin Money UK Plc 'GMTN' FRN 22/06/2025 154,333 0.20
100,000 Virgin Money UK Plc 'GMTN' FRN 24/04/2026 103,369 0.13
100,000 Virgin Money UK Plc 'GMTN' FRN 03/09/2027 107,555 0.14
200,000 Virgin Money UK Plc 'GMTN' FRN 11/12/2030 216,114 0.27
80,000 Vodafone Group Plc 'EMTN' 5.90% 26/11/2032 109,016 0.14
340,000 Vodafone Group Plc 'EMTN' 3.38% 08/08/2049 382,360 0.48
170,000 Vodafone Group Plc 'EMTN' 3.00% 12/08/2056 177,776 0.22
200,000 Western Power Distribution Plc 3.63% 06/11/2023 208,237 0.26
100,000 Western Power Distribution Plc 3.50% 16/10/2026 108,015 0.14
220,000 Western Power Distribution West Midlands Plc 'EMTN' 5.75% 16/04/2032 294,618 0.37
100,000 Whitbread Group Plc 3.38% 16/10/2025 103,732 0.13
80,000 Yorkshire Water Finance Plc 6.38% 19/08/2039 129,920 0.16
100,000 Yorkshire Water Finance Plc 'EMTN' 1.75% 27/10/2032 98,590 0.12
200,000 Yorkshire Water Finance Plc 'EMTN' 2.75% 18/04/2041 219,037 0.28
Total United Kingdom 38,642,922 48.90

December 2021 Legal & General UCITS ETF Plc
L&G ESG GBP Corporate Bond UCITS ETF
Schedule of Investments (continued)
As at 31 December 2021
410
Nominal Description
Coupon Rate
Maturity Date
Value £
% of Net
Assets
Corporate Bond (30 June 2021: 98.75%) (continued)
United States (30 June 2021: 17.74%)
600,000 American Honda Finance Corp 0.75% 25/11/2026 580,661 0.73
149,000 American Honda Finance Corp 'EMTN' 1.50% 19/10/2027 148,094 0.19
100,000 Amgen Inc 5.50% 07/12/2026 119,003 0.15
200,000 Amgen Inc 4.00% 13/09/2029 232,480 0.29
100,000 Apple Inc 3.05% 31/07/2029 112,743 0.14
250,000 Apple Inc 3.60% 31/07/2042 332,988 0.42
370,000 AT&T Inc 2.90% 04/12/2026 389,444 0.49
100,000 AT&T Inc 5.50% 15/03/2027 118,424 0.15
200,000 AT&T Inc 4.38% 14/09/2029 233,326 0.30
200,000 AT&T Inc 4.25% 01/06/2043 248,577 0.31
250,000 AT&T Inc 4.88% 01/06/2044 338,343 0.43
300,000 AT&T Inc 'EMTN' 7.00% 30/04/2040 484,257 0.61
200,000 Bank of America Corp 'EMTN' 2.30% 25/07/2025 206,017 0.26
200,000 Bank of America Corp 'EMTN' 7.00% 31/07/2028 265,024 0.34
258,000 Bank of America Corp 'EMTN' FRN 02/06/2029 254,950 0.32
100,000 Citigroup Inc 1.75% 23/10/2026 100,100 0.13
184,000 Citigroup Inc 'EMTN' 5.15% 21/05/2026 211,277 0.27
100,000 Citigroup Inc 'EMTN' 6.80% 25/06/2038 165,542 0.21
50,000 Citigroup Inc 'EMTN' 7.38% 01/09/2039 88,371 0.11
100,000 Comcast Corp 5.50% 23/11/2029 127,944 0.16
200,000 Comcast Corp 1.88% 20/02/2036 197,087 0.25
100,000 Digital Stout Holding LLC 3.30% 19/07/2029 107,641 0.14
300,000 Digital Stout Holding LLC 3.75% 17/10/2030 335,536 0.42
250,000 Digital Stout Holding LLC 'EMTN' 4.25% 17/01/2025 268,803 0.34
200,000 Fidelity National Information Services Inc 3.36% 21/05/2031 221,020 0.28
100,000 Fiserv Inc 2.25% 01/07/2025 102,688 0.13
400,000 Fiserv Inc 3.00% 01/07/2031 430,015 0.54
50,000 Goldman Sachs Group Inc/The 6.88% 18/01/2038 75,262 0.10
300,000 Goldman Sachs Group Inc/The 'EMTN' 4.25% 29/01/2026 329,948 0.42

December 2021 Legal & General UCITS ETF Plc
L&G ESG GBP Corporate Bond UCITS ETF
Schedule of Investments (continued)
As at 31 December 2021
411
Nominal Description
Coupon Rate
Maturity Date
Value £
% of Net
Assets
Corporate Bond (30 June 2021: 98.75%) (continued)
United States (30 June 2021: 17.74%) (continued)
178,000 Goldman Sachs Group Inc/The 'EMTN' 1.50% 07/12/2027 174,375 0.22
100,000 Goldman Sachs Group Inc/The 'EMTN' 3.13% 25/07/2029 108,070 0.14
141,000 Goldman Sachs Group Inc/The 'EMTN' 1.88% 16/12/2030 138,949 0.18
250,000 Goldman Sachs Group Inc/The 'EMTN' FRN 16/12/2025 245,046 0.31
200,000 Goldman Sachs Group Inc/The 'GMTN' 7.25% 10/04/2028 262,786 0.33
650,000 JPMorgan Chase & Co 'EMTN' 3.50% 18/12/2026 713,725 0.90
200,000 JPMorgan Chase & Co 'EMTN' FRN 28/04/2033 198,869 0.25
250,000 JPMorgan Chase & Co FRN 28/04/2026 245,139 0.31
170,000 MetLife Inc 5.38% 09/12/2024 189,208 0.24
100,000 Metropolitan Life Global Funding I 0.63% 08/12/2027 95,266 0.12
300,000 Metropolitan Life Global Funding I 'GMTN' 2.63% 05/12/2022 305,103 0.39
100,000 Metropolitan Life Global Funding I 'GMTN' 3.50% 30/09/2026 109,743 0.14
200,000 Metropolitan Life Global Funding I 'GMTN' 1.63% 21/09/2029 200,836 0.25
200,000 Morgan Stanley 'GMTN' 2.63% 09/03/2027 208,916 0.26
113,000 Nestle Holdings Inc 'EMTN' 0.63% 18/12/2025 110,646 0.14
100,000 Nestle Holdings Inc 'EMTN' 1.38% 23/06/2033 97,908 0.12
140,000 New York Life Global Funding 1.63% 15/12/2023 141,334 0.18
200,000 New York Life Global Funding 'GMTN' 1.75% 15/12/2022 202,036 0.26
477,000 New York Life Global Funding 'GMTN' 0.75% 14/12/2028 454,700 0.58
100,000 Pfizer Inc 6.50% 03/06/2038 165,801 0.21
230,000 Pfizer Inc 'REGS' 2.74% 15/06/2043 259,924 0.33
100,000 Procter & Gamble Co/The 1.80% 03/05/2029 103,835 0.13
200,000 Realty Income Corp 1.13% 13/07/2027 194,412 0.25
175,000 Realty Income Corp 1.75% 13/07/2033 170,002 0.22
180,000 Time Warner Cable LLC 5.75% 02/06/2031 225,507 0.29
100,000 Time Warner Cable LLC 5.25% 15/07/2042 131,229 0.17
100,000 Verizon Communications Inc 4.07% 18/06/2024 106,939 0.14
100,000 Verizon Communications Inc 1.13% 03/11/2028 95,888 0.12
100,000 Verizon Communications Inc 1.88% 19/09/2030 99,655 0.13

December 2021 Legal & General UCITS ETF Plc
L&G ESG GBP Corporate Bond UCITS ETF
Schedule of Investments (continued)
As at 31 December 2021
412
Nominal Description
Coupon Rate
Maturity Date
Value £
% of Net
Assets
Corporate Bond (30 June 2021: 98.75%) (continued)
United States (30 June 2021: 17.74%) (continued)
100,000 Verizon Communications Inc 2.50% 08/04/2031 104,275 0.13
200,000 Verizon Communications Inc 3.38% 27/10/2036 228,560 0.29
150,000 Verizon Communications Inc 1.88% 03/11/2038 142,139 0.18
200,000 Verizon Communications Inc 'EMTN' 4.75% 17/02/2034 256,594 0.32
100,000 Walmart Inc 5.75% 19/12/2030 136,069 0.17
120,000 Walmart Inc 5.63% 27/03/2034 173,024 0.22
150,000 Walmart Inc 5.25% 28/09/2035 213,802 0.27
50,000 Walmart Inc 4.88% 19/01/2039 72,801 0.09
100,000 Wells Fargo & Co 4.63% 02/11/2035 127,246 0.16
100,000 Wells Fargo & Co 'EMTN' 1.38% 30/06/2022 100,363 0.13
150,000 Wells Fargo & Co 'EMTN' 2.13% 20/12/2023 152,138 0.19
100,000 Wells Fargo & Co 'EMTN' 2.00% 28/07/2025 101,238 0.13
310,000 Wells Fargo & Co 'EMTN' 2.50% 02/05/2029 321,000 0.41
100,000 Wells Fargo & Co 'EMTN' 3.50% 12/09/2029 110,681 0.14
262,000 Wells Fargo & Co 'EMTN' 2.13% 24/09/2031 260,924 0.33
50,000 Wells Fargo & Co 'EMTN' 4.88% 29/11/2035 62,889 0.08
100,000 Wells Fargo Bank NA 'EMTN' 5.25% 01/08/2023 105,979 0.13
320,000 Welltower Inc 4.80% 20/11/2028 374,892 0.47
100,000 Welltower Inc 4.50% 01/12/2034 122,294 0.15
Total United States 15,748,320 19.93
Total Corporate Bond 77,914,852 98.60
Government Bond (30 June 2021: –%)
United Kingdom (30 June 2021: –%)
100,000 United Kingdom Gilt 0.13% 30/01/2026 97,587 0.12
Total United Kingdom 97,587 0.12
Total Government Bond
97,587 0.12

December 2021 Legal & General UCITS ETF Plc
L&G ESG GBP Corporate Bond UCITS ETF
Schedule of Investments (continued)
As at 31 December 2021
413
Total Investments
Corporate Bond 77,914,852 98.60
Government Bond 97,587 0.12
Other Assets and Liabilities* 1,006,414 1.28
Net Assets Attributable to Holders of Redeemable Participating Shares 79,018,853 100.00
Analysis of Total Assets
% of Total
Assets
Transferable securities admitted to an official stock exchange listing or dealt on a regulated market 98.72
Other assets 1.28
100.00
Analysis of Total Assets rather than Net Assets is required under Schedule 12 of the UCITS Regulations.
*Included within other assets are holdings in LGIM Sterling Liquidity Fund with a value of £34,424. These are shown as "Cash and cash equivalents" within the Fund's Statement of Financial Position.

December 2021 Legal & General UCITS ETF Plc
L&G ESG Emerging Markets Government Bond (USD) 0-5 Year UCITS ETF
Schedule of Investments
As at 31 December 2021
414
Nominal Description
Coupon Rate
Maturity Date
Value $
% of Net
Assets
Government Bond (30 June 2021: 85.14%)
Armenia (30 June 2021: 0.45%)
200,000 Republic of Armenia International Bond 'REGS' 7.15% 26/03/2025 222,912 0.43
Total Armenia 222,912 0.43
Azerbaijan (30 June 2021: –%)
250,000 Republic of Azerbaijan International Bond 'REGS' 4.75% 18/03/2024 264,734 0.51
Total Azerbaijan 264,734 0.51
Bahrain (30 June 2021: 0.46%)
220,000 Bahrain Government International Bond 'REGS' 6.13% 05/07/2022 224,579 0.43
Total Bahrain 224,579 0.43
Belarus (30 June 2021: 0.85%)
210,000 Development Bank of the Republic of Belarus JSC 'REGS' 6.75% 02/05/2024 184,800 0.36
250,000 Republic of Belarus International Bond 'REGS' 5.88% 24/02/2026 220,937 0.42
Total Belarus 405,737 0.78
Bolivia (30 June 2021: 0.42%)
200,000 Bolivian Government International Bond 'REGS' 5.95% 22/08/2023 208,850 0.40
Total Bolivia 208,850 0.40
Brazil (30 June 2021: 3.58%)
260,000 Brazilian Government International Bond 2.63% 05/01/2023 264,761 0.51
200,000 Brazilian Government International Bond 8.88% 15/04/2024 234,538 0.45
600,000 Brazilian Government International Bond 4.25% 07/01/2025 637,612 1.22
275,000 Brazilian Government International Bond 8.75% 04/02/2025 332,544 0.64
200,000 Brazilian Government International Bond 6.00% 07/04/2026 223,850 0.43
Total Brazil 1,693,305 3.25
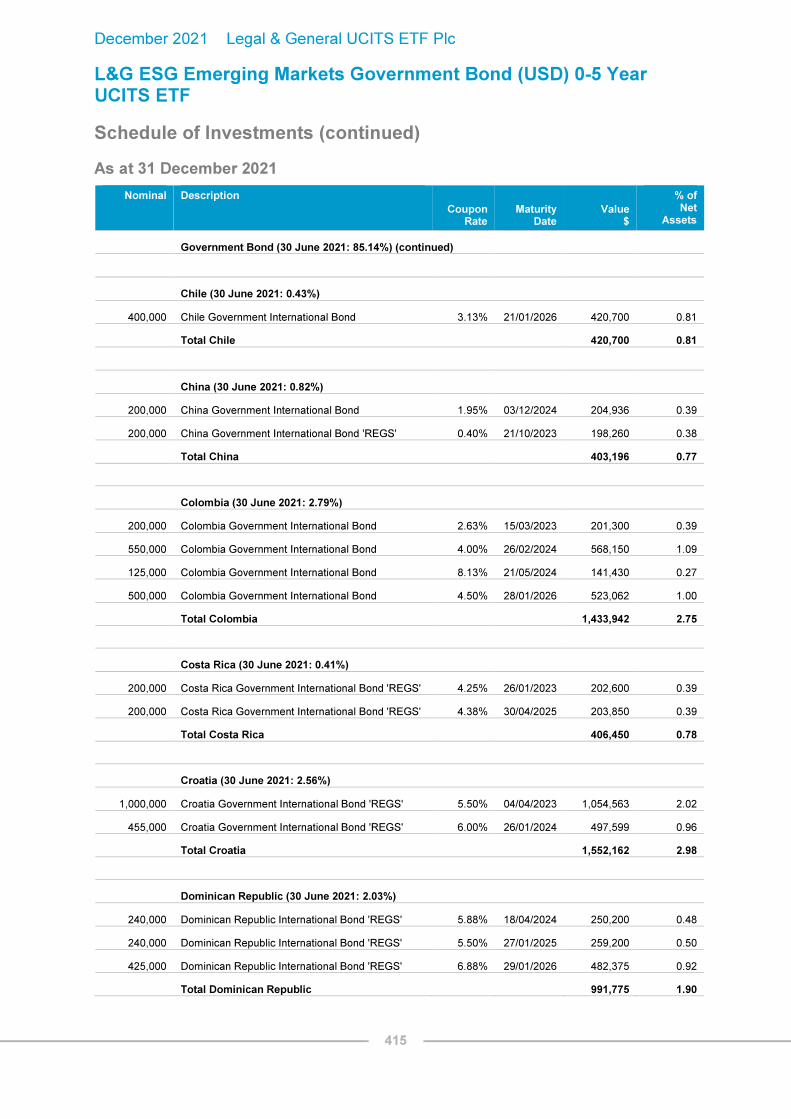
December 2021 Legal & General UCITS ETF Plc
L&G ESG Emerging Markets Government Bond (USD) 0-5 Year UCITS ETF
Schedule of Investments (continued)
As at 31 December 2021
415
Nominal Description
Coupon Rate
Maturity Date
Value $
% of Net
Assets
Government Bond (30 June 2021: 85.14%) (continued)
Chile (30 June 2021: 0.43%)
400,000 Chile Government International Bond 3.13% 21/01/2026 420,700 0.81
Total Chile 420,700 0.81
China (30 June 2021: 0.82%)
200,000 China Government International Bond 1.95% 03/12/2024 204,936 0.39
200,000 China Government International Bond 'REGS' 0.40% 21/10/2023 198,260 0.38
Total China 403,196 0.77
Colombia (30 June 2021: 2.79%)
200,000 Colombia Government International Bond 2.63% 15/03/2023 201,300 0.39
550,000 Colombia Government International Bond 4.00% 26/02/2024 568,150 1.09
125,000 Colombia Government International Bond 8.13% 21/05/2024 141,430 0.27
500,000 Colombia Government International Bond 4.50% 28/01/2026 523,062 1.00
Total Colombia 1,433,942 2.75
Costa Rica (30 June 2021: 0.41%)
200,000 Costa Rica Government International Bond 'REGS' 4.25% 26/01/2023 202,600 0.39
200,000 Costa Rica Government International Bond 'REGS' 4.38% 30/04/2025 203,850 0.39
Total Costa Rica 406,450 0.78
Croatia (30 June 2021: 2.56%)
1,000,000 Croatia Government International Bond 'REGS' 5.50% 04/04/2023 1,054,563 2.02
455,000 Croatia Government International Bond 'REGS' 6.00% 26/01/2024 497,599 0.96
Total Croatia 1,552,162 2.98
Dominican Republic (30 June 2021: 2.03%)
240,000 Dominican Republic International Bond 'REGS' 5.88% 18/04/2024 250,200 0.48
240,000 Dominican Republic International Bond 'REGS' 5.50% 27/01/2025 259,200 0.50
425,000 Dominican Republic International Bond 'REGS' 6.88% 29/01/2026 482,375 0.92
Total Dominican Republic 991,775 1.90

December 2021 Legal & General UCITS ETF Plc
L&G ESG Emerging Markets Government Bond (USD) 0-5 Year UCITS ETF
Schedule of Investments (continued)
As at 31 December 2021
416
Nominal Description
Coupon Rate
Maturity Date
Value $
% of Net
Assets
Government Bond (30 June 2021: 85.14%) (continued)
Egypt (30 June 2021: 2.31%)
200,000 Egypt Government International Bond 'REGS' 5.58% 21/02/2023 206,960 0.40
210,000 Egypt Government International Bond 'REGS' 6.20% 01/03/2024 220,030 0.42
400,000 Egypt Government International Bond 'REGS' 5.75% 29/05/2024 415,640 0.80
200,000 Egypt Government International Bond 'REGS' 5.88% 11/06/2025 205,600 0.39
200,000 Egypt Government International Bond 'REGS' 3.88% 16/02/2026 186,900 0.36
Total Egypt 1,235,130 2.37
El Salvador (30 June 2021: 0.96%)
200,000 El Salvador Government International Bond 'REGS' 7.75% 24/01/2023 157,413 0.30
200,000 El Salvador Government International Bond 'REGS' 5.88% 30/01/2025 123,350 0.24
Total El Salvador 280,763 0.54
Georgia (30 June 2021: –%)
200,000 Georgia Government International Bond 'REGS' 2.75% 22/04/2026 198,438 0.38
Total Georgia 198,438 0.38
Ghana (30 June 2021: 1.90%)
500,000 Ghana Government International Bond 'REGS' 8.13% 18/01/2026 461,900 0.88
200,000 Ghana Government International Bond 'REGS' 6.38% 11/02/2027 167,938 0.32
200,000 Ghana Government International Bond 'REGS' 7.88% 26/03/2027 175,260 0.34
200,000 Ghana Government International Bond 'REGS' (Zero Coupon) 0.00% 07/04/2025 139,412 0.27
Total Ghana 944,510 1.81
Guatemala (30 June 2021: 0.42%)
200,000 Guatemala Government Bond 'REGS' 5.75% 06/06/2022 202,850 0.39
200,000 Guatemala Government Bond 'REGS' 4.50% 03/05/2026 210,288 0.40
Total Guatemala 413,138 0.79

December 2021 Legal & General UCITS ETF Plc
L&G ESG Emerging Markets Government Bond (USD) 0-5 Year UCITS ETF
Schedule of Investments (continued)
As at 31 December 2021
417
Nominal Description
Coupon Rate
Maturity Date
Value $
% of Net
Assets
Government Bond (30 June 2021: 85.14%) (continued)
Hungary (30 June 2021: 4.33%)
670,000 Hungary Government International Bond 5.38% 21/02/2023 702,884 1.35
640,000 Hungary Government International Bond 5.75% 22/11/2023 693,607 1.33
684,000 Hungary Government International Bond 5.38% 25/03/2024 742,111 1.42
Total Hungary 2,138,602 4.10
Indonesia (30 June 2021: 3.49%)
200,000 Indonesia Government International Bond 'REGS' 3.38% 15/04/2023 206,000 0.39
200,000 Indonesia Government International Bond 'REGS' 5.88% 15/01/2024 218,787 0.42
200,000 Indonesia Government International Bond 'REGS' 4.13% 15/01/2025 214,725 0.41
200,000 Indonesia Government International Bond 'REGS' 4.75% 08/01/2026 222,913 0.43
Total Indonesia 862,425 1.65
Jordan (30 June 2021: 0.43%)
200,000 Jordan Government International Bond 'REGS' 4.95% 07/07/2025 205,937 0.39
200,000 Jordan Government International Bond 'REGS' 6.13% 29/01/2026 212,600 0.41
Total Jordan 418,537 0.80
Kazakhstan (30 June 2021: 2.26%)
440,000 Kazakhstan Government International Bond 'REGS' 3.88% 14/10/2024 471,020 0.90
745,000 Kazakhstan Government International Bond 'REGS' 5.13% 21/07/2025 838,423 1.61
Total Kazakhstan 1,309,443 2.51
Kenya (30 June 2021: 0.90%)
610,000 Republic of Kenya Government International Bond 'REGS' 6.88% 24/06/2024 644,343 1.24
Total Kenya 644,343 1.24
Lebanon (30 June 2021: 0.06%)
350,000 Lebanon Government International Bond (Defaulted) 6.00% 27/01/2023 35,000 0.07
250,000 Lebanon Government International Bond 'GMTN' (Defaulted) 6.20% 26/02/2025 25,000 0.05
Total Lebanon 60,000 0.12
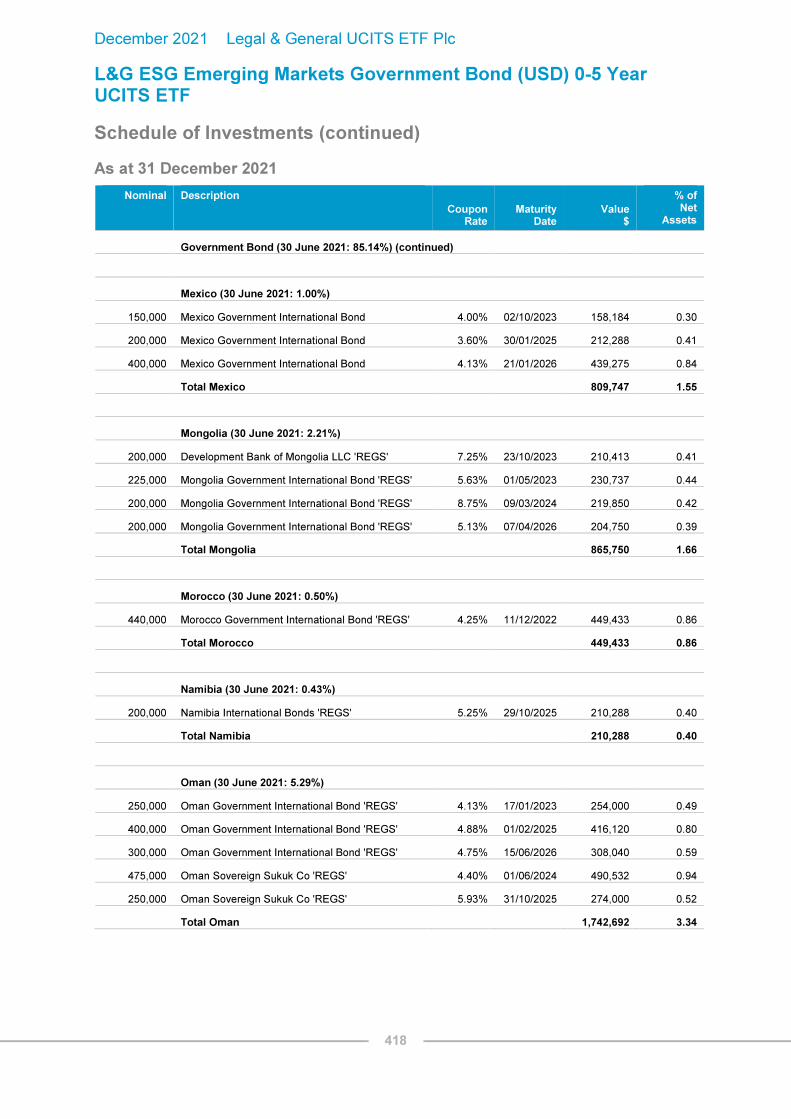
December 2021 Legal & General UCITS ETF Plc
L&G ESG Emerging Markets Government Bond (USD) 0-5 Year UCITS ETF
Schedule of Investments (continued)
As at 31 December 2021
418
Nominal Description
Coupon Rate
Maturity Date
Value $
% of Net
Assets
Government Bond (30 June 2021: 85.14%) (continued)
Mexico (30 June 2021: 1.00%)
150,000 Mexico Government International Bond 4.00% 02/10/2023 158,184 0.30
200,000 Mexico Government International Bond 3.60% 30/01/2025 212,288 0.41
400,000 Mexico Government International Bond 4.13% 21/01/2026 439,275 0.84
Total Mexico 809,747 1.55
Mongolia (30 June 2021: 2.21%)
200,000 Development Bank of Mongolia LLC 'REGS' 7.25% 23/10/2023 210,413 0.41
225,000 Mongolia Government International Bond 'REGS' 5.63% 01/05/2023 230,737 0.44
200,000 Mongolia Government International Bond 'REGS' 8.75% 09/03/2024 219,850 0.42
200,000 Mongolia Government International Bond 'REGS' 5.13% 07/04/2026 204,750 0.39
Total Mongolia 865,750 1.66
Morocco (30 June 2021: 0.50%)
440,000 Morocco Government International Bond 'REGS' 4.25% 11/12/2022 449,433 0.86
Total Morocco 449,433 0.86
Namibia (30 June 2021: 0.43%)
200,000 Namibia International Bonds 'REGS' 5.25% 29/10/2025 210,288 0.40
Total Namibia 210,288 0.40
Oman (30 June 2021: 5.29%)
250,000 Oman Government International Bond 'REGS' 4.13% 17/01/2023 254,000 0.49
400,000 Oman Government International Bond 'REGS' 4.88% 01/02/2025 416,120 0.80
300,000 Oman Government International Bond 'REGS' 4.75% 15/06/2026 308,040 0.59
475,000 Oman Sovereign Sukuk Co 'REGS' 4.40% 01/06/2024 490,532 0.94
250,000 Oman Sovereign Sukuk Co 'REGS' 5.93% 31/10/2025 274,000 0.52
Total Oman 1,742,692 3.34

December 2021 Legal & General UCITS ETF Plc
L&G ESG Emerging Markets Government Bond (USD) 0-5 Year UCITS ETF
Schedule of Investments (continued)
As at 31 December 2021
419
Nominal Description
Coupon Rate
Maturity Date
Value $
% of Net
Assets
Government Bond (30 June 2021: 85.14%) (continued)
Panama (30 June 2021: 2.77%)
260,000 Panama Government International Bond 4.00% 22/09/2024 275,892 0.53
295,000 Panama Government International Bond 3.75% 16/03/2025 312,110 0.60
550,000 Panama Government International Bond 7.13% 29/01/2026 657,697 1.26
Total Panama 1,245,699 2.39
Paraguay (30 June 2021: 0.68%)
300,000 Paraguay Government International Bond 'REGS' 5.00% 15/04/2026 332,963 0.64
Total Paraguay 332,963 0.64
Peru (30 June 2021: 1.93%)
150,000 Fondo MIVIVIENDA SA 'REGS' 3.50% 31/01/2023 152,559 0.30
325,000 Peruvian Government International Bond 7.35% 21/07/2025 386,506 0.74
330,000 Peruvian Government International Bond 2.39% 23/01/2026 334,084 0.64
Total Peru 873,149 1.68
Philippines (30 June 2021: 2.67%)
535,000 Philippine Government International Bond 4.20% 21/01/2024 568,437 1.09
350,000 Philippine Government International Bond 10.63% 16/03/2025 455,438 0.88
225,000 Philippine Government International Bond 5.50% 30/03/2026 262,502 0.50
Total Philippines 1,286,377 2.47
Poland (30 June 2021: 4.40%)
880,000 Republic of Poland Government International Bond 3.00% 17/03/2023 903,305 1.73
930,000 Republic of Poland Government International Bond 4.00% 22/01/2024 984,335 1.89
800,000 Republic of Poland Government International Bond 3.25% 06/04/2026 855,314 1.64
Total Poland 2,742,954 5.26
Qatar (30 June 2021: 2.84%)
580,000 Qatar Government International Bond 'REGS' 3.88% 23/04/2023 602,439 1.16

December 2021 Legal & General UCITS ETF Plc
L&G ESG Emerging Markets Government Bond (USD) 0-5 Year UCITS ETF
Schedule of Investments (continued)
As at 31 December 2021
420
Nominal Description
Coupon Rate
Maturity Date
Value $
% of Net
Assets
Government Bond (30 June 2021: 85.14%) (continued)
Qatar (30 June 2021: 2.84%) (continued)
420,000 Qatar Government International Bond 'REGS' 3.38% 14/03/2024 439,609 0.84
305,000 Qatar Government International Bond 'REGS' 3.40% 16/04/2025 323,357 0.62
400,000 Qatar Government International Bond 'REGS' 3.25% 02/06/2026 425,675 0.82
Total Qatar 1,791,080 3.44
Romania (30 June 2021: 3.15%)
410,000 Romanian Government International Bond 'REGS' 4.38% 22/08/2023 430,623 0.83
436,000 Romanian Government International Bond 'REGS' 4.88% 22/01/2024 463,986 0.89
Total Romania 894,609 1.72
Russia (30 June 2021: 2.98%)
200,000 Russian Foreign Bond - Eurobond 'REGS' 4.50% 04/04/2022 201,720 0.39
400,000 Russian Foreign Bond - Eurobond 'REGS' 4.88% 16/09/2023 421,120 0.81
400,000 Russian Foreign Bond - Eurobond 'REGS' 4.75% 27/05/2026 437,000 0.84
268,125 Russian Foreign Bond - Eurobond Step-Up Coupon 'REGS' 7.50% 31/03/2030 303,330 0.58
Total Russia 1,363,170 2.62
Saudi Arabia (30 June 2021: 2.57%)
230,000 Saudi Government International Bond 'REGS' 2.88% 04/03/2023 235,333 0.45
340,000 Saudi Government International Bond 'REGS' 4.00% 17/04/2025 366,074 0.70
625,000 Saudi Government International Bond 'REGS' 2.90% 22/10/2025 653,711 1.25
400,000 Saudi Government International Bond 'REGS' 3.25% 26/10/2026 425,375 0.82
Total Saudi Arabia 1,680,493 3.22
Slovakia (30 June 2021: 1.24%)
600,000 Slovakia Government International Bond 'REGS' 4.38% 21/05/2022 608,550 1.17
Total Slovakia 608,550 1.17

December 2021 Legal & General UCITS ETF Plc
L&G ESG Emerging Markets Government Bond (USD) 0-5 Year UCITS ETF
Schedule of Investments (continued)
As at 31 December 2021
421
Nominal Description
Coupon Rate
Maturity Date
Value $
% of Net
Assets
Government Bond (30 June 2021: 85.14%) (continued)
South Africa (30 June 2021: 2.38%)
300,000 Republic of South Africa Government International Bond 5.88% 30/05/2022 305,925 0.58
550,000 Republic of South Africa Government International Bond 4.67% 17/01/2024 577,500 1.11
250,000 Republic of South Africa Government International Bond 5.88% 16/09/2025 275,375 0.53
200,000 Republic of South Africa Government International Bond 4.88% 14/04/2026 212,850 0.41
Total South Africa 1,371,650 2.63
Sri Lanka (30 June 2021: 1.89%)
200,000 Sri Lanka Government International Bond 'REGS' 5.88% 25/07/2022 134,163 0.26
200,000 Sri Lanka Government International Bond 'REGS' 5.75% 18/04/2023 110,787 0.21
425,000 Sri Lanka Government International Bond 'REGS' 6.85% 14/03/2024 221,611 0.43
200,000 Sri Lanka Government International Bond 'REGS' 6.13% 03/06/2025 103,850 0.20
300,000 Sri Lanka Government International Bond 'REGS' 6.85% 03/11/2025 151,556 0.29
300,000 Sri Lanka Government International Bond 'REGS' 6.83% 18/07/2026 151,181 0.29
Total Sri Lanka 873,148 1.68
Suriname (30 June 2021: –%)
200,000 Suriname Government International Bond 'REGS' 9.25% 26/10/2026 147,100 0.28
Total Suriname 147,100 0.28
Trinidad and Tobago (30 June 2021: 0.42%)
200,000 Trinidad & Tobago Government International Bond 'REGS' 4.38% 16/01/2024 204,912 0.39
325,000 Trinidad & Tobago Government International Bond 'REGS' 4.50% 04/08/2026 331,561 0.64
Total Trinidad and Tobago 536,473 1.03
Turkey (30 June 2021: 3.27%)
200,000 Hazine Mustesarligi Varlik Kiralama AS 'REGS' 5.13% 22/06/2026 190,537 0.36
200,000 Turkey Government International Bond 6.25% 26/09/2022 200,320 0.38

December 2021 Legal & General UCITS ETF Plc
L&G ESG Emerging Markets Government Bond (USD) 0-5 Year UCITS ETF
Schedule of Investments (continued)
As at 31 December 2021
422
Nominal Description
Coupon Rate
Maturity Date
Value $
% of Net
Assets
Government Bond (30 June 2021: 85.14%) (continued)
Turkey (30 June 2021: 3.27%) (continued)
400,000 Turkey Government International Bond 5.75% 22/03/2024 390,325 0.75
150,000 Turkey Government International Bond 7.38% 05/02/2025 150,525 0.29
250,000 Turkey Government International Bond 6.38% 14/10/2025 243,172 0.47
200,000 Turkey Government International Bond 4.75% 26/01/2026 182,000 0.35
200,000 Turkey Government International Bond 4.88% 09/10/2026 181,038 0.35
200,000 Turkiye Ihracat Kredi Bankasi AS 'REGS' 5.75% 06/07/2026 181,975 0.35
Total Turkey 1,719,892 3.30
Ukraine (30 June 2021: 2.76%)
500,000 Ukraine Government International Bond 'REGS' 7.75% 01/09/2023 487,500 0.93
250,000 Ukraine Government International Bond 'REGS' 8.99% 01/02/2024 248,672 0.48
220,000 Ukraine Government International Bond 'REGS' 7.75% 01/09/2024 213,029 0.41
420,000 Ukraine Government International Bond 'REGS' 7.75% 01/09/2025 401,730 0.77
225,000 Ukraine Government International Bond 'REGS' 7.75% 01/09/2026 213,187 0.41
Total Ukraine 1,564,118 3.00
United Arab Emirates (30 June 2021: 3.80%)
400,000 Abu Dhabi Government International Bond 'REGS' 2.50% 11/10/2022 406,450 0.78
250,000 Abu Dhabi Government International Bond 'REGS' 0.75% 02/09/2023 249,047 0.48
275,000 Abu Dhabi Government International Bond 'REGS' 2.13% 30/09/2024 281,600 0.54
490,000 Abu Dhabi Government International Bond 'REGS' 2.50% 16/04/2025 508,620 0.97
200,000 Abu Dhabi Government International Bond 'REGS' 3.13% 03/05/2026 212,900 0.41
Total United Arab Emirates 1,658,617 3.18
Uruguay (30 June 2021: 0.89%)
410,000 Uruguay Government International Bond 4.50% 14/08/2024 434,549 0.84
685,000 Uruguay Government International Bond 4.38% 27/10/2027 767,114 1.47
Total Uruguay 1,201,663 2.31

December 2021 Legal & General UCITS ETF Plc
L&G ESG Emerging Markets Government Bond (USD) 0-5 Year UCITS ETF
Schedule of Investments (continued)
As at 31 December 2021
423
Nominal Description
Coupon Rate
Maturity Date
Value $
% of Net
Assets
Government Bond (30 June 2021: 85.14%) (continued)
Uzbekistan (30 June 2021: 0.43%)
200,000 Republic of Uzbekistan International Bond 'REGS' 4.75% 20/02/2024 208,000 0.40
Total Uzbekistan 208,000 0.40
Vietnam (30 June 2021: 0.44%)
200,000 Vietnam Government International Bond 'REGS' 4.80% 19/11/2024 216,162 0.41
Total Vietnam 216,162 0.41
Zambia (30 June 2021: 0.29%)
225,000 Zambia Government International Bond 'REGS' 8.50% 14/04/2024 176,555 0.34
250,000 Zambia Government International Bond 'REGS' 8.97% 30/07/2027 192,156 0.37
Total Zambia 368,711 0.71
Total Government Bond 43,496,159 83.45
Corporate Bond (30 June 2021: 13.57%)
Azerbaijan (30 June 2021: 1.17%)
400,000 Southern Gas Corridor CJSC 'REGS' 6.88% 24/03/2026 459,325 0.88
Total Azerbaijan 459,325 0.88
Bahrain (30 June 2021: 2.02%)
270,000 CBB International Sukuk Co 5 Spc 'REGS' 5.62% 12/02/2024 283,382 0.54
200,000 CBB International Sukuk Co 7 SPC 'REGS' 6.88% 05/10/2025 224,187 0.43
450,000 CBB International Sukuk Programme Co WLL 'REGS' 6.25% 14/11/2024 483,413 0.93
200,000 Oil and Gas Holding Co BSCC/The 'REGS' 7.63% 07/11/2024 215,437 0.41
Total Bahrain 1,206,419 2.31
British Virgin Islands (30 June 2021: 0.49%)
200,000 State Grid Overseas Investment BVI Ltd 1.13% 08/09/2026 194,742 0.37
Total British Virgin Islands 194,742 0.37

December 2021 Legal & General UCITS ETF Plc
L&G ESG Emerging Markets Government Bond (USD) 0-5 Year UCITS ETF
Schedule of Investments (continued)
As at 31 December 2021
424
Nominal Description
Coupon Rate
Maturity Date
Value $
% of Net
Assets
Corporate Bond (30 June 2021: 85.14%) (continued)
Cayman Islands (30 June 2021: 1.10%)
175,000 Brazil Minas SPE via State of Minas Gerais 'REGS' 5.33% 15/02/2028 182,033 0.35
540,000 KSA Sukuk Ltd 'REGS' 2.89% 20/04/2022 543,611 1.04
200,000 Maldives Sukuk Issuance Ltd 'REGS' 9.88% 08/04/2026 197,438 0.38
300,000 Sharjah Sukuk Program Ltd 'EMTN' 3.85% 03/04/2026 317,025 0.61
Total Cayman Islands 1,240,107 2.38
Chile (30 June 2021: 1.48%)
200,000 Banco del Estado de Chile 'REGS' 2.70% 09/01/2025 204,038 0.39
200,000 Empresa Nacional del Petroleo 'REGS' 3.75% 05/08/2026 204,975 0.39
Total Chile 409,013 0.78
Indonesia (30 June 2021: 0.84%)
200,000 Pelabuhan Indonesia II PT 'REGS' 4.25% 05/05/2025 214,750 0.41
200,000 Pertamina Persero PT 'REGS' 4.88% 03/05/2022 202,788 0.39
200,000 Perusahaan Penerbit SBSN Indonesia III 'REGS' 3.75% 01/03/2023 206,787 0.40
200,000 Perusahaan Penerbit SBSN Indonesia III 'REGS' 4.35% 10/09/2024 216,100 0.41
400,000 Perusahaan Penerbit SBSN Indonesia III 'REGS' 4.33% 28/05/2025 437,700 0.84
Total Indonesia 1,278,125 2.45
Ireland (30 June 2021: –%)
200,000 Gtlk Europe Capital DAC 5.95% 17/04/2025 211,913 0.41
Total Ireland 211,913 0.41
Kazakhstan (30 June 2021: 0.90%)
200,000 Development Bank of Kazakhstan JSC 'REGS' 4.13% 10/12/2022 204,100 0.39
200,000 KazMunayGas National Co JSC 'REGS' 4.75% 24/04/2025 217,600 0.42
Total Kazakhstan 421,700 0.81

December 2021 Legal & General UCITS ETF Plc
L&G ESG Emerging Markets Government Bond (USD) 0-5 Year UCITS ETF
Schedule of Investments (continued)
As at 31 December 2021
425
Nominal Description
Coupon Rate
Maturity Date
Value $
% of Net
Assets
Corporate Bond (30 June 2021: 85.14%) (continued)
Malaysia (30 June 2021: 1.34%)
200,000 Malaysia Sovereign Sukuk Bhd 'REGS' 3.04% 22/04/2025 209,912 0.40
250,000 Malaysia Sukuk Global Bhd 'REGS' 3.18% 27/04/2026 266,844 0.51
Total Malaysia 476,756 0.91
Philippines (30 June 2021: 0.91%)
300,000 Power Sector Assets & Liabilities Management Corp 'REGS' 7.39% 02/12/2024 351,750 0.68
Total Philippines 351,750 0.68
Qatar (30 June 2021: 0.47%)
200,000 Qatar Energy 'REGS' 1.38% 12/09/2026 195,937 0.38
225,000 SoQ Sukuk A QSC 3.24% 18/01/2023 231,005 0.44
Total Qatar 426,942 0.82
Trinidad and Tobago (30 June 2021: –%)
260,000 Trinidad Petroleum Holdings Ltd 'REGS' 9.75% 15/06/2026 280,686 0.54
Total Trinidad and Tobago 280,686 0.54
Ukraine (30 June 2021: –%)
200,000 NPC Ukrenergo 'REGS' 6.88% 09/11/2026 174,770 0.34
Total Ukraine 174,770 0.34
United Arab Emirates (30 June 2021: –%)
200,000 DAE Sukuk Difc Ltd 'REGS' 3.75% 15/02/2026 206,000 0.40
200,000 Emirates Development Bank PJSC 'EMTN' 3.52% 06/03/2024 209,437 0.40
400,000 MDGH GMTN RSC Ltd 'REGS' 2.50% 07/11/2024 412,200 0.79
Total United Arab Emirates 827,637 1.59
Total Corporate Bond 7,959,885 15.27

December 2021 Legal & General UCITS ETF Plc
L&G ESG Emerging Markets Government Bond (USD) 0-5 Year UCITS ETF
Schedule of Investments (continued)
As at 31 December 2021
426
Total Investments
Government Bond 43,496,159 83.45
Corporate Bond 7,959,885 15.27
Other Assets and Liabilities 668,256 1.28
Net Assets Attributable to Holders of Redeemabl Participating Shares 52,124,300 100.00
Analysis of Total Assets
% of Total
Assets
Transferable securities admitted to an official stock exchange listing or dealt on a regulated market 97.48
Other assets 2.52
100.00
Analysis of Total Assets rather than Net Assets is required under Schedule 12 of the UCITS Regulations.

December 2021 Legal & General UCITS ETF Plc
L&G ESG China CNY Bond UCITS ETF
Schedule of Investments
As at 31 December 2021
427
Nominal Description
Coupon Rate
Maturity Date
Value $
% of Net
Assets
Government Bond (30 June 2021: 98.44%)
China (30 June 2021: 98.44%)
6,500,000 Agricultural Development Bank of China 4.21% 23/08/2022 1,031,446 0.35
8,000,000 Agricultural Development Bank of China 3.32% 06/01/2023 1,266,934 0.42
8,100,000 Agricultural Development Bank of China 4.99% 24/01/2023 1,302,862 0.44
5,000,000 Agricultural Development Bank of China 3.28% 26/02/2023 791,912 0.27
13,530,000 Agricultural Development Bank of China 2.20% 01/04/2023 2,117,422 0.71
5,000,000 Agricultural Development Bank of China 3.54% 22/04/2023 795,553 0.27
6,350,000 Agricultural Development Bank of China 4.37% 25/05/2023 1,021,388 0.34
5,000,000 Agricultural Development Bank of China 3.06% 05/08/2023 791,183 0.27
11,200,000 Agricultural Development Bank of China 3.55% 21/11/2023 1,791,399 0.60
9,100,000 Agricultural Development Bank of China 3.83% 06/01/2024 1,462,828 0.49
10,000,000 Agricultural Development Bank of China 3.19% 03/03/2024 1,589,246 0.53
4,800,000 Agricultural Development Bank of China 3.51% 03/04/2024 768,108 0.26
2,500,000 Agricultural Development Bank of China 2.78% 21/07/2024 393,652 0.13
11,000,000 Agricultural Development Bank of China 3.24% 14/08/2024 1,752,405 0.59
10,300,000 Agricultural Development Bank of China 4.98% 12/01/2025 1,724,203 0.58
11,000,000 Agricultural Development Bank of China 3.97% 27/02/2025 1,791,863 0.60
11,700,000 Agricultural Development Bank of China 2.25% 22/04/2025 1,810,358 0.61
8,000,000 Agricultural Development Bank of China 3.45% 23/09/2025 1,286,033 0.43
10,350,000 Agricultural Development Bank of China 4.00% 12/11/2025 1,693,513 0.57
10,120,000 Agricultural Development Bank of China 3.33% 06/01/2026 1,619,033 0.54
7,500,000 Agricultural Development Bank of China 3.37% 26/02/2026 1,201,358 0.40
6,500,000 Agricultural Development Bank of China 3.35% 24/03/2026 1,040,795 0.35
17,750,000 Agricultural Development Bank of China 3.58% 22/04/2026 2,869,609 0.96
12,000,000 Agricultural Development Bank of China 3.63% 19/07/2026 1,944,183 0.65
11,000,000 Agricultural Development Bank of China 3.85% 06/01/2027 1,804,990 0.61
17,800,000 Agricultural Development Bank of China 4.39% 08/09/2027 3,005,597 1.01
8,500,000 Agricultural Development Bank of China 3.48% 04/02/2028 1,371,232 0.46
12,400,000 Agricultural Development Bank of China 4.65% 11/05/2028 2,127,778 0.71
5,000,000 Agricultural Development Bank of China 3.19% 12/08/2028 793,116 0.27
10,340,000 Agricultural Development Bank of China 3.75% 25/01/2029 1,692,958 0.57

December 2021 Legal & General UCITS ETF Plc
L&G ESG China CNY Bond UCITS ETF
Schedule of Investments (continued)
As at 31 December 2021
428
Nominal Description
Coupon Rate
Maturity Date
Value $
% of Net
Assets
Government Bond (30 June 2021: 98.44%) (continued)
China (30 June 2021: 98.44%) (continued)
15,700,000 Agricultural Development Bank of China 3.74% 12/07/2029 2,569,848 0.86
18,800,000 Agricultural Development Bank of China 2.96% 17/04/2030 2,914,531 0.98
13,500,000 Agricultural Development Bank of China 3.79% 26/10/2030 2,221,717 0.75
16,500,000 Agricultural Development Bank of China 3.52% 24/05/2031 2,667,299 0.89
3,000,000 Agricultural Development Bank of China 3.30% 05/11/2031 476,870 0.16
2,000,000 China Development Bank 3.59% 22/10/2022 316,841 0.11
6,200,000 China Development Bank 2.97% 25/10/2022 978,007 0.33
7,000,000 China Development Bank 4.44% 09/11/2022 1,117,744 0.37
7,000,000 China Development Bank 3.24% 25/02/2023 1,108,551 0.37
8,700,000 China Development Bank 4.69% 23/03/2023 1,401,969 0.47
3,350,000 China Development Bank 1.86% 09/04/2023 522,120 0.17
7,000,000 China Development Bank 3.00% 07/08/2023 1,107,373 0.37
8,500,000 China Development Bank 3.76% 14/08/2023 1,360,436 0.46
5,500,000 China Development Bank 2.98% 08/01/2024 870,740 0.29
5,300,000 China Development Bank 3.85% 09/01/2024 849,690 0.28
3,000,000 China Development Bank 5.90% 20/01/2024 504,988 0.17
6,790,000 China Development Bank 3.30% 01/02/2024 1,081,790 0.36
7,700,000 China Development Bank 3.42% 02/07/2024 1,232,056 0.41
8,600,000 China Development Bank 4.30% 21/08/2024 1,407,211 0.47
9,500,000 China Development Bank 3.23% 10/01/2025 1,516,819 0.51
5,100,000 China Development Bank 3.81% 05/02/2025 827,715 0.28
2,100,000 China Development Bank 4.73% 02/04/2025 350,120 0.12
11,000,000 China Development Bank 4.21% 13/04/2025 1,807,835 0.61
4,000,000 China Development Bank 2.89% 22/06/2025 631,599 0.21
10,000,000 China Development Bank 3.34% 14/07/2025 1,602,245 0.54
9,380,000 China Development Bank 3.74% 10/09/2025 1,522,236 0.51
6,000,000 China Development Bank 4.15% 26/10/2025 987,671 0.33
6,000,000 China Development Bank 3.68% 26/02/2026 972,851 0.33
12,500,000 China Development Bank 3.30% 03/03/2026 2,002,830 0.67
8,050,000 China Development Bank 3.18% 05/04/2026 1,282,201 0.43

December 2021 Legal & General UCITS ETF Plc
L&G ESG China CNY Bond UCITS ETF
Schedule of Investments (continued)
As at 31 December 2021
429
Nominal Description
Coupon Rate
Maturity Date
Value $
% of Net
Assets
Government Bond (30 June 2021: 98.44%) (continued)
China (30 June 2021: 98.44%) (continued)
8,000,000 China Development Bank 3.50% 13/08/2026 1,290,990 0.43
8,800,000 China Development Bank 3.05% 25/08/2026 1,392,753 0.47
4,470,000 China Development Bank 3.43% 14/01/2027 719,907 0.24
8,500,000 China Development Bank 4.04% 10/04/2027 1,407,344 0.47
7,000,000 China Development Bank 3.39% 10/07/2027 1,125,180 0.38
6,500,000 China Development Bank 4.24% 24/08/2027 1,089,100 0.37
4,000,000 China Development Bank 3.40% 08/01/2028 643,004 0.22
9,900,000 China Development Bank 4.88% 09/02/2028 1,716,657 0.58
12,000,000 China Development Bank 4.04% 06/07/2028 1,999,531 0.67
12,100,000 China Development Bank 3.48% 08/01/2029 1,950,157 0.65
11,500,000 China Development Bank 3.65% 21/05/2029 1,873,676 0.63
11,250,000 China Development Bank 3.45% 20/09/2029 1,809,191 0.61
17,600,000 China Development Bank 3.07% 10/03/2030 2,749,267 0.92
11,600,000 China Development Bank 3.09% 18/06/2030 1,815,367 0.61
10,600,000 China Development Bank 3.70% 20/10/2030 1,733,386 0.58
12,000,000 China Development Bank 3.66% 01/03/2031 1,959,289 0.66
11,000,000 China Development Bank 3.41% 07/06/2031 1,763,260 0.59
7,000,000 China Development Bank 3.12% 13/09/2031 1,102,760 0.37
32,700,000 China Government Bond 2.75% 08/08/2022 5,146,381 1.73
14,000,000 China Government Bond 3.73% 19/10/2022 2,226,154 0.75
11,100,000 China Government Bond 3.05% 22/10/2022 1,752,385 0.59
12,000,000 China Government Bond 3.81% 18/01/2023 1,915,334 0.64
18,400,000 China Government Bond 2.24% 05/03/2023 2,882,816 0.97
7,700,000 China Government Bond 2.75% 17/03/2023 1,213,096 0.41
11,100,000 China Government Bond 3.17% 19/04/2023 1,760,190 0.59
7,500,000 China Government Bond 2.95% 16/06/2023 1,186,437 0.40
27,100,000 China Government Bond 2.36% 02/07/2023 4,251,165 1.43
10,000,000 China Government Bond 3.30% 12/07/2023 1,592,230 0.53
18,500,000 China Government Bond 2.75% 01/09/2023 2,916,943 0.98
17,800,000 China Government Bond 3.29% 18/10/2023 2,838,958 0.95

December 2021 Legal & General UCITS ETF Plc
L&G ESG China CNY Bond UCITS ETF
Schedule of Investments (continued)
As at 31 December 2021
430
Nominal Description
Coupon Rate
Maturity Date
Value $
% of Net
Assets
Government Bond (30 June 2021: 98.44%) (continued)
China (30 June 2021: 98.44%) (continued)
32,500,000 China Government Bond 2.88% 05/11/2023 5,143,928 1.73
7,500,000 China Government Bond 3.20% 16/03/2024 1,198,329 0.40
13,300,000 China Government Bond 4.42% 20/03/2024 2,198,352 0.74
29,000,000 China Government Bond 2.84% 08/04/2024 4,592,390 1.54
28,200,000 China Government Bond 3.19% 11/04/2024 4,501,169 1.51
14,000,000 China Government Bond 4.00% 19/06/2024 2,295,315 0.77
9,800,000 China Government Bond 3.57% 22/06/2024 1,584,755 0.53
13,500,000 China Government Bond 2.47% 02/09/2024 2,119,668 0.71
8,500,000 China Government Bond 4.13% 18/09/2024 1,402,588 0.47
11,750,000 China Government Bond 3.69% 21/09/2024 1,910,850 0.64
22,540,000 China Government Bond 2.94% 17/10/2024 3,583,209 1.20
10,000,000 China Government Bond 3.90% 21/12/2024 1,645,208 0.55
6,000,000 China Government Bond 3.77% 08/03/2025 983,683 0.33
33,900,000 China Government Bond 1.99% 09/04/2025 5,225,514 1.75
11,500,000 China Government Bond 3.61% 07/06/2025 1,874,216 0.63
11,200,000 China Government Bond 3.60% 06/09/2025 1,829,794 0.61
9,000,000 China Government Bond 2.99% 15/10/2025 1,433,201 0.48
33,920,000 China Government Bond 3.02% 22/10/2025 5,411,290 1.81
22,100,000 China Government Bond 3.22% 06/12/2025 3,554,422 1.19
12,400,000 China Government Bond 2.85% 28/01/2026 1,967,470 0.66
29,000,000 China Government Bond 3.03% 11/03/2026 4,632,816 1.55
12,000,000 China Government Bond 2.90% 05/05/2026 1,905,286 0.64
28,200,000 China Government Bond 3.25% 06/06/2026 4,548,433 1.53
15,500,000 China Government Bond 2.74% 04/08/2026 2,443,943 0.82
23,200,000 China Government Bond 2.69% 12/08/2026 3,657,114 1.23
5,800,000 China Government Bond 2.70% 03/11/2026 912,716 0.31
21,200,000 China Government Bond 3.12% 05/12/2026 3,407,461 1.14
11,500,000 China Government Bond 3.40% 09/02/2027 1,875,463 0.63
8,500,000 China Government Bond 3.52% 04/05/2027 1,394,842 0.47
34,000,000 China Government Bond 2.85% 04/06/2027 5,383,391 1.81

December 2021 Legal & General UCITS ETF Plc
L&G ESG China CNY Bond UCITS ETF
Schedule of Investments (continued)
As at 31 December 2021
431
Nominal Description
Coupon Rate
Maturity Date
Value $
% of Net
Assets
Government Bond (30 June 2021: 98.44%) (continued)
China (30 June 2021: 98.44%) (continued)
11,500,000 China Government Bond 3.59% 03/08/2027 1,893,860 0.64
10,500,000 China Government Bond 3.82% 02/11/2027 1,762,154 0.59
30,500,000 China Government Bond 3.28% 03/12/2027 4,950,108 1.66
14,000,000 China Government Bond 3.85% 01/02/2028 2,361,565 0.79
28,000,000 China Government Bond 3.01% 13/05/2028 4,454,820 1.49
13,000,000 China Government Bond 3.69% 17/05/2028 2,157,725 0.72
11,000,000 China Government Bond 3.54% 16/08/2028 1,811,621 0.61
13,500,000 China Government Bond 2.91% 14/10/2028 2,134,887 0.72
18,550,000 China Government Bond 3.25% 22/11/2028 2,991,680 1.00
26,300,000 China Government Bond 3.29% 23/05/2029 4,257,746 1.43
24,500,000 China Government Bond 3.13% 21/11/2029 3,914,554 1.31
33,160,000 China Government Bond 2.68% 21/05/2030 5,129,664 1.72
35,950,000 China Government Bond 3.27% 19/11/2030 5,838,588 1.96
32,900,000 China Government Bond 3.02% 27/05/2031 5,246,718 1.76
11,700,000 China Government Bond 2.89% 18/11/2031 1,854,645 0.62
3,000,000 Export-Import Bank of China/The 3.23% 04/11/2022 474,064 0.16
1,500,000 Export-Import Bank of China/The 4.97% 29/01/2023 241,638 0.08
4,400,000 Export-Import Bank of China/The 2.17% 07/04/2023 688,174 0.23
5,000,000 Export-Import Bank of China/The 4.37% 19/06/2023 805,055 0.27
5,000,000 Export-Import Bank of China/The 3.34% 04/09/2023 794,942 0.27
8,900,000 Export-Import Bank of China/The 3.28% 11/02/2024 1,416,089 0.47
7,000,000 Export-Import Bank of China/The 3.14% 02/04/2024 1,111,589 0.37
4,190,000 Export-Import Bank of China/The 2.93% 02/03/2025 662,247 0.22
2,750,000 Export-Import Bank of China/The 4.29% 07/04/2025 452,455 0.15
7,000,000 Export-Import Bank of China/The 3.87% 14/09/2025 1,139,208 0.38
9,800,000 Export-Import Bank of China/The 3.43% 23/10/2025 1,574,783 0.53
6,400,000 Export-Import Bank of China/The 3.33% 22/02/2026 1,024,153 0.34
4,500,000 Export-Import Bank of China/The 3.22% 14/05/2026 717,310 0.24
2,000,000 Export-Import Bank of China/The 3.18% 05/09/2026 318,211 0.11
5,350,000 Export-Import Bank of China/The 3.26% 24/02/2027 854,994 0.29

December 2021 Legal & General UCITS ETF Plc
L&G ESG China CNY Bond UCITS ETF
Schedule of Investments (continued)
As at 31 December 2021
432
Nominal Description
Coupon Rate
Maturity Date
Value $
% of Net
Assets
Government Bond (30 June 2021: 98.44%) (continued)
China (30 June 2021: 98.44%) (continued)
1,500,000 Export-Import Bank of China/The 4.11% 20/03/2027 249,087 0.08
7,270,000 Export-Import Bank of China/The 4.89% 26/03/2028 1,262,299 0.42
8,000,000 Export-Import Bank of China/The 3.86% 20/05/2029 1,320,029 0.44
8,300,000 Export-Import Bank of China/The 3.23% 23/03/2030 1,311,148 0.44
5,500,000 Export-Import Bank of China/The 3.74% 16/11/2030 902,701 0.30
3,000,000 Export-Import Bank of China/The 3.38% 16/07/2031 479,516 0.16
Total China 293,866,611 98.57
Total Government Bond 293,866,611 98.57
Total Investments
Government Bond 293,866,611 98.57
Other Assets and Liabilities 4,255,717 1.43
Net Assets Attributable to Holders of Redeemable Participating Shares
298,122,328 100.00
Analysis of Total Assets
% of Total
Assets
Transferable securities admitted to an official stock exchange listing or dealt on a regulated market 97.72
Other assets 2.28
100.00
Analysis of Total Assets rather than Net Assets is required under Schedule 12 of the UCITS Regulations.

December 2021 Legal & General UCITS ETF Plc
L&G UK Gilt 0-5 Year UCITS ETF
Schedule of Investments
As at 31 December 2021
433
Nominal Description
Coupon Rate
Maturity Date
Value £
% of Net
Assets
Government Bond (30 June 2021: 99.48%)
United Kingdom (30 June 2021: 99.48%)
1,530,000 United Kingdom Gilt 0.50% 22/07/2022 1,533,397 5.56
1,625,000 United Kingdom Gilt 1.75% 07/09/2022 1,641,542 5.95
1,920,000 United Kingdom Gilt 0.13% 31/01/2023 1,911,965 6.93
1,900,000 United Kingdom Gilt 0.75% 22/07/2023 1,907,543 6.92
1,860,000 United Kingdom Gilt 2.25% 07/09/2023 1,911,578 6.93
1,925,000 United Kingdom Gilt 0.13% 31/01/2024 1,903,883 6.90
1,915,000 United Kingdom Gilt 1.00% 22/04/2024 1,931,143 7.00
1,885,000 United Kingdom Gilt 2.75% 07/09/2024 1,987,487 7.20
715,000 United Kingdom Gilt 0.25% 31/01/2025 703,968 2.55
1,680,000 United Kingdom Gilt 5.00% 07/03/2025 1,904,347 6.90
2,310,000 United Kingdom Gilt 0.63% 07/06/2025 2,306,731 8.36
2,090,000 United Kingdom Gilt 2.00% 07/09/2025 2,187,164 7.93
1,910,000 United Kingdom Gilt 0.13% 30/01/2026 1,863,912 6.76
2,310,000 United Kingdom Gilt 1.50% 22/07/2026 2,390,596 8.67
1,410,000 United Kingdom Gilt 0.38% 22/10/2026 1,381,025 5.01
Total United Kingdom 27,466,281 99.57
Total Government Bond 27,466,281 99.57
Total Investments
Government Bond 27,466,281 99.57
Other Assets and Liabilities* 118,011 0.43
Net Assets Attributable to Holders of Redeemable Participating Shares 27,584,292 100.00
Analysis of Total Assets
% of Total
Assets
Transferable securities admitted to an official stock exchange listing or dealt on a regulated market 99.51
Other assets 0.49
100.00
Analysis of Total Assets rather than Net Assets is required under Schedule 12 of the UCITS Regulations.
*Included within other assets are holdings in LGIM Sterling Liquidity Fund with a value of £20,331. These are shown as "Cash and cash equivalents" within the Fund's Statement of Financial Position.
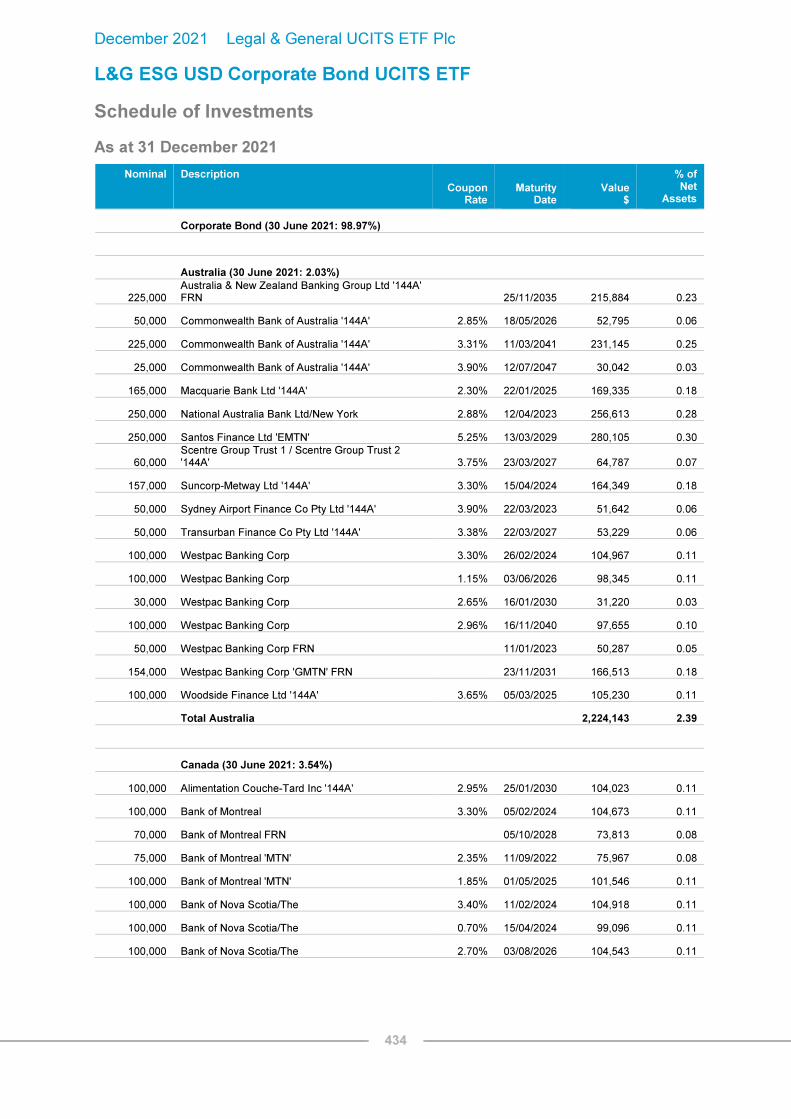
December 2021 Legal & General UCITS ETF Plc
L&G ESG USD Corporate Bond UCITS ETF
Schedule of Investments
As at 31 December 2021
434
Nominal Description
Coupon Rate
Maturity Date
Value $
% of Net
Assets
Corporate Bond (30 June 2021: 98.97%)
Australia (30 June 2021: 2.03%)
225,000 Australia & New Zealand Banking Group Ltd '144A' FRN 25/11/2035 215,884 0.23
50,000 Commonwealth Bank of Australia '144A' 2.85% 18/05/2026 52,795 0.06
225,000 Commonwealth Bank of Australia '144A' 3.31% 11/03/2041 231,145 0.25
25,000 Commonwealth Bank of Australia '144A' 3.90% 12/07/2047 30,042 0.03
165,000 Macquarie Bank Ltd '144A' 2.30% 22/01/2025 169,335 0.18
250,000 National Australia Bank Ltd/New York 2.88% 12/04/2023 256,613 0.28
250,000 Santos Finance Ltd 'EMTN' 5.25% 13/03/2029 280,105 0.30
60,000 Scentre Group Trust 1 / Scentre Group Trust 2 '144A' 3.75% 23/03/2027 64,787 0.07
157,000 Suncorp-Metway Ltd '144A' 3.30% 15/04/2024 164,349 0.18
50,000 Sydney Airport Finance Co Pty Ltd '144A' 3.90% 22/03/2023 51,642 0.06
50,000 Transurban Finance Co Pty Ltd '144A' 3.38% 22/03/2027 53,229 0.06
100,000 Westpac Banking Corp 3.30% 26/02/2024 104,967 0.11
100,000 Westpac Banking Corp 1.15% 03/06/2026 98,345 0.11
30,000 Westpac Banking Corp 2.65% 16/01/2030 31,220 0.03
100,000 Westpac Banking Corp 2.96% 16/11/2040 97,655 0.10
50,000 Westpac Banking Corp FRN 11/01/2023 50,287 0.05
154,000 Westpac Banking Corp 'GMTN' FRN 23/11/2031 166,513 0.18
100,000 Woodside Finance Ltd '144A' 3.65% 05/03/2025 105,230 0.11
Total Australia 2,224,143 2.39
Canada (30 June 2021: 3.54%)
100,000 Alimentation Couche-Tard Inc '144A' 2.95% 25/01/2030 104,023 0.11
100,000 Bank of Montreal 3.30% 05/02/2024 104,673 0.11
70,000 Bank of Montreal FRN 05/10/2028 73,813 0.08
75,000 Bank of Montreal 'MTN' 2.35% 11/09/2022 75,967 0.08
100,000 Bank of Montreal 'MTN' 1.85% 01/05/2025 101,546 0.11
100,000 Bank of Nova Scotia/The 3.40% 11/02/2024 104,918 0.11
100,000 Bank of Nova Scotia/The 0.70% 15/04/2024 99,096 0.11
100,000 Bank of Nova Scotia/The 2.70% 03/08/2026 104,543 0.11
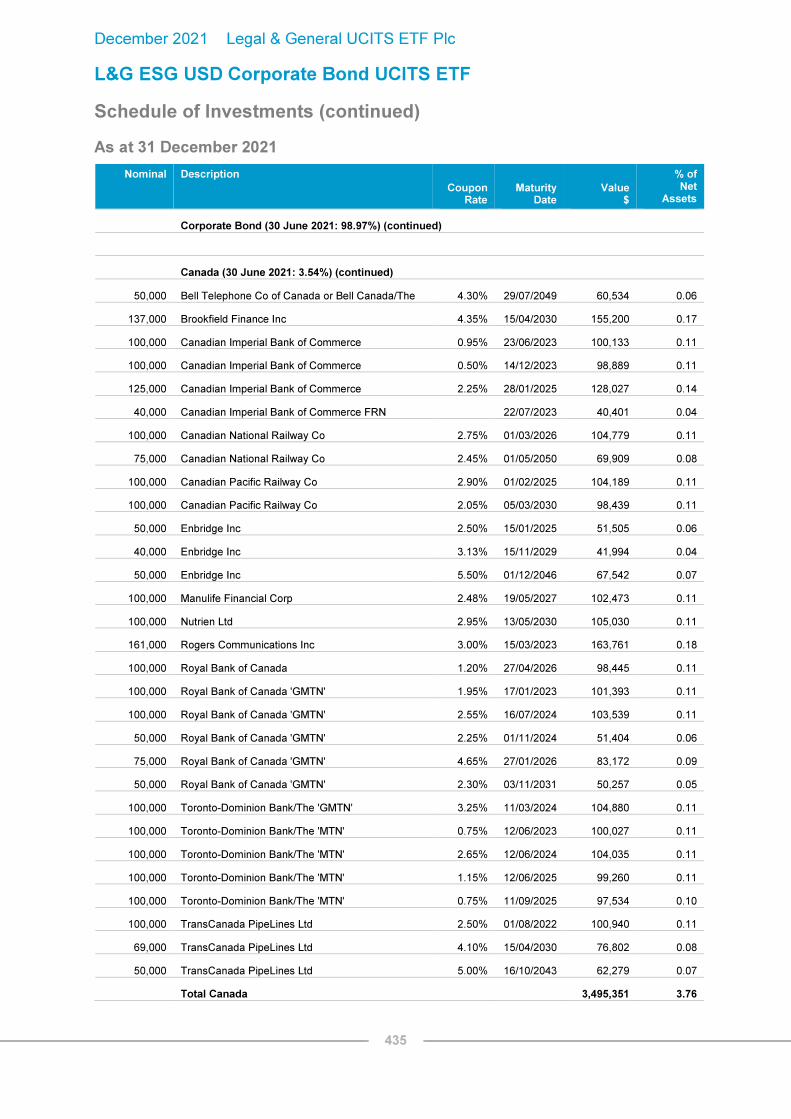
December 2021 Legal & General UCITS ETF Plc
L&G ESG USD Corporate Bond UCITS ETF
Schedule of Investments (continued)
As at 31 December 2021
435
Nominal Description
Coupon Rate
Maturity Date
Value $
% of Net
Assets
Corporate Bond (30 June 2021: 98.97%) (continued)
Canada (30 June 2021: 3.54%) (continued)
50,000 Bell Telephone Co of Canada or Bell Canada/The 4.30% 29/07/2049 60,534 0.06
137,000 Brookfield Finance Inc 4.35% 15/04/2030 155,200 0.17
100,000 Canadian Imperial Bank of Commerce 0.95% 23/06/2023 100,133 0.11
100,000 Canadian Imperial Bank of Commerce 0.50% 14/12/2023 98,889 0.11
125,000 Canadian Imperial Bank of Commerce 2.25% 28/01/2025 128,027 0.14
40,000 Canadian Imperial Bank of Commerce FRN 22/07/2023 40,401 0.04
100,000 Canadian National Railway Co 2.75% 01/03/2026 104,779 0.11
75,000 Canadian National Railway Co 2.45% 01/05/2050 69,909 0.08
100,000 Canadian Pacific Railway Co 2.90% 01/02/2025 104,189 0.11
100,000 Canadian Pacific Railway Co 2.05% 05/03/2030 98,439 0.11
50,000 Enbridge Inc 2.50% 15/01/2025 51,505 0.06
40,000 Enbridge Inc 3.13% 15/11/2029 41,994 0.04
50,000 Enbridge Inc 5.50% 01/12/2046 67,542 0.07
100,000 Manulife Financial Corp 2.48% 19/05/2027 102,473 0.11
100,000 Nutrien Ltd 2.95% 13/05/2030 105,030 0.11
161,000 Rogers Communications Inc 3.00% 15/03/2023 163,761 0.18
100,000 Royal Bank of Canada 1.20% 27/04/2026 98,445 0.11
100,000 Royal Bank of Canada 'GMTN' 1.95% 17/01/2023 101,393 0.11
100,000 Royal Bank of Canada 'GMTN' 2.55% 16/07/2024 103,539 0.11
50,000 Royal Bank of Canada 'GMTN' 2.25% 01/11/2024 51,404 0.06
75,000 Royal Bank of Canada 'GMTN' 4.65% 27/01/2026 83,172 0.09
50,000 Royal Bank of Canada 'GMTN' 2.30% 03/11/2031 50,257 0.05
100,000 Toronto-Dominion Bank/The 'GMTN' 3.25% 11/03/2024 104,880 0.11
100,000 Toronto-Dominion Bank/The 'MTN' 0.75% 12/06/2023 100,027 0.11
100,000 Toronto-Dominion Bank/The 'MTN' 2.65% 12/06/2024 104,035 0.11
100,000 Toronto-Dominion Bank/The 'MTN' 1.15% 12/06/2025 99,260 0.11
100,000 Toronto-Dominion Bank/The 'MTN' 0.75% 11/09/2025 97,534 0.10
100,000 TransCanada PipeLines Ltd 2.50% 01/08/2022 100,940 0.11
69,000 TransCanada PipeLines Ltd 4.10% 15/04/2030 76,802 0.08
50,000 TransCanada PipeLines Ltd 5.00% 16/10/2043 62,279 0.07
Total Canada 3,495,351 3.76

December 2021 Legal & General UCITS ETF Plc
L&G ESG USD Corporate Bond UCITS ETF
Schedule of Investments (continued)
As at 31 December 2021
436
Nominal Description
Coupon Rate
Maturity Date
Value $
% of Net
Assets
Corporate Bond (30 June 2021: 98.97%) (continued)
Cayman Islands (30 June 2021: 0.47%)
100,000 Avolon Holdings Funding Ltd '144A' 3.25% 15/02/2027 101,246 0.11
79,000 Avolon Holdings Funding Ltd '144A' 2.53% 18/11/2027 77,014 0.09
28,000 Park Aerospace Holdings Ltd '144A' 5.50% 15/02/2024 30,074 0.03
Total Cayman Islands 208,334 0.23
France (30 June 2021: 2.01%)
200,000 Banque Federative du Credit Mutuel SA '144A' 3.75% 20/07/2023 208,604 0.22
200,000 BNP Paribas SA '144A' 4.63% 13/03/2027 221,124 0.24
200,000 BNP Paribas SA '144A' 4.40% 14/08/2028 224,463 0.24
100,000 BNP Paribas SA 'MTN' 3.25% 03/03/2023 102,906 0.11
200,000 BPCE SA '144A' 5.15% 21/07/2024 216,463 0.23
250,000 BPCE SA '144A' 1.00% 20/01/2026 242,381 0.26
75,000 Electricite de France SA '144A' 3.63% 13/10/2025 80,284 0.09
230,000 La Mondiale SAM FRN 26/01/2047 258,463 0.28
70,000 Orange SA 9.00% 01/03/2031 107,215 0.11
150,000 Pernod Ricard SA '144A' 3.25% 08/06/2026 160,276 0.17
100,000 Sanofi 3.63% 19/06/2028 112,764 0.12
100,000 Schneider Electric SE '144A' 2.95% 27/09/2022 101,653 0.11
200,000 Societe Generale SA '144A' 4.25% 14/09/2023 210,173 0.23
200,000 Societe Generale SA '144A' 4.75% 14/09/2028 228,298 0.25
Total France 2,475,067 2.66
Germany (30 June 2021: 0.19%)
75,000 Deutsche Bank AG/London 3.70% 30/05/2024 78,735 0.08
100,000 Deutsche Bank AG/New York NY FRN 16/11/2022 100,551 0.11
Total Germany 179,286 0.19
International (30 June 2021: 0.51%)
99,000 Broadcom Corp / Broadcom Cayman Finance Ltd 3.88% 15/01/2027 107,550 0.11
100,000 Delta Air Lines Inc / SkyMiles IP Ltd '144A' 4.75% 20/10/2028 109,784 0.12

December 2021 Legal & General UCITS ETF Plc
L&G ESG USD Corporate Bond UCITS ETF
Schedule of Investments (continued)
As at 31 December 2021
437
Nominal Description
Coupon Rate
Maturity Date
Value $
% of Net
Assets
Corporate Bond (30 June 2021: 98.97%) (continued)
International (30 June 2021: 0.51%) (continued)
121,000 NXP BV / NXP Funding LLC / NXP USA Inc '144A' 4.30% 18/06/2029 135,850 0.15
100,000 NXP BV / NXP Funding LLC '144A' 5.35% 01/03/2026 112,967 0.12
Total International 466,151 0.50
Ireland (30 June 2021: 0.66%)
150,000 AerCap Ireland Capital DAC / AerCap Global Aviation Trust 4.88% 16/01/2024 159,552 0.17
150,000 AerCap Ireland Capital DAC / AerCap Global Aviation Trust 2.88% 14/08/2024 154,316 0.17
200,000 AerCap Ireland Capital DAC / AerCap Global Aviation Trust 3.30% 30/01/2032 203,580 0.22
100,000 Johnson Controls International plc / Tyco Fire & Security Finance SCA 1.75% 15/09/2030 95,688 0.10
40,000 Shire Acquisitions Investments Ireland DAC 2.88% 23/09/2023 41,148 0.04
Total Ireland 654,284 0.70
Japan (30 June 2021: 2.65%)
40,000 Mitsubishi UFJ Financial Group Inc 3.00% 22/02/2022 40,138 0.04
200,000 Mitsubishi UFJ Financial Group Inc 3.46% 02/03/2023 206,001 0.22
200,000 Mitsubishi UFJ Financial Group Inc 2.80% 18/07/2024 207,569 0.22
71,000 Mitsubishi UFJ Financial Group Inc 4.29% 26/07/2038 85,068 0.09
50,000 Mitsubishi UFJ Financial Group Inc 4.15% 07/03/2039 59,291 0.06
40,000 Mitsubishi UFJ Financial Group Inc FRN 25/07/2022 40,141 0.04
173,000 Mitsubishi UFJ Financial Group Inc FRN 26/07/2023 174,349 0.19
200,000 Mizuho Financial Group Inc '144A' 3.48% 12/04/2026 213,659 0.23
200,000 Mizuho Financial Group Inc FRN 25/05/2026 202,917 0.22
200,000 Nippon Life Insurance Co '144A' FRN 20/01/2046 218,125 0.24
200,000 Nomura Holdings Inc 2.17% 14/07/2028 196,054 0.21
200,000 NTT Finance Corp '144A' 1.16% 03/04/2026 196,190 0.21
75,000 Sumitomo Mitsui Financial Group Inc 3.94% 16/10/2023 78,837 0.09
100,000 Sumitomo Mitsui Financial Group Inc 3.78% 09/03/2026 108,271 0.12
157,000 Sumitomo Mitsui Financial Group Inc 3.45% 11/01/2027 169,027 0.18
157,000 Sumitomo Mitsui Financial Group Inc 3.20% 17/09/2029 163,549 0.18
75,000 Sumitomo Mitsui Financial Group Inc 2.14% 23/09/2030 72,218 0.08

December 2021 Legal & General UCITS ETF Plc
L&G ESG USD Corporate Bond UCITS ETF
Schedule of Investments (continued)
As at 31 December 2021
438
Nominal Description
Coupon Rate
Maturity Date
Value $
% of Net
Assets
Corporate Bond (30 June 2021: 98.97%) (continued)
Japan (30 June 2021: 2.65%) (continued)
225,000 Takeda Pharmaceutical Co Ltd 3.03% 09/07/2040 227,095 0.24
Total Japan 2,658,499 2.86
Luxembourg (30 June 2021: 0.19%)
100,000 DH Europe Finance II Sarl 2.05% 15/11/2022 101,024 0.11
50,000 DH Europe Finance II Sarl 3.25% 15/11/2039 53,449 0.06
50,000 Schlumberger Investment SA 3.65% 01/12/2023 52,168 0.05
72,000 Schlumberger Investment SA 2.65% 26/06/2030 73,801 0.08
Total Luxembourg 280,442 0.30
Netherlands (30 June 2021: 2.34%)
250,000 Cooperatieve Rabobank UA '144A' 2.63% 22/07/2024 258,579 0.28
51,000 Cooperatieve Rabobank UA 'BKNT' 5.25% 24/05/2041 71,685 0.08
115,000 Deutsche Telekom International Finance BV 8.75% 15/06/2030 167,396 0.18
150,000 Deutsche Telekom International Finance BV '144A' 3.60% 19/01/2027 161,010 0.17
136,000 Heineken NV '144A' 3.50% 29/01/2028 146,883 0.16
200,000 ING Groep NV 3.95% 29/03/2027 219,093 0.23
200,000 ING Groep NV FRN 01/04/2032 204,463 0.22
100,000 Koninklijke Philips NV 5.00% 15/03/2042 126,815 0.14
50,000 LyondellBasell Industries NV 4.63% 26/02/2055 61,748 0.07
250,000 Siemens Financieringsmaatschappij NV '144A' 3.40% 16/03/2027 269,334 0.29
Total Netherlands 1,687,006 1.82
Norway (30 June 2021: 0.29%)
60,000 Equinor ASA 3.70% 01/03/2024 63,321 0.07
81,000 Equinor ASA 3.63% 10/09/2028 89,371 0.10
58,000 Equinor ASA 3.70% 06/04/2050 66,703 0.07
100,000 Yara International ASA '144A' 3.15% 04/06/2030 103,795 0.11
Total Norway 323,190 0.35

December 2021 Legal & General UCITS ETF Plc
L&G ESG USD Corporate Bond UCITS ETF
Schedule of Investments (continued)
As at 31 December 2021
439
Nominal Description
Coupon Rate
Maturity Date
Value $
% of Net
Assets
Corporate Bond (30 June 2021: 98.97%) (continued)
Spain (30 June 2021: 0.67%)
200,000 Banco Santander SA 2.75% 28/05/2025 206,614 0.22
200,000 Banco Santander SA 4.25% 11/04/2027 220,021 0.24
150,000 Telefonica Emisiones SA 5.21% 08/03/2047 190,153 0.20
Total Spain 616,788 0.66
Switzerland (30 June 2021: 1.63%)
250,000 Credit Suisse AG/New York NY 1.00% 05/05/2023 250,672 0.27
250,000 Credit Suisse Group AG 3.75% 26/03/2025 265,466 0.29
200,000 UBS Group AG '144A' 4.13% 15/04/2026 218,469 0.23
200,000 UBS Group AG '144A' 4.25% 23/03/2028 220,575 0.24
225,000 UBS Group AG '144A' FRN 11/02/2032 217,884 0.23
Total Switzerland 1,173,066 1.26
United Kingdom (30 June 2021: 5.40%)
100,000 AstraZeneca Plc 3.38% 16/11/2025 107,147 0.11
100,000 AstraZeneca Plc 0.70% 08/04/2026 96,523 0.10
100,000 AstraZeneca Plc 2.13% 06/08/2050 89,364 0.10
200,000 Barclays Bank Plc 'BKNT' 3.75% 15/05/2024 212,185 0.23
200,000 Barclays Plc 4.34% 10/01/2028 218,970 0.24
200,000 Barclays Plc FRN 10/03/2032 198,456 0.21
200,000 Diageo Capital Plc 2.13% 24/10/2024 204,850 0.22
200,000 Diageo Capital Plc 2.38% 24/10/2029 204,463 0.22
40,000 GlaxoSmithKline Capital Plc 2.88% 01/06/2022 40,268 0.04
100,000 HSBC Holdings Plc 6.50% 02/05/2036 135,552 0.15
150,000 HSBC Holdings Plc 6.80% 01/06/2038 212,355 0.23
75,000 HSBC Holdings Plc 6.10% 14/01/2042 107,176 0.11
200,000 HSBC Holdings Plc FRN 22/11/2023 203,537 0.22
200,000 HSBC Holdings Plc FRN 18/04/2026 198,756 0.21
200,000 HSBC Holdings Plc FRN 19/06/2029 224,377 0.24
200,000 Lloyds Banking Group Plc 4.05% 16/08/2023 209,572 0.22
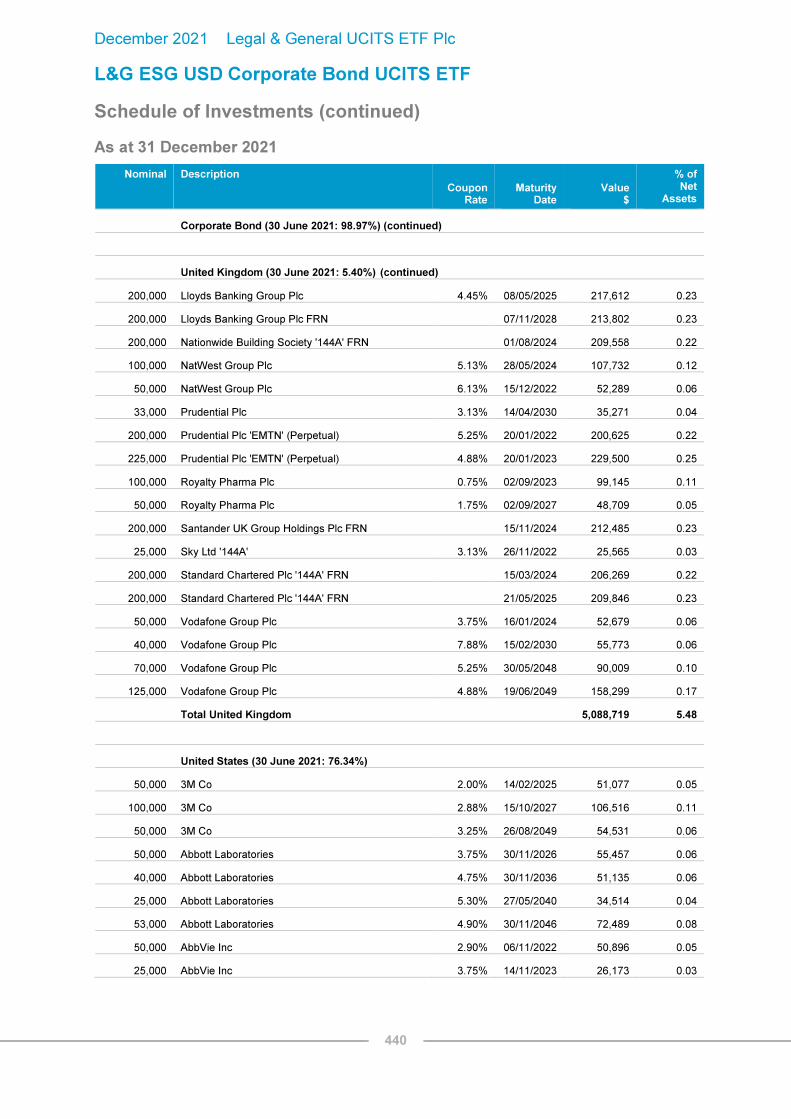
December 2021 Legal & General UCITS ETF Plc
L&G ESG USD Corporate Bond UCITS ETF
Schedule of Investments (continued)
As at 31 December 2021
440
Nominal Description
Coupon Rate
Maturity Date
Value $
% of Net
Assets
Corporate Bond (30 June 2021: 98.97%) (continued)
United Kingdom (30 June 2021: 5.40%) (continued)
200,000 Lloyds Banking Group Plc 4.45% 08/05/2025 217,612 0.23
200,000 Lloyds Banking Group Plc FRN 07/11/2028 213,802 0.23
200,000 Nationwide Building Society '144A' FRN 01/08/2024 209,558 0.22
100,000 NatWest Group Plc 5.13% 28/05/2024 107,732 0.12
50,000 NatWest Group Plc 6.13% 15/12/2022 52,289 0.06
33,000 Prudential Plc 3.13% 14/04/2030 35,271 0.04
200,000 Prudential Plc 'EMTN' (Perpetual) 5.25% 20/01/2022 200,625 0.22
225,000 Prudential Plc 'EMTN' (Perpetual) 4.88% 20/01/2023 229,500 0.25
100,000 Royalty Pharma Plc 0.75% 02/09/2023 99,145 0.11
50,000 Royalty Pharma Plc 1.75% 02/09/2027 48,709 0.05
200,000 Santander UK Group Holdings Plc FRN 15/11/2024 212,485 0.23
25,000 Sky Ltd '144A' 3.13% 26/11/2022 25,565 0.03
200,000 Standard Chartered Plc '144A' FRN 15/03/2024 206,269 0.22
200,000 Standard Chartered Plc '144A' FRN 21/05/2025 209,846 0.23
50,000 Vodafone Group Plc 3.75% 16/01/2024 52,679 0.06
40,000 Vodafone Group Plc 7.88% 15/02/2030 55,773 0.06
70,000 Vodafone Group Plc 5.25% 30/05/2048 90,009 0.10
125,000 Vodafone Group Plc 4.88% 19/06/2049 158,299 0.17
Total United Kingdom 5,088,719 5.48
United States (30 June 2021: 76.34%)
50,000 3M Co 2.00% 14/02/2025 51,077 0.05
100,000 3M Co 2.88% 15/10/2027 106,516 0.11
50,000 3M Co 3.25% 26/08/2049 54,531 0.06
50,000 Abbott Laboratories 3.75% 30/11/2026 55,457 0.06
40,000 Abbott Laboratories 4.75% 30/11/2036 51,135 0.06
25,000 Abbott Laboratories 5.30% 27/05/2040 34,514 0.04
53,000 Abbott Laboratories 4.90% 30/11/2046 72,489 0.08
50,000 AbbVie Inc 2.90% 06/11/2022 50,896 0.05
25,000 AbbVie Inc 3.75% 14/11/2023 26,173 0.03

December 2021 Legal & General UCITS ETF Plc
L&G ESG USD Corporate Bond UCITS ETF
Schedule of Investments (continued)
As at 31 December 2021
441
Nominal Description
Coupon Rate
Maturity Date
Value $
% of Net
Assets
Corporate Bond (30 June 2021: 98.97%) (continued)
United States (30 June 2021: 76.34%) (continued)
60,000 AbbVie Inc 3.85% 15/06/2024 63,395 0.07
100,000 AbbVie Inc 2.60% 21/11/2024 103,254 0.11
50,000 AbbVie Inc 3.60% 14/05/2025 53,121 0.06
40,000 AbbVie Inc 3.20% 14/05/2026 42,316 0.05
100,000 AbbVie Inc 2.95% 21/11/2026 105,343 0.11
40,000 AbbVie Inc 4.30% 14/05/2036 47,182 0.05
50,000 AbbVie Inc 4.05% 21/11/2039 57,333 0.06
100,000 AbbVie Inc 4.40% 06/11/2042 120,467 0.13
105,000 AbbVie Inc 4.45% 14/05/2046 127,116 0.14
65,000 AbbVie Inc 4.25% 21/11/2049 77,765 0.08
100,000 Activision Blizzard Inc 3.40% 15/09/2026 107,150 0.12
100,000 Activision Blizzard Inc 1.35% 15/09/2030 92,513 0.10
50,000 Aflac Inc 4.75% 15/01/2049 66,591 0.07
100,000 Air Lease Corp 3.63% 01/12/2027 105,620 0.11
50,000 Air Lease Corp 'MTN' 4.25% 01/02/2024 52,888 0.06
40,000 Air Products and Chemicals Inc 1.85% 15/05/2027 40,594 0.04
30,000 Air Products and Chemicals Inc 2.80% 15/05/2050 30,595 0.03
51,000 Alexandria Real Estate Equities Inc 4.90% 15/12/2030 61,023 0.07
100,000 Alexandria Real Estate Equities Inc 3.38% 15/08/2031 108,265 0.12
25,000 Alexandria Real Estate Equities Inc 2.00% 18/05/2032 24,031 0.03
40,000 Allstate Corp/The 5.55% 09/05/2035 53,071 0.06
50,000 Allstate Corp/The 4.20% 15/12/2046 60,995 0.07
100,000 Ally Financial Inc 8.00% 01/11/2031 141,368 0.15
50,000 Alphabet Inc 2.00% 15/08/2026 51,498 0.06
50,000 Alphabet Inc 2.05% 15/08/2050 44,770 0.05
112,000 American Equity Investment Life Holding Co 5.00% 15/06/2027 127,662 0.14
100,000 American Express Co 3.70% 03/08/2023 104,357 0.11
100,000 American Express Credit Corp 'MTN' 3.30% 03/05/2027 107,575 0.12
156,000 American Honda Finance Corp 'MTN' 2.90% 16/02/2024 162,100 0.17
40,000 American Honda Finance Corp 'MTN' 1.80% 13/01/2031 39,210 0.04

December 2021 Legal & General UCITS ETF Plc
L&G ESG USD Corporate Bond UCITS ETF
Schedule of Investments (continued)
As at 31 December 2021
442
Nominal Description
Coupon Rate
Maturity Date
Value $
% of Net
Assets
Corporate Bond (30 June 2021: 98.97%) (continued)
United States (30 June 2021: 76.34%) (continued)
100,000 American International Group Inc 3.40% 30/06/2030 108,251 0.12
61,000 American International Group Inc 4.50% 16/07/2044 75,047 0.08
125,000 American International Group Inc 4.75% 01/04/2048 161,175 0.17
125,000 American Tower Corp 2.95% 15/01/2025 129,887 0.14
100,000 American Tower Corp 1.50% 31/01/2028 95,595 0.10
40,000 American Tower Corp 2.70% 15/04/2031 40,566 0.04
67,000 American Water Capital Corp 3.75% 01/09/2047 74,839 0.08
50,000 AmerisourceBergen Corp 2.80% 15/05/2030 51,296 0.06
40,000 Amgen Inc 3.63% 22/05/2024 42,118 0.05
40,000 Amgen Inc 2.20% 21/02/2027 40,730 0.04
40,000 Amgen Inc 2.30% 25/02/2031 40,182 0.04
100,000 Amgen Inc 3.15% 21/02/2040 102,118 0.11
100,000 Amgen Inc 4.95% 01/10/2041 126,741 0.14
50,000 Amgen Inc 3.38% 21/02/2050 52,101 0.06
25,000 Amgen Inc 2.77% 01/09/2053 23,018 0.02
100,000 Anheuser-Busch Cos LLC / Anheuser-Busch InBev Worldwide Inc 3.65% 01/02/2026 108,068 0.12
100,000 Anheuser-Busch Cos LLC / Anheuser-Busch InBev Worldwide Inc 4.90% 01/02/2046 126,554 0.14
65,000 Anheuser-Busch InBev Finance Inc 4.00% 17/01/2043 72,716 0.08
125,000 Anheuser-Busch InBev Worldwide Inc 3.50% 01/06/2030 136,442 0.15
50,000 Anheuser-Busch InBev Worldwide Inc 5.45% 23/01/2039 65,518 0.07
80,000 Anheuser-Busch InBev Worldwide Inc 4.60% 15/04/2048 98,144 0.11
50,000 Anheuser-Busch InBev Worldwide Inc 5.55% 23/01/2049 69,480 0.07
60,000 Anheuser-Busch InBev Worldwide Inc 5.80% 23/01/2059 87,219 0.09
40,000 Anheuser-Busch InBev Worldwide Inc 4.60% 01/06/2060 49,899 0.05
100,000 Anthem Inc 2.88% 15/09/2029 104,757 0.11
100,000 Anthem Inc 4.38% 01/12/2047 123,233 0.13
40,000 Anthem Inc 3.70% 15/09/2049 44,874 0.05
125,000 Anthem Inc 3.13% 15/05/2050 129,179 0.14
50,000 Aon Corp 3.75% 02/05/2029 54,984 0.06
100,000 Apollo Management Holdings LP '144A' 4.00% 30/05/2024 106,167 0.11

December 2021 Legal & General UCITS ETF Plc
L&G ESG USD Corporate Bond UCITS ETF
Schedule of Investments (continued)
As at 31 December 2021
443
Nominal Description
Coupon Rate
Maturity Date
Value $
% of Net
Assets
Corporate Bond (30 June 2021: 98.97%) (continued)
United States (30 June 2021: 76.34%) (continued)
150,000 Apple Inc 2.50% 09/02/2022 150,021 0.16
100,000 Apple Inc 3.45% 06/05/2024 105,838 0.11
100,000 Apple Inc 2.85% 11/05/2024 104,410 0.11
100,000 Apple Inc 2.75% 13/01/2025 104,847 0.11
100,000 Apple Inc 1.13% 11/05/2025 99,813 0.11
100,000 Apple Inc 2.05% 11/09/2026 102,285 0.11
100,000 Apple Inc 3.20% 11/05/2027 108,174 0.12
25,000 Apple Inc 1.20% 08/02/2028 24,401 0.03
100,000 Apple Inc 2.20% 11/09/2029 102,319 0.11
100,000 Apple Inc 3.45% 09/02/2045 111,384 0.12
117,000 Apple Inc 3.75% 12/09/2047 137,042 0.15
140,000 Apple Inc 2.65% 08/02/2051 136,421 0.15
125,000 Apple Inc 2.55% 20/08/2060 117,695 0.13
70,000 Applied Materials Inc 5.10% 01/10/2035 91,235 0.10
100,000 Archer-Daniels-Midland Co 3.25% 27/03/2030 108,755 0.12
160,000 Ares Capital Corp 3.50% 10/02/2023 163,745 0.18
35,000 Ares Capital Corp 2.88% 15/06/2028 34,896 0.04
63,000 Arrow Electronics Inc 3.88% 12/01/2028 67,690 0.07
50,000 AT&T Inc 3.00% 30/06/2022 50,414 0.05
40,000 AT&T Inc 3.40% 15/05/2025 42,380 0.05
100,000 AT&T Inc 4.25% 01/03/2027 111,317 0.12
100,000 AT&T Inc 2.30% 01/06/2027 101,765 0.11
100,000 AT&T Inc 1.65% 01/02/2028 98,032 0.11
100,000 AT&T Inc 4.30% 15/02/2030 113,068 0.12
75,000 AT&T Inc 2.75% 01/06/2031 76,179 0.08
100,000 AT&T Inc 2.55% 01/12/2033 97,917 0.11
50,000 AT&T Inc 4.85% 01/03/2039 58,589 0.06
51,000 AT&T Inc 3.50% 01/06/2041 52,514 0.06
76,000 AT&T Inc 4.30% 15/12/2042 84,872 0.09
225,000 AT&T Inc 3.10% 01/02/2043 218,253 0.23
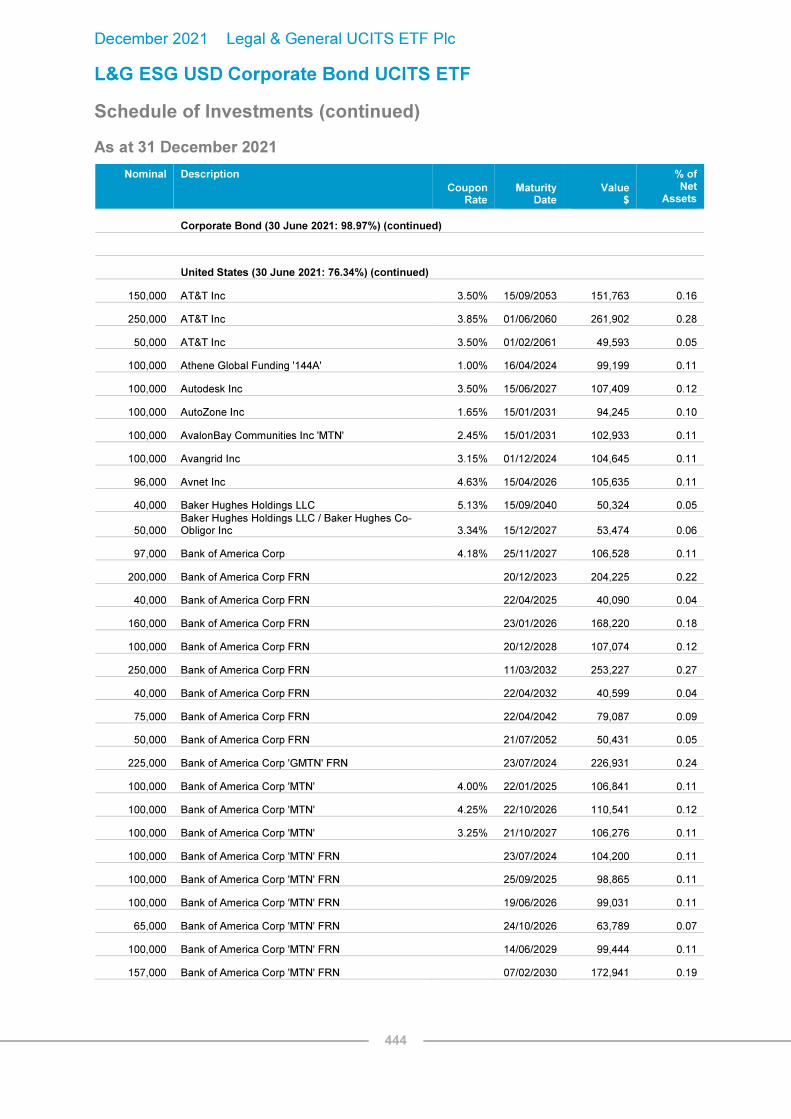
December 2021 Legal & General UCITS ETF Plc
L&G ESG USD Corporate Bond UCITS ETF
Schedule of Investments (continued)
As at 31 December 2021
444
Nominal Description
Coupon Rate
Maturity Date
Value $
% of Net
Assets
Corporate Bond (30 June 2021: 98.97%) (continued)
United States (30 June 2021: 76.34%) (continued)
150,000 AT&T Inc 3.50% 15/09/2053 151,763 0.16
250,000 AT&T Inc 3.85% 01/06/2060 261,902 0.28
50,000 AT&T Inc 3.50% 01/02/2061 49,593 0.05
100,000 Athene Global Funding '144A' 1.00% 16/04/2024 99,199 0.11
100,000 Autodesk Inc 3.50% 15/06/2027 107,409 0.12
100,000 AutoZone Inc 1.65% 15/01/2031 94,245 0.10
100,000 AvalonBay Communities Inc 'MTN' 2.45% 15/01/2031 102,933 0.11
100,000 Avangrid Inc 3.15% 01/12/2024 104,645 0.11
96,000 Avnet Inc 4.63% 15/04/2026 105,635 0.11
40,000 Baker Hughes Holdings LLC 5.13% 15/09/2040 50,324 0.05
50,000 Baker Hughes Holdings LLC / Baker Hughes Co-Obligor Inc 3.34% 15/12/2027 53,474 0.06
97,000 Bank of America Corp 4.18% 25/11/2027 106,528 0.11
200,000 Bank of America Corp FRN 20/12/2023 204,225 0.22
40,000 Bank of America Corp FRN 22/04/2025 40,090 0.04
160,000 Bank of America Corp FRN 23/01/2026 168,220 0.18
100,000 Bank of America Corp FRN 20/12/2028 107,074 0.12
250,000 Bank of America Corp FRN 11/03/2032 253,227 0.27
40,000 Bank of America Corp FRN 22/04/2032 40,599 0.04
75,000 Bank of America Corp FRN 22/04/2042 79,087 0.09
50,000 Bank of America Corp FRN 21/07/2052 50,431 0.05
225,000 Bank of America Corp 'GMTN' FRN 23/07/2024 226,931 0.24
100,000 Bank of America Corp 'MTN' 4.00% 22/01/2025 106,841 0.11
100,000 Bank of America Corp 'MTN' 4.25% 22/10/2026 110,541 0.12
100,000 Bank of America Corp 'MTN' 3.25% 21/10/2027 106,276 0.11
100,000 Bank of America Corp 'MTN' FRN 23/07/2024 104,200 0.11
100,000 Bank of America Corp 'MTN' FRN 25/09/2025 98,865 0.11
100,000 Bank of America Corp 'MTN' FRN 19/06/2026 99,031 0.11
65,000 Bank of America Corp 'MTN' FRN 24/10/2026 63,789 0.07
100,000 Bank of America Corp 'MTN' FRN 14/06/2029 99,444 0.11
157,000 Bank of America Corp 'MTN' FRN 07/02/2030 172,941 0.19

December 2021 Legal & General UCITS ETF Plc
L&G ESG USD Corporate Bond UCITS ETF
Schedule of Investments (continued)
As at 31 December 2021
445
Nominal Description
Coupon Rate
Maturity Date
Value $
% of Net
Assets
Corporate Bond (30 June 2021: 98.97%) (continued)
United States (30 June 2021: 76.34%) (continued)
100,000 Bank of America Corp 'MTN' FRN 13/02/2031 100,259 0.11
40,000 Bank of America Corp 'MTN' FRN 23/04/2040 46,153 0.05
40,000 Bank of America Corp 'MTN' FRN 19/06/2041 38,458 0.04
48,000 Bank of America Corp 'MTN' FRN 20/01/2048 59,865 0.06
135,000 Bank of America Corp 'MTN' FRN 20/03/2051 162,467 0.17
75,000 Bank of New York Mellon Corp/The 'MTN' 2.20% 16/08/2023 76,693 0.08
100,000 Bank of New York Mellon Corp/The 'MTN' 1.60% 24/04/2025 100,980 0.11
154,000 Bank of New York Mellon Corp/The 'MTN' 3.25% 16/05/2027 165,982 0.18
100,000 Barrick North America Finance LLC 5.70% 30/05/2041 136,460 0.15
50,000 Baxter International Inc 2.60% 15/08/2026 51,973 0.06
100,000 Baxter International Inc 3.95% 01/04/2030 112,101 0.12
50,000 Baxter International Inc '144A' 2.54% 01/02/2032 50,587 0.05
50,000 Bayer US Finance II LLC '144A' 3.38% 15/07/2024 52,194 0.06
50,000 Baylor Scott & White Holdings 2.84% 15/11/2050 50,196 0.05
75,000 Becton Dickinson and Co 3.70% 06/06/2027 81,475 0.09
50,000 Becton Dickinson and Co 4.67% 06/06/2047 63,366 0.07
75,000 Berry Global Inc 1.57% 15/01/2026 73,764 0.08
100,000 Best Buy Co Inc 4.45% 01/10/2028 114,551 0.12
100,000 Biogen Inc 3.15% 01/05/2050 97,640 0.11
67,000 Biogen Inc '144A' 3.25% 15/02/2051 66,393 0.07
40,000 BlackRock Inc 1.90% 28/01/2031 39,426 0.04
100,000 BMW US Capital LLC '144A' 3.80% 06/04/2023 103,660 0.11
100,000 BMW US Capital LLC '144A' 4.15% 09/04/2030 113,822 0.12
100,000 Boston Properties LP 3.65% 01/02/2026 107,095 0.12
66,000 Boston Properties LP 3.25% 30/01/2031 69,213 0.07
50,000 Boston Scientific Corp 2.65% 01/06/2030 50,884 0.05
50,000 Bristol-Myers Squibb Co 2.75% 15/02/2023 50,999 0.05
75,000 Bristol-Myers Squibb Co 2.90% 26/07/2024 78,081 0.08
100,000 Bristol-Myers Squibb Co 3.45% 15/11/2027 109,216 0.12
30,000 Bristol-Myers Squibb Co 4.13% 15/06/2039 34,877 0.04

December 2021 Legal & General UCITS ETF Plc
L&G ESG USD Corporate Bond UCITS ETF
Schedule of Investments (continued)
As at 31 December 2021
446
Nominal Description
Coupon Rate
Maturity Date
Value $
% of Net
Assets
Corporate Bond (30 June 2021: 98.97%) (continued)
United States (30 June 2021: 76.34%) (continued)
100,000 Bristol-Myers Squibb Co 4.25% 26/10/2049 124,910 0.13
100,000 Bristol-Myers Squibb Co 2.55% 13/11/2050 92,570 0.10
50,000 Brixmor Operating Partnership LP 4.13% 15/06/2026 54,253 0.06
75,000 Broadcom Inc 3.46% 15/09/2026 80,034 0.09
160,000 Broadcom Inc 4.11% 15/09/2028 175,701 0.19
40,000 Broadcom Inc 4.75% 15/04/2029 45,587 0.05
100,000 Broadcom Inc 5.00% 15/04/2030 116,676 0.13
60,000 Broadcom Inc 4.15% 15/11/2030 66,526 0.07
140,000 Broadcom Inc 4.30% 15/11/2032 157,731 0.17
50,000 Broadcom Inc '144A' 2.45% 15/02/2031 48,862 0.05
130,000 Broadcom Inc '144A' 2.60% 15/02/2033 125,653 0.14
26,000 Broadcom Inc '144A' 3.47% 15/04/2034 27,145 0.03
75,000 Broadcom Inc '144A' 3.75% 15/02/2051 79,416 0.09
100,000 Brookfield Finance LLC 3.45% 15/04/2050 104,271 0.11
100,000 Brooklyn Union Gas Co/The '144A' 4.50% 10/03/2046 117,426 0.13
25,000 Bunge Ltd Finance Corp 3.75% 25/09/2027 27,186 0.03
101,000 Burlington Northern Santa Fe LLC 4.15% 01/04/2045 122,119 0.13
100,000 Burlington Northern Santa Fe LLC 3.90% 01/08/2046 117,266 0.13
75,000 Burlington Northern Santa Fe LLC 3.05% 15/02/2051 77,972 0.08
100,000 California Institute of Technology 3.65% 01/09/2119 119,036 0.13
150,000 Cameron LNG LLC '144A' 3.70% 15/01/2039 162,238 0.17
25,000 Campbell Soup Co 4.15% 15/03/2028 27,726 0.03
57,000 Campbell Soup Co 4.80% 15/03/2048 71,750 0.08
43,000 Cardinal Health Inc 3.41% 15/06/2027 46,186 0.05
100,000 Caterpillar Financial Services Corp 'MTN' 0.45% 14/09/2023 99,409 0.11
100,000 Caterpillar Financial Services Corp 'MTN' 2.15% 08/11/2024 102,533 0.11
100,000 Caterpillar Financial Services Corp 'MTN' 0.80% 13/11/2025 98,031 0.11
100,000 Caterpillar Inc 2.60% 09/04/2030 104,641 0.11
51,000 Caterpillar Inc 3.80% 15/08/2042 59,370 0.06
150,000 Caterpillar Inc 3.25% 19/09/2049 164,495 0.18

December 2021 Legal & General UCITS ETF Plc
L&G ESG USD Corporate Bond UCITS ETF
Schedule of Investments (continued)
As at 31 December 2021
447
Nominal Description
Coupon Rate
Maturity Date
Value $
% of Net
Assets
Corporate Bond (30 June 2021: 98.97%) (continued)
United States (30 June 2021: 76.34%) (continued)
50,000 CF Industries Inc 4.95% 01/06/2043 60,136 0.06
50,000 CF Industries Inc '144A' 4.50% 01/12/2026 55,710 0.06
30,000 Charles Schwab Corp/The 0.75% 18/03/2024 29,904 0.03
100,000 Charles Schwab Corp/The 0.90% 11/03/2026 97,478 0.10
100,000 Charles Schwab Corp/The 3.30% 01/04/2027 107,516 0.12
100,000 Charles Schwab Corp/The 3.20% 25/01/2028 107,575 0.12
75,000 Charles Schwab Corp/The 1.65% 11/03/2031 72,040 0.08
40,000 Charter Communications Operating LLC / Charter Communications Operating Capital 4.46% 23/07/2022 40,581 0.04
25,000 Charter Communications Operating LLC / Charter Communications Operating Capital 4.91% 23/07/2025 27,665 0.03
100,000 Charter Communications Operating LLC / Charter Communications Operating Capital 4.20% 15/03/2028 109,877 0.12
70,000 Charter Communications Operating LLC / Charter Communications Operating Capital 3.50% 01/06/2041 68,338 0.07
92,000 Charter Communications Operating LLC / Charter Communications Operating Capital 6.48% 23/10/2045 126,824 0.14
50,000 Charter Communications Operating LLC / Charter Communications Operating Capital 3.90% 01/06/2052 50,000 0.05
125,000 Cheniere Corpus Christi Holdings LLC 7.00% 30/06/2024 138,925 0.15
50,000 Cheniere Corpus Christi Holdings LLC 5.13% 30/06/2027 56,705 0.06
100,000 Chevron Phillips Chemical Co LLC / Chevron Phillips Chemical Co LP '144A' 3.40% 01/12/2026 107,386 0.12
30,000 Chubb Corp/The 6.50% 15/05/2038 45,131 0.05
50,000 Chubb INA Holdings Inc 3.35% 15/05/2024 52,743 0.06
125,000 Chubb INA Holdings Inc 4.35% 03/11/2045 156,909 0.17
50,000 Cigna Corp 3.00% 15/07/2023 51,458 0.06
100,000 Cigna Corp 3.25% 15/04/2025 105,066 0.11
50,000 Cigna Corp 3.40% 01/03/2027 53,760 0.06
75,000 Cigna Corp 4.38% 15/10/2028 85,355 0.09
50,000 Cigna Corp 4.80% 15/08/2038 61,301 0.07
150,000 Cigna Corp 4.90% 15/12/2048 192,201 0.21
50,000 Cisco Systems Inc/Delaware 2.60% 28/02/2023 51,160 0.06
25,000 Cisco Systems Inc/Delaware 3.63% 04/03/2024 26,440 0.03
77,000 Cisco Systems Inc/Delaware 5.90% 15/02/2039 110,869 0.12
100,000 Citadel LP '144A' 4.88% 15/01/2027 106,642 0.11

December 2021 Legal & General UCITS ETF Plc
L&G ESG USD Corporate Bond UCITS ETF
Schedule of Investments (continued)
As at 31 December 2021
448
Nominal Description
Coupon Rate
Maturity Date
Value $
% of Net
Assets
Corporate Bond (30 June 2021: 98.97%) (continued)
United States (30 June 2021: 76.34%) (continued)
100,000 Citigroup Inc 3.75% 16/06/2024 106,274 0.11
100,000 Citigroup Inc 4.40% 10/06/2025 108,690 0.12
100,000 Citigroup Inc 4.13% 25/07/2028 110,021 0.12
30,000 Citigroup Inc 6.63% 15/06/2032 39,865 0.04
66,000 Citigroup Inc 8.13% 15/07/2039 112,138 0.12
100,000 Citigroup Inc 6.68% 13/09/2043 150,174 0.16
66,000 Citigroup Inc 4.75% 18/05/2046 81,701 0.09
50,000 Citigroup Inc 4.65% 23/07/2048 64,342 0.07
22,000 Citigroup Inc FRN 15/05/2024 22,243 0.02
72,000 Citigroup Inc FRN 17/05/2024 72,746 0.08
130,000 Citigroup Inc FRN 01/07/2026 132,819 0.14
125,000 Citigroup Inc FRN 10/01/2028 135,716 0.15
100,000 Citigroup Inc FRN 31/03/2031 114,113 0.12
100,000 Citigroup Inc FRN 01/05/2032 101,288 0.11
100,000 Citrix Systems Inc 3.30% 01/03/2030 101,899 0.11
30,000 CME Group Inc 5.30% 15/09/2043 41,995 0.05
100,000 CNA Financial Corp 3.45% 15/08/2027 107,670 0.12
100,000 Coca-Cola Co/The 2.50% 01/06/2040 100,022 0.11
20,000 Coca-Cola Co/The 2.75% 01/06/2060 19,960 0.02
42,000 Colonial Enterprises Inc '144A' 3.25% 15/05/2030 44,349 0.05
100,000 Comcast Corp 3.38% 15/02/2025 106,099 0.11
50,000 Comcast Corp 3.30% 01/02/2027 53,824 0.06
100,000 Comcast Corp 3.15% 15/02/2028 107,535 0.12
100,000 Comcast Corp 1.50% 15/02/2031 93,890 0.10
134,000 Comcast Corp 3.90% 01/03/2038 151,887 0.16
50,000 Comcast Corp 4.70% 15/10/2048 64,324 0.07
89,000 Comcast Corp '144A' 2.94% 01/11/2056 86,139 0.09
50,000 Commonwealth Edison Co 2.55% 15/06/2026 52,320 0.06
150,000 Commonwealth Edison Co 3.75% 15/08/2047 172,378 0.19
100,000 Conagra Brands Inc 4.30% 01/05/2024 106,350 0.11

December 2021 Legal & General UCITS ETF Plc
L&G ESG USD Corporate Bond UCITS ETF
Schedule of Investments (continued)
As at 31 December 2021
449
Nominal Description
Coupon Rate
Maturity Date
Value $
% of Net
Assets
Corporate Bond (30 June 2021: 98.97%) (continued)
United States (30 June 2021: 76.34%) (continued)
46,000 Conagra Brands Inc 5.40% 01/11/2048 62,130 0.07
100,000 Connecticut Light and Power Co/The 4.00% 01/04/2048 120,496 0.13
50,000 Consolidated Edison Co of New York Inc 4.45% 15/03/2044 58,958 0.06
100,000 Consolidated Edison Co of New York Inc 3.95% 01/04/2050 114,558 0.12
125,000 Consolidated Edison Co of New York Inc 3.00% 01/12/2060 117,389 0.13
100,000 Constellation Brands Inc 3.50% 09/05/2027 107,524 0.12
100,000 Constellation Brands Inc 3.15% 01/08/2029 104,910 0.11
100,000 Constellation Brands Inc 4.50% 09/05/2047 120,554 0.13
50,000 Corning Inc 5.35% 15/11/2048 68,623 0.07
100,000 Cox Communications Inc '144A' 3.50% 15/08/2027 107,769 0.12
25,000 Crown Castle International Corp 4.00% 01/03/2027 27,336 0.03
100,000 Crown Castle International Corp 3.65% 01/09/2027 107,711 0.12
40,000 Crown Castle International Corp 2.25% 15/01/2031 38,969 0.04
100,000 CSX Corp 4.25% 15/03/2029 112,864 0.12
50,000 CSX Corp 3.80% 01/11/2046 56,653 0.06
100,000 CVS Health Corp 3.63% 01/04/2027 108,119 0.12
100,000 CVS Health Corp 3.25% 15/08/2029 106,852 0.11
100,000 CVS Health Corp 1.75% 21/08/2030 95,451 0.10
115,000 CVS Health Corp 4.78% 25/03/2038 140,214 0.15
90,000 CVS Health Corp 2.70% 21/08/2040 86,375 0.09
150,000 Daimler Finance North America LLC '144A' 3.40% 22/02/2022 150,612 0.16
150,000 Daimler Finance North America LLC '144A' 3.25% 01/08/2024 156,984 0.17
150,000 Daimler Finance North America LLC '144A' 3.45% 06/01/2027 161,843 0.17
100,000 Deere & Co 2.75% 15/04/2025 104,389 0.11
100,000 Dell International LLC / EMC Corp 5.30% 01/10/2029 118,851 0.13
100,000 Dell International LLC / EMC Corp 6.20% 15/07/2030 125,815 0.14
45,000 Dell International LLC / EMC Corp 8.10% 15/07/2036 68,903 0.07
100,000 DENTSPLY SIRONA Inc 3.25% 01/06/2030 105,622 0.11
75,000 Devon Energy Corp 5.60% 15/07/2041 94,377 0.10
100,000 Digital Realty Trust LP 3.70% 15/08/2027 108,696 0.12

December 2021 Legal & General UCITS ETF Plc
L&G ESG USD Corporate Bond UCITS ETF
Schedule of Investments (continued)
As at 31 December 2021
450
Nominal Description
Coupon Rate
Maturity Date
Value $
% of Net
Assets
Corporate Bond (30 June 2021: 98.97%) (continued)
United States (30 June 2021: 76.34%) (continued)
100,000 Discovery Communications LLC 2.95% 20/03/2023 102,179 0.11
100,000 Discovery Communications LLC 5.20% 20/09/2047 123,537 0.13
25,000 Discovery Communications LLC 4.65% 15/05/2050 29,254 0.03
25,000 Discovery Communications LLC 4.00% 15/09/2055 26,336 0.03
50,000 Dollar General Corp 4.13% 03/04/2050 58,174 0.06
75,000 Dow Chemical Co/The 4.38% 15/11/2042 89,182 0.10
25,000 Dow Chemical Co/The 3.60% 15/11/2050 27,108 0.03
100,000 Eastman Chemical Co 4.50% 01/12/2028 114,776 0.12
172,000 Eaton Corp 2.75% 02/11/2022 174,700 0.19
75,000 eBay Inc 3.60% 05/06/2027 81,350 0.09
50,000 Ecolab Inc 4.80% 24/03/2030 59,781 0.06
100,000 Edison International 3.55% 15/11/2024 104,873 0.11
100,000 Eli Lilly & Co 2.25% 15/05/2050 92,055 0.10
165,000 EMD Finance LLC '144A' 3.25% 19/03/2025 173,022 0.19
100,000 Emerson Electric Co 1.95% 15/10/2030 98,445 0.11
50,000 Enterprise Products Operating LLC 3.75% 15/02/2025 53,212 0.06
50,000 Enterprise Products Operating LLC 4.15% 16/10/2028 56,195 0.06
40,000 Enterprise Products Operating LLC 2.80% 31/01/2030 41,670 0.04
100,000 Enterprise Products Operating LLC 5.95% 01/02/2041 132,905 0.14
47,000 Enterprise Products Operating LLC 4.25% 15/02/2048 53,721 0.06
48,000 Enterprise Products Operating LLC 4.20% 31/01/2050 54,656 0.06
69,000 Enterprise Products Operating LLC 3.20% 15/02/2052 67,902 0.07
100,000 Enterprise Products Operating LLC FRN 16/08/2077 93,806 0.10
25,000 EOG Resources Inc 4.15% 15/01/2026 27,365 0.03
50,000 EOG Resources Inc 4.95% 15/04/2050 67,960 0.07
100,000 Equinix Inc 2.63% 18/11/2024 103,211 0.11
75,000 Equitable Holdings Inc 4.35% 20/04/2028 84,016 0.09
75,000 Equitable Holdings Inc 5.00% 20/04/2048 95,068 0.10
50,000 ERAC USA Finance LLC '144A' 3.85% 15/11/2024 53,203 0.06
50,000 ERAC USA Finance LLC '144A' 7.00% 15/10/2037 73,838 0.08

December 2021 Legal & General UCITS ETF Plc
L&G ESG USD Corporate Bond UCITS ETF
Schedule of Investments (continued)
As at 31 December 2021
451
Nominal Description
Coupon Rate
Maturity Date
Value $
% of Net
Assets
Corporate Bond (30 June 2021: 98.97%) (continued)
United States (30 June 2021: 76.34%) (continued)
40,000 Essex Portfolio LP 2.65% 15/03/2032 40,306 0.04
51,000 Exelon Corp 5.10% 15/06/2045 66,292 0.07
164,000 Exelon Generation Co LLC 4.25% 15/06/2022 164,875 0.18
100,000 Farmers Exchange Capital III '144A' FRN 15/10/2054 120,291 0.13
20,000 Federal Realty Investment Trust 4.50% 01/12/2044 23,928 0.03
30,000 FedEx Corp 3.40% 15/02/2028 32,469 0.03
150,000 FedEx Corp 4.10% 15/04/2043 168,880 0.18
40,000 FedEx Corp 4.10% 01/02/2045 44,700 0.05
100,000 Fifth Third Bancorp 1.63% 05/05/2023 100,992 0.11
90,000 Fifth Third Bancorp 2.55% 05/05/2027 92,919 0.10
100,000 Fiserv Inc 3.50% 01/10/2022 101,572 0.11
100,000 Fiserv Inc 2.75% 01/07/2024 103,158 0.11
100,000 Fiserv Inc 3.50% 01/07/2029 107,587 0.12
100,000 Five Corners Funding Trust II '144A' 2.85% 15/05/2030 103,231 0.11
43,000 Florida Gas Transmission Co LLC '144A' 2.55% 01/07/2030 43,370 0.05
49,000 Fox Corp 5.58% 25/01/2049 66,617 0.07
25,000 General Mills Inc 4.20% 17/04/2028 27,954 0.03
25,000 General Motors Co 6.13% 01/10/2025 28,727 0.03
75,000 General Motors Co 6.25% 02/10/2043 102,787 0.11
125,000 General Motors Financial Co Inc 3.70% 09/05/2023 128,769 0.14
40,000 General Motors Financial Co Inc 4.15% 19/06/2023 41,615 0.04
75,000 General Motors Financial Co Inc 3.95% 13/04/2024 78,996 0.09
100,000 General Motors Financial Co Inc 4.35% 17/01/2027 110,037 0.12
90,000 Georgia Power Co 4.30% 15/03/2042 103,062 0.11
40,000 Georgia-Pacific LLC '144A' 1.75% 30/09/2025 40,195 0.04
40,000 Gilead Sciences Inc 3.65% 01/03/2026 43,147 0.05
100,000 Gilead Sciences Inc 1.65% 01/10/2030 95,941 0.10
100,000 Gilead Sciences Inc 4.00% 01/09/2036 115,212 0.12
69,000 Gilead Sciences Inc 5.65% 01/12/2041 95,030 0.10
100,000 Gilead Sciences Inc 4.50% 01/02/2045 122,453 0.13
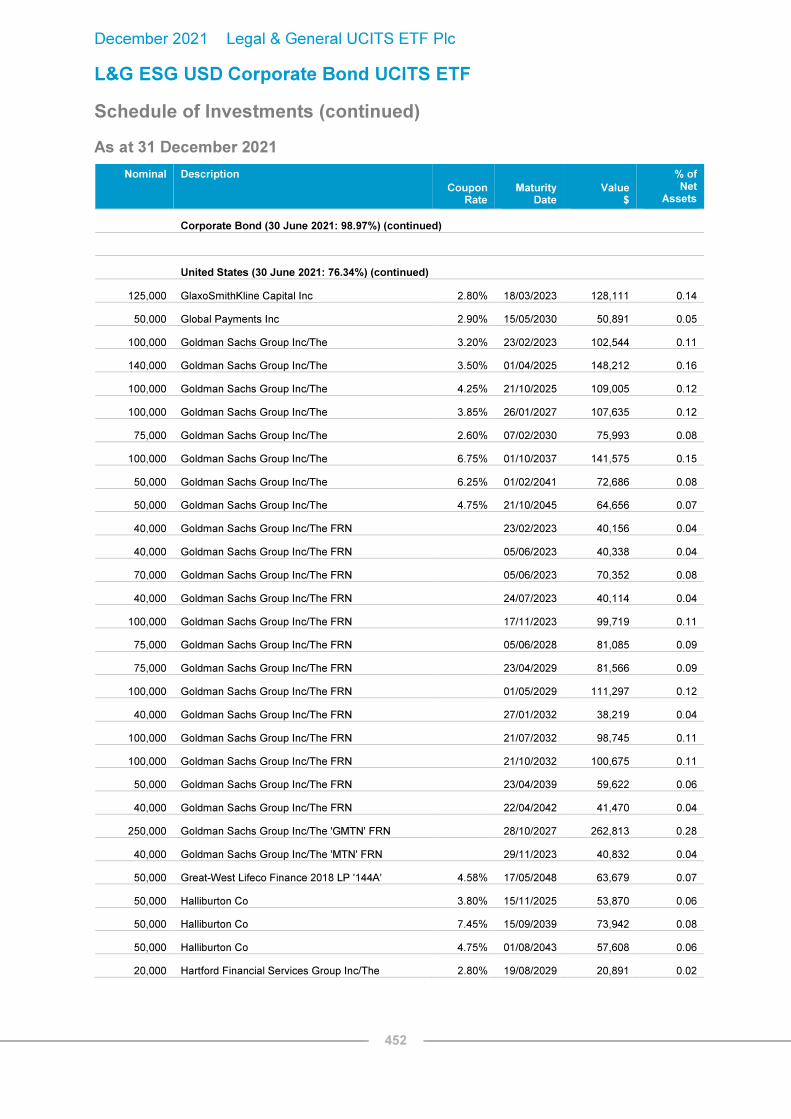
December 2021 Legal & General UCITS ETF Plc
L&G ESG USD Corporate Bond UCITS ETF
Schedule of Investments (continued)
As at 31 December 2021
452
Nominal Description
Coupon Rate
Maturity Date
Value $
% of Net
Assets
Corporate Bond (30 June 2021: 98.97%) (continued)
United States (30 June 2021: 76.34%) (continued)
125,000 GlaxoSmithKline Capital Inc 2.80% 18/03/2023 128,111 0.14
50,000 Global Payments Inc 2.90% 15/05/2030 50,891 0.05
100,000 Goldman Sachs Group Inc/The 3.20% 23/02/2023 102,544 0.11
140,000 Goldman Sachs Group Inc/The 3.50% 01/04/2025 148,212 0.16
100,000 Goldman Sachs Group Inc/The 4.25% 21/10/2025 109,005 0.12
100,000 Goldman Sachs Group Inc/The 3.85% 26/01/2027 107,635 0.12
75,000 Goldman Sachs Group Inc/The 2.60% 07/02/2030 75,993 0.08
100,000 Goldman Sachs Group Inc/The 6.75% 01/10/2037 141,575 0.15
50,000 Goldman Sachs Group Inc/The 6.25% 01/02/2041 72,686 0.08
50,000 Goldman Sachs Group Inc/The 4.75% 21/10/2045 64,656 0.07
40,000 Goldman Sachs Group Inc/The FRN 23/02/2023 40,156 0.04
40,000 Goldman Sachs Group Inc/The FRN 05/06/2023 40,338 0.04
70,000 Goldman Sachs Group Inc/The FRN 05/06/2023 70,352 0.08
40,000 Goldman Sachs Group Inc/The FRN 24/07/2023 40,114 0.04
100,000 Goldman Sachs Group Inc/The FRN 17/11/2023 99,719 0.11
75,000 Goldman Sachs Group Inc/The FRN 05/06/2028 81,085 0.09
75,000 Goldman Sachs Group Inc/The FRN 23/04/2029 81,566 0.09
100,000 Goldman Sachs Group Inc/The FRN 01/05/2029 111,297 0.12
40,000 Goldman Sachs Group Inc/The FRN 27/01/2032 38,219 0.04
100,000 Goldman Sachs Group Inc/The FRN 21/07/2032 98,745 0.11
100,000 Goldman Sachs Group Inc/The FRN 21/10/2032 100,675 0.11
50,000 Goldman Sachs Group Inc/The FRN 23/04/2039 59,622 0.06
40,000 Goldman Sachs Group Inc/The FRN 22/04/2042 41,470 0.04
250,000 Goldman Sachs Group Inc/The 'GMTN' FRN 28/10/2027 262,813 0.28
40,000 Goldman Sachs Group Inc/The 'MTN' FRN 29/11/2023 40,832 0.04
50,000 Great-West Lifeco Finance 2018 LP '144A' 4.58% 17/05/2048 63,679 0.07
50,000 Halliburton Co 3.80% 15/11/2025 53,870 0.06
50,000 Halliburton Co 7.45% 15/09/2039 73,942 0.08
50,000 Halliburton Co 4.75% 01/08/2043 57,608 0.06
20,000 Hartford Financial Services Group Inc/The 2.80% 19/08/2029 20,891 0.02

December 2021 Legal & General UCITS ETF Plc
L&G ESG USD Corporate Bond UCITS ETF
Schedule of Investments (continued)
As at 31 December 2021
453
Nominal Description
Coupon Rate
Maturity Date
Value $
% of Net
Assets
Corporate Bond (30 June 2021: 98.97%) (continued)
United States (30 June 2021: 76.34%) (continued)
50,000 Hartford Financial Services Group Inc/The '144A' FRN 12/02/2047 47,875 0.05
50,000 HCA Inc 5.00% 15/03/2024 54,011 0.06
100,000 HCA Inc 5.25% 15/06/2026 112,966 0.12
50,000 HCA Inc 5.13% 15/06/2039 61,860 0.07
25,000 HCA Inc 5.25% 15/06/2049 32,294 0.03
140,000 Hess Corp 4.30% 01/04/2027 153,412 0.17
101,000 Hewlett Packard Enterprise Co 6.35% 15/10/2045 135,333 0.15
100,000 Home Depot Inc/The 1.38% 15/03/2031 94,568 0.10
82,000 Home Depot Inc/The 4.20% 01/04/2043 98,982 0.11
100,000 Home Depot Inc/The 3.35% 15/04/2050 109,788 0.12
100,000 Hormel Foods Corp 1.80% 11/06/2030 98,263 0.11
70,000 HP Inc 3.00% 17/06/2027 73,792 0.08
25,000 HP Inc 6.00% 15/09/2041 33,332 0.04
153,000 Humana Inc 3.85% 01/10/2024 162,469 0.17
40,000 Hyundai Capital America '144A' 5.75% 06/04/2023 42,238 0.05
40,000 Hyundai Capital America '144A' 1.25% 18/09/2023 39,971 0.04
100,000 Hyundai Capital America '144A' 1.80% 15/10/2025 99,698 0.11
40,000 Hyundai Capital America '144A' 2.38% 15/10/2027 39,811 0.04
25,000 Hyundai Capital America '144A' 6.38% 08/04/2030 31,456 0.03
80,000 Intel Corp 2.70% 15/12/2022 81,677 0.09
40,000 Intel Corp 3.40% 25/03/2025 42,757 0.05
100,000 Intel Corp 3.70% 29/07/2025 108,334 0.12
100,000 Intel Corp 2.00% 12/08/2031 98,483 0.11
70,000 Intel Corp 4.60% 25/03/2040 87,194 0.09
50,000 Intel Corp 4.10% 19/05/2046 59,345 0.06
25,000 Intel Corp 4.75% 25/03/2050 33,204 0.04
100,000 Intel Corp 3.05% 12/08/2051 102,196 0.11
25,000 Intel Corp 4.95% 25/03/2060 35,184 0.04
50,000 Intercontinental Exchange Inc 4.00% 15/10/2023 52,656 0.06
50,000 Intercontinental Exchange Inc 2.10% 15/06/2030 49,616 0.05

December 2021 Legal & General UCITS ETF Plc
L&G ESG USD Corporate Bond UCITS ETF
Schedule of Investments (continued)
As at 31 December 2021
454
Nominal Description
Coupon Rate
Maturity Date
Value $
% of Net
Assets
Corporate Bond (30 June 2021: 98.97%) (continued)
United States (30 June 2021: 76.34%) (continued)
50,000 Intercontinental Exchange Inc 4.25% 21/09/2048 62,310 0.07
150,000 International Business Machines Corp 2.50% 27/01/2022 150,198 0.16
100,000 International Business Machines Corp 3.63% 12/02/2024 105,360 0.11
100,000 International Business Machines Corp 3.45% 19/02/2026 106,990 0.12
40,000 International Business Machines Corp 5.88% 29/11/2032 52,789 0.06
100,000 International Business Machines Corp 4.25% 15/05/2049 120,720 0.13
40,000 International Flavors & Fragrances Inc '144A' 1.23% 01/10/2025 39,203 0.04
190,000 International Flavors & Fragrances Inc '144A' 2.30% 01/11/2030 186,930 0.20
70,000 International Lease Finance Corp 5.88% 15/08/2022 72,132 0.08
60,000 International Paper Co 7.30% 15/11/2039 92,259 0.10
75,000 International Paper Co 4.80% 15/06/2044 94,633 0.10
40,000 Interpublic Group of Cos Inc/The 3.38% 01/03/2041 41,120 0.04
100,000 Intuit Inc 0.65% 15/07/2023 99,709 0.11
100,000 J M Smucker Co/The 2.38% 15/03/2030 100,436 0.11
75,000 Jefferies Group LLC / Jefferies Group Capital Finance Inc 4.15% 23/01/2030 83,276 0.09
100,000 John Deere Capital Corp 1.45% 15/01/2031 95,114 0.10
75,000 John Deere Capital Corp 'MTN' 2.45% 09/01/2030 77,260 0.08
50,000 Johnson & Johnson 2.95% 03/03/2027 53,589 0.06
100,000 Johnson & Johnson 2.10% 01/09/2040 94,089 0.10
97,000 Johnson & Johnson 3.50% 15/01/2048 111,864 0.12
100,000 Johnson & Johnson 2.25% 01/09/2050 93,372 0.10
150,000 JPMorgan Chase & Co 3.20% 25/01/2023 154,082 0.17
50,000 JPMorgan Chase & Co 3.88% 10/09/2024 53,179 0.06
100,000 JPMorgan Chase & Co 3.13% 23/01/2025 105,351 0.11
42,000 JPMorgan Chase & Co 2.95% 01/10/2026 44,252 0.05
100,000 JPMorgan Chase & Co 7.63% 15/10/2026 125,929 0.14
100,000 JPMorgan Chase & Co 4.13% 15/12/2026 109,927 0.12
50,000 JPMorgan Chase & Co 8.00% 29/04/2027 64,762 0.07
100,000 JPMorgan Chase & Co 4.25% 01/10/2027 111,982 0.12
100,000 JPMorgan Chase & Co 3.63% 01/12/2027 107,790 0.12

December 2021 Legal & General UCITS ETF Plc
L&G ESG USD Corporate Bond UCITS ETF
Schedule of Investments (continued)
As at 31 December 2021
455
Nominal Description
Coupon Rate
Maturity Date
Value $
% of Net
Assets
Corporate Bond (30 June 2021: 98.97%) (continued)
United States (30 June 2021: 76.34%) (continued)
200,000 JPMorgan Chase & Co 5.60% 15/07/2041 277,193 0.30
40,000 JPMorgan Chase & Co 5.40% 06/01/2042 54,691 0.06
50,000 JPMorgan Chase & Co 5.63% 16/08/2043 69,499 0.07
225,000 JPMorgan Chase & Co FRN 15/01/2023 225,198 0.24
75,000 JPMorgan Chase & Co FRN 25/04/2023 75,174 0.08
40,000 JPMorgan Chase & Co FRN 24/10/2023 40,294 0.04
100,000 JPMorgan Chase & Co FRN 23/04/2024 103,447 0.11
100,000 JPMorgan Chase & Co FRN 23/07/2024 100,808 0.11
125,000 JPMorgan Chase & Co FRN 01/03/2025 130,311 0.14
100,000 JPMorgan Chase & Co FRN 15/10/2025 102,459 0.11
100,000 JPMorgan Chase & Co FRN 13/03/2026 101,270 0.11
100,000 JPMorgan Chase & Co FRN 22/04/2026 101,628 0.11
100,000 JPMorgan Chase & Co FRN 19/11/2026 97,381 0.10
40,000 JPMorgan Chase & Co FRN 22/04/2027 39,695 0.04
125,000 JPMorgan Chase & Co FRN 01/02/2028 135,491 0.15
50,000 JPMorgan Chase & Co FRN 01/06/2029 49,680 0.05
100,000 JPMorgan Chase & Co FRN 15/10/2030 102,703 0.11
100,000 JPMorgan Chase & Co FRN 04/02/2032 96,170 0.10
175,000 JPMorgan Chase & Co FRN 22/04/2032 176,806 0.19
40,000 JPMorgan Chase & Co FRN 24/07/2038 45,368 0.05
40,000 JPMorgan Chase & Co FRN 22/04/2041 41,509 0.04
40,000 JPMorgan Chase & Co FRN 22/04/2042 41,643 0.04
54,000 JPMorgan Chase & Co FRN 22/02/2048 66,498 0.07
80,000 JPMorgan Chase & Co FRN 15/11/2048 94,457 0.10
75,000 JPMorgan Chase & Co FRN 22/04/2051 77,616 0.08
75,000 JPMorgan Chase & Co FRN 22/04/2052 80,714 0.09
40,000 Kellogg Co 3.40% 15/11/2027 43,042 0.05
40,000 Kellogg Co 2.10% 01/06/2030 39,256 0.04
50,000 Keurig Dr Pepper Inc 4.60% 25/05/2028 56,928 0.06
68,000 Keurig Dr Pepper Inc 3.20% 01/05/2030 72,050 0.08

December 2021 Legal & General UCITS ETF Plc
L&G ESG USD Corporate Bond UCITS ETF
Schedule of Investments (continued)
As at 31 December 2021
456
Nominal Description
Coupon Rate
Maturity Date
Value $
% of Net
Assets
Corporate Bond (30 June 2021: 98.97%) (continued)
United States (30 June 2021: 76.34%) (continued)
60,000 Keurig Dr Pepper Inc 5.09% 25/05/2048 78,692 0.08
250,000 KeyBank NA/Cleveland OH 'BKNT' 3.40% 20/05/2026 266,132 0.29
100,000 Keysight Technologies Inc 3.00% 30/10/2029 104,914 0.11
100,000 KeySpan Gas East Corp '144A' 2.74% 15/08/2026 102,197 0.11
100,000 Kimberly-Clark Corp 3.95% 01/11/2028 113,176 0.12
100,000 Kimberly-Clark Corp 3.20% 25/04/2029 108,035 0.12
100,000 Kimberly-Clark Corp 3.10% 26/03/2030 108,036 0.12
50,000 Kimberly-Clark Corp 6.63% 01/08/2037 75,484 0.08
50,000 Kimco Realty Corp 2.70% 01/10/2030 50,935 0.05
100,000 Kinder Morgan Inc 4.30% 01/06/2025 108,189 0.12
40,000 Kinder Morgan Inc 2.00% 15/02/2031 38,142 0.04
126,000 Kinder Morgan Inc 5.30% 01/12/2034 151,844 0.16
150,000 Kinder Morgan Inc 'GMTN' 7.75% 15/01/2032 211,071 0.23
50,000 KLA Corp 3.30% 01/03/2050 53,505 0.06
100,000 Kohl's Corp 3.38% 01/05/2031 102,304 0.11
70,000 Kroger Co/The 4.65% 15/01/2048 87,354 0.09
50,000 L3Harris Technologies Inc 1.80% 15/01/2031 47,658 0.05
30,000 Laboratory Corp of America Holdings 3.25% 01/09/2024 31,350 0.03
50,000 Laboratory Corp of America Holdings 3.60% 01/09/2027 53,818 0.06
20,000 Laboratory Corp of America Holdings 2.95% 01/12/2029 20,995 0.02
20,000 Laboratory Corp of America Holdings 4.70% 01/02/2045 24,526 0.03
50,000 Lam Research Corp 3.75% 15/03/2026 54,635 0.06
50,000 Lam Research Corp 4.88% 15/03/2049 67,813 0.07
100,000 Las Vegas Sands Corp 3.20% 08/08/2024 101,922 0.11
41,000 Lear Corp 3.80% 15/09/2027 44,729 0.05
100,000 Level 3 Financing Inc '144A' 3.40% 01/03/2027 103,745 0.11
100,000 Level 3 Financing Inc '144A' 3.88% 15/11/2029 102,250 0.11
100,000 Liberty Mutual Group Inc '144A' 4.25% 15/06/2023 104,466 0.11
170,000 Liberty Mutual Group Inc '144A' 4.57% 01/02/2029 195,900 0.21
100,000 Lincoln National Corp 3.40% 15/01/2031 108,433 0.12

December 2021 Legal & General UCITS ETF Plc
L&G ESG USD Corporate Bond UCITS ETF
Schedule of Investments (continued)
As at 31 December 2021
457
Nominal Description
Coupon Rate
Maturity Date
Value $
% of Net
Assets
Corporate Bond (30 June 2021: 98.97%) (continued)
United States (30 June 2021: 76.34%) (continued)
75,000 Linde Inc/CT 3.20% 30/01/2026 80,124 0.09
100,000 Lowe's Cos Inc 1.70% 15/10/2030 95,215 0.10
55,000 Lowe's Cos Inc 4.05% 03/05/2047 63,602 0.07
40,000 Magellan Midstream Partners LP 3.25% 01/06/2030 42,127 0.05
52,000 Magellan Midstream Partners LP 3.95% 01/03/2050 55,186 0.06
250,000 Manufacturers & Traders Trust Co 'BKNT' 3.40% 17/08/2027 268,736 0.29
69,000 Marathon Oil Corp 4.40% 15/07/2027 75,867 0.08
50,000 Marathon Oil Corp 6.80% 15/03/2032 64,615 0.07
45,000 Marathon Oil Corp 5.20% 01/06/2045 53,975 0.06
230,000 Marathon Petroleum Corp 3.63% 15/09/2024 242,115 0.26
75,000 Marathon Petroleum Corp 4.70% 01/05/2025 81,914 0.09
75,000 Markel Corp 4.15% 17/09/2050 87,161 0.09
6,000 Marriott International Inc/MD 5.75% 01/05/2025 6,743 0.01
100,000 Marsh & McLennan Cos Inc 2.25% 15/11/2030 99,898 0.11
30,000 Marsh & McLennan Cos Inc 4.75% 15/03/2039 37,697 0.04
50,000 Martin Marietta Materials Inc 2.40% 15/07/2031 49,744 0.05
100,000 Marvell Technology Inc 1.65% 15/04/2026 98,924 0.11
25,000 Masco Corp 1.50% 15/02/2028 24,228 0.03
100,000 Massachusetts Mutual Life Insurance Co '144A' 3.38% 15/04/2050 106,433 0.11
40,000 Massachusetts Mutual Life Insurance Co '144A' 3.73% 15/10/2070 44,514 0.05
75,000 Mastercard Inc 3.30% 26/03/2027 81,256 0.09
100,000 Mastercard Inc 3.35% 26/03/2030 110,104 0.12
71,000 Mastercard Inc 3.80% 21/11/2046 84,063 0.09
11,000 Mastercard Inc 2.95% 15/03/2051 11,438 0.01
40,000 McCormick & Co Inc/MD 3.40% 15/08/2027 43,072 0.05
70,000 McCormick & Co Inc/MD 2.50% 15/04/2030 70,874 0.08
100,000 McDonald's Corp 'MTN' 3.38% 26/05/2025 106,205 0.11
80,000 McDonald's Corp 'MTN' 4.60% 26/05/2045 99,593 0.11
26,000 Mead Johnson Nutrition Co 4.13% 15/11/2025 28,370 0.03
50,000 Merck & Co Inc 2.80% 18/05/2023 51,492 0.06
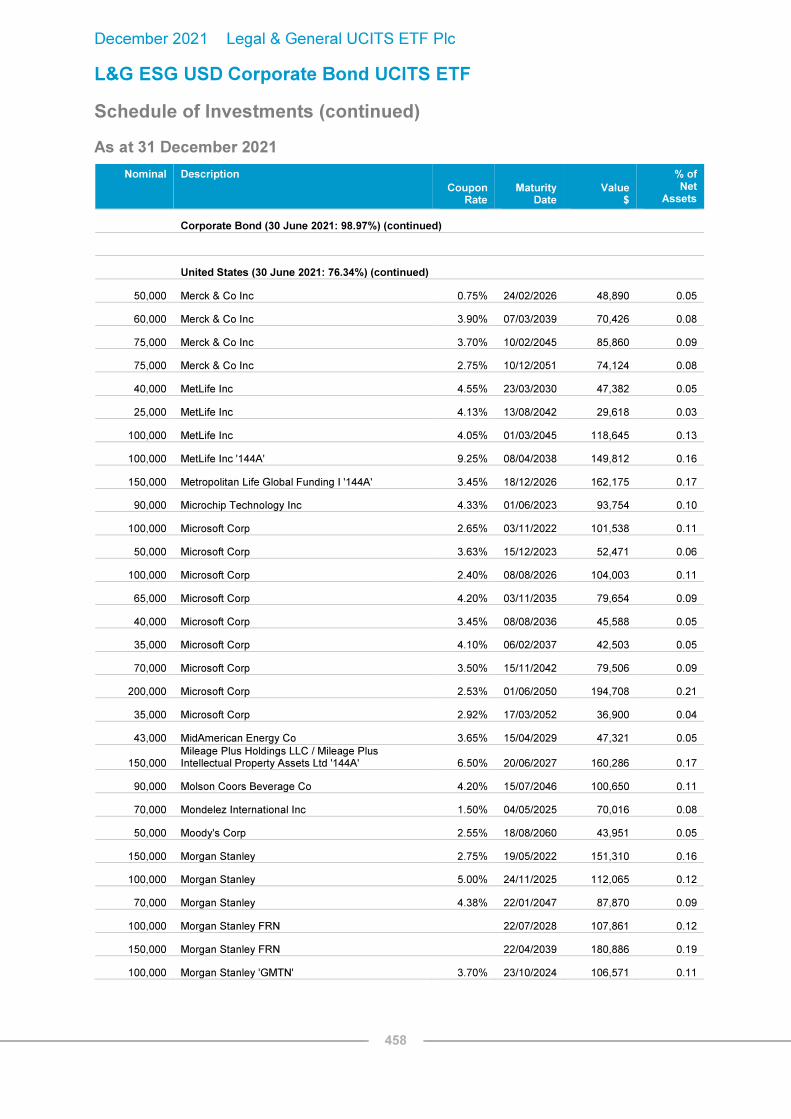
December 2021 Legal & General UCITS ETF Plc
L&G ESG USD Corporate Bond UCITS ETF
Schedule of Investments (continued)
As at 31 December 2021
458
Nominal Description
Coupon Rate
Maturity Date
Value $
% of Net
Assets
Corporate Bond (30 June 2021: 98.97%) (continued)
United States (30 June 2021: 76.34%) (continued)
50,000 Merck & Co Inc 0.75% 24/02/2026 48,890 0.05
60,000 Merck & Co Inc 3.90% 07/03/2039 70,426 0.08
75,000 Merck & Co Inc 3.70% 10/02/2045 85,860 0.09
75,000 Merck & Co Inc 2.75% 10/12/2051 74,124 0.08
40,000 MetLife Inc 4.55% 23/03/2030 47,382 0.05
25,000 MetLife Inc 4.13% 13/08/2042 29,618 0.03
100,000 MetLife Inc 4.05% 01/03/2045 118,645 0.13
100,000 MetLife Inc '144A' 9.25% 08/04/2038 149,812 0.16
150,000 Metropolitan Life Global Funding I '144A' 3.45% 18/12/2026 162,175 0.17
90,000 Microchip Technology Inc 4.33% 01/06/2023 93,754 0.10
100,000 Microsoft Corp 2.65% 03/11/2022 101,538 0.11
50,000 Microsoft Corp 3.63% 15/12/2023 52,471 0.06
100,000 Microsoft Corp 2.40% 08/08/2026 104,003 0.11
65,000 Microsoft Corp 4.20% 03/11/2035 79,654 0.09
40,000 Microsoft Corp 3.45% 08/08/2036 45,588 0.05
35,000 Microsoft Corp 4.10% 06/02/2037 42,503 0.05
70,000 Microsoft Corp 3.50% 15/11/2042 79,506 0.09
200,000 Microsoft Corp 2.53% 01/06/2050 194,708 0.21
35,000 Microsoft Corp 2.92% 17/03/2052 36,900 0.04
43,000 MidAmerican Energy Co 3.65% 15/04/2029 47,321 0.05
150,000 Mileage Plus Holdings LLC / Mileage Plus Intellectual Property Assets Ltd '144A' 6.50% 20/06/2027 160,286 0.17
90,000 Molson Coors Beverage Co 4.20% 15/07/2046 100,650 0.11
70,000 Mondelez International Inc 1.50% 04/05/2025 70,016 0.08
50,000 Moody's Corp 2.55% 18/08/2060 43,951 0.05
150,000 Morgan Stanley 2.75% 19/05/2022 151,310 0.16
100,000 Morgan Stanley 5.00% 24/11/2025 112,065 0.12
70,000 Morgan Stanley 4.38% 22/01/2047 87,870 0.09
100,000 Morgan Stanley FRN 22/07/2028 107,861 0.12
150,000 Morgan Stanley FRN 22/04/2039 180,886 0.19
100,000 Morgan Stanley 'GMTN' 3.70% 23/10/2024 106,571 0.11

December 2021 Legal & General UCITS ETF Plc
L&G ESG USD Corporate Bond UCITS ETF
Schedule of Investments (continued)
As at 31 December 2021
459
Nominal Description
Coupon Rate
Maturity Date
Value $
% of Net
Assets
Corporate Bond (30 June 2021: 98.97%) (continued)
United States (30 June 2021: 76.34%) (continued)
125,000 Morgan Stanley 'GMTN' 4.00% 23/07/2025 135,599 0.15
40,000 Morgan Stanley 'GMTN' 3.88% 27/01/2026 43,463 0.05
100,000 Morgan Stanley 'GMTN' 4.35% 08/09/2026 110,544 0.12
125,000 Morgan Stanley 'GMTN' FRN 08/05/2024 126,608 0.14
50,000 Morgan Stanley 'GMTN' FRN 20/07/2027 49,182 0.05
100,000 Morgan Stanley 'GMTN' FRN 24/01/2029 108,807 0.12
100,000 Morgan Stanley 'GMTN' FRN 23/01/2030 113,938 0.12
100,000 Morgan Stanley 'GMTN' FRN 21/07/2032 97,710 0.11
50,000 Morgan Stanley 'GMTN' FRN 24/03/2051 74,808 0.08
75,000 Morgan Stanley 'MTN' 3.13% 27/07/2026 79,409 0.09
100,000 Morgan Stanley 'MTN' FRN 25/01/2024 99,656 0.11
40,000 Motorola Solutions Inc 4.60% 23/02/2028 45,177 0.05
75,000 MPLX LP 4.25% 01/12/2027 83,043 0.09
50,000 MPLX LP 2.65% 15/08/2030 49,788 0.05
50,000 MPLX LP 5.50% 15/02/2049 64,069 0.07
75,000 Mylan Inc 4.55% 15/04/2028 84,138 0.09
121,000 Narragansett Electric Co/The '144A' 3.40% 09/04/2030 129,550 0.14
100,000 Nasdaq Inc 1.65% 15/01/2031 93,283 0.10
100,000 NBCUniversal Media LLC 4.45% 15/01/2043 119,900 0.13
150,000 Nestle Holdings Inc '144A' 3.90% 24/09/2038 176,150 0.19
100,000 Nestle Holdings Inc 'EMTN' 3.13% 22/03/2023 102,836 0.11
25,000 New York and Presbyterian Hospital/The 4.02% 01/08/2045 30,551 0.03
75,000 New York Life Global Funding '144A' 2.90% 17/01/2024 77,869 0.08
50,000 New York Life Global Funding '144A' 1.85% 01/08/2031 48,432 0.05
50,000 New York Life Insurance Co '144A' 6.75% 15/11/2039 75,449 0.08
100,000 Newmont Corp 6.25% 01/10/2039 140,052 0.15
100,000 NIKE Inc 3.25% 27/03/2040 109,141 0.12
35,000 Nordstrom Inc 5.00% 15/01/2044 32,736 0.04
50,000 Norfolk Southern Corp 3.80% 01/08/2028 55,291 0.06
50,000 Norfolk Southern Corp 4.05% 15/08/2052 59,932 0.06

December 2021 Legal & General UCITS ETF Plc
L&G ESG USD Corporate Bond UCITS ETF
Schedule of Investments (continued)
As at 31 December 2021
460
Nominal Description
Coupon Rate
Maturity Date
Value $
% of Net
Assets
Corporate Bond (30 June 2021: 98.97%) (continued)
United States (30 June 2021: 76.34%) (continued)
75,000 Northern Trust Corp 1.95% 01/05/2030 74,462 0.08
76,000 Northwestern Mutual Life Insurance Co/The '144A' 3.45% 30/03/2051 81,444 0.09
164,000 Novartis Capital Corp 1.75% 14/02/2025 166,607 0.18
40,000 Novartis Capital Corp 2.00% 14/02/2027 40,635 0.04
100,000 Novartis Capital Corp 2.75% 14/08/2050 101,013 0.11
100,000 NSTAR Electric Co 3.20% 15/05/2027 107,051 0.12
25,000 NVIDIA Corp 2.85% 01/04/2030 26,544 0.03
100,000 NVIDIA Corp 3.50% 01/04/2040 112,873 0.12
15,000 NVIDIA Corp 3.70% 01/04/2060 17,787 0.02
75,000 Office Properties Income Trust 4.50% 01/02/2025 79,250 0.09
16,000 Omega Healthcare Investors Inc 4.38% 01/08/2023 16,670 0.02
100,000 Omega Healthcare Investors Inc 3.38% 01/02/2031 100,841 0.11
100,000 Oncor Electric Delivery Co LLC 3.10% 15/09/2049 105,126 0.11
40,000 ONEOK Inc 2.75% 01/09/2024 41,174 0.04
100,000 ONEOK Inc 6.35% 15/01/2031 125,561 0.14
50,000 ONEOK Inc 4.95% 13/07/2047 58,547 0.06
40,000 ONEOK Partners LP 6.13% 01/02/2041 51,022 0.05
40,000 Oracle Corp 2.50% 15/05/2022 40,166 0.04
50,000 Oracle Corp 2.63% 15/02/2023 50,941 0.05
50,000 Oracle Corp 2.40% 15/09/2023 51,079 0.06
75,000 Oracle Corp 2.50% 01/04/2025 76,930 0.08
100,000 Oracle Corp 2.95% 15/05/2025 104,035 0.11
100,000 Oracle Corp 2.65% 15/07/2026 102,809 0.11
100,000 Oracle Corp 2.80% 01/04/2027 103,609 0.11
50,000 Oracle Corp 2.88% 25/03/2031 50,277 0.05
82,000 Oracle Corp 3.90% 15/05/2035 88,684 0.10
250,000 Oracle Corp 3.80% 15/11/2037 261,347 0.28
87,000 Oracle Corp 4.00% 15/07/2046 92,803 0.10
108,000 Oracle Corp 3.60% 01/04/2050 106,049 0.11
190,000 Oracle Corp 3.95% 25/03/2051 196,621 0.21

December 2021 Legal & General UCITS ETF Plc
L&G ESG USD Corporate Bond UCITS ETF
Schedule of Investments (continued)
As at 31 December 2021
461
Nominal Description
Coupon Rate
Maturity Date
Value $
% of Net
Assets
Corporate Bond (30 June 2021: 98.97%) (continued)
United States (30 June 2021: 76.34%) (continued)
30,000 Oracle Corp 4.10% 25/03/2061 31,244 0.03
10,000 O'Reilly Automotive Inc 4.20% 01/04/2030 11,314 0.01
25,000 O'Reilly Automotive Inc 1.75% 15/03/2031 23,776 0.03
50,000 Otis Worldwide Corp 2.06% 05/04/2025 50,923 0.05
100,000 Otis Worldwide Corp 3.11% 15/02/2040 102,796 0.11
100,000 Owl Rock Capital Corp 4.25% 15/01/2026 105,334 0.11
100,000 Pacific Gas and Electric Co 3.50% 15/06/2025 103,549 0.11
225,000 Pacific Gas and Electric Co 2.95% 01/03/2026 228,908 0.25
100,000 Pacific Gas and Electric Co 4.50% 01/07/2040 105,084 0.11
97,000 Pacific Gas and Electric Co 4.95% 01/07/2050 106,566 0.11
75,000 PayPal Holdings Inc 2.30% 01/06/2030 76,038 0.08
25,000 Penske Truck Leasing Co Lp / PTL Finance Corp '144A' 4.20% 01/04/2027 27,622 0.03
100,000 PepsiCo Inc 3.60% 01/03/2024 105,161 0.11
50,000 PepsiCo Inc 2.38% 06/10/2026 52,161 0.06
100,000 PepsiCo Inc 2.75% 19/03/2030 105,758 0.11
50,000 PepsiCo Inc 2.75% 21/10/2051 51,285 0.06
100,000 PerkinElmer Inc 3.30% 15/09/2029 106,140 0.11
30,000 Pfizer Inc 2.75% 03/06/2026 31,841 0.03
80,000 Pfizer Inc 2.63% 01/04/2030 83,890 0.09
100,000 Pfizer Inc 2.55% 28/05/2040 98,720 0.11
20,000 Pfizer Inc 4.13% 15/12/2046 24,781 0.03
82,000 Phillips 66 3.90% 15/03/2028 89,026 0.10
40,000 Phillips 66 Partners LP 3.55% 01/10/2026 42,699 0.05
100,000 Phillips 66 Partners LP 3.75% 01/03/2028 107,424 0.12
93,000 Pioneer Natural Resources Co 4.45% 15/01/2026 101,744 0.11
100,000 Plains All American Pipeline LP / PAA Finance Corp 3.80% 15/09/2030 105,358 0.11
100,000 PNC Financial Services Group Inc/The 2.60% 23/07/2026 104,997 0.11
112,000 PNC Financial Services Group Inc/The 2.55% 22/01/2030 114,233 0.12
52,000 Principal Financial Group Inc 3.70% 15/05/2029 57,563 0.06
250,000 Principal Life Global Funding II '144A' 3.00% 18/04/2026 263,213 0.28

December 2021 Legal & General UCITS ETF Plc
L&G ESG USD Corporate Bond UCITS ETF
Schedule of Investments (continued)
As at 31 December 2021
462
Nominal Description
Coupon Rate
Maturity Date
Value $
% of Net
Assets
Corporate Bond (30 June 2021: 98.97%) (continued)
United States (30 June 2021: 76.34%) (continued)
50,000 Procter & Gamble Co/The 3.00% 25/03/2030 54,267 0.06
40,000 Procter & Gamble Co/The 3.55% 25/03/2040 46,639 0.05
50,000 Progressive Corp/The 4.20% 15/03/2048 62,443 0.07
100,000 Prologis LP 2.25% 15/04/2030 100,627 0.11
100,000 Prologis LP 1.25% 15/10/2030 93,102 0.10
100,000 Prologis LP 2.13% 15/10/2050 87,111 0.09
109,000 Prudential Financial Inc 3.94% 07/12/2049 128,083 0.14
50,000 Prudential Financial Inc FRN 15/09/2042 50,960 0.05
230,000 Prudential Financial Inc FRN 15/06/2043 238,146 0.26
71,000 Public Service Co of Colorado 3.20% 01/03/2050 74,915 0.08
75,000 QUALCOMM Inc 3.00% 20/05/2022 75,589 0.08
75,000 QUALCOMM Inc 3.25% 20/05/2027 81,136 0.09
40,000 QUALCOMM Inc 4.65% 20/05/2035 49,593 0.05
40,000 QUALCOMM Inc 4.80% 20/05/2045 52,977 0.06
25,000 QUALCOMM Inc 3.25% 20/05/2050 27,587 0.03
25,000 Ralph Lauren Corp 2.95% 15/06/2030 26,009 0.03
100,000 Raymond James Financial Inc 4.65% 01/04/2030 116,423 0.13
100,000 Realty Income Corp 4.88% 01/06/2026 113,398 0.12
74,000 Realty Income Corp 3.25% 15/06/2029 79,993 0.09
60,000 Regeneron Pharmaceuticals Inc 1.75% 15/09/2030 56,750 0.06
75,000 Regions Financial Corp 2.25% 18/05/2025 76,729 0.08
71,000 RELX Capital Inc 4.00% 18/03/2029 78,814 0.08
100,000 Republic Services Inc 2.30% 01/03/2030 100,404 0.11
40,000 Republic Services Inc 1.75% 15/02/2032 37,729 0.04
200,000 Roche Holdings Inc '144A' 2.38% 28/01/2027 207,006 0.22
200,000 Roche Holdings Inc '144A' 4.00% 28/11/2044 245,194 0.26
100,000 Rockwell Automation Inc 4.20% 01/03/2049 125,878 0.14
40,000 Roper Technologies Inc 3.80% 15/12/2026 43,634 0.05
85,000 Roper Technologies Inc 2.95% 15/09/2029 87,878 0.09
25,000 Ross Stores Inc 4.60% 15/04/2025 27,375 0.03

December 2021 Legal & General UCITS ETF Plc
L&G ESG USD Corporate Bond UCITS ETF
Schedule of Investments (continued)
As at 31 December 2021
463
Nominal Description
Coupon Rate
Maturity Date
Value $
% of Net
Assets
Corporate Bond (30 June 2021: 98.97%) (continued)
United States (30 June 2021: 76.34%) (continued)
159,000 Ryder System Inc 'MTN' 2.50% 01/09/2024 163,530 0.18
40,000 S&P Global Inc 3.25% 01/12/2049 43,685 0.05
20,000 S&P Global Inc 2.30% 15/08/2060 17,399 0.02
100,000 Sabine Pass Liquefaction LLC 5.63% 15/04/2023 104,617 0.11
42,000 Sabine Pass Liquefaction LLC 5.63% 01/03/2025 46,687 0.05
75,000 Sabine Pass Liquefaction LLC 5.00% 15/03/2027 84,416 0.09
50,000 Sabra Health Care LP 5.13% 15/08/2026 55,266 0.06
100,000 salesforce.com Inc 1.50% 15/07/2028 97,917 0.11
330,000 salesforce.com Inc 2.90% 15/07/2051 336,635 0.36
75,000 Santander Holdings USA Inc 3.50% 07/06/2024 78,225 0.08
100,000 Santander Holdings USA Inc 4.50% 17/07/2025 108,268 0.12
25,000 Santander Holdings USA Inc 4.40% 13/07/2027 27,395 0.03
75,000 Schlumberger Holdings Corp '144A' 3.90% 17/05/2028 81,213 0.09
100,000 Sempra Energy 3.25% 15/06/2027 105,951 0.11
25,000 SES GLOBAL Americas Holdings GP '144A' 5.30% 25/03/2044 29,007 0.03
40,000 Sherwin-Williams Co/The 3.80% 15/08/2049 45,477 0.05
125,000 Simon Property Group LP 3.50% 01/09/2025 133,468 0.14
50,000 Simon Property Group LP 3.38% 15/06/2027 53,787 0.06
50,000 Simon Property Group LP 2.65% 15/07/2030 51,000 0.05
50,000 Simon Property Group LP 3.25% 13/09/2049 51,386 0.06
100,000 Smithfield Foods Inc '144A' 4.25% 01/02/2027 107,905 0.12
100,000 Snap-on Inc 3.10% 01/05/2050 105,502 0.11
150,000 Southern California Edison Co 4.13% 01/03/2048 170,217 0.18
50,000 Southern California Edison Co 3.65% 01/02/2050 53,637 0.06
100,000 Southern California Gas Co 4.30% 15/01/2049 124,539 0.13
50,000 Southern Co/The 4.40% 01/07/2046 59,084 0.06
100,000 Southern Co/The FRN 15/01/2051 102,167 0.11
80,000 Southern Power Co 4.15% 01/12/2025 86,976 0.09
100,000 Southwest Airlines Co 5.13% 15/06/2027 114,634 0.12
50,000 Stanley Black & Decker Inc 2.30% 15/03/2030 50,620 0.05

December 2021 Legal & General UCITS ETF Plc
L&G ESG USD Corporate Bond UCITS ETF
Schedule of Investments (continued)
As at 31 December 2021
464
Nominal Description
Coupon Rate
Maturity Date
Value $
% of Net
Assets
Corporate Bond (30 June 2021: 98.97%) (continued)
United States (30 June 2021: 76.34%) (continued)
50,000 Stanley Black & Decker Inc 2.75% 15/11/2050 47,988 0.05
40,000 Starbucks Corp 3.10% 01/03/2023 40,966 0.04
75,000 Starbucks Corp 4.50% 15/11/2048 93,068 0.10
100,000 State Street Corp FRN 03/12/2029 113,550 0.12
100,000 Stryker Corp 0.60% 01/12/2023 99,233 0.11
100,000 Synchrony Financial 3.70% 04/08/2026 106,044 0.11
40,000 Sysco Corp 2.40% 15/02/2030 40,159 0.04
25,000 Sysco Corp 4.85% 01/10/2045 31,544 0.03
39,000 Sysco Corp 4.45% 15/03/2048 46,213 0.05
30,000 Sysco Corp 6.60% 01/04/2050 46,796 0.05
40,000 Target Corp 2.35% 15/02/2030 41,207 0.04
46,000 Teachers Insurance & Annuity Association of America '144A' 4.27% 15/05/2047 55,520 0.06
25,000 Texas Instruments Inc 1.38% 12/03/2025 25,130 0.03
75,000 Texas Instruments Inc 2.25% 04/09/2029 76,604 0.08
40,000 Texas Instruments Inc 4.15% 15/05/2048 49,989 0.05
75,000 Time Warner Cable LLC 5.50% 01/09/2041 90,871 0.10
100,000 Time Warner Cable LLC 4.50% 15/09/2042 108,961 0.12
100,000 Time Warner Entertainment Co LP 8.38% 15/03/2023 109,125 0.12
100,000 TJX Cos Inc/The 1.60% 15/05/2031 96,105 0.10
40,000 T-Mobile USA Inc 2.05% 15/02/2028 39,826 0.04
100,000 T-Mobile USA Inc 3.88% 15/04/2030 109,688 0.12
40,000 T-Mobile USA Inc 2.25% 15/11/2031 38,850 0.04
25,000 T-Mobile USA Inc 4.50% 15/04/2050 29,312 0.03
50,000 T-Mobile USA Inc 3.30% 15/02/2051 48,625 0.05
25,000 T-Mobile USA Inc 3.60% 15/11/2060 24,979 0.03
40,000 Toyota Motor Credit Corp 'MTN' 2.15% 13/02/2030 40,192 0.04
50,000 Tractor Supply Co 1.75% 01/11/2030 47,066 0.05
50,000 Transcontinental Gas Pipe Line Co LLC 4.60% 15/03/2048 60,726 0.07
122,000 Travelers Cos Inc/The 4.00% 30/05/2047 147,372 0.16
100,000 Truist Bank 'BKNT' 3.00% 02/02/2023 102,278 0.11

December 2021 Legal & General UCITS ETF Plc
L&G ESG USD Corporate Bond UCITS ETF
Schedule of Investments (continued)
As at 31 December 2021
465
Nominal Description
Coupon Rate
Maturity Date
Value $
% of Net
Assets
Corporate Bond (30 June 2021: 98.97%) (continued)
United States (30 June 2021: 76.34%) (continued)
100,000 Truist Bank 'BKNT' 4.05% 03/11/2025 109,819 0.12
100,000 TWDC Enterprises 18 Corp 'MTN' 1.85% 30/07/2026 101,031 0.11
100,000 TWDC Enterprises 18 Corp 'MTN' 2.95% 15/06/2027 106,353 0.11
152,000 Unilever Capital Corp 3.10% 30/07/2025 161,375 0.17
100,000 Union Pacific Corp 2.40% 05/02/2030 102,155 0.11
50,000 Union Pacific Corp 2.38% 20/05/2031 50,951 0.05
70,000 Union Pacific Corp 3.84% 20/03/2060 82,177 0.09
40,000 United Parcel Service Inc 2.35% 16/05/2022 40,225 0.04
35,000 United Parcel Service Inc 4.45% 01/04/2030 41,205 0.04
30,000 United Parcel Service Inc 3.40% 01/09/2049 34,145 0.04
75,000 UnitedHealth Group Inc 3.50% 15/06/2023 77,886 0.08
50,000 UnitedHealth Group Inc 2.38% 15/08/2024 51,606 0.06
100,000 UnitedHealth Group Inc 3.45% 15/01/2027 108,417 0.12
50,000 UnitedHealth Group Inc 2.00% 15/05/2030 49,751 0.05
35,000 UnitedHealth Group Inc 4.75% 15/07/2045 46,493 0.05
40,000 UnitedHealth Group Inc 4.20% 15/01/2047 49,708 0.05
40,000 UnitedHealth Group Inc 4.25% 15/04/2047 50,134 0.05
44,000 UnitedHealth Group Inc 3.75% 15/10/2047 51,295 0.06
125,000 UnitedHealth Group Inc 3.88% 15/08/2059 150,067 0.16
50,000 US Bancorp 2.40% 30/07/2024 51,677 0.06
100,000 US Bancorp 1.45% 12/05/2025 100,527 0.11
121,000 US Bancorp 3.00% 30/07/2029 127,725 0.14
64,000 Ventas Realty LP 4.75% 15/11/2030 75,173 0.08
75,000 Verizon Communications Inc 3.38% 15/02/2025 79,860 0.09
25,000 Verizon Communications Inc 4.13% 16/03/2027 27,857 0.03
100,000 Verizon Communications Inc 3.00% 22/03/2027 105,260 0.11
100,000 Verizon Communications Inc 4.02% 03/12/2029 112,085 0.12
100,000 Verizon Communications Inc 1.68% 30/10/2030 95,137 0.10
100,000 Verizon Communications Inc 1.75% 20/01/2031 94,899 0.10
40,000 Verizon Communications Inc 4.40% 01/11/2034 46,640 0.05

December 2021 Legal & General UCITS ETF Plc
L&G ESG USD Corporate Bond UCITS ETF
Schedule of Investments (continued)
As at 31 December 2021
466
Nominal Description
Coupon Rate
Maturity Date
Value $
% of Net
Assets
Corporate Bond (30 June 2021: 98.97%) (continued)
United States (30 June 2021: 76.34%) (continued)
40,000 Verizon Communications Inc 4.81% 15/03/2039 48,782 0.05
100,000 Verizon Communications Inc 2.65% 20/11/2040 94,865 0.10
20,000 Verizon Communications Inc 3.40% 22/03/2041 20,692 0.02
50,000 Verizon Communications Inc 4.86% 21/08/2046 64,448 0.07
83,000 Verizon Communications Inc 2.88% 20/11/2050 78,716 0.08
120,000 Verizon Communications Inc 3.55% 22/03/2051 128,681 0.14
65,000 Verizon Communications Inc 3.00% 20/11/2060 61,588 0.07
8,000 Verizon Communications Inc 3.70% 22/03/2061 8,798 0.01
100,000 Verizon Communications Inc '144A' 2.36% 15/03/2032 98,818 0.11
50,000 Verizon Communications Inc '144A' 2.99% 30/10/2056 47,790 0.05
30,000 Verizon Communications Inc FRN 20/03/2026 30,369 0.03
20,000 Verizon Communications Inc 'REGS' 2.36% 15/03/2032 19,764 0.02
54,000 Verizon Communications Inc 'REGS' 2.36% 15/03/2032 53,362 0.06
28,000 VF Corp 2.95% 23/04/2030 29,112 0.03
100,000 ViacomCBS Inc 4.85% 01/07/2042 119,570 0.13
58,000 ViacomCBS Inc 5.85% 01/09/2043 78,587 0.08
100,000 Viatris Inc 4.00% 22/06/2050 107,517 0.12
100,000 Visa Inc 3.15% 14/12/2025 106,685 0.11
75,000 Visa Inc 2.70% 15/04/2040 76,838 0.08
100,000 Visa Inc 2.00% 15/08/2050 88,156 0.09
100,000 VMware Inc 1.00% 15/08/2024 98,990 0.11
102,000 VMware Inc 3.90% 21/08/2027 111,448 0.12
40,000 Voya Financial Inc 3.65% 15/06/2026 43,201 0.05
25,000 Vulcan Materials Co 3.50% 01/06/2030 26,951 0.03
70,000 Walmart Inc 3.25% 08/07/2029 77,306 0.08
100,000 Walmart Inc 5.25% 01/09/2035 136,584 0.15
70,000 Walmart Inc 3.95% 28/06/2038 84,457 0.09
100,000 Walt Disney Co/The 1.75% 13/01/2026 100,947 0.11
100,000 Walt Disney Co/The 2.00% 01/09/2029 99,522 0.11
100,000 Walt Disney Co/The 3.80% 22/03/2030 112,594 0.12

December 2021 Legal & General UCITS ETF Plc
L&G ESG USD Corporate Bond UCITS ETF
Schedule of Investments (continued)
As at 31 December 2021
467
Nominal Description
Coupon Rate
Maturity Date
Value $
% of Net
Assets
Corporate Bond (30 June 2021: 98.97%) (continued)
United States (30 June 2021: 76.34%) (continued)
83,000 Walt Disney Co/The 6.40% 15/12/2035 119,392 0.13
100,000 Walt Disney Co/The 3.60% 13/01/2051 113,465 0.12
50,000 Waste Management Inc 3.13% 01/03/2025 52,548 0.06
30,000 WEA Finance LLC '144A' 4.63% 20/09/2048 32,371 0.03
100,000 Wells Fargo & Co 3.07% 24/01/2023 100,154 0.11
40,000 Wells Fargo & Co 5.38% 02/11/2043 52,624 0.06
100,000 Wells Fargo & Co FRN 30/04/2026 101,866 0.11
100,000 Wells Fargo & Co 'MTN' 2.63% 22/07/2022 101,209 0.11
100,000 Wells Fargo & Co 'MTN' 3.75% 24/01/2024 105,112 0.11
60,000 Wells Fargo & Co 'MTN' 4.65% 04/11/2044 72,872 0.08
125,000 Wells Fargo & Co 'MTN' FRN 02/06/2024 126,038 0.14
125,000 Wells Fargo & Co 'MTN' FRN 11/02/2026 127,009 0.14
125,000 Wells Fargo & Co 'MTN' FRN 22/05/2028 134,445 0.14
25,000 Wells Fargo & Co 'MTN' FRN 04/04/2031 29,012 0.03
30,000 Wells Fargo & Co 'MTN' FRN 04/04/2051 40,966 0.04
158,000 Welltower Inc 3.63% 15/03/2024 165,966 0.18
150,000 Welltower Inc 4.13% 15/03/2029 167,637 0.18
40,000 Western Union Co/The 1.35% 15/03/2026 39,056 0.04
100,000 Whirlpool Corp 4.75% 26/02/2029 115,641 0.12
50,000 Williams Cos Inc/The 4.55% 24/06/2024 53,564 0.06
59,000 Williams Cos Inc/The 5.40% 04/03/2044 73,266 0.08
70,000 Williams Cos Inc/The 4.85% 01/03/2048 84,997 0.09
100,000 WRKCo Inc 3.90% 01/06/2028 109,865 0.12
100,000 Xylem Inc/NY 1.95% 30/01/2028 98,995 0.11
76,000 Zoetis Inc 3.95% 12/09/2047 91,015 0.10
Total United States 70,634,350 75.98
Total Corporate Bond 92,164,676 99.14
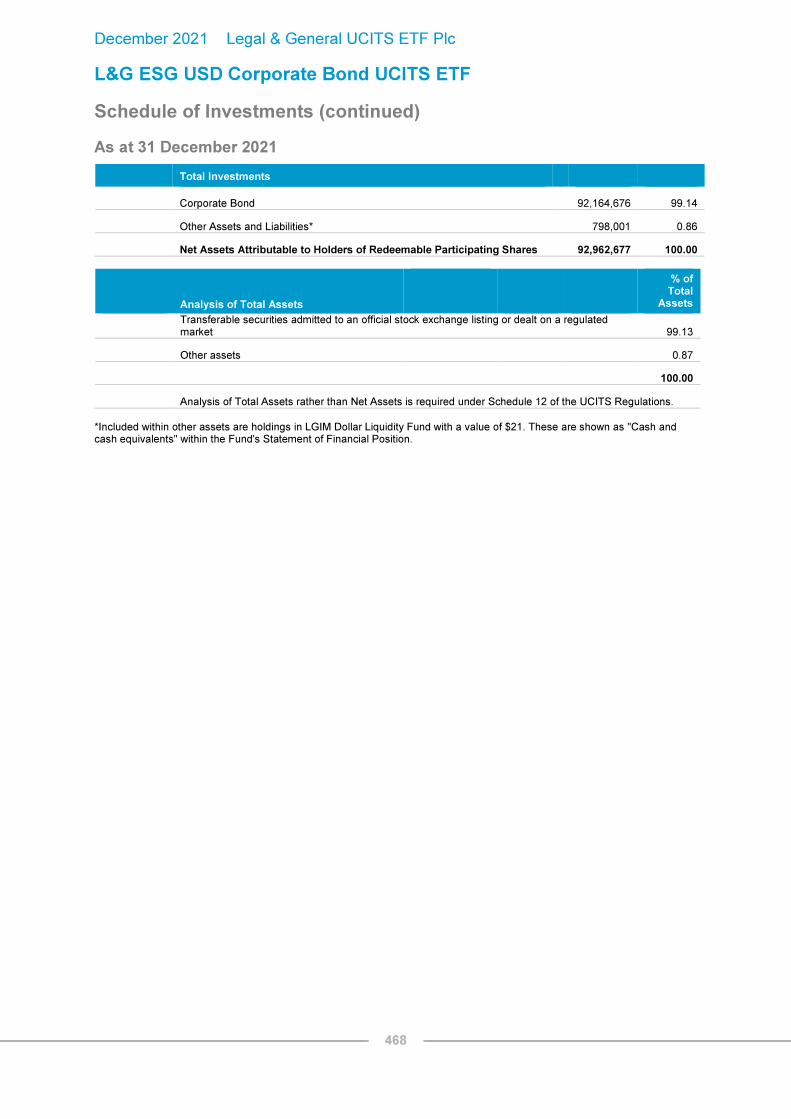
December 2021 Legal & General UCITS ETF Plc
L&G ESG USD Corporate Bond UCITS ETF
Schedule of Investments (continued)
As at 31 December 2021
468
Total Investments
Corporate Bond 92,164,676 99.14
Other Assets and Liabilities* 798,001 0.86
Net Assets Attributable to Holders of Redeemable Participating Shares 92,962,677 100.00
Analysis of Total Assets
% of Total
Assets
Transferable securities admitted to an official stock exchange listing or dealt on a regulated market 99.13
Other assets 0.87
100.00
Analysis of Total Assets rather than Net Assets is required under Schedule 12 of the UCITS Regulations.
*Included within other assets are holdings in LGIM Dollar Liquidity Fund with a value of $21. These are shown as "Cash and cash equivalents" within the Fund's Statement of Financial Position.

December 2021 Legal & General UCITS ETF Plc
L&G ESG Emerging Markets Corporate Bond (USD) UCITS ETF
Schedule of Investments
As at 31 December 2021
469
Nominal Description
Coupon Rate
Maturity Date
Value $
% of Net
Assets
Corporate Bond (30 June 2021: 98.04%)
Argentina (30 June 2021: 0.94%)
400,000 Arcor SAIC 'REGS' 6.00% 06/07/2023 392,950 0.08
200,000 MSU Energy SA / UGEN SA / UENSA SA 'REGS' 6.88% 01/02/2025 158,350 0.03
500,000 Pampa Energia SA 'REGS' 7.50% 24/01/2027 432,125 0.09
300,000 Tecpetrol SA 'REGS' 4.88% 12/12/2022 298,275 0.06
400,000 Transportadora de Gas del Sur SA 'REGS' 6.75% 02/05/2025 366,450 0.08
600,000 YPF SA 'REGS' 8.75% 04/04/2024 517,425 0.11
750,000 YPF SA 'REGS' 8.50% 28/07/2025 561,703 0.12
400,000 YPF SA 'REGS' 6.95% 21/07/2027 257,825 0.05
350,000 YPF SA 'REGS' 7.00% 15/12/2047 210,503 0.04
700,000 YPF SA Step-Up Coupon 'REGS' 4.00% 12/02/2026 553,000 0.11
600,000 YPF SA Step-Up Coupon 'REGS' 2.50% 30/06/2029 349,312 0.07
550,000 YPF SA Step-Up Coupon 'REGS' 1.50% 30/09/2033 264,791 0.05
Total Argentina 4,362,709 0.89
Austria (30 June 2021: 1.10%)
300,000 Klabin Austria GmbH 'REGS' 5.75% 03/04/2029 326,775 0.07
450,000 Klabin Austria GmbH 'REGS' 3.20% 12/01/2031 416,250 0.09
400,000 Klabin Austria GmbH 'REGS' 7.00% 03/04/2049 460,200 0.09
263,000 Suzano Austria GmbH 2.50% 15/09/2028 253,713 0.05
1,200,000 Suzano Austria GmbH 6.00% 15/01/2029 1,387,350 0.28
1,100,000 Suzano Austria GmbH 3.75% 15/01/2031 1,116,363 0.23
700,000 Suzano Austria GmbH 3.13% 15/01/2032 677,250 0.14
300,000 Suzano Austria GmbH 'REGS' 5.75% 14/07/2026 341,587 0.07
600,000 Suzano Austria GmbH 'REGS' 7.00% 16/03/2047 758,362 0.15
Total Austria 5,737,850 1.17
Azerbaijan (30 June 2021: 0.11%)
650,000 International Bank of Azerbaijan OJSC 'REGS' 3.50% 01/09/2024 651,885 0.13
Total Azerbaijan 651,885 0.13

December 2021 Legal & General UCITS ETF Plc
L&G ESG Emerging Markets Corporate Bond (USD) UCITS ETF
Schedule of Investments (continued)
As at 31 December 2021
470
Nominal Description
Coupon Rate
Maturity Date
Value $
% of Net
Assets
Corporate Bond (30 June 2021: 98.04%) (continued)
Bahamas, The (30 June 2021: 0.35%)
1,375,000 Competition Team Technologies Ltd 3.75% 12/03/2024 1,443,578 0.29
Total Bahamas, The 1,443,578 0.29
Bermuda (30 June 2021: 1.74%)
350,000 CBQ Finance Ltd 'EMTN' 5.00% 24/05/2023 368,003 0.08
200,000 CBQ Finance Ltd 'EMTN' 2.00% 15/09/2025 199,937 0.04
400,000 CBQ Finance Ltd 'EMTN' 2.00% 12/05/2026 397,125 0.08
400,000 Credicorp Ltd 'REGS' 2.75% 17/06/2025 404,950 0.08
424,200 Digicel Group Holdings Ltd 10.00% 01/04/2024 424,942 0.09
300,000 Digicel Ltd 'REGS' 6.75% 01/03/2023 289,500 0.06
250,000 Geopark Ltd 'REGS' 5.50% 17/01/2027 240,594 0.05
200,000 Haitong International Securities Group Ltd 3.38% 19/07/2024 206,912 0.04
600,000 Inkia Energy Ltd 'REGS' 5.88% 09/11/2027 615,113 0.13
600,000 Investment Energy Resources Ltd 'REGS' 6.25% 26/04/2029 644,250 0.13
200,000 Kunlun Energy Co Ltd 'REGS' 3.75% 13/05/2025 209,725 0.04
600,000 Li & Fung Ltd 'EMTN' 4.50% 18/08/2025 611,925 0.12
400,000 Li & Fung Ltd 'EMTN' (Perpetual) 5.25% 03/05/2022 291,000 0.06
650,000 Star Energy Geothermal Darajat II / Star Energy Geothermal Salak 'REGS' 4.85% 14/10/2038 712,278 0.14
450,000 Tengizchevroil Finance Co International Ltd 'REGS' 2.63% 15/08/2025 449,955 0.09
1,150,000 Tengizchevroil Finance Co International Ltd 'REGS' 4.00% 15/08/2026 1,212,388 0.25
800,000 Tengizchevroil Finance Co International Ltd 'REGS' 3.25% 15/08/2030 798,640 0.16
Total Bermuda 8,077,237 1.64
Brazil (30 June 2021: 3.45%)
300,000 B3 SA - Brasil Bolsa Balcao 'REGS' 4.13% 20/09/2031 288,713 0.06
400,000 Banco Bradesco SA/Cayman Islands 'REGS' 3.20% 27/01/2025 404,875 0.08
600,000 Banco BTG Pactual SA/Cayman Islands 'REGS' 4.50% 10/01/2025 604,612 0.12
400,000 Banco BTG Pactual SA/Cayman Islands 'REGS' FRN 15/02/2029 418,825 0.09
749,000 Banco do Brasil SA/Cayman 3.88% 10/10/2022 761,312 0.16
400,000 Banco do Brasil SA/Cayman 'REGS' 5.88% 19/01/2023 414,950 0.08
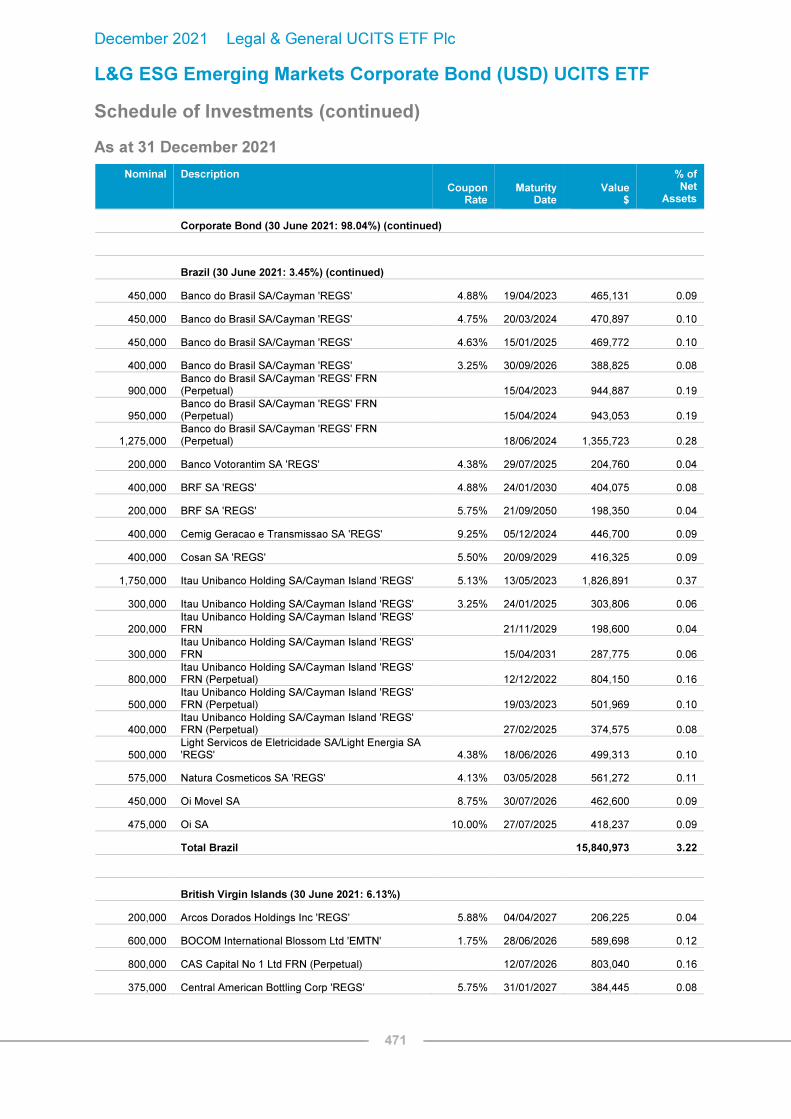
December 2021 Legal & General UCITS ETF Plc
L&G ESG Emerging Markets Corporate Bond (USD) UCITS ETF
Schedule of Investments (continued)
As at 31 December 2021
471
Nominal Description
Coupon Rate
Maturity Date
Value $
% of Net
Assets
Corporate Bond (30 June 2021: 98.04%) (continued)
Brazil (30 June 2021: 3.45%) (continued)
450,000 Banco do Brasil SA/Cayman 'REGS' 4.88% 19/04/2023 465,131 0.09
450,000 Banco do Brasil SA/Cayman 'REGS' 4.75% 20/03/2024 470,897 0.10
450,000 Banco do Brasil SA/Cayman 'REGS' 4.63% 15/01/2025 469,772 0.10
400,000 Banco do Brasil SA/Cayman 'REGS' 3.25% 30/09/2026 388,825 0.08
900,000 Banco do Brasil SA/Cayman 'REGS' FRN (Perpetual) 15/04/2023 944,887 0.19
950,000 Banco do Brasil SA/Cayman 'REGS' FRN (Perpetual) 15/04/2024 943,053 0.19
1,275,000 Banco do Brasil SA/Cayman 'REGS' FRN (Perpetual) 18/06/2024 1,355,723 0.28
200,000 Banco Votorantim SA 'REGS' 4.38% 29/07/2025 204,760 0.04
400,000 BRF SA 'REGS' 4.88% 24/01/2030 404,075 0.08
200,000 BRF SA 'REGS' 5.75% 21/09/2050 198,350 0.04
400,000 Cemig Geracao e Transmissao SA 'REGS' 9.25% 05/12/2024 446,700 0.09
400,000 Cosan SA 'REGS' 5.50% 20/09/2029 416,325 0.09
1,750,000 Itau Unibanco Holding SA/Cayman Island 'REGS' 5.13% 13/05/2023 1,826,891 0.37
300,000 Itau Unibanco Holding SA/Cayman Island 'REGS' 3.25% 24/01/2025 303,806 0.06
200,000 Itau Unibanco Holding SA/Cayman Island 'REGS' FRN 21/11/2029 198,600 0.04
300,000 Itau Unibanco Holding SA/Cayman Island 'REGS' FRN 15/04/2031 287,775 0.06
800,000 Itau Unibanco Holding SA/Cayman Island 'REGS' FRN (Perpetual) 12/12/2022 804,150 0.16
500,000 Itau Unibanco Holding SA/Cayman Island 'REGS' FRN (Perpetual) 19/03/2023 501,969 0.10
400,000 Itau Unibanco Holding SA/Cayman Island 'REGS' FRN (Perpetual) 27/02/2025 374,575 0.08
500,000 Light Servicos de Eletricidade SA/Light Energia SA 'REGS' 4.38% 18/06/2026 499,313 0.10
575,000 Natura Cosmeticos SA 'REGS' 4.13% 03/05/2028 561,272 0.11
450,000 Oi Movel SA 8.75% 30/07/2026 462,600 0.09
475,000 Oi SA 10.00% 27/07/2025 418,237 0.09
Total Brazil 15,840,973 3.22
British Virgin Islands (30 June 2021: 6.13%)
200,000 Arcos Dorados Holdings Inc 'REGS' 5.88% 04/04/2027 206,225 0.04
600,000 BOCOM International Blossom Ltd 'EMTN' 1.75% 28/06/2026 589,698 0.12
800,000 CAS Capital No 1 Ltd FRN (Perpetual) 12/07/2026 803,040 0.16
375,000 Central American Bottling Corp 'REGS' 5.75% 31/01/2027 384,445 0.08

December 2021 Legal & General UCITS ETF Plc
L&G ESG Emerging Markets Corporate Bond (USD) UCITS ETF
Schedule of Investments (continued)
As at 31 December 2021
472
Nominal Description
Coupon Rate
Maturity Date
Value $
% of Net
Assets
Corporate Bond (30 June 2021: 98.04%) (continued)
British Virgin Islands (30 June 2021: 6.13%) (continued)
200,000 Champion Path Holdings Ltd 4.50% 27/01/2026 191,500 0.04
500,000 Champion Path Holdings Ltd 4.85% 27/01/2028 476,031 0.10
200,000 China Cinda 2020 I Management Ltd 'EMTN' 3.00% 20/01/2031 197,538 0.04
700,000 China Cinda Finance 2014 Ltd 'REGS' 5.63% 14/05/2024 753,506 0.15
450,000 China Cinda Finance 2017 I Ltd 'EMTN' 4.40% 09/03/2027 483,694 0.10
250,000 China Cinda Finance 2017 I Ltd 'EMTN' 4.75% 08/02/2028 274,109 0.06
200,000 China Great Wall International Holdings V Ltd 2.38% 18/08/2030 188,600 0.04
200,000 CICC Hong Kong Finance 2016 MTN Ltd 'EMTN' 1.75% 10/08/2023 200,140 0.04
350,000 CICC Hong Kong Finance 2016 MTN Ltd 'EMTN' 1.63% 26/01/2024 348,722 0.07
400,000 CMHI Finance BVI Co Ltd 4.38% 06/08/2023 417,800 0.09
200,000 CMHI Finance BVI Co Ltd FRN (Perpetual) 09/10/2023 204,975 0.04
250,000 COSL Finance BVI Ltd 'REGS' 3.25% 06/09/2022 252,560 0.05
200,000 CSCIF Asia Ltd 'EMTN' 1.75% 04/08/2025 196,937 0.04
200,000 Ease Trade Global Ltd 4.00% 10/11/2025 200,288 0.04
550,000 Elect Global Investments Ltd (Perpetual) 4.85% 25/08/2023 556,160 0.11
900,000 Elect Global Investments Ltd FRN (Perpetual) 03/06/2025 906,075 0.18
240,000 Franshion Brilliant Ltd 3.20% 09/04/2026 225,300 0.05
200,000 Franshion Brilliant Ltd FRN (Perpetual) 03/01/2023 193,975 0.04
200,000 Fuqing Investment Management Ltd 'EMTN' 3.25% 23/06/2025 188,600 0.04
500,000 Gold Fields Orogen Holdings BVI Ltd 'REGS' 5.13% 15/05/2024 532,594 0.11
200,000 Gold Fields Orogen Holdings BVI Ltd 'REGS' 6.13% 15/05/2029 229,475 0.05
200,000 GTL Trade Finance Inc 'REGS' 7.25% 16/04/2044 266,662 0.05
400,000 Henderson Land MTN Ltd 'EMTN' 2.38% 27/05/2025 395,700 0.08
400,000 HKT Capital No 2 Ltd 3.63% 02/04/2025 420,450 0.09
1,200,000 HKT Capital No 4 Ltd 3.00% 14/07/2026 1,241,850 0.25
400,000 HKT Capital No 5 Ltd 3.25% 30/09/2029 421,450 0.09
200,000 Horse Gallop Finance Ltd 'EMTN' 1.70% 28/07/2025 197,350 0.04
200,000 Huarong Finance 2017 Co Ltd 4.75% 27/04/2027 205,938 0.04
200,000 Huarong Finance 2017 Co Ltd 'EMTN' 4.25% 07/11/2027 202,000 0.04
200,000 Huarong Finance 2017 Co Ltd 'EMTN' 4.95% 07/11/2047 192,500 0.04

December 2021 Legal & General UCITS ETF Plc
L&G ESG Emerging Markets Corporate Bond (USD) UCITS ETF
Schedule of Investments (continued)
As at 31 December 2021
473
Nominal Description
Coupon Rate
Maturity Date
Value $
% of Net
Assets
Corporate Bond (30 June 2021: 98.04%) (continued)
British Virgin Islands (30 June 2021: 6.13%) (continued)
200,000 Huarong Finance 2017 Co Ltd 'EMTN' FRN 07/11/2022 196,937 0.04
200,000 Huarong Finance 2017 Co Ltd 'EMTN' FRN (Perpetual) 07/11/2022 198,000 0.04
400,000 Huarong Finance 2017 Co Ltd FRN (Perpetual) 24/07/2022 398,500 0.08
200,000 Huarong Finance 2019 Co Ltd 'EMTN' 2.13% 30/09/2023 197,000 0.04
400,000 Huarong Finance 2019 Co Ltd 'EMTN' 3.25% 13/11/2024 397,875 0.08
200,000 Huarong Finance 2019 Co Ltd 'EMTN' 4.50% 29/05/2029 204,000 0.04
250,000 Huarong Finance 2019 Co Ltd 'EMTN' 3.38% 24/02/2030 238,750 0.05
300,000 Huarong Finance II Co Ltd 'EMTN' 5.50% 16/01/2025 315,000 0.06
200,000 Huarong Finance II Co Ltd 'EMTN' 5.00% 19/11/2025 207,937 0.04
600,000 Huarong Finance II Co Ltd 'EMTN' 4.63% 03/06/2026 618,000 0.13
500,000 Hysan MTN Ltd 'EMTN' 2.82% 04/09/2029 513,219 0.10
500,000 IFC Development Corporate Treasury Ltd 3.63% 17/04/2029 538,531 0.11
300,000 JGSH Philippines Ltd 4.13% 09/07/2030 315,338 0.06
400,000 Nan Fung Treasury III Ltd (Perpetual) 5.00% 10/09/2023 401,450 0.08
400,000 Nan Fung Treasury Ltd 'EMTN' 5.00% 05/09/2028 438,825 0.09
400,000 Nan Fung Treasury Ltd 'EMTN' 3.63% 27/08/2030 401,840 0.08
700,000 Panther Ventures Ltd (Perpetual) 3.50% 22/12/2023 654,850 0.13
550,000 Phoenix Lead Ltd (Perpetual) 4.85% 23/08/2022 549,416 0.11
200,000 Pioneer Reward Ltd 2.00% 09/04/2026 197,188 0.04
200,000 RKPF Overseas 2020 A Ltd 5.20% 12/01/2026 185,760 0.04
200,000 Shanghai Port Group BVI Development Co Ltd 2.85% 11/09/2029 205,820 0.04
250,000 Sino-Ocean Land Treasure Finance I Ltd 6.00% 30/07/2024 251,875 0.05
407,000 Sino-Ocean Land Treasure III Ltd FRN (Perpetual) 21/09/2022 332,926 0.07
200,000 Studio City Finance Ltd 'REGS' 6.00% 15/07/2025 193,037 0.04
700,000 Studio City Finance Ltd 'REGS' 6.50% 15/01/2028 675,500 0.14
700,000 Studio City Finance Ltd 'REGS' 5.00% 15/01/2029 628,819 0.13
800,000 TSMC Global Ltd 'REGS' 0.75% 28/09/2025 773,280 0.16
1,175,000 TSMC Global Ltd 'REGS' 1.25% 23/04/2026 1,151,853 0.23
575,000 TSMC Global Ltd 'REGS' 1.00% 28/09/2027 543,202 0.11
900,000 TSMC Global Ltd 'REGS' 1.75% 23/04/2028 884,970 0.18

December 2021 Legal & General UCITS ETF Plc
L&G ESG Emerging Markets Corporate Bond (USD) UCITS ETF
Schedule of Investments (continued)
As at 31 December 2021
474
Nominal Description
Coupon Rate
Maturity Date
Value $
% of Net
Assets
Corporate Bond (30 June 2021: 98.04%) (continued)
British Virgin Islands (30 June 2021: 6.13%) (continued)
1,150,000 TSMC Global Ltd 'REGS' 1.38% 28/09/2030 1,067,085 0.22
1,400,000 TSMC Global Ltd 'REGS' 2.25% 23/04/2031 1,387,120 0.28
400,000 Vigorous Champion International Ltd 'EMTN' 4.38% 10/09/2023 415,240 0.08
200,000 Vigorous Champion International Ltd 'EMTN' 2.75% 02/06/2025 199,250 0.04
500,000 Wharf REIC Finance BVI Ltd 'EMTN' 3.50% 17/01/2028 530,094 0.11
622,000 Wheelock MTN BVI Ltd 'EMTN' 2.38% 25/01/2026 617,646 0.13
200,000 Yili Holding Investment Ltd 1.63% 19/11/2025 196,440 0.04
Total British Virgin Islands 29,968,460 6.09
Canada (30 June 2021: 0.55%)
1,000,000 MEGlobal Canada ULC 'REGS' 5.00% 18/05/2025 1,090,500 0.22
350,000 MEGlobal Canada ULC 'REGS' 5.88% 18/05/2030 423,784 0.09
400,000 St Marys Cement Inc Canada 'REGS' 5.75% 28/01/2027 448,700 0.09
Total Canada 1,962,984 0.40
Cayman Islands (30 June 2021: 17.46%)
700,000 ABQ Finance Ltd 'EMTN' 3.13% 24/09/2024 723,406 0.15
450,000 ADCB Finance Cayman Ltd 'EMTN' 4.50% 06/03/2023 463,444 0.09
400,000 ADCB Finance Cayman Ltd 'REGS' 4.00% 29/03/2023 411,950 0.08
400,000 ADIB Capital Invest 2 Ltd FRN (Perpetual) 20/09/2023 422,575 0.09
200,000 Agile Group Holdings Ltd FRN (Perpetual) 04/12/2023 93,663 0.02
500,000 AHB Sukuk Co Ltd 4.38% 19/09/2023 526,344 0.11
450,000 AKCB Finance Ltd 4.75% 09/10/2023 476,859 0.10
600,000 Aldar Sukuk Ltd 4.75% 29/09/2025 656,175 0.13
400,000 Aldar Sukuk No 2 Ltd 3.88% 22/10/2029 426,825 0.09
300,000 Almarai Sukuk Ltd 4.31% 05/03/2024 316,931 0.06
450,000 Arabian Centres Sukuk II Ltd 'REGS' 5.63% 07/10/2026 442,688 0.09
200,000 Arabian Centres Sukuk Ltd 'REGS' 5.38% 26/11/2024 199,288 0.04
500,000 Baidu Inc 1.72% 09/04/2026 492,410 0.10
525,848 Bioceanico Sovereign Certificate Ltd 'REGS' (Zero Coupon) 0.00% 05/06/2034 394,222 0.08

December 2021 Legal & General UCITS ETF Plc
L&G ESG Emerging Markets Corporate Bond (USD) UCITS ETF
Schedule of Investments (continued)
As at 31 December 2021
475
Nominal Description
Coupon Rate
Maturity Date
Value $
% of Net
Assets
Corporate Bond (30 June 2021: 98.04%) (continued)
Cayman Islands (30 June 2021: 17.46%) (continued)
500,000 BOS Funding Ltd 'EMTN' 4.00% 18/09/2024 512,750 0.10
400,000 Braskem Finance Ltd 6.45% 03/02/2024 437,204 0.09
400,000 CCBL Cayman 1 Corp Ltd 'EMTN' 3.50% 16/05/2024 416,540 0.09
200,000 CDBL Funding 2 'EMTN' 1.38% 04/03/2024 198,412 0.04
200,000 CDBL Funding 2 'EMTN' 2.00% 04/03/2026 197,676 0.04
200,000 China Mengniu Dairy Co Ltd 3.00% 18/07/2024 205,850 0.04
431,000 China Overseas Finance Cayman III Ltd 5.38% 29/10/2023 456,402 0.09
200,000 China Overseas Finance Cayman III Ltd 6.38% 29/10/2043 271,787 0.06
200,000 China Overseas Finance Cayman V Ltd 3.95% 15/11/2022 203,287 0.04
400,000 China Overseas Finance Cayman VI Ltd 5.95% 08/05/2024 434,450 0.09
200,000 China Overseas Finance Cayman VI Ltd 6.45% 11/06/2034 259,250 0.05
317,000 China Overseas Finance Cayman VII Ltd 4.75% 26/04/2028 351,434 0.07
200,000 China Resources Land Ltd 'EMTN' 6.00% 27/02/2024 216,288 0.04
400,000 China Resources Land Ltd 'EMTN' FRN (Perpetual) 09/12/2024 411,999 0.08
200,000 China SCE Group Holdings Ltd 7.38% 09/04/2024 169,260 0.03
200,000 CIFI Holdings Group Co Ltd 6.45% 07/11/2024 197,437 0.04
500,000 CK Hutchison Capital Securities 17 Ltd 'REGS' FRN (Perpetual) 12/05/2022 504,156 0.10
700,000 CK Hutchison International 16 Ltd 'REGS' 2.75% 03/10/2026 726,740 0.15
400,000 CK Hutchison International 17 II Ltd 'REGS' 2.75% 29/03/2023 407,450 0.08
500,000 CK Hutchison International 17 Ltd 'REGS' 3.50% 05/04/2027 535,094 0.11
500,000 CK Hutchison International 19 II Ltd 'REGS' 3.38% 06/09/2049 543,063 0.11
400,000 CK Hutchison International 19 Ltd 'REGS' 3.25% 11/04/2024 417,720 0.09
500,000 CK Hutchison International 19 Ltd 'REGS' 3.63% 11/04/2029 546,700 0.11
300,000 CK Hutchison International 20 Ltd 'REGS' 2.50% 08/05/2030 303,480 0.06
500,000 CK Hutchison International 20 Ltd 'REGS' 3.38% 08/05/2050 544,312 0.11
500,000 CK Hutchison International 21 Ltd 'REGS' 1.50% 15/04/2026 493,800 0.10
300,000 CK Hutchison International 21 Ltd 'REGS' 3.13% 15/04/2041 309,510 0.06
200,000 Cosan Overseas Ltd (Perpetual) 8.25% 05/02/2022 203,600 0.04
500,000 Country Garden Holdings Co Ltd 3.13% 22/10/2025 439,844 0.09
200,000 Country Garden Holdings Co Ltd 7.25% 08/04/2026 197,250 0.04

December 2021 Legal & General UCITS ETF Plc
L&G ESG Emerging Markets Corporate Bond (USD) UCITS ETF
Schedule of Investments (continued)
As at 31 December 2021
476
Nominal Description
Coupon Rate
Maturity Date
Value $
% of Net
Assets
Corporate Bond (30 June 2021: 98.04%) (continued)
Cayman Islands (30 June 2021: 17.46%) (continued)
300,000 Country Garden Holdings Co Ltd 4.80% 06/08/2030 270,000 0.06
200,000 Country Garden Holdings Co Ltd 3.88% 22/10/2030 173,000 0.04
750,000 CSN Inova Ventures 'REGS' 6.75% 28/01/2028 787,172 0.16
400,000 Dar Al-Arkan Sukuk Co Ltd 6.88% 21/03/2023 411,325 0.08
200,000 Dar Al-Arkan Sukuk Co Ltd 6.75% 15/02/2025 207,850 0.04
400,000 DIB Sukuk Ltd 3.63% 06/02/2023 409,875 0.08
400,000 DIB Sukuk Ltd 2.95% 20/02/2025 412,950 0.08
800,000 DIB Sukuk Ltd 'EMTN' 2.95% 16/01/2026 825,900 0.17
600,000 DIB Sukuk Ltd 'EMTN' 1.96% 22/06/2026 597,562 0.12
500,000 DIB Tier 1 Sukuk 3 Ltd FRN (Perpetual) 22/01/2025 527,344 0.11
800,000 DIB Tier 1 Sukuk 4 Ltd FRN (Perpetual) 19/05/2026 812,750 0.17
600,000 Doha Finance Ltd 'EMTN' 2.38% 31/03/2026 603,563 0.12
800,000 EI Sukuk Co Ltd 1.83% 23/09/2025 798,750 0.16
400,000 EMG SUKUK Ltd 4.56% 18/06/2024 421,700 0.09
200,000 ENN Energy Holdings Ltd 'REGS' 2.63% 17/09/2030 198,913 0.04
450,000 Esic Sukuk Ltd 'EMTN' 3.94% 30/07/2024 459,984 0.09
500,000 Fab Sukuk Co Ltd 3.63% 05/03/2023 516,344 0.11
956,000 Fab Sukuk Co Ltd 3.88% 22/01/2024 1,008,281 0.21
400,000 Fab Sukuk Co Ltd 2.50% 21/01/2025 412,450 0.08
550,000 Fab Sukuk Co Ltd 1.41% 14/01/2026 545,703 0.11
650,000 Fibria Overseas Finance Ltd 5.50% 17/01/2027 727,309 0.15
500,000 Formosa Group Cayman Ltd 3.38% 22/04/2025 520,875 0.11
200,000 Foxconn Far East Ltd 'EMTN' 1.63% 28/10/2025 199,020 0.04
1,000,000 Foxconn Far East Ltd 'EMTN' 2.50% 28/10/2030 993,625 0.20
600,000 FWD Group Ltd 5.75% 09/07/2024 614,175 0.13
800,000 FWD Group Ltd FRN (Perpetual) 15/06/2022 773,650 0.16
300,000 FWD Group Ltd FRN (Perpetual) 13/09/2024 303,431 0.06
200,000 Geely Automobile Holdings Ltd FRN (Perpetual) 09/12/2024 205,225 0.04
450,000 GFH Sukuk Ltd 7.50% 28/01/2025 459,928 0.09
700,000 Grupo Aval Ltd 'REGS' 4.75% 26/09/2022 711,506 0.14

December 2021 Legal & General UCITS ETF Plc
L&G ESG Emerging Markets Corporate Bond (USD) UCITS ETF
Schedule of Investments (continued)
As at 31 December 2021
477
Nominal Description
Coupon Rate
Maturity Date
Value $
% of Net
Assets
Corporate Bond (30 June 2021: 98.04%) (continued)
Cayman Islands (30 June 2021: 17.46%) (continued)
750,000 Grupo Aval Ltd 'REGS' 4.38% 04/02/2030 718,500 0.15
400,000 Hongkong Land Finance Cayman Islands Co Ltd/The 'EMTN' 4.50% 07/10/2025 437,825 0.09
600,000 Hongkong Land Finance Cayman Islands Co Ltd/The 'EMTN' 2.88% 27/05/2030 621,487 0.13
800,000 Hongkong Land Finance Cayman Islands Co Ltd/The 'EMTN' 2.25% 15/07/2031 787,040 0.16
400,000 HPHT Finance 17 Ltd 2.75% 11/09/2022 403,412 0.08
400,000 HPHT Finance 19 Ltd 2.88% 05/11/2024 412,450 0.08
800,000 HPHT Finance 21 II Ltd 1.50% 17/09/2026 779,760 0.16
1,050,000 Hutchison Whampoa International 03/33 Ltd 'REGS' 7.45% 24/11/2033 1,552,425 0.32
825,000 Hutchison Whampoa International 14 Ltd 'REGS' 3.63% 31/10/2024 876,459 0.18
200,000 IHS Holding Ltd 'REGS' 5.63% 29/11/2026 201,500 0.04
200,000 KWG Group Holdings Ltd 5.88% 10/11/2024 145,000 0.03
350,234 Lima Metro Line 2 Finance Ltd 'REGS' 5.88% 05/07/2034 399,442 0.08
585,638 Lima Metro Line 2 Finance Ltd 'REGS' 4.35% 05/04/2036 622,423 0.13
500,000 Link Finance Cayman 2009 Ltd/The 'EMTN' 3.60% 03/09/2024 524,625 0.11
500,000 Link Finance Cayman 2009 Ltd/The 'EMTN' 2.88% 21/07/2026 516,500 0.11
200,000 Longfor Group Holdings Ltd 3.95% 16/09/2029 204,600 0.04
1,036,000 MAF Global Securities Ltd 4.75% 07/05/2024 1,104,376 0.22
550,000 MAF Global Securities Ltd FRN (Perpetual) 07/09/2022 555,775 0.11
700,000 MAF Sukuk Ltd 4.64% 14/05/2029 777,350 0.16
700,000 MAF Sukuk Ltd 'EMTN' 3.93% 28/02/2030 748,694 0.15
700,000 MAR Sukuk Ltd 2.21% 02/09/2025 703,194 0.14
550,000 Melco Resorts Finance Ltd 'REGS' 4.88% 06/06/2025 536,697 0.11
650,000 Melco Resorts Finance Ltd 'REGS' 5.63% 17/07/2027 642,200 0.13
400,000 Melco Resorts Finance Ltd 'REGS' 5.75% 21/07/2028 390,400 0.08
400,000 Melco Resorts Finance Ltd 'REGS' 5.38% 04/12/2029 386,325 0.08
600,000 MGM China Holdings Ltd 'REGS' 5.38% 15/05/2024 597,488 0.12
450,000 MGM China Holdings Ltd 'REGS' 5.25% 18/06/2025 444,319 0.09
700,000 MGM China Holdings Ltd 'REGS' 5.88% 15/05/2026 701,006 0.14
650,000 MTR Corp CI Ltd 2.50% 02/11/2026 675,106 0.14
310,000 NagaCorp Ltd 7.95% 06/07/2024 302,793 0.06

December 2021 Legal & General UCITS ETF Plc
L&G ESG Emerging Markets Corporate Bond (USD) UCITS ETF
Schedule of Investments (continued)
As at 31 December 2021
478
Nominal Description
Coupon Rate
Maturity Date
Value $
% of Net
Assets
Corporate Bond (30 June 2021: 98.04%) (continued)
Cayman Islands (30 June 2021: 17.46%) (continued)
250,000 Noor Sukuk Co Ltd 4.47% 24/04/2023 260,203 0.05
724,207 Odebrecht Drilling Norbe VIII/IX Ltd 'REGS' 7.35% 01/12/2026 394,617 0.08
348,697 Odebrecht Offshore Drilling Finance Ltd 'REGS' 7.72% 01/12/2026 66,216 0.01
850,000 PCPD Capital Ltd 5.13% 18/06/2026 848,980 0.17
291,750 Poinsettia Finance Ltd 'REGS' 6.63% 17/06/2031 288,847 0.06
225,000 QIIB Senior Sukuk Ltd 'REGS' 4.26% 05/03/2024 237,586 0.05
1,100,000 QNB Finance Ltd 'EMTN' 1.63% 22/09/2025 1,091,406 0.22
500,000 QNB Finance Ltd 'EMTN' 1.38% 26/01/2026 489,219 0.10
400,000 QNB Finance Ltd 'EMTN' 2.75% 12/02/2027 410,950 0.08
800,000 Riyad Sukuk Ltd FRN 25/02/2030 817,650 0.17
400,000 Sable International Finance Ltd 'REGS' 5.75% 07/09/2027 409,500 0.08
850,000 Samba Funding Ltd 2.75% 02/10/2024 871,144 0.18
350,000 Samba Funding Ltd 2.90% 29/01/2027 362,972 0.07
1,100,000 Sands China Ltd 5.13% 08/08/2025 1,147,762 0.23
600,000 Sands China Ltd 3.80% 08/01/2026 600,810 0.12
1,200,000 Sands China Ltd 5.40% 08/08/2028 1,279,212 0.26
400,000 Sands China Ltd 4.38% 18/06/2030 407,520 0.08
750,000 Sands China Ltd 'REGS' 2.30% 08/03/2027 705,938 0.14
500,000 Sands China Ltd 'REGS' 2.85% 08/03/2029 468,850 0.10
350,000 Sands China Ltd 'REGS' 3.25% 08/08/2031 326,512 0.07
850,000 Saudi Electricity Global Sukuk Co 2 'REGS' 3.47% 08/04/2023 874,066 0.18
813,000 Saudi Electricity Global Sukuk Co 2 'REGS' 5.06% 08/04/2043 995,823 0.20
1,100,000 Saudi Electricity Global Sukuk Co 3 'REGS' 4.00% 08/04/2024 1,162,906 0.24
750,000 Saudi Electricity Global Sukuk Co 3 'REGS' 5.50% 08/04/2044 969,984 0.20
200,000 Saudi Electricity Global Sukuk Co 4 4.22% 27/01/2024 211,687 0.04
950,000 Saudi Electricity Global Sukuk Co 4 4.72% 27/09/2028 1,094,578 0.22
650,000 Saudi Electricity Global Sukuk Co 5 1.74% 17/09/2025 645,734 0.13
500,000 Saudi Electricity Global Sukuk Co 5 2.41% 17/09/2030 500,875 0.10
550,000 Shelf Drilling Holdings Ltd 'REGS' 8.25% 15/02/2025 397,375 0.08
450,000 Shimao Group Holdings Ltd 6.13% 21/02/2024 283,500 0.06
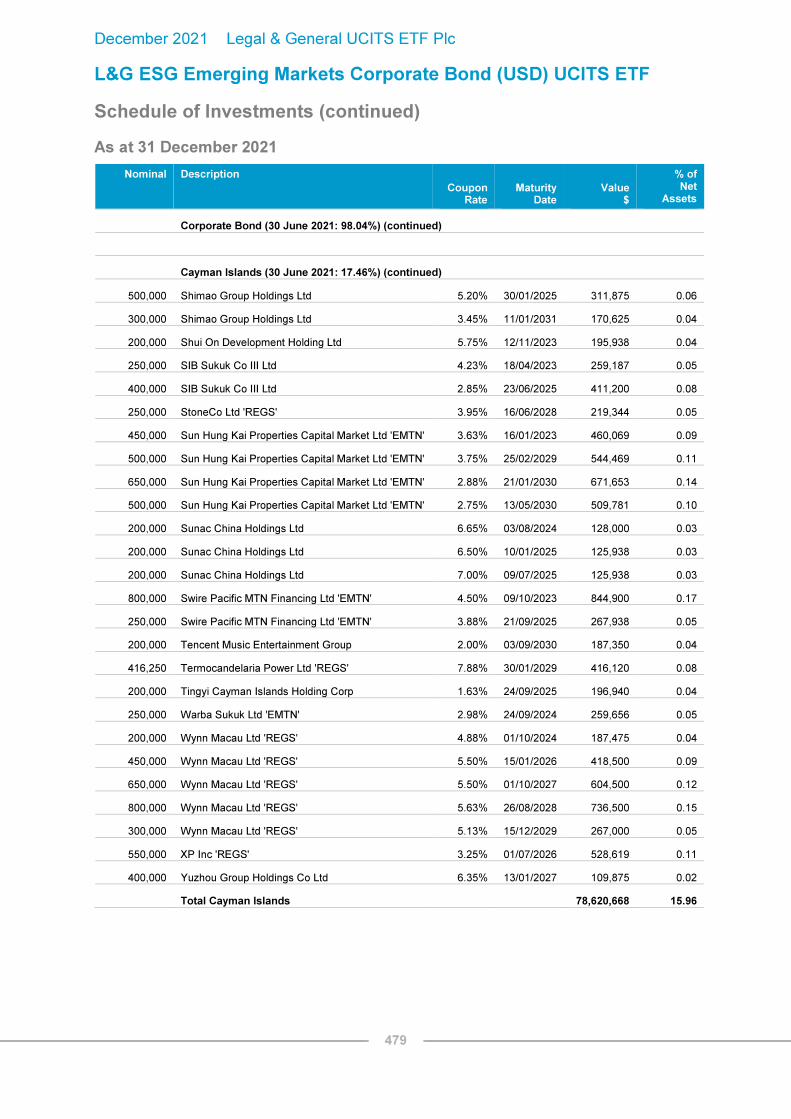
December 2021 Legal & General UCITS ETF Plc
L&G ESG Emerging Markets Corporate Bond (USD) UCITS ETF
Schedule of Investments (continued)
As at 31 December 2021
479
Nominal Description
Coupon Rate
Maturity Date
Value $
% of Net
Assets
Corporate Bond (30 June 2021: 98.04%) (continued)
Cayman Islands (30 June 2021: 17.46%) (continued)
500,000 Shimao Group Holdings Ltd 5.20% 30/01/2025 311,875 0.06
300,000 Shimao Group Holdings Ltd 3.45% 11/01/2031 170,625 0.04
200,000 Shui On Development Holding Ltd 5.75% 12/11/2023 195,938 0.04
250,000 SIB Sukuk Co III Ltd 4.23% 18/04/2023 259,187 0.05
400,000 SIB Sukuk Co III Ltd 2.85% 23/06/2025 411,200 0.08
250,000 StoneCo Ltd 'REGS' 3.95% 16/06/2028 219,344 0.05
450,000 Sun Hung Kai Properties Capital Market Ltd 'EMTN' 3.63% 16/01/2023 460,069 0.09
500,000 Sun Hung Kai Properties Capital Market Ltd 'EMTN' 3.75% 25/02/2029 544,469 0.11
650,000 Sun Hung Kai Properties Capital Market Ltd 'EMTN' 2.88% 21/01/2030 671,653 0.14
500,000 Sun Hung Kai Properties Capital Market Ltd 'EMTN' 2.75% 13/05/2030 509,781 0.10
200,000 Sunac China Holdings Ltd 6.65% 03/08/2024 128,000 0.03
200,000 Sunac China Holdings Ltd 6.50% 10/01/2025 125,938 0.03
200,000 Sunac China Holdings Ltd 7.00% 09/07/2025 125,938 0.03
800,000 Swire Pacific MTN Financing Ltd 'EMTN' 4.50% 09/10/2023 844,900 0.17
250,000 Swire Pacific MTN Financing Ltd 'EMTN' 3.88% 21/09/2025 267,938 0.05
200,000 Tencent Music Entertainment Group 2.00% 03/09/2030 187,350 0.04
416,250 Termocandelaria Power Ltd 'REGS' 7.88% 30/01/2029 416,120 0.08
200,000 Tingyi Cayman Islands Holding Corp 1.63% 24/09/2025 196,940 0.04
250,000 Warba Sukuk Ltd 'EMTN' 2.98% 24/09/2024 259,656 0.05
200,000 Wynn Macau Ltd 'REGS' 4.88% 01/10/2024 187,475 0.04
450,000 Wynn Macau Ltd 'REGS' 5.50% 15/01/2026 418,500 0.09
650,000 Wynn Macau Ltd 'REGS' 5.50% 01/10/2027 604,500 0.12
800,000 Wynn Macau Ltd 'REGS' 5.63% 26/08/2028 736,500 0.15
300,000 Wynn Macau Ltd 'REGS' 5.13% 15/12/2029 267,000 0.05
550,000 XP Inc 'REGS' 3.25% 01/07/2026 528,619 0.11
400,000 Yuzhou Group Holdings Co Ltd 6.35% 13/01/2027 109,875 0.02
Total Cayman Islands 78,620,668 15.96

December 2021 Legal & General UCITS ETF Plc
L&G ESG Emerging Markets Corporate Bond (USD) UCITS ETF
Schedule of Investments (continued)
As at 31 December 2021
480
Nominal Description
Coupon Rate
Maturity Date
Value $
% of Net
Assets
Corporate Bond (30 June 2021: 98.04%) (continued)
Chile (30 June 2021: 2.61%)
650,000 Banco de Credito e Inversiones SA 'REGS' 4.00% 11/02/2023 669,622 0.14
300,000 Banco de Credito e Inversiones SA 'REGS' 3.50% 12/10/2027 320,400 0.07
300,000 Banco de Credito e Inversiones SA 'REGS' 2.88% 14/10/2031 295,406 0.06
1,000,000 Banco Santander Chile 'REGS' 2.70% 10/01/2025 1,021,125 0.21
300,000 Banco Santander Chile 'REGS' 3.18% 26/10/2031 303,750 0.06
200,000 Celulosa Arauco y Constitucion SA 4.50% 01/08/2024 212,100 0.04
350,000 Celulosa Arauco y Constitucion SA 'REGS' 4.20% 29/01/2030 372,378 0.08
300,000 Celulosa Arauco y Constitucion SA 'REGS' 5.50% 30/04/2049 347,587 0.07
250,000 Celulosa Arauco y Constitucion SA 'REGS' 5.15% 29/01/2050 284,188 0.06
350,000 Cencosud SA 'REGS' 5.15% 12/02/2025 377,300 0.08
700,000 Cencosud SA 'REGS' 4.38% 17/07/2027 743,663 0.15
750,000 Colbun SA 'REGS' 3.15% 19/01/2032 740,531 0.15
500,000 Empresa Nacional de Telecomunicaciones SA 'REGS' 4.75% 01/08/2026 540,406 0.11
528,000 Empresa Nacional de Telecomunicaciones SA 'REGS' 3.05% 14/09/2032 517,374 0.10
400,000 Falabella SA 'REGS' 3.38% 15/01/2032 395,400 0.08
894,140 GNL Quintero SA 'REGS' 4.63% 31/07/2029 946,280 0.19
900,000 Interchile SA 'REGS' 4.50% 30/06/2056 957,263 0.19
550,000 Inversiones CMPC SA 'REGS' 4.75% 15/09/2024 587,572 0.12
200,000 Inversiones CMPC SA 'REGS' 4.38% 04/04/2027 219,350 0.04
400,000 Inversiones CMPC SA 'REGS' 3.85% 13/01/2030 416,325 0.08
550,000 Inversiones CMPC SA 'REGS' 3.00% 06/04/2031 539,103 0.11
900,000 Inversiones CMPC SA/Cayman Islands Branch 'REGS' 4.38% 15/05/2023 926,606 0.19
900,000 Sociedad Quimica y Minera de Chile SA 'REGS' 3.50% 10/09/2051 867,262 0.18
500,000 Telefonica Chile SA 'REGS' 3.88% 12/10/2022 508,063 0.10
600,000 Telefonica Moviles Chile SA 'REGS' 3.54% 18/11/2031 595,050 0.12
Total Chile 13,704,104 2.78
China (30 June 2021: 0.51%)
200,000 China Construction Bank Corp/Hong Kong 'EMTN' 1.00% 04/08/2023 198,790 0.04
200,000 China Construction Bank Corp/Hong Kong 'EMTN' 1.25% 04/08/2025 197,000 0.04

December 2021 Legal & General UCITS ETF Plc
L&G ESG Emerging Markets Corporate Bond (USD) UCITS ETF
Schedule of Investments (continued)
As at 31 December 2021
481
Nominal Description
Coupon Rate
Maturity Date
Value $
% of Net
Assets
Corporate Bond (30 June 2021: 98.04%) (continued)
China (30 June 2021: 0.51%) (continued)
400,000 China Everbright Bank Co Ltd/Hong Kong 'EMTN' 0.84% 15/06/2024 394,600 0.08
250,000 China Merchants Bank Co Ltd/Hong Kong 'EMTN' 1.20% 10/09/2025 244,687 0.05
400,000 China Minsheng Banking Corp Ltd/Hong Kong 'EMTN' FRN 09/03/2023 398,492 0.08
300,000 ZhongAn Online P&C Insurance Co Ltd 3.13% 16/07/2025 289,500 0.06
Total China 1,723,069 0.35
Colombia (30 June 2021: 3.15%)
500,000 Banco Davivienda SA 'REGS' FRN (Perpetual) 22/04/2031 505,250 0.10
300,000 Banco de Bogota SA 'REGS' 5.38% 19/02/2023 307,837 0.06
500,000 Banco de Bogota SA 'REGS' 6.25% 12/05/2026 540,650 0.11
200,000 Banco de Bogota SA 'REGS' 4.38% 03/08/2027 204,787 0.04
600,000 Bancolombia SA 5.13% 11/09/2022 609,863 0.13
1,200,000 Bancolombia SA 3.00% 29/01/2025 1,195,350 0.24
600,000 Bancolombia SA FRN 18/10/2027 598,425 0.12
200,000 Bancolombia SA FRN 18/12/2029 199,725 0.04
300,000 Colombia Telecomunicaciones SA ESP 'REGS' 4.95% 17/07/2030 298,931 0.06
1,175,000 Ecopetrol SA 5.88% 18/09/2023 1,247,850 0.26
750,000 Ecopetrol SA 4.13% 16/01/2025 763,266 0.16
1,330,000 Ecopetrol SA 5.38% 26/06/2026 1,399,659 0.29
1,450,000 Ecopetrol SA 6.88% 29/04/2030 1,619,650 0.33
800,000 Ecopetrol SA 4.63% 02/11/2031 777,040 0.16
550,000 Ecopetrol SA 7.38% 18/09/2043 607,166 0.12
1,400,000 Ecopetrol SA 5.88% 28/05/2045 1,336,388 0.27
700,000 Ecopetrol SA 5.88% 02/11/2051 654,500 0.13
700,000 Grupo de Inversiones Suramericana SA 'REGS' 5.50% 29/04/2026 743,881 0.15
700,000 Oleoducto Central SA 'REGS' 4.00% 14/07/2027 695,975 0.14
750,000 SURA Asset Management SA 'REGS' 4.88% 17/04/2024 791,859 0.16
317,000 Transportadora de Gas Internacional SA ESP 'REGS' 5.55% 01/11/2028 349,750 0.07
Total Colombia 15,447,802 3.14

December 2021 Legal & General UCITS ETF Plc
L&G ESG Emerging Markets Corporate Bond (USD) UCITS ETF
Schedule of Investments (continued)
As at 31 December 2021
482
Nominal Description
Coupon Rate
Maturity Date
Value $
% of Net
Assets
Corporate Bond (30 June 2021: 98.04%) (continued)
Curacao (30 June 2021: 0.19%)
226,000 Teva Pharmaceutical Finance Co BV 2.95% 18/12/2022 226,409 0.05
Total Curacao 226,409 0.05
Cyprus (30 June 2021: 0.08%)
450,000 MHP SE 'REGS' 7.75% 10/05/2024 457,397 0.09
Total Cyprus 457,397 0.09
Hong Kong (30 June 2021: 4.76%)
500,000 AIA Group Ltd 'EMTN' 3.13% 13/03/2023 511,344 0.10
500,000 AIA Group Ltd 'GMTN' FRN (Perpetual) 07/04/2026 499,400 0.10
500,000 AIA Group Ltd 'REGS' 3.20% 11/03/2025 521,188 0.11
450,000 AIA Group Ltd 'REGS' 3.90% 06/04/2028 495,647 0.10
900,000 AIA Group Ltd 'REGS' 3.60% 09/04/2029 981,731 0.20
1,300,000 AIA Group Ltd 'REGS' 3.38% 07/04/2030 1,403,431 0.29
1,700,000 AIA Group Ltd 'REGS' 3.20% 16/09/2040 1,732,194 0.35
500,000 AIA Group Ltd 'REGS' 4.88% 11/03/2044 646,812 0.13
650,000 AIA Group Ltd 'REGS' 4.50% 16/03/2046 811,687 0.17
1,700,000 Bank of China Hong Kong Ltd 'REGS' FRN (Perpetual) 14/09/2023 1,816,875 0.37
850,000 Bank of Communications Hong Kong Ltd FRN 08/07/2031 831,054 0.17
300,000 Bank of Communications Hong Kong Ltd FRN (Perpetual) 03/03/2025 309,000 0.06
450,000 Bank of East Asia Ltd/The 'EMTN' FRN 29/05/2030 465,272 0.09
472,000 Bank of East Asia Ltd/The 'EMTN' FRN (Perpetual) 21/10/2025 496,190 0.10
325,000 Bank of East Asia Ltd/The FRN (Perpetual) 18/05/2022 327,905 0.07
500,000 Bank of East Asia Ltd/The FRN (Perpetual) 19/09/2024 520,875 0.11
550,000 Cathay Pacific MTN Financing HK Ltd 'EMTN' 4.88% 17/08/2026 544,328 0.11
250,000 China CITIC Bank International Ltd 'EMTN' FRN 28/02/2029 260,984 0.05
400,000 China CITIC Bank International Ltd 'EMTN' FRN (Perpetual) 06/11/2023 432,500 0.09
400,000 China CITIC Bank International Ltd 'EMTN' FRN (Perpetual) 29/07/2026 403,000 0.08
400,000 CMB International Leasing Management Ltd 'EMTN' 3.00% 03/07/2024 410,325 0.08

December 2021 Legal & General UCITS ETF Plc
L&G ESG Emerging Markets Corporate Bond (USD) UCITS ETF
Schedule of Investments (continued)
As at 31 December 2021
483
Nominal Description
Coupon Rate
Maturity Date
Value $
% of Net
Assets
Corporate Bond (30 June 2021: 98.04%) (continued)
Hong Kong (30 June 2021: 4.76%) (continued)
200,000 GLP China Holdings Ltd 'EMTN' 4.97% 26/02/2024 209,412 0.04
280,000 GLP China Holdings Ltd 'EMTN' 2.95% 29/03/2026 277,077 0.06
500,000 ICBCIL Finance Co Ltd 'EMTN' 3.75% 05/03/2024 522,594 0.11
450,000 ICBCIL Finance Co Ltd 'EMTN' 1.63% 02/11/2024 447,615 0.09
250,000 ICBCIL Finance Co Ltd 'EMTN' 1.75% 25/08/2025 246,766 0.05
200,000 ICBCIL Finance Co Ltd 'EMTN' 1.75% 02/08/2026 195,180 0.04
250,000 ICBCIL Finance Co Ltd 'EMTN' 2.25% 02/11/2026 249,375 0.05
200,000 Lenovo Group Ltd 'EMTN' 4.75% 29/03/2023 206,850 0.04
400,000 Lenovo Group Ltd 'EMTN' 5.88% 24/04/2025 440,500 0.09
400,000 Lenovo Group Ltd 'REGS' 3.42% 02/11/2030 404,325 0.08
1,150,000 MTR Corp Ltd 'EMTN' 1.63% 19/08/2030 1,111,044 0.23
550,000 Nanyang Commercial Bank Ltd FRN 20/11/2029 562,822 0.11
850,000 Nanyang Commercial Bank Ltd FRN (Perpetual) 02/06/2022 861,156 0.18
400,000 Swire Pacific Mtn Financing HK Ltd 'EMTN' 2.88% 30/01/2030 413,950 0.08
550,000 Swire Properties MTN Financing Ltd 'EMTN' 3.63% 13/01/2026 585,166 0.12
500,000 Swire Properties MTN Financing Ltd 'EMTN' 3.50% 10/01/2028 535,719 0.11
400,000 Vanke Real Estate Hong Kong Co Ltd 'EMTN' 4.15% 18/04/2023 408,450 0.08
300,000 Vanke Real Estate Hong Kong Co Ltd 'EMTN' 4.20% 07/06/2024 311,681 0.06
400,000 Weichai International Hong Kong Energy Group Co Ltd FRN (Perpetual) 14/09/2022 403,875 0.08
400,000 Westwood Group Holdings Ltd 'EMTN' 2.80% 20/01/2026 387,950 0.08
200,000 Yanlord Land HK Co Ltd 5.13% 20/05/2026 193,500 0.04
Total Hong Kong 23,396,749 4.75
India (30 June 2021: 3.22%)
700,000 Adani Green Energy Ltd 'REGS' 4.38% 08/09/2024 709,625 0.14
400,000 Adani Green Energy UP Ltd / Prayatna Developers Pvt Ltd / Parampujya Solar Energ 'REGS' 6.25% 10/12/2024 432,950 0.09
250,000 Adani Ports & Special Economic Zone Ltd 'REGS' 4.00% 30/07/2027 257,469 0.05
700,000 Adani Ports & Special Economic Zone Ltd 'REGS' 4.20% 04/08/2027 727,037 0.15
451,000 Adani Ports & Special Economic Zone Ltd 'REGS' 4.38% 03/07/2029 470,393 0.10
400,000 Adani Ports & Special Economic Zone Ltd 'REGS' 3.10% 02/02/2031 381,450 0.08

December 2021 Legal & General UCITS ETF Plc
L&G ESG Emerging Markets Corporate Bond (USD) UCITS ETF
Schedule of Investments (continued)
As at 31 December 2021
484
Nominal Description
Coupon Rate
Maturity Date
Value $
% of Net
Assets
Corporate Bond (30 June 2021: 98.04%) (continued)
India (30 June 2021: 3.22%) (continued)
300,000 Axis Bank Ltd/Gift City 'REGS' FRN (Perpetual) 08/09/2026 298,140 0.06
300,000 Bharat Petroleum Corp Ltd 4.63% 25/10/2022 307,369 0.06
450,000 Bharat Petroleum Corp Ltd 'EMTN' 4.00% 08/05/2025 470,475 0.10
850,000 Bharti Airtel Ltd 'REGS' 4.38% 10/06/2025 904,081 0.18
600,000 Bharti Airtel Ltd 'REGS' 3.25% 03/06/2031 608,382 0.12
200,000 Delhi International Airport Ltd 'REGS' 6.13% 31/10/2026 204,850 0.04
450,000 Delhi International Airport Ltd 'REGS' 6.45% 04/06/2029 445,500 0.09
200,000 Future Retail Ltd 'REGS' 5.60% 22/01/2025 123,100 0.03
600,000 HDFC Bank Ltd 'REGS' FRN (Perpetual) 25/08/2026 597,750 0.12
300,000 Hindustan Petroleum Corp Ltd 4.00% 12/07/2027 314,869 0.06
500,000 Indian Oil Corp Ltd 4.75% 16/01/2024 527,906 0.11
200,000 Indian Railway Finance Corp Ltd 3.84% 13/12/2027 213,038 0.04
386,000 JSW Hydro Energy Ltd 'REGS' 4.13% 18/05/2031 384,070 0.08
450,000 JSW Steel Ltd 5.95% 18/04/2024 477,000 0.10
400,000 JSW Steel Ltd 'REGS' 3.95% 05/04/2027 395,000 0.08
400,000 JSW Steel Ltd 'REGS' 5.05% 05/04/2032 395,500 0.08
400,000 ONGC Videsh Ltd 4.63% 15/07/2024 426,950 0.09
308,000 Power Finance Corp Ltd 4.50% 18/06/2029 329,040 0.07
800,000 Power Finance Corp Ltd 'GMTN' 3.35% 16/05/2031 790,232 0.16
600,000 Power Finance Corp Ltd 'REGS' 6.15% 06/12/2028 707,550 0.14
300,000 Power Grid Corp of India Ltd 3.88% 17/01/2023 307,556 0.06
900,000 REC Ltd 3.50% 12/12/2024 931,669 0.19
700,000 REC Ltd 'REGS' 5.25% 13/11/2023 740,381 0.15
800,000 Reliance Industries Ltd 'REGS' 4.13% 28/01/2025 855,150 0.17
600,000 Reliance Industries Ltd 'REGS' 3.67% 30/11/2027 643,238 0.13
250,000 Reliance Industries Ltd 'REGS' 6.25% 19/10/2040 353,875 0.07
650,000 Reliance Industries Ltd 'REGS' 4.88% 10/02/2045 813,434 0.17
500,000 ReNew Power Synthetic 'REGS' 6.67% 12/03/2024 519,625 0.11
400,000 ReNew Wind Energy AP2 / ReNew Power Pvt Ltd other 9 Subsidiaries 'REGS' 4.50% 14/07/2028 402,520 0.08
600,000 Shriram Transport Finance Co Ltd 'REGS' 4.40% 13/03/2024 609,000 0.12

December 2021 Legal & General UCITS ETF Plc
L&G ESG Emerging Markets Corporate Bond (USD) UCITS ETF
Schedule of Investments (continued)
As at 31 December 2021
485
Nominal Description
Coupon Rate
Maturity Date
Value $
% of Net
Assets
Corporate Bond (30 June 2021: 98.04%) (continued)
India (30 June 2021: 3.22%) (continued)
325,000 Summit Digitel Infrastructure Pvt Ltd 'REGS' 2.88% 12/08/2031 313,609 0.06
Total India 18,389,783 3.73
Indonesia (30 June 2021: 0.74%)
800,000 Bank Mandiri Persero Tbk PT 'EMTN' 3.75% 11/04/2024 834,000 0.17
250,000 Bank Negara Indonesia Persero Tbk PT 'EMTN' 3.75% 30/03/2026 253,750 0.05
450,000 Bank Negara Indonesia Persero Tbk PT FRN (Perpetual) 24/03/2027 447,609 0.09
700,000 Bank Rakyat Indonesia Persero Tbk PT 3.95% 28/03/2024 735,000 0.15
1,057,000 Indofood CBP Sukses Makmur Tbk PT 3.40% 09/06/2031 1,064,928 0.22
250,000 Indofood CBP Sukses Makmur Tbk PT 4.75% 09/06/2051 257,187 0.05
1,300,000 Perusahaan Gas Negara Tbk PT 'REGS' 5.13% 16/05/2024 1,401,400 0.28
550,000 Saka Energi Indonesia PT 'REGS' 4.45% 05/05/2024 533,088 0.11
Total Indonesia 5,526,962 1.12
International (30 June 2021: 0.69%)
400,000 Africa Finance Corp 3.13% 16/06/2025 411,875 0.08
200,000 Africa Finance Corp 3.75% 30/10/2029 207,760 0.04
700,000 Africa Finance Corp 'REGS' 3.88% 13/04/2024 734,160 0.15
300,000 Africa Finance Corp 'REGS' 2.88% 28/04/2028 298,500 0.06
800,000 Canpack SA / Canpack US LLC 'REGS' 3.88% 15/11/2029 768,320 0.16
260,000 Digicel International Finance Ltd/Digicel international Holdings Ltd 'REGS' 8.75% 25/05/2024 267,686 0.05
600,000 Digicel International Finance Ltd/Digicel international Holdings Ltd 'REGS' 8.75% 25/05/2024 616,988 0.13
750,000 Eastern & Southern African Trade & Development Bank/The 'EMTN' 4.88% 23/05/2024 768,765 0.16
450,000 Eastern & Southern African Trade & Development Bank/The 'EMTN' 4.13% 30/06/2028 447,593 0.09
400,000 GEMS MENASA Cayman Ltd / GEMS Education Delaware LLC 'REGS' 7.13% 31/07/2026 410,575 0.08
600,000 Promigas SA ESP / Gases del Pacifico SAC 'REGS' 3.75% 16/10/2029 590,175 0.12
Total International 5,522,397 1.12
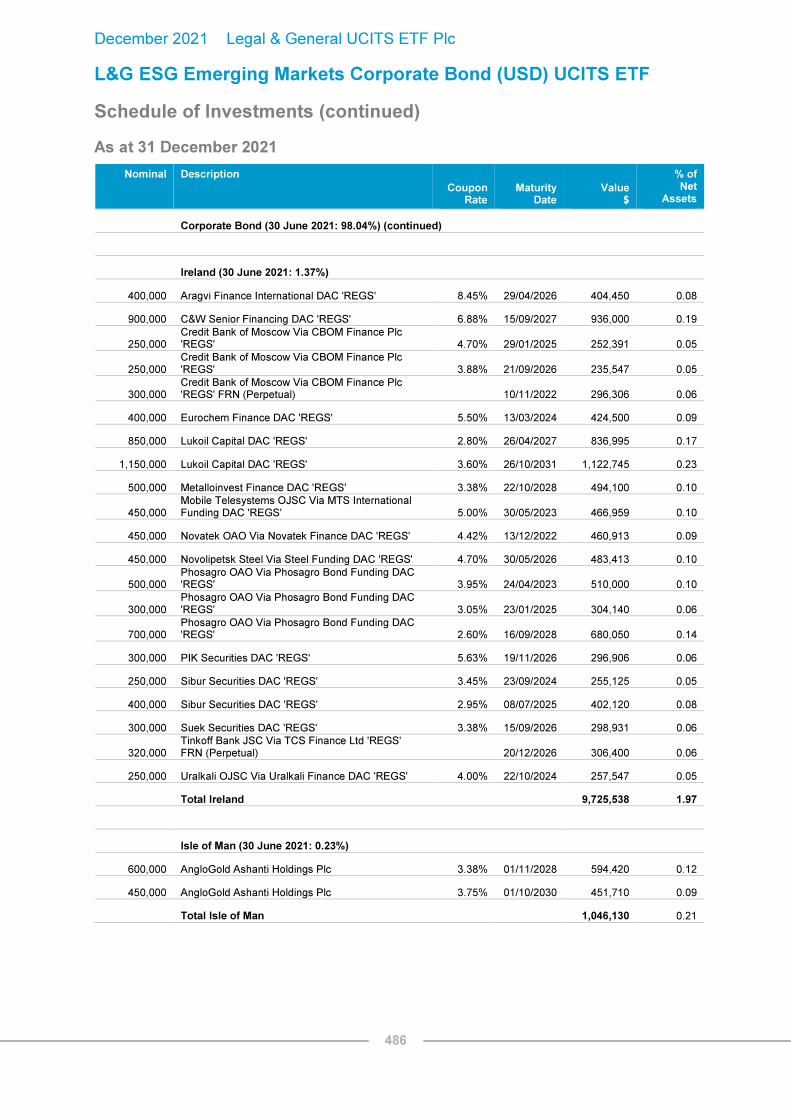
December 2021 Legal & General UCITS ETF Plc
L&G ESG Emerging Markets Corporate Bond (USD) UCITS ETF
Schedule of Investments (continued)
As at 31 December 2021
486
Nominal Description
Coupon Rate
Maturity Date
Value $
% of Net
Assets
Corporate Bond (30 June 2021: 98.04%) (continued)
Ireland (30 June 2021: 1.37%)
400,000 Aragvi Finance International DAC 'REGS' 8.45% 29/04/2026 404,450 0.08
900,000 C&W Senior Financing DAC 'REGS' 6.88% 15/09/2027 936,000 0.19
250,000 Credit Bank of Moscow Via CBOM Finance Plc 'REGS' 4.70% 29/01/2025 252,391 0.05
250,000 Credit Bank of Moscow Via CBOM Finance Plc 'REGS' 3.88% 21/09/2026 235,547 0.05
300,000 Credit Bank of Moscow Via CBOM Finance Plc 'REGS' FRN (Perpetual) 10/11/2022 296,306 0.06
400,000 Eurochem Finance DAC 'REGS' 5.50% 13/03/2024 424,500 0.09
850,000 Lukoil Capital DAC 'REGS' 2.80% 26/04/2027 836,995 0.17
1,150,000 Lukoil Capital DAC 'REGS' 3.60% 26/10/2031 1,122,745 0.23
500,000 Metalloinvest Finance DAC 'REGS' 3.38% 22/10/2028 494,100 0.10
450,000 Mobile Telesystems OJSC Via MTS International Funding DAC 'REGS' 5.00% 30/05/2023 466,959 0.10
450,000 Novatek OAO Via Novatek Finance DAC 'REGS' 4.42% 13/12/2022 460,913 0.09
450,000 Novolipetsk Steel Via Steel Funding DAC 'REGS' 4.70% 30/05/2026 483,413 0.10
500,000 Phosagro OAO Via Phosagro Bond Funding DAC 'REGS' 3.95% 24/04/2023 510,000 0.10
300,000 Phosagro OAO Via Phosagro Bond Funding DAC 'REGS' 3.05% 23/01/2025 304,140 0.06
700,000 Phosagro OAO Via Phosagro Bond Funding DAC 'REGS' 2.60% 16/09/2028 680,050 0.14
300,000 PIK Securities DAC 'REGS' 5.63% 19/11/2026 296,906 0.06
250,000 Sibur Securities DAC 'REGS' 3.45% 23/09/2024 255,125 0.05
400,000 Sibur Securities DAC 'REGS' 2.95% 08/07/2025 402,120 0.08
300,000 Suek Securities DAC 'REGS' 3.38% 15/09/2026 298,931 0.06
320,000 Tinkoff Bank JSC Via TCS Finance Ltd 'REGS' FRN (Perpetual) 20/12/2026 306,400 0.06
250,000 Uralkali OJSC Via Uralkali Finance DAC 'REGS' 4.00% 22/10/2024 257,547 0.05
Total Ireland 9,725,538 1.97
Isle of Man (30 June 2021: 0.23%)
600,000 AngloGold Ashanti Holdings Plc 3.38% 01/11/2028 594,420 0.12
450,000 AngloGold Ashanti Holdings Plc 3.75% 01/10/2030 451,710 0.09
Total Isle of Man 1,046,130 0.21
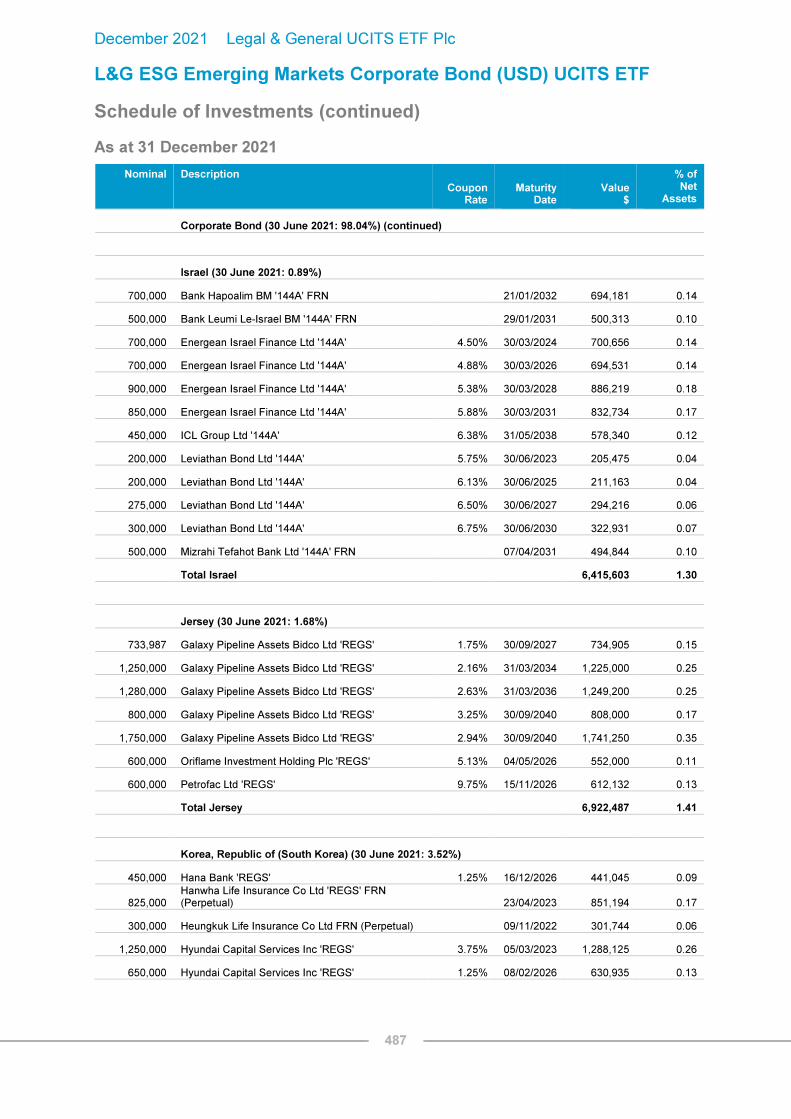
December 2021 Legal & General UCITS ETF Plc
L&G ESG Emerging Markets Corporate Bond (USD) UCITS ETF
Schedule of Investments (continued)
As at 31 December 2021
487
Nominal Description
Coupon Rate
Maturity Date
Value $
% of Net
Assets
Corporate Bond (30 June 2021: 98.04%) (continued)
Israel (30 June 2021: 0.89%)
700,000 Bank Hapoalim BM '144A' FRN 21/01/2032 694,181 0.14
500,000 Bank Leumi Le-Israel BM '144A' FRN 29/01/2031 500,313 0.10
700,000 Energean Israel Finance Ltd '144A' 4.50% 30/03/2024 700,656 0.14
700,000 Energean Israel Finance Ltd '144A' 4.88% 30/03/2026 694,531 0.14
900,000 Energean Israel Finance Ltd '144A' 5.38% 30/03/2028 886,219 0.18
850,000 Energean Israel Finance Ltd '144A' 5.88% 30/03/2031 832,734 0.17
450,000 ICL Group Ltd '144A' 6.38% 31/05/2038 578,340 0.12
200,000 Leviathan Bond Ltd '144A' 5.75% 30/06/2023 205,475 0.04
200,000 Leviathan Bond Ltd '144A' 6.13% 30/06/2025 211,163 0.04
275,000 Leviathan Bond Ltd '144A' 6.50% 30/06/2027 294,216 0.06
300,000 Leviathan Bond Ltd '144A' 6.75% 30/06/2030 322,931 0.07
500,000 Mizrahi Tefahot Bank Ltd '144A' FRN 07/04/2031 494,844 0.10
Total Israel 6,415,603 1.30
Jersey (30 June 2021: 1.68%)
733,987 Galaxy Pipeline Assets Bidco Ltd 'REGS' 1.75% 30/09/2027 734,905 0.15
1,250,000 Galaxy Pipeline Assets Bidco Ltd 'REGS' 2.16% 31/03/2034 1,225,000 0.25
1,280,000 Galaxy Pipeline Assets Bidco Ltd 'REGS' 2.63% 31/03/2036 1,249,200 0.25
800,000 Galaxy Pipeline Assets Bidco Ltd 'REGS' 3.25% 30/09/2040 808,000 0.17
1,750,000 Galaxy Pipeline Assets Bidco Ltd 'REGS' 2.94% 30/09/2040 1,741,250 0.35
600,000 Oriflame Investment Holding Plc 'REGS' 5.13% 04/05/2026 552,000 0.11
600,000 Petrofac Ltd 'REGS' 9.75% 15/11/2026 612,132 0.13
Total Jersey 6,922,487 1.41
Korea, Republic of (South Korea) (30 June 2021: 3.52%)
450,000 Hana Bank 'REGS' 1.25% 16/12/2026 441,045 0.09
825,000 Hanwha Life Insurance Co Ltd 'REGS' FRN (Perpetual) 23/04/2023 851,194 0.17
300,000 Heungkuk Life Insurance Co Ltd FRN (Perpetual) 09/11/2022 301,744 0.06
1,250,000 Hyundai Capital Services Inc 'REGS' 3.75% 05/03/2023 1,288,125 0.26
650,000 Hyundai Capital Services Inc 'REGS' 1.25% 08/02/2026 630,935 0.13

December 2021 Legal & General UCITS ETF Plc
L&G ESG Emerging Markets Corporate Bond (USD) UCITS ETF
Schedule of Investments (continued)
As at 31 December 2021
488
Nominal Description
Coupon Rate
Maturity Date
Value $
% of Net
Assets
Corporate Bond (30 June 2021: 98.04%) (continued)
Korea, Republic of (South Korea) (30 June 2021: 3.52%) (continued)
800,000 Kookmin Bank 'REGS' 1.75% 04/05/2025 805,520 0.16
500,000 Kookmin Bank 'REGS' 1.38% 06/05/2026 494,050 0.10
500,000 Kookmin Bank 'REGS' 2.50% 04/11/2030 490,550 0.10
500,000 Kookmin Bank 'REGS' FRN (Perpetual) 02/07/2024 520,875 0.11
400,000 Kyobo Life Insurance Co Ltd 'REGS' FRN (Perpetual) 24/07/2022 403,450 0.08
500,000 LG Chem Ltd 'REGS' 3.25% 15/10/2024 524,950 0.11
300,000 LG Chem Ltd 'REGS' 1.38% 07/07/2026 293,370 0.06
600,000 LG Chem Ltd 'REGS' 3.63% 15/04/2029 654,300 0.13
450,000 NAVER Corp 1.50% 29/03/2026 442,710 0.09
400,000 NongHyup Bank 'REGS' 1.25% 20/07/2025 395,884 0.08
1,100,000 Shinhan Bank Co Ltd 'REGS' 3.88% 05/11/2023 1,155,660 0.24
750,000 Shinhan Bank Co Ltd 'REGS' 1.38% 21/10/2026 740,175 0.15
550,000 Shinhan Financial Group Co Ltd FRN (Perpetual) 13/08/2023 577,947 0.12
500,000 Shinhan Financial Group Co Ltd 'REGS' 1.35% 10/01/2026 492,650 0.10
1,150,000 Shinhan Financial Group Co Ltd 'REGS' FRN 05/02/2030 1,182,919 0.24
200,000 Shinhan Financial Group Co Ltd 'REGS' FRN (Perpetual) 12/05/2026 196,937 0.04
800,000 SK Hynix Inc 3.00% 17/09/2024 826,650 0.17
1,050,000 SK Hynix Inc 'REGS' 1.50% 19/01/2026 1,027,845 0.21
850,000 SK Hynix Inc 'REGS' 2.38% 19/01/2031 818,550 0.17
300,000 SK Telecom Co Ltd 'REGS' 3.75% 16/04/2023 310,041 0.06
600,000 Woori Bank 'REGS' 4.75% 30/04/2024 643,237 0.13
700,000 Woori Bank 'REGS' FRN (Perpetual) 16/05/2022 707,569 0.14
Total Korea, Republic of (South Korea) 17,218,882 3.50
Kuwait (30 June 2021: 0.15%)
300,000 Burgan Bank SAK FRN 15/12/2031 270,656 0.06
200,000 Burgan Bank SAK FRN (Perpetual) 09/07/2024 200,475 0.04
Total Kuwait 471,131 0.10

December 2021 Legal & General UCITS ETF Plc
L&G ESG Emerging Markets Corporate Bond (USD) UCITS ETF
Schedule of Investments (continued)
As at 31 December 2021
489
Nominal Description
Coupon Rate
Maturity Date
Value $
% of Net
Assets
Corporate Bond (30 June 2021: 98.04%) (continued)
Luxembourg (30 June 2021: 3.71%)
350,000 Adecoagro SA 'REGS' 6.00% 21/09/2027 360,566 0.07
750,000 Altice Financing SA 'REGS' 5.00% 15/01/2028 731,918 0.15
1,360,000 Altice Financing SA 'REGS' 5.75% 15/08/2029 1,340,443 0.27
450,000 Amaggi Luxembourg International Sarl 'REGS' 5.25% 28/01/2028 452,194 0.09
400,000 Atento Luxco 1 SA 'REGS' 8.00% 10/02/2026 425,450 0.09
300,000 B2W Digital Lux Sarl 'REGS' 4.38% 20/12/2030 269,681 0.05
200,000 Cosan Luxembourg SA 'REGS' 7.00% 20/01/2027 206,663 0.04
550,000 CSN Resources SA 'REGS' 7.63% 17/04/2026 575,884 0.12
300,000 CSN Resources SA 'REGS' 4.63% 10/06/2031 285,525 0.06
771,850 FEL Energy VI Sarl 'REGS' 5.75% 01/12/2040 765,000 0.15
410,000 FS Luxembourg Sarl 'REGS' 10.00% 15/12/2025 449,155 0.09
400,000 Gol Finance SA 'REGS' 8.00% 30/06/2026 376,325 0.08
671,678 Guara Norte Sarl 'REGS' 5.20% 15/06/2034 661,519 0.13
250,000 JSM Global Sarl 'REGS' 4.75% 20/10/2030 229,578 0.05
300,000 Kenbourne Invest SA 'REGS' 6.88% 26/11/2024 313,088 0.06
400,000 Klabin Finance SA 'REGS' 4.88% 19/09/2027 424,325 0.09
1,250,000 MC Brazil Downstream Trading SARL 'REGS' 7.25% 30/06/2031 1,243,359 0.25
450,000 MHP Lux SA 'REGS' 6.95% 03/04/2026 448,116 0.09
720,000 Millicom International Cellular SA 'REGS' 6.25% 25/03/2029 775,935 0.16
200,000 Millicom International Cellular SA 'REGS' 4.50% 27/04/2031 201,287 0.04
250,000 Movida Europe SA 'REGS' 5.25% 08/02/2031 230,828 0.05
500,000 Nexa Resources SA 'REGS' 5.38% 04/05/2027 529,781 0.11
300,000 Nexa Resources SA 'REGS' 6.50% 18/01/2028 329,588 0.07
400,000 Petrorio Luxembourg Sarl 'REGS' 6.13% 09/06/2026 397,450 0.08
400,000 Raizen Fuels Finance SA 'REGS' 5.30% 20/01/2027 434,950 0.09
200,000 Rede D'or Finance Sarl 'REGS' 4.95% 17/01/2028 203,100 0.04
400,000 Rede D'or Finance Sarl 'REGS' 4.50% 22/01/2030 389,450 0.08
650,000 Rumo Luxembourg Sarl 'REGS' 5.88% 18/01/2025 667,591 0.14
300,000 Rumo Luxembourg Sarl 'REGS' 4.20% 18/01/2032 281,963 0.06
1,200,000 Sberbank of Russia Via SB Capital SA 'REGS' 5.13% 29/10/2022 1,222,725 0.25

December 2021 Legal & General UCITS ETF Plc
L&G ESG Emerging Markets Corporate Bond (USD) UCITS ETF
Schedule of Investments (continued)
As at 31 December 2021
490
Nominal Description
Coupon Rate
Maturity Date
Value $
% of Net
Assets
Corporate Bond (30 June 2021: 98.04%) (continued)
Luxembourg (30 June 2021: 3.71%) (continued)
550,000 Sberbank of Russia Via SB Capital SA 'REGS' 5.25% 23/05/2023 569,009 0.11
250,000 Simpar Europe SA 'REGS' 5.20% 26/01/2031 232,937 0.05
200,000 TMK OAO Via TMK Capital SA 4.30% 12/02/2027 199,850 0.04
200,000 Ultrapar International SA 'REGS' 5.25% 06/10/2026 211,162 0.04
250,000 Ultrapar International SA 'REGS' 5.25% 06/06/2029 258,328 0.05
200,000 Unigel Luxembourg SA 'REGS' 8.75% 01/10/2026 211,100 0.04
400,000 Votorantim Cimentos International SA 'REGS' 7.25% 05/04/2041 521,825 0.11
Total Luxembourg 17,427,648 3.54
Malaysia (30 June 2021: 0.83%)
400,000 Axiata SPV2 Bhd 'EMTN' 4.36% 24/03/2026 438,075 0.09
404,000 Axiata SPV2 Bhd 'EMTN' 2.16% 19/08/2030 398,142 0.08
800,000 Axiata Spv5 Labuan Ltd 'EMTN' 3.06% 19/08/2050 772,650 0.16
550,000 CIMB Bank Bhd 'EMTN' FRN 09/10/2024 552,853 0.11
800,000 Genm Capital Labuan Ltd 'REGS' 3.88% 19/04/2031 781,650 0.16
450,000 Malayan Banking Bhd 'EMTN' FRN 16/08/2024 452,335 0.09
600,000 RHB Bank Bhd 'EMTN' 1.66% 29/06/2026 595,140 0.12
Total Malaysia 3,990,845 0.81
Marshall Islands (30 June 2021: 0.16%)
408,844 Nakilat Inc 'REGS' 6.07% 31/12/2033 499,122 0.10
350,000 Seaspan Corp 'REGS' 5.50% 01/08/2029 351,750 0.07
Total Marshall Islands 850,872 0.17
Mauritius (30 June 2021: 1.07%)
950,000 CA Magnum Holdings 'REGS' 5.38% 31/10/2026 982,110 0.20
650,000 Greenko Investment Co 'REGS' 4.88% 16/08/2023 656,500 0.13
997,000 Greenko Power II Ltd 'REGS' 4.30% 13/12/2028 1,014,447 0.21
550,000 Greenko Solar Mauritius Ltd 'REGS' 5.55% 29/01/2025 561,000 0.12
600,000 Greenko Solar Mauritius Ltd 'REGS' 5.95% 29/07/2026 638,250 0.13

December 2021 Legal & General UCITS ETF Plc
L&G ESG Emerging Markets Corporate Bond (USD) UCITS ETF
Schedule of Investments (continued)
As at 31 December 2021
491
Nominal Description
Coupon Rate
Maturity Date
Value $
% of Net
Assets
Corporate Bond (30 June 2021: 98.04%) (continued)
Mauritius (30 June 2021: 1.07%) (continued)
850,000 HTA Group Ltd/Mauritius 'REGS' 7.00% 18/12/2025 885,222 0.18
200,000 MTN Mauritius Investments Ltd 'REGS' 4.76% 11/11/2024 208,975 0.04
767,000 MTN Mauritius Investments Ltd 'REGS' 6.50% 13/10/2026 856,308 0.17
750,000 Network i2i Ltd 'REGS' FRN (Perpetual) 15/01/2025 788,109 0.16
Total Mauritius 6,590,921 1.34
Mexico (30 June 2021: 9.40%)
250,000 Alfa SAB de CV 'REGS' 5.25% 25/03/2024 264,266 0.05
200,000 Alfa SAB de CV 'REGS' 6.88% 25/03/2044 261,312 0.05
200,000 Alpek SAB de CV 'REGS' 4.25% 18/09/2029 212,413 0.04
300,000 Alpek SAB de CV 'REGS' 3.25% 25/02/2031 300,525 0.06
400,000 America Movil SAB de CV 3.63% 22/04/2029 431,825 0.09
700,000 America Movil SAB de CV 2.88% 07/05/2030 723,756 0.15
380,000 America Movil SAB de CV 6.38% 01/03/2035 524,837 0.11
850,000 America Movil SAB de CV 6.13% 30/03/2040 1,175,550 0.24
650,000 America Movil SAB de CV 4.38% 16/07/2042 766,716 0.16
500,000 America Movil SAB de CV 4.38% 22/04/2049 607,594 0.12
400,000 Banco Inbursa SA Institucion De Banca Multiple Grupo Financiero Inbursa 'REGS' 4.13% 06/06/2024 416,450 0.08
400,000 Banco Inbursa SA Institucion De Banca Multiple Grupo Financiero Inbursa 'REGS' 4.38% 11/04/2027 424,325 0.09
500,000 Banco Mercantil del Norte SA/Grand Cayman 'REGS' FRN (Perpetual) 27/09/2024 517,750 0.11
450,000 Banco Mercantil del Norte SA/Grand Cayman 'REGS' FRN (Perpetual) 24/01/2027 446,906 0.09
450,000 Banco Mercantil del Norte SA/Grand Cayman 'REGS' FRN (Perpetual) 10/01/2028 480,459 0.10
400,000 Banco Mercantil del Norte SA/Grand Cayman 'REGS' FRN (Perpetual) 27/06/2029 424,950 0.09
550,000 Banco Mercantil del Norte SA/Grand Cayman 'REGS' FRN (Perpetual) 14/10/2030 631,744 0.13
525,000 Banco Mercantil del Norte SA/Grand Cayman 'REGS' FRN (Perpetual) 24/01/2032 521,817 0.11
600,000 Banco Santander Mexico SA Institucion de Banca Multiple Grupo Financiero Santand 'REGS' 4.13% 09/11/2022 613,425 0.12
1,285,000 Banco Santander Mexico SA Institucion de Banca Multiple Grupo Financiero Santand 'REGS' 5.38% 17/04/2025 1,399,686 0.28
1,000,000 Banco Santander Mexico SA Institucion de Banca Multiple Grupo Financiero Santand 'REGS' FRN 01/10/2028 1,049,562 0.21
1,050,000 BBVA Bancomer SA/Texas 'REGS' 6.75% 30/09/2022 1,089,047 0.22
650,000 BBVA Bancomer SA/Texas 'REGS' 4.38% 10/04/2024 690,137 0.14

December 2021 Legal & General UCITS ETF Plc
L&G ESG Emerging Markets Corporate Bond (USD) UCITS ETF
Schedule of Investments (continued)
As at 31 December 2021
492
Nominal Description
Coupon Rate
Maturity Date
Value $
% of Net
Assets
Corporate Bond (30 June 2021: 98.04%) (continued)
Mexico (30 June 2021: 9.40%) (continued)
300,000 BBVA Bancomer SA/Texas 'REGS' 1.88% 18/09/2025 297,806 0.06
650,000 BBVA Bancomer SA/Texas 'REGS' FRN 18/01/2033 667,388 0.14
450,000 BBVA Bancomer SA/Texas 'REGS' FRN 13/09/2034 492,412 0.10
390,000 Becle SAB de CV 'REGS' 2.50% 14/10/2031 382,317 0.08
550,000 Braskem Idesa SAPI 'REGS' 7.45% 15/11/2029 571,416 0.12
900,000 Braskem Idesa SAPI 'REGS' 6.99% 20/02/2032 904,219 0.18
750,000 Cemex SAB de CV 'REGS' 7.38% 05/06/2027 825,844 0.17
700,000 Cemex SAB de CV 'REGS' 5.45% 19/11/2029 750,881 0.15
750,000 Cemex SAB de CV 'REGS' 5.20% 17/09/2030 804,047 0.16
1,200,000 Cemex SAB de CV 'REGS' 3.88% 11/07/2031 1,196,250 0.24
661,000 Cemex SAB de CV 'REGS' FRN (Perpetual) 08/06/2026 684,135 0.14
400,000 Cibanco SA Ibm / PLA Administradora Industrial S de RL de CV 'REGS' 4.96% 18/07/2029 431,825 0.09
350,000 CIBANCO SA Institucion de Banca Multiple Trust CIB/3332 'REGS' 4.38% 22/07/2031 334,972 0.07
1,000,000 Coca-Cola Femsa SAB de CV 2.75% 22/01/2030 1,021,125 0.21
550,000 Coca-Cola Femsa SAB de CV 1.85% 01/09/2032 518,134 0.11
350,000 Coca-Cola Femsa SAB de CV 5.25% 26/11/2043 457,472 0.09
404,550 Cometa Energia SA de CV 'REGS' 6.38% 24/04/2035 457,142 0.09
400,000 Fomento Economico Mexicano SAB de CV 4.38% 10/05/2043 472,125 0.10
1,100,000 Fomento Economico Mexicano SAB de CV 3.50% 16/01/2050 1,146,063 0.23
625,000 Grupo Bimbo SAB de CV 'REGS' 3.88% 27/06/2024 659,102 0.13
300,000 Grupo Bimbo SAB de CV 'REGS' 4.88% 27/06/2044 356,306 0.07
300,000 Grupo Bimbo SAB de CV 'REGS' 4.70% 10/11/2047 356,775 0.07
400,000 Grupo Bimbo SAB de CV 'REGS' 4.00% 06/09/2049 430,700 0.09
300,000 Grupo Bimbo SAB de CV 'REGS' FRN (Perpetual) 17/04/2023 309,994 0.06
400,000 Grupo Televisa SAB 6.63% 18/03/2025 455,575 0.09
650,000 Grupo Televisa SAB 6.63% 15/01/2040 881,075 0.18
700,000 Grupo Televisa SAB 5.00% 13/05/2045 824,600 0.17
650,000 Grupo Televisa SAB 6.13% 31/01/2046 878,028 0.18
500,000 Grupo Televisa SAB 5.25% 24/05/2049 624,625 0.13
450,000 Industrias Penoles SAB de CV 'REGS' 4.15% 12/09/2029 486,647 0.10

December 2021 Legal & General UCITS ETF Plc
L&G ESG Emerging Markets Corporate Bond (USD) UCITS ETF
Schedule of Investments (continued)
As at 31 December 2021
493
Nominal Description
Coupon Rate
Maturity Date
Value $
% of Net
Assets
Corporate Bond (30 June 2021: 98.04%) (continued)
Mexico (30 June 2021: 9.40%) (continued)
550,000 Industrias Penoles SAB de CV 'REGS' 5.65% 12/09/2049 674,197 0.14
325,000 Industrias Penoles SAB de CV 'REGS' 4.75% 06/08/2050 355,123 0.07
200,000 Infraestructura Energetica Nova SAB de CV 'REGS' 4.88% 14/01/2048 201,350 0.04
700,000 Infraestructura Energetica Nova SAB de CV 'REGS' 4.75% 15/01/2051 699,912 0.14
500,000 Kimberly-Clark de Mexico SAB de CV 'REGS' 2.43% 01/07/2031 496,094 0.10
550,000 Minera Mexico SA de CV 'REGS' 4.50% 26/01/2050 600,806 0.12
450,000 Nemak SAB de CV 'REGS' 3.63% 28/06/2031 436,866 0.09
350,000 Orbia Advance Corp SAB de CV 'REGS' 1.88% 11/05/2026 344,313 0.07
400,000 Orbia Advance Corp SAB de CV 'REGS' 4.00% 04/10/2027 427,450 0.09
300,000 Orbia Advance Corp SAB de CV 'REGS' 2.88% 11/05/2031 294,150 0.06
450,000 Orbia Advance Corp SAB de CV 'REGS' 5.88% 17/09/2044 553,162 0.11
400,000 Orbia Advance Corp SAB de CV 'REGS' 5.50% 15/01/2048 467,825 0.09
850,000 Sigma Alimentos SA de CV 'REGS' 4.13% 02/05/2026 899,300 0.18
450,000 Trust Fibra Uno 'REGS' 5.25% 15/12/2024 486,084 0.10
850,000 Trust Fibra Uno 'REGS' 5.25% 30/01/2026 929,688 0.19
850,000 Trust Fibra Uno 'REGS' 4.87% 15/01/2030 902,753 0.18
600,000 Trust Fibra Uno 'REGS' 6.95% 30/01/2044 736,613 0.15
750,000 Trust Fibra Uno 'REGS' 6.39% 15/01/2050 872,953 0.18
250,000 Unifin Financiera SAB de CV 'REGS' 9.88% 28/01/2029 210,281 0.04
Total Mexico 43,242,972 8.78
Morocco (30 June 2021: 0.32%)
200,000 OCP SA 'REGS' 4.50% 22/10/2025 210,725 0.04
616,000 OCP SA 'REGS' 3.75% 23/06/2031 598,867 0.12
450,000 OCP SA 'REGS' 6.88% 25/04/2044 522,225 0.11
650,000 OCP SA 'REGS' 5.13% 23/06/2051 614,575 0.13
Total Morocco 1,946,392 0.40

December 2021 Legal & General UCITS ETF Plc
L&G ESG Emerging Markets Corporate Bond (USD) UCITS ETF
Schedule of Investments (continued)
As at 31 December 2021
494
Nominal Description
Coupon Rate
Maturity Date
Value $
% of Net
Assets
Corporate Bond (30 June 2021: 98.04%) (continued)
Netherlands (30 June 2021: 7.13%)
1,050,000 Bharti Airtel International Netherlands BV 'REGS' 5.35% 20/05/2024 1,129,931 0.23
800,000 Braskem Netherlands Finance BV 'REGS' 4.50% 10/01/2028 848,000 0.17
900,000 Braskem Netherlands Finance BV 'REGS' 4.50% 31/01/2030 957,150 0.19
400,000 Braskem Netherlands Finance BV 'REGS' 5.88% 31/01/2050 459,250 0.09
300,000 Braskem Netherlands Finance BV 'REGS' FRN 23/01/2081 347,962 0.07
1,425,000 Equate Petrochemical BV 'REGS' 4.25% 03/11/2026 1,547,728 0.31
650,000 Equate Petrochemical BV 'REGS' 2.63% 28/04/2028 651,625 0.13
1,053,950 Greenko Dutch BV 'REGS' 3.85% 29/03/2026 1,064,490 0.22
1,250,000 IHS Netherlands Holdco BV 'REGS' 8.00% 18/09/2027 1,320,156 0.27
300,000 InterCement Financial Operations BV 'REGS' 5.75% 17/07/2024 266,625 0.05
1,200,000 Lukoil International Finance BV 'REGS' 4.56% 24/04/2023 1,237,350 0.25
600,000 Lukoil International Finance BV 'REGS' 4.75% 02/11/2026 640,800 0.13
900,000 Lukoil Securities BV 'REGS' 3.88% 06/05/2030 922,680 0.19
500,000 Metinvest BV 'REGS' 8.50% 23/04/2026 520,563 0.11
500,000 Metinvest BV 'REGS' 7.75% 17/10/2029 495,562 0.10
450,000 Petrobras Global Finance BV 5.30% 27/01/2025 482,850 0.10
350,000 Petrobras Global Finance BV 8.75% 23/05/2026 424,769 0.09
700,000 Petrobras Global Finance BV 7.38% 17/01/2027 812,000 0.17
925,000 Petrobras Global Finance BV 6.00% 27/01/2028 1,001,312 0.20
350,000 Petrobras Global Finance BV 5.75% 01/02/2029 376,097 0.08
780,000 Petrobras Global Finance BV 5.09% 15/01/2030 811,444 0.16
1,000,000 Petrobras Global Finance BV 5.60% 03/01/2031 1,065,000 0.22
525,000 Petrobras Global Finance BV 6.88% 20/01/2040 574,317 0.12
450,000 Petrobras Global Finance BV 6.75% 27/01/2041 486,788 0.10
600,000 Petrobras Global Finance BV 7.25% 17/03/2044 662,363 0.13
605,000 Petrobras Global Finance BV 6.90% 19/03/2049 642,170 0.13
400,000 Petrobras Global Finance BV 6.75% 03/06/2050 416,575 0.08
665,000 Petrobras Global Finance BV 5.50% 10/06/2051 615,250 0.13
1,235,000 Petrobras Global Finance BV 6.85% 05/06/2115 1,226,355 0.25
500,000 Prosus NV 'REGS' 4.85% 06/07/2027 557,344 0.11

December 2021 Legal & General UCITS ETF Plc
L&G ESG Emerging Markets Corporate Bond (USD) UCITS ETF
Schedule of Investments (continued)
As at 31 December 2021
495
Nominal Description
Coupon Rate
Maturity Date
Value $
% of Net
Assets
Corporate Bond (30 June 2021: 98.04%) (continued)
Netherlands (30 June 2021: 7.13%) (continued)
500,000 SABIC Capital I BV 2.15% 14/09/2030 479,844 0.10
550,000 SABIC Capital I BV 3.00% 14/09/2050 516,828 0.11
1,100,000 SABIC Capital II BV 'REGS' 4.00% 10/10/2023 1,153,281 0.23
800,000 SABIC Capital II BV 'REGS' 4.50% 10/10/2028 900,900 0.18
800,000 Teva Pharmaceutical Finance Netherlands III BV 2.80% 21/07/2023 799,900 0.16
1,200,000 Teva Pharmaceutical Finance Netherlands III BV 6.00% 15/04/2024 1,258,896 0.26
1,950,000 Teva Pharmaceutical Finance Netherlands III BV 3.15% 01/10/2026 1,844,334 0.37
400,000 Teva Pharmaceutical Finance Netherlands III BV 6.75% 01/03/2028 430,575 0.09
800,000 Teva Pharmaceutical Finance Netherlands III BV 5.13% 09/05/2029 784,248 0.16
900,000 Teva Pharmaceutical Finance Netherlands III BV 4.10% 01/10/2046 762,750 0.16
500,000 VEON Holdings BV 'REGS' 7.25% 26/04/2023 524,938 0.11
700,000 VEON Holdings BV 'REGS' 4.95% 16/06/2024 732,725 0.15
750,000 VEON Holdings BV 'REGS' 4.00% 09/04/2025 762,187 0.15
900,000 VEON Holdings BV 'REGS' 3.38% 25/11/2027 879,637 0.18
400,000 VTR Finance NV 'REGS' 6.38% 15/07/2028 418,000 0.08
Total Netherlands 34,813,549 7.07
Nigeria (30 June 2021: 0.10%)
200,000 Access Bank Plc 'REGS' 6.13% 21/09/2026 198,500 0.04
250,000 Access Bank Plc 'REGS' FRN (Perpetual) 07/10/2026 243,750 0.05
350,000 SEPLAT Energy Plc 'REGS' 7.75% 01/04/2026 348,250 0.07
Total Nigeria 790,500 0.16
Oman (30 June 2021: 0.26%)
400,000 Bank Muscat SAOG 'EMTN' 4.88% 14/03/2023 411,000 0.08
400,000 Bank Muscat SAOG 'EMTN' 4.75% 17/03/2026 412,875 0.08
400,000 National Bank of Oman SAOG 'EMTN' 5.63% 25/09/2023 416,450 0.09
Total Oman 1,240,325 0.25

December 2021 Legal & General UCITS ETF Plc
L&G ESG Emerging Markets Corporate Bond (USD) UCITS ETF
Schedule of Investments (continued)
As at 31 December 2021
496
Nominal Description
Coupon Rate
Maturity Date
Value $
% of Net
Assets
Corporate Bond (30 June 2021: 98.04%) (continued)
Panama (30 June 2021: 0.68%)
1,442,000 AES Panama Generation Holdings SRL 'REGS' 4.38% 31/05/2030 1,499,951 0.30
550,000 Banco General SA 'REGS' 4.13% 07/08/2027 588,431 0.12
450,000 Banistmo SA 'REGS' 3.65% 19/09/2022 455,428 0.09
700,000 Cable Onda SA 'REGS' 4.50% 30/01/2030 720,475 0.15
Total Panama 3,264,285 0.66
Paraguay (30 June 2021: 0.16%)
402,000 Telefonica Celular del Paraguay SA 'REGS' 5.88% 15/04/2027 416,271 0.08
Total Paraguay 416,271 0.08
Peru (30 June 2021: 1.01%)
400,000 Banco de Credito del Peru 'REGS' 4.25% 01/04/2023 413,700 0.08
650,000 Banco de Credito del Peru 'REGS' 2.70% 11/01/2025 661,375 0.14
200,000 Banco de Credito del Peru 'REGS' FRN 01/07/2030 197,600 0.04
450,000 Banco de Credito del Peru 'REGS' FRN 30/09/2031 444,178 0.09
525,000 Cia de Minas Buenaventura SAA 'REGS' 5.50% 23/07/2026 511,481 0.10
650,000 Consorcio Transmantaro SA 'REGS' 4.70% 16/04/2034 715,731 0.15
191,600 Hunt Oil Co of Peru LLC Sucursal Del Peru 'REGS' 6.38% 01/06/2028 194,151 0.04
500,000 InRetail Consumer 'REGS' 3.25% 22/03/2028 495,875 0.10
650,000 Kallpa Generacion SA 'REGS' 4.13% 16/08/2027 674,294 0.14
400,000 Minsur SA 'REGS' 4.50% 28/10/2031 405,200 0.08
315,000 Orazul Energy Egenor SCA 'REGS' 5.63% 28/04/2027 304,526 0.06
450,000 Transportadora de Gas del Peru SA 'REGS' 4.25% 30/04/2028 475,397 0.10
Total Peru 5,493,508 1.12
Philippines (30 June 2021: 0.56%)
400,000 Bank of the Philippine Islands 'EMTN' 4.25% 04/09/2023 418,450 0.09
400,000 BDO Unibank Inc 'EMTN' 2.95% 06/03/2023 407,825 0.08
200,000 BDO Unibank Inc 'EMTN' 2.13% 13/01/2026 200,600 0.04
500,000 Manila Water Co Inc 4.38% 30/07/2030 517,125 0.11

December 2021 Legal & General UCITS ETF Plc
L&G ESG Emerging Markets Corporate Bond (USD) UCITS ETF
Schedule of Investments (continued)
As at 31 December 2021
497
Nominal Description
Coupon Rate
Maturity Date
Value $
% of Net
Assets
Corporate Bond (30 June 2021: 98.04%) (continued)
Philippines (30 June 2021: 0.56%) (continued)
300,000 Petron Corp FRN (Perpetual) 19/07/2023 299,494 0.06
300,000 Petron Corp FRN (Perpetual) 19/04/2026 309,750 0.06
600,000 Philippine National Bank 'EMTN' 3.28% 27/09/2024 608,925 0.12
350,000 Union Bank of the Philippines 'EMTN' 3.37% 29/11/2022 357,612 0.07
Total Philippines 3,119,781 0.63
Qatar (30 June 2021: 0.41%)
300,000 Commercial Bank PSQC/The FRN (Perpetual) 03/03/2026 302,156 0.06
750,000 Ras Laffan Liquefied Natural Gas Co Ltd 3 'REGS' 6.33% 30/09/2027 843,422 0.17
550,320 Ras Laffan Liquefied Natural Gas Co Ltd 3 'REGS' 5.84% 30/09/2027 621,449 0.13
Total Qatar 1,767,027 0.36
Saudi Arabia (30 June 2021: 0.32%)
500,000 Arab National Bank FRN 28/10/2030 510,469 0.10
Total Saudi Arabia 510,469 0.10
Singapore (30 June 2021: 5.62%)
400,000 BOC Aviation Ltd 'EMTN' 4.38% 02/05/2023 414,928 0.08
600,000 BOC Aviation Ltd 'GMTN' 4.00% 25/01/2024 626,175 0.13
525,000 BOC Aviation Ltd 'REGS' 2.75% 18/09/2022 529,430 0.11
900,000 BOC Aviation Ltd 'REGS' 3.50% 10/10/2024 943,481 0.19
850,000 BOC Aviation Ltd 'REGS' 3.25% 29/04/2025 879,644 0.18
700,000 BOC Aviation Ltd 'REGS' 3.88% 27/04/2026 744,538 0.15
500,000 BOC Aviation Ltd 'REGS' 3.50% 18/09/2027 526,719 0.11
700,000 BOC Aviation Ltd 'REGS' 3.00% 11/09/2029 714,131 0.15
800,000 BOC Aviation Ltd 'REGS' 2.63% 17/09/2030 795,400 0.16
400,000 BOC Aviation Ltd 'REGS' FRN 26/09/2023 400,575 0.08
595,500 Continuum Energy Levanter Pte Ltd 'REGS' 4.50% 09/02/2027 608,154 0.12
400,000 COSL Singapore Capital Ltd 'EMTN' 4.50% 30/07/2025 430,096 0.09
300,000 DBS Group Holdings Ltd 'GMTN' FRN 10/03/2031 295,680 0.06

December 2021 Legal & General UCITS ETF Plc
L&G ESG Emerging Markets Corporate Bond (USD) UCITS ETF
Schedule of Investments (continued)
As at 31 December 2021
498
Nominal Description
Coupon Rate
Maturity Date
Value $
% of Net
Assets
Corporate Bond (30 June 2021: 98.04%) (continued)
Singapore (30 June 2021: 5.62%) (continued)
875,000 DBS Group Holdings Ltd 'GMTN' FRN (Perpetual) 27/02/2025 889,875 0.18
800,000 DBS Group Holdings Ltd 'REGS' 1.19% 15/03/2027 784,496 0.16
550,000 DBS Group Holdings Ltd 'REGS' FRN 11/12/2028 580,256 0.12
600,000 Flex Ltd 4.75% 15/06/2025 653,250 0.13
925,000 Flex Ltd 3.75% 01/02/2026 985,587 0.20
900,000 Flex Ltd 4.88% 15/06/2029 1,020,960 0.21
1,120,000 Flex Ltd 4.88% 12/05/2030 1,277,808 0.26
800,000 GLP Pte Ltd 'EMTN' 3.88% 04/06/2025 830,400 0.17
1,100,000 GLP Pte Ltd FRN (Perpetual) 17/05/2026 1,066,519 0.22
450,000 Medco Bell Pte Ltd 'REGS' 6.38% 30/01/2027 444,375 0.09
350,000 Medco Oak Tree Pte Ltd 'REGS' 7.38% 14/05/2026 361,830 0.07
450,000 Medco Platinum Road Pte Ltd 'REGS' 6.75% 30/01/2025 459,084 0.09
350,000 ONGC Videsh Vankorneft Pte Ltd 3.75% 27/07/2026 366,581 0.07
600,000 Oversea-Chinese Banking Corp Ltd 'REGS' 4.25% 19/06/2024 639,112 0.13
850,000 Oversea-Chinese Banking Corp Ltd 'REGS' FRN 10/09/2030 838,874 0.17
300,000 Parkway Pantai Ltd 'EMTN' FRN (Perpetual) 27/07/2022 300,525 0.06
350,000 Singapore Airlines Ltd 'EMTN' 3.00% 20/07/2026 356,055 0.07
400,000 Singapore Telecommunications Ltd 'REGS' 7.38% 01/12/2031 575,075 0.12
400,000 SingTel Group Treasury Pte Ltd 'EMTN' 3.25% 30/06/2025 423,075 0.09
600,000 SingTel Group Treasury Pte Ltd 'EMTN' 2.38% 03/10/2026 619,050 0.13
1,100,000 SingTel Group Treasury Pte Ltd 'EMTN' 2.38% 28/08/2029 1,125,987 0.23
700,000 SingTel Group Treasury Pte Ltd 'EMTN' 1.88% 10/06/2030 688,975 0.14
700,000 United Overseas Bank Ltd 'EMTN' FRN 08/03/2027 701,881 0.14
350,000 United Overseas Bank Ltd 'EMTN' FRN (Perpetual) 19/10/2023 358,816 0.07
550,000 United Overseas Bank Ltd 'GMTN' FRN 16/03/2031 541,475 0.11
600,000 United Overseas Bank Ltd 'REGS' 1.25% 14/04/2026 592,200 0.12
650,000 United Overseas Bank Ltd 'REGS' FRN 15/04/2029 679,778 0.14
700,000 United Overseas Bank Ltd 'REGS' FRN 14/10/2031 693,140 0.14
500,000 Vena Energy Capital Pte Ltd 'EMTN' 3.13% 26/02/2025 508,375 0.10
Total Singapore 27,272,365 5.54
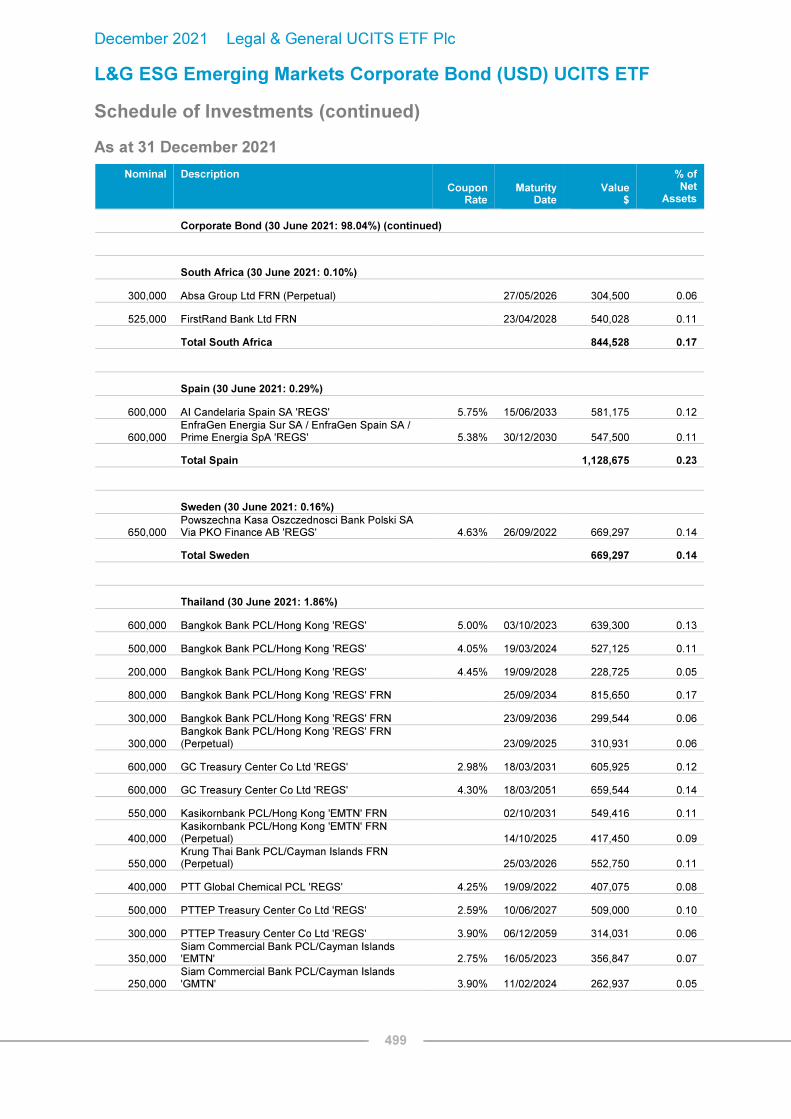
December 2021 Legal & General UCITS ETF Plc
L&G ESG Emerging Markets Corporate Bond (USD) UCITS ETF
Schedule of Investments (continued)
As at 31 December 2021
499
Nominal Description
Coupon Rate
Maturity Date
Value $
% of Net
Assets
Corporate Bond (30 June 2021: 98.04%) (continued)
South Africa (30 June 2021: 0.10%)
300,000 Absa Group Ltd FRN (Perpetual) 27/05/2026 304,500 0.06
525,000 FirstRand Bank Ltd FRN 23/04/2028 540,028 0.11
Total South Africa 844,528 0.17
Spain (30 June 2021: 0.29%)
600,000 AI Candelaria Spain SA 'REGS' 5.75% 15/06/2033 581,175 0.12
600,000 EnfraGen Energia Sur SA / EnfraGen Spain SA / Prime Energia SpA 'REGS' 5.38% 30/12/2030 547,500 0.11
Total Spain 1,128,675 0.23
Sweden (30 June 2021: 0.16%)
650,000 Powszechna Kasa Oszczednosci Bank Polski SA Via PKO Finance AB 'REGS' 4.63% 26/09/2022 669,297 0.14
Total Sweden 669,297 0.14
Thailand (30 June 2021: 1.86%)
600,000 Bangkok Bank PCL/Hong Kong 'REGS' 5.00% 03/10/2023 639,300 0.13
500,000 Bangkok Bank PCL/Hong Kong 'REGS' 4.05% 19/03/2024 527,125 0.11
200,000 Bangkok Bank PCL/Hong Kong 'REGS' 4.45% 19/09/2028 228,725 0.05
800,000 Bangkok Bank PCL/Hong Kong 'REGS' FRN 25/09/2034 815,650 0.17
300,000 Bangkok Bank PCL/Hong Kong 'REGS' FRN 23/09/2036 299,544 0.06
300,000 Bangkok Bank PCL/Hong Kong 'REGS' FRN (Perpetual) 23/09/2025 310,931 0.06
600,000 GC Treasury Center Co Ltd 'REGS' 2.98% 18/03/2031 605,925 0.12
600,000 GC Treasury Center Co Ltd 'REGS' 4.30% 18/03/2051 659,544 0.14
550,000 Kasikornbank PCL/Hong Kong 'EMTN' FRN 02/10/2031 549,416 0.11
400,000 Kasikornbank PCL/Hong Kong 'EMTN' FRN (Perpetual) 14/10/2025 417,450 0.09
550,000 Krung Thai Bank PCL/Cayman Islands FRN (Perpetual) 25/03/2026 552,750 0.11
400,000 PTT Global Chemical PCL 'REGS' 4.25% 19/09/2022 407,075 0.08
500,000 PTTEP Treasury Center Co Ltd 'REGS' 2.59% 10/06/2027 509,000 0.10
300,000 PTTEP Treasury Center Co Ltd 'REGS' 3.90% 06/12/2059 314,031 0.06
350,000 Siam Commercial Bank PCL/Cayman Islands 'EMTN' 2.75% 16/05/2023 356,847 0.07
250,000 Siam Commercial Bank PCL/Cayman Islands 'GMTN' 3.90% 11/02/2024 262,937 0.05

December 2021 Legal & General UCITS ETF Plc
L&G ESG Emerging Markets Corporate Bond (USD) UCITS ETF
Schedule of Investments (continued)
As at 31 December 2021
500
Nominal Description
Coupon Rate
Maturity Date
Value $
% of Net
Assets
Corporate Bond (30 June 2021: 98.04%) (continued)
Thailand (30 June 2021: 1.86%) (continued)
400,000 Siam Commercial Bank PCL/Cayman Islands 'GMTN' 4.40% 11/02/2029 454,200 0.09
750,000 Thaioil Treasury Center Co Ltd 'REGS' 5.38% 20/11/2048 816,938 0.17
600,000 Thaioil Treasury Center Co Ltd 'REGS' 3.50% 17/10/2049 511,050 0.11
450,000 Thaioil Treasury Center Co Ltd 'REGS' 3.75% 18/06/2050 401,130 0.08
Total Thailand 9,639,568 1.96
Togo (30 June 2021: 0.07%)
200,000 Ecobank Transnational Inc 'REGS' 9.50% 18/04/2024 215,663 0.04
Total Togo 215,663 0.04
Turkey (30 June 2021: 4.09%)
350,000 Akbank TAS 'REGS' 5.13% 31/03/2025 323,312 0.07
400,000 Akbank TAS 'REGS' 6.80% 06/02/2026 385,000 0.08
250,000 Akbank TAS 'REGS' FRN 16/03/2027 247,000 0.05
250,000 Akbank TAS 'REGS' FRN 22/06/2031 226,297 0.05
300,000 Anadolu Efes Biracilik Ve Malt Sanayii AS 'REGS' 3.38% 29/06/2028 290,625 0.06
300,000 Arcelik AS 'REGS' 5.00% 03/04/2023 299,681 0.06
800,000 Aydem Yenilenebilir Enerji AS 'REGS' 7.75% 02/02/2027 645,150 0.13
300,000 Coca-Cola Icecek AS 'REGS' 4.22% 19/09/2024 302,119 0.06
400,000 Mersin Uluslararasi Liman Isletmeciligi AS 'REGS' 5.38% 15/11/2024 404,575 0.08
350,000 QNB Finansbank AS 'REGS' 6.88% 07/09/2024 354,769 0.07
650,000 Turk Telekomunikasyon AS 'REGS' 6.88% 28/02/2025 657,231 0.13
200,000 Turkcell Iletisim Hizmetleri AS 'REGS' 5.75% 15/10/2025 197,475 0.04
200,000 Turkcell Iletisim Hizmetleri AS 'REGS' 5.80% 11/04/2028 190,938 0.04
900,000 Turkiye Garanti Bankasi AS 'REGS' 5.25% 13/09/2022 899,325 0.18
550,000 Turkiye Garanti Bankasi AS 'REGS' FRN 24/05/2027 538,416 0.11
550,000 Turkiye Is Bankasi AS FRN 22/01/2030 528,619 0.11
500,000 Turkiye Is Bankasi AS 'REGS' 6.00% 24/10/2022 497,500 0.10
925,000 Turkiye Is Bankasi AS 'REGS' 6.13% 25/04/2024 896,556 0.18
400,000 Turkiye Is Bankasi AS 'REGS' FRN 29/06/2028 384,950 0.08
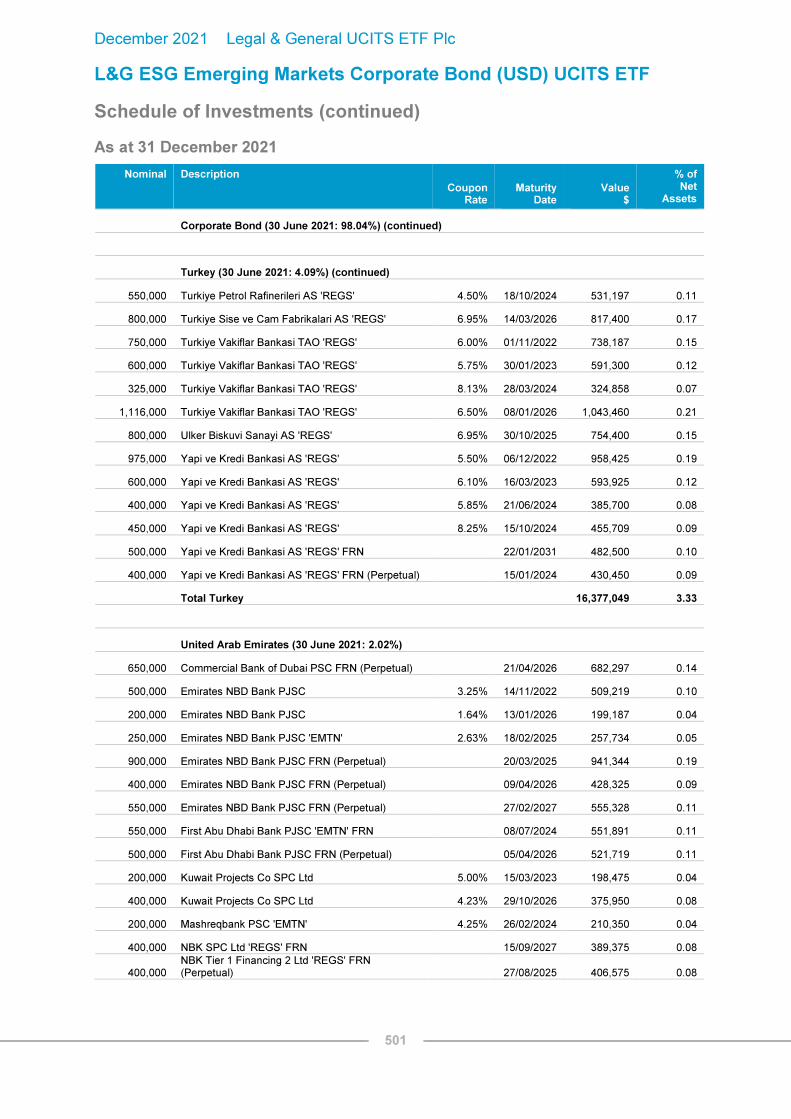
December 2021 Legal & General UCITS ETF Plc
L&G ESG Emerging Markets Corporate Bond (USD) UCITS ETF
Schedule of Investments (continued)
As at 31 December 2021
501
Nominal Description
Coupon Rate
Maturity Date
Value $
% of Net
Assets
Corporate Bond (30 June 2021: 98.04%) (continued)
Turkey (30 June 2021: 4.09%) (continued)
550,000 Turkiye Petrol Rafinerileri AS 'REGS' 4.50% 18/10/2024 531,197 0.11
800,000 Turkiye Sise ve Cam Fabrikalari AS 'REGS' 6.95% 14/03/2026 817,400 0.17
750,000 Turkiye Vakiflar Bankasi TAO 'REGS' 6.00% 01/11/2022 738,187 0.15
600,000 Turkiye Vakiflar Bankasi TAO 'REGS' 5.75% 30/01/2023 591,300 0.12
325,000 Turkiye Vakiflar Bankasi TAO 'REGS' 8.13% 28/03/2024 324,858 0.07
1,116,000 Turkiye Vakiflar Bankasi TAO 'REGS' 6.50% 08/01/2026 1,043,460 0.21
800,000 Ulker Biskuvi Sanayi AS 'REGS' 6.95% 30/10/2025 754,400 0.15
975,000 Yapi ve Kredi Bankasi AS 'REGS' 5.50% 06/12/2022 958,425 0.19
600,000 Yapi ve Kredi Bankasi AS 'REGS' 6.10% 16/03/2023 593,925 0.12
400,000 Yapi ve Kredi Bankasi AS 'REGS' 5.85% 21/06/2024 385,700 0.08
450,000 Yapi ve Kredi Bankasi AS 'REGS' 8.25% 15/10/2024 455,709 0.09
500,000 Yapi ve Kredi Bankasi AS 'REGS' FRN 22/01/2031 482,500 0.10
400,000 Yapi ve Kredi Bankasi AS 'REGS' FRN (Perpetual) 15/01/2024 430,450 0.09
Total Turkey 16,377,049 3.33
United Arab Emirates (30 June 2021: 2.02%)
650,000 Commercial Bank of Dubai PSC FRN (Perpetual) 21/04/2026 682,297 0.14
500,000 Emirates NBD Bank PJSC 3.25% 14/11/2022 509,219 0.10
200,000 Emirates NBD Bank PJSC 1.64% 13/01/2026 199,187 0.04
250,000 Emirates NBD Bank PJSC 'EMTN' 2.63% 18/02/2025 257,734 0.05
900,000 Emirates NBD Bank PJSC FRN (Perpetual) 20/03/2025 941,344 0.19
400,000 Emirates NBD Bank PJSC FRN (Perpetual) 09/04/2026 428,325 0.09
550,000 Emirates NBD Bank PJSC FRN (Perpetual) 27/02/2027 555,328 0.11
550,000 First Abu Dhabi Bank PJSC 'EMTN' FRN 08/07/2024 551,891 0.11
500,000 First Abu Dhabi Bank PJSC FRN (Perpetual) 05/04/2026 521,719 0.11
200,000 Kuwait Projects Co SPC Ltd 5.00% 15/03/2023 198,475 0.04
400,000 Kuwait Projects Co SPC Ltd 4.23% 29/10/2026 375,950 0.08
200,000 Mashreqbank PSC 'EMTN' 4.25% 26/02/2024 210,350 0.04
400,000 NBK SPC Ltd 'REGS' FRN 15/09/2027 389,375 0.08
400,000 NBK Tier 1 Financing 2 Ltd 'REGS' FRN (Perpetual) 27/08/2025 406,575 0.08

December 2021 Legal & General UCITS ETF Plc
L&G ESG Emerging Markets Corporate Bond (USD) UCITS ETF
Schedule of Investments (continued)
As at 31 December 2021
502
Nominal Description
Coupon Rate
Maturity Date
Value $
% of Net
Assets
Corporate Bond (30 June 2021: 98.04%) (continued)
United Arab Emirates (30 June 2021: 2.02%) (continued)
400,000 NBK Tier 1 Ltd 'REGS' FRN (Perpetual) 24/08/2026 394,625 0.08
400,000 Oztel Holdings SPC Ltd 'REGS' 5.63% 24/10/2023 413,875 0.08
700,000 Oztel Holdings SPC Ltd 'REGS' 6.63% 24/04/2028 760,288 0.16
600,000 Tabreed Sukuk Spc Ltd 5.50% 31/10/2025 677,062 0.14
Total United Arab Emirates 8,473,619 1.72
United Kingdom (30 June 2021: 0.80%)
450,000 Antofagasta Plc 'REGS' 2.38% 14/10/2030 427,584 0.09
600,000 Bidvest Group UK Plc/The 'REGS' 3.63% 23/09/2026 595,500 0.12
500,000 Endeavour Mining Plc 'REGS' 5.00% 14/10/2026 495,000 0.10
700,000 Fresnillo Plc 'REGS' 4.25% 02/10/2050 732,944 0.15
700,000 Liquid Telecommunications Financing Plc 'REGS' 5.50% 04/09/2026 719,031 0.14
300,000 Polyus Finance Plc 'REGS' 3.25% 14/10/2028 291,780 0.06
300,000 Tullow Oil Plc 'REGS' 7.00% 01/03/2025 246,000 0.05
1,650,000 Tullow Oil Plc 'REGS' 10.25% 15/05/2026 1,654,950 0.34
Total United Kingdom 5,162,789 1.05
United States (30 June 2021: 1.29%)
250,000 Azul Investments LLP 'REGS' 7.25% 15/06/2026 228,953 0.05
550,000 Bimbo Bakeries USA Inc 'REGS' 4.00% 17/05/2051 596,681 0.12
1,100,000 BOC Aviation USA Corp 'REGS' 1.63% 29/04/2024 1,097,987 0.22
400,000 Braskem America Finance Co 'REGS' 7.13% 22/07/2041 514,700 0.10
200,000 GUSAP III LP 'REGS' 4.25% 21/01/2030 211,913 0.04
550,000 HCL America Inc 'REGS' 1.38% 10/03/2026 535,494 0.11
650,000 Hikma Finance USA LLC 3.25% 09/07/2025 667,062 0.14
550,000 Kosmos Energy Ltd 'REGS' 7.13% 04/04/2026 533,431 0.11
600,000 MercadoLibre Inc 3.13% 14/01/2031 567,863 0.11
200,000 Periama Holdings LLC/DE 5.95% 19/04/2026 212,500 0.04
500,000 Playtika Holding Corp 'REGS' 4.25% 15/03/2029 490,000 0.10
500,000 SierraCol Energy Andina LLC 'REGS' 6.00% 15/06/2028 469,469 0.09
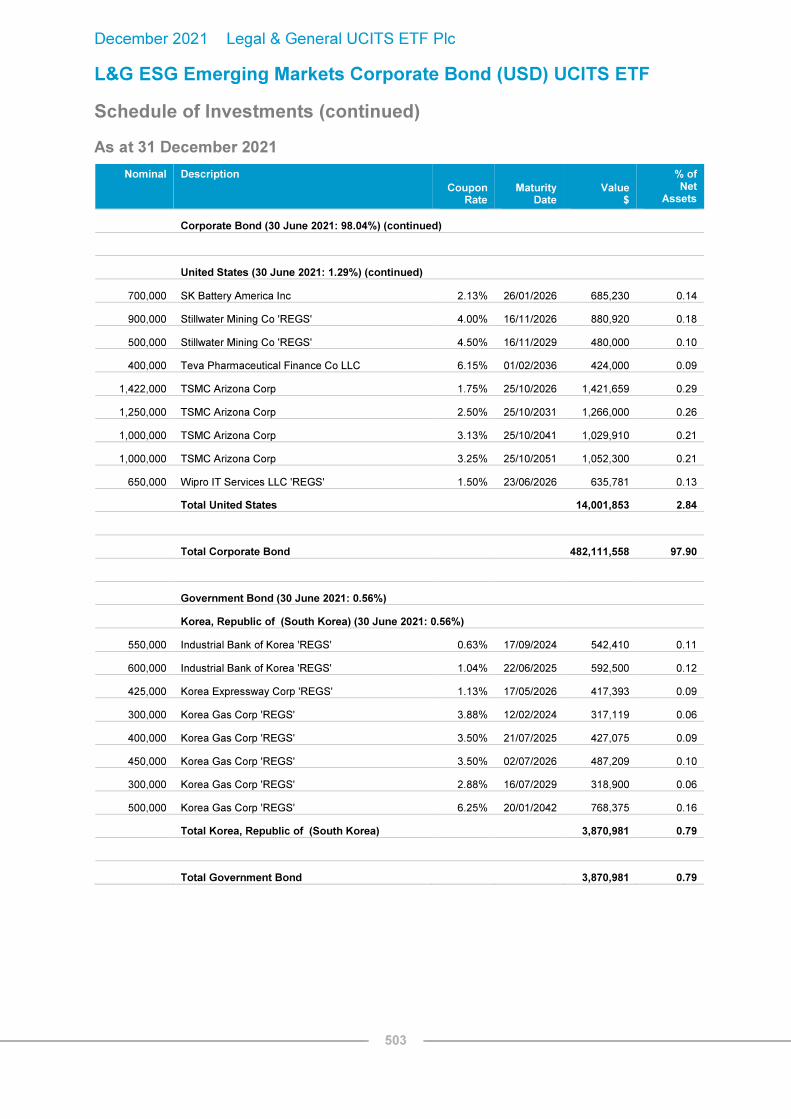
December 2021 Legal & General UCITS ETF Plc
L&G ESG Emerging Markets Corporate Bond (USD) UCITS ETF
Schedule of Investments (continued)
As at 31 December 2021
503
Nominal Description
Coupon Rate
Maturity Date
Value $
% of Net
Assets
Corporate Bond (30 June 2021: 98.04%) (continued)
United States (30 June 2021: 1.29%) (continued)
700,000 SK Battery America Inc 2.13% 26/01/2026 685,230 0.14
900,000 Stillwater Mining Co 'REGS' 4.00% 16/11/2026 880,920 0.18
500,000 Stillwater Mining Co 'REGS' 4.50% 16/11/2029 480,000 0.10
400,000 Teva Pharmaceutical Finance Co LLC 6.15% 01/02/2036 424,000 0.09
1,422,000 TSMC Arizona Corp 1.75% 25/10/2026 1,421,659 0.29
1,250,000 TSMC Arizona Corp 2.50% 25/10/2031 1,266,000 0.26
1,000,000 TSMC Arizona Corp 3.13% 25/10/2041 1,029,910 0.21
1,000,000 TSMC Arizona Corp 3.25% 25/10/2051 1,052,300 0.21
650,000 Wipro IT Services LLC 'REGS' 1.50% 23/06/2026 635,781 0.13
Total United States 14,001,853 2.84
Total Corporate Bond 482,111,558 97.90
Government Bond (30 June 2021: 0.56%)
Korea, Republic of (South Korea) (30 June 2021: 0.56%)
550,000 Industrial Bank of Korea 'REGS' 0.63% 17/09/2024 542,410 0.11
600,000 Industrial Bank of Korea 'REGS' 1.04% 22/06/2025 592,500 0.12
425,000 Korea Expressway Corp 'REGS' 1.13% 17/05/2026 417,393 0.09
300,000 Korea Gas Corp 'REGS' 3.88% 12/02/2024 317,119 0.06
400,000 Korea Gas Corp 'REGS' 3.50% 21/07/2025 427,075 0.09
450,000 Korea Gas Corp 'REGS' 3.50% 02/07/2026 487,209 0.10
300,000 Korea Gas Corp 'REGS' 2.88% 16/07/2029 318,900 0.06
500,000 Korea Gas Corp 'REGS' 6.25% 20/01/2042 768,375 0.16
Total Korea, Republic of (South Korea) 3,870,981 0.79
Total Government Bond 3,870,981 0.79

December 2021 Legal & General UCITS ETF Plc
L&G ESG Emerging Markets Corporate Bond (USD) UCITS ETF
Schedule of Investments (continued)
As at 31 December 2021
504
Total Investments
Corporate Bond 482,111,558 97.90
Government Bond 3,870,981 0.79
No. of Contracts Purchases Sales
Maturity Date
Unrealised Gain
$
% of Total
Assets
Forward Currency Contracts1
1 GBP300,000 USD(402,444) 02/02/2022 3,864 0.00
1 GBP300,000 USD(396,435) 04/01/2022 9,900 0.00
2 EUR71,254,113 USD(80,799,462) 02/02/2022 277,336 0.06
5 EUR73,144,159 USD(82,716,666) 04/01/2022 462,132 0.09
2 CHF171,236,838 USD(186,864,057) 02/02/2022 1,210,724 0.25
7 CHF172,005,046 USD(186,454,040) 04/01/2022 2,325,016 0.47
Unrealised Gain on Forward Currency Contracts (30 June 2021: –%) 4,288,972 0.87
No. of Contracts Purchases Sales
Maturity Date
Unrealised Loss
$
% of Total
Assets
2 USD565,957 EUR(499,196) 02/02/2022 (2,056) (0.00)
2 USD1,394,030 CHF(1,281,339) 04/01/2022 (12,267) (0.01)
3 USD2,141,319 EUR(1,894,127) 04/01/2022 (12,662) (0.00)
Unrealised Loss on Forward Currency Contracts (30 June 2021: –%) (26,985) (0.01)
Other Assets and Liabilities* 2,208,161 0.45
Net Assets Attributable to Holders of Redeemable Participating Shares 492,452,687 100.00
Analysis of Total Assets
% of Total
Assets
Transferable securities admitted to an official stock exchange listing or dealt on a regulated market 97.96
OTC financial derivative instruments 0.86
Other assets 1.18
100.00
Analysis of Total Assets rather than Net Assets is required under Schedule 12 of the UCITS Regulations.
1 The counterparty for Forward currency contracts is The Bank of New York Mellon.
*Included within other assets are holdings in LGIM Dollar Liquidity Fund with a value of $25. These are shown as "Cash and cash equivalents" within the Fund's Statement of Financial Position.

December 2021 Legal & General UCITS ETF Plc
L&G Hydrogen Economy UCITS ETF
Schedule of Investments
As at 31 December 2021
505
Nominal Description
Value
$
% of Net
Assets
Common Stock (30 June 2021: 99.94%)
Canada (30 June 2021: 6.54%)
1,156,537 Ballard Power Systems Inc 14,526,105 2.59
1,995,906 Xebec Adsorption Inc 3,965,995 0.71
Total Canada 18,492,100 3.30
China (30 June 2021: 3.11%)
12,043,323 Weichai Power Co Ltd 'H' 23,572,859 4.20
Total China 23,572,859 4.20
Denmark (30 June 2021: 2.98%)
150,724 Orsted AS '144A' 19,247,669 3.43
Total Denmark 19,247,669 3.43
France (30 June 2021: 5.36%)
118,436 Air Liquide SA 20,649,785 3.68
769,354 McPhy Energy SA 18,932,870 3.38
Total France 39,582,655 7.06
Germany (30 June 2021: 11.46%)
202,724 Daimler AG 15,581,907 2.78
101,370 Daimler Truck Holding AG 3,722,292 0.66
163,489 SFC Energy AG 5,280,072 0.94
778,119 Siemens Energy AG 19,900,705 3.55
459,899 Uniper SE 21,861,086 3.90
Total Germany 66,346,062 11.83
Ireland (30 June 2021: 3.01%)
61,698 Linde Plc 21,469,676 3.83
Total Ireland 21,469,676 3.83

December 2021 Legal & General UCITS ETF Plc
L&G Hydrogen Economy UCITS ETF
Schedule of Investments (continued)
As at 31 December 2021
506
Nominal Description
Value
$
% of Net
Assets
Common Stock (30 June 2021: 99.94%) (continued)
Japan (30 June 2021: 9.83%)
325,512 Kyocera Corp 20,315,702 3.62
872,529 Nippon Sanso Holdings Corp 19,040,990 3.40
1,143,895 Toyota Motor Corp 20,915,034 3.73
Total Japan 60,271,726 10.75
Norway (30 June 2021: 3.05%)
9,198,892 NEL ASA 15,866,449 2.83
Total Norway 15,866,449 2.83
South Korea (30 June 2021: 11.01%)
451,127 Doosan Fuel Cell Co Ltd 18,215,853 3.25
113,095 Hyundai Motor Co 19,883,790 3.54
296,895 Kolon Industries Inc 17,707,554 3.16
Total South Korea 55,807,197 9.95
Sweden (30 June 2021: 7.48%)
1,476,336 Cell Impact AB 4,353,760 0.78
933,068 PowerCell Sweden AB 19,076,018 3.40
Total Sweden 23,429,778 4.18
United Kingdom (30 June 2021: 12.96%)
14,748,513 AFC Energy Plc 9,848,229 1.76
1,296,590 Ceres Power Holdings Plc 17,500,198 3.12
3,183,133 ITM Power Plc 16,986,894 3.03
559,566 Johnson Matthey Plc 15,506,719 2.76
Total United Kingdom 59,842,040 10.67
United States (30 June 2021: 23.15%)
1,287,005 Advent Technologies Holdings Inc 9,021,905 1.61
66,336 Air Products & Chemicals Inc 20,183,391 3.60
641,155 Bloom Energy Corp 14,060,529 2.51

December 2021 Legal & General UCITS ETF Plc
L&G Hydrogen Economy UCITS ETF
Schedule of Investments (continued)
As at 31 December 2021
507
Nominal Description
Value
$
% of Net
Assets
Common Stock (30 June 2021: 99.94%) (continued)
United States (30 June 2021: 23.15%) (continued)
630,128 Chemours Co/The 21,147,096 3.77
86,544 Cummins Inc 18,878,708 3.37
2,292,397 FuelCell Energy Inc 11,920,465 2.13
3,605,792 Hyzon Motors Inc 23,401,590 4.17
534,714 Plug Power Inc 15,094,976 2.69
321,583 Xcel Energy Inc 21,771,169 3.88
Total United States 155,479,829 27.73
Total Common Stock 559,408,040 99.76
Total Investments
Common Stock 559,408,040 99.76
Other Assets and Liabilities 1,344,463 0.24
Net Assets Attributable to Holders of Redeemable Participating Shares 560,752,503 100.00
Analysis of Total Assets
% of Total
Assets
Transferable securities admitted to an official stock exchange listing 99.61
Other assets 0.39
100.00
Analysis of Total Assets rather than Net Assets is required under Schedule 12 of the UCITS Regulations.

December 2021 Legal & General UCITS ETF Plc
L&G ESG Green Bond UCITS ETF
Schedule of Investments
As at 31 December 2021
508
Nominal Description Coupon
rate
Maturity
date Value
€
% of Net
Assets
Corporate Bond (30 June 2021: 65.95%)
Australia (30 June 2021: 0.66%)
150,000 National Australia Bank Ltd 'GMTN' 0.63% 30/08/2023 152,214 0.65
100,000 Westpac Banking Corp FRN 13/05/2031 98,840 0.43
Total Australia 251,054 1.08
Austria (30 June 2021: 0.44%)
100,000 Raiffeisen Bank International AG 'EMTN' 0.38% 25/09/2026 100,510 0.43
Total Austria 100,510 0.43
Belgium (30 June 2021: 0.43%)
100,000 KBC Group NV 'EMTN' FRN 16/06/2027 100,334 0.43
Total Belgium 100,334 0.43
Canada (30 June 2021: 0.18%)
50,000 Canadian Imperial Bank of Commerce 0.95% 23/10/2025 43,072 0.19
Total Canada 43,072 0.19
Cayman Islands (30 June 2021: 2.51%)
140,000 Fibria Overseas Finance Ltd 5.50% 17/01/2027 138,242 0.59
200,000 MAF Sukuk Ltd 4.64% 14/05/2029 195,989 0.84
240,000 MTR Corp CI Ltd 2.50% 02/11/2026 219,687 0.95
Total Cayman Islands 553,918 2.38
Denmark (30 June 2021: 0.53%)
100,000 Orsted AS 'EMTN' 2.13% 17/05/2027 123,505 0.53
Total Denmark 123,505 0.53
Finland (30 June 2021: 0.86%)
100,000 Citycon Oyj FRN (Perpetual) 10/06/2026 94,913 0.41
100,000 UPM-Kymmene Oyj 'EMTN' 0.13% 19/11/2028 97,544 0.42
Total Finland 192,457 0.83

December 2021 Legal & General UCITS ETF Plc
L&G ESG Green Bond UCITS ETF
Schedule of Investments (continued)
As at 31 December 2021
509
Nominal Description
Value
€
% of Net
Assets
Corporate Bond (30 June 2021: 65.95%) (continued)
France (30 June 2021: 5.25%)
100,000 Banque Federative du Credit Mutuel SA 'EMTN' 0.25% 29/06/2028 98,699 0.43
100,000 Covivio 1.88% 20/05/2026 107,205 0.46
100,000 Credit Agricole SA 'EMTN' 0.38% 21/10/2025 100,831 0.43
150,000 Electricite de France SA '144A' 3.63% 13/10/2025 141,197 0.61
100,000 Electricite de France SA 'EMTN' 1.00% 13/10/2026 103,564 0.45
100,000 Engie SA 'EMTN' 2.38% 19/05/2026 109,906 0.47
100,000 Engie SA 'EMTN' 1.50% 27/03/2028 106,755 0.46
100,000 Engie SA 'EMTN' 2.13% 30/03/2032 113,499 0.49
100,000 Engie SA FRN (Perpetual) 28/11/2024 107,702 0.46
100,000 Gecina SA 'EMTN' 0.88% 30/06/2036 97,488 0.42
100,000 Unibail-Rodamco-Westfield SE 'EMTN' 2.50% 26/02/2024 105,485 0.45
Total France 1,192,331 5.13
Germany (30 June 2021: 8.37%)
100,000 Commerzbank AG 'EMTN' 1.25% 23/10/2023 102,227 0.44
50,000 Daimler AG 'EMTN' 0.75% 10/09/2030 51,392 0.22
100,000 E.ON SE 'EMTN' 0.38% 29/09/2027 100,741 0.43
150,000 E.ON SE 'EMTN' 0.35% 28/02/2030 149,081 0.64
100,000 EnBW Energie Baden-Wuerttemberg AG FRN 05/08/2079 100,125 0.43
100,000 Eurogrid GmbH 'EMTN' 1.11% 15/05/2032 104,150 0.45
60,000 Kreditanstalt fuer Wiederaufbau 2.00% 29/09/2022 53,410 0.23
110,000 Kreditanstalt fuer Wiederaufbau 1.75% 14/09/2029 98,302 0.42
120,000 Kreditanstalt fuer Wiederaufbau 0.75% 30/09/2030 98,685 0.42
80,000 Kreditanstalt fuer Wiederaufbau 'EMTN' 0.25% 30/06/2025 81,705 0.35
83,000 Kreditanstalt fuer Wiederaufbau 'EMTN' 0.88% 15/09/2026 98,187 0.42
250,000 Kreditanstalt fuer Wiederaufbau 'EMTN' 0.01% 05/05/2027 252,561 1.09
320,000 Kreditanstalt fuer Wiederaufbau 'EMTN' 0.00% 15/09/2028 322,041 1.39
50,000 Kreditanstalt fuer Wiederaufbau 'EMTN' 0.00% 15/06/2029 50,122 0.22

December 2021 Legal & General UCITS ETF Plc
L&G ESG Green Bond UCITS ETF
Schedule of Investments (continued)
As at 31 December 2021
510
Nominal Description
Value
€
% of Net
Assets
Corporate Bond (30 June 2021: 65.95%) (continued)
Germany (30 June 2021: 8.37%) (continued)
170,000 Kreditanstalt fuer Wiederaufbau 'EMTN' 0.00% 15/09/2031 168,258 0.72
100,000 Landwirtschaftliche Rentenbank 'EMTN' 0.00% 22/09/2027 100,535 0.43
100,000 Muenchener Rueckversicherungs-Gesellschaft AG in Muenchen FRN 26/05/2041 98,815 0.43
Total Germany 2,030,337 8.73
Guernsey (30 June 2021: 0.47%)
100,000 Globalworth Real Estate Investments Ltd 'EMTN' 2.95% 29/07/2026 106,610 0.46
Total Guernsey 106,610 0.46
India (30 June 2021: 1.51%)
200,000 Power Finance Corp Ltd 'EMTN' 3.75% 06/12/2027 184,442 0.79
200,000 ReNew Power Pvt Ltd 'REGS' 6.45% 27/09/2022 178,774 0.77
Total India 363,216 1.56
International (30 June 2021: 8.69%)
20,000 Asian Development Bank 1.88% 10/08/2022 17,743 0.08
50,000 Asian Development Bank 0.00% 24/10/2029 49,527 0.21
65,000 Asian Development Bank 'GMTN' 3.13% 26/09/2028 63,192 0.27
100,000 EUROFIMA 'EMTN' 0.15% 10/10/2034 95,596 0.41
99,000 European Investment Bank 2.38% 24/05/2027 91,503 0.39
75,000 European Investment Bank 0.75% 23/09/2030 61,793 0.27
100,000 European Investment Bank 1.50% 15/11/2047 122,398 0.53
100,000 European Investment Bank '144A' 2.88% 13/06/2025 93,168 0.40
80,000 European Investment Bank 'EMTN' 0.50% 15/11/2023 81,591 0.35
60,000 European Investment Bank 'EMTN' 0.38% 15/05/2026 61,587 0.27
40,000 European Investment Bank 'EMTN' 1.25% 13/11/2026 42,910 0.18
100,000 European Investment Bank 'EMTN' 0.50% 13/11/2037 101,890 0.44
30,000 International Bank for Reconstruction & Development 2.13% 03/03/2025 27,268 0.12

December 2021 Legal & General UCITS ETF Plc
L&G ESG Green Bond UCITS ETF
Schedule of Investments (continued)
As at 31 December 2021
511
Nominal Description
Value
€
% of Net
Assets
Corporate Bond (30 June 2021: 65.95%) (continued)
International (30 June 2021: 8.69%) (continued)
60,000 International Bank for Reconstruction & Development 3.13% 20/11/2025 56,894 0.24
70,000 International Bank for Reconstruction & Development 0.63% 22/11/2027 72,830 0.31
100,000 International Finance Corp 'GMTN' 2.13% 07/04/2026 91,087 0.39
100,000 Nordic Investment Bank 0.00% 25/09/2026 100,818 0.43
130,000 Nordic Investment Bank 'EMTN' 0.13% 10/06/2024 131,684 0.57
Total International 1,363,479 5.86
Ireland (30 June 2021: 1.09%)
100,000 AIB Group Plc 'EMTN' FRN 30/05/2031 105,606 0.46
100,000 ESB Finance DAC 'EMTN' 1.13% 11/06/2030 104,794 0.45
50,000 Johnson Controls International plc / Tyco Fire & Security Finance SCA 1.75% 15/09/2030 42,072 0.18
Total Ireland 252,472 1.09
Italy (30 June 2021: 3.20%)
100,000 Assicurazioni Generali SpA 'EMTN' 2.43% 14/07/2031 106,259 0.45
100,000 ERG SpA 'EMTN' 1.88% 11/04/2025 104,952 0.45
100,000 Ferrovie dello Stato Italiane SpA 'EMTN' 1.13% 09/07/2026 104,379 0.45
100,000 Intesa Sanpaolo SpA 'EMTN' 0.75% 04/12/2024 101,714 0.44
100,000 UniCredit SpA 'EMTN' FRN 05/07/2029 99,973 0.43
100,000 Unipol Gruppo SpA 'EMTN' 3.25% 23/09/2030 113,878 0.49
Total Italy 631,155 2.71
Japan (30 June 2021: 0.89%)
100,000 Mizuho Financial Group Inc 'EMTN' 0.96% 16/10/2024 102,509 0.44
Total Japan 102,509 0.44
Lithuania (30 June 2021: –%)
100,000 AB Ignitis Grupe 'EMTN' 1.88% 10/07/2028 107,644 0.46
Total Lithuania 107,644 0.46

December 2021 Legal & General UCITS ETF Plc
L&G ESG Green Bond UCITS ETF
Schedule of Investments (continued)
As at 31 December 2021
512
Nominal Description
Value
€
% of Net
Assets
Corporate Bond (30 June 2021: 65.95%) (continued)
Luxembourg (30 June 2021: 1.03%)
100,000 CBRE Global Investors Open-Ended Fund SCA SICAV-SIF Pan European Core Fund 0.90% 12/10/2029 98,733 0.43
100,000 CPI Property Group SA 'EMTN' 2.75% 12/05/2026 107,534 0.46
100,000 CPI Property Group SA 'EMTN' 2.75% 22/01/2028 119,118 0.51
125,000 Prologis International Funding II SA 'EMTN' 0.88% 09/07/2029 126,884 0.55
Total Luxembourg 452,269 1.95
Netherlands (30 June 2021: 11.35%)
100,000 ABN AMRO Bank NV 'EMTN' 0.88% 22/04/2025 102,905 0.44
110,000 Alliander NV 'EMTN' 0.88% 24/06/2032 113,564 0.49
100,000 de Volksbank NV 'EMTN' 0.38% 03/03/2028 98,184 0.42
150,000 Digital Intrepid Holding BV 0.63% 15/07/2031 141,789 0.61
200,000 EDP Finance BV '144A' 1.71% 24/01/2028 171,241 0.74
100,000 Enel Finance International NV 'EMTN' 1.13% 16/09/2026 103,646 0.45
110,000 Global Switch Finance BV 'EMTN' 1.38% 07/10/2030 108,946 0.47
100,000 Iberdrola International BV FRN (Perpetual) 22/02/2023 102,212 0.44
100,000 Iberdrola International BV FRN (Perpetual) 09/08/2029 99,503 0.43
200,000 ING Groep NV '144A' FRN 01/07/2026 173,984 0.75
100,000 ING Groep NV 'EMTN' 2.50% 15/11/2030 116,312 0.50
100,000 ING Groep NV 'EMTN' FRN 07/12/2028 114,627 0.49
150,000 LeasePlan Corp NV 'EMTN' 3.50% 09/04/2025 165,922 0.71
100,000 Naturgy Finance BV 'EMTN' 0.88% 15/05/2025 102,775 0.44
100,000 PostNL NV 0.63% 23/09/2026 101,590 0.44
100,000 Royal Schiphol Group NV 'EMTN' 1.50% 05/11/2030 107,673 0.46
100,000 TenneT Holding BV 'EMTN' 1.00% 13/06/2026 103,755 0.45
100,000 TenneT Holding BV 'EMTN' 1.38% 26/06/2029 106,752 0.46
100,000 TenneT Holding BV 'EMTN' 1.25% 24/10/2033 105,576 0.45
100,000 TenneT Holding BV 'EMTN' 1.50% 03/06/2039 107,079 0.46
150,000 TenneT Holding BV FRN (Perpetual) 01/03/2024 157,136 0.67
100,000 Volkswagen International Finance NV 'EMTN' 0.88% 22/09/2028 102,844 0.44
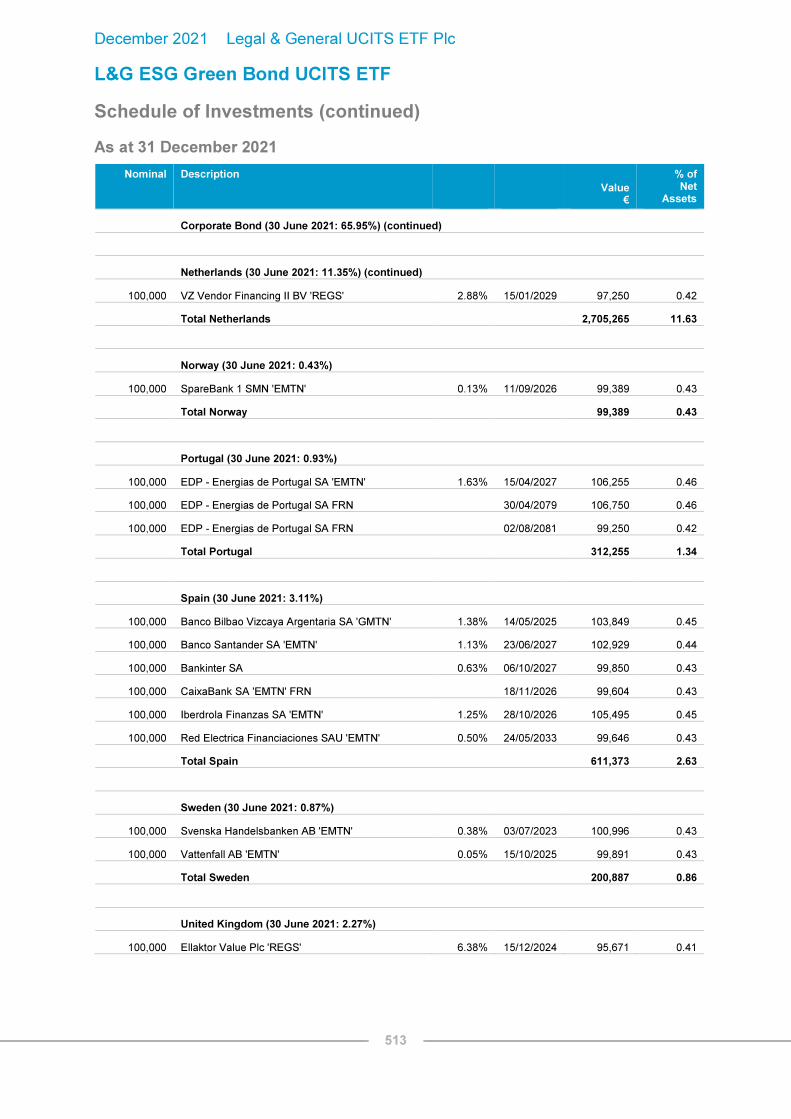
December 2021 Legal & General UCITS ETF Plc
L&G ESG Green Bond UCITS ETF
Schedule of Investments (continued)
As at 31 December 2021
513
Nominal Description
Value
€
% of Net
Assets
Corporate Bond (30 June 2021: 65.95%) (continued)
Netherlands (30 June 2021: 11.35%) (continued)
100,000 VZ Vendor Financing II BV 'REGS' 2.88% 15/01/2029 97,250 0.42
Total Netherlands 2,705,265 11.63
Norway (30 June 2021: 0.43%)
100,000 SpareBank 1 SMN 'EMTN' 0.13% 11/09/2026 99,389 0.43
Total Norway 99,389 0.43
Portugal (30 June 2021: 0.93%)
100,000 EDP - Energias de Portugal SA 'EMTN' 1.63% 15/04/2027 106,255 0.46
100,000 EDP - Energias de Portugal SA FRN 30/04/2079 106,750 0.46
100,000 EDP - Energias de Portugal SA FRN 02/08/2081 99,250 0.42
Total Portugal 312,255 1.34
Spain (30 June 2021: 3.11%)
100,000 Banco Bilbao Vizcaya Argentaria SA 'GMTN' 1.38% 14/05/2025 103,849 0.45
100,000 Banco Santander SA 'EMTN' 1.13% 23/06/2027 102,929 0.44
100,000 Bankinter SA 0.63% 06/10/2027 99,850 0.43
100,000 CaixaBank SA 'EMTN' FRN 18/11/2026 99,604 0.43
100,000 Iberdrola Finanzas SA 'EMTN' 1.25% 28/10/2026 105,495 0.45
100,000 Red Electrica Financiaciones SAU 'EMTN' 0.50% 24/05/2033 99,646 0.43
Total Spain 611,373 2.63
Sweden (30 June 2021: 0.87%)
100,000 Svenska Handelsbanken AB 'EMTN' 0.38% 03/07/2023 100,996 0.43
100,000 Vattenfall AB 'EMTN' 0.05% 15/10/2025 99,891 0.43
Total Sweden 200,887 0.86
United Kingdom (30 June 2021: 2.27%)
100,000 Ellaktor Value Plc 'REGS' 6.38% 15/12/2024 95,671 0.41

December 2021 Legal & General UCITS ETF Plc
L&G ESG Green Bond UCITS ETF
Schedule of Investments (continued)
As at 31 December 2021
514
Nominal Description
Value
€
% of Net
Assets
Corporate Bond (30 June 2021: 65.95%) (continued)
United Kingdom (30 June 2021: 2.27%) (continued)
100,000 HSBC Holdings Plc 'EMTN' FRN 04/12/2024 102,931 0.45
100,000 South Eastern Power Networks Plc 'EMTN' 1.75% 30/09/2034 116,651 0.50
100,000 SSE Plc 'EMTN' 0.88% 06/09/2025 102,381 0.44
Total United Kingdom 417,634 1.80
United States (30 June 2021: 10.15%)
50,000 AES Corp/The 2.45% 15/01/2031 42,936 0.18
80,000 Apple Inc 2.85% 23/02/2023 71,851 0.31
100,000 Apple Inc 0.00% 15/11/2025 100,236 0.43
150,000 Avangrid Inc 3.20% 15/04/2025 138,949 0.60
150,000 Boston Properties LP 4.50% 01/12/2028 149,510 0.64
65,000 Citigroup Inc FRN 15/05/2024 57,789 0.25
100,000 Clearway Energy Operating LLC '144A' 4.75% 15/03/2028 92,882 0.40
100,000 Dana Inc 4.25% 01/09/2030 89,585 0.39
100,000 Digital Euro Finco LLC 2.50% 16/01/2026 108,032 0.46
100,000 Duke Energy Carolinas LLC 3.95% 15/11/2028 98,396 0.42
60,000 Duke Realty LP 2.88% 15/11/2029 54,997 0.24
100,000 Equinix Inc 1.00% 15/09/2025 85,628 0.37
100,000 Equinix Inc 1.00% 15/03/2033 96,276 0.41
80,000 HAT Holdings I LLC / HAT Holdings II LLC '144A' 3.75% 15/09/2030 70,437 0.30
80,000 Interstate Power and Light Co 4.10% 26/09/2028 78,558 0.34
130,000 JPMorgan Chase & Co FRN 16/09/2024 113,835 0.49
50,000 Kaiser Foundation Hospitals 3.15% 01/05/2027 46,972 0.20
50,000 Kilroy Realty LP 4.75% 15/12/2028 50,621 0.22
40,000 Massachusetts Institute of Technology 3.96% 01/07/2038 42,500 0.18
100,000 MidAmerican Energy Co 3.65% 15/04/2029 96,772 0.42
120,000 MidAmerican Energy Co 4.25% 15/07/2049 130,763 0.56
50,000 Niagara Mohawk Power Corp '144A' 1.96% 27/06/2030 42,181 0.18
120,000 Northern States Power Co/MN 2.90% 01/03/2050 107,464 0.46

December 2021 Legal & General UCITS ETF Plc
L&G ESG Green Bond UCITS ETF
Schedule of Investments (continued)
As at 31 December 2021
515
Nominal Description
Value
€
% of Net
Assets
Corporate Bond (30 June 2021: 65.95%) (continued)
United States (30 June 2021: 10.15%) (continued)
100,000 Pattern Energy Operations LP / Pattern Energy Operations Inc '144A' 4.50% 15/08/2028 91,893 0.40
84,000 PNC Financial Services Group Inc/The 2.20% 01/11/2024 75,770 0.33
100,000 Prologis Euro Finance LLC 0.38% 06/02/2028 99,640 0.43
50,000 Prologis LP 1.25% 15/10/2030 40,935 0.18
50,000 Union Electric Co 2.63% 15/03/2051 42,452 0.18
70,000 Verizon Communications Inc 3.88% 08/02/2029 68,135 0.29
Total United States 2,385,995 10.26
Total Corporate Bond 14,699,670 63.21
Government Bond (30 June 2021: 33.21%) (continued)
Belgium (30 June 2021: 2.88%)
502,000 Kingdom of Belgium Government Bond '144A' 1.25% 22/04/2033 561,924 2.42
Total Belgium 561,924 2.42
Chile (30 June 2021: 1.87%)
100,000 Chile Government International Bond 1.25% 29/01/2040 97,880 0.42
240,000 Chile Government International Bond 3.50% 25/01/2050 219,933 0.95
Total Chile 317,813 1.37
France (30 June 2021: 15.67%)
100,000 Agence Francaise de Developpement EPIC 'EMTN' 1.38% 17/09/2024 104,579 0.45
1,452,000 French Republic Government Bond OAT '144A' 1.75% 25/06/2039 1,753,158 7.54
543,000 French Republic Government Bond OAT '144A' 0.50% 25/06/2044 519,244 2.23
100,000 SNCF Reseau 'EMTN' 0.88% 22/01/2029 104,976 0.45
200,000 SNCF Reseau 'EMTN' 0.75% 25/05/2036 201,193 0.86
100,000 Societe Du Grand Paris EPIC 'EMTN' 1.13% 22/10/2028 107,277 0.46
100,000 Societe Du Grand Paris EPIC 'EMTN' 1.13% 25/05/2034 106,659 0.46

December 2021 Legal & General UCITS ETF Plc
L&G ESG Green Bond UCITS ETF
Schedule of Investments (continued)
As at 31 December 2021
516
Nominal Description
Value
€
% of Net
Assets
Government Bond (30 June 2021: 65.95%) (continued)
France (30 June 2021: 15.67%) (continued)
100,000 Societe Du Grand Paris EPIC 'EMTN' 1.70% 25/05/2050 115,905 0.50
100,000 Societe Du Grand Paris EPIC 'EMTN' 0.70% 15/10/2060 84,999 0.37
100,000 Societe Du Grand Paris EPIC 'EMTN' 1.00% 18/02/2070 90,240 0.39
100,000 Societe Nationale SNCF SA 'EMTN' 0.63% 17/04/2030 102,522 0.44
Total France 3,290,752 14.15
Germany (30 June 2021: 4.66%)
185,000 Bundesobligation 0.00% 10/10/2025 189,331 0.81
311,000 Bundesrepublik Deutschland Bundesanleihe 0.00% 15/08/2030 319,944 1.38
310,000 Bundesrepublik Deutschland Bundesanleihe 0.00% 15/08/2031 316,147 1.36
289,000 Bundesrepublik Deutschland Bundesanleihe 0.00% 15/08/2050 279,486 1.20
Total Germany 1,104,908 4.75
Hong Kong (30 June 2021: 0.71%)
200,000 Hong Kong Government International Bond 'REGS' 1.38% 02/02/2031 169,004 0.73
Total Hong Kong 169,004 0.73
Hungary (30 June 2021: 0.41%)
70,000 Hungary Government International Bond 1.75% 05/06/2035 72,888 0.31
Total Hungary 72,888 0.31
Ireland (30 June 2021: 1.81%)
324,000 Ireland Government Bond 1.35% 18/03/2031 361,023 1.55
Total Ireland 361,023 1.55
Italy (30 June 2021: –%)
581,000 Italy Buoni Poliennali Del Tesoro '144A' 1.50% 30/04/2045 544,932 2.34
Total Italy 544,932 2.34

December 2021 Legal & General UCITS ETF Plc
L&G ESG Green Bond UCITS ETF
Schedule of Investments (continued)
As at 31 December 2021
517
Nominal Description
Value
€
% of Net
Assets
Government Bond (30 June 2021: 65.95%) (continued)
Netherlands (30 June 2021: 2.99%)
516,000 Netherlands Government Bond '144A' 0.50% 15/01/2040 549,003 2.36
Total Netherlands 549,003 2.36
Poland (30 June 2021: 0.72%)
100,000 Republic of Poland Government International Bond 'EMTN' 1.00% 07/03/2029 106,000 0.46
30,000 Republic of Poland Government International Bond 'EMTN' 2.00% 08/03/2049 36,030 0.15
Total Poland 142,030 0.61
Spain (30 June 2021: 0.72%)
100,000 Adif Alta Velocidad 'EMTN' 1.25% 04/05/2026 105,463 0.45
40,000 Instituto de Credito Oficial 'EMTN' 0.00% 30/04/2027 40,049 0.17
60,000 Instituto de Credito Oficial 'GMTN' 0.20% 31/01/2024 60,869 0.26
200,000 Spain Government Bond '144A' 1.00% 30/07/2042 194,826 0.84
Total Spain 401,207 1.72
United Kingdom (30 June 2021: –%)
466,000 United Kingdom Gilt 0.88% 31/07/2033 545,139 2.34
280,000 United Kingdom Gilt 1.50% 31/07/2053 368,547 1.59
Total United Kingdom 913,686 3.93
Total Government Bond 8,429,170 36.24
Total Investments
Corporate Bond 14,699,670 63.21
Government Bond 8,429,170 36.24
Other Assets and Liabilities 128,117 0.55
Net Assets Attributable to Holders of Redeemable Participating Shares 23,256,957 100.00

December 2021 Legal & General UCITS ETF Plc
L&G ESG Green Bond UCITS ETF
Schedule of Investments (continued)
As at 31 December 2021
518
Analysis of Total Assets
% of Total
Assets
Transferable securities admitted to an official stock exchange listing or dealt on a regulated market 99.01
Other assets 0.99
100.00
Analysis of Total Assets rather than Net Assets is required under Schedule 12 of the UCITS Regulations.
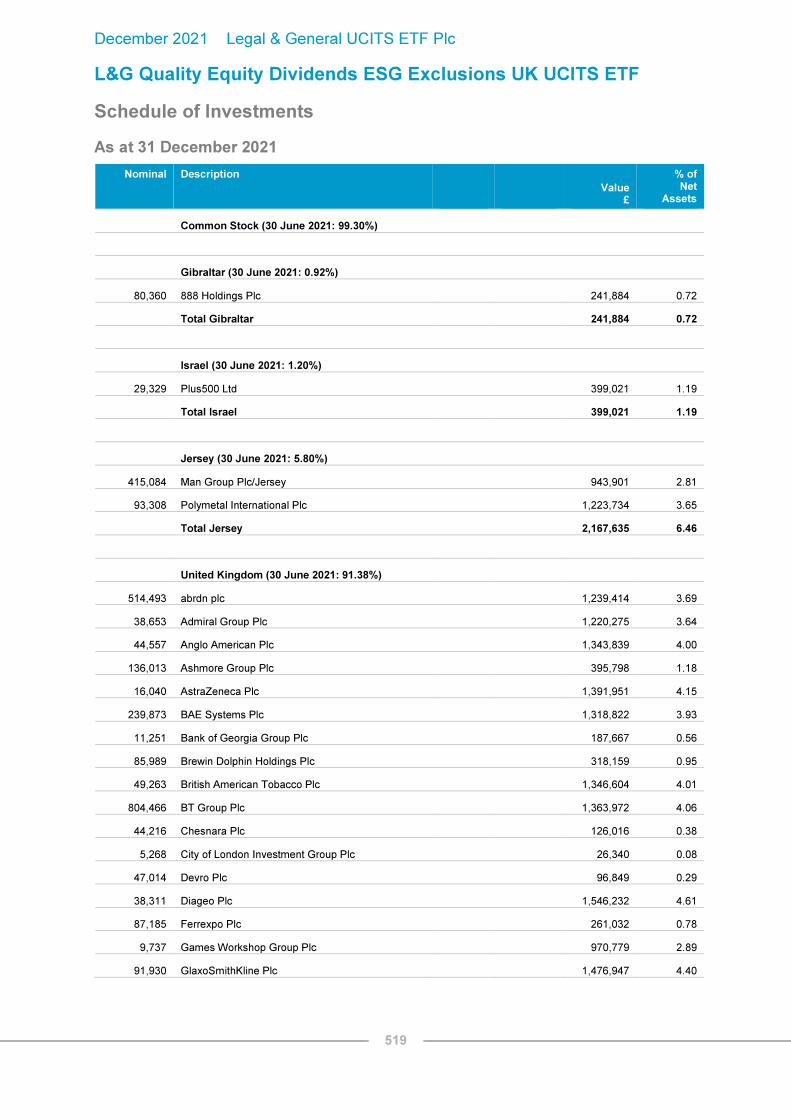
December 2021 Legal & General UCITS ETF Plc
L&G Quality Equity Dividends ESG Exclusions UK UCITS ETF
Schedule of Investments
As at 31 December 2021
519
Nominal Description
Value
£
% of Net
Assets
Common Stock (30 June 2021: 99.30%)
Gibraltar (30 June 2021: 0.92%)
80,360 888 Holdings Plc 241,884 0.72
Total Gibraltar 241,884 0.72
Israel (30 June 2021: 1.20%)
29,329 Plus500 Ltd 399,021 1.19
Total Israel 399,021 1.19
Jersey (30 June 2021: 5.80%)
415,084 Man Group Plc/Jersey 943,901 2.81
93,308 Polymetal International Plc 1,223,734 3.65
Total Jersey 2,167,635 6.46
United Kingdom (30 June 2021: 91.38%)
514,493 abrdn plc 1,239,414 3.69
38,653 Admiral Group Plc 1,220,275 3.64
44,557 Anglo American Plc 1,343,839 4.00
136,013 Ashmore Group Plc 395,798 1.18
16,040 AstraZeneca Plc 1,391,951 4.15
239,873 BAE Systems Plc 1,318,822 3.93
11,251 Bank of Georgia Group Plc 187,667 0.56
85,989 Brewin Dolphin Holdings Plc 318,159 0.95
49,263 British American Tobacco Plc 1,346,604 4.01
804,466 BT Group Plc 1,363,972 4.06
44,216 Chesnara Plc 126,016 0.38
5,268 City of London Investment Group Plc 26,340 0.08
47,014 Devro Plc 96,849 0.29
38,311 Diageo Plc 1,546,232 4.61
87,185 Ferrexpo Plc 261,032 0.78
9,737 Games Workshop Group Plc 970,779 2.89
91,930 GlaxoSmithKline Plc 1,476,947 4.40

December 2021 Legal & General UCITS ETF Plc
L&G Quality Equity Dividends ESG Exclusions UK UCITS ETF
Schedule of Investments (continued)
As at 31 December 2021
520
Nominal Description
Value
£
% of Net
Assets
Common Stock (30 June 2021: 99.30%) (continued)
United Kingdom (30 June 2021: 91.38%) (continued)
104,659 IG Group Holdings Plc 850,878 2.54
86,888 Imperial Brands Plc 1,404,545 4.18
62,232 Intermediate Capital Group Plc 1,365,370 4.07
128,465 Jupiter Fund Management Plc 329,384 0.98
21,364 Keller Group Plc 210,435 0.63
3,118,940 Lloyds Banking Group Plc 1,490,853 4.44
153,739 Moneysupermarket.com Group Plc 332,076 0.99
142,993 National Grid Plc 1,515,440 4.52
74,012 Paragon Banking Group Plc 419,278 1.25
83,468 Pennon Group Plc 974,072 2.90
46,574 Persimmon Plc 1,330,153 3.96
17,838 Rathbones Group Plc 353,906 1.05
25,424 Rio Tinto Plc 1,243,742 3.71
12,222 River & Mercantile Group Plc 37,155 0.11
1,132 S&U Plc 30,564 0.09
48,871 Severn Trent Plc 1,440,228 4.29
134,564 Tate & Lyle Plc 890,006 2.65
18,646 Telecom Plus Plc 295,726 0.88
127,495 United Utilities Group Plc 1,388,421 4.14
Total United Kingdom 30,532,928 90.98
Total Common Stock 33,341,468 99.35
Total Investments
Common Stock 33,341,468 99.35
Other Assets and Liabilities 219,499 0.65
Net Assets Attributable to Holders of Redeemable Participating Shares 33,560,967 100.00

December 2021 Legal & General UCITS ETF Plc
L&G Quality Equity Dividends ESG Exclusions UK UCITS ETF
Schedule of Investments (continued)
As at 31 December 2021
521
Analysis of Total Assets
% of Total
Assets
Transferable securities admitted to an official stock exchange listing 99.33
Other assets 0.67
100.00
Analysis of Total Assets rather than Net Assets is required under Schedule 12 of the UCITS Regulations.

December 2021 Legal & General UCITS ETF Plc
L&G Quality Equity Dividends ESG Exclusions Europe ex-UK UCITS ETF
Schedule of Investments
As at 31 December 2021
522
Nominal Description
Value
€
% of Net
Assets
Common Stock (30 June 2021: 99.24%)
Austria (30 June 2021: 3.04%)
365 Agrana Beteiligungs AG 6,278 0.03
3,459 ANDRITZ AG 156,969 0.73
7,919 Erste Group Bank AG 327,451 1.52
1,550 Oesterreichische Post AG 58,590 0.27
5,773 OMV AG 288,361 1.33
539 Strabag SE 19,754 0.09
4,738 UNIQA Insurance Group AG 38,236 0.18
Total Austria 895,639 4.15
Belgium (30 June 2021: 1.77%)
6,227 Ageas SA/NV 283,640 1.31
6,351 Econocom Group SA/NV 23,149 0.11
9,302 Euronav NV 72,556 0.34
3,748 KBC Group NV 282,824 1.31
Total Belgium 662,169 3.07
Denmark (30 June 2021: 1.75%)
3,524 Spar Nord Bank A/S 39,611 0.18
2,981 Sydbank AS 82,886 0.39
12,889 Tryg A/S 279,875 1.30
Total Denmark 402,372 1.87
Finland (30 June 2021: 11.10%)
4,987 Elisa Oyj 269,896 1.25
10,489 Fortum Oyj 283,098 1.31
4,733 Huhtamaki Oyj 184,066 0.85
3,640 Kemira Oyj 48,521 0.22
6,667 Nokian Renkaat Oyj 222,011 1.03

December 2021 Legal & General UCITS ETF Plc
L&G Quality Equity Dividends ESG Exclusions Europe ex-UK UCITS ETF
Schedule of Investments (continued)
As at 31 December 2021
523
Nominal Description
Value
€
% of Net
Assets
Common Stock (30 June 2021: 99.24%) (continued)
Finland (30 June 2021: 11.10%) (continued)
27,324 Nordea Bank Abp 294,717 1.37
5,302 Orion Oyj 193,629 0.90
5,134 Raisio Oyj 17,302 0.08
6,177 Sampo Oyj - Class A 272,159 1.26
4,395 TietoEVRY Oyj 120,775 0.56
7,857 UPM-Kymmene Oyj 262,895 1.22
Total Finland 2,169,069 10.05
France (30 June 2021: 16.06%)
1,785 Air Liquide SA 273,676 1.27
10,911 AXA SA 285,705 1.32
4,991 BNP Paribas SA 303,303 1.41
7,555 Bouygues SA 237,907 1.10
1,880 Cie Generale des Etablissements Michelin SCA 271,002 1.26
22,077 Credit Agricole SA 277,066 1.28
9,195 Eutelsat Communications SA 98,708 0.46
1,288 Gaztransport Et Technigaz SA 105,938 0.49
2,156 Imerys SA 78,780 0.37
28,297 Orange SA 266,360 1.24
4,878 Publicis Groupe SA 288,778 1.34
4,766 Rubis SCA 125,155 0.58
3,055 Sanofi 270,612 1.25
1,775 Schneider Electric SE 306,117 1.42
7,737 SCOR SE 212,303 0.98
Total France 3,401,410 15.77
Germany (30 June 2021: 12.88%)
1,348 Allianz SE 279,912 1.30
2,934 Bayerische Motoren Werke AG - Preference 215,062 1.00

December 2021 Legal & General UCITS ETF Plc
L&G Quality Equity Dividends ESG Exclusions Europe ex-UK UCITS ETF
Schedule of Investments (continued)
As at 31 December 2021
524
Nominal Description
Value
€
% of Net
Assets
Common Stock (30 June 2021: 99.24%) (continued)
Germany (30 June 2021: 12.88%) (continued)
3,284 FUCHS PETROLUB SE - Preference 131,097 0.61
1,714 Hannover Rueck SE 286,495 1.33
817 HOCHTIEF AG 58,007 0.27
1,081 Muenchener Rueckversicherungs-Gesellschaft AG in Muenchen 281,601 1.30
3,170 Porsche Automobil Holding SE - Preference 264,505 1.23
1,916 Siemens AG 292,535 1.36
1,118 Takkt AG 17,172 0.08
2,753 Talanx AG 117,113 0.54
33,129 Telefonica Deutschland Holding AG 80,868 0.37
637 Wuestenrot & Wuerttembergische AG 11,249 0.05
Total Germany 2,035,616 9.44
Italy (30 June 2021: 11.17%)
75,952 A2A SpA 130,637 0.60
2,255 ACEA SpA 42,304 0.20
14,801 Assicurazioni Generali SpA 275,743 1.28
5,909 Azimut Holding SpA 145,834 0.67
2,743 Banca Generali SpA 106,291 0.49
875 Banca IFIS SpA 14,936 0.07
12,513 Banca Mediolanum SpA 108,613 0.50
34,828 Enel SpA 245,398 1.14
113,623 Intesa Sanpaolo SpA 258,379 1.20
31,412 Iren SpA 83,367 0.39
27,048 Mediobanca Banca di Credito Finanziario SpA 273,455 1.27
6,557 Piaggio & C SpA 18,845 0.09
4,891 Recordati Industria Chimica e Farmaceutica SpA 276,342 1.28
53,965 Snam SpA 286,014 1.32
40,277 Terna - Rete Elettrica Nazionale 286,531 1.33
24,768 Unipol Gruppo SpA 118,366 0.55

December 2021 Legal & General UCITS ETF Plc
L&G Quality Equity Dividends ESG Exclusions Europe ex-UK UCITS ETF
Schedule of Investments (continued)
As at 31 December 2021
525
Nominal Description
Value
€
% of Net
Assets
Common Stock (30 June 2021: 99.24%) (continued)
Italy (30 June 2021: 11.17%) (continued)
22,647 UnipolSai Assicurazioni SpA 56,165 0.26
Total Italy 2,727,220 12.64
Liechtenstein (30 June 2021: 0.03%)
47 VP Bank AG 4,382 0.02
Total Liechtenstein 4,382 0.02
Netherlands (30 June 2021: 5.36%)
6,873 ASR Nederland NV 278,356 1.29
22,938 ING Groep NV 280,807 1.30
1,499 Koninklijke DSM NV 296,802 1.38
98,712 Koninklijke KPN NV 269,484 1.25
4,150 Randstad NV 249,166 1.15
Total Netherlands 1,374,615 6.37
Norway (30 June 2021: 6.00%)
4,275 Atea ASA 69,914 0.32
15,197 DNB Bank ASA 306,120 1.42
8,030 Gjensidige Forsikring ASA 171,361 0.79
12,516 Leroy Seafood Group ASA 86,069 0.40
7,015 SpareBank 1 SMN 104,231 0.48
8,834 SpareBank 1 SR-Bank ASA 117,339 0.54
18,347 Telenor ASA 253,577 1.18
5,109 TGS ASA 43,091 0.20
5,067 Veidekke ASA 66,899 0.31
6,693 Yara International ASA 297,004 1.38
Total Norway 1,515,605 7.02

December 2021 Legal & General UCITS ETF Plc
L&G Quality Equity Dividends ESG Exclusions Europe ex-UK UCITS ETF
Schedule of Investments (continued)
As at 31 December 2021
526
Nominal Description
Value
€
% of Net
Assets
Common Stock (30 June 2021: 99.24%) (continued)
Poland (30 June 2021: 1.48%)
2,670 Asseco Poland SA 50,361 0.23
2,665 Eurocash SA 6,303 0.03
15,590 Polski Koncern Naftowy ORLEN SA 252,866 1.17
Total Poland 309,530 1.43
Portugal (30 June 2021: 1.85%)
57,751 EDP - Energias de Portugal SA 279,053 1.29
13,624 Navigator Co SA/The 45,640 0.21
9,802 NOS SGPS SA 33,425 0.16
18,293 REN - Redes Energeticas Nacionais SGPS SA 46,556 0.22
45,428 Sonae SGPS SA 45,564 0.21
Total Portugal 450,238 2.09
Spain (30 June 2021: 7.34%)
2,697 Atresmedia Corp de Medios de Comunicacion SA 8,997 0.04
32,337 Bankinter SA 145,808 0.68
3,413 Ebro Foods SA 57,612 0.27
12,431 Enagas SA 253,592 1.17
25,496 Iberdrola SA 265,413 1.23
50,061 Mapfre SA 90,385 0.42
6,269 Mediaset Espana Comunicacion SA 25,766 0.12
10,443 Prosegur Cia de Seguridad SA 24,123 0.11
15,801 Red Electrica Corp SA 300,614 1.39
Total Spain 1,172,310 5.43
Sweden (30 June 2021: 7.91%)
4,687 Atlas Copco AB 284,882 1.32
4,634 Axfood AB 117,201 0.54
3,558 Bilia AB 55,361 0.26

December 2021 Legal & General UCITS ETF Plc
L&G Quality Equity Dividends ESG Exclusions Europe ex-UK UCITS ETF
Schedule of Investments (continued)
As at 31 December 2021
527
Nominal Description
Value
€
% of Net
Assets
Common Stock (30 June 2021: 99.24%) (continued)
Sweden (30 June 2021: 7.91%) (continued)
9,217 Boliden AB 313,323 1.45
1,336 Clas Ohlson AB 17,816 0.08
11,367 Electrolux AB 242,335 1.12
3,962 Intrum AB 89,815 0.42
3,463 Loomis AB - Class B 80,959 0.38
4,700 Nobia AB 24,879 0.12
9,738 Peab AB 108,012 0.50
12,600 Sandvik AB 309,128 1.43
1,509 Skandinaviska Enskilda Banken AB 19,229 0.09
2,937 Svenska Handelsbanken AB 30,751 0.14
27,342 Svenska Handelsbanken AB 259,879 1.20
Total Sweden 1,953,570 9.05
Switzerland (30 June 2021: 11.50%)
1,979 Baloise Holding AG 284,776 1.32
1,360 Banque Cantonale Vaudoise 92,929 0.43
1,492 Cembra Money Bank AG 95,685 0.44
2,534 EFG International AG 16,997 0.08
1,701 Helvetia Holding AG 176,315 0.82
5,391 Holcim Ltd 241,989 1.12
795 Roche Holding AG 290,871 1.35
46 Schweiter Technologies AG 60,022 0.28
594 Swiss Life Holding AG 320,463 1.49
518 Swisscom AG 257,264 1.19
18,577 UBS Group AG 294,394 1.37
792 Valiant Holding AG 69,787 0.32
705 Zurich Insurance Group AG 272,435 1.26
Total Switzerland 2,473,927 11.47
Total Common Stock 21,547,672 99.87

December 2021 Legal & General UCITS ETF Plc
L&G Quality Equity Dividends ESG Exclusions Europe ex-UK UCITS ETF
Schedule of Investments (continued)
As at 31 December 2021
528
Total Investments
Common Stock 21,547,672 99.87
Other Assets and Liabilities 28,283 0.13
Net Assets Attributable to Holders of Redeemable Participating Shares 21,575,955 100.00
Analysis of Total Assets
% of Total
Assets
Transferable securities admitted to an official stock exchange listing 99.85
Other assets 0.15
100.00
Analysis of Total Assets rather than Net Assets is required under Schedule 12 of the UCITS Regulations.
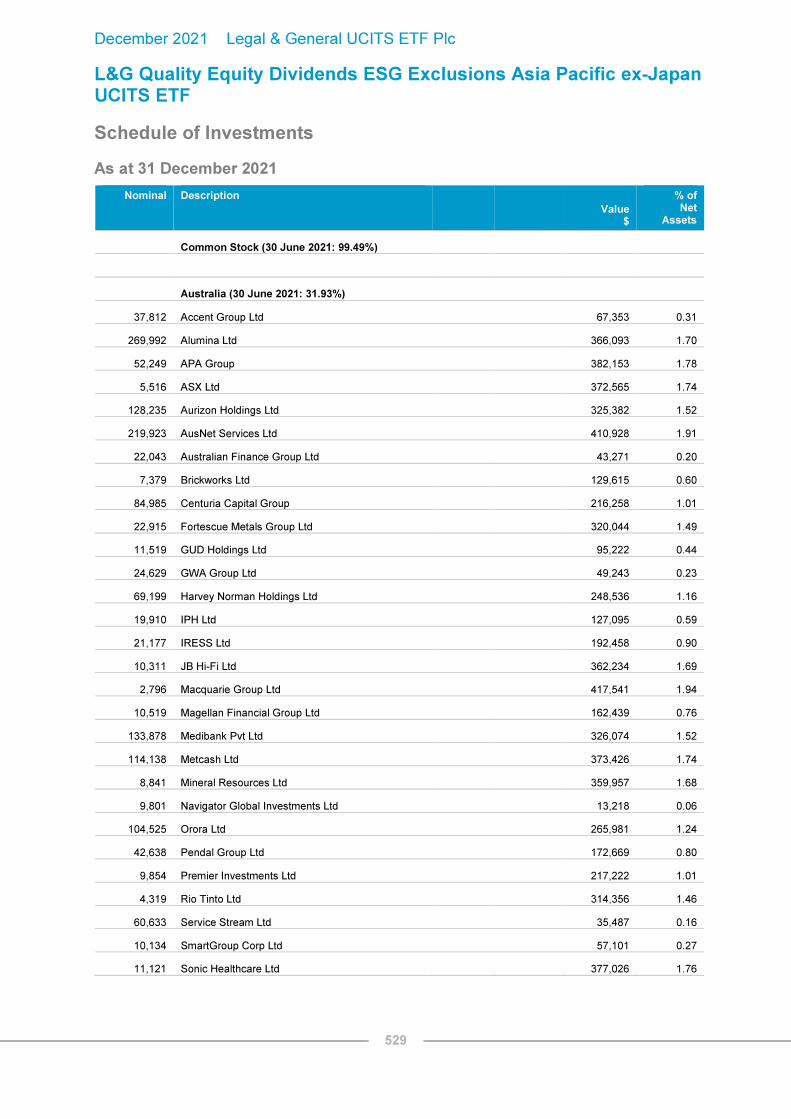
December 2021 Legal & General UCITS ETF Plc
L&G Quality Equity Dividends ESG Exclusions Asia Pacific ex-Japan UCITS ETF
Schedule of Investments
As at 31 December 2021
529
Nominal Description
Value
$
% of Net
Assets
Common Stock (30 June 2021: 99.49%)
Australia (30 June 2021: 31.93%)
37,812 Accent Group Ltd 67,353 0.31
269,992 Alumina Ltd 366,093 1.70
52,249 APA Group 382,153 1.78
5,516 ASX Ltd 372,565 1.74
128,235 Aurizon Holdings Ltd 325,382 1.52
219,923 AusNet Services Ltd 410,928 1.91
22,043 Australian Finance Group Ltd 43,271 0.20
7,379 Brickworks Ltd 129,615 0.60
84,985 Centuria Capital Group 216,258 1.01
22,915 Fortescue Metals Group Ltd 320,044 1.49
11,519 GUD Holdings Ltd 95,222 0.44
24,629 GWA Group Ltd 49,243 0.23
69,199 Harvey Norman Holdings Ltd 248,536 1.16
19,910 IPH Ltd 127,095 0.59
21,177 IRESS Ltd 192,458 0.90
10,311 JB Hi-Fi Ltd 362,234 1.69
2,796 Macquarie Group Ltd 417,541 1.94
10,519 Magellan Financial Group Ltd 162,439 0.76
133,878 Medibank Pvt Ltd 326,074 1.52
114,138 Metcash Ltd 373,426 1.74
8,841 Mineral Resources Ltd 359,957 1.68
9,801 Navigator Global Investments Ltd 13,218 0.06
104,525 Orora Ltd 265,981 1.24
42,638 Pendal Group Ltd 172,669 0.80
9,854 Premier Investments Ltd 217,222 1.01
4,319 Rio Tinto Ltd 314,356 1.46
60,633 Service Stream Ltd 35,487 0.16
10,134 SmartGroup Corp Ltd 57,101 0.27
11,121 Sonic Healthcare Ltd 377,026 1.76

December 2021 Legal & General UCITS ETF Plc
L&G Quality Equity Dividends ESG Exclusions Asia Pacific ex-Japan UCITS ETF
Schedule of Investments (continued)
As at 31 December 2021
530
Nominal Description
Coupon Rate
Maturity Date
Value $
% of Net
Assets
Common Stock (30 June 2021: 99.49%) (continued)
Australia (30 June 2021: 31.93%) (continued)
18,243 Super Retail Group Ltd 165,263 0.77
22,645 Tassal Group Ltd 57,459 0.27
Total Australia 7,023,669 32.71
Bermuda (30 June 2021: 5.37%)
58,000 CK Infrastructure Holdings Ltd 369,368 1.72
38,000 Luk Fook Holdings International Ltd 102,356 0.48
178,800 Man Wah Holdings Ltd 277,042 1.29
Total Bermuda 748,766 3.49
Cayman Islands (30 June 2021: 12.35%)
49,500 Asia Cement China Holdings Corp 31,619 0.15
164,000 Lee & Man Paper Manufacturing Ltd 114,013 0.53
81,000 SITC International Holdings Co Ltd 292,985 1.36
198,000 Tingyi Cayman Islands Holding Corp 406,855 1.90
129,000 Towngas China Co Ltd 112,184 0.52
131,000 Uni-President China Holdings Ltd 127,029 0.59
108,118 Value Partners Group Ltd 53,946 0.25
82,000 VSTECS Holdings Ltd 76,885 0.36
518,000 Want Want China Holdings Ltd 475,723 2.22
411,000 WH Group Ltd '144A' 257,788 1.20
80,000 Xinyi Glass Holdings Ltd 200,095 0.93
Total Cayman Islands 2,149,122 10.01
Hong Kong (30 June 2021: 7.64%)
112,000 BOC Hong Kong Holdings Ltd 367,046 1.71
137,000 CITIC Telecom International Holdings Ltd 46,215 0.22
19,600 Hang Seng Bank Ltd 358,750 1.67
319,447 Lenovo Group Ltd 367,128 1.71
466,000 PCCW Ltd 236,099 1.10

December 2021 Legal & General UCITS ETF Plc
L&G Quality Equity Dividends ESG Exclusions Asia Pacific ex-Japan UCITS ETF
Schedule of Investments (continued)
As at 31 December 2021
531
Nominal Description
Coupon Rate
Maturity Date
Value $
% of Net
Assets
Common Stock (30 June 2021: 99.49%) (continued)
Hong Kong (30 June 2021: 7.64%) (continued)
55,500 Power Assets Holdings Ltd 345,972 1.61
Total Hong Kong 1,721,210 8.02
New Zealand (30 June 2021: 9.41%)
54,278 Chorus Ltd 266,449 1.24
62,069 Contact Energy Ltd 344,216 1.60
11,350 EBOS Group Ltd 320,158 1.49
55,687 Genesis Energy Ltd 109,041 0.51
46,919 Heartland Group Holdings Ltd 80,950 0.38
95,827 Meridian Energy Ltd 318,200 1.48
11,801 Scales Corp Ltd 45,246 0.21
99,225 Spark New Zealand Ltd 307,065 1.43
26,964 Vector Ltd 74,028 0.35
Total New Zealand 1,865,353 8.69
Singapore (30 June 2021: 6.58%)
15,411 DBS Group Holdings Ltd 373,344 1.74
11,700 Jardine Cycle & Carriage Ltd 178,778 0.83
39,500 Oversea-Chinese Banking Corp Ltd 334,014 1.56
60,721 Riverstone Holdings Ltd 31,528 0.15
57,600 Silverlake Axis Ltd 11,749 0.05
122,900 Singapore Technologies Engineering Ltd 342,769 1.60
202,719 Singapore Telecommunications Ltd 348,855 1.63
17,800 United Overseas Bank Ltd 355,169 1.65
24,374 Venture Corp Ltd 331,038 1.54
Total Singapore 2,307,244 10.75
South Korea (30 June 2021: 26.21%)
1,334 Amorepacific Corp - Preference 82,144 0.38
35,100 BNK Financial Group Inc 248,025 1.16

December 2021 Legal & General UCITS ETF Plc
L&G Quality Equity Dividends ESG Exclusions Asia Pacific ex-Japan UCITS ETF
Schedule of Investments (continued)
As at 31 December 2021
532
Nominal Description
Coupon Rate
Maturity Date
Value $
% of Net
Assets
Common Stock (30 June 2021: 99.49%) (continued)
South Korea (30 June 2021: 26.21%) (continued)
7,963 Cheil Worldwide Inc 153,064 0.71
5,335 DB Insurance Co Ltd 242,347 1.13
17,332 DGB Financial Group Inc 136,761 0.64
786 Halla Holdings Corp 30,316 0.14
9,205 Hana Financial Group Inc 325,611 1.52
2,277 Huchems Fine Chemical Corp 44,343 0.21
6,532 Hyundai Marine & Fire Insurance Co Ltd 126,107 0.59
2,660 Hyundai Motor Co - Preference 220,408 1.03
4,116 Hyundai Motor Co - Preference 349,708 1.63
30,356 Industrial Bank of Korea 263,021 1.22
7,804 KB Financial Group Inc 361,068 1.68
2,390 KEPCO Plant Service & Engineering Co Ltd 77,505 0.36
8,643 Korean Reinsurance Co 67,254 0.31
4,965 KT&G Corp 329,956 1.54
1,843 LG Electronics Inc - Preference 101,549 0.47
228 LG Household & Health Care Ltd - Preference 118,148 0.55
6,844 Meritz Fire & Marine Insurance Co Ltd 193,158 0.90
31,528 Meritz Securities Co Ltd 136,588 0.64
14,435 NH Investment & Securities Co Ltd 151,788 0.71
146 Samchully Co Ltd 11,152 0.05
3,684 Samsung Card Co Ltd 97,620 0.45
1,801 Samsung Fire & Marine Insurance Co Ltd 306,037 1.43
240 Samsung Fire & Marine Insurance Co Ltd - Preference 32,101 0.15
5,553 Samsung Life Insurance Co Ltd 299,430 1.39
7,245 Samsung Securities Co Ltd 273,649 1.27
10,679 Shinhan Financial Group Co Ltd 330,589 1.54
2,636 SK Square Co Ltd 147,239 0.69
4,025 SK Telecom Co Ltd 196,044 0.91
Total South Korea 5,452,730 25.40
Total Common Stock 21,268,094 99.07

December 2021 Legal & General UCITS ETF Plc
L&G Quality Equity Dividends ESG Exclusions Asia Pacific ex-Japan UCITS ETF
Schedule of Investments (continued)
As at 31 December 2021
533
Total Investments
Common Stock 21,268,094 99.07
Other Assets and Liabilities 200,025 0.93
Net Assets Attributable to Holders of Redeemable Participating Shares 21,468,119 100.00
Analysis of Total Assets
% of Total
Assets
Transferable securities admitted to an official stock exchange listing 99.04
Other assets 0.96
100.00
Analysis of Total Assets rather than Net Assets is required under Schedule 12 of the UCITS Regulations.

December 2021 Legal & General UCITS ETF Plc
L&G Digital Payments UCITS ETF
Schedule of Investments
As at 31 December 2021
534
Nominal Description
Value
$
% of Net
Assets
Common Stock (30 June 2021: 99.86%)
Australia (30 June 2021: 5.00%)
4,430 Afterpay Ltd 267,360 1.66
133,150 EML Payments Ltd 312,684 1.94
Total Australia 580,044 3.60
Bermuda (30 June 2021: 2.45%)
88,535 Paysafe Ltd 346,172 2.15
Total Bermuda 346,172 2.15
Canada (30 June 2021: 7.85%)
6,352 Lightspeed Commerce Inc 256,862 1.60
3,732 Nuvei Corp '144A' 242,267 1.50
218 Shopify Inc - Class A 300,271 1.86
Total Canada 799,400 4.96
Cayman Islands (30 June 2021: 9.26%)
12,826 Pagseguro Digital Ltd - Class A 336,298 2.09
21,077 StoneCo Ltd - Class A 355,358 2.21
5,838 Tencent Holdings Ltd 342,059 2.12
83,220 Yeahka Ltd 275,397 1.71
Total Cayman Islands 1,309,112 8.13
Cyprus (30 June 2021: 2.20%)
40,066 QIWI plc ADR 319,727 1.98
Total Cyprus 319,727 1.98
France (30 June 2021: 4.62%)
7,531 Edenred 347,449 2.16
6,415 Worldline SA/France '144A' 357,531 2.22
Total France 704,980 4.38

December 2021 Legal & General UCITS ETF Plc
L&G Digital Payments UCITS ETF
Schedule of Investments (continued)
As at 31 December 2021
535
Nominal Description
Value
$
% of Net
Assets
Common Stock (30 June 2021: 99.86%) (continued)
Italy (30 June 2021: 2.53%)
22,176 Nexi SpA '144A' 352,804 2.19
Total Italy 352,804 2.19
Japan (30 June 2021: 4.75%)
32,800 Credit Saison Co Ltd 344,364 2.14
2,590 GMO Payment Gateway Inc 322,752 2.00
Total Japan 667,116 4.14
Netherlands (30 June 2021: 2.42%)
126 Adyen NV '144A' 331,206 2.06
Total Netherlands 331,206 2.06
New Zealand (30 June 2021: 2.26%)
179,816 Pushpay Holdings Ltd 162,507 1.01
Total New Zealand 162,507 1.01
Puerto Rico (30 June 2021: 2.29%)
8,198 EVERTEC Inc 409,736 2.54
Total Puerto Rico 409,736 2.54
South Korea (30 June 2021: –%)
1,847 Kakao Pay Corp 271,126 1.68
Total South Korea 271,126 1.68
United Kingdom (30 June 2021: 2.04%)
92,525 Network International Holdings Plc '144A' 366,186 2.27
34,850 Wise Plc - Class A 357,135 2.22
Total United Kingdom 723,321 4.49

December 2021 Legal & General UCITS ETF Plc
L&G Digital Payments UCITS ETF
Schedule of Investments (continued)
As at 31 December 2021
536
Nominal Description
Value
$
% of Net
Assets
Common Stock (30 June 2021: 99.86%) (continued)
United States (30 June 2021: 52.19%)
11,355 ACI Worldwide Inc 394,018 2.45
2,196 American Express Co 359,266 2.23
1,623 Block Inc 262,131 1.63
44,268 BTRS Holdings Inc 346,176 2.15
1,712 Coupa Software Inc 270,582 1.68
3,006 Discover Financial Services 347,373 2.16
3,211 Euronet Worldwide Inc 382,655 2.37
16,439 Evo Payments Inc - Class A 420,838 2.61
997 Fair Isaac Corp 432,369 2.68
3,188 Fidelity National Information Services Inc 347,970 2.16
3,505 Fiserv Inc 363,784 2.26
8,293 Flywire Corp 315,631 1.96
2,796 Global Payments Inc 377,963 2.35
8,945 Green Dot Corp - Class A 324,167 2.01
17,716 I3 Verticals Inc - Class A 403,748 2.51
22,884 International Money Express Inc 365,229 2.27
15,619 Marqeta Inc 268,178 1.66
1,062 Mastercard Inc 381,598 2.37
20,379 OneSpan Inc 345,016 2.14
51,790 Paya Holdings Inc 328,349 2.04
44,097 Payoneer Global Inc 324,113 2.01
1,834 PayPal Holdings Inc 345,856 2.15
4,270 Q2 Holdings Inc 339,209 2.10
20,129 Repay Holdings Corp - Class A 367,757 2.28
1,743 Visa Inc - Class A 377,725 2.34
17,464 Zuora Inc 326,227 2.02
Total United States 9,117,928 56.59
Total Common Stock 16,095,179 99.90

December 2021 Legal & General UCITS ETF Plc
L&G Digital Payments UCITS ETF
Schedule of Investments (continued)
As at 31 December 2021
537
Total Investments
Common Stock 16,095,179 99.90
Other Assets and Liabilities 16,297 0.10
Net Assets Attributable to Holders of Redeemable Participating Shares 16,111,476 100.00
Analysis of Total Assets
% of Total
Assets
Transferable securities admitted to an official stock exchange listing 99.86
Other assets
0.14
100.00
Analysis of Total Assets rather than Net Assets is required under Schedule 12 of the UCITS Regulations.

December 2021 Legal & General UCITS ETF Plc
L&G Multi-Strategy Enhanced Commodities UCITS ETF*
Schedule of Investments
As at 31 December 2021
Nominal Description
Coupon Rate
Maturity Date
Value $
% of Net
Assets
Reverse Repurchase Agreements
624,000 Barclays Bank Plc 0.16% 24/01/2022 624,000 0.10
542,559,955 Barclays Bank Plc 0.16% 24/01/2022 542,559,955 89.21
Total Reverse Repurchase Agreements 543,183,955 89.31
Notional Amount
Description
Unrealised Gain
$
% of Net
Assets
Swap Contracts
581,274,896 Barclays Backwardation Tilt Multi-Strategy Capped Total Return Index
1 20/01/2022 27,042,440 4.45
Unrealised Gain on Swap Contracts 27,042,440 4.45
Nominal Description
Value $
% of Net
Assets
Money Market Instruments
71,174,335 BlackRock Institutional US Dollar Cash Plus Fund 71,174,335 11.70
Total Money Market Instruments 71,174,335 11.70
Total Investments
Reverse Repurchase Agreements 543,183,955 89.31
Money Market Instruments 71,174,335 11.70
Unrealised Gain on Swap Contracts 27,042,440 4.45
Other Assets and Liabilities (33,170,154) (5.46)
Net Assets Attributable to Holders of Redeemable Participating Shares 608,230,576 100.00
Analysis of Total Assets
% of Total
Assets
Transferable securities admitted to an official stock exchange listing or dealt on a regulated market 11.08
Deposits with credit institutions 84.59
OTC financial derivative instruments 4.21
Other assets 0.12
100.00
Analysis of Total Assets rather than Net Assets is required under Schedule 12 of the UCITS Regulations.
* The Fund launched on 2 July 2021.
1 The counterparty for the swap contracts was Barclays Bank Plc.

December 2021 Legal & General UCITS ETF Plc
L&G Quality Equity Dividends ESG Exclusions Emerging Markets UCITS ETF *
Schedule of Investments
As at 31 December 2021
539
Nominal Description
Value
$
% of Net
Assets
Common Stock
Bermuda
28,000 China Water Affairs Group Ltd
40,152 0.27
52,000 Kunlun Energy Co Ltd
48,757 0.33
43,000 Nine Dragons Paper Holdings Ltd
46,164 0.31
33,000 Shenzhen International Holdings Ltd
34,286 0.23
Total Bermuda
169,359 1.14
Brazil
21,200 B3 SA - Brasil Bolsa Balcao
42,400 0.29
21,400 Banco Bradesco SA
62,203 0.42
7,500 Banco Bradesco SA - Preference
25,866 0.17
8,700 Banco do Estado do Rio Grande do Sul SA - Preference
15,073 0.10
8,200 Banco Santander Brasil SA
44,136 0.30
35,200 CCR SA
73,244 0.49
8,600 Cia de Saneamento Basico do Estado de Sao Paulo
62,038 0.42
7,100 Cia de Saneamento de Minas Gerais-COPASA
16,201 0.11
6,900 Cia de Saneamento do Parana (Units)
23,748 0.16
6,600 Cia de Transmissao de Energia Eletrica Paulista - Preference
28,806 0.19
31,800 Cia Paranaense de Energia - Preference
36,767 0.25
6,400 Energisa SA
50,982 0.34
5,300 Engie Brasil Energia SA
36,548 0.25
2,050 Getnet Adquirencia e Servicos para Meios de Pagamento SA
1,417 0.01
3,100 Guararapes Confeccoes SA
5,482 0.04
17,500 MRV Engenharia e Participacoes SA
37,702 0.25
5,400 Porto Seguro SA
20,282 0.14
6,700 Sao Martinho SA
41,427 0.28
7,900 Transmissora Alianca de Energia Eletrica SA (Units)
51,584 0.35
Total Brazil
675,906 4.56

December 2021 Legal & General UCITS ETF Plc
L&G Quality Equity Dividends ESG Exclusions Emerging Markets UCITS ETF *
Schedule of Investments (continued)
As at 31 December 2021
540
Nominal Description
Value
$
% of Net
Assets
Common Stock (continued)
Cayman Islands
5,000 Bizlink Holding Inc 47,168 0.32
68,000 Bosideng International Holdings Ltd 42,825 0.29
41,000 China Hongqiao Group Ltd 43,281 0.29
29,000 China Lesso Group Holdings Ltd 41,661 0.28
10,000 China Lilang Ltd 5,592 0.04
30,000 China Medical System Holdings Ltd 50,101 0.34
66,000 China State Construction International Holdings Ltd 82,031 0.55
66,400 China Zhongwang Holdings Ltd** – –
18,000 CIMC Enric Holdings Ltd 26,182 0.18
17,000 Consun Pharmaceutical Group Ltd 9,594 0.06
53,000 Fufeng Group Ltd 18,287 0.12
32,000 Greatview Aseptic Packaging Co Ltd 11,698 0.08
10,000 Hengan International Group Co Ltd 51,499 0.35
14,500 Kingboard Holdings Ltd 70,582 0.47
38,500 Kingboard Laminates Holdings Ltd 65,481 0.44
67,000 Lonking Holdings Ltd 18,820 0.13
25,000 TCL Electronics Holdings Ltd 12,987 0.09
22,000 Tianneng Power International Ltd 23,280 0.16
32,000 Xingda International Holdings Ltd 7,019 0.05
41,000 Xtep International Holdings Ltd 68,366 0.46
Total Cayman Islands 696,454 4.70
Chile
99,286 Aguas Andinas SA 18,063 0.12
743,120 Banco de Chile 58,054 0.39
6,351 Embotelladora Andina SA - Preference 13,790 0.09
1,272 Sociedad Quimica y Minera de Chile SA - Preference 64,927 0.44
Total Chile 154,834 1.04
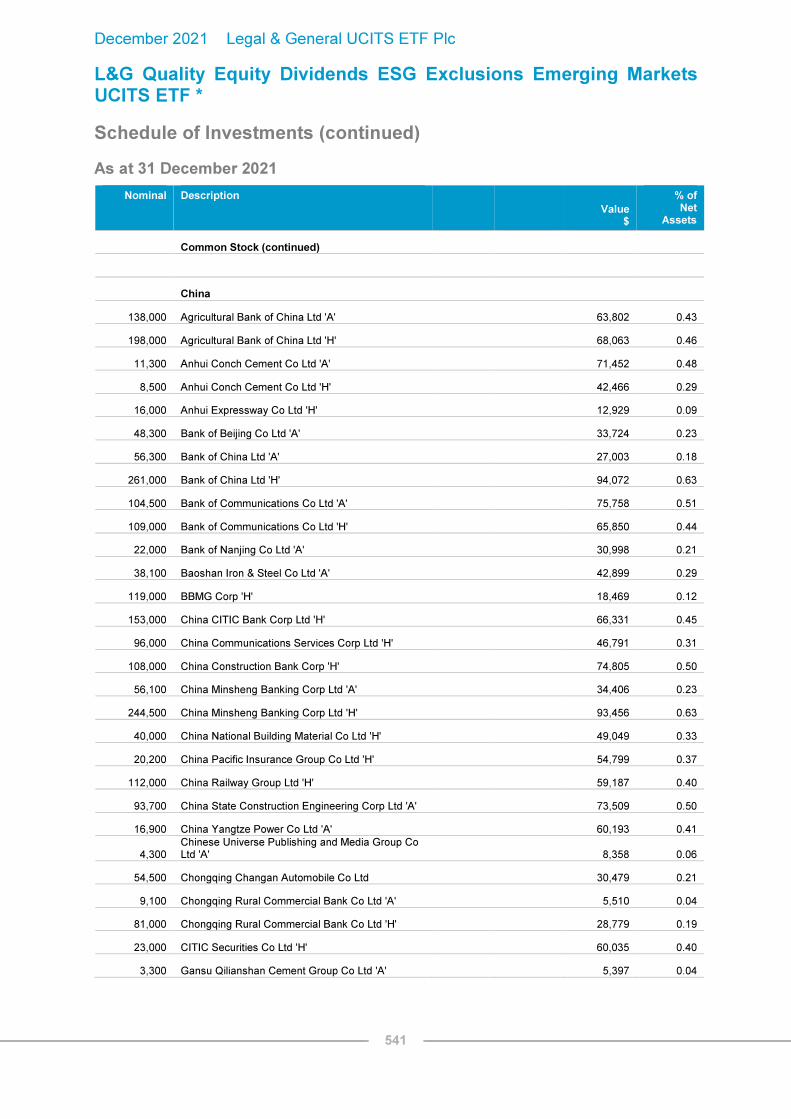
December 2021 Legal & General UCITS ETF Plc
L&G Quality Equity Dividends ESG Exclusions Emerging Markets UCITS ETF *
Schedule of Investments (continued)
As at 31 December 2021
541
Nominal Description
Value
$
% of Net
Assets
Common Stock (continued)
China
138,000 Agricultural Bank of China Ltd 'A' 63,802 0.43
198,000 Agricultural Bank of China Ltd 'H' 68,063 0.46
11,300 Anhui Conch Cement Co Ltd 'A' 71,452 0.48
8,500 Anhui Conch Cement Co Ltd 'H' 42,466 0.29
16,000 Anhui Expressway Co Ltd 'H' 12,929 0.09
48,300 Bank of Beijing Co Ltd 'A' 33,724 0.23
56,300 Bank of China Ltd 'A' 27,003 0.18
261,000 Bank of China Ltd 'H' 94,072 0.63
104,500 Bank of Communications Co Ltd 'A' 75,758 0.51
109,000 Bank of Communications Co Ltd 'H' 65,850 0.44
22,000 Bank of Nanjing Co Ltd 'A' 30,998 0.21
38,100 Baoshan Iron & Steel Co Ltd 'A' 42,899 0.29
119,000 BBMG Corp 'H' 18,469 0.12
153,000 China CITIC Bank Corp Ltd 'H' 66,331 0.45
96,000 China Communications Services Corp Ltd 'H' 46,791 0.31
108,000 China Construction Bank Corp 'H' 74,805 0.50
56,100 China Minsheng Banking Corp Ltd 'A' 34,406 0.23
244,500 China Minsheng Banking Corp Ltd 'H' 93,456 0.63
40,000 China National Building Material Co Ltd 'H' 49,049 0.33
20,200 China Pacific Insurance Group Co Ltd 'H' 54,799 0.37
112,000 China Railway Group Ltd 'H' 59,187 0.40
93,700 China State Construction Engineering Corp Ltd 'A' 73,509 0.50
16,900 China Yangtze Power Co Ltd 'A' 60,193 0.41
4,300 Chinese Universe Publishing and Media Group Co Ltd 'A' 8,358 0.06
54,500 Chongqing Changan Automobile Co Ltd 30,479 0.21
9,100 Chongqing Rural Commercial Bank Co Ltd 'A' 5,510 0.04
81,000 Chongqing Rural Commercial Bank Co Ltd 'H' 28,779 0.19
23,000 CITIC Securities Co Ltd 'H' 60,035 0.40
3,300 Gansu Qilianshan Cement Group Co Ltd 'A' 5,397 0.04

December 2021 Legal & General UCITS ETF Plc
L&G Quality Equity Dividends ESG Exclusions Emerging Markets UCITS ETF *
Schedule of Investments (continued)
As at 31 December 2021
542
Nominal Description
Value
$
% of Net
Assets
Common Stock (continued)
China (continued)
33,400 GF Securities Co Ltd 'H' 63,662 0.43
58,000 Guangzhou Automobile Group Co Ltd 'H' 57,209 0.46
6,800 Huaibei Mining Holdings Co Ltd 'A' 11,955 0.48
43,200 Huatai Securities Co Ltd 'H' '144A' 71,923 0.29
39,500 Huaxia Bank Co Ltd 'A' 34,785 0.09
9,600 Huaxin Cement Co Ltd 'A' 29,137 0.23
8,600 Huayu Automotive Systems Co Ltd 'A' 38,187 0.18
124,900 Industrial & Commercial Bank of China Ltd 'A' 90,939 0.63
61,000 Industrial & Commercial Bank of China Ltd 'H' 34,427 0.51
47,500 Jiangsu Expressway Co Ltd 'A' 64,389 0.44
2,800 Lao Feng Xiang Co Ltd 'A' 20,189 0.21
21,900 Nanjing Iron & Steel Co Ltd 'A' 12,743 0.29
226,000 People's Insurance Co Group of China Ltd/The 'H' 68,412 0.12
64,000 PICC Property & Casualty Co Ltd 'H' 52,291 0.45
19,700 SAIC Motor Corp Ltd 'A' 63,767 0.31
48,000 Shanghai Jin Jiang Capital Co Ltd 'H' 18,039 0.50
1,000 Shanghai Jinjiang International Hotels Co Ltd 'A' 9,215 0.23
25,000 Shanghai Pharmaceuticals Holding Co Ltd 'H' 47,394 0.63
36,500 Shanghai Pudong Development Bank Co Ltd 'A' 48,961 0.33
24,000 Shenzhen Expressway Corp Ltd 'H' 23,242 0.37
19,800 Shenzhen Overseas Chinese Town Co Ltd 'A' 21,920 0.40
29,600 Sinopharm Group Co Ltd 'H' 64,392 0.50
59,000 Sinotrans Ltd 'H' 18,919 0.41
20,000 Tong Ren Tang Technologies Co Ltd 'H' 21,497 0.06
18,000 TravelSky Technology Ltd 'H' 30,291 0.21
3,000 Weifu High-Technology Group Co Ltd 'A' 10,162 0.04
2,500 Xinjiang Tianshan Cement Co Ltd 'A' 6,019 0.19
46,000 Zhejiang Expressway Co Ltd 'H' 41,007 0.40

December 2021 Legal & General UCITS ETF Plc
L&G Quality Equity Dividends ESG Exclusions Emerging Markets UCITS ETF *
Schedule of Investments (continued)
As at 31 December 2021
543
Nominal Description
Value
$
% of Net
Assets
Common Stock (continued)
China (continued)
34,100 Zoomlion Heavy Industry Science and Technology Co Ltd 'A' 38,362 0.04
37,200 Zoomlion Heavy Industry Science and Technology Co Ltd 'H' 23,428 0.16
Total China 2,535,432 17.09
Colombia
132,394 Grupo Aval Acciones y Valores SA - Preference 34,448 0.23
11,989 Interconexion Electrica SA ESP 65,984 0.45
Total Colombia 100,432 0.68
Czech Republic
25 Philip Morris CR AS 18,419 0.12
Total Czech Republic 18,419 0.12
Egypt
24,581 Commercial International Bank Egypt SAE 82,912 0.56
33,434 Eastern Co SAE 22,814 0.15
26,698 Egypt Kuwait Holding Co SAE 35,215 0.24
28,031 Egyptian Financial Group-Hermes Holding Co 26,425 0.18
9,547 Oriental Weavers 5,281 0.03
Total Egypt 172,647 1.16
Hong Kong
18,000 Beijing Enterprises Holdings Ltd 62,106 0.42
36,596 China Merchants Port Holdings Co Ltd 66,655 0.45
48,000 CITIC Ltd 47,407 0.32
11,000 CPMC Holdings Ltd 6,152 0.04
54,000 Far East Horizon Ltd 47,931 0.32
39,000 Fosun International Ltd 42,070 0.28
38,000 Guangdong Investment Ltd 48,302 0.33

December 2021 Legal & General UCITS ETF Plc
L&G Quality Equity Dividends ESG Exclusions Emerging Markets UCITS ETF *
Schedule of Investments (continued)
As at 31 December 2021
544
Nominal Description
Value
$
% of Net
Assets
Common Stock (continued)
Hong Kong (continued)
126,000 Shougang Fushan Resources Group Ltd 42,666 0.29
19,000 Sinotruk Hong Kong Ltd 29,245 0.20
Total Hong Kong 392,534 2.65
India
7,602 Bharat Petroleum Corp Ltd 39,418 0.27
21,500 Castrol India Ltd 35,517 0.24
30,200 GAIL India Ltd 52,490 0.36
13,178 Hindustan Petroleum Corp Ltd 51,827 0.35
24,467 Indian Oil Corp Ltd 36,699 0.25
23,163 ITC Ltd 67,945 0.46
32,986 National Aluminium Co Ltd 44,818 0.30
122,235 NHPC Ltd (Units) 50,893 0.34
24,872 NMDC Ltd 44,601 0.30
11,246 Oil India Ltd 30,091 0.20
16,370 Petronet LNG Ltd 47,655 0.32
35,118 Power Finance Corp Ltd 56,573 0.38
29,864 Power Grid Corp of India Ltd 82,117 0.55
29,955 REC Ltd 53,917 0.36
Total India 694,561 4.68
Indonesia
116,600 Bank Mandiri Persero Tbk PT 57,472 0.39
103,200 Bank Pembangunan Daerah Jawa Barat Dan Banten Tbk PT 9,667 0.06
21,500 Gudang Garam Tbk PT 46,160 0.31
224,500 Media Nusantara Citra Tbk PT 14,176 0.10
229,100 Telkom Indonesia Persero Tbk PT 64,940 0.44
193,000 Unilever Indonesia Tbk PT 55,656 0.37
50,800 United Tractors Tbk PT 78,949 0.53
Total Indonesia 327,020 2.20

December 2021 Legal & General UCITS ETF Plc
L&G Quality Equity Dividends ESG Exclusions Emerging Markets UCITS ETF *
Schedule of Investments (continued)
As at 31 December 2021
545
Nominal Description
Value
$
% of Net
Assets
Common Stock (continued)
Kuwait
53,140 Ahli United Bank BSC 48,874 0.33
Total Kuwait 48,874 0.33
Malaysia
39,600 Alliance Bank Malaysia Bhd 27,186 0.18
55,100 Astro Malaysia Holdings Bhd 12,565 0.09
11,200 Bursa Malaysia Bhd 17,609 0.12
51,500 CIMB Group Holdings Bhd 67,373 0.46
30,600 Hartalega Holdings Bhd 42,088 0.28
10,300 Hong Leong Bank Bhd 46,036 0.31
48,300 Kossan Rubber Industries Bhd 22,260 0.15
22,800 Magnum Bhd 10,398 0.07
12,300 Petronas Dagangan Bhd 60,821 0.41
13,500 Petronas Gas Bhd 58,329 0.39
41,900 RHB Bank Bhd 54,009 0.36
21,600 Tenaga Nasional Bhd 48,426 0.33
56,500 Top Glove Corp Bhd 35,126 0.24
Total Malaysia 502,226 3.39
Mexico
64,100 Alfa SAB de CV 47,045 0.32
12,800 Alpek SAB de CV 13,935 0.09
14,300 Bolsa Mexicana de Valores SAB de CV 27,196 0.18
14,610 Coca-Cola Femsa SAB de CV (Units) 79,743 0.54
5,700 Grupo Aeroportuario del Pacifico SAB de CV 78,588 0.53
8,800 Grupo Financiero Banorte SAB de CV 57,199 0.38
22,600 Kimberly-Clark de Mexico SAB de CV 34,245 0.23
22,400 Orbia Advance Corp SAB de CV 57,212 0.39
Total Mexico 395,163 2.66

December 2021 Legal & General UCITS ETF Plc
L&G Quality Equity Dividends ESG Exclusions Emerging Markets UCITS ETF *
Schedule of Investments (continued)
As at 31 December 2021
546
Nominal Description
Value
$
% of Net
Assets
Common Stock (continued)
Philippines
34,500 Manila Water Co Inc 16,745 0.11
17,640 Universal Robina Corp 44,280 0.30
Total Philippines 61,025 0.41
Qatar
2,713 Al Meera Consumer Goods Co QSC 14,604 0.10
56,758 Masraf Al Rayan QSC 72,331 0.49
15,417 Qatar Electricity & Water Co QSC 70,289 0.47
23,530 Qatar International Islamic Bank QSC 59,520 0.40
Total Qatar 216,744 1.46
Russia
28,030 Alrosa PJSC 45,891 0.31
15,030 Gazprom PJSC 68,788 0.46
784 LUKOIL PJSC 68,673 0.46
477 Magnit PJSC 34,605 0.23
12,100 Mobile TeleSystems PJSC 48,170 0.32
458,000 Mosenergo PJSC 12,811 0.09
20,240 Novolipetsk Steel PJSC 58,729 0.40
19,790 Rostelecom PJSC 23,012 0.16
3,302,000 RusHydro PJSC 32,665 0.22
11,010 Sberbank of Russia PJSC 43,100 0.29
2,311 Severstal PAO 49,457 0.33
78,400 Sistema PJSFC 24,504 0.17
84,800 Surgutneftegas PJSC - Preference 43,504 0.29
13,280 Tatneft PJSC 88,614 0.60
3,314 Tatneft PJSC - Preference 20,293 0.14
23 Transneft PJSC - Preference 48,695 0.33
73,400,000 VTB Bank PJSC 47,266 0.32
Total Russia 758,777 5.12

December 2021 Legal & General UCITS ETF Plc
L&G Quality Equity Dividends ESG Exclusions Emerging Markets UCITS ETF *
Schedule of Investments (continued)
As at 31 December 2021
547
Nominal Description
Value
$
% of Net
Assets
Common Stock (continued)
Saudi Arabia
3,782 Advanced Petrochemical Co 70,918 0.48
1,555 Arabian Cement Co/Saudi Arabia 15,656 0.11
5,045 Banque Saudi Fransi 63,492 0.43
970 Jarir Marketing Co 50,846 0.34
6,973 Riyad Bank 50,332 0.34
8,204 Saudi Industrial Investment Group 68,068 0.46
1,736 Saudi Telecom Co 51,973 0.35
1,124 United International Transportation Co 13,936 0.09
2,037 Yanbu National Petrochemical Co 37,274 0.25
Total Saudi Arabia 422,495 2.85
South Africa
3,838 African Rainbow Minerals Ltd 55,603 0.37
1,315 Astral Foods Ltd 14,225 0.10
10,562 AVI Ltd 48,906 0.33
2,230 Clicks Group Ltd 44,087 0.30
2,550 JSE Ltd 17,895 0.12
1,890 Kumba Iron Ore Ltd 54,484 0.37
13,501 Pick n Pay Stores Ltd 44,386 0.30
13,373 Sanlam Ltd 49,738 0.33
1,279 Santam Ltd 21,557 0.15
3,696 SPAR Group Ltd/The 38,702 0.26
5,143 Standard Bank Group Ltd 45,117 0.30
4,468 Vodacom Group Ltd 37,687 0.25
Total South Africa 472,387 3.18
Taiwan
7,000 Accton Technology Corp 65,782 0.44
5,000 Advantech Co Ltd 71,656 0.48
6,000 Arcadyan Technology Corp 27,650 0.19

December 2021 Legal & General UCITS ETF Plc
L&G Quality Equity Dividends ESG Exclusions Emerging Markets UCITS ETF *
Schedule of Investments (continued)
As at 31 December 2021
548
Nominal Description
Value
$
% of Net
Assets
Common Stock (continued)
Taiwan (continued)
48,000 Asia Cement Corp 76,857 0.52
11,000 Asia Vital Components Co Ltd 35,067 0.24
4,000 Aten International Co Ltd 11,812 0.08
93,000 AU Optronics Corp 76,976 0.52
13,000 Catcher Technology Co Ltd 73,535 0.50
24,000 Cathay Financial Holding Co Ltd 54,216 0.37
6,000 Century Iron & Steel Industrial Co Ltd 23,964 0.16
38,000 Cheng Shin Rubber Industry Co Ltd 49,583 0.33
17,000 Chicony Electronics Co Ltd 50,569 0.34
7,000 Chilisin Electronics Corp 23,935 0.16
14,700 China General Plastics Corp 18,437 0.12
19,000 Chipbond Technology Corp 45,805 0.31
8,000 Chroma ATE Inc 57,831 0.39
48,000 Compeq Manufacturing Co Ltd 75,903 0.51
81,000 CTBC Financial Holding Co Ltd 75,973 0.51
3,000 Cub Elecparts Inc 20,439 0.14
5,000 Delta Electronics Inc 49,698 0.33
21,000 E Ink Holdings Inc 114,613 0.77
9,000 Elan Microelectronics Corp 55,301 0.37
7,000 Elite Material Co Ltd 70,337 0.47
33,000 Far EasTone Telecommunications Co Ltd 77,052 0.52
8,000 Feng TAY Enterprise Co Ltd 66,939 0.45
48,000 First Financial Holding Co Ltd 42,506 0.29
11,000 FLEXium Interconnect Inc 41,548 0.28
18,000 Formosa Chemicals & Fibre Corp 52,568 0.35
21,000 Formosa Plastics Corp 78,939 0.53
18,800 Fubon Financial Holding Co Ltd 51,847 0.35
11,000 Getac Holdings Corp 22,146 0.15
19,000 Gigabyte Technology Co Ltd 106,788 0.72
16,000 Gloria Material Technology Corp 12,694 0.09

December 2021 Legal & General UCITS ETF Plc
L&G Quality Equity Dividends ESG Exclusions Emerging Markets UCITS ETF *
Schedule of Investments (continued)
As at 31 December 2021
549
Nominal Description
Value
$
% of Net
Assets
Common Stock (continued)
Taiwan (continued)
3,000 Grape King Bio Ltd 17,349 0.12
5,000 Holtek Semiconductor Inc 20,331 0.14
5,000 Holy Stone Enterprise Co Ltd 21,596 0.15
14,000 Hon Hai Precision Industry Co Ltd 52,626 0.35
94,000 Innolux Corp 66,592 0.45
1,400 International Games System Co Ltd 40,127 0.27
64,000 Inventec Corp 57,715 0.39
15,321 ITEQ Corp 78,635 0.53
36,000 King Yuan Electronics Co Ltd 58,293 0.39
5,000 Kinik Co 21,867 0.15
27,000 Lite-On Technology Corp 62,262 0.42
7,000 Makalot Industrial Co Ltd 62,493 0.42
52,000 Mega Financial Holding Co Ltd 66,816 0.45
11,000 Micro-Star International Co Ltd 63,813 0.43
16,000 Nan Ya Plastics Corp 49,387 0.33
13,000 Nantex Industry Co Ltd 40,033 0.27
4,000 Novatek Microelectronics Corp 77,927 0.53
11,000 Pan Jit International Inc 42,542 0.29
5,000 Phison Electronics Corp 92,529 0.62
4,000 Pixart Imaging Inc 21,976 0.15
2,000 Posiflex Technology Inc 8,928 0.06
16,000 Powertech Technology Inc 56,501 0.38
3,090 Poya International Co Ltd 47,299 0.32
10,000 Primax Electronics Ltd 20,494 0.14
20,000 Radiant Opto-Electronics Corp 73,011 0.49
2,000 Realtek Semiconductor Corp 41,927 0.28
8,000 Sercomm Corp 21,889 0.15
7,000 Shin Zu Shing Co Ltd 24,441 0.16
4,000 Simplo Technology Co Ltd 47,493 0.32
6,000 Sinbon Electronics Co Ltd 61,590 0.42

December 2021 Legal & General UCITS ETF Plc
L&G Quality Equity Dividends ESG Exclusions Emerging Markets UCITS ETF *
Schedule of Investments (continued)
As at 31 December 2021
550
Nominal Description
Value
$
% of Net
Assets
Common Stock (continued)
Taiwan (continued)
8,000 Sino-American Silicon Products Inc 68,240 0.46
103,000 SinoPac Financial Holdings Co Ltd 60,124 0.41
2,000 St Shine Optical Co Ltd 22,662 0.15
8,000 Sunonwealth Electric Machine Industry Co Ltd 12,838 0.09
2,000 TaiDoc Technology Corp 13,120 0.09
5,000 Taiflex Scientific Co Ltd 8,584 0.06
33,000 Taiwan Cement Corp 57,252 0.39
24,000 Taiwan Fertilizer Co Ltd 60,722 0.41
16,000 Taiwan Mobile Co Ltd 57,831 0.39
8,000 Taiwan Paiho Ltd 23,624 0.16
8,000 Taiwan Union Technology Corp 29,494 0.20
69,000 Teco Electric and Machinery Co Ltd 78,933 0.53
6,000 Tong Hsing Electronic Industries Ltd 64,517 0.43
17,000 Tong Yang Industry Co Ltd 20,338 0.14
4,000 Topco Scientific Co Ltd 22,843 0.15
15,000 Tripod Technology Corp 67,499 0.45
7,000 TTY Biopharm Co Ltd 17,407 0.12
23,450 Tung Ho Steel Enterprise Corp 56,873 0.38
9,000 TXC Corp 34,319 0.23
21,000 Uni-President Enterprises Corp 52,069 0.35
5,000 United Integrated Services Co Ltd 32,801 0.22
23,073 United Microelectronics Corp 54,207 0.37
13,000 Vanguard International Semiconductor Corp 74,240 0.50
9,000 Wistron NeWeb Corp 25,373 0.17
43,000 WPG Holdings Ltd 81,751 0.55
71,000 Yuanta Financial Holding Co Ltd 64,926 0.44
Total Taiwan 4,360,035 29.39

December 2021 Legal & General UCITS ETF Plc
L&G Quality Equity Dividends ESG Exclusions Emerging Markets UCITS ETF *
Schedule of Investments (continued)
As at 31 December 2021
551
Nominal Description
Value
$
% of Net
Assets
Common Stock (continued)
Thailand
3,100 Delta Electronics Thailand PCL 38,234 0.26
13,400 Electricity Generating PCL 70,400 0.47
18,100 Hana Microelectronics PCL 47,952 0.32
19,700 Kiatnakin Phatra Bank PCL 35,237 0.24
162,900 Krung Thai Bank PCL 64,370 0.43
67,200 PTT PCL 76,444 0.52
59,200 Ratchthani Leasing PCL 7,762 0.05
3,300 Siam Cement PCL/The 38,132 0.26
17,100 Siam Commercial Bank PCL/The 65,011 0.44
36,000 Sri Trang Agro-Industry PCL 33,408 0.23
92,500 Thai Union Group PCL 53,996 0.36
14,300 Thai Vegetable Oil PCL 13,270 0.09
30,300 Thanachart Capital PCL 34,241 0.23
23,900 Tisco Financial Group PCL 68,684 0.46
2,274,600 TMBThanachart Bank PCL 100,095 0.68
26,500 TTW PCL 9,044 0.06
Total Thailand 756,280 5.10
Turkey
2,020 Akcansa Cimento AS 2,736 0.02
5,433 Anadolu Efes Biracilik Ve Malt Sanayii AS 12,118 0.08
5,514 Arcelik AS 20,097 0.14
6,750 BIM Birlesik Magazalar AS 31,158 0.21
1,607 Coca-Cola Icecek AS 10,715 0.07
21,052 Enka Insaat ve Sanayi AS 23,874 0.16
29,195 Eregli Demir ve Celik Fabrikalari TAS 61,909 0.42
2,533 Ford Otomotiv Sanayi AS 45,416 0.31
36,019 Haci Omer Sabanci Holding AS 35,884 0.24
244 Otokar Otomotiv Ve Savunma Sanayi A.S. 6,523 0.04
3,835 Tofas Turk Otomobil Fabrikasi AS 21,861 0.15

December 2021 Legal & General UCITS ETF Plc
L&G Quality Equity Dividends ESG Exclusions Emerging Markets UCITS ETF *
Schedule of Investments (continued)
As at 31 December 2021
552
Nominal Description
Value
$
% of Net
Assets
Common Stock
Turkey (continued)
386 Turk Traktor ve Ziraat Makineleri AS 6,511 0.04
34,212 Turkcell Iletisim Hizmetleri AS 47,558 0.32
Total Turkey 326,360 2.20
United Arab Emirates
28,087 Abu Dhabi Commercial Bank PJSC 65,227 0.44
52,908 Abu Dhabi Islamic Bank PJSC 98,958 0.67
69,191 Dubai Investments PJSC 36,356 0.25
58,111 Dubai Islamic Bank PJSC 85,117 0.57
9,880 Emirates Telecommunications Group Co PJSC 85,269 0.57
16,925 First Abu Dhabi Bank PJSC 86,813 0.59
Total United Arab Emirates 457,740 3.09
Total Common Stock 14,715,704 99.20
Collective Investment Schemes
49,092 Xtrackers MSCI Pakistan Swap UCITS ETF 46,883 0.32
Total Collective Investment Schemes 46,883 0.32
Total Investments
Common Stock 14,715,704 99.20
Collective Investment Schemes 46,883 0.32
Other Assets and Liabilities 71,355 0.48
Net Assets Attributable to Holders of Redeemable Participating Shares 14,833,942 100.00
Analysis of Total Assets
% of Total
Assets
Transferable securities admitted to an official stock exchange listing 99.47
Other assets
0.53
100.00
Analysis of Total Assets rather than Net Assets is required under Schedule 12 of the UCITS Regulations.
* The Fund launched on 12 July 2021. **Security is valued at zero.

December 2021 Legal & General UCITS ETF Plc
L&G India INR Government Bond UCITS ETF*
Schedule of Investments
As at 31 December 2021
553
Nominal Description
Coupon Rate
Maturity Date
Value $
% of Net
Assets
Government Bond
India
212,200,000 India Government Bond 7.32% 28/01/2024 2,984,577 4.07
332,500,000 India Government Bond 6.18% 04/11/2024 4,576,137 6.25
380,000,000 India Government Bond 5.22% 15/06/2025 5,059,041 6.91
377,700,000 India Government Bond 5.15% 09/11/2025 4,992,345 6.82
488,500,000 India Government Bond 5.63% 12/04/2026 6,530,637 8.92
58,000,000 India Government Bond 5.74% 15/11/2026 775,064 1.06
394,700,000 India Government Bond 7.26% 14/01/2029 5,560,558 7.59
369,200,000 India Government Bond 6.45% 07/10/2029 4,985,552 6.81
363,400,000 India Government Bond 5.79% 11/05/2030 4,694,437 6.41
408,100,000 India Government Bond 5.77% 03/08/2030 5,270,023 7.20
384,200,000 India Government Bond 5.85% 01/12/2030 4,984,001 6.81
446,500,000 India Government Bond 6.10% 12/07/2031 5,843,971 7.98
273,500,000 India Government Bond 7.72% 15/06/2049 4,005,001 5.47
321,000,000 India Government Bond 7.16% 20/09/2050 4,391,841 6.00
480,000,000 India Government Bond 6.67% 17/12/2050 6,140,151 8.38
83,000,000 India Government Bond 6.99% 15/12/2051 1,124,824 1.54
Total India 71,918,160 98.22
Total Government Bond 71,918,160 98.22
Total Investments
Government Bond 71,918,160 98.22
Other Assets and Liabilities 1,306,273 1.78
Net Assets Attributable to Holders of Redeemable Participating Shares 73,224,433 100.00
Analysis of Total Assets
% of Total
Assets
Transferable securities admitted to an official stock exchange listing or dealt on a regulated market 95.59
Other assets
4.41
100.00
Analysis of Total Assets rather than Net Assets is required under Schedule 12 of the UCITS Regulations.
* The Fund launched on 26 October 2021.

December 2021 Legal & General UCITS ETF Plc
554
Additional information
Soft commissions
There were no soft commissions agreements entered into by the Investment Managers, on behalf of the Company, during the financial period ended 31 December 2021 and the financial year ended 30 June 2021.
Exchange rates
The following exchange rates as at 31 December 2021 and 30 June 2021 were used to translate foreign currency assets and liabilities in other currencies to USD:
31 Decembet 2021 30 June 2021
Australian Dollar 1.3754 1.3320
Brazilian Real 5.5700 n/a
Canadian Dollar 1.2632 1.2383
Chilean Peso 852.0001 n/a
Chinese Yuan 6.3590 n/a
Chinese Yuan Renminbi 6.3734 6.4615
Colombian Peso 4,070.0008 n/a
Czech Koruna 21.8519 n/a
Denmark Krone 6.5403 6.2705
Egyptian Pound 15.7100 n/a
Euro 0.8794 0.8432
Hong Kong Dollar 7.7963 7.7658
Indian Rupee 74.3356 n/a
Indonesian Rupiah 14,252.5005 n/a
Israeli Shekel 3.1124 3.2585
Japanese Yen 115.1550 110.9900
Korean Won 1,188.7500 1,126.1500
Kuwaiti Dinar 0.3023 n/a
Malaysian Ringgit 4.1660 n/a
Mexican Peso 20.4650 n/a
New Zealand Dollar 1.4606 1.4311
Norwegian Krone 8.8183 8.6052
Philippine Peso 50.9925 n/a
Polish Zloty 4.0304 3.8070
Pound Sterling 0.7383 0.7239
Qatari Riyal 3.6410 n/a
Russian Ruble 75.0062 n/a
Saudi Arabian Riyal 3.7544 n/a
Singapore Dollar 1.3481 1.3442
South African Rand 15.9600 14.2788
Swedish Krona 9.0538 8.5522
Swiss Franc 0.9111 0.9244
Taiwan Dollar 27.6670 27.8625
Thai Baht 33.4050 n/a
Turkish Lira 13.2797 n/a
Uae Dirham 3.6730 n/a

December 2021 Legal & General UCITS ETF Plc
555
Additional information (unaudited) (continued)
The following exchange rates as at 31 December 2021 and 30 June 2021 were used to translate foreign currency assets and liabilities in other currencies to EUR:
31 December 2021 30 June 2021
Australian Dollar 1.5641 1.5796
Denmark Krone 7.4375 7.4362
Hong Kong Dollar 8.8659 9.2095
Norwegian Krone 10.0281 10.2048
Polish Zloty 4.5833 4.5147
Pound Sterling 0.8396 0.8584
Swedish Krona 10.2959 10.1420
Swiss Franc 1.0361 1.0962
US Dollar 1.1372 1.1859
The following exchange rates as at 31 December 2021 and 30 June 2021 were used to translate foreign currency assets and liabilities in other currencies to GBP:
31 December 2021 30 June 2021
Euro 1.1911 1.1649
US Dollar 1.3545 1.3815
The following average exchange rates as at 31 December 2021 and 31 December 2020 were used to translate foreign currency income and expenses:
31 December 2021 31 December 2021 31 December 2021
USD EUR GBP
Euro 0.8614 1.0000 1.1739
Pound Sterling 0.7338 0.8519 1.0000
US Dollar 1.0000 1.1609 1.3628
31 December 2020 31 December 2020 31 December 2020
USD EUR GBP
Euro 0.8473 1.0000 1.1062
Pound Sterling 0.7659 0.9040 1.0000
US Dollar 1.0000 1.1802 1.3057

December 2021 Legal & General UCITS ETF Plc
556
Securities financing transactions regulation
I. Global Data
“Securities or commodities lending” is defined in Article 3(7) of Regulation (EU) 2015/2365 of the European Parliament and of the Council on transparency of securities financing transactions and of reuse (the “Securities Financing Transactions Regulation”). The Company has not, in respect of any of its Funds, engaged in securities or commodities lending during the financial period ended 31 December 2021.
“Securities financing transaction” or “SFT” is defined in Article 3(11) of the Securities Financing Transactions Regulation. During the financial period ended 31 December 2021, the only SFTs in which the Company invested were reverse repurchase transactions, which it entered into with respect to the Synthetically-Replicating Funds only.
“Total return swap” is defined in Article 3(18) of the Securities Financing Transactions Regulation. During the financial period ended 31 December 2021, the Company entered into total return swaps (defined as “OTC Swaps” in these financial statements) with respect to the Synthetically-Replicating Funds only.
During the financial period ended 31 December 2021, the Synthetically-Replicating Funds earned revenue from reverse repurchase transactions. This income was remitted in full to each of the respective Synthetically-Replicating Funds and is disclosed in the statement of comprehensive income beginning on page 34.
II. Concentration Data
The tables below list the ten largest issuers by value of non–cash collateral received (i.e. held) by each Synthetically-Replicating Fund pursuant to reverse repurchase transactions as at 31 December 2021:
Collateral Issuer
Market Value of Collateral Received
Collateral Issuer
Market Value of Collateral Received
L&G DAX® Daily 2x Long UCITS ETF* € L&G DAX® Daily 2x Short UCITS ETF* €
United States Treasury Note/Bond 4,770,264 Swiss Confederation Government Bond 6,115,061
French Republic Government Bond OAT 4,714,879 Finland Government Bond 6,077,529
Finland Government Bond 4,694,475 Republic of Austria Government Bond 5,982,196
Republic of Austria Government Bond 4,656,866 Netherlands Government Bond 5,928,758
Netherlands Government Bond 1,743,815 Bundesschatzanweisungen 4,124,461
Bundesobligation 1,620,397 French Republic Government Bond OAT 2,189,720
Bundesschatzanweisungen 1,391,787
L&G Longer Dated All Commodities UCITS ETF $
L&G FTSE 100® Leveraged (Daily 2x) UCITS ETF* £
Analog Devices Inc 33,681,529 Republic of Austria Government Bond 3,035,163
Deutsche Bank AG 33,681,509 Swiss Confederation Government Bond 3,014,228
Kuehne + Nagel International AG 33,681,310 Bundesrepublik Deutschland Bundesanleihe 3,008,553
NVIDIA Corp 33,681,302 Finland Government Bond 2,984,510
Vonovia SE 32,073,167 French Republic Government Bond OAT 2,424,293
General Electric Co 30,379,792 United States Treasury Note/Bond 486,143
Henkel AG & Co KGaA 24,223,240
Sartorius Stedim Biotech 23,342,041
International Flavors & Fragrances Inc 23,046,347
Novo Nordisk A/S 22,523,239
* Where there are less than 10 collateral issuers as at 31 December 2021, all issuers have been included.
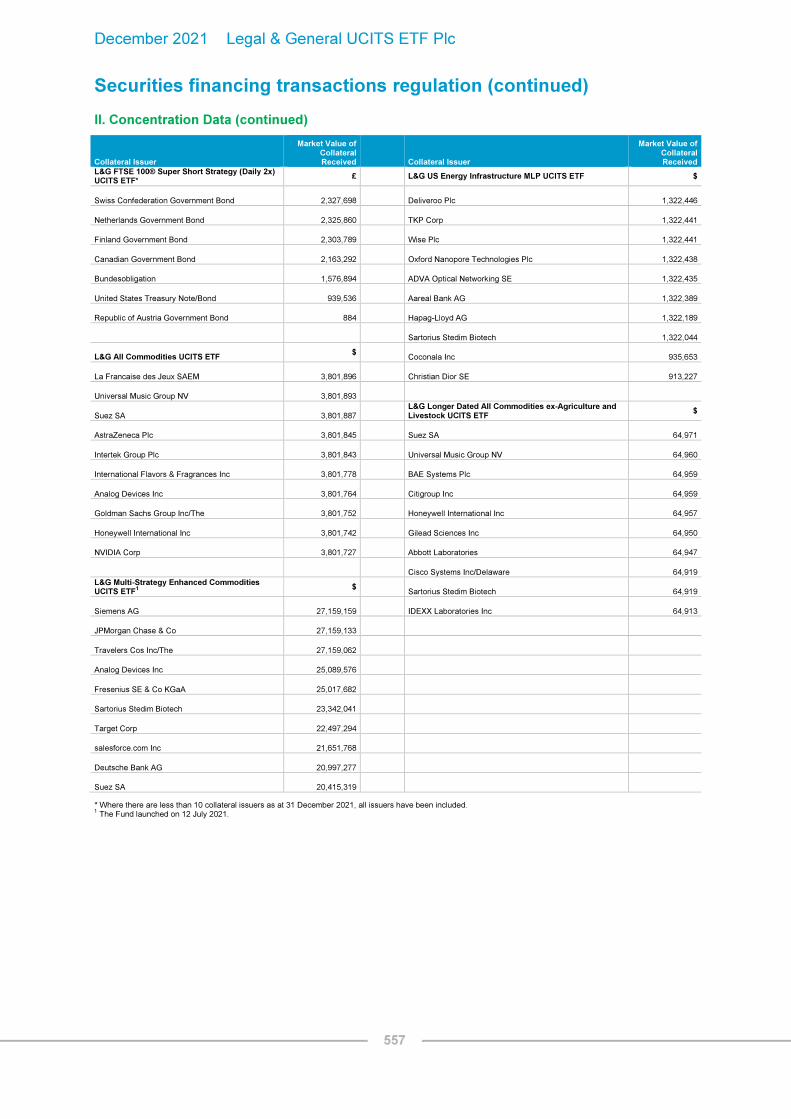
December 2021 Legal & General UCITS ETF Plc
557
Securities financing transactions regulation (continued)
II. Concentration Data (continued)
Collateral Issuer
Market Value of Collateral Received
Collateral Issuer
Market Value of Collateral Received
L&G FTSE 100® Super Short Strategy (Daily 2x) UCITS ETF*
£ L&G US Energy Infrastructure MLP UCITS ETF $
Swiss Confederation Government Bond 2,327,698 Deliveroo Plc 1,322,446
Netherlands Government Bond 2,325,860 TKP Corp 1,322,441
Finland Government Bond 2,303,789 Wise Plc 1,322,441
Canadian Government Bond 2,163,292 Oxford Nanopore Technologies Plc 1,322,438
Bundesobligation 1,576,894 ADVA Optical Networking SE 1,322,435
United States Treasury Note/Bond 939,536 Aareal Bank AG 1,322,389
Republic of Austria Government Bond 884 Hapag-Lloyd AG 1,322,189
Sartorius Stedim Biotech 1,322,044
L&G All Commodities UCITS ETF $
Coconala Inc 935,653
La Francaise des Jeux SAEM 3,801,896 Christian Dior SE 913,227
Universal Music Group NV 3,801,893
Suez SA 3,801,887 L&G Longer Dated All Commodities ex-Agriculture and Livestock UCITS ETF
$
AstraZeneca Plc 3,801,845
Suez SA 64,971
Intertek Group Plc 3,801,843
Universal Music Group NV 64,960
International Flavors & Fragrances Inc 3,801,778
BAE Systems Plc 64,959
Analog Devices Inc 3,801,764
Citigroup Inc 64,959
Goldman Sachs Group Inc/The 3,801,752
Honeywell International Inc 64,957
Honeywell International Inc 3,801,742
Gilead Sciences Inc 64,950
NVIDIA Corp 3,801,727
Abbott Laboratories 64,947
Cisco Systems Inc/Delaware 64,919
L&G Multi-Strategy Enhanced Commodities UCITS ETF
1
$ Sartorius Stedim Biotech 64,919
Siemens AG 27,159,159
IDEXX Laboratories Inc 64,913
JPMorgan Chase & Co 27,159,133
Travelers Cos Inc/The 27,159,062
Analog Devices Inc 25,089,576
Fresenius SE & Co KGaA 25,017,682
Sartorius Stedim Biotech 23,342,041
Target Corp 22,497,294
salesforce.com Inc 21,651,768
Deutsche Bank AG 20,997,277
Suez SA 20,415,319
* Where there are less than 10 collateral issuers as at 31 December 2021, all issuers have been included. 1 The Fund launched on 12 July 2021.

December 2021 Legal & General UCITS ETF Plc
558
Securities financing transactions regulation (continued)
II. Concentration Data (continued)
The tables below provide a currency analysis of non–cash collateral received (i.e. held) by each Synthetically-Replicating Fund pursuant to reverse repurchase transactions as at 31 December 2021:
Currency
Currency
L&G DAX® Daily 2x Long UCITS ETF € L&G FTSE 100® Leveraged (Daily 2x) UCITS ETF £
Euro 18,822,220 Euro 11,452,519
United States Dollar 4,770,263 Swiss Franc 3,014,228
23,592,483 United States Dollar 486,143
14,952,890
L&G DAX® Daily 2x Short UCITS ETF €
L&G FTSE 100® Super Short Strategy (Daily 2x) UCITS ETF
£
Euro 24,302,664 Canadian Dollar 2,163,292
Swiss Franc 6,115,061 Euro 6,207,427
30,417,725 Swiss Franc 2,327,698
United States Dollar 939,536
11,637,953
L&G Longer Dated All Commodities UCITS ETF $
L&G All Commodities UCITS ETF $
Australian Dollar 6,888,199 Australian Dollar 547,634
Danish Krone 22,523,239 Euro 16,385,172
Euro 206,010,190 Japanese Yen 9,628,540
Pound Sterling 145,044,775 Pound Sterling 7,603,689
Swiss Franc 33,681,310 Swiss Franc 2,074,684
United States Dollar 293,719,397 United States Dollar 43,915,218
707,867,110 80,154,937
L&G US Energy Infrastructure MLP UCITS ETF $
L&G Longer Dated All Commodities ex-Agriculture and Livestock UCITS ETF
$
Canadian Dollar 106,590 Euro 268,547
Danish Krone 894,717 Japanese Yen 63,788
Euro 12,817,417 Pound Sterling 194,509
Japanese Yen 6,612,224 United States Dollar 837,755
Pound Sterling 6,597,598 1,364,599
United States Dollar 2,002,909
29,031,455
L&G Multi-Strategy Enhanced Commodities UCITS ETF
1
$
Australian Dollar 18,465,979
Euro 166,287,666
Pound Sterling 51,665,281
Swiss Franc 5,319,394
United States Dollar 329,525,633
571,263,953
1The Fund launched on 2 July 2021.
Please refer to Note 5 for disclosures on collateral received for reverse repurchase agreements and cash collateral pledged by/to swap counterparties.

December 2021 Legal & General UCITS ETF Plc
559
Securities financing transactions regulation (continued)
II. Concentration Data (continued)
The table below outlines the fair value for each Synthetically-Replicating Fund by counterparty in respect of the reverse repurchase transactions and OTC swaps as at 31 December 2021:
Reverse Repurchase Transactions – Counterparties
L&G DAX® Daily 2x Long UCITS
ETF L&G DAX® Daily 2x
Short UCITS ETF
L&G Longer Dated All Commodities
UCITS ETF
L&G FTSE 100® Leveraged (Daily
2x) UCITS ETF
L&G FTSE 100® Super Short
Strategy (Daily 2x) UCITS ETF
L&G US Energy Infrastructure MLP
UCITS ETF
L&G All Commodities
UCITS ETF
L&G Longer Dated All Commodities
ex-Agriculture and Livestock UCITS
ETF
L&G Multi-Strategy Enhanced
Commodities UCITS ETF
1
Fair Value Fair Value Fair Value Fair Value Fair Value Fair Value Fair Value Fair Value Fair Value
€ € $ £ £ $ $ $ $
Merrill Lynch International 23,916,328 30,718,800 – 15,243,000 11,720,751 – – – –
Citigroup Global Markets Limited – – – – – 26,448,923 – – –
Barclays Bank Plc – – 673,631,724 – – – 76,038,070 1,299,553 543,183,955
23,916,328 30,718,800 673,631,724 15,243,000 11,720,751 26,448,923 76,038,070 1,299,553 543,183,955
Reverse Repurchase Transactions – Counterparties
L&G DAX® Daily 2x Long UCITS
ETF L&G DAX® Daily 2x
Short UCITS ETF
L&G Longer Dated All Commodities
UCITS ETF
L&G FTSE 100® Leveraged (Daily
2x) UCITS ETF
L&G FTSE 100® Super Short
Strategy (Daily 2x) UCITS ETF
L&G US Energy Infrastructure MLP
UCITS ETF
L&G All Commodities
UCITS ETF
L&G Longer Dated All Commodities
ex-Agriculture and Livestock UCITS
ETF
L&G Multi-Strategy Enhanced
Commodities UCITS ETF
1
Market Value of
Collateral Received Market Value of
Collateral Received Market Value of
Collateral Received Market Value of
Collateral Received Market Value of
Collateral Received Market Value of
Collateral Received Market Value of
Collateral Received Market Value of
Collateral Received Market Value of
Collateral Received
€ € $ £ £ $ $ $ $
Merrill Lynch International 23,592,483 30,417,725 – 14,952,890 11,637,953 – – – –
Citigroup Global Markets Limited – – – – – 29,031,455 – – –
Barclays Bank Plc – – 707,867,110 – – – 80,154,937 1,364,599 571,263,953
23,592,483 30,417,725 707,867,110 14,952,890 11,637,953 29,031,455 80,154,937 1,364,599 571,263,953
1The Fund launched on 2 July 2021.

December 2021 Legal & General UCITS ETF Plc
560
Securities financing transactions regulation (continued)
II. Concentration Data (continued)
OTC Swaps – Counterparties
L&G DAX® Daily 2x Long UCITS
ETF L&G DAX® Daily 2x
Short UCITS ETF
L&G Longer Dated All Commodities
UCITS ETF
L&G FTSE 100® Leveraged (Daily
2x) UCITS ETF
L&G FTSE 100® Super Short
Strategy (Daily 2x) UCITS ETF
L&G US Energy Infrastructure MLP
UCITS ETF
L&G All Commodities
UCITS ETF
L&G Longer Dated All Commodities
ex-Agriculture and Livestock
UCITS ETF
L&G Multi-Strategy Enhanced
Commodities UCITS ETF
1
Unrealised Gain/Loss
Unrealised Gain/Loss
Unrealised Gain/Loss
Unrealised Gain/Loss
Unrealised Gain/Loss
Unrealised Gain/Loss
Unrealised Gain/Loss
Unrealised Gain/Loss
Unrealised Gain/Loss
€ € $ £ £ $ $ $ $
Merrill Lynch International 2,217,848 (2,955,486) – 878,952 (656,920) – – – –
Citigroup Global Markets Limited – – – – – 2,196,343 – – –
Barclays Bank Plc – – 27,449,776 – – – 3,194,997 61,387 27,042,440
2,217,848 (2,955,486) 27,449,776 878,952 (656,920) 2,196,343 3,194,997 61,387 27,042,440
1The Fund launched on 2 July 2021.

December 2021 Legal & General UCITS ETF Plc
561
Securities financing transactions regulation (continued)
III. Transaction Data
The table below shows the maturity profile of collateral received in respect of the reverse repurchase transactions as at 31 December 2021:
Maturity Profile
L&G DAX® Daily 2x
Long UCITS ETF
L&G DAX® Daily 2x
Short UCITS ETF
L&G Longer
Dated All Commoditi
es UCITS ETF
L&G FTSE 100®
Leveraged (Daily 2x)
UCITS ETF
L&G FTSE 100® Super
Short Strategy
(Daily 2x) UCITS ETF
L&G US Energy
Infrastructure MLP
UCITS ETF
L&G All Commodities UCITS ETF
L&G Longer Dated All
Commodities ex-
Agriculture and Livestock
UCITS ETF
L&G Multi-Strategy
Enhanced Commodities
UCITS ETF1
Market Value of
Collateral Received
Market Value of Collateral
Received
Market Value of Collateral
Received
Market Value of Collateral
Received
Market Value of Collateral
Received
Market Value of Collateral
Received
Market Value of Collateral
Received
Market Value of Collateral
Received
Market Value of Collateral
Received
€ € $ £ £ $ $ $ $
Less than one day – – – – – – – – –
One day to one week – – – – – – – – –
One week to one month – – – – – – – – –
One to three months – – – – – – – – –
Three months to one year 6,400,681 5,982,334 – – – – – – –
Above one year 17,191,802 24,435,391 3,721,663 14,952,890 11,637,953 – – – –
Open maturity – – 704,145,447 – – 29,031,455 80,154,937 1,364,599 571,263,953
23,592,483 30,417,725 707,867,110 14,952,890 11,637,953 29,031,455 80,154,937 1,364,599 571,263,953
The table below shows the maturity profile of the reverse repurchase transactions as at 31 December 2021:
Maturity Profile
L&G DAX® Daily 2x
Long UCITS ETF
L&G DAX® Daily 2x
Short UCITS ETF
L&G Longer Dated All
Commodities UCITS ETF
L&G FTSE 100®
Leveraged (Daily 2x)
UCITS ETF
L&G FTSE 100® Super
Short Strategy
(Daily 2x) UCITS ETF
L&G US Energy
Infrastructure MLP
UCITS ETF
L&G All Commodities
UCITS ETF
L&G Longer Dated All
Commodities ex-
Agriculture and
Livestock UCITS ETF
L&G Multi-Strategy
Enhanced Commodities
UCITS ETF1
Fair Value Fair Value Fair Value Fair Value Fair Value Fair Value Fair Value Fair Value Fair Value
€ € $ £ £ $ $ $ $
Less than one day – – – – – – – – –
One day to one week – – – – – – – – –
One week to one month 23,916,328 30,718,800 673,631,724 15,243,000 11,720,751 26,448,923 76,038,070 1,299,553 543,183,955
One to three months – – – – – – – – –
Three months to one year – – – – – – – – –
Above one year – – – – – – – – –
Open maturity – – – – – – – – –
23,916,328 30,718,800 673,631,724 15,243,000 11,720,751 26,448,923 76,038,070 1,299,553 543,183,955
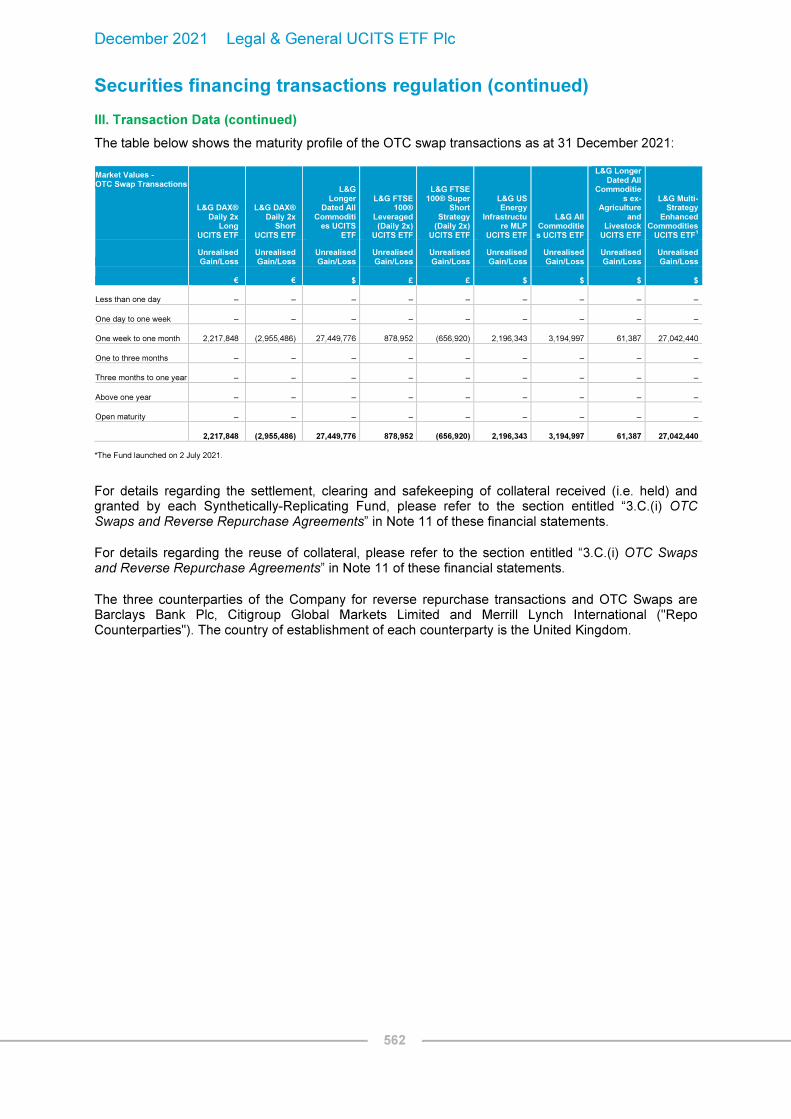
December 2021 Legal & General UCITS ETF Plc
562
Securities financing transactions regulation (continued)
III. Transaction Data (continued)
The table below shows the maturity profile of the OTC swap transactions as at 31 December 2021:
Market Values - OTC Swap Transactions
L&G DAX® Daily 2x
Long UCITS ETF
L&G DAX® Daily 2x
Short UCITS ETF
L&G Longer
Dated All Commoditi
es UCITS ETF
L&G FTSE 100®
Leveraged (Daily 2x)
UCITS ETF
L&G FTSE 100® Super
Short Strategy
(Daily 2x) UCITS ETF
L&G US Energy
Infrastructure MLP
UCITS ETF
L&G All Commodities UCITS ETF
L&G Longer Dated All
Commodities ex-
Agriculture and
Livestock UCITS ETF
L&G Multi-Strategy
Enhanced Commodities
UCITS ETF1
Unrealised Gain/Loss
Unrealised Gain/Loss
Unrealised Gain/Loss
Unrealised Gain/Loss
Unrealised Gain/Loss
Unrealised Gain/Loss
Unrealised Gain/Loss
Unrealised Gain/Loss
Unrealised Gain/Loss
€ € $ £ £ $ $ $ $
Less than one day – – – – – – – – –
One day to one week – – – – – – – – –
One week to one month 2,217,848 (2,955,486) 27,449,776 878,952 (656,920) 2,196,343 3,194,997 61,387 27,042,440
One to three months – – – – – – – – –
Three months to one year – – – – – – – – –
Above one year – – – – – – – – –
Open maturity – – – – – – – – –
2,217,848 (2,955,486) 27,449,776 878,952 (656,920) 2,196,343 3,194,997 61,387 27,042,440
*The Fund launched on 2 July 2021.
For details regarding the settlement, clearing and safekeeping of collateral received (i.e. held) and granted by each Synthetically-Replicating Fund, please refer to the section entitled “3.C.(i) OTC Swaps and Reverse Repurchase Agreements” in Note 11 of these financial statements.
For details regarding the reuse of collateral, please refer to the section entitled “3.C.(i) OTC Swaps and Reverse Repurchase Agreements” in Note 11 of these financial statements.
The three counterparties of the Company for reverse repurchase transactions and OTC Swaps are Barclays Bank Plc, Citigroup Global Markets Limited and Merrill Lynch International ("Repo Counterparties"). The country of establishment of each counterparty is the United Kingdom.

December 2021 Legal & General UCITS ETF Plc
563
Securities financing transactions regulation (continued)
III. Transaction Data (continued)
Collateral Eligibility
OTC Swaps: Only cash (in the base currency of the relevant Fund) is eligible to be transferred as collateral under the “unfunded” swaps.
Reverse Repurchase Agreements:
All collateral securities received from the Repo Counterparties for each Fund satisfy the general rules and criteria prescribed by the Central Bank UCITS Regulations. All of the collateral transferred to the Fund satisfies the requirements of the European Securities and Markets Authority's (“ESMA”) “Guidelines on ETFs and other UCITS issues”. The collateral securities transferred to a Fund must satisfy certain eligibility criteria, including that the must be either equity securities or government and/or supranational fixed income securities. A tri-party collateral agreement (“Eligible Collateral Schedule”) has been put in place pursuant to which the Company (for the account of the relevant Fund), Repo Counterparty and Collateral Manager (which is a delegate of the Depositary) have agreed to certain criteria that must be satisfied in order for collateral to be “eligible” for transfer between the parties, a summary of which is provided below for equities and fixed income securities, respectively. This ensures that only collateral which satisfies the eligibility criteria prescribed by the Central Bank UCITS Regulations (and which is agreed by the parties under the Eligible Collateral Schedule) can be transferred to the Company (for the account of the relevant Fund). Collateral related to the relevant swap or Repo Counterparty is not eligible for inclusion.
Please refer to Note 5 ("Collateral") for details of amounts representing collateral received for reverse repurchase agreements and OTC swaps.
Fixed income
Government bonds and supranational bonds must have a minimum long-term credit rating of AA and AAA (Standard & Poor's), respectively. The maturity of a government or supranational bond is not a criteria for selection, however, it is relevant to the determination of the applicable haircut which range between 0% and 2%. For each Fund, a concentration limit of 20% is imposed with respect to each issuer (with respect to government bonds, the issuer concentration limit is applied per country of issue).
Equities
Equity securities may be transferred as collateral only if they are a member of a specified index stated in the Eligible Collateral Schedule. On top of this, haircuts are applied between 5% and 10% depending on which index the equity security is a member of. For each Fund, a concentration limit of 5% is imposed with respect to each issuer and a further concentration limit is applied per country of incorporation of the issuers, such country concentration limit which varies depending on the relevant country of incorporation. Finally, no Fund may hold more than 2.5% of the market capitalisation per security and no more than 100% of the 30 day average daily value traded per security.
Collateral securities issued by the relevant Repo Counterparty are not eligible for inclusion.

December 2021 Legal & General UCITS ETF Plc
564
L&G E Fund MSCI China A UCITS ETF
Statement of significant purchases
The Statement of Significant Purchases and Sales reflects the aggregate purchases of a security exceeding one per cent of the total value of purchases and aggregate disposals greater than one per cent of the total of sales for the financial period. At a minimum the largest 20 purchases and 20 sales must be given.
Nominal Security Description Cost $
528,500 China Railway Signal & Communication Corp Ltd 'A' 430,317
4,100 WuXi AppTec Co Ltd 'A' 84,318
10,200 China Merchants Bank Co Ltd 'A' 82,692
2,100 Shede Spirits Co Ltd 'A' 75,814
300 Kweichow Moutai Co Ltd 'A' 75,336
1,500 Yunnan Energy New Material Co Ltd 'A' 65,599
4,100 China Zhenhua Group Science & Technology Co Ltd 'A' 63,815
3,000 Guangzhou Tinci Materials Technology Co Ltd 'A' 63,281
14,500 Jiangxi Special Electric Motor Co Ltd 'A' 56,287
3,800 JA Solar Technology Co Ltd 'A' 45,734
8,800 Jiangsu Eastern Shenghong Co Ltd 'A' 44,126
10,700 Jiangxi Copper Co Ltd 'A' 43,960
4,700 Trina Solar Co Ltd 'A' 43,674
4,700 Chengxin Lithium Group Co Ltd 'A' 43,528
15,800 Orient Securities Co Ltd/China 'A' 42,969
2,900 Jiangsu Hengli Hydraulic Co Ltd 'A' 42,781
11,200 Fushun Special Steel Co Ltd 'A' 42,667
42,300 Jiangsu Changshu Rural Commercial Bank Co Ltd 'A' 42,550
14,800 Industrial Bank Co Ltd 'A' 42,513
3,900 Midea Group Co Ltd 'A' 42,485

December 2021 Legal & General UCITS ETF Plc
565
L&G E Fund MSCI China A UCITS ETF
Statement of significant sales
Nominal Security Description Proceeds $
1,800 Kweichow Moutai Co Ltd 'A' 505,913
48,100 China Merchants Bank Co Ltd 'A' 383,825
33,300 Ping An Insurance Group Co of China Ltd 'A' 261,975
20,900 Midea Group Co Ltd 'A' 221,431
2,300 Contemporary Amperex Technology Co Ltd 'A' 198,541
30,300 East Money Information Co Ltd 'A' 163,928
54,600 Industrial Bank Co Ltd 'A' 160,291
4,000 Wuliangye Yibin Co Ltd 'A' 136,831
9,200 LONGi Green Energy Technology Co Ltd 'A' 123,147
2,300 NAURA Technology Group Co Ltd 'A' 122,584
30,400 CITIC Securities Co Ltd 'A' 122,233
5,600 WuXi AppTec Co Ltd 'A' 118,756
225,500 Agricultural Bank of China Ltd 'A' 103,370
17,000 Gree Electric Appliances Inc of Zhuhai 'A' 103,075
2,200 BYD Co Ltd 'A' 99,474
2,800 China Tourism Group Duty Free Corp Ltd 'A' 97,819
2,000 Yunnan Energy New Material Co Ltd 'A' 83,401
28,500 Ping An Bank Co Ltd 'A' 81,800
10,800 Jiangsu Hengrui Medicine Co Ltd 'A' 81,473
9,900 China Northern Rare Earth Group High-Tech Co Ltd 'A' 81,423
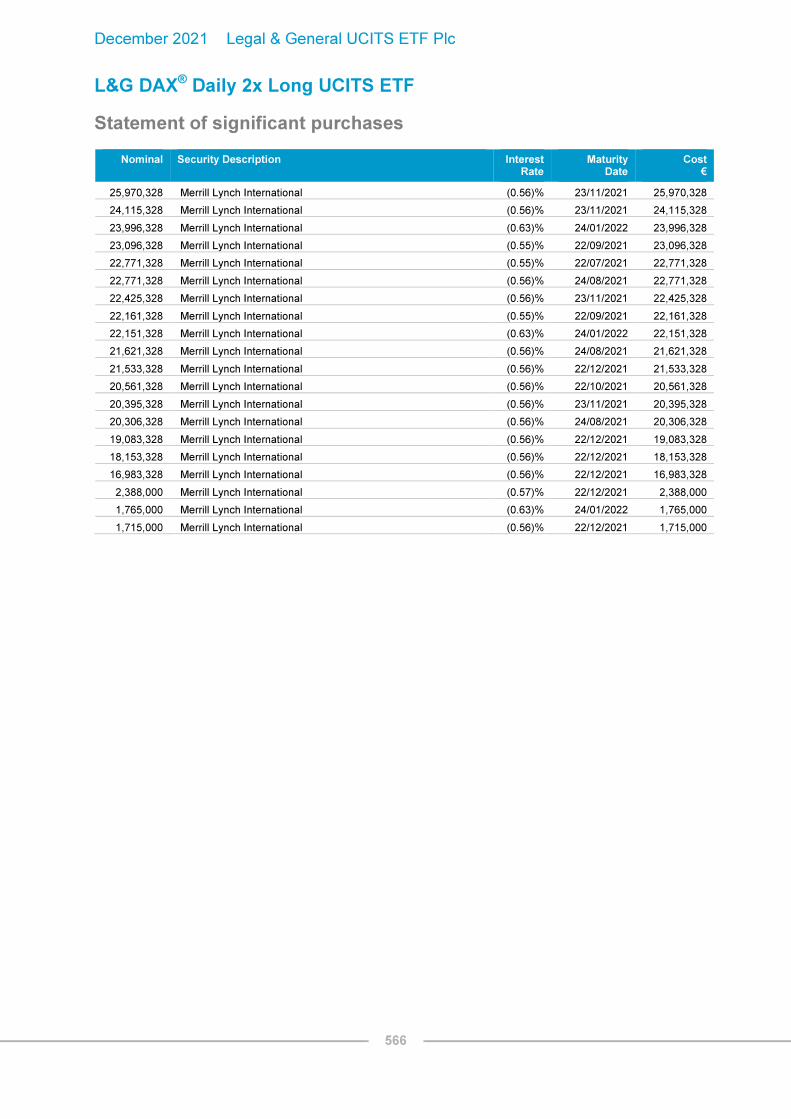
December 2021 Legal & General UCITS ETF Plc
566
L&G DAX® Daily 2x Long UCITS ETF
Statement of significant purchases
Nominal Security Description Interest Rate
Maturity Date
Cost €
25,970,328 Merrill Lynch International (0.56)% 23/11/2021 25,970,328
24,115,328 Merrill Lynch International (0.56)% 23/11/2021 24,115,328
23,996,328 Merrill Lynch International (0.63)% 24/01/2022 23,996,328
23,096,328 Merrill Lynch International (0.55)% 22/09/2021 23,096,328
22,771,328 Merrill Lynch International (0.55)% 22/07/2021 22,771,328
22,771,328 Merrill Lynch International (0.56)% 24/08/2021 22,771,328
22,425,328 Merrill Lynch International (0.56)% 23/11/2021 22,425,328
22,161,328 Merrill Lynch International (0.55)% 22/09/2021 22,161,328
22,151,328 Merrill Lynch International (0.63)% 24/01/2022 22,151,328
21,621,328 Merrill Lynch International (0.56)% 24/08/2021 21,621,328
21,533,328 Merrill Lynch International (0.56)% 22/12/2021 21,533,328
20,561,328 Merrill Lynch International (0.56)% 22/10/2021 20,561,328
20,395,328 Merrill Lynch International (0.56)% 23/11/2021 20,395,328
20,306,328 Merrill Lynch International (0.56)% 24/08/2021 20,306,328
19,083,328 Merrill Lynch International (0.56)% 22/12/2021 19,083,328
18,153,328 Merrill Lynch International (0.56)% 22/12/2021 18,153,328
16,983,328 Merrill Lynch International (0.56)% 22/12/2021 16,983,328
2,388,000 Merrill Lynch International (0.57)% 22/12/2021 2,388,000
1,765,000 Merrill Lynch International (0.63)% 24/01/2022 1,765,000
1,715,000 Merrill Lynch International (0.56)% 22/12/2021 1,715,000

December 2021 Legal & General UCITS ETF Plc
567
L&G DAX® Daily 2x Long UCITS ETF
Statement of significant sales
Nominal Security Description Interest Rate
Maturity Date
Proceeds €
25,970,328 Merrill Lynch International (0.56)% 23/11/2021 25,970,328
24,266,328 Merrill Lynch International (0.55)% 22/07/2021 24,266,328
24,115,328 Merrill Lynch International (0.56)% 23/11/2021 24,115,328
23,996,328 Merrill Lynch International (0.63)% 24/01/2022 23,996,328
23,096,328 Merrill Lynch International (0.55)% 22/09/2021 23,096,328
22,771,328 Merrill Lynch International (0.56)% 24/08/2021 22,771,328
22,771,328 Merrill Lynch International (0.55)% 22/07/2021 22,771,328
22,425,328 Merrill Lynch International (0.56)% 23/11/2021 22,425,328
22,161,328 Merrill Lynch International (0.55)% 22/09/2021 22,161,328
21,621,328 Merrill Lynch International (0.56)% 24/08/2021 21,621,328
21,533,328 Merrill Lynch International (0.56)% 22/12/2021 21,533,328
20,561,328 Merrill Lynch International (0.56)% 22/10/2021 20,561,328
20,395,328 Merrill Lynch International (0.56)% 23/11/2021 20,395,328
20,306,328 Merrill Lynch International (0.56)% 24/08/2021 20,306,328
19,083,328 Merrill Lynch International (0.56)% 22/12/2021 19,083,328
18,153,328 Merrill Lynch International (0.56)% 22/12/2021 18,153,328
16,983,328 Merrill Lynch International (0.56)% 22/12/2021 16,983,328
2,388,000 Merrill Lynch International (0.57)% 22/12/2021 2,388,000
1,715,000 Merrill Lynch International (0.56)% 22/12/2021 1,715,000
1,394,000 Merrill Lynch International (0.56)% 22/10/2021 1,394,000

December 2021 Legal & General UCITS ETF Plc
568
L&G DAX® Daily 2x Short UCITS ETF
Statement of significant purchases
Nominal Security Description Interest Rate
Maturity Date
Cost €
52,723,800 Merrill Lynch International (0.56)% 22/10/2021 52,723,800
51,168,800 Merrill Lynch International (0.55)% 22/09/2021 51,168,800
49,108,800 Merrill Lynch International (0.56)% 22/10/2021 49,108,800
47,522,800 Merrill Lynch International (0.56)% 24/08/2021 47,522,800
47,333,800 Merrill Lynch International (0.56)% 22/10/2021 47,333,800
45,647,800 Merrill Lynch International (0.56)% 24/08/2021 45,647,800
45,603,800 Merrill Lynch International (0.56)% 22/10/2021 45,603,800
43,747,800 Merrill Lynch International (0.56)% 24/08/2021 43,747,800
43,258,800 Merrill Lynch International (0.56)% 22/10/2021 43,258,800
41,030,800 Merrill Lynch International (0.56)% 23/11/2021 41,030,800
40,988,270 Merrill Lynch International (0.55)% 22/07/2021 40,988,270
39,070,800 Merrill Lynch International (0.56)% 23/11/2021 39,070,800
38,735,800 Merrill Lynch International (0.56)% 22/12/2021 38,735,800
38,678,800 Merrill Lynch International (0.63)% 24/01/2022 38,678,800
38,548,800 Merrill Lynch International (0.56)% 22/10/2021 38,548,800
37,785,800 Merrill Lynch International (0.56)% 22/12/2021 37,785,800
37,260,800 Merrill Lynch International (0.56)% 23/11/2021 37,260,800
36,025,800 Merrill Lynch International (0.56)% 22/12/2021 36,025,800
34,843,800 Merrill Lynch International (0.63)% 24/01/2022 34,843,800
34,088,800 Merrill Lynch International (0.56)% 22/10/2021 34,088,800
32,448,800 Merrill Lynch International (0.63)% 24/01/2022 32,448,800
32,170,800 Merrill Lynch International (0.56)% 22/12/2021 32,170,800
32,053,800 Merrill Lynch International (0.56)% 22/10/2021 32,053,800
30,718,800 Merrill Lynch International (0.63)% 24/01/2022 30,718,800
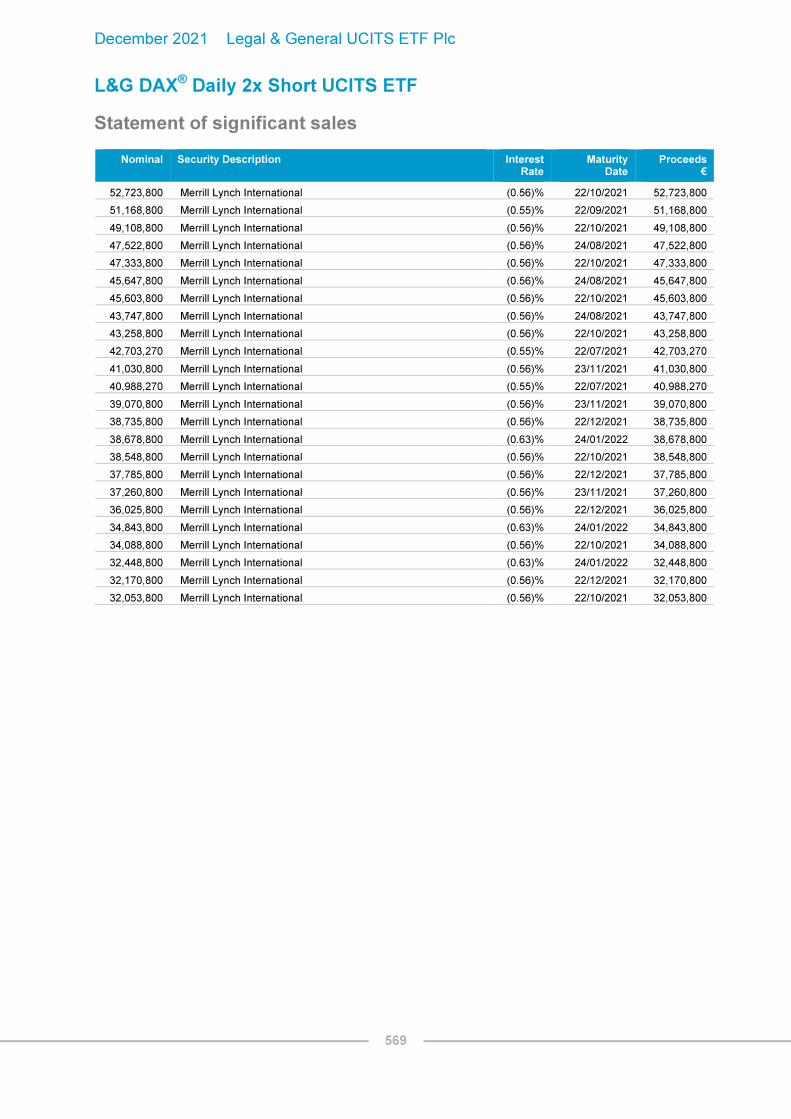
December 2021 Legal & General UCITS ETF Plc
569
L&G DAX® Daily 2x Short UCITS ETF
Statement of significant sales
Nominal Security Description Interest Rate
Maturity Date
Proceeds €
52,723,800 Merrill Lynch International (0.56)% 22/10/2021 52,723,800
51,168,800 Merrill Lynch International (0.55)% 22/09/2021 51,168,800
49,108,800 Merrill Lynch International (0.56)% 22/10/2021 49,108,800
47,522,800 Merrill Lynch International (0.56)% 24/08/2021 47,522,800
47,333,800 Merrill Lynch International (0.56)% 22/10/2021 47,333,800
45,647,800 Merrill Lynch International (0.56)% 24/08/2021 45,647,800
45,603,800 Merrill Lynch International (0.56)% 22/10/2021 45,603,800
43,747,800 Merrill Lynch International (0.56)% 24/08/2021 43,747,800
43,258,800 Merrill Lynch International (0.56)% 22/10/2021 43,258,800
42,703,270 Merrill Lynch International (0.55)% 22/07/2021 42,703,270
41,030,800 Merrill Lynch International (0.56)% 23/11/2021 41,030,800
40,988,270 Merrill Lynch International (0.55)% 22/07/2021 40,988,270
39,070,800 Merrill Lynch International (0.56)% 23/11/2021 39,070,800
38,735,800 Merrill Lynch International (0.56)% 22/12/2021 38,735,800
38,678,800 Merrill Lynch International (0.63)% 24/01/2022 38,678,800
38,548,800 Merrill Lynch International (0.56)% 22/10/2021 38,548,800
37,785,800 Merrill Lynch International (0.56)% 22/12/2021 37,785,800
37,260,800 Merrill Lynch International (0.56)% 23/11/2021 37,260,800
36,025,800 Merrill Lynch International (0.56)% 22/12/2021 36,025,800
34,843,800 Merrill Lynch International (0.63)% 24/01/2022 34,843,800
34,088,800 Merrill Lynch International (0.56)% 22/10/2021 34,088,800
32,448,800 Merrill Lynch International (0.63)% 24/01/2022 32,448,800
32,170,800 Merrill Lynch International (0.56)% 22/12/2021 32,170,800
32,053,800 Merrill Lynch International (0.56)% 22/10/2021 32,053,800

December 2021 Legal & General UCITS ETF Plc
570
L&G Longer Dated All Commodities UCITS ETF
Statement of significant purchases
Nominal Security Description Interest Rate
Maturity Date
Cost $
1,082,167,992 Barclays Bank Plc 0.22% 22/12/2021 1,082,167,992
1,061,104,992 Barclays Bank Plc 0.22% 24/08/2021 1,061,104,992
1,059,085,992 Barclays Bank Plc 0.22% 22/09/2021 1,059,085,992
1,049,382,992 Barclays Bank Plc 0.22% 23/11/2021 1,049,382,992
1,021,319,992 Barclays Bank Plc 0.22% 24/08/2021 1,021,319,992
1,016,080,992 Barclays Bank Plc 0.22% 22/09/2021 1,016,080,992
1,011,877,992 Barclays Bank Plc 0.22% 22/12/2021 1,011,877,992
1,006,757,992 Barclays Bank Plc 0.22% 23/11/2021 1,006,757,992
1,005,249,000 Barclays Bank Plc 0.23% 22/07/2021 1,005,249,000
999,303,992 Barclays Bank Plc 0.21% 22/10/2021 999,303,992
958,178,992 Barclays Bank Plc 0.21% 22/10/2021 958,178,992
939,810,992 Barclays Bank Plc 0.22% 22/09/2021 939,810,992
672,807,724 Barclays Bank Plc 0.23% 24/01/2022 672,807,724
550,072,992 Barclays Bank Plc 0.22% 22/12/2021 550,072,992
47,730,000 Barclays Bank Plc 0.22% 22/12/2021 47,730,000
35,174,000 Barclays Bank Plc 0.23% 22/07/2021 35,174,000
32,565,000 Barclays Bank Plc 0.23% 22/12/2021 32,565,000
31,133,000 Barclays Bank Plc 0.23% 24/08/2021 31,133,000
15,562,000 Barclays Bank Plc 0.21% 23/11/2021 15,562,000
15,528,732 Barclays Bank Plc 0.22% 22/12/2021 15,528,732
Statement of significant sales
Nominal Security Description Interest Rate
Maturity Date
Proceeds $
1,087,529,000 Barclays Bank Plc 0.23% 22/07/2021 1,087,529,000
1,082,167,992 Barclays Bank Plc 0.22% 22/12/2021 1,082,167,992
1,061,104,992 Barclays Bank Plc 0.22% 24/08/2021 1,061,104,992
1,059,085,992 Barclays Bank Plc 0.22% 22/09/2021 1,059,085,992
1,049,382,992 Barclays Bank Plc 0.22% 23/11/2021 1,049,382,992
1,021,319,992 Barclays Bank Plc 0.22% 24/08/2021 1,021,319,992
1,016,080,992 Barclays Bank Plc 0.22% 22/09/2021 1,016,080,992
1,011,877,992 Barclays Bank Plc 0.22% 22/12/2021 1,011,877,992
1,006,757,992 Barclays Bank Plc 0.22% 23/11/2021 1,006,757,992
1,005,249,000 Barclays Bank Plc 0.23% 22/07/2021 1,005,249,000
999,303,992 Barclays Bank Plc 0.21% 22/10/2021 999,303,992
958,178,992 Barclays Bank Plc 0.21% 22/10/2021 958,178,992
939,810,992 Barclays Bank Plc 0.22% 22/09/2021 939,810,992
550,072,992 Barclays Bank Plc 0.22% 22/12/2021 550,072,992
47,730,000 Barclays Bank Plc 0.22% 22/12/2021 47,730,000
35,174,000 Barclays Bank Plc 0.23% 22/07/2021 35,174,000
32,565,000 Barclays Bank Plc 0.23% 22/12/2021 32,565,000
31,133,000 Barclays Bank Plc 0.23% 24/08/2021 31,133,000
15,562,000 Barclays Bank Plc 0.21% 23/11/2021 15,562,000
15,528,732 Barclays Bank Plc 0.22% 22/12/2021 15,528,732

December 2021 Legal & General UCITS ETF Plc
571
L&G FTSE 100® Leveraged (Daily 2x) UCITS ETF
Statement of significant purchases
Nominal Security Description Interest Rate
Maturity Date
Cost £
21,190,000 Merrill Lynch International 0.05% 24/08/2021 21,190,000
19,977,000 Merrill Lynch International 0.05% 22/09/2021 19,977,000
18,385,000 Merrill Lynch International 0.05% 24/08/2021 18,385,000
18,172,000 Merrill Lynch International 0.05% 22/10/2021 18,172,000
17,422,000 Merrill Lynch International 0.05% 22/10/2021 17,422,000
16,800,000 Merrill Lynch International 0.05% 24/08/2021 16,800,000
16,557,000 Merrill Lynch International 0.05% 22/12/2021 16,557,000
16,528,000 Merrill Lynch International 0.19% 24/01/2022 16,528,000
16,457,000 Merrill Lynch International 0.05% 22/10/2021 16,457,000
15,862,000 Merrill Lynch International 0.05% 22/09/2021 15,862,000
15,792,000 Merrill Lynch International 0.05% 22/12/2021 15,792,000
15,282,000 Merrill Lynch International 0.05% 22/10/2021 15,282,000
15,243,000 Merrill Lynch International 0.19% 24/01/2022 15,243,000
14,640,000 Merrill Lynch International 0.05% 23/11/2021 14,640,000
14,477,000 Merrill Lynch International 0.05% 22/12/2021 14,477,000
14,355,000 Merrill Lynch International 0.05% 24/08/2021 14,355,000
14,120,000 Merrill Lynch International 0.05% 22/07/2021 14,120,000
13,340,000 Merrill Lynch International 0.05% 24/08/2021 13,340,000
13,115,000 Merrill Lynch International 0.05% 22/07/2021 13,115,000
12,962,000 Merrill Lynch International 0.05% 22/10/2021 12,962,000
10,780,000 Merrill Lynch International 0.05% 24/08/2021 10,780,000
10,512,000 Merrill Lynch International 0.05% 22/10/2021 10,512,000
4,170,000 Merrill Lynch International 0.05% 24/08/2021 4,170,000

December 2021 Legal & General UCITS ETF Plc
572
L&G FTSE 100® Leveraged (Daily 2x) UCITS ETF
Statement of significant sales
Nominal Security Description Interest Rate
Maturity Date
Proceeds £
21,190,000 Merrill Lynch International 0.05% 24/08/2021 21,190,000
19,977,000 Merrill Lynch International 0.05% 22/09/2021 19,977,000
18,385,000 Merrill Lynch International 0.05% 24/08/2021 18,385,000
18,172,000 Merrill Lynch International 0.05% 22/10/2021 18,172,000
17,422,000 Merrill Lynch International 0.05% 22/10/2021 17,422,000
16,800,000 Merrill Lynch International 0.05% 24/08/2021 16,800,000
16,557,000 Merrill Lynch International 0.05% 22/12/2021 16,557,000
16,528,000 Merrill Lynch International 0.19% 24/01/2022 16,528,000
16,457,000 Merrill Lynch International 0.05% 22/10/2021 16,457,000
15,862,000 Merrill Lynch International 0.05% 22/09/2021 15,862,000
15,792,000 Merrill Lynch International 0.05% 22/12/2021 15,792,000
15,282,000 Merrill Lynch International 0.05% 22/10/2021 15,282,000
15,015,000 Merrill Lynch International 0.05% 22/07/2021 15,015,000
14,640,000 Merrill Lynch International 0.05% 23/11/2021 14,640,000
14,477,000 Merrill Lynch International 0.05% 22/12/2021 14,477,000
14,355,000 Merrill Lynch International 0.05% 24/08/2021 14,355,000
14,120,000 Merrill Lynch International 0.05% 22/07/2021 14,120,000
13,340,000 Merrill Lynch International 0.05% 24/08/2021 13,340,000
13,115,000 Merrill Lynch International 0.05% 22/07/2021 13,115,000
12,962,000 Merrill Lynch International 0.05% 22/10/2021 12,962,000
10,780,000 Merrill Lynch International 0.05% 24/08/2021 10,780,000
10,512,000 Merrill Lynch International 0.05% 22/10/2021 10,512,000
4,170,000 Merrill Lynch International 0.05% 24/08/2021 4,170,000

December 2021 Legal & General UCITS ETF Plc
573
L&G FTSE 100® Super Short Strategy (Daily 2x) UCITS ETF
Statement of significant purchases
Nominal Security Description Interest Rate
Maturity Date
Cost £
14,225,751 Merrill Lynch International 0.05% 22/12/2021 14,225,751
12,997,751 Merrill Lynch International 0.05% 23/11/2021 12,997,751
12,661,751 Merrill Lynch International 0.05% 22/09/2021 12,661,751
12,392,751 Merrill Lynch International 0.05% 23/11/2021 12,392,751
12,225,751 Merrill Lynch International 0.05% 22/12/2021 12,225,751
12,108,751 Merrill Lynch International 0.05% 24/08/2021 12,108,751
11,403,751 Merrill Lynch International 0.05% 24/08/2021 11,403,751
11,401,751 Merrill Lynch International 0.05% 22/09/2021 11,401,751
11,366,751 Merrill Lynch International 0.19% 24/01/2022 11,366,751
10,903,751 Merrill Lynch International 0.05% 24/08/2021 10,903,751
10,776,751 Merrill Lynch International 0.19% 24/01/2022 10,776,751
10,741,751 Merrill Lynch International 0.05% 22/10/2021 10,741,751
10,196,751 Merrill Lynch International 0.05% 22/10/2021 10,196,751
10,088,751 Merrill Lynch International 0.05% 22/07/2021 10,088,751
10,073,751 Merrill Lynch International 0.05% 24/08/2021 10,073,751
9,930,751 Merrill Lynch International 0.05% 22/12/2021 9,930,751
9,926,751 Merrill Lynch International 0.05% 22/09/2021 9,926,751
9,751,751 Merrill Lynch International 0.05% 22/10/2021 9,751,751
9,100,751 Merrill Lynch International 0.05% 22/12/2021 9,100,751
2,266,000 Merrill Lynch International 0.05% 22/12/2021 2,266,000

December 2021 Legal & General UCITS ETF Plc
574
L&G FTSE 100® Super Short Strategy (Daily 2x) UCITS ETF
Statement of significant sales
Nominal Security Description Interest Rate
Maturity Date
Proceeds £
14,225,751 Merrill Lynch International 0.05% 22/12/2021 14,225,751
12,997,751 Merrill Lynch International 0.05% 23/11/2021 12,997,751
12,661,751 Merrill Lynch International 0.05% 22/09/2021 12,661,751
12,392,751 Merrill Lynch International 0.05% 23/11/2021 12,392,751
12,225,751 Merrill Lynch International 0.05% 22/12/2021 12,225,751
12,108,751 Merrill Lynch International 0.05% 24/08/2021 12,108,751
11,403,751 Merrill Lynch International 0.05% 24/08/2021 11,403,751
11,401,751 Merrill Lynch International 0.05% 22/09/2021 11,401,751
11,366,751 Merrill Lynch International 0.19% 24/01/2022 11,366,751
10,903,751 Merrill Lynch International 0.05% 24/08/2021 10,903,751
10,741,751 Merrill Lynch International 0.05% 22/10/2021 10,741,751
10,588,751 Merrill Lynch International 0.05% 22/07/2021 10,588,751
10,196,751 Merrill Lynch International 0.05% 22/10/2021 10,196,751
10,088,751 Merrill Lynch International 0.05% 22/07/2021 10,088,751
10,073,751 Merrill Lynch International 0.05% 24/08/2021 10,073,751
9,930,751 Merrill Lynch International 0.05% 22/12/2021 9,930,751
9,926,751 Merrill Lynch International 0.05% 22/09/2021 9,926,751
9,751,751 Merrill Lynch International 0.05% 22/10/2021 9,751,751
9,100,751 Merrill Lynch International 0.05% 22/12/2021 9,100,751
2,266,000 Merrill Lynch International 0.05% 22/12/2021 2,266,000

December 2021 Legal & General UCITS ETF Plc
575
L&G Russell 2000 US Small Cap Quality UCITS ETF
Statement of significant purchases
Nominal Security Description Cost $
818 Lattice Semiconductor Corp 64,017
2,497 Covanta Holding Corp 50,594
860 Raven Industries Inc 49,954
1,629 Clearway Energy Inc - Class A 48,302
277 Crocs Inc 45,938
1,374 Cadence Bank 43,725
451 Blueprint Medicines Corp 43,688
1,662 Gladstone Commercial Corp (REIT) 42,569
606 BJ's Wholesale Club Holdings Inc 39,993
576 Moelis & Co - Class A 38,072
664 Glacier Bancorp Inc 37,451
2,667 Brandywine Realty Trust (REIT) 36,595
813 Cathay General Bancorp 35,540
939 Ovintiv Inc 33,704
830 Pacific Premier Bancorp Inc 33,102
612 Heartland Financial USA Inc 30,566
1,000 Simmons First National Corp - Class A 30,463
268 Houlihan Lokey Inc - Class A 30,104
398 Tenet Healthcare Corp 30,054
735 Neogen Corp 29,962
Statement of significant sales
Nominal Security Description Proceeds $
348 Stamps.com Inc 114,698
2,251 Dicerna Pharmaceuticals Inc 85,986
1,470 Raven Industries Inc 85,238
3,981 Covanta Holding Corp 80,597
2,048 Translate Bio Inc 77,824
814 QTS Realty Trust Inc 63,423
1,523 Inovalon Holdings Inc 62,528
1,450 Macquarie Infrastructure Holdings LLC 58,740
985 Domtar Corp 54,642
1,054 CIT Group Inc 54,107
3,321 Cloudera Inc 53,067
1,422 At Home Group Inc 52,614
1,416 Clearway Energy Inc 44,885
317 Regal Rexnord Corp 42,324
730 Sykes Enterprises Inc 39,418
1,043 Luminex Corp 38,591
1,715 Columbia Property Trust Inc 33,027
322 Blueprint Medicines Corp 32,074
528 Meredith Corp 31,149
1,449 Cadence BanCorp - Class A 29,428

December 2021 Legal & General UCITS ETF Plc
576
L&G Gold Mining UCITS ETF
Statement of significant purchases
Nominal Security Description Cost $
198,522 Barrick Gold Corp 3,974,175
64,966 Newmont Corp 3,717,378
33,413 Agnico Eagle Mines Ltd (Units) 1,842,185
98,005 Newcrest Mining Ltd 1,765,236
250,004 Kinross Gold Corp 1,566,066
65,370 AngloGold Ashanti Ltd 1,130,908
299,105 Evolution Mining Ltd 929,457
45,259 Polymetal International Plc 894,447
88,358 Gold Fields Ltd 788,980
13,700 Kirkland Lake Gold Ltd 558,857
130,300 Yamana Gold Inc (Units) 555,445
309,600 Regis Resources Ltd 489,048
425,152 St Barbara Ltd 478,616
56,478 Northern Star Resources Ltd 394,231
55,809 Coeur Mining Inc 364,772
47,400 Centerra Gold Inc 348,890
26,840 Fresnillo Plc 300,299
10,823 Pan American Silver Corp 280,232
20,700 Torex Gold Resources Inc 233,626
85,700 IAMGOLD Corp 205,965

December 2021 Legal & General UCITS ETF Plc
577
L&G Gold Mining UCITS ETF
Statement of significant sales
Nominal Security Description Proceeds $
349,842 Fresnillo Plc 4,479,072
25,800 Kirkland Lake Gold Ltd 1,105,028
162,601 Hecla Mining Co 980,004
114,200 Centerra Gold Inc 885,832
915,032 DRDGOLD Ltd 882,337
52,900 Pretium Resources Inc 732,020
12,600 Barrick Gold Corp 551,702
51,283 Gold Fields Ltd 530,536
123,700 Argonaut Gold Inc 368,139
4,649 Newmont Corp 259,344
73,500 IAMGOLD Corp 218,844
28,600 Dundee Precious Metals Inc (Units) 200,862
23,700 Equinox Gold Corp 185,887
22,500 Alamos Gold Inc - Class A 184,004
8,404 AngloGold Ashanti Ltd 129,464
20,000 Kinross Gold Corp 115,207
13,100 Lundin Gold Inc 115,083
6,340 Newcrest Mining Ltd 112,745
4,017 Polymetal International Plc 74,516
1,200 Agnico Eagle Mines Ltd (Units) 64,736

December 2021 Legal & General UCITS ETF Plc
578
L&G US Energy Infrastructure MLP UCITS ETF
Statement of significant purchases
Nominal Security Description Interest Rate
Maturity Date
Cost $
33,922,923 Citigroup Global Markets Limited 0.10% 22/07/2021 33,922,923
33,338,923 Citigroup Global Markets Limited 0.09% 24/08/2021 33,338,923
32,698,923 Citigroup Global Markets Limited 0.09% 23/11/2021 32,698,923
31,668,923 Citigroup Global Markets Limited 0.09% 22/09/2021 31,668,923
31,488,923 Citigroup Global Markets Limited 0.09% 23/11/2021 31,488,923
31,452,923 Citigroup Global Markets Limited 0.10% 22/07/2021 31,452,923
31,018,923 Citigroup Global Markets Limited 0.09% 24/08/2021 31,018,923
30,253,923 Citigroup Global Markets Limited 0.08% 22/10/2021 30,253,923
30,253,923 Citigroup Global Markets Limited 0.09% 22/09/2021 30,253,923
29,993,923 Citigroup Global Markets Limited 0.09% 22/12/2021 29,993,923
29,793,923 Citigroup Global Markets Limited 0.09% 22/12/2021 29,793,923
29,688,923 Citigroup Global Markets Limited 0.09% 24/08/2021 29,688,923
28,348,923 Citigroup Global Markets Limited 0.09% 24/08/2021 28,348,923
28,133,923 Citigroup Global Markets Limited 0.08% 22/10/2021 28,133,923
27,808,923 Citigroup Global Markets Limited 0.09% 22/12/2021 27,808,923
27,698,923 Citigroup Global Markets Limited 0.10% 24/01/2022 27,698,923
27,013,923 Citigroup Global Markets Limited 0.09% 24/08/2021 27,013,923
26,513,923 Citigroup Global Markets Limited 0.09% 22/12/2021 26,513,923
24,573,923 Citigroup Global Markets Limited 0.10% 24/01/2022 24,573,923
3,750,000 Citigroup Global Markets Limited 0.09% 24/08/2021 3,750,000

December 2021 Legal & General UCITS ETF Plc
579
L&G US Energy Infrastructure MLP UCITS ETF
Statement of significant sales
Nominal Security Description Interest Rate
Maturity Date
Proceeds $
35,597,923 Citigroup Global Markets Limited 0.10% 22/07/2021 35,597,923
33,922,923 Citigroup Global Markets Limited 0.10% 22/07/2021 33,922,923
33,338,923 Citigroup Global Markets Limited 0.09% 24/08/2021 33,338,923
32,698,923 Citigroup Global Markets Limited 0.09% 23/11/2021 32,698,923
31,668,923 Citigroup Global Markets Limited 0.09% 22/09/2021 31,668,923
31,488,923 Citigroup Global Markets Limited 0.09% 23/11/2021 31,488,923
31,452,923 Citigroup Global Markets Limited 0.10% 22/07/2021 31,452,923
31,018,923 Citigroup Global Markets Limited 0.09% 24/08/2021 31,018,923
30,253,923 Citigroup Global Markets Limited 0.09% 22/09/2021 30,253,923
30,253,923 Citigroup Global Markets Limited 0.08% 22/10/2021 30,253,923
29,993,923 Citigroup Global Markets Limited 0.09% 22/12/2021 29,993,923
29,793,923 Citigroup Global Markets Limited 0.09% 22/12/2021 29,793,923
29,688,923 Citigroup Global Markets Limited 0.09% 24/08/2021 29,688,923
28,348,923 Citigroup Global Markets Limited 0.09% 24/08/2021 28,348,923
28,133,923 Citigroup Global Markets Limited 0.08% 22/10/2021 28,133,923
27,808,923 Citigroup Global Markets Limited 0.09% 22/12/2021 27,808,923
27,698,923 Citigroup Global Markets Limited 0.10% 24/01/2022 27,698,923
27,013,923 Citigroup Global Markets Limited 0.09% 24/08/2021 27,013,923
26,513,923 Citigroup Global Markets Limited 0.09% 22/12/2021 26,513,923
3,750,000 Citigroup Global Markets Limited 0.09% 24/08/2021 3,750,000

December 2021 Legal & General UCITS ETF Plc
580
L&G ROBO Global® Robotics and Automation UCITS ETF
Statement of significant purchases
Nominal Security Description Cost $
3,615,593 AutoStore Holdings Ltd 14,766,597
146,690 GXO Logistics Inc 12,051,280
573,509 Luminar Technologies Inc - Class A 9,643,925
144,802 iRhythm Technologies Inc 9,594,850
118,470 iRobot Corp 9,112,387
188,500 Harmonic Drive Systems Inc 8,813,428
1,135,471 AppHarvest Inc 8,318,433
767,000 Vicarious Surgical Inc 8,308,847
252,600 Nabtesco Corp 8,125,023
19,104 Illumina Inc 7,482,464
44,209 IPG Photonics Corp 7,364,434
634,780 Hiwin Technologies Corp 7,214,919
305,459 Materialise NV ADR 7,190,525
10,400 SMC Corp 7,187,916
107,309 Renishaw Plc 7,109,542
71,415 Azenta Inc 7,067,519
310,050 3D Systems Corp 7,060,398
266,900 THK Co Ltd 6,398,594
28,900 FANUC Corp 6,374,122
185,624 Airtac International Group 6,052,409
372,263 Hexagon AB 5,612,064
235,452 Ocado Group Plc 5,467,473
42,239 PTC Inc 5,204,203
64,021 Cognex Corp 5,053,732
92,222 Cargotec Oyj - Class B 4,657,618
65,786 FARO Technologies Inc 4,567,983
192,000 Fuji Corp/Aichi 4,518,894
35,993 Teradyne Inc 4,460,594
362,882 Elekta AB 4,378,857
12,174 Intuitive Surgical Inc 4,357,517
306,600 Mitsubishi Electric Corp 4,289,852
59,692 Globus Medical Inc 4,186,924
46,100 Daifuku Co Ltd 4,063,225
6,041 ServiceNow Inc 3,839,867
84,972 Duerr AG 3,725,890
86,150 Daihen Corp 3,660,928
12,552 Autodesk Inc 3,659,782
130,916 Stratasys Ltd 3,616,118
40,800 Toyota Industries Corp 3,485,395
137,600 Amano Corp 3,378,802
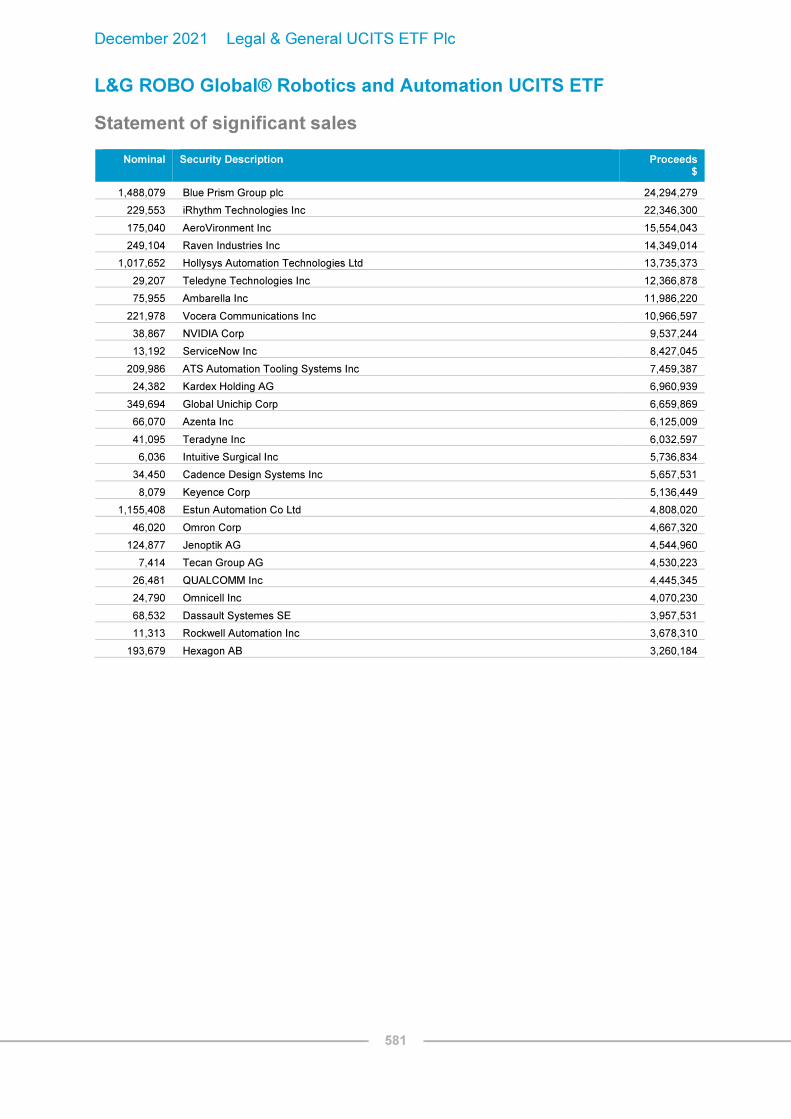
December 2021 Legal & General UCITS ETF Plc
581
L&G ROBO Global® Robotics and Automation UCITS ETF
Statement of significant sales
Nominal Security Description Proceeds $
1,488,079 Blue Prism Group plc 24,294,279
229,553 iRhythm Technologies Inc 22,346,300
175,040 AeroVironment Inc 15,554,043
249,104 Raven Industries Inc 14,349,014
1,017,652 Hollysys Automation Technologies Ltd 13,735,373
29,207 Teledyne Technologies Inc 12,366,878
75,955 Ambarella Inc 11,986,220
221,978 Vocera Communications Inc 10,966,597
38,867 NVIDIA Corp 9,537,244
13,192 ServiceNow Inc 8,427,045
209,986 ATS Automation Tooling Systems Inc 7,459,387
24,382 Kardex Holding AG 6,960,939
349,694 Global Unichip Corp 6,659,869
66,070 Azenta Inc 6,125,009
41,095 Teradyne Inc 6,032,597
6,036 Intuitive Surgical Inc 5,736,834
34,450 Cadence Design Systems Inc 5,657,531
8,079 Keyence Corp 5,136,449
1,155,408 Estun Automation Co Ltd 4,808,020
46,020 Omron Corp 4,667,320
124,877 Jenoptik AG 4,544,960
7,414 Tecan Group AG 4,530,223
26,481 QUALCOMM Inc 4,445,345
24,790 Omnicell Inc 4,070,230
68,532 Dassault Systemes SE 3,957,531
11,313 Rockwell Automation Inc 3,678,310
193,679 Hexagon AB 3,260,184

December 2021 Legal & General UCITS ETF Plc
582
L&G Cyber Security UCITS ETF
Statement of significant purchases
Nominal Security Description Cost $
7,368,955 Darktrace Plc 88,995,504
3,964,703 Cognyte Software Ltd 86,797,292
1,036,121 Fastly Inc 48,348,797
1,452,902 McAfee Corp - Class A 35,810,659
1,143,975 Telos Corp 33,726,939
188,795 VMware Inc 27,435,534
223,886 Qualys Inc 24,254,982
148,575 CyberArk Software Ltd 21,890,555
2,083,361 BlackBerry Ltd 21,626,294
1,066,222 SolarWinds Corp 20,672,760
702,440 NetScout Systems Inc 20,667,476
356,523 Cisco Systems Inc/Delaware 19,743,156
157,949 Check Point Software Technologies Ltd 18,978,970
1,148,755 Rackspace Technology Inc 18,710,550
332,500 Trend Micro Inc/Japan 18,153,270
2,233,878 Avast Plc '144A' 17,808,433
737,397 Ping Identity Holding Corp 17,325,770
561,405 Juniper Networks Inc 16,366,142
112,133 Splunk Inc 15,445,065
132,253 Akamai Technologies Inc 14,797,055
678,080 FireEye Inc 13,304,149
262,207 Atos SE 13,159,630
88,500 Cloudflare Inc 12,581,250
25,671 Palo Alto Networks Inc 11,820,775
35,982 Fortinet Inc 11,040,684
294,657 Parsons Corp 10,833,451
224,411 Sailpoint Technologies Holdings Inc 10,636,286
593,926 Sumo Logic Inc 10,168,045
387,857 NortonLifeLock Inc 10,003,055
289,915 Radware Ltd 9,884,260
117,407 ManTech International Corp/VA - Class A 9,608,620
532,510 Mandiant Inc 9,567,328
38,348 Crowdstrike Holdings Inc 9,563,393
46,627 F5 Inc 9,163,030

December 2021 Legal & General UCITS ETF Plc
583
L&G Cyber Security UCITS ETF
Statement of significant sales
Nominal Security Description Proceeds $
533,737 Proofpoint Inc 92,928,257
1,021,494 Ultra Electronics Holdings Plc 44,798,202
312,914 Cloudflare Inc 38,617,799
118,067 Fortinet Inc 35,216,671
3,941,863 Zix Corp 33,197,618
62,422 Palo Alto Networks Inc 31,633,929
148,141 CyberArk Software Ltd 26,862,002
72,114 Crowdstrike Holdings Inc 18,254,750
1,672,314 BlackBerry Ltd 16,972,618
2,197,743 Avast Plc '144A' 16,900,502
129,302 Qualys Inc 14,885,101
430,624 Radware Ltd 14,415,044
230,921 Mimecast Ltd 13,832,489
50,411 Zscaler Inc 13,199,834
113,614 Rapid7 Inc 12,737,924
921,095 N-able Inc 11,688,766
3,558,287 Fingerprint Cards AB - Class B 11,578,970
202,800 Trend Micro Inc/Japan 11,159,592
725,491 A10 Networks Inc 9,141,127
151,549 Cisco Systems Inc/Delaware 8,383,384
306,260 NortonLifeLock Inc 7,925,309
760,877 Intrusion Inc 7,118,283
237,397 Juniper Networks Inc 6,889,955
42,135 Splunk Inc 6,709,485
133,696 Tenable Holdings Inc 6,363,212
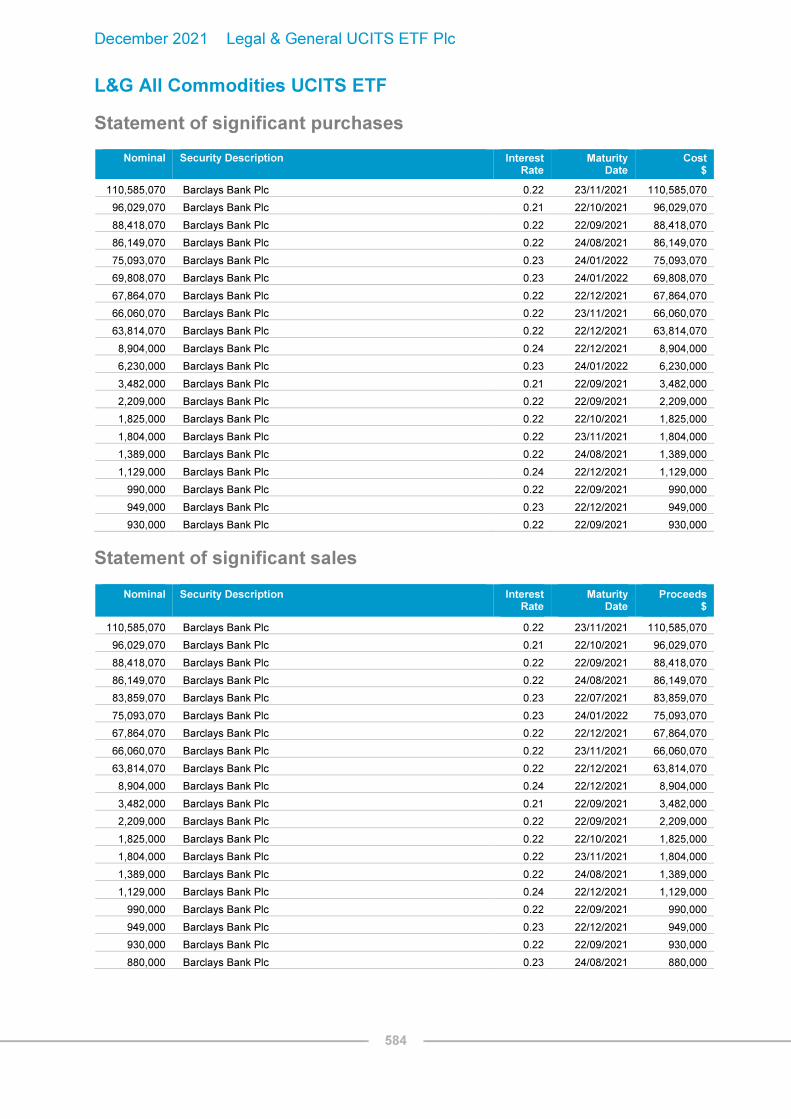
December 2021 Legal & General UCITS ETF Plc
584
L&G All Commodities UCITS ETF
Statement of significant purchases
Nominal Security Description Interest Rate
Maturity Date
Cost $
110,585,070 Barclays Bank Plc 0.22 23/11/2021 110,585,070
96,029,070 Barclays Bank Plc 0.21 22/10/2021 96,029,070
88,418,070 Barclays Bank Plc 0.22 22/09/2021 88,418,070
86,149,070 Barclays Bank Plc 0.22 24/08/2021 86,149,070
75,093,070 Barclays Bank Plc 0.23 24/01/2022 75,093,070
69,808,070 Barclays Bank Plc 0.23 24/01/2022 69,808,070
67,864,070 Barclays Bank Plc 0.22 22/12/2021 67,864,070
66,060,070 Barclays Bank Plc 0.22 23/11/2021 66,060,070
63,814,070 Barclays Bank Plc 0.22 22/12/2021 63,814,070
8,904,000 Barclays Bank Plc 0.24 22/12/2021 8,904,000
6,230,000 Barclays Bank Plc 0.23 24/01/2022 6,230,000
3,482,000 Barclays Bank Plc 0.21 22/09/2021 3,482,000
2,209,000 Barclays Bank Plc 0.22 22/09/2021 2,209,000
1,825,000 Barclays Bank Plc 0.22 22/10/2021 1,825,000
1,804,000 Barclays Bank Plc 0.22 23/11/2021 1,804,000
1,389,000 Barclays Bank Plc 0.22 24/08/2021 1,389,000
1,129,000 Barclays Bank Plc 0.24 22/12/2021 1,129,000
990,000 Barclays Bank Plc 0.22 22/09/2021 990,000
949,000 Barclays Bank Plc 0.23 22/12/2021 949,000
930,000 Barclays Bank Plc 0.22 22/09/2021 930,000
Statement of significant sales
Nominal Security Description Interest Rate
Maturity Date
Proceeds $
110,585,070 Barclays Bank Plc 0.22 23/11/2021 110,585,070
96,029,070 Barclays Bank Plc 0.21 22/10/2021 96,029,070
88,418,070 Barclays Bank Plc 0.22 22/09/2021 88,418,070
86,149,070 Barclays Bank Plc 0.22 24/08/2021 86,149,070
83,859,070 Barclays Bank Plc 0.23 22/07/2021 83,859,070
75,093,070 Barclays Bank Plc 0.23 24/01/2022 75,093,070
67,864,070 Barclays Bank Plc 0.22 22/12/2021 67,864,070
66,060,070 Barclays Bank Plc 0.22 23/11/2021 66,060,070
63,814,070 Barclays Bank Plc 0.22 22/12/2021 63,814,070
8,904,000 Barclays Bank Plc 0.24 22/12/2021 8,904,000
3,482,000 Barclays Bank Plc 0.21 22/09/2021 3,482,000
2,209,000 Barclays Bank Plc 0.22 22/09/2021 2,209,000
1,825,000 Barclays Bank Plc 0.22 22/10/2021 1,825,000
1,804,000 Barclays Bank Plc 0.22 23/11/2021 1,804,000
1,389,000 Barclays Bank Plc 0.22 24/08/2021 1,389,000
1,129,000 Barclays Bank Plc 0.24 22/12/2021 1,129,000
990,000 Barclays Bank Plc 0.22 22/09/2021 990,000
949,000 Barclays Bank Plc 0.23 22/12/2021 949,000
930,000 Barclays Bank Plc 0.22 22/09/2021 930,000
880,000 Barclays Bank Plc 0.23 24/08/2021 880,000

December 2021 Legal & General UCITS ETF Plc
585
L&G Longer Dated All Commodities ex-Agriculture and Livestock UCITS ETF
Statement of significant purchases
Nominal Security Description Interest Rate
Maturity Date
Cost $
3,218,553 Barclays Bank Plc 0.21 23/11/2021 3,218,553
3,111,553 Barclays Bank Plc 0.21 22/09/2021 3,111,553
3,111,553 Barclays Bank Plc 0.21 24/08/2021 3,111,553
3,041,553 Barclays Bank Plc 0.22 22/07/2021 3,041,553
3,023,553 Barclays Bank Plc 0.21 23/11/2021 3,023,553
2,883,553 Barclays Bank Plc 0.20 22/10/2021 2,883,553
1,791,553 Barclays Bank Plc 0.21 22/09/2021 1,791,553
1,369,553 Barclays Bank Plc 0.22 24/01/2022 1,369,553
1,359,553 Barclays Bank Plc 0.21 22/12/2021 1,359,553
1,299,553 Barclays Bank Plc 0.21 22/12/2021 1,299,553
1,299,553 Barclays Bank Plc 0.22 24/01/2022 1,299,553
932,000 Barclays Bank Plc 0.20 22/09/2021 932,000
741,000 Barclays Bank Plc 0.21 23/11/2021 741,000
298,553 Barclays Bank Plc 0.21 23/11/2021 298,553
180,000 Barclays Bank Plc 0.21 23/11/2021 180,000
140,000 Barclays Bank Plc 0.21 23/11/2021 140,000
70,000 Barclays Bank Plc 0.21 22/12/2021 70,000
The above constitutes all the purchases of the Fund during the financial period.
Statement of significant sales
Nominal Security Description Proceeds $
10,061,553 Barclays Bank Plc 0.22 22/07/2021 10,061,553
3,218,553 Barclays Bank Plc 0.21 23/11/2021 3,218,553
3,111,553 Barclays Bank Plc 0.21 24/08/2021 3,111,553
3,111,553 Barclays Bank Plc 0.21 22/09/2021 3,111,553
3,041,553 Barclays Bank Plc 0.22 22/07/2021 3,041,553
3,023,553 Barclays Bank Plc 0.21 23/11/2021 3,023,553
2,883,553 Barclays Bank Plc 0.20 22/10/2021 2,883,553
1,791,553 Barclays Bank Plc 0.21 22/09/2021 1,791,553
1,369,553 Barclays Bank Plc 0.22 24/01/2022 1,369,553
1,359,553 Barclays Bank Plc 0.21 22/12/2021 1,359,553
1,299,553 Barclays Bank Plc 0.21 22/12/2021 1,299,553
932,000 Barclays Bank Plc 0.20 22/09/2021 932,000
741,000 Barclays Bank Plc 0.21 23/11/2021 741,000
298,553 Barclays Bank Plc 0.21 23/11/2021 298,553
180,000 Barclays Bank Plc 0.21 23/11/2021 180,000
140,000 Barclays Bank Plc 0.21 23/11/2021 140,000
70,000 Barclays Bank Plc 0.21 22/12/2021 70,000
The above constitutes all the sales of the Fund during the financial period.

December 2021 Legal & General UCITS ETF Plc
586
L&G Battery Value-Chain UCITS ETF
Statement of significant purchases
Nominal Security Description Cost $
546,486 Mineral Resources Ltd 17,285,967
503,076 AMG Advanced Metallurgical Group NV 15,425,231
657,800 GS Yuasa Corp 13,907,455
21,235 LG Chem Ltd 13,897,091
616,879 Hyundai Electric & Energy System Co Ltd 13,024,784
927,400 Sumitomo Electric Industries Ltd 12,950,151
279,300 TDK Corp 12,850,890
37,175 Lockheed Martin Corp 12,819,667
1,289,451 Delta Electronics Inc 12,205,875
171,500 Sebang Global Battery Co Ltd 12,134,629
702,700 NGK Insulators Ltd 12,047,770
314,011 Renault SA 11,671,701
129,708 EnerSys 10,545,312
889,151 Eos Energy Enterprises Inc 10,108,573
1,814,300 Nissan Motor Co Ltd 9,758,655
43,941 Honeywell International Inc 9,650,381
276,146 BYD Co Ltd 'H' 9,625,037
268,817 ABB Ltd 9,598,315
725,600 Panasonic Corp 8,764,005
5,351,795 Pilbara Minerals Ltd 8,578,306
119,432 General Electric Co 8,553,364
81,240 Bayerische Motoren Werke AG 8,247,400
24,174 SolarEdge Technologies Inc 7,356,542
173,500 Toshiba Corp 7,278,970
11,092 Samsung SDI Co Ltd 7,037,026
276,627 Livent Corp 7,036,025
7,739 Tesla Inc 6,690,133
1,113,245 Bollore SA 6,388,107
3,655,827 Rolls-Royce Holdings Plc 6,151,177
64,617 Daimler AG 5,957,776
97,855 Brookfield Business Partners LP (Units) 4,426,489
130,900 Showa Denko KK 3,506,967

December 2021 Legal & General UCITS ETF Plc
587
L&G Battery Value-Chain UCITS ETF
Statement of significant sales
Nominal Security Description Proceeds $
7,897,765 Galaxy Resources Ltd 30,724,659
754,744 BYD Co Ltd 'H' 28,582,479
12,820,382 Pilbara Minerals Ltd 21,533,527
880,680 Showa Denko KK 20,463,649
16,994 Tesla Inc 18,436,737
567,031 Livent Corp 16,579,367
39,005 SolarEdge Technologies Inc 13,737,777
184,600 Brookfield Business Partners LP (Units) 8,776,815
2,927,377 Rolls-Royce Holdings Plc 5,150,492
106,197 Eos Energy Enterprises Inc 1,599,818
235,289 Bollore SA 1,353,257
2,063 Samsung SDI Co Ltd 1,318,713
104,200 Panasonic Corp 1,253,781
16,073 Sebang Global Battery Co Ltd 1,253,072
34,753 ABB Ltd 1,225,723
28,000 Toshiba Corp 1,224,486
31,632 Mineral Resources Ltd 1,211,535
45,567 General Electric Co 1,167,653
11,601 Bayerische Motoren Werke AG 1,166,240
56,485 Hyundai Electric & Energy System Co Ltd 1,164,096

December 2021 Legal & General UCITS ETF Plc
588
L&G Pharma Breakthrough UCITS ETF
Statement of significant purchases
Nominal Security Description Cost $
573,532 Endo International Plc 1,621,871
44,905 Supernus Pharmaceuticals Inc 1,222,851
27,930 PTC Therapeutics Inc 1,190,894
7,045 Johnson & Johnson 1,160,722
32,582 Xencor Inc 1,126,585
8,471 Zai Lab Ltd ADR 1,089,927
24,317 Clinuvel Pharmaceuticals Ltd 738,082
9,476 Emergent BioSolutions Inc 547,868
13,658 Ionis Pharmaceuticals Inc 510,848
531,690 Sino Biopharmaceutical Ltd 438,730
4,229 Ultragenyx Pharmaceutical Inc 407,034
4,393 Sarepta Therapeutics Inc 366,628
4,669 Incyte Corp 355,863
1,857 Vertex Pharmaceuticals Inc 354,063
8,344 Chugai Pharmaceutical Co Ltd 319,139
6,571 Halozyme Therapeutics Inc 274,086
10,576 Grifols SA 266,775
2,369 AbbVie Inc 264,213
3,470 Bristol-Myers Squibb Co 222,546
2,604 BioMarin Pharmaceutical Inc 202,880
2,292 Novartis AG 200,067
1,766 Sanofi 177,257
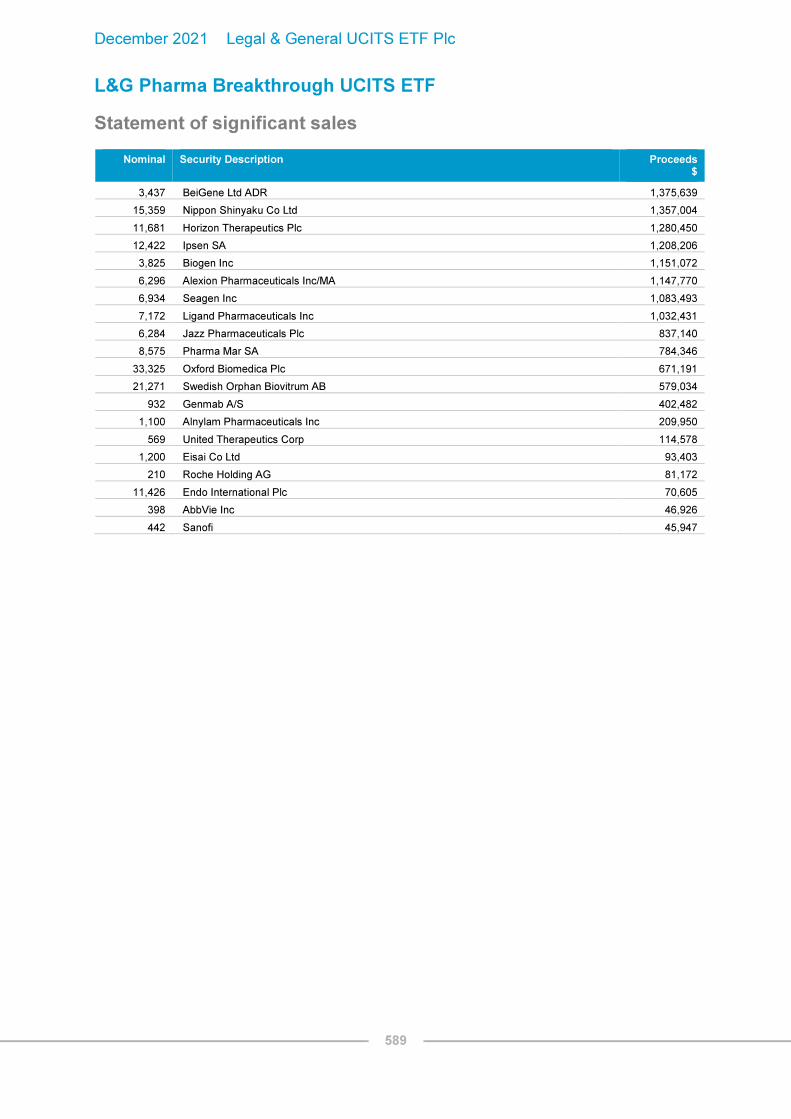
December 2021 Legal & General UCITS ETF Plc
589
L&G Pharma Breakthrough UCITS ETF
Statement of significant sales
Nominal Security Description Proceeds $
3,437 BeiGene Ltd ADR 1,375,639
15,359 Nippon Shinyaku Co Ltd 1,357,004
11,681 Horizon Therapeutics Plc 1,280,450
12,422 Ipsen SA 1,208,206
3,825 Biogen Inc 1,151,072
6,296 Alexion Pharmaceuticals Inc/MA 1,147,770
6,934 Seagen Inc 1,083,493
7,172 Ligand Pharmaceuticals Inc 1,032,431
6,284 Jazz Pharmaceuticals Plc 837,140
8,575 Pharma Mar SA 784,346
33,325 Oxford Biomedica Plc 671,191
21,271 Swedish Orphan Biovitrum AB 579,034
932 Genmab A/S 402,482
1,100 Alnylam Pharmaceuticals Inc 209,950
569 United Therapeutics Corp 114,578
1,200 Eisai Co Ltd 93,403
210 Roche Holding AG 81,172
11,426 Endo International Plc 70,605
398 AbbVie Inc 46,926
442 Sanofi 45,947

December 2021 Legal & General UCITS ETF Plc
590
L&G Ecommerce Logistics UCITS ETF
Statement of significant purchases
Nominal Security Description Cost $
205,855 NTG Nordic Transport Group A/S 16,836,351
1,059,726 Vipshop Holdings Ltd ADR 12,876,007
59,970 Alibaba Group Holding Ltd ADR 10,368,992
107,763 XPO Logistics Inc 9,427,295
3,148,584 Kerry Logistics Network Ltd 8,412,859
322,712 Ocado Group Plc 8,250,260
111,851 Nippon Yusen KK 8,084,054
31,551 FedEx Corp 7,814,568
92,797 JD.com Inc ADR 7,373,206
19,853 ID Logistics Group 7,306,703
64,348 Zalando SE '144A' 6,762,934
48,478 CJ Logistics Corp 6,644,021
93,662 Nippon Express Co Ltd 6,605,369
627,536 Rakuten Group Inc 6,498,834
52,679 TD SYNNEX Corp 6,079,038
1,402,252 Dimerco Express Corp 5,630,749
462,745 Clipper Logistics Plc 5,424,547
519,179 bpost SA 5,258,352
117,302 Hitachi Transport System Ltd 4,985,673
3,300 Shopify Inc - Class A 4,949,580
577,077 Japan Post Holdings Co Ltd 4,903,083
31,101 Manhattan Associates Inc 4,877,923
19,329 DSV A/S 4,870,707
1,636 AP Moller - Maersk A/S - Class B 4,850,397
509,556 Senko Group Holdings Co Ltd 4,794,694
196,894 Kintetsu World Express Inc 4,764,838
68,762 Deutsche Post AG 4,744,028
61,227 Descartes Systems Group Inc/The 4,715,396
12,956 Kuehne + Nagel International AG 4,662,617
32,372 Walmart Inc 4,652,368
37,065 SPS Commerce Inc 4,615,678
53,082 Oracle Corp 4,614,590
793,722 Bollore SA 4,600,425
21,988 United Parcel Service Inc - Class B 4,402,055
60,439 eBay Inc 4,374,302
29,986 SAP SE 4,364,263
1,237 Amazon.com Inc 4,338,510
34,624 Expeditors International of Washington Inc 4,323,062
25,616 Concentrix Corp 4,282,379
191,051 Cia de Distribucion Integral Logista Holdings SA 4,095,355
9,684,355 Sinotrans Ltd 'H' 4,086,181
65,121 Mainfreight Ltd 4,027,547
49,597 Ryder System Inc 3,831,660

December 2021 Legal & General UCITS ETF Plc
591
L&G Ecommerce Logistics UCITS ETF
Statement of significant sales
Nominal Security Description Proceeds $
343,800 Nippon Yusen KK 22,465,619
1,543,146 Clipper Logistics Plc 14,725,235
90,781 SPS Commerce Inc 14,254,421
129,353 GXO Logistics Inc 10,497,271
62,135 Manhattan Associates Inc 10,401,297
123,549 Descartes Systems Group Inc/The 10,155,723
245,100 Hitachi Transport System Ltd 10,029,162
100,579 Oracle Corp 9,541,373
2,764,986 Dimerco Express Corp 8,850,100
47,424 Concentrix Corp 8,514,554
1,419,159 Bollore SA 8,291,088
5,697 Shopify Inc - Class A 8,280,502
34,947 DSV A/S 8,232,146
2,778 AP Moller - Maersk A/S - Class B 7,713,517
116,044 Deutsche Post AG 7,307,166
94,552 eBay Inc 7,079,443
22,205 Kuehne + Nagel International AG 7,065,166
106,421 Mainfreight Ltd 6,615,383
44,719 SAP SE 6,487,522
31,906 United Parcel Service Inc - Class B 6,465,009
51,085 Expeditors International of Washington Inc 6,271,153
74,225 Ryder System Inc 6,234,941
94,200 Nippon Express Co Ltd 6,133,307
17,290,000 Sinotrans Ltd 'H' 6,127,582
1,235,833 Wincanton Plc 6,053,086
74,495 JD.com Inc ADR 5,899,354
40,394 Walmart Inc 5,879,651
1,701 Amazon.com Inc 5,798,869
269,303 Cia de Distribucion Integral Logista Holdings SA 5,785,287
33,860 Alibaba Group Holding Ltd ADR 5,631,506
59,429 Zalando SE '144A' 5,590,958
229,408 Ocado Group Plc 5,587,833
520,200 Rakuten Group Inc 5,541,812
23,077 FedEx Corp 5,528,397
50,372 TD SYNNEX Corp 5,438,525
219,900 Kintetsu World Express Inc 5,273,548
60,206 XPO Logistics Inc 5,202,565
651,700 Japan Post Holdings Co Ltd 5,134,267
562,900 Senko Group Holdings Co Ltd 5,062,083
495,909 bpost SA 4,505,257
1,757,026 Kerry Logistics Network Ltd 4,413,641
375,334 Vipshop Holdings Ltd ADR 4,309,921
33,846 CJ Logistics Corp 4,272,596
42,663 NTG Nordic Transport Group A/S 3,567,876

December 2021 Legal & General UCITS ETF Plc
592
L&G US Equity UCITS ETF
Statement of significant purchases
Nominal Security Description Cost $
20,236 Johnson & Johnson 3,331,040
10,928 Apple Inc 1,626,918
4,824 Microsoft Corp 1,410,846
301 Amazon.com Inc 1,026,727
268 Alphabet Inc - Class A 729,361
727 Tesla Inc 630,682
1,553 Meta Platforms Inc - Class A 554,610
184 Alphabet Inc 508,969
11,432 Freeport-McMoRan Inc 417,576
1,638 NVIDIA Corp 344,662
983 Coinbase Global Inc 338,628
2,054 JPMorgan Chase & Co 320,017
1,791 Airbnb Inc 301,248
630 UnitedHealth Group Inc 263,133
1,114 Visa Inc - Class A 259,864
759 Home Depot Inc/The 255,276
472 MongoDB Inc - Class A 252,583
832 PayPal Holdings Inc 225,507
1,537 Procter & Gamble Co/The 218,717
5,403 Bank of America Corp 216,255

December 2021 Legal & General UCITS ETF Plc
593
L&G US Equity UCITS ETF
Statement of significant sales
Nominal Security Description Proceeds $
17,727 Apple Inc 2,577,282
7,187 Microsoft Corp 2,159,600
386 Amazon.com Inc 1,292,233
454 Alphabet Inc 1,271,254
2,394 Meta Platforms Inc - Class A 803,018
227 Alphabet Inc - Class A 637,162
3,336 JPMorgan Chase & Co 551,325
617 Tesla Inc 474,021
2,178 NVIDIA Corp 473,332
12,048 Freeport-McMoRan Inc 439,799
1,226 Home Depot Inc/The 417,668
9,105 Bank of America Corp 397,520
2,732 Procter & Gamble Co/The 389,252
923 UnitedHealth Group Inc 383,457
1,653 Visa Inc - Class A 376,167
1,296 Berkshire Hathaway Inc - Class B 366,525
866 Mastercard Inc 306,792
1,652 Alexion Pharmaceuticals Inc/MA 301,474
1,157 PayPal Holdings Inc 299,610
1,662 Walt Disney Co/The 290,300

December 2021 Legal & General UCITS ETF Plc
594
L&G UK Equity UCITS ETF
Statement of significant purchases
Nominal Security Description Cost £
2,970 AstraZeneca Plc 274,274
18,025 JD Sports Fashion Plc 203,585
2,138 Unilever Plc 85,908
2,343 Diageo Plc 84,359
5,385 Royal Dutch Shell Plc 81,360
14,825 HSBC Holdings Plc 53,603
3,680 GlaxoSmithKline Plc 52,484
5,470 National Grid Plc 51,812
6,589 Meggitt Plc 49,376
724 Reckitt Benckiser Group Plc 43,115
6,781 B&M European Value Retail SA 42,272
498 London Stock Exchange Group Plc 39,143
3,107 Allfunds Group Plc 39,042
805 Rio Tinto Plc 38,702
12,588 BP Plc 38,656
1,422 British American Tobacco Plc 38,103
300 Endava Plc ADR 36,626
10,021 Glencore Plc 31,174
2,256 Prudential Plc 30,917
1,625 BHP Group Plc 30,633
3,363 Wise Plc - Class A 29,245
10,851 Tesco Plc 27,042
1,835 Compass Group Plc 26,928
1,200 RELX Plc 26,776
726 Experian Plc 24,171
952 Anglo American Plc 23,878
11,133 NatWest Group Plc 23,383
12,829 Barclays Plc 22,568

December 2021 Legal & General UCITS ETF Plc
595
L&G UK Equity UCITS ETF
Statement of significant sales
Nominal Security Description Proceeds £
1,365 London Stock Exchange Group Plc 96,612
3,670 Clarivate Plc 65,002
21,542 WM Morrison Supermarkets Ltd 61,692
15,753 Glencore Plc 60,453
2,652 Royal Dutch Shell Plc 43,956
1,122 Unilever Plc 43,744
1,106 Diageo Plc 41,688
12,435 BP Plc 40,886
2,675 GlaxoSmithKline Plc 40,083
6,658 HSBC Holdings Plc 28,853
2,549 WPP Plc 27,010
8,321 Tesco Plc 22,925
689 Experian Plc 22,397
2,295 National Grid Plc 21,926
271 Reckitt Benckiser Group Plc 16,444
8,916 BT Group Plc 15,534
4,393 J Sainsbury Plc 12,663
585 Jackson Financial Inc 11,870
468 Schroders Plc 11,468
328 Anglo American Plc 11,295

December 2021 Legal & General UCITS ETF Plc
596
L&G Japan Equity UCITS ETF
Statement of significant purchases
Nominal Security Description Cost $
810 BayCurrent Consulting Inc 380,754
5,300 MEIJI Holdings Co Ltd 318,942
5,400 Recruit Holdings Co Ltd 297,688
2,300 Sony Group Corp 275,048
23,800 Renesas Electronics Corp 266,426
400 Keyence Corp 249,636
81 Daiwa House REIT Investment Corp (REIT) 236,942
4,679 Benefit One Inc 236,831
2,900 Secom Co Ltd 196,849
4,800 Terumo Corp 192,232
6,000 Ezaki Glico Co Ltd 190,449
10,100 Toyota Motor Corp 184,272
22,700 Japan Post Holdings Co Ltd 170,349
7,000 Benesse Holdings Inc 164,773
3,300 West Japan Railway Co 161,513
10,300 Nisshin Seifun Group Inc 149,389
2,800 SoftBank Group Corp 146,275
5,400 Ajinomoto Co Inc 143,858
4,374 Rakus Co Ltd 141,307
24,500 Mitsubishi UFJ Financial Group Inc 136,902
700 Fujitsu Ltd 126,586
1,700 Nissin Foods Holdings Co Ltd 124,486
700 Shin-Etsu Chemical Co Ltd 122,327
1,500 FUJIFILM Holdings Corp 120,347
14,400 Japan Post Bank Co Ltd 117,943

December 2021 Legal & General UCITS ETF Plc
597
L&G Japan Equity UCITS ETF
Statement of significant sales
Nominal Security Description Proceeds $
8,500 Toyota Motor Corp 394,322
4,100 MEIJI Holdings Co Ltd 250,576
77 Advance Residence Investment Corp (REIT) 248,269
5,100 MatsukiyoCocokara & Co 223,253
26,500 Japan Post Holdings Co Ltd 223,134
5,900 Sumitomo Mitsui Financial Group Inc 200,772
3,100 SoftBank Group Corp 200,594
1,600 Sony Group Corp 162,066
300 Keyence Corp 158,727
12,900 Alps Alpine Co Ltd 131,302
3,200 Terumo Corp 129,163
42 Daiwa House REIT Investment Corp (REIT) 125,922
4,700 Benesse Holdings Inc 113,998
2,500 Asahi Group Holdings Ltd 113,357
2,900 NH Foods Ltd 107,532
10,900 Chugoku Electric Power Co Inc/The 99,504
3,500 Ajinomoto Co Inc 96,661
1,700 Recruit Holdings Co Ltd 95,263
3,000 Itochu Techno-Solutions Corp 91,919
5,100 Sekisui Chemical Co Ltd 89,771
8,100 Nippon Paint Holdings Co Ltd 87,720
200 Tokyo Electron Ltd 84,584
1,500 Tokyo Century Corp 83,744

December 2021 Legal & General UCITS ETF Plc
598
L&G Global Equity UCITS ETF
Statement of significant purchases
Nominal Security Description Cost $
2,753 Johnson & Johnson 453,438
2,241 Apple Inc 347,618
992 Microsoft Corp 304,517
62 Amazon.com Inc 209,300
65 Alphabet Inc - Class A 182,334
161 Tesla Inc 138,819
1,074 Nestle SA 137,890
380 Meta Platforms Inc - Class A 132,143
641 Procter & Gamble Co/The 93,586
221 Roche Holding AG 89,677
308 NVIDIA Corp 89,311
262 Visa Inc - Class A 60,537
335 Walt Disney Co/The 57,178
329 Airbnb Inc 54,897
195 PayPal Holdings Inc 54,557
905 Holcim Ltd 53,272
72 ASML Holding NV 53,108
591 Prosus NV 51,682
478 Prudential Financial Inc 50,078
143 Coinbase Global Inc 49,261

December 2021 Legal & General UCITS ETF Plc
599
L&G Global Equity UCITS ETF
Statement of significant sales
Nominal Security Description Proceeds $
187 Roche Holding AG 86,013
488 Apple Inc 73,661
508 Nestle SA 66,077
382 Waste Management Inc 61,385
415 Procter & Gamble Co/The 60,301
623 Bayerische Motoren Werke AG - Preference 55,152
158 Microsoft Corp 53,152
27 Mettler-Toledo International Inc 40,075
1,500 Nippon Telegraph & Telephone Corp 38,684
13 Alphabet Inc 38,654
709 Talanx AG 34,370
175 Alexion Pharmaceuticals Inc/MA 31,936
844 CSX Corp 29,900
197 mBank SA 28,162
122 Ecolab Inc 27,825
366 Johnson Controls International plc 27,008
2,309 PG&E Corp 26,920
440 Fastenal Co 25,750
400 Nippon Yusen KK 25,301
300 FUJIFILM Holdings Corp 25,081
840 Universal Music Group NV 25,067
7 Amazon.com Inc 24,336
210 Prudential Financial Inc 23,476
211 George Weston Ltd 23,187
144 Arthur J Gallagher & Co 23,150
344 Bank of Nova Scotia/The 22,887
100 FANUC Corp 22,864
150 Teradyne Inc 21,686
404 Deutsche Wohnen SE 21,608
7 Daiwa House REIT Investment Corp (REIT) 21,212
102 Cloudflare Inc 20,509
107 Chubb Ltd 20,328
27 EPAM Systems Inc 19,337
57 Meta Platforms Inc - Class A 19,141
1,000 Toyota Motor Corp 18,149

December 2021 Legal & General UCITS ETF Plc
600
L&G Europe ex UK Equity UCITS ETF
Statement of significant purchases
Nominal Security Description Cost €
7,263 Prosus NV 550,119
166 Straumann Holding AG 326,929
738 ASM International NV 310,422
1,614 Pandora A/S 197,551
1,616 Puma SE 179,511
3,058 Cellnex Telecom SA '144A' 174,541
6,051 Kesko Oyj 166,236
3,130 Vonovia SE 150,254
42,406 Samhallsbyggnadsbolaget i Norden AB 135,715
7,465 Nexi SpA '144A' 131,896
1,168 Zalando SE '144A' 113,181
604 Carl Zeiss Meditec AG 112,106
1,029 Nestle SA 109,217
479 ICON Plc 99,505
1,677 Thule Group AB '144A' 88,032
4,110 AddTech AB 87,959
1,279 Interpump Group SpA 87,405
112 ASML Holding NV 84,430
1,142 Just Eat Takeaway.com NV '144A' 83,941
6,700 Nordea Bank Abp 73,409
3,885 Epiroc AB 72,908
186 L'Oreal SA 72,248
5,852 Credit Agricole SA 70,262
346 Volkswagen AG - Preference 64,998
1,140 Cie de Saint-Gobain 64,161
1,109 Vitrolife AB 63,589
96 LVMH Moet Hennessy Louis Vuitton SE 62,985
5,610 E.ON SE 61,825
400 Siemens AG 60,107
161 Roche Holding AG 57,496
1,743 UPM-Kymmene Oyj 56,162

December 2021 Legal & General UCITS ETF Plc
601
L&G Europe ex UK Equity UCITS ETF
Statement of significant sales
Nominal Security Description Proceeds €
10,946 Universal Music Group NV 282,924
5,354 Deutsche Wohnen SE 250,231
1,926 Nestle SA 210,592
170 ASML Holding NV 123,213
5,456 Investor AB 115,291
3,892 Kesko Oyj 114,818
492 DSV A/S 103,470
1,525 Cie de Saint-Gobain 95,677
5,983 Nexi SpA '144A' 88,313
181 L'Oreal SA 73,971
1,341 ICA Gruppen AB 69,313
2,329 ArcelorMittal SA 66,217
2,859 Epiroc AB 62,188
24 AP Moller - Maersk A/S - Class B 56,508
187 Volkswagen AG 54,962
275 NXP Semiconductors NV 52,220
698 Novartis AG 50,538
114 Roche Holding AG 45,417
755 Atlas Copco AB 42,972
2,779 UBS Group AG 42,322
840 Vitesco Technologies Group AG 41,807
1,271 ABB Ltd 39,884
1,339 Industrivarden AB - Class A 39,636
395 Novo Nordisk A/S 39,541
1,306 Societe Generale SA 38,796
3,428 E.ON SE 38,547
158 Swatch Group AG/The 38,248
257 Siemens AG 37,495
54 LVMH Moet Hennessy Louis Vuitton SE 37,384
6,873 Nokia Oyj 36,659
1,678 Entra ASA '144A' 35,947
581 Fastighets AB Balder - Class B 35,586

December 2021 Legal & General UCITS ETF Plc
602
L&G Asia Pacific ex Japan Equity UCITS ETF
Statement of significant purchases
Nominal Security Description Cost $
427,600 AIA Group Ltd 4,824,792
61,889 Commonwealth Bank of Australia 4,640,302
16,233 CSL Ltd 3,535,595
56,900 Jardine Matheson Holdings Ltd 3,385,168
103,551 BHP Group Ltd 3,130,919
8,109 Sea Ltd ADR 2,822,978
44,900 Hong Kong Exchanges & Clearing Ltd 2,743,715
116,321 National Australia Bank Ltd 2,397,385
128,536 Westpac Banking Corp 2,254,194
95,649 Australia & New Zealand Banking Group Ltd 1,959,980
41,114 Wesfarmers Ltd 1,759,552
11,765 Macquarie Group Ltd 1,624,883
67,200 DBS Group Holdings Ltd 1,549,475
173,900 Oversea-Chinese Banking Corp Ltd 1,522,051
70,400 United Overseas Bank Ltd 1,380,186
46,677 Woolworths Group Ltd 1,351,986
129,521 Transurban Group 1,312,149
437,229 Telstra Corp Ltd 1,254,592
62,770 Goodman Group (REIT) 1,062,088
48,000 Techtronic Industries Co Ltd 983,552
12,821 Rio Tinto Ltd 961,117

December 2021 Legal & General UCITS ETF Plc
603
L&G Asia Pacific ex Japan Equity UCITS ETF
Statement of significant sales
Nominal Security Description Proceeds $
10,538 Commonwealth Bank of Australia 846,195
253,404 Capitaland Investment Ltd/Singapore 646,882
85,221 Boral Ltd 412,408
18,700 United Overseas Bank Ltd 376,425
26,600 AIA Group Ltd 292,076
1,952 Wesfarmers Ltd 258,898
35,500 CK Asset Holdings Ltd 238,061
985 CSL Ltd 227,392
8,661 National Australia Bank Ltd 183,964
2,800 Hong Kong Exchanges & Clearing Ltd 166,798
5,994 BHP Group Ltd 159,832
51,718 CapitaLand Ltd 153,093
217,000 WH Group Ltd '144A' 151,426
6,664 Australia & New Zealand Banking Group Ltd 141,645
193,671 SJM Holdings Ltd 138,262
5,700 DBS Group Holdings Ltd 135,873
7,762 Westpac Banking Corp 133,274
982 Macquarie Group Ltd 132,566
14,700 Oversea-Chinese Banking Corp Ltd 129,133
11,653 Transurban Group 117,979
70,600 CapitaLand Integrated Commercial Trust (Units) (REIT) 112,100
862 REA Group Ltd 106,832
3,398 Aristocrat Leisure Ltd 103,180
29,800 Wilmar International Ltd (Units) 99,647
95,550 Swire Pacific Ltd 98,394
2,845 Woolworths Group Ltd 82,306
1,400 Jardine Matheson Holdings Ltd 81,177

December 2021 Legal & General UCITS ETF Plc
604
L&G Clean Water UCITS ETF
Statement of significant purchases
Nominal Security Description Cost $
45,933 Tetra Tech Inc 6,853,811
103,667 Bentley Systems Inc - Class B 6,834,186
398,448 Pennon Group Plc 6,749,881
74,621 American States Water Co 6,581,163
632,201 Metso Outotec Oyj 6,545,773
88,381 Ingevity Corp 6,452,415
140,806 Gorman-Rupp Co/The 5,309,147
48,213 Itron Inc 3,792,024
95,646 Artesian Resources Corp - Class A 3,694,311
660,590 Rotork Plc 3,237,807
2,340,000 Guangdong Investment Ltd 3,146,067
332,105 Cadiz Inc 2,867,380
119,470 Forterra Inc 2,824,682
72,079 Evoqua Water Technologies Corp 2,780,024
15,552 Watts Water Technologies Inc - Class A 2,663,483
17,011 Lindsay Corp 2,663,012
395,416 Cia de Saneamento Basico do Estado de Sao Paulo ADR 2,659,473
25,160 Badger Meter Inc 2,604,228
24,677 Middlesex Water Co 2,554,506
1,694 Mettler-Toledo International Inc 2,542,840
8,144 Danaher Corp 2,506,100
11,252 Ecolab Inc 2,501,492
3,092 Geberit AG 2,464,146
28,611 Franklin Electric Co Inc 2,436,924
5,076 Roper Technologies Inc 2,434,440
32,485 Pentair Plc 2,418,284
60,271 Alfa Laval AB 2,396,749
745,509 TETRA Technologies Inc 2,395,788
13,721 American Water Works Co Inc 2,389,662
147,960 Kemira Oyj 2,380,867
10,619 IDEX Corp 2,380,206
62,631 Severn Trent Plc 2,378,295
18,575 Xylem Inc/NY 2,368,515
48,500 Kurita Water Industries Ltd 2,359,102
19,856 Advanced Drainage Systems Inc 2,330,808
39,541 Aalberts NV 2,330,677
11,166 Kadant Inc 2,326,475
34,077 SJW Group 2,326,273
112,333 Energy Recovery Inc 2,322,439
160,643 United Utilities Group Plc 2,312,947
26,584 Trimble Inc 2,312,797
32,045 A O Smith Corp 2,312,194
37,105 California Water Service Group 2,307,212
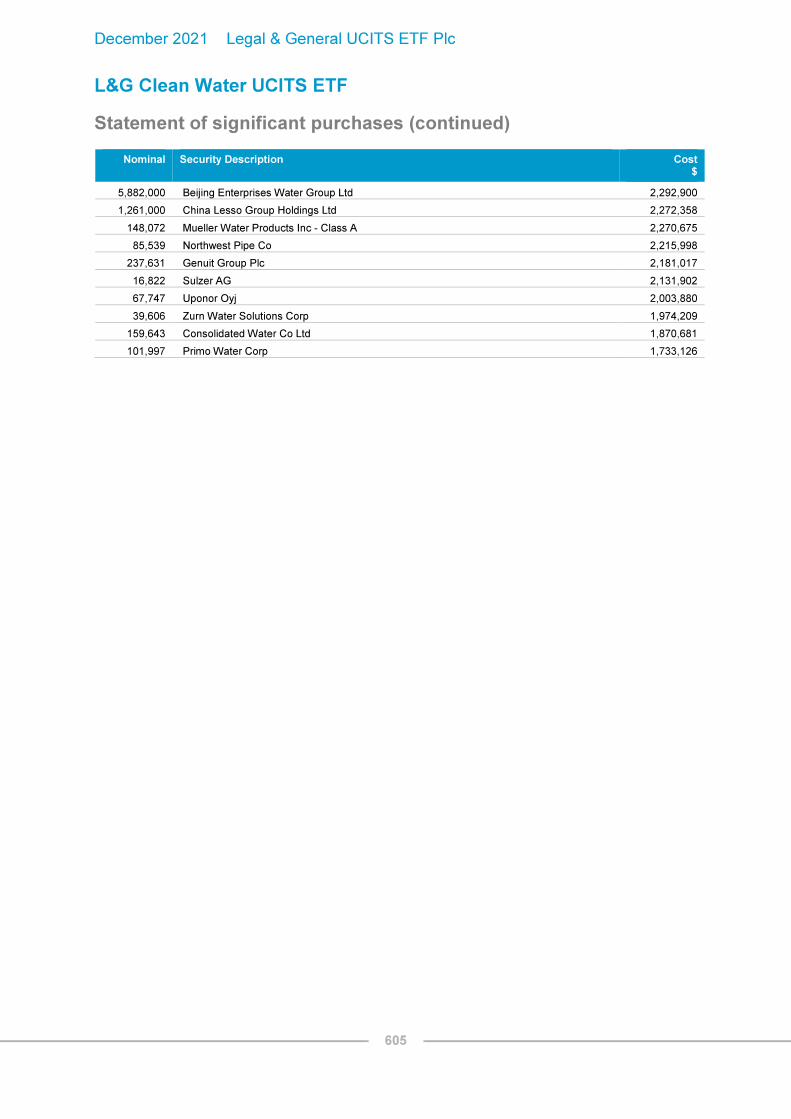
December 2021 Legal & General UCITS ETF Plc
605
L&G Clean Water UCITS ETF
Statement of significant purchases (continued)
Nominal Security Description Cost $
5,882,000 Beijing Enterprises Water Group Ltd 2,292,900
1,261,000 China Lesso Group Holdings Ltd 2,272,358
148,072 Mueller Water Products Inc - Class A 2,270,675
85,539 Northwest Pipe Co 2,215,998
237,631 Genuit Group Plc 2,181,017
16,822 Sulzer AG 2,131,902
67,747 Uponor Oyj 2,003,880
39,606 Zurn Water Solutions Corp 1,974,209
159,643 Consolidated Water Co Ltd 1,870,681
101,997 Primo Water Corp 1,733,126

December 2021 Legal & General UCITS ETF Plc
606
L&G Clean Water UCITS ETF
Statement of significant sales
Nominal Security Description Proceeds $
165,904 Halma Plc 6,938,753
120,099 Essential Utilities Inc 5,600,941
147,402 Uponor Oyj 4,083,670
162,553 Primo Water Corp 2,721,541
64,295 Evoqua Water Technologies Corp 2,458,687
37,041 Organo Corp 2,391,864
21,852 Middlesex Water Co 2,334,384
6,319 Danaher Corp 2,046,650
1,212 Mettler-Toledo International Inc 1,873,394
43,037 Norma Group SE 1,773,783
10,201 Watts Water Technologies Inc - Class A 1,737,807
83,152 METAWATER Co Ltd 1,473,721
1,773 Geberit AG 1,416,108
21,422 Aalberts NV 1,289,748
65,456 Energy Recovery Inc 1,268,140
9,588 Xylem Inc/NY 1,245,036
8,938 Sulzer AG 1,236,549
6,884 American Water Works Co Inc 1,228,710
15,637 Pentair Plc 1,179,994
117,983 Genuit Group Plc 1,159,581
12,418 Trimble Inc 1,115,589
17,255 Zurn Water Solutions Corp 1,005,656
23,667 Alfa Laval AB 920,760
1,872 Roper Technologies Inc 873,603
19,111 Severn Trent Plc 732,725
2,701 Kadant Inc 583,666

December 2021 Legal & General UCITS ETF Plc
607
L&G Artificial Intelligence UCITS ETF
Statement of significant purchases
Nominal Security Description Cost $
22,158 Upstart Holdings Inc 5,792,185
32,700 Alibaba Group Holding Ltd ADR 4,778,903
1,504,196 Kingdee International Software Group Co Ltd 4,728,624
105,315 C3.ai Inc 4,308,978
488,069 Butterfly Network Inc 4,174,937
734,657 Darktrace Plc 4,044,434
2,948 MercadoLibre Inc 3,994,190
21,890 Wix.com Ltd 3,947,417
62,442 Lemonade Inc 3,627,532
22,835 Baidu Inc ADR 3,596,576
41,870 iRobot Corp 3,366,755
24,873 Splunk Inc 3,296,289
7,499 Fair Isaac Corp 3,268,536
27,507 Zendesk Inc 3,230,760
7,541 Illumina Inc 3,204,931
57,759 Varonis Systems Inc - Class B 3,130,915
23,443 International Business Machines Corp 3,123,396
255,491 Yext Inc 3,098,197
50,922 Tencent Holdings Ltd 3,089,597
43,719 Alteryx Inc - Class A 3,056,688
69,610 Veracyte Inc 3,055,766
9,533 Twilio Inc - Class A 2,955,629
13,762 Block Inc 2,837,802
15,141 Analog Devices Inc 2,575,391
8,148 Autodesk Inc 2,508,897
8,367 Veeva Systems Inc - Class A 2,466,744
7,028 Atlassian Corp Plc 2,466,190
69,760 MediaTek Inc 2,349,240
294,874 Appen Ltd 2,339,380
7,065 Arista Networks Inc 2,313,968
66,382 JFrog Ltd 2,302,319
3,811 Lam Research Corp 2,287,026
16,127 Cloudflare Inc 2,189,558
17,596 Rapid7 Inc 2,070,373
18,665 Fiserv Inc 2,048,653
24,317 Cognex Corp 2,034,878
8,360 Spotify Technology SA 2,009,058
588 Amazon.com Inc 2,007,130
3,218 ServiceNow Inc 2,005,528
14,532 Electronic Arts Inc 1,985,121
14,200 Aspen Technology Inc 1,927,034
6,287 Microsoft Corp 1,911,885
8,345 NVIDIA Corp 1,911,298
15,572 Teradyne Inc 1,900,387
21,806 CoStar Group Inc 1,887,946

December 2021 Legal & General UCITS ETF Plc
608
L&G Artificial Intelligence UCITS ETF
Statement of significant purchases (continued)
Nominal Security Description Cost $
809 Booking Holdings Inc 1,856,915
6,922 salesforce.com Inc 1,846,164
2,338 ASML Holding NV NY Reg Shrs 1,839,258
654 Alphabet Inc - Class A 1,834,286
86,427 Taiwan Semiconductor Manufacturing Co Ltd 1,829,592
16,304 Advanced Micro Devices Inc 1,802,295
25,737 Yandex NV - Class A 1,796,876

December 2021 Legal & General UCITS ETF Plc
609
L&G Artificial Intelligence UCITS ETF
Statement of significant sales
Nominal Security Description Proceeds $
403,200 Blue Prism Group plc 6,698,515
34,277 Aspen Technology Inc 5,079,556
67,458 Cornerstone OnDemand Inc 3,853,542
28,069 Cloudflare Inc 3,849,775
8,796 Atlassian Corp Plc 3,510,792
135,066 McAfee Corp 3,458,759
12,938 NVIDIA Corp 3,407,525
1,066,532 Kingdee International Software Group Co Ltd 3,301,378
25,216 Advanced Micro Devices Inc 3,191,543
22,303 Arista Networks Inc 3,091,999
28,410 New Relic Inc 2,664,155
2,858 Tesla Inc 2,625,031
3,104 HubSpot Inc 2,184,111
42,739 Veracyte Inc 2,108,978
17,146 Rapid7 Inc 2,065,833
69,339 Pure Storage Inc 2,003,817
30,036 Varonis Systems Inc - Class B 1,978,679
94,461 Global Unichip Corp 1,895,774
3,727 MongoDB Inc - Class A 1,871,637
2,870 ServiceNow Inc 1,859,978
7,973 Etsy Inc 1,845,936
3,577 Palo Alto Networks Inc 1,811,338
12,068 Splunk Inc 1,750,377
1,000 MercadoLibre Inc 1,742,055
2,872 Intuit Inc 1,741,433
10,944 Teradyne Inc 1,658,072
5,056 Microsoft Corp 1,601,213
8,622 Analog Devices Inc 1,485,238
24,023 Dassault Systemes SE 1,404,078
6,299 Verisk Analytics Inc - Class A 1,365,042
4,633 Nice Ltd ADR 1,327,656
34,000 MediaTek Inc 1,306,926
1,813 Lam Research Corp 1,195,246
1,780 Netflix Inc 1,070,344
373 Alphabet Inc - Class A 1,048,978
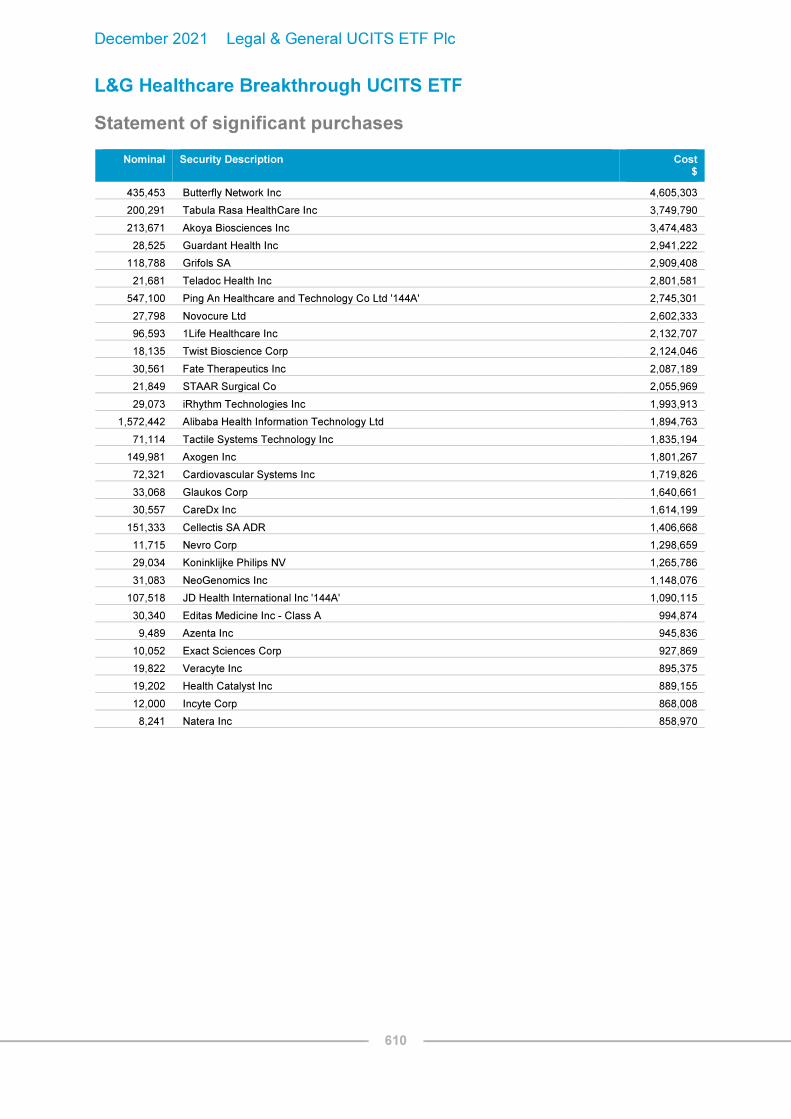
December 2021 Legal & General UCITS ETF Plc
610
L&G Healthcare Breakthrough UCITS ETF
Statement of significant purchases
Nominal Security Description Cost $
435,453 Butterfly Network Inc 4,605,303
200,291 Tabula Rasa HealthCare Inc 3,749,790
213,671 Akoya Biosciences Inc 3,474,483
28,525 Guardant Health Inc 2,941,222
118,788 Grifols SA 2,909,408
21,681 Teladoc Health Inc 2,801,581
547,100 Ping An Healthcare and Technology Co Ltd '144A' 2,745,301
27,798 Novocure Ltd 2,602,333
96,593 1Life Healthcare Inc 2,132,707
18,135 Twist Bioscience Corp 2,124,046
30,561 Fate Therapeutics Inc 2,087,189
21,849 STAAR Surgical Co 2,055,969
29,073 iRhythm Technologies Inc 1,993,913
1,572,442 Alibaba Health Information Technology Ltd 1,894,763
71,114 Tactile Systems Technology Inc 1,835,194
149,981 Axogen Inc 1,801,267
72,321 Cardiovascular Systems Inc 1,719,826
33,068 Glaukos Corp 1,640,661
30,557 CareDx Inc 1,614,199
151,333 Cellectis SA ADR 1,406,668
11,715 Nevro Corp 1,298,659
29,034 Koninklijke Philips NV 1,265,786
31,083 NeoGenomics Inc 1,148,076
107,518 JD Health International Inc '144A' 1,090,115
30,340 Editas Medicine Inc - Class A 994,874
9,489 Azenta Inc 945,836
10,052 Exact Sciences Corp 927,869
19,822 Veracyte Inc 895,375
19,202 Health Catalyst Inc 889,155
12,000 Incyte Corp 868,008
8,241 Natera Inc 858,970

December 2021 Legal & General UCITS ETF Plc
611
L&G Healthcare Breakthrough UCITS ETF
Statement of significant sales
Nominal Security Description Proceeds $
48,134 iRhythm Technologies Inc 4,952,530
68,905 Editas Medicine Inc - Class A 4,135,694
85,232 Invitae Corp 2,681,779
49,180 Vocera Communications Inc 2,625,719
88,499 CryoLife Inc 2,178,470
3,160 Thermo Fisher Scientific Inc 1,986,776
3,389 Dexcom Inc 1,892,203
11,250 Quidel Corp 1,743,633
60,606 Codexis Inc 1,698,788
33,670 Veracyte Inc 1,600,939
4,856 Danaher Corp 1,554,469
19,861 Siemens Healthineers AG '144A' 1,419,809
7,415 PerkinElmer Inc 1,390,477
7,723 Omnicell Inc 1,335,538
1,717 Bio-Rad Laboratories Inc 1,323,997
2,021 Regeneron Pharmaceuticals Inc 1,293,866
2,230 Intuitive Surgical Inc 1,209,034
4,318 Masimo Corp 1,201,837
5,267 DiaSorin SpA 1,191,623
1,398 Lonza Group AG 1,133,715
5,292 Medpace Holdings Inc 1,100,374
1,757 Tecan Group AG 1,066,485
7,839 Catalent Inc 1,045,331
13,464 Hologic Inc 1,042,090
7,165 Eurofins Scientific SE 1,021,163
10,873 Fulgent Genetics Inc 1,015,810
2,312 Charles River Laboratories International Inc 982,208
3,635 IQVIA Holdings Inc 966,898
6,413 Abbott Laboratories 855,296
7,083 Edwards Lifesciences Corp 851,533
2,411 ABIOMED Inc 838,394
125,230 Cerus Corp 829,409
3,847 Vertex Pharmaceuticals Inc 814,733
2,010 Roche Holding AG 811,629
6,826 Natera Inc 803,168
4,643 Agilent Technologies Inc 778,660
1,064 Align Technology Inc 724,751
4,254 Novanta Inc 712,460

December 2021 Legal & General UCITS ETF Plc
612
L&G Europe Equity (Responsible Exclusions) UCITS ETF
Statement of significant purchases
Nominal Security Description Cost €
11,910 Prosus NV 834,886
6,879 AstraZeneca Plc 662,915
55,160 Nordea Bank Abp 573,174
3,722 Nestle SA 410,686
23,719 Swedbank AB 395,424
904 Roche Holding AG 307,682
403 ASML Holding NV 284,756
17,269 Danske Bank A/S 242,707
16,747 Wise Plc - Class A 215,552
733 Linde Plc 202,866
2,075 Novo Nordisk A/S 196,589
2,467 Novartis AG 185,946
230 LVMH Moet Hennessy Louis Vuitton SE 159,963
58 AP Moller - Maersk A/S - Class B 154,803
3,113 Vonovia SE 154,763
1,481 Zalando SE '144A' 139,221
1,854 Just Eat Takeaway.com NV '144A' 138,130
1,078 SAP SE 132,461
7,095 Nexi SpA '144A' 128,341
7,441 Atlantia SpA 124,538

December 2021 Legal & General UCITS ETF Plc
613
L&G Europe Equity (Responsible Exclusions) UCITS ETF
Statement of significant sales
Nominal Security Description Proceeds €
39,399 Nestle SA 4,527,179
5,830 ASML Holding NV 4,135,673
9,399 Roche Holding AG 3,178,049
3,577 LVMH Moet Hennessy Louis Vuitton SE 2,546,325
30,006 Novartis AG 2,195,537
21,972 Novo Nordisk A/S 2,120,787
7,306 Linde Plc 2,118,107
20,001 AstraZeneca Plc 2,012,511
14,156 SAP SE 1,693,870
36,327 Unilever Plc 1,683,734
10,190 Siemens AG 1,559,532
32,740 Diageo Plc 1,486,871
286,020 HSBC Holdings Plc 1,483,538
15,109 Sanofi 1,329,385
3,216 L'Oreal SA 1,315,281
66,193 GlaxoSmithKline Plc 1,194,955
7,315 Schneider Electric SE 1,165,400
5,660 Allianz SE 1,144,749
107,553 Nordea Bank Abp 1,136,790
11,835 Daimler AG 1,048,729

December 2021 Legal & General UCITS ETF Plc
614
L&G US Equity (Responsible Exclusions) UCITS ETF
Statement of significant purchases
Nominal Security Description Cost $
11,655 Microsoft Corp 3,591,701
21,784 Apple Inc 3,266,335
861 Amazon.com Inc 2,934,595
71,336 Freeport-McMoRan Inc 2,501,628
2,793 Tesla Inc 2,301,238
23,199 ROBLOX Corp 2,208,998
7,026 Coinbase Global Inc 1,736,790
623 Alphabet Inc 1,736,687
77,680 Lucid Group Inc 1,693,248
4,796 Bill.com Holdings Inc 1,403,694
34,948 Weyerhaeuser Co (REIT) 1,385,128
7,801 Airbnb Inc 1,303,830
3,363 Meta Platforms Inc - Class A 1,152,513
24,968 AMC Entertainment Holdings Inc - Class A 1,145,862
12,587 Lennar Corp 1,049,085
3,877 NVIDIA Corp 999,228
3,438 Upstart Holdings Inc 970,023
314 Alphabet Inc - Class A 900,660
8,961 Affirm Holdings Inc 889,379
15,649 Nuance Communications Inc 864,580
Statement of significant sales
Nominal Security Description Proceeds $
67,635 Apple Inc 10,288,924
95,919 NextEra Energy Inc 8,801,245
27,130 Microsoft Corp 8,762,999
1,541 Amazon.com Inc 5,222,689
17,875 Sea Ltd ADR 3,975,551
1,269 Alphabet Inc 3,701,185
1,048 Alphabet Inc - Class A 3,056,524
9,347 Meta Platforms Inc - Class A 2,996,242
2,808 Tesla Inc 2,881,041
14,760 JPMorgan Chase & Co 2,421,634
8,389 NVIDIA Corp 2,092,528
45,312 Bank of America Corp 2,053,537
10,521 Alexion Pharmaceuticals Inc/MA 1,917,827
6,080 Berkshire Hathaway Inc - Class B 1,759,100
4,322 Home Depot Inc/The 1,614,111
3,461 UnitedHealth Group Inc 1,573,088
9,332 Johnson & Johnson 1,538,789
6,776 Visa Inc - Class A 1,462,929
1,958 Charter Communications Inc 1,459,079
9,363 Procter & Gamble Co/The 1,352,800
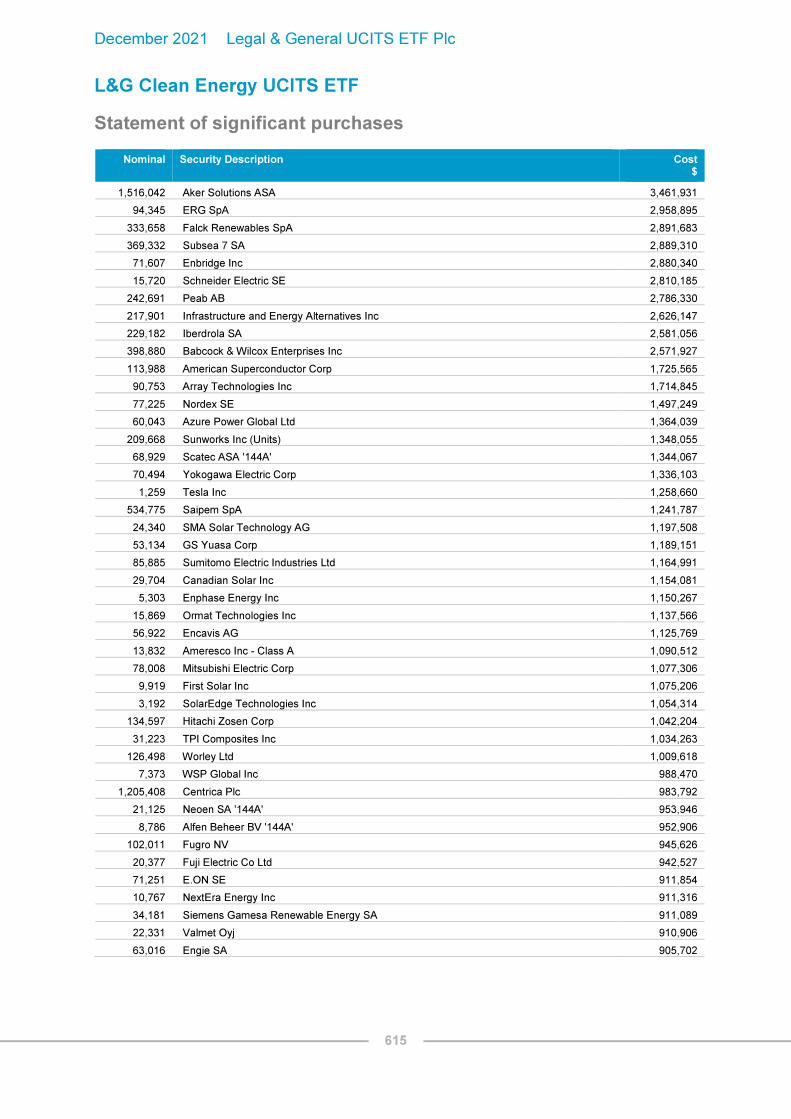
December 2021 Legal & General UCITS ETF Plc
615
L&G Clean Energy UCITS ETF
Statement of significant purchases
Nominal Security Description Cost $
1,516,042 Aker Solutions ASA 3,461,931
94,345 ERG SpA 2,958,895
333,658 Falck Renewables SpA 2,891,683
369,332 Subsea 7 SA 2,889,310
71,607 Enbridge Inc 2,880,340
15,720 Schneider Electric SE 2,810,185
242,691 Peab AB 2,786,330
217,901 Infrastructure and Energy Alternatives Inc 2,626,147
229,182 Iberdrola SA 2,581,056
398,880 Babcock & Wilcox Enterprises Inc 2,571,927
113,988 American Superconductor Corp 1,725,565
90,753 Array Technologies Inc 1,714,845
77,225 Nordex SE 1,497,249
60,043 Azure Power Global Ltd 1,364,039
209,668 Sunworks Inc (Units) 1,348,055
68,929 Scatec ASA '144A' 1,344,067
70,494 Yokogawa Electric Corp 1,336,103
1,259 Tesla Inc 1,258,660
534,775 Saipem SpA 1,241,787
24,340 SMA Solar Technology AG 1,197,508
53,134 GS Yuasa Corp 1,189,151
85,885 Sumitomo Electric Industries Ltd 1,164,991
29,704 Canadian Solar Inc 1,154,081
5,303 Enphase Energy Inc 1,150,267
15,869 Ormat Technologies Inc 1,137,566
56,922 Encavis AG 1,125,769
13,832 Ameresco Inc - Class A 1,090,512
78,008 Mitsubishi Electric Corp 1,077,306
9,919 First Solar Inc 1,075,206
3,192 SolarEdge Technologies Inc 1,054,314
134,597 Hitachi Zosen Corp 1,042,204
31,223 TPI Composites Inc 1,034,263
126,498 Worley Ltd 1,009,618
7,373 WSP Global Inc 988,470
1,205,408 Centrica Plc 983,792
21,125 Neoen SA '144A' 953,946
8,786 Alfen Beheer BV '144A' 952,906
102,011 Fugro NV 945,626
20,377 Fuji Electric Co Ltd 942,527
71,251 E.ON SE 911,854
10,767 NextEra Energy Inc 911,316
34,181 Siemens Gamesa Renewable Energy SA 911,089
22,331 Valmet Oyj 910,906
63,016 Engie SA 905,702
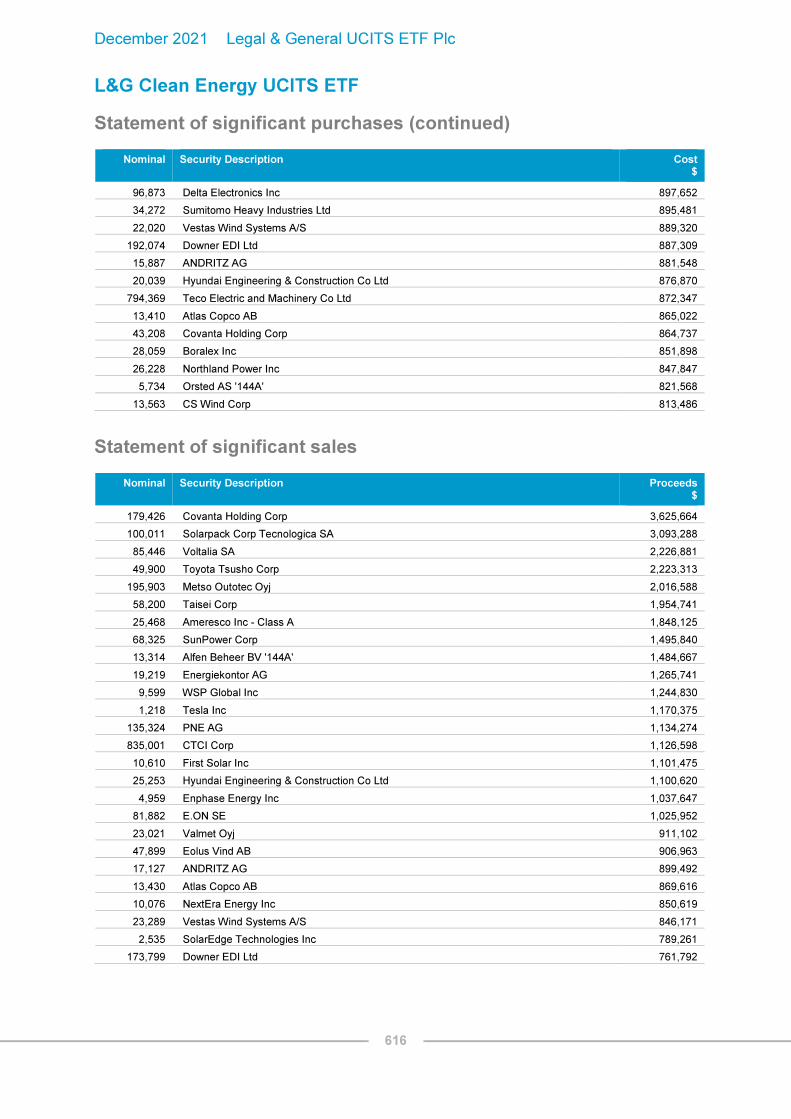
December 2021 Legal & General UCITS ETF Plc
616
L&G Clean Energy UCITS ETF
Statement of significant purchases (continued)
Nominal Security Description Cost $
96,873 Delta Electronics Inc 897,652
34,272 Sumitomo Heavy Industries Ltd 895,481
22,020 Vestas Wind Systems A/S 889,320
192,074 Downer EDI Ltd 887,309
15,887 ANDRITZ AG 881,548
20,039 Hyundai Engineering & Construction Co Ltd 876,870
794,369 Teco Electric and Machinery Co Ltd 872,347
13,410 Atlas Copco AB 865,022
43,208 Covanta Holding Corp 864,737
28,059 Boralex Inc 851,898
26,228 Northland Power Inc 847,847
5,734 Orsted AS '144A' 821,568
13,563 CS Wind Corp 813,486
Statement of significant sales
Nominal Security Description Proceeds $
179,426 Covanta Holding Corp 3,625,664
100,011 Solarpack Corp Tecnologica SA 3,093,288
85,446 Voltalia SA 2,226,881
49,900 Toyota Tsusho Corp 2,223,313
195,903 Metso Outotec Oyj 2,016,588
58,200 Taisei Corp 1,954,741
25,468 Ameresco Inc - Class A 1,848,125
68,325 SunPower Corp 1,495,840
13,314 Alfen Beheer BV '144A' 1,484,667
19,219 Energiekontor AG 1,265,741
9,599 WSP Global Inc 1,244,830
1,218 Tesla Inc 1,170,375
135,324 PNE AG 1,134,274
835,001 CTCI Corp 1,126,598
10,610 First Solar Inc 1,101,475
25,253 Hyundai Engineering & Construction Co Ltd 1,100,620
4,959 Enphase Energy Inc 1,037,647
81,882 E.ON SE 1,025,952
23,021 Valmet Oyj 911,102
47,899 Eolus Vind AB 906,963
17,127 ANDRITZ AG 899,492
13,430 Atlas Copco AB 869,616
10,076 NextEra Energy Inc 850,619
23,289 Vestas Wind Systems A/S 846,171
2,535 SolarEdge Technologies Inc 789,261
173,799 Downer EDI Ltd 761,792

December 2021 Legal & General UCITS ETF Plc
617
L&G Clean Energy UCITS ETF
Statement of significant sales (continued)
Nominal Security Description Proceeds $
13,800 Fuji Electric Co Ltd 704,677
37,360 Nordex SE 658,384
246,365 Aker Solutions ASA 649,418
11,845 CS Wind Corp 640,162
65,033 Babcock & Wilcox Enterprises Inc 591,738
661,312 Centrica Plc 562,277

December 2021 Legal & General UCITS ETF Plc
618
L&G ESG GBP Corporate Bond 0-5 Year UCITS ETF
Statement of significant purchases
Nominal Security Description Interest Rate
Maturity Date
Cost £
813,000 RAC Bond Co Plc 'EMTN' 4.87% 06/05/2026 896,466
850,000 Bank of Montreal 'EMTN' 1.00% 09/09/2026 834,377
830,000 Royal Bank of Canada 'EMTN' 1.00% 09/09/2026 820,506
600,000 Unilever Plc 1.50% 22/07/2026 625,593
564,000 Rothesay Life Plc 3.38% 12/07/2026 603,723
500,000 Barclays Plc 'EMTN' 3.00% 08/05/2026 538,093
500,000 AT&T Inc 2.90% 04/12/2026 527,725
500,000 Banque Federative du Credit Mutuel SA 'EMTN' 1.00% 16/07/2026 492,710
400,000 Scentre Group Trust 1 'EMTN' 3.88% 16/07/2026 448,303
420,000 United Kingdom Gilt 2.75% 07/09/2024 445,610
400,000 Western Power Distribution Plc 3.63% 06/11/2023 421,072
400,000 NatWest Group Plc 'EMTN' FRN 2.88% 19/09/2026 418,778
400,000 Phoenix Group Holdings Plc 'EMTN' 4.13% 20/07/2022 411,395
400,000 Scentre Group Trust 1 / Scentre Group Trust 2 'EMTN' 2.38% 08/04/2022 403,592
400,000 OP Corporate Bank plc 'GMTN' 1.38% 04/09/2026 397,153
300,000 Gatwick Funding Ltd 'EMTN' 6.13% 02/03/2026 348,333
300,000 BUPA Finance Plc 5.00% 08/12/2026 339,498
300,000 Volkswagen Financial Services NV 'EMTN' 4.25% 09/10/2025 333,957
300,000 Western Power Distribution Plc 3.50% 16/10/2026 325,902
300,000 Verizon Communications Inc 4.07% 18/06/2024 323,544
300,000 Western Power Distribution West Midlands Plc 'EMTN' 3.88% 17/10/2024 323,052
300,000 AA Bond Co Ltd 'EMTN' 4.88% 31/07/2024 318,054
309,000 InterContinental Hotels Group Plc 'EMTN' 2.13% 24/08/2026 316,586
300,000 Virgin Money UK Plc 'GMTN' FRN 3.13% 22/06/2025 313,272
300,000 Virgin Money UK Plc 'GMTN' FRN 3.38% 24/04/2026 311,871
300,000 Santander UK Group Holdings Plc 'EMTN' FRN 2.92% 08/05/2026 311,373
300,000 Diageo Finance Plc 'EMTN' 1.75% 12/10/2026 309,690
300,000 Cooperatieve Rabobank UA 'GMTN' 2.25% 23/03/2022 304,190
300,000 Wells Fargo & Co 'EMTN' 1.38% 30/06/2022 301,198
300,000 Barclays Plc FRN 1.70% 03/11/2026 300,075
300,000 Macquarie Bank Ltd 'EMTN' 1.13% 15/12/2025 296,508
257,000 Thames Water Utilities Finance Plc 'EMTN' 4.00% 19/06/2025 282,412
250,000 American Honda Finance Corp 0.75% 25/11/2026 243,158
238,000 Henkel AG & Co KGaA 'EMTN' 0.88% 13/09/2022 238,277
200,000 America Movil SAB de CV 5.00% 27/10/2026 233,326
200,000 Telefonica Emisiones SA 'EMTN' 5.38% 02/02/2026 231,512
230,000 New York Life Global Funding 'GMTN' 1.25% 17/12/2026 228,266
200,000 Gatwick Funding Ltd 'EMTN' 5.25% 23/01/2024 219,750
200,000 JPMorgan Chase & Co 'EMTN' 3.50% 18/12/2026 219,564
200,000 Volkswagen International Finance NV 3.38% 16/11/2026 215,718
200,000 London & Quadrant Housing Trust 2.63% 05/05/2026 215,092

December 2021 Legal & General UCITS ETF Plc
619
L&G ESG GBP Corporate Bond 0-5 Year UCITS ETF
Statement of significant sales
Nominal Security Description Interest Rate
Maturity Date
Proceeds £
660,000 BUPA Finance Plc 5.00% 25/04/2023 701,691
600,000 Unilever Plc 1.50% 22/07/2026 615,743
520,000 Deutsche Telekom International Finance BV 'EMTN' 6.50% 08/04/2022 528,450
400,000 Scentre Group Trust 1 'EMTN' 3.88% 16/07/2026 437,432
400,000 Scottish Widows Ltd 5.50% 16/06/2023 424,064
400,000 Lloyds Banking Group Plc 'EMTN' 2.25% 16/10/2024 413,614
330,000 Anheuser-Busch InBev SA/NV 'EMTN' 9.75% 30/07/2024 408,843
400,000 United Utilities Water Ltd 'EMTN' 5.75% 25/03/2022 408,290
400,000 BNP Paribas SA 'EMTN' FRN 2.00% 24/05/2031 404,284
400,000 ABN AMRO Bank NV 'EMTN' 1.38% 07/06/2022 402,639
400,000 Scentre Group Trust 1 / Scentre Group Trust 2 'EMTN' 2.38% 08/04/2022 402,320
390,000 Svenska Handelsbanken AB 'EMTN' 2.38% 18/01/2022 390,421
370,000 Bank of Montreal 'EMTN' 1.38% 29/12/2021 371,558
320,000 National Australia Bank Ltd 'GMTN' 1.38% 27/06/2022 323,000
300,000 Friends Life Holdings Plc 8.25% 21/04/2022 306,765
300,000 Banque Federative du Credit Mutuel SA 'EMTN' 1.38% 20/12/2021 301,013
300,000 Metropolitan Life Global Funding I 'GMTN' 1.13% 15/12/2021 300,753
250,000 Wells Fargo & Co 'EMTN' 1.38% 30/06/2022 250,975
240,000 Toyota Motor Finance Netherlands BV 'EMTN' 1.38% 23/05/2023 244,540
215,000 United Kingdom Gilt 2.75% 07/09/2024 228,031
220,000 Tesco Plc 'EMTN' 6.13% 24/02/2022 223,852
200,000 Experian Finance Plc 'EMTN' 2.13% 27/09/2024 205,220
208,000 First Abu Dhabi Bank PJSC 'EMTN' 1.13% 07/09/2026 204,903
200,000 Lloyds Bank Corporate Markets Plc 'EMTN' 1.75% 11/07/2024 204,241
200,000 Lloyds Bank Corporate Markets Plc 'EMTN' 1.50% 23/06/2023 203,000
200,000 National Australia Bank Ltd 'GMTN' 5.13% 09/12/2021 202,644
200,000 ABN AMRO Bank NV 'EMTN' 1.38% 16/01/2025 202,305
200,000 Wells Fargo & Co 'EMTN' 2.13% 22/04/2022 202,114
200,000 Deutsche Bank AG 1.75% 16/12/2021 200,282
200,000 AA Bond Co Ltd 'EMTN' 2.88% 31/01/2022 200,000
200,000 Coventry Building Society 'EMTN' 1.00% 21/09/2025 199,079
150,000 Coventry Building Society 'EMTN' 5.88% 28/09/2022 159,185
150,000 Coventry Building Society 'EMTN' 1.50% 23/01/2023 152,038
140,000 Daimler International Finance BV 'EMTN' 1.50% 13/01/2022 140,448
130,000 Experian Finance Plc 'EMTN' 3.50% 15/10/2021 130,000
100,000 Telefonica Emisiones SA 'EMTN' 5.38% 02/02/2026 118,362
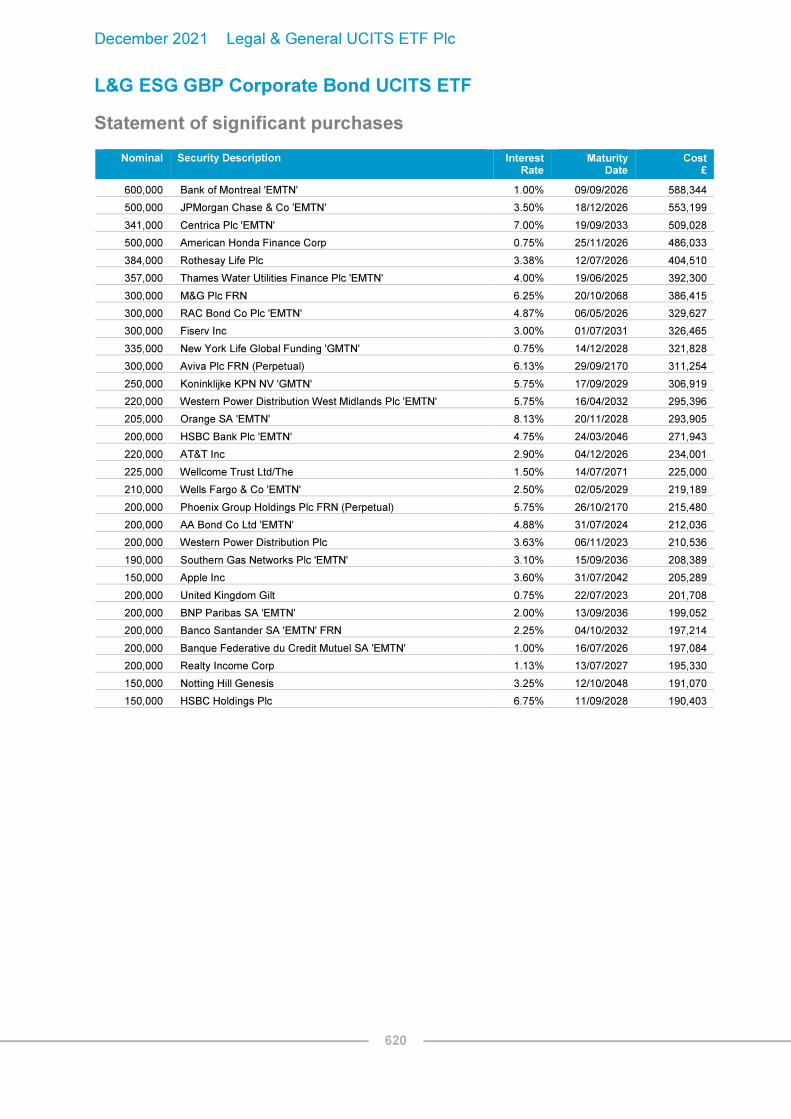
December 2021 Legal & General UCITS ETF Plc
620
L&G ESG GBP Corporate Bond UCITS ETF
Statement of significant purchases
Nominal Security Description Interest Rate
Maturity Date
Cost £
600,000 Bank of Montreal 'EMTN' 1.00% 09/09/2026 588,344
500,000 JPMorgan Chase & Co 'EMTN' 3.50% 18/12/2026 553,199
341,000 Centrica Plc 'EMTN' 7.00% 19/09/2033 509,028
500,000 American Honda Finance Corp 0.75% 25/11/2026 486,033
384,000 Rothesay Life Plc 3.38% 12/07/2026 404,510
357,000 Thames Water Utilities Finance Plc 'EMTN' 4.00% 19/06/2025 392,300
300,000 M&G Plc FRN 6.25% 20/10/2068 386,415
300,000 RAC Bond Co Plc 'EMTN' 4.87% 06/05/2026 329,627
300,000 Fiserv Inc 3.00% 01/07/2031 326,465
335,000 New York Life Global Funding 'GMTN' 0.75% 14/12/2028 321,828
300,000 Aviva Plc FRN (Perpetual) 6.13% 29/09/2170 311,254
250,000 Koninklijke KPN NV 'GMTN' 5.75% 17/09/2029 306,919
220,000 Western Power Distribution West Midlands Plc 'EMTN' 5.75% 16/04/2032 295,396
205,000 Orange SA 'EMTN' 8.13% 20/11/2028 293,905
200,000 HSBC Bank Plc 'EMTN' 4.75% 24/03/2046 271,943
220,000 AT&T Inc 2.90% 04/12/2026 234,001
225,000 Wellcome Trust Ltd/The 1.50% 14/07/2071 225,000
210,000 Wells Fargo & Co 'EMTN' 2.50% 02/05/2029 219,189
200,000 Phoenix Group Holdings Plc FRN (Perpetual) 5.75% 26/10/2170 215,480
200,000 AA Bond Co Ltd 'EMTN' 4.88% 31/07/2024 212,036
200,000 Western Power Distribution Plc 3.63% 06/11/2023 210,536
190,000 Southern Gas Networks Plc 'EMTN' 3.10% 15/09/2036 208,389
150,000 Apple Inc 3.60% 31/07/2042 205,289
200,000 United Kingdom Gilt 0.75% 22/07/2023 201,708
200,000 BNP Paribas SA 'EMTN' 2.00% 13/09/2036 199,052
200,000 Banco Santander SA 'EMTN' FRN 2.25% 04/10/2032 197,214
200,000 Banque Federative du Credit Mutuel SA 'EMTN' 1.00% 16/07/2026 197,084
200,000 Realty Income Corp 1.13% 13/07/2027 195,330
150,000 Notting Hill Genesis 3.25% 12/10/2048 191,070
150,000 HSBC Holdings Plc 6.75% 11/09/2028 190,403

December 2021 Legal & General UCITS ETF Plc
621
L&G ESG GBP Corporate Bond UCITS ETF
Statement of significant sales
Nominal Security Description Interest Rate
Maturity Date
Proceeds £
200,000 THFC Funding No 2 Plc 'EMTN' 6.35% 08/07/2039 321,033
210,000 University of Oxford 2.54% 08/12/2117 257,626
225,000 Wellcome Trust Ltd/The 1.50% 14/07/2071 235,796
200,000 RSA Insurance Group Ltd FRN 5.13% 10/10/2045 228,890
210,000 NGG Finance Plc FRN 5.63% 18/06/2073 228,113
120,000 Wellcome Trust Ltd/The 4.00% 09/05/2059 216,799
200,000 Friends Life Holdings Plc 8.25% 21/04/2022 208,458
200,000 Toyota Motor Finance Netherlands BV 'EMTN' 1.38% 23/05/2023 203,812
200,000 National Australia Bank Ltd 'GMTN' 1.38% 27/06/2022 201,890
200,000 United Kingdom Gilt 0.75% 22/07/2023 201,518
130,000 Wellcome Trust Ltd/The 2.52% 07/02/2118 179,958
100,000 Sanctuary Capital Plc 6.70% 23/03/2039 168,147
150,000 Deutsche Telekom International Finance BV 'EMTN' 6.50% 08/04/2022 153,857
130,000 Legal & General Group Plc 'EMTN' FRN 5.38% 27/10/2045 148,151
100,000 Wellcome Trust Finance Plc 4.63% 25/07/2036 147,368
100,000 Thames Water Utilities Finance Plc 'EMTN' 4.63% 04/06/2046 141,685
70,000 Lloyds Bank Plc 'EMTN' 6.50% 17/09/2040 117,011
100,000 Lloyds Bank Plc 'EMTN' 7.50% 15/04/2024 116,599
100,000 Eastern Power Networks Plc 'EMTN' 5.75% 08/03/2024 113,295
100,000 Yorkshire Water Finance Plc 'EMTN' 2.75% 18/04/2041 113,052
100,000 Nationwide Building Society 'EMTN' 3.25% 20/01/2028 111,860
100,000 Scentre Group Trust 1 'EMTN' 3.88% 16/07/2026 109,358
100,000 Aroundtown SA 'EMTN' 3.25% 18/07/2027 109,250
80,000 Thames Water Utilities Finance Plc 'EMTN' 6.75% 16/11/2028 108,162
100,000 BUPA Finance Plc 5.00% 25/04/2023 106,940
100,000 Vodafone Group Plc 'EMTN' 3.00% 12/08/2056 102,814
100,000 Credit Suisse Group Funding Guernsey Ltd 3.00% 27/05/2022 101,251
100,000 Coventry Building Society 'EMTN' 2.00% 20/12/2030 98,712
70,000 Vodafone Group Plc 'EMTN' 5.90% 26/11/2032 97,453
75,000 United Utilities Water Ltd 'EMTN' 5.75% 25/03/2022 77,187
70,000 Cooperatieve Rabobank UA 'GMTN' 2.25% 23/03/2022 70,794
60,000 Daimler International Finance BV 'EMTN' 2.13% 07/06/2022 60,762

December 2021 Legal & General UCITS ETF Plc
622
L&G ESG Emerging Markets Government Bond (USD) 0-5 Year UCITS ETF
Statement of significant purchases
Nominal Security Description Interest Rate
Maturity Date
Cost $
685,000 Uruguay Government International Bond 4.38% 27/10/2027 783,283
400,000 Southern Gas Corridor CJSC 'REGS' 6.88% 24/03/2026 468,080
400,000 Qatar Government International Bond 'REGS' 3.25% 02/06/2026 436,400
400,000 Republic of Poland Government International Bond 3.25% 06/04/2026 430,105
400,000 Saudi Government International Bond 'REGS' 3.25% 26/10/2026 429,202
400,000 Egypt Government International Bond 'REGS' 5.75% 29/05/2024 415,920
325,000 Trinidad & Tobago Government International Bond 'REGS' 4.50% 04/08/2026 350,009
300,000 Croatia Government International Bond 'REGS' 5.50% 04/04/2023 325,152
300,000 Sharjah Sukuk Program Ltd 'EMTN' 3.85% 03/04/2026 321,900
260,000 Trinidad Petroleum Holdings Ltd 'REGS' 9.75% 15/06/2026 291,938
270,000 Republic of Poland Government International Bond 4.00% 22/01/2024 286,286
250,000 Ukraine Government International Bond 'REGS' 8.99% 01/02/2024 276,538
250,000 Malaysia Sukuk Global Bhd 'REGS' 3.18% 27/04/2026 274,090
250,000 Republic of Azerbaijan International Bond 'REGS' 4.75% 18/03/2024 264,700
225,000 Ukraine Government International Bond 'REGS' 7.75% 01/09/2026 247,237
200,000 Mexico Government International Bond 4.13% 21/01/2026 225,560
200,000 Indonesia Government International Bond 'REGS' 5.88% 15/01/2024 223,400
200,000 Republic of Kenya Government International Bond 'REGS' 6.88% 24/06/2024 220,250
200,000 Gtlk Europe Capital DAC 5.95% 17/04/2025 219,660
200,000 Oil and Gas Holding Co BSCC/The 'REGS' 7.63% 07/11/2024 219,400
200,000 Pelabuhan Indonesia II PT 'REGS' 4.25% 05/05/2025 218,750
200,000 Kazakhstan Government International Bond 'REGS' 3.88% 14/10/2024 218,250
200,000 Republic of South Africa Government International Bond 4.88% 14/04/2026 217,480
200,000 Emirates Development Bank PJSC 'EMTN' 3.52% 06/03/2024 214,000
200,000 Mexico Government International Bond 4.00% 02/10/2023 213,972
200,000 Chile Government International Bond 3.13% 21/01/2026 213,220
200,000 DAE Sukuk Difc Ltd 'REGS' 3.75% 15/02/2026 213,150
200,000 Empresa Nacional del Petroleo 'REGS' 3.75% 05/08/2026 212,036
200,000 Guatemala Government Bond 'REGS' 4.50% 03/05/2026 210,400
200,000 Mongolia Government International Bond 'REGS' 5.13% 07/04/2026 210,198
200,000 Qatar Government International Bond 'REGS' 3.38% 14/03/2024 210,100
190,000 Hungary Government International Bond 5.75% 22/11/2023 208,851
200,000 Morocco Government International Bond 'REGS' 4.25% 11/12/2022 208,000
200,000 Jordan Government International Bond 'REGS' 4.95% 07/07/2025 206,744
200,000 Development Bank of Kazakhstan JSC 'REGS' 4.13% 10/12/2022 206,380
200,000 Georgia Government International Bond 'REGS' 2.75% 22/04/2026 204,100
200,000 Costa Rica Government International Bond 'REGS' 4.25% 26/01/2023 204,080
200,000 KSA Sukuk Ltd 'REGS' 2.89% 20/04/2022 203,300
200,000 Maldives Sukuk Issuance Ltd 'REGS' 9.88% 08/04/2026 202,800
200,000 Oman Government International Bond 'REGS' 3.88% 08/03/2022 202,400
200,000 Qatar Energy 'REGS' 1.38% 12/09/2026 198,750
200,000 State Grid Overseas Investment BVI Ltd 1.13% 08/09/2026 196,416
250,000 Zambia Government International Bond 'REGS' 0.00% 30/07/2027 195,600
200,000 Ghana Government International Bond 'REGS' 7.88% 26/03/2027 195,440
200,000 Turkey Government International Bond 4.88% 09/10/2026 193,440

December 2021 Legal & General UCITS ETF Plc
623
L&G ESG Emerging Markets Government Bond (USD) 0-5 Year UCITS ETF
Statement of significant purchases (continued)
Nominal Security Description Interest Rate
Maturity Date
Cost $
300,000 Sri Lanka Government International Bond 'REGS' 6.83% 18/07/2026 191,625
175,000 Brazil Minas SPE via State of Minas Gerais 'REGS' 5.33% 15/02/2028 189,788
200,000 NPC Ukrenergo 'REGS' 6.88% 09/11/2026 188,000
180,000 Republic of Poland Government International Bond 3.00% 17/03/2023 185,504
200,000 Ghana Government International Bond 'REGS' (Zero Coupon) 0.00% 07/04/2025 160,000
150,000 Republic of Poland Government International Bond 5.00% 23/03/2022 154,650
125,000 Power Sector Assets & Liabilities Management Corp 'REGS' 7.39% 02/12/2024 151,781
200,000 Suriname Government International Bond 'REGS' 0.00% 26/10/2026 149,200
Statement of significant sales
Nominal Security Description Interest Rate
Maturity Date
Proceeds $
806,000 Romanian Government International Bond 'REGS' 6.75% 07/02/2022 818,823
600,000 Oman Government International Bond 'REGS' 3.88% 08/03/2022 605,352
420,000 Petronas Capital Ltd 'REGS' 3.50% 18/03/2025 455,242
445,000 Republic of Poland Government International Bond 5.00% 23/03/2022 451,101
400,000 Gabon Government International Bond 'REGS' 6.38% 12/12/2024 427,394
400,000 Lithuania Government International Bond 'REGS' 6.63% 01/02/2022 408,040
275,000 Southern Gas Corridor CJSC 'REGS' 6.88% 24/03/2026 327,113
300,000 DAE Funding LLC 'REGS' 5.00% 01/08/2024 307,458
300,000 Egypt Government International Bond 'REGS' 6.13% 31/01/2022 302,610
300,000 Banco del Estado de Chile 'REGS' 3.88% 08/02/2022 301,920
250,000 Oman Sovereign Sukuk Co 'REGS' 5.93% 31/10/2025 275,975
240,000 State Oil Co of the Azerbaijan Republic 'EMTN' 4.75% 13/03/2023 255,254
200,000 Power Sector Assets & Liabilities Management Corp 'REGS' 7.39% 02/12/2024 243,271
240,000 State Grid Overseas Investment BVI Ltd 'REGS' 2.75% 04/05/2022 241,486
215,000 Qatar Government International Bond 'REGS' 3.40% 16/04/2025 231,607
200,000 KazMunayGas National Co JSC 'REGS' 4.75% 24/04/2025 224,286
200,000 Corp Nacional del Cobre de Chile 'REGS' 4.50% 16/09/2025 221,642
200,000 Panama Government International Bond 3.75% 16/03/2025 218,089
200,000 Pertamina Persero PT 'REGS' 4.30% 20/05/2023 212,622
200,000 Mongolia Government International Bond 'REGS' 5.63% 01/05/2023 211,167
200,000 Mongolia Government International Bond 'REGS' 5.13% 05/12/2022 209,730
200,000 Oman Government International Bond 'REGS' 4.13% 17/01/2023 205,550
200,000 Abu Dhabi Government International Bond 'REGS' 2.50% 11/10/2022 205,279
200,000 Indonesia Government International Bond 'REGS' 3.75% 25/04/2022 204,400
200,000 KSA Sukuk Ltd 'REGS' 2.89% 20/04/2022 201,760
200,000 Instituto Costarricense de Electricidad 'REGS' 6.95% 10/11/2021 200,000
176,000 Hungary Government International Bond 5.38% 25/03/2024 198,409
175,000 Turkey Government International Bond 7.38% 05/02/2025 189,794
200,000 Banque Centrale de Tunisie International Bond 'REGS' 5.75% 30/01/2025 183,171
200,000 Ghana Government International Bond '144A' 7.88% 26/03/2027 177,020
130,000 Ukraine Government International Bond 'REGS' 7.75% 01/09/2022 131,404
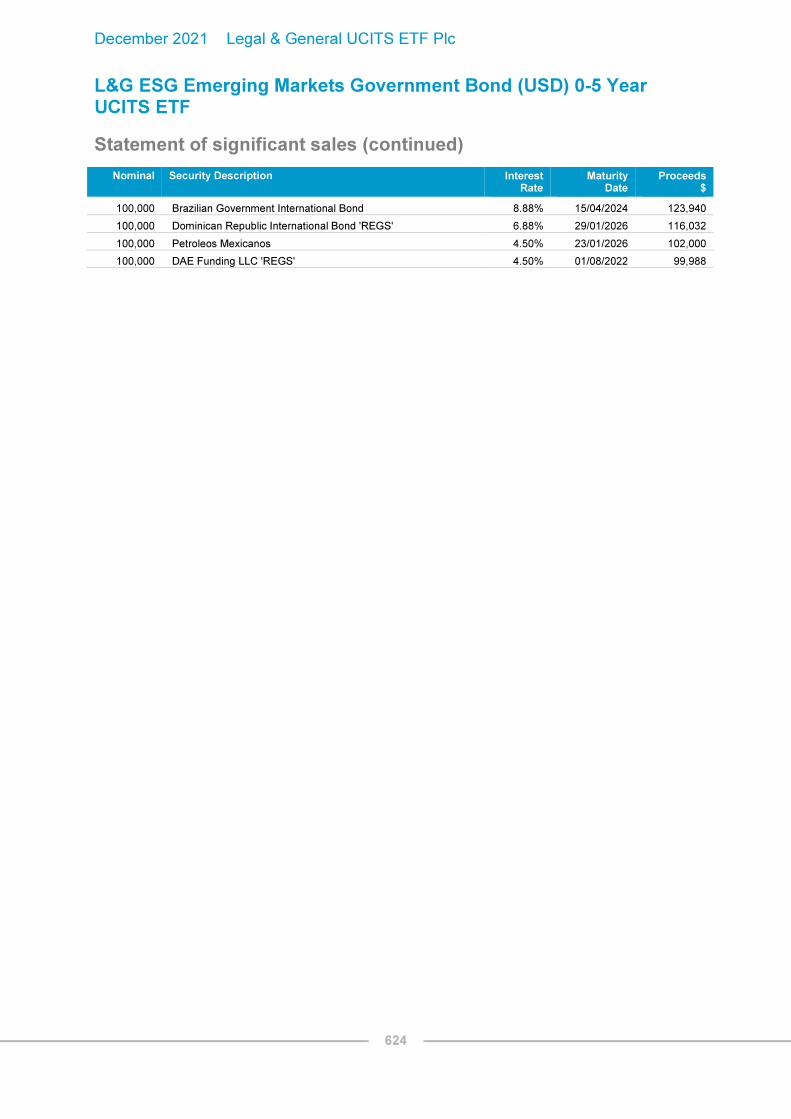
December 2021 Legal & General UCITS ETF Plc
624
L&G ESG Emerging Markets Government Bond (USD) 0-5 Year UCITS ETF
Statement of significant sales (continued)
Nominal Security Description Interest Rate
Maturity Date
Proceeds $
100,000 Brazilian Government International Bond 8.88% 15/04/2024 123,940
100,000 Dominican Republic International Bond 'REGS' 6.88% 29/01/2026 116,032
100,000 Petroleos Mexicanos 4.50% 23/01/2026 102,000
100,000 DAE Funding LLC 'REGS' 4.50% 01/08/2022 99,988
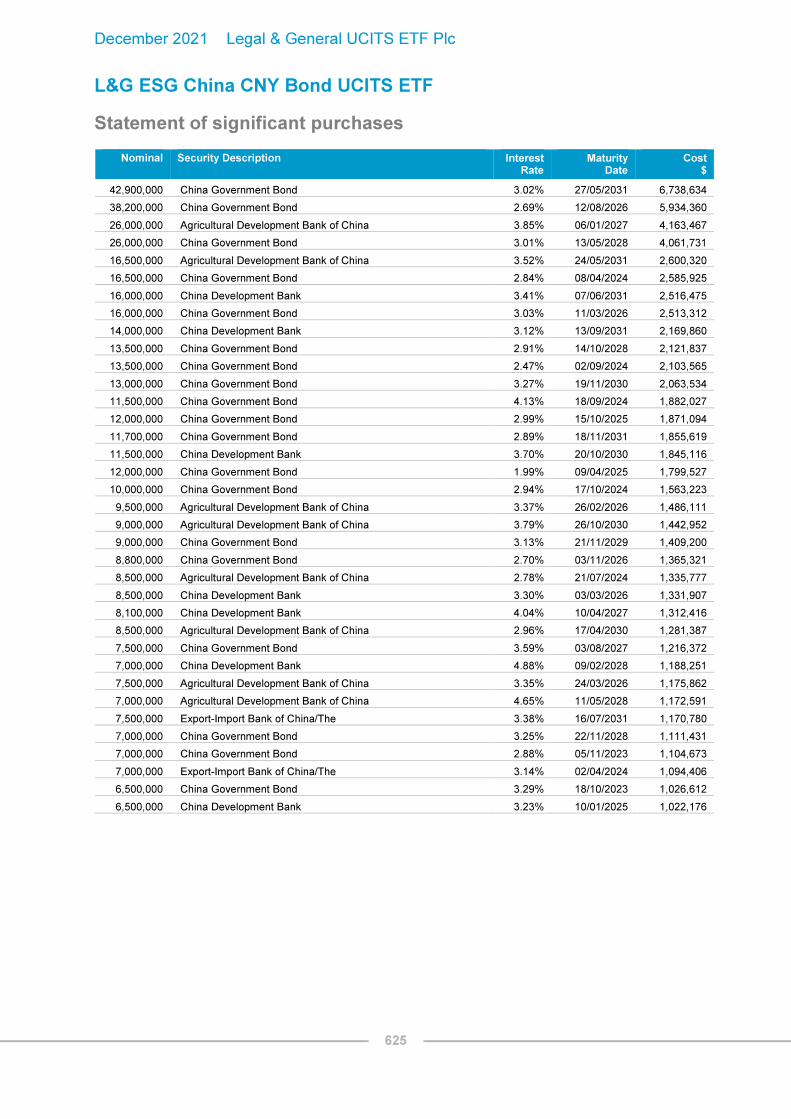
December 2021 Legal & General UCITS ETF Plc
625
L&G ESG China CNY Bond UCITS ETF
Statement of significant purchases
Nominal Security Description Interest Rate
Maturity Date
Cost $
42,900,000 China Government Bond 3.02% 27/05/2031 6,738,634
38,200,000 China Government Bond 2.69% 12/08/2026 5,934,360
26,000,000 Agricultural Development Bank of China 3.85% 06/01/2027 4,163,467
26,000,000 China Government Bond 3.01% 13/05/2028 4,061,731
16,500,000 Agricultural Development Bank of China 3.52% 24/05/2031 2,600,320
16,500,000 China Government Bond 2.84% 08/04/2024 2,585,925
16,000,000 China Development Bank 3.41% 07/06/2031 2,516,475
16,000,000 China Government Bond 3.03% 11/03/2026 2,513,312
14,000,000 China Development Bank 3.12% 13/09/2031 2,169,860
13,500,000 China Government Bond 2.91% 14/10/2028 2,121,837
13,500,000 China Government Bond 2.47% 02/09/2024 2,103,565
13,000,000 China Government Bond 3.27% 19/11/2030 2,063,534
11,500,000 China Government Bond 4.13% 18/09/2024 1,882,027
12,000,000 China Government Bond 2.99% 15/10/2025 1,871,094
11,700,000 China Government Bond 2.89% 18/11/2031 1,855,619
11,500,000 China Development Bank 3.70% 20/10/2030 1,845,116
12,000,000 China Government Bond 1.99% 09/04/2025 1,799,527
10,000,000 China Government Bond 2.94% 17/10/2024 1,563,223
9,500,000 Agricultural Development Bank of China 3.37% 26/02/2026 1,486,111
9,000,000 Agricultural Development Bank of China 3.79% 26/10/2030 1,442,952
9,000,000 China Government Bond 3.13% 21/11/2029 1,409,200
8,800,000 China Government Bond 2.70% 03/11/2026 1,365,321
8,500,000 Agricultural Development Bank of China 2.78% 21/07/2024 1,335,777
8,500,000 China Development Bank 3.30% 03/03/2026 1,331,907
8,100,000 China Development Bank 4.04% 10/04/2027 1,312,416
8,500,000 Agricultural Development Bank of China 2.96% 17/04/2030 1,281,387
7,500,000 China Government Bond 3.59% 03/08/2027 1,216,372
7,000,000 China Development Bank 4.88% 09/02/2028 1,188,251
7,500,000 Agricultural Development Bank of China 3.35% 24/03/2026 1,175,862
7,000,000 Agricultural Development Bank of China 4.65% 11/05/2028 1,172,591
7,500,000 Export-Import Bank of China/The 3.38% 16/07/2031 1,170,780
7,000,000 China Government Bond 3.25% 22/11/2028 1,111,431
7,000,000 China Government Bond 2.88% 05/11/2023 1,104,673
7,000,000 Export-Import Bank of China/The 3.14% 02/04/2024 1,094,406
6,500,000 China Government Bond 3.29% 18/10/2023 1,026,612
6,500,000 China Development Bank 3.23% 10/01/2025 1,022,176

December 2021 Legal & General UCITS ETF Plc
626
L&G ESG China CNY Bond UCITS ETF
Statement of significant sales
Nominal Security Description Interest Rate
Maturity Date
Proceeds $
31,000,000 Agricultural Development Bank of China 3.85% 06/01/2027 4,996,838
30,000,000 China Government Bond 3.12% 05/12/2026 4,792,910
30,000,000 China Government Bond 3.02% 27/05/2031 4,746,563
27,000,000 China Government Bond 2.88% 05/11/2023 4,269,172
26,000,000 China Government Bond 3.27% 19/11/2030 4,207,167
26,000,000 China Government Bond 3.28% 03/12/2027 4,196,222
27,000,000 China Government Bond 2.68% 21/05/2030 4,153,957
26,000,000 China Government Bond 3.02% 22/10/2025 4,132,771
25,500,000 China Government Bond 3.29% 23/05/2029 4,104,481
25,000,000 China Government Bond 2.85% 04/06/2027 3,936,939
24,750,000 China Government Bond 2.69% 07/03/2022 3,839,913
24,000,000 China Government Bond 3.47% 13/07/2022 3,794,591
24,000,000 China Government Bond 1.99% 09/04/2025 3,686,899
23,000,000 China Government Bond 3.03% 11/03/2026 3,659,054
21,500,000 China Government Bond 2.24% 05/03/2023 3,358,547
21,000,000 China Government Bond 3.13% 13/04/2022 3,290,955
20,000,000 China Government Bond 3.25% 06/06/2026 3,212,935
20,000,000 China Government Bond 2.94% 17/10/2024 3,170,891
20,000,000 China Government Bond 2.84% 08/04/2024 3,161,973
20,000,000 China Government Bond 2.36% 02/07/2023 3,133,910
19,000,000 China Government Bond 3.13% 21/11/2029 3,024,961
18,000,000 China Government Bond 3.01% 13/05/2028 2,852,983
17,000,000 China Government Bond 3.77% 08/03/2025 2,770,969
16,000,000 China Development Bank 3.70% 20/10/2030 2,593,937
16,000,000 China Government Bond 3.25% 22/11/2028 2,570,700
16,000,000 China Government Bond 3.22% 06/12/2025 2,560,386
16,000,000 China Government Bond 3.29% 18/10/2023 2,550,388
15,900,000 Agricultural Development Bank of China 3.12% 17/07/2022 2,506,344
15,000,000 Agricultural Development Bank of China 3.79% 26/10/2030 2,451,111
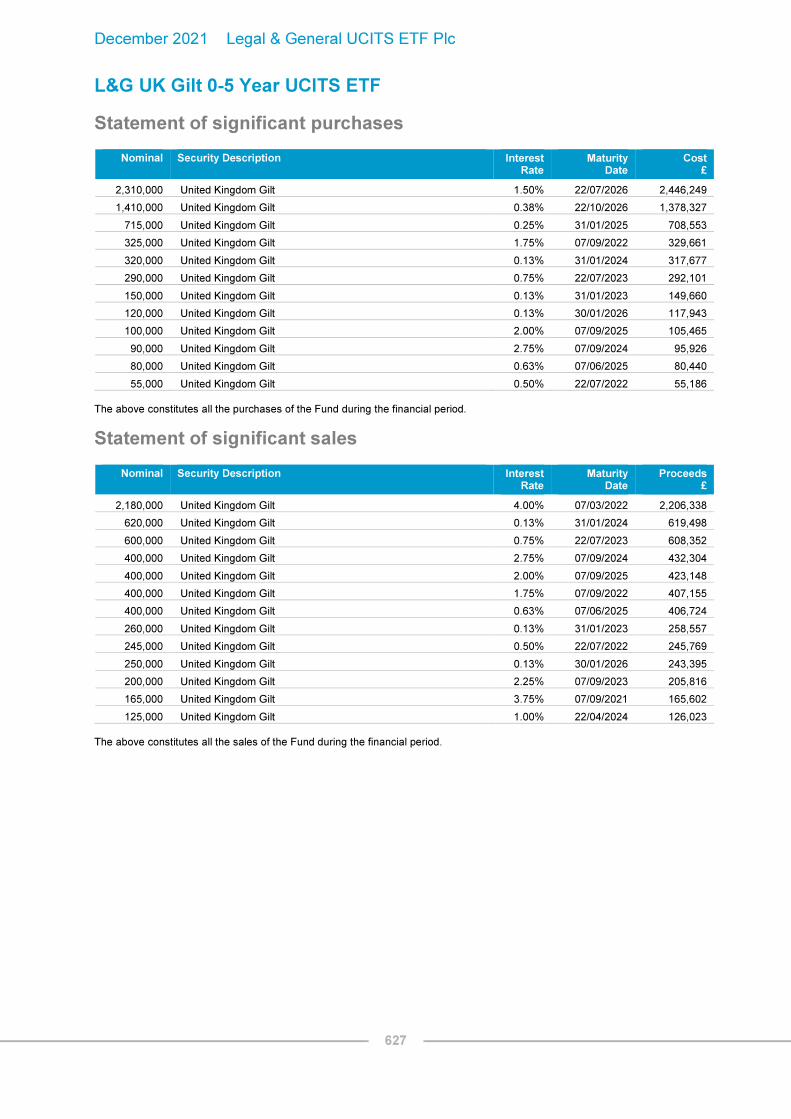
December 2021 Legal & General UCITS ETF Plc
627
L&G UK Gilt 0-5 Year UCITS ETF
Statement of significant purchases
Nominal Security Description Interest Rate
Maturity Date
Cost £
2,310,000 United Kingdom Gilt 1.50% 22/07/2026 2,446,249
1,410,000 United Kingdom Gilt 0.38% 22/10/2026 1,378,327
715,000 United Kingdom Gilt 0.25% 31/01/2025 708,553
325,000 United Kingdom Gilt 1.75% 07/09/2022 329,661
320,000 United Kingdom Gilt 0.13% 31/01/2024 317,677
290,000 United Kingdom Gilt 0.75% 22/07/2023 292,101
150,000 United Kingdom Gilt 0.13% 31/01/2023 149,660
120,000 United Kingdom Gilt 0.13% 30/01/2026 117,943
100,000 United Kingdom Gilt 2.00% 07/09/2025 105,465
90,000 United Kingdom Gilt 2.75% 07/09/2024 95,926
80,000 United Kingdom Gilt 0.63% 07/06/2025 80,440
55,000 United Kingdom Gilt 0.50% 22/07/2022 55,186
The above constitutes all the purchases of the Fund during the financial period.
Statement of significant sales
Nominal Security Description Interest Rate
Maturity Date
Proceeds £
2,180,000 United Kingdom Gilt 4.00% 07/03/2022 2,206,338
620,000 United Kingdom Gilt 0.13% 31/01/2024 619,498
600,000 United Kingdom Gilt 0.75% 22/07/2023 608,352
400,000 United Kingdom Gilt 2.75% 07/09/2024 432,304
400,000 United Kingdom Gilt 2.00% 07/09/2025 423,148
400,000 United Kingdom Gilt 1.75% 07/09/2022 407,155
400,000 United Kingdom Gilt 0.63% 07/06/2025 406,724
260,000 United Kingdom Gilt 0.13% 31/01/2023 258,557
245,000 United Kingdom Gilt 0.50% 22/07/2022 245,769
250,000 United Kingdom Gilt 0.13% 30/01/2026 243,395
200,000 United Kingdom Gilt 2.25% 07/09/2023 205,816
165,000 United Kingdom Gilt 3.75% 07/09/2021 165,602
125,000 United Kingdom Gilt 1.00% 22/04/2024 126,023
The above constitutes all the sales of the Fund during the financial period.

December 2021 Legal & General UCITS ETF Plc
628
L&G ESG USD Corporate Bond UCITS ETF
Statement of significant purchases
Nominal Security Description Interest Rate
Maturity Date
Cost $
330,000 salesforce.com Inc 2.90% 15/07/2051 345,642
250,000 Cooperatieve Rabobank UA '144A' 2.63% 22/07/2024 258,945
250,000 BPCE SA '144A' 1.00% 20/01/2026 245,958
200,000 BNP Paribas SA '144A' 4.40% 14/08/2028 226,480
200,000 HSBC Holdings Plc FRN 4.58% 19/06/2029 224,158
200,000 Nippon Life Insurance Co '144A' FRN 4.70% 20/01/2046 223,084
200,000 BPCE SA '144A' 5.15% 21/07/2024 218,160
200,000 Banque Federative du Credit Mutuel SA '144A' 3.75% 20/07/2023 210,348
200,000 Bank of America Corp FRN 3.00% 20/12/2023 204,374
200,000 HSBC Holdings Plc FRN 1.65% 18/04/2026 201,660
200,000 Nomura Holdings Inc 2.17% 14/07/2028 200,404
200,000 AerCap Ireland Capital DAC / AerCap Global Aviation Trust 3.30% 30/01/2032 199,832
200,000 Barclays Plc FRN 2.67% 10/03/2032 198,570
200,000 NTT Finance Corp '144A' 1.16% 03/04/2026 196,936
175,000 JPMorgan Chase & Co FRN 2.58% 22/04/2032 176,734
140,000 Goldman Sachs Group Inc/The 3.50% 01/04/2025 149,324
100,000 Ally Financial Inc 8.00% 01/11/2031 141,618
125,000 American Tower Corp 2.95% 15/01/2025 130,091
100,000 ONEOK Inc 6.35% 15/01/2031 130,055
100,000 Citigroup Inc FRN 4.41% 31/03/2031 114,372
The above constitutes all the purchases of the Fund during the financial period.
Statement of significant Sales
Nominal Security Description Interest Rate
Maturity Date
Proceeds $
250,000 Credit Suisse Group AG 4.88% 15/05/2045 318,506
250,000 PNC Bank NA 'BKNT' 4.20% 01/11/2025 279,988
250,000 Cooperatieve Rabobank UA 4.63% 01/12/2023 267,473
250,000 Mizuho Financial Group Inc FRN 1.12% 28/02/2022 250,461
225,000 Lennar Corp 4.13% 15/01/2022 226,996
225,000 Goldman Sachs Group Inc/The FRN 0.91% 31/10/2022 225,114
200,000 Sky Ltd '144A' 3.75% 16/09/2024 218,726
200,000 BNP Paribas SA 'GMTN' 4.25% 15/10/2024 216,910
200,000 Mondelez International Holdings Netherlands BV '144A' 2.25% 19/09/2024 209,044
200,000 Union Pacific Corp 2.38% 20/05/2031 204,552
159,000 Howmet Aerospace Inc 5.13% 01/10/2024 175,504
125,000 Verizon Communications Inc 4.67% 15/03/2055 168,820
167,000 Gilead Sciences Inc 4.40% 01/12/2021 167,983
156,000 Aptiv Corp 4.15% 15/03/2024 166,883
164,000 Truist Bank 'BKNT' FRN 3.50% 02/08/2022 164,000
150,000 STERIS Irish FinCo UnLtd Co 2.70% 15/03/2031 153,547
150,000 Citigroup Inc FRN 1.68% 15/05/2024 152,961
150,000 AT&T Inc '144A' 3.50% 15/09/2053 145,388
100,000 Verizon Communications Inc 5.01% 21/08/2054 142,566
The above constitutes all the sales of the Fund during the financial period.
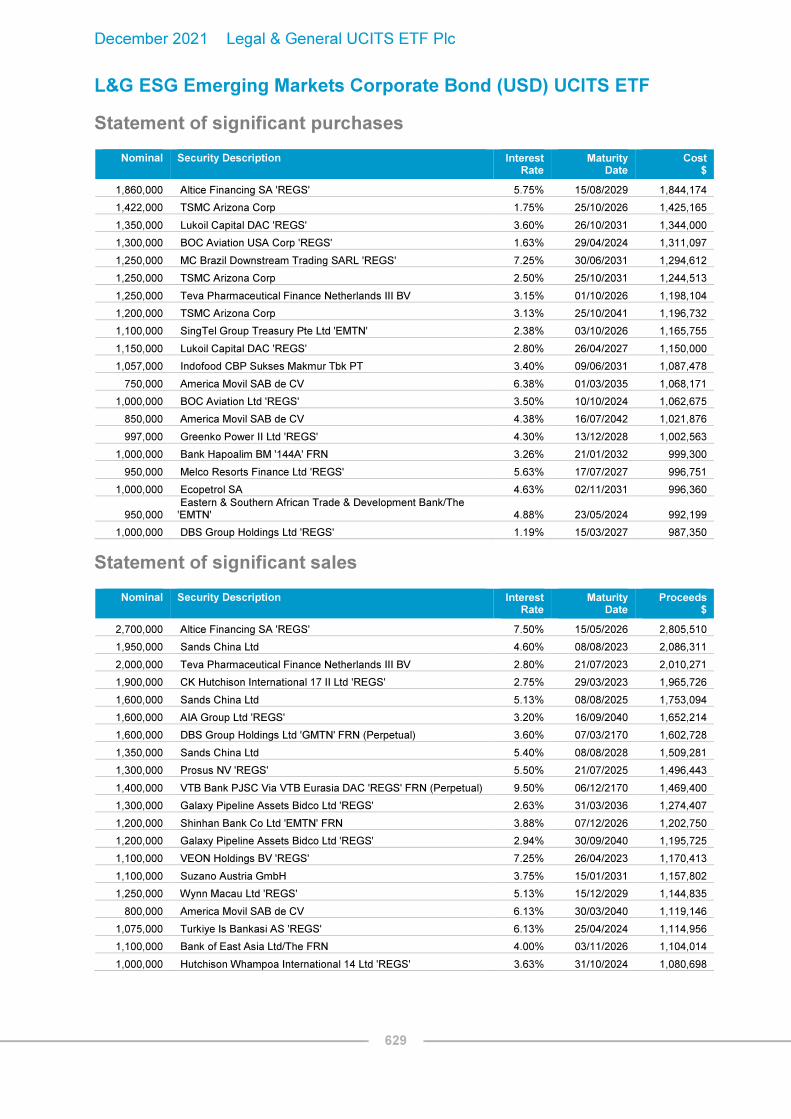
December 2021 Legal & General UCITS ETF Plc
629
L&G ESG Emerging Markets Corporate Bond (USD) UCITS ETF
Statement of significant purchases
Nominal Security Description Interest Rate
Maturity Date
Cost $
1,860,000 Altice Financing SA 'REGS' 5.75% 15/08/2029 1,844,174
1,422,000 TSMC Arizona Corp 1.75% 25/10/2026 1,425,165
1,350,000 Lukoil Capital DAC 'REGS' 3.60% 26/10/2031 1,344,000
1,300,000 BOC Aviation USA Corp 'REGS' 1.63% 29/04/2024 1,311,097
1,250,000 MC Brazil Downstream Trading SARL 'REGS' 7.25% 30/06/2031 1,294,612
1,250,000 TSMC Arizona Corp 2.50% 25/10/2031 1,244,513
1,250,000 Teva Pharmaceutical Finance Netherlands III BV 3.15% 01/10/2026 1,198,104
1,200,000 TSMC Arizona Corp 3.13% 25/10/2041 1,196,732
1,100,000 SingTel Group Treasury Pte Ltd 'EMTN' 2.38% 03/10/2026 1,165,755
1,150,000 Lukoil Capital DAC 'REGS' 2.80% 26/04/2027 1,150,000
1,057,000 Indofood CBP Sukses Makmur Tbk PT 3.40% 09/06/2031 1,087,478
750,000 America Movil SAB de CV 6.38% 01/03/2035 1,068,171
1,000,000 BOC Aviation Ltd 'REGS' 3.50% 10/10/2024 1,062,675
850,000 America Movil SAB de CV 4.38% 16/07/2042 1,021,876
997,000 Greenko Power II Ltd 'REGS' 4.30% 13/12/2028 1,002,563
1,000,000 Bank Hapoalim BM '144A' FRN 3.26% 21/01/2032 999,300
950,000 Melco Resorts Finance Ltd 'REGS' 5.63% 17/07/2027 996,751
1,000,000 Ecopetrol SA 4.63% 02/11/2031 996,360
950,000 Eastern & Southern African Trade & Development Bank/The 'EMTN' 4.88% 23/05/2024 992,199
1,000,000 DBS Group Holdings Ltd 'REGS' 1.19% 15/03/2027 987,350
Statement of significant sales
Nominal Security Description Interest Rate
Maturity Date
Proceeds $
2,700,000 Altice Financing SA 'REGS' 7.50% 15/05/2026 2,805,510
1,950,000 Sands China Ltd 4.60% 08/08/2023 2,086,311
2,000,000 Teva Pharmaceutical Finance Netherlands III BV 2.80% 21/07/2023 2,010,271
1,900,000 CK Hutchison International 17 II Ltd 'REGS' 2.75% 29/03/2023 1,965,726
1,600,000 Sands China Ltd 5.13% 08/08/2025 1,753,094
1,600,000 AIA Group Ltd 'REGS' 3.20% 16/09/2040 1,652,214
1,600,000 DBS Group Holdings Ltd 'GMTN' FRN (Perpetual) 3.60% 07/03/2170 1,602,728
1,350,000 Sands China Ltd 5.40% 08/08/2028 1,509,281
1,300,000 Prosus NV 'REGS' 5.50% 21/07/2025 1,496,443
1,400,000 VTB Bank PJSC Via VTB Eurasia DAC 'REGS' FRN (Perpetual) 9.50% 06/12/2170 1,469,400
1,300,000 Galaxy Pipeline Assets Bidco Ltd 'REGS' 2.63% 31/03/2036 1,274,407
1,200,000 Shinhan Bank Co Ltd 'EMTN' FRN 3.88% 07/12/2026 1,202,750
1,200,000 Galaxy Pipeline Assets Bidco Ltd 'REGS' 2.94% 30/09/2040 1,195,725
1,100,000 VEON Holdings BV 'REGS' 7.25% 26/04/2023 1,170,413
1,100,000 Suzano Austria GmbH 3.75% 15/01/2031 1,157,802
1,250,000 Wynn Macau Ltd 'REGS' 5.13% 15/12/2029 1,144,835
800,000 America Movil SAB de CV 6.13% 30/03/2040 1,119,146
1,075,000 Turkiye Is Bankasi AS 'REGS' 6.13% 25/04/2024 1,114,956
1,100,000 Bank of East Asia Ltd/The FRN 4.00% 03/11/2026 1,104,014
1,000,000 Hutchison Whampoa International 14 Ltd 'REGS' 3.63% 31/10/2024 1,080,698

December 2021 Legal & General UCITS ETF Plc
630
L&G Hydrogen Economy UCITS ETF
Statement of significant purchases
Nominal Security Description Cost $
3,988,393 Hyzon Motors Inc 31,843,268
321,583 Xcel Energy Inc 20,887,552
5,702,919 Weichai Power Co Ltd 'H' 11,035,109
338,942 Siemens Energy AG 9,337,173
375,566 PowerCell Sweden AB 9,004,314
372,743 McPhy Energy SA 8,989,760
253,858 Johnson Matthey Plc 8,395,436
43,220 Hyundai Motor Co 7,788,565
33,061 Cummins Inc 7,555,179
54,736 Orsted AS '144A' 7,492,656
228,490 Chemours Co/The 7,224,278
215,224 Plug Power Inc 6,820,036
38,316 Air Liquide SA 6,590,502
90,799 Kolon Industries Inc 6,586,926
8,025,052 AFC Energy Plc 6,454,973
3,281,509 NEL ASA 6,431,166
277,200 Nippon Sanso Holdings Corp 6,390,980
102,500 Kyocera Corp 6,326,662
146,219 Doosan Fuel Cell Co Ltd 6,310,943
231,600 Toyota Motor Corp 6,189,860
408,764 Ceres Power Holdings Plc 6,051,399
139,149 Uniper SE 5,819,462
958,270 ITM Power Plc 5,785,666
17,836 Linde Plc 5,551,577
59,632 Daimler AG 5,446,260
341,055 Ballard Power Systems Inc 5,405,939
219,428 Bloom Energy Corp 5,196,149
929,510 Cell Impact AB 5,163,996
17,782 Air Products & Chemicals Inc 5,094,311
648,194 FuelCell Energy Inc 4,917,643
113,782 SFC Energy AG 3,885,553
459,196 Advent Technologies Holdings Inc 3,857,274
1,334,600 Xebec Adsorption Inc 3,577,099
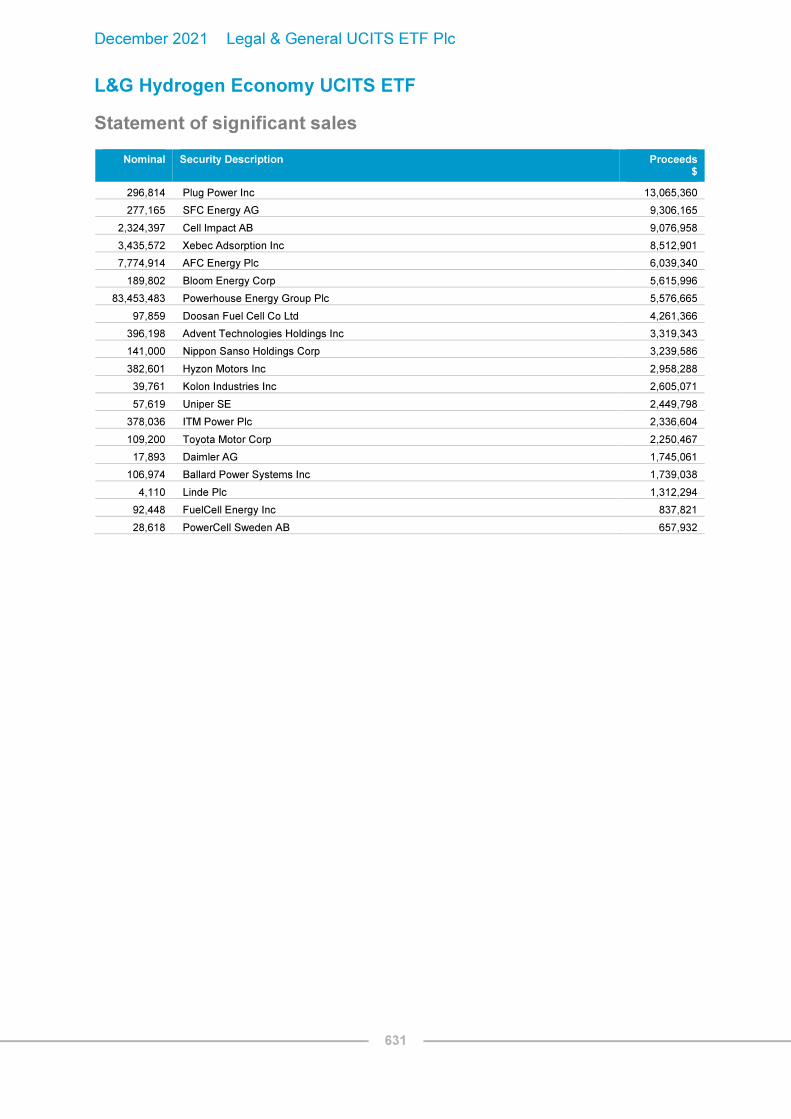
December 2021 Legal & General UCITS ETF Plc
631
L&G Hydrogen Economy UCITS ETF
Statement of significant sales
Nominal Security Description Proceeds $
296,814 Plug Power Inc 13,065,360
277,165 SFC Energy AG 9,306,165
2,324,397 Cell Impact AB 9,076,958
3,435,572 Xebec Adsorption Inc 8,512,901
7,774,914 AFC Energy Plc 6,039,340
189,802 Bloom Energy Corp 5,615,996
83,453,483 Powerhouse Energy Group Plc 5,576,665
97,859 Doosan Fuel Cell Co Ltd 4,261,366
396,198 Advent Technologies Holdings Inc 3,319,343
141,000 Nippon Sanso Holdings Corp 3,239,586
382,601 Hyzon Motors Inc 2,958,288
39,761 Kolon Industries Inc 2,605,071
57,619 Uniper SE 2,449,798
378,036 ITM Power Plc 2,336,604
109,200 Toyota Motor Corp 2,250,467
17,893 Daimler AG 1,745,061
106,974 Ballard Power Systems Inc 1,739,038
4,110 Linde Plc 1,312,294
92,448 FuelCell Energy Inc 837,821
28,618 PowerCell Sweden AB 657,932

December 2021 Legal & General UCITS ETF Plc
632
L&G ESG Green Bond UCITS ETF
Statement of significant purchases
Nominal Security Description Interest Rate
Maturity Date
Cost €
600,000 Italy Buoni Poliennali Del Tesoro '144A' 1.50% 30/04/2045 581,489
490,000 United Kingdom Gilt 0.88% 31/07/2033 567,601
289,000 United Kingdom Gilt 1.50% 31/07/2053 400,094
330,000 Bundesrepublik Deutschland Bundesanleihe 0.00% 15/08/2031 335,360
200,000 Spain Government Bond '144A' 1.00% 30/07/2042 196,368
170,000 Kreditanstalt fuer Wiederaufbau 'EMTN' 0.00% 15/09/2031 171,049
100,000 CPI Property Group SA 'EMTN' 2.75% 22/01/2028 120,835
100,000 South Eastern Power Networks Plc 'EMTN' 1.75% 30/09/2034 116,199
100,000 AB Ignitis Grupe 'EMTN' 1.88% 10/07/2028 109,848
100,000 Gecina SA 'EMTN' 0.88% 30/06/2036 104,280
100,000 Westpac Banking Corp FRN 0.77% 13/05/2031 100,924
100,000 UniCredit SpA 'EMTN' FRN 0.80% 05/07/2029 100,540
100,000 EDP - Energias de Portugal SA FRN 1.88% 02/08/2081 100,430
100,000 de Volksbank NV 'EMTN' 0.38% 03/03/2028 100,295
100,000 Citycon Oyj FRN (Perpetual) 3.63% 10/09/2170 100,159
100,000 Banque Federative du Credit Mutuel SA 'EMTN' 0.25% 29/06/2028 99,366
100,000 CBRE Global Investors Open-Ended Fund SCA SICAV-SIF Pan European Core Fund 0.90% 12/10/2029 98,948
100,000 Dana Inc 4.25% 01/09/2030 86,891
90,000 French Republic Government Bond OAT '144A' 0.50% 25/06/2044 86,135
80,000 HAT Holdings I LLC / HAT Holdings II LLC '144A' 3.75% 15/09/2030 66,554
60,000 Kreditanstalt fuer Wiederaufbau 2.00% 29/09/2022 54,111
45,000 Kreditanstalt fuer Wiederaufbau 'EMTN' 0.88% 15/09/2026 52,931
40,000 Instituto de Credito Oficial 'EMTN' 0.00% 30/04/2027 40,414
The above constitutes all the purchases of the Fund during the financial period.
Statement of significant sales
Nominal Security Description Interest Rate
Maturity Date
Proceeds €
200,000 Perusahaan Penerbit SBSN Indonesia III 'REGS' 3.75% 01/03/2023 179,588
200,000 Industrial & Commercial Bank of China Ltd/Singapore 'EMTN' FRN 0.85% 25/04/2022 172,891
140,000 Netherlands Government Bond '144A' 0.50% 15/01/2040 150,726
130,000 European Investment Bank 'EMTN' 1.25% 13/11/2026 140,752
130,000 Bundesobligation 0.00% 10/10/2025 133,659
101,000 French Republic Government Bond OAT '144A' 1.75% 25/06/2039 124,714
120,000 Kreditanstalt fuer Wiederaufbau 'EMTN' 0.25% 30/06/2025 123,174
100,000 Anglian Water Services Financing PLC 'EMTN' 1.63% 10/08/2025 120,722
120,000 Chile Government International Bond 0.83% 02/07/2031 119,622
100,000 La Banque Postale SA 'EMTN' 1.38% 24/04/2029 104,854
100,000 Hera SpA 'EMTN' 0.88% 05/07/2027 104,383
100,000 Iberdrola Finanzas SA 'EMTN' 1.00% 07/03/2025 103,243
100,000 BNP Paribas SA 'EMTN' 1.13% 28/08/2024 103,028
100,000 European Investment Bank 'EMTN' 0.50% 13/11/2037 102,674

December 2021 Legal & General UCITS ETF Plc
633
L&G ESG Green Bond UCITS ETF*
Statement of significant sales (continued)
Nominal Security Description Interest Rate
Maturity Date
Proceeds €
100,000 Terna - Rete Elettrica Nazionale 'EMTN' 1.00% 23/07/2023 102,195
100,000 Mitsubishi UFJ Financial Group Inc 'EMTN' 0.98% 09/10/2023 102,079
90,000 Kingdom of Belgium Government Bond '144A' 1.25% 22/04/2033 100,849
100,000 Nordea Bank Abp 'EMTN' 0.30% 30/06/2022 100,456
100,000 National Grid Electricity Transmission PLC 0.19% 20/01/2025 100,354
100,000 SFIL SA 'EMTN' 0.00% 23/11/2028 100,140
100,000 Societe Du Grand Paris EPIC 'EMTN' 0.00% 25/11/2030 99,622
100,000 European Investment Bank '144A' 2.88% 13/06/2025 92,208
89,000 Bundesrepublik Deutschland Bundesanleihe 0.00% 15/08/2030 92,007
100,000 Societe Du Grand Paris EPIC 'EMTN' 0.70% 15/10/2060 91,445
100,000 Toyota Motor Credit Corp 'GMTN' 2.15% 13/02/2030 86,417
81,000 Bundesrepublik Deutschland Bundesanleihe 0.00% 15/08/2050 80,295
70,000 Ireland Government Bond 1.35% 18/03/2031 78,038
70,000 European Investment Bank 'EMTN' 0.50% 15/11/2023 71,678
47,000 Kreditanstalt fuer Wiederaufbau 'EMTN' 0.88% 15/09/2026 55,772
50,000 Asian Development Bank 0.00% 24/10/2029 49,330
40,000 European Investment Bank 'EMTN' 0.75% 15/11/2024 46,689
50,000 AES Corp/The 2.45% 15/01/2031 42,905
46,000 European Investment Bank 2.38% 24/05/2027 42,530
40,000 Fibria Overseas Finance Ltd 5.50% 17/01/2027 38,955
40,000 International Bank for Reconstruction & Development 3.13% 20/11/2025 37,386

December 2021 Legal & General UCITS ETF Plc
634
L&G Quality Equity Dividends ESG Exclusions UK UCITS ETF
Statement of significant purchases
Nominal Security Description Cost £
3,118,940 Lloyds Banking Group Plc 1,426,744
44,557 Anglo American Plc 1,171,060
236,154 abrdn plc 613,060
11,290 Rio Tinto Plc 561,460
36,954 Polymetal International Plc 505,545
17,372 British American Tobacco Plc 461,084
15,759 Persimmon Plc 435,648
12,693 Admiral Group Plc 413,405
43,239 National Grid Plc 401,091
24,279 Imperial Brands Plc 378,094
4,200 AstraZeneca Plc 368,344
10,132 Diageo Plc 361,136
24,982 GlaxoSmithKline Plc 352,376
61,121 BAE Systems Plc 348,985
34,056 United Utilities Group Plc 345,286
12,141 Severn Trent Plc 326,531
15,225 Intermediate Capital Group Plc 320,939
197,781 BT Group Plc 308,881
2,379 Games Workshop Group Plc 253,061
27,423 IG Group Holdings Plc 225,806
18,184 Pennon Group Plc 218,391
28,222 Tate & Lyle Plc 196,704
81,832 Man Group Plc/Jersey 174,337
44,216 Chesnara Plc 133,039
Statement of significant sales
Nominal Security Description Proceeds £
32,170 Bellway Plc 1,105,851
368,278 Legal & General Group Plc 1,031,126
142,455 Barratt Developments Plc 968,360
29,741 Dunelm Group Plc 435,618
267,056 Cineworld Group Plc 169,652
88,865 BT Group Plc 141,085
2,811 British American Tobacco Plc 76,264
2,095 Diageo Plc 76,216
8,841 IG Group Holdings Plc 73,445
4,595 GlaxoSmithKline Plc 68,285
6,325 United Utilities Group Plc 67,663
2,455 Persimmon Plc 66,698
2,259 Severn Trent Plc 64,512
1,795 Admiral Group Plc 62,677
5,944 National Grid Plc 57,902
2,575 Intermediate Capital Group Plc 57,238

December 2021 Legal & General UCITS ETF Plc
635
L&G Quality Equity Dividends ESG Exclusions UK UCITS ETF
Statement of significant sales (continued)
Nominal Security Description Proceeds £
3,860 Polymetal International Plc 54,298
496 AstraZeneca Plc 41,234
328 Games Workshop Group Plc 39,259
1,570 Imperial Brands Plc 24,923

December 2021 Legal & General UCITS ETF Plc
636
L&G Quality Equity Dividends ESG Exclusions Europe ex-UK UCITS ETF
Statement of significant purchases
Nominal Security Description Cost €
5,773 OMV AG 286,716
15,197 DNB Bank ASA 286,701
3,748 KBC Group NV 273,417
22,938 ING Groep NV 272,111
27,048 Mediobanca Banca di Credito Finanziario SpA 271,229
4,991 BNP Paribas SA 270,567
15,590 Polski Koncern Naftowy ORLEN SA 262,171
11,861 Electrolux AB 237,584
4,766 Rubis SCA 142,096
24,768 Unipol Gruppo SpA 121,283
14,845 Terna - Rete Elettrica Nazionale 98,347
2,462 ASR Nederland NV 95,686
1,492 Cembra Money Bank AG 88,991
198 Swiss Life Holding AG 88,630
1,985 Holcim Ltd 88,229
2,835 Boliden AB 86,392
3,197 Fortum Oyj 83,690
4,411 Assicurazioni Generali SpA 80,464
1,869 Ageas SA/NV 78,952
3,247 AXA SA 76,912
570 Baloise Holding AG 76,149
855 Porsche Automobil Holding SE - Preference 75,297
202 Zurich Insurance Group AG 74,731
30,663 Intesa Sanpaolo SpA 74,338
5,106 Telenor ASA 72,911
219 Roche Holding AG 72,503
26,610 Koninklijke KPN NV 72,440
485 Air Liquide SA 71,071
1,574 Sampo Oyj - Class A 70,883
290 Muenchener Rueckversicherungs-Gesellschaft AG in Muenchen 70,793
3,157 Sandvik AB 68,228
1,203 Atlas Copco AB 68,110
3,258 Tryg A/S 67,940

December 2021 Legal & General UCITS ETF Plc
637
L&G Quality Equity Dividends ESG Exclusions Europe ex-UK UCITS ETF
Statement of significant sales
Nominal Security Description Proceeds €
3,156 Bayerische Motoren Werke AG 253,603
3,392 Daimler AG 242,041
27,755 Powszechny Zaklad Ubezpieczen SA 228,096
11,385 Endesa SA 207,424
34,270 Natixis SA 137,077
3,063 Fortum Oyj 80,278
6,676 Nordea Bank Abp 73,846
829 Porsche Automobil Holding SE - Preference 69,135
3,734 Assicurazioni Generali SpA 66,810
2,663 AXA SA 62,840
339 Koninklijke DSM NV 62,508
134 Swiss Life Holding AG 61,290
1,563 ASR Nederland NV 61,137
1,023 Atlas Copco AB 59,628
403 Air Liquide SA 57,949
1,320 Holcim Ltd 57,186
1,036 Societe BIC SA 55,112
8,374 Terna - Rete Elettrica Nazionale 54,907
27,940 Linea Directa Aseguradora SA Cia de Seguros y Reaseguros 52,161
1,190 Sampo Oyj - Class A 51,275
1,436 Erste Group Bank AG 51,176
130 Zurich Insurance Group AG 46,832
145 Roche Holding AG 45,487
9,135 Snam SpA 44,951
286 Schneider Electric SE 43,750
18,046 Intesa Sanpaolo SpA 42,839
2,413 Red Electrica Corp SA 41,260
2,758 Telenor ASA 39,551
501 Publicis Groupe SA 28,105
327 Sanofi 26,666
177 Siemens AG 26,464
412 Bayerische Motoren Werke AG - Preference 26,264
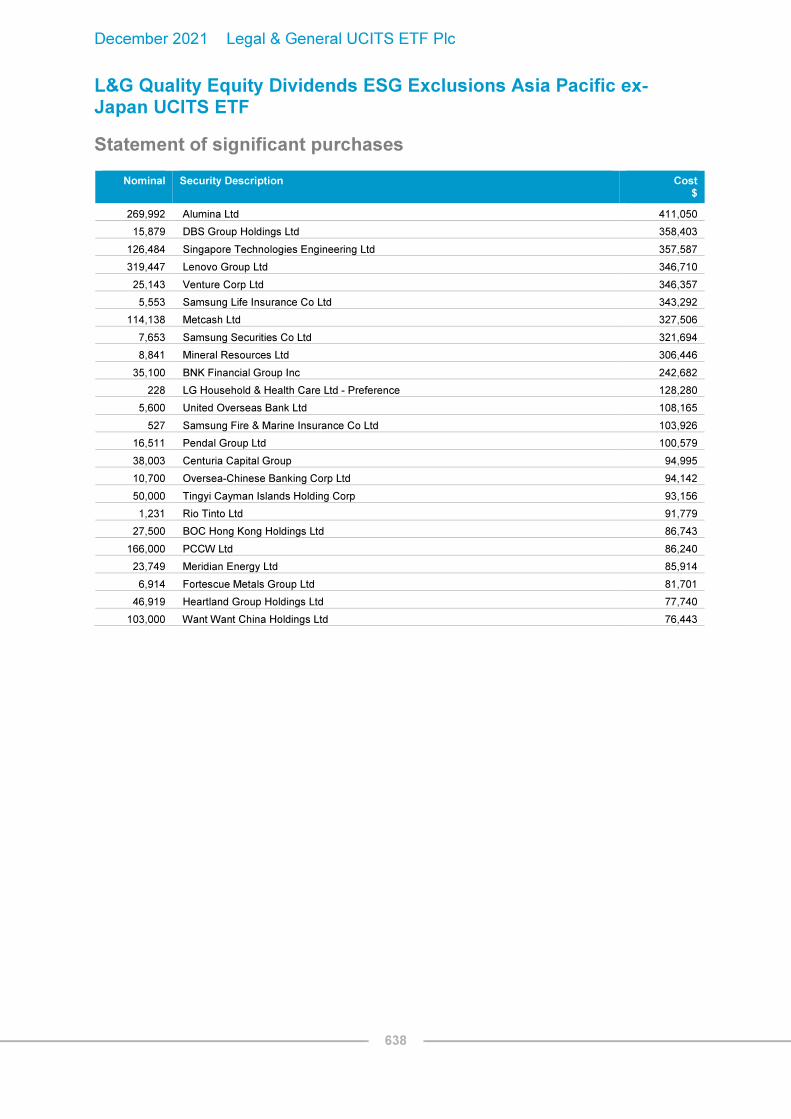
December 2021 Legal & General UCITS ETF Plc
638
L&G Quality Equity Dividends ESG Exclusions Asia Pacific ex-Japan UCITS ETF
Statement of significant purchases
Nominal Security Description Cost $
269,992 Alumina Ltd 411,050
15,879 DBS Group Holdings Ltd 358,403
126,484 Singapore Technologies Engineering Ltd 357,587
319,447 Lenovo Group Ltd 346,710
25,143 Venture Corp Ltd 346,357
5,553 Samsung Life Insurance Co Ltd 343,292
114,138 Metcash Ltd 327,506
7,653 Samsung Securities Co Ltd 321,694
8,841 Mineral Resources Ltd 306,446
35,100 BNK Financial Group Inc 242,682
228 LG Household & Health Care Ltd - Preference 128,280
5,600 United Overseas Bank Ltd 108,165
527 Samsung Fire & Marine Insurance Co Ltd 103,926
16,511 Pendal Group Ltd 100,579
38,003 Centuria Capital Group 94,995
10,700 Oversea-Chinese Banking Corp Ltd 94,142
50,000 Tingyi Cayman Islands Holding Corp 93,156
1,231 Rio Tinto Ltd 91,779
27,500 BOC Hong Kong Holdings Ltd 86,743
166,000 PCCW Ltd 86,240
23,749 Meridian Energy Ltd 85,914
6,914 Fortescue Metals Group Ltd 81,701
46,919 Heartland Group Holdings Ltd 77,740
103,000 Want Want China Holdings Ltd 76,443
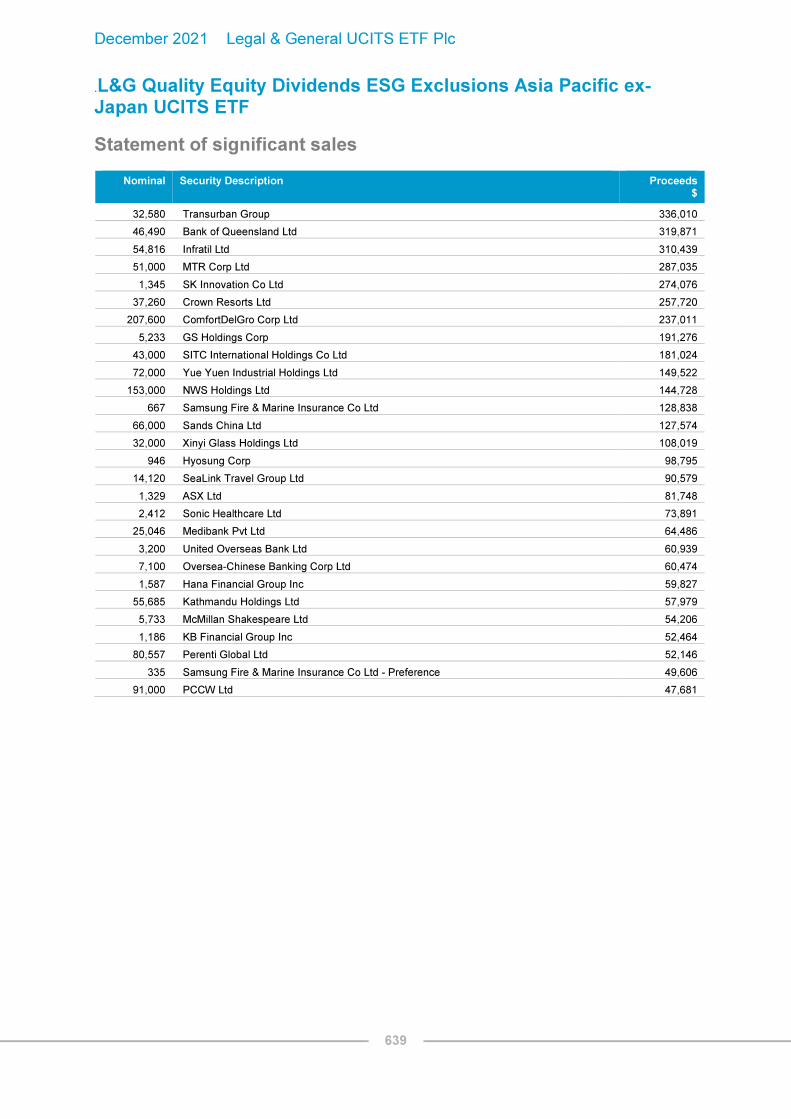
December 2021 Legal & General UCITS ETF Plc
639
.L&G Quality Equity Dividends ESG Exclusions Asia Pacific ex-Japan UCITS ETF
Statement of significant sales
Nominal Security Description Proceeds $
32,580 Transurban Group 336,010
46,490 Bank of Queensland Ltd 319,871
54,816 Infratil Ltd 310,439
51,000 MTR Corp Ltd 287,035
1,345 SK Innovation Co Ltd 274,076
37,260 Crown Resorts Ltd 257,720
207,600 ComfortDelGro Corp Ltd 237,011
5,233 GS Holdings Corp 191,276
43,000 SITC International Holdings Co Ltd 181,024
72,000 Yue Yuen Industrial Holdings Ltd 149,522
153,000 NWS Holdings Ltd 144,728
667 Samsung Fire & Marine Insurance Co Ltd 128,838
66,000 Sands China Ltd 127,574
32,000 Xinyi Glass Holdings Ltd 108,019
946 Hyosung Corp 98,795
14,120 SeaLink Travel Group Ltd 90,579
1,329 ASX Ltd 81,748
2,412 Sonic Healthcare Ltd 73,891
25,046 Medibank Pvt Ltd 64,486
3,200 United Overseas Bank Ltd 60,939
7,100 Oversea-Chinese Banking Corp Ltd 60,474
1,587 Hana Financial Group Inc 59,827
55,685 Kathmandu Holdings Ltd 57,979
5,733 McMillan Shakespeare Ltd 54,206
1,186 KB Financial Group Inc 52,464
80,557 Perenti Global Ltd 52,146
335 Samsung Fire & Marine Insurance Co Ltd - Preference 49,606
91,000 PCCW Ltd 47,681

December 2021 Legal & General UCITS ETF Plc
640
L&G Digital Payments UCITS ETF
Statement of significant purchases
Nominal Security Description Cost $
47,272 GreenSky Inc 439,601
18,908 StoneCo Ltd - Class A 436,511
75,830 Paysafe Ltd 403,066
4,032 Nuvei Corp '144A' 394,173
20,018 Zuora Inc 387,134
17,716 I3 Verticals Inc - Class A 380,066
9,892 Pagseguro Digital Ltd - Class A 372,575
133 Adyen NV '144A' 369,536
20,129 Repay Holdings Corp - Class A 368,241
243 Shopify Inc - Class A 367,483
4,193 Afterpay Ltd 358,465
34,850 Wise Plc - Class A 351,044
2,600 GMO Payment Gateway Inc 338,699
7,730 Green Dot Corp - Class A 338,411
37,479 Paya Holdings Inc 335,398
1,942 American Express Co 332,966
4,900 Worldline SA/France '144A' 331,206
1,406 Block Inc 328,437
8,293 Flywire Corp 327,618
20,326 International Money Express Inc 326,664
33,685 BTRS Holdings Inc 322,399
7,129 EVERTEC Inc 319,588
2,631 Discover Financial Services 313,831
1,280 PayPal Holdings Inc 308,385
1,387 Visa Inc - Class A 307,491
710 Fair Isaac Corp 307,282
864 Mastercard Inc 306,793
5,731 Edenred 306,170
2,052 Global Payments Inc 305,612
25,900 Credit Saison Co Ltd 304,555
16,058 Nexi SpA '144A' 304,266
1,847 Kakao Pay Corp 303,702
1,320 Coupa Software Inc 302,687
67,181 Network International Holdings Plc '144A' 297,357
14,855 OneSpan Inc 295,885
3,295 Q2 Holdings Inc 293,762
11,541 Evo Payments Inc - Class A 288,211
2,729 Fiserv Inc 287,869
44,097 Payoneer Global Inc 286,860
116,347 EML Payments Ltd 285,960
2,251 Euronet Worldwide Inc 279,477
8,199 ACI Worldwide Inc 277,226
15,619 Marqeta Inc 275,940

December 2021 Legal & General UCITS ETF Plc
641
L&G Digital Payments UCITS ETF
Statement of significant purchases (continued)
Nominal Security Description Cost $
2,228 Fidelity National Information Services Inc 273,888
234,107 Pushpay Holdings Ltd 273,081
4,238 Tencent Holdings Ltd 270,450
28,729 QIWI plc ADR 262,707
61,592 Yeahka Ltd 246,360
3,052 Lightspeed Commerce Inc 225,780
Statement of significant sales
Nominal Security Description Proceeds $
71,943 GreenSky Inc 839,757
12,105 Zuora Inc 238,080
141 Shopify Inc - Class A 206,061
69 Adyen NV '144A' 188,705
71,174 Boku Inc '144A' 162,111
1,200 GMO Payment Gateway Inc 157,801
166,902 Pushpay Holdings Ltd 157,386
2,200 Nuvei Corp '144A' 131,202
1,717 Afterpay Ltd 118,007
6,873 International Money Express Inc 110,781
2,229 EVERTEC Inc 109,611
646 American Express Co 107,890
844 Discover Financial Services 98,544
36,833 EML Payments Ltd 89,760
2,360 Green Dot Corp - Class A 83,724
434 Block Inc 78,685
200 Mastercard Inc 69,977
278 Visa Inc - Class A 59,319
4,800 Credit Saison Co Ltd 49,413
467 Fiserv Inc 48,185
524 Q2 Holdings Inc 41,559
802 Edenred 35,202
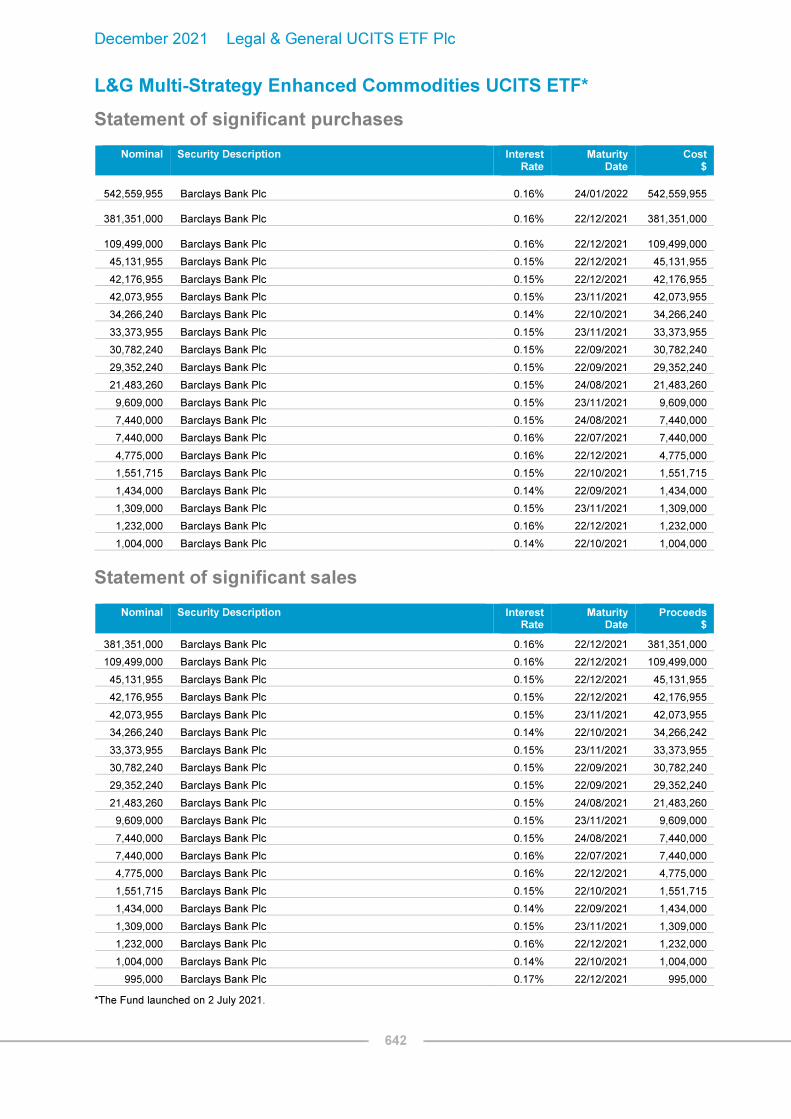
December 2021 Legal & General UCITS ETF Plc
642
L&G Multi-Strategy Enhanced Commodities UCITS ETF*
Statement of significant purchases
Nominal Security Description Interest Rate
Maturity Date
Cost $
542,559,955 Barclays Bank Plc 0.16% 24/01/2022 542,559,955
381,351,000 Barclays Bank Plc 0.16% 22/12/2021 381,351,000
109,499,000 Barclays Bank Plc 0.16% 22/12/2021 109,499,000
45,131,955 Barclays Bank Plc 0.15% 22/12/2021 45,131,955
42,176,955 Barclays Bank Plc 0.15% 22/12/2021 42,176,955
42,073,955 Barclays Bank Plc 0.15% 23/11/2021 42,073,955
34,266,240 Barclays Bank Plc 0.14% 22/10/2021 34,266,240
33,373,955 Barclays Bank Plc 0.15% 23/11/2021 33,373,955
30,782,240 Barclays Bank Plc 0.15% 22/09/2021 30,782,240
29,352,240 Barclays Bank Plc 0.15% 22/09/2021 29,352,240
21,483,260 Barclays Bank Plc 0.15% 24/08/2021 21,483,260
9,609,000 Barclays Bank Plc 0.15% 23/11/2021 9,609,000
7,440,000 Barclays Bank Plc 0.15% 24/08/2021 7,440,000
7,440,000 Barclays Bank Plc 0.16% 22/07/2021 7,440,000
4,775,000 Barclays Bank Plc 0.16% 22/12/2021 4,775,000
1,551,715 Barclays Bank Plc 0.15% 22/10/2021 1,551,715
1,434,000 Barclays Bank Plc 0.14% 22/09/2021 1,434,000
1,309,000 Barclays Bank Plc 0.15% 23/11/2021 1,309,000
1,232,000 Barclays Bank Plc 0.16% 22/12/2021 1,232,000
1,004,000 Barclays Bank Plc 0.14% 22/10/2021 1,004,000
Statement of significant sales
Nominal Security Description Interest Rate
Maturity Date
Proceeds $
381,351,000 Barclays Bank Plc 0.16% 22/12/2021 381,351,000
109,499,000 Barclays Bank Plc 0.16% 22/12/2021 109,499,000
45,131,955 Barclays Bank Plc 0.15% 22/12/2021 45,131,955
42,176,955 Barclays Bank Plc 0.15% 22/12/2021 42,176,955
42,073,955 Barclays Bank Plc 0.15% 23/11/2021 42,073,955
34,266,240 Barclays Bank Plc 0.14% 22/10/2021 34,266,242
33,373,955 Barclays Bank Plc 0.15% 23/11/2021 33,373,955
30,782,240 Barclays Bank Plc 0.15% 22/09/2021 30,782,240
29,352,240 Barclays Bank Plc 0.15% 22/09/2021 29,352,240
21,483,260 Barclays Bank Plc 0.15% 24/08/2021 21,483,260
9,609,000 Barclays Bank Plc 0.15% 23/11/2021 9,609,000
7,440,000 Barclays Bank Plc 0.15% 24/08/2021 7,440,000
7,440,000 Barclays Bank Plc 0.16% 22/07/2021 7,440,000
4,775,000 Barclays Bank Plc 0.16% 22/12/2021 4,775,000
1,551,715 Barclays Bank Plc 0.15% 22/10/2021 1,551,715
1,434,000 Barclays Bank Plc 0.14% 22/09/2021 1,434,000
1,309,000 Barclays Bank Plc 0.15% 23/11/2021 1,309,000
1,232,000 Barclays Bank Plc 0.16% 22/12/2021 1,232,000
1,004,000 Barclays Bank Plc 0.14% 22/10/2021 1,004,000
995,000 Barclays Bank Plc 0.17% 22/12/2021 995,000
*The Fund launched on 2 July 2021.

December 2021 Legal & General UCITS ETF Plc
643
L&G Quality Equity Dividends ESG Exclusions Emerging Markets UCITS ETF*
Statement of significant purchases
Nominal Security Description Cost $
99,657 iShares MSCI India UCITS ETF - ETF 707,240
219,700 Surgutneftegas PJSC - Preference 132,192
22,425 Coca-Cola Femsa SAB de CV (Units) 119,119
10,063 Foschini Group Ltd/The 109,929
244,500 China Minsheng Banking Corp Ltd 'H' 107,053
38,000 Fubon Financial Holding Co Ltd 103,743
43,000 China Medical System Holdings Ltd 103,445
34,000 E Ink Holdings Inc 103,366
43 Transneft PJSC - Preference 100,961
86,211 Xtrackers MSCI Pakistan Swap UCITS ETF 99,737
50,000 Cathay Financial Holding Co Ltd 99,613
25,020 Gazprom PJSC 99,039
20,000 Banco Bradesco SA - Preference 96,776
54,080 Alrosa PJSC 96,569
12,000 Elite Material Co Ltd 94,647
100,000 Inventec Corp 92,606
261,000 Bank of China Ltd 'H' 92,514
9,522 Banque Saudi Fransi 92,419
13,280 Tatneft PJSC 92,396
1,715 Jarir Marketing Co 92,237
*The Fund launched on 12 July 2021.

December 2021 Legal & General UCITS ETF Plc
644
L&G Quality Equity Dividends ESG Exclusions Emerging Markets UCITS ETF*
Statement of significant sales
Nominal Security Description Proceeds $
99,657 iShares MSCI India UCITS ETF - ETF 786,265
10,063 Foschini Group Ltd/The 93,144
81,500 DiGi.Com Bhd 87,652
134,900 Surgutneftegas PJSC - Preference 72,554
16,078 FirstRand Ltd 66,290
23,000 Fubon Financial Holding Co Ltd 65,181
26,000 Cathay Financial Holding Co Ltd 55,075
15,900 Bangkok Bank PCL (Foreign Market) 54,290
66,600 AMMB Holdings Bhd 52,325
26,050 Alrosa PJSC 51,193
4,477 Banque Saudi Fransi 48,388
12,500 Banco Bradesco SA - Preference 47,032
9,990 Gazprom PJSC 46,025
7,815 Coca-Cola Femsa SAB de CV (Units) 44,492
20 Transneft PJSC - Preference 44,231
745 Jarir Marketing Co 41,331
4,283 Vodacom Group Ltd 41,218
45,154 Ahli United Bank BSC 41,160
5,000 Elite Material Co Ltd 40,909
5,690 Riyad Bank 40,746
1,963 Clicks Group Ltd 39,695
37,119 Xtrackers MSCI Pakistan Swap UCITS ETF 38,565
2,414 Motor Oil Hellas Corinth Refineries SA 38,501
74,000 SinoPac Financial Holdings Co Ltd 37,125
11,000 Nan Ya Plastics Corp 35,565
13,000 E Ink Holdings Inc 35,392
5,500 Grupo Financiero Banorte SAB de CV 34,636
14,000 United Microelectronics Corp 33,029
36,000 Inventec Corp 32,238
3,397 Standard Bank Group Ltd 31,908
34,000 PICC Property & Casualty Co Ltd 'H' 31,071
16,400 GF Securities Co Ltd 'H' 30,900
12,200 MRV Engenharia e Participacoes SA 30,564
*The Fund launched on 12 July 2021.

December 2021 Legal & General UCITS ETF Plc
645
L&G India INR Government Bond UCITS ETF*
Statement of significant purchases
Nominal Security Description Interest Rate
Maturity Date
Cost $
488,500,000 India Government Bond 5.63% 12/04/2026 6,453,907
480,000,000 India Government Bond 6.67% 17/12/2050 6,119,947
446,500,000 India Government Bond 6.10% 12/07/2031 5,796,470
394,700,000 India Government Bond 7.26% 14/01/2029 5,526,007
408,100,000 India Government Bond 5.77% 03/08/2030 5,221,756
380,000,000 India Government Bond 5.22% 15/06/2025 5,009,882
379,700,000 India Government Bond 5.15% 09/11/2025 4,974,040
369,200,000 India Government Bond 6.45% 07/10/2029 4,942,235
384,200,000 India Government Bond 5.85% 01/12/2030 4,940,877
363,400,000 India Government Bond 5.79% 11/05/2030 4,656,184
332,500,000 India Government Bond 6.18% 04/11/2024 4,531,193
321,000,000 India Government Bond 7.16% 20/09/2050 4,360,637
273,500,000 India Government Bond 7.72% 15/06/2049 3,962,417
212,200,000 India Government Bond 7.32% 28/01/2024 2,955,033
83,000,000 India Government Bond 6.99% 15/12/2051 1,100,022
58,000,000 India Government Bond 5.74% 15/11/2026 768,426
6,000,000 India Government Bond 6.67% 15/12/2035 78,820
The above constitutes all the purchases of the Fund during the financial period.
Statement of significant sales
Nominal Security Description Interest Rate
Maturity Date
Proceeds $
6,000,000 India Government Bond 6.67% 15/12/2035 78,964
2,000,000 India Government Bond 5.15% 09/11/2025 25,849
The above constitutes all the sales of the Fund during the financial period. *The Fund launched on 26 October 2021.

Copyright 2021 Legal & General UCITS ETF Plc. All rights reserved.