Testing Draft EU Ecolabel Criteria on UCITS equity funds
76
Written by Malte Hessenius, Maurice Dumrose, Christina Anselm, Stefanie Berendsen, Ingmar Juergens, Christian Klein, Felicitas Koch, Karsten Löffler, Sebastian Rink June - 2020 Testing Draft EU Ecolabel Criteria on UCITS equity funds
-
Upload
khangminh22 -
Category
Documents
-
view
2 -
download
0
Transcript of Testing Draft EU Ecolabel Criteria on UCITS equity funds

Written by Malte Hessenius, Maurice Dumrose, Christina Anselm, Stefanie Berendsen, Ingmar Juergens, Christian Klein, Felicitas Koch, Karsten Löffler, Sebastian Rink June - 2020
Testing Draft EU Ecolabel
Criteria on UCITS equity funds

EUROPEAN COMMISSION
Directorate-General for Financial Stability, Financial Services and Capital Markets Union
Directorate C – Financial Markets Unit C.4 – Asset Management
-
E-mail: [email protected]
European Commission B-1049 Brussels

EUROPEAN COMMISSION
DG FISMA
Testing Draft EU Ecolabel Criteria on UCITS equity funds

LEGAL NOTICE
The information and views set out in this study are those of the author(s) and do not necessarily reflect the official opinion of the European Commission. The European Commission does not guarantee the accuracy of the data included in this study. Neither the European Commission nor any person acting on the European Commission’s behalf may be held responsible for the use which may be made of the information contained therein.
The European Commission is not liable for any consequence stemming from the reuse of this publication.
Luxembourg: Publications Office of the European Union, 2020
© European Union, 2020 Reuse is authorised provided the source is acknowledged. The reuse policy of European Commission documents is regulated by Decision 2011/833/EU (OJ L 330, 14.12.2011, p. 39).
For any use or reproduction of photos or other material that is not under the copyright of the European Union (*), permission must be sought directly from the copyright holders.
PDF ISBN 978-92-76-18949-7 doi: 10.2874/61501 EV-04-20-278-EN-N

I
List of Abbreviations
AIF Alternative Investments Funds
AIFM Alternative Investment Fund Managers Directive
AUM Assets under Management
CAPEX Capital Expenditure
CO2 Carbon Dioxide
COM European Commission
DG FISMA Directorate-General for Financial Stability, Financial Services and Capital Markets
DNSH Do No Significant Harm
EEA European Economic Area
EFTA European Free Trading Association
ESG Environmental, Social and Governance
ETF Exchange Traded Fund
EU European Union
EU Action Plan EU Action Plan on Financing Sustainable Growth
EU-ETS European Union Emission Trading System
EV Earned Value
FNG Forum Nachhaltige Geldanlagen
gCO2e/kWh Gram Carbon Dioxide Equivalent per Kilowatt Hour
GHG Greenhouse Gas
HLEG High-Level Expert Group on Sustainable Finance
HQT Hard Qualitative Threshold
ISO International Organization for Standardization
JRC Joint Research Centre
MF Mutual Funds
NACE Statistical Classification of Economic Activities in the European Community (Nomenclature statistique des activités économiques dans la Communauté européenne)
NAICS North American Industry Classification System
OPEX Operational Expenditure
PRIIP Packaged Retail and Insurance-based Investment Products
PV Photovoltaics
QT Quantitative Threshold
SDGs Sustainable Development Goals
SIC Standard Industrial Classification
SQT Soft Qualitative Threshold
TCFD Taskforce on Climate-related Financial Disclosure
tCO2e/t Tonnes of Carbon Dioxide Emissions
TEG Technical Expert Group on Sustainable Finance
TNA Total Net Assets
TR Thomson Reuters
TRBC Thomson Reuters Business Classification
TSC Technical Screening Criteria
UCITS Undertakings for Collective Investments in Transferable Securities
UN United Nations

List of Figures
Figure 1 - Structure of the study ................................................................................................. 3
Figure 2 - Six environmental objectives outlined in the EU Taxonomy proposal ..................... 6
Figure 3 - Economic Sectors covered by the EU Taxonomy ..................................................... 7
Figure 4 - EU Taxonomy Approach towards Climate Adaptation ............................................. 8
Figure 5 - Defining the sample of 100 UCITS equity funds ...................................................... 9
Figure 6 - Distribution of TNA invested in four (macro) sectors (C, D, J, E) ......................... 12
Figure 7 - Distribution of TNA invested in companies falling under NFRD .......................... 13
Figure 8 - Analytical approach to determining EU Taxonomy eligibility and compliance ..... 16
Figure 9 - Weight of assigned pockets across sample, Baseline .............................................. 28
Figure 10 - Pocket Aggregation, Baseline ............................................................................... 29
Figure 11 - Pocket Aggregation for each Scenario .................................................................. 30
Figure 12 - Weight of assigned pockets across sample, Baseline Plus .................................... 31
Figure 13 - Pocket Aggregation, Baseline Plus........................................................................ 31
Figure 14 - Weight of assigned pockets across sample, MSCI Proxy Scenario ...................... 32
Figure 15 - Pocket Aggregation, MSCI ................................................................................... 33
Figure 16 - Results: Baseline Assessment, Baseline Plus, MSCI Proxy Scenario ................... 33
Figure 17 - Changing the EU Ecolabel Draft Criterion I ......................................................... 35
Figure 18 - NACE Codes to Taxonomy ................................................................................... 48
Figure 19 - Mapping of Primary Activities .............................................................................. 48
Figure 20 - Example of reported SIC Segments ...................................................................... 49
Figure 21 - Exemplary SIC to EU Taxonomy Mapping I ........................................................ 49
Figure 22 - Exemplary SIC to EU Taxonomy Mapping II ...................................................... 49
Figure 23 - Methodology of the DNSH Assessment ................................................................ 60
Figure 24 - DNSH criteria of EU Taxonomy activities and underlying EU regulation ........... 61
Figure 25 - Clustering DNSH criteria into QT, HQT & SQT .................................................. 61

III
List of tables
Table 1 - Overview over the relevant national Green- or ESG-related fund labels ................... 4
Table 2 - Distribution of constituents by sub-samples ............................................................. 10
Table 3 - Geographical Distribution of Funds TNA ................................................................ 11
Table 4 - Distribution of TNA by NACE sectors ..................................................................... 11
Table 5 - Average constituents per fund .................................................................................. 13
Table 6 - Clustering of Revenue Segments .............................................................................. 20
Table 7 - Share of (potentially) identified EU Taxonomy Activities ....................................... 21
Table 8 - Manufacture of low carbon technologies .................................................................. 23
Table 9 - Information and Communication .............................................................................. 26
Table 10 - Funds aligned with criterion I in at least one scenario ........................................... 34
Table 11 - Sector Distribution of Funds that are aligned with criterion I ................................ 34
Table 12 - Classification of EU Taxonomy Activities ............................................................. 39
Table 13 - Assessment in the baseline and baseline plus scenario ........................................... 42
Table 14 - Variables used, their description and source .......................................................... 46
Table 15 - Scenario Overview (Fund-Level) ........................................................................... 51
Table 16 - Distribution of Fund Domiciles .............................................................................. 58
Table 17 - Comparison between relevant EU and US legislation (Solar PV) .......................... 62
Table 18 - Comparison between relevant EU and US legislation (Wind) ............................... 63

Table of Contents
1. INTRODUCTION ..................................................................................................... 2
2. BACKGROUND ....................................................................................................... 3
2.1. The EU Ecolabel ............................................................................................ 3
2.2. The EU Taxonomy ......................................................................................... 6
2.3. Objectives ................................................................................................... 8
3. METHODOLOGY ..................................................................................................... 9
3.1. Definition of the sample ................................................................................. 9
3.2. Mapping of Revenue Segments to the Taxonomy Activities .............................. 13
3.3. Assessment of EU Taxonomy compliant activities ............................................ 16
4. DATA ANALYSIS .................................................................................................. 20
4.1. Mapping of economic activities: the distribution of EU Taxonomy activities ........ 20
4.2. Assessment of compliance with EU Taxonomy screening criteria at sectoral level 22
5. FUND ASSESSMENT AND RESULTS ........................................................................ 27
6. CONCLUSION AND SUGGESTIONS ON DRAFT CRITERIA ........................................... 36
ANNEX I – EU TAXONOMY ACTIVITIES, NACE CODES AND CATEGORIES ............................ 39
ANNEX II– BASELINE VS BASELINE PLUS – METHODOLOGY AND ASSUMPTIONS ................ 42
ANNEX III – DATA SOURCES ........................................................................................ 46
ANNEX IV – MAPPING ROUTINE .................................................................................... 48
ANNEX V – DATA DESCRIPTIVES ................................................................................... 51
ANNEX VI – PILOT: DO NO SIGNIFICANT HARM .............................................................. 58
Methodology - Pilot Application of the DNSH principle under the EU Taxonomy ............ 58
Exemplification - DNSH ......................................................................................... 60

1
Abstract (EN)
The objective of this study is to carry out a test run in relation to the draft EU Ecolabel criteria for financial products and in particular to test the application of draft criterion I for equity funds to a sample of 101 “green” UCITS equity funds domiciled in the EU27. Focused on the EU environmental objective “climate change mitigation”, we analyse the share of EU Taxonomy aligned revenues of
these funds’ constituents and hence provide insights into the potential qualification of the equity funds under draft criterion I. The results show that from the sample, only three “green” UCITS equity funds qualify under draft Ecolabel criterion I. This finding is driven by two main factors. First, a lack of relevant data disclosed by the constituents of the “green” UCITS equity funds, and second, the (as of yet) limited scope of the EU Taxonomy, which has so far only been defined for a subset of economic sectors. Disclosure obligations under the EU Taxonomy and the Non-Financial Reporting Directive will help address data gaps (at least for large and publicly listed EU companies), while the
expansion of the EU Taxonomy to other environmental objectives will enlarge the universe of potentially EU Taxonomy eligible economic activities.
We gratefully acknowledge support provided by JRC. In particular, we acknowledge support provided by Roberto Panzica (JRC Ispra) for screening the MSCI ESG database.
Abstract (FR)
L'objectif de cette étude est d'effectuer un test en relation avec le projet Critère 1 de l’Écolabel
européen pour les produits financiers et, en particulier, de tester l'application du projet Critère I pour les fonds d'actions à un échantillon de 101 fonds d'actions d'OPCVM "verts" domiciliés dans l'UE27. Centrés sur l'objectif environnemental de l'Union Européen d‘atténuation du changement climatique", nous analysons la part des revenus alignés sur la taxonomie de l'UE des constituants de ces fonds et donnons ainsi un aperçu de la qualification potentielle des fonds d'actions au titre du projet Critère I. Les résultats montrent que, sur l'échantillon, seuls trois fonds d'actions d'OPCVM "verts" sont
qualifiés au titre du projet Critère I du label écologique. Cela résulte d‘un manque de données pertinentes divulguées par les constituants des fonds d'actions "verts" d'OPCVM, mais aussi du champ d'application (encore) limité de la taxonomie de l'UE, qui n'a été définie jusqu'à présent que pour un sous-ensemble de secteurs économiques. Les obligations de divulgation de données ESG prévues par la directive sur l'information non financière contribueront à combler les lacunes en matière de données (au moins pour les grandes sociétés européennes et les sociétés cotées en bourse), tandis que l'extension de la taxonomie européenne à d'autres objectifs environnementaux
élargira l'univers des activités économiques potentiellement éligibles à la taxonomie européenne.

2
1. INTRODUCTION
The EU takes a leading role in transforming the financial system to align with the goals of the Paris Climate Accord and the United Nations (UN) Sustainable Development Goals (SDGs). In this respect,
the European Commission adopted its Action Plan on Financing Sustainable Growth (EU Action Plan). Two components of the Action Plan are highly relevant to this study: first, the development of the EU Ecolabel, which should be extended to financial products to increase access to sustainable financial products by retail investors (Action 2), and second, the development of the EU Taxonomy, which defines what constitutes environmentally sustainable economic activities (Action 1).
The objective of this study is to support the work of the European Commission services involved in
developing EU Ecolabel criteria1 for financial products. In particular, the study serves as a test run for the Draft Criterion I ”Investment in green economic activities” for UCITS equity funds of the upcoming EU Ecolabel for financial products. In this study, Draft Criterion I is tested on a sample of 101 “green” UCITS equity funds, domiciled in the EU27. The analysis of this sample provides an excellent basis for understanding both the feasibility and involved challenges of applying Draft Criterion I in practice.
As specified in the tender2, the study tests the feasibility of the application of Draft Criterion I of the
upcoming EU Ecolabel for financial products to marketed UCITS equity funds. As Draft Criterion I builds on the EU Taxonomy, the analysis requires an in-depth assessment of the economic activities of all underlying constituents of the “green” UCITS equity funds to determine whether their share of “green” (i.e. EU Taxonomy-aligned) economic activities is sufficient to qualify for the EU Ecolabel by satisfying the thresholds as set out by Draft Criterion I. Specifically, this study only assesses economic activities in regards to their substantial contribution to the environmental objective climate change mitigation.
The purpose of this thorough investigation is to understand whether Draft Criterion I strikes an appropriate balance between promoting environmental excellence of financial products and allowing the best-in class existing financial products to be eligible under the upcoming EU Ecolabel. The study identifies key challenges such as data availability issues and a lack of disaggregated disclosure that must be considered in the final stages of developing the EU Ecolabel for financial products. Such hurdles are expected to be reduced when large EU-based companies are required to report in
accordance with the EU Taxonomy form 31 December 2021. There is the need to understand the level of EU Taxonomy compliance before that date to adjust and re-calibrate Draft Criterion I to allow the finalisation of Criterion I to be carried out with the appropriate degree of rigor and reliability.
This study is structured as follows. Chapter 2 provides additional background information on the EU
Ecolabel for financial products and the EU Taxonomy. Chapter 3 describes the methodological steps
and Chapter 4 presents corresponding results. First, the analysis screens the universe of “green”
funds to derive a final sample of 101 UCITS equity funds and obtain reported revenue segments for
all underlying constituents (section 3.1). Second, the study links the revenue segments to the
activities defined by the EU Taxonomy and clusters their respective screening criteria to determine
the scope of the assessment against the backdrop of data restrictions (section 3.2 & 4.2). Third,
having established a revenue mapping the EU Taxonomy-aligned share for each constituent is as far
as possible derived (section 3.3 & 4.3). Afterwards, the funds are assessed against their compliance
with Draft Criterion I in Chapter 5. Since insufficient company disclosure did not allow a complete
evaluation of the Taxonomy’s screening criteria, the study conducts a scenario analysis. Chapter 6
concludes and provides policy suggestions.
1 JRC. Development of EU Ecolabel criteria for Retail Financial Products. Technical Report 2.0: Draft proposal for the product scope and
criteria. (link).
2 https://ec.europa.eu/info/tender/191129-ecolabel-ucits-equity-funds_en

3
Figure 1 - Structure of the study
Source: Own elaboration.
2. BACKGROUND
The development of the upcoming EU Ecolabel for financial products is part of a larger effort by the EU towards driving and promoting the objectives of the EU sustainable finance strategy, as outlined in the EU Action Plan (link). This chapter introduces key aspects of the EU Ecolabel and the EU Taxonomy, both highly relevant for the Draft Criterion I of the upcoming EU Ecolabel for financial products.
2.1. The EU Ecolabel
As part of the EU Action Plan (Action 2.3), the Commission aims to expand the EU Ecolabel, which currently exists for various goods and services, to financial products. Through this, the Commission aims to increase both transparency on environmental performance and the accessibility of “green” financial products for a broader range of stakeholders.
The EU Ecolabel, which signals environmental excellence, was established in 1992 by the European Commission. The label is awarded to products and services that meet high environmental standards throughout their lifecycle, including the materials of products, the production, distribution and
disposal. Additionally, it provides crucial guidelines for companies wishing to decrease their environmental impact.
Labelling of “green” or “environmentally focused” financial products has increased over the last years. The Commission refers to various studies that indicate a retail investors’ growing demand for this type of information as investors aim to include ESG considerations in their investment decisions. Such labelling schemes have been in use at national and international level for years: the German

4
FNG label was launched in 2015 while other existing labels at national level include the Austrian
Ecolabel, Greenfin, Nordic Swan Ecolabel, and LUXflag Climate Finance (see brief overview in Table 1 below). They can be particularly useful for retail investors enabling them to invest according to their sustainability preferences. The EU Action Plan however rightly pointed out the lack of an EU-wide environmental label for financial products. The upcoming EU Ecolabel for financial products will serve as a new, EU-wide label, and will thus elevate market transparency and enhance consumer
choice. Expanding the EU Ecolabel to financial products is furthermore linked to relevant existing EU regulation such as the UCITS3 and the AIFM Directives4, the Non-Financial Reporting Directive (NFRD)5 and the PRIIP regulation6.
Table 1 - Overview over the relevant national Green- or ESG-related fund labels
Label Labelling body Purpose of the label (according to the website)
FNG Label (Germany)
FNG (QNG - Qualitäts-sicherungs-gesellschaft Nachhaltiger Geldanlagen mbH)
“One of the core tasks of the FNG is to further develop and continuously improve quality standards for sustainable investment products in order to ensure the quality of sustainable investments.”
The criteria underlying the FNG label are structured as follows:
• Minimum requirements: o Exclusions o Sustainability coverage o Transparency
• Stage model: o Institutional credibility o Product standards o Impact
Austrian Ecolabel Federal Ministry for Climate Action, Environment, Energy, Mobility, Innovation and Technology
The Austrian ecolabel assesses whether an investment fund qualifies for an award in the following sectors:
• climate, • water, and • renewable energy and environmental technologies.
The Ecolabel is built around three main pillars:
• Positive environmental and social performance, • Qualification and integrity of auditors, • Transparency.
Greenfin (France)
Novethic supported by Ministère de la Transition écologique et solidaire
“Its creation has been guided by a desire to promote "green" funds in order to further steer savings towards energy and ecological transition and the fight against climate change, either by drawing attention to existing investment funds or by giving rise to the creation of such funds. It is a guarantee, for investors and individual savers in particular, of the quality and transparency of the environmental characteristics of the funds distinguished in this way and of their contribution to the energy and ecological transition and the fight against climate change. As a public label, the Greenfin Label must be ambitious.
In addition, although covered by French legal standards, this label can be applied to financial funds from other countries in the European Union or non-member countries.
The Criteria Guidelines centres on the following concepts:
• Eligibility criteria in terms of scope; • Pillars – Label criteria; • Definition of the activities falling within the scope of the
energy and ecological transition and the fight against climate change;
• Strict and partial exclusions;
3 https://www.esma.europa.eu/databases-library/interactive-single-rulebook/ucits
4 https://eur-lex.europa.eu/legal-content/EN/TXT/?uri=CELEX%3A32011L0061
5 https://eur-lex.europa.eu/legal-content/EN/TXT/?uri=CELEX%3A32014L0095
6 https://eur-lex.europa.eu/legal-content/EN/TXT/?uri=CELEX%3A32014R1286

5
• Requirements for the use of derivative instruments within the framework of Greenfin management.”
Nordic Swan Ecolabel
Nordic Ecolabelling
“The Nordic Swan Ecolabel provides consumers with guidance about investment funds that have taken on a role and function in influencing companies and capital markets to act in a more sustainable way. Everything that a Nordic Swan Ecolabelled fund must attain - the exclusion of unsustainable companies, the inclusion of more sustainable companies and acting in a transparent manner - is undertaken to encourage companies and capital markets to act more sustainably in the long run.
A Nordic Swan Ecolabelled investment fund has to comply with requirements within three areas:
• Exclusions • Inclusion • Transparency & Ownership”
LUXflag Climate Finance (Luxembourg)
LUXflag “The primary objective of the LuxFLAG Climate Finance Label is to reassure investors that the Investment Product invests at least 75% of total assets in investments related, with a clear and direct link, to mitigation and/or adaptation of climate change or cross-cutting activities.”
Criteria for eligibility are:
• Focus (i.e. the 75% benchmark) • Transparency • Monitoring • ESG • Exclusion • Fund objective • Legal structure • Regulatory framework
JRC’s second technical report “Development of EU Ecolabel criteria for Retail Financial Products Technical Report 2.0: Draft proposal for the product scope and criteria” includes a draft version of the proposed six criteria:
• Criterion I: Investment in green economic activities
• Criterion II: Exclusions based on environmental aspects
• Criterion III: Social and governance aspects
• Criterion IV: Engagement
• Criterion V: Retail investor information
• Criterion VI: Information appearing on the EU Ecolabel
JRC will revise its technical report and present the final criteria to the EU Ecolabelling board. The
revised criteria are then to define the minimum level of environmental performance of this product
group, based on the requirements of the EU Ecolabel Regulation 66/2010.

6
2.2. The EU Taxonomy
The EU Taxonomy is a central element of the EU’s goal to promote sustainable finance. It specifies to what extent certain economic activities can be deemed environmentally sustainable. As such, the EU Taxonomy will be used by regulators on EU and national level as well as by any financial market participant offering environmentally sustainable financial products.
With the establishment of the EU Taxonomy, the
European Commission aims to address, inter alia, the
following challenges:
• A lack of clarity on what can be considered an
environmentally sustainable economic activity for investment purposes makes it costly for investors to identify truly sustainable investment opportunities, which impedes faster scaling of “green” investment.
• In the absence of any binding guidelines on what constitutes “green” financial products,
there is a risk of greenwashing and inefficient capital allocation
Against this backdrop, the legislative proposal requires an environmentally sustainable economic activity to fulfil the following requirements:
• Contribute substantially to at least one of the six environmental objectives set by the Commission, as demonstrated in Figure 2;
• Do not significantly harm any of the other environmental objectives;
• Comply with a number of minimum social and governance safeguards;
• Comply with quantitative or qualitative Technical Screening Criteria.
Figure 2 - Six environmental objectives outlined in the EU Taxonomy proposal
Source: Own elaboration based on the EU Taxonomy Regulation.
The Technical Expert Group on Sustainable Finance (TEG) supports the Commission among other
aspects with the development of the Technical Screening Criteria (TSC) for each of the environmental
objectives. The TEG published its final EU Taxonomy Technical Report on 9 March 2020, which further
elaborates on the Technical Screening Criteria and provides additional guidance for their application.
In the report, the TEG proposes criteria for the first two of the six environmental objectives, i.e.
climate change mitigation and climate change adaptation. The following sectors are considered in
the EU Taxonomy (Figure 3).
Nomenclature EU Taxonomy
EU Taxonomy eligibility: an economic activity could potentially fall under the EU Taxonomy due to its industry classification
EU Taxonomy alignment: an
economic activity meets the substantial contribution technical criteria as set out
in the technical annex to the EU Taxonomy Report by the TEG
EU Taxonomy compliance: an economic activity meets all criteria as set out in the technical annex to the EU
Taxonomy Report by the TEG

7
Figure 3 - Economic Sectors covered by the EU Taxonomy
Source: TEG elaborations from final EU Taxonomy report presentation, 9 March 2020.
Climate Change Mitigation
To develop Technical Screening Criteria for mitigation, the TEG first identified priority sectors based
on the “Nomenclature statistique des activités économiques dans la Communauté européenne“
(NACE). Then, the TEG identified and defined activities within these sectors that substantially
contribute to the environmental objective of climate change mitigation. The developed technical
screening criteria have two main components:
• Principles: Underlying rational for contribution and/or avoidance of harm
• Metrics and Thresholds: Methods of measurement and respective boundary and qualitative
or quantitative conditions that must be met
Climate Change Adaptation
In recognition of the context- and location-specific nature of climate change adaptation activities,
the development of an exhaustive list of eligible activities is limited. Thus, the TEG suggests a set of guiding principles and qualitative Technical Screening Criteria to assess the potential contribution of an economic activity to climate change adaptation. The TEG has created Do No Significant Harm (DNSH) criteria for the 68 adaptation criteria. Similar to the ‘greening of´ and ̀ greening by’ approach in the case of climate change mitigation activities as illustrated above, the following distinction is made (Figure 4):

8
Figure 4 - EU Taxonomy Approach towards Climate Adaptation
Source: TEG elaborations from final report presentation, 9 March 2020.
2.3. Objectives
The overall objective of this study is to support the JRC and European Commission Services in their
task of developing Draft Criterion I for an EU Ecolabel for financial products that will increase
transparency of such products to (retail) investors and support the flow of investments to
environmentally sustainable economic activities. This study intends to test Draft Criterion I on a
sample of 101 UCITS equity funds, either labelled as “green” or having a “green” theme.
A thorough analysis of the sample aims to understand the specific challenges arising from applying
the Draft Criterion I to financial products. The study aims to evaluate where adjustments and
recalibrations to the proposed Draft Criterion I may be taken into consideration, including the
respective benchmarks and sectoral scopes. In line with the tender specifications and the underlying
rationale, this study intends to support the Commission in finding the right balance between
promoting environmental excellence of financial products and allowing for a meaningful proportion
of existing (green) financial products to satisfy the criteria of the upcoming EU Ecolabel for financial
products.
In a first step, the availability of required data in the appropriate quality is evaluated. As only a
fraction of companies discloses the data required for the analysis, estimates on a range of both
financial and non-financial firm-level variables are necessary. Hence, the study broadens the strict
scope of the assessment as defined in the tender specifications by including the additional (explicit)
objective of testing different methodological approaches to address the data-related challenges of
applying the Draft Criterion I for financial products.

9
3. METHODOLOGY
3.1. Definition of the sample
In order to test the proposed Draft Criterion I of the EU Ecolabel for financial products, a sample of
“green” UCITS equity funds, domiciled in the EU27 was defined. To ensure a representative data set,
the sample comprises two categories:7
A. Category A – Green funds with (eco)label: approximately 50 “green” UCITS equity funds already awarded one of the following national (eco)labels: Austrian Eco Label
(Umweltzeichen), FNG-Siegel, Greenfin, Luxflag Climate Finance and Nordic Swan.
B. Category B – Green funds without (eco)label: approximately 50 “green” UCITS equity funds without a national (eco)label.
The funds with national labels (category A) are taken from a list of all UCITS equity funds that received one of the labels mentioned above8. Since the FNG label is the only label among the six that is primarily “sustainable” and not exclusively “green” (i.e. not explicitly focused on environmental
performance), fund prospectuses and fund names of FNG-labelled funds were screened manually. Following, only funds labelled by the FNG with an explicit focus on environmental performance were included. Additional exclusion criteria were applied as stated in Figure 5. Furthermore, nine funds from category A were excluded due to the unavailability of their constituents from neither Bloomberg nor Thomson Reuters.
Figure 5 - Defining the sample of 100 UCITS equity funds
Source: Own elaboration.
For the selection of funds marketed as green but without a national label (category B), the entire fund universe available in Bloomberg and Thomson Reuters was assessed according to four specific
criteria: i) the fund is active; ii) the fund is domiciled in the EU27; iii) the fund’s share class is
7 In line with the tender specifications (link), all UCITS equity funds are domiciled in the EU 27 with at least one fund domiciled in Austria,
Denmark, France, Germany, Ireland, Luxembourg and Sweden. 8 The list consisted of 125 equity funds. 14 received two labels and were mentioned twice (= 111). 4 are domiciled in non-EU27 countries
(=107). 3 are ETFs (=104). 25 are FNG-labelled but not explicitly green (=79). For 8 funds underlying assets could not be retrieved in both
databases (=71). 4 were excluded in the outlier-treatment with >200 or <5 constituents (=67). 1 is inactive as of today (=66) and another
contained a share of bonds, although it was labelled a pure equity fund (=65).
10
designated as “primary” 9; and iv) the fund is designated with at least one of the attributes “clean
energy”, “climate change” and “green” by either Bloomberg or Thomson Reuters. This approach resulted in a list of 60 funds designated with green attributes by Bloomberg and Thomson Reuters. In the next step, funds that are not actively managed, those holdings bonds (i.e. funds that were mistakenly designated as “equity funds” in the databases), those with more than 20010 or less than 5 constituents (deemed outliers in terms of the number of constituents since the mean number of
constituents is 55.7), and those with constituents not retrievable from Bloomberg and Thomson Reuters were excluded from. The distribution of constituents across the sample is presented in Table 2 below.
Following the steps outlined in Figure 5, a list of 65 green funds in category A and 48 in category B was obtained from a universe of 113 green UCITS equity funds. Although this number may seem low considering other sources11, it is nonetheless justified given the narrow definition of “green” and the explicit exclusion of UCITS equity funds related to “sustainable” or “ESG”.12 To reach a balanced
sample, the 65 funds of category A were divided into three groups small, medium and large, based on the funds’ Total Net Assets (TNA). Following, the top 17 funds of each group were chosen, resulting in 51 labelled green funds. For category B, two green UCITS equity funds were manually added, given their name and fund prospectus.13
Finally, the resulting sample of 101 funds was screened to ensure this sample included at least one fund for each of the countries required: Austria, Denmark, France, Germany, Ireland, Luxembourg
and Sweden (see Table 16). A list of all funds included in the final sample is provided in Table 15 of Annex V.
Sample Description
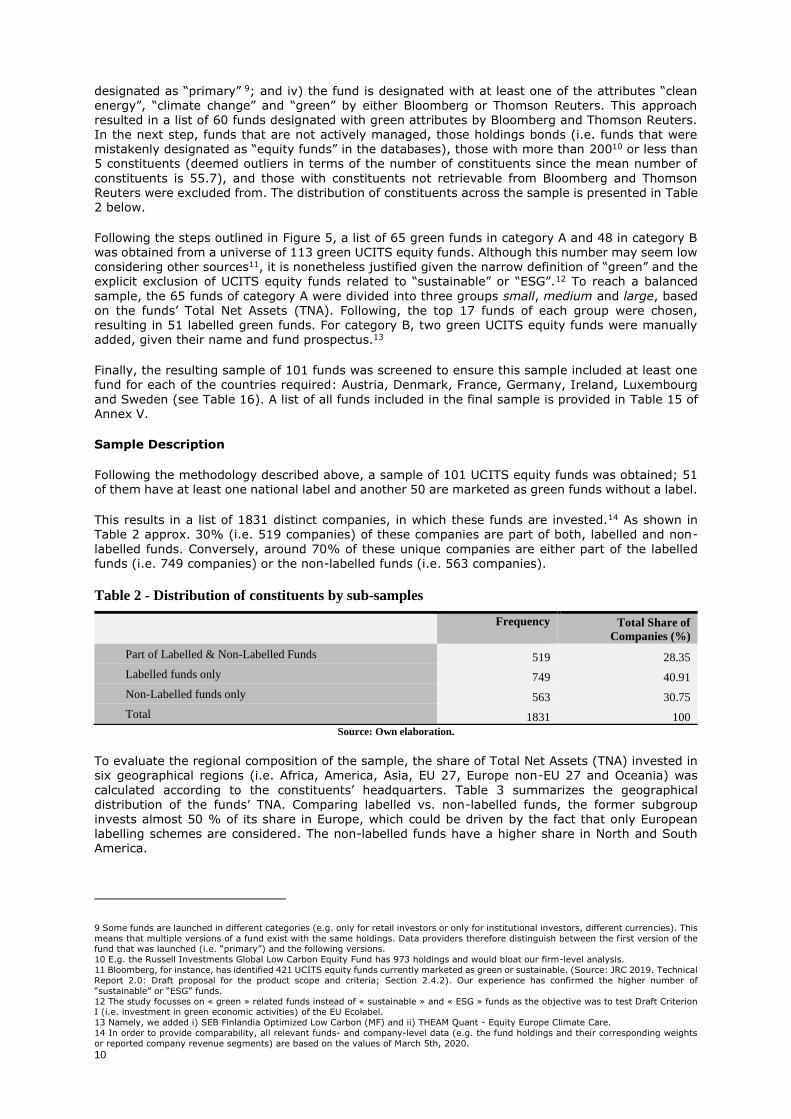
Following the methodology described above, a sample of 101 UCITS equity funds was obtained; 51 of them have at least one national label and another 50 are marketed as green funds without a label.
This results in a list of 1831 distinct companies, in which these funds are invested.14 As shown in Table 2 approx. 30% (i.e. 519 companies) of these companies are part of both, labelled and non-
labelled funds. Conversely, around 70% of these unique companies are either part of the labelled funds (i.e. 749 companies) or the non-labelled funds (i.e. 563 companies).
Table 2 - Distribution of constituents by sub-samples
Frequency Total Share of
Companies (%)
Part of Labelled & Non-Labelled Funds 519 28.35
Labelled funds only 749 40.91
Non-Labelled funds only 563 30.75
Total 1831 100
Source: Own elaboration.
To evaluate the regional composition of the sample, the share of Total Net Assets (TNA) invested in six geographical regions (i.e. Africa, America, Asia, EU 27, Europe non-EU 27 and Oceania) was
calculated according to the constituents’ headquarters. Table 3 summarizes the geographical distribution of the funds’ TNA. Comparing labelled vs. non-labelled funds, the former subgroup
invests almost 50 % of its share in Europe, which could be driven by the fact that only European labelling schemes are considered. The non-labelled funds have a higher share in North and South America.
9 Some funds are launched in different categories (e.g. only for retail investors or only for institutional investors, different currencies). This
means that multiple versions of a fund exist with the same holdings. Data providers therefore distinguish between the first version of the fund that was launched (i.e. “primary”) and the following versions.
10 E.g. the Russell Investments Global Low Carbon Equity Fund has 973 holdings and would bloat our firm-level analysis.
11 Bloomberg, for instance, has identified 421 UCITS equity funds currently marketed as green or sustainable. (Source: JRC 2019. Technical
Report 2.0: Draft proposal for the product scope and criteria; Section 2.4.2). Our experience has confirmed the higher number of
“sustainable” or “ESG” funds.
12 The study focusses on « green » related funds instead of « sustainable » and « ESG » funds as the objective was to test Draft Criterion I (i.e. investment in green economic activities) of the EU Ecolabel.
13 Namely, we added i) SEB Finlandia Optimized Low Carbon (MF) and ii) THEAM Quant - Equity Europe Climate Care.
14 In order to provide comparability, all relevant funds- and company-level data (e.g. the fund holdings and their corresponding weights
or reported company revenue segments) are based on the values of March 5th, 2020.

11
Table 3 - Geographical Distribution of Funds TNA
TNA share (%) invested in…
All Funds
(#101)
Labelled
(#51)
Non-Labelled
(#50)
Africa 0.47 0.86 0.08
(North & South) America 37.54 34.89 40.24
Asia 15.16 13.98 16.37
EU 27 33.39 35.92 30.82
Europe (non-EU27) 11.54 12.87 10.18
Oceania 0.79 0.69 0.89
N/A 0.17 0.18 0.16
Cash 0.94 0.62 1.26
Total 100 100 100
Source: Own elaboration.
The last section of this chapter describes the sectoral distribution of all constituents according to the NACE nomenclature15 and the respective share of TNA. The NACE code, obtained from the Thomson Reuters database, refers to the primary turnover segment of each company. More than 43% (i.e. 795 companies) of all companies generate their primary turnover from activities assigned to NACE-
section C (i.e. manufacturing). This corresponds to an average weight of 52.3% of a fund’s TNA. In descending order, 8.4% of TNA are invested in information and communications (NACE section J) and 7% in electricity, gas, steam and air conditioning (NACE section D). Although these numbers imply that the economic (macro) sector itself is covered by the EU Taxonomy, it does not mean that all economic activities falling under, for example manufacturing, are EU Taxonomy-eligible (e.g. Adidas, NACE code 15.20, “Manufacturing of footwear”). These non-eligible TNA shares - in
combination with the 518 companies, or 18.9% of the average TNA share, under a NACE section not yet covered by the EU Taxonomy (i.e. NACE-sector A, E, F, H, L resp.16) – will restrict the analysis as EU Taxonomy-alignment (i.e. “green”) cannot be evaluated. A detailed overview is provided in Table 4 below.
Table 4 - Distribution of TNA by NACE sectors
NACE-
Sector
Description No. of
Companies
% of
Companies
Avg. TNA (%)17 Labelled
(#51)
Non-
Labelled
(#50)
A Agriculture, Forestry
and Fishing 8 0.44 0.17 0.16 0.18
C Manufacturing 795 43.42 52.31 48.13 56.58
D Electricity, Gas, Steam
and Air Conditioning 92 5.02 6.98 3.70 10.32
E
Water Supply, Sewerage,
Waste Management
and Remediation Activities
39 2.13 4.23 2.98 5.51
F Construction 67 3.66 2.52 1.97 3.08
H Transportation and Storage 49 2.68 1.86 2.12 1.60
J Information and
Communication 147 8.03 8.44 11.05 5.78
L Real Estate Activities 116 6.34 3.72 4.84 2.58
Rest Not yet covered by the
Taxonomy 518 28.29 18.83 24.42 13.12
15 The NACE Code, obtained from the Thomson Reuters database, refers to the primary segment of the specific company. Unfortunately,
the reported NACE-Code classification for each company is not necessarily equal to the primary revenue segment the companies report.
16 Within the group of sectors not yet covered by the taxonomy, the largest proportion of TNA is invested in sector K “Financial and Insurance Activities” (7.75%), G “Wholesale and Retail Trade; Repair of Motor Vehicles and Motorcycles” (3.44 %) and M “Professional,
Scientific and Technical Activities”(2.04%).
17 The methodology used to calculate the average weight of TNA that are invested in each NACE-sector is the same methodology described
in the previous section.
12
NACE-
Sector
Description No. of
Companies
% of
Companies
Avg. TNA (%) Labelled
(#51)
Non-
Labelled
(#50)
Cash 0.94 0.62 1.26
Total
1831 100 100 100 100
Source: Own elaboration.
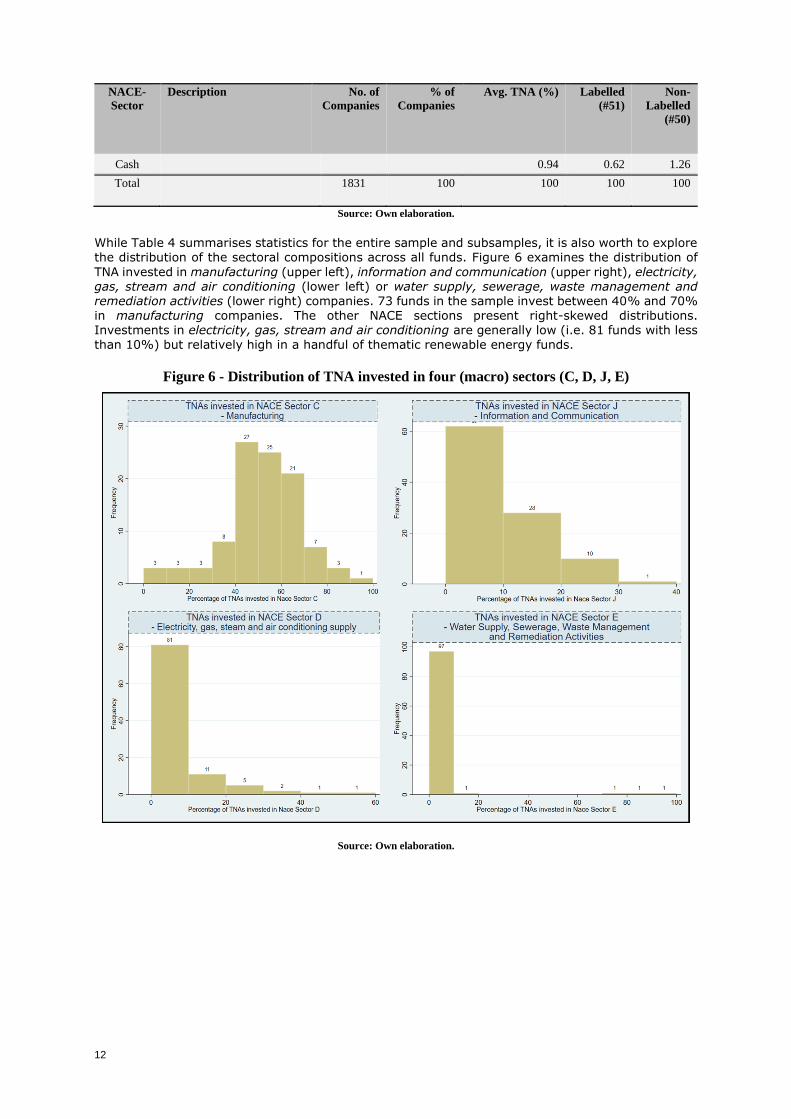
While Table 4 summarises statistics for the entire sample and subsamples, it is also worth to explore the distribution of the sectoral compositions across all funds. Figure 6 examines the distribution of
TNA invested in manufacturing (upper left), information and communication (upper right), electricity, gas, stream and air conditioning (lower left) or water supply, sewerage, waste management and remediation activities (lower right) companies. 73 funds in the sample invest between 40% and 70% in manufacturing companies. The other NACE sections present right-skewed distributions. Investments in electricity, gas, stream and air conditioning are generally low (i.e. 81 funds with less
than 10%) but relatively high in a handful of thematic renewable energy funds.
Figure 6 - Distribution of TNA invested in four (macro) sectors (C, D, J, E)
Source: Own elaboration.

13
Companies that fall under the NFRD
Approximately 6,000+ companies in the EU fall under the NFRD, meaning they already have to abide to stricter disclosure obligations and will be further required to disclose information regarding their economic activities’ alignment and compliance with the EU Taxonomy on climate change mitigation and climate change adaptation.18 Therefore, it is worth having a closer look at their share in the sample. Even though different rules apply in a few EU member states, this study uses “number of
employees > 500” and “company is headquartered in the EU27” as a NFRD proxy. Table 5 presents the mean and median of constituents per fund and the companies that fall under the NFRD. In comparison to funds without a label, labelled funds (i.e. those with a higher share invested in EU27, see Table 3) have more companies falling under the NFRD (20.27% vs. 12.78% on average) in their portfolio and also have a higher TNA share invested (33.6% vs. 27.25%).
Table 5 - Average constituents per fund
Entire Universe
(#115)
Sample
(#101)
Labelled
(#51)
Non-Labelled
(#50)
Companies (Mean) 54.48 54.19 57.18 51.14
Companies (Median) 50.00 51.00 55.00 50.00
Companies under NFRD (Mean) 16.93 16.56 20.27 12.78
TNA in Companies under NFRD (Mean) 31.71% 30.46% 33.60% 27.25%
Source: Own elaboration.
Complementing the summary statistics in the table above, Figure 7 presents the distribution of TNA invested in companies under the NFRD across all funds.
Figure 7 - Distribution of TNA invested in companies falling under NFRD
Source: Own elaboration.
3.2. Mapping of Revenue Segments to the Taxonomy Activities19
To assess the degree of EU Taxonomy eligibility (i.e. economic activities covered by the EU
Taxonomy) and potential EU Taxonomy alignment (i.e. economic activity is eligible and complies with
the EU Taxonomy’s Technical Screening Criteria for substantial contribution to climate change
mitigation) of each fund according to the proposed Draft Criterion I of the EU Ecolabel for financial
products, the share of green turnover of each underlying company must be determined. Hence, one
18 The EU Taxonomy includes six environmental objectives, as stated earlier. To this date, specific criteria have been defined for only two
of them, namely climate change mitigation and climate change adaptation. Since the TEG understands climate change mitigation objectives
to be consistent with the commitments under the EU Green Deal and due to the explicit focus of this study on climate change mitigation, this study refers to the part of the EU Taxonomy for substantial contribution to climate change mitigation whenever ”EU Taxonomy" is
mentioned.
19 Note for clarification : Taxonomy MAPPING is not to be confused with Taxonomy ASSESSMENT. This subchapter solely describes the
methodology of MAPPING revenue segment (i.e. economic activities) to activities of taxonomy relevance.

14
needs to link companies’ economic activities (i.e. reported turnover segments) accurately to the
activities described in the EU Taxonomy before one can start labelling turnover segments as “green”.
To determine the green turnover share according to the EU Taxonomy, firm-level turnover segments
obtained from Thomson Reuters20 were used. As part of an accurate data preparation, one needs to
match the given turnover segments for each company with the economic activities in the NACE
nomenclature system21, which builds the bridge to the EU Taxonomy.
The NACE code system is the statistical classification of economic activities in the European Community. It consists of a four-digit classification framework in order to accumulate and present statistical data on productive economic activities, breaking down the economic activities into sections (alphabetical code), divisions (two-digit code), groups (three-digit code) and classes (four-digit
code).
Thomson Reuters provides “sales” data for up to ten product segments22, with sales being defined as “the total revenue from the product line”. The obtained segments are clustered i) according to the company’s own description and ii) according to the Standard Industry Classification System (SIC),
which has been replaced by the North American Industry Classification System (NAICS) in 1997 but is still used for company reporting and by data providers. Therefore, in the absence of company data
reported under the EU Taxonomy, the challenge is to link SIC via NAICS to NACE, and then, ultimately, to the corresponding activities under the EU Taxonomy.
Before this procedure is explained in more detail, the current data situation provides a simplification
used in this study. In the databases, each firm is classified by one single NACE and Thomson Reuters
Business Classification (TRBC) code, which captures the firm’s primary activity. As the sales reported
in the first segment represent per default the largest share among all segments, the primary share
for 𝑐𝑜𝑚𝑝𝑎𝑛𝑦 𝑖 and segments j (j = 1,…,10) is defined as:
𝑃𝑟𝑖𝑚𝑎𝑟𝑦𝑆ℎ𝑎𝑟𝑒𝑖
= 𝑆𝑎𝑙𝑒𝑠𝑖,1
∑ 𝑆𝑎𝑙𝑒𝑠𝑖,𝑗101
After mapping the industry classification codes, the share of the company’s primary activity was
recalibrated, given that the activity falls under the EU Taxonomy, and added to the share of other
segments for which the mapping routine yields the same activity. This may be the case if a company
reports sales of a certain activity for different regions in the sales segments. This procedure allows
a smoother data processing as it reduces the number of activities that need to be assessed.
Expressed more formally, the primary share of the economic activity j under the EU Taxonomy for
𝑐𝑜𝑚𝑝𝑎𝑛𝑦 𝑖 is derived from sales in segment 1 and all other segments that can be linked to the same
activity j.
𝑃𝑟𝑖𝑚𝑎𝑟𝑦𝑆ℎ𝑎𝑟𝑒𝑖
= 𝑆𝑎𝑙𝑒𝑠𝑖,1 + ∑ 𝑆𝑎𝑙𝑒𝑠𝑖,𝑗
102
∑ 𝑆𝑎𝑙𝑒𝑠𝑖,𝑗101
After the primary activity has been classified, a SIC-to-NAICS-to-NACE-to-EU Taxonomy mapping
was conducted for all other segments that are not captured by the primary activity. For this routine, a correspondence table linking SIC codes to EU Taxonomy activities was created, which comes with the following challenges:
a) Since an immediate SIC to NACE conversion table does not exist, we relied on a SIC to
NAICS, and second, a NAICS to NACE correspondence table.
b) It is evident that this mapping can be ambiguous for certain activities. Due to the different
structures of the classification systems, certain SIC codes, which are a starting point for
identifying economic activities’ revenue shares correspond with several and not one unique
20 Thomson Reuters was used here due to its better usability. However, firm-level revenue segments are identical in Thomson Reuters and
Bloomberg according to a manual comparison of a handful of companies. 21 https://ec.europa.eu/eurostat/statistics-
explained/index.php?title=Glossary:Statistical_classification_of_economic_activities_in_the_European_Community_(NACE).
22 If a company has more than ten product segments, all remaining segments are included in product segment #10. However, this is rarely
the case.

15
NAICS codes. For the second mapping step of the procedure, certain NAICS codes correspond
with several NACE codes.
c) To reduce the ambiguity, a table displays all 73 Taxonomy activities and their respective
NACE codes (see Annex I), which allows for the following simplifications:
i. if one SIC code can be mapped to, for example, three different NACE codes, but all NACE codes unambiguously refer to the same EU Taxonomy activity, the mapping routine is unambiguous;
ii. if one SIC code can be mapped to, for example, three different NACE codes, but all
NACE codes do not fall under the EU Taxonomy, an unambiguous result for the
purpose of the analysis was retrieved as this SIC code does not fall or is not eligible
under the EU Taxonomy;
iii. if the mapping remains ambiguous, manual research was undertaken whether or not a clear assignment is feasible within the budget and time constraints of this project. All remaining SIC codes are not verifiable, considering the project’s limited budget and duration.
This complex exercise is illustrated in Annex IV and presents the “default option”. However, further workarounds were implemented in case of data restrictions (e.g. missing NACE code for some companies) and manual research was carried out in case it was feasible. All “further steps” are listed at the end of Annex IV.
16
3.3. Assessment of EU Taxonomy compliant activities
Clustering of the EU Taxonomy Activities
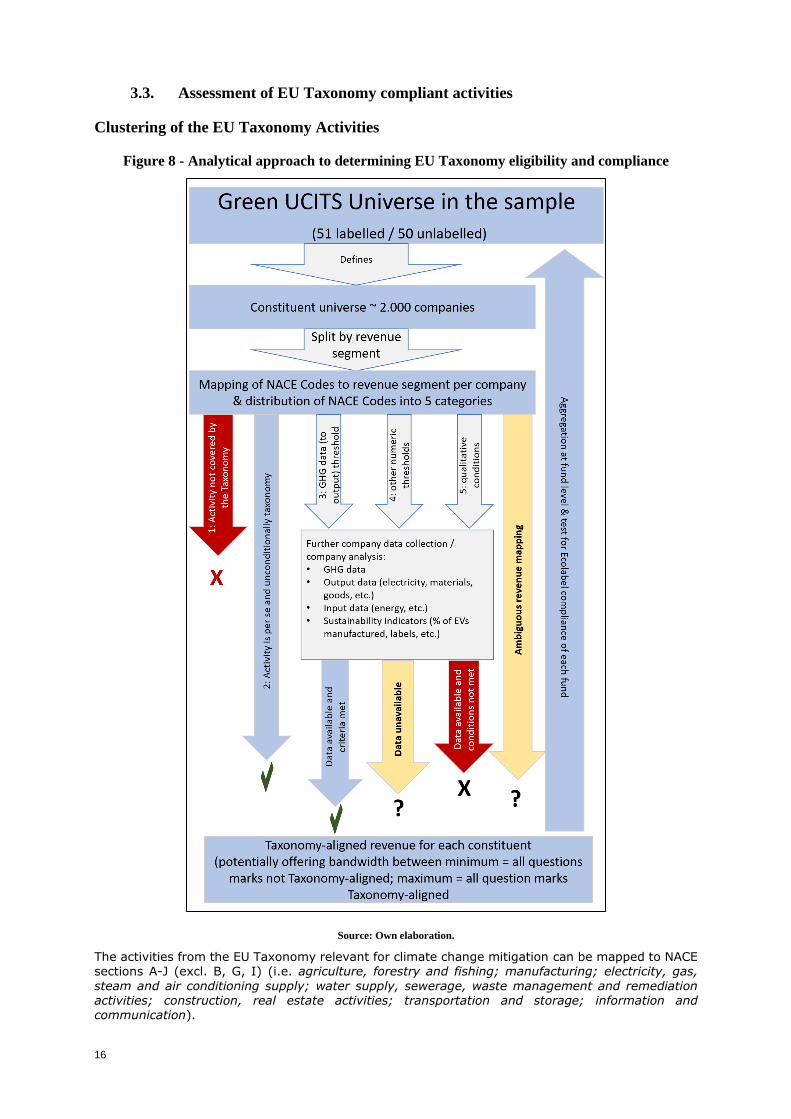
Figure 8 - Analytical approach to determining EU Taxonomy eligibility and compliance
Source: Own elaboration.
The activities from the EU Taxonomy relevant for climate change mitigation can be mapped to NACE sections A-J (excl. B, G, I) (i.e. agriculture, forestry and fishing; manufacturing; electricity, gas,
steam and air conditioning supply; water supply, sewerage, waste management and remediation activities; construction, real estate activities; transportation and storage; information and communication).
17
In order to map the activities according to NACE with the EU Taxonomy activities, the observed NACE
activities were analysed using the following classification categories:
0. Ambiguous mapping 1. Activity is not covered by the EU Taxonomy 2. Activity is per se and unconditionally EU Taxonomy compliant 3. Activity is evaluated against a GHG intensity threshold23
4. Activity is evaluated against another numeric threshold 5. Activity is evaluated against qualitative criteria
Category 0 “Ambiguous mapping”. This category captures all economic activities for which the mapping routine (see section 3.2) did not yield an unambiguous result. The economic activity could fall under the EU Taxonomy (but several activities are possible) or it is not covered (but it is not certain)24.
Category 1 “Activity is not covered by the EU Taxonomy, i.e. not eligible” covers all activities of the
NACE code system that are not mentioned in the EU Taxonomy to this date. While activities such as “raising of dairy cattle” are part of the EU Taxonomy, “marine aquaculture” is not. This is particularly relevant for sectors such as pharmaceuticals, which represent a large share of many green funds, but are not covered by the EU Taxonomy under its current focus on substantial contribution in terms of climate change mitigation and adaptation.
Category 2 “Activity is per se and unconditionally EU Taxonomy-compliant” shows all activities in the NACE code system that are EU Taxonomy-compliant without the additional requirement to meet thresholds or that are currently derogated from thresholds. This includes for example “production of electricity”, which is partly derogated as low carbon/ renewable energy sources tend to perform below the given threshold of 100 gCO2e/kWh of electricity produced nearly all the time.25 Access to more granular company data would allow to classify more activities into this category such as but not limited to some waste activities.
Category 3 “Activity is evaluated against a GHG data intensity threshold (generally GHG emissions/ output)” includes all NACE activities that need to fulfil GHG data thresholds in order to be EU Taxonomy aligned. GHG data thresholds are in most cases compared to an output variable such as
tonnes of iron produces. For example, “manufacturing of other inorganic chemicals” requires a maximum GHG emission per unit of products (tCO2e/t) according to the methodology of the EU-ETS benchmarks to be aligned with the EU Taxonomy. Electricity generation from liquid fossil fuels falls under this category as well.
Category 4 “Activity is evaluated against another numeric threshold” classifies all NACE activities that achieve EU Taxonomy alignment through non-GHG numeric thresholds. This includes for instance “casting of iron” where no threshold is applicable if at least 90% of the final product is sourced from scrap steel. For this activity, two non-GHG input variables are required, namely total steel input material and total scrap steel used.
Category 5 "Activity is evaluated against qualitative criteria” shows all NACE activities that need to
demonstrate EU Taxonomy alignment under qualitative/ non-numerical thresholds or conditions. This category includes, for instance, check-the-box tests such as the existence of a certain forestry management plan in the forestry EU Taxonomy criteria.
Annex I present makes the classification of EU Taxonomy activities transparent and assigns one (or several) categories to each activity. In case multiple categories applied, the bold category (see Annex I) was used which present the dominant metric.
23 In general, this threshold is calculated as follow: GHG emissions/output.
24 The illustration in Annex IV makes it clear. 25 Category 2 does only apply to the production of electricity / heat / co-generation as all other potential fields of application do not allow
for an outside assessment of whether revenues are purely dedicated to category 2 activities. For the production of electricity / heat / co-
generation, TRBC does classify revenues in sufficient detail so that e.g. production of electricity from solar PV and production of electricity
from gas can be distinguished.

18
Data availability as a key challenge26
Access to adequate data represents the key challenge in the assessment of EU Taxonomy eligibility
and alignment of economic activities in this study. Key data challenges were identified and cross-
checked with various stakeholders, including various asset managers, ESG data providers, and other
experts.
Main data challenges include:
Different levels of disaggregation in turnover data: companies’ reporting on their turnover share
differs widely in quality and depth. Some companies report just one revenue segment whereas other
companies break down their turnover by single economic activities. This may be driven by varying
levels of turnover diversification between companies and different granularity of the reporting
(requirements). In order to apply the EU Taxonomy in an appropriate manner on economic activities,
all companies would need to report turnover at a four-digit NACE level. However, this would not be
sufficient for all activities and reporting would need to be even more detailed. For instance, a
company that is producing electricity might report at NACE level 35.11 (i.e. Production of electricity).
However, this does not allow to analyse for eligibility with the EU Taxonomy for economic activities
as a further breakdown into production of electricity from gas, solar, wind etc. is required, but is not
foreseen in the NACE system.
Data gaps at installation and single activity level: the mandate of the TEG includes the development
of the Technical Screening Criteria for the EU Taxonomy with a single activity or installation
perspective. Here a bottom-up analysis to check for eligibility with the EU Taxonomy is pursued (i.e.
using data from the installation or the single activity). Current reporting by companies does not allow
testing the criteria at the installation and single activity level. The only viable option is the utilisation
of company level data from databases. However, this does not allow for a comprehensive top-down
application of the methodological approach as suggested in the TEG usability guidance.
For categories 3 to 5, the availability of relevant data is scarce. The classification of EU Taxonomy-
aligned economic activities as performed in the section above is already hinting at the key challenge
of data availability for categories 3 to 5. What the initial research shows is that the matching of
turnover data to emissions data or other input and output data is quite challenging (i.e. as would be
required for evaluating economic activities falling into categories 3 and 4). At the level of qualitative
condition (category 5), data availability is even more challenging.
Time lag in databases: Reporting of EU Taxonomy-relevant data is not up to date. Companies tend
to report annual data usually in the first or second quarter of the following year. Thus, several months lay between company reporting and data availability in databases such as Thomson Reuters and Bloomberg. Therefore, data available in databases is usually at least one year old and therefore does not necessarily reflect the level of EU Taxonomy eligibility of 2020 but rather of 2018.
Bridging data gaps through estimation models
In the framework of this study, the attempt to estimate CO2-emission data for non-disclosing
companies to evaluate EU Taxonomy alignment was undertaken. This applies at least for screening criteria related to carbon intensities for manufacturing companies already today.
In line with the existent literature (e.g. Griffin, 2017)27 and our own experience with modelling
emissions estimates, a model estimating CO2 scope 1 emissions for 915 non-disclosing companies
was built (out of 1831 distinct companies in the sample).28
For this approach, the estimation model on European time-series data covering 2010-2018 was trained and CO2 scope 1 emission data for non-disclosing companies based on the following covariates was estimated, including total revenue, cost of goods sold, long term debt, total assets,
26 One again we gratefully acknowledge support provided by Roberto Panzica (JRC Ispra) for screening the MSCI ESG database.
27 Griffin, P. A., Lont, D. H., & Sun, E. Y. (2017). The relevance to investors of greenhouse gas emission disclosures. Contemporary
Accounting Research, 34(2), 1265-1297. 28 N.B : While is it firmly outside the scope of this study to develop fully fledged estimation methods, we do however want to go beyond
just the available, disclosed data, to be able to derive at least order of magnitude estimates to guide the further work of DG ENV, DG FISMA
and the JRC on the EU Ecolabel.
19
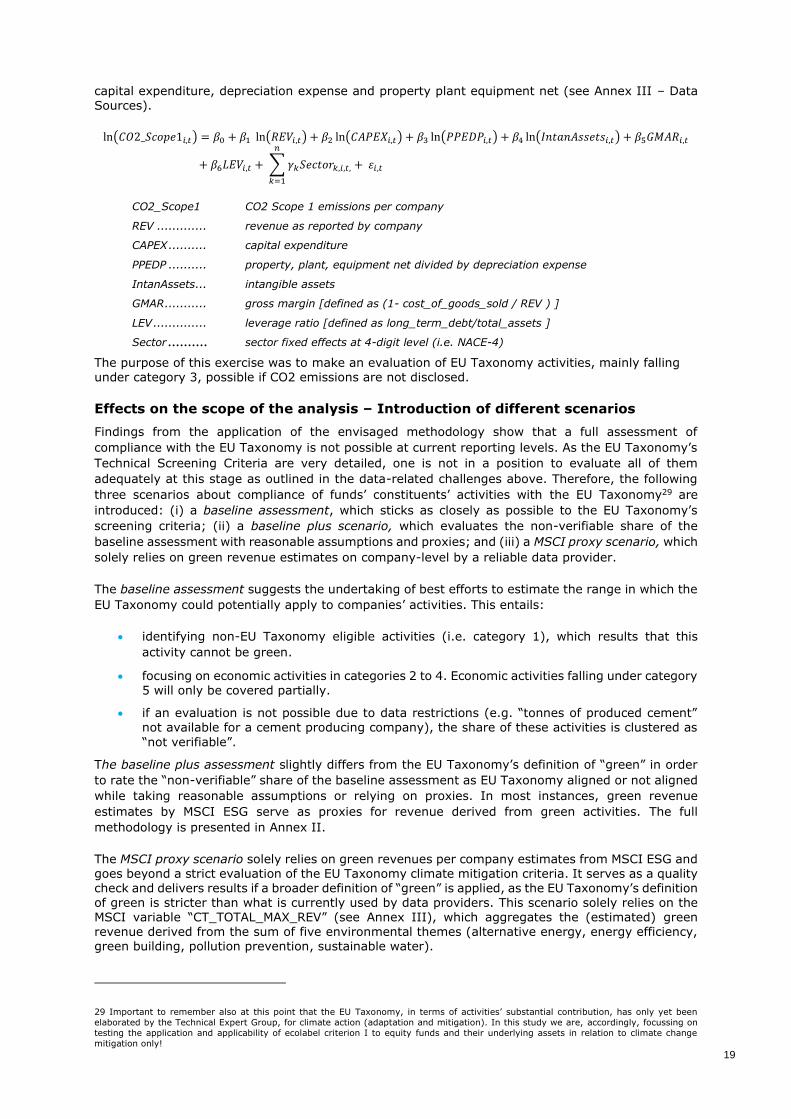
capital expenditure, depreciation expense and property plant equipment net (see Annex III – Data
Sources).
ln(𝐶𝑂2_𝑆𝑐𝑜𝑝𝑒1𝑖,𝑡) = 𝛽0 + 𝛽1 ln(𝑅𝐸𝑉𝑖,𝑡) + 𝛽2 ln(𝐶𝐴𝑃𝐸𝑋𝑖,𝑡) + 𝛽3 ln(𝑃𝑃𝐸𝐷𝑃𝑖,𝑡) + 𝛽4 ln(𝐼𝑛𝑡𝑎𝑛𝐴𝑠𝑠𝑒𝑡𝑠𝑖,𝑡) + 𝛽5𝐺𝑀𝐴𝑅𝑖,𝑡
+ 𝛽6𝐿𝐸𝑉𝑖,𝑡 + ∑ 𝛾𝑘𝑆𝑒𝑐𝑡𝑜𝑟𝑘,𝑖,𝑡,
𝑛
𝑘=1
+ 𝜀𝑖,𝑡
CO2_Scope1 CO2 Scope 1 emissions per company
REV ............. revenue as reported by company
CAPEX .......... capital expenditure
PPEDP .......... property, plant, equipment net divided by depreciation expense
IntanAssets ... intangible assets
GMAR ........... gross margin [defined as (1- cost_of_goods_sold / REV ) ]
LEV .............. leverage ratio [defined as long_term_debt/total_assets ]
Sector .......... sector fixed effects at 4-digit level (i.e. NACE-4)
The purpose of this exercise was to make an evaluation of EU Taxonomy activities, mainly falling under category 3, possible if CO2 emissions are not disclosed.
Effects on the scope of the analysis – Introduction of different scenarios
Findings from the application of the envisaged methodology show that a full assessment of
compliance with the EU Taxonomy is not possible at current reporting levels. As the EU Taxonomy’s
Technical Screening Criteria are very detailed, one is not in a position to evaluate all of them
adequately at this stage as outlined in the data-related challenges above. Therefore, the following
three scenarios about compliance of funds’ constituents’ activities with the EU Taxonomy29 are
introduced: (i) a baseline assessment, which sticks as closely as possible to the EU Taxonomy’s
screening criteria; (ii) a baseline plus scenario, which evaluates the non-verifiable share of the
baseline assessment with reasonable assumptions and proxies; and (iii) a MSCI proxy scenario, which
solely relies on green revenue estimates on company-level by a reliable data provider.
The baseline assessment suggests the undertaking of best efforts to estimate the range in which the
EU Taxonomy could potentially apply to companies’ activities. This entails:
• identifying non-EU Taxonomy eligible activities (i.e. category 1), which results that this
activity cannot be green.
• focusing on economic activities in categories 2 to 4. Economic activities falling under category 5 will only be covered partially.
• if an evaluation is not possible due to data restrictions (e.g. “tonnes of produced cement” not available for a cement producing company), the share of these activities is clustered as
“not verifiable”.
The baseline plus assessment slightly differs from the EU Taxonomy’s definition of “green” in order
to rate the “non-verifiable” share of the baseline assessment as EU Taxonomy aligned or not aligned
while taking reasonable assumptions or relying on proxies. In most instances, green revenue
estimates by MSCI ESG serve as proxies for revenue derived from green activities. The full
methodology is presented in Annex II.
The MSCI proxy scenario solely relies on green revenues per company estimates from MSCI ESG and goes beyond a strict evaluation of the EU Taxonomy climate mitigation criteria. It serves as a quality check and delivers results if a broader definition of “green” is applied, as the EU Taxonomy’s definition of green is stricter than what is currently used by data providers. This scenario solely relies on the MSCI variable “CT_TOTAL_MAX_REV” (see Annex III), which aggregates the (estimated) green revenue derived from the sum of five environmental themes (alternative energy, energy efficiency, green building, pollution prevention, sustainable water).
29 Important to remember also at this point that the EU Taxonomy, in terms of activities’ substantial contribution, has only yet been
elaborated by the Technical Expert Group, for climate action (adaptation and mitigation). In this study we are, accordingly, focussing on
testing the application and applicability of ecolabel criterion I to equity funds and their underlying assets in relation to climate change
mitigation only!

20
4. DATA ANALYSIS
4.1. Mapping of economic activities: the distribution of EU Taxonomy activities
Mapping the obtained revenue segments as described in section 3.2, one retrieves mapping results
for the companies’ primary segments (i.e. a NACE four-digit code as a starting point) and the
remaining segments 2 to 10 (i.e. SIC codes as a starting point)30. The resulting numbers are
presented in Table 6 below. Results are weighted according to the company’s weight in the sample
and the revenue-share of the economic activity within the company. For example, if Tesla’s weight
across the entire sample equals 1% and its second revenue-segment, classified as category 5 (see
section 3.3), accounts for 20% of its revenue, Tesla’s second revenue-segment would contribute with
0.2% to the respective cell under category 5 "Activity is evaluated against qualitative criteria”.
Table 6 - Clustering of Revenue Segments
Revenue-weighted
share of activities
Entire Sample (#101) Labelled (#51) Non-Labelled (#50)
Category Primary
(1)
Segments
2-10 (2)
Total (3) (1) (2) (3) (1) (2) (3)
0: Ambiguous
Mapping
2.3 11.3 13.7 1.8 10.9 12.7 2.8 11.8 14.6
1: No Taxonomy
exposure
50.1 2.6 52.7 57.4 2.5 59.9 42.7 2.6 45.4
2: Per se Green 6.8 0.6 7.4 3.7 0.4 4.1 9.9 0.8 10.7
3: GHG intensities 1.7 0.2 1.9 1.6 0.2 1.8 1.7 0.2 2.0
4: Numeric 2.9 0.0 2.9 3.7 0.0 3.8 2.0 0.0 2.0
5: Qualitative 13.1 2.0 15.0 12.5 1.9 14.4 13.7 2.0 15.7
Energy Production* 3.9 1.5 5.4 1.9 0.7 2.6 5.9 2.3 8.2
Data restrictions No firm data obtained 0.1
0.1
0.1
Cash / Currencies 1.0
0.7
1.3
100 100 100
* Energy production is listed separately since several activities fall under NACE code 35.11 (i.e. “ambiguous mapping”).
Nonetheless, an evaluation of energy production activities with the proposed methodology described in section 4.3 is
possible.
Source: Own elaboration.
For the entire sample, the largest share is by far category 1 “Activity not covered by Taxonomy” (52.6%). This large share is partly subject to the study’s focus on climate mitigation, whereas an extension of the analysis to the other objectives of the EU Taxonomy (e.g. water or biodiversity) might decrease this share. For 13.7% of the sample, an ambiguous mapping to the Technical Screening Criteria for substantial contribution to climate change mitigation of the EU Taxonomy is obtained. This can be explained since certain SIC or NACE codes may potentially fall under more than one EU Taxonomy activity or because of insufficient reporting (e.g. the SIC Code is defined as
“9999”, which is not covered by correspondence tables). Without further manual research, it is not possible to evaluate the latter activities.
Activities that fall under “energy production” are listed separately, since the top-down mapping
routine yields several possible EU Taxonomy activities for NACE code 35.11 (e.g. production of
electricity from solar PV, wind power, ocean energy, among others). An evaluation is nonetheless
possible (see sectoral discussion below).
An important limitation is the scope of some EU Taxonomy activities. “Manufacture of low carbon
technologies”, for instance, yields the highest share among all. This is partly because it corresponds with 13 different NACE codes (see Annex I). This does not mean that every company, identified in the mapping routine, is linked to this activity per se. It solely means that the 𝑟𝑒𝑣𝑒𝑛𝑢𝑒 𝑠𝑒𝑔𝑚𝑒𝑛𝑡𝑖 of
𝑐𝑜𝑚𝑝𝑎𝑛𝑦𝑗 falls potentially under this activity. A good example is NACE code 29.10 Manufacture of
motor vehicles - Tesla would fall under that activity, whereas Renault would not. The same is true for “Data-driven climate change monitoring solutions”, linked to nine underlying NACE codes, ranging
30 Again, the link to the EU Taxonomy is based on all activities and corresponding NACE code presented in Annex I.

21
from Wired telecommunication activities (61.10) to Computer programming activities (61.01).
Determining whether one of them contains “climate change monitoring solutions” requires further research.
From this angle, zooming into categories 2 to 5 (i.e. the economic activities that could potentially be mapped to an EU Taxonomy activity), Table 7 below presents the distribution of possible activities, sorted in descending order by macro sectors. The results from the baseline assessment are already
attached and will be explained in the discussion in the next section.
Table 7 - Share of (potentially) identified EU Taxonomy Activities
Sector
&
Weight
*
EU Taxonomy
Activity
(Potential)
companies* Weight1
Aligned2
Not
aligned2
Non-
verifiable2
# of distinct
companies
Revenue-weighted
share Results Baseline Assessment2
C 15.
4
Manufacture of low
carbon technologies* 202 13.20 6.35 0.02 6.86
Manufacture of other
organic basic
chemicals
31 1.33 0.00 0.00 1.33
Manufacture of Iron
and Steel 18 0.30 0.01 0.00 0.29
Manufacture of
Biogas or Biofuels 2 0.23 0.00 0.00 0.23
Manufacture of
Cement 11 0.17 0.01 0.05 0.12
Manufacture of
plastics in primary
form
1 0.07 0.00 0.00 0.07
Manufacture of
Aluminium 4 0.04 0.00 0.01 0.04
Manufacture of
fertilizers and
nitrogen compounds
2 0.02 0.00 0.00 0.02
D 5.6
Energy Production3 74 5.36 2.29 0.82 2.25
Retrofit of Gas
Transmission and
Distribution Networks
12 0.26 0.00 0.00 0.26
J 4.7
Data-driven climate
change monitoring
solutions*
126 4.42 0.00 4.42 0.00
Data processing,
hosting and related
activities
4 0.26 0.00 0.26 0.00
L 2.9
Acquisition and
ownership of
buildings
130 2.89 0.00 0.00 2.89
E 1.9
Water collection,
treatment and supply
18 1.36 0.00 0.00 1.36
Separate collection
and transport of non-
hazardous waste in
source segregated
fractions
8 0.53 0.53 0.00 0.00
H 0.8
Freight Rail Transport 8 0.35 0.00 0.23 0.11
Passenger Rail
Transport (interurb.)
4 0.22 0.00 0.00 0.22
Public transport 5 0.10 0.00 0.00 0.10
Operation for low
carbon transport (air)
7 0.07 0.00 0.00 0.07
Passenger
cars and commercial
vehicles
4 0.04 0.00 0.00 0.04
Interurb. scheduled
road transport
3 0.03 0.00 0.00 0.03
22
Operation for low
carbon transport
(land)
2 0.03 0.00 0.00 0.03
F 0.2
Construction of new
buildings
6 0.13 0.00 0.00 0.13
Infrastructure for low
carbon transport (land
transport)
7 0.08 0.00 0.00 0.08
A 0.1
Growing of non-
perennial crops
5 0.07 0.00 0.00 0.07
Livestock production 1 0.01 0.00 0.00 0.01
Forestry (no findings) 0 0 0 0 0
* Activities marked with “**” are only potentially linked to this activity. See explanations in the text.
1) the weight of this activity across the entire sample
2) Foreshadowing the results of the baseline assessment. Green = EU Taxonomy aligned based on screening criteria;
Brown = not aligned with EU Taxonomy (but an assessment has been done); Grey = no assessment possible.
3) Energy production covers solar, wind, geothermal etc. Source: Own elaboration.
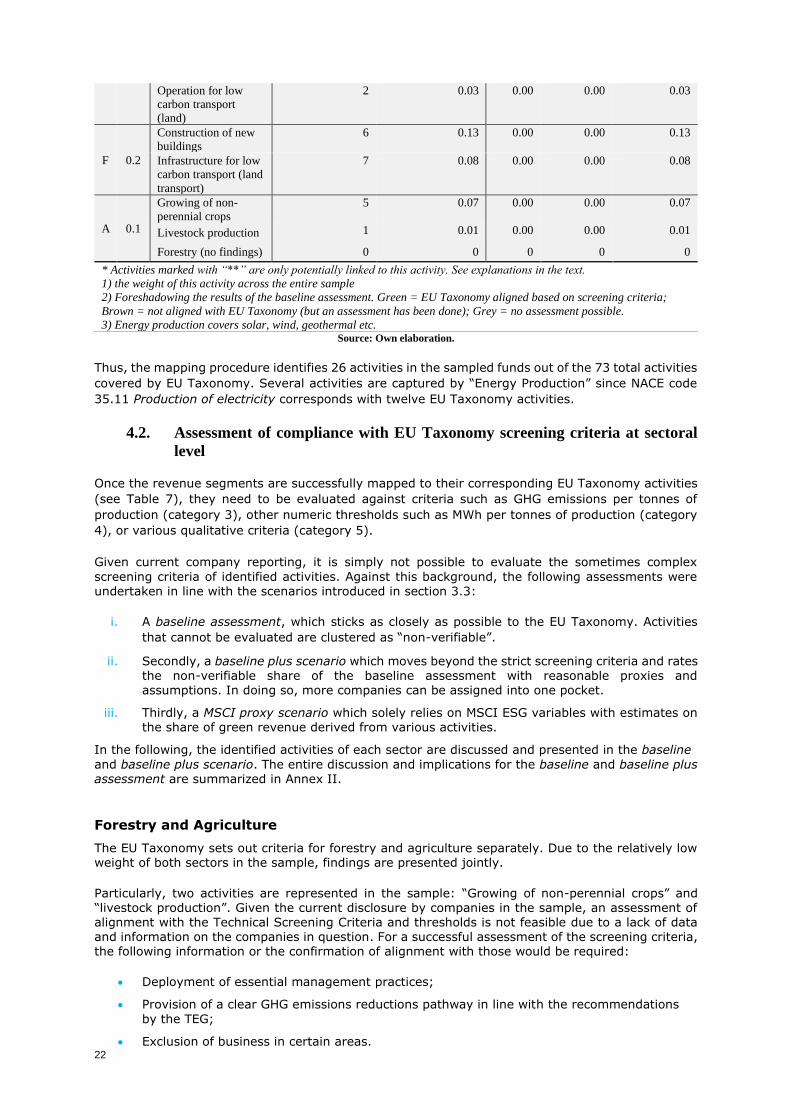
Thus, the mapping procedure identifies 26 activities in the sampled funds out of the 73 total activities
covered by EU Taxonomy. Several activities are captured by “Energy Production” since NACE code
35.11 Production of electricity corresponds with twelve EU Taxonomy activities.
4.2. Assessment of compliance with EU Taxonomy screening criteria at sectoral
level
Once the revenue segments are successfully mapped to their corresponding EU Taxonomy activities
(see Table 7), they need to be evaluated against criteria such as GHG emissions per tonnes of
production (category 3), other numeric thresholds such as MWh per tonnes of production (category
4), or various qualitative criteria (category 5).
Given current company reporting, it is simply not possible to evaluate the sometimes complex
screening criteria of identified activities. Against this background, the following assessments were
undertaken in line with the scenarios introduced in section 3.3:
i. A baseline assessment, which sticks as closely as possible to the EU Taxonomy. Activities
that cannot be evaluated are clustered as “non-verifiable”.
ii. Secondly, a baseline plus scenario which moves beyond the strict screening criteria and rates the non-verifiable share of the baseline assessment with reasonable proxies and assumptions. In doing so, more companies can be assigned into one pocket.
iii. Thirdly, a MSCI proxy scenario which solely relies on MSCI ESG variables with estimates on the share of green revenue derived from various activities.
In the following, the identified activities of each sector are discussed and presented in the baseline
and baseline plus scenario. The entire discussion and implications for the baseline and baseline plus assessment are summarized in Annex II.
Forestry and Agriculture
The EU Taxonomy sets out criteria for forestry and agriculture separately. Due to the relatively low weight of both sectors in the sample, findings are presented jointly.
Particularly, two activities are represented in the sample: “Growing of non-perennial crops” and “livestock production”. Given the current disclosure by companies in the sample, an assessment of alignment with the Technical Screening Criteria and thresholds is not feasible due to a lack of data and information on the companies in question. For a successful assessment of the screening criteria, the following information or the confirmation of alignment with those would be required:
• Deployment of essential management practices;
• Provision of a clear GHG emissions reductions pathway in line with the recommendations
by the TEG;
• Exclusion of business in certain areas.

23
As a result, agricultural activities are excluded in the baseline assessment. In the baseline plus and
MSCI proxy scenario, the MSCI’s estimates on the revenue derived from “agricultural goods produced
using certified sustainable or organic practices”31 are used. In case this variable is missing, it is
pragmatically assumed that 5% of revenues are derived from EU Taxonomy-aligned activities. The
proxy is based on (i) the comparison to the German organic food revenue share32 in the total food
market in 2017 of 5.1%, and (ii) the assumption that the green skewedness of the sample will
compensate Germanys’ above average consumption of organic food. Considering the lack of data,
further analysis on these two sectors would be recommended.
Manufacturing
While the assessment of manufacturing companies is straight-forward and intuitive, data availability presents the main obstacle. The EU Taxonomy defines EU-ETS benchmarks for manufacturing companies. To derive the company’s GHG intensity from the production of the good 𝑖, data on the
produced tonnes output of good 𝑖 and the CO2 scope 1 emissions from the production process is
required.
𝐶𝑂2 𝐼𝑛𝑡𝑒𝑛𝑠𝑖𝑡𝑦𝑖 = 𝐶𝑂2 (𝑝𝑟𝑜𝑑𝑢𝑐𝑡𝑖𝑜𝑛𝑖)
𝑂𝑢𝑡𝑝𝑢𝑡𝑖
Where CO2 scope 1 emissions are unavailable, CO2 emissions based on the methodology presented
in section 3.3 were estimated, given that all financial variables that mimic the production are
available. However, the more challenging part is to retrieve the produced tonnes of output of
aluminium, cement, or steel. Even after retrieving data from Thomson Reuters and Bloomberg,
output data was still missing for the majority of companies.
Thus, in the baseline assessment, all activities were evaluated for which CO2 data (reported or
estimated) and production data (reported) is available. The remaining activities were classified as
“non-verifiable”. In the baseline plus scenario, the MSCI proxy on revenue derived from alternative
energy or energy efficiency was used to assign the non-verifiable share into “EU Taxonomy aligned”
or “not aligned”.
Manufacture of low carbon technologies
Furthermore, the mapping routine identified numerous companies that are potentially falling under “Manufacture of low carbon technologies”. In total, this activity contributes with 13.2% to the entire sample. This activity is an umbrella term and combines several subgroups with different screening criteria and data requirements (see Table 8 below).
Table 8 - Manufacture of low carbon technologies
Subgroups Screening Criteria (1) Manufacturing of items essential for renewable energy
technologies Per se green. Requires identification of the activity.
(2) Manufacture of low-carbon transport vehicles Tailpipe emissions: g CO2 / km, among others.
(3) Energy Efficiency Equipment
Product-specific data required (e.g. U value of
windows or products with EU Energy Label)
(4) Manufacture of items resulting in substantial GHG
reduction Third-party carbon footprint assessment.
Source: Own elaboration.
Activities which fall under subgroup (1) due to the mapping routine are identified based on relevant
TRBC codes. The identification includes a buzzword screening on turnover segments such as “wind
turbine manufacturing” or “solar power projects”. Determining the alignment of subgroups (2), (3)
and (4) with the EU Taxonomy was obstructed by two aspects. Specifically, a lack of downstream
value chain information and a general lack of disclosed data on low carbon vehicles.
For instance, if data on low carbon vehicles (2) is available, then companies usually disclose an
aggregated number of total vehicles sold since the vehicles market introduction (e.g. of the Toyota
31 See variable CT_SUST_AG_MAX_REV in Annex III.
32https://www.boelw.de/fileadmin/user_upload/Dokumente/Zahlen_und_Fakten/Brosch%C3%BCre_2018/ZDF_2018_Inhalt_Web_Einzel
seiten_kleiner.pdf

24
Prius) or a rough estimate of average annual sales numbers. Due to this lack of data and the generally
low share of low carbon vehicles (e.g. 1.2% of total vehicle sales of Renault), this assessment
excluded vehicle manufacturers in the baseline assessment. Subgroups (3) and (4) were bot
excluded since product-specific data is not easily available in the used databases. In the baseline
plus and MSCI proxy assessment, the sum of (estimated) green revenue derived from green
buildings, energy efficiency and alternative energy was used.
This activity’s Technical Screening Criteria encompass the manufacturing process of not only low carbon technologies themselves, but also of their respective key components. This significantly impairs the feasibility of a correct assessment of companies supplying manufacturers of renewable technologies (e.g. wind turbines) due to a lack of available downstream value chain information. For example, a company may produce key components for renewable technologies or electric vehicles
(e.g. semiconductors, software, etc.), but it is unclear what share of revenue is derived from the sale to such downstream manufacturers, thus making an assessment impossible.
Electricity, Gas, Steam and Air Conditioning Supply
The EU Taxonomy covers production of electricity and heat / cool from solar PV, concentrated solar power (CSP), wind power, ocean energy, hydropower, geothermal, (natural) gas and bioenergy. The screening threshold is currently set at a product carbon footprint of 100 gCO2e/kWh for both production of electricity and production of heat / cool. Solar PV, CSP, wind power, ocean energy and
hydropower with a power density above 5 W/m2 are currently derogated from performing any test of this threshold. Since the NACE system only covers the umbrella term “production of electricity”, a methodology was developed within the scope of this assessment to approximately determine the proportion of the EU Taxonomy-aligned revenue share while relying on ASSET4-ESG variables on the purchased and produced amount of (renewable) electricity (see Annex III – Data sources). The following methodology applies for companies falling under NACE code 35.11 or 35.1433. For those falling under NACE 35.12 and 35.13 a different Taxonomy activity applies ("Transmission and
distribution of electricity”).
First, the share of energy produced in the company's total supply was calculated. The resulting share was further divided into energy produced from renewable sources and energy produced from fossil fuels. In order to take the share of bioenergy produced into account – for which a threshold applies
- the respective country’s share of bioenergy produced34 from the share of generated renewable energy was subtracted. The remaining share of renewable energy produced was used as the share of the EU Taxonomy-aligned revenue of the respective company.
Since data is available for approximately 50% of these companies (i.e. NACE code 35.11 or 35.14),
the assessment relies on the TRBC nomenclature of the company’s primary activity, when data was
not available. Regarding energy production, TRBC differentiates between production of energy using
i) renewable energy sources (e.g. Renewable IPP`s), ii) fossil energy sources (e.g. Fossil Fuel IPP`s)
and iii) a third group, where no precise information on the energy source is given (e.g. Electric
Utilities). In the latter case, the revenue is classified to be in category 4, which indicates that further
assessment and data is needed.
For companies with a primary NACE codes that equals 35.12 or 35.13 (i.e. companies that generate
the largest proportion of their revenues by transmitting and distributing energy), the following
procedure applies. Since the interconnected European System meets the Technical Screening
Criteria35, the underlying revenues were assessed as EU Taxonomy-aligned for all companies with
headquarters in the EU27 and the UK. The remaining, non-EU27 based companies were screened
manually while taking IRENA36 data on (renewable) electricity generation and capacity into account.
Since both methodologies provide a satisfying EU Taxonomy screening, no further assumptions are
made in the baseline plus assessment.
33 Production of electricity (35.11) or Trade of electricity (35.14)
34 https://www.irena.org/Statistics/Download-Data 35 TEG Report p. 238
36 The database of the International Renewable Energy Agency (IRENA) publishes detailed statistics on renewable energy capacity, power
generation and renewable energy balances. Data is collected from members using the IRENA Renewable Energy Statistics questionnaire.
IRENA provides access to comprehensive and up-to-date renewable energy data.
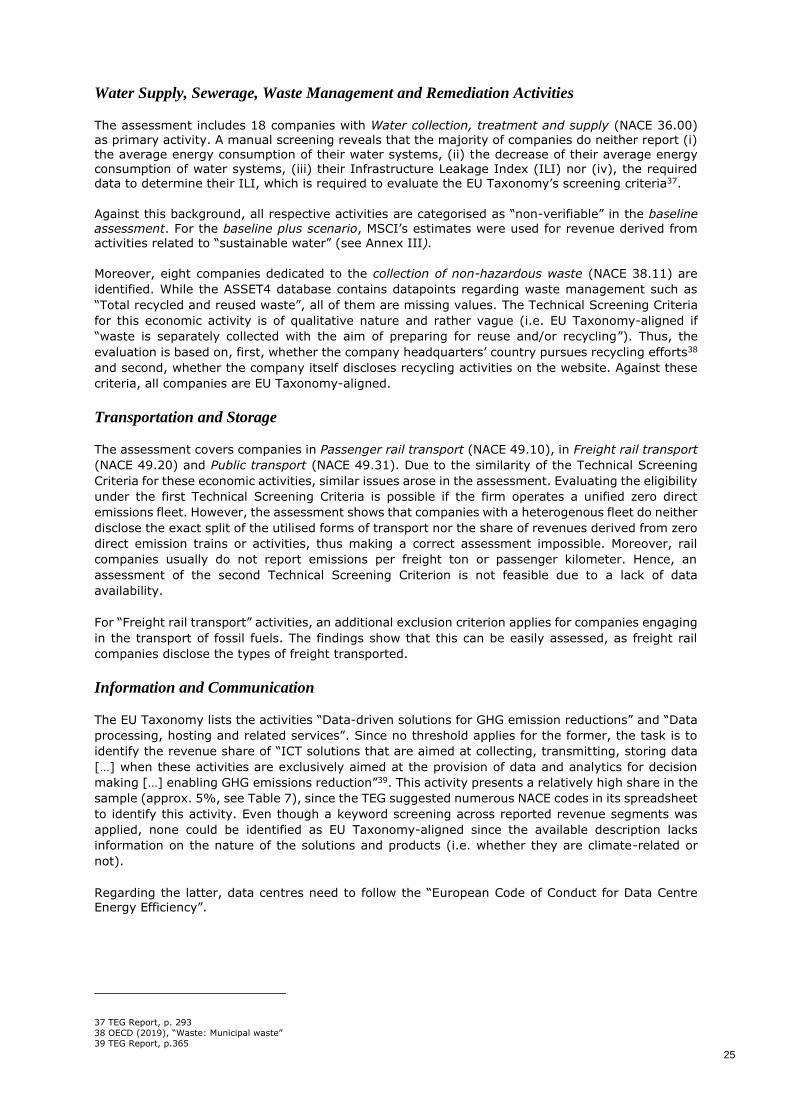
25
Water Supply, Sewerage, Waste Management and Remediation Activities
The assessment includes 18 companies with Water collection, treatment and supply (NACE 36.00) as primary activity. A manual screening reveals that the majority of companies do neither report (i) the average energy consumption of their water systems, (ii) the decrease of their average energy consumption of water systems, (iii) their Infrastructure Leakage Index (ILI) nor (iv), the required data to determine their ILI, which is required to evaluate the EU Taxonomy’s screening criteria37.
Against this background, all respective activities are categorised as “non-verifiable” in the baseline
assessment. For the baseline plus scenario, MSCI’s estimates were used for revenue derived from activities related to “sustainable water” (see Annex III).
Moreover, eight companies dedicated to the collection of non-hazardous waste (NACE 38.11) are
identified. While the ASSET4 database contains datapoints regarding waste management such as
“Total recycled and reused waste”, all of them are missing values. The Technical Screening Criteria
for this economic activity is of qualitative nature and rather vague (i.e. EU Taxonomy-aligned if
“waste is separately collected with the aim of preparing for reuse and/or recycling”). Thus, the
evaluation is based on, first, whether the company headquarters’ country pursues recycling efforts38
and second, whether the company itself discloses recycling activities on the website. Against these
criteria, all companies are EU Taxonomy-aligned.
Transportation and Storage
The assessment covers companies in Passenger rail transport (NACE 49.10), in Freight rail transport
(NACE 49.20) and Public transport (NACE 49.31). Due to the similarity of the Technical Screening
Criteria for these economic activities, similar issues arose in the assessment. Evaluating the eligibility
under the first Technical Screening Criteria is possible if the firm operates a unified zero direct
emissions fleet. However, the assessment shows that companies with a heterogenous fleet do neither
disclose the exact split of the utilised forms of transport nor the share of revenues derived from zero
direct emission trains or activities, thus making a correct assessment impossible. Moreover, rail
companies usually do not report emissions per freight ton or passenger kilometer. Hence, an
assessment of the second Technical Screening Criterion is not feasible due to a lack of data
availability.
For “Freight rail transport” activities, an additional exclusion criterion applies for companies engaging
in the transport of fossil fuels. The findings show that this can be easily assessed, as freight rail
companies disclose the types of freight transported.
Information and Communication
The EU Taxonomy lists the activities “Data-driven solutions for GHG emission reductions” and “Data
processing, hosting and related services”. Since no threshold applies for the former, the task is to
identify the revenue share of “ICT solutions that are aimed at collecting, transmitting, storing data
[…] when these activities are exclusively aimed at the provision of data and analytics for decision
making […] enabling GHG emissions reduction”39. This activity presents a relatively high share in the
sample (approx. 5%, see Table 7), since the TEG suggested numerous NACE codes in its spreadsheet
to identify this activity. Even though a keyword screening across reported revenue segments was
applied, none could be identified as EU Taxonomy-aligned since the available description lacks
information on the nature of the solutions and products (i.e. whether they are climate-related or
not).
Regarding the latter, data centres need to follow the “European Code of Conduct for Data Centre Energy Efficiency”.
37 TEG Report, p. 293
38 OECD (2019), “Waste: Municipal waste”
39 TEG Report, p.365

26
Table 9 - Information and Communication
Activity Baseline Assessment Baseline Plus Scenario Data-driven solutions for GHG emissions reductions
Identify relevant segments through buzzwords (“GHG”, “CO2”, “climate” and other appropriate). None are
identified.
Baseline Plus: MSCI variable CT_CC_TOTAL_MAX_REV (see Annex III) as a proxy for the green revenue share of IT
companies.
Data processing, hosting and related activities
Non-EU: not aligned with EU Taxonomy; EU28: manual research whether company applies the Code of Conduct.40
Same as in baseline assessment.
Source: Own elaboration.
Construction & Real Estate Activities
The assessment includes all companies listed under the EU Taxonomy activity “Building acquisition and ownership” (NACE 68.10 and 68.20). In order to define the performance of buildings, the
environmental performance of the buildings is required. Building acquisition and ownership is EU Taxonomy-aligned if the building performance falls in the top 15% of local stock or a certification scheme is available, such as Environmental Performance Certification EPC for companies operating in the EU is available that falls into the top 15%.
Data on environmental performance of buildings (in kWh/m2/y) is available in many cases. However, to be able to determine whether a building or portfolio falls into the top 15% of local stock, (i) a
(regional) benchmark and (ii) the distribution of the environmental building performance of other companies in the peer group is required.
For companies operating outside of the EU, the EU Taxonomy lists no equivalent certification
schemes. For companies operating in the EU, the EU Taxonomy defines currently one certification
scheme (EPC) but leaves room for interpretation. Thus, to be able to assess the companies according
to the EU Taxonomy, a narrower specification of the suitability of equivalent certificates is required.
Access to databases such as GRESB (Global Real Estate Sustainability Benchmark) would allow to identify the performance of many companies and their performance in their peer group. Data on the
distribution of certificates such as EPC, BREEAM or LEED for companies in North America would allow to assess the companies further.
40 List of participants https://e3p.jrc.ec.europa.eu/communities/data-centres-code-conduct

27
5. FUND ASSESSMENT AND RESULTS
Having discussed the assessment at a firm and economic activity level, this chapter aggregates the results at the fund level.
By applying draft criterion I, as included in the JRC’s Technical Report 2.041 (see box below), each fund’s constituents are assigned to either i) a green pocket if at least 50% of the revenue is determined to be “green” revenue, ii) a transition pocket if between 20% and 49% of the revenue is determined to be “green” revenue or iii) a diversification pocket if less than 20% of the revenue is
from green activities, other assets or cash. After the allocation, the weight of each pocket is aggregated at the fund-level to calculate the percentage of the fund’s portfolio invested in each pocket. A decision can then be made about whether a fund could obtain the Ecolabel, based on criterion I from the current draft. Other EU Ecolabel criteria42 are beyond the scope of this study (e.g the exclusion criterion would exclude companies that derive more than 5% of their revenue from a list of excluded activities, which requires sufficient reporting).
However, depending on the company’s economic activity and the quality of reporting, it was at times
not possible to stringently assess their alignment with the EU Taxonomy objective on substantial
contribution to climate change mitigation. In these cases, these activities were clustered (i.e. revenue
share) as “non-verifiable”. This could make a clear-cut assignment into the three pockets impossible
– depending on the size of the “non-verifiable” share.43 Given this restriction, the following six
pockets are defined to for the analysis:
1. Pocket “green”: a company derives at least 50% of its revenues from EU Taxonomy-aligned activities.
2. Pocket “green or transition”: a company derives at least 20% to below 50% of its revenue from EU Taxonomy-aligned activities (“green” revenue). The remaining economic activities are EU Taxonomy eligible but are not verifiable due to data restrictions, at least to a certain degree. Due to the non-verifiable share, the company may also be assigned to the green
pocket. Based on this uncertainty, the company is classified in the “green or transition” pocket.
3. Pocket “transition”: a company generates at least 50% and up to 80% of its revenue from activities not aligned with EU Taxonomy thresholds or activities not eligible under the EU Taxonomy. Further, it achieves at least 20% and below 50% EU Taxonomy-aligned (“green”) revenues. Given both conditions, the company is in the “transition” pocket.
4. Pocket “transition or diversification”: a company derives more than 50% to maximum 80% of its revenues from activities that are either not covered by the EU Taxonomy or not aligned with EU Taxonomy thresholds. In addition, at least 20% of its reported revenues are not verifiable. This indicates that the company could still fall into “transition”.
5. Pocket “diversification”: a company derives more than 80% of its revenue from activities not covered by the EU Taxonomy or not aligned with EU Taxonomy thresholds. In other words, this means that less than 20% of the company’s revenue is from green activities. In this
case, the total share of currencies for each fund in this pocket was added.
41 JRC. Development of EU Ecolabel criteria for Retail Financial Products. Technical Report 2.0: Draft proposal for the product scope and
criteria. (link).
42 Criterion 2: Exclusions based on environmental aspects; Criterion 3: Social and governance aspects; Criterion 4: Engagement; Criterion 5: Retail investor information; Criterion 6: Information appearing on the EU Ecolabel.
43 Two examples. 1) Company A derives 51% green revenue. The remaining 49% is non-verifiable. A clear-cut assignment is possible.
Company A is assigned to the green pocket. 2) Company B derives 10% green revenue. The remaining 90% is non-verifiable. The company
could potentially fall into every pocket. A clear-cut assignment is impossible.
“At least 60% of the total portfolio asset value under management (AuM) shall be invested in companies whose economic activities comply with the following thresholds i. and ii.:
i. At least 20% of the total portfolio shall be invested in companies deriving a revenue of at least 50% from “green” economic activities,
ii. between 0-40% of the total portfolio asset value under management shall be invested in companies deriving a revenue of at least 20 - 49% “green” economic activities
The remaining proportion of the total portfolio shall consist of companies that are not complying with points i. or ii., or other assets or cash."

28
6. Pocket “potentially everything”: The proportion of “non-verifiable” activities is too large (i.e.
larger than 80% of total revenue) to narrow down to possible pockets. Following, these companies are classified as “potentially everything”.
From these six pockets defined above, the following conditions under which a fund is aligned or not aligned with criterion I of the EU Ecolabel can be derived:
• A fund is compliant with the thresholds of criterion I if the total share of TNA invested in companies of pocket 1) (i.e. “green” companies”) is at least 20% and the accumulated share of pocket 1), 2) and 3) (i.e. “green”, “green or transition” and “transition” companies) exceeds 60%.
• A fund is not compliant with the thresholds of criterion I, if the share of TNA in pocket 5) (i.e. “diversification” companies) exceeds 40%; or total share of TNAs invested in pocket 3), 4) and 5) (i.e. no “transition”, “transition or diversification” and “diversification”)
exceeds 80%.
In the following, this logic is taken into account in three scenarios to evaluate if a company’s activities satisfy the screening criteria of the EU Taxonomy. The logic of the three scenarios is illustrated below:
• The baseline assessment follows the EU Taxonomy as closely as possible. Activities that are not able to be evaluated are classified as “non-verifiable”;
• The baseline plus assessment evaluates the “non-verifiable” share of the baseline
assessment with MSCI ESG proxies and further assumptions (see Annex II for all the details);
• The MSCI proxy scenario does not build on the previous assessments and is not closely linked to the EU Taxonomy. The Ecolabel eligibility assessment is based on firm-level MSCI proxies. These proxies provide an estimate of companies’ green revenue derived from five environmental impact themes (alternative energy, energy efficiency, green building, pollution prevention, sustainable water).
Baseline Assessment
Given the “pocket logic” explained above, each company is assigned to one pocket. Aggregating the
share of all six pockets for the entire sample obtains the numbers presented in Figure 9.
Figure 9 - Weight of assigned pockets across sample, Baseline
Source: Own elaboration.
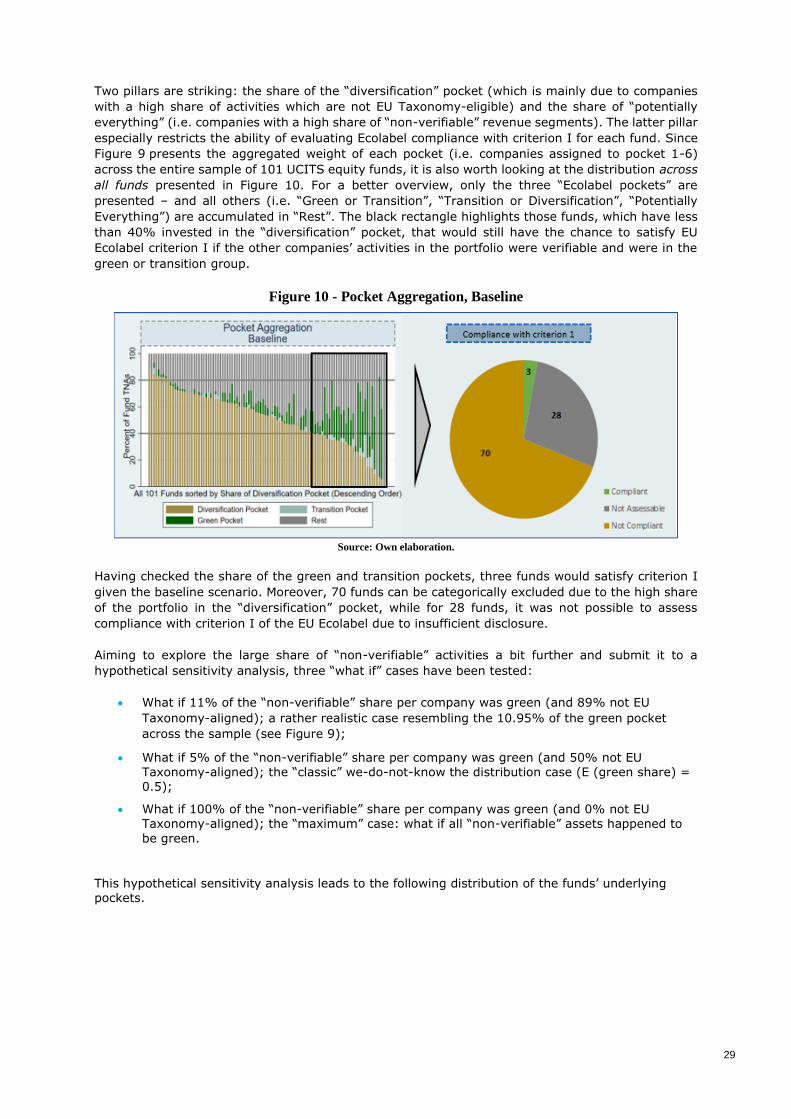
29
Two pillars are striking: the share of the “diversification” pocket (which is mainly due to companies
with a high share of activities which are not EU Taxonomy-eligible) and the share of “potentially
everything” (i.e. companies with a high share of “non-verifiable” revenue segments). The latter pillar
especially restricts the ability of evaluating Ecolabel compliance with criterion I for each fund. Since
Figure 9 presents the aggregated weight of each pocket (i.e. companies assigned to pocket 1-6)
across the entire sample of 101 UCITS equity funds, it is also worth looking at the distribution across
all funds presented in Figure 10. For a better overview, only the three “Ecolabel pockets” are
presented – and all others (i.e. “Green or Transition”, “Transition or Diversification”, “Potentially
Everything”) are accumulated in “Rest”. The black rectangle highlights those funds, which have less
than 40% invested in the “diversification” pocket, that would still have the chance to satisfy EU
Ecolabel criterion I if the other companies’ activities in the portfolio were verifiable and were in the
green or transition group.
Figure 10 - Pocket Aggregation, Baseline
Source: Own elaboration.
Having checked the share of the green and transition pockets, three funds would satisfy criterion I
given the baseline scenario. Moreover, 70 funds can be categorically excluded due to the high share
of the portfolio in the “diversification” pocket, while for 28 funds, it was not possible to assess
compliance with criterion I of the EU Ecolabel due to insufficient disclosure.
Aiming to explore the large share of “non-verifiable” activities a bit further and submit it to a
hypothetical sensitivity analysis, three “what if” cases have been tested:
• What if 11% of the “non-verifiable” share per company was green (and 89% not EU
Taxonomy-aligned); a rather realistic case resembling the 10.95% of the green pocket
across the sample (see Figure 9);
• What if 5% of the “non-verifiable” share per company was green (and 50% not EU Taxonomy-aligned); the “classic” we-do-not-know the distribution case (E (green share) = 0.5);
• What if 100% of the “non-verifiable” share per company was green (and 0% not EU
Taxonomy-aligned); the “maximum” case: what if all “non-verifiable” assets happened to
be green.
This hypothetical sensitivity analysis leads to the following distribution of the funds’ underlying pockets.

30
Figure 11 - Pocket Aggregation for each Scenario
Source: Own elaboration
Based on the distributions above, three funds could potentially satisfy criterion I in the 11% test case. This is equal to the number in the baseline scenario. For the 50% (100%) cases, the number
of funds compliant with criterion I increases to 17 (31) funds.
The first sensitivity test is the most “realistic” as it is the closest to the sample distribution with its
green share of approximately 11% (see green pocket in Figure 9). In addition, as shown below, the sensitivity test renders a number of funds in the same order of magnitude as the baseline and baseline plus assessment. As the distribution for the “non-verifiable” assets is unknown, the 100%-sensitivity test is the only robust test, in the sense that it shows the (unrealistic but theoretical and robust) maximum green share; and based on that, the maximum number of funds which could
theoretically qualify as “significantly contributing to climate change mitigation” if all “non-verifiable” activities happened to be green.

31
Baseline Plus Assessment
To better evaluate the “non-verifiable” share, results from the baseline assessment are taken. The
baseline plus slightly shifts away from the strict EU Taxonomy screening criteria for the “non-
verifiable” activities by using reasonable proxies and assumptions. In doing so, one can classify a
higher share as “green” or “not aligned” with the EU Taxonomy. The proxies in use are listed in Annex
II. For the entire sample of 101 UCITS equity funds, the following share of TNA are invested in the
six pockets (see Figure 12).
Figure 12 - Weight of assigned pockets across sample, Baseline Plus
Source: Own elaboration.
An increase of the “diversification” pocket (from ~49.6% to ~59%) is observed since the share of
non-verifiable activities share decreases. The sample aggregation builds on the distribution across funds presented in Figure 13. The share of non-assessable funds decreases significantly (from 28 to 9) and 5 instead of 3 funds satisfy criterion I.
Figure 13 - Pocket Aggregation, Baseline Plus
Source: Own elaboration.

32
MSCI Proxy Scenario based on MSCI-ESG variables
In this sub-section, light is shed on the results one would obtain if one had done this analysis solely based on MSCI estimates. For this purpose, data was obtained from MSCI through JRC for all constituents of the sample. MSCI has developed thorough estimation models on a company-level, covering the five clean tech schemes; alternative energy, energy efficiency, green building, pollution
prevention and sustainable water. This scenario analysis solely relied on the MSCI variable “CT_TOTAL_MAX_REV” (see Annex III), which aggregates the (estimated) revenue derived from the sum of all themes. This being said, the analysis did not stick strictly to the EU Taxonomy in this scenario, but the results obtained from a reliable data provider.
The variable CT_TOTAL_MAX_REV offers a comprehensive coverage but is missing for roughly 10% of the companies in the sample (in this case the firm is assigned into the pocket “potentially everything”). The assignment of the remaining companies is straight forward: green pocket if
>=50%; transition pocket if 20-49%; and diversification if 0-19%.
Figure 14 - Weight of assigned pockets across sample, MSCI Proxy Scenario
Source: Own elaboration.

33
Figure 15 - Pocket Aggregation, MSCI
Source: Own elaboration.
Given that the MSCI estimates provides either a precise number of “green revenue”, each company is assigned to green, transition, diversification or, if missing, “potentially everything” (see Figure 14). Looking at the distribution across funds, 6 would be compliant with criterion I (see Figure 15).
Compliance with criterion I - Baseline vs. Baseline Plus vs. MSCI Proxy Scenario
Aggregating the three assessments, the obtained results are presented in Figure 16 below. According
to the baseline assessment, three funds comply with draft criterion I of the Ecolabel. This number
can potentially increase given that a final statement for 28 funds due to data restrictions and current
company disclosure was not feasible. In further analysis (with a less strict application of the EU
Taxonomy and use of proxies), the share of unclassified funds was reduced (10 and 8 respectively).
Figure 16 - Results: Baseline Assessment, Baseline Plus, MSCI Proxy Scenario
Source: Own elaboration.

34
Table 10 below lists all funds that are compliant with draft criterion I in at least one of the three
scenarios, namely Baseline, Baseline Plus or MSCI. Only one fund (the Kepler Umwelt Aktienfonds in bold letters) has already received a national label (i.e. the Austrian Ecolabel).
Table 10 - Funds aligned with criterion I in at least one scenario
Ecolabel Alignment Baseline Baseline Plus MSCI Scenario
LSF – Solar & Sustainable Energy Fund (MF) 1 1 0
Luxembourg Selection Fd – Active Solar (MF) 1 1 1
Quaero Capital Funds (Lux) –
Accessible Clean Energy (MF)
1 1 1
Lyxor New Energy 0 1 1
green benefit – Nachhaltigkeit Plus 0 1 1
Guinness Alternative Energy Fund 0 0 1
KEPLER Umwelt Aktienfonds
(Austrian Ecolabel)
0 0 1
Source: Own elaboration.
Zooming into the sectoral composition of these 7 funds (see Table 11) reveals a shift towards manufacturing (67.2% vs. 52.3%) and electricity production (18.3% vs. 7%) compared to the entire sample. This is in line with Table 4 indicating the same shift for the non-labelled funds, and Table 7, indicating that most of the “green” share comes from “Manufacture of low-carbon technologies” of renewable energies.
Table 11 - Sector Distribution of Funds that are aligned with criterion I
Macro
Sector
Description Number of
Constituents
Total Share of
TNA (%)
Avg.
Sample
(%)
C Manufacturing 79 67.19 52.31
D Electricity, Gas, Steam and Air Conditioning 26 18.30 6.98
F Construction 7 4.14 4.23
E Water Supply, Sewerage, Waste Management and
Remediation Activities
7 2.04 2.52
H Transportation and Storage 4 1.70 1.86
J Information and Communication 3 1.06 8.44
L Real Estate Activities 2 0.54 3.72
A Agriculture 0 0.00 0.17
Others Not Included in Taxo 17 4.74 18.83
Cash
0.28 0.94
100 100
Source: Own elaboration.
Changing the EU Ecolabel draft criterion
In a last step of the analysis a shift of the thresholds at the level of company’s activities compliant with EU Taxonomy was applied in order to test possible implications on fund-level. In a first sensitivity analysis, the thresholds are assumed to be stricter (i.e. a sum of at least 70% of the green and
transition pocket) than specified in the current draft. This modification results in only one fund being compliant with these stricter thresholds. Further, in a second analysis, thresholds are assumed to be “less strict” (i.e. a sum of 50% of green and transition pocket). Loosening the thresholds for the sum of “green and transition” pocket results in 5 funds being compliant with these thresholds. A comparison of fund-level compliance with criterion I in case of different thresholds is provided in Figure 17 below.44
44 Note that in both scenarios the required 20% of fund TNA invested in “green” companies were not changed. The mentioned modifications
refer exclusively to the sum of the green pocket and the transition pocket.

35
Figure 17 - Changing the EU Ecolabel Draft Criterion I
Source: Own elaboration.

36
6. CONCLUSION AND SUGGESTIONS ON DRAFT CRITERIA
In this study, a first large-scale test of the draft EU Ecolabel criterion I (i.e. the criterion defining
green shares in equity funds) was conducted. The study shows results of some initial lessons and challenges related to applying the EU Taxonomy’s substantial contribution criteria for climate change mitigation to green UCITS equity funds and their constituents.
While a range of organisations are (apparently) currently involved in similar assessments, no results
or respective studies about a large-scale application of the EU Ecolabel and/or the EU Taxonomy
criteria on listed EU companies have as of yet been published. Some initial assessments of individual
companies are slowly emerging.45
From the analysis and the corresponding results above it becomes clear that the principle approach
in the draft Ecolabel criteria proposed by the responsible European Commission services provides a
potentially feasible framework for evaluating the environmental performance of equity funds, as far
as criterion I (covered under the scope of this study) is concerned. The results presented above also
show however that currently due to data limitations (in particular limited reporting) and the limited
coverage of the EU Taxonomy, the evaluation of funds against criterion I of the draft Ecolabel
proposal is limited. 28/101 funds fall in the first category (they are not fully assessable based on
available data) and 70/101 of the funds from the sample are excluded due to the latter constraint
(falling into the “diversification” pocket). Only three funds would qualify for draft Ecolabel criterion
I, having a sufficiently large share of EU Taxonomy aligned and green (i.e. falling into the “green” or
“transition” pocket) activities. This number even remains unchanged if it is assumed that 11% of the
“non-verifiable” share per company was green as per EU Taxonomy (and 89% not EU Taxonomy
aligned), leading to 98 excluded and 3 qualified funds.
The conducted additional scenario analysis, deviating from the strict EU Taxonomy based application of criterion I, confirms in principle the order of magnitude, leading to 5 (baseline plus) and in total
maximum 6 (MSCI scenario) out of 101 funds complying with criterion I. Interestingly, only one of the 51 funds, which already qualified for a national eco-label, is included in this final group.
It is noteworthy that despite the fact that all funds are marketed as green or even have obtained a
national eco-label, it is difficult to evaluate their greenness (at least in the sense of draft Ecolabel
criterion I linked to the EU Taxonomy) based on available data from the major ESG data providers.
If one agrees with the plausibility of the EU Taxonomy indicators and thresholds proposed by the
TEG and serving as a basis for criterion I, the interpretation of this fact would lead to the conclusion
that transparency around green (labelled and unlabelled) funds can be improved. Another
interpretation would be that the indicators proposed for the EU Taxonomy and those being used by,
for example, (“green”) equity fund managers and “green” label providers differ substantially. A third
interpretation would be that the latter are at least obtained through other means than using data
available from the most common and established ESG data providers (including the likes of
Bloomberg, ISS_ESG, MSCI or Refinitiv/Thomson Reuters, etc.).
To make best use of the analysis presented in this report for the further development of the EU
Ecolabel, it will be important, however, to take account of a set of key observations:
1. Data gaps
As the delegated act on the EU Taxonomy criteria will become effective in 2022, the data availability problem for the verification of the compliance of companies’ activities with the EU Taxonomy, will most likely be largely solved due to the corresponding disclosure obligation, at least for large and publicly listed companies. Until the required data is being disclosed by relevant46 companies, the identification of EU Taxonomy eligible economic activities via different industry classification systems will continue to present the first obstacle. In terms of evaluation, the lack of disaggregated company
data, such as but not limited to product-specific data on energy efficiency equipment, limits a comprehensive evaluation.
45 One example is this report of Acciona https://mediacdn.acciona.com/media/3592143/acciona-case-study-eu-taxonomy-report-feb-
2020.pdf.
46 Relevant in this context refers to companies with economic activities relevant for the environmental dimensions of the taxonomy.

37
While this challenge could be addressed once EU Taxonomy-specific reporting by companies becomes
more common (e.g. through mandatory EU-reporting), key limitations still apply. The relevance of
non-EU companies for EU investors, as shown in the sample of 101 UCITS equity funds, points at the
limitation of introducing mandatory reporting for EU companies only, as no globally agreed
sustainable finance taxonomy is on the horizon, which could quickly solve this issue.
2. Limited coverage and scope of the EU Taxonomy
The current coverage and scope of the EU Taxonomy also limits its economy wide applicability. Whereas the TEG defined the relevant sectors in descending order of GHG emissions, this does not necessarily coincide with the sectoral distribution of UCITS equity funds. Looking at the mapping results in Table 6 (“Clustering of revenue segments”), more than 50% of the revenue-weighted activities are not covered by the EU Taxonomy. This implies that 50% do by definition not count against the green revenue share. This can partly be explained by the fact that the focus of this study
is on draft Ecolabel criterion I (and the “climate part” of the EU Taxonomy) and therefore only a limited number of activities can be considered. Only climate change mitigation was considered in this study as one out of six EU Environmental objectives. Climate change adaptation criteria are probably
more difficult to evaluate, as, opposed to greenhouse gas emissions, no comparable well-established market for tradeable certificates or regulation targeting emissions or their disclosure exists for adaptation. With exceptions like SO2, the same holds for the other four objectives ecosystems, water, pollution and circular economy, for which specific criteria and indicators are yet to be defined.
Limitations of this study
This study is obviously not free from limitations. The assessments approach primarily relied on
publicly available data for selected companies and accessible data from Bloomberg and Thomson
Reuters for the entire sample. In addition, MSCI data was used for the extended analyses. This
contrasts the approach suggested by the TEG (i.e. utilising EU Taxonomy-aligned turnover shares as
disclosed by companies) and limits the precision of this analysis (e.g. the share of ambiguous
mapping which could technically be solved with more resources and greater use of manual research
such as screening of annual reports).
While the application of the DNSH criteria was not part of this assignment, the pilot assessment of
DNSH criteria already identified important data limitations, which made it difficult to estimate the potential effect of DNSH criteria today. Moreover, the application of the EU Taxonomy’s “Social Safeguards” were also outside the scope of this analysis. Considering that hence additional constraints (namely compliance with DNSH and social safeguards criteria) would be added in a full assessment of EU Taxonomy compliance, it is reasonable assume that the share of EU Taxonomy aligned activities (and correspondingly, funds) would further decrease once a “full” EU Taxonomy
assessment is feasible.
Other limitations include the time lag in reporting, as all firm- and activity level data is from end of 2018, and data coverage. This is since promising variables such as “total recycled waste” or simply the “produced tonnes of cement” are available but the poor coverage restricts an evaluation. Furthermore, the quality of reported revenue segments was not superb.
However, these limitations can largely be addressed and in the final section of the conclusions, some possible solutions are discussed, and corresponding suggestions provided.
Outlook and suggestions
The challenges and limitations discussed above underline first of all the need for further work on understanding the data and analytical basis from which thresholds for Criterion I can be derived, and can secondly set at a high level of confidence. Potential for further research includes:
• Applying the EU Taxonomy and the EU Ecolabel Criterion I to further financial products.
• Verifying studies’ findings with individual companies of the sample, which might help to gain
further insights into the degree of companies’ Taxonomy-compliant operations.
• Applying further EU Taxonomy criteria for the other five EU Environmental Objectives. Such
work could be closely designed along technical discussions at the Platform on Sustainable
Finance.

38
Derived from the extensive research and analysis carried out for this study, this part includes
suggestions on the further development of the EU Ecolabel. Due to the challenges and limitations of the study, it is difficult to derive concrete suggestions for the setting of the threshold values in the EU Ecolabel Criterion I. The analysis has shown that only few “green” UCITS equity funds would comply with Criterion I given currently available data. However, do-no-harm criteria, social safeguards and other provisions of the draft Ecolabel proposal and the underlying, corresponding EU
Taxonomy proposal was outside the scope of this study. Applying additional conditions would however change the number of eligible funds only downwards.
Therefore, a careful approach in determining Criterion I thresholds should be sought. In support of setting the threshold values for the final Criterion I for equity funds for the EU Ecolabel for financial products with a high level of confidence, further work is most likely necessary to better understand the data and the equity fund universe with respect to the potential share of EU Taxonomy compliant activities. Firstly, a verification of these studies’ data at the individual firm level might help to derive
a more accurate share of companies’ EU Taxonomy-compliant turnover and thus improve the informative value to the development of Criterion I. Secondly, final decisions on the EU Ecolabel Criterion I for equity funds need to be made in the absence of EU Taxonomy disclosure by companies. Therefore, the utilisation of a fully-fledged estimation model might help to bridge data gaps (e.g. for
GHG emissions or other output variables), decreasing the share non-verifiable revenue. Thirdly (and most importantly), for a full understanding of potentially qualifying equity funds under the three-
pocket logic of the Draft Criterion, a further analysis applying the EU Taxonomy criteria for the other five EU Environmental Objectives is needed, coincidentally expanding the applicability of the taxonomy to sectors not yet covered by the EU Taxonomy. Such work could be closely designed along technical discussions at the Platform on Sustainable Finance.
In the absence of such additional analysis and the conceivable challenge of carrying out this work within the proposed timeframe for the Ecolabel application to financial instruments, the final proposal for the Ecolabel (in general) and criterion I (in particular) might need to leave sufficient flexibility
regarding the review options, once additional data and analysis becomes available and the scope of the EU Taxonomy is expanded.

39
ANNEX I – EU TAXONOMY ACTIVITIES, NACE CODES AND CATEGORIES
The following table makes the classification of EU Taxonomy activities transparent. For each activity,
the metrics and thresholds were examined and assigned to a category (see section 3.3). In addition,
it was determined whether multiple thresholds must be met (see AND/OR). For the descriptive
statistics in chapter 4.1 the latter category was used (in case multiple categories applied, see bold
figure in respective column). To determine corresponding NACE Codes, the TEG Spreadsheet was
used (tab “TRBC”), which lists NACE codes that are not mentioned by the EU Taxonomy report (e.g.
the EU Taxonomy report does not define NACE codes for “Manufacture of low carbon technologies”).
Table 12 - Classification of EU Taxonomy Activities
Source: EU Taxonomy Clustering of
Metrics
Source: EU
Taxonomy or TEG Spreadsheet
NACE Activity Link to Taxonomy Category
AND/ OR
Corresponding NACE Codes
A2 Afforestation
p. 52 3, 5 AND
02.10; 02.20; 02.30;
02.40
A2 Rehabilitation, Reforestation
p. 60 3, 5 AND 02.10; 02.20; 02.30; 02.40
A2 Reforestation
p. 68 3, 5 AND
02.10; 02.20; 02.30;
02.40
A2 Existing forest management
p. 76 3, 5 AND 02.10; 02.20; 02.30; 02.40
A2 Conservation forest p. 85 3, 5 AND
A1.2 Growing of perennial crops p. 112 3, 5 AND 01.21 – 01.29
A1.1 Growing of non-perennial crops p. 126 3, 5 AND 01.11 – 01.16; 01.19
A1.4 Livestock production p. 140 3, 5 AND 01.41 – 01.47; 01.48
C
Manufacture of low carbon
technologies
p. 162 5
20.12; 25.30; 26.11; 27.90; 28.11; 28.12;
28.25; 28.30; 28.92; 29.10; 29.32; 38.21;
42.44
C23.5.1 Manufacture of Cement
p. 167 3, 5 AND
23.51; 23.52; 23.61; 23.62; 23.64; 23.65; 23.69
C24.4.2 Manufacture of Aluminium p. 172 3, 4, 5 AND 24.42
C24.5.1 C24.5.2
Manufacture of Iron and Steel p. 176 3, 4 OR
24.10; 24.20; 24.31 – 24.34; 24.51; 24.52; 25.92
C20.1.1 Manufacture of Hydrogen p. 180 3, 4 AND 20.11
C20.1.3
Manufacture of other inorganic
basic chemicals – Manufacture of carbon black p. 183 2, 3 AND
20.13
C20.1.4
Manufacture of other inorganic
basic chemicals – Manufacture of disodium carbonate (soda ash) p. 183 2, 3 AND
20.13; 20.14
C20.1.5
Manufacture of other inorganic basic chemicals – Manufacture of
chlorine p. 183 2, 3 AND
20.13; 20.14
C20.1.4
Manufacture of other organic basic chemicals
p. 189 3, 5 AND
20.11; 20.12; 20.14; 20.16; 20.30; 20.51; 20.52; 20.59; 20.60, 26.11
C20.1.5
Manufacture of fertilizers and
nitrogen compounds p. 196 3
20.15
C20.1.6 Manufacture of plastics in primary form p. 200 3, 4, 5 AND
20.16
D35.1.1 Production of Electricity from Solar PV p. 212 2
35.11

40
D35.1.1
Production of Electricity from
Concentrated Solar Power p. 215 2
35.11
D35.1.1
Production of Electricity from Wind Power p. 218 2
35.11
D35.1.1
Production of Electricity from Ocean Energy p. 221 2
35.11
D35.1.1
Production of Electricity from Hydropower p. 224 3, 4 OR
35.11
D35.1.1
Production of Electricity from
Geothermal p. 228 3
35.11
D35.1.1
Production of Electricity from Gas (not exclusive to natural gas) p. 231 3
35.11
D35.1.1
Production of Electricity from Bioenergy (Biomass, Biogas and Biofuels) p. 234 3, 5 AND
35.11
D35.1.2
D35.1.3
Transmission and Distribution of Electricity p. 238 2, 3 OR
35.12; 35.13
D Storage of Electricity p. 243 2
D Storage of Thermal Energy p. 245 2
D Storage of Hydrogen p. 247 5
D35.2.1 Manufacture of Biogas or Biofuels p. 249 3, 5 AND 20.14; 35.21
D35.2.1 H49.5.0
Retrofit of Gas Transmission and
Distribution Networks p. 252 5
35.21; 49.50
D35.3.0 District Heating/Cooling Distribution p. 255 4, 5 OR
35.30
D35.3.0
Installation and operation of Electric Heat Pumps p. 258 2
35.30
D35.1.1
D35.3.0
Cogeneration of Heat/cool and
Power from Concentrated Solar
Power p. 260 2
35.11; 35.30
D35.1.1 D35.3.0
Cogeneration of Heat/Cool and Power from Geothermal Energy p. 263 3
35.11; 35.30
D35.1.1 D35.3.0
Cogeneration of Heat/Cool and Power from Gas (not exclusive to natural gas) p. 266 3
35.11; 35.30
D35.1.1
D35.3.0
Cogeneration of Heat/Cool and Power from Bioenergy (Biomass, Biogas, Biofuels) p. 269 3
35.11; 35.30
D35.3.0
Production of Heat/cool from Concentrated Solar Power p. 273 2
35.30
D35.3.0 Production of Heat/cool from Geothermal p. 275 3
35.30
D35.3.0
Production of Heat/Cool from Gas
Combustion (not exclusive to natural gas) p. 278 3
35.30
D35.3.0
Production of Heat/cool from Bioenergy (Biomass, Biogas, Biofuels) p. 281 3
35.30
D35.3.0 Production of Heat/cool using Waste Heat p. 285 2
35.30
E36.0.0 Water collection, treatment and supply p. 293 4, 5 AND
36.00
E37.0.0 Centralized wastewater treatment p. 296 4, 5 OR 37.00
E37.0.0 Anaerobic Digestion of Sewage sludge p. 298 5
37.00

41
E38.1.1
Separate collection and transport
of non-hazardous waste in source segregated fractions p. 300 5
38.11
E38.2.1 Anaerobic digestion of bio-waste p. 302 5 38.21
E38.2.1 Composting of bio-waste p. 305 5 38.21
E38.3.2
Material recovery from non-hazardous waste p. 307 4, 5 AND
38.32
E39.0.0 Landfill gas capture and utilization p. 309 5 39.00
E39.0.0 Direct Air Capture of CO2 p. 311 2 39.00
E39.0.0 Capture of anthropogenic emissions p. 313 2
39.00
E39.0.0 Transport of CO2 p. 316 2, 4 OR 39.00
E39.0.0
Permanent Sequestration of captured CO2 p. 319 2
39.00
F41.1 F41.2
Construction of new buildings
p. 375 4, 5 OR
41.10; 41.20; 43.21; 43.22; 43.29; 43.31– 43.34; 43.39; 43.91; 43.99
F41.1
F41.2
Building renovation
p. 379 4, 5 OR
41.20
F41.2
Individual renovation measures, installation of renewables on-site and professional, scientific and technical activities
p. 383 5
41.10; 41.20; 43.21; 43.22; 43.29; 43.31 – 43.34; 43.39; 43.91; 43.99
L68 Acquisition and ownership of buildings p. 387 4
68.10; 68.20; 68.31 – 68.32
F42.9.1
Infrastructure for low carbon
transport (water transport) p. 356 3, 5 AND
42.91
F42.1.1 F42.1.2
F42.1.3
Infrastructure for low carbon
transport (land transport) p. 336 3, 5 AND
42.11 – 42.13
H49.1.0 Passenger Rail Transport (Interurban) p. 328 3, 5 OR
49.10
H49.2.0 Freight Rail Transport p. 331 3, 5 OR 49.20
H49.3.1 Public transport p. 333 3, 5 OR 49.31
H49.4.1 Freight transport services by road p. 343 3, 5 OR 49.41
H49.3.9 Interurban scheduled road transport p. 346 3, 5 OR
49.39
H50.3.0 Inland passenger water transport p. 350 3, 5 OR 50.30
H50.4.0 Inland freight water transport p. 353 3, 5 OR 50.40
H
Passenger cars and commercial
vehicles p. 339 3, 5 OR
49.32; 77.11 – 77.12
J63.1.1
Data-driven climate change monitoring solutions
p. 365 2, 5
61.10; 61.20; 61.30; 61.90; 62.01 – 62.03; 62.09; 63.11
J63.1.1
Data processing, hosting and related activities p. 363 5
63.11
n/a
Operation for low carbon transport (land) n/a 3, 5 AND
52.21 (mentioned by TEG Spreadsheet)
n/a
Operation for low carbon transport (water) n/a 3, 5 AND
52.22 (mentioned by TEG Spreadsheet)
n/a
Operation for low carbon transport (air) n/a 3, 5 AND
52.23 (mentioned by TEG Spreadsheet)
Source: Own elaboration.

42
ANNEX II– BASELINE VS BASELINE PLUS – METHODOLOGY AND ASSUMPTIONS
This Annex complements the sectoral discussion in section 4.3 and provides a detailed overview on the analysis in the baseline and baseline plus assessment.
Table 13 - Assessment in the baseline and baseline plus scenario
Activity Weight across
sample (%)
Screening Criteria / Data points Baseline Baseline Plus
Manufacture of
Low Carbon Technologies
13.27 An “umbrella activity” capturing
different sub-activities: (1) Items essential for RE
technologies (per se green) (2) Low-carbon transport vehicles
(g CO2 / km, a.o.) (3) Energy Efficiency Equipment
(product-specific data required) (4) Manufacture of items resulting in
substantial GHG reduction (third-party carbon footprint
assessment)
- Identification of “green”
activities via the mapping routine incl. buzzword screening. - Non-verifiable for the
remaining activities. (as explained in the study, if the mapping routine links a revenue segment to this activity, it does not mean the
activity is EU Taxonomy-aligned per ser)
Results from the baseline
assessment, plus: - insert MSCI green revenue estimates for energy efficiency, alternative energy, and green
building for the non-verifiable share (i.e. clustering into “green” and “brown”)
Energy production
4.09 For production of electricity and heat/cool, a threshold of 100gCO2e/kWh applies. RE technologies are partly or fully
derogated from the assessment of this threshold and automatically deemed EU Taxonomy-aligned.
Methodology explained in section 4.3.
Same as in baseline assessment.
Data-driven solutions for
GHG emissions
reduction
4.45 No threshold applies. Activity is EU Taxonomy-aligned ICT solutions
“exclusively aimed at the provision of
data and analytics for decision making […] enabling GHG emissions reduction”.
Since it’s “just” about identifying the nature of the
activity (i.e. whether it is
climate-related or not), we apply a buzzword screening of appropriate terms across all reported revenue segments. Not a single segment could
potentially be assigned to that activity (i.e. all are assigned to the diversification pocket).
Since the methodology in the left cell is rather vague, we use the
MSCI proxy
CT_CC_TOTAL_MAX_REV (see Annex III) as a proxy for the green revenue share of IT companies.
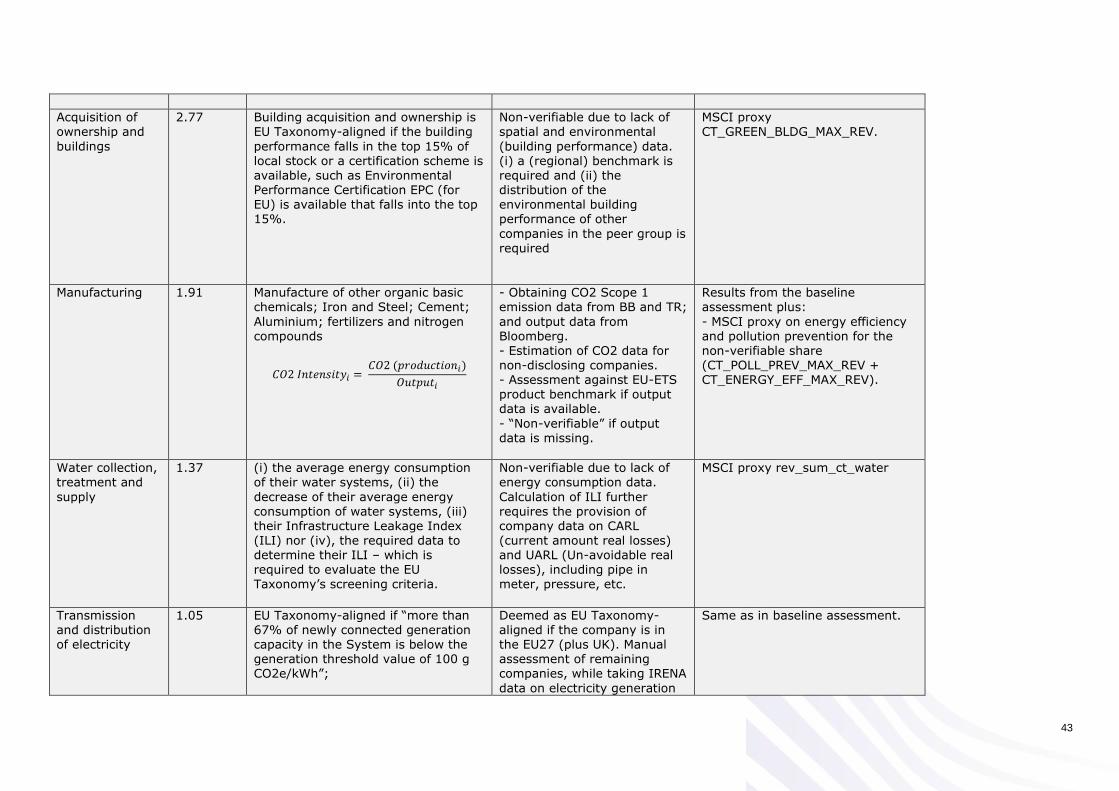
43
Acquisition of ownership and
buildings
2.77 Building acquisition and ownership is EU Taxonomy-aligned if the building
performance falls in the top 15% of local stock or a certification scheme is available, such as Environmental Performance Certification EPC (for EU) is available that falls into the top 15%.
Non-verifiable due to lack of spatial and environmental
(building performance) data. (i) a (regional) benchmark is required and (ii) the distribution of the environmental building performance of other
companies in the peer group is
required
MSCI proxy CT_GREEN_BLDG_MAX_REV.
Manufacturing
1.91 Manufacture of other organic basic chemicals; Iron and Steel; Cement;
Aluminium; fertilizers and nitrogen compounds
𝐶𝑂2 𝐼𝑛𝑡𝑒𝑛𝑠𝑖𝑡𝑦𝑖 = 𝐶𝑂2 (𝑝𝑟𝑜𝑑𝑢𝑐𝑡𝑖𝑜𝑛𝑖)
𝑂𝑢𝑡𝑝𝑢𝑡𝑖
- Obtaining CO2 Scope 1 emission data from BB and TR;
and output data from Bloomberg. - Estimation of CO2 data for non-disclosing companies. - Assessment against EU-ETS product benchmark if output
data is available.
- “Non-verifiable” if output data is missing.
Results from the baseline assessment plus:
- MSCI proxy on energy efficiency and pollution prevention for the non-verifiable share (CT_POLL_PREV_MAX_REV + CT_ENERGY_EFF_MAX_REV).
Water collection, treatment and
supply
1.37 (i) the average energy consumption of their water systems, (ii) the
decrease of their average energy consumption of water systems, (iii) their Infrastructure Leakage Index (ILI) nor (iv), the required data to determine their ILI – which is required to evaluate the EU
Taxonomy’s screening criteria.
Non-verifiable due to lack of energy consumption data.
Calculation of ILI further requires the provision of company data on CARL (current amount real losses) and UARL (Un-avoidable real losses), including pipe in
meter, pressure, etc.
MSCI proxy rev_sum_ct_water
Transmission and distribution of electricity
1.05 EU Taxonomy-aligned if “more than 67% of newly connected generation capacity in the System is below the generation threshold value of 100 g CO2e/kWh”;
Deemed as EU Taxonomy-aligned if the company is in the EU27 (plus UK). Manual assessment of remaining companies, while taking IRENA
data on electricity generation
Same as in baseline assessment.

44
EU Taxonomy-alignment for the interconnected European System per se.
and capacity into account. (link)
Separate collection and transport of non-hazardous waste in source
segregated
fractions
0.54 EU Taxonomy-aligned if “waste is
separately collected with the aim of
preparing for reuse and/or recycling”.
EU Taxonomy-aligned if (1)
company headquarters’
country pursues recycling
efforts (OECD (2019), “Waste:
Municipal waste”) and (2) if
company itself engages in
recycling activities as disclosed
on the website.
Same as in baseline assessment.
Freight Rail Transport
0.32 Trains are EU Taxonomy-aligned if they have (a) zero direct emissions or (b) “direct emissions per tonne-km (g CO2e/tkm) are 50% lower than average reference CO2 emissions of
HDVs as defined for the Heavy-Duty CO2 Regulation” Exclusion criterion if company engages
in transport of fossil fuels.
Manual screening whether a company transports mainly fossil fuels.
Same as in baseline assessment.
Data processing, hosting and related activities
0.25 EU Taxonomy-aligned if it follows the “European Code of Conduct for Data Centre Energy Efficiency”.
Not EU Taxonomy-aligned if company is based outside Europe. If based in EU28: manual research whether company applies the Code of
Conduct47.
Same as in baseline assessment.
Growing of perennial crops & Livestock
production
0.2 Deployment of essential management practices; Provision of a clear GHG emissions
reductions pathway in line with the recommendations by the TEG; Exclusion of business in certain areas.
Classified as non-verifiable. We make use of MSCI’s estimate on the revenue derived from “agricultural goods produced using
certified sustainable or organic practices” (CT_SUST_AG_MAX_REV). In case this variable is missing, we
pragmatically assume that 5% of
47 List of participants https://e3p.jrc.ec.europa.eu/communities/data-centres-code-conduct

45
revenues are derived from EU Taxonomy-aligned activities. The proxy is based on (i) the comparison to the German organic
food revenue share48 in the total food market in 2017 of 5.1% and (ii) the assumption that the green skewedness of the sample will compensate Germanys’ above average consumption of organic
food.
Remaining (identified) activities not mentioned in this list.
~ 1 % (excluded of further assessment due to insignificant weight in the sample)
Classified as non-verifiable. Classified as non-verifiable.
Source: Own elaboration.
48 https://www.boelw.de/fileadmin/user_upload/Dokumente/Zahlen_und_Fakten/Brosch%C3%BCre_2018/ZDF_2018_Inhalt_Web_Einzelseiten_kleiner.pdf.

46
ANNEX III – DATA SOURCES
The ESG data contained herein is the property of MSCI ESG Research LLC (ESG). ESG, its affiliates and information providers make no warranties with respect to any such data. The ESG data contained herein is used under license and may not be further used, distributed or disseminated without the express written consent of ESG.
Reproduced by permission of MSCI ESG Research LLC
©2020 MSCI ESG Research LLC All rights reserved.
Table 14 - Variables used, their description and source
Mapping routine
Name Description Source SIC to NAICS SIC to NAICS 2017 correspondence table. Naics.com (link) NAICS to NACE NACE REV. 2 to NAICS 2017 correspondence
table. Eurostat – Ramon (link)
TRBC to NACE Mapping of (EU Taxonomy relevant) TRBC codes to NACE.
TEG Spreadsheet, sheet “TRBC” (link)
NACE to EU Taxonomy activities
Link between activities under the EU Taxonomy and the NACE nomenclature.
Technical annex to the TEG final report on the EU Taxonomy (link); supplemented by TEG spreadsheet.
Funds & Constituents
Name Description Source Weight of constituents
The weight of each holding in corresponding fund (March 2020). We screened the UCITS equity fund universe in Bloomberg and Thomson Reuters and downloaded the composition of portfolios in alignment with our methodology.
Bloomberg & Thomson Reuters
Revenue segments (Sales)
Sales in up to 10 different product lines. (End of year 2018 due to time lag in reporting).
Worldscope (WC19501, WC19511, …, WC19591)
Revenue segments (Description)
Description of the product line as reported by the company.
Worldscope (WC19500, …, WC19590)
Revenue segments (SIC)
The Standard Industry Classification of the product line.
Worldscope (WC19506, …, WC19596)
Variables used for Taxonomy Assessment
Name Description Source CO2 Scope 1 CO2 Scope 1 emissions (insert definition) Thomson Reuters (ENERDP024) &
Bloomberg () Renewable Energy Variables
Electricity Purchased (ENRRDP0401); Electricity Produced (ENRRDP0402); Total Renewable Energy (ENRRDP060); RE produced (ENRRDP0452); RE purchased (ENRRDP0451); RE use ratio (ENRRO06V)
Thomson Reuters (ASSET4)
CO2 estimation variables
Time-series variables from 2010-2018 to parametrise the CO2 estimation model: Total Revenue (WC01001); Cost of goods sold (WC01051); Intangible Assets (WC01149); Long Term Debt (WC03251); Total Assets (WC02999); Capital Expenditure (WC04601); Depreciation Expense (WC02401); Property Plant Equipment Net (WC02501)
Thomson Reuters (Worldscope)

47
Geographic Segments
The sales in geographic regions to determine the revenue share in and outside of Europe.
Geographic Segment 1 to 10 – Sales (WC19601, … WC19691)
Variables used in baseline plus & MSCI proxy scenario
Name Description Source Energy Efficiency Maximum (estimated) percentage of revenue
derived from products, services, infrastructure, or technologies that proactively address the growing global demand for energy while minimizing impacts to the environment.
MSCI (CT_ENERGY_EFF_MAX_REV)
Alternative Energy Maximum (estimated) percentage of revenue derived from products, services, or infrastructure projects supporting the development or delivery of renewable energy and alternative fuels.
MSCI (CT_ALT_ENERGY_MAX_REV)
Green Building Maximum (estimated) percentage of revenue derived from design, construction, redevelopment, retrofitting, or acquisition of ‘green’ certified properties – subject to local green building criteria.
MSCI (CT_GREEN_BLDG_MAX_REV)
Pollution Prevention Maximum(estimated) percentage of revenue derived from products, services, or projects that support pollution prevention, waste minimization, or recycling as a means of alleviating the burden of unsustainable waste generation.
MSCI (CT_POLL_PREV_MAX_REV)
Sustainable Agriculture
Maximum(estimated) percentage of revenue derived from agricultural goods produced using certified sustainable or organic practices
MSCI (CT_SUST_AG_MAX_REV)
Sustainable Water Maximum (estimated) percentage of revenue derived from products, services, and projects that attempt to resolve water scarcity and water quality issues, including minimizing and monitoring current water use
and demand increases, improving the quality of water supply, and improving the availability and reliability of water.
MSCI (CT_SUST_WATER_MAX_REV)
Climate Change Total of all (estimated) revenues derived from any of the climate change environment impact themes including alternative energy, energy efficiency or green building.
MSCI (CT_CC_TOTAL_MAX_REV)
Environmental Impact Solutions
Total of all (estimated) revenues derived from any of the five clean tech themes including alternative energy, energy efficiency, green building, pollution prevention, or sustainable water.
MSCI (CT_TOTAL_MAX_REV)
Source: Own elaboration.
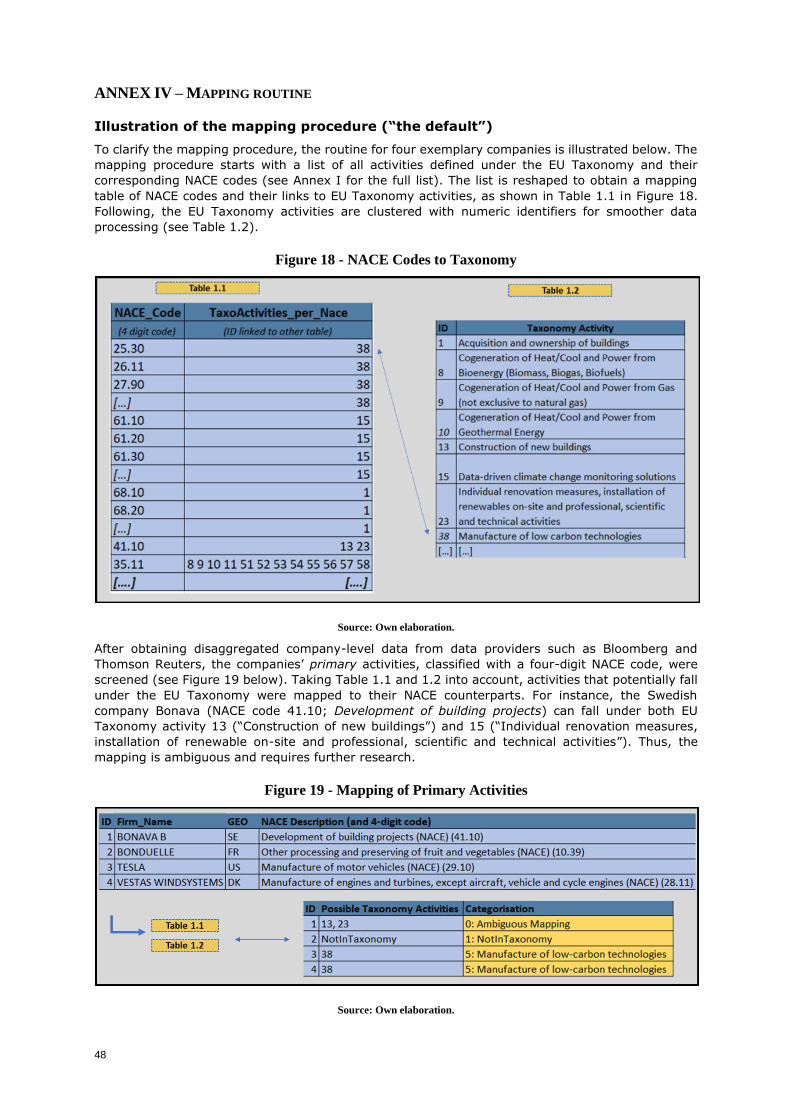
48
ANNEX IV – MAPPING ROUTINE
Illustration of the mapping procedure (“the default”)
To clarify the mapping procedure, the routine for four exemplary companies is illustrated below. The
mapping procedure starts with a list of all activities defined under the EU Taxonomy and their
corresponding NACE codes (see Annex I for the full list). The list is reshaped to obtain a mapping
table of NACE codes and their links to EU Taxonomy activities, as shown in Table 1.1 in Figure 18.
Following, the EU Taxonomy activities are clustered with numeric identifiers for smoother data
processing (see Table 1.2).
Figure 18 - NACE Codes to Taxonomy
Source: Own elaboration.
After obtaining disaggregated company-level data from data providers such as Bloomberg and
Thomson Reuters, the companies’ primary activities, classified with a four-digit NACE code, were
screened (see Figure 19 below). Taking Table 1.1 and 1.2 into account, activities that potentially fall
under the EU Taxonomy were mapped to their NACE counterparts. For instance, the Swedish
company Bonava (NACE code 41.10; Development of building projects) can fall under both EU
Taxonomy activity 13 (“Construction of new buildings”) and 15 (“Individual renovation measures,
installation of renewable on-site and professional, scientific and technical activities”). Thus, the
mapping is ambiguous and requires further research.
Figure 19 - Mapping of Primary Activities
Source: Own elaboration.

49
For the remaining up to ten different, non-primary segments, clustered via SIC codes, the mapping
routine is more complex. Looking at Figure 20 below, one needs to link each SIC code to the EU
Taxonomy or conclude that the activity is not EU Taxonomy eligible.
Figure 20 - Example of reported SIC Segments
Source: Own elaboration.
As a first step, the NAICS to NACE correspondence table was used to aggregate all corresponding
NACE codes into one column (see Table 2.2 in Figure 21). In a second step, Table 2.2 was mapped
to Table 2.1 in order to obtain the same information on the SIC code level.
Figure 21 - Exemplary SIC to EU Taxonomy Mapping I
Source: Own elaboration.
Figure 22 - Exemplary SIC to EU Taxonomy Mapping II
Source: Own elaboration.

50
Table 2.3 in Figure 22 presents the result. For example, SIC code 2033 refers to four NACE codes,
according to both correspondence tables. To simplify the mapping, the methodology refers again to
Table 1.1 and 1.2 and moves from a SIC to NACE mapping to a SIC to EU Taxonomy mapping as the
final objective of the analysis.
For the company Bonduelle, for example, all potential NACE codes of SIC code 2033 are not covered
by the EU Taxonomy. For Bonava, the mapping is ambiguous. For Tesla, one can map the SIC code
unambiguously to NACE code 27.11, which falls under the EU Taxonomy activity “Manufacture of
low-carbon technologies”, which falls under category 549 (see Annex I).
The procedure just described presents the “default option” and illustrates the underlying logic and
data situation. However, further workarounds were implemented in case of data restrictions (e.g. missing NACE code for some companies) and manual research was carried out in case it was feasible. All these “further steps” are listed in the section below.
Further steps
This part complements section 3.2 and describes all other steps and assumptions that go beyond the “default” option.
Leveraging on TRBC codes
Since the NACE nomenclature does not always capture the level of granularity of the EU Taxonomy
activities, the assessment also leveraged on the sometimes more disaggregated TRBC nomenclature.
The TEG has provided a spreadsheet containing a TRBC to NACE correspondence table for all EU
Taxonomy-eligibile activities. All TRBC codes were identified that are capturing economic activities
that are per se defined as “green”. Following, a TRBC-to-NACE-to-EU-Taxonomy conversion table
was created and these results in the following instances inserted:
• the TRBC code identified an activity per se deemed as green;
• if the NACE code for 𝑐𝑜𝑚𝑝𝑎𝑛𝑦𝑖 was missing;
• if the NACE code for 𝑐𝑜𝑚𝑝𝑎𝑛𝑦𝑖 resulted in an ambiguous mapping.
Buzzword screening
Activities were identified as green once the segment contained buzzwords such as “wind power” and other appropriate. Further, revenue segments containing terms as “fossil fuels”, “oil” etc. were
“blacklisted” during the screening process.
Quality of reported revenue segments
For some companies, sales among product lines (i.e. turnover segments) could not been retrieved. This was either because 𝑐𝑜𝑚𝑝𝑎𝑛𝑦𝑖 does not report them or because it was not available in Thomson
Reuters. In this case, the primary NACE code (or TRBC if not available) was used and it was assumed that 100% of the companies’ turnover is derived from this particular activity.
Manual research
To reduce the amount of “ambiguous” mapping cases, manual research for activities potentially
linked to two EU Taxonomy activities was conducted. For example, in case of NACE 63.11 Data
processing, hosting and related activities, the mapping routine yields two potential EU Taxonomy
activities (i.e. “Data-driven solutions for GHG emissions reduction” and “Data processing, hosting
and related activities”). Results from manually screening these cases were incorporated into the data
processing structure.
49 A description of the 5 categories used is provided in section 3.3.

51
ANNEX V – DATA DESCRIPTIVES
Fund Descriptives:
Table 15 below lists the name of all funds included in the entire sample (#101) and the allocation
into the six pockets (i.e. (1) “green”, (2) “green or transition”, (3) “transition”, (4) “transition or
diversification”, (5) “diversification” and (6) “potentially everything”, see Section 5) for the baseline
assessment (B), the baseline plus assessment (1) and the MSCI proxy scenario (2). The column
“Label” indicates if a fund has received one of the mentioned national labels (1) or not (0).
Table 15 - Scenario Overview (Fund-Level)
Name of Fund from data providers Label Sce. (1) (2) (3) (4) (5) (6)
3 Banken Mensch &
Umwelt Aktienfonds
(AT0000A23YE9) 1
B 8.7 0.0 0.0 11.3 54.9 25.1
B+ 8.7 0.0 1.7 10.1 69.7 9.7
MSCI 6.3 0.0 5.4 0.0 86.4 2.0
3 Banken Nachhaltigkeitsfonds
(AT0000701156) 1
B 0.0 0.0 0.0 9.9 83.7 6.4
B+ 0.0 0.0 0.0 9.9 86.1 4.1
MSCI 0.8 0.0 1.0 0.0 98.2 0.0
3 Banken Verantwortung + Zukunft 2024
(AT00ZUKUNFT5) 1
B 15.9 2.9 0.0 21.9 46.9 12.4
B+ 15.9 2.9 0.0 19.3 54.7 7.2
MSCI 7.7 0.0 10.7 0.0 77.0 4.7
Amundi Funds Global Ecology ESG
(LU1883318666) 0
B 6.4 0.0 0.0 5.2 46.8 41.6
B+ 9.5 0.0 4.5 5.2 59.2 21.7
MSCI 8.5 0.0 13.6 0.0 77.4 0.6
Amundi Oeko Sozial Stock (MF)
(AT0000A06Q23) 1
B 0.0 0.0 0.0 13.1 86.9 0.0
B+ 0.0 0.0 0.0 13.1 86.9 0.0
MSCI 0.0 0.0 0.0 0.0 100.0 0.0
BGF Sustainable Energy Fund (MF)
(LU0124384867) 0
B 19.0 0.0 0.0 7.0 30.9 43.1
B+ 19.0 0.0 7.6 7.0 37.2 29.2
MSCI 20.9 0.0 16.9 0.0 54.6 7.7
BMO Responsible Global Equity (MF)
(LU1890813915) 0
B 0.0 1.1 0.0 14.0 66.2 18.7
B+ 0.0 1.1 0.0 12.9 80.2 5.9
MSCI 2.7 0.0 6.7 0.0 89.3 1.3
BNP Paribas Climate Impact (MF)
(LU0406802339) 0
B 8.8 0.0 0.0 15.3 55.6 20.3
B+ 11.2 0.0 1.6 9.9 67.7 9.6
MSCI 26.9 0.0 17.5 0.0 52.2 3.3
BNP Paribas Easy FTSE EPRA
Nareit Developed Europe ex UK Green
(LU2008764073)
0
B 0.0 0.0 0.0 0.0 0.7 99.3
B+ 23.7 0.0 13.9 0.0 61.4 1.0
MSCI 23.7 0.0 15.7 0.0 59.5 1.0
BNP Paribas Energy Transition (MF)
(LU0823414718) 0
B 36.6 0.8 0.6 5.2 37.6 19.2
B+ 41.5 0.8 0.6 2.0 49.8 5.2
MSCI 45.4 0.0 14.4 0.0 35.9 4.3
Bellevue F (Lux) BB Adamant
Sustainable Healthcare
(LU1819586261)
1
B 0.0 0.0 0.0 11.9 85.2 2.9
B+ 0.0 0.0 0.0 11.9 86.5 1.6
MSCI 0.0 0.0 0.0 0.0 100.0 0.0

52
CB - Save Earth
(LU0354788688) 1
B 5.7 2.7 0.0 16.9 53.4 21.4
B+ 5.7 2.7 5.5 16.9 59.1 10.2
MSCI 13.9 0.0 14.2 0.0 71.9 0.0
CROWN SIG-SUS QUAL EQ
(IE00BYVTJT56) 0
B 0.0 0.0 0.0 6.9 80.5 12.6
B+ 0.0 0.0 1.8 4.6 84.8 8.8
MSCI 0.0 0.0 3.0 0.0 97.0 0.0
Crown S EQ
(IE00BYVTJF11) 0
B 4.0 0.0 4.5 3.0 84.8 3.6
B+ 4.0 0.0 4.5 3.0 88.5 0.0
MSCI 1.1 0.0 0.0 0.0 97.6 1.3
DNB Fund ECO Absolute Return
(LU0547714286) 0
B 15.8 1.4 7.7 8.4 14.7 52.0
B+ 15.8 1.4 7.7 8.4 26.2 40.4
MSCI 33.1 0.0 6.7 0.0 49.5 10.7
DNB Fund Renewable Energy
(LU0302296149) 1
B 39.7 0.0 3.4 7.3 9.6 40.1
B+ 40.5 0.0 3.4 7.3 16.5 32.4
MSCI 44.8 0.0 5.5 0.0 39.4 10.3
DWS Invest ESG Climate Tech (MF)
(LU1863264070) 0
B 14.1 1.0 0.0 5.2 58.4 21.3
B+ 17.8 1.0 4.9 5.2 62.2 8.8
MSCI 24.0 0.0 17.6 0.0 56.6 1.7
DWS SDG Global Equities (MF)
(DE0005152466) 0
B 9.9 0.0 0.0 7.6 60.0 22.5
B+ 14.4 0.0 5.4 7.6 58.4 14.2
MSCI 26.5 0.0 23.0 0.0 49.9 0.6
Deka-UmweltInvest
(DE000DK0ECS2) 0
B 12.2 5.3 3.2 11.6 35.8 31.9
B+ 12.7 5.3 3.3 11.6 45.1 22.0
MSCI 17.6 0.0 16.1 0.0 64.9 1.5
Didner & Gerge Global
(SE0004167567) 1
B 4.9 0.0 0.0 3.4 83.2 8.5
B+ 4.9 0.0 0.0 3.4 88.3 3.4
MSCI 0.0 0.0 3.4 0.0 89.8 6.8
EB-Oeko-Aktienfonds (MF)
(LU0037079380) 1
B 2.5 0.0 3.2 5.9 66.2 22.2
B+ 2.5 0.0 5.5 5.9 76.1 10.1
MSCI 0.0 0.0 7.2 0.0 92.8 0.0
ERSTE RESPONSIBLE STOCK DIVIDEND
(AT0000A1QA61) 1
B 2.4 0.0 0.0 15.9 62.5 19.3
B+ 4.1 0.0 1.5 8.5 76.5 9.4
MSCI 1.7 0.0 4.5 0.0 93.8 0.0
ERSTE RESPONSIBLE STOCK EUROPE
(AT0000645973) 1
B 3.6 0.0 0.0 8.2 69.8 18.4
B+ 3.6 0.0 2.6 6.8 76.5 10.4
MSCI 2.4 0.0 4.8 0.0 92.8 0.0
ERSTE RESPONSIBLE STOCK GLOBAL
(AT0000646799) 1
B 4.7 0.0 0.0 8.2 73.3 13.8
B+ 4.7 0.0 4.1 7.7 78.8 4.7
MSCI 3.7 0.0 6.4 0.0 88.7 1.2
East Capital China Environmental Fund
(LU0289591256) 1
B 21.1 1.5 2.7 9.8 33.6 31.3
B+ 31.4 1.5 4.8 9.8 40.6 12.0
MSCI 25.9 0.0 10.6 0.0 47.2 16.3
Ecofi Enjeux Futurs (MF)
(FR0010596759) 0
B 3.5 0.0 2.7 10.1 49.3 34.4
B+ 4.6 0.0 6.5 7.7 60.2 21.0
MSCI 11.1 0.0 12.5 0.0 76.5 0.0

53
Energies Renouvelables
(FR0010244160) 0
B 17.9 4.6 2.8 7.9 33.8 33.0
B+ 17.9 4.6 5.0 6.7 37.1 28.7
MSCI 5.7 0.0 14.0 0.0 66.5 13.7
FBG 4Elements (MF)
(LU0298627968) 0
B 7.9 0.0 0.9 15.2 52.0 24.0
B+ 7.9 0.0 3.7 15.2 56.0 17.2
MSCI 0.5 0.0 11.7 0.0 87.8 0.0
Green Effects - NAI Werte Fonds
(IE0005895655) 0
B 23.1 0.0 0.0 24.2 46.8 5.9
B+ 23.1 0.0 0.0 24.2 47.0 5.8
MSCI 30.8 0.0 22.4 0.0 39.1 7.7
Guinness Alternative Energy Fund
(IE00B2PGVJ29) 0
B 40.8 3.2 3.9 7.2 35.3 9.6
B+ 40.8 3.2 7.9 7.2 34.5 6.4
MSCI 50.3 0.0 17.7 0.0 28.4 3.6
Gutmann Aktien Nachhaltigkeitsfonds
(AT0000A15M75) 1
B 2.4 0.0 0.0 6.2 82.3 9.1
B+ 2.4 0.0 1.5 4.4 89.0 2.7
MSCI 0.0 0.0 1.8 0.0 98.2 0.0
HMT Euro Aktien defensiv ESG (MF)
(DE000A2DR2Q1) 1
B 0.0 2.8 0.0 2.0 60.2 35.0
B+ 4.3 2.8 0.0 0.0 78.0 14.9
MSCI 4.3 0.0 5.2 0.0 89.3 1.2
HSBC Europe Equity
Green Transition (MF)
(FR0000982449)
1
B 9.4 3.9 0.0 9.9 42.7 34.1
B+ 9.4 3.9 7.5 7.9 47.9 23.4
MSCI 16.9 0.0 22.1 0.0 58.9 2.1
HSBC GIF Global Equity
Climate Change (MF)
(LU0323240290)
0
B 10.6 0.0 2.1 7.1 59.6 20.7
B+ 11.3 0.0 5.8 5.6 67.5 9.8
MSCI 10.4 0.0 11.0 0.0 77.9 0.7
Handelsbanken Hallbar Energi
(SE0005965662) 1
B 52.1 0.0 0.0 3.6 26.1 18.2
B+ 56.4 0.0 1.4 1.4 33.0 7.7
MSCI 50.0 0.0 9.8 0.0 27.1 13.1
IQAM Equity Emerging Markets (MF)
(AT0000823281) 1
B 1.8 0.0 2.1 18.0 52.4 25.7
B+ 4.0 0.0 5.3 15.6 59.8 15.4
MSCI 2.1 0.0 5.4 0.0 92.5 0.0
Impax Asian Environmental
Markets (Ireland) Fund
(IE00B3MGK730)
0
B 8.1 0.0 0.7 13.3 39.5 38.4
B+ 12.4 0.0 4.0 9.9 58.7 15.1
MSCI 16.2 0.0 11.3 0.0 67.7 4.7
Impax Environmental
Markets (Ireland) Fund
(IE00B04R3307)
0
B 7.6 0.0 0.0 17.7 53.7 20.9
B+ 9.2 0.0 1.3 13.1 63.2 13.2
MSCI 19.7 0.0 12.2 0.0 62.4 5.7
JSS Sustainable Equity - Europe (MF)
(LU0058891119) 1
B 2.6 1.6 0.0 12.3 76.1 7.4
B+ 2.6 1.6 0.0 12.3 76.1 7.4
MSCI 1.1 0.0 7.7 0.0 88.9 2.3
JSS Sustainable Equity
- Global Thematic Fund (MF)
(LU0229773345)
1
B 1.6 0.0 0.0 5.9 81.5 11.0
B+ 1.6 0.0 3.4 3.7 86.2 5.1
MSCI 0.0 0.0 5.2 0.0 92.9 1.9
JSS Sustainable Equity
- Water Fund (MF)
(LU0333595436)
1
B 0.0 5.0 0.0 13.9 45.3 35.8
B+ 1.0 5.0 2.3 13.9 56.5 21.2
MSCI 5.7 0.0 19.6 0.0 74.7 0.0

54
JSS Sustainable Equity
Real Estate Global (MF)
(LU0288928376) 1
B 0.0 0.0 0.0 0.0 7.9 92.1
B+ 11.2 0.0 8.1 0.0 68.7 12.0
MSCI 13.2 0.0 16.1 0.0 66.5 4.2
Jupiter Global Ecology Growth (MF)
(LU0231118026) 0
B 11.1 5.1 0.0 14.8 42.4 26.6
B+ 10.2 5.1 2.8 12.7 48.8 20.3
MSCI 18.2 0.0 28.4 0.0 51.9 1.5
KBC Eco Alternative Energy
(BE0175280016) 0
B 42.3 0.6 5.7 5.7 23.5 22.2
B+ 44.5 0.6 7.8 5.0 28.1 14.0
MSCI 39.0 0.0 12.4 0.0 34.3 14.3
KBC Eco Climate Change
(BE0946844272) 0
B 19.3 1.0 6.2 11.0 29.6 32.9
B+ 21.0 1.0 9.1 9.8 43.1 15.9
MSCI 22.2 0.0 18.4 0.0 50.9 8.5
KBI Institutional Energy
Solutions Fund (MF)
(IE00B2Q0LH16)
0
B 30.7 0.0 3.3 7.5 22.4 36.1
B+ 32.8 0.0 5.9 7.5 32.4 21.4
MSCI 40.6 0.0 17.0 0.0 35.3 7.1
KBI Institutional GRS Fund (MF)
(IE00B3QJ9N79) 0
B 14.0 0.0 1.4 11.3 32.3 41.1
B+ 14.8 0.0 5.0 11.3 41.3 27.7
MSCI 19.3 0.0 18.6 0.0 54.5 7.7
KEPLER Ethik Aktienfonds
(AT0000675657) 1
B 3.8 0.0 0.0 10.6 59.7 25.9
B+ 3.7 0.0 5.1 6.0 76.9 8.3
MSCI 5.5 0.0 8.7 0.0 83.0 2.8
KEPLER Umwelt Aktienfonds
(AT000UMWELT5) 1
B 25.2 0.0 0.0 9.2 34.8 30.8
B+ 24.6 0.0 5.4 9.2 37.8 23.0
MSCI 39.0 0.0 23.9 0.0 26.1 11.1
LBBW Global Warming
(DE000A0KEYM4) 1
B 1.9 0.6 0.0 9.3 63.4 24.9
B+ 1.9 0.6 6.9 7.7 70.7 12.2
MSCI 0.0 0.0 8.1 0.0 89.4 2.6
LBPAM Responsable action environnement
(FR0010750901) 1
B 18.8 3.0 0.0 12.1 36.2 30.0
B+ 18.8 3.0 3.6 10.1 42.2 22.4
MSCI 21.7 0.0 23.2 0.0 47.1 8.0
LSF - Solar & Sustainable Energy Fund (MF)
(LU0405846410) 0
B 47.4 1.7 14.2 0.0 13.9 22.8
B+ 56.5 1.7 20.4 0.0 13.9 7.5
MSCI 35.6 0.0 12.4 0.0 39.0 13.1
La Francaise LUX
- Inflection Point Carbon Impact Global (MF)
(LU1523323605) 0
B 1.4 0.0 0.0 5.8 68.9 23.9
B+ 2.1 0.0 4.5 5.8 82.6 5.1
MSCI 5.5 0.0 7.7 0.0 86.7 0.0
Lansforsakringar Sverige Aktiv
(SE0000837221) 1
B 0.0 0.0 0.0 20.2 64.5 15.2
B+ 1.5 0.0 0.0 20.2 72.9 5.4
MSCI 1.5 0.0 0.4 0.0 97.2 0.9
Luxembourg Selection Fd
- Active Solar (MF)
(LU0377296479) 0
B 75.4 3.0 0.0 0.0 7.2 14.4
B+ 79.8 3.0 3.5 0.0 7.2 6.5
MSCI 59.8 0.0 13.2 0.0 18.4 8.6
Lyxor New Energy
(FR0010524777) 0
B 27.0 0.0 16.9 17.0 22.1 17.1
B+ 29.1 0.0 33.1 17.0 14.8 6.0
MSCI 23.1 0.0 42.0 0.0 34.0 0.9

55
MAJ INVEST GLOBAL SUNDHED
(DK0060852887) 0
B 14.4 0.0 0.0 4.6 62.9 18.2
B+ 14.4 0.0 3.1 4.6 67.7 10.2
MSCI 23.6 0.0 7.0 0.0 69.4 0.0
Matthews Asia Funds-China
Small Companies Fund (MF)
(LU0721876364)
0
B 0.0 0.0 0.0 7.7 53.1 39.2
B+ 0.0 0.0 0.0 7.0 75.0 18.1
MSCI 4.2 0.0 3.0 0.0 68.0 24.8
Meridio Funds – Meridio
Green Balance P (MF)
(LU0117185156) 0
B 15.6 0.0 0.0 27.9 41.4 15.1
B+ 15.6 0.0 0.0 27.9 48.2 8.2
MSCI 36.5 0.0 12.9 0.0 24.8 25.8
Mirova Europe Environmental
Equity Fund (MF)
(LU0914733059) 1
B 11.5 0.2 0.0 9.7 54.5 24.1
B+ 11.0 0.2 4.7 8.3 54.5 21.4
MSCI 17.5 0.0 9.4 0.0 68.4 4.7
Monega Fair Invest Aktien
(DE0007560849) 0
B 0.0 0.0 2.5 13.7 67.7 16.1
B+ 2.2 0.0 3.8 13.7 71.2 9.1
MSCI 2.2 0.0 3.8 0.0 94.0 0.0
NSF SICAV Climate Change
Plus Fund
(LU1320042267) 1
B 16.4 0.0 0.0 14.5 40.2 28.9
B+ 20.3 0.0 0.0 14.5 51.1 14.1
MSCI 22.1 0.0 3.6 0.0 74.3 0.0
Nordea 1 - Global Climate and
Environment Fund (MF)
(LU0348926287) 0
B 7.1 4.5 0.0 8.9 39.7 39.8
B+ 7.1 4.5 1.6 7.8 53.5 25.4
MSCI 4.0 0.0 8.2 0.0 87.8 0.0
ONE Sustainable Fund
-Global Environment (MF)
(LU0594231770) 0
B 0.0 0.0 0.0 8.6 41.6 49.8
B+ 0.0 0.0 5.7 8.6 56.6 29.1
MSCI 7.1 0.0 7.9 0.0 83.9 1.2
OP-Clean Water (MF)
(FI4000048442) 0
B 4.4 4.9 0.0 14.6 26.5 49.6
B+ 6.8 4.9 3.7 14.6 44.9 25.1
MSCI 9.9 0.0 26.2 0.0 63.4 0.5
OekoWorld Water for Life
(LU0332822492) 0
B 25.7 4.1 0.0 3.4 34.4 32.3
B+ 28.2 4.1 5.1 3.4 43.2 16.0
MSCI 28.5 0.0 15.6 0.0 54.8 1.1
PARVEST Green Tigers
(LU0823437925) 0
B 4.6 0.0 0.0 12.8 49.2 33.4
B+ 9.9 0.0 3.2 9.4 65.7 11.8
MSCI 13.7 0.0 10.9 0.0 70.2 5.2
PRIMA - Global Challenges (MF)
(LU0254565053) 1
B 1.9 0.0 0.0 4.9 47.4 45.8
B+ 3.0 0.0 15.2 4.9 52.8 24.1
MSCI 5.3 0.0 16.5 0.0 78.1 0.0
Pictet - Global Environmental
Opportunities (MF)
(LU0503631714) 1
B 9.0 5.7 0.0 10.4 47.3 27.7
B+ 11.0 5.7 3.6 10.4 53.0 16.3
MSCI 7.1 0.0 22.4 0.0 70.5 0.0
Pictet-Clean Energy
(LU0280430660) 0
B 20.4 2.3 2.1 12.6 34.9 27.7
B+ 20.6 2.3 7.5 12.6 45.8 11.2
MSCI 19.9 0.0 21.4 0.0 58.7 0.0
Pictet-European Sustainable Equities
(LU0144509717) 1
B 1.6 0.0 0.0 8.7 82.6 7.2
B+ 3.5 0.0 3.9 8.7 78.8 5.2
MSCI 5.9 0.0 3.9 0.0 90.2 0.0

56
Quaero Capital Funds (Lux)
- Accessible Clean Energy (MF)
(LU1633832503) 0
B 57.1 0.0 6.4 5.7 15.3 15.5
B+ 58.2 0.0 8.2 5.7 20.5 7.5
MSCI 45.4 0.0 16.8 0.0 31.6 6.2
Quest Cleantech
(LU0346063406) 0
B 6.6 0.0 0.0 20.2 56.0 17.2
B+ 6.6 0.0 0.0 20.2 58.2 14.9
MSCI 9.8 0.0 20.2 0.0 40.3 29.7
Raiffeisen-Nachhaltigkeit-EM-Aktien
(AT0000A1TB34) 1
B 3.2 0.0 0.0 7.1 60.4 29.3
B+ 3.2 0.0 0.0 4.3 82.7 9.8
MSCI 4.2 0.0 1.5 0.0 91.7 2.6
Raiffeisen-Nachhaltigkeit-Momentum
(AT0000A1PKP3) 1
B 5.0 0.0 0.0 8.0 62.4 24.5
B+ 5.0 0.0 5.7 6.4 67.6 15.4
MSCI 4.2 0.0 10.4 0.0 82.8 2.7
Raiffeisen-Nachhaltigkeitsfonds-Aktien (MF)
(AT0000677901) 1
B 2.1 1.5 0.0 7.9 68.9 19.5
B+ 2.1 1.5 2.7 6.8 72.8 14.2
MSCI 3.6 0.0 13.0 0.0 81.0 2.4
Raiffeisen-PAXetBONUM-Aktien
(AT0000A261K9) 1
B 0.0 1.9 0.0 6.3 70.1 21.7
B+ 0.0 1.9 5.6 6.3 78.7 7.5
MSCI 0.0 0.0 10.6 0.0 89.4 0.0
RobecoSAM Sustainable Water Fund (MF)
(LU0133061175) 0
B 0.0 5.1 0.0 14.9 45.5 34.6
B+ 1.6 5.1 1.9 14.9 53.4 23.2
MSCI 5.9 0.0 19.4 0.0 74.5 0.2
SEB Finlandia Optimized Low Carbon (MF)
(FI0008802558) 0
B 0.0 0.0 1.9 23.3 66.0 8.8
B+ 0.8 0.0 1.9 17.8 76.8 2.7
MSCI 0.8 0.0 11.5 0.0 66.3 21.4
Schroder ISF Global Climate Change Equity (MF)
(LU0302445910) 0
B 13.4 0.0 3.2 15.9 41.8 25.7
B+ 13.4 0.0 6.8 14.4 53.0 12.4
MSCI 20.5 0.0 15.1 0.0 62.7 1.7
Skandia Sverige Hallbar
(SE0010547943) 1
B 1.8 0.0 0.0 26.1 58.2 13.9
B+ 2.9 0.0 0.0 26.1 66.0 5.0
MSCI 3.8 0.0 3.0 0.0 86.4 6.8
Steyler Fair Invest - Equities (MF)
(DE000A1JUVL8) 1
B 3.2 0.0 0.0 4.9 72.4 19.5
B+ 3.2 0.0 5.8 3.0 73.6 14.4
MSCI 5.8 0.0 7.9 0.0 84.0 2.3
Sustainable Real Estate Securities
(LU1586242577) 1
B 0.0 0.0 0.0 4.0 5.0 91.0
B+ 18.8 0.0 14.5 2.9 57.7 6.0
MSCI 22.6 0.0 20.4 0.0 56.4 0.6
Swedbank Robur Ethica Global (MF)
(SE0000537680) 1
B 6.8 0.0 0.0 14.3 63.9 15.1
B+ 6.8 0.0 0.0 14.3 72.7 6.2
MSCI 5.4 0.0 5.5 0.0 89.1 0.0
Swedbank Robur Ethica Global Mega
(SE0001003864) 1
B 6.7 0.0 0.0 14.3 64.1 14.9
B+ 6.7 0.0 0.0 14.3 73.0 6.0
MSCI 5.4 0.0 5.4 0.0 89.2 0.0
Swedbank Robur Humanfond
(SE0000708950) 1
B 3.0 0.0 0.0 18.9 67.1 11.0
B+ 4.3 0.0 0.0 18.9 72.7 4.1
MSCI 4.3 0.0 1.9 0.0 91.8 2.0
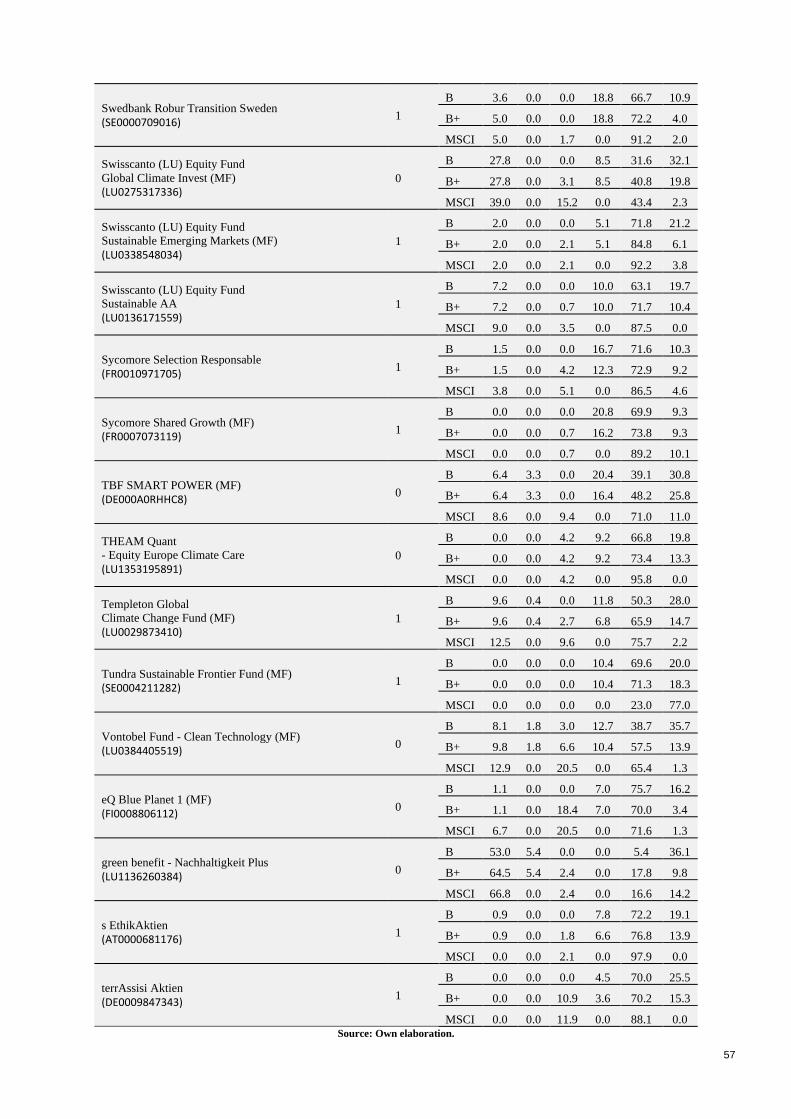
57
Swedbank Robur Transition Sweden
(SE0000709016) 1
B 3.6 0.0 0.0 18.8 66.7 10.9
B+ 5.0 0.0 0.0 18.8 72.2 4.0
MSCI 5.0 0.0 1.7 0.0 91.2 2.0
Swisscanto (LU) Equity Fund
Global Climate Invest (MF)
(LU0275317336) 0
B 27.8 0.0 0.0 8.5 31.6 32.1
B+ 27.8 0.0 3.1 8.5 40.8 19.8
MSCI 39.0 0.0 15.2 0.0 43.4 2.3
Swisscanto (LU) Equity Fund
Sustainable Emerging Markets (MF)
(LU0338548034) 1
B 2.0 0.0 0.0 5.1 71.8 21.2
B+ 2.0 0.0 2.1 5.1 84.8 6.1
MSCI 2.0 0.0 2.1 0.0 92.2 3.8
Swisscanto (LU) Equity Fund
Sustainable AA
(LU0136171559) 1
B 7.2 0.0 0.0 10.0 63.1 19.7
B+ 7.2 0.0 0.7 10.0 71.7 10.4
MSCI 9.0 0.0 3.5 0.0 87.5 0.0
Sycomore Selection Responsable
(FR0010971705) 1
B 1.5 0.0 0.0 16.7 71.6 10.3
B+ 1.5 0.0 4.2 12.3 72.9 9.2
MSCI 3.8 0.0 5.1 0.0 86.5 4.6
Sycomore Shared Growth (MF)
(FR0007073119) 1
B 0.0 0.0 0.0 20.8 69.9 9.3
B+ 0.0 0.0 0.7 16.2 73.8 9.3
MSCI 0.0 0.0 0.7 0.0 89.2 10.1
TBF SMART POWER (MF)
(DE000A0RHHC8) 0
B 6.4 3.3 0.0 20.4 39.1 30.8
B+ 6.4 3.3 0.0 16.4 48.2 25.8
MSCI 8.6 0.0 9.4 0.0 71.0 11.0
THEAM Quant
- Equity Europe Climate Care
(LU1353195891) 0
B 0.0 0.0 4.2 9.2 66.8 19.8
B+ 0.0 0.0 4.2 9.2 73.4 13.3
MSCI 0.0 0.0 4.2 0.0 95.8 0.0
Templeton Global
Climate Change Fund (MF)
(LU0029873410) 1
B 9.6 0.4 0.0 11.8 50.3 28.0
B+ 9.6 0.4 2.7 6.8 65.9 14.7
MSCI 12.5 0.0 9.6 0.0 75.7 2.2
Tundra Sustainable Frontier Fund (MF)
(SE0004211282) 1
B 0.0 0.0 0.0 10.4 69.6 20.0
B+ 0.0 0.0 0.0 10.4 71.3 18.3
MSCI 0.0 0.0 0.0 0.0 23.0 77.0
Vontobel Fund - Clean Technology (MF)
(LU0384405519) 0
B 8.1 1.8 3.0 12.7 38.7 35.7
B+ 9.8 1.8 6.6 10.4 57.5 13.9
MSCI 12.9 0.0 20.5 0.0 65.4 1.3
eQ Blue Planet 1 (MF)
(FI0008806112) 0
B 1.1 0.0 0.0 7.0 75.7 16.2
B+ 1.1 0.0 18.4 7.0 70.0 3.4
MSCI 6.7 0.0 20.5 0.0 71.6 1.3
green benefit - Nachhaltigkeit Plus
(LU1136260384) 0
B 53.0 5.4 0.0 0.0 5.4 36.1
B+ 64.5 5.4 2.4 0.0 17.8 9.8
MSCI 66.8 0.0 2.4 0.0 16.6 14.2
s EthikAktien
(AT0000681176) 1
B 0.9 0.0 0.0 7.8 72.2 19.1
B+ 0.9 0.0 1.8 6.6 76.8 13.9
MSCI 0.0 0.0 2.1 0.0 97.9 0.0
terrAssisi Aktien
(DE0009847343) 1
B 0.0 0.0 0.0 4.5 70.0 25.5
B+ 0.0 0.0 10.9 3.6 70.2 15.3
MSCI 0.0 0.0 11.9 0.0 88.1 0.0 Source: Own elaboration.

58
The following Table 16 describes the composition of funds regarding their fund domiciles. During the
analyses, it was differentiated between the four different samples mentioned in section 4.1.
Obviously, the distribution of funds domiciles varies widely across the sample of labelled and non-
labelled funds.
Table 16 - Distribution of Fund Domiciles
Fund Domicile Entire Sample Labelled Non-Labelled
Austria 16 16 0
Belgium 2 0 2
Denmark 1 0 1
Finland 3 0 3
France 7 4 3
Germany 8 4 4
Ireland 8 0 8
Luxembourg 47 18 29
Sweden 9 9 0
Total 101 51 50
Source: Own elaboration.
ANNEX VI – PILOT: DO NO SIGNIFICANT HARM
This pilot is aimed at assessing in how far do no significant harm (DNSH) considerations of the EU Taxonomy can be applied at the fund level.
Methodology - Pilot Application of the DNSH principle under the EU Taxonomy
In a first step of this pilot, all UCITS equity funds from the fund universe under the scope of this
study with an unambiguous revenue mapping of at least 90% of the total turnover are listed. One representative fund of the fund universe is to be selected from the sample for the analysis of this pilot. The pilot focuses on one fund only due to the high degree of manual analysis going into the constituents of the fund.
In preparation of the analysis, DNSH criteria for all EU Taxonomy activities are classified in a binary manner to establish which DNSH criteria are directly covered by existing EU legislations on climate
and environmental issues and international standards. Furthermore, all DNSH criteria proposed under
the EU Taxonomy are classified into the following three categories in preparation of the analysis:
1. Quantitative Threshold (QT): DNSH criteria has a quantitative threshold, such as the
“compliance with the limit of 170 kg nitrogen application per hectare” for livestock
production.
2. Hard Qualitative Threshold (HQT): includes DNSH criteria such as minimum / maximum or
other hard requirements like, the implementation and adherence to ISO standards in
manufacturing.
3. Soft Qualitative Threshold (SQT): DNSH criteria that are relatively open and cannot easily be
checked by the provision of documentation such “as identifying and managing risks related
to water quality at the appropriate level” for e.g. manufacturing processes (i.e. it leaves room
for interpretation).

59
The classification will help to identify the level of difficulty for obtaining by top-down measures about
non-existent information on DNSH. Generally, one can assume that from classification one to three an outside assessment is assumed to become more difficult as more direct data and or concrete statements (e.g. statement of intent or document of certain action) will be necessary at the asset or company level. The effect is expected to vanish as soon as companies report bottom-up data.
In the next step, a DNSH assessment for the EU is conducted on the selected fund. The pilot of DNSH
adherence in the EU is potentially simpler compared to the outside EU DNSH assessment as the TEG has largely built DNSH criteria on the basis of EU legislation. For this, the turnover share of each constituent’s operation in the EU has to be derived. In addition to the EU27 countries, the UK, Norway, Iceland, Liechtenstein and Switzerland are also considered as EU compliant as they form part of the EEA and / or EFTA.
To determine whether constituents of the selected fund meet EU legislation on climate and environmental issues, desk-based research is conducted to identify relevant governance
misconducts, which would lead to a flagging of the respective companies’ meeting of the DNSH criteria. If no evidence of misconduct can be found, the assumption is that the turnover share of EU operations is compliant with the DNSH criteria. In addition, turnover from activities where DNSH is
not linked to EU regulations is highlighted, which could potentially not meet the criteria however is assumed to do so. This assumption is in line with assumption taken by sustainability data providers.
Next, a DNSH application for operations outside in the US is exemplified for the energy sector. For
this sector, the comparability of EU legislation with the legislation of the US legislation is assessed based on publicly available legal analysis. If the legislation outside the EU is comparable with EU legislation (in terms of requirements and obligations) and no governance misconduct is found, the revenue is counted as meeting the DNSH criteria. If the legislation is not comparable and / or no information on compliance with relevant international standards exist, it is assumed that the share of the revenue does not comply with DNSH considerations.
Figure 23 below summarises and illustrates the methodology described in this chapter.

60
Figure 23 - Methodology of the DNSH Assessment
Source: Own elaboration.
Exemplification - DNSH
The reference to EU legislation to assess compliance with the by DNSH criteria and the differentiation between different types of DNSH criteria provides an overarching picture of the complexity of applying DNSH criteria from an outsider's perspective. Although the majority of the DNSH criteria references an EU legislation, the official matching by the TEG still leaves ample room for further assessment needs beyond EU legislation. Therefore, the analytical shortcut through assuming that
DNSH criteria should be met as long as companies EU operations comply with EU legislation could be questionable. Furthermore, most DNSH criteria are not quantitative by nature but rather qualitative with the extra challenge that a high share of criteria only applies soft qualitative criteria resulting in ambiguous outside verification of those criteria. This pilot did not take DNSH criteria for
adaptation into account due to the principle-based nature of the DNSH for adaption to mitigation. In addition, these criteria are not easily quantifiable and are this beyond the scope of this study.

61
Figure 24 - DNSH criteria of EU Taxonomy activities and underlying EU regulation
Source: Own elaboration.
Out of a total of 73 relevant activities in the EU Taxonomy for Water, approximately 66% of the
activities with DNSH criteria under the EU Taxonomy for Water fall at least under one EU regulation.
For Circular Economy criteria, Pollution criteria and Ecosystems criteria, these percentage are 40%, 76% and 69%, respectively. DNSH criteria for adaptation are not listed as they are equal throughout the EU Taxonomy and probably not testable from an outside perspective.
Figure 25 - Clustering DNSH criteria into QT, HQT & SQT
Source: Own elaboration.
The division of DNSH criteria into “Quantitative Thresholds” (QT), “Hard Qualitative Thresholds” (HQT) and “Soft Qualitative Thresholds” (SQT) (see definition in chapter 3) highlights the qualitative
nature of DNSH criteria. For an outsider's assessment, qualitative DNSH criteria seem particularly challenging to verify as those criteria are similar to category five substantial contribution criteria and require in-depth information on operations at the asset level. Hence a bottom-up reporting by companies to assess compliance with DNSH is necessary in order for those DNSH criteria to be tested in Europe (in the absence of regulation) and the rest of the world.

62
Policy environment comparison EU / US in the energy sector
As part of the pilot DNSH analysis, a policy environment comparison between the EU and US are
conducted in order to streamline the top-down DNSH analysis. The analysis shows that the policy
environments for energy production are largely comparable between the EU and the US and that key
DNSH criteria should be fulfilled by US legislation. For instance, wind and solar PV projects in the US
have to submit environmental impacts assessments, which seem to fulfil key criteria laid-out by the
EU Taxonomy. Further analysis and stakeholder dialogues should verify this finding and make the
EU Taxonomy more easily applicable for companies operating outside the EU.
The analysis also highlights the difficulties in assessing compliance with DNSH criteria from a top-
down (or outside-in) perspective. A key challenge remains divergent information levels between
project / asset level requirements through the DNSH criteria and the aggregated information reported
by companies. For example, the adaptation criteria or the circular economy criterion for wind are
site-specific, which simply cannot be assessed through the regulatory framework or at the company
level. A compliance assessment-useful data collection would either require an analysis of energy
projects operated by each company (given sufficient project-specific information is available in public
registers) or require statements by energy companies confirming compliance with DNSH criteria.
Table 17 - Comparison between relevant EU and US legislation (Solar PV)
Solar PV EU Taxonomy Criteria
Referenced
Taxonomy Criteria
EU
Regulation
US
Regulation Assessment
Adaptation Refer to the screening
criteria for DNSH to
climate change adaptation.
Very difficult to
assess from a top-
down perspective.
Water
Circular
economy
•Ensure PV panels and
associated components have
been designed and
manufactured for high
durability, easy
dismantling, refurbishment,
and recycling in alignment
with ‘Manufacture of
Renewable Energy
Equipment’ for DNSH
criteria. •Ensure reparability of the
solar photovoltaic (PV)
installation or plant thanks
to accessibility and
exchangeability of the
components.
Embodied carbon
emissions should
represent less than
50% of the total
carbon emissions
saved by the use of
the energy efficient
equipment. Carbon
emissions and
savings at the end-
of-life stage are not
included in the
assessment for this
criterion (too
uncertain).
N/A State of
Washington -solar
stewardship bill
ESSB 5939:
requiring
manufacturers
selling solar
products into the
state to have end-
of-life recycling
programs for their
own products
Possible however
geographically
limited and only
partially covering
the criteria
Pollution
Ecosystems Ensure an Environmental
Impact Assessment (EIA)
has been completed in
accordance with the EU
Directives on
Environmental Impact
Assessment (2014/52/EU)
and Strategic
Environmental Assessment
(2001/42/EC) or in the case
of activities located in non-
EU countries other
equivalent national
provisions or international
standards for activities in
non-EU countries (e.g. IFC
Performance Standard 1:
Assessment and
Management of
EU
Directive
(2014/52/
EU)
Environme
ntal
Impact
Assessmen
t
Local Planning
and Natural
Resources
Departments
collect
Environmental
Forms for all
large solar PV
installations.
The requirements
in assessed forms
seem to match the
requirements by
the Taxonomy
Criteria. A further
comparative
analysis should be
sought.

63
Environmental and Social
Risks) – including ancillary
services, e.g. transport
infrastructure and
operations). Ensure any
required mitigation
measures for protecting
biodiversity/eco-systems
have been implemented.
[for the remainder please
refer to the final EU
Taxonomy report by the
TEG]
Source: Own elaboration.
Table 18 - Comparison between relevant EU and US legislation (Wind)
Wind EU Taxonomy Criteria
Referenced
Taxonomy
Criteria
EU
Regulation
US
Regulation Assessment
Adaptation •Refer to the screening criteria for
DNSH to climate change
adaptation.
Very difficult to
assess from a top-
down perspective.
Water •Identify and manage risks related
to water quality and/or water
consumption at the appropriate
level. Ensure that water
use/conservation management
plans, developed in consultation
with relevant stakeholders, have
been developed and implemented. •In the EU, fulfil the requirements
of EU water legislation.
General EU
water
legislation
Guidelines
provided by
the Bureau
of Ocean
Energy
Management
(e.g. see:
Link)
BOEM seems to
require
information
fulfilling the
Taxonomy
Criteria.
Circular
economy
State ambition to maximise
recycling at end of life based on
waste management plans,
dismantling/decommissioning
processes at time of
decommissioning (e.g. through
contractual agreements with
recycling partners, reflection in
financial projections or official
project documentation).
N/A N/A The criterion is
site-specific.
Pollution
Ecosystems Ensure an Environmental Impact
Assessment (EIA) has been
completed in accordance with the
EU Directives on Environmental
Impact Assessment (2014/52/EU)
and Strategic Environmental
Assessment (2001/42/EC) or in the
case of activities located in non-
EU countries other equivalent
national provisions or international
standards for activities in non-EU
countries (e.g. IFC Performance
Standard 1: Assessment and
Management of Environmental
and Social Risks) – including
ancillary services, e.g. transport
infrastructure and operations).
Ensure any required mitigation
measures for protecting
biodiversity/eco-systems have
been implemented. [for the
remainder please refer to the final
EU taxonomy report by the TEG]
EU Directive
(2014/52/EU)
Environmental
Impact
Assessment
Guidelines
provided by
the Bureau
of Ocean
Energy
Management
(e.g. see:
Link)
BOEM seems to
require
information
fulfilling the
Taxonomy
Criteria. A
detailed
comparison
between US and
EU regulation
should be sought.

64
Source: Own elaboration.
Do No Significant Harm (DNSH) Pilot application Results
The DNSH criteria of the EU Taxonomy have been applied at the fund level via a top-down analysis on the underlying constituents of the 3 Banken, Mensch & Umweltfonds (ISIN: AT0000A23YE9). The fund is based in Austria and holds the Austrian Ecolabel certificate indicating that the company’s operations comply with comprehensive environmental criteria and guidelines throughout the life cycle process of the respective product, including its manufacturing, usage and recycling.50 The fund holds 62 companies, of which 24 show green turnover shares above or equal to 20%.
The 24 companies’ headquarters are primarily based in Europe, the United States and Asia (Japan,
People’s Republic of China, Hong Kong). Their economic activities, including sales, are in many cases
not bound to these geographical locations. The majority of the funds’ underlying constituents can be
allocated to manufactural activities, the remaining constituents have activities in energy, water
management or transport. Four of the companies listed in the fund show an EU Taxonomy-aligned
turnover share above 50%. The observed data suggests that the majority of revenue turnover is
generated in the EU, the United States and Asia, in particular China and Japan. Nevertheless, a minor
share of the companies’ turnover is generated in geographical regions such as the Middle East, Africa
or Latin America.
In a first step of the DNSH pilot application, it was assessed whether the company has committed
any violation against the relevant environmental, health and safety guidelines in 2018 (i.e. the proxy
for compliance in the EU with the criteria). This assessment was based on the publicly available
information (in Thomson Reuters and Bloomberg) regarding:
• environmental fines received by the company,
• information on compliance misconducts provided in their annual reports and
• independent third sources such as newspapers or misconduct databases.
Out of the 24 companies, findings show that four companies may be subject to environmental
compliance violations. Nevertheless, due to insufficient disclosure and collection of relevant
information these numbers may not represent the actual amount of companies violating
environmental, health or safety regulations. Hence, more comprehensive disclosure or data collection
would be necessary in order to utilise this proxy reliably. For this pilot analysis, the assumption was
made that all relevant violations are captured in the data base.
In a second step, it was evaluated whether the company complies with the DNSH criteria outside the
EU. As outlined above, an in-depth comparison of policy environments might support the a DNSH
assessment outside the EU with similar proxies as inside the EU. Future research might look into
creating a harmonisation between environmental regulations of countries outside the EU with those
of the EU for this purpose.
In order to develop a first impression of where compliance with DNSH criteria outside the EU might
be more easily feasible, a sector-based analysis was conducted. The analysis shows that some DNSH
criteria might be more straight-forward to assess given the current data availability (e.g. compliance
with ISO Standards, which are partly reported) whereas other aspects are asset/ project-specific and
hence testing is currently highly difficult.
50 https://www.umweltzeichen.at/en/for-companies/guidelines/

65
A clear conclusion can be drawn for top-down DNSH assessments. Currently, it is not possible to
assess the EU Taxonomy alignment to EU Taxonomy compliance ratio, i.e. the effect of DNSH on the
reduction of EU Taxonomy shares in funds.
Sector-specific findings on DNSH
Manufacturing Sector
The majority of companies in this sector operates in the segment Manufacture of low carbon materials, such as manufacture of semiconductors, turbines and air conditioning equipment. Most of
the manufacturing companies have diversified production lines with turnover generated all over the globe. From data available, it is not always assessable in which regions the economic activity generates what degree of turnover. For example, a company may generate 66% of its turnovers through the manufacture and sale of electronic equipment for life care products, but information on where turnover is generated is only given for the company as a whole.
Most DNSH criteria in the manufacturing sector are difficult to assess as they are not reported or not
consistently reported. For example, information on whether and to what extent manufactures use
Best Available Technologies in their facilities is not readily available. As the use of technologies
according to relevant Best Available Techniques (BAT) Reference Documents builds the core of the
majority of the pollution related-DSNH criteria, comprehensive reporting on this aspect would be a
prerequisite for EU Taxonomy-compliance. One can draw similar conclusions for disclosure for EU
Taxonomy relevant water and ecosystem regulations.
Information on compliance with REACH (Registration, Evaluation, Authorisation and Restriction of
Chemicals) Regulation (1272/2008/EC) and the RoHS (Restriction of Hazardous Substances)
Regulation (2002/95/EC) is relatively easy to retrieve, as most assessed manufacturing companies
publicly disclose this documentation. For an in-depth assessment of the compliance with REACH- or
RoHS-related DNSH criteria, a careful analysis of compliance statements would need to be conducted.
Assessing whether a company has obtained specific certifications, like ISO 14001 (Environmental
Management System) to comply with hard qualitative thresholds is also relatively straightforward to
retrieve. In the assessment, 83% of the companies displayed the obtained certificates on their
website.
Considering the numerous reporting deficits, it can be concluded that reporting in the manufacturing
sector needs to be much more detailed and comprehensive in order to allow for a DNSH assessment.
From this pilot study, it is only possible to derive EU Taxonomy compliance statements for two out
of the 13 companies studied for the manufacturing sector. It is very likely that those two do not fulfil
the DNSH criteria, as they had to pay fines due to environmental misconduct in 2018. For the
remaining companies in the manufacturing sector, too little information to support a DNSH
assessment is available at this point.
To offer another perspective on the assessment, third-party assessments of sustainability and ESG
for the observed companies was also taken into account. For example, a cross-check was conducted
on whether the relevant companies received notable awards, such as the FORBES Sustainability
Award51, or had a high ESG score (e.g. in the S&P ESG Rating). Here, the assumption was made that
the higher the ESG score or the more sustainability awards a company has received, the more likely
it is to not have been involved in environmental misconduct. Whereas the S&P ESG Assessment52
does important work for assessing a company’s ESG profile, access to the underlying methodology
of the S&P ESG Assessment was not available and cannot further verify the assumption. The S&P
ESG Assessment further allows companies to compensate low ESG scores in e.g. environmental
performance with high ESG scores in e.g. social matters, which further lowers the significance of
their assessment for the pilot assessment of DNSH criteria. Is it nonetheless striking, that 35% of
the assessed companies received a distinction from the S&P ESG Assessment.
51 https://www.forbes.com/sites/karstenstrauss/2019/01/22/the-most-sustainable-companies-in-2019/#20a994cf6d7d
52 https://www.spglobal.com/esg/csa/yearbook/ranking/

66
Energy Sector
The fund includes four EU Taxonomy-aligned energy companies. Of those, two companies primarily operate transmission and distribution (T&D) systems and two primarily produce (and sell) electricity. Whereas T&D operators only generate turnover on one continent, electricity producers are globally active potentially increasing ease of assessing DNSH compliance of T&D companies.
Generally, the electricity DNSH criteria tend to be facility specific and require statements from electricity producers or underlying manufacturers on respective low carbon technologies. As a result,
an assessment of DNSH compliance at the company level is difficult. An exemplified assessment of Environmental Impact Assessments as part of this pilot shows that data at the energy project level is partly available. For a restricted amount of energy constituents in a fund, it might be feasible to assess DNSH criteria in a relatively high level of detail if energy companies operate in countries with a good coverage of public fillings and companies report their project portfolios. Such an approach would however involve a high time commitment by analysists which appears to relatively inefficient given the uncertainty about the usefulness of outcomes.
Water sector
The fund includes two EU Taxonomy-aligned companies, primarily focused on the collection, treatment and supply of water. Since the companies are based outside of the EU and their respective revenues are generated in Hong Kong and the US, EU regulations on environmental impact assessment do not apply in those cases. Equivalent regional regulations would require in-depth analysis. The companies do not openly disclose whether or not they comply with other (international) guidelines such as the IFC Performance Standards (Standard 6), as recommended by the EU Taxonomy for non-EU based companies. A reliable further assessment regarding the DNSH criteria
would therefore involve direct communication with the companies.
Transport Sector
The fund holds two companies from the transport sector, more precisely in Freight Rail Transport as well as Urban and Suburban Passenger Land Transport. For these activities, the EU Taxonomy provides detailed minimum thresholds for pollution and noise for the operating vehicles of the
respective companies as well as the reference to compliance with EU regulations. As the companies in this example operate outside the EU, the regulations of the EU Taxonomy do not apply and
equivalent regional regulations would require in-depth analysis. Furthermore, companies do neither provide general information on the noise level of their vehicle fleet nor on the noise level of the different vehicle kinds in their fleet, as requested by the EU Taxonomy. Thus, further assessment would involve direct communication with the companie

67
GETTING IN TOUCH WITH THE EU In person
All over the European Union, there are hundreds of Europe Direct information centres.
You can find the address of the centre nearest you at: https://europa.eu/european-
union/contact/meet-us_en
On the phone or by email
Europe Direct is a service that answers your questions about the European Union. You
can contact this service:
- by Freephone: 00 800 6 7 8 9 10 11 (certain operators may charge for these calls),
- at the following standard number: +32 2 299 96 96, or
- by email via: https://europa.eu/european-union/contact_en
FINDING INFORMATION ABOUT THE EU
Online
Information about the European Union in all the official languages of the EU is available
on the Europa website at: https://europa.eu/european-union/index_en
EU publications
You can download or order free and priced EU publications from:
https://publications.europa.eu/en/publications.
Multiple copies of free publications may be obtained by contacting Europe Direct or your
local information centre (see https://europa.eu/european-union/contact/meet-us_en ).
EU law and related documents
For access to legal information from the EU, including all EU law since 1952 in all the
official language versions, go to EUR-Lex at: http://eur-lex.europa.eu
Open data from the EU
The EU Open Data Portal (http://data.europa.eu/euodp/en) provides access to datasets
from the EU. Data can be downloaded and reused for free, for both commercial and non-
commercial purposes.

68