Mercer UCITS Common Contractual Fund
265
Mercer UCITS Common Contractual Fund (an open-ended umbrella common contractual fund with segregated liability between Sub-Funds) Annual Report and Audited Financial Statements For the financial year ended 30 June 2021
-
Upload
khangminh22 -
Category
Documents
-
view
0 -
download
0
Transcript of Mercer UCITS Common Contractual Fund
Mercer UCITSCommon Contractual Fund(an open-ended umbrella common contractual fund with segregated liability between Sub-Funds)
Annual Report and Audited Financial StatementsFor the financial year ended 30 June 2021

Management and Administration 2
Investment Manager’s Report 3
Statement of Manager’s Responsibilities 14
Report of the Depositary to the Unitholders of Mercer UCITS Common Contractual Fund 15
Independent Auditor’s report to the Unitholders of Mercer UCITS Common Contractual Fund 16
Financial Statements 18
Statement of Financial Position – as at 30 June 2021 18
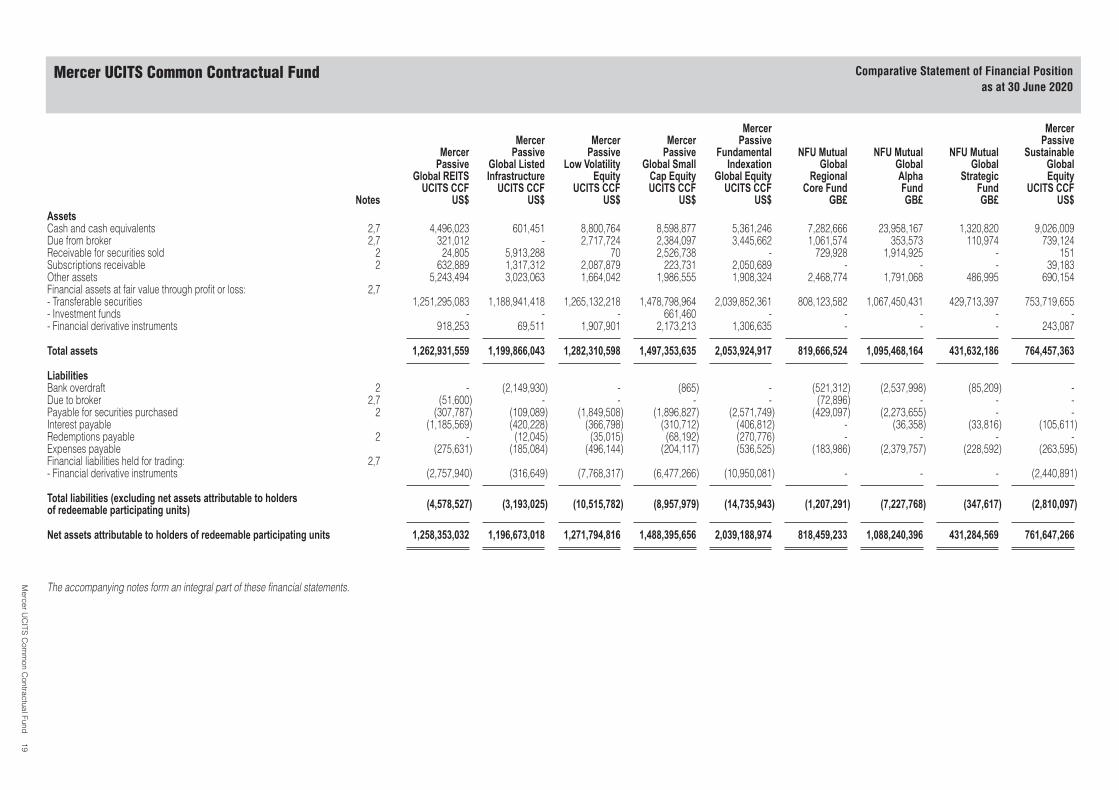
Comparative Statement of Financial Position – as at 30 June 2020 19
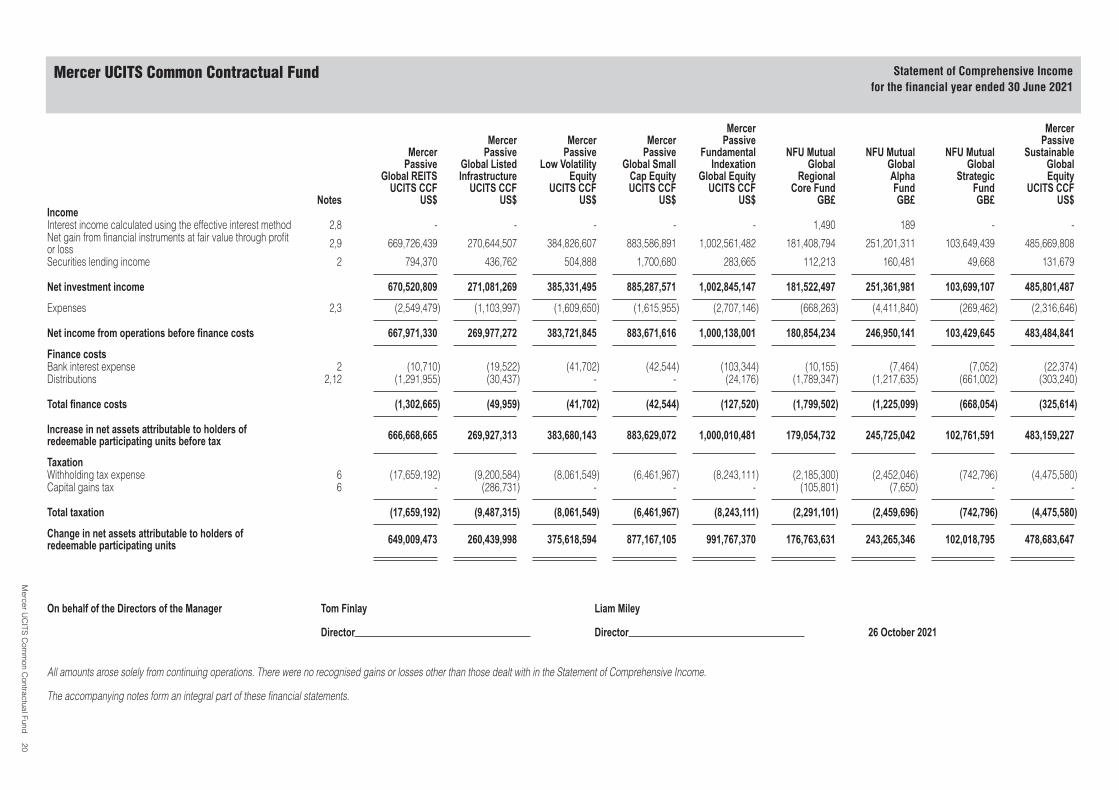
Statement of Comprehensive Income – for the financial year ended 30 June 2021 20
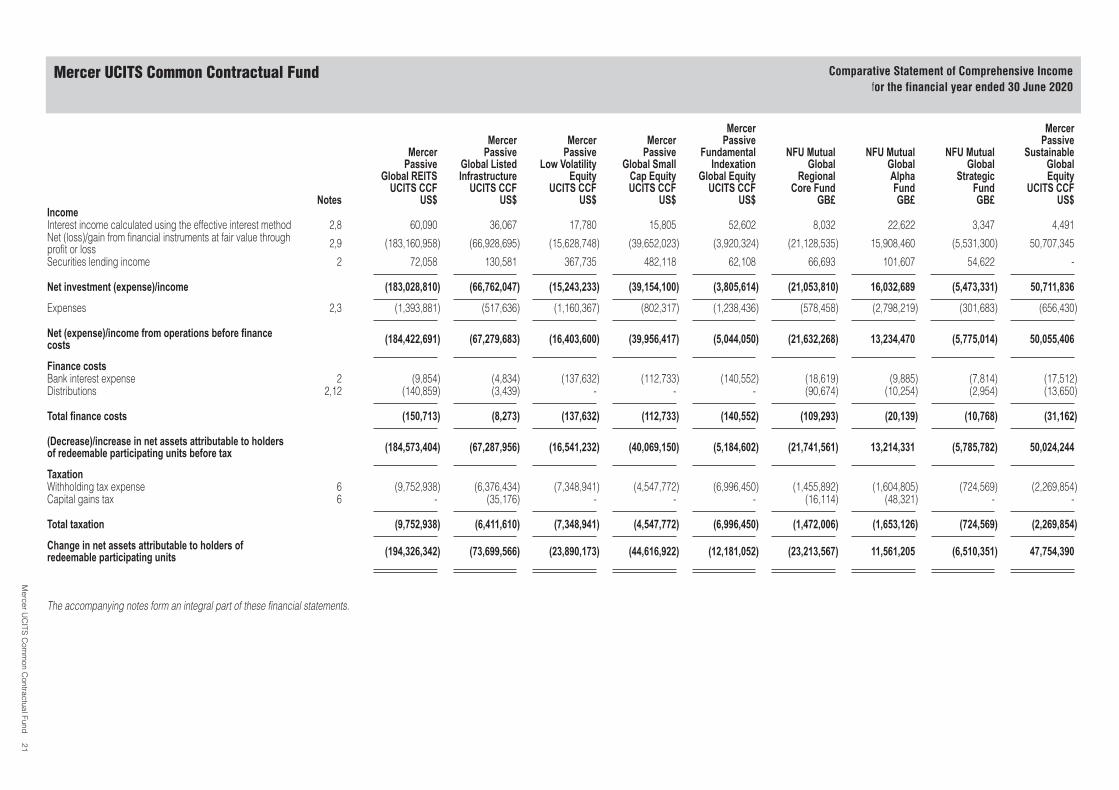
Comparative Statement of Comprehensive Income – for the financial year ended 30 June 2020 21
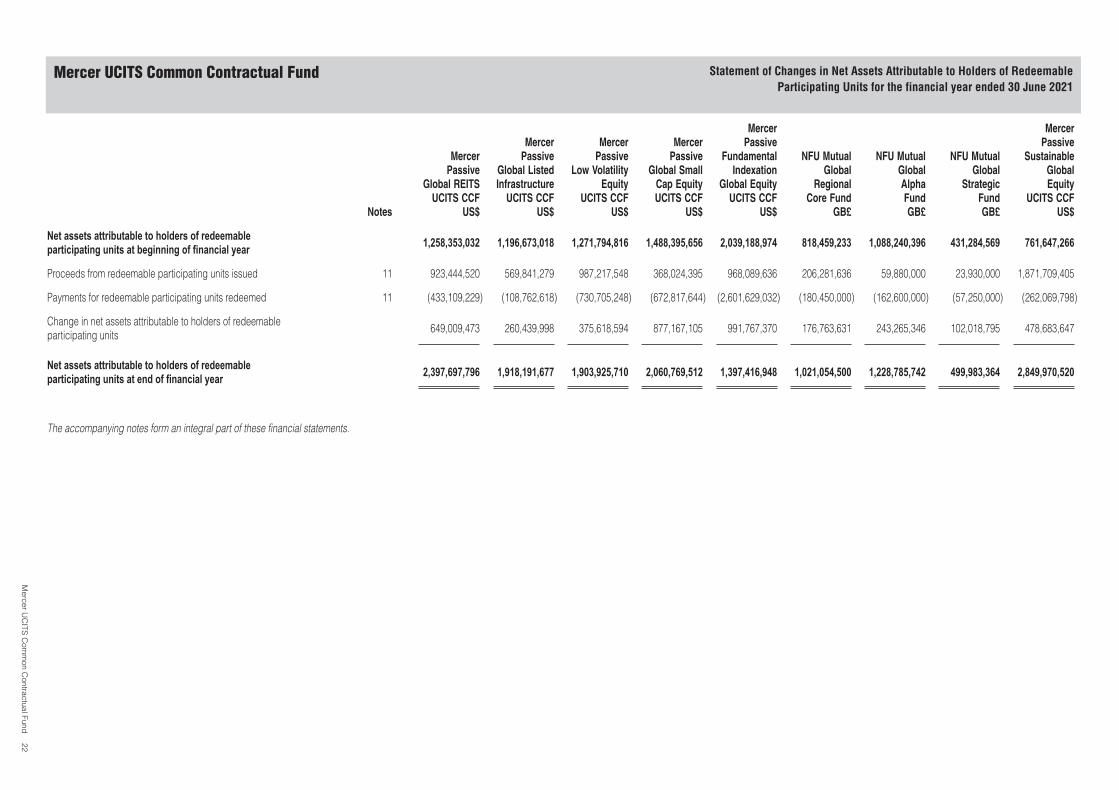
Statement of Changes in Net Assets Attributable to Holders of RedeemableParticipating Units – for the financial year ended 30 June 2021
22
Comparative Statement of Changes in Net Assets Attributable to Holders ofRedeemable Participating Units – for the financial year ended 30 June 2020
23
Statement of Cash Flows – for the financial year ended 30 June 2021 24
Comparative Statement of Cash Flows – for the financial year ended 30 June 2020 25
Notes to the Financial Statements 26
Unaudited Supplemental Information 96
Unaudited Portfolio Statements 139
Mercer UCITS Common Contractual Fund Contents
Mercer UCITS Common Contractual Fund 1
MANAGERMercer Global Investments Management Limited70 Sir John Rogerson’s QuayDublin 2Ireland
INVESTMENT MANAGER AND DISTRIBUTORMercer Global Investments Europe LimitedCharlotte HouseCharlemont StreetDublin 2Ireland
INDEPENDENT AUDITORKPMGChartered Accountants Statutory Audit Firm1 Harbourmaster PlaceInternational Financial Services CentreDublin 1Ireland
LEGAL ADVISOR IN IRELANDUp to 30 June 2021Matheson70 Sir John Rogerson’s QuayDublin 2Ireland
From 1 July 2021William Fry2 Grand Canal SquareDublin 2Ireland
SECRETARY AND REGISTERED OFFICE OF THEMANAGERMatsack Trust Limited70 Sir John Rogerson’s QuayDublin 2Ireland
DIRECTORS OF THE MANAGERGráinne Alexander*§Tom Finlay*§Hooman Kaveh§Helen O’Beirne**Liam Miley*§Carmel Jordan**
ADMINISTRATOR, REGISTRAR & TRANSFER AGENTState Street Fund Services (Ireland) Limited78 Sir John Rogerson’s QuayDublin 2Ireland
DEPOSITARYState Street Custodial Services (Ireland) Limited78 Sir John Rogerson’s QuayDublin 2Ireland
For the Sub-Funds named hereafter, no notification for distribution in Germany has been made so no units of theseSub-Funds may be publicly distributed to investors within the scope of the German Investment Act:Mercer Passive Global Listed Infrastructure UCITS CCF, NFU Mutual Global Regional Core Fund, NFU Mutual Global Alpha Fund,NFU Mutual Global Strategic Fund.
The Prospectus, the Key Investor Information Document (“KIID”), the Deed of Constitution of the CCF, the annual and semi-annualreports, a list of changes in the composition of the portfolios as well as the issue and redemption prices are available free ofcharge pursuant to Sec. 297(1) of the German Capital Investment Code at the office of the German information agent (MercerGlobal Investments Europe Limited - Niederlassung Deutschland, Platz der Einheit 1, 60327 Frankfurt am Main, Hessen,Germany).
Mercer UCITS Common Contractual Fund (the “CCF”) may only be offered in Switzerland to qualified investors within the meaningof Article. 10 para 3 and 3ter CISA. The Prospectus, the KIID, the Deed of Constitution of the CCF as well as the annual andsemi-annual reports can be obtained free of charge from the representative agent in Switzerland, Mercer Alternatives AG,Kasernenstrasse 77b, 8004 Zurich, Switzerland. The paying agent of the CCF in Switzerland is NPB Neue Privat Bank AG,Limmatquai 1 / am Bellevue, P.O. Box, CH-8024 Zürich, Switzerland.
* Independent Director.** Executive Director.§ Non-executive Director.
Mercer UCITS Common Contractual Fund Management and Administration
Mercer UCITS Common Contractual Fund 2

Mercer UCITS Common Contractual Fund Investment Manager’s Report for the financial year ended 30 June 2021
Mercer UCITS Common Contractual Fund 3
Report Contents:
Introduction 4
Mercer UCITS Common Contractual Fund Overview 5
Unit Class Investment Performance to 30 June 2021 (EUR) 5
Unit Class Investment Performance to 30 June 2021 (GBP) 7
Unit Class Investment Performance to 30 June 2021 (USD) 10
Market Outlook 12
Benchmark Tracking Error Appendix 13
Mercer UCITS Common Contractual Fund Investment Manager’s Report for the financial year ended 30 June 2021
(continued)
Mercer UCITS Common Contractual Fund 4
Introduction
The Sub-Funds of Mercer UCITS Common Contractual Fund (the “CCF”) are managed using a proprietary multi-manager investment
strategy. This strategy involves allocating portions of the Sub-Funds to specialist third party managers or sub-advisors (“Sub-Investment Managers”), who are selected by Mercer Global Investments Europe Limited (the “Investment Manager”) based on
criteria for producing consistent superior returns and who, in aggregate, are most likely to achieve the overall objectives of the CCF.
Global financial markets strengthened over the 12 months to end June 2021 with significant gains across equity markets.
Q3 2020
Equity and credit markets rallied as a result of global economic recovery, ongoing support for the economy by governments and central banks and optimism for a global vaccination programme. Government bond yields were largely unchanged and the US Dollar
weakened. Retail sales generally rose back to levels seen before lockdown, however, the services industry still suffered from weak demand due to inactivity by consumers and some lockdown restrictions. Having reached its highest level in April 2020, US
unemployment fell sharply to just below 8% compared to the 15% seen in April. In Europe and other countries, unemployment remained low as governments led support for private sector wages through furlough schemes.
Q4 2020
Q4 2020 saw financial markets rally strongly off the back of much better than expected news from a number of the vaccine
candidates. While COVID-19 cases continued to soar in both the US and Europe, markets were cheered by the news that vaccines by Pfizer-BioNTech, Moderna etc. were highly effective, bringing hope that the global crisis could be eliminated in 2021.
Q1 2021
The first quarter of 2021 began with lockdowns in numerous countries including the UK as much of the world faced another wave
of COVID-19. Nevertheless, gradual vaccine rollout in developed countries drove economic recovery optimism. Political risk declined as Joe Biden was sworn in as US President and the UK completed its transition out of the EU without major incidents. Markets
looked beyond the temporary setbacks created by COVID-19 restrictions, which led to another quarter of positive returns for risk assets and weaker performance for defensive assets, in particular government bonds.
Q2 2021
Q2 2021 began with many developed countries gradually emerging from restrictions as vaccine rollouts started to have a notable
positive impact on healthcare systems, in spite of the emergence of a “variant of concern” first identified in India. Global growth momentum remained robust as the service sector started to recover lost ground whilst goods demand remained solid. Global
equities continued to rally with the US S&P 500 index now twice the level it was in March 2020. Equity markets continue to be driven higher by hopes of stronger economic growth and loose monetary policy. Commodity markets rallied over the quarter with several
commodity prices reaching decade highs. Economic recovery gained pace in Q2 2021 supported by demand for cyclical commodities such as oil and industrial metals.
Mercer UCITS Common Contractual Fund Investment Manager’s Report for the financial year ended 30 June 2021
(continued)
Mercer UCITS Common Contractual Fund 5
Mercer UCITS Common Contractual Fund Overview
All performance figures shown below are calculated by the Investment Manager using pricing from State Street Fund Services
(Ireland) Limited (the “Administrator”). Unless otherwise stated, figures shown are gross of the Investment Manager’s fee, net of
Sub-Investment Managers’ fees and all other expenses including custody and administration costs depending on fund structure.
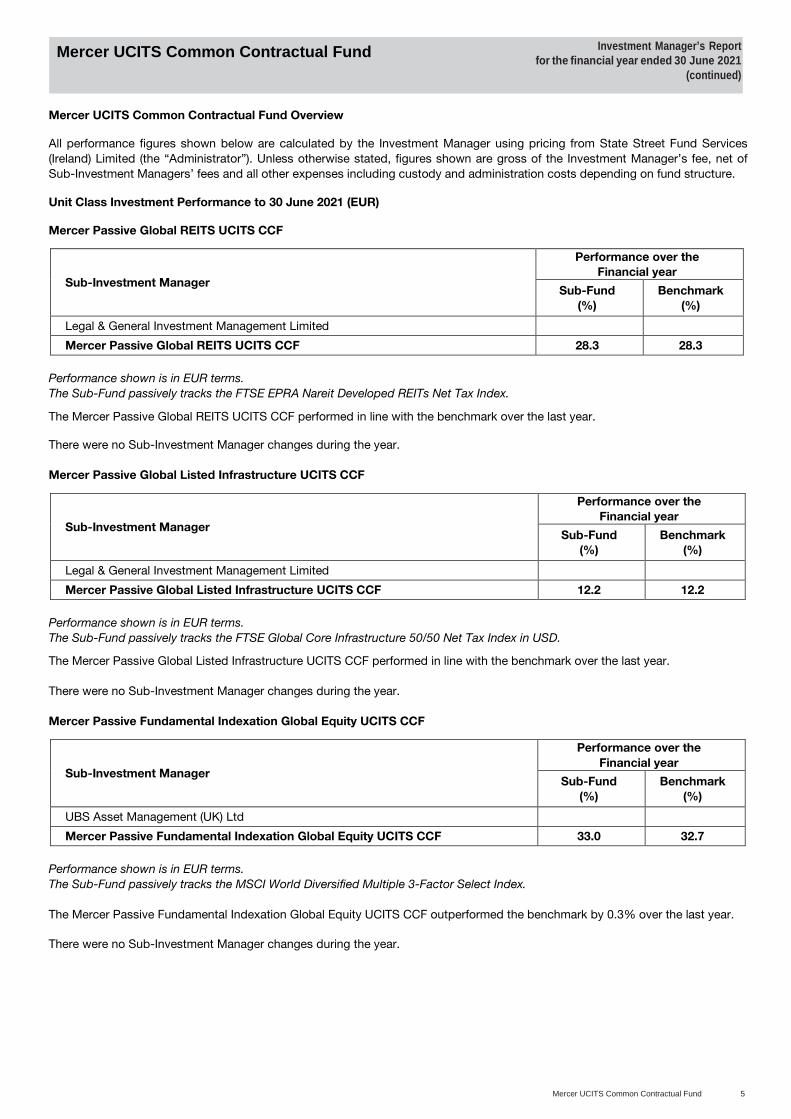
Unit Class Investment Performance to 30 June 2021 (EUR)
Mercer Passive Global REITS UCITS CCF
Sub-Investment Manager
Performance over the
Financial year
Sub-Fund
(%)
Benchmark
(%)
Legal & General Investment Management Limited
Mercer Passive Global REITS UCITS CCF 28.3 28.3
Performance shown is in EUR terms.
The Sub-Fund passively tracks the FTSE EPRA Nareit Developed REITs Net Tax Index.
The Mercer Passive Global REITS UCITS CCF performed in line with the benchmark over the last year.
There were no Sub-Investment Manager changes during the year.
Mercer Passive Global Listed Infrastructure UCITS CCF
Sub-Investment Manager
Performance over the
Financial year
Sub-Fund
(%)
Benchmark
(%)
Legal & General Investment Management Limited
Mercer Passive Global Listed Infrastructure UCITS CCF 12.2 12.2
Performance shown is in EUR terms.
The Sub-Fund passively tracks the FTSE Global Core Infrastructure 50/50 Net Tax Index in USD.
The Mercer Passive Global Listed Infrastructure UCITS CCF performed in line with the benchmark over the last year.
There were no Sub-Investment Manager changes during the year.
Mercer Passive Fundamental Indexation Global Equity UCITS CCF
Sub-Investment Manager
Performance over the
Financial year
Sub-Fund
(%)
Benchmark
(%)
UBS Asset Management (UK) Ltd
Mercer Passive Fundamental Indexation Global Equity UCITS CCF 33.0 32.7
Performance shown is in EUR terms.
The Sub-Fund passively tracks the MSCI World Diversified Multiple 3-Factor Select Index.
The Mercer Passive Fundamental Indexation Global Equity UCITS CCF outperformed the benchmark by 0.3% over the last year.
There were no Sub-Investment Manager changes during the year.
Mercer UCITS Common Contractual Fund Investment Manager’s Report for the financial year ended 30 June 2021
(continued)
Mercer UCITS Common Contractual Fund 6
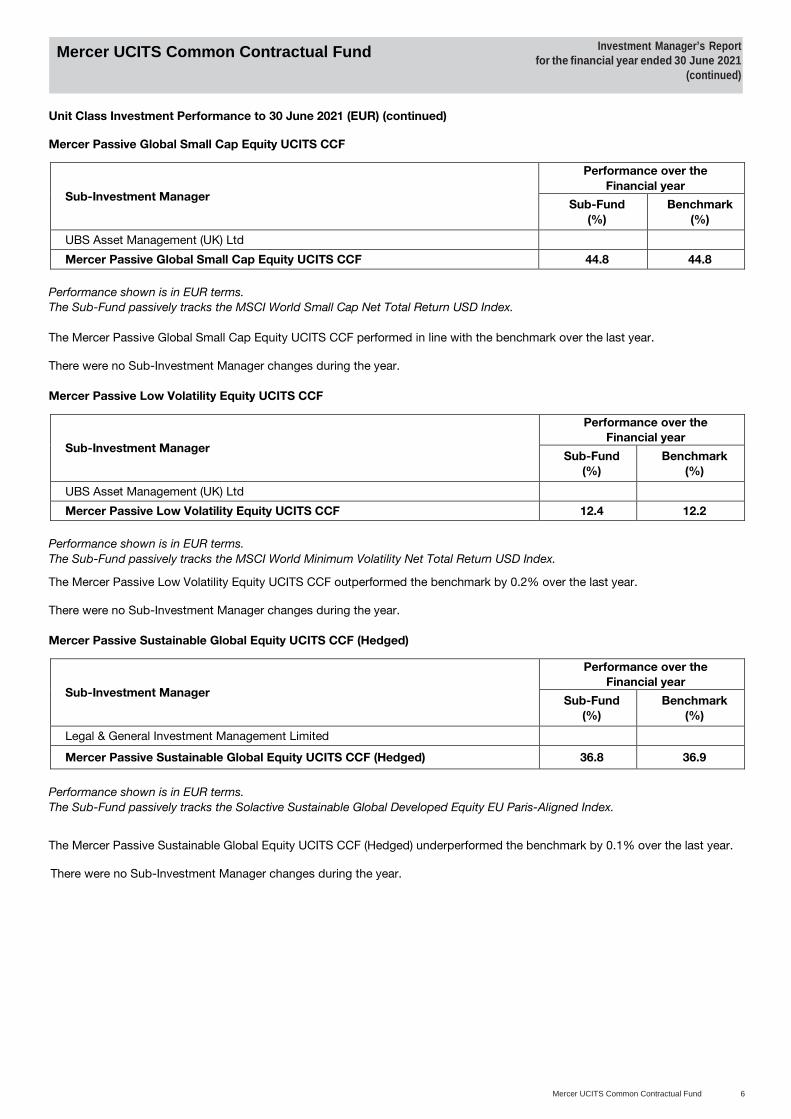
Unit Class Investment Performance to 30 June 2021 (EUR) (continued)
Mercer Passive Global Small Cap Equity UCITS CCF
Sub-Investment Manager
Performance over the
Financial year
Sub-Fund
(%)
Benchmark
(%)
UBS Asset Management (UK) Ltd
Mercer Passive Global Small Cap Equity UCITS CCF 44.8 44.8
Performance shown is in EUR terms.
The Sub-Fund passively tracks the MSCI World Small Cap Net Total Return USD Index.
The Mercer Passive Global Small Cap Equity UCITS CCF performed in line with the benchmark over the last year.
There were no Sub-Investment Manager changes during the year.
Mercer Passive Low Volatility Equity UCITS CCF
Sub-Investment Manager
Performance over the
Financial year
Sub-Fund
(%)
Benchmark
(%)
UBS Asset Management (UK) Ltd
Mercer Passive Low Volatility Equity UCITS CCF 12.4 12.2
Performance shown is in EUR terms.
The Sub-Fund passively tracks the MSCI World Minimum Volatility Net Total Return USD Index.
The Mercer Passive Low Volatility Equity UCITS CCF outperformed the benchmark by 0.2% over the last year.
There were no Sub-Investment Manager changes during the year.
Mercer Passive Sustainable Global Equity UCITS CCF (Hedged)
Sub-Investment Manager
Performance over the
Financial year
Sub-Fund
(%)
Benchmark
(%)
Legal & General Investment Management Limited
Mercer Passive Sustainable Global Equity UCITS CCF (Hedged) 36.8 36.9
Performance shown is in EUR terms.
The Sub-Fund passively tracks the Solactive Sustainable Global Developed Equity EU Paris-Aligned Index.
The Mercer Passive Sustainable Global Equity UCITS CCF (Hedged) underperformed the benchmark by 0.1% over the last year.
There were no Sub-Investment Manager changes during the year.
Mercer UCITS Common Contractual Fund Investment Manager’s Report for the financial year ended 30 June 2021
(continued)
Mercer UCITS Common Contractual Fund 7
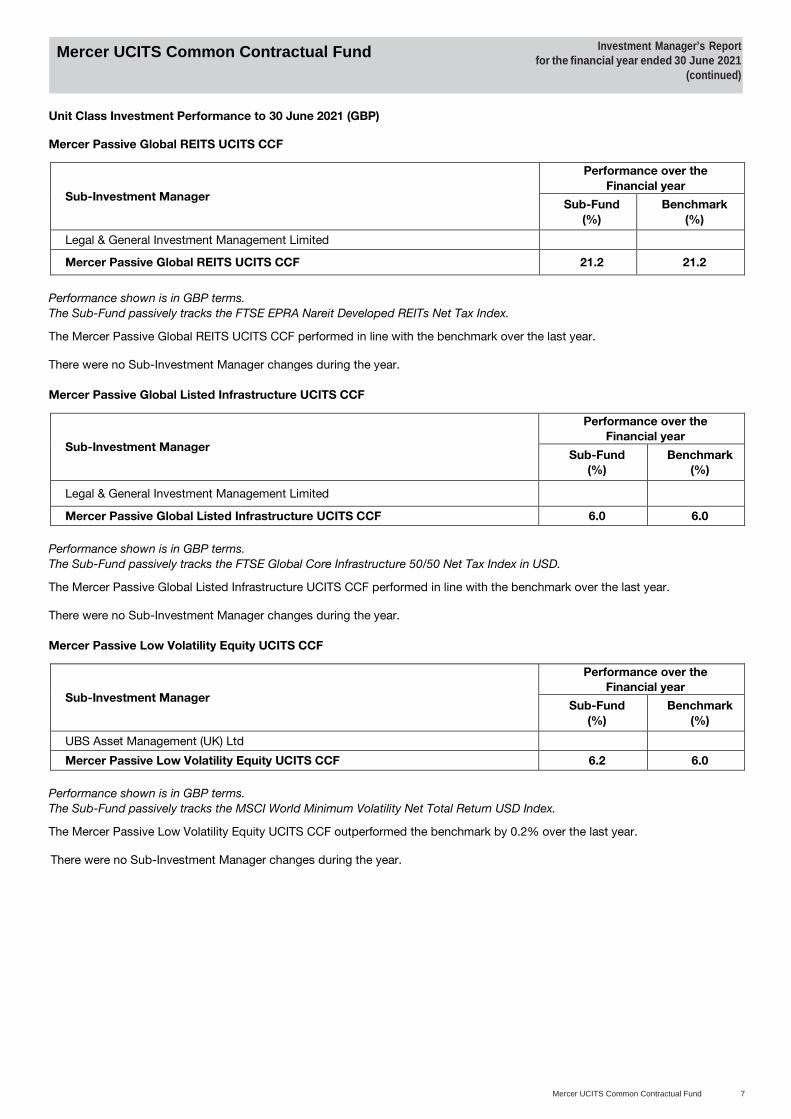
Unit Class Investment Performance to 30 June 2021 (GBP)
Mercer Passive Global REITS UCITS CCF
Sub-Investment Manager
Performance over the
Financial year
Sub-Fund
(%)
Benchmark
(%)
Legal & General Investment Management Limited
Mercer Passive Global REITS UCITS CCF 21.2 21.2
Performance shown is in GBP terms.
The Sub-Fund passively tracks the FTSE EPRA Nareit Developed REITs Net Tax Index.
The Mercer Passive Global REITS UCITS CCF performed in line with the benchmark over the last year.
There were no Sub-Investment Manager changes during the year.
Mercer Passive Global Listed Infrastructure UCITS CCF
Sub-Investment Manager
Performance over the
Financial year
Sub-Fund
(%)
Benchmark
(%)
Legal & General Investment Management Limited
Mercer Passive Global Listed Infrastructure UCITS CCF 6.0 6.0
Performance shown is in GBP terms.
The Sub-Fund passively tracks the FTSE Global Core Infrastructure 50/50 Net Tax Index in USD.
The Mercer Passive Global Listed Infrastructure UCITS CCF performed in line with the benchmark over the last year.
There were no Sub-Investment Manager changes during the year.
Mercer Passive Low Volatility Equity UCITS CCF
Sub-Investment Manager
Performance over the
Financial year
Sub-Fund
(%)
Benchmark
(%)
UBS Asset Management (UK) Ltd
Mercer Passive Low Volatility Equity UCITS CCF 6.2 6.0
Performance shown is in GBP terms.
The Sub-Fund passively tracks the MSCI World Minimum Volatility Net Total Return USD Index.
The Mercer Passive Low Volatility Equity UCITS CCF outperformed the benchmark by 0.2% over the last year.
There were no Sub-Investment Manager changes during the year.
Mercer UCITS Common Contractual Fund Investment Manager’s Report for the financial year ended 30 June 2021
(continued)
Mercer UCITS Common Contractual Fund 8
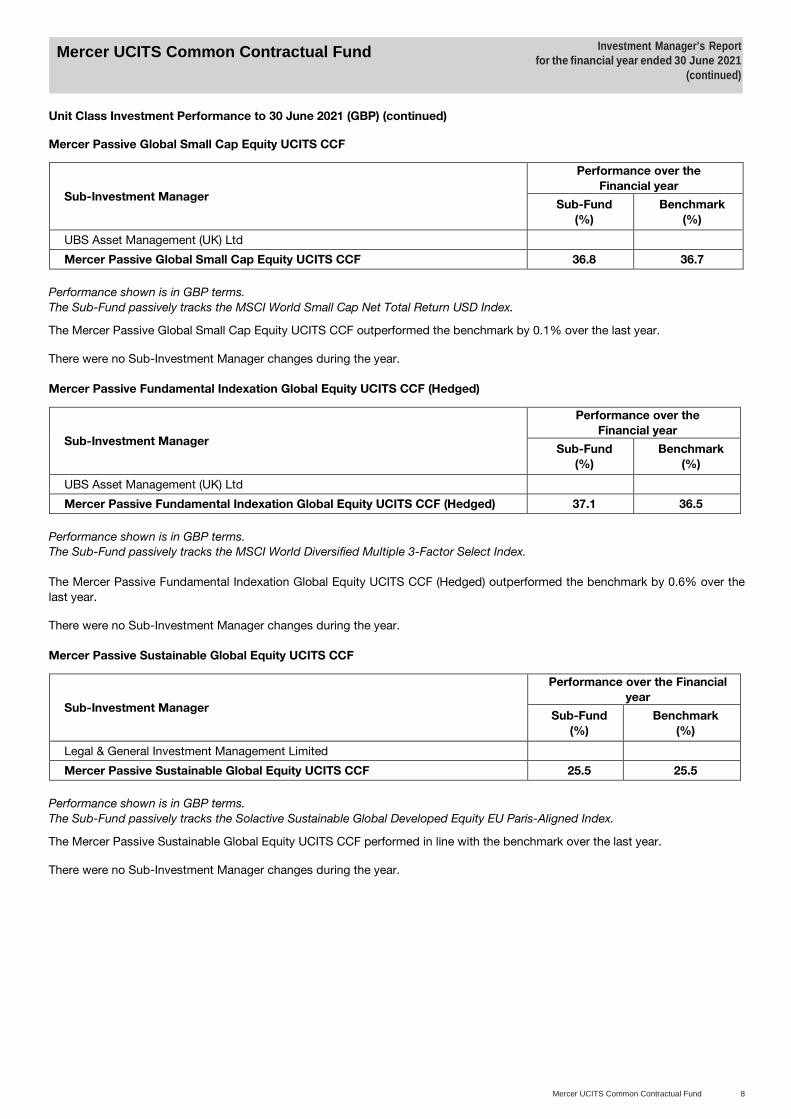
Unit Class Investment Performance to 30 June 2021 (GBP) (continued)
Mercer Passive Global Small Cap Equity UCITS CCF
Sub-Investment Manager
Performance over the
Financial year
Sub-Fund
(%)
Benchmark
(%)
UBS Asset Management (UK) Ltd
Mercer Passive Global Small Cap Equity UCITS CCF 36.8 36.7
Performance shown is in GBP terms.
The Sub-Fund passively tracks the MSCI World Small Cap Net Total Return USD Index.
The Mercer Passive Global Small Cap Equity UCITS CCF outperformed the benchmark by 0.1% over the last year.
There were no Sub-Investment Manager changes during the year.
Mercer Passive Fundamental Indexation Global Equity UCITS CCF (Hedged)
Sub-Investment Manager
Performance over the
Financial year
Sub-Fund
(%)
Benchmark
(%)
UBS Asset Management (UK) Ltd
Mercer Passive Fundamental Indexation Global Equity UCITS CCF (Hedged) 37.1 36.5
Performance shown is in GBP terms.
The Sub-Fund passively tracks the MSCI World Diversified Multiple 3-Factor Select Index.
The Mercer Passive Fundamental Indexation Global Equity UCITS CCF (Hedged) outperformed the benchmark by 0.6% over the
last year.
There were no Sub-Investment Manager changes during the year.
Mercer Passive Sustainable Global Equity UCITS CCF
Sub-Investment Manager
Performance over the Financial
year
Sub-Fund
(%)
Benchmark
(%)
Legal & General Investment Management Limited
Mercer Passive Sustainable Global Equity UCITS CCF 25.5 25.5
Performance shown is in GBP terms.
The Sub-Fund passively tracks the Solactive Sustainable Global Developed Equity EU Paris-Aligned Index.
The Mercer Passive Sustainable Global Equity UCITS CCF performed in line with the benchmark over the last year.
There were no Sub-Investment Manager changes during the year.
Mercer UCITS Common Contractual Fund Investment Manager’s Report for the financial year ended 30 June 2021
(continued)
Mercer UCITS Common Contractual Fund 9
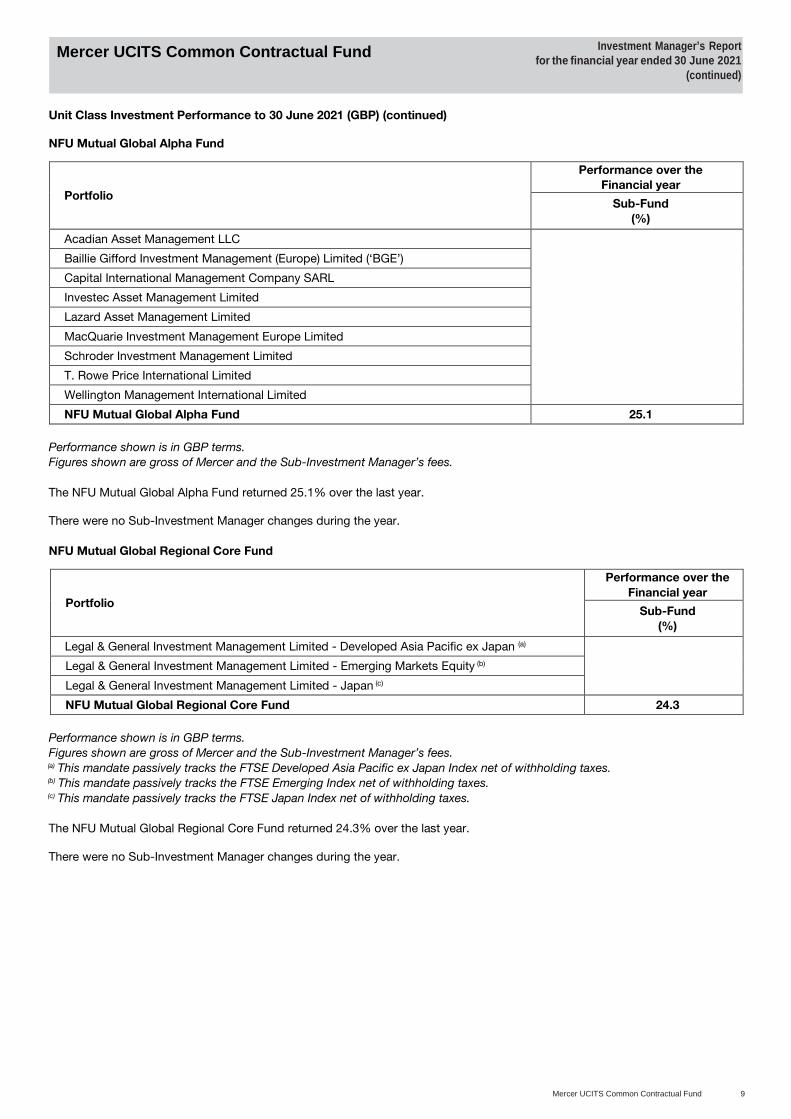
Unit Class Investment Performance to 30 June 2021 (GBP) (continued)
NFU Mutual Global Alpha Fund
Portfolio
Performance over the
Financial year
Sub-Fund
(%)
Acadian Asset Management LLC
Baillie Gifford Investment Management (Europe) Limited (‘BGE’)
Capital International Management Company SARL
Investec Asset Management Limited
Lazard Asset Management Limited
MacQuarie Investment Management Europe Limited
Schroder Investment Management Limited
T. Rowe Price International Limited
Wellington Management International Limited
NFU Mutual Global Alpha Fund 25.1
Performance shown is in GBP terms.
Figures shown are gross of Mercer and the Sub-Investment Manager’s fees.
The NFU Mutual Global Alpha Fund returned 25.1% over the last year.
There were no Sub-Investment Manager changes during the year.
NFU Mutual Global Regional Core Fund
Portfolio
Performance over the
Financial year
Sub-Fund
(%)
Legal & General Investment Management Limited - Developed Asia Pacific ex Japan (a)
Legal & General Investment Management Limited - Emerging Markets Equity (b)
Legal & General Investment Management Limited - Japan (c)
NFU Mutual Global Regional Core Fund 24.3
Performance shown is in GBP terms.
Figures shown are gross of Mercer and the Sub-Investment Manager’s fees. (a) This mandate passively tracks the FTSE Developed Asia Pacific ex Japan Index net of withholding taxes. (b) This mandate passively tracks the FTSE Emerging Index net of withholding taxes. (c) This mandate passively tracks the FTSE Japan Index net of withholding taxes.
The NFU Mutual Global Regional Core Fund returned 24.3% over the last year.
There were no Sub-Investment Manager changes during the year.

Mercer UCITS Common Contractual Fund Investment Manager’s Report for the financial year ended 30 June 2021
(continued)
Mercer UCITS Common Contractual Fund 10
Unit Class Investment Performance to 30 June 2021 (GBP) (continued)
NFU Mutual Global Strategic Fund
Sub-Investment Manager
Performance over the
Financial year
Sub-Fund
(%)
Benchmark
(%)
Legal & General Investment Management Limited
NFU Mutual Global Strategic Fund 25.5 25.7
Performance shown is in GBP terms.
Figures shown are gross Mercer and gross of the Sub-Investment Manager’s fees.
The Sub-Fund passively tracks the MSCI World Diversified Multiple Factor Total Return Index.
The NFU Mutual Global Strategic Fund underperformed the benchmark by 0.2% over the last year.
There were no Sub-Investment Manager changes during the year.
Unit Class Investment Performance to 30 June 2021 (USD)
Mercer Passive Global REITS UCITS CCF
Sub-Investment Manager
Performance over the
Financial year
Sub-Fund
(%)
Benchmark
(%)
Legal & General Investment Management Limited
Mercer Passive Global REITS UCITS CCF 35.5 35.5
Performance shown is in USD terms.
The Sub-Fund passively tracks the FTSE EPRA Nareit Developed REITs Net Tax Index.
The Mercer Passive Global REITS UCITS CCF performed in line with the benchmark over the last year.
There were no Sub-Investment Manager changes during the year.
Mercer Passive Global Listed Infrastructure UCITS CCF
Sub-Investment Manager
Performance over the
Financial year
Sub-Fund
(%)
Benchmark
(%)
Legal & General Investment Management Limited
Mercer Passive Global Listed Infrastructure UCITS CCF 18.5 18.5
Performance shown is in USD terms.
The Sub-Fund passively tracks the FTSE Global Core Infrastructure 50/50 Net Tax Index in USD.
The Mercer Passive Global Listed Infrastructure UCITS CCF performed in line with the benchmark over the last year.
There were no Sub-Investment Manager changes during the year.
Mercer UCITS Common Contractual Fund Investment Manager’s Report for the financial year ended 30 June 2021
(continued)
Mercer UCITS Common Contractual Fund 11
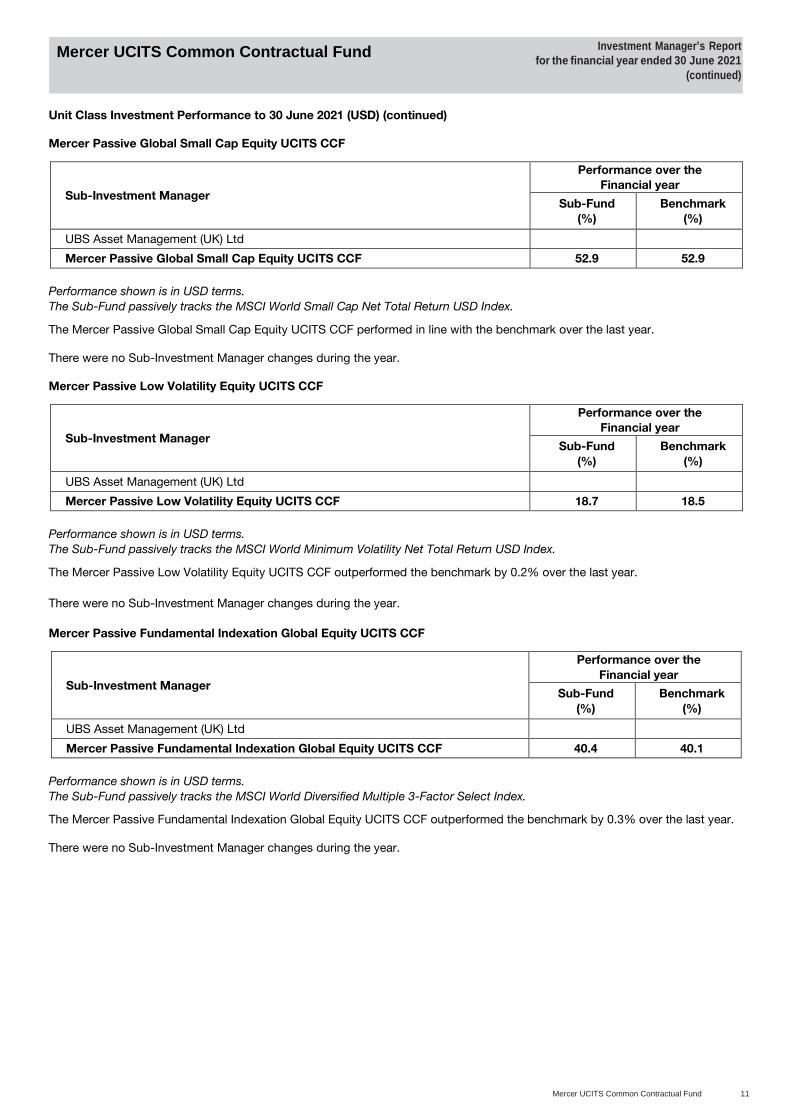
Unit Class Investment Performance to 30 June 2021 (USD) (continued)
Mercer Passive Global Small Cap Equity UCITS CCF
Sub-Investment Manager
Performance over the
Financial year
Sub-Fund
(%)
Benchmark
(%)
UBS Asset Management (UK) Ltd
Mercer Passive Global Small Cap Equity UCITS CCF 52.9 52.9
Performance shown is in USD terms.
The Sub-Fund passively tracks the MSCI World Small Cap Net Total Return USD Index.
The Mercer Passive Global Small Cap Equity UCITS CCF performed in line with the benchmark over the last year.
There were no Sub-Investment Manager changes during the year.
Mercer Passive Low Volatility Equity UCITS CCF
Sub-Investment Manager
Performance over the
Financial year
Sub-Fund
(%)
Benchmark
(%)
UBS Asset Management (UK) Ltd
Mercer Passive Low Volatility Equity UCITS CCF 18.7 18.5
Performance shown is in USD terms.
The Sub-Fund passively tracks the MSCI World Minimum Volatility Net Total Return USD Index.
The Mercer Passive Low Volatility Equity UCITS CCF outperformed the benchmark by 0.2% over the last year.
There were no Sub-Investment Manager changes during the year.
Mercer Passive Fundamental Indexation Global Equity UCITS CCF
Sub-Investment Manager
Performance over the
Financial year
Sub-Fund
(%)
Benchmark
(%)
UBS Asset Management (UK) Ltd
Mercer Passive Fundamental Indexation Global Equity UCITS CCF 40.4 40.1
Performance shown is in USD terms.
The Sub-Fund passively tracks the MSCI World Diversified Multiple 3-Factor Select Index.
The Mercer Passive Fundamental Indexation Global Equity UCITS CCF outperformed the benchmark by 0.3% over the last year.
There were no Sub-Investment Manager changes during the year.
Mercer UCITS Common Contractual Fund Investment Manager’s Report for the financial year ended 30 June 2021
(continued)
Mercer UCITS Common Contractual Fund 12
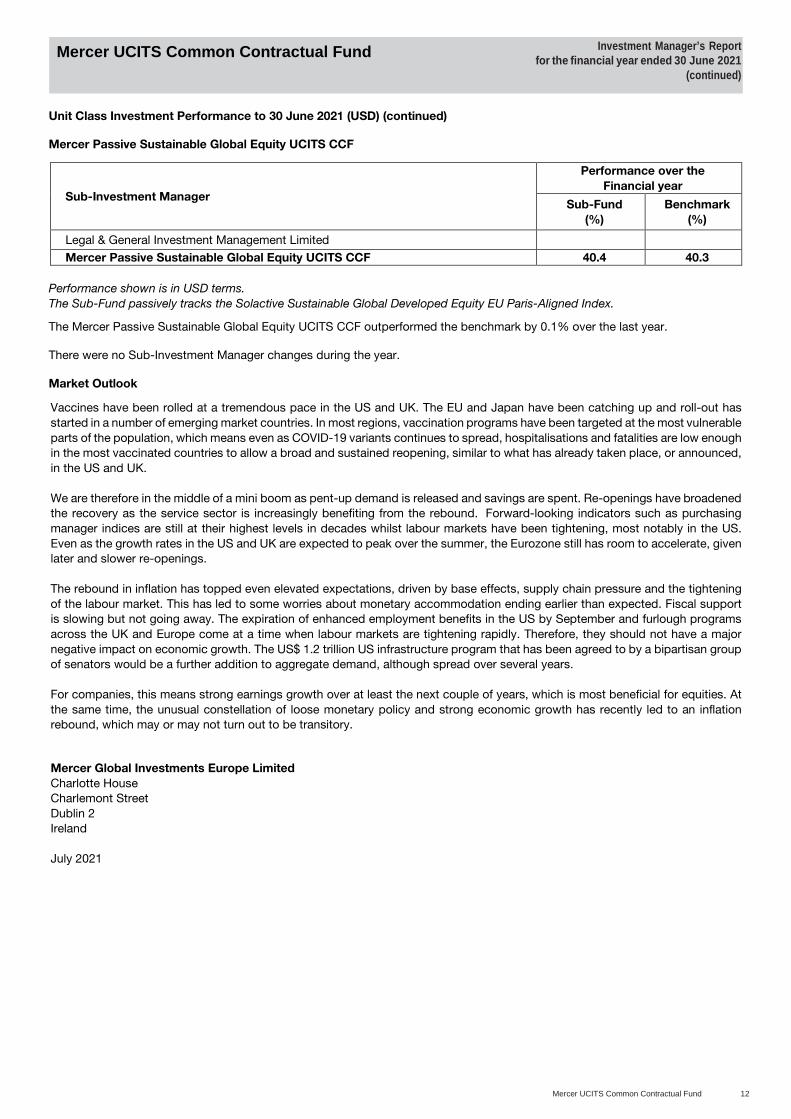
Unit Class Investment Performance to 30 June 2021 (USD) (continued)
Mercer Passive Sustainable Global Equity UCITS CCF
Sub-Investment Manager
Performance over the
Financial year
Sub-Fund
(%)
Benchmark
(%)
Legal & General Investment Management Limited
Mercer Passive Sustainable Global Equity UCITS CCF 40.4 40.3
Performance shown is in USD terms.
The Sub-Fund passively tracks the Solactive Sustainable Global Developed Equity EU Paris-Aligned Index.
The Mercer Passive Sustainable Global Equity UCITS CCF outperformed the benchmark by 0.1% over the last year.
There were no Sub-Investment Manager changes during the year.
Market Outlook
Vaccines have been rolled at a tremendous pace in the US and UK. The EU and Japan have been catching up and roll-out has
started in a number of emerging market countries. In most regions, vaccination programs have been targeted at the most vulnerable
parts of the population, which means even as COVID-19 variants continues to spread, hospitalisations and fatalities are low enough in the most vaccinated countries to allow a broad and sustained reopening, similar to what has already taken place, or announced,
in the US and UK.
We are therefore in the middle of a mini boom as pent-up demand is released and savings are spent. Re-openings have broadened the recovery as the service sector is increasingly benefiting from the rebound. Forward-looking indicators such as purchasing
manager indices are still at their highest levels in decades whilst labour markets have been tightening, most notably in the US.
Even as the growth rates in the US and UK are expected to peak over the summer, the Eurozone still has room to accelerate, given later and slower re-openings.
The rebound in inflation has topped even elevated expectations, driven by base effects, supply chain pressure and the tightening
of the labour market. This has led to some worries about monetary accommodation ending earlier than expected. Fiscal support is slowing but not going away. The expiration of enhanced employment benefits in the US by September and furlough programs
across the UK and Europe come at a time when labour markets are tightening rapidly. Therefore, they should not have a major
negative impact on economic growth. The US$ 1.2 trillion US infrastructure program that has been agreed to by a bipartisan group of senators would be a further addition to aggregate demand, although spread over several years.
For companies, this means strong earnings growth over at least the next couple of years, which is most beneficial for equities. At
the same time, the unusual constellation of loose monetary policy and strong economic growth has recently led to an inflation rebound, which may or may not turn out to be transitory.
Mercer Global Investments Europe Limited
Charlotte House Charlemont Street
Dublin 2 Ireland
July 2021
Mercer UCITS Common Contractual Fund Investment Manager’s Report for the financial year ended 30 June 2021
(continued)
Mercer UCITS Common Contractual Fund 13
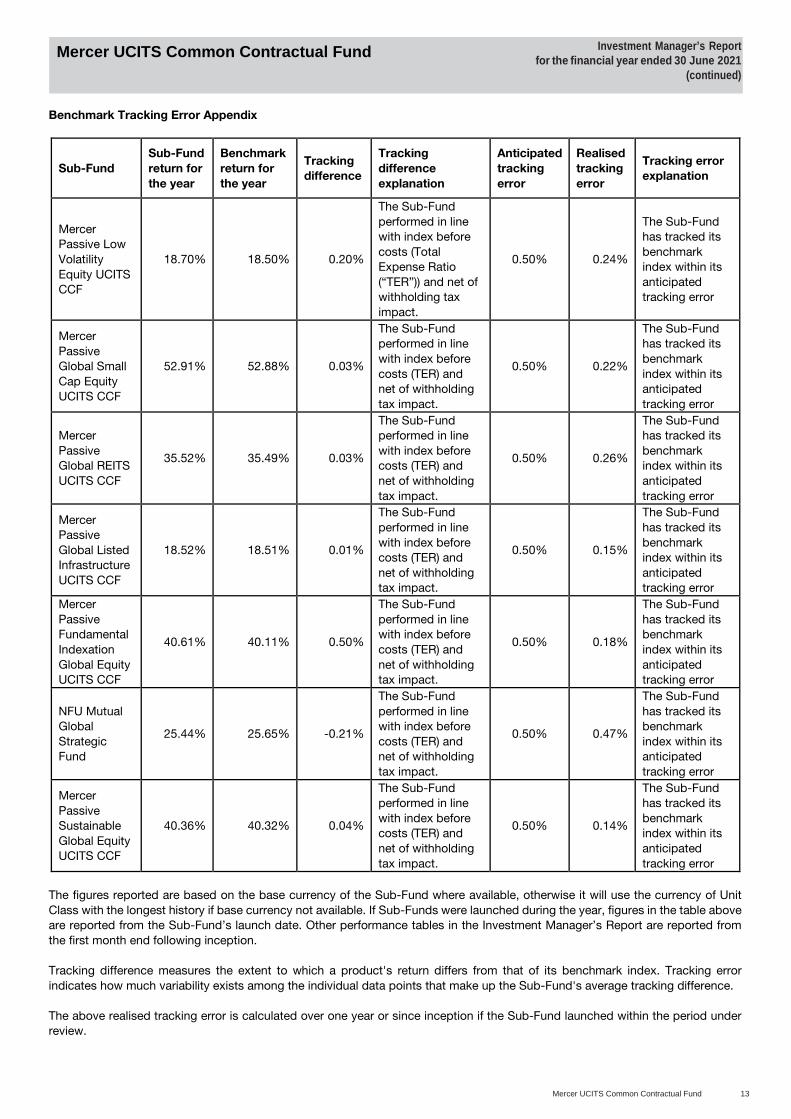
Benchmark Tracking Error Appendix
Sub-Fund
Sub-Fund
return for
the year
Benchmark
return for
the year
Tracking
difference
Tracking
difference
explanation
Anticipated
tracking
error
Realised
tracking
error
Tracking error
explanation
Mercer Passive Low
Volatility
Equity UCITS CCF
18.70% 18.50% 0.20%
The Sub-Fund
performed in line with index before
costs (Total Expense Ratio
(“TER”)) and net of withholding tax
impact.
0.50% 0.24%
The Sub-Fund has tracked its
benchmark index within its
anticipated tracking error
Mercer
Passive Global Small
Cap Equity UCITS CCF
52.91% 52.88% 0.03%
The Sub-Fund performed in line
with index before
costs (TER) and net of withholding
tax impact.
0.50% 0.22%
The Sub-Fund has tracked its
benchmark
index within its anticipated
tracking error
Mercer
Passive Global REITS
UCITS CCF
35.52% 35.49% 0.03%
The Sub-Fund performed in line
with index before costs (TER) and
net of withholding
tax impact.
0.50% 0.26%
The Sub-Fund has tracked its
benchmark index within its
anticipated
tracking error
Mercer Passive
Global Listed Infrastructure
UCITS CCF
18.52% 18.51% 0.01%
The Sub-Fund
performed in line
with index before costs (TER) and
net of withholding tax impact.
0.50% 0.15%
The Sub-Fund
has tracked its
benchmark index within its
anticipated tracking error
Mercer
Passive Fundamental
Indexation
Global Equity UCITS CCF
40.61% 40.11% 0.50%
The Sub-Fund
performed in line with index before
costs (TER) and
net of withholding tax impact.
0.50% 0.18%
The Sub-Fund
has tracked its benchmark
index within its
anticipated tracking error
NFU Mutual Global
Strategic Fund
25.44% 25.65% -0.21%
The Sub-Fund
performed in line with index before
costs (TER) and net of withholding
tax impact.
0.50% 0.47%
The Sub-Fund
has tracked its benchmark
index within its anticipated
tracking error
Mercer
Passive Sustainable
Global Equity UCITS CCF
40.36% 40.32% 0.04%
The Sub-Fund performed in line
with index before costs (TER) and
net of withholding
tax impact.
0.50% 0.14%
The Sub-Fund has tracked its
benchmark index within its
anticipated
tracking error
The figures reported are based on the base currency of the Sub-Fund where available, otherwise it will use the currency of Unit
Class with the longest history if base currency not available. If Sub-Funds were launched during the year, figures in the table above are reported from the Sub-Fund’s launch date. Other performance tables in the Investment Manager’s Report are reported from
the first month end following inception.
Tracking difference measures the extent to which a product's return differs from that of its benchmark index. Tracking error
indicates how much variability exists among the individual data points that make up the Sub-Fund's average tracking difference.
The above realised tracking error is calculated over one year or since inception if the Sub-Fund launched within the period under review.
Mercer Global Investments Management Limited (the “Manager” or “MGIM”) is responsible for preparing the financial statementsof Mercer Passive Global REITS UCITS CCF, Mercer Passive Global Listed Infrastructure UCITS CCF, Mercer Passive LowVolatility Equity UCITS CCF, Mercer Passive Global Small Cap Equity UCITS CCF, Mercer Passive Fundamental Indexation GlobalEquity UCITS CCF, NFU Mutual Global Regional Core Fund, NFU Mutual Global Alpha Fund, NFU Mutual Global Strategic Fundand Mercer Passive Sustainable Global Equity UCITS CCF (collectively the “Sub-Funds”) of Mercer UCITS Common ContractualFund (the “CCF”), in accordance with applicable law and regulations.
Irish law requires the Manager of the Sub-Funds of the CCF to prepare financial statements for each financial year. The Managerhas elected to prepare the financial statements in accordance with International Financial Reporting Standards (“IFRS”) asadopted by the European Union (“EU”) and applicable law.
The financial statements are required to give a true and fair view of the assets, liabilities and financial position of the Sub-Fundsand of its change in net assets attributable to holders of redeemable participating units for that year. In preparing these financialstatements, the Manager is required to:
• select suitable accounting policies and then apply them consistently;• make judgements and estimates that are reasonable and prudent;• state whether applicable accounting standards have been followed, subject to any material departures disclosed
and explained in the financial statements;• assess the Sub-Funds’ ability to continue as a going concern, disclosing, as applicable, matters related to going
concern; and• use the going concern basis of accounting unless they either intend to liquidate the Sub-Funds or to cease
operations, or have no realistic alternative but to do so.
The Manager is responsible for keeping adequate accounting records which disclose with reasonable accuracy at any time thefinancial position of the Sub-Funds and enable it to ensure that the financial statements are prepared in accordance with theEuropean Communities (Undertakings for Collective Investment in Transferable Securities) Regulations 2011 (the “UCITSRegulations”) and the Central Bank (Supervision and Enforcement) Act 2013 (Section 48(1)) (Undertakings for CollectiveInvestment in Transferable Securities) Regulations 2019 (the “Central Bank UCITS Regulations”). They have generalresponsibility for taking such steps as are reasonably open to them to safeguard the assets of the Sub-Funds. In this regard theyhave entrusted the assets of the Sub-Funds to a depositary for safe-keeping. They are responsible for such internal controls asthey determine is necessary to enable the preparation of financial statements that are free from material misstatement, whetherdue to fraud or error, and to prevent and detect fraud and other irregularities.
On behalf of the Directors of the Manager
Tom Finlay Liam Miley
Director Director
26 October 2021
Mercer UCITS Common Contractual Fund Statement of Manager’s Responsibilities
Mercer UCITS Common Contractual Fund 14

We have enquired into the conduct of the Manager in respect of Mercer UCITS Common Contractual Fund (the “CCF”) for thefinancial year ended 30 June 2021 in our capacity as Depositary to the CCF.
This report including the opinion has been prepared for and solely for the Unitholders in the CCF, in accordance withRegulation 34, (1), (3) and (4) in Part 5 of the European Communities (Undertakings for Collective Investment in TransferableSecurities) Regulations, 2011 (the “UCITS Regulations”) and for no other purpose. We do not, in giving this opinion, accept orassume responsibility for any other purpose or to any other person to whom this report is shown.
Responsibilities of the Depositary
Our duties and responsibilities are outlined in Regulation 34, (1), (3) and (4) in Part 5 of the UCITS Regulations. One of thoseduties is to enquire into the conduct of the Manager in each annual accounting period and report thereon to the Unitholders.
Our report shall state whether, in our opinion, the CCF has been managed in that financial year in accordance with the provisionsof the CCF Deed of Constitution and the UCITS Regulations. It is the overall responsibility of the Manager to comply with theseprovisions. If the Manager has not so complied, we as Depositary must state why this is the case and outline the steps which wehave taken to rectify the situation.
Basis of Depositary Opinion
The Depositary conducts such reviews as it, in its reasonable opinion, considers necessary in order to comply with its duties asoutlined in Regulation 34, (1), (3) and (4) in Part 5 of the UCITS Regulations, and to ensure that, in all material respects, the CCFhas been managed:
(i) in accordance with the limitations imposed on its investment and borrowing powers by the provisions of the Deed ofConstitution and the appropriate regulations; and
(ii) otherwise in accordance with the CCF’s constitutional documentation and the appropriate regulations.
Opinion
In our opinion, the CCF has been managed during the financial year, in all material respects:
(i) in accordance with the limitations imposed on the investment and borrowing powers of the Manager and the Depositary bythe Deed of Constitution, the UCITS Regulations and the Central Bank (Supervision and Enforcement) Act2013 (Section 48(1)) (Undertakings for Collective Investment in Transferable Securities) Regulations 2019 (the “CentralBank UCITS Regulations”) and
(ii) otherwise in accordance with the provisions of the Deed of Constitution, the UCITS Regulations and the Central Bank UCITSRegulations.
State Street Custodial Services (Ireland) Limited78 Sir John Rogerson’s QuayDublin 2Ireland
26 October 2021
Mercer UCITS Common Contractual Fund Report of the Depositary to the Unitholdersof Mercer UCITS Common Contractual Fund
for the financial year ended 30 June 2021
Mercer UCITS Common Contractual Fund 15
Report on the audit of the financial statements
Opinion
We have audited the English language version of financial statements of:
• Mercer Passive Global REITS UCITS CCF• Mercer Passive Global Listed Infrastructure UCITS CCF• Mercer Passive Low Volatility Equity UCITS CCF• Mercer Passive Global Small Cap Equity UCITS CCF• Mercer Passive Fundamental Indexation Global Equity UCITS CCF• NFU Mutual Global Regional Core Fund• NFU Mutual Global Alpha Fund• NFU Mutual Global Strategic Fund• Mercer Passive Sustainable Global Equity UCITS CCF
(collectively the “Sub-Funds”) of Mercer UCITS Common Contractual Fund (the “CCF”) for the year ended 30 June 2021, set outon pages 18 to 95, which comprise the Statement of Financial Position, Statement of Comprehensive Income, Statement ofChanges in Net Assets Attributable to Holders of Redeemable Participating Units, Statement of Cash Flows and related notes,including the summary of significant accounting policies set out in Note 2. The financial reporting framework that has beenapplied in their preparation is Irish Law and International Financial Reporting Standards (“IFRS”) as adopted by the EuropeanUnion (“EU”).
In our opinion, the accompanying financial statements:
• give a true and fair view of the assets, liabilities and financial position of the Sub-Funds of the CCF as at 30 June 2021 andof its change in net assets attributable to holders to redeemable participating units for the year then ended;
• have been properly prepared in accordance with IFRS as adopted by the European Union; and• have been properly prepared in accordance with the European Communities (Undertakings for Collective Investment in
Transferable Securities Regulations) 2011 and the Central Bank (Supervision and Enforcement) Act 2013 (Section 48(1))(Undertakings for Collective Investment in Transferable Securities) Regulations 2019.
Basis for opinion
We conducted our audit in accordance with International Standards on Auditing (Ireland) (ISAs (Ireland)) and applicable law. Ourresponsibilities under those standards are further described in the Auditor’s responsibilities for the audit of the financialstatements section of our report. We are independent of the CCF and its Sub-Funds in accordance with ethical requirements thatare relevant to our audit of financial statements in Ireland, including the Ethical Standard issued by the Irish Auditing andAccounting Supervisory Authority (IAASA), and we have fulfilled our other ethical responsibilities in accordance with theserequirements.
We believe that the audit evidence we have obtained is sufficient and appropriate to provide a basis for our opinion.
Conclusions relating to going concern
In auditing the financial statements we have concluded that the managers’ use of the going concern basis of accounting in thepreparation of the financial statements is appropriate.
Based on the work we have performed, we have not identified any material uncertainties relating to events or conditions that,individually or collectively, may cast significant doubt on the Sub-Funds ability to continue as a going concern for a period of atleast twelve months from the date when the financial statements are authorised for issue.
Our responsibilities and the responsibilities of the Directors with respect to going concern are described on the relevant sectionsof this report.
Other information
The Manager is responsible for the other information presented in the Annual Report together with the financial statements. Theother information comprises the information included in Management and Administration, Investment Manager’s Report,Statement of Manager’s Responsibilities, Report of the Depositary to the Unitholders of Mercer UCITS Common Contractual Fund,Unaudited Information in Respect of Underlying Investment, Unaudited Supplemental Information and Unaudited PortfolioStatements. The financial statements and our auditor’s report thereon do not comprise part of the other information. Our opinionon the financial statements does not cover the other information and, accordingly, we do not express an audit opinion or, exceptas explicitly stated below, any form of assurance conclusion thereon.
Mercer UCITS Common Contractual Fund Independent Auditor’s Report to the Unitholders of
Mercer UCITS Common Contractual Fund
Mercer UCITS Common Contractual Fund 16

Report on the audit of the financial statements (continued)
Other information (continued)
Our responsibility is to read the other information and, in doing so, consider whether, based on our financial statements auditwork, the information therein is materially misstated or inconsistent with the financial statements or our audit knowledge. Basedsolely on that work undertaken during the course of the audit, we have not identified material misstatements in the otherinformation.
Respective responsibilities and restrictions on use
Responsibilities of the Manager for the financial statements
As explained more fully in the Manager’s responsibilities statement set out on page 14, the Manager is responsible for: thepreparation of the financial statements including being satisfied that they give a true and fair view; such internal control as theydetermine is necessary to enable the preparation of financial statements that are free from material misstatement, whether due tofraud or error; assessing the Sub-Funds ability to continue as a going concern, disclosing, as applicable, matters related to goingconcern; and using the going concern basis of accounting unless they either intend to liquidate the Sub-Funds or to ceaseoperations, or have no realistic alternative but to do so.
The Directors together with the Investment Manager are responsible for the maintenance and integrity of the corporate andfinancial information related to Mercer UCITS Common Contractual Fund on the Investment Manager website. The Legislation inthe Republic of Ireland governing the preparation and dissemination of financial statements may differ from legislation in otherjurisdictions.
Auditor’s responsibilities for the audit of the financial statements
Our objectives are to obtain reasonable assurance about whether the financial statements as a whole are free from materialmisstatement, whether due to fraud or error, and to issue an auditor’s report that includes our opinion. Reasonable assurance isa high level of assurance, but is not a guarantee that an audit conducted in accordance with ISAs (Ireland) will always detect amaterial misstatement when it exists. Misstatements can arise from fraud or error and are considered material if, individually or inthe aggregate, they could reasonably be expected to influence the economic decisions of users taken on the basis of thesefinancial statements.
A fuller description of our responsibilities is provided on IAASA’s website athttp://www.iaasa.ie/Publications/Auditing-standards/International-Standards-on-Auditing-for-use-in-Ire/Description-of-the-auditor-s-responsibilities-for.
The purpose of our audit work and to whom we owe our responsibilities
Our report is made solely to the Sub-Funds Unitholders, as a body, in accordance with Regulation 93 of the EuropeanCommunities (Undertakings for Collective Investment in Transferable Securities) Regulations 2011. Our audit work has beenundertaken so that we might state to the Sub-Funds Unitholders those matters we are required to state to them in an auditor’sreport and for no other purpose. To the fullest extent permitted by law, we do not accept or assume responsibility to anyone otherthan the Sub-Funds of the CCF and the Sub-Funds Unitholders as a body, for our audit work, for this report, or for the opinions wehave formed.
James Caseyfor and on behalf ofKPMGChartered Accountants, Statutory Audit Firm1 Harbourmaster PlaceInternational Financial Services CentreDublin 1Ireland
26 October 2021
Mercer UCITS Common Contractual Fund Independent Auditor’s Report to the Unitholders of
Mercer UCITS Common Contractual Fund
(continued)
Mercer UCITS Common Contractual Fund 17
Notes
MercerPassive
Global REITSUCITS CCF
US$
MercerPassive
Global ListedInfrastructure
UCITS CCFUS$
MercerPassive
Low VolatilityEquity
UCITS CCFUS$
MercerPassive
Global SmallCap EquityUCITS CCF
US$
MercerPassive
FundamentalIndexation
Global EquityUCITS CCF
US$
NFU MutualGlobal
RegionalCore Fund
GB£
NFU MutualGlobalAlphaFundGB£
NFU MutualGlobal
StrategicFundGB£
MercerPassive
SustainableGlobalEquity
UCITS CCFUS$
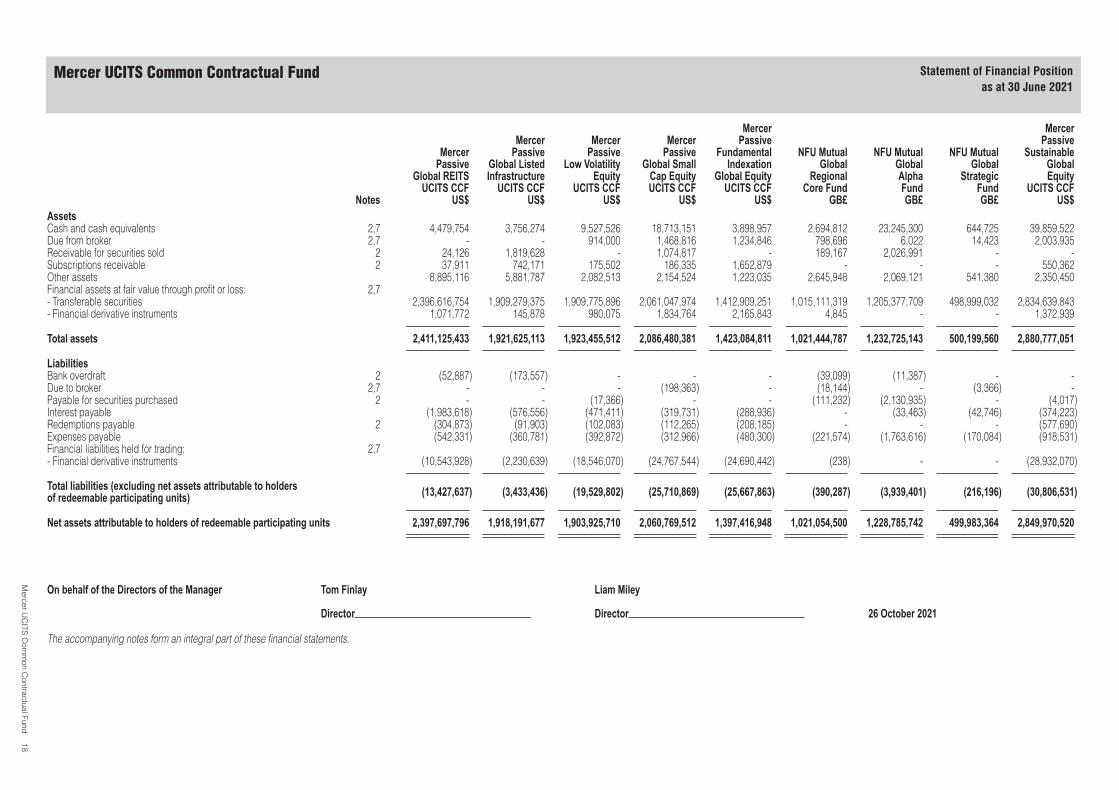
AssetsCash and cash equivalents 2,7 4,479,754 3,756,274 9,527,526 18,713,151 3,898,957 2,694,812 23,245,300 644,725 39,859,522Due from broker 2,7 - - 914,000 1,468,816 1,234,846 798,696 6,022 14,423 2,003,935Receivable for securities sold 2 24,126 1,819,628 - 1,074,817 - 189,167 2,026,991 - -Subscriptions receivable 2 37,911 742,171 175,502 186,335 1,652,879 - - - 550,362Other assets 8,895,116 5,881,787 2,082,513 2,154,524 1,223,035 2,645,948 2,069,121 541,380 2,350,450Financial assets at fair value through profit or loss: 2,7- Transferable securities 2,396,616,754 1,909,279,375 1,909,775,896 2,061,047,974 1,412,909,251 1,015,111,319 1,205,377,709 498,999,032 2,834,639,843- Financial derivative instruments 1,071,772 145,878 980,075 1,834,764 2,165,843 4,845 - - 1,372,939
Total assets 2,411,125,433 1,921,625,113 1,923,455,512 2,086,480,381 1,423,084,811 1,021,444,787 1,232,725,143 500,199,560 2,880,777,051
LiabilitiesBank overdraft 2 (52,887) (173,557) - - - (39,099) (11,387) - -Due to broker 2,7 - - - (198,363) - (18,144) - (3,366) -Payable for securities purchased 2 - - (17,366) - - (111,232) (2,130,935) - (4,017)Interest payable (1,983,618) (576,556) (471,411) (319,731) (288,936) - (33,463) (42,746) (374,223)Redemptions payable 2 (304,873) (91,903) (102,083) (112,265) (208,185) - - - (577,690)Expenses payable (542,331) (360,781) (392,872) (312,966) (480,300) (221,574) (1,763,616) (170,084) (918,531)Financial liabilities held for trading: 2,7- Financial derivative instruments (10,543,928) (2,230,639) (18,546,070) (24,767,544) (24,690,442) (238) - - (28,932,070)
Total liabilities (excluding net assets attributable to holdersof redeemable participating units) (13,427,637) (3,433,436) (19,529,802) (25,710,869) (25,667,863) (390,287) (3,939,401) (216,196) (30,806,531)
Net assets attributable to holders of redeemable participating units 2,397,697,796 1,918,191,677 1,903,925,710 2,060,769,512 1,397,416,948 1,021,054,500 1,228,785,742 499,983,364 2,849,970,520
On behalf of the Directors of the Manager Tom Finlay Liam Miley
Director Director 26 October 2021
The accompanying notes form an integral part of these financial statements.
Mercer UCITS Common Contractual Fund Statement of Financial Positionas at 30 June 2021
Mercer
UC
ITSC
omm
onC
ontractualFund18
Notes
MercerPassive
Global REITSUCITS CCF
US$
MercerPassive
Global ListedInfrastructure
UCITS CCFUS$
MercerPassive
Low VolatilityEquity
UCITS CCFUS$
MercerPassive
Global SmallCap EquityUCITS CCF
US$
MercerPassive
FundamentalIndexation
Global EquityUCITS CCF
US$
NFU MutualGlobal
RegionalCore Fund
GB£
NFU MutualGlobalAlphaFundGB£
NFU MutualGlobal
StrategicFundGB£
MercerPassive
SustainableGlobalEquity
UCITS CCFUS$
AssetsCash and cash equivalents 2,7 4,496,023 601,451 8,800,764 8,598,877 5,361,246 7,282,666 23,958,167 1,320,820 9,026,009Due from broker 2,7 321,012 - 2,717,724 2,384,097 3,445,662 1,061,574 353,573 110,974 739,124Receivable for securities sold 2 24,805 5,913,288 70 2,526,738 - 729,928 1,914,925 - 151Subscriptions receivable 2 632,889 1,317,312 2,087,879 223,731 2,050,689 - - - 39,183Other assets 5,243,494 3,023,063 1,664,042 1,986,555 1,908,324 2,468,774 1,791,068 486,995 690,154Financial assets at fair value through profit or loss: 2,7- Transferable securities 1,251,295,083 1,188,941,418 1,265,132,218 1,478,798,964 2,039,852,361 808,123,582 1,067,450,431 429,713,397 753,719,655- Investment funds - - - 661,460 - - - - -- Financial derivative instruments 918,253 69,511 1,907,901 2,173,213 1,306,635 - - - 243,087
Total assets 1,262,931,559 1,199,866,043 1,282,310,598 1,497,353,635 2,053,924,917 819,666,524 1,095,468,164 431,632,186 764,457,363
LiabilitiesBank overdraft 2 - (2,149,930) - (865) - (521,312) (2,537,998) (85,209) -Due to broker 2,7 (51,600) - - - - (72,896) - - -Payable for securities purchased 2 (307,787) (109,089) (1,849,508) (1,896,827) (2,571,749) (429,097) (2,273,655) - -Interest payable (1,185,569) (420,228) (366,798) (310,712) (406,812) - (36,358) (33,816) (105,611)Redemptions payable 2 - (12,045) (35,015) (68,192) (270,776) - - - -Expenses payable (275,631) (185,084) (496,144) (204,117) (536,525) (183,986) (2,379,757) (228,592) (263,595)Financial liabilities held for trading: 2,7- Financial derivative instruments (2,757,940) (316,649) (7,768,317) (6,477,266) (10,950,081) - - - (2,440,891)
Total liabilities (excluding net assets attributable to holdersof redeemable participating units) (4,578,527) (3,193,025) (10,515,782) (8,957,979) (14,735,943) (1,207,291) (7,227,768) (347,617) (2,810,097)
Net assets attributable to holders of redeemable participating units 1,258,353,032 1,196,673,018 1,271,794,816 1,488,395,656 2,039,188,974 818,459,233 1,088,240,396 431,284,569 761,647,266
The accompanying notes form an integral part of these financial statements.
Mercer UCITS Common Contractual Fund Comparative Statement of Financial Positionas at 30 June 2020
Mercer
UC
ITSC
omm
onC
ontractualFund19
Notes
MercerPassive
Global REITSUCITS CCF
US$
MercerPassive
Global ListedInfrastructure
UCITS CCFUS$
MercerPassive
Low VolatilityEquity
UCITS CCFUS$
MercerPassive
Global SmallCap EquityUCITS CCF
US$
MercerPassive
FundamentalIndexation
Global EquityUCITS CCF
US$
NFU MutualGlobal
RegionalCore Fund
GB£
NFU MutualGlobalAlphaFundGB£
NFU MutualGlobal
StrategicFundGB£
MercerPassive
SustainableGlobalEquity
UCITS CCFUS$
IncomeInterest income calculated using the effective interest method 2,8 - - - - - 1,490 189 - -Net gain from financial instruments at fair value through profitor loss 2,9 669,726,439 270,644,507 384,826,607 883,586,891 1,002,561,482 181,408,794 251,201,311 103,649,439 485,669,808
Securities lending income 2 794,370 436,762 504,888 1,700,680 283,665 112,213 160,481 49,668 131,679
Net investment income 670,520,809 271,081,269 385,331,495 885,287,571 1,002,845,147 181,522,497 251,361,981 103,699,107 485,801,487
Expenses 2,3 (2,549,479) (1,103,997) (1,609,650) (1,615,955) (2,707,146) (668,263) (4,411,840) (269,462) (2,316,646)
Net income from operations before finance costs 667,971,330 269,977,272 383,721,845 883,671,616 1,000,138,001 180,854,234 246,950,141 103,429,645 483,484,841
Finance costsBank interest expense 2 (10,710) (19,522) (41,702) (42,544) (103,344) (10,155) (7,464) (7,052) (22,374)Distributions 2,12 (1,291,955) (30,437) - - (24,176) (1,789,347) (1,217,635) (661,002) (303,240)
Total finance costs (1,302,665) (49,959) (41,702) (42,544) (127,520) (1,799,502) (1,225,099) (668,054) (325,614)
Increase in net assets attributable to holders ofredeemable participating units before tax 666,668,665 269,927,313 383,680,143 883,629,072 1,000,010,481 179,054,732 245,725,042 102,761,591 483,159,227
TaxationWithholding tax expense 6 (17,659,192) (9,200,584) (8,061,549) (6,461,967) (8,243,111) (2,185,300) (2,452,046) (742,796) (4,475,580)Capital gains tax 6 - (286,731) - - - (105,801) (7,650) - -
Total taxation (17,659,192) (9,487,315) (8,061,549) (6,461,967) (8,243,111) (2,291,101) (2,459,696) (742,796) (4,475,580)
Change in net assets attributable to holders ofredeemable participating units 649,009,473 260,439,998 375,618,594 877,167,105 991,767,370 176,763,631 243,265,346 102,018,795 478,683,647
On behalf of the Directors of the Manager Tom Finlay Liam Miley
Director Director 26 October 2021
All amounts arose solely from continuing operations. There were no recognised gains or losses other than those dealt with in the Statement of Comprehensive Income.
The accompanying notes form an integral part of these financial statements.
Mercer UCITS Common Contractual Fund Statement of Comprehensive Incomefor the financial year ended 30 June 2021
Mercer
UC
ITSC
omm
onC
ontractualFund20
Notes
MercerPassive
Global REITSUCITS CCF
US$
MercerPassive
Global ListedInfrastructure
UCITS CCFUS$
MercerPassive
Low VolatilityEquity
UCITS CCFUS$
MercerPassive
Global SmallCap EquityUCITS CCF
US$
MercerPassive
FundamentalIndexation
Global EquityUCITS CCF
US$
NFU MutualGlobal
RegionalCore Fund
GB£
NFU MutualGlobalAlphaFundGB£
NFU MutualGlobal
StrategicFundGB£
MercerPassive
SustainableGlobalEquity
UCITS CCFUS$
IncomeInterest income calculated using the effective interest method 2,8 60,090 36,067 17,780 15,805 52,602 8,032 22,622 3,347 4,491Net (loss)/gain from financial instruments at fair value throughprofit or loss 2,9 (183,160,958) (66,928,695) (15,628,748) (39,652,023) (3,920,324) (21,128,535) 15,908,460 (5,531,300) 50,707,345
Securities lending income 2 72,058 130,581 367,735 482,118 62,108 66,693 101,607 54,622 -
Net investment (expense)/income (183,028,810) (66,762,047) (15,243,233) (39,154,100) (3,805,614) (21,053,810) 16,032,689 (5,473,331) 50,711,836
Expenses 2,3 (1,393,881) (517,636) (1,160,367) (802,317) (1,238,436) (578,458) (2,798,219) (301,683) (656,430)
Net (expense)/income from operations before financecosts (184,422,691) (67,279,683) (16,403,600) (39,956,417) (5,044,050) (21,632,268) 13,234,470 (5,775,014) 50,055,406
Finance costsBank interest expense 2 (9,854) (4,834) (137,632) (112,733) (140,552) (18,619) (9,885) (7,814) (17,512)Distributions 2,12 (140,859) (3,439) - - - (90,674) (10,254) (2,954) (13,650)
Total finance costs (150,713) (8,273) (137,632) (112,733) (140,552) (109,293) (20,139) (10,768) (31,162)
(Decrease)/increase in net assets attributable to holdersof redeemable participating units before tax (184,573,404) (67,287,956) (16,541,232) (40,069,150) (5,184,602) (21,741,561) 13,214,331 (5,785,782) 50,024,244
TaxationWithholding tax expense 6 (9,752,938) (6,376,434) (7,348,941) (4,547,772) (6,996,450) (1,455,892) (1,604,805) (724,569) (2,269,854)Capital gains tax 6 - (35,176) - - - (16,114) (48,321) - -
Total taxation (9,752,938) (6,411,610) (7,348,941) (4,547,772) (6,996,450) (1,472,006) (1,653,126) (724,569) (2,269,854)
Change in net assets attributable to holders ofredeemable participating units (194,326,342) (73,699,566) (23,890,173) (44,616,922) (12,181,052) (23,213,567) 11,561,205 (6,510,351) 47,754,390
The accompanying notes form an integral part of these financial statements.
Mercer UCITS Common Contractual Fund Comparative Statement of Comprehensive Incomefor the financial year ended 30 June 2020
Mercer
UC
ITSC
omm
onC
ontractualFund21
Notes
MercerPassive
Global REITSUCITS CCF
US$
MercerPassive
Global ListedInfrastructure
UCITS CCFUS$
MercerPassive
Low VolatilityEquity
UCITS CCFUS$
MercerPassive
Global SmallCap EquityUCITS CCF
US$
MercerPassive
FundamentalIndexation
Global EquityUCITS CCF
US$
NFU MutualGlobal
RegionalCore Fund
GB£
NFU MutualGlobalAlphaFundGB£
NFU MutualGlobal
StrategicFundGB£
MercerPassive
SustainableGlobalEquity
UCITS CCFUS$
Net assets attributable to holders of redeemableparticipating units at beginning of financial year
1,258,353,032 1,196,673,018 1,271,794,816 1,488,395,656 2,039,188,974 818,459,233 1,088,240,396 431,284,569 761,647,266
Proceeds from redeemable participating units issued 11 923,444,520 569,841,279 987,217,548 368,024,395 968,089,636 206,281,636 59,880,000 23,930,000 1,871,709,405
Payments for redeemable participating units redeemed 11 (433,109,229) (108,762,618) (730,705,248) (672,817,644) (2,601,629,032) (180,450,000) (162,600,000) (57,250,000) (262,069,798)
Change in net assets attributable to holders of redeemableparticipating units 649,009,473 260,439,998 375,618,594 877,167,105 991,767,370 176,763,631 243,265,346 102,018,795 478,683,647
Net assets attributable to holders of redeemableparticipating units at end of financial year
2,397,697,796 1,918,191,677 1,903,925,710 2,060,769,512 1,397,416,948 1,021,054,500 1,228,785,742 499,983,364 2,849,970,520
The accompanying notes form an integral part of these financial statements.
Mercer UCITS Common Contractual Fund Statement of Changes in Net Assets Attributable to Holders of RedeemableParticipating Units for the financial year ended 30 June 2021
Mercer
UC
ITSC
omm
onC
ontractualFund22
Notes
MercerPassive
Global REITSUCITS CCF
US$
MercerPassive
Global ListedInfrastructure
UCITS CCFUS$
MercerPassive
Low VolatilityEquity
UCITS CCFUS$
MercerPassive
Global SmallCap EquityUCITS CCF
US$
MercerPassive
FundamentalIndexation
Global EquityUCITS CCF
US$
NFU MutualGlobal
RegionalCore Fund
GB£
NFU MutualGlobalAlphaFundGB£
NFU MutualGlobal
StrategicFundGB£
MercerPassive
SustainableGlobalEquity
UCITS CCFUS$
Net assets attributable to holders of redeemableparticipating units at beginning of financial year
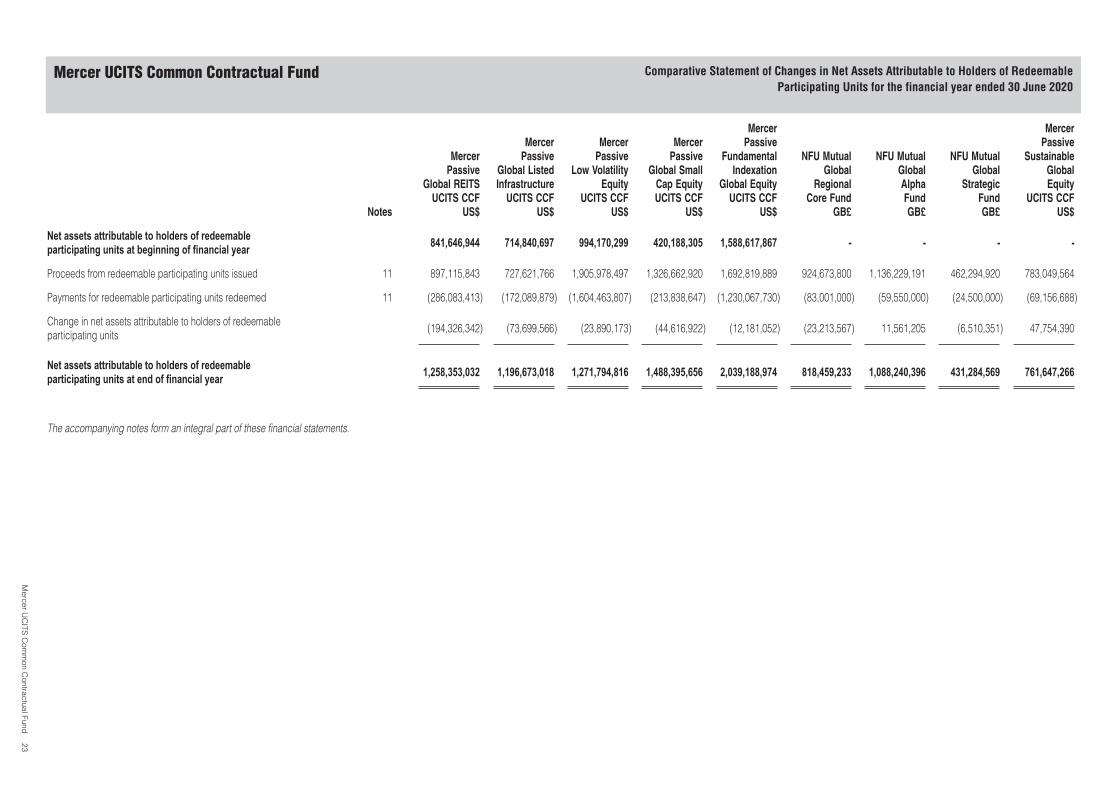
841,646,944 714,840,697 994,170,299 420,188,305 1,588,617,867 - - - -
Proceeds from redeemable participating units issued 11 897,115,843 727,621,766 1,905,978,497 1,326,662,920 1,692,819,889 924,673,800 1,136,229,191 462,294,920 783,049,564
Payments for redeemable participating units redeemed 11 (286,083,413) (172,089,879) (1,604,463,807) (213,838,647) (1,230,067,730) (83,001,000) (59,550,000) (24,500,000) (69,156,688)
Change in net assets attributable to holders of redeemableparticipating units (194,326,342) (73,699,566) (23,890,173) (44,616,922) (12,181,052) (23,213,567) 11,561,205 (6,510,351) 47,754,390
Net assets attributable to holders of redeemableparticipating units at end of financial year
1,258,353,032 1,196,673,018 1,271,794,816 1,488,395,656 2,039,188,974 818,459,233 1,088,240,396 431,284,569 761,647,266
The accompanying notes form an integral part of these financial statements.
Mercer UCITS Common Contractual Fund Comparative Statement of Changes in Net Assets Attributable to Holders of RedeemableParticipating Units for the financial year ended 30 June 2020
Mercer
UC
ITSC
omm
onC
ontractualFund23
MercerPassive
Global REITSUCITS CCF
US$
MercerPassive
Global ListedInfrastructure
UCITS CCFUS$
MercerPassive
Low VolatilityEquity
UCITS CCFUS$
MercerPassive
Global SmallCap EquityUCITS CCF
US$
MercerPassive
FundamentalIndexation
Global EquityUCITS CCF
US$
NFU MutualGlobal
RegionalCore Fund
GB£
NFU MutualGlobalAlphaFundGB£
NFU MutualGlobal
StrategicFundGB£
MercerPassive
SustainableGlobalEquity
UCITS CCFUS$
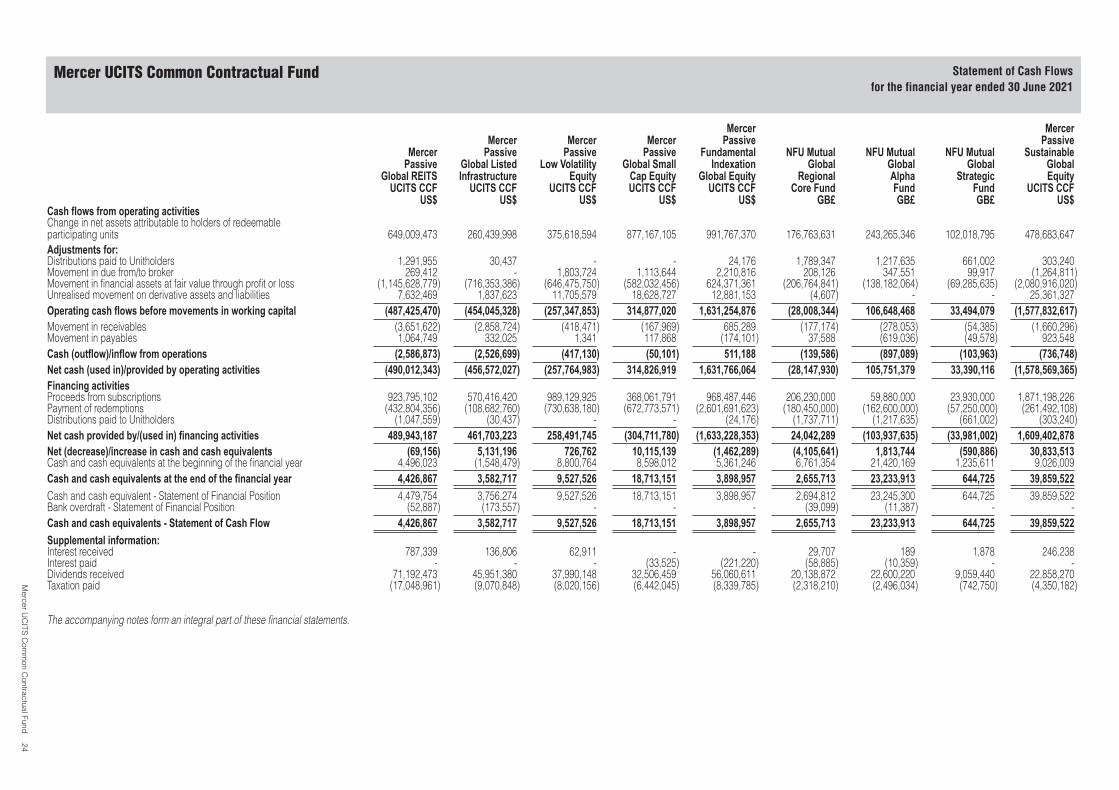
Cash flows from operating activitiesChange in net assets attributable to holders of redeemableparticipating units 649,009,473 260,439,998 375,618,594 877,167,105 991,767,370 176,763,631 243,265,346 102,018,795 478,683,647Adjustments for:Distributions paid to Unitholders 1,291,955 30,437 - - 24,176 1,789,347 1,217,635 661,002 303,240Movement in due from/to broker 269,412 - 1,803,724 1,113,644 2,210,816 208,126 347,551 99,917 (1,264,811)Movement in financial assets at fair value through profit or loss (1,145,628,779) (716,353,386) (646,475,750) (582,032,456) 624,371,361 (206,764,841) (138,182,064) (69,285,635) (2,080,916,020)Unrealised movement on derivative assets and liabilities 7,632,469 1,837,623 11,705,579 18,628,727 12,881,153 (4,607) - - 25,361,327Operating cash flows before movements in working capital (487,425,470) (454,045,328) (257,347,853) 314,877,020 1,631,254,876 (28,008,344) 106,648,468 33,494,079 (1,577,832,617)Movement in receivables (3,651,622) (2,858,724) (418,471) (167,969) 685,289 (177,174) (278,053) (54,385) (1,660,296)Movement in payables 1,064,749 332,025 1,341 117,868 (174,101) 37,588 (619,036) (49,578) 923,548Cash (outflow)/inflow from operations (2,586,873) (2,526,699) (417,130) (50,101) 511,188 (139,586) (897,089) (103,963) (736,748)Net cash (used in)/provided by operating activities (490,012,343) (456,572,027) (257,764,983) 314,826,919 1,631,766,064 (28,147,930) 105,751,379 33,390,116 (1,578,569,365)Financing activitiesProceeds from subscriptions 923,795,102 570,416,420 989,129,925 368,061,791 968,487,446 206,230,000 59,880,000 23,930,000 1,871,198,226Payment of redemptions (432,804,356) (108,682,760) (730,638,180) (672,773,571) (2,601,691,623) (180,450,000) (162,600,000) (57,250,000) (261,492,108)Distributions paid to Unitholders (1,047,559) (30,437) - - (24,176) (1,737,711) (1,217,635) (661,002) (303,240)Net cash provided by/(used in) financing activities 489,943,187 461,703,223 258,491,745 (304,711,780) (1,633,228,353) 24,042,289 (103,937,635) (33,981,002) 1,609,402,878Net (decrease)/increase in cash and cash equivalents (69,156) 5,131,196 726,762 10,115,139 (1,462,289) (4,105,641) 1,813,744 (590,886) 30,833,513Cash and cash equivalents at the beginning of the financial year 4,496,023 (1,548,479) 8,800,764 8,598,012 5,361,246 6,761,354 21,420,169 1,235,611 9,026,009Cash and cash equivalents at the end of the financial year 4,426,867 3,582,717 9,527,526 18,713,151 3,898,957 2,655,713 23,233,913 644,725 39,859,522
Cash and cash equivalent - Statement of Financial Position 4,479,754 3,756,274 9,527,526 18,713,151 3,898,957 2,694,812 23,245,300 644,725 39,859,522Bank overdraft - Statement of Financial Position (52,887) (173,557) - - - (39,099) (11,387) - -Cash and cash equivalents - Statement of Cash Flow 4,426,867 3,582,717 9,527,526 18,713,151 3,898,957 2,655,713 23,233,913 644,725 39,859,522
Supplemental information:Interest received 787,339 136,806 62,911 - - 29,707 189 1,878 246,238Interest paid - - - (33,525) (221,220) (58,885) (10,359) - -Dividends received 71,192,473 45,951,380 37,990,148 32,506,459 56,060,611 20,138,872 22,600,220 9,059,440 22,858,270Taxation paid (17,048,961) (9,070,848) (8,020,156) (6,442,045) (8,339,785) (2,318,210) (2,496,034) (742,750) (4,350,182)
The accompanying notes form an integral part of these financial statements.
Mercer UCITS Common Contractual Fund Statement of Cash Flowsfor the financial year ended 30 June 2021
Mercer
UC
ITSC
omm
onC
ontractualFund24
MercerPassive
Global REITSUCITS CCF
US$
MercerPassive
Global ListedInfrastructure
UCITS CCFUS$
MercerPassive
Low VolatilityEquity
UCITS CCFUS$
MercerPassive
Global SmallCap EquityUCITS CCF
US$
MercerPassive
FundamentalIndexation
Global EquityUCITS CCF
US$
NFU MutualGlobal
RegionalCore Fund
GB£
NFU MutualGlobalAlphaFundGB£
NFU MutualGlobal
StrategicFundGB£
MercerPassive
SustainableGlobalEquity
UCITS CCFUS$
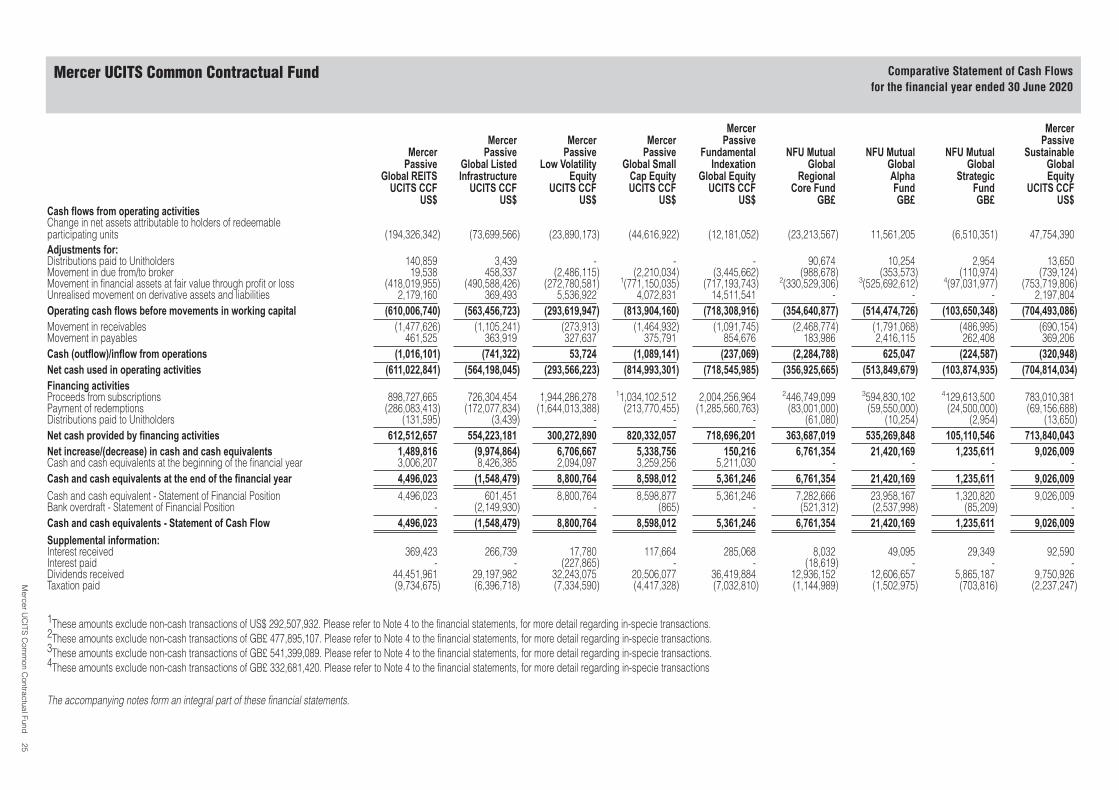
Cash flows from operating activitiesChange in net assets attributable to holders of redeemableparticipating units (194,326,342) (73,699,566) (23,890,173) (44,616,922) (12,181,052) (23,213,567) 11,561,205 (6,510,351) 47,754,390Adjustments for:Distributions paid to Unitholders 140,859 3,439 - - - 90,674 10,254 2,954 13,650Movement in due from/to broker 19,538 458,337 (2,486,115) (2,210,034) (3,445,662) (988,678) (353,573) (110,974) (739,124)Movement in financial assets at fair value through profit or loss (418,019,955) (490,588,426) (272,780,581) 1(771,150,035) (717,193,743) 2(330,529,306) 3(525,692,612) 4(97,031,977) (753,719,806)Unrealised movement on derivative assets and liabilities 2,179,160 369,493 5,536,922 4,072,831 14,511,541 - - - 2,197,804Operating cash flows before movements in working capital (610,006,740) (563,456,723) (293,619,947) (813,904,160) (718,308,916) (354,640,877) (514,474,726) (103,650,348) (704,493,086)Movement in receivables (1,477,626) (1,105,241) (273,913) (1,464,932) (1,091,745) (2,468,774) (1,791,068) (486,995) (690,154)Movement in payables 461,525 363,919 327,637 375,791 854,676 183,986 2,416,115 262,408 369,206Cash (outflow)/inflow from operations (1,016,101) (741,322) 53,724 (1,089,141) (237,069) (2,284,788) 625,047 (224,587) (320,948)Net cash used in operating activities (611,022,841) (564,198,045) (293,566,223) (814,993,301) (718,545,985) (356,925,665) (513,849,679) (103,874,935) (704,814,034)Financing activitiesProceeds from subscriptions 898,727,665 726,304,454 1,944,286,278 11,034,102,512 2,004,256,964 2446,749,099 3594,830,102 4129,613,500 783,010,381Payment of redemptions (286,083,413) (172,077,834) (1,644,013,388) (213,770,455) (1,285,560,763) (83,001,000) (59,550,000) (24,500,000) (69,156,688)Distributions paid to Unitholders (131,595) (3,439) - - - (61,080) (10,254) (2,954) (13,650)Net cash provided by financing activities 612,512,657 554,223,181 300,272,890 820,332,057 718,696,201 363,687,019 535,269,848 105,110,546 713,840,043Net increase/(decrease) in cash and cash equivalents 1,489,816 (9,974,864) 6,706,667 5,338,756 150,216 6,761,354 21,420,169 1,235,611 9,026,009Cash and cash equivalents at the beginning of the financial year 3,006,207 8,426,385 2,094,097 3,259,256 5,211,030 - - - -Cash and cash equivalents at the end of the financial year 4,496,023 (1,548,479) 8,800,764 8,598,012 5,361,246 6,761,354 21,420,169 1,235,611 9,026,009
Cash and cash equivalent - Statement of Financial Position 4,496,023 601,451 8,800,764 8,598,877 5,361,246 7,282,666 23,958,167 1,320,820 9,026,009Bank overdraft - Statement of Financial Position - (2,149,930) - (865) - (521,312) (2,537,998) (85,209) -Cash and cash equivalents - Statement of Cash Flow 4,496,023 (1,548,479) 8,800,764 8,598,012 5,361,246 6,761,354 21,420,169 1,235,611 9,026,009
Supplemental information:Interest received 369,423 266,739 17,780 117,664 285,068 8,032 49,095 29,349 92,590Interest paid - - (227,865) - - (18,619) - - -Dividends received 44,451,961 29,197,982 32,243,075 20,506,077 36,419,884 12,936,152 12,606,657 5,865,187 9,750,926Taxation paid (9,734,675) (6,396,718) (7,334,590) (4,417,328) (7,032,810) (1,144,989) (1,502,975) (703,816) (2,237,247)
1These amounts exclude non-cash transactions of US$ 292,507,932. Please refer to Note 4 to the financial statements, for more detail regarding in-specie transactions.2These amounts exclude non-cash transactions of GB£ 477,895,107. Please refer to Note 4 to the financial statements, for more detail regarding in-specie transactions.3These amounts exclude non-cash transactions of GB£ 541,399,089. Please refer to Note 4 to the financial statements, for more detail regarding in-specie transactions.4These amounts exclude non-cash transactions of GB£ 332,681,420. Please refer to Note 4 to the financial statements, for more detail regarding in-specie transactions
The accompanying notes form an integral part of these financial statements.
Mercer UCITS Common Contractual Fund Comparative Statement of Cash Flowsfor the financial year ended 30 June 2020
Mercer
UC
ITSC
omm
onC
ontractualFund25
1. Reporting entity
Mercer UCITS Common Contractual Fund (the “CCF”) is a common contractual fund with variable capital organised underthe laws of Ireland. The CCF is organised in the form of an umbrella fund insofar as the unit capital of the CCF will bedivided into different series of units with each series of units representing a portfolio of assets which will comprise aseparate fund (each a “Sub-Fund”). As at 30 June 2021, there were nine Sub-Funds in operation.
Each Sub-Fund of the CCF is a reporting entity.
2. Accounting policies
The principal accounting policies adopted by the Sub-Funds are as follows:
a) Basis of preparation
The financial statements have been prepared in accordance with IFRS as adopted by the EU, Irish statute comprising theInvestment Funds, Companies and Miscellaneous Provisions Act 2005 and 2020, the European Communities(Undertakings for Collective Investment in Transferable Securities), Regulations 2011, (the “UCITS Regulations”) and theCentral Bank (Supervision and Enforcement) Act 2013 (Section 48(1)) (Undertakings For Collective Investment InTransferable Securities) Regulations 2019 (the “Central Bank UCITS Regulations”).
The financial statements of the Sub-Funds have been prepared on the going concern basis as it has been determined thatthe Sub-Funds can continue in operational existence for at least twelve months from the date of approval of these financialstatements (the period of assessment). For the CCF, the assessment is completed at Sub-Fund level by the Manager andtakes multiple factors including Sub-Fund size, Net Asset Value (“NAV”) movements and Sub-Fund type into account.
b) Functional and presentation currency
Items included in the Sub-Funds’ financial statements are measured using the currency of the primary economicenvironment in which the respective Sub-Funds’ operate (the “functional currency”). If indicators of the primary economicenvironment are mixed, then management uses its judgement to determine the functional currency that most faithfullyrepresents the economic effects of the underlying transactions, events and conditions. The functional currency of theSub-Funds is US Dollar (“US$”) with the exception of NFU Mutual Global Regional Core Fund, NFU Mutual Global AlphaFund and NFU Mutual Global Strategic Fund whose functional currency is British Pound (“GB£”). The Sub-Funds havealso adopted these functional currencies as the presentation currencies of the Sub-Funds.
Translation and balancesMonetary assets and liabilities denominated in currencies other than the functional currency of a particular Sub-Fund aretranslated to the functional currency at the closing rates of exchange at financial year end. Transactions during thefinancial year are translated at the rate of exchange prevailing on the date of the transaction. Foreign currency gains andlosses are included in Net gain from financial instruments at fair value through profit or loss (“FVTPL”) in the Statement ofComprehensive Income.
Average rates of exchange were used to translate transfers of units between Unit Classes with functional currencies otherthan the functional currency of the Sub-Fund, where those rates represent a reasonable approximation of actual rates.
c) Use of judgements and estimates
The preparation of financial statements in conformity with IFRS as adopted by the EU requires management to makejudgements, estimates and assumptions which affects the application of accounting policies and the reported amounts ofassets and liabilities, income and expenses and the disclosure of contingent assets and liabilities as at the date of thefinancial statements. The estimates and associated assumptions are based on historical experience and various otherfactors which are believed to be reasonable under the circumstances, the results of which form the basis of makingjudgements about carrying values of assets and liabilities which are not readily apparent from others.
Actual results may differ from these estimates. Estimates and underlying assumptions are reviewed on an ongoing basis.Revisions to accounting estimates are recognised in the financial year in which the estimates are revised and in any futureyears affected.
(i) JudgementsInformation about judgements made in applying accounting policies that have the most significant effect on the amountsrecognised in the financial statements of the Sub-Funds are included in Note 2b and in Note 5 to the financial statements.
Mercer UCITS Common Contractual Fund Notes to the Financial Statementsfor the financial year ended 30 June 2021
Mercer UCITS Common Contractual Fund 26
2. Accounting policies (continued)
c) Use of judgements and estimates (continued)
(ii) Assumptions and estimation uncertaintiesInformation about assumptions and estimation uncertainties that have a significant risk of resulting in a materialadjustment to the carrying amounts of assets and liabilities within the financial year ending 30 June 2021 and financialyear ending 30 June 2020 are included in Note 7 to the financial statements, and relates to the determination of fair valueof certain financial instruments.
d) New standards, amendments and interpretations issued and effective for the financial year beginning1 July 2020
The following amendments are effective for annual reporting periods beginning 1 July 2020. These have been applied inpreparing the Sub-Funds’ financial statements and have not had a significant impact on the Sub-Funds.
Interest Rate Benchmark Reform (amendments to IFRS 9, IAS 39 and IFRS 7) concludes phase one of its work to respondto the effects of Interbank Offered Rates (“IBOR”) reform on financial reporting were issued in September 2019 and areeffective for accounting periods beginning on or after 1 January 2020. The amendments provide temporary reliefs whichenable hedge accounting to continue during the period of uncertainty before the replacement of an existing interest ratebenchmark with an alternative nearly risk-free interest rate. The amendments must be applied retrospectively. However,any hedge relationships that have previously been de-designated cannot be reinstated upon application, nor can anyhedge relationships be designated with the benefit of hindsight.
e) New standards, amendments and interpretations issued but not effective for the financial year beginning1 July 2020 and not early adopted
The following amendments are issued but not-effective for the financial year beginning 1 July 2020 and not early adopted:
Interest Rate Benchmark Reform – Phase 2 (amendments to IFRS 9, IAS 39, IFRS 7, IFRS 4 and IFRS 16) are intended toadopt and simplify accounting requirements in the context of interest rate benchmark reform and introduce newrequirements for disclosure of the nature and extent of risks arising from the interest rate benchmark reform. Additionaldisclosures on the nature and extent of risk arising from financial instruments subject to interest rate benchmark reform willbe detailed in the financial risk note to the financial statements.
f) Financial instruments
(i) Recognition and initial measurementFinancial assets and financial liabilities are initially recognised at FVTPL on the trade date, which is the date on which theSub-Funds become a party to the contractual provisions of the instrument. Other financial assets and financial liabilitiesare recognised at the date they are originated. From this date any gains and losses arising from changes in fair value ofthe financial assets or financial liabilities are recorded in the Statement of Comprehensive Income.
Financial assets and financial liabilities are measured initially at fair value. For an item not classified at FVTPL, it ismeasured initially at fair value plus transaction costs that are directly attributable to its acquisition or issue. Transactioncosts on financial assets and financial liabilities at FVTPL are expensed immediately, while on other financial instrumentsthey are amortised.
(ii) Classification and subsequent measurementOn initial recognition, the Sub-Funds classify financial assets as measured at amortised cost or FVTPL.
A financial asset is measured at amortised cost if it meets both of the following conditions and is not designated as atFVTPL:- it is held within a business model whose objective is to hold assets to collect contractual cash flows; and- its contractual terms give rise on specified dates to cash flows that are solely payments of principal and interest
(“SPPI”) on the principal amount outstanding.
Mercer UCITS Common Contractual Fund Notes to the Financial Statementsfor the financial year ended 30 June 2021
(continued)
Mercer UCITS Common Contractual Fund 27
2. Accounting policies (continued)
f) Financial instruments (continued)
(ii) Classification and subsequent measurement (continued)Business model assessmentIn making an assessment of the objectives of the business model in which a financial asset is held, the Sub-Fundsconsider all of the relevant information about how the business is managed, including:- the documented investment strategy and the execution of this strategy in practice. This includes whether the
investment strategy focuses on earning contractual interest income, maintaining a particular interest rate profile,matching the duration of the financial assets to the duration of any related liabilities or expected cash outflows orrealising cash flows through the sale of assets;
- how the performance of the portfolio is evaluated and reported to the Sub-Funds’ management;- the risks that affect the performance of the business model (and the financial assets held within that business model)
and how those risks are managed;- how the Investment Manager is compensated: e.g. whether compensation is based on the fair value of the assets
managed or the contractual cash flows collected; and- the frequency, volume and timing of sales of financial assets in prior periods, the reasons for such sales and
expectations about future sales activity.
Transfers of financial assets to third parties in transactions that do not qualify for de-recognition are not considered salesfor this purpose, consistent with the Sub-Funds’ continuing recognition of the assets. The Sub-Funds have determinedthat there are two business models.- Held to collect business model: this includes cash and cash equivalents, due from broker, subscriptions receivable,
receivable for securities sold and other assets. These financial assets are held to collect contractual cash flows.- Other business model: this includes debt securities, equity investments, open-ended investment funds and financial
derivative instruments (“FDIs”). These financial assets are managed and their performance is evaluated on a fairvalue basis, with frequent sales taking place.
Assessment whether contractual cash flows are SPPIFor the purpose of this assessment, ‘principal’ is defined as the fair value of the financial asset on initial recognition.‘Interest’ is defined as consideration for the time value of money and for the credit risk associated with the principalamount outstanding during a particular period of time and for other basic lending risks and costs (e.g. liquidity risk andadministrative costs), as well as a profit margin.
In assessing whether the contractual cash flows are SPPI, the Sub-Funds consider the contractual terms of the instrument.This includes assessing whether the financial asset contains a contractual term that could change the timing or amount ofcontractual cash flows such that it would not meet this condition. In making assessment, the Sub-Funds consider:- contingent events that would change the amount or timing of cash flows;- leverage features;- prepayments and extension features;- terms that limit the Sub-Funds’ claim to cash flows from specified assets (e.g. non-recourse features); and- features that modify consideration of the time value of money (e.g. periodical reset of interest rates).
A financial liability is classified as at FVTPL if it is classified as held-for-trading, if it is an FDI or, if it is designated as suchon initial recognition.
The Sub-Funds have classified their financial assets and financial liabilities into the following categories:- Financial assets at FVTPL - investments in transferable securities, investment funds, FDIs with positive fair values.- Financial assets at amortised cost - cash and cash equivalents, due from broker, receivable for securities sold,
subscriptions receivable and other assets.- Financial liabilities at amortised cost - bank overdraft, due to broker, expenses payable, interest payable,
redemptions payable, payable for securities purchased and net assets attributable to holders of redeemableparticipating units.
- Financial liabilities held for trading - FDIs with negative fair values.
Financial assets and financial liabilities at FVTPL are subsequently measured at fair value. Net gains and losses arisingfrom changes in the fair value of financial assets and financial liabilities at FVTPL are included in the Statement ofComprehensive Income in the year in which they arise.
Financial assets and financial liabilities at amortised cost are subsequently measured at amortised cost using theeffective interest method. Interest income from the financial assets measured at amortised cost are recognised in interestincome calculated using effective interest method in the Statement of Comprehensive Income. Interest expense from thefinancial liabilities measured at amortised cost is recognised in the Statement of Comprehensive Income. Net gains andlosses from the financial assets and financial liabilities measured at amortised cost are recognised in the Statement ofComprehensive Income.
Mercer UCITS Common Contractual Fund Notes to the Financial Statementsfor the financial year ended 30 June 2021
(continued)
Mercer UCITS Common Contractual Fund 28
2. Accounting policies (continued)
f) Financial instruments (continued)
(ii) Classification and subsequent measurement (continued)ReclassificationsFinancial assets are not reclassified subsequent to their initial recognition unless a Sub-Fund was to change its businessmodel for managing financial assets, in which case all affected financial assets would be reclassified on the first day of thefirst reporting period following the change in the business model.
(iii) Fair value measurement“Fair Value” is the price that would be received to sell an asset or paid to transfer a liability in an orderly transactionbetween market participants at the measurement date in the principal or, in its absence, the most advantageous market towhich the Sub-Funds have access at that date. The fair value of a liability reflects its non-performance risk.
The fair value of financial instruments traded in active markets (such as equities) or any other regulated market (such ascorporate bonds, government bonds, municipal bonds, asset-backed securities (“ABS”), mortgage-backed securities(“MBS”), convertible securities and credit linked notes) is based on their quoted market prices at the reporting datewithout any deduction for estimated future selling costs. Financial assets are priced at current last traded market prices,while financial liabilities are priced at current ask prices.
A market is regarded as “active” if transactions for the asset or liability take place with sufficient frequency and volume toprovide pricing information on an ongoing basis. The Sub-Funds measure instruments quoted in an active market atcurrent last traded market price, because this price provides a reasonable approximation of the exit price. If there is noquoted price in an active market, then the Sub-Fund uses valuation techniques that maximise the use of relevantobservable inputs and minimise the use of unobservable inputs. The chosen valuation technique incorporates all of thefactors that market participants would take into account in pricing a transaction.
This includes, but is not limited to, reviewing information on stale and static prices, suspended securities and securities inliquidation and securities valued at cost. If the Investment Manager has reasonable belief that the valuation of a particularsecurity may not reflect fair market value, the Investment Manager Valuation Committee (“VC”) will meet to consider theappropriate valuation of the security in question. The VC meets on a regular basis and formally reviews all new fair valueassessments and other pricing issues. Ad-hoc fair value approvals may be received via email to the committee membersor by means of extraordinary meetings of the VC should the need arise.
The Sub-Funds recognise transfers between levels of the fair value hierarchy as at the end of the reporting year duringwhich the change has occurred.
(iv) Amortised cost measurementThe amortised cost of a financial asset or financial liability is the amount at which the financial asset or financial liability ismeasured at initial recognition, minus principal repayments, plus or minus the cumulative amortisation using the effectiveinterest method of any difference between the initial amount recognised and the maturity amount, minus any adjustmentfor any loss allowances.
(v) Impairment of financial assetsIFRS 9 requires an impairment assessment to be carried out on its financial assets held at amortised cost. The Managerhas reviewed the impairment assessment of financial assets held at amortised cost. The Manager considers theprobability of default to be close to zero, as these instruments have a low risk of default and the counterparties have astrong capacity to meet their contractual obligations in the near term. As a result, no loss allowance has been recognisedin the financial statements based on 12-month expected credit losses as any such impairment would be whollyinsignificant to the Sub-Funds.
The Manager recognises loss allowances of expected credit losses (“ECLs”) on financial assets measured at amortisedcost. The Manager measures loss allowances at an amount equal to lifetime ECLs, except for the following which aremeasured at 12-month ECLs:- financial assets that are determined to have low credit risk at the reporting date; and- other financial assets for which credit risk (i.e. the risk of default occurring over the expected life of the asset) has not
increased significantly since initial recognition.
When determining whether the credit risk of a financial asset has increased significantly since initial recognition and whenestimating ECLs, the Manager considers reasonable and supportable information that is relevant and available withoutundue cost or effort. This includes both quantitative and qualitative information and analysis, based on the Manager’shistorical experience and informed credit assessment and including forward-looking information.
The Manager assumes that the credit risk on a financial asset has increased significantly if it is more than 30 days pastdue. The Manager considers a financial asset to have low credit risk when the credit rating of the counterparty is
Mercer UCITS Common Contractual Fund Notes to the Financial Statementsfor the financial year ended 30 June 2021
(continued)
Mercer UCITS Common Contractual Fund 29
2. Accounting policies (continued)
f) Financial instruments (continued)
(v) Impairment of financial assets (continued)equivalent to the globally understood definition of ‘investment grade’. The Manager considers this to be Baa3 or higherper Moody’s or BBB- or higher per Standard and Poor’s.
Lifetime ECLs are the ECLs that result from all possible default events over the expected life of a financial instrument.12-month ECLs are the portion of ECLs that result from the default events that are possible within the 12 months after thereporting date (or a shorter period if the expected life of the instrument is less than 12 months). The maximum periodconsidered when estimating ECLs is the maximum contractual period over which the Sub-Funds are exposed to creditrisk.
Measurement of ECLsECLs are a probability-weighted estimate of credit losses. Credit losses are measured as the present value of all cashshortfalls (i.e. the difference between the cash flows due to the entity in accordance with the contract and the cash flowsthat the Sub-Funds expect to receive). ECLs are discounted at the effective interest rate of the financial asset.
Credit-impaired financial assetsAt each reporting date, the Manager assesses whether financial assets carried at amortised cost are credit-impaired. Afinancial asset is ‘credit-impaired’ when one or more events that have a detrimental impact on the estimated future cashflows of the financial asset have occurred.
Evidence that a financial asset is credit impaired includes the following observable data:- significant financial difficulty of the borrower or issuer;- a breach of contract such as a default or being more than 90 days past due; or- it is probable that the borrower will enter bankruptcy or other financial reorganisations.- Presentation of allowance for ECLs in the Statement of Financial Position.
Loss allowances for financial assets measured at amortised cost are deducted from the gross carrying amount of theassets.
Write offThe gross carrying amount of financial assets is written off when the Manager has no reasonable expectations ofrecovering a financial asset in its entirety or a portion thereof.
(vi) DerecognitionThe Sub-Funds derecognise a financial asset when the contractual rights to the cash flows from the financial asset expireor it transfers the financial asset and the transfer qualifies for derecognition in accordance with IFRS 9.
A financial liability is derecognised when the obligation specified in the contract is discharged, cancelled or expired. TheSub-Funds use the average cost method to determine realised gains and losses on derecognition.
(vii) OffsettingFinancial assets and financial liabilities are offset and the net amount presented in the Statement of Financial Positionwhen and only when there is a legally enforceable right to offset the recognised amounts and there is an intention to settleon a net basis, or realise the assets and settle the liability simultaneously.
Income and expenses are presented on a net basis for gains and losses from financial instruments at FVTPL and foreignexchange gains and losses.
g) Dividend and interest income/expense
Dividend income is recognised in Net gain from financial instruments at FVTPL in the Statement of Comprehensive Incomeon the date that the right to receive payment is established. For quoted equity securities this is usually the ex-dividenddate. Dividend income from unquoted equities is recognised when the dividend is declared.
Bank interest income and interest expense are recognised in Interest income calculated using the effective interestmethod and Bank interest expense, respectively in the Statement of Comprehensive Income using the effective interestmethod.
Interest income and interest expense generated from assets classified as FVTPL is disclosed in Net gain from financialinstruments at FVTPL in the Statement of Comprehensive Income.
Mercer UCITS Common Contractual Fund Notes to the Financial Statementsfor the financial year ended 30 June 2021
(continued)
Mercer UCITS Common Contractual Fund 30
2. Accounting policies (continued)
h) Net gain from financial instruments at FVTPL
Net gain from financial instruments at FVTPL includes all realised gains and losses, unrealised gains and losses from fairvalue changes, foreign exchange differences, dividend and interest income/expense on financial instruments at FVTPL.The Sub-Funds records its investment transactions on trade date basis. Realised gains and losses are calculated basedon the average cost method.
The change in unrealised gain or loss represents a movement in fair value to cost of the investment between reportingperiods. Where a security’s fair value over cost increases over the period, this is recorded as a change in unrealised gainon investments. Where a security’s fair value over cost decreases over the period, this is recorded as a change inunrealised loss on investments. For investments and derivatives held at the end of the prior financial period and sold intheir entirety during the current financial year, the realised gain or loss represents the difference between the carryingamount of a financial instrument at the beginning of the period, or the transaction price if it was purchased in the currentreporting period, and its carrying amount at the end of the period, being US$ or GB£.
i) Operating expenses
Operating expenses are recognised in the Statement of Comprehensive Income on an accrual basis.
j) Cash and cash equivalents and bank overdraftCash and cash equivalents comprise deposits with banks and highly liquid financial assets with maturities of three monthsor less from the date of acquisition, that are subject to an insignificant risk of changes in their fair value and are used by theSub-Funds in the management of short-term commitments, other than cash collateral provided in respect of derivativesand securities borrowing transactions.
k) Redeemable participating units
Redeemable participating units are redeemable at the Unitholder’s option and are classified as financial liabilities.
The redeemable participating units can be put back to the Sub-Funds at any dealing day for cash equal to a proportionateunit of the relevant Sub-Fund’s NAV. The redeemable participating units are carried at the redemption amount that ispayable at the reporting date if the Unitholder’s exercised their right to put the unit back to the Sub-Fund.
Swing PricingThe Directors of the Manager may determine, at their discretion, to “swing” the NAV to counter the possible negativeeffects of dilution. Swing pricing is applied to a Sub-Fund once net subscriptions or redemptions for a Sub-Fund for agiven dealing day exceeds a predetermined amount.
Anti-Dilution levyAn anti-dilution levy is applied to a Sub-Fund on any dealing day where there are net subscriptions or net redemptions, theDirectors of the Manager may determine to add or deduct, as appropriate an anti-dilution levy to or from the subscriptionor redemption amount on that dealing day in order to cover dealing costs and to preserve the value of the underlyingassets of the Sub-Fund for existing Unitholders.
Please see Note 11 to the financial statements for further details.
l) Financial derivative instruments
(i) Forward foreign currency contractsThe fair value of open forward foreign currency contracts is calculated as the difference between the contracted rate andthe current forward rate that would close out the contract on the valuation date. Gains or losses arising on the settlementof forward foreign currency contracts are included in Net gain from financial instruments at FVTPL in the Statement ofComprehensive Income. Unrealised gains and losses on unsettled forward foreign currency contracts are included in theStatement of Financial Position. The unrealised gain/(loss) on open forward foreign currency contracts is calculated byreference to the forward price. Realised gains or losses include net gains and losses on contracts which have beensettled or offset by other contracts.
(ii) Futures contracts on securitiesThe fair value of futures contracts is based upon daily quoted settlement prices. Changes in the value of the contract arerecognised as unrealised gains or losses in the Statement of Comprehensive Income by “marking to market” the value ofthe contract at the reporting date. When the contract is closed, the difference between the proceeds from (or cost of) theclosing transactions and the original transaction is recorded as a realised gain/(loss) in Net gain from financial instruments
Mercer UCITS Common Contractual Fund Notes to the Financial Statementsfor the financial year ended 30 June 2021
(continued)
Mercer UCITS Common Contractual Fund 31
2. Accounting policies (continued)
l) Financial derivative instruments (continued)
(ii) Futures contracts on securities (continued)at FVTPL in the Statement of Comprehensive Income. Futures contracts are presented in the Portfolio Statements on agross basis. Futures contracts are treated as settled to market and are included in due from/to broker in the Statement ofFinancial Position.
(iii) WarrantsWarrants are sometimes used to gain exposure to emerging market equities where custody, liquidity, or other issues makeownership of local shares sub-optimal.
The valuation of the warrants depends on the level of trading. If the warrants are actively traded in the market then themarket price is used. If the warrants are not actively traded in the market the intrinsic value of the warrant based onunderlying equity price and warrant strike price is used. Warrants by their nature are covered investments.
m) Due from/to broker
Due from/to broker is margin cash and cash collateral which is held by or due to brokers. This amount is the minimumdeemed by the brokers and counterparties for collateral requirements and is as such restricted and is reported separatelyto the unrestricted cash in the Statement of Financial Position.
Upon entering into a centrally cleared derivative contract, the Sub-Funds are required to pledge cash or securities ascollateral to a central clearing house, through a broker, in accordance with the initial margin requirements of the centralclearing house. At the financial year end, the balances of the initial margin requirements at each broker, excluding thevalue of any securities pledged as collateral, are recorded as due from/to broker in the Statement of Financial Position.Any security that has been pledged as collateral is identified as an asset in the Statement of Financial Position.
n) Collateral
A Sub-Fund’s assets may be deposited by the Sub-Fund for collateral purposes with counterparties in respect of over thecounter (“OTC”) FDIs held by the Sub-Fund. Investments pledged by the Sub-Funds as collateral are recognised at fairvalue in the relevant Sub-Fund’s Portfolio Statements and such investments are referenced accordingly at the base of thePortfolio Statement. These assets remain in the ownership of the relevant Sub-Fund and are recorded as an asset in theStatement of Financial Position.
A Sub-Fund may also receive assets as collateral from counterparties. Securities received by the Sub-Funds as collateralfrom counterparties do not form part of the NAV of the Sub-Funds and are disclosed at the end of the relevant PortfolioStatement.
Cash collateral received is disclosed in the Statement of Financial Position as an asset and a related liability to repay thecollateral is recorded, both of which are valued at amortised cost.
Cash pledged by the Sub-Funds as collateral is disclosed in the Statement of Financial Position within due from broker.
o) Tax
The Sub-Funds currently incur withholding taxes imposed by certain countries on investment income and capital gains.Such income or gains are recorded gross of withholding taxes in the Statement of Comprehensive Income. Withholdingtaxes are shown as a separate item in the Statement of Comprehensive Income.
p) Other assets
Other assets do not carry any interest and are short-term in nature and are accordingly stated at their nominal value asreduced by appropriate allowances for estimated irrecoverable amounts.
q) Expenses payable
Accrued expenses are recognised initially at fair value and subsequently stated at amortised cost using the effectiveinterest method.
r) Receivables for securities sold/payables for securities purchased
Receivables for securities sold and payables for securities purchased represent sales and purchases that have beencontracted for but not yet delivered by the end of the financial year. They are disclosed as assets and liabilities,respectively, in the Statement of Financial Position.
Mercer UCITS Common Contractual Fund Notes to the Financial Statementsfor the financial year ended 30 June 2021
(continued)
Mercer UCITS Common Contractual Fund 32
2. Accounting policies (continued)
s) Subscriptions receivable / redemptions payable
The subscriptions receivable/redemptions payable represents amounts receivable and payable from/to investors forSub-Fund units issued/redeemed for which settlement has not occurred at the end of the financial year and are includedas assets/liabilities in the Statement of Financial Position.
t) Distributions
Distributions with an ex-date during the financial year under review are included as a finance cost in the Statement ofComprehensive Income. The reinvestment of distributions if applicable, being the portion of the total distributionreinvested, are included as a Unit transaction in the Statement of Changes in Net Assets Attributable to Holders ofRedeemable Participating Units. None of the distributions were paid out of capital.
u) Transaction costs
Transaction costs are incremental costs that are directly attributable to the acquisition, issue or disposal of a financialasset or financial liability. An incremental cost is one that would not have been incurred if the entity had not acquired,issued or disposed of the financial instrument. When a financial asset or financial liability is recognised initially, an entityshall measure it at its fair value plus transaction costs that are directly attributable to the acquisition or issue of the financialasset or financial liability.
Transaction costs on the purchase and sale of forwards are included in the purchase and sale price of the investment.They cannot be practically or reliably gathered as they are embedded in the cost of the investment and cannot beseparately verified or disclosed.
Transaction costs on purchases and sales of equities and futures and are included in Net gain from financial instrumentsat FVTPL in the Statement of Comprehensive Income for each Sub-Fund. Depositary transactions costs are included inDepositary/sub-depositary fees in the Statement of Comprehensive Income for each Sub-Fund. These costs areseparately identifiable transaction costs and the total of these costs incurred by each Sub-Fund during the financial yearare disclosed in Note 3 to the financial statements.
v) Securities lending income
Income earned from securities lending activities is accounted for on an accruals basis. Securities lending income isrecognised in the Statement of Comprehensive Income. Investments lent under securities lending agreement continue tobe recognised in the Statement of Financial Position, as the Sub-Funds continue to be exposed to all gains and lossesarising from the ownership of these securities and are measured in accordance with the accounting policy for financialinstruments.
w) Interest payable
Interest payable is stated at its accrued value.
3. Fees and expenses
Management Fees, Sub-Investment Managers' Fees and Voluntary Cap
The Manager is responsible for the payment of the Investment Manager’s fee and the Distributor’s fee (includingreasonable out of pocket expenses) out of the management fee. The fees and expenses of any Sub-Investment Manager,State Street Fund Services (Ireland) Limited (the “Administrator”) and State Street Custodial Services (Ireland) Limited (the“Depositary”) (including reasonable out of pocket expenses) shall be paid out of the assets of the relevant Sub-Fund.Investments by Sub-Funds of the CCF into funds also managed by the Manager are not charged a management fee at thelevel of the underlying fund, thereby ensuring that there is no double charging of fees by the Manager. The Sub-Fundsmay be charged a hedging fee on any investments by the Sub-Funds in to hedged Share Classes of the underlying fund.The aggregate fees and expenses of the Manager, Administrator, Depositary, Investment Manager, distributor and anySub-Investment Manager will not exceed 1.25% per annum of the NAV of the Mercer Passive Sustainable Global EquityUCITS CCF and 3% per annum of the NAV for the remaining Sub-Funds.
The Manager, on behalf of the CCF, can under-take to limit the annual expenses for certain classes within certainSub-Funds through the use of a Voluntary Cap. There was no Voluntary Cap in place for the financial year ended 30 June2021 and 30 June 2020.
Mercer UCITS Common Contractual Fund Notes to the Financial Statementsfor the financial year ended 30 June 2021
(continued)
Mercer UCITS Common Contractual Fund 33
3. Fees and expenses (continued)
Management Fees, Sub-Investment Managers' Fees and Voluntary Cap (continued)
30 Jun 2021 30 Jun 2020
Sub-FundUnit ClassDescription
ManagementFee
MaximumFee
ManagementFee
MaximumFee
Mercer Passive Global REITS Class A1-H-0.0200 JPY 0.02% 3.00% 0.02% 3.00%UCITS CCF Class A3-H-0.0700 € 0.07% 3.00% 0.07% 3.00%
Class A9-H-0.1950 £ GB-1 0.195% 3.00% 0.195% 3.00%Class A13-0.3000 €,Class A13-0.3000 € IE-4 0.30% 3.00% 0.30% 3.00%Class A17-0.5000 € IE-1 0.50% 3.00% 0.50% 3.00%Class A17-H-0.5200 £ GB-4,Class A17-H-0.5200-D £ GB-1,Class A17-H-0.5200-D £ GB-4,Class A17-H-0.5200 CHF 0.52% 3.00% 0.52% 3.00%Class A17-H-0.5200-D £* - - 0.52% 3.00%Class A20-H-0.8200 £,Class A20-H-0.8200 £ GB-1 0.82% 3.00% 0.82% 3.00%Class Z1-0.0000 £,Class Z1-0.0000 US$ 0.00% 3.00% 0.00% 3.00%Class Z1-0.0000 JPY* - - 0.00% 3.00%Class A4-H-0.0950 € 0.095% 3.00% - -Class A1-H-0.0200 SGD,Class Z2-H-0.0200 € 0.02% 3.00% - -Class B2-0.0475 € IE-6 0.0475% 3.00% - -Class B2-H-0.0675 € IE-6 0.0675% 3.00% - -Class A17-0.5000 $ 0.50% 3.00% - -Class A13-H-0.3200 € IE-1 0.32% 3.00% - -
Mercer Passive Global Listed Class A14-0.3500 £ GB-3* - - 0.35% 3.00%Infrastructure UCITS CCF Class A15-H-0.4200 £ GB-3 0.42% 3.00% 0.42% 3.00%
Class A17-0.5000 €,Class A17-0.5000 € IE-3,Class A17-0.5000-D £ GB-6 0.50% 3.00% 0.50% 3.00%Class A17-0.5000-D £* - - 0.50% 3.00%Class A19-0.7000 £ GB-3 0.70% 3.00% 0.70% 3.00%Class A20-H-0.8200 £ GB-3 0.82% 3.00% 0.82% 3.00%Class B2-0.0475 € IE-6 0.0475% 3.00% 0.0475% 3.00%Class B2-H-0.0675 € IE-6 0.0675% 3.00% 0.0675% 3.00%Class Z1-0.0000 $,Class Z1-0.0000 £ 0.00% 3.00% 0.00% 3.00%Class A17-H-0.5200 € IE-3,Class A17-H-0.5200 £ GB-6 0.52% 3.00% - -Class A12-0.2500 SEK 0.25% 3.00% - -Class A17-0.5000 £ GB-6 0.50% 3.00% - -
Mercer Passive Low Volatility Equity Class A14-0.3500 £ GB-3 0.35% 3.00% 0.35% 3.00%UCITS CCF Class A15-H-0.4200 £ GB-3 0.42% 3.00% 0.42% 3.00%
Class A17-0.5000 € IE-3 0.50% 3.00% 0.50% 3.00%Class A17-H-0.5200 € IE-3 0.52% 3.00% 0.52% 3.00%Class A19-0.7000 £ GB-3 0.70% 3.00% 0.70% 3.00%Class A20-H-0.8200 £ GB-3 0.82% 3.00% 0.82% 3.00%Class B2-0.0480 € IE-6 0.048% 3.00% 0.048% 3.00%Class B2-H-0.0680 € IE-6 0.068% 3.00% 0.068% 3.00%Class Z1-0.0000 $,Class Z1-0.0000 £ 0.00% 3.00% 0.00% 3.00%Class Z2-H-0.0200 £ 0.02% 3.00% 0.02% 3.00%
Mercer UCITS Common Contractual Fund Notes to the Financial Statementsfor the financial year ended 30 June 2021
(continued)
Mercer UCITS Common Contractual Fund 34
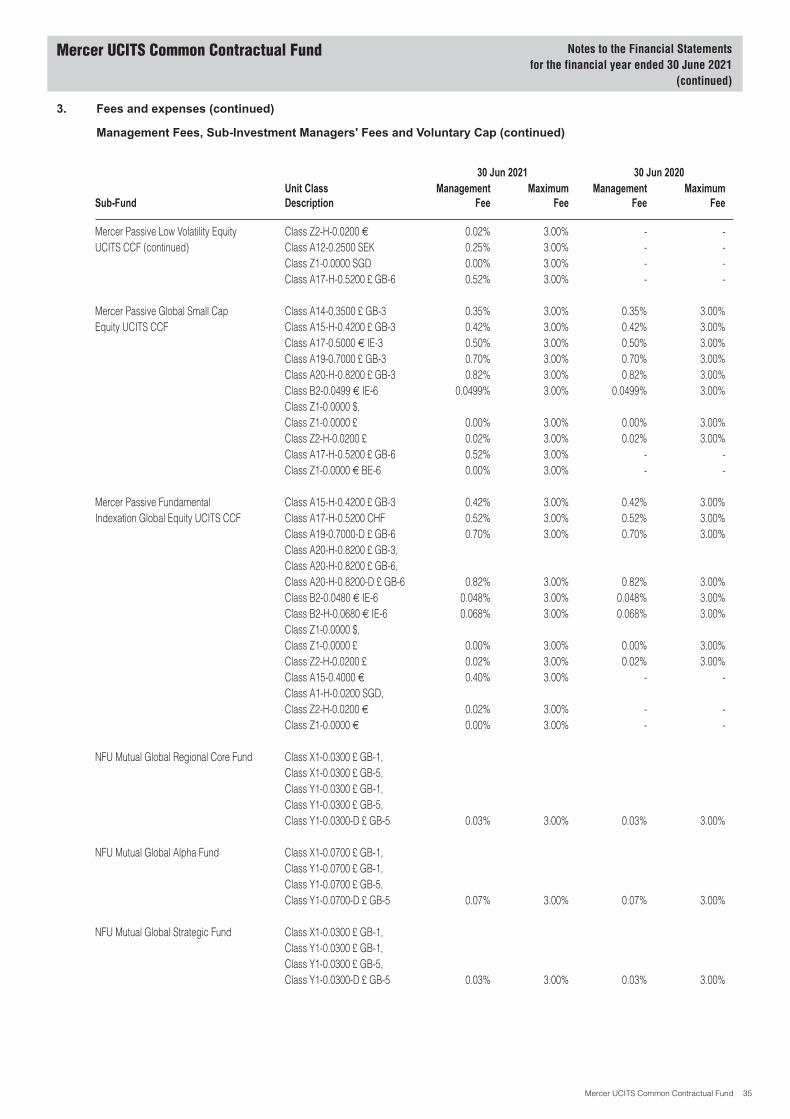
3. Fees and expenses (continued)
Management Fees, Sub-Investment Managers' Fees and Voluntary Cap (continued)
30 Jun 2021 30 Jun 2020
Sub-FundUnit ClassDescription
ManagementFee
MaximumFee
ManagementFee
MaximumFee
Mercer Passive Low Volatility Equity Class Z2-H-0.0200 € 0.02% 3.00% - -UCITS CCF (continued) Class A12-0.2500 SEK 0.25% 3.00% - -
Class Z1-0.0000 SGD 0.00% 3.00% - -Class A17-H-0.5200 £ GB-6 0.52% 3.00% - -
Mercer Passive Global Small Cap Class A14-0.3500 £ GB-3 0.35% 3.00% 0.35% 3.00%Equity UCITS CCF Class A15-H-0.4200 £ GB-3 0.42% 3.00% 0.42% 3.00%
Class A17-0.5000 € IE-3 0.50% 3.00% 0.50% 3.00%Class A19-0.7000 £ GB-3 0.70% 3.00% 0.70% 3.00%Class A20-H-0.8200 £ GB-3 0.82% 3.00% 0.82% 3.00%Class B2-0.0499 € IE-6 0.0499% 3.00% 0.0499% 3.00%Class Z1-0.0000 $,Class Z1-0.0000 £ 0.00% 3.00% 0.00% 3.00%Class Z2-H-0.0200 £ 0.02% 3.00% 0.02% 3.00%Class A17-H-0.5200 £ GB-6 0.52% 3.00% - -Class Z1-0.0000 € BE-6 0.00% 3.00% - -
Mercer Passive Fundamental Class A15-H-0.4200 £ GB-3 0.42% 3.00% 0.42% 3.00%Indexation Global Equity UCITS CCF Class A17-H-0.5200 CHF 0.52% 3.00% 0.52% 3.00%
Class A19-0.7000-D £ GB-6 0.70% 3.00% 0.70% 3.00%Class A20-H-0.8200 £ GB-3,Class A20-H-0.8200 £ GB-6,Class A20-H-0.8200-D £ GB-6 0.82% 3.00% 0.82% 3.00%Class B2-0.0480 € IE-6 0.048% 3.00% 0.048% 3.00%Class B2-H-0.0680 € IE-6 0.068% 3.00% 0.068% 3.00%Class Z1-0.0000 $,Class Z1-0.0000 £ 0.00% 3.00% 0.00% 3.00%Class Z2-H-0.0200 £ 0.02% 3.00% 0.02% 3.00%Class A15-0.4000 € 0.40% 3.00% - -Class A1-H-0.0200 SGD,Class Z2-H-0.0200 € 0.02% 3.00% - -Class Z1-0.0000 € 0.00% 3.00% - -
NFU Mutual Global Regional Core Fund Class X1-0.0300 £ GB-1,Class X1-0.0300 £ GB-5,Class Y1-0.0300 £ GB-1,Class Y1-0.0300 £ GB-5,Class Y1-0.0300-D £ GB-5 0.03% 3.00% 0.03% 3.00%
NFU Mutual Global Alpha Fund Class X1-0.0700 £ GB-1,Class Y1-0.0700 £ GB-1,Class Y1-0.0700 £ GB-5,Class Y1-0.0700-D £ GB-5 0.07% 3.00% 0.07% 3.00%
NFU Mutual Global Strategic Fund Class X1-0.0300 £ GB-1,Class Y1-0.0300 £ GB-1,Class Y1-0.0300 £ GB-5,Class Y1-0.0300-D £ GB-5 0.03% 3.00% 0.03% 3.00%
Mercer UCITS Common Contractual Fund Notes to the Financial Statementsfor the financial year ended 30 June 2021
(continued)
Mercer UCITS Common Contractual Fund 35
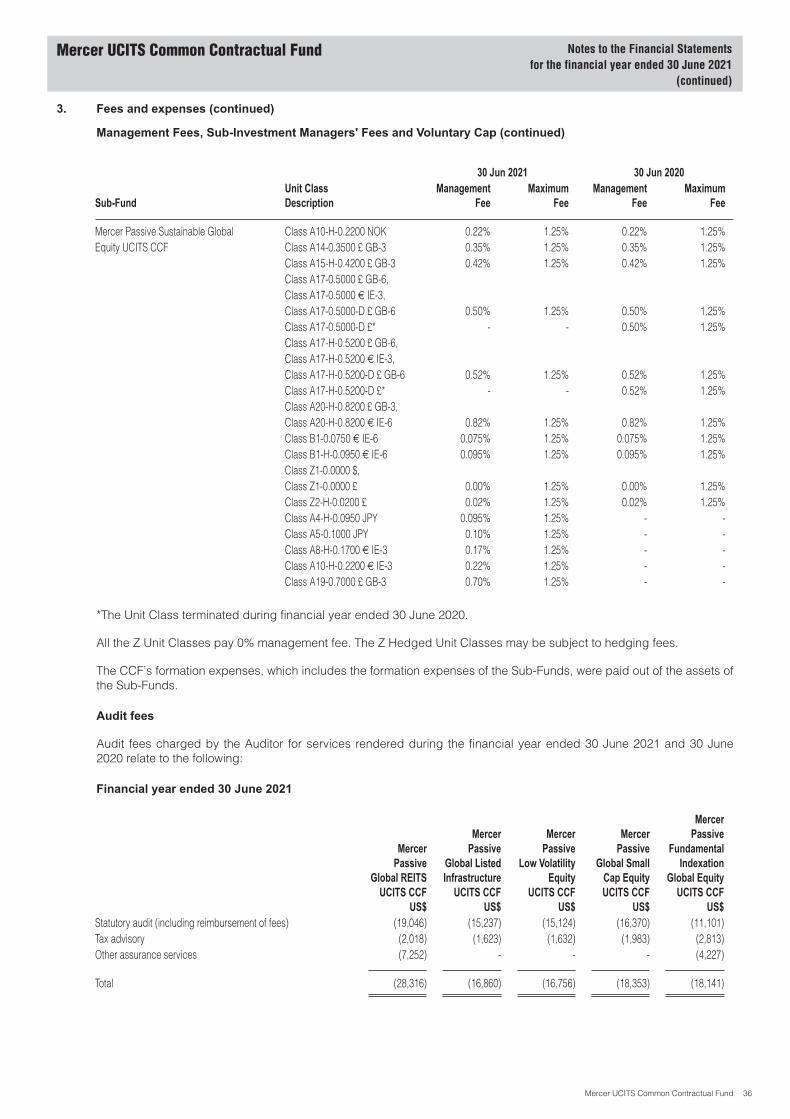
3. Fees and expenses (continued)
Management Fees, Sub-Investment Managers' Fees and Voluntary Cap (continued)
30 Jun 2021 30 Jun 2020
Sub-FundUnit ClassDescription
ManagementFee
MaximumFee
ManagementFee
MaximumFee
Mercer Passive Sustainable Global Class A10-H-0.2200 NOK 0.22% 1.25% 0.22% 1.25%Equity UCITS CCF Class A14-0.3500 £ GB-3 0.35% 1.25% 0.35% 1.25%
Class A15-H-0.4200 £ GB-3 0.42% 1.25% 0.42% 1.25%Class A17-0.5000 £ GB-6,Class A17-0.5000 € IE-3,Class A17-0.5000-D £ GB-6 0.50% 1.25% 0.50% 1.25%Class A17-0.5000-D £* - - 0.50% 1.25%Class A17-H-0.5200 £ GB-6,Class A17-H-0.5200 € IE-3,Class A17-H-0.5200-D £ GB-6 0.52% 1.25% 0.52% 1.25%Class A17-H-0.5200-D £* - - 0.52% 1.25%Class A20-H-0.8200 £ GB-3,Class A20-H-0.8200 € IE-6 0.82% 1.25% 0.82% 1.25%Class B1-0.0750 € IE-6 0.075% 1.25% 0.075% 1.25%Class B1-H-0.0950 € IE-6 0.095% 1.25% 0.095% 1.25%Class Z1-0.0000 $,Class Z1-0.0000 £ 0.00% 1.25% 0.00% 1.25%Class Z2-H-0.0200 £ 0.02% 1.25% 0.02% 1.25%Class A4-H-0.0950 JPY 0.095% 1.25% - -Class A5-0.1000 JPY 0.10% 1.25% - -Class A8-H-0.1700 € IE-3 0.17% 1.25% - -Class A10-H-0.2200 € IE-3 0.22% 1.25% - -Class A19-0.7000 £ GB-3 0.70% 1.25% - -
*The Unit Class terminated during financial year ended 30 June 2020.
All the Z Unit Classes pay 0% management fee. The Z Hedged Unit Classes may be subject to hedging fees.
The CCF’s formation expenses, which includes the formation expenses of the Sub-Funds, were paid out of the assets ofthe Sub-Funds.
Audit fees
Audit fees charged by the Auditor for services rendered during the financial year ended 30 June 2021 and 30 June2020 relate to the following:
Financial year ended 30 June 2021
MercerPassive
Global REITSUCITS CCF
US$
MercerPassive
Global ListedInfrastructure
UCITS CCFUS$
MercerPassive
Low VolatilityEquity
UCITS CCFUS$
MercerPassive
Global SmallCap EquityUCITS CCF
US$
MercerPassive
FundamentalIndexation
Global EquityUCITS CCF
US$Statutory audit (including reimbursement of fees) (19,046) (15,237) (15,124) (16,370) (11,101)Tax advisory (2,018) (1,623) (1,632) (1,983) (2,813)Other assurance services (7,252) - - - (4,227)
Total (28,316) (16,860) (16,756) (18,353) (18,141)
Mercer UCITS Common Contractual Fund Notes to the Financial Statementsfor the financial year ended 30 June 2021
(continued)
Mercer UCITS Common Contractual Fund 36
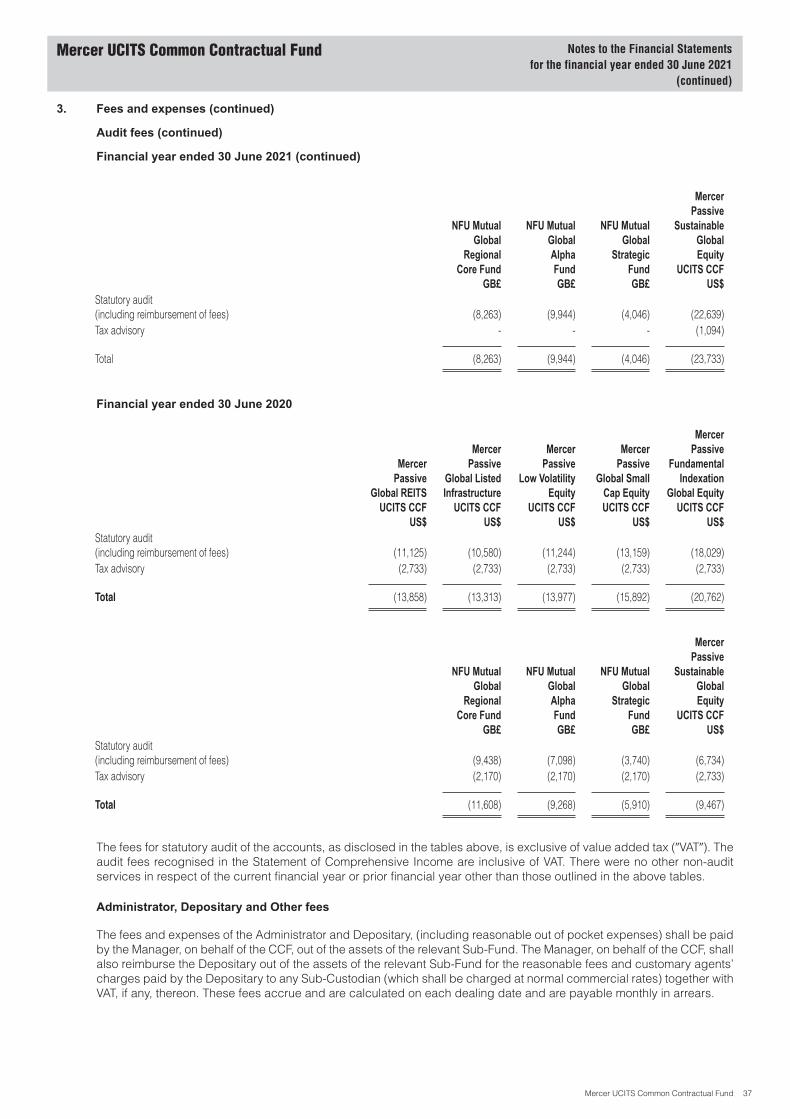
3. Fees and expenses (continued)
Audit fees (continued)
Financial year ended 30 June 2021 (continued)
NFU MutualGlobal
RegionalCore Fund
GB£
NFU MutualGlobalAlphaFundGB£
NFU MutualGlobal
StrategicFundGB£
MercerPassive
SustainableGlobalEquity
UCITS CCFUS$
Statutory audit(including reimbursement of fees) (8,263) (9,944) (4,046) (22,639)Tax advisory - - - (1,094)
Total (8,263) (9,944) (4,046) (23,733)
Financial year ended 30 June 2020
MercerPassive
Global REITSUCITS CCF
US$
MercerPassive
Global ListedInfrastructure
UCITS CCFUS$
MercerPassive
Low VolatilityEquity
UCITS CCFUS$
MercerPassive
Global SmallCap EquityUCITS CCF
US$
MercerPassive
FundamentalIndexation
Global EquityUCITS CCF
US$Statutory audit(including reimbursement of fees) (11,125) (10,580) (11,244) (13,159) (18,029)Tax advisory (2,733) (2,733) (2,733) (2,733) (2,733)
Total (13,858) (13,313) (13,977) (15,892) (20,762)
NFU MutualGlobal
RegionalCore Fund
GB£
NFU MutualGlobalAlphaFundGB£
NFU MutualGlobal
StrategicFundGB£
MercerPassive
SustainableGlobalEquity
UCITS CCFUS$
Statutory audit(including reimbursement of fees) (9,438) (7,098) (3,740) (6,734)Tax advisory (2,170) (2,170) (2,170) (2,733)
Total (11,608) (9,268) (5,910) (9,467)
The fees for statutory audit of the accounts, as disclosed in the tables above, is exclusive of value added tax (�VAT�). Theaudit fees recognised in the Statement of Comprehensive Income are inclusive of VAT. There were no other non-auditservices in respect of the current financial year or prior financial year other than those outlined in the above tables.
Administrator, Depositary and Other fees
The fees and expenses of the Administrator and Depositary, (including reasonable out of pocket expenses) shall be paidby the Manager, on behalf of the CCF, out of the assets of the relevant Sub-Fund. The Manager, on behalf of the CCF, shallalso reimburse the Depositary out of the assets of the relevant Sub-Fund for the reasonable fees and customary agents’charges paid by the Depositary to any Sub-Custodian (which shall be charged at normal commercial rates) together withVAT, if any, thereon. These fees accrue and are calculated on each dealing date and are payable monthly in arrears.
Mercer UCITS Common Contractual Fund Notes to the Financial Statementsfor the financial year ended 30 June 2021
(continued)
Mercer UCITS Common Contractual Fund 37

3. Fees and expenses (continued)
Administrator, Depositary and Other fees (continued)
The Sub-Funds are charged Administration fees, which includes fund accounting, Unit Class fees, transfer agency,financial and tax reporting fees, at fee rates ranging between 0.425 basis points (“bps”) and 1.5bps of the NAV based onthe daily Assets under Administration (“AUA”). The Sub-Funds are charged Depositary fees, at fee rates ranging between0.18bps and 0.625bps of the NAV based on the daily AUA.
The Sub-Funds are charged Sub-Investment Managers’ fees, fees incurred by the Sub-Funds during the financial yearare recognised within Expenses in the Statement of Comprehensive Income.
The table below outlines the Administration fees, Depositary fees and Other fees incurred during the financial year ended30 June 2021 and 30 June 2020 and the amounts payable at the financial year/period end:
Financial year ended 30 June 2021
MercerPassive
Global REITSUCITS CCF
US$
MercerPassive
Global ListedInfrastructure
UCITS CCFUS$
MercerPassive
Low VolatilityEquity
UCITS CCFUS$
MercerPassive
Global SmallCap EquityUCITS CCF
US$
MercerPassive
FundamentalIndexation
Global EquityUCITS CCF
US$Administration fees (145,927) (113,446) (122,710) (138,957) (181,475)Administration fees payable (28,522) (22,139) (24,264) (24,575) (19,824)Depositary fees (56,084) (44,302) (47,109) (54,039) (70,077)Depositary fees payable (11,347) (8,807) (9,653) (9,776) (7,887)Other fees (573,821) (489,403) (909,863) (794,115) (1,343,042)Other fees payable (328,772) (278,564) (310,335) (225,086) (357,725)
NFU MutualGlobal
RegionalCore Fund
GB£
NFU MutualGlobalAlphaFundGB£
NFU MutualGlobal
StrategicFundGB£
MercerPassive
SustainableGlobalEquity
UCITS CCFUS$
Administration fees (117,500) (158,852) (32,531) (102,430)Administration fees payable (23,109) (27,862) (5,722) (31,449)Depositary fees (48,909) (66,143) (12,878) (39,126)Depositary fees payable (9,632) (11,613) (2,277) (12,511)Other fees (269,903) (3,608,488) (96,802) (682,227)Other fees payable (165,890) (1,674,240) (150,904) (682,741)
Financial year ended 30 June 2020
MercerPassive
Global REITSUCITS CCF
US$
MercerPassive
Global ListedInfrastructure
UCITS CCFUS$
MercerPassive
Low VolatilityEquity
UCITS CCFUS$
MercerPassive
Global SmallCap EquityUCITS CCF
US$
MercerPassive
FundamentalIndexation
Global EquityUCITS CCF
US$Administration fees (87,044) (72,187) (95,562) (80,727) (115,403)Administration fees payable (20,644) (19,557) (20,534) (23,296) (27,119)Depositary fees (32,341) (28,202) (36,329) (32,005) (45,706)Depositary fees payable (8,345) (7,891) (8,326) (9,330) (11,060)Other fees (277,329) (292,021) (687,375) (418,652) (702,735)Other fees payable (143,191) (135,454) (432,081) (131,970) (446,979)
Mercer UCITS Common Contractual Fund Notes to the Financial Statementsfor the financial year ended 30 June 2021
(continued)
Mercer UCITS Common Contractual Fund 38
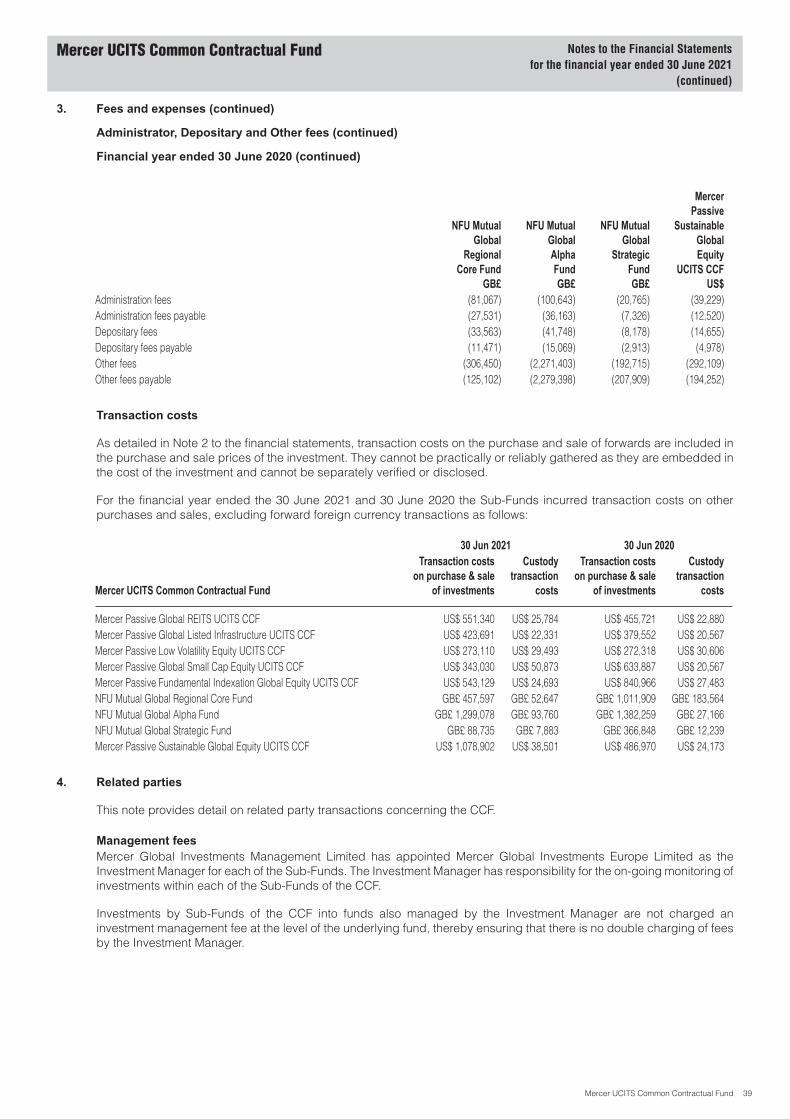
3. Fees and expenses (continued)
Administrator, Depositary and Other fees (continued)
Financial year ended 30 June 2020 (continued)
NFU MutualGlobal
RegionalCore Fund
GB£
NFU MutualGlobalAlphaFundGB£
NFU MutualGlobal
StrategicFundGB£
MercerPassive
SustainableGlobalEquity
UCITS CCFUS$
Administration fees (81,067) (100,643) (20,765) (39,229)Administration fees payable (27,531) (36,163) (7,326) (12,520)Depositary fees (33,563) (41,748) (8,178) (14,655)Depositary fees payable (11,471) (15,069) (2,913) (4,978)Other fees (306,450) (2,271,403) (192,715) (292,109)Other fees payable (125,102) (2,279,398) (207,909) (194,252)
Transaction costs
As detailed in Note 2 to the financial statements, transaction costs on the purchase and sale of forwards are included inthe purchase and sale prices of the investment. They cannot be practically or reliably gathered as they are embedded inthe cost of the investment and cannot be separately verified or disclosed.
For the financial year ended the 30 June 2021 and 30 June 2020 the Sub-Funds incurred transaction costs on otherpurchases and sales, excluding forward foreign currency transactions as follows:
30 Jun 2021 30 Jun 2020
Mercer UCITS Common Contractual Fund
Transaction costson purchase & sale
of investments
Custodytransaction
costs
Transaction costson purchase & sale
of investments
Custodytransaction
costs
Mercer Passive Global REITS UCITS CCF US$ 551,340 US$ 25,784 US$ 455,721 US$ 22,880Mercer Passive Global Listed Infrastructure UCITS CCF US$ 423,691 US$ 22,331 US$ 379,552 US$ 20,567Mercer Passive Low Volatility Equity UCITS CCF US$ 273,110 US$ 29,493 US$ 272,318 US$ 30,606Mercer Passive Global Small Cap Equity UCITS CCF US$ 343,030 US$ 50,873 US$ 633,887 US$ 20,567Mercer Passive Fundamental Indexation Global Equity UCITS CCF US$ 543,129 US$ 24,693 US$ 840,966 US$ 27,483NFU Mutual Global Regional Core Fund GB£ 457,597 GB£ 52,647 GB£ 1,011,909 GB£ 183,564NFU Mutual Global Alpha Fund GB£ 1,299,078 GB£ 93,760 GB£ 1,382,259 GB£ 27,166NFU Mutual Global Strategic Fund GB£ 88,735 GB£ 7,883 GB£ 366,848 GB£ 12,239Mercer Passive Sustainable Global Equity UCITS CCF US$ 1,078,902 US$ 38,501 US$ 486,970 US$ 24,173
4. Related parties
This note provides detail on related party transactions concerning the CCF.
Management feesMercer Global Investments Management Limited has appointed Mercer Global Investments Europe Limited as theInvestment Manager for each of the Sub-Funds. The Investment Manager has responsibility for the on-going monitoring ofinvestments within each of the Sub-Funds of the CCF.
Investments by Sub-Funds of the CCF into funds also managed by the Investment Manager are not charged aninvestment management fee at the level of the underlying fund, thereby ensuring that there is no double charging of feesby the Investment Manager.
Mercer UCITS Common Contractual Fund Notes to the Financial Statementsfor the financial year ended 30 June 2021
(continued)
Mercer UCITS Common Contractual Fund 39
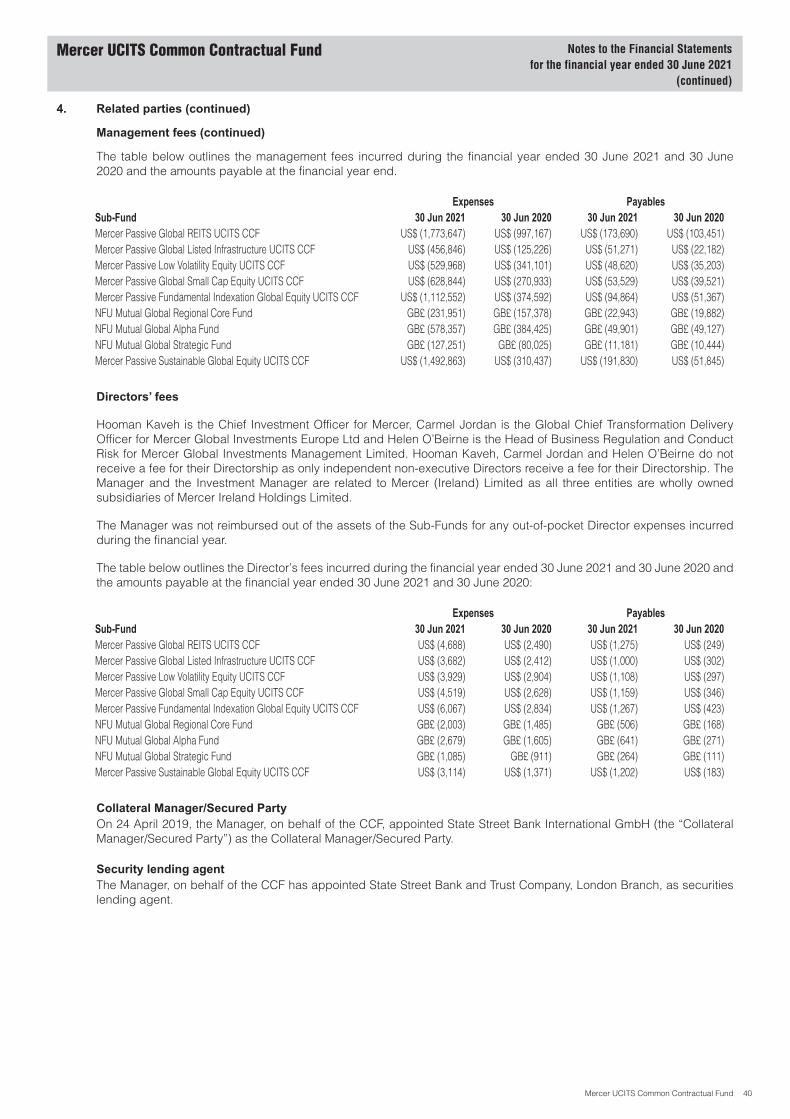
4. Related parties (continued)
Management fees (continued)
The table below outlines the management fees incurred during the financial year ended 30 June 2021 and 30 June2020 and the amounts payable at the financial year end.
Expenses PayablesSub-Fund 30 Jun 2021 30 Jun 2020 30 Jun 2021 30 Jun 2020Mercer Passive Global REITS UCITS CCF US$ (1,773,647) US$ (997,167) US$ (173,690) US$ (103,451)Mercer Passive Global Listed Infrastructure UCITS CCF US$ (456,846) US$ (125,226) US$ (51,271) US$ (22,182)Mercer Passive Low Volatility Equity UCITS CCF US$ (529,968) US$ (341,101) US$ (48,620) US$ (35,203)Mercer Passive Global Small Cap Equity UCITS CCF US$ (628,844) US$ (270,933) US$ (53,529) US$ (39,521)Mercer Passive Fundamental Indexation Global Equity UCITS CCF US$ (1,112,552) US$ (374,592) US$ (94,864) US$ (51,367)NFU Mutual Global Regional Core Fund GB£ (231,951) GB£ (157,378) GB£ (22,943) GB£ (19,882)NFU Mutual Global Alpha Fund GB£ (578,357) GB£ (384,425) GB£ (49,901) GB£ (49,127)NFU Mutual Global Strategic Fund GB£ (127,251) GB£ (80,025) GB£ (11,181) GB£ (10,444)Mercer Passive Sustainable Global Equity UCITS CCF US$ (1,492,863) US$ (310,437) US$ (191,830) US$ (51,845)
Directors’ fees
Hooman Kaveh is the Chief Investment Officer for Mercer, Carmel Jordan is the Global Chief Transformation DeliveryOfficer for Mercer Global Investments Europe Ltd and Helen O’Beirne is the Head of Business Regulation and ConductRisk for Mercer Global Investments Management Limited. Hooman Kaveh, Carmel Jordan and Helen O’Beirne do notreceive a fee for their Directorship as only independent non-executive Directors receive a fee for their Directorship. TheManager and the Investment Manager are related to Mercer (Ireland) Limited as all three entities are wholly ownedsubsidiaries of Mercer Ireland Holdings Limited.
The Manager was not reimbursed out of the assets of the Sub-Funds for any out-of-pocket Director expenses incurredduring the financial year.
The table below outlines the Director’s fees incurred during the financial year ended 30 June 2021 and 30 June 2020 andthe amounts payable at the financial year ended 30 June 2021 and 30 June 2020:
Expenses PayablesSub-Fund 30 Jun 2021 30 Jun 2020 30 Jun 2021 30 Jun 2020Mercer Passive Global REITS UCITS CCF US$ (4,688) US$ (2,490) US$ (1,275) US$ (249)Mercer Passive Global Listed Infrastructure UCITS CCF US$ (3,682) US$ (2,412) US$ (1,000) US$ (302)Mercer Passive Low Volatility Equity UCITS CCF US$ (3,929) US$ (2,904) US$ (1,108) US$ (297)Mercer Passive Global Small Cap Equity UCITS CCF US$ (4,519) US$ (2,628) US$ (1,159) US$ (346)Mercer Passive Fundamental Indexation Global Equity UCITS CCF US$ (6,067) US$ (2,834) US$ (1,267) US$ (423)NFU Mutual Global Regional Core Fund GB£ (2,003) GB£ (1,485) GB£ (506) GB£ (168)NFU Mutual Global Alpha Fund GB£ (2,679) GB£ (1,605) GB£ (641) GB£ (271)NFU Mutual Global Strategic Fund GB£ (1,085) GB£ (911) GB£ (264) GB£ (111)Mercer Passive Sustainable Global Equity UCITS CCF US$ (3,114) US$ (1,371) US$ (1,202) US$ (183)
Collateral Manager/Secured PartyOn 24 April 2019, the Manager, on behalf of the CCF, appointed State Street Bank International GmbH (the “CollateralManager/Secured Party”) as the Collateral Manager/Secured Party.
Security lending agentThe Manager, on behalf of the CCF has appointed State Street Bank and Trust Company, London Branch, as securitieslending agent.
Mercer UCITS Common Contractual Fund Notes to the Financial Statementsfor the financial year ended 30 June 2021
(continued)
Mercer UCITS Common Contractual Fund 40
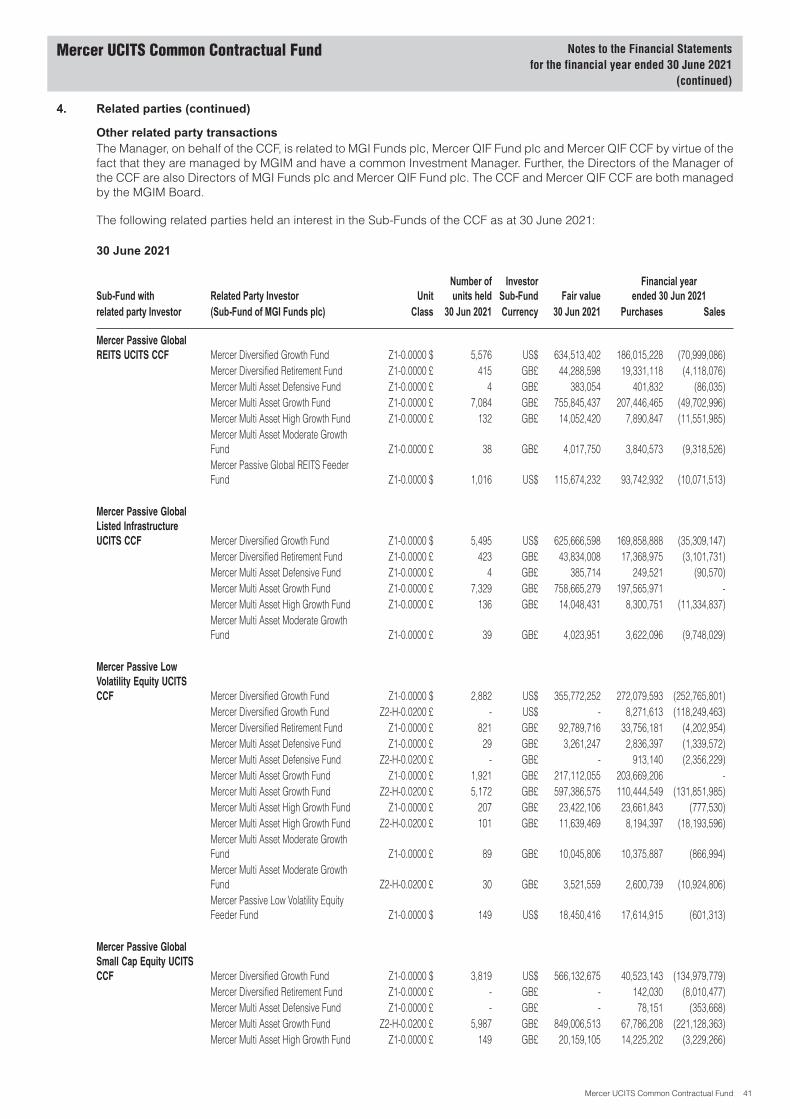
4. Related parties (continued)
Other related party transactionsThe Manager, on behalf of the CCF, is related to MGI Funds plc, Mercer QIF Fund plc and Mercer QIF CCF by virtue of thefact that they are managed by MGIM and have a common Investment Manager. Further, the Directors of the Manager ofthe CCF are also Directors of MGI Funds plc and Mercer QIF Fund plc. The CCF and Mercer QIF CCF are both managedby the MGIM Board.
The following related parties held an interest in the Sub-Funds of the CCF as at 30 June 2021:
30 June 2021
Sub-Fund with Related Party Investor UnitNumber ofunits held
InvestorSub-Fund Fair value
Financial yearended 30 Jun 2021
related party Investor (Sub-Fund of MGI Funds plc) Class 30 Jun 2021 Currency 30 Jun 2021 Purchases Sales
Mercer Passive GlobalREITS UCITS CCF Mercer Diversified Growth Fund Z1-0.0000 $ 5,576 US$ 634,513,402 186,015,228 (70,999,086)
Mercer Diversified Retirement Fund Z1-0.0000 £ 415 GB£ 44,288,598 19,331,118 (4,118,076)Mercer Multi Asset Defensive Fund Z1-0.0000 £ 4 GB£ 383,054 401,832 (86,035)Mercer Multi Asset Growth Fund Z1-0.0000 £ 7,084 GB£ 755,845,437 207,446,465 (49,702,996)Mercer Multi Asset High Growth Fund Z1-0.0000 £ 132 GB£ 14,052,420 7,890,847 (11,551,985)Mercer Multi Asset Moderate GrowthFund Z1-0.0000 £ 38 GB£ 4,017,750 3,840,573 (9,318,526)Mercer Passive Global REITS FeederFund Z1-0.0000 $ 1,016 US$ 115,674,232 93,742,932 (10,071,513)
Mercer Passive GlobalListed InfrastructureUCITS CCF Mercer Diversified Growth Fund Z1-0.0000 $ 5,495 US$ 625,666,598 169,858,888 (35,309,147)
Mercer Diversified Retirement Fund Z1-0.0000 £ 423 GB£ 43,834,008 17,368,975 (3,101,731)Mercer Multi Asset Defensive Fund Z1-0.0000 £ 4 GB£ 385,714 249,521 (90,570)Mercer Multi Asset Growth Fund Z1-0.0000 £ 7,329 GB£ 758,665,279 197,565,971 -Mercer Multi Asset High Growth Fund Z1-0.0000 £ 136 GB£ 14,048,431 8,300,751 (11,334,837)Mercer Multi Asset Moderate GrowthFund Z1-0.0000 £ 39 GB£ 4,023,951 3,622,096 (9,748,029)
Mercer Passive LowVolatility Equity UCITSCCF Mercer Diversified Growth Fund Z1-0.0000 $ 2,882 US$ 355,772,252 272,079,593 (252,765,801)
Mercer Diversified Growth Fund Z2-H-0.0200 £ - US$ - 8,271,613 (118,249,463)Mercer Diversified Retirement Fund Z1-0.0000 £ 821 GB£ 92,789,716 33,756,181 (4,202,954)Mercer Multi Asset Defensive Fund Z1-0.0000 £ 29 GB£ 3,261,247 2,836,397 (1,339,572)Mercer Multi Asset Defensive Fund Z2-H-0.0200 £ - GB£ - 913,140 (2,356,229)Mercer Multi Asset Growth Fund Z1-0.0000 £ 1,921 GB£ 217,112,055 203,669,206 -Mercer Multi Asset Growth Fund Z2-H-0.0200 £ 5,172 GB£ 597,386,575 110,444,549 (131,851,985)Mercer Multi Asset High Growth Fund Z1-0.0000 £ 207 GB£ 23,422,106 23,661,843 (777,530)Mercer Multi Asset High Growth Fund Z2-H-0.0200 £ 101 GB£ 11,639,469 8,194,397 (18,193,596)Mercer Multi Asset Moderate GrowthFund Z1-0.0000 £ 89 GB£ 10,045,806 10,375,887 (866,994)Mercer Multi Asset Moderate GrowthFund Z2-H-0.0200 £ 30 GB£ 3,521,559 2,600,739 (10,924,806)Mercer Passive Low Volatility EquityFeeder Fund Z1-0.0000 $ 149 US$ 18,450,416 17,614,915 (601,313)
Mercer Passive GlobalSmall Cap Equity UCITSCCF Mercer Diversified Growth Fund Z1-0.0000 $ 3,819 US$ 566,132,675 40,523,143 (134,979,779)
Mercer Diversified Retirement Fund Z1-0.0000 £ - GB£ - 142,030 (8,010,477)Mercer Multi Asset Defensive Fund Z1-0.0000 £ - GB£ - 78,151 (353,668)Mercer Multi Asset Growth Fund Z2-H-0.0200 £ 5,987 GB£ 849,006,513 67,786,208 (221,128,363)Mercer Multi Asset High Growth Fund Z1-0.0000 £ 149 GB£ 20,159,105 14,225,202 (3,229,266)
Mercer UCITS Common Contractual Fund Notes to the Financial Statementsfor the financial year ended 30 June 2021
(continued)
Mercer UCITS Common Contractual Fund 41
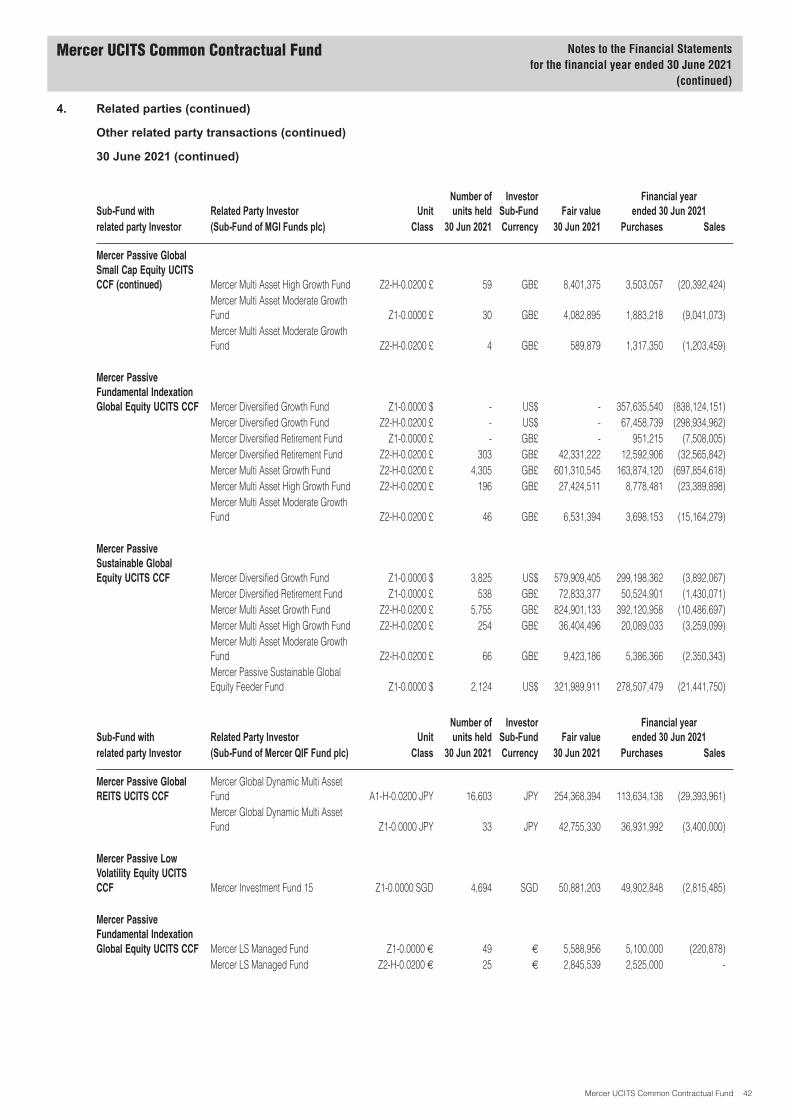
4. Related parties (continued)
Other related party transactions (continued)
30 June 2021 (continued)
Sub-Fund with Related Party Investor UnitNumber ofunits held
InvestorSub-Fund Fair value
Financial yearended 30 Jun 2021
related party Investor (Sub-Fund of MGI Funds plc) Class 30 Jun 2021 Currency 30 Jun 2021 Purchases Sales
Mercer Passive GlobalSmall Cap Equity UCITSCCF (continued) Mercer Multi Asset High Growth Fund Z2-H-0.0200 £ 59 GB£ 8,401,375 3,503,057 (20,392,424)
Mercer Multi Asset Moderate GrowthFund Z1-0.0000 £ 30 GB£ 4,082,895 1,883,218 (9,041,073)Mercer Multi Asset Moderate GrowthFund Z2-H-0.0200 £ 4 GB£ 589,879 1,317,350 (1,203,459)
Mercer PassiveFundamental IndexationGlobal Equity UCITS CCF Mercer Diversified Growth Fund Z1-0.0000 $ - US$ - 357,635,540 (838,124,151)
Mercer Diversified Growth Fund Z2-H-0.0200 £ - US$ - 67,458,739 (298,934,962)Mercer Diversified Retirement Fund Z1-0.0000 £ - GB£ - 951,215 (7,508,005)Mercer Diversified Retirement Fund Z2-H-0.0200 £ 303 GB£ 42,331,222 12,592,906 (32,565,842)Mercer Multi Asset Growth Fund Z2-H-0.0200 £ 4,305 GB£ 601,310,545 163,874,120 (697,854,618)Mercer Multi Asset High Growth Fund Z2-H-0.0200 £ 196 GB£ 27,424,511 8,778,481 (23,389,898)Mercer Multi Asset Moderate GrowthFund Z2-H-0.0200 £ 46 GB£ 6,531,394 3,698,153 (15,164,279)
Mercer PassiveSustainable GlobalEquity UCITS CCF Mercer Diversified Growth Fund Z1-0.0000 $ 3,825 US$ 579,909,405 299,198,362 (3,892,067)
Mercer Diversified Retirement Fund Z1-0.0000 £ 538 GB£ 72,833,377 50,524,901 (1,430,071)Mercer Multi Asset Growth Fund Z2-H-0.0200 £ 5,755 GB£ 824,901,133 392,120,958 (10,486,697)Mercer Multi Asset High Growth Fund Z2-H-0.0200 £ 254 GB£ 36,404,496 20,089,033 (3,259,099)Mercer Multi Asset Moderate GrowthFund Z2-H-0.0200 £ 66 GB£ 9,423,186 5,386,366 (2,350,343)Mercer Passive Sustainable GlobalEquity Feeder Fund Z1-0.0000 $ 2,124 US$ 321,989,911 278,507,479 (21,441,750)
Sub-Fund with Related Party Investor UnitNumber ofunits held
InvestorSub-Fund Fair value
Financial yearended 30 Jun 2021
related party Investor (Sub-Fund of Mercer QIF Fund plc) Class 30 Jun 2021 Currency 30 Jun 2021 Purchases Sales
Mercer Passive GlobalREITS UCITS CCF
Mercer Global Dynamic Multi AssetFund A1-H-0.0200 JPY 16,603 JPY 254,368,394 113,634,138 (29,393,961)Mercer Global Dynamic Multi AssetFund Z1-0.0000 JPY 33 JPY 42,755,330 36,931,992 (3,400,000)
Mercer Passive LowVolatility Equity UCITSCCF Mercer Investment Fund 15 Z1-0.0000 SGD 4,694 SGD 50,881,203 49,902,848 (2,815,485)
Mercer PassiveFundamental IndexationGlobal Equity UCITS CCF Mercer LS Managed Fund Z1-0.0000 € 49 € 5,588,956 5,100,000 (220,878)
Mercer LS Managed Fund Z2-H-0.0200 € 25 € 2,845,539 2,525,000 -
Mercer UCITS Common Contractual Fund Notes to the Financial Statementsfor the financial year ended 30 June 2021
(continued)
Mercer UCITS Common Contractual Fund 42
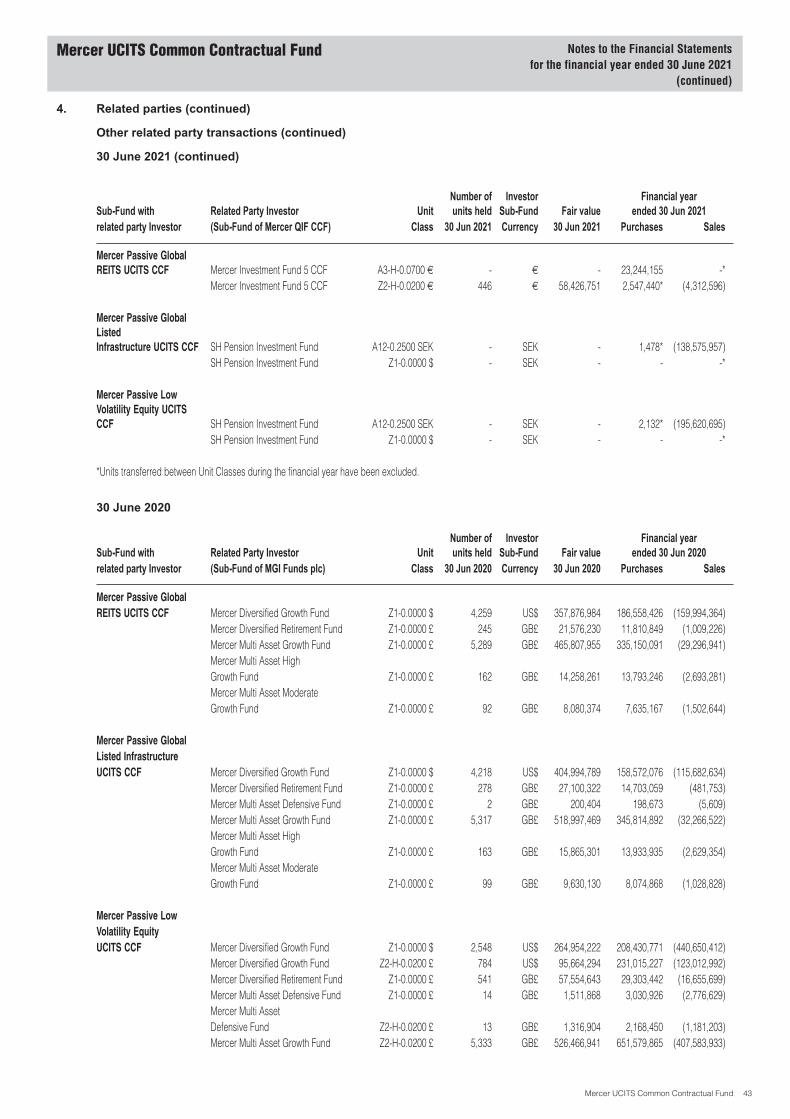
4. Related parties (continued)
Other related party transactions (continued)
30 June 2021 (continued)
Sub-Fund with Related Party Investor UnitNumber ofunits held
InvestorSub-Fund Fair value
Financial yearended 30 Jun 2021
related party Investor (Sub-Fund of Mercer QIF CCF) Class 30 Jun 2021 Currency 30 Jun 2021 Purchases Sales
Mercer Passive GlobalREITS UCITS CCF Mercer Investment Fund 5 CCF A3-H-0.0700 € - € - 23,244,155 -*
Mercer Investment Fund 5 CCF Z2-H-0.0200 € 446 € 58,426,751 2,547,440* (4,312,596)
Mercer Passive GlobalListedInfrastructure UCITS CCF SH Pension Investment Fund A12-0.2500 SEK - SEK - 1,478* (138,575,957)
SH Pension Investment Fund Z1-0.0000 $ - SEK - - -*
Mercer Passive LowVolatility Equity UCITSCCF SH Pension Investment Fund A12-0.2500 SEK - SEK - 2,132* (195,620,695)
SH Pension Investment Fund Z1-0.0000 $ - SEK - - -*
*Units transferred between Unit Classes during the financial year have been excluded.
30 June 2020
Sub-Fund with Related Party Investor UnitNumber ofunits held
InvestorSub-Fund Fair value
Financial yearended 30 Jun 2020
related party Investor (Sub-Fund of MGI Funds plc) Class 30 Jun 2020 Currency 30 Jun 2020 Purchases Sales
Mercer Passive GlobalREITS UCITS CCF Mercer Diversified Growth Fund Z1-0.0000 $ 4,259 US$ 357,876,984 186,558,426 (159,994,364)
Mercer Diversified Retirement Fund Z1-0.0000 £ 245 GB£ 21,576,230 11,810,849 (1,009,226)Mercer Multi Asset Growth Fund Z1-0.0000 £ 5,289 GB£ 465,807,955 335,150,091 (29,296,941)Mercer Multi Asset HighGrowth Fund Z1-0.0000 £ 162 GB£ 14,258,261 13,793,246 (2,693,281)Mercer Multi Asset ModerateGrowth Fund Z1-0.0000 £ 92 GB£ 8,080,374 7,635,167 (1,502,644)
Mercer Passive GlobalListed InfrastructureUCITS CCF Mercer Diversified Growth Fund Z1-0.0000 $ 4,218 US$ 404,994,789 158,572,076 (115,682,634)
Mercer Diversified Retirement Fund Z1-0.0000 £ 278 GB£ 27,100,322 14,703,059 (481,753)Mercer Multi Asset Defensive Fund Z1-0.0000 £ 2 GB£ 200,404 198,673 (5,609)Mercer Multi Asset Growth Fund Z1-0.0000 £ 5,317 GB£ 518,997,469 345,814,892 (32,266,522)Mercer Multi Asset HighGrowth Fund Z1-0.0000 £ 163 GB£ 15,865,301 13,933,935 (2,629,354)Mercer Multi Asset ModerateGrowth Fund Z1-0.0000 £ 99 GB£ 9,630,130 8,074,868 (1,028,828)
Mercer Passive LowVolatility EquityUCITS CCF Mercer Diversified Growth Fund Z1-0.0000 $ 2,548 US$ 264,954,222 208,430,771 (440,650,412)
Mercer Diversified Growth Fund Z2-H-0.0200 £ 784 US$ 95,664,294 231,015,227 (123,012,992)Mercer Diversified Retirement Fund Z1-0.0000 £ 541 GB£ 57,554,643 29,303,442 (16,655,699)Mercer Multi Asset Defensive Fund Z1-0.0000 £ 14 GB£ 1,511,868 3,030,926 (2,776,629)Mercer Multi AssetDefensive Fund Z2-H-0.0200 £ 13 GB£ 1,316,904 2,168,450 (1,181,203)Mercer Multi Asset Growth Fund Z2-H-0.0200 £ 5,333 GB£ 526,466,941 651,579,865 (407,583,933)
Mercer UCITS Common Contractual Fund Notes to the Financial Statementsfor the financial year ended 30 June 2021
(continued)
Mercer UCITS Common Contractual Fund 43
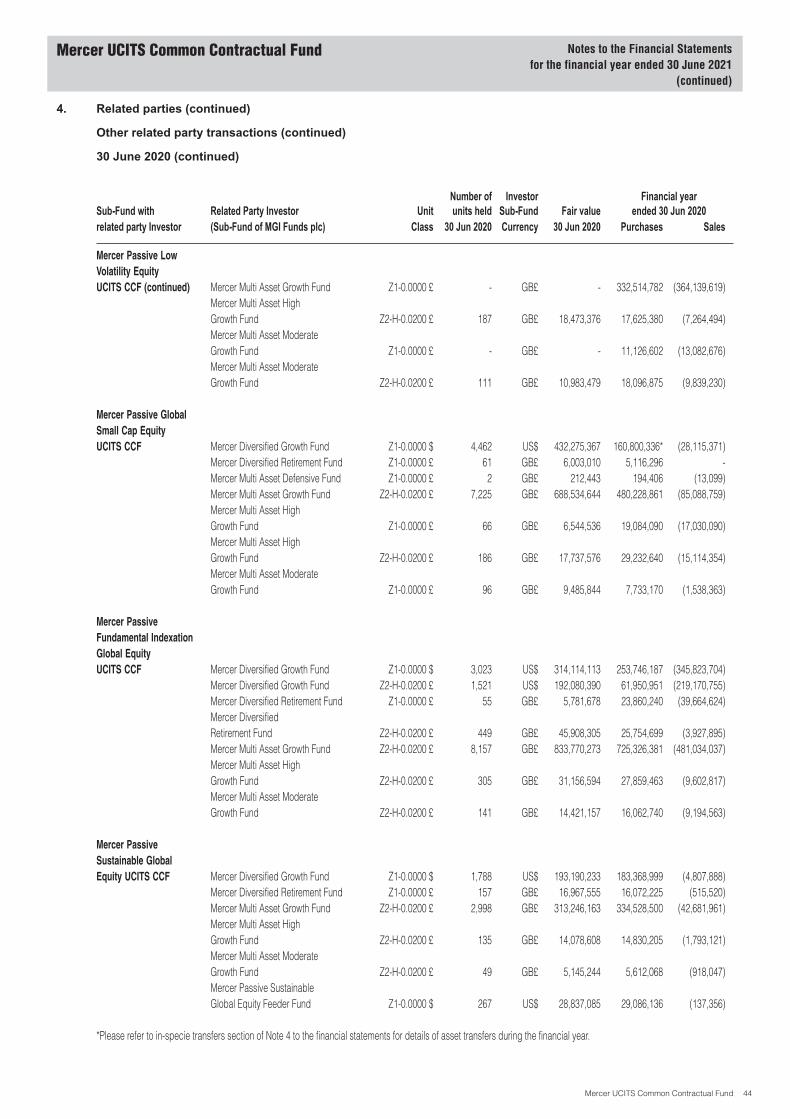
4. Related parties (continued)
Other related party transactions (continued)
30 June 2020 (continued)
Sub-Fund with Related Party Investor UnitNumber ofunits held
InvestorSub-Fund Fair value
Financial yearended 30 Jun 2020
related party Investor (Sub-Fund of MGI Funds plc) Class 30 Jun 2020 Currency 30 Jun 2020 Purchases Sales
Mercer Passive LowVolatility EquityUCITS CCF (continued) Mercer Multi Asset Growth Fund Z1-0.0000 £ - GB£ - 332,514,782 (364,139,619)
Mercer Multi Asset HighGrowth Fund Z2-H-0.0200 £ 187 GB£ 18,473,376 17,625,380 (7,264,494)Mercer Multi Asset ModerateGrowth Fund Z1-0.0000 £ - GB£ - 11,126,602 (13,082,676)Mercer Multi Asset ModerateGrowth Fund Z2-H-0.0200 £ 111 GB£ 10,983,479 18,096,875 (9,839,230)
Mercer Passive GlobalSmall Cap EquityUCITS CCF Mercer Diversified Growth Fund Z1-0.0000 $ 4,462 US$ 432,275,367 160,800,336* (28,115,371)
Mercer Diversified Retirement Fund Z1-0.0000 £ 61 GB£ 6,003,010 5,116,296 -Mercer Multi Asset Defensive Fund Z1-0.0000 £ 2 GB£ 212,443 194,406 (13,099)Mercer Multi Asset Growth Fund Z2-H-0.0200 £ 7,225 GB£ 688,534,644 480,228,861 (85,088,759)Mercer Multi Asset HighGrowth Fund Z1-0.0000 £ 66 GB£ 6,544,536 19,084,090 (17,030,090)Mercer Multi Asset HighGrowth Fund Z2-H-0.0200 £ 186 GB£ 17,737,576 29,232,640 (15,114,354)Mercer Multi Asset ModerateGrowth Fund Z1-0.0000 £ 96 GB£ 9,485,844 7,733,170 (1,538,363)
Mercer PassiveFundamental IndexationGlobal EquityUCITS CCF Mercer Diversified Growth Fund Z1-0.0000 $ 3,023 US$ 314,114,113 253,746,187 (345,823,704)
Mercer Diversified Growth Fund Z2-H-0.0200 £ 1,521 US$ 192,080,390 61,950,951 (219,170,755)Mercer Diversified Retirement Fund Z1-0.0000 £ 55 GB£ 5,781,678 23,860,240 (39,664,624)Mercer DiversifiedRetirement Fund Z2-H-0.0200 £ 449 GB£ 45,908,305 25,754,699 (3,927,895)Mercer Multi Asset Growth Fund Z2-H-0.0200 £ 8,157 GB£ 833,770,273 725,326,381 (481,034,037)Mercer Multi Asset HighGrowth Fund Z2-H-0.0200 £ 305 GB£ 31,156,594 27,859,463 (9,602,817)Mercer Multi Asset ModerateGrowth Fund Z2-H-0.0200 £ 141 GB£ 14,421,157 16,062,740 (9,194,563)
Mercer PassiveSustainable GlobalEquity UCITS CCF Mercer Diversified Growth Fund Z1-0.0000 $ 1,788 US$ 193,190,233 183,368,999 (4,807,888)
Mercer Diversified Retirement Fund Z1-0.0000 £ 157 GB£ 16,967,555 16,072,225 (515,520)Mercer Multi Asset Growth Fund Z2-H-0.0200 £ 2,998 GB£ 313,246,163 334,528,500 (42,681,961)Mercer Multi Asset HighGrowth Fund Z2-H-0.0200 £ 135 GB£ 14,078,608 14,830,205 (1,793,121)Mercer Multi Asset ModerateGrowth Fund Z2-H-0.0200 £ 49 GB£ 5,145,244 5,612,068 (918,047)Mercer Passive SustainableGlobal Equity Feeder Fund Z1-0.0000 $ 267 US$ 28,837,085 29,086,136 (137,356)
*Please refer to in-specie transfers section of Note 4 to the financial statements for details of asset transfers during the financial year.
Mercer UCITS Common Contractual Fund Notes to the Financial Statementsfor the financial year ended 30 June 2021
(continued)
Mercer UCITS Common Contractual Fund 44

4. Related parties (continued)
Other related party transactions (continued)
30 June 2020 (continued)
Sub-Fund with Related Party Investor UnitNumber ofunits held
InvestorSub-Fund Fair value
Financial yearended 30 Jun 2020
related party Investor (Sub-Fund of Mercer QIF Fund plc) Class 30 Jun 2020 Currency 30 Jun 2020 Purchases Sales
Mercer Passive GlobalREITS UCITS CCF Mercer Global Dynamic
Multi Asset Fund Class A1-H-0.0200 JPY 10,160 JPY 116,751,217 111,581,046 (9,514,006)
Mercer Global DynamicMulti Asset Fund Z1-0.0000 JPY - JPY - 56,224,430 (41,624,569)
Sub-Fund with Related Party Investor UnitNumber ofunits held
InvestorSub-Fund Fair value
Financial yearended 30 Jun 2020
related party Investor (Sub-Fund of Mercer QIF CCF) Class 30 Jun 2020 Currency 30 Jun 2020 Purchases Sales
Mercer Passive GlobalREITS UCITS CCF Mercer Investment Fund 5 CCF A3-H-0.0700 € 222,762 € 22,490,035 22,296,232 -
Mercer Passive GlobalListed InfrastructureUCITS CCF SH Pension Investment Fund Z1-0.0000 $ 151 SEK 135,387,418 134,885,648 -
Mercer Passive LowVolatility EquityUCITS CCF SH Pension Investment Fund Z1-0.0000 $ 202 SEK 195,696,271 193,412,960 -
In-specie transfers
30 June 2021There were no in-specie transfers during the financial year ended 30 June 2021.
30 June 2020Mercer Passive Global Small Cap Equity UCITS CCF accepted an in-specie transfer of assets during the financial yearamounting to US$ 301,161,584, which includes cash of US$ 8,653,652.
NFU Mutual Global Regional Core Fund accepted an in-specie transfer of assets during the financial year amounting toGB£ 477,895,107.
NFU Mutual Global Strategic Fund accepted an in-specie transfer of assets during the financial year amounting to GB£332,681,420.
NFU Mutual Global Alpha Fund accepted an in-specie transfer of assets during the financial year amounting to GB£541,399,089.
Unitholders of the Sub-Funds
Significant Unitholders in the Sub-Funds are disclosed in Note 11 to the financial statements.
Class Z Units
Class Z Units are offered primarily to clients of the Investment Manager or its affiliates pursuant to an investmentmanagement agreement. The Sub-Funds and any other fund for which the Manager or any of its affiliates may serve asmanager or investment manager may also invest in Class Z Units. Those investors in the Class Z Units are given a 0%management fee (hedging fees may apply for hedged Unit Classes).
Mercer UCITS Common Contractual Fund Notes to the Financial Statementsfor the financial year ended 30 June 2021
(continued)
Mercer UCITS Common Contractual Fund 45
5. Interests in unconsolidated structured entities
The Sub-Funds meet the definition of an Investment Entity under IFRS 10 and therefore does not consolidate anyinvestments. IFRS 12 requires disclosures around “Unconsolidated Structured Entities”.
IFRS 12 defines a structured entity as an entity that has been designed so that voting or similar rights are not the dominantfactor in deciding who controls the entity, such as when any voting rights relate to the administrative tasks only and therelevant activities are directed by means of contractual agreements. Disclosures are required where an interest is held ina structured entity and where, for example the investor has been involved in the setting up of the structured entity and theinvestor would have exposure to potential losses or costs over and above the amount actually invested.
Where it is within their investment objectives, at 30 June 2021 the Sub-Funds held no investments in investment funds. At30 June 2020 the Sub-Funds held various investments in investment funds. The fair value of the investment funds arerecorded in the Investment funds line in the Statement of Financial Position. All gains and losses are recognised as part ofNet gain from financial instruments at FVTPL in the Statement of Comprehensive Income. The carrying value of theseinvestments is equivalent to fair value, and the Sub-Funds’ maximum exposure to loss from these investments is equal totheir total fair value. Once a Sub-Fund has disposed of its holding in any of these investments, the Sub-Fund ceases to beexposed to any risk from that investment.
At 30 June 2021 and 30 June 2020, there were no significant restrictions on the ability of the structured entity to transferfunds to the Sub-Funds in the form of redemption of the units held by the Sub-Funds. The Sub-Funds have no commitmentor intention to provide financial support or other support to the structured entity.
The Sub-Funds have concluded that open-ended investment funds in which they invest, but that they do not consolidate,meet the definition of structured entities because:• the voting rights in these entities are not the dominant rights in deciding who controls them, as they relate to
administrative tasks only;• each entity’s activities are restricted by its Prospectus; and• the entities have narrow and well-defined objectives to provide investment opportunities to investors.
The table below describes the type of unconsolidated structured entities, nature, purpose and interest held by theSub-Funds.
Type of structured entity Nature and purpose Interests held by the Sub-Fund
Investment funds To manage assets on behalf of third party investors. These vehicles arefinanced through the issue of units to investors. Investment in units issued by the funds
At 30 June 2021 the Sub-Funds held no investments in open ended investment funds. At 30 June 2020 the Sub-Fundsheld no investments in open ended investment funds that exceeded 1% of total net assets of the underlying structuredentity.
6. Taxation
In accordance with Section 739I Taxes Consolidation Act, 1997, the CCF is not subject to Irish taxation on its income orgains and is considered fiscally transparent for Irish tax purposes, provided that all units in the Sub-Funds are: 1)beneficially owned by a person other than an individual; or 2) held for the benefit of a person other than an individual.
Capital gains, dividends and interest received by the Sub-Funds may be subject to withholding tax imposed by thecountry of origin and such taxes may not be recoverable by the Sub-Funds or the Unitholders.
The Sub-Funds currently incur withholding taxes imposed by certain countries on investment income and capital gains.Such income or gains are recorded gross of withholding taxes in the Statement of Comprehensive Income. Withholdingtaxes are shown as a separate item in the Statement of Comprehensive Income.
The Sub-Funds may be subject to taxes imposed on realised and unrealised gains on securities of foreign countries inwhich the Sub-Funds invest. The amount of foreign tax owed, if any, is included in the capital gains taxes in the Statementof Comprehensive Income.
7. Financial Instruments and Associated Risks
Introduction and overview
The Sub-Funds’ financial instruments consist of investments, cash and cash equivalents, derivatives and otherreceivables and payables which are realised or settled within a short period of time. The carrying values of these otherfinancial instruments approximate their fair value.
Mercer UCITS Common Contractual Fund Notes to the Financial Statementsfor the financial year ended 30 June 2021
(continued)
Mercer UCITS Common Contractual Fund 46
7. Financial Instruments and Associated Risks (continued)
Introduction and overview (continued)
The investments of a Sub-Fund in securities and derivatives is subject to normal market fluctuations and other risksinherent in investing in securities and derivatives. In pursuing its investment objectives, the Sub-Funds holds a number ofinvestments, including:
• Equities;• Investment funds;• Bonds;• Cash and liquid resources;• Futures, warrants and forward foreign currency contracts.
The Sub-Funds’ activities expose it to a variety of financial risks: market risk (including currency risk, interest rate risk andequity price risk), credit risk and liquidity risk. The Sub-Funds’ overall risk management program focuses on theunpredictability of financial markets and seeks to minimise potential adverse effects on the Sub-Funds’ financialperformance. The Sub-Funds have maintained the aim of spreading investment risk during the financial year.
The following information is not intended to be a comprehensive summary of all risks and investors should refer to theProspectus and Supplements for a more detailed discussion of the risks inherent in investing in the Sub-Funds.
The Board of Directors of the Manager (the “Directors”) review reports from the Investment Manager in relation to theSub-Funds’ performance and risk profile on a quarterly basis or more frequently as required. The Investment Manager isalso responsible for ensuring that the Sub-Funds are managed in accordance with the terms of each Sub-Fund’sinvestment objective, policy, guidelines and limits as set out in the Prospectus and relevant Supplement, as well as theInvestment Manager’s own internal investment guidelines and limits. The Manager delegates to the Investment Manager,responsibility for the monitoring and risk oversight for the Sub-Funds.
Risk Management Framework
The Sub-Funds’ Depositary is responsible for independent day to day monitoring of compliance of each Sub-Fund’sinvestment guidelines and limits, reporting any breaches to the Manager or Investment Manager as appropriate. Theseguidelines and limits are set to ensure that the risk borne by each Sub-Fund is appropriate. In addition, the InvestmentManager reviews and monitors risk, exposure and performance from internally generated analysis using data fed directlyfrom the Depositary, and this is supplemented with data received directly from the Sub-Investment Manager.
Role of the Investment Manager
The Investment Manager has responsibility for the on-going monitoring of investments within each of the Sub-Funds of theCCF. This includes, but is not limited to, reviewing information on stale and static prices, suspended securities, securitiesin liquidation and securities valued at cost. If the Investment Manager has reasonable belief that the valuation of aparticular security may not reflect fair market value, the VC will meet to consider the appropriate valuation of the securityin question. The VC meets on a regular basis and formally reviews all new fair value assessments and other pricing issues.Ad-hoc fair value approvals may be received via email to the VC members or by means of extraordinary meetings of theVC should the need arise. The VC may then make recommendations to the Directors, who in turn can then review fair valuepricing.
Further to this, the Investment Manager has responsibility for the selection and monitoring of the Sub-InvestmentManagers. To that end, the Investment Manager follows a well defined and rigorous due diligence review of eachSub-Investment Manager. As part of this process the Investment Manager will review the proposed use of FDIs and theSub-Investment Managers’ risk management processes (“RMP”). Additionally, Sub-Investment Managers will agree withthe Investment Managers that their use of FDIs will comply with the provisions of the Sub-Funds/CCF’s RMP. Any materialdeviations to a Sub-Investment Manager’s use of FDI and RMP require the prior notification of and approval of theInvestment Manager. This is a condition of the investment or currency management agreements with the Sub-InvestmentManagers. Each Sub-Investment Manager must complete annual compliance questionnaires and are subject to periodiccompliance reviews by the Compliance Group of the Investment Manager.
The portfolio managers within the Investment Manager monitor the Sub-Funds on an ongoing basis. Any inappropriateuse of FDIs (such as a non-approved FDI) or excessive exposures will typically be picked up as part of their ongoingreview. Apart from ongoing review of the portfolios, the Investment Manager will receive a detailed FDI report monthly fromeach Sub-Investment Manager. The report will list out the FDI positions and give details of the various exposure levels.This is reviewed in detail by the Investment Manager and any issues arising are followed up with the relevantSub-Investment Manager.
Mercer UCITS Common Contractual Fund Notes to the Financial Statementsfor the financial year ended 30 June 2021
(continued)
Mercer UCITS Common Contractual Fund 47
7. Financial Instruments and Associated Risks (continued)
Role of the Administrator
The Administrator provides the fund administration services and valuation of all assets and liabilities including FDIs usedby the Sub-Funds at each valuation point. Any issues that are identified by the Administrator are immediately brought tothe attention of the Investment Manager for further investigation.
Role of the Depositary - Independent Compliance Monitoring
The CCF’s Depositary carries out a separate and independent compliance monitoring role to those carried out by theInvestment Manager, investment service providers, and Administrator. As part of its fiduciary role to a regulated CCF, theDepositary reviews all of the investment objectives and limits (including FDI limits) on an ongoing basis. While notappointed by the Investment Manager (the Depositary is appointed by the CCF), any breaches identified by theDepositary are immediately brought to the attention of the Investment Manager for investigation and resolution.
Role of Sub-Investment Managers
As mentioned above, discretionary investment management has been outsourced to the Sub-Investment Managers. Inaddition to the oversight and independent monitoring being carried out by the Investment Manager, Administrator andDepositary, each Sub-Investment Manager must have adequate controls and procedures in place to manage theirrespective portfolios within the limits prescribed under the UCITS Regulations and the Central Bank guidance in respectof FDIs.
Each Sub-Investment Manager must have a robust RMP in place which is UCITS V compliant. As outlined in the variousSub-Investment Managers’ RMP documents, each Sub-Investment Manager must manage its portfolio in accordancewith the UCITS Regulations and the Central Bank’s guidance on FDIs. Furthermore, the Sub-Investment Managers willonly use the FDIs outlined in their respective RMPs. If a Sub-Investment Manager wishes to use a FDI not covered by theexisting RMP, this change will necessitate an amendment to their RMP document and, by implication, the Sub-Funds RMP.This will require the approval of the Central Bank before the FDI can be used.
Permanent Risk Management Function
The permanent risk management function is provided by the Investment Manager who is responsible for implementingand procuring the implementation by the delegates of their respective obligations under the risk management policy andprocedures. The Investment Manager is responsible for ensuring compliance with the UCITS risk limit system, includingstatutory limits concerning global exposure and counterparty risk. The Investment Manager provides the relevantdesignated person and the Directors with:
• Advice as regards the identification of the risk profile of each managed Sub-Fund;• Reports on the consistency between the current levels of risk incurred by each managed Sub-Fund and the risk
profile agreed for that Sub-Fund;• Reports on exceptions to the compliance of each managed Sub-Fund with relevant investment guidelines and
restrictions which are monitored by the Depositary and reported to the Compliance team daily;• Reports, where applicable, on the adequacy and effectiveness of the RMP, indicating in particular whether
appropriate remedial measures have been taken in the event of any deficiencies; and• Review and support of the arrangements and procedures for the valuation of OTC derivatives.
Market Price Risk
Market price risk results mainly from the uncertainty about the future prices of financial instruments held. It represents thepotential loss a Sub-Fund may suffer through holding market positions in the face of market movements and changes inexchange rates.
All Sub-Funds’ investments present a risk of loss of capital. The Investment Manager and Sub-Investment Managersmoderate this risk through a careful selection of securities and other financial instruments within the specified limits whichhave been approved by the Directors of the Manager.
Market risk is controlled and monitored through the application of pre-agreed portfolio control ranges which cover assetallocation, duration, yield curve and liquidity. The Investment Manager uses historic data to measure market risk, which iscontrolled relative to the benchmark.
Mercer UCITS Common Contractual Fund Notes to the Financial Statementsfor the financial year ended 30 June 2021
(continued)
Mercer UCITS Common Contractual Fund 48

7. Financial Instruments and Associated Risks (continued)
Market Price Risk (continued)
The following tables highlight the market price risk associated with the various financial instruments held by theSub-Funds other than FDIs. The market price risk of futures and warrants is shown separately by Sub-Fund. Other FDIsare not exposed to market price risk.
Transferable securities and Investment fundsSub-FundCurrency
Fair Value30 Jun 2021
Impact of 5%price increase
30 Jun 2021Fair Value
30 Jun 2020
Impact of 5%price increase
30 Jun 2020Transferable securitiesMercer Passive Global REITS UCITS CCF US$ 2,396,616,754 119,830,838 1,251,295,083 62,564,754Mercer Passive Global Listed Infrastructure UCITS CCF US$ 1,909,279,375 95,463,969 1,188,941,418 59,447,071Mercer Passive Low Volatility Equity UCITS CCF US$ 1,909,775,896 95,488,795 1,265,132,218 63,256,611Mercer Passive Global Small Cap Equity UCITS CCF US$ 2,061,047,974 103,052,399 1,478,798,964 73,939,948Mercer Passive Fundamental Indexation Global Equity UCITS CCF US$ 1,412,909,251 70,645,463 2,039,852,361 101,992,618NFU Mutual Global Regional Core Fund GB£ 1,015,111,319 50,755,566 808,123,582 40,406,179NFU Mutual Global Alpha Fund GB£ 1,205,377,709 60,268,885 1,067,450,431 53,372,522NFU Mutual Global Strategic Fund GB£ 498,999,032 24,949,952 429,713,397 21,485,670Mercer Passive Sustainable Global Equity UCITS CCF US$ 2,834,639,843 141,731,992 753,719,655 37,685,983
Investment fundsMercer Passive Global Small Cap Equity UCITS CCF US$ - - 661,460 33,073
Sub-FundCurrency
Notional30 Jun 2021
Impact of 5%price increase
30 Jun 2021Notional
30 Jun 2020
Impact of 5%price increase
30 Jun 2020FDIsFuturesMercer Passive Global REITS UCITS CCF US$ - - 1,858,800 92,940Mercer Passive Low Volatility Equity UCITS CCF US$ 6,546,526 327,326 9,468,385 473,419Mercer Passive Global Small Cap Equity UCITS CCF US$ 18,387,663 919,383 10,261,728 513,086Mercer Passive Fundamental Indexation Global Equity UCITS CCF US$ 5,007,878 250,394 6,889,722 344,486NFU Mutual Global Regional Core Fund GB£ 4,855,013 242,751 9,040,763 452,038NFU Mutual Global Alpha Fund GB£ 98,795 4,940 3,031,449 151,572NFU Mutual Global Strategic Fund GB£ 174,071 8,704 1,061,863 53,093Mercer Passive Sustainable Global Equity UCITS CCF US$ 38,093,083 1,904,654 8,781,617 439,081
WarrantsMercer Passive Global Small Cap Equity UCITS CCF US$ 400 20 - -NFU Mutual Global Regional Core Fund GB£ 37,682 1,884 - -
If the price of each of the Sub-Fund’s underlying investments to which the relevant Sub-Fund had exposure at 30 June2021 and at 30 June 2020 had increased by 5%, with all other variables held constant, the impact is as shown in the tablesabove. Conversely, if the price of each of the Sub-Fund’s underlying investments to which the relevant Sub-Fund hasexposure had decreased by 5%, this would have an equal but opposite effect on net assets attributable to holders ofredeemable participating units of the relevant Sub-Fund.
Liquidity Risk
The Sub-Funds’ assets comprise mainly of realisable securities and investments in investment funds. The Sub-Funds’main liability and exposure is to daily cash redemptions of redeemable units. Assets from a Sub-Fund may need to be soldif insufficient cash is available to finance such redemptions. It therefore invests the majority of its assets in investments thatare traded in an active market and can be readily disposed of.
The Investment Manager carries out a liquidity analysis on a quarterly basis. The liquidity analysis is then reviewed by theInvestment Risk Management Committee and Fund Risk Committee. This liquidity analysis incorporates specific liabilitystress scenarios, which assess the ability of the asset liquidity profile to meet stressed investor redemptions, takinginvestor concentration into consideration. In the event that these stress tests indicate that investors’ stressed liquidityrequirements may exceed the asset liquidity capacity, this will be escalated and brought to the attention of the MGIMBoard as a Key Risk Indicator, alongside analysis and comment as well as any remedial action proposed. The liquidity ofpooled Sub-Funds has been derived with consideration of redemption notification, dealing and settlement terms, in line
Mercer UCITS Common Contractual Fund Notes to the Financial Statementsfor the financial year ended 30 June 2021
(continued)
Mercer UCITS Common Contractual Fund 49
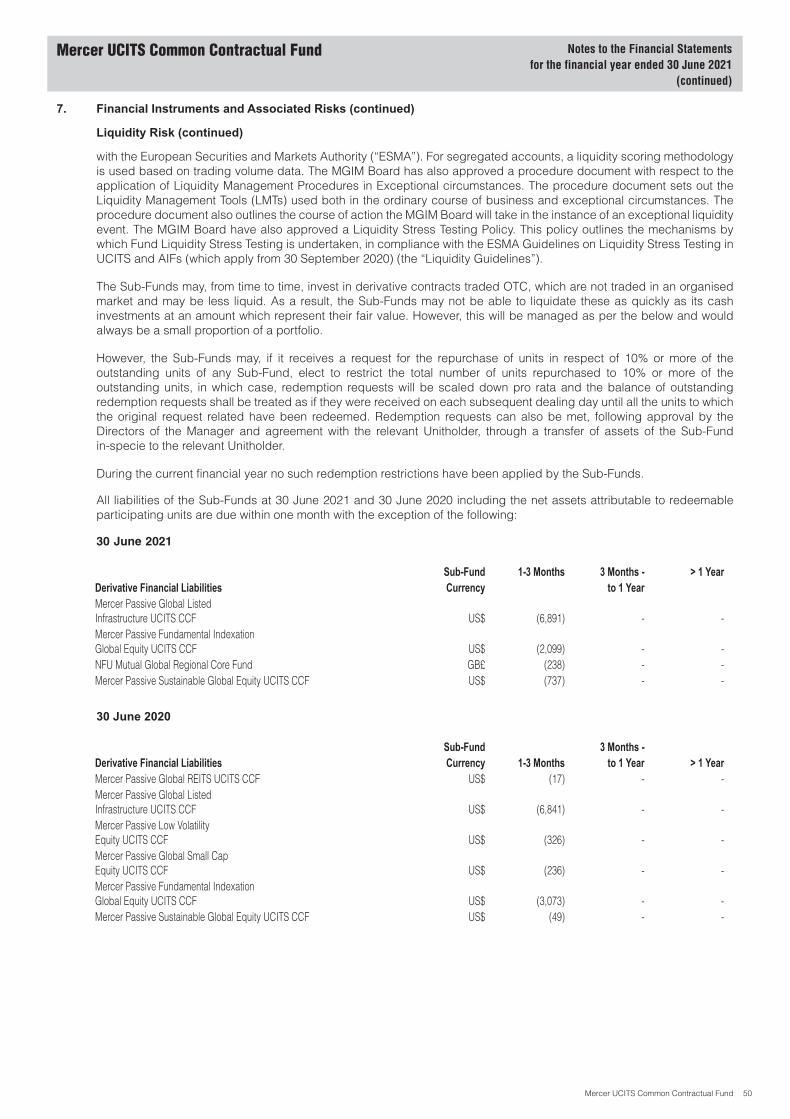
7. Financial Instruments and Associated Risks (continued)
Liquidity Risk (continued)
with the European Securities and Markets Authority (“ESMA”). For segregated accounts, a liquidity scoring methodologyis used based on trading volume data. The MGIM Board has also approved a procedure document with respect to theapplication of Liquidity Management Procedures in Exceptional circumstances. The procedure document sets out theLiquidity Management Tools (LMTs) used both in the ordinary course of business and exceptional circumstances. Theprocedure document also outlines the course of action the MGIM Board will take in the instance of an exceptional liquidityevent. The MGIM Board have also approved a Liquidity Stress Testing Policy. This policy outlines the mechanisms bywhich Fund Liquidity Stress Testing is undertaken, in compliance with the ESMA Guidelines on Liquidity Stress Testing inUCITS and AIFs (which apply from 30 September 2020) (the “Liquidity Guidelines”).
The Sub-Funds may, from time to time, invest in derivative contracts traded OTC, which are not traded in an organisedmarket and may be less liquid. As a result, the Sub-Funds may not be able to liquidate these as quickly as its cashinvestments at an amount which represent their fair value. However, this will be managed as per the below and wouldalways be a small proportion of a portfolio.
However, the Sub-Funds may, if it receives a request for the repurchase of units in respect of 10% or more of theoutstanding units of any Sub-Fund, elect to restrict the total number of units repurchased to 10% or more of theoutstanding units, in which case, redemption requests will be scaled down pro rata and the balance of outstandingredemption requests shall be treated as if they were received on each subsequent dealing day until all the units to whichthe original request related have been redeemed. Redemption requests can also be met, following approval by theDirectors of the Manager and agreement with the relevant Unitholder, through a transfer of assets of the Sub-Fundin-specie to the relevant Unitholder.
During the current financial year no such redemption restrictions have been applied by the Sub-Funds.
All liabilities of the Sub-Funds at 30 June 2021 and 30 June 2020 including the net assets attributable to redeemableparticipating units are due within one month with the exception of the following:
30 June 2021
Sub-Fund 1-3 Months 3 Months - > 1 YearDerivative Financial Liabilities Currency to 1 YearMercer Passive Global ListedInfrastructure UCITS CCF US$ (6,891) - -Mercer Passive Fundamental IndexationGlobal Equity UCITS CCF US$ (2,099) - -NFU Mutual Global Regional Core Fund GB£ (238) - -Mercer Passive Sustainable Global Equity UCITS CCF US$ (737) - -
30 June 2020
Sub-Fund 3 Months -Derivative Financial Liabilities Currency 1-3 Months to 1 Year > 1 YearMercer Passive Global REITS UCITS CCF US$ (17) - -Mercer Passive Global ListedInfrastructure UCITS CCF US$ (6,841) - -Mercer Passive Low VolatilityEquity UCITS CCF US$ (326) - -Mercer Passive Global Small CapEquity UCITS CCF US$ (236) - -Mercer Passive Fundamental IndexationGlobal Equity UCITS CCF US$ (3,073) - -Mercer Passive Sustainable Global Equity UCITS CCF US$ (49) - -
Mercer UCITS Common Contractual Fund Notes to the Financial Statementsfor the financial year ended 30 June 2021
(continued)
Mercer UCITS Common Contractual Fund 50
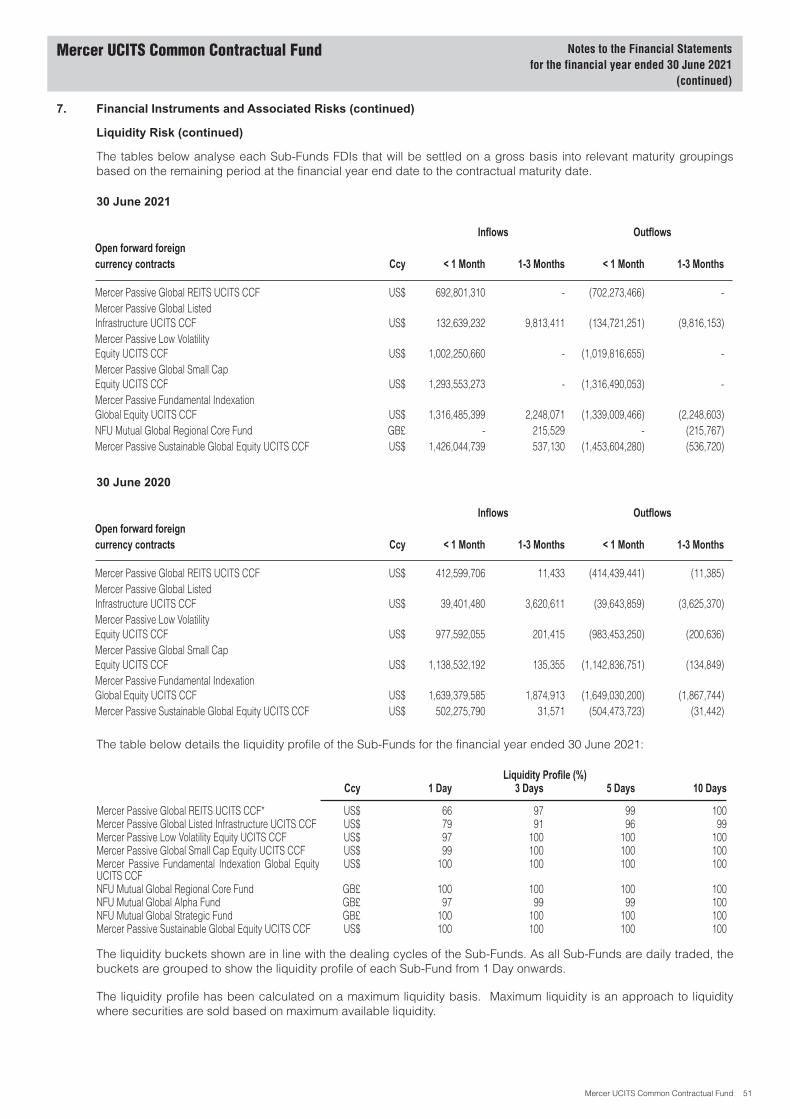
7. Financial Instruments and Associated Risks (continued)
Liquidity Risk (continued)
The tables below analyse each Sub-Funds FDIs that will be settled on a gross basis into relevant maturity groupingsbased on the remaining period at the financial year end date to the contractual maturity date.
30 June 2021
Inflows OutflowsOpen forward foreigncurrency contracts Ccy < 1 Month 1-3 Months < 1 Month 1-3 Months
Mercer Passive Global REITS UCITS CCF US$ 692,801,310 - (702,273,466) -Mercer Passive Global ListedInfrastructure UCITS CCF US$ 132,639,232 9,813,411 (134,721,251) (9,816,153)Mercer Passive Low VolatilityEquity UCITS CCF US$ 1,002,250,660 - (1,019,816,655) -Mercer Passive Global Small CapEquity UCITS CCF US$ 1,293,553,273 - (1,316,490,053) -Mercer Passive Fundamental IndexationGlobal Equity UCITS CCF US$ 1,316,485,399 2,248,071 (1,339,009,466) (2,248,603)NFU Mutual Global Regional Core Fund GB£ - 215,529 - (215,767)Mercer Passive Sustainable Global Equity UCITS CCF US$ 1,426,044,739 537,130 (1,453,604,280) (536,720)
30 June 2020
Inflows OutflowsOpen forward foreigncurrency contracts Ccy < 1 Month 1-3 Months < 1 Month 1-3 Months
Mercer Passive Global REITS UCITS CCF US$ 412,599,706 11,433 (414,439,441) (11,385)Mercer Passive Global ListedInfrastructure UCITS CCF US$ 39,401,480 3,620,611 (39,643,859) (3,625,370)Mercer Passive Low VolatilityEquity UCITS CCF US$ 977,592,055 201,415 (983,453,250) (200,636)Mercer Passive Global Small CapEquity UCITS CCF US$ 1,138,532,192 135,355 (1,142,836,751) (134,849)Mercer Passive Fundamental IndexationGlobal Equity UCITS CCF US$ 1,639,379,585 1,874,913 (1,649,030,200) (1,867,744)Mercer Passive Sustainable Global Equity UCITS CCF US$ 502,275,790 31,571 (504,473,723) (31,442)
The table below details the liquidity profile of the Sub-Funds for the financial year ended 30 June 2021:
Liquidity Profile (%)Ccy 1 Day 3 Days 5 Days 10 Days
Mercer Passive Global REITS UCITS CCF* US$ 66 97 99 100Mercer Passive Global Listed Infrastructure UCITS CCF US$ 79 91 96 99Mercer Passive Low Volatility Equity UCITS CCF US$ 97 100 100 100Mercer Passive Global Small Cap Equity UCITS CCF US$ 99 100 100 100Mercer Passive Fundamental Indexation Global EquityUCITS CCF
US$ 100 100 100 100
NFU Mutual Global Regional Core Fund GB£ 100 100 100 100NFU Mutual Global Alpha Fund GB£ 97 99 99 100NFU Mutual Global Strategic Fund GB£ 100 100 100 100Mercer Passive Sustainable Global Equity UCITS CCF US$ 100 100 100 100
The liquidity buckets shown are in line with the dealing cycles of the Sub-Funds. As all Sub-Funds are daily traded, thebuckets are grouped to show the liquidity profile of each Sub-Fund from 1 Day onwards.
The liquidity profile has been calculated on a maximum liquidity basis. Maximum liquidity is an approach to liquiditywhere securities are sold based on maximum available liquidity.
Mercer UCITS Common Contractual Fund Notes to the Financial Statementsfor the financial year ended 30 June 2021
(continued)
Mercer UCITS Common Contractual Fund 51
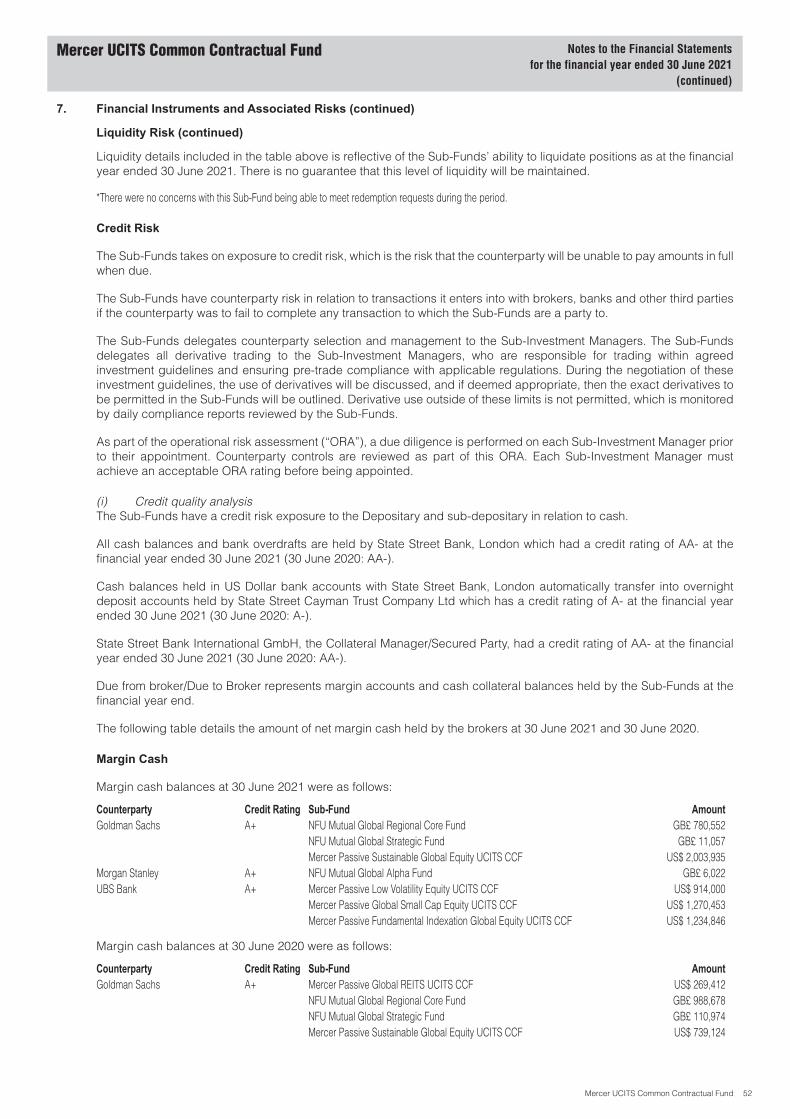
7. Financial Instruments and Associated Risks (continued)
Liquidity Risk (continued)
Liquidity details included in the table above is reflective of the Sub-Funds’ ability to liquidate positions as at the financialyear ended 30 June 2021. There is no guarantee that this level of liquidity will be maintained.
*There were no concerns with this Sub-Fund being able to meet redemption requests during the period.
Credit Risk
The Sub-Funds takes on exposure to credit risk, which is the risk that the counterparty will be unable to pay amounts in fullwhen due.
The Sub-Funds have counterparty risk in relation to transactions it enters into with brokers, banks and other third partiesif the counterparty was to fail to complete any transaction to which the Sub-Funds are a party to.
The Sub-Funds delegates counterparty selection and management to the Sub-Investment Managers. The Sub-Fundsdelegates all derivative trading to the Sub-Investment Managers, who are responsible for trading within agreedinvestment guidelines and ensuring pre-trade compliance with applicable regulations. During the negotiation of theseinvestment guidelines, the use of derivatives will be discussed, and if deemed appropriate, then the exact derivatives tobe permitted in the Sub-Funds will be outlined. Derivative use outside of these limits is not permitted, which is monitoredby daily compliance reports reviewed by the Sub-Funds.
As part of the operational risk assessment (“ORA”), a due diligence is performed on each Sub-Investment Manager priorto their appointment. Counterparty controls are reviewed as part of this ORA. Each Sub-Investment Manager mustachieve an acceptable ORA rating before being appointed.
(i) Credit quality analysisThe Sub-Funds have a credit risk exposure to the Depositary and sub-depositary in relation to cash.
All cash balances and bank overdrafts are held by State Street Bank, London which had a credit rating of AA- at thefinancial year ended 30 June 2021 (30 June 2020: AA-).
Cash balances held in US Dollar bank accounts with State Street Bank, London automatically transfer into overnightdeposit accounts held by State Street Cayman Trust Company Ltd which has a credit rating of A- at the financial yearended 30 June 2021 (30 June 2020: A-).
State Street Bank International GmbH, the Collateral Manager/Secured Party, had a credit rating of AA- at the financialyear ended 30 June 2021 (30 June 2020: AA-).
Due from broker/Due to Broker represents margin accounts and cash collateral balances held by the Sub-Funds at thefinancial year end.
The following table details the amount of net margin cash held by the brokers at 30 June 2021 and 30 June 2020.
Margin Cash
Margin cash balances at 30 June 2021 were as follows:
Counterparty Credit Rating Sub-Fund AmountGoldman Sachs A+ NFU Mutual Global Regional Core Fund GB£ 780,552
NFU Mutual Global Strategic Fund GB£ 11,057Mercer Passive Sustainable Global Equity UCITS CCF US$ 2,003,935
Morgan Stanley A+ NFU Mutual Global Alpha Fund GB£ 6,022UBS Bank A+ Mercer Passive Low Volatility Equity UCITS CCF US$ 914,000
Mercer Passive Global Small Cap Equity UCITS CCF US$ 1,270,453Mercer Passive Fundamental Indexation Global Equity UCITS CCF US$ 1,234,846
Margin cash balances at 30 June 2020 were as follows:
Counterparty Credit Rating Sub-Fund AmountGoldman Sachs A+ Mercer Passive Global REITS UCITS CCF US$ 269,412
NFU Mutual Global Regional Core Fund GB£ 988,678NFU Mutual Global Strategic Fund GB£ 110,974Mercer Passive Sustainable Global Equity UCITS CCF US$ 739,124
Mercer UCITS Common Contractual Fund Notes to the Financial Statementsfor the financial year ended 30 June 2021
(continued)
Mercer UCITS Common Contractual Fund 52

7. Financial Instruments and Associated Risks (continued)
Credit Risk (continued)
(i) Credit quality analysis (continued)
Margin Cash (continued)
Counterparty Credit Rating Sub-Fund AmountMorgan Stanley A+ NFU Mutual Global Alpha Fund GB£ 353,573UBS Bank A+ Mercer Passive Low Volatility Equity UCITS CCF US$ 2,717,724
Mercer Passive Global Small Cap Equity UCITS CCF US$ 2,384,097Mercer Passive Fundamental Indexation Global Equity UCITS CCF US$ 3,445,662
DerivativesThe following are the credit ratings of the counterparties to the derivative contracts held by the Sub-Funds:
30 June 2021 30 June 2020Citigroup A+ A+Goldman Sachs A+ A+HSBC Bank - A+Morgan Stanley A+ -State Street Bank and Trust AA- AA-UBS Bank A+ A+
The Sub-Funds are also exposed to counterparty risk on its derivative positions, being the risk that a counterparty willdefault or be unable to pay in full its financial obligations. Controlling credit risk is paramount in the Investment Manager’schoice of counterparties. Credit risk arising from receivables from investee funds relating to redemptions or transactionsawaiting settlement. Risk relating to unsettled receivables is considered small due to short settlement period involved andthe due diligence permitted on the investee funds. The maximum exposure related to unsettled trades equals the amountshown in the Statement of Financial Position. There are no past due or impaired assets as at 30 June 2021 or at 30 June2020.
Securities Lending
The Sub-Funds may have a credit risk exposure to the counterparties to any securities lending contract. Sub-Fundinvestments can be lent to counterparties over a period of time.
The table below details the value of securities on loan, the value of collateral received for the securities on loan andpercentage of collateral on the value of the loaned securities by Sub-Fund and by Counterparty at 30 June 2021 and30 June 2020.
30 Jun 2021 30 Jun 2020
Sub-Fund Counterparty
S&PCreditRating
Value ofSecurities on
LoanValue of
Collateral
% Collateralon
Value ofLoan
Value ofSecurities on
LoanValue of
Collateral
% Collateralon
Value ofLoan
Mercer PassiveGlobal REITS UCITSCCF
Bank of AmericaMerrill Lynch A+ US$ 10,007,721 US$ 10,559,194 106% US$ 5,070,422 US$ 5,371,996 106%
Citigroup A+ US$ 9,915,256 US$ 10,393,291 105% US$ 7,292,505 US$ 7,763,706 106%Credit Suisse A+ US$ 2,890,051 US$ 3,074,169 106% US$ 6,930,684 US$ 7,351,699 106%HSBC Bank A+ US$ 1,798 US$ 1,865 104% - - -Morgan Stanley A+ US$ 5,921,946 US$ 6,224,910 105% US$ 13,756,736 US$ 14,450,710 105%UBS Bank A+ US$ 2,713,189 US$ 2,861,643 105% US$ 1,661,013 US$ 1,891,056 114%
Mercer PassiveGlobal ListedInfrastructure UCITSCCF
Bank of AmericaMerrill Lynch A+ US$ 5,977,879 US$ 6,285,893 105% US$ 4,170,645 US$ 4,437,292 106%
Credit Suisse A+ US$ 21,029,616 US$ 22,090,822 105% US$ 7,476,232 US$ 7,895,060 106%Morgan Stanley A+ US$ 9,885,576 US$ 10,379,820 105% - - -UBS Bank A+ US$ 5,297,533 US$ 5,586,366 105% US$ 19,951,614 US$ 21,277,523 107%
Mercer UCITS Common Contractual Fund Notes to the Financial Statementsfor the financial year ended 30 June 2021
(continued)
Mercer UCITS Common Contractual Fund 53
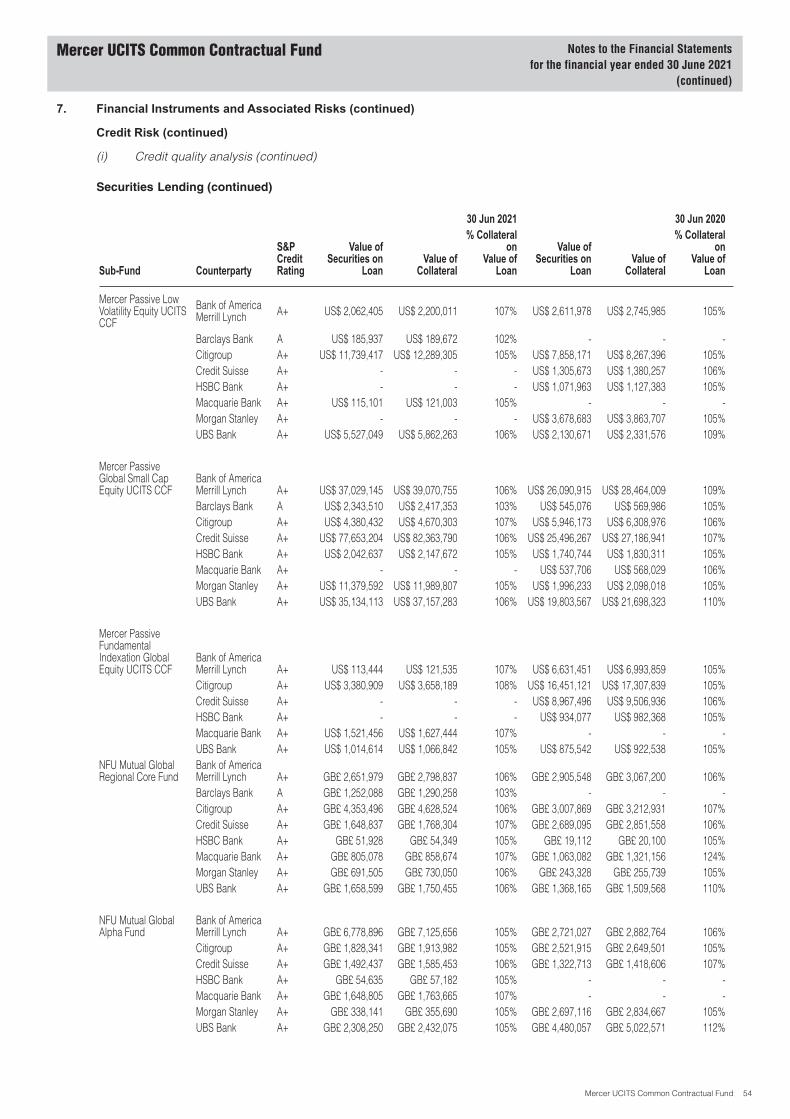
7. Financial Instruments and Associated Risks (continued)
Credit Risk (continued)
(i) Credit quality analysis (continued)
Securities Lending (continued)
30 Jun 2021 30 Jun 2020
Sub-Fund Counterparty
S&PCreditRating
Value ofSecurities on
LoanValue of
Collateral
% Collateralon
Value ofLoan
Value ofSecurities on
LoanValue of
Collateral
% Collateralon
Value ofLoan
Mercer Passive LowVolatility Equity UCITSCCF
Bank of AmericaMerrill Lynch A+ US$ 2,062,405 US$ 2,200,011 107% US$ 2,611,978 US$ 2,745,985 105%
Barclays Bank A US$ 185,937 US$ 189,672 102% - - -Citigroup A+ US$ 11,739,417 US$ 12,289,305 105% US$ 7,858,171 US$ 8,267,396 105%Credit Suisse A+ - - - US$ 1,305,673 US$ 1,380,257 106%HSBC Bank A+ - - - US$ 1,071,963 US$ 1,127,383 105%Macquarie Bank A+ US$ 115,101 US$ 121,003 105% - - -Morgan Stanley A+ - - - US$ 3,678,683 US$ 3,863,707 105%UBS Bank A+ US$ 5,527,049 US$ 5,862,263 106% US$ 2,130,671 US$ 2,331,576 109%
Mercer PassiveGlobal Small CapEquity UCITS CCF
Bank of AmericaMerrill Lynch A+ US$ 37,029,145 US$ 39,070,755 106% US$ 26,090,915 US$ 28,464,009 109%Barclays Bank A US$ 2,343,510 US$ 2,417,353 103% US$ 545,076 US$ 569,986 105%Citigroup A+ US$ 4,380,432 US$ 4,670,303 107% US$ 5,946,173 US$ 6,308,976 106%Credit Suisse A+ US$ 77,653,204 US$ 82,363,790 106% US$ 25,496,267 US$ 27,186,941 107%HSBC Bank A+ US$ 2,042,637 US$ 2,147,672 105% US$ 1,740,744 US$ 1,830,311 105%Macquarie Bank A+ - - - US$ 537,706 US$ 568,029 106%Morgan Stanley A+ US$ 11,379,592 US$ 11,989,807 105% US$ 1,996,233 US$ 2,098,018 105%UBS Bank A+ US$ 35,134,113 US$ 37,157,283 106% US$ 19,803,567 US$ 21,698,323 110%
Mercer PassiveFundamentalIndexation GlobalEquity UCITS CCF
Bank of AmericaMerrill Lynch A+ US$ 113,444 US$ 121,535 107% US$ 6,631,451 US$ 6,993,859 105%Citigroup A+ US$ 3,380,909 US$ 3,658,189 108% US$ 16,451,121 US$ 17,307,839 105%Credit Suisse A+ - - - US$ 8,967,496 US$ 9,506,936 106%HSBC Bank A+ - - - US$ 934,077 US$ 982,368 105%Macquarie Bank A+ US$ 1,521,456 US$ 1,627,444 107% - - -UBS Bank A+ US$ 1,014,614 US$ 1,066,842 105% US$ 875,542 US$ 922,538 105%
NFU Mutual GlobalRegional Core Fund
Bank of AmericaMerrill Lynch A+ GB£ 2,651,979 GB£ 2,798,837 106% GB£ 2,905,548 GB£ 3,067,200 106%Barclays Bank A GB£ 1,252,088 GB£ 1,290,258 103% - - -Citigroup A+ GB£ 4,353,496 GB£ 4,628,524 106% GB£ 3,007,869 GB£ 3,212,931 107%Credit Suisse A+ GB£ 1,648,837 GB£ 1,768,304 107% GB£ 2,689,095 GB£ 2,851,558 106%HSBC Bank A+ GB£ 51,928 GB£ 54,349 105% GB£ 19,112 GB£ 20,100 105%Macquarie Bank A+ GB£ 805,078 GB£ 858,674 107% GB£ 1,063,082 GB£ 1,321,156 124%Morgan Stanley A+ GB£ 691,505 GB£ 730,050 106% GB£ 243,328 GB£ 255,739 105%UBS Bank A+ GB£ 1,658,599 GB£ 1,750,455 106% GB£ 1,368,165 GB£ 1,509,568 110%
NFU Mutual GlobalAlpha Fund
Bank of AmericaMerrill Lynch A+ GB£ 6,778,896 GB£ 7,125,656 105% GB£ 2,721,027 GB£ 2,882,764 106%Citigroup A+ GB£ 1,828,341 GB£ 1,913,982 105% GB£ 2,521,915 GB£ 2,649,501 105%Credit Suisse A+ GB£ 1,492,437 GB£ 1,585,453 106% GB£ 1,322,713 GB£ 1,418,606 107%HSBC Bank A+ GB£ 54,635 GB£ 57,182 105% - - -Macquarie Bank A+ GB£ 1,648,805 GB£ 1,763,665 107% - - -Morgan Stanley A+ GB£ 338,141 GB£ 355,690 105% GB£ 2,697,116 GB£ 2,834,667 105%UBS Bank A+ GB£ 2,308,250 GB£ 2,432,075 105% GB£ 4,480,057 GB£ 5,022,571 112%
Mercer UCITS Common Contractual Fund Notes to the Financial Statementsfor the financial year ended 30 June 2021
(continued)
Mercer UCITS Common Contractual Fund 54
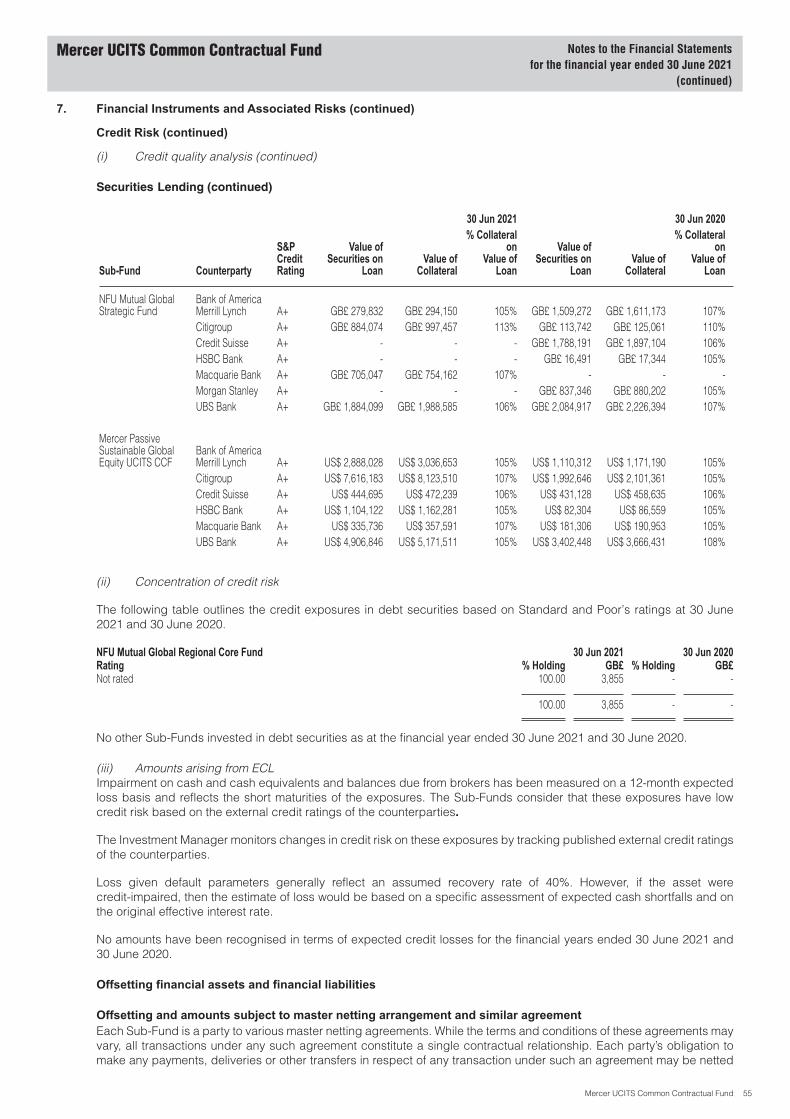
7. Financial Instruments and Associated Risks (continued)
Credit Risk (continued)
(i) Credit quality analysis (continued)
Securities Lending (continued)
30 Jun 2021 30 Jun 2020
Sub-Fund Counterparty
S&PCreditRating
Value ofSecurities on
LoanValue of
Collateral
% Collateralon
Value ofLoan
Value ofSecurities on
LoanValue of
Collateral
% Collateralon
Value ofLoan
NFU Mutual GlobalStrategic Fund
Bank of AmericaMerrill Lynch A+ GB£ 279,832 GB£ 294,150 105% GB£ 1,509,272 GB£ 1,611,173 107%Citigroup A+ GB£ 884,074 GB£ 997,457 113% GB£ 113,742 GB£ 125,061 110%Credit Suisse A+ - - - GB£ 1,788,191 GB£ 1,897,104 106%HSBC Bank A+ - - - GB£ 16,491 GB£ 17,344 105%Macquarie Bank A+ GB£ 705,047 GB£ 754,162 107% - - -Morgan Stanley A+ - - - GB£ 837,346 GB£ 880,202 105%UBS Bank A+ GB£ 1,884,099 GB£ 1,988,585 106% GB£ 2,084,917 GB£ 2,226,394 107%
Mercer PassiveSustainable GlobalEquity UCITS CCF
Bank of AmericaMerrill Lynch A+ US$ 2,888,028 US$ 3,036,653 105% US$ 1,110,312 US$ 1,171,190 105%Citigroup A+ US$ 7,616,183 US$ 8,123,510 107% US$ 1,992,646 US$ 2,101,361 105%Credit Suisse A+ US$ 444,695 US$ 472,239 106% US$ 431,128 US$ 458,635 106%HSBC Bank A+ US$ 1,104,122 US$ 1,162,281 105% US$ 82,304 US$ 86,559 105%Macquarie Bank A+ US$ 335,736 US$ 357,591 107% US$ 181,306 US$ 190,953 105%UBS Bank A+ US$ 4,906,846 US$ 5,171,511 105% US$ 3,402,448 US$ 3,666,431 108%
(ii) Concentration of credit risk
The following table outlines the credit exposures in debt securities based on Standard and Poor’s ratings at 30 June2021 and 30 June 2020.
NFU Mutual Global Regional Core Fund 30 Jun 2021 30 Jun 2020Rating % Holding GB£ % Holding GB£Not rated 100.00 3,855 - -
100.00 3,855 - -
No other Sub-Funds invested in debt securities as at the financial year ended 30 June 2021 and 30 June 2020.
(iii) Amounts arising from ECLImpairment on cash and cash equivalents and balances due from brokers has been measured on a 12-month expectedloss basis and reflects the short maturities of the exposures. The Sub-Funds consider that these exposures have lowcredit risk based on the external credit ratings of the counterparties.
The Investment Manager monitors changes in credit risk on these exposures by tracking published external credit ratingsof the counterparties.
Loss given default parameters generally reflect an assumed recovery rate of 40%. However, if the asset werecredit-impaired, then the estimate of loss would be based on a specific assessment of expected cash shortfalls and onthe original effective interest rate.
No amounts have been recognised in terms of expected credit losses for the financial years ended 30 June 2021 and30 June 2020.
Offsetting financial assets and financial liabilities
Offsetting and amounts subject to master netting arrangement and similar agreementEach Sub-Fund is a party to various master netting agreements. While the terms and conditions of these agreements mayvary, all transactions under any such agreement constitute a single contractual relationship. Each party’s obligation tomake any payments, deliveries or other transfers in respect of any transaction under such an agreement may be netted
Mercer UCITS Common Contractual Fund Notes to the Financial Statementsfor the financial year ended 30 June 2021
(continued)
Mercer UCITS Common Contractual Fund 55
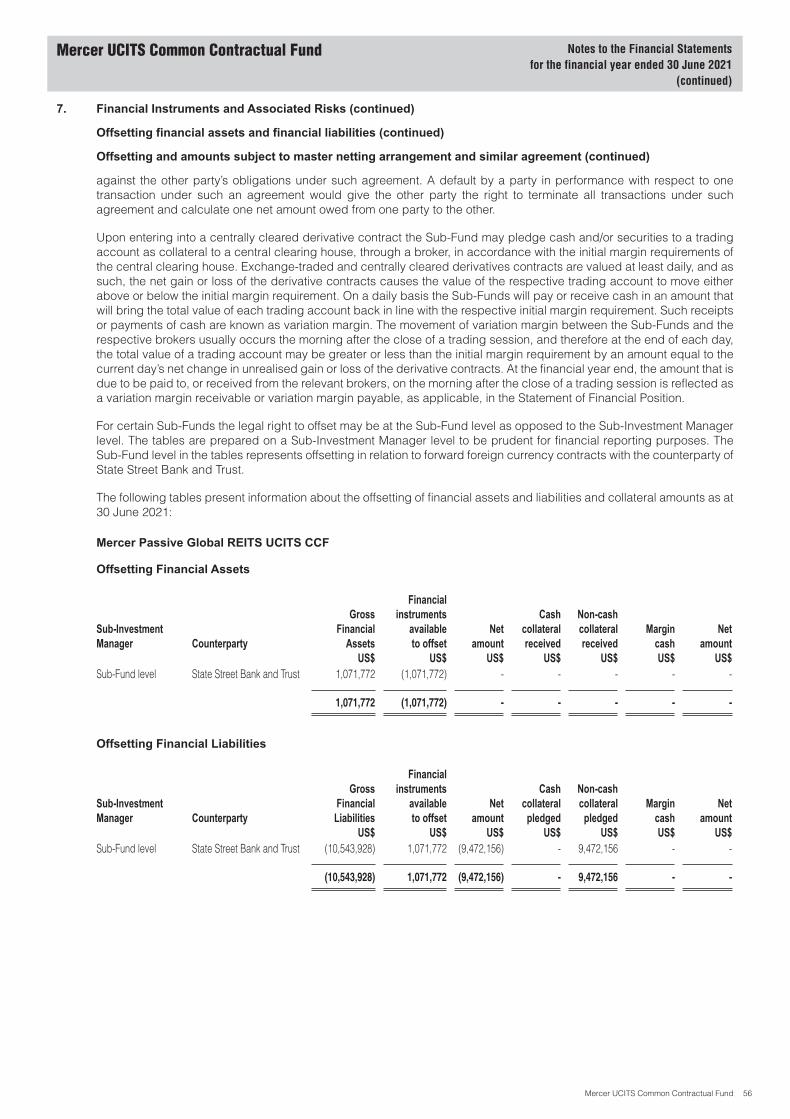
7. Financial Instruments and Associated Risks (continued)
Offsetting financial assets and financial liabilities (continued)
Offsetting and amounts subject to master netting arrangement and similar agreement (continued)
against the other party’s obligations under such agreement. A default by a party in performance with respect to onetransaction under such an agreement would give the other party the right to terminate all transactions under suchagreement and calculate one net amount owed from one party to the other.
Upon entering into a centrally cleared derivative contract the Sub-Fund may pledge cash and/or securities to a tradingaccount as collateral to a central clearing house, through a broker, in accordance with the initial margin requirements ofthe central clearing house. Exchange-traded and centrally cleared derivatives contracts are valued at least daily, and assuch, the net gain or loss of the derivative contracts causes the value of the respective trading account to move eitherabove or below the initial margin requirement. On a daily basis the Sub-Funds will pay or receive cash in an amount thatwill bring the total value of each trading account back in line with the respective initial margin requirement. Such receiptsor payments of cash are known as variation margin. The movement of variation margin between the Sub-Funds and therespective brokers usually occurs the morning after the close of a trading session, and therefore at the end of each day,the total value of a trading account may be greater or less than the initial margin requirement by an amount equal to thecurrent day’s net change in unrealised gain or loss of the derivative contracts. At the financial year end, the amount that isdue to be paid to, or received from the relevant brokers, on the morning after the close of a trading session is reflected asa variation margin receivable or variation margin payable, as applicable, in the Statement of Financial Position.
For certain Sub-Funds the legal right to offset may be at the Sub-Fund level as opposed to the Sub-Investment Managerlevel. The tables are prepared on a Sub-Investment Manager level to be prudent for financial reporting purposes. TheSub-Fund level in the tables represents offsetting in relation to forward foreign currency contracts with the counterparty ofState Street Bank and Trust.
The following tables present information about the offsetting of financial assets and liabilities and collateral amounts as at30 June 2021:
Mercer Passive Global REITS UCITS CCF
Offsetting Financial Assets
Sub-InvestmentManager Counterparty
GrossFinancial
AssetsUS$
Financialinstruments
availableto offset
US$
Netamount
US$
Cashcollateralreceived
US$
Non-cashcollateralreceived
US$
MargincashUS$
Netamount
US$Sub-Fund level State Street Bank and Trust 1,071,772 (1,071,772) - - - - -
1,071,772 (1,071,772) - - - - -
Offsetting Financial Liabilities
Sub-InvestmentManager Counterparty
GrossFinancialLiabilities
US$
Financialinstruments
availableto offset
US$
Netamount
US$
Cashcollateral
pledgedUS$
Non-cashcollateral
pledgedUS$
MargincashUS$
Netamount
US$Sub-Fund level State Street Bank and Trust (10,543,928) 1,071,772 (9,472,156) - 9,472,156 - -
(10,543,928) 1,071,772 (9,472,156) - 9,472,156 - -
Mercer UCITS Common Contractual Fund Notes to the Financial Statementsfor the financial year ended 30 June 2021
(continued)
Mercer UCITS Common Contractual Fund 56
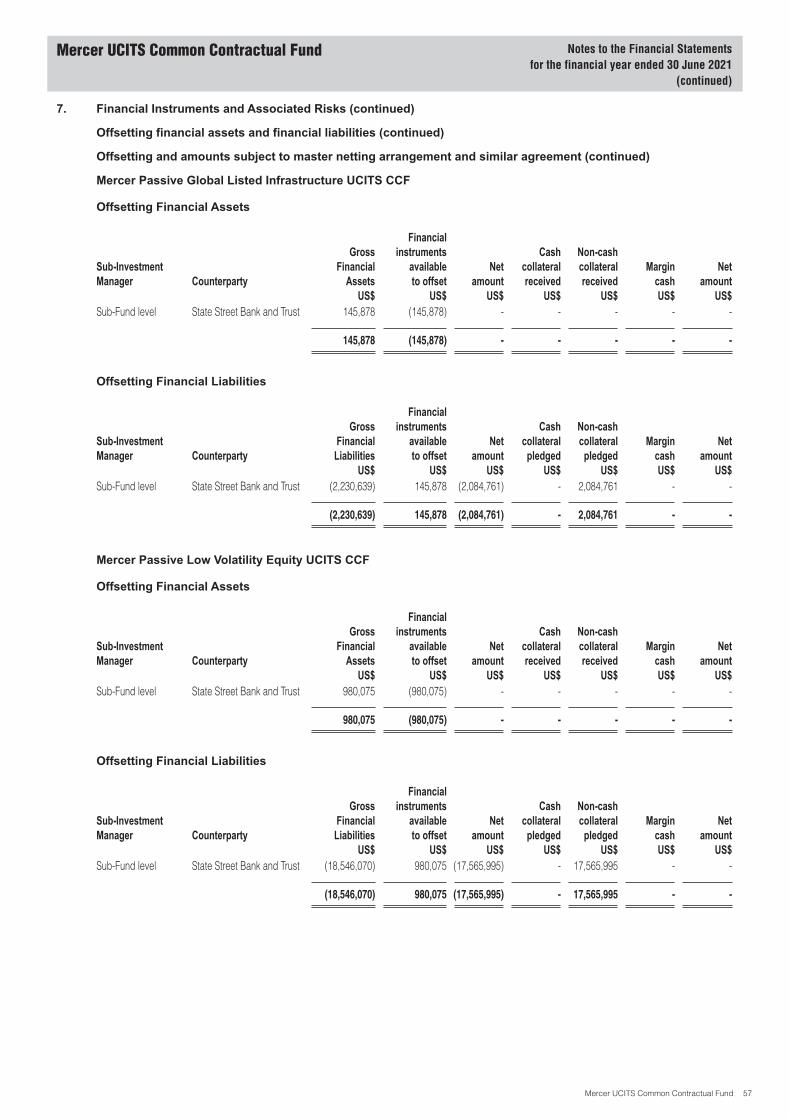
7. Financial Instruments and Associated Risks (continued)
Offsetting financial assets and financial liabilities (continued)
Offsetting and amounts subject to master netting arrangement and similar agreement (continued)
Mercer Passive Global Listed Infrastructure UCITS CCF
Offsetting Financial Assets
Sub-InvestmentManager Counterparty
GrossFinancial
AssetsUS$
Financialinstruments
availableto offset
US$
Netamount
US$
Cashcollateralreceived
US$
Non-cashcollateralreceived
US$
MargincashUS$
Netamount
US$Sub-Fund level State Street Bank and Trust 145,878 (145,878) - - - - -
145,878 (145,878) - - - - -
Offsetting Financial Liabilities
Sub-InvestmentManager Counterparty
GrossFinancialLiabilities
US$
Financialinstruments
availableto offset
US$
Netamount
US$
Cashcollateral
pledgedUS$
Non-cashcollateral
pledgedUS$
MargincashUS$
Netamount
US$Sub-Fund level State Street Bank and Trust (2,230,639) 145,878 (2,084,761) - 2,084,761 - -
(2,230,639) 145,878 (2,084,761) - 2,084,761 - -
Mercer Passive Low Volatility Equity UCITS CCF
Offsetting Financial Assets
Sub-InvestmentManager Counterparty
GrossFinancial
AssetsUS$
Financialinstruments
availableto offset
US$
Netamount
US$
Cashcollateralreceived
US$
Non-cashcollateralreceived
US$
MargincashUS$
Netamount
US$Sub-Fund level State Street Bank and Trust 980,075 (980,075) - - - - -
980,075 (980,075) - - - - -
Offsetting Financial Liabilities
Sub-InvestmentManager Counterparty
GrossFinancialLiabilities
US$
Financialinstruments
availableto offset
US$
Netamount
US$
Cashcollateral
pledgedUS$
Non-cashcollateral
pledgedUS$
MargincashUS$
Netamount
US$Sub-Fund level State Street Bank and Trust (18,546,070) 980,075 (17,565,995) - 17,565,995 - -
(18,546,070) 980,075 (17,565,995) - 17,565,995 - -
Mercer UCITS Common Contractual Fund Notes to the Financial Statementsfor the financial year ended 30 June 2021
(continued)
Mercer UCITS Common Contractual Fund 57
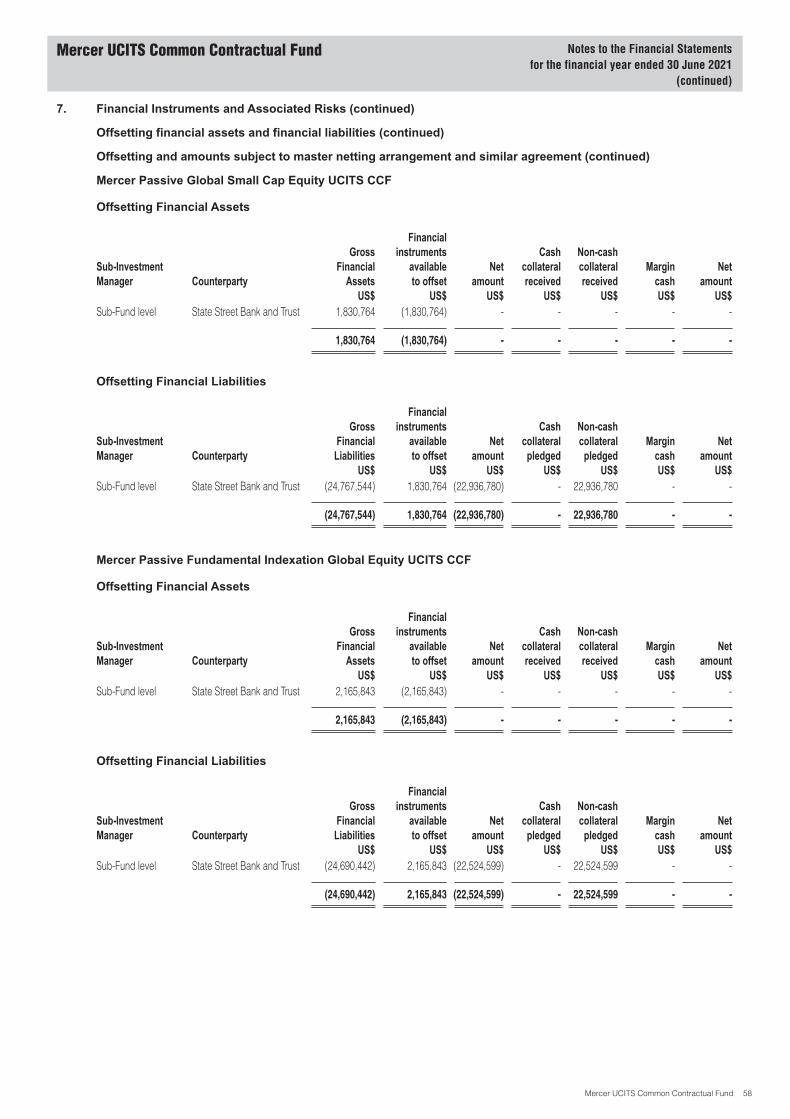
7. Financial Instruments and Associated Risks (continued)
Offsetting financial assets and financial liabilities (continued)
Offsetting and amounts subject to master netting arrangement and similar agreement (continued)
Mercer Passive Global Small Cap Equity UCITS CCF
Offsetting Financial Assets
Sub-InvestmentManager Counterparty
GrossFinancial
AssetsUS$
Financialinstruments
availableto offset
US$
Netamount
US$
Cashcollateralreceived
US$
Non-cashcollateralreceived
US$
MargincashUS$
Netamount
US$Sub-Fund level State Street Bank and Trust 1,830,764 (1,830,764) - - - - -
1,830,764 (1,830,764) - - - - -
Offsetting Financial Liabilities
Sub-InvestmentManager Counterparty
GrossFinancialLiabilities
US$
Financialinstruments
availableto offset
US$
Netamount
US$
Cashcollateral
pledgedUS$
Non-cashcollateral
pledgedUS$
MargincashUS$
Netamount
US$Sub-Fund level State Street Bank and Trust (24,767,544) 1,830,764 (22,936,780) - 22,936,780 - -
(24,767,544) 1,830,764 (22,936,780) - 22,936,780 - -
Mercer Passive Fundamental Indexation Global Equity UCITS CCF
Offsetting Financial Assets
Sub-InvestmentManager Counterparty
GrossFinancial
AssetsUS$
Financialinstruments
availableto offset
US$
Netamount
US$
Cashcollateralreceived
US$
Non-cashcollateralreceived
US$
MargincashUS$
Netamount
US$Sub-Fund level State Street Bank and Trust 2,165,843 (2,165,843) - - - - -
2,165,843 (2,165,843) - - - - -
Offsetting Financial Liabilities
Sub-InvestmentManager Counterparty
GrossFinancialLiabilities
US$
Financialinstruments
availableto offset
US$
Netamount
US$
Cashcollateral
pledgedUS$
Non-cashcollateral
pledgedUS$
MargincashUS$
Netamount
US$Sub-Fund level State Street Bank and Trust (24,690,442) 2,165,843 (22,524,599) - 22,524,599 - -
(24,690,442) 2,165,843 (22,524,599) - 22,524,599 - -
Mercer UCITS Common Contractual Fund Notes to the Financial Statementsfor the financial year ended 30 June 2021
(continued)
Mercer UCITS Common Contractual Fund 58
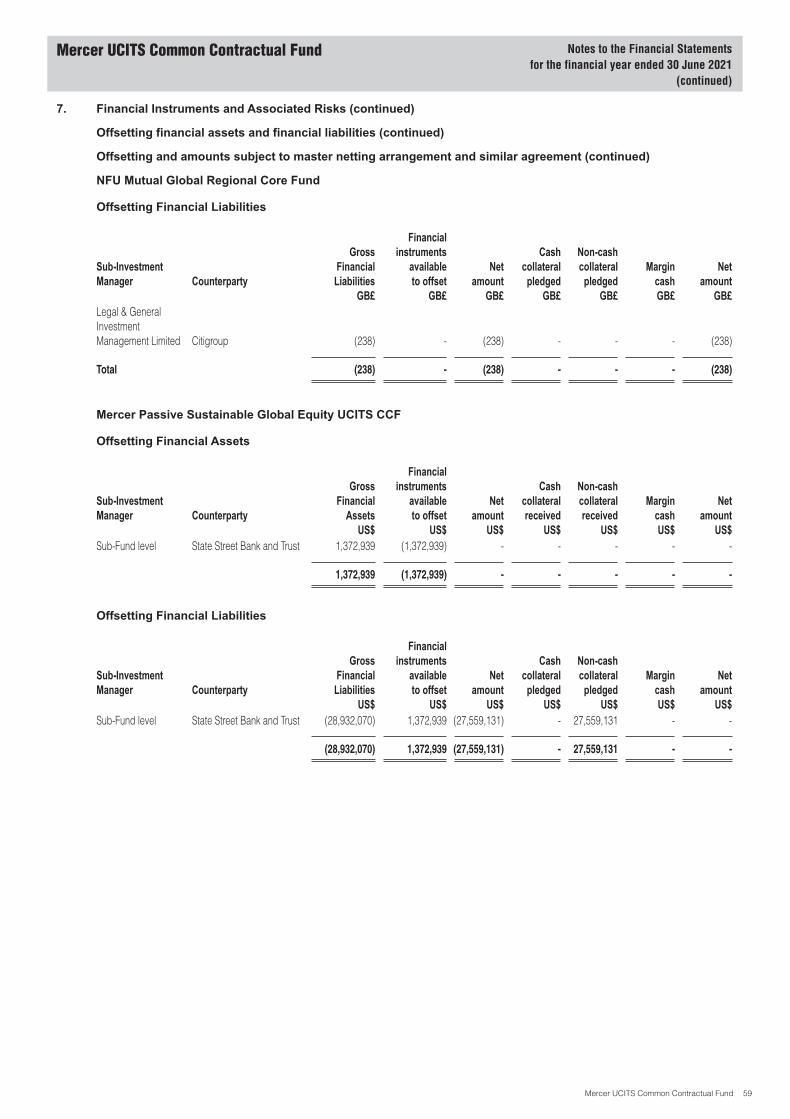
7. Financial Instruments and Associated Risks (continued)
Offsetting financial assets and financial liabilities (continued)
Offsetting and amounts subject to master netting arrangement and similar agreement (continued)
NFU Mutual Global Regional Core Fund
Offsetting Financial Liabilities
Sub-InvestmentManager Counterparty
GrossFinancialLiabilities
GB£
Financialinstruments
availableto offset
GB£
Netamount
GB£
Cashcollateral
pledgedGB£
Non-cashcollateral
pledgedGB£
MargincashGB£
Netamount
GB£Legal & GeneralInvestmentManagement Limited Citigroup (238) - (238) - - - (238)
Total (238) - (238) - - - (238)
Mercer Passive Sustainable Global Equity UCITS CCF
Offsetting Financial Assets
Sub-InvestmentManager Counterparty
GrossFinancial
AssetsUS$
Financialinstruments
availableto offset
US$
Netamount
US$
Cashcollateralreceived
US$
Non-cashcollateralreceived
US$
MargincashUS$
Netamount
US$Sub-Fund level State Street Bank and Trust 1,372,939 (1,372,939) - - - - -
1,372,939 (1,372,939) - - - - -
Offsetting Financial Liabilities
Sub-InvestmentManager Counterparty
GrossFinancialLiabilities
US$
Financialinstruments
availableto offset
US$
Netamount
US$
Cashcollateral
pledgedUS$
Non-cashcollateral
pledgedUS$
MargincashUS$
Netamount
US$Sub-Fund level State Street Bank and Trust (28,932,070) 1,372,939 (27,559,131) - 27,559,131 - -
(28,932,070) 1,372,939 (27,559,131) - 27,559,131 - -
Mercer UCITS Common Contractual Fund Notes to the Financial Statementsfor the financial year ended 30 June 2021
(continued)
Mercer UCITS Common Contractual Fund 59
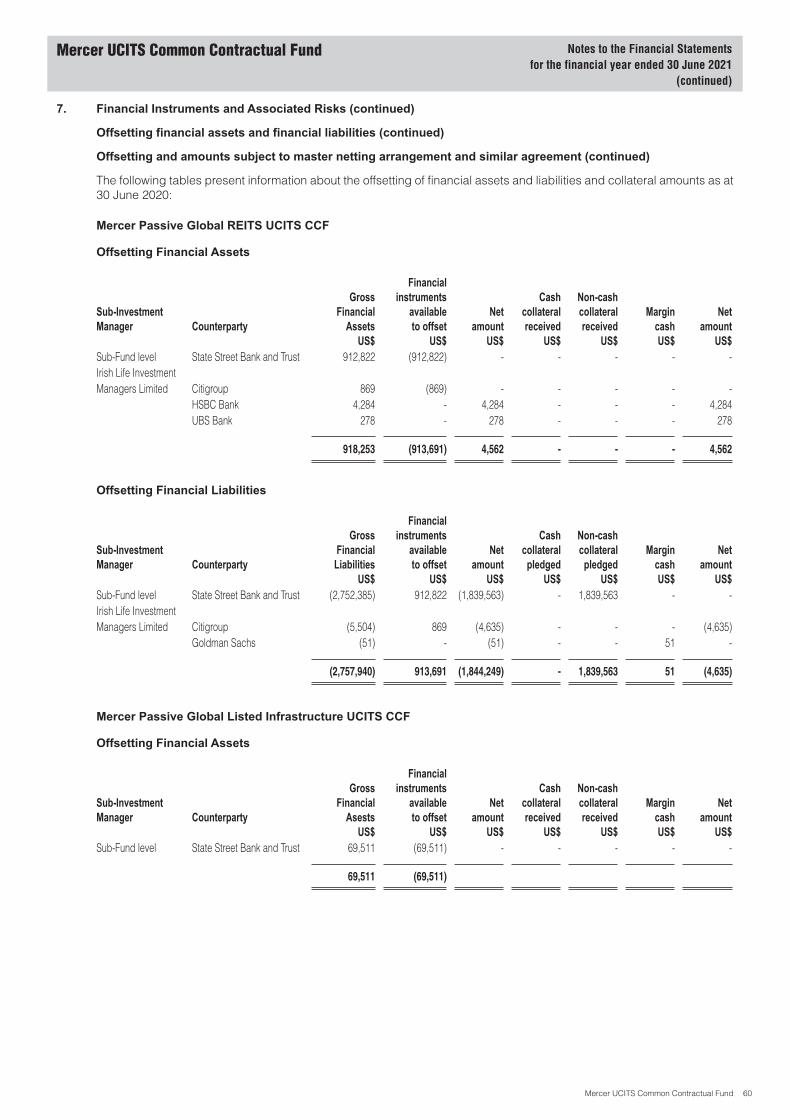
7. Financial Instruments and Associated Risks (continued)
Offsetting financial assets and financial liabilities (continued)
Offsetting and amounts subject to master netting arrangement and similar agreement (continued)
The following tables present information about the offsetting of financial assets and liabilities and collateral amounts as at30 June 2020:
Mercer Passive Global REITS UCITS CCF
Offsetting Financial Assets
Sub-InvestmentManager Counterparty
GrossFinancial
AssetsUS$
Financialinstruments
availableto offset
US$
Netamount
US$
Cashcollateralreceived
US$
Non-cashcollateralreceived
US$
MargincashUS$
Netamount
US$Sub-Fund level State Street Bank and Trust 912,822 (912,822) - - - - -Irish Life InvestmentManagers Limited Citigroup 869 (869) - - - - -
HSBC Bank 4,284 - 4,284 - - - 4,284UBS Bank 278 - 278 - - - 278
918,253 (913,691) 4,562 - - - 4,562
Offsetting Financial Liabilities
Sub-InvestmentManager Counterparty
GrossFinancialLiabilities
US$
Financialinstruments
availableto offset
US$
Netamount
US$
Cashcollateral
pledgedUS$
Non-cashcollateral
pledgedUS$
MargincashUS$
Netamount
US$Sub-Fund level State Street Bank and Trust (2,752,385) 912,822 (1,839,563) - 1,839,563 - -Irish Life InvestmentManagers Limited Citigroup (5,504) 869 (4,635) - - - (4,635)
Goldman Sachs (51) - (51) - - 51 -
(2,757,940) 913,691 (1,844,249) - 1,839,563 51 (4,635)
Mercer Passive Global Listed Infrastructure UCITS CCF
Offsetting Financial Assets
Sub-InvestmentManager Counterparty
GrossFinancial
AsestsUS$
Financialinstruments
availableto offset
US$
Netamount
US$
Cashcollateralreceived
US$
Non-cashcollateralreceived
US$
MargincashUS$
Netamount
US$Sub-Fund level State Street Bank and Trust 69,511 (69,511) - - - - -
69,511 (69,511)
Mercer UCITS Common Contractual Fund Notes to the Financial Statementsfor the financial year ended 30 June 2021
(continued)
Mercer UCITS Common Contractual Fund 60

7. Financial Instruments and Associated Risks (continued)
Offsetting financial assets and financial liabilities (continued)
Offsetting and amounts subject to master netting arrangement and similar agreement (continued)
Mercer Passive Global Listed Infrastructure UCITS CCF (continued)
Offsetting Financial Liabilities
Sub-InvestmentManager Counterparty
GrossFinancialLiabilities
US$
Financialinstruments
availableto offset
US$
Netamount
US$
Cashcollateral
pledgedUS$
Non-cashcollateral
pledgedUS$
MargincashUS$
Netamount
US$Sub-Fund level State Street Bank and Trust (316,649) 69,511 (247,138) - 247,138 - -
(316,649) 69,511 (247,138) - 247,138 - -
Mercer Passive Low Volatility Equity UCITS CCF
Offsetting Financial Assets
Sub-InvestmentManager Counterparty
GrossFinancial
AssetsUS$
Financialinstruments
availableto offset
US$
Netamount
US$
Cashcollateralreceived
US$
Non-cashcollateralreceived
US$
MargincashUS$
Netamount
US$Sub-Fund level State Street Bank and Trust 1,907,901 (1,907,901) - - - - -
1,907,901 (1,907,901) - - - - -
Offsetting Financial Liabilities
Sub-InvestmentManager Counterparty
GrossFinancialLiabilities
US$
Financialinstruments
availableto offset
US$
Netamount
US$
Cashcollateral
pledgedUS$
Non-cashcollateral
pledgedUS$
MargincashUS$
Netamount
US$Sub-Fund level State Street Bank and Trust (7,768,317) 1,907,901 (5,860,416) - 5,860,416 - -
(7,768,317) 1,907,901 (5,860,416) - 5,860,416 - -
Mercer Passive Global Small Cap Equity UCITS CCF
Offsetting Financial Assets
Sub-InvestmentManager Counterparty
GrossFinancial
AsestsUS$
Financialinstruments
availableto offset
US$
Netamount
US$
Cashcollateralreceived
US$
Non-cashcollateralreceived
US$
MargincashUS$
Netamount
US$Sub-Fund level State Street Bank and Trust 2,173,213 (2,173,213) - - - - -
2,173,213 (2,173,213) - - - - -
Mercer UCITS Common Contractual Fund Notes to the Financial Statementsfor the financial year ended 30 June 2021
(continued)
Mercer UCITS Common Contractual Fund 61
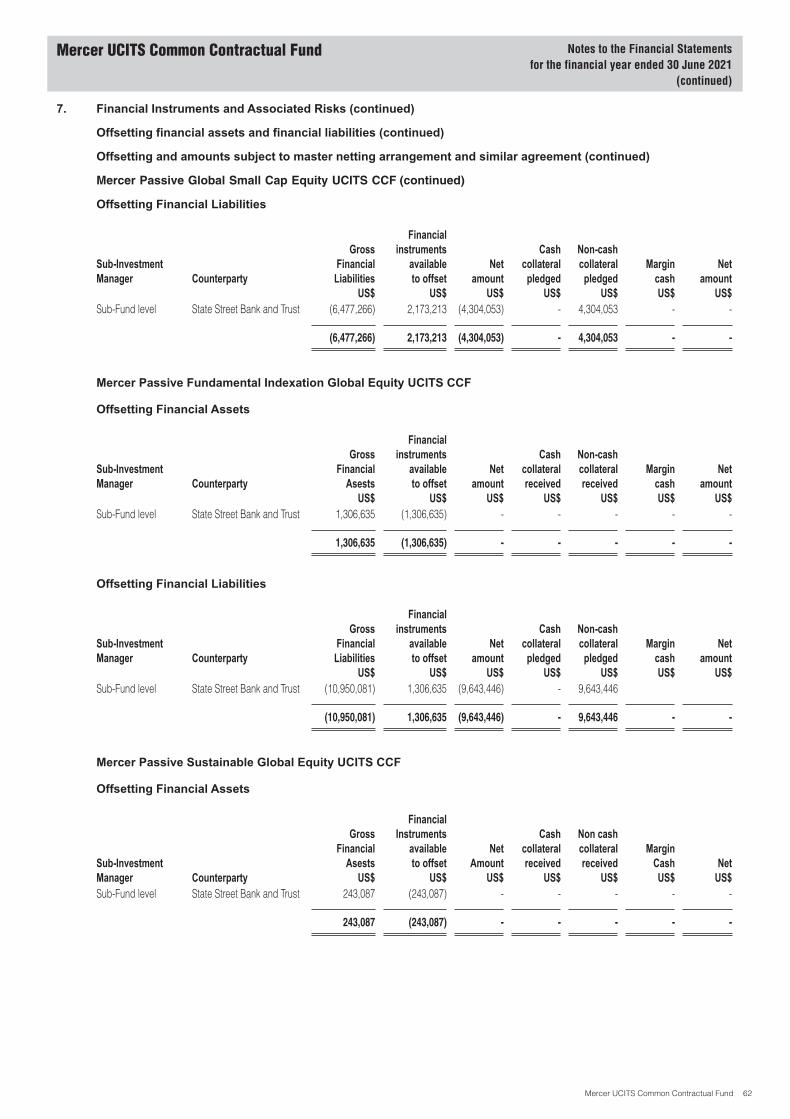
7. Financial Instruments and Associated Risks (continued)
Offsetting financial assets and financial liabilities (continued)
Offsetting and amounts subject to master netting arrangement and similar agreement (continued)
Mercer Passive Global Small Cap Equity UCITS CCF (continued)
Offsetting Financial Liabilities
Sub-InvestmentManager Counterparty
GrossFinancialLiabilities
US$
Financialinstruments
availableto offset
US$
Netamount
US$
Cashcollateral
pledgedUS$
Non-cashcollateral
pledgedUS$
MargincashUS$
Netamount
US$Sub-Fund level State Street Bank and Trust (6,477,266) 2,173,213 (4,304,053) - 4,304,053 - -
(6,477,266) 2,173,213 (4,304,053) - 4,304,053 - -
Mercer Passive Fundamental Indexation Global Equity UCITS CCF
Offsetting Financial Assets
Sub-InvestmentManager Counterparty
GrossFinancial
AsestsUS$
Financialinstruments
availableto offset
US$
Netamount
US$
Cashcollateralreceived
US$
Non-cashcollateralreceived
US$
MargincashUS$
Netamount
US$Sub-Fund level State Street Bank and Trust 1,306,635 (1,306,635) - - - - -
1,306,635 (1,306,635) - - - - -
Offsetting Financial Liabilities
Sub-InvestmentManager Counterparty
GrossFinancialLiabilities
US$
Financialinstruments
availableto offset
US$
Netamount
US$
Cashcollateral
pledgedUS$
Non-cashcollateral
pledgedUS$
MargincashUS$
Netamount
US$Sub-Fund level State Street Bank and Trust (10,950,081) 1,306,635 (9,643,446) - 9,643,446
(10,950,081) 1,306,635 (9,643,446) - 9,643,446 - -
Mercer Passive Sustainable Global Equity UCITS CCF
Offsetting Financial Assets
Sub-InvestmentManager Counterparty
GrossFinancial
AsestsUS$
FinancialInstruments
availableto offset
US$
NetAmount
US$
Cashcollateralreceived
US$
Non cashcollateralreceived
US$
MarginCashUS$
NetUS$
Sub-Fund level State Street Bank and Trust 243,087 (243,087) - - - - -
243,087 (243,087) - - - - -
Mercer UCITS Common Contractual Fund Notes to the Financial Statementsfor the financial year ended 30 June 2021
(continued)
Mercer UCITS Common Contractual Fund 62
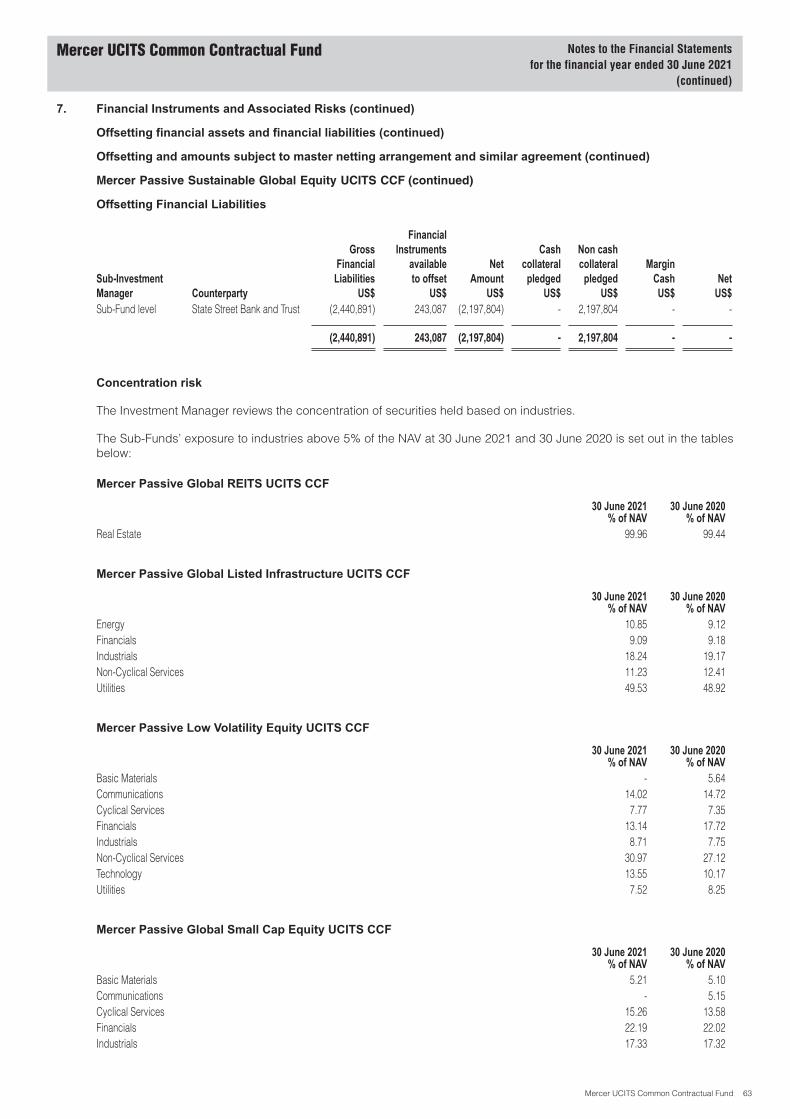
7. Financial Instruments and Associated Risks (continued)
Offsetting financial assets and financial liabilities (continued)
Offsetting and amounts subject to master netting arrangement and similar agreement (continued)
Mercer Passive Sustainable Global Equity UCITS CCF (continued)
Offsetting Financial Liabilities
Sub-InvestmentManager Counterparty
GrossFinancialLiabilities
US$
FinancialInstruments
availableto offset
US$
NetAmount
US$
Cashcollateral
pledgedUS$
Non cashcollateral
pledgedUS$
MarginCashUS$
NetUS$
Sub-Fund level State Street Bank and Trust (2,440,891) 243,087 (2,197,804) - 2,197,804 - -
(2,440,891) 243,087 (2,197,804) - 2,197,804 - -
Concentration risk
The Investment Manager reviews the concentration of securities held based on industries.
The Sub-Funds’ exposure to industries above 5% of the NAV at 30 June 2021 and 30 June 2020 is set out in the tablesbelow:
Mercer Passive Global REITS UCITS CCF
30 June 2021% of NAV
30 June 2020% of NAV
Real Estate 99.96 99.44
Mercer Passive Global Listed Infrastructure UCITS CCF
30 June 2021% of NAV
30 June 2020% of NAV
Energy 10.85 9.12Financials 9.09 9.18Industrials 18.24 19.17Non-Cyclical Services 11.23 12.41Utilities 49.53 48.92
Mercer Passive Low Volatility Equity UCITS CCF
30 June 2021% of NAV
30 June 2020% of NAV
Basic Materials - 5.64Communications 14.02 14.72Cyclical Services 7.77 7.35Financials 13.14 17.72Industrials 8.71 7.75Non-Cyclical Services 30.97 27.12Technology 13.55 10.17Utilities 7.52 8.25
Mercer Passive Global Small Cap Equity UCITS CCF
30 June 2021% of NAV
30 June 2020% of NAV
Basic Materials 5.21 5.10Communications - 5.15Cyclical Services 15.26 13.58Financials 22.19 22.02Industrials 17.33 17.32
Mercer UCITS Common Contractual Fund Notes to the Financial Statementsfor the financial year ended 30 June 2021
(continued)
Mercer UCITS Common Contractual Fund 63
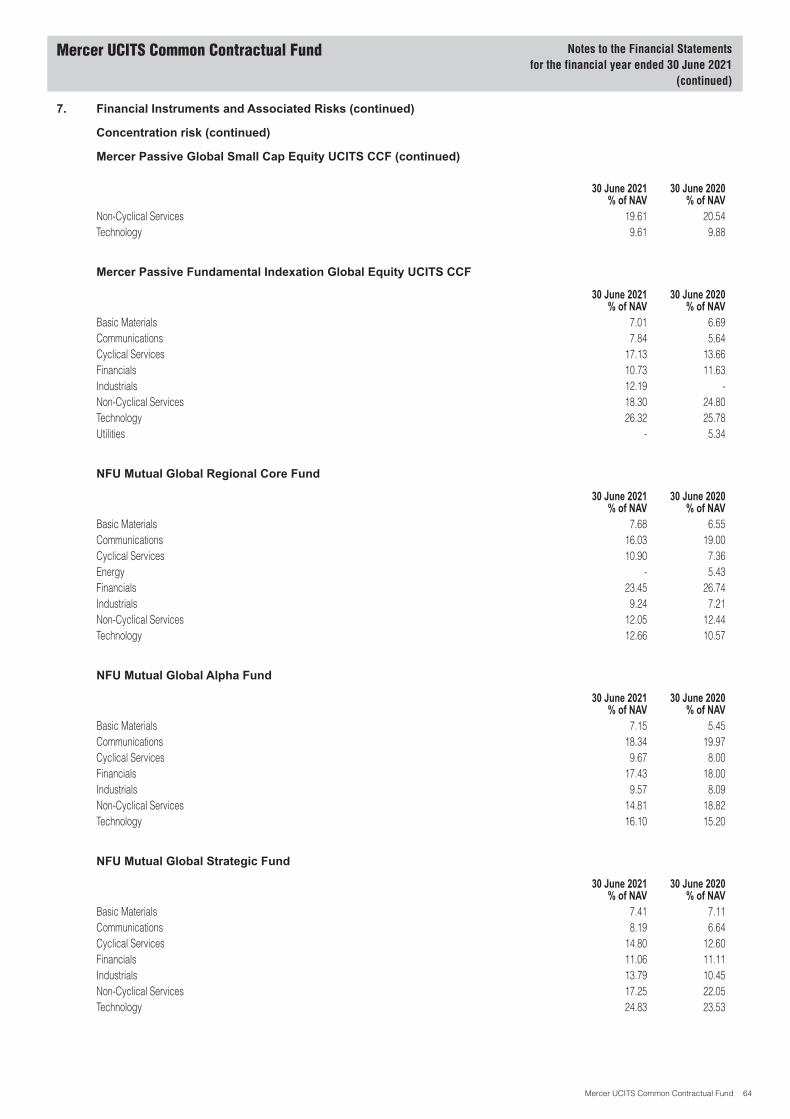
7. Financial Instruments and Associated Risks (continued)
Concentration risk (continued)
Mercer Passive Global Small Cap Equity UCITS CCF (continued)
30 June 2021% of NAV
30 June 2020% of NAV
Non-Cyclical Services 19.61 20.54Technology 9.61 9.88
Mercer Passive Fundamental Indexation Global Equity UCITS CCF
30 June 2021% of NAV
30 June 2020% of NAV
Basic Materials 7.01 6.69Communications 7.84 5.64Cyclical Services 17.13 13.66Financials 10.73 11.63Industrials 12.19 -Non-Cyclical Services 18.30 24.80Technology 26.32 25.78Utilities - 5.34
NFU Mutual Global Regional Core Fund
30 June 2021% of NAV
30 June 2020% of NAV
Basic Materials 7.68 6.55Communications 16.03 19.00Cyclical Services 10.90 7.36Energy - 5.43Financials 23.45 26.74Industrials 9.24 7.21Non-Cyclical Services 12.05 12.44Technology 12.66 10.57
NFU Mutual Global Alpha Fund
30 June 2021% of NAV
30 June 2020% of NAV
Basic Materials 7.15 5.45Communications 18.34 19.97Cyclical Services 9.67 8.00Financials 17.43 18.00Industrials 9.57 8.09Non-Cyclical Services 14.81 18.82Technology 16.10 15.20
NFU Mutual Global Strategic Fund
30 June 2021% of NAV
30 June 2020% of NAV
Basic Materials 7.41 7.11Communications 8.19 6.64Cyclical Services 14.80 12.60Financials 11.06 11.11Industrials 13.79 10.45Non-Cyclical Services 17.25 22.05Technology 24.83 23.53
Mercer UCITS Common Contractual Fund Notes to the Financial Statementsfor the financial year ended 30 June 2021
(continued)
Mercer UCITS Common Contractual Fund 64
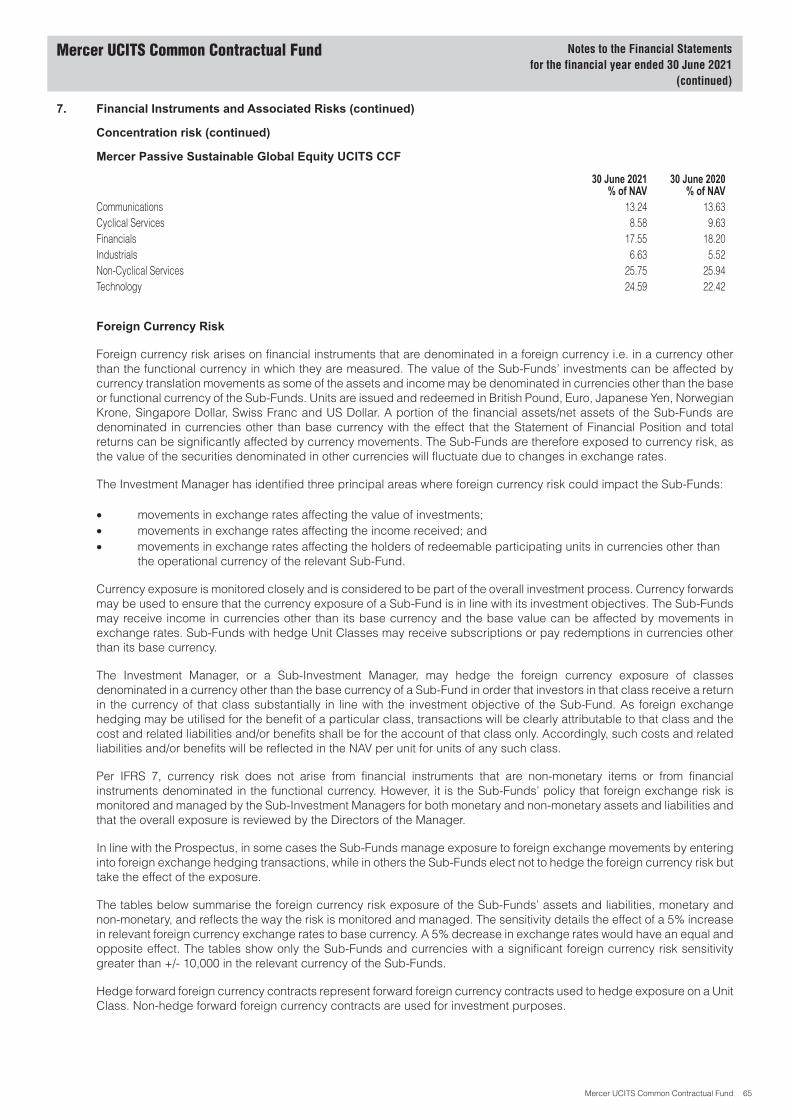
7. Financial Instruments and Associated Risks (continued)
Concentration risk (continued)
Mercer Passive Sustainable Global Equity UCITS CCF
30 June 2021% of NAV
30 June 2020% of NAV
Communications 13.24 13.63Cyclical Services 8.58 9.63Financials 17.55 18.20Industrials 6.63 5.52Non-Cyclical Services 25.75 25.94Technology 24.59 22.42
Foreign Currency Risk
Foreign currency risk arises on financial instruments that are denominated in a foreign currency i.e. in a currency otherthan the functional currency in which they are measured. The value of the Sub-Funds’ investments can be affected bycurrency translation movements as some of the assets and income may be denominated in currencies other than the baseor functional currency of the Sub-Funds. Units are issued and redeemed in British Pound, Euro, Japanese Yen, NorwegianKrone, Singapore Dollar, Swiss Franc and US Dollar. A portion of the financial assets/net assets of the Sub-Funds aredenominated in currencies other than base currency with the effect that the Statement of Financial Position and totalreturns can be significantly affected by currency movements. The Sub-Funds are therefore exposed to currency risk, asthe value of the securities denominated in other currencies will fluctuate due to changes in exchange rates.
The Investment Manager has identified three principal areas where foreign currency risk could impact the Sub-Funds:
• movements in exchange rates affecting the value of investments;• movements in exchange rates affecting the income received; and• movements in exchange rates affecting the holders of redeemable participating units in currencies other than
the operational currency of the relevant Sub-Fund.
Currency exposure is monitored closely and is considered to be part of the overall investment process. Currency forwardsmay be used to ensure that the currency exposure of a Sub-Fund is in line with its investment objectives. The Sub-Fundsmay receive income in currencies other than its base currency and the base value can be affected by movements inexchange rates. Sub-Funds with hedge Unit Classes may receive subscriptions or pay redemptions in currencies otherthan its base currency.
The Investment Manager, or a Sub-Investment Manager, may hedge the foreign currency exposure of classesdenominated in a currency other than the base currency of a Sub-Fund in order that investors in that class receive a returnin the currency of that class substantially in line with the investment objective of the Sub-Fund. As foreign exchangehedging may be utilised for the benefit of a particular class, transactions will be clearly attributable to that class and thecost and related liabilities and/or benefits shall be for the account of that class only. Accordingly, such costs and relatedliabilities and/or benefits will be reflected in the NAV per unit for units of any such class.
Per IFRS 7, currency risk does not arise from financial instruments that are non-monetary items or from financialinstruments denominated in the functional currency. However, it is the Sub-Funds’ policy that foreign exchange risk ismonitored and managed by the Sub-Investment Managers for both monetary and non-monetary assets and liabilities andthat the overall exposure is reviewed by the Directors of the Manager.
In line with the Prospectus, in some cases the Sub-Funds manage exposure to foreign exchange movements by enteringinto foreign exchange hedging transactions, while in others the Sub-Funds elect not to hedge the foreign currency risk buttake the effect of the exposure.
The tables below summarise the foreign currency risk exposure of the Sub-Funds’ assets and liabilities, monetary andnon-monetary, and reflects the way the risk is monitored and managed. The sensitivity details the effect of a 5% increasein relevant foreign currency exchange rates to base currency. A 5% decrease in exchange rates would have an equal andopposite effect. The tables show only the Sub-Funds and currencies with a significant foreign currency risk sensitivitygreater than +/- 10,000 in the relevant currency of the Sub-Funds.
Hedge forward foreign currency contracts represent forward foreign currency contracts used to hedge exposure on a UnitClass. Non-hedge forward foreign currency contracts are used for investment purposes.
Mercer UCITS Common Contractual Fund Notes to the Financial Statementsfor the financial year ended 30 June 2021
(continued)
Mercer UCITS Common Contractual Fund 65
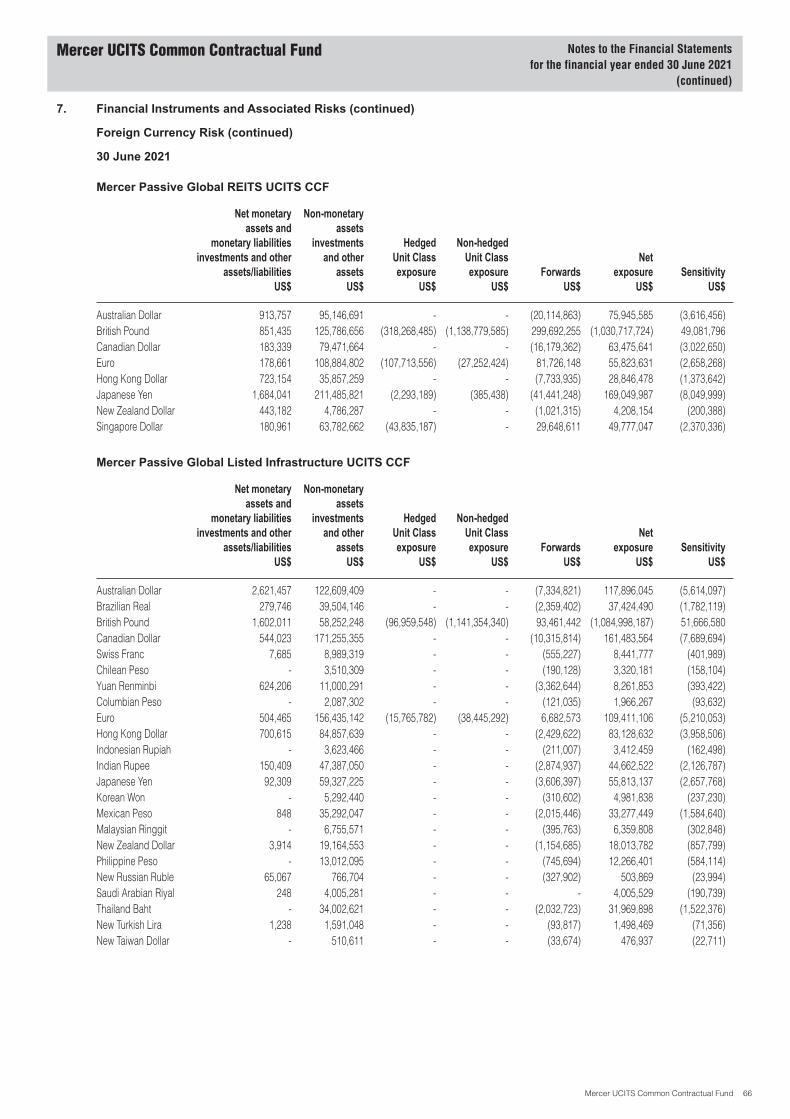
7. Financial Instruments and Associated Risks (continued)
Foreign Currency Risk (continued)
30 June 2021
Mercer Passive Global REITS UCITS CCF
Net monetaryassets and
monetary liabilitiesinvestments and other
assets/liabilitiesUS$
Non-monetaryassets
investmentsand other
assetsUS$
HedgedUnit Classexposure
US$
Non-hedgedUnit Classexposure
US$Forwards
US$
Netexposure
US$Sensitivity
US$
Australian Dollar 913,757 95,146,691 - - (20,114,863) 75,945,585 (3,616,456)British Pound 851,435 125,786,656 (318,268,485) (1,138,779,585) 299,692,255 (1,030,717,724) 49,081,796Canadian Dollar 183,339 79,471,664 - - (16,179,362) 63,475,641 (3,022,650)Euro 178,661 108,884,802 (107,713,556) (27,252,424) 81,726,148 55,823,631 (2,658,268)Hong Kong Dollar 723,154 35,857,259 - - (7,733,935) 28,846,478 (1,373,642)Japanese Yen 1,684,041 211,485,821 (2,293,189) (385,438) (41,441,248) 169,049,987 (8,049,999)New Zealand Dollar 443,182 4,786,287 - - (1,021,315) 4,208,154 (200,388)Singapore Dollar 180,961 63,782,662 (43,835,187) - 29,648,611 49,777,047 (2,370,336)
Mercer Passive Global Listed Infrastructure UCITS CCF
Net monetaryassets and
monetary liabilitiesinvestments and other
assets/liabilitiesUS$
Non-monetaryassets
investmentsand other
assetsUS$
HedgedUnit Classexposure
US$
Non-hedgedUnit Classexposure
US$Forwards
US$
Netexposure
US$Sensitivity
US$
Australian Dollar 2,621,457 122,609,409 - - (7,334,821) 117,896,045 (5,614,097)Brazilian Real 279,746 39,504,146 - - (2,359,402) 37,424,490 (1,782,119)British Pound 1,602,011 58,252,248 (96,959,548) (1,141,354,340) 93,461,442 (1,084,998,187) 51,666,580Canadian Dollar 544,023 171,255,355 - - (10,315,814) 161,483,564 (7,689,694)Swiss Franc 7,685 8,989,319 - - (555,227) 8,441,777 (401,989)Chilean Peso - 3,510,309 - - (190,128) 3,320,181 (158,104)Yuan Renminbi 624,206 11,000,291 - - (3,362,644) 8,261,853 (393,422)Columbian Peso - 2,087,302 - - (121,035) 1,966,267 (93,632)Euro 504,465 156,435,142 (15,765,782) (38,445,292) 6,682,573 109,411,106 (5,210,053)Hong Kong Dollar 700,615 84,857,639 - - (2,429,622) 83,128,632 (3,958,506)Indonesian Rupiah - 3,623,466 - - (211,007) 3,412,459 (162,498)Indian Rupee 150,409 47,387,050 - - (2,874,937) 44,662,522 (2,126,787)Japanese Yen 92,309 59,327,225 - - (3,606,397) 55,813,137 (2,657,768)Korean Won - 5,292,440 - - (310,602) 4,981,838 (237,230)Mexican Peso 848 35,292,047 - - (2,015,446) 33,277,449 (1,584,640)Malaysian Ringgit - 6,755,571 - - (395,763) 6,359,808 (302,848)New Zealand Dollar 3,914 19,164,553 - - (1,154,685) 18,013,782 (857,799)Philippine Peso - 13,012,095 - - (745,694) 12,266,401 (584,114)New Russian Ruble 65,067 766,704 - - (327,902) 503,869 (23,994)Saudi Arabian Riyal 248 4,005,281 - - - 4,005,529 (190,739)Thailand Baht - 34,002,621 - - (2,032,723) 31,969,898 (1,522,376)New Turkish Lira 1,238 1,591,048 - - (93,817) 1,498,469 (71,356)New Taiwan Dollar - 510,611 - - (33,674) 476,937 (22,711)
Mercer UCITS Common Contractual Fund Notes to the Financial Statementsfor the financial year ended 30 June 2021
(continued)
Mercer UCITS Common Contractual Fund 66
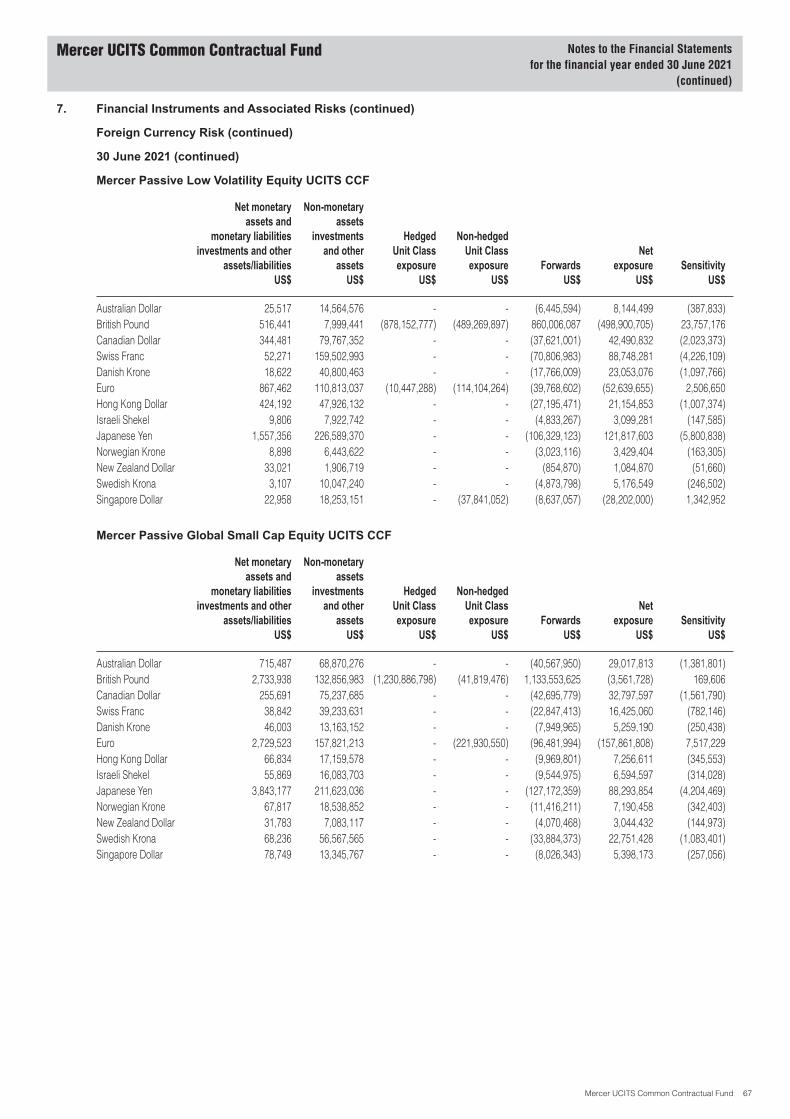
7. Financial Instruments and Associated Risks (continued)
Foreign Currency Risk (continued)
30 June 2021 (continued)
Mercer Passive Low Volatility Equity UCITS CCF
Net monetaryassets and
monetary liabilitiesinvestments and other
assets/liabilitiesUS$
Non-monetaryassets
investmentsand other
assetsUS$
HedgedUnit Classexposure
US$
Non-hedgedUnit Classexposure
US$Forwards
US$
Netexposure
US$Sensitivity
US$
Australian Dollar 25,517 14,564,576 - - (6,445,594) 8,144,499 (387,833)British Pound 516,441 7,999,441 (878,152,777) (489,269,897) 860,006,087 (498,900,705) 23,757,176Canadian Dollar 344,481 79,767,352 - - (37,621,001) 42,490,832 (2,023,373)Swiss Franc 52,271 159,502,993 - - (70,806,983) 88,748,281 (4,226,109)Danish Krone 18,622 40,800,463 - - (17,766,009) 23,053,076 (1,097,766)Euro 867,462 110,813,037 (10,447,288) (114,104,264) (39,768,602) (52,639,655) 2,506,650Hong Kong Dollar 424,192 47,926,132 - - (27,195,471) 21,154,853 (1,007,374)Israeli Shekel 9,806 7,922,742 - - (4,833,267) 3,099,281 (147,585)Japanese Yen 1,557,356 226,589,370 - - (106,329,123) 121,817,603 (5,800,838)Norwegian Krone 8,898 6,443,622 - - (3,023,116) 3,429,404 (163,305)New Zealand Dollar 33,021 1,906,719 - - (854,870) 1,084,870 (51,660)Swedish Krona 3,107 10,047,240 - - (4,873,798) 5,176,549 (246,502)Singapore Dollar 22,958 18,253,151 - (37,841,052) (8,637,057) (28,202,000) 1,342,952
Mercer Passive Global Small Cap Equity UCITS CCF
Net monetaryassets and
monetary liabilitiesinvestments and other
assets/liabilitiesUS$
Non-monetaryassets
investmentsand other
assetsUS$
HedgedUnit Classexposure
US$
Non-hedgedUnit Classexposure
US$Forwards
US$
Netexposure
US$Sensitivity
US$
Australian Dollar 715,487 68,870,276 - - (40,567,950) 29,017,813 (1,381,801)British Pound 2,733,938 132,856,983 (1,230,886,798) (41,819,476) 1,133,553,625 (3,561,728) 169,606Canadian Dollar 255,691 75,237,685 - - (42,695,779) 32,797,597 (1,561,790)Swiss Franc 38,842 39,233,631 - - (22,847,413) 16,425,060 (782,146)Danish Krone 46,003 13,163,152 - - (7,949,965) 5,259,190 (250,438)Euro 2,729,523 157,821,213 - (221,930,550) (96,481,994) (157,861,808) 7,517,229Hong Kong Dollar 66,834 17,159,578 - - (9,969,801) 7,256,611 (345,553)Israeli Shekel 55,869 16,083,703 - - (9,544,975) 6,594,597 (314,028)Japanese Yen 3,843,177 211,623,036 - - (127,172,359) 88,293,854 (4,204,469)Norwegian Krone 67,817 18,538,852 - - (11,416,211) 7,190,458 (342,403)New Zealand Dollar 31,783 7,083,117 - - (4,070,468) 3,044,432 (144,973)Swedish Krona 68,236 56,567,565 - - (33,884,373) 22,751,428 (1,083,401)Singapore Dollar 78,749 13,345,767 - - (8,026,343) 5,398,173 (257,056)
Mercer UCITS Common Contractual Fund Notes to the Financial Statementsfor the financial year ended 30 June 2021
(continued)
Mercer UCITS Common Contractual Fund 67
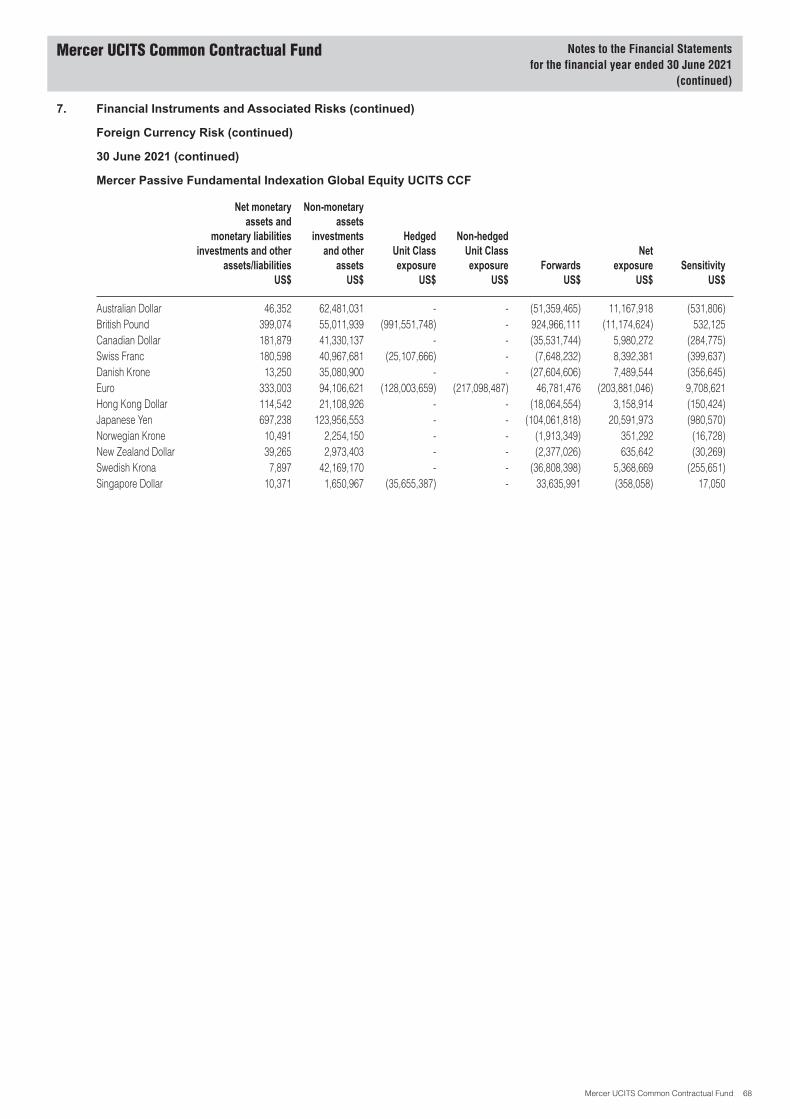
7. Financial Instruments and Associated Risks (continued)
Foreign Currency Risk (continued)
30 June 2021 (continued)
Mercer Passive Fundamental Indexation Global Equity UCITS CCF
Net monetaryassets and
monetary liabilitiesinvestments and other
assets/liabilitiesUS$
Non-monetaryassets
investmentsand other
assetsUS$
HedgedUnit Classexposure
US$
Non-hedgedUnit Classexposure
US$Forwards
US$
Netexposure
US$Sensitivity
US$
Australian Dollar 46,352 62,481,031 - - (51,359,465) 11,167,918 (531,806)British Pound 399,074 55,011,939 (991,551,748) - 924,966,111 (11,174,624) 532,125Canadian Dollar 181,879 41,330,137 - - (35,531,744) 5,980,272 (284,775)Swiss Franc 180,598 40,967,681 (25,107,666) - (7,648,232) 8,392,381 (399,637)Danish Krone 13,250 35,080,900 - - (27,604,606) 7,489,544 (356,645)Euro 333,003 94,106,621 (128,003,659) (217,098,487) 46,781,476 (203,881,046) 9,708,621Hong Kong Dollar 114,542 21,108,926 - - (18,064,554) 3,158,914 (150,424)Japanese Yen 697,238 123,956,553 - - (104,061,818) 20,591,973 (980,570)Norwegian Krone 10,491 2,254,150 - - (1,913,349) 351,292 (16,728)New Zealand Dollar 39,265 2,973,403 - - (2,377,026) 635,642 (30,269)Swedish Krona 7,897 42,169,170 - - (36,808,398) 5,368,669 (255,651)Singapore Dollar 10,371 1,650,967 (35,655,387) - 33,635,991 (358,058) 17,050
Mercer UCITS Common Contractual Fund Notes to the Financial Statementsfor the financial year ended 30 June 2021
(continued)
Mercer UCITS Common Contractual Fund 68
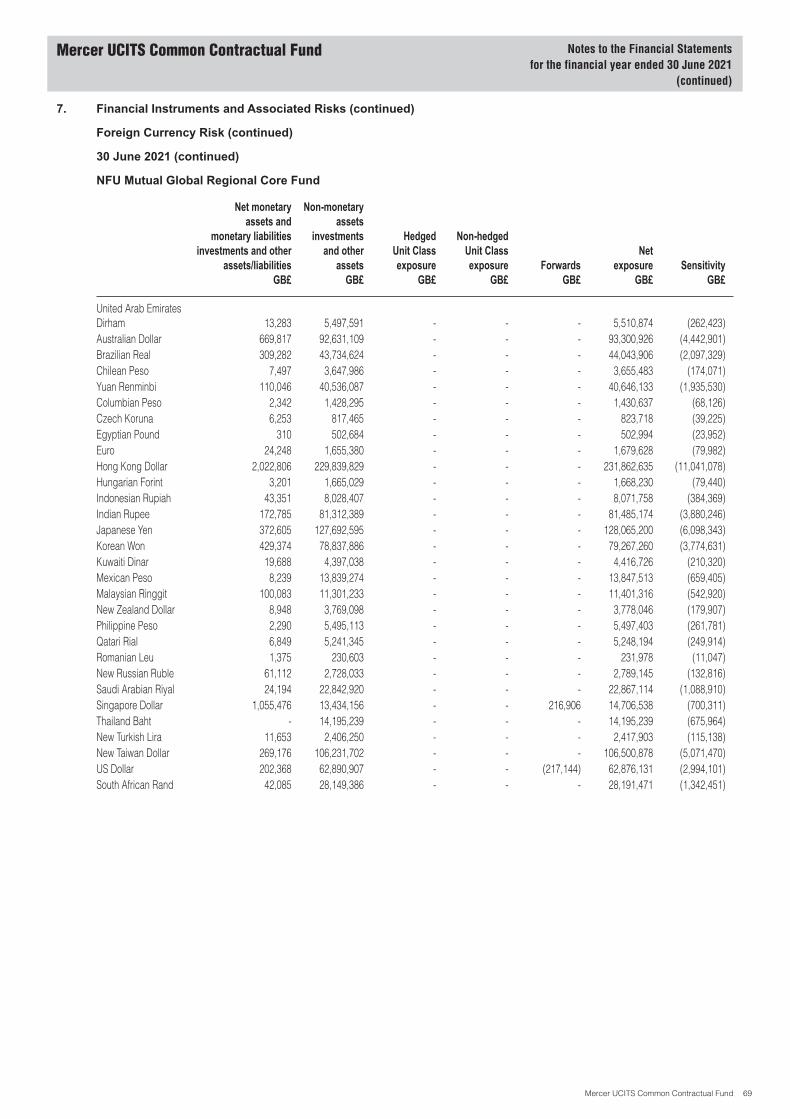
7. Financial Instruments and Associated Risks (continued)
Foreign Currency Risk (continued)
30 June 2021 (continued)
NFU Mutual Global Regional Core Fund
Net monetaryassets and
monetary liabilitiesinvestments and other
assets/liabilitiesGB£
Non-monetaryassets
investmentsand other
assetsGB£
HedgedUnit Classexposure
GB£
Non-hedgedUnit Classexposure
GB£Forwards
GB£
Netexposure
GB£Sensitivity
GB£
United Arab EmiratesDirham 13,283 5,497,591 - - - 5,510,874 (262,423)Australian Dollar 669,817 92,631,109 - - - 93,300,926 (4,442,901)Brazilian Real 309,282 43,734,624 - - - 44,043,906 (2,097,329)Chilean Peso 7,497 3,647,986 - - - 3,655,483 (174,071)Yuan Renminbi 110,046 40,536,087 - - - 40,646,133 (1,935,530)Columbian Peso 2,342 1,428,295 - - - 1,430,637 (68,126)Czech Koruna 6,253 817,465 - - - 823,718 (39,225)Egyptian Pound 310 502,684 - - - 502,994 (23,952)Euro 24,248 1,655,380 - - - 1,679,628 (79,982)Hong Kong Dollar 2,022,806 229,839,829 - - - 231,862,635 (11,041,078)Hungarian Forint 3,201 1,665,029 - - - 1,668,230 (79,440)Indonesian Rupiah 43,351 8,028,407 - - - 8,071,758 (384,369)Indian Rupee 172,785 81,312,389 - - - 81,485,174 (3,880,246)Japanese Yen 372,605 127,692,595 - - - 128,065,200 (6,098,343)Korean Won 429,374 78,837,886 - - - 79,267,260 (3,774,631)Kuwaiti Dinar 19,688 4,397,038 - - - 4,416,726 (210,320)Mexican Peso 8,239 13,839,274 - - - 13,847,513 (659,405)Malaysian Ringgit 100,083 11,301,233 - - - 11,401,316 (542,920)New Zealand Dollar 8,948 3,769,098 - - - 3,778,046 (179,907)Philippine Peso 2,290 5,495,113 - - - 5,497,403 (261,781)Qatari Rial 6,849 5,241,345 - - - 5,248,194 (249,914)Romanian Leu 1,375 230,603 - - - 231,978 (11,047)New Russian Ruble 61,112 2,728,033 - - - 2,789,145 (132,816)Saudi Arabian Riyal 24,194 22,842,920 - - - 22,867,114 (1,088,910)Singapore Dollar 1,055,476 13,434,156 - - 216,906 14,706,538 (700,311)Thailand Baht - 14,195,239 - - - 14,195,239 (675,964)New Turkish Lira 11,653 2,406,250 - - - 2,417,903 (115,138)New Taiwan Dollar 269,176 106,231,702 - - - 106,500,878 (5,071,470)US Dollar 202,368 62,890,907 - - (217,144) 62,876,131 (2,994,101)South African Rand 42,085 28,149,386 - - - 28,191,471 (1,342,451)
Mercer UCITS Common Contractual Fund Notes to the Financial Statementsfor the financial year ended 30 June 2021
(continued)
Mercer UCITS Common Contractual Fund 69
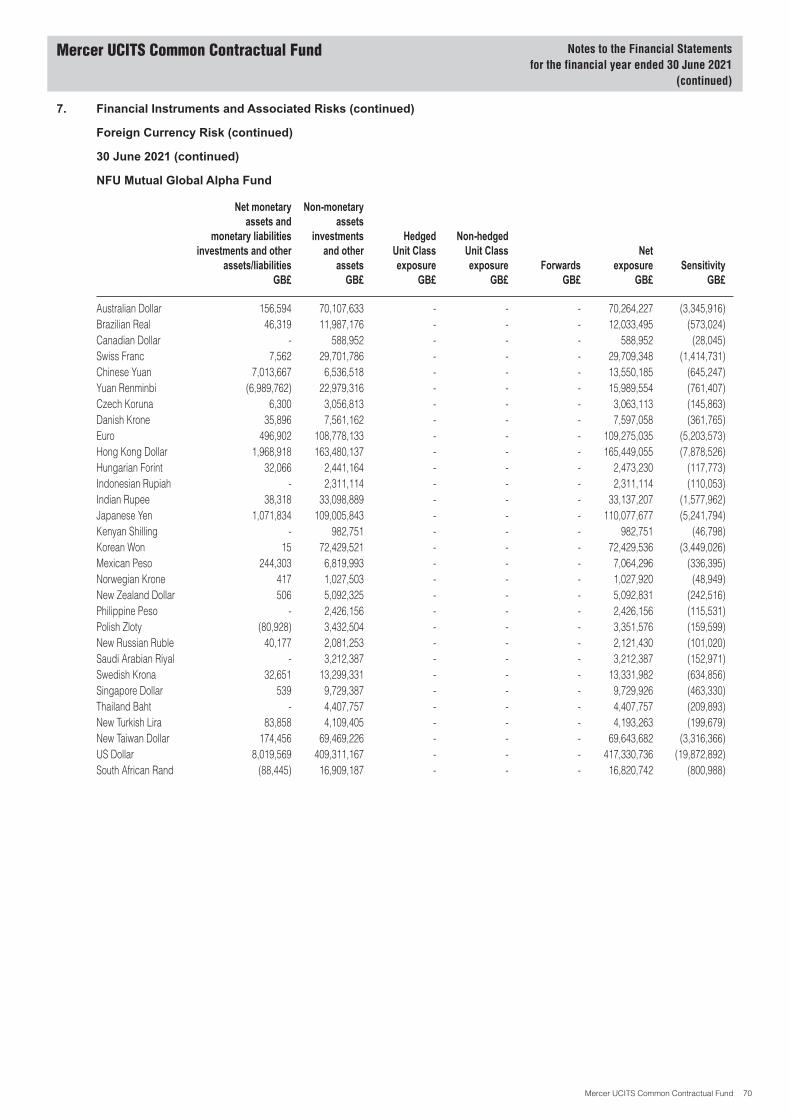
7. Financial Instruments and Associated Risks (continued)
Foreign Currency Risk (continued)
30 June 2021 (continued)
NFU Mutual Global Alpha Fund
Net monetaryassets and
monetary liabilitiesinvestments and other
assets/liabilitiesGB£
Non-monetaryassets
investmentsand other
assetsGB£
HedgedUnit Classexposure
GB£
Non-hedgedUnit Classexposure
GB£Forwards
GB£
Netexposure
GB£Sensitivity
GB£
Australian Dollar 156,594 70,107,633 - - - 70,264,227 (3,345,916)Brazilian Real 46,319 11,987,176 - - - 12,033,495 (573,024)Canadian Dollar - 588,952 - - - 588,952 (28,045)Swiss Franc 7,562 29,701,786 - - - 29,709,348 (1,414,731)Chinese Yuan 7,013,667 6,536,518 - - - 13,550,185 (645,247)Yuan Renminbi (6,989,762) 22,979,316 - - - 15,989,554 (761,407)Czech Koruna 6,300 3,056,813 - - - 3,063,113 (145,863)Danish Krone 35,896 7,561,162 - - - 7,597,058 (361,765)Euro 496,902 108,778,133 - - - 109,275,035 (5,203,573)Hong Kong Dollar 1,968,918 163,480,137 - - - 165,449,055 (7,878,526)Hungarian Forint 32,066 2,441,164 - - - 2,473,230 (117,773)Indonesian Rupiah - 2,311,114 - - - 2,311,114 (110,053)Indian Rupee 38,318 33,098,889 - - - 33,137,207 (1,577,962)Japanese Yen 1,071,834 109,005,843 - - - 110,077,677 (5,241,794)Kenyan Shilling - 982,751 - - - 982,751 (46,798)Korean Won 15 72,429,521 - - - 72,429,536 (3,449,026)Mexican Peso 244,303 6,819,993 - - - 7,064,296 (336,395)Norwegian Krone 417 1,027,503 - - - 1,027,920 (48,949)New Zealand Dollar 506 5,092,325 - - - 5,092,831 (242,516)Philippine Peso - 2,426,156 - - - 2,426,156 (115,531)Polish Zloty (80,928) 3,432,504 - - - 3,351,576 (159,599)New Russian Ruble 40,177 2,081,253 - - - 2,121,430 (101,020)Saudi Arabian Riyal - 3,212,387 - - - 3,212,387 (152,971)Swedish Krona 32,651 13,299,331 - - - 13,331,982 (634,856)Singapore Dollar 539 9,729,387 - - - 9,729,926 (463,330)Thailand Baht - 4,407,757 - - - 4,407,757 (209,893)New Turkish Lira 83,858 4,109,405 - - - 4,193,263 (199,679)New Taiwan Dollar 174,456 69,469,226 - - - 69,643,682 (3,316,366)US Dollar 8,019,569 409,311,167 - - - 417,330,736 (19,872,892)South African Rand (88,445) 16,909,187 - - - 16,820,742 (800,988)
Mercer UCITS Common Contractual Fund Notes to the Financial Statementsfor the financial year ended 30 June 2021
(continued)
Mercer UCITS Common Contractual Fund 70
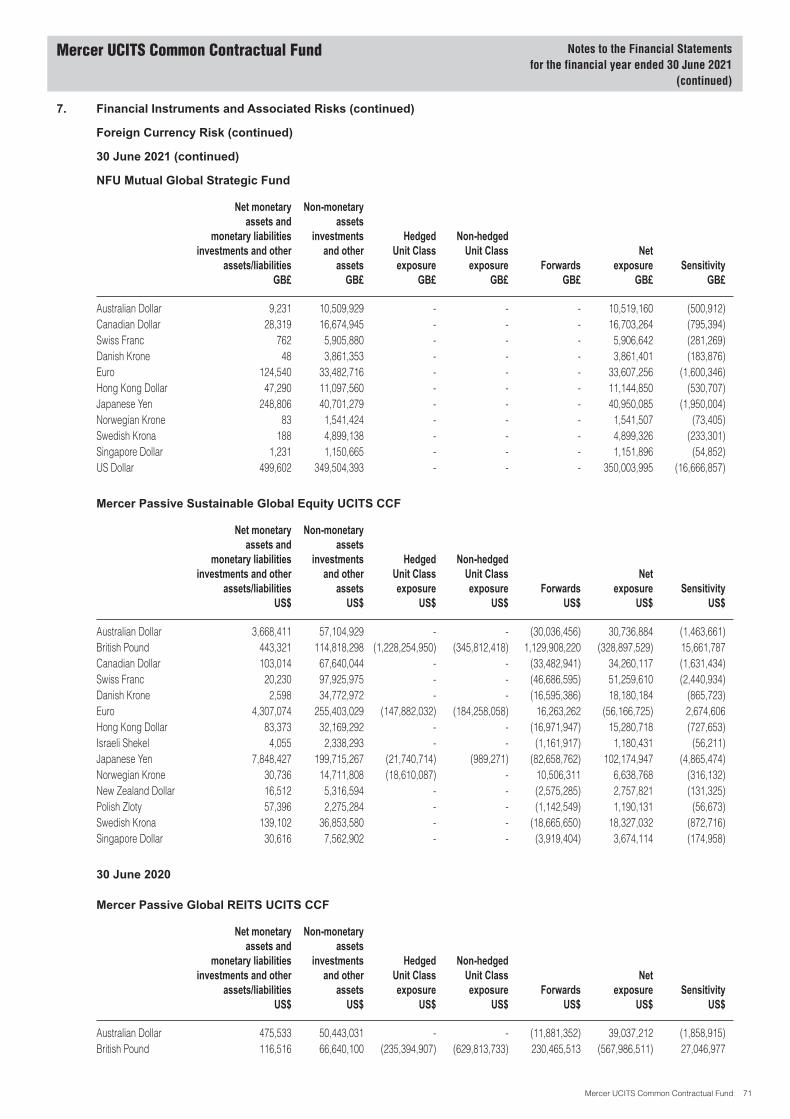
7. Financial Instruments and Associated Risks (continued)
Foreign Currency Risk (continued)
30 June 2021 (continued)
NFU Mutual Global Strategic Fund
Net monetaryassets and
monetary liabilitiesinvestments and other
assets/liabilitiesGB£
Non-monetaryassets
investmentsand other
assetsGB£
HedgedUnit Classexposure
GB£
Non-hedgedUnit Classexposure
GB£Forwards
GB£
Netexposure
GB£Sensitivity
GB£
Australian Dollar 9,231 10,509,929 - - - 10,519,160 (500,912)Canadian Dollar 28,319 16,674,945 - - - 16,703,264 (795,394)Swiss Franc 762 5,905,880 - - - 5,906,642 (281,269)Danish Krone 48 3,861,353 - - - 3,861,401 (183,876)Euro 124,540 33,482,716 - - - 33,607,256 (1,600,346)Hong Kong Dollar 47,290 11,097,560 - - - 11,144,850 (530,707)Japanese Yen 248,806 40,701,279 - - - 40,950,085 (1,950,004)Norwegian Krone 83 1,541,424 - - - 1,541,507 (73,405)Swedish Krona 188 4,899,138 - - - 4,899,326 (233,301)Singapore Dollar 1,231 1,150,665 - - - 1,151,896 (54,852)US Dollar 499,602 349,504,393 - - - 350,003,995 (16,666,857)
Mercer Passive Sustainable Global Equity UCITS CCF
Net monetaryassets and
monetary liabilitiesinvestments and other
assets/liabilitiesUS$
Non-monetaryassets
investmentsand other
assetsUS$
HedgedUnit Classexposure
US$
Non-hedgedUnit Classexposure
US$Forwards
US$
Netexposure
US$Sensitivity
US$
Australian Dollar 3,668,411 57,104,929 - - (30,036,456) 30,736,884 (1,463,661)British Pound 443,321 114,818,298 (1,228,254,950) (345,812,418) 1,129,908,220 (328,897,529) 15,661,787Canadian Dollar 103,014 67,640,044 - - (33,482,941) 34,260,117 (1,631,434)Swiss Franc 20,230 97,925,975 - - (46,686,595) 51,259,610 (2,440,934)Danish Krone 2,598 34,772,972 - - (16,595,386) 18,180,184 (865,723)Euro 4,307,074 255,403,029 (147,882,032) (184,258,058) 16,263,262 (56,166,725) 2,674,606Hong Kong Dollar 83,373 32,169,292 - - (16,971,947) 15,280,718 (727,653)Israeli Shekel 4,055 2,338,293 - - (1,161,917) 1,180,431 (56,211)Japanese Yen 7,848,427 199,715,267 (21,740,714) (989,271) (82,658,762) 102,174,947 (4,865,474)Norwegian Krone 30,736 14,711,808 (18,610,087) - 10,506,311 6,638,768 (316,132)New Zealand Dollar 16,512 5,316,594 - - (2,575,285) 2,757,821 (131,325)Polish Zloty 57,396 2,275,284 - - (1,142,549) 1,190,131 (56,673)Swedish Krona 139,102 36,853,580 - - (18,665,650) 18,327,032 (872,716)Singapore Dollar 30,616 7,562,902 - - (3,919,404) 3,674,114 (174,958)
30 June 2020
Mercer Passive Global REITS UCITS CCF
Net monetaryassets and
monetary liabilitiesinvestments and other
assets/liabilitiesUS$
Non-monetaryassets
investmentsand other
assetsUS$
HedgedUnit Classexposure
US$
Non-hedgedUnit Classexposure
US$Forwards
US$
Netexposure
US$Sensitivity
US$
Australian Dollar 475,533 50,443,031 - - (11,881,352) 39,037,212 (1,858,915)British Pound 116,516 66,640,100 (235,394,907) (629,813,733) 230,465,513 (567,986,511) 27,046,977
Mercer UCITS Common Contractual Fund Notes to the Financial Statementsfor the financial year ended 30 June 2021
(continued)
Mercer UCITS Common Contractual Fund 71
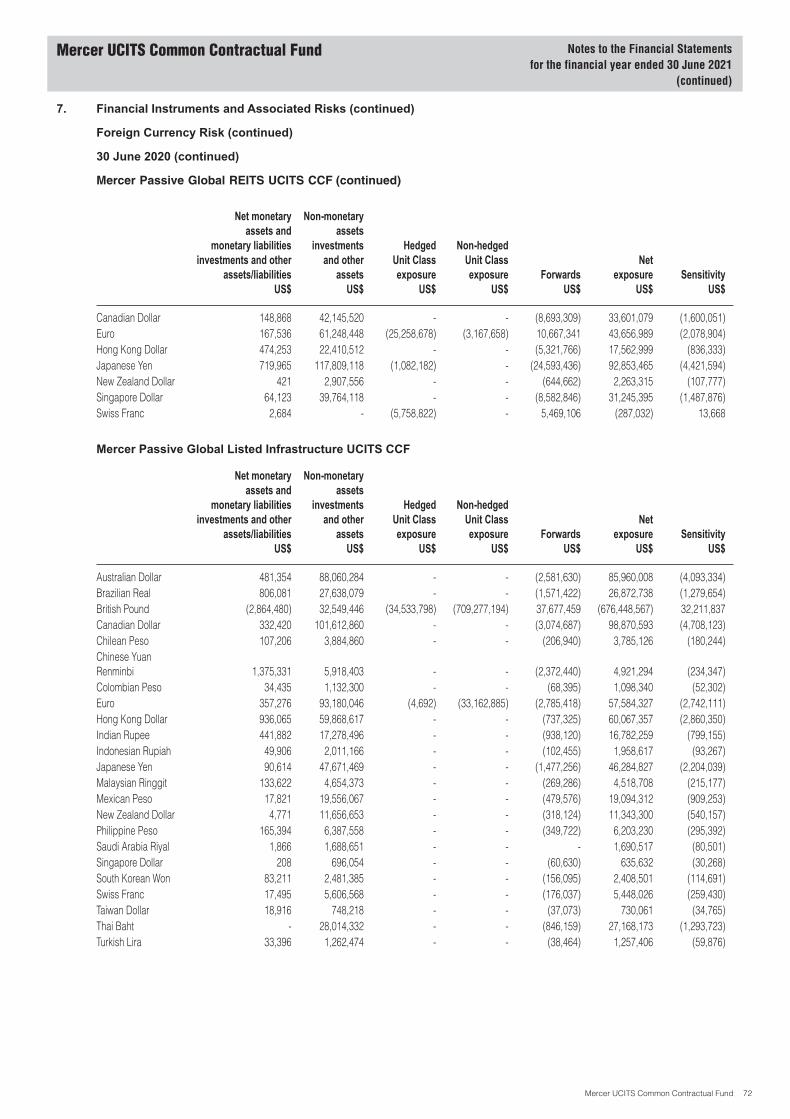
7. Financial Instruments and Associated Risks (continued)
Foreign Currency Risk (continued)
30 June 2020 (continued)
Mercer Passive Global REITS UCITS CCF (continued)
Net monetaryassets and
monetary liabilitiesinvestments and other
assets/liabilitiesUS$
Non-monetaryassets
investmentsand other
assetsUS$
HedgedUnit Classexposure
US$
Non-hedgedUnit Classexposure
US$Forwards
US$
Netexposure
US$Sensitivity
US$
Canadian Dollar 148,868 42,145,520 - - (8,693,309) 33,601,079 (1,600,051)Euro 167,536 61,248,448 (25,258,678) (3,167,658) 10,667,341 43,656,989 (2,078,904)Hong Kong Dollar 474,253 22,410,512 - - (5,321,766) 17,562,999 (836,333)Japanese Yen 719,965 117,809,118 (1,082,182) - (24,593,436) 92,853,465 (4,421,594)New Zealand Dollar 421 2,907,556 - - (644,662) 2,263,315 (107,777)Singapore Dollar 64,123 39,764,118 - - (8,582,846) 31,245,395 (1,487,876)Swiss Franc 2,684 - (5,758,822) - 5,469,106 (287,032) 13,668
Mercer Passive Global Listed Infrastructure UCITS CCF
Net monetaryassets and
monetary liabilitiesinvestments and other
assets/liabilitiesUS$
Non-monetaryassets
investmentsand other
assetsUS$
HedgedUnit Classexposure
US$
Non-hedgedUnit Classexposure
US$Forwards
US$
Netexposure
US$Sensitivity
US$
Australian Dollar 481,354 88,060,284 - - (2,581,630) 85,960,008 (4,093,334)Brazilian Real 806,081 27,638,079 - - (1,571,422) 26,872,738 (1,279,654)British Pound (2,864,480) 32,549,446 (34,533,798) (709,277,194) 37,677,459 (676,448,567) 32,211,837Canadian Dollar 332,420 101,612,860 - - (3,074,687) 98,870,593 (4,708,123)Chilean Peso 107,206 3,884,860 - - (206,940) 3,785,126 (180,244)Chinese YuanRenminbi 1,375,331 5,918,403 - - (2,372,440) 4,921,294 (234,347)Colombian Peso 34,435 1,132,300 - - (68,395) 1,098,340 (52,302)Euro 357,276 93,180,046 (4,692) (33,162,885) (2,785,418) 57,584,327 (2,742,111)Hong Kong Dollar 936,065 59,868,617 - - (737,325) 60,067,357 (2,860,350)Indian Rupee 441,882 17,278,496 - - (938,120) 16,782,259 (799,155)Indonesian Rupiah 49,906 2,011,166 - - (102,455) 1,958,617 (93,267)Japanese Yen 90,614 47,671,469 - - (1,477,256) 46,284,827 (2,204,039)Malaysian Ringgit 133,622 4,654,373 - - (269,286) 4,518,708 (215,177)Mexican Peso 17,821 19,556,067 - - (479,576) 19,094,312 (909,253)New Zealand Dollar 4,771 11,656,653 - - (318,124) 11,343,300 (540,157)Philippine Peso 165,394 6,387,558 - - (349,722) 6,203,230 (295,392)Saudi Arabia Riyal 1,866 1,688,651 - - - 1,690,517 (80,501)Singapore Dollar 208 696,054 - - (60,630) 635,632 (30,268)South Korean Won 83,211 2,481,385 - - (156,095) 2,408,501 (114,691)Swiss Franc 17,495 5,606,568 - - (176,037) 5,448,026 (259,430)Taiwan Dollar 18,916 748,218 - - (37,073) 730,061 (34,765)Thai Baht - 28,014,332 - - (846,159) 27,168,173 (1,293,723)Turkish Lira 33,396 1,262,474 - - (38,464) 1,257,406 (59,876)
Mercer UCITS Common Contractual Fund Notes to the Financial Statementsfor the financial year ended 30 June 2021
(continued)
Mercer UCITS Common Contractual Fund 72

7. Financial Instruments and Associated Risks (continued)
Foreign Currency Risk (continued)
30 June 2020 (continued)
Mercer Passive Low Volatility Equity UCITS CCF
Net monetaryassets and
monetary liabilitiesinvestments and other
assets/liabilitiesUS$
Non-monetaryassets
investmentsand other
assetsUS$
HedgedUnit Classexposure
US$
Non-hedgedUnit Classexposure
US$Forwards
US$
Netexposure
US$Sensitivity
US$
Australian Dollar 6,525 11,178,911 - - (8,617,744) 2,567,692 (122,271)British Pound 286,010 8,939,970 (813,883,218) (73,750,557) 802,566,898 (75,840,897) 3,611,471Canadian Dollar 506,960 82,130,950 - - (57,114,790) 25,523,120 (1,215,387)Danish Krone 757 15,557,794 - - (7,257,943) 8,300,608 (395,267)Euro 519,335 66,994,151 (1,356,944) (96,930,517) (48,259,811) (79,033,786) 3,763,514Hong Kong Dollar 168,756 30,849,104 - - (23,900,754) 7,117,106 (338,910)Israeli Shekel 1,282 5,278,292 - - (4,390,781) 888,793 (42,323)Japanese Yen 1,154,708 163,895,089 - - (104,015,354) 61,034,443 (2,906,402)Norwegian Krone 2,489 5,009,656 - - (3,335,211) 1,676,934 (79,854)Singapore Dollar 70,908 11,115,746 - - (7,956,300) 3,230,354 (153,826)Swedish Krona 632 3,891,522 - - (2,789,953) 1,102,201 (52,486)Swiss Franc (56,838) 76,009,361 - - (55,342,892) 20,609,631 (981,411)
Mercer Passive Global Small Cap Equity UCITS CCF
Net monetaryassets and
monetary liabilitiesinvestments and other
assets/liabilitiesUS$
Non-monetaryassets
investmentsand other
assetsUS$
HedgedUnit Classexposure
US$
Non-hedgedUnit Classexposure
US$Forwards
US$
Netexposure
US$Sensitivity
US$
Australian Dollar 268,008 48,089,842 - - (29,644,883) 18,712,967 (891,094)British Pound 337,428 94,909,355 (884,991,685) (58,828,302) 868,590,948 20,017,744 (953,226)Canadian Dollar 146,514 52,660,055 - - (31,353,160) 21,453,409 (1,021,591)Danish Krone (865) 9,771,519 - - (6,239,260) 3,531,394 (168,162)Euro 1,733,704 119,471,818 - (111,954,214) (75,359,140) (66,107,832) 3,147,992Hong Kong Dollar 105,635 13,191,292 - - (7,613,132) 5,683,795 (270,657)Israeli Shekel 2,064 9,586,598 - - (6,691,243) 2,897,419 (137,972)Japanese Yen 1,361,521 180,125,309 - - (120,124,525) 61,362,305 (2,922,015)New Zealand Dollar 17,309 5,445,078 - - (3,312,037) 2,150,350 (102,398)Norwegian Krone 24,674 12,542,628 - - (7,352,160) 5,215,142 (248,340)Singapore Dollar 74,628 10,293,437 - - (6,566,770) 3,801,295 (181,014)Swedish Krona 122,300 38,466,970 - - (23,242,329) 15,346,941 (730,807)Swiss Franc 13,236 31,312,195 - - (19,652,310) 11,673,121 (555,863)
Mercer Passive Fundamental Indexation Global Equity UCITS CCF
Net monetaryassets and
monetary liabilitiesinvestments and other
assets/liabilitiesUS$
Non-monetaryassets
investmentsand other
assetsUS$
HedgedUnit Classexposure
US$
Non-hedgedUnit Classexposure
US$Forwards
US$
Netexposure
US$Sensitivity
US$
Australian Dollar 457,311 109,475,057 - - (80,390,396) 29,541,972 (1,406,761)British Pound 428,426 95,367,458 (1,364,324,611) (8,466,655) 1,331,413,257 54,417,875 (2,591,327)Canadian Dollar 244,150 64,597,190 - - (48,553,070) 16,288,270 (775,632)
Mercer UCITS Common Contractual Fund Notes to the Financial Statementsfor the financial year ended 30 June 2021
(continued)
Mercer UCITS Common Contractual Fund 73
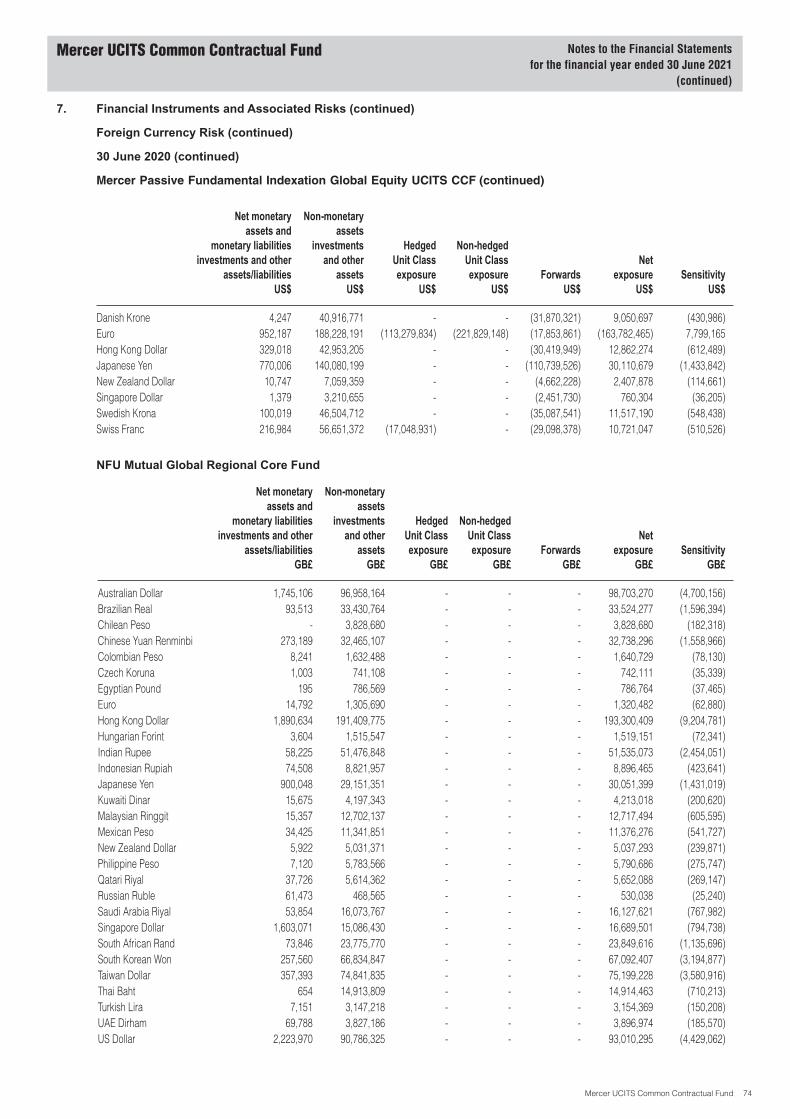
7. Financial Instruments and Associated Risks (continued)
Foreign Currency Risk (continued)
30 June 2020 (continued)
Mercer Passive Fundamental Indexation Global Equity UCITS CCF (continued)
Net monetaryassets and
monetary liabilitiesinvestments and other
assets/liabilitiesUS$
Non-monetaryassets
investmentsand other
assetsUS$
HedgedUnit Classexposure
US$
Non-hedgedUnit Classexposure
US$Forwards
US$
Netexposure
US$Sensitivity
US$
Danish Krone 4,247 40,916,771 - - (31,870,321) 9,050,697 (430,986)Euro 952,187 188,228,191 (113,279,834) (221,829,148) (17,853,861) (163,782,465) 7,799,165Hong Kong Dollar 329,018 42,953,205 - - (30,419,949) 12,862,274 (612,489)Japanese Yen 770,006 140,080,199 - - (110,739,526) 30,110,679 (1,433,842)New Zealand Dollar 10,747 7,059,359 - - (4,662,228) 2,407,878 (114,661)Singapore Dollar 1,379 3,210,655 - - (2,451,730) 760,304 (36,205)Swedish Krona 100,019 46,504,712 - - (35,087,541) 11,517,190 (548,438)Swiss Franc 216,984 56,651,372 (17,048,931) - (29,098,378) 10,721,047 (510,526)
NFU Mutual Global Regional Core Fund
Net monetaryassets and
monetary liabilitiesinvestments and other
assets/liabilitiesGB£
Non-monetaryassets
investmentsand other
assetsGB£
HedgedUnit Classexposure
GB£
Non-hedgedUnit Classexposure
GB£Forwards
GB£
Netexposure
GB£Sensitivity
GB£
Australian Dollar 1,745,106 96,958,164 - - - 98,703,270 (4,700,156)Brazilian Real 93,513 33,430,764 - - - 33,524,277 (1,596,394)Chilean Peso - 3,828,680 - - - 3,828,680 (182,318)Chinese Yuan Renminbi 273,189 32,465,107 - - - 32,738,296 (1,558,966)Colombian Peso 8,241 1,632,488 - - - 1,640,729 (78,130)Czech Koruna 1,003 741,108 - - - 742,111 (35,339)Egyptian Pound 195 786,569 - - - 786,764 (37,465)Euro 14,792 1,305,690 - - - 1,320,482 (62,880)Hong Kong Dollar 1,890,634 191,409,775 - - - 193,300,409 (9,204,781)Hungarian Forint 3,604 1,515,547 - - - 1,519,151 (72,341)Indian Rupee 58,225 51,476,848 - - - 51,535,073 (2,454,051)Indonesian Rupiah 74,508 8,821,957 - - - 8,896,465 (423,641)Japanese Yen 900,048 29,151,351 - - - 30,051,399 (1,431,019)Kuwaiti Dinar 15,675 4,197,343 - - - 4,213,018 (200,620)Malaysian Ringgit 15,357 12,702,137 - - - 12,717,494 (605,595)Mexican Peso 34,425 11,341,851 - - - 11,376,276 (541,727)New Zealand Dollar 5,922 5,031,371 - - - 5,037,293 (239,871)Philippine Peso 7,120 5,783,566 - - - 5,790,686 (275,747)Qatari Riyal 37,726 5,614,362 - - - 5,652,088 (269,147)Russian Ruble 61,473 468,565 - - - 530,038 (25,240)Saudi Arabia Riyal 53,854 16,073,767 - - - 16,127,621 (767,982)Singapore Dollar 1,603,071 15,086,430 - - - 16,689,501 (794,738)South African Rand 73,846 23,775,770 - - - 23,849,616 (1,135,696)South Korean Won 257,560 66,834,847 - - - 67,092,407 (3,194,877)Taiwan Dollar 357,393 74,841,835 - - - 75,199,228 (3,580,916)Thai Baht 654 14,913,809 - - - 14,914,463 (710,213)Turkish Lira 7,151 3,147,218 - - - 3,154,369 (150,208)UAE Dirham 69,788 3,827,186 - - - 3,896,974 (185,570)US Dollar 2,223,970 90,786,325 - - - 93,010,295 (4,429,062)
Mercer UCITS Common Contractual Fund Notes to the Financial Statementsfor the financial year ended 30 June 2021
(continued)
Mercer UCITS Common Contractual Fund 74

7. Financial Instruments and Associated Risks (continued)
Foreign Currency Risk (continued)
30 June 2020 (continued)
NFU Mutual Global Alpha Fund
Net monetaryassets and
monetary liabilitiesinvestments and other
assets/liabilitiesGB£
Non-monetaryassets
investmentsand other
assetsGB£
HedgedUnit Classexposure
GB£
Non-hedgedUnit Classexposure
GB£Forwards
GB£
Netexposure
GB£Sensitivity
GB£
Australian Dollar 24,860 69,871,886 - - - 69,896,746 (3,328,416)Brazilian Real (61,140) 16,786,804 - - - 16,725,664 (796,460)Chinese Renminbi Offshore (2,537,998) 9,908,932 - - - 7,370,934 (350,997)Chinese Yuan Renminbi 2,640,317 9,824,195 - - - 12,464,512 (593,548)Czech Koruna 5,256 1,263,943 - - - 1,269,199 (60,438)Danish Krone 37,899 7,200,354 - - - 7,238,253 (344,679)Euro 47,406 76,535,941 - - - 76,583,347 (3,646,826)Hong Kong Dollar 728,296 153,912,340 - - - 154,640,636 (7,363,840)Hungarian Forint 8,603 2,365,864 - - - 2,374,467 (113,070)Indian Rupee (1,195,205) 9,880,644 - - - 8,685,439 (413,592)Indonesian Rupiah 85,707 6,143,002 - - - 6,228,709 (296,605)Japanese Yen 2,158,433 110,252,921 - - - 112,411,354 (5,352,922)Kenyan Shilling - 761,097 - - - 761,097 (36,243)Malaysian Ringgit 8,927 1,638,877 - - - 1,647,804 (78,467)Mexican Peso 77,801 8,093,494 - - - 8,171,295 (389,109)New Zealand Dollar 521 4,192,446 - - - 4,192,967 (199,665)Norwegian Krone 11,306 760,178 - - - 771,484 (36,737)Philippine Peso - 2,044,854 - - - 2,044,854 (97,374)Polish Zloty 2,569 2,425,605 - - - 2,428,174 (115,627)Singapore Dollar 67,064 10,131,954 - - - 10,199,018 (485,668)South African Rand 56,151 10,431,722 - - - 10,487,873 (499,423)South Korean Won (56,869) 38,566,093 - - - 38,509,224 (1,833,773)Swedish Krona (328,752) 5,578,986 - - - 5,250,234 (250,011)Swiss Franc 14 18,438,356 - - - 18,438,370 (878,018)Taiwan Dollar 212,018 54,395,452 - - - 54,607,470 (2,600,356)Thai Baht - 5,700,086 - - - 5,700,086 (271,433)Turkish Lira 40,473 3,460,632 - - - 3,501,105 (166,719)UAE Dirham - 568,863 - - - 568,863 (27,089)US Dollar 9,575,998 418,485,324 - - - 428,061,322 (20,383,872)
Mercer UCITS Common Contractual Fund Notes to the Financial Statementsfor the financial year ended 30 June 2021
(continued)
Mercer UCITS Common Contractual Fund 75
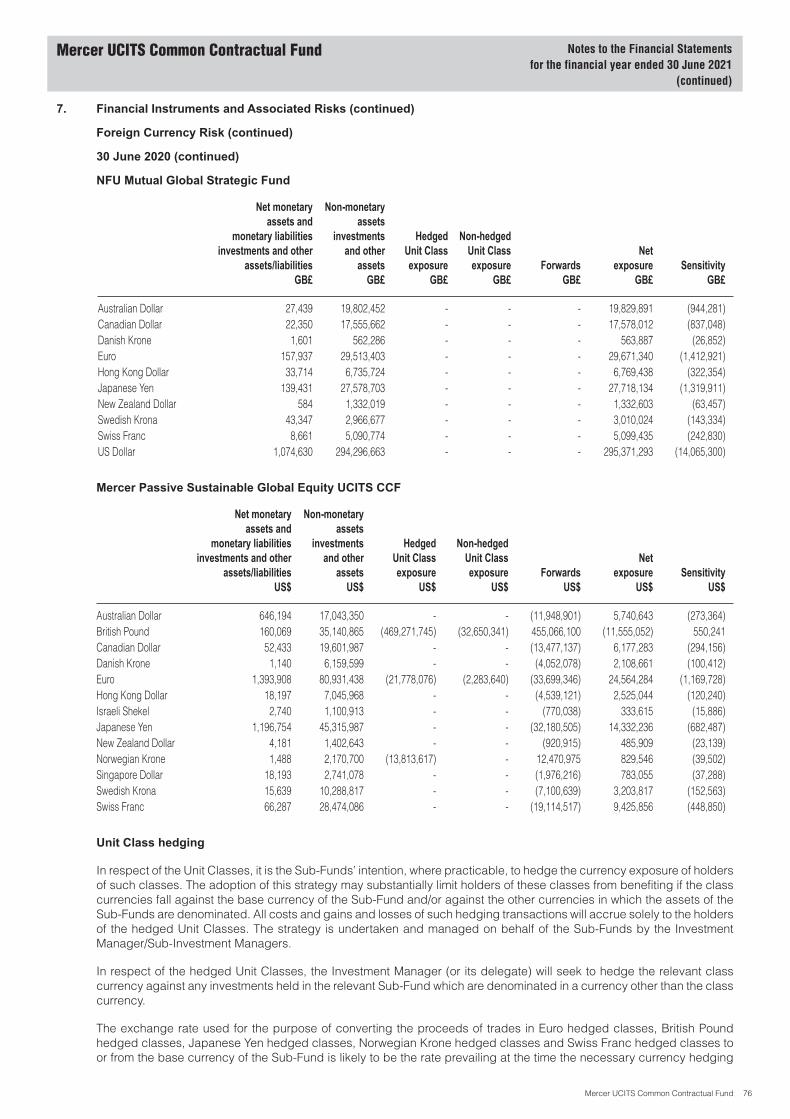
7. Financial Instruments and Associated Risks (continued)
Foreign Currency Risk (continued)
30 June 2020 (continued)
NFU Mutual Global Strategic Fund
Net monetaryassets and
monetary liabilitiesinvestments and other
assets/liabilitiesGB£
Non-monetaryassets
investmentsand other
assetsGB£
HedgedUnit Classexposure
GB£
Non-hedgedUnit Classexposure
GB£Forwards
GB£
Netexposure
GB£Sensitivity
GB£
Australian Dollar 27,439 19,802,452 - - - 19,829,891 (944,281)Canadian Dollar 22,350 17,555,662 - - - 17,578,012 (837,048)Danish Krone 1,601 562,286 - - - 563,887 (26,852)Euro 157,937 29,513,403 - - - 29,671,340 (1,412,921)Hong Kong Dollar 33,714 6,735,724 - - - 6,769,438 (322,354)Japanese Yen 139,431 27,578,703 - - - 27,718,134 (1,319,911)New Zealand Dollar 584 1,332,019 - - - 1,332,603 (63,457)Swedish Krona 43,347 2,966,677 - - - 3,010,024 (143,334)Swiss Franc 8,661 5,090,774 - - - 5,099,435 (242,830)US Dollar 1,074,630 294,296,663 - - - 295,371,293 (14,065,300)
Mercer Passive Sustainable Global Equity UCITS CCF
Net monetaryassets and
monetary liabilitiesinvestments and other
assets/liabilitiesUS$
Non-monetaryassets
investmentsand other
assetsUS$
HedgedUnit Classexposure
US$
Non-hedgedUnit Classexposure
US$Forwards
US$
Netexposure
US$Sensitivity
US$
Australian Dollar 646,194 17,043,350 - - (11,948,901) 5,740,643 (273,364)British Pound 160,069 35,140,865 (469,271,745) (32,650,341) 455,066,100 (11,555,052) 550,241Canadian Dollar 52,433 19,601,987 - - (13,477,137) 6,177,283 (294,156)Danish Krone 1,140 6,159,599 - - (4,052,078) 2,108,661 (100,412)Euro 1,393,908 80,931,438 (21,778,076) (2,283,640) (33,699,346) 24,564,284 (1,169,728)Hong Kong Dollar 18,197 7,045,968 - - (4,539,121) 2,525,044 (120,240)Israeli Shekel 2,740 1,100,913 - - (770,038) 333,615 (15,886)Japanese Yen 1,196,754 45,315,987 - - (32,180,505) 14,332,236 (682,487)New Zealand Dollar 4,181 1,402,643 - - (920,915) 485,909 (23,139)Norwegian Krone 1,488 2,170,700 (13,813,617) - 12,470,975 829,546 (39,502)Singapore Dollar 18,193 2,741,078 - - (1,976,216) 783,055 (37,288)Swedish Krona 15,639 10,288,817 - - (7,100,639) 3,203,817 (152,563)Swiss Franc 66,287 28,474,086 - - (19,114,517) 9,425,856 (448,850)
Unit Class hedging
In respect of the Unit Classes, it is the Sub-Funds’ intention, where practicable, to hedge the currency exposure of holdersof such classes. The adoption of this strategy may substantially limit holders of these classes from benefiting if the classcurrencies fall against the base currency of the Sub-Fund and/or against the other currencies in which the assets of theSub-Funds are denominated. All costs and gains and losses of such hedging transactions will accrue solely to the holdersof the hedged Unit Classes. The strategy is undertaken and managed on behalf of the Sub-Funds by the InvestmentManager/Sub-Investment Managers.
In respect of the hedged Unit Classes, the Investment Manager (or its delegate) will seek to hedge the relevant classcurrency against any investments held in the relevant Sub-Fund which are denominated in a currency other than the classcurrency.
The exchange rate used for the purpose of converting the proceeds of trades in Euro hedged classes, British Poundhedged classes, Japanese Yen hedged classes, Norwegian Krone hedged classes and Swiss Franc hedged classes toor from the base currency of the Sub-Fund is likely to be the rate prevailing at the time the necessary currency hedging
Mercer UCITS Common Contractual Fund Notes to the Financial Statementsfor the financial year ended 30 June 2021
(continued)
Mercer UCITS Common Contractual Fund 76

7. Financial Instruments and Associated Risks (continued)
Foreign Currency Risk (continued)
Unit Class hedging (continued)
contracts are put in place which means that this exchange rate risk is borne by those transacting investors rather than bythe other investors in the Sub-Funds.
The following details the Unit Class naming convention:
Unit Class Type – Hedged/Unhedged – Management Fee – Accumulating/Distributing – Currency.
Interest Rate Risk
Interest rate risk profile and sensitivity analysisInterest rate risk is defined as the risk that the fair value or future cash flows of a financial instrument will fluctuate becauseof changes in market interest rates.
The Sub-Funds invest most of their assets in equities, investment funds and open forward foreign currency exchangecontracts, none of which pay interest. As a result, the Sub-Funds are subject to immaterial risk due to fluctuations in theprevailing levels of market interest rates on these investments.
NFU Mutual Global Regional Core Fund holds one interest bearing security, with fair value of GB£ 3,855 as at the financialyear ended 30 June 2021 which earns a fixed interest rate.
The following table summarise the interest rate sensitivity of NFU Mutual Global Regional Core Fund’s exposure to interestrate risks. It includes the Sub-Fund’s assets at fair values, categorised by the earlier of contractual re-pricing or maturitydates.
The sensitivity analysis reflects how net assets attributable to holders of redeemable participating units would have beenaffected by changes in the relevant risk variable that were reasonably possible at the reporting date.
The Manager, on behalf of the CCF, has determined that a fluctuation in yield of 25 bps is reasonably possible,considering the economic environment in which the Sub-Fund operates. The table below sets out the effect on theSub-Fund’s net assets attributable to holders of redeemable participating units of a reasonably possible reduction of25 bps in yield at 30 June 2021. An increase in yield of the same amount would have resulted in a roughly equal butopposite effect to the amounts shown. The impact of such an increase or reduction has been estimated by calculating thefair value changes of the fixed-interest debt securities and other fixed-interest bearing assets less liabilities andderivatives, if any. This impact is primarily from the change in the fair value of fixed income securities. This analysisassumes that all other variables, in particular foreign currency rates, remain constant.
Ccy < 1 Month1-3
Months3 Monthsto 1 Year 1-5 Years > 5 Years
Non-interestbearing
NetAssets (%)*
EffectiveDuration
(Years)NFU Mutual Global Regional Core Fund GB£ 2,655,713 - - 3,855 - 1,018,394,932 1,021,054,500 - -
*Impact of 25bps decrease in interest rates on NAV.
Valuation Techniques
The fair value of the instruments that are not traded in an active market (for example, OTC derivatives) is estimated usingvaluation techniques, including use of recent arm’s length market transactions, reference to the current fair value oranother investment that is substantially the same, discounted cash flow techniques, option pricing models or any othervaluation technique that provide a reliable estimate or prices obtained in actual market transactions.
Where the discounted cash flow techniques are used, estimated future cash flows are based on management’s bestestimate and the discount rate used is a market rate at the reporting date applicable for an instrument with similar termsand conditions. Where other pricing models are used, inputs are based on market data at the reporting date. Fair valuesfor unquoted equity instruments are estimated, if possible, using applicable price/earnings ratios for similar listedcompanies adjusted to reflect the specific circumstances of the issuer.
The fair value of derivatives that are not exchange traded are estimated at the amount that the Sub-Funds would receiveor pay to terminate the contract at the reporting date taking into account current market conditions and thecreditworthiness of the counterparties.
Financial assets include investments in open-ended investment funds. The fair value of such assets is based on theunderlying fund administrator’s calculation of the NAV per share (market value of the fund’s assets less liabilities dividedby the number of units) which will be the latest bid price published by the investment funds, taking into account any
Mercer UCITS Common Contractual Fund Notes to the Financial Statementsfor the financial year ended 30 June 2021
(continued)
Mercer UCITS Common Contractual Fund 77

7. Financial Instruments and Associated Risks (continued)
Valuation Techniques (continued)
adjustments that may be required to account for illiquidity, low trading volumes or any such factors that may indicate thatthe bid price may not be fair value. The fair value of any investments in closed-ended investment funds is based on the bidprices available on the principal market for such security at the valuation date taking into account any adjustments thatmay be required to account for illiquidity, low trading volumes or any such factors that may indicate that the bid price maynot be fair value. There were no adjustments or discounts applied in the valuation of any of the underlying investments insuch investment funds.
Fair Value of Financial Assets and Liabilities
Transferable securities, investment funds and FDIs are held at FVTPL. All other assets and financial liabilities are stated atamortised cost, which approximates fair value with the exception of redeemable participating units which are stated attheir redemption amount.
IFRS 13 requires the Sub-Funds to classify assets and liabilities in fair value hierarchy that reflects the significance of theinputs used in making the measurements. IFRS 13 establishes a fair value hierarchy that prioritises the inputs to valuationtechniques used to measure fair value. The hierarchy gives the highest priority to unadjusted quoted prices in activemarkets for identical assets or liabilities (Level 1 measurements) and the lowest priority to unobservable inputs (Level 3measurements). The three levels of the fair value hierarchy under IFRS 13 are as follows:
Level 1 - Quoted prices (unadjusted) in active markets for identical assets or liabilities;
Level 2 - Inputs other than quoted prices included within Level 1 that are observable for the asset or liability either directly(that is, as prices) or indirectly (that is, derived from prices);
Level 3 - Inputs for the asset or liability that are not based on observable market data (that is, unobservable inputs).
The level in the fair value hierarchy within which the fair value measurement is categorised in its entirety is determined onthe basis of the lowest level input that is significant to the fair value measurement in its entirety. For this purpose, thesignificance of an input is assessed against the fair value measurement in its entirety. If a fair value measurement usesobservable inputs that require significant adjustment based on unobservable inputs, that measurement is a Level 3measurement. Assessing the significance of a particular input to the fair value measurement in its entirety requiresjudgement, considering factors specific to the asset or liability.
The determination of what constitutes “observable” requires significant judgement by the Manager. The Managerconsiders observable data to be that market data that is readily available, regularly distributed or updated, reliable andverifiable, not proprietary, and provided by independent sources that are actively involved in the relevant market.
For each class of assets and liabilities not measured at fair value in the Statement of Financial Position but for which fairvalue is disclosed, IFRS 13 requires the Sub-Funds to disclose the level within the fair value hierarchy which the fair valuemeasurement would be categorised and a description of the valuation technique and inputs used in the technique.
The financial instruments not measured at FVTPL are short-term financial assets and financial liabilities whose carryingamounts approximate fair value, because of their short-term nature and, for the financial assets, high credit quality ofcounterparties.
Cash and cash equivalents include deposits held with banks and other short-term investments in an active market andthey are categorised as Level 1.
Receivable for investments sold and other receivables include the contractual amounts for settlement of trades and otherobligations due to the Sub-Funds. Payable for investments sold and other expenses payable represent the contractualamounts and obligations due by the Sub-Funds for settlement of trades and expenses. All receivable and payablebalances are categorised as Level 2.
The puttable value of redeemable units is calculated based on the net difference between total assets and all otherliabilities of each Sub-Fund within the CCF in accordance with the Sub-Funds offering memorandum. A demand feature isattached to these units, as they are redeemable at the holders’ option and can be put back to the Sub-Funds at anydealing date for cash equal to a proportionate unit of the Sub-Funds NAV attributable to the Unit Class. The fair value isbased on the amount payable on demand. As such, Level 2 is deemed to be the most appropriate categorisation for netassets attributable to holders of redeemable units.
Mercer UCITS Common Contractual Fund Notes to the Financial Statementsfor the financial year ended 30 June 2021
(continued)
Mercer UCITS Common Contractual Fund 78
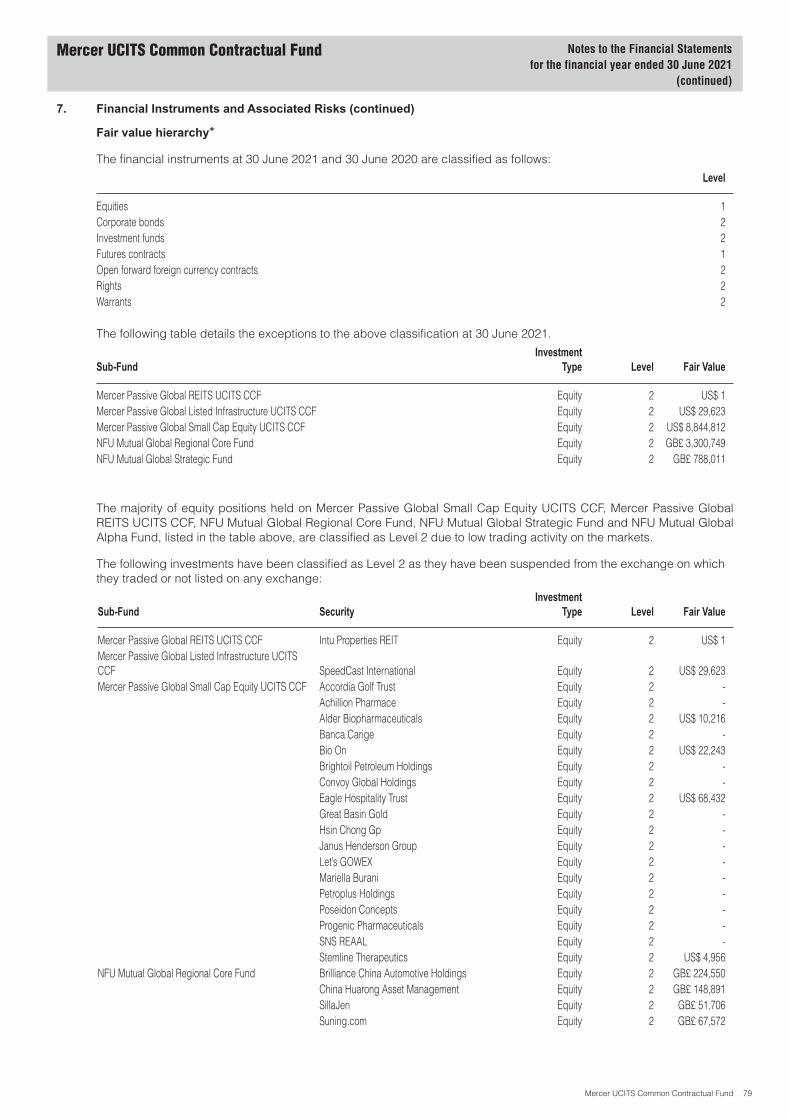
7. Financial Instruments and Associated Risks (continued)
Fair value hierarchy+
The financial instruments at 30 June 2021 and 30 June 2020 are classified as follows:
Level
Equities 1Corporate bonds 2Investment funds 2Futures contracts 1Open forward foreign currency contracts 2Rights 2Warrants 2
The following table details the exceptions to the above classification at 30 June 2021.
Sub-FundInvestment
Type Level Fair Value
Mercer Passive Global REITS UCITS CCF Equity 2 US$ 1Mercer Passive Global Listed Infrastructure UCITS CCF Equity 2 US$ 29,623Mercer Passive Global Small Cap Equity UCITS CCF Equity 2 US$ 8,844,812NFU Mutual Global Regional Core Fund Equity 2 GB£ 3,300,749NFU Mutual Global Strategic Fund Equity 2 GB£ 788,011
The majority of equity positions held on Mercer Passive Global Small Cap Equity UCITS CCF, Mercer Passive GlobalREITS UCITS CCF, NFU Mutual Global Regional Core Fund, NFU Mutual Global Strategic Fund and NFU Mutual GlobalAlpha Fund, listed in the table above, are classified as Level 2 due to low trading activity on the markets.
The following investments have been classified as Level 2 as they have been suspended from the exchange on whichthey traded or not listed on any exchange:
Sub-Fund SecurityInvestment
Type Level Fair Value
Mercer Passive Global REITS UCITS CCF Intu Properties REIT Equity 2 US$ 1Mercer Passive Global Listed Infrastructure UCITSCCF SpeedCast International Equity 2 US$ 29,623Mercer Passive Global Small Cap Equity UCITS CCF Accordia Golf Trust Equity 2 -
Achillion Pharmace Equity 2 -Alder Biopharmaceuticals Equity 2 US$ 10,216Banca Carige Equity 2 -Bio On Equity 2 US$ 22,243Brightoil Petroleum Holdings Equity 2 -Convoy Global Holdings Equity 2 -Eagle Hospitality Trust Equity 2 US$ 68,432Great Basin Gold Equity 2 -Hsin Chong Gp Equity 2 -Janus Henderson Group Equity 2 -Let’s GOWEX Equity 2 -Mariella Burani Equity 2 -Petroplus Holdings Equity 2 -Poseidon Concepts Equity 2 -Progenic Pharmaceuticals Equity 2 -SNS REAAL Equity 2 -Stemline Therapeutics Equity 2 US$ 4,956
NFU Mutual Global Regional Core Fund Brilliance China Automotive Holdings Equity 2 GB£ 224,550China Huarong Asset Management Equity 2 GB£ 148,891SillaJen Equity 2 GB£ 51,706Suning.com Equity 2 GB£ 67,572
Mercer UCITS Common Contractual Fund Notes to the Financial Statementsfor the financial year ended 30 June 2021
(continued)
Mercer UCITS Common Contractual Fund 79
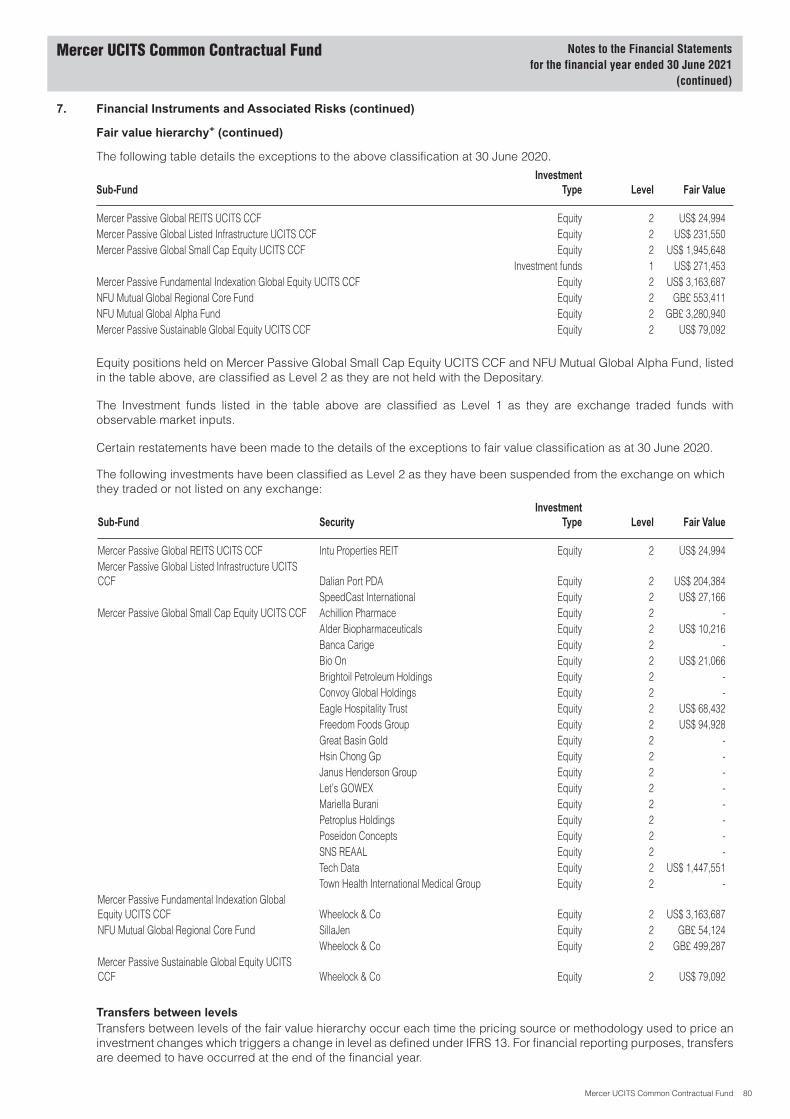
7. Financial Instruments and Associated Risks (continued)
Fair value hierarchy+ (continued)
The following table details the exceptions to the above classification at 30 June 2020.
Sub-FundInvestment
Type Level Fair Value
Mercer Passive Global REITS UCITS CCF Equity 2 US$ 24,994Mercer Passive Global Listed Infrastructure UCITS CCF Equity 2 US$ 231,550Mercer Passive Global Small Cap Equity UCITS CCF Equity 2 US$ 1,945,648
Investment funds 1 US$ 271,453Mercer Passive Fundamental Indexation Global Equity UCITS CCF Equity 2 US$ 3,163,687NFU Mutual Global Regional Core Fund Equity 2 GB£ 553,411NFU Mutual Global Alpha Fund Equity 2 GB£ 3,280,940Mercer Passive Sustainable Global Equity UCITS CCF Equity 2 US$ 79,092
Equity positions held on Mercer Passive Global Small Cap Equity UCITS CCF and NFU Mutual Global Alpha Fund, listedin the table above, are classified as Level 2 as they are not held with the Depositary.
The Investment funds listed in the table above are classified as Level 1 as they are exchange traded funds withobservable market inputs.
Certain restatements have been made to the details of the exceptions to fair value classification as at 30 June 2020.
The following investments have been classified as Level 2 as they have been suspended from the exchange on whichthey traded or not listed on any exchange:
Sub-Fund SecurityInvestment
Type Level Fair Value
Mercer Passive Global REITS UCITS CCF Intu Properties REIT Equity 2 US$ 24,994Mercer Passive Global Listed Infrastructure UCITSCCF Dalian Port PDA Equity 2 US$ 204,384
SpeedCast International Equity 2 US$ 27,166Mercer Passive Global Small Cap Equity UCITS CCF Achillion Pharmace Equity 2 -
Alder Biopharmaceuticals Equity 2 US$ 10,216Banca Carige Equity 2 -Bio On Equity 2 US$ 21,066Brightoil Petroleum Holdings Equity 2 -Convoy Global Holdings Equity 2 -Eagle Hospitality Trust Equity 2 US$ 68,432Freedom Foods Group Equity 2 US$ 94,928Great Basin Gold Equity 2 -Hsin Chong Gp Equity 2 -Janus Henderson Group Equity 2 -Let’s GOWEX Equity 2 -Mariella Burani Equity 2 -Petroplus Holdings Equity 2 -Poseidon Concepts Equity 2 -SNS REAAL Equity 2 -Tech Data Equity 2 US$ 1,447,551Town Health International Medical Group Equity 2 -
Mercer Passive Fundamental Indexation GlobalEquity UCITS CCF Wheelock & Co Equity 2 US$ 3,163,687NFU Mutual Global Regional Core Fund SillaJen Equity 2 GB£ 54,124
Wheelock & Co Equity 2 GB£ 499,287Mercer Passive Sustainable Global Equity UCITSCCF Wheelock & Co Equity 2 US$ 79,092
Transfers between levelsTransfers between levels of the fair value hierarchy occur each time the pricing source or methodology used to price aninvestment changes which triggers a change in level as defined under IFRS 13. For financial reporting purposes, transfersare deemed to have occurred at the end of the financial year.
Mercer UCITS Common Contractual Fund Notes to the Financial Statementsfor the financial year ended 30 June 2021
(continued)
Mercer UCITS Common Contractual Fund 80
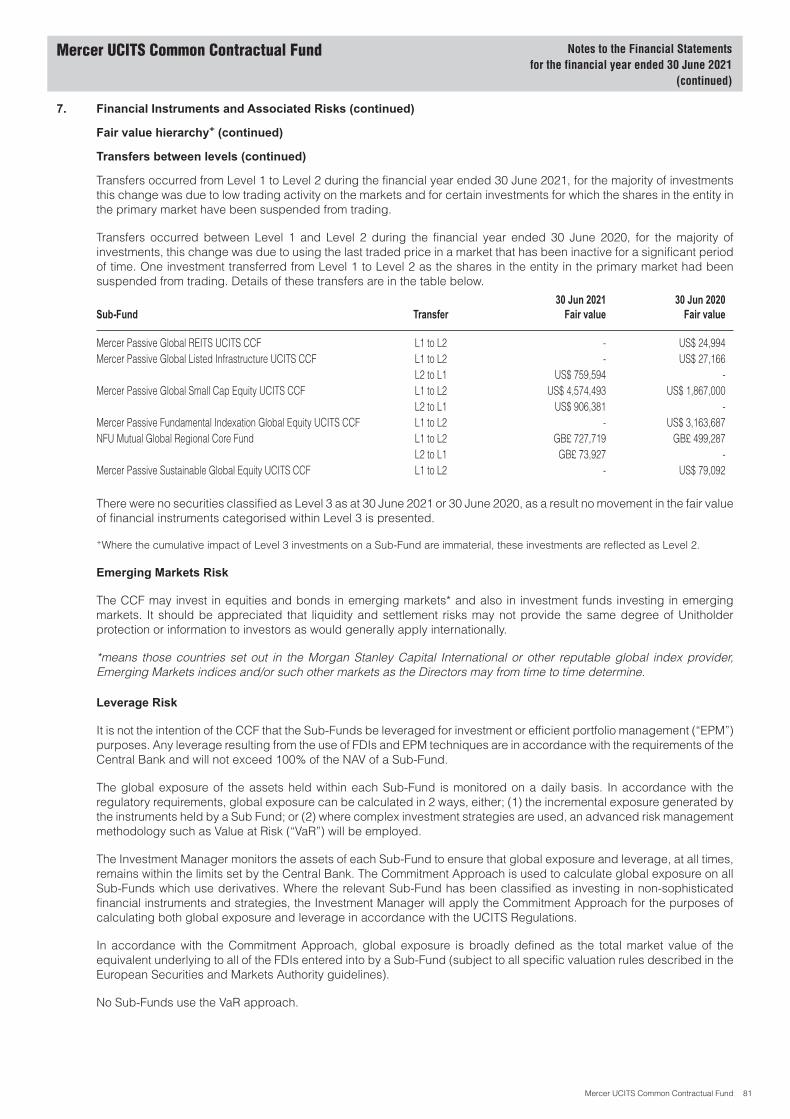
7. Financial Instruments and Associated Risks (continued)
Fair value hierarchy+ (continued)
Transfers between levels (continued)
Transfers occurred from Level 1 to Level 2 during the financial year ended 30 June 2021, for the majority of investmentsthis change was due to low trading activity on the markets and for certain investments for which the shares in the entity inthe primary market have been suspended from trading.
Transfers occurred between Level 1 and Level 2 during the financial year ended 30 June 2020, for the majority ofinvestments, this change was due to using the last traded price in a market that has been inactive for a significant periodof time. One investment transferred from Level 1 to Level 2 as the shares in the entity in the primary market had beensuspended from trading. Details of these transfers are in the table below.
Sub-Fund Transfer30 Jun 2021
Fair value30 Jun 2020
Fair value
Mercer Passive Global REITS UCITS CCF L1 to L2 - US$ 24,994Mercer Passive Global Listed Infrastructure UCITS CCF L1 to L2 - US$ 27,166
L2 to L1 US$ 759,594 -Mercer Passive Global Small Cap Equity UCITS CCF L1 to L2 US$ 4,574,493 US$ 1,867,000
L2 to L1 US$ 906,381 -Mercer Passive Fundamental Indexation Global Equity UCITS CCF L1 to L2 - US$ 3,163,687NFU Mutual Global Regional Core Fund L1 to L2 GB£ 727,719 GB£ 499,287
L2 to L1 GB£ 73,927 -Mercer Passive Sustainable Global Equity UCITS CCF L1 to L2 - US$ 79,092
There were no securities classified as Level 3 as at 30 June 2021 or 30 June 2020, as a result no movement in the fair valueof financial instruments categorised within Level 3 is presented.
+Where the cumulative impact of Level 3 investments on a Sub-Fund are immaterial, these investments are reflected as Level 2.
Emerging Markets Risk
The CCF may invest in equities and bonds in emerging markets* and also in investment funds investing in emergingmarkets. It should be appreciated that liquidity and settlement risks may not provide the same degree of Unitholderprotection or information to investors as would generally apply internationally.
*means those countries set out in the Morgan Stanley Capital International or other reputable global index provider,Emerging Markets indices and/or such other markets as the Directors may from time to time determine.
Leverage Risk
It is not the intention of the CCF that the Sub-Funds be leveraged for investment or efficient portfolio management (“EPM”)purposes. Any leverage resulting from the use of FDIs and EPM techniques are in accordance with the requirements of theCentral Bank and will not exceed 100% of the NAV of a Sub-Fund.
The global exposure of the assets held within each Sub-Fund is monitored on a daily basis. In accordance with theregulatory requirements, global exposure can be calculated in 2 ways, either; (1) the incremental exposure generated bythe instruments held by a Sub Fund; or (2) where complex investment strategies are used, an advanced risk managementmethodology such as Value at Risk (“VaR”) will be employed.
The Investment Manager monitors the assets of each Sub-Fund to ensure that global exposure and leverage, at all times,remains within the limits set by the Central Bank. The Commitment Approach is used to calculate global exposure on allSub-Funds which use derivatives. Where the relevant Sub-Fund has been classified as investing in non-sophisticatedfinancial instruments and strategies, the Investment Manager will apply the Commitment Approach for the purposes ofcalculating both global exposure and leverage in accordance with the UCITS Regulations.
In accordance with the Commitment Approach, global exposure is broadly defined as the total market value of theequivalent underlying to all of the FDIs entered into by a Sub-Fund (subject to all specific valuation rules described in theEuropean Securities and Markets Authority guidelines).
No Sub-Funds use the VaR approach.
Mercer UCITS Common Contractual Fund Notes to the Financial Statementsfor the financial year ended 30 June 2021
(continued)
Mercer UCITS Common Contractual Fund 81

7. Financial Instruments and Associated Risks (continued)
Coronavirus (“COVID-19”)
Since the start of January 2020, global financial markets have been monitoring and reacting to the novel coronavirus(2019-nCoV) that is believed to have originated in Wuhan, China. On 11 March 2020, the World Health Organisation(“WHO”) officially declared the COVID-19 outbreak a pandemic. As of October 2021, approximately 219 million cases ofCOVID-19 have been reported, including over 4.5 million deaths. The virus has spread across the globe, withCOVID-19 major outbreaks across almost every continent with new variants of the virus emerging, resulting in a significantworldwide slowdown in economic activity. Widespread restrictions have been in place in many countries, limiting theability of people to travel, socialise and leave their homes. Global financial markets initially reacted sharply to this news,with concerns regarding the economic impact this may have on a global scale. While some sectors have since recovered,the number of people infected by the virus continues to grow meaning the full impact on the global economy and marketsis not yet known. While the roll out and global administration of the vaccines has in many countries slowed thetransmission of the virus although the longer term impact of the virus, there are new variants of concern emerging and thelonger term impact of the virus will largely depend upon the scale and the duration of the outbreak.
The Manager and Investment Manager both enacted their business continuity plans in March 2020 and at presentcontinue to, where possible, work from home, although plans to re-open the offices have commenced. Any re-opening oftheir offices will be completed in line with government guidelines. They have had a Core Crisis Management Team in placefrom the initial stages of the outbreak that have successfully implemented activities to mitigate the impact ofCOVID-19 across their operations. In keeping with their Risk Management Framework, the Manager and InvestmentManager have rigorous policies and procedures in place to continuously monitor operations performance covering bothinternal operations and that of their delegates. The Manager, Investment Manager and other delegates have remainedoperationally effective during the crisis.
While the long-term impact of COVID-19 on the CCF will take longer to assess and quantify, the Investment Manager,Manager and other delegates continue to monitor this situation closely.
Legal, Tax and Regulatory Risk
Legal, tax and regulatory changes could occur during the duration of the Sub-Funds which may adversely affect theSub-Funds. See Note 6 to the financial statements for details of taxation.
Taxation in the People’s Republic of China (“PRC”)*
PRC withholding tax has been enforced on payment of dividends and interest to Qualified Foreign Institutional Investors(“QFIIs”) from PRC listed companies at the rate of 10%. However, PRC tax authorities have generally not sought to collectsuch withholding tax to date on capital gains realised by QFIIs on selling of A-Units although withholding tax is legallyapplicable to such capital gains. There is a risk that the PRC tax authorities would seek to collect this tax on capital gainsrealised by QFIIs on sales of A-Units, on a retrospective basis, without giving any prior warning. In such a case, theSub-Funds might be adversely impacted.
*Tax Risk Disclaimer for Mercer UCITS Common Contractual Fund on Mercer Passive Global REITS UCITS CCF, MercerPassive Global Listed Infrastructure UCITS CCF, Mercer Passive Low Volatility Equity UCITS CCF, Mercer Passive GlobalSmall Cap Equity UCITS CCF, Mercer Passive Fundamental Indexation Global Equity UCITS CCF, NFU Mutual GlobalRegional Core Fund, NFU Mutual Global Alpha Fund, NFU Mutual Global Strategic Fund and Mercer Passive SustainableGlobal Equity UCITS CCF.
Mercer UCITS Common Contractual Fund Notes to the Financial Statementsfor the financial year ended 30 June 2021
(continued)
Mercer UCITS Common Contractual Fund 82
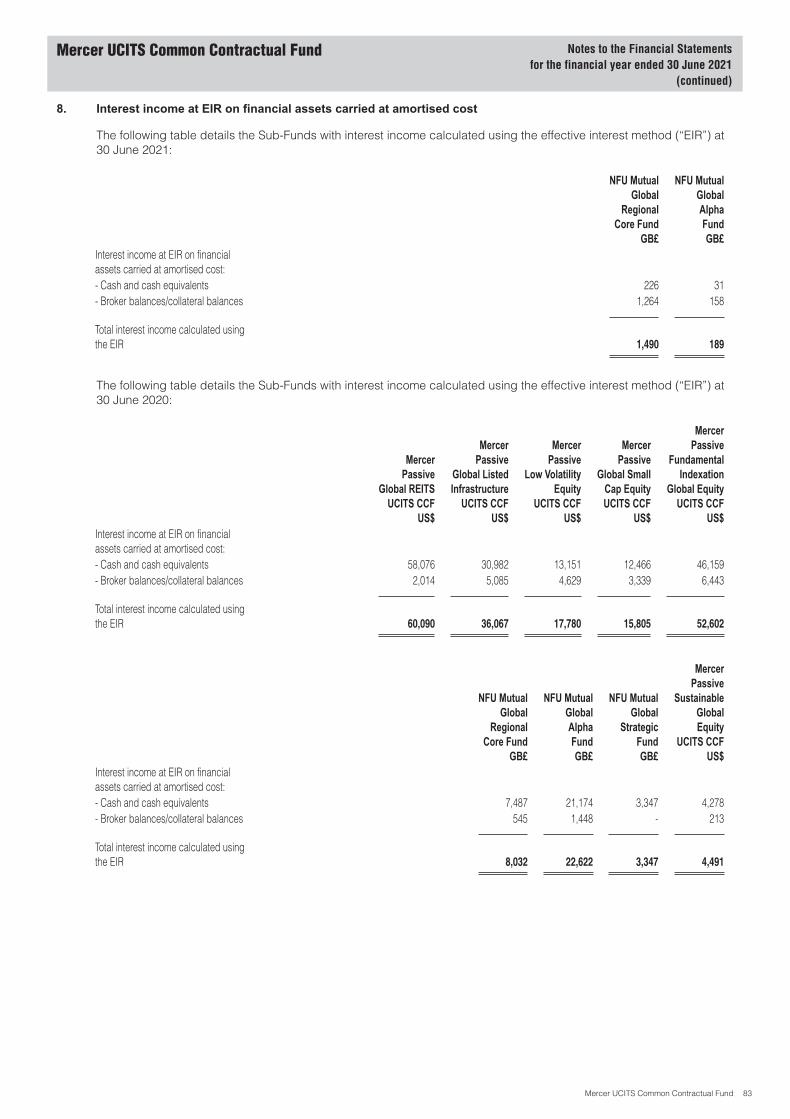
8. Interest income at EIR on financial assets carried at amortised cost
The following table details the Sub-Funds with interest income calculated using the effective interest method (“EIR”) at30 June 2021:
NFU MutualGlobal
RegionalCore Fund
GB£
NFU MutualGlobalAlphaFundGB£
Interest income at EIR on financialassets carried at amortised cost:- Cash and cash equivalents 226 31- Broker balances/collateral balances 1,264 158
Total interest income calculated usingthe EIR 1,490 189
The following table details the Sub-Funds with interest income calculated using the effective interest method (“EIR”) at30 June 2020:
MercerPassive
Global REITSUCITS CCF
US$
MercerPassive
Global ListedInfrastructure
UCITS CCFUS$
MercerPassive
Low VolatilityEquity
UCITS CCFUS$
MercerPassive
Global SmallCap EquityUCITS CCF
US$
MercerPassive
FundamentalIndexation
Global EquityUCITS CCF
US$Interest income at EIR on financialassets carried at amortised cost:- Cash and cash equivalents 58,076 30,982 13,151 12,466 46,159- Broker balances/collateral balances 2,014 5,085 4,629 3,339 6,443
Total interest income calculated usingthe EIR 60,090 36,067 17,780 15,805 52,602
NFU MutualGlobal
RegionalCore Fund
GB£
NFU MutualGlobalAlphaFundGB£
NFU MutualGlobal
StrategicFundGB£
MercerPassive
SustainableGlobalEquity
UCITS CCFUS$
Interest income at EIR on financialassets carried at amortised cost:- Cash and cash equivalents 7,487 21,174 3,347 4,278- Broker balances/collateral balances 545 1,448 - 213
Total interest income calculated usingthe EIR 8,032 22,622 3,347 4,491
Mercer UCITS Common Contractual Fund Notes to the Financial Statementsfor the financial year ended 30 June 2021
(continued)
Mercer UCITS Common Contractual Fund 83
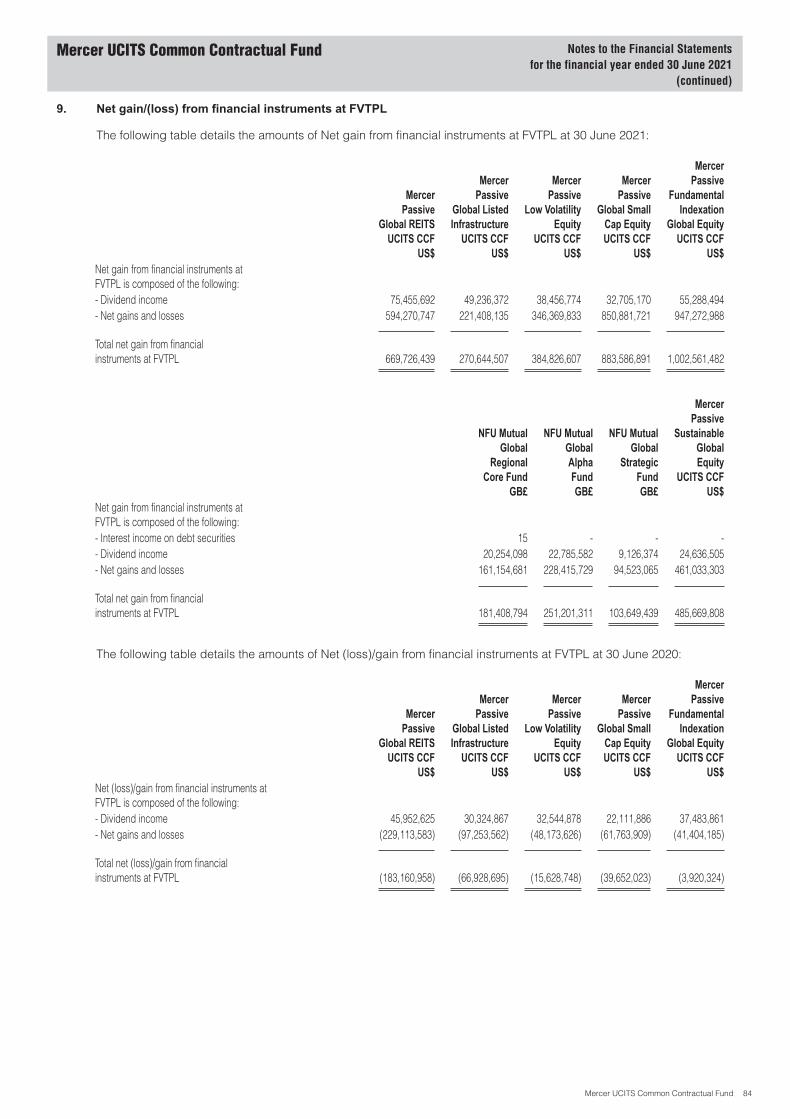
9. Net gain/(loss) from financial instruments at FVTPL
The following table details the amounts of Net gain from financial instruments at FVTPL at 30 June 2021:
MercerPassive
Global REITSUCITS CCF
US$
MercerPassive
Global ListedInfrastructure
UCITS CCFUS$
MercerPassive
Low VolatilityEquity
UCITS CCFUS$
MercerPassive
Global SmallCap EquityUCITS CCF
US$
MercerPassive
FundamentalIndexation
Global EquityUCITS CCF
US$Net gain from financial instruments atFVTPL is composed of the following:- Dividend income 75,455,692 49,236,372 38,456,774 32,705,170 55,288,494- Net gains and losses 594,270,747 221,408,135 346,369,833 850,881,721 947,272,988
Total net gain from financialinstruments at FVTPL 669,726,439 270,644,507 384,826,607 883,586,891 1,002,561,482
NFU MutualGlobal
RegionalCore Fund
GB£
NFU MutualGlobalAlphaFundGB£
NFU MutualGlobal
StrategicFundGB£
MercerPassive
SustainableGlobalEquity
UCITS CCFUS$
Net gain from financial instruments atFVTPL is composed of the following:- Interest income on debt securities 15 - - -- Dividend income 20,254,098 22,785,582 9,126,374 24,636,505- Net gains and losses 161,154,681 228,415,729 94,523,065 461,033,303
Total net gain from financialinstruments at FVTPL 181,408,794 251,201,311 103,649,439 485,669,808
The following table details the amounts of Net (loss)/gain from financial instruments at FVTPL at 30 June 2020:
MercerPassive
Global REITSUCITS CCF
US$
MercerPassive
Global ListedInfrastructure
UCITS CCFUS$
MercerPassive
Low VolatilityEquity
UCITS CCFUS$
MercerPassive
Global SmallCap EquityUCITS CCF
US$
MercerPassive
FundamentalIndexation
Global EquityUCITS CCF
US$Net (loss)/gain from financial instruments atFVTPL is composed of the following:- Dividend income 45,952,625 30,324,867 32,544,878 22,111,886 37,483,861- Net gains and losses (229,113,583) (97,253,562) (48,173,626) (61,763,909) (41,404,185)
Total net (loss)/gain from financialinstruments at FVTPL (183,160,958) (66,928,695) (15,628,748) (39,652,023) (3,920,324)
Mercer UCITS Common Contractual Fund Notes to the Financial Statementsfor the financial year ended 30 June 2021
(continued)
Mercer UCITS Common Contractual Fund 84

9. Net gain/(loss) from financial instruments at FVTPL (continued)
NFU MutualGlobal
RegionalCore Fund
GB£
NFU MutualGlobalAlphaFundGB£
NFU MutualGlobal
StrategicFundGB£
MercerPassive
SustainableGlobalEquity
UCITS CCFUS$
Net (loss)/gain from financial instruments atFVTPL is composed of the following:- Dividend income 15,672,317 14,276,983 6,334,189 10,451,778- Net gains and losses (36,800,852) 1,631,477 (11,865,489) 40,255,567
Total net (loss)/gain from financialinstruments at FVTPL (21,128,535) 15,908,460 (5,531,300) 50,707,345
10. Debtors and creditors
All debtors and creditors amounts fall due within one year.
11. Unit capital
The rights attaching to units issued in the CCF or any Sub-Fund or class may be varied or abrogated provided, of theUnitholders in the CCF or the relevant Sub-Fund or class in question responding to a request for confirmation, at least 50%of written responses, by NAV, consent to the variation or abrogation, provided always that the rights conferred upon theholders of units in the CCF or any Sub-Fund or class which have been issued with other rights shall not, unless otherwiseexpressly provided by the terms of issue of Units in the CCF or relevant Sub-Fund or class be deemed to be varied by thecreation or issue of further units ranking pari passu therewith.
The CCF does not have any externally imposed capital requirements.
Swing pricing and anti-dilution levy
To enable a Sub-Fund to recover the cost of investing Sub-Fund assets upon an investor’s subscription for units and thecost of liquidating Sub-Fund assets upon a Unitholder’s redemption of units and to preserve the value of the assets of therelevant Sub-Fund, each Unitholder may be subject to swing pricing or an anti-dilution levy of up to 3% of the subscriptionproceeds or redemption proceeds. In calculating the swing pricing, the NAV of a Sub-Fund is swung by a “swing factor”,the Directors may, in respect of net redemptions, adjust downward the NAV per Unit and may also, in respect of netsubscriptions, adjust upward the NAV per Unit. The Administrator will calculate the NAV for the relevant Sub-Fund andthen adjust (“swing”) the NAV by a pre-determined amount. The direction of the swing will depend on whether there arenet subscriptions or redemptions in the relevant Sub-Fund on the relevant dealing day, while the magnitude of the swingwill be based on pre-determined estimates of the average trading costs in the relevant asset class(es) in which theSub-Fund is invested. The Net assets attributable to holders of redeemable participating units in the Statement ofFinancial Position is inclusive of any swing adjustments applied to the Sub-Funds.
Please see table below detailing the Sub-Funds’ that applied swing pricing as at the financial year ended 30 June 2021:
Sub-FundMercer Passive Global REITS UCITS CCFMercer Passive Low Volatility Equity UCITS CCFMercer Passive Fundamental Indexation Global Equity UCITS CCFNFU Mutual Global Regional Core FundNFU Mutual Global Alpha FundNFU Mutual Global Strategic FundMercer Passive Sustainable Global Equity UCITS CCF
There was no swing pricing applied to the Sub-Funds’ at the financial year ended 30 June 2020.
An anti-dilution levy, if applicable, would be paid to the Sub-Fund for the benefit of all Unitholders and would not be paidto the Manager or Investment Manager. The anti-dilution levy is deducted from subscription proceeds and willcorrespondingly reduce the number of units purchased by the investor or will be deducted from redemption proceedsand will correspondingly reduce the amounts received by a Unitholder upon redeeming its units from the Sub-Fund.Proceeds from redeemable participating units are inclusive of anti-dilution charges.
Mercer UCITS Common Contractual Fund Notes to the Financial Statementsfor the financial year ended 30 June 2021
(continued)
Mercer UCITS Common Contractual Fund 85

11. Unit capital (continued)
Swing pricing and anti-dilution levy (continued)
All proceeds from redeemable participating units issued and payments for redeemable participating units redeemed areshown in the base currency of the Sub-Fund.
Units in issue
All proceeds from redeemable participating units issued and payments for redeemable participating units redeemed areshown in the base currency of the Sub-Fund.
Units at30 Jun 2020
Unitsissued
Unitsredeemed
Unitstransferred
Units at30 Jun 2021
Proceeds fromunits issued
Payment forunits redeemed
Mercer Passive Global REITS UCITS CCF US$ US$Class A9-H-0.1950 £ GB-1 1,047,377 737,165 (717,747) (64,181) 1,002,614 85,433,092 (91,528,409)Class A13-0.3000 € 15,990 15 (2,327) - 13,678 1,647 (281,447)Class A20-H-0.8200 £ 118,921 157,048 (20,066) (22,499) 233,404 19,524,965 (2,534,508)Class A20-H-0.8200 £ GB-1 696,511 441,723 (378,902) (59,055) 700,277 49,605,346 (45,706,458)Class Z1-0.0000 $ 4,259 3,164 (831) - 6,592 279,758,171 (81,070,591)Class Z1-0.0000 £ 5,787 2,647 (713) - 7,721 319,424,781 (96,348,255)Class Z1-0.0000 JPY*** - 36 (3) - 33 353,298 (30,685)Class A17-H-0.5200-D £ GB-1 130,132 78,015 (141,936) 164,326 230,537 7,061,287 (14,425,049)Class A17-H-0.5200-D £ GB-4 206,925 94,750 (267,893) - 33,782 8,907,278 (34,117,763)Class A13-0.3000 € IE-4** 14,707 5,083 (19,790) - - 465,680 (2,056,319)Class A17-H-0.5200 £ GB-4 223,325 94,591 (302,973) - 14,943 10,203,964 (43,708,918)Class A17-0.5000 € IE-1 2,830 631 (10) - 3,451 81,231 (1,406)Class A1-H-0.0200 JPY 10,160 8,459 (2,016) - 16,603 1,066,037 (269,627)Class A3-H-0.0700 €** 222,762 225,452 - (448,214) - 26,381,582 -Class A17-H-0.5200 CHF 54,066 10,727 (7,199) - 57,594 1,176,571 (961,992)Class A4-H-0.0950 €* - 5,190 (775) - 4,415 613,098 (104,672)Class A1-H-0.0200 SGD* - 610,958 (157,878) - 453,080 47,836,714 (13,957,270)Class Z2-H-0.0200 €* - 24 (34) 456 446 3,079,739 (5,177,837)Class B2-0.0475 € IE-6* - 173,735 (5,497) - 168,238 25,076,321 (796,309)Class B2-H-0.0675 € IE-6* - 406 (48) - 358 55,450 (6,043)Class A17-0.5000 $* - 2,687 (233) - 2,454 269,064 (25,671)Class A13-H-0.3200 € IE-1* - 306,345 - - 306,345 37,069,204 -
Mercer Passive Global Listed Infrastructure UCITS CCF US$ US$Class A17-0.5000 € 12,066 2,122 (995) - 13,193 251,870 (127,097)Class Z1-0.0000 $ 4,369 1,604 (327) (151) 5,495 169,858,884 (35,320,639)Class Z1-0.0000 £ 5,858 2,312 (189) - 7,981 308,886,404 (25,648,065)Class A19-0.7000 £ GB-3** 10,908 729 (52) (11,585) - 85,488 (7,203)Class A15-H-0.4200 £ GB-3 308,410 507,865 (172,293) - 643,982 65,075,950 (22,030,736)Class A17-0.5000 € IE-3 157,486 8,171 (26,944) - 138,713 836,233 (2,868,471)Class A17-0.5000-D £ GB-6** 11,327 2,718 (14,045) - - 305,281 (1,756,651)Class B2-0.0475 € IE-6 180,291 46,700 (35,995) - 190,996 4,647,634 (3,735,232)Class B2-H-0.0675 € IE-6 49 302 - - 351 35,331 -Class A20-H-0.8200 £ GB-3 6,991 22,685 (4,105) 10,110 35,681 3,712,444 (632,541)Class A17-H-0.5200 € IE-3* - 124,031 (4,719) - 119,312 14,754,551 (604,836)Class A17-0.5000 £ GB-6*/** - 9,362 - (9,362) - 1,246,824 -Class A12-0.2500 SEK*/** - 1 (133,896) 133,895 - 224 (16,021,598)Class A17-H-0.5200 £ GB-6* - 1,009 (64) 8,778 9,723 144,161 (9,549)
Mercer Passive Low Volatility Equity UCITS CCF US$ US$Class A14-0.3500 £ GB-3*** - 84,624 - - 84,624 11,933,714 -Class A15-H-0.4200 £ GB-3 232,322 340,272 (384,570) - 188,024 50,618,081 (61,213,760)Class A17-0.5000 € IE-3 159,959 15,919 (58,783) (11,487) 105,608 1,995,083 (7,106,898)Class A19-0.7000 £ GB-3**** 6,286 6,719 (6,356) - 6,649 947,387 (830,090)Class A20-H-0.8200 £ GB-3 8,844 25,204 (21,225) - 12,823 3,705,791 (3,298,776)Class Z1-0.0000 £ 555 2,564 (66) - 3,053 380,895,884 (9,810,418)Class Z1-0.0000 $ 2,750 2,560 (2,076) (202) 3,032 289,694,535 (253,383,655)Class Z2-H-0.0200 £ 6,430 1,192 (2,323) - 5,299 174,095,885 (346,195,646)
Mercer UCITS Common Contractual Fund Notes to the Financial Statementsfor the financial year ended 30 June 2021
(continued)
Mercer UCITS Common Contractual Fund 86
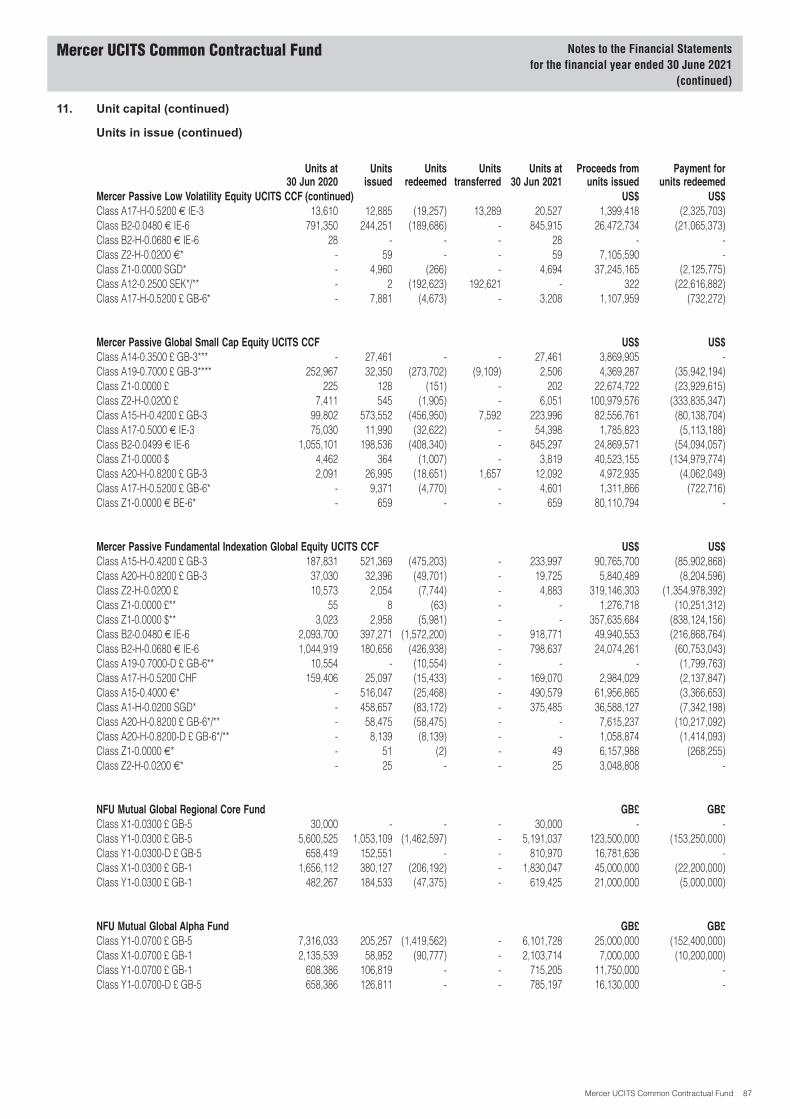
11. Unit capital (continued)
Units in issue (continued)
Units at30 Jun 2020
Unitsissued
Unitsredeemed
Unitstransferred
Units at30 Jun 2021
Proceeds fromunits issued
Payment forunits redeemed
Mercer Passive Low Volatility Equity UCITS CCF (continued) US$ US$Class A17-H-0.5200 € IE-3 13,610 12,885 (19,257) 13,289 20,527 1,399,418 (2,325,703)Class B2-0.0480 € IE-6 791,350 244,251 (189,686) - 845,915 26,472,734 (21,065,373)Class B2-H-0.0680 € IE-6 28 - - - 28 - -Class Z2-H-0.0200 €* - 59 - - 59 7,105,590 -Class Z1-0.0000 SGD* - 4,960 (266) - 4,694 37,245,165 (2,125,775)Class A12-0.2500 SEK*/** - 2 (192,623) 192,621 - 322 (22,616,882)Class A17-H-0.5200 £ GB-6* - 7,881 (4,673) - 3,208 1,107,959 (732,272)
Mercer Passive Global Small Cap Equity UCITS CCF US$ US$Class A14-0.3500 £ GB-3*** - 27,461 - - 27,461 3,869,905 -Class A19-0.7000 £ GB-3**** 252,967 32,350 (273,702) (9,109) 2,506 4,369,287 (35,942,194)Class Z1-0.0000 £ 225 128 (151) - 202 22,674,722 (23,929,615)Class Z2-H-0.0200 £ 7,411 545 (1,905) - 6,051 100,979,576 (333,835,347)Class A15-H-0.4200 £ GB-3 99,802 573,552 (456,950) 7,592 223,996 82,556,761 (80,138,704)Class A17-0.5000 € IE-3 75,030 11,990 (32,622) - 54,398 1,785,823 (5,113,188)Class B2-0.0499 € IE-6 1,055,101 198,536 (408,340) - 845,297 24,869,571 (54,094,057)Class Z1-0.0000 $ 4,462 364 (1,007) - 3,819 40,523,155 (134,979,774)Class A20-H-0.8200 £ GB-3 2,091 26,995 (18,651) 1,657 12,092 4,972,935 (4,062,049)Class A17-H-0.5200 £ GB-6* - 9,371 (4,770) - 4,601 1,311,866 (722,716)Class Z1-0.0000 € BE-6* - 659 - - 659 80,110,794 -
Mercer Passive Fundamental Indexation Global Equity UCITS CCF US$ US$Class A15-H-0.4200 £ GB-3 187,831 521,369 (475,203) - 233,997 90,765,700 (85,902,868)Class A20-H-0.8200 £ GB-3 37,030 32,396 (49,701) - 19,725 5,840,489 (8,204,596)Class Z2-H-0.0200 £ 10,573 2,054 (7,744) - 4,883 319,146,303 (1,354,978,392)Class Z1-0.0000 £** 55 8 (63) - - 1,276,718 (10,251,312)Class Z1-0.0000 $** 3,023 2,958 (5,981) - - 357,635,684 (838,124,156)Class B2-0.0480 € IE-6 2,093,700 397,271 (1,572,200) - 918,771 49,940,553 (216,868,764)Class B2-H-0.0680 € IE-6 1,044,919 180,656 (426,938) - 798,637 24,074,261 (60,753,043)Class A19-0.7000-D £ GB-6** 10,554 - (10,554) - - - (1,799,763)Class A17-H-0.5200 CHF 159,406 25,097 (15,433) - 169,070 2,984,029 (2,137,847)Class A15-0.4000 €* - 516,047 (25,468) - 490,579 61,956,865 (3,366,653)Class A1-H-0.0200 SGD* - 458,657 (83,172) - 375,485 36,588,127 (7,342,198)Class A20-H-0.8200 £ GB-6*/** - 58,475 (58,475) - - 7,615,237 (10,217,092)Class A20-H-0.8200-D £ GB-6*/** - 8,139 (8,139) - - 1,058,874 (1,414,093)Class Z1-0.0000 €* - 51 (2) - 49 6,157,988 (268,255)Class Z2-H-0.0200 €* - 25 - - 25 3,048,808 -
NFU Mutual Global Regional Core Fund GB£ GB£Class X1-0.0300 £ GB-5 30,000 - - - 30,000 - -Class Y1-0.0300 £ GB-5 5,600,525 1,053,109 (1,462,597) - 5,191,037 123,500,000 (153,250,000)Class Y1-0.0300-D £ GB-5 658,419 152,551 - - 810,970 16,781,636 -Class X1-0.0300 £ GB-1 1,656,112 380,127 (206,192) - 1,830,047 45,000,000 (22,200,000)Class Y1-0.0300 £ GB-1 482,267 184,533 (47,375) - 619,425 21,000,000 (5,000,000)
NFU Mutual Global Alpha Fund GB£ GB£Class Y1-0.0700 £ GB-5 7,316,033 205,257 (1,419,562) - 6,101,728 25,000,000 (152,400,000)Class X1-0.0700 £ GB-1 2,135,539 58,952 (90,777) - 2,103,714 7,000,000 (10,200,000)Class Y1-0.0700 £ GB-1 608,386 106,819 - - 715,205 11,750,000 -Class Y1-0.0700-D £ GB-5 658,386 126,811 - - 785,197 16,130,000 -
Mercer UCITS Common Contractual Fund Notes to the Financial Statementsfor the financial year ended 30 June 2021
(continued)
Mercer UCITS Common Contractual Fund 87

11. Unit capital (continued)
Units in issue (continued)
Units at30 Jun 2020
Unitsissued
Unitsredeemed
Unitstransferred
Units at30 Jun 2021
Proceeds fromunits issued
Payment forunits redeemed
NFU Mutual Global Strategic Fund GB£ GB£Class Y1-0.0300 £ GB-5 2,939,458 66,207 (519,088) - 2,486,577 6,750,000 (53,750,000)Class X1-0.0300 £ GB-1 885,906 20,264 (21,802) - 884,368 2,100,000 (2,500,000)Class Y1-0.0300 £ GB-1 245,205 63,435 (8,463) - 300,177 6,550,000 (1,000,000)Class Y1-0.0300-D £ GB-5 291,743 75,295 - - 367,038 8,530,000 -
Mercer Passive Sustainable Global Equity UCITS CCF US$ US$Class A10-H-0.2200 NOK 131,524 3,252 (3,327) (14,863) 116,586 508,375 (117,277)Class A15-H-0.4200 £ GB-3 333,990 654,943 (812,836) (78,177) 97,920 109,867,346 (139,965,539)Class A20-H-0.8200 £ GB-3** 21,717 23,440 (42,708) (2,449) - 3,948,276 (7,390,495)Class A20-H-0.8200 € IE-6 151,130 53,067 (29,430) - 174,767 8,308,822 (4,433,768)Class Z1-0.0000 $ 2,055 4,069 (183) 16 5,957 576,543,725 (25,333,860)Class Z1-0.0000 £ 157 411 (12) - 556 73,028,880 (1,944,241)Class Z2-H-0.0200 £ 3,182 3,001 (141) - 6,042 574,602,165 (21,232,110)Class A17-H-0.5200 € IE-3 32,444 516,654 (44,264) - 504,834 66,433,777 (6,354,971)Class A17-0.5000 € IE-3 19,883 27,036 (25,281) - 21,638 3,654,709 (3,120,329)Class A17-0.5000-D £ GB-6 18,216 289,552 (30,920) - 276,848 38,243,093 (4,973,568)Class A17-H-0.5200-D £ GB-6 31,789 2,453 (27,363) - 6,879 291,343 (4,582,231)Class A17-0.5000 £ GB-6 76,580 244,786 (6,728) 622 315,260 35,421,067 (925,599)Class A17-H-0.5200 £ GB-6 81,291 9,333 (19,572) (606) 70,446 1,367,919 (3,079,035)Class B1-0.0750 € IE-6 2,328 1,228,562 (28,046) - 1,202,844 176,430,747 (4,057,293)Class B1-H-0.0950 € IE-6 1,538 202,098 (8,157) - 195,479 30,499,892 (1,251,406)Class A14-0.3500 £ GB-3*** - 850,122 (161,329) 95,568 784,361 124,818,608 (23,758,893)Class A4-H-0.0950 JPY* - 239,470 (52,771) (1,008) 185,691 22,894,944 (5,737,532)Class A19-0.7000 £ GB-3* - 95,745 (18,820) 3,463 80,388 14,133,322 (2,747,739)Class A10-H-0.2200 € IE-3* - 77,870 (8,122) - 69,748 9,477,910 (1,063,912)Class A5-0.1000 JPY* - 9,293 - 1,267 10,560 846,173 -Class A8-H-0.1700 € IE-3* - 3,066 - - 3,066 388,312 -
*The Unit Class launched during the financial year ended 30 June 2021.**The Unit Class terminated during the financial year ended 30 June 2021.***The Unit Class re-launched during the financial year ended 30 June 2021.****The Unit Class terminated and re-launched during the financial year ended 30 June 2021.
Mercer UCITS Common Contractual Fund Notes to the Financial Statementsfor the financial year ended 30 June 2021
(continued)
Mercer UCITS Common Contractual Fund 88
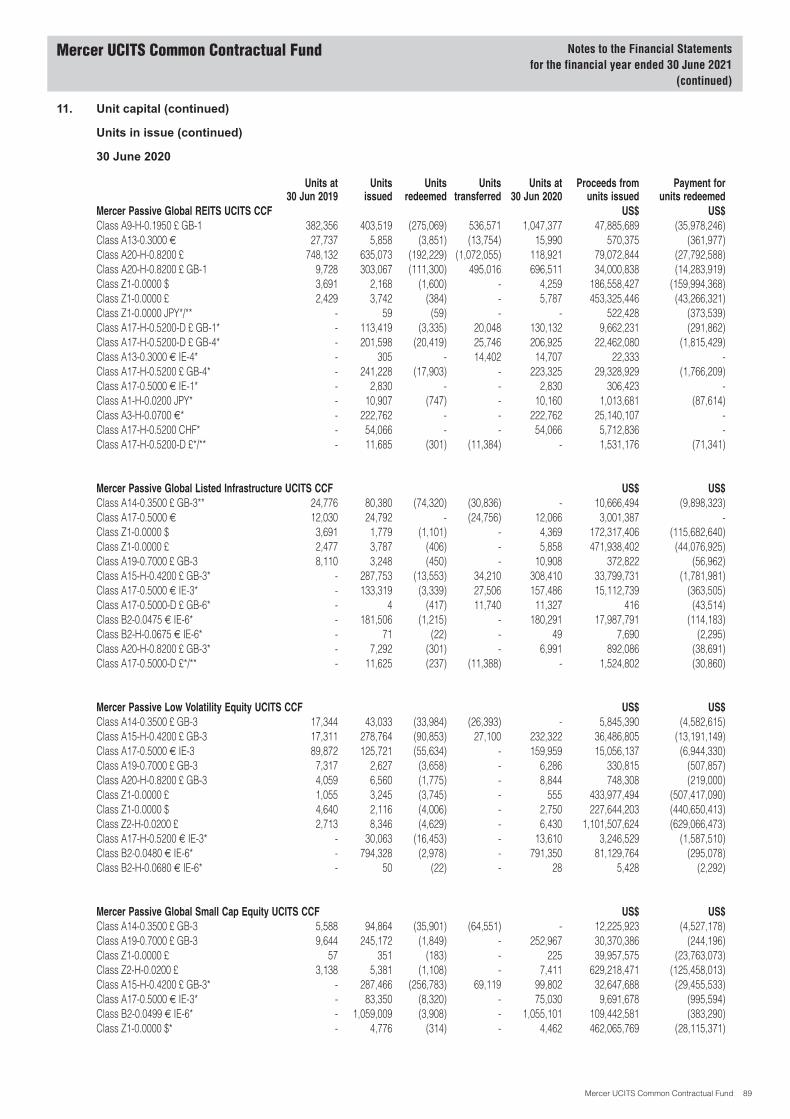
11. Unit capital (continued)
Units in issue (continued)
30 June 2020
Units at30 Jun 2019
Unitsissued
Unitsredeemed
Unitstransferred
Units at30 Jun 2020
Proceeds fromunits issued
Payment forunits redeemed
Mercer Passive Global REITS UCITS CCF US$ US$Class A9-H-0.1950 £ GB-1 382,356 403,519 (275,069) 536,571 1,047,377 47,885,689 (35,978,246)Class A13-0.3000 € 27,737 5,858 (3,851) (13,754) 15,990 570,375 (361,977)Class A20-H-0.8200 £ 748,132 635,073 (192,229) (1,072,055) 118,921 79,072,844 (27,792,588)Class A20-H-0.8200 £ GB-1 9,728 303,067 (111,300) 495,016 696,511 34,000,838 (14,283,919)Class Z1-0.0000 $ 3,691 2,168 (1,600) - 4,259 186,558,427 (159,994,368)Class Z1-0.0000 £ 2,429 3,742 (384) - 5,787 453,325,446 (43,266,321)Class Z1-0.0000 JPY*/** - 59 (59) - - 522,428 (373,539)Class A17-H-0.5200-D £ GB-1* - 113,419 (3,335) 20,048 130,132 9,662,231 (291,862)Class A17-H-0.5200-D £ GB-4* - 201,598 (20,419) 25,746 206,925 22,462,080 (1,815,429)Class A13-0.3000 € IE-4* - 305 - 14,402 14,707 22,333 -Class A17-H-0.5200 £ GB-4* - 241,228 (17,903) - 223,325 29,328,929 (1,766,209)Class A17-0.5000 € IE-1* - 2,830 - - 2,830 306,423 -Class A1-H-0.0200 JPY* - 10,907 (747) - 10,160 1,013,681 (87,614)Class A3-H-0.0700 €* - 222,762 - - 222,762 25,140,107 -Class A17-H-0.5200 CHF* - 54,066 - - 54,066 5,712,836 -Class A17-H-0.5200-D £*/** - 11,685 (301) (11,384) - 1,531,176 (71,341)
Mercer Passive Global Listed Infrastructure UCITS CCF US$ US$Class A14-0.3500 £ GB-3** 24,776 80,380 (74,320) (30,836) - 10,666,494 (9,898,323)Class A17-0.5000 € 12,030 24,792 - (24,756) 12,066 3,001,387 -Class Z1-0.0000 $ 3,691 1,779 (1,101) - 4,369 172,317,406 (115,682,640)Class Z1-0.0000 £ 2,477 3,787 (406) - 5,858 471,938,402 (44,076,925)Class A19-0.7000 £ GB-3 8,110 3,248 (450) - 10,908 372,822 (56,962)Class A15-H-0.4200 £ GB-3* - 287,753 (13,553) 34,210 308,410 33,799,731 (1,781,981)Class A17-0.5000 € IE-3* - 133,319 (3,339) 27,506 157,486 15,112,739 (363,505)Class A17-0.5000-D £ GB-6* - 4 (417) 11,740 11,327 416 (43,514)Class B2-0.0475 € IE-6* - 181,506 (1,215) - 180,291 17,987,791 (114,183)Class B2-H-0.0675 € IE-6* - 71 (22) - 49 7,690 (2,295)Class A20-H-0.8200 £ GB-3* - 7,292 (301) - 6,991 892,086 (38,691)Class A17-0.5000-D £*/** - 11,625 (237) (11,388) - 1,524,802 (30,860)
Mercer Passive Low Volatility Equity UCITS CCF US$ US$Class A14-0.3500 £ GB-3 17,344 43,033 (33,984) (26,393) - 5,845,390 (4,582,615)Class A15-H-0.4200 £ GB-3 17,311 278,764 (90,853) 27,100 232,322 36,486,805 (13,191,149)Class A17-0.5000 € IE-3 89,872 125,721 (55,634) - 159,959 15,056,137 (6,944,330)Class A19-0.7000 £ GB-3 7,317 2,627 (3,658) - 6,286 330,815 (507,857)Class A20-H-0.8200 £ GB-3 4,059 6,560 (1,775) - 8,844 748,308 (219,000)Class Z1-0.0000 £ 1,055 3,245 (3,745) - 555 433,977,494 (507,417,090)Class Z1-0.0000 $ 4,640 2,116 (4,006) - 2,750 227,644,203 (440,650,413)Class Z2-H-0.0200 £ 2,713 8,346 (4,629) - 6,430 1,101,507,624 (629,066,473)Class A17-H-0.5200 € IE-3* - 30,063 (16,453) - 13,610 3,246,529 (1,587,510)Class B2-0.0480 € IE-6* - 794,328 (2,978) - 791,350 81,129,764 (295,078)Class B2-H-0.0680 € IE-6* - 50 (22) - 28 5,428 (2,292)
Mercer Passive Global Small Cap Equity UCITS CCF US$ US$Class A14-0.3500 £ GB-3 5,588 94,864 (35,901) (64,551) - 12,225,923 (4,527,178)Class A19-0.7000 £ GB-3 9,644 245,172 (1,849) - 252,967 30,370,386 (244,196)Class Z1-0.0000 £ 57 351 (183) - 225 39,957,575 (23,763,073)Class Z2-H-0.0200 £ 3,138 5,381 (1,108) - 7,411 629,218,471 (125,458,013)Class A15-H-0.4200 £ GB-3* - 287,466 (256,783) 69,119 99,802 32,647,688 (29,455,533)Class A17-0.5000 € IE-3* - 83,350 (8,320) - 75,030 9,691,678 (995,594)Class B2-0.0499 € IE-6* - 1,059,009 (3,908) - 1,055,101 109,442,581 (383,290)Class Z1-0.0000 $* - 4,776 (314) - 4,462 462,065,769 (28,115,371)
Mercer UCITS Common Contractual Fund Notes to the Financial Statementsfor the financial year ended 30 June 2021
(continued)
Mercer UCITS Common Contractual Fund 89
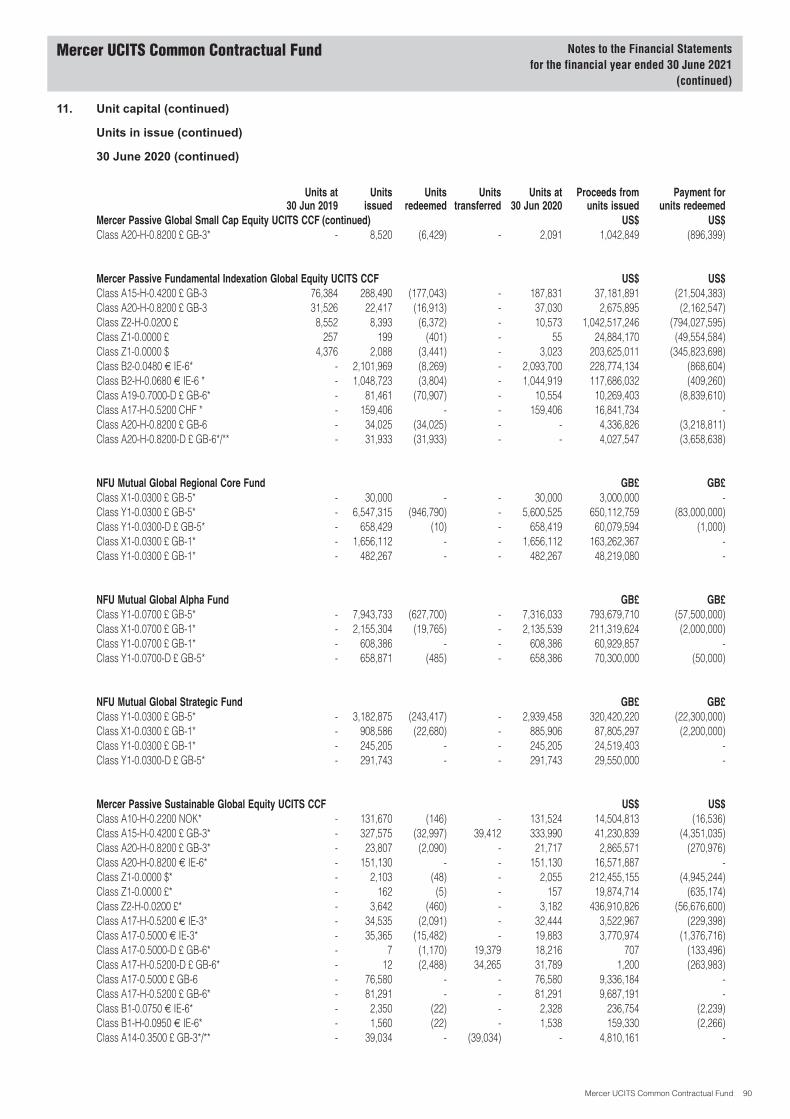
11. Unit capital (continued)
Units in issue (continued)
30 June 2020 (continued)
Units at30 Jun 2019
Unitsissued
Unitsredeemed
Unitstransferred
Units at30 Jun 2020
Proceeds fromunits issued
Payment forunits redeemed
Mercer Passive Global Small Cap Equity UCITS CCF (continued) US$ US$Class A20-H-0.8200 £ GB-3* - 8,520 (6,429) - 2,091 1,042,849 (896,399)
Mercer Passive Fundamental Indexation Global Equity UCITS CCF US$ US$Class A15-H-0.4200 £ GB-3 76,384 288,490 (177,043) - 187,831 37,181,891 (21,504,383)Class A20-H-0.8200 £ GB-3 31,526 22,417 (16,913) - 37,030 2,675,895 (2,162,547)Class Z2-H-0.0200 £ 8,552 8,393 (6,372) - 10,573 1,042,517,246 (794,027,595)Class Z1-0.0000 £ 257 199 (401) - 55 24,884,170 (49,554,584)Class Z1-0.0000 $ 4,376 2,088 (3,441) - 3,023 203,625,011 (345,823,698)Class B2-0.0480 € IE-6* - 2,101,969 (8,269) - 2,093,700 228,774,134 (868,604)Class B2-H-0.0680 € IE-6 * - 1,048,723 (3,804) - 1,044,919 117,686,032 (409,260)Class A19-0.7000-D £ GB-6* - 81,461 (70,907) - 10,554 10,269,403 (8,839,610)Class A17-H-0.5200 CHF * - 159,406 - - 159,406 16,841,734 -Class A20-H-0.8200 £ GB-6 - 34,025 (34,025) - - 4,336,826 (3,218,811)Class A20-H-0.8200-D £ GB-6*/** - 31,933 (31,933) - - 4,027,547 (3,658,638)
NFU Mutual Global Regional Core Fund GB£ GB£Class X1-0.0300 £ GB-5* - 30,000 - - 30,000 3,000,000 -Class Y1-0.0300 £ GB-5* - 6,547,315 (946,790) - 5,600,525 650,112,759 (83,000,000)Class Y1-0.0300-D £ GB-5* - 658,429 (10) - 658,419 60,079,594 (1,000)Class X1-0.0300 £ GB-1* - 1,656,112 - - 1,656,112 163,262,367 -Class Y1-0.0300 £ GB-1* - 482,267 - - 482,267 48,219,080 -
NFU Mutual Global Alpha Fund GB£ GB£Class Y1-0.0700 £ GB-5* - 7,943,733 (627,700) - 7,316,033 793,679,710 (57,500,000)Class X1-0.0700 £ GB-1* - 2,155,304 (19,765) - 2,135,539 211,319,624 (2,000,000)Class Y1-0.0700 £ GB-1* - 608,386 - - 608,386 60,929,857 -Class Y1-0.0700-D £ GB-5* - 658,871 (485) - 658,386 70,300,000 (50,000)
NFU Mutual Global Strategic Fund GB£ GB£Class Y1-0.0300 £ GB-5* - 3,182,875 (243,417) - 2,939,458 320,420,220 (22,300,000)Class X1-0.0300 £ GB-1* - 908,586 (22,680) - 885,906 87,805,297 (2,200,000)Class Y1-0.0300 £ GB-1* - 245,205 - - 245,205 24,519,403 -Class Y1-0.0300-D £ GB-5* - 291,743 - - 291,743 29,550,000 -
Mercer Passive Sustainable Global Equity UCITS CCF US$ US$Class A10-H-0.2200 NOK* - 131,670 (146) - 131,524 14,504,813 (16,536)Class A15-H-0.4200 £ GB-3* - 327,575 (32,997) 39,412 333,990 41,230,839 (4,351,035)Class A20-H-0.8200 £ GB-3* - 23,807 (2,090) - 21,717 2,865,571 (270,976)Class A20-H-0.8200 € IE-6* - 151,130 - - 151,130 16,571,887 -Class Z1-0.0000 $* - 2,103 (48) - 2,055 212,455,155 (4,945,244)Class Z1-0.0000 £* - 162 (5) - 157 19,874,714 (635,174)Class Z2-H-0.0200 £* - 3,642 (460) - 3,182 436,910,826 (56,676,600)Class A17-H-0.5200 € IE-3* - 34,535 (2,091) - 32,444 3,522,967 (229,398)Class A17-0.5000 € IE-3* - 35,365 (15,482) - 19,883 3,770,974 (1,376,716)Class A17-0.5000-D £ GB-6* - 7 (1,170) 19,379 18,216 707 (133,496)Class A17-H-0.5200-D £ GB-6* - 12 (2,488) 34,265 31,789 1,200 (263,983)Class A17-0.5000 £ GB-6 - 76,580 - - 76,580 9,336,184 -Class A17-H-0.5200 £ GB-6* - 81,291 - - 81,291 9,687,191 -Class B1-0.0750 € IE-6* - 2,350 (22) - 2,328 236,754 (2,239)Class B1-H-0.0950 € IE-6* - 1,560 (22) - 1,538 159,330 (2,266)Class A14-0.3500 £ GB-3*/** - 39,034 - (39,034) - 4,810,161 -
Mercer UCITS Common Contractual Fund Notes to the Financial Statementsfor the financial year ended 30 June 2021
(continued)
Mercer UCITS Common Contractual Fund 90

11. Unit capital (continued)
Units in issue (continued)
30 June 2020 (continued)
Units at30 Jun 2019
Unitsissued
Unitsredeemed
Unitstransferred
Units at30 Jun 2020
Proceeds fromunits issued
Payment forunits redeemed
Mercer Passive Sustainable Global Equity UCITS CCF (continued) US$ US$Class A17-0.5000-D £** - 19,477 (719) (18,758) - 2,551,276 (91,817)Class A17-H-0.5200-D £*/** - 34,818 (1,274) (33,544) - 4,559,016 (161,209)
*The Unit Class launched during the financial year ended 30 June 2020.**The Unit Class terminated during the financial year ended 30 June 2020.***The Unit Class terminated and re-launched during the financial year ended 30 June 2020.****The Unit Class launched, terminated, re-launched and re-terminated during the financial year ended 30 June 2020.
Significant Unitholders
The following table details the number of Unitholders with significant holdings of at least 20% of the relevant Sub-Fundsand the percentage of that holding as at 30 June 2021 and 30 June 2020.
Sub-Fund
Number ofSignificant
Unitholders30 Jun 2021
Total valueof Significant
Unitholders30 Jun 2021
AggregateUnitholding
as a % of theNAV
30 Jun 2021
Number ofSignificant
Unitholders30 Jun 2020
Total valueof Significant
Unitholders30 Jun 2020
AggregateUnitholding
as a % of theNAV
30 Jun 2020Mercer Passive Global REITS UCITSCCF 2 US$ 1,679,683,507 70.05% 2 US$ 933,429,204 74.18%Mercer Passive Global ListedInfrastructure UCITS CCF 2 US$ 1,673,724,976 87.26% 2 US$ 1,046,686,966 87.47%Mercer Passive Low Volatility EquityUCITS CCF 1 US$ 1,124,851,300 59.08% 2 US$ 1,010,817,979 79.48%Mercer Passive Global Small CapEquity UCITS CCF 2 US$ 1,738,993,155 84.39% 2 US$ 1,284,056,474 86.27%Mercer Passive FundamentalIndexation Global Equity UCITS CCF 1 US$ 831,012,367 59.47% 2 US$ 1,537,016,061 75.37%NFU Mutual Global Regional Core Fund 3 GB£ 785,611,191 76.94% 2 GB£ 496,015,968 60.61%NFU Mutual Global Alpha Fund 3 GB£ 948,078,649 77.16% 2 GB£ 666,568,246 61.25%NFU Mutual Global Strategic Fund 3 GB£ 382,498,742 76.50% 3 GB£ 348,679,525 80.84%Mercer Passive Sustainable GlobalEquity UCITS CCF 2 US$ 1,718,094,463 60.28% 2 US$ 579,773,639 76.12%
Mercer UCITS Common Contractual Fund Notes to the Financial Statementsfor the financial year ended 30 June 2021
(continued)
Mercer UCITS Common Contractual Fund 91

12. Dividends
The following Sub-Funds paid a dividend during the financial year ended 30 June 2021:
Sub-Fund Unit ClassTotal dividendper Unit Class
Dividendper Unit Ex-Date
Mercer Passive Global REITS UCITS CCF Class A17-H-0.5200-D £ GB-1 GB£ 72,470 GB£ 0.5569 1 Jul 2020Class A17-H-0.5200-D £ GB-4 GB£ 100,297 GB£ 0.4847 1 Jul 2020Class A17-H-0.5200-D £ GB-1 GB£ 85,962 GB£ 0.6085 1 Oct 2020Class A17-H-0.5200-D £ GB-4 GB£ 154,861 GB£ 0.5307 1 Oct 2020Class A17-H-0.5200-D £ GB-1 GB£ 166,741 GB£ 0.8744 4 Jan 2021Class A17-H-0.5200-D £ GB-4 GB£ 158,700 GB£ 0.7550 4 Jan 2021Class A17-H-0.5200-D £ GB-1 GB£ 106,985 GB£ 0.4679 1 Apr 2021Class A17-H-0.5200-D £ GB-4 GB£ 126,610 GB£ 0.4377 1 Apr 2021
Mercer Passive Global Listed InfrastructureUCITS CCF Class A17-0.5000-D £ GB-6 GB£ 6,450 GB£ 0.5694 1 Jul 2020
Class A17-0.5000-D £ GB-6 GB£ 5,866 GB£ 0.4906 1 Oct 2020Class A17-0.5000-D £ GB-6 GB£ 5,206 GB£ 0.5334 4 Jan 2021Class A17-0.5000-D £ GB-6 GB£ 5,630 GB£ 0.4219 1 Apr 2021
Mercer Passive Fundamental Indexation GlobalEquity UCITS CCF Class A19-0.7000-D £ GB-6 GB£ 667 GB£ 0.0632 1 Jul 2020
Class A19-0.7000-D £ GB-6 GB£ 4,154 GB£ 0.3936 1 Oct 2020Class A20-H-0.8200-D £ GB-6 GB£ 686 GB£ 0.0843 1 Oct 2020Class A19-0.7000-D £ GB-6 GB£ 1,039 GB£ 0.1345 4 Jan 2021Class A20-H-0.8200-D £ GB-6 GB£ 513 GB£ 0.0862 4 Jan 2021Class A19-0.7000-D £ GB-6 GB£ 6,268 GB£ 0.5939 1 Apr 2021Class A20-H-0.8200-D £ GB-6 GB£ 4,585 GB£ 0.5633 1 Apr 2021
NFU Mutual Global Regional Core Fund Class Y1-0.0300-D £ GB-5 GB£ 782,202 GB£ 1.1880 17 Aug 2020Class Y1-0.0300-D £ GB-5 GB£ 305,552 GB£ 0.4356 16 Nov 2020Class Y1-0.0300-D £ GB-5 GB£ 174,542 GB£ 0.2488 12 Feb 2021Class Y1-0.0300-D £ GB-5 GB£ 527,051 GB£ 0.6500 17 May 2021
NFU Mutual Global Alpha Fund Class Y1-0.0700-D £ GB-5 GB£ 367,050 GB£ 0.5575 17 Aug 2020Class Y1-0.0700-D £ GB-5 GB£ 246,260 GB£ 0.3545 16 Nov 2020Class Y1-0.0700-D £ GB-5 GB£ 100,700 GB£ 0.1379 12 Feb 2021Class Y1-0.0700-D £ GB-5 GB£ 503,625 GB£ 0.6414 17 May 2021
NFU Mutual Global Strategic Fund Class Y1-0.0300-D £ GB-5 GB£ 131,197 GB£ 0.4497 17 Aug 2020Class Y1-0.0300-D £ GB-5 GB£ 159,112 GB£ 0.4812 16 Nov 2020Class Y1-0.0300-D £ GB-5 GB£ 107,563 GB£ 0.3092 12 Feb 2021Class Y1-0.0300-D £ GB-5 GB£ 263,130 GB£ 0.7169 17 May 2021
Mercer Passive Sustainable Global EquityUCITS CCF Class A17-0.5000-D £ GB-6 GB£ 5,426 GB£ 0.2979 1 Jul 2020
Class A17-H-0.5200-D £ GB-6 GB£ 9,117 GB£ 0.2868 1 Jul 2020Class A17-0.5000-D £ GB-6 GB£ 63,119 GB£ 0.2155 1 Oct 2020Class A17-H-0.5200-D £ GB-6 GB£ 7,205 GB£ 0.2107 1 Oct 2020Class A17-0.5000-D £ GB-6 GB£ 49,656 GB£ 0.2340 4 Jan 2021Class A17-H-0.5200-D £ GB-6 GB£ 5,043 GB£ 0.2036 4 Jan 2021Class A17-0.5000-D £ GB-6 GB£ 78,068 GB£ 0.2689 1 Apr 2021Class A17-H-0.5200-D £ GB-6 GB£ 8,611 GB£ 0.2660 1 Apr 2021
Mercer UCITS Common Contractual Fund Notes to the Financial Statementsfor the financial year ended 30 June 2021
(continued)
Mercer UCITS Common Contractual Fund 92

12. Dividends (continued)
The following Sub-Funds paid a dividend during the financial year ended 30 June 2020:
Sub-Fund Unit ClassTotal dividendper Unit Class
Dividendper Unit Ex-Date
Mercer Passive Global REITS UCITS CCF Class A17-H-0.5200-D £ GB-1 GB£ 14,101 GB£ 0.6089 1 Apr 2020Class A17-H-0.5200-D £ GB-4 GB£ 99,496 GB£ 0.5221 1 Apr 2020
Mercer Passive Global Listed InfrastructureUCITS CCF Class A17-0.5000-D £ GB-6 GB£ 2,774 GB£ 0.2363 1 Apr 2020
NFU Mutual Global Regional Core Fund Class Y1-0.0300-D £ GB-5 GB£ 16,262 GB£ 0.8135 15 Nov 2019Class Y1-0.0300-D £ GB-5 GB£ 5,766 GB£ 0.2861 14 Feb 2020Class Y1-0.0300-D £ GB-5 GB£ 68,646 GB£ 0.3743 15 May 2020
NFU Mutual Global Alpha Fund Class Y1-0.0700-D £ GB-5 GB£ 10,254 GB£ 0.0562 15 May 2020
NFU Mutual Global Strategic Fund Class Y1-0.0300-D £ GB-5 GB£ 2,954 GB£ 0.0405 15 May 2020
Mercer Passive Sustainable Global Equity UCITSCCF Class A17-0.5000-D £ GB-6 GB£ 4,382 GB£ 0.2261 1 Apr 2020
Class A17-H-0.5200-D £ GB-6 GB£ 6,628 GB£ 0.1934 1 Apr 2020
13. Charges
A number of counterparties used by the Sub-Funds hold a number of charges granting first priority security interest inrelation to collateral and principal broker securities relating to the relevant Sub-Funds account.
14. Significant events during the financial year
Prospectus and Supplement updatesThe Prospectus, Supplements and other documents of the CCF have been updated during the year. Details of theseupdates have been outlined in Unaudited Supplemental Information.
COVID-19COVID-19 disclosure is included in Note 7 to the financial statements.
Unit Class launches and terminationsThe following Unit Classes launched during the financial year ended 30 June 2021:
Sub-Fund Class Launch date
Mercer Passive Global REITS UCITS CCF Class A4-H-0.0950 € 29 Jul 2020Class A1-H-0.0200 SGD 1 Oct 2020Class Z2-H-0.0200 € 20 Oct 2020Class B2-0.0475 € IE-6 9 Nov 2020Class B2-H-0.0675 € IE-6 10 Nov 2020Class Z1-0.0000 JPY 13 Jan 2021Class A17-0.5000 $ 19 Mar 2021Class A13-H-0.3200 € IE-1 28 Apr 2021
Mercer Passive Global Listed Infrastructure UCITS CCF Class A17-H-0.5200 € IE-3 21 Jul 2020Class A12-0.2500 SEK 26 Oct 2020Class A17-0.5000 £ GB-6 14 Dec 2020Class A17-H-0.5200 £ GB-6 26 Feb 2021
Mercer Passive Low Volatility Equity UCITS CCF Class Z2-H-0.0200 € 24 Jul 2020Class A12-0.2500 SEK 26 Oct 2020Class Z1-0.0000 SGD 13 Nov 2020Class A17-H-0.5200 £ GB-6 26 Feb 2021Class A14-0.3500 £ GB-3 16 Jun 2021Class A19-0.7000 £ GB-3 16 Jun 2021
Mercer Passive Global Small Cap Equity UCITS CCF Class A17-H-0.5200 £ GB-6 26 Feb 2021
Mercer UCITS Common Contractual Fund Notes to the Financial Statementsfor the financial year ended 30 June 2021
(continued)
Mercer UCITS Common Contractual Fund 93
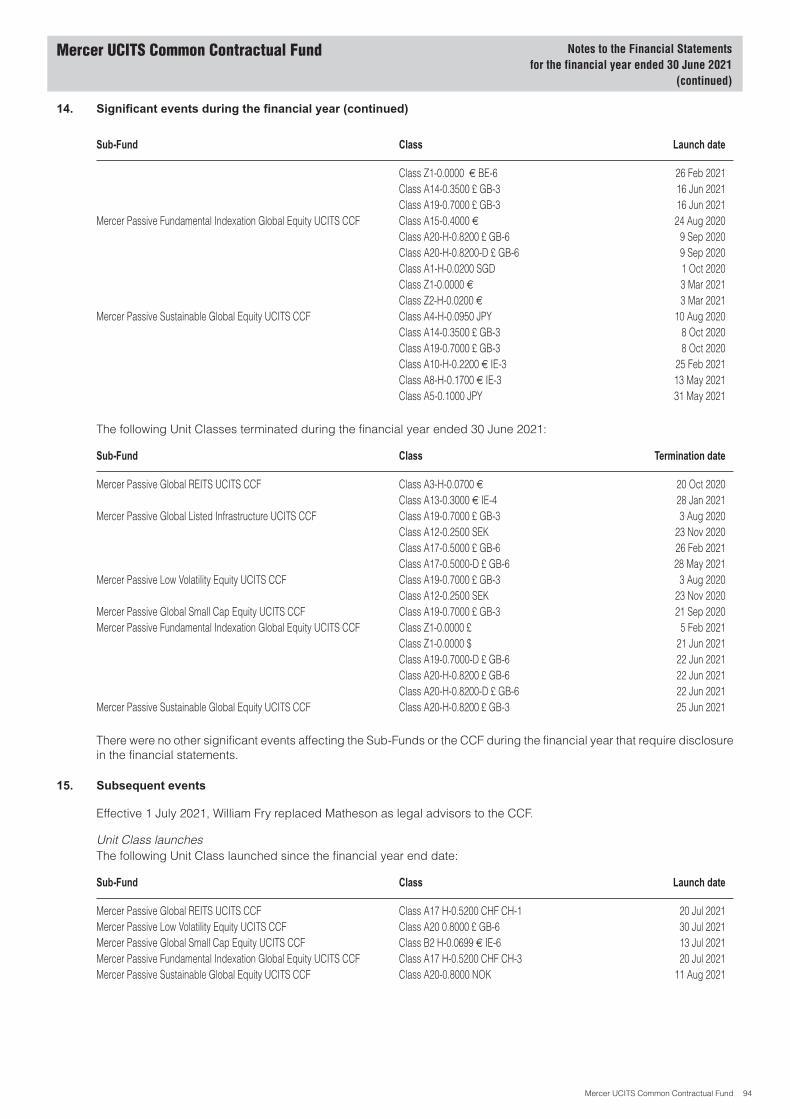
14. Significant events during the financial year (continued)
Sub-Fund Class Launch date
Class Z1-0.0000 € BE-6 26 Feb 2021Class A14-0.3500 £ GB-3 16 Jun 2021Class A19-0.7000 £ GB-3 16 Jun 2021
Mercer Passive Fundamental Indexation Global Equity UCITS CCF Class A15-0.4000 € 24 Aug 2020Class A20-H-0.8200 £ GB-6 9 Sep 2020Class A20-H-0.8200-D £ GB-6 9 Sep 2020Class A1-H-0.0200 SGD 1 Oct 2020Class Z1-0.0000 € 3 Mar 2021Class Z2-H-0.0200 € 3 Mar 2021
Mercer Passive Sustainable Global Equity UCITS CCF Class A4-H-0.0950 JPY 10 Aug 2020Class A14-0.3500 £ GB-3 8 Oct 2020Class A19-0.7000 £ GB-3 8 Oct 2020Class A10-H-0.2200 € IE-3 25 Feb 2021Class A8-H-0.1700 € IE-3 13 May 2021Class A5-0.1000 JPY 31 May 2021
The following Unit Classes terminated during the financial year ended 30 June 2021:
Sub-Fund Class Termination date
Mercer Passive Global REITS UCITS CCF Class A3-H-0.0700 € 20 Oct 2020Class A13-0.3000 € IE-4 28 Jan 2021
Mercer Passive Global Listed Infrastructure UCITS CCF Class A19-0.7000 £ GB-3 3 Aug 2020Class A12-0.2500 SEK 23 Nov 2020Class A17-0.5000 £ GB-6 26 Feb 2021Class A17-0.5000-D £ GB-6 28 May 2021
Mercer Passive Low Volatility Equity UCITS CCF Class A19-0.7000 £ GB-3 3 Aug 2020Class A12-0.2500 SEK 23 Nov 2020
Mercer Passive Global Small Cap Equity UCITS CCF Class A19-0.7000 £ GB-3 21 Sep 2020Mercer Passive Fundamental Indexation Global Equity UCITS CCF Class Z1-0.0000 £ 5 Feb 2021
Class Z1-0.0000 $ 21 Jun 2021Class A19-0.7000-D £ GB-6 22 Jun 2021Class A20-H-0.8200 £ GB-6 22 Jun 2021Class A20-H-0.8200-D £ GB-6 22 Jun 2021
Mercer Passive Sustainable Global Equity UCITS CCF Class A20-H-0.8200 £ GB-3 25 Jun 2021
There were no other significant events affecting the Sub-Funds or the CCF during the financial year that require disclosurein the financial statements.
15. Subsequent events
Effective 1 July 2021, William Fry replaced Matheson as legal advisors to the CCF.
Unit Class launchesThe following Unit Class launched since the financial year end date:
Sub-Fund Class Launch date
Mercer Passive Global REITS UCITS CCF Class A17 H-0.5200 CHF CH-1 20 Jul 2021Mercer Passive Low Volatility Equity UCITS CCF Class A20 0.8000 £ GB-6 30 Jul 2021Mercer Passive Global Small Cap Equity UCITS CCF Class B2 H-0.0699 € IE-6 13 Jul 2021Mercer Passive Fundamental Indexation Global Equity UCITS CCF Class A17 H-0.5200 CHF CH-3 20 Jul 2021Mercer Passive Sustainable Global Equity UCITS CCF Class A20-0.8000 NOK 11 Aug 2021
Mercer UCITS Common Contractual Fund Notes to the Financial Statementsfor the financial year ended 30 June 2021
(continued)
Mercer UCITS Common Contractual Fund 94
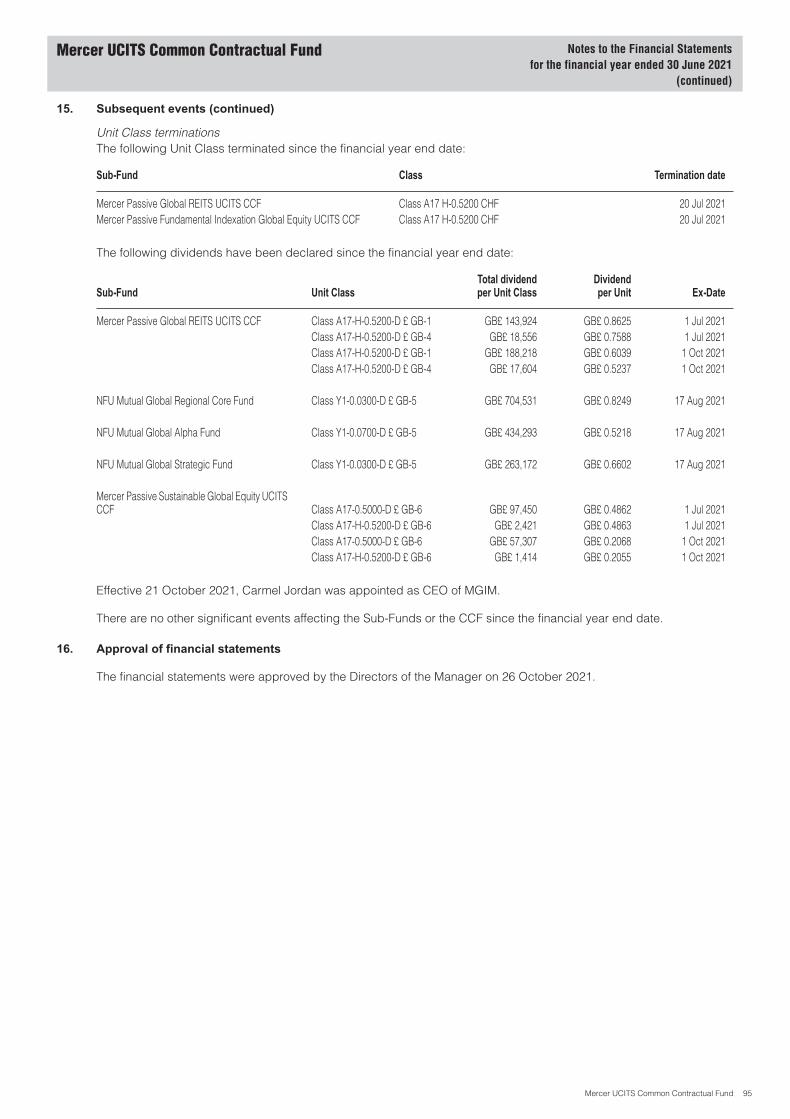
15. Subsequent events (continued)
Unit Class terminationsThe following Unit Class terminated since the financial year end date:
Sub-Fund Class Termination date
Mercer Passive Global REITS UCITS CCF Class A17 H-0.5200 CHF 20 Jul 2021Mercer Passive Fundamental Indexation Global Equity UCITS CCF Class A17 H-0.5200 CHF 20 Jul 2021
The following dividends have been declared since the financial year end date:
Sub-Fund Unit ClassTotal dividendper Unit Class
Dividendper Unit Ex-Date
Mercer Passive Global REITS UCITS CCF Class A17-H-0.5200-D £ GB-1 GB£ 143,924 GB£ 0.8625 1 Jul 2021Class A17-H-0.5200-D £ GB-4 GB£ 18,556 GB£ 0.7588 1 Jul 2021Class A17-H-0.5200-D £ GB-1 GB£ 188,218 GB£ 0.6039 1 Oct 2021Class A17-H-0.5200-D £ GB-4 GB£ 17,604 GB£ 0.5237 1 Oct 2021
NFU Mutual Global Regional Core Fund Class Y1-0.0300-D £ GB-5 GB£ 704,531 GB£ 0.8249 17 Aug 2021
NFU Mutual Global Alpha Fund Class Y1-0.0700-D £ GB-5 GB£ 434,293 GB£ 0.5218 17 Aug 2021
NFU Mutual Global Strategic Fund Class Y1-0.0300-D £ GB-5 GB£ 263,172 GB£ 0.6602 17 Aug 2021
Mercer Passive Sustainable Global Equity UCITSCCF Class A17-0.5000-D £ GB-6 GB£ 97,450 GB£ 0.4862 1 Jul 2021
Class A17-H-0.5200-D £ GB-6 GB£ 2,421 GB£ 0.4863 1 Jul 2021Class A17-0.5000-D £ GB-6 GB£ 57,307 GB£ 0.2068 1 Oct 2021Class A17-H-0.5200-D £ GB-6 GB£ 1,414 GB£ 0.2055 1 Oct 2021
Effective 21 October 2021, Carmel Jordan was appointed as CEO of MGIM.
There are no other significant events affecting the Sub-Funds or the CCF since the financial year end date.
16. Approval of financial statements
The financial statements were approved by the Directors of the Manager on 26 October 2021.
Mercer UCITS Common Contractual Fund Notes to the Financial Statementsfor the financial year ended 30 June 2021
(continued)
Mercer UCITS Common Contractual Fund 95
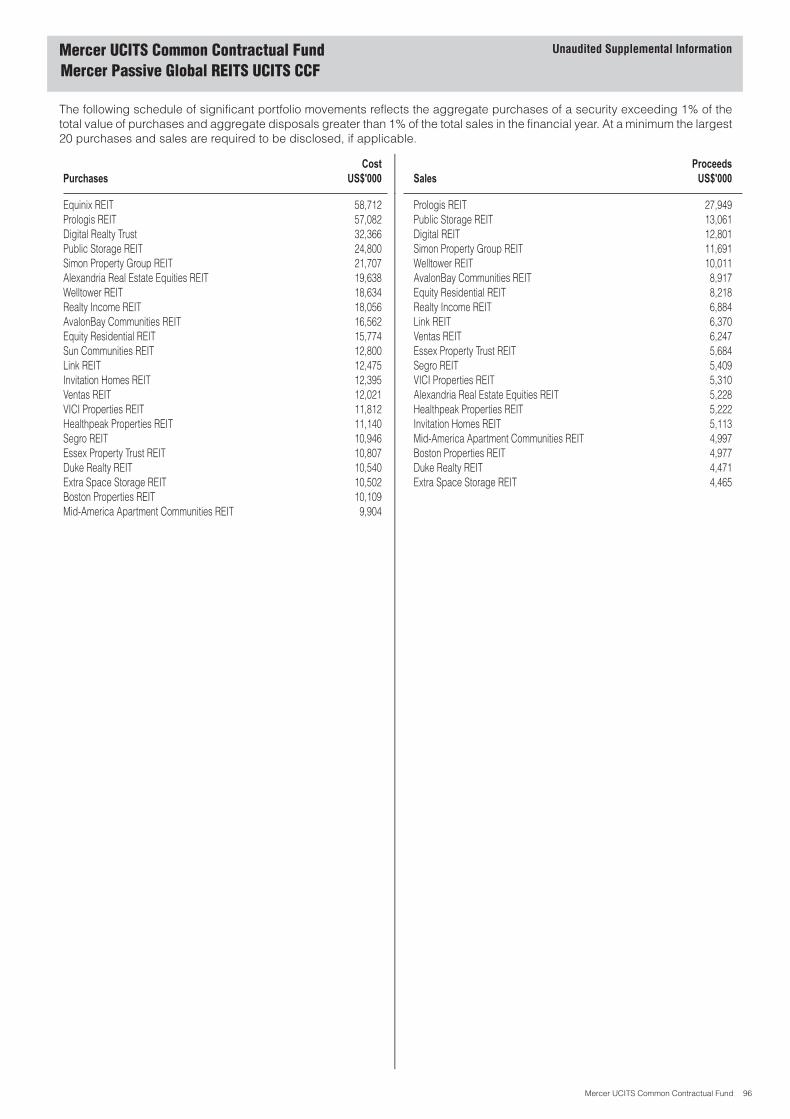
Mercer UCITS Common Contractual FundMercer Passive Global REITS UCITS CCF
The following schedule of significant portfolio movements reflects the aggregate purchases of a security exceeding 1% of thetotal value of purchases and aggregate disposals greater than 1% of the total sales in the financial year. At a minimum the largest20 purchases and sales are required to be disclosed, if applicable.
PurchasesCost
US$'000 SalesProceeds
US$'000
Equinix REIT 58,712 Prologis REIT 27,949Prologis REIT 57,082 Public Storage REIT 13,061Digital Realty Trust 32,366 Digital REIT 12,801Public Storage REIT 24,800 Simon Property Group REIT 11,691Simon Property Group REIT 21,707 Welltower REIT 10,011Alexandria Real Estate Equities REIT 19,638 AvalonBay Communities REIT 8,917Welltower REIT 18,634 Equity Residential REIT 8,218Realty Income REIT 18,056 Realty Income REIT 6,884AvalonBay Communities REIT 16,562 Link REIT 6,370Equity Residential REIT 15,774 Ventas REIT 6,247Sun Communities REIT 12,800 Essex Property Trust REIT 5,684Link REIT 12,475 Segro REIT 5,409Invitation Homes REIT 12,395 VICI Properties REIT 5,310Ventas REIT 12,021 Alexandria Real Estate Equities REIT 5,228VICI Properties REIT 11,812 Healthpeak Properties REIT 5,222Healthpeak Properties REIT 11,140 Invitation Homes REIT 5,113Segro REIT 10,946 Mid-America Apartment Communities REIT 4,997Essex Property Trust REIT 10,807 Boston Properties REIT 4,977Duke Realty REIT 10,540 Duke Realty REIT 4,471Extra Space Storage REIT 10,502 Extra Space Storage REIT 4,465Boston Properties REIT 10,109Mid-America Apartment Communities REIT 9,904
Unaudited Supplemental Information
Mercer UCITS Common Contractual Fund 96
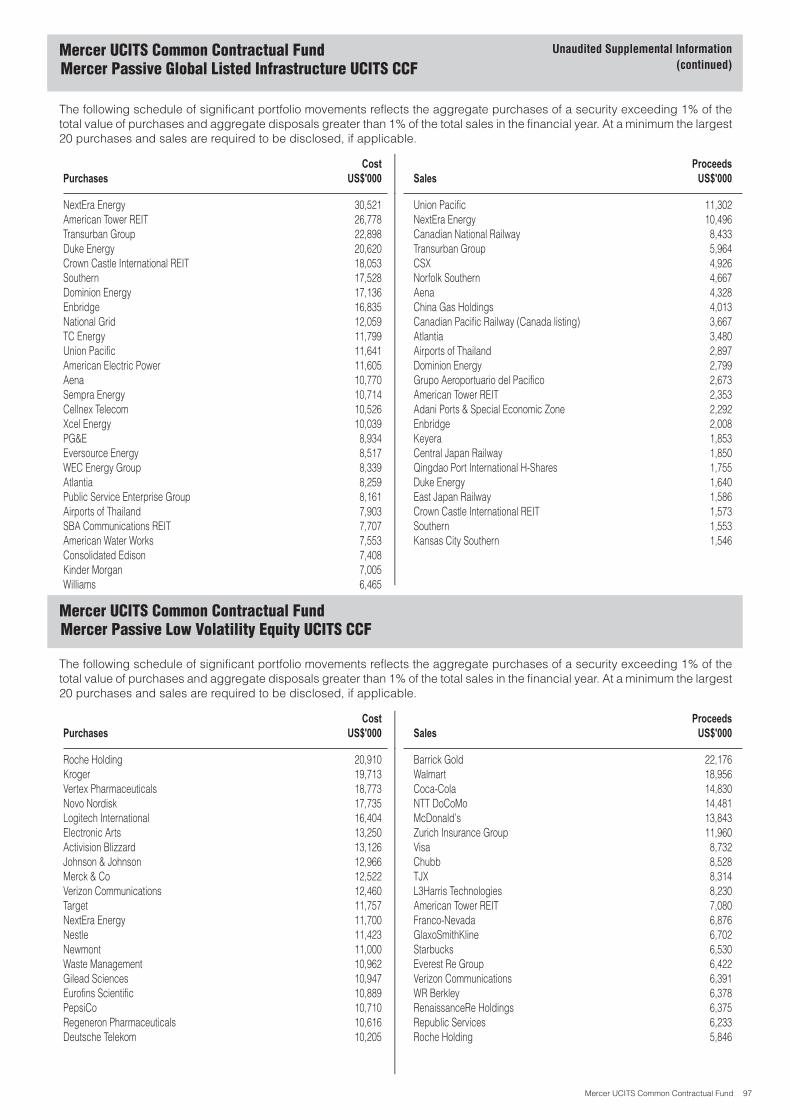
Mercer UCITS Common Contractual FundMercer Passive Global Listed Infrastructure UCITS CCF
The following schedule of significant portfolio movements reflects the aggregate purchases of a security exceeding 1% of thetotal value of purchases and aggregate disposals greater than 1% of the total sales in the financial year. At a minimum the largest20 purchases and sales are required to be disclosed, if applicable.
PurchasesCost
US$'000 SalesProceeds
US$'000
NextEra Energy 30,521 Union Pacific 11,302American Tower REIT 26,778 NextEra Energy 10,496Transurban Group 22,898 Canadian National Railway 8,433Duke Energy 20,620 Transurban Group 5,964Crown Castle International REIT 18,053 CSX 4,926Southern 17,528 Norfolk Southern 4,667Dominion Energy 17,136 Aena 4,328Enbridge 16,835 China Gas Holdings 4,013National Grid 12,059 Canadian Pacific Railway (Canada listing) 3,667TC Energy 11,799 Atlantia 3,480Union Pacific 11,641 Airports of Thailand 2,897American Electric Power 11,605 Dominion Energy 2,799Aena 10,770 Grupo Aeroportuario del Pacifico 2,673Sempra Energy 10,714 American Tower REIT 2,353Cellnex Telecom 10,526 Adani Ports & Special Economic Zone 2,292Xcel Energy 10,039 Enbridge 2,008PG&E 8,934 Keyera 1,853Eversource Energy 8,517 Central Japan Railway 1,850WEC Energy Group 8,339 Qingdao Port International H-Shares 1,755Atlantia 8,259 Duke Energy 1,640Public Service Enterprise Group 8,161 East Japan Railway 1,586Airports of Thailand 7,903 Crown Castle International REIT 1,573SBA Communications REIT 7,707 Southern 1,553American Water Works 7,553 Kansas City Southern 1,546Consolidated Edison 7,408Kinder Morgan 7,005Williams 6,465
Mercer UCITS Common Contractual FundMercer Passive Low Volatility Equity UCITS CCF
The following schedule of significant portfolio movements reflects the aggregate purchases of a security exceeding 1% of thetotal value of purchases and aggregate disposals greater than 1% of the total sales in the financial year. At a minimum the largest20 purchases and sales are required to be disclosed, if applicable.
PurchasesCost
US$'000 SalesProceeds
US$'000
Roche Holding 20,910 Barrick Gold 22,176Kroger 19,713 Walmart 18,956Vertex Pharmaceuticals 18,773 Coca-Cola 14,830Novo Nordisk 17,735 NTT DoCoMo 14,481Logitech International 16,404 McDonald’s 13,843Electronic Arts 13,250 Zurich Insurance Group 11,960Activision Blizzard 13,126 Visa 8,732Johnson & Johnson 12,966 Chubb 8,528Merck & Co 12,522 TJX 8,314Verizon Communications 12,460 L3Harris Technologies 8,230Target 11,757 American Tower REIT 7,080NextEra Energy 11,700 Franco-Nevada 6,876Nestle 11,423 GlaxoSmithKline 6,702Newmont 11,000 Starbucks 6,530Waste Management 10,962 Everest Re Group 6,422Gilead Sciences 10,947 Verizon Communications 6,391Eurofins Scientific 10,889 WR Berkley 6,378PepsiCo 10,710 RenaissanceRe Holdings 6,375Regeneron Pharmaceuticals 10,616 Republic Services 6,233Deutsche Telekom 10,205 Roche Holding 5,846
Unaudited Supplemental Information(continued)
Mercer UCITS Common Contractual Fund 97
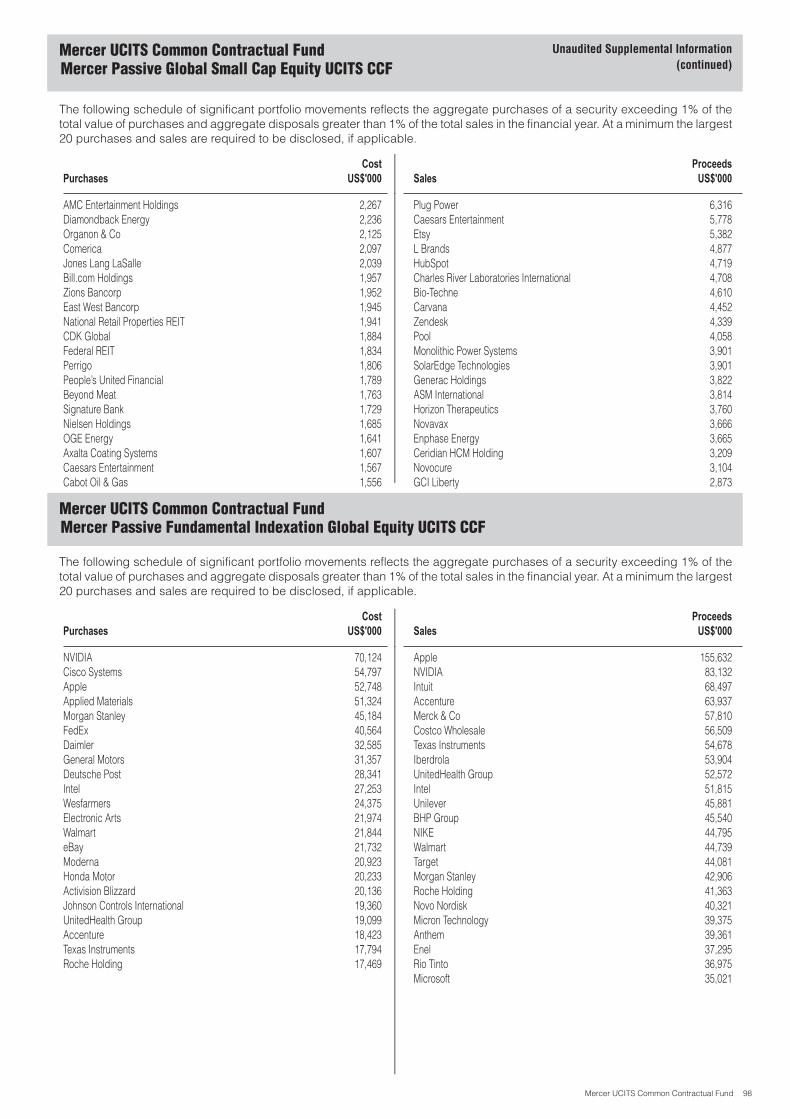
Mercer UCITS Common Contractual FundMercer Passive Global Small Cap Equity UCITS CCF
The following schedule of significant portfolio movements reflects the aggregate purchases of a security exceeding 1% of thetotal value of purchases and aggregate disposals greater than 1% of the total sales in the financial year. At a minimum the largest20 purchases and sales are required to be disclosed, if applicable.
PurchasesCost
US$'000 SalesProceeds
US$'000
AMC Entertainment Holdings 2,267 Plug Power 6,316Diamondback Energy 2,236 Caesars Entertainment 5,778Organon & Co 2,125 Etsy 5,382Comerica 2,097 L Brands 4,877Jones Lang LaSalle 2,039 HubSpot 4,719Bill.com Holdings 1,957 Charles River Laboratories International 4,708Zions Bancorp 1,952 Bio-Techne 4,610East West Bancorp 1,945 Carvana 4,452National Retail Properties REIT 1,941 Zendesk 4,339CDK Global 1,884 Pool 4,058Federal REIT 1,834 Monolithic Power Systems 3,901Perrigo 1,806 SolarEdge Technologies 3,901People’s United Financial 1,789 Generac Holdings 3,822Beyond Meat 1,763 ASM International 3,814Signature Bank 1,729 Horizon Therapeutics 3,760Nielsen Holdings 1,685 Novavax 3,666OGE Energy 1,641 Enphase Energy 3,665Axalta Coating Systems 1,607 Ceridian HCM Holding 3,209Caesars Entertainment 1,567 Novocure 3,104Cabot Oil & Gas 1,556 GCI Liberty 2,873
Mercer UCITS Common Contractual FundMercer Passive Fundamental Indexation Global Equity UCITS CCF
The following schedule of significant portfolio movements reflects the aggregate purchases of a security exceeding 1% of thetotal value of purchases and aggregate disposals greater than 1% of the total sales in the financial year. At a minimum the largest20 purchases and sales are required to be disclosed, if applicable.
PurchasesCost
US$'000 SalesProceeds
US$'000
NVIDIA 70,124 Apple 155,632Cisco Systems 54,797 NVIDIA 83,132Apple 52,748 Intuit 68,497Applied Materials 51,324 Accenture 63,937Morgan Stanley 45,184 Merck & Co 57,810FedEx 40,564 Costco Wholesale 56,509Daimler 32,585 Texas Instruments 54,678General Motors 31,357 Iberdrola 53,904Deutsche Post 28,341 UnitedHealth Group 52,572Intel 27,253 Intel 51,815Wesfarmers 24,375 Unilever 45,881Electronic Arts 21,974 BHP Group 45,540Walmart 21,844 NIKE 44,795eBay 21,732 Walmart 44,739Moderna 20,923 Target 44,081Honda Motor 20,233 Morgan Stanley 42,906Activision Blizzard 20,136 Roche Holding 41,363Johnson Controls International 19,360 Novo Nordisk 40,321UnitedHealth Group 19,099 Micron Technology 39,375Accenture 18,423 Anthem 39,361Texas Instruments 17,794 Enel 37,295Roche Holding 17,469 Rio Tinto 36,975
Microsoft 35,021
Unaudited Supplemental Information(continued)
Mercer UCITS Common Contractual Fund 98
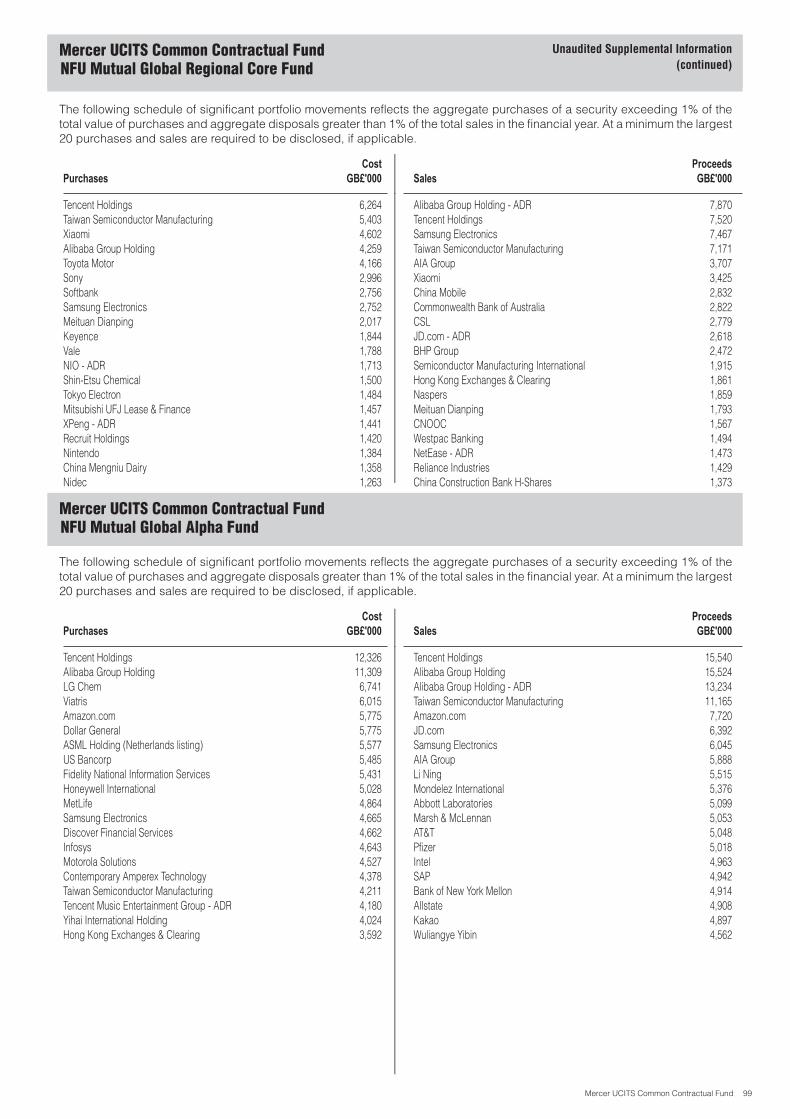
Mercer UCITS Common Contractual FundNFU Mutual Global Regional Core Fund
The following schedule of significant portfolio movements reflects the aggregate purchases of a security exceeding 1% of thetotal value of purchases and aggregate disposals greater than 1% of the total sales in the financial year. At a minimum the largest20 purchases and sales are required to be disclosed, if applicable.
PurchasesCost
GB£'000 SalesProceedsGB£'000
Tencent Holdings 6,264 Alibaba Group Holding - ADR 7,870Taiwan Semiconductor Manufacturing 5,403 Tencent Holdings 7,520Xiaomi 4,602 Samsung Electronics 7,467Alibaba Group Holding 4,259 Taiwan Semiconductor Manufacturing 7,171Toyota Motor 4,166 AIA Group 3,707Sony 2,996 Xiaomi 3,425Softbank 2,756 China Mobile 2,832Samsung Electronics 2,752 Commonwealth Bank of Australia 2,822Meituan Dianping 2,017 CSL 2,779Keyence 1,844 JD.com - ADR 2,618Vale 1,788 BHP Group 2,472NIO - ADR 1,713 Semiconductor Manufacturing International 1,915Shin-Etsu Chemical 1,500 Hong Kong Exchanges & Clearing 1,861Tokyo Electron 1,484 Naspers 1,859Mitsubishi UFJ Lease & Finance 1,457 Meituan Dianping 1,793XPeng - ADR 1,441 CNOOC 1,567Recruit Holdings 1,420 Westpac Banking 1,494Nintendo 1,384 NetEase - ADR 1,473China Mengniu Dairy 1,358 Reliance Industries 1,429Nidec 1,263 China Construction Bank H-Shares 1,373
Mercer UCITS Common Contractual FundNFU Mutual Global Alpha Fund
The following schedule of significant portfolio movements reflects the aggregate purchases of a security exceeding 1% of thetotal value of purchases and aggregate disposals greater than 1% of the total sales in the financial year. At a minimum the largest20 purchases and sales are required to be disclosed, if applicable.
PurchasesCost
GB£'000 SalesProceedsGB£'000
Tencent Holdings 12,326 Tencent Holdings 15,540Alibaba Group Holding 11,309 Alibaba Group Holding 15,524LG Chem 6,741 Alibaba Group Holding - ADR 13,234Viatris 6,015 Taiwan Semiconductor Manufacturing 11,165Amazon.com 5,775 Amazon.com 7,720Dollar General 5,775 JD.com 6,392ASML Holding (Netherlands listing) 5,577 Samsung Electronics 6,045US Bancorp 5,485 AIA Group 5,888Fidelity National Information Services 5,431 Li Ning 5,515Honeywell International 5,028 Mondelez International 5,376MetLife 4,864 Abbott Laboratories 5,099Samsung Electronics 4,665 Marsh & McLennan 5,053Discover Financial Services 4,662 AT&T 5,048Infosys 4,643 Pfizer 5,018Motorola Solutions 4,527 Intel 4,963Contemporary Amperex Technology 4,378 SAP 4,942Taiwan Semiconductor Manufacturing 4,211 Bank of New York Mellon 4,914Tencent Music Entertainment Group - ADR 4,180 Allstate 4,908Yihai International Holding 4,024 Kakao 4,897Hong Kong Exchanges & Clearing 3,592 Wuliangye Yibin 4,562
Unaudited Supplemental Information(continued)
Mercer UCITS Common Contractual Fund 99
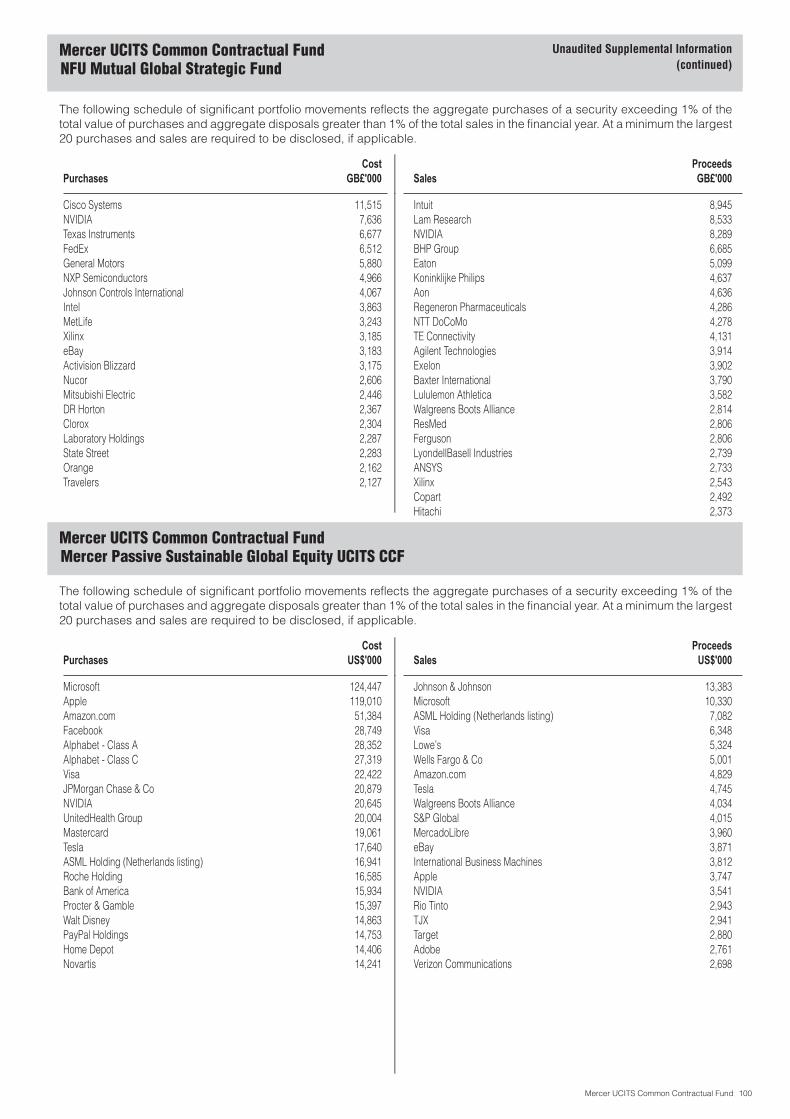
Mercer UCITS Common Contractual FundNFU Mutual Global Strategic Fund
The following schedule of significant portfolio movements reflects the aggregate purchases of a security exceeding 1% of thetotal value of purchases and aggregate disposals greater than 1% of the total sales in the financial year. At a minimum the largest20 purchases and sales are required to be disclosed, if applicable.
PurchasesCost
GB£'000 SalesProceedsGB£'000
Cisco Systems 11,515 Intuit 8,945NVIDIA 7,636 Lam Research 8,533Texas Instruments 6,677 NVIDIA 8,289FedEx 6,512 BHP Group 6,685General Motors 5,880 Eaton 5,099NXP Semiconductors 4,966 Koninklijke Philips 4,637Johnson Controls International 4,067 Aon 4,636Intel 3,863 Regeneron Pharmaceuticals 4,286MetLife 3,243 NTT DoCoMo 4,278Xilinx 3,185 TE Connectivity 4,131eBay 3,183 Agilent Technologies 3,914Activision Blizzard 3,175 Exelon 3,902Nucor 2,606 Baxter International 3,790Mitsubishi Electric 2,446 Lululemon Athletica 3,582DR Horton 2,367 Walgreens Boots Alliance 2,814Clorox 2,304 ResMed 2,806Laboratory Holdings 2,287 Ferguson 2,806State Street 2,283 LyondellBasell Industries 2,739Orange 2,162 ANSYS 2,733Travelers 2,127 Xilinx 2,543
Copart 2,492Hitachi 2,373
Mercer UCITS Common Contractual FundMercer Passive Sustainable Global Equity UCITS CCF
The following schedule of significant portfolio movements reflects the aggregate purchases of a security exceeding 1% of thetotal value of purchases and aggregate disposals greater than 1% of the total sales in the financial year. At a minimum the largest20 purchases and sales are required to be disclosed, if applicable.
PurchasesCost
US$'000 SalesProceeds
US$'000
Microsoft 124,447 Johnson & Johnson 13,383Apple 119,010 Microsoft 10,330Amazon.com 51,384 ASML Holding (Netherlands listing) 7,082Facebook 28,749 Visa 6,348Alphabet - Class A 28,352 Lowe’s 5,324Alphabet - Class C 27,319 Wells Fargo & Co 5,001Visa 22,422 Amazon.com 4,829JPMorgan Chase & Co 20,879 Tesla 4,745NVIDIA 20,645 Walgreens Boots Alliance 4,034UnitedHealth Group 20,004 S&P Global 4,015Mastercard 19,061 MercadoLibre 3,960Tesla 17,640 eBay 3,871ASML Holding (Netherlands listing) 16,941 International Business Machines 3,812Roche Holding 16,585 Apple 3,747Bank of America 15,934 NVIDIA 3,541Procter & Gamble 15,397 Rio Tinto 2,943Walt Disney 14,863 TJX 2,941PayPal Holdings 14,753 Target 2,880Home Depot 14,406 Adobe 2,761Novartis 14,241 Verizon Communications 2,698
Unaudited Supplemental Information(continued)
Mercer UCITS Common Contractual Fund 100
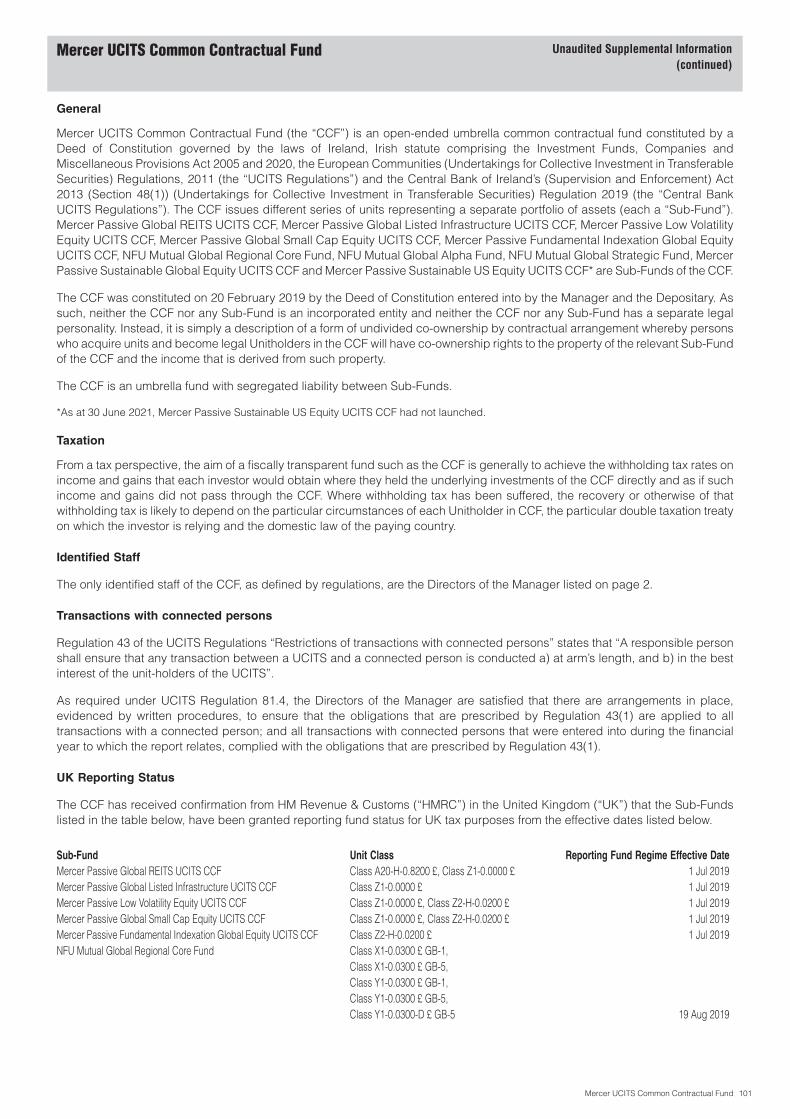
General
Mercer UCITS Common Contractual Fund (the “CCF”) is an open-ended umbrella common contractual fund constituted by aDeed of Constitution governed by the laws of Ireland, Irish statute comprising the Investment Funds, Companies andMiscellaneous Provisions Act 2005 and 2020, the European Communities (Undertakings for Collective Investment in TransferableSecurities) Regulations, 2011 (the “UCITS Regulations”) and the Central Bank of Ireland’s (Supervision and Enforcement) Act2013 (Section 48(1)) (Undertakings for Collective Investment in Transferable Securities) Regulation 2019 (the “Central BankUCITS Regulations”). The CCF issues different series of units representing a separate portfolio of assets (each a “Sub-Fund”).Mercer Passive Global REITS UCITS CCF, Mercer Passive Global Listed Infrastructure UCITS CCF, Mercer Passive Low VolatilityEquity UCITS CCF, Mercer Passive Global Small Cap Equity UCITS CCF, Mercer Passive Fundamental Indexation Global EquityUCITS CCF, NFU Mutual Global Regional Core Fund, NFU Mutual Global Alpha Fund, NFU Mutual Global Strategic Fund, MercerPassive Sustainable Global Equity UCITS CCF and Mercer Passive Sustainable US Equity UCITS CCF* are Sub-Funds of the CCF.
The CCF was constituted on 20 February 2019 by the Deed of Constitution entered into by the Manager and the Depositary. Assuch, neither the CCF nor any Sub-Fund is an incorporated entity and neither the CCF nor any Sub-Fund has a separate legalpersonality. Instead, it is simply a description of a form of undivided co-ownership by contractual arrangement whereby personswho acquire units and become legal Unitholders in the CCF will have co-ownership rights to the property of the relevant Sub-Fundof the CCF and the income that is derived from such property.
The CCF is an umbrella fund with segregated liability between Sub-Funds.
*As at 30 June 2021, Mercer Passive Sustainable US Equity UCITS CCF had not launched.
Taxation
From a tax perspective, the aim of a fiscally transparent fund such as the CCF is generally to achieve the withholding tax rates onincome and gains that each investor would obtain where they held the underlying investments of the CCF directly and as if suchincome and gains did not pass through the CCF. Where withholding tax has been suffered, the recovery or otherwise of thatwithholding tax is likely to depend on the particular circumstances of each Unitholder in CCF, the particular double taxation treatyon which the investor is relying and the domestic law of the paying country.
Identified Staff
The only identified staff of the CCF, as defined by regulations, are the Directors of the Manager listed on page 2.
Transactions with connected persons
Regulation 43 of the UCITS Regulations “Restrictions of transactions with connected persons” states that “A responsible personshall ensure that any transaction between a UCITS and a connected person is conducted a) at arm’s length, and b) in the bestinterest of the unit-holders of the UCITS”.
As required under UCITS Regulation 81.4, the Directors of the Manager are satisfied that there are arrangements in place,evidenced by written procedures, to ensure that the obligations that are prescribed by Regulation 43(1) are applied to alltransactions with a connected person; and all transactions with connected persons that were entered into during the financialyear to which the report relates, complied with the obligations that are prescribed by Regulation 43(1).
UK Reporting Status
The CCF has received confirmation from HM Revenue & Customs (“HMRC”) in the United Kingdom (“UK”) that the Sub-Fundslisted in the table below, have been granted reporting fund status for UK tax purposes from the effective dates listed below.
Sub-Fund Unit Class Reporting Fund Regime Effective DateMercer Passive Global REITS UCITS CCF Class A20-H-0.8200 £, Class Z1-0.0000 £ 1 Jul 2019Mercer Passive Global Listed Infrastructure UCITS CCF Class Z1-0.0000 £ 1 Jul 2019Mercer Passive Low Volatility Equity UCITS CCF Class Z1-0.0000 £, Class Z2-H-0.0200 £ 1 Jul 2019Mercer Passive Global Small Cap Equity UCITS CCF Class Z1-0.0000 £, Class Z2-H-0.0200 £ 1 Jul 2019Mercer Passive Fundamental Indexation Global Equity UCITS CCF Class Z2-H-0.0200 £ 1 Jul 2019NFU Mutual Global Regional Core Fund Class X1-0.0300 £ GB-1,
Class X1-0.0300 £ GB-5,Class Y1-0.0300 £ GB-1,Class Y1-0.0300 £ GB-5,Class Y1-0.0300-D £ GB-5 19 Aug 2019
Mercer UCITS Common Contractual Fund Unaudited Supplemental Information(continued)
Mercer UCITS Common Contractual Fund 101

UK Reporting Status (continued)
Sub-Fund Unit Class Reporting Fund Regime Effective DateNFU Mutual Global Alpha Fund Class X1-0.0700 £ GB-1,
Class X1-0.0700 £ GB-5,Class Y1-0.0700 £ GB-1,Class Y1-0.0700 £ GB-5,Class Y1-0.0700-D £ GB-5 19 Aug 2019
NFU Mutual Global Strategic Fund Class X1-0.0300 £ GB-1,Class X1-0.0300 £ GB-5,Class Y1-0.0300 £ GB-1,Class Y1-0.0300 £ GB-5,Class Y1-0.0300-D £ GB-5 19 Aug 2019
Mercer Passive Sustainable Global Equity UCITS CCF Class Z2-H-0.0200 £ 1 Jul 2019
Statement of Compliance on Corporate Governance Code
The Sub-Funds have adopted in full the voluntary Code of Corporate Governance (the “Corporate Governance Code”) forInvestment Funds and Management Companies issued by the Irish Funds (“IF”), the text of which is available from the IF website,www.irishfunds.ie.
The Sub-Funds have been in compliance with the Corporate Governance Code during the financial year ended 30 June 2021.
Data Protection Notice
The General Data Protection Regulation (Regulation (EU) 2016/679) came into effect on 25 May 2018.
Soft commissions and directed brokerage arrangements
With effect from 3 January 2018, with the exception of minor non-monetary benefits as defined in Markets in Financial InstrumentsDirective (“MiFID”), Sub-Investment Managers appointed by the Investment Manager are not permitted to enter into softcommission arrangements which would result in them receiving research for free. Managers can accept research if they pay forit themselves or if they pay for it via a Research Payment Account (“RPA”) which is funded by the assets of the Sub-Fund or similarmeans which result in the same level of protection as the RPA method.
COVID-19
COVID-19 disclosure is included in Note 7 to the financial statements.
EPM techniques
The Sub-Funds may employ investment techniques and instruments for EPM of the assets of the Sub-Funds or of any Sub-Fundand for short-term investment purposes under the conditions and limits set out in the Prospectus. The Sub-Funds may, for thepurposes of hedging, enter into put and call options, spot and forward contracts, financial futures, stock and bond index futurescontracts, repurchase and reverse repurchase agreements and securities lending agreements. In particular, a Sub-Fund mayseek to hedge its investments against currency fluctuations which are adverse to its base currency by utilising currency options,futures contracts and forward foreign exchange contracts. For FDIs that were entered into during the financial year whichremained open at year end and the resulting amount of commitments/exposures, please refer to the Portfolio Statements. FDIsand EPM techniques and instruments were used during the financial year.
A Sub-Fund may also from time to time make use of exchange traded stock index and other futures contracts for the purpose ofEPM to enable it to maintain the appropriate exposure to stock markets in accordance with the relevant Investment Manager’srecommended overall asset allocation. The use of exchange traded stock index and other futures contracts by the Sub-Fund willbe subject to the conditions and limits laid down by the Central Bank under the UCITS Regulations.
Certain Sub-Funds utilise FDIs for investment purposes and/or for EPM purposes. In addition to investment in FDIs set down in theProspectus, and subject to the conditions and within the limits laid down by the Central Bank, certain Sub-Funds may employtechniques and instruments for EPM of the assets of the Sub-Fund relating to transferable securities and money marketinstruments. Transactions for the purposes of EPM may be undertaken with a view to achieving a reduction in risk and/or areduction in costs and may not be speculative in nature. These techniques and instruments may include investment in FDIs. Newtechniques and instruments may be developed which may be suitable for use by a Sub-Fund and the Manager may employ suchtechniques and instruments. Investment in FDIs are subject to the conditions and limits laid down by the Central Bank.
Mercer UCITS Common Contractual Fund Unaudited Supplemental Information(continued)
Mercer UCITS Common Contractual Fund 102
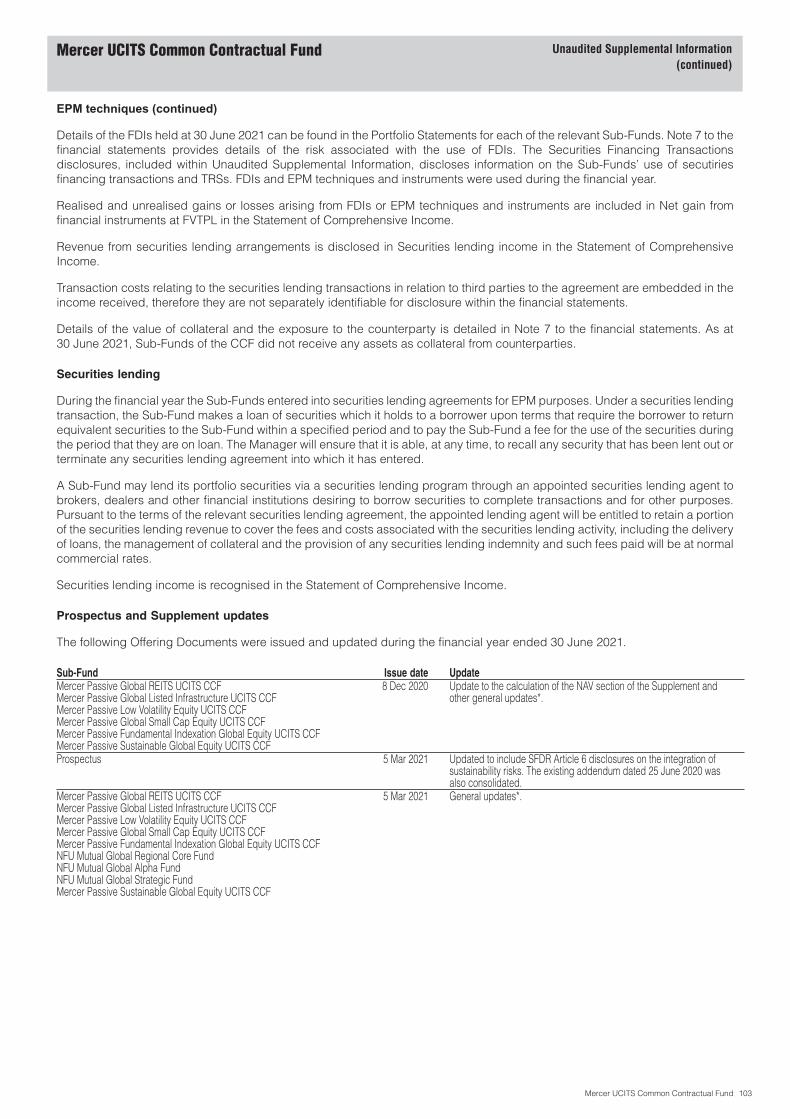
EPM techniques (continued)
Details of the FDIs held at 30 June 2021 can be found in the Portfolio Statements for each of the relevant Sub-Funds. Note 7 to thefinancial statements provides details of the risk associated with the use of FDIs. The Securities Financing Transactionsdisclosures, included within Unaudited Supplemental Information, discloses information on the Sub-Funds’ use of secutiriesfinancing transactions and TRSs. FDIs and EPM techniques and instruments were used during the financial year.
Realised and unrealised gains or losses arising from FDIs or EPM techniques and instruments are included in Net gain fromfinancial instruments at FVTPL in the Statement of Comprehensive Income.
Revenue from securities lending arrangements is disclosed in Securities lending income in the Statement of ComprehensiveIncome.
Transaction costs relating to the securities lending transactions in relation to third parties to the agreement are embedded in theincome received, therefore they are not separately identifiable for disclosure within the financial statements.
Details of the value of collateral and the exposure to the counterparty is detailed in Note 7 to the financial statements. As at30 June 2021, Sub-Funds of the CCF did not receive any assets as collateral from counterparties.
Securities lending
During the financial year the Sub-Funds entered into securities lending agreements for EPM purposes. Under a securities lendingtransaction, the Sub-Fund makes a loan of securities which it holds to a borrower upon terms that require the borrower to returnequivalent securities to the Sub-Fund within a specified period and to pay the Sub-Fund a fee for the use of the securities duringthe period that they are on loan. The Manager will ensure that it is able, at any time, to recall any security that has been lent out orterminate any securities lending agreement into which it has entered.
A Sub-Fund may lend its portfolio securities via a securities lending program through an appointed securities lending agent tobrokers, dealers and other financial institutions desiring to borrow securities to complete transactions and for other purposes.Pursuant to the terms of the relevant securities lending agreement, the appointed lending agent will be entitled to retain a portionof the securities lending revenue to cover the fees and costs associated with the securities lending activity, including the deliveryof loans, the management of collateral and the provision of any securities lending indemnity and such fees paid will be at normalcommercial rates.
Securities lending income is recognised in the Statement of Comprehensive Income.
Prospectus and Supplement updates
The following Offering Documents were issued and updated during the financial year ended 30 June 2021.
Sub-Fund Issue date UpdateMercer Passive Global REITS UCITS CCFMercer Passive Global Listed Infrastructure UCITS CCFMercer Passive Low Volatility Equity UCITS CCFMercer Passive Global Small Cap Equity UCITS CCFMercer Passive Fundamental Indexation Global Equity UCITS CCFMercer Passive Sustainable Global Equity UCITS CCF
8 Dec 2020 Update to the calculation of the NAV section of the Supplement andother general updates*.
Prospectus 5 Mar 2021 Updated to include SFDR Article 6 disclosures on the integration ofsustainability risks. The existing addendum dated 25 June 2020 wasalso consolidated.
Mercer Passive Global REITS UCITS CCFMercer Passive Global Listed Infrastructure UCITS CCFMercer Passive Low Volatility Equity UCITS CCFMercer Passive Global Small Cap Equity UCITS CCFMercer Passive Fundamental Indexation Global Equity UCITS CCFNFU Mutual Global Regional Core FundNFU Mutual Global Alpha FundNFU Mutual Global Strategic FundMercer Passive Sustainable Global Equity UCITS CCF
5 Mar 2021 General updates*.
Mercer UCITS Common Contractual Fund Unaudited Supplemental Information(continued)
Mercer UCITS Common Contractual Fund 103
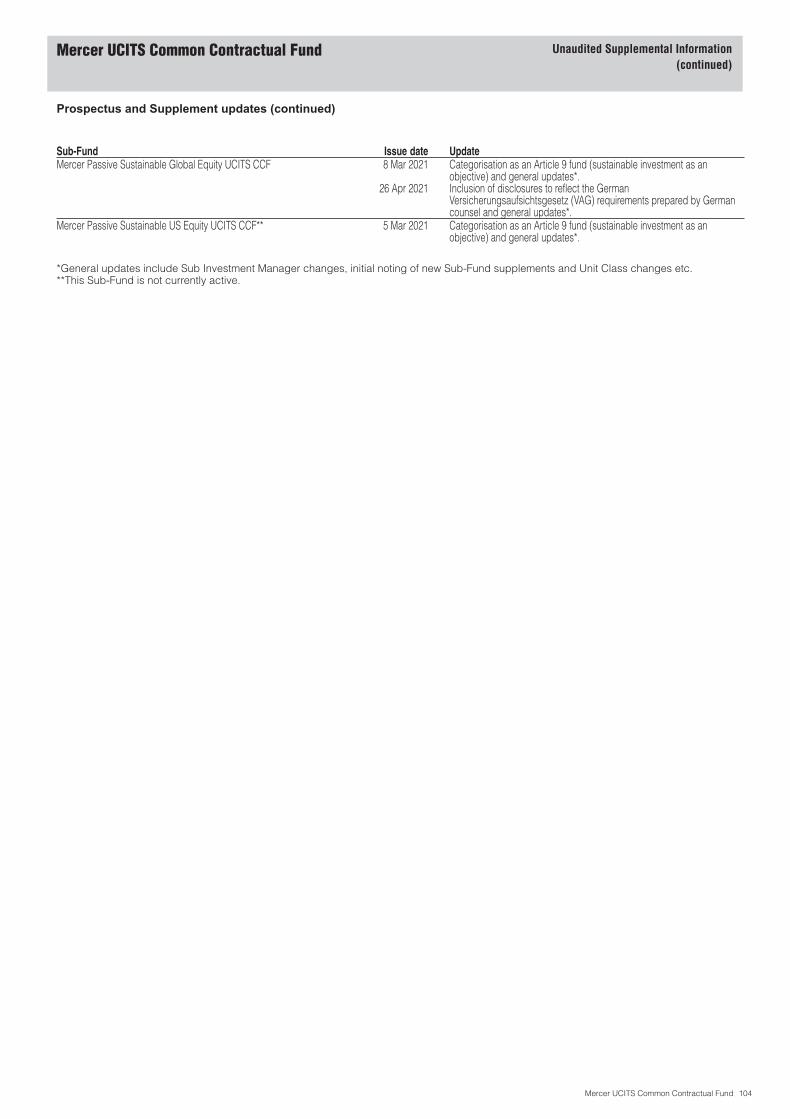
Prospectus and Supplement updates (continued)
Sub-Fund Issue date UpdateMercer Passive Sustainable Global Equity UCITS CCF 8 Mar 2021
26 Apr 2021
Categorisation as an Article 9 fund (sustainable investment as anobjective) and general updates*.Inclusion of disclosures to reflect the GermanVersicherungsaufsichtsgesetz (VAG) requirements prepared by Germancounsel and general updates*.
Mercer Passive Sustainable US Equity UCITS CCF** 5 Mar 2021 Categorisation as an Article 9 fund (sustainable investment as anobjective) and general updates*.
*General updates include Sub Investment Manager changes, initial noting of new Sub-Fund supplements and Unit Class changes etc.**This Sub-Fund is not currently active.
Mercer UCITS Common Contractual Fund Unaudited Supplemental Information(continued)
Mercer UCITS Common Contractual Fund 104
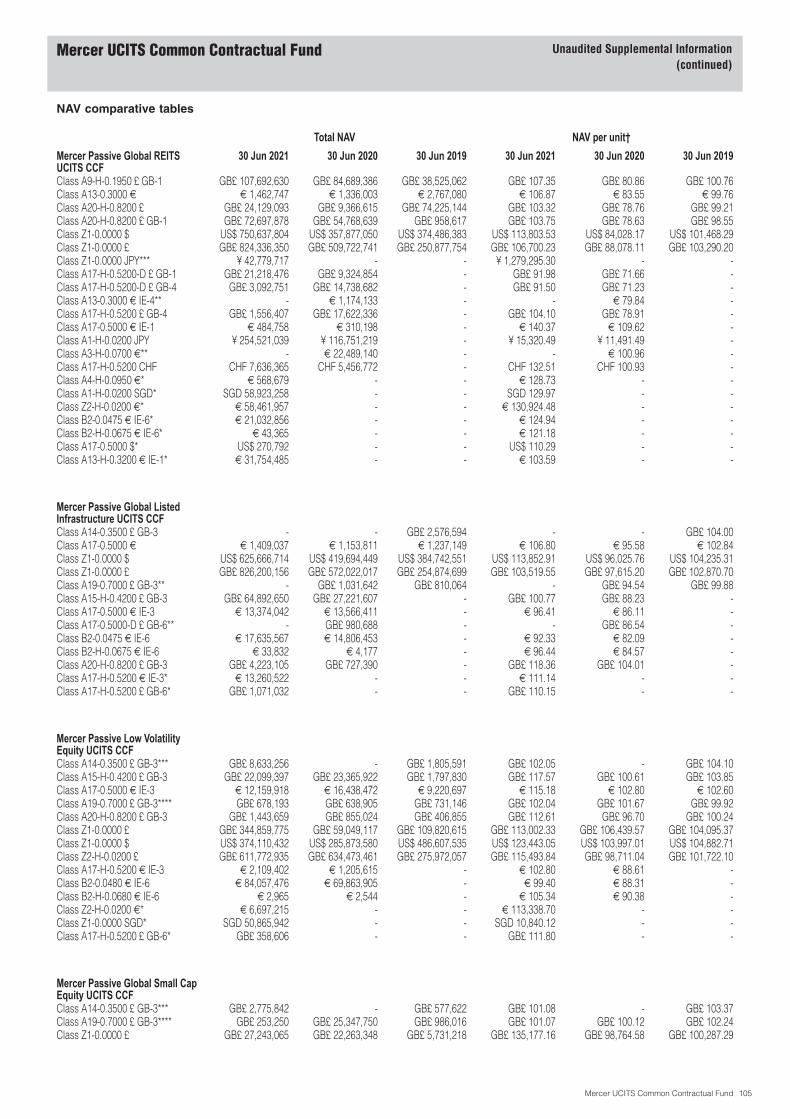
NAV comparative tables
Total NAV NAV per unit†
Mercer Passive Global REITSUCITS CCF
30 Jun 2021 30 Jun 2020 30 Jun 2019 30 Jun 2021 30 Jun 2020 30 Jun 2019
Class A9-H-0.1950 £ GB-1 GB£ 107,692,630 GB£ 84,689,386 GB£ 38,525,062 GB£ 107.35 GB£ 80.86 GB£ 100.76Class A13-0.3000 € € 1,462,747 € 1,336,003 € 2,767,080 € 106.87 € 83.55 € 99.76Class A20-H-0.8200 £ GB£ 24,129,093 GB£ 9,366,615 GB£ 74,225,144 GB£ 103.32 GB£ 78.76 GB£ 99.21Class A20-H-0.8200 £ GB-1 GB£ 72,697,878 GB£ 54,768,639 GB£ 958,617 GB£ 103.75 GB£ 78.63 GB£ 98.55Class Z1-0.0000 $ US$ 750,637,804 US$ 357,877,050 US$ 374,486,383 US$ 113,803.53 US$ 84,028.17 US$ 101,468.29Class Z1-0.0000 £ GB£ 824,336,350 GB£ 509,722,741 GB£ 250,877,754 GB£ 106,700.23 GB£ 88,078.11 GB£ 103,290.20Class Z1-0.0000 JPY*** ¥ 42,779,717 - - ¥ 1,279,295.30 - -Class A17-H-0.5200-D £ GB-1 GB£ 21,218,476 GB£ 9,324,854 - GB£ 91.98 GB£ 71.66 -Class A17-H-0.5200-D £ GB-4 GB£ 3,092,751 GB£ 14,738,682 - GB£ 91.50 GB£ 71.23 -Class A13-0.3000 € IE-4** - € 1,174,133 - - € 79.84 -Class A17-H-0.5200 £ GB-4 GB£ 1,556,407 GB£ 17,622,336 - GB£ 104.10 GB£ 78.91 -Class A17-0.5000 € IE-1 € 484,758 € 310,198 - € 140.37 € 109.62 -Class A1-H-0.0200 JPY ¥ 254,521,039 ¥ 116,751,219 - ¥ 15,320.49 ¥ 11,491.49 -Class A3-H-0.0700 €** - € 22,489,140 - - € 100.96 -Class A17-H-0.5200 CHF CHF 7,636,365 CHF 5,456,772 - CHF 132.51 CHF 100.93 -Class A4-H-0.0950 €* € 568,679 - - € 128.73 - -Class A1-H-0.0200 SGD* SGD 58,923,258 - - SGD 129.97 - -Class Z2-H-0.0200 €* € 58,461,957 - - € 130,924.48 - -Class B2-0.0475 € IE-6* € 21,032,856 - - € 124.94 - -Class B2-H-0.0675 € IE-6* € 43,365 - - € 121.18 - -Class A17-0.5000 $* US$ 270,792 - - US$ 110.29 - -Class A13-H-0.3200 € IE-1* € 31,754,485 - - € 103.59 - -
Mercer Passive Global ListedInfrastructure UCITS CCFClass A14-0.3500 £ GB-3 - - GB£ 2,576,594 - - GB£ 104.00Class A17-0.5000 € € 1,409,037 € 1,153,811 € 1,237,149 € 106.80 € 95.58 € 102.84Class Z1-0.0000 $ US$ 625,666,714 US$ 419,694,449 US$ 384,742,551 US$ 113,852.91 US$ 96,025.76 US$ 104,235.31Class Z1-0.0000 £ GB£ 826,200,156 GB£ 572,022,017 GB£ 254,874,699 GB£ 103,519.55 GB£ 97,615.20 GB£ 102,870.70Class A19-0.7000 £ GB-3** - GB£ 1,031,642 GB£ 810,064 - GB£ 94.54 GB£ 99.88Class A15-H-0.4200 £ GB-3 GB£ 64,892,650 GB£ 27,221,607 - GB£ 100.77 GB£ 88.23 -Class A17-0.5000 € IE-3 € 13,374,042 € 13,566,411 - € 96.41 € 86.11 -Class A17-0.5000-D £ GB-6** - GB£ 980,688 - - GB£ 86.54 -Class B2-0.0475 € IE-6 € 17,635,567 € 14,806,453 - € 92.33 € 82.09 -Class B2-H-0.0675 € IE-6 € 33,832 € 4,177 - € 96.44 € 84.57 -Class A20-H-0.8200 £ GB-3 GB£ 4,223,105 GB£ 727,390 - GB£ 118.36 GB£ 104.01 -Class A17-H-0.5200 € IE-3* € 13,260,522 - - € 111.14 - -Class A17-H-0.5200 £ GB-6* GB£ 1,071,032 - - GB£ 110.15 - -
Mercer Passive Low VolatilityEquity UCITS CCFClass A14-0.3500 £ GB-3*** GB£ 8,633,256 - GB£ 1,805,591 GB£ 102.05 - GB£ 104.10Class A15-H-0.4200 £ GB-3 GB£ 22,099,397 GB£ 23,365,922 GB£ 1,797,830 GB£ 117.57 GB£ 100.61 GB£ 103.85Class A17-0.5000 € IE-3 € 12,159,918 € 16,438,472 € 9,220,697 € 115.18 € 102.80 € 102.60Class A19-0.7000 £ GB-3**** GB£ 678,193 GB£ 638,905 GB£ 731,146 GB£ 102.04 GB£ 101.67 GB£ 99.92Class A20-H-0.8200 £ GB-3 GB£ 1,443,659 GB£ 855,024 GB£ 406,855 GB£ 112.61 GB£ 96.70 GB£ 100.24Class Z1-0.0000 £ GB£ 344,859,775 GB£ 59,049,117 GB£ 109,820,615 GB£ 113,002.33 GB£ 106,439.57 GB£ 104,095.37Class Z1-0.0000 $ US$ 374,110,432 US$ 285,873,580 US$ 486,607,535 US$ 123,443.05 US$ 103,997.01 US$ 104,882.71Class Z2-H-0.0200 £ GB£ 611,772,935 GB£ 634,473,461 GB£ 275,972,057 GB£ 115,493.84 GB£ 98,711.04 GB£ 101,722.10Class A17-H-0.5200 € IE-3 € 2,109,402 € 1,205,615 - € 102.80 € 88.61 -Class B2-0.0480 € IE-6 € 84,057,476 € 69,863,905 - € 99.40 € 88.31 -Class B2-H-0.0680 € IE-6 € 2,965 € 2,544 - € 105.34 € 90.38 -Class Z2-H-0.0200 €* € 6,697,215 - - € 113,338.70 - -Class Z1-0.0000 SGD* SGD 50,865,942 - - SGD 10,840.12 - -Class A17-H-0.5200 £ GB-6* GB£ 358,606 - - GB£ 111.80 - -
Mercer Passive Global Small CapEquity UCITS CCFClass A14-0.3500 £ GB-3*** GB£ 2,775,842 - GB£ 577,622 GB£ 101.08 - GB£ 103.37Class A19-0.7000 £ GB-3**** GB£ 253,250 GB£ 25,347,750 GB£ 986,016 GB£ 101.07 GB£ 100.12 GB£ 102.24Class Z1-0.0000 £ GB£ 27,243,065 GB£ 22,263,348 GB£ 5,731,218 GB£ 135,177.16 GB£ 98,764.58 GB£ 100,287.29
Mercer UCITS Common Contractual Fund Unaudited Supplemental Information(continued)
Mercer UCITS Common Contractual Fund 105

NAV comparative tables (continued)
Total NAV NAV per unit†
Mercer Passive Global Small CapEquity UCITS CCF (continued)
30 Jun 2021 30 Jun 2020 30 Jun 2019 30 Jun 2021 30 Jun 2020 30 Jun 2019
Class Z2-H-0.0200 £ GB£ 857,997,904 GB£ 706,837,906 GB£ 322,860,122 GB£ 141,797.75 GB£ 95,298.24 GB£ 102,901.26Class A15-H-0.4200 £ GB-3 GB£ 30,505,427 GB£ 9,170,643 - GB£ 136.19 GB£ 91.81 -Class A17-0.5000 € IE-3 € 7,626,760 € 7,294,269 - € 140.20 € 97.14 -Class B2-0.0499 € IE-6 € 107,226,258 € 92,384,501 - € 126.85 € 87.49 -Class Z1-0.0000 $ US$ 566,132,688 US$ 432,621,450 - US$ 148,259.44 US$ 96,878.72 -Class A20-H-0.8200 £ GB-3 GB£ 2,010,984 GB£ 235,577 - GB£ 166.31 GB£ 112.58 -Class A17-H-0.5200 £ GB-6* GB£ 496,327 - - GB£ 107.87 - -Class Z1-0.0000 € BE-6* € 72,287,920 - - € 109,669.56 - -
Mercer Passive FundamentalIndexation Global Equity UCITSCCFClass A15-H-0.4200 £ GB-3 GB£ 32,756,949 GB£ 19,265,016 GB£ 7,743,825 GB£ 139.93 GB£ 102.52 GB£ 101.38Class A20-H-0.8200 £ GB-3 GB£ 2,729,398 GB£ 3,770,553 GB£ 3,195,587 GB£ 138.32 GB£ 101.78 GB£ 101.36Class Z2-H-0.0200 £ GB£ 682,275,157 GB£ 1,081,143,718 GB£ 867,170,149 GB£ 139,677.96 GB£ 102,211.75 GB£ 101,399.69Class Z1-0.0000 £** - GB£ 5,783,992 GB£ 25,739,437 - GB£ 104,545.47 GB£ 100,153.45Class Z1-0.0000 $** - US$ 314,239,794 US$ 438,287,995 - US$ 103,908.11 US$ 100,157.22Class B2-0.0480 € IE-6 € 115,367,112 € 197,506,247 - € 125.52 € 94.30 -Class B2-H-0.0680 € IE-6 € 105,091,255 € 100,859,040 - € 131.54 € 96.48 -Class A19-0.7000-D £ GB-6** - GB£ 1,068,267 - - GB£ 101.18 -Class A17-H-0.5200 CHF CHF 23,208,272 CHF 16,154,715 - CHF 137.22 CHF 101.30 -Class A15-0.4000 €* € 62,108,040 - - € 126.55 - -Class A1-H-0.0200 SGD* SGD 47,927,972 - - SGD 127.59 - -Class Z1-0.0000 €* € 5,591,193 - - € 114,193.17 - -Class Z2-H-0.0200 €* € 2,846,678 - - € 112,783.96 - -
NFU Mutual Global Regional CoreFundClass X1-0.0300 £ GB-5 GB£ 3,620,794 GB£ 2,912,365 - GB£ 120.92 GB£ 97.08 -Class Y1-0.0300 £ GB-5 GB£ 625,229,149 GB£ 543,131,090 - GB£ 120.67 GB£ 96.98 -Class Y1-0.0300-D £ GB-5 GB£ 93,881,227 GB£ 62,877,965 - GB£ 115.98 GB£ 95.50 -Class X1-0.0300 £ GB-1 GB£ 222,987,392 GB£ 162,311,002 - GB£ 122.08 GB£ 98.01 -Class Y1-0.0300 £ GB-1 GB£ 75,335,938 GB£ 47,226,811 - GB£ 121.85 GB£ 97.93 -
NFU Mutual Global Alpha FundClass Y1-0.0700 £ GB-5 GB£ 762,832,742 GB£ 735,483,099 - GB£ 125.19 GB£ 100.53 -Class X1-0.0700 £ GB-1 GB£ 267,529,749 GB£ 217,130,950 - GB£ 127.35 GB£ 101.67 -Class Y1-0.0700 £ GB-1 GB£ 90,214,946 GB£ 61,666,540 - GB£ 126.32 GB£ 101.36 -Class Y1-0.0700-D £ GB-5 GB£ 108,208,305 GB£ 73,959,807 - GB£ 138.00 GB£ 112.34 -
NFU Mutual Global StrategicFundClass Y1-0.0300 £ GB-5 GB£ 307,187,515 GB£ 290,027,377 - GB£ 123.60 GB£ 98.67 -Class X1-0.0300 £ GB-1 GB£ 108,430,748 GB£ 86,576,191 - GB£ 122.67 GB£ 97.73 -Class Y1-0.0300 £ GB-1 GB£ 36,746,145 GB£ 23,943,064 - GB£ 122.48 GB£ 97.64 -Class Y1-0.0300-D £ GB-5 GB£ 47,618,956 GB£ 30,737,937 - GB£ 129.80 GB£ 105.36 -
Mercer Passive SustainableGlobal Equity UCITS CCFClass A10-H-0.2200 NOK NOK 160,143,520 NOK 133,259,966 - NOK 1,374.71 NOK 1,014.01 -Class A15-H-0.4200 £ GB-3 GB£ 13,975,855 GB£ 34,849,915 - GB£ 142.84 GB£ 104.43 -Class A20-H-0.8200 £ GB-3** - GB£ 2,256,751 - - GB£ 104.00 -Class A20-H-0.8200 € IE-6 € 25,362,304 € 16,162,245 - € 145.24 € 107.03 -Class Z1-0.0000 $ US$ 902,422,984 US$ 221,849,847 - US$ 151,622.63 US$ 108,026.72 -Class Z1-0.0000 £ GB£ 75,081,143 GB£ 16,953,993 - GB£ 135,253.58 GB£ 107,737.35 -Class Z2-H-0.0200 £ GB£ 865,324,535 GB£ 332,204,030 - GB£ 143,327.61 GB£ 104,482.57 -Class A17-H-0.5200 € IE-3 € 65,198,083 € 3,077,605 - € 129.25 € 94.94 -
Mercer UCITS Common Contractual Fund Unaudited Supplemental Information(continued)
Mercer UCITS Common Contractual Fund 106

NAV comparative tables (continued)
Total NAV NAV per unit†
Mercer Passive SustainableGlobal Equity UCITS CCF(continued)
30 Jun 2021 30 Jun 2020 30 Jun 2019 30 Jun 2021 30 Jun 2020 30 Jun 2019
Class A17-0.5000 € IE-3 € 2,609,929 € 1,810,968 - € 120.71 € 91.16 -Class A17-0.5000-D £ GB-6 GB£ 33,812,157 GB£ 1,794,948 - GB£ 122.23 GB£ 98.62 -Class A17-H-0.5200-D £ GB-6 GB£ 856,705 GB£ 2,924,273 - GB£ 124.64 GB£ 92.06 -Class A17-0.5000 £ GB-6 GB£ 39,519,606 GB£ 7,675,732 - GB£ 125.46 GB£ 100.31 -Class A17-H-0.5200 £ GB-6 GB£ 8,948,414 GB£ 7,557,448 - GB£ 127.13 GB£ 93.04 -Class B1-0.0750 € IE-6 € 152,764,020 € 222,277 - € 127.10 € 95.57 -Class B1-H-0.0950 € IE-6 € 26,116,807 € 150,325 - € 133.71 € 97.80 -Class A14-0.3500 £ GB-3***, * GB£ 92,460,203 - - GB£ 117.97 - -Class A4-H-0.0950 JPY* ¥ 2,413,001,783 - - ¥ 13,005.11 - -Class A19-0.7000 £ GB-3* GB£ 9,452,547 - - GB£ 117.68 - -Class A10-H-0.2200 € IE-3* € 7,696,576 - - € 110.44 - -Class A5-0.1000 JPY* ¥ 109,799,161 - - ¥ 10,406.20 - -Class A8-H-0.1700 € IE-3* € 326,422 - - € 106.55 - -
*The Unit Class launched during the financial year ended 30 June 2021.**The Unit Class terminated during the financial year ended 30 June 2021.***The Unit Class re-launched during the financial year ended 30 June 2021.****The Unit Class terminated and re-launched during the financial year ended 30 June 2021.†Dealing NAV.
Mercer UCITS Common Contractual Fund Unaudited Supplemental Information(continued)
Mercer UCITS Common Contractual Fund 107

Exchange rates
The applicable financial year end exchange rates were as follows:
As at30 Jun 2021
Exchangerate to US$
As at30 Jun 2020
Exchangerate to US$
Australian Dollar 1.3320 1.4524Brazilian Real 5.0179 5.4908British Pound 0.7239 0.8093Canadian Dollar 1.2383 1.3620Chilean Peso 728.1100 820.6000Chinese Offshore Yuan - 7.0678Chinese Yuan Renminbi 6.4615 7.0741Colombian Peso 3,734.0000 3,739.2800Czech Koruna - 23.7213Danish Krone 6.2706 6.6360Egyptian Pound 15.6950 16.1400Euro 0.8432 0.8904Hong Kong Dollar 7.7659 7.7505Hungarian Forint - 315.5768Indian Rupee 74.3300 75.5038Indonesian Rupiah 14,500.0000 14,285.0000Israeli Shekel 3.2585 3.4610Japanese Yen 110.9900 107.8850Kenyan Shilling - 106.5500Korean Won 1,126.1500 1,202.8500Kuwaiti Dinar - 0.3077Malaysian Ringgit 4.1515 4.2850Mexican Peso 19.9105 23.1070New Zealand Dollar 1.4311 1.5534Norwegian Krone 8.6052 9.6470Pakistani Rupee 157.6000 167.9000Philippines Peso 48.8150 49.8250Polish Zloty 3.8070 3.9557Qatari Riyal - 3.6410Russian Ruble 73.0538 71.2544Saudi Arabian Riyal 3.7504 3.7510Singapore Dollar 1.3442 1.3951South African Rand - 17.3750Swedish Krone 8.5522 9.3167Swiss Franc 0.9244 0.9476Taiwan Dollar 27.8625 29.5045Thailand Baht 32.0500 30.9075Turkish Lira 8.6875 6.8548United Arab Emirates Dirham - 3.6732
Mercer UCITS Common Contractual Fund Unaudited Supplemental Information(continued)
Mercer UCITS Common Contractual Fund 108

Exchange rates (continued)
The applicable financial year end exchange rates were as follows:
As at30 Jun 2021
Exchangerate to GB£
As at30 Jun 2020
Exchangerate to GB£
Australian Dollar 1.8401 1.7946Brazilian Real 6.9319 6.7844Canadian Dollar 1.7106 1.6829Chilean Peso 1,005.8477 1,013.9339Chinese Offshore Yuan 8.9253 8.7329Chinese Yuan Renminbi 8.9262 8.7408Colombian Peso 5,158.3349 4,620.2567Czech Koruna 29.7130 29.3100Danish Krone 8.6625 8.1994Egyptian Pound 21.6819 19.9426Euro 1.1649 1.1001Hong Kong Dollar 10.7281 9.5765Hungarian Forint 408.9135 389.9268Indian Rupee 102.6832 93.2925Indonesian Rupiah 20,031.0274 17,650.5548Israeli Shekel 4.5015 4.2764Japanese Yen 153.3272 133.3028Kenyan Shilling 149.0585 131.6532Korean Won 1,555.7201 1,486.2422Kuwaiti Dinar 0.4162 0.3801Malaysian Ringgit 5.7351 5.2945Mexican Peso 27.5054 28.5510New Romanian Leu 5.7365 -New Zealand Dollar 1.9770 1.9194Norwegian Krone 11.8877 11.9198Pakistani Rupee 217.7165 207.4573Philippines Peso 67.4355 61.5638Polish Zloty 5.2592 4.8876Qatari Riyal 5.0299 4.4988Russian Ruble 100.9201 88.0420Saudi Arabian Riyal 5.1810 4.6347Singapore Dollar 1.8569 1.7237South African Rand 19.7254 21.4686Swedish Krone 11.8144 11.5117Swiss Franc 1.2769 1.1708Taiwan Dollar 38.4907 36.4558Thailand Baht 44.2755 38.1893Turkish Lira 12.0013 8.4697United Arab Emirates Dirham 5.0743 4.5385United States Dollar 1.3815 1.2356
Mercer UCITS Common Contractual Fund Unaudited Supplemental Information(continued)
Mercer UCITS Common Contractual Fund 109
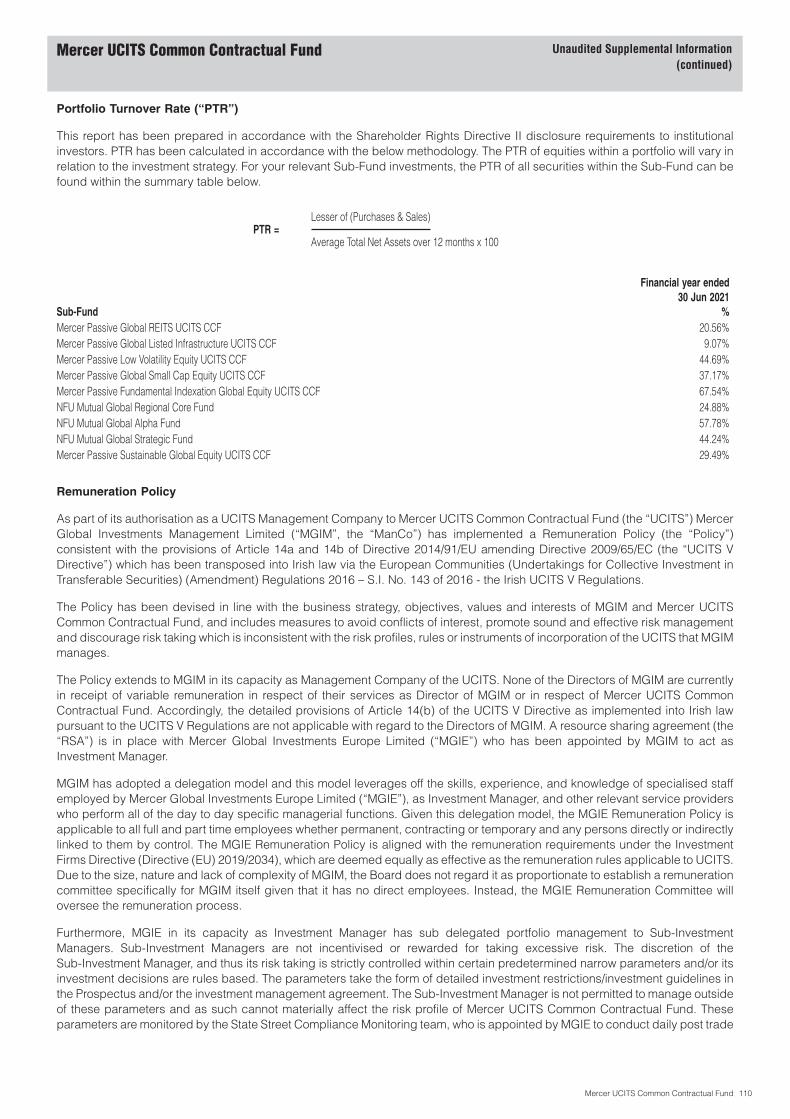
Portfolio Turnover Rate (“PTR”)
This report has been prepared in accordance with the Shareholder Rights Directive II disclosure requirements to institutionalinvestors. PTR has been calculated in accordance with the below methodology. The PTR of equities within a portfolio will vary inrelation to the investment strategy. For your relevant Sub-Fund investments, the PTR of all securities within the Sub-Fund can befound within the summary table below.
PTR =Lesser of (Purchases & Sales)
Average Total Net Assets over 12 months x 100
Sub-Fund
Financial year ended30 Jun 2021
%Mercer Passive Global REITS UCITS CCF 20.56%Mercer Passive Global Listed Infrastructure UCITS CCF 9.07%Mercer Passive Low Volatility Equity UCITS CCF 44.69%Mercer Passive Global Small Cap Equity UCITS CCF 37.17%Mercer Passive Fundamental Indexation Global Equity UCITS CCF 67.54%NFU Mutual Global Regional Core Fund 24.88%NFU Mutual Global Alpha Fund 57.78%NFU Mutual Global Strategic Fund 44.24%Mercer Passive Sustainable Global Equity UCITS CCF 29.49%
Remuneration Policy
As part of its authorisation as a UCITS Management Company to Mercer UCITS Common Contractual Fund (the “UCITS”) MercerGlobal Investments Management Limited (“MGIM”, the “ManCo”) has implemented a Remuneration Policy (the “Policy”)consistent with the provisions of Article 14a and 14b of Directive 2014/91/EU amending Directive 2009/65/EC (the “UCITS VDirective”) which has been transposed into Irish law via the European Communities (Undertakings for Collective Investment inTransferable Securities) (Amendment) Regulations 2016 – S.I. No. 143 of 2016 - the Irish UCITS V Regulations.
The Policy has been devised in line with the business strategy, objectives, values and interests of MGIM and Mercer UCITSCommon Contractual Fund, and includes measures to avoid conflicts of interest, promote sound and effective risk managementand discourage risk taking which is inconsistent with the risk profiles, rules or instruments of incorporation of the UCITS that MGIMmanages.
The Policy extends to MGIM in its capacity as Management Company of the UCITS. None of the Directors of MGIM are currentlyin receipt of variable remuneration in respect of their services as Director of MGIM or in respect of Mercer UCITS CommonContractual Fund. Accordingly, the detailed provisions of Article 14(b) of the UCITS V Directive as implemented into Irish lawpursuant to the UCITS V Regulations are not applicable with regard to the Directors of MGIM. A resource sharing agreement (the“RSA”) is in place with Mercer Global Investments Europe Limited (“MGIE”) who has been appointed by MGIM to act asInvestment Manager.
MGIM has adopted a delegation model and this model leverages off the skills, experience, and knowledge of specialised staffemployed by Mercer Global Investments Europe Limited (“MGIE”), as Investment Manager, and other relevant service providerswho perform all of the day to day specific managerial functions. Given this delegation model, the MGIE Remuneration Policy isapplicable to all full and part time employees whether permanent, contracting or temporary and any persons directly or indirectlylinked to them by control. The MGIE Remuneration Policy is aligned with the remuneration requirements under the InvestmentFirms Directive (Directive (EU) 2019/2034), which are deemed equally as effective as the remuneration rules applicable to UCITS.Due to the size, nature and lack of complexity of MGIM, the Board does not regard it as proportionate to establish a remunerationcommittee specifically for MGIM itself given that it has no direct employees. Instead, the MGIE Remuneration Committee willoversee the remuneration process.
Furthermore, MGIE in its capacity as Investment Manager has sub delegated portfolio management to Sub-InvestmentManagers. Sub-Investment Managers are not incentivised or rewarded for taking excessive risk. The discretion of theSub-Investment Manager, and thus its risk taking is strictly controlled within certain predetermined narrow parameters and/or itsinvestment decisions are rules based. The parameters take the form of detailed investment restrictions/investment guidelines inthe Prospectus and/or the investment management agreement. The Sub-Investment Manager is not permitted to manage outsideof these parameters and as such cannot materially affect the risk profile of Mercer UCITS Common Contractual Fund. Theseparameters are monitored by the State Street Compliance Monitoring team, who is appointed by MGIE to conduct daily post trade
Mercer UCITS Common Contractual Fund Unaudited Supplemental Information(continued)
Mercer UCITS Common Contractual Fund 110
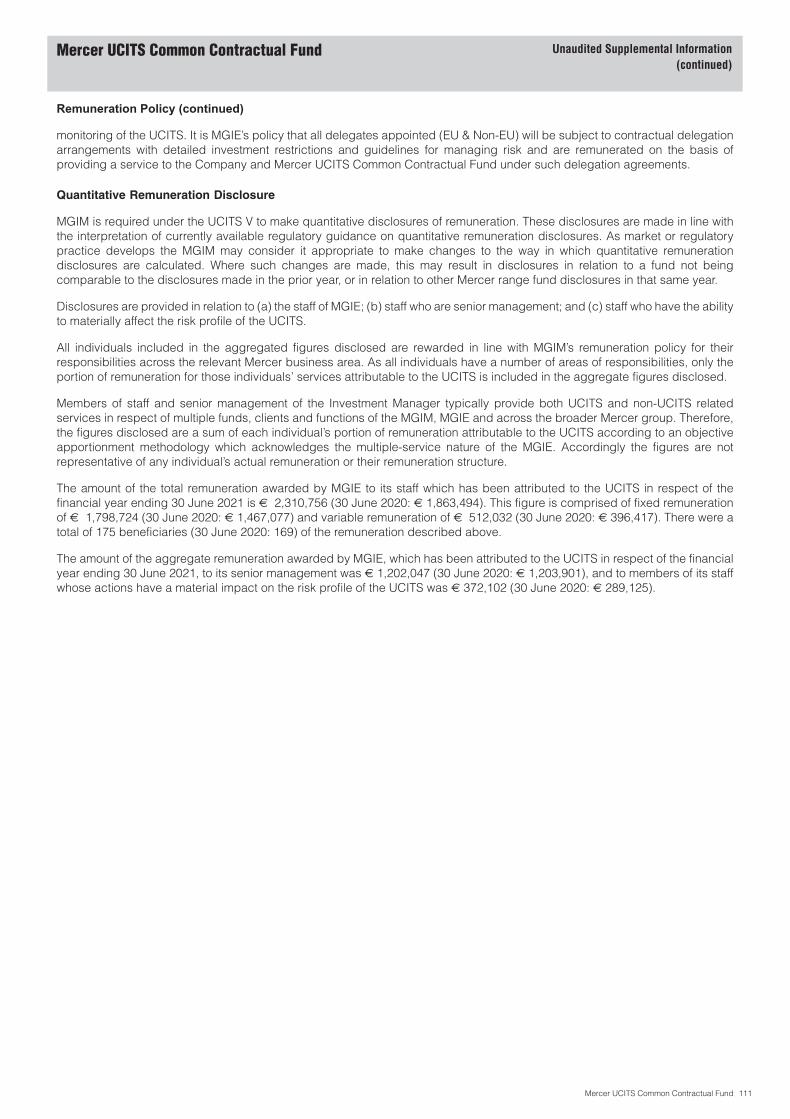
Remuneration Policy (continued)
monitoring of the UCITS. It is MGIE’s policy that all delegates appointed (EU & Non-EU) will be subject to contractual delegationarrangements with detailed investment restrictions and guidelines for managing risk and are remunerated on the basis ofproviding a service to the Company and Mercer UCITS Common Contractual Fund under such delegation agreements.
Quantitative Remuneration Disclosure
MGIM is required under the UCITS V to make quantitative disclosures of remuneration. These disclosures are made in line withthe interpretation of currently available regulatory guidance on quantitative remuneration disclosures. As market or regulatorypractice develops the MGIM may consider it appropriate to make changes to the way in which quantitative remunerationdisclosures are calculated. Where such changes are made, this may result in disclosures in relation to a fund not beingcomparable to the disclosures made in the prior year, or in relation to other Mercer range fund disclosures in that same year.
Disclosures are provided in relation to (a) the staff of MGIE; (b) staff who are senior management; and (c) staff who have the abilityto materially affect the risk profile of the UCITS.
All individuals included in the aggregated figures disclosed are rewarded in line with MGIM’s remuneration policy for theirresponsibilities across the relevant Mercer business area. As all individuals have a number of areas of responsibilities, only theportion of remuneration for those individuals’ services attributable to the UCITS is included in the aggregate figures disclosed.
Members of staff and senior management of the Investment Manager typically provide both UCITS and non-UCITS relatedservices in respect of multiple funds, clients and functions of the MGIM, MGIE and across the broader Mercer group. Therefore,the figures disclosed are a sum of each individual’s portion of remuneration attributable to the UCITS according to an objectiveapportionment methodology which acknowledges the multiple-service nature of the MGIE. Accordingly the figures are notrepresentative of any individual’s actual remuneration or their remuneration structure.
The amount of the total remuneration awarded by MGIE to its staff which has been attributed to the UCITS in respect of thefinancial year ending 30 June 2021 is € 2,310,756 (30 June 2020: € 1,863,494). This figure is comprised of fixed remunerationof € 1,798,724 (30 June 2020: € 1,467,077) and variable remuneration of € 512,032 (30 June 2020: € 396,417). There were atotal of 175 beneficiaries (30 June 2020: 169) of the remuneration described above.
The amount of the aggregate remuneration awarded by MGIE, which has been attributed to the UCITS in respect of the financialyear ending 30 June 2021, to its senior management was € 1,202,047 (30 June 2020: € 1,203,901), and to members of its staffwhose actions have a material impact on the risk profile of the UCITS was € 372,102 (30 June 2020: € 289,125).
Mercer UCITS Common Contractual Fund Unaudited Supplemental Information(continued)
Mercer UCITS Common Contractual Fund 111
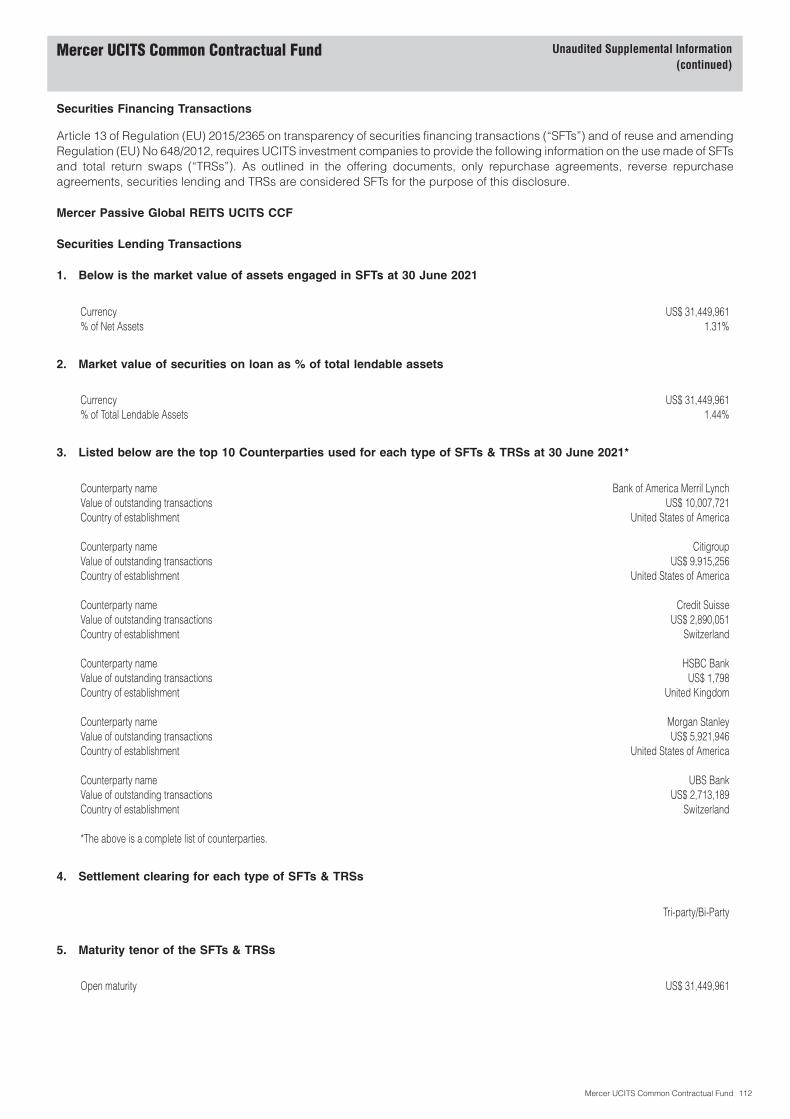
Securities Financing Transactions
Article 13 of Regulation (EU) 2015/2365 on transparency of securities financing transactions (“SFTs”) and of reuse and amendingRegulation (EU) No 648/2012, requires UCITS investment companies to provide the following information on the use made of SFTsand total return swaps (“TRSs”). As outlined in the offering documents, only repurchase agreements, reverse repurchaseagreements, securities lending and TRSs are considered SFTs for the purpose of this disclosure.
Mercer Passive Global REITS UCITS CCF
Securities Lending Transactions
1. Below is the market value of assets engaged in SFTs at 30 June 2021
Currency US$ 31,449,961% of Net Assets 1.31%
2. Market value of securities on loan as % of total lendable assets
Currency US$ 31,449,961% of Total Lendable Assets 1.44%
3. Listed below are the top 10 Counterparties used for each type of SFTs & TRSs at 30 June 2021*
Counterparty name Bank of America Merril LynchValue of outstanding transactions US$ 10,007,721Country of establishment United States of America
Counterparty name CitigroupValue of outstanding transactions US$ 9,915,256Country of establishment United States of America
Counterparty name Credit SuisseValue of outstanding transactions US$ 2,890,051Country of establishment Switzerland
Counterparty name HSBC BankValue of outstanding transactions US$ 1,798Country of establishment United Kingdom
Counterparty name Morgan StanleyValue of outstanding transactions US$ 5,921,946Country of establishment United States of America
Counterparty name UBS BankValue of outstanding transactions US$ 2,713,189Country of establishment Switzerland
*The above is a complete list of counterparties.
4. Settlement clearing for each type of SFTs & TRSs
Tri-party/Bi-Party
5. Maturity tenor of the SFTs & TRSs
Open maturity US$ 31,449,961
Mercer UCITS Common Contractual Fund Unaudited Supplemental Information(continued)
Mercer UCITS Common Contractual Fund 112

Securities Financing Transactions (continued)
Mercer Passive Global REITS UCITS CCF (continued)
Securities Lending Transactions (continued)
6. Type and Quality of Collateral
Collateral Type BondCollateral Quality/Rating:Cash -Bonds A/AA/AAAEquities -Other -
7. Currency of Collateral
GB£/US$
8. Maturity tenor of the Collateral received
Less than 1 day -1 day to 1 week US$ 1,4441 week to 1 month US$ 4521 to 3 months US$ 511,2033 months to 1 year US$ 911,545Greater than 1 year US$ 31,690,428Open Maturity -
9. Ten largest Collateral issuers*
Collateral Issuer Canada (Government of)Volume of collateral received US$ 1,629
Collateral Issuer Federal Republic of Germany (Government of)Volume of collateral received US$ 2,739,527
Collateral Issuer French Republic (Government of)Volume of collateral received US$ 6,418,406
Collateral Issuer Japan (Government of)Volume of collateral received US$ 13,981,972
Collateral Issuer Kingdom of Belgium (Government of)Volume of collateral received US$ 4,120,153
Collateral Issuer Kingdom of Netherlands (Government of)Volume of collateral received US$ 833,057
Collateral Issuer Sweden (Government of)Volume of collateral received US$ 34,222
Collateral Issuer United Kingdom (Government of)Volume of collateral received US$ 2,582,089
Collateral Issuer United States of America (Government of)Volume of collateral received US$ 2,404,017
*The above is a complete list of collateral issuers.
Mercer UCITS Common Contractual Fund Unaudited Supplemental Information(continued)
Mercer UCITS Common Contractual Fund 113

Securities Financing Transactions (continued)
Mercer Passive Global REITS UCITS CCF (continued)
Securities Lending Transactions (continued)
10. Re-investment of Collateral received
Stock Collateral re-invested n/aPermitted re-investment of Stock Collateral n/aReturns on Cash Collateral re-invested n/a
11. Safe-keeping of Collateral received
Detailed in the table below are the number and names of the depositaries who are responsible for the safe-keeping of thecollateral received in relation to each of the SFTs/TRSs held on the Sub-Fund.
Number of Depositaries 1
Depositary State Street Custodial Services (Ireland) LimitedStock Collateral US$ 33,115,072Cash Collateral n/a
12. Returns and costs of the SFTs & TRSs
Sub-FundIncome received US$ 794,370Gains/Losses -Costs incurred US$ 79,437Net returns US$ 714,933% of overall SFT Return 90.00%
Third parties to the agreementIncome received US$ 79,437Gains/Losses -Costs incurred* -Net returns US$ 79,437% of overall SFT Return 10.00%
*Transaction costs relating to the securities lending transactions in relation to Third parties to the agreement are embedded in the income received, therefore theyare not separately identifiable for disclosure within the financial statements.
Mercer UCITS Common Contractual Fund Unaudited Supplemental Information(continued)
Mercer UCITS Common Contractual Fund 114

Securities Financing Transactions (continued)
Mercer Passive Global Listed Infrastructure UCITS CCF
Securities Lending Transactions
1. Below is the market value of assets engaged in SFTs at 30 June 2021
Currency US$ 42,190,604% of Net Assets 2.20%
2. Market value of securities on loan as % of total lendable assets
Currency US$ 42,190,604% of Total Lendable Assets 2.64%
3. Listed below are the top 10 Counterparties used for each type of SFTs & TRSs at 30 June 2021*
Counterparty name Bank of America Merril LynchValue of outstanding transactions US$ 5,977,879Country of establishment United States of America
Counterparty name Credit SuisseValue of outstanding transactions US$ 21,029,616Country of establishment Switzerland
Counterparty name Morgan StanleyValue of outstanding transactions US$ 9,885,576Country of establishment United States of America
Counterparty name UBS BankValue of outstanding transactions US$ 5,297,533Country of establishment Switzerland
*The above is a complete list of counterparties.
4. Settlement clearing for each type of SFTs & TRSs
Tri-party/Bi-Party
5. Maturity tenor of the SFTs & TRSs
Open maturity US$ 42,190,604
6. Type and Quality of Collateral
Collateral Type BondCollateral Quality/Rating:Cash -Bonds A/AA/AAAEquities -Other -
7. Currency of Collateral
US$
Mercer UCITS Common Contractual Fund Unaudited Supplemental Information(continued)
Mercer UCITS Common Contractual Fund 115

Securities Financing Transactions (continued)
Mercer Passive Global Listed Infrastructure UCITS CCF (continued)
Securities Lending Transactions (continued)
8. Maturity tenor of the Collateral received
Less than 1 day -1 day to 1 week US$ 559,3901 week to 1 month US$ 85,4181 to 3 months US$ 697,5213 months to 1 year US$ 2,424,166Greater than 1 year US$ 40,576,406Open Maturity -
9. Ten largest Collateral issuers*
Collateral Issuer Canada (Government of)Volume of collateral received US$ 2,070
Collateral Issuer Federal Republic of Germany (Government of)Volume of collateral received US$ 6,478,975
Collateral Issuer French Republic (Government of)Volume of collateral received US$ 7,740,869
Collateral Issuer Japan (Government of)Volume of collateral received US$ 7,919,856
Collateral Issuer Kingdom of Belgium (Government of)Volume of collateral received US$ 8,398,821
Collateral Issuer Kingdom of Netherlands (Government of)Volume of collateral received US$ 4,517,524
Collateral Issuer United Kingdom (Government of)Volume of collateral received US$ 6,214,934
Collateral Issuer United States of America (Government of)Volume of collateral received US$ 3,069,852
*The above is a complete list of collateral issuers.
10. Re-investment of Collateral received
Stock Collateral re-invested n/aPermitted re-investment of Stock Collateral n/aReturns on Cash Collateral re-invested n/a
11. Safe-keeping of Collateral received
Detailed in the table below are the number and names of the depositaries who are responsible for the safe-keeping of thecollateral received in relation to each of the SFTs/TRSs held on the Sub-Fund.
Number of Depositaries 1
Depositary State Street Custodial Services (Ireland) LimitedStock Collateral US$ 44,342,901Cash Collateral n/a
Mercer UCITS Common Contractual Fund Unaudited Supplemental Information(continued)
Mercer UCITS Common Contractual Fund 116
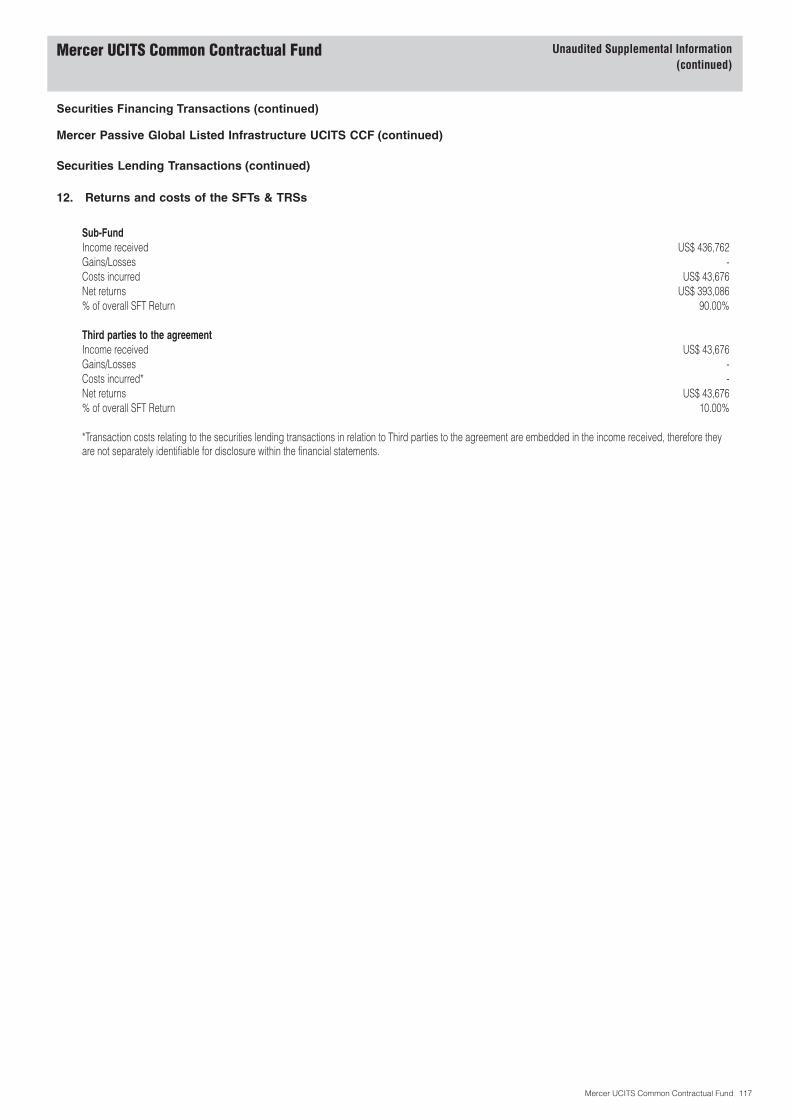
Securities Financing Transactions (continued)
Mercer Passive Global Listed Infrastructure UCITS CCF (continued)
Securities Lending Transactions (continued)
12. Returns and costs of the SFTs & TRSs
Sub-FundIncome received US$ 436,762Gains/Losses -Costs incurred US$ 43,676Net returns US$ 393,086% of overall SFT Return 90.00%
Third parties to the agreementIncome received US$ 43,676Gains/Losses -Costs incurred* -Net returns US$ 43,676% of overall SFT Return 10.00%
*Transaction costs relating to the securities lending transactions in relation to Third parties to the agreement are embedded in the income received, therefore theyare not separately identifiable for disclosure within the financial statements.
Mercer UCITS Common Contractual Fund Unaudited Supplemental Information(continued)
Mercer UCITS Common Contractual Fund 117
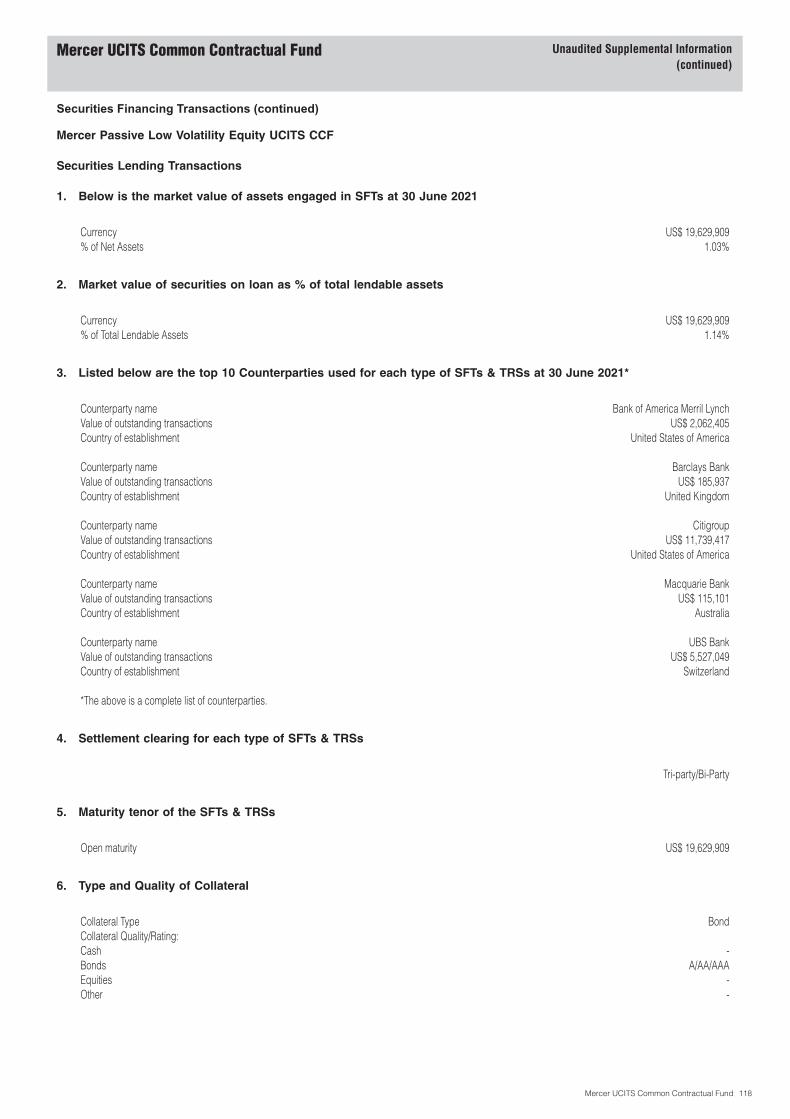
Securities Financing Transactions (continued)
Mercer Passive Low Volatility Equity UCITS CCF
Securities Lending Transactions
1. Below is the market value of assets engaged in SFTs at 30 June 2021
Currency US$ 19,629,909% of Net Assets 1.03%
2. Market value of securities on loan as % of total lendable assets
Currency US$ 19,629,909% of Total Lendable Assets 1.14%
3. Listed below are the top 10 Counterparties used for each type of SFTs & TRSs at 30 June 2021*
Counterparty name Bank of America Merril LynchValue of outstanding transactions US$ 2,062,405Country of establishment United States of America
Counterparty name Barclays BankValue of outstanding transactions US$ 185,937Country of establishment United Kingdom
Counterparty name CitigroupValue of outstanding transactions US$ 11,739,417Country of establishment United States of America
Counterparty name Macquarie BankValue of outstanding transactions US$ 115,101Country of establishment Australia
Counterparty name UBS BankValue of outstanding transactions US$ 5,527,049Country of establishment Switzerland
*The above is a complete list of counterparties.
4. Settlement clearing for each type of SFTs & TRSs
Tri-party/Bi-Party
5. Maturity tenor of the SFTs & TRSs
Open maturity US$ 19,629,909
6. Type and Quality of Collateral
Collateral Type BondCollateral Quality/Rating:Cash -Bonds A/AA/AAAEquities -Other -
Mercer UCITS Common Contractual Fund Unaudited Supplemental Information(continued)
Mercer UCITS Common Contractual Fund 118
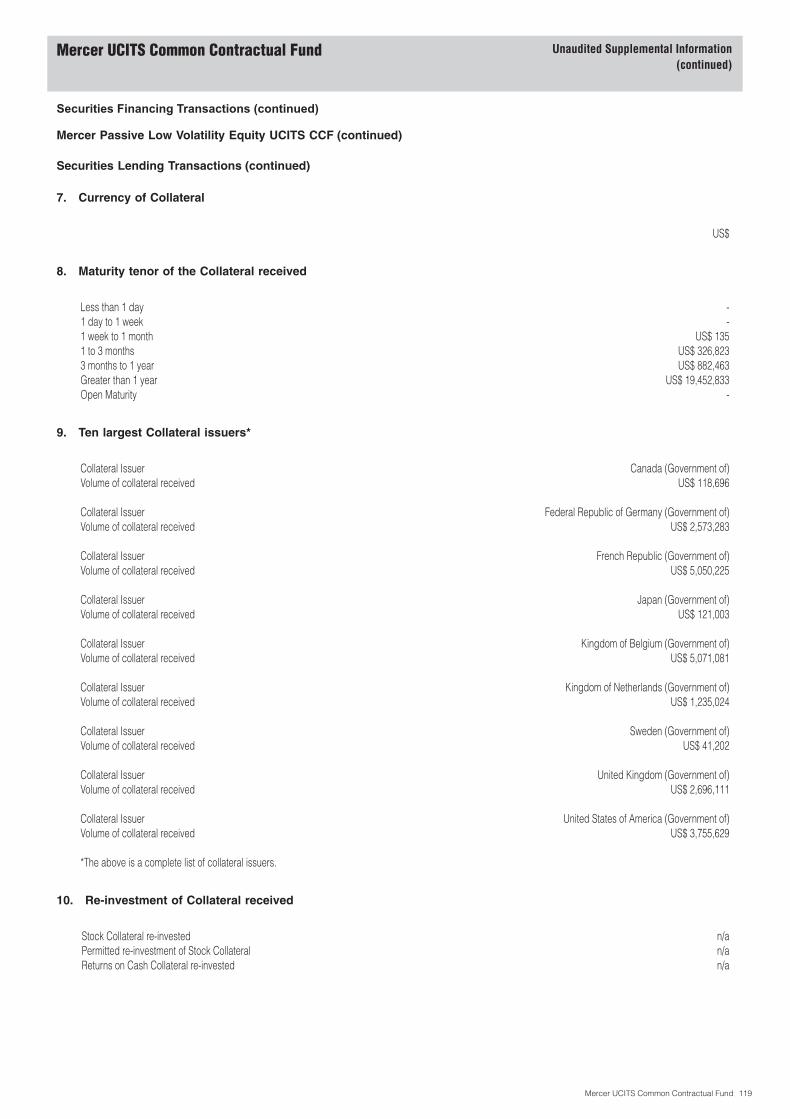
Securities Financing Transactions (continued)
Mercer Passive Low Volatility Equity UCITS CCF (continued)
Securities Lending Transactions (continued)
7. Currency of Collateral
US$
8. Maturity tenor of the Collateral received
Less than 1 day -1 day to 1 week -1 week to 1 month US$ 1351 to 3 months US$ 326,8233 months to 1 year US$ 882,463Greater than 1 year US$ 19,452,833Open Maturity -
9. Ten largest Collateral issuers*
Collateral Issuer Canada (Government of)Volume of collateral received US$ 118,696
Collateral Issuer Federal Republic of Germany (Government of)Volume of collateral received US$ 2,573,283
Collateral Issuer French Republic (Government of)Volume of collateral received US$ 5,050,225
Collateral Issuer Japan (Government of)Volume of collateral received US$ 121,003
Collateral Issuer Kingdom of Belgium (Government of)Volume of collateral received US$ 5,071,081
Collateral Issuer Kingdom of Netherlands (Government of)Volume of collateral received US$ 1,235,024
Collateral Issuer Sweden (Government of)Volume of collateral received US$ 41,202
Collateral Issuer United Kingdom (Government of)Volume of collateral received US$ 2,696,111
Collateral Issuer United States of America (Government of)Volume of collateral received US$ 3,755,629
*The above is a complete list of collateral issuers.
10. Re-investment of Collateral received
Stock Collateral re-invested n/aPermitted re-investment of Stock Collateral n/aReturns on Cash Collateral re-invested n/a
Mercer UCITS Common Contractual Fund Unaudited Supplemental Information(continued)
Mercer UCITS Common Contractual Fund 119
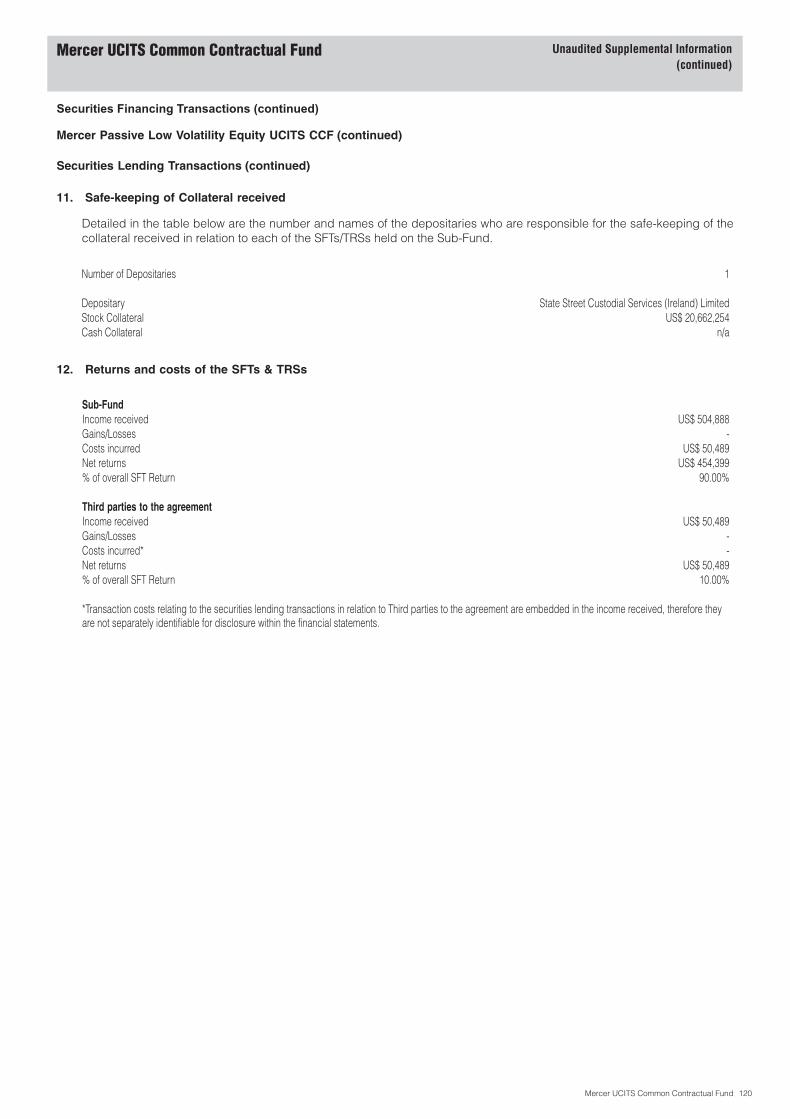
Securities Financing Transactions (continued)
Mercer Passive Low Volatility Equity UCITS CCF (continued)
Securities Lending Transactions (continued)
11. Safe-keeping of Collateral received
Detailed in the table below are the number and names of the depositaries who are responsible for the safe-keeping of thecollateral received in relation to each of the SFTs/TRSs held on the Sub-Fund.
Number of Depositaries 1
Depositary State Street Custodial Services (Ireland) LimitedStock Collateral US$ 20,662,254Cash Collateral n/a
12. Returns and costs of the SFTs & TRSs
Sub-FundIncome received US$ 504,888Gains/Losses -Costs incurred US$ 50,489Net returns US$ 454,399% of overall SFT Return 90.00%
Third parties to the agreementIncome received US$ 50,489Gains/Losses -Costs incurred* -Net returns US$ 50,489% of overall SFT Return 10.00%
*Transaction costs relating to the securities lending transactions in relation to Third parties to the agreement are embedded in the income received, therefore theyare not separately identifiable for disclosure within the financial statements.
Mercer UCITS Common Contractual Fund Unaudited Supplemental Information(continued)
Mercer UCITS Common Contractual Fund 120
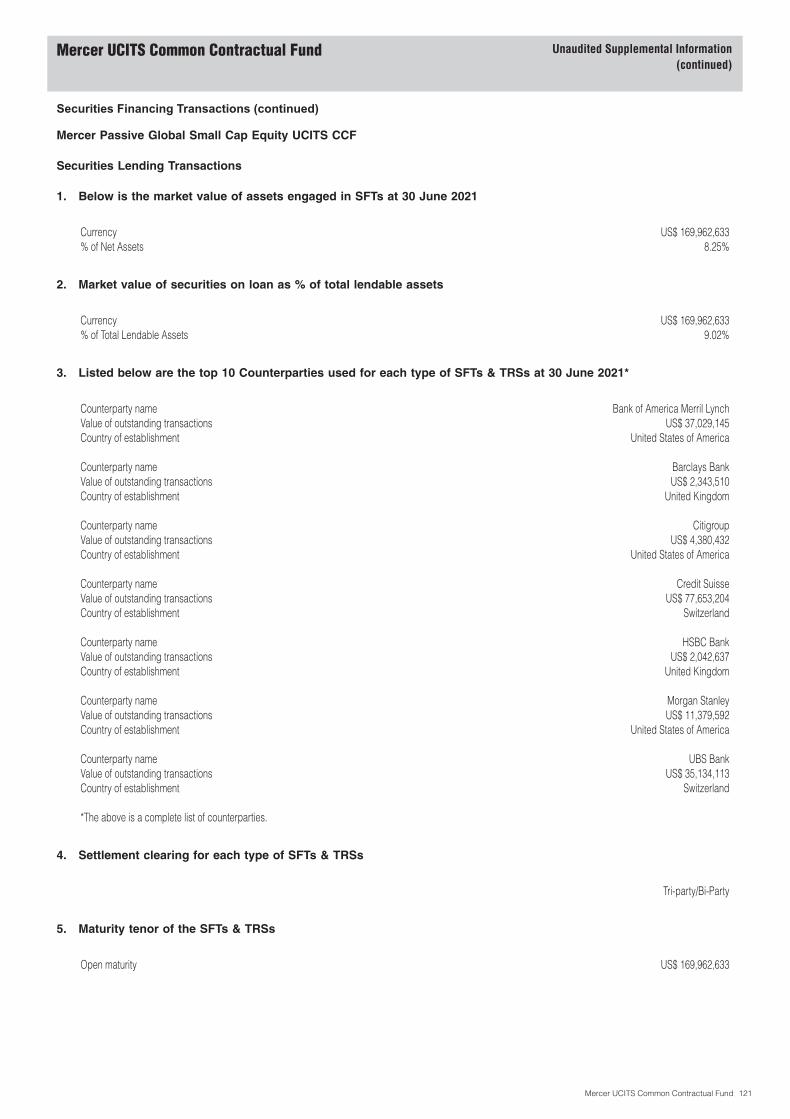
Securities Financing Transactions (continued)
Mercer Passive Global Small Cap Equity UCITS CCF
Securities Lending Transactions
1. Below is the market value of assets engaged in SFTs at 30 June 2021
Currency US$ 169,962,633% of Net Assets 8.25%
2. Market value of securities on loan as % of total lendable assets
Currency US$ 169,962,633% of Total Lendable Assets 9.02%
3. Listed below are the top 10 Counterparties used for each type of SFTs & TRSs at 30 June 2021*
Counterparty name Bank of America Merril LynchValue of outstanding transactions US$ 37,029,145Country of establishment United States of America
Counterparty name Barclays BankValue of outstanding transactions US$ 2,343,510Country of establishment United Kingdom
Counterparty name CitigroupValue of outstanding transactions US$ 4,380,432Country of establishment United States of America
Counterparty name Credit SuisseValue of outstanding transactions US$ 77,653,204Country of establishment Switzerland
Counterparty name HSBC BankValue of outstanding transactions US$ 2,042,637Country of establishment United Kingdom
Counterparty name Morgan StanleyValue of outstanding transactions US$ 11,379,592Country of establishment United States of America
Counterparty name UBS BankValue of outstanding transactions US$ 35,134,113Country of establishment Switzerland
*The above is a complete list of counterparties.
4. Settlement clearing for each type of SFTs & TRSs
Tri-party/Bi-Party
5. Maturity tenor of the SFTs & TRSs
Open maturity US$ 169,962,633
Mercer UCITS Common Contractual Fund Unaudited Supplemental Information(continued)
Mercer UCITS Common Contractual Fund 121
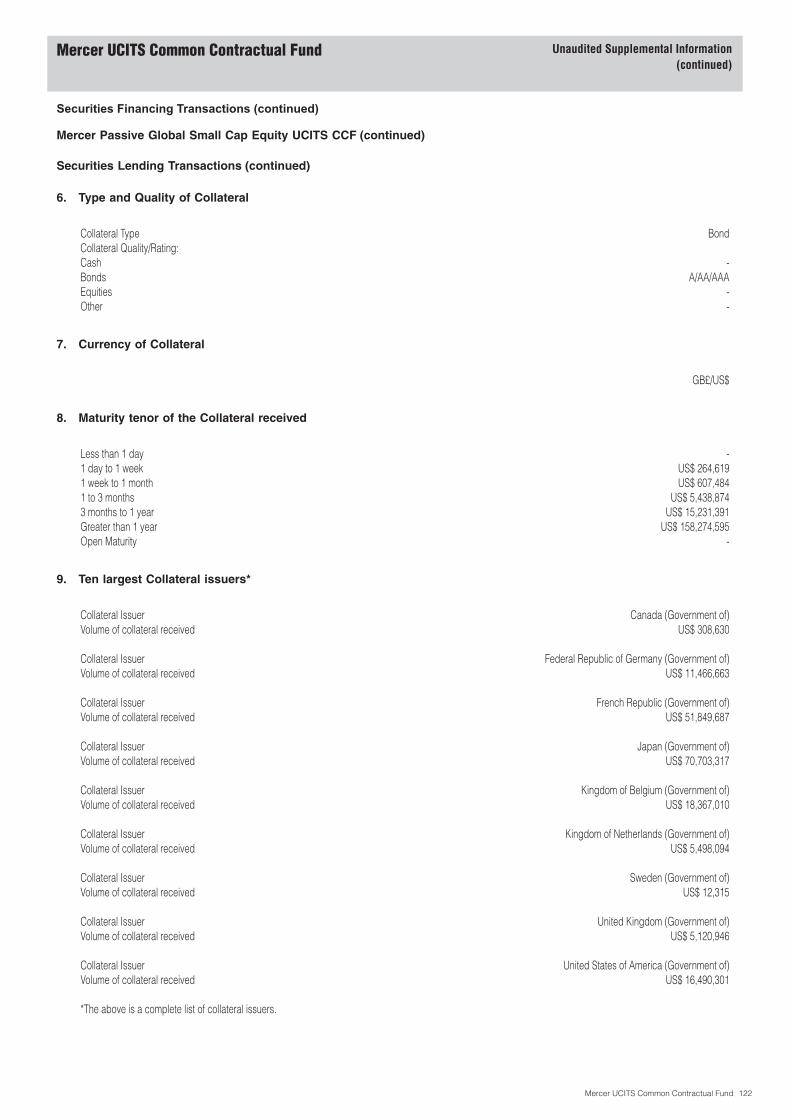
Securities Financing Transactions (continued)
Mercer Passive Global Small Cap Equity UCITS CCF (continued)
Securities Lending Transactions (continued)
6. Type and Quality of Collateral
Collateral Type BondCollateral Quality/Rating:Cash -Bonds A/AA/AAAEquities -Other -
7. Currency of Collateral
GB£/US$
8. Maturity tenor of the Collateral received
Less than 1 day -1 day to 1 week US$ 264,6191 week to 1 month US$ 607,4841 to 3 months US$ 5,438,8743 months to 1 year US$ 15,231,391Greater than 1 year US$ 158,274,595Open Maturity -
9. Ten largest Collateral issuers*
Collateral Issuer Canada (Government of)Volume of collateral received US$ 308,630
Collateral Issuer Federal Republic of Germany (Government of)Volume of collateral received US$ 11,466,663
Collateral Issuer French Republic (Government of)Volume of collateral received US$ 51,849,687
Collateral Issuer Japan (Government of)Volume of collateral received US$ 70,703,317
Collateral Issuer Kingdom of Belgium (Government of)Volume of collateral received US$ 18,367,010
Collateral Issuer Kingdom of Netherlands (Government of)Volume of collateral received US$ 5,498,094
Collateral Issuer Sweden (Government of)Volume of collateral received US$ 12,315
Collateral Issuer United Kingdom (Government of)Volume of collateral received US$ 5,120,946
Collateral Issuer United States of America (Government of)Volume of collateral received US$ 16,490,301
*The above is a complete list of collateral issuers.
Mercer UCITS Common Contractual Fund Unaudited Supplemental Information(continued)
Mercer UCITS Common Contractual Fund 122

Securities Financing Transactions (continued)
Mercer Passive Global Small Cap Equity UCITS CCF (continued)
Securities Lending Transactions (continued)
10. Re-investment of Collateral received
Stock Collateral re-invested n/aPermitted re-investment of Stock Collateral n/aReturns on Cash Collateral re-invested n/a
11. Safe-keeping of Collateral received
Detailed in the table below are the number and names of the depositaries who are responsible for the safe-keeping of thecollateral received in relation to each of the SFTs/TRSs held on the Sub-Fund.
Number of Depositaries 1
Depositary State Street Custodial Services (Ireland) LimitedStock Collateral US$ 179,816,963Cash Collateral n/a
12. Returns and costs of the SFTs & TRSs
Sub-FundIncome received US$ 1,700,680Gains/Losses -Costs incurred US$ 170,068Net returns US$ 1,530,612% of overall SFT Return 90.00%
Third parties to the agreementIncome received US$ 170,068Gains/Losses -Costs incurred* -Net returns US$ 170,068% of overall SFT Return 10.00%
*Transaction costs relating to the securities lending transactions in relation to Third parties to the agreement are embedded in the income received, therefore theyare not separately identifiable for disclosure within the financial statements.
Mercer UCITS Common Contractual Fund Unaudited Supplemental Information(continued)
Mercer UCITS Common Contractual Fund 123
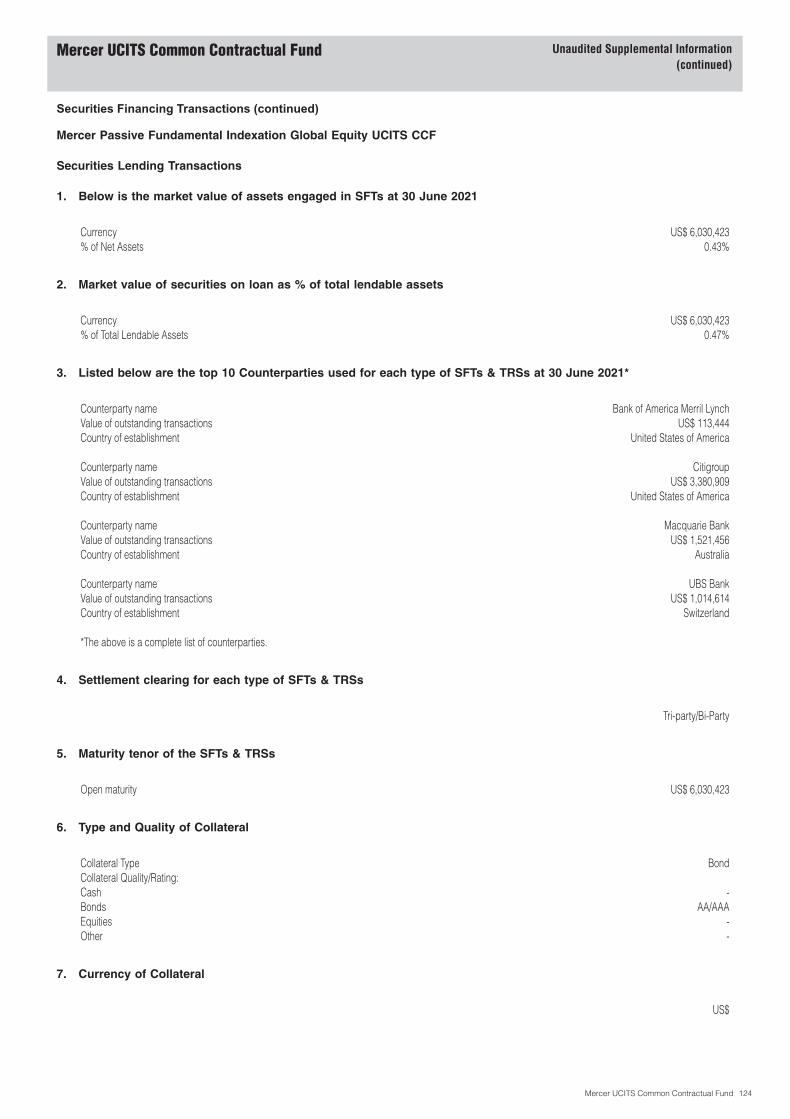
Securities Financing Transactions (continued)
Mercer Passive Fundamental Indexation Global Equity UCITS CCF
Securities Lending Transactions
1. Below is the market value of assets engaged in SFTs at 30 June 2021
Currency US$ 6,030,423% of Net Assets 0.43%
2. Market value of securities on loan as % of total lendable assets
Currency US$ 6,030,423% of Total Lendable Assets 0.47%
3. Listed below are the top 10 Counterparties used for each type of SFTs & TRSs at 30 June 2021*
Counterparty name Bank of America Merril LynchValue of outstanding transactions US$ 113,444Country of establishment United States of America
Counterparty name CitigroupValue of outstanding transactions US$ 3,380,909Country of establishment United States of America
Counterparty name Macquarie BankValue of outstanding transactions US$ 1,521,456Country of establishment Australia
Counterparty name UBS BankValue of outstanding transactions US$ 1,014,614Country of establishment Switzerland
*The above is a complete list of counterparties.
4. Settlement clearing for each type of SFTs & TRSs
Tri-party/Bi-Party
5. Maturity tenor of the SFTs & TRSs
Open maturity US$ 6,030,423
6. Type and Quality of Collateral
Collateral Type BondCollateral Quality/Rating:Cash -Bonds AA/AAAEquities -Other -
7. Currency of Collateral
US$
Mercer UCITS Common Contractual Fund Unaudited Supplemental Information(continued)
Mercer UCITS Common Contractual Fund 124
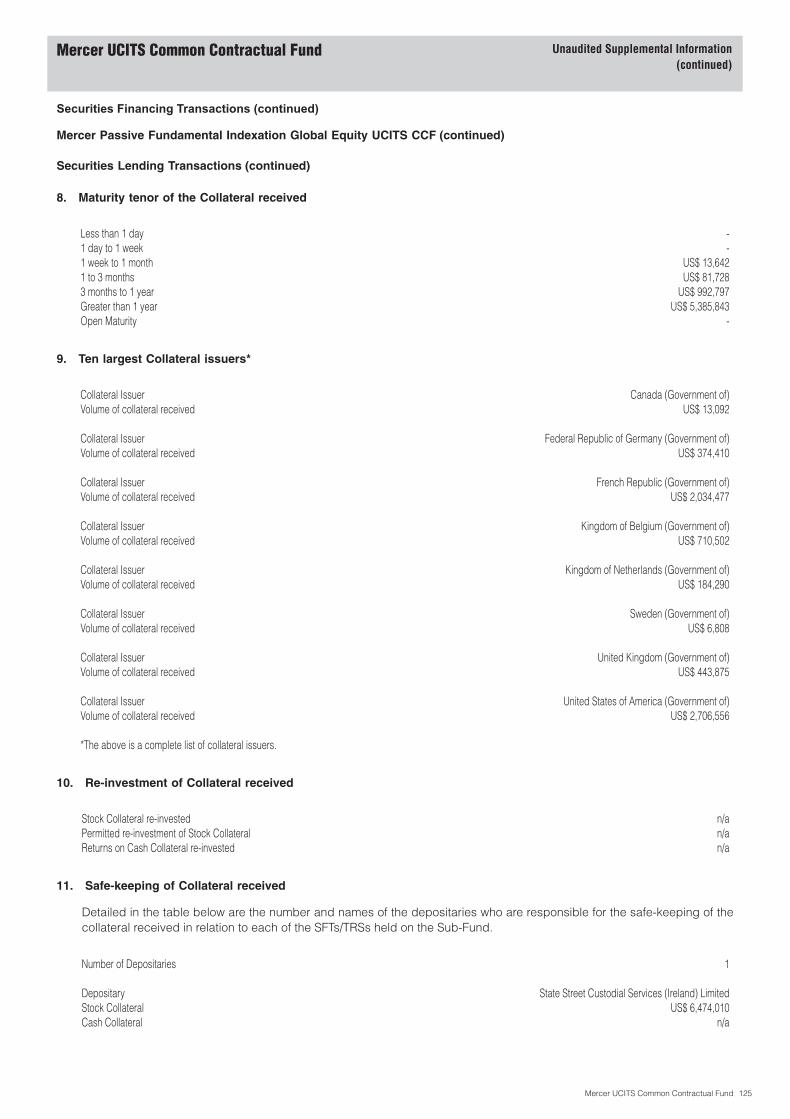
Securities Financing Transactions (continued)
Mercer Passive Fundamental Indexation Global Equity UCITS CCF (continued)
Securities Lending Transactions (continued)
8. Maturity tenor of the Collateral received
Less than 1 day -1 day to 1 week -1 week to 1 month US$ 13,6421 to 3 months US$ 81,7283 months to 1 year US$ 992,797Greater than 1 year US$ 5,385,843Open Maturity -
9. Ten largest Collateral issuers*
Collateral Issuer Canada (Government of)Volume of collateral received US$ 13,092
Collateral Issuer Federal Republic of Germany (Government of)Volume of collateral received US$ 374,410
Collateral Issuer French Republic (Government of)Volume of collateral received US$ 2,034,477
Collateral Issuer Kingdom of Belgium (Government of)Volume of collateral received US$ 710,502
Collateral Issuer Kingdom of Netherlands (Government of)Volume of collateral received US$ 184,290
Collateral Issuer Sweden (Government of)Volume of collateral received US$ 6,808
Collateral Issuer United Kingdom (Government of)Volume of collateral received US$ 443,875
Collateral Issuer United States of America (Government of)Volume of collateral received US$ 2,706,556
*The above is a complete list of collateral issuers.
10. Re-investment of Collateral received
Stock Collateral re-invested n/aPermitted re-investment of Stock Collateral n/aReturns on Cash Collateral re-invested n/a
11. Safe-keeping of Collateral received
Detailed in the table below are the number and names of the depositaries who are responsible for the safe-keeping of thecollateral received in relation to each of the SFTs/TRSs held on the Sub-Fund.
Number of Depositaries 1
Depositary State Street Custodial Services (Ireland) LimitedStock Collateral US$ 6,474,010Cash Collateral n/a
Mercer UCITS Common Contractual Fund Unaudited Supplemental Information(continued)
Mercer UCITS Common Contractual Fund 125

Securities Financing Transactions (continued)
Mercer Passive Fundamental Indexation Global Equity UCITS CCF (continued)
Securities Lending Transactions (continued)
12. Returns and costs of the SFTs & TRSs
Sub-FundIncome received US$ 283,665Gains/Losses -Costs incurred US$ 28,367Net returns US$ 255,298% of overall SFT Return 90.00%
Third parties to the agreementIncome received US$ 28,367Gains/Losses -Costs incurred* -Net returns US$ 28,367% of overall SFT Return 10.00%
*Transaction costs relating to the securities lending transactions in relation to Third parties to the agreement are embedded in the income received, therefore theyare not separately identifiable for disclosure within the financial statements.
Mercer UCITS Common Contractual Fund Unaudited Supplemental Information(continued)
Mercer UCITS Common Contractual Fund 126
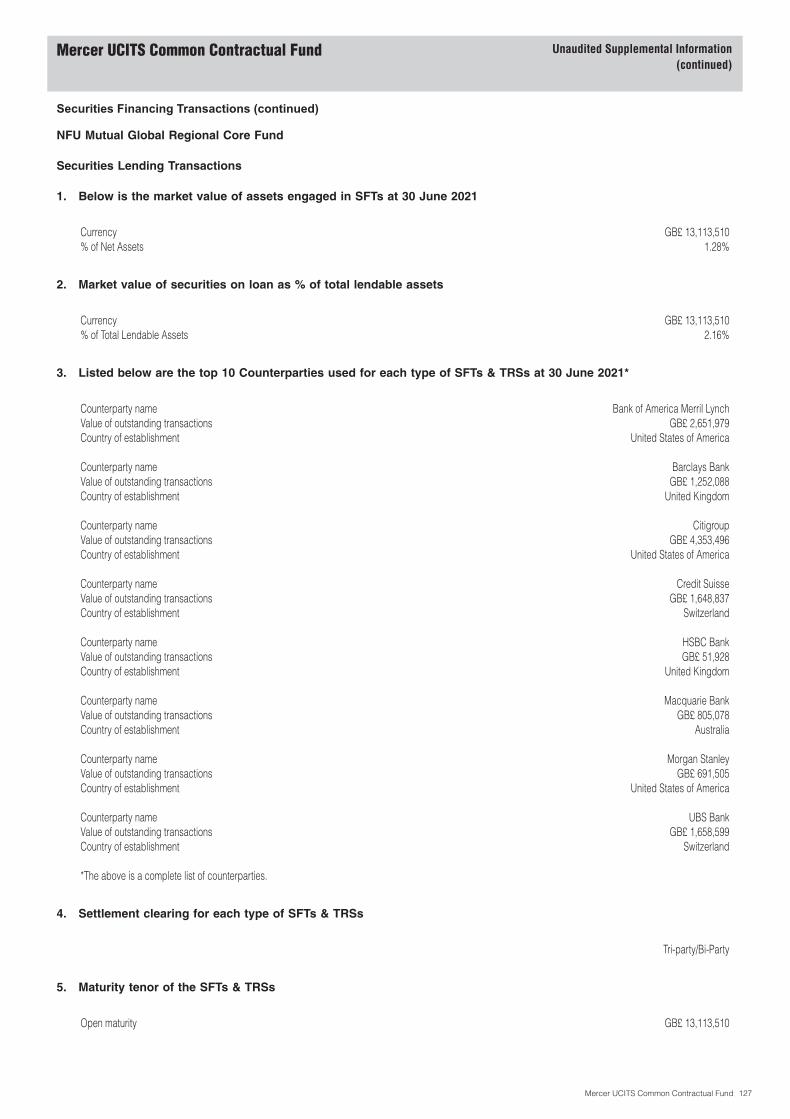
Securities Financing Transactions (continued)
NFU Mutual Global Regional Core Fund
Securities Lending Transactions
1. Below is the market value of assets engaged in SFTs at 30 June 2021
Currency GB£ 13,113,510% of Net Assets 1.28%
2. Market value of securities on loan as % of total lendable assets
Currency GB£ 13,113,510% of Total Lendable Assets 2.16%
3. Listed below are the top 10 Counterparties used for each type of SFTs & TRSs at 30 June 2021*
Counterparty name Bank of America Merril LynchValue of outstanding transactions GB£ 2,651,979Country of establishment United States of America
Counterparty name Barclays BankValue of outstanding transactions GB£ 1,252,088Country of establishment United Kingdom
Counterparty name CitigroupValue of outstanding transactions GB£ 4,353,496Country of establishment United States of America
Counterparty name Credit SuisseValue of outstanding transactions GB£ 1,648,837Country of establishment Switzerland
Counterparty name HSBC BankValue of outstanding transactions GB£ 51,928Country of establishment United Kingdom
Counterparty name Macquarie BankValue of outstanding transactions GB£ 805,078Country of establishment Australia
Counterparty name Morgan StanleyValue of outstanding transactions GB£ 691,505Country of establishment United States of America
Counterparty name UBS BankValue of outstanding transactions GB£ 1,658,599Country of establishment Switzerland
*The above is a complete list of counterparties.
4. Settlement clearing for each type of SFTs & TRSs
Tri-party/Bi-Party
5. Maturity tenor of the SFTs & TRSs
Open maturity GB£ 13,113,510
Mercer UCITS Common Contractual Fund Unaudited Supplemental Information(continued)
Mercer UCITS Common Contractual Fund 127

Securities Financing Transactions (continued)
NFU Mutual Global Regional Core Fund (continued)
Securities Lending Transactions (continued)
6. Type and Quality of Collateral
Collateral Type BondCollateral Quality/Rating:Cash -Bonds A/AA/AAAEquities -Other -
7. Currency of Collateral
US$
8. Maturity tenor of the Collateral received
Less than 1 day -1 day to 1 week -1 week to 1 month GB£ 3,3131 to 3 months GB£ 388,2183 months to 1 year GB£ 812,068Greater than 1 year GB£ 12,675,852Open Maturity -
9. Ten largest Collateral issuers*
Collateral Issuer Canada (Government of)Volume of collateral received GB£ 33,817
Collateral Issuer Federal Republic of Germany (Government of)Volume of collateral received GB£ 1,252,767
Collateral Issuer French Republic (Government of)Volume of collateral received GB£ 2,657,111
Collateral Issuer Japan (Government of)Volume of collateral received GB£ 2,559,903
Collateral Issuer Kingdom of Belgium (Government of)Volume of collateral received GB£ 1,687,513
Collateral Issuer Kingdom of Netherlands (Government of)Volume of collateral received GB£ 453,604
Collateral Issuer Sweden (Government of)Volume of collateral received GB£ 13,299
Collateral Issuer United Kingdom (Government of)Volume of collateral received GB£ 901,111
Collateral Issuer United States of America (Government of)Volume of collateral received GB£ 4,320,326
*The above is a complete list of collateral issuers.
Mercer UCITS Common Contractual Fund Unaudited Supplemental Information(continued)
Mercer UCITS Common Contractual Fund 128
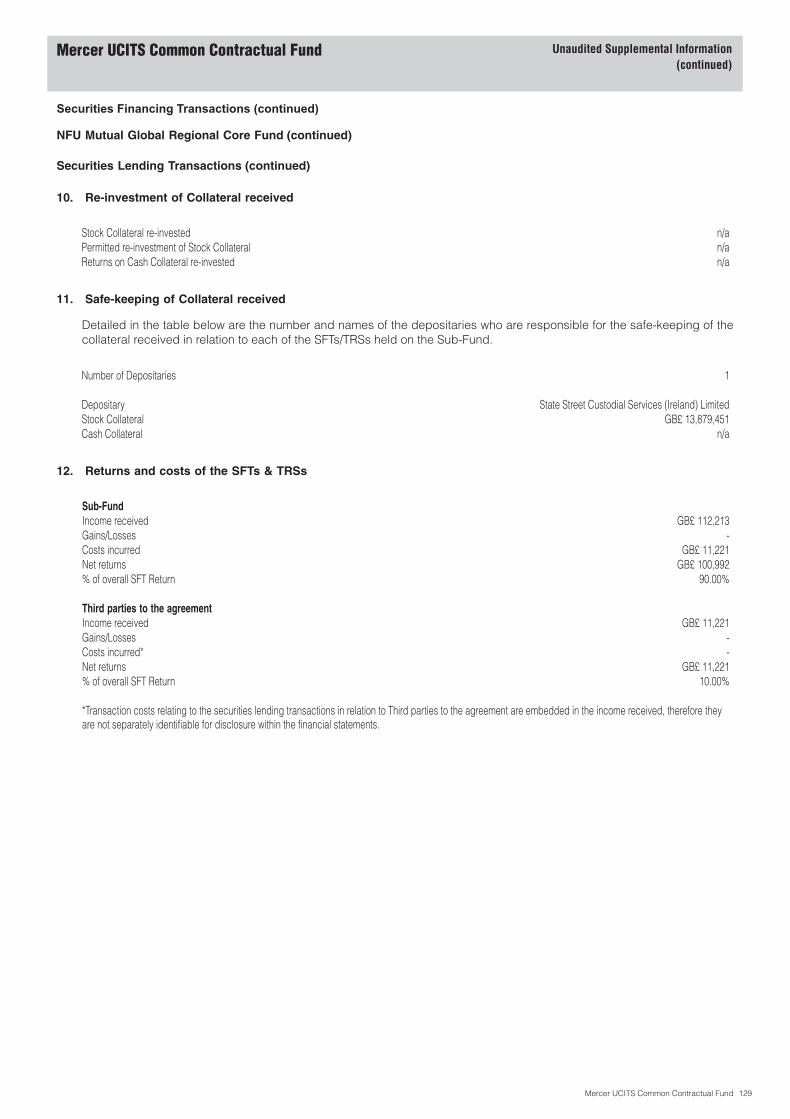
Securities Financing Transactions (continued)
NFU Mutual Global Regional Core Fund (continued)
Securities Lending Transactions (continued)
10. Re-investment of Collateral received
Stock Collateral re-invested n/aPermitted re-investment of Stock Collateral n/aReturns on Cash Collateral re-invested n/a
11. Safe-keeping of Collateral received
Detailed in the table below are the number and names of the depositaries who are responsible for the safe-keeping of thecollateral received in relation to each of the SFTs/TRSs held on the Sub-Fund.
Number of Depositaries 1
Depositary State Street Custodial Services (Ireland) LimitedStock Collateral GB£ 13,879,451Cash Collateral n/a
12. Returns and costs of the SFTs & TRSs
Sub-FundIncome received GB£ 112,213Gains/Losses -Costs incurred GB£ 11,221Net returns GB£ 100,992% of overall SFT Return 90.00%
Third parties to the agreementIncome received GB£ 11,221Gains/Losses -Costs incurred* -Net returns GB£ 11,221% of overall SFT Return 10.00%
*Transaction costs relating to the securities lending transactions in relation to Third parties to the agreement are embedded in the income received, therefore theyare not separately identifiable for disclosure within the financial statements.
Mercer UCITS Common Contractual Fund Unaudited Supplemental Information(continued)
Mercer UCITS Common Contractual Fund 129

Securities Financing Transactions (continued)
NFU Mutual Global Alpha Fund
Securities Lending Transactions
1. Below is the market value of assets engaged in SFTs at 30 June 2021
Currency GB£ 14,449,505% of Net Assets 1.18%
2. Market value of securities on loan as % of total lendable assets
Currency GB£ 14,449,505% of Total Lendable Assets 1.45%
3. Listed below are the top 10 Counterparties used for each type of SFTs & TRSs at 30 June 2021*
Counterparty name Bank of America Merril LynchValue of outstanding transactions GB£ 6,778,896Country of establishment United States of America
Counterparty name CitigroupValue of outstanding transactions GB£ 1,828,341Country of establishment United States of America
Counterparty name Credit SuisseValue of outstanding transactions GB£ 1,492,437Country of establishment Switzerland
Counterparty name HSBC BankValue of outstanding transactions GB£ 54,635Country of establishment United Kingdom
Counterparty name Macquarie BankValue of outstanding transactions GB£ 1,648,805Country of establishment Australia
Counterparty name Morgan StanleyValue of outstanding transactions GB£ 338,141Country of establishment United States of America
Counterparty name UBS BankValue of outstanding transactions GB£ 2,308,250Country of establishment Switzerland
*The above is a complete list of counterparties.
4. Settlement clearing for each type of SFTs & TRSs
Tri-party/Bi-Party
5. Maturity tenor of the SFTs & TRSs
Open maturity GB£ 14,449,505
Mercer UCITS Common Contractual Fund Unaudited Supplemental Information(continued)
Mercer UCITS Common Contractual Fund 130
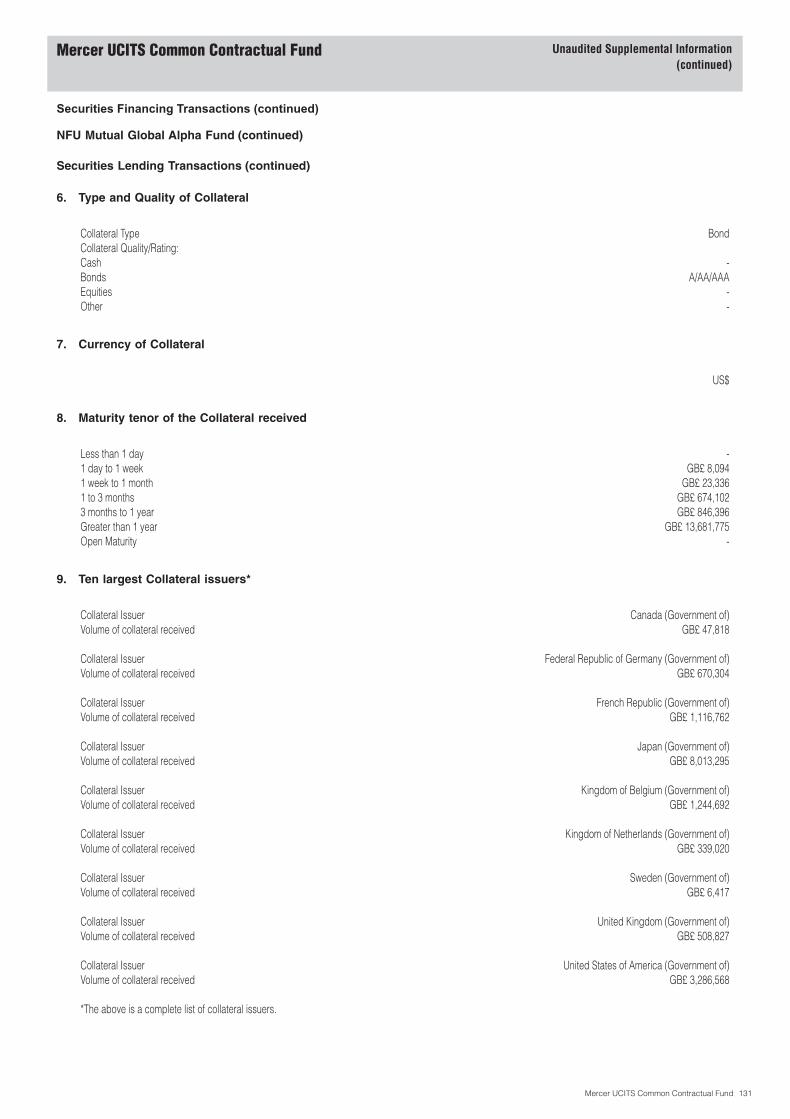
Securities Financing Transactions (continued)
NFU Mutual Global Alpha Fund (continued)
Securities Lending Transactions (continued)
6. Type and Quality of Collateral
Collateral Type BondCollateral Quality/Rating:Cash -Bonds A/AA/AAAEquities -Other -
7. Currency of Collateral
US$
8. Maturity tenor of the Collateral received
Less than 1 day -1 day to 1 week GB£ 8,0941 week to 1 month GB£ 23,3361 to 3 months GB£ 674,1023 months to 1 year GB£ 846,396Greater than 1 year GB£ 13,681,775Open Maturity -
9. Ten largest Collateral issuers*
Collateral Issuer Canada (Government of)Volume of collateral received GB£ 47,818
Collateral Issuer Federal Republic of Germany (Government of)Volume of collateral received GB£ 670,304
Collateral Issuer French Republic (Government of)Volume of collateral received GB£ 1,116,762
Collateral Issuer Japan (Government of)Volume of collateral received GB£ 8,013,295
Collateral Issuer Kingdom of Belgium (Government of)Volume of collateral received GB£ 1,244,692
Collateral Issuer Kingdom of Netherlands (Government of)Volume of collateral received GB£ 339,020
Collateral Issuer Sweden (Government of)Volume of collateral received GB£ 6,417
Collateral Issuer United Kingdom (Government of)Volume of collateral received GB£ 508,827
Collateral Issuer United States of America (Government of)Volume of collateral received GB£ 3,286,568
*The above is a complete list of collateral issuers.
Mercer UCITS Common Contractual Fund Unaudited Supplemental Information(continued)
Mercer UCITS Common Contractual Fund 131
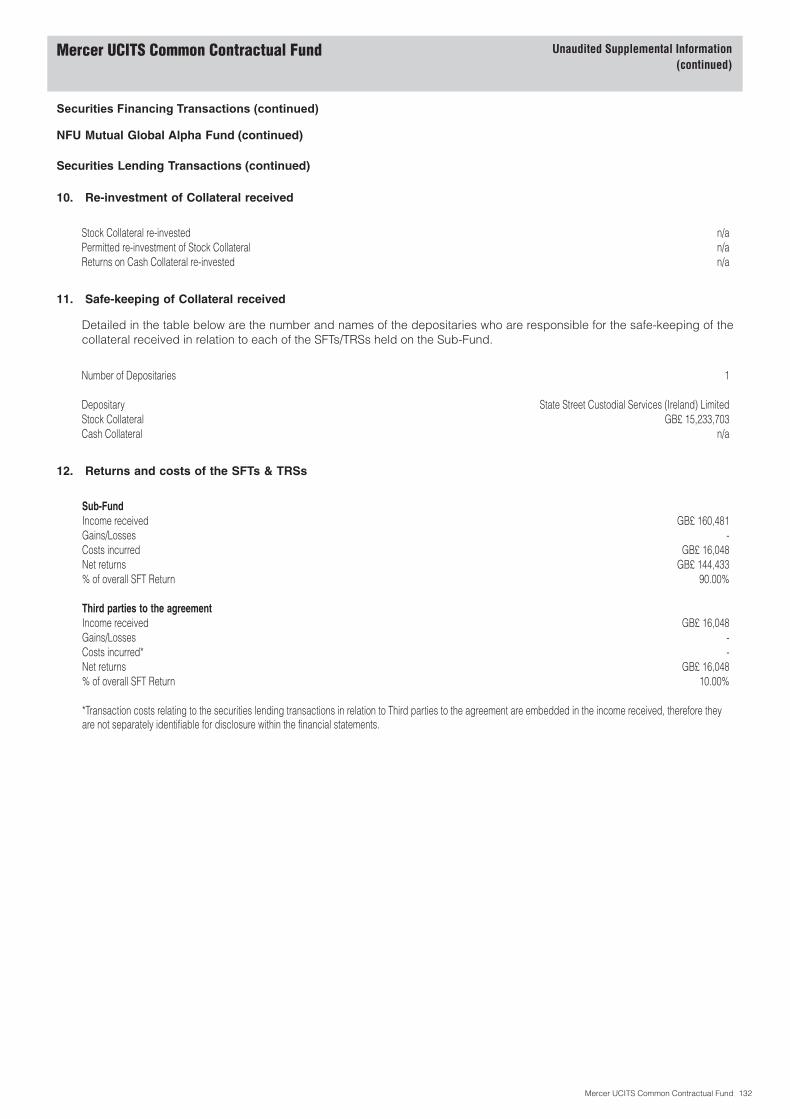
Securities Financing Transactions (continued)
NFU Mutual Global Alpha Fund (continued)
Securities Lending Transactions (continued)
10. Re-investment of Collateral received
Stock Collateral re-invested n/aPermitted re-investment of Stock Collateral n/aReturns on Cash Collateral re-invested n/a
11. Safe-keeping of Collateral received
Detailed in the table below are the number and names of the depositaries who are responsible for the safe-keeping of thecollateral received in relation to each of the SFTs/TRSs held on the Sub-Fund.
Number of Depositaries 1
Depositary State Street Custodial Services (Ireland) LimitedStock Collateral GB£ 15,233,703Cash Collateral n/a
12. Returns and costs of the SFTs & TRSs
Sub-FundIncome received GB£ 160,481Gains/Losses -Costs incurred GB£ 16,048Net returns GB£ 144,433% of overall SFT Return 90.00%
Third parties to the agreementIncome received GB£ 16,048Gains/Losses -Costs incurred* -Net returns GB£ 16,048% of overall SFT Return 10.00%
*Transaction costs relating to the securities lending transactions in relation to Third parties to the agreement are embedded in the income received, therefore theyare not separately identifiable for disclosure within the financial statements.
Mercer UCITS Common Contractual Fund Unaudited Supplemental Information(continued)
Mercer UCITS Common Contractual Fund 132
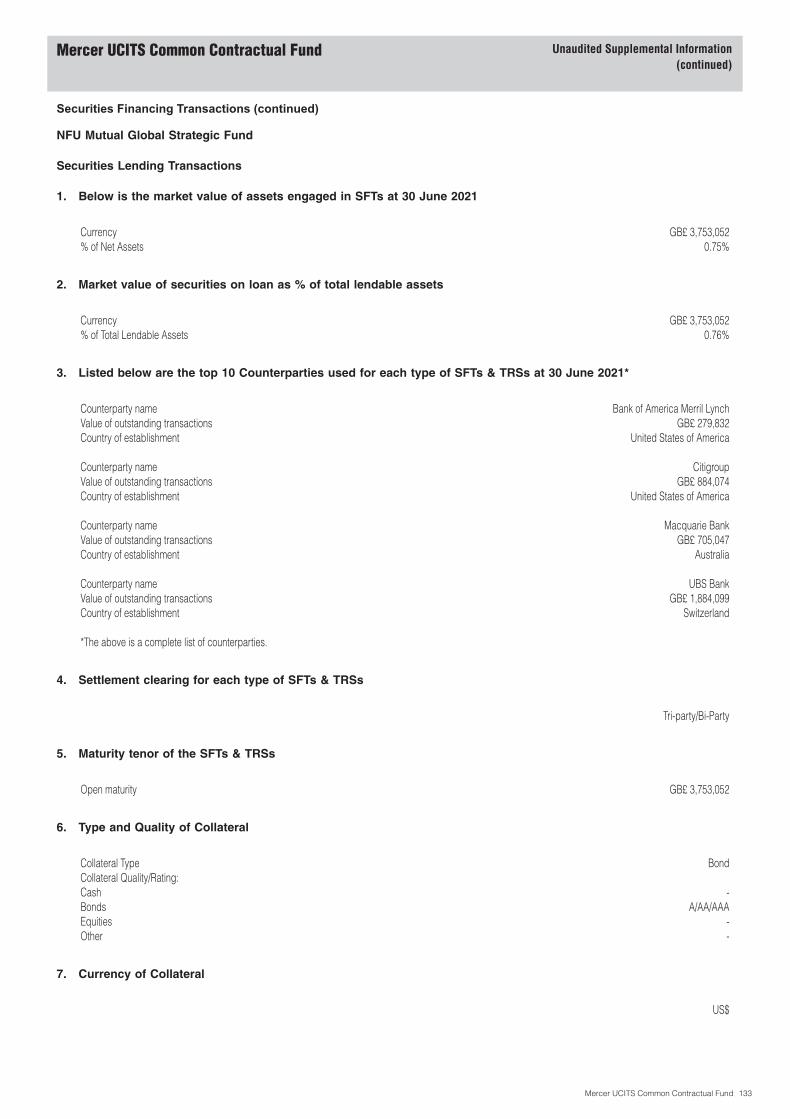
Securities Financing Transactions (continued)
NFU Mutual Global Strategic Fund
Securities Lending Transactions
1. Below is the market value of assets engaged in SFTs at 30 June 2021
Currency GB£ 3,753,052% of Net Assets 0.75%
2. Market value of securities on loan as % of total lendable assets
Currency GB£ 3,753,052% of Total Lendable Assets 0.76%
3. Listed below are the top 10 Counterparties used for each type of SFTs & TRSs at 30 June 2021*
Counterparty name Bank of America Merril LynchValue of outstanding transactions GB£ 279,832Country of establishment United States of America
Counterparty name CitigroupValue of outstanding transactions GB£ 884,074Country of establishment United States of America
Counterparty name Macquarie BankValue of outstanding transactions GB£ 705,047Country of establishment Australia
Counterparty name UBS BankValue of outstanding transactions GB£ 1,884,099Country of establishment Switzerland
*The above is a complete list of counterparties.
4. Settlement clearing for each type of SFTs & TRSs
Tri-party/Bi-Party
5. Maturity tenor of the SFTs & TRSs
Open maturity GB£ 3,753,052
6. Type and Quality of Collateral
Collateral Type BondCollateral Quality/Rating:Cash -Bonds A/AA/AAAEquities -Other -
7. Currency of Collateral
US$
Mercer UCITS Common Contractual Fund Unaudited Supplemental Information(continued)
Mercer UCITS Common Contractual Fund 133
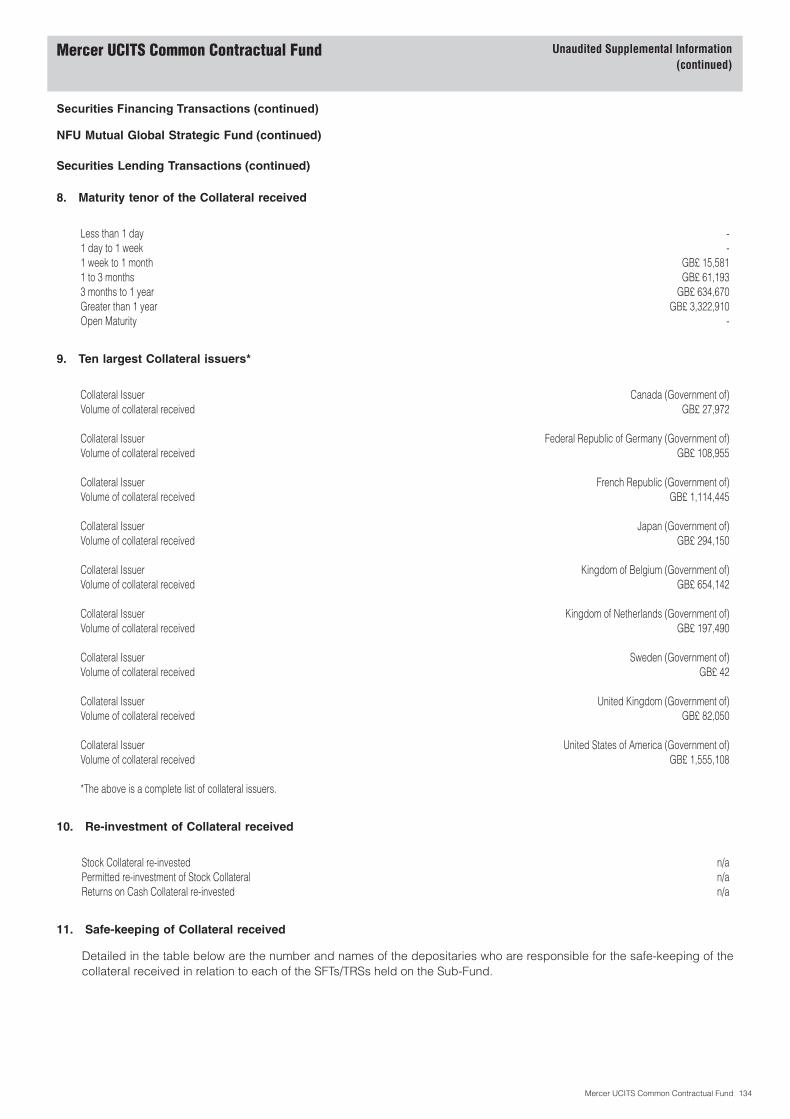
Securities Financing Transactions (continued)
NFU Mutual Global Strategic Fund (continued)
Securities Lending Transactions (continued)
8. Maturity tenor of the Collateral received
Less than 1 day -1 day to 1 week -1 week to 1 month GB£ 15,5811 to 3 months GB£ 61,1933 months to 1 year GB£ 634,670Greater than 1 year GB£ 3,322,910Open Maturity -
9. Ten largest Collateral issuers*
Collateral Issuer Canada (Government of)Volume of collateral received GB£ 27,972
Collateral Issuer Federal Republic of Germany (Government of)Volume of collateral received GB£ 108,955
Collateral Issuer French Republic (Government of)Volume of collateral received GB£ 1,114,445
Collateral Issuer Japan (Government of)Volume of collateral received GB£ 294,150
Collateral Issuer Kingdom of Belgium (Government of)Volume of collateral received GB£ 654,142
Collateral Issuer Kingdom of Netherlands (Government of)Volume of collateral received GB£ 197,490
Collateral Issuer Sweden (Government of)Volume of collateral received GB£ 42
Collateral Issuer United Kingdom (Government of)Volume of collateral received GB£ 82,050
Collateral Issuer United States of America (Government of)Volume of collateral received GB£ 1,555,108
*The above is a complete list of collateral issuers.
10. Re-investment of Collateral received
Stock Collateral re-invested n/aPermitted re-investment of Stock Collateral n/aReturns on Cash Collateral re-invested n/a
11. Safe-keeping of Collateral received
Detailed in the table below are the number and names of the depositaries who are responsible for the safe-keeping of thecollateral received in relation to each of the SFTs/TRSs held on the Sub-Fund.
Mercer UCITS Common Contractual Fund Unaudited Supplemental Information(continued)
Mercer UCITS Common Contractual Fund 134
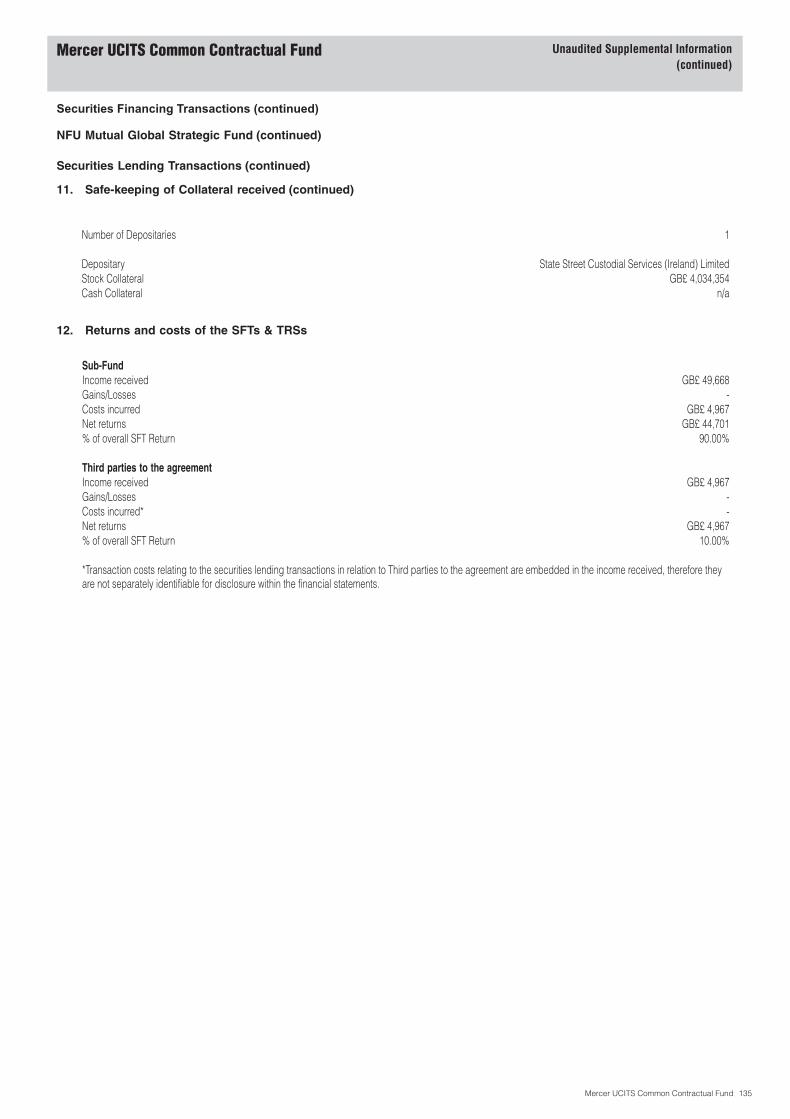
Securities Financing Transactions (continued)
NFU Mutual Global Strategic Fund (continued)
Securities Lending Transactions (continued)
11. Safe-keeping of Collateral received (continued)
Number of Depositaries 1
Depositary State Street Custodial Services (Ireland) LimitedStock Collateral GB£ 4,034,354Cash Collateral n/a
12. Returns and costs of the SFTs & TRSs
Sub-FundIncome received GB£ 49,668Gains/Losses -Costs incurred GB£ 4,967Net returns GB£ 44,701% of overall SFT Return 90.00%
Third parties to the agreementIncome received GB£ 4,967Gains/Losses -Costs incurred* -Net returns GB£ 4,967% of overall SFT Return 10.00%
*Transaction costs relating to the securities lending transactions in relation to Third parties to the agreement are embedded in the income received, therefore theyare not separately identifiable for disclosure within the financial statements.
Mercer UCITS Common Contractual Fund Unaudited Supplemental Information(continued)
Mercer UCITS Common Contractual Fund 135
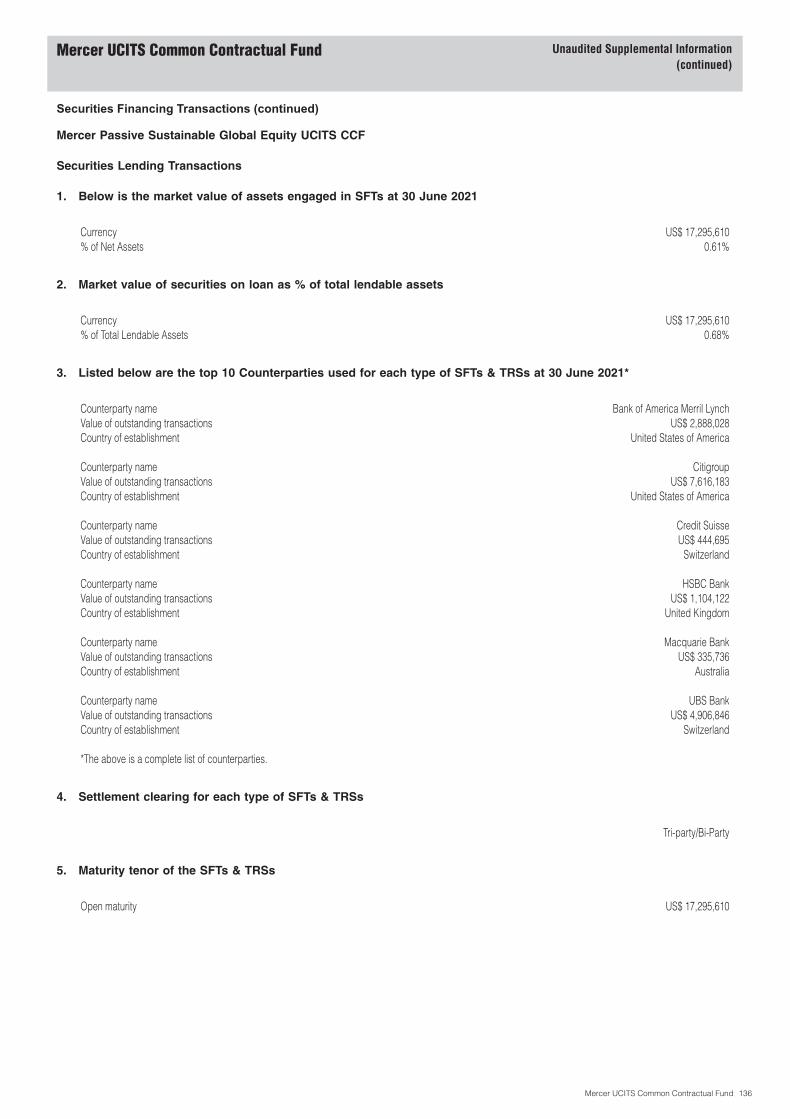
Securities Financing Transactions (continued)
Mercer Passive Sustainable Global Equity UCITS CCF
Securities Lending Transactions
1. Below is the market value of assets engaged in SFTs at 30 June 2021
Currency US$ 17,295,610% of Net Assets 0.61%
2. Market value of securities on loan as % of total lendable assets
Currency US$ 17,295,610% of Total Lendable Assets 0.68%
3. Listed below are the top 10 Counterparties used for each type of SFTs & TRSs at 30 June 2021*
Counterparty name Bank of America Merril LynchValue of outstanding transactions US$ 2,888,028Country of establishment United States of America
Counterparty name CitigroupValue of outstanding transactions US$ 7,616,183Country of establishment United States of America
Counterparty name Credit SuisseValue of outstanding transactions US$ 444,695Country of establishment Switzerland
Counterparty name HSBC BankValue of outstanding transactions US$ 1,104,122Country of establishment United Kingdom
Counterparty name Macquarie BankValue of outstanding transactions US$ 335,736Country of establishment Australia
Counterparty name UBS BankValue of outstanding transactions US$ 4,906,846Country of establishment Switzerland
*The above is a complete list of counterparties.
4. Settlement clearing for each type of SFTs & TRSs
Tri-party/Bi-Party
5. Maturity tenor of the SFTs & TRSs
Open maturity US$ 17,295,610
Mercer UCITS Common Contractual Fund Unaudited Supplemental Information(continued)
Mercer UCITS Common Contractual Fund 136

Securities Financing Transactions (continued)
Mercer Passive Sustainable Global Equity UCITS CCF (continued)
Securities Lending Transactions (continued)
6. Type and Quality of Collateral
Collateral Type BondCollateral Quality/Rating:Cash -Bonds A/AA/AAAEquities -Other -
7. Currency of Collateral
US$
8. Maturity tenor of the Collateral received
Less than 1 day -1 day to 1 week US$ 8211 week to 1 month US$ 7,8711 to 3 months US$ 1,113,4303 months to 1 year US$ 1,198,426Greater than 1 year US$ 16,003,237Open Maturity -
9. Ten largest Collateral issuers*
Collateral Issuer Canada (Government of)Volume of collateral received US$ 54,999
Collateral Issuer Federal Republic of Germany (Government of)Volume of collateral received US$ 1,847,814
Collateral Issuer French Republic (Government of)Volume of collateral received US$ 3,681,265
Collateral Issuer Japan (Government of)Volume of collateral received US$ 4,070,103
Collateral Issuer Kingdom of Belgium (Government of)Volume of collateral received US$ 3,639,752
Collateral Issuer Kingdom of Netherlands (Government of)Volume of collateral received US$ 761,838
Collateral Issuer Sweden (Government of)Volume of collateral received US$ 18,113
Collateral Issuer United Kingdom (Government of)Volume of collateral received US$ 1,313,073
Collateral Issuer United States of America (Government of)Volume of collateral received US$ 2,936,828
*The above is a complete list of collateral issuers.
Mercer UCITS Common Contractual Fund Unaudited Supplemental Information(continued)
Mercer UCITS Common Contractual Fund 137
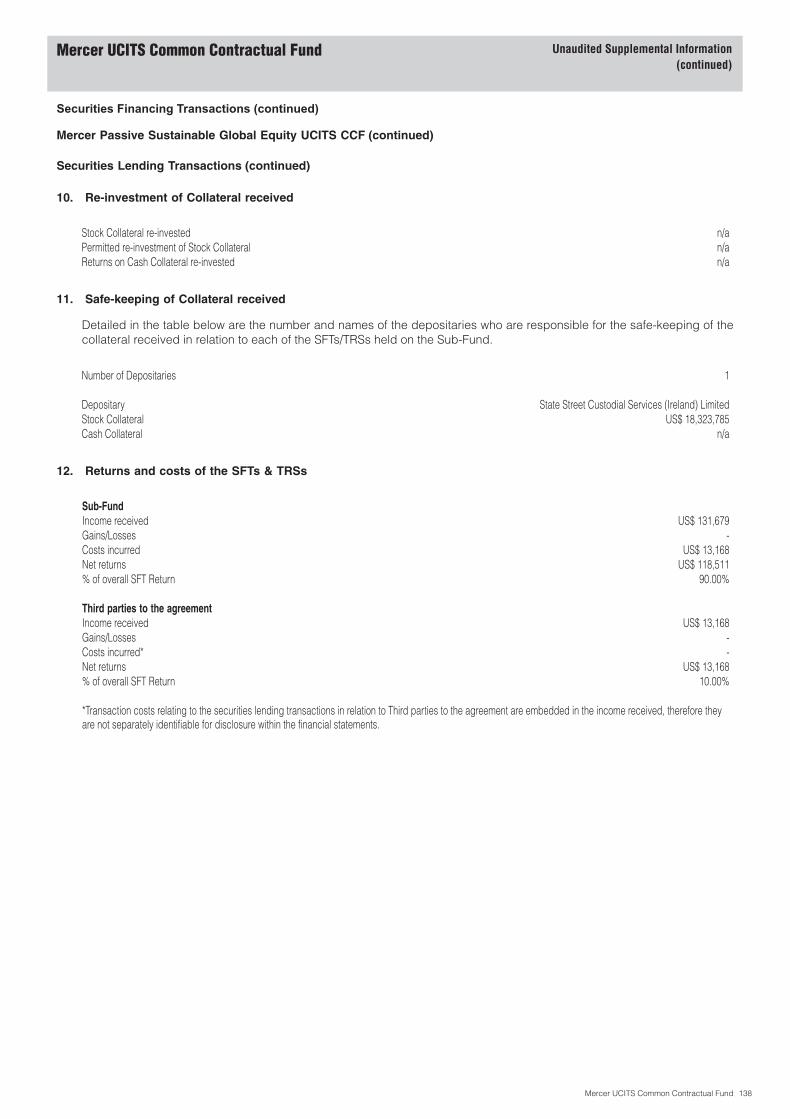
Securities Financing Transactions (continued)
Mercer Passive Sustainable Global Equity UCITS CCF (continued)
Securities Lending Transactions (continued)
10. Re-investment of Collateral received
Stock Collateral re-invested n/aPermitted re-investment of Stock Collateral n/aReturns on Cash Collateral re-invested n/a
11. Safe-keeping of Collateral received
Detailed in the table below are the number and names of the depositaries who are responsible for the safe-keeping of thecollateral received in relation to each of the SFTs/TRSs held on the Sub-Fund.
Number of Depositaries 1
Depositary State Street Custodial Services (Ireland) LimitedStock Collateral US$ 18,323,785Cash Collateral n/a
12. Returns and costs of the SFTs & TRSs
Sub-FundIncome received US$ 131,679Gains/Losses -Costs incurred US$ 13,168Net returns US$ 118,511% of overall SFT Return 90.00%
Third parties to the agreementIncome received US$ 13,168Gains/Losses -Costs incurred* -Net returns US$ 13,168% of overall SFT Return 10.00%
*Transaction costs relating to the securities lending transactions in relation to Third parties to the agreement are embedded in the income received, therefore theyare not separately identifiable for disclosure within the financial statements.
Mercer UCITS Common Contractual Fund Unaudited Supplemental Information(continued)
Mercer UCITS Common Contractual Fund 138
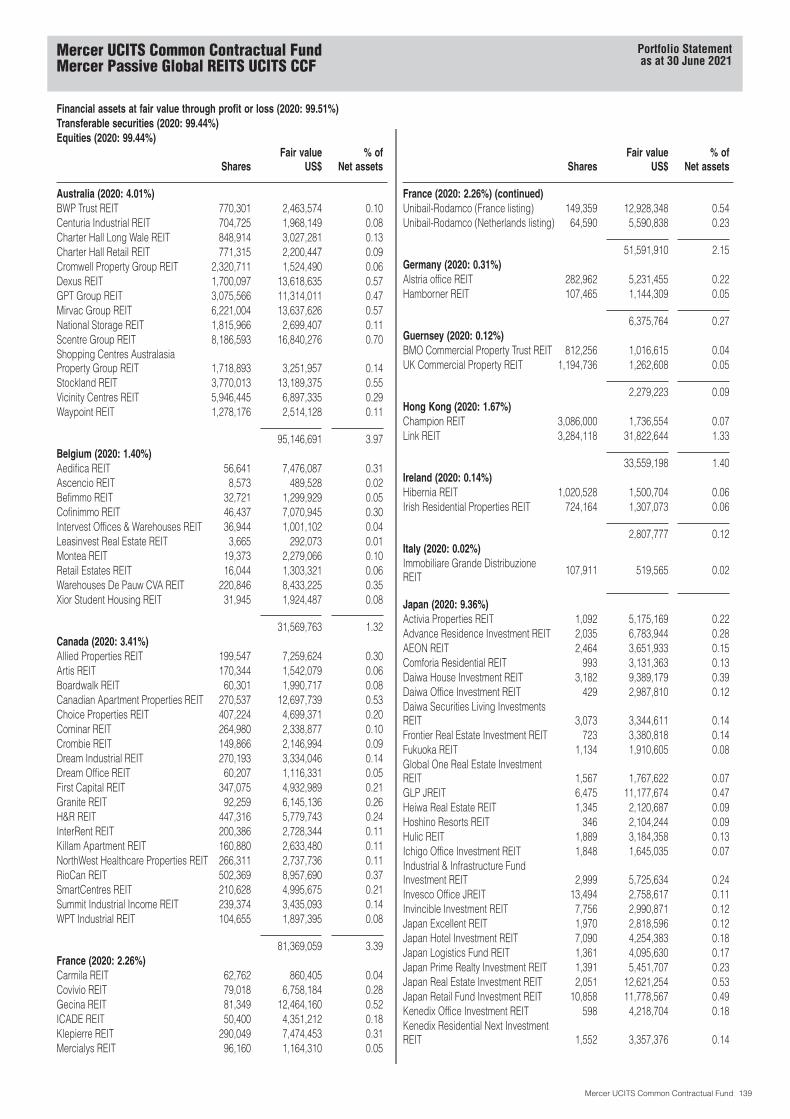
Financial assets at fair value through profit or loss (2020: 99.51%)Transferable securities (2020: 99.44%)Equities (2020: 99.44%)
SharesFair value
US$% of
Net assets
Australia (2020: 4.01%)BWP Trust REIT 770,301 2,463,574 0.10Centuria Industrial REIT 704,725 1,968,149 0.08Charter Hall Long Wale REIT 848,914 3,027,281 0.13Charter Hall Retail REIT 771,315 2,200,447 0.09Cromwell Property Group REIT 2,320,711 1,524,490 0.06Dexus REIT 1,700,097 13,618,635 0.57GPT Group REIT 3,075,566 11,314,011 0.47Mirvac Group REIT 6,221,004 13,637,626 0.57National Storage REIT 1,815,966 2,699,407 0.11Scentre Group REIT 8,186,593 16,840,276 0.70Shopping Centres AustralasiaProperty Group REIT 1,718,893 3,251,957 0.14Stockland REIT 3,770,013 13,189,375 0.55Vicinity Centres REIT 5,946,445 6,897,335 0.29Waypoint REIT 1,278,176 2,514,128 0.11
95,146,691 3.97Belgium (2020: 1.40%)Aedifica REIT 56,641 7,476,087 0.31Ascencio REIT 8,573 489,528 0.02Befimmo REIT 32,721 1,299,929 0.05Cofinimmo REIT 46,437 7,070,945 0.30Intervest Offices & Warehouses REIT 36,944 1,001,102 0.04Leasinvest Real Estate REIT 3,665 292,073 0.01Montea REIT 19,373 2,279,066 0.10Retail Estates REIT 16,044 1,303,321 0.06Warehouses De Pauw CVA REIT 220,846 8,433,225 0.35Xior Student Housing REIT 31,945 1,924,487 0.08
31,569,763 1.32Canada (2020: 3.41%)Allied Properties REIT 199,547 7,259,624 0.30Artis REIT 170,344 1,542,079 0.06Boardwalk REIT 60,301 1,990,717 0.08Canadian Apartment Properties REIT 270,537 12,697,739 0.53Choice Properties REIT 407,224 4,699,371 0.20Cominar REIT 264,980 2,338,877 0.10Crombie REIT 149,866 2,146,994 0.09Dream Industrial REIT 270,193 3,334,046 0.14Dream Office REIT 60,207 1,116,331 0.05First Capital REIT 347,075 4,932,989 0.21Granite REIT 92,259 6,145,136 0.26H&R REIT 447,316 5,779,743 0.24InterRent REIT 200,386 2,728,344 0.11Killam Apartment REIT 160,880 2,633,480 0.11NorthWest Healthcare Properties REIT 266,311 2,737,736 0.11RioCan REIT 502,369 8,957,690 0.37SmartCentres REIT 210,628 4,995,675 0.21Summit Industrial Income REIT 239,374 3,435,093 0.14WPT Industrial REIT 104,655 1,897,395 0.08
81,369,059 3.39France (2020: 2.26%)Carmila REIT 62,762 860,405 0.04Covivio REIT 79,018 6,758,184 0.28Gecina REIT 81,349 12,464,160 0.52ICADE REIT 50,400 4,351,212 0.18Klepierre REIT 290,049 7,474,453 0.31Mercialys REIT 96,160 1,164,310 0.05
SharesFair value
US$% of
Net assets
France (2020: 2.26%) (continued)Unibail-Rodamco (France listing) 149,359 12,928,348 0.54Unibail-Rodamco (Netherlands listing) 64,590 5,590,838 0.23
51,591,910 2.15Germany (2020: 0.31%)Alstria office REIT 282,962 5,231,455 0.22Hamborner REIT 107,465 1,144,309 0.05
6,375,764 0.27Guernsey (2020: 0.12%)BMO Commercial Property Trust REIT 812,256 1,016,615 0.04UK Commercial Property REIT 1,194,736 1,262,608 0.05
2,279,223 0.09Hong Kong (2020: 1.67%)Champion REIT 3,086,000 1,736,554 0.07Link REIT 3,284,118 31,822,644 1.33
33,559,198 1.40Ireland (2020: 0.14%)Hibernia REIT 1,020,528 1,500,704 0.06Irish Residential Properties REIT 724,164 1,307,073 0.06
2,807,777 0.12Italy (2020: 0.02%)Immobiliare Grande DistribuzioneREIT 107,911 519,565 0.02
Japan (2020: 9.36%)Activia Properties REIT 1,092 5,175,169 0.22Advance Residence Investment REIT 2,035 6,783,944 0.28AEON REIT 2,464 3,651,933 0.15Comforia Residential REIT 993 3,131,363 0.13Daiwa House Investment REIT 3,182 9,389,179 0.39Daiwa Office Investment REIT 429 2,987,810 0.12Daiwa Securities Living InvestmentsREIT 3,073 3,344,611 0.14Frontier Real Estate Investment REIT 723 3,380,818 0.14Fukuoka REIT 1,134 1,910,605 0.08Global One Real Estate InvestmentREIT 1,567 1,767,622 0.07GLP JREIT 6,475 11,177,674 0.47Heiwa Real Estate REIT 1,345 2,120,687 0.09Hoshino Resorts REIT 346 2,104,244 0.09Hulic REIT 1,889 3,184,358 0.13Ichigo Office Investment REIT 1,848 1,645,035 0.07Industrial & Infrastructure FundInvestment REIT 2,999 5,725,634 0.24Invesco Office JREIT 13,494 2,758,617 0.11Invincible Investment REIT 7,756 2,990,871 0.12Japan Excellent REIT 1,970 2,818,596 0.12Japan Hotel Investment REIT 7,090 4,254,383 0.18Japan Logistics Fund REIT 1,361 4,095,630 0.17Japan Prime Realty Investment REIT 1,391 5,451,707 0.23Japan Real Estate Investment REIT 2,051 12,621,254 0.53Japan Retail Fund Investment REIT 10,858 11,778,567 0.49Kenedix Office Investment REIT 598 4,218,704 0.18Kenedix Residential Next InvestmentREIT 1,552 3,357,376 0.14
Mercer UCITS Common Contractual FundMercer Passive Global REITS UCITS CCF
Portfolio Statementas at 30 June 2021
Mercer UCITS Common Contractual Fund 139
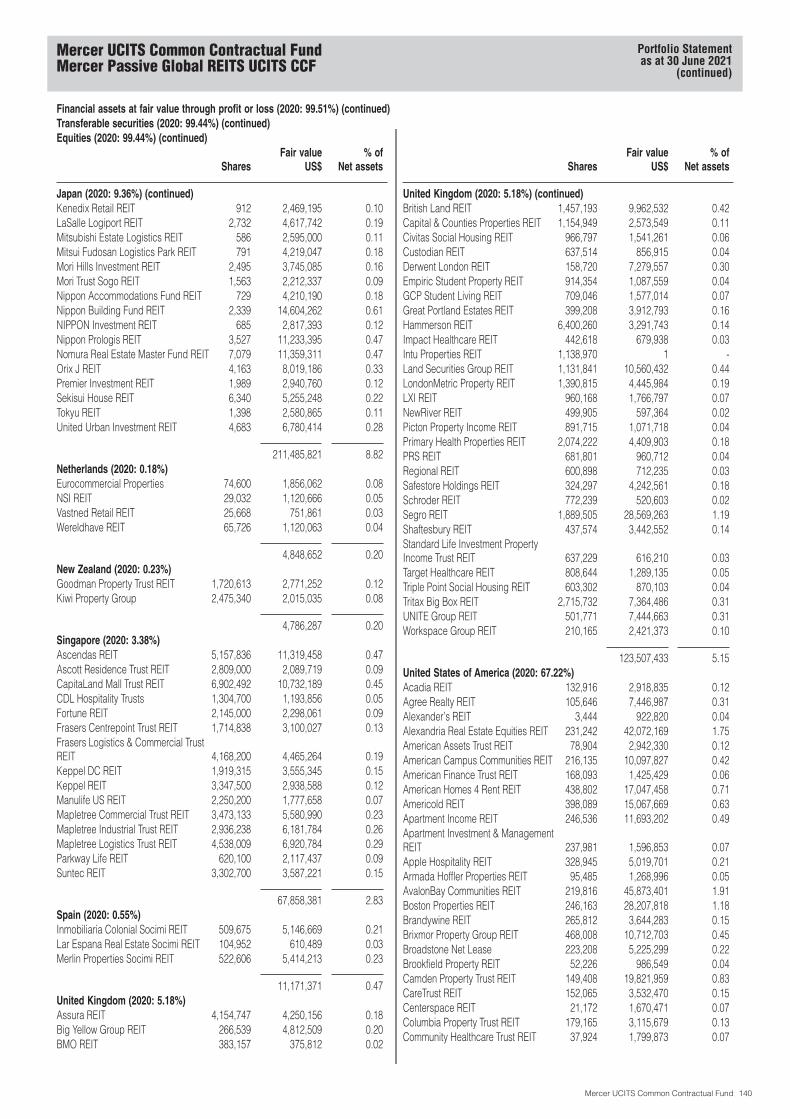
Financial assets at fair value through profit or loss (2020: 99.51%) (continued)Transferable securities (2020: 99.44%) (continued)Equities (2020: 99.44%) (continued)
SharesFair value
US$% of
Net assets
Japan (2020: 9.36%) (continued)Kenedix Retail REIT 912 2,469,195 0.10LaSalle Logiport REIT 2,732 4,617,742 0.19Mitsubishi Estate Logistics REIT 586 2,595,000 0.11Mitsui Fudosan Logistics Park REIT 791 4,219,047 0.18Mori Hills Investment REIT 2,495 3,745,085 0.16Mori Trust Sogo REIT 1,563 2,212,337 0.09Nippon Accommodations Fund REIT 729 4,210,190 0.18Nippon Building Fund REIT 2,339 14,604,262 0.61NIPPON Investment REIT 685 2,817,393 0.12Nippon Prologis REIT 3,527 11,233,395 0.47Nomura Real Estate Master Fund REIT 7,079 11,359,311 0.47Orix J REIT 4,163 8,019,186 0.33Premier Investment REIT 1,989 2,940,760 0.12Sekisui House REIT 6,340 5,255,248 0.22Tokyu REIT 1,398 2,580,865 0.11United Urban Investment REIT 4,683 6,780,414 0.28
211,485,821 8.82Netherlands (2020: 0.18%)Eurocommercial Properties 74,600 1,856,062 0.08NSI REIT 29,032 1,120,666 0.05Vastned Retail REIT 25,668 751,861 0.03Wereldhave REIT 65,726 1,120,063 0.04
4,848,652 0.20New Zealand (2020: 0.23%)Goodman Property Trust REIT 1,720,613 2,771,252 0.12Kiwi Property Group 2,475,340 2,015,035 0.08
4,786,287 0.20Singapore (2020: 3.38%)Ascendas REIT 5,157,836 11,319,458 0.47Ascott Residence Trust REIT 2,809,000 2,089,719 0.09CapitaLand Mall Trust REIT 6,902,492 10,732,189 0.45CDL Hospitality Trusts 1,304,700 1,193,856 0.05Fortune REIT 2,145,000 2,298,061 0.09Frasers Centrepoint Trust REIT 1,714,838 3,100,027 0.13Frasers Logistics & Commercial TrustREIT 4,168,200 4,465,264 0.19Keppel DC REIT 1,919,315 3,555,345 0.15Keppel REIT 3,347,500 2,938,588 0.12Manulife US REIT 2,250,200 1,777,658 0.07Mapletree Commercial Trust REIT 3,473,133 5,580,990 0.23Mapletree Industrial Trust REIT 2,936,238 6,181,784 0.26Mapletree Logistics Trust REIT 4,538,009 6,920,784 0.29Parkway Life REIT 620,100 2,117,437 0.09Suntec REIT 3,302,700 3,587,221 0.15
67,858,381 2.83Spain (2020: 0.55%)Inmobiliaria Colonial Socimi REIT 509,675 5,146,669 0.21Lar Espana Real Estate Socimi REIT 104,952 610,489 0.03Merlin Properties Socimi REIT 522,606 5,414,213 0.23
11,171,371 0.47United Kingdom (2020: 5.18%)Assura REIT 4,154,747 4,250,156 0.18Big Yellow Group REIT 266,539 4,812,509 0.20BMO REIT 383,157 375,812 0.02
SharesFair value
US$% of
Net assets
United Kingdom (2020: 5.18%) (continued)British Land REIT 1,457,193 9,962,532 0.42Capital & Counties Properties REIT 1,154,949 2,573,549 0.11Civitas Social Housing REIT 966,797 1,541,261 0.06Custodian REIT 637,514 856,915 0.04Derwent London REIT 158,720 7,279,557 0.30Empiric Student Property REIT 914,354 1,087,559 0.04GCP Student Living REIT 709,046 1,577,014 0.07Great Portland Estates REIT 399,208 3,912,793 0.16Hammerson REIT 6,400,260 3,291,743 0.14Impact Healthcare REIT 442,618 679,938 0.03Intu Properties REIT 1,138,970 1 -Land Securities Group REIT 1,131,841 10,560,432 0.44LondonMetric Property REIT 1,390,815 4,445,984 0.19LXI REIT 960,168 1,766,797 0.07NewRiver REIT 499,905 597,364 0.02Picton Property Income REIT 891,715 1,071,718 0.04Primary Health Properties REIT 2,074,222 4,409,903 0.18PRS REIT 681,801 960,712 0.04Regional REIT 600,898 712,235 0.03Safestore Holdings REIT 324,297 4,242,561 0.18Schroder REIT 772,239 520,603 0.02Segro REIT 1,889,505 28,569,263 1.19Shaftesbury REIT 437,574 3,442,552 0.14Standard Life Investment PropertyIncome Trust REIT 637,229 616,210 0.03Target Healthcare REIT 808,644 1,289,135 0.05Triple Point Social Housing REIT 603,302 870,103 0.04Tritax Big Box REIT 2,715,732 7,364,486 0.31UNITE Group REIT 501,771 7,444,663 0.31Workspace Group REIT 210,165 2,421,373 0.10
123,507,433 5.15United States of America (2020: 67.22%)Acadia REIT 132,916 2,918,835 0.12Agree Realty REIT 105,646 7,446,987 0.31Alexander’s REIT 3,444 922,820 0.04Alexandria Real Estate Equities REIT 231,242 42,072,169 1.75American Assets Trust REIT 78,904 2,942,330 0.12American Campus Communities REIT 216,135 10,097,827 0.42American Finance Trust REIT 168,093 1,425,429 0.06American Homes 4 Rent REIT 438,802 17,047,458 0.71Americold REIT 398,089 15,067,669 0.63Apartment Income REIT 246,536 11,693,202 0.49Apartment Investment & ManagementREIT 237,981 1,596,853 0.07Apple Hospitality REIT 328,945 5,019,701 0.21Armada Hoffler Properties REIT 95,485 1,268,996 0.05AvalonBay Communities REIT 219,816 45,873,401 1.91Boston Properties REIT 246,163 28,207,818 1.18Brandywine REIT 265,812 3,644,283 0.15Brixmor Property Group REIT 468,008 10,712,703 0.45Broadstone Net Lease 223,208 5,225,299 0.22Brookfield Property REIT 52,226 986,549 0.04Camden Property Trust REIT 149,408 19,821,959 0.83CareTrust REIT 152,065 3,532,470 0.15Centerspace REIT 21,172 1,670,471 0.07Columbia Property Trust REIT 179,165 3,115,679 0.13Community Healthcare Trust REIT 37,924 1,799,873 0.07
Mercer UCITS Common Contractual FundMercer Passive Global REITS UCITS CCF
Portfolio Statementas at 30 June 2021
(continued)
Mercer UCITS Common Contractual Fund 140
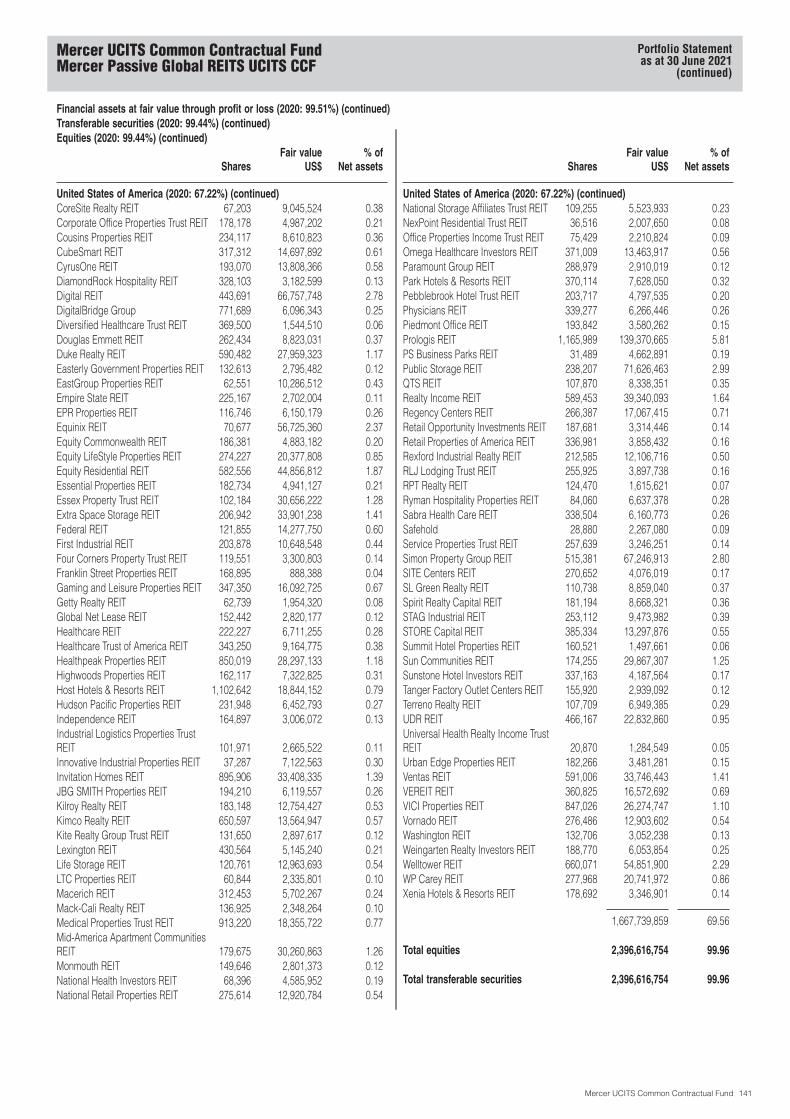
Financial assets at fair value through profit or loss (2020: 99.51%) (continued)Transferable securities (2020: 99.44%) (continued)Equities (2020: 99.44%) (continued)
SharesFair value
US$% of
Net assets
United States of America (2020: 67.22%) (continued)CoreSite Realty REIT 67,203 9,045,524 0.38Corporate Office Properties Trust REIT 178,178 4,987,202 0.21Cousins Properties REIT 234,117 8,610,823 0.36CubeSmart REIT 317,312 14,697,892 0.61CyrusOne REIT 193,070 13,808,366 0.58DiamondRock Hospitality REIT 328,103 3,182,599 0.13Digital REIT 443,691 66,757,748 2.78DigitalBridge Group 771,689 6,096,343 0.25Diversified Healthcare Trust REIT 369,500 1,544,510 0.06Douglas Emmett REIT 262,434 8,823,031 0.37Duke Realty REIT 590,482 27,959,323 1.17Easterly Government Properties REIT 132,613 2,795,482 0.12EastGroup Properties REIT 62,551 10,286,512 0.43Empire State REIT 225,167 2,702,004 0.11EPR Properties REIT 116,746 6,150,179 0.26Equinix REIT 70,677 56,725,360 2.37Equity Commonwealth REIT 186,381 4,883,182 0.20Equity LifeStyle Properties REIT 274,227 20,377,808 0.85Equity Residential REIT 582,556 44,856,812 1.87Essential Properties REIT 182,734 4,941,127 0.21Essex Property Trust REIT 102,184 30,656,222 1.28Extra Space Storage REIT 206,942 33,901,238 1.41Federal REIT 121,855 14,277,750 0.60First Industrial REIT 203,878 10,648,548 0.44Four Corners Property Trust REIT 119,551 3,300,803 0.14Franklin Street Properties REIT 168,895 888,388 0.04Gaming and Leisure Properties REIT 347,350 16,092,725 0.67Getty Realty REIT 62,739 1,954,320 0.08Global Net Lease REIT 152,442 2,820,177 0.12Healthcare REIT 222,227 6,711,255 0.28Healthcare Trust of America REIT 343,250 9,164,775 0.38Healthpeak Properties REIT 850,019 28,297,133 1.18Highwoods Properties REIT 162,117 7,322,825 0.31Host Hotels & Resorts REIT 1,102,642 18,844,152 0.79Hudson Pacific Properties REIT 231,948 6,452,793 0.27Independence REIT 164,897 3,006,072 0.13Industrial Logistics Properties TrustREIT 101,971 2,665,522 0.11Innovative Industrial Properties REIT 37,287 7,122,563 0.30Invitation Homes REIT 895,906 33,408,335 1.39JBG SMITH Properties REIT 194,210 6,119,557 0.26Kilroy Realty REIT 183,148 12,754,427 0.53Kimco Realty REIT 650,597 13,564,947 0.57Kite Realty Group Trust REIT 131,650 2,897,617 0.12Lexington REIT 430,564 5,145,240 0.21Life Storage REIT 120,761 12,963,693 0.54LTC Properties REIT 60,844 2,335,801 0.10Macerich REIT 312,453 5,702,267 0.24Mack-Cali Realty REIT 136,925 2,348,264 0.10Medical Properties Trust REIT 913,220 18,355,722 0.77Mid-America Apartment CommunitiesREIT 179,675 30,260,863 1.26Monmouth REIT 149,646 2,801,373 0.12National Health Investors REIT 68,396 4,585,952 0.19National Retail Properties REIT 275,614 12,920,784 0.54
SharesFair value
US$% of
Net assets
United States of America (2020: 67.22%) (continued)National Storage Affiliates Trust REIT 109,255 5,523,933 0.23NexPoint Residential Trust REIT 36,516 2,007,650 0.08Office Properties Income Trust REIT 75,429 2,210,824 0.09Omega Healthcare Investors REIT 371,009 13,463,917 0.56Paramount Group REIT 288,979 2,910,019 0.12Park Hotels & Resorts REIT 370,114 7,628,050 0.32Pebblebrook Hotel Trust REIT 203,717 4,797,535 0.20Physicians REIT 339,277 6,266,446 0.26Piedmont Office REIT 193,842 3,580,262 0.15Prologis REIT 1,165,989 139,370,665 5.81PS Business Parks REIT 31,489 4,662,891 0.19Public Storage REIT 238,207 71,626,463 2.99QTS REIT 107,870 8,338,351 0.35Realty Income REIT 589,453 39,340,093 1.64Regency Centers REIT 266,387 17,067,415 0.71Retail Opportunity Investments REIT 187,681 3,314,446 0.14Retail Properties of America REIT 336,981 3,858,432 0.16Rexford Industrial Realty REIT 212,585 12,106,716 0.50RLJ Lodging Trust REIT 255,925 3,897,738 0.16RPT Realty REIT 124,470 1,615,621 0.07Ryman Hospitality Properties REIT 84,060 6,637,378 0.28Sabra Health Care REIT 338,504 6,160,773 0.26Safehold 28,880 2,267,080 0.09Service Properties Trust REIT 257,639 3,246,251 0.14Simon Property Group REIT 515,381 67,246,913 2.80SITE Centers REIT 270,652 4,076,019 0.17SL Green Realty REIT 110,738 8,859,040 0.37Spirit Realty Capital REIT 181,194 8,668,321 0.36STAG Industrial REIT 253,112 9,473,982 0.39STORE Capital REIT 385,334 13,297,876 0.55Summit Hotel Properties REIT 160,521 1,497,661 0.06Sun Communities REIT 174,255 29,867,307 1.25Sunstone Hotel Investors REIT 337,163 4,187,564 0.17Tanger Factory Outlet Centers REIT 155,920 2,939,092 0.12Terreno Realty REIT 107,709 6,949,385 0.29UDR REIT 466,167 22,832,860 0.95Universal Health Realty Income TrustREIT 20,870 1,284,549 0.05Urban Edge Properties REIT 182,266 3,481,281 0.15Ventas REIT 591,006 33,746,443 1.41VEREIT REIT 360,825 16,572,692 0.69VICI Properties REIT 847,026 26,274,747 1.10Vornado REIT 276,486 12,903,602 0.54Washington REIT 132,706 3,052,238 0.13Weingarten Realty Investors REIT 188,770 6,053,854 0.25Welltower REIT 660,071 54,851,900 2.29WP Carey REIT 277,968 20,741,972 0.86Xenia Hotels & Resorts REIT 178,692 3,346,901 0.14
1,667,739,859 69.56
Total equities 2,396,616,754 99.96
Total transferable securities 2,396,616,754 99.96
Mercer UCITS Common Contractual FundMercer Passive Global REITS UCITS CCF
Portfolio Statementas at 30 June 2021
(continued)
Mercer UCITS Common Contractual Fund 141
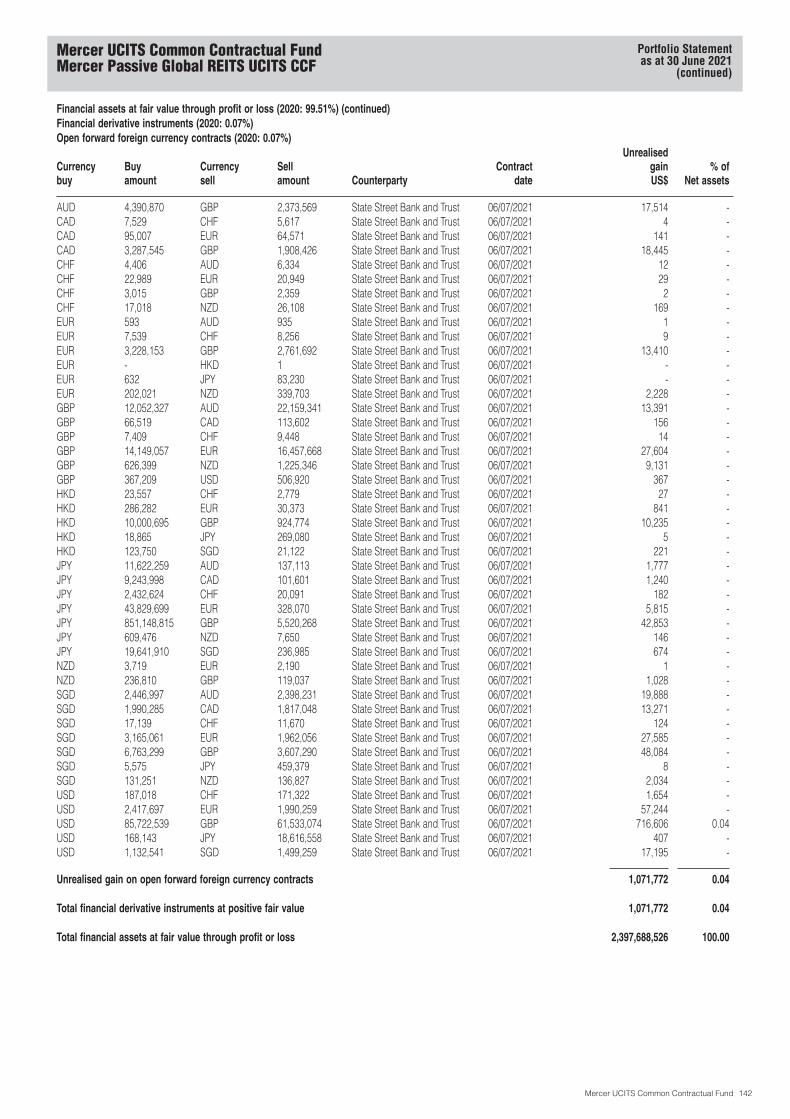
Financial assets at fair value through profit or loss (2020: 99.51%) (continued)Financial derivative instruments (2020: 0.07%)Open forward foreign currency contracts (2020: 0.07%)
Currencybuy
Buyamount
Currencysell
Sellamount Counterparty
Contractdate
UnrealisedgainUS$
% ofNet assets
AUD 4,390,870 GBP 2,373,569 State Street Bank and Trust 06/07/2021 17,514 -CAD 7,529 CHF 5,617 State Street Bank and Trust 06/07/2021 4 -CAD 95,007 EUR 64,571 State Street Bank and Trust 06/07/2021 141 -CAD 3,287,545 GBP 1,908,426 State Street Bank and Trust 06/07/2021 18,445 -CHF 4,406 AUD 6,334 State Street Bank and Trust 06/07/2021 12 -CHF 22,989 EUR 20,949 State Street Bank and Trust 06/07/2021 29 -CHF 3,015 GBP 2,359 State Street Bank and Trust 06/07/2021 2 -CHF 17,018 NZD 26,108 State Street Bank and Trust 06/07/2021 169 -EUR 593 AUD 935 State Street Bank and Trust 06/07/2021 1 -EUR 7,539 CHF 8,256 State Street Bank and Trust 06/07/2021 9 -EUR 3,228,153 GBP 2,761,692 State Street Bank and Trust 06/07/2021 13,410 -EUR - HKD 1 State Street Bank and Trust 06/07/2021 - -EUR 632 JPY 83,230 State Street Bank and Trust 06/07/2021 - -EUR 202,021 NZD 339,703 State Street Bank and Trust 06/07/2021 2,228 -GBP 12,052,327 AUD 22,159,341 State Street Bank and Trust 06/07/2021 13,391 -GBP 66,519 CAD 113,602 State Street Bank and Trust 06/07/2021 156 -GBP 7,409 CHF 9,448 State Street Bank and Trust 06/07/2021 14 -GBP 14,149,057 EUR 16,457,668 State Street Bank and Trust 06/07/2021 27,604 -GBP 626,399 NZD 1,225,346 State Street Bank and Trust 06/07/2021 9,131 -GBP 367,209 USD 506,920 State Street Bank and Trust 06/07/2021 367 -HKD 23,557 CHF 2,779 State Street Bank and Trust 06/07/2021 27 -HKD 286,282 EUR 30,373 State Street Bank and Trust 06/07/2021 841 -HKD 10,000,695 GBP 924,774 State Street Bank and Trust 06/07/2021 10,235 -HKD 18,865 JPY 269,080 State Street Bank and Trust 06/07/2021 5 -HKD 123,750 SGD 21,122 State Street Bank and Trust 06/07/2021 221 -JPY 11,622,259 AUD 137,113 State Street Bank and Trust 06/07/2021 1,777 -JPY 9,243,998 CAD 101,601 State Street Bank and Trust 06/07/2021 1,240 -JPY 2,432,624 CHF 20,091 State Street Bank and Trust 06/07/2021 182 -JPY 43,829,699 EUR 328,070 State Street Bank and Trust 06/07/2021 5,815 -JPY 851,148,815 GBP 5,520,268 State Street Bank and Trust 06/07/2021 42,853 -JPY 609,476 NZD 7,650 State Street Bank and Trust 06/07/2021 146 -JPY 19,641,910 SGD 236,985 State Street Bank and Trust 06/07/2021 674 -NZD 3,719 EUR 2,190 State Street Bank and Trust 06/07/2021 1 -NZD 236,810 GBP 119,037 State Street Bank and Trust 06/07/2021 1,028 -SGD 2,446,997 AUD 2,398,231 State Street Bank and Trust 06/07/2021 19,888 -SGD 1,990,285 CAD 1,817,048 State Street Bank and Trust 06/07/2021 13,271 -SGD 17,139 CHF 11,670 State Street Bank and Trust 06/07/2021 124 -SGD 3,165,061 EUR 1,962,056 State Street Bank and Trust 06/07/2021 27,585 -SGD 6,763,299 GBP 3,607,290 State Street Bank and Trust 06/07/2021 48,084 -SGD 5,575 JPY 459,379 State Street Bank and Trust 06/07/2021 8 -SGD 131,251 NZD 136,827 State Street Bank and Trust 06/07/2021 2,034 -USD 187,018 CHF 171,322 State Street Bank and Trust 06/07/2021 1,654 -USD 2,417,697 EUR 1,990,259 State Street Bank and Trust 06/07/2021 57,244 -USD 85,722,539 GBP 61,533,074 State Street Bank and Trust 06/07/2021 716,606 0.04USD 168,143 JPY 18,616,558 State Street Bank and Trust 06/07/2021 407 -USD 1,132,541 SGD 1,499,259 State Street Bank and Trust 06/07/2021 17,195 -
Unrealised gain on open forward foreign currency contracts 1,071,772 0.04
Total financial derivative instruments at positive fair value 1,071,772 0.04
Total financial assets at fair value through profit or loss 2,397,688,526 100.00
Mercer UCITS Common Contractual FundMercer Passive Global REITS UCITS CCF
Portfolio Statementas at 30 June 2021
(continued)
Mercer UCITS Common Contractual Fund 142

Financial liabilities held for trading (2020: (0.22%))Financial derivative instruments (2020: (0.22%))Open forward foreign currency contracts (2020: (0.22%))
Currencybuy
Buyamount
Currencysell
Sellamount Counterparty
Contractdate
UnrealisedlossUS$
% ofNet assets
AUD 9,938 CHF 6,925 State Street Bank and Trust 06/07/2021 (31) -AUD 125,394 EUR 79,795 State Street Bank and Trust 06/07/2021 (494) -AUD 201,943 GBP 109,941 State Street Bank and Trust 06/07/2021 (269) -AUD 8,952 JPY 753,110 State Street Bank and Trust 06/07/2021 (65) -AUD 54,204 SGD 55,487 State Street Bank and Trust 06/07/2021 (585) -CAD 109,432 GBP 64,031 State Street Bank and Trust 06/07/2021 (84) -CAD 6,218 JPY 560,776 State Street Bank and Trust 06/07/2021 (31) -CAD 41,068 SGD 44,992 State Street Bank and Trust 06/07/2021 (305) -CHF 312,443 AUD 450,636 State Street Bank and Trust 06/07/2021 (271) -CHF 257,710 CAD 346,229 State Street Bank and Trust 06/07/2021 (766) -CHF 357,038 EUR 325,736 State Street Bank and Trust 06/07/2021 (22) -CHF 431,403 GBP 338,341 State Street Bank and Trust 06/07/2021 (645) -CHF 120,974 HKD 1,044,154 State Street Bank and Trust 06/07/2021 (3,566) -CHF 689,903 JPY 84,351,127 State Street Bank and Trust 06/07/2021 (13,562) -CHF 218,000 SGD 320,795 State Street Bank and Trust 06/07/2021 (2,782) -CHF 5,293,334 USD 5,885,522 State Street Bank and Trust 06/07/2021 (158,336) (0.01)EUR 3,764,063 AUD 5,950,804 State Street Bank and Trust 06/07/2021 (3,477) -EUR 3,062,099 CAD 4,509,406 State Street Bank and Trust 06/07/2021 (9,937) -EUR 5,385,166 GBP 4,629,663 State Street Bank and Trust 06/07/2021 (8,898) -EUR 1,436,228 HKD 13,588,115 State Street Bank and Trust 06/07/2021 (46,356) -EUR 8,195,603 JPY 1,098,389,304 State Street Bank and Trust 06/07/2021 (176,563) (0.01)EUR 23 NZD 39 State Street Bank and Trust 06/07/2021 - -EUR 2,637,241 SGD 4,254,013 State Street Bank and Trust 06/07/2021 (36,925) -EUR 62,911,316 USD 76,687,949 State Street Bank and Trust 06/07/2021 (2,074,909) (0.09)GBP 260,911 AUD 480,314 State Street Bank and Trust 06/07/2021 (163) -GBP 9,743,757 CAD 16,693,906 State Street Bank and Trust 06/07/2021 (20,570) -GBP 560,808 EUR 653,561 State Street Bank and Trust 06/07/2021 (390) -GBP 4,570,815 HKD 50,292,645 State Street Bank and Trust 06/07/2021 (161,698) (0.01)GBP 26,427,268 JPY 4,113,696,329 State Street Bank and Trust 06/07/2021 (556,316) (0.02)GBP 12,074 NZD 23,925 State Street Bank and Trust 06/07/2021 (39) -GBP 8,269,058 SGD 15,513,890 State Street Bank and Trust 06/07/2021 (117,851) -GBP 224,996,111 USD 317,434,410 State Street Bank and Trust 06/07/2021 (6,609,643) (0.28)HKD 191,141 GBP 17,836 State Street Bank and Trust 06/07/2021 (26) -JPY 16,520,956 GBP 108,546 State Street Bank and Trust 06/07/2021 (1,098) -JPY 4,316,058 HKD 304,670 State Street Bank and Trust 06/07/2021 (344) -JPY 200,041,655 USD 1,819,062 State Street Bank and Trust 06/07/2021 (16,671) -NZD 1,177 CHF 768 State Street Bank and Trust 06/07/2021 (8) -NZD 11,085 EUR 6,586 State Street Bank and Trust 06/07/2021 (65) -NZD 38,375 GBP 19,609 State Street Bank and Trust 06/07/2021 (273) -NZD 711 JPY 55,942 State Street Bank and Trust 06/07/2021 (7) -NZD 6,099 SGD 5,834 State Street Bank and Trust 06/07/2021 (79) -SGD 933,496 HKD 5,475,279 State Street Bank and Trust 06/07/2021 (10,588) -SGD 5,315,526 JPY 441,605,399 State Street Bank and Trust 06/07/2021 (24,506) -SGD 41,037,642 USD 31,013,042 State Street Bank and Trust 06/07/2021 (483,807) (0.02)USD 1,565,148 GBP 1,133,616 State Street Bank and Trust 06/07/2021 (907) -
Unrealised loss on open forward foreign currency contracts (10,543,928) (0.44)
Total financial derivative instruments at negative fair value (10,543,928) (0.44)
Total financial liabilities held for trading (10,543,928) (0.44)
Mercer UCITS Common Contractual FundMercer Passive Global REITS UCITS CCF
Portfolio Statementas at 30 June 2021
(continued)
Mercer UCITS Common Contractual Fund 143
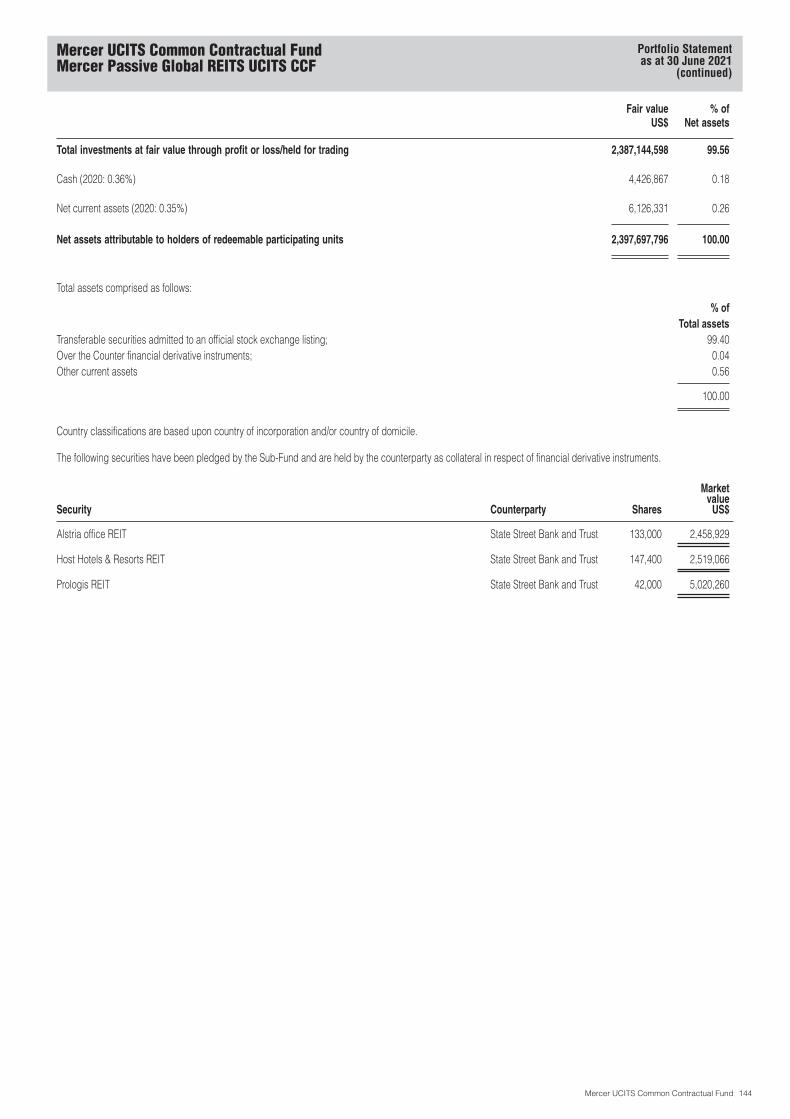
Fair valueUS$
% ofNet assets
Total investments at fair value through profit or loss/held for trading 2,387,144,598 99.56
Cash (2020: 0.36%) 4,426,867 0.18
Net current assets (2020: 0.35%) 6,126,331 0.26
Net assets attributable to holders of redeemable participating units 2,397,697,796 100.00
Total assets comprised as follows:
% ofTotal assets
Transferable securities admitted to an official stock exchange listing; 99.40Over the Counter financial derivative instruments; 0.04Other current assets 0.56
100.00
Country classifications are based upon country of incorporation and/or country of domicile.
The following securities have been pledged by the Sub-Fund and are held by the counterparty as collateral in respect of financial derivative instruments.
Security Counterparty Shares
Marketvalue
US$
Alstria office REIT State Street Bank and Trust 133,000 2,458,929
Host Hotels & Resorts REIT State Street Bank and Trust 147,400 2,519,066
Prologis REIT State Street Bank and Trust 42,000 5,020,260
Mercer UCITS Common Contractual FundMercer Passive Global REITS UCITS CCF
Portfolio Statementas at 30 June 2021
(continued)
Mercer UCITS Common Contractual Fund 144
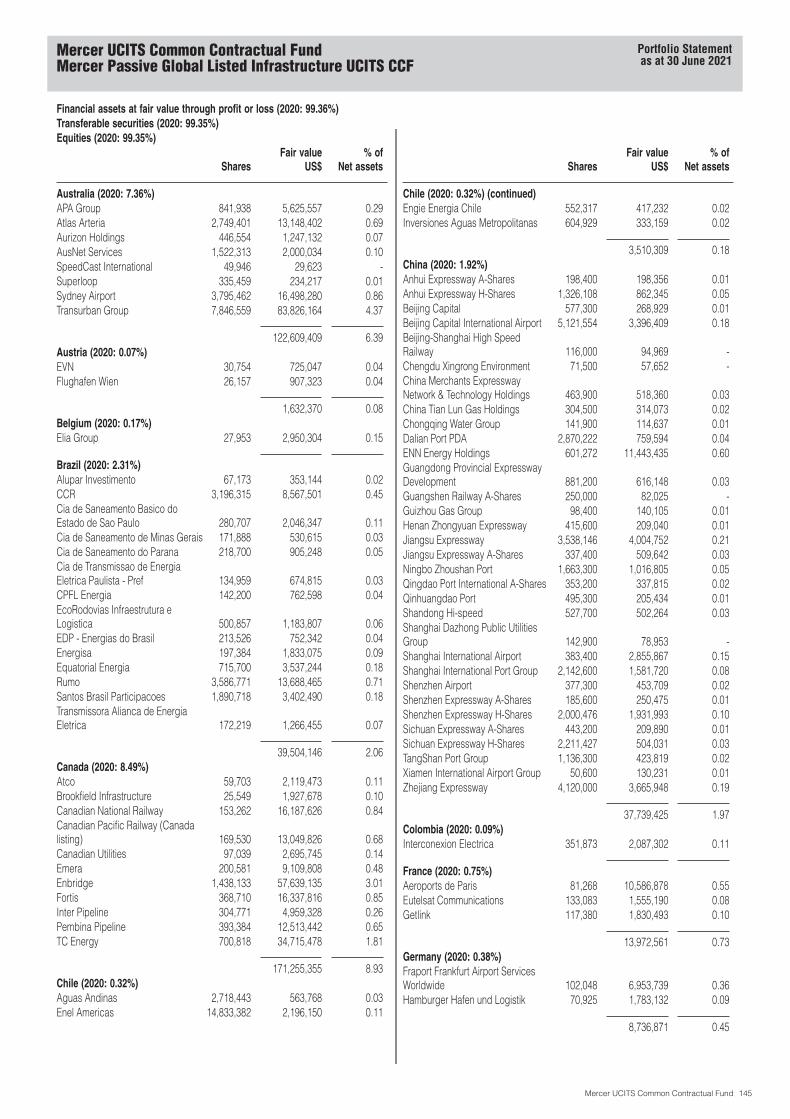
Financial assets at fair value through profit or loss (2020: 99.36%)Transferable securities (2020: 99.35%)Equities (2020: 99.35%)
SharesFair value
US$% of
Net assets
Australia (2020: 7.36%)APA Group 841,938 5,625,557 0.29Atlas Arteria 2,749,401 13,148,402 0.69Aurizon Holdings 446,554 1,247,132 0.07AusNet Services 1,522,313 2,000,034 0.10SpeedCast International 49,946 29,623 -Superloop 335,459 234,217 0.01Sydney Airport 3,795,462 16,498,280 0.86Transurban Group 7,846,559 83,826,164 4.37
122,609,409 6.39Austria (2020: 0.07%)EVN 30,754 725,047 0.04Flughafen Wien 26,157 907,323 0.04
1,632,370 0.08Belgium (2020: 0.17%)Elia Group 27,953 2,950,304 0.15
Brazil (2020: 2.31%)Alupar Investimento 67,173 353,144 0.02CCR 3,196,315 8,567,501 0.45Cia de Saneamento Basico doEstado de Sao Paulo 280,707 2,046,347 0.11Cia de Saneamento de Minas Gerais 171,888 530,615 0.03Cia de Saneamento do Parana 218,700 905,248 0.05Cia de Transmissao de EnergiaEletrica Paulista - Pref 134,959 674,815 0.03CPFL Energia 142,200 762,598 0.04EcoRodovias Infraestrutura eLogistica 500,857 1,183,807 0.06EDP - Energias do Brasil 213,526 752,342 0.04Energisa 197,384 1,833,075 0.09Equatorial Energia 715,700 3,537,244 0.18Rumo 3,586,771 13,688,465 0.71Santos Brasil Participacoes 1,890,718 3,402,490 0.18Transmissora Alianca de EnergiaEletrica 172,219 1,266,455 0.07
39,504,146 2.06Canada (2020: 8.49%)Atco 59,703 2,119,473 0.11Brookfield Infrastructure 25,549 1,927,678 0.10Canadian National Railway 153,262 16,187,626 0.84Canadian Pacific Railway (Canadalisting) 169,530 13,049,826 0.68Canadian Utilities 97,039 2,695,745 0.14Emera 200,581 9,109,808 0.48Enbridge 1,438,133 57,639,135 3.01Fortis 368,710 16,337,816 0.85Inter Pipeline 304,771 4,959,328 0.26Pembina Pipeline 393,384 12,513,442 0.65TC Energy 700,818 34,715,478 1.81
171,255,355 8.93Chile (2020: 0.32%)Aguas Andinas 2,718,443 563,768 0.03Enel Americas 14,833,382 2,196,150 0.11
SharesFair value
US$% of
Net assets
Chile (2020: 0.32%) (continued)Engie Energia Chile 552,317 417,232 0.02Inversiones Aguas Metropolitanas 604,929 333,159 0.02
3,510,309 0.18China (2020: 1.92%)Anhui Expressway A-Shares 198,400 198,356 0.01Anhui Expressway H-Shares 1,326,108 862,345 0.05Beijing Capital 577,300 268,929 0.01Beijing Capital International Airport 5,121,554 3,396,409 0.18Beijing-Shanghai High SpeedRailway 116,000 94,969 -Chengdu Xingrong Environment 71,500 57,652 -China Merchants ExpresswayNetwork & Technology Holdings 463,900 518,360 0.03China Tian Lun Gas Holdings 304,500 314,073 0.02Chongqing Water Group 141,900 114,637 0.01Dalian Port PDA 2,870,222 759,594 0.04ENN Energy Holdings 601,272 11,443,435 0.60Guangdong Provincial ExpresswayDevelopment 881,200 616,148 0.03Guangshen Railway A-Shares 250,000 82,025 -Guizhou Gas Group 98,400 140,105 0.01Henan Zhongyuan Expressway 415,600 209,040 0.01Jiangsu Expressway 3,538,146 4,004,752 0.21Jiangsu Expressway A-Shares 337,400 509,642 0.03Ningbo Zhoushan Port 1,663,300 1,016,805 0.05Qingdao Port International A-Shares 353,200 337,815 0.02Qinhuangdao Port 495,300 205,434 0.01Shandong Hi-speed 527,700 502,264 0.03Shanghai Dazhong Public UtilitiesGroup 142,900 78,953 -Shanghai International Airport 383,400 2,855,867 0.15Shanghai International Port Group 2,142,600 1,581,720 0.08Shenzhen Airport 377,300 453,709 0.02Shenzhen Expressway A-Shares 185,600 250,475 0.01Shenzhen Expressway H-Shares 2,000,476 1,931,993 0.10Sichuan Expressway A-Shares 443,200 209,890 0.01Sichuan Expressway H-Shares 2,211,427 504,031 0.03TangShan Port Group 1,136,300 423,819 0.02Xiamen International Airport Group 50,600 130,231 0.01Zhejiang Expressway 4,120,000 3,665,948 0.19
37,739,425 1.97Colombia (2020: 0.09%)Interconexion Electrica 351,873 2,087,302 0.11
France (2020: 0.75%)Aeroports de Paris 81,268 10,586,878 0.55Eutelsat Communications 133,083 1,555,190 0.08Getlink 117,380 1,830,493 0.10
13,972,561 0.73Germany (2020: 0.38%)Fraport Frankfurt Airport ServicesWorldwide 102,048 6,953,739 0.36Hamburger Hafen und Logistik 70,925 1,783,132 0.09
8,736,871 0.45
Mercer UCITS Common Contractual FundMercer Passive Global Listed Infrastructure UCITS CCF
Portfolio Statementas at 30 June 2021
Mercer UCITS Common Contractual Fund 145
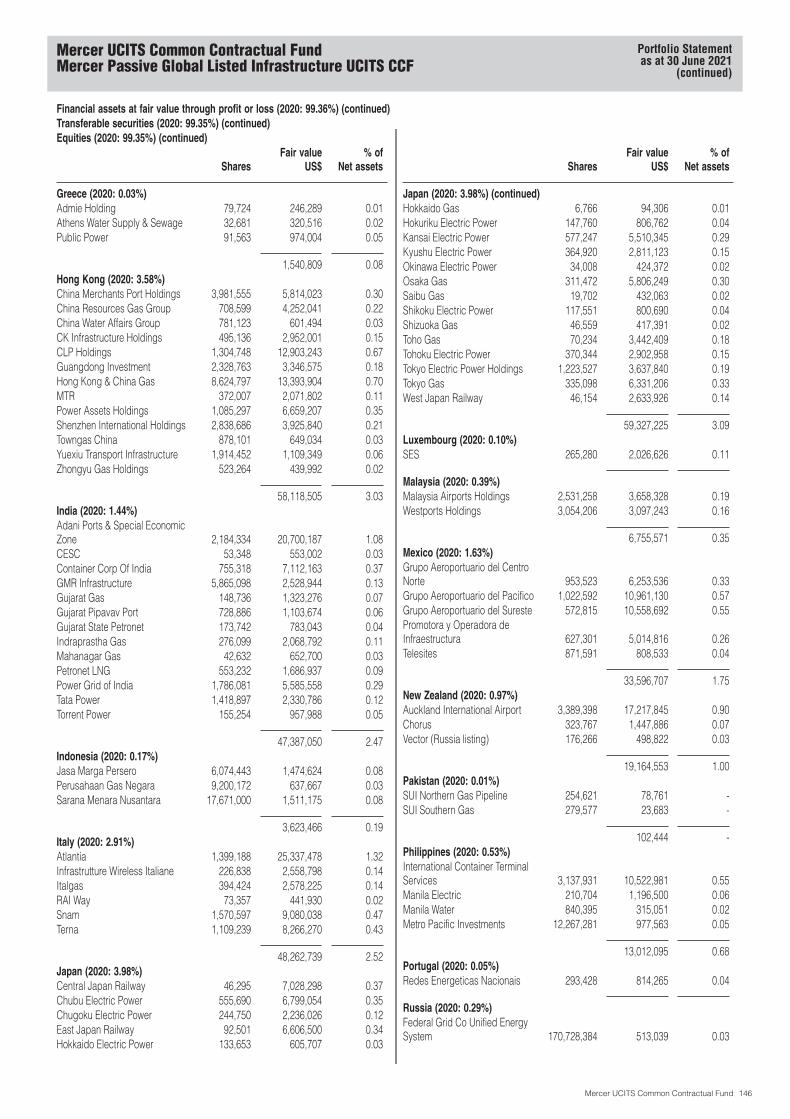
Financial assets at fair value through profit or loss (2020: 99.36%) (continued)Transferable securities (2020: 99.35%) (continued)Equities (2020: 99.35%) (continued)
SharesFair value
US$% of
Net assets
Greece (2020: 0.03%)Admie Holding 79,724 246,289 0.01Athens Water Supply & Sewage 32,681 320,516 0.02Public Power 91,563 974,004 0.05
1,540,809 0.08Hong Kong (2020: 3.58%)China Merchants Port Holdings 3,981,555 5,814,023 0.30China Resources Gas Group 708,599 4,252,041 0.22China Water Affairs Group 781,123 601,494 0.03CK Infrastructure Holdings 495,136 2,952,001 0.15CLP Holdings 1,304,748 12,903,243 0.67Guangdong Investment 2,328,763 3,346,575 0.18Hong Kong & China Gas 8,624,797 13,393,904 0.70MTR 372,007 2,071,802 0.11Power Assets Holdings 1,085,297 6,659,207 0.35Shenzhen International Holdings 2,838,686 3,925,840 0.21Towngas China 878,101 649,034 0.03Yuexiu Transport Infrastructure 1,914,452 1,109,349 0.06Zhongyu Gas Holdings 523,264 439,992 0.02
58,118,505 3.03India (2020: 1.44%)Adani Ports & Special EconomicZone 2,184,334 20,700,187 1.08CESC 53,348 553,002 0.03Container Corp Of India 755,318 7,112,163 0.37GMR Infrastructure 5,865,098 2,528,944 0.13Gujarat Gas 148,736 1,323,276 0.07Gujarat Pipavav Port 728,886 1,103,674 0.06Gujarat State Petronet 173,742 783,043 0.04Indraprastha Gas 276,099 2,068,792 0.11Mahanagar Gas 42,632 652,700 0.03Petronet LNG 553,232 1,686,937 0.09Power Grid of India 1,786,081 5,585,558 0.29Tata Power 1,418,897 2,330,786 0.12Torrent Power 155,254 957,988 0.05
47,387,050 2.47Indonesia (2020: 0.17%)Jasa Marga Persero 6,074,443 1,474,624 0.08Perusahaan Gas Negara 9,200,172 637,667 0.03Sarana Menara Nusantara 17,671,000 1,511,175 0.08
3,623,466 0.19Italy (2020: 2.91%)Atlantia 1,399,188 25,337,478 1.32Infrastrutture Wireless Italiane 226,838 2,558,798 0.14Italgas 394,424 2,578,225 0.14RAI Way 73,357 441,930 0.02Snam 1,570,597 9,080,038 0.47Terna 1,109,239 8,266,270 0.43
48,262,739 2.52Japan (2020: 3.98%)Central Japan Railway 46,295 7,028,298 0.37Chubu Electric Power 555,690 6,799,054 0.35Chugoku Electric Power 244,750 2,236,026 0.12East Japan Railway 92,501 6,606,500 0.34Hokkaido Electric Power 133,653 605,707 0.03
SharesFair value
US$% of
Net assets
Japan (2020: 3.98%) (continued)Hokkaido Gas 6,766 94,306 0.01Hokuriku Electric Power 147,760 806,762 0.04Kansai Electric Power 577,247 5,510,345 0.29Kyushu Electric Power 364,920 2,811,123 0.15Okinawa Electric Power 34,008 424,372 0.02Osaka Gas 311,472 5,806,249 0.30Saibu Gas 19,702 432,063 0.02Shikoku Electric Power 117,551 800,690 0.04Shizuoka Gas 46,559 417,391 0.02Toho Gas 70,234 3,442,409 0.18Tohoku Electric Power 370,344 2,902,958 0.15Tokyo Electric Power Holdings 1,223,527 3,637,840 0.19Tokyo Gas 335,098 6,331,206 0.33West Japan Railway 46,154 2,633,926 0.14
59,327,225 3.09Luxembourg (2020: 0.10%)SES 265,280 2,026,626 0.11
Malaysia (2020: 0.39%)Malaysia Airports Holdings 2,531,258 3,658,328 0.19Westports Holdings 3,054,206 3,097,243 0.16
6,755,571 0.35Mexico (2020: 1.63%)Grupo Aeroportuario del CentroNorte 953,523 6,253,536 0.33Grupo Aeroportuario del Pacifico 1,022,592 10,961,130 0.57Grupo Aeroportuario del Sureste 572,815 10,558,692 0.55Promotora y Operadora deInfraestructura 627,301 5,014,816 0.26Telesites 871,591 808,533 0.04
33,596,707 1.75New Zealand (2020: 0.97%)Auckland International Airport 3,389,398 17,217,845 0.90Chorus 323,767 1,447,886 0.07Vector (Russia listing) 176,266 498,822 0.03
19,164,553 1.00Pakistan (2020: 0.01%)SUI Northern Gas Pipeline 254,621 78,761 -SUI Southern Gas 279,577 23,683 -
102,444 -Philippines (2020: 0.53%)International Container TerminalServices 3,137,931 10,522,981 0.55Manila Electric 210,704 1,196,500 0.06Manila Water 840,395 315,051 0.02Metro Pacific Investments 12,267,281 977,563 0.05
13,012,095 0.68Portugal (2020: 0.05%)Redes Energeticas Nacionais 293,428 814,265 0.04
Russia (2020: 0.29%)Federal Grid Co Unified EnergySystem 170,728,384 513,039 0.03
Mercer UCITS Common Contractual FundMercer Passive Global Listed Infrastructure UCITS CCF
Portfolio Statementas at 30 June 2021
(continued)
Mercer UCITS Common Contractual Fund 146
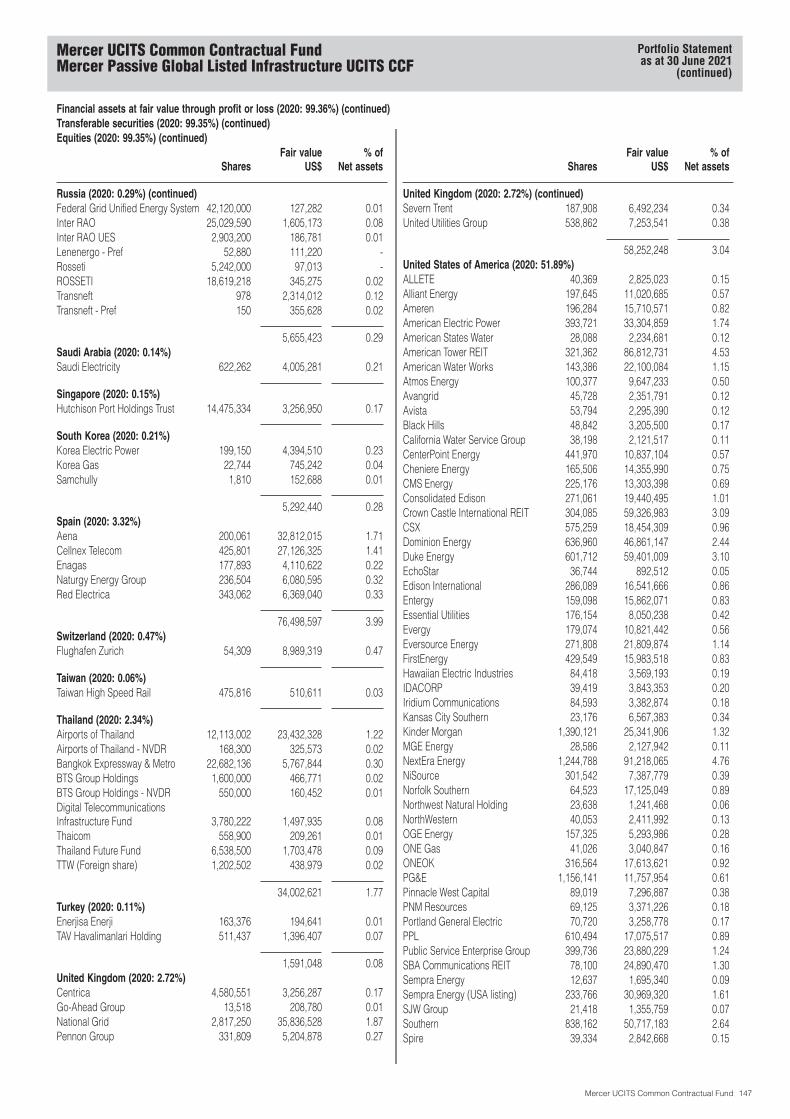
Financial assets at fair value through profit or loss (2020: 99.36%) (continued)Transferable securities (2020: 99.35%) (continued)Equities (2020: 99.35%) (continued)
SharesFair value
US$% of
Net assets
Russia (2020: 0.29%) (continued)Federal Grid Unified Energy System 42,120,000 127,282 0.01Inter RAO 25,029,590 1,605,173 0.08Inter RAO UES 2,903,200 186,781 0.01Lenenergo - Pref 52,880 111,220 -Rosseti 5,242,000 97,013 -ROSSETI 18,619,218 345,275 0.02Transneft 978 2,314,012 0.12Transneft - Pref 150 355,628 0.02
5,655,423 0.29Saudi Arabia (2020: 0.14%)Saudi Electricity 622,262 4,005,281 0.21
Singapore (2020: 0.15%)Hutchison Port Holdings Trust 14,475,334 3,256,950 0.17
South Korea (2020: 0.21%)Korea Electric Power 199,150 4,394,510 0.23Korea Gas 22,744 745,242 0.04Samchully 1,810 152,688 0.01
5,292,440 0.28Spain (2020: 3.32%)Aena 200,061 32,812,015 1.71Cellnex Telecom 425,801 27,126,325 1.41Enagas 177,893 4,110,622 0.22Naturgy Energy Group 236,504 6,080,595 0.32Red Electrica 343,062 6,369,040 0.33
76,498,597 3.99Switzerland (2020: 0.47%)Flughafen Zurich 54,309 8,989,319 0.47
Taiwan (2020: 0.06%)Taiwan High Speed Rail 475,816 510,611 0.03
Thailand (2020: 2.34%)Airports of Thailand 12,113,002 23,432,328 1.22Airports of Thailand - NVDR 168,300 325,573 0.02Bangkok Expressway & Metro 22,682,136 5,767,844 0.30BTS Group Holdings 1,600,000 466,771 0.02BTS Group Holdings - NVDR 550,000 160,452 0.01Digital TelecommunicationsInfrastructure Fund 3,780,222 1,497,935 0.08Thaicom 558,900 209,261 0.01Thailand Future Fund 6,538,500 1,703,478 0.09TTW (Foreign share) 1,202,502 438,979 0.02
34,002,621 1.77Turkey (2020: 0.11%)Enerjisa Enerji 163,376 194,641 0.01TAV Havalimanlari Holding 511,437 1,396,407 0.07
1,591,048 0.08United Kingdom (2020: 2.72%)Centrica 4,580,551 3,256,287 0.17Go-Ahead Group 13,518 208,780 0.01National Grid 2,817,250 35,836,528 1.87Pennon Group 331,809 5,204,878 0.27
SharesFair value
US$% of
Net assets
United Kingdom (2020: 2.72%) (continued)Severn Trent 187,908 6,492,234 0.34United Utilities Group 538,862 7,253,541 0.38
58,252,248 3.04United States of America (2020: 51.89%)ALLETE 40,369 2,825,023 0.15Alliant Energy 197,645 11,020,685 0.57Ameren 196,284 15,710,571 0.82American Electric Power 393,721 33,304,859 1.74American States Water 28,088 2,234,681 0.12American Tower REIT 321,362 86,812,731 4.53American Water Works 143,386 22,100,084 1.15Atmos Energy 100,377 9,647,233 0.50Avangrid 45,728 2,351,791 0.12Avista 53,794 2,295,390 0.12Black Hills 48,842 3,205,500 0.17California Water Service Group 38,198 2,121,517 0.11CenterPoint Energy 441,970 10,837,104 0.57Cheniere Energy 165,506 14,355,990 0.75CMS Energy 225,176 13,303,398 0.69Consolidated Edison 271,061 19,440,495 1.01Crown Castle International REIT 304,085 59,326,983 3.09CSX 575,259 18,454,309 0.96Dominion Energy 636,960 46,861,147 2.44Duke Energy 601,712 59,401,009 3.10EchoStar 36,744 892,512 0.05Edison International 286,089 16,541,666 0.86Entergy 159,098 15,862,071 0.83Essential Utilities 176,154 8,050,238 0.42Evergy 179,074 10,821,442 0.56Eversource Energy 271,808 21,809,874 1.14FirstEnergy 429,549 15,983,518 0.83Hawaiian Electric Industries 84,418 3,569,193 0.19IDACORP 39,419 3,843,353 0.20Iridium Communications 84,593 3,382,874 0.18Kansas City Southern 23,176 6,567,383 0.34Kinder Morgan 1,390,121 25,341,906 1.32MGE Energy 28,586 2,127,942 0.11NextEra Energy 1,244,788 91,218,065 4.76NiSource 301,542 7,387,779 0.39Norfolk Southern 64,523 17,125,049 0.89Northwest Natural Holding 23,638 1,241,468 0.06NorthWestern 40,053 2,411,992 0.13OGE Energy 157,325 5,293,986 0.28ONE Gas 41,026 3,040,847 0.16ONEOK 316,564 17,613,621 0.92PG&E 1,156,141 11,757,954 0.61Pinnacle West Capital 89,019 7,296,887 0.38PNM Resources 69,125 3,371,226 0.18Portland General Electric 70,720 3,258,778 0.17PPL 610,494 17,075,517 0.89Public Service Enterprise Group 399,736 23,880,229 1.24SBA Communications REIT 78,100 24,890,470 1.30Sempra Energy 12,637 1,695,340 0.09Sempra Energy (USA listing) 233,766 30,969,320 1.61SJW Group 21,418 1,355,759 0.07Southern 838,162 50,717,183 2.64Spire 39,334 2,842,668 0.15
Mercer UCITS Common Contractual FundMercer Passive Global Listed Infrastructure UCITS CCF
Portfolio Statementas at 30 June 2021
(continued)
Mercer UCITS Common Contractual Fund 147
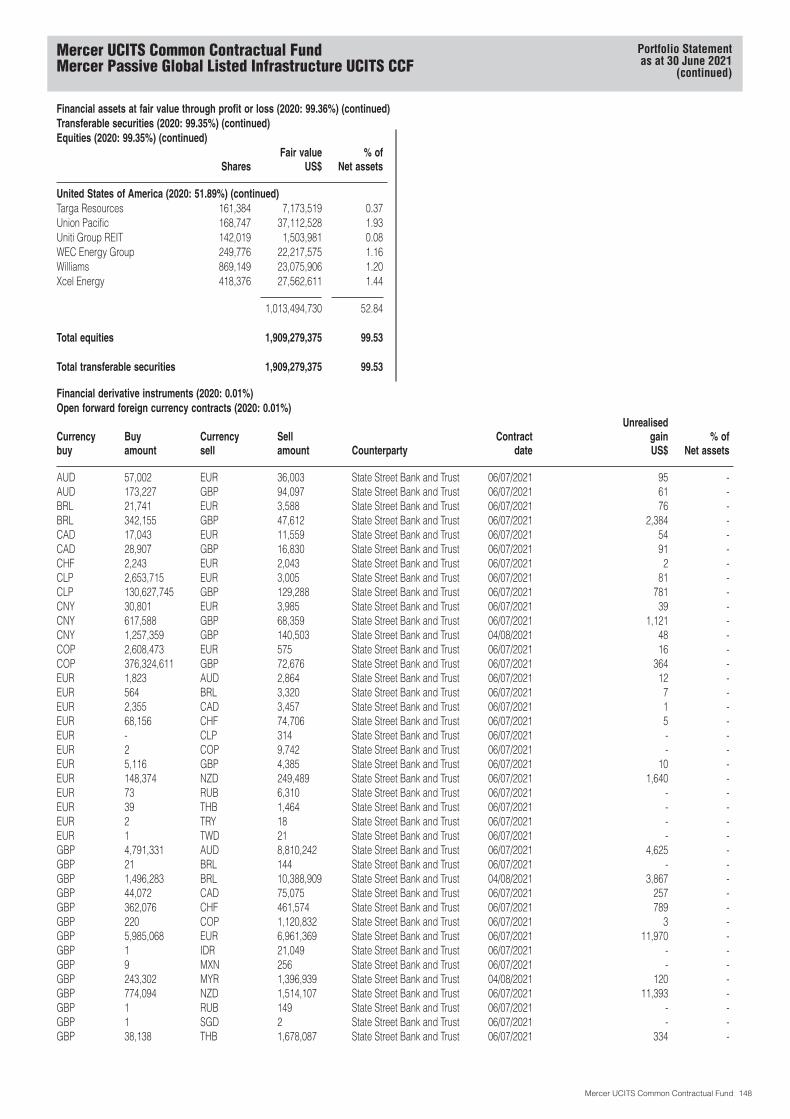
Financial assets at fair value through profit or loss (2020: 99.36%) (continued)Transferable securities (2020: 99.35%) (continued)Equities (2020: 99.35%) (continued)
SharesFair value
US$% of
Net assets
United States of America (2020: 51.89%) (continued)Targa Resources 161,384 7,173,519 0.37Union Pacific 168,747 37,112,528 1.93Uniti Group REIT 142,019 1,503,981 0.08WEC Energy Group 249,776 22,217,575 1.16Williams 869,149 23,075,906 1.20Xcel Energy 418,376 27,562,611 1.44
1,013,494,730 52.84
Total equities 1,909,279,375 99.53
Total transferable securities 1,909,279,375 99.53
Financial derivative instruments (2020: 0.01%)Open forward foreign currency contracts (2020: 0.01%)
Currencybuy
Buyamount
Currencysell
Sellamount Counterparty
Contractdate
UnrealisedgainUS$
% ofNet assets
AUD 57,002 EUR 36,003 State Street Bank and Trust 06/07/2021 95 -AUD 173,227 GBP 94,097 State Street Bank and Trust 06/07/2021 61 -BRL 21,741 EUR 3,588 State Street Bank and Trust 06/07/2021 76 -BRL 342,155 GBP 47,612 State Street Bank and Trust 06/07/2021 2,384 -CAD 17,043 EUR 11,559 State Street Bank and Trust 06/07/2021 54 -CAD 28,907 GBP 16,830 State Street Bank and Trust 06/07/2021 91 -CHF 2,243 EUR 2,043 State Street Bank and Trust 06/07/2021 2 -CLP 2,653,715 EUR 3,005 State Street Bank and Trust 06/07/2021 81 -CLP 130,627,745 GBP 129,288 State Street Bank and Trust 06/07/2021 781 -CNY 30,801 EUR 3,985 State Street Bank and Trust 06/07/2021 39 -CNY 617,588 GBP 68,359 State Street Bank and Trust 06/07/2021 1,121 -CNY 1,257,359 GBP 140,503 State Street Bank and Trust 04/08/2021 48 -COP 2,608,473 EUR 575 State Street Bank and Trust 06/07/2021 16 -COP 376,324,611 GBP 72,676 State Street Bank and Trust 06/07/2021 364 -EUR 1,823 AUD 2,864 State Street Bank and Trust 06/07/2021 12 -EUR 564 BRL 3,320 State Street Bank and Trust 06/07/2021 7 -EUR 2,355 CAD 3,457 State Street Bank and Trust 06/07/2021 1 -EUR 68,156 CHF 74,706 State Street Bank and Trust 06/07/2021 5 -EUR - CLP 314 State Street Bank and Trust 06/07/2021 - -EUR 2 COP 9,742 State Street Bank and Trust 06/07/2021 - -EUR 5,116 GBP 4,385 State Street Bank and Trust 06/07/2021 10 -EUR 148,374 NZD 249,489 State Street Bank and Trust 06/07/2021 1,640 -EUR 73 RUB 6,310 State Street Bank and Trust 06/07/2021 - -EUR 39 THB 1,464 State Street Bank and Trust 06/07/2021 - -EUR 2 TRY 18 State Street Bank and Trust 06/07/2021 - -EUR 1 TWD 21 State Street Bank and Trust 06/07/2021 - -GBP 4,791,331 AUD 8,810,242 State Street Bank and Trust 06/07/2021 4,625 -GBP 21 BRL 144 State Street Bank and Trust 06/07/2021 - -GBP 1,496,283 BRL 10,388,909 State Street Bank and Trust 04/08/2021 3,867 -GBP 44,072 CAD 75,075 State Street Bank and Trust 06/07/2021 257 -GBP 362,076 CHF 461,574 State Street Bank and Trust 06/07/2021 789 -GBP 220 COP 1,120,832 State Street Bank and Trust 06/07/2021 3 -GBP 5,985,068 EUR 6,961,369 State Street Bank and Trust 06/07/2021 11,970 -GBP 1 IDR 21,049 State Street Bank and Trust 06/07/2021 - -GBP 9 MXN 256 State Street Bank and Trust 06/07/2021 - -GBP 243,302 MYR 1,396,939 State Street Bank and Trust 04/08/2021 120 -GBP 774,094 NZD 1,514,107 State Street Bank and Trust 06/07/2021 11,393 -GBP 1 RUB 149 State Street Bank and Trust 06/07/2021 - -GBP 1 SGD 2 State Street Bank and Trust 06/07/2021 - -GBP 38,138 THB 1,678,087 State Street Bank and Trust 06/07/2021 334 -
Mercer UCITS Common Contractual FundMercer Passive Global Listed Infrastructure UCITS CCF
Portfolio Statementas at 30 June 2021
(continued)
Mercer UCITS Common Contractual Fund 148
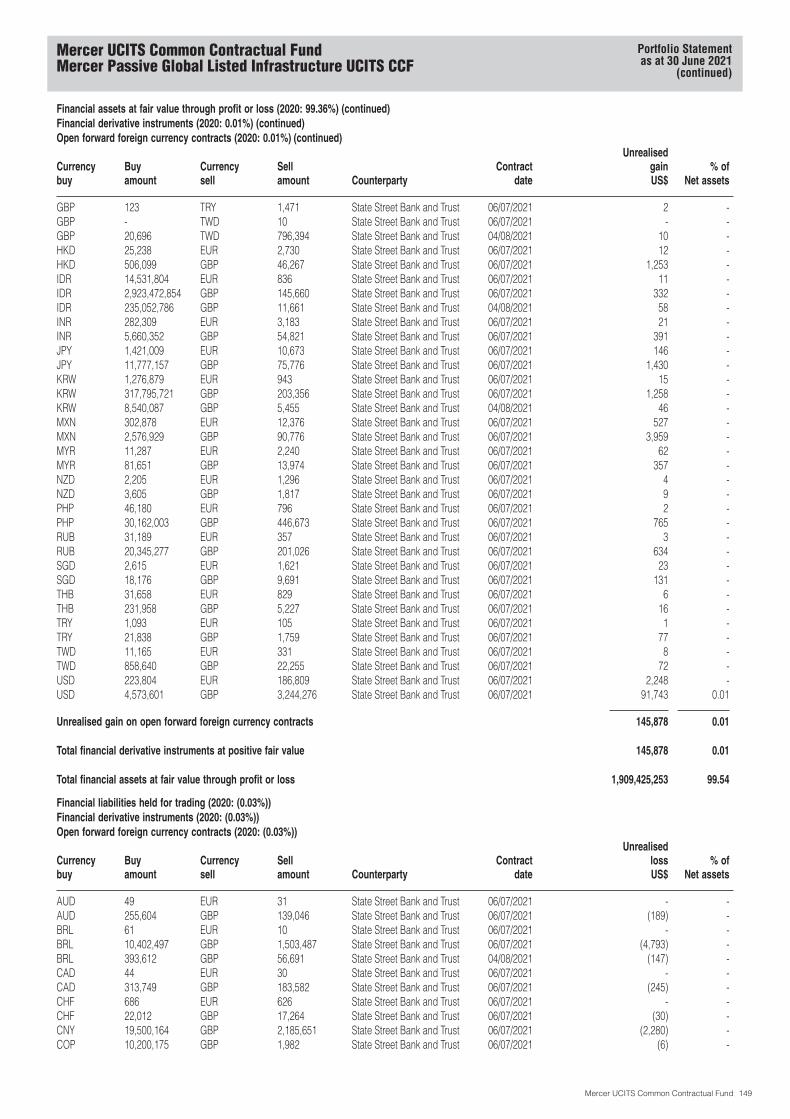
Financial assets at fair value through profit or loss (2020: 99.36%) (continued)Financial derivative instruments (2020: 0.01%) (continued)Open forward foreign currency contracts (2020: 0.01%) (continued)
Currencybuy
Buyamount
Currencysell
Sellamount Counterparty
Contractdate
UnrealisedgainUS$
% ofNet assets
GBP 123 TRY 1,471 State Street Bank and Trust 06/07/2021 2 -GBP - TWD 10 State Street Bank and Trust 06/07/2021 - -GBP 20,696 TWD 796,394 State Street Bank and Trust 04/08/2021 10 -HKD 25,238 EUR 2,730 State Street Bank and Trust 06/07/2021 12 -HKD 506,099 GBP 46,267 State Street Bank and Trust 06/07/2021 1,253 -IDR 14,531,804 EUR 836 State Street Bank and Trust 06/07/2021 11 -IDR 2,923,472,854 GBP 145,660 State Street Bank and Trust 06/07/2021 332 -IDR 235,052,786 GBP 11,661 State Street Bank and Trust 04/08/2021 58 -INR 282,309 EUR 3,183 State Street Bank and Trust 06/07/2021 21 -INR 5,660,352 GBP 54,821 State Street Bank and Trust 06/07/2021 391 -JPY 1,421,009 EUR 10,673 State Street Bank and Trust 06/07/2021 146 -JPY 11,777,157 GBP 75,776 State Street Bank and Trust 06/07/2021 1,430 -KRW 1,276,879 EUR 943 State Street Bank and Trust 06/07/2021 15 -KRW 317,795,721 GBP 203,356 State Street Bank and Trust 06/07/2021 1,258 -KRW 8,540,087 GBP 5,455 State Street Bank and Trust 04/08/2021 46 -MXN 302,878 EUR 12,376 State Street Bank and Trust 06/07/2021 527 -MXN 2,576,929 GBP 90,776 State Street Bank and Trust 06/07/2021 3,959 -MYR 11,287 EUR 2,240 State Street Bank and Trust 06/07/2021 62 -MYR 81,651 GBP 13,974 State Street Bank and Trust 06/07/2021 357 -NZD 2,205 EUR 1,296 State Street Bank and Trust 06/07/2021 4 -NZD 3,605 GBP 1,817 State Street Bank and Trust 06/07/2021 9 -PHP 46,180 EUR 796 State Street Bank and Trust 06/07/2021 2 -PHP 30,162,003 GBP 446,673 State Street Bank and Trust 06/07/2021 765 -RUB 31,189 EUR 357 State Street Bank and Trust 06/07/2021 3 -RUB 20,345,277 GBP 201,026 State Street Bank and Trust 06/07/2021 634 -SGD 2,615 EUR 1,621 State Street Bank and Trust 06/07/2021 23 -SGD 18,176 GBP 9,691 State Street Bank and Trust 06/07/2021 131 -THB 31,658 EUR 829 State Street Bank and Trust 06/07/2021 6 -THB 231,958 GBP 5,227 State Street Bank and Trust 06/07/2021 16 -TRY 1,093 EUR 105 State Street Bank and Trust 06/07/2021 1 -TRY 21,838 GBP 1,759 State Street Bank and Trust 06/07/2021 77 -TWD 11,165 EUR 331 State Street Bank and Trust 06/07/2021 8 -TWD 858,640 GBP 22,255 State Street Bank and Trust 06/07/2021 72 -USD 223,804 EUR 186,809 State Street Bank and Trust 06/07/2021 2,248 -USD 4,573,601 GBP 3,244,276 State Street Bank and Trust 06/07/2021 91,743 0.01
Unrealised gain on open forward foreign currency contracts 145,878 0.01
Total financial derivative instruments at positive fair value 145,878 0.01
Total financial assets at fair value through profit or loss 1,909,425,253 99.54
Financial liabilities held for trading (2020: (0.03%))Financial derivative instruments (2020: (0.03%))Open forward foreign currency contracts (2020: (0.03%))
Currencybuy
Buyamount
Currencysell
Sellamount Counterparty
Contractdate
UnrealisedlossUS$
% ofNet assets
AUD 49 EUR 31 State Street Bank and Trust 06/07/2021 - -AUD 255,604 GBP 139,046 State Street Bank and Trust 06/07/2021 (189) -BRL 61 EUR 10 State Street Bank and Trust 06/07/2021 - -BRL 10,402,497 GBP 1,503,487 State Street Bank and Trust 06/07/2021 (4,793) -BRL 393,612 GBP 56,691 State Street Bank and Trust 04/08/2021 (147) -CAD 44 EUR 30 State Street Bank and Trust 06/07/2021 - -CAD 313,749 GBP 183,582 State Street Bank and Trust 06/07/2021 (245) -CHF 686 EUR 626 State Street Bank and Trust 06/07/2021 - -CHF 22,012 GBP 17,264 State Street Bank and Trust 06/07/2021 (30) -CNY 19,500,164 GBP 2,185,651 State Street Bank and Trust 06/07/2021 (2,280) -COP 10,200,175 GBP 1,982 State Street Bank and Trust 06/07/2021 (6) -
Mercer UCITS Common Contractual FundMercer Passive Global Listed Infrastructure UCITS CCF
Portfolio Statementas at 30 June 2021
(continued)
Mercer UCITS Common Contractual Fund 149

Financial liabilities held for trading (2020: (0.03%)) (continued)Financial derivative instruments (2020: (0.03)%) (continued)
Currencybuy
Buyamount
Currencysell
Sellamount Counterparty
Contractdate
UnrealisedlossUS$
% ofNet assets
EUR 899,479 AUD 1,422,011 State Street Bank and Trust 06/07/2021 (815) -EUR 270,912 BRL 1,736,001 State Street Bank and Trust 06/07/2021 (24,518) -EUR 1,223,717 CAD 1,802,083 State Street Bank and Trust 06/07/2021 (3,950) -EUR 63 CHF 69 State Street Bank and Trust 06/07/2021 - -EUR 24,258 CLP 21,418,915 State Street Bank and Trust 06/07/2021 (644) -EUR 417,508 CNY 3,254,613 State Street Bank and Trust 06/07/2021 (8,397) -EUR 13,946 COP 63,297,589 State Street Bank and Trust 06/07/2021 (408) -EUR 794,094 GBP 682,960 State Street Bank and Trust 06/07/2021 (1,690) -EUR 281,874 HKD 2,666,879 State Street Bank and Trust 06/07/2021 (9,108) -EUR 27,148 IDR 476,753,410 State Street Bank and Trust 06/07/2021 (672) -EUR 335,246 INR 29,830,899 State Street Bank and Trust 06/07/2021 (3,575) -EUR 428,753 JPY 57,460,116 State Street Bank and Trust 06/07/2021 (9,216) -EUR 37,770 KRW 51,453,875 State Street Bank and Trust 06/07/2021 (894) -EUR 242,588 MXN 5,923,930 State Street Bank and Trust 06/07/2021 (9,668) -EUR 47,053 MYR 238,091 State Street Bank and Trust 06/07/2021 (1,537) -EUR 83,351 PHP 4,879,744 State Street Bank and Trust 06/07/2021 (1,100) -EUR 36,620 RUB 3,289,412 State Street Bank and Trust 06/07/2021 (1,572) -EUR 25,574 SGD 41,252 State Street Bank and Trust 06/07/2021 (359) -EUR 241,809 THB 9,238,226 State Street Bank and Trust 06/07/2021 (1,458) -EUR 10,827 TRY 115,473 State Street Bank and Trust 06/07/2021 (417) -EUR 4,170 TWD 140,778 State Street Bank and Trust 06/07/2021 (108) -EUR 7,254,892 USD 8,841,501 State Street Bank and Trust 06/07/2021 (237,175) (0.01)GBP 11,093 AUD 20,529 State Street Bank and Trust 06/07/2021 (87) -GBP 1,465,358 BRL 10,905,542 State Street Bank and Trust 06/07/2021 (148,091) (0.01)GBP 6,568,478 CAD 11,253,257 State Street Bank and Trust 06/07/2021 (13,485) -GBP 1,373 CHF 1,758 State Street Bank and Trust 06/07/2021 (4) -GBP 128,978 CLP 132,387,225 State Street Bank and Trust 06/07/2021 (3,624) -GBP 116,952 CLP 118,018,999 State Street Bank and Trust 04/08/2021 (362) -GBP 2,253,251 CNY 20,420,024 State Street Bank and Trust 06/07/2021 (46,652) -GBP 2,179,033 CNY 19,500,164 State Street Bank and Trust 04/08/2021 (744) -GBP 74,149 COP 391,095,159 State Street Bank and Trust 06/07/2021 (2,281) -GBP 74,462 COP 386,191,486 State Street Bank and Trust 04/08/2021 (382) -GBP 29,045 EUR 33,913 State Street Bank and Trust 06/07/2021 (95) -GBP 1,520,560 HKD 16,732,533 State Street Bank and Trust 06/07/2021 (54,026) -GBP 145,358 IDR 2,966,790,309 State Street Bank and Trust 06/07/2021 (3,735) -GBP 138,706 IDR 2,795,851,328 State Street Bank and Trust 04/08/2021 (688) -GBP 1,809,161 INR 187,164,036 State Street Bank and Trust 06/07/2021 (17,751) -GBP 1,765,601 INR 182,013,616 State Street Bank and Trust 04/08/2021 (990) -GBP 2,285,757 JPY 356,265,618 State Street Bank and Trust 06/07/2021 (52,283) -GBP 203,654 KRW 322,500,382 State Street Bank and Trust 06/07/2021 (5,027) -GBP 193,867 KRW 303,498,522 State Street Bank and Trust 04/08/2021 (1,610) -GBP 1,306,170 MXN 37,104,308 State Street Bank and Trust 06/07/2021 (58,187) (0.01)GBP 250,772 MYR 1,474,819 State Street Bank and Trust 06/07/2021 (8,754) -GBP 15,638 NZD 30,984 State Street Bank and Trust 06/07/2021 (49) -GBP 449,872 PHP 30,615,203 State Street Bank and Trust 06/07/2021 (5,633) -GBP 460,253 PHP 31,143,469 State Street Bank and Trust 04/08/2021 (1,528) -GBP 198,097 RUB 20,677,040 State Street Bank and Trust 06/07/2021 (9,221) -GBP 201,662 RUB 20,485,004 State Street Bank and Trust 04/08/2021 (440) -GBP 136,175 SGD 255,499 State Street Bank and Trust 06/07/2021 (1,951) -GBP 1,265,775 THB 56,255,359 State Street Bank and Trust 06/07/2021 (6,612) -GBP 58,317 TRY 723,132 State Street Bank and Trust 06/07/2021 (2,469) -GBP 22,185 TWD 870,785 State Street Bank and Trust 06/07/2021 (604) -GBP 40,573,874 USD 57,508,047 State Street Bank and Trust 06/07/2021 (1,456,563) (0.08)INR 178,733,168 GBP 1,740,239 State Street Bank and Trust 06/07/2021 (416) -JPY 265,039 GBP 1,731 State Street Bank and Trust 06/07/2021 (3) -MYR 1,371,903 GBP 239,318 State Street Bank and Trust 06/07/2021 (208) -NZD 15,927 EUR 9,464 State Street Bank and Trust 06/07/2021 (96) -NZD 120,356 GBP 61,373 State Street Bank and Trust 06/07/2021 (682) -RUB 25,828 GBP 257 State Street Bank and Trust 06/07/2021 (2) -THB 86,819 EUR 2,297 State Street Bank and Trust 06/07/2021 (16) -
Mercer UCITS Common Contractual FundMercer Passive Global Listed Infrastructure UCITS CCF
Portfolio Statementas at 30 June 2021
(continued)
Mercer UCITS Common Contractual Fund 150

Financial liabilities held for trading (2020: (0.03%)) (continued)Financial derivative instruments (2020: (0.03)%) (continued)
Currencybuy
Buyamount
Currencysell
Sellamount Counterparty
Contractdate
UnrealisedlossUS$
% ofNet assets
THB 1,673,920 GBP 38,036 State Street Bank and Trust 06/07/2021 (317) -TRY 79 GBP 7 State Street Bank and Trust 06/07/2021 - -
Unrealised loss on open forward foreign currency contracts (2,230,639) (0.11)
Total financial derivative instruments at negative fair value (2,230,639) (0.11)
Total financial liabilities held for trading (2,230,639) (0.11)
Fair valueUS$
% ofNet assets
Total investments at fair value through profit or loss/held for trading 1,907,194,614 99.43
Cash/(bank overdraft) (2020: (0.13%)) 3,582,717 0.19
Net current assets (2020: 0.80%) 7,414,346 0.38
Net assets attributable to holders of redeemable participating units 1,918,191,677 100.00
Total assets comprised as follows:
% ofTotal assets
Transferable securities admitted to an official stock exchange listing; 99.36Over the Counter financial derivative instruments; 0.01Other current assets 0.63
100.00
Country classifications are based upon country of incorporation and/or country of domicile.
The following security has been pledged by the Sub-Fund and is held by the counterparty as collateral in respect of financial derivative instruments.
Security Counterparty Shares
Marketvalue
US$
American Electric Power State Street Bank and Trust 26,240 2,219,642
Mercer UCITS Common Contractual FundMercer Passive Global Listed Infrastructure UCITS CCF
Portfolio Statementas at 30 June 2021
(continued)
Mercer UCITS Common Contractual Fund 151
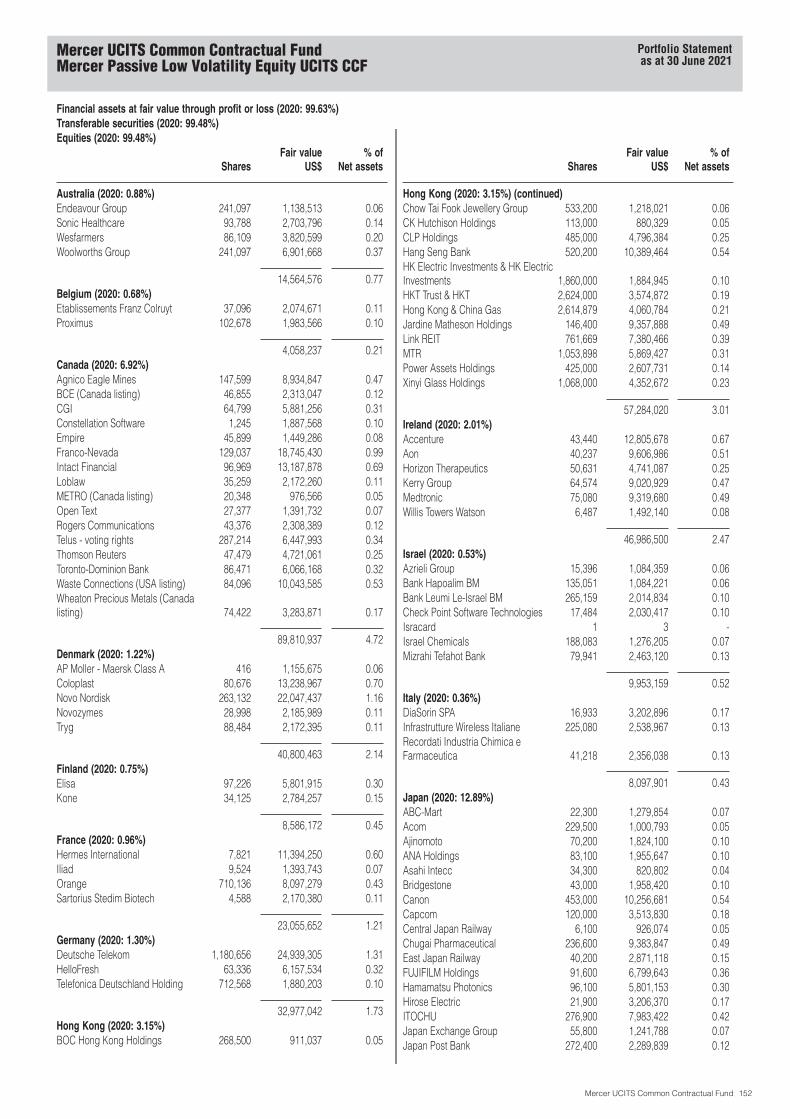
Financial assets at fair value through profit or loss (2020: 99.63%)Transferable securities (2020: 99.48%)Equities (2020: 99.48%)
SharesFair value
US$% of
Net assets
Australia (2020: 0.88%)Endeavour Group 241,097 1,138,513 0.06Sonic Healthcare 93,788 2,703,796 0.14Wesfarmers 86,109 3,820,599 0.20Woolworths Group 241,097 6,901,668 0.37
14,564,576 0.77Belgium (2020: 0.68%)Etablissements Franz Colruyt 37,096 2,074,671 0.11Proximus 102,678 1,983,566 0.10
4,058,237 0.21Canada (2020: 6.92%)Agnico Eagle Mines 147,599 8,934,847 0.47BCE (Canada listing) 46,855 2,313,047 0.12CGI 64,799 5,881,256 0.31Constellation Software 1,245 1,887,568 0.10Empire 45,899 1,449,286 0.08Franco-Nevada 129,037 18,745,430 0.99Intact Financial 96,969 13,187,878 0.69Loblaw 35,259 2,172,260 0.11METRO (Canada listing) 20,348 976,566 0.05Open Text 27,377 1,391,732 0.07Rogers Communications 43,376 2,308,389 0.12Telus - voting rights 287,214 6,447,993 0.34Thomson Reuters 47,479 4,721,061 0.25Toronto-Dominion Bank 86,471 6,066,168 0.32Waste Connections (USA listing) 84,096 10,043,585 0.53Wheaton Precious Metals (Canadalisting) 74,422 3,283,871 0.17
89,810,937 4.72Denmark (2020: 1.22%)AP Moller - Maersk Class A 416 1,155,675 0.06Coloplast 80,676 13,238,967 0.70Novo Nordisk 263,132 22,047,437 1.16Novozymes 28,998 2,185,989 0.11Tryg 88,484 2,172,395 0.11
40,800,463 2.14Finland (2020: 0.75%)Elisa 97,226 5,801,915 0.30Kone 34,125 2,784,257 0.15
8,586,172 0.45France (2020: 0.96%)Hermes International 7,821 11,394,250 0.60Iliad 9,524 1,393,743 0.07Orange 710,136 8,097,279 0.43Sartorius Stedim Biotech 4,588 2,170,380 0.11
23,055,652 1.21Germany (2020: 1.30%)Deutsche Telekom 1,180,656 24,939,305 1.31HelloFresh 63,336 6,157,534 0.32Telefonica Deutschland Holding 712,568 1,880,203 0.10
32,977,042 1.73Hong Kong (2020: 3.15%)BOC Hong Kong Holdings 268,500 911,037 0.05
SharesFair value
US$% of
Net assets
Hong Kong (2020: 3.15%) (continued)Chow Tai Fook Jewellery Group 533,200 1,218,021 0.06CK Hutchison Holdings 113,000 880,329 0.05CLP Holdings 485,000 4,796,384 0.25Hang Seng Bank 520,200 10,389,464 0.54HK Electric Investments & HK ElectricInvestments 1,860,000 1,884,945 0.10HKT Trust & HKT 2,624,000 3,574,872 0.19Hong Kong & China Gas 2,614,879 4,060,784 0.21Jardine Matheson Holdings 146,400 9,357,888 0.49Link REIT 761,669 7,380,466 0.39MTR 1,053,898 5,869,427 0.31Power Assets Holdings 425,000 2,607,731 0.14Xinyi Glass Holdings 1,068,000 4,352,672 0.23
57,284,020 3.01Ireland (2020: 2.01%)Accenture 43,440 12,805,678 0.67Aon 40,237 9,606,986 0.51Horizon Therapeutics 50,631 4,741,087 0.25Kerry Group 64,574 9,020,929 0.47Medtronic 75,080 9,319,680 0.49Willis Towers Watson 6,487 1,492,140 0.08
46,986,500 2.47Israel (2020: 0.53%)Azrieli Group 15,396 1,084,359 0.06Bank Hapoalim BM 135,051 1,084,221 0.06Bank Leumi Le-Israel BM 265,159 2,014,834 0.10Check Point Software Technologies 17,484 2,030,417 0.10Isracard 1 3 -Israel Chemicals 188,083 1,276,205 0.07Mizrahi Tefahot Bank 79,941 2,463,120 0.13
9,953,159 0.52Italy (2020: 0.36%)DiaSorin SPA 16,933 3,202,896 0.17Infrastrutture Wireless Italiane 225,080 2,538,967 0.13Recordati Industria Chimica eFarmaceutica 41,218 2,356,038 0.13
8,097,901 0.43Japan (2020: 12.89%)ABC-Mart 22,300 1,279,854 0.07Acom 229,500 1,000,793 0.05Ajinomoto 70,200 1,824,100 0.10ANA Holdings 83,100 1,955,647 0.10Asahi Intecc 34,300 820,802 0.04Bridgestone 43,000 1,958,420 0.10Canon 453,000 10,256,681 0.54Capcom 120,000 3,513,830 0.18Central Japan Railway 6,100 926,074 0.05Chugai Pharmaceutical 236,600 9,383,847 0.49East Japan Railway 40,200 2,871,118 0.15FUJIFILM Holdings 91,600 6,799,643 0.36Hamamatsu Photonics 96,100 5,801,153 0.30Hirose Electric 21,900 3,206,370 0.17ITOCHU 276,900 7,983,422 0.42Japan Exchange Group 55,800 1,241,788 0.07Japan Post Bank 272,400 2,289,839 0.12
Mercer UCITS Common Contractual FundMercer Passive Low Volatility Equity UCITS CCF
Portfolio Statementas at 30 June 2021
Mercer UCITS Common Contractual Fund 152
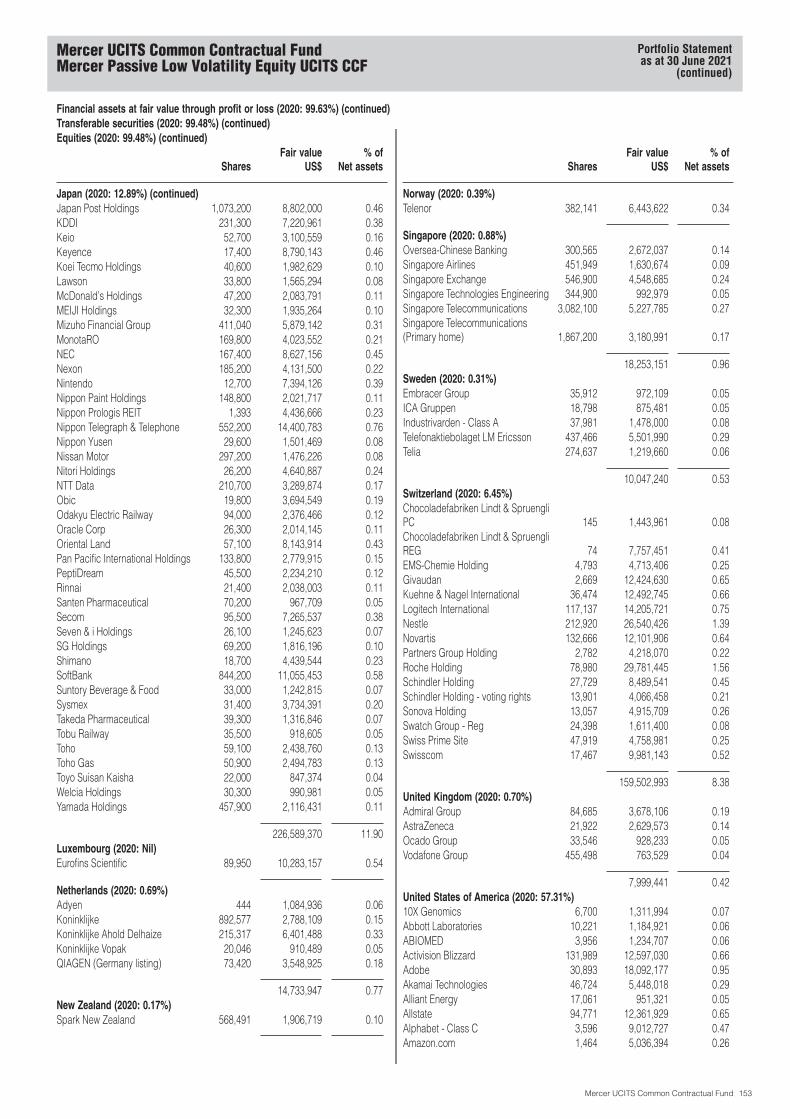
Financial assets at fair value through profit or loss (2020: 99.63%) (continued)Transferable securities (2020: 99.48%) (continued)Equities (2020: 99.48%) (continued)
SharesFair value
US$% of
Net assets
Japan (2020: 12.89%) (continued)Japan Post Holdings 1,073,200 8,802,000 0.46KDDI 231,300 7,220,961 0.38Keio 52,700 3,100,559 0.16Keyence 17,400 8,790,143 0.46Koei Tecmo Holdings 40,600 1,982,629 0.10Lawson 33,800 1,565,294 0.08McDonald’s Holdings 47,200 2,083,791 0.11MEIJI Holdings 32,300 1,935,264 0.10Mizuho Financial Group 411,040 5,879,142 0.31MonotaRO 169,800 4,023,552 0.21NEC 167,400 8,627,156 0.45Nexon 185,200 4,131,500 0.22Nintendo 12,700 7,394,126 0.39Nippon Paint Holdings 148,800 2,021,717 0.11Nippon Prologis REIT 1,393 4,436,666 0.23Nippon Telegraph & Telephone 552,200 14,400,783 0.76Nippon Yusen 29,600 1,501,469 0.08Nissan Motor 297,200 1,476,226 0.08Nitori Holdings 26,200 4,640,887 0.24NTT Data 210,700 3,289,874 0.17Obic 19,800 3,694,549 0.19Odakyu Electric Railway 94,000 2,376,466 0.12Oracle Corp 26,300 2,014,145 0.11Oriental Land 57,100 8,143,914 0.43Pan Pacific International Holdings 133,800 2,779,915 0.15PeptiDream 45,500 2,234,210 0.12Rinnai 21,400 2,038,003 0.11Santen Pharmaceutical 70,200 967,709 0.05Secom 95,500 7,265,537 0.38Seven & i Holdings 26,100 1,245,623 0.07SG Holdings 69,200 1,816,196 0.10Shimano 18,700 4,439,544 0.23SoftBank 844,200 11,055,453 0.58Suntory Beverage & Food 33,000 1,242,815 0.07Sysmex 31,400 3,734,391 0.20Takeda Pharmaceutical 39,300 1,316,846 0.07Tobu Railway 35,500 918,605 0.05Toho 59,100 2,438,760 0.13Toho Gas 50,900 2,494,783 0.13Toyo Suisan Kaisha 22,000 847,374 0.04Welcia Holdings 30,300 990,981 0.05Yamada Holdings 457,900 2,116,431 0.11
226,589,370 11.90Luxembourg (2020: Nil)Eurofins Scientific 89,950 10,283,157 0.54
Netherlands (2020: 0.69%)Adyen 444 1,084,936 0.06Koninklijke 892,577 2,788,109 0.15Koninklijke Ahold Delhaize 215,317 6,401,488 0.33Koninklijke Vopak 20,046 910,489 0.05QIAGEN (Germany listing) 73,420 3,548,925 0.18
14,733,947 0.77New Zealand (2020: 0.17%)Spark New Zealand 568,491 1,906,719 0.10
SharesFair value
US$% of
Net assets
Norway (2020: 0.39%)Telenor 382,141 6,443,622 0.34
Singapore (2020: 0.88%)Oversea-Chinese Banking 300,565 2,672,037 0.14Singapore Airlines 451,949 1,630,674 0.09Singapore Exchange 546,900 4,548,685 0.24Singapore Technologies Engineering 344,900 992,979 0.05Singapore Telecommunications 3,082,100 5,227,785 0.27Singapore Telecommunications(Primary home) 1,867,200 3,180,991 0.17
18,253,151 0.96Sweden (2020: 0.31%)Embracer Group 35,912 972,109 0.05ICA Gruppen 18,798 875,481 0.05Industrivarden - Class A 37,981 1,478,000 0.08Telefonaktiebolaget LM Ericsson 437,466 5,501,990 0.29Telia 274,637 1,219,660 0.06
10,047,240 0.53Switzerland (2020: 6.45%)Chocoladefabriken Lindt & SpruengliPC 145 1,443,961 0.08Chocoladefabriken Lindt & SpruengliREG 74 7,757,451 0.41EMS-Chemie Holding 4,793 4,713,406 0.25Givaudan 2,669 12,424,630 0.65Kuehne & Nagel International 36,474 12,492,745 0.66Logitech International 117,137 14,205,721 0.75Nestle 212,920 26,540,426 1.39Novartis 132,666 12,101,906 0.64Partners Group Holding 2,782 4,218,070 0.22Roche Holding 78,980 29,781,445 1.56Schindler Holding 27,729 8,489,541 0.45Schindler Holding - voting rights 13,901 4,066,458 0.21Sonova Holding 13,057 4,915,709 0.26Swatch Group - Reg 24,398 1,611,400 0.08Swiss Prime Site 47,919 4,758,981 0.25Swisscom 17,467 9,981,143 0.52
159,502,993 8.38United Kingdom (2020: 0.70%)Admiral Group 84,685 3,678,106 0.19AstraZeneca 21,922 2,629,573 0.14Ocado Group 33,546 928,233 0.05Vodafone Group 455,498 763,529 0.04
7,999,441 0.42United States of America (2020: 57.31%)10X Genomics 6,700 1,311,994 0.07Abbott Laboratories 10,221 1,184,921 0.06ABIOMED 3,956 1,234,707 0.06Activision Blizzard 131,989 12,597,030 0.66Adobe 30,893 18,092,177 0.95Akamai Technologies 46,724 5,448,018 0.29Alliant Energy 17,061 951,321 0.05Allstate 94,771 12,361,929 0.65Alphabet - Class C 3,596 9,012,727 0.47Amazon.com 1,464 5,036,394 0.26
Mercer UCITS Common Contractual FundMercer Passive Low Volatility Equity UCITS CCF
Portfolio Statementas at 30 June 2021
(continued)
Mercer UCITS Common Contractual Fund 153
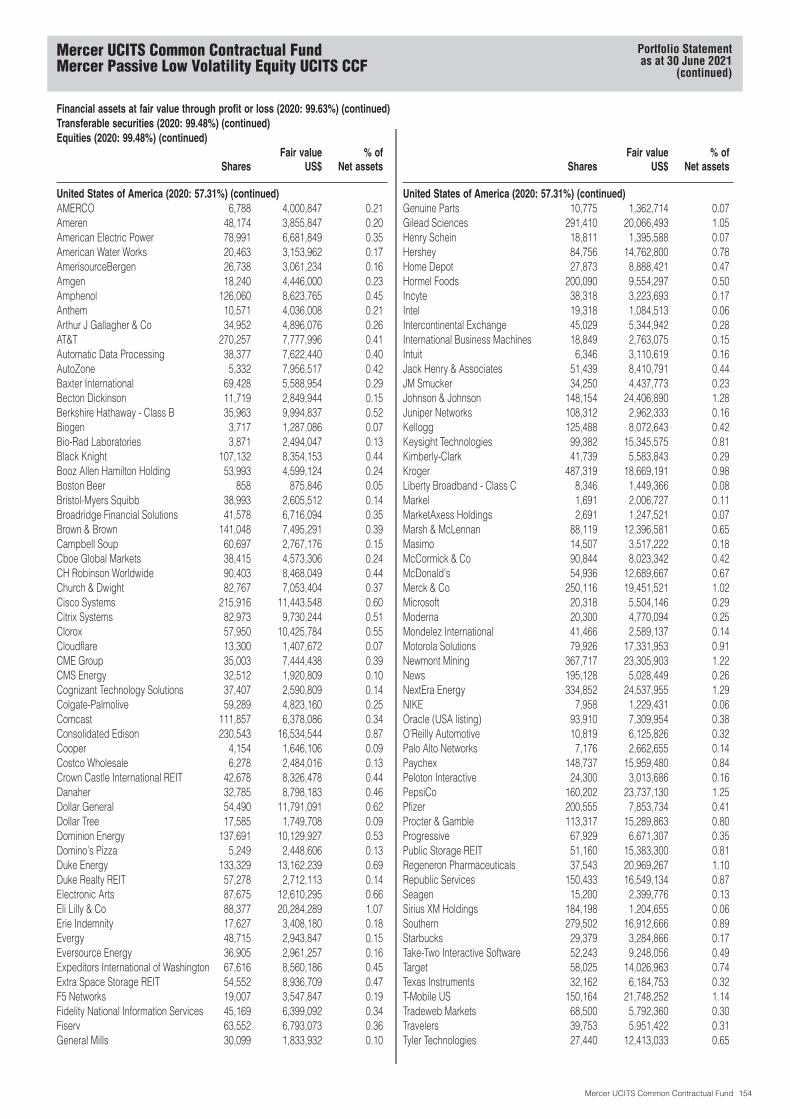
Financial assets at fair value through profit or loss (2020: 99.63%) (continued)Transferable securities (2020: 99.48%) (continued)Equities (2020: 99.48%) (continued)
SharesFair value
US$% of
Net assets
United States of America (2020: 57.31%) (continued)AMERCO 6,788 4,000,847 0.21Ameren 48,174 3,855,847 0.20American Electric Power 78,991 6,681,849 0.35American Water Works 20,463 3,153,962 0.17AmerisourceBergen 26,738 3,061,234 0.16Amgen 18,240 4,446,000 0.23Amphenol 126,060 8,623,765 0.45Anthem 10,571 4,036,008 0.21Arthur J Gallagher & Co 34,952 4,896,076 0.26AT&T 270,257 7,777,996 0.41Automatic Data Processing 38,377 7,622,440 0.40AutoZone 5,332 7,956,517 0.42Baxter International 69,428 5,588,954 0.29Becton Dickinson 11,719 2,849,944 0.15Berkshire Hathaway - Class B 35,963 9,994,837 0.52Biogen 3,717 1,287,086 0.07Bio-Rad Laboratories 3,871 2,494,047 0.13Black Knight 107,132 8,354,153 0.44Booz Allen Hamilton Holding 53,993 4,599,124 0.24Boston Beer 858 875,846 0.05Bristol-Myers Squibb 38,993 2,605,512 0.14Broadridge Financial Solutions 41,578 6,716,094 0.35Brown & Brown 141,048 7,495,291 0.39Campbell Soup 60,697 2,767,176 0.15Cboe Global Markets 38,415 4,573,306 0.24CH Robinson Worldwide 90,403 8,468,049 0.44Church & Dwight 82,767 7,053,404 0.37Cisco Systems 215,916 11,443,548 0.60Citrix Systems 82,973 9,730,244 0.51Clorox 57,950 10,425,784 0.55Cloudflare 13,300 1,407,672 0.07CME Group 35,003 7,444,438 0.39CMS Energy 32,512 1,920,809 0.10Cognizant Technology Solutions 37,407 2,590,809 0.14Colgate-Palmolive 59,289 4,823,160 0.25Comcast 111,857 6,378,086 0.34Consolidated Edison 230,543 16,534,544 0.87Cooper 4,154 1,646,106 0.09Costco Wholesale 6,278 2,484,016 0.13Crown Castle International REIT 42,678 8,326,478 0.44Danaher 32,785 8,798,183 0.46Dollar General 54,490 11,791,091 0.62Dollar Tree 17,585 1,749,708 0.09Dominion Energy 137,691 10,129,927 0.53Domino’s Pizza 5,249 2,448,606 0.13Duke Energy 133,329 13,162,239 0.69Duke Realty REIT 57,278 2,712,113 0.14Electronic Arts 87,675 12,610,295 0.66Eli Lilly & Co 88,377 20,284,289 1.07Erie Indemnity 17,627 3,408,180 0.18Evergy 48,715 2,943,847 0.15Eversource Energy 36,905 2,961,257 0.16Expeditors International of Washington 67,616 8,560,186 0.45Extra Space Storage REIT 54,552 8,936,709 0.47F5 Networks 19,007 3,547,847 0.19Fidelity National Information Services 45,169 6,399,092 0.34Fiserv 63,552 6,793,073 0.36General Mills 30,099 1,833,932 0.10
SharesFair value
US$% of
Net assets
United States of America (2020: 57.31%) (continued)Genuine Parts 10,775 1,362,714 0.07Gilead Sciences 291,410 20,066,493 1.05Henry Schein 18,811 1,395,588 0.07Hershey 84,756 14,762,800 0.78Home Depot 27,873 8,888,421 0.47Hormel Foods 200,090 9,554,297 0.50Incyte 38,318 3,223,693 0.17Intel 19,318 1,084,513 0.06Intercontinental Exchange 45,029 5,344,942 0.28International Business Machines 18,849 2,763,075 0.15Intuit 6,346 3,110,619 0.16Jack Henry & Associates 51,439 8,410,791 0.44JM Smucker 34,250 4,437,773 0.23Johnson & Johnson 148,154 24,406,890 1.28Juniper Networks 108,312 2,962,333 0.16Kellogg 125,488 8,072,643 0.42Keysight Technologies 99,382 15,345,575 0.81Kimberly-Clark 41,739 5,583,843 0.29Kroger 487,319 18,669,191 0.98Liberty Broadband - Class C 8,346 1,449,366 0.08Markel 1,691 2,006,727 0.11MarketAxess Holdings 2,691 1,247,521 0.07Marsh & McLennan 88,119 12,396,581 0.65Masimo 14,507 3,517,222 0.18McCormick & Co 90,844 8,023,342 0.42McDonald’s 54,936 12,689,667 0.67Merck & Co 250,116 19,451,521 1.02Microsoft 20,318 5,504,146 0.29Moderna 20,300 4,770,094 0.25Mondelez International 41,466 2,589,137 0.14Motorola Solutions 79,926 17,331,953 0.91Newmont Mining 367,717 23,305,903 1.22News 195,128 5,028,449 0.26NextEra Energy 334,852 24,537,955 1.29NIKE 7,958 1,229,431 0.06Oracle (USA listing) 93,910 7,309,954 0.38O’Reilly Automotive 10,819 6,125,826 0.32Palo Alto Networks 7,176 2,662,655 0.14Paychex 148,737 15,959,480 0.84Peloton Interactive 24,300 3,013,686 0.16PepsiCo 160,202 23,737,130 1.25Pfizer 200,555 7,853,734 0.41Procter & Gamble 113,317 15,289,863 0.80Progressive 67,929 6,671,307 0.35Public Storage REIT 51,160 15,383,300 0.81Regeneron Pharmaceuticals 37,543 20,969,267 1.10Republic Services 150,433 16,549,134 0.87Seagen 15,200 2,399,776 0.13Sirius XM Holdings 184,198 1,204,655 0.06Southern 279,502 16,912,666 0.89Starbucks 29,379 3,284,866 0.17Take-Two Interactive Software 52,243 9,248,056 0.49Target 58,025 14,026,963 0.74Texas Instruments 32,162 6,184,753 0.32T-Mobile US 150,164 21,748,252 1.14Tradeweb Markets 68,500 5,792,360 0.30Travelers 39,753 5,951,422 0.31Tyler Technologies 27,440 12,413,033 0.65
Mercer UCITS Common Contractual FundMercer Passive Low Volatility Equity UCITS CCF
Portfolio Statementas at 30 June 2021
(continued)
Mercer UCITS Common Contractual Fund 154

Financial assets at fair value through profit or loss (2020: 99.63%) (continued)Transferable securities (2020: 99.48%) (continued)Equities (2020: 99.48%) (continued)
SharesFair value
US$% of
Net assets
United States of America (2020: 57.31%) (continued)UnitedHealth Group 13,113 5,250,970 0.28VeriSign 15,555 3,541,718 0.19Verizon Communications 446,830 25,035,885 1.32Vertex Pharmaceuticals 111,440 22,469,647 1.18Visa 73,714 17,235,807 0.91Walt Disney 31,861 5,600,208 0.29Waste Management 199,706 27,980,808 1.47WEC Energy Group 112,475 10,004,651 0.53West Pharmaceutical Services 11,595 4,163,765 0.22Western Union 276,988 6,362,414 0.33
SharesFair value
US$% of
Net assets
United States of America (2020: 57.31%) (continued)Xcel Energy 205,563 13,542,490 0.71Zoetis 11,505 2,144,072 0.11Zoom Video Communications 15,500 5,998,965 0.32
1,117,841,597 58.71
Total equities 1,909,775,896 100.31
Total transferable securities 1,909,775,896 100.31
Financial derivative instruments (2020: 0.15%)Open forward foreign currency contracts (2020: 0.15%)
Currencybuy
Buyamount
Currencysell
Sellamount Counterparty
Contractdate
UnrealisedgainUS$
% ofNet assets
AUD 26,270 EUR 16,618 State Street Bank and Trust 06/07/2021 14 -AUD 5,132 GBP 2,785 State Street Bank and Trust 06/07/2021 4 -CAD 285,839 EUR 193,395 State Street Bank and Trust 06/07/2021 1,465 -CAD 18,156,877 GBP 10,568,827 State Street Bank and Trust 06/07/2021 62,188 -CHF 74 GBP 58 State Street Bank and Trust 06/07/2021 - -DKK 176,671 EUR 23,756 State Street Bank and Trust 06/07/2021 2 -DKK 36,019 GBP 4,147 State Street Bank and Trust 06/07/2021 14 -EUR 33,901 CHF 37,080 State Street Bank and Trust 06/07/2021 87 -EUR 8,413 DKK 62,554 State Street Bank and Trust 06/07/2021 1 -EUR 13,614 GBP 11,662 State Street Bank and Trust 06/07/2021 39 -EUR 12,877 HKD 118,541 State Street Bank and Trust 06/07/2021 8 -EUR 51,165 JPY 6,686,604 State Street Bank and Trust 06/07/2021 435 -EUR 33,190 NOK 337,793 State Street Bank and Trust 06/07/2021 109 -EUR 9,311 NZD 15,649 State Street Bank and Trust 06/07/2021 108 -EUR 16 SEK 165 State Street Bank and Trust 06/07/2021 - -EUR 417,427 USD 495,046 State Street Bank and Trust 06/07/2021 23 -GBP 5,921,973 AUD 10,873,512 State Street Bank and Trust 06/07/2021 17,533 -GBP 311,536 CAD 532,249 State Street Bank and Trust 06/07/2021 556 -GBP 2,874,280 CHF 3,640,178 State Street Bank and Trust 06/07/2021 32,194 -GBP 13,455,856 DKK 116,301,399 State Street Bank and Trust 06/07/2021 40,234 -GBP 37,930,596 EUR 44,071,650 State Street Bank and Trust 06/07/2021 130,750 0.01GBP 2,305,259 NOK 27,251,626 State Street Bank and Trust 06/07/2021 17,694 -GBP 626,818 NZD 1,224,079 State Street Bank and Trust 06/07/2021 10,592 -GBP 3,692,710 SEK 43,515,754 State Street Bank and Trust 06/07/2021 12,870 -HKD 334,956 EUR 35,599 State Street Bank and Trust 06/07/2021 912 -HKD 11,835,120 GBP 1,081,463 State Street Bank and Trust 06/07/2021 29,989 -ILS 38,579 EUR 9,785 State Street Bank and Trust 06/07/2021 234 -ILS 1,743,316 GBP 379,598 State Street Bank and Trust 06/07/2021 10,617 -JPY 18,607,249 EUR 139,631 State Street Bank and Trust 06/07/2021 2,050 -JPY 661,046,333 GBP 4,263,897 State Street Bank and Trust 06/07/2021 65,650 0.01NOK 2 EUR - State Street Bank and Trust 06/07/2021 - -NOK 600 GBP 50 State Street Bank and Trust 06/07/2021 - -NZD 1,940 EUR 1,143 State Street Bank and Trust 06/07/2021 - -NZD 690 GBP 348 State Street Bank and Trust 06/07/2021 1 -SEK 386 EUR 38 State Street Bank and Trust 06/07/2021 - -SEK 13,544 GBP 1,141 State Street Bank and Trust 06/07/2021 7 -SGD 25,210 EUR 15,658 State Street Bank and Trust 06/07/2021 183 -SGD 1,038,398 GBP 554,300 State Street Bank and Trust 06/07/2021 6,747 -
Mercer UCITS Common Contractual FundMercer Passive Low Volatility Equity UCITS CCF
Portfolio Statementas at 30 June 2021
(continued)
Mercer UCITS Common Contractual Fund 155
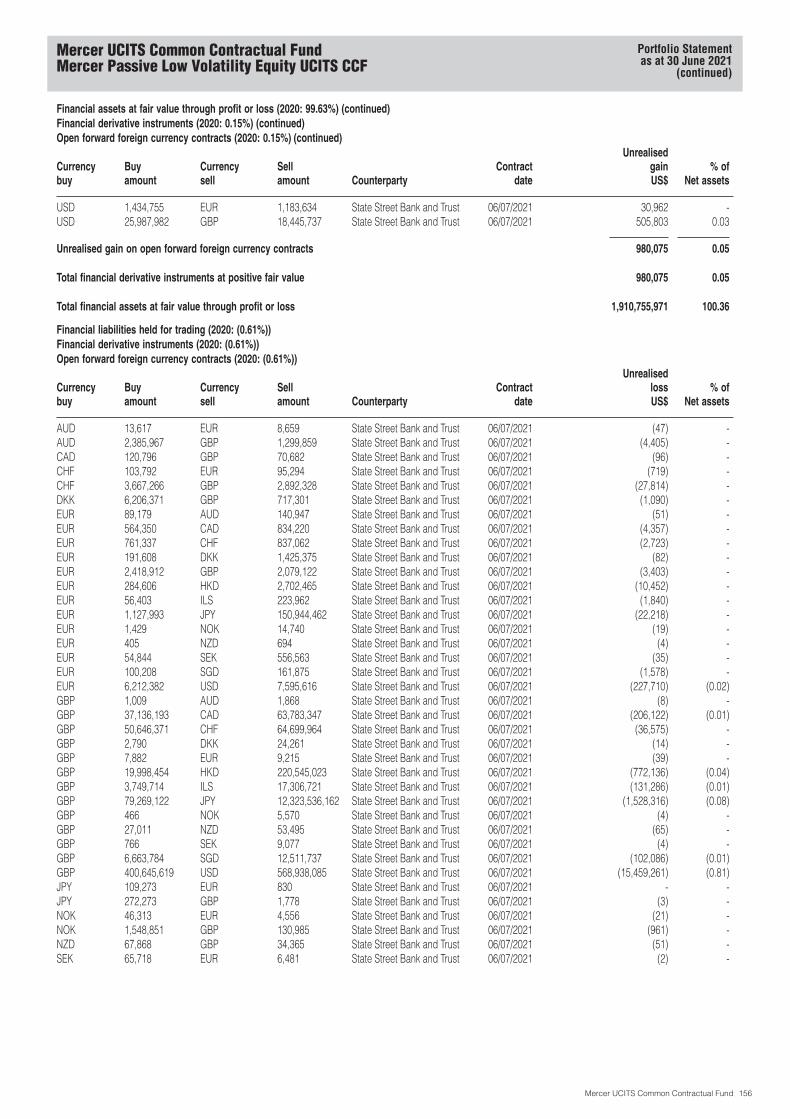
Financial assets at fair value through profit or loss (2020: 99.63%) (continued)Financial derivative instruments (2020: 0.15%) (continued)Open forward foreign currency contracts (2020: 0.15%) (continued)
Currencybuy
Buyamount
Currencysell
Sellamount Counterparty
Contractdate
UnrealisedgainUS$
% ofNet assets
USD 1,434,755 EUR 1,183,634 State Street Bank and Trust 06/07/2021 30,962 -USD 25,987,982 GBP 18,445,737 State Street Bank and Trust 06/07/2021 505,803 0.03
Unrealised gain on open forward foreign currency contracts 980,075 0.05
Total financial derivative instruments at positive fair value 980,075 0.05
Total financial assets at fair value through profit or loss 1,910,755,971 100.36
Financial liabilities held for trading (2020: (0.61%))Financial derivative instruments (2020: (0.61%))Open forward foreign currency contracts (2020: (0.61%))
Currencybuy
Buyamount
Currencysell
Sellamount Counterparty
Contractdate
UnrealisedlossUS$
% ofNet assets
AUD 13,617 EUR 8,659 State Street Bank and Trust 06/07/2021 (47) -AUD 2,385,967 GBP 1,299,859 State Street Bank and Trust 06/07/2021 (4,405) -CAD 120,796 GBP 70,682 State Street Bank and Trust 06/07/2021 (96) -CHF 103,792 EUR 95,294 State Street Bank and Trust 06/07/2021 (719) -CHF 3,667,266 GBP 2,892,328 State Street Bank and Trust 06/07/2021 (27,814) -DKK 6,206,371 GBP 717,301 State Street Bank and Trust 06/07/2021 (1,090) -EUR 89,179 AUD 140,947 State Street Bank and Trust 06/07/2021 (51) -EUR 564,350 CAD 834,220 State Street Bank and Trust 06/07/2021 (4,357) -EUR 761,337 CHF 837,062 State Street Bank and Trust 06/07/2021 (2,723) -EUR 191,608 DKK 1,425,375 State Street Bank and Trust 06/07/2021 (82) -EUR 2,418,912 GBP 2,079,122 State Street Bank and Trust 06/07/2021 (3,403) -EUR 284,606 HKD 2,702,465 State Street Bank and Trust 06/07/2021 (10,452) -EUR 56,403 ILS 223,962 State Street Bank and Trust 06/07/2021 (1,840) -EUR 1,127,993 JPY 150,944,462 State Street Bank and Trust 06/07/2021 (22,218) -EUR 1,429 NOK 14,740 State Street Bank and Trust 06/07/2021 (19) -EUR 405 NZD 694 State Street Bank and Trust 06/07/2021 (4) -EUR 54,844 SEK 556,563 State Street Bank and Trust 06/07/2021 (35) -EUR 100,208 SGD 161,875 State Street Bank and Trust 06/07/2021 (1,578) -EUR 6,212,382 USD 7,595,616 State Street Bank and Trust 06/07/2021 (227,710) (0.02)GBP 1,009 AUD 1,868 State Street Bank and Trust 06/07/2021 (8) -GBP 37,136,193 CAD 63,783,347 State Street Bank and Trust 06/07/2021 (206,122) (0.01)GBP 50,646,371 CHF 64,699,964 State Street Bank and Trust 06/07/2021 (36,575) -GBP 2,790 DKK 24,261 State Street Bank and Trust 06/07/2021 (14) -GBP 7,882 EUR 9,215 State Street Bank and Trust 06/07/2021 (39) -GBP 19,998,454 HKD 220,545,023 State Street Bank and Trust 06/07/2021 (772,136) (0.04)GBP 3,749,714 ILS 17,306,721 State Street Bank and Trust 06/07/2021 (131,286) (0.01)GBP 79,269,122 JPY 12,323,536,162 State Street Bank and Trust 06/07/2021 (1,528,316) (0.08)GBP 466 NOK 5,570 State Street Bank and Trust 06/07/2021 (4) -GBP 27,011 NZD 53,495 State Street Bank and Trust 06/07/2021 (65) -GBP 766 SEK 9,077 State Street Bank and Trust 06/07/2021 (4) -GBP 6,663,784 SGD 12,511,737 State Street Bank and Trust 06/07/2021 (102,086) (0.01)GBP 400,645,619 USD 568,938,085 State Street Bank and Trust 06/07/2021 (15,459,261) (0.81)JPY 109,273 EUR 830 State Street Bank and Trust 06/07/2021 - -JPY 272,273 GBP 1,778 State Street Bank and Trust 06/07/2021 (3) -NOK 46,313 EUR 4,556 State Street Bank and Trust 06/07/2021 (21) -NOK 1,548,851 GBP 130,985 State Street Bank and Trust 06/07/2021 (961) -NZD 67,868 GBP 34,365 State Street Bank and Trust 06/07/2021 (51) -SEK 65,718 EUR 6,481 State Street Bank and Trust 06/07/2021 (2) -
Mercer UCITS Common Contractual FundMercer Passive Low Volatility Equity UCITS CCF
Portfolio Statementas at 30 June 2021
(continued)
Mercer UCITS Common Contractual Fund 156
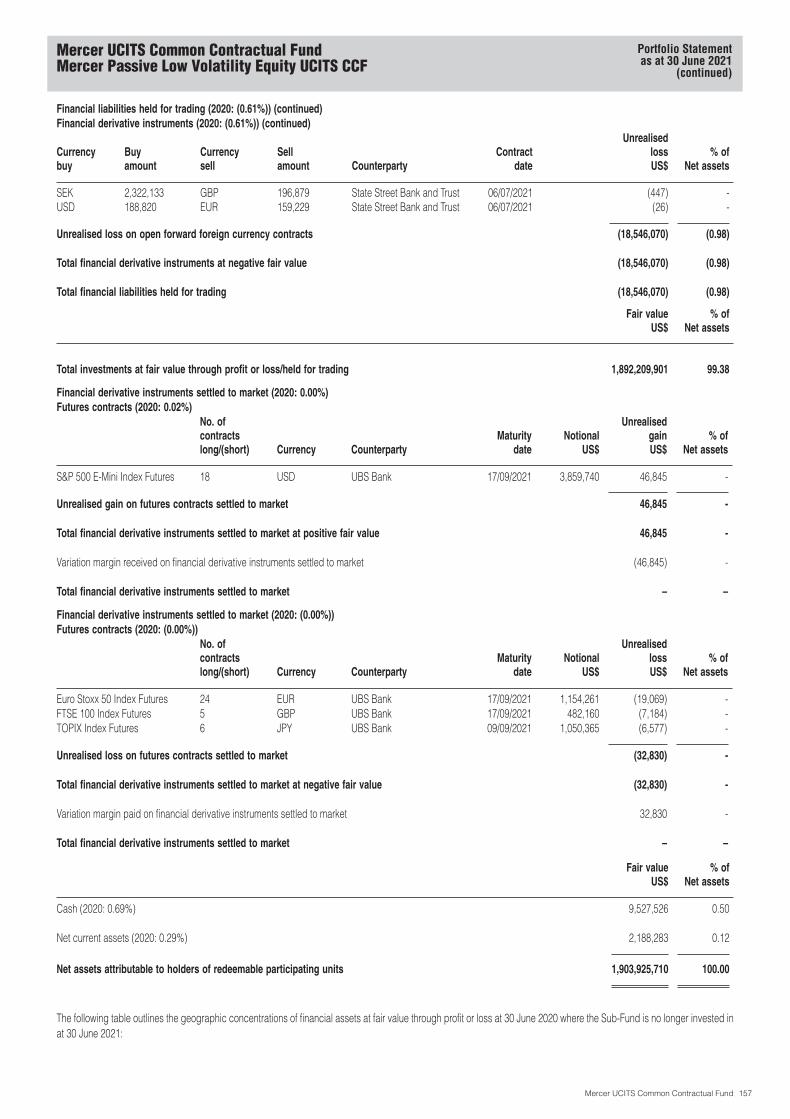
Financial liabilities held for trading (2020: (0.61%)) (continued)Financial derivative instruments (2020: (0.61%)) (continued)
Currencybuy
Buyamount
Currencysell
Sellamount Counterparty
Contractdate
UnrealisedlossUS$
% ofNet assets
SEK 2,322,133 GBP 196,879 State Street Bank and Trust 06/07/2021 (447) -USD 188,820 EUR 159,229 State Street Bank and Trust 06/07/2021 (26) -
Unrealised loss on open forward foreign currency contracts (18,546,070) (0.98)
Total financial derivative instruments at negative fair value (18,546,070) (0.98)
Total financial liabilities held for trading (18,546,070) (0.98)
Fair valueUS$
% ofNet assets
Total investments at fair value through profit or loss/held for trading 1,892,209,901 99.38
Financial derivative instruments settled to market (2020: 0.00%)Futures contracts (2020: 0.02%)
No. ofcontractslong/(short) Currency Counterparty
Maturitydate
NotionalUS$
UnrealisedgainUS$
% ofNet assets
S&P 500 E-Mini Index Futures 18 USD UBS Bank 17/09/2021 3,859,740 46,845 -
Unrealised gain on futures contracts settled to market 46,845 -
Total financial derivative instruments settled to market at positive fair value 46,845 -
Variation margin received on financial derivative instruments settled to market (46,845) -
Total financial derivative instruments settled to market – –
Financial derivative instruments settled to market (2020: (0.00%))Futures contracts (2020: (0.00%))
No. ofcontractslong/(short) Currency Counterparty
Maturitydate
NotionalUS$
UnrealisedlossUS$
% ofNet assets
Euro Stoxx 50 Index Futures 24 EUR UBS Bank 17/09/2021 1,154,261 (19,069) -FTSE 100 Index Futures 5 GBP UBS Bank 17/09/2021 482,160 (7,184) -TOPIX Index Futures 6 JPY UBS Bank 09/09/2021 1,050,365 (6,577) -
Unrealised loss on futures contracts settled to market (32,830) -
Total financial derivative instruments settled to market at negative fair value (32,830) -
Variation margin paid on financial derivative instruments settled to market 32,830 -
Total financial derivative instruments settled to market – –
Fair valueUS$
% ofNet assets
Cash (2020: 0.69%) 9,527,526 0.50
Net current assets (2020: 0.29%) 2,188,283 0.12
Net assets attributable to holders of redeemable participating units 1,903,925,710 100.00
The following table outlines the geographic concentrations of financial assets at fair value through profit or loss at 30 June 2020 where the Sub-Fund is no longer invested inat 30 June 2021:
Mercer UCITS Common Contractual FundMercer Passive Low Volatility Equity UCITS CCF
Portfolio Statementas at 30 June 2021
(continued)
Mercer UCITS Common Contractual Fund 157
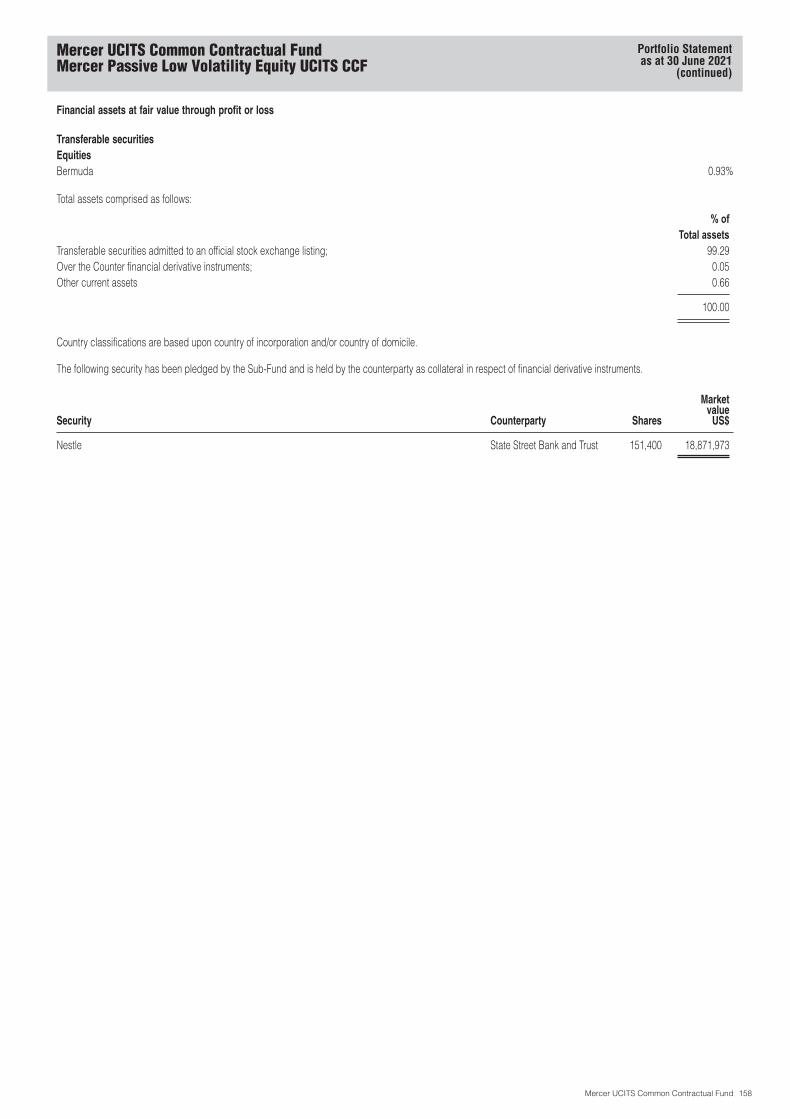
Financial assets at fair value through profit or loss
Transferable securitiesEquitiesBermuda 0.93%
Total assets comprised as follows:
% ofTotal assets
Transferable securities admitted to an official stock exchange listing; 99.29Over the Counter financial derivative instruments; 0.05Other current assets 0.66
100.00
Country classifications are based upon country of incorporation and/or country of domicile.
The following security has been pledged by the Sub-Fund and is held by the counterparty as collateral in respect of financial derivative instruments.
Security Counterparty Shares
Marketvalue
US$
Nestle State Street Bank and Trust 151,400 18,871,973
Mercer UCITS Common Contractual FundMercer Passive Low Volatility Equity UCITS CCF
Portfolio Statementas at 30 June 2021
(continued)
Mercer UCITS Common Contractual Fund 158
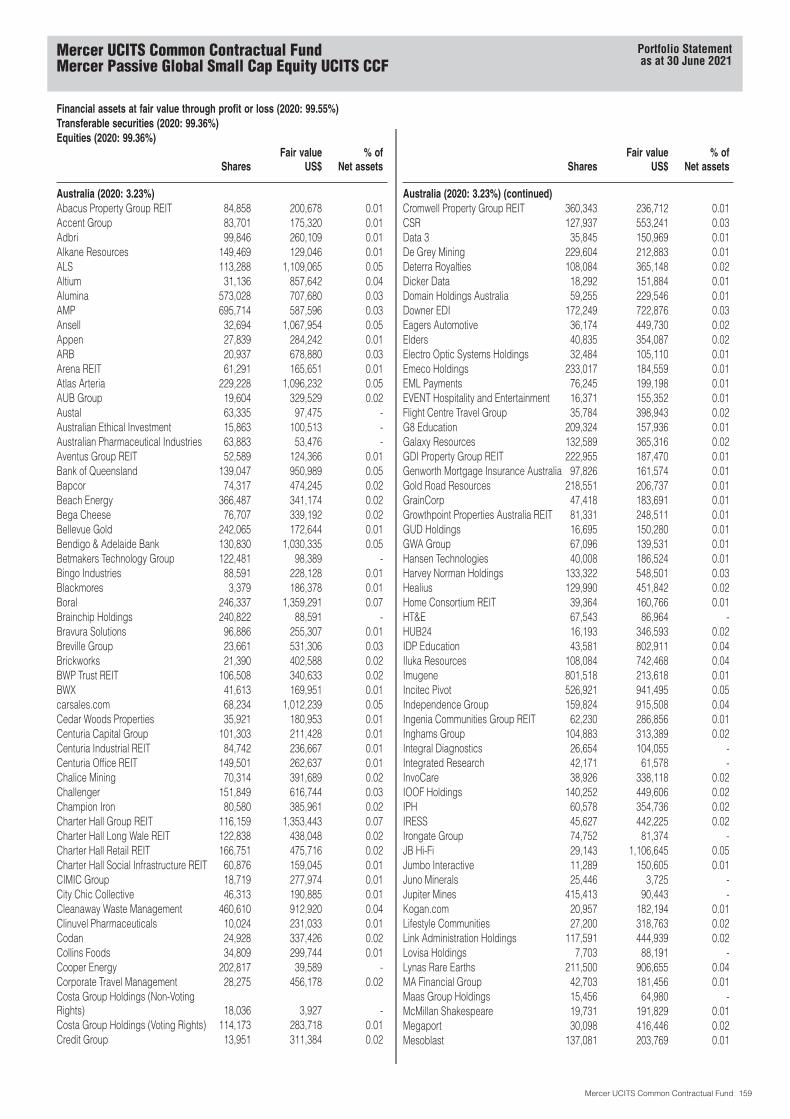
Financial assets at fair value through profit or loss (2020: 99.55%)Transferable securities (2020: 99.36%)Equities (2020: 99.36%)
SharesFair value
US$% of
Net assets
Australia (2020: 3.23%)Abacus Property Group REIT 84,858 200,678 0.01Accent Group 83,701 175,320 0.01Adbri 99,846 260,109 0.01Alkane Resources 149,469 129,046 0.01ALS 113,288 1,109,065 0.05Altium 31,136 857,642 0.04Alumina 573,028 707,680 0.03AMP 695,714 587,596 0.03Ansell 32,694 1,067,954 0.05Appen 27,839 284,242 0.01ARB 20,937 678,880 0.03Arena REIT 61,291 165,651 0.01Atlas Arteria 229,228 1,096,232 0.05AUB Group 19,604 329,529 0.02Austal 63,335 97,475 -Australian Ethical Investment 15,863 100,513 -Australian Pharmaceutical Industries 63,883 53,476 -Aventus Group REIT 52,589 124,366 0.01Bank of Queensland 139,047 950,989 0.05Bapcor 74,317 474,245 0.02Beach Energy 366,487 341,174 0.02Bega Cheese 76,707 339,192 0.02Bellevue Gold 242,065 172,644 0.01Bendigo & Adelaide Bank 130,830 1,030,335 0.05Betmakers Technology Group 122,481 98,389 -Bingo Industries 88,591 228,128 0.01Blackmores 3,379 186,378 0.01Boral 246,337 1,359,291 0.07Brainchip Holdings 240,822 88,591 -Bravura Solutions 96,886 255,307 0.01Breville Group 23,661 531,306 0.03Brickworks 21,390 402,588 0.02BWP Trust REIT 106,508 340,633 0.02BWX 41,613 169,951 0.01carsales.com 68,234 1,012,239 0.05Cedar Woods Properties 35,921 180,953 0.01Centuria Capital Group 101,303 211,428 0.01Centuria Industrial REIT 84,742 236,667 0.01Centuria Office REIT 149,501 262,637 0.01Chalice Mining 70,314 391,689 0.02Challenger 151,849 616,744 0.03Champion Iron 80,580 385,961 0.02Charter Hall Group REIT 116,159 1,353,443 0.07Charter Hall Long Wale REIT 122,838 438,048 0.02Charter Hall Retail REIT 166,751 475,716 0.02Charter Hall Social Infrastructure REIT 60,876 159,045 0.01CIMIC Group 18,719 277,974 0.01City Chic Collective 46,313 190,885 0.01Cleanaway Waste Management 460,610 912,920 0.04Clinuvel Pharmaceuticals 10,024 231,033 0.01Codan 24,928 337,426 0.02Collins Foods 34,809 299,744 0.01Cooper Energy 202,817 39,589 -Corporate Travel Management 28,275 456,178 0.02Costa Group Holdings (Non-VotingRights) 18,036 3,927 -Costa Group Holdings (Voting Rights) 114,173 283,718 0.01Credit Group 13,951 311,384 0.02
SharesFair value
US$% of
Net assets
Australia (2020: 3.23%) (continued)Cromwell Property Group REIT 360,343 236,712 0.01CSR 127,937 553,241 0.03Data 3 35,845 150,969 0.01De Grey Mining 229,604 212,883 0.01Deterra Royalties 108,084 365,148 0.02Dicker Data 18,292 151,884 0.01Domain Holdings Australia 59,255 229,546 0.01Downer EDI 172,249 722,876 0.03Eagers Automotive 36,174 449,730 0.02Elders 40,835 354,087 0.02Electro Optic Systems Holdings 32,484 105,110 0.01Emeco Holdings 233,017 184,559 0.01EML Payments 76,245 199,198 0.01EVENT Hospitality and Entertainment 16,371 155,352 0.01Flight Centre Travel Group 35,784 398,943 0.02G8 Education 209,324 157,936 0.01Galaxy Resources 132,589 365,316 0.02GDI Property Group REIT 222,955 187,470 0.01Genworth Mortgage Insurance Australia 97,826 161,574 0.01Gold Road Resources 218,551 206,737 0.01GrainCorp 47,418 183,691 0.01Growthpoint Properties Australia REIT 81,331 248,511 0.01GUD Holdings 16,695 150,280 0.01GWA Group 67,096 139,531 0.01Hansen Technologies 40,008 186,524 0.01Harvey Norman Holdings 133,322 548,501 0.03Healius 129,990 451,842 0.02Home Consortium REIT 39,364 160,766 0.01HT&E 67,543 86,964 -HUB24 16,193 346,593 0.02IDP Education 43,581 802,911 0.04Iluka Resources 108,084 742,468 0.04Imugene 801,518 213,618 0.01Incitec Pivot 526,921 941,495 0.05Independence Group 159,824 915,508 0.04Ingenia Communities Group REIT 62,230 286,856 0.01Inghams Group 104,883 313,389 0.02Integral Diagnostics 26,654 104,055 -Integrated Research 42,171 61,578 -InvoCare 38,926 338,118 0.02IOOF Holdings 140,252 449,606 0.02IPH 60,578 354,736 0.02IRESS 45,627 442,225 0.02Irongate Group 74,752 81,374 -JB Hi-Fi 29,143 1,106,645 0.05Jumbo Interactive 11,289 150,605 0.01Juno Minerals 25,446 3,725 -Jupiter Mines 415,413 90,443 -Kogan.com 20,957 182,194 0.01Lifestyle Communities 27,200 318,763 0.02Link Administration Holdings 117,591 444,939 0.02Lovisa Holdings 7,703 88,191 -Lynas Rare Earths 211,500 906,655 0.04MA Financial Group 42,703 181,456 0.01Maas Group Holdings 15,456 64,980 -McMillan Shakespeare 19,731 191,829 0.01Megaport 30,098 416,446 0.02Mesoblast 137,081 203,769 0.01
Mercer UCITS Common Contractual FundMercer Passive Global Small Cap Equity UCITS CCF
Portfolio Statementas at 30 June 2021
Mercer UCITS Common Contractual Fund 159
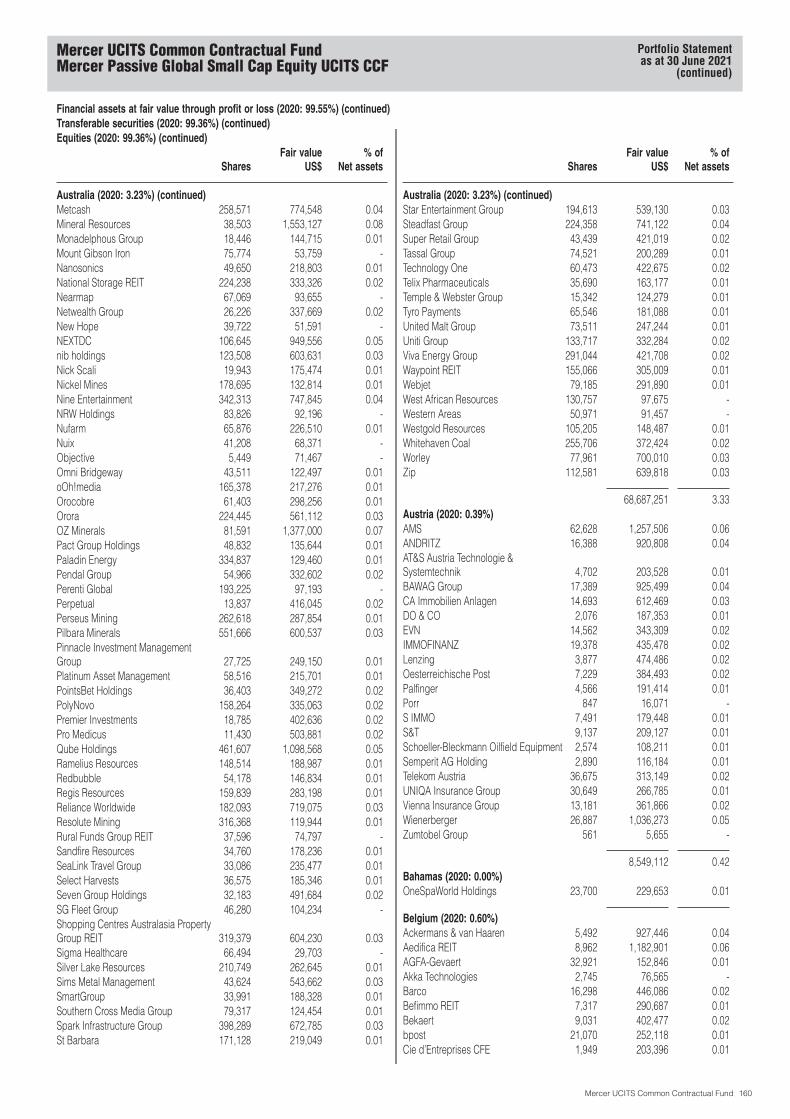
Financial assets at fair value through profit or loss (2020: 99.55%) (continued)Transferable securities (2020: 99.36%) (continued)Equities (2020: 99.36%) (continued)
SharesFair value
US$% of
Net assets
Australia (2020: 3.23%) (continued)Metcash 258,571 774,548 0.04Mineral Resources 38,503 1,553,127 0.08Monadelphous Group 18,446 144,715 0.01Mount Gibson Iron 75,774 53,759 -Nanosonics 49,650 218,803 0.01National Storage REIT 224,238 333,326 0.02Nearmap 67,069 93,655 -Netwealth Group 26,226 337,669 0.02New Hope 39,722 51,591 -NEXTDC 106,645 949,556 0.05nib holdings 123,508 603,631 0.03Nick Scali 19,943 175,474 0.01Nickel Mines 178,695 132,814 0.01Nine Entertainment 342,313 747,845 0.04NRW Holdings 83,826 92,196 -Nufarm 65,876 226,510 0.01Nuix 41,208 68,371 -Objective 5,449 71,467 -Omni Bridgeway 43,511 122,497 0.01oOh!media 165,378 217,276 0.01Orocobre 61,403 298,256 0.01Orora 224,445 561,112 0.03OZ Minerals 81,591 1,377,000 0.07Pact Group Holdings 48,832 135,644 0.01Paladin Energy 334,837 129,460 0.01Pendal Group 54,966 332,602 0.02Perenti Global 193,225 97,193 -Perpetual 13,837 416,045 0.02Perseus Mining 262,618 287,854 0.01Pilbara Minerals 551,666 600,537 0.03Pinnacle Investment ManagementGroup 27,725 249,150 0.01Platinum Asset Management 58,516 215,701 0.01PointsBet Holdings 36,403 349,272 0.02PolyNovo 158,264 335,063 0.02Premier Investments 18,785 402,636 0.02Pro Medicus 11,430 503,881 0.02Qube Holdings 461,607 1,098,568 0.05Ramelius Resources 148,514 188,987 0.01Redbubble 54,178 146,834 0.01Regis Resources 159,839 283,198 0.01Reliance Worldwide 182,093 719,075 0.03Resolute Mining 316,368 119,944 0.01Rural Funds Group REIT 37,596 74,797 -Sandfire Resources 34,760 178,236 0.01SeaLink Travel Group 33,086 235,477 0.01Select Harvests 36,575 185,346 0.01Seven Group Holdings 32,183 491,684 0.02SG Fleet Group 46,280 104,234 -Shopping Centres Australasia PropertyGroup REIT 319,379 604,230 0.03Sigma Healthcare 66,494 29,703 -Silver Lake Resources 210,749 262,645 0.01Sims Metal Management 43,624 543,662 0.03SmartGroup 33,991 188,328 0.01Southern Cross Media Group 79,317 124,454 0.01Spark Infrastructure Group 398,289 672,785 0.03St Barbara 171,128 219,049 0.01
SharesFair value
US$% of
Net assets
Australia (2020: 3.23%) (continued)Star Entertainment Group 194,613 539,130 0.03Steadfast Group 224,358 741,122 0.04Super Retail Group 43,439 421,019 0.02Tassal Group 74,521 200,289 0.01Technology One 60,473 422,675 0.02Telix Pharmaceuticals 35,690 163,177 0.01Temple & Webster Group 15,342 124,279 0.01Tyro Payments 65,546 181,088 0.01United Malt Group 73,511 247,244 0.01Uniti Group 133,717 332,284 0.02Viva Energy Group 291,044 421,708 0.02Waypoint REIT 155,066 305,009 0.01Webjet 79,185 291,890 0.01West African Resources 130,757 97,675 -Western Areas 50,971 91,457 -Westgold Resources 105,205 148,487 0.01Whitehaven Coal 255,706 372,424 0.02Worley 77,961 700,010 0.03Zip 112,581 639,818 0.03
68,687,251 3.33Austria (2020: 0.39%)AMS 62,628 1,257,506 0.06ANDRITZ 16,388 920,808 0.04AT&S Austria Technologie &Systemtechnik 4,702 203,528 0.01BAWAG Group 17,389 925,499 0.04CA Immobilien Anlagen 14,693 612,469 0.03DO & CO 2,076 187,353 0.01EVN 14,562 343,309 0.02IMMOFINANZ 19,378 435,478 0.02Lenzing 3,877 474,486 0.02Oesterreichische Post 7,229 384,493 0.02Palfinger 4,566 191,414 0.01Porr 847 16,071 -S IMMO 7,491 179,448 0.01S&T 9,137 209,127 0.01Schoeller-Bleckmann Oilfield Equipment 2,574 108,211 0.01Semperit AG Holding 2,890 116,184 0.01Telekom Austria 36,675 313,149 0.02UNIQA Insurance Group 30,649 266,785 0.01Vienna Insurance Group 13,181 361,866 0.02Wienerberger 26,887 1,036,273 0.05Zumtobel Group 561 5,655 -
8,549,112 0.42Bahamas (2020: 0.00%)OneSpaWorld Holdings 23,700 229,653 0.01
Belgium (2020: 0.60%)Ackermans & van Haaren 5,492 927,446 0.04Aedifica REIT 8,962 1,182,901 0.06AGFA-Gevaert 32,921 152,846 0.01Akka Technologies 2,745 76,565 -Barco 16,298 446,086 0.02Befimmo REIT 7,317 290,687 0.01Bekaert 9,031 402,477 0.02bpost 21,070 252,118 0.01Cie d’Entreprises CFE 1,949 203,396 0.01
Mercer UCITS Common Contractual FundMercer Passive Global Small Cap Equity UCITS CCF
Portfolio Statementas at 30 June 2021
(continued)
Mercer UCITS Common Contractual Fund 160
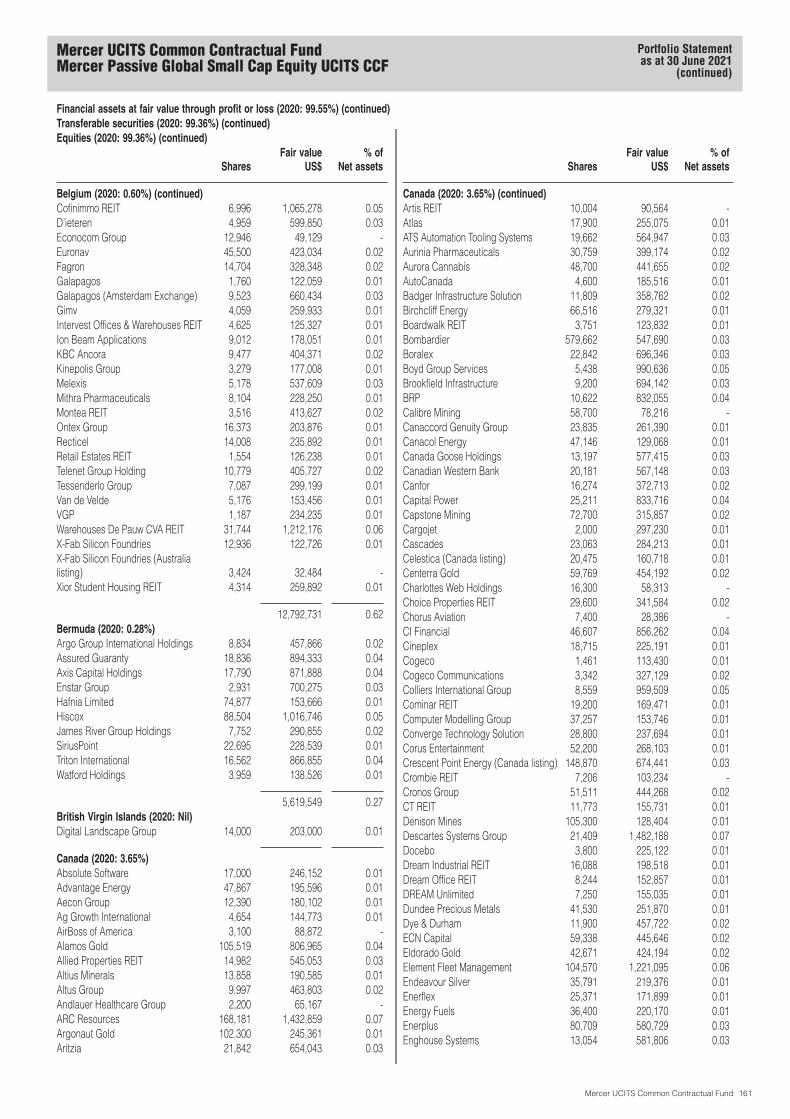
Financial assets at fair value through profit or loss (2020: 99.55%) (continued)Transferable securities (2020: 99.36%) (continued)Equities (2020: 99.36%) (continued)
SharesFair value
US$% of
Net assets
Belgium (2020: 0.60%) (continued)Cofinimmo REIT 6,996 1,065,278 0.05D’ieteren 4,959 599,850 0.03Econocom Group 12,946 49,129 -Euronav 45,500 423,034 0.02Fagron 14,704 328,348 0.02Galapagos 1,760 122,059 0.01Galapagos (Amsterdam Exchange) 9,523 660,434 0.03Gimv 4,059 259,933 0.01Intervest Offices & Warehouses REIT 4,625 125,327 0.01Ion Beam Applications 9,012 178,051 0.01KBC Ancora 9,477 404,371 0.02Kinepolis Group 3,279 177,008 0.01Melexis 5,178 537,609 0.03Mithra Pharmaceuticals 8,104 228,250 0.01Montea REIT 3,516 413,627 0.02Ontex Group 16,373 203,876 0.01Recticel 14,008 235,892 0.01Retail Estates REIT 1,554 126,238 0.01Telenet Group Holding 10,779 405,727 0.02Tessenderlo Group 7,087 299,199 0.01Van de Velde 5,176 153,456 0.01VGP 1,187 234,235 0.01Warehouses De Pauw CVA REIT 31,744 1,212,176 0.06X-Fab Silicon Foundries 12,936 122,726 0.01X-Fab Silicon Foundries (Australialisting) 3,424 32,484 -Xior Student Housing REIT 4,314 259,892 0.01
12,792,731 0.62Bermuda (2020: 0.28%)Argo Group International Holdings 8,834 457,866 0.02Assured Guaranty 18,836 894,333 0.04Axis Capital Holdings 17,790 871,888 0.04Enstar Group 2,931 700,275 0.03Hafnia Limited 74,877 153,666 0.01Hiscox 88,504 1,016,746 0.05James River Group Holdings 7,752 290,855 0.02SiriusPoint 22,695 228,539 0.01Triton International 16,562 866,855 0.04Watford Holdings 3,959 138,526 0.01
5,619,549 0.27British Virgin Islands (2020: Nil)Digital Landscape Group 14,000 203,000 0.01
Canada (2020: 3.65%)Absolute Software 17,000 246,152 0.01Advantage Energy 47,867 195,596 0.01Aecon Group 12,390 180,102 0.01Ag Growth International 4,654 144,773 0.01AirBoss of America 3,100 88,872 -Alamos Gold 105,519 806,965 0.04Allied Properties REIT 14,982 545,053 0.03Altius Minerals 13,858 190,585 0.01Altus Group 9,997 463,803 0.02Andlauer Healthcare Group 2,200 65,167 -ARC Resources 168,181 1,432,859 0.07Argonaut Gold 102,300 245,361 0.01Aritzia 21,842 654,043 0.03
SharesFair value
US$% of
Net assets
Canada (2020: 3.65%) (continued)Artis REIT 10,004 90,564 -Atlas 17,900 255,075 0.01ATS Automation Tooling Systems 19,662 564,947 0.03Aurinia Pharmaceuticals 30,759 399,174 0.02Aurora Cannabis 48,700 441,655 0.02AutoCanada 4,600 185,516 0.01Badger Infrastructure Solution 11,809 358,762 0.02Birchcliff Energy 66,516 279,321 0.01Boardwalk REIT 3,751 123,832 0.01Bombardier 579,662 547,690 0.03Boralex 22,842 696,346 0.03Boyd Group Services 5,438 990,636 0.05Brookfield Infrastructure 9,200 694,142 0.03BRP 10,622 832,055 0.04Calibre Mining 58,700 78,216 -Canaccord Genuity Group 23,835 261,390 0.01Canacol Energy 47,146 129,068 0.01Canada Goose Holdings 13,197 577,415 0.03Canadian Western Bank 20,181 567,148 0.03Canfor 16,274 372,713 0.02Capital Power 25,211 833,716 0.04Capstone Mining 72,700 315,857 0.02Cargojet 2,000 297,230 0.01Cascades 23,063 284,213 0.01Celestica (Canada listing) 20,475 160,718 0.01Centerra Gold 59,769 454,192 0.02Charlottes Web Holdings 16,300 58,313 -Choice Properties REIT 29,600 341,584 0.02Chorus Aviation 7,400 28,386 -CI Financial 46,607 856,262 0.04Cineplex 18,715 225,191 0.01Cogeco 1,461 113,430 0.01Cogeco Communications 3,342 327,129 0.02Colliers International Group 8,559 959,509 0.05Cominar REIT 19,200 169,471 0.01Computer Modelling Group 37,257 153,746 0.01Converge Technology Solution 28,800 237,694 0.01Corus Entertainment 52,200 268,103 0.01Crescent Point Energy (Canada listing) 148,870 674,441 0.03Crombie REIT 7,206 103,234 -Cronos Group 51,511 444,268 0.02CT REIT 11,773 155,731 0.01Denison Mines 105,300 128,404 0.01Descartes Systems Group 21,409 1,482,188 0.07Docebo 3,800 225,122 0.01Dream Industrial REIT 16,088 198,518 0.01Dream Office REIT 8,244 152,857 0.01DREAM Unlimited 7,250 155,035 0.01Dundee Precious Metals 41,530 251,870 0.01Dye & Durham 11,900 457,722 0.02ECN Capital 59,338 445,646 0.02Eldorado Gold 42,671 424,194 0.02Element Fleet Management 104,570 1,221,095 0.06Endeavour Silver 35,791 219,376 0.01Enerflex 25,371 171,899 0.01Energy Fuels 36,400 220,170 0.01Enerplus 80,709 580,729 0.03Enghouse Systems 13,054 581,806 0.03
Mercer UCITS Common Contractual FundMercer Passive Global Small Cap Equity UCITS CCF
Portfolio Statementas at 30 June 2021
(continued)
Mercer UCITS Common Contractual Fund 161
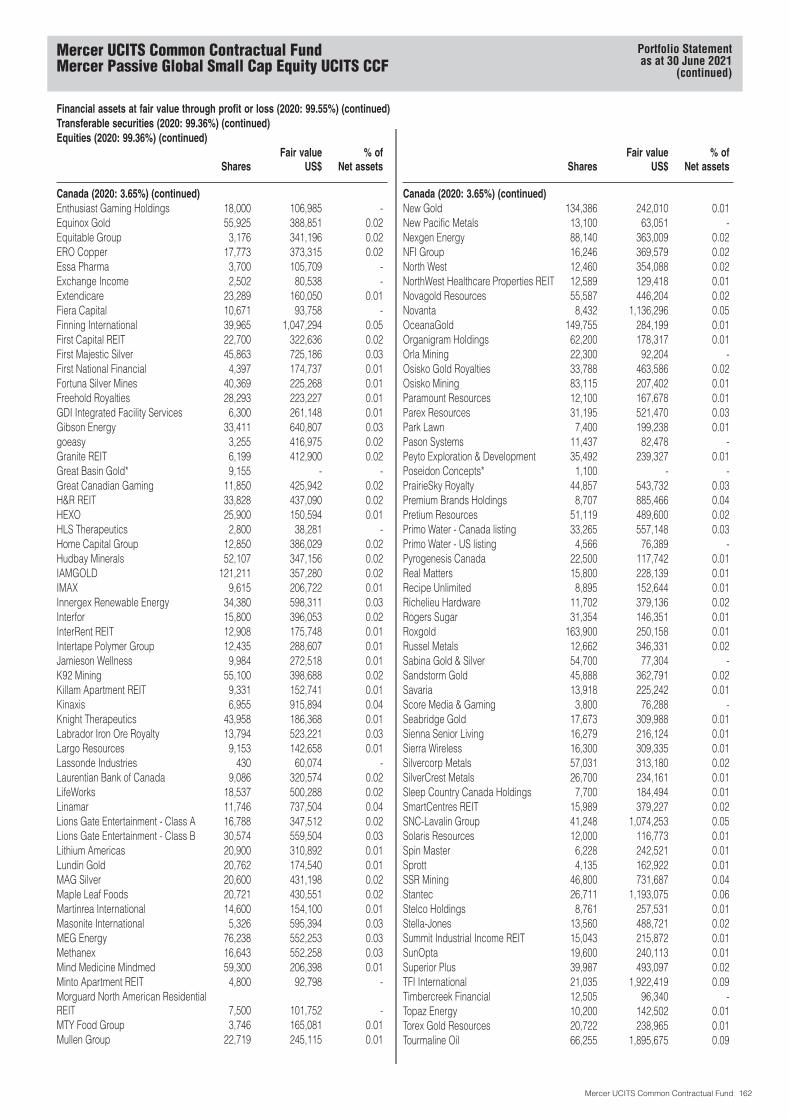
Financial assets at fair value through profit or loss (2020: 99.55%) (continued)Transferable securities (2020: 99.36%) (continued)Equities (2020: 99.36%) (continued)
SharesFair value
US$% of
Net assets
Canada (2020: 3.65%) (continued)Enthusiast Gaming Holdings 18,000 106,985 -Equinox Gold 55,925 388,851 0.02Equitable Group 3,176 341,196 0.02ERO Copper 17,773 373,315 0.02Essa Pharma 3,700 105,709 -Exchange Income 2,502 80,538 -Extendicare 23,289 160,050 0.01Fiera Capital 10,671 93,758 -Finning International 39,965 1,047,294 0.05First Capital REIT 22,700 322,636 0.02First Majestic Silver 45,863 725,186 0.03First National Financial 4,397 174,737 0.01Fortuna Silver Mines 40,369 225,268 0.01Freehold Royalties 28,293 223,227 0.01GDI Integrated Facility Services 6,300 261,148 0.01Gibson Energy 33,411 640,807 0.03goeasy 3,255 416,975 0.02Granite REIT 6,199 412,900 0.02Great Basin Gold* 9,155 - -Great Canadian Gaming 11,850 425,942 0.02H&R REIT 33,828 437,090 0.02HEXO 25,900 150,594 0.01HLS Therapeutics 2,800 38,281 -Home Capital Group 12,850 386,029 0.02Hudbay Minerals 52,107 347,156 0.02IAMGOLD 121,211 357,280 0.02IMAX 9,615 206,722 0.01Innergex Renewable Energy 34,380 598,311 0.03Interfor 15,800 396,053 0.02InterRent REIT 12,908 175,748 0.01Intertape Polymer Group 12,435 288,607 0.01Jamieson Wellness 9,984 272,518 0.01K92 Mining 55,100 398,688 0.02Killam Apartment REIT 9,331 152,741 0.01Kinaxis 6,955 915,894 0.04Knight Therapeutics 43,958 186,368 0.01Labrador Iron Ore Royalty 13,794 523,221 0.03Largo Resources 9,153 142,658 0.01Lassonde Industries 430 60,074 -Laurentian Bank of Canada 9,086 320,574 0.02LifeWorks 18,537 500,288 0.02Linamar 11,746 737,504 0.04Lions Gate Entertainment - Class A 16,788 347,512 0.02Lions Gate Entertainment - Class B 30,574 559,504 0.03Lithium Americas 20,900 310,892 0.01Lundin Gold 20,762 174,540 0.01MAG Silver 20,600 431,198 0.02Maple Leaf Foods 20,721 430,551 0.02Martinrea International 14,600 154,100 0.01Masonite International 5,326 595,394 0.03MEG Energy 76,238 552,253 0.03Methanex 16,643 552,258 0.03Mind Medicine Mindmed 59,300 206,398 0.01Minto Apartment REIT 4,800 92,798 -Morguard North American ResidentialREIT 7,500 101,752 -MTY Food Group 3,746 165,081 0.01Mullen Group 22,719 245,115 0.01
SharesFair value
US$% of
Net assets
Canada (2020: 3.65%) (continued)New Gold 134,386 242,010 0.01New Pacific Metals 13,100 63,051 -Nexgen Energy 88,140 363,009 0.02NFI Group 16,246 369,579 0.02North West 12,460 354,088 0.02NorthWest Healthcare Properties REIT 12,589 129,418 0.01Novagold Resources 55,587 446,204 0.02Novanta 8,432 1,136,296 0.05OceanaGold 149,755 284,199 0.01Organigram Holdings 62,200 178,317 0.01Orla Mining 22,300 92,204 -Osisko Gold Royalties 33,788 463,586 0.02Osisko Mining 83,115 207,402 0.01Paramount Resources 12,100 167,678 0.01Parex Resources 31,195 521,470 0.03Park Lawn 7,400 199,238 0.01Pason Systems 11,437 82,478 -Peyto Exploration & Development 35,492 239,327 0.01Poseidon Concepts* 1,100 - -PrairieSky Royalty 44,857 543,732 0.03Premium Brands Holdings 8,707 885,466 0.04Pretium Resources 51,119 489,600 0.02Primo Water - Canada listing 33,265 557,148 0.03Primo Water - US listing 4,566 76,389 -Pyrogenesis Canada 22,500 117,742 0.01Real Matters 15,800 228,139 0.01Recipe Unlimited 8,895 152,644 0.01Richelieu Hardware 11,702 379,136 0.02Rogers Sugar 31,354 146,351 0.01Roxgold 163,900 250,158 0.01Russel Metals 12,662 346,331 0.02Sabina Gold & Silver 54,700 77,304 -Sandstorm Gold 45,888 362,791 0.02Savaria 13,918 225,242 0.01Score Media & Gaming 3,800 76,288 -Seabridge Gold 17,673 309,988 0.01Sienna Senior Living 16,279 216,124 0.01Sierra Wireless 16,300 309,335 0.01Silvercorp Metals 57,031 313,180 0.02SilverCrest Metals 26,700 234,161 0.01Sleep Country Canada Holdings 7,700 184,494 0.01SmartCentres REIT 15,989 379,227 0.02SNC-Lavalin Group 41,248 1,074,253 0.05Solaris Resources 12,000 116,773 0.01Spin Master 6,228 242,521 0.01Sprott 4,135 162,922 0.01SSR Mining 46,800 731,687 0.04Stantec 26,711 1,193,075 0.06Stelco Holdings 8,761 257,531 0.01Stella-Jones 13,560 488,721 0.02Summit Industrial Income REIT 15,043 215,872 0.01SunOpta 19,600 240,113 0.01Superior Plus 39,987 493,097 0.02TFI International 21,035 1,922,419 0.09Timbercreek Financial 12,505 96,340 -Topaz Energy 10,200 142,502 0.01Torex Gold Resources 20,722 238,965 0.01Tourmaline Oil 66,255 1,895,675 0.09
Mercer UCITS Common Contractual FundMercer Passive Global Small Cap Equity UCITS CCF
Portfolio Statementas at 30 June 2021
(continued)
Mercer UCITS Common Contractual Fund 162
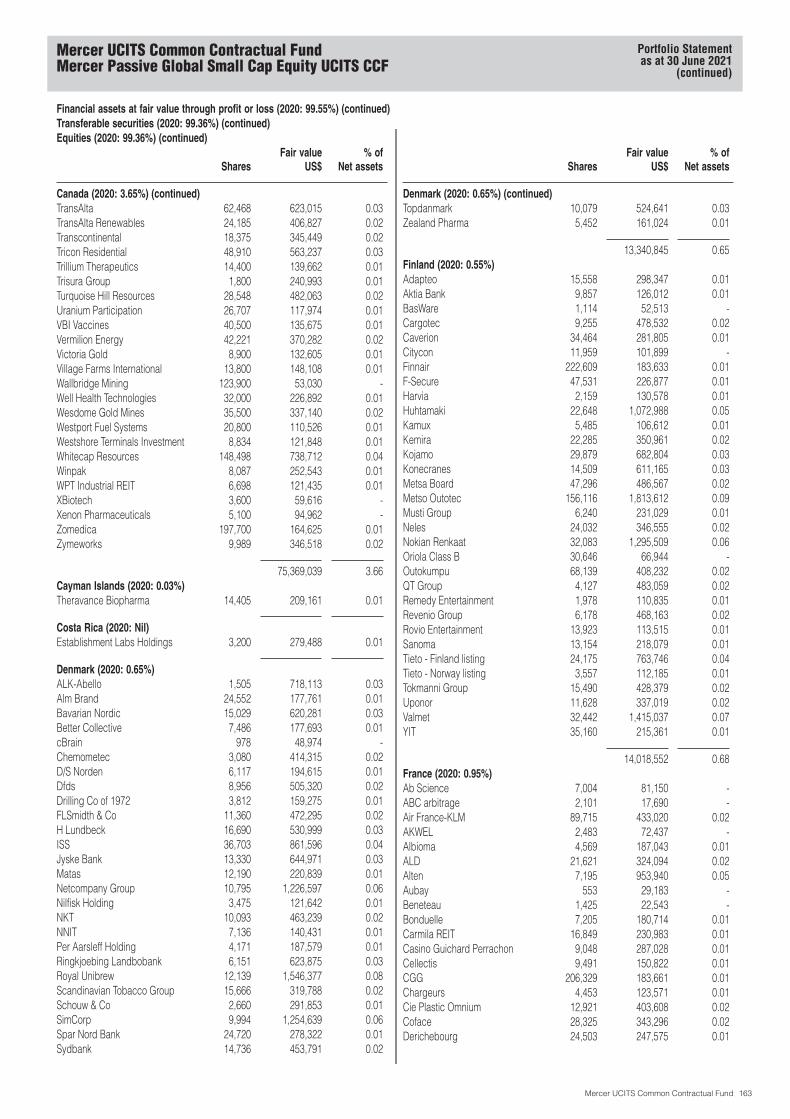
Financial assets at fair value through profit or loss (2020: 99.55%) (continued)Transferable securities (2020: 99.36%) (continued)Equities (2020: 99.36%) (continued)
SharesFair value
US$% of
Net assets
Canada (2020: 3.65%) (continued)TransAlta 62,468 623,015 0.03TransAlta Renewables 24,185 406,827 0.02Transcontinental 18,375 345,449 0.02Tricon Residential 48,910 563,237 0.03Trillium Therapeutics 14,400 139,662 0.01Trisura Group 1,800 240,993 0.01Turquoise Hill Resources 28,548 482,063 0.02Uranium Participation 26,707 117,974 0.01VBI Vaccines 40,500 135,675 0.01Vermilion Energy 42,221 370,282 0.02Victoria Gold 8,900 132,605 0.01Village Farms International 13,800 148,108 0.01Wallbridge Mining 123,900 53,030 -Well Health Technologies 32,000 226,892 0.01Wesdome Gold Mines 35,500 337,140 0.02Westport Fuel Systems 20,800 110,526 0.01Westshore Terminals Investment 8,834 121,848 0.01Whitecap Resources 148,498 738,712 0.04Winpak 8,087 252,543 0.01WPT Industrial REIT 6,698 121,435 0.01XBiotech 3,600 59,616 -Xenon Pharmaceuticals 5,100 94,962 -Zomedica 197,700 164,625 0.01Zymeworks 9,989 346,518 0.02
75,369,039 3.66Cayman Islands (2020: 0.03%)Theravance Biopharma 14,405 209,161 0.01
Costa Rica (2020: Nil)Establishment Labs Holdings 3,200 279,488 0.01
Denmark (2020: 0.65%)ALK-Abello 1,505 718,113 0.03Alm Brand 24,552 177,761 0.01Bavarian Nordic 15,029 620,281 0.03Better Collective 7,486 177,693 0.01cBrain 978 48,974 -Chemometec 3,080 414,315 0.02D/S Norden 6,117 194,615 0.01Dfds 8,956 505,320 0.02Drilling Co of 1972 3,812 159,275 0.01FLSmidth & Co 11,360 472,295 0.02H Lundbeck 16,690 530,999 0.03ISS 36,703 861,596 0.04Jyske Bank 13,330 644,971 0.03Matas 12,190 220,839 0.01Netcompany Group 10,795 1,226,597 0.06Nilfisk Holding 3,475 121,642 0.01NKT 10,093 463,239 0.02NNIT 7,136 140,431 0.01Per Aarsleff Holding 4,171 187,579 0.01Ringkjoebing Landbobank 6,151 623,875 0.03Royal Unibrew 12,139 1,546,377 0.08Scandinavian Tobacco Group 15,666 319,788 0.02Schouw & Co 2,660 291,853 0.01SimCorp 9,994 1,254,639 0.06Spar Nord Bank 24,720 278,322 0.01Sydbank 14,736 453,791 0.02
SharesFair value
US$% of
Net assets
Denmark (2020: 0.65%) (continued)Topdanmark 10,079 524,641 0.03Zealand Pharma 5,452 161,024 0.01
13,340,845 0.65Finland (2020: 0.55%)Adapteo 15,558 298,347 0.01Aktia Bank 9,857 126,012 0.01BasWare 1,114 52,513 -Cargotec 9,255 478,532 0.02Caverion 34,464 281,805 0.01Citycon 11,959 101,899 -Finnair 222,609 183,633 0.01F-Secure 47,531 226,877 0.01Harvia 2,159 130,578 0.01Huhtamaki 22,648 1,072,988 0.05Kamux 5,485 106,612 0.01Kemira 22,285 350,961 0.02Kojamo 29,879 682,804 0.03Konecranes 14,509 611,165 0.03Metsa Board 47,296 486,567 0.02Metso Outotec 156,116 1,813,612 0.09Musti Group 6,240 231,029 0.01Neles 24,032 346,555 0.02Nokian Renkaat 32,083 1,295,509 0.06Oriola Class B 30,646 66,944 -Outokumpu 68,139 408,232 0.02QT Group 4,127 483,059 0.02Remedy Entertainment 1,978 110,835 0.01Revenio Group 6,178 468,163 0.02Rovio Entertainment 13,923 113,515 0.01Sanoma 13,154 218,079 0.01Tieto - Finland listing 24,175 763,746 0.04Tieto - Norway listing 3,557 112,185 0.01Tokmanni Group 15,490 428,379 0.02Uponor 11,628 337,019 0.02Valmet 32,442 1,415,037 0.07YIT 35,160 215,361 0.01
14,018,552 0.68France (2020: 0.95%)Ab Science 7,004 81,150 -ABC arbitrage 2,101 17,690 -Air France-KLM 89,715 433,020 0.02AKWEL 2,483 72,437 -Albioma 4,569 187,043 0.01ALD 21,621 324,094 0.02Alten 7,195 953,940 0.05Aubay 553 29,183 -Beneteau 1,425 22,543 -Bonduelle 7,205 180,714 0.01Carmila REIT 16,849 230,983 0.01Casino Guichard Perrachon 9,048 287,028 0.01Cellectis 9,491 150,822 0.01CGG 206,329 183,661 0.01Chargeurs 4,453 123,571 0.01Cie Plastic Omnium 12,921 403,608 0.02Coface 28,325 343,296 0.02Derichebourg 24,503 247,575 0.01
Mercer UCITS Common Contractual FundMercer Passive Global Small Cap Equity UCITS CCF
Portfolio Statementas at 30 June 2021
(continued)
Mercer UCITS Common Contractual Fund 163

Financial assets at fair value through profit or loss (2020: 99.55%) (continued)Transferable securities (2020: 99.36%) (continued)Equities (2020: 99.36%) (continued)
SharesFair value
US$% of
Net assets
France (2020: 0.95%) (continued)Elior Group 24,825 185,472 0.01Elis 46,595 878,034 0.04Eramet 2,333 152,307 0.01Eutelsat Communications 38,444 449,251 0.02Fnac Darty 4,110 264,417 0.01Gaztransport Et Technigaz 5,357 432,630 0.02ICADE REIT 7,176 619,530 0.03ID Logistics Group 483 135,179 0.01Imerys 7,426 346,976 0.02Interparfums 2,695 175,141 0.01IPSOS 8,188 345,196 0.02JCDecaux 16,224 449,832 0.02Kaufman & Broad 3,140 149,322 0.01Korian 15,525 573,322 0.03Lagardere 10,308 254,754 0.01LISI 8,022 262,091 0.01LNA Sante 944 59,333 -Maisons du Monde 8,961 222,101 0.01McPhy Energy 5,291 134,026 0.01Mercialys REIT 17,558 212,593 0.01Mersen 6,871 267,672 0.01Metropole Television 7,205 151,578 0.01Neoen 11,191 502,721 0.02Nexans 7,035 641,145 0.03Nexity 9,435 471,951 0.02Peugeot Invest 1,901 255,649 0.01Pharmagest Interactive 1,618 178,255 0.01Quadient 11,092 333,323 0.02Rexel 55,817 1,167,652 0.06Rubis 21,995 977,885 0.05SMCP 14,663 106,333 -Societe 5,491 381,590 0.02SOITEC 5,774 1,272,930 0.06Sopra Steria Group 4,115 791,533 0.04SPIE 30,459 700,754 0.03Tarkett 6,047 143,423 0.01Technicolor 55,026 213,385 0.01Television Francaise 1 6,518 65,896 -Trigano 1,727 356,770 0.02Valneva 18,406 243,161 0.01Verallia 9,699 359,554 0.02Vicat 4,120 199,101 0.01Vilmorin & Cie 1,877 124,652 0.01Virbac 1,257 430,806 0.02
20,911,584 1.02Germany (2020: 2.08%)1&1 Drillisch 10,608 324,565 0.02Aareal Bank 15,362 354,701 0.02ADVA Optical Networking 15,299 211,911 0.01AIXTRON 29,159 790,146 0.04Alstria office REIT 39,454 729,433 0.04Amadeus Fire 1,992 364,269 0.02Aurelius Equity Opportunitie 5,854 179,943 0.01Aurubis 7,771 720,294 0.03BayWa 1,713 73,945 -Bertrandt 3,211 214,767 0.01Bilfinger 8,972 268,551 0.01
SharesFair value
US$% of
Net assets
Germany (2020: 2.08%) (continued)Borussia Dortmund 15,603 115,000 0.01CANCOM 10,442 631,542 0.03CECONOMY 42,824 209,031 0.01Cewe Stiftung 899 139,236 0.01Compugroup Medical 6,618 518,380 0.02CropEnergies 10,203 130,919 0.01CTS Eventim 14,767 922,893 0.04Datagroup 417 32,144 -Dermapharm Holding 4,032 321,559 0.02Deutsche Beteiligungs 1,843 74,529 -Deutsche EuroShop 13,812 327,593 0.02Deutsche Pfandbriefbank 28,381 280,632 0.01Deutz 28,792 232,865 0.01DIC Asset 14,987 258,954 0.01Draegerwerk 1,630 151,549 0.01Draegerwerk - Pref 2,245 212,455 0.01Duerr 12,469 474,367 0.02Eckert & Ziegler Strahlen- undMedizintechnik 3,070 350,783 0.02ElringKlinger 11,265 200,521 0.01Encavis 19,155 362,092 0.02Evotec 33,289 1,509,223 0.07Exasol 2,909 60,475 -FinTech Group 2,679 360,593 0.02Fraport Frankfurt Airport ServicesWorldwide 8,756 596,650 0.03Freenet 31,537 745,003 0.04Gerresheimer 7,294 806,609 0.04GRENKE 6,269 275,073 0.01Hamborner REIT 16,740 178,251 0.01Hamburger Hafen und Logistik 2,942 73,965 -Hensoldt 3,648 65,758 -HOCHTIEF 5,071 389,447 0.02Home24 9,736 181,848 0.01Hornbach Baumarkt 2,798 122,937 0.01Hornbach Holding 3,090 352,152 0.02HUGO BOSS 14,686 799,052 0.04Hypoport 910 470,518 0.02Indus Holding 6,295 249,339 0.01Instone Real Estate Group 7,968 240,011 0.01Jenoptik 11,542 315,638 0.02JOST Werke 3,457 206,213 0.01Jungheinrich - Pref 10,778 526,859 0.03K&S 42,952 584,754 0.03Kloeckner & Co 18,903 258,693 0.01Koenig & Bauer 6,436 214,854 0.01Krones 2,778 248,235 0.01KWS Saat 3,272 269,291 0.01LPKF Laser & Electronics 6,520 189,900 0.01MBB 1,206 187,928 0.01Medios 1,875 74,712 -METRO (Germany listing) 26,523 328,376 0.02MLP 28,096 232,234 0.01MorphoSys 9,061 702,967 0.03Nagarro 1,165 142,993 0.01New Work 487 153,046 0.01Nordex 17,152 416,575 0.02Norma Group 7,873 403,154 0.02
Mercer UCITS Common Contractual FundMercer Passive Global Small Cap Equity UCITS CCF
Portfolio Statementas at 30 June 2021
(continued)
Mercer UCITS Common Contractual Fund 164
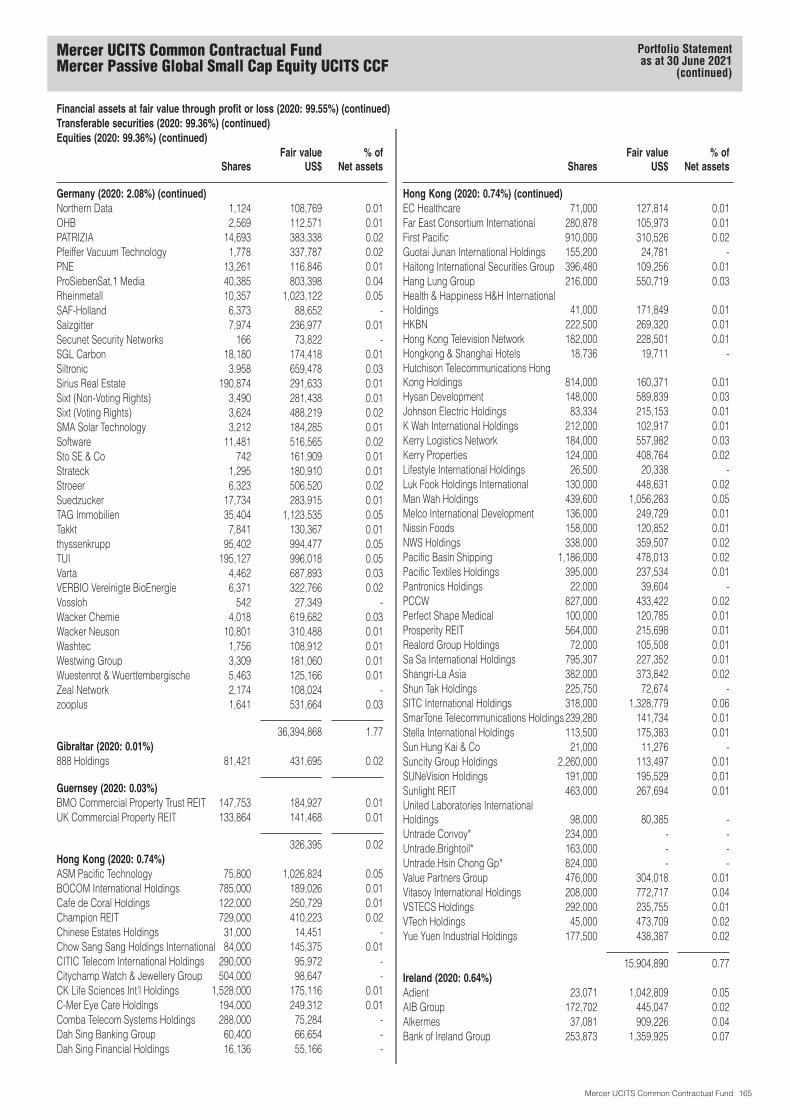
Financial assets at fair value through profit or loss (2020: 99.55%) (continued)Transferable securities (2020: 99.36%) (continued)Equities (2020: 99.36%) (continued)
SharesFair value
US$% of
Net assets
Germany (2020: 2.08%) (continued)Northern Data 1,124 108,769 0.01OHB 2,569 112,571 0.01PATRIZIA 14,693 383,338 0.02Pfeiffer Vacuum Technology 1,778 337,787 0.02PNE 13,261 116,846 0.01ProSiebenSat.1 Media 40,385 803,398 0.04Rheinmetall 10,357 1,023,122 0.05SAF-Holland 6,373 88,652 -Salzgitter 7,974 236,977 0.01Secunet Security Networks 166 73,822 -SGL Carbon 18,180 174,418 0.01Siltronic 3,958 659,478 0.03Sirius Real Estate 190,874 291,633 0.01Sixt (Non-Voting Rights) 3,490 281,438 0.01Sixt (Voting Rights) 3,624 488,219 0.02SMA Solar Technology 3,212 184,285 0.01Software 11,481 516,565 0.02Sto SE & Co 742 161,909 0.01Strateck 1,295 180,910 0.01Stroeer 6,323 506,520 0.02Suedzucker 17,734 283,915 0.01TAG Immobilien 35,404 1,123,535 0.05Takkt 7,841 130,367 0.01thyssenkrupp 95,402 994,477 0.05TUI 195,127 996,018 0.05Varta 4,462 687,893 0.03VERBIO Vereinigte BioEnergie 6,371 322,766 0.02Vossloh 542 27,349 -Wacker Chemie 4,018 619,682 0.03Wacker Neuson 10,801 310,488 0.01Washtec 1,756 108,912 0.01Westwing Group 3,309 181,060 0.01Wuestenrot & Wuerttembergische 5,463 125,166 0.01Zeal Network 2,174 108,024 -zooplus 1,641 531,664 0.03
36,394,868 1.77Gibraltar (2020: 0.01%)888 Holdings 81,421 431,695 0.02
Guernsey (2020: 0.03%)BMO Commercial Property Trust REIT 147,753 184,927 0.01UK Commercial Property REIT 133,864 141,468 0.01
326,395 0.02Hong Kong (2020: 0.74%)ASM Pacific Technology 75,800 1,026,824 0.05BOCOM International Holdings 785,000 189,026 0.01Cafe de Coral Holdings 122,000 250,729 0.01Champion REIT 729,000 410,223 0.02Chinese Estates Holdings 31,000 14,451 -Chow Sang Sang Holdings International 84,000 145,375 0.01CITIC Telecom International Holdings 290,000 95,972 -Citychamp Watch & Jewellery Group 504,000 98,647 -CK Life Sciences Int’l Holdings 1,528,000 175,116 0.01C-Mer Eye Care Holdings 194,000 249,312 0.01Comba Telecom Systems Holdings 288,000 75,284 -Dah Sing Banking Group 60,400 66,654 -Dah Sing Financial Holdings 16,136 55,166 -
SharesFair value
US$% of
Net assets
Hong Kong (2020: 0.74%) (continued)EC Healthcare 71,000 127,814 0.01Far East Consortium International 280,878 105,973 0.01First Pacific 910,000 310,526 0.02Guotai Junan International Holdings 155,200 24,781 -Haitong International Securities Group 396,480 109,256 0.01Hang Lung Group 216,000 550,719 0.03Health & Happiness H&H InternationalHoldings 41,000 171,849 0.01HKBN 222,500 269,320 0.01Hong Kong Television Network 182,000 228,501 0.01Hongkong & Shanghai Hotels 18,736 19,711 -Hutchison Telecommunications HongKong Holdings 814,000 160,371 0.01Hysan Development 148,000 589,839 0.03Johnson Electric Holdings 83,334 215,153 0.01K Wah International Holdings 212,000 102,917 0.01Kerry Logistics Network 184,000 557,982 0.03Kerry Properties 124,000 408,764 0.02Lifestyle International Holdings 26,500 20,338 -Luk Fook Holdings International 130,000 448,631 0.02Man Wah Holdings 439,600 1,056,283 0.05Melco International Development 136,000 249,729 0.01Nissin Foods 158,000 120,852 0.01NWS Holdings 338,000 359,507 0.02Pacific Basin Shipping 1,186,000 478,013 0.02Pacific Textiles Holdings 395,000 237,534 0.01Pantronics Holdings 22,000 39,604 -PCCW 827,000 433,422 0.02Perfect Shape Medical 100,000 120,785 0.01Prosperity REIT 564,000 215,698 0.01Realord Group Holdings 72,000 105,508 0.01Sa Sa International Holdings 795,307 227,352 0.01Shangri-La Asia 382,000 373,842 0.02Shun Tak Holdings 225,750 72,674 -SITC International Holdings 318,000 1,328,779 0.06SmarTone Telecommunications Holdings 239,280 141,734 0.01Stella International Holdings 113,500 175,383 0.01Sun Hung Kai & Co 21,000 11,276 -Suncity Group Holdings 2,260,000 113,497 0.01SUNeVision Holdings 191,000 195,529 0.01Sunlight REIT 463,000 267,694 0.01United Laboratories InternationalHoldings 98,000 80,385 -Untrade Convoy* 234,000 - -Untrade.Brightoil* 163,000 - -Untrade.Hsin Chong Gp* 824,000 - -Value Partners Group 476,000 304,018 0.01Vitasoy International Holdings 208,000 772,717 0.04VSTECS Holdings 292,000 235,755 0.01VTech Holdings 45,000 473,709 0.02Yue Yuen Industrial Holdings 177,500 438,387 0.02
15,904,890 0.77Ireland (2020: 0.64%)Adient 23,071 1,042,809 0.05AIB Group 172,702 445,047 0.02Alkermes 37,081 909,226 0.04Bank of Ireland Group 253,873 1,359,925 0.07
Mercer UCITS Common Contractual FundMercer Passive Global Small Cap Equity UCITS CCF
Portfolio Statementas at 30 June 2021
(continued)
Mercer UCITS Common Contractual Fund 165

Financial assets at fair value through profit or loss (2020: 99.55%) (continued)Transferable securities (2020: 99.36%) (continued)Equities (2020: 99.36%) (continued)
SharesFair value
US$% of
Net assets
Ireland (2020: 0.64%) (continued)C&C Group (UK listing) 69,853 234,491 0.01Cairn Homes - IRE listing 113,937 144,036 0.01Cairn Homes - UK listing 36,440 46,061 -Cimpress 4,128 447,516 0.02Dalata Hotel Group 63,381 288,252 0.01Endo International 46,853 219,272 0.01Glanbia 51,325 833,260 0.04Glenveagh Properties 301,959 343,770 0.02Grafton Group 55,518 879,696 0.04Greencore Group 166,510 288,912 0.01Hibernia REIT 249,866 367,432 0.02Irish Residential Properties REIT 82,909 149,646 0.01nVent Electric 44,658 1,395,116 0.07Origin Enterprises 20,929 81,781 -Perrigo 32,824 1,504,980 0.07Prothena 7,930 407,681 0.02Total Produce 46,092 144,304 0.01UDG Healthcare 63,660 940,112 0.05Uniphar 44,853 181,382 0.01
12,654,707 0.61Isle of Man (2020: 0.02%)Bakkafrost 12,908 1,066,517 0.05Playtech 71,614 420,655 0.02Strix Group 35,221 153,510 0.01
1,640,682 0.08Israel (2020: 0.78%)1 REIT 36,097 190,760 0.01AFI Properties 5,797 251,040 0.01Airport City 14,473 242,779 0.01Alony Hetz Properties & Investments 35,108 489,152 0.02Altshuler Shaham Provident Funds &Pension 14,553 87,537 -Amot Investments 31,683 207,882 0.01Ashtrom Group 13,749 312,237 0.02AudioCodes 5,857 196,821 0.01Azorim-Investment Development &Construction 24,871 99,988 -Bayside Land 36,746 351,954 0.02Bezeq The Israeli Telecommunication 524,410 571,323 0.03Big Shopping Centers 2,714 347,319 0.02Blue Square Real Estate 2,784 213,510 0.01Camtek 4,361 165,420 0.01Cellcom Israel 5,899 25,653 -Clal Insurance Enterprises Holdings 13,368 265,432 0.01Cognyte Software 16,320 399,840 0.02Compugen 12,714 105,272 0.01Danel Adir Yeoshua 1,265 265,151 0.01Delek Automotive Systems 11,600 152,365 0.01Delek Group 2,586 173,405 0.01Delta Galil Industries 540 22,372 -Doral Group Renewable Energy 29,239 138,097 0.01Elco 1,638 97,521 -Electra 403 228,678 0.01Electra Consumer Products 1970 1,337 76,851 -Electreon Wireless 1,974 119,161 0.01Energix-Renewable Energies 43,119 165,542 0.01Enlight Renewable Energy 248,677 533,833 0.03
SharesFair value
US$% of
Net assets
Israel (2020: 0.78%) (continued)Equital 3,067 83,205 -Fattal Holdings 1998 1,887 179,463 0.01FIBI Holdings 3,918 146,572 0.01First International Bank Of Israel 14,160 453,676 0.02Fiverr International 6,700 1,624,683 0.08Formula Systems 1985 3,416 306,638 0.01Fox Wizel 2,369 271,470 0.01Gazit Globe 27,836 200,836 0.01Gilat Satellite Networks 6,944 70,196 -Harel Insurance Investments & FinancialServices 31,586 313,097 0.02Hilan 2,382 114,915 0.01IDI Insurance 4,547 152,102 0.01Inmode 6,700 634,356 0.03Isracard 51,758 212,210 0.01Israel 749 227,010 0.01Israel Canada T.R 54,303 220,812 0.01Ituran Location and Control 2,362 64,341 -JFrog 9,300 423,336 0.02Kornit Digital 11,217 1,394,610 0.07Magic Software Enterprises 12,497 201,693 0.01Matrix IT 12,606 340,906 0.02Maytronics 15,976 332,954 0.02Mega Or Holdings 9,717 313,115 0.02Mehadrin 0 7 -Melisron 4,357 298,177 0.01Menora Mivtachim Holdings 2,298 45,487 -Migdal Insurance & Financial Holdings 93,402 128,702 0.01Mivne Real Estate 159,813 463,475 0.02Nano Dimension 55,400 456,496 0.02Nano-X Imaging 8,100 259,605 0.01Nova Measuring Instruments (Israellisting) 7,479 768,213 0.04Oil Refineries 568,230 146,482 0.01One Software Technologies 7,420 111,260 0.01OPC Energy 21,268 207,687 0.01Partner Communications 26,478 121,237 0.01Paz Oil 1,952 239,739 0.01Phoenix Holdings 31,625 295,723 0.01Plus500 23,437 432,234 0.02Prashkovsky Investments andConstruction 2,108 60,746 -Property & Building 1,306 159,117 0.01Radware 8,018 246,794 0.01Rami Levy Chain Stores HashikmaMarketing 2006 1,152 75,798 -Sapiens International 3,791 101,683 -Shapir Engineering and Industry 23,098 176,150 0.01Shikun & Binui 58,559 378,829 0.02Shufersal 69,822 555,833 0.03Strauss Group 15,710 439,938 0.02Summit Real Estate Holdings 3,907 58,908 -Taro Pharmaceutical Industries 1,838 132,262 0.01Tower Semiconductor 23,202 685,130 0.03Tremor International 15,181 149,319 0.01
Mercer UCITS Common Contractual FundMercer Passive Global Small Cap Equity UCITS CCF
Portfolio Statementas at 30 June 2021
(continued)
Mercer UCITS Common Contractual Fund 166
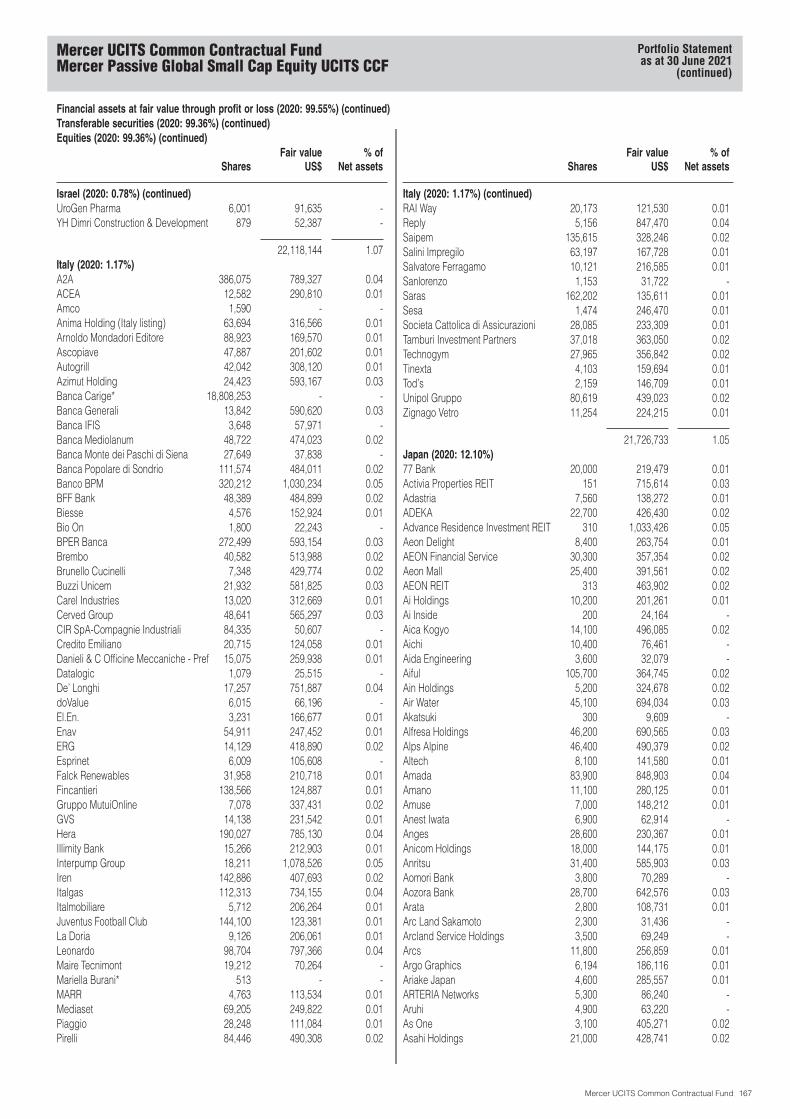
Financial assets at fair value through profit or loss (2020: 99.55%) (continued)Transferable securities (2020: 99.36%) (continued)Equities (2020: 99.36%) (continued)
SharesFair value
US$% of
Net assets
Israel (2020: 0.78%) (continued)UroGen Pharma 6,001 91,635 -YH Dimri Construction & Development 879 52,387 -
22,118,144 1.07Italy (2020: 1.17%)A2A 386,075 789,327 0.04ACEA 12,582 290,810 0.01Amco 1,590 - -Anima Holding (Italy listing) 63,694 316,566 0.01Arnoldo Mondadori Editore 88,923 169,570 0.01Ascopiave 47,887 201,602 0.01Autogrill 42,042 308,120 0.01Azimut Holding 24,423 593,167 0.03Banca Carige* 18,808,253 - -Banca Generali 13,842 590,620 0.03Banca IFIS 3,648 57,971 -Banca Mediolanum 48,722 474,023 0.02Banca Monte dei Paschi di Siena 27,649 37,838 -Banca Popolare di Sondrio 111,574 484,011 0.02Banco BPM 320,212 1,030,234 0.05BFF Bank 48,389 484,899 0.02Biesse 4,576 152,924 0.01Bio On 1,800 22,243 -BPER Banca 272,499 593,154 0.03Brembo 40,582 513,988 0.02Brunello Cucinelli 7,348 429,774 0.02Buzzi Unicem 21,932 581,825 0.03Carel Industries 13,020 312,669 0.01Cerved Group 48,641 565,297 0.03CIR SpA-Compagnie Industriali 84,335 50,607 -Credito Emiliano 20,715 124,058 0.01Danieli & C Officine Meccaniche - Pref 15,075 259,938 0.01Datalogic 1,079 25,515 -De’ Longhi 17,257 751,887 0.04doValue 6,015 66,196 -El.En. 3,231 166,677 0.01Enav 54,911 247,452 0.01ERG 14,129 418,890 0.02Esprinet 6,009 105,608 -Falck Renewables 31,958 210,718 0.01Fincantieri 138,566 124,887 0.01Gruppo MutuiOnline 7,078 337,431 0.02GVS 14,138 231,542 0.01Hera 190,027 785,130 0.04Illimity Bank 15,266 212,903 0.01Interpump Group 18,211 1,078,526 0.05Iren 142,886 407,693 0.02Italgas 112,313 734,155 0.04Italmobiliare 5,712 206,264 0.01Juventus Football Club 144,100 123,381 0.01La Doria 9,126 206,061 0.01Leonardo 98,704 797,366 0.04Maire Tecnimont 19,212 70,264 -Mariella Burani* 513 - -MARR 4,763 113,534 0.01Mediaset 69,205 249,822 0.01Piaggio 28,248 111,084 0.01Pirelli 84,446 490,308 0.02
SharesFair value
US$% of
Net assets
Italy (2020: 1.17%) (continued)RAI Way 20,173 121,530 0.01Reply 5,156 847,470 0.04Saipem 135,615 328,246 0.02Salini Impregilo 63,197 167,728 0.01Salvatore Ferragamo 10,121 216,585 0.01Sanlorenzo 1,153 31,722 -Saras 162,202 135,611 0.01Sesa 1,474 246,470 0.01Societa Cattolica di Assicurazioni 28,085 233,309 0.01Tamburi Investment Partners 37,018 363,050 0.02Technogym 27,965 356,842 0.02Tinexta 4,103 159,694 0.01Tod’s 2,159 146,709 0.01Unipol Gruppo 80,619 439,023 0.02Zignago Vetro 11,254 224,215 0.01
21,726,733 1.05Japan (2020: 12.10%)77 Bank 20,000 219,479 0.01Activia Properties REIT 151 715,614 0.03Adastria 7,560 138,272 0.01ADEKA 22,700 426,430 0.02Advance Residence Investment REIT 310 1,033,426 0.05Aeon Delight 8,400 263,754 0.01AEON Financial Service 30,300 357,354 0.02Aeon Mall 25,400 391,561 0.02AEON REIT 313 463,902 0.02Ai Holdings 10,200 201,261 0.01Ai Inside 200 24,164 -Aica Kogyo 14,100 496,085 0.02Aichi 10,400 76,461 -Aida Engineering 3,600 32,079 -Aiful 105,700 364,745 0.02Ain Holdings 5,200 324,678 0.02Air Water 45,100 694,034 0.03Akatsuki 300 9,609 -Alfresa Holdings 46,200 690,565 0.03Alps Alpine 46,400 490,379 0.02Altech 8,100 141,580 0.01Amada 83,900 848,903 0.04Amano 11,100 280,125 0.01Amuse 7,000 148,212 0.01Anest Iwata 6,900 62,914 -Anges 28,600 230,367 0.01Anicom Holdings 18,000 144,175 0.01Anritsu 31,400 585,903 0.03Aomori Bank 3,800 70,289 -Aozora Bank 28,700 642,576 0.03Arata 2,800 108,731 0.01Arc Land Sakamoto 2,300 31,436 -Arcland Service Holdings 3,500 69,249 -Arcs 11,800 256,859 0.01Argo Graphics 6,194 186,116 0.01Ariake Japan 4,600 285,557 0.01ARTERIA Networks 5,300 86,240 -Aruhi 4,900 63,220 -As One 3,100 405,271 0.02Asahi Holdings 21,000 428,741 0.02
Mercer UCITS Common Contractual FundMercer Passive Global Small Cap Equity UCITS CCF
Portfolio Statementas at 30 June 2021
(continued)
Mercer UCITS Common Contractual Fund 167
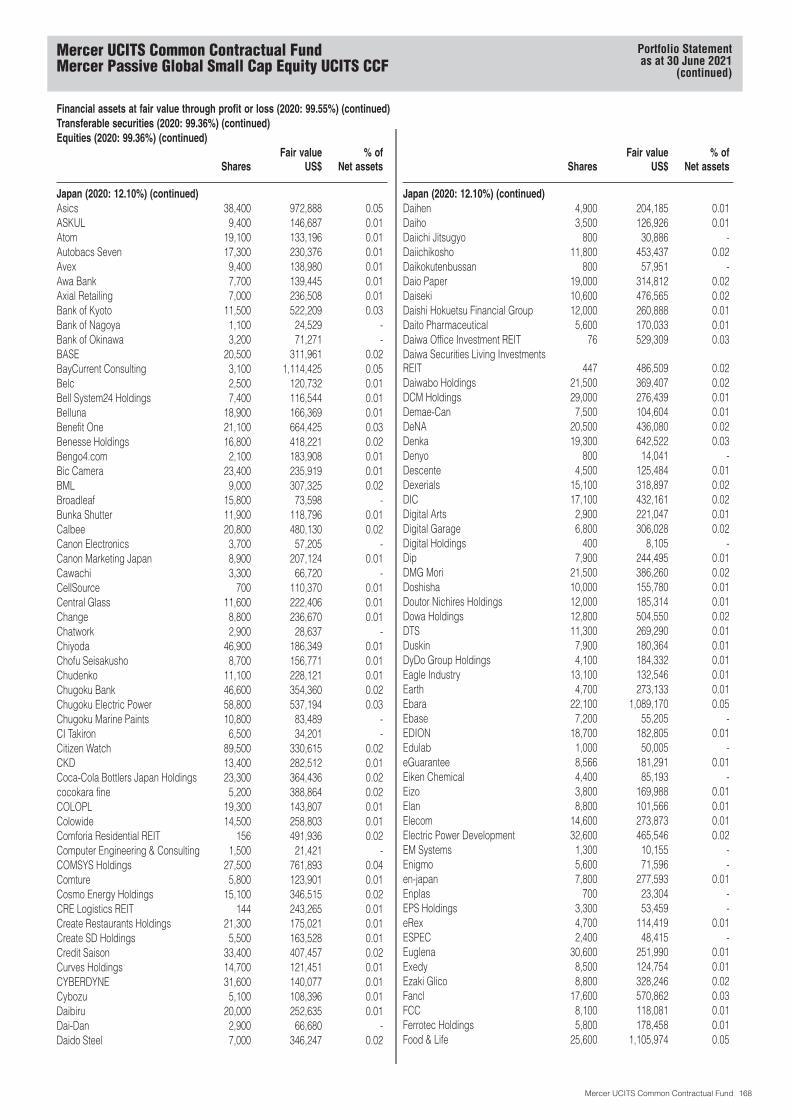
Financial assets at fair value through profit or loss (2020: 99.55%) (continued)Transferable securities (2020: 99.36%) (continued)Equities (2020: 99.36%) (continued)
SharesFair value
US$% of
Net assets
Japan (2020: 12.10%) (continued)Asics 38,400 972,888 0.05ASKUL 9,400 146,687 0.01Atom 19,100 133,196 0.01Autobacs Seven 17,300 230,376 0.01Avex 9,400 138,980 0.01Awa Bank 7,700 139,445 0.01Axial Retailing 7,000 236,508 0.01Bank of Kyoto 11,500 522,209 0.03Bank of Nagoya 1,100 24,529 -Bank of Okinawa 3,200 71,271 -BASE 20,500 311,961 0.02BayCurrent Consulting 3,100 1,114,425 0.05Belc 2,500 120,732 0.01Bell System24 Holdings 7,400 116,544 0.01Belluna 18,900 166,369 0.01Benefit One 21,100 664,425 0.03Benesse Holdings 16,800 418,221 0.02Bengo4.com 2,100 183,908 0.01Bic Camera 23,400 235,919 0.01BML 9,000 307,325 0.02Broadleaf 15,800 73,598 -Bunka Shutter 11,900 118,796 0.01Calbee 20,800 480,130 0.02Canon Electronics 3,700 57,205 -Canon Marketing Japan 8,900 207,124 0.01Cawachi 3,300 66,720 -CellSource 700 110,370 0.01Central Glass 11,600 222,406 0.01Change 8,800 236,670 0.01Chatwork 2,900 28,637 -Chiyoda 46,900 186,349 0.01Chofu Seisakusho 8,700 156,771 0.01Chudenko 11,100 228,121 0.01Chugoku Bank 46,600 354,360 0.02Chugoku Electric Power 58,800 537,194 0.03Chugoku Marine Paints 10,800 83,489 -CI Takiron 6,500 34,201 -Citizen Watch 89,500 330,615 0.02CKD 13,400 282,512 0.01Coca-Cola Bottlers Japan Holdings 23,300 364,436 0.02cocokara fine 5,200 388,864 0.02COLOPL 19,300 143,807 0.01Colowide 14,500 258,803 0.01Comforia Residential REIT 156 491,936 0.02Computer Engineering & Consulting 1,500 21,421 -COMSYS Holdings 27,500 761,893 0.04Comture 5,800 123,901 0.01Cosmo Energy Holdings 15,100 346,515 0.02CRE Logistics REIT 144 243,265 0.01Create Restaurants Holdings 21,300 175,021 0.01Create SD Holdings 5,500 163,528 0.01Credit Saison 33,400 407,457 0.02Curves Holdings 14,700 121,451 0.01CYBERDYNE 31,600 140,077 0.01Cybozu 5,100 108,396 0.01Daibiru 20,000 252,635 0.01Dai-Dan 2,900 66,680 -Daido Steel 7,000 346,247 0.02
SharesFair value
US$% of
Net assets
Japan (2020: 12.10%) (continued)Daihen 4,900 204,185 0.01Daiho 3,500 126,926 0.01Daiichi Jitsugyo 800 30,886 -Daiichikosho 11,800 453,437 0.02Daikokutenbussan 800 57,951 -Daio Paper 19,000 314,812 0.02Daiseki 10,600 476,565 0.02Daishi Hokuetsu Financial Group 12,000 260,888 0.01Daito Pharmaceutical 5,600 170,033 0.01Daiwa Office Investment REIT 76 529,309 0.03Daiwa Securities Living InvestmentsREIT 447 486,509 0.02Daiwabo Holdings 21,500 369,407 0.02DCM Holdings 29,000 276,439 0.01Demae-Can 7,500 104,604 0.01DeNA 20,500 436,080 0.02Denka 19,300 642,522 0.03Denyo 800 14,041 -Descente 4,500 125,484 0.01Dexerials 15,100 318,897 0.02DIC 17,100 432,161 0.02Digital Arts 2,900 221,047 0.01Digital Garage 6,800 306,028 0.02Digital Holdings 400 8,105 -Dip 7,900 244,495 0.01DMG Mori 21,500 386,260 0.02Doshisha 10,000 155,780 0.01Doutor Nichires Holdings 12,000 185,314 0.01Dowa Holdings 12,800 504,550 0.02DTS 11,300 269,290 0.01Duskin 7,900 180,364 0.01DyDo Group Holdings 4,100 184,332 0.01Eagle Industry 13,100 132,546 0.01Earth 4,700 273,133 0.01Ebara 22,100 1,089,170 0.05Ebase 7,200 55,205 -EDION 18,700 182,805 0.01Edulab 1,000 50,005 -eGuarantee 8,566 181,291 0.01Eiken Chemical 4,400 85,193 -Eizo 3,800 169,988 0.01Elan 8,800 101,566 0.01Elecom 14,600 273,873 0.01Electric Power Development 32,600 465,546 0.02EM Systems 1,300 10,155 -Enigmo 5,600 71,596 -en-japan 7,800 277,593 0.01Enplas 700 23,304 -EPS Holdings 3,300 53,459 -eRex 4,700 114,419 0.01ESPEC 2,400 48,415 -Euglena 30,600 251,990 0.01Exedy 8,500 124,754 0.01Ezaki Glico 8,800 328,246 0.02Fancl 17,600 570,862 0.03FCC 8,100 118,081 0.01Ferrotec Holdings 5,800 178,458 0.01Food & Life 25,600 1,105,974 0.05
Mercer UCITS Common Contractual FundMercer Passive Global Small Cap Equity UCITS CCF
Portfolio Statementas at 30 June 2021
(continued)
Mercer UCITS Common Contractual Fund 168
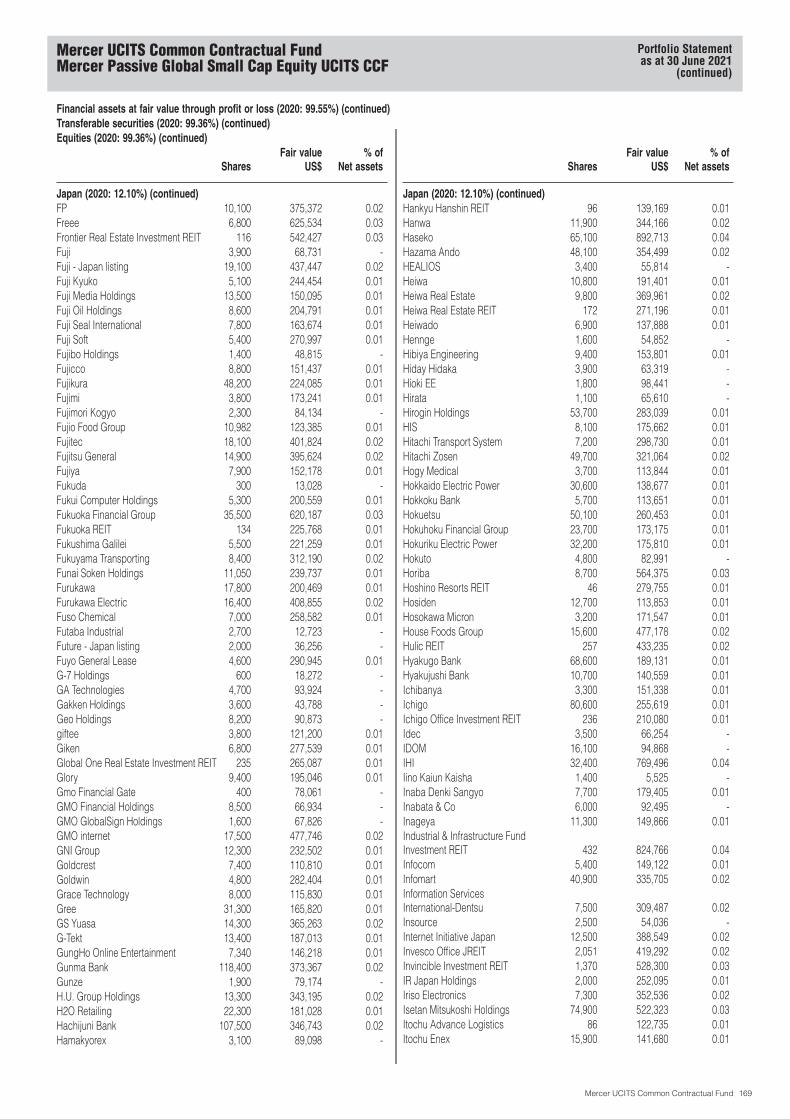
Financial assets at fair value through profit or loss (2020: 99.55%) (continued)Transferable securities (2020: 99.36%) (continued)Equities (2020: 99.36%) (continued)
SharesFair value
US$% of
Net assets
Japan (2020: 12.10%) (continued)FP 10,100 375,372 0.02Freee 6,800 625,534 0.03Frontier Real Estate Investment REIT 116 542,427 0.03Fuji 3,900 68,731 -Fuji - Japan listing 19,100 437,447 0.02Fuji Kyuko 5,100 244,454 0.01Fuji Media Holdings 13,500 150,095 0.01Fuji Oil Holdings 8,600 204,791 0.01Fuji Seal International 7,800 163,674 0.01Fuji Soft 5,400 270,997 0.01Fujibo Holdings 1,400 48,815 -Fujicco 8,800 151,437 0.01Fujikura 48,200 224,085 0.01Fujimi 3,800 173,241 0.01Fujimori Kogyo 2,300 84,134 -Fujio Food Group 10,982 123,385 0.01Fujitec 18,100 401,824 0.02Fujitsu General 14,900 395,624 0.02Fujiya 7,900 152,178 0.01Fukuda 300 13,028 -Fukui Computer Holdings 5,300 200,559 0.01Fukuoka Financial Group 35,500 620,187 0.03Fukuoka REIT 134 225,768 0.01Fukushima Galilei 5,500 221,259 0.01Fukuyama Transporting 8,400 312,190 0.02Funai Soken Holdings 11,050 239,737 0.01Furukawa 17,800 200,469 0.01Furukawa Electric 16,400 408,855 0.02Fuso Chemical 7,000 258,582 0.01Futaba Industrial 2,700 12,723 -Future - Japan listing 2,000 36,256 -Fuyo General Lease 4,600 290,945 0.01G-7 Holdings 600 18,272 -GA Technologies 4,700 93,924 -Gakken Holdings 3,600 43,788 -Geo Holdings 8,200 90,873 -giftee 3,800 121,200 0.01Giken 6,800 277,539 0.01Global One Real Estate Investment REIT 235 265,087 0.01Glory 9,400 195,046 0.01Gmo Financial Gate 400 78,061 -GMO Financial Holdings 8,500 66,934 -GMO GlobalSign Holdings 1,600 67,826 -GMO internet 17,500 477,746 0.02GNI Group 12,300 232,502 0.01Goldcrest 7,400 110,810 0.01Goldwin 4,800 282,404 0.01Grace Technology 8,000 115,830 0.01Gree 31,300 165,820 0.01GS Yuasa 14,300 365,263 0.02G-Tekt 13,400 187,013 0.01GungHo Online Entertainment 7,340 146,218 0.01Gunma Bank 118,400 373,367 0.02Gunze 1,900 79,174 -H.U. Group Holdings 13,300 343,195 0.02H2O Retailing 22,300 181,028 0.01Hachijuni Bank 107,500 346,743 0.02Hamakyorex 3,100 89,098 -
SharesFair value
US$% of
Net assets
Japan (2020: 12.10%) (continued)Hankyu Hanshin REIT 96 139,169 0.01Hanwa 11,900 344,166 0.02Haseko 65,100 892,713 0.04Hazama Ando 48,100 354,499 0.02HEALIOS 3,400 55,814 -Heiwa 10,800 191,401 0.01Heiwa Real Estate 9,800 369,961 0.02Heiwa Real Estate REIT 172 271,196 0.01Heiwado 6,900 137,888 0.01Hennge 1,600 54,852 -Hibiya Engineering 9,400 153,801 0.01Hiday Hidaka 3,900 63,319 -Hioki EE 1,800 98,441 -Hirata 1,100 65,610 -Hirogin Holdings 53,700 283,039 0.01HIS 8,100 175,662 0.01Hitachi Transport System 7,200 298,730 0.01Hitachi Zosen 49,700 321,064 0.02Hogy Medical 3,700 113,844 0.01Hokkaido Electric Power 30,600 138,677 0.01Hokkoku Bank 5,700 113,651 0.01Hokuetsu 50,100 260,453 0.01Hokuhoku Financial Group 23,700 173,175 0.01Hokuriku Electric Power 32,200 175,810 0.01Hokuto 4,800 82,991 -Horiba 8,700 564,375 0.03Hoshino Resorts REIT 46 279,755 0.01Hosiden 12,700 113,853 0.01Hosokawa Micron 3,200 171,547 0.01House Foods Group 15,600 477,178 0.02Hulic REIT 257 433,235 0.02Hyakugo Bank 68,600 189,131 0.01Hyakujushi Bank 10,700 140,559 0.01Ichibanya 3,300 151,338 0.01Ichigo 80,600 255,619 0.01Ichigo Office Investment REIT 236 210,080 0.01Idec 3,500 66,254 -IDOM 16,100 94,868 -IHI 32,400 769,496 0.04Iino Kaiun Kaisha 1,400 5,525 -Inaba Denki Sangyo 7,700 179,405 0.01Inabata & Co 6,000 92,495 -Inageya 11,300 149,866 0.01Industrial & Infrastructure FundInvestment REIT 432 824,766 0.04Infocom 5,400 149,122 0.01Infomart 40,900 335,705 0.02Information ServicesInternational-Dentsu 7,500 309,487 0.02Insource 2,500 54,036 -Internet Initiative Japan 12,500 388,549 0.02Invesco Office JREIT 2,051 419,292 0.02Invincible Investment REIT 1,370 528,300 0.03IR Japan Holdings 2,000 252,095 0.01Iriso Electronics 7,300 352,536 0.02Isetan Mitsukoshi Holdings 74,900 522,323 0.03Itochu Advance Logistics 86 122,735 0.01Itochu Enex 15,900 141,680 0.01
Mercer UCITS Common Contractual FundMercer Passive Global Small Cap Equity UCITS CCF
Portfolio Statementas at 30 June 2021
(continued)
Mercer UCITS Common Contractual Fund 169
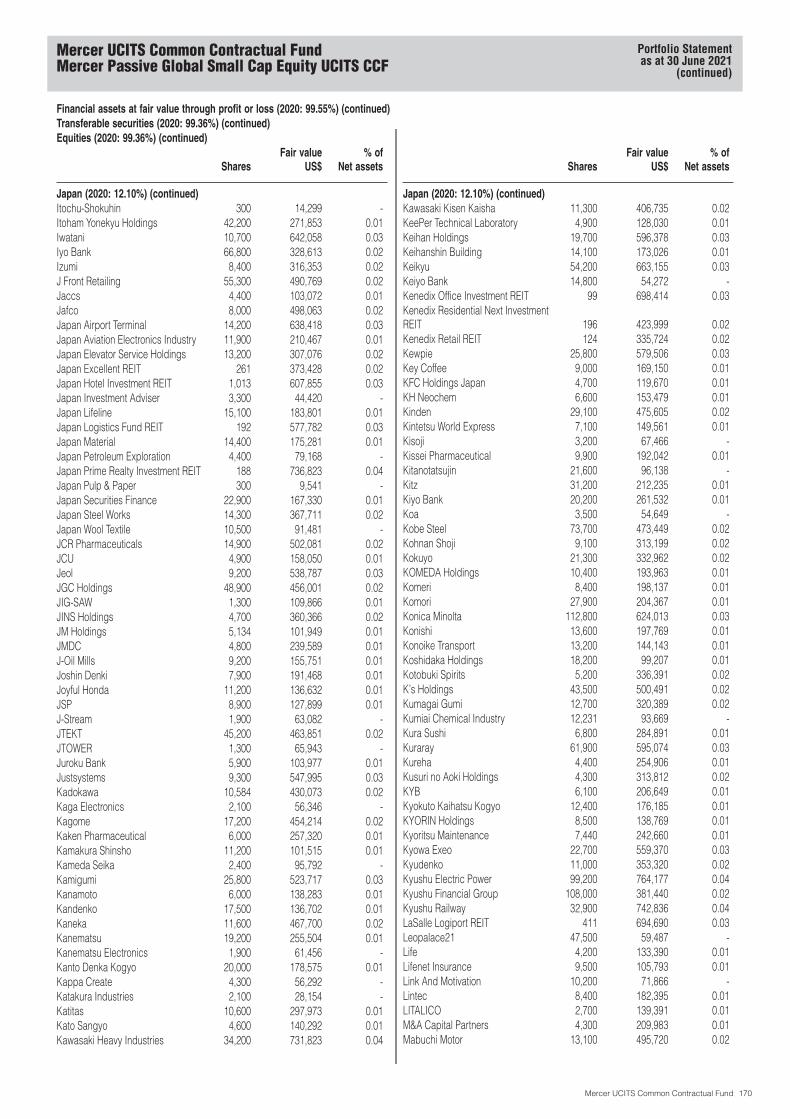
Financial assets at fair value through profit or loss (2020: 99.55%) (continued)Transferable securities (2020: 99.36%) (continued)Equities (2020: 99.36%) (continued)
SharesFair value
US$% of
Net assets
Japan (2020: 12.10%) (continued)Itochu-Shokuhin 300 14,299 -Itoham Yonekyu Holdings 42,200 271,853 0.01Iwatani 10,700 642,058 0.03Iyo Bank 66,800 328,613 0.02Izumi 8,400 316,353 0.02J Front Retailing 55,300 490,769 0.02Jaccs 4,400 103,072 0.01Jafco 8,000 498,063 0.02Japan Airport Terminal 14,200 638,418 0.03Japan Aviation Electronics Industry 11,900 210,467 0.01Japan Elevator Service Holdings 13,200 307,076 0.02Japan Excellent REIT 261 373,428 0.02Japan Hotel Investment REIT 1,013 607,855 0.03Japan Investment Adviser 3,300 44,420 -Japan Lifeline 15,100 183,801 0.01Japan Logistics Fund REIT 192 577,782 0.03Japan Material 14,400 175,281 0.01Japan Petroleum Exploration 4,400 79,168 -Japan Prime Realty Investment REIT 188 736,823 0.04Japan Pulp & Paper 300 9,541 -Japan Securities Finance 22,900 167,330 0.01Japan Steel Works 14,300 367,711 0.02Japan Wool Textile 10,500 91,481 -JCR Pharmaceuticals 14,900 502,081 0.02JCU 4,900 158,050 0.01Jeol 9,200 538,787 0.03JGC Holdings 48,900 456,001 0.02JIG-SAW 1,300 109,866 0.01JINS Holdings 4,700 360,366 0.02JM Holdings 5,134 101,949 0.01JMDC 4,800 239,589 0.01J-Oil Mills 9,200 155,751 0.01Joshin Denki 7,900 191,468 0.01Joyful Honda 11,200 136,632 0.01JSP 8,900 127,899 0.01J-Stream 1,900 63,082 -JTEKT 45,200 463,851 0.02JTOWER 1,300 65,943 -Juroku Bank 5,900 103,977 0.01Justsystems 9,300 547,995 0.03Kadokawa 10,584 430,073 0.02Kaga Electronics 2,100 56,346 -Kagome 17,200 454,214 0.02Kaken Pharmaceutical 6,000 257,320 0.01Kamakura Shinsho 11,200 101,515 0.01Kameda Seika 2,400 95,792 -Kamigumi 25,800 523,717 0.03Kanamoto 6,000 138,283 0.01Kandenko 17,500 136,702 0.01Kaneka 11,600 467,700 0.02Kanematsu 19,200 255,504 0.01Kanematsu Electronics 1,900 61,456 -Kanto Denka Kogyo 20,000 178,575 0.01Kappa Create 4,300 56,292 -Katakura Industries 2,100 28,154 -Katitas 10,600 297,973 0.01Kato Sangyo 4,600 140,292 0.01Kawasaki Heavy Industries 34,200 731,823 0.04
SharesFair value
US$% of
Net assets
Japan (2020: 12.10%) (continued)Kawasaki Kisen Kaisha 11,300 406,735 0.02KeePer Technical Laboratory 4,900 128,030 0.01Keihan Holdings 19,700 596,378 0.03Keihanshin Building 14,100 173,026 0.01Keikyu 54,200 663,155 0.03Keiyo Bank 14,800 54,272 -Kenedix Office Investment REIT 99 698,414 0.03Kenedix Residential Next InvestmentREIT 196 423,999 0.02Kenedix Retail REIT 124 335,724 0.02Kewpie 25,800 579,506 0.03Key Coffee 9,000 169,150 0.01KFC Holdings Japan 4,700 119,670 0.01KH Neochem 6,600 153,479 0.01Kinden 29,100 475,605 0.02Kintetsu World Express 7,100 149,561 0.01Kisoji 3,200 67,466 -Kissei Pharmaceutical 9,900 192,042 0.01Kitanotatsujin 21,600 96,138 -Kitz 31,200 212,235 0.01Kiyo Bank 20,200 261,532 0.01Koa 3,500 54,649 -Kobe Steel 73,700 473,449 0.02Kohnan Shoji 9,100 313,199 0.02Kokuyo 21,300 332,962 0.02KOMEDA Holdings 10,400 193,963 0.01Komeri 8,400 198,137 0.01Komori 27,900 204,367 0.01Konica Minolta 112,800 624,013 0.03Konishi 13,600 197,769 0.01Konoike Transport 13,200 144,143 0.01Koshidaka Holdings 18,200 99,207 0.01Kotobuki Spirits 5,200 336,391 0.02K’s Holdings 43,500 500,491 0.02Kumagai Gumi 12,700 320,389 0.02Kumiai Chemical Industry 12,231 93,669 -Kura Sushi 6,800 284,891 0.01Kuraray 61,900 595,074 0.03Kureha 4,400 254,906 0.01Kusuri no Aoki Holdings 4,300 313,812 0.02KYB 6,100 206,649 0.01Kyokuto Kaihatsu Kogyo 12,400 176,185 0.01KYORIN Holdings 8,500 138,769 0.01Kyoritsu Maintenance 7,440 242,660 0.01Kyowa Exeo 22,700 559,370 0.03Kyudenko 11,000 353,320 0.02Kyushu Electric Power 99,200 764,177 0.04Kyushu Financial Group 108,000 381,440 0.02Kyushu Railway 32,900 742,836 0.04LaSalle Logiport REIT 411 694,690 0.03Leopalace21 47,500 59,487 -Life 4,200 133,390 0.01Lifenet Insurance 9,500 105,793 0.01Link And Motivation 10,200 71,866 -Lintec 8,400 182,395 0.01LITALICO 2,700 139,391 0.01M&A Capital Partners 4,300 209,983 0.01Mabuchi Motor 13,100 495,720 0.02
Mercer UCITS Common Contractual FundMercer Passive Global Small Cap Equity UCITS CCF
Portfolio Statementas at 30 June 2021
(continued)
Mercer UCITS Common Contractual Fund 170

Financial assets at fair value through profit or loss (2020: 99.55%) (continued)Transferable securities (2020: 99.36%) (continued)Equities (2020: 99.36%) (continued)
SharesFair value
US$% of
Net assets
Japan (2020: 12.10%) (continued)Macnica Fuji Electronics Holdings 11,700 281,563 0.01Maeda 26,000 225,588 0.01Maeda Kosen 2,800 88,044 -Maeda Road Construction 9,200 180,867 0.01Makino Milling Machine 4,700 189,711 0.01Makuake 1,000 58,834 -Mandom 8,200 152,933 0.01Mani 15,900 364,730 0.02Marudai Food 800 12,217 -Maruha Nichiro 7,400 157,414 0.01Marui Group 44,900 844,682 0.04Maruichi Steel Tube 13,400 314,989 0.02Marusan Securities 5,000 27,210 -Maruwa 2,100 211,722 0.01Maruwa Unyu Kikan 11,600 165,027 0.01Maruzen Showa Unyu 1,100 33,102 -Marvelous 17,800 126,696 0.01Matsui Securities 39,100 285,350 0.01Matsumotokiyoshi Holdings 20,800 919,218 0.04Max 11,600 190,424 0.01Maxell Holdings 5,600 62,665 -MCJ 21,800 243,357 0.01Mebuki Financial Group 232,200 489,547 0.02Media Do 2,500 102,599 0.01Medical Data Vision 7,400 146,680 0.01Medley 5,000 216,236 0.01MedPeer 3,900 154,784 0.01Megachips 4,700 134,873 0.01Megmilk Snow Brand 9,000 171,421 0.01Meidensha 4,800 95,533 -Meiko Electronics 5,500 161,546 0.01Meitec 5,300 286,990 0.01Menicon 6,800 477,881 0.02METAWATER 10,000 190,017 0.01Micronics Japan 8,800 122,101 0.01Milbon 6,380 360,991 0.02Mimasu Semiconductor Industry 5,000 123,480 0.01Mirai REIT 211 98,666 0.01Mirait Holdings 16,400 291,237 0.01Miroku Jyoho Service 8,200 117,839 0.01Mitsubishi Estate Logistics REIT 88 389,693 0.02Mitsubishi Logistics 11,100 329,030 0.02Mitsubishi Materials 25,700 512,889 0.03Mitsubishi Motors 145,900 410,134 0.02Mitsubishi Pencil 16,400 212,480 0.01Mitsubishi Shokuhin 7,900 199,938 0.01Mitsuboshi Belting 1,200 18,921 -Mitsui Fudosan Logistics Park REIT 117 624,056 0.03Mitsui High-Tec 5,500 316,650 0.02Mitsui Mining & Smelting 15,000 416,254 0.02Mitsui OSK Lines 25,600 1,231,679 0.06Mitsui Sugar 1,800 30,278 -Mitsui-Soko Holdings 1,800 40,966 -Mitsuuroko Group Holdings 2,200 23,409 -Mixi 8,300 219,110 0.01Mizuho Leasing 6,100 205,825 0.01Mizuno 1,900 40,434 -Mochida Pharmaceutical 8,600 282,043 0.01
SharesFair value
US$% of
Net assets
Japan (2020: 12.10%) (continued)Modalis Therapeutics 3,300 51,586 -Modec 9,500 176,151 0.01Monex Group 36,200 243,964 0.01Money Forward 9,800 626,020 0.03Monogatari 1,600 107,685 0.01Mori Hills Investment REIT 365 547,878 0.03Mori Trust Hotel REIT 32 40,566 -Mori Trust Sogo REIT 170 240,625 0.01Morinaga & Co 6,400 204,703 0.01Morinaga Milk Industry 9,800 511,235 0.03Morita Holdings 12,200 175,762 0.01Mos Food Services 6,200 169,538 0.01MTI 16,000 97,450 -Musashi Seimitsu Industry 12,500 278,629 0.01Musashino Bank 6,200 93,288 -Nachi-Fujikoshi 2,000 70,457 -Nagaileben 9,700 233,782 0.01Nagase & Co 24,600 367,482 0.02Nagatanien Holdings 500 9,623 -Nagoya Railroad 44,100 820,890 0.04Nakanishi 19,600 429,120 0.02Nankai Electric Railway 22,600 483,195 0.02Nanto Bank 12,600 208,543 0.01NEC Networks & System Integration 18,300 289,364 0.01NET One Systems 22,100 729,764 0.04Nextage 10,900 184,826 0.01NGK Spark Plug 37,800 560,580 0.03NHK Spring 54,800 450,289 0.02Nichias 11,900 299,671 0.01Nichicon 4,600 49,527 -Nichiha 9,500 241,630 0.01Nichi-iko Pharmaceutical 12,450 99,833 0.01Nichirei 27,000 710,091 0.03Nichireki 1,700 20,019 -Nifco 21,200 801,279 0.04Nihon Chouzai 5,800 81,678 -Nihon Kohden 22,200 634,057 0.03Nihon Parkerizing 18,800 187,848 0.01Nihon Unisys 15,800 475,466 0.02Nikkiso 13,900 139,889 0.01Nikkon Holdings 11,700 254,893 0.01Nikon 78,200 834,913 0.04Nippo 11,100 316,529 0.02Nippon Accommodations Fund REIT 99 571,754 0.03Nippon Carbon 2,000 75,502 -Nippon Ceramic 8,900 234,227 0.01Nippon Densetsu Kogyo 10,200 165,880 0.01Nippon Electric Glass 18,000 423,281 0.02Nippon Flour Mills 5,900 83,405 -Nippon Gas 28,800 489,904 0.02NIPPON Investment REIT 120 493,558 0.02Nippon Kanzai 1,400 31,433 -Nippon Kayaku 26,700 252,590 0.01Nippon Koei 5,200 144,536 0.01Nippon Light Metal Holdings 12,680 213,637 0.01Nippon Paper Industries 16,300 182,694 0.01Nippon Parking Development 137,300 209,061 0.01Nippon Road 2,300 159,771 0.01
Mercer UCITS Common Contractual FundMercer Passive Global Small Cap Equity UCITS CCF
Portfolio Statementas at 30 June 2021
(continued)
Mercer UCITS Common Contractual Fund 171
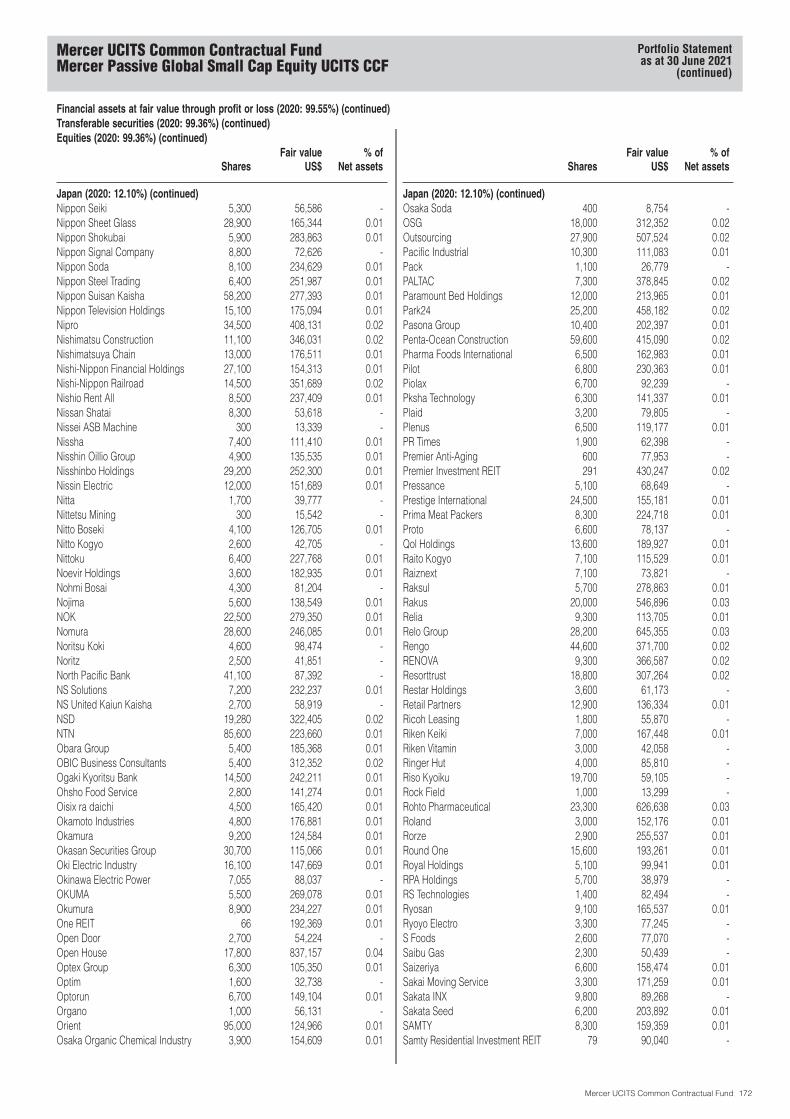
Financial assets at fair value through profit or loss (2020: 99.55%) (continued)Transferable securities (2020: 99.36%) (continued)Equities (2020: 99.36%) (continued)
SharesFair value
US$% of
Net assets
Japan (2020: 12.10%) (continued)Nippon Seiki 5,300 56,586 -Nippon Sheet Glass 28,900 165,344 0.01Nippon Shokubai 5,900 283,863 0.01Nippon Signal Company 8,800 72,626 -Nippon Soda 8,100 234,629 0.01Nippon Steel Trading 6,400 251,987 0.01Nippon Suisan Kaisha 58,200 277,393 0.01Nippon Television Holdings 15,100 175,094 0.01Nipro 34,500 408,131 0.02Nishimatsu Construction 11,100 346,031 0.02Nishimatsuya Chain 13,000 176,511 0.01Nishi-Nippon Financial Holdings 27,100 154,313 0.01Nishi-Nippon Railroad 14,500 351,689 0.02Nishio Rent All 8,500 237,409 0.01Nissan Shatai 8,300 53,618 -Nissei ASB Machine 300 13,339 -Nissha 7,400 111,410 0.01Nisshin Oillio Group 4,900 135,535 0.01Nisshinbo Holdings 29,200 252,300 0.01Nissin Electric 12,000 151,689 0.01Nitta 1,700 39,777 -Nittetsu Mining 300 15,542 -Nitto Boseki 4,100 126,705 0.01Nitto Kogyo 2,600 42,705 -Nittoku 6,400 227,768 0.01Noevir Holdings 3,600 182,935 0.01Nohmi Bosai 4,300 81,204 -Nojima 5,600 138,549 0.01NOK 22,500 279,350 0.01Nomura 28,600 246,085 0.01Noritsu Koki 4,600 98,474 -Noritz 2,500 41,851 -North Pacific Bank 41,100 87,392 -NS Solutions 7,200 232,237 0.01NS United Kaiun Kaisha 2,700 58,919 -NSD 19,280 322,405 0.02NTN 85,600 223,660 0.01Obara Group 5,400 185,368 0.01OBIC Business Consultants 5,400 312,352 0.02Ogaki Kyoritsu Bank 14,500 242,211 0.01Ohsho Food Service 2,800 141,274 0.01Oisix ra daichi 4,500 165,420 0.01Okamoto Industries 4,800 176,881 0.01Okamura 9,200 124,584 0.01Okasan Securities Group 30,700 115,066 0.01Oki Electric Industry 16,100 147,669 0.01Okinawa Electric Power 7,055 88,037 -OKUMA 5,500 269,078 0.01Okumura 8,900 234,227 0.01One REIT 66 192,369 0.01Open Door 2,700 54,224 -Open House 17,800 837,157 0.04Optex Group 6,300 105,350 0.01Optim 1,600 32,738 -Optorun 6,700 149,104 0.01Organo 1,000 56,131 -Orient 95,000 124,966 0.01Osaka Organic Chemical Industry 3,900 154,609 0.01
SharesFair value
US$% of
Net assets
Japan (2020: 12.10%) (continued)Osaka Soda 400 8,754 -OSG 18,000 312,352 0.02Outsourcing 27,900 507,524 0.02Pacific Industrial 10,300 111,083 0.01Pack 1,100 26,779 -PALTAC 7,300 378,845 0.02Paramount Bed Holdings 12,000 213,965 0.01Park24 25,200 458,182 0.02Pasona Group 10,400 202,397 0.01Penta-Ocean Construction 59,600 415,090 0.02Pharma Foods International 6,500 162,983 0.01Pilot 6,800 230,363 0.01Piolax 6,700 92,239 -Pksha Technology 6,300 141,337 0.01Plaid 3,200 79,805 -Plenus 6,500 119,177 0.01PR Times 1,900 62,398 -Premier Anti-Aging 600 77,953 -Premier Investment REIT 291 430,247 0.02Pressance 5,100 68,649 -Prestige International 24,500 155,181 0.01Prima Meat Packers 8,300 224,718 0.01Proto 6,600 78,137 -Qol Holdings 13,600 189,927 0.01Raito Kogyo 7,100 115,529 0.01Raiznext 7,100 73,821 -Raksul 5,700 278,863 0.01Rakus 20,000 546,896 0.03Relia 9,300 113,705 0.01Relo Group 28,200 645,355 0.03Rengo 44,600 371,700 0.02RENOVA 9,300 366,587 0.02Resorttrust 18,800 307,264 0.02Restar Holdings 3,600 61,173 -Retail Partners 12,900 136,334 0.01Ricoh Leasing 1,800 55,870 -Riken Keiki 7,000 167,448 0.01Riken Vitamin 3,000 42,058 -Ringer Hut 4,000 85,810 -Riso Kyoiku 19,700 59,105 -Rock Field 1,000 13,299 -Rohto Pharmaceutical 23,300 626,638 0.03Roland 3,000 152,176 0.01Rorze 2,900 255,537 0.01Round One 15,600 193,261 0.01Royal Holdings 5,100 99,941 0.01RPA Holdings 5,700 38,979 -RS Technologies 1,400 82,494 -Ryosan 9,100 165,537 0.01Ryoyo Electro 3,300 77,245 -S Foods 2,600 77,070 -Saibu Gas 2,300 50,439 -Saizeriya 6,600 158,474 0.01Sakai Moving Service 3,300 171,259 0.01Sakata INX 9,800 89,268 -Sakata Seed 6,200 203,892 0.01SAMTY 8,300 159,359 0.01Samty Residential Investment REIT 79 90,040 -
Mercer UCITS Common Contractual FundMercer Passive Global Small Cap Equity UCITS CCF
Portfolio Statementas at 30 June 2021
(continued)
Mercer UCITS Common Contractual Fund 172

Financial assets at fair value through profit or loss (2020: 99.55%) (continued)Transferable securities (2020: 99.36%) (continued)Equities (2020: 99.36%) (continued)
SharesFair value
US$% of
Net assets
Japan (2020: 12.10%) (continued)San-A 6,600 250,942 0.01San-Ai Oil 13,300 154,102 0.01SanBio 7,400 93,875 -Sangetsu 16,400 228,734 0.01San-In Godo Bank 51,400 249,613 0.01Sanken Electric 4,300 214,245 0.01Sanki Engineering 4,100 51,901 -Sankyo 9,700 247,940 0.01Sankyu 13,700 594,337 0.03Sanrio 9,200 162,962 0.01Sansan 3,600 317,866 0.02Sanwa Holdings 43,700 537,047 0.03Sanyo Chemical Industries 1,700 82,863 -Sanyo Denki 2,100 145,310 0.01Sapporo Holdings 12,800 266,633 0.01Sato Holdings 6,700 164,436 0.01Sawai Group Holdings 9,500 423,687 0.02SBS Holdings 1,200 36,003 -SCREEN Holdings 9,000 890,350 0.04Sega Sammy Holdings 41,300 542,530 0.03Seibu Holdings 53,300 625,251 0.03Seikagaku 1,500 14,609 -Seiko Holdings 8,100 161,796 0.01Seino Holdings 30,600 392,598 0.02Seiren 12,300 243,141 0.01Sekisui House REIT 1,036 858,744 0.04Sekisui Jushi 10,900 207,217 0.01Senko Group Holdings 24,700 241,236 0.01Senshu Ikeda Holdings 105,240 150,763 0.01Seria 9,700 357,884 0.02Seven Bank 119,800 254,733 0.01Shibaura Machine 4,100 90,614 -Shibuya 1,700 47,558 -SHIFT 2,800 434,165 0.02Shiga Bank 13,700 239,710 0.01Shikoku Chemicals 3,100 36,589 -Shikoku Electric Power 36,600 249,298 0.01Shima Seiki Manufacturing 5,400 92,392 -Shimamura 5,300 509,037 0.02Shin-Etsu Polymer 24,100 222,782 0.01Shinko Electric Industries 17,700 648,261 0.03Shinmaywa Industries 15,600 134,791 0.01Shinnihon 1,300 9,839 -Shinsei Bank 30,800 404,321 0.02Ship Healthcare Holdings 20,600 481,267 0.02Shizuoka Gas 3,400 30,480 -SHO-BOND Holdings 10,000 416,704 0.02Shochiku 2,600 300,081 0.01Shoei 5,700 215,438 0.01Shoei Foods 1,200 40,598 -Showa Denko 31,700 942,517 0.05Showa Sangyo 2,000 53,843 -Siix 7,900 101,143 0.01SKY Perfect JSAT Holdings 24,700 90,130 -Skylark Holdings 57,100 793,813 0.04SMS 20,100 602,149 0.03Snow Peak 3,000 90,819 -Sodick 13,200 121,427 0.01
SharesFair value
US$% of
Net assets
Japan (2020: 12.10%) (continued)Software Service 200 18,740 -Sojitz 290,900 878,021 0.04Solasto 12,700 160,881 0.01Sosei Group 20,200 332,875 0.02SOSiLA Logistics REIT 135 191,693 0.01Sotetsu Holdings 18,700 368,811 0.02Sparx Group 3,100 7,150 -S-Pool 14,300 128,969 0.01SRE Holdings 900 59,438 -Star Asia Investment REIT 526 294,776 0.01Star Micronics 6,100 92,937 -Starts 10,700 274,080 0.01Starts Proceed Investment REIT 50 109,019 0.01Starzen 600 11,369 -Strike 2,000 79,917 -Sugi Holdings 7,900 576,538 0.03Sumitomo Bakelite 8,100 358,330 0.02Sumitomo Densetsu 1,200 24,716 -Sumitomo Forestry 32,200 590,387 0.03Sumitomo Heavy Industries 25,800 711,307 0.03Sumitomo Mitsui Construction 37,960 161,430 0.01Sumitomo Osaka Cement 8,600 234,003 0.01Sumitomo Rubber Industries 38,200 527,621 0.03Sumitomo Seika Chemicals 200 6,487 -Sumitomo Warehouse 15,300 220,147 0.01Sun 2,100 70,479 -Sun Frontier Fudousan 16,000 150,788 0.01Sundrug 17,000 540,679 0.03Suruga Bank 26,900 80,465 -Suzuken 12,700 372,452 0.02Systena 13,200 253,201 0.01T Hasegawa 12,600 279,268 0.01Tachi-S 17,900 239,656 0.01Tadano 24,400 255,014 0.01Taihei Dengyo Kaisha 1,200 28,262 -Taiheiyo Cement 27,300 599,424 0.03Taikisha 6,000 179,205 0.01Taiko Pharmaceutical 4,800 44,026 -Taiyo Holdings 3,300 156,095 0.01Taiyo Yuden 29,500 1,459,186 0.07Takamatsu Construction Group 7,200 131,169 0.01Takara Bio 11,400 304,541 0.01Takara Holdings 34,600 431,760 0.02Takara Leben Real Estate InvestmentREIT 49 54,876 -Takara Standard 15,300 209,532 0.01Takasago International 700 17,029 -Takasago Thermal Engineering 14,800 246,956 0.01Takashimaya 32,300 351,549 0.02Takeuchi Manufacturing 8,100 201,934 0.01Taki Chemical 1,400 66,853 -Takuma 16,900 255,655 0.01Tama Home 4,700 97,184 -Tamura 36,900 276,941 0.01TBS Holdings 9,900 152,170 0.01TechMatrix 8,500 140,990 0.01TechnoPro Holdings 28,500 674,818 0.03Teijin 36,200 552,181 0.03
Mercer UCITS Common Contractual FundMercer Passive Global Small Cap Equity UCITS CCF
Portfolio Statementas at 30 June 2021
(continued)
Mercer UCITS Common Contractual Fund 173
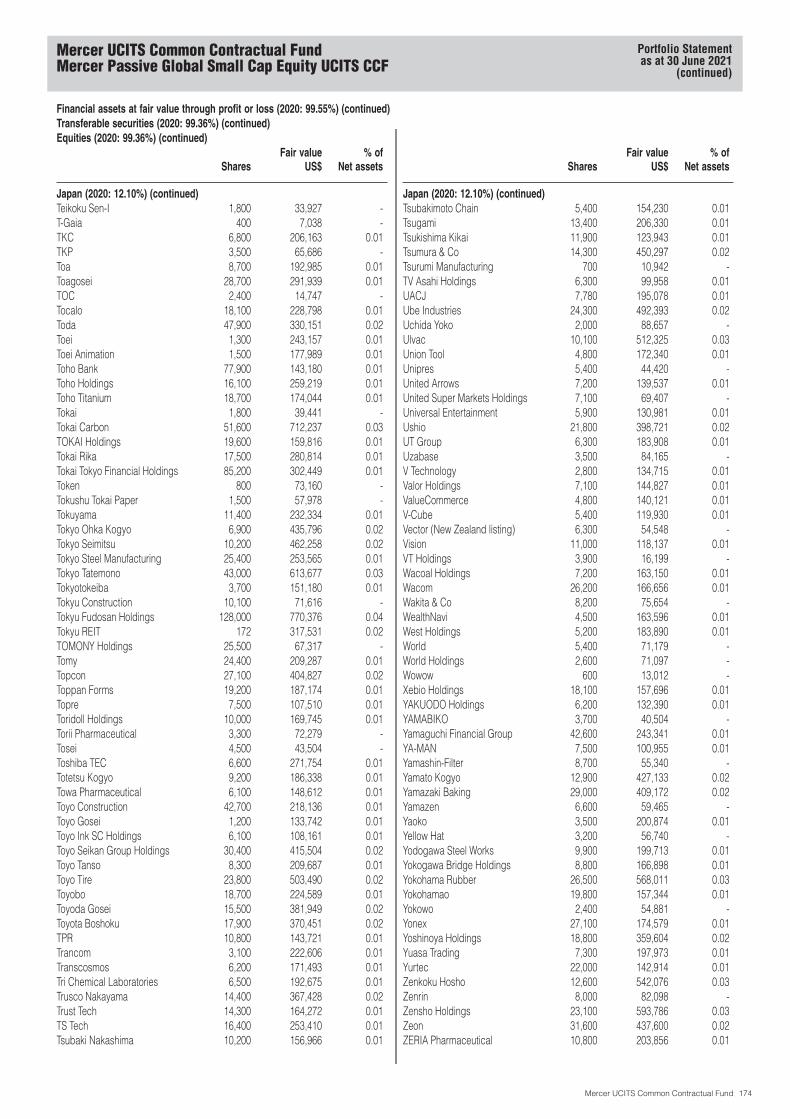
Financial assets at fair value through profit or loss (2020: 99.55%) (continued)Transferable securities (2020: 99.36%) (continued)Equities (2020: 99.36%) (continued)
SharesFair value
US$% of
Net assets
Japan (2020: 12.10%) (continued)Teikoku Sen-I 1,800 33,927 -T-Gaia 400 7,038 -TKC 6,800 206,163 0.01TKP 3,500 65,686 -Toa 8,700 192,985 0.01Toagosei 28,700 291,939 0.01TOC 2,400 14,747 -Tocalo 18,100 228,798 0.01Toda 47,900 330,151 0.02Toei 1,300 243,157 0.01Toei Animation 1,500 177,989 0.01Toho Bank 77,900 143,180 0.01Toho Holdings 16,100 259,219 0.01Toho Titanium 18,700 174,044 0.01Tokai 1,800 39,441 -Tokai Carbon 51,600 712,237 0.03TOKAI Holdings 19,600 159,816 0.01Tokai Rika 17,500 280,814 0.01Tokai Tokyo Financial Holdings 85,200 302,449 0.01Token 800 73,160 -Tokushu Tokai Paper 1,500 57,978 -Tokuyama 11,400 232,334 0.01Tokyo Ohka Kogyo 6,900 435,796 0.02Tokyo Seimitsu 10,200 462,258 0.02Tokyo Steel Manufacturing 25,400 253,565 0.01Tokyo Tatemono 43,000 613,677 0.03Tokyotokeiba 3,700 151,180 0.01Tokyu Construction 10,100 71,616 -Tokyu Fudosan Holdings 128,000 770,376 0.04Tokyu REIT 172 317,531 0.02TOMONY Holdings 25,500 67,317 -Tomy 24,400 209,287 0.01Topcon 27,100 404,827 0.02Toppan Forms 19,200 187,174 0.01Topre 7,500 107,510 0.01Toridoll Holdings 10,000 169,745 0.01Torii Pharmaceutical 3,300 72,279 -Tosei 4,500 43,504 -Toshiba TEC 6,600 271,754 0.01Totetsu Kogyo 9,200 186,338 0.01Towa Pharmaceutical 6,100 148,612 0.01Toyo Construction 42,700 218,136 0.01Toyo Gosei 1,200 133,742 0.01Toyo Ink SC Holdings 6,100 108,161 0.01Toyo Seikan Group Holdings 30,400 415,504 0.02Toyo Tanso 8,300 209,687 0.01Toyo Tire 23,800 503,490 0.02Toyobo 18,700 224,589 0.01Toyoda Gosei 15,500 381,949 0.02Toyota Boshoku 17,900 370,451 0.02TPR 10,800 143,721 0.01Trancom 3,100 222,606 0.01Transcosmos 6,200 171,493 0.01Tri Chemical Laboratories 6,500 192,675 0.01Trusco Nakayama 14,400 367,428 0.02Trust Tech 14,300 164,272 0.01TS Tech 16,400 253,410 0.01Tsubaki Nakashima 10,200 156,966 0.01
SharesFair value
US$% of
Net assets
Japan (2020: 12.10%) (continued)Tsubakimoto Chain 5,400 154,230 0.01Tsugami 13,400 206,330 0.01Tsukishima Kikai 11,900 123,943 0.01Tsumura & Co 14,300 450,297 0.02Tsurumi Manufacturing 700 10,942 -TV Asahi Holdings 6,300 99,958 0.01UACJ 7,780 195,078 0.01Ube Industries 24,300 492,393 0.02Uchida Yoko 2,000 88,657 -Ulvac 10,100 512,325 0.03Union Tool 4,800 172,340 0.01Unipres 5,400 44,420 -United Arrows 7,200 139,537 0.01United Super Markets Holdings 7,100 69,407 -Universal Entertainment 5,900 130,981 0.01Ushio 21,800 398,721 0.02UT Group 6,300 183,908 0.01Uzabase 3,500 84,165 -V Technology 2,800 134,715 0.01Valor Holdings 7,100 144,827 0.01ValueCommerce 4,800 140,121 0.01V-Cube 5,400 119,930 0.01Vector (New Zealand listing) 6,300 54,548 -Vision 11,000 118,137 0.01VT Holdings 3,900 16,199 -Wacoal Holdings 7,200 163,150 0.01Wacom 26,200 166,656 0.01Wakita & Co 8,200 75,654 -WealthNavi 4,500 163,596 0.01West Holdings 5,200 183,890 0.01World 5,400 71,179 -World Holdings 2,600 71,097 -Wowow 600 13,012 -Xebio Holdings 18,100 157,696 0.01YAKUODO Holdings 6,200 132,390 0.01YAMABIKO 3,700 40,504 -Yamaguchi Financial Group 42,600 243,341 0.01YA-MAN 7,500 100,955 0.01Yamashin-Filter 8,700 55,340 -Yamato Kogyo 12,900 427,133 0.02Yamazaki Baking 29,000 409,172 0.02Yamazen 6,600 59,465 -Yaoko 3,500 200,874 0.01Yellow Hat 3,200 56,740 -Yodogawa Steel Works 9,900 199,713 0.01Yokogawa Bridge Holdings 8,800 166,898 0.01Yokohama Rubber 26,500 568,011 0.03Yokohamao 19,800 157,344 0.01Yokowo 2,400 54,881 -Yonex 27,100 174,579 0.01Yoshinoya Holdings 18,800 359,604 0.02Yuasa Trading 7,300 197,973 0.01Yurtec 22,000 142,914 0.01Zenkoku Hosho 12,600 542,076 0.03Zenrin 8,000 82,098 -Zensho Holdings 23,100 593,786 0.03Zeon 31,600 437,600 0.02ZERIA Pharmaceutical 10,800 203,856 0.01
Mercer UCITS Common Contractual FundMercer Passive Global Small Cap Equity UCITS CCF
Portfolio Statementas at 30 June 2021
(continued)
Mercer UCITS Common Contractual Fund 174
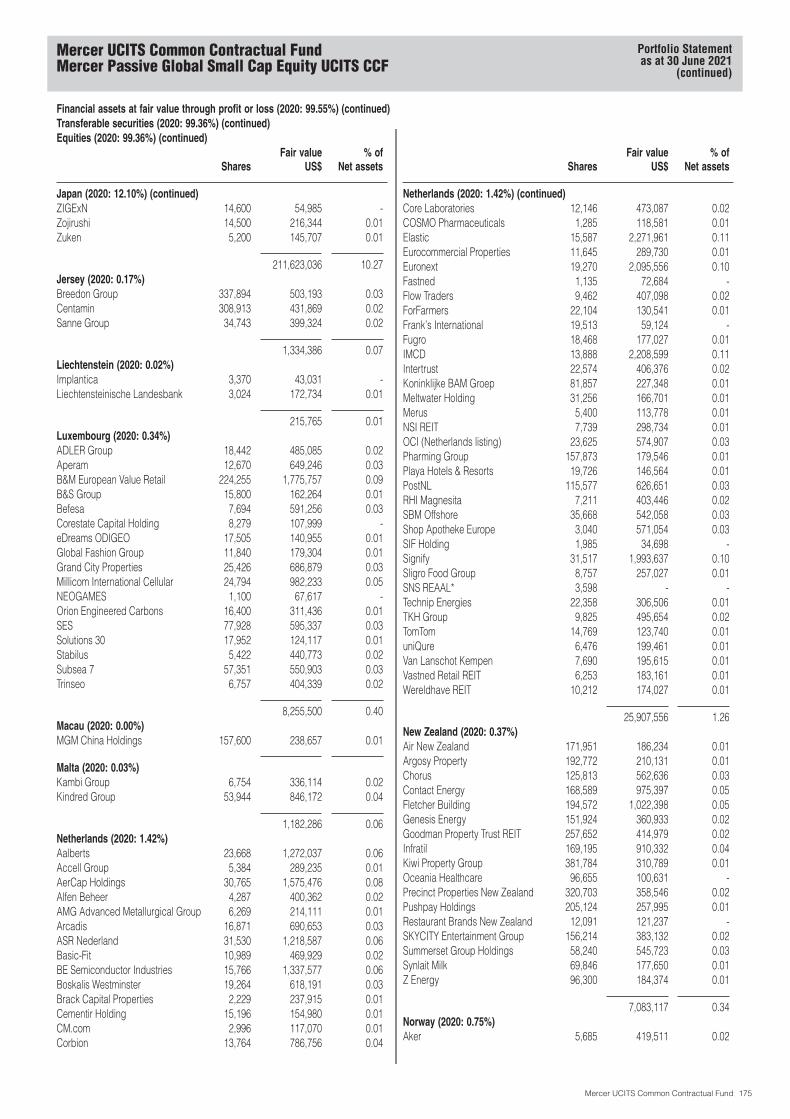
Financial assets at fair value through profit or loss (2020: 99.55%) (continued)Transferable securities (2020: 99.36%) (continued)Equities (2020: 99.36%) (continued)
SharesFair value
US$% of
Net assets
Japan (2020: 12.10%) (continued)ZIGExN 14,600 54,985 -Zojirushi 14,500 216,344 0.01Zuken 5,200 145,707 0.01
211,623,036 10.27Jersey (2020: 0.17%)Breedon Group 337,894 503,193 0.03Centamin 308,913 431,869 0.02Sanne Group 34,743 399,324 0.02
1,334,386 0.07Liechtenstein (2020: 0.02%)Implantica 3,370 43,031 -Liechtensteinische Landesbank 3,024 172,734 0.01
215,765 0.01Luxembourg (2020: 0.34%)ADLER Group 18,442 485,085 0.02Aperam 12,670 649,246 0.03B&M European Value Retail 224,255 1,775,757 0.09B&S Group 15,800 162,264 0.01Befesa 7,694 591,256 0.03Corestate Capital Holding 8,279 107,999 -eDreams ODIGEO 17,505 140,955 0.01Global Fashion Group 11,840 179,304 0.01Grand City Properties 25,426 686,879 0.03Millicom International Cellular 24,794 982,233 0.05NEOGAMES 1,100 67,617 -Orion Engineered Carbons 16,400 311,436 0.01SES 77,928 595,337 0.03Solutions 30 17,952 124,117 0.01Stabilus 5,422 440,773 0.02Subsea 7 57,351 550,903 0.03Trinseo 6,757 404,339 0.02
8,255,500 0.40Macau (2020: 0.00%)MGM China Holdings 157,600 238,657 0.01
Malta (2020: 0.03%)Kambi Group 6,754 336,114 0.02Kindred Group 53,944 846,172 0.04
1,182,286 0.06Netherlands (2020: 1.42%)Aalberts 23,668 1,272,037 0.06Accell Group 5,384 289,235 0.01AerCap Holdings 30,765 1,575,476 0.08Alfen Beheer 4,287 400,362 0.02AMG Advanced Metallurgical Group 6,269 214,111 0.01Arcadis 16,871 690,653 0.03ASR Nederland 31,530 1,218,587 0.06Basic-Fit 10,989 469,929 0.02BE Semiconductor Industries 15,766 1,337,577 0.06Boskalis Westminster 19,264 618,191 0.03Brack Capital Properties 2,229 237,915 0.01Cementir Holding 15,196 154,980 0.01CM.com 2,996 117,070 0.01Corbion 13,764 786,756 0.04
SharesFair value
US$% of
Net assets
Netherlands (2020: 1.42%) (continued)Core Laboratories 12,146 473,087 0.02COSMO Pharmaceuticals 1,285 118,581 0.01Elastic 15,587 2,271,961 0.11Eurocommercial Properties 11,645 289,730 0.01Euronext 19,270 2,095,556 0.10Fastned 1,135 72,684 -Flow Traders 9,462 407,098 0.02ForFarmers 22,104 130,541 0.01Frank’s International 19,513 59,124 -Fugro 18,468 177,027 0.01IMCD 13,888 2,208,599 0.11Intertrust 22,574 406,376 0.02Koninklijke BAM Groep 81,857 227,348 0.01Meltwater Holding 31,256 166,701 0.01Merus 5,400 113,778 0.01NSI REIT 7,739 298,734 0.01OCI (Netherlands listing) 23,625 574,907 0.03Pharming Group 157,873 179,546 0.01Playa Hotels & Resorts 19,726 146,564 0.01PostNL 115,577 626,651 0.03RHI Magnesita 7,211 403,446 0.02SBM Offshore 35,668 542,058 0.03Shop Apotheke Europe 3,040 571,054 0.03SIF Holding 1,985 34,698 -Signify 31,517 1,993,637 0.10Sligro Food Group 8,757 257,027 0.01SNS REAAL* 3,598 - -Technip Energies 22,358 306,506 0.01TKH Group 9,825 495,654 0.02TomTom 14,769 123,740 0.01uniQure 6,476 199,461 0.01Van Lanschot Kempen 7,690 195,615 0.01Vastned Retail REIT 6,253 183,161 0.01Wereldhave REIT 10,212 174,027 0.01
25,907,556 1.26New Zealand (2020: 0.37%)Air New Zealand 171,951 186,234 0.01Argosy Property 192,772 210,131 0.01Chorus 125,813 562,636 0.03Contact Energy 168,589 975,397 0.05Fletcher Building 194,572 1,022,398 0.05Genesis Energy 151,924 360,933 0.02Goodman Property Trust REIT 257,652 414,979 0.02Infratil 169,195 910,332 0.04Kiwi Property Group 381,784 310,789 0.01Oceania Healthcare 96,655 100,631 -Precinct Properties New Zealand 320,703 358,546 0.02Pushpay Holdings 205,124 257,995 0.01Restaurant Brands New Zealand 12,091 121,237 -SKYCITY Entertainment Group 156,214 383,132 0.02Summerset Group Holdings 58,240 545,723 0.03Synlait Milk 69,846 177,650 0.01Z Energy 96,300 184,374 0.01
7,083,117 0.34Norway (2020: 0.75%)Aker 5,685 419,511 0.02
Mercer UCITS Common Contractual FundMercer Passive Global Small Cap Equity UCITS CCF
Portfolio Statementas at 30 June 2021
(continued)
Mercer UCITS Common Contractual Fund 175
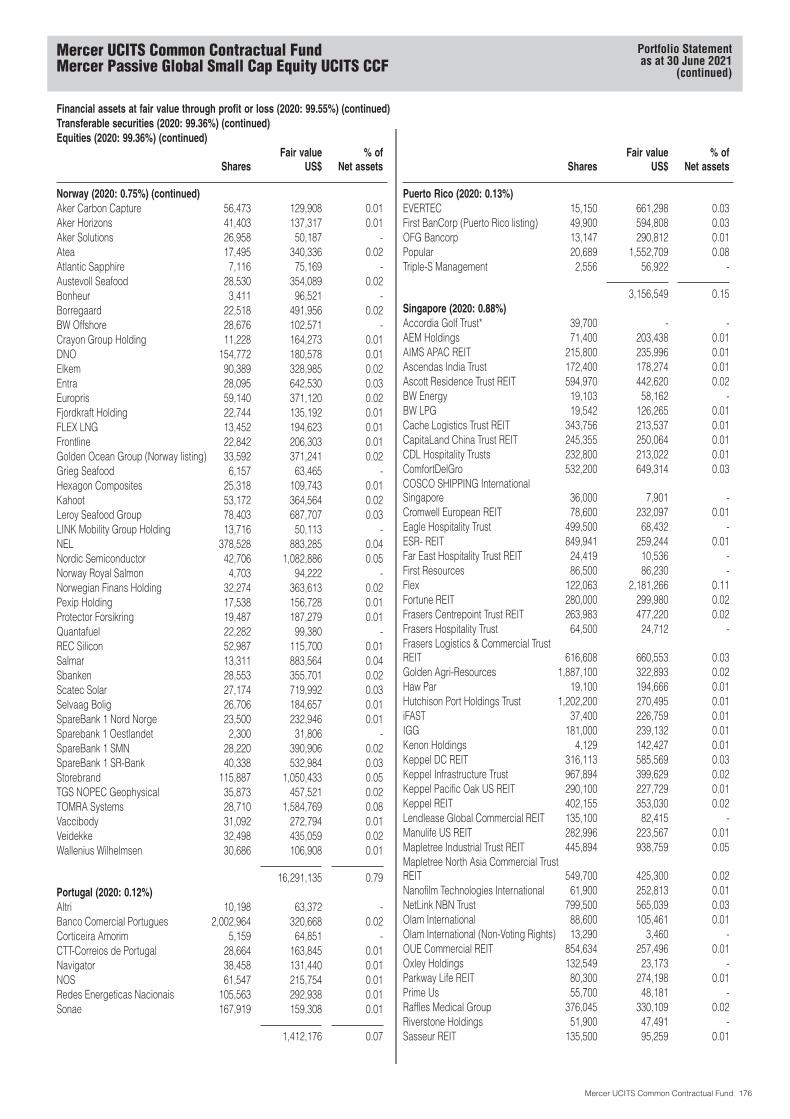
Financial assets at fair value through profit or loss (2020: 99.55%) (continued)Transferable securities (2020: 99.36%) (continued)Equities (2020: 99.36%) (continued)
SharesFair value
US$% of
Net assets
Norway (2020: 0.75%) (continued)Aker Carbon Capture 56,473 129,908 0.01Aker Horizons 41,403 137,317 0.01Aker Solutions 26,958 50,187 -Atea 17,495 340,336 0.02Atlantic Sapphire 7,116 75,169 -Austevoll Seafood 28,530 354,089 0.02Bonheur 3,411 96,521 -Borregaard 22,518 491,956 0.02BW Offshore 28,676 102,571 -Crayon Group Holding 11,228 164,273 0.01DNO 154,772 180,578 0.01Elkem 90,389 328,985 0.02Entra 28,095 642,530 0.03Europris 59,140 371,120 0.02Fjordkraft Holding 22,744 135,192 0.01FLEX LNG 13,452 194,623 0.01Frontline 22,842 206,303 0.01Golden Ocean Group (Norway listing) 33,592 371,241 0.02Grieg Seafood 6,157 63,465 -Hexagon Composites 25,318 109,743 0.01Kahoot 53,172 364,564 0.02Leroy Seafood Group 78,403 687,707 0.03LINK Mobility Group Holding 13,716 50,113 -NEL 378,528 883,285 0.04Nordic Semiconductor 42,706 1,082,886 0.05Norway Royal Salmon 4,703 94,222 -Norwegian Finans Holding 32,274 363,613 0.02Pexip Holding 17,538 156,728 0.01Protector Forsikring 19,487 187,279 0.01Quantafuel 22,282 99,380 -REC Silicon 52,987 115,700 0.01Salmar 13,311 883,564 0.04Sbanken 28,553 355,701 0.02Scatec Solar 27,174 719,992 0.03Selvaag Bolig 26,706 184,657 0.01SpareBank 1 Nord Norge 23,500 232,946 0.01Sparebank 1 Oestlandet 2,300 31,806 -SpareBank 1 SMN 28,220 390,906 0.02SpareBank 1 SR-Bank 40,338 532,984 0.03Storebrand 115,887 1,050,433 0.05TGS NOPEC Geophysical 35,873 457,521 0.02TOMRA Systems 28,710 1,584,769 0.08Vaccibody 31,092 272,794 0.01Veidekke 32,498 435,059 0.02Wallenius Wilhelmsen 30,686 106,908 0.01
16,291,135 0.79Portugal (2020: 0.12%)Altri 10,198 63,372 -Banco Comercial Portugues 2,002,964 320,668 0.02Corticeira Amorim 5,159 64,851 -CTT-Correios de Portugal 28,664 163,845 0.01Navigator 38,458 131,440 0.01NOS 61,547 215,754 0.01Redes Energeticas Nacionais 105,563 292,938 0.01Sonae 167,919 159,308 0.01
1,412,176 0.07
SharesFair value
US$% of
Net assets
Puerto Rico (2020: 0.13%)EVERTEC 15,150 661,298 0.03First BanCorp (Puerto Rico listing) 49,900 594,808 0.03OFG Bancorp 13,147 290,812 0.01Popular 20,689 1,552,709 0.08Triple-S Management 2,556 56,922 -
3,156,549 0.15Singapore (2020: 0.88%)Accordia Golf Trust* 39,700 - -AEM Holdings 71,400 203,438 0.01AIMS APAC REIT 215,800 235,996 0.01Ascendas India Trust 172,400 178,274 0.01Ascott Residence Trust REIT 594,970 442,620 0.02BW Energy 19,103 58,162 -BW LPG 19,542 126,265 0.01Cache Logistics Trust REIT 343,756 213,537 0.01CapitaLand China Trust REIT 245,355 250,064 0.01CDL Hospitality Trusts 232,800 213,022 0.01ComfortDelGro 532,200 649,314 0.03COSCO SHIPPING InternationalSingapore 36,000 7,901 -Cromwell European REIT 78,600 232,097 0.01Eagle Hospitality Trust 499,500 68,432 -ESR- REIT 849,941 259,244 0.01Far East Hospitality Trust REIT 24,419 10,536 -First Resources 86,500 86,230 -Flex 122,063 2,181,266 0.11Fortune REIT 280,000 299,980 0.02Frasers Centrepoint Trust REIT 263,983 477,220 0.02Frasers Hospitality Trust 64,500 24,712 -Frasers Logistics & Commercial TrustREIT 616,608 660,553 0.03Golden Agri-Resources 1,887,100 322,893 0.02Haw Par 19,100 194,666 0.01Hutchison Port Holdings Trust 1,202,200 270,495 0.01iFAST 37,400 226,759 0.01IGG 181,000 239,132 0.01Kenon Holdings 4,129 142,427 0.01Keppel DC REIT 316,113 585,569 0.03Keppel Infrastructure Trust 967,894 399,629 0.02Keppel Pacific Oak US REIT 290,100 227,729 0.01Keppel REIT 402,155 353,030 0.02Lendlease Global Commercial REIT 135,100 82,415 -Manulife US REIT 282,996 223,567 0.01Mapletree Industrial Trust REIT 445,894 938,759 0.05Mapletree North Asia Commercial TrustREIT 549,700 425,300 0.02Nanofilm Technologies International 61,900 252,813 0.01NetLink NBN Trust 799,500 565,039 0.03Olam International 88,600 105,461 0.01Olam International (Non-Voting Rights) 13,290 3,460 -OUE Commercial REIT 854,634 257,496 0.01Oxley Holdings 132,549 23,173 -Parkway Life REIT 80,300 274,198 0.01Prime Us 55,700 48,181 -Raffles Medical Group 376,045 330,109 0.02Riverstone Holdings 51,900 47,491 -Sasseur REIT 135,500 95,259 0.01
Mercer UCITS Common Contractual FundMercer Passive Global Small Cap Equity UCITS CCF
Portfolio Statementas at 30 June 2021
(continued)
Mercer UCITS Common Contractual Fund 176
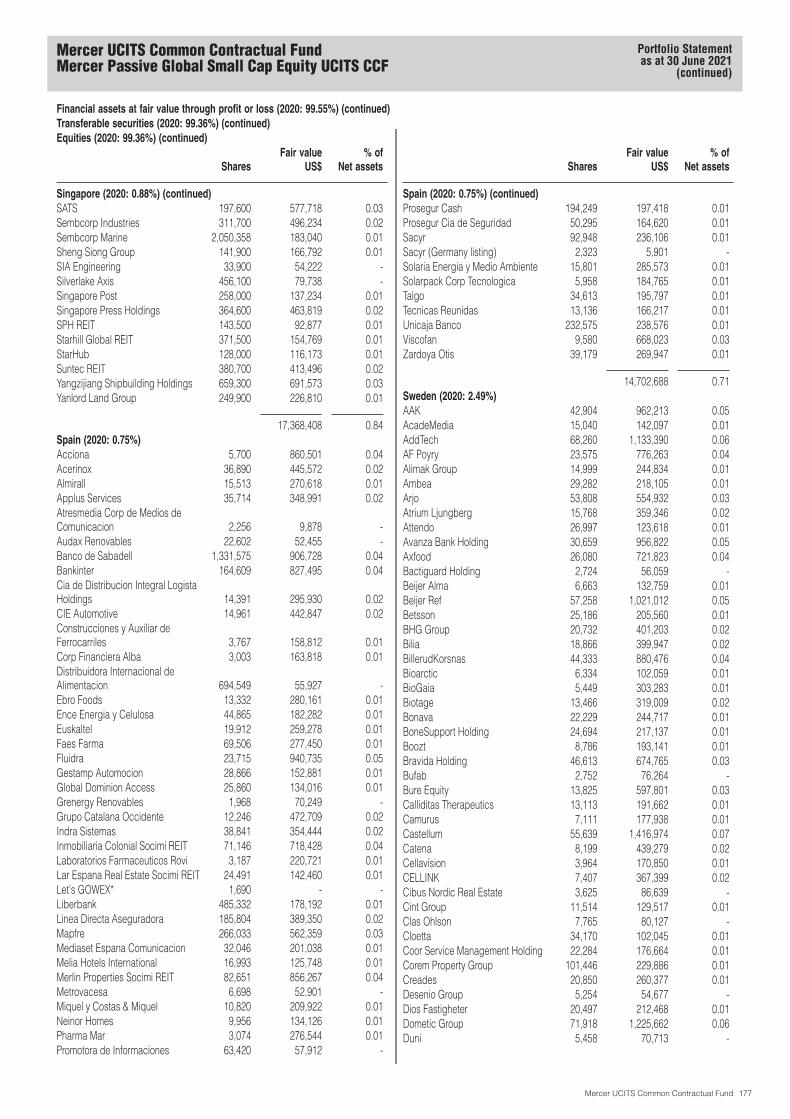
Financial assets at fair value through profit or loss (2020: 99.55%) (continued)Transferable securities (2020: 99.36%) (continued)Equities (2020: 99.36%) (continued)
SharesFair value
US$% of
Net assets
Singapore (2020: 0.88%) (continued)SATS 197,600 577,718 0.03Sembcorp Industries 311,700 496,234 0.02Sembcorp Marine 2,050,358 183,040 0.01Sheng Siong Group 141,900 166,792 0.01SIA Engineering 33,900 54,222 -Silverlake Axis 456,100 79,738 -Singapore Post 258,000 137,234 0.01Singapore Press Holdings 364,600 463,819 0.02SPH REIT 143,500 92,877 0.01Starhill Global REIT 371,500 154,769 0.01StarHub 128,000 116,173 0.01Suntec REIT 380,700 413,496 0.02Yangzijiang Shipbuilding Holdings 659,300 691,573 0.03Yanlord Land Group 249,900 226,810 0.01
17,368,408 0.84Spain (2020: 0.75%)Acciona 5,700 860,501 0.04Acerinox 36,890 445,572 0.02Almirall 15,513 270,618 0.01Applus Services 35,714 348,991 0.02Atresmedia Corp de Medios deComunicacion 2,256 9,878 -Audax Renovables 22,602 52,455 -Banco de Sabadell 1,331,575 906,728 0.04Bankinter 164,609 827,495 0.04Cia de Distribucion Integral LogistaHoldings 14,391 295,930 0.02CIE Automotive 14,961 442,847 0.02Construcciones y Auxiliar deFerrocarriles 3,767 158,812 0.01Corp Financiera Alba 3,003 163,818 0.01Distribuidora Internacional deAlimentacion 694,549 55,927 -Ebro Foods 13,332 280,161 0.01Ence Energia y Celulosa 44,865 182,282 0.01Euskaltel 19,912 259,278 0.01Faes Farma 69,506 277,450 0.01Fluidra 23,715 940,735 0.05Gestamp Automocion 28,866 152,881 0.01Global Dominion Access 25,860 134,016 0.01Grenergy Renovables 1,968 70,249 -Grupo Catalana Occidente 12,246 472,709 0.02Indra Sistemas 38,841 354,444 0.02Inmobiliaria Colonial Socimi REIT 71,146 718,428 0.04Laboratorios Farmaceuticos Rovi 3,187 220,721 0.01Lar Espana Real Estate Socimi REIT 24,491 142,460 0.01Let’s GOWEX* 1,690 - -Liberbank 485,332 178,192 0.01Linea Directa Aseguradora 185,804 389,350 0.02Mapfre 266,033 562,359 0.03Mediaset Espana Comunicacion 32,046 201,038 0.01Melia Hotels International 16,993 125,748 0.01Merlin Properties Socimi REIT 82,651 856,267 0.04Metrovacesa 6,698 52,901 -Miquel y Costas & Miquel 10,820 209,922 0.01Neinor Homes 9,956 134,126 0.01Pharma Mar 3,074 276,544 0.01Promotora de Informaciones 63,420 57,912 -
SharesFair value
US$% of
Net assets
Spain (2020: 0.75%) (continued)Prosegur Cash 194,249 197,418 0.01Prosegur Cia de Seguridad 50,295 164,620 0.01Sacyr 92,948 236,106 0.01Sacyr (Germany listing) 2,323 5,901 -Solaria Energia y Medio Ambiente 15,801 285,573 0.01Solarpack Corp Tecnologica 5,958 184,765 0.01Talgo 34,613 195,797 0.01Tecnicas Reunidas 13,136 166,217 0.01Unicaja Banco 232,575 238,576 0.01Viscofan 9,580 668,023 0.03Zardoya Otis 39,179 269,947 0.01
14,702,688 0.71Sweden (2020: 2.49%)AAK 42,904 962,213 0.05AcadeMedia 15,040 142,097 0.01AddTech 68,260 1,133,390 0.06AF Poyry 23,575 776,263 0.04Alimak Group 14,999 244,834 0.01Ambea 29,282 218,105 0.01Arjo 53,808 554,932 0.03Atrium Ljungberg 15,768 359,346 0.02Attendo 26,997 123,618 0.01Avanza Bank Holding 30,659 956,822 0.05Axfood 26,080 721,823 0.04Bactiguard Holding 2,724 56,059 -Beijer Alma 6,663 132,759 0.01Beijer Ref 57,258 1,021,012 0.05Betsson 25,186 205,560 0.01BHG Group 20,732 401,203 0.02Bilia 18,866 399,947 0.02BillerudKorsnas 44,333 880,476 0.04Bioarctic 6,334 102,059 0.01BioGaia 5,449 303,283 0.01Biotage 13,466 319,009 0.02Bonava 22,229 244,717 0.01BoneSupport Holding 24,694 217,137 0.01Boozt 8,786 193,141 0.01Bravida Holding 46,613 674,765 0.03Bufab 2,752 76,264 -Bure Equity 13,825 597,801 0.03Calliditas Therapeutics 13,113 191,662 0.01Camurus 7,111 177,938 0.01Castellum 55,639 1,416,974 0.07Catena 8,199 439,279 0.02Cellavision 3,964 170,850 0.01CELLINK 7,407 367,399 0.02Cibus Nordic Real Estate 3,625 86,639 -Cint Group 11,514 129,517 0.01Clas Ohlson 7,765 80,127 -Cloetta 34,170 102,045 0.01Coor Service Management Holding 22,284 176,664 0.01Corem Property Group 101,446 229,886 0.01Creades 20,850 260,377 0.01Desenio Group 5,254 54,677 -Dios Fastigheter 20,497 212,468 0.01Dometic Group 71,918 1,225,662 0.06Duni 5,458 70,713 -
Mercer UCITS Common Contractual FundMercer Passive Global Small Cap Equity UCITS CCF
Portfolio Statementas at 30 June 2021
(continued)
Mercer UCITS Common Contractual Fund 177

Financial assets at fair value through profit or loss (2020: 99.55%) (continued)Transferable securities (2020: 99.36%) (continued)Equities (2020: 99.36%) (continued)
SharesFair value
US$% of
Net assets
Sweden (2020: 2.49%) (continued)Dustin Group 16,857 222,732 0.01Electrolux Professional 60,734 430,712 0.02Elekta 90,679 1,314,780 0.06Enad Global 7 9,130 76,011 -Fabege 62,276 999,806 0.05Fagerhult 12,682 101,727 0.01Fingerprint Cards 62,678 239,362 0.01Fortnox 12,797 629,664 0.03GARO 14,465 199,584 0.01Getinge 56,255 2,123,339 0.10Granges 22,190 308,506 0.02Hansa Biopharma 8,625 151,278 0.01Hexpol 62,043 766,818 0.04HMS Networks 9,436 399,412 0.02Holmen 22,613 1,021,428 0.05Hufvudstaden 24,300 413,422 0.02Indutrade 64,337 1,647,516 0.08Instalco 13,023 540,585 0.03Intrum 14,998 491,214 0.02Investment Ab Oresund 2,963 51,484 -INVISIO 8,506 187,582 0.01Inwido 16,149 279,468 0.01JM 13,272 459,204 0.02Karo Pharma 9,350 59,912 -K-fast Holding 912 6,665 -KNOW IT 3,045 99,872 -Kungsleden 41,218 499,311 0.02LeoVegas 20,002 88,875 -Lifco 57,301 1,340,037 0.07Lime Technologies 4,921 187,354 0.01Lindab International 19,542 456,322 0.02Loomis 16,739 523,965 0.03Mekonomen 11,156 184,452 0.01MIPS 5,673 488,220 0.02Modern Times Group 26,266 355,961 0.02Munters Group 34,294 306,764 0.01Mycronic 18,307 552,711 0.03NCC B-Shares 16,781 286,677 0.01New Wave Group 8,484 107,735 0.01Nobia 32,739 279,456 0.01Nobina 24,109 219,041 0.01Nolato 63,790 628,043 0.03Nordic Entertainment Group 18,845 830,734 0.04Nordnet 26,887 454,135 0.02Nyfosa 36,755 497,250 0.02Oncopeptides 13,159 143,636 0.01Pandox 19,709 328,170 0.02Paradox Interactive 11,205 235,835 0.01Peab 39,085 483,070 0.02Platzer Fastigheter Holding 15,661 237,694 0.01PowerCell Sweden 13,130 346,821 0.02Ratos 46,522 282,326 0.01Re:NewCell 3,451 71,666 -Resurs Holding 37,009 182,965 0.01Saab 18,071 479,870 0.02Sagax - Class B 34,784 1,033,903 0.05Sagax - Class D 53,734 208,913 0.01
SharesFair value
US$% of
Net assets
Sweden (2020: 2.49%) (continued)Samhallsbyggnadsbolaget i Norden -Class B 208,799 875,515 0.04Samhallsbyggnadsbolaget i Norden -Class D 4,873 16,604 -SAS 790,837 194,192 0.01Scandi Standard 20,119 134,799 0.01Scandic Hotels Group 31,284 122,288 0.01Sdiptech 5,993 305,882 0.01Sedana Medical 11,176 93,306 -SkiStar 8,687 144,849 0.01SSAB - Class A 62,667 306,881 0.02SSAB - Class B 131,328 574,780 0.03Stillfront Group 75,340 724,580 0.04Storytel 9,268 240,582 0.01Svolder AB 5,471 154,557 0.01Sweco 46,423 845,175 0.04SwedenCare 13,351 179,530 0.01Swedish Orphan Biovitrum 45,789 835,506 0.04Thule Group 27,997 1,242,034 0.06Tobii 27,410 212,334 0.01Trelleborg 59,387 1,379,793 0.07Troax Group 7,862 256,945 0.01Vitrolife 15,836 658,464 0.03Wallenstam 36,965 585,240 0.03Wihlborgs Fastigheter 31,691 688,133 0.03Xvivo Perfusion 3,824 156,499 0.01
53,883,975 2.62Switzerland (2020: 2.11%)Allreal Holding 3,305 651,453 0.03ALSO Holding 1,398 403,058 0.02APG SGA 769 188,849 0.01Arbonia 17,963 343,578 0.02Aryzta 273,873 373,914 0.02Ascom Holding 11,898 196,680 0.01Autoneum Holding 866 161,798 0.01Bachem Holding 1,478 876,231 0.04Basilea Pharmaceutica 2,718 132,908 0.01Belimo Holding 2,306 1,055,269 0.05Bell Food Group 904 277,259 0.01BKW 4,736 493,403 0.02Bobst Group 1,186 94,947 -Bossard Holding 1,711 522,916 0.03Bucher Industries 1,553 812,832 0.04Burckhardt Compression Holding 705 285,630 0.01Bystronic 295 398,929 0.02Cembra Money Bank 8,427 945,399 0.05Coltene Holding 1,158 157,098 0.01Comet Holding 1,484 408,588 0.02CRISPR Therapeutics 14,177 2,295,115 0.11Daetwyler Holding 2,004 677,503 0.03DKSH Holding 8,173 626,006 0.03dormakaba Holding 667 454,961 0.02Dufry 13,892 823,586 0.04EFG International 33,074 271,576 0.01Emmi 476 488,694 0.02Flughafen Zurich 4,926 815,360 0.04Forbo Holding 261 494,696 0.02
Mercer UCITS Common Contractual FundMercer Passive Global Small Cap Equity UCITS CCF
Portfolio Statementas at 30 June 2021
(continued)
Mercer UCITS Common Contractual Fund 178
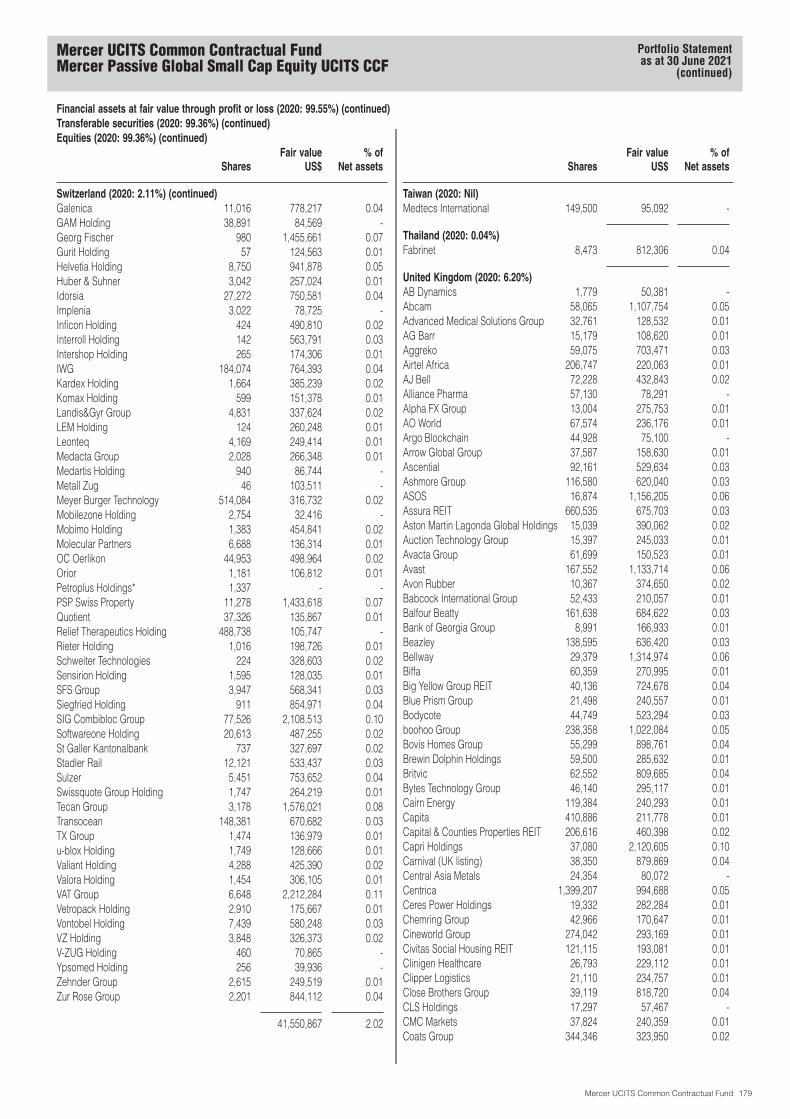
Financial assets at fair value through profit or loss (2020: 99.55%) (continued)Transferable securities (2020: 99.36%) (continued)Equities (2020: 99.36%) (continued)
SharesFair value
US$% of
Net assets
Switzerland (2020: 2.11%) (continued)Galenica 11,016 778,217 0.04GAM Holding 38,891 84,569 -Georg Fischer 980 1,455,661 0.07Gurit Holding 57 124,563 0.01Helvetia Holding 8,750 941,878 0.05Huber & Suhner 3,042 257,024 0.01Idorsia 27,272 750,581 0.04Implenia 3,022 78,725 -Inficon Holding 424 490,810 0.02Interroll Holding 142 563,791 0.03Intershop Holding 265 174,306 0.01IWG 184,074 764,393 0.04Kardex Holding 1,664 385,239 0.02Komax Holding 599 151,378 0.01Landis&Gyr Group 4,831 337,624 0.02LEM Holding 124 260,248 0.01Leonteq 4,169 249,414 0.01Medacta Group 2,028 266,348 0.01Medartis Holding 940 86,744 -Metall Zug 46 103,511 -Meyer Burger Technology 514,084 316,732 0.02Mobilezone Holding 2,754 32,416 -Mobimo Holding 1,383 454,841 0.02Molecular Partners 6,688 136,314 0.01OC Oerlikon 44,953 498,964 0.02Orior 1,181 106,812 0.01Petroplus Holdings* 1,337 - -PSP Swiss Property 11,278 1,433,618 0.07Quotient 37,326 135,867 0.01Relief Therapeutics Holding 488,738 105,747 -Rieter Holding 1,016 198,726 0.01Schweiter Technologies 224 328,603 0.02Sensirion Holding 1,595 128,035 0.01SFS Group 3,947 568,341 0.03Siegfried Holding 911 854,971 0.04SIG Combibloc Group 77,526 2,108,513 0.10Softwareone Holding 20,613 487,255 0.02St Galler Kantonalbank 737 327,697 0.02Stadler Rail 12,121 533,437 0.03Sulzer 5,451 753,652 0.04Swissquote Group Holding 1,747 264,219 0.01Tecan Group 3,178 1,576,021 0.08Transocean 148,381 670,682 0.03TX Group 1,474 136,979 0.01u-blox Holding 1,749 128,666 0.01Valiant Holding 4,288 425,390 0.02Valora Holding 1,454 306,105 0.01VAT Group 6,648 2,212,284 0.11Vetropack Holding 2,910 175,667 0.01Vontobel Holding 7,439 580,248 0.03VZ Holding 3,848 326,373 0.02V-ZUG Holding 460 70,865 -Ypsomed Holding 256 39,936 -Zehnder Group 2,615 249,519 0.01Zur Rose Group 2,201 844,112 0.04
41,550,867 2.02
SharesFair value
US$% of
Net assets
Taiwan (2020: Nil)Medtecs International 149,500 95,092 -
Thailand (2020: 0.04%)Fabrinet 8,473 812,306 0.04
United Kingdom (2020: 6.20%)AB Dynamics 1,779 50,381 -Abcam 58,065 1,107,754 0.05Advanced Medical Solutions Group 32,761 128,532 0.01AG Barr 15,179 108,620 0.01Aggreko 59,075 703,471 0.03Airtel Africa 206,747 220,063 0.01AJ Bell 72,228 432,843 0.02Alliance Pharma 57,130 78,291 -Alpha FX Group 13,004 275,753 0.01AO World 67,574 236,176 0.01Argo Blockchain 44,928 75,100 -Arrow Global Group 37,587 158,630 0.01Ascential 92,161 529,634 0.03Ashmore Group 116,580 620,040 0.03ASOS 16,874 1,156,205 0.06Assura REIT 660,535 675,703 0.03Aston Martin Lagonda Global Holdings 15,039 390,062 0.02Auction Technology Group 15,397 245,033 0.01Avacta Group 61,699 150,523 0.01Avast 167,552 1,133,714 0.06Avon Rubber 10,367 374,650 0.02Babcock International Group 52,433 210,057 0.01Balfour Beatty 161,638 684,622 0.03Bank of Georgia Group 8,991 166,933 0.01Beazley 138,595 636,420 0.03Bellway 29,379 1,314,974 0.06Biffa 60,359 270,995 0.01Big Yellow Group REIT 40,136 724,678 0.04Blue Prism Group 21,498 240,557 0.01Bodycote 44,749 523,294 0.03boohoo Group 238,358 1,022,084 0.05Bovis Homes Group 55,299 898,761 0.04Brewin Dolphin Holdings 59,500 285,632 0.01Britvic 62,552 809,685 0.04Bytes Technology Group 46,140 295,117 0.01Cairn Energy 119,384 240,293 0.01Capita 410,886 211,778 0.01Capital & Counties Properties REIT 206,616 460,398 0.02Capri Holdings 37,080 2,120,605 0.10Carnival (UK listing) 38,350 879,869 0.04Central Asia Metals 24,354 80,072 -Centrica 1,399,207 994,688 0.05Ceres Power Holdings 19,332 282,284 0.01Chemring Group 42,966 170,647 0.01Cineworld Group 274,042 293,169 0.01Civitas Social Housing REIT 121,115 193,081 0.01Clinigen Healthcare 26,793 229,112 0.01Clipper Logistics 21,110 234,757 0.01Close Brothers Group 39,119 818,720 0.04CLS Holdings 17,297 57,467 -CMC Markets 37,824 240,359 0.01Coats Group 344,346 323,950 0.02
Mercer UCITS Common Contractual FundMercer Passive Global Small Cap Equity UCITS CCF
Portfolio Statementas at 30 June 2021
(continued)
Mercer UCITS Common Contractual Fund 179
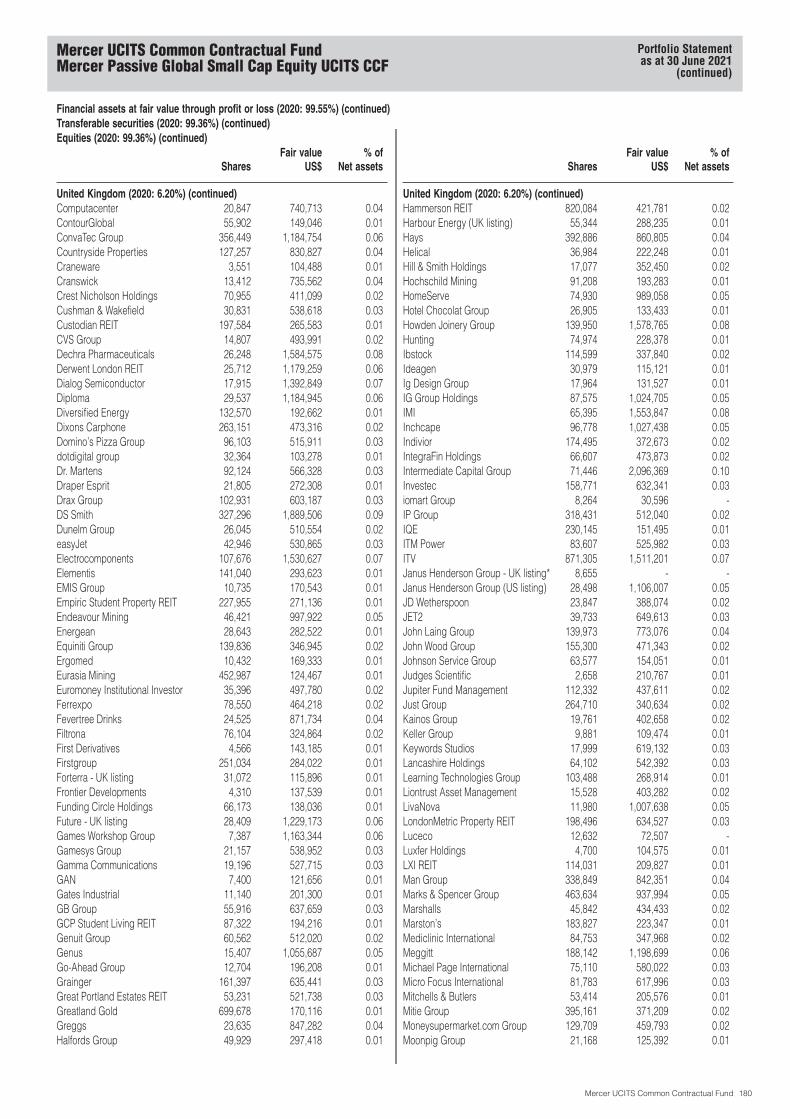
Financial assets at fair value through profit or loss (2020: 99.55%) (continued)Transferable securities (2020: 99.36%) (continued)Equities (2020: 99.36%) (continued)
SharesFair value
US$% of
Net assets
United Kingdom (2020: 6.20%) (continued)Computacenter 20,847 740,713 0.04ContourGlobal 55,902 149,046 0.01ConvaTec Group 356,449 1,184,754 0.06Countryside Properties 127,257 830,827 0.04Craneware 3,551 104,488 0.01Cranswick 13,412 735,562 0.04Crest Nicholson Holdings 70,955 411,099 0.02Cushman & Wakefield 30,831 538,618 0.03Custodian REIT 197,584 265,583 0.01CVS Group 14,807 493,991 0.02Dechra Pharmaceuticals 26,248 1,584,575 0.08Derwent London REIT 25,712 1,179,259 0.06Dialog Semiconductor 17,915 1,392,849 0.07Diploma 29,537 1,184,945 0.06Diversified Energy 132,570 192,662 0.01Dixons Carphone 263,151 473,316 0.02Domino’s Pizza Group 96,103 515,911 0.03dotdigital group 32,364 103,278 0.01Dr. Martens 92,124 566,328 0.03Draper Esprit 21,805 272,308 0.01Drax Group 102,931 603,187 0.03DS Smith 327,296 1,889,506 0.09Dunelm Group 26,045 510,554 0.02easyJet 42,946 530,865 0.03Electrocomponents 107,676 1,530,627 0.07Elementis 141,040 293,623 0.01EMIS Group 10,735 170,543 0.01Empiric Student Property REIT 227,955 271,136 0.01Endeavour Mining 46,421 997,922 0.05Energean 28,643 282,522 0.01Equiniti Group 139,836 346,945 0.02Ergomed 10,432 169,333 0.01Eurasia Mining 452,987 124,467 0.01Euromoney Institutional Investor 35,396 497,780 0.02Ferrexpo 78,550 464,218 0.02Fevertree Drinks 24,525 871,734 0.04Filtrona 76,104 324,864 0.02First Derivatives 4,566 143,185 0.01Firstgroup 251,034 284,022 0.01Forterra - UK listing 31,072 115,896 0.01Frontier Developments 4,310 137,539 0.01Funding Circle Holdings 66,173 138,036 0.01Future - UK listing 28,409 1,229,173 0.06Games Workshop Group 7,387 1,163,344 0.06Gamesys Group 21,157 538,952 0.03Gamma Communications 19,196 527,715 0.03GAN 7,400 121,656 0.01Gates Industrial 11,140 201,300 0.01GB Group 55,916 637,659 0.03GCP Student Living REIT 87,322 194,216 0.01Genuit Group 60,562 512,020 0.02Genus 15,407 1,055,687 0.05Go-Ahead Group 12,704 196,208 0.01Grainger 161,397 635,441 0.03Great Portland Estates REIT 53,231 521,738 0.03Greatland Gold 699,678 170,116 0.01Greggs 23,635 847,282 0.04Halfords Group 49,929 297,418 0.01
SharesFair value
US$% of
Net assets
United Kingdom (2020: 6.20%) (continued)Hammerson REIT 820,084 421,781 0.02Harbour Energy (UK listing) 55,344 288,235 0.01Hays 392,886 860,805 0.04Helical 36,984 222,248 0.01Hill & Smith Holdings 17,077 352,450 0.02Hochschild Mining 91,208 193,283 0.01HomeServe 74,930 989,058 0.05Hotel Chocolat Group 26,905 133,433 0.01Howden Joinery Group 139,950 1,578,765 0.08Hunting 74,974 228,378 0.01Ibstock 114,599 337,840 0.02Ideagen 30,979 115,121 0.01Ig Design Group 17,964 131,527 0.01IG Group Holdings 87,575 1,024,705 0.05IMI 65,395 1,553,847 0.08Inchcape 96,778 1,027,438 0.05Indivior 174,495 372,673 0.02IntegraFin Holdings 66,607 473,873 0.02Intermediate Capital Group 71,446 2,096,369 0.10Investec 158,771 632,341 0.03iomart Group 8,264 30,596 -IP Group 318,431 512,040 0.02IQE 230,145 151,495 0.01ITM Power 83,607 525,982 0.03ITV 871,305 1,511,201 0.07Janus Henderson Group - UK listing* 8,655 - -Janus Henderson Group (US listing) 28,498 1,106,007 0.05JD Wetherspoon 23,847 388,074 0.02JET2 39,733 649,613 0.03John Laing Group 139,973 773,076 0.04John Wood Group 155,300 471,343 0.02Johnson Service Group 63,577 154,051 0.01Judges Scientific 2,658 210,767 0.01Jupiter Fund Management 112,332 437,611 0.02Just Group 264,710 340,634 0.02Kainos Group 19,761 402,658 0.02Keller Group 9,881 109,474 0.01Keywords Studios 17,999 619,132 0.03Lancashire Holdings 64,102 542,392 0.03Learning Technologies Group 103,488 268,914 0.01Liontrust Asset Management 15,528 403,282 0.02LivaNova 11,980 1,007,638 0.05LondonMetric Property REIT 198,496 634,527 0.03Luceco 12,632 72,507 -Luxfer Holdings 4,700 104,575 0.01LXI REIT 114,031 209,827 0.01Man Group 338,849 842,351 0.04Marks & Spencer Group 463,634 937,994 0.05Marshalls 45,842 434,433 0.02Marston’s 183,827 223,347 0.01Mediclinic International 84,753 347,968 0.02Meggitt 188,142 1,198,699 0.06Michael Page International 75,110 580,022 0.03Micro Focus International 81,783 617,996 0.03Mitchells & Butlers 53,414 205,576 0.01Mitie Group 395,161 371,209 0.02Moneysupermarket.com Group 129,709 459,793 0.02Moonpig Group 21,168 125,392 0.01
Mercer UCITS Common Contractual FundMercer Passive Global Small Cap Equity UCITS CCF
Portfolio Statementas at 30 June 2021
(continued)
Mercer UCITS Common Contractual Fund 180
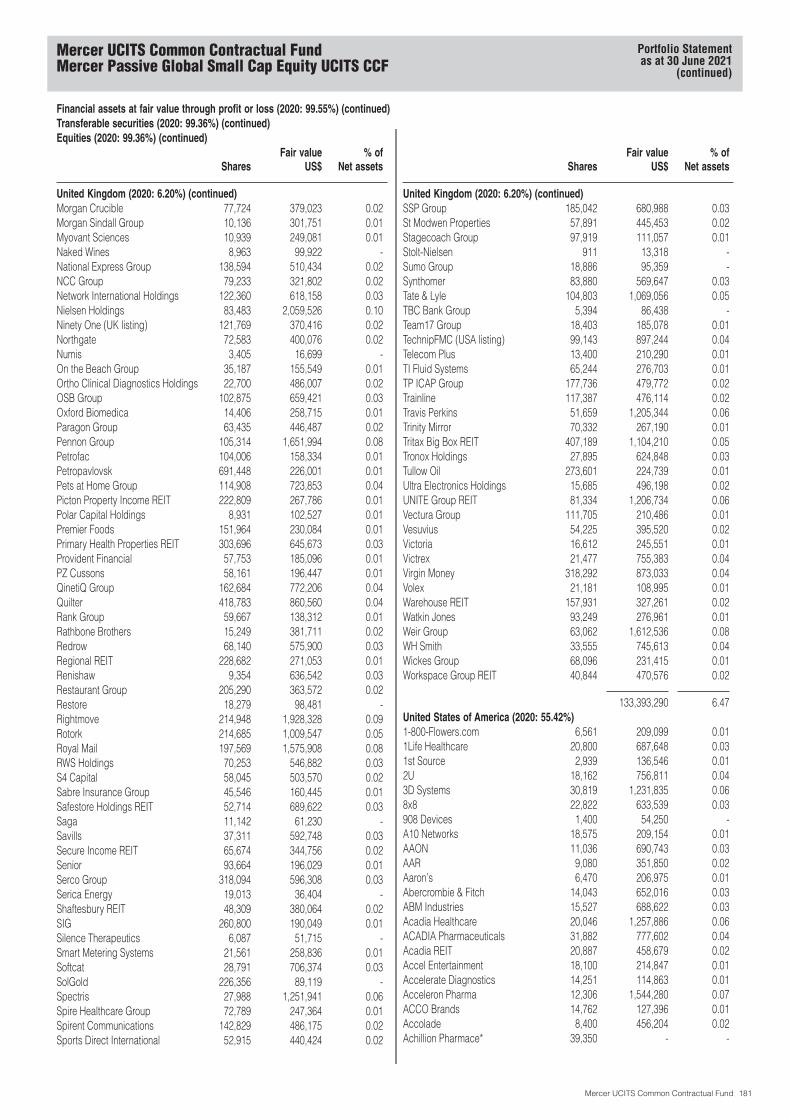
Financial assets at fair value through profit or loss (2020: 99.55%) (continued)Transferable securities (2020: 99.36%) (continued)Equities (2020: 99.36%) (continued)
SharesFair value
US$% of
Net assets
United Kingdom (2020: 6.20%) (continued)Morgan Crucible 77,724 379,023 0.02Morgan Sindall Group 10,136 301,751 0.01Myovant Sciences 10,939 249,081 0.01Naked Wines 8,963 99,922 -National Express Group 138,594 510,434 0.02NCC Group 79,233 321,802 0.02Network International Holdings 122,360 618,158 0.03Nielsen Holdings 83,483 2,059,526 0.10Ninety One (UK listing) 121,769 370,416 0.02Northgate 72,583 400,076 0.02Numis 3,405 16,699 -On the Beach Group 35,187 155,549 0.01Ortho Clinical Diagnostics Holdings 22,700 486,007 0.02OSB Group 102,875 659,421 0.03Oxford Biomedica 14,406 258,715 0.01Paragon Group 63,435 446,487 0.02Pennon Group 105,314 1,651,994 0.08Petrofac 104,006 158,334 0.01Petropavlovsk 691,448 226,001 0.01Pets at Home Group 114,908 723,853 0.04Picton Property Income REIT 222,809 267,786 0.01Polar Capital Holdings 8,931 102,527 0.01Premier Foods 151,964 230,084 0.01Primary Health Properties REIT 303,696 645,673 0.03Provident Financial 57,753 185,096 0.01PZ Cussons 58,161 196,447 0.01QinetiQ Group 162,684 772,206 0.04Quilter 418,783 860,560 0.04Rank Group 59,667 138,312 0.01Rathbone Brothers 15,249 381,711 0.02Redrow 68,140 575,900 0.03Regional REIT 228,682 271,053 0.01Renishaw 9,354 636,542 0.03Restaurant Group 205,290 363,572 0.02Restore 18,279 98,481 -Rightmove 214,948 1,928,328 0.09Rotork 214,685 1,009,547 0.05Royal Mail 197,569 1,575,908 0.08RWS Holdings 70,253 546,882 0.03S4 Capital 58,045 503,570 0.02Sabre Insurance Group 45,546 160,445 0.01Safestore Holdings REIT 52,714 689,622 0.03Saga 11,142 61,230 -Savills 37,311 592,748 0.03Secure Income REIT 65,674 344,756 0.02Senior 93,664 196,029 0.01Serco Group 318,094 596,308 0.03Serica Energy 19,013 36,404 -Shaftesbury REIT 48,309 380,064 0.02SIG 260,800 190,049 0.01Silence Therapeutics 6,087 51,715 -Smart Metering Systems 21,561 258,836 0.01Softcat 28,791 706,374 0.03SolGold 226,356 89,119 -Spectris 27,988 1,251,941 0.06Spire Healthcare Group 72,789 247,364 0.01Spirent Communications 142,829 486,175 0.02Sports Direct International 52,915 440,424 0.02
SharesFair value
US$% of
Net assets
United Kingdom (2020: 6.20%) (continued)SSP Group 185,042 680,988 0.03St Modwen Properties 57,891 445,453 0.02Stagecoach Group 97,919 111,057 0.01Stolt-Nielsen 911 13,318 -Sumo Group 18,886 95,359 -Synthomer 83,880 569,647 0.03Tate & Lyle 104,803 1,069,056 0.05TBC Bank Group 5,394 86,438 -Team17 Group 18,403 185,078 0.01TechnipFMC (USA listing) 99,143 897,244 0.04Telecom Plus 13,400 210,290 0.01TI Fluid Systems 65,244 276,703 0.01TP ICAP Group 177,736 479,772 0.02Trainline 117,387 476,114 0.02Travis Perkins 51,659 1,205,344 0.06Trinity Mirror 70,332 267,190 0.01Tritax Big Box REIT 407,189 1,104,210 0.05Tronox Holdings 27,895 624,848 0.03Tullow Oil 273,601 224,739 0.01Ultra Electronics Holdings 15,685 496,198 0.02UNITE Group REIT 81,334 1,206,734 0.06Vectura Group 111,705 210,486 0.01Vesuvius 54,225 395,520 0.02Victoria 16,612 245,551 0.01Victrex 21,477 755,383 0.04Virgin Money 318,292 873,033 0.04Volex 21,181 108,995 0.01Warehouse REIT 157,931 327,261 0.02Watkin Jones 93,249 276,961 0.01Weir Group 63,062 1,612,536 0.08WH Smith 33,555 745,613 0.04Wickes Group 68,096 231,415 0.01Workspace Group REIT 40,844 470,576 0.02
133,393,290 6.47United States of America (2020: 55.42%)1-800-Flowers.com 6,561 209,099 0.011Life Healthcare 20,800 687,648 0.031st Source 2,939 136,546 0.012U 18,162 756,811 0.043D Systems 30,819 1,231,835 0.068x8 22,822 633,539 0.03908 Devices 1,400 54,250 -A10 Networks 18,575 209,154 0.01AAON 11,036 690,743 0.03AAR 9,080 351,850 0.02Aaron’s 6,470 206,975 0.01Abercrombie & Fitch 14,043 652,016 0.03ABM Industries 15,527 688,622 0.03Acadia Healthcare 20,046 1,257,886 0.06ACADIA Pharmaceuticals 31,882 777,602 0.04Acadia REIT 20,887 458,679 0.02Accel Entertainment 18,100 214,847 0.01Accelerate Diagnostics 14,251 114,863 0.01Acceleron Pharma 12,306 1,544,280 0.07ACCO Brands 14,762 127,396 0.01Accolade 8,400 456,204 0.02Achillion Pharmace* 39,350 - -
Mercer UCITS Common Contractual FundMercer Passive Global Small Cap Equity UCITS CCF
Portfolio Statementas at 30 June 2021
(continued)
Mercer UCITS Common Contractual Fund 181
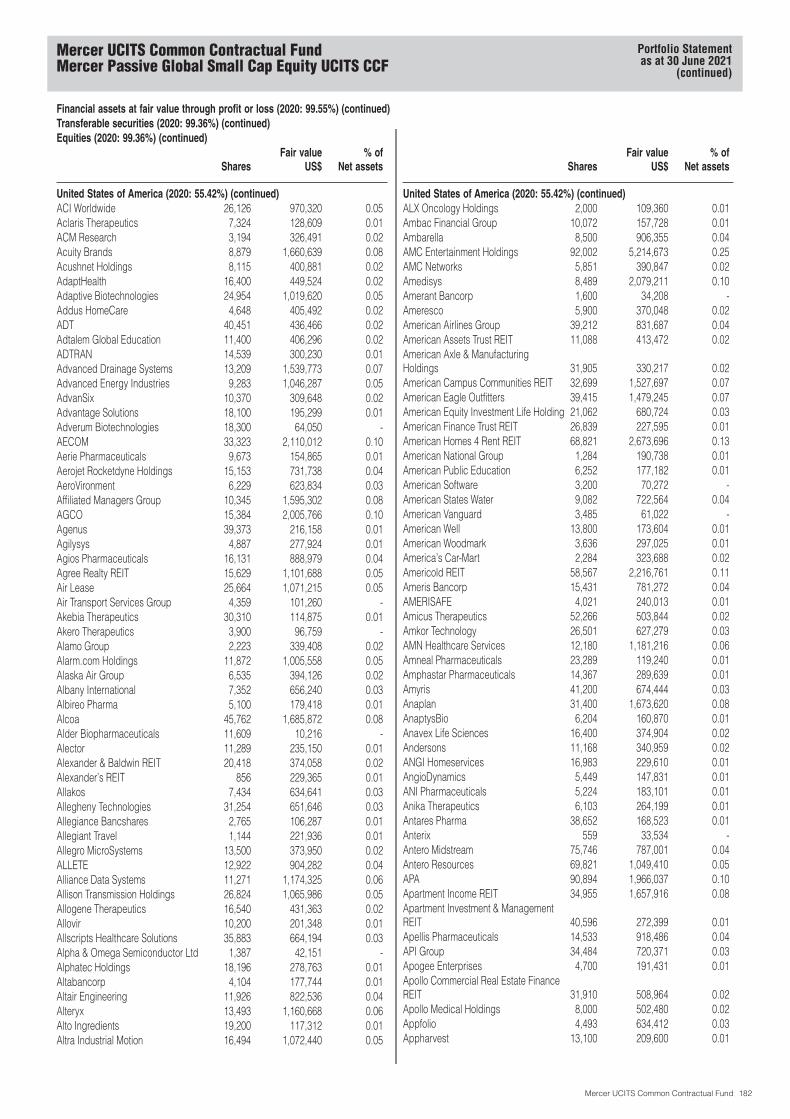
Financial assets at fair value through profit or loss (2020: 99.55%) (continued)Transferable securities (2020: 99.36%) (continued)Equities (2020: 99.36%) (continued)
SharesFair value
US$% of
Net assets
United States of America (2020: 55.42%) (continued)ACI Worldwide 26,126 970,320 0.05Aclaris Therapeutics 7,324 128,609 0.01ACM Research 3,194 326,491 0.02Acuity Brands 8,879 1,660,639 0.08Acushnet Holdings 8,115 400,881 0.02AdaptHealth 16,400 449,524 0.02Adaptive Biotechnologies 24,954 1,019,620 0.05Addus HomeCare 4,648 405,492 0.02ADT 40,451 436,466 0.02Adtalem Global Education 11,400 406,296 0.02ADTRAN 14,539 300,230 0.01Advanced Drainage Systems 13,209 1,539,773 0.07Advanced Energy Industries 9,283 1,046,287 0.05AdvanSix 10,370 309,648 0.02Advantage Solutions 18,100 195,299 0.01Adverum Biotechnologies 18,300 64,050 -AECOM 33,323 2,110,012 0.10Aerie Pharmaceuticals 9,673 154,865 0.01Aerojet Rocketdyne Holdings 15,153 731,738 0.04AeroVironment 6,229 623,834 0.03Affiliated Managers Group 10,345 1,595,302 0.08AGCO 15,384 2,005,766 0.10Agenus 39,373 216,158 0.01Agilysys 4,887 277,924 0.01Agios Pharmaceuticals 16,131 888,979 0.04Agree Realty REIT 15,629 1,101,688 0.05Air Lease 25,664 1,071,215 0.05Air Transport Services Group 4,359 101,260 -Akebia Therapeutics 30,310 114,875 0.01Akero Therapeutics 3,900 96,759 -Alamo Group 2,223 339,408 0.02Alarm.com Holdings 11,872 1,005,558 0.05Alaska Air Group 6,535 394,126 0.02Albany International 7,352 656,240 0.03Albireo Pharma 5,100 179,418 0.01Alcoa 45,762 1,685,872 0.08Alder Biopharmaceuticals 11,609 10,216 -Alector 11,289 235,150 0.01Alexander & Baldwin REIT 20,418 374,058 0.02Alexander’s REIT 856 229,365 0.01Allakos 7,434 634,641 0.03Allegheny Technologies 31,254 651,646 0.03Allegiance Bancshares 2,765 106,287 0.01Allegiant Travel 1,144 221,936 0.01Allegro MicroSystems 13,500 373,950 0.02ALLETE 12,922 904,282 0.04Alliance Data Systems 11,271 1,174,325 0.06Allison Transmission Holdings 26,824 1,065,986 0.05Allogene Therapeutics 16,540 431,363 0.02Allovir 10,200 201,348 0.01Allscripts Healthcare Solutions 35,883 664,194 0.03Alpha & Omega Semiconductor Ltd 1,387 42,151 -Alphatec Holdings 18,196 278,763 0.01Altabancorp 4,104 177,744 0.01Altair Engineering 11,926 822,536 0.04Alteryx 13,493 1,160,668 0.06Alto Ingredients 19,200 117,312 0.01Altra Industrial Motion 16,494 1,072,440 0.05
SharesFair value
US$% of
Net assets
United States of America (2020: 55.42%) (continued)ALX Oncology Holdings 2,000 109,360 0.01Ambac Financial Group 10,072 157,728 0.01Ambarella 8,500 906,355 0.04AMC Entertainment Holdings 92,002 5,214,673 0.25AMC Networks 5,851 390,847 0.02Amedisys 8,489 2,079,211 0.10Amerant Bancorp 1,600 34,208 -Ameresco 5,900 370,048 0.02American Airlines Group 39,212 831,687 0.04American Assets Trust REIT 11,088 413,472 0.02American Axle & ManufacturingHoldings 31,905 330,217 0.02American Campus Communities REIT 32,699 1,527,697 0.07American Eagle Outfitters 39,415 1,479,245 0.07American Equity Investment Life Holding 21,062 680,724 0.03American Finance Trust REIT 26,839 227,595 0.01American Homes 4 Rent REIT 68,821 2,673,696 0.13American National Group 1,284 190,738 0.01American Public Education 6,252 177,182 0.01American Software 3,200 70,272 -American States Water 9,082 722,564 0.04American Vanguard 3,485 61,022 -American Well 13,800 173,604 0.01American Woodmark 3,636 297,025 0.01America’s Car-Mart 2,284 323,688 0.02Americold REIT 58,567 2,216,761 0.11Ameris Bancorp 15,431 781,272 0.04AMERISAFE 4,021 240,013 0.01Amicus Therapeutics 52,266 503,844 0.02Amkor Technology 26,501 627,279 0.03AMN Healthcare Services 12,180 1,181,216 0.06Amneal Pharmaceuticals 23,289 119,240 0.01Amphastar Pharmaceuticals 14,367 289,639 0.01Amyris 41,200 674,444 0.03Anaplan 31,400 1,673,620 0.08AnaptysBio 6,204 160,870 0.01Anavex Life Sciences 16,400 374,904 0.02Andersons 11,168 340,959 0.02ANGI Homeservices 16,983 229,610 0.01AngioDynamics 5,449 147,831 0.01ANI Pharmaceuticals 5,224 183,101 0.01Anika Therapeutics 6,103 264,199 0.01Antares Pharma 38,652 168,523 0.01Anterix 559 33,534 -Antero Midstream 75,746 787,001 0.04Antero Resources 69,821 1,049,410 0.05APA 90,894 1,966,037 0.10Apartment Income REIT 34,955 1,657,916 0.08Apartment Investment & ManagementREIT 40,596 272,399 0.01Apellis Pharmaceuticals 14,533 918,486 0.04API Group 34,484 720,371 0.03Apogee Enterprises 4,700 191,431 0.01Apollo Commercial Real Estate FinanceREIT 31,910 508,964 0.02Apollo Medical Holdings 8,000 502,480 0.02Appfolio 4,493 634,412 0.03Appharvest 13,100 209,600 0.01
Mercer UCITS Common Contractual FundMercer Passive Global Small Cap Equity UCITS CCF
Portfolio Statementas at 30 June 2021
(continued)
Mercer UCITS Common Contractual Fund 182
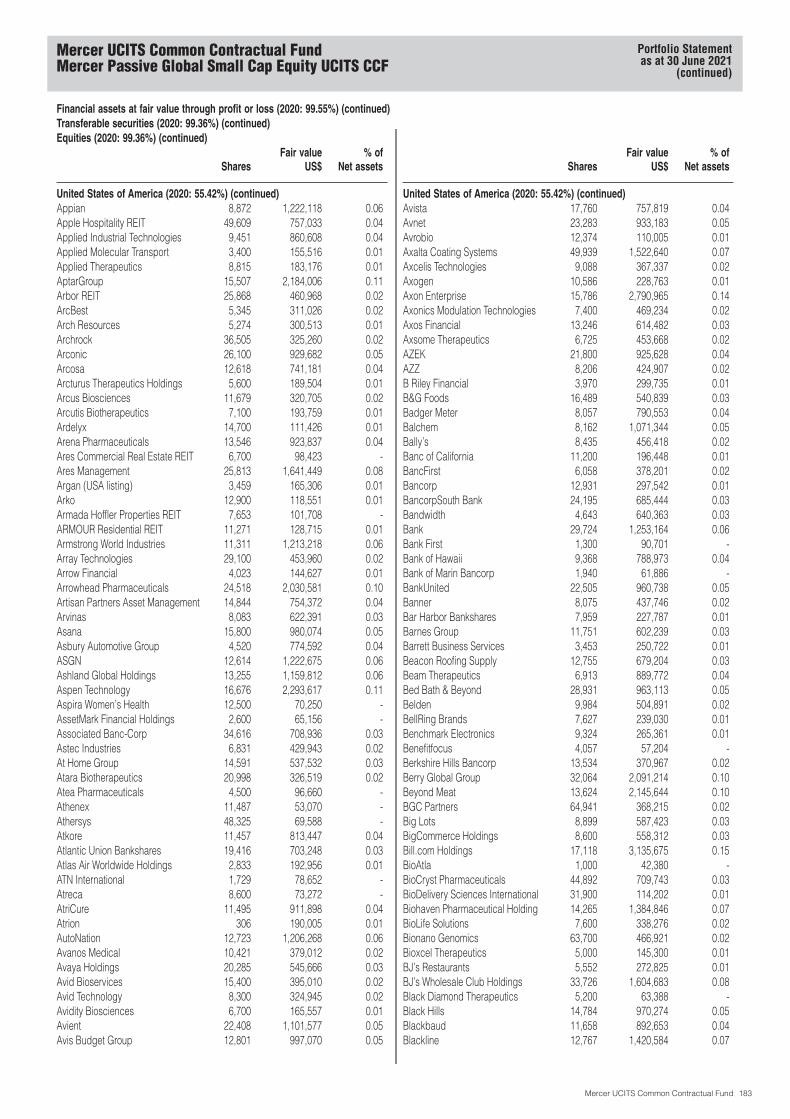
Financial assets at fair value through profit or loss (2020: 99.55%) (continued)Transferable securities (2020: 99.36%) (continued)Equities (2020: 99.36%) (continued)
SharesFair value
US$% of
Net assets
United States of America (2020: 55.42%) (continued)Appian 8,872 1,222,118 0.06Apple Hospitality REIT 49,609 757,033 0.04Applied Industrial Technologies 9,451 860,608 0.04Applied Molecular Transport 3,400 155,516 0.01Applied Therapeutics 8,815 183,176 0.01AptarGroup 15,507 2,184,006 0.11Arbor REIT 25,868 460,968 0.02ArcBest 5,345 311,026 0.02Arch Resources 5,274 300,513 0.01Archrock 36,505 325,260 0.02Arconic 26,100 929,682 0.05Arcosa 12,618 741,181 0.04Arcturus Therapeutics Holdings 5,600 189,504 0.01Arcus Biosciences 11,679 320,705 0.02Arcutis Biotherapeutics 7,100 193,759 0.01Ardelyx 14,700 111,426 0.01Arena Pharmaceuticals 13,546 923,837 0.04Ares Commercial Real Estate REIT 6,700 98,423 -Ares Management 25,813 1,641,449 0.08Argan (USA listing) 3,459 165,306 0.01Arko 12,900 118,551 0.01Armada Hoffler Properties REIT 7,653 101,708 -ARMOUR Residential REIT 11,271 128,715 0.01Armstrong World Industries 11,311 1,213,218 0.06Array Technologies 29,100 453,960 0.02Arrow Financial 4,023 144,627 0.01Arrowhead Pharmaceuticals 24,518 2,030,581 0.10Artisan Partners Asset Management 14,844 754,372 0.04Arvinas 8,083 622,391 0.03Asana 15,800 980,074 0.05Asbury Automotive Group 4,520 774,592 0.04ASGN 12,614 1,222,675 0.06Ashland Global Holdings 13,255 1,159,812 0.06Aspen Technology 16,676 2,293,617 0.11Aspira Women’s Health 12,500 70,250 -AssetMark Financial Holdings 2,600 65,156 -Associated Banc-Corp 34,616 708,936 0.03Astec Industries 6,831 429,943 0.02At Home Group 14,591 537,532 0.03Atara Biotherapeutics 20,998 326,519 0.02Atea Pharmaceuticals 4,500 96,660 -Athenex 11,487 53,070 -Athersys 48,325 69,588 -Atkore 11,457 813,447 0.04Atlantic Union Bankshares 19,416 703,248 0.03Atlas Air Worldwide Holdings 2,833 192,956 0.01ATN International 1,729 78,652 -Atreca 8,600 73,272 -AtriCure 11,495 911,898 0.04Atrion 306 190,005 0.01AutoNation 12,723 1,206,268 0.06Avanos Medical 10,421 379,012 0.02Avaya Holdings 20,285 545,666 0.03Avid Bioservices 15,400 395,010 0.02Avid Technology 8,300 324,945 0.02Avidity Biosciences 6,700 165,557 0.01Avient 22,408 1,101,577 0.05Avis Budget Group 12,801 997,070 0.05
SharesFair value
US$% of
Net assets
United States of America (2020: 55.42%) (continued)Avista 17,760 757,819 0.04Avnet 23,283 933,183 0.05Avrobio 12,374 110,005 0.01Axalta Coating Systems 49,939 1,522,640 0.07Axcelis Technologies 9,088 367,337 0.02Axogen 10,586 228,763 0.01Axon Enterprise 15,786 2,790,965 0.14Axonics Modulation Technologies 7,400 469,234 0.02Axos Financial 13,246 614,482 0.03Axsome Therapeutics 6,725 453,668 0.02AZEK 21,800 925,628 0.04AZZ 8,206 424,907 0.02B Riley Financial 3,970 299,735 0.01B&G Foods 16,489 540,839 0.03Badger Meter 8,057 790,553 0.04Balchem 8,162 1,071,344 0.05Bally’s 8,435 456,418 0.02Banc of California 11,200 196,448 0.01BancFirst 6,058 378,201 0.02Bancorp 12,931 297,542 0.01BancorpSouth Bank 24,195 685,444 0.03Bandwidth 4,643 640,363 0.03Bank 29,724 1,253,164 0.06Bank First 1,300 90,701 -Bank of Hawaii 9,368 788,973 0.04Bank of Marin Bancorp 1,940 61,886 -BankUnited 22,505 960,738 0.05Banner 8,075 437,746 0.02Bar Harbor Bankshares 7,959 227,787 0.01Barnes Group 11,751 602,239 0.03Barrett Business Services 3,453 250,722 0.01Beacon Roofing Supply 12,755 679,204 0.03Beam Therapeutics 6,913 889,772 0.04Bed Bath & Beyond 28,931 963,113 0.05Belden 9,984 504,891 0.02BellRing Brands 7,627 239,030 0.01Benchmark Electronics 9,324 265,361 0.01Benefitfocus 4,057 57,204 -Berkshire Hills Bancorp 13,534 370,967 0.02Berry Global Group 32,064 2,091,214 0.10Beyond Meat 13,624 2,145,644 0.10BGC Partners 64,941 368,215 0.02Big Lots 8,899 587,423 0.03BigCommerce Holdings 8,600 558,312 0.03Bill.com Holdings 17,118 3,135,675 0.15BioAtla 1,000 42,380 -BioCryst Pharmaceuticals 44,892 709,743 0.03BioDelivery Sciences International 31,900 114,202 0.01Biohaven Pharmaceutical Holding 14,265 1,384,846 0.07BioLife Solutions 7,600 338,276 0.02Bionano Genomics 63,700 466,921 0.02Bioxcel Therapeutics 5,000 145,300 0.01BJ’s Restaurants 5,552 272,825 0.01BJ’s Wholesale Club Holdings 33,726 1,604,683 0.08Black Diamond Therapeutics 5,200 63,388 -Black Hills 14,784 970,274 0.05Blackbaud 11,658 892,653 0.04Blackline 12,767 1,420,584 0.07
Mercer UCITS Common Contractual FundMercer Passive Global Small Cap Equity UCITS CCF
Portfolio Statementas at 30 June 2021
(continued)
Mercer UCITS Common Contractual Fund 183
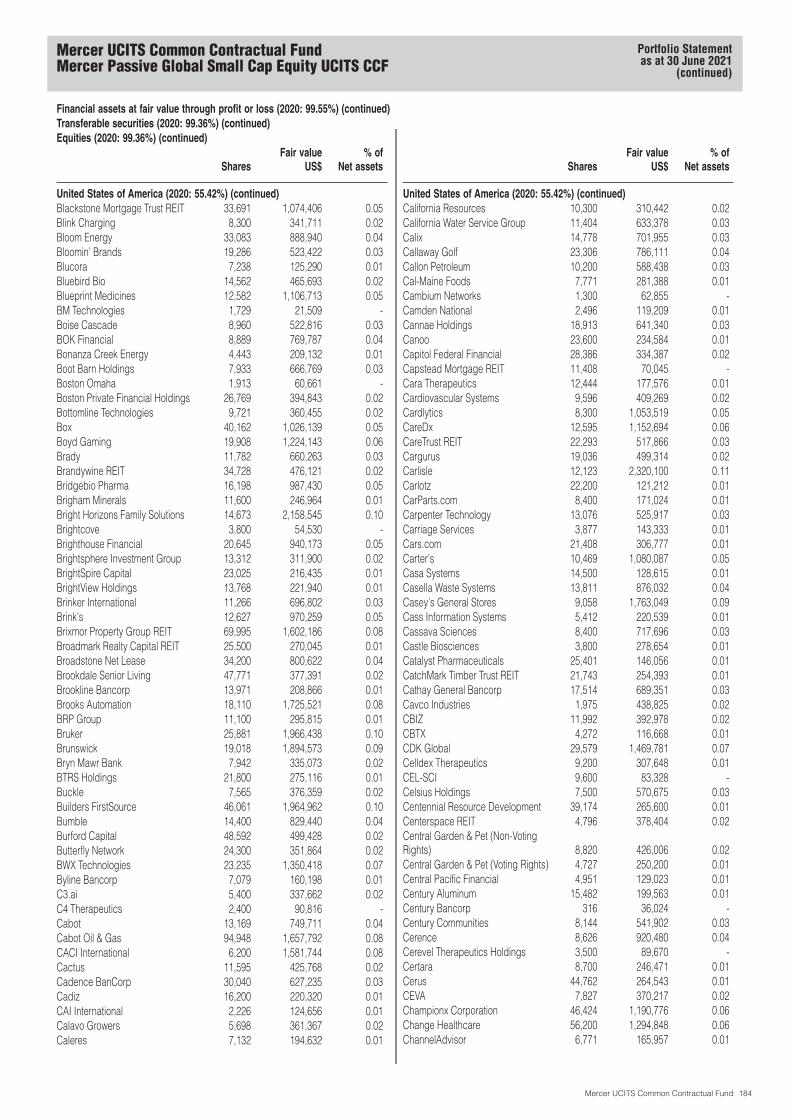
Financial assets at fair value through profit or loss (2020: 99.55%) (continued)Transferable securities (2020: 99.36%) (continued)Equities (2020: 99.36%) (continued)
SharesFair value
US$% of
Net assets
United States of America (2020: 55.42%) (continued)Blackstone Mortgage Trust REIT 33,691 1,074,406 0.05Blink Charging 8,300 341,711 0.02Bloom Energy 33,083 888,940 0.04Bloomin’ Brands 19,286 523,422 0.03Blucora 7,238 125,290 0.01Bluebird Bio 14,562 465,693 0.02Blueprint Medicines 12,582 1,106,713 0.05BM Technologies 1,729 21,509 -Boise Cascade 8,960 522,816 0.03BOK Financial 8,889 769,787 0.04Bonanza Creek Energy 4,443 209,132 0.01Boot Barn Holdings 7,933 666,769 0.03Boston Omaha 1,913 60,661 -Boston Private Financial Holdings 26,769 394,843 0.02Bottomline Technologies 9,721 360,455 0.02Box 40,162 1,026,139 0.05Boyd Gaming 19,908 1,224,143 0.06Brady 11,782 660,263 0.03Brandywine REIT 34,728 476,121 0.02Bridgebio Pharma 16,198 987,430 0.05Brigham Minerals 11,600 246,964 0.01Bright Horizons Family Solutions 14,673 2,158,545 0.10Brightcove 3,800 54,530 -Brighthouse Financial 20,645 940,173 0.05Brightsphere Investment Group 13,312 311,900 0.02BrightSpire Capital 23,025 216,435 0.01BrightView Holdings 13,768 221,940 0.01Brinker International 11,266 696,802 0.03Brink’s 12,627 970,259 0.05Brixmor Property Group REIT 69,995 1,602,186 0.08Broadmark Realty Capital REIT 25,500 270,045 0.01Broadstone Net Lease 34,200 800,622 0.04Brookdale Senior Living 47,771 377,391 0.02Brookline Bancorp 13,971 208,866 0.01Brooks Automation 18,110 1,725,521 0.08BRP Group 11,100 295,815 0.01Bruker 25,881 1,966,438 0.10Brunswick 19,018 1,894,573 0.09Bryn Mawr Bank 7,942 335,073 0.02BTRS Holdings 21,800 275,116 0.01Buckle 7,565 376,359 0.02Builders FirstSource 46,061 1,964,962 0.10Bumble 14,400 829,440 0.04Burford Capital 48,592 499,428 0.02Butterfly Network 24,300 351,864 0.02BWX Technologies 23,235 1,350,418 0.07Byline Bancorp 7,079 160,198 0.01C3.ai 5,400 337,662 0.02C4 Therapeutics 2,400 90,816 -Cabot 13,169 749,711 0.04Cabot Oil & Gas 94,948 1,657,792 0.08CACI International 6,200 1,581,744 0.08Cactus 11,595 425,768 0.02Cadence BanCorp 30,040 627,235 0.03Cadiz 16,200 220,320 0.01CAI International 2,226 124,656 0.01Calavo Growers 5,698 361,367 0.02Caleres 7,132 194,632 0.01
SharesFair value
US$% of
Net assets
United States of America (2020: 55.42%) (continued)California Resources 10,300 310,442 0.02California Water Service Group 11,404 633,378 0.03Calix 14,778 701,955 0.03Callaway Golf 23,306 786,111 0.04Callon Petroleum 10,200 588,438 0.03Cal-Maine Foods 7,771 281,388 0.01Cambium Networks 1,300 62,855 -Camden National 2,496 119,209 0.01Cannae Holdings 18,913 641,340 0.03Canoo 23,600 234,584 0.01Capitol Federal Financial 28,386 334,387 0.02Capstead Mortgage REIT 11,408 70,045 -Cara Therapeutics 12,444 177,576 0.01Cardiovascular Systems 9,596 409,269 0.02Cardlytics 8,300 1,053,519 0.05CareDx 12,595 1,152,694 0.06CareTrust REIT 22,293 517,866 0.03Cargurus 19,036 499,314 0.02Carlisle 12,123 2,320,100 0.11Carlotz 22,200 121,212 0.01CarParts.com 8,400 171,024 0.01Carpenter Technology 13,076 525,917 0.03Carriage Services 3,877 143,333 0.01Cars.com 21,408 306,777 0.01Carter’s 10,469 1,080,087 0.05Casa Systems 14,500 128,615 0.01Casella Waste Systems 13,811 876,032 0.04Casey’s General Stores 9,058 1,763,049 0.09Cass Information Systems 5,412 220,539 0.01Cassava Sciences 8,400 717,696 0.03Castle Biosciences 3,800 278,654 0.01Catalyst Pharmaceuticals 25,401 146,056 0.01CatchMark Timber Trust REIT 21,743 254,393 0.01Cathay General Bancorp 17,514 689,351 0.03Cavco Industries 1,975 438,825 0.02CBIZ 11,992 392,978 0.02CBTX 4,272 116,668 0.01CDK Global 29,579 1,469,781 0.07Celldex Therapeutics 9,200 307,648 0.01CEL-SCI 9,600 83,328 -Celsius Holdings 7,500 570,675 0.03Centennial Resource Development 39,174 265,600 0.01Centerspace REIT 4,796 378,404 0.02Central Garden & Pet (Non-VotingRights) 8,820 426,006 0.02Central Garden & Pet (Voting Rights) 4,727 250,200 0.01Central Pacific Financial 4,951 129,023 0.01Century Aluminum 15,482 199,563 0.01Century Bancorp 316 36,024 -Century Communities 8,144 541,902 0.03Cerence 8,626 920,480 0.04Cerevel Therapeutics Holdings 3,500 89,670 -Certara 8,700 246,471 0.01Cerus 44,762 264,543 0.01CEVA 7,827 370,217 0.02Championx Corporation 46,424 1,190,776 0.06Change Healthcare 56,200 1,294,848 0.06ChannelAdvisor 6,771 165,957 0.01
Mercer UCITS Common Contractual FundMercer Passive Global Small Cap Equity UCITS CCF
Portfolio Statementas at 30 June 2021
(continued)
Mercer UCITS Common Contractual Fund 184
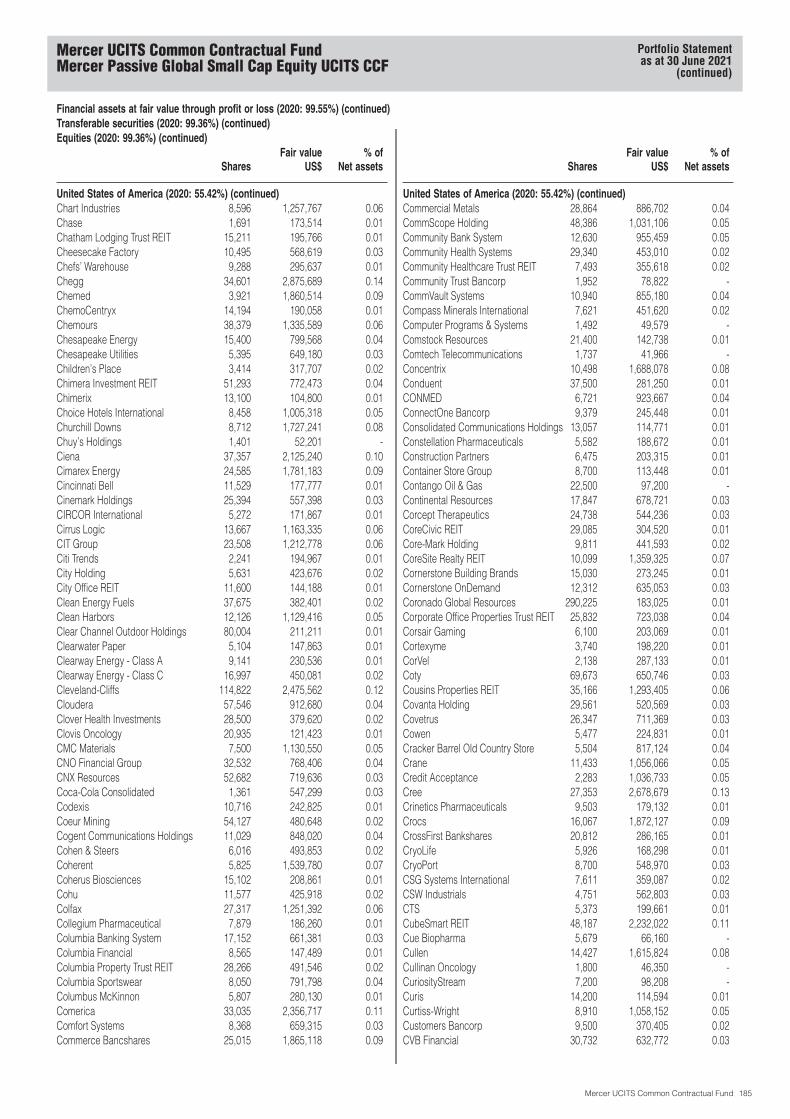
Financial assets at fair value through profit or loss (2020: 99.55%) (continued)Transferable securities (2020: 99.36%) (continued)Equities (2020: 99.36%) (continued)
SharesFair value
US$% of
Net assets
United States of America (2020: 55.42%) (continued)Chart Industries 8,596 1,257,767 0.06Chase 1,691 173,514 0.01Chatham Lodging Trust REIT 15,211 195,766 0.01Cheesecake Factory 10,495 568,619 0.03Chefs’ Warehouse 9,288 295,637 0.01Chegg 34,601 2,875,689 0.14Chemed 3,921 1,860,514 0.09ChemoCentryx 14,194 190,058 0.01Chemours 38,379 1,335,589 0.06Chesapeake Energy 15,400 799,568 0.04Chesapeake Utilities 5,395 649,180 0.03Children’s Place 3,414 317,707 0.02Chimera Investment REIT 51,293 772,473 0.04Chimerix 13,100 104,800 0.01Choice Hotels International 8,458 1,005,318 0.05Churchill Downs 8,712 1,727,241 0.08Chuy’s Holdings 1,401 52,201 -Ciena 37,357 2,125,240 0.10Cimarex Energy 24,585 1,781,183 0.09Cincinnati Bell 11,529 177,777 0.01Cinemark Holdings 25,394 557,398 0.03CIRCOR International 5,272 171,867 0.01Cirrus Logic 13,667 1,163,335 0.06CIT Group 23,508 1,212,778 0.06Citi Trends 2,241 194,967 0.01City Holding 5,631 423,676 0.02City Office REIT 11,600 144,188 0.01Clean Energy Fuels 37,675 382,401 0.02Clean Harbors 12,126 1,129,416 0.05Clear Channel Outdoor Holdings 80,004 211,211 0.01Clearwater Paper 5,104 147,863 0.01Clearway Energy - Class A 9,141 230,536 0.01Clearway Energy - Class C 16,997 450,081 0.02Cleveland-Cliffs 114,822 2,475,562 0.12Cloudera 57,546 912,680 0.04Clover Health Investments 28,500 379,620 0.02Clovis Oncology 20,935 121,423 0.01CMC Materials 7,500 1,130,550 0.05CNO Financial Group 32,532 768,406 0.04CNX Resources 52,682 719,636 0.03Coca-Cola Consolidated 1,361 547,299 0.03Codexis 10,716 242,825 0.01Coeur Mining 54,127 480,648 0.02Cogent Communications Holdings 11,029 848,020 0.04Cohen & Steers 6,016 493,853 0.02Coherent 5,825 1,539,780 0.07Coherus Biosciences 15,102 208,861 0.01Cohu 11,577 425,918 0.02Colfax 27,317 1,251,392 0.06Collegium Pharmaceutical 7,879 186,260 0.01Columbia Banking System 17,152 661,381 0.03Columbia Financial 8,565 147,489 0.01Columbia Property Trust REIT 28,266 491,546 0.02Columbia Sportswear 8,050 791,798 0.04Columbus McKinnon 5,807 280,130 0.01Comerica 33,035 2,356,717 0.11Comfort Systems 8,368 659,315 0.03Commerce Bancshares 25,015 1,865,118 0.09
SharesFair value
US$% of
Net assets
United States of America (2020: 55.42%) (continued)Commercial Metals 28,864 886,702 0.04CommScope Holding 48,386 1,031,106 0.05Community Bank System 12,630 955,459 0.05Community Health Systems 29,340 453,010 0.02Community Healthcare Trust REIT 7,493 355,618 0.02Community Trust Bancorp 1,952 78,822 -CommVault Systems 10,940 855,180 0.04Compass Minerals International 7,621 451,620 0.02Computer Programs & Systems 1,492 49,579 -Comstock Resources 21,400 142,738 0.01Comtech Telecommunications 1,737 41,966 -Concentrix 10,498 1,688,078 0.08Conduent 37,500 281,250 0.01CONMED 6,721 923,667 0.04ConnectOne Bancorp 9,379 245,448 0.01Consolidated Communications Holdings 13,057 114,771 0.01Constellation Pharmaceuticals 5,582 188,672 0.01Construction Partners 6,475 203,315 0.01Container Store Group 8,700 113,448 0.01Contango Oil & Gas 22,500 97,200 -Continental Resources 17,847 678,721 0.03Corcept Therapeutics 24,738 544,236 0.03CoreCivic REIT 29,085 304,520 0.01Core-Mark Holding 9,811 441,593 0.02CoreSite Realty REIT 10,099 1,359,325 0.07Cornerstone Building Brands 15,030 273,245 0.01Cornerstone OnDemand 12,312 635,053 0.03Coronado Global Resources 290,225 183,025 0.01Corporate Office Properties Trust REIT 25,832 723,038 0.04Corsair Gaming 6,100 203,069 0.01Cortexyme 3,740 198,220 0.01CorVel 2,138 287,133 0.01Coty 69,673 650,746 0.03Cousins Properties REIT 35,166 1,293,405 0.06Covanta Holding 29,561 520,569 0.03Covetrus 26,347 711,369 0.03Cowen 5,477 224,831 0.01Cracker Barrel Old Country Store 5,504 817,124 0.04Crane 11,433 1,056,066 0.05Credit Acceptance 2,283 1,036,733 0.05Cree 27,353 2,678,679 0.13Crinetics Pharmaceuticals 9,503 179,132 0.01Crocs 16,067 1,872,127 0.09CrossFirst Bankshares 20,812 286,165 0.01CryoLife 5,926 168,298 0.01CryoPort 8,700 548,970 0.03CSG Systems International 7,611 359,087 0.02CSW Industrials 4,751 562,803 0.03CTS 5,373 199,661 0.01CubeSmart REIT 48,187 2,232,022 0.11Cue Biopharma 5,679 66,160 -Cullen 14,427 1,615,824 0.08Cullinan Oncology 1,800 46,350 -CuriosityStream 7,200 98,208 -Curis 14,200 114,594 0.01Curtiss-Wright 8,910 1,058,152 0.05Customers Bancorp 9,500 370,405 0.02CVB Financial 30,732 632,772 0.03
Mercer UCITS Common Contractual FundMercer Passive Global Small Cap Equity UCITS CCF
Portfolio Statementas at 30 June 2021
(continued)
Mercer UCITS Common Contractual Fund 185
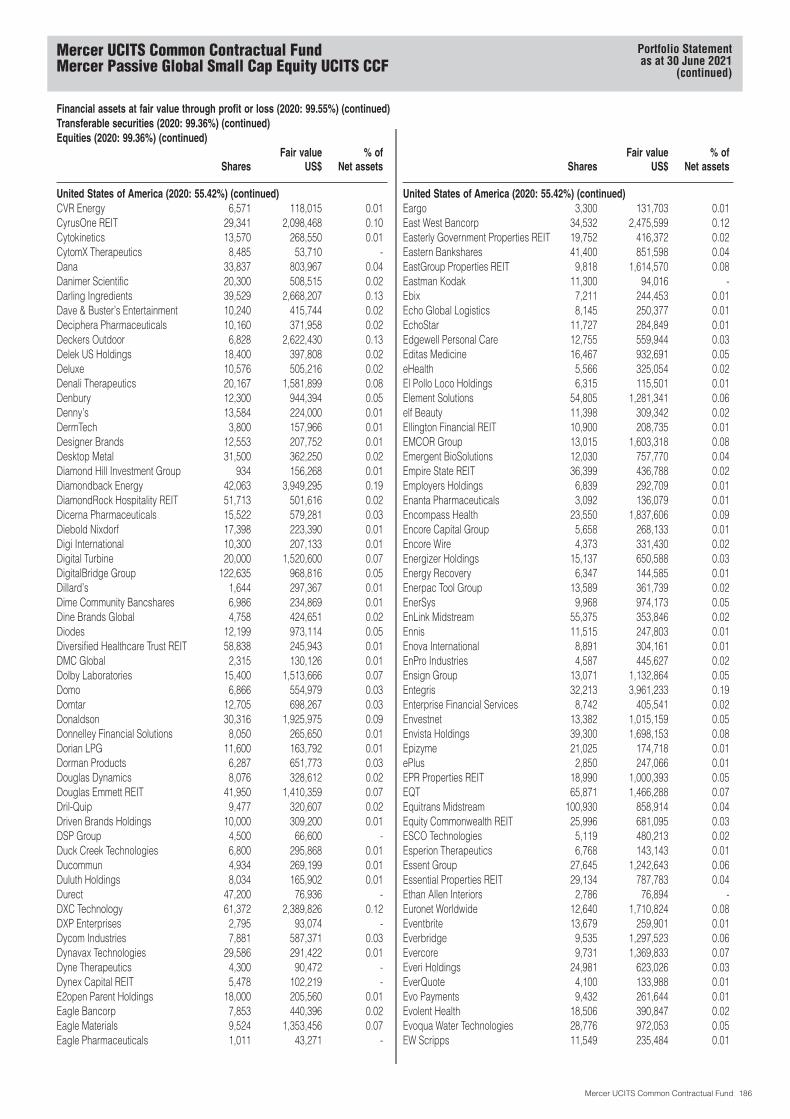
Financial assets at fair value through profit or loss (2020: 99.55%) (continued)Transferable securities (2020: 99.36%) (continued)Equities (2020: 99.36%) (continued)
SharesFair value
US$% of
Net assets
United States of America (2020: 55.42%) (continued)CVR Energy 6,571 118,015 0.01CyrusOne REIT 29,341 2,098,468 0.10Cytokinetics 13,570 268,550 0.01CytomX Therapeutics 8,485 53,710 -Dana 33,837 803,967 0.04Danimer Scientific 20,300 508,515 0.02Darling Ingredients 39,529 2,668,207 0.13Dave & Buster’s Entertainment 10,240 415,744 0.02Deciphera Pharmaceuticals 10,160 371,958 0.02Deckers Outdoor 6,828 2,622,430 0.13Delek US Holdings 18,400 397,808 0.02Deluxe 10,576 505,216 0.02Denali Therapeutics 20,167 1,581,899 0.08Denbury 12,300 944,394 0.05Denny’s 13,584 224,000 0.01DermTech 3,800 157,966 0.01Designer Brands 12,553 207,752 0.01Desktop Metal 31,500 362,250 0.02Diamond Hill Investment Group 934 156,268 0.01Diamondback Energy 42,063 3,949,295 0.19DiamondRock Hospitality REIT 51,713 501,616 0.02Dicerna Pharmaceuticals 15,522 579,281 0.03Diebold Nixdorf 17,398 223,390 0.01Digi International 10,300 207,133 0.01Digital Turbine 20,000 1,520,600 0.07DigitalBridge Group 122,635 968,816 0.05Dillard’s 1,644 297,367 0.01Dime Community Bancshares 6,986 234,869 0.01Dine Brands Global 4,758 424,651 0.02Diodes 12,199 973,114 0.05Diversified Healthcare Trust REIT 58,838 245,943 0.01DMC Global 2,315 130,126 0.01Dolby Laboratories 15,400 1,513,666 0.07Domo 6,866 554,979 0.03Domtar 12,705 698,267 0.03Donaldson 30,316 1,925,975 0.09Donnelley Financial Solutions 8,050 265,650 0.01Dorian LPG 11,600 163,792 0.01Dorman Products 6,287 651,773 0.03Douglas Dynamics 8,076 328,612 0.02Douglas Emmett REIT 41,950 1,410,359 0.07Dril-Quip 9,477 320,607 0.02Driven Brands Holdings 10,000 309,200 0.01DSP Group 4,500 66,600 -Duck Creek Technologies 6,800 295,868 0.01Ducommun 4,934 269,199 0.01Duluth Holdings 8,034 165,902 0.01Durect 47,200 76,936 -DXC Technology 61,372 2,389,826 0.12DXP Enterprises 2,795 93,074 -Dycom Industries 7,881 587,371 0.03Dynavax Technologies 29,586 291,422 0.01Dyne Therapeutics 4,300 90,472 -Dynex Capital REIT 5,478 102,219 -E2open Parent Holdings 18,000 205,560 0.01Eagle Bancorp 7,853 440,396 0.02Eagle Materials 9,524 1,353,456 0.07Eagle Pharmaceuticals 1,011 43,271 -
SharesFair value
US$% of
Net assets
United States of America (2020: 55.42%) (continued)Eargo 3,300 131,703 0.01East West Bancorp 34,532 2,475,599 0.12Easterly Government Properties REIT 19,752 416,372 0.02Eastern Bankshares 41,400 851,598 0.04EastGroup Properties REIT 9,818 1,614,570 0.08Eastman Kodak 11,300 94,016 -Ebix 7,211 244,453 0.01Echo Global Logistics 8,145 250,377 0.01EchoStar 11,727 284,849 0.01Edgewell Personal Care 12,755 559,944 0.03Editas Medicine 16,467 932,691 0.05eHealth 5,566 325,054 0.02El Pollo Loco Holdings 6,315 115,501 0.01Element Solutions 54,805 1,281,341 0.06elf Beauty 11,398 309,342 0.02Ellington Financial REIT 10,900 208,735 0.01EMCOR Group 13,015 1,603,318 0.08Emergent BioSolutions 12,030 757,770 0.04Empire State REIT 36,399 436,788 0.02Employers Holdings 6,839 292,709 0.01Enanta Pharmaceuticals 3,092 136,079 0.01Encompass Health 23,550 1,837,606 0.09Encore Capital Group 5,658 268,133 0.01Encore Wire 4,373 331,430 0.02Energizer Holdings 15,137 650,588 0.03Energy Recovery 6,347 144,585 0.01Enerpac Tool Group 13,589 361,739 0.02EnerSys 9,968 974,173 0.05EnLink Midstream 55,375 353,846 0.02Ennis 11,515 247,803 0.01Enova International 8,891 304,161 0.01EnPro Industries 4,587 445,627 0.02Ensign Group 13,071 1,132,864 0.05Entegris 32,213 3,961,233 0.19Enterprise Financial Services 8,742 405,541 0.02Envestnet 13,382 1,015,159 0.05Envista Holdings 39,300 1,698,153 0.08Epizyme 21,025 174,718 0.01ePlus 2,850 247,066 0.01EPR Properties REIT 18,990 1,000,393 0.05EQT 65,871 1,466,288 0.07Equitrans Midstream 100,930 858,914 0.04Equity Commonwealth REIT 25,996 681,095 0.03ESCO Technologies 5,119 480,213 0.02Esperion Therapeutics 6,768 143,143 0.01Essent Group 27,645 1,242,643 0.06Essential Properties REIT 29,134 787,783 0.04Ethan Allen Interiors 2,786 76,894 -Euronet Worldwide 12,640 1,710,824 0.08Eventbrite 13,679 259,901 0.01Everbridge 9,535 1,297,523 0.06Evercore 9,731 1,369,833 0.07Everi Holdings 24,981 623,026 0.03EverQuote 4,100 133,988 0.01Evo Payments 9,432 261,644 0.01Evolent Health 18,506 390,847 0.02Evoqua Water Technologies 28,776 972,053 0.05EW Scripps 11,549 235,484 0.01
Mercer UCITS Common Contractual FundMercer Passive Global Small Cap Equity UCITS CCF
Portfolio Statementas at 30 June 2021
(continued)
Mercer UCITS Common Contractual Fund 186
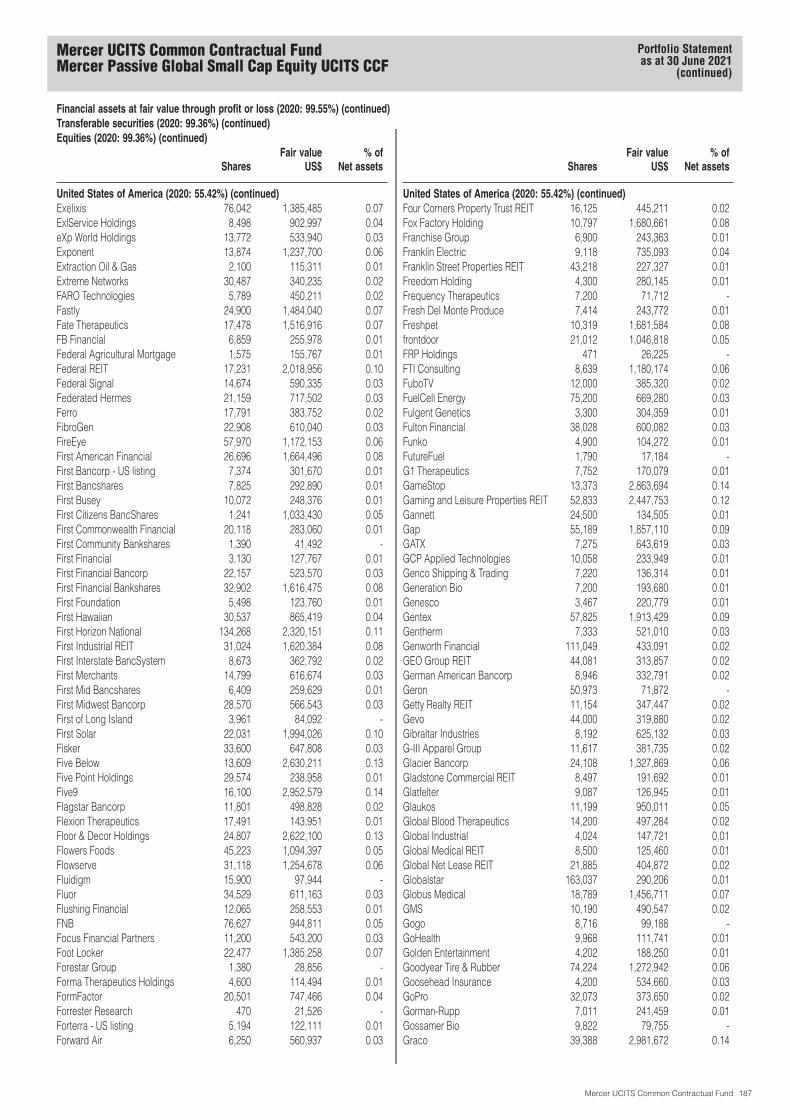
Financial assets at fair value through profit or loss (2020: 99.55%) (continued)Transferable securities (2020: 99.36%) (continued)Equities (2020: 99.36%) (continued)
SharesFair value
US$% of
Net assets
United States of America (2020: 55.42%) (continued)Exelixis 76,042 1,385,485 0.07ExlService Holdings 8,498 902,997 0.04eXp World Holdings 13,772 533,940 0.03Exponent 13,874 1,237,700 0.06Extraction Oil & Gas 2,100 115,311 0.01Extreme Networks 30,487 340,235 0.02FARO Technologies 5,789 450,211 0.02Fastly 24,900 1,484,040 0.07Fate Therapeutics 17,478 1,516,916 0.07FB Financial 6,859 255,978 0.01Federal Agricultural Mortgage 1,575 155,767 0.01Federal REIT 17,231 2,018,956 0.10Federal Signal 14,674 590,335 0.03Federated Hermes 21,159 717,502 0.03Ferro 17,791 383,752 0.02FibroGen 22,908 610,040 0.03FireEye 57,970 1,172,153 0.06First American Financial 26,696 1,664,496 0.08First Bancorp - US listing 7,374 301,670 0.01First Bancshares 7,825 292,890 0.01First Busey 10,072 248,376 0.01First Citizens BancShares 1,241 1,033,430 0.05First Commonwealth Financial 20,118 283,060 0.01First Community Bankshares 1,390 41,492 -First Financial 3,130 127,767 0.01First Financial Bancorp 22,157 523,570 0.03First Financial Bankshares 32,902 1,616,475 0.08First Foundation 5,498 123,760 0.01First Hawaiian 30,537 865,419 0.04First Horizon National 134,268 2,320,151 0.11First Industrial REIT 31,024 1,620,384 0.08First Interstate BancSystem 8,673 362,792 0.02First Merchants 14,799 616,674 0.03First Mid Bancshares 6,409 259,629 0.01First Midwest Bancorp 28,570 566,543 0.03First of Long Island 3,961 84,092 -First Solar 22,031 1,994,026 0.10Fisker 33,600 647,808 0.03Five Below 13,609 2,630,211 0.13Five Point Holdings 29,574 238,958 0.01Five9 16,100 2,952,579 0.14Flagstar Bancorp 11,801 498,828 0.02Flexion Therapeutics 17,491 143,951 0.01Floor & Decor Holdings 24,807 2,622,100 0.13Flowers Foods 45,223 1,094,397 0.05Flowserve 31,118 1,254,678 0.06Fluidigm 15,900 97,944 -Fluor 34,529 611,163 0.03Flushing Financial 12,065 258,553 0.01FNB 76,627 944,811 0.05Focus Financial Partners 11,200 543,200 0.03Foot Locker 22,477 1,385,258 0.07Forestar Group 1,380 28,856 -Forma Therapeutics Holdings 4,600 114,494 0.01FormFactor 20,501 747,466 0.04Forrester Research 470 21,526 -Forterra - US listing 5,194 122,111 0.01Forward Air 6,250 560,937 0.03
SharesFair value
US$% of
Net assets
United States of America (2020: 55.42%) (continued)Four Corners Property Trust REIT 16,125 445,211 0.02Fox Factory Holding 10,797 1,680,661 0.08Franchise Group 6,900 243,363 0.01Franklin Electric 9,118 735,093 0.04Franklin Street Properties REIT 43,218 227,327 0.01Freedom Holding 4,300 280,145 0.01Frequency Therapeutics 7,200 71,712 -Fresh Del Monte Produce 7,414 243,772 0.01Freshpet 10,319 1,681,584 0.08frontdoor 21,012 1,046,818 0.05FRP Holdings 471 26,225 -FTI Consulting 8,639 1,180,174 0.06FuboTV 12,000 385,320 0.02FuelCell Energy 75,200 669,280 0.03Fulgent Genetics 3,300 304,359 0.01Fulton Financial 38,028 600,082 0.03Funko 4,900 104,272 0.01FutureFuel 1,790 17,184 -G1 Therapeutics 7,752 170,079 0.01GameStop 13,373 2,863,694 0.14Gaming and Leisure Properties REIT 52,833 2,447,753 0.12Gannett 24,500 134,505 0.01Gap 55,189 1,857,110 0.09GATX 7,275 643,619 0.03GCP Applied Technologies 10,058 233,949 0.01Genco Shipping & Trading 7,220 136,314 0.01Generation Bio 7,200 193,680 0.01Genesco 3,467 220,779 0.01Gentex 57,825 1,913,429 0.09Gentherm 7,333 521,010 0.03Genworth Financial 111,049 433,091 0.02GEO Group REIT 44,081 313,857 0.02German American Bancorp 8,946 332,791 0.02Geron 50,973 71,872 -Getty Realty REIT 11,154 347,447 0.02Gevo 44,000 319,880 0.02Gibraltar Industries 8,192 625,132 0.03G-III Apparel Group 11,617 381,735 0.02Glacier Bancorp 24,108 1,327,869 0.06Gladstone Commercial REIT 8,497 191,692 0.01Glatfelter 9,087 126,945 0.01Glaukos 11,199 950,011 0.05Global Blood Therapeutics 14,200 497,284 0.02Global Industrial 4,024 147,721 0.01Global Medical REIT 8,500 125,460 0.01Global Net Lease REIT 21,885 404,872 0.02Globalstar 163,037 290,206 0.01Globus Medical 18,789 1,456,711 0.07GMS 10,190 490,547 0.02Gogo 8,716 99,188 -GoHealth 9,968 111,741 0.01Golden Entertainment 4,202 188,250 0.01Goodyear Tire & Rubber 74,224 1,272,942 0.06Goosehead Insurance 4,200 534,660 0.03GoPro 32,073 373,650 0.02Gorman-Rupp 7,011 241,459 0.01Gossamer Bio 9,822 79,755 -Graco 39,388 2,981,672 0.14
Mercer UCITS Common Contractual FundMercer Passive Global Small Cap Equity UCITS CCF
Portfolio Statementas at 30 June 2021
(continued)
Mercer UCITS Common Contractual Fund 187
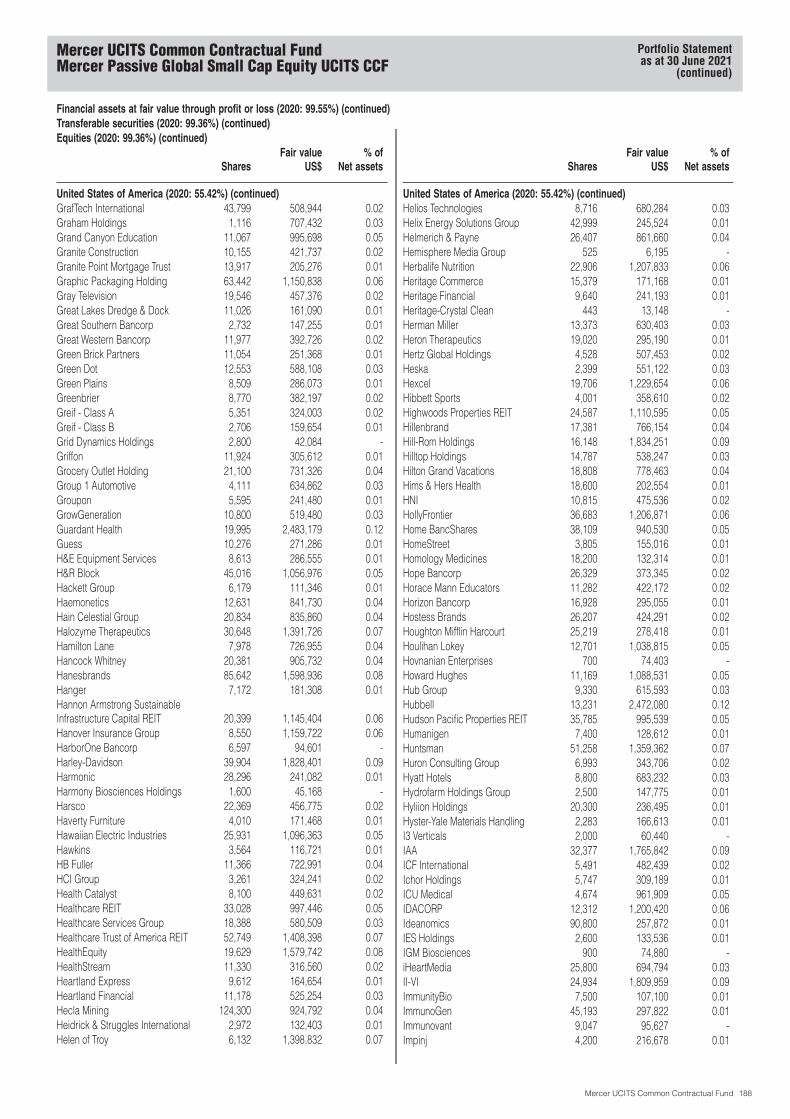
Financial assets at fair value through profit or loss (2020: 99.55%) (continued)Transferable securities (2020: 99.36%) (continued)Equities (2020: 99.36%) (continued)
SharesFair value
US$% of
Net assets
United States of America (2020: 55.42%) (continued)GrafTech International 43,799 508,944 0.02Graham Holdings 1,116 707,432 0.03Grand Canyon Education 11,067 995,698 0.05Granite Construction 10,155 421,737 0.02Granite Point Mortgage Trust 13,917 205,276 0.01Graphic Packaging Holding 63,442 1,150,838 0.06Gray Television 19,546 457,376 0.02Great Lakes Dredge & Dock 11,026 161,090 0.01Great Southern Bancorp 2,732 147,255 0.01Great Western Bancorp 11,977 392,726 0.02Green Brick Partners 11,054 251,368 0.01Green Dot 12,553 588,108 0.03Green Plains 8,509 286,073 0.01Greenbrier 8,770 382,197 0.02Greif - Class A 5,351 324,003 0.02Greif - Class B 2,706 159,654 0.01Grid Dynamics Holdings 2,800 42,084 -Griffon 11,924 305,612 0.01Grocery Outlet Holding 21,100 731,326 0.04Group 1 Automotive 4,111 634,862 0.03Groupon 5,595 241,480 0.01GrowGeneration 10,800 519,480 0.03Guardant Health 19,995 2,483,179 0.12Guess 10,276 271,286 0.01H&E Equipment Services 8,613 286,555 0.01H&R Block 45,016 1,056,976 0.05Hackett Group 6,179 111,346 0.01Haemonetics 12,631 841,730 0.04Hain Celestial Group 20,834 835,860 0.04Halozyme Therapeutics 30,648 1,391,726 0.07Hamilton Lane 7,978 726,955 0.04Hancock Whitney 20,381 905,732 0.04Hanesbrands 85,642 1,598,936 0.08Hanger 7,172 181,308 0.01Hannon Armstrong SustainableInfrastructure Capital REIT 20,399 1,145,404 0.06Hanover Insurance Group 8,550 1,159,722 0.06HarborOne Bancorp 6,597 94,601 -Harley-Davidson 39,904 1,828,401 0.09Harmonic 28,296 241,082 0.01Harmony Biosciences Holdings 1,600 45,168 -Harsco 22,369 456,775 0.02Haverty Furniture 4,010 171,468 0.01Hawaiian Electric Industries 25,931 1,096,363 0.05Hawkins 3,564 116,721 0.01HB Fuller 11,366 722,991 0.04HCI Group 3,261 324,241 0.02Health Catalyst 8,100 449,631 0.02Healthcare REIT 33,028 997,446 0.05Healthcare Services Group 18,388 580,509 0.03Healthcare Trust of America REIT 52,749 1,408,398 0.07HealthEquity 19,629 1,579,742 0.08HealthStream 11,330 316,560 0.02Heartland Express 9,612 164,654 0.01Heartland Financial 11,178 525,254 0.03Hecla Mining 124,300 924,792 0.04Heidrick & Struggles International 2,972 132,403 0.01Helen of Troy 6,132 1,398,832 0.07
SharesFair value
US$% of
Net assets
United States of America (2020: 55.42%) (continued)Helios Technologies 8,716 680,284 0.03Helix Energy Solutions Group 42,999 245,524 0.01Helmerich & Payne 26,407 861,660 0.04Hemisphere Media Group 525 6,195 -Herbalife Nutrition 22,906 1,207,833 0.06Heritage Commerce 15,379 171,168 0.01Heritage Financial 9,640 241,193 0.01Heritage-Crystal Clean 443 13,148 -Herman Miller 13,373 630,403 0.03Heron Therapeutics 19,020 295,190 0.01Hertz Global Holdings 4,528 507,453 0.02Heska 2,399 551,122 0.03Hexcel 19,706 1,229,654 0.06Hibbett Sports 4,001 358,610 0.02Highwoods Properties REIT 24,587 1,110,595 0.05Hillenbrand 17,381 766,154 0.04Hill-Rom Holdings 16,148 1,834,251 0.09Hilltop Holdings 14,787 538,247 0.03Hilton Grand Vacations 18,808 778,463 0.04Hims & Hers Health 18,600 202,554 0.01HNI 10,815 475,536 0.02HollyFrontier 36,683 1,206,871 0.06Home BancShares 38,109 940,530 0.05HomeStreet 3,805 155,016 0.01Homology Medicines 18,200 132,314 0.01Hope Bancorp 26,329 373,345 0.02Horace Mann Educators 11,282 422,172 0.02Horizon Bancorp 16,928 295,055 0.01Hostess Brands 26,207 424,291 0.02Houghton Mifflin Harcourt 25,219 278,418 0.01Houlihan Lokey 12,701 1,038,815 0.05Hovnanian Enterprises 700 74,403 -Howard Hughes 11,169 1,088,531 0.05Hub Group 9,330 615,593 0.03Hubbell 13,231 2,472,080 0.12Hudson Pacific Properties REIT 35,785 995,539 0.05Humanigen 7,400 128,612 0.01Huntsman 51,258 1,359,362 0.07Huron Consulting Group 6,993 343,706 0.02Hyatt Hotels 8,800 683,232 0.03Hydrofarm Holdings Group 2,500 147,775 0.01Hyliion Holdings 20,300 236,495 0.01Hyster-Yale Materials Handling 2,283 166,613 0.01I3 Verticals 2,000 60,440 -IAA 32,377 1,765,842 0.09ICF International 5,491 482,439 0.02Ichor Holdings 5,747 309,189 0.01ICU Medical 4,674 961,909 0.05IDACORP 12,312 1,200,420 0.06Ideanomics 90,800 257,872 0.01IES Holdings 2,600 133,536 0.01IGM Biosciences 900 74,880 -iHeartMedia 25,800 694,794 0.03II-VI 24,934 1,809,959 0.09ImmunityBio 7,500 107,100 0.01ImmunoGen 45,193 297,822 0.01Immunovant 9,047 95,627 -Impinj 4,200 216,678 0.01
Mercer UCITS Common Contractual FundMercer Passive Global Small Cap Equity UCITS CCF
Portfolio Statementas at 30 June 2021
(continued)
Mercer UCITS Common Contractual Fund 188
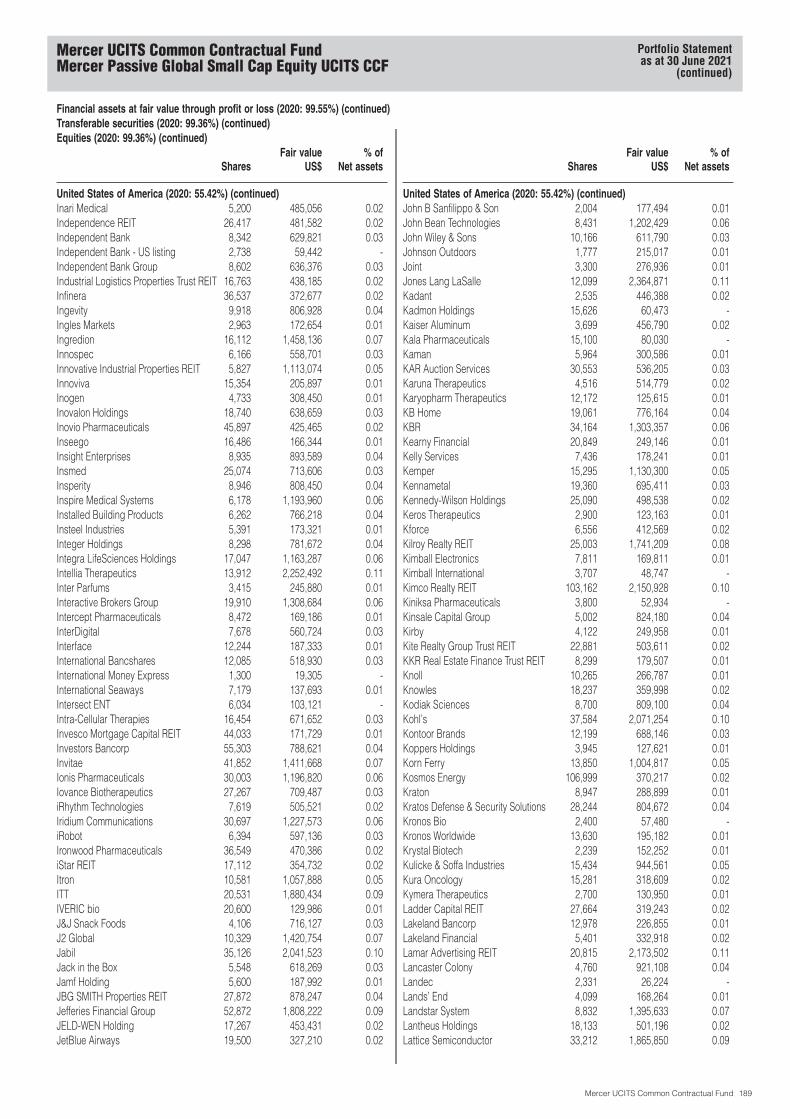
Financial assets at fair value through profit or loss (2020: 99.55%) (continued)Transferable securities (2020: 99.36%) (continued)Equities (2020: 99.36%) (continued)
SharesFair value
US$% of
Net assets
United States of America (2020: 55.42%) (continued)Inari Medical 5,200 485,056 0.02Independence REIT 26,417 481,582 0.02Independent Bank 8,342 629,821 0.03Independent Bank - US listing 2,738 59,442 -Independent Bank Group 8,602 636,376 0.03Industrial Logistics Properties Trust REIT 16,763 438,185 0.02Infinera 36,537 372,677 0.02Ingevity 9,918 806,928 0.04Ingles Markets 2,963 172,654 0.01Ingredion 16,112 1,458,136 0.07Innospec 6,166 558,701 0.03Innovative Industrial Properties REIT 5,827 1,113,074 0.05Innoviva 15,354 205,897 0.01Inogen 4,733 308,450 0.01Inovalon Holdings 18,740 638,659 0.03Inovio Pharmaceuticals 45,897 425,465 0.02Inseego 16,486 166,344 0.01Insight Enterprises 8,935 893,589 0.04Insmed 25,074 713,606 0.03Insperity 8,946 808,450 0.04Inspire Medical Systems 6,178 1,193,960 0.06Installed Building Products 6,262 766,218 0.04Insteel Industries 5,391 173,321 0.01Integer Holdings 8,298 781,672 0.04Integra LifeSciences Holdings 17,047 1,163,287 0.06Intellia Therapeutics 13,912 2,252,492 0.11Inter Parfums 3,415 245,880 0.01Interactive Brokers Group 19,910 1,308,684 0.06Intercept Pharmaceuticals 8,472 169,186 0.01InterDigital 7,678 560,724 0.03Interface 12,244 187,333 0.01International Bancshares 12,085 518,930 0.03International Money Express 1,300 19,305 -International Seaways 7,179 137,693 0.01Intersect ENT 6,034 103,121 -Intra-Cellular Therapies 16,454 671,652 0.03Invesco Mortgage Capital REIT 44,033 171,729 0.01Investors Bancorp 55,303 788,621 0.04Invitae 41,852 1,411,668 0.07Ionis Pharmaceuticals 30,003 1,196,820 0.06Iovance Biotherapeutics 27,267 709,487 0.03iRhythm Technologies 7,619 505,521 0.02Iridium Communications 30,697 1,227,573 0.06iRobot 6,394 597,136 0.03Ironwood Pharmaceuticals 36,549 470,386 0.02iStar REIT 17,112 354,732 0.02Itron 10,581 1,057,888 0.05ITT 20,531 1,880,434 0.09IVERIC bio 20,600 129,986 0.01J&J Snack Foods 4,106 716,127 0.03J2 Global 10,329 1,420,754 0.07Jabil 35,126 2,041,523 0.10Jack in the Box 5,548 618,269 0.03Jamf Holding 5,600 187,992 0.01JBG SMITH Properties REIT 27,872 878,247 0.04Jefferies Financial Group 52,872 1,808,222 0.09JELD-WEN Holding 17,267 453,431 0.02JetBlue Airways 19,500 327,210 0.02
SharesFair value
US$% of
Net assets
United States of America (2020: 55.42%) (continued)John B Sanfilippo & Son 2,004 177,494 0.01John Bean Technologies 8,431 1,202,429 0.06John Wiley & Sons 10,166 611,790 0.03Johnson Outdoors 1,777 215,017 0.01Joint 3,300 276,936 0.01Jones Lang LaSalle 12,099 2,364,871 0.11Kadant 2,535 446,388 0.02Kadmon Holdings 15,626 60,473 -Kaiser Aluminum 3,699 456,790 0.02Kala Pharmaceuticals 15,100 80,030 -Kaman 5,964 300,586 0.01KAR Auction Services 30,553 536,205 0.03Karuna Therapeutics 4,516 514,779 0.02Karyopharm Therapeutics 12,172 125,615 0.01KB Home 19,061 776,164 0.04KBR 34,164 1,303,357 0.06Kearny Financial 20,849 249,146 0.01Kelly Services 7,436 178,241 0.01Kemper 15,295 1,130,300 0.05Kennametal 19,360 695,411 0.03Kennedy-Wilson Holdings 25,090 498,538 0.02Keros Therapeutics 2,900 123,163 0.01Kforce 6,556 412,569 0.02Kilroy Realty REIT 25,003 1,741,209 0.08Kimball Electronics 7,811 169,811 0.01Kimball International 3,707 48,747 -Kimco Realty REIT 103,162 2,150,928 0.10Kiniksa Pharmaceuticals 3,800 52,934 -Kinsale Capital Group 5,002 824,180 0.04Kirby 4,122 249,958 0.01Kite Realty Group Trust REIT 22,881 503,611 0.02KKR Real Estate Finance Trust REIT 8,299 179,507 0.01Knoll 10,265 266,787 0.01Knowles 18,237 359,998 0.02Kodiak Sciences 8,700 809,100 0.04Kohl’s 37,584 2,071,254 0.10Kontoor Brands 12,199 688,146 0.03Koppers Holdings 3,945 127,621 0.01Korn Ferry 13,850 1,004,817 0.05Kosmos Energy 106,999 370,217 0.02Kraton 8,947 288,899 0.01Kratos Defense & Security Solutions 28,244 804,672 0.04Kronos Bio 2,400 57,480 -Kronos Worldwide 13,630 195,182 0.01Krystal Biotech 2,239 152,252 0.01Kulicke & Soffa Industries 15,434 944,561 0.05Kura Oncology 15,281 318,609 0.02Kymera Therapeutics 2,700 130,950 0.01Ladder Capital REIT 27,664 319,243 0.02Lakeland Bancorp 12,978 226,855 0.01Lakeland Financial 5,401 332,918 0.02Lamar Advertising REIT 20,815 2,173,502 0.11Lancaster Colony 4,760 921,108 0.04Landec 2,331 26,224 -Lands’ End 4,099 168,264 0.01Landstar System 8,832 1,395,633 0.07Lantheus Holdings 18,133 501,196 0.02Lattice Semiconductor 33,212 1,865,850 0.09
Mercer UCITS Common Contractual FundMercer Passive Global Small Cap Equity UCITS CCF
Portfolio Statementas at 30 June 2021
(continued)
Mercer UCITS Common Contractual Fund 189

Financial assets at fair value through profit or loss (2020: 99.55%) (continued)Transferable securities (2020: 99.36%) (continued)Equities (2020: 99.36%) (continued)
SharesFair value
US$% of
Net assets
United States of America (2020: 55.42%) (continued)Laureate Education 26,261 381,047 0.02La-Z-Boy 12,137 449,554 0.02LCI Industries 5,848 768,544 0.04Leggett & Platt 31,372 1,625,383 0.08LeMaitre Vascular 4,738 289,113 0.01Lemonade 8,300 908,103 0.04LendingClub 21,418 388,308 0.02LendingTree 3,245 687,551 0.03Leslie’s 28,700 788,963 0.04Levi Strauss & Co 16,600 460,152 0.02Lexicon Pharmaceuticals 13,938 63,975 -Lexington REIT 69,350 828,732 0.04LGI Homes 5,552 899,091 0.04LHC Group 7,623 1,526,582 0.07Liberty Latin America - Class A 20,528 284,518 0.01Liberty Latin America - Class C 37,073 522,729 0.03Liberty Media Corp-Liberty Braves -Class A 6,637 187,296 0.01Liberty Media Corp-Liberty Braves -Class C 6,637 184,309 0.01Liberty Oilfield Services 17,973 254,498 0.01Life Storage REIT 18,614 1,998,213 0.10Ligand Pharmaceuticals 3,798 498,260 0.02Limelight Networks 31,448 99,061 -Lincoln Electric Holdings 12,715 1,674,693 0.08Lindblad Expeditions Holdings 9,911 158,675 0.01Lindsay 3,197 528,400 0.03Lithia Motors 7,012 2,409,604 0.12Littelfuse 6,427 1,637,535 0.08Live Oak Bancshares 8,541 503,919 0.02Livent 37,889 733,531 0.04LivePerson 14,682 928,490 0.05LiveRamp Holdings 17,031 797,902 0.04Loral Space & Communications 3,566 138,539 0.01Lordstown Motors 25,200 278,712 0.01Louisiana-Pacific 27,282 1,644,832 0.08Lovesac 3,100 247,349 0.01LPL Financial Holdings 19,151 2,585,002 0.13LTC Properties REIT 7,627 292,801 0.01Lumber Liquidators Holdings 9,340 197,074 0.01Lumentum Holdings 17,964 1,473,587 0.07Luminar Technologies 41,300 906,535 0.04Luminex 10,892 400,826 0.02M/I Homes 6,302 369,738 0.02Macerich REIT 38,046 694,339 0.03Mack-Cali Realty REIT 16,922 290,212 0.01MACOM Technology Solutions Holdings 11,563 740,957 0.04Macquarie Infrastructure 16,793 642,668 0.03MacroGenics 11,292 303,303 0.01Macy’s 73,745 1,398,205 0.07Madison Square Garden Entertainment 3,848 323,117 0.02Madison Square Garden Sports 3,570 616,075 0.03Madrigal Pharmaceuticals 3,541 344,929 0.02Magellan Health 5,070 477,594 0.02Magnachip Semiconductor 9,700 231,442 0.01Magnite 28,100 950,904 0.05Magnolia Oil & Gas 34,566 540,267 0.03Malibu Boats 4,488 329,105 0.02
SharesFair value
US$% of
Net assets
United States of America (2020: 55.42%) (continued)Manhattan Associates 15,661 2,268,339 0.11Manitowoc 6,305 154,473 0.01MannKind 66,200 360,790 0.02ManpowerGroup 13,523 1,608,020 0.08ManTech International 7,552 653,550 0.03Marathon Digital Holdings 24,300 762,291 0.04Marathon Oil 195,948 2,668,812 0.13Maravai LifeSciences Holdings 22,100 922,233 0.04Marcus 5,793 122,870 0.01Marcus & Millichap 4,698 182,611 0.01MarineMax 5,431 264,707 0.01Marriott Vacations Worldwide 9,842 1,567,831 0.08Marten Transport 14,004 230,926 0.01MasTec 14,246 1,511,501 0.07Matador Resources 28,542 1,027,797 0.05Materion 4,675 352,261 0.02Matson 3,687 235,968 0.01Mattel 85,438 1,717,304 0.08Matthews International 6,112 219,788 0.01MAX Holdings 7,389 246,275 0.01Maxar Technologies 15,774 629,698 0.03Maximus 15,104 1,328,699 0.06MaxLinear 18,983 806,588 0.04MBIA 14,906 163,966 0.01McAfee 9,800 274,596 0.01McEwen Mining 159,886 220,643 0.01McGrath RentCorp 5,426 442,599 0.02MDC Holdings 14,310 724,086 0.04MDU Resources Group 49,420 1,548,823 0.08Medallia 23,400 789,750 0.04MediaAlpha 2,800 117,880 0.01Medifast 2,461 696,414 0.03MEDNAX 18,842 568,086 0.03Medpace Holdings 6,776 1,196,845 0.06MeiraGTx Holdings 3,366 52,173 -Mercantile Bank 845 25,519 -Mercer International 9,183 117,083 0.01Mercury General 7,048 457,768 0.02Mercury Systems 13,782 913,471 0.04Meredith 11,212 487,049 0.02Meridian Bancorp 6,875 140,663 0.01Meridian Bioscience 9,137 202,659 0.01Merit Medical Systems 12,085 781,416 0.04Meritage Homes 9,106 856,692 0.04Meritor 15,685 367,343 0.02Mersana Therapeutics 13,800 187,404 0.01Mesa Laboratories 976 264,662 0.01Meta Financial Group 6,638 336,082 0.02Methode Electronics 8,386 412,675 0.02Metromile 17,600 161,040 0.01MFA Financial REIT 99,452 456,485 0.02MGE Energy 9,107 677,925 0.03MGIC Investment 80,283 1,091,849 0.05MGM Growth Properties REIT 37,751 1,382,442 0.07MGP Ingredients 2,445 165,380 0.01MicroStrategy 1,908 1,267,866 0.06Microvision 37,100 621,425 0.03Middleby 13,144 2,277,329 0.11
Mercer UCITS Common Contractual FundMercer Passive Global Small Cap Equity UCITS CCF
Portfolio Statementas at 30 June 2021
(continued)
Mercer UCITS Common Contractual Fund 190
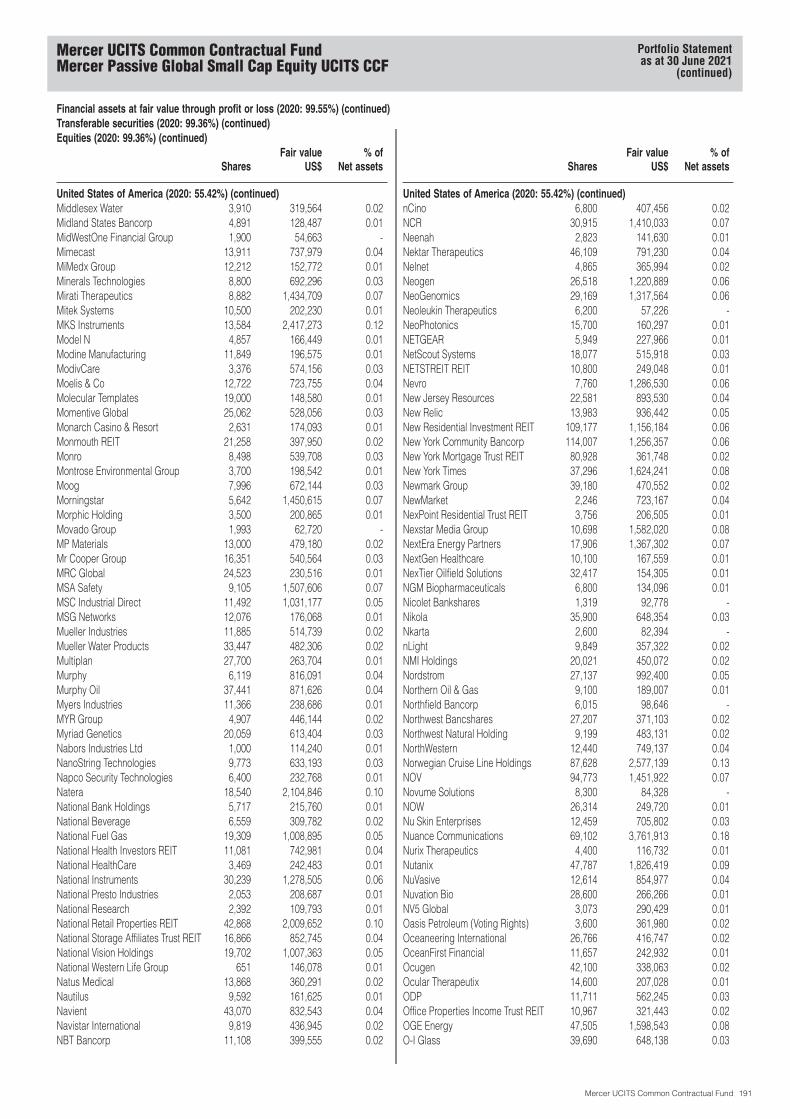
Financial assets at fair value through profit or loss (2020: 99.55%) (continued)Transferable securities (2020: 99.36%) (continued)Equities (2020: 99.36%) (continued)
SharesFair value
US$% of
Net assets
United States of America (2020: 55.42%) (continued)Middlesex Water 3,910 319,564 0.02Midland States Bancorp 4,891 128,487 0.01MidWestOne Financial Group 1,900 54,663 -Mimecast 13,911 737,979 0.04MiMedx Group 12,212 152,772 0.01Minerals Technologies 8,800 692,296 0.03Mirati Therapeutics 8,882 1,434,709 0.07Mitek Systems 10,500 202,230 0.01MKS Instruments 13,584 2,417,273 0.12Model N 4,857 166,449 0.01Modine Manufacturing 11,849 196,575 0.01ModivCare 3,376 574,156 0.03Moelis & Co 12,722 723,755 0.04Molecular Templates 19,000 148,580 0.01Momentive Global 25,062 528,056 0.03Monarch Casino & Resort 2,631 174,093 0.01Monmouth REIT 21,258 397,950 0.02Monro 8,498 539,708 0.03Montrose Environmental Group 3,700 198,542 0.01Moog 7,996 672,144 0.03Morningstar 5,642 1,450,615 0.07Morphic Holding 3,500 200,865 0.01Movado Group 1,993 62,720 -MP Materials 13,000 479,180 0.02Mr Cooper Group 16,351 540,564 0.03MRC Global 24,523 230,516 0.01MSA Safety 9,105 1,507,606 0.07MSC Industrial Direct 11,492 1,031,177 0.05MSG Networks 12,076 176,068 0.01Mueller Industries 11,885 514,739 0.02Mueller Water Products 33,447 482,306 0.02Multiplan 27,700 263,704 0.01Murphy 6,119 816,091 0.04Murphy Oil 37,441 871,626 0.04Myers Industries 11,366 238,686 0.01MYR Group 4,907 446,144 0.02Myriad Genetics 20,059 613,404 0.03Nabors Industries Ltd 1,000 114,240 0.01NanoString Technologies 9,773 633,193 0.03Napco Security Technologies 6,400 232,768 0.01Natera 18,540 2,104,846 0.10National Bank Holdings 5,717 215,760 0.01National Beverage 6,559 309,782 0.02National Fuel Gas 19,309 1,008,895 0.05National Health Investors REIT 11,081 742,981 0.04National HealthCare 3,469 242,483 0.01National Instruments 30,239 1,278,505 0.06National Presto Industries 2,053 208,687 0.01National Research 2,392 109,793 0.01National Retail Properties REIT 42,868 2,009,652 0.10National Storage Affiliates Trust REIT 16,866 852,745 0.04National Vision Holdings 19,702 1,007,363 0.05National Western Life Group 651 146,078 0.01Natus Medical 13,868 360,291 0.02Nautilus 9,592 161,625 0.01Navient 43,070 832,543 0.04Navistar International 9,819 436,945 0.02NBT Bancorp 11,108 399,555 0.02
SharesFair value
US$% of
Net assets
United States of America (2020: 55.42%) (continued)nCino 6,800 407,456 0.02NCR 30,915 1,410,033 0.07Neenah 2,823 141,630 0.01Nektar Therapeutics 46,109 791,230 0.04Nelnet 4,865 365,994 0.02Neogen 26,518 1,220,889 0.06NeoGenomics 29,169 1,317,564 0.06Neoleukin Therapeutics 6,200 57,226 -NeoPhotonics 15,700 160,297 0.01NETGEAR 5,949 227,966 0.01NetScout Systems 18,077 515,918 0.03NETSTREIT REIT 10,800 249,048 0.01Nevro 7,760 1,286,530 0.06New Jersey Resources 22,581 893,530 0.04New Relic 13,983 936,442 0.05New Residential Investment REIT 109,177 1,156,184 0.06New York Community Bancorp 114,007 1,256,357 0.06New York Mortgage Trust REIT 80,928 361,748 0.02New York Times 37,296 1,624,241 0.08Newmark Group 39,180 470,552 0.02NewMarket 2,246 723,167 0.04NexPoint Residential Trust REIT 3,756 206,505 0.01Nexstar Media Group 10,698 1,582,020 0.08NextEra Energy Partners 17,906 1,367,302 0.07NextGen Healthcare 10,100 167,559 0.01NexTier Oilfield Solutions 32,417 154,305 0.01NGM Biopharmaceuticals 6,800 134,096 0.01Nicolet Bankshares 1,319 92,778 -Nikola 35,900 648,354 0.03Nkarta 2,600 82,394 -nLight 9,849 357,322 0.02NMI Holdings 20,021 450,072 0.02Nordstrom 27,137 992,400 0.05Northern Oil & Gas 9,100 189,007 0.01Northfield Bancorp 6,015 98,646 -Northwest Bancshares 27,207 371,103 0.02Northwest Natural Holding 9,199 483,131 0.02NorthWestern 12,440 749,137 0.04Norwegian Cruise Line Holdings 87,628 2,577,139 0.13NOV 94,773 1,451,922 0.07Novume Solutions 8,300 84,328 -NOW 26,314 249,720 0.01Nu Skin Enterprises 12,459 705,802 0.03Nuance Communications 69,102 3,761,913 0.18Nurix Therapeutics 4,400 116,732 0.01Nutanix 47,787 1,826,419 0.09NuVasive 12,614 854,977 0.04Nuvation Bio 28,600 266,266 0.01NV5 Global 3,073 290,429 0.01Oasis Petroleum (Voting Rights) 3,600 361,980 0.02Oceaneering International 26,766 416,747 0.02OceanFirst Financial 11,657 242,932 0.01Ocugen 42,100 338,063 0.02Ocular Therapeutix 14,600 207,028 0.01ODP 11,711 562,245 0.03Office Properties Income Trust REIT 10,967 321,443 0.02OGE Energy 47,505 1,598,543 0.08O-I Glass 39,690 648,138 0.03
Mercer UCITS Common Contractual FundMercer Passive Global Small Cap Equity UCITS CCF
Portfolio Statementas at 30 June 2021
(continued)
Mercer UCITS Common Contractual Fund 191
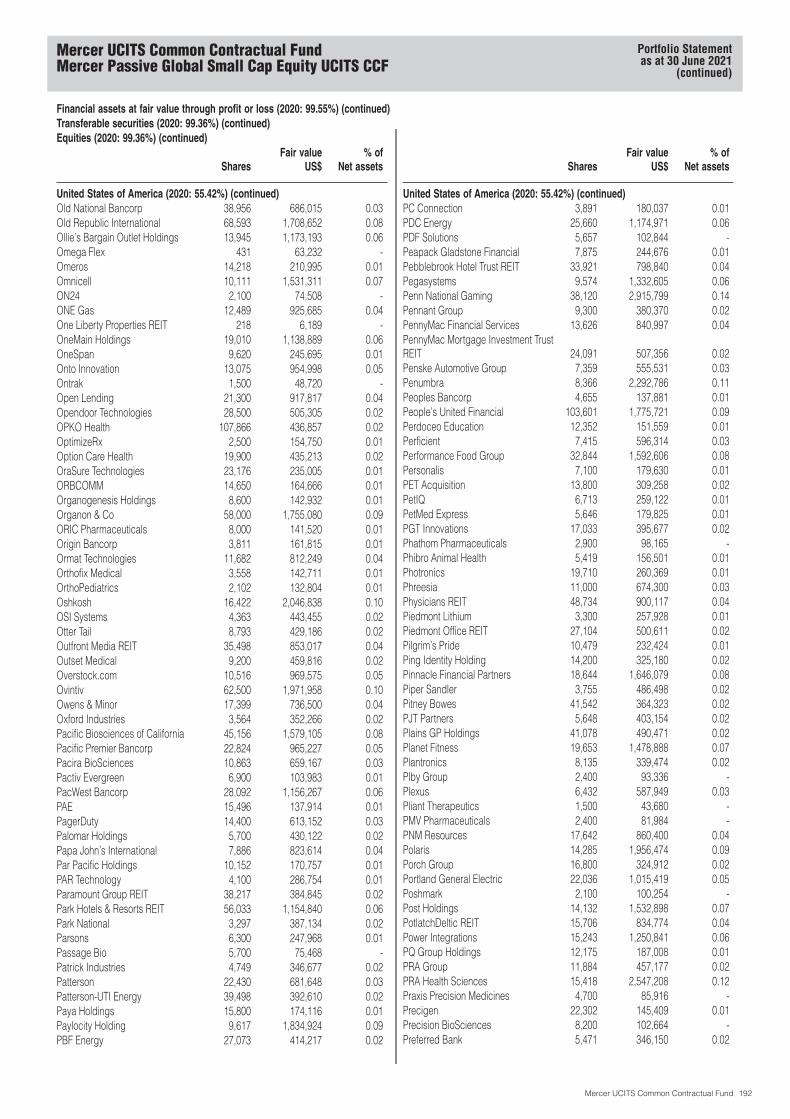
Financial assets at fair value through profit or loss (2020: 99.55%) (continued)Transferable securities (2020: 99.36%) (continued)Equities (2020: 99.36%) (continued)
SharesFair value
US$% of
Net assets
United States of America (2020: 55.42%) (continued)Old National Bancorp 38,956 686,015 0.03Old Republic International 68,593 1,708,652 0.08Ollie’s Bargain Outlet Holdings 13,945 1,173,193 0.06Omega Flex 431 63,232 -Omeros 14,218 210,995 0.01Omnicell 10,111 1,531,311 0.07ON24 2,100 74,508 -ONE Gas 12,489 925,685 0.04One Liberty Properties REIT 218 6,189 -OneMain Holdings 19,010 1,138,889 0.06OneSpan 9,620 245,695 0.01Onto Innovation 13,075 954,998 0.05Ontrak 1,500 48,720 -Open Lending 21,300 917,817 0.04Opendoor Technologies 28,500 505,305 0.02OPKO Health 107,866 436,857 0.02OptimizeRx 2,500 154,750 0.01Option Care Health 19,900 435,213 0.02OraSure Technologies 23,176 235,005 0.01ORBCOMM 14,650 164,666 0.01Organogenesis Holdings 8,600 142,932 0.01Organon & Co 58,000 1,755,080 0.09ORIC Pharmaceuticals 8,000 141,520 0.01Origin Bancorp 3,811 161,815 0.01Ormat Technologies 11,682 812,249 0.04Orthofix Medical 3,558 142,711 0.01OrthoPediatrics 2,102 132,804 0.01Oshkosh 16,422 2,046,838 0.10OSI Systems 4,363 443,455 0.02Otter Tail 8,793 429,186 0.02Outfront Media REIT 35,498 853,017 0.04Outset Medical 9,200 459,816 0.02Overstock.com 10,516 969,575 0.05Ovintiv 62,500 1,971,958 0.10Owens & Minor 17,399 736,500 0.04Oxford Industries 3,564 352,266 0.02Pacific Biosciences of California 45,156 1,579,105 0.08Pacific Premier Bancorp 22,824 965,227 0.05Pacira BioSciences 10,863 659,167 0.03Pactiv Evergreen 6,900 103,983 0.01PacWest Bancorp 28,092 1,156,267 0.06PAE 15,496 137,914 0.01PagerDuty 14,400 613,152 0.03Palomar Holdings 5,700 430,122 0.02Papa John’s International 7,886 823,614 0.04Par Pacific Holdings 10,152 170,757 0.01PAR Technology 4,100 286,754 0.01Paramount Group REIT 38,217 384,845 0.02Park Hotels & Resorts REIT 56,033 1,154,840 0.06Park National 3,297 387,134 0.02Parsons 6,300 247,968 0.01Passage Bio 5,700 75,468 -Patrick Industries 4,749 346,677 0.02Patterson 22,430 681,648 0.03Patterson-UTI Energy 39,498 392,610 0.02Paya Holdings 15,800 174,116 0.01Paylocity Holding 9,617 1,834,924 0.09PBF Energy 27,073 414,217 0.02
SharesFair value
US$% of
Net assets
United States of America (2020: 55.42%) (continued)PC Connection 3,891 180,037 0.01PDC Energy 25,660 1,174,971 0.06PDF Solutions 5,657 102,844 -Peapack Gladstone Financial 7,875 244,676 0.01Pebblebrook Hotel Trust REIT 33,921 798,840 0.04Pegasystems 9,574 1,332,605 0.06Penn National Gaming 38,120 2,915,799 0.14Pennant Group 9,300 380,370 0.02PennyMac Financial Services 13,626 840,997 0.04PennyMac Mortgage Investment TrustREIT 24,091 507,356 0.02Penske Automotive Group 7,359 555,531 0.03Penumbra 8,366 2,292,786 0.11Peoples Bancorp 4,655 137,881 0.01People’s United Financial 103,601 1,775,721 0.09Perdoceo Education 12,352 151,559 0.01Perficient 7,415 596,314 0.03Performance Food Group 32,844 1,592,606 0.08Personalis 7,100 179,630 0.01PET Acquisition 13,800 309,258 0.02PetIQ 6,713 259,122 0.01PetMed Express 5,646 179,825 0.01PGT Innovations 17,033 395,677 0.02Phathom Pharmaceuticals 2,900 98,165 -Phibro Animal Health 5,419 156,501 0.01Photronics 19,710 260,369 0.01Phreesia 11,000 674,300 0.03Physicians REIT 48,734 900,117 0.04Piedmont Lithium 3,300 257,928 0.01Piedmont Office REIT 27,104 500,611 0.02Pilgrim’s Pride 10,479 232,424 0.01Ping Identity Holding 14,200 325,180 0.02Pinnacle Financial Partners 18,644 1,646,079 0.08Piper Sandler 3,755 486,498 0.02Pitney Bowes 41,542 364,323 0.02PJT Partners 5,648 403,154 0.02Plains GP Holdings 41,078 490,471 0.02Planet Fitness 19,653 1,478,888 0.07Plantronics 8,135 339,474 0.02Plby Group 2,400 93,336 -Plexus 6,432 587,949 0.03Pliant Therapeutics 1,500 43,680 -PMV Pharmaceuticals 2,400 81,984 -PNM Resources 17,642 860,400 0.04Polaris 14,285 1,956,474 0.09Porch Group 16,800 324,912 0.02Portland General Electric 22,036 1,015,419 0.05Poshmark 2,100 100,254 -Post Holdings 14,132 1,532,898 0.07PotlatchDeltic REIT 15,706 834,774 0.04Power Integrations 15,243 1,250,841 0.06PQ Group Holdings 12,175 187,008 0.01PRA Group 11,884 457,177 0.02PRA Health Sciences 15,418 2,547,208 0.12Praxis Precision Medicines 4,700 85,916 -Precigen 22,302 145,409 0.01Precision BioSciences 8,200 102,664 -Preferred Bank 5,471 346,150 0.02
Mercer UCITS Common Contractual FundMercer Passive Global Small Cap Equity UCITS CCF
Portfolio Statementas at 30 June 2021
(continued)
Mercer UCITS Common Contractual Fund 192

Financial assets at fair value through profit or loss (2020: 99.55%) (continued)Transferable securities (2020: 99.36%) (continued)Equities (2020: 99.36%) (continued)
SharesFair value
US$% of
Net assets
United States of America (2020: 55.42%) (continued)Prelude Therapeutics 3,000 85,890 -Premier 28,752 1,000,282 0.05Premier Financial 13,253 376,518 0.02Prestige Consumer Healthcare 12,069 628,795 0.03PriceSmart 5,502 500,737 0.02Primerica 10,312 1,579,180 0.08Primoris Services 12,749 375,203 0.02ProAssurance 14,711 334,675 0.02PROG Holdings 15,741 757,614 0.04Progenic Pharmaceuticals* 19,919 - -Progress Software 11,324 523,735 0.03Progyny 12,600 743,400 0.04Proofpoint 14,060 2,443,066 0.12ProPetro Holding 17,149 157,085 0.01PROS Holdings 8,752 398,829 0.02Prosperity Bancshares 22,054 1,583,477 0.08Protagonist Therapeutics 8,100 363,528 0.02Proto Labs 6,900 633,420 0.03Provention Bio 12,900 108,747 0.01Provident Financial Services 20,634 472,312 0.02PS Business Parks REIT 5,249 777,272 0.04PTC Therapeutics 13,798 583,241 0.03Pubmatic 1,600 62,512 -Pulmonx 3,600 158,832 0.01Puma Biotechnology 8,413 77,231 -Pure Storage 63,889 1,247,752 0.06Purple Innovation 13,300 351,253 0.02PVH 17,008 1,829,891 0.09Q2 Holdings 11,461 1,175,669 0.06QAD 4,580 398,552 0.02QCR Holdings 3,585 172,403 0.01QTS REIT 15,851 1,225,282 0.06Quaker Chemical 3,085 731,731 0.04Qualys 7,672 772,494 0.04Quanex Building Products 10,797 268,197 0.01Quanta Services 33,501 3,034,186 0.15Quanterix 6,550 384,223 0.02Quidel 8,946 1,146,162 0.06QuinStreet 8,955 166,384 0.01Quotient Technology 22,174 239,701 0.01Qurate Retail 92,313 1,208,377 0.06R1 RCM 28,044 623,699 0.03Rackspace Technology 11,900 233,359 0.01Radian Group 48,418 1,077,300 0.05Radius Health 13,530 246,787 0.01RadNet 11,548 389,052 0.02Ralph Lauren 11,689 1,377,081 0.07Rambus 27,463 651,148 0.03Range Resources 59,421 995,896 0.05Ranpak Holdings 9,300 232,779 0.01Rapid7 11,535 1,091,557 0.05Raven Industries 7,487 433,123 0.02Rayonier REIT 32,511 1,168,120 0.06RBC Bearings 5,965 1,189,540 0.06Ready Capital REIT 15,401 244,414 0.01Realogy Holdings 29,320 534,210 0.03RealReal 16,300 322,088 0.02Reata Pharmaceuticals 6,821 965,376 0.05
SharesFair value
US$% of
Net assets
United States of America (2020: 55.42%) (continued)Red Rock Resorts 15,346 652,205 0.03Redfin 23,060 1,462,235 0.07Redwood Trust REIT 28,017 338,165 0.02Regal Beloit 9,728 1,298,785 0.06REGENXBIO 8,312 322,921 0.02Relay Therapeutics 7,500 274,425 0.01Reliance Steel & Aluminum 15,174 2,289,757 0.11Relmada Therapeutics 5,600 179,256 0.01Renasant 12,749 509,960 0.02Renewable Energy Group 11,273 702,759 0.03Rent-A-Center 12,345 655,149 0.03Repay Holdings 19,000 456,760 0.02Repligen 12,267 2,448,739 0.12Replimune Group 5,800 222,836 0.01Republic Bancorp 5,060 233,418 0.01Resideo Technologies 33,055 991,650 0.05Resources Connection 2,325 33,387 -Retail Opportunity Investments REIT 29,122 514,295 0.02Retail Properties of America REIT 49,171 563,008 0.03REV Group 6,966 109,297 0.01Revance Therapeutics 16,306 483,310 0.02REVOLUTION Medicines 9,500 301,530 0.01Revolve Group 8,798 606,182 0.03REX American Resources 1,337 120,571 0.01Rexford Industrial Realty REIT 31,998 1,822,286 0.09Rexnord 29,627 1,482,535 0.07Reynolds Consumer Products 15,000 455,250 0.02RH 3,963 2,690,877 0.13Rhythm Pharmaceuticals 9,017 176,553 0.01Ribbon Communications 22,956 174,695 0.01Rigel Pharmaceuticals 34,023 147,660 0.01Riot Blockchain 19,400 730,798 0.04Rite Aid 14,005 228,281 0.01RLI 10,162 1,062,844 0.05RLJ Lodging Trust REIT 39,391 599,925 0.03RMR Group 1,810 69,938 -Rocket 30,700 594,045 0.03Rocket Pharmaceuticals 9,157 405,564 0.02Rogers 5,291 1,062,433 0.05Romeo Power 20,600 167,684 0.01Royal Gold 15,225 1,737,172 0.08RPC 23,606 116,850 0.01RPT Realty REIT 20,046 260,197 0.01Rubius Therapeutics 10,200 248,982 0.01Rush Enterprises - Class A 10,938 472,959 0.02Rush Enterprises - Class B 1,242 47,370 -Rush Street Interactive 9,500 116,470 0.01Ruth’s Hospitality Group 8,458 194,788 0.01Ryder System 13,158 978,034 0.05Ryman Hospitality Properties REIT 13,105 1,034,771 0.05S&T Bancorp 6,855 214,561 0.01Sabra Health Care REIT 48,236 877,895 0.04Sabre 73,983 923,308 0.04Safehold 4,400 345,400 0.02Safety Insurance Group 5,026 393,435 0.02Sage Therapeutics 13,360 758,982 0.04Saia 6,616 1,385,986 0.07SailPoint Technologies Holding 24,287 1,240,337 0.06
Mercer UCITS Common Contractual FundMercer Passive Global Small Cap Equity UCITS CCF
Portfolio Statementas at 30 June 2021
(continued)
Mercer UCITS Common Contractual Fund 193
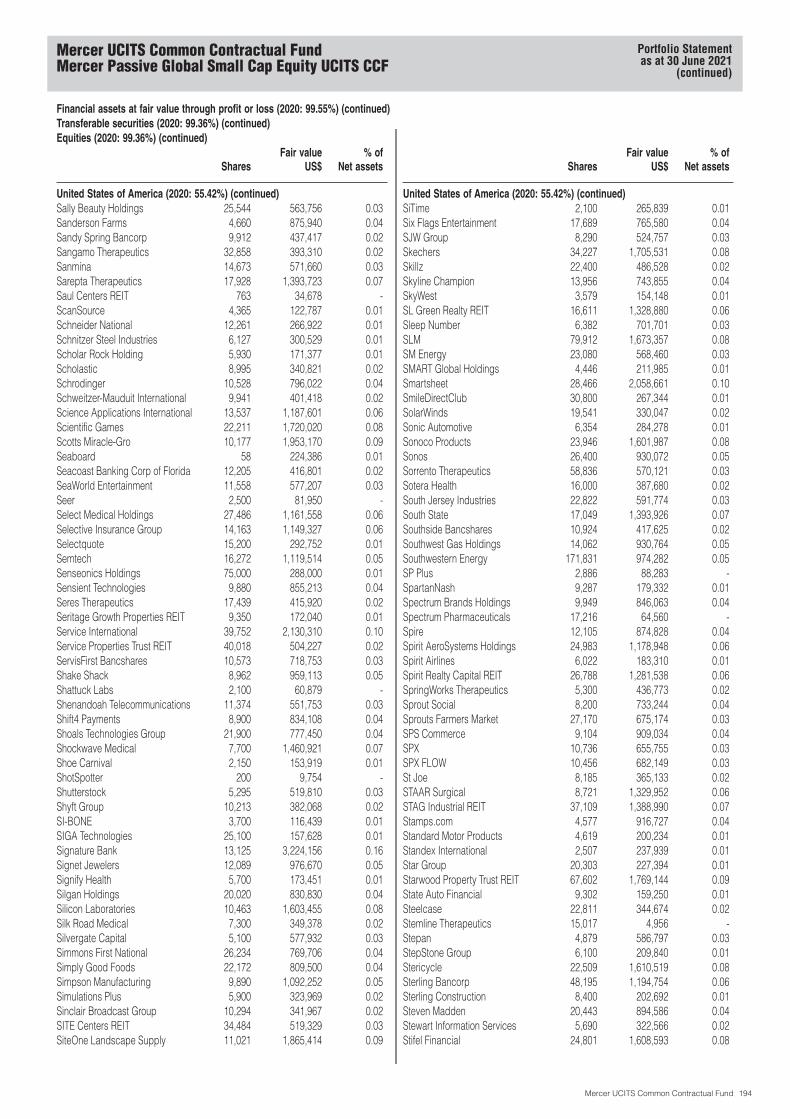
Financial assets at fair value through profit or loss (2020: 99.55%) (continued)Transferable securities (2020: 99.36%) (continued)Equities (2020: 99.36%) (continued)
SharesFair value
US$% of
Net assets
United States of America (2020: 55.42%) (continued)Sally Beauty Holdings 25,544 563,756 0.03Sanderson Farms 4,660 875,940 0.04Sandy Spring Bancorp 9,912 437,417 0.02Sangamo Therapeutics 32,858 393,310 0.02Sanmina 14,673 571,660 0.03Sarepta Therapeutics 17,928 1,393,723 0.07Saul Centers REIT 763 34,678 -ScanSource 4,365 122,787 0.01Schneider National 12,261 266,922 0.01Schnitzer Steel Industries 6,127 300,529 0.01Scholar Rock Holding 5,930 171,377 0.01Scholastic 8,995 340,821 0.02Schrodinger 10,528 796,022 0.04Schweitzer-Mauduit International 9,941 401,418 0.02Science Applications International 13,537 1,187,601 0.06Scientific Games 22,211 1,720,020 0.08Scotts Miracle-Gro 10,177 1,953,170 0.09Seaboard 58 224,386 0.01Seacoast Banking Corp of Florida 12,205 416,801 0.02SeaWorld Entertainment 11,558 577,207 0.03Seer 2,500 81,950 -Select Medical Holdings 27,486 1,161,558 0.06Selective Insurance Group 14,163 1,149,327 0.06Selectquote 15,200 292,752 0.01Semtech 16,272 1,119,514 0.05Senseonics Holdings 75,000 288,000 0.01Sensient Technologies 9,880 855,213 0.04Seres Therapeutics 17,439 415,920 0.02Seritage Growth Properties REIT 9,350 172,040 0.01Service International 39,752 2,130,310 0.10Service Properties Trust REIT 40,018 504,227 0.02ServisFirst Bancshares 10,573 718,753 0.03Shake Shack 8,962 959,113 0.05Shattuck Labs 2,100 60,879 -Shenandoah Telecommunications 11,374 551,753 0.03Shift4 Payments 8,900 834,108 0.04Shoals Technologies Group 21,900 777,450 0.04Shockwave Medical 7,700 1,460,921 0.07Shoe Carnival 2,150 153,919 0.01ShotSpotter 200 9,754 -Shutterstock 5,295 519,810 0.03Shyft Group 10,213 382,068 0.02SI-BONE 3,700 116,439 0.01SIGA Technologies 25,100 157,628 0.01Signature Bank 13,125 3,224,156 0.16Signet Jewelers 12,089 976,670 0.05Signify Health 5,700 173,451 0.01Silgan Holdings 20,020 830,830 0.04Silicon Laboratories 10,463 1,603,455 0.08Silk Road Medical 7,300 349,378 0.02Silvergate Capital 5,100 577,932 0.03Simmons First National 26,234 769,706 0.04Simply Good Foods 22,172 809,500 0.04Simpson Manufacturing 9,890 1,092,252 0.05Simulations Plus 5,900 323,969 0.02Sinclair Broadcast Group 10,294 341,967 0.02SITE Centers REIT 34,484 519,329 0.03SiteOne Landscape Supply 11,021 1,865,414 0.09
SharesFair value
US$% of
Net assets
United States of America (2020: 55.42%) (continued)SiTime 2,100 265,839 0.01Six Flags Entertainment 17,689 765,580 0.04SJW Group 8,290 524,757 0.03Skechers 34,227 1,705,531 0.08Skillz 22,400 486,528 0.02Skyline Champion 13,956 743,855 0.04SkyWest 3,579 154,148 0.01SL Green Realty REIT 16,611 1,328,880 0.06Sleep Number 6,382 701,701 0.03SLM 79,912 1,673,357 0.08SM Energy 23,080 568,460 0.03SMART Global Holdings 4,446 211,985 0.01Smartsheet 28,466 2,058,661 0.10SmileDirectClub 30,800 267,344 0.01SolarWinds 19,541 330,047 0.02Sonic Automotive 6,354 284,278 0.01Sonoco Products 23,946 1,601,987 0.08Sonos 26,400 930,072 0.05Sorrento Therapeutics 58,836 570,121 0.03Sotera Health 16,000 387,680 0.02South Jersey Industries 22,822 591,774 0.03South State 17,049 1,393,926 0.07Southside Bancshares 10,924 417,625 0.02Southwest Gas Holdings 14,062 930,764 0.05Southwestern Energy 171,831 974,282 0.05SP Plus 2,886 88,283 -SpartanNash 9,287 179,332 0.01Spectrum Brands Holdings 9,949 846,063 0.04Spectrum Pharmaceuticals 17,216 64,560 -Spire 12,105 874,828 0.04Spirit AeroSystems Holdings 24,983 1,178,948 0.06Spirit Airlines 6,022 183,310 0.01Spirit Realty Capital REIT 26,788 1,281,538 0.06SpringWorks Therapeutics 5,300 436,773 0.02Sprout Social 8,200 733,244 0.04Sprouts Farmers Market 27,170 675,174 0.03SPS Commerce 9,104 909,034 0.04SPX 10,736 655,755 0.03SPX FLOW 10,456 682,149 0.03St Joe 8,185 365,133 0.02STAAR Surgical 8,721 1,329,952 0.06STAG Industrial REIT 37,109 1,388,990 0.07Stamps.com 4,577 916,727 0.04Standard Motor Products 4,619 200,234 0.01Standex International 2,507 237,939 0.01Star Group 20,303 227,394 0.01Starwood Property Trust REIT 67,602 1,769,144 0.09State Auto Financial 9,302 159,250 0.01Steelcase 22,811 344,674 0.02Stemline Therapeutics 15,017 4,956 -Stepan 4,879 586,797 0.03StepStone Group 6,100 209,840 0.01Stericycle 22,509 1,610,519 0.08Sterling Bancorp 48,195 1,194,754 0.06Sterling Construction 8,400 202,692 0.01Steven Madden 20,443 894,586 0.04Stewart Information Services 5,690 322,566 0.02Stifel Financial 24,801 1,608,593 0.08
Mercer UCITS Common Contractual FundMercer Passive Global Small Cap Equity UCITS CCF
Portfolio Statementas at 30 June 2021
(continued)
Mercer UCITS Common Contractual Fund 194
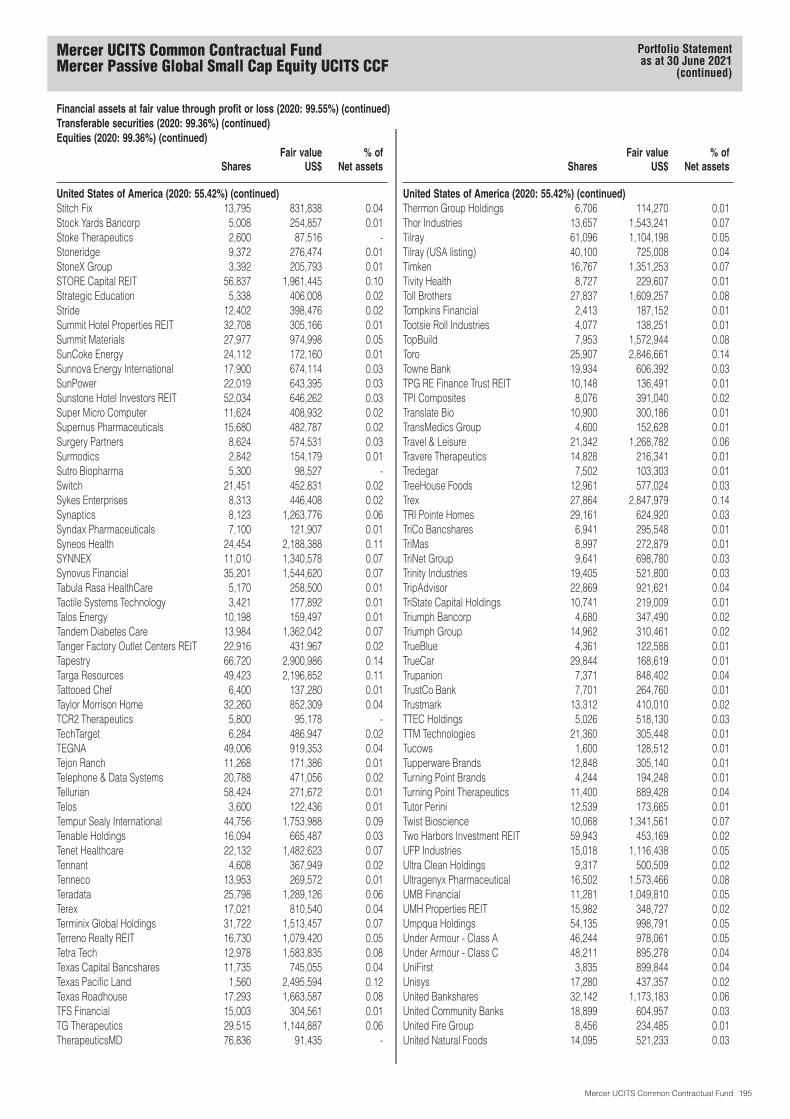
Financial assets at fair value through profit or loss (2020: 99.55%) (continued)Transferable securities (2020: 99.36%) (continued)Equities (2020: 99.36%) (continued)
SharesFair value
US$% of
Net assets
United States of America (2020: 55.42%) (continued)Stitch Fix 13,795 831,838 0.04Stock Yards Bancorp 5,008 254,857 0.01Stoke Therapeutics 2,600 87,516 -Stoneridge 9,372 276,474 0.01StoneX Group 3,392 205,793 0.01STORE Capital REIT 56,837 1,961,445 0.10Strategic Education 5,338 406,008 0.02Stride 12,402 398,476 0.02Summit Hotel Properties REIT 32,708 305,166 0.01Summit Materials 27,977 974,998 0.05SunCoke Energy 24,112 172,160 0.01Sunnova Energy International 17,900 674,114 0.03SunPower 22,019 643,395 0.03Sunstone Hotel Investors REIT 52,034 646,262 0.03Super Micro Computer 11,624 408,932 0.02Supernus Pharmaceuticals 15,680 482,787 0.02Surgery Partners 8,624 574,531 0.03Surmodics 2,842 154,179 0.01Sutro Biopharma 5,300 98,527 -Switch 21,451 452,831 0.02Sykes Enterprises 8,313 446,408 0.02Synaptics 8,123 1,263,776 0.06Syndax Pharmaceuticals 7,100 121,907 0.01Syneos Health 24,454 2,188,388 0.11SYNNEX 11,010 1,340,578 0.07Synovus Financial 35,201 1,544,620 0.07Tabula Rasa HealthCare 5,170 258,500 0.01Tactile Systems Technology 3,421 177,892 0.01Talos Energy 10,198 159,497 0.01Tandem Diabetes Care 13,984 1,362,042 0.07Tanger Factory Outlet Centers REIT 22,916 431,967 0.02Tapestry 66,720 2,900,986 0.14Targa Resources 49,423 2,196,852 0.11Tattooed Chef 6,400 137,280 0.01Taylor Morrison Home 32,260 852,309 0.04TCR2 Therapeutics 5,800 95,178 -TechTarget 6,284 486,947 0.02TEGNA 49,006 919,353 0.04Tejon Ranch 11,268 171,386 0.01Telephone & Data Systems 20,788 471,056 0.02Tellurian 58,424 271,672 0.01Telos 3,600 122,436 0.01Tempur Sealy International 44,756 1,753,988 0.09Tenable Holdings 16,094 665,487 0.03Tenet Healthcare 22,132 1,482,623 0.07Tennant 4,608 367,949 0.02Tenneco 13,953 269,572 0.01Teradata 25,798 1,289,126 0.06Terex 17,021 810,540 0.04Terminix Global Holdings 31,722 1,513,457 0.07Terreno Realty REIT 16,730 1,079,420 0.05Tetra Tech 12,978 1,583,835 0.08Texas Capital Bancshares 11,735 745,055 0.04Texas Pacific Land 1,560 2,495,594 0.12Texas Roadhouse 17,293 1,663,587 0.08TFS Financial 15,003 304,561 0.01TG Therapeutics 29,515 1,144,887 0.06TherapeuticsMD 76,836 91,435 -
SharesFair value
US$% of
Net assets
United States of America (2020: 55.42%) (continued)Thermon Group Holdings 6,706 114,270 0.01Thor Industries 13,657 1,543,241 0.07Tilray 61,096 1,104,198 0.05Tilray (USA listing) 40,100 725,008 0.04Timken 16,767 1,351,253 0.07Tivity Health 8,727 229,607 0.01Toll Brothers 27,837 1,609,257 0.08Tompkins Financial 2,413 187,152 0.01Tootsie Roll Industries 4,077 138,251 0.01TopBuild 7,953 1,572,944 0.08Toro 25,907 2,846,661 0.14Towne Bank 19,934 606,392 0.03TPG RE Finance Trust REIT 10,148 136,491 0.01TPI Composites 8,076 391,040 0.02Translate Bio 10,900 300,186 0.01TransMedics Group 4,600 152,628 0.01Travel & Leisure 21,342 1,268,782 0.06Travere Therapeutics 14,828 216,341 0.01Tredegar 7,502 103,303 0.01TreeHouse Foods 12,961 577,024 0.03Trex 27,864 2,847,979 0.14TRI Pointe Homes 29,161 624,920 0.03TriCo Bancshares 6,941 295,548 0.01TriMas 8,997 272,879 0.01TriNet Group 9,641 698,780 0.03Trinity Industries 19,405 521,800 0.03TripAdvisor 22,869 921,621 0.04TriState Capital Holdings 10,741 219,009 0.01Triumph Bancorp 4,680 347,490 0.02Triumph Group 14,962 310,461 0.02TrueBlue 4,361 122,588 0.01TrueCar 29,844 168,619 0.01Trupanion 7,371 848,402 0.04TrustCo Bank 7,701 264,760 0.01Trustmark 13,312 410,010 0.02TTEC Holdings 5,026 518,130 0.03TTM Technologies 21,360 305,448 0.01Tucows 1,600 128,512 0.01Tupperware Brands 12,848 305,140 0.01Turning Point Brands 4,244 194,248 0.01Turning Point Therapeutics 11,400 889,428 0.04Tutor Perini 12,539 173,665 0.01Twist Bioscience 10,068 1,341,561 0.07Two Harbors Investment REIT 59,943 453,169 0.02UFP Industries 15,018 1,116,438 0.05Ultra Clean Holdings 9,317 500,509 0.02Ultragenyx Pharmaceutical 16,502 1,573,466 0.08UMB Financial 11,281 1,049,810 0.05UMH Properties REIT 15,982 348,727 0.02Umpqua Holdings 54,135 998,791 0.05Under Armour - Class A 46,244 978,061 0.05Under Armour - Class C 48,211 895,278 0.04UniFirst 3,835 899,844 0.04Unisys 17,280 437,357 0.02United Bankshares 32,142 1,173,183 0.06United Community Banks 18,899 604,957 0.03United Fire Group 8,456 234,485 0.01United Natural Foods 14,095 521,233 0.03
Mercer UCITS Common Contractual FundMercer Passive Global Small Cap Equity UCITS CCF
Portfolio Statementas at 30 June 2021
(continued)
Mercer UCITS Common Contractual Fund 195
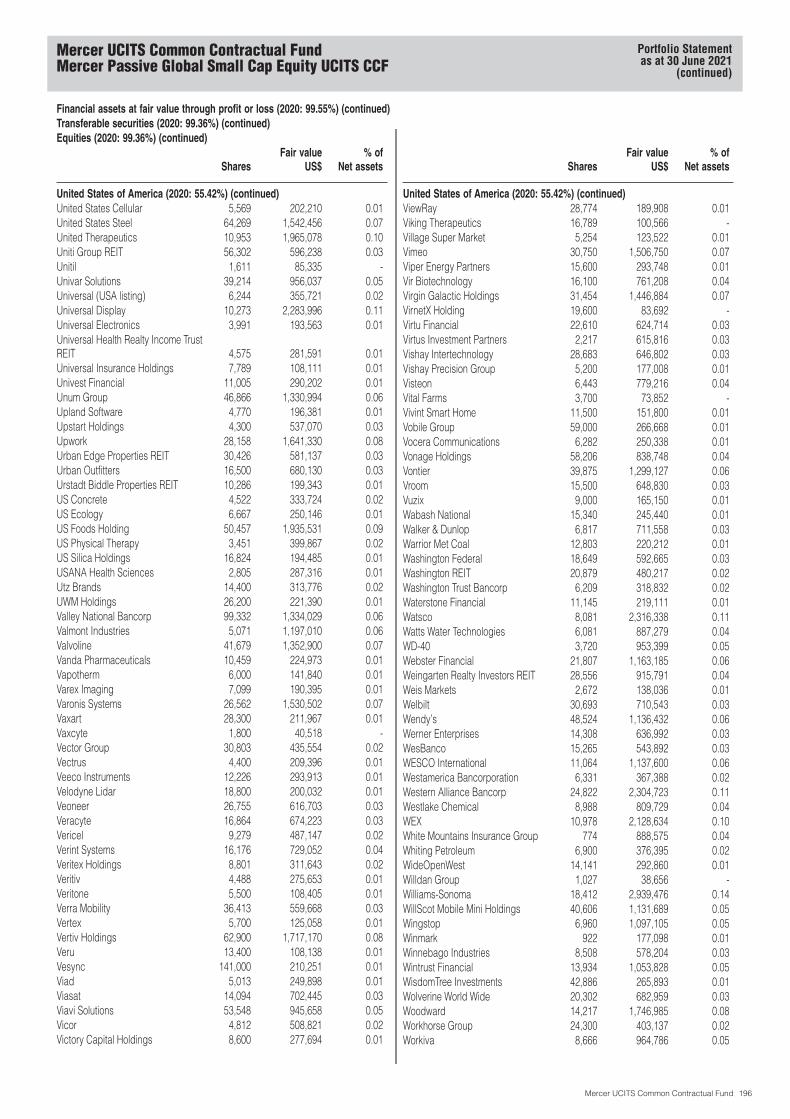
Financial assets at fair value through profit or loss (2020: 99.55%) (continued)Transferable securities (2020: 99.36%) (continued)Equities (2020: 99.36%) (continued)
SharesFair value
US$% of
Net assets
United States of America (2020: 55.42%) (continued)United States Cellular 5,569 202,210 0.01United States Steel 64,269 1,542,456 0.07United Therapeutics 10,953 1,965,078 0.10Uniti Group REIT 56,302 596,238 0.03Unitil 1,611 85,335 -Univar Solutions 39,214 956,037 0.05Universal (USA listing) 6,244 355,721 0.02Universal Display 10,273 2,283,996 0.11Universal Electronics 3,991 193,563 0.01Universal Health Realty Income TrustREIT 4,575 281,591 0.01Universal Insurance Holdings 7,789 108,111 0.01Univest Financial 11,005 290,202 0.01Unum Group 46,866 1,330,994 0.06Upland Software 4,770 196,381 0.01Upstart Holdings 4,300 537,070 0.03Upwork 28,158 1,641,330 0.08Urban Edge Properties REIT 30,426 581,137 0.03Urban Outfitters 16,500 680,130 0.03Urstadt Biddle Properties REIT 10,286 199,343 0.01US Concrete 4,522 333,724 0.02US Ecology 6,667 250,146 0.01US Foods Holding 50,457 1,935,531 0.09US Physical Therapy 3,451 399,867 0.02US Silica Holdings 16,824 194,485 0.01USANA Health Sciences 2,805 287,316 0.01Utz Brands 14,400 313,776 0.02UWM Holdings 26,200 221,390 0.01Valley National Bancorp 99,332 1,334,029 0.06Valmont Industries 5,071 1,197,010 0.06Valvoline 41,679 1,352,900 0.07Vanda Pharmaceuticals 10,459 224,973 0.01Vapotherm 6,000 141,840 0.01Varex Imaging 7,099 190,395 0.01Varonis Systems 26,562 1,530,502 0.07Vaxart 28,300 211,967 0.01Vaxcyte 1,800 40,518 -Vector Group 30,803 435,554 0.02Vectrus 4,400 209,396 0.01Veeco Instruments 12,226 293,913 0.01Velodyne Lidar 18,800 200,032 0.01Veoneer 26,755 616,703 0.03Veracyte 16,864 674,223 0.03Vericel 9,279 487,147 0.02Verint Systems 16,176 729,052 0.04Veritex Holdings 8,801 311,643 0.02Veritiv 4,488 275,653 0.01Veritone 5,500 108,405 0.01Verra Mobility 36,413 559,668 0.03Vertex 5,700 125,058 0.01Vertiv Holdings 62,900 1,717,170 0.08Veru 13,400 108,138 0.01Vesync 141,000 210,251 0.01Viad 5,013 249,898 0.01Viasat 14,094 702,445 0.03Viavi Solutions 53,548 945,658 0.05Vicor 4,812 508,821 0.02Victory Capital Holdings 8,600 277,694 0.01
SharesFair value
US$% of
Net assets
United States of America (2020: 55.42%) (continued)ViewRay 28,774 189,908 0.01Viking Therapeutics 16,789 100,566 -Village Super Market 5,254 123,522 0.01Vimeo 30,750 1,506,750 0.07Viper Energy Partners 15,600 293,748 0.01Vir Biotechnology 16,100 761,208 0.04Virgin Galactic Holdings 31,454 1,446,884 0.07VirnetX Holding 19,600 83,692 -Virtu Financial 22,610 624,714 0.03Virtus Investment Partners 2,217 615,816 0.03Vishay Intertechnology 28,683 646,802 0.03Vishay Precision Group 5,200 177,008 0.01Visteon 6,443 779,216 0.04Vital Farms 3,700 73,852 -Vivint Smart Home 11,500 151,800 0.01Vobile Group 59,000 266,668 0.01Vocera Communications 6,282 250,338 0.01Vonage Holdings 58,206 838,748 0.04Vontier 39,875 1,299,127 0.06Vroom 15,500 648,830 0.03Vuzix 9,000 165,150 0.01Wabash National 15,340 245,440 0.01Walker & Dunlop 6,817 711,558 0.03Warrior Met Coal 12,803 220,212 0.01Washington Federal 18,649 592,665 0.03Washington REIT 20,879 480,217 0.02Washington Trust Bancorp 6,209 318,832 0.02Waterstone Financial 11,145 219,111 0.01Watsco 8,081 2,316,338 0.11Watts Water Technologies 6,081 887,279 0.04WD-40 3,720 953,399 0.05Webster Financial 21,807 1,163,185 0.06Weingarten Realty Investors REIT 28,556 915,791 0.04Weis Markets 2,672 138,036 0.01Welbilt 30,693 710,543 0.03Wendy’s 48,524 1,136,432 0.06Werner Enterprises 14,308 636,992 0.03WesBanco 15,265 543,892 0.03WESCO International 11,064 1,137,600 0.06Westamerica Bancorporation 6,331 367,388 0.02Western Alliance Bancorp 24,822 2,304,723 0.11Westlake Chemical 8,988 809,729 0.04WEX 10,978 2,128,634 0.10White Mountains Insurance Group 774 888,575 0.04Whiting Petroleum 6,900 376,395 0.02WideOpenWest 14,141 292,860 0.01Willdan Group 1,027 38,656 -Williams-Sonoma 18,412 2,939,476 0.14WillScot Mobile Mini Holdings 40,606 1,131,689 0.05Wingstop 6,960 1,097,105 0.05Winmark 922 177,098 0.01Winnebago Industries 8,508 578,204 0.03Wintrust Financial 13,934 1,053,828 0.05WisdomTree Investments 42,886 265,893 0.01Wolverine World Wide 20,302 682,959 0.03Woodward 14,217 1,746,985 0.08Workhorse Group 24,300 403,137 0.02Workiva 8,666 964,786 0.05
Mercer UCITS Common Contractual FundMercer Passive Global Small Cap Equity UCITS CCF
Portfolio Statementas at 30 June 2021
(continued)
Mercer UCITS Common Contractual Fund 196

Financial assets at fair value through profit or loss (2020: 99.55%) (continued)Transferable securities (2020: 99.36%) (continued)Equities (2020: 99.36%) (continued)
SharesFair value
US$% of
Net assets
United States of America (2020: 55.42%) (continued)World Acceptance 857 137,326 0.01World Fuel Services 16,415 520,848 0.03World Wrestling Entertainment 10,542 610,276 0.03Worthington Industries 9,122 558,084 0.03WR Grace & Co 13,061 902,776 0.04WSFS Financial 13,824 644,060 0.03WW International 12,343 446,076 0.02Wyndham Hotels & Resorts 24,296 1,756,358 0.09Xencor 11,456 395,117 0.02Xenia Hotels & Resorts REIT 25,263 473,176 0.02Xerox Holdings 41,428 973,144 0.05Xl Fleet 20,700 172,431 0.01XPEL 4,400 369,028 0.02Xperi Holding 23,497 522,573 0.03Yelp 16,928 676,443 0.03YETI Holdings 20,507 1,882,953 0.09Yext 21,152 302,262 0.01
SharesFair value
US$% of
Net assets
United States of America (2020: 55.42%) (continued)Y-mAbs Therapeutics 4,749 160,516 0.01York Water 2,854 129,286 0.01Zentalis Pharmaceuticals 4,100 218,120 0.01Zions Bancorp 39,580 2,092,199 0.10ZIOPHARM Oncology 63,971 168,883 0.01Zogenix 15,717 271,590 0.01ZoomInfo Technologies 21,700 1,132,089 0.05Zumiez 5,955 291,735 0.01Zuora 22,197 382,898 0.02Zynex 5,500 85,415 -Zynga 224,113 2,382,321 0.12
1,191,133,106 57.80
Total equities 2,061,047,974 100.01
Total transferable securities 2,061,047,974 100.01
Financial derivative instruments (2020: 0.15%)Warrants (2020: Nil)
Notionalholdings
Fair valueUS$
% ofNet assets
United States of America (2020: Nil)Nabors Industries 400 4,000 -
Total warrants 4,000 -
Open forward foreign currency contracts (2020: 0.15%)
Currencybuy
Buyamount
Currencysell
Sellamount Counterparty
Contractdate
UnrealisedgainUS$
% ofNet assets
AUD 7,864 GBP 4,267 State Street Bank and Trust 06/07/2021 9 -CAD 1,567,784 GBP 912,795 State Street Bank and Trust 06/07/2021 5,075 -CHF 44,421 GBP 34,764 State Street Bank and Trust 06/07/2021 35 -DKK 7,263 GBP 836 State Street Bank and Trust 06/07/2021 2 -EUR 11,842 GBP 10,142 State Street Bank and Trust 06/07/2021 31 -GBP 30,392,298 AUD 55,807,097 State Street Bank and Trust 06/07/2021 87,822 0.01GBP 16,526 CAD 28,197 State Street Bank and Trust 06/07/2021 59 -GBP 588,286 CHF 744,312 State Street Bank and Trust 06/07/2021 7,380 -GBP 5,956,158 DKK 51,481,479 State Street Bank and Trust 06/07/2021 17,598 -GBP 72,309,084 EUR 84,017,924 State Street Bank and Trust 06/07/2021 247,091 0.01GBP 8,581,158 NOK 101,457,808 State Street Bank and Trust 06/07/2021 64,050 -GBP 3,081,062 NZD 6,016,731 State Street Bank and Trust 06/07/2021 52,162 -GBP 26,059,437 SEK 307,089,094 State Street Bank and Trust 06/07/2021 90,997 0.01HKD 2,551,413 GBP 233,097 State Street Bank and Trust 06/07/2021 6,524 -ILS 1,024,911 GBP 224,315 State Street Bank and Trust 06/07/2021 4,659 -JPY 464,813,438 GBP 2,997,571 State Street Bank and Trust 06/07/2021 46,961 -NOK 2,165 GBP 181 State Street Bank and Trust 06/07/2021 1 -NZD 1,583 GBP 798 State Street Bank and Trust 06/07/2021 4 -SEK 42,646 GBP 3,593 State Street Bank and Trust 06/07/2021 23 -SGD 355,540 GBP 190,026 State Street Bank and Trust 06/07/2021 1,980 -USD 60,000,175 GBP 42,564,797 State Street Bank and Trust 06/07/2021 1,198,301 0.06
Unrealised gain on open forward foreign currency contracts 1,830,764 0.09
Total financial derivative instruments at positive fair value 1,834,764 0.09
Total financial assets at fair value through profit or loss 2,062,882,738 100.10
Mercer UCITS Common Contractual FundMercer Passive Global Small Cap Equity UCITS CCF
Portfolio Statementas at 30 June 2021
(continued)
Mercer UCITS Common Contractual Fund 197

Financial liabilities held for trading (2020: (0.44%))Financial derivative instruments (2020: (0.44%))Open forward foreign currency contracts (2020: (0.44%))
Currencybuy
Buyamount
Currencysell
Sellamount Counterparty
Contractdate
UnrealisedlossUS$
% ofNet assets
AUD 1,772,801 GBP 968,429 State Street Bank and Trust 06/07/2021 (6,892) -CAD 174,495 GBP 102,103 State Street Bank and Trust 06/07/2021 (137) -CHF 695,854 GBP 548,593 State Street Bank and Trust 06/07/2021 (4,981) -DKK 1,635,385 GBP 189,019 State Street Bank and Trust 06/07/2021 (301) -EUR 2,668,966 GBP 2,294,052 State Street Bank and Trust 06/07/2021 (3,755) -GBP 4,801 AUD 8,885 State Street Bank and Trust 06/07/2021 (38) -GBP 31,780,326 CAD 54,584,512 State Street Bank and Trust 06/07/2021 (176,516) (0.01)GBP 16,527,785 CHF 21,112,617 State Street Bank and Trust 06/07/2021 (10,448) -GBP 941 DKK 8,185 State Street Bank and Trust 06/07/2021 (5) -GBP 11,465 EUR 13,402 State Street Bank and Trust 06/07/2021 (58) -GBP 7,250,785 HKD 79,975,393 State Street Bank and Trust 06/07/2021 (281,622) (0.01)GBP 6,959,712 ILS 32,126,396 State Street Bank and Trust 06/07/2021 (244,900) (0.01)GBP 93,776,349 JPY 14,579,581,356 State Street Bank and Trust 06/07/2021 (1,814,205) (0.10)GBP 1,351 NOK 16,154 State Street Bank and Trust 06/07/2021 (11) -GBP 102,168 NZD 202,342 State Street Bank and Trust 06/07/2021 (247) -GBP 4,021 SEK 47,685 State Street Bank and Trust 06/07/2021 (21) -GBP 5,935,360 SGD 11,144,616 State Street Bank and Trust 06/07/2021 (91,336) -GBP 564,428,072 USD 801,862,949 State Street Bank and Trust 06/07/2021 (22,124,022) (1.07)JPY 311,128 GBP 2,032 State Street Bank and Trust 06/07/2021 (3) -NOK 3,235,105 GBP 273,635 State Street Bank and Trust 06/07/2021 (2,063) -NZD 392,178 GBP 199,766 State Street Bank and Trust 06/07/2021 (1,935) -SEK 17,321,507 GBP 1,469,110 State Street Bank and Trust 06/07/2021 (4,048) -
Unrealised loss on open forward foreign currency contracts (24,767,544) (1.20)
Total financial derivative instruments at negative fair value (24,767,544) (1.20)
Total financial liabilities held for trading (24,767,544) (1.20)
Fair valueUS$
% ofNet assets
Total investments at fair value through profit or loss/held for trading 2,038,115,194 98.90
Financial derivative instruments settled to market (2020: (0.00%))Futures contracts (2020: (0.00%))
No. ofcontractslong/(short) Currency Counterparty
Maturitydate
NotionalUS$
UnrealisedlossUS$
% ofNet assets
Euro Stoxx 50 Index Futures 60 EUR UBS Bank 17/09/2021 2,885,652 (49,458) -FTSE 250 Index Futures 44 GBP UBS Bank 17/09/2021 2,713,875 (31,770) -Russell 2000 E-Mini Futures 82 USD UBS Bank 17/09/2021 9,461,980 (75,960) (0.01)TOPIX Index Futures 19 JPY UBS Bank 09/09/2021 3,326,156 (41,175) -
Unrealised loss on futures contracts settled to market (198,363) (0.01)
Total financial derivative instruments settled to market at negative fair value (198,363) (0.01)
Variation margin paid on financial derivative instruments settled to market 198,363 0.01
Total financial derivative instruments settled to market – –
Mercer UCITS Common Contractual FundMercer Passive Global Small Cap Equity UCITS CCF
Portfolio Statementas at 30 June 2021
(continued)
Mercer UCITS Common Contractual Fund 198
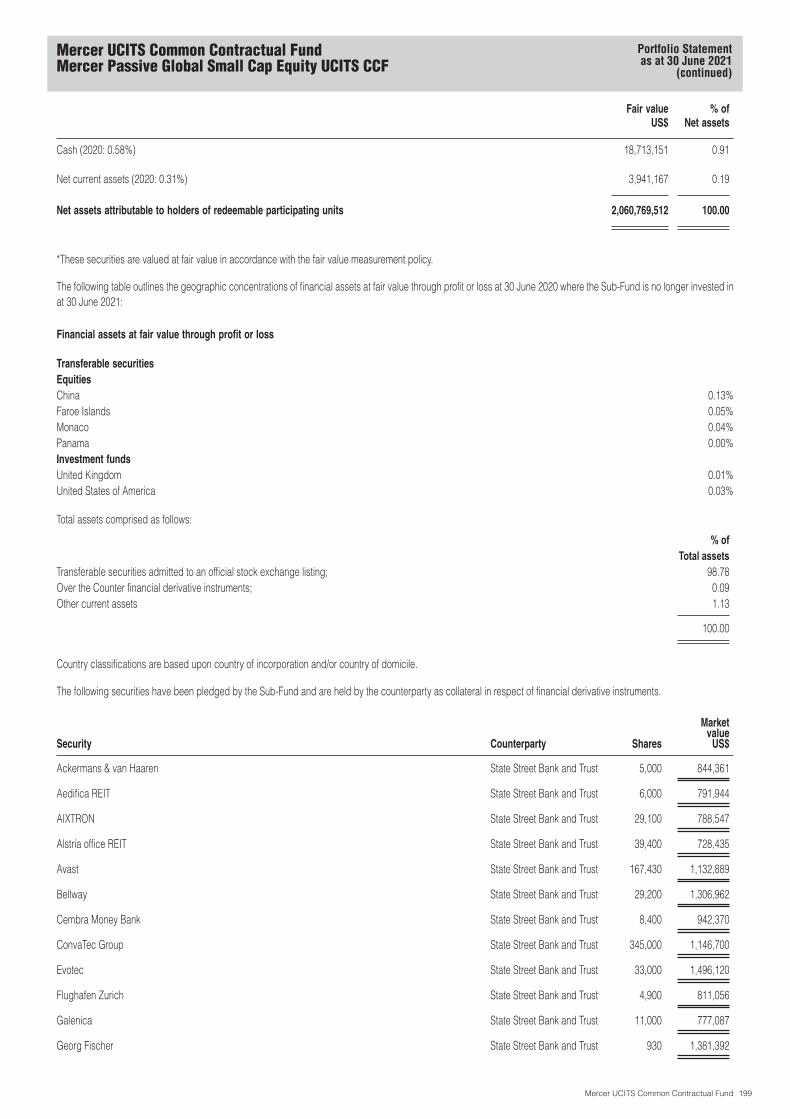
Fair valueUS$
% ofNet assets
Cash (2020: 0.58%) 18,713,151 0.91
Net current assets (2020: 0.31%) 3,941,167 0.19
Net assets attributable to holders of redeemable participating units 2,060,769,512 100.00
*These securities are valued at fair value in accordance with the fair value measurement policy.
The following table outlines the geographic concentrations of financial assets at fair value through profit or loss at 30 June 2020 where the Sub-Fund is no longer invested inat 30 June 2021:
Financial assets at fair value through profit or loss
Transferable securitiesEquitiesChina 0.13%Faroe Islands 0.05%Monaco 0.04%Panama 0.00%Investment fundsUnited Kingdom 0.01%United States of America 0.03%
Total assets comprised as follows:
% ofTotal assets
Transferable securities admitted to an official stock exchange listing; 98.78Over the Counter financial derivative instruments; 0.09Other current assets 1.13
100.00
Country classifications are based upon country of incorporation and/or country of domicile.
The following securities have been pledged by the Sub-Fund and are held by the counterparty as collateral in respect of financial derivative instruments.
Security Counterparty Shares
Marketvalue
US$
Ackermans & van Haaren State Street Bank and Trust 5,000 844,361
Aedifica REIT State Street Bank and Trust 6,000 791,944
AIXTRON State Street Bank and Trust 29,100 788,547
Alstria office REIT State Street Bank and Trust 39,400 728,435
Avast State Street Bank and Trust 167,430 1,132,889
Bellway State Street Bank and Trust 29,200 1,306,962
Cembra Money Bank State Street Bank and Trust 8,400 942,370
ConvaTec Group State Street Bank and Trust 345,000 1,146,700
Evotec State Street Bank and Trust 33,000 1,496,120
Flughafen Zurich State Street Bank and Trust 4,900 811,056
Galenica State Street Bank and Trust 11,000 777,087
Georg Fischer State Street Bank and Trust 930 1,381,392
Mercer UCITS Common Contractual FundMercer Passive Global Small Cap Equity UCITS CCF
Portfolio Statementas at 30 June 2021
(continued)
Mercer UCITS Common Contractual Fund 199

Security Counterparty Shares
Marketvalue
US$
Glanbia State Street Bank and Trust 51,000 827,984
Hays State Street Bank and Trust 390,000 854,482
Helvetia Holding State Street Bank and Trust 8,700 936,496
K&S State Street Bank and Trust 42,000 571,794
MorphoSys State Street Bank and Trust 8,000 620,653
ProSiebenSat.1 Media State Street Bank and Trust 33,000 656,485
PSP Swiss Property State Street Bank and Trust 6,600 838,968
Rheinmetall State Street Bank and Trust 10,320 1,019,467
SIG Combibloc Group State Street Bank and Trust 74,200 2,018,054
Software State Street Bank and Trust 11,300 508,422
TAG Immobilien State Street Bank and Trust 30,000 952,041
thyssenkrupp State Street Bank and Trust 95,000 990,286
UDG Healthcare State Street Bank and Trust 63,000 930,365
Warehouses De Pauw CVA REIT State Street Bank and Trust 19,600 748,446
Mercer UCITS Common Contractual FundMercer Passive Global Small Cap Equity UCITS CCF
Portfolio Statementas at 30 June 2021
(continued)
Mercer UCITS Common Contractual Fund 200

Financial assets at fair value through profit or loss (2020: 100.09%)Transferable securities (2020: 100.03%)Equities (2020: 100.03%)
SharesFair value
US$% of
Net assets
Australia (2020: 5.38%)BHP Group (Australia listing) 734,618 26,787,064 1.92Fortescue Metals Group 420,301 7,364,728 0.53Medibank 705,377 1,673,416 0.12REA Group 12,826 1,627,610 0.11Rio Tinto (Australia listing) 93,056 8,847,300 0.63Telstra 1,027,007 2,899,057 0.21Washington H Soul Pattinson & Co 26,993 683,538 0.05Wesfarmers 283,942 12,598,318 0.90
62,481,031 4.47Belgium (2020: 0.52%)Etablissements Franz Colruyt 14,104 788,795 0.06Proximus 38,574 745,185 0.05Sofina 3,847 1,659,714 0.12
3,193,694 0.23Canada (2020: 3.17%)B2Gold 254,100 1,067,044 0.08Canadian Apartment Properties REIT 17,975 843,662 0.06CGI 57,575 5,225,595 0.37Constellation Software 5,016 7,604,852 0.54Empire 42,136 1,330,467 0.09iA Financial 27,178 1,481,259 0.11Kinross Gold 323,414 2,052,842 0.15Loblaw 44,322 2,730,619 0.19Lundin Mining 101,425 915,716 0.07Magna International 70,549 6,538,730 0.47Manulife Financial 75,489 1,487,468 0.11Thomson Reuters 43,418 4,317,256 0.31West Fraser Timber 20,764 1,492,198 0.11WSP Global 28,054 3,278,215 0.23Yamana Gold 228,733 964,214 0.07
41,330,137 2.96Denmark (2020: 2.01%)AP Moller - Maersk Class A 792 2,200,228 0.16AP Moller - Maersk Class B 1,539 4,423,930 0.32Novo Nordisk 299,244 25,073,207 1.79Pandora 25,168 3,383,535 0.24
35,080,900 2.51Finland (2020: 0.13%)Orion Corp 27,113 1,165,558 0.08
France (2020: 0.67%)Atos 25,372 1,543,549 0.11Cie de Saint-Gobain 126,518 8,333,098 0.60Iliad 3,731 545,995 0.04Orange 493,100 5,622,540 0.40
16,045,182 1.15Germany (2020: 0.79%)Daimler 213,250 19,042,866 1.36Deutsche Post 246,881 16,793,650 1.20HelloFresh 37,142 3,610,950 0.26Porsche Automobil Holding - Pref 38,547 4,130,618 0.30Zalando 9,751 1,178,921 0.08
44,757,005 3.20
SharesFair value
US$% of
Net assets
Hong Kong (2020: 2.23%)CK Asset Holdings 648,000 4,472,505 0.32CK Hutchison Holdings 674,000 5,250,810 0.38Henderson Land Development 350,000 1,658,544 0.12Sun Hung Kai Properties 322,500 4,804,786 0.34Swire Properties 302,200 900,858 0.06WH Group 2,406,500 2,162,979 0.16Xinyi Glass Holdings 456,000 1,858,444 0.13
21,108,926 1.51Ireland (2020: 4.55%)Accenture 92,064 27,139,546 1.94Eaton 46,882 6,946,975 0.50Jazz Pharmaceuticals 13,910 2,470,972 0.18Johnson Controls International 181,333 12,444,884 0.89Pentair 41,077 2,772,287 0.20Seagate Technology Holdings 58,015 5,101,259 0.36
56,875,923 4.07Italy (2020: 1.81%)Telecom Italia 2,135,968 1,061,093 0.07Telecom Italia - Pref 1,515,575 803,043 0.06
1,864,136 0.13Japan (2020: 6.87%)AGC 47,600 1,998,522 0.14Astellas Pharma 463,600 8,080,315 0.58Brother Industries 54,800 1,094,618 0.08Chubu Electric Power 163,600 2,001,701 0.14Daito Trust Construction 16,100 1,762,456 0.13Denso 108,800 7,429,455 0.53Fujitsu 48,900 9,164,069 0.66Hino Motors 72,800 640,829 0.05Hitachi 241,200 13,823,526 0.99Honda Motor 406,800 13,011,442 0.93Hoya 60,500 8,029,237 0.57Iida Group Holdings 37,400 963,726 0.07Kajima 65,900 835,402 0.06KDDI 402,700 12,571,903 0.90Konami Holdings 22,700 1,364,168 0.10Mitsubishi Electric 454,400 6,601,676 0.47Nexon 121,400 2,708,230 0.19Nippon Telegraph & Telephone 323,000 8,423,493 0.60Nippon Yusen 37,600 1,907,271 0.14Nitto Denko 39,800 2,972,718 0.21Obayashi 166,800 1,327,006 0.09Panasonic 547,900 6,345,846 0.45Sumitomo Electric Industries 188,500 2,783,598 0.20Tohoku Electric Power 107,400 841,860 0.06Toppan Printing 66,400 1,067,880 0.08Tosoh 65,700 1,134,167 0.08Toyota Industries 36,700 3,177,647 0.23Yamaha Motor 69,600 1,893,792 0.14
123,956,553 8.87Netherlands (2020: 3.68%)ASM International 7,136 2,344,137 0.17Koninklijke Ahold Delhaize 273,754 8,138,851 0.58Koninklijke Vopak 17,828 809,748 0.06NN Group 74,679 3,522,991 0.25
Mercer UCITS Common Contractual FundMercer Passive Fundamental Indexation Global Equity UCITS CCF
Portfolio Statementas at 30 June 2021
Mercer UCITS Common Contractual Fund 201
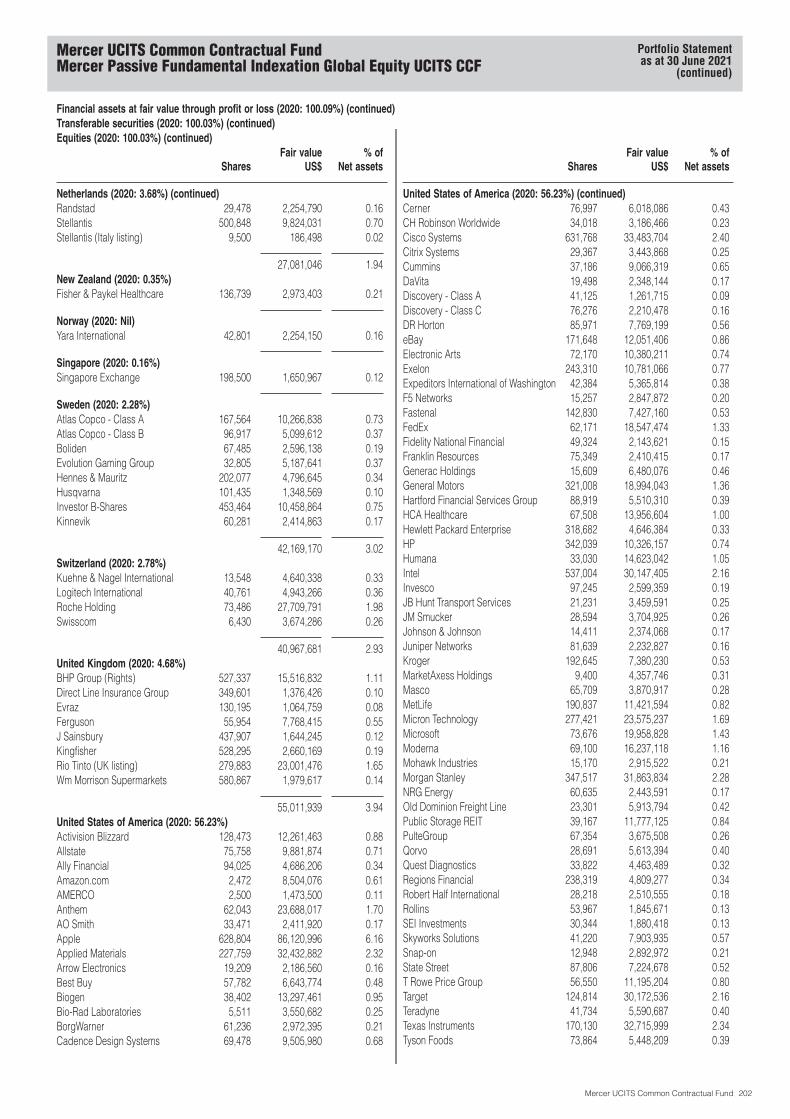
Financial assets at fair value through profit or loss (2020: 100.09%) (continued)Transferable securities (2020: 100.03%) (continued)Equities (2020: 100.03%) (continued)
SharesFair value
US$% of
Net assets
Netherlands (2020: 3.68%) (continued)Randstad 29,478 2,254,790 0.16Stellantis 500,848 9,824,031 0.70Stellantis (Italy listing) 9,500 186,498 0.02
27,081,046 1.94New Zealand (2020: 0.35%)Fisher & Paykel Healthcare 136,739 2,973,403 0.21
Norway (2020: Nil)Yara International 42,801 2,254,150 0.16
Singapore (2020: 0.16%)Singapore Exchange 198,500 1,650,967 0.12
Sweden (2020: 2.28%)Atlas Copco - Class A 167,564 10,266,838 0.73Atlas Copco - Class B 96,917 5,099,612 0.37Boliden 67,485 2,596,138 0.19Evolution Gaming Group 32,805 5,187,641 0.37Hennes & Mauritz 202,077 4,796,645 0.34Husqvarna 101,435 1,348,569 0.10Investor B-Shares 453,464 10,458,864 0.75Kinnevik 60,281 2,414,863 0.17
42,169,170 3.02Switzerland (2020: 2.78%)Kuehne & Nagel International 13,548 4,640,338 0.33Logitech International 40,761 4,943,266 0.36Roche Holding 73,486 27,709,791 1.98Swisscom 6,430 3,674,286 0.26
40,967,681 2.93United Kingdom (2020: 4.68%)BHP Group (Rights) 527,337 15,516,832 1.11Direct Line Insurance Group 349,601 1,376,426 0.10Evraz 130,195 1,064,759 0.08Ferguson 55,954 7,768,415 0.55J Sainsbury 437,907 1,644,245 0.12Kingfisher 528,295 2,660,169 0.19Rio Tinto (UK listing) 279,883 23,001,476 1.65Wm Morrison Supermarkets 580,867 1,979,617 0.14
55,011,939 3.94United States of America (2020: 56.23%)Activision Blizzard 128,473 12,261,463 0.88Allstate 75,758 9,881,874 0.71Ally Financial 94,025 4,686,206 0.34Amazon.com 2,472 8,504,076 0.61AMERCO 2,500 1,473,500 0.11Anthem 62,043 23,688,017 1.70AO Smith 33,471 2,411,920 0.17Apple 628,804 86,120,996 6.16Applied Materials 227,759 32,432,882 2.32Arrow Electronics 19,209 2,186,560 0.16Best Buy 57,782 6,643,774 0.48Biogen 38,402 13,297,461 0.95Bio-Rad Laboratories 5,511 3,550,682 0.25BorgWarner 61,236 2,972,395 0.21Cadence Design Systems 69,478 9,505,980 0.68
SharesFair value
US$% of
Net assets
United States of America (2020: 56.23%) (continued)Cerner 76,997 6,018,086 0.43CH Robinson Worldwide 34,018 3,186,466 0.23Cisco Systems 631,768 33,483,704 2.40Citrix Systems 29,367 3,443,868 0.25Cummins 37,186 9,066,319 0.65DaVita 19,498 2,348,144 0.17Discovery - Class A 41,125 1,261,715 0.09Discovery - Class C 76,276 2,210,478 0.16DR Horton 85,971 7,769,199 0.56eBay 171,648 12,051,406 0.86Electronic Arts 72,170 10,380,211 0.74Exelon 243,310 10,781,066 0.77Expeditors International of Washington 42,384 5,365,814 0.38F5 Networks 15,257 2,847,872 0.20Fastenal 142,830 7,427,160 0.53FedEx 62,171 18,547,474 1.33Fidelity National Financial 49,324 2,143,621 0.15Franklin Resources 75,349 2,410,415 0.17Generac Holdings 15,609 6,480,076 0.46General Motors 321,008 18,994,043 1.36Hartford Financial Services Group 88,919 5,510,310 0.39HCA Healthcare 67,508 13,956,604 1.00Hewlett Packard Enterprise 318,682 4,646,384 0.33HP 342,039 10,326,157 0.74Humana 33,030 14,623,042 1.05Intel 537,004 30,147,405 2.16Invesco 97,245 2,599,359 0.19JB Hunt Transport Services 21,231 3,459,591 0.25JM Smucker 28,594 3,704,925 0.26Johnson & Johnson 14,411 2,374,068 0.17Juniper Networks 81,639 2,232,827 0.16Kroger 192,645 7,380,230 0.53MarketAxess Holdings 9,400 4,357,746 0.31Masco 65,709 3,870,917 0.28MetLife 190,837 11,421,594 0.82Micron Technology 277,421 23,575,237 1.69Microsoft 73,676 19,958,828 1.43Moderna 69,100 16,237,118 1.16Mohawk Industries 15,170 2,915,522 0.21Morgan Stanley 347,517 31,863,834 2.28NRG Energy 60,635 2,443,591 0.17Old Dominion Freight Line 23,301 5,913,794 0.42Public Storage REIT 39,167 11,777,125 0.84PulteGroup 67,354 3,675,508 0.26Qorvo 28,691 5,613,394 0.40Quest Diagnostics 33,822 4,463,489 0.32Regions Financial 238,319 4,809,277 0.34Robert Half International 28,218 2,510,555 0.18Rollins 53,967 1,845,671 0.13SEI Investments 30,344 1,880,418 0.13Skyworks Solutions 41,220 7,903,935 0.57Snap-on 12,948 2,892,972 0.21State Street 87,806 7,224,678 0.52T Rowe Price Group 56,550 11,195,204 0.80Target 124,814 30,172,536 2.16Teradyne 41,734 5,590,687 0.40Texas Instruments 170,130 32,715,999 2.34Tyson Foods 73,864 5,448,209 0.39
Mercer UCITS Common Contractual FundMercer Passive Fundamental Indexation Global Equity UCITS CCF
Portfolio Statementas at 30 June 2021
(continued)
Mercer UCITS Common Contractual Fund 202
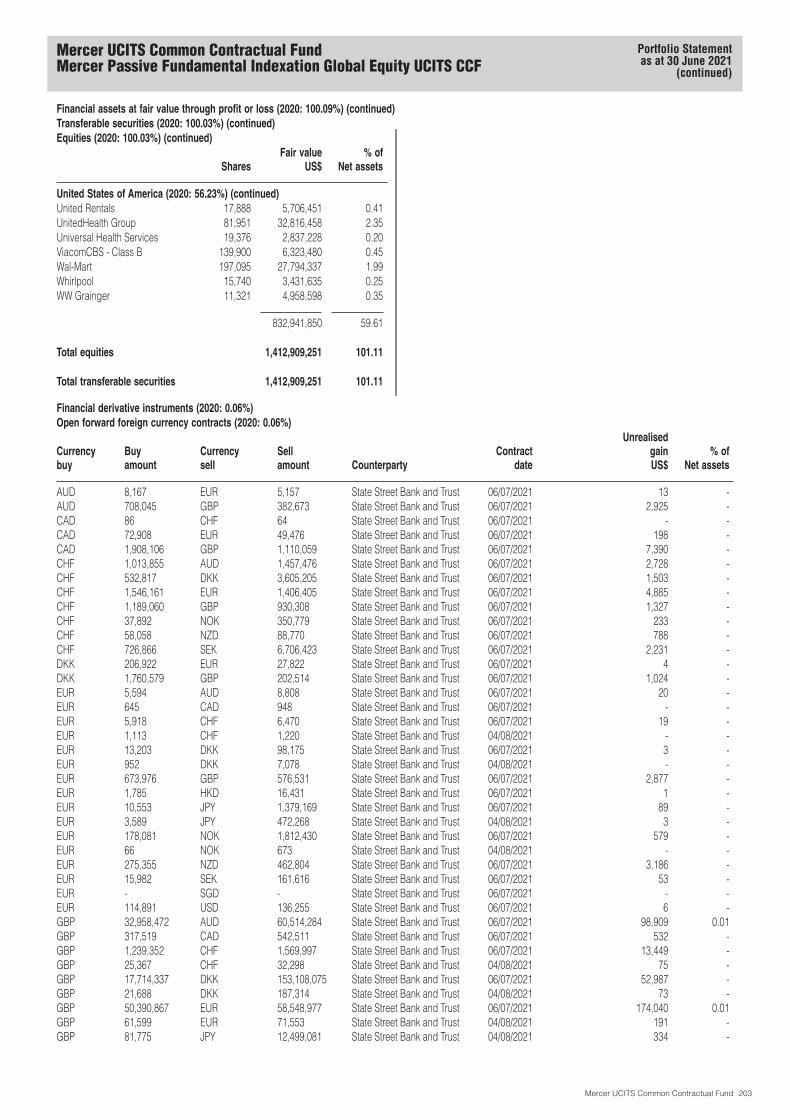
Financial assets at fair value through profit or loss (2020: 100.09%) (continued)Transferable securities (2020: 100.03%) (continued)Equities (2020: 100.03%) (continued)
SharesFair value
US$% of
Net assets
United States of America (2020: 56.23%) (continued)United Rentals 17,888 5,706,451 0.41UnitedHealth Group 81,951 32,816,458 2.35Universal Health Services 19,376 2,837,228 0.20ViacomCBS - Class B 139,900 6,323,480 0.45Wal-Mart 197,095 27,794,337 1.99Whirlpool 15,740 3,431,635 0.25WW Grainger 11,321 4,958,598 0.35
832,941,850 59.61
Total equities 1,412,909,251 101.11
Total transferable securities 1,412,909,251 101.11
Financial derivative instruments (2020: 0.06%)Open forward foreign currency contracts (2020: 0.06%)
Currencybuy
Buyamount
Currencysell
Sellamount Counterparty
Contractdate
UnrealisedgainUS$
% ofNet assets
AUD 8,167 EUR 5,157 State Street Bank and Trust 06/07/2021 13 -AUD 708,045 GBP 382,673 State Street Bank and Trust 06/07/2021 2,925 -CAD 86 CHF 64 State Street Bank and Trust 06/07/2021 - -CAD 72,908 EUR 49,476 State Street Bank and Trust 06/07/2021 198 -CAD 1,908,106 GBP 1,110,059 State Street Bank and Trust 06/07/2021 7,390 -CHF 1,013,855 AUD 1,457,476 State Street Bank and Trust 06/07/2021 2,728 -CHF 532,817 DKK 3,605,205 State Street Bank and Trust 06/07/2021 1,503 -CHF 1,546,161 EUR 1,406,405 State Street Bank and Trust 06/07/2021 4,885 -CHF 1,189,060 GBP 930,308 State Street Bank and Trust 06/07/2021 1,327 -CHF 37,892 NOK 350,779 State Street Bank and Trust 06/07/2021 233 -CHF 58,058 NZD 88,770 State Street Bank and Trust 06/07/2021 788 -CHF 726,866 SEK 6,706,423 State Street Bank and Trust 06/07/2021 2,231 -DKK 206,922 EUR 27,822 State Street Bank and Trust 06/07/2021 4 -DKK 1,760,579 GBP 202,514 State Street Bank and Trust 06/07/2021 1,024 -EUR 5,594 AUD 8,808 State Street Bank and Trust 06/07/2021 20 -EUR 645 CAD 948 State Street Bank and Trust 06/07/2021 - -EUR 5,918 CHF 6,470 State Street Bank and Trust 06/07/2021 19 -EUR 1,113 CHF 1,220 State Street Bank and Trust 04/08/2021 - -EUR 13,203 DKK 98,175 State Street Bank and Trust 06/07/2021 3 -EUR 952 DKK 7,078 State Street Bank and Trust 04/08/2021 - -EUR 673,976 GBP 576,531 State Street Bank and Trust 06/07/2021 2,877 -EUR 1,785 HKD 16,431 State Street Bank and Trust 06/07/2021 1 -EUR 10,553 JPY 1,379,169 State Street Bank and Trust 06/07/2021 89 -EUR 3,589 JPY 472,268 State Street Bank and Trust 04/08/2021 3 -EUR 178,081 NOK 1,812,430 State Street Bank and Trust 06/07/2021 579 -EUR 66 NOK 673 State Street Bank and Trust 04/08/2021 - -EUR 275,355 NZD 462,804 State Street Bank and Trust 06/07/2021 3,186 -EUR 15,982 SEK 161,616 State Street Bank and Trust 06/07/2021 53 -EUR - SGD - State Street Bank and Trust 06/07/2021 - -EUR 114,891 USD 136,255 State Street Bank and Trust 06/07/2021 6 -GBP 32,958,472 AUD 60,514,284 State Street Bank and Trust 06/07/2021 98,909 0.01GBP 317,519 CAD 542,511 State Street Bank and Trust 06/07/2021 532 -GBP 1,239,352 CHF 1,569,997 State Street Bank and Trust 06/07/2021 13,449 -GBP 25,367 CHF 32,298 State Street Bank and Trust 04/08/2021 75 -GBP 17,714,337 DKK 153,108,075 State Street Bank and Trust 06/07/2021 52,987 -GBP 21,688 DKK 187,314 State Street Bank and Trust 04/08/2021 73 -GBP 50,390,867 EUR 58,548,977 State Street Bank and Trust 06/07/2021 174,040 0.01GBP 61,599 EUR 71,553 State Street Bank and Trust 04/08/2021 191 -GBP 81,775 JPY 12,499,081 State Street Bank and Trust 04/08/2021 334 -
Mercer UCITS Common Contractual FundMercer Passive Fundamental Indexation Global Equity UCITS CCF
Portfolio Statementas at 30 June 2021
(continued)
Mercer UCITS Common Contractual Fund 203
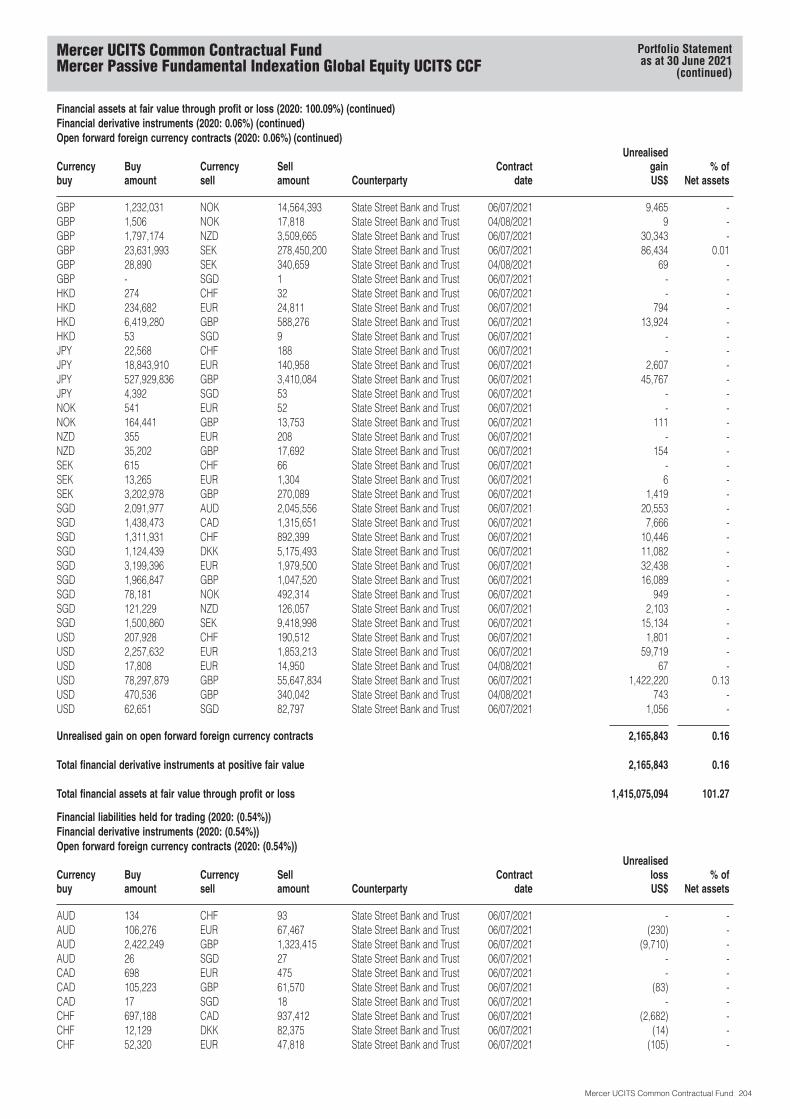
Financial assets at fair value through profit or loss (2020: 100.09%) (continued)Financial derivative instruments (2020: 0.06%) (continued)Open forward foreign currency contracts (2020: 0.06%) (continued)
Currencybuy
Buyamount
Currencysell
Sellamount Counterparty
Contractdate
UnrealisedgainUS$
% ofNet assets
GBP 1,232,031 NOK 14,564,393 State Street Bank and Trust 06/07/2021 9,465 -GBP 1,506 NOK 17,818 State Street Bank and Trust 04/08/2021 9 -GBP 1,797,174 NZD 3,509,665 State Street Bank and Trust 06/07/2021 30,343 -GBP 23,631,993 SEK 278,450,200 State Street Bank and Trust 06/07/2021 86,434 0.01GBP 28,890 SEK 340,659 State Street Bank and Trust 04/08/2021 69 -GBP - SGD 1 State Street Bank and Trust 06/07/2021 - -HKD 274 CHF 32 State Street Bank and Trust 06/07/2021 - -HKD 234,682 EUR 24,811 State Street Bank and Trust 06/07/2021 794 -HKD 6,419,280 GBP 588,276 State Street Bank and Trust 06/07/2021 13,924 -HKD 53 SGD 9 State Street Bank and Trust 06/07/2021 - -JPY 22,568 CHF 188 State Street Bank and Trust 06/07/2021 - -JPY 18,843,910 EUR 140,958 State Street Bank and Trust 06/07/2021 2,607 -JPY 527,929,836 GBP 3,410,084 State Street Bank and Trust 06/07/2021 45,767 -JPY 4,392 SGD 53 State Street Bank and Trust 06/07/2021 - -NOK 541 EUR 52 State Street Bank and Trust 06/07/2021 - -NOK 164,441 GBP 13,753 State Street Bank and Trust 06/07/2021 111 -NZD 355 EUR 208 State Street Bank and Trust 06/07/2021 - -NZD 35,202 GBP 17,692 State Street Bank and Trust 06/07/2021 154 -SEK 615 CHF 66 State Street Bank and Trust 06/07/2021 - -SEK 13,265 EUR 1,304 State Street Bank and Trust 06/07/2021 6 -SEK 3,202,978 GBP 270,089 State Street Bank and Trust 06/07/2021 1,419 -SGD 2,091,977 AUD 2,045,556 State Street Bank and Trust 06/07/2021 20,553 -SGD 1,438,473 CAD 1,315,651 State Street Bank and Trust 06/07/2021 7,666 -SGD 1,311,931 CHF 892,399 State Street Bank and Trust 06/07/2021 10,446 -SGD 1,124,439 DKK 5,175,493 State Street Bank and Trust 06/07/2021 11,082 -SGD 3,199,396 EUR 1,979,500 State Street Bank and Trust 06/07/2021 32,438 -SGD 1,966,847 GBP 1,047,520 State Street Bank and Trust 06/07/2021 16,089 -SGD 78,181 NOK 492,314 State Street Bank and Trust 06/07/2021 949 -SGD 121,229 NZD 126,057 State Street Bank and Trust 06/07/2021 2,103 -SGD 1,500,860 SEK 9,418,998 State Street Bank and Trust 06/07/2021 15,134 -USD 207,928 CHF 190,512 State Street Bank and Trust 06/07/2021 1,801 -USD 2,257,632 EUR 1,853,213 State Street Bank and Trust 06/07/2021 59,719 -USD 17,808 EUR 14,950 State Street Bank and Trust 04/08/2021 67 -USD 78,297,879 GBP 55,647,834 State Street Bank and Trust 06/07/2021 1,422,220 0.13USD 470,536 GBP 340,042 State Street Bank and Trust 04/08/2021 743 -USD 62,651 SGD 82,797 State Street Bank and Trust 06/07/2021 1,056 -
Unrealised gain on open forward foreign currency contracts 2,165,843 0.16
Total financial derivative instruments at positive fair value 2,165,843 0.16
Total financial assets at fair value through profit or loss 1,415,075,094 101.27
Financial liabilities held for trading (2020: (0.54%))Financial derivative instruments (2020: (0.54%))Open forward foreign currency contracts (2020: (0.54%))
Currencybuy
Buyamount
Currencysell
Sellamount Counterparty
Contractdate
UnrealisedlossUS$
% ofNet assets
AUD 134 CHF 93 State Street Bank and Trust 06/07/2021 - -AUD 106,276 EUR 67,467 State Street Bank and Trust 06/07/2021 (230) -AUD 2,422,249 GBP 1,323,415 State Street Bank and Trust 06/07/2021 (9,710) -AUD 26 SGD 27 State Street Bank and Trust 06/07/2021 - -CAD 698 EUR 475 State Street Bank and Trust 06/07/2021 - -CAD 105,223 GBP 61,570 State Street Bank and Trust 06/07/2021 (83) -CAD 17 SGD 18 State Street Bank and Trust 06/07/2021 - -CHF 697,188 CAD 937,412 State Street Bank and Trust 06/07/2021 (2,682) -CHF 12,129 DKK 82,375 State Street Bank and Trust 06/07/2021 (14) -CHF 52,320 EUR 47,818 State Street Bank and Trust 06/07/2021 (105) -
Mercer UCITS Common Contractual FundMercer Passive Fundamental Indexation Global Equity UCITS CCF
Portfolio Statementas at 30 June 2021
(continued)
Mercer UCITS Common Contractual Fund 204
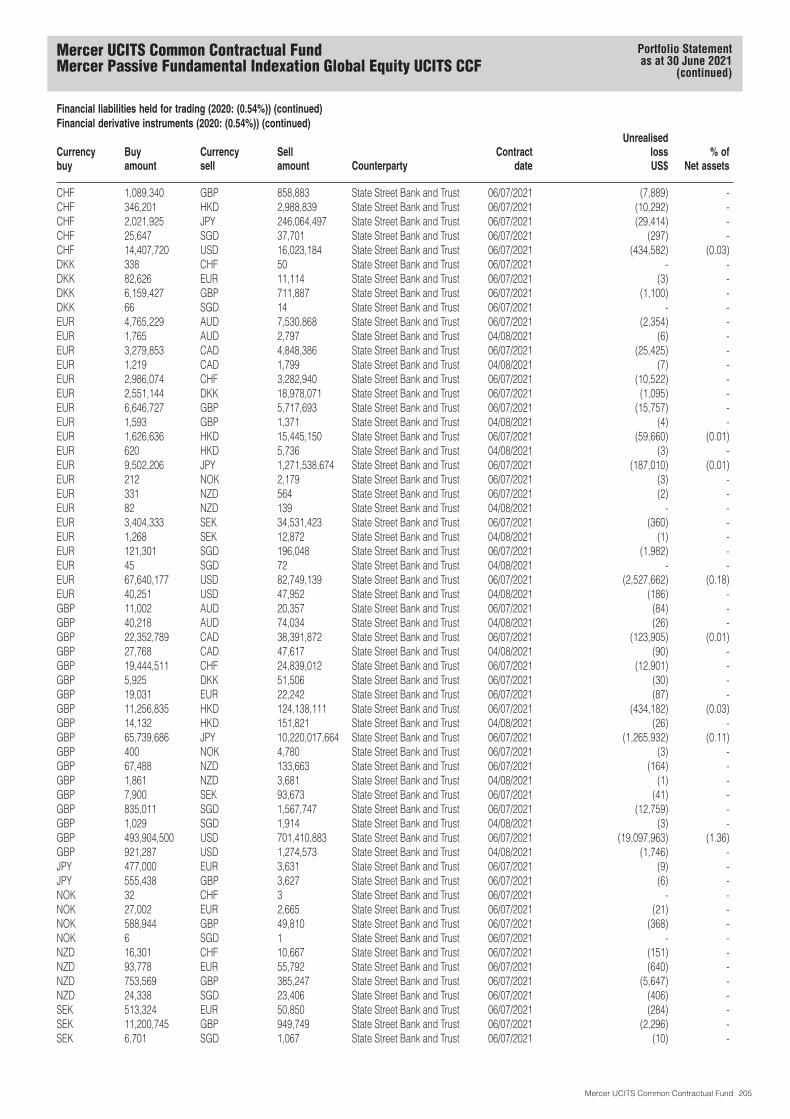
Financial liabilities held for trading (2020: (0.54%)) (continued)Financial derivative instruments (2020: (0.54%)) (continued)
Currencybuy
Buyamount
Currencysell
Sellamount Counterparty
Contractdate
UnrealisedlossUS$
% ofNet assets
CHF 1,089,340 GBP 858,883 State Street Bank and Trust 06/07/2021 (7,889) -CHF 346,201 HKD 2,988,839 State Street Bank and Trust 06/07/2021 (10,292) -CHF 2,021,925 JPY 246,064,497 State Street Bank and Trust 06/07/2021 (29,414) -CHF 25,647 SGD 37,701 State Street Bank and Trust 06/07/2021 (297) -CHF 14,407,720 USD 16,023,184 State Street Bank and Trust 06/07/2021 (434,582) (0.03)DKK 338 CHF 50 State Street Bank and Trust 06/07/2021 - -DKK 82,626 EUR 11,114 State Street Bank and Trust 06/07/2021 (3) -DKK 6,159,427 GBP 711,887 State Street Bank and Trust 06/07/2021 (1,100) -DKK 66 SGD 14 State Street Bank and Trust 06/07/2021 - -EUR 4,765,229 AUD 7,530,868 State Street Bank and Trust 06/07/2021 (2,354) -EUR 1,765 AUD 2,797 State Street Bank and Trust 04/08/2021 (6) -EUR 3,279,853 CAD 4,848,386 State Street Bank and Trust 06/07/2021 (25,425) -EUR 1,219 CAD 1,799 State Street Bank and Trust 04/08/2021 (7) -EUR 2,986,074 CHF 3,282,940 State Street Bank and Trust 06/07/2021 (10,522) -EUR 2,551,144 DKK 18,978,071 State Street Bank and Trust 06/07/2021 (1,095) -EUR 6,646,727 GBP 5,717,693 State Street Bank and Trust 06/07/2021 (15,757) -EUR 1,593 GBP 1,371 State Street Bank and Trust 04/08/2021 (4) -EUR 1,626,636 HKD 15,445,150 State Street Bank and Trust 06/07/2021 (59,660) (0.01)EUR 620 HKD 5,736 State Street Bank and Trust 04/08/2021 (3) -EUR 9,502,206 JPY 1,271,538,674 State Street Bank and Trust 06/07/2021 (187,010) (0.01)EUR 212 NOK 2,179 State Street Bank and Trust 06/07/2021 (3) -EUR 331 NZD 564 State Street Bank and Trust 06/07/2021 (2) -EUR 82 NZD 139 State Street Bank and Trust 04/08/2021 - -EUR 3,404,333 SEK 34,531,423 State Street Bank and Trust 06/07/2021 (360) -EUR 1,268 SEK 12,872 State Street Bank and Trust 04/08/2021 (1) -EUR 121,301 SGD 196,048 State Street Bank and Trust 06/07/2021 (1,982) -EUR 45 SGD 72 State Street Bank and Trust 04/08/2021 - -EUR 67,640,177 USD 82,749,139 State Street Bank and Trust 06/07/2021 (2,527,662) (0.18)EUR 40,251 USD 47,952 State Street Bank and Trust 04/08/2021 (186) -GBP 11,002 AUD 20,357 State Street Bank and Trust 06/07/2021 (84) -GBP 40,218 AUD 74,034 State Street Bank and Trust 04/08/2021 (26) -GBP 22,352,789 CAD 38,391,872 State Street Bank and Trust 06/07/2021 (123,905) (0.01)GBP 27,768 CAD 47,617 State Street Bank and Trust 04/08/2021 (90) -GBP 19,444,511 CHF 24,839,012 State Street Bank and Trust 06/07/2021 (12,901) -GBP 5,925 DKK 51,506 State Street Bank and Trust 06/07/2021 (30) -GBP 19,031 EUR 22,242 State Street Bank and Trust 06/07/2021 (87) -GBP 11,256,835 HKD 124,138,111 State Street Bank and Trust 06/07/2021 (434,182) (0.03)GBP 14,132 HKD 151,821 State Street Bank and Trust 04/08/2021 (26) -GBP 65,739,686 JPY 10,220,017,664 State Street Bank and Trust 06/07/2021 (1,265,932) (0.11)GBP 400 NOK 4,780 State Street Bank and Trust 06/07/2021 (3) -GBP 67,488 NZD 133,663 State Street Bank and Trust 06/07/2021 (164) -GBP 1,861 NZD 3,681 State Street Bank and Trust 04/08/2021 (1) -GBP 7,900 SEK 93,673 State Street Bank and Trust 06/07/2021 (41) -GBP 835,011 SGD 1,567,747 State Street Bank and Trust 06/07/2021 (12,759) -GBP 1,029 SGD 1,914 State Street Bank and Trust 04/08/2021 (3) -GBP 493,904,500 USD 701,410,883 State Street Bank and Trust 06/07/2021 (19,097,963) (1.36)GBP 921,287 USD 1,274,573 State Street Bank and Trust 04/08/2021 (1,746) -JPY 477,000 EUR 3,631 State Street Bank and Trust 06/07/2021 (9) -JPY 555,438 GBP 3,627 State Street Bank and Trust 06/07/2021 (6) -NOK 32 CHF 3 State Street Bank and Trust 06/07/2021 - -NOK 27,002 EUR 2,665 State Street Bank and Trust 06/07/2021 (21) -NOK 588,944 GBP 49,810 State Street Bank and Trust 06/07/2021 (368) -NOK 6 SGD 1 State Street Bank and Trust 06/07/2021 - -NZD 16,301 CHF 10,667 State Street Bank and Trust 06/07/2021 (151) -NZD 93,778 EUR 55,792 State Street Bank and Trust 06/07/2021 (640) -NZD 753,569 GBP 385,247 State Street Bank and Trust 06/07/2021 (5,647) -NZD 24,338 SGD 23,406 State Street Bank and Trust 06/07/2021 (406) -SEK 513,324 EUR 50,850 State Street Bank and Trust 06/07/2021 (284) -SEK 11,200,745 GBP 949,749 State Street Bank and Trust 06/07/2021 (2,296) -SEK 6,701 SGD 1,067 State Street Bank and Trust 06/07/2021 (10) -
Mercer UCITS Common Contractual FundMercer Passive Fundamental Indexation Global Equity UCITS CCF
Portfolio Statementas at 30 June 2021
(continued)
Mercer UCITS Common Contractual Fund 205
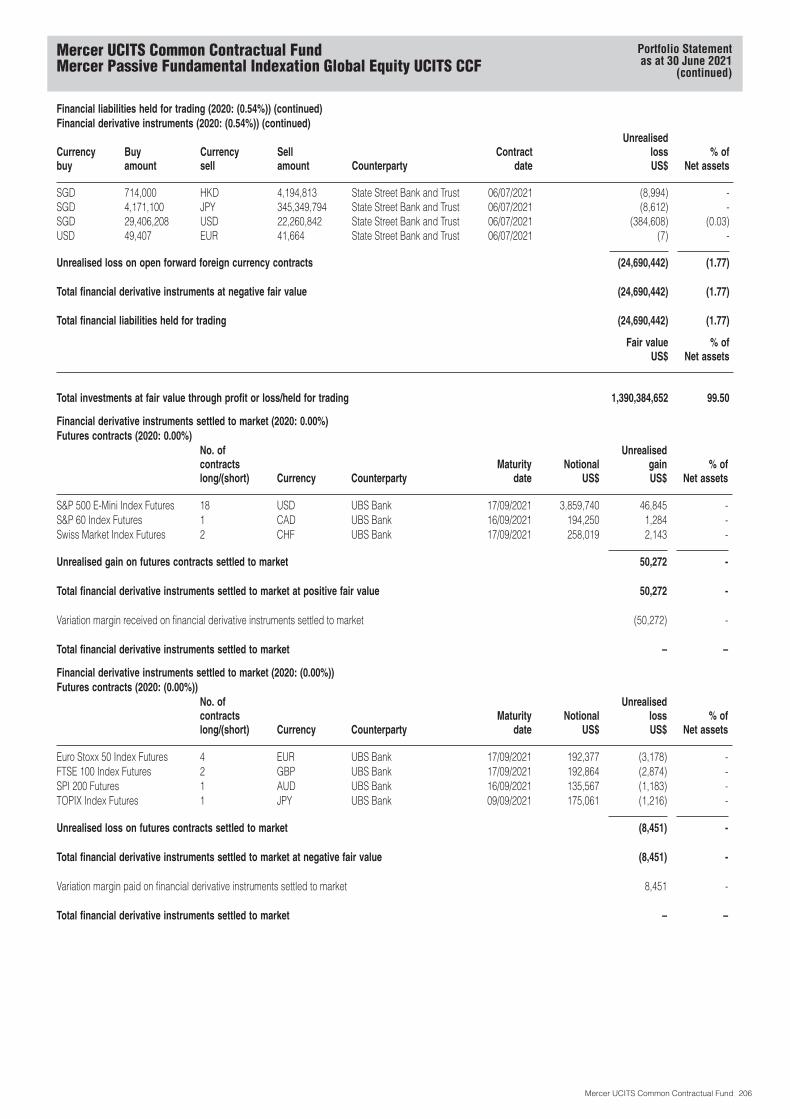
Financial liabilities held for trading (2020: (0.54%)) (continued)Financial derivative instruments (2020: (0.54%)) (continued)
Currencybuy
Buyamount
Currencysell
Sellamount Counterparty
Contractdate
UnrealisedlossUS$
% ofNet assets
SGD 714,000 HKD 4,194,813 State Street Bank and Trust 06/07/2021 (8,994) -SGD 4,171,100 JPY 345,349,794 State Street Bank and Trust 06/07/2021 (8,612) -SGD 29,406,208 USD 22,260,842 State Street Bank and Trust 06/07/2021 (384,608) (0.03)USD 49,407 EUR 41,664 State Street Bank and Trust 06/07/2021 (7) -
Unrealised loss on open forward foreign currency contracts (24,690,442) (1.77)
Total financial derivative instruments at negative fair value (24,690,442) (1.77)
Total financial liabilities held for trading (24,690,442) (1.77)
Fair valueUS$
% ofNet assets
Total investments at fair value through profit or loss/held for trading 1,390,384,652 99.50
Financial derivative instruments settled to market (2020: 0.00%)Futures contracts (2020: 0.00%)
No. ofcontractslong/(short) Currency Counterparty
Maturitydate
NotionalUS$
UnrealisedgainUS$
% ofNet assets
S&P 500 E-Mini Index Futures 18 USD UBS Bank 17/09/2021 3,859,740 46,845 -S&P 60 Index Futures 1 CAD UBS Bank 16/09/2021 194,250 1,284 -Swiss Market Index Futures 2 CHF UBS Bank 17/09/2021 258,019 2,143 -
Unrealised gain on futures contracts settled to market 50,272 -
Total financial derivative instruments settled to market at positive fair value 50,272 -
Variation margin received on financial derivative instruments settled to market (50,272) -
Total financial derivative instruments settled to market – –
Financial derivative instruments settled to market (2020: (0.00%))Futures contracts (2020: (0.00%))
No. ofcontractslong/(short) Currency Counterparty
Maturitydate
NotionalUS$
UnrealisedlossUS$
% ofNet assets
Euro Stoxx 50 Index Futures 4 EUR UBS Bank 17/09/2021 192,377 (3,178) -FTSE 100 Index Futures 2 GBP UBS Bank 17/09/2021 192,864 (2,874) -SPI 200 Futures 1 AUD UBS Bank 16/09/2021 135,567 (1,183) -TOPIX Index Futures 1 JPY UBS Bank 09/09/2021 175,061 (1,216) -
Unrealised loss on futures contracts settled to market (8,451) -
Total financial derivative instruments settled to market at negative fair value (8,451) -
Variation margin paid on financial derivative instruments settled to market 8,451 -
Total financial derivative instruments settled to market – –
Mercer UCITS Common Contractual FundMercer Passive Fundamental Indexation Global Equity UCITS CCF
Portfolio Statementas at 30 June 2021
(continued)
Mercer UCITS Common Contractual Fund 206
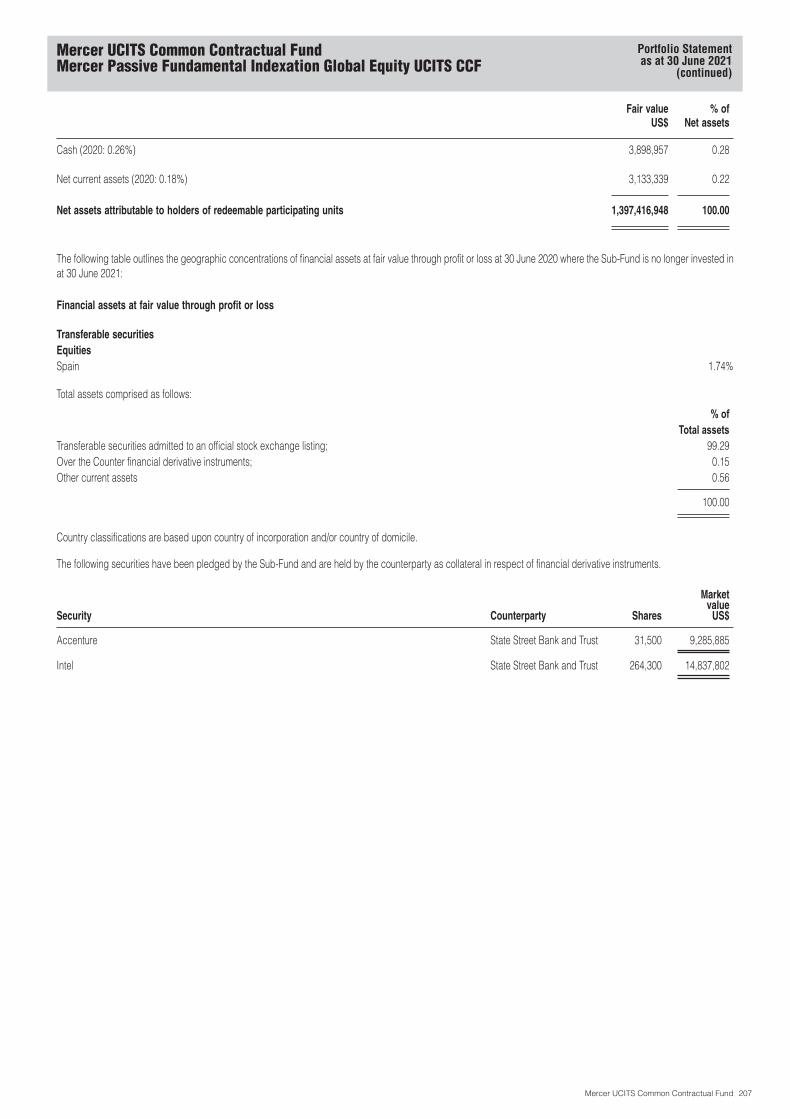
Fair valueUS$
% ofNet assets
Cash (2020: 0.26%) 3,898,957 0.28
Net current assets (2020: 0.18%) 3,133,339 0.22
Net assets attributable to holders of redeemable participating units 1,397,416,948 100.00
The following table outlines the geographic concentrations of financial assets at fair value through profit or loss at 30 June 2020 where the Sub-Fund is no longer invested inat 30 June 2021:
Financial assets at fair value through profit or loss
Transferable securitiesEquitiesSpain 1.74%
Total assets comprised as follows:
% ofTotal assets
Transferable securities admitted to an official stock exchange listing; 99.29Over the Counter financial derivative instruments; 0.15Other current assets 0.56
100.00
Country classifications are based upon country of incorporation and/or country of domicile.
The following securities have been pledged by the Sub-Fund and are held by the counterparty as collateral in respect of financial derivative instruments.
Security Counterparty Shares
Marketvalue
US$
Accenture State Street Bank and Trust 31,500 9,285,885
Intel State Street Bank and Trust 264,300 14,837,802
Mercer UCITS Common Contractual FundMercer Passive Fundamental Indexation Global Equity UCITS CCF
Portfolio Statementas at 30 June 2021
(continued)
Mercer UCITS Common Contractual Fund 207

Financial assets at fair value through profit or loss (2020: 98.74%)Transferable securities (2020: 98.74%)Equities (2020: 98.74%)
SharesFair value
GB£% of
Net assets
Australia (2020: 11.48%)Adbri 42,611 80,355 0.01Afterpay Touch Group 20,872 1,340,391 0.13AGL Energy 58,140 259,089 0.02ALS 45,669 323,638 0.03Altium 10,508 209,521 0.02Alumina 231,585 207,032 0.02AMP 315,883 193,125 0.02Ampol 22,049 338,028 0.03Ansell 11,944 282,422 0.03APA Group 109,215 528,241 0.05Appen 10,132 74,885 0.01Aristocrat Leisure 60,029 1,405,717 0.14ASX 18,740 791,419 0.08Atlas Arteria 89,446 309,642 0.03Aurizon Holdings 164,218 331,989 0.03AusNet Services 178,626 169,880 0.02Australia & New Zealand Banking Group 266,870 4,082,615 0.40Bank of Queensland 62,121 307,551 0.03Beach Energy 181,921 122,593 0.01Bendigo & Adelaide Bank 49,815 283,985 0.03BHP Group (Australia listing) 276,668 7,302,764 0.71BlueScope Steel 48,219 575,454 0.06Boral 116,954 467,157 0.05Brambles 136,257 847,120 0.08carsales.com 22,636 243,079 0.02Challenger 61,227 180,012 0.02Charter Hall Group REIT 44,424 374,688 0.04CIMIC Group 9,312 100,099 0.01Cleanaway Waste Management 126,513 181,509 0.02Cochlear 5,982 818,160 0.08Coles Group 121,498 1,128,422 0.11Commonwealth Bank of Australia 166,765 9,051,075 0.89Computershare 52,273 480,092 0.05Crown Resorts 31,552 204,220 0.02CSL 42,577 6,598,870 0.65CSR 43,297 135,532 0.01Deterra Royalties 35,943 87,900 0.01Dexus REIT 101,005 585,690 0.06Domain Holdings Australia 26,409 74,056 0.01Domino’s Pizza Enterprises 5,601 366,817 0.04Downer EDI 65,361 198,560 0.02Endeavour Group 119,660 409,034 0.04Evolution Mining 148,385 362,880 0.04Flight Centre Travel Group 15,154 122,296 0.01Fortescue Metals Group 149,582 1,897,319 0.19Goodman Group REIT 169,902 1,954,698 0.19GPT Group REIT 180,307 480,141 0.05Harvey Norman Holdings 57,851 172,287 0.02IDP Education 12,393 165,277 0.02Iluka Resources 38,627 192,076 0.02Incitec Pivot 179,473 232,133 0.02Independence Group 56,739 235,270 0.02Insurance Australia Group 228,041 639,474 0.06IOOF Holdings 59,212 137,404 0.01JB Hi-Fi 10,447 287,164 0.03Lendlease Group 63,490 395,412 0.04Macquarie Group 30,892 2,626,191 0.26Magellan Financial Group 12,654 370,386 0.04
SharesFair value
GB£% of
Net assets
Australia (2020: 11.48%) (continued)Medibank 253,822 435,890 0.04Metcash 94,199 204,258 0.02Mineral Resources 13,557 395,859 0.04Mirvac Group REIT 363,738 577,207 0.06National Australia Bank 309,117 4,404,695 0.43Newcrest Mining 76,376 1,049,287 0.10NEXTDC 41,695 268,738 0.03Northern Star Resources 104,455 555,173 0.05Nufarm 32,078 79,842 0.01Oil Search 199,566 413,211 0.04Orica 37,015 267,138 0.03Origin Energy 162,518 398,326 0.04Orora 86,734 156,962 0.01OZ Minerals 31,058 379,429 0.04Perpetual 4,950 107,738 0.01Platinum Asset Management 29,099 77,646 0.01Qantas Airways 72,435 183,440 0.02QBE Insurance Group 140,202 822,121 0.08Qube Holdings 135,528 233,479 0.02Ramsay Health Care 16,244 555,711 0.05REA Group 4,644 426,595 0.04Reece 25,588 328,316 0.03Rio Tinto (Australia listing) 34,842 2,397,917 0.23Santos 170,619 657,406 0.06Scentre Group REIT 489,161 728,388 0.07SEEK 33,009 594,491 0.06Seven Group Holdings 13,076 144,610 0.01Shopping Centres Australasia PropertyGroup REIT 106,356 145,654 0.01Sims Metal Management 16,323 147,254 0.01Sonic Healthcare 44,461 927,835 0.09South32 451,088 718,272 0.07Star Entertainment Group 79,541 159,506 0.02Stockland REIT 225,989 572,313 0.06Suncorp Group 120,220 725,857 0.07Sydney Airport 122,399 385,138 0.04Tabcorp Holdings 197,363 555,592 0.05Telstra 385,309 787,331 0.08TPG Telecom 32,431 110,330 0.01Transurban Group 254,926 1,971,420 0.19Treasury Wine Estates 66,720 423,506 0.04Tuas 22,667 7,945 -Vicinity Centres REIT 346,953 291,313 0.03Washington H Soul Pattinson & Co 9,079 166,423 0.02Wesfarmers 106,939 3,434,661 0.34Westpac Banking 344,415 4,830,925 0.47Whitehaven Coal 83,883 88,437 0.01WiseTech Global 7,950 137,951 0.01Woodside Petroleum 89,206 1,076,720 0.10Woolworths Group 119,660 2,479,568 0.24Worley 29,335 190,668 0.02
89,501,328 8.77Bahrain (2020: 0.04%)Ahli United Bank BSC 748,329 431,489 0.04
Brazil (2020: 4.08%)Aliansce Sonae Shopping Centers 13,400 56,137 0.01
Mercer UCITS Common Contractual FundNFU Mutual Global Regional Core Fund
Portfolio Statementas at 30 June 2021
Mercer UCITS Common Contractual Fund 208
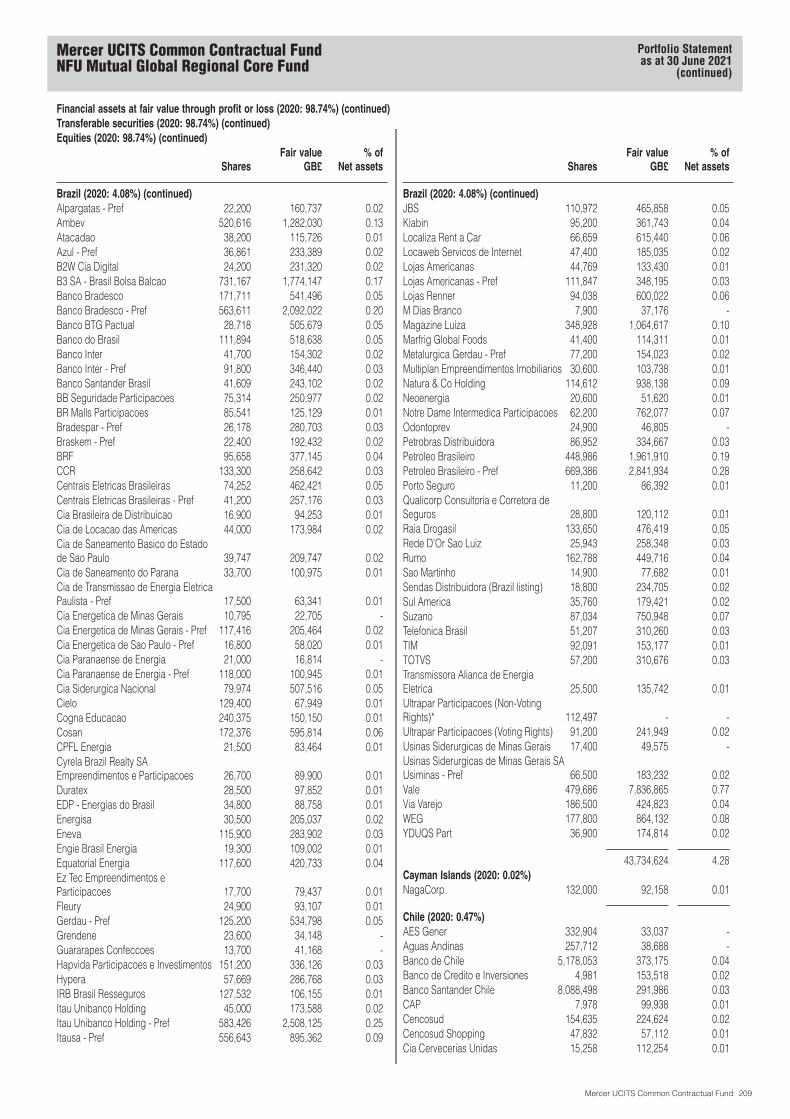
Financial assets at fair value through profit or loss (2020: 98.74%) (continued)Transferable securities (2020: 98.74%) (continued)Equities (2020: 98.74%) (continued)
SharesFair value
GB£% of
Net assets
Brazil (2020: 4.08%) (continued)Alpargatas - Pref 22,200 160,737 0.02Ambev 520,616 1,282,030 0.13Atacadao 38,200 115,726 0.01Azul - Pref 36,861 233,389 0.02B2W Cia Digital 24,200 231,320 0.02B3 SA - Brasil Bolsa Balcao 731,167 1,774,147 0.17Banco Bradesco 171,711 541,496 0.05Banco Bradesco - Pref 563,611 2,092,022 0.20Banco BTG Pactual 28,718 505,679 0.05Banco do Brasil 111,894 518,638 0.05Banco Inter 41,700 154,302 0.02Banco Inter - Pref 91,800 346,440 0.03Banco Santander Brasil 41,609 243,102 0.02BB Seguridade Participacoes 75,314 250,977 0.02BR Malls Participacoes 85,541 125,129 0.01Bradespar - Pref 26,178 280,703 0.03Braskem - Pref 22,400 192,432 0.02BRF 95,658 377,145 0.04CCR 133,300 258,642 0.03Centrais Eletricas Brasileiras 74,252 462,421 0.05Centrais Eletricas Brasileiras - Pref 41,200 257,176 0.03Cia Brasileira de Distribuicao 16,900 94,253 0.01Cia de Locacao das Americas 44,000 173,984 0.02Cia de Saneamento Basico do Estadode Sao Paulo 39,747 209,747 0.02Cia de Saneamento do Parana 33,700 100,975 0.01Cia de Transmissao de Energia EletricaPaulista - Pref 17,500 63,341 0.01Cia Energetica de Minas Gerais 10,795 22,705 -Cia Energetica de Minas Gerais - Pref 117,416 205,464 0.02Cia Energetica de Sao Paulo - Pref 16,800 58,020 0.01Cia Paranaense de Energia 21,000 16,814 -Cia Paranaense de Energia - Pref 118,000 100,945 0.01Cia Siderurgica Nacional 79,974 507,516 0.05Cielo 129,400 67,949 0.01Cogna Educacao 240,375 150,150 0.01Cosan 172,376 595,814 0.06CPFL Energia 21,500 83,464 0.01Cyrela Brazil Realty SAEmpreendimentos e Participacoes 26,700 89,900 0.01Duratex 28,500 97,852 0.01EDP - Energias do Brasil 34,800 88,758 0.01Energisa 30,500 205,037 0.02Eneva 115,900 283,902 0.03Engie Brasil Energia 19,300 109,002 0.01Equatorial Energia 117,600 420,733 0.04Ez Tec Empreendimentos eParticipacoes 17,700 79,437 0.01Fleury 24,900 93,107 0.01Gerdau - Pref 125,200 534,798 0.05Grendene 23,600 34,148 -Guararapes Confeccoes 13,700 41,168 -Hapvida Participacoes e Investimentos 151,200 336,126 0.03Hypera 57,669 286,768 0.03IRB Brasil Resseguros 127,532 106,155 0.01Itau Unibanco Holding 45,000 173,588 0.02Itau Unibanco Holding - Pref 583,426 2,508,125 0.25Itausa - Pref 556,643 895,362 0.09
SharesFair value
GB£% of
Net assets
Brazil (2020: 4.08%) (continued)JBS 110,972 465,858 0.05Klabin 95,200 361,743 0.04Localiza Rent a Car 66,659 615,440 0.06Locaweb Servicos de Internet 47,400 185,035 0.02Lojas Americanas 44,769 133,430 0.01Lojas Americanas - Pref 111,847 348,195 0.03Lojas Renner 94,038 600,022 0.06M Dias Branco 7,900 37,176 -Magazine Luiza 348,928 1,064,617 0.10Marfrig Global Foods 41,400 114,311 0.01Metalurgica Gerdau - Pref 77,200 154,023 0.02Multiplan Empreendimentos Imobiliarios 30,600 103,738 0.01Natura & Co Holding 114,612 938,138 0.09Neoenergia 20,600 51,620 0.01Notre Dame Intermedica Participacoes 62,200 762,077 0.07Odontoprev 24,900 46,805 -Petrobras Distribuidora 86,952 334,667 0.03Petroleo Brasileiro 448,986 1,961,910 0.19Petroleo Brasileiro - Pref 669,386 2,841,934 0.28Porto Seguro 11,200 86,392 0.01Qualicorp Consultoria e Corretora deSeguros 28,800 120,112 0.01Raia Drogasil 133,650 476,419 0.05Rede D’Or Sao Luiz 25,943 258,348 0.03Rumo 162,788 449,716 0.04Sao Martinho 14,900 77,682 0.01Sendas Distribuidora (Brazil listing) 18,800 234,705 0.02Sul America 35,760 179,421 0.02Suzano 87,034 750,948 0.07Telefonica Brasil 51,207 310,260 0.03TIM 92,091 153,177 0.01TOTVS 57,200 310,676 0.03Transmissora Alianca de EnergiaEletrica 25,500 135,742 0.01Ultrapar Participacoes (Non-VotingRights)* 112,497 - -Ultrapar Participacoes (Voting Rights) 91,200 241,949 0.02Usinas Siderurgicas de Minas Gerais 17,400 49,575 -Usinas Siderurgicas de Minas Gerais SAUsiminas - Pref 66,500 183,232 0.02Vale 479,686 7,836,865 0.77Via Varejo 186,500 424,823 0.04WEG 177,800 864,132 0.08YDUQS Part 36,900 174,814 0.02
43,734,624 4.28Cayman Islands (2020: 0.02%)NagaCorp 132,000 92,158 0.01
Chile (2020: 0.47%)AES Gener 332,904 33,037 -Aguas Andinas 257,712 38,688 -Banco de Chile 5,178,053 373,175 0.04Banco de Credito e Inversiones 4,981 153,518 0.02Banco Santander Chile 8,088,498 291,986 0.03CAP 7,978 99,938 0.01Cencosud 154,635 224,624 0.02Cencosud Shopping 47,832 57,112 0.01Cia Cervecerias Unidas 15,258 112,254 0.01
Mercer UCITS Common Contractual FundNFU Mutual Global Regional Core Fund
Portfolio Statementas at 30 June 2021
(continued)
Mercer UCITS Common Contractual Fund 209
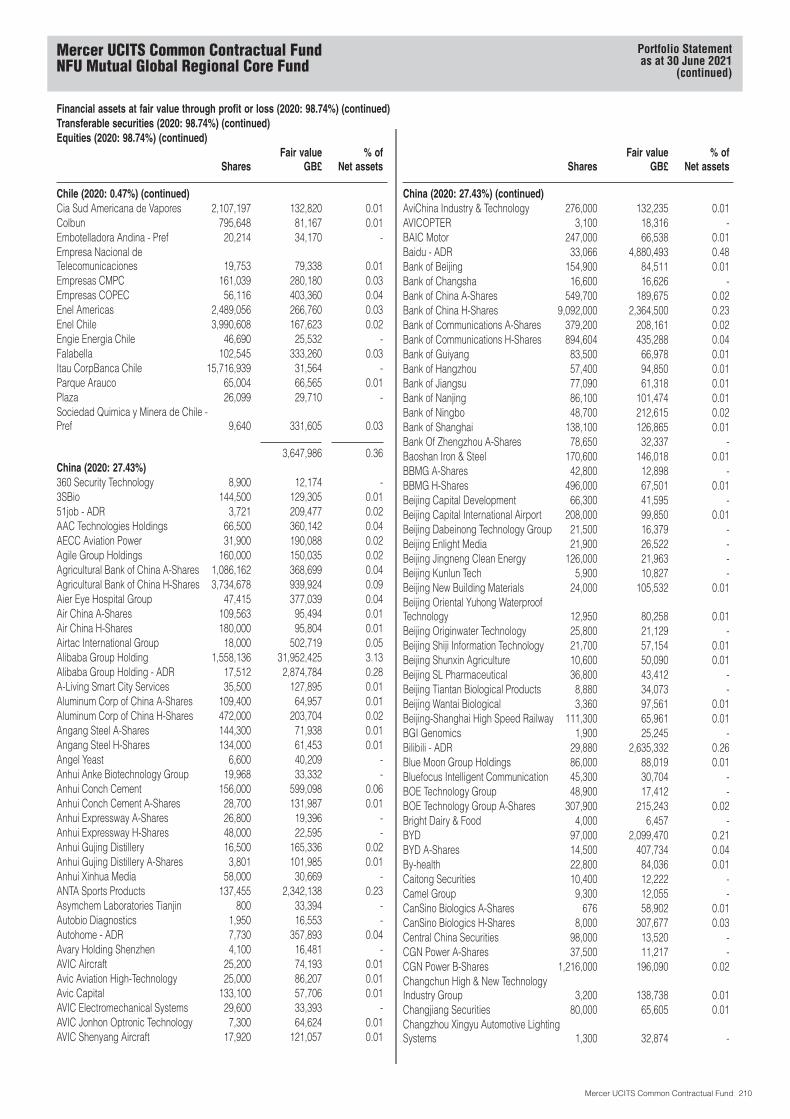
Financial assets at fair value through profit or loss (2020: 98.74%) (continued)Transferable securities (2020: 98.74%) (continued)Equities (2020: 98.74%) (continued)
SharesFair value
GB£% of
Net assets
Chile (2020: 0.47%) (continued)Cia Sud Americana de Vapores 2,107,197 132,820 0.01Colbun 795,648 81,167 0.01Embotelladora Andina - Pref 20,214 34,170 -Empresa Nacional deTelecomunicaciones 19,753 79,338 0.01Empresas CMPC 161,039 280,180 0.03Empresas COPEC 56,116 403,360 0.04Enel Americas 2,489,056 266,760 0.03Enel Chile 3,990,608 167,623 0.02Engie Energia Chile 46,690 25,532 -Falabella 102,545 333,260 0.03Itau CorpBanca Chile 15,716,939 31,564 -Parque Arauco 65,004 66,565 0.01Plaza 26,099 29,710 -Sociedad Quimica y Minera de Chile -Pref 9,640 331,605 0.03
3,647,986 0.36China (2020: 27.43%)360 Security Technology 8,900 12,174 -3SBio 144,500 129,305 0.0151job - ADR 3,721 209,477 0.02AAC Technologies Holdings 66,500 360,142 0.04AECC Aviation Power 31,900 190,088 0.02Agile Group Holdings 160,000 150,035 0.02Agricultural Bank of China A-Shares 1,086,162 368,699 0.04Agricultural Bank of China H-Shares 3,734,678 939,924 0.09Aier Eye Hospital Group 47,415 377,039 0.04Air China A-Shares 109,563 95,494 0.01Air China H-Shares 180,000 95,804 0.01Airtac International Group 18,000 502,719 0.05Alibaba Group Holding 1,558,136 31,952,425 3.13Alibaba Group Holding - ADR 17,512 2,874,784 0.28A-Living Smart City Services 35,500 127,895 0.01Aluminum Corp of China A-Shares 109,400 64,957 0.01Aluminum Corp of China H-Shares 472,000 203,704 0.02Angang Steel A-Shares 144,300 71,938 0.01Angang Steel H-Shares 134,000 61,453 0.01Angel Yeast 6,600 40,209 -Anhui Anke Biotechnology Group 19,968 33,332 -Anhui Conch Cement 156,000 599,098 0.06Anhui Conch Cement A-Shares 28,700 131,987 0.01Anhui Expressway A-Shares 26,800 19,396 -Anhui Expressway H-Shares 48,000 22,595 -Anhui Gujing Distillery 16,500 165,336 0.02Anhui Gujing Distillery A-Shares 3,801 101,985 0.01Anhui Xinhua Media 58,000 30,669 -ANTA Sports Products 137,455 2,342,138 0.23Asymchem Laboratories Tianjin 800 33,394 -Autobio Diagnostics 1,950 16,553 -Autohome - ADR 7,730 357,893 0.04Avary Holding Shenzhen 4,100 16,481 -AVIC Aircraft 25,200 74,193 0.01Avic Aviation High-Technology 25,000 86,207 0.01Avic Capital 133,100 57,706 0.01AVIC Electromechanical Systems 29,600 33,393 -AVIC Jonhon Optronic Technology 7,300 64,624 0.01AVIC Shenyang Aircraft 17,920 121,057 0.01
SharesFair value
GB£% of
Net assets
China (2020: 27.43%) (continued)AviChina Industry & Technology 276,000 132,235 0.01AVICOPTER 3,100 18,316 -BAIC Motor 247,000 66,538 0.01Baidu - ADR 33,066 4,880,493 0.48Bank of Beijing 154,900 84,511 0.01Bank of Changsha 16,600 16,626 -Bank of China A-Shares 549,700 189,675 0.02Bank of China H-Shares 9,092,000 2,364,500 0.23Bank of Communications A-Shares 379,200 208,161 0.02Bank of Communications H-Shares 894,604 435,288 0.04Bank of Guiyang 83,500 66,978 0.01Bank of Hangzhou 57,400 94,850 0.01Bank of Jiangsu 77,090 61,318 0.01Bank of Nanjing 86,100 101,474 0.01Bank of Ningbo 48,700 212,615 0.02Bank of Shanghai 138,100 126,865 0.01Bank Of Zhengzhou A-Shares 78,650 32,337 -Baoshan Iron & Steel 170,600 146,018 0.01BBMG A-Shares 42,800 12,898 -BBMG H-Shares 496,000 67,501 0.01Beijing Capital Development 66,300 41,595 -Beijing Capital International Airport 208,000 99,850 0.01Beijing Dabeinong Technology Group 21,500 16,379 -Beijing Enlight Media 21,900 26,522 -Beijing Jingneng Clean Energy 126,000 21,963 -Beijing Kunlun Tech 5,900 10,827 -Beijing New Building Materials 24,000 105,532 0.01Beijing Oriental Yuhong WaterproofTechnology 12,950 80,258 0.01Beijing Originwater Technology 25,800 21,129 -Beijing Shiji Information Technology 21,700 57,154 0.01Beijing Shunxin Agriculture 10,600 50,090 0.01Beijing SL Pharmaceutical 36,800 43,412 -Beijing Tiantan Biological Products 8,880 34,073 -Beijing Wantai Biological 3,360 97,561 0.01Beijing-Shanghai High Speed Railway 111,300 65,961 0.01BGI Genomics 1,900 25,245 -Bilibili - ADR 29,880 2,635,332 0.26Blue Moon Group Holdings 86,000 88,019 0.01Bluefocus Intelligent Communication 45,300 30,704 -BOE Technology Group 48,900 17,412 -BOE Technology Group A-Shares 307,900 215,243 0.02Bright Dairy & Food 4,000 6,457 -BYD 97,000 2,099,470 0.21BYD A-Shares 14,500 407,734 0.04By-health 22,800 84,036 0.01Caitong Securities 10,400 12,222 -Camel Group 9,300 12,055 -CanSino Biologics A-Shares 676 58,902 0.01CanSino Biologics H-Shares 8,000 307,677 0.03Central China Securities 98,000 13,520 -CGN Power A-Shares 37,500 11,217 -CGN Power B-Shares 1,216,000 196,090 0.02Changchun High & New TechnologyIndustry Group 3,200 138,738 0.01Changjiang Securities 80,000 65,605 0.01Changzhou Xingyu Automotive LightingSystems 1,300 32,874 -
Mercer UCITS Common Contractual FundNFU Mutual Global Regional Core Fund
Portfolio Statementas at 30 June 2021
(continued)
Mercer UCITS Common Contractual Fund 210
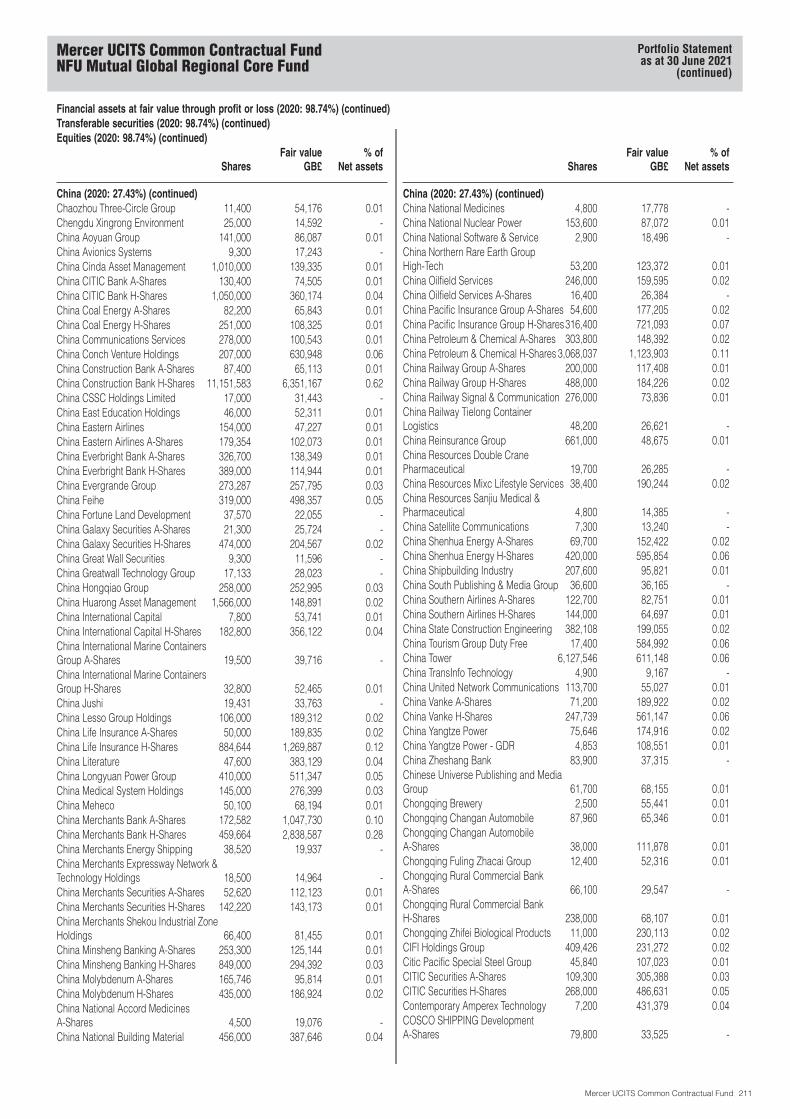
Financial assets at fair value through profit or loss (2020: 98.74%) (continued)Transferable securities (2020: 98.74%) (continued)Equities (2020: 98.74%) (continued)
SharesFair value
GB£% of
Net assets
China (2020: 27.43%) (continued)Chaozhou Three-Circle Group 11,400 54,176 0.01Chengdu Xingrong Environment 25,000 14,592 -China Aoyuan Group 141,000 86,087 0.01China Avionics Systems 9,300 17,243 -China Cinda Asset Management 1,010,000 139,335 0.01China CITIC Bank A-Shares 130,400 74,505 0.01China CITIC Bank H-Shares 1,050,000 360,174 0.04China Coal Energy A-Shares 82,200 65,843 0.01China Coal Energy H-Shares 251,000 108,325 0.01China Communications Services 278,000 100,543 0.01China Conch Venture Holdings 207,000 630,948 0.06China Construction Bank A-Shares 87,400 65,113 0.01China Construction Bank H-Shares 11,151,583 6,351,167 0.62China CSSC Holdings Limited 17,000 31,443 -China East Education Holdings 46,000 52,311 0.01China Eastern Airlines 154,000 47,227 0.01China Eastern Airlines A-Shares 179,354 102,073 0.01China Everbright Bank A-Shares 326,700 138,349 0.01China Everbright Bank H-Shares 389,000 114,944 0.01China Evergrande Group 273,287 257,795 0.03China Feihe 319,000 498,357 0.05China Fortune Land Development 37,570 22,055 -China Galaxy Securities A-Shares 21,300 25,724 -China Galaxy Securities H-Shares 474,000 204,567 0.02China Great Wall Securities 9,300 11,596 -China Greatwall Technology Group 17,133 28,023 -China Hongqiao Group 258,000 252,995 0.03China Huarong Asset Management 1,566,000 148,891 0.02China International Capital 7,800 53,741 0.01China International Capital H-Shares 182,800 356,122 0.04China International Marine ContainersGroup A-Shares 19,500 39,716 -China International Marine ContainersGroup H-Shares 32,800 52,465 0.01China Jushi 19,431 33,763 -China Lesso Group Holdings 106,000 189,312 0.02China Life Insurance A-Shares 50,000 189,835 0.02China Life Insurance H-Shares 884,644 1,269,887 0.12China Literature 47,600 383,129 0.04China Longyuan Power Group 410,000 511,347 0.05China Medical System Holdings 145,000 276,399 0.03China Meheco 50,100 68,194 0.01China Merchants Bank A-Shares 172,582 1,047,730 0.10China Merchants Bank H-Shares 459,664 2,838,587 0.28China Merchants Energy Shipping 38,520 19,937 -China Merchants Expressway Network &Technology Holdings 18,500 14,964 -China Merchants Securities A-Shares 52,620 112,123 0.01China Merchants Securities H-Shares 142,220 143,173 0.01China Merchants Shekou Industrial ZoneHoldings 66,400 81,455 0.01China Minsheng Banking A-Shares 253,300 125,144 0.01China Minsheng Banking H-Shares 849,000 294,392 0.03China Molybdenum A-Shares 165,746 95,814 0.01China Molybdenum H-Shares 435,000 186,924 0.02China National Accord MedicinesA-Shares 4,500 19,076 -China National Building Material 456,000 387,646 0.04
SharesFair value
GB£% of
Net assets
China (2020: 27.43%) (continued)China National Medicines 4,800 17,778 -China National Nuclear Power 153,600 87,072 0.01China National Software & Service 2,900 18,496 -China Northern Rare Earth GroupHigh-Tech 53,200 123,372 0.01China Oilfield Services 246,000 159,595 0.02China Oilfield Services A-Shares 16,400 26,384 -China Pacific Insurance Group A-Shares 54,600 177,205 0.02China Pacific Insurance Group H-Shares316,400 721,093 0.07China Petroleum & Chemical A-Shares 303,800 148,392 0.02China Petroleum & Chemical H-Shares 3,068,037 1,123,903 0.11China Railway Group A-Shares 200,000 117,408 0.01China Railway Group H-Shares 488,000 184,226 0.02China Railway Signal & Communication 276,000 73,836 0.01China Railway Tielong ContainerLogistics 48,200 26,621 -China Reinsurance Group 661,000 48,675 0.01China Resources Double CranePharmaceutical 19,700 26,285 -China Resources Mixc Lifestyle Services 38,400 190,244 0.02China Resources Sanjiu Medical &Pharmaceutical 4,800 14,385 -China Satellite Communications 7,300 13,240 -China Shenhua Energy A-Shares 69,700 152,422 0.02China Shenhua Energy H-Shares 420,000 595,854 0.06China Shipbuilding Industry 207,600 95,821 0.01China South Publishing & Media Group 36,600 36,165 -China Southern Airlines A-Shares 122,700 82,751 0.01China Southern Airlines H-Shares 144,000 64,697 0.01China State Construction Engineering 382,108 199,055 0.02China Tourism Group Duty Free 17,400 584,992 0.06China Tower 6,127,546 611,148 0.06China TransInfo Technology 4,900 9,167 -China United Network Communications 113,700 55,027 0.01China Vanke A-Shares 71,200 189,922 0.02China Vanke H-Shares 247,739 561,147 0.06China Yangtze Power 75,646 174,916 0.02China Yangtze Power - GDR 4,853 108,551 0.01China Zheshang Bank 83,900 37,315 -Chinese Universe Publishing and MediaGroup 61,700 68,155 0.01Chongqing Brewery 2,500 55,441 0.01Chongqing Changan Automobile 87,960 65,346 0.01Chongqing Changan AutomobileA-Shares 38,000 111,878 0.01Chongqing Fuling Zhacai Group 12,400 52,316 0.01Chongqing Rural Commercial BankA-Shares 66,100 29,547 -Chongqing Rural Commercial BankH-Shares 238,000 68,107 0.01Chongqing Zhifei Biological Products 11,000 230,113 0.02CIFI Holdings Group 409,426 231,272 0.02Citic Pacific Special Steel Group 45,840 107,023 0.01CITIC Securities A-Shares 109,300 305,388 0.03CITIC Securities H-Shares 268,000 486,631 0.05Contemporary Amperex Technology 7,200 431,379 0.04COSCO SHIPPING DevelopmentA-Shares 79,800 33,525 -
Mercer UCITS Common Contractual FundNFU Mutual Global Regional Core Fund
Portfolio Statementas at 30 June 2021
(continued)
Mercer UCITS Common Contractual Fund 211
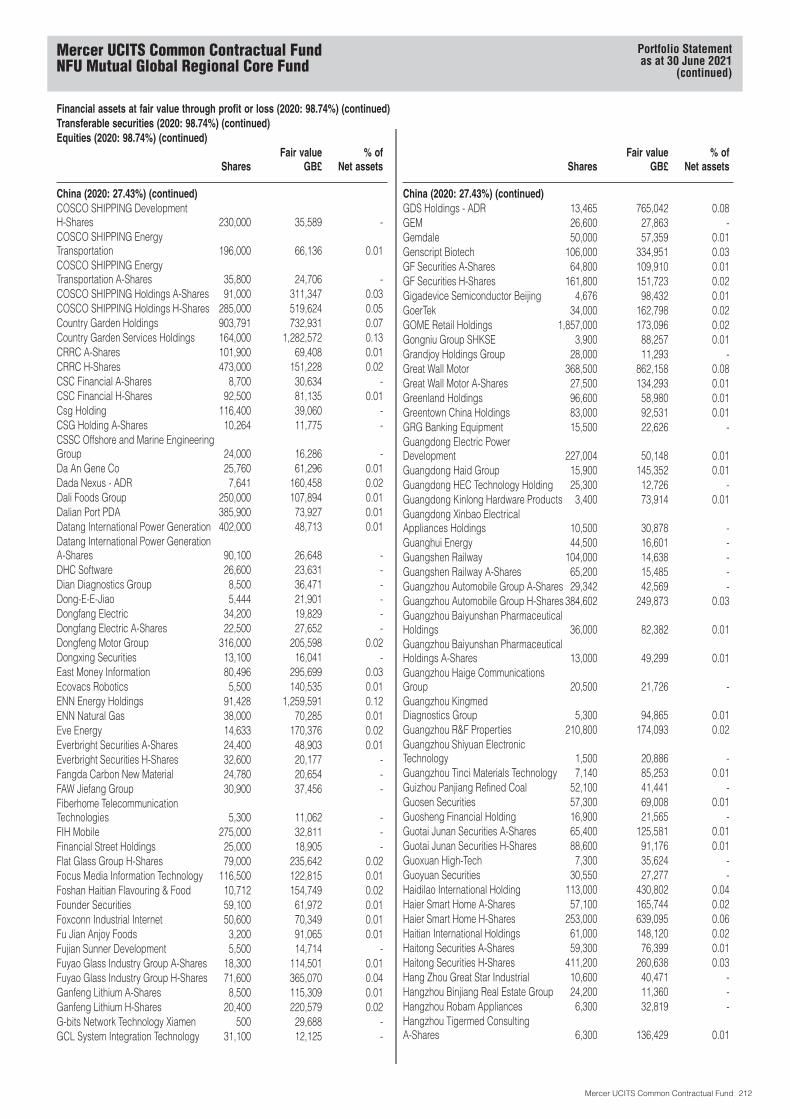
Financial assets at fair value through profit or loss (2020: 98.74%) (continued)Transferable securities (2020: 98.74%) (continued)Equities (2020: 98.74%) (continued)
SharesFair value
GB£% of
Net assets
China (2020: 27.43%) (continued)COSCO SHIPPING DevelopmentH-Shares 230,000 35,589 -COSCO SHIPPING EnergyTransportation 196,000 66,136 0.01COSCO SHIPPING EnergyTransportation A-Shares 35,800 24,706 -COSCO SHIPPING Holdings A-Shares 91,000 311,347 0.03COSCO SHIPPING Holdings H-Shares 285,000 519,624 0.05Country Garden Holdings 903,791 732,931 0.07Country Garden Services Holdings 164,000 1,282,572 0.13CRRC A-Shares 101,900 69,408 0.01CRRC H-Shares 473,000 151,228 0.02CSC Financial A-Shares 8,700 30,634 -CSC Financial H-Shares 92,500 81,135 0.01Csg Holding 116,400 39,060 -CSG Holding A-Shares 10,264 11,775 -CSSC Offshore and Marine EngineeringGroup 24,000 16,286 -Da An Gene Co 25,760 61,296 0.01Dada Nexus - ADR 7,641 160,458 0.02Dali Foods Group 250,000 107,894 0.01Dalian Port PDA 385,900 73,927 0.01Datang International Power Generation 402,000 48,713 0.01Datang International Power GenerationA-Shares 90,100 26,648 -DHC Software 26,600 23,631 -Dian Diagnostics Group 8,500 36,471 -Dong-E-E-Jiao 5,444 21,901 -Dongfang Electric 34,200 19,829 -Dongfang Electric A-Shares 22,500 27,652 -Dongfeng Motor Group 316,000 205,598 0.02Dongxing Securities 13,100 16,041 -East Money Information 80,496 295,699 0.03Ecovacs Robotics 5,500 140,535 0.01ENN Energy Holdings 91,428 1,259,591 0.12ENN Natural Gas 38,000 70,285 0.01Eve Energy 14,633 170,376 0.02Everbright Securities A-Shares 24,400 48,903 0.01Everbright Securities H-Shares 32,600 20,177 -Fangda Carbon New Material 24,780 20,654 -FAW Jiefang Group 30,900 37,456 -Fiberhome TelecommunicationTechnologies 5,300 11,062 -FIH Mobile 275,000 32,811 -Financial Street Holdings 25,000 18,905 -Flat Glass Group H-Shares 79,000 235,642 0.02Focus Media Information Technology 116,500 122,815 0.01Foshan Haitian Flavouring & Food 10,712 154,749 0.02Founder Securities 59,100 61,972 0.01Foxconn Industrial Internet 50,600 70,349 0.01Fu Jian Anjoy Foods 3,200 91,065 0.01Fujian Sunner Development 5,500 14,714 -Fuyao Glass Industry Group A-Shares 18,300 114,501 0.01Fuyao Glass Industry Group H-Shares 71,600 365,070 0.04Ganfeng Lithium A-Shares 8,500 115,309 0.01Ganfeng Lithium H-Shares 20,400 220,579 0.02G-bits Network Technology Xiamen 500 29,688 -GCL System Integration Technology 31,100 12,125 -
SharesFair value
GB£% of
Net assets
China (2020: 27.43%) (continued)GDS Holdings - ADR 13,465 765,042 0.08GEM 26,600 27,863 -Gemdale 50,000 57,359 0.01Genscript Biotech 106,000 334,951 0.03GF Securities A-Shares 64,800 109,910 0.01GF Securities H-Shares 161,800 151,723 0.02Gigadevice Semiconductor Beijing 4,676 98,432 0.01GoerTek 34,000 162,798 0.02GOME Retail Holdings 1,857,000 173,096 0.02Gongniu Group SHKSE 3,900 88,257 0.01Grandjoy Holdings Group 28,000 11,293 -Great Wall Motor 368,500 862,158 0.08Great Wall Motor A-Shares 27,500 134,293 0.01Greenland Holdings 96,600 58,980 0.01Greentown China Holdings 83,000 92,531 0.01GRG Banking Equipment 15,500 22,626 -Guangdong Electric PowerDevelopment 227,004 50,148 0.01Guangdong Haid Group 15,900 145,352 0.01Guangdong HEC Technology Holding 25,300 12,726 -Guangdong Kinlong Hardware Products 3,400 73,914 0.01Guangdong Xinbao ElectricalAppliances Holdings 10,500 30,878 -Guanghui Energy 44,500 16,601 -Guangshen Railway 104,000 14,638 -Guangshen Railway A-Shares 65,200 15,485 -Guangzhou Automobile Group A-Shares 29,342 42,569 -Guangzhou Automobile Group H-Shares 384,602 249,873 0.03Guangzhou Baiyunshan PharmaceuticalHoldings 36,000 82,382 0.01Guangzhou Baiyunshan PharmaceuticalHoldings A-Shares 13,000 49,299 0.01Guangzhou Haige CommunicationsGroup 20,500 21,726 -Guangzhou KingmedDiagnostics Group 5,300 94,865 0.01Guangzhou R&F Properties 210,800 174,093 0.02Guangzhou Shiyuan ElectronicTechnology 1,500 20,886 -Guangzhou Tinci Materials Technology 7,140 85,253 0.01Guizhou Panjiang Refined Coal 52,100 41,441 -Guosen Securities 57,300 69,008 0.01Guosheng Financial Holding 16,900 21,565 -Guotai Junan Securities A-Shares 65,400 125,581 0.01Guotai Junan Securities H-Shares 88,600 91,176 0.01Guoxuan High-Tech 7,300 35,624 -Guoyuan Securities 30,550 27,277 -Haidilao International Holding 113,000 430,802 0.04Haier Smart Home A-Shares 57,100 165,744 0.02Haier Smart Home H-Shares 253,000 639,095 0.06Haitian International Holdings 61,000 148,120 0.02Haitong Securities A-Shares 59,300 76,399 0.01Haitong Securities H-Shares 411,200 260,638 0.03Hang Zhou Great Star Industrial 10,600 40,471 -Hangzhou Binjiang Real Estate Group 24,200 11,360 -Hangzhou Robam Appliances 6,300 32,819 -Hangzhou Tigermed ConsultingA-Shares 6,300 136,429 0.01
Mercer UCITS Common Contractual FundNFU Mutual Global Regional Core Fund
Portfolio Statementas at 30 June 2021
(continued)
Mercer UCITS Common Contractual Fund 212
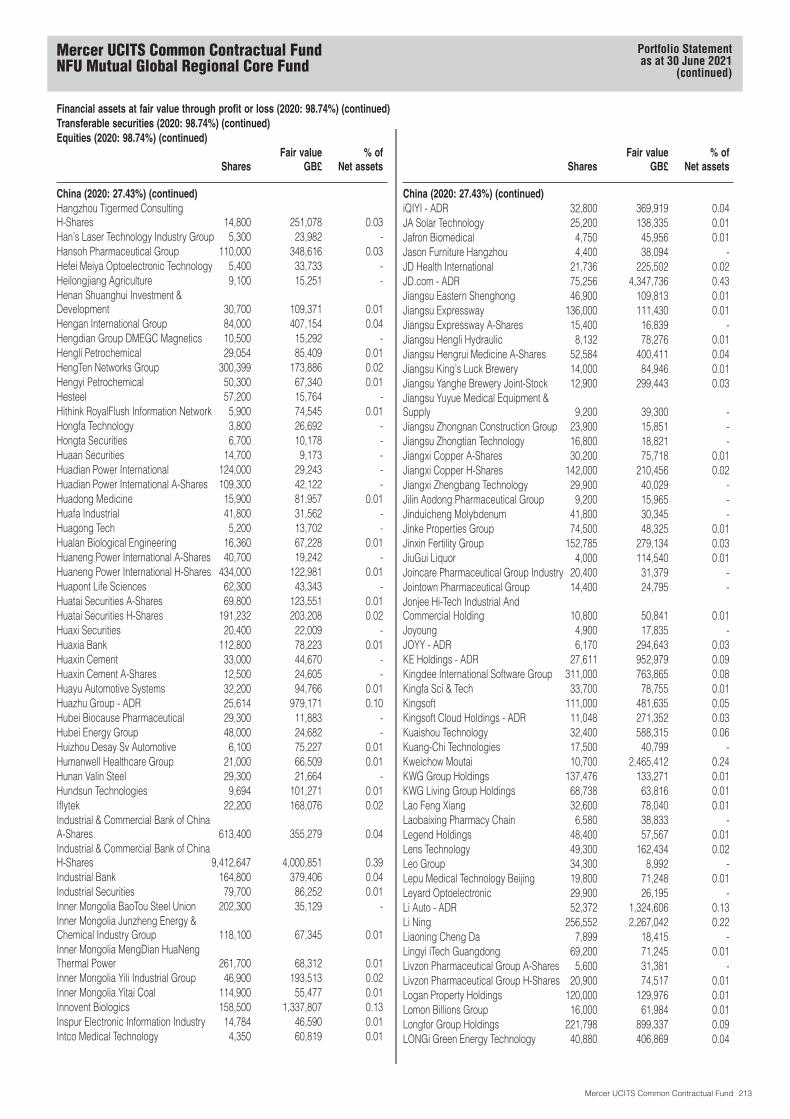
Financial assets at fair value through profit or loss (2020: 98.74%) (continued)Transferable securities (2020: 98.74%) (continued)Equities (2020: 98.74%) (continued)
SharesFair value
GB£% of
Net assets
China (2020: 27.43%) (continued)Hangzhou Tigermed ConsultingH-Shares 14,800 251,078 0.03Han’s Laser Technology Industry Group 5,300 23,982 -Hansoh Pharmaceutical Group 110,000 348,616 0.03Hefei Meiya Optoelectronic Technology 5,400 33,733 -Heilongjiang Agriculture 9,100 15,251 -Henan Shuanghui Investment &Development 30,700 109,371 0.01Hengan International Group 84,000 407,154 0.04Hengdian Group DMEGC Magnetics 10,500 15,292 -Hengli Petrochemical 29,054 85,409 0.01HengTen Networks Group 300,399 173,886 0.02Hengyi Petrochemical 50,300 67,340 0.01Hesteel 57,200 15,764 -Hithink RoyalFlush Information Network 5,900 74,545 0.01Hongfa Technology 3,800 26,692 -Hongta Securities 6,700 10,178 -Huaan Securities 14,700 9,173 -Huadian Power International 124,000 29,243 -Huadian Power International A-Shares 109,300 42,122 -Huadong Medicine 15,900 81,957 0.01Huafa Industrial 41,800 31,562 -Huagong Tech 5,200 13,702 -Hualan Biological Engineering 16,360 67,228 0.01Huaneng Power International A-Shares 40,700 19,242 -Huaneng Power International H-Shares 434,000 122,981 0.01Huapont Life Sciences 62,300 43,343 -Huatai Securities A-Shares 69,800 123,551 0.01Huatai Securities H-Shares 191,232 203,208 0.02Huaxi Securities 20,400 22,009 -Huaxia Bank 112,800 78,223 0.01Huaxin Cement 33,000 44,670 -Huaxin Cement A-Shares 12,500 24,605 -Huayu Automotive Systems 32,200 94,766 0.01Huazhu Group - ADR 25,614 979,171 0.10Hubei Biocause Pharmaceutical 29,300 11,883 -Hubei Energy Group 48,000 24,682 -Huizhou Desay Sv Automotive 6,100 75,227 0.01Humanwell Healthcare Group 21,000 66,509 0.01Hunan Valin Steel 29,300 21,664 -Hundsun Technologies 9,694 101,271 0.01Iflytek 22,200 168,076 0.02Industrial & Commercial Bank of ChinaA-Shares 613,400 355,279 0.04Industrial & Commercial Bank of ChinaH-Shares 9,412,647 4,000,851 0.39Industrial Bank 164,800 379,406 0.04Industrial Securities 79,700 86,252 0.01Inner Mongolia BaoTou Steel Union 202,300 35,129 -Inner Mongolia Junzheng Energy &Chemical Industry Group 118,100 67,345 0.01Inner Mongolia MengDian HuaNengThermal Power 261,700 68,312 0.01Inner Mongolia Yili Industrial Group 46,900 193,513 0.02Inner Mongolia Yitai Coal 114,900 55,477 0.01Innovent Biologics 158,500 1,337,807 0.13Inspur Electronic Information Industry 14,784 46,590 0.01Intco Medical Technology 4,350 60,819 0.01
SharesFair value
GB£% of
Net assets
China (2020: 27.43%) (continued)iQIYI - ADR 32,800 369,919 0.04JA Solar Technology 25,200 138,335 0.01Jafron Biomedical 4,750 45,956 0.01Jason Furniture Hangzhou 4,400 38,094 -JD Health International 21,736 225,502 0.02JD.com - ADR 75,256 4,347,736 0.43Jiangsu Eastern Shenghong 46,900 109,813 0.01Jiangsu Expressway 136,000 111,430 0.01Jiangsu Expressway A-Shares 15,400 16,839 -Jiangsu Hengli Hydraulic 8,132 78,276 0.01Jiangsu Hengrui Medicine A-Shares 52,584 400,411 0.04Jiangsu King’s Luck Brewery 14,000 84,946 0.01Jiangsu Yanghe Brewery Joint-Stock 12,900 299,443 0.03Jiangsu Yuyue Medical Equipment &Supply 9,200 39,300 -Jiangsu Zhongnan Construction Group 23,900 15,851 -Jiangsu Zhongtian Technology 16,800 18,821 -Jiangxi Copper A-Shares 30,200 75,718 0.01Jiangxi Copper H-Shares 142,000 210,456 0.02Jiangxi Zhengbang Technology 29,900 40,029 -Jilin Aodong Pharmaceutical Group 9,200 15,965 -Jinduicheng Molybdenum 41,800 30,345 -Jinke Properties Group 74,500 48,325 0.01Jinxin Fertility Group 152,785 279,134 0.03JiuGui Liquor 4,000 114,540 0.01Joincare Pharmaceutical Group Industry 20,400 31,379 -Jointown Pharmaceutical Group 14,400 24,795 -Jonjee Hi-Tech Industrial AndCommercial Holding 10,800 50,841 0.01Joyoung 4,900 17,835 -JOYY - ADR 6,170 294,643 0.03KE Holdings - ADR 27,611 952,979 0.09Kingdee International Software Group 311,000 763,865 0.08Kingfa Sci & Tech 33,700 78,755 0.01Kingsoft 111,000 481,635 0.05Kingsoft Cloud Holdings - ADR 11,048 271,352 0.03Kuaishou Technology 32,400 588,315 0.06Kuang-Chi Technologies 17,500 40,799 -Kweichow Moutai 10,700 2,465,412 0.24KWG Group Holdings 137,476 133,271 0.01KWG Living Group Holdings 68,738 63,816 0.01Lao Feng Xiang 32,600 78,040 0.01Laobaixing Pharmacy Chain 6,580 38,833 -Legend Holdings 48,400 57,567 0.01Lens Technology 49,300 162,434 0.02Leo Group 34,300 8,992 -Lepu Medical Technology Beijing 19,800 71,248 0.01Leyard Optoelectronic 29,900 26,195 -Li Auto - ADR 52,372 1,324,606 0.13Li Ning 256,552 2,267,042 0.22Liaoning Cheng Da 7,899 18,415 -Lingyi iTech Guangdong 69,200 71,245 0.01Livzon Pharmaceutical Group A-Shares 5,600 31,381 -Livzon Pharmaceutical Group H-Shares 20,900 74,517 0.01Logan Property Holdings 120,000 129,976 0.01Lomon Billions Group 16,000 61,984 0.01Longfor Group Holdings 221,798 899,337 0.09LONGi Green Energy Technology 40,880 406,869 0.04
Mercer UCITS Common Contractual FundNFU Mutual Global Regional Core Fund
Portfolio Statementas at 30 June 2021
(continued)
Mercer UCITS Common Contractual Fund 213
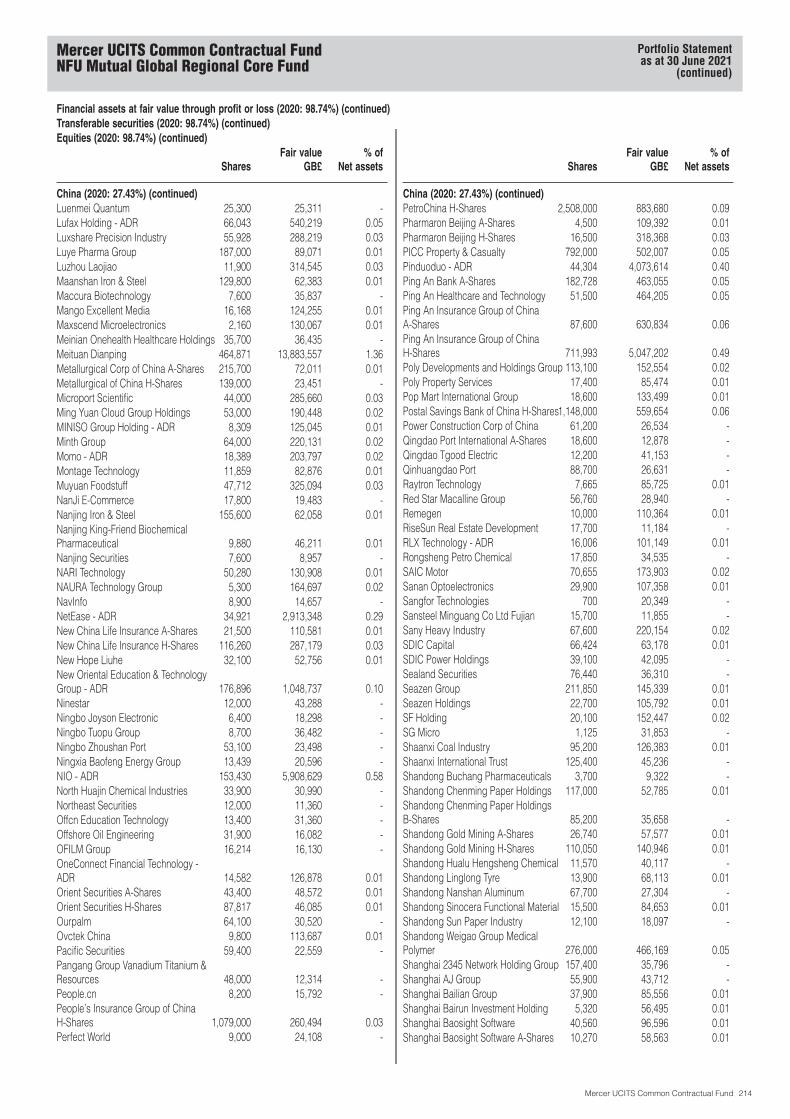
Financial assets at fair value through profit or loss (2020: 98.74%) (continued)Transferable securities (2020: 98.74%) (continued)Equities (2020: 98.74%) (continued)
SharesFair value
GB£% of
Net assets
China (2020: 27.43%) (continued)Luenmei Quantum 25,300 25,311 -Lufax Holding - ADR 66,043 540,219 0.05Luxshare Precision Industry 55,928 288,219 0.03Luye Pharma Group 187,000 89,071 0.01Luzhou Laojiao 11,900 314,545 0.03Maanshan Iron & Steel 129,800 62,383 0.01Maccura Biotechnology 7,600 35,837 -Mango Excellent Media 16,168 124,255 0.01Maxscend Microelectronics 2,160 130,067 0.01Meinian Onehealth Healthcare Holdings 35,700 36,435 -Meituan Dianping 464,871 13,883,557 1.36Metallurgical Corp of China A-Shares 215,700 72,011 0.01Metallurgical of China H-Shares 139,000 23,451 -Microport Scientific 44,000 285,660 0.03Ming Yuan Cloud Group Holdings 53,000 190,448 0.02MINISO Group Holding - ADR 8,309 125,045 0.01Minth Group 64,000 220,131 0.02Momo - ADR 18,389 203,797 0.02Montage Technology 11,859 82,876 0.01Muyuan Foodstuff 47,712 325,094 0.03NanJi E-Commerce 17,800 19,483 -Nanjing Iron & Steel 155,600 62,058 0.01Nanjing King-Friend BiochemicalPharmaceutical 9,880 46,211 0.01Nanjing Securities 7,600 8,957 -NARI Technology 50,280 130,908 0.01NAURA Technology Group 5,300 164,697 0.02NavInfo 8,900 14,657 -NetEase - ADR 34,921 2,913,348 0.29New China Life Insurance A-Shares 21,500 110,581 0.01New China Life Insurance H-Shares 116,260 287,179 0.03New Hope Liuhe 32,100 52,756 0.01New Oriental Education & TechnologyGroup - ADR 176,896 1,048,737 0.10Ninestar 12,000 43,288 -Ningbo Joyson Electronic 6,400 18,298 -Ningbo Tuopu Group 8,700 36,482 -Ningbo Zhoushan Port 53,100 23,498 -Ningxia Baofeng Energy Group 13,439 20,596 -NIO - ADR 153,430 5,908,629 0.58North Huajin Chemical Industries 33,900 30,990 -Northeast Securities 12,000 11,360 -Offcn Education Technology 13,400 31,360 -Offshore Oil Engineering 31,900 16,082 -OFILM Group 16,214 16,130 -OneConnect Financial Technology -ADR 14,582 126,878 0.01Orient Securities A-Shares 43,400 48,572 0.01Orient Securities H-Shares 87,817 46,085 0.01Ourpalm 64,100 30,520 -Ovctek China 9,800 113,687 0.01Pacific Securities 59,400 22,559 -Pangang Group Vanadium Titanium &Resources 48,000 12,314 -People.cn 8,200 15,792 -People’s Insurance Group of ChinaH-Shares 1,079,000 260,494 0.03Perfect World 9,000 24,108 -
SharesFair value
GB£% of
Net assets
China (2020: 27.43%) (continued)PetroChina H-Shares 2,508,000 883,680 0.09Pharmaron Beijing A-Shares 4,500 109,392 0.01Pharmaron Beijing H-Shares 16,500 318,368 0.03PICC Property & Casualty 792,000 502,007 0.05Pinduoduo - ADR 44,304 4,073,614 0.40Ping An Bank A-Shares 182,728 463,055 0.05Ping An Healthcare and Technology 51,500 464,205 0.05Ping An Insurance Group of ChinaA-Shares 87,600 630,834 0.06Ping An Insurance Group of ChinaH-Shares 711,993 5,047,202 0.49Poly Developments and Holdings Group 113,100 152,554 0.02Poly Property Services 17,400 85,474 0.01Pop Mart International Group 18,600 133,499 0.01Postal Savings Bank of China H-Shares1,148,000 559,654 0.06Power Construction Corp of China 61,200 26,534 -Qingdao Port International A-Shares 18,600 12,878 -Qingdao Tgood Electric 12,200 41,153 -Qinhuangdao Port 88,700 26,631 -Raytron Technology 7,665 85,725 0.01Red Star Macalline Group 56,760 28,940 -Remegen 10,000 110,364 0.01RiseSun Real Estate Development 17,700 11,184 -RLX Technology - ADR 16,006 101,149 0.01Rongsheng Petro Chemical 17,850 34,535 -SAIC Motor 70,655 173,903 0.02Sanan Optoelectronics 29,900 107,358 0.01Sangfor Technologies 700 20,349 -Sansteel Minguang Co Ltd Fujian 15,700 11,855 -Sany Heavy Industry 67,600 220,154 0.02SDIC Capital 66,424 63,178 0.01SDIC Power Holdings 39,100 42,095 -Sealand Securities 76,440 36,310 -Seazen Group 211,850 145,339 0.01Seazen Holdings 22,700 105,792 0.01SF Holding 20,100 152,447 0.02SG Micro 1,125 31,853 -Shaanxi Coal Industry 95,200 126,383 0.01Shaanxi International Trust 125,400 45,236 -Shandong Buchang Pharmaceuticals 3,700 9,322 -Shandong Chenming Paper Holdings 117,000 52,785 0.01Shandong Chenming Paper HoldingsB-Shares 85,200 35,658 -Shandong Gold Mining A-Shares 26,740 57,577 0.01Shandong Gold Mining H-Shares 110,050 140,946 0.01Shandong Hualu Hengsheng Chemical 11,570 40,117 -Shandong Linglong Tyre 13,900 68,113 0.01Shandong Nanshan Aluminum 67,700 27,304 -Shandong Sinocera Functional Material 15,500 84,653 0.01Shandong Sun Paper Industry 12,100 18,097 -Shandong Weigao Group MedicalPolymer 276,000 466,169 0.05Shanghai 2345 Network Holding Group 157,400 35,796 -Shanghai AJ Group 55,900 43,712 -Shanghai Bailian Group 37,900 85,556 0.01Shanghai Bairun Investment Holding 5,320 56,495 0.01Shanghai Baosight Software 40,560 96,596 0.01Shanghai Baosight Software A-Shares 10,270 58,563 0.01
Mercer UCITS Common Contractual FundNFU Mutual Global Regional Core Fund
Portfolio Statementas at 30 June 2021
(continued)
Mercer UCITS Common Contractual Fund 214
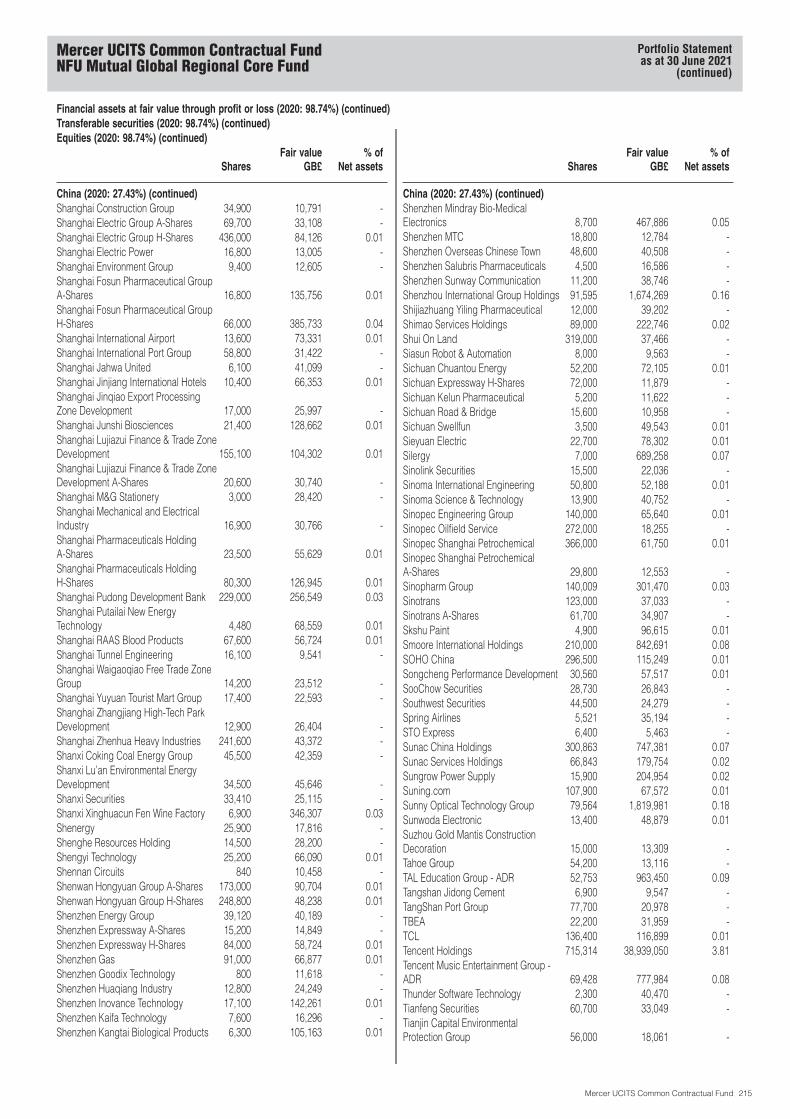
Financial assets at fair value through profit or loss (2020: 98.74%) (continued)Transferable securities (2020: 98.74%) (continued)Equities (2020: 98.74%) (continued)
SharesFair value
GB£% of
Net assets
China (2020: 27.43%) (continued)Shanghai Construction Group 34,900 10,791 -Shanghai Electric Group A-Shares 69,700 33,108 -Shanghai Electric Group H-Shares 436,000 84,126 0.01Shanghai Electric Power 16,800 13,005 -Shanghai Environment Group 9,400 12,605 -Shanghai Fosun Pharmaceutical GroupA-Shares 16,800 135,756 0.01Shanghai Fosun Pharmaceutical GroupH-Shares 66,000 385,733 0.04Shanghai International Airport 13,600 73,331 0.01Shanghai International Port Group 58,800 31,422 -Shanghai Jahwa United 6,100 41,099 -Shanghai Jinjiang International Hotels 10,400 66,353 0.01Shanghai Jinqiao Export ProcessingZone Development 17,000 25,997 -Shanghai Junshi Biosciences 21,400 128,662 0.01Shanghai Lujiazui Finance & Trade ZoneDevelopment 155,100 104,302 0.01Shanghai Lujiazui Finance & Trade ZoneDevelopment A-Shares 20,600 30,740 -Shanghai M&G Stationery 3,000 28,420 -Shanghai Mechanical and ElectricalIndustry 16,900 30,766 -Shanghai Pharmaceuticals HoldingA-Shares 23,500 55,629 0.01Shanghai Pharmaceuticals HoldingH-Shares 80,300 126,945 0.01Shanghai Pudong Development Bank 229,000 256,549 0.03Shanghai Putailai New EnergyTechnology 4,480 68,559 0.01Shanghai RAAS Blood Products 67,600 56,724 0.01Shanghai Tunnel Engineering 16,100 9,541 -Shanghai Waigaoqiao Free Trade ZoneGroup 14,200 23,512 -Shanghai Yuyuan Tourist Mart Group 17,400 22,593 -Shanghai Zhangjiang High-Tech ParkDevelopment 12,900 26,404 -Shanghai Zhenhua Heavy Industries 241,600 43,372 -Shanxi Coking Coal Energy Group 45,500 42,359 -Shanxi Lu’an Environmental EnergyDevelopment 34,500 45,646 -Shanxi Securities 33,410 25,115 -Shanxi Xinghuacun Fen Wine Factory 6,900 346,307 0.03Shenergy 25,900 17,816 -Shenghe Resources Holding 14,500 28,200 -Shengyi Technology 25,200 66,090 0.01Shennan Circuits 840 10,458 -Shenwan Hongyuan Group A-Shares 173,000 90,704 0.01Shenwan Hongyuan Group H-Shares 248,800 48,238 0.01Shenzhen Energy Group 39,120 40,189 -Shenzhen Expressway A-Shares 15,200 14,849 -Shenzhen Expressway H-Shares 84,000 58,724 0.01Shenzhen Gas 91,000 66,877 0.01Shenzhen Goodix Technology 800 11,618 -Shenzhen Huaqiang Industry 12,800 24,249 -Shenzhen Inovance Technology 17,100 142,261 0.01Shenzhen Kaifa Technology 7,600 16,296 -Shenzhen Kangtai Biological Products 6,300 105,163 0.01
SharesFair value
GB£% of
Net assets
China (2020: 27.43%) (continued)Shenzhen Mindray Bio-MedicalElectronics 8,700 467,886 0.05Shenzhen MTC 18,800 12,784 -Shenzhen Overseas Chinese Town 48,600 40,508 -Shenzhen Salubris Pharmaceuticals 4,500 16,586 -Shenzhen Sunway Communication 11,200 38,746 -Shenzhou International Group Holdings 91,595 1,674,269 0.16Shijiazhuang Yiling Pharmaceutical 12,000 39,202 -Shimao Services Holdings 89,000 222,746 0.02Shui On Land 319,000 37,466 -Siasun Robot & Automation 8,000 9,563 -Sichuan Chuantou Energy 52,200 72,105 0.01Sichuan Expressway H-Shares 72,000 11,879 -Sichuan Kelun Pharmaceutical 5,200 11,622 -Sichuan Road & Bridge 15,600 10,958 -Sichuan Swellfun 3,500 49,543 0.01Sieyuan Electric 22,700 78,302 0.01Silergy 7,000 689,258 0.07Sinolink Securities 15,500 22,036 -Sinoma International Engineering 50,800 52,188 0.01Sinoma Science & Technology 13,900 40,752 -Sinopec Engineering Group 140,000 65,640 0.01Sinopec Oilfield Service 272,000 18,255 -Sinopec Shanghai Petrochemical 366,000 61,750 0.01Sinopec Shanghai PetrochemicalA-Shares 29,800 12,553 -Sinopharm Group 140,009 301,470 0.03Sinotrans 123,000 37,033 -Sinotrans A-Shares 61,700 34,907 -Skshu Paint 4,900 96,615 0.01Smoore International Holdings 210,000 842,691 0.08SOHO China 296,500 115,249 0.01Songcheng Performance Development 30,560 57,517 0.01SooChow Securities 28,730 26,843 -Southwest Securities 44,500 24,279 -Spring Airlines 5,521 35,194 -STO Express 6,400 5,463 -Sunac China Holdings 300,863 747,381 0.07Sunac Services Holdings 66,843 179,754 0.02Sungrow Power Supply 15,900 204,954 0.02Suning.com 107,900 67,572 0.01Sunny Optical Technology Group 79,564 1,819,981 0.18Sunwoda Electronic 13,400 48,879 0.01Suzhou Gold Mantis ConstructionDecoration 15,000 13,309 -Tahoe Group 54,200 13,116 -TAL Education Group - ADR 52,753 963,450 0.09Tangshan Jidong Cement 6,900 9,547 -TangShan Port Group 77,700 20,978 -TBEA 22,200 31,959 -TCL 136,400 116,899 0.01Tencent Holdings 715,314 38,939,050 3.81Tencent Music Entertainment Group -ADR 69,428 777,984 0.08Thunder Software Technology 2,300 40,470 -Tianfeng Securities 60,700 33,049 -Tianjin Capital EnvironmentalProtection Group 56,000 18,061 -
Mercer UCITS Common Contractual FundNFU Mutual Global Regional Core Fund
Portfolio Statementas at 30 June 2021
(continued)
Mercer UCITS Common Contractual Fund 215
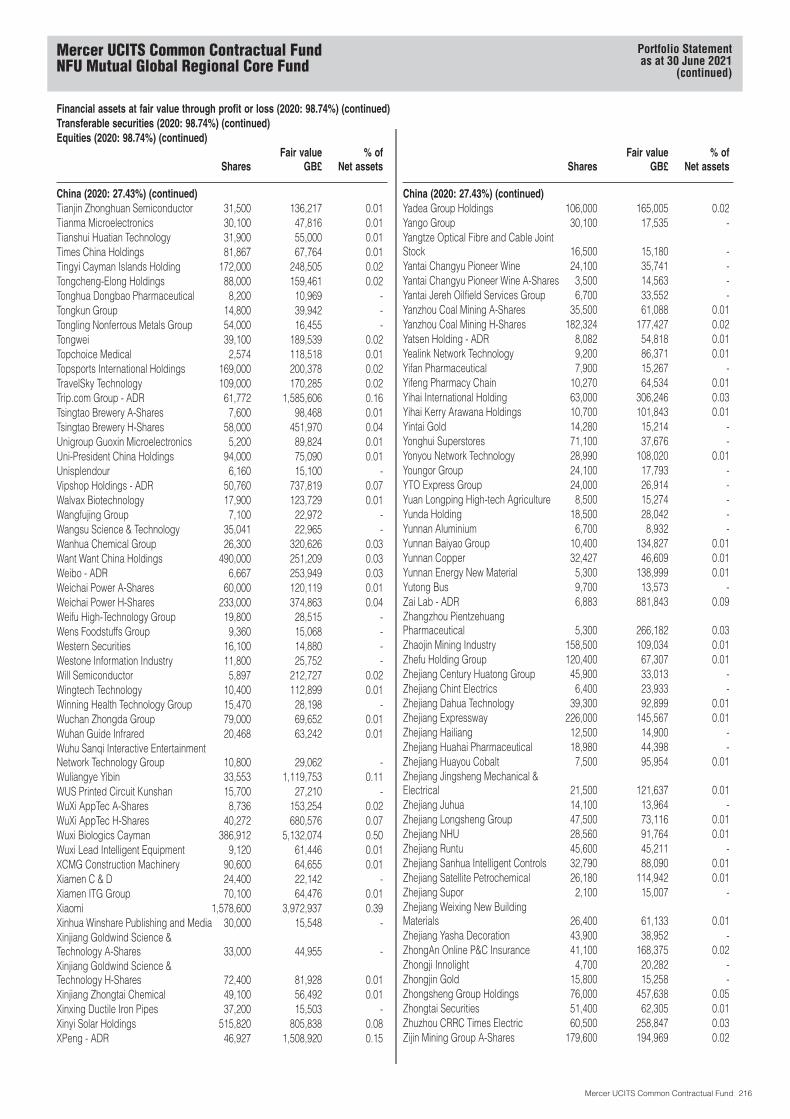
Financial assets at fair value through profit or loss (2020: 98.74%) (continued)Transferable securities (2020: 98.74%) (continued)Equities (2020: 98.74%) (continued)
SharesFair value
GB£% of
Net assets
China (2020: 27.43%) (continued)Tianjin Zhonghuan Semiconductor 31,500 136,217 0.01Tianma Microelectronics 30,100 47,816 0.01Tianshui Huatian Technology 31,900 55,000 0.01Times China Holdings 81,867 67,764 0.01Tingyi Cayman Islands Holding 172,000 248,505 0.02Tongcheng-Elong Holdings 88,000 159,461 0.02Tonghua Dongbao Pharmaceutical 8,200 10,969 -Tongkun Group 14,800 39,942 -Tongling Nonferrous Metals Group 54,000 16,455 -Tongwei 39,100 189,539 0.02Topchoice Medical 2,574 118,518 0.01Topsports International Holdings 169,000 200,378 0.02TravelSky Technology 109,000 170,285 0.02Trip.com Group - ADR 61,772 1,585,606 0.16Tsingtao Brewery A-Shares 7,600 98,468 0.01Tsingtao Brewery H-Shares 58,000 451,970 0.04Unigroup Guoxin Microelectronics 5,200 89,824 0.01Uni-President China Holdings 94,000 75,090 0.01Unisplendour 6,160 15,100 -Vipshop Holdings - ADR 50,760 737,819 0.07Walvax Biotechnology 17,900 123,729 0.01Wangfujing Group 7,100 22,972 -Wangsu Science & Technology 35,041 22,965 -Wanhua Chemical Group 26,300 320,626 0.03Want Want China Holdings 490,000 251,209 0.03Weibo - ADR 6,667 253,949 0.03Weichai Power A-Shares 60,000 120,119 0.01Weichai Power H-Shares 233,000 374,863 0.04Weifu High-Technology Group 19,800 28,515 -Wens Foodstuffs Group 9,360 15,068 -Western Securities 16,100 14,880 -Westone Information Industry 11,800 25,752 -Will Semiconductor 5,897 212,727 0.02Wingtech Technology 10,400 112,899 0.01Winning Health Technology Group 15,470 28,198 -Wuchan Zhongda Group 79,000 69,652 0.01Wuhan Guide Infrared 20,468 63,242 0.01Wuhu Sanqi Interactive EntertainmentNetwork Technology Group 10,800 29,062 -Wuliangye Yibin 33,553 1,119,753 0.11WUS Printed Circuit Kunshan 15,700 27,210 -WuXi AppTec A-Shares 8,736 153,254 0.02WuXi AppTec H-Shares 40,272 680,576 0.07Wuxi Biologics Cayman 386,912 5,132,074 0.50Wuxi Lead Intelligent Equipment 9,120 61,446 0.01XCMG Construction Machinery 90,600 64,655 0.01Xiamen C & D 24,400 22,142 -Xiamen ITG Group 70,100 64,476 0.01Xiaomi 1,578,600 3,972,937 0.39Xinhua Winshare Publishing and Media 30,000 15,548 -Xinjiang Goldwind Science &Technology A-Shares 33,000 44,955 -Xinjiang Goldwind Science &Technology H-Shares 72,400 81,928 0.01Xinjiang Zhongtai Chemical 49,100 56,492 0.01Xinxing Ductile Iron Pipes 37,200 15,503 -Xinyi Solar Holdings 515,820 805,838 0.08XPeng - ADR 46,927 1,508,920 0.15
SharesFair value
GB£% of
Net assets
China (2020: 27.43%) (continued)Yadea Group Holdings 106,000 165,005 0.02Yango Group 30,100 17,535 -Yangtze Optical Fibre and Cable JointStock 16,500 15,180 -Yantai Changyu Pioneer Wine 24,100 35,741 -Yantai Changyu Pioneer Wine A-Shares 3,500 14,563 -Yantai Jereh Oilfield Services Group 6,700 33,552 -Yanzhou Coal Mining A-Shares 35,500 61,088 0.01Yanzhou Coal Mining H-Shares 182,324 177,427 0.02Yatsen Holding - ADR 8,082 54,818 0.01Yealink Network Technology 9,200 86,371 0.01Yifan Pharmaceutical 7,900 15,267 -Yifeng Pharmacy Chain 10,270 64,534 0.01Yihai International Holding 63,000 306,246 0.03Yihai Kerry Arawana Holdings 10,700 101,843 0.01Yintai Gold 14,280 15,214 -Yonghui Superstores 71,100 37,676 -Yonyou Network Technology 28,990 108,020 0.01Youngor Group 24,100 17,793 -YTO Express Group 24,000 26,914 -Yuan Longping High-tech Agriculture 8,500 15,274 -Yunda Holding 18,500 28,042 -Yunnan Aluminium 6,700 8,932 -Yunnan Baiyao Group 10,400 134,827 0.01Yunnan Copper 32,427 46,609 0.01Yunnan Energy New Material 5,300 138,999 0.01Yutong Bus 9,700 13,573 -Zai Lab - ADR 6,883 881,843 0.09Zhangzhou PientzehuangPharmaceutical 5,300 266,182 0.03Zhaojin Mining Industry 158,500 109,034 0.01Zhefu Holding Group 120,400 67,307 0.01Zhejiang Century Huatong Group 45,900 33,013 -Zhejiang Chint Electrics 6,400 23,933 -Zhejiang Dahua Technology 39,300 92,899 0.01Zhejiang Expressway 226,000 145,567 0.01Zhejiang Hailiang 12,500 14,900 -Zhejiang Huahai Pharmaceutical 18,980 44,398 -Zhejiang Huayou Cobalt 7,500 95,954 0.01Zhejiang Jingsheng Mechanical &Electrical 21,500 121,637 0.01Zhejiang Juhua 14,100 13,964 -Zhejiang Longsheng Group 47,500 73,116 0.01Zhejiang NHU 28,560 91,764 0.01Zhejiang Runtu 45,600 45,211 -Zhejiang Sanhua Intelligent Controls 32,790 88,090 0.01Zhejiang Satellite Petrochemical 26,180 114,942 0.01Zhejiang Supor 2,100 15,007 -Zhejiang Weixing New BuildingMaterials 26,400 61,133 0.01Zhejiang Yasha Decoration 43,900 38,952 -ZhongAn Online P&C Insurance 41,100 168,375 0.02Zhongji Innolight 4,700 20,282 -Zhongjin Gold 15,800 15,258 -Zhongsheng Group Holdings 76,000 457,638 0.05Zhongtai Securities 51,400 62,305 0.01Zhuzhou CRRC Times Electric 60,500 258,847 0.03Zijin Mining Group A-Shares 179,600 194,969 0.02
Mercer UCITS Common Contractual FundNFU Mutual Global Regional Core Fund
Portfolio Statementas at 30 June 2021
(continued)
Mercer UCITS Common Contractual Fund 216

Financial assets at fair value through profit or loss (2020: 98.74%) (continued)Transferable securities (2020: 98.74%) (continued)Equities (2020: 98.74%) (continued)
SharesFair value
GB£% of
Net assets
China (2020: 27.43%) (continued)Zijin Mining Group H-Shares 678,000 659,790 0.07Zoomlion Heavy Industry Science andTechnology A-Shares 78,400 81,156 0.01Zoomlion Heavy Industry Science andTechnology H-Shares 176,400 133,680 0.01ZTE A-Shares 35,400 131,786 0.01ZTE H-Shares 89,200 201,629 0.02ZTO Express Cayman - ADR 14,948 328,403 0.03
257,399,050 25.21Colombia (2020: 0.20%)Bancolombia 38,010 194,532 0.02Bancolombia - Pref 55,867 290,472 0.03Cementos Argos 76,217 79,049 0.01Corp Financiera Colombiana 10,294 58,272 -Ecopetrol 610,813 322,320 0.03Grupo Argos 37,743 73,169 0.01Grupo Aval Acciones y Valores - Pref 426,437 89,531 0.01Grupo de Inversiones Suramericana 28,347 101,664 0.01Grupo de Inversiones Suramericana -Pref 5,635 18,047 -Interconexion Electrica 46,865 201,239 0.02
1,428,295 0.14Czech Republic (2020: 0.09%)CEZ 20,197 433,672 0.04Komercni banka 8,446 215,180 0.02Moneta Money Bank 42,813 117,720 0.01O2 Czech Republic 5,728 50,893 0.01
817,465 0.08Egypt (2020: 0.11%)Commercial International Bank Egypt 159,506 386,225 0.04Eastern 92,935 50,793 0.01Egypt Kuwait Holding 115,167 83,283 0.01ElSewedy Electric 48,515 18,952 -Talaat Moustafa Group 98,054 30,029 -Telecom Egypt 26,957 16,685 -
585,967 0.06Greece (2020: 0.16%)Alpha Services and Holdings 152,819 141,419 0.01Eurobank Ergasias Services andHoldings 354,257 258,494 0.03Hellenic Petroleum 5,874 30,961 -Hellenic TelecommunicationsOrganization 25,604 311,012 0.03JUMBO 12,157 148,089 0.01Motor Oil Hellas Corinth Refineries 5,137 63,061 0.01Mytilineos 13,483 177,552 0.02National Bank of Greece 54,852 113,010 0.01OPAP 22,410 244,512 0.02Public Power 12,273 94,505 0.01Terna Energy 7,123 72,765 0.01
1,655,380 0.16Hong Kong (2020: 8.45%)AIA Group 1,128,600 10,151,802 0.99Alibaba Health Information Technology 572,000 918,132 0.09
SharesFair value
GB£% of
Net assets
Hong Kong (2020: 8.45%) (continued)Alibaba Pictures Group 1,510,000 152,011 0.02ASM Pacific Technology 31,200 305,947 0.03Bank of East Asia 110,646 148,723 0.02Beijing Enterprises Holdings 59,000 151,513 0.02Beijing Enterprises Water Group 560,000 153,466 0.02BOC Hong Kong Holdings 330,000 810,532 0.08Bosideng International Holdings 388,000 200,725 0.02Brilliance China Automotive Holdings 330,000 224,550 0.02Budweiser Brewing Co APAC 153,800 351,235 0.03BYD Electronic International 93,698 445,427 0.04Cafe de Coral Holdings 28,000 41,655 -Cathay Pacific Airways 88,363 54,032 0.01Champion REIT 200,000 81,468 0.01China Everbright 102,000 86,900 0.01China Everbright International 531,000 217,782 0.02China Gas Holdings 365,897 808,319 0.08China Jinmao Holdings Group 684,000 165,770 0.02China Mengniu Dairy 373,000 1,632,376 0.16China Merchants Port Holdings 158,544 167,586 0.02China Overseas Land & Investment 465,961 766,168 0.08China Power International Development 747,000 118,371 0.01China Resources Beer Holdings 190,463 1,238,313 0.12China Resources Cement Holdings 246,000 169,226 0.02China Resources Gas Group 115,076 499,858 0.05China Resources Land 332,584 974,985 0.10China Resources Pharmaceutical Group 201,500 90,907 0.01China Resources Power Holdings 216,000 213,420 0.02China State Construction InternationalHoldings 266,585 131,700 0.01China Taiping Insurance Holdings 206,200 248,329 0.02China Traditional Chinese MedicineHoldings 374,000 185,464 0.02China Travel International InvestmentHong Kong 214,000 25,732 -Chow Tai Fook Jewellery Group 160,800 265,898 0.03CITIC 575,000 448,610 0.04CK Asset Holdings 221,500 1,106,660 0.11CK Hutchison Holdings 250,000 1,409,844 0.14CK Infrastructure Holdings 56,000 241,682 0.02CLP Holdings 154,000 1,102,447 0.11COSCO SHIPPING Ports 210,006 118,626 0.01CSPC Pharmaceutical Group 1,001,990 1,049,797 0.10Dah Sing Banking Group 34,400 27,480 -Dah Sing Financial Holdings 12,000 29,698 -Dairy Farm International Holdings 26,900 82,562 0.01ESR Cayman 171,400 418,589 0.04Far East Horizon 238,000 180,139 0.02First Pacific 196,000 48,415 0.01Fosun International 256,500 267,304 0.03Galaxy Entertainment Group 199,000 1,152,843 0.11Geely Automobile Holdings 643,788 1,467,228 0.14Guangdong Investment 369,058 383,915 0.04Guotai Junan International Holdings 213,000 24,619 -Haitong International Securities Group 213,000 42,488 -Hang Lung Group 80,000 147,649 0.01Hang Lung Properties 190,000 334,019 0.03Hang Seng Bank 66,600 962,857 0.09
Mercer UCITS Common Contractual FundNFU Mutual Global Regional Core Fund
Portfolio Statementas at 30 June 2021
(continued)
Mercer UCITS Common Contractual Fund 217
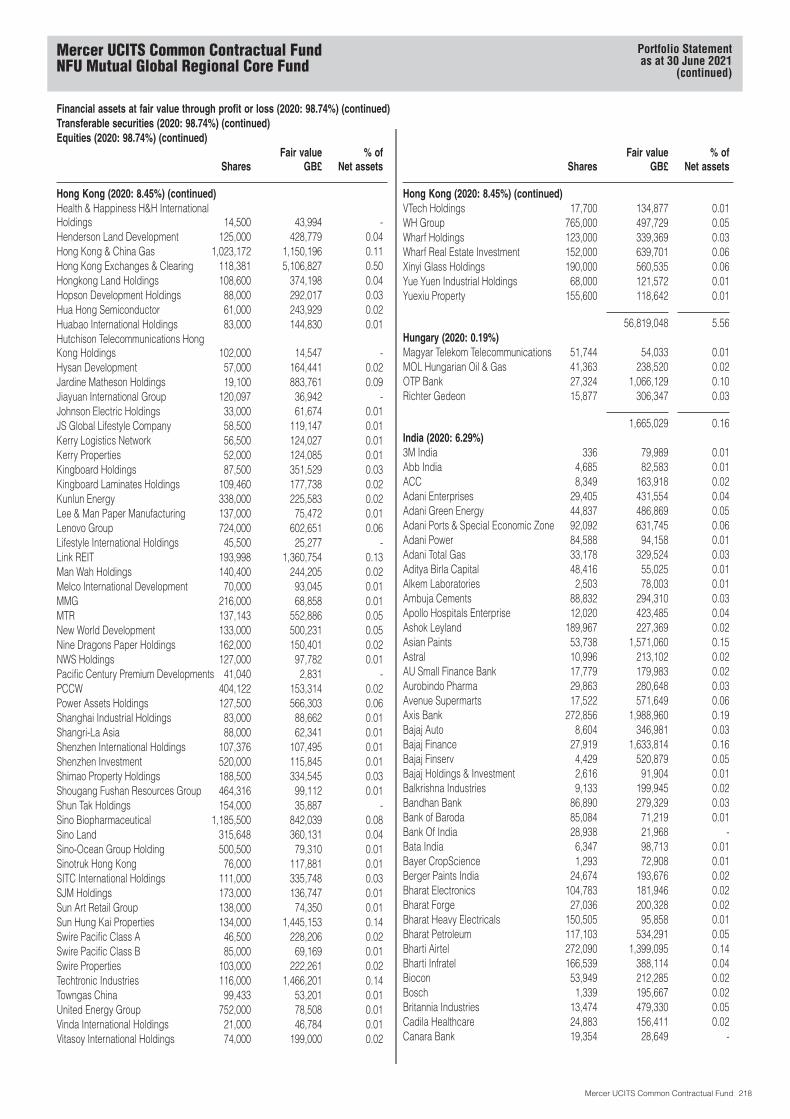
Financial assets at fair value through profit or loss (2020: 98.74%) (continued)Transferable securities (2020: 98.74%) (continued)Equities (2020: 98.74%) (continued)
SharesFair value
GB£% of
Net assets
Hong Kong (2020: 8.45%) (continued)Health & Happiness H&H InternationalHoldings 14,500 43,994 -Henderson Land Development 125,000 428,779 0.04Hong Kong & China Gas 1,023,172 1,150,196 0.11Hong Kong Exchanges & Clearing 118,381 5,106,827 0.50Hongkong Land Holdings 108,600 374,198 0.04Hopson Development Holdings 88,000 292,017 0.03Hua Hong Semiconductor 61,000 243,929 0.02Huabao International Holdings 83,000 144,830 0.01Hutchison Telecommunications HongKong Holdings 102,000 14,547 -Hysan Development 57,000 164,441 0.02Jardine Matheson Holdings 19,100 883,761 0.09Jiayuan International Group 120,097 36,942 -Johnson Electric Holdings 33,000 61,674 0.01JS Global Lifestyle Company 58,500 119,147 0.01Kerry Logistics Network 56,500 124,027 0.01Kerry Properties 52,000 124,085 0.01Kingboard Holdings 87,500 351,529 0.03Kingboard Laminates Holdings 109,460 177,738 0.02Kunlun Energy 338,000 225,583 0.02Lee & Man Paper Manufacturing 137,000 75,472 0.01Lenovo Group 724,000 602,651 0.06Lifestyle International Holdings 45,500 25,277 -Link REIT 193,998 1,360,754 0.13Man Wah Holdings 140,400 244,205 0.02Melco International Development 70,000 93,045 0.01MMG 216,000 68,858 0.01MTR 137,143 552,886 0.05New World Development 133,000 500,231 0.05Nine Dragons Paper Holdings 162,000 150,401 0.02NWS Holdings 127,000 97,782 0.01Pacific Century Premium Developments 41,040 2,831 -PCCW 404,122 153,314 0.02Power Assets Holdings 127,500 566,303 0.06Shanghai Industrial Holdings 83,000 88,662 0.01Shangri-La Asia 88,000 62,341 0.01Shenzhen International Holdings 107,376 107,495 0.01Shenzhen Investment 520,000 115,845 0.01Shimao Property Holdings 188,500 334,545 0.03Shougang Fushan Resources Group 464,316 99,112 0.01Shun Tak Holdings 154,000 35,887 -Sino Biopharmaceutical 1,185,500 842,039 0.08Sino Land 315,648 360,131 0.04Sino-Ocean Group Holding 500,500 79,310 0.01Sinotruk Hong Kong 76,000 117,881 0.01SITC International Holdings 111,000 335,748 0.03SJM Holdings 173,000 136,747 0.01Sun Art Retail Group 138,000 74,350 0.01Sun Hung Kai Properties 134,000 1,445,153 0.14Swire Pacific Class A 46,500 228,206 0.02Swire Pacific Class B 85,000 69,169 0.01Swire Properties 103,000 222,261 0.02Techtronic Industries 116,000 1,466,201 0.14Towngas China 99,433 53,201 0.01United Energy Group 752,000 78,508 0.01Vinda International Holdings 21,000 46,784 0.01Vitasoy International Holdings 74,000 199,000 0.02
SharesFair value
GB£% of
Net assets
Hong Kong (2020: 8.45%) (continued)VTech Holdings 17,700 134,877 0.01WH Group 765,000 497,729 0.05Wharf Holdings 123,000 339,369 0.03Wharf Real Estate Investment 152,000 639,701 0.06Xinyi Glass Holdings 190,000 560,535 0.06Yue Yuen Industrial Holdings 68,000 121,572 0.01Yuexiu Property 155,600 118,642 0.01
56,819,048 5.56Hungary (2020: 0.19%)Magyar Telekom Telecommunications 51,744 54,033 0.01MOL Hungarian Oil & Gas 41,363 238,520 0.02OTP Bank 27,324 1,066,129 0.10Richter Gedeon 15,877 306,347 0.03
1,665,029 0.16India (2020: 6.29%)3M India 336 79,989 0.01Abb India 4,685 82,583 0.01ACC 8,349 163,918 0.02Adani Enterprises 29,405 431,554 0.04Adani Green Energy 44,837 486,869 0.05Adani Ports & Special Economic Zone 92,092 631,745 0.06Adani Power 84,588 94,158 0.01Adani Total Gas 33,178 329,524 0.03Aditya Birla Capital 48,416 55,025 0.01Alkem Laboratories 2,503 78,003 0.01Ambuja Cements 88,832 294,310 0.03Apollo Hospitals Enterprise 12,020 423,485 0.04Ashok Leyland 189,967 227,369 0.02Asian Paints 53,738 1,571,060 0.15Astral 10,996 213,102 0.02AU Small Finance Bank 17,779 179,983 0.02Aurobindo Pharma 29,863 280,648 0.03Avenue Supermarts 17,522 571,649 0.06Axis Bank 272,856 1,988,960 0.19Bajaj Auto 8,604 346,981 0.03Bajaj Finance 27,919 1,633,814 0.16Bajaj Finserv 4,429 520,879 0.05Bajaj Holdings & Investment 2,616 91,904 0.01Balkrishna Industries 9,133 199,945 0.02Bandhan Bank 86,890 279,329 0.03Bank of Baroda 85,084 71,219 0.01Bank Of India 28,938 21,968 -Bata India 6,347 98,713 0.01Bayer CropScience 1,293 72,908 0.01Berger Paints India 24,674 193,676 0.02Bharat Electronics 104,783 181,946 0.02Bharat Forge 27,036 200,328 0.02Bharat Heavy Electricals 150,505 95,858 0.01Bharat Petroleum 117,103 534,291 0.05Bharti Airtel 272,090 1,399,095 0.14Bharti Infratel 166,539 388,114 0.04Biocon 53,949 212,285 0.02Bosch 1,339 195,667 0.02Britannia Industries 13,474 479,330 0.05Cadila Healthcare 24,883 156,411 0.02Canara Bank 19,354 28,649 -
Mercer UCITS Common Contractual FundNFU Mutual Global Regional Core Fund
Portfolio Statementas at 30 June 2021
(continued)
Mercer UCITS Common Contractual Fund 218
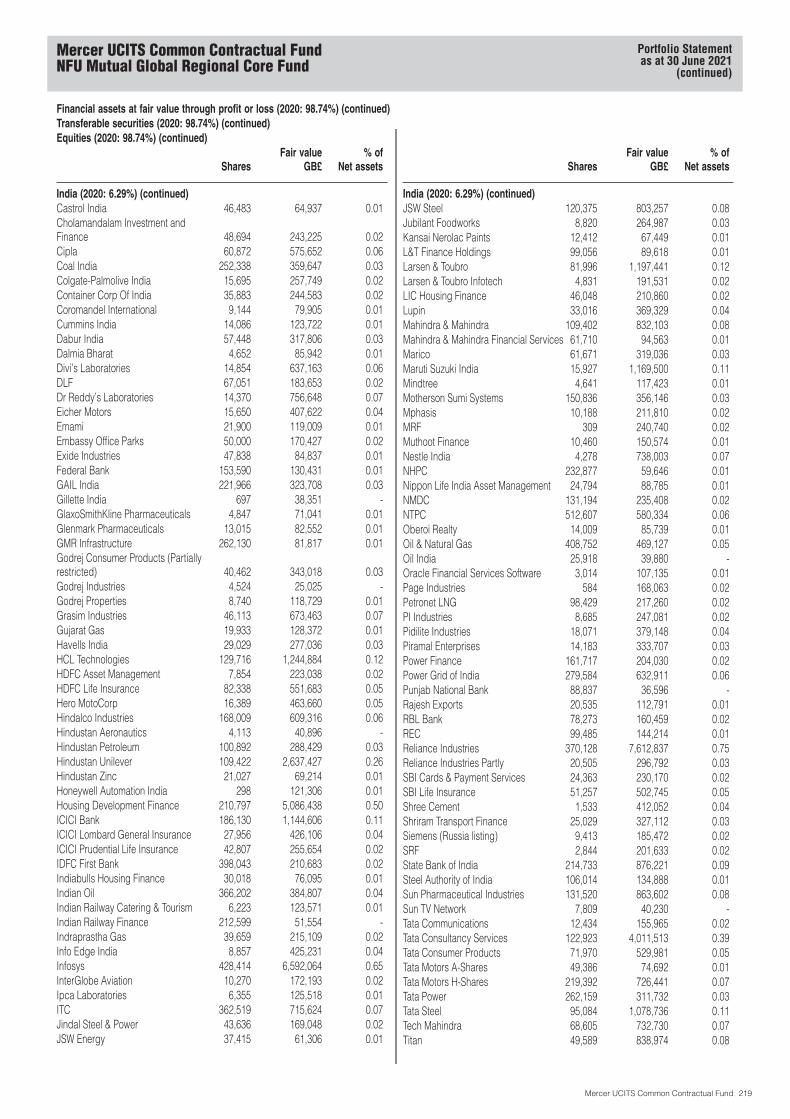
Financial assets at fair value through profit or loss (2020: 98.74%) (continued)Transferable securities (2020: 98.74%) (continued)Equities (2020: 98.74%) (continued)
SharesFair value
GB£% of
Net assets
India (2020: 6.29%) (continued)Castrol India 46,483 64,937 0.01Cholamandalam Investment andFinance 48,694 243,225 0.02Cipla 60,872 575,652 0.06Coal India 252,338 359,647 0.03Colgate-Palmolive India 15,695 257,749 0.02Container Corp Of India 35,883 244,583 0.02Coromandel International 9,144 79,905 0.01Cummins India 14,086 123,722 0.01Dabur India 57,448 317,806 0.03Dalmia Bharat 4,652 85,942 0.01Divi’s Laboratories 14,854 637,163 0.06DLF 67,051 183,653 0.02Dr Reddy’s Laboratories 14,370 756,648 0.07Eicher Motors 15,650 407,622 0.04Emami 21,900 119,009 0.01Embassy Office Parks 50,000 170,427 0.02Exide Industries 47,838 84,837 0.01Federal Bank 153,590 130,431 0.01GAIL India 221,966 323,708 0.03Gillette India 697 38,351 -GlaxoSmithKline Pharmaceuticals 4,847 71,041 0.01Glenmark Pharmaceuticals 13,015 82,552 0.01GMR Infrastructure 262,130 81,817 0.01Godrej Consumer Products (Partiallyrestricted) 40,462 343,018 0.03Godrej Industries 4,524 25,025 -Godrej Properties 8,740 118,729 0.01Grasim Industries 46,113 673,463 0.07Gujarat Gas 19,933 128,372 0.01Havells India 29,029 277,036 0.03HCL Technologies 129,716 1,244,884 0.12HDFC Asset Management 7,854 223,038 0.02HDFC Life Insurance 82,338 551,683 0.05Hero MotoCorp 16,389 463,660 0.05Hindalco Industries 168,009 609,316 0.06Hindustan Aeronautics 4,113 40,896 -Hindustan Petroleum 100,892 288,429 0.03Hindustan Unilever 109,422 2,637,427 0.26Hindustan Zinc 21,027 69,214 0.01Honeywell Automation India 298 121,306 0.01Housing Development Finance 210,797 5,086,438 0.50ICICI Bank 186,130 1,144,606 0.11ICICI Lombard General Insurance 27,956 426,106 0.04ICICI Prudential Life Insurance 42,807 255,654 0.02IDFC First Bank 398,043 210,683 0.02Indiabulls Housing Finance 30,018 76,095 0.01Indian Oil 366,202 384,807 0.04Indian Railway Catering & Tourism 6,223 123,571 0.01Indian Railway Finance 212,599 51,554 -Indraprastha Gas 39,659 215,109 0.02Info Edge India 8,857 425,231 0.04Infosys 428,414 6,592,064 0.65InterGlobe Aviation 10,270 172,193 0.02Ipca Laboratories 6,355 125,518 0.01ITC 362,519 715,624 0.07Jindal Steel & Power 43,636 169,048 0.02JSW Energy 37,415 61,306 0.01
SharesFair value
GB£% of
Net assets
India (2020: 6.29%) (continued)JSW Steel 120,375 803,257 0.08Jubilant Foodworks 8,820 264,987 0.03Kansai Nerolac Paints 12,412 67,449 0.01L&T Finance Holdings 99,056 89,618 0.01Larsen & Toubro 81,996 1,197,441 0.12Larsen & Toubro Infotech 4,831 191,531 0.02LIC Housing Finance 46,048 210,860 0.02Lupin 33,016 369,329 0.04Mahindra & Mahindra 109,402 832,103 0.08Mahindra & Mahindra Financial Services 61,710 94,563 0.01Marico 61,671 319,036 0.03Maruti Suzuki India 15,927 1,169,500 0.11Mindtree 4,641 117,423 0.01Motherson Sumi Systems 150,836 356,146 0.03Mphasis 10,188 211,810 0.02MRF 309 240,740 0.02Muthoot Finance 10,460 150,574 0.01Nestle India 4,278 738,003 0.07NHPC 232,877 59,646 0.01Nippon Life India Asset Management 24,794 88,785 0.01NMDC 131,194 235,408 0.02NTPC 512,607 580,334 0.06Oberoi Realty 14,009 85,739 0.01Oil & Natural Gas 408,752 469,127 0.05Oil India 25,918 39,880 -Oracle Financial Services Software 3,014 107,135 0.01Page Industries 584 168,063 0.02Petronet LNG 98,429 217,260 0.02PI Industries 8,685 247,081 0.02Pidilite Industries 18,071 379,148 0.04Piramal Enterprises 14,183 333,707 0.03Power Finance 161,717 204,030 0.02Power Grid of India 279,584 632,911 0.06Punjab National Bank 88,837 36,596 -Rajesh Exports 20,535 112,791 0.01RBL Bank 78,273 160,459 0.02REC 99,485 144,214 0.01Reliance Industries 370,128 7,612,837 0.75Reliance Industries Partly 20,505 296,792 0.03SBI Cards & Payment Services 24,363 230,170 0.02SBI Life Insurance 51,257 502,745 0.05Shree Cement 1,533 412,052 0.04Shriram Transport Finance 25,029 327,112 0.03Siemens (Russia listing) 9,413 185,472 0.02SRF 2,844 201,633 0.02State Bank of India 214,733 876,221 0.09Steel Authority of India 106,014 134,888 0.01Sun Pharmaceutical Industries 131,520 863,602 0.08Sun TV Network 7,809 40,230 -Tata Communications 12,434 155,965 0.02Tata Consultancy Services 122,923 4,011,513 0.39Tata Consumer Products 71,970 529,981 0.05Tata Motors A-Shares 49,386 74,692 0.01Tata Motors H-Shares 219,392 726,441 0.07Tata Power 262,159 311,732 0.03Tata Steel 95,084 1,078,736 0.11Tech Mahindra 68,605 732,730 0.07Titan 49,589 838,974 0.08
Mercer UCITS Common Contractual FundNFU Mutual Global Regional Core Fund
Portfolio Statementas at 30 June 2021
(continued)
Mercer UCITS Common Contractual Fund 219
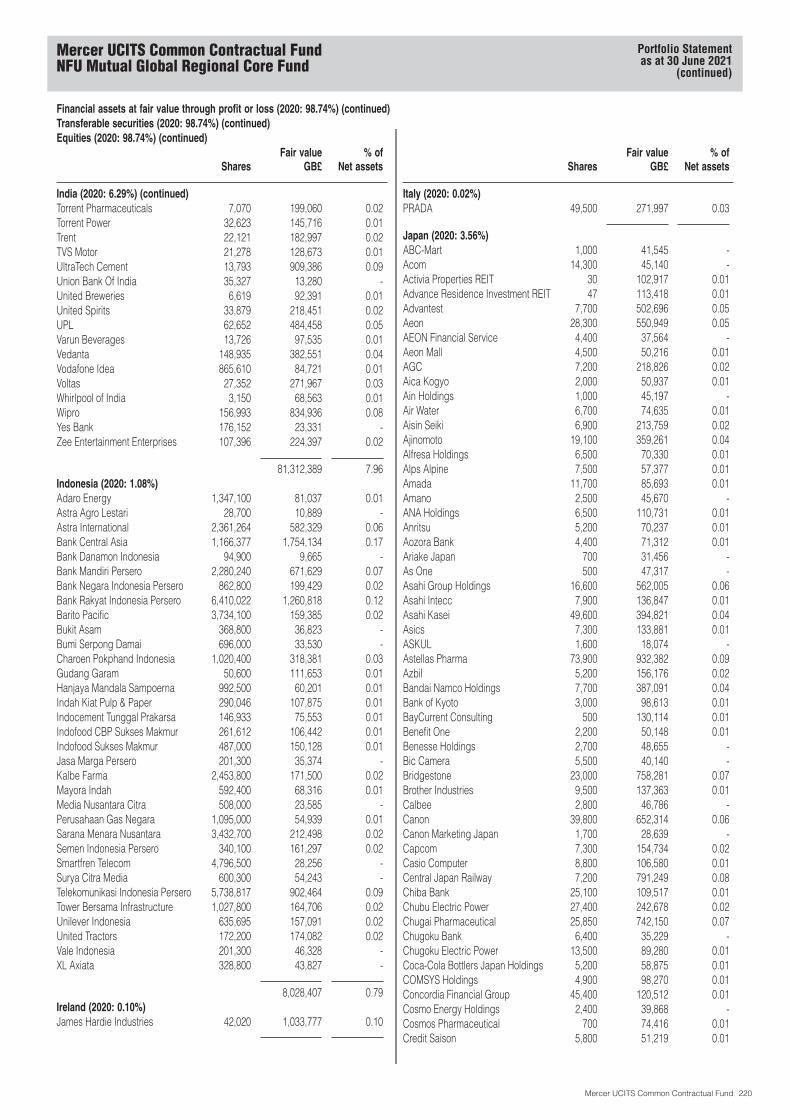
Financial assets at fair value through profit or loss (2020: 98.74%) (continued)Transferable securities (2020: 98.74%) (continued)Equities (2020: 98.74%) (continued)
SharesFair value
GB£% of
Net assets
India (2020: 6.29%) (continued)Torrent Pharmaceuticals 7,070 199,060 0.02Torrent Power 32,623 145,716 0.01Trent 22,121 182,997 0.02TVS Motor 21,278 128,673 0.01UltraTech Cement 13,793 909,386 0.09Union Bank Of India 35,327 13,280 -United Breweries 6,619 92,391 0.01United Spirits 33,879 218,451 0.02UPL 62,652 484,458 0.05Varun Beverages 13,726 97,535 0.01Vedanta 148,935 382,551 0.04Vodafone Idea 865,610 84,721 0.01Voltas 27,352 271,967 0.03Whirlpool of India 3,150 68,563 0.01Wipro 156,993 834,936 0.08Yes Bank 176,152 23,331 -Zee Entertainment Enterprises 107,396 224,397 0.02
81,312,389 7.96Indonesia (2020: 1.08%)Adaro Energy 1,347,100 81,037 0.01Astra Agro Lestari 28,700 10,889 -Astra International 2,361,264 582,329 0.06Bank Central Asia 1,166,377 1,754,134 0.17Bank Danamon Indonesia 94,900 9,665 -Bank Mandiri Persero 2,280,240 671,629 0.07Bank Negara Indonesia Persero 862,800 199,429 0.02Bank Rakyat Indonesia Persero 6,410,022 1,260,818 0.12Barito Pacific 3,734,100 159,385 0.02Bukit Asam 368,800 36,823 -Bumi Serpong Damai 696,000 33,530 -Charoen Pokphand Indonesia 1,020,400 318,381 0.03Gudang Garam 50,600 111,653 0.01Hanjaya Mandala Sampoerna 992,500 60,201 0.01Indah Kiat Pulp & Paper 290,046 107,875 0.01Indocement Tunggal Prakarsa 146,933 75,553 0.01Indofood CBP Sukses Makmur 261,612 106,442 0.01Indofood Sukses Makmur 487,000 150,128 0.01Jasa Marga Persero 201,300 35,374 -Kalbe Farma 2,453,800 171,500 0.02Mayora Indah 592,400 68,316 0.01Media Nusantara Citra 508,000 23,585 -Perusahaan Gas Negara 1,095,000 54,939 0.01Sarana Menara Nusantara 3,432,700 212,498 0.02Semen Indonesia Persero 340,100 161,297 0.02Smartfren Telecom 4,796,500 28,256 -Surya Citra Media 600,300 54,243 -Telekomunikasi Indonesia Persero 5,738,817 902,464 0.09Tower Bersama Infrastructure 1,027,800 164,706 0.02Unilever Indonesia 635,695 157,091 0.02United Tractors 172,200 174,082 0.02Vale Indonesia 201,300 46,328 -XL Axiata 328,800 43,827 -
8,028,407 0.79Ireland (2020: 0.10%)James Hardie Industries 42,020 1,033,777 0.10
SharesFair value
GB£% of
Net assets
Italy (2020: 0.02%)PRADA 49,500 271,997 0.03
Japan (2020: 3.56%)ABC-Mart 1,000 41,545 -Acom 14,300 45,140 -Activia Properties REIT 30 102,917 0.01Advance Residence Investment REIT 47 113,418 0.01Advantest 7,700 502,696 0.05Aeon 28,300 550,949 0.05AEON Financial Service 4,400 37,564 -Aeon Mall 4,500 50,216 0.01AGC 7,200 218,826 0.02Aica Kogyo 2,000 50,937 0.01Ain Holdings 1,000 45,197 -Air Water 6,700 74,635 0.01Aisin Seiki 6,900 213,759 0.02Ajinomoto 19,100 359,261 0.04Alfresa Holdings 6,500 70,330 0.01Alps Alpine 7,500 57,377 0.01Amada 11,700 85,693 0.01Amano 2,500 45,670 -ANA Holdings 6,500 110,731 0.01Anritsu 5,200 70,237 0.01Aozora Bank 4,400 71,312 0.01Ariake Japan 700 31,456 -As One 500 47,317 -Asahi Group Holdings 16,600 562,005 0.06Asahi Intecc 7,900 136,847 0.01Asahi Kasei 49,600 394,821 0.04Asics 7,300 133,881 0.01ASKUL 1,600 18,074 -Astellas Pharma 73,900 932,382 0.09Azbil 5,200 156,176 0.02Bandai Namco Holdings 7,700 387,091 0.04Bank of Kyoto 3,000 98,613 0.01BayCurrent Consulting 500 130,114 0.01Benefit One 2,200 50,148 0.01Benesse Holdings 2,700 48,655 -Bic Camera 5,500 40,140 -Bridgestone 23,000 758,281 0.07Brother Industries 9,500 137,363 0.01Calbee 2,800 46,786 -Canon 39,800 652,314 0.06Canon Marketing Japan 1,700 28,639 -Capcom 7,300 154,734 0.02Casio Computer 8,800 106,580 0.01Central Japan Railway 7,200 791,249 0.08Chiba Bank 25,100 109,517 0.01Chubu Electric Power 27,400 242,678 0.02Chugai Pharmaceutical 25,850 742,150 0.07Chugoku Bank 6,400 35,229 -Chugoku Electric Power 13,500 89,280 0.01Coca-Cola Bottlers Japan Holdings 5,200 58,875 0.01COMSYS Holdings 4,900 98,270 0.01Concordia Financial Group 45,400 120,512 0.01Cosmo Energy Holdings 2,400 39,868 -Cosmos Pharmaceutical 700 74,416 0.01Credit Saison 5,800 51,219 0.01
Mercer UCITS Common Contractual FundNFU Mutual Global Regional Core Fund
Portfolio Statementas at 30 June 2021
(continued)
Mercer UCITS Common Contractual Fund 220

Financial assets at fair value through profit or loss (2020: 98.74%) (continued)Transferable securities (2020: 98.74%) (continued)Equities (2020: 98.74%) (continued)
SharesFair value
GB£% of
Net assets
Japan (2020: 3.56%) (continued)CyberAgent 15,200 236,436 0.02Dai Nippon Printing 11,100 170,054 0.02Daicel 9,800 58,419 0.01Daido Steel 1,300 46,548 -Daifuku 3,900 256,647 0.03Dai-ichi Life Holdings 42,500 563,794 0.06Daiichi Sankyo 74,200 1,158,776 0.11Daiichikosho 1,500 41,724 -Daikin Industries 10,500 1,416,872 0.14Daio Paper 3,100 37,181 -Daito Trust Construction 2,500 198,106 0.02Daiwa House Industry 25,200 548,122 0.05Daiwa House Investment REIT 75 160,197 0.02Daiwa Office Investment REIT 8 40,332 -Daiwa Securities Group 58,900 234,367 0.02DeNA 3,500 53,895 0.01Denka 3,300 79,526 0.01Denso 18,000 889,745 0.09Dentsu Group 8,700 225,547 0.02DIC 3,100 56,712 0.01Disco 1,140 252,421 0.02DMG Mori 3,800 49,418 0.01Dowa Holdings 1,700 48,507 -East Japan Railway 14,400 744,479 0.07Ebara 3,600 128,431 0.01Eisai 10,500 748,155 0.07Elecom 1,700 23,084 -Electric Power Development 6,200 64,092 0.01ENEOS Holdings 121,100 367,185 0.04Ezaki Glico 1,900 51,302 0.01Fancl 2,600 61,046 0.01FANUC 7,600 1,328,154 0.13Fast Retailing 2,040 1,112,687 0.11Food & Life 4,100 128,219 0.01FP 1,700 45,736 -Fuji Electric 5,000 169,246 0.02Fuji Kyuko 900 31,227 -Fuji Media Holdings 1,700 13,682 -Fuji Oil Holdings 1,700 29,304 -FUJIFILM Holdings 14,100 757,660 0.07Fujitsu 7,500 1,017,432 0.10Fujitsu General 2,100 40,363 -Fukuoka Financial Group 6,100 77,142 0.01Fukuyama Transporting 1,200 32,284 -Furukawa Electric 2,300 41,507 -Fuyo General Lease 700 32,049 -GLP JREIT 163 203,687 0.02GMO internet 2,200 43,476 -GMO Payment Gateway 1,700 160,435 0.02Goldwin 1,300 55,365 0.01GS Yuasa 2,900 53,621 0.01GungHo Online Entertainment 1,300 18,746 -Gunma Bank 15,500 35,382 -H.U. Group Holdings 2,000 37,358 -Hachijuni Bank 16,800 39,226 -Hakuhodo DY Holdings 9,700 109,066 0.01Hamamatsu Photonics 5,000 218,487 0.02Hankyu Hanshin Holdings 8,600 192,106 0.02
SharesFair value
GB£% of
Net assets
Japan (2020: 3.56%) (continued)Haseko 11,400 113,162 0.01Heiwa 2,000 25,658 -Hikari Tsushin 900 114,520 0.01Hino Motors 10,100 64,357 0.01Hirogin Holdings 11,100 42,351 -Hirose Electric 1,300 137,777 0.01Hisamitsu Pharmaceutical 2,800 99,891 0.01Hitachi 36,600 1,518,404 0.15Hitachi Construction Machinery 4,000 88,569 0.01Hitachi Metals 8,500 117,748 0.01Hitachi Transport System 1,200 36,041 -Hokuriku Electric Power 6,400 25,295 -Honda Motor 67,700 1,567,465 0.15Horiba 1,500 70,438 0.01Hoshizaki 2,000 123,135 0.01House Foods Group 2,700 59,784 0.01Hoya 14,100 1,354,574 0.13Hulic 15,600 127,179 0.01Ibiden 4,600 179,707 0.02Ichigo 7,400 16,989 -Idemitsu Kosan 9,400 164,486 0.02IHI 4,700 80,802 0.01Iida Group Holdings 5,300 98,860 0.01Industrial & Infrastructure FundInvestment REIT 74 102,269 0.01Inpex 36,300 196,265 0.02IR Japan Holdings 300 27,373 -Isetan Mitsukoshi Holdings 13,100 66,129 0.01Isuzu Motors 20,500 196,139 0.02Ito En 2,300 98,854 0.01ITOCHU 53,800 1,122,828 0.11Itochu Techno-Solutions 3,600 80,768 0.01Itoham Yonekyu Holdings 5,000 23,316 -Iwatani 1,900 82,529 0.01Iyo Bank 10,300 36,678 -Izumi 1,500 40,893 -J Front Retailing 9,300 59,745 0.01Japan Airlines 5,500 86,126 0.01Japan Airport Terminal 2,000 65,090 0.01Japan Aviation Electronics Industry 1,700 21,765 -Japan Exchange Group 21,600 347,962 0.03Japan Logistics Fund REIT 34 74,064 0.01Japan Post Bank 15,400 93,709 0.01Japan Post Holdings 54,000 320,597 0.03Japan Post Insurance 6,900 92,434 0.01Japan Prime Realty Investment REIT 35 99,297 0.01Japan Real Estate Investment REIT 49 218,272 0.02Japan Retail Fund Investment REIT 268 210,447 0.02Japan Tobacco 47,300 647,368 0.06JCR Pharmaceuticals 2,100 51,224 0.01JFE Holdings 20,400 173,097 0.02JGC Holdings 8,100 54,677 0.01JSR 7,300 159,972 0.02JTEKT 8,500 63,143 0.01Justsystems 1,300 55,450 0.01Kagome 3,000 57,348 0.01Kajima 17,800 163,341 0.02Kakaku.com 4,900 107,218 0.01
Mercer UCITS Common Contractual FundNFU Mutual Global Regional Core Fund
Portfolio Statementas at 30 June 2021
(continued)
Mercer UCITS Common Contractual Fund 221
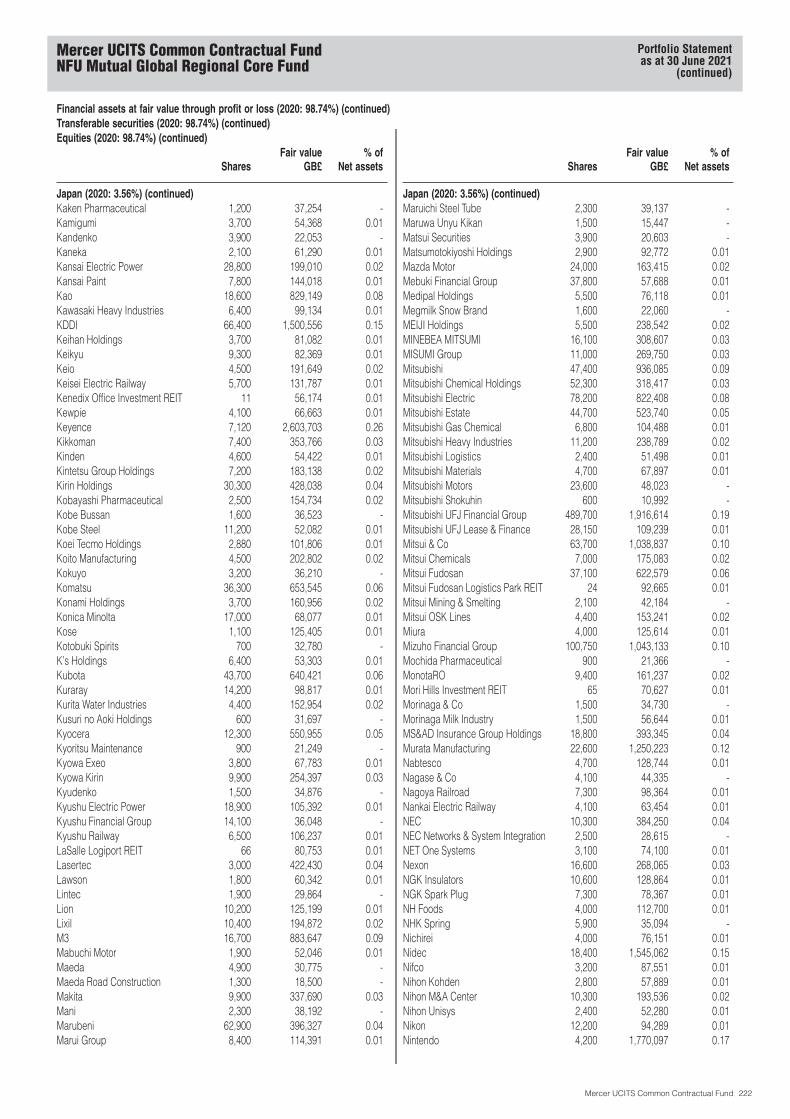
Financial assets at fair value through profit or loss (2020: 98.74%) (continued)Transferable securities (2020: 98.74%) (continued)Equities (2020: 98.74%) (continued)
SharesFair value
GB£% of
Net assets
Japan (2020: 3.56%) (continued)Kaken Pharmaceutical 1,200 37,254 -Kamigumi 3,700 54,368 0.01Kandenko 3,900 22,053 -Kaneka 2,100 61,290 0.01Kansai Electric Power 28,800 199,010 0.02Kansai Paint 7,800 144,018 0.01Kao 18,600 829,149 0.08Kawasaki Heavy Industries 6,400 99,134 0.01KDDI 66,400 1,500,556 0.15Keihan Holdings 3,700 81,082 0.01Keikyu 9,300 82,369 0.01Keio 4,500 191,649 0.02Keisei Electric Railway 5,700 131,787 0.01Kenedix Office Investment REIT 11 56,174 0.01Kewpie 4,100 66,663 0.01Keyence 7,120 2,603,703 0.26Kikkoman 7,400 353,766 0.03Kinden 4,600 54,422 0.01Kintetsu Group Holdings 7,200 183,138 0.02Kirin Holdings 30,300 428,038 0.04Kobayashi Pharmaceutical 2,500 154,734 0.02Kobe Bussan 1,600 36,523 -Kobe Steel 11,200 52,082 0.01Koei Tecmo Holdings 2,880 101,806 0.01Koito Manufacturing 4,500 202,802 0.02Kokuyo 3,200 36,210 -Komatsu 36,300 653,545 0.06Konami Holdings 3,700 160,956 0.02Konica Minolta 17,000 68,077 0.01Kose 1,100 125,405 0.01Kotobuki Spirits 700 32,780 -K’s Holdings 6,400 53,303 0.01Kubota 43,700 640,421 0.06Kuraray 14,200 98,817 0.01Kurita Water Industries 4,400 152,954 0.02Kusuri no Aoki Holdings 600 31,697 -Kyocera 12,300 550,955 0.05Kyoritsu Maintenance 900 21,249 -Kyowa Exeo 3,800 67,783 0.01Kyowa Kirin 9,900 254,397 0.03Kyudenko 1,500 34,876 -Kyushu Electric Power 18,900 105,392 0.01Kyushu Financial Group 14,100 36,048 -Kyushu Railway 6,500 106,237 0.01LaSalle Logiport REIT 66 80,753 0.01Lasertec 3,000 422,430 0.04Lawson 1,800 60,342 0.01Lintec 1,900 29,864 -Lion 10,200 125,199 0.01Lixil 10,400 194,872 0.02M3 16,700 883,647 0.09Mabuchi Motor 1,900 52,046 0.01Maeda 4,900 30,775 -Maeda Road Construction 1,300 18,500 -Makita 9,900 337,690 0.03Mani 2,300 38,192 -Marubeni 62,900 396,327 0.04Marui Group 8,400 114,391 0.01
SharesFair value
GB£% of
Net assets
Japan (2020: 3.56%) (continued)Maruichi Steel Tube 2,300 39,137 -Maruwa Unyu Kikan 1,500 15,447 -Matsui Securities 3,900 20,603 -Matsumotokiyoshi Holdings 2,900 92,772 0.01Mazda Motor 24,000 163,415 0.02Mebuki Financial Group 37,800 57,688 0.01Medipal Holdings 5,500 76,118 0.01Megmilk Snow Brand 1,600 22,060 -MEIJI Holdings 5,500 238,542 0.02MINEBEA MITSUMI 16,100 308,607 0.03MISUMI Group 11,000 269,750 0.03Mitsubishi 47,400 936,085 0.09Mitsubishi Chemical Holdings 52,300 318,417 0.03Mitsubishi Electric 78,200 822,408 0.08Mitsubishi Estate 44,700 523,740 0.05Mitsubishi Gas Chemical 6,800 104,488 0.01Mitsubishi Heavy Industries 11,200 238,789 0.02Mitsubishi Logistics 2,400 51,498 0.01Mitsubishi Materials 4,700 67,897 0.01Mitsubishi Motors 23,600 48,023 -Mitsubishi Shokuhin 600 10,992 -Mitsubishi UFJ Financial Group 489,700 1,916,614 0.19Mitsubishi UFJ Lease & Finance 28,150 109,239 0.01Mitsui & Co 63,700 1,038,837 0.10Mitsui Chemicals 7,000 175,083 0.02Mitsui Fudosan 37,100 622,579 0.06Mitsui Fudosan Logistics Park REIT 24 92,665 0.01Mitsui Mining & Smelting 2,100 42,184 -Mitsui OSK Lines 4,400 153,241 0.02Miura 4,000 125,614 0.01Mizuho Financial Group 100,750 1,043,133 0.10Mochida Pharmaceutical 900 21,366 -MonotaRO 9,400 161,237 0.02Mori Hills Investment REIT 65 70,627 0.01Morinaga & Co 1,500 34,730 -Morinaga Milk Industry 1,500 56,644 0.01MS&AD Insurance Group Holdings 18,800 393,345 0.04Murata Manufacturing 22,600 1,250,223 0.12Nabtesco 4,700 128,744 0.01Nagase & Co 4,100 44,335 -Nagoya Railroad 7,300 98,364 0.01Nankai Electric Railway 4,100 63,454 0.01NEC 10,300 384,250 0.04NEC Networks & System Integration 2,500 28,615 -NET One Systems 3,100 74,100 0.01Nexon 16,600 268,065 0.03NGK Insulators 10,600 128,864 0.01NGK Spark Plug 7,300 78,367 0.01NH Foods 4,000 112,700 0.01NHK Spring 5,900 35,094 -Nichirei 4,000 76,151 0.01Nidec 18,400 1,545,062 0.15Nifco 3,200 87,551 0.01Nihon Kohden 2,800 57,889 0.01Nihon M&A Center 10,300 193,536 0.02Nihon Unisys 2,400 52,280 0.01Nikon 12,200 94,289 0.01Nintendo 4,200 1,770,097 0.17
Mercer UCITS Common Contractual FundNFU Mutual Global Regional Core Fund
Portfolio Statementas at 30 June 2021
(continued)
Mercer UCITS Common Contractual Fund 222
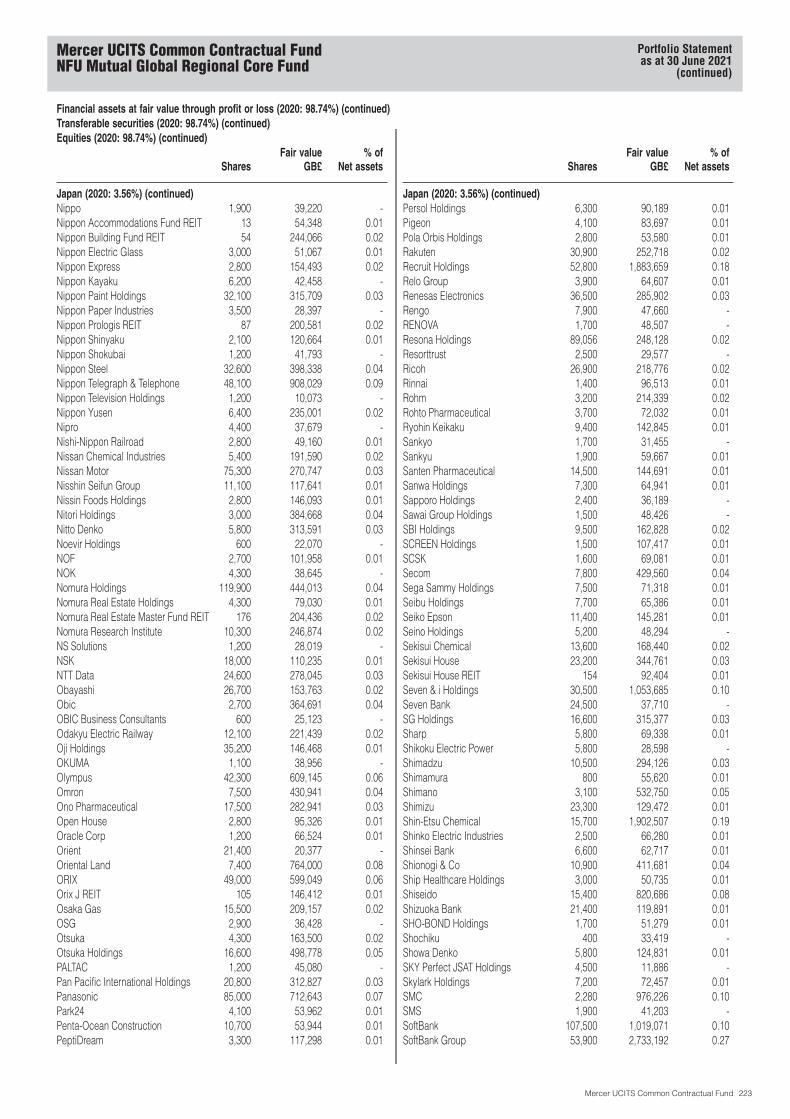
Financial assets at fair value through profit or loss (2020: 98.74%) (continued)Transferable securities (2020: 98.74%) (continued)Equities (2020: 98.74%) (continued)
SharesFair value
GB£% of
Net assets
Japan (2020: 3.56%) (continued)Nippo 1,900 39,220 -Nippon Accommodations Fund REIT 13 54,348 0.01Nippon Building Fund REIT 54 244,066 0.02Nippon Electric Glass 3,000 51,067 0.01Nippon Express 2,800 154,493 0.02Nippon Kayaku 6,200 42,458 -Nippon Paint Holdings 32,100 315,709 0.03Nippon Paper Industries 3,500 28,397 -Nippon Prologis REIT 87 200,581 0.02Nippon Shinyaku 2,100 120,664 0.01Nippon Shokubai 1,200 41,793 -Nippon Steel 32,600 398,338 0.04Nippon Telegraph & Telephone 48,100 908,029 0.09Nippon Television Holdings 1,200 10,073 -Nippon Yusen 6,400 235,001 0.02Nipro 4,400 37,679 -Nishi-Nippon Railroad 2,800 49,160 0.01Nissan Chemical Industries 5,400 191,590 0.02Nissan Motor 75,300 270,747 0.03Nisshin Seifun Group 11,100 117,641 0.01Nissin Foods Holdings 2,800 146,093 0.01Nitori Holdings 3,000 384,668 0.04Nitto Denko 5,800 313,591 0.03Noevir Holdings 600 22,070 -NOF 2,700 101,958 0.01NOK 4,300 38,645 -Nomura Holdings 119,900 444,013 0.04Nomura Real Estate Holdings 4,300 79,030 0.01Nomura Real Estate Master Fund REIT 176 204,436 0.02Nomura Research Institute 10,300 246,874 0.02NS Solutions 1,200 28,019 -NSK 18,000 110,235 0.01NTT Data 24,600 278,045 0.03Obayashi 26,700 153,763 0.02Obic 2,700 364,691 0.04OBIC Business Consultants 600 25,123 -Odakyu Electric Railway 12,100 221,439 0.02Oji Holdings 35,200 146,468 0.01OKUMA 1,100 38,956 -Olympus 42,300 609,145 0.06Omron 7,500 430,941 0.04Ono Pharmaceutical 17,500 282,941 0.03Open House 2,800 95,326 0.01Oracle Corp 1,200 66,524 0.01Orient 21,400 20,377 -Oriental Land 7,400 764,000 0.08ORIX 49,000 599,049 0.06Orix J REIT 105 146,412 0.01Osaka Gas 15,500 209,157 0.02OSG 2,900 36,428 -Otsuka 4,300 163,500 0.02Otsuka Holdings 16,600 498,778 0.05PALTAC 1,200 45,080 -Pan Pacific International Holdings 20,800 312,827 0.03Panasonic 85,000 712,643 0.07Park24 4,100 53,962 0.01Penta-Ocean Construction 10,700 53,944 0.01PeptiDream 3,300 117,298 0.01
SharesFair value
GB£% of
Net assets
Japan (2020: 3.56%) (continued)Persol Holdings 6,300 90,189 0.01Pigeon 4,100 83,697 0.01Pola Orbis Holdings 2,800 53,580 0.01Rakuten 30,900 252,718 0.02Recruit Holdings 52,800 1,883,659 0.18Relo Group 3,900 64,607 0.01Renesas Electronics 36,500 285,902 0.03Rengo 7,900 47,660 -RENOVA 1,700 48,507 -Resona Holdings 89,056 248,128 0.02Resorttrust 2,500 29,577 -Ricoh 26,900 218,776 0.02Rinnai 1,400 96,513 0.01Rohm 3,200 214,339 0.02Rohto Pharmaceutical 3,700 72,032 0.01Ryohin Keikaku 9,400 142,845 0.01Sankyo 1,700 31,455 -Sankyu 1,900 59,667 0.01Santen Pharmaceutical 14,500 144,691 0.01Sanwa Holdings 7,300 64,941 0.01Sapporo Holdings 2,400 36,189 -Sawai Group Holdings 1,500 48,426 -SBI Holdings 9,500 162,828 0.02SCREEN Holdings 1,500 107,417 0.01SCSK 1,600 69,081 0.01Secom 7,800 429,560 0.04Sega Sammy Holdings 7,500 71,318 0.01Seibu Holdings 7,700 65,386 0.01Seiko Epson 11,400 145,281 0.01Seino Holdings 5,200 48,294 -Sekisui Chemical 13,600 168,440 0.02Sekisui House 23,200 344,761 0.03Sekisui House REIT 154 92,404 0.01Seven & i Holdings 30,500 1,053,685 0.10Seven Bank 24,500 37,710 -SG Holdings 16,600 315,377 0.03Sharp 5,800 69,338 0.01Shikoku Electric Power 5,800 28,598 -Shimadzu 10,500 294,126 0.03Shimamura 800 55,620 0.01Shimano 3,100 532,750 0.05Shimizu 23,300 129,472 0.01Shin-Etsu Chemical 15,700 1,902,507 0.19Shinko Electric Industries 2,500 66,280 0.01Shinsei Bank 6,600 62,717 0.01Shionogi & Co 10,900 411,681 0.04Ship Healthcare Holdings 3,000 50,735 0.01Shiseido 15,400 820,686 0.08Shizuoka Bank 21,400 119,891 0.01SHO-BOND Holdings 1,700 51,279 0.01Shochiku 400 33,419 -Showa Denko 5,800 124,831 0.01SKY Perfect JSAT Holdings 4,500 11,886 -Skylark Holdings 7,200 72,457 0.01SMC 2,280 976,226 0.10SMS 1,900 41,203 -SoftBank 107,500 1,019,071 0.10SoftBank Group 53,900 2,733,192 0.27
Mercer UCITS Common Contractual FundNFU Mutual Global Regional Core Fund
Portfolio Statementas at 30 June 2021
(continued)
Mercer UCITS Common Contractual Fund 223

Financial assets at fair value through profit or loss (2020: 98.74%) (continued)Transferable securities (2020: 98.74%) (continued)Equities (2020: 98.74%) (continued)
SharesFair value
GB£% of
Net assets
Japan (2020: 3.56%) (continued)Sohgo Security Services 2,900 95,704 0.01Sojitz 52,100 113,832 0.01Sompo Holdings 13,300 356,165 0.04Sony 48,900 3,449,184 0.34Sotetsu Holdings 2,900 41,402 -Square Enix Holdings 3,300 118,590 0.01Stanley Electric 5,800 121,616 0.01Subaru 24,700 353,036 0.03Sugi Holdings 1,600 84,525 0.01SUMCO 9,200 163,507 0.02Sumitomo 44,200 428,949 0.04Sumitomo Bakelite 1,200 38,428 -Sumitomo Chemical 59,400 228,183 0.02Sumitomo Dainippon Pharma 6,300 95,654 0.01Sumitomo Electric Industries 30,600 327,101 0.03Sumitomo Forestry 5,100 67,689 0.01Sumitomo Heavy Industries 4,300 85,816 0.01Sumitomo Metal Mining 9,700 273,614 0.03Sumitomo Mitsui Financial Group 51,500 1,286,432 0.13Sumitomo Mitsui Trust Holdings 14,800 340,542 0.03Sumitomo Realty & Development 15,900 411,688 0.04Sumitomo Rubber Industries 6,800 67,988 0.01Sundrug 2,500 57,557 0.01Suntory Beverage & Food 5,300 144,488 0.01Suzuken 2,800 59,442 0.01Suzuki Motor 18,300 561,077 0.06Sysmex 7,600 654,287 0.06T&D Holdings 21,300 199,487 0.02Taiheiyo Cement 4,900 77,881 0.01Taisei 6,500 154,311 0.02Taisho Pharmaceutical Holdings 1,600 62,089 0.01Taiyo Nippon Sanso 5,400 80,193 0.01Taiyo Yuden 5,100 182,610 0.02Takara Bio 1,700 32,874 -Takara Holdings 6,500 58,714 0.01Takashimaya 5,300 41,756 -Takeda Pharmaceutical 60,400 1,465,022 0.14TBS Holdings 1,300 14,464 -TDK 4,700 413,514 0.04TechnoPro Holdings 4,200 71,987 0.01Teijin 6,900 76,188 0.01Terumo 26,100 766,350 0.08THK 4,300 92,968 0.01TIS 9,500 175,778 0.02Tobu Railway 8,100 151,723 0.02Toda 8,700 43,407 -Toho 4,500 134,418 0.01Toho Gas 3,500 124,179 0.01Tohoku Electric Power 20,300 115,185 0.01Tokai Carbon 7,400 73,939 0.01Tokai Rika 1,900 22,070 -Tokio Marine Holdings 25,700 856,180 0.08Tokuyama 2,600 38,357 -Tokyo Century 2,500 97,341 0.01Tokyo Electric Power Holdings 63,000 135,592 0.01Tokyo Electron 5,880 1,843,838 0.18Tokyo Gas 16,600 227,032 0.02Tokyo Ohka Kogyo 1,400 64,007 0.01
SharesFair value
GB£% of
Net assets
Japan (2020: 3.56%) (continued)Tokyo Tatemono 7,500 77,481 0.01Tokyu 19,500 192,168 0.02Tokyu Fudosan Holdings 25,200 109,789 0.01Toppan Printing 11,500 133,880 0.01Toray Industries 62,600 301,758 0.03Toshiba 17,800 557,820 0.05Toshiba TEC 900 26,825 -Tosoh 11,200 139,957 0.01TOTO 6,000 225,009 0.02Toyo Seikan Group Holdings 5,600 55,406 0.01Toyo Suisan Kaisha 3,900 108,738 0.01Toyo Tire 3,800 58,192 0.01Toyoda Gosei 2,800 49,945 0.01Toyota Boshoku 2,300 34,456 -Toyota Industries 6,300 394,862 0.04Toyota Motor 97,500 6,174,542 0.60Toyota Tsusho 8,700 297,892 0.03Trend Micro 4,700 178,403 0.02TS Tech 3,800 42,504 -Tsumura & Co 2,500 56,986 0.01Tsuruha Holdings 1,400 117,879 0.01TV Asahi Holdings 900 10,337 -Ube Industries 3,800 55,738 0.01Ulvac 1,800 66,094 0.01Unicharm 15,300 446,046 0.04United Urban Investment REIT 118 123,674 0.01Ushio 4,200 55,607 0.01USS 7,900 99,853 0.01Welcia Holdings 3,800 89,964 0.01West Japan Railway 7,100 293,304 0.03Yakult Honsha 5,300 217,424 0.02Yamada Holdings 31,600 105,727 0.01Yamaguchi Financial Group 8,700 35,974 -Yamaha 6,400 251,697 0.02Yamaha Motor 11,000 216,661 0.02Yamato Holdings 13,100 269,985 0.03Yamato Kogyo 1,300 31,159 -Yamazaki Baking 4,700 48,003 -Yaoko 800 33,236 -Yaskawa Electric 10,200 361,228 0.04Yokogawa Electric 9,900 107,183 0.01Yokohama Rubber 3,900 60,512 0.01Z Holdings 105,200 382,029 0.04Zenkoku Hosho 1,900 59,171 0.01Zensho Holdings 4,000 74,429 0.01Zeon 5,500 55,134 0.01ZOZO 3,700 91,096 0.01
127,692,595 12.51Kuwait (2020: 0.48%)Agility Public Warehousing 137,134 302,450 0.03Boubyan Bank 110,268 193,922 0.02Boubyan Petrochemicals 35,993 74,367 0.01Burgan Bank 68,400 37,139 -Gulf Bank 204,467 124,282 0.01Humansoft Holding 10,065 90,801 0.01Kuwait Finance House 533,027 971,978 0.10Mabanee 62,106 106,984 0.01
Mercer UCITS Common Contractual FundNFU Mutual Global Regional Core Fund
Portfolio Statementas at 30 June 2021
(continued)
Mercer UCITS Common Contractual Fund 224

Financial assets at fair value through profit or loss (2020: 98.74%) (continued)Transferable securities (2020: 98.74%) (continued)Equities (2020: 98.74%) (continued)
SharesFair value
GB£% of
Net assets
Kuwait (2020: 0.48%) (continued)Mobile Telecommunications 276,292 390,975 0.04National Bank of Kuwait 820,034 1,672,651 0.16
3,965,549 0.39Luxembourg (2020: 0.02%)L’Occitane International 42,000 111,184 0.01Reinet Investments 18,843 267,694 0.03Samsonite International 126,300 186,952 0.02
565,830 0.06Macau (2020: 0.16%)MGM China Holdings 73,600 80,679 0.01Sands China 223,600 681,547 0.07Wynn Macau 134,000 152,634 0.01
914,860 0.09Malaysia (2020: 1.55%)AirAsia Group 139,000 21,571 -Alliance Bank Malaysia 105,000 44,123 -AMMB Holdings 327,744 168,584 0.02Astro Malaysia Holdings 163,200 32,725 -Axiata Group 536,747 350,027 0.03British American Tobacco Malaysia 14,100 35,108 -CIMB Group Holdings 865,782 695,936 0.07Dialog Group 545,810 275,042 0.03DiGi.Com 504,449 363,268 0.04Fraser & Neave Holdings 9,800 45,112 -Gamuda 258,303 140,972 0.01Genting 315,900 271,554 0.03Genting Malaysia 312,300 150,838 0.01HAP Seng Consolidated 66,900 90,987 0.01Hartalega Holdings 173,300 222,099 0.02Hong Leong Bank 69,500 226,856 0.02Hong Leong Financial Group 21,400 66,419 0.01IHH Healthcare 335,081 319,593 0.03IJM 374,800 116,980 0.01IOI 441,500 289,453 0.03IOI Properties Group 203,000 39,644 -Kuala Lumpur Kepong 51,084 181,352 0.02Malayan Banking 747,717 1,057,348 0.10Malaysia Airports Holdings 100,000 104,619 0.01Maxis 304,100 232,777 0.02MISC 219,000 258,901 0.03MR DIY Group 117,500 73,552 0.01Nestle Malaysia 9,064 210,673 0.02Petronas Chemicals Group 323,300 454,360 0.04Petronas Dagangan 47,400 153,727 0.02Petronas Gas 60,062 162,327 0.02PPB Group 73,696 235,155 0.02Press Metal Aluminium Holdings 445,200 371,059 0.04Public Bank 1,867,170 1,338,090 0.13QL Resources 164,400 161,961 0.02RHB Bank 163,900 154,324 0.02Sime Darby 414,200 157,444 0.02Sime Darby Plantation 408,310 283,356 0.03Sime Darby Property 327,600 34,273 -Supermax 172,100 99,027 0.01Telekom Malaysia 175,300 185,537 0.02Tenaga Nasional 475,846 812,286 0.08
SharesFair value
GB£% of
Net assets
Malaysia (2020: 1.55%) (continued)Top Glove 678,100 493,048 0.05Westports Holdings 95,300 69,958 0.01YTL 430,680 49,188 -
11,301,233 1.11Mexico (2020: 1.39%)Alfa 272,700 147,923 0.01Alpek 44,700 39,848 -America Movil 3,586,320 1,955,793 0.19Arca Continental 56,712 237,855 0.02Banco Santander Mexico SA Institucionde Banca Multiple Grupo FinancieroSantand 50,957 46,501 0.01Becle 59,100 113,192 0.01Cemex 1,757,519 1,072,197 0.11Coca-Cola Femsa 62,746 240,670 0.02Concentradora Fibra Danhos REIT 15,400 12,441 -El Puerto de Liverpool 18,200 58,394 0.01Fibra Uno Administracion REIT 391,733 306,204 0.03Fomento Economico Mexicano 221,342 1,356,844 0.13Gruma 24,520 199,741 0.02Grupo Aeroportuario del Centro Norte 40,100 190,372 0.02Grupo Aeroportuario del Pacifico 42,600 330,543 0.03Grupo Aeroportuario del Sureste 24,875 331,912 0.03Grupo Bimbo 266,463 425,289 0.04Grupo Carso 54,900 123,870 0.01Grupo Cementos de Chihuahua 17,700 103,135 0.01Grupo Elektra SAB DE 7,090 415,934 0.04Grupo Financiero Banorte 349,164 1,629,453 0.16Grupo Financiero Inbursa 249,300 178,011 0.02Grupo Lala 54,600 32,515 -Grupo Mexico 382,464 1,306,520 0.13Grupo Televisa 279,370 578,539 0.06Industrias Bachoco 15,100 41,306 -Industrias Penoles 14,845 148,955 0.02Kimberly-Clark de Mexico 99,100 127,580 0.01Megacable Holdings 31,500 81,094 0.01Orbia Advance 109,500 207,452 0.02Promotora y Operadora deInfraestructura 24,000 138,885 0.01Qualitas Controladora 28,300 96,047 0.01Telesites 131,300 88,169 0.01Wal-Mart de Mexico 623,525 1,475,993 0.15
13,839,177 1.35New Zealand (2020: 0.69%)a2 Milk 68,906 224,455 0.02Air New Zealand 43,322 33,965 -Auckland International Airport 113,235 416,391 0.04Contact Energy 72,119 302,041 0.03Fisher & Paykel Healthcare 53,516 842,383 0.08Fletcher Building 81,221 308,939 0.03Infratil 47,840 186,324 0.02Kiwi Property Group 156,580 92,268 0.01Mercury 66,213 223,386 0.02Meridian Energy 114,871 309,688 0.03Ryman Healthcare 40,583 269,523 0.03SKYCITY Entertainment Group 78,290 138,995 0.02
Mercer UCITS Common Contractual FundNFU Mutual Global Regional Core Fund
Portfolio Statementas at 30 June 2021
(continued)
Mercer UCITS Common Contractual Fund 225
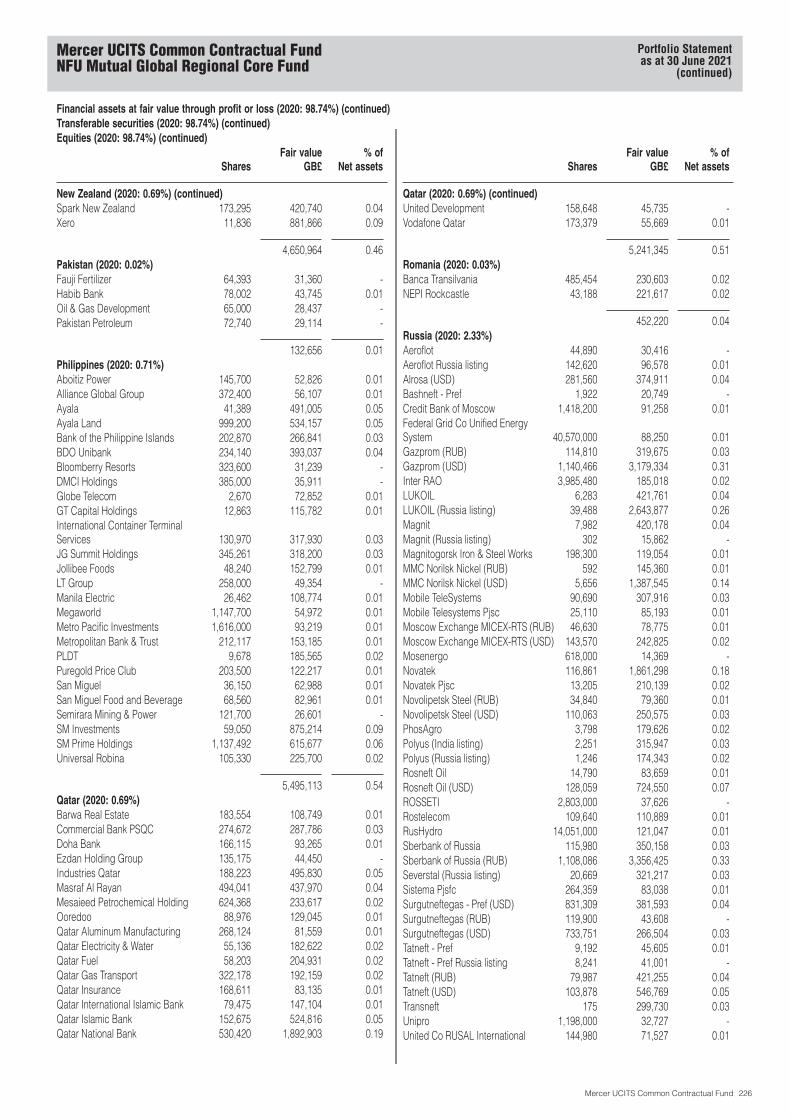
Financial assets at fair value through profit or loss (2020: 98.74%) (continued)Transferable securities (2020: 98.74%) (continued)Equities (2020: 98.74%) (continued)
SharesFair value
GB£% of
Net assets
New Zealand (2020: 0.69%) (continued)Spark New Zealand 173,295 420,740 0.04Xero 11,836 881,866 0.09
4,650,964 0.46Pakistan (2020: 0.02%)Fauji Fertilizer 64,393 31,360 -Habib Bank 78,002 43,745 0.01Oil & Gas Development 65,000 28,437 -Pakistan Petroleum 72,740 29,114 -
132,656 0.01Philippines (2020: 0.71%)Aboitiz Power 145,700 52,826 0.01Alliance Global Group 372,400 56,107 0.01Ayala 41,389 491,005 0.05Ayala Land 999,200 534,157 0.05Bank of the Philippine Islands 202,870 266,841 0.03BDO Unibank 234,140 393,037 0.04Bloomberry Resorts 323,600 31,239 -DMCI Holdings 385,000 35,911 -Globe Telecom 2,670 72,852 0.01GT Capital Holdings 12,863 115,782 0.01International Container TerminalServices 130,970 317,930 0.03JG Summit Holdings 345,261 318,200 0.03Jollibee Foods 48,240 152,799 0.01LT Group 258,000 49,354 -Manila Electric 26,462 108,774 0.01Megaworld 1,147,700 54,972 0.01Metro Pacific Investments 1,616,000 93,219 0.01Metropolitan Bank & Trust 212,117 153,185 0.01PLDT 9,678 185,565 0.02Puregold Price Club 203,500 122,217 0.01San Miguel 36,150 62,988 0.01San Miguel Food and Beverage 68,560 82,961 0.01Semirara Mining & Power 121,700 26,601 -SM Investments 59,050 875,214 0.09SM Prime Holdings 1,137,492 615,677 0.06Universal Robina 105,330 225,700 0.02
5,495,113 0.54Qatar (2020: 0.69%)Barwa Real Estate 183,554 108,749 0.01Commercial Bank PSQC 274,672 287,786 0.03Doha Bank 166,115 93,265 0.01Ezdan Holding Group 135,175 44,450 -Industries Qatar 188,223 495,830 0.05Masraf Al Rayan 494,041 437,970 0.04Mesaieed Petrochemical Holding 624,368 233,617 0.02Ooredoo 88,976 129,045 0.01Qatar Aluminum Manufacturing 268,124 81,559 0.01Qatar Electricity & Water 55,136 182,622 0.02Qatar Fuel 58,203 204,931 0.02Qatar Gas Transport 322,178 192,159 0.02Qatar Insurance 168,611 83,135 0.01Qatar International Islamic Bank 79,475 147,104 0.01Qatar Islamic Bank 152,675 524,816 0.05Qatar National Bank 530,420 1,892,903 0.19
SharesFair value
GB£% of
Net assets
Qatar (2020: 0.69%) (continued)United Development 158,648 45,735 -Vodafone Qatar 173,379 55,669 0.01
5,241,345 0.51Romania (2020: 0.03%)Banca Transilvania 485,454 230,603 0.02NEPI Rockcastle 43,188 221,617 0.02
452,220 0.04Russia (2020: 2.33%)Aeroflot 44,890 30,416 -Aeroflot Russia listing 142,620 96,578 0.01Alrosa (USD) 281,560 374,911 0.04Bashneft - Pref 1,922 20,749 -Credit Bank of Moscow 1,418,200 91,258 0.01Federal Grid Co Unified EnergySystem 40,570,000 88,250 0.01Gazprom (RUB) 114,810 319,675 0.03Gazprom (USD) 1,140,466 3,179,334 0.31Inter RAO 3,985,480 185,018 0.02LUKOIL 6,283 421,761 0.04LUKOIL (Russia listing) 39,488 2,643,877 0.26Magnit 7,982 420,178 0.04Magnit (Russia listing) 302 15,862 -Magnitogorsk Iron & Steel Works 198,300 119,054 0.01MMC Norilsk Nickel (RUB) 592 145,360 0.01MMC Norilsk Nickel (USD) 5,656 1,387,545 0.14Mobile TeleSystems 90,690 307,916 0.03Mobile Telesystems Pjsc 25,110 85,193 0.01Moscow Exchange MICEX-RTS (RUB) 46,630 78,775 0.01Moscow Exchange MICEX-RTS (USD) 143,570 242,825 0.02Mosenergo 618,000 14,369 -Novatek 116,861 1,861,298 0.18Novatek Pjsc 13,205 210,139 0.02Novolipetsk Steel (RUB) 34,840 79,360 0.01Novolipetsk Steel (USD) 110,063 250,575 0.03PhosAgro 3,798 179,626 0.02Polyus (India listing) 2,251 315,947 0.03Polyus (Russia listing) 1,246 174,343 0.02Rosneft Oil 14,790 83,659 0.01Rosneft Oil (USD) 128,059 724,550 0.07ROSSETI 2,803,000 37,626 -Rostelecom 109,640 110,889 0.01RusHydro 14,051,000 121,047 0.01Sberbank of Russia 115,980 350,158 0.03Sberbank of Russia (RUB) 1,108,086 3,356,425 0.33Severstal (Russia listing) 20,669 321,217 0.03Sistema Pjsfc 264,359 83,038 0.01Surgutneftegas - Pref (USD) 831,309 381,593 0.04Surgutneftegas (RUB) 119,900 43,608 -Surgutneftegas (USD) 733,751 266,504 0.03Tatneft - Pref 9,192 45,605 0.01Tatneft - Pref Russia listing 8,241 41,001 -Tatneft (RUB) 79,987 421,255 0.04Tatneft (USD) 103,878 546,769 0.05Transneft 175 299,730 0.03Unipro 1,198,000 32,727 -United Co RUSAL International 144,980 71,527 0.01
Mercer UCITS Common Contractual FundNFU Mutual Global Regional Core Fund
Portfolio Statementas at 30 June 2021
(continued)
Mercer UCITS Common Contractual Fund 226

Financial assets at fair value through profit or loss (2020: 98.74%) (continued)Transferable securities (2020: 98.74%) (continued)Equities (2020: 98.74%) (continued)
SharesFair value
GB£% of
Net assets
Russia (2020: 2.33%) (continued)United Company RUSAL 142,410 70,048 0.01VTB Bank (USD) 559,438,707 268,492 0.03
21,017,660 2.06Saudi Arabia (2020: 1.96%)Abdullah Al Othaim Markets 4,399 105,284 0.01Advanced Petrochemical 15,148 211,388 0.02Al Rajhi Bank 146,349 3,135,450 0.31Alinma Bank 117,079 475,458 0.05Almarai 28,411 347,667 0.03Arab National Bank 81,767 358,254 0.04Arabian Centres 19,441 98,312 0.01Bank AlBilad 43,019 304,729 0.03Bank Al-Jazira 53,465 190,910 0.02Banque Saudi Fransi 71,929 533,117 0.05BinDawood Holding 3,500 74,851 0.01Bupa Arabia for Cooperative Insurance 5,870 140,717 0.01Co for Cooperative Insurance 8,205 131,128 0.01Dallah Healthcare 3,291 50,435 -Dar Al Arkan Real Estate Development 51,223 104,404 0.01Dr Sulaiman Al Habib Medical ServicesGroup 9,722 306,616 0.03Emaar Economic City 49,764 122,945 0.01Etihad Etisalat 52,882 338,360 0.03Fawaz Abdulaziz Al Hokair & Co 5,105 24,781 -Jarir Marketing 6,813 277,728 0.03Mobile Telecommunications Co SaudiArabia 58,781 164,964 0.02Mouwasat Medical Services 4,678 162,705 0.02National Industrialization 39,158 146,021 0.01National Petrochemical 17,200 146,072 0.01Qassim Cement 6,466 107,330 0.01Rabigh Refining & Petrochemical 20,669 93,751 0.01Riyad Bank 177,133 906,009 0.09Sahara International Petrochemical 46,683 276,170 0.03Saudi Airlines Catering 3,336 50,674 -Saudi Arabian Fertilizer 22,853 526,665 0.05Saudi Arabian Mining 48,247 588,538 0.06Saudi Arabian Oil 310,477 2,103,409 0.21Saudi Basic Industries 108,013 2,539,280 0.25Saudi British Bank 106,477 647,371 0.06Saudi Cement 6,675 81,940 0.01Saudi Electricity 101,997 475,239 0.05Saudi Ground Services 13,327 93,117 0.01Saudi Industrial Investment Group 32,490 219,485 0.02Saudi Kayan Petrochemical 101,399 353,459 0.03Saudi National Bank 256,665 2,853,490 0.28Saudi Research & Media Group 2,346 80,147 0.01Saudi Telecom 72,202 1,833,970 0.18Saudia Dairy & Foodstuff 1,329 46,275 -Savola Group 31,259 260,341 0.03Seera Group Holding 21,469 89,921 0.01Southern Province Cement 9,200 155,198 0.02Yamama Cement 14,472 95,810 0.01Yanbu Cement 5,946 51,071 -Yanbu National Petrochemical 25,831 361,964 0.04
22,842,920 2.24
SharesFair value
GB£% of
Net assets
Singapore (2020: 1.87%)Ascendas REIT 278,196 441,951 0.04Ascott Residence Trust REIT 151,900 81,801 0.01BOC Aviation 18,300 111,730 0.01CapitaLand 214,786 429,122 0.04CapitaLand Mall Trust REIT 370,776 417,310 0.04City Developments 38,200 149,966 0.02ComfortDelGro 193,300 170,717 0.02DBS Group Holdings 152,457 2,447,430 0.24Frasers Logistics & Commercial TrustREIT 256,900 199,218 0.02Genting Singapore 499,100 224,427 0.02Golden Agri-Resources 543,400 67,305 0.01Hutchison Port Holdings Trust 542,600 88,375 0.01Jardine Cycle & Carriage 10,000 115,028 0.01Keppel 122,200 359,964 0.04Keppel DC REIT 116,800 156,619 0.02Keppel REIT 202,200 128,488 0.01Mapletree Commercial Trust REIT 181,234 210,812 0.02Mapletree Industrial Trust REIT 175,225 267,044 0.03Mapletree Logistics Trust REIT 239,135 263,996 0.03Mapletree North Asia Commercial TrustREIT 231,590 129,704 0.01NetLink NBN Trust 281,200 143,860 0.01Olam International 53,600 46,183 -Olam International (Non-Voting Rights) 8,040 1,515 -Oversea-Chinese Banking 301,036 1,937,257 0.19SATS 56,700 119,999 0.01Sembcorp Industries 97,100 111,901 0.01Sembcorp Marine 621,090 40,136 -SIA Engineering 15,100 17,483 -Singapore Airlines 111,099 290,170 0.03Singapore Exchange 71,700 431,680 0.04Singapore Post 127,900 49,247 0.01Singapore Press Holdings 150,100 138,222 0.01Singapore Technologies Engineering 132,700 276,556 0.03Singapore Telecommunications 538,030 660,606 0.07Singapore Telecommunications (Primaryhome) 86,800 107,042 0.01StarHub 52,400 34,426 -Suntec REIT 178,100 140,029 0.01United Overseas Bank 110,200 1,532,282 0.15UOL Group 43,300 170,220 0.02Venture 22,100 228,623 0.02Wilmar International 186,600 452,194 0.04Wing Tai Holdings 32,000 31,019 -Yangzijiang Shipbuilding Holdings 225,399 171,148 0.02Yanlord Land Group 63,100 41,456 -
13,634,261 1.33South Africa (2020: 2.87%)Absa Group 83,441 574,114 0.06African Rainbow Minerals 15,230 197,156 0.02Anglo American Platinum 7,171 599,629 0.06AngloGold Ashanti 51,394 691,728 0.07Aspen Pharmacare Holdings 45,556 374,349 0.04AVI 33,344 120,104 0.01Barloworld 25,305 136,676 0.01Bid 41,547 652,123 0.06
Mercer UCITS Common Contractual FundNFU Mutual Global Regional Core Fund
Portfolio Statementas at 30 June 2021
(continued)
Mercer UCITS Common Contractual Fund 227
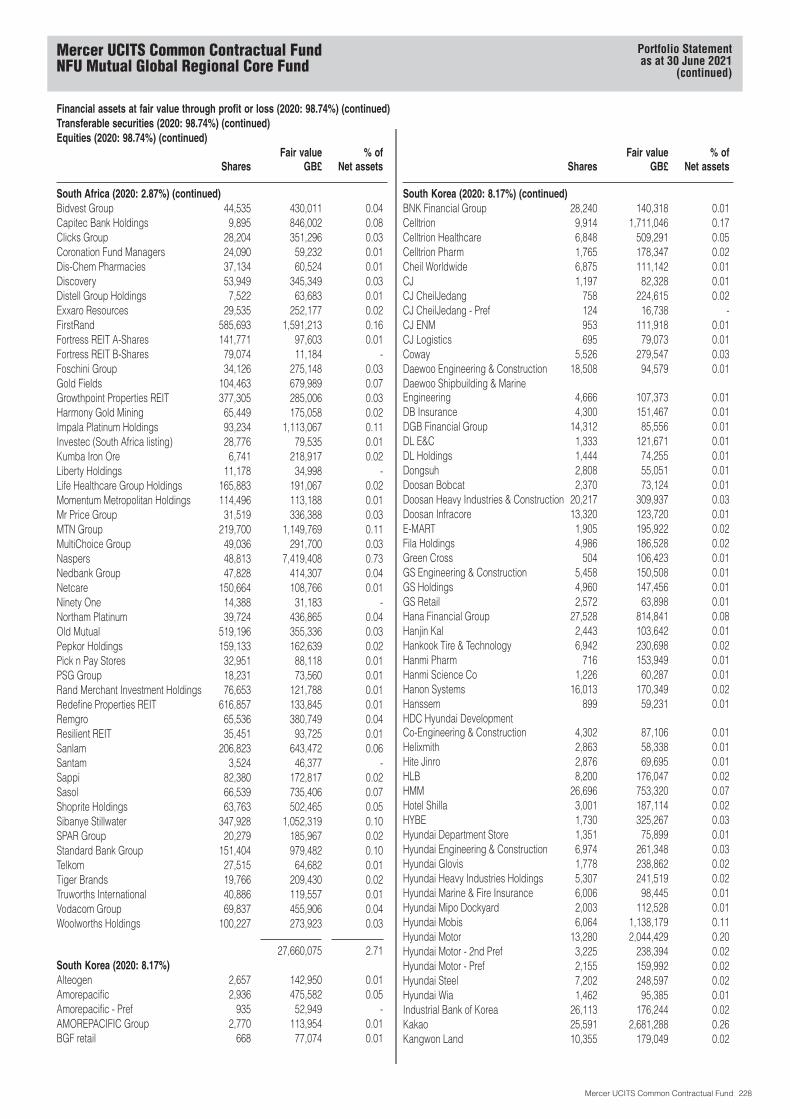
Financial assets at fair value through profit or loss (2020: 98.74%) (continued)Transferable securities (2020: 98.74%) (continued)Equities (2020: 98.74%) (continued)
SharesFair value
GB£% of
Net assets
South Africa (2020: 2.87%) (continued)Bidvest Group 44,535 430,011 0.04Capitec Bank Holdings 9,895 846,002 0.08Clicks Group 28,204 351,296 0.03Coronation Fund Managers 24,090 59,232 0.01Dis-Chem Pharmacies 37,134 60,524 0.01Discovery 53,949 345,349 0.03Distell Group Holdings 7,522 63,683 0.01Exxaro Resources 29,535 252,177 0.02FirstRand 585,693 1,591,213 0.16Fortress REIT A-Shares 141,771 97,603 0.01Fortress REIT B-Shares 79,074 11,184 -Foschini Group 34,126 275,148 0.03Gold Fields 104,463 679,989 0.07Growthpoint Properties REIT 377,305 285,006 0.03Harmony Gold Mining 65,449 175,058 0.02Impala Platinum Holdings 93,234 1,113,067 0.11Investec (South Africa listing) 28,776 79,535 0.01Kumba Iron Ore 6,741 218,917 0.02Liberty Holdings 11,178 34,998 -Life Healthcare Group Holdings 165,883 191,067 0.02Momentum Metropolitan Holdings 114,496 113,188 0.01Mr Price Group 31,519 336,388 0.03MTN Group 219,700 1,149,769 0.11MultiChoice Group 49,036 291,700 0.03Naspers 48,813 7,419,408 0.73Nedbank Group 47,828 414,307 0.04Netcare 150,664 108,766 0.01Ninety One 14,388 31,183 -Northam Platinum 39,724 436,865 0.04Old Mutual 519,196 355,336 0.03Pepkor Holdings 159,133 162,639 0.02Pick n Pay Stores 32,951 88,118 0.01PSG Group 18,231 73,560 0.01Rand Merchant Investment Holdings 76,653 121,788 0.01Redefine Properties REIT 616,857 133,845 0.01Remgro 65,536 380,749 0.04Resilient REIT 35,451 93,725 0.01Sanlam 206,823 643,472 0.06Santam 3,524 46,377 -Sappi 82,380 172,817 0.02Sasol 66,539 735,406 0.07Shoprite Holdings 63,763 502,465 0.05Sibanye Stillwater 347,928 1,052,319 0.10SPAR Group 20,279 185,967 0.02Standard Bank Group 151,404 979,482 0.10Telkom 27,515 64,682 0.01Tiger Brands 19,766 209,430 0.02Truworths International 40,886 119,557 0.01Vodacom Group 69,837 455,906 0.04Woolworths Holdings 100,227 273,923 0.03
27,660,075 2.71South Korea (2020: 8.17%)Alteogen 2,657 142,950 0.01Amorepacific 2,936 475,582 0.05Amorepacific - Pref 935 52,949 -AMOREPACIFIC Group 2,770 113,954 0.01BGF retail 668 77,074 0.01
SharesFair value
GB£% of
Net assets
South Korea (2020: 8.17%) (continued)BNK Financial Group 28,240 140,318 0.01Celltrion 9,914 1,711,046 0.17Celltrion Healthcare 6,848 509,291 0.05Celltrion Pharm 1,765 178,347 0.02Cheil Worldwide 6,875 111,142 0.01CJ 1,197 82,328 0.01CJ CheilJedang 758 224,615 0.02CJ CheilJedang - Pref 124 16,738 -CJ ENM 953 111,918 0.01CJ Logistics 695 79,073 0.01Coway 5,526 279,547 0.03Daewoo Engineering & Construction 18,508 94,579 0.01Daewoo Shipbuilding & MarineEngineering 4,666 107,373 0.01DB Insurance 4,300 151,467 0.01DGB Financial Group 14,312 85,556 0.01DL E&C 1,333 121,671 0.01DL Holdings 1,444 74,255 0.01Dongsuh 2,808 55,051 0.01Doosan Bobcat 2,370 73,124 0.01Doosan Heavy Industries & Construction 20,217 309,937 0.03Doosan Infracore 13,320 123,720 0.01E-MART 1,905 195,922 0.02Fila Holdings 4,986 186,528 0.02Green Cross 504 106,423 0.01GS Engineering & Construction 5,458 150,508 0.01GS Holdings 4,960 147,456 0.01GS Retail 2,572 63,898 0.01Hana Financial Group 27,528 814,841 0.08Hanjin Kal 2,443 103,642 0.01Hankook Tire & Technology 6,942 230,698 0.02Hanmi Pharm 716 153,949 0.01Hanmi Science Co 1,226 60,287 0.01Hanon Systems 16,013 170,349 0.02Hanssem 899 59,231 0.01HDC Hyundai DevelopmentCo-Engineering & Construction 4,302 87,106 0.01Helixmith 2,863 58,338 0.01Hite Jinro 2,876 69,695 0.01HLB 8,200 176,047 0.02HMM 26,696 753,320 0.07Hotel Shilla 3,001 187,114 0.02HYBE 1,730 325,267 0.03Hyundai Department Store 1,351 75,899 0.01Hyundai Engineering & Construction 6,974 261,348 0.03Hyundai Glovis 1,778 238,862 0.02Hyundai Heavy Industries Holdings 5,307 241,519 0.02Hyundai Marine & Fire Insurance 6,006 98,445 0.01Hyundai Mipo Dockyard 2,003 112,528 0.01Hyundai Mobis 6,064 1,138,179 0.11Hyundai Motor 13,280 2,044,429 0.20Hyundai Motor - 2nd Pref 3,225 238,394 0.02Hyundai Motor - Pref 2,155 159,992 0.02Hyundai Steel 7,202 248,597 0.02Hyundai Wia 1,462 95,385 0.01Industrial Bank of Korea 26,113 176,244 0.02Kakao 25,591 2,681,288 0.26Kangwon Land 10,355 179,049 0.02
Mercer UCITS Common Contractual FundNFU Mutual Global Regional Core Fund
Portfolio Statementas at 30 June 2021
(continued)
Mercer UCITS Common Contractual Fund 228
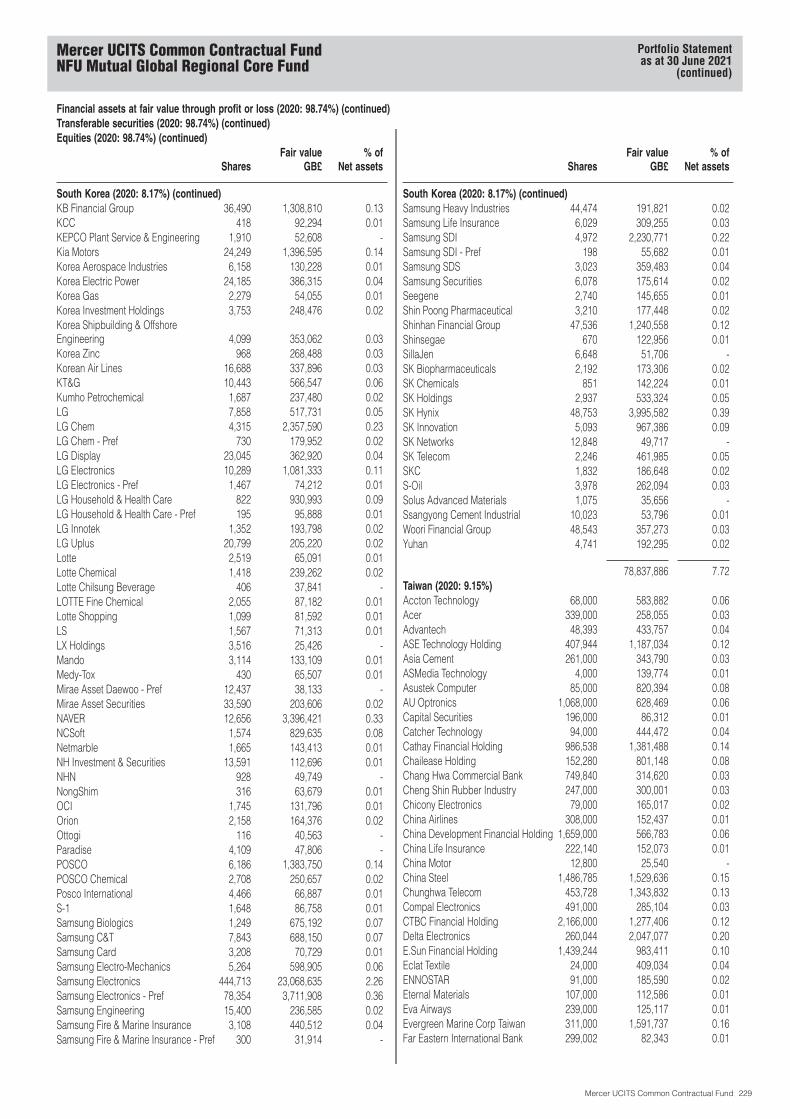
Financial assets at fair value through profit or loss (2020: 98.74%) (continued)Transferable securities (2020: 98.74%) (continued)Equities (2020: 98.74%) (continued)
SharesFair value
GB£% of
Net assets
South Korea (2020: 8.17%) (continued)KB Financial Group 36,490 1,308,810 0.13KCC 418 92,294 0.01KEPCO Plant Service & Engineering 1,910 52,608 -Kia Motors 24,249 1,396,595 0.14Korea Aerospace Industries 6,158 130,228 0.01Korea Electric Power 24,185 386,315 0.04Korea Gas 2,279 54,055 0.01Korea Investment Holdings 3,753 248,476 0.02Korea Shipbuilding & OffshoreEngineering 4,099 353,062 0.03Korea Zinc 968 268,488 0.03Korean Air Lines 16,688 337,896 0.03KT&G 10,443 566,547 0.06Kumho Petrochemical 1,687 237,480 0.02LG 7,858 517,731 0.05LG Chem 4,315 2,357,590 0.23LG Chem - Pref 730 179,952 0.02LG Display 23,045 362,920 0.04LG Electronics 10,289 1,081,333 0.11LG Electronics - Pref 1,467 74,212 0.01LG Household & Health Care 822 930,993 0.09LG Household & Health Care - Pref 195 95,888 0.01LG Innotek 1,352 193,798 0.02LG Uplus 20,799 205,220 0.02Lotte 2,519 65,091 0.01Lotte Chemical 1,418 239,262 0.02Lotte Chilsung Beverage 406 37,841 -LOTTE Fine Chemical 2,055 87,182 0.01Lotte Shopping 1,099 81,592 0.01LS 1,567 71,313 0.01LX Holdings 3,516 25,426 -Mando 3,114 133,109 0.01Medy-Tox 430 65,507 0.01Mirae Asset Daewoo - Pref 12,437 38,133 -Mirae Asset Securities 33,590 203,606 0.02NAVER 12,656 3,396,421 0.33NCSoft 1,574 829,635 0.08Netmarble 1,665 143,413 0.01NH Investment & Securities 13,591 112,696 0.01NHN 928 49,749 -NongShim 316 63,679 0.01OCI 1,745 131,796 0.01Orion 2,158 164,376 0.02Ottogi 116 40,563 -Paradise 4,109 47,806 -POSCO 6,186 1,383,750 0.14POSCO Chemical 2,708 250,657 0.02Posco International 4,466 66,887 0.01S-1 1,648 86,758 0.01Samsung Biologics 1,249 675,192 0.07Samsung C&T 7,843 688,150 0.07Samsung Card 3,208 70,729 0.01Samsung Electro-Mechanics 5,264 598,905 0.06Samsung Electronics 444,713 23,068,635 2.26Samsung Electronics - Pref 78,354 3,711,908 0.36Samsung Engineering 15,400 236,585 0.02Samsung Fire & Marine Insurance 3,108 440,512 0.04Samsung Fire & Marine Insurance - Pref 300 31,914 -
SharesFair value
GB£% of
Net assets
South Korea (2020: 8.17%) (continued)Samsung Heavy Industries 44,474 191,821 0.02Samsung Life Insurance 6,029 309,255 0.03Samsung SDI 4,972 2,230,771 0.22Samsung SDI - Pref 198 55,682 0.01Samsung SDS 3,023 359,483 0.04Samsung Securities 6,078 175,614 0.02Seegene 2,740 145,655 0.01Shin Poong Pharmaceutical 3,210 177,448 0.02Shinhan Financial Group 47,536 1,240,558 0.12Shinsegae 670 122,956 0.01SillaJen 6,648 51,706 -SK Biopharmaceuticals 2,192 173,306 0.02SK Chemicals 851 142,224 0.01SK Holdings 2,937 533,324 0.05SK Hynix 48,753 3,995,582 0.39SK Innovation 5,093 967,386 0.09SK Networks 12,848 49,717 -SK Telecom 2,246 461,985 0.05SKC 1,832 186,648 0.02S-Oil 3,978 262,094 0.03Solus Advanced Materials 1,075 35,656 -Ssangyong Cement Industrial 10,023 53,796 0.01Woori Financial Group 48,543 357,273 0.03Yuhan 4,741 192,295 0.02
78,837,886 7.72Taiwan (2020: 9.15%)Accton Technology 68,000 583,882 0.06Acer 339,000 258,055 0.03Advantech 48,393 433,757 0.04ASE Technology Holding 407,944 1,187,034 0.12Asia Cement 261,000 343,790 0.03ASMedia Technology 4,000 139,774 0.01Asustek Computer 85,000 820,394 0.08AU Optronics 1,068,000 628,469 0.06Capital Securities 196,000 86,312 0.01Catcher Technology 94,000 444,472 0.04Cathay Financial Holding 986,538 1,381,488 0.14Chailease Holding 152,280 801,148 0.08Chang Hwa Commercial Bank 749,840 314,620 0.03Cheng Shin Rubber Industry 247,000 300,001 0.03Chicony Electronics 79,000 165,017 0.02China Airlines 308,000 152,437 0.01China Development Financial Holding 1,659,000 566,783 0.06China Life Insurance 222,140 152,073 0.01China Motor 12,800 25,540 -China Steel 1,486,785 1,529,636 0.15Chunghwa Telecom 453,728 1,343,832 0.13Compal Electronics 491,000 285,104 0.03CTBC Financial Holding 2,166,000 1,277,406 0.12Delta Electronics 260,044 2,047,077 0.20E.Sun Financial Holding 1,439,244 983,411 0.10Eclat Textile 24,000 409,034 0.04ENNOSTAR 91,000 185,590 0.02Eternal Materials 107,000 112,586 0.01Eva Airways 239,000 125,117 0.01Evergreen Marine Corp Taiwan 311,000 1,591,737 0.16Far Eastern International Bank 299,002 82,343 0.01
Mercer UCITS Common Contractual FundNFU Mutual Global Regional Core Fund
Portfolio Statementas at 30 June 2021
(continued)
Mercer UCITS Common Contractual Fund 229

Financial assets at fair value through profit or loss (2020: 98.74%) (continued)Transferable securities (2020: 98.74%) (continued)Equities (2020: 98.74%) (continued)
SharesFair value
GB£% of
Net assets
Taiwan (2020: 9.15%) (continued)Far Eastern New Century 432,000 359,152 0.03Far EasTone Telecommunications 180,313 302,625 0.03Feng TAY Enterprise 52,800 335,396 0.03First Financial Holding 1,231,710 726,405 0.07FIT Hon Teng 96,000 19,060 -Formosa Chemicals & Fibre 417,000 917,623 0.09Formosa Petrochemical 155,000 428,870 0.04Formosa Plastics 584,916 1,565,220 0.15Formosa Taffeta 119,000 100,788 0.01Foxconn Technology 127,000 216,777 0.02Fubon Financial Holding 871,918 1,674,036 0.16Genius Electronic Optical 9,000 131,876 0.01Giant Manufacturing 36,000 297,890 0.03Globalwafers 24,567 586,560 0.06Hiwin Technologies 32,692 335,493 0.03Hon Hai Precision Industry 1,424,929 4,146,254 0.41Hotai Motor 37,000 590,221 0.06HTC 75,000 76,577 0.01Hua Nan Financial Holdings 1,193,680 572,175 0.06Innolux 1,018,000 548,796 0.05Inventec 346,000 235,966 0.02Largan Precision 12,711 1,023,732 0.10Lite-On Technology 254,000 380,103 0.04MediaTek 176,468 4,410,479 0.43Mega Financial Holding 1,299,428 1,109,002 0.11Micro-Star International 91,000 372,363 0.04momo.com 5,000 244,865 0.02Nan Ya Plastics 676,039 1,461,301 0.14Nan Ya Printed Circuit Board 26,000 263,103 0.03Nanya Technology 95,000 196,710 0.02Nien Made Enterprise 17,000 182,629 0.02Novatek Microelectronics 69,000 894,529 0.09Obi Pharma 13,000 38,334 -Oneness Biotech 31,000 186,851 0.02Pegatron 229,000 409,325 0.04Pou Chen 299,000 305,287 0.03Powertech Technology 88,000 245,774 0.02President Chain Store 72,000 491,964 0.05Quanta Computer 324,000 736,542 0.07Realtek Semiconductor 59,000 774,084 0.08Shanghai Commercial & Savings Bank 389,000 457,312 0.04Shin Kong Financial Holding 1,309,356 324,187 0.03Sino-American Silicon Products 67,000 335,952 0.03SinoPac Financial Holdings 1,348,669 481,784 0.05Synnex Technology International 155,000 204,972 0.02Taishin Financial Holding 1,192,975 472,657 0.05Taiwan Business Bank 522,900 128,379 0.01Taiwan Cement 612,559 811,639 0.08Taiwan Cooperative Financial Holding 1,158,490 639,582 0.06Taiwan Fertilizer 75,000 114,768 0.01Taiwan Glass Industry 156,000 151,580 0.01Taiwan High Speed Rail 286,000 222,168 0.02Taiwan Mobile 206,262 546,593 0.05Taiwan Secom 27,000 66,008 0.01Taiwan Semiconductor Manufacturing 2,864,041 44,273,198 4.34Teco Electric and Machinery 212,000 182,860 0.02TPK Holding 32,000 38,742 -Transcend Information 28,000 53,758 -
SharesFair value
GB£% of
Net assets
Taiwan (2020: 9.15%) (continued)U-Ming Marine Transport 28,000 64,816 0.01Unimicron Technology 153,000 512,774 0.05Uni-President Enterprises 572,573 1,088,897 0.11United Microelectronics 1,402,989 1,935,501 0.19Vanguard International Semiconductor 99,000 303,502 0.03Walsin Lihwa 377,000 286,981 0.03Walsin Technology 58,000 342,810 0.03Wan Hai Lines 81,000 675,515 0.07Win Semiconductors 48,000 467,646 0.05Winbond Electronics 360,000 325,949 0.03Wistron 323,000 260,141 0.03Wiwynn 10,000 259,024 0.03Yageo 56,000 807,469 0.08Yuanta Financial Holding 1,409,480 983,214 0.10Yulon Motor 55,946 61,919 0.01Yulon Nissan Motor 4,448 31,375 -Zhen Ding Technology Holding 75,000 204,595 0.02
104,770,923 10.26Thailand (2020: 1.81%)Advanced Info Service (Foreign share) 140,775 543,699 0.05Airports of Thailand 524,123 733,942 0.07Asset World - Foreign share 540,700 53,001 0.01Asset World - NVDR 209,500 20,536 -B Grimm Power - Foreign share 1,232 1,169 -B Grimm Power - NVDR 82,000 77,786 0.01Bangkok Bank - Foreign share 82,200 209,791 0.02Bangkok Bank - NVDR 31,000 79,118 0.01Bangkok Dusit Medical Services -Foreign share 684,786 355,729 0.04Bangkok Dusit Medical Services - NVDR 485,500 252,205 0.03Bangkok Expressway & Metro 885,600 163,017 0.02Bangkok Life Assurance 84,089 55,552 0.01Banpu 132,300 46,615 -Banpu - Foreign share 342,200 120,571 0.01Berli Jucker 100,000 78,486 0.01BTS Group Holdings 917,200 193,692 0.02Bumrungrad Hospital 34,283 99,499 0.01Carabao Group 27,100 86,609 0.01Central Pattana - Foreign share 177,300 210,235 0.02Central Pattana - NVDR 162,035 192,134 0.02Central Retail 361,800 273,747 0.03Charoen Pokphand Foods 519,781 311,102 0.03CP ALL 632,206 856,735 0.08Delta Electronics Thailand 30,111 393,088 0.04Digital TelecommunicationsInfrastructure Fund 563,400 161,606 0.02Electricity Generating 30,500 120,552 0.01Energy Absolute - Foreign share 181,100 249,508 0.02Energy Absolute - NVDR 13,400 18,462 -Global Power Synergy 79,709 131,422 0.01Gulf Energy Development 491,397 380,128 0.04Home Product Center - Foreign share 518,100 168,505 0.02Home Product Center - NVDR 143,100 46,541 -Indorama Ventures 209,474 192,794 0.02Intouch Holdings 285,100 418,550 0.04IRPC 1,138,000 98,698 0.01Kasikornbank - Foreign share 131,700 350,998 0.03
Mercer UCITS Common Contractual FundNFU Mutual Global Regional Core Fund
Portfolio Statementas at 30 June 2021
(continued)
Mercer UCITS Common Contractual Fund 230
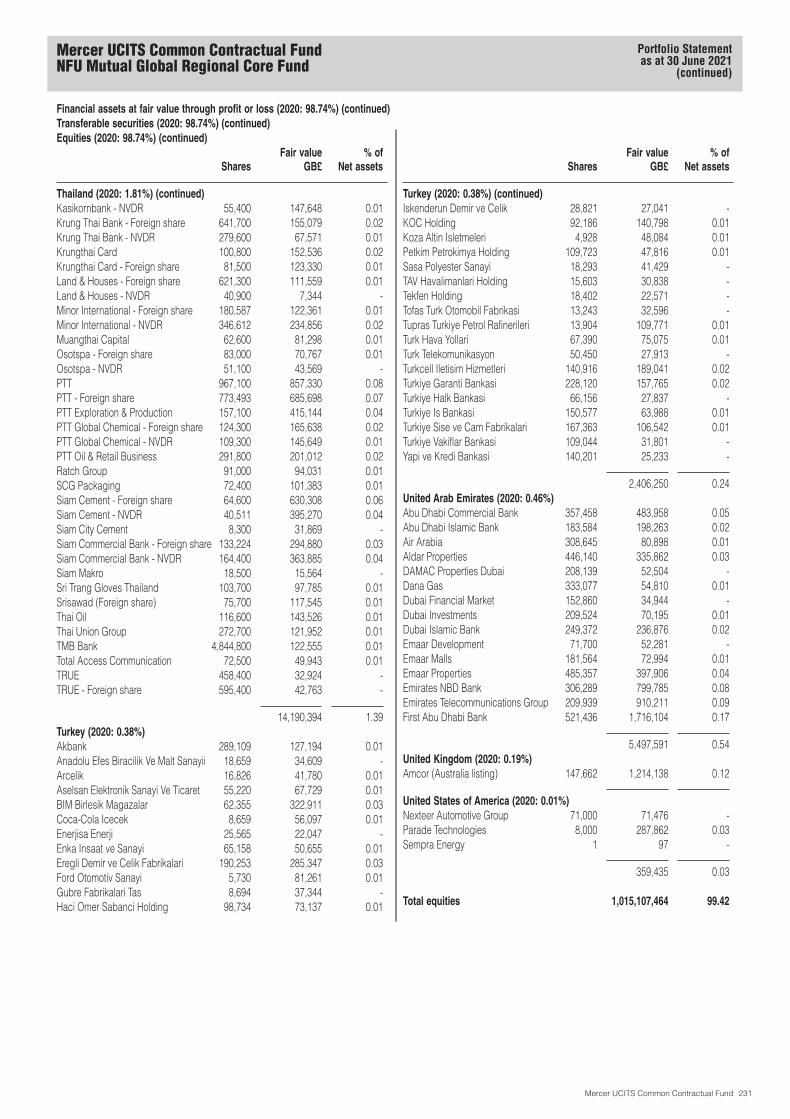
Financial assets at fair value through profit or loss (2020: 98.74%) (continued)Transferable securities (2020: 98.74%) (continued)Equities (2020: 98.74%) (continued)
SharesFair value
GB£% of
Net assets
Thailand (2020: 1.81%) (continued)Kasikornbank - NVDR 55,400 147,648 0.01Krung Thai Bank - Foreign share 641,700 155,079 0.02Krung Thai Bank - NVDR 279,600 67,571 0.01Krungthai Card 100,800 152,536 0.02Krungthai Card - Foreign share 81,500 123,330 0.01Land & Houses - Foreign share 621,300 111,559 0.01Land & Houses - NVDR 40,900 7,344 -Minor International - Foreign share 180,587 122,361 0.01Minor International - NVDR 346,612 234,856 0.02Muangthai Capital 62,600 81,298 0.01Osotspa - Foreign share 83,000 70,767 0.01Osotspa - NVDR 51,100 43,569 -PTT 967,100 857,330 0.08PTT - Foreign share 773,493 685,698 0.07PTT Exploration & Production 157,100 415,144 0.04PTT Global Chemical - Foreign share 124,300 165,638 0.02PTT Global Chemical - NVDR 109,300 145,649 0.01PTT Oil & Retail Business 291,800 201,012 0.02Ratch Group 91,000 94,031 0.01SCG Packaging 72,400 101,383 0.01Siam Cement - Foreign share 64,600 630,308 0.06Siam Cement - NVDR 40,511 395,270 0.04Siam City Cement 8,300 31,869 -Siam Commercial Bank - Foreign share 133,224 294,880 0.03Siam Commercial Bank - NVDR 164,400 363,885 0.04Siam Makro 18,500 15,564 -Sri Trang Gloves Thailand 103,700 97,785 0.01Srisawad (Foreign share) 75,700 117,545 0.01Thai Oil 116,600 143,526 0.01Thai Union Group 272,700 121,952 0.01TMB Bank 4,844,800 122,555 0.01Total Access Communication 72,500 49,943 0.01TRUE 458,400 32,924 -TRUE - Foreign share 595,400 42,763 -
14,190,394 1.39Turkey (2020: 0.38%)Akbank 289,109 127,194 0.01Anadolu Efes Biracilik Ve Malt Sanayii 18,659 34,609 -Arcelik 16,826 41,780 0.01Aselsan Elektronik Sanayi Ve Ticaret 55,220 67,729 0.01BIM Birlesik Magazalar 62,355 322,911 0.03Coca-Cola Icecek 8,659 56,097 0.01Enerjisa Enerji 25,565 22,047 -Enka Insaat ve Sanayi 65,158 50,655 0.01Eregli Demir ve Celik Fabrikalari 190,253 285,347 0.03Ford Otomotiv Sanayi 5,730 81,261 0.01Gubre Fabrikalari Tas 8,694 37,344 -Haci Omer Sabanci Holding 98,734 73,137 0.01
SharesFair value
GB£% of
Net assets
Turkey (2020: 0.38%) (continued)Iskenderun Demir ve Celik 28,821 27,041 -KOC Holding 92,186 140,798 0.01Koza Altin Isletmeleri 4,928 48,084 0.01Petkim Petrokimya Holding 109,723 47,816 0.01Sasa Polyester Sanayi 18,293 41,429 -TAV Havalimanlari Holding 15,603 30,838 -Tekfen Holding 18,402 22,571 -Tofas Turk Otomobil Fabrikasi 13,243 32,596 -Tupras Turkiye Petrol Rafinerileri 13,904 109,771 0.01Turk Hava Yollari 67,390 75,075 0.01Turk Telekomunikasyon 50,450 27,913 -Turkcell Iletisim Hizmetleri 140,916 189,041 0.02Turkiye Garanti Bankasi 228,120 157,765 0.02Turkiye Halk Bankasi 66,156 27,837 -Turkiye Is Bankasi 150,577 63,988 0.01Turkiye Sise ve Cam Fabrikalari 167,363 106,542 0.01Turkiye Vakiflar Bankasi 109,044 31,801 -Yapi ve Kredi Bankasi 140,201 25,233 -
2,406,250 0.24United Arab Emirates (2020: 0.46%)Abu Dhabi Commercial Bank 357,458 483,958 0.05Abu Dhabi Islamic Bank 183,584 198,263 0.02Air Arabia 308,645 80,898 0.01Aldar Properties 446,140 335,862 0.03DAMAC Properties Dubai 208,139 52,504 -Dana Gas 333,077 54,810 0.01Dubai Financial Market 152,860 34,944 -Dubai Investments 209,524 70,195 0.01Dubai Islamic Bank 249,372 236,876 0.02Emaar Development 71,700 52,281 -Emaar Malls 181,564 72,994 0.01Emaar Properties 485,357 397,906 0.04Emirates NBD Bank 306,289 799,785 0.08Emirates Telecommunications Group 209,939 910,211 0.09First Abu Dhabi Bank 521,436 1,716,104 0.17
5,497,591 0.54United Kingdom (2020: 0.19%)Amcor (Australia listing) 147,662 1,214,138 0.12
United States of America (2020: 0.01%)Nexteer Automotive Group 71,000 71,476 -Parade Technologies 8,000 287,862 0.03Sempra Energy 1 97 -
359,435 0.03
Total equities 1,015,107,464 99.42
Mercer UCITS Common Contractual FundNFU Mutual Global Regional Core Fund
Portfolio Statementas at 30 June 2021
(continued)
Mercer UCITS Common Contractual Fund 231

Financial assets at fair value through profit or loss (2020: 98.74%) (continued)Transferable securities (2020: 98.74%) (continued)Corporate bonds (2020: Nil)
Couponrate
Maturitydate Currency
Parvalue
Fair valueGB£
% ofNet assets
India (2020: Nil)Britannia Industries 5.50 03/06/2024 INR 390,746 3,855 -
Total corporate bonds 3,855 -
Total transferable securities 1,015,111,319 99.42
Financial derivative instruments (2020: 0.00%)Warrants (2020: Nil)
Notionalholdings
Fair valueGB£
% ofNet assets
Thailand (2020: Nil)Minor International (Malaysia listing) 11,952 1,404 -Minor International (Russia listing) 10,832 1,125 -Minor International no.8 6,227 731 -Minor International no.9 5,643 586 -Srisawad 3,028 999 -
4,845 0.00
Total warrants 4,845 -
Total financial derivative instruments at positive fair value 4,845 -
Total financial assets at fair value through profit or loss 1,015,116,164 99.42
Financial liabilities held for trading (2020: (0.01%))Financial derivative instruments (2020: (0.01%))Open forward foreign currency contracts (2020: Nil)
Currencybuy
Buyamount
Currencysell
Sellamount Counterparty
Contractdate
UnrealisedlossGB£
% ofNet assets
SGD 402,848 USD 300,000 Citigroup 02/08/2021 (238) -
Unrealised loss on open forward foreign currency contracts (238) -
Total financial derivative instruments at negative fair value (238) -
Total financial liabilities held for trading (238) -
Fair valueGB£
% ofNet assets
Total investments at fair value through profit or loss/held for trading 1,015,115,926 99.42
Financial derivative instruments settled to market (2020: Nil)Futures contracts (2020: Nil)
No. ofcontractslong/(short) Currency Counterparty
Maturitydate
NotionalGB£
UnrealisedgainGB£
% ofNet assets
SPI 200 Futures 8 AUD Goldman Sachs 16/09/2021 785,069 381 -
Unrealised gain on futures contracts settled to market 381 -
Total financial derivative instruments settled to market at positive fair value 381 -
Variation margin received on financial derivative instruments settled to market (381) -
Total financial derivative instruments settled to market – –
Mercer UCITS Common Contractual FundNFU Mutual Global Regional Core Fund
Portfolio Statementas at 30 June 2021
(continued)
Mercer UCITS Common Contractual Fund 232
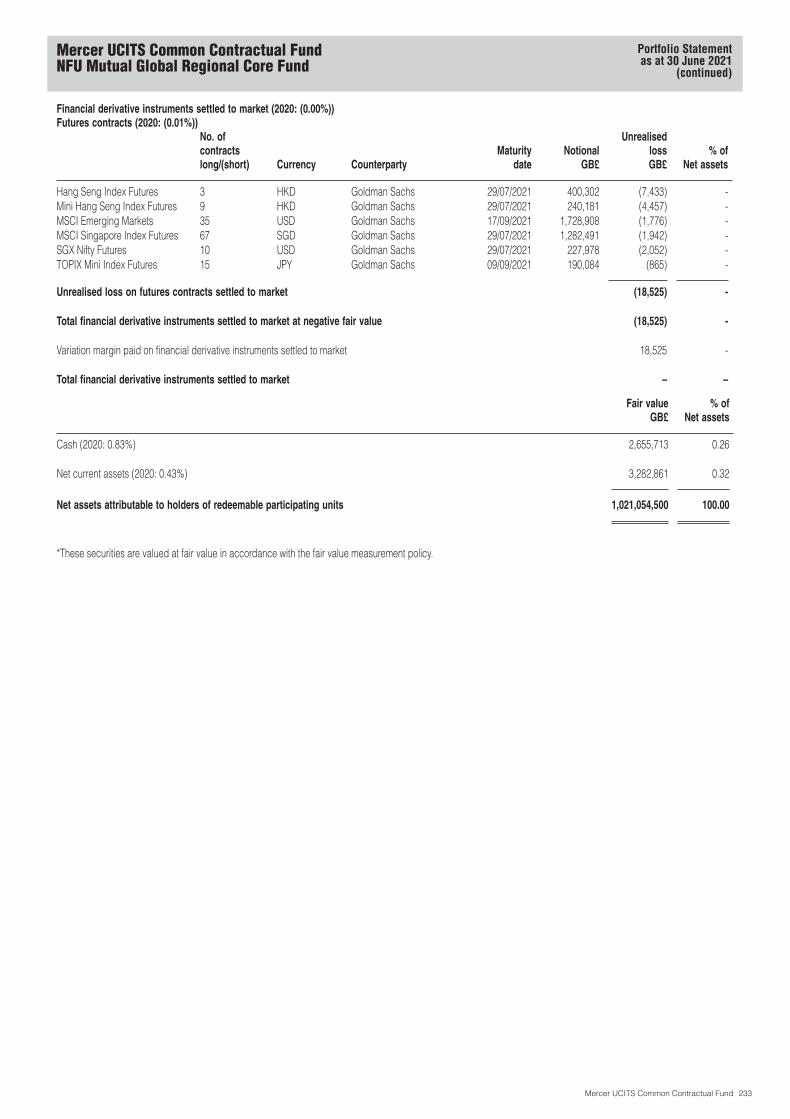
Financial derivative instruments settled to market (2020: (0.00%))Futures contracts (2020: (0.01%))
No. ofcontractslong/(short) Currency Counterparty
Maturitydate
NotionalGB£
UnrealisedlossGB£
% ofNet assets
Hang Seng Index Futures 3 HKD Goldman Sachs 29/07/2021 400,302 (7,433) -Mini Hang Seng Index Futures 9 HKD Goldman Sachs 29/07/2021 240,181 (4,457) -MSCI Emerging Markets 35 USD Goldman Sachs 17/09/2021 1,728,908 (1,776) -MSCI Singapore Index Futures 67 SGD Goldman Sachs 29/07/2021 1,282,491 (1,942) -SGX Nifty Futures 10 USD Goldman Sachs 29/07/2021 227,978 (2,052) -TOPIX Mini Index Futures 15 JPY Goldman Sachs 09/09/2021 190,084 (865) -
Unrealised loss on futures contracts settled to market (18,525) -
Total financial derivative instruments settled to market at negative fair value (18,525) -
Variation margin paid on financial derivative instruments settled to market 18,525 -
Total financial derivative instruments settled to market – –
Fair valueGB£
% ofNet assets
Cash (2020: 0.83%) 2,655,713 0.26
Net current assets (2020: 0.43%) 3,282,861 0.32
Net assets attributable to holders of redeemable participating units 1,021,054,500 100.00
*These securities are valued at fair value in accordance with the fair value measurement policy.
Mercer UCITS Common Contractual FundNFU Mutual Global Regional Core Fund
Portfolio Statementas at 30 June 2021
(continued)
Mercer UCITS Common Contractual Fund 233
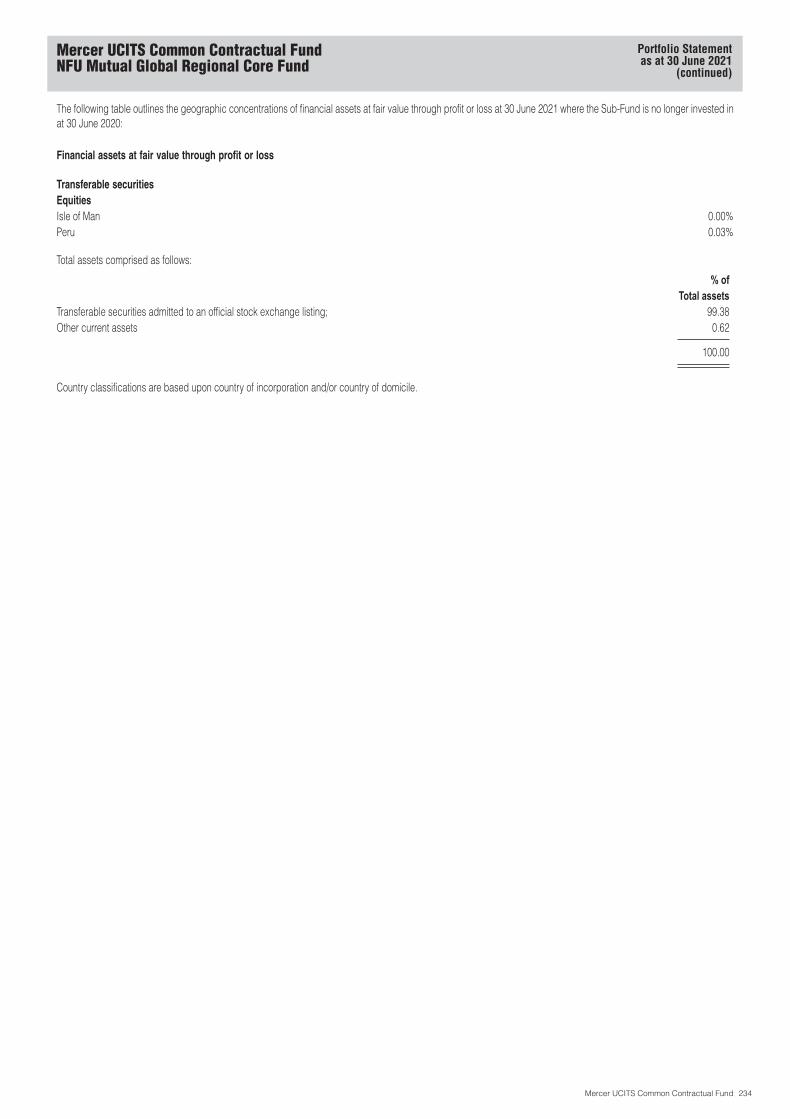
The following table outlines the geographic concentrations of financial assets at fair value through profit or loss at 30 June 2021 where the Sub-Fund is no longer invested inat 30 June 2020:
Financial assets at fair value through profit or loss
Transferable securitiesEquitiesIsle of Man 0.00%Peru 0.03%
Total assets comprised as follows:
% ofTotal assets
Transferable securities admitted to an official stock exchange listing; 99.38Other current assets 0.62
100.00
Country classifications are based upon country of incorporation and/or country of domicile.
Mercer UCITS Common Contractual FundNFU Mutual Global Regional Core Fund
Portfolio Statementas at 30 June 2021
(continued)
Mercer UCITS Common Contractual Fund 234
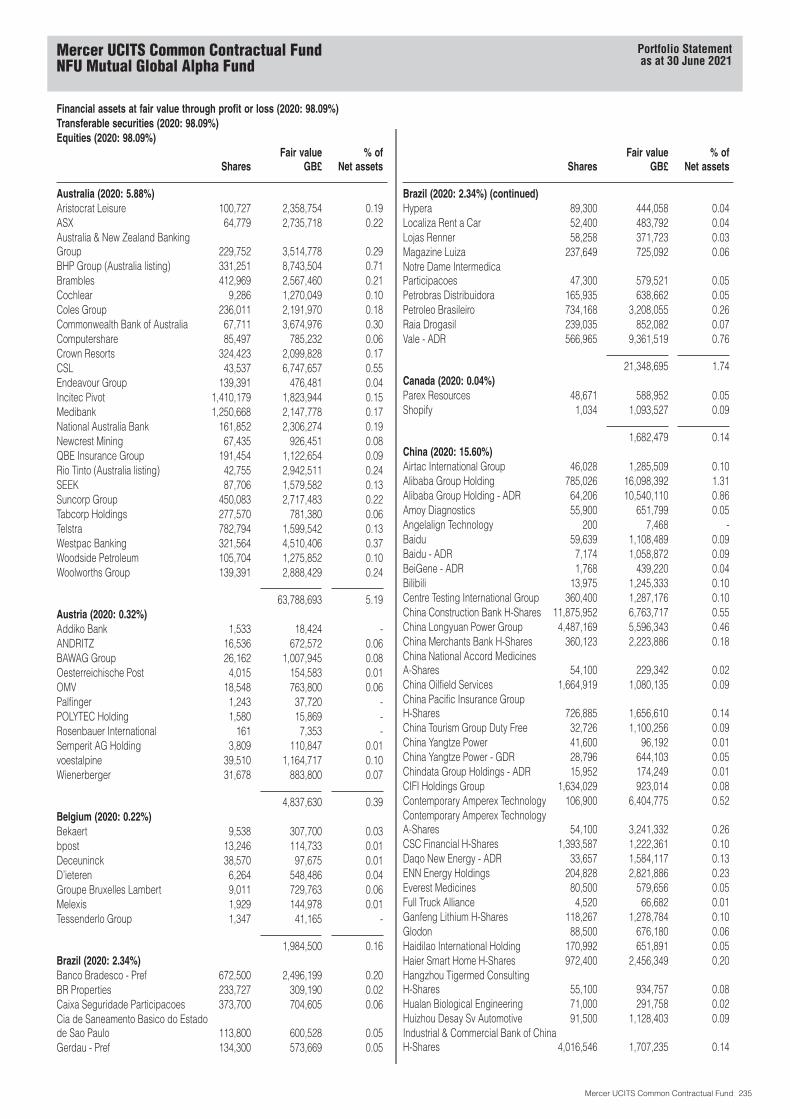
Financial assets at fair value through profit or loss (2020: 98.09%)Transferable securities (2020: 98.09%)Equities (2020: 98.09%)
SharesFair value
GB£% of
Net assets
Australia (2020: 5.88%)Aristocrat Leisure 100,727 2,358,754 0.19ASX 64,779 2,735,718 0.22Australia & New Zealand BankingGroup 229,752 3,514,778 0.29BHP Group (Australia listing) 331,251 8,743,504 0.71Brambles 412,969 2,567,460 0.21Cochlear 9,286 1,270,049 0.10Coles Group 236,011 2,191,970 0.18Commonwealth Bank of Australia 67,711 3,674,976 0.30Computershare 85,497 785,232 0.06Crown Resorts 324,423 2,099,828 0.17CSL 43,537 6,747,657 0.55Endeavour Group 139,391 476,481 0.04Incitec Pivot 1,410,179 1,823,944 0.15Medibank 1,250,668 2,147,778 0.17National Australia Bank 161,852 2,306,274 0.19Newcrest Mining 67,435 926,451 0.08QBE Insurance Group 191,454 1,122,654 0.09Rio Tinto (Australia listing) 42,755 2,942,511 0.24SEEK 87,706 1,579,582 0.13Suncorp Group 450,083 2,717,483 0.22Tabcorp Holdings 277,570 781,380 0.06Telstra 782,794 1,599,542 0.13Westpac Banking 321,564 4,510,406 0.37Woodside Petroleum 105,704 1,275,852 0.10Woolworths Group 139,391 2,888,429 0.24
63,788,693 5.19Austria (2020: 0.32%)Addiko Bank 1,533 18,424 -ANDRITZ 16,536 672,572 0.06BAWAG Group 26,162 1,007,945 0.08Oesterreichische Post 4,015 154,583 0.01OMV 18,548 763,800 0.06Palfinger 1,243 37,720 -POLYTEC Holding 1,580 15,869 -Rosenbauer International 161 7,353 -Semperit AG Holding 3,809 110,847 0.01voestalpine 39,510 1,164,717 0.10Wienerberger 31,678 883,800 0.07
4,837,630 0.39Belgium (2020: 0.22%)Bekaert 9,538 307,700 0.03bpost 13,246 114,733 0.01Deceuninck 38,570 97,675 0.01D’ieteren 6,264 548,486 0.04Groupe Bruxelles Lambert 9,011 729,763 0.06Melexis 1,929 144,978 0.01Tessenderlo Group 1,347 41,165 -
1,984,500 0.16Brazil (2020: 2.34%)Banco Bradesco - Pref 672,500 2,496,199 0.20BR Properties 233,727 309,190 0.02Caixa Seguridade Participacoes 373,700 704,605 0.06Cia de Saneamento Basico do Estadode Sao Paulo 113,800 600,528 0.05Gerdau - Pref 134,300 573,669 0.05
SharesFair value
GB£% of
Net assets
Brazil (2020: 2.34%) (continued)Hypera 89,300 444,058 0.04Localiza Rent a Car 52,400 483,792 0.04Lojas Renner 58,258 371,723 0.03Magazine Luiza 237,649 725,092 0.06Notre Dame IntermedicaParticipacoes 47,300 579,521 0.05Petrobras Distribuidora 165,935 638,662 0.05Petroleo Brasileiro 734,168 3,208,055 0.26Raia Drogasil 239,035 852,082 0.07Vale - ADR 566,965 9,361,519 0.76
21,348,695 1.74Canada (2020: 0.04%)Parex Resources 48,671 588,952 0.05Shopify 1,034 1,093,527 0.09
1,682,479 0.14China (2020: 15.60%)Airtac International Group 46,028 1,285,509 0.10Alibaba Group Holding 785,026 16,098,392 1.31Alibaba Group Holding - ADR 64,206 10,540,110 0.86Amoy Diagnostics 55,900 651,799 0.05Angelalign Technology 200 7,468 -Baidu 59,639 1,108,489 0.09Baidu - ADR 7,174 1,058,872 0.09BeiGene - ADR 1,768 439,220 0.04Bilibili 13,975 1,245,333 0.10Centre Testing International Group 360,400 1,287,176 0.10China Construction Bank H-Shares 11,875,952 6,763,717 0.55China Longyuan Power Group 4,487,169 5,596,343 0.46China Merchants Bank H-Shares 360,123 2,223,886 0.18China National Accord MedicinesA-Shares 54,100 229,342 0.02China Oilfield Services 1,664,919 1,080,135 0.09China Pacific Insurance GroupH-Shares 726,885 1,656,610 0.14China Tourism Group Duty Free 32,726 1,100,256 0.09China Yangtze Power 41,600 96,192 0.01China Yangtze Power - GDR 28,796 644,103 0.05Chindata Group Holdings - ADR 15,952 174,249 0.01CIFI Holdings Group 1,634,029 923,014 0.08Contemporary Amperex Technology 106,900 6,404,775 0.52Contemporary Amperex TechnologyA-Shares 54,100 3,241,332 0.26CSC Financial H-Shares 1,393,587 1,222,361 0.10Daqo New Energy - ADR 33,657 1,584,117 0.13ENN Energy Holdings 204,828 2,821,886 0.23Everest Medicines 80,500 579,656 0.05Full Truck Alliance 4,520 66,682 0.01Ganfeng Lithium H-Shares 118,267 1,278,784 0.10Glodon 88,500 676,180 0.06Haidilao International Holding 170,992 651,891 0.05Haier Smart Home H-Shares 972,400 2,456,349 0.20Hangzhou Tigermed ConsultingH-Shares 55,100 934,757 0.08Hualan Biological Engineering 71,000 291,758 0.02Huizhou Desay Sv Automotive 91,500 1,128,403 0.09Industrial & Commercial Bank of ChinaH-Shares 4,016,546 1,707,235 0.14
Mercer UCITS Common Contractual FundNFU Mutual Global Alpha Fund
Portfolio Statementas at 30 June 2021
Mercer UCITS Common Contractual Fund 235
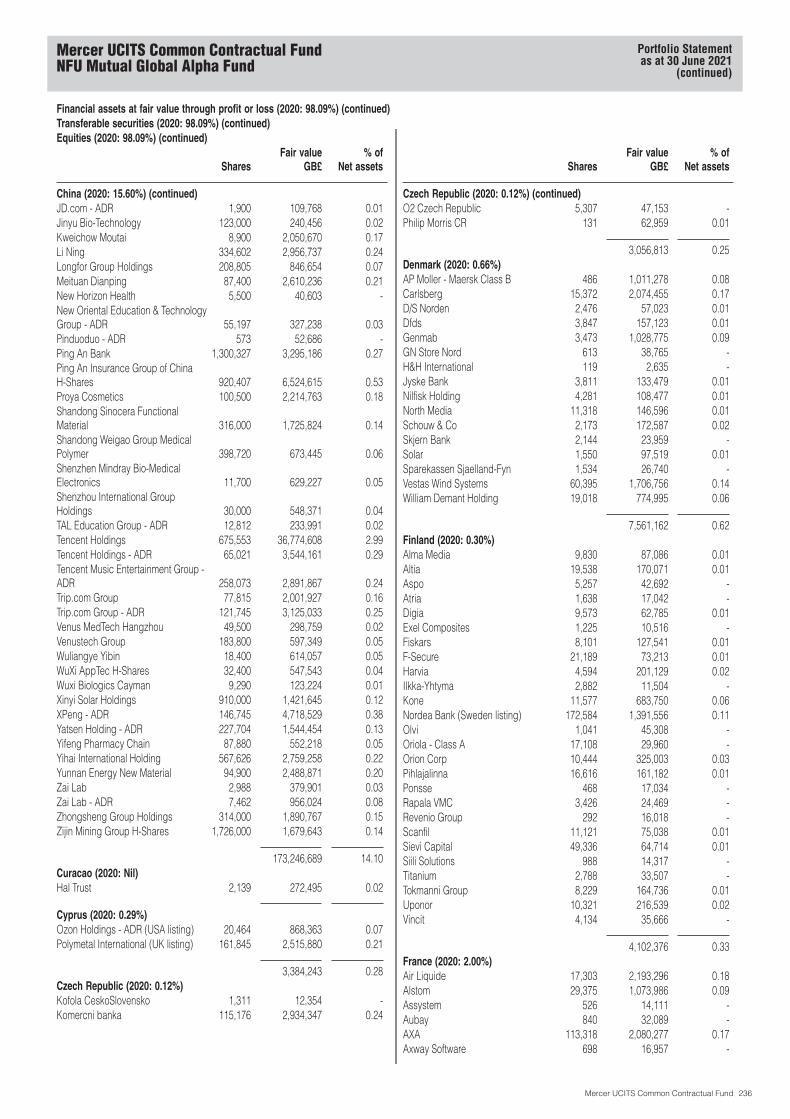
Financial assets at fair value through profit or loss (2020: 98.09%) (continued)Transferable securities (2020: 98.09%) (continued)Equities (2020: 98.09%) (continued)
SharesFair value
GB£% of
Net assets
China (2020: 15.60%) (continued)JD.com - ADR 1,900 109,768 0.01Jinyu Bio-Technology 123,000 240,456 0.02Kweichow Moutai 8,900 2,050,670 0.17Li Ning 334,602 2,956,737 0.24Longfor Group Holdings 208,805 846,654 0.07Meituan Dianping 87,400 2,610,236 0.21New Horizon Health 5,500 40,603 -New Oriental Education & TechnologyGroup - ADR 55,197 327,238 0.03Pinduoduo - ADR 573 52,686 -Ping An Bank 1,300,327 3,295,186 0.27Ping An Insurance Group of ChinaH-Shares 920,407 6,524,615 0.53Proya Cosmetics 100,500 2,214,763 0.18Shandong Sinocera FunctionalMaterial 316,000 1,725,824 0.14Shandong Weigao Group MedicalPolymer 398,720 673,445 0.06Shenzhen Mindray Bio-MedicalElectronics 11,700 629,227 0.05Shenzhou International GroupHoldings 30,000 548,371 0.04TAL Education Group - ADR 12,812 233,991 0.02Tencent Holdings 675,553 36,774,608 2.99Tencent Holdings - ADR 65,021 3,544,161 0.29Tencent Music Entertainment Group -ADR 258,073 2,891,867 0.24Trip.com Group 77,815 2,001,927 0.16Trip.com Group - ADR 121,745 3,125,033 0.25Venus MedTech Hangzhou 49,500 298,759 0.02Venustech Group 183,800 597,349 0.05Wuliangye Yibin 18,400 614,057 0.05WuXi AppTec H-Shares 32,400 547,543 0.04Wuxi Biologics Cayman 9,290 123,224 0.01Xinyi Solar Holdings 910,000 1,421,645 0.12XPeng - ADR 146,745 4,718,529 0.38Yatsen Holding - ADR 227,704 1,544,454 0.13Yifeng Pharmacy Chain 87,880 552,218 0.05Yihai International Holding 567,626 2,759,258 0.22Yunnan Energy New Material 94,900 2,488,871 0.20Zai Lab 2,988 379,901 0.03Zai Lab - ADR 7,462 956,024 0.08Zhongsheng Group Holdings 314,000 1,890,767 0.15Zijin Mining Group H-Shares 1,726,000 1,679,643 0.14
173,246,689 14.10Curacao (2020: Nil)Hal Trust 2,139 272,495 0.02
Cyprus (2020: 0.29%)Ozon Holdings - ADR (USA listing) 20,464 868,363 0.07Polymetal International (UK listing) 161,845 2,515,880 0.21
3,384,243 0.28Czech Republic (2020: 0.12%)Kofola CeskoSlovensko 1,311 12,354 -Komercni banka 115,176 2,934,347 0.24
SharesFair value
GB£% of
Net assets
Czech Republic (2020: 0.12%) (continued)O2 Czech Republic 5,307 47,153 -Philip Morris CR 131 62,959 0.01
3,056,813 0.25Denmark (2020: 0.66%)AP Moller - Maersk Class B 486 1,011,278 0.08Carlsberg 15,372 2,074,455 0.17D/S Norden 2,476 57,023 0.01Dfds 3,847 157,123 0.01Genmab 3,473 1,028,775 0.09GN Store Nord 613 38,765 -H&H International 119 2,635 -Jyske Bank 3,811 133,479 0.01Nilfisk Holding 4,281 108,477 0.01North Media 11,318 146,596 0.01Schouw & Co 2,173 172,587 0.02Skjern Bank 2,144 23,959 -Solar 1,550 97,519 0.01Sparekassen Sjaelland-Fyn 1,534 26,740 -Vestas Wind Systems 60,395 1,706,756 0.14William Demant Holding 19,018 774,995 0.06
7,561,162 0.62Finland (2020: 0.30%)Alma Media 9,830 87,086 0.01Altia 19,538 170,071 0.01Aspo 5,257 42,692 -Atria 1,638 17,042 -Digia 9,573 62,785 0.01Exel Composites 1,225 10,516 -Fiskars 8,101 127,541 0.01F-Secure 21,189 73,213 0.01Harvia 4,594 201,129 0.02Ilkka-Yhtyma 2,882 11,504 -Kone 11,577 683,750 0.06Nordea Bank (Sweden listing) 172,584 1,391,556 0.11Olvi 1,041 45,308 -Oriola - Class A 17,108 29,960 -Orion Corp 10,444 325,003 0.03Pihlajalinna 16,616 161,182 0.01Ponsse 468 17,034 -Rapala VMC 3,426 24,469 -Revenio Group 292 16,018 -Scanfil 11,121 75,038 0.01Sievi Capital 49,336 64,714 0.01Siili Solutions 988 14,317 -Titanium 2,788 33,507 -Tokmanni Group 8,229 164,736 0.01Uponor 10,321 216,539 0.02Vincit 4,134 35,666 -
4,102,376 0.33France (2020: 2.00%)Air Liquide 17,303 2,193,296 0.18Alstom 29,375 1,073,986 0.09Assystem 526 14,111 -Aubay 840 32,089 -AXA 113,318 2,080,277 0.17Axway Software 698 16,957 -
Mercer UCITS Common Contractual FundNFU Mutual Global Alpha Fund
Portfolio Statementas at 30 June 2021
(continued)
Mercer UCITS Common Contractual Fund 236

Financial assets at fair value through profit or loss (2020: 98.09%) (continued)Transferable securities (2020: 98.09%) (continued)Equities (2020: 98.09%) (continued)
SharesFair value
GB£% of
Net assets
France (2020: 2.00%) (continued)Beneteau 3,305 37,848 -BioMerieux 4,496 378,238 0.03BNP Paribas 27,582 1,251,838 0.10Capgemini 9,495 1,320,453 0.11CBo Territoria 11,446 34,980 -Cegedim 3,528 74,504 0.01Christian Dior 4 2,332 -Cie de Saint-Gobain 31,665 1,509,727 0.12Derichebourg 86,776 634,676 0.05Engie 172,553 1,711,465 0.14Eurazeo 16,331 1,030,417 0.08Fountaine Pajot 185 18,041 -Groupe Guillin 2,263 45,458 -Guerbet 1,925 49,245 0.01Haulotte Group 2,562 14,076 -HEXAOM 3,965 155,891 0.01Infotel 765 32,967 -Ipsen 316 23,796 -Jacquet Metal Service 2,377 39,790 -Kering 2,775 1,755,673 0.14Linedata Services 1,487 50,294 0.01LVMH Moet Hennessy Louis Vuitton 3,772 2,141,328 0.18Neurones 640 16,043 -Nexans 9,399 620,067 0.05Orange 98,794 815,442 0.07Pernod Ricard 10,155 1,631,920 0.13Publicis Groupe 26,045 1,206,003 0.10Quadient 15,277 332,321 0.03Rexel 45,330 686,432 0.06Samse 105 16,225 -Sanofi 40,249 3,052,979 0.25Sartorius Stedim Biotech 1,219 417,427 0.04Seche Environnement 1,229 55,178 0.01Societe 3,037 152,776 0.01Societe Generale 41,432 884,199 0.07Societe pour l’Informatique Industrielle 42 1,071 -Somfy 2,544 312,733 0.03SPIE 34,930 581,719 0.05Stef 302 23,514 -Television Francaise 1 64,415 471,405 0.04Thermador Groupe 528 40,113 -TOTAL 72,936 2,388,947 0.20Trigano 269 40,227 -Virbac 186 46,145 -Vivendi 70,212 1,707,540 0.14Wendel 4,131 402,144 0.03
33,626,323 2.74Germany (2020: 1.48%)adidas 7,306 1,968,720 0.16ADVA Optical Networking 15,571 156,125 0.01Atoss Software 589 94,249 0.01BASF 31,797 1,813,547 0.15Bayerische Motoren Werke 17,761 1,361,697 0.11BioNTech 2,829 459,602 0.04CENIT 3,804 51,106 -Continental 11,559 1,230,226 0.10Covestro 22,738 1,063,024 0.09
SharesFair value
GB£% of
Net assets
Germany (2020: 1.48%) (continued)Daimler 26,214 1,694,499 0.14Delivery Hero 5,055 483,414 0.04Deutsche Bank 83,197 784,622 0.06Deutsche Post 39,146 1,927,568 0.16Draegerwerk 3,272 220,213 0.02Einhell Germany - Pref 997 139,507 0.01Hawesko Holding 948 48,503 -HeidelbergCement 2,327 144,507 0.01Hornbach Baumarkt 1,001 31,837 -Hornbach Holding 227 18,727 -Jungheinrich - Pref 886 31,351 -KION Group 17,052 1,315,684 0.11Kloeckner & Co 3,952 39,150 -KSB - Pref 206 64,547 0.01Merck 11,782 1,635,468 0.13MTU Aero Engines 9,997 1,792,756 0.15MVV Energie 530 12,830 -Nexus 365 19,677 -Norma Group 1,081 40,070 -Paul Hartmann 35 10,666 -Porsche Automobil Holding - Pref 38,209 2,963,841 0.24Rheinmetall 3,939 281,672 0.02Salzgitter 1,500 32,269 -Sartorius - Pref 153 57,659 0.01Scout24 9,443 576,521 0.05Siemens 4,098 470,064 0.04Sto SE & Co 1,125 177,698 0.01Surteco Group 1,560 36,827 -Symrise 10,394 1,048,416 0.09Uniper 6,732 179,498 0.01USU Software 2,660 57,087 0.01Villeroy & Boch - Pref 4,031 61,941 0.01Vonovia 19,790 926,221 0.08Wuestenrot & Wuerttembergische 1,022 16,950 -
25,540,556 2.08Greece (2020: 0.13%)Hellenic TelecommunicationsOrganization 55,566 674,961 0.06Thrace Plastics Holding 4,002 23,018 -
697,979 0.06Hong Kong (2020: 5.62%)AIA Group 1,861,410 16,743,457 1.36BOC Hong Kong Holdings 810,000 1,989,488 0.16China Gas Holdings 476,696 1,053,090 0.09China Mengniu Dairy 162,000 708,968 0.06China Resources Gas Group 356,000 1,546,364 0.13China Resources Land 804,000 2,356,961 0.19CITIC 1,423,000 1,110,213 0.09CK Hutchison Holdings 189,500 1,068,662 0.09ESR Cayman 154,573 377,495 0.03Galaxy Entertainment Group 526,000 3,047,212 0.25Hang Lung Properties 1,197,000 2,104,319 0.17Hong Kong Exchanges & Clearing 76,100 3,282,871 0.27Kerry Properties 222,946 532,005 0.04New Frontier Health 76,202 616,147 0.05Shimao Property Holdings 538,560 955,821 0.08
Mercer UCITS Common Contractual FundNFU Mutual Global Alpha Fund
Portfolio Statementas at 30 June 2021
(continued)
Mercer UCITS Common Contractual Fund 237

Financial assets at fair value through profit or loss (2020: 98.09%) (continued)Transferable securities (2020: 98.09%) (continued)Equities (2020: 98.09%) (continued)
SharesFair value
GB£% of
Net assets
Hong Kong (2020: 5.62%) (continued)Sun Hung Kai Properties 156,000 1,682,417 0.14Swire Properties 755,400 1,630,061 0.13Techtronic Industries 480,000 6,067,038 0.49WH Group 2,676,500 1,741,400 0.14
48,613,989 3.96Hungary (2020: 0.22%)MOL Hungarian Oil & Gas 187,644 1,082,049 0.09OTP Bank 10,892 424,984 0.03Richter Gedeon 48,413 934,131 0.08
2,441,164 0.20India (2020: 1.23%)Apollo Hospitals Enterprise 19,705 694,240 0.06Aurobindo Pharma 260,442 2,447,592 0.20Axis Bank 237,096 1,728,290 0.14Bharat Electronics 1,199,822 2,083,382 0.17Bharti Airtel 479,395 2,465,063 0.20Dabur India 128,155 708,962 0.06Gland Pharma 71,871 2,386,060 0.20HDFC Bank - ADR 55,575 2,941,578 0.24Hero MotoCorp 67,107 1,898,518 0.16Hindustan Unilever 60,328 1,454,102 0.12ICICI Bank 123,542 759,721 0.06ICICI Bank - ADR 111,246 1,377,036 0.11Infosys - ADR 330,680 5,072,285 0.41ITC 803,043 1,585,233 0.13Kotak Mahindra Bank 62,274 1,033,966 0.08LIC Housing Finance 353,590 1,619,136 0.13Mahindra & Mahindra 224,574 1,708,092 0.14Muthoot Finance 170,965 2,461,084 0.20Power Grid of India 361,774 818,969 0.07Reliance Industries 73,052 1,502,542 0.12Tech Mahindra 234,290 2,502,316 0.20Tube Investments of India 100,085 1,137,276 0.09Wipro 395,680 2,104,345 0.17
42,489,788 3.46Indonesia (2020: 0.56%)Bank Central Asia 1,240,125 1,865,045 0.15Mitra Adiperkasa 9,884,900 308,425 0.03Unilever Indonesia 557,000 137,644 0.01
2,311,114 0.19Ireland (2020: 0.72%)Aptiv 1,497 170,490 0.02Bank of Cyprus Holdings Cypruslisting 1,442 1,349 -Bank of Cyprus Holdings UK listing 436,045 407,266 0.03James Hardie Industries 146,244 3,597,897 0.29Kerry Group 12,203 1,234,028 0.10Linde (US listing) 2,447 512,091 0.04Ryanair Holdings 71,495 979,539 0.08
6,902,660 0.56Italy (2020: 0.44%)BFF Bank 177,446 1,287,170 0.11Buzzi Unicem 31,290 600,876 0.05Comer Industries 600 10,301 -
SharesFair value
GB£% of
Net assets
Italy (2020: 0.44%) (continued)De’ Longhi 2,804 88,436 0.01El.En. 659 24,609 -Emak 67,520 100,391 0.01Enel 305,458 2,053,701 0.17Equita Group 6,462 17,585 -Ratti 6,444 21,961 -Sanlorenzo 2,168 43,178 -
4,248,208 0.35Japan (2020: 10.13%)Ain Holdings 13,400 605,646 0.05Alpen 5,600 107,853 0.01Asahi Group Holdings 25,500 863,321 0.07Asahi Intecc 23,800 412,274 0.03Asahi Kasei 80,800 643,176 0.05BASE 50,300 554,088 0.05BayCurrent Consulting 5,600 1,457,276 0.12Bengo4.com 5,600 355,006 0.03Bridgestone 50,200 1,655,030 0.13Coconala 7,800 112,579 0.01Cosmos Pharmaceutical 8,700 924,885 0.08CyberAgent 123,700 1,924,150 0.16Daifuku 4,800 315,874 0.03Daiichi Sankyo 91,500 1,428,949 0.12Daikin Industries 2,200 296,868 0.02Daiwa House Industry 22,700 493,745 0.04Denso 40,700 2,011,811 0.16Dexerials 12,300 188,037 0.02Dip 17,800 398,775 0.03Disco 3,900 863,546 0.07DMG Mori 55,100 716,568 0.06FANUC 7,400 1,293,202 0.11Fast Retailing 500 272,717 0.02FP 16,600 446,594 0.04Freee 11,300 752,463 0.06giftee 7,900 182,394 0.01GMO internet 67,700 1,337,865 0.11GMO Payment Gateway 3,400 320,869 0.03Hamamatsu Photonics 26,400 1,153,612 0.09Harmonic Drive Systems 1,000 39,915 -Hitachi 60,400 2,505,782 0.20Hoya 4,300 413,097 0.03Iida Group Holdings 47,600 887,879 0.07Inpex 252,300 1,364,120 0.11Japan Airlines 40,600 635,769 0.05Japan Elevator Service Holdings 6,000 101,039 0.01Japan Exchange Group 92,600 1,491,725 0.12Justsystems 15,100 644,074 0.05Kakaku.com 49,200 1,076,561 0.09Kaneka 8,600 250,999 0.02Kansai Paint 17,400 321,270 0.03Kao 20,600 918,304 0.07Keyence 9,700 3,547,180 0.29Komatsu 48,000 864,191 0.07Kose 14,800 1,687,268 0.14Kotobuki Spirits 3,400 159,215 0.01Kubota 104,700 1,534,372 0.12Lixil 36,300 680,179 0.06
Mercer UCITS Common Contractual FundNFU Mutual Global Alpha Fund
Portfolio Statementas at 30 June 2021
(continued)
Mercer UCITS Common Contractual Fund 238
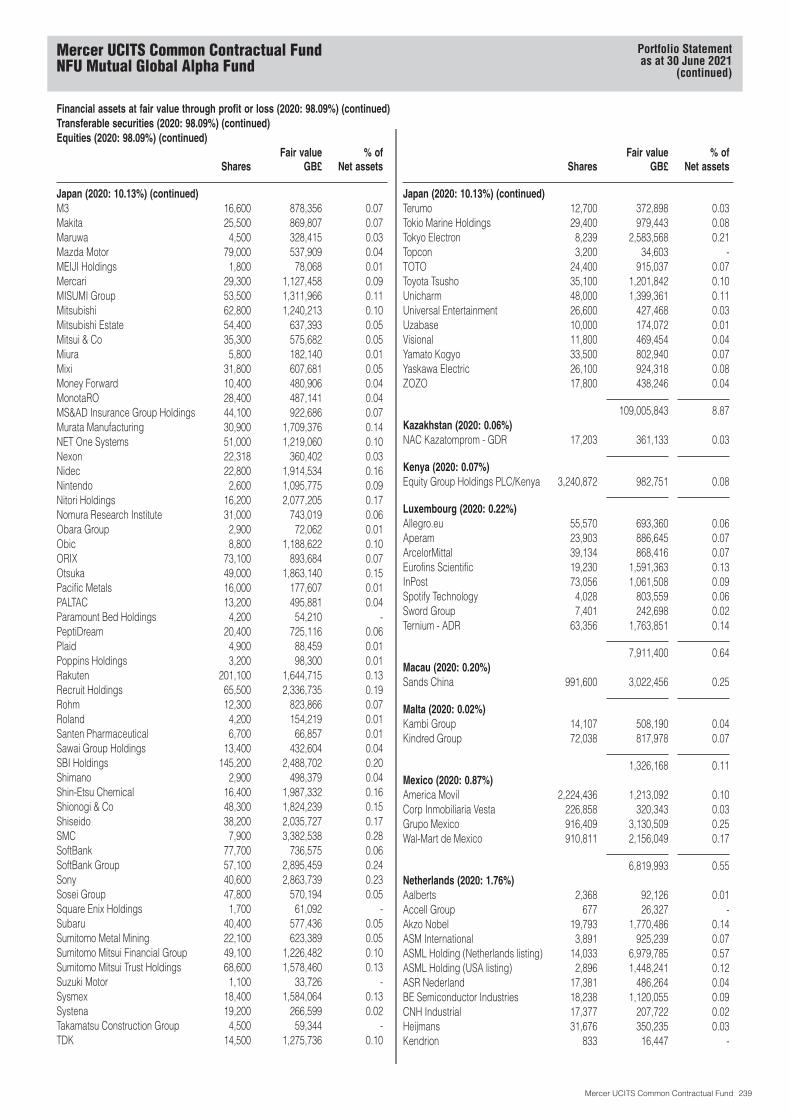
Financial assets at fair value through profit or loss (2020: 98.09%) (continued)Transferable securities (2020: 98.09%) (continued)Equities (2020: 98.09%) (continued)
SharesFair value
GB£% of
Net assets
Japan (2020: 10.13%) (continued)M3 16,600 878,356 0.07Makita 25,500 869,807 0.07Maruwa 4,500 328,415 0.03Mazda Motor 79,000 537,909 0.04MEIJI Holdings 1,800 78,068 0.01Mercari 29,300 1,127,458 0.09MISUMI Group 53,500 1,311,966 0.11Mitsubishi 62,800 1,240,213 0.10Mitsubishi Estate 54,400 637,393 0.05Mitsui & Co 35,300 575,682 0.05Miura 5,800 182,140 0.01Mixi 31,800 607,681 0.05Money Forward 10,400 480,906 0.04MonotaRO 28,400 487,141 0.04MS&AD Insurance Group Holdings 44,100 922,686 0.07Murata Manufacturing 30,900 1,709,376 0.14NET One Systems 51,000 1,219,060 0.10Nexon 22,318 360,402 0.03Nidec 22,800 1,914,534 0.16Nintendo 2,600 1,095,775 0.09Nitori Holdings 16,200 2,077,205 0.17Nomura Research Institute 31,000 743,019 0.06Obara Group 2,900 72,062 0.01Obic 8,800 1,188,622 0.10ORIX 73,100 893,684 0.07Otsuka 49,000 1,863,140 0.15Pacific Metals 16,000 177,607 0.01PALTAC 13,200 495,881 0.04Paramount Bed Holdings 4,200 54,210 -PeptiDream 20,400 725,116 0.06Plaid 4,900 88,459 0.01Poppins Holdings 3,200 98,300 0.01Rakuten 201,100 1,644,715 0.13Recruit Holdings 65,500 2,336,735 0.19Rohm 12,300 823,866 0.07Roland 4,200 154,219 0.01Santen Pharmaceutical 6,700 66,857 0.01Sawai Group Holdings 13,400 432,604 0.04SBI Holdings 145,200 2,488,702 0.20Shimano 2,900 498,379 0.04Shin-Etsu Chemical 16,400 1,987,332 0.16Shionogi & Co 48,300 1,824,239 0.15Shiseido 38,200 2,035,727 0.17SMC 7,900 3,382,538 0.28SoftBank 77,700 736,575 0.06SoftBank Group 57,100 2,895,459 0.24Sony 40,600 2,863,739 0.23Sosei Group 47,800 570,194 0.05Square Enix Holdings 1,700 61,092 -Subaru 40,400 577,436 0.05Sumitomo Metal Mining 22,100 623,389 0.05Sumitomo Mitsui Financial Group 49,100 1,226,482 0.10Sumitomo Mitsui Trust Holdings 68,600 1,578,460 0.13Suzuki Motor 1,100 33,726 -Sysmex 18,400 1,584,064 0.13Systena 19,200 266,599 0.02Takamatsu Construction Group 4,500 59,344 -TDK 14,500 1,275,736 0.10
SharesFair value
GB£% of
Net assets
Japan (2020: 10.13%) (continued)Terumo 12,700 372,898 0.03Tokio Marine Holdings 29,400 979,443 0.08Tokyo Electron 8,239 2,583,568 0.21Topcon 3,200 34,603 -TOTO 24,400 915,037 0.07Toyota Tsusho 35,100 1,201,842 0.10Unicharm 48,000 1,399,361 0.11Universal Entertainment 26,600 427,468 0.03Uzabase 10,000 174,072 0.01Visional 11,800 469,454 0.04Yamato Kogyo 33,500 802,940 0.07Yaskawa Electric 26,100 924,318 0.08ZOZO 17,800 438,246 0.04
109,005,843 8.87Kazakhstan (2020: 0.06%)NAC Kazatomprom - GDR 17,203 361,133 0.03
Kenya (2020: 0.07%)Equity Group Holdings PLC/Kenya 3,240,872 982,751 0.08
Luxembourg (2020: 0.22%)Allegro.eu 55,570 693,360 0.06Aperam 23,903 886,645 0.07ArcelorMittal 39,134 868,416 0.07Eurofins Scientific 19,230 1,591,363 0.13InPost 73,056 1,061,508 0.09Spotify Technology 4,028 803,559 0.06Sword Group 7,401 242,698 0.02Ternium - ADR 63,356 1,763,851 0.14
7,911,400 0.64Macau (2020: 0.20%)Sands China 991,600 3,022,456 0.25
Malta (2020: 0.02%)Kambi Group 14,107 508,190 0.04Kindred Group 72,038 817,978 0.07
1,326,168 0.11Mexico (2020: 0.87%)America Movil 2,224,436 1,213,092 0.10Corp Inmobiliaria Vesta 226,858 320,343 0.03Grupo Mexico 916,409 3,130,509 0.25Wal-Mart de Mexico 910,811 2,156,049 0.17
6,819,993 0.55Netherlands (2020: 1.76%)Aalberts 2,368 92,126 0.01Accell Group 677 26,327 -Akzo Nobel 19,793 1,770,486 0.14ASM International 3,891 925,239 0.07ASML Holding (Netherlands listing) 14,033 6,979,785 0.57ASML Holding (USA listing) 2,896 1,448,241 0.12ASR Nederland 17,381 486,264 0.04BE Semiconductor Industries 18,238 1,120,055 0.09CNH Industrial 17,377 207,722 0.02Heijmans 31,676 350,235 0.03Kendrion 833 16,447 -
Mercer UCITS Common Contractual FundNFU Mutual Global Alpha Fund
Portfolio Statementas at 30 June 2021
(continued)
Mercer UCITS Common Contractual Fund 239
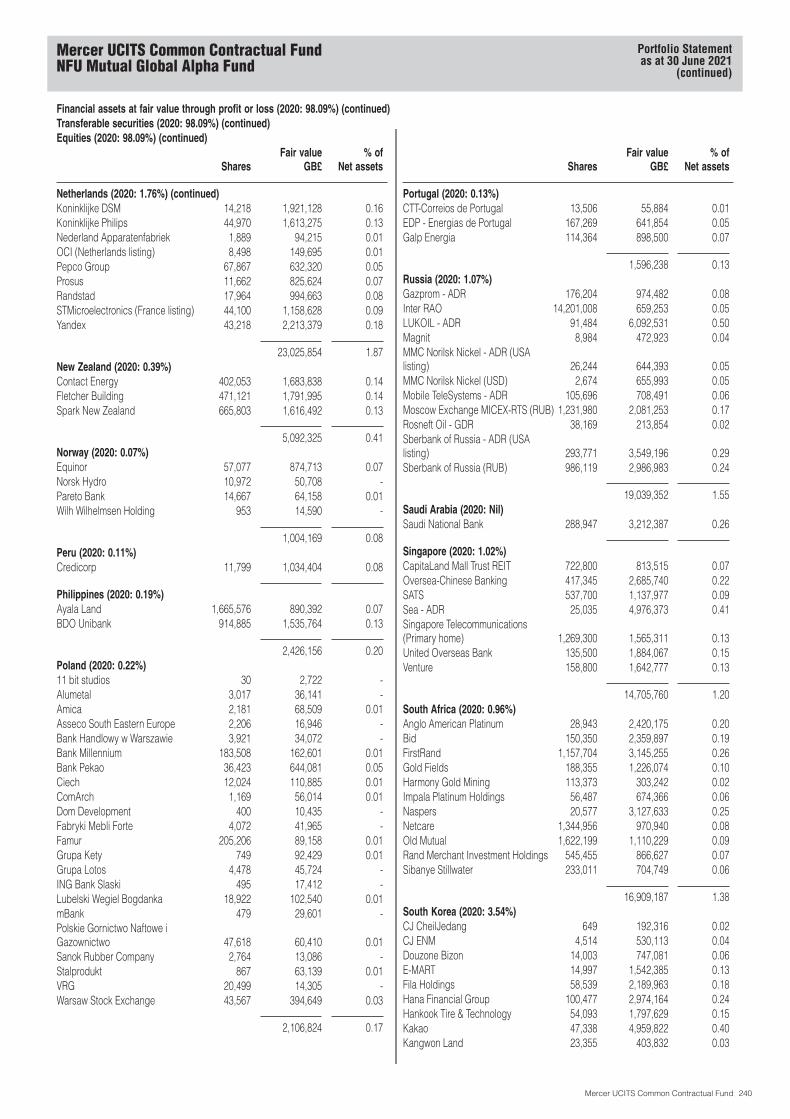
Financial assets at fair value through profit or loss (2020: 98.09%) (continued)Transferable securities (2020: 98.09%) (continued)Equities (2020: 98.09%) (continued)
SharesFair value
GB£% of
Net assets
Netherlands (2020: 1.76%) (continued)Koninklijke DSM 14,218 1,921,128 0.16Koninklijke Philips 44,970 1,613,275 0.13Nederland Apparatenfabriek 1,889 94,215 0.01OCI (Netherlands listing) 8,498 149,695 0.01Pepco Group 67,867 632,320 0.05Prosus 11,662 825,624 0.07Randstad 17,964 994,663 0.08STMicroelectronics (France listing) 44,100 1,158,628 0.09Yandex 43,218 2,213,379 0.18
23,025,854 1.87New Zealand (2020: 0.39%)Contact Energy 402,053 1,683,838 0.14Fletcher Building 471,121 1,791,995 0.14Spark New Zealand 665,803 1,616,492 0.13
5,092,325 0.41Norway (2020: 0.07%)Equinor 57,077 874,713 0.07Norsk Hydro 10,972 50,708 -Pareto Bank 14,667 64,158 0.01Wilh Wilhelmsen Holding 953 14,590 -
1,004,169 0.08Peru (2020: 0.11%)Credicorp 11,799 1,034,404 0.08
Philippines (2020: 0.19%)Ayala Land 1,665,576 890,392 0.07BDO Unibank 914,885 1,535,764 0.13
2,426,156 0.20Poland (2020: 0.22%)11 bit studios 30 2,722 -Alumetal 3,017 36,141 -Amica 2,181 68,509 0.01Asseco South Eastern Europe 2,206 16,946 -Bank Handlowy w Warszawie 3,921 34,072 -Bank Millennium 183,508 162,601 0.01Bank Pekao 36,423 644,081 0.05Ciech 12,024 110,885 0.01ComArch 1,169 56,014 0.01Dom Development 400 10,435 -Fabryki Mebli Forte 4,072 41,965 -Famur 205,206 89,158 0.01Grupa Kety 749 92,429 0.01Grupa Lotos 4,478 45,724 -ING Bank Slaski 495 17,412 -Lubelski Wegiel Bogdanka 18,922 102,540 0.01mBank 479 29,601 -Polskie Gornictwo Naftowe iGazownictwo 47,618 60,410 0.01Sanok Rubber Company 2,764 13,086 -Stalprodukt 867 63,139 0.01VRG 20,499 14,305 -Warsaw Stock Exchange 43,567 394,649 0.03
2,106,824 0.17
SharesFair value
GB£% of
Net assets
Portugal (2020: 0.13%)CTT-Correios de Portugal 13,506 55,884 0.01EDP - Energias de Portugal 167,269 641,854 0.05Galp Energia 114,364 898,500 0.07
1,596,238 0.13Russia (2020: 1.07%)Gazprom - ADR 176,204 974,482 0.08Inter RAO 14,201,008 659,253 0.05LUKOIL - ADR 91,484 6,092,531 0.50Magnit 8,984 472,923 0.04MMC Norilsk Nickel - ADR (USAlisting) 26,244 644,393 0.05MMC Norilsk Nickel (USD) 2,674 655,993 0.05Mobile TeleSystems - ADR 105,696 708,491 0.06Moscow Exchange MICEX-RTS (RUB) 1,231,980 2,081,253 0.17Rosneft Oil - GDR 38,169 213,854 0.02Sberbank of Russia - ADR (USAlisting) 293,771 3,549,196 0.29Sberbank of Russia (RUB) 986,119 2,986,983 0.24
19,039,352 1.55Saudi Arabia (2020: Nil)Saudi National Bank 288,947 3,212,387 0.26
Singapore (2020: 1.02%)CapitaLand Mall Trust REIT 722,800 813,515 0.07Oversea-Chinese Banking 417,345 2,685,740 0.22SATS 537,700 1,137,977 0.09Sea - ADR 25,035 4,976,373 0.41Singapore Telecommunications(Primary home) 1,269,300 1,565,311 0.13United Overseas Bank 135,500 1,884,067 0.15Venture 158,800 1,642,777 0.13
14,705,760 1.20South Africa (2020: 0.96%)Anglo American Platinum 28,943 2,420,175 0.20Bid 150,350 2,359,897 0.19FirstRand 1,157,704 3,145,255 0.26Gold Fields 188,355 1,226,074 0.10Harmony Gold Mining 113,373 303,242 0.02Impala Platinum Holdings 56,487 674,366 0.06Naspers 20,577 3,127,633 0.25Netcare 1,344,956 970,940 0.08Old Mutual 1,622,199 1,110,229 0.09Rand Merchant Investment Holdings 545,455 866,627 0.07Sibanye Stillwater 233,011 704,749 0.06
16,909,187 1.38South Korea (2020: 3.54%)CJ CheilJedang 649 192,316 0.02CJ ENM 4,514 530,113 0.04Douzone Bizon 14,003 747,081 0.06E-MART 14,997 1,542,385 0.13Fila Holdings 58,539 2,189,963 0.18Hana Financial Group 100,477 2,974,164 0.24Hankook Tire & Technology 54,093 1,797,629 0.15Kakao 47,338 4,959,822 0.40Kangwon Land 23,355 403,832 0.03
Mercer UCITS Common Contractual FundNFU Mutual Global Alpha Fund
Portfolio Statementas at 30 June 2021
(continued)
Mercer UCITS Common Contractual Fund 240
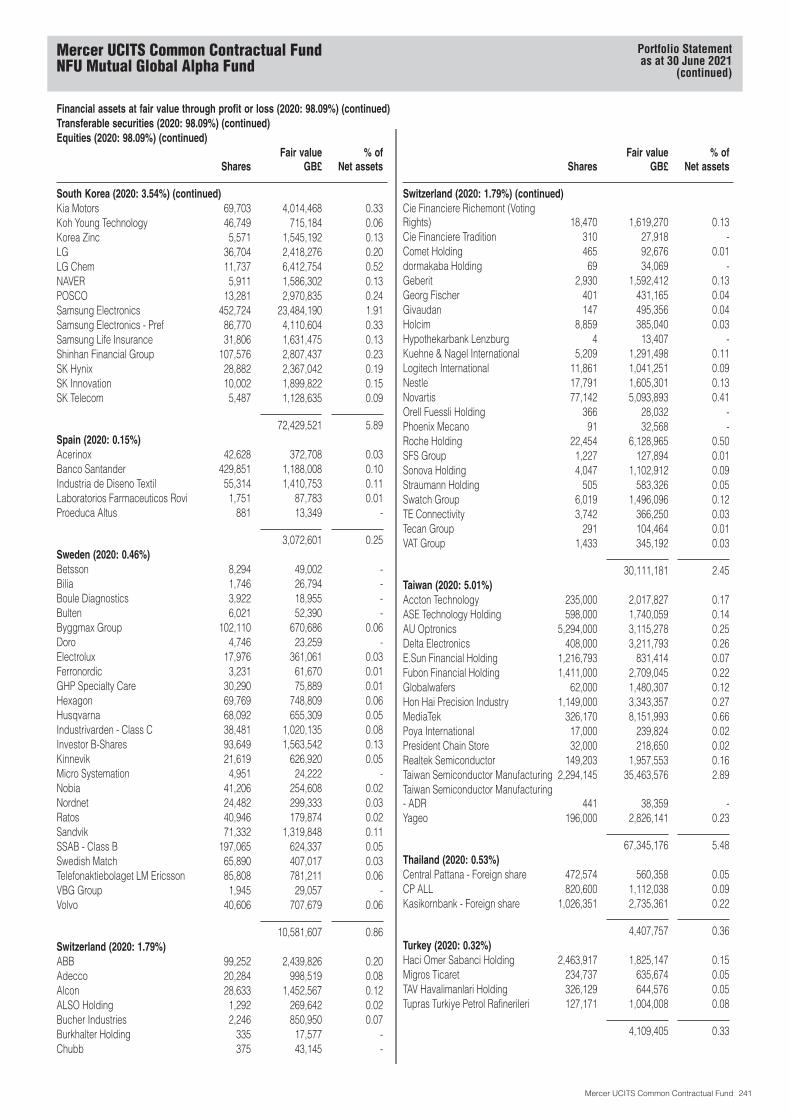
Financial assets at fair value through profit or loss (2020: 98.09%) (continued)Transferable securities (2020: 98.09%) (continued)Equities (2020: 98.09%) (continued)
SharesFair value
GB£% of
Net assets
South Korea (2020: 3.54%) (continued)Kia Motors 69,703 4,014,468 0.33Koh Young Technology 46,749 715,184 0.06Korea Zinc 5,571 1,545,192 0.13LG 36,704 2,418,276 0.20LG Chem 11,737 6,412,754 0.52NAVER 5,911 1,586,302 0.13POSCO 13,281 2,970,835 0.24Samsung Electronics 452,724 23,484,190 1.91Samsung Electronics - Pref 86,770 4,110,604 0.33Samsung Life Insurance 31,806 1,631,475 0.13Shinhan Financial Group 107,576 2,807,437 0.23SK Hynix 28,882 2,367,042 0.19SK Innovation 10,002 1,899,822 0.15SK Telecom 5,487 1,128,635 0.09
72,429,521 5.89Spain (2020: 0.15%)Acerinox 42,628 372,708 0.03Banco Santander 429,851 1,188,008 0.10Industria de Diseno Textil 55,314 1,410,753 0.11Laboratorios Farmaceuticos Rovi 1,751 87,783 0.01Proeduca Altus 881 13,349 -
3,072,601 0.25Sweden (2020: 0.46%)Betsson 8,294 49,002 -Bilia 1,746 26,794 -Boule Diagnostics 3,922 18,955 -Bulten 6,021 52,390 -Byggmax Group 102,110 670,686 0.06Doro 4,746 23,259 -Electrolux 17,976 361,061 0.03Ferronordic 3,231 61,670 0.01GHP Specialty Care 30,290 75,889 0.01Hexagon 69,769 748,809 0.06Husqvarna 68,092 655,309 0.05Industrivarden - Class C 38,481 1,020,135 0.08Investor B-Shares 93,649 1,563,542 0.13Kinnevik 21,619 626,920 0.05Micro Systemation 4,951 24,222 -Nobia 41,206 254,608 0.02Nordnet 24,482 299,333 0.03Ratos 40,946 179,874 0.02Sandvik 71,332 1,319,848 0.11SSAB - Class B 197,065 624,337 0.05Swedish Match 65,890 407,017 0.03Telefonaktiebolaget LM Ericsson 85,808 781,211 0.06VBG Group 1,945 29,057 -Volvo 40,606 707,679 0.06
10,581,607 0.86Switzerland (2020: 1.79%)ABB 99,252 2,439,826 0.20Adecco 20,284 998,519 0.08Alcon 28,633 1,452,567 0.12ALSO Holding 1,292 269,642 0.02Bucher Industries 2,246 850,950 0.07Burkhalter Holding 335 17,577 -Chubb 375 43,145 -
SharesFair value
GB£% of
Net assets
Switzerland (2020: 1.79%) (continued)Cie Financiere Richemont (VotingRights) 18,470 1,619,270 0.13Cie Financiere Tradition 310 27,918 -Comet Holding 465 92,676 0.01dormakaba Holding 69 34,069 -Geberit 2,930 1,592,412 0.13Georg Fischer 401 431,165 0.04Givaudan 147 495,356 0.04Holcim 8,859 385,040 0.03Hypothekarbank Lenzburg 4 13,407 -Kuehne & Nagel International 5,209 1,291,498 0.11Logitech International 11,861 1,041,251 0.09Nestle 17,791 1,605,301 0.13Novartis 77,142 5,093,893 0.41Orell Fuessli Holding 366 28,032 -Phoenix Mecano 91 32,568 -Roche Holding 22,454 6,128,965 0.50SFS Group 1,227 127,894 0.01Sonova Holding 4,047 1,102,912 0.09Straumann Holding 505 583,326 0.05Swatch Group 6,019 1,496,096 0.12TE Connectivity 3,742 366,250 0.03Tecan Group 291 104,464 0.01VAT Group 1,433 345,192 0.03
30,111,181 2.45Taiwan (2020: 5.01%)Accton Technology 235,000 2,017,827 0.17ASE Technology Holding 598,000 1,740,059 0.14AU Optronics 5,294,000 3,115,278 0.25Delta Electronics 408,000 3,211,793 0.26E.Sun Financial Holding 1,216,793 831,414 0.07Fubon Financial Holding 1,411,000 2,709,045 0.22Globalwafers 62,000 1,480,307 0.12Hon Hai Precision Industry 1,149,000 3,343,357 0.27MediaTek 326,170 8,151,993 0.66Poya International 17,000 239,824 0.02President Chain Store 32,000 218,650 0.02Realtek Semiconductor 149,203 1,957,553 0.16Taiwan Semiconductor Manufacturing 2,294,145 35,463,576 2.89Taiwan Semiconductor Manufacturing- ADR 441 38,359 -Yageo 196,000 2,826,141 0.23
67,345,176 5.48Thailand (2020: 0.53%)Central Pattana - Foreign share 472,574 560,358 0.05CP ALL 820,600 1,112,038 0.09Kasikornbank - Foreign share 1,026,351 2,735,361 0.22
4,407,757 0.36Turkey (2020: 0.32%)Haci Omer Sabanci Holding 2,463,917 1,825,147 0.15Migros Ticaret 234,737 635,674 0.05TAV Havalimanlari Holding 326,129 644,576 0.05Tupras Turkiye Petrol Rafinerileri 127,171 1,004,008 0.08
4,109,405 0.33
Mercer UCITS Common Contractual FundNFU Mutual Global Alpha Fund
Portfolio Statementas at 30 June 2021
(continued)
Mercer UCITS Common Contractual Fund 241
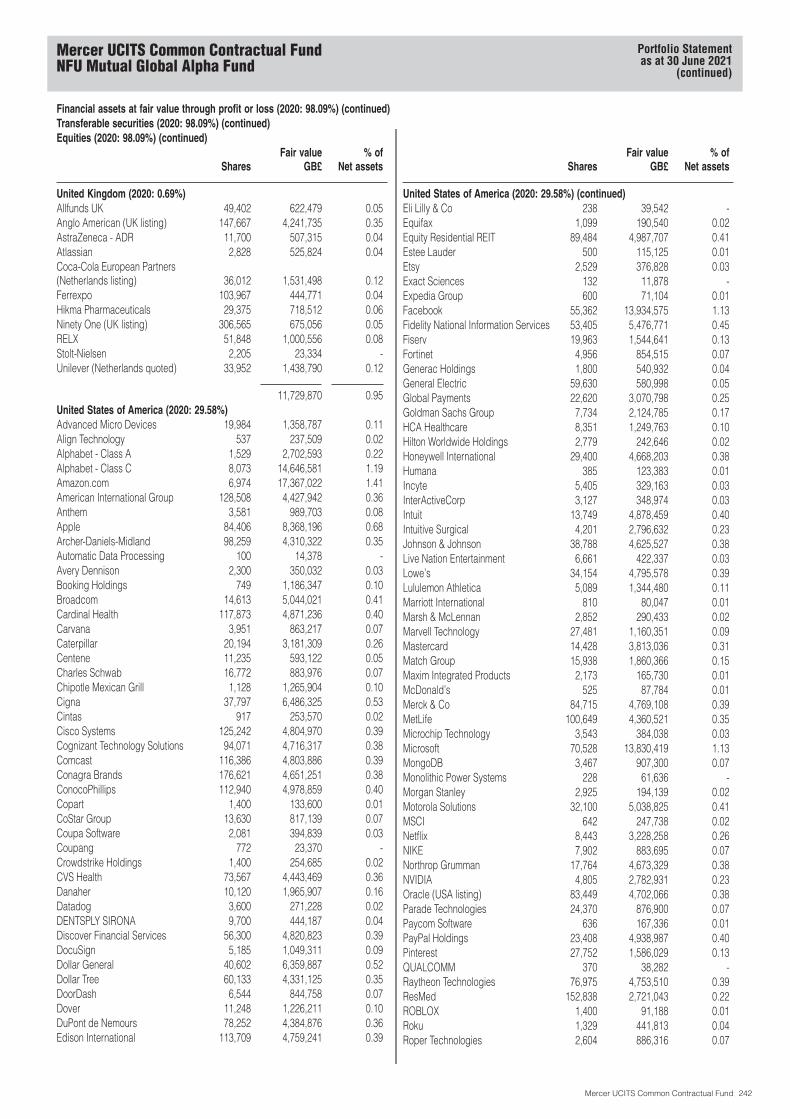
Financial assets at fair value through profit or loss (2020: 98.09%) (continued)Transferable securities (2020: 98.09%) (continued)Equities (2020: 98.09%) (continued)
SharesFair value
GB£% of
Net assets
United Kingdom (2020: 0.69%)Allfunds UK 49,402 622,479 0.05Anglo American (UK listing) 147,667 4,241,735 0.35AstraZeneca - ADR 11,700 507,315 0.04Atlassian 2,828 525,824 0.04Coca-Cola European Partners(Netherlands listing) 36,012 1,531,498 0.12Ferrexpo 103,967 444,771 0.04Hikma Pharmaceuticals 29,375 718,512 0.06Ninety One (UK listing) 306,565 675,056 0.05RELX 51,848 1,000,556 0.08Stolt-Nielsen 2,205 23,334 -Unilever (Netherlands quoted) 33,952 1,438,790 0.12
11,729,870 0.95United States of America (2020: 29.58%)Advanced Micro Devices 19,984 1,358,787 0.11Align Technology 537 237,509 0.02Alphabet - Class A 1,529 2,702,593 0.22Alphabet - Class C 8,073 14,646,581 1.19Amazon.com 6,974 17,367,022 1.41American International Group 128,508 4,427,942 0.36Anthem 3,581 989,703 0.08Apple 84,406 8,368,196 0.68Archer-Daniels-Midland 98,259 4,310,322 0.35Automatic Data Processing 100 14,378 -Avery Dennison 2,300 350,032 0.03Booking Holdings 749 1,186,347 0.10Broadcom 14,613 5,044,021 0.41Cardinal Health 117,873 4,871,236 0.40Carvana 3,951 863,217 0.07Caterpillar 20,194 3,181,309 0.26Centene 11,235 593,122 0.05Charles Schwab 16,772 883,976 0.07Chipotle Mexican Grill 1,128 1,265,904 0.10Cigna 37,797 6,486,325 0.53Cintas 917 253,570 0.02Cisco Systems 125,242 4,804,970 0.39Cognizant Technology Solutions 94,071 4,716,317 0.38Comcast 116,386 4,803,886 0.39Conagra Brands 176,621 4,651,251 0.38ConocoPhillips 112,940 4,978,859 0.40Copart 1,400 133,600 0.01CoStar Group 13,630 817,139 0.07Coupa Software 2,081 394,839 0.03Coupang 772 23,370 -Crowdstrike Holdings 1,400 254,685 0.02CVS Health 73,567 4,443,469 0.36Danaher 10,120 1,965,907 0.16Datadog 3,600 271,228 0.02DENTSPLY SIRONA 9,700 444,187 0.04Discover Financial Services 56,300 4,820,823 0.39DocuSign 5,185 1,049,311 0.09Dollar General 40,602 6,359,887 0.52Dollar Tree 60,133 4,331,125 0.35DoorDash 6,544 844,758 0.07Dover 11,248 1,226,211 0.10DuPont de Nemours 78,252 4,384,876 0.36Edison International 113,709 4,759,241 0.39
SharesFair value
GB£% of
Net assets
United States of America (2020: 29.58%) (continued)Eli Lilly & Co 238 39,542 -Equifax 1,099 190,540 0.02Equity Residential REIT 89,484 4,987,707 0.41Estee Lauder 500 115,125 0.01Etsy 2,529 376,828 0.03Exact Sciences 132 11,878 -Expedia Group 600 71,104 0.01Facebook 55,362 13,934,575 1.13Fidelity National Information Services 53,405 5,476,771 0.45Fiserv 19,963 1,544,641 0.13Fortinet 4,956 854,515 0.07Generac Holdings 1,800 540,932 0.04General Electric 59,630 580,998 0.05Global Payments 22,620 3,070,798 0.25Goldman Sachs Group 7,734 2,124,785 0.17HCA Healthcare 8,351 1,249,763 0.10Hilton Worldwide Holdings 2,779 242,646 0.02Honeywell International 29,400 4,668,203 0.38Humana 385 123,383 0.01Incyte 5,405 329,163 0.03InterActiveCorp 3,127 348,974 0.03Intuit 13,749 4,878,459 0.40Intuitive Surgical 4,201 2,796,632 0.23Johnson & Johnson 38,788 4,625,527 0.38Live Nation Entertainment 6,661 422,337 0.03Lowe’s 34,154 4,795,578 0.39Lululemon Athletica 5,089 1,344,480 0.11Marriott International 810 80,047 0.01Marsh & McLennan 2,852 290,433 0.02Marvell Technology 27,481 1,160,351 0.09Mastercard 14,428 3,813,036 0.31Match Group 15,938 1,860,366 0.15Maxim Integrated Products 2,173 165,730 0.01McDonald’s 525 87,784 0.01Merck & Co 84,715 4,769,108 0.39MetLife 100,649 4,360,521 0.35Microchip Technology 3,543 384,038 0.03Microsoft 70,528 13,830,419 1.13MongoDB 3,467 907,300 0.07Monolithic Power Systems 228 61,636 -Morgan Stanley 2,925 194,139 0.02Motorola Solutions 32,100 5,038,825 0.41MSCI 642 247,738 0.02Netflix 8,443 3,228,258 0.26NIKE 7,902 883,695 0.07Northrop Grumman 17,764 4,673,329 0.38NVIDIA 4,805 2,782,931 0.23Oracle (USA listing) 83,449 4,702,066 0.38Parade Technologies 24,370 876,900 0.07Paycom Software 636 167,336 0.01PayPal Holdings 23,408 4,938,987 0.40Pinterest 27,752 1,586,029 0.13QUALCOMM 370 38,282 -Raytheon Technologies 76,975 4,753,510 0.39ResMed 152,838 2,721,043 0.22ROBLOX 1,400 91,188 0.01Roku 1,329 441,813 0.04Roper Technologies 2,604 886,316 0.07
Mercer UCITS Common Contractual FundNFU Mutual Global Alpha Fund
Portfolio Statementas at 30 June 2021
(continued)
Mercer UCITS Common Contractual Fund 242
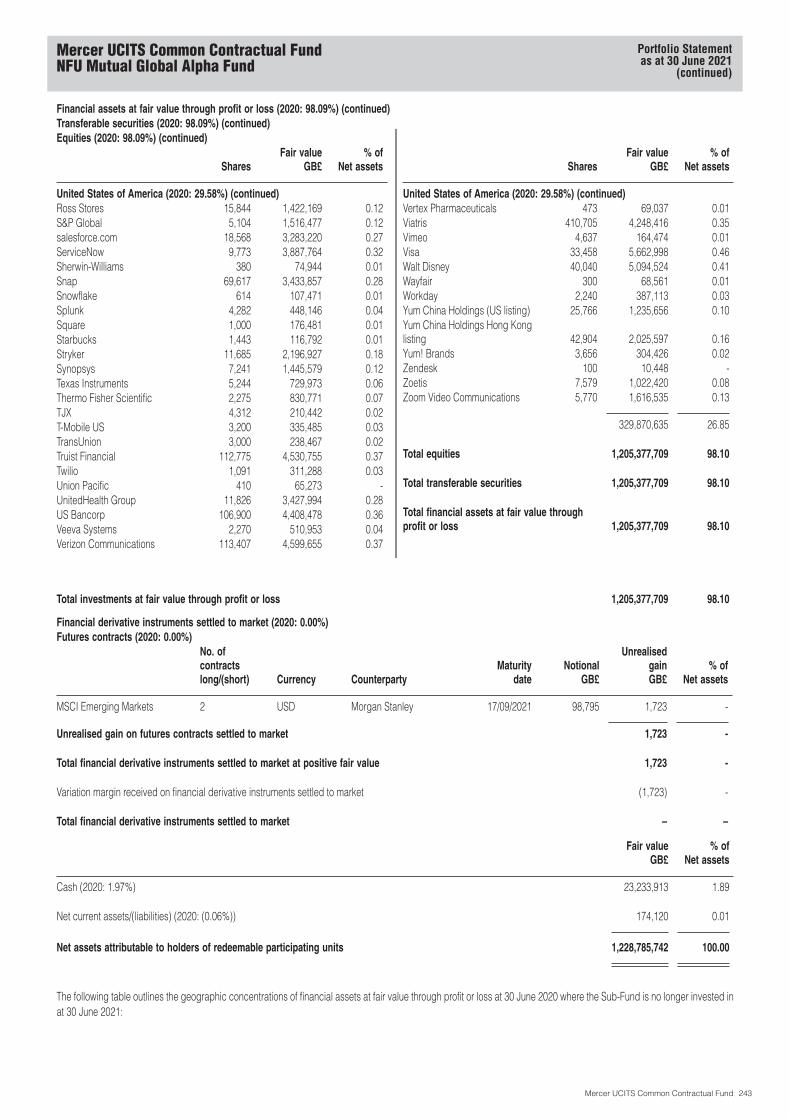
Financial assets at fair value through profit or loss (2020: 98.09%) (continued)Transferable securities (2020: 98.09%) (continued)Equities (2020: 98.09%) (continued)
SharesFair value
GB£% of
Net assets
United States of America (2020: 29.58%) (continued)Ross Stores 15,844 1,422,169 0.12S&P Global 5,104 1,516,477 0.12salesforce.com 18,568 3,283,220 0.27ServiceNow 9,773 3,887,764 0.32Sherwin-Williams 380 74,944 0.01Snap 69,617 3,433,857 0.28Snowflake 614 107,471 0.01Splunk 4,282 448,146 0.04Square 1,000 176,481 0.01Starbucks 1,443 116,792 0.01Stryker 11,685 2,196,927 0.18Synopsys 7,241 1,445,579 0.12Texas Instruments 5,244 729,973 0.06Thermo Fisher Scientific 2,275 830,771 0.07TJX 4,312 210,442 0.02T-Mobile US 3,200 335,485 0.03TransUnion 3,000 238,467 0.02Truist Financial 112,775 4,530,755 0.37Twilio 1,091 311,288 0.03Union Pacific 410 65,273 -UnitedHealth Group 11,826 3,427,994 0.28US Bancorp 106,900 4,408,478 0.36Veeva Systems 2,270 510,953 0.04Verizon Communications 113,407 4,599,655 0.37
SharesFair value
GB£% of
Net assets
United States of America (2020: 29.58%) (continued)Vertex Pharmaceuticals 473 69,037 0.01Viatris 410,705 4,248,416 0.35Vimeo 4,637 164,474 0.01Visa 33,458 5,662,998 0.46Walt Disney 40,040 5,094,524 0.41Wayfair 300 68,561 0.01Workday 2,240 387,113 0.03Yum China Holdings (US listing) 25,766 1,235,656 0.10Yum China Holdings Hong Konglisting 42,904 2,025,597 0.16Yum! Brands 3,656 304,426 0.02Zendesk 100 10,448 -Zoetis 7,579 1,022,420 0.08Zoom Video Communications 5,770 1,616,535 0.13
329,870,635 26.85
Total equities 1,205,377,709 98.10
Total transferable securities 1,205,377,709 98.10
Total financial assets at fair value throughprofit or loss 1,205,377,709 98.10
Total investments at fair value through profit or loss 1,205,377,709 98.10
Financial derivative instruments settled to market (2020: 0.00%)Futures contracts (2020: 0.00%)
No. ofcontractslong/(short) Currency Counterparty
Maturitydate
NotionalGB£
UnrealisedgainGB£
% ofNet assets
MSCI Emerging Markets 2 USD Morgan Stanley 17/09/2021 98,795 1,723 -
Unrealised gain on futures contracts settled to market 1,723 -
Total financial derivative instruments settled to market at positive fair value 1,723 -
Variation margin received on financial derivative instruments settled to market (1,723) -
Total financial derivative instruments settled to market – –
Fair valueGB£
% ofNet assets
Cash (2020: 1.97%) 23,233,913 1.89
Net current assets/(liabilities) (2020: (0.06%)) 174,120 0.01
Net assets attributable to holders of redeemable participating units 1,228,785,742 100.00
The following table outlines the geographic concentrations of financial assets at fair value through profit or loss at 30 June 2020 where the Sub-Fund is no longer invested inat 30 June 2021:
Mercer UCITS Common Contractual FundNFU Mutual Global Alpha Fund
Portfolio Statementas at 30 June 2021
(continued)
Mercer UCITS Common Contractual Fund 243

Financial assets at fair value through profit or loss
Transferable securitiesEquitiesArgentina 0.08%Israel 0.08%Malaysia 0.15%United Arab Emirates 0.05%
Total assets comprised as follows:
% ofTotal assets
Transferable securities admitted to an official stock exchange listing; 97.74Other transferable securities of the type referred to in Regulation 68 (1)(a), (b) and (c); 0.04Other current assets 2.22
100.00
Country classifications are based upon country of incorporation and/or country of domicile.
Mercer UCITS Common Contractual FundNFU Mutual Global Alpha Fund
Portfolio Statementas at 30 June 2021
(continued)
Mercer UCITS Common Contractual Fund 244

Financial assets at fair value through profit or loss (2020: 99.64%)Transferable securities (2020: 99.64%)Equities (2020: 99.64%)
SharesFair value
GB£% of
Net assets
Australia (2020: 4.59%)Aurizon Holdings 227,929 460,790 0.09BlueScope Steel 60,072 716,910 0.14Dexus REIT 130,416 756,233 0.15Evolution Mining 192,695 471,241 0.09Fortescue Metals Group 205,591 2,607,745 0.52Medibank 327,851 563,020 0.11REA Group 6,272 576,143 0.12Rio Tinto (Australia listing) 44,956 3,093,989 0.62Telstra 504,183 1,030,235 0.21Washington H Soul Pattinson & Co 12,745 233,623 0.05
10,509,929 2.10Belgium (2020: 0.60%)Etablissements Franz Colruyt 6,581 266,427 0.05Proximus 18,664 260,999 0.05Sofina 1,835 573,076 0.12
1,100,502 0.22Bermuda (2020: 0.59%)Athene Holding 15,031 734,440 0.15
Canada (2020: 4.07%)Atco 9,337 239,941 0.05B2Gold 124,435 378,255 0.08Canadian Apartment Properties REIT 10,157 345,088 0.07Canadian Tire 6,872 788,011 0.16CCL Industries 18,439 735,879 0.15CGI 27,540 1,809,383 0.36Constellation Software 2,437 2,674,568 0.53Empire 20,362 465,410 0.09George Weston 2,855 197,187 0.04Hydro One 39,125 685,228 0.14iA Financial 12,739 502,590 0.10IGM Financial 10,334 264,353 0.05Kinross Gold 152,043 698,599 0.14Loblaw 21,293 949,606 0.19Lundin Mining 78,950 515,980 0.10Magna International 34,511 2,315,394 0.46Quebecor 20,645 398,985 0.08Toromont Industries 10,069 635,695 0.13West Fraser Timber 10,146 527,807 0.10Wheaton Precious Metals (Canada listing) 157 5,015 -WSP Global 14,017 1,185,666 0.24Yamana Gold 116,765 356,305 0.07
16,674,945 3.33Denmark (2020: 0.13%)AP Moller - Maersk Class A 382 768,194 0.15AP Moller - Maersk Class B 741 1,541,887 0.31Pandora 12,069 1,174,513 0.23ROCKWOOL International 1,069 376,759 0.08
3,861,353 0.77Finland (2020: 0.34%)Elisa 16,913 730,591 0.15Orion Corp 12,820 398,941 0.08
1,129,532 0.23
SharesFair value
GB£% of
Net assets
France (2020: 1.46%)Atos 11,785 518,991 0.10BioMerieux 4,932 414,918 0.08Carrefour 74,095 1,054,915 0.21Cie Generale des Etablissements Michelin 20,471 2,363,602 0.47Faurecia (Italy listing) 2,256 79,887 0.02Iliad 1,815 192,267 0.04Ipsen 4,500 338,863 0.07La Francaise des Jeux SAEM 11,526 490,567 0.10Orange 241,062 1,989,716 0.40SEB 3,490 456,587 0.09
7,900,313 1.58Germany (2020: 0.54%)Brenntag 18,668 1,256,718 0.25Covestro 14,039 656,337 0.13Fuchs Petrolhub - Pref 8,398 295,723 0.06GEA Group 18,816 551,770 0.11HelloFresh 19,929 1,402,512 0.28LANXESS 9,970 494,864 0.10Porsche Automobil Holding - Pref 18,502 1,435,185 0.29Scout24 10,825 660,895 0.13Telefonica Deutschland Holding 128,073 244,625 0.05Uniper 11,055 294,763 0.06
7,293,392 1.46Hong Kong (2020: 1.68%)Bank of East Asia 156,800 210,759 0.04Chow Tai Fook Jewellery Group 250,200 413,730 0.08CK Asset Holdings 290,000 1,448,901 0.29CK Hutchison Holdings 330,000 1,860,995 0.37Hang Lung Properties 241,000 423,677 0.09Henderson Land Development 173,000 593,430 0.12HK Electric Investments & HK ElectricInvestments 320,500 235,114 0.05HKT Trust & HKT 458,000 451,676 0.09Power Assets Holdings 167,500 743,967 0.15Sino Land 398,906 455,122 0.09Sun Hung Kai Properties 157,500 1,698,594 0.34Swire Properties 142,200 306,850 0.06WH Group 1,144,500 744,641 0.15Wharf Real Estate Investment 206,000 866,963 0.17Xinyi Glass Holdings 218,000 643,141 0.13
11,097,560 2.22Ireland (2020: 3.02%)Eaton 3,724 399,452 0.08Horizon Therapeutics 25,720 1,743,400 0.35Jazz Pharmaceuticals 7,339 943,718 0.19Johnson Controls International 87,144 4,329,286 0.87Pentair 20,042 979,141 0.19Seagate Technology Holdings 25,708 1,636,327 0.33STERIS 10,114 1,510,383 0.30
11,541,707 2.31Italy (2020: 0.20%)DiaSorin SPA 3,004 411,314 0.08
Mercer UCITS Common Contractual FundNFU Mutual Global Strategic Fund
Portfolio Statementas at 30 June 2021
Mercer UCITS Common Contractual Fund 245

Financial assets at fair value through profit or loss (2020: 99.64%) (continued)Transferable securities (2020: 99.64%) (continued)Equities (2020: 99.64%) (continued)
SharesFair value
GB£% of
Net assets
Italy (2020: 0.20%) (continued)Telecom Italia 1,202,533 432,435 0.09Telecom Italia - Pref 728,383 279,374 0.05
1,123,123 0.22Japan (2020: 6.39%)ABC-Mart 3,900 162,026 0.03Acom 50,000 157,832 0.03AGC 23,400 711,185 0.14Azbil 14,700 441,497 0.09Brother Industries 29,300 423,657 0.08Capcom 21,000 445,127 0.09Chiba Bank 66,100 288,409 0.06Chubu Electric Power 77,000 681,980 0.14Concordia Financial Group 133,400 354,104 0.07Cosmos Pharmaceutical 2,400 255,141 0.05Dai Nippon Printing 29,000 444,285 0.09Daito Trust Construction 7,800 618,090 0.12Fujitsu 23,900 3,242,218 0.65Hino Motors 36,400 231,941 0.05Hirose Electric 3,900 413,332 0.08Hisamitsu Pharmaceutical 6,100 217,620 0.04Hitachi 44,400 1,841,999 0.37Iida Group Holdings 17,900 333,887 0.07Isuzu Motors 67,200 642,955 0.13Kajima 54,300 498,282 0.10Kakaku.com 16,500 361,042 0.07Kansai Electric Power 84,100 581,136 0.12Koei Tecmo Holdings 7,020 248,152 0.05Konami Holdings 11,100 482,869 0.10Kurita Water Industries 12,000 417,147 0.08Kyowa Kirin 33,200 853,130 0.17Lixil 32,200 603,354 0.12Medipal Holdings 22,500 311,393 0.06MEIJI Holdings 14,800 641,895 0.13Mitsubishi Electric 220,800 2,322,094 0.46Mitsubishi UFJ Lease & Finance 49,500 192,089 0.04Mitsui Chemicals 22,100 552,763 0.11Nabtesco 14,300 391,711 0.08NEC 29,700 1,107,984 0.22NGK Insulators 32,000 389,024 0.08NH Foods 9,800 276,115 0.06Nippon Express 9,600 529,691 0.11Nippon Telegraph & Telephone 156,000 2,944,958 0.59Nippon Yusen 19,500 716,018 0.14Nitto Denko 18,200 984,027 0.20Nomura Real Estate Holdings 14,800 272,009 0.05NSK 48,200 295,185 0.06Obayashi 77,300 445,165 0.09Oji Holdings 98,100 408,198 0.08Otsuka Holdings 47,900 1,439,245 0.29Ricoh 79,800 649,008 0.13Rinnai 4,300 296,432 0.06SCSK 6,200 267,689 0.05Seiko Epson 33,300 424,375 0.09Sekisui Chemical 46,100 570,962 0.11Sekisui House 74,100 1,101,154 0.22Shimizu 66,700 370,635 0.07Shizuoka Bank 54,800 307,012 0.06
SharesFair value
GB£% of
Net assets
Japan (2020: 6.39%) (continued)Sohgo Security Services 8,600 283,811 0.06Stanley Electric 15,600 327,105 0.07Sumitomo Electric Industries 91,100 973,819 0.20Taisei 22,800 541,274 0.11Taisho Pharmaceutical Holdings 4,300 166,865 0.03Toho Gas 9,000 319,317 0.06Tohoku Electric Power 52,700 299,027 0.06Tokyo Gas 44,800 612,713 0.12Toppan Printing 32,200 374,865 0.08Tosoh 31,000 387,381 0.08Toyo Suisan Kaisha 10,900 303,909 0.06Tsuruha Holdings 4,800 404,155 0.08USS 26,500 334,950 0.07Welcia Holdings 11,300 267,526 0.05Yamada Holdings 81,800 273,685 0.05Yamaha Motor 34,100 671,649 0.13
40,701,279 8.14Netherlands (2020: 4.05%)Aegon (Netherlands listing) 213,016 639,837 0.13ASM International 5,690 1,353,023 0.27Koninklijke 406,289 918,679 0.18Koninklijke Ahold Delhaize 126,284 2,717,789 0.54Koninklijke Vopak 8,357 274,765 0.06NN Group 35,143 1,200,098 0.24NXP Semiconductors 33,520 4,991,664 1.00Randstad 14,431 799,041 0.16Stellantis (Italy listing) 245,053 3,482,379 0.70Wolters Kluwer 32,501 2,363,718 0.47
18,740,993 3.75Norway (2020: Nil)Norsk Hydro 161,889 748,186 0.15Yara International 20,807 793,238 0.16
1,541,424 0.31Singapore (2020: 0.06%)Singapore Exchange 97,100 584,604 0.12UOL Group 56,100 220,540 0.04Venture 33,400 345,521 0.07
1,150,665 0.23Spain (2020: 0.38%)Enagas 28,963 484,459 0.10Red Electrica 52,241 702,066 0.14
1,186,525 0.24Sweden (2020: 0.69%)Boliden 33,048 920,303 0.18Electrolux 27,253 547,396 0.11Husqvarna 50,167 482,801 0.10ICA Gruppen 11,586 390,601 0.08Industrivarden - Class A 12,747 359,071 0.07Industrivarden - Class C 19,297 511,565 0.10Kinnevik 28,861 836,928 0.17SKF 46,112 850,473 0.17
4,899,138 0.98
Mercer UCITS Common Contractual FundNFU Mutual Global Strategic Fund
Portfolio Statementas at 30 June 2021
(continued)
Mercer UCITS Common Contractual Fund 246
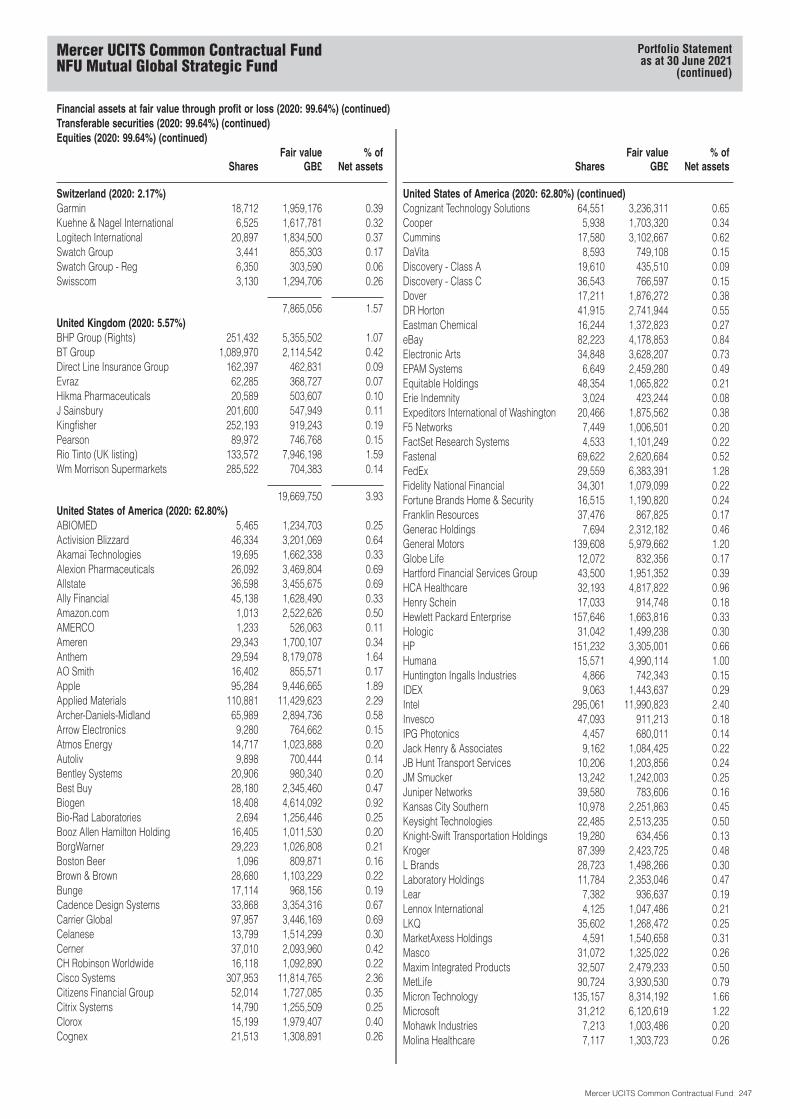
Financial assets at fair value through profit or loss (2020: 99.64%) (continued)Transferable securities (2020: 99.64%) (continued)Equities (2020: 99.64%) (continued)
SharesFair value
GB£% of
Net assets
Switzerland (2020: 2.17%)Garmin 18,712 1,959,176 0.39Kuehne & Nagel International 6,525 1,617,781 0.32Logitech International 20,897 1,834,500 0.37Swatch Group 3,441 855,303 0.17Swatch Group - Reg 6,350 303,590 0.06Swisscom 3,130 1,294,706 0.26
7,865,056 1.57United Kingdom (2020: 5.57%)BHP Group (Rights) 251,432 5,355,502 1.07BT Group 1,089,970 2,114,542 0.42Direct Line Insurance Group 162,397 462,831 0.09Evraz 62,285 368,727 0.07Hikma Pharmaceuticals 20,589 503,607 0.10J Sainsbury 201,600 547,949 0.11Kingfisher 252,193 919,243 0.19Pearson 89,972 746,768 0.15Rio Tinto (UK listing) 133,572 7,946,198 1.59Wm Morrison Supermarkets 285,522 704,383 0.14
19,669,750 3.93United States of America (2020: 62.80%)ABIOMED 5,465 1,234,703 0.25Activision Blizzard 46,334 3,201,069 0.64Akamai Technologies 19,695 1,662,338 0.33Alexion Pharmaceuticals 26,092 3,469,804 0.69Allstate 36,598 3,455,675 0.69Ally Financial 45,138 1,628,490 0.33Amazon.com 1,013 2,522,626 0.50AMERCO 1,233 526,063 0.11Ameren 29,343 1,700,107 0.34Anthem 29,594 8,179,078 1.64AO Smith 16,402 855,571 0.17Apple 95,284 9,446,665 1.89Applied Materials 110,881 11,429,623 2.29Archer-Daniels-Midland 65,989 2,894,736 0.58Arrow Electronics 9,280 764,662 0.15Atmos Energy 14,717 1,023,888 0.20Autoliv 9,898 700,444 0.14Bentley Systems 20,906 980,340 0.20Best Buy 28,180 2,345,460 0.47Biogen 18,408 4,614,092 0.92Bio-Rad Laboratories 2,694 1,256,446 0.25Booz Allen Hamilton Holding 16,405 1,011,530 0.20BorgWarner 29,223 1,026,808 0.21Boston Beer 1,096 809,871 0.16Brown & Brown 28,680 1,103,229 0.22Bunge 17,114 968,156 0.19Cadence Design Systems 33,868 3,354,316 0.67Carrier Global 97,957 3,446,169 0.69Celanese 13,799 1,514,299 0.30Cerner 37,010 2,093,960 0.42CH Robinson Worldwide 16,118 1,092,890 0.22Cisco Systems 307,953 11,814,765 2.36Citizens Financial Group 52,014 1,727,085 0.35Citrix Systems 14,790 1,255,509 0.25Clorox 15,199 1,979,407 0.40Cognex 21,513 1,308,891 0.26
SharesFair value
GB£% of
Net assets
United States of America (2020: 62.80%) (continued)Cognizant Technology Solutions 64,551 3,236,311 0.65Cooper 5,938 1,703,320 0.34Cummins 17,580 3,102,667 0.62DaVita 8,593 749,108 0.15Discovery - Class A 19,610 435,510 0.09Discovery - Class C 36,543 766,597 0.15Dover 17,211 1,876,272 0.38DR Horton 41,915 2,741,944 0.55Eastman Chemical 16,244 1,372,823 0.27eBay 82,223 4,178,853 0.84Electronic Arts 34,848 3,628,207 0.73EPAM Systems 6,649 2,459,280 0.49Equitable Holdings 48,354 1,065,822 0.21Erie Indemnity 3,024 423,244 0.08Expeditors International of Washington 20,466 1,875,562 0.38F5 Networks 7,449 1,006,501 0.20FactSet Research Systems 4,533 1,101,249 0.22Fastenal 69,622 2,620,684 0.52FedEx 29,559 6,383,391 1.28Fidelity National Financial 34,301 1,079,099 0.22Fortune Brands Home & Security 16,515 1,190,820 0.24Franklin Resources 37,476 867,825 0.17Generac Holdings 7,694 2,312,182 0.46General Motors 139,608 5,979,662 1.20Globe Life 12,072 832,356 0.17Hartford Financial Services Group 43,500 1,951,352 0.39HCA Healthcare 32,193 4,817,822 0.96Henry Schein 17,033 914,748 0.18Hewlett Packard Enterprise 157,646 1,663,816 0.33Hologic 31,042 1,499,238 0.30HP 151,232 3,305,001 0.66Humana 15,571 4,990,114 1.00Huntington Ingalls Industries 4,866 742,343 0.15IDEX 9,063 1,443,637 0.29Intel 295,061 11,990,823 2.40Invesco 47,093 911,213 0.18IPG Photonics 4,457 680,011 0.14Jack Henry & Associates 9,162 1,084,425 0.22JB Hunt Transport Services 10,206 1,203,856 0.24JM Smucker 13,242 1,242,003 0.25Juniper Networks 39,580 783,606 0.16Kansas City Southern 10,978 2,251,863 0.45Keysight Technologies 22,485 2,513,235 0.50Knight-Swift Transportation Holdings 19,280 634,456 0.13Kroger 87,399 2,423,725 0.48L Brands 28,723 1,498,266 0.30Laboratory Holdings 11,784 2,353,046 0.47Lear 7,382 936,637 0.19Lennox International 4,125 1,047,486 0.21LKQ 35,602 1,268,472 0.25MarketAxess Holdings 4,591 1,540,658 0.31Masco 31,072 1,325,022 0.26Maxim Integrated Products 32,507 2,479,233 0.50MetLife 90,724 3,930,530 0.79Micron Technology 135,157 8,314,192 1.66Microsoft 31,212 6,120,619 1.22Mohawk Industries 7,213 1,003,486 0.20Molina Healthcare 7,117 1,303,723 0.26
Mercer UCITS Common Contractual FundNFU Mutual Global Strategic Fund
Portfolio Statementas at 30 June 2021
(continued)
Mercer UCITS Common Contractual Fund 247

Financial assets at fair value through profit or loss (2020: 99.64%) (continued)Transferable securities (2020: 99.64%) (continued)Equities (2020: 99.64%) (continued)
SharesFair value
GB£% of
Net assets
United States of America (2020: 62.80%) (continued)Monolithic Power Systems 5,101 1,378,963 0.28Monster Beverage 47,088 3,113,749 0.62NetApp 27,372 1,621,178 0.32Newell Brands 46,900 932,602 0.19News 47,754 890,818 0.18Nordson 6,320 1,004,237 0.20NRG Energy 29,186 851,421 0.17Nucor 36,601 2,541,629 0.51Old Dominion Freight Line 11,996 2,203,905 0.44ON Semiconductor 49,702 1,377,243 0.28Owens Corning 12,887 913,270 0.18Packaging Corp of America 11,277 1,105,455 0.22Pinnacle West Capital 13,429 796,826 0.16Pool 4,861 1,613,917 0.32Public Storage REIT 18,999 4,135,371 0.83PulteGroup 32,186 1,271,410 0.25Qorvo 13,686 1,938,301 0.39Quest Diagnostics 16,119 1,539,849 0.31Raymond James Financial 14,958 1,406,525 0.28Regeneron Pharmaceuticals 1,304 527,226 0.11Regions Financial 118,049 1,724,441 0.34Robert Half International 13,653 879,299 0.18Rollins 26,728 661,694 0.13SEI Investments 14,887 667,811 0.13Skyworks Solutions 19,885 2,760,106 0.55Snap-on 6,608 1,068,750 0.21State Street 42,696 2,542,999 0.51Steel Dynamics 25,388 1,095,316 0.22
SharesFair value
GB£% of
Net assets
United States of America (2020: 62.80%) (continued)Synopsys 18,067 3,606,861 0.72T Rowe Price Group 27,510 3,942,346 0.79Target 60,541 10,594,071 2.12Teradyne 20,272 1,965,787 0.39Texas Instruments 49,868 6,941,703 1.39Tractor Supply 14,054 1,892,857 0.38Tradeweb Markets 12,589 770,586 0.15Travelers 18,941 2,052,667 0.41Tyson Foods 35,613 1,901,491 0.38United Rentals 8,776 2,026,589 0.41Universal Health Services 9,611 1,018,740 0.20Voya Financial 15,086 671,605 0.13Wal-Mart 81,667 8,336,660 1.67Waters 7,573 1,894,607 0.38West Pharmaceutical Services 8,790 2,284,910 0.46Western Union 49,652 825,586 0.16Whirlpool 7,713 1,217,263 0.24WW Grainger 5,444 1,726,064 0.35Zebra Technologies 6,486 2,485,991 0.50
330,277,406 66.06
Total equities 498,999,032 99.80
Total transferable securities 498,999,032 99.80
Total financial assets at fair value throughprofit or loss 498,999,032 99.80
Total investments at fair value through profit or loss 498,999,032 99.80
Financial derivative instruments settled to market (2020: (0.00%))Futures contracts (2020: (0.00%))
No. ofcontractslong/(short) Currency Counterparty
Maturitydate
NotionalGB£
UnrealisedlossGB£
% ofNet assets
Euro Stoxx 50 Index Futures 5 EUR Goldman Sachs 17/09/2021 174,071 (3,366) -
Unrealised loss on futures contracts settled to market (3,366) -
Total financial derivative instruments settled to market at negative fair value (3,366) -
Variation margin paid on financial derivative instruments settled to market 3,366 -
Total financial derivative instruments settled to market – –
Fair valueGB£
% ofNet assets
Cash (2020: 0.29%) 644,725 0.13
Net current assets (2020: 0.07%) 339,607 0.07
Net assets attributable to holders of redeemable participating units 499,983,364 100.00
Mercer UCITS Common Contractual FundNFU Mutual Global Strategic Fund
Portfolio Statementas at 30 June 2021
(continued)
Mercer UCITS Common Contractual Fund 248

The following table outlines the geographic concentrations of financial assets at fair value through profit or loss at 30 June 2020 where the Sub-Fund is no longer invested inat 30 June 2021:
Financial assets at fair value through profit or loss
Transferable securitiesEquitiesNew Zealand 0.31%
Total assets comprised as follows:
% ofTotal assets
Transferable securities admitted to an official stock exchange listing; 99.76Other current assets 0.24
100.00
Country classifications are based upon country of incorporation and/or country of domicile.
Mercer UCITS Common Contractual FundNFU Mutual Global Strategic Fund
Portfolio Statementas at 30 June 2021
(continued)
Mercer UCITS Common Contractual Fund 249
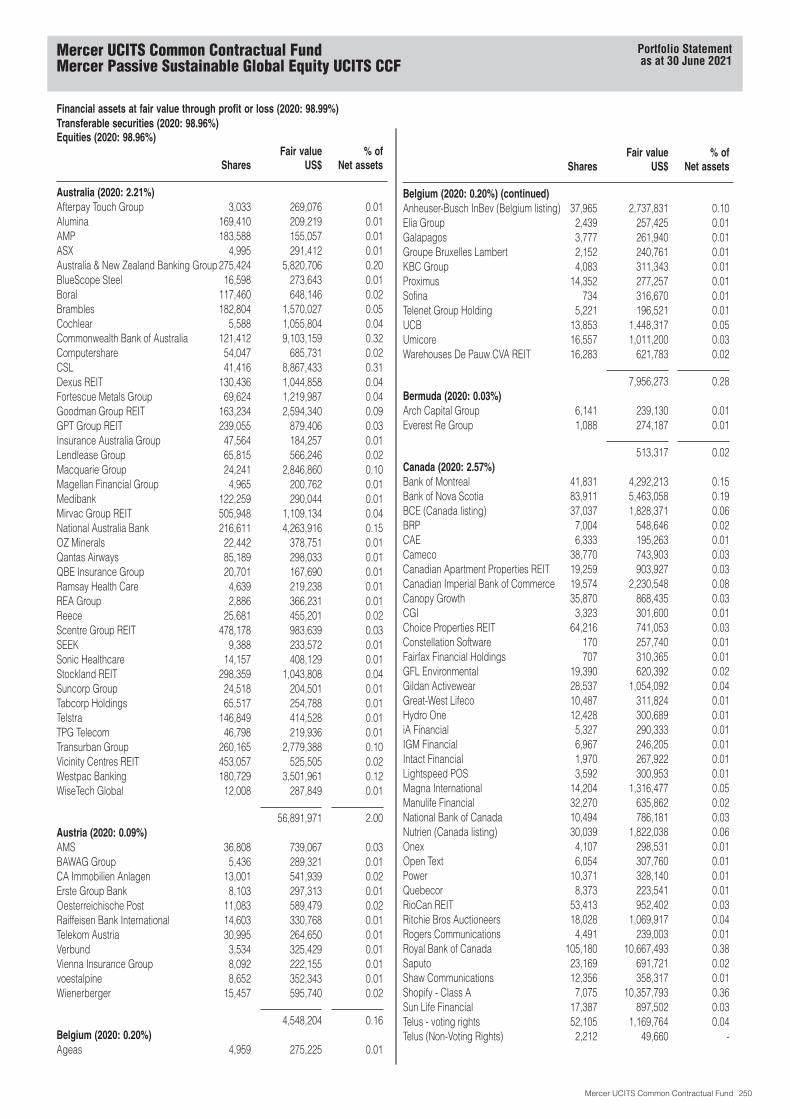
Financial assets at fair value through profit or loss (2020: 98.99%)Transferable securities (2020: 98.96%)Equities (2020: 98.96%)
SharesFair value
US$% of
Net assets
Australia (2020: 2.21%)Afterpay Touch Group 3,033 269,076 0.01Alumina 169,410 209,219 0.01AMP 183,588 155,057 0.01ASX 4,995 291,412 0.01Australia & New Zealand Banking Group 275,424 5,820,706 0.20BlueScope Steel 16,598 273,643 0.01Boral 117,460 648,146 0.02Brambles 182,804 1,570,027 0.05Cochlear 5,588 1,055,804 0.04Commonwealth Bank of Australia 121,412 9,103,159 0.32Computershare 54,047 685,731 0.02CSL 41,416 8,867,433 0.31Dexus REIT 130,436 1,044,858 0.04Fortescue Metals Group 69,624 1,219,987 0.04Goodman Group REIT 163,234 2,594,340 0.09GPT Group REIT 239,055 879,406 0.03Insurance Australia Group 47,564 184,257 0.01Lendlease Group 65,815 566,246 0.02Macquarie Group 24,241 2,846,860 0.10Magellan Financial Group 4,965 200,762 0.01Medibank 122,259 290,044 0.01Mirvac Group REIT 505,948 1,109,134 0.04National Australia Bank 216,611 4,263,916 0.15OZ Minerals 22,442 378,751 0.01Qantas Airways 85,189 298,033 0.01QBE Insurance Group 20,701 167,690 0.01Ramsay Health Care 4,639 219,238 0.01REA Group 2,886 366,231 0.01Reece 25,681 455,201 0.02Scentre Group REIT 478,178 983,639 0.03SEEK 9,388 233,572 0.01Sonic Healthcare 14,157 408,129 0.01Stockland REIT 298,359 1,043,808 0.04Suncorp Group 24,518 204,501 0.01Tabcorp Holdings 65,517 254,788 0.01Telstra 146,849 414,528 0.01TPG Telecom 46,798 219,936 0.01Transurban Group 260,165 2,779,388 0.10Vicinity Centres REIT 453,057 525,505 0.02Westpac Banking 180,729 3,501,961 0.12WiseTech Global 12,008 287,849 0.01
56,891,971 2.00Austria (2020: 0.09%)AMS 36,808 739,067 0.03BAWAG Group 5,436 289,321 0.01CA Immobilien Anlagen 13,001 541,939 0.02Erste Group Bank 8,103 297,313 0.01Oesterreichische Post 11,083 589,479 0.02Raiffeisen Bank International 14,603 330,768 0.01Telekom Austria 30,995 264,650 0.01Verbund 3,534 325,429 0.01Vienna Insurance Group 8,092 222,155 0.01voestalpine 8,652 352,343 0.01Wienerberger 15,457 595,740 0.02
4,548,204 0.16Belgium (2020: 0.20%)Ageas 4,959 275,225 0.01
SharesFair value
US$% of
Net assets
Belgium (2020: 0.20%) (continued)Anheuser-Busch InBev (Belgium listing) 37,965 2,737,831 0.10Elia Group 2,439 257,425 0.01Galapagos 3,777 261,940 0.01Groupe Bruxelles Lambert 2,152 240,761 0.01KBC Group 4,083 311,343 0.01Proximus 14,352 277,257 0.01Sofina 734 316,670 0.01Telenet Group Holding 5,221 196,521 0.01UCB 13,853 1,448,317 0.05Umicore 16,557 1,011,200 0.03Warehouses De Pauw CVA REIT 16,283 621,783 0.02
7,956,273 0.28Bermuda (2020: 0.03%)Arch Capital Group 6,141 239,130 0.01Everest Re Group 1,088 274,187 0.01
513,317 0.02Canada (2020: 2.57%)Bank of Montreal 41,831 4,292,213 0.15Bank of Nova Scotia 83,911 5,463,058 0.19BCE (Canada listing) 37,037 1,828,371 0.06BRP 7,004 548,646 0.02CAE 6,333 195,263 0.01Cameco 38,770 743,903 0.03Canadian Apartment Properties REIT 19,259 903,927 0.03Canadian Imperial Bank of Commerce 19,574 2,230,548 0.08Canopy Growth 35,870 868,435 0.03CGI 3,323 301,600 0.01Choice Properties REIT 64,216 741,053 0.03Constellation Software 170 257,740 0.01Fairfax Financial Holdings 707 310,365 0.01GFL Environmental 19,390 620,392 0.02Gildan Activewear 28,537 1,054,092 0.04Great-West Lifeco 10,487 311,824 0.01Hydro One 12,428 300,689 0.01iA Financial 5,327 290,333 0.01IGM Financial 6,967 246,205 0.01Intact Financial 1,970 267,922 0.01Lightspeed POS 3,592 300,953 0.01Magna International 14,204 1,316,477 0.05Manulife Financial 32,270 635,862 0.02National Bank of Canada 10,494 786,181 0.03Nutrien (Canada listing) 30,039 1,822,038 0.06Onex 4,107 298,531 0.01Open Text 6,054 307,760 0.01Power 10,371 328,140 0.01Quebecor 8,373 223,541 0.01RioCan REIT 53,413 952,402 0.03Ritchie Bros Auctioneers 18,028 1,069,917 0.04Rogers Communications 4,491 239,003 0.01Royal Bank of Canada 105,180 10,667,493 0.38Saputo 23,169 691,721 0.02Shaw Communications 12,356 358,317 0.01Shopify - Class A 7,075 10,357,793 0.36Sun Life Financial 17,387 897,502 0.03Telus - voting rights 52,105 1,169,764 0.04Telus (Non-Voting Rights) 2,212 49,660 -
Mercer UCITS Common Contractual FundMercer Passive Sustainable Global Equity UCITS CCF
Portfolio Statementas at 30 June 2021
Mercer UCITS Common Contractual Fund 250

Financial assets at fair value through profit or loss (2020: 98.99%) (continued)Transferable securities (2020: 98.96%) (continued)Equities (2020: 98.96%) (continued)
SharesFair value
US$% of
Net assets
Canada (2020: 2.57%) (continued)Thomson Reuters 2,690 267,479 0.01Toronto-Dominion Bank 133,929 9,395,471 0.33Waste Connections 12,389 1,481,718 0.05Wheaton Precious Metals (Canadalisting) 50,895 2,245,742 0.08
67,640,044 2.37Denmark (2020: 0.81%)Ambu 17,455 671,137 0.02AP Moller - Maersk Class A 245 680,626 0.02AP Moller - Maersk Class B 267 767,505 0.03Carlsberg 6,567 1,224,266 0.04Chr Hansen Holding 11,914 1,075,396 0.04Coloplast 10,680 1,752,593 0.06DSV Panalpina 19,011 4,433,995 0.16Genmab 1,017 416,171 0.02GN Store Nord 13,375 1,168,450 0.04H Lundbeck 15,123 481,144 0.02Novo Nordisk 165,803 13,892,385 0.49Novozymes 16,043 1,209,388 0.04Tryg 14,848 364,537 0.01Vestas Wind Systems 146,925 5,735,899 0.20William Demant Holding 15,978 899,480 0.03
34,772,972 1.22Finland (2020: 0.47%)Elisa 4,388 261,852 0.01Huhtamaki 12,087 572,643 0.02Kone 20,509 1,673,328 0.06Metso Outotec 58,540 680,064 0.02Nokia 489,145 2,619,339 0.09Nordea Bank (Finland listing) 138,005 1,538,079 0.06Orion Corp 18,273 785,536 0.03Sampo 14,405 662,133 0.02UPM-Kymmene 38,022 1,438,381 0.05
10,231,355 0.36France (2020: 2.79%)Air Liquide 7,442 1,303,169 0.05Alstom 27,572 1,392,593 0.05Amundi 2,392 210,907 0.01AXA 192,607 4,884,607 0.17BioMerieux 5,112 594,108 0.02BNP Paribas 42,055 2,636,788 0.09Bouygues 16,403 606,718 0.02Cie de Saint-Gobain 18,494 1,218,106 0.04Credit Agricole 27,036 378,781 0.01Danone 39,635 2,790,578 0.10Dassault Systemes 1,790 434,105 0.02EssilorLuxottica 18,226 3,364,038 0.12Hermes International 2,620 3,817,023 0.13Kering 6,549 5,723,883 0.20Legrand 23,702 2,508,939 0.09L’Oreal 14,989 6,680,019 0.23Orange 17,768 202,599 0.01Pernod Ricard 17,315 3,843,940 0.13Sanofi 88,835 9,308,680 0.33Sartorius Stedim Biotech 2,303 1,089,447 0.04Schneider Electric 46,027 7,242,132 0.25
SharesFair value
US$% of
Net assets
France (2020: 2.79%) (continued)Societe Generale 15,050 443,696 0.02Sodexo 3,060 285,591 0.01Teleperformance 728 295,520 0.01Vivendi 60,658 2,037,900 0.07Worldline 7,426 695,185 0.02
63,989,052 2.24Germany (2020: 3.11%)adidas 16,088 5,988,825 0.21Allianz 27,723 6,913,975 0.24Bayer 74,214 4,507,014 0.16Bayerische Motoren Werke 24,161 2,558,959 0.09Bayerische Motoren Werke - Pref 8,881 798,324 0.03Beiersdorf 12,639 1,525,090 0.05Continental 7,320 1,076,245 0.04Covestro 12,207 788,379 0.03Daimler 64,853 5,791,264 0.20Delivery Hero 1,909 252,197 0.01Deutsche Bank 23,554 306,869 0.01Deutsche Post 37,069 2,521,554 0.09Deutsche Telekom 168,208 3,553,101 0.12Deutsche Wohnen 27,203 1,663,974 0.06Fresenius 6,307 329,059 0.01Fresenius Medical Care 3,825 317,706 0.01Hannover Rueck 1,529 255,848 0.01Hapag-Lloyd 3,249 747,866 0.03HeidelbergCement 3,840 329,426 0.01Henkel 10,461 963,303 0.03Henkel - Pref 14,263 1,506,067 0.05Infineon Technologies 88,413 3,545,994 0.12Knorr-Bremse 6,282 722,633 0.02Merck 8,387 1,608,292 0.06MTU Aero Engines 4,529 1,121,990 0.04MuenchenerRueckversicherungs-Gesellschaft 10,032 2,747,602 0.10Porsche Automobil Holding - Pref 7,526 806,471 0.03SAP 100,349 14,142,428 0.50Sartorius - Pref 3,694 1,923,135 0.07Siemens Healthineers 20,633 1,264,542 0.04Symrise 9,688 1,349,958 0.05Talanx 5,349 218,720 0.01Telefonica Deutschland Holding 71,390 188,372 0.01Volkswagen 2,328 764,183 0.03Volkswagen - Pref 5,596 1,401,586 0.05Vonovia 41,403 2,676,923 0.09Zalando 20,871 2,523,357 0.09
79,701,231 2.80Hong Kong (2020: 0.92%)AIA Group 993,000 12,339,216 0.43Alibaba Health Information Technology 310,000 687,394 0.02ASM Pacific Technology 36,800 498,511 0.02Bank of East Asia 108,896 202,203 0.01Budweiser Brewing Co APAC 168,500 531,590 0.02BYD Electronic International 58,500 384,182 0.01CK Asset Holdings 151,500 1,045,655 0.04CSPC Pharmaceutical Group 402,400 582,419 0.02ESR Cayman 78,200 263,827 0.01
Mercer UCITS Common Contractual FundMercer Passive Sustainable Global Equity UCITS CCF
Portfolio Statementas at 30 June 2021
(continued)
Mercer UCITS Common Contractual Fund 251
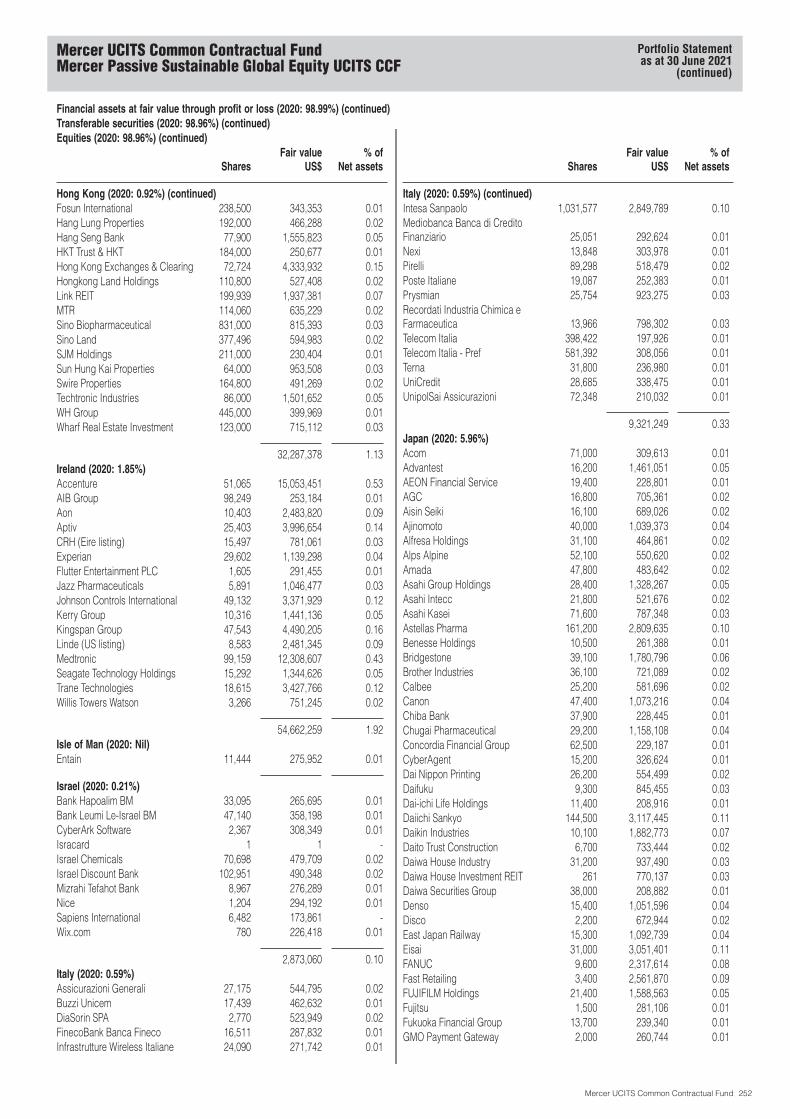
Financial assets at fair value through profit or loss (2020: 98.99%) (continued)Transferable securities (2020: 98.96%) (continued)Equities (2020: 98.96%) (continued)
SharesFair value
US$% of
Net assets
Hong Kong (2020: 0.92%) (continued)Fosun International 238,500 343,353 0.01Hang Lung Properties 192,000 466,288 0.02Hang Seng Bank 77,900 1,555,823 0.05HKT Trust & HKT 184,000 250,677 0.01Hong Kong Exchanges & Clearing 72,724 4,333,932 0.15Hongkong Land Holdings 110,800 527,408 0.02Link REIT 199,939 1,937,381 0.07MTR 114,060 635,229 0.02Sino Biopharmaceutical 831,000 815,393 0.03Sino Land 377,496 594,983 0.02SJM Holdings 211,000 230,404 0.01Sun Hung Kai Properties 64,000 953,508 0.03Swire Properties 164,800 491,269 0.02Techtronic Industries 86,000 1,501,652 0.05WH Group 445,000 399,969 0.01Wharf Real Estate Investment 123,000 715,112 0.03
32,287,378 1.13Ireland (2020: 1.85%)Accenture 51,065 15,053,451 0.53AIB Group 98,249 253,184 0.01Aon 10,403 2,483,820 0.09Aptiv 25,403 3,996,654 0.14CRH (Eire listing) 15,497 781,061 0.03Experian 29,602 1,139,298 0.04Flutter Entertainment PLC 1,605 291,455 0.01Jazz Pharmaceuticals 5,891 1,046,477 0.03Johnson Controls International 49,132 3,371,929 0.12Kerry Group 10,316 1,441,136 0.05Kingspan Group 47,543 4,490,205 0.16Linde (US listing) 8,583 2,481,345 0.09Medtronic 99,159 12,308,607 0.43Seagate Technology Holdings 15,292 1,344,626 0.05Trane Technologies 18,615 3,427,766 0.12Willis Towers Watson 3,266 751,245 0.02
54,662,259 1.92Isle of Man (2020: Nil)Entain 11,444 275,952 0.01
Israel (2020: 0.21%)Bank Hapoalim BM 33,095 265,695 0.01Bank Leumi Le-Israel BM 47,140 358,198 0.01CyberArk Software 2,367 308,349 0.01Isracard 1 1 -Israel Chemicals 70,698 479,709 0.02Israel Discount Bank 102,951 490,348 0.02Mizrahi Tefahot Bank 8,967 276,289 0.01Nice 1,204 294,192 0.01Sapiens International 6,482 173,861 -Wix.com 780 226,418 0.01
2,873,060 0.10Italy (2020: 0.59%)Assicurazioni Generali 27,175 544,795 0.02Buzzi Unicem 17,439 462,632 0.01DiaSorin SPA 2,770 523,949 0.02FinecoBank Banca Fineco 16,511 287,832 0.01Infrastrutture Wireless Italiane 24,090 271,742 0.01
SharesFair value
US$% of
Net assets
Italy (2020: 0.59%) (continued)Intesa Sanpaolo 1,031,577 2,849,789 0.10Mediobanca Banca di CreditoFinanziario 25,051 292,624 0.01Nexi 13,848 303,978 0.01Pirelli 89,298 518,479 0.02Poste Italiane 19,087 252,383 0.01Prysmian 25,754 923,275 0.03Recordati Industria Chimica eFarmaceutica 13,966 798,302 0.03Telecom Italia 398,422 197,926 0.01Telecom Italia - Pref 581,392 308,056 0.01Terna 31,800 236,980 0.01UniCredit 28,685 338,475 0.01UnipolSai Assicurazioni 72,348 210,032 0.01
9,321,249 0.33Japan (2020: 5.96%)Acom 71,000 309,613 0.01Advantest 16,200 1,461,051 0.05AEON Financial Service 19,400 228,801 0.01AGC 16,800 705,361 0.02Aisin Seiki 16,100 689,026 0.02Ajinomoto 40,000 1,039,373 0.04Alfresa Holdings 31,100 464,861 0.02Alps Alpine 52,100 550,620 0.02Amada 47,800 483,642 0.02Asahi Group Holdings 28,400 1,328,267 0.05Asahi Intecc 21,800 521,676 0.02Asahi Kasei 71,600 787,348 0.03Astellas Pharma 161,200 2,809,635 0.10Benesse Holdings 10,500 261,388 0.01Bridgestone 39,100 1,780,796 0.06Brother Industries 36,100 721,089 0.02Calbee 25,200 581,696 0.02Canon 47,400 1,073,216 0.04Chiba Bank 37,900 228,445 0.01Chugai Pharmaceutical 29,200 1,158,108 0.04Concordia Financial Group 62,500 229,187 0.01CyberAgent 15,200 326,624 0.01Dai Nippon Printing 26,200 554,499 0.02Daifuku 9,300 845,455 0.03Dai-ichi Life Holdings 11,400 208,916 0.01Daiichi Sankyo 144,500 3,117,445 0.11Daikin Industries 10,100 1,882,773 0.07Daito Trust Construction 6,700 733,444 0.02Daiwa House Industry 31,200 937,490 0.03Daiwa House Investment REIT 261 770,137 0.03Daiwa Securities Group 38,000 208,882 0.01Denso 15,400 1,051,596 0.04Disco 2,200 672,944 0.02East Japan Railway 15,300 1,092,739 0.04Eisai 31,000 3,051,401 0.11FANUC 9,600 2,317,614 0.08Fast Retailing 3,400 2,561,870 0.09FUJIFILM Holdings 21,400 1,588,563 0.05Fujitsu 1,500 281,106 0.01Fukuoka Financial Group 13,700 239,340 0.01GMO Payment Gateway 2,000 260,744 0.01
Mercer UCITS Common Contractual FundMercer Passive Sustainable Global Equity UCITS CCF
Portfolio Statementas at 30 June 2021
(continued)
Mercer UCITS Common Contractual Fund 252
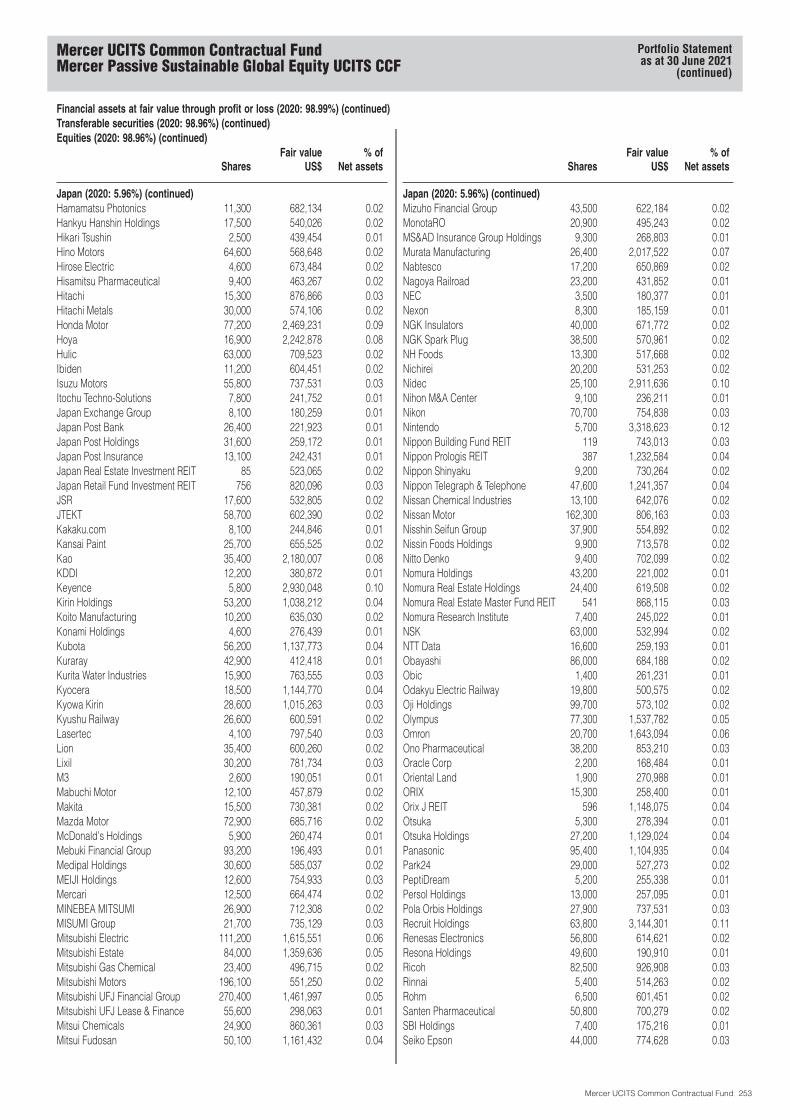
Financial assets at fair value through profit or loss (2020: 98.99%) (continued)Transferable securities (2020: 98.96%) (continued)Equities (2020: 98.96%) (continued)
SharesFair value
US$% of
Net assets
Japan (2020: 5.96%) (continued)Hamamatsu Photonics 11,300 682,134 0.02Hankyu Hanshin Holdings 17,500 540,026 0.02Hikari Tsushin 2,500 439,454 0.01Hino Motors 64,600 568,648 0.02Hirose Electric 4,600 673,484 0.02Hisamitsu Pharmaceutical 9,400 463,267 0.02Hitachi 15,300 876,866 0.03Hitachi Metals 30,000 574,106 0.02Honda Motor 77,200 2,469,231 0.09Hoya 16,900 2,242,878 0.08Hulic 63,000 709,523 0.02Ibiden 11,200 604,451 0.02Isuzu Motors 55,800 737,531 0.03Itochu Techno-Solutions 7,800 241,752 0.01Japan Exchange Group 8,100 180,259 0.01Japan Post Bank 26,400 221,923 0.01Japan Post Holdings 31,600 259,172 0.01Japan Post Insurance 13,100 242,431 0.01Japan Real Estate Investment REIT 85 523,065 0.02Japan Retail Fund Investment REIT 756 820,096 0.03JSR 17,600 532,805 0.02JTEKT 58,700 602,390 0.02Kakaku.com 8,100 244,846 0.01Kansai Paint 25,700 655,525 0.02Kao 35,400 2,180,007 0.08KDDI 12,200 380,872 0.01Keyence 5,800 2,930,048 0.10Kirin Holdings 53,200 1,038,212 0.04Koito Manufacturing 10,200 635,030 0.02Konami Holdings 4,600 276,439 0.01Kubota 56,200 1,137,773 0.04Kuraray 42,900 412,418 0.01Kurita Water Industries 15,900 763,555 0.03Kyocera 18,500 1,144,770 0.04Kyowa Kirin 28,600 1,015,263 0.03Kyushu Railway 26,600 600,591 0.02Lasertec 4,100 797,540 0.03Lion 35,400 600,260 0.02Lixil 30,200 781,734 0.03M3 2,600 190,051 0.01Mabuchi Motor 12,100 457,879 0.02Makita 15,500 730,381 0.02Mazda Motor 72,900 685,716 0.02McDonald’s Holdings 5,900 260,474 0.01Mebuki Financial Group 93,200 196,493 0.01Medipal Holdings 30,600 585,037 0.02MEIJI Holdings 12,600 754,933 0.03Mercari 12,500 664,474 0.02MINEBEA MITSUMI 26,900 712,308 0.02MISUMI Group 21,700 735,129 0.03Mitsubishi Electric 111,200 1,615,551 0.06Mitsubishi Estate 84,000 1,359,636 0.05Mitsubishi Gas Chemical 23,400 496,715 0.02Mitsubishi Motors 196,100 551,250 0.02Mitsubishi UFJ Financial Group 270,400 1,461,997 0.05Mitsubishi UFJ Lease & Finance 55,600 298,063 0.01Mitsui Chemicals 24,900 860,361 0.03Mitsui Fudosan 50,100 1,161,432 0.04
SharesFair value
US$% of
Net assets
Japan (2020: 5.96%) (continued)Mizuho Financial Group 43,500 622,184 0.02MonotaRO 20,900 495,243 0.02MS&AD Insurance Group Holdings 9,300 268,803 0.01Murata Manufacturing 26,400 2,017,522 0.07Nabtesco 17,200 650,869 0.02Nagoya Railroad 23,200 431,852 0.01NEC 3,500 180,377 0.01Nexon 8,300 185,159 0.01NGK Insulators 40,000 671,772 0.02NGK Spark Plug 38,500 570,961 0.02NH Foods 13,300 517,668 0.02Nichirei 20,200 531,253 0.02Nidec 25,100 2,911,636 0.10Nihon M&A Center 9,100 236,211 0.01Nikon 70,700 754,838 0.03Nintendo 5,700 3,318,623 0.12Nippon Building Fund REIT 119 743,013 0.03Nippon Prologis REIT 387 1,232,584 0.04Nippon Shinyaku 9,200 730,264 0.02Nippon Telegraph & Telephone 47,600 1,241,357 0.04Nissan Chemical Industries 13,100 642,076 0.02Nissan Motor 162,300 806,163 0.03Nisshin Seifun Group 37,900 554,892 0.02Nissin Foods Holdings 9,900 713,578 0.02Nitto Denko 9,400 702,099 0.02Nomura Holdings 43,200 221,002 0.01Nomura Real Estate Holdings 24,400 619,508 0.02Nomura Real Estate Master Fund REIT 541 868,115 0.03Nomura Research Institute 7,400 245,022 0.01NSK 63,000 532,994 0.02NTT Data 16,600 259,193 0.01Obayashi 86,000 684,188 0.02Obic 1,400 261,231 0.01Odakyu Electric Railway 19,800 500,575 0.02Oji Holdings 99,700 573,102 0.02Olympus 77,300 1,537,782 0.05Omron 20,700 1,643,094 0.06Ono Pharmaceutical 38,200 853,210 0.03Oracle Corp 2,200 168,484 0.01Oriental Land 1,900 270,988 0.01ORIX 15,300 258,400 0.01Orix J REIT 596 1,148,075 0.04Otsuka 5,300 278,394 0.01Otsuka Holdings 27,200 1,129,024 0.04Panasonic 95,400 1,104,935 0.04Park24 29,000 527,273 0.02PeptiDream 5,200 255,338 0.01Persol Holdings 13,000 257,095 0.01Pola Orbis Holdings 27,900 737,531 0.03Recruit Holdings 63,800 3,144,301 0.11Renesas Electronics 56,800 614,621 0.02Resona Holdings 49,600 190,910 0.01Ricoh 82,500 926,908 0.03Rinnai 5,400 514,263 0.02Rohm 6,500 601,451 0.02Santen Pharmaceutical 50,800 700,279 0.02SBI Holdings 7,400 175,216 0.01Seiko Epson 44,000 774,628 0.03
Mercer UCITS Common Contractual FundMercer Passive Sustainable Global Equity UCITS CCF
Portfolio Statementas at 30 June 2021
(continued)
Mercer UCITS Common Contractual Fund 253
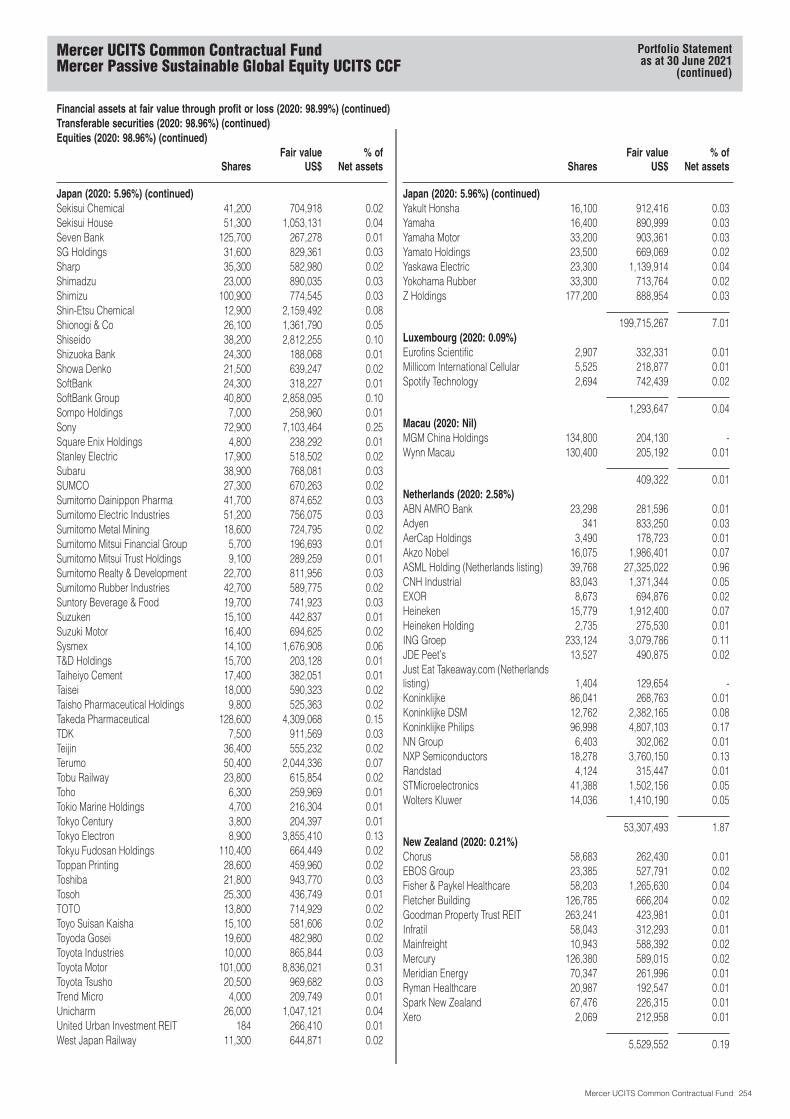
Financial assets at fair value through profit or loss (2020: 98.99%) (continued)Transferable securities (2020: 98.96%) (continued)Equities (2020: 98.96%) (continued)
SharesFair value
US$% of
Net assets
Japan (2020: 5.96%) (continued)Sekisui Chemical 41,200 704,918 0.02Sekisui House 51,300 1,053,131 0.04Seven Bank 125,700 267,278 0.01SG Holdings 31,600 829,361 0.03Sharp 35,300 582,980 0.02Shimadzu 23,000 890,035 0.03Shimizu 100,900 774,545 0.03Shin-Etsu Chemical 12,900 2,159,492 0.08Shionogi & Co 26,100 1,361,790 0.05Shiseido 38,200 2,812,255 0.10Shizuoka Bank 24,300 188,068 0.01Showa Denko 21,500 639,247 0.02SoftBank 24,300 318,227 0.01SoftBank Group 40,800 2,858,095 0.10Sompo Holdings 7,000 258,960 0.01Sony 72,900 7,103,464 0.25Square Enix Holdings 4,800 238,292 0.01Stanley Electric 17,900 518,502 0.02Subaru 38,900 768,081 0.03SUMCO 27,300 670,263 0.02Sumitomo Dainippon Pharma 41,700 874,652 0.03Sumitomo Electric Industries 51,200 756,075 0.03Sumitomo Metal Mining 18,600 724,795 0.02Sumitomo Mitsui Financial Group 5,700 196,693 0.01Sumitomo Mitsui Trust Holdings 9,100 289,259 0.01Sumitomo Realty & Development 22,700 811,956 0.03Sumitomo Rubber Industries 42,700 589,775 0.02Suntory Beverage & Food 19,700 741,923 0.03Suzuken 15,100 442,837 0.01Suzuki Motor 16,400 694,625 0.02Sysmex 14,100 1,676,908 0.06T&D Holdings 15,700 203,128 0.01Taiheiyo Cement 17,400 382,051 0.01Taisei 18,000 590,323 0.02Taisho Pharmaceutical Holdings 9,800 525,363 0.02Takeda Pharmaceutical 128,600 4,309,068 0.15TDK 7,500 911,569 0.03Teijin 36,400 555,232 0.02Terumo 50,400 2,044,336 0.07Tobu Railway 23,800 615,854 0.02Toho 6,300 259,969 0.01Tokio Marine Holdings 4,700 216,304 0.01Tokyo Century 3,800 204,397 0.01Tokyo Electron 8,900 3,855,410 0.13Tokyu Fudosan Holdings 110,400 664,449 0.02Toppan Printing 28,600 459,960 0.02Toshiba 21,800 943,770 0.03Tosoh 25,300 436,749 0.01TOTO 13,800 714,929 0.02Toyo Suisan Kaisha 15,100 581,606 0.02Toyoda Gosei 19,600 482,980 0.02Toyota Industries 10,000 865,844 0.03Toyota Motor 101,000 8,836,021 0.31Toyota Tsusho 20,500 969,682 0.03Trend Micro 4,000 209,749 0.01Unicharm 26,000 1,047,121 0.04United Urban Investment REIT 184 266,410 0.01West Japan Railway 11,300 644,871 0.02
SharesFair value
US$% of
Net assets
Japan (2020: 5.96%) (continued)Yakult Honsha 16,100 912,416 0.03Yamaha 16,400 890,999 0.03Yamaha Motor 33,200 903,361 0.03Yamato Holdings 23,500 669,069 0.02Yaskawa Electric 23,300 1,139,914 0.04Yokohama Rubber 33,300 713,764 0.02Z Holdings 177,200 888,954 0.03
199,715,267 7.01Luxembourg (2020: 0.09%)Eurofins Scientific 2,907 332,331 0.01Millicom International Cellular 5,525 218,877 0.01Spotify Technology 2,694 742,439 0.02
1,293,647 0.04Macau (2020: Nil)MGM China Holdings 134,800 204,130 -Wynn Macau 130,400 205,192 0.01
409,322 0.01Netherlands (2020: 2.58%)ABN AMRO Bank 23,298 281,596 0.01Adyen 341 833,250 0.03AerCap Holdings 3,490 178,723 0.01Akzo Nobel 16,075 1,986,401 0.07ASML Holding (Netherlands listing) 39,768 27,325,022 0.96CNH Industrial 83,043 1,371,344 0.05EXOR 8,673 694,876 0.02Heineken 15,779 1,912,400 0.07Heineken Holding 2,735 275,530 0.01ING Groep 233,124 3,079,786 0.11JDE Peet’s 13,527 490,875 0.02Just Eat Takeaway.com (Netherlandslisting) 1,404 129,654 -Koninklijke 86,041 268,763 0.01Koninklijke DSM 12,762 2,382,165 0.08Koninklijke Philips 96,998 4,807,103 0.17NN Group 6,403 302,062 0.01NXP Semiconductors 18,278 3,760,150 0.13Randstad 4,124 315,447 0.01STMicroelectronics 41,388 1,502,156 0.05Wolters Kluwer 14,036 1,410,190 0.05
53,307,493 1.87New Zealand (2020: 0.21%)Chorus 58,683 262,430 0.01EBOS Group 23,385 527,791 0.02Fisher & Paykel Healthcare 58,203 1,265,630 0.04Fletcher Building 126,785 666,204 0.02Goodman Property Trust REIT 263,241 423,981 0.01Infratil 58,043 312,293 0.01Mainfreight 10,943 588,392 0.02Mercury 126,380 589,015 0.02Meridian Energy 70,347 261,996 0.01Ryman Healthcare 20,987 192,547 0.01Spark New Zealand 67,476 226,315 0.01Xero 2,069 212,958 0.01
5,529,552 0.19
Mercer UCITS Common Contractual FundMercer Passive Sustainable Global Equity UCITS CCF
Portfolio Statementas at 30 June 2021
(continued)
Mercer UCITS Common Contractual Fund 254
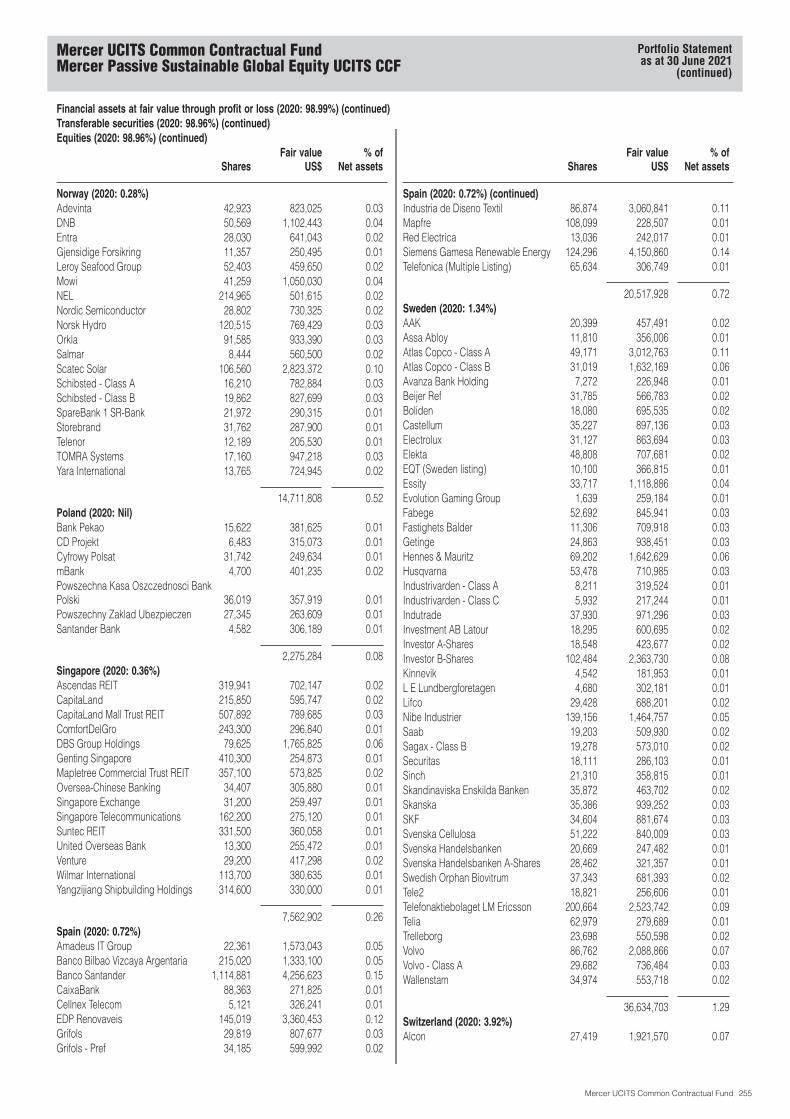
Financial assets at fair value through profit or loss (2020: 98.99%) (continued)Transferable securities (2020: 98.96%) (continued)Equities (2020: 98.96%) (continued)
SharesFair value
US$% of
Net assets
Norway (2020: 0.28%)Adevinta 42,923 823,025 0.03DNB 50,569 1,102,443 0.04Entra 28,030 641,043 0.02Gjensidige Forsikring 11,357 250,495 0.01Leroy Seafood Group 52,403 459,650 0.02Mowi 41,259 1,050,030 0.04NEL 214,965 501,615 0.02Nordic Semiconductor 28,802 730,325 0.02Norsk Hydro 120,515 769,429 0.03Orkla 91,585 933,390 0.03Salmar 8,444 560,500 0.02Scatec Solar 106,560 2,823,372 0.10Schibsted - Class A 16,210 782,884 0.03Schibsted - Class B 19,862 827,699 0.03SpareBank 1 SR-Bank 21,972 290,315 0.01Storebrand 31,762 287,900 0.01Telenor 12,189 205,530 0.01TOMRA Systems 17,160 947,218 0.03Yara International 13,765 724,945 0.02
14,711,808 0.52Poland (2020: Nil)Bank Pekao 15,622 381,625 0.01CD Projekt 6,483 315,073 0.01Cyfrowy Polsat 31,742 249,634 0.01mBank 4,700 401,235 0.02Powszechna Kasa Oszczednosci BankPolski 36,019 357,919 0.01Powszechny Zaklad Ubezpieczen 27,345 263,609 0.01Santander Bank 4,582 306,189 0.01
2,275,284 0.08Singapore (2020: 0.36%)Ascendas REIT 319,941 702,147 0.02CapitaLand 215,850 595,747 0.02CapitaLand Mall Trust REIT 507,892 789,685 0.03ComfortDelGro 243,300 296,840 0.01DBS Group Holdings 79,625 1,765,825 0.06Genting Singapore 410,300 254,873 0.01Mapletree Commercial Trust REIT 357,100 573,825 0.02Oversea-Chinese Banking 34,407 305,880 0.01Singapore Exchange 31,200 259,497 0.01Singapore Telecommunications 162,200 275,120 0.01Suntec REIT 331,500 360,058 0.01United Overseas Bank 13,300 255,472 0.01Venture 29,200 417,298 0.02Wilmar International 113,700 380,635 0.01Yangzijiang Shipbuilding Holdings 314,600 330,000 0.01
7,562,902 0.26Spain (2020: 0.72%)Amadeus IT Group 22,361 1,573,043 0.05Banco Bilbao Vizcaya Argentaria 215,020 1,333,100 0.05Banco Santander 1,114,881 4,256,623 0.15CaixaBank 88,363 271,825 0.01Cellnex Telecom 5,121 326,241 0.01EDP Renovaveis 145,019 3,360,453 0.12Grifols 29,819 807,677 0.03Grifols - Pref 34,185 599,992 0.02
SharesFair value
US$% of
Net assets
Spain (2020: 0.72%) (continued)Industria de Diseno Textil 86,874 3,060,841 0.11Mapfre 108,099 228,507 0.01Red Electrica 13,036 242,017 0.01Siemens Gamesa Renewable Energy 124,296 4,150,860 0.14Telefonica (Multiple Listing) 65,634 306,749 0.01
20,517,928 0.72Sweden (2020: 1.34%)AAK 20,399 457,491 0.02Assa Abloy 11,810 356,006 0.01Atlas Copco - Class A 49,171 3,012,763 0.11Atlas Copco - Class B 31,019 1,632,169 0.06Avanza Bank Holding 7,272 226,948 0.01Beijer Ref 31,785 566,783 0.02Boliden 18,080 695,535 0.02Castellum 35,227 897,136 0.03Electrolux 31,127 863,694 0.03Elekta 48,808 707,681 0.02EQT (Sweden listing) 10,100 366,815 0.01Essity 33,717 1,118,886 0.04Evolution Gaming Group 1,639 259,184 0.01Fabege 52,692 845,941 0.03Fastighets Balder 11,306 709,918 0.03Getinge 24,863 938,451 0.03Hennes & Mauritz 69,202 1,642,629 0.06Husqvarna 53,478 710,985 0.03Industrivarden - Class A 8,211 319,524 0.01Industrivarden - Class C 5,932 217,244 0.01Indutrade 37,930 971,296 0.03Investment AB Latour 18,295 600,695 0.02Investor A-Shares 18,548 423,677 0.02Investor B-Shares 102,484 2,363,730 0.08Kinnevik 4,542 181,953 0.01L E Lundbergforetagen 4,680 302,181 0.01Lifco 29,428 688,201 0.02Nibe Industrier 139,156 1,464,757 0.05Saab 19,203 509,930 0.02Sagax - Class B 19,278 573,010 0.02Securitas 18,111 286,103 0.01Sinch 21,310 358,815 0.01Skandinaviska Enskilda Banken 35,872 463,702 0.02Skanska 35,386 939,252 0.03SKF 34,604 881,674 0.03Svenska Cellulosa 51,222 840,009 0.03Svenska Handelsbanken 20,669 247,482 0.01Svenska Handelsbanken A-Shares 28,462 321,357 0.01Swedish Orphan Biovitrum 37,343 681,393 0.02Tele2 18,821 256,606 0.01Telefonaktiebolaget LM Ericsson 200,664 2,523,742 0.09Telia 62,979 279,689 0.01Trelleborg 23,698 550,598 0.02Volvo 86,762 2,088,866 0.07Volvo - Class A 29,682 736,484 0.03Wallenstam 34,974 553,718 0.02
36,634,703 1.29Switzerland (2020: 3.92%)Alcon 27,419 1,921,570 0.07
Mercer UCITS Common Contractual FundMercer Passive Sustainable Global Equity UCITS CCF
Portfolio Statementas at 30 June 2021
(continued)
Mercer UCITS Common Contractual Fund 255
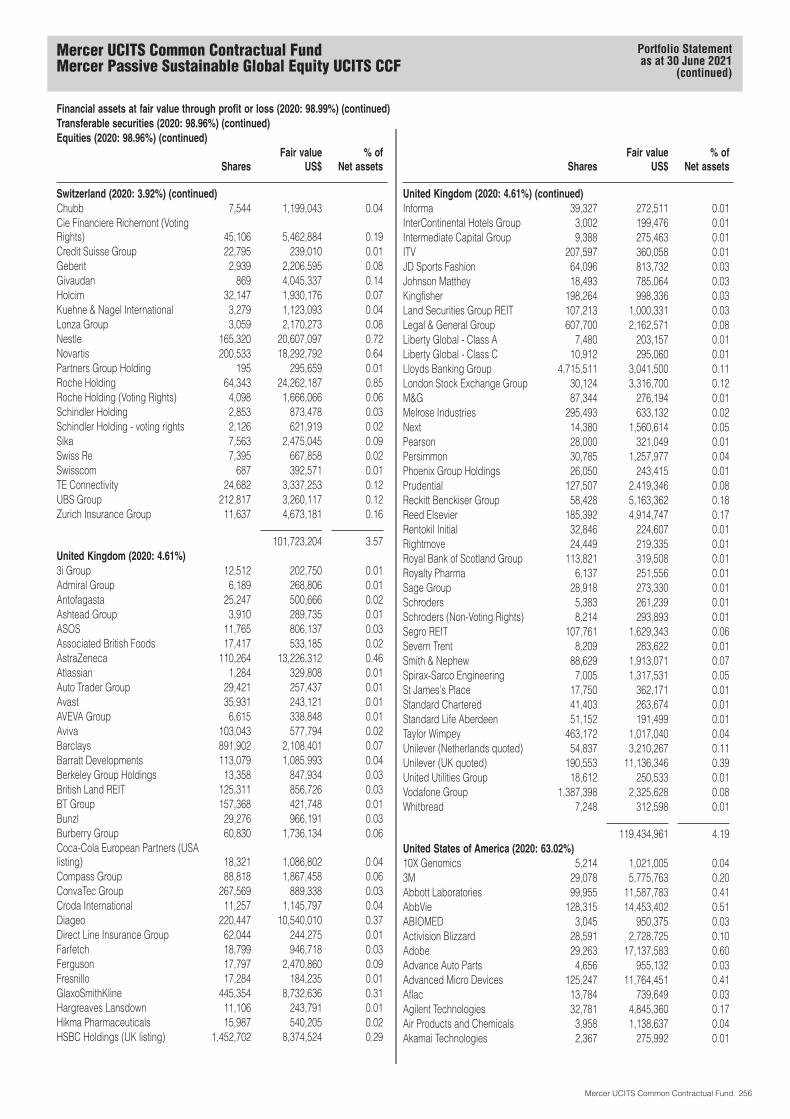
Financial assets at fair value through profit or loss (2020: 98.99%) (continued)Transferable securities (2020: 98.96%) (continued)Equities (2020: 98.96%) (continued)
SharesFair value
US$% of
Net assets
Switzerland (2020: 3.92%) (continued)Chubb 7,544 1,199,043 0.04Cie Financiere Richemont (VotingRights) 45,106 5,462,884 0.19Credit Suisse Group 22,795 239,010 0.01Geberit 2,939 2,206,595 0.08Givaudan 869 4,045,337 0.14Holcim 32,147 1,930,176 0.07Kuehne & Nagel International 3,279 1,123,093 0.04Lonza Group 3,059 2,170,273 0.08Nestle 165,320 20,607,097 0.72Novartis 200,533 18,292,792 0.64Partners Group Holding 195 295,659 0.01Roche Holding 64,343 24,262,187 0.85Roche Holding (Voting Rights) 4,098 1,666,066 0.06Schindler Holding 2,853 873,478 0.03Schindler Holding - voting rights 2,126 621,919 0.02Sika 7,563 2,475,045 0.09Swiss Re 7,395 667,858 0.02Swisscom 687 392,571 0.01TE Connectivity 24,682 3,337,253 0.12UBS Group 212,817 3,260,117 0.12Zurich Insurance Group 11,637 4,673,181 0.16
101,723,204 3.57United Kingdom (2020: 4.61%)3i Group 12,512 202,750 0.01Admiral Group 6,189 268,806 0.01Antofagasta 25,247 500,666 0.02Ashtead Group 3,910 289,735 0.01ASOS 11,765 806,137 0.03Associated British Foods 17,417 533,185 0.02AstraZeneca 110,264 13,226,312 0.46Atlassian 1,284 329,808 0.01Auto Trader Group 29,421 257,437 0.01Avast 35,931 243,121 0.01AVEVA Group 6,615 338,848 0.01Aviva 103,043 577,794 0.02Barclays 891,902 2,108,401 0.07Barratt Developments 113,079 1,085,993 0.04Berkeley Group Holdings 13,358 847,934 0.03British Land REIT 125,311 856,726 0.03BT Group 157,368 421,748 0.01Bunzl 29,276 966,191 0.03Burberry Group 60,830 1,736,134 0.06Coca-Cola European Partners (USAlisting) 18,321 1,086,802 0.04Compass Group 88,818 1,867,458 0.06ConvaTec Group 267,569 889,338 0.03Croda International 11,257 1,145,797 0.04Diageo 220,447 10,540,010 0.37Direct Line Insurance Group 62,044 244,275 0.01Farfetch 18,799 946,718 0.03Ferguson 17,797 2,470,860 0.09Fresnillo 17,284 184,235 0.01GlaxoSmithKline 445,354 8,732,636 0.31Hargreaves Lansdown 11,106 243,791 0.01Hikma Pharmaceuticals 15,987 540,205 0.02HSBC Holdings (UK listing) 1,452,702 8,374,524 0.29
SharesFair value
US$% of
Net assets
United Kingdom (2020: 4.61%) (continued)Informa 39,327 272,511 0.01InterContinental Hotels Group 3,002 199,476 0.01Intermediate Capital Group 9,388 275,463 0.01ITV 207,597 360,058 0.01JD Sports Fashion 64,096 813,732 0.03Johnson Matthey 18,493 785,064 0.03Kingfisher 198,264 998,336 0.03Land Securities Group REIT 107,213 1,000,331 0.03Legal & General Group 607,700 2,162,571 0.08Liberty Global - Class A 7,480 203,157 0.01Liberty Global - Class C 10,912 295,060 0.01Lloyds Banking Group 4,715,511 3,041,500 0.11London Stock Exchange Group 30,124 3,316,700 0.12M&G 87,344 276,194 0.01Melrose Industries 295,493 633,132 0.02Next 14,380 1,560,614 0.05Pearson 28,000 321,049 0.01Persimmon 30,785 1,257,977 0.04Phoenix Group Holdings 26,050 243,415 0.01Prudential 127,507 2,419,346 0.08Reckitt Benckiser Group 58,428 5,163,362 0.18Reed Elsevier 185,392 4,914,747 0.17Rentokil Initial 32,846 224,607 0.01Rightmove 24,449 219,335 0.01Royal Bank of Scotland Group 113,821 319,508 0.01Royalty Pharma 6,137 251,556 0.01Sage Group 28,918 273,330 0.01Schroders 5,383 261,239 0.01Schroders (Non-Voting Rights) 8,214 293,893 0.01Segro REIT 107,761 1,629,343 0.06Severn Trent 8,209 283,622 0.01Smith & Nephew 88,629 1,913,071 0.07Spirax-Sarco Engineering 7,005 1,317,531 0.05St James’s Place 17,750 362,171 0.01Standard Chartered 41,403 263,674 0.01Standard Life Aberdeen 51,152 191,499 0.01Taylor Wimpey 463,172 1,017,040 0.04Unilever (Netherlands quoted) 54,837 3,210,267 0.11Unilever (UK quoted) 190,553 11,136,346 0.39United Utilities Group 18,612 250,533 0.01Vodafone Group 1,387,398 2,325,628 0.08Whitbread 7,248 312,598 0.01
119,434,961 4.19United States of America (2020: 63.02%)10X Genomics 5,214 1,021,005 0.043M 29,078 5,775,763 0.20Abbott Laboratories 99,955 11,587,783 0.41AbbVie 128,315 14,453,402 0.51ABIOMED 3,045 950,375 0.03Activision Blizzard 28,591 2,728,725 0.10Adobe 29,263 17,137,583 0.60Advance Auto Parts 4,656 955,132 0.03Advanced Micro Devices 125,247 11,764,451 0.41Aflac 13,784 739,649 0.03Agilent Technologies 32,781 4,845,360 0.17Air Products and Chemicals 3,958 1,138,637 0.04Akamai Technologies 2,367 275,992 0.01
Mercer UCITS Common Contractual FundMercer Passive Sustainable Global Equity UCITS CCF
Portfolio Statementas at 30 June 2021
(continued)
Mercer UCITS Common Contractual Fund 256
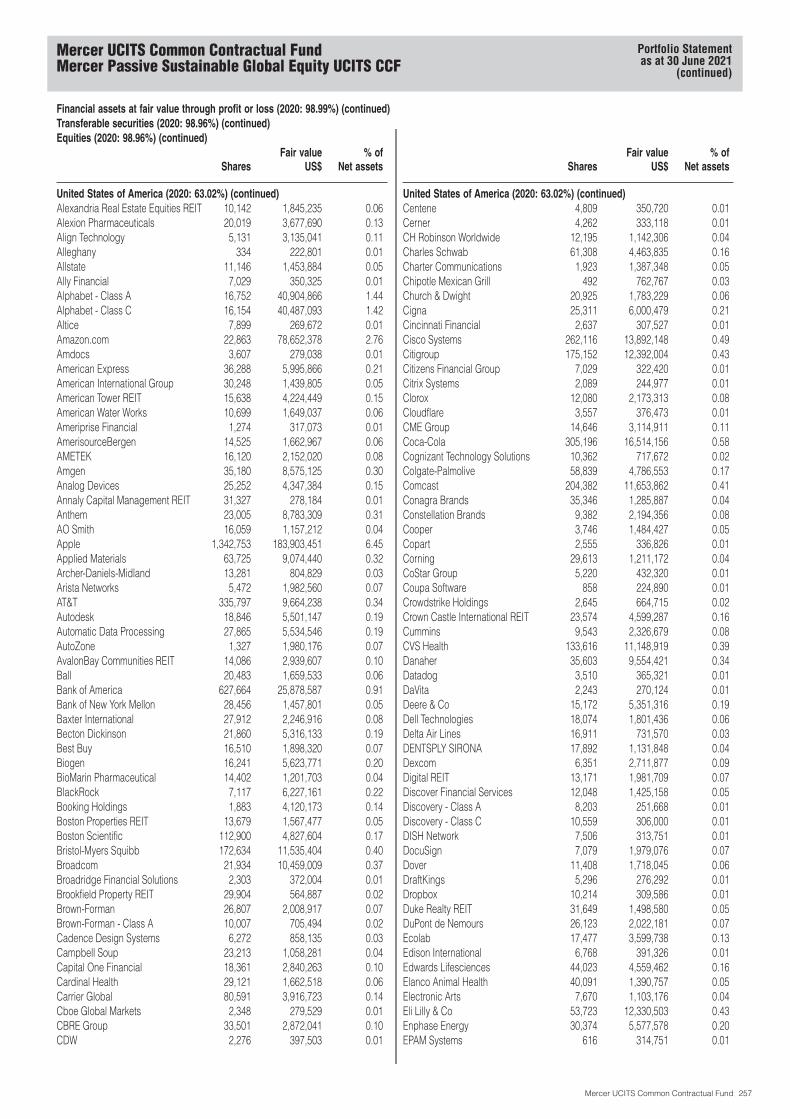
Financial assets at fair value through profit or loss (2020: 98.99%) (continued)Transferable securities (2020: 98.96%) (continued)Equities (2020: 98.96%) (continued)
SharesFair value
US$% of
Net assets
United States of America (2020: 63.02%) (continued)Alexandria Real Estate Equities REIT 10,142 1,845,235 0.06Alexion Pharmaceuticals 20,019 3,677,690 0.13Align Technology 5,131 3,135,041 0.11Alleghany 334 222,801 0.01Allstate 11,146 1,453,884 0.05Ally Financial 7,029 350,325 0.01Alphabet - Class A 16,752 40,904,866 1.44Alphabet - Class C 16,154 40,487,093 1.42Altice 7,899 269,672 0.01Amazon.com 22,863 78,652,378 2.76Amdocs 3,607 279,038 0.01American Express 36,288 5,995,866 0.21American International Group 30,248 1,439,805 0.05American Tower REIT 15,638 4,224,449 0.15American Water Works 10,699 1,649,037 0.06Ameriprise Financial 1,274 317,073 0.01AmerisourceBergen 14,525 1,662,967 0.06AMETEK 16,120 2,152,020 0.08Amgen 35,180 8,575,125 0.30Analog Devices 25,252 4,347,384 0.15Annaly Capital Management REIT 31,327 278,184 0.01Anthem 23,005 8,783,309 0.31AO Smith 16,059 1,157,212 0.04Apple 1,342,753 183,903,451 6.45Applied Materials 63,725 9,074,440 0.32Archer-Daniels-Midland 13,281 804,829 0.03Arista Networks 5,472 1,982,560 0.07AT&T 335,797 9,664,238 0.34Autodesk 18,846 5,501,147 0.19Automatic Data Processing 27,865 5,534,546 0.19AutoZone 1,327 1,980,176 0.07AvalonBay Communities REIT 14,086 2,939,607 0.10Ball 20,483 1,659,533 0.06Bank of America 627,664 25,878,587 0.91Bank of New York Mellon 28,456 1,457,801 0.05Baxter International 27,912 2,246,916 0.08Becton Dickinson 21,860 5,316,133 0.19Best Buy 16,510 1,898,320 0.07Biogen 16,241 5,623,771 0.20BioMarin Pharmaceutical 14,402 1,201,703 0.04BlackRock 7,117 6,227,161 0.22Booking Holdings 1,883 4,120,173 0.14Boston Properties REIT 13,679 1,567,477 0.05Boston Scientific 112,900 4,827,604 0.17Bristol-Myers Squibb 172,634 11,535,404 0.40Broadcom 21,934 10,459,009 0.37Broadridge Financial Solutions 2,303 372,004 0.01Brookfield Property REIT 29,904 564,887 0.02Brown-Forman 26,807 2,008,917 0.07Brown-Forman - Class A 10,007 705,494 0.02Cadence Design Systems 6,272 858,135 0.03Campbell Soup 23,213 1,058,281 0.04Capital One Financial 18,361 2,840,263 0.10Cardinal Health 29,121 1,662,518 0.06Carrier Global 80,591 3,916,723 0.14Cboe Global Markets 2,348 279,529 0.01CBRE Group 33,501 2,872,041 0.10CDW 2,276 397,503 0.01
SharesFair value
US$% of
Net assets
United States of America (2020: 63.02%) (continued)Centene 4,809 350,720 0.01Cerner 4,262 333,118 0.01CH Robinson Worldwide 12,195 1,142,306 0.04Charles Schwab 61,308 4,463,835 0.16Charter Communications 1,923 1,387,348 0.05Chipotle Mexican Grill 492 762,767 0.03Church & Dwight 20,925 1,783,229 0.06Cigna 25,311 6,000,479 0.21Cincinnati Financial 2,637 307,527 0.01Cisco Systems 262,116 13,892,148 0.49Citigroup 175,152 12,392,004 0.43Citizens Financial Group 7,029 322,420 0.01Citrix Systems 2,089 244,977 0.01Clorox 12,080 2,173,313 0.08Cloudflare 3,557 376,473 0.01CME Group 14,646 3,114,911 0.11Coca-Cola 305,196 16,514,156 0.58Cognizant Technology Solutions 10,362 717,672 0.02Colgate-Palmolive 58,839 4,786,553 0.17Comcast 204,382 11,653,862 0.41Conagra Brands 35,346 1,285,887 0.04Constellation Brands 9,382 2,194,356 0.08Cooper 3,746 1,484,427 0.05Copart 2,555 336,826 0.01Corning 29,613 1,211,172 0.04CoStar Group 5,220 432,320 0.01Coupa Software 858 224,890 0.01Crowdstrike Holdings 2,645 664,715 0.02Crown Castle International REIT 23,574 4,599,287 0.16Cummins 9,543 2,326,679 0.08CVS Health 133,616 11,148,919 0.39Danaher 35,603 9,554,421 0.34Datadog 3,510 365,321 0.01DaVita 2,243 270,124 0.01Deere & Co 15,172 5,351,316 0.19Dell Technologies 18,074 1,801,436 0.06Delta Air Lines 16,911 731,570 0.03DENTSPLY SIRONA 17,892 1,131,848 0.04Dexcom 6,351 2,711,877 0.09Digital REIT 13,171 1,981,709 0.07Discover Financial Services 12,048 1,425,158 0.05Discovery - Class A 8,203 251,668 0.01Discovery - Class C 10,559 306,000 0.01DISH Network 7,506 313,751 0.01DocuSign 7,079 1,979,076 0.07Dover 11,408 1,718,045 0.06DraftKings 5,296 276,292 0.01Dropbox 10,214 309,586 0.01Duke Realty REIT 31,649 1,498,580 0.05DuPont de Nemours 26,123 2,022,181 0.07Ecolab 17,477 3,599,738 0.13Edison International 6,768 391,326 0.01Edwards Lifesciences 44,023 4,559,462 0.16Elanco Animal Health 40,091 1,390,757 0.05Electronic Arts 7,670 1,103,176 0.04Eli Lilly & Co 53,723 12,330,503 0.43Enphase Energy 30,374 5,577,578 0.20EPAM Systems 616 314,751 0.01
Mercer UCITS Common Contractual FundMercer Passive Sustainable Global Equity UCITS CCF
Portfolio Statementas at 30 June 2021
(continued)
Mercer UCITS Common Contractual Fund 257
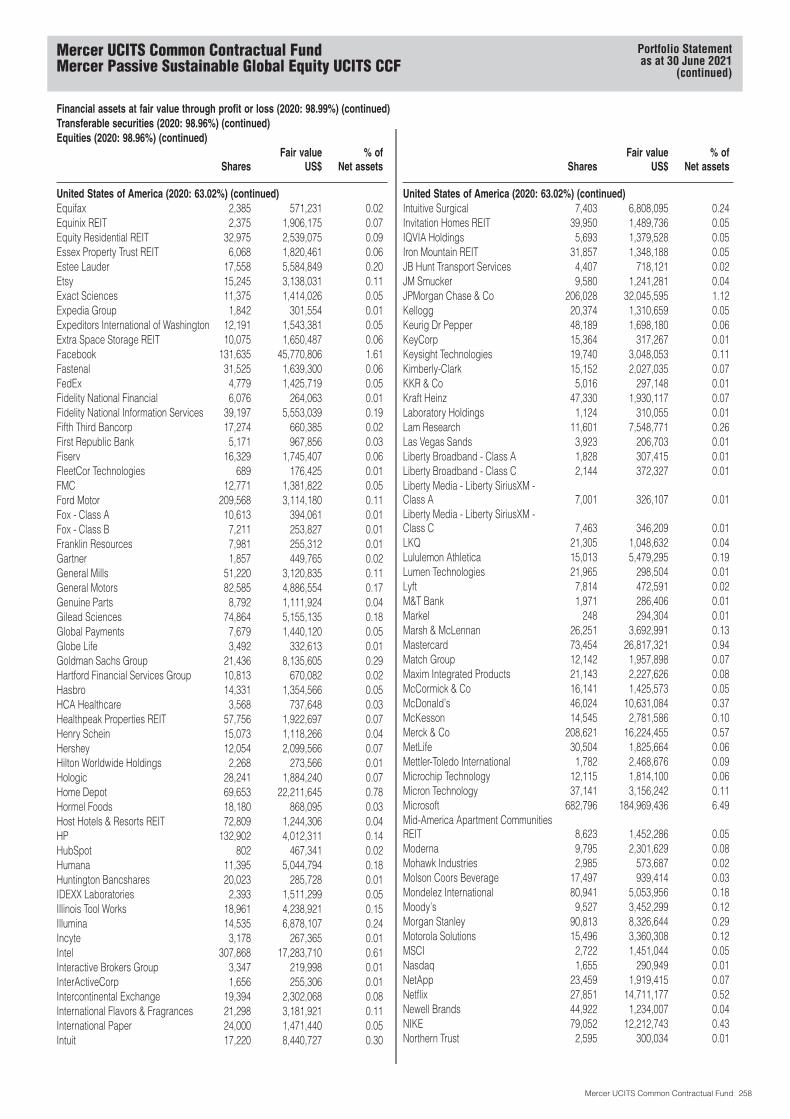
Financial assets at fair value through profit or loss (2020: 98.99%) (continued)Transferable securities (2020: 98.96%) (continued)Equities (2020: 98.96%) (continued)
SharesFair value
US$% of
Net assets
United States of America (2020: 63.02%) (continued)Equifax 2,385 571,231 0.02Equinix REIT 2,375 1,906,175 0.07Equity Residential REIT 32,975 2,539,075 0.09Essex Property Trust REIT 6,068 1,820,461 0.06Estee Lauder 17,558 5,584,849 0.20Etsy 15,245 3,138,031 0.11Exact Sciences 11,375 1,414,026 0.05Expedia Group 1,842 301,554 0.01Expeditors International of Washington 12,191 1,543,381 0.05Extra Space Storage REIT 10,075 1,650,487 0.06Facebook 131,635 45,770,806 1.61Fastenal 31,525 1,639,300 0.06FedEx 4,779 1,425,719 0.05Fidelity National Financial 6,076 264,063 0.01Fidelity National Information Services 39,197 5,553,039 0.19Fifth Third Bancorp 17,274 660,385 0.02First Republic Bank 5,171 967,856 0.03Fiserv 16,329 1,745,407 0.06FleetCor Technologies 689 176,425 0.01FMC 12,771 1,381,822 0.05Ford Motor 209,568 3,114,180 0.11Fox - Class A 10,613 394,061 0.01Fox - Class B 7,211 253,827 0.01Franklin Resources 7,981 255,312 0.01Gartner 1,857 449,765 0.02General Mills 51,220 3,120,835 0.11General Motors 82,585 4,886,554 0.17Genuine Parts 8,792 1,111,924 0.04Gilead Sciences 74,864 5,155,135 0.18Global Payments 7,679 1,440,120 0.05Globe Life 3,492 332,613 0.01Goldman Sachs Group 21,436 8,135,605 0.29Hartford Financial Services Group 10,813 670,082 0.02Hasbro 14,331 1,354,566 0.05HCA Healthcare 3,568 737,648 0.03Healthpeak Properties REIT 57,756 1,922,697 0.07Henry Schein 15,073 1,118,266 0.04Hershey 12,054 2,099,566 0.07Hilton Worldwide Holdings 2,268 273,566 0.01Hologic 28,241 1,884,240 0.07Home Depot 69,653 22,211,645 0.78Hormel Foods 18,180 868,095 0.03Host Hotels & Resorts REIT 72,809 1,244,306 0.04HP 132,902 4,012,311 0.14HubSpot 802 467,341 0.02Humana 11,395 5,044,794 0.18Huntington Bancshares 20,023 285,728 0.01IDEXX Laboratories 2,393 1,511,299 0.05Illinois Tool Works 18,961 4,238,921 0.15Illumina 14,535 6,878,107 0.24Incyte 3,178 267,365 0.01Intel 307,868 17,283,710 0.61Interactive Brokers Group 3,347 219,998 0.01InterActiveCorp 1,656 255,306 0.01Intercontinental Exchange 19,394 2,302,068 0.08International Flavors & Fragrances 21,298 3,181,921 0.11International Paper 24,000 1,471,440 0.05Intuit 17,220 8,440,727 0.30
SharesFair value
US$% of
Net assets
United States of America (2020: 63.02%) (continued)Intuitive Surgical 7,403 6,808,095 0.24Invitation Homes REIT 39,950 1,489,736 0.05IQVIA Holdings 5,693 1,379,528 0.05Iron Mountain REIT 31,857 1,348,188 0.05JB Hunt Transport Services 4,407 718,121 0.02JM Smucker 9,580 1,241,281 0.04JPMorgan Chase & Co 206,028 32,045,595 1.12Kellogg 20,374 1,310,659 0.05Keurig Dr Pepper 48,189 1,698,180 0.06KeyCorp 15,364 317,267 0.01Keysight Technologies 19,740 3,048,053 0.11Kimberly-Clark 15,152 2,027,035 0.07KKR & Co 5,016 297,148 0.01Kraft Heinz 47,330 1,930,117 0.07Laboratory Holdings 1,124 310,055 0.01Lam Research 11,601 7,548,771 0.26Las Vegas Sands 3,923 206,703 0.01Liberty Broadband - Class A 1,828 307,415 0.01Liberty Broadband - Class C 2,144 372,327 0.01Liberty Media - Liberty SiriusXM -Class A 7,001 326,107 0.01Liberty Media - Liberty SiriusXM -Class C 7,463 346,209 0.01LKQ 21,305 1,048,632 0.04Lululemon Athletica 15,013 5,479,295 0.19Lumen Technologies 21,965 298,504 0.01Lyft 7,814 472,591 0.02M&T Bank 1,971 286,406 0.01Markel 248 294,304 0.01Marsh & McLennan 26,251 3,692,991 0.13Mastercard 73,454 26,817,321 0.94Match Group 12,142 1,957,898 0.07Maxim Integrated Products 21,143 2,227,626 0.08McCormick & Co 16,141 1,425,573 0.05McDonald’s 46,024 10,631,084 0.37McKesson 14,545 2,781,586 0.10Merck & Co 208,621 16,224,455 0.57MetLife 30,504 1,825,664 0.06Mettler-Toledo International 1,782 2,468,676 0.09Microchip Technology 12,115 1,814,100 0.06Micron Technology 37,141 3,156,242 0.11Microsoft 682,796 184,969,436 6.49Mid-America Apartment CommunitiesREIT 8,623 1,452,286 0.05Moderna 9,795 2,301,629 0.08Mohawk Industries 2,985 573,687 0.02Molson Coors Beverage 17,497 939,414 0.03Mondelez International 80,941 5,053,956 0.18Moody’s 9,527 3,452,299 0.12Morgan Stanley 90,813 8,326,644 0.29Motorola Solutions 15,496 3,360,308 0.12MSCI 2,722 1,451,044 0.05Nasdaq 1,655 290,949 0.01NetApp 23,459 1,919,415 0.07Netflix 27,851 14,711,177 0.52Newell Brands 44,922 1,234,007 0.04NIKE 79,052 12,212,743 0.43Northern Trust 2,595 300,034 0.01
Mercer UCITS Common Contractual FundMercer Passive Sustainable Global Equity UCITS CCF
Portfolio Statementas at 30 June 2021
(continued)
Mercer UCITS Common Contractual Fund 258
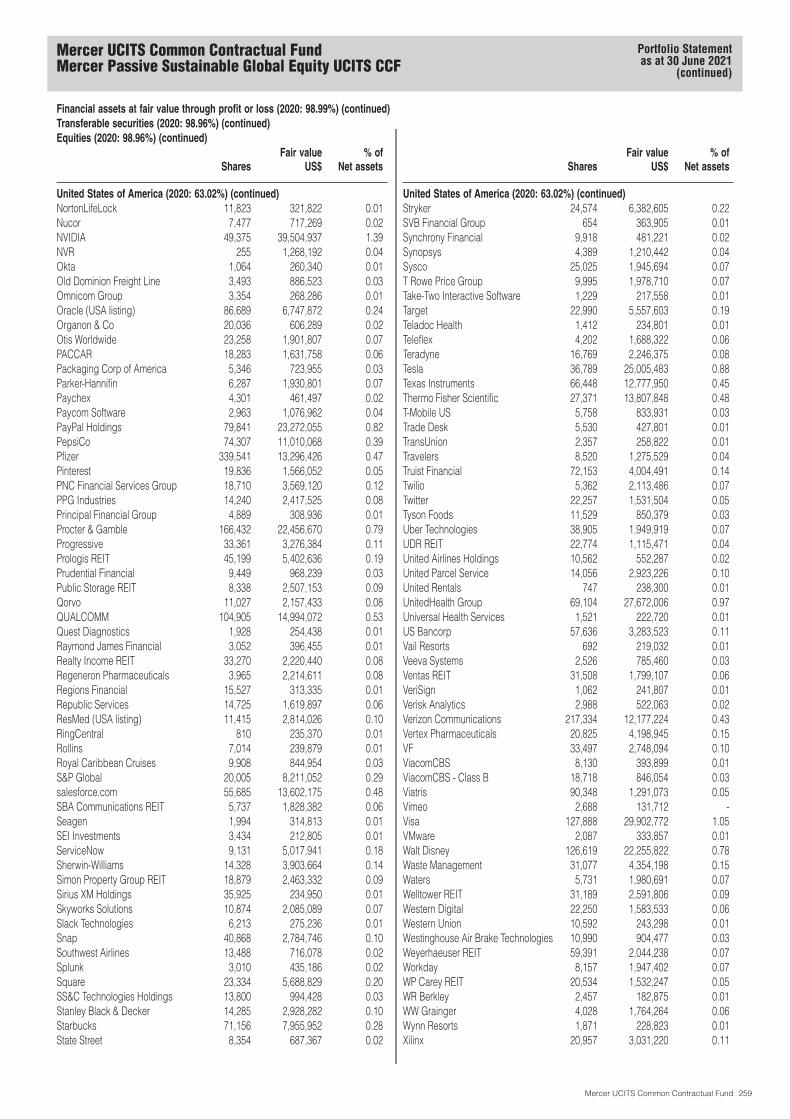
Financial assets at fair value through profit or loss (2020: 98.99%) (continued)Transferable securities (2020: 98.96%) (continued)Equities (2020: 98.96%) (continued)
SharesFair value
US$% of
Net assets
United States of America (2020: 63.02%) (continued)NortonLifeLock 11,823 321,822 0.01Nucor 7,477 717,269 0.02NVIDIA 49,375 39,504,937 1.39NVR 255 1,268,192 0.04Okta 1,064 260,340 0.01Old Dominion Freight Line 3,493 886,523 0.03Omnicom Group 3,354 268,286 0.01Oracle (USA listing) 86,689 6,747,872 0.24Organon & Co 20,036 606,289 0.02Otis Worldwide 23,258 1,901,807 0.07PACCAR 18,283 1,631,758 0.06Packaging Corp of America 5,346 723,955 0.03Parker-Hannifin 6,287 1,930,801 0.07Paychex 4,301 461,497 0.02Paycom Software 2,963 1,076,962 0.04PayPal Holdings 79,841 23,272,055 0.82PepsiCo 74,307 11,010,068 0.39Pfizer 339,541 13,296,426 0.47Pinterest 19,836 1,566,052 0.05PNC Financial Services Group 18,710 3,569,120 0.12PPG Industries 14,240 2,417,525 0.08Principal Financial Group 4,889 308,936 0.01Procter & Gamble 166,432 22,456,670 0.79Progressive 33,361 3,276,384 0.11Prologis REIT 45,199 5,402,636 0.19Prudential Financial 9,449 968,239 0.03Public Storage REIT 8,338 2,507,153 0.09Qorvo 11,027 2,157,433 0.08QUALCOMM 104,905 14,994,072 0.53Quest Diagnostics 1,928 254,438 0.01Raymond James Financial 3,052 396,455 0.01Realty Income REIT 33,270 2,220,440 0.08Regeneron Pharmaceuticals 3,965 2,214,611 0.08Regions Financial 15,527 313,335 0.01Republic Services 14,725 1,619,897 0.06ResMed (USA listing) 11,415 2,814,026 0.10RingCentral 810 235,370 0.01Rollins 7,014 239,879 0.01Royal Caribbean Cruises 9,908 844,954 0.03S&P Global 20,005 8,211,052 0.29salesforce.com 55,685 13,602,175 0.48SBA Communications REIT 5,737 1,828,382 0.06Seagen 1,994 314,813 0.01SEI Investments 3,434 212,805 0.01ServiceNow 9,131 5,017,941 0.18Sherwin-Williams 14,328 3,903,664 0.14Simon Property Group REIT 18,879 2,463,332 0.09Sirius XM Holdings 35,925 234,950 0.01Skyworks Solutions 10,874 2,085,089 0.07Slack Technologies 6,213 275,236 0.01Snap 40,868 2,784,746 0.10Southwest Airlines 13,488 716,078 0.02Splunk 3,010 435,186 0.02Square 23,334 5,688,829 0.20SS&C Technologies Holdings 13,800 994,428 0.03Stanley Black & Decker 14,285 2,928,282 0.10Starbucks 71,156 7,955,952 0.28State Street 8,354 687,367 0.02
SharesFair value
US$% of
Net assets
United States of America (2020: 63.02%) (continued)Stryker 24,574 6,382,605 0.22SVB Financial Group 654 363,905 0.01Synchrony Financial 9,918 481,221 0.02Synopsys 4,389 1,210,442 0.04Sysco 25,025 1,945,694 0.07T Rowe Price Group 9,995 1,978,710 0.07Take-Two Interactive Software 1,229 217,558 0.01Target 22,990 5,557,603 0.19Teladoc Health 1,412 234,801 0.01Teleflex 4,202 1,688,322 0.06Teradyne 16,769 2,246,375 0.08Tesla 36,789 25,005,483 0.88Texas Instruments 66,448 12,777,950 0.45Thermo Fisher Scientific 27,371 13,807,848 0.48T-Mobile US 5,758 833,931 0.03Trade Desk 5,530 427,801 0.01TransUnion 2,357 258,822 0.01Travelers 8,520 1,275,529 0.04Truist Financial 72,153 4,004,491 0.14Twilio 5,362 2,113,486 0.07Twitter 22,257 1,531,504 0.05Tyson Foods 11,529 850,379 0.03Uber Technologies 38,905 1,949,919 0.07UDR REIT 22,774 1,115,471 0.04United Airlines Holdings 10,562 552,287 0.02United Parcel Service 14,056 2,923,226 0.10United Rentals 747 238,300 0.01UnitedHealth Group 69,104 27,672,006 0.97Universal Health Services 1,521 222,720 0.01US Bancorp 57,636 3,283,523 0.11Vail Resorts 692 219,032 0.01Veeva Systems 2,526 785,460 0.03Ventas REIT 31,508 1,799,107 0.06VeriSign 1,062 241,807 0.01Verisk Analytics 2,988 522,063 0.02Verizon Communications 217,334 12,177,224 0.43Vertex Pharmaceuticals 20,825 4,198,945 0.15VF 33,497 2,748,094 0.10ViacomCBS 8,130 393,899 0.01ViacomCBS - Class B 18,718 846,054 0.03Viatris 90,348 1,291,073 0.05Vimeo 2,688 131,712 -Visa 127,888 29,902,772 1.05VMware 2,087 333,857 0.01Walt Disney 126,619 22,255,822 0.78Waste Management 31,077 4,354,198 0.15Waters 5,731 1,980,691 0.07Welltower REIT 31,189 2,591,806 0.09Western Digital 22,250 1,583,533 0.06Western Union 10,592 243,298 0.01Westinghouse Air Brake Technologies 10,990 904,477 0.03Weyerhaeuser REIT 59,391 2,044,238 0.07Workday 8,157 1,947,402 0.07WP Carey REIT 20,534 1,532,247 0.05WR Berkley 2,457 182,875 0.01WW Grainger 4,028 1,764,264 0.06Wynn Resorts 1,871 228,823 0.01Xilinx 20,957 3,031,220 0.11
Mercer UCITS Common Contractual FundMercer Passive Sustainable Global Equity UCITS CCF
Portfolio Statementas at 30 June 2021
(continued)
Mercer UCITS Common Contractual Fund 259
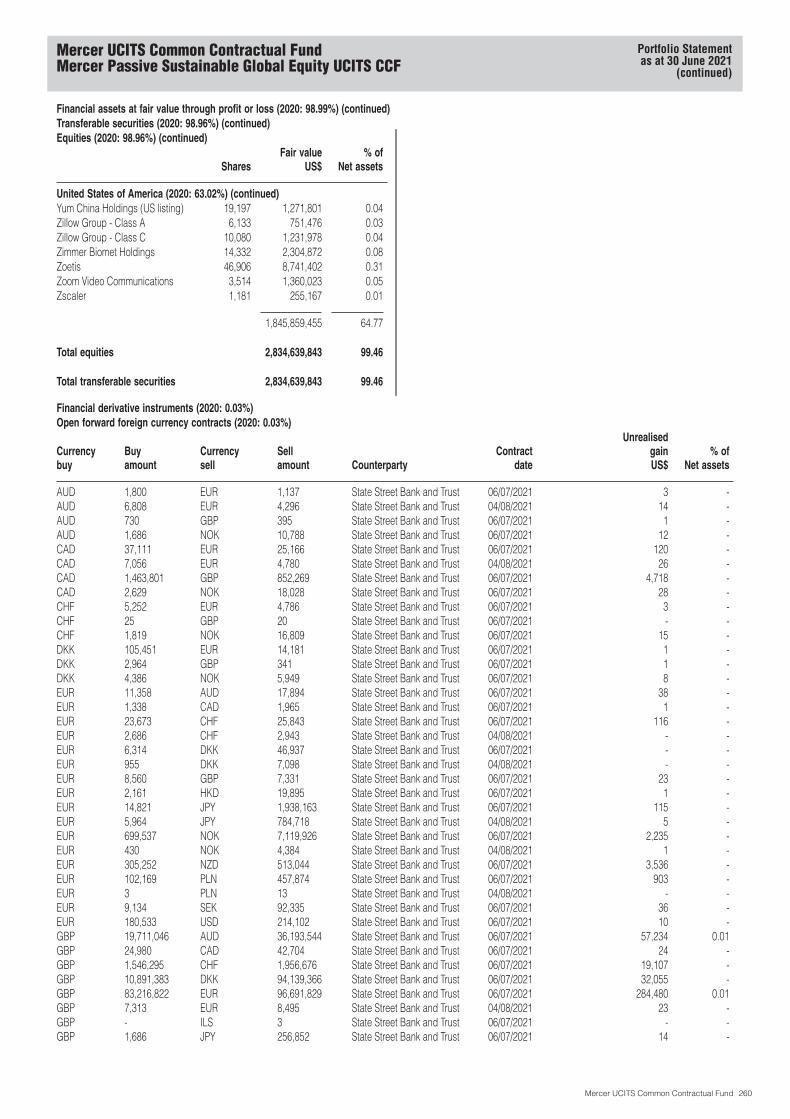
Financial assets at fair value through profit or loss (2020: 98.99%) (continued)Transferable securities (2020: 98.96%) (continued)Equities (2020: 98.96%) (continued)
SharesFair value
US$% of
Net assets
United States of America (2020: 63.02%) (continued)Yum China Holdings (US listing) 19,197 1,271,801 0.04Zillow Group - Class A 6,133 751,476 0.03Zillow Group - Class C 10,080 1,231,978 0.04Zimmer Biomet Holdings 14,332 2,304,872 0.08Zoetis 46,906 8,741,402 0.31Zoom Video Communications 3,514 1,360,023 0.05Zscaler 1,181 255,167 0.01
1,845,859,455 64.77
Total equities 2,834,639,843 99.46
Total transferable securities 2,834,639,843 99.46
Financial derivative instruments (2020: 0.03%)Open forward foreign currency contracts (2020: 0.03%)
Currencybuy
Buyamount
Currencysell
Sellamount Counterparty
Contractdate
UnrealisedgainUS$
% ofNet assets
AUD 1,800 EUR 1,137 State Street Bank and Trust 06/07/2021 3 -AUD 6,808 EUR 4,296 State Street Bank and Trust 04/08/2021 14 -AUD 730 GBP 395 State Street Bank and Trust 06/07/2021 1 -AUD 1,686 NOK 10,788 State Street Bank and Trust 06/07/2021 12 -CAD 37,111 EUR 25,166 State Street Bank and Trust 06/07/2021 120 -CAD 7,056 EUR 4,780 State Street Bank and Trust 04/08/2021 26 -CAD 1,463,801 GBP 852,269 State Street Bank and Trust 06/07/2021 4,718 -CAD 2,629 NOK 18,028 State Street Bank and Trust 06/07/2021 28 -CHF 5,252 EUR 4,786 State Street Bank and Trust 06/07/2021 3 -CHF 25 GBP 20 State Street Bank and Trust 06/07/2021 - -CHF 1,819 NOK 16,809 State Street Bank and Trust 06/07/2021 15 -DKK 105,451 EUR 14,181 State Street Bank and Trust 06/07/2021 1 -DKK 2,964 GBP 341 State Street Bank and Trust 06/07/2021 1 -DKK 4,386 NOK 5,949 State Street Bank and Trust 06/07/2021 8 -EUR 11,358 AUD 17,894 State Street Bank and Trust 06/07/2021 38 -EUR 1,338 CAD 1,965 State Street Bank and Trust 06/07/2021 1 -EUR 23,673 CHF 25,843 State Street Bank and Trust 06/07/2021 116 -EUR 2,686 CHF 2,943 State Street Bank and Trust 04/08/2021 - -EUR 6,314 DKK 46,937 State Street Bank and Trust 06/07/2021 - -EUR 955 DKK 7,098 State Street Bank and Trust 04/08/2021 - -EUR 8,560 GBP 7,331 State Street Bank and Trust 06/07/2021 23 -EUR 2,161 HKD 19,895 State Street Bank and Trust 06/07/2021 1 -EUR 14,821 JPY 1,938,163 State Street Bank and Trust 06/07/2021 115 -EUR 5,964 JPY 784,718 State Street Bank and Trust 04/08/2021 5 -EUR 699,537 NOK 7,119,926 State Street Bank and Trust 06/07/2021 2,235 -EUR 430 NOK 4,384 State Street Bank and Trust 04/08/2021 1 -EUR 305,252 NZD 513,044 State Street Bank and Trust 06/07/2021 3,536 -EUR 102,169 PLN 457,874 State Street Bank and Trust 06/07/2021 903 -EUR 3 PLN 13 State Street Bank and Trust 04/08/2021 - -EUR 9,134 SEK 92,335 State Street Bank and Trust 06/07/2021 36 -EUR 180,533 USD 214,102 State Street Bank and Trust 06/07/2021 10 -GBP 19,711,046 AUD 36,193,544 State Street Bank and Trust 06/07/2021 57,234 0.01GBP 24,980 CAD 42,704 State Street Bank and Trust 06/07/2021 24 -GBP 1,546,295 CHF 1,956,676 State Street Bank and Trust 06/07/2021 19,107 -GBP 10,891,383 DKK 94,139,366 State Street Bank and Trust 06/07/2021 32,055 -GBP 83,216,822 EUR 96,691,829 State Street Bank and Trust 06/07/2021 284,480 0.01GBP 7,313 EUR 8,495 State Street Bank and Trust 04/08/2021 23 -GBP - ILS 3 State Street Bank and Trust 06/07/2021 - -GBP 1,686 JPY 256,852 State Street Bank and Trust 06/07/2021 14 -
Mercer UCITS Common Contractual FundMercer Passive Sustainable Global Equity UCITS CCF
Portfolio Statementas at 30 June 2021
(continued)
Mercer UCITS Common Contractual Fund 260
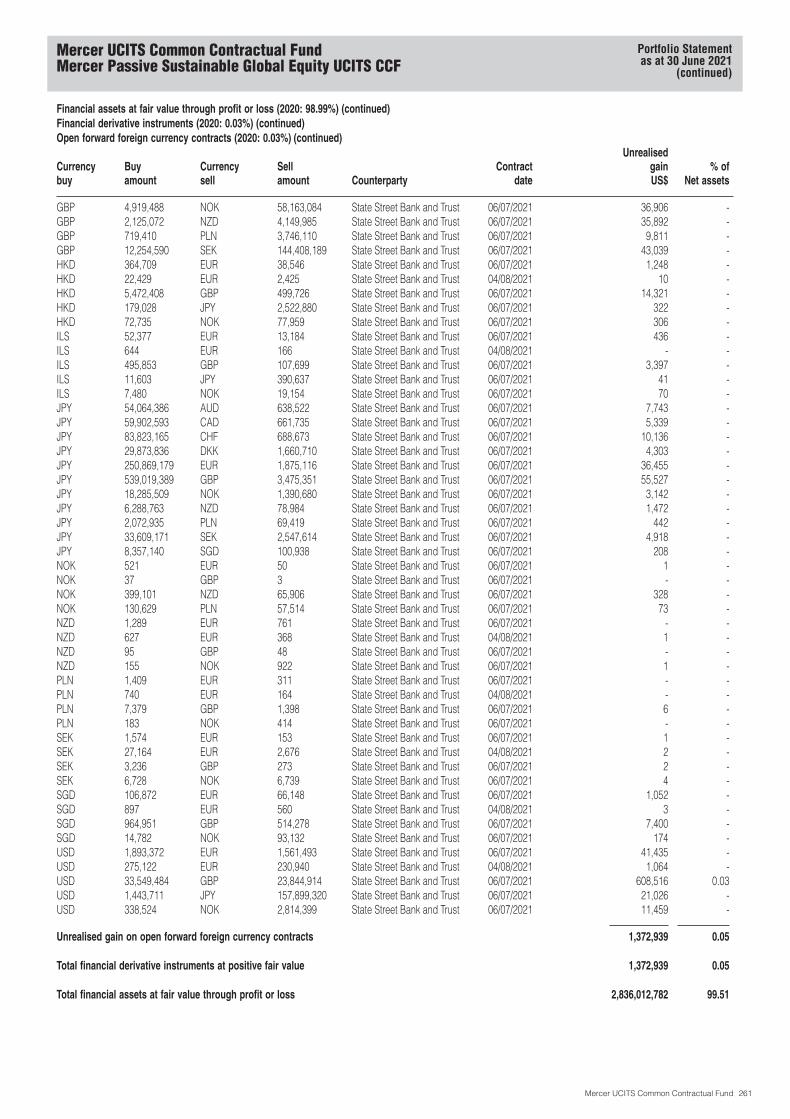
Financial assets at fair value through profit or loss (2020: 98.99%) (continued)Financial derivative instruments (2020: 0.03%) (continued)Open forward foreign currency contracts (2020: 0.03%) (continued)
Currencybuy
Buyamount
Currencysell
Sellamount Counterparty
Contractdate
UnrealisedgainUS$
% ofNet assets
GBP 4,919,488 NOK 58,163,084 State Street Bank and Trust 06/07/2021 36,906 -GBP 2,125,072 NZD 4,149,985 State Street Bank and Trust 06/07/2021 35,892 -GBP 719,410 PLN 3,746,110 State Street Bank and Trust 06/07/2021 9,811 -GBP 12,254,590 SEK 144,408,189 State Street Bank and Trust 06/07/2021 43,039 -HKD 364,709 EUR 38,546 State Street Bank and Trust 06/07/2021 1,248 -HKD 22,429 EUR 2,425 State Street Bank and Trust 04/08/2021 10 -HKD 5,472,408 GBP 499,726 State Street Bank and Trust 06/07/2021 14,321 -HKD 179,028 JPY 2,522,880 State Street Bank and Trust 06/07/2021 322 -HKD 72,735 NOK 77,959 State Street Bank and Trust 06/07/2021 306 -ILS 52,377 EUR 13,184 State Street Bank and Trust 06/07/2021 436 -ILS 644 EUR 166 State Street Bank and Trust 04/08/2021 - -ILS 495,853 GBP 107,699 State Street Bank and Trust 06/07/2021 3,397 -ILS 11,603 JPY 390,637 State Street Bank and Trust 06/07/2021 41 -ILS 7,480 NOK 19,154 State Street Bank and Trust 06/07/2021 70 -JPY 54,064,386 AUD 638,522 State Street Bank and Trust 06/07/2021 7,743 -JPY 59,902,593 CAD 661,735 State Street Bank and Trust 06/07/2021 5,339 -JPY 83,823,165 CHF 688,673 State Street Bank and Trust 06/07/2021 10,136 -JPY 29,873,836 DKK 1,660,710 State Street Bank and Trust 06/07/2021 4,303 -JPY 250,869,179 EUR 1,875,116 State Street Bank and Trust 06/07/2021 36,455 -JPY 539,019,389 GBP 3,475,351 State Street Bank and Trust 06/07/2021 55,527 -JPY 18,285,509 NOK 1,390,680 State Street Bank and Trust 06/07/2021 3,142 -JPY 6,288,763 NZD 78,984 State Street Bank and Trust 06/07/2021 1,472 -JPY 2,072,935 PLN 69,419 State Street Bank and Trust 06/07/2021 442 -JPY 33,609,171 SEK 2,547,614 State Street Bank and Trust 06/07/2021 4,918 -JPY 8,357,140 SGD 100,938 State Street Bank and Trust 06/07/2021 208 -NOK 521 EUR 50 State Street Bank and Trust 06/07/2021 1 -NOK 37 GBP 3 State Street Bank and Trust 06/07/2021 - -NOK 399,101 NZD 65,906 State Street Bank and Trust 06/07/2021 328 -NOK 130,629 PLN 57,514 State Street Bank and Trust 06/07/2021 73 -NZD 1,289 EUR 761 State Street Bank and Trust 06/07/2021 - -NZD 627 EUR 368 State Street Bank and Trust 04/08/2021 1 -NZD 95 GBP 48 State Street Bank and Trust 06/07/2021 - -NZD 155 NOK 922 State Street Bank and Trust 06/07/2021 1 -PLN 1,409 EUR 311 State Street Bank and Trust 06/07/2021 - -PLN 740 EUR 164 State Street Bank and Trust 04/08/2021 - -PLN 7,379 GBP 1,398 State Street Bank and Trust 06/07/2021 6 -PLN 183 NOK 414 State Street Bank and Trust 06/07/2021 - -SEK 1,574 EUR 153 State Street Bank and Trust 06/07/2021 1 -SEK 27,164 EUR 2,676 State Street Bank and Trust 04/08/2021 2 -SEK 3,236 GBP 273 State Street Bank and Trust 06/07/2021 2 -SEK 6,728 NOK 6,739 State Street Bank and Trust 06/07/2021 4 -SGD 106,872 EUR 66,148 State Street Bank and Trust 06/07/2021 1,052 -SGD 897 EUR 560 State Street Bank and Trust 04/08/2021 3 -SGD 964,951 GBP 514,278 State Street Bank and Trust 06/07/2021 7,400 -SGD 14,782 NOK 93,132 State Street Bank and Trust 06/07/2021 174 -USD 1,893,372 EUR 1,561,493 State Street Bank and Trust 06/07/2021 41,435 -USD 275,122 EUR 230,940 State Street Bank and Trust 04/08/2021 1,064 -USD 33,549,484 GBP 23,844,914 State Street Bank and Trust 06/07/2021 608,516 0.03USD 1,443,711 JPY 157,899,320 State Street Bank and Trust 06/07/2021 21,026 -USD 338,524 NOK 2,814,399 State Street Bank and Trust 06/07/2021 11,459 -
Unrealised gain on open forward foreign currency contracts 1,372,939 0.05
Total financial derivative instruments at positive fair value 1,372,939 0.05
Total financial assets at fair value through profit or loss 2,836,012,782 99.51
Mercer UCITS Common Contractual FundMercer Passive Sustainable Global Equity UCITS CCF
Portfolio Statementas at 30 June 2021
(continued)
Mercer UCITS Common Contractual Fund 261
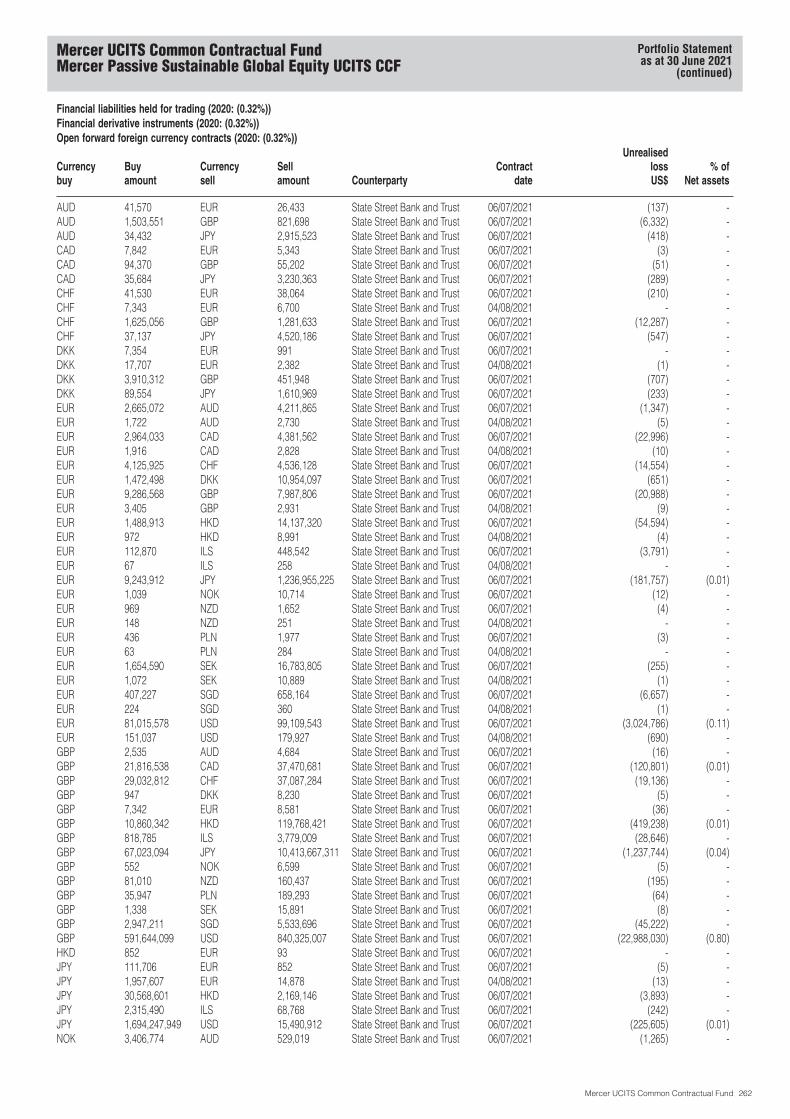
Financial liabilities held for trading (2020: (0.32%))Financial derivative instruments (2020: (0.32%))Open forward foreign currency contracts (2020: (0.32%))
Currencybuy
Buyamount
Currencysell
Sellamount Counterparty
Contractdate
UnrealisedlossUS$
% ofNet assets
AUD 41,570 EUR 26,433 State Street Bank and Trust 06/07/2021 (137) -AUD 1,503,551 GBP 821,698 State Street Bank and Trust 06/07/2021 (6,332) -AUD 34,432 JPY 2,915,523 State Street Bank and Trust 06/07/2021 (418) -CAD 7,842 EUR 5,343 State Street Bank and Trust 06/07/2021 (3) -CAD 94,370 GBP 55,202 State Street Bank and Trust 06/07/2021 (51) -CAD 35,684 JPY 3,230,363 State Street Bank and Trust 06/07/2021 (289) -CHF 41,530 EUR 38,064 State Street Bank and Trust 06/07/2021 (210) -CHF 7,343 EUR 6,700 State Street Bank and Trust 04/08/2021 - -CHF 1,625,056 GBP 1,281,633 State Street Bank and Trust 06/07/2021 (12,287) -CHF 37,137 JPY 4,520,186 State Street Bank and Trust 06/07/2021 (547) -DKK 7,354 EUR 991 State Street Bank and Trust 06/07/2021 - -DKK 17,707 EUR 2,382 State Street Bank and Trust 04/08/2021 (1) -DKK 3,910,312 GBP 451,948 State Street Bank and Trust 06/07/2021 (707) -DKK 89,554 JPY 1,610,969 State Street Bank and Trust 06/07/2021 (233) -EUR 2,665,072 AUD 4,211,865 State Street Bank and Trust 06/07/2021 (1,347) -EUR 1,722 AUD 2,730 State Street Bank and Trust 04/08/2021 (5) -EUR 2,964,033 CAD 4,381,562 State Street Bank and Trust 06/07/2021 (22,996) -EUR 1,916 CAD 2,828 State Street Bank and Trust 04/08/2021 (10) -EUR 4,125,925 CHF 4,536,128 State Street Bank and Trust 06/07/2021 (14,554) -EUR 1,472,498 DKK 10,954,097 State Street Bank and Trust 06/07/2021 (651) -EUR 9,286,568 GBP 7,987,806 State Street Bank and Trust 06/07/2021 (20,988) -EUR 3,405 GBP 2,931 State Street Bank and Trust 04/08/2021 (9) -EUR 1,488,913 HKD 14,137,320 State Street Bank and Trust 06/07/2021 (54,594) -EUR 972 HKD 8,991 State Street Bank and Trust 04/08/2021 (4) -EUR 112,870 ILS 448,542 State Street Bank and Trust 06/07/2021 (3,791) -EUR 67 ILS 258 State Street Bank and Trust 04/08/2021 - -EUR 9,243,912 JPY 1,236,955,225 State Street Bank and Trust 06/07/2021 (181,757) (0.01)EUR 1,039 NOK 10,714 State Street Bank and Trust 06/07/2021 (12) -EUR 969 NZD 1,652 State Street Bank and Trust 06/07/2021 (4) -EUR 148 NZD 251 State Street Bank and Trust 04/08/2021 - -EUR 436 PLN 1,977 State Street Bank and Trust 06/07/2021 (3) -EUR 63 PLN 284 State Street Bank and Trust 04/08/2021 - -EUR 1,654,590 SEK 16,783,805 State Street Bank and Trust 06/07/2021 (255) -EUR 1,072 SEK 10,889 State Street Bank and Trust 04/08/2021 (1) -EUR 407,227 SGD 658,164 State Street Bank and Trust 06/07/2021 (6,657) -EUR 224 SGD 360 State Street Bank and Trust 04/08/2021 (1) -EUR 81,015,578 USD 99,109,543 State Street Bank and Trust 06/07/2021 (3,024,786) (0.11)EUR 151,037 USD 179,927 State Street Bank and Trust 04/08/2021 (690) -GBP 2,535 AUD 4,684 State Street Bank and Trust 06/07/2021 (16) -GBP 21,816,538 CAD 37,470,681 State Street Bank and Trust 06/07/2021 (120,801) (0.01)GBP 29,032,812 CHF 37,087,284 State Street Bank and Trust 06/07/2021 (19,136) -GBP 947 DKK 8,230 State Street Bank and Trust 06/07/2021 (5) -GBP 7,342 EUR 8,581 State Street Bank and Trust 06/07/2021 (36) -GBP 10,860,342 HKD 119,768,421 State Street Bank and Trust 06/07/2021 (419,238) (0.01)GBP 818,785 ILS 3,779,009 State Street Bank and Trust 06/07/2021 (28,646) -GBP 67,023,094 JPY 10,413,667,311 State Street Bank and Trust 06/07/2021 (1,237,744) (0.04)GBP 552 NOK 6,599 State Street Bank and Trust 06/07/2021 (5) -GBP 81,010 NZD 160,437 State Street Bank and Trust 06/07/2021 (195) -GBP 35,947 PLN 189,293 State Street Bank and Trust 06/07/2021 (64) -GBP 1,338 SEK 15,891 State Street Bank and Trust 06/07/2021 (8) -GBP 2,947,211 SGD 5,533,696 State Street Bank and Trust 06/07/2021 (45,222) -GBP 591,644,099 USD 840,325,007 State Street Bank and Trust 06/07/2021 (22,988,030) (0.80)HKD 852 EUR 93 State Street Bank and Trust 06/07/2021 - -JPY 111,706 EUR 852 State Street Bank and Trust 06/07/2021 (5) -JPY 1,957,607 EUR 14,878 State Street Bank and Trust 04/08/2021 (13) -JPY 30,568,601 HKD 2,169,146 State Street Bank and Trust 06/07/2021 (3,893) -JPY 2,315,490 ILS 68,768 State Street Bank and Trust 06/07/2021 (242) -JPY 1,694,247,949 USD 15,490,912 State Street Bank and Trust 06/07/2021 (225,605) (0.01)NOK 3,406,774 AUD 529,019 State Street Bank and Trust 06/07/2021 (1,265) -
Mercer UCITS Common Contractual FundMercer Passive Sustainable Global Equity UCITS CCF
Portfolio Statementas at 30 June 2021
(continued)
Mercer UCITS Common Contractual Fund 262
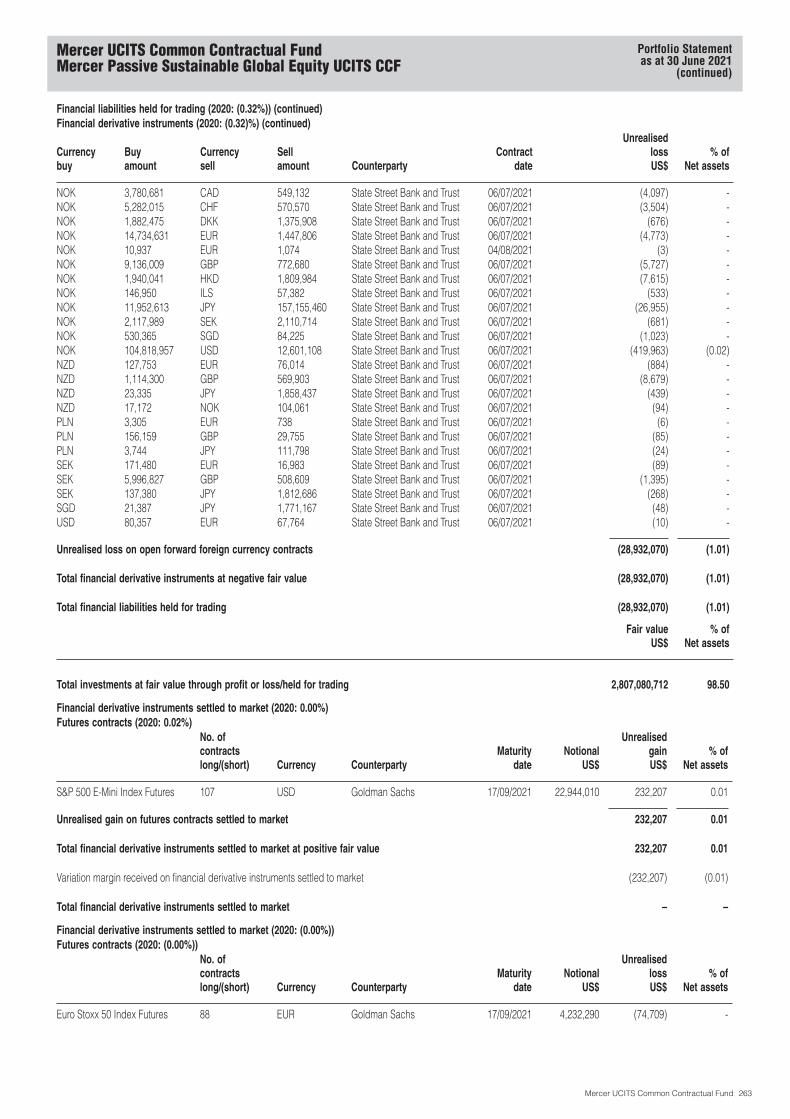
Financial liabilities held for trading (2020: (0.32%)) (continued)Financial derivative instruments (2020: (0.32)%) (continued)
Currencybuy
Buyamount
Currencysell
Sellamount Counterparty
Contractdate
UnrealisedlossUS$
% ofNet assets
NOK 3,780,681 CAD 549,132 State Street Bank and Trust 06/07/2021 (4,097) -NOK 5,282,015 CHF 570,570 State Street Bank and Trust 06/07/2021 (3,504) -NOK 1,882,475 DKK 1,375,908 State Street Bank and Trust 06/07/2021 (676) -NOK 14,734,631 EUR 1,447,806 State Street Bank and Trust 06/07/2021 (4,773) -NOK 10,937 EUR 1,074 State Street Bank and Trust 04/08/2021 (3) -NOK 9,136,009 GBP 772,680 State Street Bank and Trust 06/07/2021 (5,727) -NOK 1,940,041 HKD 1,809,984 State Street Bank and Trust 06/07/2021 (7,615) -NOK 146,950 ILS 57,382 State Street Bank and Trust 06/07/2021 (533) -NOK 11,952,613 JPY 157,155,460 State Street Bank and Trust 06/07/2021 (26,955) -NOK 2,117,989 SEK 2,110,714 State Street Bank and Trust 06/07/2021 (681) -NOK 530,365 SGD 84,225 State Street Bank and Trust 06/07/2021 (1,023) -NOK 104,818,957 USD 12,601,108 State Street Bank and Trust 06/07/2021 (419,963) (0.02)NZD 127,753 EUR 76,014 State Street Bank and Trust 06/07/2021 (884) -NZD 1,114,300 GBP 569,903 State Street Bank and Trust 06/07/2021 (8,679) -NZD 23,335 JPY 1,858,437 State Street Bank and Trust 06/07/2021 (439) -NZD 17,172 NOK 104,061 State Street Bank and Trust 06/07/2021 (94) -PLN 3,305 EUR 738 State Street Bank and Trust 06/07/2021 (6) -PLN 156,159 GBP 29,755 State Street Bank and Trust 06/07/2021 (85) -PLN 3,744 JPY 111,798 State Street Bank and Trust 06/07/2021 (24) -SEK 171,480 EUR 16,983 State Street Bank and Trust 06/07/2021 (89) -SEK 5,996,827 GBP 508,609 State Street Bank and Trust 06/07/2021 (1,395) -SEK 137,380 JPY 1,812,686 State Street Bank and Trust 06/07/2021 (268) -SGD 21,387 JPY 1,771,167 State Street Bank and Trust 06/07/2021 (48) -USD 80,357 EUR 67,764 State Street Bank and Trust 06/07/2021 (10) -
Unrealised loss on open forward foreign currency contracts (28,932,070) (1.01)
Total financial derivative instruments at negative fair value (28,932,070) (1.01)
Total financial liabilities held for trading (28,932,070) (1.01)
Fair valueUS$
% ofNet assets
Total investments at fair value through profit or loss/held for trading 2,807,080,712 98.50
Financial derivative instruments settled to market (2020: 0.00%)Futures contracts (2020: 0.02%)
No. ofcontractslong/(short) Currency Counterparty
Maturitydate
NotionalUS$
UnrealisedgainUS$
% ofNet assets
S&P 500 E-Mini Index Futures 107 USD Goldman Sachs 17/09/2021 22,944,010 232,207 0.01
Unrealised gain on futures contracts settled to market 232,207 0.01
Total financial derivative instruments settled to market at positive fair value 232,207 0.01
Variation margin received on financial derivative instruments settled to market (232,207) (0.01)
Total financial derivative instruments settled to market – –
Financial derivative instruments settled to market (2020: (0.00%))Futures contracts (2020: (0.00%))
No. ofcontractslong/(short) Currency Counterparty
Maturitydate
NotionalUS$
UnrealisedlossUS$
% ofNet assets
Euro Stoxx 50 Index Futures 88 EUR Goldman Sachs 17/09/2021 4,232,290 (74,709) -
Mercer UCITS Common Contractual FundMercer Passive Sustainable Global Equity UCITS CCF
Portfolio Statementas at 30 June 2021
(continued)
Mercer UCITS Common Contractual Fund 263
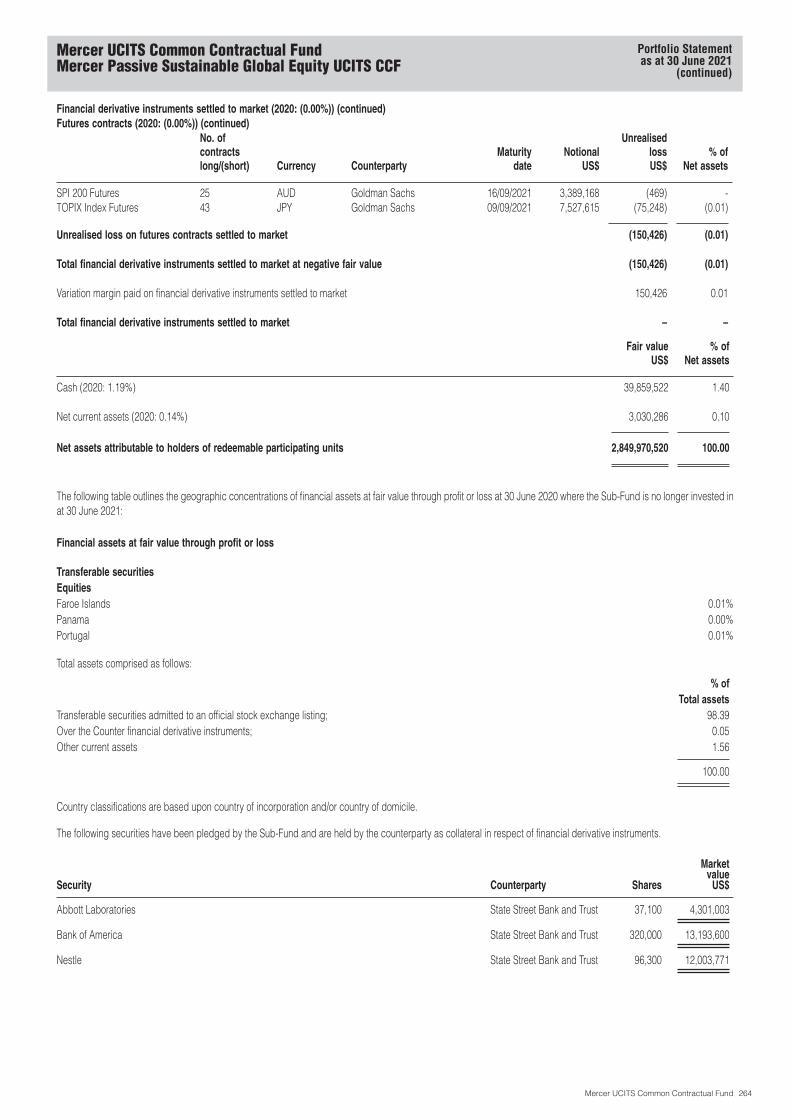
Financial derivative instruments settled to market (2020: (0.00%)) (continued)Futures contracts (2020: (0.00%)) (continued)
No. ofcontractslong/(short) Currency Counterparty
Maturitydate
NotionalUS$
UnrealisedlossUS$
% ofNet assets
SPI 200 Futures 25 AUD Goldman Sachs 16/09/2021 3,389,168 (469) -TOPIX Index Futures 43 JPY Goldman Sachs 09/09/2021 7,527,615 (75,248) (0.01)
Unrealised loss on futures contracts settled to market (150,426) (0.01)
Total financial derivative instruments settled to market at negative fair value (150,426) (0.01)
Variation margin paid on financial derivative instruments settled to market 150,426 0.01
Total financial derivative instruments settled to market – –
Fair valueUS$
% ofNet assets
Cash (2020: 1.19%) 39,859,522 1.40
Net current assets (2020: 0.14%) 3,030,286 0.10
Net assets attributable to holders of redeemable participating units 2,849,970,520 100.00
The following table outlines the geographic concentrations of financial assets at fair value through profit or loss at 30 June 2020 where the Sub-Fund is no longer invested inat 30 June 2021:
Financial assets at fair value through profit or loss
Transferable securitiesEquitiesFaroe Islands 0.01%Panama 0.00%Portugal 0.01%
Total assets comprised as follows:
% ofTotal assets
Transferable securities admitted to an official stock exchange listing; 98.39Over the Counter financial derivative instruments; 0.05Other current assets 1.56
100.00
Country classifications are based upon country of incorporation and/or country of domicile.
The following securities have been pledged by the Sub-Fund and are held by the counterparty as collateral in respect of financial derivative instruments.
Security Counterparty Shares
Marketvalue
US$
Abbott Laboratories State Street Bank and Trust 37,100 4,301,003
Bank of America State Street Bank and Trust 320,000 13,193,600
Nestle State Street Bank and Trust 96,300 12,003,771
Mercer UCITS Common Contractual FundMercer Passive Sustainable Global Equity UCITS CCF
Portfolio Statementas at 30 June 2021
(continued)
Mercer UCITS Common Contractual Fund 264