Trends in the Ownership Cost of Equity Mutual Funds
16
INVESTMENT COMPANY INSTITUTE ® PERSPECTIVE INVESTMENT COMPANY INSTITUTE ® Vol. 4 / No. 3 November 1998 Perspective is a series of occasional papers published by the Investment Company Institute, the national association of the American investment company industry. John Rea, executive editor; Craig Tyle, executive editor; Sue Duncan, managing editor. 1401 H Street, NW Suite 1200 Washington, DC 20005 www.ici.org Trends in the Ownership Cost of Equity Mutual Funds By John D. Rea and Brian K. Reid 1 ABSTRACT Most discussions of the cost of investing in equity mutual funds focus on one component of cost, the expense ratio, and ignore another significant cost, sales loads. As a result, conclusions about the total cost of mutual fund investing have often been incomplete or misleading. This paper analyzes trends in the cost of investing in equity mutual funds from 1980 to 1997 using a measure called “total shareholder cost.” This measure includes all major costs of investing in a mutual fund and is comparable to the fee and expense information required by the U.S. Securities and Exchange Commission in the mutual fund prospectus. The paper finds that the average cost of invest- ing in equity mutual funds has dropped by more than one-third since 1980. The paper also finds evidence of economies of scale among equity funds. I. OVERVIEW AND SUMMARY Mutual fund fees and expenses have been a subject of ongoing public discussion. Recent attention, in particular, has focused on the level and trend in the average cost of investing in mutual funds. Conclusions, however, have varied, largely because of the lack of a standard framework for analyzing the total cost of investing in mutual funds. Of the cost measures commonly used, most fail to account for the full range of mutual fund investment costs and thus misrepresent the actual cost incurred by the “average” buyer of a mutual fund. This paper examines the level and trend in mutual fund fees and expenses using a measure of ownership cost that overcomes the limitations of other measures. This measure, called total shareholder cost , represents the cost that an investor would expect to incur in purchasing and holding mutual fund shares. It accounts for all major fees and expenses relevant to investment decision-making and, in this regard, is comparable to the fee and expense information required by the U.S. Securities and Exchange Commission (SEC) in every mutual fund prospectus. 2 Fees and expenses included in total shareholder cost consist of fund operating expenses, 12b-1 fees, and sales loads. In contrast, most other measures used to analyze mutual fund ownership cost do not incorporate all of these costs. The paper provides estimates of total share- holder cost for equity funds over the 18-year period from 1980 to 1997. Equity funds, rather than all funds, were selected for the analysis because their fees and expenses are the most frequent subject of discussion. 1 Travis Lee and Kimberlee Millar assisted in the analysis of the data. Anne Schafer, Natalia Parmly, Linda Turner, James Erceg, Michael Bogdan, Monica Bennsky, Aaron Silverman, Jennifer Smith, and Scott Alston assisted in the collection and preparation of the database. Brady Edholm prepared the charts and tables. We would like to thank Mitchell A. Post and Lawrence J. White for comments on previous drafts of the paper. 2 Total shareholder cost also is similar to the cost concept used by Erik R. Sirri and Peter Tufano, “Competition and Change in the Mutual Fund Industry,” in Financial Services: Perspectives and Challenges , edited by Samuel L. Hayes, III, Boston: Harvard Business School Press, 1993, pp.199-202 and by Peter Tufano and Matthew Sevick, “Board Structure and Fee-Setting in the U.S. Mutual Fund Industry,” Journal of Financial Economics , 46 (1997), pp. 339-342.
-
Upload
khangminh22 -
Category
Documents
-
view
5 -
download
0
Transcript of Trends in the Ownership Cost of Equity Mutual Funds
INVESTMENT COMPANY INSTITUTE®
PERSPECTIVE
INVESTMENT
COMPANY
INSTITUTE®
Vol . 4 / No. 3
November 1998
Perspective is a series
of occasional papers
published by the
Investment Company
Institute, the national
association of the
American investment
company industry.
John Rea,
executive editor;
Craig Tyle,
executive editor;
Sue Duncan,
managing editor.
1401 H Street, NW
Suite 1200
Washington, DC 20005
www.ic i .org
Tr e n d s i n t h e O w n e r s h i p C o s t o fE q u i t y M u t u a l F u n d s
By John D. Rea and Brian K. Reid1
ABSTRACTMost discussions of the cost of investing in equity mutualfunds focus on one component of cost, the expense ratio,and ignore another significant cost, sales loads. As aresult, conclusions about the total cost of mutual fundinvesting have often been incomplete or misleading. Thispaper analyzes trends in the cost of investing in equitymutual funds from 1980 to 1997 using a measure called“total shareholder cost.” This measure includes all majorcosts of investing in a mutual fund and is comparable tothe fee and expense information required by the U.S.Securities and Exchange Commission in the mutual fundprospectus. The paper finds that the average cost of invest-ing in equity mutual funds has dropped by more thanone-third since 1980. The paper also finds evidence ofeconomies of scale among equity funds.
I. OVERVIEW AND SUMMARYMutual fund fees and expenses have been a subject
of ongoing public discussion. Recent attention, in
particular, has focused on the level and trend in
the average cost of investing in mutual funds.
Conclusions, however, have varied, largely because
of the lack of a standard framework for analyzing
the total cost of investing in mutual funds. Of the
cost measures commonly used, most fail to account
for the full range of mutual fund investment costs
and thus misrepresent the actual cost incurred by
the “average” buyer of a mutual fund.
This paper examines the level and trend in
mutual fund fees and expenses using a measure
of ownership cost that overcomes the limitations
of other measures. This measure, called total
shareholder cost, represents the cost that an
investor would expect to incur in purchasing and
holding mutual fund shares. It accounts for all
major fees and expenses relevant to investment
decision-making and, in this regard, is comparable
to the fee and expense information required by the
U.S. Securities and Exchange Commission (SEC)
in every mutual fund prospectus.2 Fees and
expenses included in total shareholder cost consist
of fund operating expenses, 12b-1 fees, and sales
loads. In contrast, most other measures used to
analyze mutual fund ownership cost do not
incorporate all of these costs.
The paper provides estimates of total share-
holder cost for equity funds over the 18-year
period from 1980 to 1997. Equity funds, rather
than all funds, were selected for the analysis
because their fees and expenses are the most
frequent subject of discussion.
1 Travis Lee and Kimberlee Millar assisted in the analysis of the data. Anne Schafer, Natalia Parmly, Linda Turner, James Erceg, MichaelBogdan, Monica Bennsky, Aaron Silverman, Jennifer Smith, and Scott Alston assisted in the collection and preparation of the database.Brady Edholm prepared the charts and tables. We would like to thank Mitchell A. Post and Lawrence J. White for comments on previousdrafts of the paper.2 Total shareholder cost also is similar to the cost concept used by Erik R. Sirri and Peter Tufano, “Competition and Change in the MutualFund Industry,” in Financial Services: Perspectives and Challenges, edited by Samuel L. Hayes, III, Boston: Harvard Business SchoolPress, 1993, pp.199-202 and by Peter Tufano and Matthew Sevick, “Board Structure and Fee-Setting in the U.S. Mutual Fund Industry,”Journal of Financial Economics, 46 (1997), pp. 339-342.
The principal findings from the analysis are as follows.
Total Shareholder Cost
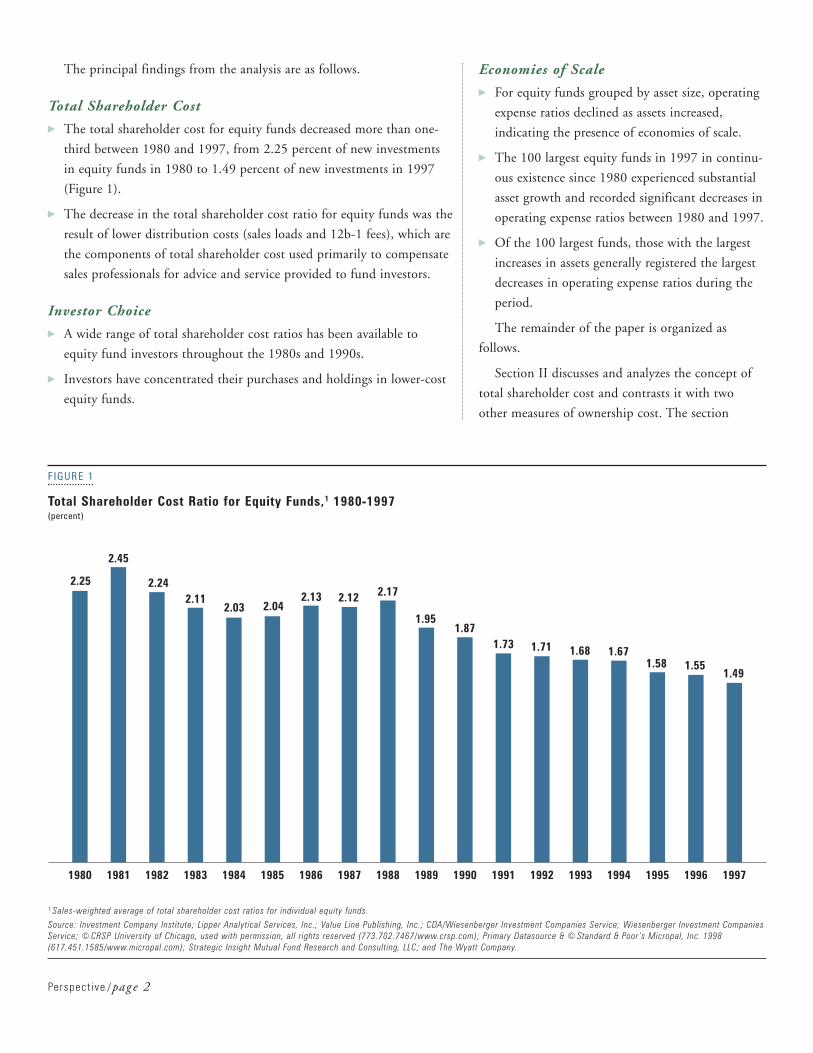
þ The total shareholder cost for equity funds decreased more than one-
third between 1980 and 1997, from 2.25 percent of new investments
in equity funds in 1980 to 1.49 percent of new investments in 1997
(Figure 1).
þ The decrease in the total shareholder cost ratio for equity funds was the
result of lower distribution costs (sales loads and 12b-1 fees), which are
the components of total shareholder cost used primarily to compensate
sales professionals for advice and service provided to fund investors.
Investor Choice
þ A wide range of total shareholder cost ratios has been available to
equity fund investors throughout the 1980s and 1990s.
þ Investors have concentrated their purchases and holdings in lower-cost
equity funds.
Economies of Scale
þ For equity funds grouped by asset size, operating
expense ratios declined as assets increased,
indicating the presence of economies of scale.
þ The 100 largest equity funds in 1997 in continu-
ous existence since 1980 experienced substantial
asset growth and recorded significant decreases in
operating expense ratios between 1980 and 1997.
þ Of the 100 largest funds, those with the largest
increases in assets generally registered the largest
decreases in operating expense ratios during the
period.
The remainder of the paper is organized as
follows.
Section II discusses and analyzes the concept of
total shareholder cost and contrasts it with two
other measures of ownership cost. The section
Perspect ive /pag e 2
FIGURE 1
Total Shareholder Cost Ratio for Equity Funds,1 1980-1997(percent)
1 Sales-weighted average of total shareholder cost ratios for individual equity funds.
Source: Investment Company Institute; Lipper Analytical Services, Inc.; Value Line Publishing, Inc.; CDA/Wiesenberger Investment Companies Service; Wiesenberger Investment CompaniesService; © CRSP University of Chicago, used with permission, all rights reserved (773.702.7467/www.crsp.com); Primary Datasource & © Standard & Poor ’s Micropal, Inc. 1998(617.451.1585/www.micropal.com); Strategic Insight Mutual Fund Research and Consulting, LLC; and The Wyatt Company.
199719961995199419931992199119901989198819871986198519841983198219811980
2.25
2.45
2.242.11
2.03 2.042.13
1.491.551.58
1.671.681.711.731.87
1.95
2.172.12
fund companies to lower fees and expenses. Finally, the section reviews
evidence that points strongly to the presence of economies of scale among
individual equity funds.
II. THE CONCEPT OF TOTAL SHAREHOLDER COSTThe paper’s principal objective is to analyze trends in the cost of owning
equity mutual funds. For the analysis, ownership cost is defined as all the
costs set by a fund organization that an investor would expect to incur in
purchasing and holding fund shares over the life of his or her investment
in the fund.3 This concept of ownership cost is called total shareholder
cost.
Total shareholder cost has two important features. First, it is an appro-
priate measure for investors to use in making purchase decisions. In fact, it
is based upon the same considerations that underlie the figures required by
the SEC in the example section of the fee table in the mutual fund
prospectus. These figures show the cumulative dollar cost that a buyer
would incur over one-, three-, five-, and 10-year investment periods on a
$10,000 initial investment that returns 5 percent per year. Total share-
holder cost provides essentially the same information but converts the
cumulative dollar cost to the equivalent of a constant, annual payment
spread over the life of the shareholder’s investment.
The second feature of total shareholder cost is that it represents the
price at which the fund is offering its investment management and other
services to investors. Thus, total shareholder cost reflects any action taken
by a fund company to change the price of those services through higher or
lower fees and expenses.
This section provides further detail about the definition of total
shareholder cost. In addition, total shareholder cost is contrasted with two
other approaches to measuring fund ownership cost.
Costs Included in Total Shareholder Cost
Total shareholder cost includes the two principal types of costs incurred by
an investor purchasing and holding shares of a mutual fund: fund expenses
and sales charges. A fund incurs expenses for services such as managing
portfolio investments, maintaining and servicing shareholder accounts,
and distributing or marketing shares under a Rule 12b-1 plan.4 Because
the fund pays these expenses directly out of its assets, shareholders in the
concludes that total shareholder cost is the best
measure for assessing the overall cost of investing
in mutual funds. Total shareholder cost incorpo-
rates all major fund fees and expenses and is
therefore a relevant gauge for investment decision-
making. In contrast, one of the other measures—
the expense ratio—omits an important cost, the
sales load. The other measure—the cost incurred
by all existing owners of mutual funds—is subject
to distortions that limit its usefulness as an indica-
tor of the cost of investing in mutual fund shares.
Section III describes the method used for
constructing estimates of total shareholder cost.
Measurement of total shareholder cost requires
combining sales loads with expense ratios. Because
sales loads are one-time payments, they cannot be
added directly to the recurrent, annual expense
ratio. Instead, the sales load must be converted to
the equivalent of an annual charge over the esti-
mated life of the investment. This section describes
the procedure used to accomplish this task. It
starts with an explanation of the method for calcu-
lating the specific components of the cost incurred
by a single equity fund investor, and it then gener-
alizes the method to all new investors in a fund
and to all equity funds. Readers not wishing to
review the technical aspects of constructing such
a methodology may wish to turn directly to
Section IV.
Section IV analyzes levels and trends in total
shareholder cost for equity funds over the 1980-
1997 period. This analysis finds that the total cost
of investing in equity mutual funds fell more than
one-third over the 18-year period. The section also
analyzes the factors that led to the decline in total
shareholder cost during this period: investor
preferences for lower-cost funds and actions by
Perspect ive /pag e 3
3 A mutual fund owner may pay fees not set by the mutual fund organization. For example, an investor acquiring a fund through a wrap program, a fee-based financialadvisor, or a personal trust would pay an annual fee based upon all of the investor’s assets held in the program. Because these costs are not set or determined by fundcompanies, they are not included in total shareholder cost.4 The 12b-1 fee can be used to pay advertising and marketing expenses and to compensate sales professionals and others for assisting investors during the sale of shares. Thefee also may be used to compensate third parties for servicing shareholder accounts.
fund indirectly bear the cost. These fund expenses are aggregated and
typically presented as a percentage of assets, known as the expense ratio.5
Investors in load funds also directly pay a one-time sales charge.
These charges are paid when the shares are either purchased or redeemed.
The former arrangement is known as a front-end sales load; the latter a
deferred sales load. Both the front-end sales load and the deferred sales
load are expressed as a percentage of the purchase price of the shares.
Deferred sales loads typically decrease with the length of time the shares
are held and eventually reach zero. (Thus, they are referred to as
contingent deferred sales loads.) Sales loads primarily compensate sales
professionals for assistance and advice provided to investors.6
Computation of Total Shareholder Cost
Total shareholder cost is measured as the dollar value of fees, expenses,
and sales loads incurred during a given year by buyers of a fund in that
year, expressed as a percentage of the amount invested in the fund. For a
no-load fund, the expense ratio is the sole component of cost, since no
sales load is incurred. For a load fund, the sales load must be included
along with the expense ratio. Since the sales load is a one-time payment, it
cannot be directly added to the recurrent, annual expense ratio. Rather, it
must be converted to the equivalent of annual payments spread over the
period the investor holds the fund. The annualized or “annuitized” sales
load, expressed as a percent of fund sales, can then be added to the
expense ratio to calculate the total cost of investing for load fund
purchasers.
Other Measures of Ownership Cost
Total shareholder cost captures all annual fees, including the annuitized
load, paid by investors purchasing fund shares. For any fund, this measure
is the price at which the fund offers its services to investors, and it can be
used to track trends in fees and expenses that reflect actions of the fund.
Although other measures have been used to determine the annual cost
borne by an average shareholder, these approaches have shortcomings that
are not shared by the total shareholder cost measurement. Two of these
measures are identified below and contrasted with total shareholder cost.
Perspect ive /pag e 4
5 Brokerage commissions and other securities transactions costs relating to fund portfolio securities, such as the bid-ask spread, are reflected in securities prices and thus notincluded directly in fund expenses. Data and information on such costs are not easily obtained for the period analyzed in the paper and thus are not included in themeasurement of total shareholder cost.6 Shareholders also may make direct payment for account maintenance fees and for services such as checkwriting. Data on such payments are not available and thus notincluded in the measurement of total shareholder cost. Some funds also charge redemption fees payable to the fund that are applied to the value of the shares at the time of the redemption. These charges generally affect only short-term investors. Information on redemption fees is not readily available and thus is not included in themeasurement of total shareholder cost. The likely effect of all such fees on total shareholder cost would, in any event, be de minimis.7 Mutual Fund Shareholders: People Behind the Growth, Investment Company Institute, Washington, DC, 1996, p. 43.8 Investment Company Institute, unpublished data from mutual fund database.
Expense ratio. The expense ratio is frequently used
to measure and analyze the cost of mutual fund
ownership. The expense ratio, however, has a
significant limitation: It does not include sales loads.
This is a critical omission, as survey evidence shows
that roughly two-thirds of retail investors buy
mutual funds primarily through sources offering
load funds.7 Furthermore, load funds accounted for
more than half of all new sales of equity funds in
1997 and represented 60 percent of equity fund
assets at the end of 1997.8 Consequently, the
expense ratio is not a representative measure of the
cost of fund ownership. Its use to characterize trends
in ownership cost, unless restricted to no-load funds,
is likely to be misleading.
Costs incurred by existing owners of a fund.
Another approach to analyzing ownership cost is
measuring all fees paid by existing shareholders who
hold a fund in a particular year. This approach esti-
mates the dollar amount of fund expenses and any
annuitized sales loads paid by existing shareholders,
expressed as a percentage of total assets.
This measurement has two shortcomings. First, it
includes loads paid by buyers in previous years, in
addition to loads incurred by current buyers. The
loads of previous buyers, however, may differ from
loads available to current buyers. As a result, this
measure could be a misleading indicator of the
current terms on which the fund is offering shares to
the public. Second, for a load fund, the measure
could suggest that ownership costs were changing
even when loads and expense ratios were not. For
example, an increase in sales, and hence an increase
in the dollar amount of sales loads, could cause
the measured cost of ownership for all the fund’s
investors to increase even though the fund had not
changed its sales load or altered its expense ratio.
Similarly, a drop in sales could produce a lower
ownership cost even though the fund had not
changed, or may have even raised, its sales load or
expense ratio.
III. DEVELOPMENT OF THE TOTALSHAREHOLDER COST MEASUREBy definition, total shareholder cost is the sum
of the expense ratio and the annuitized load. In
this section, detailed consideration is given to
the measurement and estimation of these two
components of shareholder cost.
The section begins with an explanation of the
procedure for calculating total shareholder cost and
its two components for a single investor purchasing
mutual fund shares. It then discusses the applica-
tion of the procedure to all new investors in the
fund and describes the use of a sales-weighted aver-
age of total shareholder costs for individual funds to
form a cost measure for all equity funds. The analy-
sis uses a sales-weighted average because total share-
holder cost only measures the cost to buyers in a
particular year. The sales-weighted average also
reflects actual investment choices made by
investors. The section concludes with a description
of the sources of the data used in the estimation of
total shareholder cost.
The material in this section is technical. Readers
not interested in such aspects of the estimation
method may wish to proceed to Section IV on
page 9, which contains the findings.
Perspect ive /pag e 5
Annuitized Sales Load for a New Investor with a Fixed Holding Period
Annuitizing the sales load is most simply illustrated by considering an
investor who buys and holds load fund shares for a fixed number of years
without making any partial redemptions. Under these conditions, the
annuitization procedure depends upon whether the sales charge is a front-
end load or contingent deferred load.
Annuitizing the front-end load. An investor buying a fund with a
front-end load pays the load in a lump sum at the time of purchase. To
spread the load across the period the shares are held, assume the investor is
allowed to pay the load in equal, annual installments rather than in one
lump sum. In effect, the investor is borrowing the cash necessary to pay
the front-end load and repaying the loan over the life of the investment.
The annual loan payment reflects both the amount borrowed and interest
on the loan.
To illustrate the cost of the load over the life of the investment, assume
an investor purchased $100 worth of shares from a fund with a 5 percent
front-end load and held the shares for 10 years. At an interest rate of 6
percent, paying the $5.00 sales load up front is equivalent to making
annual payments of $0.68 over the 10-year period.9 Put another way,
the annuitized value of the 5 percent sales load, as a percentage of the
investor’s initial $100 purchase, is 0.68 percent per year over the 10-year
holding period.10 If the fund had an annual expense ratio of 1.10
percent, the investor would have an annual total cost of fund ownership
of 1.78 percent.11
Annuitizing the contingent deferred load. The procedure used to
annuitize a contingent deferred sales load differs from that used for a
front-end load. The difference is that payment of the sales charge does
not occur at the time of the purchase but at the end of the holding period.
To convert the deferred sales load to an annual payment, the investor is
treated as though he or she prepays the load in equal annual installments.
The amount of the annual prepayment reflects the sales load less interest
earned on the prepayments.
9 See Figure 2 for the formula.10 The original investment in the fund is not $100 but $95. As a percentage of $95, the annuitized sales charge would be 0.72 percent. In the estimates presented inSection IV, annuitized loads are based upon the actual amount invested.11 The definition of total shareholder cost implies that a prospective investor forms an expectation of cost over the entire life of the investment. The annuitized load reflectsthat multi-year expectation. If the investor assumes that the expense ratio is constant over the holding period, then the total shareholder cost ratio is the appropriatemeasure for investment decisions. The SEC-required cumulative cost figures in the prospectus similarly assume that the expense ratio is constant through time, as doTufano and Sevick, “Board Structure and Fee-Setting,” p. 342.
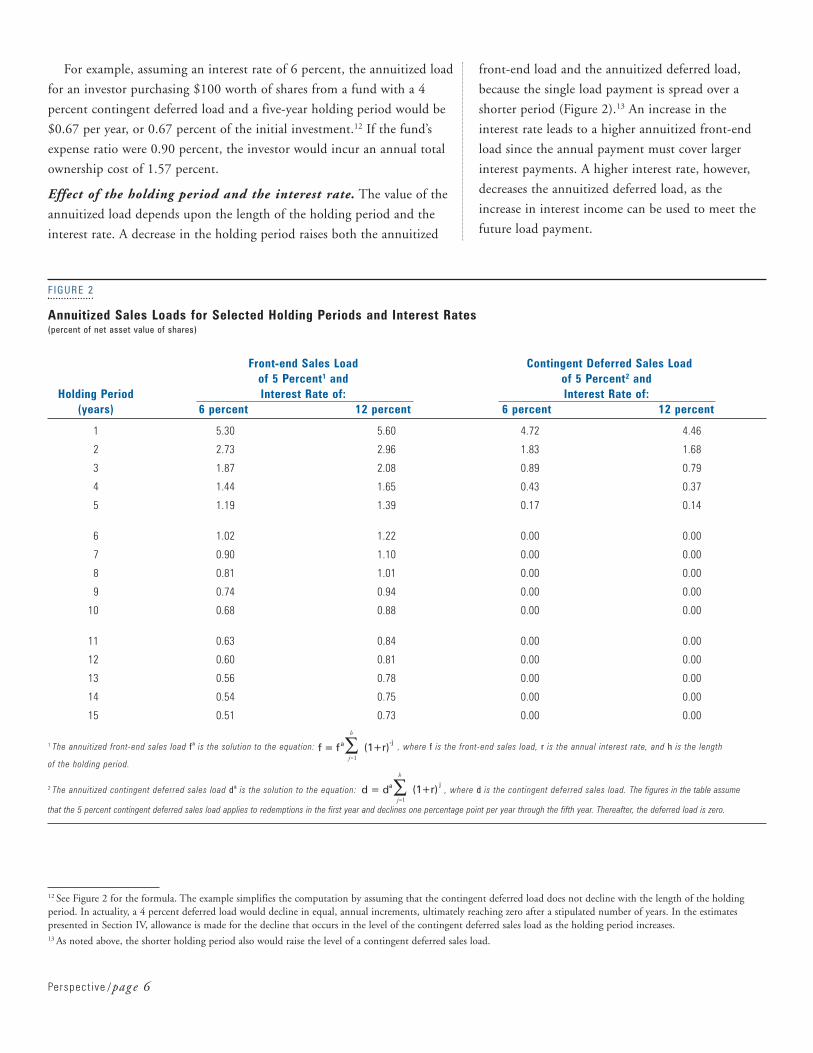
For example, assuming an interest rate of 6 percent, the annuitized load
for an investor purchasing $100 worth of shares from a fund with a 4
percent contingent deferred load and a five-year holding period would be
$0.67 per year, or 0.67 percent of the initial investment.12 If the fund’s
expense ratio were 0.90 percent, the investor would incur an annual total
ownership cost of 1.57 percent.
Effect of the holding period and the interest rate. The value of the
annuitized load depends upon the length of the holding period and the
interest rate. A decrease in the holding period raises both the annuitized
Perspect ive /pag e 6
front-end load and the annuitized deferred load,
because the single load payment is spread over a
shorter period (Figure 2).13 An increase in the
interest rate leads to a higher annuitized front-end
load since the annual payment must cover larger
interest payments. A higher interest rate, however,
decreases the annuitized deferred load, as the
increase in interest income can be used to meet the
future load payment.
12 See Figure 2 for the formula. The example simplifies the computation by assuming that the contingent deferred load does not decline with the length of the holdingperiod. In actuality, a 4 percent deferred load would decline in equal, annual increments, ultimately reaching zero after a stipulated number of years. In the estimatespresented in Section IV, allowance is made for the decline that occurs in the level of the contingent deferred sales load as the holding period increases.13 As noted above, the shorter holding period also would raise the level of a contingent deferred sales load.
FIGURE 2
Annuitized Sales Loads for Selected Holding Periods and Interest Rates(percent of net asset value of shares)
Front-end Sales Load Contingent Deferred Sales Load of 5 Percent1 and of 5 Percent2 and
Holding Period Interest Rate of: Interest Rate of:(years) 6 percent 12 percent 6 percent 12 percent
1 5.30 5.60 4.72 4.46
2 2.73 2.96 1.83 1.68
3 1.87 2.08 0.89 0.79
4 1.44 1.65 0.43 0.37
5 1.19 1.39 0.17 0.14
6 1.02 1.22 0.00 0.00
7 0.90 1.10 0.00 0.00
8 0.81 1.01 0.00 0.00
9 0.74 0.94 0.00 0.00
10 0.68 0.88 0.00 0.00
11 0.63 0.84 0.00 0.00
12 0.60 0.81 0.00 0.00
13 0.56 0.78 0.00 0.00
14 0.54 0.75 0.00 0.00
15 0.51 0.73 0.00 0.00
1 The annuitized front-end sales load fa is the solution to the equation: , where f is the front-end sales load, r is the annual interest rate, and h is the length
2 The annuitized contingent deferred sales load da is the solution to the equation: , where d is the contingent deferred sales load. The figures in the table assume d = da
h
j=1(1+r)
j
f = fa
h
j=1(1+r)
-j
of the holding period.
that the 5 percent contingent deferred sales load applies to redemptions in the first year and declines one percentage point per year through the fifth year. Thereafter, the deferred load is zero.
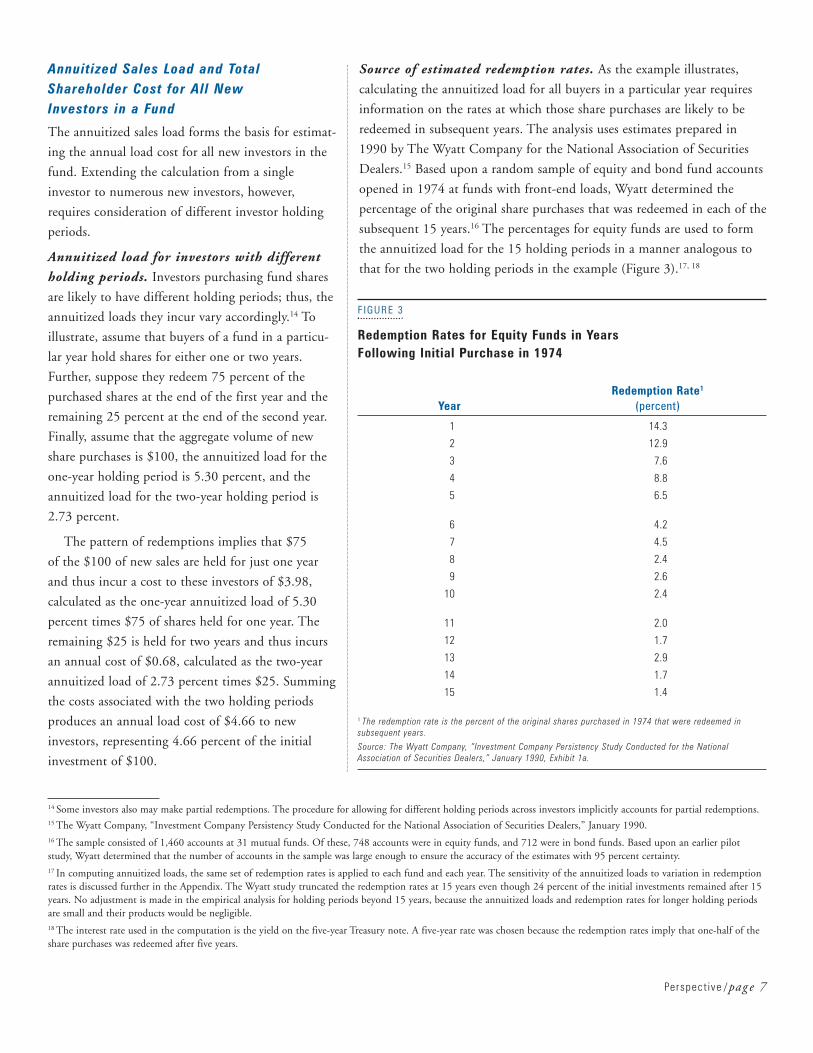
Source of estimated redemption rates. As the example illustrates,
calculating the annuitized load for all buyers in a particular year requires
information on the rates at which those share purchases are likely to be
redeemed in subsequent years. The analysis uses estimates prepared in
1990 by The Wyatt Company for the National Association of Securities
Dealers.15 Based upon a random sample of equity and bond fund accounts
opened in 1974 at funds with front-end loads, Wyatt determined the
percentage of the original share purchases that was redeemed in each of the
subsequent 15 years.16 The percentages for equity funds are used to form
the annuitized load for the 15 holding periods in a manner analogous to
that for the two holding periods in the example (Figure 3).17, 18
Annuitized Sales Load and TotalShareholder Cost for All New Investors in a Fund
The annuitized sales load forms the basis for estimat-
ing the annual load cost for all new investors in the
fund. Extending the calculation from a single
investor to numerous new investors, however,
requires consideration of different investor holding
periods.
Annuitized load for investors with different
holding periods. Investors purchasing fund shares
are likely to have different holding periods; thus, the
annuitized loads they incur vary accordingly.14 To
illustrate, assume that buyers of a fund in a particu-
lar year hold shares for either one or two years.
Further, suppose they redeem 75 percent of the
purchased shares at the end of the first year and the
remaining 25 percent at the end of the second year.
Finally, assume that the aggregate volume of new
share purchases is $100, the annuitized load for the
one-year holding period is 5.30 percent, and the
annuitized load for the two-year holding period is
2.73 percent.
The pattern of redemptions implies that $75
of the $100 of new sales are held for just one year
and thus incur a cost to these investors of $3.98,
calculated as the one-year annuitized load of 5.30
percent times $75 of shares held for one year. The
remaining $25 is held for two years and thus incurs
an annual cost of $0.68, calculated as the two-year
annuitized load of 2.73 percent times $25. Summing
the costs associated with the two holding periods
produces an annual load cost of $4.66 to new
investors, representing 4.66 percent of the initial
investment of $100.
Perspect ive /pag e 7
14 Some investors also may make partial redemptions. The procedure for allowing for different holding periods across investors implicitly accounts for partial redemptions. 15 The Wyatt Company, “Investment Company Persistency Study Conducted for the National Association of Securities Dealers,” January 1990.16 The sample consisted of 1,460 accounts at 31 mutual funds. Of these, 748 accounts were in equity funds, and 712 were in bond funds. Based upon an earlier pilotstudy, Wyatt determined that the number of accounts in the sample was large enough to ensure the accuracy of the estimates with 95 percent certainty.17 In computing annuitized loads, the same set of redemption rates is applied to each fund and each year. The sensitivity of the annuitized loads to variation in redemptionrates is discussed further in the Appendix. The Wyatt study truncated the redemption rates at 15 years even though 24 percent of the initial investments remained after 15years. No adjustment is made in the empirical analysis for holding periods beyond 15 years, because the annuitized loads and redemption rates for longer holding periodsare small and their products would be negligible.18 The interest rate used in the computation is the yield on the five-year Treasury note. A five-year rate was chosen because the redemption rates imply that one-half of theshare purchases was redeemed after five years.
FIGURE 3
Redemption Rates for Equity Funds in Years Following Initial Purchase in 1974
Redemption Rate1
Year (percent)
1 14.3
2 12.9
3 7.6
4 8.8
5 6.5
6 4.2
7 4.5
8 2.4
9 2.6
10 2.4
11 2.0
12 1.7
13 2.9
14 1.7
15 1.4
1 The redemption rate is the percent of the original shares purchased in 1974 that were redeemed insubsequent years.
Source: The Wyatt Company, “Investment Company Persistency Study Conducted for the NationalAssociation of Securities Dealers,” January 1990, Exhibit 1a.
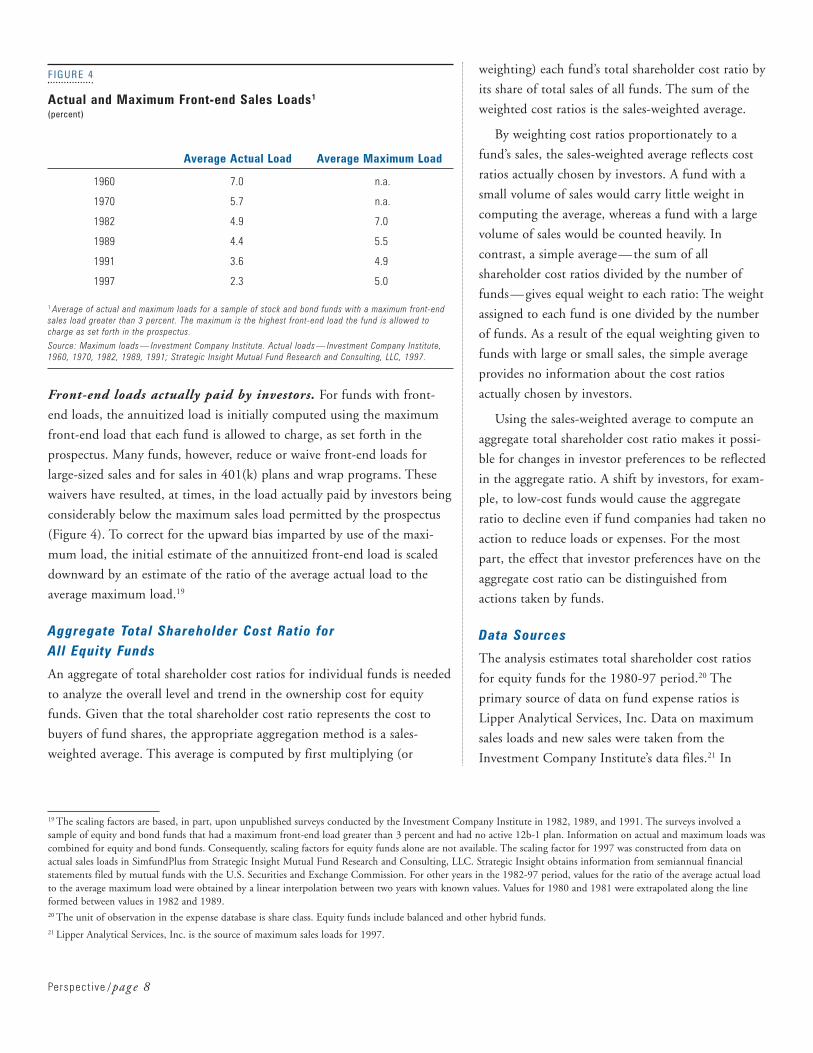
Front-end loads actually paid by investors. For funds with front-
end loads, the annuitized load is initially computed using the maximum
front-end load that each fund is allowed to charge, as set forth in the
prospectus. Many funds, however, reduce or waive front-end loads for
large-sized sales and for sales in 401(k) plans and wrap programs. These
waivers have resulted, at times, in the load actually paid by investors being
considerably below the maximum sales load permitted by the prospectus
(Figure 4). To correct for the upward bias imparted by use of the maxi-
mum load, the initial estimate of the annuitized front-end load is scaled
downward by an estimate of the ratio of the average actual load to the
average maximum load.19
Aggregate Total Shareholder Cost Ratio for All Equity Funds
An aggregate of total shareholder cost ratios for individual funds is needed
to analyze the overall level and trend in the ownership cost for equity
funds. Given that the total shareholder cost ratio represents the cost to
buyers of fund shares, the appropriate aggregation method is a sales-
weighted average. This average is computed by first multiplying (or
weighting) each fund’s total shareholder cost ratio by
its share of total sales of all funds. The sum of the
weighted cost ratios is the sales-weighted average.
By weighting cost ratios proportionately to a
fund’s sales, the sales-weighted average reflects cost
ratios actually chosen by investors. A fund with a
small volume of sales would carry little weight in
computing the average, whereas a fund with a large
volume of sales would be counted heavily. In
contrast, a simple average—the sum of all
shareholder cost ratios divided by the number of
funds—gives equal weight to each ratio: The weight
assigned to each fund is one divided by the number
of funds. As a result of the equal weighting given to
funds with large or small sales, the simple average
provides no information about the cost ratios
actually chosen by investors.
Using the sales-weighted average to compute an
aggregate total shareholder cost ratio makes it possi-
ble for changes in investor preferences to be reflected
in the aggregate ratio. A shift by investors, for exam-
ple, to low-cost funds would cause the aggregate
ratio to decline even if fund companies had taken no
action to reduce loads or expenses. For the most
part, the effect that investor preferences have on the
aggregate cost ratio can be distinguished from
actions taken by funds.
Data Sources
The analysis estimates total shareholder cost ratios
for equity funds for the 1980-97 period.20 The
primary source of data on fund expense ratios is
Lipper Analytical Services, Inc. Data on maximum
sales loads and new sales were taken from the
Investment Company Institute’s data files.21 In
Perspect ive /pag e 8
19 The scaling factors are based, in part, upon unpublished surveys conducted by the Investment Company Institute in 1982, 1989, and 1991. The surveys involved asample of equity and bond funds that had a maximum front-end load greater than 3 percent and had no active 12b-1 plan. Information on actual and maximum loads wascombined for equity and bond funds. Consequently, scaling factors for equity funds alone are not available. The scaling factor for 1997 was constructed from data onactual sales loads in SimfundPlus from Strategic Insight Mutual Fund Research and Consulting, LLC. Strategic Insight obtains information from semiannual financialstatements filed by mutual funds with the U.S. Securities and Exchange Commission. For other years in the 1982-97 period, values for the ratio of the average actual loadto the average maximum load were obtained by a linear interpolation between two years with known values. Values for 1980 and 1981 were extrapolated along the lineformed between values in 1982 and 1989.20 The unit of observation in the expense database is share class. Equity funds include balanced and other hybrid funds.21 Lipper Analytical Services, Inc. is the source of maximum sales loads for 1997.
FIGURE 4
Actual and Maximum Front-end Sales Loads1
(percent)
Average Actual Load Average Maximum Load
1960 7.0 n.a.
1970 5.7 n.a.
1982 4.9 7.0
1989 4.4 5.5
1991 3.6 4.9
1997 2.3 5.0
1 Average of actual and maximum loads for a sample of stock and bond funds with a maximum front-endsales load greater than 3 percent. The maximum is the highest front-end load the fund is allowed tocharge as set forth in the prospectus.
Source: Maximum loads — Investment Company Institute. Actual loads — Investment Company Institute,1960, 1970, 1982, 1989, 1991; Strategic Insight Mutual Fund Research and Consulting, LLC, 1997.
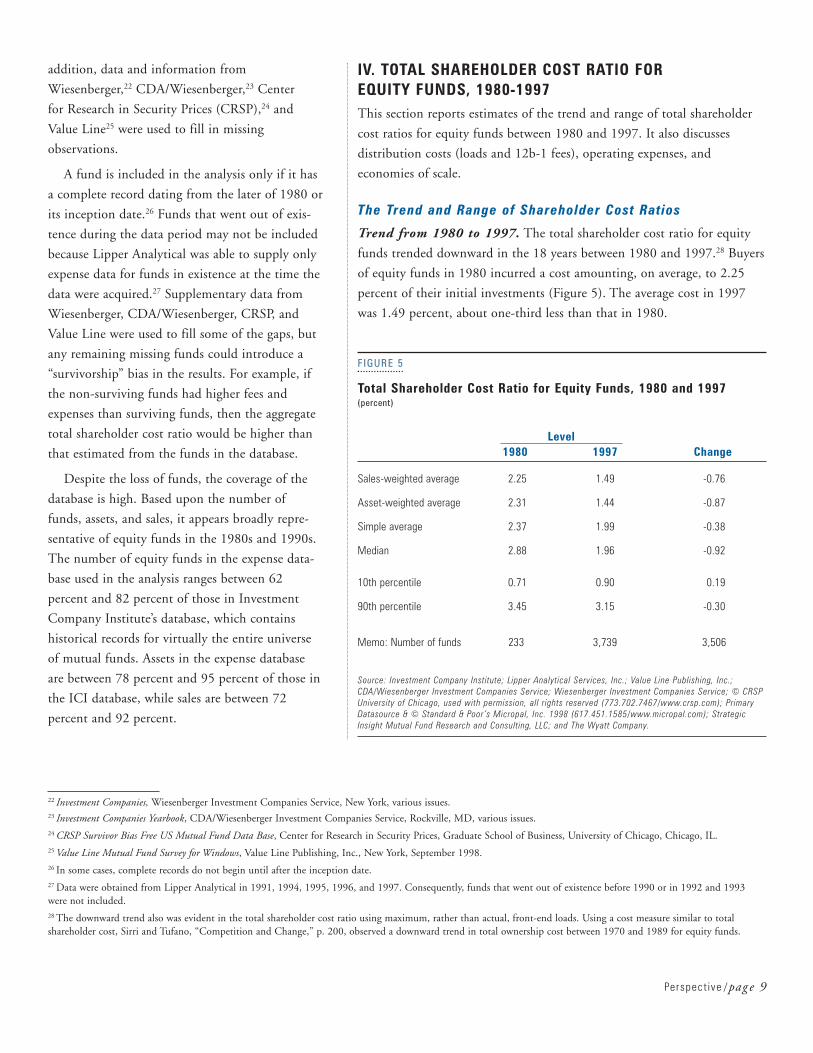
IV. TOTAL SHAREHOLDER COST RATIO FOR EQUITY FUNDS, 1980-1997This section reports estimates of the trend and range of total shareholder
cost ratios for equity funds between 1980 and 1997. It also discusses
distribution costs (loads and 12b-1 fees), operating expenses, and
economies of scale.
The Trend and Range of Shareholder Cost Ratios
Trend from 1980 to 1997. The total shareholder cost ratio for equity
funds trended downward in the 18 years between 1980 and 1997.28 Buyers
of equity funds in 1980 incurred a cost amounting, on average, to 2.25
percent of their initial investments (Figure 5). The average cost in 1997
was 1.49 percent, about one-third less than that in 1980.
addition, data and information from
Wiesenberger,22 CDA/Wiesenberger,23 Center
for Research in Security Prices (CRSP),24 and
Value Line25 were used to fill in missing
observations.
A fund is included in the analysis only if it has
a complete record dating from the later of 1980 or
its inception date.26 Funds that went out of exis-
tence during the data period may not be included
because Lipper Analytical was able to supply only
expense data for funds in existence at the time the
data were acquired.27 Supplementary data from
Wiesenberger, CDA/Wiesenberger, CRSP, and
Value Line were used to fill some of the gaps, but
any remaining missing funds could introduce a
“survivorship” bias in the results. For example, if
the non-surviving funds had higher fees and
expenses than surviving funds, then the aggregate
total shareholder cost ratio would be higher than
that estimated from the funds in the database.
Despite the loss of funds, the coverage of the
database is high. Based upon the number of
funds, assets, and sales, it appears broadly repre-
sentative of equity funds in the 1980s and 1990s.
The number of equity funds in the expense data-
base used in the analysis ranges between 62
percent and 82 percent of those in Investment
Company Institute’s database, which contains
historical records for virtually the entire universe
of mutual funds. Assets in the expense database
are between 78 percent and 95 percent of those in
the ICI database, while sales are between 72
percent and 92 percent.
Perspect ive /pag e 9
22 Investment Companies, Wiesenberger Investment Companies Service, New York, various issues.23 Investment Companies Yearbook, CDA/Wiesenberger Investment Companies Service, Rockville, MD, various issues.24 CRSP Survivor Bias Free US Mutual Fund Data Base, Center for Research in Security Prices, Graduate School of Business, University of Chicago, Chicago, IL.25 Value Line Mutual Fund Survey for Windows, Value Line Publishing, Inc., New York, September 1998.26 In some cases, complete records do not begin until after the inception date.27 Data were obtained from Lipper Analytical in 1991, 1994, 1995, 1996, and 1997. Consequently, funds that went out of existence before 1990 or in 1992 and 1993were not included.28 The downward trend also was evident in the total shareholder cost ratio using maximum, rather than actual, front-end loads. Using a cost measure similar to totalshareholder cost, Sirri and Tufano, “Competition and Change,” p. 200, observed a downward trend in total ownership cost between 1970 and 1989 for equity funds.
FIGURE 5
Total Shareholder Cost Ratio for Equity Funds, 1980 and 1997(percent)
Level1980 1997 Change
Sales-weighted average 2.25 1.49 -0.76
Asset-weighted average 2.31 1.44 -0.87
Simple average 2.37 1.99 -0.38
Median 2.88 1.96 -0.92
10th percentile 0.71 0.90 0.19
90th percentile 3.45 3.15 -0.30
Memo: Number of funds 233 3,739 3,506
Source: Investment Company Institute; Lipper Analytical Services, Inc.; Value Line Publishing, Inc.;CDA/Wiesenberger Investment Companies Service; Wiesenberger Investment Companies Service; © CRSPUniversity of Chicago, used with permission, all rights reserved (773.702.7467/www.crsp.com); PrimaryDatasource & © Standard & Poor ’s Micropal, Inc. 1998 (617.451.1585/www.micropal.com); StrategicInsight Mutual Fund Research and Consulting, LLC; and The Wyatt Company.
The decrease in ownership cost also is evident in other statistical
measures. The asset-weighted average of total shareholder cost ratios
declined nearly 40 percent, from 2.31 percent in 1980 to 1.44 percent in
1997.29 In addition, the simple average fell from 2.37 percent to 1.99
percent, while the median of the total cost ratio dropped from 2.88
percent to 1.96 percent. In sum, all of these measures point to the
conclusion that the cost of investing in equity funds declined significantly
between 1980 and 1997.
Perspect ive /pag e 10
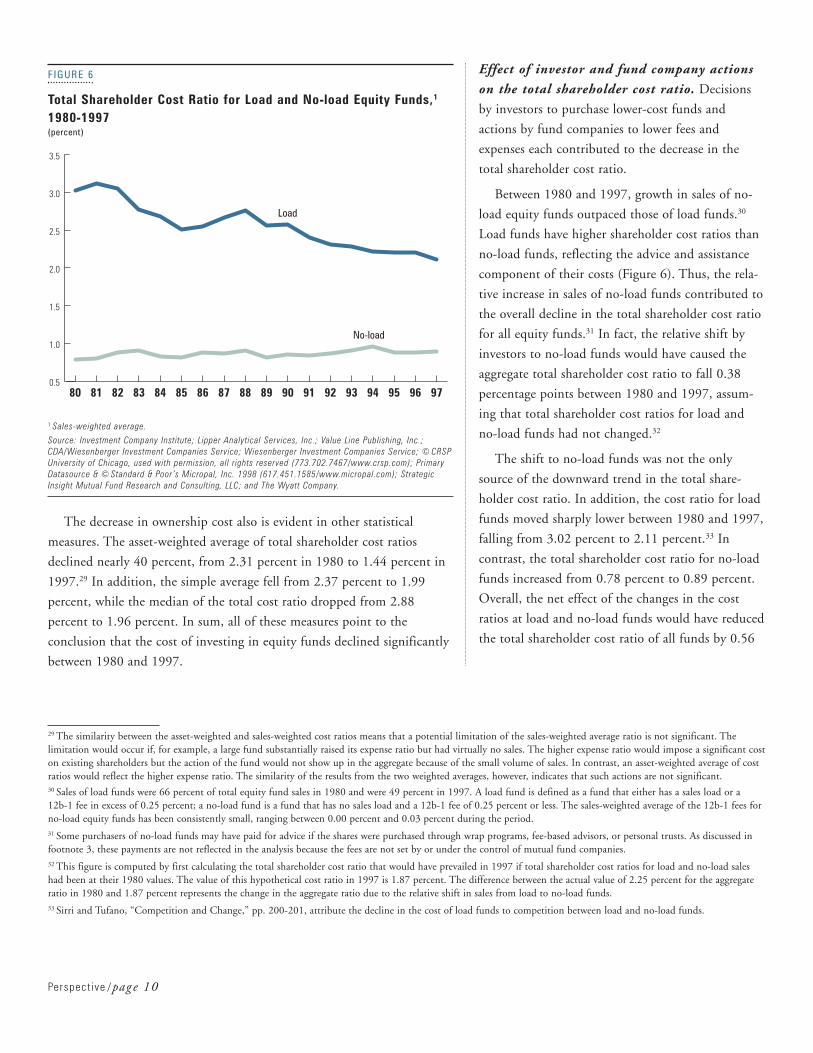
Effect of investor and fund company actions
on the total shareholder cost ratio. Decisions
by investors to purchase lower-cost funds and
actions by fund companies to lower fees and
expenses each contributed to the decrease in the
total shareholder cost ratio.
Between 1980 and 1997, growth in sales of no-
load equity funds outpaced those of load funds.30
Load funds have higher shareholder cost ratios than
no-load funds, reflecting the advice and assistance
component of their costs (Figure 6). Thus, the rela-
tive increase in sales of no-load funds contributed to
the overall decline in the total shareholder cost ratio
for all equity funds.31 In fact, the relative shift by
investors to no-load funds would have caused the
aggregate total shareholder cost ratio to fall 0.38
percentage points between 1980 and 1997, assum-
ing that total shareholder cost ratios for load and
no-load funds had not changed.32
The shift to no-load funds was not the only
source of the downward trend in the total share-
holder cost ratio. In addition, the cost ratio for load
funds moved sharply lower between 1980 and 1997,
falling from 3.02 percent to 2.11 percent.33 In
contrast, the total shareholder cost ratio for no-load
funds increased from 0.78 percent to 0.89 percent.
Overall, the net effect of the changes in the cost
ratios at load and no-load funds would have reduced
the total shareholder cost ratio of all funds by 0.56
29 The similarity between the asset-weighted and sales-weighted cost ratios means that a potential limitation of the sales-weighted average ratio is not significant. Thelimitation would occur if, for example, a large fund substantially raised its expense ratio but had virtually no sales. The higher expense ratio would impose a significant coston existing shareholders but the action of the fund would not show up in the aggregate because of the small volume of sales. In contrast, an asset-weighted average of costratios would reflect the higher expense ratio. The similarity of the results from the two weighted averages, however, indicates that such actions are not significant.30 Sales of load funds were 66 percent of total equity fund sales in 1980 and were 49 percent in 1997. A load fund is defined as a fund that either has a sales load or a 12b-1 fee in excess of 0.25 percent; a no-load fund is a fund that has no sales load and a 12b-1 fee of 0.25 percent or less. The sales-weighted average of the 12b-1 fees forno-load equity funds has been consistently small, ranging between 0.00 percent and 0.03 percent during the period. 31 Some purchasers of no-load funds may have paid for advice if the shares were purchased through wrap programs, fee-based advisors, or personal trusts. As discussed infootnote 3, these payments are not reflected in the analysis because the fees are not set by or under the control of mutual fund companies.32 This figure is computed by first calculating the total shareholder cost ratio that would have prevailed in 1997 if total shareholder cost ratios for load and no-load saleshad been at their 1980 values. The value of this hypothetical cost ratio in 1997 is 1.87 percent. The difference between the actual value of 2.25 percent for the aggregateratio in 1980 and 1.87 percent represents the change in the aggregate ratio due to the relative shift in sales from load to no-load funds. 33 Sirri and Tufano, “Competition and Change,” pp. 200-201, attribute the decline in the cost of load funds to competition between load and no-load funds.
FIGURE 6
Total Shareholder Cost Ratio for Load and No-load Equity Funds,1
1980-1997(percent)
1 Sales-weighted average.
Source: Investment Company Institute; Lipper Analytical Services, Inc.; Value Line Publishing, Inc.;CDA/Wiesenberger Investment Companies Service; Wiesenberger Investment Companies Service; © CRSPUniversity of Chicago, used with permission, all rights reserved (773.702.7467/www.crsp.com); PrimaryDatasource & © Standard & Poor ’s Micropal, Inc. 1998 (617.451.1585/www.micropal.com); StrategicInsight Mutual Fund Research and Consulting, LLC; and The Wyatt Company.
No-load
Load
0.5
1.0
1.5
2.0
2.5
3.0
3.5
979695949392919089888786858483828180
percentage points, assuming that the composition of
sales between load and no-load funds had been
unchanged over the period.34
Range of total shareholder cost ratios.
Throughout the 1980s and 1990s, equity fund
investors could choose from a wide range of cost
ratios. For example, after eliminating outliers by
focusing on cost ratios between the tenth and
ninetieth percentiles, investors could select from
186 funds in 1980 with cost ratios between 0.71
percent and 3.45 percent (Figure 5). By 1997, the
range had narrowed from 0.90 percent at the tenth
percentile to 3.15 percent at the ninetieth percentile,
but the number of funds was considerably larger at
2,991. Despite the increase of the value at the tenth
percentile, more than seven times as many equity
funds in 1997 had total shareholder cost ratios below
1980’s tenth percentile of 0.71 percent.
During these years, investors tended to purchase
and hold less expensive equity funds. This tendency
is shown by the relationship between the sales-
weighted and simple averages of the total shareholder
cost ratios. In 1997, for example, the sales-weighted
average stood at 1.49 percent, compared with the
simple average of 1.99 percent. The smaller value of
the sales-weighted average can only occur because
funds with low cost ratios have large weights. This
reduces the weighted average relative to the simple
average, which assigns the same weight to all cost
ratios. Thus, the smaller value of the sales-weighted
average indicates that investors purchased, on
average, relatively less costly funds in 1997.35 This
conclusion holds for 1980 as well, when the sales-
weighted average was below the simple average.36
Perspect ive /pag e 11
34 If the shares of sales of load and no-load funds in 1997 were at their 1980 values, the aggregate total shareholder cost ratio would have been 1.69 percent. The differencebetween the actual value of 2.25 percent for the aggregate ratio in 1980 and 1.69 represents the change in the aggregate ratio due to the change in total shareholder costratios for load and no-load funds.35 See Matthew P. Fink, Statement Before the Subcommittee on Finance and Hazardous Materials, Committee on Commerce, U.S. House of Representatives, September29, 1998, pp. 7-10. The smaller values of the asset-weighted and sales-weighted averages relative to the median point to the same conclusion.36 Erik R. Sirri and Peter Tufano, “Costly Search and Mutual Fund Flows,” The Journal of Finance, 53 (1998), p. 1590, find evidence of mutual fund flows being sensitiveto fee levels and reductions in fees.37 These figures are sales-weighted averages.
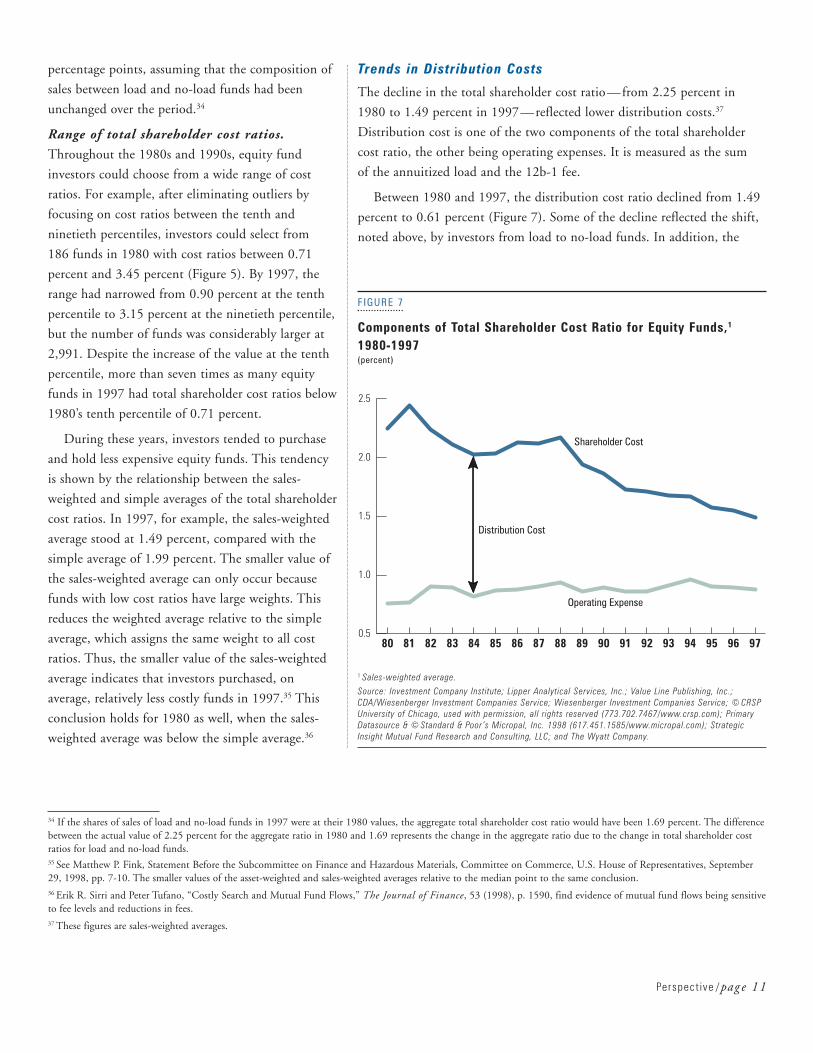
FIGURE 7
Components of Total Shareholder Cost Ratio for Equity Funds,1
1980-1997(percent)
1 Sales-weighted average.
Source: Investment Company Institute; Lipper Analytical Services, Inc.; Value Line Publishing, Inc.;CDA/Wiesenberger Investment Companies Service; Wiesenberger Investment Companies Service; © CRSPUniversity of Chicago, used with permission, all rights reserved (773.702.7467/www.crsp.com); PrimaryDatasource & © Standard & Poor ’s Micropal, Inc. 1998 (617.451.1585/www.micropal.com); StrategicInsight Mutual Fund Research and Consulting, LLC; and The Wyatt Company.
0.5
1.0
1.5
2.0
2.5
Operating Expense
Shareholder Cost
979695949392919089888786858483828180
Distribution Cost
Trends in Distribution Costs
The decline in the total shareholder cost ratio—from 2.25 percent in
1980 to 1.49 percent in 1997—reflected lower distribution costs.37
Distribution cost is one of the two components of the total shareholder
cost ratio, the other being operating expenses. It is measured as the sum
of the annuitized load and the 12b-1 fee.
Between 1980 and 1997, the distribution cost ratio declined from 1.49
percent to 0.61 percent (Figure 7). Some of the decline reflected the shift,
noted above, by investors from load to no-load funds. In addition, the
distribution costs of load funds fell significantly, from 2.28 percent to
1.23 percent (Figure 8).
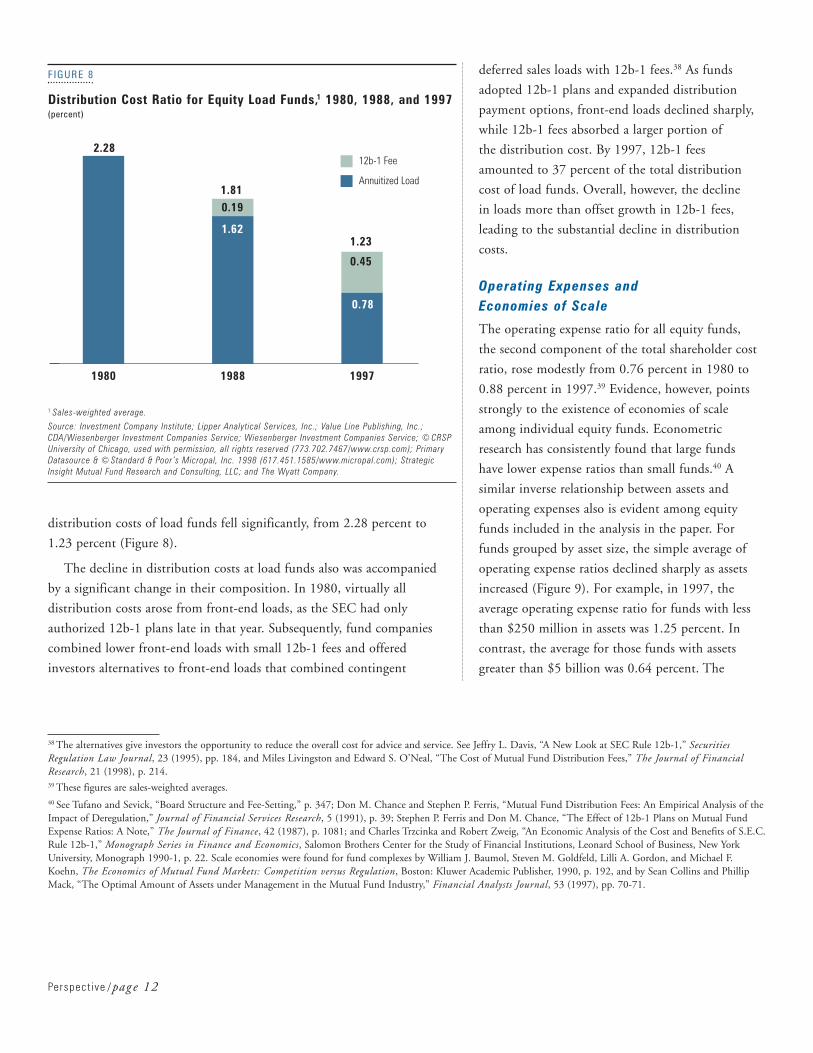
The decline in distribution costs at load funds also was accompanied
by a significant change in their composition. In 1980, virtually all
distribution costs arose from front-end loads, as the SEC had only
authorized 12b-1 plans late in that year. Subsequently, fund companies
combined lower front-end loads with small 12b-1 fees and offered
investors alternatives to front-end loads that combined contingent
deferred sales loads with 12b-1 fees.38 As funds
adopted 12b-1 plans and expanded distribution
payment options, front-end loads declined sharply,
while 12b-1 fees absorbed a larger portion of
the distribution cost. By 1997, 12b-1 fees
amounted to 37 percent of the total distribution
cost of load funds. Overall, however, the decline
in loads more than offset growth in 12b-1 fees,
leading to the substantial decline in distribution
costs.
Operating Expenses and Economies of Scale
The operating expense ratio for all equity funds,
the second component of the total shareholder cost
ratio, rose modestly from 0.76 percent in 1980 to
0.88 percent in 1997.39 Evidence, however, points
strongly to the existence of economies of scale
among individual equity funds. Econometric
research has consistently found that large funds
have lower expense ratios than small funds.40 A
similar inverse relationship between assets and
operating expenses also is evident among equity
funds included in the analysis in the paper. For
funds grouped by asset size, the simple average of
operating expense ratios declined sharply as assets
increased (Figure 9). For example, in 1997, the
average operating expense ratio for funds with less
than $250 million in assets was 1.25 percent. In
contrast, the average for those funds with assets
greater than $5 billion was 0.64 percent. The
Perspect ive /pag e 12
38 The alternatives give investors the opportunity to reduce the overall cost for advice and service. See Jeffry L. Davis, “A New Look at SEC Rule 12b-1,” SecuritiesRegulation Law Journal, 23 (1995), pp. 184, and Miles Livingston and Edward S. O’Neal, “The Cost of Mutual Fund Distribution Fees,” The Journal of FinancialResearch, 21 (1998), p. 214. 39 These figures are sales-weighted averages.40 See Tufano and Sevick, “Board Structure and Fee-Setting,” p. 347; Don M. Chance and Stephen P. Ferris, “Mutual Fund Distribution Fees: An Empirical Analysis of theImpact of Deregulation,” Journal of Financial Services Research, 5 (1991), p. 39; Stephen P. Ferris and Don M. Chance, “The Effect of 12b-1 Plans on Mutual FundExpense Ratios: A Note,” The Journal of Finance, 42 (1987), p. 1081; and Charles Trzcinka and Robert Zweig, “An Economic Analysis of the Cost and Benefits of S.E.C.Rule 12b-1,” Monograph Series in Finance and Economics, Salomon Brothers Center for the Study of Financial Institutions, Leonard School of Business, New YorkUniversity, Monograph 1990-1, p. 22. Scale economies were found for fund complexes by William J. Baumol, Steven M. Goldfeld, Lilli A. Gordon, and Michael F.Koehn, The Economics of Mutual Fund Markets: Competition versus Regulation, Boston: Kluwer Academic Publisher, 1990, p. 192, and by Sean Collins and PhillipMack, “The Optimal Amount of Assets under Management in the Mutual Fund Industry,” Financial Analysts Journal, 53 (1997), pp. 70-71.
FIGURE 8
Distribution Cost Ratio for Equity Load Funds,1 1980, 1988, and 1997(percent)
1 Sales-weighted average.
Source: Investment Company Institute; Lipper Analytical Services, Inc.; Value Line Publishing, Inc.;CDA/Wiesenberger Investment Companies Service; Wiesenberger Investment Companies Service; © CRSPUniversity of Chicago, used with permission, all rights reserved (773.702.7467/www.crsp.com); PrimaryDatasource & © Standard & Poor ’s Micropal, Inc. 1998 (617.451.1585/www.micropal.com); StrategicInsight Mutual Fund Research and Consulting, LLC; and The Wyatt Company.
199719881980
2.28
1.810.19
1.621.23
0.45
0.78
12b-1 Fee
Annuitized Load
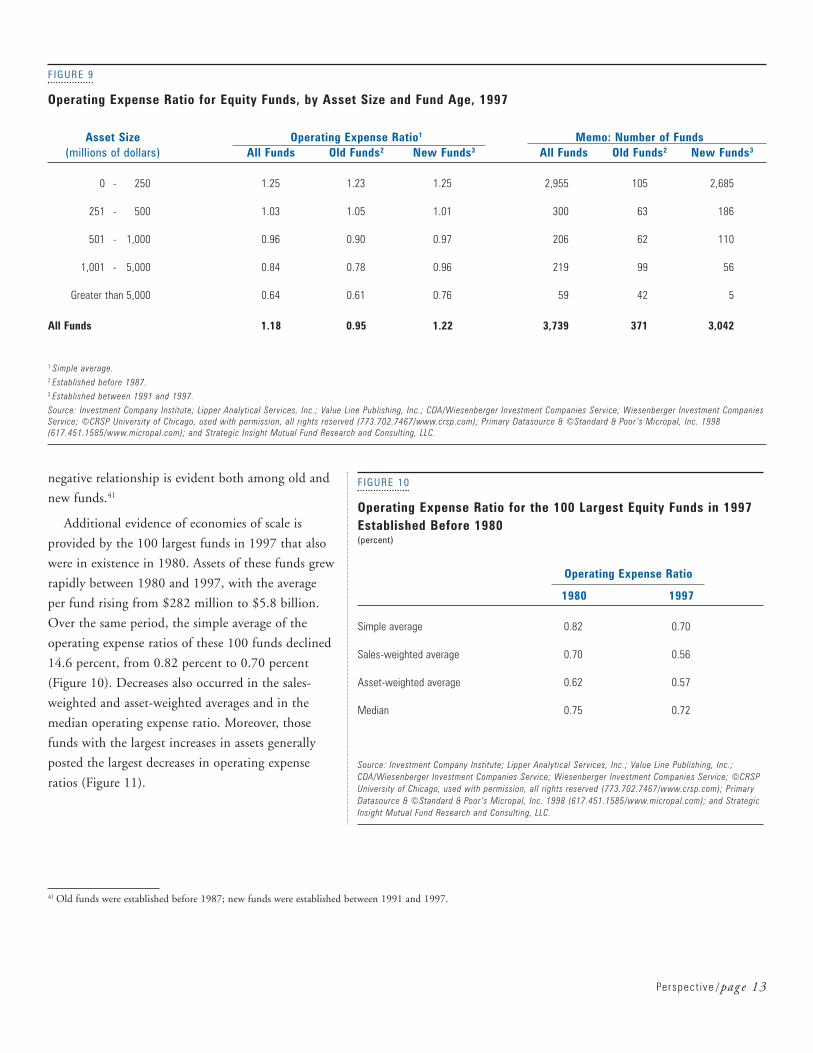
negative relationship is evident both among old and
new funds.41
Additional evidence of economies of scale is
provided by the 100 largest funds in 1997 that also
were in existence in 1980. Assets of these funds grew
rapidly between 1980 and 1997, with the average
per fund rising from $282 million to $5.8 billion.
Over the same period, the simple average of the
operating expense ratios of these 100 funds declined
14.6 percent, from 0.82 percent to 0.70 percent
(Figure 10). Decreases also occurred in the sales-
weighted and asset-weighted averages and in the
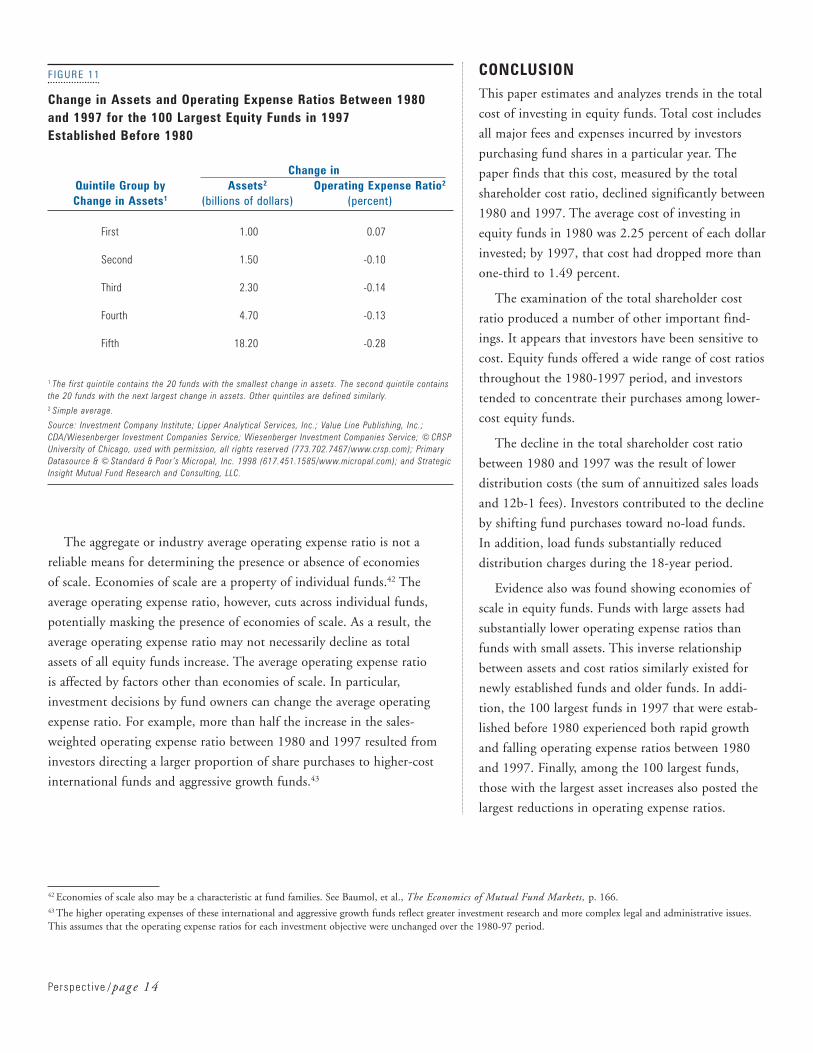
median operating expense ratio. Moreover, those
funds with the largest increases in assets generally
posted the largest decreases in operating expense
ratios (Figure 11).
Perspect ive /pag e 13
41 Old funds were established before 1987; new funds were established between 1991 and 1997.
FIGURE 9
Operating Expense Ratio for Equity Funds, by Asset Size and Fund Age, 1997
Asset Size Operating Expense Ratio1 Memo: Number of Funds(millions of dollars) All Funds Old Funds2 New Funds3 All Funds Old Funds2 New Funds3
0 - 250 1.25 1.23 1.25 2,955 105 2,685
251 - 500 1.03 1.05 1.01 300 63 186
501 - 1,000 0.96 0.90 0.97 206 62 110
1,001 - 5,000 0.84 0.78 0.96 219 99 56
Greater than 5,000 0.64 0.61 0.76 59 42 5
All Funds 1.18 0.95 1.22 3,739 371 3,042
1 Simple average.2 Established before 1987.3 Established between 1991 and 1997.
Source: Investment Company Institute; Lipper Analytical Services, Inc.; Value Line Publishing, Inc.; CDA/Wiesenberger Investment Companies Service; Wiesenberger Investment CompaniesService; ©CRSP University of Chicago, used with permission, all rights reserved (773.702.7467/www.crsp.com); Primary Datasource & ©Standard & Poor ’s Micropal, Inc. 1998(617.451.1585/www.micropal.com); and Strategic Insight Mutual Fund Research and Consulting, LLC.
FIGURE 10
Operating Expense Ratio for the 100 Largest Equity Funds in 1997Established Before 1980(percent)
Operating Expense Ratio
1980 1997
Simple average 0.82 0.70
Sales-weighted average 0.70 0.56
Asset-weighted average 0.62 0.57
Median 0.75 0.72
Source: Investment Company Institute; Lipper Analytical Services, Inc.; Value Line Publishing, Inc.;CDA/Wiesenberger Investment Companies Service; Wiesenberger Investment Companies Service; ©CRSPUniversity of Chicago, used with permission, all rights reserved (773.702.7467/www.crsp.com); PrimaryDatasource & ©Standard & Poor ’s Micropal, Inc. 1998 (617.451.1585/www.micropal.com); and StrategicInsight Mutual Fund Research and Consulting, LLC.
The aggregate or industry average operating expense ratio is not a
reliable means for determining the presence or absence of economies
of scale. Economies of scale are a property of individual funds.42 The
average operating expense ratio, however, cuts across individual funds,
potentially masking the presence of economies of scale. As a result, the
average operating expense ratio may not necessarily decline as total
assets of all equity funds increase. The average operating expense ratio
is affected by factors other than economies of scale. In particular,
investment decisions by fund owners can change the average operating
expense ratio. For example, more than half the increase in the sales-
weighted operating expense ratio between 1980 and 1997 resulted from
investors directing a larger proportion of share purchases to higher-cost
international funds and aggressive growth funds.43
Perspect ive /pag e 14
42 Economies of scale also may be a characteristic at fund families. See Baumol, et al., The Economics of Mutual Fund Markets, p. 166.43 The higher operating expenses of these international and aggressive growth funds reflect greater investment research and more complex legal and administrative issues.This assumes that the operating expense ratios for each investment objective were unchanged over the 1980-97 period.
FIGURE 11
Change in Assets and Operating Expense Ratios Between 1980 and 1997 for the 100 Largest Equity Funds in 1997 Established Before 1980
Change in Quintile Group by Assets2 Operating Expense Ratio2
Change in Assets1 (billions of dollars) (percent)
First 1.00 0.07
Second 1.50 -0.10
Third 2.30 -0.14
Fourth 4.70 -0.13
Fifth 18.20 -0.28
1 The first quintile contains the 20 funds with the smallest change in assets. The second quintile containsthe 20 funds with the next largest change in assets. Other quintiles are defined similarly.2 Simple average.
Source: Investment Company Institute; Lipper Analytical Services, Inc.; Value Line Publishing, Inc.;CDA/Wiesenberger Investment Companies Service; Wiesenberger Investment Companies Service; © CRSPUniversity of Chicago, used with permission, all rights reserved (773.702.7467/www.crsp.com); PrimaryDatasource & © Standard & Poor ’s Micropal, Inc. 1998 (617.451.1585/www.micropal.com); and StrategicInsight Mutual Fund Research and Consulting, LLC.
CONCLUSIONThis paper estimates and analyzes trends in the total
cost of investing in equity funds. Total cost includes
all major fees and expenses incurred by investors
purchasing fund shares in a particular year. The
paper finds that this cost, measured by the total
shareholder cost ratio, declined significantly between
1980 and 1997. The average cost of investing in
equity funds in 1980 was 2.25 percent of each dollar
invested; by 1997, that cost had dropped more than
one-third to 1.49 percent.
The examination of the total shareholder cost
ratio produced a number of other important find-
ings. It appears that investors have been sensitive to
cost. Equity funds offered a wide range of cost ratios
throughout the 1980-1997 period, and investors
tended to concentrate their purchases among lower-
cost equity funds.
The decline in the total shareholder cost ratio
between 1980 and 1997 was the result of lower
distribution costs (the sum of annuitized sales loads
and 12b-1 fees). Investors contributed to the decline
by shifting fund purchases toward no-load funds.
In addition, load funds substantially reduced
distribution charges during the 18-year period.
Evidence also was found showing economies of
scale in equity funds. Funds with large assets had
substantially lower operating expense ratios than
funds with small assets. This inverse relationship
between assets and cost ratios similarly existed for
newly established funds and older funds. In addi-
tion, the 100 largest funds in 1997 that were estab-
lished before 1980 experienced both rapid growth
and falling operating expense ratios between 1980
and 1997. Finally, among the 100 largest funds,
those with the largest asset increases also posted the
largest reductions in operating expense ratios.
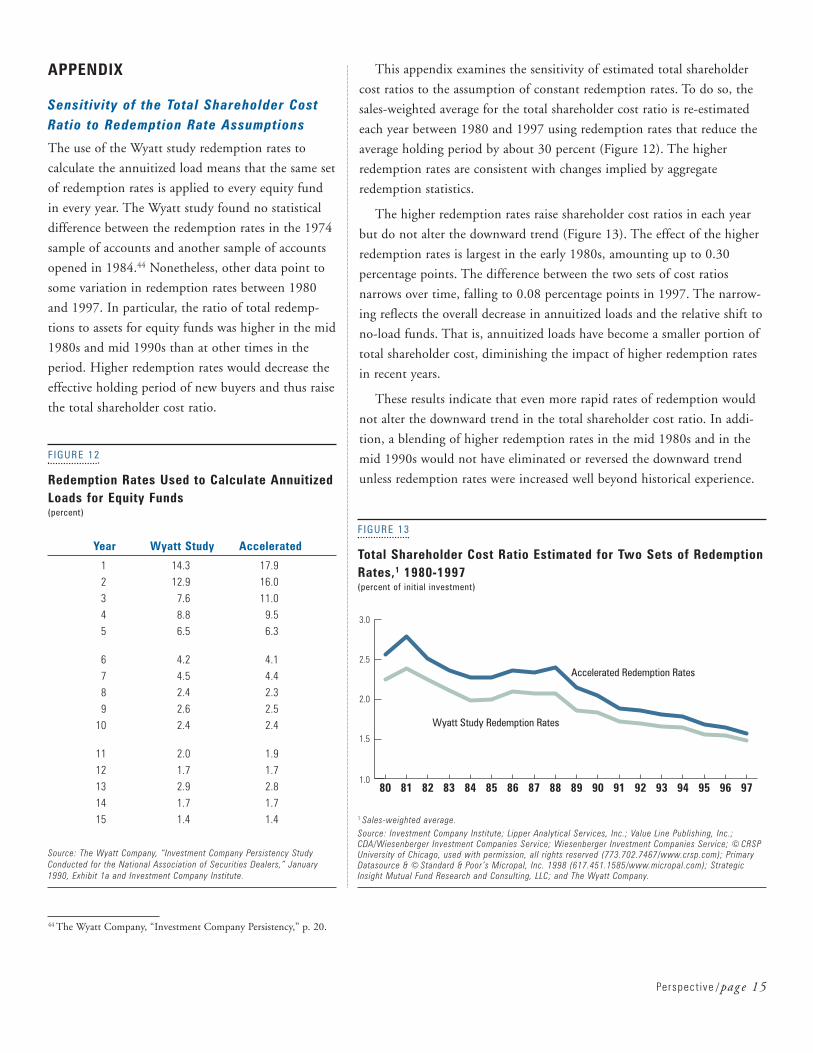
This appendix examines the sensitivity of estimated total shareholder
cost ratios to the assumption of constant redemption rates. To do so, the
sales-weighted average for the total shareholder cost ratio is re-estimated
each year between 1980 and 1997 using redemption rates that reduce the
average holding period by about 30 percent (Figure 12). The higher
redemption rates are consistent with changes implied by aggregate
redemption statistics.
The higher redemption rates raise shareholder cost ratios in each year
but do not alter the downward trend (Figure 13). The effect of the higher
redemption rates is largest in the early 1980s, amounting up to 0.30
percentage points. The difference between the two sets of cost ratios
narrows over time, falling to 0.08 percentage points in 1997. The narrow-
ing reflects the overall decrease in annuitized loads and the relative shift to
no-load funds. That is, annuitized loads have become a smaller portion of
total shareholder cost, diminishing the impact of higher redemption rates
in recent years.
These results indicate that even more rapid rates of redemption would
not alter the downward trend in the total shareholder cost ratio. In addi-
tion, a blending of higher redemption rates in the mid 1980s and in the
mid 1990s would not have eliminated or reversed the downward trend
unless redemption rates were increased well beyond historical experience.
APPENDIX
Sensitivity of the Total Shareholder CostRatio to Redemption Rate Assumptions
The use of the Wyatt study redemption rates to
calculate the annuitized load means that the same set
of redemption rates is applied to every equity fund
in every year. The Wyatt study found no statistical
difference between the redemption rates in the 1974
sample of accounts and another sample of accounts
opened in 1984.44 Nonetheless, other data point to
some variation in redemption rates between 1980
and 1997. In particular, the ratio of total redemp-
tions to assets for equity funds was higher in the mid
1980s and mid 1990s than at other times in the
period. Higher redemption rates would decrease the
effective holding period of new buyers and thus raise
the total shareholder cost ratio.
Perspect ive /pag e 15
FIGURE 12
Redemption Rates Used to Calculate AnnuitizedLoads for Equity Funds(percent)
Year Wyatt Study Accelerated
1 14.3 17.92 12.9 16.03 7.6 11.04 8.8 9.55 6.5 6.3
6 4.2 4.17 4.5 4.48 2.4 2.39 2.6 2.5
10 2.4 2.4
11 2.0 1.912 1.7 1.713 2.9 2.814 1.7 1.715 1.4 1.4
Source: The Wyatt Company, “Investment Company Persistency StudyConducted for the National Association of Securities Dealers,” January1990, Exhibit 1a and Investment Company Institute.
44 The Wyatt Company, “Investment Company Persistency,” p. 20.
FIGURE 13
Total Shareholder Cost Ratio Estimated for Two Sets of RedemptionRates,1 1980-1997(percent of initial investment)
1 Sales-weighted average.Source: Investment Company Institute; Lipper Analytical Services, Inc.; Value Line Publishing, Inc.;CDA/Wiesenberger Investment Companies Service; Wiesenberger Investment Companies Service; © CRSPUniversity of Chicago, used with permission, all rights reserved (773.702.7467/www.crsp.com); PrimaryDatasource & © Standard & Poor ’s Micropal, Inc. 1998 (617.451.1585/www.micropal.com); StrategicInsight Mutual Fund Research and Consulting, LLC; and The Wyatt Company.
Wyatt Study Redemption Rates
Accelerated Redemption Rates
1.0
1.5
2.0
2.5
3.0
979695949392919089888786858483828180

Copyr ight © 1998 by the Inve s tment Company Ins t i tute
Although information or data provided by independent sources is believed to be reliable, the Investment Company Institute is not responsible for its accuracy, completeness, or timeliness. Opinions expressed by independent
sources are not necessarily those of the Institute. If you have questions or comments about this material, please contact the source directly.
Back issues of Perspective by Institute staff, leading scholars, and other contributors, address public policy issues of importance
to mutual funds and their shareholders. Contact the Institute’s Public Information Department at 202/326-5945 for more
information. All issues of Perspective are also available on the Institute’s website; for an online index of issues, see
http://www.ici.org/economy/perspective.html.
Richard Marcis, Sandra West, Victoria Leonard-Chambers
Paul Schott Stevens, Amy Lancellotta
Matthew P. Fink
John D. Rea, Richard Marcis
Dr. John B. Shoven
Lawrence J. White
Sen. Robert J. Kerrey, Jon S. Fossel, Matthew P. Fink
John D. Rea
Brian K. Reid
Brian K. Reid
Barry P. Barbash, Don Powell,Matthew P. Fink
Paul Schott Stevens
Ross Levine
Brian K. Reid, Samuel Ankrah, Kimberlee Millar
Mitchell A. Post, Kimberlee Millar
Vol. 1, No. 1, July 1995: “Mutual Fund Shareholder Response to Market Disruptions”
Vol. 1, No. 2, November 1995: “Improving Mutual Fund Risk Disclosure”
Vol. 2, No. 1, January 1996: “Mutual Fund Regulation: Forging a New Federal and State Partnership”
Vol. 2, No. 2, March 1996: “Mutual Fund Shareholder Activity During U.S. StockMarket Cycles, 1944-95”
Vol. 2, No. 3, April 1996: “The Coming Crisis in Social Security”
Vol. 2, No. 4, May 1996: “Investing the Assets of the Social Security TrustFunds in Equity Securities: An Analysis”
Vol. 2, No. 5, June 1996: “Helping America Save for the Future”
Vol. 2, No. 6, December 1996: “U.S. Emerging Market Funds: Hot Money or Stable Source of Investment Capital?”
Vol. 3, No. 1, March 1997: “Mutual Fund Developments in 1996”
Vol. 3, No. 2, June 1997: “Growth and Development of Bond Mutual Funds”
Vol. 3, No. 3, July 1997: “Continuing a Tradition of Integrity”
Vol. 3, No. 4, August 1997: “Selected Issues in International Taxation of Retirement Savings”
Vol. 3, No. 5, December 1997: “Stock Markets, Economic Development, andCapital Control Liberalization”
Vol. 4, No. 1, March 1998: “Mutual Fund Developments in 1997”
Vol. 4, No. 2, June 1998: “U.S. Emerging Market Equity Funds and the 1997 Crisis in Asian Financial Markets”