Transformative Forces in ETF Investment - HKEX
24
November 2021 Transformative Forces in ETF Investment Megatrend Whitepaper
-
Upload
khangminh22 -
Category
Documents
-
view
1 -
download
0
Transcript of Transformative Forces in ETF Investment - HKEX

November 2021
Transformative Forces inETF Investment
Megatrend Whitepaper

Megatrends at a glance
Rapid urbanisationThe rise and rise of cities
Smart cities
Rising economic wealthGrowing a�uence, growing influence
China consumers becoming global trendsetters
E-commerce and tech upgrade
Climate changeA warming planet
Clean energy
Electric vehicles
Demographic shiftsAn ageing workforce
AI, robotoic systems, and biotech
Access megatrends through ETFsInvestment opportunities
The growth of thematic ETFs
3
4
7
8
10
13
14
15
17
18
20
20
Contents

While the world comes to terms with these four megatrends, investors can harness their powerful influence to maximise the return on their investments. In fact, megatrend-themed investments are giving rise to an ever-widening universe of thematic exchange traded funds (ETFs), ranging from climate-related ETFs to those tapping into the potential created by an ageing population.
In the following pages, we will look at the technological innovations that seek to address the biggest challenges of our times, and the investment opportunities created by these technological breakthroughs, beginning with rapid urbanisation and the rise of smart cities.
1
Megatrends at a glance
From climate change to the rise of developing nations, new trends are transforming our world faster than ever. The forces driving these long-term changes, known as ‘megatrends’, are impacting every aspect of our lives while transforming the investment landscape.
Unlike short-term cyclical trends, megatrends evolve over longer time horizons, and their impact on our lives could take years or decades to fully materialise. The four widely recognised megatrends of the 21st century are rapid urbanisation, rising economic wealth, climate change and demographic shifts.
A common thread that runs through these four megatrends is technological innovation, especially in the areas of artificial intelligence (AI), big data, electric vehicles and robotics, to name a few. The advent of technological innovation is often motivated by a need to understand and combat broader challenges - and a single technological breakthrough can be the solution to multiple problems.
Technology at the heart of solving 21st century’s challenges
Demographic shiftsThe number of people aged 65 or older is projected to double from 722 million in 2020 to 1.5 billion by 2050.5 The proportion of the global population over 65 will jump from less than one in 10 to one in six over that time span.
Rising economicwealthThe ranks of Asia’s middle class stood at an estimated 2 billion in 2020 and is forecast to swell further to 3.5 billion by 2030.2
Climate changeIn 2020, the average annual concentration of CO2 in the atmosphere was 50% higher than when the industrial revolution began.3 In about the same period, the Earth’s average surface temperature has risen about 1.18°C.4
Technologicalinnovation
Rapid urbanisationOver 50% of the population lives in urban areas today. By 2045, the world's urban population will increase by 1.5 times to 6 billion.1
“Urban Development Overview”, published on the website of The World Bank, April 2020. Buchholz, K., "This chart shows the rise of the Asian Middle Class", published on the website of the World Economic Forum,13 July 2020. “Global Energy Review 2021: CO2 emissions”, published on the website of IEA, viewed September 2021. “Climate Change: How do we know?”, published on the website of NASA, viewed September 2021.“Population ages 65 and above, total”, published on the website of The World Bank, viewed September 2021; and “World population ageing 2019: Highlights”, published by the United Nations, 2019.
12345
Transformative Forces in ETF Investment

Rapid urbanisation

3
The rise and rise of cities
Mass migrations from rural to urban areas is a recent phenomenon in human history. In 1900, around 16% of the global population lived in urban areas.6 Today, it’s over 55% – and demographers expect this to increase to 68% by 2050.7 This megatrend is especially prevalent in Asia. Take China, where the proportion of the population living in urban areas soared from 19.4% in 1980 to 35.9% in 2000, then to 61.4% by 2020.
Rapid urbanisation is translating into huge infrastructure investments, which aim to accommodate these new urban citizens. McKinsey Global Institute estimates that US$3.3 trillion will be needed to invest in global infrastructure annually through 2030 to accommodate the current economic growth projections, which is about 3.8% of global GDP.8
Despite this growing need for infrastructure investments, the world is underinvesting in this area by a wide margin. According to the Global Infrastructure Hub (a G20 initiative), the world will face a US$15 trillion infrastructure gap by 2040 with the largest deficits in the road transportation sector, followed by energy, rail transportation, telecommunications, and water supply.9
The majority of future infrastructure investments needed will be in emerging economies, with China taking the lead. Without the necessary funding to fill the infrastructure gap, the shortfall could create a drag on global economic growth and present problems to expanding urban areas. These problems include high travel costs, unreliable electricity supply, and limited broadband connectivity, which could hinder the development of a digital economy.
While capital is a prerequisite for bridging the infrastructure gap, new technologies may also help to alleviate the burden. In this respect, smart city technologies are attracting capital in recent years as private equity firms and institutional investors step up investments in sustainable initiatives, which may provide solutions for problems emerging due to rapid urbanisation.
Urbanisation continues to proliferate in coming decades
Source: Our World in Data and the United Nations
1950 1970 1990 2010 2030 20401960 1980 2000 2020 2050
80%
100%
60%
40%
20%
0%
WorldAsiaAfricaIndia
JapanUnited StatesEuropeChina
Ritchie H. and M. Roser, “Urbanization”, published on the website of Our World in Data, September 2018 (revised November 2019).Ritchie H. and M. Roser, “Future urbanization”, published on the website of Our World in Data, September 2018 (revised November 2019); and “World urbanization prospects 2018”, published on the website of the United Nations, viewed October 2021.“Bridging global infrastructure gaps”, published on the website of McKinsey & Company, June 2016. “Forecasting infrastructure investment needs and gaps”, published on the website of Global Infrastructure Hub, viewed September 2021.
67
89
Transformative Forces in ETF Investment

4
George, A., R-R Kaldany and J. Losavio, “The world is facing a $15 trillion infrastructure gap by 2040. Here’s how to bridge it”, published on the website of World Economic Forum, 11 April 2019. “Enhancing the contribution of digitalisation to the smart cities of the future,” published on the website of OECD, 2019.“Smart Cities Market”, published on the website of Markets and Markets, viewed September 2021. “5G Infrastructure Market”, published on the website of Research and Markets, July 2021. “The China 5G opportunity”, published on the website of UBS, viewed September 2021.
10
11121314
Although new technologies are transforming di�erent facets of human society, such as telecommunications and e-commerce, infrastructure systems remain among the least digitally transformed in the global economy.10 Digitising infrastructure, or building “smarter” urban environments, has become the imperative for cities to ensure public safety, and to also ensure that residents have access to public services and employment opportunities.
The ‘smart city’ concept is relatively new. Based on the OECD definition, smart cities are “initiatives or approaches that e�ectively leverage digitalisation to boost citizen well-being and deliver more e�cient, sustainable and inclusive urban services and environments as part of a collaborative, multi-stakeholder process.” In short, smart cities use digital innovations to improve the e�ciency of urban services.11
To be sure, emerging technologies such as the Internet of Things (IoT), big data and blockchain are already making a major impact, potentially alleviating the problems posed by rapid urbanisation:
Challenges of urbanisation and potential solutions
Source: “Smart cities: Digital solutions for a more livable future”, published by McKinsey Global Institute, 2018.
Urbanisation increasesdemand for... Smart technologies as solutions
Urban tra�c
Clean water
Energy
Healthcare
Real-time publictransit information
Water consumptiontracking
Smart grids
Remote patientmonitoring
Autonomous vehicles
Leakage detectionand control
Home energy consumptiontracking
Real-time air qualityinformation
E-hailing
Water qualitymonitoring
Dynamic electricitypricing
Infectious diseasesurveillance
Smart cities
Transformative Forces in ETF Investment
Despite the progress made, smart cities also require substantial investments when it comes to setting up smart grids, establishing high-speed connectivity, and funding research and development. Nevertheless, experts expect the global smart cities market to grow from US$457.0 billion in 2021 to US$873.7 billion by 2026, at a CAGR of 13.8%.12 As a key enabler of smart city developments, 5G networks will contribute significantly to that growth. By one estimate, the global 5G infrastructure market is forecast to expand at a CAGR of 49.8% to US$80.5 billion by 2028,13 with China leading the investment rankings – representing almost a third of the world’s 5G capex.14

5
“What are 5G speeds?”, published on the website of Cisco, viewed September 2021. 15
Combined with other technologies, 5G will help address the challenges of rapid urbanisation. With an average speed of 10 gigabytes per second,15 5G will be able to channel the massive data loads created by surging volumes of end-to-end data exchanges within smart cities. Furthermore, 5G technology can be applied to a wide variety of smart terminals, such as smart electricity meters and smart manhole covers. These terminals form connected networks that should, in theory, capture timely data sets that result in more e�cient management of urban environments.
Beyond smart cities, 5G is also bringing more consumers to online platforms – especially in countries with increasing household savings.
Industrial technology nowadays is about increasing production, and optimizing supply chain with IoT and 5G. We see technologies including cloud computing, IoT, 5G and robotics as the dominant trending themes in the long-run.
Kinger LauChief China Equity Strategist at Goldman Sachs
“
Transformative Forces in ETF Investment

Rising economic wealth

7
Growing a�uence, growing influence
Accompanying the rapid shift to urban living is the rise of the middle class. Despite a short blip during the COVID-19 pandemic, the long-term growth trend of the global middle class is expected to continue unabated. The world’s middle-class segment has expanded from fewer than 1.8 billion people in 200916 to 3.7 billion in 202117 – and it is expected to exceed 5 billion in 2030.18
While the middle-class segment was largely a developed market phenomenon in the past, growth in the demographic has shifted to developing countries in recent years. In the 1950s, over 90% of the global middle class resided in Europe and North America;19 by 2030, two in three members of the middle class will be in Asia.20
As incomes rise, the world’s middle classes are spending more and embracing the latest technologies. This is fueling the growth of consumer electronics and the adoption of e-commerce – which is reshaping consumption patterns across the world.
Growth of the global middle class
Middle class
Upper class
Poor & vunerable
1950 1960 1970 1980 1990 2000 2010 2020 20301955 1965 1975 1985 1995 2005 2015 2025 2035 2040
8
9
6
7
4
5
2
1
3
0
Popu
lati
on (b
illio
n)
Source: “A long-term view of COVID-19’s impact on the rise of the global consumer class”, published on the website of Brookings Institution, 20 May 2021.
“Poverty, middle class and purchasing power”, published on the website of European commission, retrieved on 4 November 2021.Retrieved from the website of World Data Lab on 4 November 2021.Kharas, H. and Hamel, K. “A global tipping point: Half the world is now middle class or wealthier”, published on the website on Brookings Institution, September 2018.Dooley, M. and H. Kharas, “China’s influence on the global middle class”, published on the website of Brookings Institute, October 2020. Buchholz, K. “This chart shows the rise of the Asian Middle Class”, published on the website of the World Economic Forum, 13 July 2020.
161718
1920
Transformative Forces in ETF Investment
6% 5%4% 4%
Asia Pacific dominates middle-class growth
54%
20%
14%
17%13%
65%
2020 2030
EuropeAsia Pacific Americas
Middle East and North Africa Sub-Saharan Africa
Source: “The unprecedented expansion of the global middle class”,published by Brookings Institution, February 2017.

8
Dooley, M., and H. Kharas, “China’s influence on the global middle class”, published on the website of Brookings Institute, October 2020. Ho, J., F. Poh, J. Zhou and Daniel Zipser, “China consumer report”, published by McKinsey, December 2019. Deng, I., and Y. Xue, “Chinese consumers push Apple to record second quarter in China thanks to 5G iPhones”, published by the South China Morning Post, 29 April 2021.“Global FinTech Adoption Index 2019”, published on the website of EY, viewed October 2021.“中国普惠金融指标分析报告(2020年)”(China Inclusive Financial Indicators Analysis Report), published on the website of The People’s Bank of China, viewed October 2021. “Mobile Wallets Report 2021”, published by Boku, viewed October 2021. “China ecommerce forecast 2021”, published on the website of eMarketer, 9 July 2021.“E-commerce in China Report 2020 by the Ministry of Commerce of the People’s Republic of China” (page 20), published by The Ministry of Commerce of the People’s Republic of China, viewed October 2021.
212223
2425
262728
Transformative Forces in ETF Investment
China’s middle-class growth rate is the fastest in the world. The Brookings Institution estimates that the middle class share in China’s population increased from 10% in 2006 to around 50% in 2016.21 By 2027, 1.2 billion Chinese will achieve middle-class status, making up one quarter of the world’s total.
The Chinese middle-class boom is ushering in a new generation of consumer power oriented towards improving the standard of living in China. McKinsey identified the young digital natives residing in lower-tier cities22 as an important pillar in China’s consumer growth. These emerging young consumers are shifting China’s consumer spending towards tech products. In the first quarter of 2021, the Greater China region (including Hong Kong and Taiwan) accounted for nearly 20% of Apple’s global revenue.23 These young buyers are also a new force in the global luxury market. For example, 50% of post-1990-born spenders started buying luxury goods in 2020.
China consumers becoming global trendsetters
Against this backdrop, fintech and e-commerce are also key enablers of China’s increasing consumption. In 2019, the population of consumers who adopted fintech in the nation reached 87%,24 highest among 27 major markets around the world. By 2020, the penetration of digital payments in China’s adult population has reached 89.2%,25 and 83.6% of Chinese consumers were already using mobile payments for purchases, significantly higher than other economies in Asia Pacific and is likely to surpass 90% by 2025.26
The ubiquitous acceptance of digital payment has propelled China’s e-commerce market to be the world’s largest, account for more than half of all ecommerce globally (52.1%).27 According to China’s Ministry of Commerce, in 2020 China’s online retail sales has grown to US$1.83 trillion albeit at a slower growth rate:28
China’s young consumers entering the luxury goods market
2-3 years agoLast year
>3 years ago
Post-1965 and post-1970consumers started buying luxury
Post-1980 consumersstarted buying luxury
Post-1990 consumersstarted buying luxury
80%
100%
60%
40%
20%
0%
3431 50
42
8
40
29
14
52
Source: “China luxury report 2019”, published by McKinsey, 2019.

China’s middle class is the growth engine of the thriving e-commerce market across Asia, as its increasing per-capita income is giving a boost to internet penetration and consumer spending. The prevalence of ‘superapps’ and e-wallets provides further fuel to e-commence growth in the nation.
Douglas WallsManaging Director, APAC Head of Index Products at MSCI
“
9
Transformative Forces in ETF Investment
With China’s e-commerce growth accelerating, consumer goods companies that can harness the power of big data to understand and improve consumer experience will be at an advantage. In turn, this will create many “winners” – which will be of interest to those investors seeking exposure to China’s digital-savvy consumer market.
Share of China’s internet users who shopped online
2011 2012 2013 2014 2015 2016 2017 2018 2019 2020
2,000
1,000
1,250
1,500
1,750
250
500
750
0
HK
$ (m
illio
n)
80%
70%
60%
50%
40%
30%
20%
10%
0%203 287
433602
801
1,114
1,398
1,6491,825
Note: The currency conversion rate was based on Bloomberg as of 30 September, 2021.Source: Ministry of Commerce of the People's Republic of China
121
Online sales volume (LHS)Year on year growth (RHS)

10
Although e-commerce sales have seen consistent growth in the past decade, the real milestone year for e-commerce arrived in 2020 during the pandemic. In the UK and Spain, for example, e-commerce growth leapt nearly fivefold29 in 2020, while in the US the share of retail sales through e-commerce channels grew to 19.6% in 2020, up from 15.8% in the previous year.30
The growth of e-commerce continues unabated as the pandemic recedes. In 2021, global e-commerce sales are expected to reach US$4.9 trillion, an increase of 14.3% from the previous year, with China contributing more than half of the global e-commerce market size.31
China
United States
United Kingdom
Japan
South Korea
Germany
France
India
Canada
Spain
E-commerce sales by country in 2021 (US$ billion)
$2,779.31
$843.15
$169.02
$144.08
$120.56
$101.51
$80.00
$67.53
$44.12
$37.12
Source: Oberlo
As the pandemic-induced “stay-at-home economy” prompted consumers to shop online, Global X ETFs Research predicted that the next wave of growth will come from greater penetration of retail categories that historically lagged, such as groceries, health, and autos. For example, before COVID-19, e-commerce’s penetration rate for food and beverage in the US was a mere 2.5%.32 By May 2020, 49% of US grocery shoppers had purchased groceries online in the previous month, with 21% of those being first-time online grocery shoppers.33
Furthermore, increasing smartphone penetration will likely spark further growth in e-commerce. Mobile commerce, or m-commerce, has become a dominant branch of e-commerce. By one estimate, nearly three out of every four dollars spent on online purchases today are made with a mobile device.34
“How e-commerce share of retail soared across the globe: A look at eight countries”, published on the website of McKinsey, 5 March 2021. Ali, F. and J. Young, “US ecommerce grows 32.4% in 2020”, published on the website of Digital Commerce, 29 January 2021. . “E-commerce sales by country”, published on the website of Oberlo, viewed September 2021. “2018 E-commerce multi-sector data tables,” published on the website of the US Census Bureau, 13 May 2020.Wilkinson, S., D. E. Feit, D. Fikes and S. Markenson, “U.S. grocery shoppers trends: The impact of COVID-19”, published on the website of the Food Marketing Institute (FMI), 7 May 2020. “Mobile commerce sales in 2021”, published on the website of Oberlo, viewed September 2021.
2930313233
34
Transformative Forces in ETF Investment
E-commerce and tech upgrade

11
Smartphone penetration in top 20 markets
China
India
United States
Indonesia
Brazil
Russia
Japan
Mexico
Germany
Vietnam
Smartphone users (million)
% of population
40%
439
270
160
109
100
76
70
65
61
912
32%
82%
59%
51%
69%
60%
54%
78%
63%
63%
Source: “Global mobile market report”, published by Newzoo, 2021.
Meanwhile, 5G technologies are unlocking more engaging shopping experiences via online channels, providing a strong catalyst for e-commerce growth. 5G technology is also expected to boost smartphone sales as middle-class consumers demand faster connection speeds and enhanced user experiences. A 2020 survey found that around 60% of global consumers intended to upgrade to 5G compatible smartphones – 75% of whom planned to upgrade their devices by 2021,35 coinciding with a rebound in the smartphone replacement cycle.36
The rapidly growing ranks of the middle-class are also transforming electronics into consumer staples. As more high-tech products come onto the market – aided by the strong growth of e-commerce – upgrades in the consumer electronics sector will continue to be an important investment theme to watch.
“5G smartphone upgrades and the secondary device deluge”, published on the website of Blancco, February 2020. Metodiev, B., “Smartphone replacement rate to rebound from 2021”, published on the website of Strategy Analytics, 28 June 2021.
3536
Transformative Forces in ETF Investment

Climate change

13
“Global Energy Review 2021: CO2 emissions”, published on the IEA website, viewed September 2021. “Climate Change: How do we know?”, published on the website of NASA, viewed September 2021.“Go deeper: Sectorial analysis”, published on the website of Breakthrough Energy, viewed September 2021.
373839
A warming planet
Global warming is perhaps the most significant megatrend of our time, a�ecting everyone on the planet. Scientists have established the strong link between increased concentrations of greenhouse gases (GHG) in the atmosphere and global warming. GHG emissions from human activities have been rising since the industrial revolution, trapping higher levels of heat in the atmosphere. In 2020, the average annual concentration of CO2 in the atmosphere was 50% higher than when the industrial revolution began.37 At about the same period, the Earth’s average surface temperature has risen about an average of 1.18°C.38
Understanding the main sources of today’s emissions is the first step in curbing the rise in GHG concentrations. Breakthrough Energy, a network of organisations that promotes energy innovations, relates the challenges of GHG reduction in our everyday life in five aspects:
Manufacturing – How we make things: Every ton of cement creates a ton of carbon dioxide.
Electricity – How we plug in: Energy demand is expected to increase 50% by 2050.
Agriculture – How we grow things: GHG sources include nitrous oxides in the soil and methane from livestock.
Transportation – How we get around: Transportation emissions are projected to go up 50% by 2040.
Buildings – How we live: By 2060, the world’s building stock is expected to double.39
Carbon emissions (LHS)Temperature change (RHS)
Global carbon emissions and average temperature change over the past century
1880 1900 1920 1940 1960 1980 2000 2020
35
40
25
15
5
30
20
10
0
Bill
ion
tons
of C
O2 0.8
1
1.2
0.4
0
-0.4
0.6
0.2
-0.2
-0.6 Ave
rage
tem
pera
ture
cha
nge
(°C
)
Source: “CO2 and greenhouse gas emissions”, published on the website of Our World in Data, 2020; “Climate at a glance: Global time series”, published on the website of NOAA National Centers for Environmental information, October 2021.
Global greenhouse gas emissions by sector
31%
27%
19%
16%
7%
ElectricityManufacturing AgricultureTransportation Buildings
Source: Breakthrough Energy, Rhodium Group
Transformative Forces in ETF Investment

14
Guo, J., D. Kubli and P. Saner, “The economics of climate change: No action not an option”, published by Swiss Re, April 2021. “Five grand challenges: The landscape of innovation”, published on the website of Breakthrough Energy, viewed September 2021. “Energy transition trends: Tracking global investment in the low-carbon energy transition”, published by BloombergNEF, January 2021. “Global Energy Review: Assessing the e�ects of economic recoveries on global energy demand and CO2 emissions in 2021”, published on the website of IEA, April 2021. “Net zero by 2050: A roadmap for the global energy sector”, published on the website of IEA, May 2021.“Global energy review 2021: Renewables”, published on the website of IEA, viewed September 2021.“Global energy review 2021: Renewables”, published on the website of IEA, viewed September 2021. “The solar-powered future is being assembled in China”, published on the website of Bloomberg, 15 September 2020.
40414243
44454647
Transformative Forces in ETF Investment
The energy sector is a major source of GHG emissions, but it has also made significant progress in providing cleaner and more reliable energy. The costs of onshore wind and solar power have declined by 44% and 87% respectively since 2005.41 Meanwhile, the drive to net zero is attracting environmentally conscious capital into the clean energy sector. In 2020, the renewable energy sector saw US$303.5 billion in new investment, up 2% from 2019.42 This new capital is facilitating the acceleration of green energy adoption. According to the International Energy Agency, the share of renewable sources in global electricity generation increased to 29% in 2020; it is forecast to expand by more than 8% this year, the fastest year-on-year growth in decades.43 Achieving these clean energy goals will be a challenge: To reach net zero emissions by 2050, annual clean energy investment worldwide will need to more than triple by 2030 to around $4 trillion.44 At the same time, new capital invested into the green energy sectors is set to unleash fresh investment opportunities.
Sector-wise, solar photovoltaic (PV) and wind are expected to remain the leading technologies in renewable electricity generation in the future. Electricity generation from these two sources is projected to grow 17% - 18% year-on-year in 2021,45 surpassing the growth rate of hydropower and bioenergy, and contributing two-thirds of renewables growth.
In terms of geography, China has been the global leader in renewable energy investment, accounting for almost half of the world’s increase in renewable electricity in 2021.46 China’s expanding ESG regulations promote not only its own environmental policy goals but also the use of clean energy technologies overseas, with its share of global solar cell production increased to 80% in 2019.47
Clean energy
Climate risk is investment risk, but it also creates a once in a generation opportunity, because all this capital needs to be allocated to new businesses that help us generate energy in a much better and more e�cient way.
Geir EspeskogHead of iShares Distribution & Co-Head of Sustainable Investing Asia Pacific at BlackRock
“
The economic consequences of allowing unbridled carbon pollution would be profound: the world’s GDP may contract 11% for every 2°C increase in global temperatures from pre-industrial times to mid-21st Century.40 To avoid a climate and economic crisis, the world needs to take concerted actions to get to net zero. To that end, technological innovations, including clean energy solutions and electric vehicles, can help achieve this goal – creating new investment opportunities in the transition to carbon neutrality.

15
“Global EV outlook 2021: Accelerating ambitions despite the pandemic”, published on the website of IEA, April 2021. “Trends and developments in electric vehicle markets”, published on the website of IEA, viewed October 2021.“Improving the financial subsidy policy for the promotion and application of new energy vehicles”, published on the website of Ministry of Finance of the People’s Republic of China, 23 April 2020. Wong, D., “How can foreign technology investors benefit from China’s new infrastructure plan?”, published on the website of China Briefing, 7 August 2020. “Global EV outlook 2021: Accelerating ambitions despite the pandemic”, published on the website of IEA, April 2021.Sovacool, B.K., J. Kester, L. Noel, G. Zarazua de Rubens,, “The demographics of decarbonizing transport: The influence of gender, education, occupation, age, and household size on electric mobility preferences in the Nordic region”, Global Environmental Change, Volume 52, 2018
484950
51
5253
An important application of clean energy is found in the increasing use of electric vehicles (EV). The EV market has expanded significantly in recent years given the continuous technological progress in the electrification of two/three-wheelers, buses, and trucks. Despite the worldwide downturn in car sales during the pandemic, the share of electric car sales continued to rise and reached 4.6% globally in 2020.48 Of the new EVs registered in 2020, Europe overtook China for the first time with 1.4 million new registrations, followed by the US with 295,000 registrations.
Incentives and support from the government also drum up consumer interest and spending on EVs. While governments around the globe spent US$14 billion on direct purchase incentives and tax deductions for EVs in 2020 – which represented a 25% rise year-on-year – global consumer purchases of EVs leaped by 50% from 2019 to US$120 billion.49
As a leader in the global EV market, China has advanced its EV initiatives through a combination of government support, investment in the sector, license plate restrictions on internal combustion engine (ICE) cars, and more stringent environmental regulations. For instance, China’s government implemented a subsidy programme for new EVs from 2020 to 2022 and introduced a four-year pilot programme on fuel-cell EV development in select cities.50 It has also announced a US$1.4 trillion digital infrastructure programme, with a target to install about 1.2 million EV chargers in more than 10 cities by 2025.51
Local policy measures, coupled with continuously diminishing battery costs and a wider array of EV models, will remain key drivers of the worldwide EV market. Looking ahead, EVs are poised to penetrate all road transport modes in the near term, with its stock across all transport modes (excluding two/three-wheelers) swelling from over 11 million in 2020 to almost 145 million vehicles by 2030 globally – an annual average growth rate of nearly 30%.52
An emerging prime market for EVs are ageing baby boomers as studies found that they often prefer personal automobile to other forms of mobility.53 Next, we will explore other implications of demographic shifts in the coming decades.
2020 2021 2022 2023 2024 2025 2026 2027 2028 2029 2030
150
100
50
125
75
25
0
Projection of global EV stock through 2030Plug-in hybrid electric vehiclesBattery electric vehicles
Mill
ion
Note: Both battery electric vehicles and plug-in hybrid electric vehicles include trucks, buses, light-commercial vehicles and passenger light-duty vehicles. The figure does not include electric two/three-wheelers.Source: International Energy Agency
Transformative Forces in ETF Investment
Electric vehicles
Part of the turning investor sentiment towards climate-related considerations is driven by growing concern about extreme weather events. It’s also driven by market factors, including the falling cost of renewables and the growing availability of electric cars.
Edward BakerSenior Specialist, Climate Change and Energy Transition at the UN-supported Principles for Responsible Investment
“
Demographic shifts
17
“World Population Prospects 2019 highlights”, published on the website of the United Nations, viewed September 2021. World undergoing major population shift with far-reaching implications for migration, poverty, development: WB/IMF”, published on the website of The World Bank, 7 October 2015.
5455
An ageing workforce
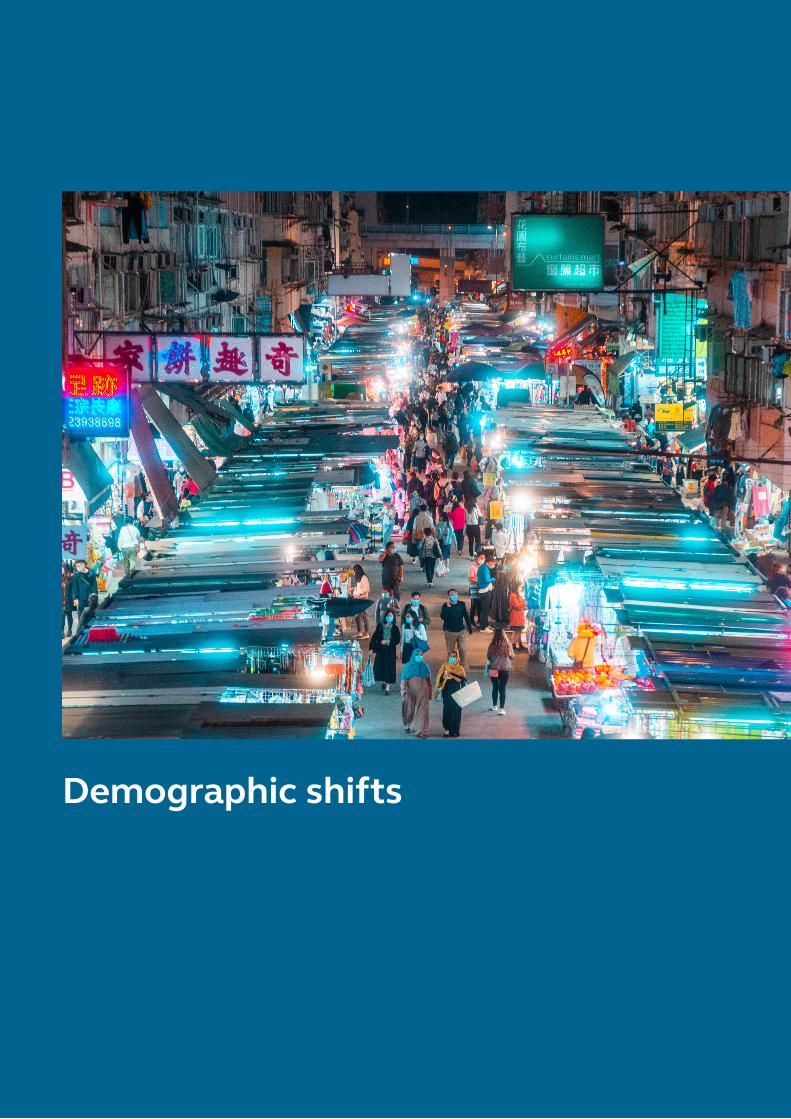
The ageing of the world’s populations is the result of a combination of factors, including longer life expectancy due to greater accessibility of healthcare, and declining birth rates due to changing societal values and higher participation of women in the workforce. Today, the population aged 65 years and above comprises the world’s fastest growing age segment. According to the UN, this age group outnumbered children under the age of five for the first time in 2018. By 2050, older persons are expected to outnumber adolescents and youth aged 15 to 24.54 Population ageing is especially prominent in some regions, with Europe and East Asia projected to have the fastest growth in the elderly segment.
Percentage of population aged 60 years or over by region, from 1980 to 2050OceanaWorldAfrica
EuropeNorthern AmericaLatin America and the CarribbeanAsia
1980 1985 1990 1995 2000 2005 2010 2020 2030 20402015 2025 2035 2045 2050
35
40
25
15
5
30
20
10
0
Popu
lati
on a
ged
60 y
ears
or
abov
e (%
)
Source: United Nations
As a result, the world’s working-age population is shrinking. The World Bank estimates that the share of the global population that is working age (15-64 years old) peaked at 66% in the early 2010s and will gradually decline to around 63% by 2050.55
The changes in age structure are posing significant challenges to societies – especially when it comes to providing adequate healthcare for their older populations and in sustaining productivity. Addressing these challenges requires a reexamination of government policies, such as measures to promote employment of older persons, to promoting greater female participation in the workforce, to harnessing the power of technology to boost productivity and to reduce the cost of providing healthcare for the older population.
Percentage of global population aged 15-64
1950 1970 1990 2010 2030 2050
70
65
55
60
50Shar
e of
wor
king
-age
popu
lati
on (%
)
Source: The World Bank
Transformative Forces in ETF Investment

18
“Four robotic applications that benefit from artificial intelligence”, published on the website of Control Engineering, 18 September 2018.Guevarra, A.R., “Here come the robot nurses”, published on the website of the Boston Review, 2 August 2021. Bushweller, K., “Teachers, the robots are coming. But that’s not a bad thing”, published on the website of EducationWeek, 7 January 2020. “Biotechnology market size, share & trends analysis report by technology (DNA sequencing, nanobiotechnology), by application (health, bioinformatics), by region, and segment forecasts, 2021 – 2028”, published by Grand View Research, March 2021. Definition published by Merriam-Webster, viewed September 2021. “Biopharmaceuticals market - growth, trends, covid-19 impact, and forecasts (2021 - 2026),” published on the website of Mordor Intelligence, retrieved on 27 October 2021. Bodine, D.M.,“Genetic Engineering”, published on the website of National Human Genome Research Institute, viewed September 2021.
56575859
6061
62
Given these global demographic shifts, the role of automation – enabled by AI and robotic systems – may be the answer to sustainable productivity. Automation, which has already moved beyond monotonous and mechanical activities, now has a much wider application potential outside of factories.
Applications of AI and robotic beyond manufacturing
Customer service
Health service
Intelligent home
Education
Customer service robots are already in use in retail stores globally. Most of them have AI natural language processing capabilities to interact with customers in new sta�-less stores.56
Robotic nurses (some in pilot) are used to carry out di�erent repetitive tasks, such as measuring patients’ vital signs, delivering medicines, and even engaging patients in therapeutic interactions.57
Robots found a place in smart homes. They perform household tasks such as vacuum cleaning and lawn mowing. They are increasingly being used for home security and surveillance.
AI robots in classrooms can have diverse uses. For example, In China, robotic teachers are in pilot in hundreds of kindergarten classes to tell stories, pose logic problems, and react with facial expressions when students master content.58
As AI and robotic systems continue to evolve, they will be integrated with di�erent technologies to respond to demographic changes. For instance, AI can be integrated into biotech to detect diseases, support diagnosis, and develop drugs for age-associated disorders.
An ageing population and health-conscious consumers are also driving demand for science-backed healthy ageing products, fueling the growth of the biotech market: in 2020, the global biotech market was valued at US$752.88 billion; it is projected to expand at a CAGR of 15.83% from 2021 to 2028.59 Meanwhile, new investments into the biotech space are powering the development of biopharmaceuticals.
Biopharmaceuticals (or, biologics) are pharmaceuticals derived from biological sources, especially sources produced by biotechnology.60 They di�er from regular pharmaceuticals in that the latter are manufactured using chemical-based processes. In 2020, the global biopharmaceuticals market was valued at US$325.2 billion and is expected to grow at a CAGR of 7.3% from 2021 to 2026.61
Additionally, biopharmaceuticals are poised for further breakthroughs thanks to advancements in genetic engineering – a building block of biologics that is broadly defined as “taking pieces of DNA and combining them with other pieces of DNA”.62 Equipped with a growing body of knowledge about the interaction between drugs and the genetic makeup of patients, biopharmaceuticals can be used to develop therapies that employ a higher level of precision.
More specifically, biopharmaceuticals hold promise in the treatment of age-related illnesses, such as dementia and diabetes. And in doing so, they play a critical role in lowering healthcare expenditures for the elderly population and alleviating the burden on medical systems across the world.
Transformative Forces in ETF Investment
AI, robotoic systems, and biotech
We are not talking about the traditional chemical drugs that come in a pill form. We are talking about vaccines, targeted treatments for critical illnesses that are not treatable right now. Considering China’s fast–growing economy and rapidly ageing population, this is clearly a structural growth opportunity.
Stephen ChungGlobal X ETFs Sales Vice President at Mirae Asset Global Investments
“

Access megatrends through ETFs
20
Investment opportunities
ETFs provide a simple and cost-e�cient way to gain exposure to the megatrends explored above, o�ering greater diversification to investors who previously may have sought to buy into these themes through individual stocks.
Thematic ETFs generally track bespoke indices developed by index providers. A key enabler of these new indices has been the shift in index construction away from market cap weightings to embody either more forward-looking considerations, in the case of megatrends and themes, or more principles-based and regulatory-based factors when it comes to climate and ESG investing.
Another advantage of thematic ETFs is that they can cross geographic and sector lines. For example, a China-themed ETF listed in Hong Kong can o�er exposure to Chinese companies listed in Hong Kong as well as in mainland China and the US. Through Hong Kong-listed ETFs, individual investors can diversify into China A-shares and capture unique opportunities in China-related investment themes.
The growth of thematic ETFs
Spurred by innovation and growing investor awareness, there has been a boom in the adoption of thematic ETFs globally and the industry has been expanding steadily. Five years ago, there were fewer than 200 so-called thematic ETFs globally. Now there are over 700, covering a much broader range of themes for investors to consider, from EV batteries to gender diversity.
Hong Kong has also seen a significant ramp-up in thematic ETF adoption. In 2020, HK$15 billion (US$1.9 billion) worth of investments flowed into thematic ETFs. In 2021, growth has only accelerated with last year’s figure being nearly matched in the first quarter of 2021 alone. As of October 2021, thematic ETFs in Hong Kong surpassed HK$50 billion (US$6.4 billion) in AUM, representing around 12% of the market’s total ETF AUM.
Transformative Forces in ETF Investment

Source: HKEX. Data as of 31 October 2021.
2018 2019 2020 2021
60
30
40
50
10
20
0
HK
$ (b
illio
n)
21
The accelerating pace of innovation and adoption of technology is driving the awareness of megatrends to new heights. The megatrends highlighted in this paper are likely to remain the key themes reshaping the global investment climate for years to come. Still, there is room for further ETF innovation within the broad categories of rapid urbanisation, rising economic wealth, climate change and demographic shifts. The next step will be to develop di�erentiated investment products that can capture these emerging themes at low cost. In this regard, the arrival of an array of thematic ETFs, aided by a growing cognizance and understanding of their merits, will open the door for investors to gain more exposure to these megatrends.
Transformative Forces in ETF Investment
Megatrends are a game-changer in the ETF market. At present, around 12% of AUM in the Hong Kong ETF market are invested in megatrend-themed ETFs. As technological innovations continue to engender new investment themes, the growth of megatrend ETFs is without doubt a trend to stay.
Brian RobertsHead of Exchange Traded Products at HKEX
“
Disclaimer
The information contained in this document is for general informational purposes only and does not constitute an o�er, solicitation, invitation or recommendation to buy or sell any securities or other products or to provide any investment advice or service of any kind. This document is not directed at, and is not intended for distribu-tion to or use by, any person or entity in any jurisdiction or country where such distribution or use would be contrary to law or regulation or which would subject Hong Kong Exchanges and Clearing Limited, The Stock Exchange of Hong Kong Limited (“SEHK”) (together, the “Entities”, each an “Entity”), or any of their a�liates, or any of the companies that they operate, to any registration requirement within such jurisdiction or country.
No section or clause in this document may be regarded as creating any obligation on the part of any of the Entities. Rights and obligations with regard to the trading, clearing and settlement of any securities e�ected on SEHK shall depend solely on the applicable rules of SEHK and the relevant clearing house, as well as the applicable laws, rules and regulations of Hong Kong.
Although the information contained in this document is obtained or compiled from sources believed to be reliable, neither of the Entities guarantees the accuracy, validity, timeliness or completeness of the information or data for any particular purpose, and the Entities and the companies that they operate shall not accept any responsibility for, or be liable for, errors, omissions or other inaccuracies in the information or for the consequences thereof. The information set out in this document is provided on an “as is” and “as available” basis and may be amended or changed. It is not a substitute for professional advice which takes account of your specific circumstances and nothing in this document constitutes legal advice. Neither of the Entities shall be responsible or liable for any loss or damage, directly or indirectly, arising from the use of or reliance upon any information provided in this document.
Contact us
For more information please visit www.hkex.com.hk/etp or contact [email protected]
AUM growth of thematic ETFs in Hong Kong

8/F, Two Exchange Square8 Connaught PlaceCentral, Hong Kong
hkexgroup.com | hkex.com.hk
Hong Kong Exchangesand Clearing Limited