Real-Time Measurements of Nitrogen Oxide Emissions from In-Use New York City Transit Buses Using a...
10
Real-Time Measurements of Nitrogen Oxide Emissions from In-Use New York City Transit Buses Using a Chase Vehicle JOANNE H. SHORTER,* , SCOTT HERNDON, MARK S. ZAHNISER, DAVID D. NELSON, JODA WORMHOUDT, KENNETH L. DEMERJIAN, ‡ AND CHARLES E. KOLB Center for Atmospheric and Environmental Chemistry, Aerodyne Research, Inc., 45 Manning Road, Billerica, Massachusetts 01821, and Atmospheric Sciences Research Center, State University of New York, Albany, New York 12203 New diesel engine technologies and alternative fuel engines are being introduced into fleets of mass transit buses to try to meet stricter emission regulations of nitrogen oxides and particulates. Real-time instruments including an Aerodyne Research tunable infrared laser differential absorption spectrometer (TILDAS) were deployed in a mobile laboratory to assess the impact of the implementation of the new technologies on nitrogen oxide emissions in real world driving conditions. Using a “chase” vehicle sampling strategy, the mobile laboratory followed target vehicles, repeatedly sampling their exhaust. Nitrogen oxides from approximately 170 in-use New York City mass transit buses were sampled during the field campaigns. Emissions from conventional diesel buses, diesel buses with continuously regenerating technology (CRT), diesel hybrid electric buses, and compressed natural gas (CNG) buses were compared. The chase vehicle sampling method yields real world emissions that can be included in more realistic emission inventories. The NO x emissions from the diesel and CNG buses were comparable. The hybrid electric buses had approximately one-half the NO x emissions. In CRT diesels, NO 2 accounts for about one-third of the NO x emitted in the exhaust, while for non-CRT buses the NO 2 fraction is less than 10%. Introduction Emissions of oxides of nitrogen (NO and NO2, collectively referred to as NOx) contribute to a variety of environmental problems, including photochemical smog, acid deposition, adverse human health impacts, and visibility reduction (1). For example, ground level ozone (smog) is formed when NOx and volatile organic compounds (VOCs) react in the presence of heat and light. Oxidation of NO2 by ambient OH radicals produces nitric acid contributing to acid deposition, while fine particle health effects and visibility reduction are compounded by the formation of ammonium nitrate sec- ondary aerosol particles. There are also growing health concerns associated with exposure to direct diesel exhaust. Recent evidence indicates that diesel exhaust or diesel particulate matter can cause lung cancer in humans, as well as other respiratory problems (2). As the NOx emissions of passenger cars and light-duty vehicles have become more tightly controlled, the relative importance of heavy-duty diesel vehicles as a NOx source has increased. The 1999 EPA National Emissions inventory estimated that diesel vehicles emitted 42% of the on-road NOx emissions in the U.S. versus 33% from cars and motorcycles, 19% from light gasoline trucks, and 5% from heavy gasoline vehicles (3). A recent assessment of on-road emissions estimated that diesel mobile sources contribute as much NOx as gasoline mobile sources; it also indicated that large uncertainties remain about the magnitude and distribution of these emissions (4). Another study found that California’s emission inventory model may underestimate NOx emissions from heavy-duty diesel trucks by up to a factor of 2.3 (5). Tunnel studies of NOx and PM emissions in California indicate that heavy-duty diesel vehicles are responsible for nearly 50% of the NOx and 75% of exhaust fine particle emissions from on-road motor vehicles (6). The growing recognition of the harmful effects of diesel emissions on air quality and human health led the U.S. EPA to propose new heavy-duty engine and vehicle standards on May 17, 2000 (2). This major regulatory initiative addresses the problem of PM and NOx emissions by setting much stricter standards for emissions and for the sulfur content of diesel fuel. The restriction on sulfur content is needed because sulfur oxides in vehicle exhausts may poison catalytic converters designed to reduce NOx emissions. The regulation calls for a factor of 20 reduction in the NOx standard, to be phased between the years 2007 and 2010. As a result, each new bus would be as much as 95% cleaner than today’s conventional buses. Engine manufacturers and heavy-duty vehicle users, including transit authorities, have begun to take actions to address the changing standards. New diesel technologies and engines using alternative fuels are being developed and deployed. The New York City Metropolitan Transit Authority (NY MTA) has been working to reduce emissions from its fleet of buses. It has initiated deployment of several different new technologies in its fleet, including compressed natural gas (CNG) buses, hybrid electric buses, and diesel buses equipped with continuously regenerating technology (CRT) designed to reduce fine particulate emissions. In addition to testing the in-use performance of these vehicles, the NY MTA has solicited emission testing in dynamometer tests and quantitative real world in-use emission testing. On-road NOx emission measurements are the subject of this paper. A companion paper in this issue presents formaldehyde, methane, and sulfur dioxide emission results from this study (7). A previous paper has presented data on fine PM emissions measured at the same time (8). Emission inventories for pollutant emissions from heavy- duty vehicles are based on engine certification data from dynamometer tests following the Federal Test Procedure (FTP) (9). In the FTP certification tests, the engine (not installed in a vehicle) is run in a transient manner over a range of load and speed set points while measuring emissions using specified procedures. Regulated pollutants are reported in units of mass emitted per unit work (in grams per brake horsepower hour (g/bhp-h), or grams per kilowatt hour (g/ kW-h)). The EPA then uses models that combine these emissions numbers with vehicle sales data to get heavy-duty vehicle emission factors. The use of certification results for * Corresponding author phone: (978)663-9500; fax: (978)663-4918; e-mail: [email protected]. Aerodyne Research, Inc. ‡ State University of New York.
-
Upload
independent -
Category
Documents
-
view
0 -
download
0
Transcript of Real-Time Measurements of Nitrogen Oxide Emissions from In-Use New York City Transit Buses Using a...
Real-Time Measurements ofNitrogen Oxide Emissions fromIn-Use New York City Transit BusesUsing a Chase VehicleJ O A N N E H . S H O R T E R , * , †
S C O T T H E R N D O N , † M A R K S . Z A H N I S E R , †
D A V I D D . N E L S O N , † J O D A W O R M H O U D T , †
K E N N E T H L . D E M E R J I A N , ‡ A N DC H A R L E S E . K O L B †
Center for Atmospheric and Environmental Chemistry,Aerodyne Research, Inc., 45 Manning Road,Billerica, Massachusetts 01821, and AtmosphericSciences Research Center, State University of New York,Albany, New York 12203
New diesel engine technologies and alternative fuelengines are being introduced into fleets of mass transitbuses to try to meet stricter emission regulations of nitrogenoxides and particulates. Real-time instruments includingan Aerodyne Research tunable infrared laser differentialabsorption spectrometer (TILDAS) were deployed in a mobilelaboratory to assess the impact of the implementation ofthe new technologies on nitrogen oxide emissions in realworld driving conditions. Using a “chase” vehicle samplingstrategy, the mobile laboratory followed target vehicles,repeatedly sampling their exhaust. Nitrogen oxides fromapproximately 170 in-use New York City mass transit buseswere sampled during the field campaigns. Emissionsfrom conventional diesel buses, diesel buses with continuouslyregenerating technology (CRT), diesel hybrid electricbuses, and compressed natural gas (CNG) buses werecompared. The chase vehicle sampling method yields realworld emissions that can be included in more realisticemission inventories. The NOx emissions from the dieseland CNG buses were comparable. The hybrid electric buseshad approximately one-half the NOx emissions. In CRTdiesels, NO2 accounts for about one-third of the NOx emittedin the exhaust, while for non-CRT buses the NO2 fractionis less than 10%.
IntroductionEmissions of oxides of nitrogen (NO and NO2, collectivelyreferred to as NOx) contribute to a variety of environmentalproblems, including photochemical smog, acid deposition,adverse human health impacts, and visibility reduction (1).For example, ground level ozone (smog) is formed whenNOx and volatile organic compounds (VOCs) react in thepresence of heat and light. Oxidation of NO2 by ambient OHradicals produces nitric acid contributing to acid deposition,while fine particle health effects and visibility reduction arecompounded by the formation of ammonium nitrate sec-ondary aerosol particles. There are also growing health
concerns associated with exposure to direct diesel exhaust.Recent evidence indicates that diesel exhaust or dieselparticulate matter can cause lung cancer in humans, as wellas other respiratory problems (2).
As the NOx emissions of passenger cars and light-dutyvehicles have become more tightly controlled, the relativeimportance of heavy-duty diesel vehicles as a NOx sourcehas increased. The 1999 EPA National Emissions inventoryestimated that diesel vehicles emitted 42% of the on-roadNOx emissions in the U.S. versus 33% from cars andmotorcycles, 19% from light gasoline trucks, and 5% fromheavy gasoline vehicles (3). A recent assessment of on-roademissions estimated that diesel mobile sources contributeas much NOx as gasoline mobile sources; it also indicatedthat large uncertainties remain about the magnitude anddistribution of these emissions (4). Another study found thatCalifornia’s emission inventory model may underestimateNOx emissions from heavy-duty diesel trucks by up to a factorof 2.3 (5). Tunnel studies of NOx and PM emissions inCalifornia indicate that heavy-duty diesel vehicles areresponsible for nearly 50% of the NOx and 75% of exhaustfine particle emissions from on-road motor vehicles (6).
The growing recognition of the harmful effects of dieselemissions on air quality and human health led the U.S. EPAto propose new heavy-duty engine and vehicle standards onMay 17, 2000 (2). This major regulatory initiative addressesthe problem of PM and NOx emissions by setting much stricterstandards for emissions and for the sulfur content of dieselfuel. The restriction on sulfur content is needed becausesulfur oxides in vehicle exhausts may poison catalyticconverters designed to reduce NOx emissions. The regulationcalls for a factor of 20 reduction in the NOx standard, to bephased between the years 2007 and 2010. As a result, eachnew bus would be as much as 95% cleaner than today’sconventional buses.
Engine manufacturers and heavy-duty vehicle users,including transit authorities, have begun to take actions toaddress the changing standards. New diesel technologiesand engines using alternative fuels are being developed anddeployed. The New York City Metropolitan Transit Authority(NY MTA) has been working to reduce emissions from itsfleet of buses. It has initiated deployment of several differentnew technologies in its fleet, including compressed naturalgas (CNG) buses, hybrid electric buses, and diesel busesequipped with continuously regenerating technology (CRT)designed to reduce fine particulate emissions. In addition totesting the in-use performance of these vehicles, the NY MTAhas solicited emission testing in dynamometer tests andquantitative real world in-use emission testing. On-road NOx
emission measurements are the subject of this paper. Acompanion paper in this issue presents formaldehyde,methane, and sulfur dioxide emission results from this study(7). A previous paper has presented data on fine PM emissionsmeasured at the same time (8).
Emission inventories for pollutant emissions from heavy-duty vehicles are based on engine certification data fromdynamometer tests following the Federal Test Procedure(FTP) (9). In the FTP certification tests, the engine (notinstalled in a vehicle) is run in a transient manner over arange of load and speed set points while measuring emissionsusing specified procedures. Regulated pollutants are reportedin units of mass emitted per unit work (in grams per brakehorsepower hour (g/bhp-h), or grams per kilowatt hour (g/kW-h)). The EPA then uses models that combine theseemissions numbers with vehicle sales data to get heavy-dutyvehicle emission factors. The use of certification results for
* Corresponding author phone: (978)663-9500; fax: (978)663-4918;e-mail: [email protected].
† Aerodyne Research, Inc.‡ State University of New York.

predicting real use emissions is problematic. Issues includethe representativeness of the FTP for actual vehicle use, andthe ability to estimate the deterioration in emissions overthe engine lifetime. A recent review of heavy-duty vehicleemissions showed that measured trends were different fromboth certification test data and from model output (10); yetthe certification-based emissions are routinely used in airquality evaluations and inventories. The inventories do nottake into proper account parameters that probably havesignificant impact on actual emissions, including vehicleclass, weight, vehicle age, terrain traveled, driving cycle,quality and frequency of maintenance, and vehicle vocation(11). The errors in the emissions based on the certificationestimations are thus propagated. The fraction of NOx as NO2
in exhaust is also not well described by emission inventories.Carslaw and Beevers (12) have recently formulated a pre-liminary primary NO2 emission inventory for road transportsources in London, but call for a large database to strengthenthe robustness of the inventory.
Emission inventories and air quality management planscan be improved through the application of measurementmethods to quantify emissions from in-use heavy-dutyvehicles. Real world measurement of NOx emissions is alsoimportant for evaluating the effectiveness of emissioncontrols and to verify emissions from new classes of heavy-duty vehicles (e.g., CNG and hybrid electric).
On-road NOx emissions have been evaluated throughchassis dynamometer testing (10, 11, 13-15), tunnel studies(6, 16-18), and on-road remote sensing (10, 19-22). Thesetechniques have been recently reviewed with relationship toheavy-duty diesel emissions (10). Each of these threemeasurement methodologies have their respective strengthsand limitations. Chassis dynamometer studies are not realworld measurements because they are performed in anartificial environment, which usually fails to simulate thefull range of real world driving parameters. The low samplesize of dynamometer studies, due to their high cost, addsuncertainty to the results and limits how well they mightrepresent the actual fleet. Tunnel studies are made in thereal environment, but do not easily provide emissions byvehicle type; an ensemble average of all vehicles passingthrough the tunnel is obtained. Cross road remote sensingmeasurements allow a large number of individual vehiclesto be sampled, but each vehicle is usually sampled only undera single driving condition. On-board measurement systems(23) and mobile instrument platforms (24-29) are indevelopment and starting to be deployed to characterize on-road emissions. Real world on-road measurements of a heavy-duty diesel (HDD) vehicle by a mobile laboratory being pulledby the HDD vehicle have been reported (30). This arrange-ment provides total capture gaseous measurements. Althoughit provides important real world data on HDD emissions, thesystem is limited in the number and types of vehicles it canstudy.
Over the past few years, we have implemented anothertechnique to quantify individual vehicle in-use emissions (8,24, 31, 32), chase measurements with our instrumented van.Similar studies have been reported for on-road heavy-dutyvehicles by Kittelson and co-workers (26-28) and by Vogt etal. (33) for light-duty vehicles on high-speed test track.Johnson and Caldow have also reported making chaseexperiments (34). In the chase vehicle/plume extractionmethod, a mobile laboratory equipped with sensitive in-strumentation selects and “chases” individual vehicles tosample their emission plume. Emissions can be monitoredfor many different driving conditions, terrains, environmentalconditions, etc., and for different vehicle types. We havesuccessfully deployed both gas-phase monitoring instru-ments and particulate characterization instruments in themobile laboratory for chase experiments (24). This paper
presents the application of this new technique to theevaluation of heavy-duty vehicle NOx emissions from theNew York City bus fleet.
The emission measurements of this paper were conductedas part of the CNG/CRT Emission Perturbation Experiment(CEPEX) during the PM2.5 Technology Assessment andCharacterization Study in New York City (PMTACS-NY). Itincluded a 2-week demonstration period in October 2000and a 5-week intensive measurement campaign in summer2001. The goal of the study was to characterize new andexisting bus technologies of the New York MetropolitanTransit Authority (MTA) and to contrast them with the restof the New York heavy-duty fleet.
This project was possible through the cooperation of theMTA. They provided the classification information of eachMTA bus in a detailed database of vehicle and engineinformation.
Experimental SectionAll of the measurements presented in this paper wereobtained with the Aerodyne Research (ARI) Mobile Labora-tory, a step-van deployed with a series of sensitive real-timeinstruments for the measurement of gaseous and particulateemissions (24). Prior to these measurements, the mobilelaboratory was used extensively in mobile field measurementsof gas-phase species, including gaseous emissions fromnatural gas systems (35, 36), landfills (37), and urban areas(31, 38, 39). During the New York City campaigns, gas-phasespecies were measured with an ARI two-color tunable diodelaser (TDL) tunable infrared laser differential absorptionspectrometer (TILDAS) and a NDIR Licor CO2 instrument,while particulate species were detected with an ARI AerosolMass Spectrometer (AMS), a condensation particle counter(CPC), and an electrical low-pressure impactor (ELPI).Additional instruments in the mobile laboratory include aglobal positioning system (GPS), thermocouple for sampletemperature, a video camera monitoring conditions forwardof the mobile lab, and a central data logging computer.Interactive notetaking systems were used to collect time-stamped experiment notes and observeration. A 5 kW gasolinegenerator (Honda EZ5000) mounted on a platform on theback of the van provides all of the required power when thetruck is moving.
We conducted all measurements while traveling at normalroadway speeds. Continuous air samples are drawn throughan inlet located on the driver side bulkhead at the front ofthe van. Two different inlet systems were used in the 2000and 2001 campaigns. During the 2000 campaign, the TDLand Licor sampled from a common port located at a heightof 2.4 m, approximately 5 cm above a second inlet for theparticle instruments (AMS, CPC). For the summer 2001campaign, a common inlet was constructed for the particulateand gas-phase instruments. This inlet was 2.4 m from roadlevel. The common inlet was a 1” OD stainless steel tube,which protruded forward from the driver side bulkhead. Thetotal flow through the inlet was 18.9 L per minute (LPM). Ofthis total flow, 8.9 LPM was delivered to the gas-phaseinstruments. The 2.11 cm ID main inlet tube extended 1.2m forward of the bulkhead. The longer inlet was used toprovide sufficient time for laminar flow to develop beforethe flow was split, to avoid possible vehicle boundary layersampling artifacts at the mobile lab bulkhead, and to get theinlet closer to the top emitting diesel buses. On average, thelonger inlet resulted in increased signal intensity from topemitting buses, because there was less dilution of the exhaustwith the inlet in closer proximity. The signal intensity for lowemitting buses (i.e., buses with exhaust pipe near the groundor at the bottom of the chassis body) was slightly less thanthat with the shorter inlet. The reduction is due to samplingof a less concentrated portion of the bus exhaust plume than
with a shorter inlet. Although the height of the inlet wasunchanged, the shorter inlet captured the exhaust entrappedin the mobile lab bulkhead air and resulted in a higher signalintensity than that obtained with the longer inlet.
Inside the mobile lab, the flow is isokinetically split toprovide sample to the different instruments in the mobilelab. After the first isokinetic split, the TILDAS and Licorsystems sampled through 1/4” PFA Teflon tubing of 3.8 and4.6 m length, respectively. The respective sample flows tothe TILDAS and Licor instruments were ∼9000 and ∼500sccm.
Instrumentation. The principal gas-phase instrument onthe mobile lab was the TILDAS instrument, configured forNO and NO2 detection during the measurements presentedin this paper. The high sensitivity, fast response two-colorTDL was developed at ARI (20, 40). This instrument simul-taneously operates two infrared diode lasers mounted in asingle liquid nitrogen dewar, measuring between two andfour species at one time. The lasers are scanned across distinctresolved absorption lines, including background to eitherside of the lines, at a rate of 3 kHz. The absorption featuresare fit in real time using a nonlinear least squares algorithm,HITRAN (41) tabulated line parameters, and full Voigt lineshapes. Absolute concentrations are recorded without theneed for calibration gases.
The light from the two lasers is directed on separate pathsthrough a long multipass low pressure, low volume absorp-tion cell (153 m path length, 5 L), operating at ∼40 Torr. Afterpassing through the cell, the beams are directed to separateinfrared detectors housed in the dewar. The instrumentsensitivity is generally 1 ppbv (parts per billion by volume)at a data rate of 1/s, and the gas flow replacement rate isequal to the data rate. Pressure inside the cell was continu-ously monitored with a 1 atm MKS Baratron.
A total of eight lead salt tunable diode lasers (four on eachof two mounts) can be housed in the liquid nitrogen dewar.One laser on each mount is operated at a time, but it is easyto switch between lasers. During the fall 2000 campaign, weused this instrument to measure a number of differentspecies. In the first week, NO (1912 cm-1) was measuredwith 1 laser and NO2 (1600 cm-1) with a second laser. In thesecond week, we measured CH4 (1348 cm-1) with one laserand N2O and CO (2212 cm-1) with a second laser for 2 days,replacing CH4 with SO2 (1349 cm-1) as a target species on thelast 3 days of the campaign. In summer 2001, the pairs oftarget species were NO (1909-1935 cm-1) and NO2 (1593-1601 cm-1), H2CO (1700 cm-1) and CH4 (1348 cm-1), andH2CO and SO2 (1349 cm-1). An accompanying paper describesthe CH4, H2CO, and SO2 emissions.
In the summer campaign, NO and NO2 were targeted for3 of the 5 weeks of the campaign. During this time, wemonitored different NO and NO2 lines as necessitated bychanges in the laser mode characteristics. Nitrogen dioxidelines at 1593.3, 1601.3, and 1583.1 cm-1 were monitored. TheNO lines at 1909, 1935, and 1930 cm-1 were monitored atdifferent times during the campaign, with the NO lines at1909 cm-1 the target region for all but a portion of the lastweek. At all times, mode purity was confirmed using referencecells and nearby optically thick water lines. In the TILDASmethod, the accuracy of the mixing ratios is largely deter-mined by how well the line strengths are known. For the NOand NO2 absorption lines used in this study, the presentlyaccepted band strengths are known to within 6% and 4%,respectively (42).
We measured carbon dioxide, CO2, with a Licor NDIRinstrument (LI-6262) with a 1 s response time and 1 ppmv(part per million by volume) sensitivity. The instrumentsampled a small flow from the same inlet as the TDL. Carbondioxide is a reference gas, which provides a measure of the
extent of dilution of the exhaust plume and allows computa-tion of the emission rate of the other measured exhaustspecies.
The TILDAS and Licor instruments were tested andcalibrated in the laboratory prior to deployment.
Additional ancillary measurements were made during thecampaigns. A bare thermocouple in the sample line yieldsa continuous measure of the temperature of the sample. ATrimble global positioning system (GPS) yields position dataand, consequently, the velocity and acceleration of the mobilelab. A video camera, capturing at one frame every 2 s, isaimed out of the front of the Mobile Laboratory. A visualrecord of the bus number and type, as well as the roadwaycondition, is made. An onboard notetaking scheme wasdeployed by operators, whereby “events” were recorded onmultiple computers. This included traffic conditions andwhether the mobile laboratory was chasing a bus. During abus chase event, information including the bus company,number, type, etc. was recorded. Onboard computers weretime synchronized to a common time by means of Clock-watch software (Beagle Software).
Measurement Strategy. Numerous in-use buses and heavy-duty vehicles (e.g., semi-trucks, sanitation trucks, box vans,fuel delivery trucks) were sampled in a range of urban areas.Approximately 300 in-use buses were “chased” on theirnormal, scheduled routes in Queens, Manhattan, Bronx, andBrooklyn between October 23-November 2, 2000, and July3-August 3, 2001. Of these buses, NO and NO2 emissionswere monitored for 168, including 105 in the New York CityMetropolitan Transit Authority (MTA) fleet, 58 non-MTAtransit buses, four school buses, and a private coach bus.
The MTA fleet of buses was the focus of much of themeasurement campaign. This fleet includes traditional dieselbuses, alternative fuel buses running with compressed naturalgas (CNG), and diesel buses with new emission controltechnologies. This last group includes diesel-fueled buseswith Continuously Regenerating Technology (CRT) andelectric/diesel hybrid buses. All of the diesel-fueled buses inthe MTA fleet had also switched in early October 2000 to alow sulfur fuel, containing no more than 30 parts-per-million-by-weight (ppmw) sulfur. The cooperation of MTA authoritieswas obtained in advance. The MTA provided detailedinformation on the individual MTA buses (e.g., engine type,year built, fuel type, etc).
A smaller sample of non-MTA transit buses, school buses,and coach buses in New York City was also examined. Thenon-MTA transit buses are part of independent bus com-panies operating as contractors for the MTA. These com-panies include the Queen’s Surface Corp., The Green Line,and the Command Buses. Although the fuel type (diesel versusCNG) could be identified for each bus, more detailed engineor usage information was not available. These buses aregrouped by fuel type for analysis and comparison purposes.
The emission measurements were made in all boroughsof New York City, with the exception of Staten Island, tosample buses based at different MTA depots. The buses werefollowed while driving their normal routes without notifica-tion of the operators. The mobile laboratory attempted tofollow or “chase” each bus through several cycles of ac-celeration, cruise, deceleration, and braking/stopping. Ingeneral, the mobile laboratory followed directly behind abus, mimicking its driving pattern as much as possible,including stopping directly behind the bus when it stoppedat bus stops to load and unload passengers. Traffic oc-casionally precluded us from continually following a par-ticular bus.
The continuous measurement of carbon dioxide from allvehicles was used to differentiate plumes from differentmobile sources. The identification of contaminated busplumes was accomplished through the combination of CO2
data, video images, and operator notes during chase events.Forward-looking video images identified the traffic level andwhen a nontarget vehicle drove into the gap between themobile lab and the target. Self-contamination can also be aproblem in low speed periods. These periods are identifiedand eliminated from event analysis. Clear changes in emissionratios, such as in the NO2/NOx ratio when following CRTdiesels, serve as markers of possible contamination.
Results and DiscussionEmission ratios for trace gas species in vehicle exhaust weredetermined from real-time data through the correlation ofthe trace species with the carbon dioxide in the exhaust.Individual time segments of exhaust data are associated withparticular buses or other events by association of the datawith time stamped documentation made during the event,as well as from the digital pictures of the traffic in front ofthe mobile lab. A detailed description of the analysis routinewas given in a previous publication (43).
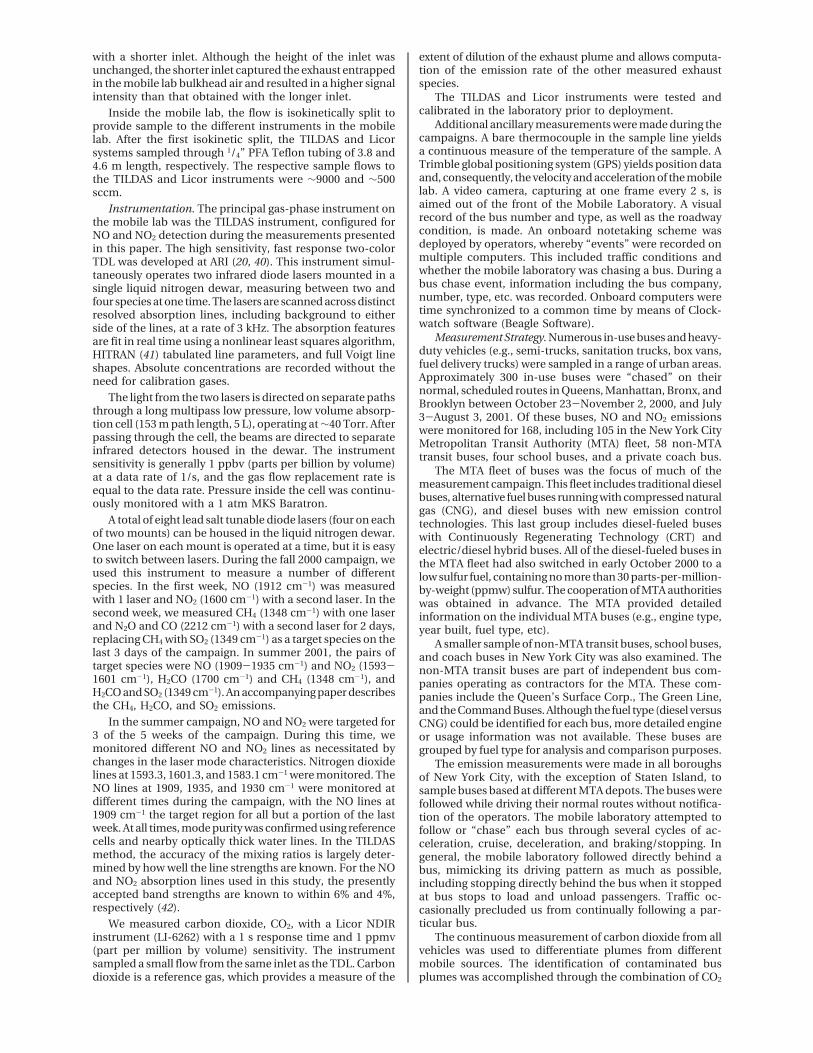
The analysis procedure is illustrated in Figure 1 with typicaldata collected when sampling the exhaust of a diesel bus.The left side of Figure 1 shows real-time data collected whensampling an MTA diesel bus over approximately 6 min. TheNO and NO2 plumes are clearly correlated with the CO2 inthe exhaust. During a typical curbside passenger bus chaseevent, plumes of 4-10 s in duration (fwhm) of varyingelevation are encountered, with plumes occurring during∼30-60% of the overall duty cycle during the event. Theplume strengths during the chase are also greater than thebackground variability. An additional example of plumestrengths and their occurrence is given in the companionpaper (7).
The real-time data are used to create correlation plots ofthe data segment, as shown in the right-hand panel of Figure1. Linear correlations of the NO2 with CO2 and NO with CO2
are shown in the figure. The result is a molar emission ratioin units of µmol of NOx to µmol of CO2. The individual NOand NO2 emission ratios for the bus of Figure 1 are (8.2 (0.18) × 10-3 µmol NO/µmol CO2 and (0.0975 ( 0.0028) ×10-3 µmol NO2/µmol CO2. The open data points in the plotsare points that are not included in the fits because they wereassociated with periods of known interference (e.g., exhaustfrom another vehicle was sampled).
During each chase event, the bus operates in a variety ofdriving modes. It is important to assess the degree to which
variations in this driving cycle (or in our sampling of thiscycle) affect our overall emission measurements. We havedone this for a few buses by dividing each chase event intosubsections with characterized driving states. The drive states(i.e., idle, acceleration, cruise, and deceleration) are obtainedfrom information from the GPS and rangefinder on the mobilelaboratory. Details on the analysis and the definition of eachstate are given in detail in Herndon et al. in this issue (7). Thestates are defined as follows: idle is when the bus wasstopped; accelerating was when the bus’ acceleration was>0.2 m s-2 and the velocity was between 1 and 5 m s-1; cruisewas when the bus’ velocity was over 6.7 m s-1; anddecelerating was when the velocity was over 1 m s-1 and theacceleration was less than -0.67 m s-2. The purpose of asimple coarse characterization of drive state was to determineif there was any effect on emissions. Analysis of thesubsections (usually individual plumes) shows that thevariations in the emissions of NOx between buses are generallysignificantly larger than the variations for a single bus as afunction of its driving cycle. In other words, the emissionratios that we report are at most weakly dependent on drivecycle and are strongly dependent on which bus is beingmeasured.
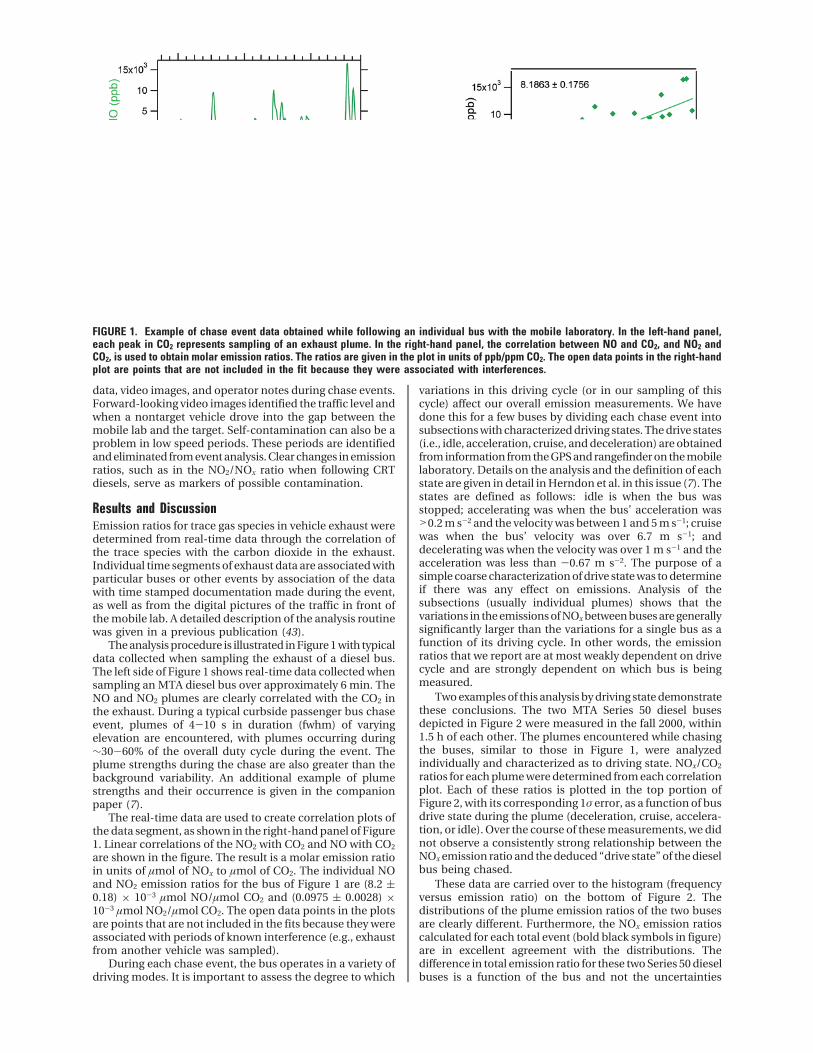
Two examples of this analysis by driving state demonstratethese conclusions. The two MTA Series 50 diesel busesdepicted in Figure 2 were measured in the fall 2000, within1.5 h of each other. The plumes encountered while chasingthe buses, similar to those in Figure 1, were analyzedindividually and characterized as to driving state. NOx/CO2
ratios for each plume were determined from each correlationplot. Each of these ratios is plotted in the top portion ofFigure 2, with its corresponding 1σ error, as a function of busdrive state during the plume (deceleration, cruise, accelera-tion, or idle). Over the course of these measurements, we didnot observe a consistently strong relationship between theNOx emission ratio and the deduced “drive state” of the dieselbus being chased.
These data are carried over to the histogram (frequencyversus emission ratio) on the bottom of Figure 2. Thedistributions of the plume emission ratios of the two busesare clearly different. Furthermore, the NOx emission ratioscalculated for each total event (bold black symbols in figure)are in excellent agreement with the distributions. Thedifference in total emission ratio for these two Series 50 dieselbuses is a function of the bus and not the uncertainties
FIGURE 1. Example of chase event data obtained while following an individual bus with the mobile laboratory. In the left-hand panel,each peak in CO2 represents sampling of an exhaust plume. In the right-hand panel, the correlation between NO and CO2, and NO2 andCO2, is used to obtain molar emission ratios. The ratios are given in the plot in units of ppb/ppm CO2. The open data points in the right-handplot are points that are not included in the fit because they were associated with interferences.
associated with the measurements or the chase methodology.A detailed plume-by-plume analysis is also given in thecompanion paper with similar results obtained for other tracespecies in the bus exhaust (7).
The molar emission ratio is formed from the trace speciesconcentration (above background) and the CO2 concentration(above background), where the CO2 level in the exhaust isa measure of fuel consumption. By assuming a carbon contentin the fuel, one can convert the molar emission ratio to aratio in terms of the fuel consumption, that is, units of g NOx
per kg fuel. These units are particularly appropriate with themobile data where a measure of fuel consumption (observedCO2) is available, but gas mileage during the chase is not. Atrue accounting of carbon species from fuel would requirethe addition of CO and hydrocarbon emissions to CO2, butthese emissions are generally too small for diesel vehicles tobe significant in the total carbon balance (10). In addition,Yanowitz et al. (10, 13) have compared NOx emissions fromdifferent drive cycles in dynamometer testing and shownthat the NOx emission rate is independent of drive cycle whenthe rate is expressed on a fuel consumption basis (g/gal org/kg fuel) as compared to when expressed in units of g/mile.When particulate matter and carbon monoxide emission ratesare expressed on the same basis (g/gal), variation as a functionof drive cycle can still be observed. The carbon content, basedon typical fuel composition, is assumed to be 3180 g CO2/kgfuel for diesel fuel and 2757 g CO2/kg fuel for compressednatural gas (CNG) (95% CH4 in CNG). The NOx emissionratios are reported here as equivalent NO2. This was chosento be consistent with the accepted units for mass emissionsfor purposes of compliance with heavy-duty emissionsstandards.
Validation of Methodology. The emission ratio of indi-vidual trace species in the exhaust is determined using CO2
as the exhaust dilution tracer, as described above. The chasemeasurement method can be described as essentially themeasurement of a diluted mixture of trace gases (e.g., NO,NO2) and a tracer gas (CO2) by instrumentation deployed ina mobile laboratory. This is analogous to previous studies
with the ARI mobile laboratory in which emissions fromstationary point sources, including natural gas facilities andlandfills, were determined with atmospheric tracer measure-ments (35-37, 44). The method compares diluted trace gasmixing ratios to tracer gas (typically SF6) mixing ratios atdownwind locations. Controlled release tests were conductedto validate the method, as well as intercomparisons of real-time data with downwind canister samples (35). Results forcontrolled release experiments had excellent agreement, asdid the comparison between canister and real-time results.Details of the validation tests are given in Lamb et al. (35).Landfill results from the mobile laboratory have also beencompared with static enclosure methods (44). In all of thesetests, excellent agreement between the different methodswas obtained.
A concern that often surfaces in attempts to assign a singleemission factor to a category encompassing a large, poten-tially variable sample set is how representative are themeasurements used to generate the emission factor? Withregards to the measurements in this paper, there are twoaspects to this question. First, have the individual buses beencharacterized under operating conditions representative oftypical conditions, and such that the emissions reported foreach bus are free of any systematic bias? We must alsoconsider whether the buses that were studied are represen-tative of the overall fleet of buses in NYC. An attribute of ourmeasurement approach is that it is able to address both ofthese concerns. With respect to the first concern, theemissions of the buses were measured while in-use underreal world driving conditions, and over their entire range ofdriving conditions. The issue of fleet representation wasconsidered through random selection of individual buses.Measurements were also conducted in four of the fiveborough of NYC. We estimate that we only measured about4% of the total MTA fleet; nevertheless, this still is a significantnumber of vehicles and an unbiased sample to the best ofour knowledge.
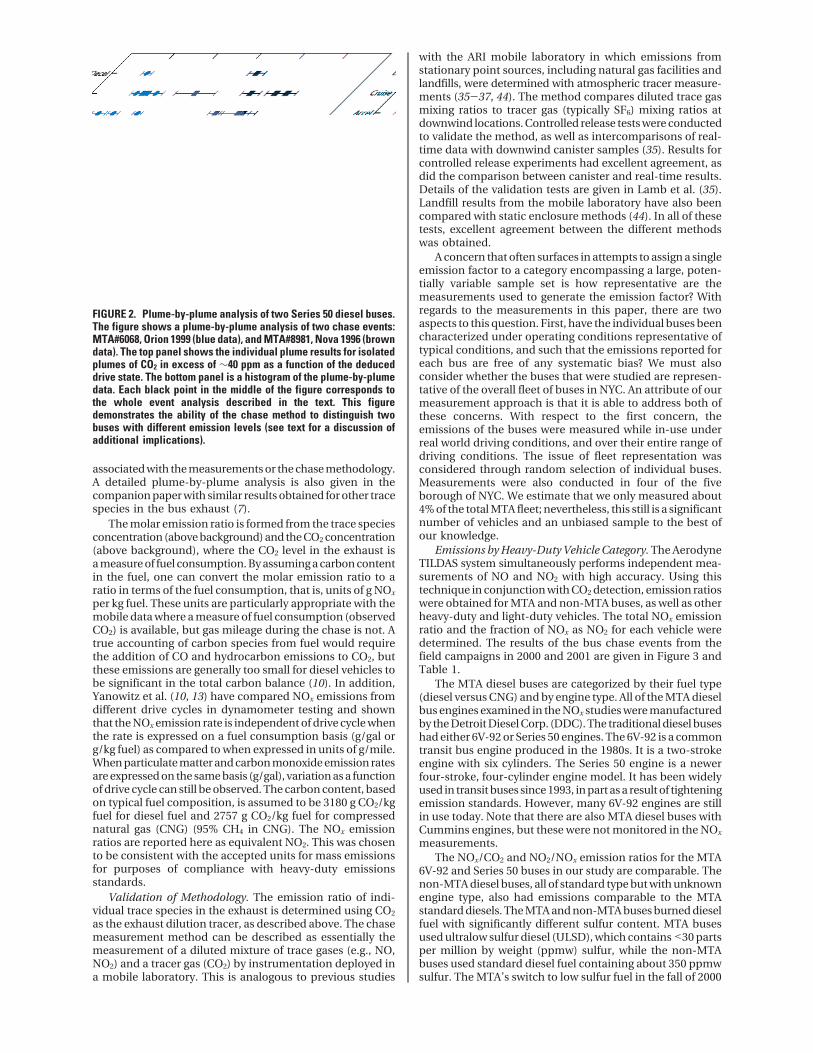
Emissions by Heavy-Duty Vehicle Category. The AerodyneTILDAS system simultaneously performs independent mea-surements of NO and NO2 with high accuracy. Using thistechnique in conjunction with CO2 detection, emission ratioswere obtained for MTA and non-MTA buses, as well as otherheavy-duty and light-duty vehicles. The total NOx emissionratio and the fraction of NOx as NO2 for each vehicle weredetermined. The results of the bus chase events from thefield campaigns in 2000 and 2001 are given in Figure 3 andTable 1.
The MTA diesel buses are categorized by their fuel type(diesel versus CNG) and by engine type. All of the MTA dieselbus engines examined in the NOx studies were manufacturedby the Detroit Diesel Corp. (DDC). The traditional diesel buseshad either 6V-92 or Series 50 engines. The 6V-92 is a commontransit bus engine produced in the 1980s. It is a two-strokeengine with six cylinders. The Series 50 engine is a newerfour-stroke, four-cylinder engine model. It has been widelyused in transit buses since 1993, in part as a result of tighteningemission standards. However, many 6V-92 engines are stillin use today. Note that there are also MTA diesel buses withCummins engines, but these were not monitored in the NOx
measurements.The NOx/CO2 and NO2/NOx emission ratios for the MTA
6V-92 and Series 50 buses in our study are comparable. Thenon-MTA diesel buses, all of standard type but with unknownengine type, also had emissions comparable to the MTAstandard diesels. The MTA and non-MTA buses burned dieselfuel with significantly different sulfur content. MTA busesused ultralow sulfur diesel (ULSD), which contains <30 partsper million by weight (ppmw) sulfur, while the non-MTAbuses used standard diesel fuel containing about 350 ppmwsulfur. The MTA’s switch to low sulfur fuel in the fall of 2000
FIGURE 2. Plume-by-plume analysis of two Series 50 diesel buses.The figure shows a plume-by-plume analysis of two chase events:MTA#6068, Orion 1999 (blue data), and MTA#8981, Nova 1996 (browndata). The top panel shows the individual plume results for isolatedplumes of CO2 in excess of ∼40 ppm as a function of the deduceddrive state. The bottom panel is a histogram of the plume-by-plumedata. Each black point in the middle of the figure corresponds tothe whole event analysis described in the text. This figuredemonstrates the ability of the chase method to distinguish twobuses with different emission levels (see text for a discussion ofadditional implications).
was necessitated by the deployment of CRT diesel buses,which require the ULSD fuel.
Three hybrid electric buses were sampled in our study.The hybrid electric system combines a diesel engine with
electric drive components and electric energy storagecapability. This reduces the total energy (fuel) used by thevehicle, increases the fuel economy, and subsequently canlead to lower total vehicular emissions. At the time of the
FIGURE 3. Classification of average NOx (NO + NO2) emissions by vehicle type. The height of each bar reflects the average emissionratio calculated over all relevant chase events that represent the particular vehicle class. Error bars represent (1 standard error of themean. The orange section of each bar represents the portion of total NOx emission resulting from NO2 emissions. OB ) other buses; SAN) sanitation trucks; SEMI ) semitrucks; OTHER ) other light-duty and heavy-duty vehicles that do not fall in the other categories;BACKGROUND ) emissions in background urban area, when not directly sampling other vehicles; dirty car ) a car with particularly highparticulate emissions.
TABLE 1. Comparison of Emission Data from the Present Study with Previous Chassis Dynamometer Studies
ref approacha vehicle type cycleNOx
b
(g NOx/kg fuel)sample
size
Prucz, 2001 CD transit busesDDC 6V-92TA CBD 40.2 ( 1.0c 612DDC Series 50 CBD 42.6 ( 1.3c 248
Yanowitz, 2000 CD transit buses multiple, includingCBD, HCT, WVT
34.2 ( 1.6 >100
Ramamurthy andClark, 1999
CD transit buses
DDC Series 50 CBD, WVT, 5-mile 33.7 ( 11.3e 5Yanowitz, 1999 CD transit buses all cycles 49.7 (40.0-61.2) 4
CBD cycle, only 48.2 (40.0-57.4) 4DDC 6V-92TA 55.6 (50.2-61.2) 2DDC Series 50 44.7 (40.0-48.8) 2school buses 27.8 (20.4-33.9) 2
Wang, 1997 CD diesel buses CBD 38.6 ( 2.4c 131CNG buses CBD 44.4 ( 5.9d 60
Lowell, 2003 CD diesel buses, standard fuel CBD 33.7 ( 8.0e 6diesel buses, ULSD CBD 30.2 ( 6.3e 5diesel buses with CRT CBD 31.2 ( 5.4e 8diesel buses, standard fuel NYB 32.7 1diesel buses with CRT NYB 30.9 ( 5.5e 3CNG buses CBD 26.4 ( 15.2e 13CNG buses NYB 25.6 ( 20.7e 6
this work mobile lab MTA transit diesel busesDDC 6V-92TA 31.2 ( 5.9 (8.1-72.0) 29Series 50 38.2 ( 6.2 (15.4-117.1) 41CRT real world conditions, 27.8 ( 6.3 (6.5-62.9) 22hybrid New York City 17.2 ( 7.9 (12.6-21.3) 3CNG 33.0 ( 9.4 (16.7-62.7) 10non-MTA diesel buses 34.0 ( 4.7 (8.1-67.0) 36non-MTA CNG buses 18.7 ( 3.9 (7.9-41.3) 22school buses 15.0 ( 12.5 (5.6-23.4) 4
a CD ) chassis dynamometer. b NOx emissions reported as mean ( 95% confidence interval, unless otherwise noted. Values in parenthesesare the range of results. c Assumes diesel bus fuel economy of 3.9 mile/gal (45) and fuel density of 7.1 lb/gal ()3.22 kg/gal). d Assumes CNG busfuel economy of 3.4 mile/gal (45) and fuel density of 2.43 kg/gal. e 1σ standard deviation of the mean, determined from reported results.
study, the MTA had only 10 prototype hybrid-electric busesin revenue service. In NYC, the hybrid electric buses in servicehave shown an average of 10-30% improvement in fueleconomy in comparison to the standard diesel buses (45).The NOx emissions from the hybrid electric buses were afactor of about 2 lower than the standard diesel.
NOx emissions from CNG buses were comparable to thosefrom the diesel buses. This is consistent with results by Wanget al. (14), who found insignificant NOx reductions in CNGsas compared with comparable diesel buses. Lanni et al. (46)report similar results for dynamometer tests on a smallnumber of New York City buses. Other studies, however,suggest that with careful engineering and maintenance, CNGengines have the capacity for greatly reduced emissionsrelative to diesel engines (45, 47).
Variability of NOx emissions from CNG buses has beenobserved by several other groups (45, 46, 48). In addition tothe effects of bus routes on emissions, possible causes of thevariability that have been suggested are vehicle maintenanceand variations in the composition of the natural gas, whichleads to changes in the stoichiometry and octane number.Higher NOx emissions have also been observed duringbackfiring events, which might be associated with vehiclemaintenance (45).
There was variability in the NOx emission ratios withinindividual categories of buses. In Table 1, the 95% confidencelimit in the mean of our measurements is given, as well asthe range of the values in each category. In comparison, the1σ of the emission rate of single bus event is on average ∼3%of the rate. The NOx/CO2 bus-to-bus variability for a singlebus/engine type is likely a result of a combination of factors.Operating parameters, including temperature and humidity,maintenance of the individual buses, driver habits, andcharacteristics of the bus route, may affect the NOx emissionratios. The buses were monitored while driven in actual in-use real world environments on their regular bus routes. Asthe bus operators were uninformed of the sampling beingperformed, no attempt was made to operate the buses inany prescribed mode other than the individual operator’snormal driving habits.
The total NOx for MTA and non-MTA diesel buses wasapproximately 31-38 g NOx/kg fuel with some deviatingbuses. The three MTA hybrid electric buses had loweremission ratios of 17.2 g NOx/kg fuel. Emission ratios forCNG buses were comparable to those of diesel buses, butthe emission ratios of the non-MTA CNG buses were slightlylower.
Nitrogen Dioxide from CRT Diesel Buses. While the meanNOx emission ratios for the different bus types vary little, the
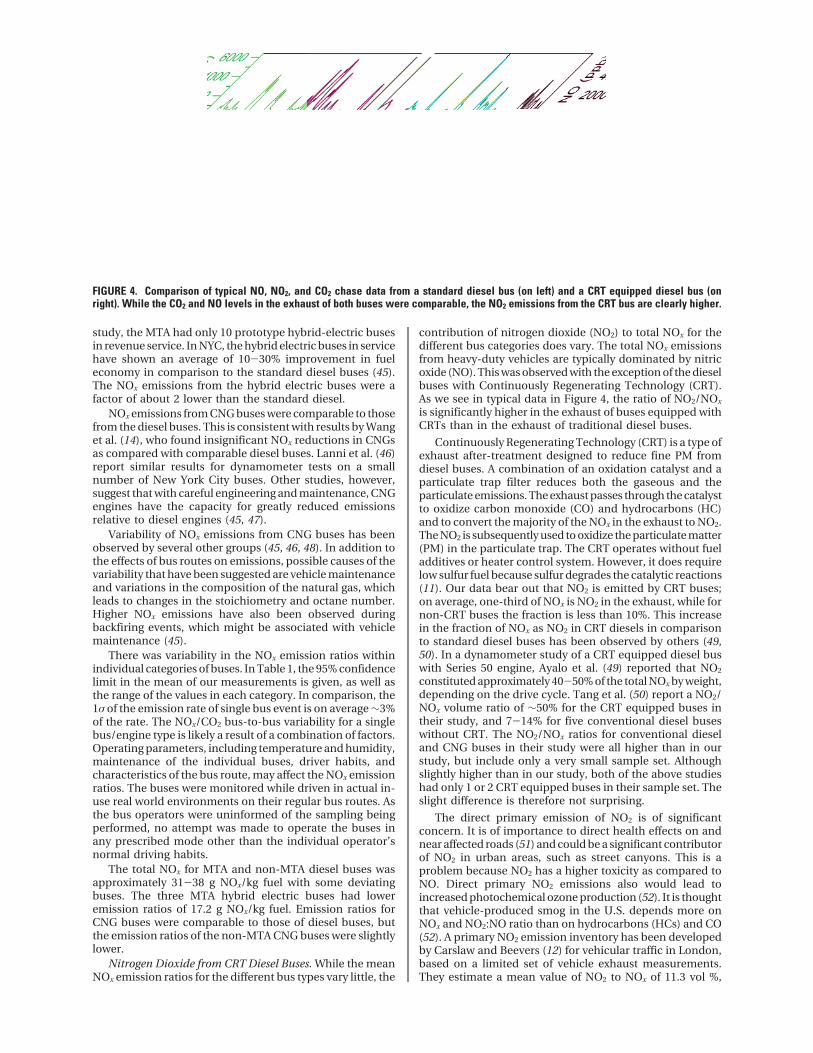
contribution of nitrogen dioxide (NO2) to total NOx for thedifferent bus categories does vary. The total NOx emissionsfrom heavy-duty vehicles are typically dominated by nitricoxide (NO). This was observed with the exception of the dieselbuses with Continuously Regenerating Technology (CRT).As we see in typical data in Figure 4, the ratio of NO2/NOx
is significantly higher in the exhaust of buses equipped withCRTs than in the exhaust of traditional diesel buses.
Continuously Regenerating Technology (CRT) is a type ofexhaust after-treatment designed to reduce fine PM fromdiesel buses. A combination of an oxidation catalyst and aparticulate trap filter reduces both the gaseous and theparticulate emissions. The exhaust passes through the catalystto oxidize carbon monoxide (CO) and hydrocarbons (HC)and to convert the majority of the NOx in the exhaust to NO2.The NO2 is subsequently used to oxidize the particulate matter(PM) in the particulate trap. The CRT operates without fueladditives or heater control system. However, it does requirelow sulfur fuel because sulfur degrades the catalytic reactions(11). Our data bear out that NO2 is emitted by CRT buses;on average, one-third of NOx is NO2 in the exhaust, while fornon-CRT buses the fraction is less than 10%. This increasein the fraction of NOx as NO2 in CRT diesels in comparisonto standard diesel buses has been observed by others (49,50). In a dynamometer study of a CRT equipped diesel buswith Series 50 engine, Ayalo et al. (49) reported that NO2
constituted approximately 40-50% of the total NOx by weight,depending on the drive cycle. Tang et al. (50) report a NO2/NOx volume ratio of ∼50% for the CRT equipped buses intheir study, and 7-14% for five conventional diesel buseswithout CRT. The NO2/NOx ratios for conventional dieseland CNG buses in their study were all higher than in ourstudy, but include only a very small sample set. Althoughslightly higher than in our study, both of the above studieshad only 1 or 2 CRT equipped buses in their sample set. Theslight difference is therefore not surprising.
The direct primary emission of NO2 is of significantconcern. It is of importance to direct health effects on andnear affected roads (51) and could be a significant contributorof NO2 in urban areas, such as street canyons. This is aproblem because NO2 has a higher toxicity as compared toNO. Direct primary NO2 emissions also would lead toincreased photochemical ozone production (52). It is thoughtthat vehicle-produced smog in the U.S. depends more onNOx and NO2:NO ratio than on hydrocarbons (HCs) and CO(52). A primary NO2 emission inventory has been developedby Carslaw and Beevers (12) for vehicular traffic in London,based on a limited set of vehicle exhaust measurements.They estimate a mean value of NO2 to NOx of 11.3 vol %,
FIGURE 4. Comparison of typical NO, NO2, and CO2 chase data from a standard diesel bus (on left) and a CRT equipped diesel bus (onright). While the CO2 and NO levels in the exhaust of both buses were comparable, the NO2 emissions from the CRT bus are clearly higher.

considerably higher than the 5% that is often assumed (12).Incorporation of our NO2/NOx results (∼30%) in the modelwould increase the primary NO2 emission inventory inLondon.
Comparison with Dynamometer Studies. The measure-ment study presented in this paper is one of the first attemptsto extensively quantify exhaust emissions from in-use transitbuses. The standard technique to determine exhaust emis-sions is through the use of chassis dynamometers. Indynamometer testing, a predescribed driving cycle is followedin an attempt to simulate typical driving conditions. Themost commonly used cycle is the Central Bus District (CBD)cycle. The CBD cycle has 14 successive acceleration, cruise,deceleration events, which cover 2 miles (3.2 km) in about10 min. It is widely used as a metric for characterization ofemissions. Other driving cycles for bus and other heavy-duty vehicle emission tests include the New York Bus (NYB)cycle, more representative of New York operation, covering0.5 miles with an average speed of 1.5 mph; the heavy-dutytransient (HDT) cycle, representing heavy-duty driving inurban areas and covering various speeds including highwayspeeds; and the West Virginia Truck (WVT) cycle, to simulatetypical driving of large trucks using five steps of increasingspeed, steady run, and braking with a maximum speed of 40mph.
Our experimental methodology is critically different fromchassis dynamometer testing. It studies in-use buses underreal world conditions. The “chased” bus does not have apredescribed driving pattern to follow. Instead, it is drivenin normal bus transit operation, on its normal bus route. Inour experiments, the specific buses were not preselected forsampling and efforts were made to avoid interfering withnormal operations. Emissions should therefore reflect normaloperating procedures. Buses were measured as encountered,without prior knowledge of maintenance records or of thedriving habits of the operator. The total reported NOx fromthe mobile lab is a sum of the individually measured NO andNO2. In most dynamometer studies, total NOx is reported.
Table 1 compares the NOx emission ratios of buses asdetermined from our studies with reported emission ratesfrom dynamometer studies. All of the results are expressedin units of g NOx/kg fuel in Table 1 to minimize the effectof different drive cycles, or driving habits, on the indices. Ingeneral, the ARI real world rates are similar to the dyna-mometer results. The NOx emission rates for diesel busesagree well, with the mobile lab results at the low end of therange of reported dynamometer emission rates. We can alsolook at the different engine types within the diesel categoryof buses. The MTA diesel buses with DDC 6V-92TA enginesand Series 50 engines had comparable NOx emissions in ourstudy. The emission rates of each engine type are within theerror of the rates reported by the Prucz et al. review (15),which included a large sample size. The mobile results ingeneral have more variability than the other studies. Thisreflects the variability of the vehicle maintenance and driverhabits of real world driving.
The average NOx emission rate from the CRT diesel busesfrom our studies (27.8 ( 6.3 g NOx/kg fuel) agrees well withthe rates reported by Lowell (45), that is, 31.2 ( 5.4 and 30.9( 5.5 g NOx/kg fuel for CBD and NYB dynamometer cycles,respectively.
Our results for CNG buses agree well with other reportedvalues. Our average mobile MTA CNG NOx emission rate liesbetween the Wang (14) and Lowell (45) rates, while the non-MTA CNGs have a 40% lower emission rate. The Lowellresults, which include the results of Lanni et al. (46), haveone CNG bus with significantly higher emissions than theother CNG buses in the study. This bus was noted to backfire,with higher NOx emissions correlated to periods of backfiring.This bus is included in the average because it represents real
world in service behavior. There is evidence that busesexperienced backfiring events during our studies, as seenboth in changes in NOx and also in higher elevations inmethane (7). At this time, we do not have a definitiveexplanation for why the non-MTA CNGs produced a lowerNOx emission ratio in our study. Possible explanations arethat more MTA buses had backfiring events, more frequentMTA backfiring events were observed, non-MTA buses hadbetter maintenance, or the fuel ratio was different in MTAand non-MTA buses.
Comparison to Tunnel and Remote Sensing Studies. Thereal world NOx emission ratios of the chase experiments canbe compared to in-use emission ratios from tunnel andremote sensing studies presented in the literature, althoughno such literature results for buses only have been identified.Rather we can compare our results for diesel buses withheavy-duty diesel vehicles, which are predominantly trucks.We have also obtained NOx emission ratios for NYC tunnels,where we sampled NOx emissions from the ensemble ofvehicles in the tunnels on five occasions (see Figure 3).
Yanowitz et al. (10) reviewed tunnel studies to deduceemissions from heavy-duty diesel vehicles. The NOx emissionsof this vehicle class in tunnel studies ranged from 38 to 49g/kg fuel (see ref 10 and references therein). Kirchstetterreported heavy-duty and light-duty emissions in a Californiatunnel: 9.0 ( 0.2 g/kg fuel and 42 ( 5 g/kg fuel for light-dutyand heavy-duty vehicles, respectively (6). The heavy-dutyemission ratio, higher than the average diesel bus emissionratio that we observed in the chase experiments, reflectsdifferent vehicle types under different environmental anddriving conditions (highway cruise versus city/bus routes).We also compare our NYC tunnel results with those ofKirchstetter. The NOx emissions in tunnels in NYC, 10.9 (5.3 g/kg fuel (assuming diesel fuel), are slightly higher thanthe light-duty vehicle result. Although the vehicles in theNYC tunnels were predominantly light-duty vehicles (au-tomobiles, light-duty trucks, etc.), heavy-duty vehicles alsocontributed to the tunnel ensemble average NOx emissions,resulting in higher average NOx emissions ratios.
There have been several remote sensing studies of heavy-duty truck emissions. Jimenez et al. (19) used an AerodyneTDL-TILDAS system configured for open path cross roaddetection of NO and NO2. They observed NOx emissionsranging from 35 to 38 g/kg fuel from heavy-duty diesels.Other remote sensing studies had average NOx emissionsfrom 21 to 53 g/kg (see ref 19 and references therein). Theseresults span the NOx emission ratios that we measured viachase experiments (see Table 1). The highest of the literaturevalues, 53 g/kg, was from a study performed in Golden, CO(22). Bishop et al. (53) attribute the increased engineemissions to the higher altitude of the site (1800 m).
The chase vehicle sampling method deployed by the ARImobile laboratory yields real world vehicle emissions. Theresults of these measurements can be used to generate morerealistic emission inventories. This is a task outside of thescope of this paper. The data, however, will be important toresearchers presently building and evaluating emissioninventories. As described above, our real world rates aresimilar to the dynamometer results. The NOx emission ratesfor diesel buses agree well, with the mobile lab results at thelow end of the range of reported dynamometer emissionrates. If the cited literature values are considered representa-tive of emission factors used to generate emission inventoriesof NOx, inclusion of our results in the inventory models shouldcause a slight decrease in total NOx from transit buses in theinventory. Perhaps more important, the knowledge that theemission rates represent actual in-use drive cycle measure-ments would give increased confidence in the representationof the actual emissions.
The emission of NOx from transit buses will come underever-increasing scrutiny as their relative importance growswith the increasing control of emissions from light-dutyvehicles. Transit buses and other heavy-duty vehicles willlikely be the targets of future environmental legislation. Abaseline of the real world heavy-duty vehicle emissions iscritical to the regulation process, as is the development oftechniques and instrumentation to accurately quantify realworld emissions.
AcknowledgmentsWe thank the MTA for its cooperation, especially Chris Bushfor bus fleet information and Dana Lowell for help inorganizing the logistics of the fall 2000 campaign, the NYSDEC for providing drivers, and Queens College for logisticalsupport during the summer 2001 campaign. This work wassupported in part by a sub award with the State Universityat Albany under the U.S. Environmental Protection Agency(EPA) cooperative agreement # R828060010 and the NewYork State Energy Research and Development Authority(NYSERDA), contract # 4918ERTERES99. Although the re-search described in this Article has been funded in part bythe U.S. Environmental Protection Agency, it has not beensubjected to the Agency’s required peer and policy reviewand therefore does not necessarily reflect the views of theAgency and no official endorsement should be inferred.
Literature Cited(1) Seinfeld, J. H.; Pandis, S. N. Atmospheric Chemistry and Physics:
From Air Pollution to Climate Change; John Wiley and Sons:New York, 1998.
(2) U.S. EPA. Regulatory Announcement: Proposed Heavy-DutyEngine and Vehicle Standards and Highway Diesel Fuel SulphurControl Requirements; 2000.
(3) U.S. EPA. http://www.epa.gov/otaq/invntory/overview/pollut-ants/nox.htm, 2003.
(4) Sawyer, R. F.; Harley, R. A.; Cadle, S. H.; Norbeck, J. M.; Slott,R.; Bravo, H. A. Mobile sources critical review: 1998 NARSTOassessment. Atmos. Environ. 2000, 34, 2161-2181.
(5) Dreher, D. B.; Harley, R. A. A fuel-based inventory for heavy-duty diesel truck emissions. J. Air Waste Manage. Assoc. 1998,48, 352-358.
(6) Kirchstetter, T. W.; Harley, R. A.; Kreisberg, N. M.; Stolzenburg,M. R.; Hering, S. V. On-road measurement of fine particle andnitrogen oxide emissions from light- and heavy-duty motorvehicles. Atmos. Environ. 1999, 33, 2955-2968.
(7) Herndon, S. C.; Shorter, J. H.; Zahniser, M. S.; Wormhoudt, J.;Nelson, D. D.; Demerjian, K. L.; Kolb, C. E. Real-time measure-ments of SO2, H2CO, and CH4 emissions from in-use curbsidepassenger buses in New York City using a chase vehicle. Environ.Sci. Technol. 2005, 39, 7984-7990.
(8) Canagaratna, M. R.; Jayne, J. T.; Ghertner, A.; Herndon, S. C.;Shi, Q.; Jimenez, J. L.; Silva, P.; Williams, P.; Lanni, T.; Drewnick,F.; Demerjian, K. L.; Kolb, C. E.; Worsnop, D. R. Chase studiesof particulate emissions from in-use New York City vehicles.Aerosol Sci. Technol. 2004, 38, 555-573.
(9) Code of Federal Regulations, Title 40, Subpart N.(10) Yanowitz, J.; McCormick, R. L.; Graboski, M. S. In-use emissions
from heavy-duty diesel vehicles. Environ. Sci. Technol. 2000,34, 729-740.
(11) Clark, N. N.; Kern, J. M.; Atkinson, C. M.; Nine, R. D. Factorsaffecting heavy-duty diesel vehicle emissions. J. Air WasteManage. Assoc. 2002, 52, 84-94.
(12) Carslaw, D. C.; Beevers, S. E. Development of an urban inventoryfor road transport emissions of NO2 and comparison withestimates derived from ambient measurements. Atmos. Environ.2005, 39, 2049-2059.
(13) Yanowitz, J.; Graboski, M. S.; Ryan, L. B. A.; Alleman, T. L.;McCormick, R. L. Chassis dynamometer study of emissions from21 in-use heavy-duty diesel vehicles. Environ. Sci. Technol. 1999,33, 209-216.
(14) Wang, W. G.; Clark, N. N.; Lyons, D. W.; Yang, R. M.; Gautman,M.; Bata, R. M.; Loth, J. L. Emissions comparisons fromalternative fuel buses and diesel buses with a chassis dyna-mometer testing facility. Environ. Sci. Technol. 1997, 31, 3132-3137.
(15) Prucz, J. C.; Clark, N. N.; Gautam, M.; Lyons, D. W. Exhaustemissions from engines of the Detroit Diesel Corporation intransit buses: a decade of trends. Environ. Sci. Technol. 2001,35, 1755-1764.
(16) Pierson, W. R.; Gertler, A. W.; Robinson, N. F.; Sagebiel, J. C.;Zielinska, B.; Bishop, G. A.; Stedman, D. H.; Zweidinger, R. B.;Ray, W. D. Real-world automotive emissions - Summary ofstudies in the Fort McHenry and Tuscarora Mountain tunnels.Atmos. Environ. 1996, 30, 2233-2256.
(17) Rogak, S. N.; Pott, U.; Dann, T.; Wang, D. Gaseous emissionsfrom vehicles in a traffic tunnel in Vancouver, BC. J. Air WasteManage. Assoc. 1998, 48, 604-615.
(18) Fraser, M. P.; Cass, G. R.; Simoneit, B. R. T. Gas-phase andparticle phase organic compounds emitted from motor vehicletraffic in a Los Angeles roadway tunnel. Environ. Sci. Technol.1998, 32, 2051-2060.
(19) Jimenez, J. L.; McRae, G. J.; Nelson, D. D.; Zahniser, M. S.; Kolb,C. E. Remote sensing of NO and NO2 emissions from heavy-duty diesel trucks using tunable diode lasers. Environ. Sci.Technol. 2000, 34, 2380-2387.
(20) Nelson, D. D.; Zahniser, M. S.; McManus, J. B.; Kolb, C. E.;Jimenez, J. L. A tunable diode laser system for the remote sensingof on-road vehicle emissions. Appl. Phys. B 1998, 67, 433-441.
(21) Countess, R.; Cohen, L.; Countess, S. J.; Bishop, B. A.; Stedman,D. H. Remote Sensing of Heavy-Duty Diesel Truck Exhaust.Eighth CRC On-Road Vehicle Emissions Workshop, San Diego,CA; Coordinating Research Council: Atlanta, GA, 1998.
(22) Countess, R.; Countess, S. J.; Cohen, L. Remote Sensing of Heavy-Duty Diesel Trucks Revisited. Ninth CRC On-Road VehicleEmissions Workshop, San Diego, CA; Coordinating ResearchCouncil: Atlanta, GA, 1999.
(23) Cadle, S. H.; Belian, T. C.; Black, K. N.; Minassian, F.; Natarajan,M.; Tierney, E. J.; Lawson, D. R. Real-world vehicle emissions:A summary of the 14th Coordinating Research Council on-roadvehicle emissions workshop. J. Air Waste Manage. Assoc. 2005,55, 130-146.
(24) Kolb, C. E.; Herndon, S. C.; McManus, J. B.; Shorter, J. H.;Zahniser, M. S.; Nelson, D. D.; Jayne, J. T.; Canagaratna, M. R.;Worsnop, D. R. Mobile laboratory with rapid response instru-ments for real-time measurements of urban and regional tracegas and particulate distributions and emission source charac-teristics. Environ. Sci. Technol. 2004, 38, 5694-5703.
(25) Westerdahl, D.; Fruin, S.; Sax, T.; Fine, P. M.; Sioutas, C. Mobileplatform measurements of ultrafine particles and associatedpollutant concentrations on freeways and residential streets inLos Angeles. Atmos. Environ. 2005, 39, 3597-3610.
(26) Kittelson, D. B.; Watts, W. F.; Johnson, J. P. Nanoparticleemissions on Minnesota highways. Atmos. Environ. 2004, 38,9-19.
(27) Kittelson, D. B.; Watts, W. F.; Johnson, J. P.; Remerowki, M. L.;Ische, E. E.; Oberdorster, G.; Gelein, R. M.; Elder, A.; Hopke, P.K.; Kim, E.; Zhao, W.; Zhou, L.; Jeong, C. H. On-road exposureto highway aerosols. 1. Aerosol and gas measurements. Inhala-tion Toxicol. 2004, S1, 31-39.
(28) Kittelson, D.; Johnson, J.; Watts, W.; Wei, Q.; Drayton, M.;Paulsen, D. Diesel aerosol sampling in the atmosphere. SAETech. Pap. Ser. 2000, 2000-01-2212.
(29) Bukowiecki, N.; Dommen, J.; Prevot, A. S. H.; Richter, R.;Weingartner, E.; Baltensperger, U. A mobile pollutant measure-ment laboratory - measuring gas phase and aerosol ambientconcentrations with high spatial and temporal resolution. Atmos.Environ. 2002, 36, 5569-5579.
(30) Cocker, D. R., III; Shah, S. D.; Johnson, K.; Miller, J. W.; Norbeck,J. M. Development and application of a mobile laboratory formeasuring emissions from diesel engines. 1. Regulated gaseousemissions. Environ. Sci. Technol. 2004, 38, 2182-2189.
(31) Jimenez, J. L.; McManus, J. B.; Shorter, J. H.; Nelson, D. D.;Zahniser, M. S.; Koplow, M.; McRae, G. J.; Kolb, C. E. Cross roadand mobile tunable infrared laser measurements of nitrous oxideemissions from motor vehicles. Chemosphere: Global ChangeSci. 2000, 2, 397-412.
(32) Shorter, J. H.; Herndon, S. C.; Zahniser, M. S.; Nelson, D. D.;Jayne, J. T.; Kolb, C. E. Characterization of heavy-duty vehicleexhaust in dense urban environments. 10th InternationalSymposium “Transport and Air Pollution”; 2001; pp 33-40.
(33) Vogt, R.; Scheer, V.; Casati, R.; Benter, T. On-road measurementof particle emission in the exhaust plume of a diesel passengercar. Environ. Sci. Technol. 2003, 37, 4070-4076.
(34) Johnson, T.; Caldow, R. Making mobile measurements using anEEPS spectrometer. Proceedings of DEER 2004: 10th DieselEngine Emission Reduction Conference; Coronado, CA, 2004.
(35) Lamb, B.; McManus, J. B.; Shorter, J. H.; Kolb, C. E.; Mosher,B.; Harriss, R. C.; Allwine, E.; Blaha, D.; Howard, T.; Guenther,A.; Lott, R. A.; Siverson, R.; Westberg, H.; Zimmerman, P.Development of atmospheric tracer methods to measuremethane emissions from natural gas facilities and urban areas.Environ. Sci. Technol. 1995, 29, 1468-1479.
(36) Shorter, J. H.; McManus, J. B.; Kolb, C. E.; Allwine, E. J.; Siverson,R.; Lamb, B. K.; Mosher, B. W.; Harriss, R. C.; Howard, R.; Lott,R. A. Collection of leakage statistics in the natural gas systemby tracer methods. Environ. Sci. Technol. 1997, 31, 2012-2019.
(37) Mosher, B. W.; Czepiel, P. N.; Harriss, R. C.; Shorter, J. H.; Kolb,C. E.; McManus, J. B.; Allwine, E.; Lamb, B. K. Methane emissionsat nine landfill sites in the northeastern United States. Environ.Sci. Technol. 1999, 33, 2088-2094.
(38) Shorter, J. H.; McManus, J. B.; Kolb, C. E.; Allwine, E. J.; O’Neill,S. M.; Lamb, B. K.; Scheuer, E.; Crill, P. M.; Talbot, R. W.; Ferreira,J., Jr.; McRae, G. J. Recent measurements of urban metabolismand trace gas respiration. AMS Second Urban EnvironmentSymposium; 1998; pp 49-52.
(39) Shorter, J. H.; McManus, J. B.; Kolb, C. E.; Lamb, B. K.; O’Neill,S. M.; Allwine, E. J.; Talbot, R. W.; Scheuer, E.; Crill, P. M.; Ferreira,J., Jr.; McRae, G. J. Understanding the influence of local andregional sources on the temporal and spatial variability ofpollutants in urban environments. AMS Third Symposium onthe Urban Environment; 2000; pp 90-91.
(40) Zahniser, M. S.; Nelson, D. D.; McManus, J. B.; Kebabian, P. L.Measurement of trace gas fluxes using tunable diode laserspectroscopy. Philos. Trans. R. Soc. London, Ser. A 1995, 351,357-369.
(41) Rothman, L. S.; Rinsland, C. P.; Goldman, A.; Massie, S. T.;Edwards, D. P.; Flaud, J.-M.; Perrin, A.; Camy-Peyret, C.; Dana,V.; Mandin, J.-Y.; Schroeder, J.; McCann, A.; Gamache, R. R.;Wattson, R. B.; Yoshino, K.; Chance, K. V.; Jucks, K. W.; Brown,L. R.; Nemtchinov, V.; Varanasi, P. The Hitran MolecularSpectroscopic Database and Hawks (HItran Atmospheric Work-station): 1996 Edition. J. Quant. Spectrosc. Radiat. Transfer 1998,60, 665-710.
(42) Smith, M. A. H.; Rinsland, C. P.; Fridovich, B.; Rao, K. N.Intensities and Collision Broadening Parameters From InfraredSpectra. Molecular Spectroscopy: Modern Research; AcademicPress: New York, 1985; Chapter 3.
(43) Herndon, S. C.; Shorter, J. H.; Zahniser, M. S.; Nelson, D. D.;Jayne, J. T.; Brown, R. C.; Miake-Lye, R. C.; Waitz, I.; Silva, P.;Lanni, T.; Demerjian, K. L.; Kolb, C. E. NO and NO2 emission
ratios measured from in-use commercial aircraft during taxiand takeoff. Environ. Sci. Technol. 2004, 38, 6078-6084.
(44) Czepiel, P. M.; Mosher, B.; Harriss, R. C.; Shorter, J. H.; McManus,J. B.; Kolb, C. E.; Allwine, E.; Lamb, B. K. Landfill methaneemissions measured by enclosure and atmospheric tracermethods. J. Geophys. Res. 1996, 101, 16711-17619.
(45) Lowell, D. M.; Parsley, W.; Bush, C.; Zupo, D. Comparison ofclean diesel buses to CNG buses. MTA New York Transit; 2003.
(46) Lanni, T.; Frank, B. P.; Tang, S.; Rosenblatt, D.; Lowell, D.Performance and emissions evaluation of compressed naturalgas and clean diesel buses at New York City’s MetropolitanTransit Authority. SAE Tech. Pap. 2003, 2003-2001-0300.
(47) Lloyd, A. C.; Cackette, T. A. Diesel engines: Environmentalimpact and control. J. Air Waste Manage. Assoc. 2001, 51, 809-847.
(48) Ayala, A.; Gebel, M. E.; Okamoto, R. A.; Rieger, P. L.; Kado, N.Y.; Cotter, C.; Verma, N. Oxidation catalyst effect on CNG transitbus emissions. SAE 2003-01-1900 2003, 2003-2001-1900.
(49) Ayala, A.; Kado, N.; Okamoto, R. A.; Holmen, B. A.; Kuzmicky,P. A.; Kobayashi, R.; Stiglitz, K. E. Diesel and CNG heavy-dutytransit bus emissions over multiple driving schedules: Regulatedpollutants and project overview. SAE Tech. Pap. 2002, 2002-2001-1722.
(50) Tang, S.; Graham, L.; Shen, L.; Zhou, X.; Lanni, T. Simultaneousdetermination of carbonyls and NO2 in exhausts of heavy-dutydiesel trucks and transit buses by HPLC flowing 2,4-dinitro-phenylhydrazine cartridge collection. Environ. Sci. Technol.2004, 38, 5968-5976.
(51) Carslaw, D. C.; Beevers, S. D. New Directions: Should roadvehicle emissions legislation consider primary NO2? Atmos.Environ. 2004, 38, 1233-1234.
(52) Jacobson, M. Z.; Seinfeld, J. H.; Carmichael, G. R.; Streets, D. G.The effect of photochemical smog of converting the U.S. fleetof gasoline vehicles to modern diesel vehicles. Geophys Res.Lett. 2004, 31, doi: 10.1029/2003GL018448.
(53) Bishop, G. A.; Morris, J. A.; Stedman, D. H.; Cohen, L. H.;Countess, R. J.; Countess, S. J.; Maly, P.; Scherer, S. The effectsof altitude on heavy-duty diesel truck on-road emissions.Environ. Sci. Technol. 2001, 35, 1574-1578.
Received for review November 1, 2004. Revised manuscriptreceived June 30, 2005. Accepted July 28, 2005.