1q19-10-q.pdf - JPMorgan Chase
166
UNITED STATES SECURITIES AND EXCHANGE COMMISSION Washington, D.C. 20549 FORM 10-Q Quarterly report pursuant to Section 13 or 15(d) of the Securities Exchange Act of 1934 For the quarterly period ended Commission file March 31, 2019 number 1-5805 JPMorgan Chase & Co. (Exact name of registrant as specified in its charter) Delaware 13-2624428 (State or other jurisdiction of incorporation or organization) (I.R.S. employer identification no.) 383 Madison Avenue, New York, New York 10179 (Address of principal executive offices) (Zip Code) Registrant’s telephone number, including area code: (212) 270-6000 Indicate by check mark whether the registrant (1) has filed all reports required to be filed by Section 13 or 15(d) of the Securities Exchange Act of 1934 during the preceding 12 months (or for such shorter period that the registrant was required to file such reports), and (2) has been subject to such filing requirements for the past 90 days. Yes No Indicate by check mark whether the registrant has submitted electronically every Interactive Data File required to be submitted pursuant to Rule 405 of Regulation S-T (§232.405 of this chapter) during the preceding 12 months (or for such shorter period that the registrant was required to submit such files). Yes No Indicate by check mark whether the registrant is a large accelerated filer, an accelerated filer, a non-accelerated filer, a smaller reporting company, or an emerging growth company. See the definitions of “large accelerated filer,” “accelerated filer,” “smaller reporting company,” and “emerging growth company” in Rule 12b-2 of the Exchange Act. Large accelerated filer Accelerated filer Non-accelerated filer Smaller reporting company Emerging growth company If an emerging growth company, indicate by check mark if the registrant has elected not to use the extended transition period for complying with any new or revised financial accounting standards provided pursuant to Section 13(a) of the Exchange Act. Indicate by check mark whether the registrant is a shell company (as defined in Rule 12b-2 of the Exchange Act). Yes No Securities registered pursuant to Section 12(b) of the Act: Title of each class Trading Symbol(s) Name of each exchange on which registered Common stock JPM The New York Stock Exchange Depositary Shares, each representing a one-four hundredth interest in a share of 5.45% Non-Cumulative Preferred Stock, Series P JPM PR A The New York Stock Exchange Depositary Shares, each representing a one-four hundredth interest in a share of 6.30% Non-Cumulative Preferred Stock, Series W JPM PR E The New York Stock Exchange Depositary Shares, each representing a one-four hundredth interest in a share of 6.125% Non-Cumulative Preferred Stock, Series Y JPM PR F The New York Stock Exchange Depositary Shares, each representing a one-four hundredth interest in a share of 6.10% Non-Cumulative Preferred Stock, Series AA JPM PR G The New York Stock Exchange Depositary Shares, each representing a one-four hundredth interest in a share of 6.15% Non-Cumulative Preferred Stock, Series BB JPM PR H The New York Stock Exchange Depositary Shares, each representing a one-four hundredth interest in a share of 5.75% Non-Cumulative Preferred Stock, Series DD JPM PR D The New York Stock Exchange Depositary Shares, each representing a one-four hundredth interest in a share of 6.00% Non-Cumulative Preferred Stock, Series EE JPM PR C The New York Stock Exchange Alerian MLP Index ETNs due May 24, 2024 AMJ NYSE Arca, Inc. Guarantee of Callable Step-Up Fixed Rate Notes due April 26, 2028 of JPMorgan Chase Financial Company LLC JPM/28 The New York Stock Exchange Guarantee of Cushing 30 MLP Index ETNs due June 15, 2037 of JPMorgan Chase Financial Company LLC PPLN NYSE Arca, Inc. Number of shares of common stock outstanding as of March 31, 2019: 3,243,972,971
-
Upload
khangminh22 -
Category
Documents
-
view
0 -
download
0
Transcript of 1q19-10-q.pdf - JPMorgan Chase

UNITED STATESSECURITIES AND EXCHANGE COMMISSION
Washington, D.C. 20549
FORM 10-Q Quarterly report pursuant to Section 13 or 15(d) of
the Securities Exchange Act of 1934
For the quarterly period ended Commission file
March 31, 2019 number 1-5805
JPMorgan Chase & Co.(Exact name of registrant as specified in its charter)
Delaware 13-2624428
(State or other jurisdiction ofincorporation or organization)
(I.R.S. employeridentification no.)
383 Madison Avenue, New York, New York 10179
(Address of principal executive offices) (Zip Code)
Registrant’s telephone number, including area code: (212) 270-6000
Indicate by check mark whether the registrant (1) has filed all reports required to be filed by Section 13 or 15(d) of the Securities Exchange Act of 1934 during the preceding 12 months (or for such shorter period that the registrant was required to file such reports), and (2) has been subject to such filing requirements for the past 90 days. Yes No
Indicate by check mark whether the registrant has submitted electronically every Interactive Data File required to be submitted pursuant to Rule 405 of Regulation S-T (§232.405 of this chapter) during the preceding 12 months (or for such shorter period that the registrant was required to submit such files). Yes No
Indicate by check mark whether the registrant is a large accelerated filer, an accelerated filer, a non-accelerated filer, a smaller reporting company, or an emerging growth company. See the definitions of “large accelerated filer,” “accelerated filer,” “smaller reporting company,” and “emerging growth company” in Rule 12b-2 of the Exchange Act.
Large accelerated filer Accelerated filer
Non-accelerated filer Smaller reporting company
Emerging growth company
If an emerging growth company, indicate by check mark if the registrant has elected not to use the extended transition period for complying with any new or revised financial accounting standards provided pursuant to Section 13(a) of the Exchange Act.
Indicate by check mark whether the registrant is a shell company (as defined in Rule 12b-2 of the Exchange Act). Yes No
Securities registered pursuant to Section 12(b) of the Act:
Title of each class Trading Symbol(s) Name of each exchange onwhich registered
Common stock JPM The New York Stock Exchange
Depositary Shares, each representing a one-four hundredth interest in a share of 5.45%Non-Cumulative Preferred Stock, Series P
JPM PR A The New York Stock Exchange
Depositary Shares, each representing a one-four hundredth interest in a share of 6.30%Non-Cumulative Preferred Stock, Series W
JPM PR E The New York Stock Exchange
Depositary Shares, each representing a one-four hundredth interest in a share of 6.125%Non-Cumulative Preferred Stock, Series Y
JPM PR F The New York Stock Exchange
Depositary Shares, each representing a one-four hundredth interest in a share of 6.10%Non-Cumulative Preferred Stock, Series AA
JPM PR G The New York Stock Exchange
Depositary Shares, each representing a one-four hundredth interest in a share of 6.15%Non-Cumulative Preferred Stock, Series BB
JPM PR H The New York Stock Exchange
Depositary Shares, each representing a one-four hundredth interest in a share of 5.75%Non-Cumulative Preferred Stock, Series DD
JPM PR D The New York Stock Exchange
Depositary Shares, each representing a one-four hundredth interest in a share of 6.00%Non-Cumulative Preferred Stock, Series EE
JPM PR C The New York Stock Exchange
Alerian MLP Index ETNs due May 24, 2024 AMJ NYSE Arca, Inc.
Guarantee of Callable Step-Up Fixed Rate Notes due April 26, 2028 of JPMorgan ChaseFinancial Company LLC
JPM/28 The New York Stock Exchange
Guarantee of Cushing 30 MLP Index ETNs due June 15, 2037 of JPMorgan Chase FinancialCompany LLC
PPLN NYSE Arca, Inc.
Number of shares of common stock outstanding as of March 31, 2019: 3,243,972,971

2
FORM 10-QTABLE OF CONTENTS
Part I – Financial information Page
Item 1. Financial Statements.
Consolidated Financial Statements – JPMorgan Chase & Co.:
Consolidated statements of income (unaudited) for the three months ended March 31, 2019 and 2018 69
Consolidated statements of comprehensive income (unaudited) for the three months ended March 31, 2019 and 2018 70
Consolidated balance sheets (unaudited) at March 31, 2019 and December 31, 2018 71
Consolidated statements of changes in stockholders’ equity (unaudited) for the three months ended March 31, 2019 and 2018 72
Consolidated statements of cash flows (unaudited) for the three months ended March 31, 2019 and 2018 73
Notes to Consolidated Financial Statements (unaudited) 74
Report of Independent Registered Public Accounting Firm 149
Consolidated Average Balance Sheets, Interest and Rates (unaudited) for the three months ended March 31, 2019 and 2018 150
Glossary of Terms and Acronyms and Line of Business Metrics 151
Item 2. Management’s Discussion and Analysis of Financial Condition and Results of Operations.
Consolidated Financial Highlights 3
Introduction 4
Executive Overview 5
Consolidated Results of Operations 9
Consolidated Balance Sheets and Cash Flows Analysis 11
Off-Balance Sheet Arrangements 14
Explanation and Reconciliation of the Firm’s Use of Non-GAAP Financial Measures and Key Performance Measures 15
Business Segment Results 17
Enterprise-Wide Risk Management 31
Capital Risk Management 32
Liquidity Risk Management 41
Consumer Credit Portfolio 43
Wholesale Credit Portfolio 48
Investment Portfolio Risk Management 57
Market Risk Management 58
Country Risk Management 63
Critical Accounting Estimates Used by the Firm 64
Accounting and Reporting Developments 67
Forward-Looking Statements 68
Item 3. Quantitative and Qualitative Disclosures About Market Risk. 159
Item 4. Controls and Procedures. 159
Part II – Other information
Item 1. Legal Proceedings. 159
Item 1A. Risk Factors. 159
Item 2. Unregistered Sales of Equity Securities and Use of Proceeds. 159
Item 3. Defaults Upon Senior Securities. 160
Item 4. Mine Safety Disclosures. 160
Item 5. Other Information. 160
Item 6. Exhibits. 160

3
JPMorgan Chase & Co.Consolidated financial highlights (unaudited)
As of or for the period ended, (in millions, except per share, ratio, headcount data and where otherwise noted)
1Q19 4Q18 3Q18 2Q18 1Q18
Selected income statement dataTotal net revenue $ 29,123 $ 26,109 $ 27,260 $ 27,753 $ 27,907
Total noninterest expense 16,395 15,720 15,623 15,971 16,080
Pre-provision profit 12,728 10,389 11,637 11,782 11,827
Provision for credit losses 1,495 1,548 948 1,210 1,165
Income before income tax expense 11,233 8,841 10,689 10,572 10,662
Income tax expense 2,054 1,775 2,309 2,256 1,950
Net income $ 9,179 $ 7,066 $ 8,380 $ 8,316 $ 8,712
Earnings per share data
Net income: Basic $ 2.65 $ 1.99 $ 2.35 $ 2.31 $ 2.38 Diluted 2.65 1.98 2.34 2.29 2.37
Average shares: Basic 3,298.0 3,335.8 3,376.1 3,415.2 3,458.3
Diluted 3,308.2 3,347.3 3,394.3 3,434.7 3,479.5Market and per common share data
Market capitalization 328,387 319,780 375,239 350,204 374,423
Common shares at period-end 3,244.0 3,275.8 3,325.4 3,360.9 3,404.8
Book value per share 71.78 70.35 69.52 68.85 67.59
Tangible book value per share (“TBVPS”)(a) 57.62 56.33 55.68 55.14 54.05
Cash dividends declared per share 0.80 0.80 0.80 0.56 0.56
Selected ratios and metrics
Return on common equity (“ROE”)(b) 16% 12% 14% 14% 15%
Return on tangible common equity (“ROTCE”)(a)(b) 19 14 17 17 19
Return on assets(b) 1.39 1.06 1.28 1.28 1.37
Overhead ratio 56 60 57 58 58
Loans-to-deposits ratio 64 67 65 65 63
Liquidity coverage ratio (“LCR”) (average) 111 113 115 115 115
Common equity Tier 1 (“CET1”) capital ratio(c) 12.1 12.0 12.0 12.0 11.8
Tier 1 capital ratio(c) 13.8 13.7 13.6 13.6 13.5
Total capital ratio(c) 15.7 15.5 15.4 15.5 15.3
Tier 1 leverage ratio(c) 8.1 8.1 8.2 8.2 8.2
Supplementary leverage ratio (“SLR”) 6.4 6.4 6.5 6.5 6.5
Selected balance sheet data (period-end)
Trading assets $ 533,402 $ 413,714 $ 419,827 $ 418,799 $ 412,282
Investment securities 267,365 261,828 231,398 233,015 238,188
Loans 956,245 984,554 954,318 948,414 934,424
Core loans 905,943 931,856 899,006 889,433 870,536
Average core loans 916,567 907,271 894,279 877,640 861,089
Total assets 2,737,188 2,622,532 2,615,183 2,590,050 2,609,785
Deposits 1,493,441 1,470,666 1,458,762 1,452,122 1,486,961
Long-term debt 290,893 282,031 270,124 273,114 274,449
Common stockholders’ equity 232,844 230,447 231,192 231,390 230,133
Total stockholders’ equity 259,837 256,515 258,956 257,458 256,201
Headcount 255,998 256,105 255,313 252,942 253,707
Credit quality metrics
Allowance for credit losses $ 14,591 $ 14,500 $ 14,225 $ 14,367 $ 14,482
Allowance for loan losses to total retained loans 1.43% 1.39% 1.39% 1.41% 1.44%
Allowance for loan losses to retained loans excluding purchased credit-impaired loans(d) 1.28 1.23 1.23 1.22 1.25
Nonperforming assets $ 5,616 $ 5,190 $ 5,034 $ 5,767 $ 6,364
Net charge-offs 1,361 1,236 1,033 1,252 1,335
Net charge-off rate 0.58% 0.52% 0.43% 0.54% 0.59%
(a) TBVPS and ROTCE are non-GAAP financial measures. For a further discussion of these measures, refer to Explanation and Reconciliation of the Firm’s Use of Non-GAAP Financial Measures and Key Performance Measures on pages 15–16.
(b) Quarterly ratios are based upon annualized amounts.(c) Effective January 1, 2019, the capital adequacy of the Firm is now evaluated against the fully phased-in measures under Basel III and represents the lower of
the Standardized or Advanced approaches. During 2018, the required capital measures were subject to the transitional rules and as of December 31, 2018 and September 30, 2018, were the same on a fully phased-in and on a transitional basis. Refer to Capital Risk Management on pages 32–36 for additional information on Basel III.
(d) Excludes the impact of residential real estate purchased credit-impaired (“PCI”) loans, a non-GAAP financial measure. For a further discussion of these measures, refer to Explanation and Reconciliation of the Firm’s Use of Non-GAAP Financial Measures and Key Performance Measures on pages 15–16, and the Allowance for credit losses on pages 55–56.

4
INTRODUCTION
The following is Management’s discussion and analysis of the financial condition and results of operations (“MD&A”) of JPMorgan Chase & Co. (“JPMorgan Chase” or the “Firm”) for the first quarter of 2019.
This Quarterly Report on Form 10-Q for the first quarter of 2019 (“Form 10-Q”) should be read together with JPMorgan Chase’s Annual Report on Form 10-K for the year ended December 31, 2018 (“2018 Form 10-K”), to which reference is hereby made, and which is referred to throughout this Form 10-Q. Refer to the Glossary of terms and acronyms and line of business metrics on pages 151–158 for definitions of terms and acronyms used throughout this Form 10-Q.
This document contains statements that are forward-looking within the meaning of the Private Securities Litigation Reform Act of 1995. These statements are based on the current beliefs and expectations of JPMorgan Chase’s management and are subject to significant risks and uncertainties. For a further discussion of certain of those risks and uncertainties and the factors that could cause JPMorgan Chase’s actual results to differ materially because of those risks and uncertainties, refer to Forward-looking Statements on page 68 of this Form 10-Q and Part I, Item 1A, Risk factors, on pages 7–28 of the 2018 Form 10-K.
JPMorgan Chase & Co. (NYSE: JPM), a financial holding company incorporated under Delaware law in 1968, is a leading global financial services firm and one of the largest banking institutions in the United States of America (“U.S.”), with operations worldwide; JPMorgan Chase had $2.7 trillion in assets and $259.8 billion in stockholders’ equity as of March 31, 2019. The Firm is a leader in investment banking, financial services for consumers and small businesses, commercial banking, financial transaction processing and asset management. Under the J.P. Morgan and Chase brands, the Firm serves millions of customers in the U.S. and many of the world’s most prominent corporate, institutional and government clients.
JPMorgan Chase’s principal bank subsidiaries are JPMorgan Chase Bank, National Association (“JPMorgan Chase Bank, N.A.”), a national banking association with U.S. branches in 27 states and Washington, D.C. as of March 31, 2019, and Chase Bank USA, National Association (“Chase Bank USA, N.A.”), a national banking association that is the Firm’s principal credit card-issuing bank. In January 2019, the OCC approved an application of merger which was filed by JPMorgan Chase Bank, N.A. and Chase Bank USA, N.A. and which contemplates that Chase Bank USA, N.A. will merge with and into JPMorgan Chase Bank, N.A., with JPMorgan Chase Bank, N.A. as the surviving bank. Completion of the merger is expected to occur in the second quarter of 2019. JPMorgan Chase’s principal nonbank subsidiary is J.P. Morgan Securities LLC (“J.P. Morgan Securities”), a U.S. broker-dealer. The bank and non-bank subsidiaries of JPMorgan Chase operate nationally as well as through overseas branches and subsidiaries, representative offices and subsidiary foreign banks. The Firm’s principal operating subsidiary in the United Kingdom (“U.K.”) is J.P. Morgan Securities plc, a subsidiary of JPMorgan Chase Bank, N.A.
For management reporting purposes, the Firm’s activities are organized into four major reportable business segments, as well as a Corporate segment. The Firm’s consumer business segment is Consumer & Community Banking (“CCB”). The Firm’s wholesale business segments are Corporate & Investment Bank (“CIB”), Commercial Banking (“CB”), and Asset & Wealth Management (“AWM”). For a description of the Firm’s business segments and the products and services they provide to their respective client bases, refer to Note 31 of JPMorgan Chase’s 2018 Form 10-K.

5
EXECUTIVE OVERVIEW
This executive overview of the MD&A highlights selected information and does not contain all of the information that is important to readers of this Form 10-Q. For a complete description of the trends and uncertainties, as well as the risks and critical accounting estimates affecting the Firm and its various lines of business, this Form 10-Q and the 2018 Form 10-K should be read together and in their entirety.
Financial performance of JPMorgan Chase(unaudited)As of or for the period ended,(in millions, except per share data
and ratios)
Three months ended March 31,
2019 2018 Change
Selected income statement data
Total net revenue $29,123 $27,907 4%
Total noninterest expense 16,395 16,080 2
Pre-provision profit 12,728 11,827 8
Provision for credit losses 1,495 1,165 28
Net income 9,179 8,712 5
Diluted earnings per share $ 2.65 $ 2.37 12
Selected ratios and metrics
Return on common equity 16% 15%
Return on tangible common equity 19 19
Book value per share $ 71.78 $ 67.59 6
Tangible book value per share 57.62 54.05 7
Capital ratios(a)
CET1 12.1% 11.8%
Tier 1 capital 13.8 13.5
Total capital 15.7 15.3
(a) Effective January 1, 2019, the capital adequacy of the Firm is now evaluated against the fully phased-in measures under Basel III and represents the lower of the Standardized or Advanced approaches. During 2018, the required capital measures were subject to the transitional rules. Refer to Capital Risk Management on pages 32–36 for additional information on Basel III.
Comparisons noted in the sections below are for the first quarter of 2019 versus the first quarter of 2018, unless otherwise specified.
Firmwide overview JPMorgan Chase reported strong results in the first quarter of 2019, with record net income and EPS of $9.2 billion, or $2.65 per share, on record net revenue of $29.1 billion. The Firm reported ROE of 16% and ROTCE of 19%.
• The Firm had record net income of $9.2 billion, up 5%, driven by strong revenue growth, partially offset by increases in the provision for credit losses and noninterest expense.
• Total net revenue increased 4%. Net interest income was $14.5 billion, up 9%, predominantly driven by the impact of higher rates, as well as balance sheet growth and change in mix. Noninterest revenue was $14.7 billion, up 1%. The prior year included $505 million of fair value gains related to the adoption of the recognition and measurement accounting guidance. Excluding these gains, noninterest revenue was up 4%, driven by higher auto lease income and investment banking fees, as well as the absence of net losses on investment securities and certain legacy private equity investments in the prior year, with lower Markets revenue more than offset by lower funding spreads on derivatives.
• Noninterest expense was $16.4 billion, up 2%, driven by investments in the business, including technology, marketing, real estate and front office hires, as well as higher auto lease depreciation, partially offset by the absence of the prior-year FDIC surcharge and lower performance-based compensation.
• The provision for credit losses was $1.5 billion, an increase of $330 million. The increase was driven by the wholesale portfolio, reflecting a net addition to the allowance for credit losses of $135 million on select Commercial and Industrial client downgrades. This compares to a net reduction in the allowance for credit losses of $170 million in the prior year driven by a single name in the Oil & Gas Portfolio.
• The total allowance for credit losses was $14.6 billion at March 31, 2019, and the Firm had a loan loss coverage ratio, excluding the PCI portfolio, of 1.28%, compared with 1.25% in the prior year. The Firm’s nonperforming assets totaled $5.6 billion at March 31, 2019, a decrease from $6.4 billion in the prior year, reflecting improved credit performance in the consumer portfolio.
• Firmwide average core loans increased 6%, and excluding CIB, core loans increased 5%.

6
Selected capital-related metrics• The Firm’s CET1 capital was $186 billion, and the
Standardized and Advanced CET1 ratios were 12.1% and 13.0%, respectively.
• The Firm’s supplementary leverage ratio (“SLR”) was 6.4% at March 31, 2019.
• The Firm continued to grow tangible book value per share (“TBVPS”), ending the first quarter of 2019 at $57.62, up 7%.
ROTCE and TBVPS are non-GAAP financial measures. Core loans is a key performance measure. For a further discussion of each of these measures, refer to Explanation and Reconciliation of the Firm’s Use of Non-GAAP Financial Measures and Key Performance Measures on pages 15–16.
Lines of business highlightsSelected business metrics for each of the Firm’s four lines of business are presented below for the first quarter of 2019.
CCBROE 30%
• Average core loans up 4%; average deposits up 3%
• Client investment assets of $312 billion, up 13%
• Credit card sales volume up 10% and merchant processing volume up 13%
CIBROE 16%
• Maintained #1 ranking for Global Investment Banking fees with 9.6% wallet share in the first quarter of 2019
• Debt underwriting revenue of $935 million, up 21%; Advisory revenue of $644 million, up 12%
• Total Markets revenue of $5.5 billion, down 17%, or 10% adjusted(a)
CBROE 19%
• Record gross Investment Banking revenue of $818 million, up 44%
• Strong credit performance with net charge-offs of 2 bps
AWMROE 25%
• Average loan balances up 10%
• Record assets under management (“AUM”) of $2.1 trillion, up 4%
(a) Adjusted Markets revenue excludes approximately $500 million of fair value gains related to the adoption of the recognition and measurement accounting guidance in the first quarter of 2018.
For a detailed discussion of results by line of business, refer to the Business Segment Results on pages 17–30.
Credit provided and capital raisedJPMorgan Chase continues to support consumers, businesses and communities around the globe. The Firm provided credit and raised capital for wholesale and consumer clients during the first three months of 2019, consisting of:
$529billion
Total credit provided and capital raised
$55billion
Credit for consumers
$7billion
Credit for U.S. small businesses
$196billion
Credit for corporations
$256billion
Capital raised for corporate clients andnon-U.S. government entities
$15billion
Credit and capital raised for U.S. government and nonprofit entities(a)
(a) Includes states, municipalities, hospitals and universities.

7
Recent eventsOn April 17, 2019, JPMorgan Chase announced that Jennifer A. Piepszak, formerly Chief Executive Officer (“CEO”) of Credit Card, would become Chief Financial Officer and a member of the Operating Committee reporting to the Firm’s CEO. Marianne Lake would continue as a member of the Operating Committee and would become CEO of Consumer Lending, which includes Credit Card, Home Lending and Auto, reporting to Gordon Smith, CEO of CCB. All changes became effective May 1, 2019.
On March 29, 2019, JPMorgan Chase announced that it has received approval from the China Securities Regulatory Commission to establish a new majority owned and controlled securities company in China, J.P. Morgan Securities (China) Company Limited.
On March 18, 2019, JPMorgan Chase announced a $350 million, five-year global initiative to prepare for the future of work and meet the growing demand for skilled workers. Building on the Firm’s original, five year $250 million commitment in 2013, this New Skills at Work investment will provide substantial support to community college and other non-traditional career pathway programs.
On March 13, 2019, Chase announced that it plans to expand its retail branches and open up to 90 branches this year in new markets.
On February 11, 2019, JPMorgan Chase announced Advancing Black Pathways to build on the Firm’s existing efforts helping black Americans achieve economic success. As part of this, the Firm is expanding its Entrepreneurs of Color Fund model to Greater Washington, D.C., providing capital and business training to underserved minority entrepreneurs in the region.
2019 outlookThere are no updates to the information provided in the 2019 outlook section of the 2018 Form 10-K.

8
Business Developments Expected departure of the U.K. from the EUThe U.K.’s expected departure from the EU, which is commonly referred to as “Brexit,” is scheduled to occur not later than October 31, 2019.
The Firm continues to execute the relevant elements of its Firmwide Brexit Implementation program with the objective of delivering the Firm’s capabilities to its EU clients on “day one” of any departure by the U.K. from the EU, whether or not an agreement has been reached to allow an orderly withdrawal.
The principal operational risks associated with Brexit continue to be the potential for disruption caused by insufficient preparations by individual market participants or in the overall market ecosystem, and risks related to potential disruptions of connectivity among market participants. Although legislative and regulatory actions taken by the EU and the U.K. have mitigated some of the most significant market-wide risks, there continues to be regulatory and legal uncertainty with respect to various matters including contract continuity and access by market participants to liquidity in certain products, such as equities that are listed on both U.K. and EU exchanges. As discussed in Business Developments on page 46 of the 2018 Form 10-K, the Firm is focused on the following key areas to ensure continuation of service to its EU clients: regulatory and legal entity readiness; client readiness; and business and operational readiness. Following are the significant updates from the matters discussed in the 2018 Form 10-K.
Regulatory and legal entity readiness
The Firm’s legal entities in Germany, Luxembourg and Ireland are now prepared and licensed to provide continuity of services to the Firm’s EU clients, including after any departure by the U.K. from the EU.
Client readiness
A significant proportion of the Firm’s EU client agreements have been re-documented to other EU legal entities to help facilitate continuation of service. The Firm continues to actively engage with clients that have not completed re-documentation to ensure preparedness both in terms of documentation and any operational changes that may be required. The Firm may be negatively impacted by any operational disruption stemming from delays of or lapses in the readiness of other market participants or market infrastructures.
Business and operational readiness
The Firm relocated certain employees during the first quarter of 2019. However, the Firm’s final staffing plan will depend upon the timing and terms of any withdrawal by the U.K. from the EU.
If Brexit is further delayed due to a transition deal or another mechanism, the Firm will continue to review the timing and extent of any further expansion of activities in its EU legal entities, as appropriate. The Firm continues to closely monitor legislative developments, and its implementation plan allows for flexibility given the continued uncertainties.

9
CONSOLIDATED RESULTS OF OPERATIONS
This section provides a comparative discussion of JPMorgan Chase’s Consolidated Results of Operations on a reported basis for the three months ended March 31, 2019 and 2018, unless otherwise specified. Factors that relate primarily to a single business segment are discussed in more detail within that business segment. For a discussion of the Critical Accounting Estimates Used by the Firm that affect the Consolidated Results of Operations, refer to pages 64–66 of this Form 10-Q and pages 141-143 of JPMorgan Chase’s 2018 Form 10-K.
RevenueThree months ended March 31,
(in millions) 2019 2018 Change
Investment banking fees $ 1,840 $ 1,736 6%
Principal transactions 4,076 3,952 3
Lending- and deposit-relatedfees 1,482 1,477 —
Asset management,administration andcommissions 4,114 4,309 (5)
Investment securities gains/(losses) 13 (245) NM
Mortgage fees and relatedincome 396 465 (15)
Card income 1,274 1,275 —
Other income(a) 1,475 1,626 (9)
Noninterest revenue 14,670 14,595 1
Net interest income 14,453 13,312 9
Total net revenue $ 29,123 $ 27,907 4%
(a) Included operating lease income of $1.3 billion and $1.0 billion for the three months ended March 31, 2019 and 2018,
Investment banking fees increased, with overall share gains, reflecting:
• higher debt underwriting fees driven by large acquisition financing deals
• higher advisory fees compared to a strong prior year, driven by a higher number of large completed transactions
partially offset by
• lower equity underwriting fees driven by declines in industry-wide fee levels.
For additional information, refer to CIB segment results on pages 21–25 and Note 5.
Principal transactions revenue increased reflecting in CIB:
• a gain from lower funding spreads on derivatives in Credit Adjustments & Other, predominantly offset by
• lower Fixed Income Markets revenue primarily driven by lower client activity in Currencies & Emerging Markets, and
• lower Equity Markets revenue driven by lower client activity in derivatives compared to a strong prior year.
the increase in CIB was offset by
• lower revenue related to hedges on certain investments in AWM, which was more than offset by higher investment valuation gains in other income, and
• losses on cash deployment transactions in Treasury and Chief Investment Office (“CIO”), which were more than offset by the net interest income earned on those transactions.
The increase also reflects the absence of net losses on certain legacy private equity investments in the prior year in Corporate.
For additional information, refer to CIB, AWM and Corporate segment results on pages 21–25, pages 28–29 and page 30, and Note 5.
Asset management, administration and commissions revenue decreased reflecting:
• lower asset management fees in AWM driven by lower average market levels
• lower brokerage commissions in CIB and AWM on lower activity.
For additional information, refer to AWM and CIB segment results on pages 28–29 and pages 21–25, respectively, and Note 5.
For information on lending- and deposit-related fees, refer to the segment results for CCB on pages 28–29, CIB on pages 18–20 and CB on pages 21–25 and Note 5.
Investment securities gains/(losses) increased due to the absence of net losses related to the repositioning of the investment securities portfolio in the prior year. For additional information, refer to Corporate segment results on page 30 and Note 9.
Mortgage fees and related income decreased driven by:
• lower net mortgage servicing revenue reflecting a lower level of third-party loans serviced and lower MSR risk management results
largely offset by
• higher net mortgage production revenue reflecting higher mortgage production margins, as well as the impact of a loan sale.
For further information, refer to CCB segment results on pages 18–20, Note 5 and 14 .
For information on card income, refer to Note 5.

10
Other income reflects:
• higher operating lease income from growth in auto operating lease volume in CCB, and
• higher investment valuation gains in AWM, which were largely offset by the impact of the related hedges in principal transactions revenue
which were more than offset by
• the absence of the $505 million of fair value gains related to the adoption of the recognition and measurement accounting guidance in the first quarter of 2018.
For further information, refer to Note 5.
Net interest income increased driven by the impact of higher rates, as well as balance sheet growth and change in mix, partially offset by lower CIB Markets net interest income. The Firm’s average interest-earning assets were $2.3 trillion, up $110 billion, and the net interest yield on these assets, on a fully taxable-equivalent (“FTE”) basis, was 2.56%, an increase of 8 basis points. The net interest yield excluding CIB Markets was 3.43%, an increase of 30 basis points. Net interest yield excluding CIB markets is a non-GAAP financial measure. For a further discussion of this measure, refer to Explanation and Reconciliation of the Firm’s Use of Non-GAAP Financial Measures and Key Performance Measures on pages 15–16.
Provision for credit lossesThree months ended March 31,
(in millions) 2019 2018 Change
Consumer, excluding credit card $ 114 $ 146 (22)%
Credit card 1,202 1,170 3
Total consumer 1,316 1,316 —
Wholesale 179 (151) NM
Total provision for creditlosses $ 1,495 $ 1,165 28 %
The provision for credit losses increased driven by wholesale, reflecting a net addition to the allowance for credit losses of $135 million on select Commercial and Industrial ("C&I") client downgrades. The prior period was a benefit reflecting a net reduction of $170 million in the allowance for credit losses driven by a single name in the Oil & Gas portfolio.
The total consumer provision was flat reflecting lower net charge-offs in the residential real estate and auto portfolios, offset by higher net charge-offs in the credit card portfolio, driven by loan growth.
For additional information on the credit portfolio and the allowance for credit losses, refer to the segment discussions of CCB on pages 18–20, CIB on pages 21–25, CB on pages 26–27, the Allowance for Credit Losses on pages 55–56 and Note 12.
Noninterest expenseThree months ended March 31,
(in millions) 2019 2018 Change
Compensation expense $ 8,937 $ 8,862 1%
Noncompensation expense:
Occupancy 1,068 888 20
Technology, communicationsand equipment 2,364 2,054 15
Professional and outsideservices 2,039 2,121 (4)
Marketing 879 800 10
Other expense(a)(b) 1,108 1,355 (18)
Total noncompensationexpense 7,458 7,218 3
Total noninterest expense $ 16,395 $ 16,080 2%
(a) Included Firmwide legal expense/(benefit) of $(81) million and $70 million for the three months ended March 31, 2019 and 2018, respectively.
(b) Included FDIC-related expense of $143 million and $383 million for the three months ended March 31, 2019 and 2018, respectively.
Compensation expense increased driven by investments in the businesses, including front office hires, as well as technology staff, largely offset by lower performance-related compensation in CIB.
Noncompensation expense increased as a result of:
• higher investments in the businesses, including real estate, technology, and marketing
• higher depreciation expense from growth in auto operating lease volume in CCB
• a contribution to the Firm’s Foundation
largely offset by
• lower FDIC-related expense as a result of the elimination of the surcharge at the end of the third quarter of 2018, and
• a net legal benefit compared with an expense in the prior year.
Income tax expenseThree months ended March 31,
(in millions) 2019 2018 Change
Income before income taxexpense $11,233 $10,662 5%
Income tax expense 2,054 1,950 5
Effective tax rate 18.3% 18.3%
The effective tax rate was in-line with the prior year and lower than the U.S. Federal statutory rate largely due to tax benefits related to the vesting of employee stock-based awards.

11
CONSOLIDATED BALANCE SHEETS AND CASH FLOWS ANALYSIS
Consolidated balance sheets analysisThe following is a discussion of the significant changes between March 31, 2019, and December 31, 2018.
Selected Consolidated balance sheets data
(in millions)Mar 31,
2019Dec 31,
2018 Change
Assets
Cash and due from banks $ 21,946 $ 22,324 (2)%
Deposits with banks 280,658 256,469 9
Federal funds sold and securities purchased under resale agreements 299,140 321,588 (7)
Securities borrowed 123,186 111,995 10
Trading assets 533,402 413,714 29
Investment securities 267,365 261,828 2
Loans 956,245 984,554 (3)
Allowance for loan losses (13,533) (13,445) 1
Loans, net of allowance for loan losses 942,712 971,109 (3)
Accrued interest and accounts receivable 72,240 73,200 (1)
Premises and equipment 24,160 14,934 62
Goodwill, MSRs and other intangible assets 54,168 54,349 —
Other assets 118,211 121,022 (2)
Total assets $ 2,737,188 $ 2,622,532 4%
Cash and due from banks and deposits with banks increased primarily as a result of a shift in the deployment of cash in Treasury and CIO from securities purchased under resale agreements to deposits with banks. Deposits with banks reflect the Firm’s placements of its excess cash with various central banks, including the Federal Reserve Banks.
Federal funds sold and securities purchased under resale agreements decreased primarily as a result of a shift in the deployment of cash in Treasury and CIO from securities purchased under resale agreements to deposits with banks, the impact of a decline in securities used to collateralize deposits in CB, and client-driven market-making activities in CIB. For additional information on the Firm’s Liquidity Risk Management, refer to pages 37–41.
Securities borrowed increased driven by higher demand for securities to cover short positions related to client-driven market-making activities in CIB.
Trading assets increased predominantly related to client-driven market-making activities in CIB, reflecting the impact of improved market conditions and when compared with lower levels at year-end. This resulted in higher levels of debt instruments in Fixed Income Markets, and equity instruments in Equity Markets, including prime brokerage. In addition, but to a lesser extent, trading assets increased in Treasury and CIO associated with the deployment of excess cash into short-term instruments. For additional information, refer to Notes 2 and 4.
Investment securities increased primarily reflecting net purchases of U.S. government agency mortgage-backed securities (“MBS”) in Treasury and CIO. For additional
information on Investment securities, refer to Corporate segment results on page 30, Investment Portfolio Risk Management on page 57, and Notes 2 and 9.
Loans decreased reflecting:
• lower consumer loans due to a decline in the residential real estate portfolio, predominantly driven by a loan sale, and a seasonal decline in credit card balances and
• lower loans across the wholesale businesses, primarily driven by a loan syndication in CIB, and seasonality and paydowns in AWM.
The allowance for loan losses was relatively flat, with the increase in the wholesale allowance reflecting a net addition to the allowance of $132 million on select C&I client downgrades, partially offset by a decline in the consumer allowance as a result of write-offs of PCI loans.
For a more detailed discussion of loans and the allowance for loan losses, refer to Credit and Investment Risk Management on pages 42–57, and Notes 2, 3, 11 and 12.
Accrued interest and accounts receivable was relatively flat and reflected lower client receivables related to client-driven activities in CIB, partially offset by higher receivables in CCB related to the timing of payment activities in Card Services, due to the end of the quarter falling on a weekend.
Premises and equipment increased due to the adoption of the new lease accounting guidance effective January 1, 2019. For additional information, refer to Note 16.
For information on Goodwill and MSRs, refer to Note 14.

12
Selected Consolidated balance sheets data (continued)
(in millions)Mar 31,
2019Dec 31,
2018 Change
Liabilities
Deposits $ 1,493,441 $ 1,470,666 2%
Federal funds purchased and securities loaned or sold under repurchase agreements 222,677 182,320 22
Short-term borrowings 71,305 69,276 3
Trading liabilities 156,907 144,773 8
Accounts payable and other liabilities 216,173 196,710 10
Beneficial interests issued by consolidated variable interest entities (“VIEs”) 25,955 20,241 28
Long-term debt 290,893 282,031 3
Total liabilities 2,477,351 2,366,017 5
Stockholders’ equity 259,837 256,515 1
Total liabilities and stockholders’ equity $ 2,737,188 $ 2,622,532 4%
Deposits increased driven by the impact of seasonality in CCB, short-term inflows and growth in time deposits in AWM, and the net issuance of structured notes in CIB. The increase was partially offset by a decline from seasonally higher year-end balances in CB, and lower deposits in Treasury Services in CIB. For more information, refer to the Liquidity Risk Management discussion on pages 37–41; and Notes 2 and 15.
Federal funds purchased and securities loaned or sold under repurchase agreements increased primarily due to client-driven market-making activities and higher secured financing of trading assets-debt and equity instruments in CIB.
Trading liabilities increased as a result of client-driven market-making activities in CIB, which resulted in higher levels of short positions in debt instruments in Fixed Income Markets, partially offset by a decline in equity instruments in prime brokerage.
For additional information, refer to Derivative contracts on pages 53–54, and Notes 2 and 4.
Accounts payable and other liabilities increased reflecting:
• higher client payables related to client-driven market-making activities in CIB,
• the impact of the adoption of the new lease accounting guidance, and
• higher payables in CCB related to the timing of payment activities in Card Services, due to the end of the quarter falling on a weekend.
For additional information about Leases, refer to Note 16.
Beneficial interests issued by consolidated VIEs increased due to lower levels of CIB conduit-issued commercial paper held by the Firm, in line with the Firm’s short-term funding plans. For further information on Firm-sponsored VIEs and loan securitization trusts, refer to Off-Balance Sheet Arrangements on page 14 and Notes 13 and 22.
Long-term debt increased primarily driven by the net issuance of structured notes in CIB and senior debt in Treasury and CIO. For additional information on the Firm’s long-term debt activities, refer to Liquidity Risk Management on pages 37–41.
For information on changes in stockholders’ equity, refer to page 72, and on the Firm’s capital actions, refer to Capital actions on pages 34–35.

13
Consolidated cash flows analysisThe following is a discussion of cash flow activities during the three months ended March 31, 2019 and 2018.
(in millions)
Three months endedMarch 31,
2019 2018
Net cash provided by/(used in)
Operating activities $ (80,880) $ (35,109)
Investing activities 36,301 (45,021)
Financing activities 69,435 60,589
Effect of exchange rate changes on cash (1,045) 3,049
Net increase/(decrease) in cash and duefrom banks and deposits with banks $ 23,811 $ (16,492)
Operating activities• In 2019, cash used primarily reflected an increase in
trading assets-debt and equity instruments and higher securities borrowed, partially offset by increased trading liabilities and accounts payable and other liabilities, and net proceeds from loans held-for-sale.
• In 2018, cash used primarily reflected increases in trading assets-debt and equity instruments, and securities borrowed.
Investing activities• In 2019, cash provided reflected a decrease in securities
purchased under resale agreements, and net proceeds from sales of loans held-for-investment.
• In 2018, cash used reflected an increase in securities purchased under resale agreements, partially offset by lower investment securities.
Financing activities• In 2019, cash provided reflected higher securities loaned
or sold under repurchase agreements and higher deposits.
• In 2018, cash provided reflected higher deposits, and securities loaned or sold under repurchase agreements, partially offset by a decrease in long-term borrowings.
• For both periods, cash was used for repurchases of common stock and cash dividends on common and preferred stock.
* * *
For a further discussion of the activities affecting the Firm’s cash flows, refer to Consolidated Balance Sheets Analysis on pages 11–13, Capital Risk Management on pages 32–36, and Liquidity Risk Management on pages 37–41 of this Form 10-Q, and pages 95–100 of JPMorgan Chase’s 2018 Form 10-K.

14
OFF-BALANCE SHEET ARRANGEMENTS
In the normal course of business, the Firm enters into various off-balance sheet arrangements and contractual obligations that may require future cash payments. Certain obligations are recognized on-balance sheet, while others are disclosed off-balance sheet under accounting principles generally accepted in the U.S. (“U.S. GAAP”).
Special-purpose entitiesThe Firm has several types of off–balance sheet arrangements, including through nonconsolidated special-purpose entities (“SPEs”), which are a type of VIE, and through lending-related financial instruments (e.g., commitments and guarantees).
The Firm holds capital, as appropriate, against all SPE-related transactions and related exposures, such as derivative contracts and lending-related commitments and guarantees.
The Firm has no commitments to issue its own stock to support any SPE transaction, and its policies require that transactions with SPEs be conducted at arm’s length and reflect market pricing. Consistent with this policy, no JPMorgan Chase employee is permitted to invest in SPEs with which the Firm is involved where such investment would violate the Firm’s Code of Conduct.
The table below provides an index of where in this Form 10-Q a discussion of the Firm’s various off-balance sheet arrangements can be found. In addition, refer to Note 1 for information about the Firm’s consolidation policies.
Type of off-balance sheet arrangement Location of disclosure Page references
Special-purpose entities: variable interests and otherobligations, including contingent obligations, arisingfrom variable interests in nonconsolidated VIEs
Refer to Note 13 123-128
Off-balance sheet lending-related financial instruments,guarantees, and other commitments
Refer to Note 22 140-143

15
EXPLANATION AND RECONCILIATION OF THE FIRM’S USE OF NON-GAAP FINANCIAL MEASURES AND KEYPERFORMANCE MEASURES
The Firm prepares its Consolidated Financial Statements in accordance with U.S. GAAP and this presentation is referred to as “reported” basis; these financial statements appear on pages 69-73.
In addition to analyzing the Firm’s results on a reported basis, the Firm also reviews and uses certain non-GAAP financial measures at the Firmwide and segment level. These non-GAAP measures include:
• Firmwide “managed” basis results, including the overhead ratio, which include certain reclassifications to present total net revenue from investments that receive tax credits and tax-exempt securities on a basis comparable to taxable investments and securities (“FTE” basis)
• Net interest income and net yield excluding CIB’s Markets businesses
• Certain credit metrics and ratios, which exclude PCI loans
• Tangible common equity (“TCE”), ROTCE, and TBVPS.
In addition, core loans is a key performance measure utilized by the Firm and its investors and analysts in assessing actual growth in the loan portfolio.
For a further discussion of management’s use of non-GAAP financial measures and key performance measures, refer to Explanation and Reconciliation Of the Firm’s Use Of Non-GAAP Financial Measures and Key Performance Measures on pages 57-59 of JPMorgan Chase’s 2018 Form 10-K.
The following summary table provides a reconciliation from the Firm’s reported U.S. GAAP results to managed basis.
Three months ended March 31,
2019 2018
(in millions, except ratios)Reported
results
Fully taxable-equivalent
adjustments(a)
Managedbasis
Reportedresults
Fully taxable-equivalent
adjustments(a)
Managedbasis
Other income $ 1,475 $ 585 $ 2,060 $ 1,626 $ 455 $ 2,081Total noninterest revenue 14,670 585 15,255 14,595 455 15,050Net interest income 14,453 143 14,596 13,312 158 13,470Total net revenue 29,123 728 29,851 27,907 613 28,520
Pre-provision profit 12,728 728 13,456 11,827 613 12,440Income before income tax expense 11,233 728 11,961 10,662 613 11,275Income tax expense $ 2,054 $ 728 $ 2,782 $ 1,950 $ 613 $ 2,563Overhead ratio 56% NM 55% 58% NM 56%
(a) Predominantly recognized in CIB, CB and Corporate.
The following table provides information on net interest income and net yield excluding CIB’s Markets businesses.
(in millions, except rates)
Three months ended March 31,
2019 2018 Change
Net interest income – managed basis(a)(b) $ 14,596 $ 13,470 8%
Less: CIB Markets net interest income(c) 624 1,030 (39)
Net interest income excluding CIB Markets(a) $ 13,972 $ 12,440 12
Average interest-earning assets $ 2,313,103 $ 2,203,413 5
Less: Average CIB Markets interest-earning assets(c) 663,389 591,547 12
Average interest-earning assets excluding CIB Markets $ 1,649,714 $ 1,611,866 2%
Net interest yield on average interest-earning assets – managed basis 2.56% 2.48%
Net interest yield on average CIB Markets interest-earning assets(c) 0.38 0.71
Net interest yield on average interest-earning assets excluding CIB Markets 3.43% 3.13%
(a) Interest includes the effect of related hedges. Taxable-equivalent amounts are used where applicable.
(b) For a reconciliation of net interest income on a reported and managed basis, refer to the table above relating to the reconciliation from the Firm’s reported U.S. GAAP results to managed basis.
(c) For further information on CIB’s Markets businesses, refer to page 24.

16
The following summary table provides a reconciliation from the Firm’s common stockholders’ equity to TCE.
Period-end Average
(in millions, except per share and ratio data)Mar 31,
2019Dec 31,
2018
Three months ended March 31,
2019 2018
Common stockholders’ equity $ 232,844 $ 230,447 $ 230,051 $ 227,615
Less: Goodwill 47,474 47,471 47,475 47,504
Less: Other intangible assets 737 748 744 845
Add: Certain Deferred tax liabilities(a) 2,293 2,280 2,287 2,210
Tangible common equity $ 186,926 $ 184,508 $ 184,119 $ 181,476
Return on tangible common equity NA NA 19% 19%
Tangible book value per share $ 57.62 $ 56.33 NA NA
(a) Represents deferred tax liabilities related to tax-deductible goodwill and to identifiable intangibles created in nontaxable transactions, which are netted against goodwill and other intangibles when calculating TCE.
17
BUSINESS SEGMENT RESULTS
The Firm is managed on a line of business basis. There are four major reportable business segments – Consumer & Community Banking, Corporate & Investment Bank, Commercial Banking and Asset & Wealth Management. In addition, there is a Corporate segment.
The business segments are determined based on the products and services provided, or the type of customer served, and they reflect the manner in which financial information is currently evaluated by the Firm’s Operating Committee. Segment results are presented on a managed basis. For a definition of managed basis, refer to Explanation and Reconciliation of the Firm’s use of Non-GAAP Financial Measures and Key Performance Measures on pages 15–16.
Description of business segment reporting methodologyResults of the business segments are intended to present each segment as if it were essentially a stand-alone business. The management reporting process that derives business segment results includes the allocation of certain
income and expense items. For further information about line of business capital, refer to Line of business equity on page 34. The Firm periodically assesses the assumptions, methodologies and reporting classifications used for segment reporting, and further refinements may be implemented in future periods.
Business segment capital allocationThe amount of capital assigned to each business is referred to as equity. On at least an annual basis, the assumptions and methodologies used in capital allocation are assessed and as a result, the capital allocated to lines of business may change. For additional information on business segment capital allocation, refer to Line of business equity on page 91 of JPMorgan Chase’s 2018 Form 10-K.
For a further discussion of those methodologies, refer to Business Segment Results – Description of business segment reporting methodology on pages 60–61 of JPMorgan Chase’s 2018 Form 10-K.
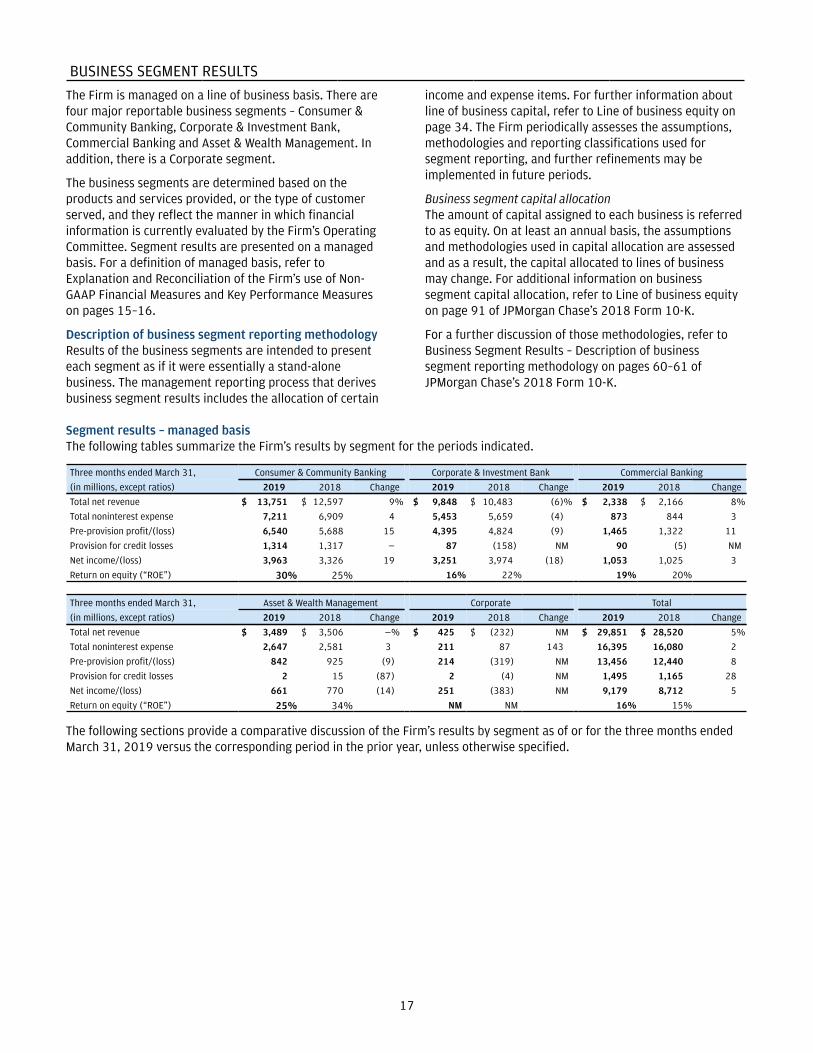
Segment results – managed basisThe following tables summarize the Firm’s results by segment for the periods indicated.
Three months ended March 31, Consumer & Community Banking Corporate & Investment Bank Commercial Banking
(in millions, except ratios) 2019 2018 Change 2019 2018 Change 2019 2018 Change
Total net revenue $ 13,751 $ 12,597 9% $ 9,848 $ 10,483 (6)% $ 2,338 $ 2,166 8%
Total noninterest expense 7,211 6,909 4 5,453 5,659 (4) 873 844 3
Pre-provision profit/(loss) 6,540 5,688 15 4,395 4,824 (9) 1,465 1,322 11
Provision for credit losses 1,314 1,317 — 87 (158) NM 90 (5) NM
Net income/(loss) 3,963 3,326 19 3,251 3,974 (18) 1,053 1,025 3
Return on equity (“ROE”) 30% 25% 16% 22% 19% 20%
Three months ended March 31, Asset & Wealth Management Corporate Total
(in millions, except ratios) 2019 2018 Change 2019 2018 Change 2019 2018 Change
Total net revenue $ 3,489 $ 3,506 —% $ 425 $ (232) NM $ 29,851 $ 28,520 5%
Total noninterest expense 2,647 2,581 3 211 87 143 16,395 16,080 2
Pre-provision profit/(loss) 842 925 (9) 214 (319) NM 13,456 12,440 8
Provision for credit losses 2 15 (87) 2 (4) NM 1,495 1,165 28
Net income/(loss) 661 770 (14) 251 (383) NM 9,179 8,712 5
Return on equity (“ROE”) 25% 34% NM NM 16% 15%
The following sections provide a comparative discussion of the Firm’s results by segment as of or for the three months ended March 31, 2019 versus the corresponding period in the prior year, unless otherwise specified.

18
CONSUMER & COMMUNITY BANKING
For a discussion of the business profile of CCB, refer to pages 62–65 of JPMorgan Chase’s 2018 Form 10-K and Line of Business Metrics on page 156.
Selected income statement data
Three months ended March 31,
(in millions, except ratios) 2019 2018 Change
Revenue
Lending- and deposit-relatedfees $ 873 $ 857 2%
Asset management,administration andcommissions 618 575 7
Mortgage fees and relatedincome 396 465 (15)
Card income 1,168 1,170 —
All other income 1,278 1,072 19
Noninterest revenue 4,333 4,139 5
Net interest income 9,418 8,458 11
Total net revenue 13,751 12,597 9
Provision for credit losses 1,314 1,317 —
Noninterest expense
Compensation expense 2,708 2,660 2
Noncompensation expense(a) 4,503 4,249 6
Total noninterest expense 7,211 6,909 4
Income before income taxexpense 5,226 4,371 20
Income tax expense 1,263 1,045 21
Net income $ 3,963 $ 3,326 19
Revenue by line of business
Consumer & Business Banking $ 6,568 $ 5,722 15
Home Lending 1,346 1,509 (11)
Card, Merchant Services & Auto 5,837 5,366 9
Mortgage fees and relatedincome details:
Net production revenue 200 95 111
Net mortgage servicing revenue(b) 196 370 (47)
Mortgage fees and relatedincome $ 396 $ 465 (15)%
Financial ratios
Return on equity 30% 25%
Overhead ratio 52 55
Note: In the discussion and the tables which follow, CCB presents certain financial measures which exclude the impact of PCI loans; these are non-GAAP financial measures.
(a) Included operating lease depreciation expense of $969 million and $777 million for the three months ended March 31, 2019 and 2018, respectively.
(b) Included MSR risk management results of $(9) million and $17 million for the three months ended March 31, 2019 and 2018, respectively.
Quarterly resultsNet income was $4.0 billion, an increase of 19%.
Net revenue was $13.8 billion, an increase of 9%.
Net interest income was $9.4 billion, up 11%, driven by:
• higher deposit margins and balance growth in CBB, as well as higher loan balances and margin expansion in Card,
partially offset by
• higher rates driving loan spread compression in Home Lending.
Noninterest revenue was $4.3 billion, up 5%, driven by:
• higher auto lease volume and
• higher net mortgage production revenue reflecting higher mortgage production margins, as well as the impact of a loan sale,
partially offset by
• lower net mortgage servicing revenue reflecting a lower level of third-party loans serviced and lower MSR risk management results.
Refer to Note 14 for further information regarding changes in value of the MSR asset and related hedges, and mortgage fees and related income.
Noninterest expense was $7.2 billion, up 4%, driven by:
• technology, marketing and other investments in the business, as well as higher auto lease depreciation,
partially offset by
• expense efficiencies and the absence of the prior-year FDIC surcharge.
The provision for credit losses was $1.3 billion, flat compared with the prior year, reflecting:
• lower net charge-offs in the residential real estate and auto portfolios, offset by higher net charge-offs in the credit card portfolio, driven by loan growth.

19
Selected metricsAs of or for the three months
ended March 31,
(in millions, except headcount) 2019 2018 Change
Selected balance sheet data(period-end)
Total assets $ 552,486 $ 540,659 2%
Loans:
Consumer & Business Banking 26,492 25,856 2
Home equity 34,417 40,777 (16)
Residential mortgage 196,182 199,548 (2)
Home Lending 230,599 240,325 (4)
Card 150,527 140,414 7
Auto 62,786 66,042 (5)
Total loans 470,404 472,637 —
Core loans 420,417 409,296 3
Deposits 702,587 685,170 3
Equity 52,000 51,000 2
Selected balance sheet data(average)
Total assets $ 553,832 $ 538,938 3
Loans:
Consumer & Business Banking 26,488 25,845 2
Home equity 35,224 41,786 (16)
Residential mortgage 203,725 198,653 3
Home Lending 238,949 240,439 (1)
Card 151,134 142,927 6
Auto 62,763 65,863 (5)
Total loans 479,334 475,074 1
Core loans 428,215 410,147 4
Deposits 681,013 659,599 3
Equity 52,000 51,000 2
Headcount(a) 128,419 133,408 (4)%
(a) During the third quarter of 2018, approximately 1,200 employees transferred from CCB to CIB as part of the reorganization of the Commercial Card business.
Selected metricsAs of or for the three months
ended March 31,
(in millions, except ratio data) 2019 2018 Change
Credit data and quality statistics
Nonaccrual loans(a)(b) $ 3,265 $ 4,104 (20)%
Net charge-offs/(recoveries)(c)
Consumer & Business Banking 59 53 11
Home equity — 16 NM
Residential mortgage (5) 2 NM
Home Lending (5) 18 NM
Card 1,202 1,170 3
Auto 58 76 (24)
Total net charge-offs/(recoveries) $ 1,314 $ 1,317 —
Net charge-off/(recovery) rate(c)
Consumer & Business Banking 0.90% 0.83%
Home equity(d) — 0.21
Residential mortgage(d) (0.01) —
Home Lending(d) (0.01) 0.03
Card 3.23 3.32
Auto 0.37 0.47
Total net charge-off/(recovery) rate(d) 1.17 1.20
30+ day delinquency rate
Home Lending(e)(f) 0.77% 0.98%
Card 1.85 1.82
Auto 0.63 0.71
90+ day delinquency rate — Card 0.97 0.95
Allowance for loan losses
Consumer & Business Banking $ 796 $ 796 —
Home Lending, excluding PCIloans 1,003 1,003 —
Home Lending — PCI loans(c) 1,738 2,205 (21)
Card 5,183 4,884 6
Auto 465 464 —
Total allowance for loan losses(c) $ 9,185 $ 9,352 (2)%
(a) Excludes PCI loans. The Firm is recognizing interest income on each pool of PCI loans as each of the pools is performing.
(b) At March 31, 2019 and 2018, nonaccrual loans excluded mortgage loans 90 or more days past due and insured by U.S. government agencies of $2.2 billion and $4.0 billion, respectively. These amounts have been excluded based upon the government guarantee.
(c) Net charge-offs/(recoveries) and the net charge-off/(recovery) rates for the three months ended March 31, 2019 and 2018, excluded $50 million and $20 million, respectively, of write-offs in the PCI portfolio. These write-offs decreased the allowance for loan losses for PCI loans. For further information on PCI write-offs, refer to Summary of changes in the allowance for credit losses on page 56.
(d) Excludes the impact of PCI loans. For the three months ended March 31, 2019 and 2018, the net charge-off/(recovery) rates including the impact of PCI loans were as follows: (1) home equity of –% and 0.16%, respectively; (2) residential mortgage of (0.01)% and –%, respectively; (3) Home Lending of (0.01)% and 0.03%, respectively; and (4) total CCB of 1.11% and 1.12%, respectively.
(e) At March 31, 2019 and 2018, excluded mortgage loans insured by U.S. government agencies of $3.2 billion and $5.7 billion, respectively, that are 30 or more days past due. These amounts have been excluded based upon the government guarantee.
(f) Excludes PCI loans. The 30+ day delinquency rate for PCI loans was 8.90% and 9.49% at March 31, 2019 and 2018, respectively.

20
Selected metrics
As of or for the three monthsended March 31,
(in billions, except ratios and whereotherwise noted) 2019 2018 Change
Business Metrics
Number of branches 5,028 5,106 (2)%
Active digital customers (in thousands)(a) 50,651 47,911 6
Active mobile customers (in thousands)(b) 34,371 30,924 11
Debit and credit card sales volume $ 255.1 $ 232.4 10
Consumer & Business Banking
Average deposits $ 668.5 $ 646.4 3
Deposit margin 2.62% 2.20%
Business banking origination volume $ 1.5 $ 1.7 (11)
Client investment assets 312.3 276.2 13
Home Lending
Mortgage origination volume bychannel
Retail $ 7.9 $ 8.3 (5)
Correspondent 7.1 9.9 (28)
Total mortgage origination volume(c) $ 15.0 $ 18.2 (18)
Total loans serviced (period-end) $ 791.5 $ 804.9 (2)
Third-party mortgage loans serviced(period-end) 529.6 539.0 (2)
MSR carrying value (period-end) 6.0 6.2 (3)
Ratio of MSR carrying value (period-end) to third-party mortgage loansserviced (period-end) 1.13% 1.15%
MSR revenue multiple(d) 3.32x 3.19x
Card, excluding Commercial Card
Credit card sales volume $ 172.5 $ 157.1 10
Card Services
Net revenue rate 11.63% 11.61%
Merchant Services
Merchant processing volume $ 356.5 $ 316.3 13
Auto
Loan and lease origination volume $ 7.9 $ 8.4 (6)
Average auto operating lease assets 20.8 17.6 18%
(a) Users of all web and/or mobile platforms who have logged in within the past 90 days.
(b) Users of all mobile platforms who have logged in within the past 90 days.
(c) Firmwide mortgage origination volume was $16.4 billion and $20.0 billion for the three months ended March 31, 2019 and 2018, respectively.
(d) Represents the ratio of MSR carrying value (period-end) to third-party mortgage loans serviced (period-end) divided by the ratio of annualized loan servicing-related revenue to third-party mortgage loans serviced (average).

21
CORPORATE & INVESTMENT BANK
For a discussion of the business profile of CIB, refer to pages 66–70 of JPMorgan Chase’s 2018 Form 10-K and Line of Business Metrics on page 156.
Selected income statement dataThree months ended March 31,
(in millions, except ratios) 2019 2018 Change
Revenue
Investment banking fees $ 1,844 $ 1,696 9%
Principal transactions 4,163 4,029 3
Lending- and deposit-relatedfees 361 381 (5)
Asset management,administration andcommissions 1,101 1,131 (3)
All other income 194 680 (71)
Noninterest revenue 7,663 7,917 (3)
Net interest income 2,185 2,566 (15)
Total net revenue(a) 9,848 10,483 (6)
Provision for credit losses 87 (158) NM
Noninterest expense
Compensation expense 2,949 3,036 (3)
Noncompensation expense 2,504 2,623 (5)
Total noninterest expense 5,453 5,659 (4)
Income before income taxexpense 4,308 4,982 (14)
Income tax expense 1,057 1,008 5
Net income $ 3,251 $ 3,974 (18)%
Financial ratios
Return on equity 16% 22%
Overhead ratio 55 54
Compensation expense aspercentage of total netrevenue 30 29
(a) Includes tax-equivalent adjustments, predominantly due to income tax credits related to alternative energy investments; income tax credits and amortization of the cost of investments in affordable housing projects; and tax-exempt income from municipal bonds of $539 million and $405 million for the three months ended March 31, 2019 and 2018, respectively.
Selected income statement dataThree months ended March 31,
(in millions) 2019 2018 Change
Revenue by business
Investment Banking $ 1,745 $ 1,587 10%
Treasury Services 1,147 1,116 3
Lending 340 302 13
Total Banking 3,232 3,005 8
Fixed Income Markets 3,725 4,553 (18)
Equity Markets 1,741 2,017 (14)
Securities Services 1,014 1,059 (4)
Credit Adjustments & Other(a) 136 (151) NM
Total Markets & InvestorServices 6,616 7,478 (12)
Total net revenue $ 9,848 $ 10,483 (6)%
(a) Consists primarily of credit valuation adjustments (“CVA”) managed centrally within CIB and funding valuation adjustments (“FVA”) on derivatives. Results are primarily reported in principal transactions revenue. Results are presented net of associated hedging activities and net of CVA and FVA amounts allocated to Fixed Income Markets and Equity Markets.
Quarterly results Net income was $3.3 billion, down 18%.
Net revenue was $9.8 billion, down 6%.
Banking revenue was $3.2 billion, up 8%.
• Investment Banking revenue was $1.7 billion, up 10%, predominantly driven by higher debt underwriting and advisory fees, partially offset by lower equity underwriting fees. The Firm maintained its #1 ranking for Global Investment Banking fees with overall share gains, according to Dealogic.
– Debt underwriting fees were $935 million, up 21%, driven by large acquisition financing deals.
– Advisory fees were $644 million, up 12% compared to a strong prior year, driven by a higher number of large completed transactions.
– Equity underwriting fees were $265 million, down 23%, driven by declines in industry-wide fee levels.
• Treasury Services revenue was $1.1 billion, up 3%, driven by growth in operating deposits as well as higher fees on increased payments volume partially offset by deposit margin compression.
• Lending revenue was $340 million, up 13%, driven by higher net interest income reflecting growth in loan balances.
Markets & Investor Services revenue was $6.6 billion, down 12%. Markets revenue of $5.5 billion was down 17%, on lower Fixed Income and Equity Markets revenue. Prior year results included approximately $500 million of fair value gains related to the adoption of the recognition and measurement accounting guidance. Excluding these gains, total Markets revenue was down 10%, Fixed Income

22
Markets revenue was down 8%, and Equity Markets revenue was down 13%.
• Fixed Income Markets revenue was $3.7 billion reflecting lower client activity in Currencies & Emerging Markets and Rates compared to the prior year, which benefited from strong performance. This decline was partially offset by improved performance in Credit Trading and Commodities from higher client flows.
• Equity Markets revenue was $1.7 billion, compared to a strong prior year, reflecting lower client activity, predominantly in derivatives.
• Securities Services revenue was $1.0 billion, down 4%, predominantly driven by fee and deposit margin compression, lower market levels, and the impact of a business exit, largely offset by increased client activity.
• Credit Adjustments & Other was a gain of $136 million, predominantly driven by the impact of lower funding spreads on derivatives.
The provision for credit losses was $87 million, largely driven by a net addition to the allowance for credit losses on select C&I client downgrades. The prior year was a benefit of $158 million, driven by a reduction in the allowance for credit losses in the Oil & Gas portfolio related to a single name.
Noninterest expense was $5.5 billion, down 4%, driven by lower performance-related compensation expense and the absence of the prior year FDIC surcharge, partially offset by higher investments in technology.
Selected metricsAs of or for the three months
ended March 31,
(in millions, exceptheadcount) 2019 2018 Change
Selected balance sheetdata (period-end)
Assets $ 1,006,111 $ 909,845 11%
Loans:
Loans retained(a) 127,086 112,626 13
Loans held-for-sale andloans at fair value 7,783 6,122 27
Total loans 134,869 118,748 14
Core loans 134,692 118,434 14
Equity 80,000 70,000 14
Selected balance sheetdata (average)
Assets $ 959,842 $ 910,146 5
Trading assets-debt andequity instruments 381,312 354,869 7
Trading assets-derivativereceivables 50,609 60,161 (16)
Loans:
Loans retained(a) $ 126,990 $ 109,355 16
Loans held-for-sale andloans at fair value 8,615 5,480 57
Total loans $ 135,605 $ 114,835 18
Core loans 135,420 114,514 18
Equity 80,000 70,000 14
Headcount(b) 54,697 51,291 7%
(a) Loans retained includes credit portfolio loans, loans held by consolidated Firm-administered multi-seller conduits, trade finance loans, other held-for-investment loans and overdrafts.
(b) During the third quarter of 2018 approximately 1,200 employees transferred from CCB to CIB as part of the reorganization of the Commercial Card business.

23
Selected metricsAs of or for the three months
ended March 31,
(in millions, except ratios) 2019 2018 Change
Credit data and qualitystatistics
Net charge-offs/(recoveries) $ 30 $ 20 50%
Nonperforming assets:
Nonaccrual loans:
Nonaccrual loans retained(a) $ 812 $ 668 22%
Nonaccrual loans held-for-sale and loans at fair value 313 29 NM
Total nonaccrual loans 1,125 697 61
Derivative receivables 44 132 (67)
Assets acquired in loansatisfactions 58 91 (36)
Total nonperformingassets $ 1,227 $ 920 33
Allowance for credit losses:
Allowance for loanlosses $ 1,252 $ 1,128 11
Allowance for lending-related commitments 758 800 (5)
Total allowance for creditlosses $ 2,010 $ 1,928 4%
Net charge-off/(recovery) rate(b) 0.10% 0.07%
Allowance for loan lossesto period-end loansretained 0.99 1.00
Allowance for loan losses to period-end loans retained, excluding trade finance and conduits(c) 1.34 1.46
Allowance for loan losses to nonaccrual loans retained(a) 154 169
Nonaccrual loans to totalperiod-end loans 0.83% 0.59%
(a) Allowance for loan losses of $252 million and $298 million were held against these nonaccrual loans at March 31, 2019 and 2018, respectively.
(b) Loans held-for-sale and loans at fair value were excluded when calculating the net charge-off/(recovery) rate.
(c) Management uses allowance for loan losses to period-end loans retained, excluding trade finance and conduits, a non-GAAP financial measure, to provide a more meaningful assessment of CIB’s allowance coverage ratio.
Investment banking feesThree months ended March 31,
(in millions) 2019 2018 Change
Advisory $ 644 $ 575 12%
Equity underwriting 265 346 (23)
Debt underwriting(a) 935 775 21
Total investmentbanking fees $ 1,844 $ 1,696 9%
(a) Includes loan syndications.
League table results – wallet shareThree months ended
March 31, 2019 Full-year 2018
Rank Share Rank Share
Based on fees(a)
Long-term debt(b)
Global # 1 7.4% # 1 7.2%
U.S. 1 11.0 1 11.2
Equity and equity-related(c)
Global 3 8.6 1 9.0
U.S. 1 12.4 1 12.3
M&A(d)
Global 2 10.5 2 8.7
U.S. 2 10.9 2 9.0
Loan syndications
Global 1 13.0 1 9.5
U.S. 1 15.6 1 12.0
Global investment banking fees(e) # 1 9.6% # 1 8.6%
(a) Source: Dealogic as of April 1, 2019. Reflects the ranking of revenue wallet and market share.
(b) Long-term debt rankings include investment-grade, high-yield, supranationals, sovereigns, agencies, covered bonds, asset-backed securities (“ABS”) and mortgage-backed securities (“MBS”); and exclude money market, short-term debt, and U.S. municipal securities.
(c) Global equity and equity-related ranking includes rights offerings and Chinese A-Shares.
(d) Global M&A excludes any withdrawn transactions. U.S. M&A revenue wallet represents wallet from client parents based in the U.S.
(e) Global investment banking fees exclude money market, short-term debt and shelf deals.

24
Markets revenueThe following table summarizes select income statement data for the Markets businesses. Markets includes both Fixed Income Markets and Equity Markets. Markets revenue comprises principal transactions, fees, commissions and other income, as well as net interest income. The Firm assesses its Markets business performance on a total revenue basis, as offsets may occur across revenue line items. For example, securities that generate net interest income may be risk-managed by derivatives that are
recorded in principal transactions revenue. For a description of the composition of these income statement line items, refer to Notes 5 and 6. For further information, refer to Markets revenue on page 69 of JPMorgan Chase’s 2018 Form 10-K.
For the periods presented below, the predominant source of principal transactions revenue was the amount recognized upon executing new transactions.
Three months ended March 31, Three months ended March 31,
2019 2018
(in millions)Fixed Income
Markets Equity Markets Total MarketsFixed Income
Markets Equity Markets Total Markets
Principal transactions $ 2,482 $ 1,557 $ 4,039 $ 2,732 $ 1,612 $ 4,344
Lending- and deposit-related fees 49 2 51 47 1 48
Asset management, administration and commissions 103 434 537 113 458 571
All other income 219 (4) 215 560 17 577
Noninterest revenue 2,853 1,989 4,842 3,452 2,088 5,540
Net interest income(a) 872 (248) 624 1,101 (71) 1,030
Total net revenue $ 3,725 $ 1,741 $ 5,466 $ 4,553 $ 2,017 $ 6,570
(a) Declines in Markets net interest income were driven by higher funding costs.

25
Selected metricsAs of or for the three months
ended March 31,
(in millions, except whereotherwise noted) 2019 2018 Change
Assets under custody (“AUC”) by asset class (period-end)(in billions):
Fixed Income $ 12,772 $ 13,145 (3)%
Equity 9,028 8,241 10
Other(a) 2,916 2,640 10
Total AUC $ 24,716 $ 24,026 3
Client deposits and other third-party liabilities (average)(b) $ 444,055 $ 423,301 5%
(a) Consists of mutual funds, unit investment trusts, currencies, annuities, insurance contracts, options and other contracts.
(b) Client deposits and other third-party liabilities pertain to the Treasury Services and Securities Services businesses.
International metricsAs of or for the three months
ended March 31,
(in millions, except where otherwise noted) 2019 2018(c) Change
Total net revenue(a)
Europe/Middle East/Africa $ 3,153 $ 3,693 (15)%
Asia/Pacific 1,419 1,422 —
Latin America/Caribbean 403 436 (8)
Total international netrevenue 4,975 5,551 (10)
North America 4,873 4,932 (1)
Total net revenue $ 9,848 $ 10,483 (6)
Loans retained (period-end)(a)
Europe/Middle East/Africa $ 26,359 $ 26,483 —
Asia/Pacific 18,006 16,179 11
Latin America/Caribbean 7,397 6,321 17
Total international loans 51,762 48,983 6
North America 75,324 63,643 18
Total loans retained(a) $ 127,086 $ 112,626 13
Client deposits and other third-party liabilities (average)(b)
Europe/Middle East/Africa $ 164,138 $ 159,483 3
Asia/Pacific 85,082 83,599 2
Latin America/Caribbean 27,484 25,480 8
Total international $ 276,704 $ 268,562 3
North America 167,351 154,739 8
Total client deposits andother third-party liabilities $ 444,055 $ 423,301 5
AUC (period-end)(b)
(in billions)
North America $ 15,352 $ 14,493 6
All other regions 9,364 9,533 (2)
Total AUC $ 24,716 $ 24,026 3%
(a) Total net revenue and loans retained (excluding loans held-for-sale and loans at fair value) are based on the location of the trading desk, booking location, or domicile of the client, as applicable.
(b) Client deposits and other third-party liabilities pertaining to the Treasury Services and Securities Services businesses, and AUC, are based on the domicile of the client.
(c) The prior period amounts have been revised to conform with the current period presentation.

26
COMMERCIAL BANKING
For a discussion of the business profile of CB, refer to pages 71-73 of JPMorgan Chase’s 2018 Form 10-K and Line of Business Metrics on page 157.
Selected income statement dataThree months ended March 31,
(in millions) 2019 2018 Change
Revenue
Lending- and deposit-relatedfees $ 227 $ 226 —%
All other income(a) 431 323 33
Noninterest revenue 658 549 20
Net interest income 1,680 1,617 4
Total net revenue(b) 2,338 2,166 8
Provision for credit losses 90 (5) NM
Noninterest expense
Compensation expense 449 421 7
Noncompensation expense 424 423 —
Total noninterest expense 873 844 3
Income before income taxexpense 1,375 1,327 4
Income tax expense 322 302 7
Net income $ 1,053 $ 1,025 3%
(a) Includes revenue from investment banking products, commercial card transactions and asset management fees. The prior period amounts have been revised to conform with the current period presentation.
(b) Total net revenue included tax-equivalent adjustments from income tax credits related to equity investments in designated community development entities that provide loans to qualified businesses in low-income communities, as well as tax-exempt income related to municipal financing activities of $94 million and $103 million for the three months ended March 31, 2019 and 2018, respectively.
Quarterly resultsNet income was $1.1 billion, an increase of 3%.
Net revenue was $2.3 billion, up 8%. Net interest income was $1.7 billion, up 4%, driven by higher deposit margins, partially offset by lower deposit balances. Noninterest revenue was $658 million, an increase of 20%, driven by higher investment banking revenue due to a number of large investment banking transactions.
Noninterest expense was $873 million, up 3%, driven by continued investments in technology and banker coverage.
The provision for credit losses was $90 million, predominantly driven by a net addition to the allowance for credit losses on select C&I client downgrades.
Commercial Banking provides comprehensive financial solutions, including lending, treasury services, investment banking and asset management products across three primary client segments: Middle Market Banking, Corporate Client Banking and Commercial Real Estate Banking.(a) Other includes amounts not aligned with a primary client segment.
Middle Market Banking covers midsized corporations, local governments and nonprofit clients.
Corporate Client Banking covers large corporations.
Commercial Real Estate Banking covers investors, developers, and owners of multifamily, office, retail, industrial and affordable housing properties.
Selected income statement data (continued)Three months ended March 31,
(in millions, except ratios) 2019 2018 Change
Revenue by product
Lending $ 1,012 $ 999 1%
Treasury services 1,029 972 6
Investment banking(b) 289 184 57
Other 8 11 (27)
Total Commercial Bankingnet revenue $ 2,338 $ 2,166 8
Investment banking revenue, gross(c) $ 818 $ 569 44
Revenue by client segments
Middle Market Banking $ 951 $ 895 6
Corporate Client Banking 816 687 19
Commercial Real Estate Banking(a) 547 560 (2)
Other(a) 24 24 —
Total Commercial Bankingnet revenue $ 2,338 $ 2,166 8%
Financial ratios
Return on equity 19% 20%
Overhead ratio 37 39
(a) Effective in the first quarter of 2019, client segment data includes Commercial Real Estate Banking which comprises the former Commercial Term Lending and Real Estate Banking client segments, and Community Development Banking (previously part of Other). The prior period amounts have been revised to conform with the current period presentation.
(b) Includes CB’s share of revenue from investment banking products sold to CB clients through the CIB.
(c) For discussion of revenue sharing, refer to page 60 of the 2018 Form 10-K.

27
Selected metricsAs of or for the three months
ended March 31,
(in millions, exceptheadcount) 2019 2018 Change
Selected balance sheet data(period-end)
Total assets $ 216,111 $ 220,880 (2)%
Loans:
Loans retained 204,927 202,812 1
Loans held-for-sale andloans at fair value 410 2,473 (83)
Total loans $ 205,337 $ 205,285 —
Core loans 205,199 205,087 —
Equity 22,000 20,000 10
Period-end loans by clientsegment
Middle Market Banking $ 56,846 $ 57,835 (2)
Corporate Client Banking 46,897 47,562 (1)
Commercial Real Estate Banking(a) 100,622 98,395 2
Other(a) 972 1,493 (35)
Total Commercial Bankingloans $ 205,337 $ 205,285 —
Selected balance sheet data(average)
Total assets $ 218,297 $ 217,159 1
Loans:
Loans retained 204,462 201,966 1
Loans held-for-sale andloans at fair value 1,634 406 302
Total loans $ 206,096 $ 202,372 2
Core loans 205,949 202,161 2
Average loans by clientsegment
Middle Market Banking $ 56,723 $ 56,754 —
Corporate Client Banking 48,141 45,760 5
Commercial Real Estate Banking(a) 100,264 98,398 2
Other(a) 968 1,460 (34)
Total Commercial Bankingloans $ 206,096 $ 202,372 2
Client deposits and otherthird-party liabilities $ 167,260 $ 175,618 (5)
Equity 22,000 20,000 10
Headcount 11,033 10,372 6 %
(a) Effective in the first quarter of 2019, client segment data includes Commercial Real Estate Banking which comprises the former Commercial Term Lending and Real Estate Banking client segments, and Community Development Banking (previously part of Other). The prior period amounts have been revised to conform with the current period presentation.
Selected metrics (continued)As of or for the three months
ended March 31,
(in millions, except ratios) 2019 2018 Change
Credit data and qualitystatistics
Net charge-offs/(recoveries) $ 11 $ — NM
Nonperforming assets
Nonaccrual loans:
Nonaccrual loans retained(a) $ 544 $ 666 (18)%
Nonaccrual loans held-for-sale and loans at fair value — — —
Total nonaccrual loans $ 544 $ 666 (18)
Assets acquired in loansatisfactions — 1 NM
Total nonperforming assets $ 544 $ 667 (18)
Allowance for credit losses:
Allowance for loan losses $ 2,766 $ 2,591 7
Allowance for lending-related commitments 250 263 (5)
Total allowance for creditlosses $ 3,016 $ 2,854 6 %
Net charge-off/(recovery) rate(b) 0.02% —%
Allowance for loan losses to period-end loans retained 1.35 1.28
Allowance for loan losses to nonaccrual loans retained(a) 508 389
Nonaccrual loans to period-end total loans 0.26 0.32
(a) Allowance for loan losses of $132 million and $116 million was held against nonaccrual loans retained at March 31, 2019 and 2018, respectively.
(b) Loans held-for-sale and loans at fair value were excluded when calculating the net charge-off/(recovery) rate.

28
ASSET & WEALTH MANAGEMENTFor a discussion of the business profile of AWM, refer to pages 74–76 of JPMorgan Chase’s 2018 Form 10-K and Line of Business Metrics on pages 157–158.
Selected income statement data
(in millions, except ratios)
Three months ended March 31,
2019 2018 Change
Revenue
Asset management, administrationand commissions $ 2,416 $ 2,528 (4)%
All other income 177 102 74
Noninterest revenue 2,593 2,630 (1)
Net interest income 896 876 2
Total net revenue 3,489 3,506 —
Provision for credit losses 2 15 (87)
Noninterest expense
Compensation expense 1,462 1,392 5
Noncompensation expense 1,185 1,189 —
Total noninterest expense 2,647 2,581 3
Income before income tax expense 840 910 (8)
Income tax expense 179 140 28
Net income $ 661 $ 770 (14)
Revenue by line of business
Asset Management $ 1,761 $ 1,787 (1)
Wealth Management 1,728 1,719 1
Total net revenue $ 3,489 $ 3,506 —%
Financial ratios
Return on equity 25% 34%
Overhead ratio 76 74
Pre-tax margin ratio:
Asset Management 23 26
Wealth Management 25 26
Asset & Wealth Management 24 26
Quarterly resultsNet income was $661 million, a decrease of 14%.
Net revenue of $3.5 billion was flat. Net interest income was $896 million, up 2%, driven by loan growth. Noninterest revenue was $2.6 billion, down 1%, driven by lower management fees on lower average market levels and lower brokerage activity, predominantly offset by higher net investment valuation gains.
Noninterest expense was $2.6 billion, up 3%, predominantly driven by continued investments in the business, and other headcount related costs, partially offset by lower external fees.
Selected metricsAs of or for the three months
ended March 31,
(in millions, except ranking data,headcount and ratios) 2019 2018 Change
% of JPM mutual fund assets rated as 4- or 5-star(a) 60% 58%
% of JPM mutual fund assets ranked in 1st or 2nd quartile:(b)
1 year 72 61
3 years 78 67
5 years 86 82
Selected balance sheet data(period-end)
Total assets $ 165,865 $ 158,439 5%
Loans 143,750 136,030 6
Core loans 143,750 136,030 6
Deposits 143,348 147,238 (3)
Equity 10,500 9,000 17
Selected balance sheet data(average)
Total assets $ 167,358 $ 154,345 8
Loans 145,406 132,634 10
Core loans 145,406 132,634 10
Deposits 138,235 144,199 (4)
Equity 10,500 9,000 17
Headcount 24,347 23,268 5
Number of Wealth Managementclient advisors 2,877 2,640 9
Credit data and quality statistics
Net charge-offs $ 4 $ 1 300
Nonaccrual loans 285 359 (21)
Allowance for credit losses:
Allowance for loan losses $ 325 $ 301 8
Allowance for lending-relatedcommitments 18 13 38
Total allowance for credit losses $ 343 $ 314 9%
Net charge-off rate 0.01% —%
Allowance for loan losses toperiod-end loans 0.23 0.22
Allowance for loan losses tononaccrual loans 114 84
Nonaccrual loans to period-endloans 0.20 0.26
(a) Represents the “overall star rating” derived from Morningstar for the U.S., the U.K., Luxembourg, Hong Kong and Taiwan domiciled funds; and Nomura “star rating” for Japan domiciled funds. Includes only Asset Management retail open-ended mutual funds that have a rating. Excludes money market funds, Undiscovered Managers Fund, and Brazil and India domiciled funds.
(b) Quartile ranking sourced from: Lipper for the U.S. and Taiwan domiciled funds; Morningstar for the U.K., Luxembourg and Hong Kong domiciled funds; Nomura for Japan domiciled funds and Fund Doctor for South Korea domiciled funds. Includes only Asset Management retail open-ended mutual funds that are ranked by the aforementioned sources. Excludes money market funds, Undiscovered Managers Fund, and Brazil and India domiciled funds.

29
Client assetsClient assets of $2.9 trillion and assets under management of $2.1 trillion were both up 4%, predominantly driven by net inflows into liquidity and long-term products.
Client assetsMarch 31,
(in billions) 2019 2018 Change
Assets by asset class
Liquidity $ 476 $ 432 10%
Fixed income 495 467 6
Equity 427 432 (1)
Multi-asset and alternatives 698 685 2
Total assets undermanagement 2,096 2,016 4
Custody/brokerage/administration/deposits 801 772 4
Total client assets $ 2,897 $ 2,788 4
Memo:
Alternatives client assets (a) $ 172 $ 169 2
Assets by client segment
Private Banking $ 597 $ 537 11
Institutional 943 937 1
Retail 556 542 3
Total assets undermanagement $ 2,096 $ 2,016 4
Private Banking $ 1,371 $ 1,285 7
Institutional 965 958 1
Retail 561 545 3
Total client assets $ 2,897 $ 2,788 4%
(a) Represents assets under management, as well as client balances in brokerage accounts
Client assets (continued)Three months ended
March 31,
(in billions) 2019 2018
Assets under management rollforward
Beginning balance $ 1,987 $ 2,034
Net asset flows:
Liquidity (5) (21)
Fixed income 19 (5)
Equity (6) 5
Multi-asset and alternatives (3) 16
Market/performance/other impacts 104 (13)
Ending balance, March 31 $ 2,096 $ 2,016
Client assets rollforward
Beginning balance $ 2,733 $ 2,789
Net asset flows 9 14
Market/performance/other impacts 155 (15)
Ending balance, March 31 $ 2,897 $ 2,788
International metrics
As of or for the three monthsended March 31,
(in millions) 2019 2018 Change
Total net revenue (a)
Europe/Middle East/Africa $ 662 $ 726 (9)%
Asia/Pacific 358 393 (9)
Latin America/Caribbean 221 227 (3)
Total international netrevenue 1,241 1,346 (8)
North America 2,248 2,160 4
Total net revenue(a) $ 3,489 $ 3,506 —%
(a) Regional revenue is based on the domicile of the client.
As of or for the three monthsended March 31,
(in billions) 2019 2018 Change
Assets under management
Europe/Middle East/Africa $ 367 $ 378 (3)%
Asia/Pacific 177 171 4
Latin America/Caribbean 66 59 12
Total international assetsunder management 610 608 —
North America 1,486 1,408 6
Total assets undermanagement $ 2,096 $ 2,016 4
Client assets
Europe/Middle East/Africa $ 432 $ 435 (1)
Asia/Pacific 243 237 3
Latin America/Caribbean 165 156 6
Total international clientassets 840 828 1
North America 2,057 1,960 5
Total client assets $ 2,897 $ 2,788 4%

30
CORPORATE
For a discussion of Corporate, refer to pages 77–78 of JPMorgan Chase’s 2018 Form 10-K.
Selected income statement and balance sheet dataAs of or for the three months
ended March 31,
(in millions, except headcount) 2019 2018 Change
Revenue
Principal transactions $ (62) $ (144) 57%
Investment securities gains/(losses) 13 (245) NM
All other income 57 204 (72)
Noninterest revenue 8 (185) NM
Net interest income 417 (47) NM
Total net revenue(a) 425 (232) NM
Provision for credit losses 2 (4) NM
Noninterest expense(b) 211 87 143
Income/(loss) before incometax expense/(benefit) 212 (315) NM
Income tax expense/(benefit) (39) 68 NM
Net income/(loss) $ 251 $ (383) NM
Total net revenue
Treasury and CIO $ 511 $ (38) NM
Other Corporate (86) (194) 56
Total net revenue $ 425 $ (232) NM
Net income/(loss)
Treasury and CIO $ 334 $ (187) NM
Other Corporate (83) (196) 58
Total net income/(loss) $ 251 $ (383) NM
Total assets (period-end) $ 796,615 $ 779,962 2
Loans (period-end) 1,885 1,724 9
Core loans(c) 1,885 1,689 12
Headcount 37,502 35,368 6%
(a) Included tax-equivalent adjustments, driven by tax-exempt income from municipal bond investments, of $86 million and $98 million for the three months ended March 31, 2019 and 2018, respectively.
(b) Included a net legal benefit of $(90) million and $(42) million for the three months ended March 31, 2019 and 2018, respectively.
(c) Average core loans were $1.6 billion for both the three months ended March 31, 2019 and 2018.
Quarterly results
Net income was $251 million, compared with a net loss of $383 million in the prior year.
Net revenue was $425 million, compared with a net loss of $232 million in the prior year. This increase was driven by higher net interest income on higher rates, and the net benefit of cash deployment transactions, as well as the absence of net losses on investment securities and certain legacy private equity investments in the prior year.
Noninterest expense of $211 million included a contribution to the JPMorgan Chase Foundation of $100 million.
The current period income tax benefit is predominantly driven by the settlement of certain tax audits.
Treasury and CIO overviewAt March 31, 2019, the average credit rating of the Treasury and CIO investment securities comprising the portfolio in the table below was AA+ (based upon external ratings where available and, where not available, based primarily upon internal ratings that correspond to ratings as defined by S&P and Moody’s). Refer to Note 9 for further information on the Firm’s investment securities portfolio.
For further information on liquidity and funding risk, refer to Liquidity Risk Management on pages 37–41. For information on interest rate, foreign exchange and other risks, refer to Market Risk Management on pages 58–62.
Selected income statement and balance sheet dataAs of or for the three months
ended March 31,
(in millions) 2019 2018 Change
Investment securities gains/(losses) $ 13 $ (245) NM
Available-for-sale (“AFS”)investment securities(average) $ 226,605 $ 204,323 11%
Held-to-maturity (“HTM”)investment securities(average) 31,082 34,020 (9)
Investment securitiesportfolio (average) $ 257,687 $ 238,343 8
AFS investment securities(period-end) $ 234,832 $ 207,703 13
HTM investment securities(period-end) 30,849 29,042 6
Investment securitiesportfolio (period-end) $ 265,681 $ 236,745 12%

31
ENTERPRISE-WIDE RISK MANAGEMENT
Risk is an inherent part of JPMorgan Chase’s business activities. When the Firm extends a consumer or wholesale loan, advises customers on their investment decisions, makes markets in securities, or offers other products or services, the Firm takes on some degree of risk. The Firm’s overall objective is to manage its businesses and the associated risks in a manner that balances serving the interests of its clients, customers and investors and protects the safety and soundness of the Firm.
The Firm believes that effective risk management requires:
• Acceptance of responsibility, including identification and escalation of risk issues, by all individuals within the Firm;
• Ownership of risk identification, assessment, data and management within each of the lines of business and Corporate; and
• Firmwide structures for risk governance.
The Firm strives for continual improvement through efforts to enhance controls, ongoing employee training and development, talent retention, and other measures. The Firm follows a disciplined and balanced compensation framework with strong internal governance and independent Board oversight. The impact of risk and control issues are carefully considered in the Firm’s performance evaluation and incentive compensation processes.
Firmwide Risk Management is overseen and managed on an enterprise-wide basis. The Firm’s risk management governance and oversight framework involves understanding drivers of risks, types of risks, and impacts of risks.
For a further discussion of Enterprise-wide risk management governance and oversight, refer to pages 79-83 of JPMorgan Chase’s 2018 Form 10-K.
Governance and Oversight FunctionsThe following sections of this Form 10-Q and the 2018 Form 10-K discuss the risk governance and oversight functions in place to manage the risks inherent in the Firm’s business activities.
Risk governance and oversight functions
Form 10-Qpage
reference
Form 10-Kpage
reference
Strategic risk 84
Capital risk 32–36 85–94
Liquidity risk 37–41 95–100
Reputation risk 101
Consumer credit risk 43–47 106-111
Wholesale credit risk 48–54 112-119
Investment portfolio risk 57 123
Market risk 58–62 124-131
Country risk 63 132–133
Operational risk 134-136
Compliance risk 137
Conduct risk 138
Legal risk 139
Estimations and Model risk 140

32
CAPITAL RISK MANAGEMENT
Capital risk is the risk the Firm has an insufficient level and composition of capital to support the Firm’s business activities and associated risks during normal economic environments and under stressed conditions.
For a further discussion of the Firm’s Capital Risk Management, including capital planning and stress testing, refer to pages 85-94 of JPMorgan Chase’s 2018 Form 10-K, Note 21 of this Form 10-Q, and the Firm’s Pillar 3 Regulatory Capital Disclosures reports, which are available on the Firm’s website (https://jpmorganchaseco.gcs-web.com/financial-information/basel-pillar-3-us-lcr-disclosures).
The capital rules under Basel III establish minimum capital ratios and overall capital adequacy standards for large and internationally active U.S. bank holding companies (“BHC”) and banks, including the Firm and its insured depository institution (“IDI”) subsidiaries. Two comprehensive approaches are prescribed for calculating RWA: a standardized approach (“Basel III Standardized”), and an advanced approach (“Basel III Advanced”). Effective January 1, 2019, the capital adequacy of the Firm is now
evaluated against the fully phased-in measures under Basel III and represents the lower of the Standardized or Advanced approaches. During 2018, the required capital measures were subject to the transitional rules and as of December 31, 2018 were the same on a fully phased-in and on a transitional basis. The Firm’s Basel III Standardized risk-based ratios are currently more binding than the Basel III Advanced risk-based ratios, and the Firm expects that this will remain the case for the foreseeable future.
Basel III also includes a requirement for Advanced Approach banking organizations, including the Firm, to calculate the supplementary leverage ratio (“SLR”). For additional information on SLR, refer to page 91 of the Firm’s 2018 Form 10-K.
In addition to meeting the capital ratio requirements of Basel III, the Firm and its IDI subsidiaries also must maintain minimum capital and leverage ratios in order to be “well-capitalized” under the regulations issued by the Federal Reserve and the Prompt Corrective Action requirements of the FDIC Improvement Act respectively.
The following tables present the Firm’s risk-based and leverage-based capital metrics under both the Basel III Standardized and Advanced Approaches. The Firm’s Basel III ratios exceeded regulatory minimums as of March 31, 2019 and December 31, 2018. For a further discussion of these capital metrics, refer to Capital Risk Management on pages 85-94 of JPMorgan Chase’s 2018 Form 10-K.
March 31, 2019 December 31, 2018
(in millions) Standardized AdvancedMinimum
capital ratios Standardized(b) Advanced(b)Minimum
capital ratios
Risk-based capital metrics:
CET1 capital $ 186,116 $ 186,116 $ 183,474 $ 183,474
Tier 1 capital 212,644 212,644 209,093 209,093
Total capital 241,483 231,454 237,511 227,435
Risk-weighted assets 1,542,903 1,432,526 1,528,916 1,421,205
CET1 capital ratio 12.1% 13.0% 10.5% 12.0% 12.9% 9.0%
Tier 1 capital ratio 13.8 14.8 12.0 13.7 14.7 10.5
Total capital ratio 15.7 16.2 14.0 15.5 16.0 12.5
Leverage-based capital metrics:
Adjusted average assets(a) $ 2,637,741 $ 2,637,741 $ 2,589,887 $ 2,589,887
Tier 1 leverage ratio 8.1% 8.1% 4.0% 8.1% 8.1% 4.0%
Total leverage exposure NA $ 3,309,501 NA $ 3,269,988
SLR NA 6.4% 5.0% NA 6.4% 5.0%
(a) Adjusted average assets, for purposes of calculating the Tier 1 leverage ratio, includes total quarterly average assets adjusted for on-balance sheet assets that are subject to deduction from Tier 1 capital, predominantly goodwill and other intangible assets.
(b) The Firm’s capital ratios as of December 31, 2018 were equivalent whether calculated on a transitional or fully phased-in basis.

33
Capital componentsThe following table presents reconciliations of total stockholders’ equity to Basel III CET1 capital, Tier 1 capital and Total capital as of March 31, 2019 and December 31, 2018.
(in millions)March 31,
2019December 31,
2018
Total stockholders’ equity $ 259,837 $ 256,515
Less: Preferred stock 26,993 26,068
Common stockholders’ equity 232,844 230,447
Less:
Goodwill 47,474 47,471
Other intangible assets 737 748
Other CET1 capital adjustments 810 1,034
Add:
Deferred tax liabilities(a) 2,293 2,280
Standardized/Advanced CET1 capital 186,116 183,474
Preferred stock 26,993 26,068
Less: Other Tier 1 adjustments 465 449
Standardized/Advanced Tier 1 capital $ 212,644 $ 209,093
Long-term debt and other instrumentsqualifying as Tier 2 capital $ 14,105 $ 13,772
Qualifying allowance for credit losses 14,591 14,500
Other 143 146
Standardized Tier 2 capital $ 28,839 $ 28,418
Standardized Total capital $ 241,483 $ 237,511
Adjustment in qualifying allowance forcredit losses for Advanced Tier 2capital (10,029) (10,076)
Advanced Tier 2 capital $ 18,810 $ 18,342
Advanced Total capital $ 231,454 $ 227,435
(a) Represents certain deferred tax liabilities related to tax-deductible goodwill and identifiable intangibles created in nontaxable transactions, which are netted against goodwill and other intangibles when calculating CET1 capital.
Capital rollforwardThe following table presents the changes in Basel III CET1 capital, Tier 1 capital and Tier 2 capital for the three months ended March 31, 2019.
Three months ended March 31,(in millions) 2019
Standardized/Advanced CET1 capital at December 31, 2018 $ 183,474
Net income applicable to common equity 8,805
Dividends declared on common stock (2,632)
Net purchase of treasury stock (3,795)
Changes in additional paid-in capital (992)
Changes related to AOCI 811
Adjustment related to DVA(a) 719
Changes related to other CET1 capital adjustments (274)
Change in Standardized/Advanced CET1 capital 2,642
Standardized/Advanced CET1 capital at March 31, 2019 $ 186,116
Standardized/Advanced Tier 1 capital at December 31,2018 $ 209,093
Change in CET1 capital 2,642
Net issuance of noncumulative perpetual preferred stock 925
Other (16)
Change in Standardized/Advanced Tier 1 capital 3,551
Standardized/Advanced Tier 1 capital at March 31, 2019 $ 212,644
Standardized Tier 2 capital at December 31, 2018 $ 28,418
Change in long-term debt and other instruments qualifyingas Tier 2 333
Change in qualifying allowance for credit losses 91
Other (3)
Change in Standardized Tier 2 capital 421
Standardized Tier 2 capital at March 31, 2019 $ 28,839
Standardized Total capital at March 31, 2019 $ 241,483
Advanced Tier 2 capital at December 31, 2018 $ 18,342
Change in long-term debt and other instruments qualifyingas Tier 2 333
Change in qualifying allowance for credit losses 138
Other (3)
Change in Advanced Tier 2 capital 468
Advanced Tier 2 capital at March 31, 2019 $ 18,810
Advanced Total capital at March 31, 2019 $ 231,454
(a) Includes DVA related to structured notes recorded in AOCI.
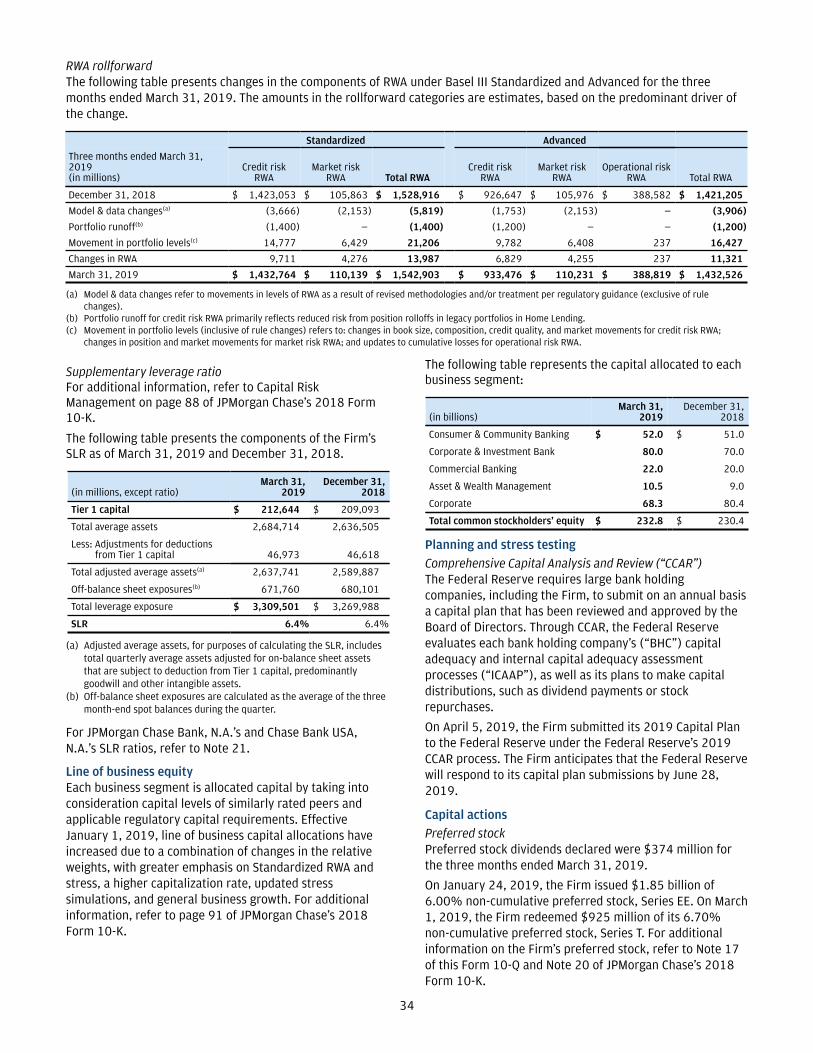
34
RWA rollforwardThe following table presents changes in the components of RWA under Basel III Standardized and Advanced for the three months ended March 31, 2019. The amounts in the rollforward categories are estimates, based on the predominant driver of the change.
Standardized Advanced
Three months ended March 31,2019(in millions)
Credit riskRWA
Market riskRWA Total RWA
Credit riskRWA
Market riskRWA
Operational risk RWA Total RWA
December 31, 2018 $ 1,423,053 $ 105,863 $ 1,528,916 $ 926,647 $ 105,976 $ 388,582 $ 1,421,205
Model & data changes(a) (3,666) (2,153) (5,819) (1,753) (2,153) — (3,906)
Portfolio runoff(b) (1,400) — (1,400) (1,200) — — (1,200)
Movement in portfolio levels(c) 14,777 6,429 21,206 9,782 6,408 237 16,427
Changes in RWA 9,711 4,276 13,987 6,829 4,255 237 11,321
March 31, 2019 $ 1,432,764 $ 110,139 $ 1,542,903 $ 933,476 $ 110,231 $ 388,819 $ 1,432,526
(a) Model & data changes refer to movements in levels of RWA as a result of revised methodologies and/or treatment per regulatory guidance (exclusive of rule changes).
(b) Portfolio runoff for credit risk RWA primarily reflects reduced risk from position rolloffs in legacy portfolios in Home Lending.(c) Movement in portfolio levels (inclusive of rule changes) refers to: changes in book size, composition, credit quality, and market movements for credit risk RWA;
changes in position and market movements for market risk RWA; and updates to cumulative losses for operational risk RWA.
Supplementary leverage ratioFor additional information, refer to Capital Risk Management on page 88 of JPMorgan Chase’s 2018 Form 10-K.
The following table presents the components of the Firm’s SLR as of March 31, 2019 and December 31, 2018.
(in millions, except ratio)March 31,
2019December 31,
2018
Tier 1 capital $ 212,644 $ 209,093
Total average assets 2,684,714 2,636,505
Less: Adjustments for deductionsfrom Tier 1 capital 46,973 46,618
Total adjusted average assets(a) 2,637,741 2,589,887
Off-balance sheet exposures(b) 671,760 680,101
Total leverage exposure $ 3,309,501 $ 3,269,988
SLR 6.4% 6.4%
(a) Adjusted average assets, for purposes of calculating the SLR, includes total quarterly average assets adjusted for on-balance sheet assets that are subject to deduction from Tier 1 capital, predominantly goodwill and other intangible assets.
(b) Off-balance sheet exposures are calculated as the average of the three month-end spot balances during the quarter.
For JPMorgan Chase Bank, N.A.’s and Chase Bank USA, N.A.’s SLR ratios, refer to Note 21.
Line of business equityEach business segment is allocated capital by taking into consideration capital levels of similarly rated peers and applicable regulatory capital requirements. Effective January 1, 2019, line of business capital allocations have increased due to a combination of changes in the relative weights, with greater emphasis on Standardized RWA and stress, a higher capitalization rate, updated stress simulations, and general business growth. For additional information, refer to page 91 of JPMorgan Chase’s 2018 Form 10-K.
The following table represents the capital allocated to each business segment:
(in billions)March 31,
2019December 31,
2018
Consumer & Community Banking $ 52.0 $ 51.0
Corporate & Investment Bank 80.0 70.0
Commercial Banking 22.0 20.0
Asset & Wealth Management 10.5 9.0
Corporate 68.3 80.4
Total common stockholders’ equity $ 232.8 $ 230.4
Planning and stress testingComprehensive Capital Analysis and Review (“CCAR”)The Federal Reserve requires large bank holding companies, including the Firm, to submit on an annual basis a capital plan that has been reviewed and approved by the Board of Directors. Through CCAR, the Federal Reserve evaluates each bank holding company’s (“BHC”) capital adequacy and internal capital adequacy assessment processes (“ICAAP”), as well as its plans to make capital distributions, such as dividend payments or stock repurchases.
On April 5, 2019, the Firm submitted its 2019 Capital Plan to the Federal Reserve under the Federal Reserve’s 2019 CCAR process. The Firm anticipates that the Federal Reserve will respond to its capital plan submissions by June 28, 2019.
Capital actionsPreferred stock Preferred stock dividends declared were $374 million for the three months ended March 31, 2019.
On January 24, 2019, the Firm issued $1.85 billion of 6.00% non-cumulative preferred stock, Series EE. On March 1, 2019, the Firm redeemed $925 million of its 6.70% non-cumulative preferred stock, Series T. For additional information on the Firm’s preferred stock, refer to Note 17 of this Form 10-Q and Note 20 of JPMorgan Chase’s 2018 Form 10-K.

35
Common stock dividends
The Firm’s quarterly common stock dividend is currently $0.80 per share. The Firm’s dividends are subject to the Board of Directors’ approval on a quarterly basis.
Common equity
Effective June 28, 2018, the Firm’s Board of Directors authorized the repurchase of up to $20.7 billion of common equity between July 1, 2018 and June 30, 2019, as part of the Firm’s annual capital plan.
The following table sets forth the Firm’s repurchases of common equity, on a settlement-date basis, for the three months ended March 31, 2019 and 2018. There were no repurchases of warrants during the three months ended March 31, 2018 and any warrants that were not exercised on or before October 29, 2018 have expired.
Three months endedMarch 31,
(in millions) 2019 2018
Total shares of common stock repurchased 49.5 41.4
Aggregate common stock repurchases $ 5,091 $ 4,671
For additional information regarding repurchases of the Firm’s equity securities, refer to Part II, Item 2: Unregistered Sales of Equity Securities and Use of Proceeds and Part II, Item 5: Market for Registrant’s Common Equity, Related Stockholder Matters and Issuer Purchases of Equity Securities on page 159 of this Form 10-Q and page 30 of JPMorgan Chase’s 2018 Form 10-K, respectively.
Other capital requirementsTLAC The Federal Reserve’s TLAC rule requires the top-tier U.S. GSIB holding companies, including the Firm, to maintain minimum levels of external TLAC and eligible LTD effective January 1, 2019.
As of March 31, 2019, the Firm was compliant with the requirements of the TLAC rule. For additional information, refer to page 93 of JPMorgan Chase’s 2018 Form 10-K.
The following table presents the eligible external TLAC and LTD amounts, as well as a representation of the amounts as a percentage of the Firm’s total RWA and total leverage exposure.
March 31, 2019
(in billions, except ratio)Eligible
External TLAC Eligible LTD
Total eligible TLAC & LTD $ 382.7 $ 160.5
% of RWA 24.8% 10.4%
Minimum requirement 23.0 9.5
Surplus/(shortfall) $ 27.8 $ 13.9
% of total leverage exposure 11.6% 4.8%
Minimum requirement 9.5 4.5
Surplus/(shortfall) $ 68.3 $ 11.5
For information on the financial consequences to holders ofthe Firm’s debt and equity securities in a resolutionscenario, refer to Part I, Item 1A: Risk Factors on pages7-28 of the Firm’s 2018 Form 10-K.

36
Broker-dealer regulatory capital
J.P. Morgan SecuritiesJPMorgan Chase’s principal U.S. broker-dealer subsidiary is J.P. Morgan Securities. J.P. Morgan Securities is subject to Rule 15c3-1 under the Securities Exchange Act of 1934 (the “Net Capital Rule”). J.P. Morgan Securities is also registered as a futures commission merchant and subject to Rule 1.17 of the Commodity Futures Trading Commission (“CFTC”).
For a discussion on J.P. Morgan Securities’ capital requirements, refer to Capital risk management on pages 85-94 of the Firm’s 2018 Form 10-K.
The following table presents J.P. Morgan Securities’ net capital information:
March 31, 2019
(in millions) Actual Minimum
Net Capital $ 18,067 $ 3,160
J.P. Morgan Securities plc J.P. Morgan Securities plc is a wholly-owned subsidiary of JPMorgan Chase Bank, N.A. and has authority to engage in banking, investment banking and broker-dealer activities. J.P. Morgan Securities plc is jointly regulated by the U.K. Prudential Regulation Authority (“PRA”) and the Financial Conduct Authority (“FCA”).
For a further discussion on J.P. Morgan Securities plc, refer to Capital risk management on pages 85-94 of the Firm’s 2018 Form 10-K.
Effective January 1, 2019, the Bank of England requires, on a transitional basis, that U.K. banks, including U.K. regulated subsidiaries of overseas groups, maintain a minimum requirement for own funds and eligible liabilities (“MREL”). As of March 31, 2019, J.P. Morgan Securities plc was compliant with the requirements of the MREL rule. For additional information on MREL, refer to Supervision and Regulation on pages 1-6 of the Firm’s 2018 Form 10-K.
The following table presents J.P. Morgan Securities plc’s capital information:
March 31, 2019
(in millions, except ratios) Estimated Minimum ratios
Total capital $ 55,732
CET1 ratio 18.1% 4.5%
Total capital ratio 23.1% 8.0%

37
LIQUIDITY RISK MANAGEMENT
Liquidity risk is the risk that the Firm will be unable to meet its contractual and contingent financial obligations as they arise or that it does not have the appropriate amount, composition and tenor of funding and liquidity to support its assets and liabilities. For a further discussion of the Firm’s Liquidity Risk Management, refer to pages 95–100 of JPMorgan Chase’s 2018 Form 10-K and the Firm’s US LCR Disclosure reports, which are available on the Firm’s website at: (https://jpmorganchaseco.gcs-web.com/financial-information/basel-pillar-3-us-lcr-disclosures).
LCR and HQLAThe LCR rule requires the Firm to maintain an amount of unencumbered HQLA that is sufficient to meet its estimated total net cash outflows over a prospective 30 calendar-day period of significant stress. HQLA is the amount of liquid assets that qualify for inclusion in the LCR. HQLA primarily consist of unencumbered cash and certain high-quality liquid securities as defined in the LCR rule.
Under the LCR rule, the amounts of HQLA held by JPMorgan Chase Bank N.A. and Chase Bank USA, N.A that are in excess of each entity’s standalone 100% minimum LCR requirement, and that are not transferable to non-bank affiliates, must be excluded from the Firm’s reported HQLA. The LCR is required to be a minimum of 100%.
The following table summarizes the Firm’s average LCR for the three months ended March 31, 2019, December 31, 2018 and March 31, 2018 based on the Firm’s interpretation of the finalized LCR framework.
Three months ended
Average amount(in millions)
March 31,2019
December31, 2018
March 31,2018
HQLA
Eligible cash(a) $ 216,787 $ 297,069 $ 358,257
Eligible securities(b)(c) 303,249 232,201 180,765
Total HQLA(d) $ 520,036 $ 529,270 $ 539,022
Net cash outflows $ 467,329 $ 467,704 $ 467,629
LCR 111% 113% 115%
Net excess HQLA(d) $ 52,707 $ 61,566 $ 71,393
(a) Represents cash on deposit at central banks, primarily Federal Reserve Banks.
(b) Predominantly U.S. Treasuries, U.S. Agency MBS, and sovereign bonds net of applicable haircuts under the LCR rules.
(c) HQLA eligible securities may be reported in securities borrowed or purchased under resale agreements, trading assets, or investment securities on the Firm’s Consolidated balance sheets.
(d) Excludes average excess HQLA at JPMorgan Chase Bank, N.A. and Chase Bank USA, N.A. that are not transferable to non-bank affiliates.
The Firm’s average LCR decreased during the three months ended March 31, 2019, compared with the three-month period ended December 31, 2018 and the prior year period due to a decrease in the average amount of HQLA. The decrease in HQLA was driven by a decrease in the amount of HQLA in JPMorgan Chase Bank, N.A. and Chase Bank USA, N.A. that was determined to be transferable to non-bank affiliates based on a change in the Firm’s interpretation of amounts available for transfer during the three months ended December 31, 2018. This change in interpretation had no impact on the HQLA in JPMorgan Chase Bank, N.A. and Chase Bank USA, N.A., which was relatively unchanged over both periods.
The Firm’s average LCR may fluctuate from period to period, due to changes in its HQLA and estimated net cash outflows under the LCR as a result of ongoing business activity.
Other liquidity sourcesAs of March 31, 2019, in addition to assets reported in the Firm’s HQLA under the LCR rule, the Firm had approximately $281 billion of unencumbered marketable securities, such as equity securities and fixed income debt securities, available to raise liquidity, if required. This includes HQLA-eligible securities included as part of the excess liquidity at JPMorgan Chase Bank, N.A. that are not transferable to non-bank affiliates.
As of March 31, 2019, the Firm also had approximately $265 billion of available borrowing capacity at FHLBs, discount windows at Federal Reserve Banks and various other central banks as a result of collateral pledged by the Firm to such banks. This borrowing capacity excludes the benefit of securities reported in the Firm’s HQLA or other unencumbered securities that are currently pledged at Federal Reserve Bank discount windows. Although available, the Firm does not view the borrowing capacity at the Federal Reserve Bank discount windows and the various other central banks as a primary source of liquidity.

38
Funding Sources of fundsManagement believes that the Firm’s unsecured and secured funding capacity is sufficient to meet its on- and off-balance sheet obligations.
The Firm funds its global balance sheet through diverse sources of funding including stable deposits as well as secured and unsecured funding in the capital markets. The Firm’s loan portfolio is funded with a portion of the Firm’s deposits, through securitizations and, with respect to a portion of the Firm’s real estate-related loans, with secured borrowings from the FHLBs. Deposits in excess of the amount utilized to fund loans are primarily invested by Treasury and CIO in the Firm’s investment securities portfolio or deployed in cash or other short-term liquid investments based on their interest rate and liquidity risk
characteristics. Securities borrowed or purchased under resale agreements and trading assets-debt and equity instruments are primarily funded by the Firm’s securities loaned or sold under agreements to repurchase, trading liabilities-debt and equity instruments, and a portion of the Firm’s long-term debt and stockholders’ equity. In addition to funding securities borrowed or purchased under resale agreements and trading assets-debt and equity instruments, proceeds from the Firm’s debt and equity issuances are used to fund certain loans and other financial and non-financial assets, or may be invested in the Firm’s investment securities portfolio. Refer to the discussion below for additional information relating to Deposits, Short-term funding, and Long-term funding and issuance.
DepositsThe table below summarizes, by line of business, the deposit balances as of March 31, 2019, and December 31, 2018, and the average deposit balances for the three months ended March 31, 2019 and 2018, respectively.
March 31,2019
December 31,2018
Three months ended March 31,
Deposits Average
(in millions) 2019 2018
Consumer & Community Banking $ 702,587 $ 678,854 $ 681,013 $ 659,599
Corporate & Investment Bank 485,869 482,084 492,354 465,822
Commercial Banking 161,096 170,859 167,177 175,523
Asset & Wealth Management 143,348 138,546 138,235 144,199
Corporate 541 323 963 865
Total Firm $ 1,493,441 $ 1,470,666 $ 1,479,742 $ 1,446,008
Deposits provide a stable source of funding and reduce the Firm’s reliance on the wholesale funding markets. A significant portion of the Firm’s deposits are consumer and wholesale operating deposits, which are both considered to be stable sources of liquidity. Wholesale operating deposits are considered to be stable sources of liquidity because they are generated from customers that maintain operating service relationships with the Firm.
The table below shows the loan and deposit balances, the loans-to-deposits ratios, and deposits as a percentage of total liabilities, as of March 31, 2019 and December 31, 2018.
(in billions except ratios)March 31,
2019December 31,
2018
Deposits $ 1,493.4 $ 1,470.7
Deposits as a % of total liabilities 60% 62%
Loans $ 956.2 $ 984.6
Loans-to-deposits ratio 64% 67%
The Firm believes that average deposit balances are generally more representative of deposit trends than period-end deposit balances.
Average deposits increased for the three months ended March 31, 2019 in CIB and CCB, partially offset by declines in CB and AWM.
• The increase in CIB reflected growth in operating deposits in Treasury Services. The increase in CCB was driven by growth in new accounts.
• The decrease in CB was primarily driven by migration of non-operating deposits. The decrease in AWM was largely driven by migration predominantly into the Firm’s investment-related products.
For further information on deposit and liability balance trends, refer to the discussion of the Firm’s Business Segment Results and the Consolidated Balance Sheets Analysis on pages 17–30 and pages 11–13, respectively.

39
The following table summarizes short-term and long-term funding, excluding deposits, as of March 31, 2019, and December 31, 2018, and average balances for the three months ended March 31, 2019 and 2018, respectively. For additional information, refer to the Consolidated Balance Sheets Analysis on pages 11–13 and Note 10.
March 31,2019
December 31,2018
Three months ended March 31,
Sources of funds (excluding deposits) Average
(in millions) 2019 2018
Commercial paper $ 26,563 $ 30,059 $ 28,731 $ 25,993
Other borrowed funds(a) 9,648 8,789 10,247 12,147
Total short-term unsecured funding(a) $ 36,211 $ 38,848 $ 38,978 $ 38,140
Securities sold under agreements to repurchase(b) $ 208,338 $ 171,975 $ 197,454 $ 184,396
Securities loaned(b) 13,577 9,481 10,781 10,526
Other borrowed funds(a)(c) 35,094 30,428 35,583 19,463
Obligations of Firm-administered multi-seller conduits(d) $ 10,788 $ 4,843 $ 7,386 $ 3,116
Total short-term secured funding(a) $ 267,797 $ 216,727 $ 251,204 $ 217,501
Senior notes $ 167,030 $ 162,733 $ 162,952 $ 150,218
Trust preferred securities — — — 688
Subordinated debt 16,945 16,743 16,722 16,231
Structured notes(e) 59,634 53,090 57,395 47,001
Total long-term unsecured funding $ 243,609 $ 232,566 $ 237,069 $ 214,138
Credit card securitization(d) $ 13,416 $ 13,404 $ 13,409 $ 18,665
Federal Home Loan Bank (“FHLB”) advances 42,453 44,455 43,965 60,385
Other long-term secured funding(f) 4,831 5,010 4,891 4,482
Total long-term secured funding $ 60,700 $ 62,869 $ 62,265 $ 83,532
Preferred stock(g) $ 26,993 $ 26,068 $ 27,126 $ 26,068
Common stockholders’ equity(g) $ 232,844 $ 230,447 $ 230,051 $ 227,615
(a) The prior period amounts have been revised to conform with the current period presentation.(b) Primarily consists of short-term securities loaned or sold under agreements to repurchase.(c) Includes FHLB advances with original maturities of less than one year of $14.9 billion and $11.4 billion as of March 31, 2019 and December 31, 2018,
respectively.(d) Included in beneficial interests issued by consolidated variable interest entities on the Firm’s Consolidated balance sheets.(e) Includes certain TLAC-eligible long-term unsecured debt issued by the Parent Company.(f) Includes long-term structured notes which are secured.(g) For additional information on preferred stock and common stockholders’ equity refer to Capital Risk Management on pages 32–36, Consolidated
statements of changes in stockholders’ equity, and Note 20 and Note 21 of JPMorgan Chase’s 2018 Form 10-K.
Short-term funding The Firm’s sources of short-term secured funding primarily consist of securities loaned or sold under agreements to repurchase. These instruments are secured predominantly by high-quality securities collateral, including government-issued debt and agency MBS, and constitute a significant portion of the federal funds purchased and securities loaned or sold under repurchase agreements on the Consolidated balance sheets. The increase at March 31, 2019, from December 31, 2018, reflected client-driven market-making activities and higher secured financing of trading assets-debt and equity instruments in CIB.
The balances associated with securities loaned or sold under agreements to repurchase fluctuate over time due to customers’ investment and financing activities, the Firm’s demand for financing, the ongoing management of the mix of the Firm’s liabilities, including its secured and unsecured financing (for both the investment securities and market-making portfolios), and other market and portfolio factors.
The Firm’s sources of short-term unsecured funding primarily consist of issuance of wholesale commercial paper. The decrease in commercial paper was due to lower net issuance primarily for short-term liquidity management.

40
Long-term funding and issuanceLong-term funding provides additional sources of stable funding and liquidity for the Firm. The Firm’s long-term funding plan is driven primarily by expected client activity, liquidity considerations, and regulatory requirements, including TLAC. Long-term funding objectives include maintaining diversification, maximizing market access and optimizing funding costs. The Firm evaluates various funding markets, tenors and currencies in creating its optimal long-term funding plan.
The significant majority of the Firm’s long-term unsecured funding is issued by the Parent Company to provide maximum flexibility in support of both bank and nonbank subsidiary funding needs. The Parent Company advances substantially all net funding proceeds to its subsidiary, the Intermediate Holding Company (“IHC”). The IHC does not issue debt to external counterparties. The following table summarizes long-term unsecured issuance and maturities or redemptions for the three months ended March 31, 2019 and 2018. For additional information on the IHC and long-term debt, refer to Liquidity Risk Management and Note 19 of JPMorgan Chase’s 2018 Form 10-K.
Long-term unsecured fundingThree months
ended March 31,Three months
ended March 31,
2019 2018 2019 2018
(Notional in millions) Parent Company(b) Subsidiaries(b)
Issuance
Senior notes issued in the U.S.market $ 4,250 $ 4,000 $ 1,750 $ 4,011
Senior notes issued in non-U.S.markets 2,248 — — —
Total senior notes 6,498 4,000 1,750 4,011
Structured notes(a) 1,185 831 6,116 6,958
Total long-term unsecuredfunding – issuance $ 7,683 $ 4,831 $ 7,866 $ 10,969
Maturities/redemptions
Senior notes $ 3,750 $ 14,059 $ 1,815 $ 65
Subordinated debt 146 — — —
Structured notes 628 815 3,833 4,712
Total long-term unsecuredfunding – maturities/redemptions $ 4,524 $ 14,874 $ 5,648 $ 4,777
(a) Includes certain TLAC-eligible long-term unsecured debt issued by the Parent Company.
(b) The prior period amounts have been revised to conform with the current period presentation.
The Firm raises secured long-term funding through securitization of consumer credit card loans and advances from the FHLBs. The following table summarizes the securitization issuance and FHLB advances and their respective maturities or redemptions for the three months ended March 31, 2019 and 2018, respectively.
Long-term secured fundingThree months ended March 31,
IssuanceMaturities/
Redemptions
(in millions) 2019 2018 2019 2018
Credit card securitization $ — $ — $ — $ 4,400
FHLB advances — 4,000 2,001 7,751
Other long-term secured funding(a) 35 121 246 16
Total long-term securedfunding $ 35 $ 4,121 $ 2,247 $ 12,167
(a) Includes long-term structured notes which are secured.
The Firm’s wholesale businesses also securitize loans for client-driven transactions; those client-driven loan securitizations are not considered to be a source of funding for the Firm and are not included in the table above. For further description of the client-driven loan securitizations, refer to Note 14 of JPMorgan Chase’s 2018 Form 10-K.

41
Credit ratingsThe cost and availability of financing are influenced by credit ratings. Reductions in these ratings could have an adverse effect on the Firm’s access to liquidity sources, increase the cost of funds, trigger additional collateral or funding requirements and decrease the number of investors and counterparties willing to lend to the Firm. The nature and magnitude of the impact of ratings downgrades depends on numerous contractual and behavioral factors, which the Firm believes are incorporated in its liquidity risk and stress testing metrics. The Firm believes that it maintains sufficient liquidity to withstand a potential decrease in funding capacity due to ratings downgrades.
Additionally, the Firm’s funding requirements for VIEs and other third-party commitments may be adversely affected by a decline in credit ratings. For additional information on the impact of a credit ratings downgrade on the funding requirements for VIEs, and on derivatives and collateral agreements, refer to SPEs on page 14, and liquidity risk and credit-related contingent features in Note 4.
The credit ratings of the Parent Company and the Firm’s principal bank and non-bank subsidiaries as of March 31, 2019, were as follows.
JPMorgan Chase & Co.JPMorgan Chase Bank, N.A.
Chase Bank USA, N.A.J.P. Morgan Securities LLCJ.P. Morgan Securities plc
March 31, 2019Long-term
issuerShort-term
issuer OutlookLong-term
issuerShort-term
issuer OutlookLong-term
issuerShort-term
issuer Outlook
Moody’s Investors Service A2 P-1 Stable Aa2 P-1 Stable Aa3 P-1 Stable
Standard & Poor’s A- A-2 Stable A+ A-1 Stable A+ A-1 Stable
Fitch Ratings AA- F1+ Stable AA F1+ Stable AA F1+ Stable
For a discussion of the factors that could affect credit ratings of the Parent Company and the Firm’s principal bank and non-bank subsidiaries, refer to page 100 of the Firm’s 2018 10-K.
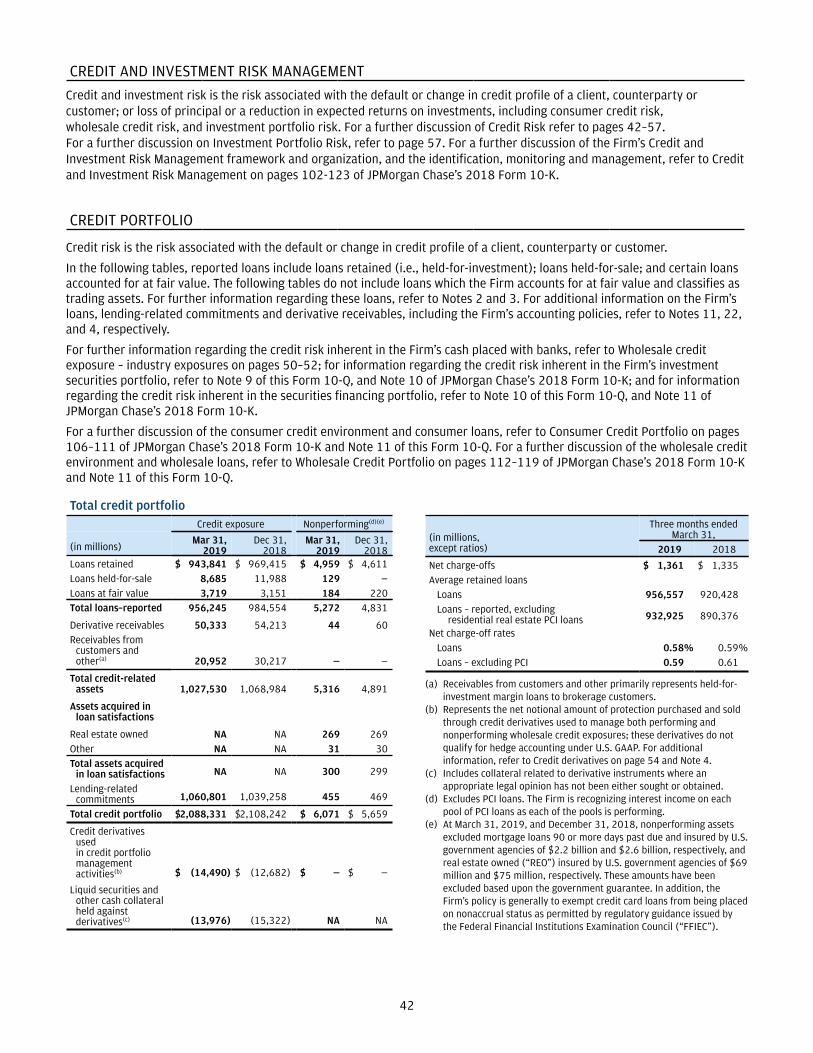
42
CREDIT AND INVESTMENT RISK MANAGEMENT
Credit and investment risk is the risk associated with the default or change in credit profile of a client, counterparty or customer; or loss of principal or a reduction in expected returns on investments, including consumer credit risk,wholesale credit risk, and investment portfolio risk. For a further discussion of Credit Risk refer to pages 42–57. For a further discussion on Investment Portfolio Risk, refer to page 57. For a further discussion of the Firm’s Credit and Investment Risk Management framework and organization, and the identification, monitoring and management, refer to Credit and Investment Risk Management on pages 102-123 of JPMorgan Chase’s 2018 Form 10-K.
CREDIT PORTFOLIO
Credit risk is the risk associated with the default or change in credit profile of a client, counterparty or customer.
In the following tables, reported loans include loans retained (i.e., held-for-investment); loans held-for-sale; and certain loans accounted for at fair value. The following tables do not include loans which the Firm accounts for at fair value and classifies as trading assets. For further information regarding these loans, refer to Notes 2 and 3. For additional information on the Firm’s loans, lending-related commitments and derivative receivables, including the Firm’s accounting policies, refer to Notes 11, 22, and 4, respectively.
For further information regarding the credit risk inherent in the Firm’s cash placed with banks, refer to Wholesale credit exposure – industry exposures on pages 50–52; for information regarding the credit risk inherent in the Firm’s investment securities portfolio, refer to Note 9 of this Form 10-Q, and Note 10 of JPMorgan Chase’s 2018 Form 10-K; and for information regarding the credit risk inherent in the securities financing portfolio, refer to Note 10 of this Form 10-Q, and Note 11 of JPMorgan Chase’s 2018 Form 10-K.
For a further discussion of the consumer credit environment and consumer loans, refer to Consumer Credit Portfolio on pages 106–111 of JPMorgan Chase’s 2018 Form 10-K and Note 11 of this Form 10-Q. For a further discussion of the wholesale credit environment and wholesale loans, refer to Wholesale Credit Portfolio on pages 112–119 of JPMorgan Chase’s 2018 Form 10-K and Note 11 of this Form 10-Q.
Total credit portfolioCredit exposure Nonperforming(d)(e)
(in millions)Mar 31,
2019Dec 31,
2018Mar 31,
2019Dec 31,
2018Loans retained $ 943,841 $ 969,415 $ 4,959 $ 4,611Loans held-for-sale 8,685 11,988 129 —Loans at fair value 3,719 3,151 184 220Total loans–reported 956,245 984,554 5,272 4,831
Derivative receivables 50,333 54,213 44 60Receivables from
customers and other(a) 20,952 30,217 — —
Total credit-relatedassets 1,027,530 1,068,984 5,316 4,891
Assets acquired inloan satisfactions
Real estate owned NA NA 269 269Other NA NA 31 30Total assets acquired
in loan satisfactions NA NA 300 299
Lending-relatedcommitments 1,060,801 1,039,258 455 469
Total credit portfolio $2,088,331 $2,108,242 $ 6,071 $ 5,659
Credit derivatives used in credit portfolio management activities(b) $ (14,490) $ (12,682) $ — $ —
Liquid securities and other cash collateral held against derivatives(c) (13,976) (15,322) NA NA
(in millions, except ratios)
Three months endedMarch 31,
2019 2018
Net charge-offs $ 1,361 $ 1,335Average retained loans
Loans 956,557 920,428Loans – reported, excluding
residential real estate PCI loans 932,925 890,376
Net charge-off ratesLoans 0.58% 0.59%Loans – excluding PCI 0.59 0.61
(a) Receivables from customers and other primarily represents held-for-investment margin loans to brokerage customers.
(b) Represents the net notional amount of protection purchased and sold through credit derivatives used to manage both performing and nonperforming wholesale credit exposures; these derivatives do not qualify for hedge accounting under U.S. GAAP. For additional information, refer to Credit derivatives on page 54 and Note 4.
(c) Includes collateral related to derivative instruments where an appropriate legal opinion has not been either sought or obtained.
(d) Excludes PCI loans. The Firm is recognizing interest income on each pool of PCI loans as each of the pools is performing.
(e) At March 31, 2019, and December 31, 2018, nonperforming assets excluded mortgage loans 90 or more days past due and insured by U.S. government agencies of $2.2 billion and $2.6 billion, respectively, and real estate owned (“REO”) insured by U.S. government agencies of $69 million and $75 million, respectively. These amounts have been excluded based upon the government guarantee. In addition, the Firm’s policy is generally to exempt credit card loans from being placed on nonaccrual status as permitted by regulatory guidance issued by the Federal Financial Institutions Examination Council (“FFIEC”).

43
CONSUMER CREDIT PORTFOLIO
The Firm’s retained consumer portfolio consists primarily of residential real estate loans, credit card loans, auto loans, and business banking loans, as well as associated lending-related commitments. The Firm’s focus is on serving primarily the prime segment of the consumer credit market. For further information on consumer loans, refer to Note 11 of this Form 10-Q and Consumer Credit Portfolio on pages 106–111 and Note 12 of JPMorgan Chase’s 2018 Form 10-K. For further information on lending-related commitments, refer to Note 22 of this Form 10-Q and Note 27 of JPMorgan Chase’s 2018 Form 10-K.
The following table presents consumer credit-related information with respect to the credit portfolio held by CCB, prime mortgage and home equity loans held by AWM, and prime mortgage loans held by Corporate. For further information about the Firm’s nonaccrual and charge-off accounting policies, refer to Note 12 of JPMorgan Chase’s 2018 Form 10-K.
Consumer credit portfolioThree months ended March 31,
(in millions, except ratios)
Credit exposure Nonaccrual loans(f)(g)
Net charge-offs/(recoveries)(h)
Net charge-off/(recoveries) rate(h)(i)
Mar 31,2019
Dec 31,2018
Mar 31,2019
Dec 31,2018 2019 2018 2019 2018
Consumer, excluding credit card
Loans, excluding PCI loans and loans held-for-sale
Residential mortgage $ 220,158 $ 231,078 $ 1,755 $ 1,765 $ (3) $ — (0.01)% —%
Home equity 27,072 28,340 1,276 1,323 1 17 0.01 0.21
Auto(a)(b) 62,786 63,573 111 128 58 76 0.37 0.47
Consumer & Business Banking(b)(c) 26,492 26,612 247 245 59 53 0.90 0.83
Total loans, excluding PCI loans and loans held-for-sale 336,508 349,603 3,389 3,461 115 146 0.13 0.17
Loans – PCI
Home equity 8,584 8,963 NA NA NA NA NA NA
Prime mortgage 4,529 4,690 NA NA NA NA NA NA
Subprime mortgage 1,909 1,945 NA NA NA NA NA NA
Option ARMs 8,185 8,436 NA NA NA NA NA NA
Total loans – PCI 23,207 24,034 NA NA NA NA NA NA
Total loans – retained 359,715 373,637 3,389 3,461 115 146 0.13 0.16
Loans held-for-sale 4,199 95 — — NA NA NA NA
Total consumer, excluding credit card loans 363,914 373,732 3,389 3,461 115 146 0.13 0.16
Lending-related commitments(d) 48,922 46,066
Receivables from customers 20 154
Total consumer exposure, excluding credit card 412,856 419,952
Credit card
Loans retained(e) 150,515 156,616 — — 1,202 1,170 3.23 3.32
Loans held-for-sale 12 16 — — NA NA NA NA
Total credit card loans 150,527 156,632 — — 1,202 1,170 3.23 3.32
Lending-related commitments(d) 626,922 605,379
Total credit card exposure 777,449 762,011
Total consumer credit portfolio $ 1,190,305 $ 1,181,963 $ 3,389 $ 3,461 $ 1,317 $ 1,316 1.02 % 1.04%
Memo: Total consumer credit portfolio, excluding PCI $ 1,167,098 $ 1,157,929 $ 3,389 $ 3,461 $ 1,317 $ 1,316 1.07 % 1.10%
(a) At March 31, 2019, and December 31, 2018, excluded operating lease assets of $21.1 billion and $20.5 billion, respectively. These operating lease assets are included in other assets on the Firm’s Consolidated balance sheets. For further information, refer to Note 16.
(b) Includes certain business banking and auto dealer risk-rated loans that apply the wholesale methodology for determining the allowance for loan losses; these loans are managed by CCB, and therefore, for consistency in presentation, are included within the consumer portfolio.
(c) Predominantly includes Business Banking loans.(d) Credit card and home equity lending-related commitments represent the total available lines of credit for these products. The Firm has not experienced, and does not
anticipate, that all available lines of credit would be used at the same time. For credit card commitments, and if certain conditions are met, home equity commitments, the Firm can reduce or cancel these lines of credit by providing the borrower notice or, in some cases as permitted by law, without notice. For further information, refer to Note 22.
(e) Includes billed interest and fees net of an allowance for uncollectible interest and fees.(f) At March 31, 2019 and December 31, 2018, nonaccrual loans excluded mortgage loans 90 or more days past due and insured by U.S. government agencies of $2.2
billion and $2.6 billion, respectively. These amounts have been excluded from nonaccrual loans based upon the government guarantee. In addition, the Firm’s policy is generally to exempt credit card loans from being placed on nonaccrual status, as permitted by regulatory guidance issued by the FFIEC.
(g) Excludes PCI loans. The Firm is recognizing interest income on each pool of PCI loans as each of the pools is performing.(h) Net charge-offs/(recoveries) and the net charge-off/(recovery) rates excluded write-offs in the PCI portfolio of $50 million and $20 million for the three months ended
March 31, 2019 and 2018, respectively. These write-offs decreased the allowance for loan losses for PCI loans. Refer to Allowance for Credit Losses on pages 55–56 for further information.
(i) Average consumer loans held-for-sale were $1.2 billion and $234 million for the three months ended March 31, 2019 and 2018, respectively. These amounts were excluded when calculating net charge-off/(recovery) rates.

44
Consumer, excluding credit card Portfolio analysisLoan balances decreased from December 31, 2018 predominantly due to lower residential real estate loans. The credit performance of the portfolio continues to benefit from a strong labor market and increasing home prices.
The following discussions provide information concerning individual loan products, excluding PCI loans which are addressed separately. For further information about this portfolio, including information about delinquencies, loan modifications and other credit quality indicators, refer to Note 11 of this Form 10-Q.
Residential mortgage: The residential mortgage portfolio, including loans held-for-sale, predominantly consists of prime mortgage loans. The residential mortgage portfolio decreased from December 31, 2018 driven by a loan sale as well as paydowns, partially offset by originations of prime mortgage loans that have been retained on the balance sheet.
At March 31, 2019, and December 31, 2018, the Firm’s residential mortgage portfolio included $21.8 billion and $21.6 billion, respectively, of interest-only loans. These loans have an interest-only payment period generally followed by an adjustable-rate or fixed-rate fully amortizing payment period to maturity and are typically originated as higher-balance loans to higher-income borrowers, predominantly in AWM. Performance of this portfolio for the three months ended March 31, 2019 was in line with the performance of the broader residential mortgage portfolio for the same period.
The following table provides a summary of the Firm’s residential mortgage portfolio insured and/or guaranteed by U.S. government agencies, including loans held-for-sale. The Firm monitors its exposure to certain potential unrecoverable claim payments related to government-insured loans and considers this exposure in estimating the allowance for loan losses.
(in millions)March 31,
2019December 31,
2018
Current $ 2,463 $ 2,884
30-89 days past due 1,074 1,528
90 or more days past due 2,168 2,600
Total government guaranteed loans $ 5,705 $ 7,012
Home equity: The home equity portfolio declined from December 31, 2018 primarily reflecting loan paydowns.
At March 31, 2019, approximately 90% of the Firm’s home equity portfolio consisted of home equity lines of credit (“HELOCs”) and the remainder consisted of home equity loans (“HELOANs”). The carrying value of HELOCs outstanding was $24 billion at March 31, 2019. This amount included $11 billion of HELOCs that have recast from interest-only to fully amortizing payments or have been modified and $4 billion of interest-only balloon HELOCs, which primarily mature after 2030. The Firm manages the risk of HELOCs during their revolving period by
closing or reducing the undrawn line to the extent permitted by law when borrowers are exhibiting a material deterioration in their credit risk profile.
For further information on the Firm’s home equity portfolio, refer to Note 11 of this Form 10-Q and Consumer Credit Portfolio on pages 106–111 of JPMorgan Chase’s 2018 Form 10-K.
Auto: The auto loan portfolio, which predominantly consists of prime-quality loans, declined when compared with December 31, 2018, as paydowns and charge-offs or liquidation of delinquent loans were predominantly offset by new originations.
Consumer & Business Banking: Consumer & Business Banking loans were flat when compared with December 31, 2018 as paydowns and charge-offs of delinquent loans were predominantly offset by loan originations. Net charge-offs for the three months ended March 31, 2019 increased when compared with the same period in the prior year due to higher deposit overdraft losses.
Purchased credit-impaired loans: PCI loans represent certain loans that were acquired and deemed to be credit-impaired on the acquisition date. PCI loans decreased from December 31, 2018 due to portfolio run off. As of March 31, 2019, approximately 10% of the option ARM PCI loans were delinquent and approximately 69% of the portfolio had been modified into fixed-rate, fully amortizing loans. The borrowers for substantially all of the remaining option ARM loans are making amortizing payments, although such payments are not necessarily fully amortizing. This latter group of loans is subject to the risk of payment shock due to future payment recast. Default rates generally increase on option ARM loans when payment recast results in a payment increase. The expected increase in default rates is considered in the Firm’s quarterly impairment assessment.

45
The following table provides a summary of lifetime principal loss estimates included in either the nonaccretable difference or the allowance for loan losses.
Summary of PCI loans lifetime principal loss estimatesLifetime loss estimates(a)
Life-to-date liquidation losses(b)
(in billions)Mar 31,
2019Dec 31,
2018Mar 31,
2019Dec 31,
2018
Home equity $ 14.3 $ 14.1 $ 13.0 $ 13.0
Prime mortgage 4.1 4.1 3.9 3.9
Subprime mortgage 3.4 3.3 3.2 3.2
Option ARMs 10.3 10.3 9.9 9.9
Total $ 32.1 $ 31.8 $ 30.0 $ 30.0
(a) Includes the original nonaccretable difference established in purchase accounting of $30.5 billion for principal losses plus additional principal losses recognized subsequent to acquisition through the provision and allowance for loan losses. The remaining nonaccretable difference for principal losses was $496 million and $512 million at March 31, 2019, and December 31, 2018, respectively.
(b) Represents both realization of loss upon loan resolution and any principal forgiven upon modification.
Geographic composition of residential real estate loansFor information on the geographic composition of the Firm’s residential real estate loans, refer to Note 11.
Current estimated loan-to-value ratio of residential real estate loansAverage current estimated loan-to-value (“LTV”) ratios have declined consistent with recent improvements in home prices, customer paydowns, and charge-offs or liquidations of higher LTV loans. For information on current estimated LTVs of the Firm’s residential real estate loans, refer to Note 11.
Loan modification activities for residential real estate loansThe performance of modified loans generally differs by product type due to differences in both the credit quality and the types of modifications provided. Performance metrics for modifications to the residential real estate portfolios as measured through redefault rates, were not materially different from December 31, 2018. For further information on the Firm’s redefault rates, refer to Consumer Credit Portfolio on pages 106–111 of JPMorgan Chase’s 2018 Form 10-K.
Certain modified loans have interest rate reset provisions (“step-rate modifications”) where the interest rates on these loans generally began to increase commencing in 2014 by 1% per year, and will continue to do so, until the rate reaches a specified cap. The cap on these loans is typically at a prevailing market interest rate for a fixed-rate mortgage loan as of the modification date. At March 31, 2019, the carrying value of non-PCI loans and the unpaid principal balance of PCI loans modified in step-rate modifications, which have not yet met their specified caps, were $1.5 billion and $2.9 billion, respectively. The Firm continues to monitor this risk exposure and the impact of these potential interest rate increases is considered in the Firm’s allowance for loan losses.
The following table presents information as of March 31, 2019, and December 31, 2018, relating to modified retained residential real estate loans for which concessions have been granted to borrowers experiencing financial difficulty. For further information on modifications for the three months ended March 31, 2019 and 2018, refer to Note 11.
Modified residential real estate loansMarch 31, 2019 December 31, 2018
(in millions)Retained
loans
Non-accrual retained loans(d)
Retainedloans
Non-accrual retained loans(d)
Modified residential real estate loans, excluding PCI loans(a)(b)
Residential mortgage $ 4,499 $ 1,456 $ 4,565 $ 1,459
Home equity 1,996 960 2,012 955
Total modifiedresidential real estateloans, excluding PCIloans $ 6,495 $ 2,416 $ 6,577 $ 2,414
Modified PCI loans(c)
Home equity $ 2,061 NA $ 2,086 NA
Prime mortgage 3,115 NA 3,179 NA
Subprime mortgage 2,014 NA 2,041 NA
Option ARMs 6,262 NA 6,410 NA
Total modified PCI loans $ 13,452 NA $ 13,716 NA
(a) Amounts represent the carrying value of modified residential real estate loans.
(b) At March 31, 2019, and December 31, 2018, $3.3 billion and $4.1 billion, respectively, of loans modified subsequent to repurchase from Ginnie Mae in accordance with the standards of the appropriate government agency (i.e., Federal Housing Administration (“FHA”), U.S. Department of Veterans Affairs (“VA”), Rural Housing Service of the U.S. Department of Agriculture (“RHS”)) are not included in the table above. When such loans perform subsequent to modification in accordance with Ginnie Mae guidelines, they are generally sold back into Ginnie Mae loan pools. Modified loans that do not re-perform become subject to foreclosure. For additional information about sales of loans in securitization transactions with Ginnie Mae, refer to Note 13.
(c) Amounts represent the unpaid principal balance of modified PCI loans.(d) At March 31, 2019, and December 31, 2018, nonaccrual loans included
$1.9 billion and $2.0 billion, respectively, of troubled debt restructurings (“TDRs”) for which the borrowers were less than 90 days past due. For additional information about loans modified in a TDR that are on nonaccrual status, refer to Note 11.

46
Nonperforming assetsThe following table presents information as of March 31, 2019, and December 31, 2018, about consumer, excluding credit card, nonperforming assets.
Nonperforming assets(a)
(in millions)March 31,
2019December 31,
2018
Nonaccrual loans(b)
Residential real estate $ 3,031 $ 3,088
Other consumer 358 373
Total nonaccrual loans 3,389 3,461
Assets acquired in loan satisfactions
Real estate owned 211 210
Other 31 30
Total assets acquired in loansatisfactions 242 240
Total nonperforming assets $ 3,631 $ 3,701
(a) At March 31, 2019, and December 31, 2018, nonperforming assets excluded mortgage loans 90 or more days past due and insured by U.S. government agencies of $2.2 billion and $2.6 billion, respectively, and REO insured by U.S. government agencies of $69 million and $75 million, respectively. These amounts have been excluded based upon the government guarantee.
(b) Excludes PCI loans, which are accounted for on a pool basis. Since each pool is accounted for as a single asset with a single composite interest rate and an aggregate expectation of cash flows, the past-due status of the pools, or that of individual loans within the pools, is not meaningful. The Firm is recognizing interest income on each pool of loans as each of the pools is performing.
Nonaccrual loans in the residential real estate portfolio at March 31, 2019 decreased to $3.0 billion from $3.1 billion at December 31, 2018, of which 23% and 24% were greater than 150 days past due, respectively. In the aggregate, the unpaid principal balance of residential real estate loans greater than 150 days past due was charged down by approximately 31% and 32% to the estimated net realizable value of the collateral at March 31, 2019, and December 31, 2018, respectively.
Nonaccrual loans: The following table presents changes in consumer, excluding credit card, nonaccrual loans for the three months ended March 31, 2019 and 2018.
Nonaccrual loan activityThree months ended March 31,(in millions) 2019 2018
Beginning balance $ 3,461 $ 4,209
Additions 581 911
Reductions:
Principal payments and other(a) 235 340
Charge-offs 106 140
Returned to performing status 242 309
Foreclosures and other liquidations 70 71
Total reductions 653 860
Net changes (72) 51
Ending balance $ 3,389 $ 4,260
(a) Other reductions includes loan sales.
Active and suspended foreclosure: For information on loans that were in the process of active or suspended foreclosure, refer to Note 11.

47
Credit card Total credit card loans decreased from December 31, 2018 due to seasonality. The March 31, 2019 30+ day delinquency rate increased to 1.85% from 1.83% at December 31, 2018, and the March 31, 2019 90+ day delinquency rate increased to 0.97% from 0.92% at December 31, 2018, in line with expectations. Net charge-offs increased for the three months ended March 31, 2019 when compared with the same period in the prior year primarily due to loan growth.
Consistent with the Firm’s policy, all credit card loans typically remain on accrual status until charged off. However, the Firm establishes an allowance, which is offset against loans and reduces interest income, for the estimated uncollectible portion of accrued and billed interest and fee income.
Geographic and FICO composition of credit card loansFor information on the geographic and FICO composition of the Firm’s credit card loans, refer to Note 11.
Modifications of credit card loansAt March 31, 2019 and December 31, 2018, the Firm had $1.4 billion and $1.3 billion, respectively, of credit card loans outstanding that have been modified in TDRs. For additional information about loan modification programs to borrowers, refer to Note 11.

48
WHOLESALE CREDIT PORTFOLIO
In its wholesale businesses, the Firm is exposed to credit risk primarily through its underwriting, lending, market-making, and hedging activities with and for clients and counterparties, as well as through various operating services (such as cash management and clearing activities), securities financing activities and cash placed with banks. A portion of the loans originated or acquired by the Firm’s wholesale businesses is generally retained on the balance sheet. The Firm distributes a significant percentage of the loans that it originates into the market as part of its syndicated loan business and to manage portfolio concentrations and credit risk.
The credit quality of the wholesale portfolio was stable for the three months ended March 31, 2019, characterized by low levels of criticized exposure, nonaccrual loans and charge-offs. Refer to the industry discussion on pages 50–52 for further information. Retained loans decreased, predominantly driven by Wealth Management clients globally in AWM, and held-for-sale loans decreased, driven by a loan syndication in CIB. The wholesale portfolio is actively managed, in part by conducting ongoing, in-depth reviews of client credit quality and transaction structure inclusive of collateral where applicable, and of industry, product and client concentrations.
In the following tables, the Firm’s wholesale credit portfolio includes exposure held in CIB, CB, AWM and Corporate, and excludes all exposure managed by CCB.
Wholesale credit portfolioCredit exposure Nonperforming(c)
(in millions)Mar 31,
2019Dec 31,
2018Mar 31,
2019Dec 31,
2018
Loans retained $ 433,611 $ 439,162 $ 1,570 $ 1,150
Loans held-for-sale 4,474 11,877 129 —
Loans at fair value 3,719 3,151 184 220
Loans – reported 441,804 454,190 1,883 1,370
Derivative receivables 50,333 54,213 44 60
Receivables from customers and other(a) 20,932 30,063 — —
Total wholesalecredit-relatedassets 513,069 538,466 1,927 1,430
Lending-relatedcommitments 384,957 387,813 455 469
Total wholesalecredit exposure $ 898,026 $ 926,279 $ 2,382 $ 1,899
Credit derivatives used in credit portfolio management activities(b) $ (14,490) $ (12,682) $ — $ —
Liquid securities andother cash collateralheld againstderivatives (13,976) (15,322) NA NA
(a) Receivables from customers and other include $20.9 billion and $30.1 billion of held-for-investment margin loans at March 31, 2019, and December 31, 2018, respectively, to prime brokerage customers in CIB and AWM; these are classified in accrued interest and accounts receivable on the Consolidated balance sheets.
(b) Represents the net notional amount of protection purchased and sold through credit derivatives used to manage both performing and nonperforming wholesale credit exposures; these derivatives do not qualify for hedge accounting under U.S. GAAP. For additional information, refer to Credit derivatives on page 54, and Note 4.
(c) Excludes assets acquired in loan satisfactions.

49
The following tables present the maturity and ratings profiles of the wholesale credit portfolio as of March 31, 2019, and December 31, 2018. The ratings scale is based on the Firm’s internal risk ratings, which generally correspond to the ratings assigned by S&P and Moody’s. For additional information on wholesale loan portfolio risk ratings, refer to Note 12 of JPMorgan Chase’s 2018 Form 10-K.
Wholesale credit exposure – maturity and ratings profileMaturity profile(d) Ratings profile
Due in 1year or less
Due after 1year
through 5years
Due after 5years Total
Investment-grade
Noninvestment-grade
TotalTotal %
of IGMarch 31, 2019(in millions, except ratios)
AAA/Aaa toBBB-/Baa3
BB+/Ba1 &below
Loans retained $ 130,048 $ 200,469 $ 103,094 $ 433,611 $ 332,514 $ 101,097 $ 433,611 77%
Derivative receivables 50,333 50,333
Less: Liquid securities and other cash collateralheld against derivatives (13,976) (13,976)
Total derivative receivables, net of all collateral 10,007 8,674 17,676 36,357 29,689 6,668 36,357 82
Lending-related commitments 71,622 302,913 10,422 384,957 293,073 91,884 384,957 76
Subtotal 211,677 512,056 131,192 854,925 655,276 199,649 854,925 77
Loans held-for-sale and loans at fair value(a) 8,193 8,193
Receivables from customers and other 20,932 20,932
Total exposure – net of liquid securities andother cash collateral held against derivatives $ 884,050 $ 884,050
Credit derivatives used in credit portfolio management activities(b)(c) $ (1,238) $ (7,087) $ (6,165) $ (14,490) $ (12,987) $ (1,503) $ (14,490) 90%
Maturity profile(d) Ratings profile
Due in 1year or less
Due after 1year
through 5years
Due after 5years Total
Investment-grade
Noninvestment-grade
TotalTotal %
of IGDecember 31, 2018(in millions, except ratios)
AAA/Aaa toBBB-/Baa3
BB+/Ba1 &below
Loans retained $ 138,458 $ 196,974 $ 103,730 $ 439,162 $ 339,729 $ 99,433 $ 439,162 77%
Derivative receivables 54,213 54,213
Less: Liquid securities and other cash collateralheld against derivatives (15,322) (15,322)
Total derivative receivables, net of all collateral 11,038 9,169 18,684 38,891 31,794 7,097 38,891 82
Lending-related commitments 79,400 294,855 13,558 387,813 288,724 99,089 387,813 74
Subtotal 228,896 500,998 135,972 865,866 660,247 205,619 865,866 76
Loans held-for-sale and loans at fair value(a) 15,028 15,028
Receivables from customers and other 30,063 30,063
Total exposure – net of liquid securities andother cash collateral held against derivatives $ 910,957 $ 910,957
Credit derivatives used in credit portfolio management activities(b)(c) $ (447) $ (9,318) $ (2,917) $ (12,682) $ (11,213) $ (1,469) $ (12,682) 88%
(a) Represents loans held-for-sale, primarily related to syndicated loans and loans transferred from the retained portfolio, and loans at fair value.(b) These derivatives do not qualify for hedge accounting under U.S. GAAP.(c) The notional amounts are presented on a net basis by underlying reference entity and the ratings profile shown is based on the ratings of the reference
entity on which protection has been purchased. Predominantly all of the credit derivatives entered into by the Firm where it has purchased protection used in credit portfolio management activities are executed with investment-grade counterparties.
(d) The maturity profile of retained loans, lending-related commitments and derivative receivables is based on the remaining contractual maturity. Derivative contracts that are in a receivable position at March 31, 2019, may become payable prior to maturity based on their cash flow profile or changes in market conditions.
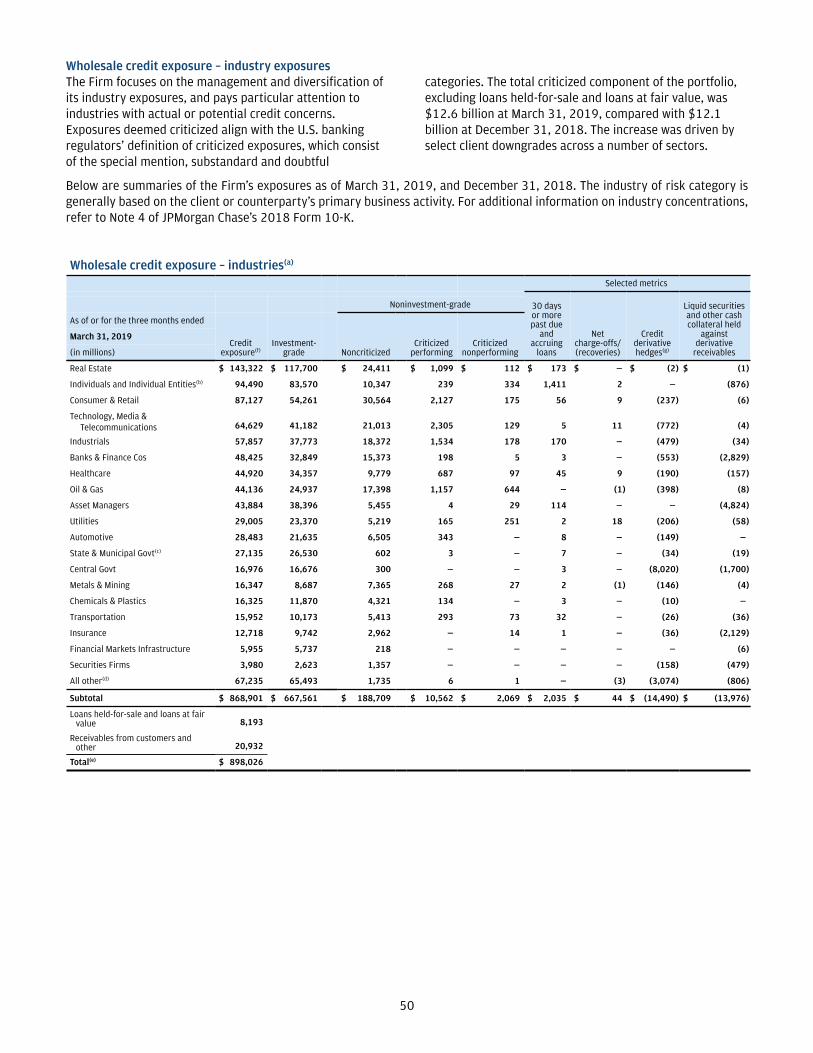
50
Wholesale credit exposure – industry exposuresThe Firm focuses on the management and diversification of its industry exposures, and pays particular attention to industries with actual or potential credit concerns. Exposures deemed criticized align with the U.S. banking regulators’ definition of criticized exposures, which consist of the special mention, substandard and doubtful
categories. The total criticized component of the portfolio, excluding loans held-for-sale and loans at fair value, was $12.6 billion at March 31, 2019, compared with $12.1 billion at December 31, 2018. The increase was driven by select client downgrades across a number of sectors.
Below are summaries of the Firm’s exposures as of March 31, 2019, and December 31, 2018. The industry of risk category is generally based on the client or counterparty’s primary business activity. For additional information on industry concentrations, refer to Note 4 of JPMorgan Chase’s 2018 Form 10-K.
Wholesale credit exposure – industries(a)
Selected metrics
30 daysor morepast due
andaccruing
loans
Net charge-offs/(recoveries)
Credit derivative hedges(g)
Liquid securitiesand other cashcollateral held
againstderivative
receivables
Noninvestment-grade
As of or for the three months ended
Credit exposure(f)
Investment-grade Noncriticized
Criticizedperforming
Criticizednonperforming
March 31, 2019
(in millions)
Real Estate $ 143,322 $ 117,700 $ 24,411 $ 1,099 $ 112 $ 173 $ — $ (2) $ (1)
Individuals and Individual Entities(b) 94,490 83,570 10,347 239 334 1,411 2 — (876)
Consumer & Retail 87,127 54,261 30,564 2,127 175 56 9 (237) (6)
Technology, Media & Telecommunications 64,629 41,182 21,013 2,305 129 5 11 (772) (4)
Industrials 57,857 37,773 18,372 1,534 178 170 — (479) (34)
Banks & Finance Cos 48,425 32,849 15,373 198 5 3 — (553) (2,829)
Healthcare 44,920 34,357 9,779 687 97 45 9 (190) (157)
Oil & Gas 44,136 24,937 17,398 1,157 644 — (1) (398) (8)
Asset Managers 43,884 38,396 5,455 4 29 114 — — (4,824)
Utilities 29,005 23,370 5,219 165 251 2 18 (206) (58)
Automotive 28,483 21,635 6,505 343 — 8 — (149) —
State & Municipal Govt(c) 27,135 26,530 602 3 — 7 — (34) (19)
Central Govt 16,976 16,676 300 — — 3 — (8,020) (1,700)
Metals & Mining 16,347 8,687 7,365 268 27 2 (1) (146) (4)
Chemicals & Plastics 16,325 11,870 4,321 134 — 3 — (10) —
Transportation 15,952 10,173 5,413 293 73 32 — (26) (36)
Insurance 12,718 9,742 2,962 — 14 1 — (36) (2,129)
Financial Markets Infrastructure 5,955 5,737 218 — — — — — (6)
Securities Firms 3,980 2,623 1,357 — — — — (158) (479)
All other(d) 67,235 65,493 1,735 6 1 — (3) (3,074) (806)
Subtotal $ 868,901 $ 667,561 $ 188,709 $ 10,562 $ 2,069 $ 2,035 $ 44 $ (14,490) $ (13,976)
Loans held-for-sale and loans at fairvalue 8,193
Receivables from customers andother 20,932
Total(e) $ 898,026

51
(continued from previous page)
Selected metrics
30 daysor morepast due
andaccruing
loans
Net charge-offs/(recoveries)
Credit derivative hedges(g)
Liquid securitiesand other cashcollateral held
againstderivative
receivables
Noninvestment-grade
As of or for the year ended
Credit exposure(f)
Investment-grade Noncriticized
Criticizedperforming
Criticizednonperforming
December 31, 2018
(in millions)
Real Estate $ 143,316 $ 117,988 $ 24,174 $ 1,019 $ 135 $ 70 $ (20) $ (2) $ (1)
Individuals and Individual Entities(b) 97,077 86,581 10,164 174 158 703 12 — (915)
Consumer & Retail 94,815 60,678 31,901 2,033 203 43 55 (248) (14)
Technology, Media &Telecommunications 72,646 46,334 24,081 2,170 61 8 12 (1,011) (12)
Industrials 58,528 38,487 18,594 1,311 136 171 20 (207) (29)
Banks & Finance Cos 49,920 34,120 15,496 299 5 11 — (575) (2,290)
Healthcare 48,142 36,687 10,625 761 69 23 (5) (150) (133)
Oil & Gas 42,600 23,356 17,451 1,158 635 6 36 (248) —
Asset Managers 42,807 36,722 6,067 4 14 10 — — (5,829)
Utilities 28,172 23,558 4,326 138 150 — 38 (142) (60)
Automotive 17,339 9,637 7,310 392 — 1 — (125) —
State & Municipal Govt(c) 27,351 26,746 603 2 — 18 (1) — (42)
Central Govt 18,456 18,251 124 81 — 4 — (7,994) (2,130)
Metals & Mining 15,359 8,188 6,767 385 19 1 — (174) (22)
Chemicals & Plastics 16,035 11,490 4,427 118 — 4 — — —
Transportation 15,660 10,508 4,699 393 60 21 6 (31) (112)
Insurance 12,639 9,777 2,830 — 32 — — (36) (2,080)
Financial Markets Infrastructure 7,484 6,746 738 — — — — — (26)
Securities Firms 4,558 3,099 1,459 — — — — (158) (823)
All other(d) 68,284 64,664 3,606 12 2 2 2 (1,581) (804)
Subtotal $ 881,188 $ 673,617 $ 195,442 $ 10,450 $ 1,679 $ 1,096 $ 155 $ (12,682) $ (15,322)
Loans held-for-sale and loans at fairvalue 15,028
Receivables from customers andother 30,063
Total(e) $ 926,279
(a) The industry rankings presented in the table as of December 31, 2018, are based on the industry rankings of the corresponding exposures at March 31, 2019, not actual rankings of such exposures at December 31, 2018.
(b) Individuals and Individual Entities predominantly consists of Wealth Management clients within AWM and includes exposure to personal investment companies and personal and testamentary trusts.
(c) In addition to the credit risk exposure to states and municipal governments (both U.S. and non-U.S.) at March 31, 2019, and December 31, 2018, noted above, the Firm held: $6.8 billion and $7.8 billion, respectively, of trading securities; $34.5 billion and $37.7 billion, respectively, of AFS securities; and $4.8 billion at both periods of held-to-maturity (“HTM”) securities, issued by U.S. state and municipal governments. For further information, refer to Note 2 and Note 9.
(d) All other includes: SPEs and Private education and civic organizations, representing approximately 91% and 9%, respectively, at March 31, 2019, and 92% and 8%, respectively, at December 31, 2018.
(e) Excludes cash placed with banks of $294.9 billion and $268.1 billion, at March 31, 2019, and December 31, 2018, respectively, which is predominantly placed with various central banks, primarily Federal Reserve Banks.
(f) Credit exposure is net of risk participations and excludes the benefit of credit derivatives used in credit portfolio management activities held against derivative receivables or loans and liquid securities and other cash collateral held against derivative receivables.
(g) Represents the net notional amounts of protection purchased and sold through credit derivatives used to manage the credit exposures; these derivatives do not qualify for hedge accounting under U.S. GAAP. The All other category includes purchased credit protection on certain credit indices.
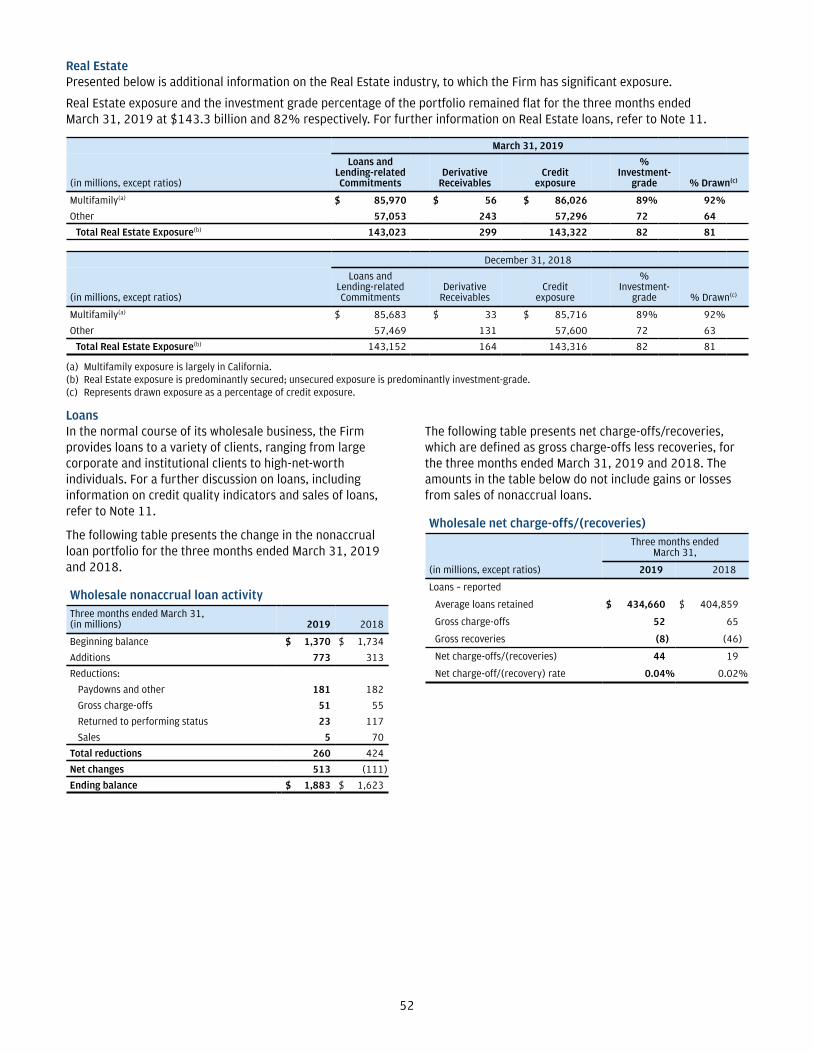
52
Real EstatePresented below is additional information on the Real Estate industry, to which the Firm has significant exposure.
Real Estate exposure and the investment grade percentage of the portfolio remained flat for the three months ended March 31, 2019 at $143.3 billion and 82% respectively. For further information on Real Estate loans, refer to Note 11.
March 31, 2019
(in millions, except ratios)
Loans andLending-relatedCommitments
DerivativeReceivables
Creditexposure
%Investment-
grade % Drawn(c)
Multifamily(a) $ 85,970 $ 56 $ 86,026 89% 92%
Other 57,053 243 57,296 72 64
Total Real Estate Exposure(b) 143,023 299 143,322 82 81
December 31, 2018
(in millions, except ratios)
Loans andLending-relatedCommitments
Derivative Receivables
Creditexposure
% Investment-
grade % Drawn(c)
Multifamily(a) $ 85,683 $ 33 $ 85,716 89% 92%
Other 57,469 131 57,600 72 63
Total Real Estate Exposure(b) 143,152 164 143,316 82 81
(a) Multifamily exposure is largely in California.(b) Real Estate exposure is predominantly secured; unsecured exposure is predominantly investment-grade.(c) Represents drawn exposure as a percentage of credit exposure.
LoansIn the normal course of its wholesale business, the Firm provides loans to a variety of clients, ranging from large corporate and institutional clients to high-net-worth individuals. For a further discussion on loans, including information on credit quality indicators and sales of loans, refer to Note 11.
The following table presents the change in the nonaccrual loan portfolio for the three months ended March 31, 2019 and 2018.
Wholesale nonaccrual loan activityThree months ended March 31,(in millions) 2019 2018
Beginning balance $ 1,370 $ 1,734
Additions 773 313
Reductions:
Paydowns and other 181 182
Gross charge-offs 51 55
Returned to performing status 23 117
Sales 5 70
Total reductions 260 424
Net changes 513 (111)
Ending balance $ 1,883 $ 1,623
The following table presents net charge-offs/recoveries, which are defined as gross charge-offs less recoveries, for the three months ended March 31, 2019 and 2018. The amounts in the table below do not include gains or losses from sales of nonaccrual loans.
Wholesale net charge-offs/(recoveries)
(in millions, except ratios)
Three months endedMarch 31,
2019 2018
Loans – reported
Average loans retained $ 434,660 $ 404,859
Gross charge-offs 52 65
Gross recoveries (8) (46)
Net charge-offs/(recoveries) 44 19
Net charge-off/(recovery) rate 0.04% 0.02%

53
Lending-related commitments The Firm uses lending-related financial instruments, such as commitments (including revolving credit facilities) and guarantees, to address the financing needs of its clients. The contractual amounts of these financial instruments represent the maximum possible credit risk should the clients draw down on these commitments or the Firm fulfill its obligations under these guarantees, and the clients subsequently fail to perform according to the terms of these contracts. Most of these commitments and guarantees are refinanced, extended, cancelled, or expire without being drawn upon or a default occurring. In the Firm’s view, the total contractual amount of these wholesale lending-related commitments is not representative of the Firm’s expected future credit exposure or funding requirements. For further information on wholesale lending-related commitments, refer to Note 22 .
Derivative contractsDerivatives enable clients and counterparties to manage risks including credit risk and risks arising from fluctuations in interest rates, foreign exchange, equities, and commodities. The Firm makes markets in derivatives in order to meet these needs and uses derivatives to manage certain risks associated with net open risk positions from its market-making activities, including the counterparty credit risk arising from derivative receivables. The Firm also uses derivative instruments to manage its own credit and other market risk exposure. For a further discussion of derivative contracts, refer to Note 4.
The following table summarizes the net derivative receivables for the periods presented.
Derivative receivables
(in millions)March 31,
2019December 31,
2018
Total, net of cash collateral 50,333 54,213
Liquid securities and other cash collateral held against derivative receivables(a) (13,976) (15,322)
Total, net of collateral $ 36,357 $ 38,891
(a) Includes collateral related to derivative instruments where appropriate legal opinions have not been either sought or obtained with respect to master netting agreements.
The fair value of derivative receivables reported on the Consolidated balance sheets were $50.3 billion and $54.2 billion at March 31, 2019, and December 31, 2018, respectively. Derivative receivables represent the fair value of the derivative contracts after giving effect to legally enforceable master netting agreements and cash collateral held by the Firm. However, in management’s view, the appropriate measure of current credit risk should also take into consideration additional liquid securities (primarily U.S. government and agency securities and other group of seven nations (“G7”) government securities) and other cash collateral held by the Firm aggregating $14.0 billion and $15.3 billion at March 31, 2019, and December 31, 2018, respectively, that may be used as security when the fair value of the client’s exposure is in the Firm’s favor.
In addition to the collateral described in the preceding paragraph, the Firm also holds additional collateral (primarily cash, G7 government securities, other liquid government-agency and guaranteed securities, and corporate debt and equity securities) delivered by clients at the initiation of transactions, as well as collateral related to contracts that have a non-daily call frequency and collateral that the Firm has agreed to return but has not yet settled as of the reporting date. Although this collateral does not reduce the balances and is not included in the table above, it is available as security against potential exposure that could arise should the fair value of the client’s derivative contracts move in the Firm’s favor. The derivative receivables fair value, net of all collateral, also does not include other credit enhancements, such as letters of credit. For additional information on the Firm’s use of collateral agreements, refer to Note 4.

54
The following table summarizes the ratings profile of the Firm’s derivative receivables, including credit derivatives, net of all collateral, at the dates indicated. The ratings scale is based on the Firm’s internal ratings, which generally correspond to the ratings as assigned by S&P and Moody’s.
Ratings profile of derivative receivables
Rating equivalent March 31, 2019 December 31, 2018
(in millions, except ratios)Exposure net of
all collateral% of exposure net
of all collateralExposure net of
all collateral% of exposure net
of all collateral
AAA/Aaa to AA-/Aa3 $ 11,249 31% $ 11,831 31%
A+/A1 to A-/A3 5,072 14 7,428 19
BBB+/Baa1 to BBB-/Baa3 13,368 37 12,536 32
BB+/Ba1 to B-/B3 5,994 16 6,373 16
CCC+/Caa1 and below 674 2 723 2
Total $ 36,357 100% $ 38,891 100%
As previously noted, the Firm uses collateral agreements to mitigate counterparty credit risk. The percentage of the Firm’s over-the-counter derivative contracts subject to collateral agreements — excluding foreign exchange spot trades, which are not typically covered by collateral agreements due to their short maturity and centrally cleared trades that are settled daily — was approximately 90% at both March 31, 2019, and December 31, 2018.
Credit derivativesThe Firm uses credit derivatives for two primary purposes: first, in its capacity as a market-maker, and second, as an end-user, to manage the Firm’s own credit risk associated with various exposures.
Credit portfolio management activitiesIncluded in the Firm’s end-user activities are credit derivatives used to mitigate the credit risk associated with traditional lending activities (loans and unfunded commitments) and derivatives counterparty exposure in the Firm’s wholesale businesses (collectively, “credit portfolio management” activities). Information on credit portfolio management activities is provided in the table below.
Credit derivatives used in credit portfolio managementactivities
Notional amount of protection purchased and sold(a)
(in millions)March 31,
2019December 31,
2018
Credit derivatives used to manage:
Loans and lending-relatedcommitments $ 1,529 $ 1,272
Derivative receivables 12,961 11,410
Credit derivatives used in creditportfolio management activities $ 14,490 $ 12,682
(a) Amounts are presented net, considering the Firm’s net protection purchased or sold with respect to each underlying reference entity or index.
For further information on credit derivatives and derivatives used in credit portfolio management activities, refer to Credit derivatives in Note 4 of this Form 10-Q, and Note 5 of JPMorgan Chase’s 2018 Form 10-K.

55
ALLOWANCE FOR CREDIT LOSSES
The Firm’s allowance for credit losses covers the retained consumer and wholesale loan portfolios, as well as the Firm’s wholesale and certain consumer lending-related commitments.
For further information on the components of the allowance for credit losses and related management judgments, refer to Critical Accounting Estimates Used by the Firm on pages 64–66 and Note 12 of this Form 10-Q, and Critical Accounting Estimates Used by the Firm on pages 141-143 and Note 13 of JPMorgan Chase’s 2018 Form 10-K.
At least quarterly, the allowance for credit losses is reviewed by the CRO, the CFO and the Controller of the Firm. As of March 31, 2019, JPMorgan Chase deemed the allowance for credit losses to be appropriate and sufficient to absorb probable credit losses inherent in the portfolio.
The allowance for credit losses was relatively flat compared with December 31, 2018, with the increase in the wholesale allowance reflecting a net addition to the allowance of $135 million on select C&I client downgrades, partially offset by a decline in the consumer allowance as a result of write-offs of PCI loans.
For additional information on the consumer and wholesale credit portfolios, refer to Consumer Credit Portfolio on pages 43–47, Wholesale Credit Portfolio on pages 48–54 and Note 11.

56
Summary of changes in the allowance for credit losses2019 2018
Three months ended March 31, Consumer, excluding
credit card Credit card Wholesale Total
Consumer, excluding
credit card Credit card Wholesale Total(in millions, except ratios)
Allowance for loan losses
Beginning balance at January 1, $ 4,146 $ 5,184 $ 4,115 $ 13,445 $ 4,579 $ 4,884 $ 4,141 $ 13,604
Gross charge-offs 246 1,344 52 1,642 284 1,291 65 1,640
Gross recoveries (131) (142) (8) (281) (138) (121) (46) (305)
Net charge-offs 115 1,202 44 1,361 146 1,170 19 1,335
Write-offs of PCI loans(a) 50 — — 50 20 — — 20
Provision for loan losses 114 1,202 176 1,492 146 1,170 (189) 1,127
Other 2 (1) 6 7 1 — (2) (1)
Ending balance at March 31, $ 4,097 $ 5,183 $ 4,253 $ 13,533 $ 4,560 $ 4,884 $ 3,931 $ 13,375
Impairment methodology
Asset-specific(b) $ 151 $ 461 $ 417 $ 1,029 $ 266 $ 393 $ 474 $ 1,133
Formula-based 2,208 4,722 3,836 10,766 2,089 4,491 3,457 10,037
PCI 1,738 — — 1,738 2,205 — — 2,205
Total allowance for loan losses $ 4,097 $ 5,183 $ 4,253 $ 13,533 $ 4,560 $ 4,884 $ 3,931 $ 13,375
Allowance for lending-relatedcommitments
Beginning balance at January 1, $ 33 $ — $ 1,022 $ 1,055 $ 33 $ — $ 1,035 $ 1,068
Provision for lending-related commitments — — 3 3 — — 38 38
Other — — — — — — 1 1
Ending balance at March 31, $ 33 $ — $ 1,025 $ 1,058 $ 33 $ — $ 1,074 $ 1,107
Impairment methodology
Asset-specific $ — $ — $ 114 $ 114 $ — $ — $ 167 $ 167
Formula-based 33 — 911 944 33 — 907 940
Total allowance for lending-related commitments(c) $ 33 $ — $ 1,025 $ 1,058 $ 33 $ — $ 1,074 $ 1,107
Total allowance for credit losses $ 4,130 $ 5,183 $ 5,278 $ 14,591 $ 4,593 $ 4,884 $ 5,005 $ 14,482
Memo:
Retained loans, end of period $359,715 $ 150,515 $ 433,611 $943,841 $373,243 $140,348 $ 412,020 $925,611
Retained loans, average 370,777 151,120 434,660 956,557 372,739 142,830 404,859 920,428
PCI loans, end of period 23,207 — — 23,207 29,505 — 3 29,508
Credit ratios
Allowance for loan losses to retained loans 1.14% 3.44% 0.98% 1.43% 1.22% 3.48% 0.95% 1.44%
Allowance for loan losses to retained nonaccrual loans(d) 121 NM 271 273 108 NM 247 230
Allowance for loan losses to retainednonaccrual loans excluding credit card 121 NM 271 168 108 NM 247 146
Net charge-off rates 0.13 3.23 0.04 0.58 0.16 3.32 0.02 0.59
Credit ratios, excluding residential realestate PCI loans
Allowance for loan losses to retained loans 0.70 3.44 0.98 1.28 0.69 3.48 0.95 1.25
Allowance for loan losses to retained nonaccrual loans(d) 70 NM 271 238 56 NM 247 192
Allowance for loan losses to retainednonaccrual loans excluding credit card 70 NM 271 133 56 NM 247 108
Net charge-off rates 0.13% 3.23% 0.04% 0.59% 0.17% 3.32% 0.02% 0.61%
Note: In the table above, the financial measures which exclude the impact of PCI loans are non-GAAP financial measures.
(a) Write-offs of PCI loans are recorded against the allowance for loan losses when actual losses for a pool exceed estimated losses that were recorded as purchase accounting adjustments at the time of acquisition. A write-off of a PCI loan is recognized when the underlying loan is removed from a pool.
(b) Includes risk-rated loans that have been placed on nonaccrual status and loans that have been modified in a TDR. The asset-specific credit card allowance for loan losses modified in a TDR is calculated based on the loans’ original contractual interest rates and does not consider any incremental penalty rates.
(c) The allowance for lending-related commitments is reported in accounts payable and other liabilities on the Consolidated balance sheets.(d) The Firm’s policy is generally to exempt credit card loans from being placed on nonaccrual status as permitted by regulatory guidance.

57
INVESTMENT PORTFOLIO RISK MANAGEMENT
Investment portfolio risk is the risk associated with the loss of principal or a reduction in expected returns on investments arising from the investment securities portfolio held predominantly by Treasury and CIO in connection with the Firm’s balance sheet or asset-liability management objectives or from principal investments managed in various LOBs and Corporate in predominantly privately-held financial instruments. Investments are typically intended to be held over extended periods and, accordingly, the Firm has no expectation for short-term realized gains with respect to these investments.
Investment securities risk Investment securities risk includes the exposure associated with a default in the payment of principal and interest. This risk is minimized given that Treasury and CIO substantially invest in high-quality securities. At March 31, 2019, the investment securities portfolio was $265.7 billion, and the average credit rating of the securities comprising the portfolio was AA+ (based upon external ratings where available and where not available, based primarily upon internal ratings that correspond to ratings as defined by S&P and Moody’s). For further information on the investment securities portfolio, refer to Corporate segment results on page 30 and Note 9. For further information on the market risk inherent in the portfolio, refer to Market Risk Management on pages 58–62. For further information on related liquidity risk, refer to Liquidity Risk on pages 37–41.
Principal investment riskPrincipal investments are typically private non-traded financial instruments representing ownership or other forms of junior capital. Principal investments cover multiple asset classes and are made either in stand-alone investing businesses or as part of a broader business platform. In general, new principal investments include tax-oriented investments, as well as investments made to enhance or accelerate LOB and Corporate strategic business initiatives. The Firm’s principal investments are managed by the various LOBs and Corporate and are reflected within their respective financial results.
As of March 31, 2019 and December 31, 2018, the aggregate carrying values of the principal investment portfolios were $22.4 billion and $22.2 billion, respectively, which included tax-oriented investments (e.g., affordable housing and alternative energy investments) of $16.4 billion and $16.6 billion, respectively, and private equity, various debt and equity instruments, and real assets of $6.0 billion and $5.6 billion, respectively.
For a discussion of the Firm’s Investment Portfolio Risk Management governance and oversight, refer to page 123 of JPMorgan Chase’s 2018 Form 10-K.

58
MARKET RISK MANAGEMENT
Market risk is the risk associated with the effect of changes in market factors such as interest and foreign exchange rates, equity and commodity prices, credit spreads or implied volatilities, on the value of assets and liabilities held for both the short and long term. For discussion of the Firm’s Market Risk Management organization, market risk measurement, risk monitoring and control, and predominant business activities that give rise to market risk, refer to Market Risk Management on pages 124–131 of JPMorgan Chase’s 2018 Form 10-K.
Value-at-risk JPMorgan Chase utilizes value-at-risk (“VaR”), a statistical risk measure, to estimate the potential loss from adverse market moves in the current market environment. The Firm has a single VaR framework used as a basis for calculating Risk Management VaR and Regulatory VaR.
The Firm’s Risk Management VaR is calculated assuming a one-day holding period and an expected tail-loss methodology which approximates a 95% confidence level. For risk management purposes, the Firm believes this methodology provides a daily measure of risk that is closely aligned to risk management decisions made by the lines of business and Corporate, and provides the appropriate information needed to respond to risk events. The Firm calculates separately a daily aggregated VaR in accordance with regulatory rules (“Regulatory VaR”), which is used to derive the Firm’s regulatory VaR-based capital requirements under Basel III.
The Firm’s VaR model calculations are periodically evaluated and enhanced in response to changes in the composition of the Firm’s portfolios, changes in market conditions, improvements in the Firm’s modeling techniques and measurements, and other factors. Such changes may affect historical comparisons of VaR results. For information regarding model reviews and approvals, refer to Estimations and Model Risk Management on page 140 of JPMorgan Chase’s 2018 Form 10-K.
For further information regarding VaR, including the inherent limitations, and the key differences between Risk Management VaR and Regulatory VaR, refer to page 126 of JPMorgan Chase’s 2018 Form 10-K. For additional information on Regulatory VaR and the other components of market risk regulatory capital for the Firm (e.g., VaR-based measure, stressed VaR-based measure and the respective backtesting), refer to JPMorgan Chase’s Basel III Pillar 3 Regulatory Capital Disclosures reports, which are available on the Firm’s website at:(http://investor.shareholder.com/jpmorganchase/basel.cfm). For further information regarding nonstatistical market risk measures used by the Firm, refer to Other risk measures on pages 129-131 of JPMorgan Chase’s 2018 Form 10-K.

59
The table below shows the results of the Firm’s Risk Management VaR measure using a 95% confidence level.
Total VaRThree months ended
March 31, 2019 December 31, 2018 March 31, 2018
(in millions) Avg. Min Max Avg. Min Max Avg. Min Max
CIB trading VaR by risk type
Fixed income $44 $ 38 $ 50 $37 $ 28 $ 46 $34 $30 $ 39
Foreign exchange 9 4 15 6 3 10 9 6 15
Equities 16 13 22 20 16 26 17 15 22
Commodities and other 10 9 12 11 9 13 5 4 6
Diversification benefit to CIB trading VaR (32) (a) NM (b) NM (b) (25) (a) NM (b) NM (b) (25) (a) NM (b) NM (b)
CIB trading VaR 47 36 (b) 61 (b) 49 32 (b) 58 (b) 40 35 (b) 49 (b)
Credit portfolio VaR 5 4 6 4 3 4 3 3 4
Diversification benefit to CIB VaR (4) (a) NM (b) NM (b) (4) (a) NM (b) NM (b) (3) (a) NM (b) NM (b)
CIB VaR 48 37 (b) 63 (b) 49 32 (b) 59 (b) 40 35 (b) 51 (b)
CCB VaR 2 1 3 1 — 2 1 1 2
Corporate VaR 10 9 12 11 9 13 12 10 14
Diversification benefit to other VaR (2) (a) NM (b) NM (b) (1) (a) NM (b) NM (b) (1) (a) NM (b) NM (b)
Other VaR 10 9 (b) 11 (b) 11 9 (b) 13 (b) 12 10 (b) 14 (b)
Diversification benefit to CIB and other VaR (6) (a) NM (b) NM (b) (9) (a) NM (b) NM (b) (9) (a) NM (b) NM (b)
Total VaR $52 $ 40 (b) $ 65 (b) $51 $ 34 (b) $ 62 (b) $43 $37 (b) $ 53 (b)
(a) Average portfolio VaR is less than the sum of the VaR of the components described above, which is due to portfolio diversification. The diversification effect reflects that the risks are not perfectly correlated.
(b) Diversification benefit represents the difference between the total VaR and each reported level and the sum of its individual components. Diversification benefit reflects the non-additive nature of VaR due to imperfect correlation across lines of business, Corporate, and risk types. The maximum and minimum VaR for each portfolio may have occurred on different trading days than the components and consequently diversification benefit is not meaningful.
Quarter over quarter results Average total VaR was relatively flat for the three months ended March 31, 2019 as compared with the prior quarter. This reflects changes in the risk profile for Fixed Income and Foreign Exchange risk types, offset by reductions in Equities risk type.
Year over year results Average total VaR increased by $9 million for the three months ended March 31, 2019, compared with the same period in the prior year. The increase in average total VaR is primarily due to increased volatility and changes in the risk profile for Fixed Income and Commodities risk types.
VaR can vary significantly as positions change, market volatility fluctuates, and diversification benefits change.

60
VaR back-testing The Firm evaluates the effectiveness of its VaR methodology by back-testing, which compares the daily Risk Management VaR results with the daily gains and losses actually recognized on market-risk related revenue.
The Firm’s definition of market risk-related gains and losses is consistent with the definition used by the banking regulators under Basel III. Under this definition market risk-related gains and losses are defined as: gains and losses on the positions included in the Firm’s Risk Management VaR excluding fees, commissions, certain valuation adjustments, net interest income, and gains and losses arising from intraday trading.
The following chart compares actual daily market risk-related gains and losses with the Firm’s Risk Management VaR for the three months ended March 31, 2019. As the chart presents market risk-related gains and losses related to those positions included in the Firm’s Risk Management VaR, the results in the table below differ from the results of back-testing disclosed in the Market Risk section of the Firm’s Basel III Pillar 3 Regulatory Capital Disclosures reports, which are based on Regulatory VaR applied to CIB’s covered positions. The chart shows that for the three months ended March 31, 2019, the Firm observed one VaR back-testing exception and posted market risk-related gains on 45 of the 63 days.
Daily Market Risk-Related Gains and Lossesvs. Risk Management VaR (1-day, 95% Confidence level)Three months ended March 31, 2019
Market Risk-Related Gains and Losses Risk Management VaR
January February March

61
Earnings-at-riskThe VaR and sensitivity measures illustrate the economic sensitivity of the Firm’s Consolidated balance sheets to changes in market variables.
The effect of interest rate exposure on the Firm’s reported net income is also important as interest rate risk represents one of the Firm’s significant market risks. Interest rate risk arises not only from trading activities but also from the Firm’s traditional banking activities, which include extension of loans and credit facilities, taking deposits and issuing debt as well as from the investment securities portfolio. The Firm evaluates its structural interest rate risk exposure through earnings-at-risk, which measures the extent to which changes in interest rates will affect the Firm’s net interest income and interest rate-sensitive fees. For a summary by line of business and Corporate, identifying positions included in earnings-at-risk, refer to the table on page 125 of JPMorgan Chase’s 2018 Form 10-K.
The Firm generates a baseline for net interest income and certain interest rate-sensitive fees, and then conducts simulations of changes for interest rate-sensitive assets and liabilities denominated in U.S. dollars and other currencies (“non-U.S. dollar” currencies). This simulation primarily includes retained loans, deposits, deposits with banks, investment securities, long term debt and any related interest rate hedges, and excludes other positions in risk management VaR and other sensitivity-based measures as described on page 125 of JPMorgan Chase’s 2018 Form 10-K.
Earnings-at-risk scenarios estimate the potential change in this baseline, over the following 12 months utilizing multiple assumptions. These scenarios include a parallel shift involving changes to both short-term and long-term rates by an equal amount; a steeper yield curve involving holding short-term rates constant and increasing long-term rates or decreasing short-term rates and holding long-term rates constant; and a flatter yield curve involving holding short-term rates constant and decreasing long-term rates or increasing short-term rates and holding long-term rates constant. These scenarios consider the impact on exposures as a result of changes in interest rates from baseline rates, as well as pricing sensitivities of deposits, optionality and changes in product mix. The scenarios include forecasted balance sheet changes, as well as modeled prepayment and reinvestment behavior, but do not include assumptions about actions that could be taken by the Firm in response to any such instantaneous rate changes. Mortgage prepayment assumptions are based on the interest rates used in the scenarios compared with underlying contractual rates, the time since origination, and other factors which are updated periodically based on historical experience. The pricing sensitivity of deposits in the baseline and scenarios use assumed rates paid which may differ from actual rates paid due to timing lags and other factors. The Firm’s earnings-at-risk scenarios are periodically evaluated and enhanced in response to changes in the composition of the Firm’s balance sheet, changes in market conditions, improvements in the Firm’s simulation and other factors.
The Firm’s U.S. dollar sensitivities are presented in the table below.
(in billions)March 31,
2019December 31,
2018
Parallel shift:
+100 bps shift in rates $ 1.2 $ 0.9
-100 bps shift in rates (2.5) (2.1)
Steeper yield curve:
+100 bps shift in long-term rates 0.7 0.5
-100 bps shift in short-term rates (1.3) (1.2)
Flatter yield curve:
+100 bps shift in short-term rates 0.5 0.4
-100 bps shift in long-term rates (1.2) (0.9)
The Firm’s sensitivity to rates is largely a result of assets repricing at a faster pace than deposits.
The Firm’s net U.S. dollar sensitivities as of March 31, 2019 increased when compared to December 31, 2018 primarily as a result of updating the Firm’s baseline to reflect lower interest rates.
The Firm’s non-U.S. dollar sensitivities are presented in the table below.
(in billions)March 31,
2019December 31,
2018
Parallel shift:
+100 bps shift in rates $ 0.6 $ 0.5
Flatter yield curve:
+100 bps shift in short-term rates 0.6 0.5
The results of the non-U.S. dollar interest rate scenario involving a steeper yield curve with long-term rates rising by 100 basis points and short-term rates staying at current levels were not material to the Firm’s earnings-at-risk at March 31, 2019 and December 31, 2018.

62
Other sensitivity-based measuresThe Firm quantifies the market risk of certain investment and funding activities by assessing the potential impact on net revenue and OCI due to changes in relevant market variables. For additional information on the positions
captured in other sensitivity-based measures, refer to the table Predominant business activities that give rise to market risk on page 125 of JPMorgan Chase’s 2018 Form 10-K.
The table below represents the potential impact to net revenue or OCI for market risk-sensitive instruments that are not included in VaR or earnings-at-risk. Where appropriate, instruments used for hedging purposes are reported along with the positions being hedged. The sensitivities disclosed in the table below may not be representative of the actual gain or loss that would have been realized at March 31, 2019 and December 31, 2018, as the movement in market parameters across maturities may vary and are not intended to imply management’s expectation of future deterioration in these sensitivities.
Gain/(loss) (in millions)March 31,
2019December 31,
2018Activity Description Sensitivity measure
Investment activities(a)
Investment managementactivities
Consists of seed capital and relatedhedges; and fund co-investments
10% decline in marketvalue
$ (112) $ (102)
Other investments Consists of privately held equity andother investments held at fair value
10% decline in marketvalue
(221) (218)
Funding activities
Non-USD LTD cross-currencybasis
Represents the basis risk on derivatives used to hedge the foreign exchange risk on the non-USD LTD(b)
1 basis point paralleltightening of cross currencybasis
(14) (13)
Non-USD LTD hedges foreigncurrency (“FX”) exposure
Primarily represents the foreign exchange revaluation on the fair value of the derivative hedges(b)
10% depreciation ofcurrency
17 17
Derivatives – funding spread risk Impact of changes in the spread relatedto derivatives FVA
1 basis point parallelincrease in spread
(4) (4)
Fair value option electedliabilities – funding spread risk
Impact of changes in the spread related to fair value option elected liabilities DVA(b)
1 basis point parallelincrease in spread
28 30
Fair value option electedliabilities – interest ratesensitivity
Interest rate sensitivity on fair value option liabilities resulting from a change in the Firm’s own credit spread(b)
1 basis point parallelincrease in spread
— 1
(a) Excludes equity securities without readily determinable fair values that are measured under the measurement alternative. Refer to Note 2 for additional information.
(b) Impact recognized through OCI.

63
COUNTRY RISK MANAGEMENT
The Firm, through its lines of business and Corporate, may be exposed to country risk resulting from financial, economic, political or other significant developments which adversely affect the value of the Firm’s exposures related to a particular country or set of countries. The Country Risk Management group actively monitors the various portfolios which may be impacted by these developments and measures the extent to which the Firm’s exposures are diversified given the Firm’s strategy and risk tolerance relative to a country.
For a further discussion of the Firm’s country risk management, refer to pages 132–133 of JPMorgan Chase’s 2018 Form 10-K.
The following table presents the Firm’s top 20 exposures by country (excluding the U.S.) as of March 31, 2019 and their comparative exposures as of December 31, 2018. The selection of countries represents the Firm’s largest total exposures by country, based on the Firm’s internal country risk management approach, and does not represent the Firm’s view of any actual or potentially adverse credit conditions. Country exposures may fluctuate from period to period due to client activity and market flows.
Top 20 country exposures (excluding the U.S.)(a)
(in billions) March 31, 2019December 31, 2018(f)
Lending and
deposits(b)Trading and investing(c)(d) Other(e)
Totalexposure
Totalexposure
Germany $ 59.4 $ 11.2 $ 0.2 $ 70.8 $ 62.1
UnitedKingdom 31.8 10.2 1.4 43.4 40.7
Japan 29.7 6.0 0.3 36.0 29.1
China 9.8 7.5 2.5 19.8 19.3
Switzerland 10.1 0.5 5.6 16.2 12.8
Canada 12.1 3.1 — 15.2 14.3
India 6.2 4.8 2.0 13.0 11.8
Luxembourg 11.2 0.5 — 11.7 11.0
Australia 6.9 4.1 — 11.0 13.0
Brazil 5.0 5.6 — 10.6 7.3
France 9.5 (0.1) 0.9 10.3 17.9
Netherlands 5.4 1.2 2.5 9.1 5.8
Italy 2.5 4.1 0.1 6.7 6.4
Singapore 3.9 1.3 1.3 6.5 6.8
South Korea 4.2 2.0 0.3 6.5 7.6
Spain 3.6 2.3 — 5.9 5.1
Saudi Arabia 4.8 0.4 — 5.2 5.3
Mexico 4.3 0.5 — 4.8 5.5
Belgium 3.5 1.0 — 4.5 2.3
Hong Kong 2.1 1.2 0.8 4.1 5.4
(a) Country exposures presented in the table reflect 87% of total firmwide non-U.S. exposure, where exposure is attributed to a specific country, at both March 31, 2019, and December 31, 2018.
(b) Lending and deposits includes loans and accrued interest receivable (net of eligible collateral and the allowance for loan losses), deposits with banks (including central banks), acceptances, other monetary assets, issued letters of credit net of participations, and unused commitments to extend credit. Excludes intra-day and operating exposures, such as those from settlement and clearing activities.
(c) Includes market-making inventory, AFS securities, and counterparty exposure on derivative and securities financings net of eligible collateral and hedging.
(d) Includes single reference entity (“single-name”), index and other multiple reference entity transactions for which one or more of the underlying reference entities is in a country listed in the above table.
(e) Predominantly includes physical commodity inventory.(f) The country rankings presented in the table as of December 31, 2018,
are based on the country rankings of the corresponding exposures at March 31, 2019, not actual rankings of such exposures at December 31, 2018.

64
CRITICAL ACCOUNTING ESTIMATES USED BY THE FIRM
JPMorgan Chase’s accounting policies and use of estimates are integral to understanding its reported results. The Firm’s most complex accounting estimates require management’s judgment to ascertain the appropriate carrying value of assets and liabilities. The Firm has established policies and control procedures intended to ensure that estimation methods, including any judgments made as part of such methods, are well-controlled, independently reviewed and applied consistently from period to period. The methods used and judgments made reflect, among other factors, the nature of the assets or liabilities and the related business and risk management strategies, which may vary across the Firm’s businesses and portfolios. In addition, the policies and procedures are intended to ensure that the process for changing methodologies occurs in an appropriate manner. The Firm believes its estimates for determining the carrying value of its assets and liabilities are appropriate. The following is a brief description of the Firm’s critical accounting estimates involving significant judgments.
Allowance for credit losses The Firm’s allowance for credit losses covers the retained consumer and wholesale loan portfolios, as well as the Firm’s wholesale and certain consumer lending-related commitments. The allowance for loan losses is intended to adjust the carrying value of the Firm’s loan assets to reflect probable credit losses inherent in the loan portfolio as of the balance sheet date. Similarly, the allowance for lending-related commitments is established to cover probable credit losses inherent in the lending-related commitments portfolio as of the balance sheet date.
The allowance for credit losses includes a formula-based component, an asset-specific component, and a component related to PCI loans. The determination of each of these components involves significant judgment on a number of matters. For further information on these components, areas of judgment and methodologies used in establishing the Firm’s allowance for credit losses, refer to pages 120–122, page 141 and Note 13 of JPMorgan Chase’s 2018 Form 10-K; and refer to Allowance for credit losses on pages 55–56 and Note 12 of this Form 10-Q.
As noted in the discussion on page 141 of JPMorgan Chase’s 2018 Form 10-K, the Firm’s allowance for credit losses is sensitive to numerous factors, which may differ depending on the portfolio. Changes in economic conditions or in the Firm’s assumptions and estimates could affect its estimate of probable credit losses inherent in the portfolio at the balance sheet date. The Firm uses its best judgment to assess these economic conditions and loss data in estimating the allowance for credit losses and these estimates are subject to periodic refinement based on changes to underlying external or Firm-specific historical data. Refer to Note 12 of this Form 10-Q for further discussion.
To illustrate the potential magnitude of certain alternate judgments, the Firm estimates that changes in the following inputs would have the following effects on the Firm’s
modeled credit loss estimates as of March 31, 2019, without consideration of any offsetting or correlated effects of other inputs in the Firm’s allowance for loan losses:
• A combined 5% decline in housing prices and a 100 basis point increase in unemployment rates from expectations could imply:
an increase to modeled credit loss estimates of approximately $225 million for PCI loans.
an increase to modeled annual credit loss estimates of approximately $50 million for residential real estate loans, excluding PCI loans.
• For credit card loans, a 100 basis point increase in unemployment rates from expectations could imply an increase to modeled annual credit loss estimates of approximately $800 million.
• An increase in probability of default (“PD”) factors consistent with a one-notch downgrade in the Firm’s internal risk ratings for its entire wholesale loan portfolio could imply an increase in the Firm’s modeled credit loss estimates of approximately $1.7 billion.
• A 100 basis point increase in estimated loss given default (“LGD”) for the Firm’s entire wholesale loan portfolio could imply an increase in the Firm’s modeled credit loss estimates of approximately $175 million.
The purpose of these sensitivity analyses is to provide an indication of the isolated impacts of hypothetical alternative assumptions on modeled loss estimates. The changes in the inputs presented above are not intended to imply management’s expectation of future deterioration of those risk factors. In addition, these analyses are not intended to estimate changes in the overall allowance for loan losses, which would also be influenced by the judgment management applies to the modeled loss estimates to reflect the uncertainty and imprecision of these modeled loss estimates based on then-current circumstances and conditions.
It is difficult to estimate how potential changes in specific factors might affect the overall allowance for credit losses because management considers a variety of factors and inputs in estimating the allowance for credit losses. Changes in these factors and inputs may not occur at the same rate and may not be consistent across all geographies or product types, and changes in factors may be directionally inconsistent, such that improvement in one factor may offset deterioration in other factors. In addition, it is difficult to predict how changes in specific economic conditions or assumptions could affect borrower behavior or other factors considered by management in estimating the allowance for credit losses. Given the process the Firm follows and the judgments made in evaluating the risk factors related to its loss estimates, management believes that its current estimate of the allowance for credit losses is appropriate.

65
Fair value
Assets measured at fair valueThe following table includes the Firm’s assets measured at fair value and the portion of such assets that are classified within level 3 of the valuation hierarchy. For further information, refer to Note 2.
March 31, 2019(in billions, except ratios)
Total assets atfair value
Total level 3assets
Trading–debt and equity instruments $ 483.0 $ 4.2
Derivative receivables(a) 50.3 5.9
Trading assets 533.3 10.1
AFS securities 236.5 —
Loans 3.7 0.1
MSRs 6.0 6.0
Other 29.2 0.9
Total assets measured at fair value on a recurring basis $ 808.7 $ 17.1
Total assets measured at fair value on anonrecurring basis 1.0 0.5
Total assets measured at fair value $ 809.7 $ 17.6
Total Firm assets $ 2,737.2
Level 3 assets as a percentage of total Firm assets(a) 0.6%
Level 3 assets as a percentage of total Firm assets at fair value(a) 2.2%
(a) For purposes of the table above, the derivative receivables total reflects the impact of netting adjustments; however, the $5.9 billion of derivative receivables classified as level 3 does not reflect the netting adjustment as such netting is not relevant to a presentation based on the transparency of inputs to the valuation of an asset. The level 3 balances would be reduced if netting were applied, including the netting benefit associated with cash collateral.
ValuationEstimating fair value requires the application of judgment. The type and level of judgment required is largely dependent on the amount of observable market information available to the Firm. For instruments valued using internally developed valuation models and other valuation techniques that use significant unobservable inputs and are therefore classified within level 3 of the valuation hierarchy, judgments used to estimate fair value are more significant than those required when estimating the fair value of instruments classified within levels 1 and 2.
In arriving at an estimate of fair value for an instrument within level 3, management must first determine the appropriate valuation technique to use. Second, the lack of observability of certain significant inputs requires management to assess all relevant empirical data in deriving valuation inputs including, for example, transaction details, yield curves, interest rates, prepayment rates, default rates, volatilities, correlations, equity or debt prices, valuations of comparable instruments, foreign exchange rates and credit curves. For a further discussion of the valuation of level 3 instruments, including unobservable inputs used, refer to Note 2.
For instruments classified in levels 2 and 3, management judgment must be applied to assess the appropriate level of valuation adjustments to reflect counterparty credit quality, the Firm’s creditworthiness, market funding rates, liquidity considerations, unobservable parameters, and for portfolios that meet specified criteria, the size of the net open risk position. The judgments made are typically affected by the type of product and its specific contractual terms, and the level of liquidity for the product or within the market as a whole. For a further discussion of valuation adjustments applied by the Firm refer to Note 2.
Imprecision in estimating unobservable market inputs or other factors can affect the amount of gain or loss recorded for a particular position. Furthermore, while the Firm believes its valuation methods are appropriate and consistent with those of other market participants, the methods and assumptions used reflect management judgment and may vary across the Firm’s businesses and portfolios.
The Firm uses various methodologies and assumptions in the determination of fair value. The use of methodologies or assumptions different than those used by the Firm could result in a different estimate of fair value at the reporting date. For a detailed discussion of the Firm’s valuation process and hierarchy, and its determination of fair value for individual financial instruments, refer to Note 2.
Goodwill impairmentManagement applies significant judgment when testing goodwill for impairment. The goodwill associated with each business combination is allocated to the related reporting units for goodwill impairment testing. For a description of the significant valuation judgments associated with goodwill impairment, refer to Goodwill impairment on page 142 of JPMorgan Chase’s 2018 Form 10-K.
For the three months ended March 31, 2019, the Firm reviewed current economic conditions, estimated market cost of equity, as well as actual and projections of business performance for all its businesses. Based upon such reviews, the Firm concluded that the goodwill allocated to its reporting units was not impaired as of March 31, 2019.
Declines in business performance, increases in credit losses, increases in capital requirements, as well as deterioration in economic or market conditions, adverse regulatory or legislative changes or increases in the estimated market cost of equity, could cause the estimated fair values of the Firm’s reporting units or their associated goodwill to decline in the future, which could result in a material impairment charge to earnings in a future period related to some portion of the associated goodwill.
For additional information on goodwill, refer to Note 14.

66
Credit card rewards liabilityJPMorgan Chase offers credit cards with various rewards programs which allow cardholders to earn rewards points based on their account activity and the terms and conditions of the rewards program. Generally, there are no limits on the points that an eligible cardholder can earn, nor do the points expire, and the points can be redeemed for a variety of rewards, including cash (predominantly in the form of account credits), gift cards and travel. The Firm maintains a rewards liability which represents the estimated cost of rewards points earned and expected to be redeemed by cardholders. The rewards liability is sensitive to various assumptions, including cost per point and redemption rates for each of the various rewards programs, which are evaluated periodically. The liability is accrued as the cardholder earns the benefit and is reduced when the cardholder redeems points. This liability was $5.8 billion at both March 31, 2019 and December 31, 2018, and is recorded in accounts payable and other liabilities on the Consolidated balance sheets.
Income taxesFor a description of the significant assumptions, judgments and interpretations associated with the accounting for income taxes, refer to Income taxes on page 143 of JPMorgan Chase’s 2018 Form 10-K.
Litigation reservesFor a description of the significant estimates and judgments associated with establishing litigation reserves, refer to Note 24 of this Form 10-Q, and Note 29 of JPMorgan Chase’s 2018 Form 10-K.

67
ACCOUNTING AND REPORTING DEVELOPMENTS
Financial Accounting Standards Board (“FASB”) Standards Adopted January 1, 2019
Standard Summary of guidance Effects on financial statements
Leases
Issued February 2016
• Requires lessees to recognize all leases longer than twelve months on the Consolidated balance sheets as a lease liability with a corresponding right-of-use asset.
• Requires lessees and lessors to classify most leases using principles similar to existing lease accounting, but eliminates the “bright line” classification tests.
• Expands qualitative and quantitative leasing disclosures.
• Adopted January 1, 2019.
• The Firm elected the available practical expedient to not reassess whether existing contracts contain a lease or whether classification or unamortized initial lease costs would be different under the new lease guidance. The Firm elected the modified retrospective transition method, through a cumulative-effect adjustment to retained earnings without revising prior periods.
• For further information, refer to Note 16.
FASB Standards Issued but not yet Adopted
Standard Summary of guidance Effects on financial statements
Financial instruments – credit losses
Issued June 2016
• Replaces existing incurred loss impairment guidance and establishes a single allowance framework for financial assets carried at amortized cost, which will reflect management’s estimate of credit losses over the full remaining expected life of the financial assets and will consider expected future changes in macroeconomic conditions.
• Eliminates existing guidance for PCI loans, and requires recognition of the nonaccretable difference as an increase to the allowance for expected credit losses on financial assets purchased with more than insignificant credit deterioration since origination, which will be offset by an increase in the recorded investment of the related loans.
• Requires inclusion of expected recoveries, limited to the cumulative amount of prior write-offs, when estimating the allowance for credit losses for in scope financial assets (including collateral dependent assets).
• Amends existing impairment guidance for AFS securities to incorporate an allowance, which will allow for reversals of credit impairments in the event that the credit of an issuer improves.
• Requires a cumulative-effect adjustment to retained earnings as of the beginning of the reporting period of adoption.
• Required effective date: January 1, 2020.(a)
• The Firm has established a Firmwide, cross-discipline governance structure, which provides implementation oversight. The Firm continues to test and refine its current expected credit loss models that satisfy the requirements of the new standard. Oversight and testing, as well as efforts to meet expanded disclosure requirements, will extend through the remainder of 2019.
• The Firm expects that the allowance related to the Firm’s loans and commitments will increase as it will cover credit losses over the full remaining expected life of the portfolios. The Firm currently intends to estimate losses over a two-year forecast period using the weighted-average of a range of macroeconomic scenarios (established on a Firmwide basis), and then revert to longer term historical loss experience to estimate losses over more extended periods.
• The Firm currently expects the increase in the allowance to be in the range of $4-6 billion, primarily driven by Card. This estimate is subject to further refinement based on continuing reviews and approvals of models, methodologies and judgments. The ultimate impact will depend upon the nature and characteristics of the Firm’s portfolio at the adoption date, the macroeconomic conditions and forecasts at that date, and other management judgments.
• The Firm plans to adopt the new guidance on January 1, 2020.
Goodwill
Issued January 2017
• Requires an impairment loss to be recognized when the estimated fair value of a reporting unit falls below its carrying value.
• Eliminates the second condition in the current guidance that requires an impairment loss to be recognized only if the estimated implied fair value of the goodwill is below its carrying value.
• Required effective date: January 1, 2020.(a)
• Based on current impairment test results, the Firm does not expect a material effect on the Consolidated Financial Statements. However, the impact of the new accounting guidance will depend on the performance of the reporting units and the market conditions at the time of adoption.
• After adoption, the guidance may result in more frequent goodwill impairment losses due to the removal of the second condition.
• The Firm plans to adopt the new guidance on January 1, 2020.
(a) Early adoption is permitted.

68
FORWARD-LOOKING STATEMENTS
From time to time, the Firm has made and will make forward-looking statements. These statements can be identified by the fact that they do not relate strictly to historical or current facts. Forward-looking statements often use words such as “anticipate,” “target,” “expect,” “estimate,” “intend,” “plan,” “goal,” “believe,” or other words of similar meaning. Forward-looking statements provide JPMorgan Chase’s current expectations or forecasts of future events, circumstances, results or aspirations. JPMorgan Chase’s disclosures in this Form 10-Q contain forward-looking statements within the meaning of the Private Securities Litigation Reform Act of 1995. The Firm also may make forward-looking statements in its other documents filed or furnished with the SEC. In addition, the Firm’s senior management may make forward-looking statements orally to investors, analysts, representatives of the media and others.
All forward-looking statements are, by their nature, subject to risks and uncertainties, many of which are beyond the Firm’s control. JPMorgan Chase’s actual future results may differ materially from those set forth in its forward-looking statements. While there is no assurance that any list of risks and uncertainties or risk factors is complete, below are certain factors which could cause actual results to differ from those in the forward-looking statements:
• Local, regional and global business, economic and political conditions and geopolitical events;
• Changes in laws and regulatory requirements, including capital and liquidity requirements affecting the Firm’s businesses, and the ability of the Firm to address those requirements;
• Heightened regulatory and governmental oversight and scrutiny of JPMorgan Chase’s business practices, including dealings with retail customers;
• Changes in trade, monetary and fiscal policies and laws;
• Changes in income tax laws and regulations;
• Securities and capital markets behavior, including changes in market liquidity and volatility;
• Changes in investor sentiment or consumer spending or savings behavior;
• Ability of the Firm to manage effectively its capital and liquidity, including approval of its capital plans by banking regulators;
• Changes in credit ratings assigned to the Firm or its subsidiaries;
• Damage to the Firm’s reputation;
• Ability of the Firm to appropriately address social and environmental concerns that may arise from its business activities;
• Ability of the Firm to deal effectively with an economic slowdown or other economic or market disruption;
• Technology changes instituted by the Firm, its counterparties or competitors;
• The effectiveness of the Firm’s control agenda;
• Ability of the Firm to develop or discontinue products and services, and the extent to which products or services previously sold by the Firm (including but not limited to mortgages and asset-backed securities) require the Firm to incur liabilities or absorb losses not contemplated at their initiation or origination;
• Acceptance of the Firm’s new and existing products and services by the marketplace and the ability of the Firm to innovate and to increase market share;
• Ability of the Firm to attract and retain qualified employees;
• Ability of the Firm to control expenses;
• Competitive pressures;
• Changes in the credit quality of the Firm’s customers and counterparties;
• Adequacy of the Firm’s risk management framework, disclosure controls and procedures and internal control over financial reporting;
• Adverse judicial or regulatory proceedings;
• Changes in applicable accounting policies, including the introduction of new accounting standards;
• Ability of the Firm to determine accurate values of certain assets and liabilities;
• Occurrence of natural or man-made disasters or calamities or conflicts and the Firm’s ability to deal effectively with disruptions caused by the foregoing;
• Ability of the Firm to maintain the security of its financial, accounting, technology, data processing and other operational systems and facilities;
• Ability of the Firm to withstand disruptions that may be caused by any failure of its operational systems or those of third parties;
• Ability of the Firm to effectively defend itself against cyberattacks and other attempts by unauthorized parties to access information of the Firm or its customers or to disrupt the Firm’s systems; and
• The other risks and uncertainties detailed in Part I, Item 1A: Risk Factors in JPMorgan Chase’s 2018 Form 10-K.
Any forward-looking statements made by or on behalf of the Firm speak only as of the date they are made, and JPMorgan Chase does not undertake to update any forward-looking statements. The reader should, however, consult any further disclosures of a forward-looking nature the Firm may make in any subsequent Form 10-Ks, Form 10-Qs, or Current Reports on Form 8-K.
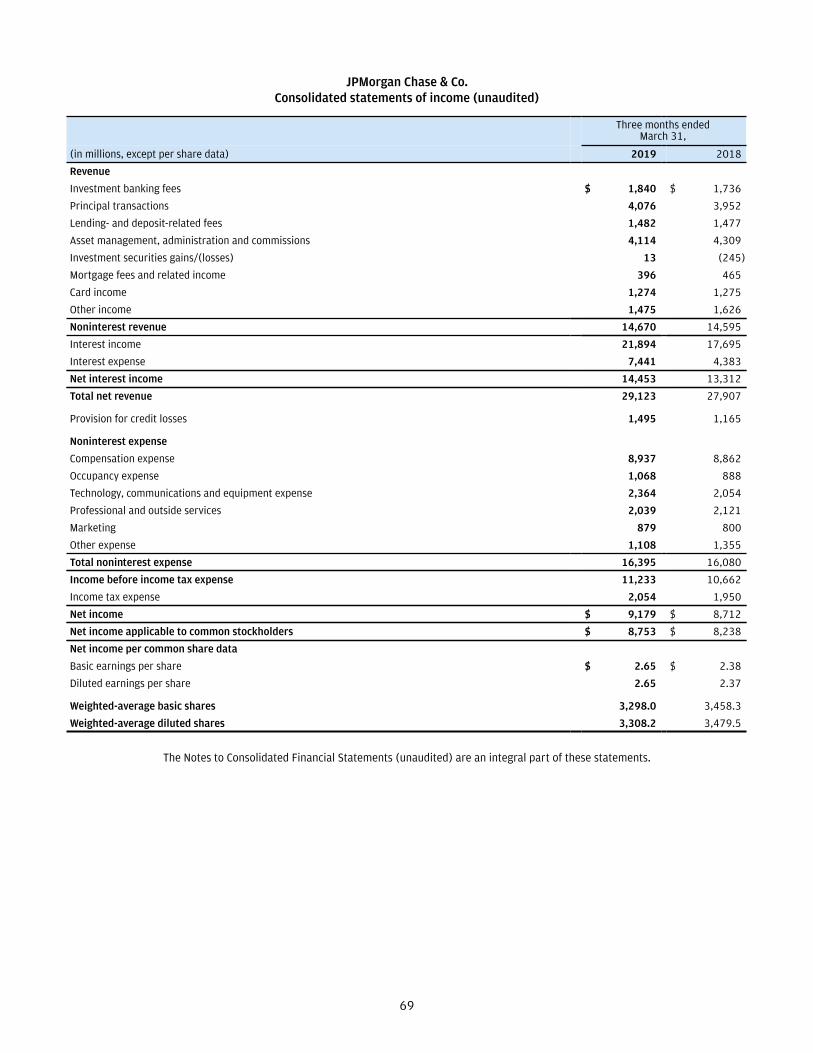
69
JPMorgan Chase & Co.Consolidated statements of income (unaudited)
Three months endedMarch 31,
(in millions, except per share data) 2019 2018
Revenue
Investment banking fees $ 1,840 $ 1,736
Principal transactions 4,076 3,952
Lending- and deposit-related fees 1,482 1,477
Asset management, administration and commissions 4,114 4,309
Investment securities gains/(losses) 13 (245)
Mortgage fees and related income 396 465
Card income 1,274 1,275
Other income 1,475 1,626
Noninterest revenue 14,670 14,595
Interest income 21,894 17,695
Interest expense 7,441 4,383
Net interest income 14,453 13,312
Total net revenue 29,123 27,907
Provision for credit losses 1,495 1,165
Noninterest expense
Compensation expense 8,937 8,862
Occupancy expense 1,068 888
Technology, communications and equipment expense 2,364 2,054
Professional and outside services 2,039 2,121
Marketing 879 800
Other expense 1,108 1,355
Total noninterest expense 16,395 16,080
Income before income tax expense 11,233 10,662
Income tax expense 2,054 1,950
Net income $ 9,179 $ 8,712
Net income applicable to common stockholders $ 8,753 $ 8,238
Net income per common share data
Basic earnings per share $ 2.65 $ 2.38
Diluted earnings per share 2.65 2.37
Weighted-average basic shares 3,298.0 3,458.3
Weighted-average diluted shares 3,308.2 3,479.5
The Notes to Consolidated Financial Statements (unaudited) are an integral part of these statements.

70
JPMorgan Chase & Co.Consolidated statements of comprehensive income (unaudited)
Three months endedMarch 31,
(in millions) 2019 2018
Net income $ 9,179 $ 8,712
Other comprehensive income/(loss), after–tax
Unrealized gains/(losses) on investment securities 1,414 (1,234)
Translation adjustments, net of hedges (24) 27
Fair value hedges 2 (40)
Cash flow hedges 138 (73)
Defined benefit pension and OPEB plans 36 21
DVA on fair value option elected liabilities (617) 267
Total other comprehensive income/(loss), after–tax 949 (1,032)
Comprehensive income $ 10,128 $ 7,680
The Notes to Consolidated Financial Statements (unaudited) are an integral part of these statements.

71
JPMorgan Chase & Co.Consolidated balance sheets (unaudited)
(in millions, except share data) Mar 31, 2019 Dec 31, 2018
AssetsCash and due from banks $ 21,946 $ 22,324Deposits with banks 280,658 256,469Federal funds sold and securities purchased under resale agreements (included $13,969 and $13,235 at fair value) 299,140 321,588Securities borrowed (included $5,642 and $5,105 at fair value) 123,186 111,995Trading assets (included assets pledged of $153,313 and $89,073) 533,402 413,714Investment securities (included $236,516 and $230,394 at fair value and assets pledged of $10,516 and $11,432) 267,365 261,828
Loans (included $3,719 and $3,151 at fair value) 956,245 984,554Allowance for loan losses (13,533) (13,445)Loans, net of allowance for loan losses 942,712 971,109Accrued interest and accounts receivable 72,240 73,200Premises and equipment 24,160 14,934Goodwill, MSRs and other intangible assets 54,168 54,349Other assets (included $10,277 and $9,630 at fair value and assets pledged of $3,090 and $3,457) 118,211 121,022Total assets(a) $ 2,737,188 $ 2,622,532
LiabilitiesDeposits (included $31,804 and $23,217 at fair value) $ 1,493,441 $ 1,470,666Federal funds purchased and securities loaned or sold under repurchase agreements (included $971 and $935
at fair value) 222,677 182,320
Short-term borrowings (included $7,198 and $7,130 at fair value) 71,305 69,276Trading liabilities 156,907 144,773Accounts payable and other liabilities (included $3,277 and $3,269 at fair value) 216,173 196,710Beneficial interests issued by consolidated VIEs (included $13 and $28 at fair value) 25,955 20,241Long-term debt (included $61,241 and $54,886 at fair value) 290,893 282,031Total liabilities(a) 2,477,351 2,366,017
Commitments and contingencies (refer to Notes 22, 23 and 24)Stockholders’ equityPreferred stock ($1 par value; authorized 200,000,000 shares; issued 2,699,250 and 2,606,750 shares) 26,993 26,068Common stock ($1 par value; authorized 9,000,000,000 shares; issued 4,104,933,895 shares) 4,105 4,105Additional paid-in capital 88,170 89,162Retained earnings 205,437 199,202Accumulated other comprehensive loss (558) (1,507)Shares held in restricted stock units (“RSU”) Trust, at cost (472,953 shares) (21) (21)Treasury stock, at cost (860,960,924 and 829,167,674 shares) (64,289) (60,494)Total stockholders’ equity 259,837 256,515
Total liabilities and stockholders’ equity $ 2,737,188 $ 2,622,532
(a) The following table presents information on assets and liabilities related to VIEs that are consolidated by the Firm at March 31, 2019, and December 31, 2018. The assets of the consolidated VIEs are used to settle the liabilities of those entities. The holders of the beneficial interests generally do not have recourse to the general credit of JPMorgan Chase. The assets and liabilities in the table below include third-party assets and liabilities of consolidated VIEs and exclude intercompany balances that eliminate in consolidation. For a further discussion, refer to Note 13.
(in millions) Mar 31, 2019 Dec 31, 2018
Assets
Trading assets $ 1,605 $ 1,966
Loans 55,460 59,456
All other assets 1,058 1,013
Total assets $ 58,123 $ 62,435
Liabilities
Beneficial interests issued by consolidated VIEs $ 25,955 $ 20,241
All other liabilities 302 312
Total liabilities $ 26,257 $ 20,553
The Notes to Consolidated Financial Statements (unaudited) are an integral part of these statements.

72
JPMorgan Chase & Co.Consolidated statements of changes in stockholders’ equity (unaudited)
Three months ended March 31,
(in millions, except per share data) 2019 2018
Preferred stock
Balance at January 1 $ 26,068 $ 26,068
Issuance 1,850 —
Redemption (925) —
Balance at March 31 $ 26,993 $ 26,068
Common stock
Balance at January 1 and March 31 4,105 4,105
Additional paid-in capital
Balance at January 1 89,162 90,579
Shares issued and commitments to issue common stock for employee shared-based compensation awards,and related tax effects (949) (1,307)
Other (43) (61)
Balance at March 31 88,170 89,211
Retained earnings
Balance at January 1 199,202 177,676
Cumulative effect of changes in accounting principles 62 (183)
Net income 9,179 8,712
Dividends declared:
Preferred stock (374) (409)
Common stock ($0.80 and $0.56 per share) (2,632) (1,941)
Balance at March 31 205,437 183,855
Accumulated other comprehensive income/(loss)
Balance at January 1 (1,507) (119)
Cumulative effect of changes in accounting principles — 88
Other comprehensive income/(loss), after-tax 949 (1,032)
Balance at March 31 (558) (1,063)
Shares held in RSU Trust, at cost
Balance at January 1 and March 31 (21) (21)
Treasury stock, at cost
Balance at January 1 (60,494) (42,595)
Repurchase (5,091) (4,671)
Reissuance 1,296 1,312
Balance at March 31 (64,289) (45,954)
Total stockholders’ equity $ 259,837 $ 256,201
The Notes to Consolidated Financial Statements (unaudited) are an integral part of these statements.

73
JPMorgan Chase & Co.Consolidated statements of cash flows (unaudited)
Three months ended March 31,
(in millions) 2019 2018
Operating activities
Net income $ 9,179 $ 8,712
Adjustments to reconcile net income to net cash used in operating activities:
Provision for credit losses 1,495 1,165Depreciation and amortization 2,038 1,797Deferred tax (benefit)/expense 233 (175)Other 640 951
Originations and purchases of loans held-for-sale (15,611) (20,010)
Proceeds from sales, securitizations and paydowns of loans held-for-sale 23,528 18,300
Net change in:Trading assets (123,064) (37,231)Securities borrowed (11,154) (11,047)Accrued interest and accounts receivable 869 (5,009)Other assets 2,292 (3,929)Trading liabilities 13,353 11,855Accounts payable and other liabilities 10,705 (90)
Other operating adjustments 4,617 (398)Net cash (used in) operating activities (80,880) (35,109)
Investing activities
Net change in:Federal funds sold and securities purchased under resale agreements 22,459 (49,179)
Held-to-maturity securities:Proceeds from paydowns and maturities 570 698Purchases — (4,686)
Available-for-sale securities:Proceeds from paydowns and maturities 7,613 10,785Proceeds from sales 22,289 16,697Purchases (33,244) (14,680)
Proceeds from sales and securitizations of loans held-for-investment 14,584 4,219Other changes in loans, net 3,799 (8,226)All other investing activities, net (1,769) (649)Net cash provided by/(used in) investing activities 36,301 (45,021)
Financing activities
Net change in:Deposits 26,799 49,429Federal funds purchased and securities loaned or sold under repurchase agreements 40,352 20,185Short-term borrowings 1,455 11,029Beneficial interests issued by consolidated VIEs 5,671 (93)
Proceeds from long-term borrowings 15,560 19,916Payments of long-term borrowings (12,425) (31,887)Proceeds from issuance of preferred stock 1,850 —Redemption of preferred stock (925) —Treasury stock repurchased (5,091) (4,671)Dividends paid (3,033) (2,236)All other financing activities, net (778) (1,083)Net cash provided by financing activities 69,435 60,589
Effect of exchange rate changes on cash and due from banks and deposits with banks (1,045) 3,049Net increase/(decrease) in cash and due from banks and deposits with banks 23,811 (16,492)Cash and due from banks and deposits with banks at the beginning of the period 278,793 431,304Cash and due from banks and deposits with banks at the end of the period $ 302,604 $ 414,812
Cash interest paid $ 7,336 $ 4,431Cash income taxes paid, net 534 429
The Notes to Consolidated Financial Statements (unaudited) are an integral part of these statements.

74
Refer to the Glossary of Terms and Acronyms on pages 151–155 for definitions of terms and acronyms used throughout the Notes to Consolidated Financial Statements.
NOTES TO CONSOLIDATED FINANCIAL STATEMENTS (unaudited)
Note 1 – Basis of presentationJPMorgan Chase & Co. (“JPMorgan Chase” or “the Firm”), a financial holding company incorporated under Delaware law in 1968, is a leading global financial services firm and one of the largest banking institutions in the U.S., with operations worldwide. The Firm is a leader in investment banking, financial services for consumers and small businesses, commercial banking, financial transaction processing and asset management. For a further discussion of the Firm’s business segments, refer to Note 25.
The accounting and financial reporting policies of JPMorgan Chase and its subsidiaries conform to U.S. GAAP. Additionally, where applicable, the policies conform to the accounting and reporting guidelines prescribed by regulatory authorities.
The unaudited Consolidated Financial Statements prepared in conformity with U.S. GAAP require management to make estimates and assumptions that affect the reported amounts of assets, liabilities, revenue and expense, and the disclosures of contingent assets and liabilities. Actual results could be different from these estimates. In the opinion of management, all normal, recurring adjustments have been included such that this interim financial information is fairly presented.
These unaudited Consolidated Financial Statements should be read in conjunction with the audited Consolidated Financial Statements, and related notes thereto, included in JPMorgan Chase’s 2018 Form 10-K.
Certain amounts reported in prior periods have been reclassified to conform with the current presentation.
Consolidation The Consolidated Financial Statements include the accounts of JPMorgan Chase and other entities in which the Firm has a controlling financial interest. All material intercompany balances and transactions have been eliminated.
Assets held for clients in an agency or fiduciary capacity by the Firm are not assets of JPMorgan Chase and are not included on the Consolidated balance sheets.
The Firm determines whether it has a controlling financial interest in an entity by first evaluating whether the entity is a voting interest entity or a variable interest entity.
For a further description of JPMorgan Chase’s accounting policies regarding consolidation, refer to Notes 1 and 14 of JPMorgan Chase’s 2018 Form 10-K.
Offsetting assets and liabilitiesU.S. GAAP permits entities to present derivative receivables and derivative payables with the same counterparty and the related cash collateral receivables and payables on a net
basis on the Consolidated balance sheets when a legally enforceable master netting agreement exists. U.S. GAAP also permits securities financing activities to be presented on a net basis when specified conditions are met, including the existence of a legally enforceable master netting agreement. The Firm has elected to net such balances when the specified conditions are met. For further information on offsetting assets and liabilities, refer to Note 1 of JPMorgan Chase’s 2018 Form 10-K.
Note 2 – Fair value measurementFor a discussion of the Firm’s valuation methodologies for assets, liabilities and lending-related commitments measured at fair value and the fair value hierarchy, refer to Note 2 of JPMorgan Chase’s 2018 Form 10-K.
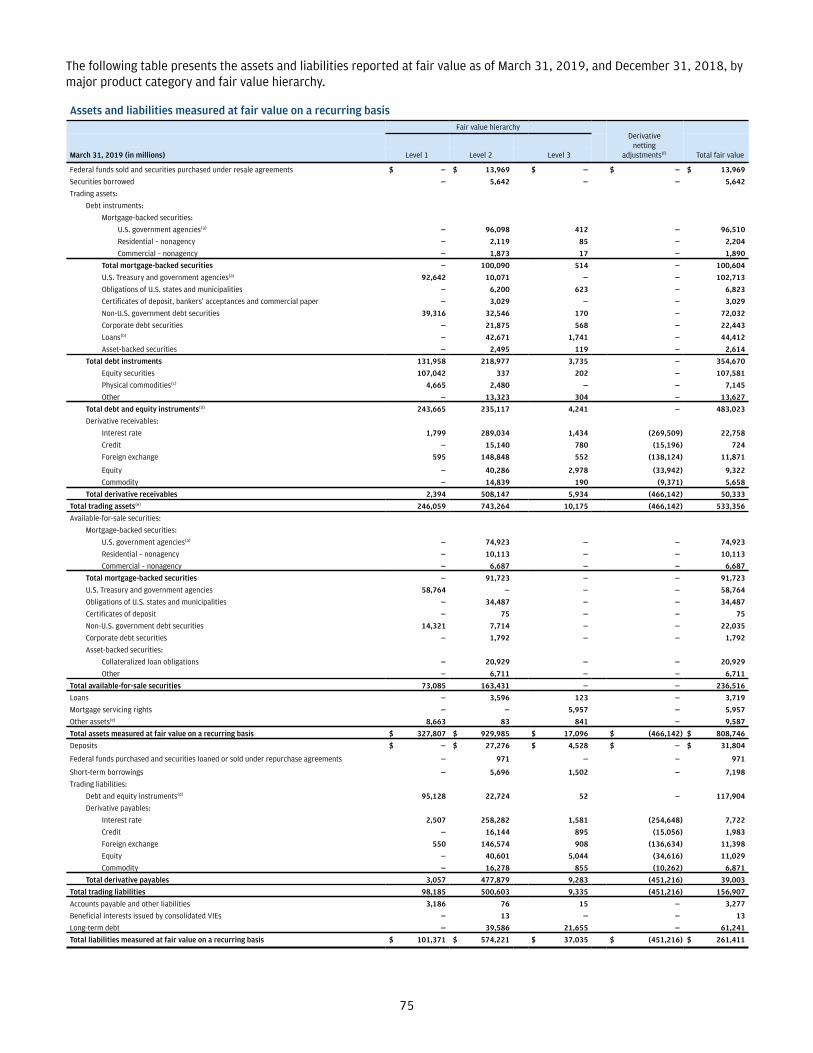
75
The following table presents the assets and liabilities reported at fair value as of March 31, 2019, and December 31, 2018, by major product category and fair value hierarchy.
Assets and liabilities measured at fair value on a recurring basisFair value hierarchy
Derivativenetting
adjustments(f)March 31, 2019 (in millions) Level 1 Level 2 Level 3 Total fair value
Federal funds sold and securities purchased under resale agreements $ — $ 13,969 $ — $ — $ 13,969
Securities borrowed — 5,642 — — 5,642
Trading assets:
Debt instruments:
Mortgage-backed securities:
U.S. government agencies(a) — 96,098 412 — 96,510
Residential – nonagency — 2,119 85 — 2,204
Commercial – nonagency — 1,873 17 — 1,890
Total mortgage-backed securities — 100,090 514 — 100,604
U.S. Treasury and government agencies(a) 92,642 10,071 — — 102,713
Obligations of U.S. states and municipalities — 6,200 623 — 6,823
Certificates of deposit, bankers’ acceptances and commercial paper — 3,029 — — 3,029
Non-U.S. government debt securities 39,316 32,546 170 — 72,032
Corporate debt securities — 21,875 568 — 22,443
Loans(b) — 42,671 1,741 — 44,412
Asset-backed securities — 2,495 119 — 2,614
Total debt instruments 131,958 218,977 3,735 — 354,670
Equity securities 107,042 337 202 — 107,581
Physical commodities(c) 4,665 2,480 — — 7,145
Other — 13,323 304 — 13,627
Total debt and equity instruments(d) 243,665 235,117 4,241 — 483,023
Derivative receivables:
Interest rate 1,799 289,034 1,434 (269,509) 22,758
Credit — 15,140 780 (15,196) 724
Foreign exchange 595 148,848 552 (138,124) 11,871
Equity — 40,286 2,978 (33,942) 9,322
Commodity — 14,839 190 (9,371) 5,658
Total derivative receivables 2,394 508,147 5,934 (466,142) 50,333
Total trading assets(e) 246,059 743,264 10,175 (466,142) 533,356
Available-for-sale securities:
Mortgage-backed securities:
U.S. government agencies(a) — 74,923 — — 74,923
Residential – nonagency — 10,113 — — 10,113
Commercial – nonagency — 6,687 — — 6,687
Total mortgage-backed securities — 91,723 — — 91,723
U.S. Treasury and government agencies 58,764 — — — 58,764
Obligations of U.S. states and municipalities — 34,487 — — 34,487
Certificates of deposit — 75 — — 75
Non-U.S. government debt securities 14,321 7,714 — — 22,035
Corporate debt securities — 1,792 — — 1,792
Asset-backed securities:
Collateralized loan obligations — 20,929 — — 20,929
Other — 6,711 — — 6,711
Total available-for-sale securities 73,085 163,431 — — 236,516
Loans — 3,596 123 — 3,719
Mortgage servicing rights — — 5,957 — 5,957
Other assets(e) 8,663 83 841 — 9,587
Total assets measured at fair value on a recurring basis $ 327,807 $ 929,985 $ 17,096 $ (466,142) $ 808,746
Deposits $ — $ 27,276 $ 4,528 $ — $ 31,804
Federal funds purchased and securities loaned or sold under repurchase agreements — 971 — — 971
Short-term borrowings — 5,696 1,502 — 7,198
Trading liabilities:
Debt and equity instruments(d) 95,128 22,724 52 — 117,904
Derivative payables:
Interest rate 2,507 258,282 1,581 (254,648) 7,722
Credit — 16,144 895 (15,056) 1,983
Foreign exchange 550 146,574 908 (136,634) 11,398
Equity — 40,601 5,044 (34,616) 11,029
Commodity — 16,278 855 (10,262) 6,871
Total derivative payables 3,057 477,879 9,283 (451,216) 39,003
Total trading liabilities 98,185 500,603 9,335 (451,216) 156,907
Accounts payable and other liabilities 3,186 76 15 — 3,277
Beneficial interests issued by consolidated VIEs — 13 — — 13
Long-term debt — 39,586 21,655 — 61,241
Total liabilities measured at fair value on a recurring basis $ 101,371 $ 574,221 $ 37,035 $ (451,216) $ 261,411

76
Fair value hierarchyDerivative
nettingadjustments(f)December 31, 2018 (in millions) Level 1 Level 2 Level 3 Total fair value
Federal funds sold and securities purchased under resale agreements $ — $ 13,235 $ — $ — $ 13,235
Securities borrowed — 5,105 — — 5,105
Trading assets:
Debt instruments:
Mortgage-backed securities:
U.S. government agencies(a) — 76,249 549 — 76,798
Residential – nonagency — 1,798 64 — 1,862
Commercial – nonagency — 1,501 11 — 1,512
Total mortgage-backed securities — 79,548 624 — 80,172
U.S. Treasury and government agencies(a) 51,477 7,702 — — 59,179
Obligations of U.S. states and municipalities — 7,121 689 — 7,810
Certificates of deposit, bankers’ acceptances and commercial paper — 1,214 — — 1,214
Non-U.S. government debt securities 27,878 27,056 155 — 55,089
Corporate debt securities — 18,655 334 — 18,989
Loans(b) — 40,047 1,706 — 41,753
Asset-backed securities — 2,756 127 — 2,883
Total debt instruments 79,355 184,099 3,635 — 267,089
Equity securities 71,119 482 232 — 71,833
Physical commodities(c) 5,182 1,855 — — 7,037
Other — 13,192 301 — 13,493
Total debt and equity instruments(d) 155,656 199,628 4,168 — 359,452
Derivative receivables:
Interest rate 682 266,380 1,642 (245,490) 23,214
Credit — 19,235 860 (19,483) 612
Foreign exchange 771 166,238 676 (154,235) 13,450
Equity — 46,777 2,508 (39,339) 9,946
Commodity — 20,339 131 (13,479) 6,991
Total derivative receivables 1,453 518,969 5,817 (472,026) 54,213
Total trading assets(e) 157,109 718,597 9,985 (472,026) 413,665
Available-for-sale securities:
Mortgage-backed securities:
U.S. government agencies(a) — 68,646 — — 68,646
Residential – nonagency — 8,519 1 — 8,520
Commercial – nonagency — 6,654 — — 6,654
Total mortgage-backed securities — 83,819 1 — 83,820
U.S. Treasury and government agencies 56,059 — — — 56,059
Obligations of U.S. states and municipalities — 37,723 — — 37,723
Certificates of deposit — 75 — — 75
Non-U.S. government debt securities 15,313 8,789 — — 24,102
Corporate debt securities — 1,918 — — 1,918
Asset-backed securities:
Collateralized loan obligations — 19,437 — — 19,437
Other — 7,260 — — 7,260
Total available-for-sale securities 71,372 159,021 1 — 230,394
Loans — 3,029 122 — 3,151
Mortgage servicing rights — — 6,130 — 6,130
Other assets(e) 7,810 195 927 — 8,932
Total assets measured at fair value on a recurring basis $ 236,291 $ 899,182 $ 17,165 $ (472,026) $ 680,612
Deposits $ — $ 19,048 $ 4,169 $ — $ 23,217
Federal funds purchased and securities loaned or sold under repurchase agreements — 935 — — 935
Short-term borrowings — 5,607 1,523 — 7,130
Trading liabilities:
Debt and equity instruments(d) 80,199 22,755 50 — 103,004
Derivative payables:
Interest rate 1,526 239,576 1,680 (234,998) 7,784
Credit — 19,309 967 (18,609) 1,667
Foreign exchange 695 163,549 973 (152,432) 12,785
Equity — 46,462 4,733 (41,034) 10,161
Commodity — 21,158 1,260 (13,046) 9,372
Total derivative payables 2,221 490,054 9,613 (460,119) 41,769
Total trading liabilities 82,420 512,809 9,663 (460,119) 144,773
Accounts payable and other liabilities 3,063 196 10 — 3,269
Beneficial interests issued by consolidated VIEs — 27 1 — 28
Long-term debt — 35,468 19,418 — 54,886
Total liabilities measured at fair value on a recurring basis $ 85,483 $ 574,090 $ 34,784 $ (460,119) $ 234,238
(a) At March 31, 2019, and December 31, 2018, included total U.S. government-sponsored enterprise obligations of $128.0 billion and $92.3 billion, respectively, which were predominantly mortgage-related.
(b) At March 31, 2019, and December 31, 2018, included within trading loans were $15.2 billion and $13.2 billion, respectively, of residential first-lien mortgages, and $2.7 billion and $2.3 billion, respectively, of commercial first-lien mortgages. Residential mortgage loans include conforming mortgage loans originated with the intent to sell to U.S. government agencies of $8.1 billion and $7.6 billion, respectively.
(c) Physical commodities inventories are generally accounted for at the lower of cost or net realizable value. “Net realizable value” is a term defined in U.S. GAAP as not exceeding fair value less costs to sell (“transaction costs”). Transaction costs for the Firm’s physical commodities inventories are either not applicable or immaterial to the value of the inventory. Therefore, net realizable value approximates fair value for the Firm’s physical commodities

77
inventories. When fair value hedging has been applied (or when net realizable value is below cost), the carrying value of physical commodities approximates fair value, because under fair value hedge accounting, the cost basis is adjusted for changes in fair value. For a further discussion of the Firm’s hedge accounting relationships, refer to Note 4. To provide consistent fair value disclosure information, all physical commodities inventories have been included in each period presented.
(d) Balances reflect the reduction of securities owned (long positions) by the amount of identical securities sold but not yet purchased (short positions). (e) Certain investments that are measured at fair value using the net asset value per share (or its equivalent) as a practical expedient are not required to be
classified in the fair value hierarchy. At March 31, 2019, and December 31, 2018, the fair values of these investments, which include certain hedge funds, private equity funds, real estate and other funds, were $736 million and $747 million, respectively. Included in these balances at March 31, 2019, and December 31, 2018, were trading assets of $46 million and $49 million, respectively, and other assets of $690 million and $698 million, respectively.
(f) As permitted under U.S. GAAP, the Firm has elected to net derivative receivables and derivative payables and the related cash collateral received and paid when a legally enforceable master netting agreement exists. The level 3 balances would be reduced if netting were applied, including the netting benefit associated with cash collateral.
Level 3 valuations For further information on the Firm’s valuation process and a detailed discussion of the determination of fair value for individual financial instruments, refer to Note 2 of JPMorgan Chase’s 2018 Form 10-K.
The following table presents the Firm’s primary level 3 financial instruments, the valuation techniques used to measure the fair value of those financial instruments, the significant unobservable inputs, the range of values for those inputs and, for certain instruments, the weighted averages of such inputs. While the determination to classify an instrument within level 3 is based on the significance of the unobservable inputs to the overall fair value measurement, level 3 financial instruments typically include observable components (that is, components that are actively quoted and can be validated to external sources) in addition to the unobservable components. The level 1 and/or level 2 inputs are not included in the table. In addition, the Firm manages the risk of the observable components of level 3 financial instruments using securities and derivative positions that are classified within levels 1 or 2 of the fair value hierarchy.
The range of values presented in the table is representative of the highest and lowest level input used to value the significant groups of instruments within a product/instrument classification. Where provided, the weighted averages of the input values presented in the table are calculated based on the fair value of the instruments that the input is being used to value.
In the Firm’s view, the input range and the weighted average value do not reflect the degree of input uncertainty or an assessment of the reasonableness of the Firm’s estimates and assumptions. Rather, they reflect the characteristics of the various instruments held by the Firm and the relative distribution of instruments within the range of characteristics. For example, two option contracts may have
similar levels of market risk exposure and valuation uncertainty, but may have significantly different implied volatility levels because the option contracts have different underlyings, tenors, or strike prices. The input range and weighted average values will therefore vary from period-to-period and parameter-to-parameter based on the characteristics of the instruments held by the Firm at each balance sheet date.
For the Firm’s derivatives and structured notes positions classified within level 3 at March 31, 2019, interest rate correlation inputs used in estimating fair value were concentrated towards the upper end of the range; equity correlation, equity-FX, and equity-IR correlation inputs were concentrated in the middle of the range; commodity correlation inputs were concentrated in the middle of the range; credit correlation inputs were concentrated towards the lower end of the range; and the interest rate-foreign exchange (“IR-FX”) correlation inputs were distributed across the range. In addition, the interest rate spread volatility inputs used in estimating fair value were distributed across the range; equity volatilities and commodity volatilities were concentrated towards the lower end of the range; and forward commodity prices used in estimating the fair value of commodity derivatives were concentrated in the middle of the range. Prepayment speed inputs used in estimating fair value of interest rate derivatives were concentrated towards the lower end of the range. Recovery rate inputs used in estimating fair value of credit derivatives were distributed across the range; credit spreads and conditional default rates were concentrated towards the lower end of the range; loss severity inputs were concentrated towards the upper end of the range and price inputs were concentrated towards the lower end of the range.

78
Level 3 inputs(a)
March 31, 2019
Product/InstrumentFair value
(in millions)Principal valuation
technique Unobservable inputs(g) Range of input values Weighted average
Residential mortgage-backed securities and loans(b)
$ 748 Discounted cash flows Yield 0% – 18% 7%
Prepayment speed 0% – 22% 11%
Conditional default rate 0% – 5% 1%
Loss severity 0% – 100% 3%
Commercial mortgage-backed securities and loans(c) 397 Market comparables Price $ 0 – $ 102 $ 87
Obligations of U.S. states andmunicipalities 623 Market comparables Price $ 63 – $ 100 $ 98
Corporate debt securities 568 Market comparables Price $ 0 – $ 111 $ 82
Loans(d) 226 Discounted cash flows Yield 6% – 18% 8%
1,007 Market comparables Price $ 2 – $ 102 $ 80
Asset-backed securities 119 Market comparables Price $ 0 – $ 105 $ 65
Net interest rate derivatives (217) Option pricing Interest rate spread volatility 16 bps – 38 bps
Interest rate correlation (25)% – 97%
IR-FX correlation 45% – 60%
70 Discounted cash flows Prepayment speed 4% – 30%
Net credit derivatives (162) Discounted cash flows Credit correlation 30% – 55%
Credit spread 6 bps – 1,396 bps
Recovery rate 20% – 70%
Conditional default rate 1% – 93%
Loss severity 100%
47 Market comparables Price $ 1 – $ 115
Net foreign exchange derivatives (198) Option pricing IR-FX correlation (50)% – 60%
(158) Discounted cash flows Prepayment speed 9%
Net equity derivatives (2,066) Option pricing Equity volatility 14% – 65%
Equity correlation 25% – 98%
Equity-FX correlation (75)% – 59%
Equity-IR correlation 20% – 60%
Net commodity derivatives (665) Option pricing Forward commodity price $ 52 – $ 69 per barrel
Commodity volatility 5% – 57%
Commodity correlation (51)% – 95%
MSRs 5,957 Discounted cash flows Refer to Note 14
Other assets 214 Discounted cash flows Credit spread 55bps 55bps
Yield 8% – 10% 9%
930 Market comparables Price $ 19 – $ 110 $ 34
Long-term debt, short-term borrowings, and deposits(e)
27,685 Option pricing Interest rate spread volatility 16 bps – 38 bps
Interest rate correlation (25)% – 97%
IR-FX correlation (50)% – 60%
Equity correlation 25% – 98%
Equity-FX correlation (75)% – 59%
Equity-IR correlation 20% – 60%
Other level 3 assets and liabilities, net(f) 305
(a) The categories presented in the table have been aggregated based upon the product type, which may differ from their classification on the Consolidated balance sheets. Furthermore, the inputs presented for each valuation technique in the table are, in some cases, not applicable to every instrument valued using the technique as the characteristics of the instruments can differ.
(b) Includes U.S. government agency securities of $408 million, nonagency securities of $85 million and trading loans of $255 million.(c) Includes U.S. government agency securities of $4 million, nonagency securities of $17 million, trading loans of $253 million and non-trading loans of
$123 million.(d) Comprises trading loans.(e) Long-term debt, short-term borrowings and deposits include structured notes issued by the Firm that are financial instruments that typically contain
embedded derivatives. The estimation of the fair value of structured notes includes the derivative features embedded within the instrument. The significant unobservable inputs are broadly consistent with those presented for derivative receivables.
(f) Includes level 3 assets and liabilities that are insignificant both individually and in aggregate.(g) Price is a significant unobservable input for certain instruments. When quoted market prices are not readily available, reliance is generally placed on
price-based internal valuation techniques. The price input is expressed assuming a par value of $100.

79
Changes in and ranges of unobservable inputsFor a discussion of the impact on fair value of changes in unobservable inputs and the relationships between unobservable inputs as well as a description of attributes of the underlying instruments and external market factors that affect the range of inputs used in the valuation of the Firm’s positions refer to Note 2 of JPMorgan Chase’s 2018 Form 10-K.
Changes in level 3 recurring fair value measurementsThe following tables include a rollforward of the Consolidated balance sheets amounts (including changes in fair value) for financial instruments classified by the Firm within level 3 of the fair value hierarchy for the three months ended March 31, 2019 and 2018. When a determination is made to classify a financial instrument within level 3, the determination is based on the significance of the unobservable inputs to the overall fair
value measurement. However, level 3 financial instruments typically include, in addition to the unobservable or level 3 components, observable components (that is, components that are actively quoted and can be validated to external sources); accordingly, the gains and losses in the table below include changes in fair value due in part to observable factors that are part of the valuation methodology. Also, the Firm risk-manages the observable components of level 3 financial instruments using securities and derivative positions that are classified within level 1 or 2 of the fair value hierarchy; as these level 1 and level 2 risk management instruments are not included below, the gains or losses in the following tables do not reflect the effect of the Firm’s risk management activities related to such level 3 instruments.

80
Fair value measurements using significant unobservable inputs
Three months endedMarch 31, 2019(in millions)
Fair value atJanuary 1,
2019
Totalrealized/
unrealizedgains/
(losses)
Transfers into
level 3(h)
Transfers (out of) level 3(h)
Fair value at March 31,
2019
Change in unrealized gains/(losses) related
to financial instruments held
at March 31, 2019Purchases(f) Sales Settlements(g)
Assets:(a)
Trading assets:
Debt instruments:
Mortgage-backed securities:
U.S. government agencies $ 549 $ (15) $ 5 $ (100) $ (18) $ 1 $ (10) $ 412 $ (16)
Residential – nonagency 64 24 70 (69) (1) 15 (18) 85 1
Commercial – nonagency 11 2 12 (19) (2) 15 (2) 17 1
Total mortgage-backedsecurities 624 11 87 (188) (21) 31 (30) 514 (14)
U.S. Treasury and government agencies — — — — — — — — —
Obligations of U.S. statesand municipalities 689 13 1 (74) (6) — — 623 14
Non-U.S. government debtsecurities 155 (1) 71 (54) — 2 (3) 170 (1)
Corporate debt securities 334 22 223 (7) — 28 (32) 568 39
Loans 1,706 83 72 (118) (120) 159 (41) 1,741 83
Asset-backed securities 127 (2) 17 (21) (7) 20 (15) 119 (4)
Total debt instruments 3,635 126 471 (462) (154) 240 (121) 3,735 117
Equity securities 232 (2) 15 (79) (22) 75 (17) 202 (2)
Other 301 4 12 (1) (11) 1 (2) 304 13
Total trading assets – debtand equity instruments 4,168 128 (c) 498 (542) (187) 316 (140) 4,241 128 (c)
Net derivative receivables:(b)
Interest rate (38) (322) 19 (147) 298 18 25 (147) (376)
Credit (107) (17) — (1) 6 3 1 (115) (21)
Foreign exchange (297) (245) 1 (9) 181 (8) 21 (356) (220)
Equity (2,225) 731 127 (297) (401) (67) 66 (2,066) 226
Commodity (1,129) 533 3 (88) 24 1 (9) (665) 507
Total net derivativereceivables (3,796) 680 (c) 150 (542) 108 (53) 104 (3,349) 116 (c)
Available-for-sale securities:
Mortgage-backed securities 1 — — — (1) — — — —
Asset-backed securities — — — — — — — — —
Total available-for-salesecurities 1 — — — (1) — — — —
Loans 122 3 (c) — — (2) — — 123 3 (c)
Mortgage servicing rights 6,130 (299) (e) 436 (111) (199) — — 5,957 (299) (e)
Other assets 927 (7) (c) 9 (80) (1) — (7) 841 (10) (c)
Fair value measurements using significant unobservable inputs
Three months endedMarch 31, 2019(in millions)
Fair value atJanuary 1,
2019
Totalrealized/
unrealized(gains)/losses
Transfers into
level 3(h)
Transfers (out of) level 3(h)
Fair value atMarch 31,
2019
Change in unrealized (gains)/
losses related to financial
instruments held at March 31, 2019Purchases Sales Issuances Settlements(g)
Liabilities:(a)
Deposits $ 4,169 $ 152 (c)(i) $ — $ — $ 335 $ (24) $ — $ (104) $ 4,528 $ 144 (c)(i)
Short-term borrowings 1,523 46 (c)(i) — — 651 (601) 1 (118) 1,502 80 (c)(i)
Trading liabilities – debt andequity instruments 50 — (2) 11 — — 3 (10) 52 1 (c)
Accounts payable and otherliabilities 10 — (5) 10 — — — — 15 —
Beneficial interests issued byconsolidated VIEs 1 (1) (c) — — — — — — — —
Long-term debt 19,418 1,273 (c)(i) — — 2,051 (1,188) 273 (172) 21,655 1,625 (c)(i)

81
Fair value measurements using significant unobservable inputs
Three months endedMarch 31, 2018(in millions)
Fair value atJanuary 1,
2018
Totalrealized/
unrealizedgains/
(losses)
Transfers into
level 3(h)
Transfers (out of) level 3(h)
Fair value atMarch 31,
2018
Change in unrealized gains/(losses) related
to financial instruments held at
March 31, 2018Purchases(f) Sales Settlements(g)
Assets:(a)
Trading assets:
Debt instruments:
Mortgage-backedsecurities:
U.S. government agencies $ 307 $ 3 $ 329 $ (87) $ (20) $ 4 $ (28) $ 508 $ 1
Residential – nonagency 60 (2) — (2) (2) 29 (28) 55 —
Commercial – nonagency 11 1 6 (7) (1) 4 — 14 —
Total mortgage-backedsecurities 378 2 335 (96) (23) 37 (56) 577 1
U.S. Treasury andgovernment agencies 1 — — — — — (1) — —
Obligations of U.S. statesand municipalities 744 (2) 39 — (77) — — 704 (2)
Non-U.S. government debtsecurities 78 2 225 (92) — 17 (33) 197 3
Corporate debt securities 312 (1) 81 (100) (1) 131 (116) 306 (1)
Loans 2,719 62 470 (728) (137) 123 (141) 2,368 30
Asset-backed securities 153 5 14 (13) (34) 11 (73) 63 —
Total debt instruments 4,385 68 1,164 (1,029) (272) 319 (420) 4,215 31
Equity securities 295 (8) 28 (10) — 4 (9) 300 (7)
Other 690 15 18 (6) (20) 1 — 698 15
Total trading assets – debtand equity instruments 5,370 75 (c) 1,210 (1,045) (292) 324 (429) 5,213 39 (c)
Net derivative receivables:(b)
Interest rate 264 53 17 (4) 46 26 70 472 131
Credit (35) 17 1 (2) 4 3 17 5 11
Foreign exchange (396) 146 — (5) 11 (38) (6) (288) 156
Equity (3,409) 639 218 (242) 434 (111) (41) (2,512) 448
Commodity (674) 185 — — 12 1 (43) (519) 227
Total net derivativereceivables (4,250) 1,040 (c) 236 (253) 507 (119) (3) (2,842) 973 (c)
Available-for-sale securities:
Mortgage-backed securities 1 — — — — — — 1 —
Asset-backed securities 276 1 — — (73) — — 204 1
Total available-for-salesecurities 277 1 (d) — — (73) — — 205 1 (d)
Loans 276 5 (c) 122 — (7) — — 396 5 (c)
Mortgage servicing rights 6,030 384 (e) 243 (295) (160) — — 6,202 384 (e)
Other assets 1,265 (37) (c) 23 (14) (16) — (1) 1,220 (38) (c)
Fair value measurements using significant unobservable inputs
Three months endedMarch 31, 2018(in millions)
Fair value atJanuary 1,
2018
Totalrealized/
unrealized(gains)/losses
Transfers into
level 3(h)
Transfers (out of) level 3(h)
Fair value atMarch 31,
2018
Change inunrealized (gains)/
losses relatedto financial
instruments held atMarch 31, 2018Purchases Sales Issuances Settlements(g)
Liabilities:(a)
Deposits $ 4,142 $ (90) (c)(i) $ — $ — $ 321 $ (198) $ — $ (158) $ 4,017 $ (125) (c)(i)
Short-term borrowings 1,665 15 (c)(i) — — 1,208 (746) 12 (29) 2,125 43 (c)(i)
Trading liabilities – debt andequity instruments 39 3 (c) (37) 43 — 1 2 (1) 50 5 (c)
Accounts payable and otherliabilities 13 — (6) — — — — — 7 —
Beneficial interests issued byconsolidated VIEs 39 — — — — (38) — — 1 —
Long-term debt 16,125 (246) (c)(i) — — 3,091 (2,263) 375 (132) 16,950 (354) (c)(i)

82
(a) Level 3 assets as a percentage of total Firm assets accounted for at fair value (including assets measured at fair value on a nonrecurring basis) were 2% and 3% at March 31, 2019 and December 31, 2018, respectively. Level 3 liabilities as a percentage of total Firm liabilities accounted for at fair value (including liabilities measured at fair value on a nonrecurring basis) were 14% and 15% at March 31, 2019 and December 31, 2018, respectively.
(b) All level 3 derivatives are presented on a net basis, irrespective of the underlying counterparty.(c) Predominantly reported in principal transactions revenue, except for changes in fair value for CCB mortgage loans and lending-related commitments
originated with the intent to sell, and mortgage loan purchase commitments, which are reported in mortgage fees and related income.(d) Realized gains/(losses) on AFS securities, as well as other-than-temporary impairment (“OTTI”) losses that are recorded in earnings, are reported in
investment securities gains/(losses). Unrealized gains/(losses) are reported in OCI. There were no realized gains/(losses) or foreign exchange hedge accounting adjustments recorded in income on AFS securities for the three months ended March 31, 2019 and 2018, respectively. Unrealized gains/(losses) recorded on AFS securities in OCI were zero and $1 million for the three months ended March 31, 2019 and 2018, respectively.
(e) Changes in fair value for MSRs are reported in mortgage fees and related income.(f) Loan originations are included in purchases.(g) Includes financial assets and liabilities that have matured, been partially or fully repaid, impacts of modifications, deconsolidations associated with
beneficial interests in VIEs and other items.(h) All transfers into and/or out of level 3 are based on changes in the observability and/or significance of the valuation inputs and are assumed to occur at the
beginning of the quarterly reporting period in which they occur.(i) Realized (gains)/losses due to DVA for fair value option elected liabilities are reported in principal transactions revenue, and they were not material for the
three months ended March 31, 2019 and 2018, respectively. Unrealized (gains)/losses are reported in OCI, and they were $176 million and $52 million for the three months ended March 31, 2019 and 2018, respectively.
Level 3 analysis Consolidated balance sheets changesLevel 3 assets, including assets measured at fair value on a nonrecurring basis, were 0.6% of total Firm assets at March 31, 2019. The following describes significant changes to level 3 assets since December 31, 2018, for those items measured at fair value on a recurring basis. For further information on changes impacting items measured at fair value on a nonrecurring basis, refer to Assets and liabilities measured at fair value on a nonrecurring basis on page 83.
Three months ended March 31, 2019 Level 3 assets were $17.1 billion at March 31, 2019, reflecting a decrease of $69 million from December 31, 2018 with no movements that were individually significant.
Transfers between levels for instruments carried at fair value on a recurring basis For both the three months ended March 31, 2019 and 2018 there were no individually significant transfers.
All transfers are based on changes in the observability and/or significance of the valuation inputs and are assumed to occur at the beginning of the quarterly reporting period in which they occur.
Gains and lossesThe following describes significant components of total realized/unrealized gains/(losses) for instruments measured at fair value on a recurring basis for the periods indicated. For further information on these instruments, refer to Changes in level 3 recurring fair value measurements rollforward tables on pages 79–82.
Three months ended March 31, 2019• $505 million of net gains on assets, none of which were
individually significant and $1.5 billion of net losses on liabilities predominantly driven by market movements in long-term debt.
Three months ended March 31, 2018 • $1.5 billion of net gains on assets and $318 million of
net gains on liabilities, none of which were individually significant.
Credit and funding adjustments — derivativesThe following table provides the impact of credit and funding adjustments on principal transactions revenue in the respective periods, excluding the effect of any associated hedging activities. The FVA presented below includes the impact of the Firm’s own credit quality on the inception value of liabilities as well as the impact of changes in the Firm’s own credit quality over time.
Three months endedMarch 31,
(in millions) 2019 2018
Credit and funding adjustments:
Derivatives CVA $ 60 $ 84
Derivatives FVA 152 (83)
For further information about both credit and funding adjustments, as well as information about valuation adjustments on fair value option elected liabilities, refer to Note 2 of JPMorgan Chase’s 2018 Form 10-K.

83
Assets and liabilities measured at fair value on a nonrecurring basisThe following tables present the assets held as of March 31, 2019 and 2018, respectively, for which a nonrecurring fair value adjustment was recorded during the three months ended March 31, 2019 and 2018, respectively, by major product category and fair value hierarchy.
Fair value hierarchy
Total fair valueMarch 31, 2019 (in millions) Level 1 Level 2 Level 3
Loans $ — $ 441 $ 84 (b) $ 525
Other assets(a) — 11 456 467
Total assets measured at fair value on a nonrecurring basis $ — $ 452 $ 540 $ 992
Fair value hierarchy
Total fair valueMarch 31, 2018 (in millions) Level 1 Level 2 Level 3
Loans $ — $ 690 $ 165 $ 855
Other assets — 236 572 808
Total assets measured at fair value on a nonrecurring basis $ — $ 926 $ 737 $ 1,663
(a) Primarily includes equity securities without readily determinable fair values that were adjusted based on observable price changes in orderly transactions from an identical or similar investment of the same issuer (measurement alternative). Of the $456 million in level 3 assets measured at fair value on a nonrecurring basis as of March 31, 2019, $351 million related to such equity securities. These equity securities are classified as level 3 due to the infrequency of the observable prices and/or the restrictions on the shares.
(b) Of the $84 million in level 3 assets measured at fair value on a nonrecurring basis as of March 31, 2019, $65 million related to residential real estate loans carried at the net realizable value of the underlying collateral (e.g., collateral-dependent loans and other loans charged off in accordance with regulatory guidance). These amounts are classified as level 3 as they are valued using information from broker’s price opinions, appraisals and automated valuation models and discounted based upon the Firm’s experience with actual liquidation values. These discounts ranged from 14% to 49% with a weighted average of 28%.
There were no material liabilities measured at fair value on a nonrecurring basis at March 31, 2019 and at March 31, 2018.
Nonrecurring fair value changesThe following table presents the total change in value of assets and liabilities for which a fair value adjustment has been recognized for the three months ended March 31, 2019 and 2018, related to financial instruments held at those dates.
Three months endedMarch 31,
(in millions) 2019 2018
Loans $ (21) $ (15)
Other assets(a) 71 496
Total nonrecurring fair value gains/(losses) $ 50 $ 481
(a) Included $78 million and $505 million for the three months ended March 31, 2019 and 2018 respectively, of net gains as a result of the measurement alternative.
For further information about the measurement of impaired collateral-dependent loans, and other loans where the carrying value is based on the fair value of the underlying collateral (e.g., residential mortgage loans charged off in accordance with regulatory guidance), refer to Note 12 of JPMorgan Chase’s 2018 Form 10-K.

84
Equity securities without readily determinable fair values The Firm measures equity securities without readily determinable fair values at cost less impairment (if any), plus or minus observable price changes from an identical or similar investment of the same issuer, with such changes recognized in earnings.
In its determination of the new carrying values upon observable price changes, the Firm may adjust the prices if deemed necessary to arrive at the Firm’s estimated fair values. Such adjustments may include adjustments to reflect the different rights and obligations of similar securities, and other adjustments that are consistent with the Firm’s valuation techniques for private equity direct investments.
The following table presents the carrying value of equity securities without readily determinable fair values still held as of March 31, 2019 and March 31, 2018, that are measured under the measurement alternative and the related adjustments recorded during the periods presented for those securities with observable price changes. These securities are included in the nonrecurring fair value tables when applicable price changes are observable.
Three months ended
March 31,
As of or for the period ended,
(in millions) 2019 2018
Other assets
Carrying value(a) $ 1,819 $ 1,429
Upward carrying value changes(b) 84 505
Downward carrying value changes/impairment(c) (6) —
(a) The carrying value as of December 31, 2018 was $1.5 billion.(b) The cumulative upward carrying value changes between January 1, 2018 and March 31, 2019 were $393 million. (c) The cumulative downward carrying value changes/impairment between January 1, 2018 and March 31, 2019 were $(166) million.
Included in other assets above is the Firm’s interest in approximately 40 million Visa Class B shares, recorded at a nominal carrying value. These shares are subject to certain transfer restrictions currently and will be convertible into Visa Class A shares upon final resolution of certain litigation matters involving Visa. The conversion rate of Visa Class B shares into Visa Class A shares is 1.6298 at March 31, 2019, and may be adjusted by Visa depending on developments related to the litigation matters.

85
Additional disclosures about the fair value of financial instruments that are not carried on the Consolidated balance sheets at fair valueThe following table presents by fair value hierarchy classification the carrying values and estimated fair values at March 31, 2019, and December 31, 2018, of financial assets and liabilities, excluding financial instruments that are carried at fair value on a recurring basis, and their classification within the fair value hierarchy.
March 31, 2019 December 31, 2018
Estimated fair value hierarchy Estimated fair value hierarchy
(in billions)Carrying
value Level 1 Level 2 Level 3
Total estimated fair value
Carrying value Level 1 Level 2 Level 3
Total estimated fair value
Financial assets
Cash and due from banks $ 21.9 $ 21.9 $ — $ — $ 21.9 $ 22.3 $ 22.3 $ — $ — $ 22.3
Deposits with banks 280.7 280.7 — — 280.7 256.5 256.5 — — 256.5
Accrued interest and accountsreceivable 71.2 — 71.1 0.1 71.2 72.0 — 71.9 0.1 72.0
Federal funds sold andsecurities purchased underresale agreements 285.2 — 285.2 — 285.2 308.4 — 308.4 — 308.4
Securities borrowed 117.5 — 117.5 — 117.5 106.9 — 106.9 — 106.9
Investment securities, held-to-maturity 30.8 — 31.5 — 31.5 31.4 — 31.5 — 31.5
Loans, net of allowance for loan losses(a) 939.0 — 229.8 717.5 947.3 968.0 — 241.5 728.5 970.0
Other 56.5 — 55.7 0.9 56.6 60.5 — 59.6 1.0 60.6
Financial liabilities
Deposits $ 1,461.6 $ — $ 1,461.7 $ — $ 1,461.7 $ 1,447.4 $ — $ 1,447.5 $ — $ 1,447.5
Federal funds purchased andsecurities loaned or soldunder repurchase agreements 221.7 — 221.7 — 221.7 181.4 — 181.4 — 181.4
Short-term borrowings 64.1 — 64.1 — 64.1 62.1 — 62.1 — 62.1
Accounts payable and otherliabilities 176.6 0.1 173.0 3.2 176.3 160.6 0.2 157.0 3.0 160.2
Beneficial interests issued byconsolidated VIEs 25.9 — 25.9 — 25.9 20.2 — 20.2 — 20.2
Long-term debt and juniorsubordinated deferrableinterest debentures 229.4 — 229.9 3.3 233.2 227.1 — 224.6 3.3 227.9
(a) Fair value is typically estimated using a discounted cash flow model that incorporates the characteristics of the underlying loans (including principal, contractual interest rate and contractual fees) and other key inputs, including expected lifetime credit losses, interest rates, prepayment rates, and primary origination or secondary market spreads. For certain loans, the fair value is measured based on the value of the underlying collateral. The difference between the estimated fair value and carrying value of a financial asset or liability is the result of the different methodologies used to determine fair value as compared with carrying value. For example, credit losses are estimated for a financial asset’s remaining life in a fair value calculation but are estimated for a loss emergence period in the allowance for loan loss calculation; future loan income (interest and fees) is incorporated in a fair value calculation but is generally not considered in the allowance for loan losses.
The majority of the Firm’s lending-related commitments are not carried at fair value on a recurring basis on the Consolidated balance sheets. The carrying value of the wholesale allowance for lending-related commitments and the estimated fair value of these wholesale lending-related commitments were as follows for the periods indicated.
March 31, 2019 December 31, 2018
Estimated fair value hierarchy Estimated fair value hierarchy
(in billions)Carrying value(a) Level 1 Level 2 Level 3
Totalestimatedfair value
Carrying value(a) Level 1 Level 2 Level 3
Total estimated
fair value(b)
Wholesale lending-related commitments $ 1.0 $ — $ — $ 1.8 $ 1.8 $ 1.0 $ — $ — $ 1.9 $ 1.9
(a) Excludes the current carrying values of the guarantee liability and the offsetting asset, each of which is recognized at fair value at the inception of the guarantees.
(b) The prior period amounts have been revised to conform with the current period presentation.
The Firm does not estimate the fair value of consumer lending-related commitments. In many cases, the Firm can reduce or cancel these commitments by providing the borrower notice or, in some cases as permitted by law, without notice. For a further discussion of the valuation of lending-related commitments, refer to page 161 of JPMorgan Chase’s 2018 Form 10-K.

86
Note 3 – Fair value option For a discussion of the primary financial instruments for which the fair value option was elected, including the basis for those elections and the determination of instrument-specific credit risk, where relevant, refer to Note 3 of JPMorgan Chase’s 2018 Form 10-K.
Changes in fair value under the fair value option electionThe following table presents the changes in fair value included in the Consolidated statements of income for the three months ended March 31, 2019 and 2018, for items for which the fair value option was elected. The profit and loss information presented below only includes the financial instruments that were elected to be measured at fair value; related risk management instruments, which are required to be measured at fair value, are not included in the table.
Three months ended March 31,
2019 2018
(in millions)Principal
transactionsAll otherincome
Total changes in fair value recorded (d)
Principaltransactions
All otherincome
Total changes in fair value recorded (d)
Federal funds sold and securities purchased underresale agreements $ 11 $ — $ 11 $ 7 $ — $ 7
Securities borrowed 37 — 37 (27) — (27)
Trading assets:
Debt and equity instruments, excluding loans 1,354 — 1,354 (186) — (186)
Loans reported as trading assets:
Changes in instrument-specific credit risk 248 3 (c) 251 122 5 (c) 127
Other changes in fair value 80 237 (c) 317 41 (90) (c) (49)
Loans:
Changes in instrument-specific credit risk 5 — 5 — — —
Other changes in fair value — — — (1) — (1)
Other assets 1 — 1 2 (7) (e) (5)
Deposits(a) (496) — (496) 210 — 210
Federal funds purchased and securities loaned orsold under repurchase agreements (5) — (5) 10 — 10
Short-term borrowings(a) (704) — (704) 273 — 273
Trading liabilities 3 — 3 (7) — (7)
Other liabilities (4) — (4) — — —
Long-term debt(a)(b) (2,836) — (2,836) 1,031 — 1,031
(a) Unrealized gains/(losses) due to instrument-specific credit risk (DVA) for liabilities for which the fair value option has been elected is recorded in OCI, while realized gains/(losses) are recorded in principal transactions revenue. Realized gains/(losses) due to instrument-specific credit risk recorded in principal transactions revenue were not material for the three months ended March 31, 2019 and 2018, respectively.
(b) Long-term debt measured at fair value predominantly relates to structured notes. Although the risk associated with the structured notes is actively managed, the gains/(losses) reported in this table do not include the income statement impact of the risk management instruments used to manage such risk.
(c) Reported in mortgage fees and related income.(d) Changes in fair value exclude contractual interest, which is included in interest income and interest expense for all instruments other than hybrid financial
instruments. For further information regarding interest income and interest expense, refer to Note 6.(e) Reported in other income.

87
Difference between aggregate fair value and aggregate remaining contractual principal balance outstandingThe following table reflects the difference between the aggregate fair value and the aggregate remaining contractual principal balance outstanding as of March 31, 2019, and December 31, 2018, for loans, long-term debt and long-term beneficial interests for which the fair value option has been elected.
March 31, 2019 December 31, 2018
(in millions)
Contractualprincipal
outstanding Fair value
Fair valueover/(under)contractual
principaloutstanding
Contractualprincipal
outstanding Fair value
Fair valueover/(under)contractual
principaloutstanding
Loans(a)
Nonaccrual loans
Loans reported as trading assets $ 4,262 $ 1,338 $ (2,924) $ 4,240 $ 1,350 $ (2,890)
Loans 124 78 (46) 39 — (39)
Subtotal 4,386 1,416 (2,970) 4,279 1,350 (2,929)
All other performing loans
Loans reported as trading assets 44,140 43,074 (1,066) 42,215 40,403 (1,812)
Loans 3,678 3,641 (37) 3,186 3,151 (35)
Total loans $ 52,204 $ 48,131 $ (4,073) $ 49,680 $ 44,904 $ (4,776)
Long-term debt
Principal-protected debt $ 34,634 (c) $ 31,994 $ (2,640) $ 32,674 (c) $ 28,718 $ (3,956)
Nonprincipal-protected debt(b) NA 29,247 NA NA 26,168 NA
Total long-term debt NA $ 61,241 NA NA $ 54,886 NA
Long-term beneficial interests
Nonprincipal-protected debt(b) NA $ 13 NA NA $ 28 NA
Total long-term beneficial interests NA $ 13 NA NA $ 28 NA
(a) There were no performing loans that were ninety days or more past due as of March 31, 2019, and December 31, 2018, respectively.(b) Remaining contractual principal is not applicable to nonprincipal-protected structured notes and long-term beneficial interests. Unlike principal-protected
structured notes and long-term beneficial interests, for which the Firm is obligated to return a stated amount of principal at maturity, nonprincipal-protected structured notes and long-term beneficial interests do not obligate the Firm to return a stated amount of principal at maturity, but for structured notes to return an amount based on the performance of an underlying variable or derivative feature embedded in the note. However, investors are exposed to the credit risk of the Firm as issuer for both nonprincipal-protected and principal-protected notes.
(c) Where the Firm issues principal-protected zero-coupon or discount notes, the balance reflects the contractual principal payment at maturity or, if applicable, the contractual principal payment at the Firm’s next call date.
At March 31, 2019, and December 31, 2018, the contractual amount of lending-related commitments for which the fair value option was elected was $7.8 billion and $6.9 billion, respectively, with a corresponding fair value of $(78) million and $(82) million, respectively. For further information regarding off-balance sheet lending-related financial instruments, refer to Note 27 of JPMorgan Chase’s 2018 Form 10-K, and Note 22 of this Form 10-Q.
Structured note products by balance sheet classification and risk componentThe following table presents the fair value of structured notes, by balance sheet classification and the primary risk type.
March 31, 2019 December 31, 2018
(in millions)Long-term
debtShort-termborrowings Deposits Total
Long-termdebt
Short-termborrowings Deposits Total
Risk exposure
Interest rate $ 27,338 $ 95 $ 20,129 $ 47,562 $ 24,137 $ 62 $ 12,372 $ 36,571
Credit 4,205 460 — 4,665 4,009 995 — 5,004
Foreign exchange 3,368 112 38 3,518 3,169 157 38 3,364
Equity 24,061 6,182 7,927 38,170 21,382 5,422 7,368 34,172
Commodity 392 10 1,489 1,891 372 34 1,207 1,613
Total structured notes $ 59,364 $ 6,859 $ 29,583 $ 95,806 $ 53,069 $ 6,670 $ 20,985 $ 80,724

88
Note 4 – Derivative instrumentsJPMorgan Chase makes markets in derivatives for clients and also uses derivatives to hedge or manage its own risk exposures. For a further discussion of the Firm’s use of and accounting policies regarding derivative instruments, refer to Note 5 of JPMorgan Chase’s 2018 Form 10-K.
The Firm’s disclosures are based on the accounting treatment and purpose of these derivatives. A limited number of the Firm’s derivatives are designated in hedge
accounting relationships and are disclosed according to the type of hedge (fair value hedge, cash flow hedge, or net investment hedge). Derivatives not designated in hedge accounting relationships include certain derivatives that are used to manage certain risks associated with specified assets or liabilities (“specified risk management” positions) as well as derivatives used in the Firm’s market-making businesses or for other purposes.
The following table outlines the Firm’s primary uses of derivatives and the related hedge accounting designation or disclosure category.
Type of Derivative Use of Derivative Designation and disclosureAffected
segment or unit10-Q pagereference
Manage specifically identified risk exposures in qualifying hedge accounting relationships:
• Interest rate Hedge fixed rate assets and liabilities Fair value hedge Corporate 94-95
• Interest rate Hedge floating-rate assets and liabilities Cash flow hedge Corporate 96
• Foreign exchange Hedge foreign currency-denominated assets and liabilities Fair value hedge Corporate 94-95
• Foreign exchange Hedge foreign currency-denominated forecasted revenue andexpense
Cash flow hedge Corporate 96
• Foreign exchange Hedge the value of the Firm’s investments in non-U.S. dollarfunctional currency entities
Net investment hedge Corporate 97
• Commodity Hedge commodity inventory Fair value hedge CIB 94-95
Manage specifically identified risk exposures not designated in qualifying hedge accountingrelationships:• Interest rate Manage the risk of the mortgage pipeline, warehouse loans and
MSRsSpecified risk management CCB 97
• Credit Manage the credit risk of wholesale lending exposures Specified risk management CIB 97
• Interest rate and foreign exchange
Manage the risk of certain other specified assets and liabilities Specified risk management Corporate 97
Market-making derivatives and other activities:
• Various Market-making and related risk management Market-making and other CIB 97
• Various Other derivatives Market-making and other CIB, AWM,Corporate
97

89
Notional amount of derivative contractsThe following table summarizes the notional amount of derivative contracts outstanding as of March 31, 2019, and December 31, 2018.
Notional amounts(b)
(in billions)March 31,
2019December 31,
2018
Interest rate contracts
Swaps $ 26,342 $ 21,763
Futures and forwards 7,369 3,562
Written options 4,613 3,997
Purchased options 5,056 4,322
Total interest rate contracts 43,380 33,644
Credit derivatives(a) 1,366 1,501
Foreign exchange contracts
Cross-currency swaps 3,731 3,548
Spot, futures and forwards 6,936 5,871
Written options 925 835
Purchased options 938 830
Total foreign exchange contracts 12,530 11,084
Equity contracts
Swaps 373 346
Futures and forwards 122 101
Written options 586 528
Purchased options 532 490
Total equity contracts 1,613 1,465
Commodity contracts
Swaps 147 134
Spot, futures and forwards 152 156
Written options 131 135
Purchased options 119 120
Total commodity contracts 549 545
Total derivative notional amounts $ 59,438 $ 48,239
(a) For more information on volumes and types of credit derivative contracts, refer to the Credit derivatives discussion on page 98.
(b) Represents the sum of gross long and gross short third-party notional derivative contracts.
While the notional amounts disclosed above give an indication of the volume of the Firm’s derivatives activity, the notional amounts significantly exceed, in the Firm’s view, the possible losses that could arise from such transactions. For most derivative contracts, the notional amount is not exchanged; it is used simply as a reference to calculate payments.

90
Impact of derivatives on the Consolidated balance sheetsThe following table summarizes information on derivative receivables and payables (before and after netting adjustments) that are reflected on the Firm’s Consolidated balance sheets as of March 31, 2019, and December 31, 2018, by accounting designation (e.g., whether the derivatives were designated in qualifying hedge accounting relationships or not) and contract type.
Free-standing derivative receivables and payables(a)
Gross derivative receivables Gross derivative payables
March 31, 2019(in millions)
Notdesignatedas hedges
Designatedas hedges
Totalderivative
receivables
Net derivative
receivables(b)
Notdesignatedas hedges
Designated as hedges
Totalderivativepayables
Net derivative payables(b)
Trading assets andliabilities
Interest rate $ 291,442 $ 825 $ 292,267 $ 22,758 $ 262,369 $ 1 $ 262,370 $ 7,722
Credit 15,920 — 15,920 724 17,039 — 17,039 1,983
Foreign exchange 149,517 478 149,995 11,871 146,994 1,038 148,032 11,398
Equity 43,264 — 43,264 9,322 45,645 — 45,645 11,029
Commodity 14,904 125 15,029 5,658 16,918 215 17,133 6,871
Total fair value of tradingassets and liabilities $ 515,047 $ 1,428 $ 516,475 $ 50,333 $ 488,965 $ 1,254 $ 490,219 $ 39,003
Gross derivative receivables Gross derivative payables
December 31, 2018(in millions)
Notdesignatedas hedges
Designatedas hedges
Totalderivative
receivables
Net derivative
receivables(b)
Notdesignatedas hedges
Designatedas hedges
Totalderivativepayables
Net derivative payables(b)
Trading assets andliabilities
Interest rate $ 267,871 $ 833 $ 268,704 $ 23,214 $ 242,782 $ — $ 242,782 $ 7,784
Credit 20,095 — 20,095 612 20,276 — 20,276 1,667
Foreign exchange 167,057 628 167,685 13,450 164,392 825 165,217 12,785
Equity 49,285 — 49,285 9,946 51,195 — 51,195 10,161
Commodity 20,223 247 20,470 6,991 22,297 121 22,418 9,372
Total fair value of tradingassets and liabilities $ 524,531 $ 1,708 $ 526,239 $ 54,213 $ 500,942 $ 946 $ 501,888 $ 41,769
(a) Balances exclude structured notes for which the fair value option has been elected. Refer to Note 3 for further information.(b) As permitted under U.S. GAAP, the Firm has elected to net derivative receivables and derivative payables and the related cash collateral receivables and
payables when a legally enforceable master netting agreement exists.

91
Derivatives netting The following tables present, as of March 31, 2019, and December 31, 2018, gross and net derivative receivables and payables by contract and settlement type. Derivative receivables and payables, as well as the related cash collateral from the same counterparty have been netted on the Consolidated balance sheets where the Firm has obtained an appropriate legal opinion with respect to the master netting agreement. Where such a legal opinion has not been either sought or obtained, amounts are not eligible for netting on the Consolidated balance sheets, and those derivative receivables and payables are shown separately in the tables below.
In addition to the cash collateral received and transferred that is presented on a net basis with derivative receivables and payables, the Firm receives and transfers additional collateral (financial instruments and cash). These amounts mitigate counterparty credit risk associated with the Firm’s derivative instruments, but are not eligible for net presentation:
• collateral that consists of non-cash financial instruments (generally U.S. government and agency securities and other G7 government securities) and cash collateral held at third-party custodians, which are shown separately as “Collateral not nettable on the Consolidated balance sheets” in the tables below, up to the fair value exposure amount.
• the amount of collateral held or transferred that exceeds the fair value exposure at the individual counterparty level, as of the date presented, which is excluded from the tables below; and
• collateral held or transferred that relates to derivative receivables or payables where an appropriate legal opinion has not been either sought or obtained with respect to the master netting agreement, which is excluded from the tables below.
March 31, 2019 December 31, 2018
(in millions)
Grossderivative
receivables
Amountsnetted on theConsolidated
balance sheets
Netderivative
receivables
Grossderivative
receivables
Amountsnetted on theConsolidated
balance sheets
Netderivative
receivables
U.S. GAAP nettable derivative receivables
Interest rate contracts:
Over-the-counter (“OTC”) $ 279,231 $ (260,493) $ 18,738 $ 258,227 $ (239,498) $ 18,729
OTC–cleared 8,794 (8,732) 62 6,404 (5,856) 548
Exchange-traded(a) 320 (284) 36 322 (136) 186
Total interest rate contracts 288,345 (269,509) 18,836 264,953 (245,490) 19,463
Credit contracts:
OTC 12,231 (11,713) 518 12,648 (12,261) 387
OTC–cleared 3,533 (3,483) 50 7,267 (7,222) 45
Total credit contracts 15,764 (15,196) 568 19,915 (19,483) 432
Foreign exchange contracts:
OTC 147,288 (137,858) 9,430 163,862 (153,988) 9,874
OTC–cleared 275 (262) 13 235 (226) 9
Exchange-traded(a) 24 (4) 20 32 (21) 11
Total foreign exchange contracts 147,587 (138,124) 9,463 164,129 (154,235) 9,894
Equity contracts:
OTC 22,945 (20,477) 2,468 26,178 (23,879) 2,299
Exchange-traded(a) 16,500 (13,465) 3,035 18,876 (15,460) 3,416
Total equity contracts 39,445 (33,942) 5,503 45,054 (39,339) 5,715
Commodity contracts:
OTC 4,892 (3,372) 1,520 7,448 (5,261) 2,187
OTC–cleared 13 (11) 2 — — —
Exchange-traded(a) 6,106 (5,988) 118 8,815 (8,218) 597
Total commodity contracts 11,011 (9,371) 1,640 16,263 (13,479) 2,784
Derivative receivables with appropriate legal opinion 502,152 (466,142) 36,010 (d) 510,314 (472,026) 38,288 (d)
Derivative receivables where an appropriate legalopinion has not been either sought or obtained 14,323 14,323 15,925 15,925
Total derivative receivables recognized on theConsolidated balance sheets $ 516,475 $ 50,333 $ 526,239 $ 54,213
Collateral not nettable on the Consolidated balance sheets(b)(c) (11,929) (13,046)
Net amounts $ 38,404 $ 41,167

92
March 31, 2019 December 31, 2018
(in millions)
Grossderivativepayables
Amountsnetted on theConsolidated
balance sheets
Netderivativepayables
Grossderivativepayables
Amountsnetted on theConsolidated
balance sheets
Netderivativepayables
U.S. GAAP nettable derivative payables
Interest rate contracts:
OTC $ 250,582 $ (245,040) $ 5,542 $ 233,404 $ (228,369) $ 5,035
OTC–cleared 9,873 (9,290) 583 7,163 (6,494) 669
Exchange-traded(a) 350 (318) 32 210 (135) 75
Total interest rate contracts 260,805 (254,648) 6,157 240,777 (234,998) 5,779
Credit contracts:
OTC 13,617 (11,863) 1,754 13,412 (11,895) 1,517
OTC–cleared 3,251 (3,193) 58 6,716 (6,714) 2
Total credit contracts 16,868 (15,056) 1,812 20,128 (18,609) 1,519
Foreign exchange contracts:
OTC 145,047 (136,368) 8,679 160,930 (152,161) 8,769
OTC–cleared 275 (262) 13 274 (268) 6
Exchange-traded(a) 7 (4) 3 16 (3) 13
Total foreign exchange contracts 145,329 (136,634) 8,695 161,220 (152,432) 8,788
Equity contracts:
OTC 25,939 (21,157) 4,782 29,437 (25,544) 3,893
Exchange-traded(a) 14,728 (13,459) 1,269 16,285 (15,490) 795
Total equity contracts 40,667 (34,616) 6,051 45,722 (41,034) 4,688
Commodity contracts:
OTC 5,811 (4,291) 1,520 8,930 (4,838) 4,092
OTC–cleared 11 (11) — — — —
Exchange-traded(a) 6,284 (5,960) 324 8,259 (8,208) 51
Total commodity contracts 12,106 (10,262) 1,844 17,189 (13,046) 4,143
Derivative payables with appropriate legal opinion 475,775 (451,216) 24,559 (d) 485,036 (460,119) 24,917 (d)
Derivative payables where an appropriate legal opinionhas not been either sought or obtained 14,444 14,444 16,852 16,852
Total derivative payables recognized on theConsolidated balance sheets $ 490,219 $ 39,003 $ 501,888 $ 41,769
Collateral not nettable on the Consolidated balance sheets(b)(c) (4,993) (4,449)
Net amounts $ 34,010 $ 37,320
(a) Exchange-traded derivative balances that relate to futures contracts are settled daily.(b) Represents liquid security collateral as well as cash collateral held at third-party custodians related to derivative instruments where an appropriate legal
opinion has been obtained. For some counterparties, the collateral amounts of financial instruments may exceed the derivative receivables and derivative payables balances. Where this is the case, the total amount reported is limited to the net derivative receivables and net derivative payables balances with that counterparty.
(c) Derivative collateral relates only to OTC and OTC-cleared derivative instruments.(d) Net derivatives receivable included cash collateral netted of $59.5 billion and $55.2 billion at March 31, 2019, and December 31, 2018, respectively. Net
derivatives payable included cash collateral netted of $44.6 billion and $43.3 billion at March 31, 2019, and December 31, 2018, respectively. Derivative cash collateral relates to OTC and OTC-cleared derivative instruments.

93
Liquidity risk and credit-related contingent features For a more detailed discussion of liquidity risk and credit-related contingent features related to the Firm’s derivative contracts, refer to Note 5 of JPMorgan Chase’s 2018 Form 10-K.
The following table shows the aggregate fair value of net derivative payables related to OTC and OTC-cleared derivatives that contain contingent collateral or termination features that may be triggered upon a ratings downgrade, and the associated collateral the Firm has posted in the normal course of business, at March 31, 2019, and December 31, 2018.
OTC and OTC-cleared derivative payables containingdowngrade triggers
(in millions)March 31,
2019December 31,
2018
Aggregate fair value of netderivative payables $ 13,718 $ 9,396
Collateral posted 11,617 8,907
The following table shows the impact of a single-notch and two-notch downgrade of the long-term issuer ratings of JPMorgan Chase & Co. and its subsidiaries, predominantly JPMorgan Chase Bank, National Association (“JPMorgan Chase Bank, N.A.”), at March 31, 2019, and December 31, 2018, related to OTC and OTC-cleared derivative contracts with contingent collateral or termination features that may be triggered upon a ratings downgrade. Derivatives contracts generally require additional collateral to be posted or terminations to be triggered when the predefined threshold rating is breached. A downgrade by a single rating agency that does not result in a rating lower than a preexisting corresponding rating provided by another major rating agency will generally not result in additional collateral, (except in certain instances in which additional initial margin may be required upon a ratings downgrade), nor in termination payments requirements. The liquidity impact in the table is calculated based upon a downgrade below the lowest current rating of the rating agencies referred to in the derivative contract.
Liquidity impact of downgrade triggers on OTC and OTC-cleared derivativesMarch 31, 2019 December 31, 2018
(in millions)Single-notchdowngrade
Two-notchdowngrade
Single-notchdowngrade
Two-notchdowngrade
Amount of additional collateral to be posted upon downgrade(a) $ 107 $ 1,066 $ 76 $ 947
Amount required to settle contracts with termination triggers upon downgrade(b) 311 1,402 172 764
(a) Includes the additional collateral to be posted for initial margin.(b) Amounts represent fair values of derivative payables, and do not reflect collateral posted.
Derivatives executed in contemplation of a sale of the underlying financial asset In certain instances the Firm enters into transactions in which it transfers financial assets but maintains the economic exposure to the transferred assets by entering into a derivative with the same counterparty in contemplation of the initial transfer. The Firm generally accounts for such transfers as collateralized financing transactions as described in Note 10, but in limited circumstances they may qualify to be accounted for as a sale and a derivative under U.S. GAAP. The amount of such transfers accounted for as a sale where the associated derivative was outstanding was not material at both March 31, 2019 and December 31, 2018.

94
Impact of derivatives on the Consolidated statements of incomeThe following tables provide information related to gains and losses recorded on derivatives based on their hedge accounting designation or purpose.
Fair value hedge gains and lossesThe following tables present derivative instruments, by contract type, used in fair value hedge accounting relationships, as well as pre-tax gains/(losses) recorded on such derivatives and the related hedged items for the three months ended March 31, 2019 and 2018, respectively. The Firm includes gains/(losses) on the hedging derivative in the same line item in the Consolidated statements of income as the related hedged item.
Gains/(losses) recorded in incomeIncome statement impact of
excluded components(e) OCI impact
Three months ended March 31, 2019(in millions) Derivatives Hedged items
Incomestatement
impactAmortization
approachChanges in fair
value
Derivatives - Gains/(losses)
recorded in OCI(f)
Contract type
Interest rate(a)(b) $ 1,464 $ (1,293) $ 171 $ — $ 172 $ —
Foreign exchange(c) (290) 409 119 (222) 119 3
Commodity(d) (288) 294 6 — 1 —
Total $ 886 $ (590) $ 296 $ (222) $ 292 $ 3
Gains/(losses) recorded in incomeIncome statement impact of
excluded components(e) OCI impact
Three months ended March 31, 2018(in millions) Derivatives Hedged items
Incomestatement
impactAmortization
approachChanges in fair
value
Derivatives - Gains/(losses)
recorded in OCI(f)
Contract type
Interest rate(a)(b) $ (1,477) $ 1,629 $ 152 $ — $ 147 $ —
Foreign exchange(c) 144 (33) 111 (122) 111 (52)
Commodity(d) 184 (147) 37 — 18 —
Total $ (1,149) $ 1,449 $ 300 $ (122) $ 276 $ (52)
(a) Primarily consists of hedges of the benchmark (e.g., London Interbank Offered Rate (“LIBOR”)) interest rate risk of fixed-rate long-term debt and AFS securities. Gains and losses were recorded in net interest income.
(b) Excludes the amortization expense associated with the inception hedge accounting adjustment applied to the hedged item. This expense is recorded in net interest income and substantially offsets the income statement impact of the excluded components. Also excludes the accrual of interest on interest rate swaps and the related hedged items.
(c) Primarily consists of hedges of the foreign currency risk of long-term debt and AFS securities for changes in spot foreign currency rates. Gains and losses related to the derivatives and the hedged items due to changes in foreign currency rates and the income statement impact of excluded components were recorded primarily in principal transactions revenue and net interest income.
(d) Consists of overall fair value hedges of physical commodities inventories that are generally carried at the lower of cost or net realizable value (net realizable value approximates fair value). Gains and losses were recorded in principal transactions revenue.
(e) The assessment of hedge effectiveness excludes certain components of the changes in fair values of the derivatives and hedged items such as forward points on foreign exchange forward contracts, time values and cross-currency basis spreads. The initial amount of the excluded components may be amortized into income over the life of the derivative, or changes in fair value may be recognized in current period earnings.
(f) Represents the change in value of amounts excluded from the assessment of effectiveness under the amortization approach, predominantly cross-currency basis spreads. The amount excluded at inception of the hedge is recognized in earnings over the life of the derivative.
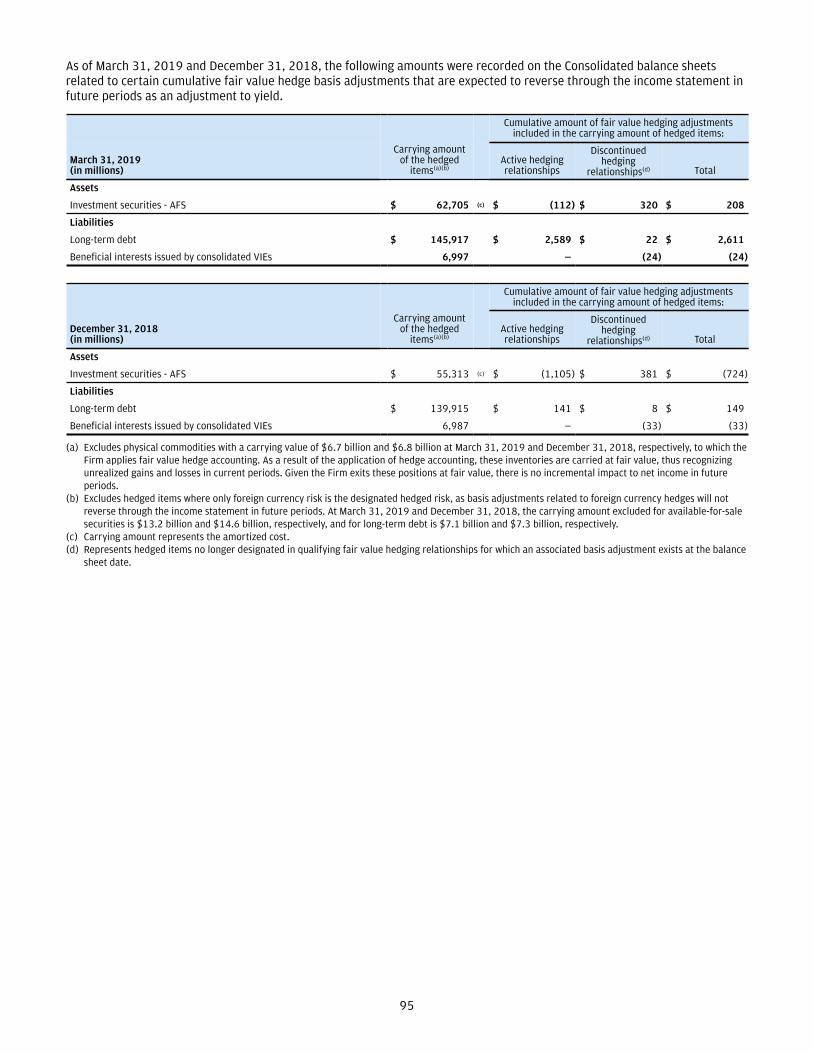
95
As of March 31, 2019 and December 31, 2018, the following amounts were recorded on the Consolidated balance sheets related to certain cumulative fair value hedge basis adjustments that are expected to reverse through the income statement in future periods as an adjustment to yield.
Carrying amount of the hedged
items(a)(b)
Cumulative amount of fair value hedging adjustments included in the carrying amount of hedged items:
March 31, 2019(in millions)
Active hedgingrelationships
Discontinued hedging
relationships(d) Total
Assets
Investment securities - AFS $ 62,705 (c) $ (112) $ 320 $ 208
Liabilities
Long-term debt $ 145,917 $ 2,589 $ 22 $ 2,611
Beneficial interests issued by consolidated VIEs 6,997 — (24) (24)
Carrying amount of the hedged
items(a)(b)
Cumulative amount of fair value hedging adjustmentsincluded in the carrying amount of hedged items:
December 31, 2018(in millions)
Active hedgingrelationships
Discontinued hedging
relationships(d) Total
Assets
Investment securities - AFS $ 55,313 (c) $ (1,105) $ 381 $ (724)
Liabilities
Long-term debt $ 139,915 $ 141 $ 8 $ 149
Beneficial interests issued by consolidated VIEs 6,987 — (33) (33)
(a) Excludes physical commodities with a carrying value of $6.7 billion and $6.8 billion at March 31, 2019 and December 31, 2018, respectively, to which the Firm applies fair value hedge accounting. As a result of the application of hedge accounting, these inventories are carried at fair value, thus recognizing unrealized gains and losses in current periods. Given the Firm exits these positions at fair value, there is no incremental impact to net income in future periods.
(b) Excludes hedged items where only foreign currency risk is the designated hedged risk, as basis adjustments related to foreign currency hedges will not reverse through the income statement in future periods. At March 31, 2019 and December 31, 2018, the carrying amount excluded for available-for-sale securities is $13.2 billion and $14.6 billion, respectively, and for long-term debt is $7.1 billion and $7.3 billion, respectively.
(c) Carrying amount represents the amortized cost.(d) Represents hedged items no longer designated in qualifying fair value hedging relationships for which an associated basis adjustment exists at the balance
sheet date.

96
Cash flow hedge gains and lossesThe following tables present derivative instruments, by contract type, used in cash flow hedge accounting relationships, and the pre-tax gains/(losses) recorded on such derivatives, for the three months ended March 31, 2019 and 2018, respectively. The Firm includes the gain/(loss) on the hedging derivative in the same line item in the Consolidated statements of income as the change in cash flows on the related hedged item.
Derivatives gains/(losses) recorded in income and othercomprehensive income/(loss)
Three months ended March 31, 2019(in millions)
Amountsreclassified fromAOCI to income
Amounts recordedin OCI
Total change in OCI
for period
Contract type
Interest rate(a) $ 2 $ 56 $ 54
Foreign exchange(b) (41) 85 126
Total $ (39) $ 141 $ 180
Derivatives gains/(losses) recorded in income and othercomprehensive income/(loss)
Three months ended March 31, 2018(in millions)
Amountsreclassified fromAOCI to income
Amounts recordedin OCI
Total changein OCI
for period
Contract type
Interest rate(a) $ 13 $ (78) $ (91)
Foreign exchange(b) 39 34 (5)
Total $ 52 $ (44) $ (96)
(a) Primarily consists of hedges of LIBOR-indexed floating-rate assets and floating-rate liabilities. Gains and losses were recorded in net interest income.(b) Primarily consists of hedges of the foreign currency risk of non-U.S. dollar-denominated revenue and expense. The income statement classification of gains
and losses follows the hedged item – primarily noninterest revenue and compensation expense.
The Firm did not experience any forecasted transactions that failed to occur for the three months ended March 31, 2019 and 2018.
Over the next 12 months, the Firm expects that approximately $24 million (after-tax) of net gains recorded in AOCI at March 31, 2019, related to cash flow hedges will be recognized in income. For cash flow hedges that have been terminated, the maximum length of time over which the derivative results recorded in AOCI will be recognized in earnings is approximately six years, corresponding to the timing of the originally hedged forecasted cash flows.
For open cash flow hedges, the maximum length of time over which forecasted transactions are hedged is approximately six years. The Firm’s longer-dated forecasted transactions relate to core lending and borrowing activities.

97
Net investment hedge gains and lossesThe following table presents hedging instruments, by contract type, that were used in net investment hedge accounting relationships, and the pre-tax gains/(losses) recorded on such instruments for the three months ended March 31, 2019 and 2018.
2019 2018
Three months ended March 31,(in millions)
Amounts recorded in income(a)
Amountsrecorded in OCI
Amounts recorded in income(a)(b)
Amountsrecorded in OCI
Foreign exchange derivatives $ 21 $ (38) $ (10) $ (389)
(a) Certain components of hedging derivatives are permitted to be excluded from the assessment of hedge effectiveness, such as forward points on foreign exchange forward contracts. The Firm elects to record changes in fair value of these amounts directly in other income.
(b) The prior period amount has been revised to conform with the current period presentation.
Gains and losses on derivatives used for specified risk management purposesThe following table presents pre-tax gains/(losses) recorded on a limited number of derivatives, not designated in hedge accounting relationships, that are used to manage risks associated with certain specified assets and liabilities, including certain risks arising from the mortgage pipeline, warehouse loans, MSRs, wholesale lending exposures, and foreign currency-denominated assets and liabilities.
Derivatives gains/(losses) recorded in income
Three months ended March 31,
(in millions) 2019 2018
Contract type
Interest rate(a) $ 292 $ (210)
Credit(b) (10) (7)
Foreign exchange(c)(d) 50 (18)
Total (d) $ 332 $ (235)
(a) Primarily represents interest rate derivatives used to hedge the interest rate risk inherent in the mortgage pipeline, warehouse loans and MSRs, as well as written commitments to originate warehouse loans. Gains and losses were recorded predominantly in mortgage fees and related income.
(b) Relates to credit derivatives used to mitigate credit risk associated with lending exposures in the Firm’s wholesale businesses. These derivatives do not include credit derivatives used to mitigate counterparty credit risk arising from derivative receivables, which is included in gains and losses on derivatives related to market-making activities and other derivatives. Gains and losses were recorded in principal transactions revenue.
(c) Primarily relates to derivatives used to mitigate foreign exchange risk of specified foreign currency-denominated assets and liabilities. Gains and losses were recorded in principal transactions revenue.
(d) The prior period amounts have been revised to conform with the current period presentation.
Gains and losses on derivatives related to market-making activities and other derivativesThe Firm makes markets in derivatives in order to meet the needs of customers and uses derivatives to manage certain risks associated with net open risk positions from its market-making activities, including the counterparty credit risk arising from derivative receivables. All derivatives not included in the hedge accounting or specified risk management categories above are included in this category. Gains and losses on these derivatives are primarily recorded in principal transactions revenue. Refer to Note 5 for information on principal transactions revenue.

98
Credit derivativesFor a more detailed discussion of credit derivatives, refer to Note 5 of JPMorgan Chase’s 2018 Form 10-K. The Firm does not use notional amounts of credit derivatives as the primary measure of risk management for such derivatives, because the notional amount does not take into account the probability of the occurrence of a credit event, the recovery value of the reference obligation, or related cash instruments and economic hedges, each of which reduces, in the Firm’s view, the risks associated with such derivatives.
Total credit derivatives and credit-related notes
Maximum payout/Notional amount
March 31, 2019 (in millions) Protection sold
Protection purchased with
identical underlyings(b)Net protection
(sold)/purchased(c)
Other protection
purchased(d)
Credit derivatives
Credit default swaps $ (637,127) $ 644,885 $ 7,758 $ 3,649
Other credit derivatives(a) (31,830) 40,308 8,478 8,562
Total credit derivatives (668,957) 685,193 16,236 12,211
Credit-related notes — — — 8,480
Total $ (668,957) $ 685,193 $ 16,236 $ 20,691
Maximum payout/Notional amount
December 31, 2018 (in millions) Protection sold
Protection purchased with
identical underlyings(b)Net protection
(sold)/purchased(c)
Other protection
purchased(d)
Credit derivatives
Credit default swaps $ (697,220) $ 707,282 $ 10,062 $ 4,053
Other credit derivatives(a) (41,244) 42,484 1,240 8,488
Total credit derivatives (738,464) 749,766 11,302 12,541
Credit-related notes — — — 8,425
Total $ (738,464) $ 749,766 $ 11,302 $ 20,966
(a) Other credit derivatives predominantly consists of credit swap options and total return swaps.(b) Represents the total notional amount of protection purchased where the underlying reference instrument is identical to the reference instrument on protection sold;
the notional amount of protection purchased for each individual identical underlying reference instrument may be greater or lower than the notional amount of protection sold.
(c) Does not take into account the fair value of the reference obligation at the time of settlement, which would generally reduce the amount the seller of protection pays to the buyer of protection in determining settlement value.
(d) Represents protection purchased by the Firm on referenced instruments (single-name, portfolio or index) where the Firm has not sold any protection on the identical reference instrument.
The following tables summarize the notional amounts by the ratings, maturity profile, and total fair value, of credit derivatives and credit-related notes as of March 31, 2019, and December 31, 2018, where JPMorgan Chase is the seller of protection. The maturity profile is based on the remaining contractual maturity of the credit derivative contracts. The ratings profile is based on the rating of the reference entity on which the credit derivative contract is based. The ratings and maturity profile of credit derivatives and credit-related notes where JPMorgan Chase is the purchaser of protection are comparable to the profile reflected below.
Protection sold — credit derivatives and credit-related notes ratings(a)/maturity profile
March 31, 2019(in millions) <1 year 1–5 years >5 years
Total notional amount
Fair value of receivables(b)
Fair value of payables(b)
Net fairvalue
Risk rating of reference entity
Investment-grade $(99,793) $(320,772) $(84,703) $(505,268) $5,166 $(1,473) $3,693
Noninvestment-grade (38,603) (97,608) (27,478) (163,689) 4,668 (4,222) 446
Total $(138,396) $(418,380) $(112,181) $(668,957) $9,834 $(5,695) $4,139
December 31, 2018(in millions) <1 year 1–5 years >5 years
Total notional amount
Fair value of receivables(b)
Fair value of payables(b)
Net fairvalue
Risk rating of reference entity
Investment-grade $(115,443) $(402,325) $(43,611) $(561,379) $5,720 $(2,791) $2,929
Noninvestment-grade (45,897) (119,348) (11,840) (177,085) 4,719 (5,660) (941)
Total $(161,340) $(521,673) $(55,451) $(738,464) $10,439 $(8,451) $1,988
(a) The ratings scale is primarily based on external credit ratings defined by S&P and Moody’s.(b) Amounts are shown on a gross basis, before the benefit of legally enforceable master netting agreements and cash collateral received by the Firm.

99
Note 5 – Noninterest revenue and noninterest expense
Noninterest revenueFor a discussion of the components of and accounting policies for the Firm’s noninterest revenue, refer to Note 6 of JPMorgan Chase’s 2018 Form 10-K.
Investment banking feesThe following table presents the components of investment banking fees.
Three months endedMarch 31,
(in millions) 2019 2018
Underwriting
Equity $ 261 $ 352
Debt 945 796
Total underwriting 1,206 1,148
Advisory 634 588
Total investment banking fees $ 1,840 $ 1,736
Principal transactionsThe following table presents all realized and unrealized gains and losses recorded in principal transactions revenue. This table excludes interest income and interest expense on trading assets and liabilities, which are an integral part of the overall performance of the Firm’s client-driven market-making activities in CIB and cash deployment activities in Treasury-CIO. Refer to Note 6 for further information on interest income and interest expense. Trading revenue is presented primarily by instrument type. The Firm’s client-driven market-making businesses generally utilize a variety of instrument types in connection with their market-making and related risk-management activities; accordingly, the trading revenue presented in the table below is not representative of the total revenue of any individual line of business.
Three months endedMarch 31,
(in millions) 2019 2018
Trading revenue by instrument type
Interest rate $ 605 $ 774
Credit 559 380
Foreign exchange 888 1,024
Equity 1,615 1,627
Commodity 383 277
Total trading revenue 4,050 4,082
Private equity gains/(losses) 26 (130)
Principal transactions $ 4,076 $ 3,952
Lending- and deposit-related feesThe following table presents the components of lending- and deposit-related fees.
Three months endedMarch 31,
(in millions) 2019 2018
Lending-related fees $ 290 $ 274
Deposit-related fees 1,192 1,203
Total lending- and deposit-related fees $ 1,482 $ 1,477
Asset management, administration and commissionsThe following table presents the components of Firmwide asset management, administration and commissions.
Three months endedMarch 31,
(in millions) 2019 2018
Asset management fees
Investment management fees(a) $ 2,577 $ 2,694
All other asset management fees(b) 69 66
Total asset management fees 2,646 2,760
Total administration fees(c) 535 561
Commissions and other fees
Brokerage commissions 586 652
All other commissions and fees 347 336
Total commissions and fees 933 988
Total asset management, administration andcommissions $ 4,114 $ 4,309
(a) Represents fees earned from managing assets on behalf of the Firm’s clients, including investors in Firm-sponsored funds and owners of separately managed investment accounts.
(b) Represents fees for services that are ancillary to investment management services, such as commissions earned on the sales or distribution of mutual funds to clients.
(c) Predominantly includes fees for custody, securities lending, funds services and securities clearance.
Card incomeThe following table presents the components of card income:
Three months endedMarch 31,
(in millions) 2019 2018
Interchange and merchant processing income $ 4,721 $ 4,359
Rewards costs and partner payments (3,236) (2,884)
Other card income(a) (211) (200)
Total card income $ 1,274 $ 1,275
(a) Predominantly represents annual fees and new account origination costs, which are deferred and recognized on a straight-line basis over a 12-month period.
For information on operating lease income included within other income, refer to Note 16.
Noninterest expenseOther expenseOther expense on the Firm’s Consolidated statements of income included the following:
Three months endedMarch 31,
(in millions) 2019 2018
Legal expense/(benefit) $ (81) $ 70
FDIC-related expense 143 383
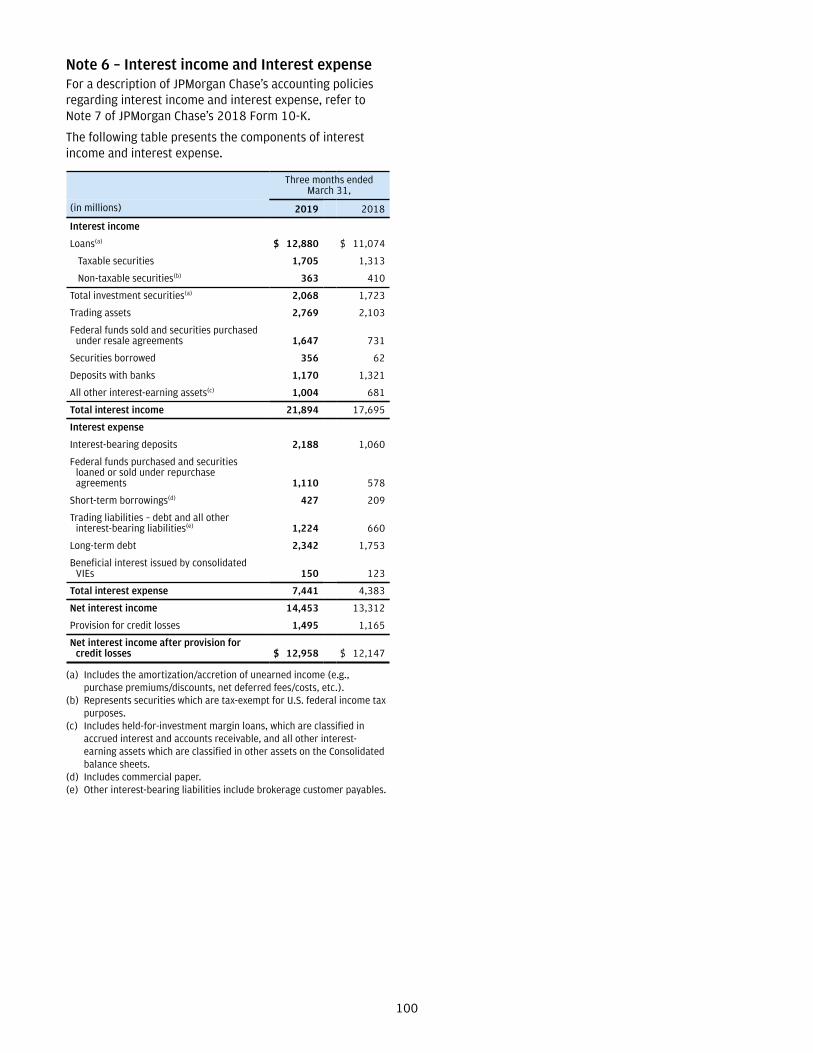
100
Note 6 – Interest income and Interest expenseFor a description of JPMorgan Chase’s accounting policies regarding interest income and interest expense, refer to Note 7 of JPMorgan Chase’s 2018 Form 10-K.
The following table presents the components of interest income and interest expense.
Three months endedMarch 31,
(in millions) 2019 2018
Interest income
Loans(a) $ 12,880 $ 11,074
Taxable securities 1,705 1,313
Non-taxable securities(b) 363 410
Total investment securities(a) 2,068 1,723
Trading assets 2,769 2,103
Federal funds sold and securities purchasedunder resale agreements 1,647 731
Securities borrowed 356 62
Deposits with banks 1,170 1,321
All other interest-earning assets(c) 1,004 681
Total interest income 21,894 17,695
Interest expense
Interest-bearing deposits 2,188 1,060
Federal funds purchased and securitiesloaned or sold under repurchaseagreements 1,110 578
Short-term borrowings(d) 427 209
Trading liabilities – debt and all other interest-bearing liabilities(e) 1,224 660
Long-term debt 2,342 1,753
Beneficial interest issued by consolidatedVIEs 150 123
Total interest expense 7,441 4,383
Net interest income 14,453 13,312
Provision for credit losses 1,495 1,165
Net interest income after provision forcredit losses $ 12,958 $ 12,147
(a) Includes the amortization/accretion of unearned income (e.g., purchase premiums/discounts, net deferred fees/costs, etc.).
(b) Represents securities which are tax-exempt for U.S. federal income tax purposes.
(c) Includes held-for-investment margin loans, which are classified in accrued interest and accounts receivable, and all other interest-earning assets which are classified in other assets on the Consolidated balance sheets.
(d) Includes commercial paper.(e) Other interest-bearing liabilities include brokerage customer payables.
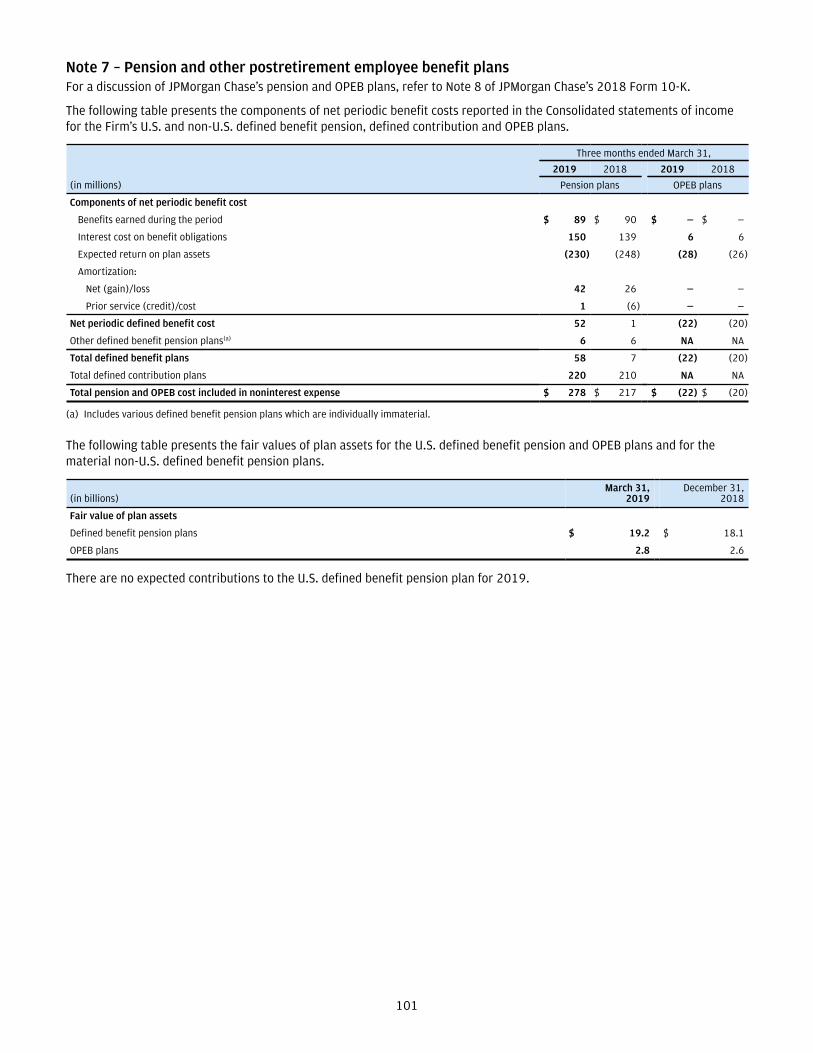
101
Note 7 – Pension and other postretirement employee benefit plansFor a discussion of JPMorgan Chase’s pension and OPEB plans, refer to Note 8 of JPMorgan Chase’s 2018 Form 10-K.
The following table presents the components of net periodic benefit costs reported in the Consolidated statements of income for the Firm’s U.S. and non-U.S. defined benefit pension, defined contribution and OPEB plans.
(in millions)
Three months ended March 31,
2019 2018 2019 2018
Pension plans OPEB plans
Components of net periodic benefit cost
Benefits earned during the period $ 89 $ 90 $ — $ —
Interest cost on benefit obligations 150 139 6 6
Expected return on plan assets (230) (248) (28) (26)
Amortization:
Net (gain)/loss 42 26 — —
Prior service (credit)/cost 1 (6) — —
Net periodic defined benefit cost 52 1 (22) (20)
Other defined benefit pension plans(a) 6 6 NA NA
Total defined benefit plans 58 7 (22) (20)
Total defined contribution plans 220 210 NA NA
Total pension and OPEB cost included in noninterest expense $ 278 $ 217 $ (22) $ (20)
(a) Includes various defined benefit pension plans which are individually immaterial.
The following table presents the fair values of plan assets for the U.S. defined benefit pension and OPEB plans and for the material non-U.S. defined benefit pension plans.
(in billions)March 31,
2019December 31,
2018
Fair value of plan assets
Defined benefit pension plans $ 19.2 $ 18.1
OPEB plans 2.8 2.6
There are no expected contributions to the U.S. defined benefit pension plan for 2019.

102
Note 8 – Employee share-based incentivesFor a discussion of the accounting policies and other information relating to employee share-based incentives, refer to Note 9 of JPMorgan Chase’s 2018 Form 10-K.
The Firm recognized the following noncash compensation expense related to its various employee share-based incentive plans in its Consolidated statements of income.
Three months endedMarch 31,
(in millions) 2019 2018
Cost of prior grants of RSUs, performance shareunits (“PSUs”) and stock appreciation rights(“SARs”) that are amortized over theirapplicable vesting periods $ 339 $ 398
Accrual of estimated costs of share-based awardsto be granted in future periods including those tofull-career eligible employees 314 308
Total noncash compensation expense related toemployee share-based incentive plans $ 653 $ 706
In the first quarter of 2019, in connection with its annual incentive grant for the 2018 performance year, the Firm granted 21 million RSUs and 630 thousand PSUs with weighted-average grant date fair values of $98.98 per RSU and $98.96 per PSU.

103
Note 9 – Investment securitiesInvestment securities consist of debt securities that are classified as AFS or HTM. Debt securities classified as trading assets are discussed in Note 2. Predominantly all of the Firm’s AFS and HTM securities are held by Treasury and CIO in connection with its asset-liability management activities. At March 31, 2019, the investment securities portfolio consisted of debt securities with an average credit rating of AA+ (based upon external ratings where available,
and where not available, based primarily upon internal ratings which correspond to ratings as defined by S&P and Moody’s). For additional information regarding the investment securities portfolio, refer to Note 10 of JPMorgan Chase’s 2018 Form 10-K.
The amortized costs and estimated fair values of the investment securities portfolio were as follows for the dates indicated.
March 31, 2019 December 31, 2018
(in millions)Amortized
cost
Grossunrealized
gains
Grossunrealized
losses Fair valueAmortized
cost
Grossunrealized
gains
Grossunrealized
losses Fair value
Available-for-sale securitiesMortgage-backed securities:
U.S. government agencies(a) $ 74,131 $ 1,144 $ 352 $ 74,923 $ 69,026 $ 594 $ 974 $ 68,646
Residential:U.S. 7,711 123 18 7,816 5,877 79 31 5,925Non-U.S. 2,229 71 3 2,297 2,529 72 6 2,595
Commercial 6,685 63 61 6,687 6,758 43 147 6,654
Total mortgage-backed securities 90,756 1,401 434 91,723 84,190 788 1,158 83,820U.S. Treasury and government agencies 58,491 302 29 58,764 55,771 366 78 56,059Obligations of U.S. states and municipalities 32,649 1,847 9 34,487 36,221 1,582 80 37,723Certificates of deposit 75 — — 75 75 — — 75Non-U.S. government debt securities 21,608 436 9 22,035 23,771 351 20 24,102Corporate debt securities 1,750 45 3 1,792 1,904 23 9 1,918
Asset-backed securities:
Collateralized loan obligations 21,037 3 111 20,929 19,612 1 176 19,437
Other 6,668 60 17 6,711 7,225 57 22 7,260
Total available-for-sale securities 233,034 4,094 612 236,516 228,769 3,168 1,543 230,394
Held-to-maturity securities
Mortgage-backed securities:
U.S. government agencies(b) 26,033 496 77 26,452 26,610 134 200 26,544
Total mortgage-backed securities 26,033 496 77 26,452 26,610 134 200 26,544
Obligations of U.S. states and municipalities 4,816 189 1 5,004 4,824 105 15 4,914
Total held-to-maturity securities 30,849 685 78 31,456 31,434 239 215 31,458
Total investment securities $ 263,883 $ 4,779 $ 690 $ 267,972 $ 260,203 $ 3,407 $ 1,758 $ 261,852
(a) Includes total U.S. government-sponsored enterprise obligations with fair values of $55.3 billion and $50.7 billion at March 31, 2019, and December 31, 2018, respectively.
(b) Included total U.S. government-sponsored enterprise obligations with amortized cost of $20.4 billion and $20.9 billion at March 31, 2019, and December 31, 2018, respectively.

104
Investment securities impairmentThe following tables present the fair value and gross unrealized losses for investment securities by aging category at March 31, 2019, and December 31, 2018.
Investment securities with gross unrealized losses
Less than 12 months 12 months or more
March 31, 2019 (in millions) Fair valueGross
unrealized losses Fair valueGross
unrealized lossesTotal fair
valueTotal gross
unrealized losses
Available-for-sale securities
Mortgage-backed securities:
U.S. government agencies $ 8,230 $ 124 $ 17,215 $ 228 $ 25,445 $ 352
Residential:
U.S. 12 — 1,404 18 1,416 18
Non-U.S. 218 1 499 2 717 3
Commercial 383 2 2,407 59 2,790 61
Total mortgage-backed securities 8,843 127 21,525 307 30,368 434
U.S. Treasury and government agencies 8,112 29 218 — 8,330 29
Obligations of U.S. states and municipalities 1 — 868 9 869 9
Certificates of deposit 75 — — — 75 —
Non-U.S. government debt securities 2,274 3 1,477 6 3,751 9
Corporate debt securities 168 1 77 2 245 3
Asset-backed securities:
Collateralized loan obligations 15,862 81 2,725 30 18,587 111
Other 846 4 2,340 13 3,186 17
Total available-for-sale securities 36,181 245 29,230 367 65,411 612
Held-to-maturity securities
Mortgage-backed securities
U.S. government agencies 18 — 5,315 77 5,333 77
Total mortgage-backed securities 18 — 5,315 77 5,333 77
Obligations of U.S. states and municipalities — — 351 1 351 1
Total held-to-maturity securities 18 — 5,666 78 5,684 78
Total investment securities with gross unrealized losses $ 36,199 $ 245 $ 34,896 $ 445 $ 71,095 $ 690

105
Investment securities with gross unrealized losses
Less than 12 months 12 months or more
December 31, 2018 (in millions) Fair valueGross
unrealized losses Fair valueGross
unrealized lossesTotal fair
valueTotal gross
unrealized losses
Available-for-sale securities
Mortgage-backed securities:
U.S. government agencies $ 17,656 $ 318 $ 22,728 $ 656 $ 40,384 $ 974
Residential:
U.S. 623 4 1,445 27 $ 2,068 31
Non-U.S. 907 5 165 1 1,072 6
Commercial 974 6 3,172 141 4,146 147
Total mortgage-backed securities 20,160 333 27,510 825 47,670 1,158
U.S. Treasury and government agencies 4,792 7 2,391 71 7,183 78
Obligations of U.S. states and municipalities 1,808 15 2,477 65 4,285 80
Certificates of deposit 75 — — — 75 —
Non-U.S. government debt securities 3,123 5 1,937 15 5,060 20
Corporate debt securities 478 8 37 1 515 9
Asset-backed securities:
Collateralized loan obligations 18,681 176 — — 18,681 176
Other 1,208 6 2,354 16 3,562 22
Total available-for-sale securities 50,325 550 36,706 993 87,031 1,543
Held-to-maturity securities
Mortgage-backed securities
U.S. government agencies 4,385 23 7,082 177 11,467 200
Total mortgage-backed securities 4,385 23 7,082 177 11,467 200
Obligations of U.S. states and municipalities 12 — 1,114 15 1,126 15
Total held-to-maturity securities 4,397 23 8,196 192 12,593 215
Total investment securities with grossunrealized losses $ 54,722 $ 573 $ 44,902 $ 1,185 $ 99,624 $ 1,758
Other-than-temporary impairment The Firm does not intend to sell any investment securities with an unrealized loss in AOCI as of March 31, 2019, and it is not likely that the Firm will be required to sell these securities before recovery of their amortized cost basis. Further, the Firm did not recognize any credit-related OTTI losses during the three months ended March 31, 2019 and 2018. Accordingly, the Firm believes that the investment securities with an unrealized loss in AOCI as of March 31, 2019, are not other-than-temporarily impaired. For additional information on other-than-temporary impairment, refer to Note 10 of JPMorgan Chase’s 2018 Form 10-K.
Investment securities gains and lossesThe following table presents realized gains and losses and OTTI from AFS securities that were recognized in income.
Three months endedMarch 31,
(in millions) 2019 2018
Realized gains $ 261 $ 70
Realized losses (248) (295)
OTTI losses — (20) (a)
Net investment securities gains/(losses) $ 13 $ (245)
(a) Represents OTTI losses recognized in income on investment securities the Firm intends to sell.
Changes in the credit loss component of credit-impaired debt securities The cumulative credit loss component, including any changes therein, of OTTI losses that have been recognized in income related to AFS securities was not material as of and during the three month periods ended March 31, 2019 and 2018.
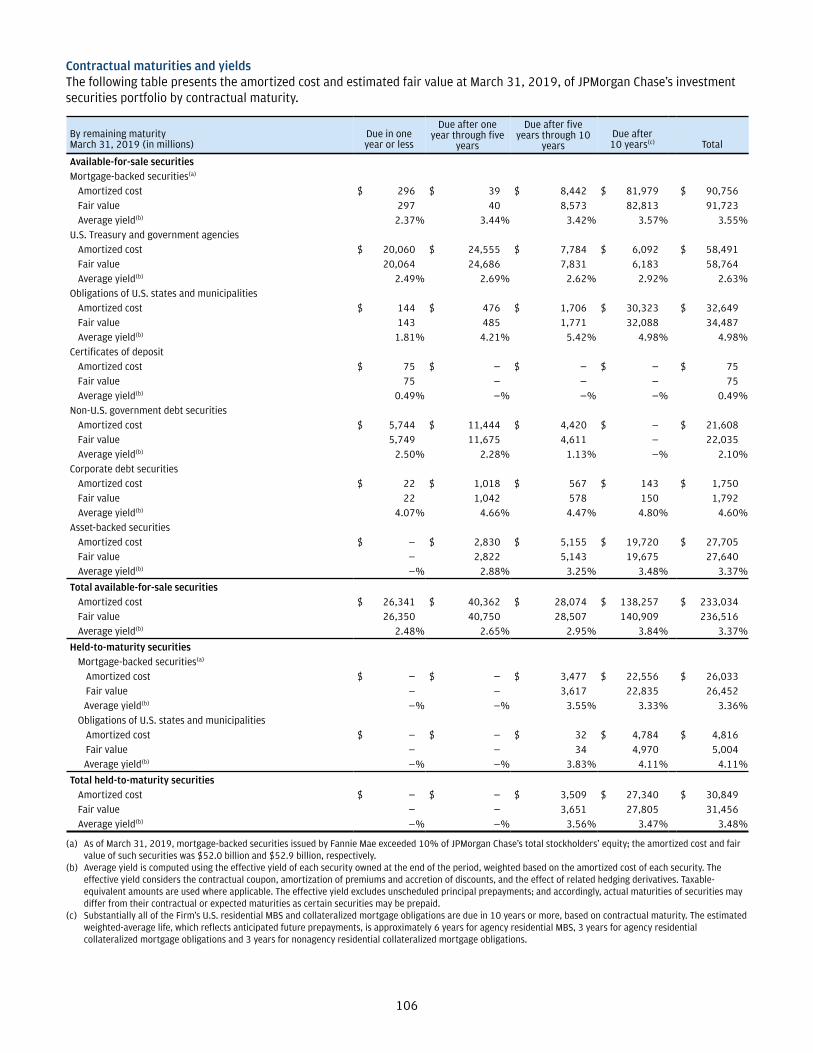
106
Contractual maturities and yieldsThe following table presents the amortized cost and estimated fair value at March 31, 2019, of JPMorgan Chase’s investment securities portfolio by contractual maturity.
By remaining maturityMarch 31, 2019 (in millions)
Due in one year or less
Due after oneyear through five
years
Due after fiveyears through 10
yearsDue after 10 years(c) Total
Available-for-sale securitiesMortgage-backed securities(a)
Amortized cost $ 296 $ 39 $ 8,442 $ 81,979 $ 90,756Fair value 297 40 8,573 82,813 91,723Average yield(b) 2.37% 3.44% 3.42% 3.57% 3.55%
U.S. Treasury and government agenciesAmortized cost $ 20,060 $ 24,555 $ 7,784 $ 6,092 $ 58,491Fair value 20,064 24,686 7,831 6,183 58,764Average yield(b) 2.49% 2.69% 2.62% 2.92% 2.63%
Obligations of U.S. states and municipalitiesAmortized cost $ 144 $ 476 $ 1,706 $ 30,323 $ 32,649Fair value 143 485 1,771 32,088 34,487Average yield(b) 1.81% 4.21% 5.42% 4.98% 4.98%
Certificates of depositAmortized cost $ 75 $ — $ — $ — $ 75Fair value 75 — — — 75Average yield(b) 0.49% —% —% —% 0.49%
Non-U.S. government debt securitiesAmortized cost $ 5,744 $ 11,444 $ 4,420 $ — $ 21,608Fair value 5,749 11,675 4,611 — 22,035Average yield(b) 2.50% 2.28% 1.13% —% 2.10%
Corporate debt securitiesAmortized cost $ 22 $ 1,018 $ 567 $ 143 $ 1,750Fair value 22 1,042 578 150 1,792Average yield(b) 4.07% 4.66% 4.47% 4.80% 4.60%
Asset-backed securitiesAmortized cost $ — $ 2,830 $ 5,155 $ 19,720 $ 27,705Fair value — 2,822 5,143 19,675 27,640Average yield(b) —% 2.88% 3.25% 3.48% 3.37%
Total available-for-sale securitiesAmortized cost $ 26,341 $ 40,362 $ 28,074 $ 138,257 $ 233,034Fair value 26,350 40,750 28,507 140,909 236,516Average yield(b) 2.48% 2.65% 2.95% 3.84% 3.37%
Held-to-maturity securitiesMortgage-backed securities(a)
Amortized cost $ — $ — $ 3,477 $ 22,556 $ 26,033Fair value — — 3,617 22,835 26,452Average yield(b) —% —% 3.55% 3.33% 3.36%
Obligations of U.S. states and municipalitiesAmortized cost $ — $ — $ 32 $ 4,784 $ 4,816Fair value — — 34 4,970 5,004Average yield(b) —% —% 3.83% 4.11% 4.11%
Total held-to-maturity securitiesAmortized cost $ — $ — $ 3,509 $ 27,340 $ 30,849Fair value — — 3,651 27,805 31,456Average yield(b) —% —% 3.56% 3.47% 3.48%
(a) As of March 31, 2019, mortgage-backed securities issued by Fannie Mae exceeded 10% of JPMorgan Chase’s total stockholders’ equity; the amortized cost and fair value of such securities was $52.0 billion and $52.9 billion, respectively.
(b) Average yield is computed using the effective yield of each security owned at the end of the period, weighted based on the amortized cost of each security. The effective yield considers the contractual coupon, amortization of premiums and accretion of discounts, and the effect of related hedging derivatives. Taxable-equivalent amounts are used where applicable. The effective yield excludes unscheduled principal prepayments; and accordingly, actual maturities of securities may differ from their contractual or expected maturities as certain securities may be prepaid.
(c) Substantially all of the Firm’s U.S. residential MBS and collateralized mortgage obligations are due in 10 years or more, based on contractual maturity. The estimated weighted-average life, which reflects anticipated future prepayments, is approximately 6 years for agency residential MBS, 3 years for agency residential collateralized mortgage obligations and 3 years for nonagency residential collateralized mortgage obligations.

107
Note 10 – Securities financing activitiesFor a discussion of accounting policies relating to securities financing activities, refer to Note 11 of JPMorgan Chase’s 2018 Form 10-K. For further information regarding securities borrowed and securities lending agreements for which the fair value option has been elected, refer to Note 3. For further information regarding assets pledged and collateral received in securities financing agreements, refer to Note 23.
The table below summarizes the gross and net amounts of the Firm’s securities financing agreements as of March 31, 2019 and December 31, 2018. When the Firm has obtained an appropriate legal opinion with respect to a master netting agreement with a counterparty and where other relevant netting criteria under U.S. GAAP are met, the Firm nets, on the Consolidated balance sheets, the balances
outstanding under its securities financing agreements with the same counterparty. In addition, the Firm exchanges securities and/or cash collateral with its counterparty to reduce the economic exposure with the counterparty, but such collateral is not eligible for net Consolidated balance sheet presentation. Where the Firm has obtained an appropriate legal opinion with respect to the counterparty master netting agreement, such collateral, along with securities financing balances that do not meet all these relevant netting criteria under U.S. GAAP, is presented in the table below as “Amounts not nettable on the Consolidated balance sheets,” and reduces the “Net amounts” presented. Where a legal opinion has not been either sought or obtained, the securities financing balances are presented gross in the “Net amounts” below.
March 31, 2019
(in millions) Gross amounts
Amounts netted onthe Consolidatedbalance sheets
Amounts presented on the Consolidated
balance sheets(b)
Amounts not nettable on the Consolidated
balance sheets(c)Net
amounts(d)
Assets
Securities purchased under resale agreements $ 758,505 $ (459,365) $ 299,140 $ (284,790) $ 14,350
Securities borrowed 147,066 (23,880) 123,186 (86,241) 36,945
Liabilities
Securities sold under repurchase agreements $ 667,703 $ (459,365) $ 208,338 $ (190,697) $ 17,641
Securities loaned and other(a) 40,722 (23,880) 16,842 (16,732) 110
December 31, 2018
(in millions) Gross amounts
Amounts netted onthe Consolidatedbalance sheets
Amounts presented on the Consolidated
balance sheets(b)
Amounts not nettable on the Consolidated
balance sheets(c)Net
amounts(d)
Assets
Securities purchased under resale agreements $ 691,116 $ (369,612) $ 321,504 $ (308,854) $ 12,650
Securities borrowed 132,955 (20,960) 111,995 (79,747) 32,248
Liabilities
Securities sold under repurchase agreements $ 541,587 $ (369,612) $ 171,975 $ (149,125) $ 22,850
Securities loaned and other(a) 33,700 (20,960) 12,740 (12,358) 382
(a) Includes securities-for-securities lending agreements of $3.3 billion at March 31, 2019 and December 31, 2018, accounted for at fair value, where the Firm is acting as lender. These amounts are presented within accounts payable and other liabilities in the Consolidated balance sheets.
(b) Includes securities financing agreements accounted for at fair value. At March 31, 2019 and December 31, 2018, included securities purchased under resale agreements of $14.0 billion and $13.2 billion, respectively; securities sold under repurchase agreements of $971 million and $935 million, respectively; and securities borrowed of $5.6 billion and $5.1 billion, respectively. There were no securities loaned accounted for at fair value in either period.
(c) In some cases, collateral exchanged with a counterparty exceeds the net asset or liability balance with that counterparty. In such cases, the amounts reported in this column are limited to the related net asset or liability with that counterparty.
(d) Includes securities financing agreements that provide collateral rights, but where an appropriate legal opinion with respect to the master netting agreement has not been either sought or obtained. At March 31, 2019 and December 31, 2018, included $8.2 billion and $7.9 billion, respectively, of securities purchased under resale agreements; $34.5 billion and $30.3 billion, respectively, of securities borrowed; $15.9 billion and $21.5 billion, respectively, of securities sold under repurchase agreements; and $46 million and $25 million, respectively, of securities loaned and other.

108
The tables below present as of March 31, 2019, and December 31, 2018 the types of financial assets pledged in securities financing agreements and the remaining contractual maturity of the securities financing agreements.
Gross liability balance
March 31, 2019 December 31, 2018
(in millions)
Securities soldunder repurchase
agreementsSecurities loaned
and other
Securities soldunder repurchase
agreementsSecurities loaned
and other
Mortgage-backed securities
U.S. government agencies $ 56,156 $ — $ 28,811 $ —
Residential - nonagency 1,679 — 2,165 —
Commercial - nonagency 1,572 — 1,390 —
U.S. Treasury and government agencies 387,049 13 323,078 69
Obligations of U.S. states and municipalities 1,079 — 1,150 —
Non-U.S. government debt 189,092 3,163 154,900 4,313
Corporate debt securities 14,348 953 13,898 428
Asset-backed securities 2,734 — 3,867 —
Equity securities 13,994 36,593 12,328 28,890
Total $ 667,703 $ 40,722 $ 541,587 $ 33,700
Remaining contractual maturity of the agreements
Overnight andcontinuous
Greater than 90 daysMarch 31, 2019 (in millions) Up to 30 days 30 – 90 days Total
Total securities sold under repurchase agreements $ 354,509 $ 175,020 $ 77,551 $ 60,623 $ 667,703
Total securities loaned and other 31,657 943 834 7,288 40,722
Remaining contractual maturity of the agreements
Overnight andcontinuous
Greater than 90 daysDecember 31, 2018 (in millions) Up to 30 days 30 – 90 days Total
Total securities sold under repurchase agreements $ 247,579 $ 174,971 $ 71,637 $ 47,400 $ 541,587
Total securities loaned and other 28,402 997 2,132 2,169 33,700
Transfers not qualifying for sale accountingAt March 31, 2019, and December 31, 2018, the Firm held $1.7 billion and $2.1 billion, respectively, of financial assets for which the rights have been transferred to third parties; however, the transfers did not qualify as a sale in accordance with U.S. GAAP. These transfers have been recognized as collateralized financing transactions. The transferred assets are recorded in trading assets and loans, and the corresponding liabilities are recorded predominantly in short-term borrowings on the Consolidated balance sheets. The prior period amount has been revised to conform with the current period presentation.

109
Note 11 – LoansLoan accounting frameworkThe accounting for a loan depends on management’s strategy for the loan, and on whether the loan was credit-impaired at the date of acquisition. The Firm accounts for loans based on the following categories:
• Originated or purchased loans held-for-investment (i.e., “retained”), other than PCI loans
• Loans held-for-sale• Loans at fair value• PCI loans held-for-investment
For a detailed discussion of loans, including accounting policies, refer to Note 12 of JPMorgan Chase’s 2018 Form 10-K. Refer to Note 3 of this Form 10-Q for further information on the Firm’s elections of fair value accounting under the fair value option. Refer to Note 2 of this Form 10-Q for information on loans carried at fair value and classified as trading assets.
Loan portfolioThe Firm’s loan portfolio is divided into three portfolio segments, which are the same segments used by the Firm to determine the allowance for loan losses: Consumer, excluding credit card; Credit card; and Wholesale. Within each portfolio segment the Firm monitors and assesses the credit risk in the following classes of loans, based on the risk characteristics of each loan class.
Consumer, excluding credit card(a)
Credit card Wholesale(f)
Residential real estate – excluding PCI• Residential mortgage(b)
• Home equity(c)
Other consumer loans(d)
• Auto• Consumer & Business Banking(e)
Residential real estate – PCI• Home equity• Prime mortgage• Subprime mortgage• Option ARMs
• Credit card loans • Commercial and industrial• Real estate• Financial institutions• Governments & Agencies• Other(g)
(a) Includes loans held in CCB, prime mortgage and home equity loans held in AWM and prime mortgage loans held in Corporate.(b) Predominantly includes prime loans (including option ARMs).(c) Includes senior and junior lien home equity loans.(d) Includes certain business banking and auto dealer risk-rated loans that apply the wholesale methodology for determining the allowance for loan losses;
these loans are managed by CCB, and therefore, for consistency in presentation, are included with the other consumer loan classes.(e) Predominantly includes Business Banking loans.(f) Includes loans held in CIB, CB, AWM and Corporate. Excludes prime mortgage and home equity loans held in AWM and prime mortgage loans held in
Corporate. Classes are internally defined and may not align with regulatory definitions.(g) Includes loans to: individuals and individual entities (predominantly consists of Wealth Management clients within AWM and includes exposure to personal
investment companies and personal and testamentary trusts), SPEs and Private education and civic organizations. For more information on SPEs, refer to Note 14 of JPMorgan Chase’s 2018 Form 10-K.
The following tables summarize the Firm’s loan balances by portfolio segment.
March 31, 2019 Consumer, excludingcredit card Credit card(a) Wholesale Total(in millions)
Retained $ 359,715 $ 150,515 $ 433,611 $ 943,841 (b)
Held-for-sale 4,199 12 4,474 8,685
At fair value — — 3,719 3,719
Total $ 363,914 $ 150,527 $ 441,804 $ 956,245
December 31, 2018 Consumer, excludingcredit card Credit card(a) Wholesale Total(in millions)
Retained $ 373,637 $ 156,616 $ 439,162 $ 969,415 (b)
Held-for-sale 95 16 11,877 11,988
At fair value — — 3,151 3,151
Total $ 373,732 $ 156,632 $ 454,190 $ 984,554
(a) Includes accrued interest and fees net of an allowance for the uncollectible portion of accrued interest and fee income.(b) Loans (other than PCI loans and loans for which the fair value option has been elected) are presented net of unamortized discounts and premiums and net
deferred loan fees or costs. These amounts were not material as of March 31, 2019, and December 31, 2018.
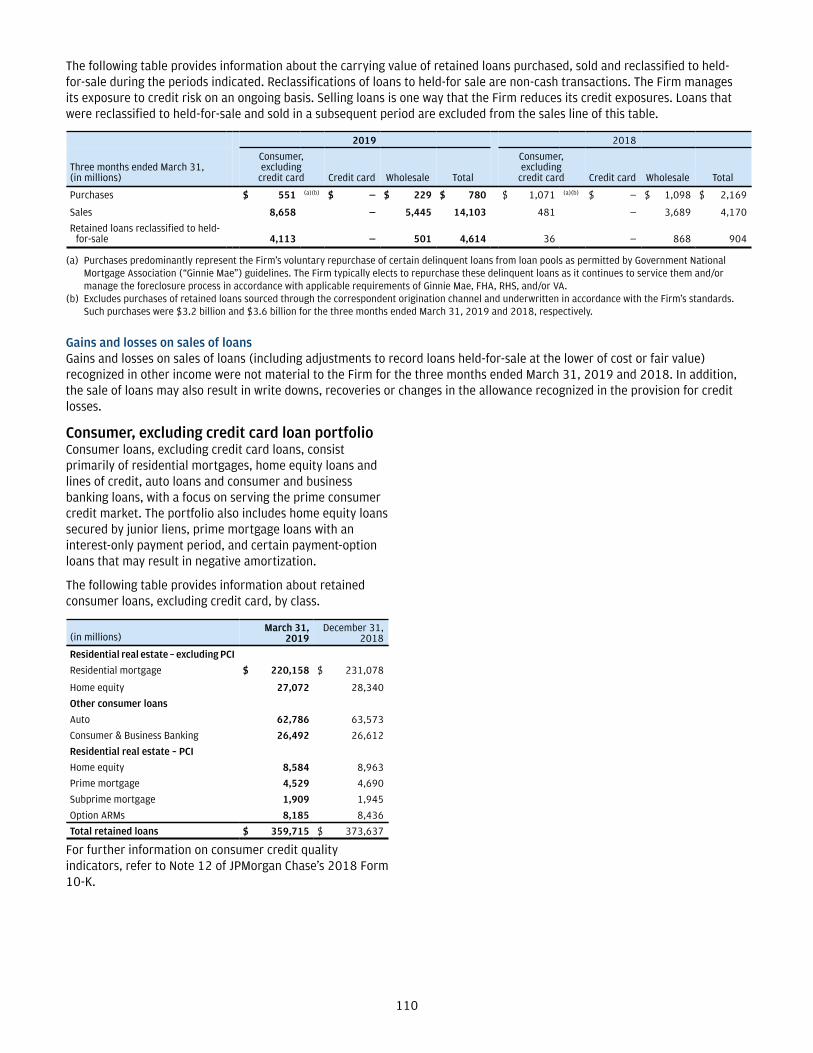
110
The following table provides information about the carrying value of retained loans purchased, sold and reclassified to held-for-sale during the periods indicated. Reclassifications of loans to held-for sale are non-cash transactions. The Firm manages its exposure to credit risk on an ongoing basis. Selling loans is one way that the Firm reduces its credit exposures. Loans that were reclassified to held-for-sale and sold in a subsequent period are excluded from the sales line of this table.
2019 2018
Three months ended March 31,(in millions)
Consumer, excluding
credit card Credit card Wholesale Total
Consumer, excluding
credit card Credit card Wholesale Total
Purchases $ 551 (a)(b) $ — $ 229 $ 780 $ 1,071 (a)(b) $ — $ 1,098 $ 2,169
Sales 8,658 — 5,445 14,103 481 — 3,689 4,170
Retained loans reclassified to held-for-sale 4,113 — 501 4,614 36 — 868 904
(a) Purchases predominantly represent the Firm’s voluntary repurchase of certain delinquent loans from loan pools as permitted by Government National Mortgage Association (“Ginnie Mae”) guidelines. The Firm typically elects to repurchase these delinquent loans as it continues to service them and/or manage the foreclosure process in accordance with applicable requirements of Ginnie Mae, FHA, RHS, and/or VA.
(b) Excludes purchases of retained loans sourced through the correspondent origination channel and underwritten in accordance with the Firm’s standards. Such purchases were $3.2 billion and $3.6 billion for the three months ended March 31, 2019 and 2018, respectively.
Gains and losses on sales of loansGains and losses on sales of loans (including adjustments to record loans held-for-sale at the lower of cost or fair value) recognized in other income were not material to the Firm for the three months ended March 31, 2019 and 2018. In addition, the sale of loans may also result in write downs, recoveries or changes in the allowance recognized in the provision for credit losses.
Consumer, excluding credit card loan portfolioConsumer loans, excluding credit card loans, consist primarily of residential mortgages, home equity loans and lines of credit, auto loans and consumer and business banking loans, with a focus on serving the prime consumer credit market. The portfolio also includes home equity loans secured by junior liens, prime mortgage loans with an interest-only payment period, and certain payment-option loans that may result in negative amortization.
The following table provides information about retained consumer loans, excluding credit card, by class.
(in millions)March 31,
2019December 31,
2018
Residential real estate – excluding PCI
Residential mortgage $ 220,158 $ 231,078
Home equity 27,072 28,340
Other consumer loans
Auto 62,786 63,573
Consumer & Business Banking 26,492 26,612
Residential real estate – PCI
Home equity 8,584 8,963
Prime mortgage 4,529 4,690
Subprime mortgage 1,909 1,945
Option ARMs 8,185 8,436
Total retained loans $ 359,715 $ 373,637
For further information on consumer credit quality indicators, refer to Note 12 of JPMorgan Chase’s 2018 Form 10-K.

111
Residential real estate – excluding PCI loansThe following table provides information by class for retained residential real estate – excluding PCI loans.
Residential real estate – excluding PCI loans
(in millions, except ratios)
Residential mortgage Home equityTotal residential realestate – excluding PCI
Mar 31,2019
Dec 31,2018
Mar 31,2019
Dec 31,2018
Mar 31,2019
Dec 31,2018
Loan delinquency(a)
Current $ 215,815 $ 225,899 $ 26,422 $ 27,611 $ 242,237 $ 253,510
30–149 days past due 2,179 2,763 399 453 2,578 3,216
150 or more days past due 2,164 2,416 251 276 2,415 2,692
Total retained loans $ 220,158 $ 231,078 $ 27,072 $ 28,340 $ 247,230 $ 259,418
% of 30+ days past due to total retained loans(b) 0.53% 0.48% 2.40% 2.57% 0.73% 0.71%
90 or more days past due and government guaranteed(c) $ 2,120 $ 2,541 $ — $ — $ 2,120 $ 2,541
Nonaccrual loans 1,755 1,765 1,276 1,323 3,031 3,088
Current estimated LTV ratios(d)(e)
Greater than 125% and refreshed FICO scores:
Equal to or greater than 660 $ 24 $ 25 $ 5 $ 6 $ 29 $ 31
Less than 660 11 13 1 1 12 14
101% to 125% and refreshed FICO scores:
Equal to or greater than 660 23 37 86 111 109 148
Less than 660 39 53 29 38 68 91
80% to 100% and refreshed FICO scores:
Equal to or greater than 660 4,465 3,977 867 986 5,332 4,963
Less than 660 228 281 270 326 498 607
Less than 80% and refreshed FICO scores:
Equal to or greater than 660 202,482 212,505 21,811 22,632 224,293 235,137
Less than 660 6,442 6,457 3,185 3,355 9,627 9,812
No FICO/LTV available 826 813 818 885 1,644 1,698
U.S. government-guaranteed 5,618 6,917 — — 5,618 6,917
Total retained loans $ 220,158 $ 231,078 $ 27,072 $ 28,340 $ 247,230 $ 259,418
Geographic region(f)
California $ 71,894 $ 74,759 $ 5,518 $ 5,695 $ 77,412 $ 80,454
New York 27,556 28,847 5,488 5,769 33,044 34,616
Illinois 14,607 15,249 2,026 2,131 16,633 17,380
Texas 13,034 13,769 1,752 1,819 14,786 15,588
Florida 10,428 10,704 1,496 1,575 11,924 12,279
Washington 7,974 8,304 835 869 8,809 9,173
Colorado 7,884 8,140 492 521 8,376 8,661
New Jersey 6,804 7,302 1,558 1,642 8,362 8,944
Massachusetts 6,350 6,574 225 236 6,575 6,810
Arizona 4,167 4,434 1,097 1,158 5,264 5,592
All other(g) 49,460 52,996 6,585 6,925 56,045 59,921
Total retained loans $ 220,158 $ 231,078 $ 27,072 $ 28,340 $ 247,230 $ 259,418
(a) Individual delinquency classifications include mortgage loans insured by U.S. government agencies as follows: current included $2.4 billion and $2.8 billion; 30–149 days past due included $1.5 billion and $2.1 billion; and 150 or more days past due included $1.7 billion and $2.0 billion at March 31, 2019, and December 31, 2018, respectively.
(b) At March 31, 2019, and December 31, 2018, residential mortgage loans excluded mortgage loans insured by U.S. government agencies of $3.2 billion and $4.1 billion, respectively, that are 30 or more days past due. These amounts have been excluded based upon the government guarantee.
(c) These balances, which are 90 days or more past due, were excluded from nonaccrual loans as the loans are guaranteed by U.S government agencies. Typically the principal balance of the loans is insured and interest is guaranteed at a specified reimbursement rate subject to meeting agreed-upon servicing guidelines. At March 31, 2019, and December 31, 2018, these balances included $880 million and $999 million, respectively, of loans that are no longer accruing interest based on the agreed-upon servicing guidelines. For the remaining balance, interest is being accrued at the guaranteed reimbursement rate. There were no loans that were not guaranteed by U.S. government agencies that are 90 or more days past due and still accruing interest at March 31, 2019, and December 31, 2018.
(d) Represents the aggregate unpaid principal balance of loans divided by the estimated current property value. Current property values are estimated, at a minimum, quarterly, based on home valuation models using nationally recognized home price index valuation estimates incorporating actual data to the extent available and forecasted data where actual data is not available. These property values do not represent actual appraised loan level collateral values; as such, the resulting ratios are necessarily imprecise and should be viewed as estimates. Current estimated combined LTV for junior lien home equity loans considers all available lien positions, as well as unused lines, related to the property.
(e) Refreshed FICO scores represent each borrower’s most recent credit score, which is obtained by the Firm on at least a quarterly basis.(f) The geographic regions presented in the table are ordered based on the magnitude of the corresponding loan balances at March 31, 2019.(g) At March 31, 2019, and December 31, 2018, included mortgage loans insured by U.S. government agencies of $5.6 billion and $6.9 billion, respectively. These
amounts have been excluded from the geographic regions presented based upon the government guarantee.

112
Approximately 37% of the home equity portfolio are senior lien loans; the remaining balance are junior lien HELOANs or HELOCs. The following table provides the Firm’s delinquency statistics for junior lien home equity loans and lines of credit as of March 31, 2019, and December 31, 2018.
Total loansTotal 30+ day
delinquency rate
(in millions, exceptratios)
Mar 31,2019
Dec 31,2018
Mar 31,2019
Dec 31,2018
HELOCs:(a)
Within the revolving period(b) $ 5,516 $ 5,608 0.25% 0.25%
Beyond the revolvingperiod 10,635 11,286 2.66 2.80
HELOANs 966 1,030 2.38 2.82
Total $ 17,117 $ 17,924 1.87% 2.00%
(a) These HELOCs are predominantly revolving loans for a 10-year period, after which time the HELOC converts to a loan with a 20-year amortization period, but also include HELOCs that allow interest-only payments beyond the revolving period.
(b) The Firm manages the risk of HELOCs during their revolving period by closing or reducing the undrawn line to the extent permitted by law when borrowers are experiencing financial difficulty.
HELOCs beyond the revolving period and HELOANs have higher delinquency rates than HELOCs within the revolving period. That is primarily because the fully-amortizing payment that is generally required for those products is higher than the minimum payment options available for HELOCs within the revolving period. The higher delinquency rates associated with amortizing HELOCs and HELOANs are factored into the Firm’s allowance for loan losses.
Impaired loansThe table below sets forth information about the Firm’s residential real estate impaired loans, excluding PCI loans. These loans are considered to be impaired as they have been modified in a TDR. All impaired loans are evaluated for an asset-specific allowance as described in Note 13 of JPMorgan Chase’s 2018 Form 10-K.
(in millions)
Residential mortgage Home equityTotal residential real estate
– excluding PCI
Mar 31,2019
Dec 31,2018
Mar 31,2019
Dec 31,2018
Mar 31,2019
Dec 31,2018
Impaired loans
With an allowance $ 3,296 $ 3,381 $ 1,122 $ 1,142 $ 4,418 $ 4,523
Without an allowance(a) 1,203 1,184 874 870 2,077 2,054
Total impaired loans(b)(c) $ 4,499 $ 4,565 $ 1,996 $ 2,012 $ 6,495 $ 6,577
Allowance for loan losses related to impaired loans $ 66 $ 88 $ 15 $ 45 $ 81 $ 133
Unpaid principal balance of impaired loans(d) 6,120 6,207 3,434 3,466 9,554 9,673
Impaired loans on nonaccrual status(e) 1,456 1,459 960 955 2,416 2,414
(a) Represents collateral-dependent residential real estate loans that are charged off to the fair value of the underlying collateral less cost to sell. The Firm reports, in accordance with regulatory guidance, residential real estate loans that have been discharged under Chapter 7 bankruptcy and not reaffirmed by the borrower (“Chapter 7 loans”) as collateral-dependent nonaccrual TDRs, regardless of their delinquency status. At March 31, 2019, Chapter 7 residential real estate loans included approximately 12% of residential mortgages and 8% of home equity that were 30 days or more past due.
(b) At March 31, 2019, and December 31, 2018, $3.3 billion and $4.1 billion, respectively, of loans modified subsequent to repurchase from Ginnie Mae in accordance with the standards of the appropriate government agency (i.e., FHA, VA, RHS) are not included in the table above. When such loans perform subsequent to modification in accordance with Ginnie Mae guidelines, they are generally sold back into Ginnie Mae loan pools. Modified loans that do not re-perform become subject to foreclosure.
(c) Predominantly all residential real estate impaired loans, excluding PCI loans, are in the U.S.(d) Represents the contractual amount of principal owed at March 31, 2019, and December 31, 2018. The unpaid principal balance differs from the impaired
loan balances due to various factors including charge-offs, net deferred loan fees or costs, and unamortized discounts or premiums on purchased loans.(e) At March 31, 2019 and December 31, 2018, nonaccrual loans included $1.9 billion and $2.0 billion, respectively, of TDRs for which the borrowers were
less than 90 days past due. For additional information about loans modified in a TDR that are on nonaccrual status refer to the Loan accounting framework in Note 12 of JPMorgan Chase’s 2018 Form 10-K.

113
The following table presents average impaired loans and the related interest income reported by the Firm.
Three months ended March 31,(in millions)
Average impaired loansInterest income onimpaired loans(a)
Interest income on impaired loans on a cash basis(a)
2019 2018 2019 2018 2019 2018
Residential mortgage $ 4,536 $ 5,608 $ 59 $ 70 $ 17 $ 19
Home equity 2,001 2,123 33 32 21 21
Total residential real estate – excluding PCI $ 6,537 $ 7,731 $ 92 $ 102 $ 38 $ 40
(a) Generally, interest income on loans modified in TDRs is recognized on a cash basis until the borrower has made a minimum of six payments under the new terms, unless the loan is deemed to be collateral-dependent.
Loan modificationsModifications of residential real estate loans, excluding PCI loans, are generally accounted for and reported as TDRs. There were no additional commitments to lend to borrowers whose residential real estate loans, excluding PCI loans, have been modified in TDRs.
The following table presents new TDRs reported by the Firm.
Three monthsended March 31,
(in millions) 2019 2018
Residential mortgage $ 69 $ 147
Home equity 66 103
Total residential real estate – excluding PCI $ 135 $ 250
Nature and extent of modificationsThe U.S. Treasury’s Making Home Affordable programs, as well as the Firm’s proprietary modification programs, generally provide various concessions to financially troubled borrowers including, but not limited to, interest rate reductions, term or payment extensions and deferral of principal and/or interest payments that would otherwise have been required under the terms of the original agreement.
The following table provides information about how residential real estate loans, excluding PCI loans, were modified under the Firm’s loss mitigation programs described above during the periods presented. This table excludes Chapter 7 loans where the sole concession granted is the discharge of debt.
Three months ended March 31,
Total residentialreal estate – excluding PCIResidential mortgage Home equity
2019 2018 2019 2018 2019 2018
Number of loans approved for a trial modification 737 299 521 460 1,258 759
Number of loans permanently modified 443 969 1,107 1,798 1,550 2,767
Concession granted:(a)
Interest rate reduction 61% 20% 84% 49% 78% 39%
Term or payment extension 88 28 61 51 68 43
Principal and/or interest deferred 27 57 7 25 12 36
Principal forgiveness 6 6 6 5 6 5
Other(b) 36 49 70 60 60 56
(a) Represents concessions granted in permanent modifications as a percentage of the number of loans permanently modified. The sum of the percentages exceeds 100% because predominantly all of the modifications include more than one type of concession. Concessions offered on trial modifications are generally consistent with those granted on permanent modifications.
(b) Includes variable interest rate to fixed interest rate modifications and forbearances that meet the definition of a TDR for the three months ended March 31, 2019 and 2018. Forbearances suspend or reduce monthly payments for a specific period of time to address a temporary hardship.

114
Financial effects of modifications and redefaultsThe following table provides information about the financial effects of the various concessions granted in modifications of residential real estate loans, excluding PCI loans, under the loss mitigation programs described above and about redefaults of certain loans modified in TDRs for the periods presented. The following table presents only the financial effects of permanent modifications and does not include temporary concessions offered through trial modifications. This table also excludes Chapter 7 loans where the sole concession granted is the discharge of debt.
Three months ended March 31,(in millions, except weighted-average data)
Residential mortgage Home equityTotal residential real estate –
excluding PCI
2019 2018 2019 2018 2019 2018
Weighted-average interest rate of loans with interest ratereductions – before TDR 6.63% 5.11% 5.63% 5.11% 5.94% 5.11%
Weighted-average interest rate of loans with interest ratereductions – after TDR 4.68 3.45 3.70 3.05 4.00 3.19
Weighted-average remaining contractual term (in years) ofloans with term or payment extensions – before TDR 21 24 20 19 20 21
Weighted-average remaining contractual term (in years) ofloans with term or payment extensions – after TDR 38 36 38 38 38 37
Charge-offs recognized upon permanent modification $ — $ — $ — $ 1 $ — $ 1
Principal deferred 3 6 1 2 4 8
Principal forgiven 1 3 1 2 2 5
Balance of loans that redefaulted within one year of permanent modification(a) $ 37 $ 23 $ 19 $ 15 $ 56 $ 38
(a) Represents loans permanently modified in TDRs that experienced a payment default in the periods presented, and for which the payment default occurred within one year of the modification. The dollar amounts presented represent the balance of such loans at the end of the reporting period in which such loans defaulted. For residential real estate loans modified in TDRs, payment default is deemed to occur when the loan becomes two contractual payments past due. In the event that a modified loan redefaults, it is probable that the loan will ultimately be liquidated through foreclosure or another similar type of liquidation transaction. Redefaults of loans modified within the last 12 months may not be representative of ultimate redefault levels.
At March 31, 2019, the weighted-average estimated remaining lives of residential real estate loans, excluding PCI loans, permanently modified in TDRs were 9 years for both residential mortgage and home equity. The estimated remaining lives of these loans reflect estimated prepayments, both voluntary and involuntary (i.e., foreclosures and other forced liquidations).
Active and suspended foreclosureAt March 31, 2019, and December 31, 2018, the Firm had non-PCI residential real estate loans, excluding those insured by U.S. government agencies, with a carrying value of $654 million and $653 million, respectively, that were not included in REO, but were in the process of active or suspended foreclosure.

115
Other consumer loansThe table below provides information for other consumer retained loan classes, including auto and business banking loans.
(in millions, except ratios)
AutoConsumer &
Business Banking Total other consumer
Mar 31,2019
Dec 31,2018
Mar 31,2019
Dec 31,2018
Mar 31,2019
Dec 31,2018
Loan delinquency
Current $ 62,389 $ 62,984 $ 26,143 $ 26,249 $ 88,532 $ 89,233
30–119 days past due 397 589 223 252 620 841
120 or more days past due — — 126 111 126 111
Total retained loans $ 62,786 $ 63,573 $ 26,492 $ 26,612 $ 89,278 $ 90,185
% of 30+ days past due to total retained loans 0.63% 0.93% 1.32% 1.36% 0.84% 1.06%
Nonaccrual loans(a) 111 128 247 245 358 373
Geographic region(b)
California $ 8,201 $ 8,330 $ 5,676 $ 5,520 $ 13,877 $ 13,850
Texas 6,489 6,531 3,010 2,993 9,499 9,524
New York 3,800 3,863 4,305 4,381 8,105 8,244
Illinois 3,631 3,716 1,729 2,046 5,360 5,762
Florida 3,243 3,256 1,528 1,502 4,771 4,758
Arizona 2,042 2,084 1,280 1,491 3,322 3,575
Ohio 1,964 1,973 1,222 1,305 3,186 3,278
New Jersey 1,972 1,981 791 723 2,763 2,704
Michigan 1,331 1,357 1,303 1,329 2,634 2,686
Colorado 1,679 1,722 697 680 2,376 2,402
All other 28,434 28,760 4,951 4,642 33,385 33,402
Total retained loans $ 62,786 $ 63,573 $ 26,492 $ 26,612 $ 89,278 $ 90,185
Loans by risk ratings(c)
Noncriticized $ 15,506 $ 15,749 $ 18,618 $ 18,743 $ 34,124 $ 34,492
Criticized performing 246 273 742 751 988 1,024
Criticized nonaccrual — — 203 191 203 191
(a) There were no loans that were 90 or more days past due and still accruing interest at March 31, 2019, and December 31, 2018.(b) The geographic regions presented in this table are ordered based on the magnitude of the corresponding loan balances at March 31, 2019.(c) For risk-rated business banking and auto loans, the primary credit quality indicator is the risk rating of the loan, including whether the loans are
considered to be criticized and/or nonaccrual.
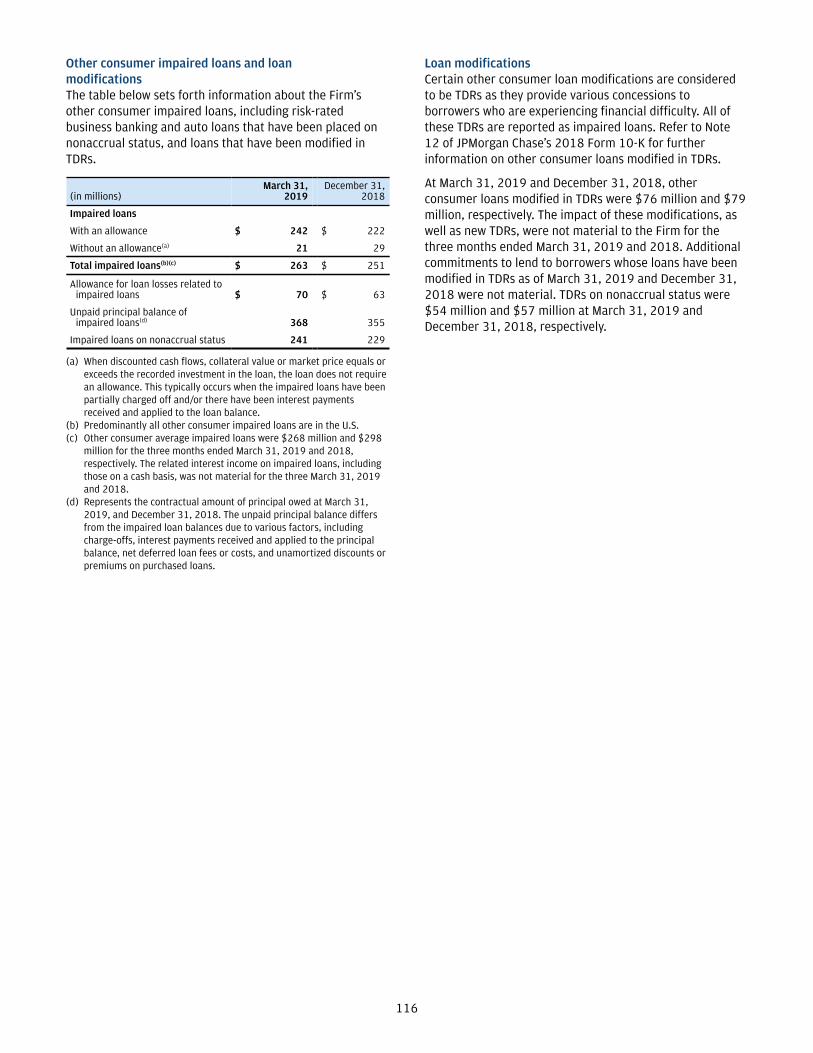
116
Other consumer impaired loans and loan modificationsThe table below sets forth information about the Firm’s other consumer impaired loans, including risk-rated business banking and auto loans that have been placed on nonaccrual status, and loans that have been modified in TDRs.
(in millions)March 31,
2019December 31,
2018
Impaired loans
With an allowance $ 242 $ 222
Without an allowance(a) 21 29
Total impaired loans(b)(c) $ 263 $ 251
Allowance for loan losses related toimpaired loans $ 70 $ 63
Unpaid principal balance of impaired loans(d) 368 355
Impaired loans on nonaccrual status 241 229
(a) When discounted cash flows, collateral value or market price equals or exceeds the recorded investment in the loan, the loan does not require an allowance. This typically occurs when the impaired loans have been partially charged off and/or there have been interest payments received and applied to the loan balance.
(b) Predominantly all other consumer impaired loans are in the U.S.(c) Other consumer average impaired loans were $268 million and $298
million for the three months ended March 31, 2019 and 2018, respectively. The related interest income on impaired loans, including those on a cash basis, was not material for the three March 31, 2019 and 2018.
(d) Represents the contractual amount of principal owed at March 31, 2019, and December 31, 2018. The unpaid principal balance differs from the impaired loan balances due to various factors, including charge-offs, interest payments received and applied to the principal balance, net deferred loan fees or costs, and unamortized discounts or premiums on purchased loans.
Loan modificationsCertain other consumer loan modifications are considered to be TDRs as they provide various concessions to borrowers who are experiencing financial difficulty. All of these TDRs are reported as impaired loans. Refer to Note 12 of JPMorgan Chase’s 2018 Form 10-K for further information on other consumer loans modified in TDRs.
At March 31, 2019 and December 31, 2018, other consumer loans modified in TDRs were $76 million and $79 million, respectively. The impact of these modifications, as well as new TDRs, were not material to the Firm for the three months ended March 31, 2019 and 2018. Additional commitments to lend to borrowers whose loans have been modified in TDRs as of March 31, 2019 and December 31, 2018 were not material. TDRs on nonaccrual status were $54 million and $57 million at March 31, 2019 and December 31, 2018, respectively.

117
Purchased credit-impaired loansFor a detailed discussion of PCI loans, including the related accounting policies, refer to Note 12 of JPMorgan Chase’s 2018 Form 10-K.
Residential real estate – PCI loansThe table below sets forth information about the Firm’s consumer, excluding credit card, PCI loans.
(in millions, except ratios)
Home equity Prime mortgage Subprime mortgage Option ARMs Total PCI
Mar 31,2019
Dec 31,2018
Mar 31,2019
Dec 31,2018
Mar 31,2019
Dec 31,2018
Mar 31,2019
Dec 31,2018
Mar 31,2019
Dec 31,2018
Carrying value(a) $ 8,584 $ 8,963 $ 4,529 $ 4,690 $ 1,909 $ 1,945 $ 8,185 $ 8,436 $23,207 $24,034
Loan delinquency (based on unpaid principal balance)
Current $ 8,299 $ 8,624 $ 4,092 $ 4,226 $ 2,004 $ 2,033 $ 7,391 $ 7,592 $21,786 $22,475
30–149 days past due 246 278 256 259 268 286 381 398 1,151 1,221
150 or more days past due 225 242 202 223 123 123 427 457 977 1,045
Total loans $ 8,770 $ 9,144 $ 4,550 $ 4,708 $ 2,395 $ 2,442 $ 8,199 $ 8,447 $23,914 $24,741
% of 30+ days past due to total loans 5.37% 5.69% 10.07% 10.24% 16.33% 16.75% 9.85% 10.12% 8.90% 9.16%
Current estimated LTV ratios (based on unpaid principal balance)(b)(c)
Greater than 125% and refreshed FICO scores:
Equal to or greater than 660 $ 17 $ 17 $ 2 $ 1 $ — $ — $ 3 $ 3 $ 22 $ 21
Less than 660 10 13 6 7 9 9 6 7 31 36
101% to 125% and refreshed FICO scores:
Equal to or greater than 660 119 135 8 6 5 4 21 17 153 162
Less than 660 53 65 19 22 30 35 22 33 124 155
80% to 100% and refreshed FICO scores:
Equal to or greater than 660 766 805 78 75 59 54 123 119 1,026 1,053
Less than 660 324 388 86 112 133 161 145 190 688 851
Lower than 80% and refreshed FICO scores:
Equal to or greater than 660 5,480 5,548 2,788 2,689 826 739 5,316 5,111 14,410 14,087
Less than 660 1,757 1,908 1,365 1,568 1,230 1,327 2,248 2,622 6,600 7,425
No FICO/LTV available 244 265 198 228 103 113 315 345 860 951
Total unpaid principal balance $ 8,770 $ 9,144 $ 4,550 $ 4,708 $ 2,395 $ 2,442 $ 8,199 $ 8,447 $23,914 $24,741
Geographic region (based on unpaid principal balance)(d)
California $ 5,196 $ 5,420 $ 2,490 $ 2,578 $ 583 $ 593 $ 4,666 $ 4,798 $12,935 $13,389
Florida 941 976 317 332 229 234 691 713 2,178 2,255
New York 507 525 359 365 264 268 491 502 1,621 1,660
Washington 401 419 94 98 42 44 171 177 708 738
Illinois 224 233 150 154 121 123 195 199 690 709
New Jersey 202 210 128 134 85 88 243 258 658 690
Massachusetts 63 65 111 113 73 73 233 240 480 491
Maryland 47 48 94 95 94 96 171 178 406 417
Virginia 51 54 88 91 36 37 204 211 379 393
Arizona 159 165 66 69 42 43 109 112 376 389
All other 979 1,029 653 679 826 843 1,025 1,059 3,483 3,610
Total unpaid principal balance $ 8,770 $ 9,144 $ 4,550 $ 4,708 $ 2,395 $ 2,442 $ 8,199 $ 8,447 $23,914 $24,741
(a) Carrying value includes the effect of fair value adjustments that were applied to the consumer PCI portfolio at the date of acquisition.(b) Represents the aggregate unpaid principal balance of loans divided by the estimated current property value. Current property values are estimated, at a
minimum, quarterly, based on home valuation models using nationally recognized home price index valuation estimates incorporating actual data to the extent available and forecasted data where actual data is not available. These property values do not represent actual appraised loan level collateral values; as such, the resulting ratios are necessarily imprecise and should be viewed as estimates. Current estimated combined LTV for junior lien home equity loans considers all available lien positions, as well as unused lines, related to the property.
(c) Refreshed FICO scores represent each borrower’s most recent credit score, which is obtained by the Firm on at least a quarterly basis.(d) The geographic regions presented in the table are ordered based on the magnitude of the corresponding loan balances at March 31, 2019.

118
Approximately 26% of the PCI home equity portfolio are senior lien loans; the remaining balance are junior lien HELOANs or HELOCs. The following table represents the Firm’s delinquency statistics for PCI junior lien home equity loans and lines of credit based on the unpaid principal balance as of March 31, 2019, and December 31, 2018.
Total loansTotal 30+ day
delinquency rate
(in millions, exceptratios)
Mar 31,2019
Dec 31,2018
Mar 31,2019
Dec 31,2018
HELOCs(a)(b) 6,256 6,531 3.80% 4.00%
HELOANs 266 280 3.76 3.57
Total $ 6,522 $ 6,811 3.80% 3.98%
(a) In general, these HELOCs are revolving loans for a 10-year period, after which time the HELOC converts to an interest-only loan with a balloon payment at the end of the loan’s term. Substantially all HELOCs are beyond the revolving period.
(b) Includes loans modified into fixed rate amortizing loans.
The table below presents the accretable yield activity for the Firm’s PCI consumer loans for the three months ended March 31, 2019 and 2018, and represents the Firm’s estimate of gross interest income expected to be earned over the remaining life of the PCI loan portfolios. The table excludes the cost to fund the PCI portfolios, and therefore the accretable yield does not represent net interest income expected to be earned on these portfolios.
Total PCI
(in millions, except ratios)
Three months endedMarch 31,
2019 2018
Beginning balance $ 8,422 $ 11,159
Accretion into interest income (286) (328)
Changes in interest rates on variable-rate loans (16) 280
Other changes in expected cash flows(a) (77) (861)
Balance at March 31 $ 8,043 $ 10,250
Accretable yield percentage 5.31% 4.78%
(a) Other changes in expected cash flows may vary from period to period as the Firm continues to refine its cash flow model, for example cash flows expected to be collected due to the impact of modifications and changes in prepayment assumptions.
Active and suspended foreclosureAt March 31, 2019, and December 31, 2018, the Firm had PCI residential real estate loans with an unpaid principal balance of $916 million and $964 million, respectively, that were not included in REO, but were in the process of active or suspended foreclosure.
Credit card loan portfolioFor further information on the credit card loan portfolio, including credit quality indicators, refer to Note 12 of JPMorgan Chase’s 2018 Form 10-K.
The table below sets forth information about the Firm’s credit card loans.
(in millions, except ratios)March 31,
2019December 31,
2018
Loan delinquency
Current and less than 30 dayspast due and still accruing $ 147,726 $ 153,746
30–89 days past due and stillaccruing 1,334 1,426
90 or more days past due and stillaccruing 1,455 1,444
Total retained loans $ 150,515 $ 156,616
Loan delinquency ratios
% of 30+ days past due to total retained loans 1.85% 1.83%
% of 90+ days past due to total retained loans 0.97 0.92
Geographic region(a)
California $ 22,935 $ 23,757
Texas 14,784 15,085
New York 13,054 13,601
Florida 9,527 9,770
Illinois 8,591 8,938
New Jersey 6,402 6,739
Ohio 4,830 5,094
Pennsylvania 4,693 4,996
Colorado 4,185 4,309
Michigan 3,713 3,912
All other 57,801 60,415
Total retained loans $ 150,515 $ 156,616
Percentage of portfolio based oncarrying value with estimatedrefreshed FICO scores
Equal to or greater than 660 83.1% 84.2%
Less than 660 15.6 15.0
No FICO available 1.3 0.8
(a) The geographic regions presented in the table are ordered based on the magnitude of the corresponding loan balances at March 31, 2019.

119
Credit card impaired loans and loan modificationsFor a detailed discussion of impaired credit card loans, including credit card loan modifications, refer to Note 12 of JPMorgan Chase’s 2018 Form 10-K.
The table below sets forth information about the Firm’s impaired credit card loans. All of these loans are considered to be impaired as they have been modified in TDRs.
(in millions)March 31,
2019December 31,
2018
Impaired credit card loans with an allowance(a)(b)(c) $ 1,365 $ 1,319
Allowance for loan losses related toimpaired credit card loans 461 440
(a) The carrying value and the unpaid principal balance are the same for credit card impaired loans.
(b) There were no impaired loans without an allowance.(c) Predominantly all impaired credit card loans are in the U.S.
The following table presents average balances of impaired credit card loans and interest income recognized on those loans.
Three months endedMarch 31,
(in millions) 2019 2018
Average impaired credit card loans $ 1,340 $ 1,224
Interest income on impaired credit card loans 17 15
Loan modificationsThe Firm may offer one of a number of loan modification programs to credit card borrowers who are experiencing financial difficulty. Most of the credit card loans have been modified under long-term programs for borrowers who are experiencing financial difficulties. These modifications involve placing the customer on a fixed payment plan, generally for 60 months, and typically include reducing the interest rate on the credit card. Substantially all modifications are considered to be TDRs. New enrollments in these loan modification programs were $249 million and $223 million for the three months ended March 31, 2019 and 2018, respectively. For all periods disclosed, new enrollments were less than 1% of total retained credit card loans.
For additional information about credit card loan modifications, refer to Note 12 of JPMorgan Chase’s 2018 Form 10-K.
Financial effects of modifications and redefaultsThe following table provides information about the financial effects of the concessions granted on credit card loans modified in TDRs and redefaults for the periods presented.
(in millions, except weighted-average data)
Three months endedMarch 31,
2019 2018
Weighted-average interest rate of loans – before TDR 19.13% 17.25%
Weighted-average interest rate of loans – after TDR 5.03 5.20
Loans that redefaulted within one year of modification(a)(b) $ 34 $ 26
(a) Represents loans modified in TDRs that experienced a payment default in the periods presented, and for which the payment default occurred within one year of the modification. The amounts presented represent the balance of such loans as of the end of the quarter in which they defaulted.
(b) The prior period amount has been revised to conform with the current period presentation.
For credit card loans modified in TDRs, payment default is deemed to have occurred when the borrower misses two consecutive contractual payments. A substantial portion of these loans are expected to be charged-off in accordance with the Firm’s standard charge-off policy. Based on historical experience, the estimated weighted-average default rate for modified credit card loans was expected to be 33.71% and 33.38% as of March 31, 2019, and December 31, 2018, respectively.

120
Wholesale loan portfolioWholesale loans include loans made to a variety of clients, ranging from large corporate and institutional clients to high-net-worth individuals. The primary credit quality indicator for wholesale loans is the risk rating assigned to
each loan. For further information on these risk ratings, refer to Note 12 and Note 13 of JPMorgan Chase’s 2018 Form 10-K.
The table below provides information by class of receivable for the retained loans in the Wholesale portfolio segment.
Commercial and industrial Real estate
Financial institutions
Governments &Agencies Other(d)
Total retained loans
(in millions, except ratios)
Mar 31,2019
Dec 31,2018
Mar 31,2019
Dec 31,2018
Mar 31,2019
Dec 31,2018
Mar 31,2019
Dec 31,2018
Mar 31,2019
Dec 31,2018
Mar 31,2019
Dec 31,2018
Loans by riskratings
Investment-grade $ 71,503 $ 73,497 $ 99,755 $100,107 $ 31,909 $32,178 $13,299 $13,984 $116,048 $119,963 $332,514 $339,729
Noninvestment-grade:
Noncriticized 53,916 51,720 15,499 14,876 15,277 15,316 299 201 9,398 11,478 94,389 93,591
Criticizedperforming 4,015 3,738 808 620 72 150 2 2 241 182 5,138 4,692
Criticizednonaccrual 1,106 851 111 134 19 4 — — 334 161 1,570 1,150
Total noninvestment-grade 59,037 56,309 16,418 15,630 15,368 15,470 301 203 9,973 11,821 101,097 99,433
Total retained loans $130,540 $129,806 $116,173 $115,737 $ 47,277 $47,648 $13,600 $14,187 $126,021 $131,784 $433,611 $439,162
% of total criticized exposure to total retained loans 3.92% 3.54% 0.79% 0.65 % 0.19% 0.32% 0.01% 0.01% 0.46% 0.26% 1.55% 1.33%
% of criticized nonaccrual to total retained loans 0.85 0.66 0.10 0.12 0.04 0.01 — — 0.27 0.12 0.36 0.26
Loans by geographic distribution(a)
Total non-U.S. $ 31,754 $ 29,572 $ 3,422 $ 2,967 $ 18,796 $18,524 $ 3,121 $ 3,150 $ 46,835 $ 48,433 $103,928 $102,646
Total U.S. 98,786 100,234 112,751 112,770 28,481 29,124 10,479 11,037 79,186 83,351 329,683 336,516
Total retained loans $130,540 $129,806 $116,173 $115,737 $ 47,277 $47,648 $13,600 $14,187 $126,021 $131,784 $433,611 $439,162
Loan delinquency(b)
Current and lessthan 30 days pastdue and stillaccruing $129,112 $128,678 $115,889 $115,533 $ 47,140 $47,622 $13,590 $14,165 $124,275 $130,918 $430,006 $436,916
30–89 days past due and still accruing 295 109 170 67 118 12 3 18 1,409 702 1,995 908
90 or more days past due and still accruing(c) 27 168 3 3 — 10 7 4 3 3 40 188
Criticized nonaccrual 1,106 851 111 134 19 4 — — 334 161 1,570 1,150
Total retained loans $130,540 $129,806 $116,173 $115,737 $ 47,277 $47,648 $13,600 $14,187 $126,021 $131,784 $433,611 $439,162
(a) The U.S. and non-U.S. distribution is determined based predominantly on the domicile of the borrower.(b) The credit quality of wholesale loans is assessed primarily through ongoing review and monitoring of an obligor’s ability to meet contractual obligations rather than relying on
the past due status, which is generally a lagging indicator of credit quality. For a further discussion, refer to Note 12 of JPMorgan Chase’s 2018 Form 10-K.(c) Represents loans that are considered well-collateralized and therefore still accruing interest.(d) Other includes individuals and individual entities (predominantly consists of Wealth Management clients within AWM and includes exposure to personal investment companies
and personal and testamentary trusts), SPEs and Private education and civic organizations. For more information on SPEs, refer to Note 14 of JPMorgan Chase’s 2018 Form 10-K.

121
The following table presents additional information on the real estate class of loans within the Wholesale portfolio for the periods indicated. For further information on real estate loans, refer to Note 12 of JPMorgan Chase’s 2018 Form 10-K.
(in millions, except ratios)
Multifamily Other commercial Total real estate loans
Mar 31,2019
Dec 31,2018
Mar 31,2019
Dec 31,2018
Mar 31,2019
Dec 31,2018
Real estate retained loans $ 79,263 $ 79,184 $ 36,910 $ 36,553 $ 116,173 $ 115,737
Criticized exposure 501 388 418 366 919 754
% of total criticized exposure to total real estate retained loans 0.63% 0.49% 1.13% 1.00% 0.79% 0.65%
Criticized nonaccrual $ 42 $ 57 $ 69 $ 77 $ 111 $ 134
% of criticized nonaccrual loans to total real estate retained loans 0.05% 0.07% 0.19% 0.21% 0.10% 0.12%
Wholesale impaired retained loans and loan modifications Wholesale impaired retained loans consist of loans that have been placed on nonaccrual status and/or that have been modified in a TDR. All impaired loans are evaluated for an asset-specific allowance as described in Note 13 of JPMorgan Chase’s 2018 Form 10-K.
The table below sets forth information about the Firm’s wholesale impaired retained loans.
(in millions)
Commercialand industrial Real estate
Financialinstitutions
Governments & Agencies Other
Total retained loans
Mar 31,2019
Dec 31,2018
Mar 31,2019
Dec 31,2018
Mar 31,2019
Dec 31,2018
Mar 31,2019
Dec 31,2018
Mar 31,2019
Dec 31,2018
Mar 31,2019
Dec 31,2018
Impaired loans
With an allowance $ 992 $ 807 $ 90 $ 107 $ 19 $ 4 $ — $ — $ 343 $ 152 $ 1,444 $ 1,070
Without an allowance(a) 168 140 24 27 — — — — 2 13 194 180
Total impaired loans $ 1,160 $ 947 $ 114 $ 134 $ 19 $ 4 $ — $ — $ 345 $ 165 $ 1,638 (c) $ 1,250 (c)
Allowance for loan lossesrelated to impairedloans $ 321 $ 252 $ 22 $ 25 $ 6 $ 1 $ — $ — $ 68 $ 19 $ 417 $ 297
Unpaid principal balance of impaired loans(b) 1,322 1,043 188 203 20 4 — — 529 473 2,059 1,723
(a) When the discounted cash flows, collateral value or market price equals or exceeds the recorded investment in the loan, the loan does not require an allowance. This typically occurs when the impaired loans have been partially charged-off and/or there have been interest payments received and applied to the loan balance.
(b) Represents the contractual amount of principal owed at March 31, 2019, and December 31, 2018. The unpaid principal balance differs from the impaired loan balances due to various factors, including charge-offs; interest payments received and applied to the carrying value; net deferred loan fees or costs; and unamortized discount or premiums on purchased loans.
(c) Based upon the domicile of the borrower, largely consists of loans in the U.S.
The following table presents the Firm’s average impaired retained loans for the periods indicated.
Three months endedMarch 31,
(in millions) 2019 2018
Commercial and industrial $ 1,220 $ 1,343
Real estate 131 144
Financial institutions 12 92
Governments & Agencies — —
Other 204 230
Total(a)(b) $ 1,567 $ 1,809
(a) The related interest income on accruing impaired loans and interest income recognized on a cash basis were not material for the three months ended March 31, 2019 and 2018.
(b) The prior period amounts have been revised to conform with the current period presentation.
Certain loan modifications are considered to be TDRs as they provide various concessions to borrowers who are experiencing financial difficulty. All TDRs are reported as impaired loans in the tables above. TDRs were $592 million and $576 million as of March 31, 2019, and December 31, 2018, respectively. The impact of these modifications, as well as new TDRs, were not material to the Firm for the three months ended March 31, 2019 and 2018.
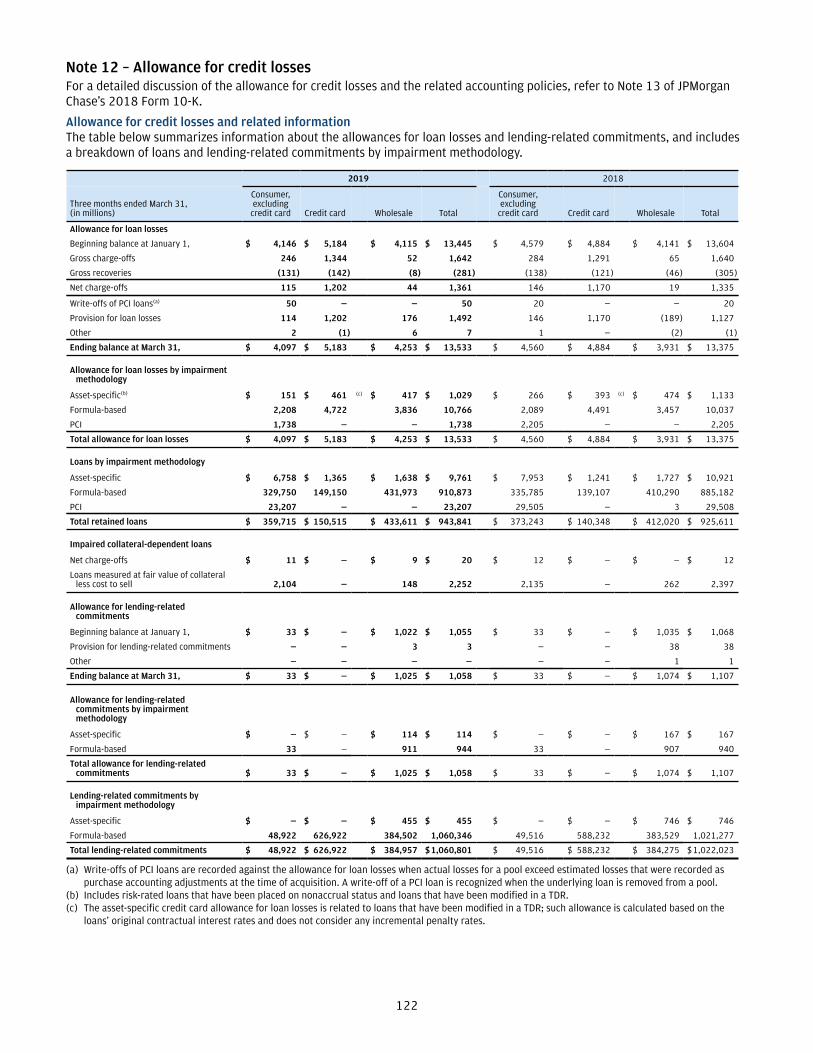
122
Note 12 – Allowance for credit lossesFor a detailed discussion of the allowance for credit losses and the related accounting policies, refer to Note 13 of JPMorgan Chase’s 2018 Form 10-K.
Allowance for credit losses and related informationThe table below summarizes information about the allowances for loan losses and lending-related commitments, and includes a breakdown of loans and lending-related commitments by impairment methodology.
2019 2018
Three months ended March 31,(in millions)
Consumer, excluding
credit card Credit card Wholesale Total
Consumer,excluding
credit card Credit card Wholesale Total
Allowance for loan losses
Beginning balance at January 1, $ 4,146 $ 5,184 $ 4,115 $ 13,445 $ 4,579 $ 4,884 $ 4,141 $ 13,604
Gross charge-offs 246 1,344 52 1,642 284 1,291 65 1,640
Gross recoveries (131) (142) (8) (281) (138) (121) (46) (305)
Net charge-offs 115 1,202 44 1,361 146 1,170 19 1,335
Write-offs of PCI loans(a) 50 — — 50 20 — — 20
Provision for loan losses 114 1,202 176 1,492 146 1,170 (189) 1,127
Other 2 (1) 6 7 1 — (2) (1)
Ending balance at March 31, $ 4,097 $ 5,183 $ 4,253 $ 13,533 $ 4,560 $ 4,884 $ 3,931 $ 13,375
Allowance for loan losses by impairmentmethodology
Asset-specific(b) $ 151 $ 461 (c) $ 417 $ 1,029 $ 266 $ 393 (c) $ 474 $ 1,133
Formula-based 2,208 4,722 3,836 10,766 2,089 4,491 3,457 10,037
PCI 1,738 — — 1,738 2,205 — — 2,205
Total allowance for loan losses $ 4,097 $ 5,183 $ 4,253 $ 13,533 $ 4,560 $ 4,884 $ 3,931 $ 13,375
Loans by impairment methodology
Asset-specific $ 6,758 $ 1,365 $ 1,638 $ 9,761 $ 7,953 $ 1,241 $ 1,727 $ 10,921
Formula-based 329,750 149,150 431,973 910,873 335,785 139,107 410,290 885,182
PCI 23,207 — — 23,207 29,505 — 3 29,508
Total retained loans $ 359,715 $ 150,515 $ 433,611 $ 943,841 $ 373,243 $ 140,348 $ 412,020 $ 925,611
Impaired collateral-dependent loans
Net charge-offs $ 11 $ — $ 9 $ 20 $ 12 $ — $ — $ 12
Loans measured at fair value of collateralless cost to sell 2,104 — 148 2,252 2,135 — 262 2,397
Allowance for lending-relatedcommitments
Beginning balance at January 1, $ 33 $ — $ 1,022 $ 1,055 $ 33 $ — $ 1,035 $ 1,068
Provision for lending-related commitments — — 3 3 — — 38 38
Other — — — — — — 1 1
Ending balance at March 31, $ 33 $ — $ 1,025 $ 1,058 $ 33 $ — $ 1,074 $ 1,107
Allowance for lending-relatedcommitments by impairmentmethodology
Asset-specific $ — $ — $ 114 $ 114 $ — $ — $ 167 $ 167
Formula-based 33 — 911 944 33 — 907 940
Total allowance for lending-relatedcommitments $ 33 $ — $ 1,025 $ 1,058 $ 33 $ — $ 1,074 $ 1,107
Lending-related commitments byimpairment methodology
Asset-specific $ — $ — $ 455 $ 455 $ — $ — $ 746 $ 746
Formula-based 48,922 626,922 384,502 1,060,346 49,516 588,232 383,529 1,021,277
Total lending-related commitments $ 48,922 $ 626,922 $ 384,957 $1,060,801 $ 49,516 $ 588,232 $ 384,275 $1,022,023
(a) Write-offs of PCI loans are recorded against the allowance for loan losses when actual losses for a pool exceed estimated losses that were recorded as purchase accounting adjustments at the time of acquisition. A write-off of a PCI loan is recognized when the underlying loan is removed from a pool.
(b) Includes risk-rated loans that have been placed on nonaccrual status and loans that have been modified in a TDR.(c) The asset-specific credit card allowance for loan losses is related to loans that have been modified in a TDR; such allowance is calculated based on the
loans’ original contractual interest rates and does not consider any incremental penalty rates.
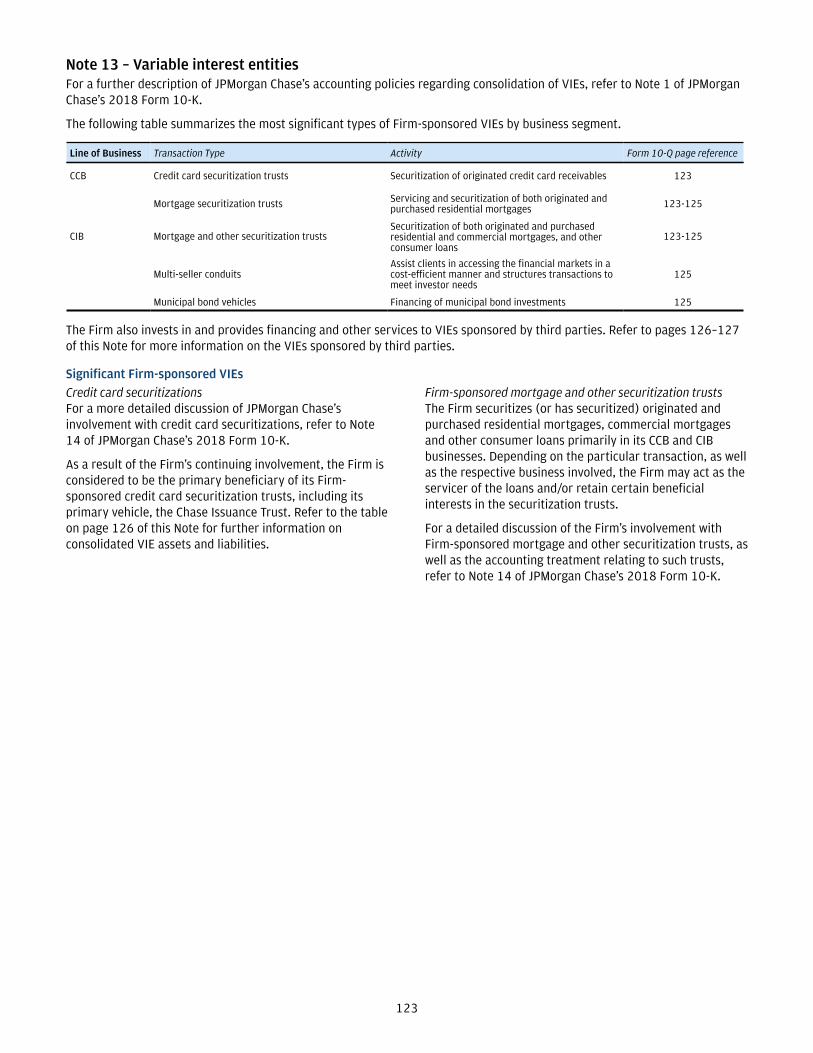
123
Note 13 – Variable interest entitiesFor a further description of JPMorgan Chase’s accounting policies regarding consolidation of VIEs, refer to Note 1 of JPMorgan Chase’s 2018 Form 10-K.
The following table summarizes the most significant types of Firm-sponsored VIEs by business segment.
Line of Business Transaction Type Activity Form 10-Q page reference
CCB Credit card securitization trusts Securitization of originated credit card receivables 123
Mortgage securitization trusts Servicing and securitization of both originated andpurchased residential mortgages 123-125
CIB Mortgage and other securitization trustsSecuritization of both originated and purchasedresidential and commercial mortgages, and otherconsumer loans
123-125
Multi-seller conduitsAssist clients in accessing the financial markets in acost-efficient manner and structures transactions tomeet investor needs
125
Municipal bond vehicles Financing of municipal bond investments 125
The Firm also invests in and provides financing and other services to VIEs sponsored by third parties. Refer to pages 126–127 of this Note for more information on the VIEs sponsored by third parties.
Significant Firm-sponsored VIEsCredit card securitizationsFor a more detailed discussion of JPMorgan Chase’s involvement with credit card securitizations, refer to Note 14 of JPMorgan Chase’s 2018 Form 10-K.
As a result of the Firm’s continuing involvement, the Firm is considered to be the primary beneficiary of its Firm-sponsored credit card securitization trusts, including its primary vehicle, the Chase Issuance Trust. Refer to the table on page 126 of this Note for further information on consolidated VIE assets and liabilities.
Firm-sponsored mortgage and other securitization trustsThe Firm securitizes (or has securitized) originated and purchased residential mortgages, commercial mortgages and other consumer loans primarily in its CCB and CIB businesses. Depending on the particular transaction, as well as the respective business involved, the Firm may act as the servicer of the loans and/or retain certain beneficial interests in the securitization trusts.
For a detailed discussion of the Firm’s involvement with Firm-sponsored mortgage and other securitization trusts, as well as the accounting treatment relating to such trusts, refer to Note 14 of JPMorgan Chase’s 2018 Form 10-K.

124
The following table presents the total unpaid principal amount of assets held in Firm-sponsored private-label securitization entities, including those in which the Firm has continuing involvement, and those that are consolidated by the Firm. Continuing involvement includes servicing the loans, holding senior interests or subordinated interests (including amounts required to be held pursuant to credit risk retention rules), recourse or guarantee arrangements, and derivative contracts. In certain instances, the Firm’s only continuing involvement is servicing the loans. Refer to Securitization activity on page 127 of this Note for further information regarding the Firm’s cash flows associated with and interests retained in nonconsolidated VIEs, and pages 127–128 of this Note for information on the Firm’s loan sales to U.S. government agencies.
Principal amount outstandingJPMorgan Chase interest in securitized assets in
nonconsolidated VIEs(c)(d)(e)
March 31, 2019 (in millions)
Total assets heldby securitization
VIEs
Assetsheld in
consolidatedsecuritization
VIEs
Assets held innonconsolidated
securitizationVIEs with
continuinginvolvement
Tradingassets
Investmentsecurities
Otherfinancial
assets
Total interestsheld by
JPMorganChase
Securitization-related(a)
Residential mortgage:
Prime/Alt-A and option ARMs $ 62,839 $ 3,179 $ 49,893 $ 567 $ 588 $ — $ 1,155
Subprime 16,252 17 14,944 49 — — 49
Commercial and other(b) 103,887 — 82,363 969 825 205 1,999
Total $ 182,978 $ 3,196 $ 147,200 $ 1,585 $ 1,413 $ 205 $ 3,203
Principal amount outstandingJPMorgan Chase interest in securitized assets in
nonconsolidated VIEs(c)(d)(e)
December 31, 2018 (in millions)
Total assets heldby securitization
VIEs
Assets held in
consolidated securitization
VIEs
Assets held innonconsolidated
securitizationVIEs with
continuinginvolvement
Tradingassets
Investmentsecurities
Otherfinancial
assets
Total interests held by
JPMorgan Chase
Securitization-related(a)
Residential mortgage:
Prime/Alt-A and option ARMs $ 63,350 $ 3,237 $ 50,679 $ 623 $ 647 $ — $ 1,270
Subprime 16,729 32 15,434 53 — — 53
Commercial and other(b) 102,961 — 79,387 783 801 210 1,794
Total $ 183,040 $ 3,269 $ 145,500 $ 1,459 $ 1,448 $ 210 $ 3,117
(a) Excludes U.S. government agency securitizations and re-securitizations, which are not Firm-sponsored. Refer to pages 127–128 of this Note for information on the Firm’s loan sales to U.S. government agencies.
(b) Consists of securities backed by commercial loans (predominantly real estate) and non-mortgage-related consumer receivables purchased from third parties.
(c) Excludes the following: retained servicing (refer to Note 14 for a discussion of MSRs); securities retained from loan sales to U.S. government agencies; interest rate and foreign exchange derivatives primarily used to manage interest rate and foreign exchange risks of securitization entities (Refer to Note 4 for further information on derivatives); senior and subordinated securities of $153 million and $91 million, respectively, at March 31, 2019, and $87 million and $28 million, respectively, at December 31, 2018, which the Firm purchased in connection with CIB’s secondary market-making activities.
(d) Includes interests held in re-securitization transactions.(e) As of March 31, 2019, and December 31, 2018, 61% and 60%, respectively, of the Firm’s retained securitization interests, which are predominantly
carried at fair value and include amounts required to be held pursuant to credit risk retention rules, were risk-rated “A” or better, on an S&P-equivalent basis. The retained interests in prime residential mortgages consisted of $1.1 billion and $1.3 billion of investment-grade, and $22 million and $16 million of noninvestment-grade at March 31, 2019, and December 31, 2018, respectively. The retained interests in commercial and other securitizations trusts consisted of $1.4 billion and $1.2 billion of investment-grade and $633 million and $623 million of noninvestment-grade retained interests at March 31, 2019, and December 31, 2018, respectively.
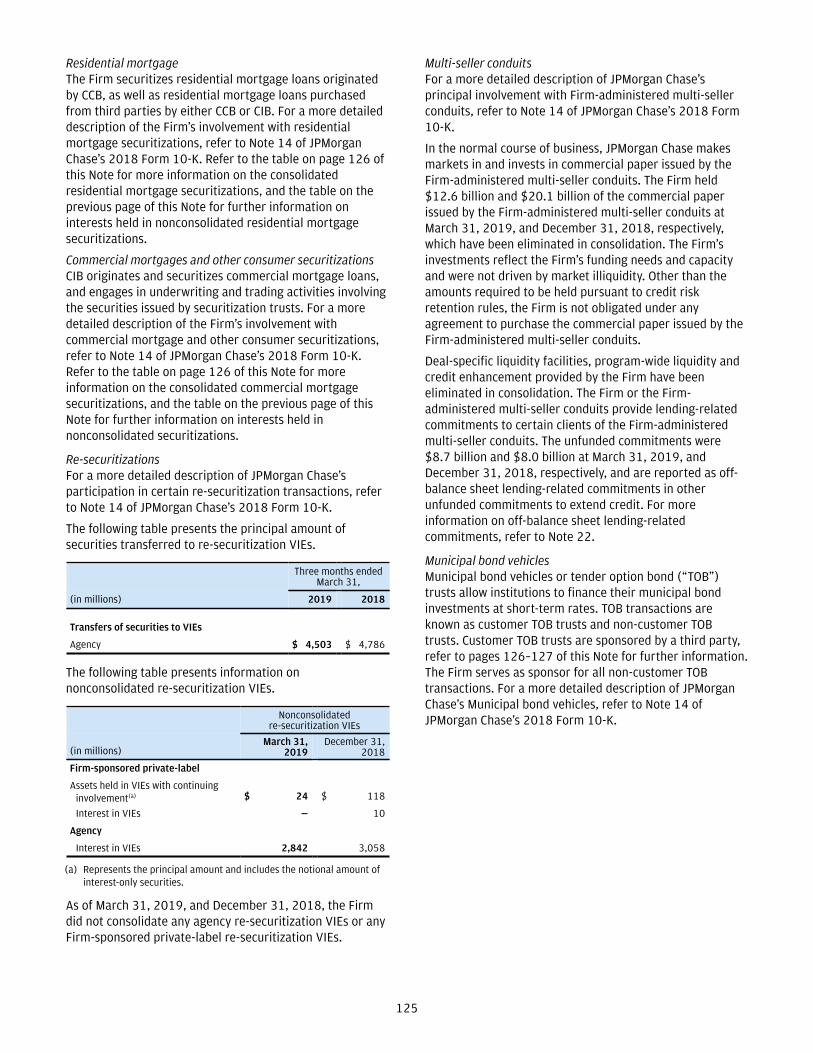
125
Residential mortgageThe Firm securitizes residential mortgage loans originated by CCB, as well as residential mortgage loans purchased from third parties by either CCB or CIB. For a more detailed description of the Firm’s involvement with residential mortgage securitizations, refer to Note 14 of JPMorgan Chase’s 2018 Form 10-K. Refer to the table on page 126 of this Note for more information on the consolidated residential mortgage securitizations, and the table on the previous page of this Note for further information on interests held in nonconsolidated residential mortgage securitizations.
Commercial mortgages and other consumer securitizationsCIB originates and securitizes commercial mortgage loans, and engages in underwriting and trading activities involving the securities issued by securitization trusts. For a more detailed description of the Firm’s involvement with commercial mortgage and other consumer securitizations, refer to Note 14 of JPMorgan Chase’s 2018 Form 10-K. Refer to the table on page 126 of this Note for more information on the consolidated commercial mortgage securitizations, and the table on the previous page of this Note for further information on interests held in nonconsolidated securitizations.
Re-securitizationsFor a more detailed description of JPMorgan Chase’s participation in certain re-securitization transactions, refer to Note 14 of JPMorgan Chase’s 2018 Form 10-K.
The following table presents the principal amount of securities transferred to re-securitization VIEs.
Three months endedMarch 31,
(in millions) 2019 2018
Transfers of securities to VIEs
Agency $ 4,503 $ 4,786
The following table presents information on nonconsolidated re-securitization VIEs.
Nonconsolidated re-securitization VIEs
(in millions)March 31,
2019December 31,
2018
Firm-sponsored private-label
Assets held in VIEs with continuing involvement(a) $ 24 $ 118
Interest in VIEs — 10
Agency
Interest in VIEs 2,842 3,058
(a) Represents the principal amount and includes the notional amount of interest-only securities.
As of March 31, 2019, and December 31, 2018, the Firm did not consolidate any agency re-securitization VIEs or any Firm-sponsored private-label re-securitization VIEs.
Multi-seller conduitsFor a more detailed description of JPMorgan Chase’s principal involvement with Firm-administered multi-seller conduits, refer to Note 14 of JPMorgan Chase’s 2018 Form 10-K.
In the normal course of business, JPMorgan Chase makes markets in and invests in commercial paper issued by the Firm-administered multi-seller conduits. The Firm held $12.6 billion and $20.1 billion of the commercial paper issued by the Firm-administered multi-seller conduits at March 31, 2019, and December 31, 2018, respectively, which have been eliminated in consolidation. The Firm’s investments reflect the Firm’s funding needs and capacity and were not driven by market illiquidity. Other than the amounts required to be held pursuant to credit risk retention rules, the Firm is not obligated under any agreement to purchase the commercial paper issued by the Firm-administered multi-seller conduits.
Deal-specific liquidity facilities, program-wide liquidity and credit enhancement provided by the Firm have been eliminated in consolidation. The Firm or the Firm-administered multi-seller conduits provide lending-related commitments to certain clients of the Firm-administered multi-seller conduits. The unfunded commitments were $8.7 billion and $8.0 billion at March 31, 2019, and December 31, 2018, respectively, and are reported as off-balance sheet lending-related commitments in other unfunded commitments to extend credit. For more information on off-balance sheet lending-related commitments, refer to Note 22.
Municipal bond vehiclesMunicipal bond vehicles or tender option bond (“TOB”) trusts allow institutions to finance their municipal bond investments at short-term rates. TOB transactions are known as customer TOB trusts and non-customer TOB trusts. Customer TOB trusts are sponsored by a third party, refer to pages 126–127 of this Note for further information. The Firm serves as sponsor for all non-customer TOB transactions. For a more detailed description of JPMorgan Chase’s Municipal bond vehicles, refer to Note 14 of JPMorgan Chase’s 2018 Form 10-K.

126
Consolidated VIE assets and liabilitiesThe following table presents information on assets and liabilities related to VIEs consolidated by the Firm as of March 31, 2019, and December 31, 2018.
Assets Liabilities
March 31, 2019 (in millions) Trading assets Loans Other(b) Total
assets(c)
Beneficial interests in VIE assets(d) Other(e)
Total liabilities
VIE program type
Firm-sponsored credit card trusts $ — $ 29,298 $ 486 $ 29,784 $ 13,416 $ 13 $ 13,429
Firm-administered multi-seller conduits 4 22,955 345 23,304 10,788 30 10,818
Municipal bond vehicles 1,454 — 4 1,458 1,462 3 1,465
Mortgage securitization entities(a) 34 3,207 42 3,283 289 155 444
Other 113 — 181 294 — 101 101
Total $ 1,605 $ 55,460 $ 1,058 $ 58,123 $ 25,955 $ 302 $ 26,257
Assets Liabilities
December 31, 2018 (in millions) Trading assets Loans Other(b) Total
assets(c)
Beneficial interests in VIE assets(d) Other(e)
Total liabilities
VIE program type
Firm-sponsored credit card trusts $ — $ 31,760 $ 491 $ 32,251 $ 13,404 $ 12 $ 13,416
Firm-administered multi-seller conduits — 24,411 300 24,711 4,842 33 4,875
Municipal bond vehicles 1,779 — 4 1,783 1,685 3 1,688
Mortgage securitization entities(a) 53 3,285 40 3,378 308 161 469
Other 134 — 178 312 2 103 105
Total $ 1,966 $ 59,456 $ 1,013 $ 62,435 $ 20,241 $ 312 $ 20,553
(a) Includes residential and commercial mortgage securitizations.(b) Includes assets classified as cash and other assets on the Consolidated balance sheets.(c) The assets of the consolidated VIEs included in the program types above are used to settle the liabilities of those entities. The assets and liabilities include third-party
assets and liabilities of consolidated VIEs and exclude intercompany balances that eliminate in consolidation.(d) The interest-bearing beneficial interest liabilities issued by consolidated VIEs are classified in the line item on the Consolidated balance sheets titled, “Beneficial
interests issued by consolidated variable interest entities.” The holders of these beneficial interests generally do not have recourse to the general credit of JPMorgan Chase. For conduits program-wide credit enhancements, refer to note 14 of JPMorgan Chase’s 2018 Form 10-K. Included in beneficial interests in VIE assets are long-term beneficial interests of $13.7 billion at March 31, 2019, and December 31, 2018.
(e) Includes liabilities classified as accounts payable and other liabilities on the Consolidated balance sheets.
VIEs sponsored by third partiesThe Firm enters into transactions with VIEs structured by other parties. These include, for example, acting as a derivative counterparty, liquidity provider, investor, underwriter, placement agent, remarketing agent, trustee or custodian. These transactions are conducted at arm’s-length, and individual credit decisions are based on the analysis of the specific VIE, taking into consideration the quality of the underlying assets. Where the Firm does not have the power to direct the activities of the VIE that most significantly impact the VIE’s economic performance, or a variable interest that could potentially be significant, the Firm generally does not consolidate the VIE, but it records and reports these positions on its Consolidated balance sheets in the same manner it would record and report positions in respect of any other third-party transaction.
Tax credit vehicles The Firm holds investments in unconsolidated tax credit vehicles, which are limited partnerships and similar entities that construct, own and operate affordable housing, wind, solar and other alternative energy projects. These entities are primarily considered VIEs. A third party is typically the
general partner or managing member and has control over the significant activities of the tax credit vehicles, and accordingly the Firm does not consolidate tax credit vehicles. The Firm generally invests in these partnerships as a limited partner and earns a return primarily through the receipt of tax credits allocated to the projects. The maximum loss exposure, represented by equity investments and funding commitments, was $16.4 billion and $16.5 billion, of which $4.3 billion and $4.0 billion was unfunded at March 31, 2019 and December 31, 2018, respectively. In order to reduce the risk of loss, the Firm assesses each project and withholds varying amounts of its capital investment until the project qualifies for tax credits. For further information on affordable housing tax credits, refer to Note 24 of JPMorgan Chase’s 2018 Form 10-K. For more information on off-balance sheet lending-related commitments, refer to Note 22 of this Form 10-Q.
Customer municipal bond vehicles (TOB trusts)The Firm may provide various services to Customer TOB trusts, including remarketing agent, liquidity or tender option provider. In certain Customer TOB transactions, the

127
Firm, as liquidity provider, has entered into a reimbursement agreement with the Residual holder.
In those transactions, upon the termination of the vehicle, the Firm has recourse to the third-party Residual holders for any shortfall. The Firm does not have any intent to protect Residual holders from potential losses on any of the underlying municipal bonds. The Firm does not consolidate Customer TOB trusts, since the Firm does not have the power to make decisions that significantly impact the economic performance of the municipal bond vehicle. The Firm’s maximum exposure as a liquidity provider to Customer TOB trusts at March 31, 2019 and December 31,
2018 was $4.6 billion and $4.8 billion, respectively. The fair value of assets held by such VIEs at March 31, 2019 and December 31, 2018, was $7.5 billion and $7.7 billion, respectively. For more information on off-balance sheet lending-related commitments, refer to Note 22.
Loan securitizationsThe Firm has securitized and sold a variety of loans, including residential mortgage, credit card, and commercial mortgage. For a further description of the Firm’s accounting policies regarding securitizations, refer to Note 14 of JPMorgan Chase’s 2018 Form 10-K.
Securitization activityThe following table provides information related to the Firm’s securitization activities for the three months ended March 31, 2019 and 2018, related to assets held in Firm-sponsored securitization entities that were not consolidated by the Firm, and where sale accounting was achieved at the time of the securitization.
Three months ended March 31,
2019 2018
(in millions)Residential mortgage(f)
Commercial and other(g)
Residential mortgage(f)
Commercial and other(g)
Principal securitized $ 1,782 $ 764 $ 1,330 $ 2,991
All cash flows during the period(a):
Proceeds received from loan sales as financial instruments(b)(c) $ 1,822 $ 782 $ 1,338 $ 2,991
Servicing fees collected(d) 77 — 80 1
Cash flows received on interests 85 51 92 47
(a) Excludes re-securitization transactions.(b) Predominantly includes Level 2 assets.(c) The carrying value of the loans accounted for at fair value approximated the proceeds received upon loan sale.(d) The prior period amounts have been revised to conform with the current period presentation.(e) Includes cash paid by the Firm to reacquire assets from nonconsolidated entities – for example, loan repurchases due to representation and warranties and
servicer “clean-up” calls.(f) Includes prime mortgages only. Excludes loan securitization transactions entered into with Ginnie Mae, Fannie Mae and Freddie Mac.(g) Includes commercial mortgage and other consumer loans.
Loans and excess MSRs sold to U.S. government-sponsored enterprises, and loans in securitization transactions pursuant to Ginnie Mae guidelines
In addition to the amounts reported in the securitization activity tables above, the Firm, in the normal course of business, sells originated and purchased mortgage loans and certain originated excess MSRs on a nonrecourse basis, predominantly to U.S. government-sponsored enterprises (“U.S. GSEs”). These loans and excess MSRs are sold primarily for the purpose of securitization by the U.S. GSEs, who provide certain guarantee provisions (e.g., credit enhancement of the loans). The Firm also sells loans into securitization transactions pursuant to Ginnie Mae guidelines; these loans are typically insured or guaranteed by another U.S. government agency. The Firm does not consolidate the securitization vehicles underlying these transactions as it is not the primary beneficiary. For a limited number of loan sales, the Firm is obligated to share
a portion of the credit risk associated with the sold loans with the purchaser. Refer to Note 22 of this Form 10-Q, and Note 27 of JPMorgan Chase’s 2018 Form 10-K for additional information about the Firm’s loan sales- and securitization-related indemnifications. Refer to Note 14 for additional information about the impact of the Firm’s sale of certain excess MSRs.

128
The following table summarizes the activities related to loans sold to the U.S. GSEs, and loans in securitization transactions pursuant to Ginnie Mae guidelines.
Three months endedMarch 31,
(in millions) 2019 2018
Carrying value of loans sold $ 15,179 $ 8,760
Proceeds received from loan sales as cash 68 —
Proceeds from loan sales as securities(a)(b) 14,837 8,619
Total proceeds received from loan sales(c) $ 14,905 $ 8,619
Gains on loan sales(d)(e) $ 49 $ 14
(a) Includes securities from U.S. GSEs and Ginnie Mae that are generally sold shortly after receipt or retained as part of the Firm’s Investment securities portfolio.
(b) Included in level 2 assets.(c) Excludes the value of MSRs retained upon the sale of loans.(d) Gains on loan sales include the value of MSRs.(e) The carrying value of the loans accounted for at fair value
approximated the proceeds received upon loan sale.
Options to repurchase delinquent loansIn addition to the Firm’s obligation to repurchase certain loans due to material breaches of representations and warranties as discussed in Note 22, the Firm also has the option to repurchase delinquent loans that it services for Ginnie Mae loan pools, as well as for other U.S. government agencies under certain arrangements. The Firm typically
elects to repurchase delinquent loans from Ginnie Mae loan pools as it continues to service them and/or manage the foreclosure process in accordance with the applicable requirements, and such loans continue to be insured or guaranteed. When the Firm’s repurchase option becomes exercisable, such loans must be reported on the Consolidated balance sheets as a loan with a corresponding liability. For additional information, refer to Note 11.
The following table presents loans the Firm repurchased or had an option to repurchase, real estate owned, and foreclosed government-guaranteed residential mortgage loans recognized on the Firm’s Consolidated balance sheets as of March 31, 2019 and December 31, 2018. Substantially all of these loans and real estate are insured or guaranteed by U.S. government agencies.
(in millions)Mar 31,
2019Dec 31,
2018
Loans repurchased or option to repurchase(a) $ 5,712 $ 7,021
Real estate owned 69 75
Foreclosed government-guaranteed residential mortgage loans(b) 356 361
(a) Predominantly all of these amounts relate to loans that have been repurchased from Ginnie Mae loan pools.
(b) Relates to voluntary repurchases of loans, which are included in accrued interest and accounts receivable.
Loan delinquencies and liquidation lossesThe table below includes information about components of nonconsolidated securitized financial assets held in Firm-sponsored private-label securitization entities, in which the Firm has continuing involvement, and delinquencies as of March 31, 2019, and December 31, 2018.
Net liquidation losses(a)
Securitized assets 90 days past dueThree months ended
March 31,
(in millions)Mar 31,
2019Dec 31,
2018Mar 31,
2019Dec 31,
2018 2019 2018
Securitized loans
Residential mortgage:
Prime / Alt-A & option ARMs $ 49,893 $ 50,679 $ 3,117 $ 3,354 $ 157 $ 102
Subprime 14,944 15,434 2,302 2,478 144 (602)
Commercial and other 82,363 79,387 268 225 141 27
Total loans securitized $ 147,200 $ 145,500 $ 5,687 $ 6,057 $ 442 $ (473)
(a) Includes liquidation gains as a result of private label mortgage settlement payments during the first quarter of 2018, which were reflected as asset recoveries by trustees.

129
Note 14 – Goodwill and Mortgage servicing rightsFor a discussion of the accounting policies related to goodwill and mortgage servicing rights, refer to Note 15 of JPMorgan Chase’s 2018 Form 10-K.
GoodwillThe following table presents goodwill attributed to the business segments.
(in millions)March 31,
2019December 31,
2018
Consumer & Community Banking $ 30,987 $ 30,984
Corporate & Investment Bank 6,770 6,770
Commercial Banking 2,860 2,860
Asset & Wealth Management 6,857 6,857
Total goodwill $ 47,474 $ 47,471
The following table presents changes in the carrying amount of goodwill.
Three months ended March 31,
(in millions) 2019 2018
Balance at beginning of period $ 47,471 $ 47,507
Changes during the period from:
Other(a) 3 (8)
Balance at March 31, $ 47,474 $ 47,499
(a) Includes foreign currency remeasurement and other adjustments.
Goodwill impairment testingFor a further description of the Firm’s goodwill impairment testing, including the primary method used to estimate the fair value of the reporting units, and the assumptions used in the goodwill impairment test, refer to Impairment testing on pages 252–253 of JPMorgan Chase’s 2018 Form 10-K.
Goodwill was not impaired at March 31, 2019, or December 31, 2018, nor was goodwill written off due to impairment during the three months ended March 31, 2019 or 2018.
Declines in business performance, increases in credit losses, increases in capital requirements, as well as deterioration in economic or market conditions, adverse regulatory or legislative changes or increases in the estimated market cost of equity, could cause the estimated fair values of the Firm’s reporting units or their associated goodwill to decline in the future, which could result in a material impairment charge to earnings in a future period related to some portion of the associated goodwill.

130
Mortgage servicing rightsMSRs represent the fair value of expected future cash flows for performing servicing activities for others. The fair value considers estimated future servicing fees and ancillary revenue, offset by estimated costs to service the loans, and generally declines over time as net servicing cash flows are received, effectively amortizing the MSR asset against contractual servicing and ancillary fee income. MSRs are either purchased from third parties or recognized upon sale or securitization of mortgage loans if servicing is retained. For a further description of the MSR asset, interest rate risk management, and the valuation of MSRs, refer to Notes 2 and 15 of JPMorgan Chase’s 2018 Form 10-K.
The following table summarizes MSR activity for the three months ended March 31, 2019 and 2018.
As of or for the three monthsended March 31,
(in millions, except where otherwise noted) 2019 2018
Fair value at beginning of period $ 6,130 $ 6,030
MSR activity:
Originations of MSRs 332 176
Purchase of MSRs 104 67
Disposition of MSRs(a) (111) (295)
Net additions/(dispositions) 325 (52)
Changes due to collection/realization of expected cash flows (199) (160)
Changes in valuation due to inputs and assumptions:
Changes due to market interest rates and other(b) (301) 382
Changes in valuation due to other inputs and assumptions:
Projected cash flows (e.g., cost to service) — —
Discount rates — 24
Prepayment model changes and other(c) 2 (22)
Total changes in valuation due to other inputs and assumptions 2 2
Total changes in valuation due to inputs and assumptions (299) 384
Fair value at March 31, $ 5,957 $ 6,202
Change in unrealized gains/(losses) included in income related to MSRs held at March 31, $ (299) $ 384
Contractual service fees, late fees and other ancillary fees included in income 420 465
Third-party mortgage loans serviced at March 31, (in billions) 530 540
Servicer advances, net of an allowance for uncollectible amounts, at March 31, (in billions)(d) 2.6 3.6
(a) Includes excess MSRs transferred to agency-sponsored trusts in exchange for stripped mortgage backed securities (“SMBS”). In each transaction, a portion of the SMBS was acquired by third parties at the transaction date; the Firm acquired the remaining balance of those SMBS as trading securities.
(b) Represents both the impact of changes in estimated future prepayments due to changes in market interest rates, and the difference between actual and expected prepayments.
(c) Represents changes in prepayments other than those attributable to changes in market interest rates.(d) Represents amounts the Firm pays as the servicer (e.g., scheduled principal and interest, taxes and insurance), which will generally be reimbursed within a
short period of time after the advance from future cash flows from the trust or the underlying loans. The Firm’s credit risk associated with these servicer advances is minimal because reimbursement of the advances is typically senior to all cash payments to investors. In addition, the Firm maintains the right to stop payment to investors if the collateral is insufficient to cover the advance. However, certain of these servicer advances may not be recoverable if they were not made in accordance with applicable rules and agreements.

131
The following table presents the components of mortgage fees and related income (including the impact of MSR risk management activities) for the three months ended March 31, 2019 and 2018.
Three months ended March 31,
(in millions) 2019 2018
CCB mortgage fees and related income
Net production revenue $ 200 $ 95
Net mortgage servicing revenue:
Operating revenue:
Loan servicing revenue 404 513
Changes in MSR asset fair value due to collection/realization of expected cash flows (199) (160)
Total operating revenue 205 353
Risk management:
Changes in MSR asset fair value due to market interest rates and other(a) (301) 382
Other changes in MSR asset fair value due to other inputs and assumptionsin model(b) 2 2
Change in derivative fair value and other 290 (367)
Total risk management (9) 17
Total net mortgage servicing revenue 196 370
Total CCB mortgage fees and related income 396 465
All other — —
Mortgage fees and related income $ 396 $ 465
(a) Represents both the impact of changes in estimated future prepayments due to changes in market interest rates, and the difference between actual and expected prepayments.
(b) Represents the aggregate impact of changes in model inputs and assumptions such as projected cash flows (e.g., cost to service), discount rates and changes in prepayments other than those attributable to changes in market interest rates (e.g., changes in prepayments due to changes in home prices).
The table below outlines the key economic assumptions used to determine the fair value of the Firm’s MSRs at March 31, 2019, and December 31, 2018, and outlines hypothetical sensitivities of those fair values to immediate adverse changes in those assumptions, as defined below.
(in millions, except rates)Mar 31,
2019Dec 31,
2018
Weighted-average prepayment speed assumption(constant prepayment rate) 9.64% 8.78%
Impact on fair value of 10% adverse change $ (202) $ (205)
Impact on fair value of 20% adverse change (422) (397)
Weighted-average option adjusted spread(a) 7.99% 7.87%
Impact on fair value of a 100 basis pointadverse change $ (222) $ (235)
Impact on fair value of a 200 basis pointadverse change (428) (452)
(a) The prior period amount has been revised to conform with the current period presentation.
Changes in fair value based on variations in assumptions generally cannot be easily extrapolated, because the relationship of the change in the assumptions to the change in fair value are often highly interrelated and may not be linear. In this table, the effect that a change in a particular assumption may have on the fair value is calculated without changing any other assumption. In reality, changes in one factor may result in changes in another, which would either magnify or counteract the impact of the initial change.
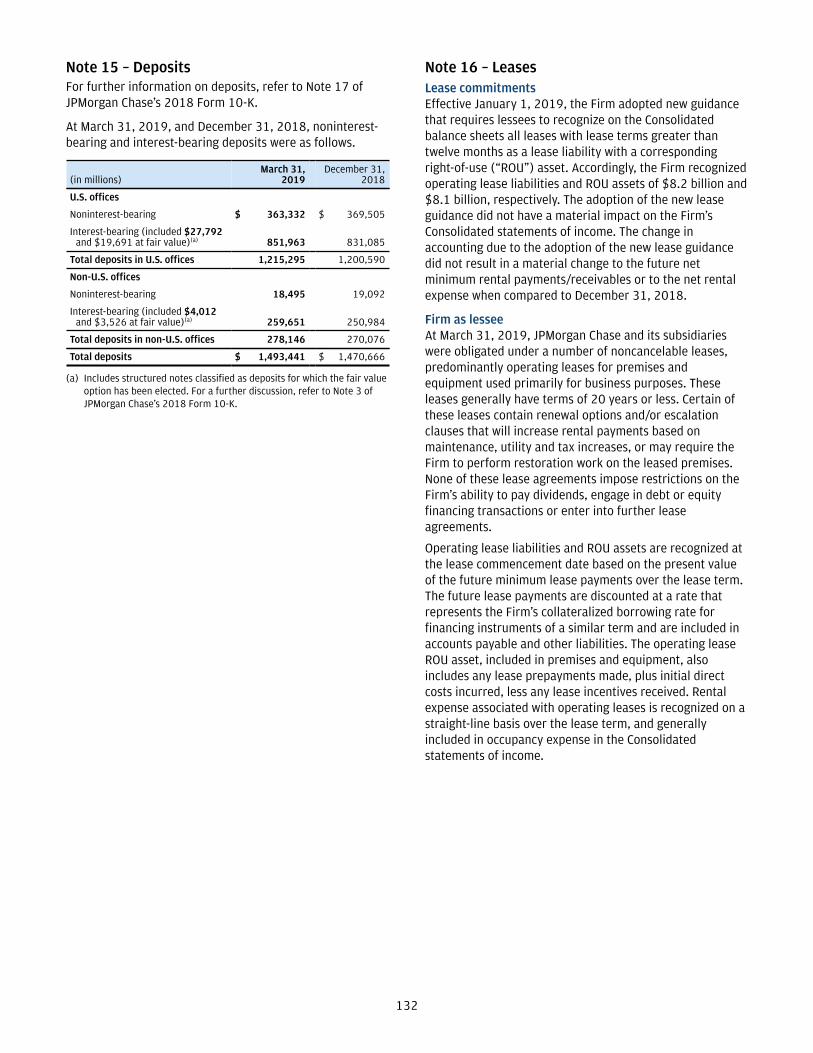
132
Note 15 – DepositsFor further information on deposits, refer to Note 17 of JPMorgan Chase’s 2018 Form 10-K.
At March 31, 2019, and December 31, 2018, noninterest-bearing and interest-bearing deposits were as follows.
(in millions)March 31,
2019December 31,
2018
U.S. offices
Noninterest-bearing $ 363,332 $ 369,505
Interest-bearing (included $27,792 and $19,691 at fair value)(a) 851,963 831,085
Total deposits in U.S. offices 1,215,295 1,200,590
Non-U.S. offices
Noninterest-bearing 18,495 19,092
Interest-bearing (included $4,012 and $3,526 at fair value)(a) 259,651 250,984
Total deposits in non-U.S. offices 278,146 270,076
Total deposits $ 1,493,441 $ 1,470,666
(a) Includes structured notes classified as deposits for which the fair value option has been elected. For a further discussion, refer to Note 3 of JPMorgan Chase’s 2018 Form 10-K.
Note 16 – LeasesLease commitmentsEffective January 1, 2019, the Firm adopted new guidance that requires lessees to recognize on the Consolidated balance sheets all leases with lease terms greater than twelve months as a lease liability with a corresponding right-of-use (“ROU”) asset. Accordingly, the Firm recognized operating lease liabilities and ROU assets of $8.2 billion and $8.1 billion, respectively. The adoption of the new lease guidance did not have a material impact on the Firm’s Consolidated statements of income. The change in accounting due to the adoption of the new lease guidance did not result in a material change to the future net minimum rental payments/receivables or to the net rental expense when compared to December 31, 2018.
Firm as lesseeAt March 31, 2019, JPMorgan Chase and its subsidiaries were obligated under a number of noncancelable leases, predominantly operating leases for premises and equipment used primarily for business purposes. These leases generally have terms of 20 years or less. Certain of these leases contain renewal options and/or escalation clauses that will increase rental payments based on maintenance, utility and tax increases, or may require the Firm to perform restoration work on the leased premises. None of these lease agreements impose restrictions on the Firm’s ability to pay dividends, engage in debt or equity financing transactions or enter into further lease agreements.
Operating lease liabilities and ROU assets are recognized at the lease commencement date based on the present value of the future minimum lease payments over the lease term. The future lease payments are discounted at a rate that represents the Firm’s collateralized borrowing rate for financing instruments of a similar term and are included in accounts payable and other liabilities. The operating lease ROU asset, included in premises and equipment, also includes any lease prepayments made, plus initial direct costs incurred, less any lease incentives received. Rental expense associated with operating leases is recognized on a straight-line basis over the lease term, and generally included in occupancy expense in the Consolidated statements of income.

133
The following table provides information related to the Firm's operating leases:
As of March 31,(in millions, except where otherwise noted) 2019
Right-of-use assets $ 8,272
Lease liabilities 8,562
Weighted average remaining lease term (in years) 8.7
Weighted average discount rate 3.74%
Three months ended March 31,(in millions) 2019Rental expense
Gross rental expense $ 514
Sublease rental income (46)
Net rental expense $ 468
Supplemental cash flow information
Cash paid for amounts included in the measurement oflease liabilities - operating cash flows $ 389
Supplemental non-cash information
Right-of-use assets obtained in exchange for operatinglease obligations $ 365
The following table presents required future minimum rental payments under operating leases with noncancelable lease terms that expire after March 31, 2019:
Year ended December 31, (in millions)
2019 (excluding three months ended March 31, 2019) $ 1,198
2020 1,515
2021 1,335
2022 1,138
2023 966
After 2023 4,043
Total future minimum lease payments 10,195
Less: Imputed interest (1,633)
Total $ 8,562
In addition to the table above, as of March 31, 2019, the Firm had $1.3 billion of minimum lease payments on operating leases that were signed but had not yet commenced. These operating leases will commence between 2019 and 2022 with lease terms up to 25 years.
Firm as lessorThe Firm provides auto and equipment lease financing to its customers through lease arrangements with lease terms that may contain renewal, termination and/or purchase options. Generally the Firm’s lease financings are operating leases. These assets are recognized in other assets on the Firm’s Consolidated balance sheets and are depreciated on a straight-line basis over the lease term to reduce the asset to its estimated residual value. Depreciation expense is included in technology, communications and equipment expense in the Consolidated statements of income. The Firm’s lease income is generally recognized on a straight-
line basis over the lease term and is included in other income in the Consolidated statements of income.
On a periodic basis, the Firm assesses leased assets for impairment, and if the carrying amount of the leased asset exceeds the undiscounted cash flows from the lease payments and the estimated residual value upon disposition of the leased asset, an impairment loss is recognized.
The risk of loss on auto and equipment leased assets relating to the residual value of the leased assets is monitored through projections of the asset residual values at lease origination and periodic review of residual values, and is mitigated through arrangements with certain manufacturers or lessees.
The following table presents the carrying value of assets subject to leases reported on the Consolidated balance sheets:
(in millions)March 31,2019
December 31,2018
Carrying value of assets subject tooperating leases, net of accumulateddepreciation $ 22,052 $ 21,428
Accumulated depreciation 5,555 5,303
The following table presents the Firm’s operating lease income and the related depreciation expense on the Consolidated statements of income:
Three months ended March 31,(in millions) 2019 2018
Operating lease income $ 1,316 $ 1,047
Depreciation expense 997 811
The following table presents future minimum operating lease payments expected to be received as of March 31, 2019:
Year ended December 31, (in millions)
2019 (excluding three months ended March 31, 2019) $ 2,964
2020 2,964
2021 1,424
2022 206
2023 66
After 2023 134
Total future minimum lease payments $ 7,758
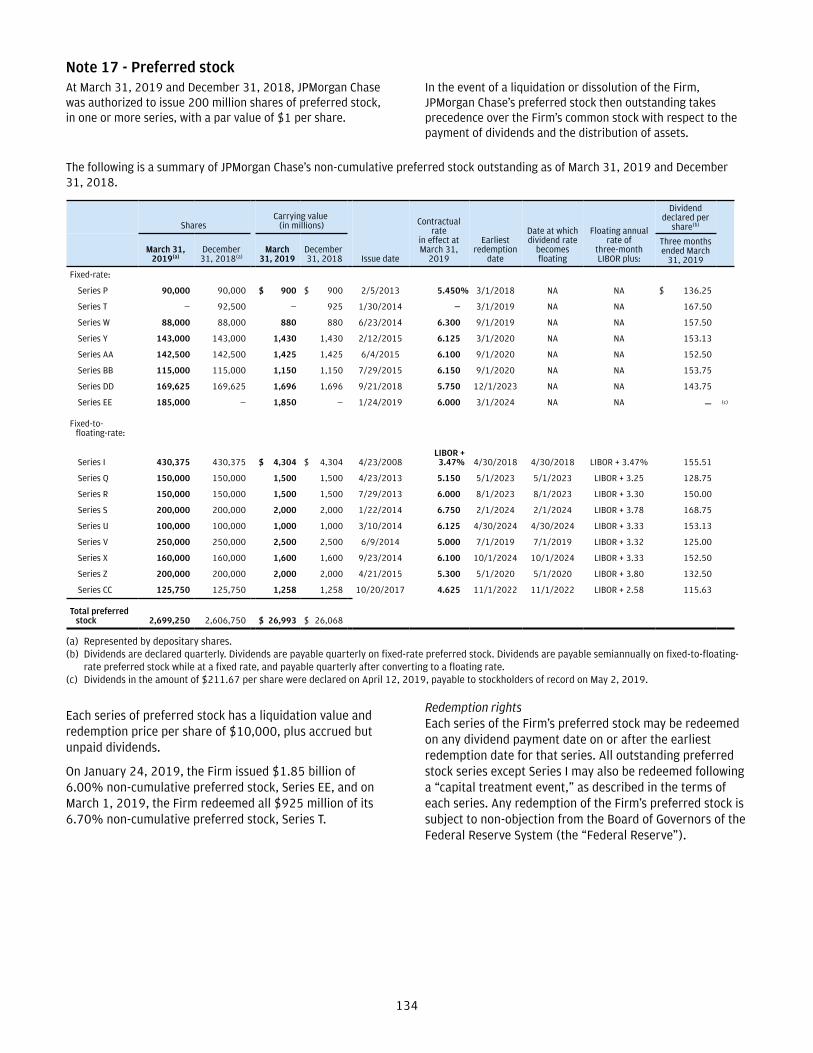
134
Note 17 - Preferred stockAt March 31, 2019 and December 31, 2018, JPMorgan Chase was authorized to issue 200 million shares of preferred stock, in one or more series, with a par value of $1 per share.
In the event of a liquidation or dissolution of the Firm, JPMorgan Chase’s preferred stock then outstanding takes precedence over the Firm’s common stock with respect to the payment of dividends and the distribution of assets.
The following is a summary of JPMorgan Chase’s non-cumulative preferred stock outstanding as of March 31, 2019 and December 31, 2018.
SharesCarrying value (in millions)
Issue date
Contractualrate
in effect atMarch 31,
2019
Earliestredemption
date
Date at whichdividend rate
becomesfloating
Floating annualrate of
three-monthLIBOR plus:
Dividend declared per
share(b)
March 31, 2019(a)
December 31, 2018(a)
March 31, 2019
December 31, 2018
Three monthsended March
31, 2019
Fixed-rate:
Series P 90,000 90,000 $ 900 $ 900 2/5/2013 5.450% 3/1/2018 NA NA $ 136.25
Series T — 92,500 — 925 1/30/2014 — 3/1/2019 NA NA 167.50
Series W 88,000 88,000 880 880 6/23/2014 6.300 9/1/2019 NA NA 157.50
Series Y 143,000 143,000 1,430 1,430 2/12/2015 6.125 3/1/2020 NA NA 153.13
Series AA 142,500 142,500 1,425 1,425 6/4/2015 6.100 9/1/2020 NA NA 152.50
Series BB 115,000 115,000 1,150 1,150 7/29/2015 6.150 9/1/2020 NA NA 153.75
Series DD 169,625 169,625 1,696 1,696 9/21/2018 5.750 12/1/2023 NA NA 143.75
Series EE 185,000 — 1,850 — 1/24/2019 6.000 3/1/2024 NA NA — (c)
Fixed-to-floating-rate:
Series I 430,375 430,375 $ 4,304 $ 4,304 4/23/2008LIBOR +
3.47% 4/30/2018 4/30/2018 LIBOR + 3.47% 155.51
Series Q 150,000 150,000 1,500 1,500 4/23/2013 5.150 5/1/2023 5/1/2023 LIBOR + 3.25 128.75
Series R 150,000 150,000 1,500 1,500 7/29/2013 6.000 8/1/2023 8/1/2023 LIBOR + 3.30 150.00
Series S 200,000 200,000 2,000 2,000 1/22/2014 6.750 2/1/2024 2/1/2024 LIBOR + 3.78 168.75
Series U 100,000 100,000 1,000 1,000 3/10/2014 6.125 4/30/2024 4/30/2024 LIBOR + 3.33 153.13
Series V 250,000 250,000 2,500 2,500 6/9/2014 5.000 7/1/2019 7/1/2019 LIBOR + 3.32 125.00
Series X 160,000 160,000 1,600 1,600 9/23/2014 6.100 10/1/2024 10/1/2024 LIBOR + 3.33 152.50
Series Z 200,000 200,000 2,000 2,000 4/21/2015 5.300 5/1/2020 5/1/2020 LIBOR + 3.80 132.50
Series CC 125,750 125,750 1,258 1,258 10/20/2017 4.625 11/1/2022 11/1/2022 LIBOR + 2.58 115.63
Total preferredstock 2,699,250 2,606,750 $ 26,993 $ 26,068
(a) Represented by depositary shares.(b) Dividends are declared quarterly. Dividends are payable quarterly on fixed-rate preferred stock. Dividends are payable semiannually on fixed-to-floating-
rate preferred stock while at a fixed rate, and payable quarterly after converting to a floating rate. (c) Dividends in the amount of $211.67 per share were declared on April 12, 2019, payable to stockholders of record on May 2, 2019.
Each series of preferred stock has a liquidation value and redemption price per share of $10,000, plus accrued but unpaid dividends.
On January 24, 2019, the Firm issued $1.85 billion of 6.00% non-cumulative preferred stock, Series EE, and on March 1, 2019, the Firm redeemed all $925 million of its 6.70% non-cumulative preferred stock, Series T.
Redemption rightsEach series of the Firm’s preferred stock may be redeemed on any dividend payment date on or after the earliest redemption date for that series. All outstanding preferred stock series except Series I may also be redeemed following a “capital treatment event,” as described in the terms of each series. Any redemption of the Firm’s preferred stock is subject to non-objection from the Board of Governors of the Federal Reserve System (the “Federal Reserve”).

135
Note 18 – Earnings per shareFor a discussion of the computation of basic and diluted earnings per share (“EPS”), refer to Note 22 of JPMorgan Chase’s 2018 Form 10-K. The following table presents the calculation of basic and diluted EPS for the three months ended March 31, 2019 and 2018.
(in millions, except per share amounts)
Three months endedMarch 31,
2019 2018
Basic earnings per share
Net income $ 9,179 $ 8,712
Less: Preferred stock dividends 374 409
Net income applicable to common equity 8,805 8,303
Less: Dividends and undistributed earningsallocated to participating securities 52 65
Net income applicable to commonstockholders $ 8,753 $ 8,238
Total weighted-average basic shares outstanding 3,298.0 3,458.3
Net income per share $ 2.65 $ 2.38
Diluted earnings per share
Net income applicable to commonstockholders $ 8,753 $ 8,238
Total weighted-average basic shares outstanding 3,298.0 3,458.3
Add: Employee stock options, SARs, warrantsand unvested PSUs 10.2 21.2
Total weighted-average diluted sharesoutstanding 3,308.2 3,479.5
Net income per share $ 2.65 $ 2.37

136
Note 19 – Accumulated other comprehensive income/(loss)AOCI includes the after-tax change in unrealized gains and losses on investment securities, foreign currency translation adjustments (including the impact of related derivatives), fair value changes of excluded components on fair value hedges, cash flow hedging activities, net loss and prior service costs/(credit) related to the Firm’s defined benefit pension and OPEB plans, and on fair value option-elected liabilities arising from changes in the Firm’s own credit risk (DVA).
As of or for the three monthsendedMarch 31, 2019(in millions)
Unrealized gains/(losses) on investment
securities
Translationadjustments,net of hedges
Fair valuehedges
Cash flowhedges
Defined benefit pension and OPEB plans
DVA on fair valueoption elected
liabilities
Accumulatedother
comprehensiveincome/(loss)
Balance at January 1, 2019 $ 1,202 $ (727) $ (161) $ (109) $ (2,308) $ 596 $ (1,507)
Net change 1,414 (24) 2 138 36 (617) 949
Balance at March 31, 2019 $ 2,616 $ (751) $ (159) $ 29 $ (2,272) $ (21) $ (558)
As of or for the three monthsendedMarch 31, 2018(in millions)
Unrealized gains/(losses) on investment
securities
Translationadjustments,net of hedges
Fair valuehedges
Cash flowhedges
Defined benefit pension and OPEB plans
DVA on fair valueoption elected
liabilities
Accumulatedother
comprehensiveincome/(loss)
Balance at January 1, 2018 $ 2,164 $ (470) — $ 76 $ (1,521) $ (368) $ (119)
Cumulative effect of changes in accounting principles(a) 896 (277) (54) 16 (414) (79) 88
Net change (1,234) 27 (40) (73) 21 267 (1,032)
Balance at March 31, 2018 $ 1,826 $ (720) $ (94) $ 19 $ (1,914) $ (180) $ (1,063)
(a) Represents the adjustment to AOCI as a result of the accounting standards adopted in the first quarter of 2018, refer to Note 1 of JPMorgan Chase’s 2018 Form 10-K.

137
The following table presents the pre-tax and after-tax changes in the components of OCI.
2019 2018
Three months ended March 31, (in millions) Pre-tax Tax effect After-tax Pre-tax Tax effect After-tax
Unrealized gains/(losses) on investment securities:
Net unrealized gains/(losses) arising during the period $ 1,875 $ (451) $ 1,424 $ (1,858) $ 437 $ (1,421)
Reclassification adjustment for realized (gains)/losses included in net income(a) (13) 3 (10) 245 (58) 187
Net change 1,862 (448) 1,414 (1,613) 379 (1,234)
Translation adjustments(b):
Translation 41 (36) 5 389 (65) 324
Hedges (38) 9 (29) (389) 92 (297)
Net change 3 (27) (24) — 27 27
Fair value hedges, net change(c): 3 (1) 2 (52) 12 (40)
Cash flow hedges:
Net unrealized gains/(losses) arising during the period 141 (33) 108 (44) 11 (33)
Reclassification adjustment for realized (gains)/losses included in net income(d) 39 (9) 30 (52) 12 (40)
Net change 180 (42) 138 (96) 23 (73)
Defined benefit pension and OPEB plans:
Net gain/(loss) arising during the period 3 (2) 1 23 (6) 17
Reclassification adjustments included in net income(e):
Amortization of net loss 42 (9) 33 26 (6) 20
Amortization of prior service cost/(credit) 1 — 1 (6) 1 (5)
Foreign exchange and other (8) 9 1 (19) 8 (11)
Net change 38 (2) 36 24 (3) 21
DVA on fair value option elected liabilities, net change: (807) 190 (617) 350 (83) 267
Total other comprehensive income/(loss) $ 1,279 $ (330) $ 949 $ (1,387) $ 355 $ (1,032)
(a) The pre-tax amount is reported in Investment securities gains/(losses) in the Consolidated statements of income.(b) Reclassifications of pre-tax realized gains/(losses) on translation adjustments and related hedges are reported in other income/expense in the
Consolidated statements of income. There were no sales or liquidations of legal entities that resulted in reclassifications in the periods presented.(c) Represents changes in fair value of cross-currency swaps attributable to changes in cross-currency basis spreads, which are excluded from the assessment
of hedge effectiveness and recorded in other comprehensive income. The initial cost of cross-currency basis spreads is recognized in earnings as part of the accrual of interest on the cross currency swap.
(d) The pre-tax amounts are predominantly recorded in noninterest revenue, net interest income and compensation expense in the Consolidated statements of income.
(e) The pre-tax amount is reported in other expense in the Consolidated statements of income.

138
Note 20 – Restricted cash and other restricted assetsFor a detailed discussion of the Firm’s restricted cash and other restricted assets, refer to Note 25 of JPMorgan Chase’s 2018 Form 10-K.
Certain of the Firm’s cash and other assets are restricted as to withdrawal or usage. These restrictions are imposed by various regulatory authorities based on the particular activities of the Firm’s subsidiaries.
The Firm is also subject to rules and regulations established by other U.S. and non U.S. regulators. As part of its compliance with the respective regulatory requirements, the Firm’s broker-dealer activities are subject to certain restrictions on cash and other assets.
The following table presents the components of the Firm’s restricted cash:
(in billions)March 31,
2019December 31,
2018
Cash reserves – Federal ReserveBanks $ 24.5 $ 22.1
Segregated for the benefit ofsecurities and futures brokeragecustomers 14.1 14.6
Cash reserves at non-U.S. centralbanks and held for other generalpurposes 4.2 4.1
Total restricted cash(a) $ 42.8 $ 40.8
(a) Comprises $41.6 billion and $39.6 billion in deposits with banks as of March 31, 2019 and December 31, 2018, respectively, and $1.2 billion in cash and due from banks at March 31, 2019 and December 31, 2018, on the Consolidated balance sheets.
Also, as of March 31, 2019 and December 31, 2018, the Firm had the following other restricted assets:
• Cash and securities pledged with clearing organizations for the benefit of customers of $21.8 billion and $20.6 billion, respectively.
• Securities with a fair value of $6.6 billion and $9.7 billion, respectively, were also restricted in relation to customer activity.
Note 21 – Regulatory capitalFor a detailed discussion on regulatory capital, refer to Note 26 of JPMorgan Chase’s 2018 Form 10-K.
The Federal Reserve establishes capital requirements, including well-capitalized standards, for the consolidated financial holding company. The Office of the Comptroller of the Currency (“OCC”) establishes similar minimum capital requirements and standards for the Firm’s insured depository institutions (“IDI”), including JPMorgan Chase Bank, N.A. and Chase Bank USA, N.A.
Effective January 1, 2019, the capital adequacy of the Firm and its IDI subsidiaries is now evaluated against the fully phased-in measures under Basel III and represents the lower of the Standardized and Advanced approaches. During 2018, the required capital measures were subject to the transitional rules and as of December 31, 2018 were the same on a fully phased-in and on a transitional basis.
Under the risk-based capital and leverage-based guidelines of the Federal Reserve, JPMorgan Chase is required to maintain minimum ratios for CET1, Tier 1, Total, Tier 1 leverage and the SLR. Failure to meet these minimum requirements could cause the Federal Reserve to take action. IDI subsidiaries are also subject to these capital requirements by their respective primary regulators.
The following table represents the minimum and well-capitalized ratios to which the Firm and its IDI subsidiaries were subject as of March 31, 2019.
Minimum capital ratios Well-capitalized ratios
BHC(a)(e)(f) IDI(b)(e)(f) BHC(c) IDI(d)
Capital ratios
CET1 10.5% 7.0% —% 6.5%
Tier 1 12.0 8.5 6.0 8.0
Total 14.0 10.5 10.0 10.0
Tier 1 leverage 4.0 4.0 5.0 5.0
SLR 5.0 6.0 — 6.0
Note: The table above is as defined by the regulations issued by the Federal Reserve, OCC and FDIC and to which the Firm and its IDI subsidiaries are subject.
(a) Represents the minimum capital ratios applicable to the Firm under Basel III. The CET1 minimum capital ratio includes a capital conservation buffer of 2.5% and GSIB surcharge of 3.5%.
(b) Represents requirements for JPMorgan Chase’s IDI subsidiaries. The CET1 minimum capital ratio includes a capital conservation buffer of 2.5% that is applicable to the IDI subsidiaries. The IDI subsidiaries are not subject to the GSIB surcharge.
(c) Represents requirements for bank holding companies pursuant to regulations issued by the Federal Reserve.
(d) Represents requirements for IDI subsidiaries pursuant to regulations issued under the FDIC Improvement Act.
(e) For the period ended December 31, 2018, the CET1, Tier 1, Total and Tier 1 leverage minimum capital ratios applicable to the Firm were 9.0%, 10.5%, 12.5%, 4.0% and 5.0% and the CET1, Tier 1, Total and Tier 1 leverage minimum capital ratios applicable to the Firm’s IDI subsidiaries were 6.375%, 7.875%, 9.875%, 4.0% and 6.0%, respectively.
(f) Represents minimum SLR requirement of 3.0%, as well as, supplementary leverage buffers of 2.0% and 3.0% for BHC and IDI, respectively.

139
The following tables present the risk-based and leverage-based capital metrics for JPMorgan Chase and its significant IDI subsidiaries under both the Basel III Standardized and Basel III Advanced Approaches. As of March 31, 2019 and December 31, 2018, JPMorgan Chase and all of its IDI subsidiaries were well-capitalized and met all capital requirements to which each was subject.
March 31, 2019(in millions, except ratios)
Basel III Standardized Fully Phased-In Basel III Advanced Fully Phased-In
JPMorgan Chase & Co.
JPMorgan Chase Bank, N.A.
Chase Bank USA, N.A.
JPMorgan Chase & Co.
JPMorgan Chase Bank, N.A.
Chase Bank USA, N.A.
Regulatory capital
CET1 capital $ 186,116 $ 190,158 $ 24,146 $ 186,116 $ 190,158 $ 24,146
Tier 1 capital 212,644 190,158 24,146 212,644 190,158 24,146
Total capital 241,483 201,483 29,044 231,454 195,212 27,646
Assets
Risk-weighted 1,542,903 1,355,463 109,635 1,432,526 1,210,801 168,715
Adjusted average(a) 2,637,741 2,219,559 122,546 2,637,741 2,219,559 122,546
Capital ratios(b)
CET1 12.1% 14.0% 22.0% 13.0% 15.7% 14.3%
Tier 1 13.8 14.0 22.0 14.8 15.7 14.3
Total 15.7 14.9 26.5 16.2 16.1 16.4
Tier 1 leverage(c) 8.1 8.6 19.7 8.1 8.6 19.7
December 31, 2018(in millions, except ratios)
Basel III Standardized Transitional Basel III Advanced Transitional
JPMorgan Chase & Co.
JPMorgan Chase Bank, N.A.
Chase Bank USA, N.A.
JPMorgan Chase & Co.
JPMorgan Chase Bank, N.A.
Chase Bank USA, N.A.
Regulatory capital
CET1 capital $ 183,474 $ 187,259 $ 23,696 $ 183,474 $ 187,259 $ 23,696
Tier 1 capital 209,093 187,259 23,696 209,093 187,259 23,696
Total capital 237,511 198,494 28,628 227,435 192,250 27,196
Assets
Risk-weighted 1,528,916 1,348,230 112,513 1,421,205 1,205,539 174,469
Adjusted average(a) 2,589,887 2,189,293 118,036 2,589,887 2,189,293 118,036
Capital ratios(b)
CET1 12.0% 13.9% 21.1% 12.9% 15.5% 13.6%
Tier 1 13.7 13.9 21.1 14.7 15.5 13.6
Total 15.5 14.7 25.4 16.0 15.9 15.6
Tier 1 leverage(c) 8.1 8.6 20.1 8.1 8.6 20.1
(a) Adjusted average assets, for purposes of calculating the Tier 1 leverage ratio, includes total quarterly average assets adjusted for on-balance sheet assets that are subject to deduction from Tier 1 capital, predominantly goodwill and other intangible assets.
(b) For each of the risk-based capital ratios, the capital adequacy of the Firm and its IDI subsidiaries is evaluated against the lower of the two ratios as calculated under Basel III approaches (Standardized or Advanced).
(c) The Tier 1 leverage ratio is not a risk-based measure of capital.
March 31, 2019 December 31, 2018
Basel III Advanced Fully Phased-In Basel III Advanced Fully Phased-In
(in millions, except ratios)JPMorgan
Chase & Co.JPMorgan
Chase Bank, N.A.Chase Bank USA, N.A.
JPMorgan Chase & Co.
JPMorgan Chase Bank, N.A.
Chase Bank USA, N.A.
Total leverage exposure $ 3,309,501 $ 2,829,536 $ 183,581 $ 3,269,988 $ 2,813,396 $ 177,328
SLR 6.4% 6.7% 13.2% 6.4% 6.7% 13.4%

140
Note 22 – Off–balance sheet lending-related financial instruments, guarantees, and other commitmentsJPMorgan Chase provides lending-related financial instruments (e.g., commitments and guarantees) to address the financing needs of its customers and clients. The contractual amount of these financial instruments represents the maximum possible credit risk to the Firm should the customer or client draw upon the commitment or the Firm be required to fulfill its obligation under the guarantee, and should the customer or client subsequently fail to perform according to the terms of the contract. Most of these commitments and guarantees are refinanced, extended, cancelled, or expire without being drawn or a default occurring. As a result, the total contractual amount of these instruments is not, in the Firm’s view, representative of its expected future credit exposure or funding requirements. For a further discussion of lending-related commitments and guarantees, and the Firm’s related accounting policies, refer to Note 27 of JPMorgan Chase’s 2018 Form 10-K.
To provide for probable credit losses inherent in wholesale and certain consumer lending-related commitments, an allowance for credit losses on lending-related commitments is maintained. Refer to Note 12 for further information regarding the allowance for credit losses on lending-related commitments. The following table summarizes the contractual amounts and carrying values of off-balance sheet lending-related financial instruments, guarantees and other commitments at March 31, 2019, and December 31, 2018. The amounts in the table below for credit card and home equity lending-related commitments represent the total available credit for these products. The Firm has not experienced, and does not anticipate, that all available lines of credit for these products will be utilized at the same time. The Firm can reduce or cancel credit card lines of credit by providing the borrower notice or, in some cases as permitted by law, without notice. In addition, the Firm typically closes credit card lines when the borrower is 60 days or more past due. The Firm may reduce or close HELOCs when there are significant decreases in the value of the underlying property, or when there has been a demonstrable decline in the creditworthiness of the borrower.

141
Off–balance sheet lending-related financial instruments, guarantees and other commitmentsContractual amount Carrying value(h)
March 31, 2019Dec 31,
2018Mar 31,
2019Dec 31,
2018
By remaining maturity (in millions)
Expires in1 year or
less
Expiresafter
1 yearthrough3 years
Expiresafter
3 yearsthrough5 years
Expiresafter 5years Total Total
Lending-related
Consumer, excluding credit card:
Home equity $ 619 $ 1,182 $ 2,006 $ 17,445 $ 21,252 $ 20,901 $ 12 $ 12
Residential mortgage(a) 7,258 — — 12 7,270 5,481 — —
Auto 7,976 434 83 71 8,564 8,011 2 2
Consumer & Business Banking 10,627 655 102 452 11,836 11,673 19 19
Total consumer, excluding credit card 26,480 2,271 2,191 17,980 48,922 46,066 33 33
Credit card 626,922 — — — 626,922 605,379 — —
Total consumer(b) 653,402 2,271 2,191 17,980 675,844 651,445 33 33
Wholesale:
Other unfunded commitments to extend credit(c) 54,308 132,028 154,748 8,519 349,603 351,490 832 852
Standby letters of credit and other financial guarantees(c) 14,788 10,986 4,874 1,903 32,551 33,498 532 521
Other letters of credit(c) 2,526 239 38 — 2,803 2,825 4 3
Total wholesale(d) 71,622 143,253 159,660 10,422 384,957 387,813 1,368 1,376
Total lending-related $ 725,024 $ 145,524 $ 161,851 $ 28,402 $ 1,060,801 $1,039,258 $ 1,401 $ 1,409
Other guarantees and commitments
Securities lending indemnification agreements and guarantees(e) $ 204,205 $ — $ — $ — $ 204,205 $ 186,077 $ — $ —
Derivatives qualifying as guarantees 2,313 129 12,620 40,404 55,466 55,271 261 367
Unsettled resale and securities borrowed agreements 167,186 — — — 167,186 102,008 — —
Unsettled repurchase and securities loanedagreements 158,039 — — — 158,039 57,732 — —
Loan sale and securitization-related indemnifications:
Mortgage repurchase liability NA NA NA NA NA NA 89 89
Loans sold with recourse NA NA NA NA 1,011 1,019 28 30
Exchange & clearing house guarantees and commitments(f) 89,699 — — — 89,699 58,960 — —
Other guarantees and commitments(g) 3,253 2,551 254 2,816 8,874 8,183 (66) (73)
(a) Includes certain commitments to purchase loans from correspondents. (b) Predominantly all consumer lending-related commitments are in the U.S.(c) At March 31, 2019, and December 31, 2018, reflected the contractual amount net of risk participations totaling $274 million and $282 million
respectively, for other unfunded commitments to extend credit; $10.1 billion and $10.4 billion, respectively, for standby letters of credit and other financial guarantees; and $703 million and $385 million, respectively, for other letters of credit. In regulatory filings with the Federal Reserve these commitments are shown gross of risk participations.
(d) Predominantly all wholesale lending-related commitments are in the U.S.(e) At March 31, 2019, and December 31, 2018, collateral held by the Firm in support of securities lending indemnification agreements was $215.6 billion
and $195.6 billion, respectively. Securities lending collateral primarily consists of cash and securities issued by governments that are members of G7 and U.S. government agencies.
(f) At December 31, 2018, includes guarantees to the Fixed Income Clearing Corporation under the sponsored member repo program and commitments and guarantees associated with the Firm’s membership in certain clearing houses.
(g) At March 31, 2019, and December 31, 2018, primarily includes letters of credit hedged by derivative transactions and managed on a market risk basis, and unfunded commitments related to institutional lending. Additionally, includes unfunded commitments predominantly related to certain tax-oriented equity investments.
(h) For lending-related products, the carrying value represents the allowance for lending-related commitments and the guarantee liability; for derivative-related products, the carrying value represents the fair value.

142
Other unfunded commitments to extend creditOther unfunded commitments to extend credit generally consist of commitments for working capital and general corporate purposes, extensions of credit to support commercial paper facilities and bond financings in the event that those obligations cannot be remarketed to new investors, as well as committed liquidity facilities to clearing organizations. The Firm also issues commitments under multipurpose facilities which could be drawn upon in several forms, including the issuance of a standby letter of credit.
Standby letters of credit and other financial guaranteesStandby letters of credit and other financial guarantees are conditional lending commitments issued by the Firm to guarantee the performance of a client or customer to a third party under certain arrangements, such as commercial paper facilities, bond financings, acquisition financings, trade and similar transactions.
The following table summarizes the contractual amount and carrying value of standby letters of credit and other financial guarantees and other letters of credit arrangements as of March 31, 2019, and December 31, 2018.
Standby letters of credit, other financial guarantees and other letters of credit
March 31, 2019 December 31, 2018
(in millions)
Standby letters ofcredit and other
financialguarantees
Other letters of credit
Standby letters ofcredit and other
financialguarantees
Other letters of credit
Investment-grade(a) $ 25,706 $ 1,797 $ 26,420 $ 2,079
Noninvestment-grade(a) 6,845 1,006 7,078 746
Total contractual amount $ 32,551 $ 2,803 $ 33,498 $ 2,825
Allowance for lending-related commitments $ 189 $ 4 $ 167 $ 3
Guarantee liability 343 — 354 —
Total carrying value $ 532 $ 4 $ 521 $ 3
Commitments with collateral $ 17,476 $ 605 $ 17,400 $ 583
(a) The ratings scale is based on the Firm’s internal ratings which generally correspond to ratings as defined by S&P and Moody’s.
Derivatives qualifying as guarantees The Firm transacts certain derivative contracts that have the characteristics of a guarantee under U.S. GAAP. For further information on these derivatives, refer to Note 27 of JPMorgan Chase’s 2018 Form 10-K.
The following table summarizes the derivatives qualifying as guarantees as of March 31, 2019, and December 31, 2018.
(in millions)March 31,
2019December 31,
2018
Notional amounts
Derivative guarantees $ 55,466 $ 55,271
Stable value contracts withcontractually limited exposure 28,757 28,637
Maximum exposure of stable valuecontracts with contractuallylimited exposure 2,972 2,963
Fair value
Derivative payables 261 367
Derivative receivables — —
In addition to derivative contracts that meet the characteristics of a guarantee, the Firm is both a purchaser and seller of credit protection in the credit derivatives market. For a further discussion of credit derivatives, refer to Note 4.
Loan sales- and securitization-related indemnificationsIn connection with the Firm’s mortgage loan sale and securitization activities with GSEs the Firm has made representations and warranties that the loans sold meet certain requirements, and that may require the Firm to repurchase mortgage loans and/or indemnify the loan purchaser if such representations and warranties are breached by the Firm. Further, although the Firm’s securitizations are predominantly nonrecourse, the Firm does provide recourse servicing in certain limited cases where it agrees to share credit risk with the owner of the mortgage loans. For additional information, refer to Note 27 of JPMorgan Chase’s 2018 Form 10-K.
The liability related to repurchase demands associated with private label securitizations is separately evaluated by the Firm in establishing its litigation reserves. For additional information regarding litigation, refer to Note 24 of this Form 10-Q and Note 29 of JPMorgan Chase’s 2018 Form 10-K.

143
Sponsored member repo program In 2018 the Firm commenced the sponsored member repo program, wherein the Firm acts as a sponsoring member to clear eligible overnight resale and repurchase agreements through the Government Securities Division of the Fixed Income Clearing Corporation (“FICC”) on behalf of clients that become sponsored members under the FICC’s rules. The Firm also guarantees to the FICC the prompt and full payment and performance of its sponsored member clients’ respective obligations under the FICC’s rules. The Firm minimizes its liability under these overnight guarantees by obtaining a security interest in the cash or high-quality securities collateral that the clients place with the clearing house therefore the Firm expects the risk of loss to be remote. The Firm’s maximum possible exposure, without taking into consideration the associated collateral, is included in the Exchange & clearing house guarantees and commitments line on page 141. For additional information on credit risk mitigation practices on resale agreements and the types of collateral pledged under repurchase agreements, refer to Note 11 of JPMorgan Chase’s 2018 Form 10-K.
Guarantees of subsidiariesThe Parent Company has guaranteed certain long-term debt and structured notes of its subsidiaries, including JPMorgan Chase Financial Company LLC (“JPMFC”), a 100%-owned finance subsidiary. All securities issued by JPMFC are fully and unconditionally guaranteed by the Parent Company. These guarantees, which rank on a parity with the Firm’s unsecured and unsubordinated indebtedness, are not included in the table on page 141 of this Note. For additional information, refer to Note 19 of JPMorgan Chase’s 2018 Form 10-K.
Note 23 – Pledged assets and collateralFor a discussion of the Firm’s pledged assets and collateral, refer to Note 28 of JPMorgan Chase’s 2018 Form 10-K.
Pledged assets The Firm may pledge financial assets that it owns to maintain potential borrowing capacity at discount windows with Federal Reserve banks, various other central banks and FHLBs. Additionally, pledged assets are used for other purposes, including to collateralize repurchase and other securities financing agreements, to cover short sales and to collateralize derivative contracts and deposits. Certain of these pledged assets may be sold or repledged or otherwise used by the secured parties and are parenthetically identified on the Consolidated balance sheets as assets pledged.
The following table presents the Firm’s pledged assets.
(in billions)March 31,
2019December 31,
2018
Assets that may be sold or repledged orotherwise used by secured parties $ 166.9 $ 104.0
Assets that may not be sold or repledgedor otherwise used by secured parties 109.9 83.7
Assets pledged at Federal Reserve banksand FHLBs 453.2 475.3
Total assets pledged $ 730.0 $ 663.0
Total assets pledged do not include assets of consolidated VIEs; these assets are used to settle the liabilities of those entities. Refer to Note 13 for additional information on assets and liabilities of consolidated VIEs. For additional information on the Firm’s securities financing activities, refer to Note 10. For additional information on the Firm’s long-term debt, refer to Note 19 of JPMorgan Chase’s 2018 Form 10-K.
Collateral The Firm accepts financial assets as collateral that it is permitted to sell or repledge, deliver or otherwise use. This collateral is generally obtained under resale and other securities financing agreements, customer margin loans and derivative contracts. Collateral is generally used under repurchase and other securities financing agreements, to cover short sales and to collateralize derivative contracts and deposits.
The following table presents the fair value of collateral accepted.
(in billions)March 31,
2019December 31,
2018
Collateral permitted to be sold orrepledged, delivered, or otherwise used $ 1,330.5 $ 1,245.3
Collateral sold, repledged, delivered orotherwise used 1,046.9 998.3

144
Note 24 – LitigationContingenciesAs of March 31, 2019, the Firm and its subsidiaries and affiliates are defendants, putative defendants or respondents in numerous legal proceedings, including private, civil litigations and regulatory/government investigations. The litigations range from individual actions involving a single plaintiff to class action lawsuits with potentially millions of class members. Investigations involve both formal and informal proceedings, by both governmental agencies and self-regulatory organizations. These legal proceedings are at varying stages of adjudication, arbitration or investigation, and involve each of the Firm’s lines of business and several geographies and a wide variety of claims (including common law tort and contract claims and statutory antitrust, securities and consumer protection claims), some of which present novel legal theories.
The Firm believes the estimate of the aggregate range of reasonably possible losses, in excess of reserves established, for its legal proceedings is from $0 to approximately $1.4 billion at March 31, 2019. This estimated aggregate range of reasonably possible losses was based upon information available as of that date for those proceedings in which the Firm believes that an estimate of reasonably possible loss can be made. For certain matters, the Firm does not believe that such an estimate can be made, as of that date. The Firm’s estimate of the aggregate range of reasonably possible losses involves significant judgment, given:
• the number, variety and varying stages of the proceedings, including the fact that many are in preliminary stages,
• the existence in many such proceedings of multiple defendants, including the Firm, whose share of liability (if any) has yet to be determined,
• the numerous yet-unresolved issues in many of the proceedings, including issues regarding class certification and the scope of many of the claims, and
• the attendant uncertainty of the various potential outcomes of such proceedings, including where the Firm has made assumptions concerning future rulings by the court or other adjudicator, or about the behavior or incentives of adverse parties or regulatory authorities, and those assumptions prove to be incorrect.
In addition, the outcome of a particular proceeding may be a result which the Firm did not take into account in its estimate because the Firm had deemed the likelihood of that outcome to be remote. Accordingly, the Firm’s estimate of the aggregate range of reasonably possible losses will change from time to time, and actual losses may vary significantly.
Set forth below are descriptions of the Firm’s material legal proceedings.
Foreign Exchange Investigations and Litigation. The Firm previously reported settlements with certain government authorities relating to its foreign exchange (“FX”) sales and trading activities and controls related to those activities. FX-related investigations and inquiries by government authorities, including competition authorities, are ongoing, and the Firm is cooperating with and working to resolve those matters. In May 2015, the Firm pleaded guilty to a single violation of federal antitrust law. In January 2017, the Firm was sentenced, with judgment entered thereafter and a term of probation ending in January 2020. The Department of Labor has granted the Firm a five-year exemption of disqualification that allows the Firm and its affiliates to continue to rely on the Qualified Professional Asset Manager exemption under the Employee Retirement Income Security Act (“ERISA”) until January 2023. The Firm will need to reapply in due course for a further exemption to cover the remainder of the ten-year disqualification period. Separately, in February 2017 the South Africa Competition Commission referred its FX investigation of the Firm and other banks to the South Africa Competition Tribunal, which is conducting civil proceedings concerning that matter.
The Firm is also one of a number of foreign exchange dealers named as defendants in a class action filed in the United States District Court for the Southern District of New York by U.S.-based plaintiffs, principally alleging violations of federal antitrust laws based on an alleged conspiracy to manipulate foreign exchange rates (the “U.S. class action”). In January 2015, the Firm entered into a settlement agreement in the U.S. class action. Following this settlement, a number of additional putative class actions were filed seeking damages for persons who transacted FX futures and options on futures (the “exchanged-based actions”), consumers who purchased foreign currencies at allegedly inflated rates (the “consumer action”), participants or beneficiaries of qualified ERISA plans (the “ERISA actions”), and purported indirect purchasers of FX instruments (the “indirect purchaser action”). Since then, the Firm has entered into a revised settlement agreement to resolve the consolidated U.S. class action, including the exchange-based actions. The Court granted final approval of that settlement agreement in August 2018. Certain members of the settlement class filed requests to the Court to be excluded from the class, and certain of them filed a complaint against the Firm and a number of other foreign exchange dealers in November 2018 (the “opt-out action”). The District Court has dismissed one of the ERISA actions, and the United States Court of Appeals for the Second Circuit affirmed that dismissal in July 2018. The second ERISA action was voluntarily dismissed with prejudice in November 2018. The indirect purchaser action, the

145
consumer action and the opt-out action remain pending in the District Court.
General Motors Litigation. JPMorgan Chase Bank, N.A. participated in, and was the Administrative Agent on behalf of a syndicate of lenders on, a $1.5 billion syndicated Term Loan facility (“Term Loan”) for General Motors Corporation (“GM”). In July 2009, in connection with the GM bankruptcy proceedings, the Official Committee of Unsecured Creditors of Motors Liquidation Company (“Creditors Committee”) filed a lawsuit against JPMorgan Chase Bank, N.A., in its individual capacity and as Administrative Agent for other lenders on the Term Loan, seeking to hold the underlying lien invalid based on the filing of a UCC-3 termination statement relating to the Term Loan. In January 2015, following several court proceedings, the United States Court of Appeals for the Second Circuit reversed the Bankruptcy Court’s dismissal of the Creditors Committee’s claim and remanded the case to the Bankruptcy Court with instructions to enter partial summary judgment for the Creditors Committee as to the termination statement. The proceedings in the Bankruptcy Court thereafter continued with respect to, among other things, additional defenses asserted by JPMorgan Chase Bank, N.A. and the value of additional collateral on the Term Loan that was unaffected by the filing of the termination statement at issue. In addition, certain Term Loan lenders filed cross-claims in the Bankruptcy Court against JPMorgan Chase Bank, N.A. seeking indemnification and asserting various claims. In January 2019, the parties reached an agreement in principle to fully resolve the litigation, including the cross-claims filed against the Firm. The agreement is subject to definitive documentation and court approval, and is not expected to have any material impact on the Firm. The Bankruptcy Court has stayed all deadlines in the action to allow the parties to finalize the settlement agreement for submission to the Bankruptcy Court.
Interchange Litigation. A group of merchants and retail associations filed a series of class action complaints alleging that Visa and Mastercard, as well as certain banks, conspired to set the price of credit and debit card interchange fees and enacted respective rules in violation of antitrust laws. The parties settled the cases for a cash payment, a temporary reduction of credit card interchange, and modifications to certain credit card network rules. In December 2013, the District Court granted final approval of the settlement.
A number of merchants appealed the settlement to the United States Court of Appeals for the Second Circuit, which, in June 2016, vacated the District Court’s certification of the class action and reversed the approval of the class settlement. In March 2017, the U.S. Supreme Court declined petitions seeking review of the decision of the Court of Appeals. The case was remanded to the District Court for further proceedings consistent with the appellate decision. The original class action was divided into two separate actions, one seeking primarily monetary relief and the other seeking primarily injunctive relief. In September
2018, the parties to the class action seeking monetary relief finalized an agreement which amends and supersedes the prior settlement agreement, and the plaintiffs filed a motion seeking preliminary approval of the modified settlement. Pursuant to this settlement, the defendants have collectively contributed an additional $900 million to the approximately $5.3 billion previously held in escrow from the original settlement. In January 2019, the amended agreement was preliminarily approved by the District Court, and formal notice of the class settlement is proceeding in accordance with the District Court’s order. The class action seeking primarily injunctive relief continues separately.
In addition, certain merchants have filed individual actions raising similar allegations against Visa and Mastercard, as well as against the Firm and other banks, and those actions are proceeding.
LIBOR and Other Benchmark Rate Investigations and Litigation. JPMorgan Chase has received subpoenas and requests for documents and, in some cases, interviews, from federal and state agencies and entities, including the U.S. Commodity Futures Trading Commission and various state attorneys general, as well as the European Commission (“EC”), the Swiss Competition Commission (“ComCo”) and other regulatory authorities and banking associations around the world relating primarily to the process by which interest rates were submitted to the British Bankers Association (“BBA”) in connection with the setting of the BBA’s London Interbank Offered Rate (“LIBOR”) for various currencies, principally in 2007 and 2008. Some of the inquiries also relate to similar processes by which information on rates was submitted to the European Banking Federation (“EBF”) in connection with the setting of the EBF’s Euro Interbank Offered Rate (“EURIBOR”). The Firm continues to cooperate with these investigations to the extent that they are ongoing. ComCo’s investigation relating to EURIBOR, to which the Firm and other banks are subject, continues. In December 2016, the EC issued a decision against the Firm and other banks finding an infringement of European antitrust rules relating to EURIBOR. The Firm has filed an appeal of that decision with the European General Court, and that appeal is pending.
In addition, the Firm has been named as a defendant along with other banks in a series of individual and putative class actions related to benchmarks filed in various United States District Courts, including three putative class actions relating to U.S. dollar LIBOR during the period that it was administered by ICE Benchmark Administration. These actions have been filed, or consolidated for pre-trial purposes, in the United States District Court for the Southern District of New York. In these actions, plaintiffs make varying allegations that in various periods, starting in 2000 or later, defendants either individually or collectively manipulated various benchmark rates by submitting rates that were artificially low or high. Plaintiffs allege that they transacted in loans, derivatives or other financial

146
instruments whose values are affected by changes in these rates and assert a variety of claims including antitrust claims seeking treble damages. These matters are in various stages of litigation.
The Firm has agreed to settle putative class actions related to exchange-traded Eurodollar futures contracts, Swiss franc LIBOR, EURIBOR, the Singapore Interbank Offered Rate, the Singapore Swap Offer Rate and the Australian Bank Bill Swap Reference Rate. Those settlements are all subject to further documentation and court approval.
In actions related to U.S. dollar LIBOR during the period that it was administered by the BBA, the District Court dismissed certain claims, including antitrust claims brought by some plaintiffs whom the District Court found did not have standing to assert such claims, and permitted certain claims to proceed, including antitrust claims, claims under the Commodity Exchange Act, claims under Section 10(b) of the Securities Exchange Act and common law claims. The plaintiffs whose antitrust claims were dismissed for lack of standing have filed an appeal. The District Court granted class certification of antitrust claims related to bonds and interest rate swaps sold directly by the defendants and denied class certification motions filed by other plaintiffs.
Municipal Derivatives Litigation. Several civil actions were commenced against the Firm generally alleging that it had made payments to certain third parties in exchange for being chosen to underwrite warrants issued by Jefferson County, Alabama (the “County”) and to act as the counterparty for certain swaps executed by the County. After the County filed for bankruptcy, the Bankruptcy Court confirmed a Plan of Adjustment which provided that all of these actions against the Firm would be released and dismissed with prejudice. The Plan of Adjustment became effective, and these actions were dismissed in December 2013. The appeal by certain sewer rate payers of the Bankruptcy Court’s order confirming the Plan of Adjustment has been dismissed, and the Supreme Court of the United States has denied the sewer rate payers’ petition for review.
Metals Investigations and Litigation. Various authorities, including the Department of Justice’s Criminal Division, are conducting investigations relating to trading practices in the metals markets and related conduct. The Firm is responding to and cooperating with these investigations. Several putative class action complaints have been filed in the United States District Court for the Southern District of New York against the Firm and certain current and former employees, alleging a precious metals futures and options price manipulation scheme in violation of the Commodity Exchange Act. Some of the complaints also allege unjust enrichment and deceptive acts or practices under the General Business Law of the State of New York. The Court consolidated these putative class actions in February 2019. The Firm is also a defendant in a consolidated action filed in the United States District Court for the Southern District of New York alleging monopolization of silver futures in violation of the Sherman Act.
Wendel. Since 2012, the French criminal authorities have been investigating a series of transactions entered into by senior managers of Wendel Investissement (“Wendel”) during the period from 2004 through 2007 to restructure their shareholdings in Wendel. JPMorgan Chase Bank, N.A., Paris branch provided financing for the transactions to a number of managers of Wendel in 2007. JPMorgan Chase has cooperated with the investigation. The investigating judges issued an ordonnance de renvoi in November 2016, referring JPMorgan Chase Bank, N.A. to the French tribunal correctionnel for alleged complicity in tax fraud. No date for trial has been set by the court. The Firm has been successful in legal challenges made to the Court of Cassation, France’s highest court, with respect to the criminal proceedings. In January 2018, the Paris Court of Appeal issued a decision cancelling the mise en examen of JPMorgan Chase Bank, N.A. The Court of Cassation ruled in September 2018 that a mise en examen is a prerequisite for an ordonnance de renvoi and remanded the case to the Court of Appeal to consider JPMorgan Chase Bank, N.A.’s application for the annulment of the ordonnance de renvoi referring JPMorgan Chase Bank, N.A. to the French tribunal correctionnel. Any further actions in the criminal proceedings are stayed pending the outcome of that application. In addition, a number of the managers have commenced civil proceedings against JPMorgan Chase Bank, N.A. The claims are separate, involve different allegations and are at various stages of proceedings.
* * *
In addition to the various legal proceedings discussed above, JPMorgan Chase and its subsidiaries are named as defendants or are otherwise involved in a substantial number of other legal proceedings. The Firm believes it has meritorious defenses to the claims asserted against it in its currently outstanding legal proceedings and it intends to defend itself vigorously. Additional legal proceedings may be initiated from time to time in the future.
The Firm has established reserves for several hundred of its currently outstanding legal proceedings. In accordance with the provisions of U.S. GAAP for contingencies, the Firm accrues for a litigation-related liability when it is probable that such a liability has been incurred and the amount of the loss can be reasonably estimated. The Firm evaluates its outstanding legal proceedings each quarter to assess its litigation reserves, and makes adjustments in such reserves, upwards or downward, as appropriate, based on management’s best judgment after consultation with counsel. The Firm’s legal expense was a benefit of $(81) million and expense of $70 million for the three months ended March 31, 2019 and 2018, respectively. There is no assurance that the Firm’s litigation reserves will not need to be adjusted in the future.

147
In view of the inherent difficulty of predicting the outcome of legal proceedings, particularly where the claimants seek very large or indeterminate damages, or where the matters present novel legal theories, involve a large number of parties or are in early stages of discovery, the Firm cannot state with confidence what will be the eventual outcomes of the currently pending matters, the timing of their ultimate resolution or the eventual losses, fines, penalties or consequences related to those matters. JPMorgan Chase believes, based upon its current knowledge and after consultation with counsel, consideration of the material legal proceedings described above and after taking into account its current litigation reserves and its estimated aggregate range of possible losses, that the other legal proceedings currently pending against it should not have a material adverse effect on the Firm’s consolidated financial condition. The Firm notes, however, that in light of the uncertainties involved in such proceedings, there is no assurance that the ultimate resolution of these matters will not significantly exceed the reserves it has currently accrued or that a matter will not have material reputational consequences. As a result, the outcome of a particular matter may be material to JPMorgan Chase’s operating results for a particular period, depending on, among other factors, the size of the loss or liability imposed and the level of JPMorgan Chase’s income for that period.

148
Note 25 – Business segmentsThe Firm is managed on a line of business basis. There are four major reportable business segments - Consumer & Community Banking, Corporate & Investment Bank, Commercial Banking and Asset & Wealth Management. In addition, there is a Corporate segment. The business segments are determined based on the products and services provided, or the type of customer served, and they reflect the manner in which financial information is currently evaluated by the Firm’s Operating Committee. Segment results are presented on a managed basis. For a further discussion concerning JPMorgan Chase’s business segments, refer to Segment results below, and Note 31 of JPMorgan Chase’s 2018 Form 10-K.
Segment resultsThe following table provides a summary of the Firm’s segment results as of or for the three months ended March 31, 2019 and 2018, on a managed basis. The Firm’s
definition of managed basis starts with the reported U.S. GAAP results and includes certain reclassifications to present total net revenue for the Firm (and each of the reportable business segments) on an FTE basis. Accordingly, revenue from investments that receive tax credits and tax-exempt securities is presented in the managed results on a basis comparable to taxable investments and securities. For additional information on the Firm’s managed basis, refer to Note 31 of JPMorgan Chase’s 2018 Form 10-K.
Business segment capital allocationThe amount of capital assigned to each business is referred to as equity. On at least an annual basis, the assumptions and methodologies used in capital allocation are assessed and as a result, the capital allocated to lines of business may change. For additional information on business segment capital allocation, refer to Line of business equity on page 91 of JPMorgan Chase’s 2018 Form 10-K.
Segment results and reconciliation(a)
As of or for the three monthsended March 31,(in millions, except ratios)
Consumer & Community Banking
Corporate & Investment Bank Commercial Banking Asset & Wealth Management
2019 2018 2019 2018 2019 2018 2019 2018
Noninterest revenue $ 4,333 $ 4,139 $ 7,663 $ 7,917 $ 658 $ 549 $ 2,593 $ 2,630
Net interest income 9,418 8,458 2,185 2,566 1,680 1,617 896 876
Total net revenue 13,751 12,597 9,848 10,483 2,338 2,166 3,489 3,506
Provision for credit losses 1,314 1,317 87 (158) 90 (5) 2 15
Noninterest expense 7,211 6,909 5,453 5,659 873 844 2,647 2,581
Income before income taxexpense 5,226 4,371 4,308 4,982 1,375 1,327 840 910
Income tax expense 1,263 1,045 1,057 1,008 322 302 179 140
Net income $ 3,963 $ 3,326 $ 3,251 $ 3,974 $ 1,053 $ 1,025 $ 661 $ 770
Average equity $ 52,000 $ 51,000 $ 80,000 $ 70,000 $ 22,000 $ 20,000 $ 10,500 $ 9,000
Total assets 552,486 540,659 1,006,111 909,845 216,111 220,880 165,865 158,439
Return on equity 30% 25% 16% 22% 19% 20% 25% 34%
Overhead ratio 52 55 55 54 37 39 76 74
As of or for the three months ended March 31,(in millions, except ratios)
Corporate Reconciling Items(a) Total
2019 2018 2019 2018 2019 2018
Noninterest revenue $ 8 $ (185) $ (585) $ (455) $ 14,670 $ 14,595
Net interest income 417 (47) (143) (158) 14,453 13,312
Total net revenue 425 (232) (728) (613) 29,123 27,907
Provision for credit losses 2 (4) — — 1,495 1,165
Noninterest expense 211 87 — — 16,395 16,080
Income/(loss) before income tax expense/(benefit) 212 (315) (728) (613) 11,233 10,662
Income tax expense/(benefit) (39) 68 (728) (613) 2,054 1,950
Net income/(loss) $ 251 $ (383) $ — $ — $ 9,179 $ 8,712
Average equity $ 65,551 $ 77,615 $ — $ — $ 230,051 $ 227,615
Total assets 796,615 779,962 NA NA 2,737,188 2,609,785
Return on equity NM NM NM NM 16% 15%
Overhead ratio NM NM NM NM 56 58
(a) Segment managed results reflect revenue on an FTE basis with the corresponding income tax impact recorded within income tax expense/(benefit). These adjustments are eliminated in reconciling items to arrive at the Firm’s reported U.S. GAAP results.

149
Report of Independent Registered Public Accounting Firm
To the Board of Directors and Shareholders of JPMorgan Chase & Co.:
Results of Review of Interim Financial StatementsWe have reviewed the accompanying consolidated balance sheet of JPMorgan Chase & Co. and its subsidiaries (the “Firm”) as of March 31, 2019, and the related consolidated statements of income, comprehensive income, changes in stockholders’ equity and cash flows for the three-month periods ended March 31, 2019 and 2018, including the related notes (collectively referred to as the “interim financial statements”). Based on our reviews, we are not aware of any material modifications that should be made to the accompanying interim financial statements for them to be in conformity with accounting principles generally accepted in the United States of America.
We have previously audited, in accordance with the standards of the Public Company Accounting Oversight Board (United States), the consolidated balance sheet of the Firm as of December 31, 2018, and the related consolidated statements of income, comprehensive income, changes in stockholders’ equity and of cash flows for the year then ended (not presented herein), and in our report dated February 26, 2019, we expressed an unqualified opinion on those consolidated financial statements. In our opinion, the information set forth in the accompanying consolidated balance sheet information as of December 31, 2018, is fairly stated, in all material respects, in relation to the consolidated balance sheet from which it has been derived.
Basis for Review ResultsThese interim financial statements are the responsibility of the Firm’s management. We are a public accounting firm registered with the Public Company Accounting Oversight Board (United States) (“PCAOB”) and are required to be independent with respect to the Firm in accordance with the U.S. federal securities laws and the applicable rules and regulations of the Securities and Exchange Commission and the PCAOB. We conducted our review in accordance with the standards of the PCAOB. A review of interim financial information consists principally of applying analytical procedures and making inquiries of persons responsible for financial and accounting matters. It is substantially less in scope than an audit conducted in accordance with the standards of the PCAOB, the objective of which is the expression of an opinion regarding the financial statements taken as a whole. Accordingly, we do not express such an opinion.
May 2, 2019
PricewaterhouseCoopers LLP, 300 Madison Avenue, New York, NY 10017

150
JPMorgan Chase & Co.Consolidated average balance sheets, interest and rates (unaudited)
(Taxable-equivalent interest and rates; in millions, except rates)
Three months ended March 31, 2019 Three months ended March 31, 2018
Averagebalance Interest(f)
Rate(annualized)
Averagebalance Interest(f)
Rate(annualized)
Assets
Deposits with banks $ 290,281 $ 1,170 1.64% $ 423,807 $ 1,321 1.26%
Federal funds sold and securities purchased under resaleagreements 288,478 1,647 2.32 198,362 731 1.49
Securities borrowed 123,467 356 1.17 109,733 62 0.23
Trading assets – debt instruments 336,750 2,782 3.35 256,040 2,118 3.35
Taxable securities 220,817 1,705 3.13 195,641 1,313 2.72
Nontaxable securities(a) 38,583 453 4.76 44,113 510 4.69
Total investment securities 259,400 2,158 3.37 (g) 239,754 1,823 3.08 (g)
Loans 968,019 12,920 5.41 926,548 11,117 4.87
All other interest-earning assets(b) 46,708 1,004 8.72 49,169 681 5.61
Total interest-earning assets 2,313,103 22,037 3.86 2,203,413 17,853 3.29
Allowance for loan losses (13,532) (13,482)
Cash and due from banks 21,458 22,173
Trading assets – equity instruments 94,389 107,688
Trading assets – derivative receivables 52,522 60,492
Goodwill, MSRs and other intangible assets 54,302 54,702
Other assets 162,472 151,057
Total assets $ 2,684,714 $ 2,586,043
Liabilities
Interest-bearing deposits $ 1,104,032 $ 2,188 0.80% $ 1,046,521 $ 1,060 0.41%
Federal funds purchased and securities loaned or sold underrepurchase agreements 209,065 1,110 2.15 196,112 578 1.20
Short-term borrowings(c) 74,562 427 2.33 57,603 209 1.47
Trading liabilities – debt and all other interest-bearingliabilities(d)(e) 183,702 1,224 2.70 171,488 660 1.56
Beneficial interests issued by consolidated VIEs 22,829 150 2.66 23,561 123 2.11
Long-term debt 285,925 2,342 3.32 279,005 1,753 2.55
Total interest-bearing liabilities 1,880,115 7,441 1.61 1,774,290 4,383 1.00
Noninterest-bearing deposits 375,710 399,487
Trading liabilities – equity instruments(e) 34,510 28,631
Trading liabilities – derivative payables 39,567 41,745
All other liabilities, including the allowance for lending-relatedcommitments 97,635 88,207
Total liabilities 2,427,537 2,332,360
Stockholders’ equity
Preferred stock 27,126 26,068
Common stockholders’ equity 230,051 227,615
Total stockholders’ equity 257,177 253,683
Total liabilities and stockholders’ equity $ 2,684,714 $ 2,586,043
Interest rate spread 2.25% 2.29%
Net interest income and net yield on interest-earning assets $ 14,596 2.56 $ 13,470 2.48
(a) Represents securities which are tax-exempt for U.S. federal income tax purposes.(b) Includes held-for-investment margin loans, which are classified in accrued interest and accounts receivable, and all other interest-earning assets, which
are classified in other assets on the Consolidated balance sheets.(c) Includes commercial paper.(d) All other interest-bearing liabilities include brokerage customer payables.(e) The combined balance of trading liabilities – debt and equity instruments were $107.0 billion and $98.0 billion for the three months ended March 31,
2019 and 2018, respectively.(f) Interest includes the effect of certain related hedging derivatives. Taxable-equivalent amounts are used where applicable.(g) The annualized rate for securities based on amortized cost was 3.40% for three months ended March 31, 2019 and 3.12% for three months ended
March 31, 2018, and does not give effect to changes in fair value that are reflected in AOCI.

151
GLOSSARY OF TERMS AND ACRONYMS
2018 Form 10-K: Annual report on Form 10-K for year ended December 31, 2018, filed with the U.S. Securities and Exchange Commission.
ABS: Asset-backed securities
Active foreclosures: Loans referred to foreclosure where formal foreclosure proceedings are ongoing. Includes both judicial and non-judicial states.
AFS: Available-for-sale
Allowance for loan losses to total retained loans: represents period-end allowance for loan losses divided by retained loans.
AOCI: Accumulated other comprehensive income/(loss)
ARM(s): Adjustable rate mortgage(s)
AWM: Asset & Wealth Management
Beneficial interests issued by consolidated VIEs: represents the interest of third-party holders of debt, equity securities, or other obligations, issued by VIEs that JPMorgan Chase consolidates.
Benefit obligation: refers to the projected benefit obligation for pension plans and the accumulated postretirement benefit obligation for OPEB plans.
BHC: Bank holding company
CB: Commercial Banking
CBB: Consumer & Business Banking
CCAR: Comprehensive Capital Analysis and Review
CCB: Consumer & Community Banking
CDS: Credit default swaps
CEO: Chief Executive Officer
CET1 Capital: Common equity Tier 1 Capital
CFTC: Commodity Futures Trading Commission
CFO: Chief Financial Officer
Chase Bank USA, N.A.: Chase Bank USA, National Association
CIB: Corporate & Investment Bank
CIO: Chief Investment Office
Client deposits and other third-party liabilities: Deposits, as well as deposits that are swept to on-balance sheet liabilities (e.g., commercial paper, federal funds purchased and securities loaned or sold under repurchase agreements) as part of client cash management programs.
CLO: Collateralized loan obligations
CLTV: Combined loan-to-value
Collateral-dependent: A loan is considered to be collateral-dependent when repayment of the loan is expected to be provided solely by the underlying collateral, rather than by cash flows from the borrower’s operations, income or other resources.
Commercial Card: provides a wide range of payment services to corporate and public sector clients worldwide through the commercial card products. Services include
procurement, corporate travel and entertainment, expense management services, and business-to-business payment solutions.
Core loans: represents loans central to the Firm’s ongoing businesses; core loans excludes loans classified as trading assets, runoff portfolios, discontinued portfolios and portfolios the Firm has an intent to exit.
Credit derivatives: Financial instruments whose value is derived from the credit risk associated with the debt of a third-party issuer (the reference entity) which allow one party (the protection purchaser) to transfer that risk to another party (the protection seller). Upon the occurrence of a credit event by the reference entity, which may include, among other events, the bankruptcy or failure to pay its obligations, or certain restructurings of the debt of the reference entity, neither party has recourse to the reference entity. The protection purchaser has recourse to the protection seller for the difference between the face value of the CDS contract and the fair value at the time of settling the credit derivative contract. The determination as to whether a credit event has occurred is generally made by the relevant International Swaps and Derivatives Association (“ISDA”) Determinations Committee.
Criticized: Criticized loans, lending-related commitments and derivative receivables that are classified as special mention, substandard and doubtful categories for regulatory purposes and are generally consistent with a rating of CCC+/Caa1 and below, as defined by S&P and Moody’s.
CRO: Chief Risk Officer
CVA: Credit valuation adjustment
DOJ: U.S. Department of Justice
DOL: U.S. Department of Labor
DVA: Debit valuation adjustment
EC: European Commission
Eligible LTD: Long-term debt satisfying certain eligibility criteria
Embedded derivatives: are implicit or explicit terms or features of a financial instrument that affect some or all of the cash flows or the value of the instrument in a manner similar to a derivative. An instrument containing such terms or features is referred to as a “hybrid.” The component of the hybrid that is the non-derivative instrument is referred to as the “host.” For example, callable debt is a hybrid instrument that contains a plain vanilla debt instrument (i.e., the host) and an embedded option that allows the issuer to redeem the debt issue at a specified date for a specified amount (i.e., the embedded derivative). However, a floating rate instrument is not a hybrid composed of a fixed-rate instrument and an interest rate swap.
ERISA: Employee Retirement Income Security Act of 1974
EPS: Earnings per share
Exchange-traded derivatives: Derivative contracts that are executed on an exchange and settled via a central clearing house.

152
Fannie Mae: Federal National Mortgage Association
FASB: Financial Accounting Standards Board
FCA: Financial Conduct Authority
FDIC: Federal Deposit Insurance Corporation
Federal Reserve: The Board of the Governors of the Federal Reserve System
FFIEC: Federal Financial Institutions Examination Council
FHA: Federal Housing Administration
FHLB: Federal Home Loan Bank
FICO score: A measure of consumer credit risk based on information in consumer credit reports produced by Fair Isaac Corporation. Because certain aged data is excluded from credit reports based on rules in the Fair Credit Reporting Act, FICO scores may not reflect all historical information about a consumer.
Firm: JPMorgan Chase & Co.
Forward points: represents the interest rate differential between two currencies, which is either added to or subtracted from the current exchange rate (i.e., “spot rate”) to determine the forward exchange rate.
Freddie Mac: Federal Home Loan Mortgage Corporation
Free-standing derivatives: is a derivative contract entered into either separate and apart from any of the Firm’s other financial instruments or equity transactions. Or, in conjunction with some other transaction and is legally detachable and separately exercisable.
FTE: Fully taxable-equivalent
FVA: Funding valuation adjustment
FX: Foreign exchange
G7: “Group of Seven nations”: Countries in the G7 are Canada, France, Germany, Italy, Japan, the U.K. and the U.S.
G7 government securities: Securities issued by the government of one of the G7 nations.
Ginnie Mae: Government National Mortgage Association
GSE: Fannie Mae and Freddie Mac
GSIB: Global systemically important banks
HELOAN: Home equity loan
HELOC: Home equity line of credit
Home equity – senior lien: represents loans and commitments where JPMorgan Chase holds the first security interest on the property.
Home equity – junior lien: represents loans and commitments where JPMorgan Chase holds a security interest that is subordinate in rank to other liens.
HQLA: High-quality liquid assets
HTM: Held-to-maturity
IDI: Insured depository institutions
IHC: JPMorgan Chase Holdings LLC, an intermediate holding company
Impaired loan: Impaired loans are loans measured at amortized cost, for which it is probable that the Firm will be unable to collect all amounts due, including principal and
interest, according to the contractual terms of the agreement. Impaired loans include the following:
• All wholesale nonaccrual loans
• All TDRs (both wholesale and consumer), including ones that have returned to accrual status
Investment-grade: An indication of credit quality based on JPMorgan Chase’s internal risk assessment system. “Investment grade” generally represents a risk profile similar to a rating of a “BBB-”/“Baa3” or better, as defined by independent rating agencies.
IR: Interest rate
ISDA: International Swaps and Derivatives Association
JPMorgan Chase: JPMorgan Chase & Co.
JPMorgan Chase Bank, N.A.: JPMorgan Chase Bank, National Association
J.P. Morgan Securities: J.P. Morgan Securities LLC
LCR: Liquidity coverage ratio
LGD: Loss given default
LIBOR: London Interbank Offered Rate
LLC: Limited Liability Company
LOB: Line of business
Loss emergence period: represents the time period between the date at which the loss is estimated to have been incurred and the ultimate realization of that loss.
LTIP: Long-term incentive plan
LTV: “Loan-to-value ratio”: For residential real estate loans, the relationship, expressed as a percentage, between the principal amount of a loan and the appraised value of the collateral (i.e., residential real estate) securing the loan.
Origination date LTV ratio
The LTV ratio at the origination date of the loan. Origination date LTV ratios are calculated based on the actual appraised values of collateral (i.e., loan-level data) at the origination date.
Current estimated LTV ratio
An estimate of the LTV as of a certain date. The current estimated LTV ratios are calculated using estimated collateral values derived from a nationally recognized home price index measured at the metropolitan statistical area (“MSA”) level. These MSA-level home price indices consist of actual data to the extent available and forecasted data where actual data is not available. As a result, the estimated collateral values used to calculate these ratios do not represent actual appraised loan-level collateral values; as such, the resulting LTV ratios are necessarily imprecise and should therefore be viewed as estimates.
Combined LTV ratio
The LTV ratio considering all available lien positions, as well as unused lines, related to the property. Combined LTV ratios are used for junior lien home equity products.
Managed basis: A non-GAAP presentation of Firmwide financial results that includes reclassifications to present revenue on a fully taxable-equivalent basis. Management

153
also uses this financial measure at the segment level, because it believes this provides information to enable investors to understand the underlying operational performance and trends of the particular business segment and facilitates a comparison of the business segment with the performance of competitors.
Master netting agreement: A single agreement with a counterparty that permits multiple transactions governed by that agreement to be terminated or accelerated and settled through a single payment in a single currency in the event of a default (e.g., bankruptcy, failure to make a required payment or securities transfer or deliver collateral or margin when due).
Measurement alternative: Measures equity securities without readily determinable fair values at cost less impairment (if any), plus or minus observable price changes from an identical or similar investment of the same issuer.
MBS: Mortgage-backed securities
MD&A: Management’s discussion and analysis
Moody’s: Moody’s Investor Services
Mortgage product types:
Alt-A
Alt-A loans are generally higher in credit quality than subprime loans but have characteristics that would disqualify the borrower from a traditional prime loan. Alt-A lending characteristics may include one or more of the following: (i) limited documentation; (ii) a high CLTV ratio; (iii) loans secured by non-owner occupied properties; or (iv) a debt-to-income ratio above normal limits. A substantial proportion of the Firm’s Alt-A loans are those where a borrower does not provide complete documentation of his or her assets or the amount or source of his or her income.
Option ARMs
The option ARM real estate loan product is an adjustable-rate mortgage loan that provides the borrower with the option each month to make a fully amortizing, interest-only or minimum payment. The minimum payment on an option ARM loan is based on the interest rate charged during the introductory period. This introductory rate is usually significantly below the fully indexed rate. The fully indexed rate is calculated using an index rate plus a margin. Once the introductory period ends, the contractual interest rate charged on the loan increases to the fully indexed rate and adjusts monthly to reflect movements in the index. The minimum payment is typically insufficient to cover interest accrued in the prior month, and any unpaid interest is deferred and added to the principal balance of the loan. Option ARM loans are subject to payment recast, which converts the loan to a variable-rate fully amortizing loan upon meeting specified loan balance and anniversary date triggers.
Prime
Prime mortgage loans are made to borrowers with good credit records who meet specific underwriting requirements, including prescriptive requirements related to income and overall debt levels. New prime mortgage
borrowers provide full documentation and generally have reliable payment histories.
Subprime
Subprime loans are loans that, prior to mid-2008, were offered to certain customers with one or more high risk characteristics, including but not limited to: (i) unreliable or poor payment histories; (ii) a high LTV ratio of greater than 80% (without borrower-paid mortgage insurance); (iii) a high debt-to-income ratio; (iv) an occupancy type for the loan is other than the borrower’s primary residence; or (v) a history of delinquencies or late payments on the loan.
MSA: Metropolitan statistical areas
MSR: Mortgage servicing rights
NA: Data is not applicable or available for the period presented.
Net Capital Rule: Rule 15c3-1 under the Securities Exchange Act of 1934.
Net charge-off/(recovery) rate: represents net charge-offs/(recoveries) (annualized) divided by average retained loans for the reporting period.
Net interchange income includes the following components:
• Interchange income: Fees earned by credit and debit card issuers on sales transactions.
• Rewards costs: The cost to the Firm for points earned by cardholders enrolled in credit card rewards programs.
• Partner payments: Payments to co-brand credit card partners based on the cost of loyalty program rewards earned by cardholders on credit card transactions.
Net yield on interest-earning assets: The average rate for interest-earning assets less the average rate paid for all sources of funds.
NM: Not meaningful
Nonaccrual loans: Loans for which interest income is not recognized on an accrual basis. Loans (other than credit card loans and certain consumer loans insured by U.S. government agencies) are placed on nonaccrual status when full payment of principal and interest is not expected, regardless of delinquency status, or when principal and interest has been in default for a period of 90 days or more unless the loan is both well-secured and in the process of collection. Collateral-dependent loans are typically maintained on nonaccrual status.
Nonperforming assets: Nonperforming assets include nonaccrual loans, nonperforming derivatives and certain assets acquired in loan satisfactions, predominantly real estate owned and other commercial and personal property.
OCC: Office of the Comptroller of the Currency
OCI: Other comprehensive income/(loss)
OPEB: Other postretirement employee benefit
OTC: “Over-the-counter derivatives”: Derivative contracts that are negotiated, executed and settled bilaterally between two derivative counterparties, where one or both counterparties is a derivatives dealer.

154
OTC cleared: “Over-the-counter cleared derivatives”: Derivative contracts that are negotiated and executed bilaterally, but subsequently settled via a central clearing house, such that each derivative counterparty is only exposed to the default of that clearing house.
OTTI: Other-than-temporary impairment
Overhead ratio: Noninterest expense as a percentage of total net revenue.
Parent Company: JPMorgan Chase & Co.
Participating securities: represents unvested share-based compensation awards containing nonforfeitable rights to dividends or dividend equivalents (collectively, “dividends”), which are included in the earnings per share calculation using the two-class method. JPMorgan Chase grants restricted stock and RSUs to certain employees under its share-based compensation programs, which entitle the recipients to receive nonforfeitable dividends during the vesting period on a basis equivalent to the dividends paid to holders of common stock. These unvested awards meet the definition of participating securities. Under the two-class method, all earnings (distributed and undistributed) are allocated to each class of common stock and participating securities, based on their respective rights to receive dividends.
PCA: Prompt corrective action
PCI: “Purchased credit-impaired” loans represents certain loans that were acquired and deemed to be credit-impaired on the acquisition date in accordance with the guidance of the FASB. The guidance allows purchasers to aggregate credit-impaired loans acquired in the same fiscal quarter into one or more pools, provided that the loans have common risk characteristics (e.g., product type, LTV ratios, FICO scores, past due status, geographic location). A pool is then accounted for as a single asset with a single composite interest rate and an aggregate expectation of cash flows.
PD: Probability of default
PRA: Prudential Regulation Authority
Pre-provision profit/(loss): represents total net revenue less noninterest expense. The Firm believes that this financial measure is useful in assessing the ability of a lending institution to generate income in excess of its provision for credit losses.
Principal transactions revenue: Principal transactions revenue is driven by many factors, including the bid-offer spread, which is the difference between the price at which the Firm is willing to buy a financial or other instrument and the price at which the Firm is willing to sell that instrument. It also consists of realized (as a result of closing out or termination of transactions, or interim cash payments) and unrealized (as a result of changes in valuation) gains and losses on financial and other instruments (including those accounted for under the fair value option) primarily used in client-driven market-making activities and on private equity investments. In connection with its client-driven market-making activities, the Firm transacts in debt and equity instruments, derivatives and commodities (including physical commodities inventories and financial instruments that reference commodities). Principal transactions revenue
also includes certain realized and unrealized gains and losses related to hedge accounting and specified risk-management activities, including: (a) certain derivatives designated in qualifying hedge accounting relationships (primarily fair value hedges of commodity and foreign exchange risk), (b) certain derivatives used for specific risk management purposes, primarily to mitigate credit risk and foreign exchange risk, and (c) other derivatives.
PSU(s): Performance share units
Receivables from customers: primarily represents margin loans to brokerage customers that are collateralized through assets maintained in the clients’ brokerage accounts, as such no allowance is held against these receivables. These receivables are reported within accrued interest and accounts receivable on the Firm’s Consolidated balance sheets.
Regulatory VaR: Daily aggregated VaR calculated in accordance with regulatory rules.
REO: Real estate owned
Reported basis: Financial statements prepared under U.S. GAAP, which excludes the impact of taxable-equivalent adjustments.
Retained loans: Loans that are held-for-investment (i.e. excludes loans held-for-sale and loans at fair value).
Revenue wallet: Total fee revenue based on estimates of investment banking fees generated across the industry (i.e., the revenue wallet) from investment banking transactions in M&A, equity and debt underwriting, and loan syndications. Source: Dealogic, a third-party provider of investment banking competitive analysis and volume based league tables for the above noted industry products.
RHS: Rural Housing Service of the U.S. Department of Agriculture
ROE: Return on equity
ROTCE: Return on tangible common equity
ROU assets: Right-of-use assets
RSU(s): Restricted stock units
RWA: “Risk-weighted assets”: Basel III establishes two comprehensive approaches for calculating RWA (a Standardized approach and an Advanced approach) which include capital requirements for credit risk, market risk, and in the case of Basel III Advanced, also operational risk. Key differences in the calculation of credit risk RWA between the Standardized and Advanced approaches are that for Basel III Advanced, credit risk RWA is based on risk-sensitive approaches which largely rely on the use of internal credit models and parameters, whereas for Basel III Standardized, credit risk RWA is generally based on supervisory risk-weightings which vary primarily by counterparty type and asset class. Market risk RWA is calculated on a generally consistent basis between Basel III Standardized and Basel III Advanced.
S&P: Standard and Poor’s 500 Index
SAR(s): Stock appreciation rights
SEC: U.S. Securities and Exchange Commission
Seed capital: Initial JPMorgan capital invested in products,

155
such as mutual funds, with the intention of ensuring the fund is of sufficient size to represent a viable offering to clients, enabling pricing of its shares, and allowing the manager to develop a track record. After these goals are achieved, the intent is to remove the Firm’s capital from the investment.
Single-name: Single reference-entities
SLR: Supplementary leverage ratio
SMBS: Stripped mortgage-backed securities
SPEs: Special purpose entities
Structural interest rate risk: represents interest rate risk of the non-trading assets and liabilities of the Firm.
Structured notes: Structured notes are financial instruments whose cash flows are linked to the movement in one or more indexes, interest rates, foreign exchange rates, commodities prices, prepayment rates, or other market variables. The notes typically contain embedded (but not separable or detachable) derivatives. Contractual cash flows for principal, interest, or both can vary in amount and timing throughout the life of the note based on non-traditional indexes or non-traditional uses of traditional interest rates or indexes.
Suspended foreclosures: Loans referred to foreclosure where formal foreclosure proceedings have started but are currently on hold, which could be due to bankruptcy or loss mitigation. Includes both judicial and non-judicial states.
Taxable-equivalent basis: In presenting managed results, the total net revenue for each of the business segments and the Firm is presented on a tax-equivalent basis. Accordingly, revenue from investments that receive tax credits and tax-exempt securities is presented in the managed results on a basis comparable to taxable investments and securities; the corresponding income tax impact related to tax-exempt items is recorded within income tax expense.
TBVPS: Tangible book value per share
TCE: Tangible common equity
TDR: “Troubled debt restructuring” is deemed to occur when the Firm modifies the original terms of a loan agreement by granting a concession to a borrower that is experiencing financial difficulty.
TLAC: Total Loss Absorbing Capacity
U.K.: United Kingdom
Unaudited: Financial statements and information that have not been subjected to auditing procedures sufficient to permit an independent certified public accountant to express an opinion.
U.S.: United States of America
U.S. GAAP: Accounting principles generally accepted in the United States of America.
U.S. GSE(s): “U.S. government-sponsored enterprises”: In the U.S., GSEs are quasi-governmental, privately-held entities established by Congress to improve the flow of credit to specific sectors of the economy and provide certain essential services to the public. U.S. GSEs include Fannie Mae and Freddie Mac, but do not include Ginnie Mae,
which is directly owned by the U.S. Department of Housing and Urban Development. U.S. GSE obligations are not explicitly guaranteed as to the timely payment of principal and interest by the full faith and credit of the U.S. government.
U.S. Treasury: U.S. Department of the Treasury
VA: U.S. Department of Veterans Affairs
VaR: “Value-at-risk” is a measure of the dollar amount of potential loss from adverse market moves in an ordinary market environment.
VIEs: Variable interest entities
Warehouse loans: consist of prime mortgages originated with the intent to sell that are accounted for at fair value and classified as trading assets.

156
LINE OF BUSINESS METRICS
CONSUMER & COMMUNITY BANKING (“CCB”)
Debit and credit card sales volume: Dollar amount of cardmember purchases, net of returns.
Deposit margin/deposit spread: represents net interest income expressed as a percentage of average deposits.
Home Lending Production and Home Lending Servicing revenue comprises the following:
Net mortgage servicing revenue: Includesoperating revenue earned from servicing third-partymortgage loans which is recognized over the period inwhich the service is provided, changes in the fair value ofMSRs and the impact of risk management activitiesassociated with MSRs.
Net production revenue: Includes fees and incomerecognized as earned on mortgage loans originated with theintent to sell; the impact of risk management activitiesassociated with the mortgage pipeline and warehouseloans; and changes in the fair value of any residual interestsheld from mortgage securitizations. Net production revenuealso includes gains and losses on sales of mortgage loans,lower of cost or fair value adjustments on mortgage loansheld-for-sale, changes in fair value on mortgage loansoriginated with the intent to sell and measured at fair valueunder the fair value option, as well as losses recognized asincurred related to repurchases of previously sold loans.
Mortgage origination channels comprise the following:
Retail: Borrowers who buy or refinance a home through direct contact with a mortgage banker employed by the Firm using a branch office, the Internet or by phone. Borrowers are frequently referred to a mortgage banker by a banker in a Chase branch, real estate brokers, home builders or other third parties.
Correspondent: Banks, thrifts, other mortgage banks and other financial institutions that sell closed loans to the Firm.
Card Services: includes the Credit Card and Merchant Services businesses.
Credit Card: is a business that primarily issues credit cards to consumers and small businesses.
Merchant Services: is a business that primarily processes transactions for merchants.
Net revenue rate: represents Card Services net revenue (annualized) expressed as a percentage of average loans for the period.
Auto loan and lease origination volume: Dollar amount of auto loans and leases originated.
CORPORATE & INVESTMENT BANK (“CIB”)
Definition of selected CIB revenue:
Investment Banking: incorporates all revenue associated with investment banking activities, and is reported net of investment banking revenue shared with other lines of business.
Treasury Services: offers a broad range of products and services that enable clients to manage payments and receipts, as well as invest and manage funds. Products include U.S. dollar and multi-currency clearing, ACH, lockbox, disbursement and reconciliation services, check deposits, and currency-related services.
Lending: includes net interest income, fees, gains or losses on loan sale activity, gains or losses on securities received as part of a loan restructuring, and the risk management results related to the credit portfolio. Lending also includes Trade Finance, which includes loans tied directly to goods crossing borders, export/import loans, commercial letters of credit, standby letters of credit, and supply chain finance.
Fixed Income Markets: primarily includes revenue related to market-making across global fixed income markets, including foreign exchange, interest rate, credit and commodities markets.
Equity Markets: primarily includes revenue related to market-making across global equity products, including cash instruments, derivatives, convertibles and prime brokerage.
Securities Services: primarily includes custody, fund accounting and administration, and securities lending products sold principally to asset managers, insurance companies and public and private investment funds. Also includes clearance, collateral management and depositary receipts business which provides broker-dealer clearing and custody services, including tri-party repo transactions, collateral management products, and depositary bank services for American and global depositary receipt programs.
Description of certain business metrics:
Assets under custody (“AUC”): represents activities associated with the safekeeping and servicing of assets on which Securities Services earns fees.
Investment banking fees: represents advisory, equity underwriting, bond underwriting and loan syndication fees.

157
COMMERCIAL BANKING (“CB”)Commercial Banking provides comprehensive financial solutions, including lending, treasury services, investment banking and asset management products across three primary client segments: Middle Market Banking, Corporate Client Banking and Commercial Real Estate Banking. Other includes amounts not aligned with a primary client segment.
Middle Market Banking: covers midsized corporations, local governments and nonprofit clients.
Corporate Client Banking: covers large corporations.
Commercial Real Estate Banking: covers investors, developers, and owners of multifamily, office, retail, industrial and affordable housing properties.
CB product revenue comprises the following:
Lending: includes a variety of financing alternatives, which are primarily provided on a secured basis; collateral includes receivables, inventory, equipment, real estate or other assets. Products include term loans, revolving lines of credit, bridge financing, asset-based structures, leases, and standby letters of credit.
Treasury services: includes revenue from a broad range of products and services that enable CB clients to manage payments and receipts, as well as invest and manage funds.
Investment banking: includes revenue from a range of products providing CB clients with sophisticated capital-raising alternatives, as well as balance sheet and risk management tools through advisory, equity underwriting, and loan syndications. Revenue from fixed income and equity market products used by CB clients is also included.
Other: product revenue primarily includes tax-equivalent adjustments generated from Community Development Banking activity and certain income derived from principal transactions.
ASSET & WEALTH MANAGEMENT (“AWM”)Assets under management (“AUM”): represent assets managed by AWM on behalf of its Private Banking, Institutional and Retail clients.
Client assets: represent assets under management, as well as custody, brokerage, administration and deposit accounts.
Multi-asset: Any fund or account that allocates assets under management to more than one asset class.
Alternative assets: The following types of assets constitute alternative investments – hedge funds, currency, real estate, private equity and other investment funds designed to focus on nontraditional strategies.
AWM’s lines of business consist of the following:
Asset Management: provides comprehensive global investment services - including asset management, pension analytics, asset-liability management and active risk-budgeting strategies.
Wealth Management: offers investment advice and wealth management, including investment management, capital markets and risk management, tax and estate planning, banking, lending and specialty-wealth advisory services.
AWM’s client segments consist of the following:
Private Banking: clients include high- and ultra-high-net-worth individuals, families, money managers, business owners and small corporations worldwide.
Institutional: clients include both corporate and public institutions, endowments, foundations, nonprofit organizations and governments worldwide.
Retail: clients include financial intermediaries and individual investors.
Asset Management has two high-level measures of its overall fund performance:
Percentage of mutual fund assets under management in funds rated 4- or 5-star: Mutual fund rating services rank funds based on their risk-adjusted performance over various periods. A 5-star rating is the best rating and represents the top 10% of industry-wide ranked funds.
A 4-star rating represents the next 22.5% of industry-wide ranked funds. A 3-star rating represents the next 35% of industry-wide ranked funds. A 2-star rating represents the next 22.5% of industry-wide ranked funds. A 1-star rating is the worst rating and represents the bottom 10% of industry-wide ranked funds. The “overall Morningstar rating” is derived from a weighted average of the performance associated with a fund’s three-, five- and ten-year (if applicable) Morningstar Rating metrics. For U.S. domiciled funds, separate star ratings are given at the individual share class level. The Nomura “star rating” is based on three-year risk-adjusted performance only. Funds with fewer than three years of history are not rated and

158
hence excluded from this analysis. All ratings, the assigned peer categories and the asset values used to derive this analysis are sourced from these fund rating providers. The data providers re-denominate the asset values into U.S. dollars. This % of AUM is based on star ratings at the share class level for U.S. domiciled funds, and at a “primary share class” level to represent the star rating of all other funds except for Japan where Nomura provides ratings at the fund level. The “primary share class”, as defined by Morningstar, denotes the share class recommended as being the best proxy for the portfolio and in most cases will be the most retail version (based upon annual management charge, minimum investment, currency and other factors). The performance data could have been different if all funds/accounts would have been included. Past performance is not indicative of future results.
Percentage of mutual fund assets under management in funds ranked in the 1st or 2nd quartile (one, three, and five years): All quartile rankings, the assigned peer categories and the asset values used to derive this analysis are sourced from the fund ranking providers. Quartile rankings are done on the net-of-fee absolute return of each fund. The data providers re-denominate the asset values into U.S. dollars. This % of AUM is based on fund performance and associated peer rankings at the share class level for U.S. domiciled funds, at a “primary share class” level to represent the quartile ranking of the U.K., Luxembourg and Hong Kong funds and at the fund level for all other funds. The “primary share class”, as defined by Morningstar, denotes the share class recommended as being the best proxy for the portfolio and in most cases will be the most retail version (based upon annual management charge, minimum investment, currency and other factors). Where peer group rankings given for a fund are in more than one “primary share class” territory both rankings are included to reflect local market competitiveness (applies to “Offshore Territories” and “HK SFC Authorized” funds only). The performance data could have been different if all funds/accounts would have been included. Past performance is not indicative of future results.

159
Item 3. Quantitative and Qualitative Disclosures About Market Risk.
For a discussion of the quantitative and qualitative disclosures about market risk, refer to the Market Risk Management section of Management’s discussion and analysis and pages 124–131 of JPMorgan Chase’s 2018 Form 10-K.
Item 4. Controls and Procedures.
As of the end of the period covered by this report, an evaluation was carried out under the supervision and with the participation of the Firm’s management, including its Chairman and Chief Executive Officer and its Chief Financial Officer, of the effectiveness of its disclosure controls and procedures (as defined in Rule 13a-15(e) under the Securities Exchange Act of 1934). Based on that evaluation, the Chairman and Chief Executive Officer and the Chief Financial Officer concluded that these disclosure controls and procedures were effective. Refer to Exhibits 31.1 and 31.2 for the Certification statements issued by the Chairman and Chief Executive Officer and Chief Financial Officer.
The Firm is committed to maintaining high standards of internal control over financial reporting. Nevertheless, because of its inherent limitations, internal control over financial reporting may not prevent or detect misstatements. In addition, in a firm as large and complex as JPMorgan Chase, lapses or deficiencies in internal controls do occur from time to time, and there can be no assurance that any such deficiencies will not result in significant deficiencies or material weaknesses in internal controls in the future. For further information, refer to “Management’s report on internal control over financial reporting” on page 148 of JPMorgan Chase’s 2018 Form 10-K. There was no change in the Firm’s internal control over financial reporting (as defined in Rule 13a-15(f) under the Securities Exchange Act of 1934) that occurred during the three months ended March 31, 2019, that has materially affected, or is reasonably likely to materially affect, the Firm’s internal control over financial reporting.
Part II – Other Information
Item 1. Legal Proceedings.
For information that updates the disclosures set forth under Part I, Item 3: Legal Proceedings, in JPMorgan Chase’s 2018 Form 10-K, refer to the discussion of the Firm’s material legal proceedings in Note 24 of this Form 10-Q.
Item 1A. Risk Factors.
For a discussion of certain risk factors affecting the Firm, refer to Part I, Item 1A: Risk Factors on pages 7–28 of JPMorgan Chase’s 2018 Form 10-K and Forward-Looking Statements on page 68 of this Form 10-Q.
Supervision and regulationFor information on Supervision and Regulation, refer to the Supervision and regulation section on pages 1–6 of JPMorgan Chase’s 2018 Form 10-K.
Item 2. Unregistered Sales of Equity Securities and Use of Proceeds.
The Firm did not have any unregistered sale of equity securities during the three months ended March 31, 2019.
Repurchases under the common equity repurchase program
For information regarding repurchases under the Firm’s common equity repurchase program, refer to Capital Risk Management on pages 32–36 of this Form 10-Q and pages 85-94 of JPMorgan Chase’s 2018 Form 10-K.

160
Shares repurchased, on a settlement-date basis, pursuant to the common equity repurchase program during the three months ended March 31, 2019, were as follows.
Three months ended March 31, 2019
Total shares ofcommon stockrepurchased
Average price paid per share of
common stock(a)
Aggregate repurchases of common equity
(in millions)(a)
Dollar value of remaining authorized repurchase
(in millions)(a)
January 17,344,594 $ 101.12 $ 1,754 $ 8,628
February 13,838,052 103.80 1,436 7,191
March 18,352,000 103.57 1,901 5,290 (b)
First quarter 49,534,646 $ 102.78 $ 5,091 $ 5,290 (b)
(a) Excludes commissions cost.(b) Represents the amount remaining under the $20.7 billion repurchase program that was authorized by the Board of Directors on June 28, 2018.
Item 3. Defaults Upon Senior Securities.
None.
Item 4. Mine Safety Disclosures.
Not applicable.
Item 5. Other Information.
None.
Item 6. Exhibits.
Exhibit No. Description of Exhibit
15 Letter re: Unaudited Interim Financial Information. (a)
31.1 Certification. (a)
31.2 Certification. (a)
32 Certification Pursuant to Section 906 of the Sarbanes-Oxley Act of 2002. (b)
101.INS The instance document does not appear in the interactive data file because its XBRL tags are embedded within the inline XBRL document.(c)
101.SCH XBRL Taxonomy Extension Schema Document.(a)
101.CAL XBRL Taxonomy Extension Calculation Linkbase Document.(a)
101.DEF XBRL Taxonomy Extension Definition Linkbase Document.(a)
101.LAB XBRL Taxonomy Extension Label Linkbase Document.(a)
101.PRE XBRL Taxonomy Extension Presentation Linkbase Document.(a)
(a) Filed herewith.(b) Furnished herewith. This exhibit shall not be deemed “filed” for purposes of Section 18 of the Securities Exchange Act of 1934, or otherwise subject to the liability
of that Section. Such exhibit shall not be deemed incorporated into any filing under the Securities Act of 1933 or the Securities Exchange Act of 1934.(c) Pursuant to Rule 405 of Regulation S-T, includes the following financial information included in the Firm’s Quarterly Report on Form 10-Q for the quarterly period
ended March 31, 2019, formatted in XBRL (eXtensible Business Reporting Language) interactive data files: (i) the Consolidated statements of income (unaudited) for the three months ended March 31, 2019 and 2018, (ii) the Consolidated statements of comprehensive income (unaudited) for the three months ended March 31, 2019 and 2018, (iii) the Consolidated balance sheets (unaudited) as of March 31, 2019, and December 31, 2018, (iv) the Consolidated statements of changes in stockholders’ equity (unaudited) for the three months ended March 31, 2019 and 2018, (v) the Consolidated statements of cash flows (unaudited) for the three months ended March 31, 2019 and 2018, and (vi) the Notes to Consolidated Financial Statements (unaudited).

161
SIGNATURE
Pursuant to the requirements of the Securities Exchange Act of 1934, the registrant has duly caused this report to be signed on its behalf by the undersigned thereunto duly authorized.
JPMorgan Chase & Co.
(Registrant)
By: /s/ Nicole Giles
Nicole Giles
Managing Director and Firmwide Controller
(Principal Accounting Officer)
Date: May 2, 2019

162
INDEX TO EXHIBITS
Exhibit No. Description of Exhibit
15 Letter re: Unaudited Interim Financial Information.
31.1 Certification.
31.2 Certification.
32 Certification Pursuant to Section 906 of the Sarbanes-Oxley Act of 2002.†
101.INSThe instance document does not appear in the interactive data file because its XBRL tags are embedded within the inlineXBRL document.
101.SCH XBRL Taxonomy Extension Schema Document.
101.CAL XBRL Taxonomy Extension Calculation Linkbase Document.
101.DEF XBRL Taxonomy Extension Definition Linkbase Document.
101.LAB XBRL Taxonomy Extension Label Linkbase Document.
101.PRE XBRL Taxonomy Extension Presentation Linkbase Document.
† This exhibit shall not be deemed “filed” for purposes of Section 18 of the Securities Exchange Act of 1934, or otherwisesubject to the liability of that Section. Such exhibit shall not be deemed incorporated into any filing under the SecuritiesAct of 1933 or the Securities Exchange Act of 1934.

Exhibit 15
May 2, 2019
Securities and Exchange Commission 100 F Street, N.E.Washington, DC 20549
Re: Registration Statements on Form S-3 (No. 333-222672) (No. 333-222672-01) (No. 333-230098)
Registration Statements on Form S-8 (No. 333-219702) (No. 333-219701) (No. 333-219699) (No. 333-185584) (No. 333-185582) (No. 333-185581) (No. 333-175681) (No. 333-158325) (No. 333-142109) (No. 333-125827) (No. 333-112967)
Commissioners:
We are aware that our report dated May 2, 2019 on our review of interim financial information of JPMorgan Chase & Co. and its subsidiaries (the “Firm”), which appears in this Quarterly Report on Form 10-Q, is incorporated by reference in the Registration Statements of the Firm referred to above. Pursuant to Rule 436(c) under the Securities Act of 1933, such report should not be considered a part of such Registration Statements, and is not a report within the meaning of Sections 7 and 11 of that Act.
Very truly yours,
/s/ PricewaterhouseCoopers LLP
PricewaterhouseCoopers LLP, 300 Madison Avenue, New York, NY 10017

Exhibit 31.1JPMorgan Chase & Co.
CERTIFICATION
I, James Dimon, certify that:
1. I have reviewed this Quarterly Report on Form 10-Q of JPMorgan Chase & Co.;
2. Based on my knowledge, this report does not contain any untrue statement of a material fact or omit to state a material fact necessary to make the statements made, in light of the circumstances under which such statements were made, not misleading with respect to the period covered by this report;
3. Based on my knowledge, the financial statements, and other financial information included in this report, fairly present in all material respects the financial condition, results of operations and cash flows of the registrant as of, and for, the periods presented in this report;
4. The registrant's other certifying officer and I are responsible for establishing and maintaining disclosure controls and procedures (as defined in Exchange Act Rules 13a-15(e) and 15d-15(e)) and internal control over financial reporting (as defined in Exchange Act Rules 13a-15(f) and 15d-15(f)) for the registrant and have:
(a) Designed such disclosure controls and procedures, or caused such disclosure controls and procedures to be designed under our supervision, to ensure that material information relating to the registrant, including its consolidated subsidiaries, is made known to us by others within those entities, particularly during the period in which this report is being prepared;
(b) Designed such internal control over financial reporting, or caused such internal control over financial reporting to be designed under our supervision, to provide reasonable assurance regarding the reliability of financial reporting and the preparation of financial statements for external purposes in accordance with generally accepted accounting principles;
(c) Evaluated the effectiveness of the registrant's disclosure controls and procedures and presented in this report our conclusions about the effectiveness of the disclosure controls and procedures, as of the end of the period covered by this report based on such evaluation; and
(d) Disclosed in this report any change in the registrant's internal control over financial reporting that occurred during the registrant's most recent fiscal quarter (the registrant's fourth quarter in the case of an annual report) that has materially affected, or is reasonably likely to materially affect, the registrant's internal control over financial reporting; and
5. The registrant's other certifying officer and I have disclosed, based on our most recent evaluation of internal control over financial reporting, to the registrant's auditors and the audit committee of the registrant's board of directors (or persons performing the equivalent function):
(a) All significant deficiencies and material weaknesses in the design or operation of internal control over financial reporting which are reasonably likely to adversely affect the registrant's ability to record, process, summarize and report financial information; and
(b) Any fraud, whether or not material, that involves management or other employees who have a significant role in the registrant's internal control over financial reporting.
Date: May 2, 2019
/s/ James Dimon
James DimonChairman and Chief Executive Officer

Exhibit 31.2JPMorgan Chase & Co.
CERTIFICATION
I, Marianne Lake, certify that:
1. I have reviewed this Quarterly Report on Form 10-Q of JPMorgan Chase & Co.;
2. Based on my knowledge, this report does not contain any untrue statement of a material fact or omit to state a material fact necessary to make the statements made, in light of the circumstances under which such statements were made, not misleading with respect to the period covered by this report;
3. Based on my knowledge, the financial statements, and other financial information included in this report, fairly present in all material respects the financial condition, results of operations and cash flows of the registrant as of, and for, the periods presented in this report;
4. The registrant's other certifying officer and I are responsible for establishing and maintaining disclosure controls and procedures (as defined in Exchange Act Rules 13a-15(e) and 15d-15(e)) and internal control over financial reporting (as defined in Exchange Act Rules 13a-15(f) and 15d-15(f)) for the registrant and have:
(a) Designed such disclosure controls and procedures, or caused such disclosure controls and procedures to be designed under our supervision, to ensure that material information relating to the registrant, including its consolidated subsidiaries, is made known to us by others within those entities, particularly during the period in which this report is being prepared;
(b) Designed such internal control over financial reporting, or caused such internal control over financial reporting to be designed under our supervision, to provide reasonable assurance regarding the reliability of financial reporting and the preparation of financial statements for external purposes in accordance with generally accepted accounting principles;
(c) Evaluated the effectiveness of the registrant's disclosure controls and procedures and presented in this report our conclusions about the effectiveness of the disclosure controls and procedures, as of the end of the period covered by this report based on such evaluation; and
(d) Disclosed in this report any change in the registrant's internal control over financial reporting that occurred during the registrant's most recent fiscal quarter (the registrant's fourth quarter in the case of an annual report) that has materially affected, or is reasonably likely to materially affect, the registrant's internal control over financial reporting; and
5. The registrant's other certifying officer and I have disclosed, based on our most recent evaluation of internal control over financial reporting, to the registrant's auditors and the audit committee of the registrant's board of directors (or persons performing the equivalent function):
(a) All significant deficiencies and material weaknesses in the design or operation of internal control over financial reporting which are reasonably likely to adversely affect the registrant's ability to record, process, summarize and report financial information; and
(b) Any fraud, whether or not material, that involves management or other employees who have a significant role in the registrant's internal control over financial reporting.
Date: May 1, 2019
/s/ Marianne Lake
Marianne Lake Executive Vice President and Chief Financial Officer

Exhibit 32JPMorgan Chase & Co.
CERTIFICATION PURSUANT TO 18 U.S.C. SECTION 1350, AS ADOPTED PURSUANT TOSECTION 906 OF THE SARBANES-OXLEY ACT OF 2002
In connection with the Quarterly Report of JPMorgan Chase & Co. on Form 10-Q for the period ended March 31, 2019 as filed with the Securities and Exchange Commission on the date hereof (the “Report”), each of the undersigned officers of JPMorgan Chase & Co., certify, pursuant to 18 U.S.C. Section 1350, as adopted pursuant to Section 906 of the Sarbanes-Oxley Act of 2002, that:
1. The Report fully complies with the requirements of Section 13(a) or 15(d) of the Securities Exchange Act of 1934; and
2. The information contained in the Report fairly presents, in all material respects, the financial condition and results of operations of JPMorgan Chase & Co.
Date: May 2, 2019 By: /s/ James Dimon
James Dimon
Chairman and Chief Executive Officer
Date: May 1, 2019 By: /s/ Marianne Lake
Marianne Lake
Executive Vice President and Chief Financial Officer
This certification accompanies this Quarterly Report on Form 10-Q and shall not be deemed “filed” for purposes of Section 18 of the Securities Exchange Act of 1934, or otherwise subject to the liability of that Section.
A signed original of this written statement required by Section 906 has been provided to, and will be retained by, JPMorgan Chase & Co. and furnished to the Securities and Exchange Commission or its staff upon request.
![Dolenjska grupa [Text] (uploaded 10. 10. 2014)](https://static.fdokumen.com/doc/165x107/631e9ee1dc32ad07f307ab90/dolenjska-grupa-text-uploaded-10-10-2014.jpg)